
Bank of Ceylon Annual Report 2018
492
-
Upload
khangminh22 -
Category
Documents
-
view
0 -
download
0
Transcript of Bank of Ceylon Annual Report 2018


Our VisionTo be the Nation’s preferred bank with a strong global presence providing customer centric innovative �nancial solutions.
Our MissionTo provide highly ef�cient, customer focused, technologically sophisticated, resilient and innovative �nancial services to the Nation with global access, empowering employees and enhancing value to the stakeholders.
Corporate Value Statement
In achieving our vision to be the Nation’s preferred bank, with a strong global presence, providing customer centric innovative �nancial solutions, we are committed to upholding our core �ve values as follows:
• Being customer centric
• Respecting all forms of diversity
• Committing towards high level of ethics, governance and professionalism
• Focusing towards agility and innovation
• Being accountable for all our actions
Bankers to the Nation

THE ICON OF TRUSTWith a 79 - year old rich heritage, the Bank of Ceylon has garnered infinite trust and credibility over the years. Occupying the vantage point of Sri Lanka’s banking landscape we reign supreme, positioned as the Number 01 Bank in Sri Lanka.
Resonating the financial aspirations of our nation we reach out to a diverse spectrum of customers from SME’s, corporates to individuals representing all walks of life. Powering our nation with financial strength we stand strong as the ‘Bankers to the Nation’.
Focused on creating future-proof banking through agile, digitally driven platforms, we have earned infinite trust through our robust performance and our contribution to society as a good corporate citizen.
All this makes Bank of Ceylon truly the icon of trust.

Bank of Ceylon | Annual Report 2018
CONTENTS
Bank of Ceylon Annual Report 2018 • 4
Performance Overview 2018 • 6
Highlights In 2018 • 9
Chairman’s Message • 10
General Manager’s Review • 14
Overview of Bank of Ceylon • 20
Our Footprint • 22
Group Structure • 23
Board of Directors • 24
Corporate Management • 28
Executive Management • 40
Approach to Value Creation • 48
Stakeholder Engagement • 50
Strategic Report • 52
Sustainability at BoC • 58
Economic Contribution • 63
Preserving ValueCorporate Governance • 70
Board Subcommittee Reports • 89
Audit Committee Report • 89
Integrated Risk Management Committee Report • 93
Human Resources and Remuneration Committee Report • 96
Nomination and Corporate Governance Committee Report • 98
Information and Communication Technology
Committee Report • 100
Risk Management • 102
Driving Strategy throughBusiness LinesEconomic and Industry Overview • 120
Retail Banking • 126
Corporate and Offshore Banking • 131
International, Treasury, Investment and
Overseas Operations • 134
“As Sri Lanka’s largest financial institution, operating the industry’s most extensive network, Bank of Ceylon is one of Sri Lanka’s most economically and socially impactful organisations.”
“I am proud to report that the Bank retained its position as the undisputed leader in Sri Lanka’s financial services industry, crossed the LKR 2.0 trillion mark in assets, was ranked as Sri Lanka’s No.1 brand..”
Chairman’s Message
General Manager’s Review
• 10
• 14

Creating Value throughOur CapitalsFinancial Capital • 137
Manufactured Capital • 142
Human Capital • 147
Intellectual Capital • 156
Social and Relationship Capital • 160
Natural Capital • 171
Financial ReportsAnnual Report of the Directors on the State of
Affairs of Bank of Ceylon • 179
Directors’ Interest in Contracts • 185
Directors’ Statement on Internal Control over
Financial Reporting • 188
Independent Assurance Report • 190
Directors’ Responsibility for Financial Reporting • 191
Report of the Auditor General • 192
Statement of Profit or Loss • 196
Statement of Comprehensive Income • 197
Statement of Financial Position • 198
Statement of Changes in Equity • 200
Statement of Cash Flows • 204
Notes to the Financial Statements • 206
Compliance AnnexesCompliance with Code of Best Practice on Corporate
Governance 2017 Issued by CA Sri Lanka • 394
Compliance Requirements as per Banking
Act Direction No. 11 of 2007 • 401
Compliance Requirements Enforced by
Colombo Stock Exchange • 428
Compliance Requirements Enforced by
the Central Bank of Sri Lanka • 430
Capital Adequacy • 434
Certificate of the Directors on Transfer Pricing • 448
Supplementary InformationMilestones • 450
GRI Index • 452
Independent Assurance Report • 457
Statement of Profit or Loss in USD • 459
Statement of Comprehensive Income in USD • 460
Statement of Financial Position in USD • 461
Quarterly Performance • 462
Share and Debenture Information • 465
Ten Year Statistical Summary – Bank • 467
Subsidiaries and Associates • 469
Correspondent Banks by Country • 472
Exchange Companies by Country • 478
Glossary of Financial/ Banking Terms • 480
Corporate Offices and Overseas Branches • 485
Corporate Information • 487
Scan the QR Codewith your smart device
to view this report online.

4 Bank of Ceylon | Annual Report 2018
Bank of CeylonANNUAL REPORT 2018
Standards and Principles
The financial statements have been
prepared in line with the Sri Lankan
Accounting Standards issued by the
Chartered Accountants of Sri Lanka. The
narrative report follows the principles of
Integrated Reporting as prescribed in
the International Integrated Reporting
Council’s (IIRC) Integrated Reporting <IR>
Framework. For sustainability reporting,
we have adopted the ‘Core’ criteria of the
GRI Standards published by the Global
Reporting Initiative and have followed
the recommendations for Environment
and Social Governance (ESG) Reporting
by the Colombo Stock Exchange. The
Corporate Governance disclosures are
in line with the requirements of the Bank
of Ceylon Ordinance No.53 of 1938 and
amendments, Banking Act No. 30 of
1988 and subsequent amendments and
the revised Code of Best Practice on
Corporate Governance 2017 issued by
CA Sri Lanka.
Welcome to our Integrated Report
As the primary publication to our stakeholders, this Integrated Annual Report aims
to provide a balanced and comprehensive assessment of how we create value
over the short, medium and long-term while managing the competing interests
of our stakeholders. The Report presents information relating to our business
model, operating landscape, strategy, corporate governance, risk management,
performance and commitment towards sustainability and is anchored by our
material topics which have been determined through a systematic materiality
analysis.
Scope and Boundary
The Report covers the domestic, overseas and offshore operations of
Bank of Ceylon (herein referred to as “BoC”) and its subsidiaries (collectively
referred to as the “Group”) for the period from 1 January 2018 to 31 December
2018. The financial information presented on pages 196 to 392 of this Report
reflects consolidated information while the non-financial information is limited
to that of the parent entity, given its dominance within the Group. We adopt an
annual reporting cycle and this Report builds on the Bank’s previous annual report
for the financial year ending 31 December 2017. There have been no material
restatements of non-financial information provided in the previous report. The
Report has been structured based on the six capitals prescribed by the Integrated
Reporting <IR> Framework.
Rep
ort
ing
Imp
rove
men
ts l Adoption of
the revised
Code of Best
Practice on
Corporate
Governance
2017 issued by
CA Sri Lanka.
l Widened the
coverage of
material topics
beyond those
prescribed
by GRI to
include entity
and industry
specific
topics.
l Followed new
format issued
by CBSL in
presenting
financial
statements.
l Dedicated
chapter on
the Bank’s
contribution to
the economy.
l Refined
structure
to facilitate
improved
readability.
l Compliance
to SLFRS 9.

5
Feedback
We are committed to consistently enhancing the
readability and relevance of our reporting and we
welcome your suggestions and comments on our
Annual Report. Please direct your feedback to,
ReportingConcepts
Connectivity and Comparability
Navigation icons and signposting have been used across the Report to show connectivity.
Relevance and Materiality
The Report is anchored by our material topics which represents information that is vital to our stakeholders.
Reliability
Material topics reflect both positive and negative matters which impacted the Bank’s value creation during the year.
Strategic Focus
The Report has presented the strategies adopted in achieving triple bottom line performance during the year and strategies for 2019 and beyond.
Reporting Boundary
Integrated Reporting
Financial Reporting
Non-Financial Reporting
GROUP
Subsidiaries AssociatesBank
Internal and external
stakeholders, Operating
landscape, Risks and
Opportunities
External Assurance
Financial Reporting and
the Internal control over
Financial Reporting
Corporate Governance disclosures
Sustainability Reporting
Auditor General
Auditor General
BDO Partners: Chartered Accountants
Nav
igat
ion
Ico
ns
Intellectual Capital
Social and Relationship
Capital
Manufactured Capital
NaturalCapital
HumanCapital
FinancialCapital

6 Bank of Ceylon | Annual Report 2018
PERFORMANCE OVERVIEW 2018
Financial Performance Highlights FINANCIAL CAPITAL
Bank Group
2018 2017 Change % 2018 2017 Change %
Results of Operations (LKR million)
Total income 221,131 189,211 16.9 229,462 197,013 16.5
Net interest income 65,558 58,356 12.3 68,689 61,490 11.7
Profit before taxes on financial services 41,480 37,592 10.3 42,246 38,195 10.6
Profit before tax 31,892 30,343 5.1 32,437 30,816 5.3
Profit after tax 19,479 21,312 (8.6) 19,515 21,487 (9.2)
Value to the Government 24,158 28,524 (15.3) 24,583 28,923 (15.0)
Financial Position (LKR million)
Total assets 2,268,154 1,951,804 16.2 2,312,923 1,999,410 15.7
Gross loans and advances 1,510,534 1,219,914 23.8 1,544,357 1,252,363 23.3
Loans and advances net of provisioning for impairment 1,429,107 1,163,161 22.9 1,460,619 1,194,294 22.3
Deposits due to customers 1,765,026 1,546,832 14.1 1,783,975 1,566,376 13.9
Total liabilities 2,146,712 1,840,649 16.6 2,180,782 1,877,084 16.2
Total equity 121,442 111,155 9.3 132,141 122,326 8.0
Per Share Data (LKR)
Basic earnings per share 1,045 1,857 (43.7) 1,048 1,870 (44.0)
Net assets value per share 6,072 7,410 (18.1) 6,574 8,093 (18.8)
Performance Ratios (%)
Return on average assets 1.5 1.7 (0.2) 1.5 1.7 (0.2)
Return on average equity 16.8 20.9 (4.1) 15.3 19.0 (3.7)
Interest margin 3.1 3.2 (0.1) 3.2 3.3 (0.1)
Cost to income 38.1 38.4 (0.3) 40.4 40.5 (0.1)
Loans to deposits 85.6 78.9 6.7 86.6 80.0 6.6
Debt to equity 41.0 41.5 (0.5) - - -
Impairment provision as a percentage of gross loans and advances 5.4 4.7 0.7 5.4 4.6 0.8
Statutory Ratio (%)
Liquid assets ratio (Domestic) (minimum requirement 20%) 24.5 27.2 (2.7) - - -
Liquidity coverage ratio (LKR) (minimum requirement 2018 - 90%, 2017 - 80%) 143.5 141.5 2.0 - - -
Liquidity coverage ratio (All currency) (minimum requirement 2018 - 90%, 2017 - 80%) 115.0 105.0 10.0 - - -
Capital Adequacy Ratios (%)
Common Equity Tier I Capital 10.3 10.8 (0.5) 10.4 10.9 (0.5)
(Minimum requirement- 2018- 7.375%, 2017- 6.250%)
Tier I capital 10.3 10.8 (0.5) 10.4 10.9 (0.5)
(Minimum requirement- 2018- 8.875%, 2017- 7.750%)
Total Capital 14.6 14.6 - 14.6 14.5 0.1
(Minimum requirement- 2018- 12.875%, 2017- 11.750%)

7
Economic Performance Highlights
Social Performance Highlights
2018 2017 Change %
Value creation to Government LKR million 24,158 28,524 (15.3)
Direct new employment creation No. 1,622 534 203.7
Penetration ratio % 62.5 59.8 2.7
Branches outside the Western Province No. 442 443 (0.2)
Road developments financed during the year LKR million 31,696 1,464 (2,065.0)
Renewable power projects financed LKR million 3,600 640 462.5
Inward remittances facilitated LKR million 580,133 449,170 29.2
2018 2017 Change %
Total employees No. 8,724 7,587 15.0
New recruits No. 1,622 534 203.7
Female representation rate % 60 57 3.0
Attrition rate % 0.9 0.3 0.6
Total payments to employees LKR million 18,875 16,996 11.1
No. of promotions No. 174 1,831 (90.4)
Investment in training and development LKR million 338 322 5.0
Total training hours Programme hours 11,768 11,884 (1.0)
Revenue per employee LKR million 25.3 24.9 1.6
Net profit per employee LKR million 2.2 2.8 (21.4)
Employees holding membership in professional bodies No. 371 292 27.1
HUMAN CAPITAL
Non - Financial Performance Highlights
SOCIAL AND RELATIONSHIP CAPITAL
2018 2017 Change %
Total customers No. million 13.4 12.8 4.7
Interest paid to customers LKR million 112,056 92,229 21.5
Customer contact points No. 1,721 1,589 8.3
Payments to suppliers LKR million 6,670 5,179 28.8
Spending on local suppliers % 95.1 91.6 3.5
Investment in CSR LKR million 108 127 (15.0)
No. of university trainees and school leavers trained No. 2,752 1,870 47.2
No. of correspondent relationships maintain No. 859 859 -

8 Bank of Ceylon | Annual Report 2018
PERFORMANCE OVERVIEW 2018
2018 2017 Change %
Brand value LKR million 42,874 40,600 5.6
Employee experience (tacit knowledge) Years 81,627 81,841 (0.3)
Corporate Management experience Years 519 566 (8.3)
2018 2017 Change %
Investment on digital infrastructure LKR million 1,964 1,693 16.0
Capital expenditure on Branch transformation and upgrade LKR million 1,518 1,455 4.3
INTELLECTUAL CAPITAL
MANUFACTURED CAPITAL
Environmental Performance Highlights
2018 2017 Change %
GHG emission Scope 1 (CO2eqv.) Tons 2,902 Not Available -
GHG emission Scope 2 (CO2eqv.) Tons 10,354 Not Available -
Solar generation kWh 885,238 492,230 79.8
Fuel usage Litres 732,101 440,180 66.3
Electricity consumption MWh 21,135 22,325 (5.3)
Water usage m3 501,229 489,560 2.4
Investment in solar LKR million 146 71 105.6
No. of loans screened under ESMS No. 508 Not Available -
NATURAL CAPITAL

9
HIGHLIGHTS IN 2018
Bank of Ceylon has launched
its first BOC DIGI in Kandy City
Centre to provide an end-to-end
digital experience to customers
Reaching 1,000 landmarkin ATM/ CDM/ CRM
Upgraded Core Banking servers with “iSeries Power 8” nonstop servers
Introduced(Near Field Communication)NFC enabled cards
Optical Character Reader (OCR) based state of art technology for inward clearing- “Image Master”
Became the first Sri Lankan Bank to establish Security Operation Centre (SOC) for information security
Be the first state bank to contribute 1Mw to the National Grid
Together with mastercard International, Bank of Ceylon jointly launched the “World mastercard” themed as “Be the master of your journey” and “GMOA Affinity- World mastercard” for the members of the Government Medical Officers Association (GMOA)

10 Bank of Ceylon | Annual Report 2018
CHAIRMAN’S MESSAGE
CHAIRMAN’SMESSAGE

11
Dear Stakeholders,
Bank of Ceylon delivered another year of
strong performance, fortifying its market
leadership position and fostering economic
activity across the island. Despite the
tough operating conditions, the Bank
successfully delivered on its shareholder
commitments and financial objectives,
recording a pre-tax Profit of LKR 31.9
billion, which is a growth of 5% in 2018.
The Bank’s triple bottom line performance
was commendable given numerous
challenges in the operating landscape and
its indeed my pleasure as the Chairman
of this prestigious organisation to present
you the Annual Report for the financial year
ending 31 December 2018.
Bankers to the Nation
As Sri Lanka’s largest financial institution,
operating the industry’s most extensive
network, Bank of Ceylon is one of
Sri Lanka’s most economically and socially
impactful organisations. As a fully-state
owned entity, the Bank’s objectives extend
beyond mere financial performance
to encompass economic and social
objectives and for nearly eight decades we
have directly contributed to the country’s
socio-economic development, partnering
the growth of individuals, entrepreneurs,
businesses and the Government. The
Bank’s growth strategy is closely aligned
to that of the Government’s national
development agenda and in 2018 we
placed strategic emphasis on empowering
entrepreneurs, supporting the SME sector,
lending towards large scale national
infrastructure projects and promoting
financial inclusion across the island. Also
by operating three foreign branches in
Maldives, Seychelles and Chennai and
one subsidiary in the United Kingdom and
maintaining more than 800 correspondent
relationships, the Bank takes pride in
owning largest correspondent network
to serve all financial needs of our nation
which extend beyond borders. We also
marked another milestone in our journey
towards broadening our presence in the
Asian region, with the opening of the
Bank’s second branch in Maldives.
Our Operating Landscape
The operating environment presented
numerous challenges during the year
due to global dynamics as well as
domestic conditions. Global economic
growth remained unchanged over the
previous year at 3.5% reflecting a general
slowdown in growth momentum driven
by region and country-specific factors.
Downside risks remain given escalating
trade tensions between the US and its
main trading partners and tighter financial
conditions in several advanced economies.
As such, global growth forecast for 2019
and 2020 were downwards to 3.5% and
3.6% respectively.
Sri Lanka also witnessed moderating
economic growth due to tightening
liquidity conditions, and subdued investor
and consumer sentiments. GDP growth
clocked in at 3.2% in 2018 led by the
expansion of the Services sector by 4.7%
and Agricultural Sector by 4.8% while
Industrial sector growth slowed to 0.9%
during the year. The regulator adopted
a more expansionary monetary policy
during the first half of the year; however,
the gradual tightening of global financial
conditions led to a more neutral stance
towards the latter part of 2018 resulting in
a gradual increase of market interest rates.
Meanwhile, the Rupee depreciated sharply
by 19% against the US Dollar in 2018 with
cascading effects across the economy.
These trends had a cascading effect on
the country’s Banking sector, which in turn
experienced mixed fortunes. The Sector’s
gross loans and advances grew by 20%
during the year although moderating
economic conditions and a subdued
construction sector led to a sharp increase
in impairments. Gross Non-Performing-
Loans increased by 64% while the sector’s
NPL ratio rose to 3.4% from 2.5% the year
before. Overall the sector’s profit after tax
declined by 9% to LKR 125.9 billion during
the year under review.
The sector’s efforts were also directed
towards complying with Sri Lanka
Financial Reporting Standards (SLFRS)
9 which necessitated a revamping
of systems as well as a change in
employee and customer mind-set. The
implementation of the standard led to an
escalation of impairment charges across
the industry. The industry also sought
to augment capital in line with the full
implementation of BASEL III with several
banks approaching the equity and debt
market to strengthen capital. Given the
sector’s subdued performance, increased
“As Sri Lanka’s largest financial institution, operating the industry’s most extensive network, Bank of Ceylon is one of Sri Lanka’s most
economically and socially impactful organisations.”
“
”

12 Bank of Ceylon | Annual Report 2018
CHAIRMAN’S MESSAGE
taxes and implementation of the Debt
Repayment Levy, shoring up internally
generated funds has been challenging for
the sector. Augmenting capital has been
pronouncedly more difficult for state banks
such as BoC which do not have access to
the equity market.
Strategy and Performance
The Bank’s performance was
commendable given developments in
the economic and industry landscape.
Our strategic actions for the year were
guided by the Bank’s Corporate Plan
(2018-2020); as we sought to reinvent
the Bank’s offering and brand attributes
to attract millennials. Driving customer
centricity was a key area of focus during
the year and we directed investments
towards empowering employees to drive a
consistent customer experience across all
our touch points. Also, in all our capacity
and skills enhancement programmes to
the employees, we continue emphasising
the fact that, It is undoubtedly our ability to
delight customers that is key to retaining
our position as the most sought after
bank in the industry. Although during
the year we focus on digital proposition,
preserving credit quality and employee
capacity building, what remains key point
in deriving the competitive advantage
is superior customer service. Hence,
customer centricity has been the top in our
Corporate cards during the year and also
in years to come.
From a lending perspective, we placed
strategic emphasis on empowering
entrepreneurs and supporting the
country’s SME sector particularly through
the Enterprise Sri Lanka Development
Loan Scheme, an initiative which will be
and catalyst for change in Sri Lanka and
foster entrepreneurship and self-reliance.
The SME sector which covers 75% of
Sri Lankan entrepreneurs has long-since
been identified as the engine of economic
growth and we remain committed to
partnering the Government’s national
development agenda by channelling funds
to this sector to help lifting Sri Lankan
village economy to global value chain
through increased business opportunities.
Since its introduction, BoC has proactively
sought to support entrepreneurial ventures
through the Enterprise Sri Lanka loan
Scheme and I am extremely proud to
report that the Bank is the largest lender
of this programme to date with accounting
to more than 40% market share of loans
disbursed under Enterprise Sri Lanka.
By end-December 2018 the Bank had
disbursed over 10,500 facilities with a
total value of LKR 13.6 billion under this
scheme. BoC has actively participated
to the Enterprise Sri Lanka Loan scheme
by operating 11 credit schemes out of
16 schemes offered under this initiative.
Some of this schemes which BoC
partnered includes “Green Loan”, a
special loan scheme to promote green
technology and environmentally-friendly
businesses. “Rivi Bala Savi”, a dedicated
loan scheme to promote renewable
energy generation. BoC is also a lending
partner in the “Erambuma” loan scheme, a
unique programme which aims to promote
entrepreneurship among the country’s
youth thereby reducing inequalities and
ensuring decent work for all.
The BoC recorded portfolio and pre-tax
profit growth of 24% and 5% respectively
during the year. While the Bank saw a
weakening of its portfolio quality, the
escalation in impairment occurred at a
relatively slower rate in comparison to
industry counterparts given the Bank’s
stringent collection and monitoring
frameworks. The Bank maintained its
market leadership position accounting
for 22% and 24% of the industry’s loans
and deposits by end-December 2018. We
also emerged as the first Sri Lankan bank
to cross the LKR 2.0 trillion milestone in
assets, further cementing our position as
the country’s No. 1 Bank.
Our value creation efforts and customer
experience are facilitated by the motivated
and dedicated BoC team and during the
year we sought to further enhance our
employee value proposition. We seek
to provide opportunities for training and
career development in a conducive and
challenging work environment while
ensuring competitive remuneration. During
the year, we successfully negotiated and
finalised the collective agreement for the
next three years with enhanced benefits to
all employees.
Corporate Governance
The Bank’s corporate governance
framework has evolved to embrace legal
and compliance requirements as well as
emerging industry best practices and
is founded on the highest standards of
corporate conduct and ethics. During the
year under review, 23 Board meetings
were held and a new Board of Directors
was appointed in February 2019.
“It is undoubtedly our ability to delight customers that is key to retaining our position as
the most sought after bank in the industry.”
“
”

13
Main areas of focus of the Board of
Directors included strategy formulation
for 2019-2021 in the areas of, IT and
cyber security risk management and
preserving portfolio quality. A dedicated
ICT subcommittee was also established
during the year with the aim of assisting
the Board in fulfilling its responsibilities
regarding the deployment of technology
across the Bank. The policy framework
was reviewed during the year subsequent
to which an Information Security Policy,
Anti-bribery and Anti-corruption Policy
were introduced.
Commitment to Sustainability As an entity driven by both financial
and social objectives, sustainability
considerations are embedded into all
aspects of our operations. During the
year we sought to further align the
Sustainable Development Goals (SDGs)
to the Bank’s Sustainability Policy and are
currently driving organisation-wide efforts
in encouraging teams to pursue projects
which can directly contribute towards
Sri Lanka’s achievement of SDGs.
Having mentioned those, I am extremely
humbled to report that BoC was ranked
among the country’s top 10 Best
Corporate Citizens by the Chamber of
Commerce- the only state institution
to receive this prestigious recognition.
Our triple bottom line approach to value
creation is also reflected in our corporate
reporting as we continue to adopt the
Integrated Reporting Framework and
the GRI Guidelines for Sustainability
Reporting. Our excellence in corporate
reporting was recognised at the South
Asian Federation of Accountants (SAFA)
Best Presented Annual Report Awards
2018 where our 2017 Annual Report
became the winner. The Report also won
the gold award in the State Institutions
sector at the CA Sri Lanka Annual Report
awards for the second consecutive year.
Way Forward
Sri Lanka’s long-term growth prospects
are extremely encouraging. Policy impetus
towards strengthening entrepreneurial
activities, recommencement of large
infrastructure projects, a booming tourism
industry and stabilisation of macro-
economic fundamentals are expected to
augur well for the economy presenting
numerous opportunities for the country’s
financial sector. BoC will maintain focus
on the objectives clearly outlined in its
Corporate Plan with emphasis on driving
customer centricity, supporting the
country’s SME sector and embracing
digital transformation.
Acknowledgements
As we look forward to an exciting
2019, I wish to extend my gratitude to
my colleagues on the Board for their
continued support in providing strategic
direction to the Bank. I also wish to
congratulate the General Manager
Mr Senarath Bandara, the members of
the management and the BoC team for
their untiring efforts and commitment in
delivering our strategic aspirations. Our
sole shareholder, the Government of
Sri Lanka has always been a pillar of
strength and I wish to place on record my
gratitude to the Hon. Minister of Finance
and the Hon. Minister of Public Enterprise
and Kandy Development and the officials
of the respective Ministries for their
continued support. My appreciation also
goes out to the Governor and officials
of the Central Bank of Sri Lanka and the
Auditor General and his staff for assisting
the Bank in navigating these uncertain
times. Our customers are at the heart of
everything we do, and I am deeply grateful
for their unstinted loyalty and partnership
throughout the Bank’s remarkable
journey. I also wish to thank all our other
stakeholders including suppliers, business
partners, trade unions and communities
for supporting our value creation efforts
and enabling us to contribute towards the
country’s socio-economic development.
Ronald C Perera PCChairman
19 March 2019
Colombo

14 Bank of Ceylon | Annual Report 2018
GENERAL MANAGER’S REVIEW
GENERAL MANAGER’S
REVIEW

15
Dear Stakeholder,
The Bank of Ceylon demonstrated strong
resilience in a year of numerous external
challenges, delivering on its stakeholder
commitments and creating shared value
across its diverse stakeholders. It is
therefore my pleasure to set before you
an overview of the factors that shaped our
strategy and performance in 2018 along
with our prospects for the future. In a year
of momentous achievements, I am proud
to report that the Bank retained its position
as the undisputed leader in Sri Lanka’s
financial services industry, crossed the
LKR 2.0 trillion mark in assets, was ranked
as Sri Lanka’s No.1 brand for the 10th
consecutive year and received 22 local and
international awards for multiple aspects of
its operations. These achievements are a
testament to the Bank’s ability to navigate
market volatilities and uncertainty through
the effective execution of a relevant and
robust strategy.
A Holistic Strategy
Our strategic agenda for 2018 was
guided by the Bank’s Corporate Plan for
2018-2020 themed ‘Refine and Define the
Bank for the future.’ The Plan is centered
on nine strategic pillars including customer
centricity, geographical expansion,
technology and cyber security and people
development (among others) which are
aimed at building a competitive and future-
fit Bank given unprecedented changes
in technology, regulatory developments,
customer preferences and sophistication.
Key areas of strategic focus during 2018
were;
• SME and Development lending: In
aligning with the Government’s national
development agenda of supporting
entrepreneurship and strengthening
the country’s SME sector, the Bank
pursued deeper penetration of this
segment, particularly through the
Enterprise Sri Lanka loan scheme.
This has afforded us the opportunity
of accessing a new customer base
while diversifying our portfolio and
contributing to the country’s socio-
economic development. In 2018
the Bank disbursed LKR 13.6 billion
through 10,507 facilities under the
Enterprise Sri Lanka loan scheme,
emerging as the largest lender of this
programme.
• Digitisation: The digital revolution
in financial services has occurred at
an unprecedented rate, transforming
the way banks interact with their
customers. For BoC, driving digital
adoption in our target market has been
an added challenge given customer
demographics. However, we have
continued to enhance our digital
platforms and self-banking channels
with the aim of enhancing customer
accessibility and convenience.
The Bank relaunched its online banking
platform, the Smart Online Banking
along with the B app in 2018 with
advanced features, introduced BOC
DIGI centres and expanded its network
of CRMs and ATMs.
• Preserving portfolio quality: The
moderation in macro-economic
fundamentals led to increased
repayment pressure with all banks
seeing a weakening of portfolio
quality. The Bank’s efforts towards
strengthening credit appraisal criteria
and deploying increased resources
towards collection and monitoring
enabled it to withstand these pressures
to a certain degree with its gross NPA
ratio clocking in at 3.6%.
• Customer centricity: We are firm
believers of the fact that a delighted
customer is the greatest asset to
the organisation and we adopted
numerous measures to develop a more
customer-centric approach. Given
increasing customer sophistication
and awareness, a customer centric
approach is an essential source
of competitive advantage. Driving
improved customer convenience and
value for money will be core elements
of our strategy and a vital part of the
Bank’s value proposition to customers.
• Employee capacity building: In 2018
we recruited around 1,600 young
employees to our team resulting in
a reduction of the average age of
our employee to 32 years. While
contributing towards the dynamism
and vibrancy of the team, this has
also underscored the importance of
strengthening our talent development
proposition in ensuring that new
employees align with the Bank’s
strategy, systems and processes and
organisational culture. During the
year we invested LKR 338.0 million in
training.
“I am proud to report that the Bank retained its position as the undisputed leader in Sri Lanka’s financial services industry, crossed the LKR 2.0 trillion mark in assets, was ranked as Sri Lanka’s No.1 brand..”
“
”

16 Bank of Ceylon | Annual Report 2018
• Sustainability: As Sri Lanka’s largest
financial institution and one of the
country’s most impactful organisations
we believe that we have a vital role
to play in addressing the country’s
most critical economic, social and
environmental issues and contributing
towards the achievement of the
country’s Sustainable Development
Goals (SDGs). During the year we
formalised the Bank’s Sustainability
Framework to make it more align with
the SDGs, driving concerted efforts
across the Bank in achieving our
sustainability agenda.
The Triple Bottom Line… With an unmatched customer penetration
of over 62%, the country’s most extensive
geographical reach and the largest
advances and deposits portfolio in the
industry, the Bank’s socio-economic
impact on the country is undeniable. As
a state-owned entity and a systemically
important bank our objectives extend
beyond mere financial returns to
encompass wider social and economic
objectives in ensuring that we generate
sustainable value across our stakeholder
universe. As such the concept of triple
bottom line is deeply embedded to our
ethos, calling for co-ordinated thinking
which ultimately results in the ethical and
responsible creation of shared value.
People
Our value creation is driven by a team
of 8,724 dedicated and competent
professionals who facilitate our customer
experience and drive our strategic
ambitions. A unique employee value
proposition centered on opportunities
for training and skill development, a
conducive work environment and a high
level of engagement has allowed the Bank
to emerge as one of the country’s top
employers. In 2018 total value created for
our employees increased by 11% to
LKR 18.9 billion while more than 93%
employees were covered via training
during the year.
We serve an island-wide base of over 13
million diverse customers, offering an array
of advances, deposits and transactional
products. Our brand attributes of trust
and stability is a key source of competitive
edge allowing us to nurture meaningful
and long-term customer relationships. In
recent years, strategic focus has been
placed on strengthening our market
position amongst the country’s youth
through enhancing our digital self-service
channels and refining our brand strategy to
attract a younger demographic.
An extensive rural network and a deep
commitment towards driving economic
empowerment has enabled the Bank to
actively support the Government’s financial
inclusion agenda through providing access
to affordable financing. The Bank’s unique
micro-financing initiative, “BoC Mithuru”
is designed to nurture financial discipline
and support the economic activity of the
country’s most underprivileged strata and
during the year we have disbursed
LKR 64.4 billion among our SME and
Micro-Financing customers. Customers
we have offered Micro Financing facilities
during the year accounts to over 496,000.
The Bank also has over 50 credit schemes
through which funding is channelled for
specific developmental purposes.
Profit
The Bank delivered a year of strong
financial performance in 2018 achieving
a 5% growth in pre-tax profit to
LKR 31.9 billion despite an array of
economic and industry challenges. The
operating landscape during the year
was characterised by global geopolitical
tensions, a slowdown in Sri Lanka’s
construction sector and adverse weather
conditions during the first half of the year
which affected the agriculture sector.
Despite these challenges the Bank
recorded a loan growth of 24% supported
by growth in the corporate and retail
banking books. Although interest rates
recorded an up-tick during the year the
Bank maintained its lending rates in
view of providing relief to customers.
Accordingly, The Bank’s net interest
margin narrowed to 3.1%, from 3.2% the
year before.
The entire industry witnessed a
deterioration of portfolio quality during
the year, reflecting economic stresses,
increased indebtedness in the micro-
financing sector and a weak agricultural
sector. The Bank too was not insulated
from these pressures although proactive
collections and rigorous monitoring
enabled BoC to preserve its credit quality
GENERAL MANAGER’S REVIEW
“Our brand attributes of trust and stability is a key source of competitive edge allowing us to nurture meaningful and long-term customer relationships.”
“
”

17
to a certain extent. The gross NPL ratio
increased to 3.6% from 2.8% the year
before. Reflecting the underlying quality
of the portfolio and the implementation of
the provisioning requirements of SLFRS-9,
impairment charges on loans and
advances increased by 48% during the
year, compared to an industry escalation
of 104%.
The Bank’s total operating expenses
increased by 19% during the year while
the cost to income ratio of 38% is
amongst the best in the industry. However,
the Bank has reported LKR 9.6 billion of
taxes on financial services with an increase
of 32% and the income tax of LKR 12.4
billion with an increase of 38% YoY. Debt
Repayment Levy (DRL) imposed under the
new Inland Revenue Act and the removal
of some concessions allowed previously
had their impacts. Profit after tax showed
a 9% decline with the resultant increase in
tax charge.
During the year the Bank paid LKR 4.8
billion as dividend to the Government
adding up the contribution made to the
Government to LKR 24.2 billion when
taxes are brought in to consideration.
The Bank maintained all its regulatory
ratios above the required norms and
successfully complied with the Basel
III norms and the Financial Statements
also has been prepared in line with the
SLFRS-9 specifications.
Planet
Although as a financial institution our direct
impact on the environment is limited,
we are cognisant of the role we can
play in propagating good environmental
practices through our lending and in
our own activities and operations. A
comprehensive Environmental and Social
screening framework is in place for
lending, ensuring that environmental and
social considerations are embedded into
the credit appraisal mechanism. The Bank
also proactively lends towards ‘green
projects’ including the installation of solar
panels, waste to energy projects and wind
projects. I am also extremely proud to
report that we have converted 27 of our
branches to solar energy resulting in the
contribution of 1 MW of renewable energy
to the national grid.
Balancing Profitability and Stability
Implementation of the Basel III guidelines
and the higher provisioning requirements
resulting from SLFRS-9 have placed
greater demand on banks to enhance
capital. As an entirely state-owned
institution the challenge is further
compounded for BoC as we are unable
to access the equity market for capital
augmentation. An equity infusion of
LKR 5.0 billion by the Government during
the year has strengthened the Bank’s
financial position although we will be
required to astutely balance growth
aspirations with capital requirements in
the coming year. While the implementation
of SLFRS-9 will lead to a more resilient
banking sector, it has required a
substantial change in the mindset of
both employees and customers and,
in the short-term, has led to increased
complexity.
Way Forward
As we embark on the Bank’s 80th
anniversary in 2019, I look forward to an
exciting and eventful year in which we
will continue to drive towards fulfilling
our economic and social aspirations.
The macro-economic environment is
expected to record improvement over
the medium to long term given effective
monetary policy, more conducive weather
patterns, stabilising oil prices and gains
made on the policy front. Our strategy
will be directed towards capitalising on
the opportunities presented by a growing
economy while aligning ourselves with the
national development agenda. Improving
customer centricity, people development,
brand enhancement and preserving
portfolio quality will be key areas of priority
during the year as we consolidate our
position as Sri Lanka’s leading financial
institution.
Acknowledgements
As the year draws to a close, I would like
to extend my gratitude to the Chairman
and the Board of Directors for their vision
and valuable counsel. I am extremely
proud to lead such a dedicated team and
wish to thank the Corporate and Executive
Management, all employees for their
commitment and efforts in delivering the
results set out in this Annual Report, the
trade unions for their cooperation and
the former employees and our valued
customers for their continuous loyalty to
our Brand. I also wish to thank the Minister
of Finance and Minister of Public Enterprise
and Kandy Development and officials of
these ministries for their continued support.
The Central Bank of Sri Lanka has provided
sterling support in ensuring the creation
of a stable and resilient financial sector
and I wish to express my appreciation of
their efforts. My gratitude also goes out
to the Auditor General and his staff for
the execution of the audit of the Financial
Statements enabling the timely publication
of this Report.
Senarath BandaraGeneral Manager
19 March 2019
Colombo

Leveraging technology to capture the growth
potential of the digital eco-system, we are in sync
with the far-reaching aspirations of our customers.
We reach out to deliver customer-centric banking experiences to inspire digital lifestyles of the youth of our country.


20 Bank of Ceylon | Annual Report 2018
OVERVIEW OF BANK OF CEYLON
Bank of Ceylon is the undisputed market leader
in Sri Lanka’s banking sector and one of the
country’s most economically and socially impactful
organisations. Accounting for a respective
22% and 24% of industry assets and deposits
2018, the Bank is a financial powerhouse with a
customer penetration rate of approximately 62%,
and the industry’s most extensive network of 1,714
direct customer contact points across the island.
As a fully-state owned entity, BoC has directly
contributed to the country’s socio-economic
development, partnering the growth of individuals,
entrepreneurs, businesses and the Government
for nearly eight decades. The Bank’s international
reach is fortified through three overseas branches,
one foreign subsidiary, 758 correspondent banks
and 101 exchange companies in 170 markets.
BoC is powered by a team of 8,724 island-wide
employees who serve a base of over 13.4 million
customers.
The Bank has 10 subsidiaries and four associate
companies which collectively form the BoC Group.
Subsidiaries are involved in diverse operations
ranging from financial services, property
management services and hydropower generation
among others. The Bank is by far the largest
entity within the Group, accounting for 98% of
consolidated assets.
As a systemically important state-owned financial
institution, the Bank’s role extends beyond that of
mere financial intermediation. BoC plays a focal
role in providing access to finance to underserved
segments, promoting financial literacy, partnering
the Government in national development projects
while maintaining public confidence in the financial
system and safeguarding public interest.
The Bank has obtained credit ratings from both
international and domestic accredited credit rating
agencies and successfully maintained its rating
throughout the year.
Market PositionSri Lanka’s largest financial institution in terms of assets, loans and advances, deposits and profit.
LKR
2.3trillion Assets
LKR
1.8trillion
Deposits
Financial Stability
Beyond the Numbers
AA+(lka) Stable
Fitch Ratings Lanka (SL)
AAA StableICRA Lanka Limited
LKR
24.2billion
Value Created to the Government
(Dividends + Taxes)
LKR
338.0million
Investment in training and development
A Sustainable Business

21
1 13.4 millionCustomers
(62% of population)
1,721Customer
touch points (direct)
B2 Stable
Moody’s Investor Services
B Stable
Fitch Ratings
Unqualified audit opinion over the years
14.6%Total Capital
10.3%CET 1 Capital
1.5%ROAA
7 millionsheets of A4 paper savings from digital
initiatives
LKR
3,600.0millionLending to
renewable energy
27Solar powered
branches
LKR
64.4 billion
Disbursements to the SME and Micro Finance Sector
LKR
139.3billion
Lending to Infrastructure
Projects
LKR
551.5 billion
Investments in Government
Securities
LKR
107.9million
Investment in CSR
Brand Finance and Inter-brand rankings
1. Assets 22%2. Deposits 24%3. Gross Loans and Advances 22%4. PBT 17%
1
2
3
4
l Bank l Others
Sri Lanka’s No.
Brand

22 Bank of Ceylon | Annual Report 2018
Northern Province
North Western Province
Western Province
Sabaragamuwa Province
57 02 01 76 33 02 02
63 05 01 52 17 01 01
125 13 01 232 90 03 01
39 02 01 53 19 01 02
65 03 01 85 37 02 03
49 02 01 64 17 01 02
North Central Province
49 02 65 24 02 01
Eastern Province
55 03 42 14 01 01
Central Province
65 06 84 27 01 02
Uva Province
Southern Province
Our Footprint
OVERVIEW OF BANK OF CEYLON
Northern Province
North Western Province
Western Province
Sabaragamuwa Province
57 02 01 76 33 02 02
63 05 01 52 17 01 01
125 13 01 232 90 03 01
39 02 01 53 19 01 02
65 03 01 85 37 02 03
49 02 01 64 17 01 02
North Central Province
49 02 65 24 02 01
Eastern Province
55 03 42 14 01 01
Central Province
65 06 84 27 01 02
Uva Province
Southern Province
Total Customer Touch Points
Branches 577
Limited Service
Branches52
Mobile Branches 06
ATMs 776
CDMs/ CRMs 281
Regional Loan
Centres14
SME Centres 15
Corporate Branches 05 14 17 03
Premier Banking 1 - 1 -
Overseas Branches 3 - 4 -
FCBU 1 - - -
Mobile Unit - - 1 -
Corporate and Overseas Customer Touch Points
MaldivesSeychelles
India

23
Group Structure
BANK OF CEYLON
Associates Subsidiaries
100%
95.55%
99.99%
100%
100%
100%
74.49%
Ceybank Asset
Management Limited
Bank of Ceylon (UK) Limited
BOC Management & Support
Services (Private) Limited *
Property Development PLC
BOC Property Development
& Management (Private) Limited
Hotels Colombo (1963) Limited
BOC Travels (Private) Limited
Merchant Bank of Sri Lanka
& Finance PLC
MBSL Insurance
Company Limited
Southern Development
Financial Company Limited *
Transnational Lanka Records
Solutions (Private) Limited
Lanka Securities
(Private) Limited
Koladeniya
Hydropower
(Private) Limited
Ceybank Holiday
Homes (Private)
Limited
95.55%43.36%
41.67%
24.69%
41.60%
100%
62.66%
42.86%
100%
42.86%
14.28%
84.12%
20%
24.69%
41.67%
43.36%100%
95.55%
99.99%
100%
100%
100%
74.49%
29%
* Not in Operation

24 Bank of Ceylon | Annual Report 2018
BOARD OF DIRECTORS
1. Mr Ronald C Perera, PC- Chairman/ Independent Non-Executive Director
2. Mr K A Vimalenthirarajah- Ex-officio Director/ Non-Independent Non-Executive Director
3. Mr Kumar Mayadunne- Independent Non-Executive Director
4. Mr P A Schaffter- Independent Non-Executive Director
5. Ms Janaki Senanayake Siriwardane- Secretary, Bank of Ceylon/ Secretary to the Board

25
Mr Ronald C Perera, PCChairman Independent Non-Executive Director
Date of Appointment:
12 February 2019 (Assumed duties on 14 February 2019)
Skills and Experience:
Mr Perera is a President’s Counsel with extensive experience in
the original courts as well as in the Court of Appeal and Supreme
Court with expertise in Civil and Criminal litigation, negotiation and
drafting of commercial and transport contracts and agreements.
He has specialised in the areas of Commercial Law, Banking
Law, Industrial Law, Injunctions, Defamation, Election Petitions,
Civil Appeals, Revision Applications, Writ Applications and
Fundamental Rights Cases. He has also appeared in several
Commercial Arbitrations.
He holds a Bachelor of Laws (LLB) from the University of Colombo
and a Master of Laws (LLM) in International Trade Law from
Northumbria University, United Kingdom.
Other Appointments:
Acting Chairman of Hotels Colombo (1963) Limited.
Previous Key Appointments:
Chairman and Director of Bank of Ceylon, Chairman, Bank of
Ceylon (UK) Limited, Chairman of Merchant Bank of Sri Lanka and
Finance PLC, Director of Mireka Capital Land (Private) Limited and
Mireka Homes (Private) Limited.
01
0203
0405

26 Bank of Ceylon | Annual Report 2018
Mr K A Vimalenthirarajah Ex-officio Director Non-Independent Non-Executive Director
Date of Appointment:
27 February 2019
Skills and Experience:
Mr Vimalenthirarajah is an Attorney - at - law who counts over
24 years of experience in the public service. He holds a Special
Degree in Economics from the University of Jaffna, Master of
Philosophy in Economics from the University of Peradeniya,
Master of Business Administration from the University of
Moratuwa and Bachelor of Laws from the Open University of
Sri Lanka. He has also completed a Postgraduate Diploma
in Development Studies and Public Policy, a Postgraduate
Diploma in International Relations, a Diploma in Human Resource
Management and a Diploma in Information Technology.
Other Appointments:
Director General-Department of Fiscal Policy at the General
Treasury, Member of the National Trade Negotiation Team of
Sri Lanka and the Country Director to the SAARC Development
Fund. Currently he is also representing the Treasury on the Boards
of Sri Lanka Tourism Promotion Bureau, Board of Investment of
Sri Lanka, Ceylon Petroleum Corporation, the Sri Lanka Insurance
Corporation and the Institute of Human Resource Advancement of
the University of Colombo.
Previous Key Appointments:
Alternate Director to the previous Ex-officio Director of
Bank of Ceylon, Director General of the Department of Trade
and Investment Policy, Senior Assistant Secretary in charge
of Administrative Reforms, the Chief Information Officer of the
Ministry of Public Administration and Home Affairs, Minister
Counsellor of the Sri Lanka Embassy in Beijing, China.
BOARD OF DIRECTORS
Mr Kumar Mayadunne Independent Non-Executive Director
Date of Appointment:
21 February 2019
Skills and Experience:
Mr Mayadunne is a retired Banker with over 45 years of multi-
disciplinary banking experience covering the areas of Strategy,
Treasury, Operations, Personal Banking, Compliance, International
Operations and Business Process Re-engineering. During the early
stages of the introduction of the free economy he contributed
immensely to establish the Foreign Exchange market operations
and was widely credited for the introduction of Custodial Services
to foreign clients to facilitate their stock market operations in
Colombo. More recently as the Chief Operating Officer of SANASA
Development Bank, he gave leadership to their transformation
process through an International Finance Corporation assisted
project.
Mr Mayadunne is an alumnus of the Ashridge Business School,
United Kingdom, holds a Diploma in Bank Management and has
had extensive overseas training and attachments with Standard
Chartered Bank’s overseas operations.
Other Appointments:
Banking Consultant
Previous Key Appointments:
Held many senior positions at Standard Chartered Bank, People’s
Bank, Nations Trust Bank and SANASA Development Bank.
He also served as a Banking Consultant at M/s Ernst & Young,
Chartered Accountants and as an Independent Director at Indra
Finance Limited.

27
Mr P A Schaffter Independent Non-Executive Director
Date of Appointment:
26 February 2019
Skills and Experience:
Mr Schaffter is a Fellow of the Chartered Insurance Institute of the
United Kingdom with over 25 years of experience in the Insurance
industry in both Sri Lanka and the United Kingdom. He holds
a Master’s in Business Administration from the University of
Cambridge, United Kingdom and a Bachelor’s Degree in Political
Science from the University of London, United Kingdom.
Other Appointments:
Chairman of Janashakthi Insurance PLC, Director of Janashakthi
PLC, Orient Finance PLC (formerly Bartleet Finance PLC),
Dunamis Capital PLC and First Capital Holdings PLC.
Previous Key Appointments:
Held Board positions at Softlogic Finance PLC, Kanrich Finance
PLC and Acland Insurance Brokers. He also served as Director/
General Manager at Janashakthi Insurance Company Limited and
Managing Director of Janashakthi Insurance PLC. He is also a
former President of the Insurance Association of Sri Lanka.
Ms Janaki Senanayake SiriwardaneSecretary, Bank of Ceylon/ Secretary to the Board
Profile given on page 33.

28 Bank of Ceylon | Annual Report 2018
CORPORATE MANAGEMENT
Seated (Left to Right)
Ms Gaya Jayasinghe, Mr Senarath Bandara (General Manager), Mr W P Russel Fonseka, Ms Janaki Senanayake Siriwardane
Standing (Left to Right)
Mr M J P Salgado, Dr Indunil Liyanage, Mr W N P Surawimala, Mr P M Liyanage, Mr C Amarasinghe, Mr D M L B Dassanayake,
Mr K E D Sumanasiri, Mr M M Luxaman Perera, Mr R M D Vipula Jayabahu, Mr E M Jayaratne, Ms W I Hettihewa,
Mr D P K Gunasekera, Mr D N L Fernando

29

30 Bank of Ceylon | Annual Report 2018
CORPORATE MANAGEMENT
Mr Senarath BandaraGeneral Manager
Appointed as the General Manager
on 22 February 2018
Appointment to the Corporate
Management: March 2012
Directorships in Group of Companies:
Merchant Bank of Sri Lanka & Finance
PLC, Hotels Colombo (1963) Limited,
Koladeniya Hydropower (Private)
Limited, BOC Management & Support
Services (Private) Limited, BOC Property
Development & Management (Private)
Limited, BOC Travels (Private) Limited,
Bank of Ceylon (UK) Limited, Ceybank
Asset Management Limited
Skills and Experience:
Mr Bandara is a career banker counting
over 29 years of experience in different
aspects of banking locally and overseas.
He graduated from the University of
Kelaniya, Sri Lanka with Bachelor of
Science Degree in Physical Science and
obtained his Master’s Degree in Business
Administration with a Merit Pass from the
Postgraduate Institute of Management
(PIM), University of Sri Jayewardenepura,
Sri Lanka. He is also a Fellow Member of
the Institute of Bankers of Sri Lanka and
has obtained an Executive Postgraduate
Diploma in Bank Management from
the same institute. He has successfully
completed the Advanced Management
Programme conducted by the Harvard
Business School (HBS), USA and is a
member of the Alumni of the HBS, USA
as well.
Positions Held in Corporate
Management:
Deputy General Manager
(Product and Development Banking) –
January 2013 to July 2016
Deputy General Manager
(Sales and Channel Management) –
July 2016 to 21 February 2018
Other Positions Held During the Year:
Mr Bandara serves as the present
Chairman of the Asia Pacific Rural and
Agricultural Credit Association (APRACA)
and as a member of the Governing Board
of the Institute of Bankers of Sri Lanka
as well. He is also the immediate Past
President of Association of Professional
Bankers of Sri Lanka, the premier body of
professional bankers in Sri Lanka.
Career Milestones:
Mr Bandara commenced his career with
the Bank in 1990 and gained exposure
both locally and internationally, mainly
in the fields of information systems,
investment, treasury management,
international banking operations and
corporate banking. He successfully
spearheaded the process of converting
Bank of Ceylon operations in London from
branch to a subsidiary, when he was the
Assistant General Manager (Overseas
Branches). Later, he served as the
Assistant General Manager (International)
and Assistant General Manager (Corporate
Relations) prior to being appointed as the
Chief Executive Officer of Bank of Ceylon
(UK) Limited in 2011.
He has been very much a part of the
technology-driven initiatives of the Bank
and provided leadership to the core
banking upgrade project in 2013/14 and
the Bank-wide transformation project
implemented with Boston Consulting
Group in 2014/15. He had been a resource
person at the Institute of Bankers of
Sri Lanka in the field of credit and
investment management.
Mr W P Russel FonsekaChief Financial Officer/
Deputy General Manager
(Corporate and Offshore Banking)
Appointment to the Corporate
Management: March 2012
Directorships in Group of Companies:
Merchant Bank of Sri Lanka & Finance
PLC, Property Development PLC, Ceybank
Asset Management Limited, Lanka
Securities (Private) Limited, Transnational
Lanka Records Solutions (Private) Ltd.,
Transnational Lanka (Private) Ltd.
Skills and Experience:
Mr Fonseka carries more than 29 years
of extensive experience in both local
and international commercial banking
operations, specialising in financial
management, corporate and strategic
planning, budgetary control systems,
investments and treasury management,
retail banking and corporate and offshore
banking activities of the Bank.
He graduated from the University
of Sri Jayewardenepura, Sri Lanka
with a Bachelor of Science (Special)
Degree in Business Administration and
obtained Master’s Degree in Business
Administration from the University of
Southern Queensland, Australia. He holds
a Postgraduate Diploma in Management
from the Postgraduate Institute of
Management (PIM), University of Sri
Jayewardenepura, Sri Lanka and has
successfully completed the Advanced
Management Programme conducted by
the Harvard Business School, USA.

31
Mr Fonseka is a Fellow Member of the
Institute of Chartered Accountants of
Sri Lanka, an Associate Member of the
Institute of Bankers of Sri Lanka and a
Member of the Alumni of the Harvard
Business School of USA as well.
Positions Held in Corporate
Management:
Deputy General Manager
(Finance and Planning) – March 2012 to
May 2013/ April 2015 to December 2016
Deputy General Manager
(Retail Banking) – May 2013 to April 2015
Acting Chief Financial Officer
July 2014 to March 2016
Chief Financial Officer
Since March 2016 to Present
Deputy General Manager
(International, Treasury and Investment) -
February 2017 to March 2018
Deputy General Manager (Corporate and
Offshore Banking) – Since March 2018
Other Positions Held During the Year:
Mr Fonseka serves as an Alternate
Director on the Board of LankaClear
(Private) Limited and acts as the Chairman
of the Audit Committee of same since
November 2012. He acts as the Chairman
to Audit Committees of Merchant Bank
of Sri Lanka & Finance PLC and Property
Development PLC as well.
Career Milestones:
Commencing the banking career in 1990
as a Management Trainee, Mr Fonseka
acquired profound knowledge and
intensive experience in retail banking,
first serving at branch level. He has also
gathered comprehensive knowledge
and hands-on experience in treasury
management and international banking
activities while serving at the
Bank of Ceylon London branch.
With his assignment to the Finance
and Planning Division, Mr Fonseka
pioneered in transiting the finance and
planning operations to a new phase
and was instrumental in reforming
working structures of Finance Division,
including instigating of a separate unit
for Taxation, through which a systematic
taxation procedure was implemented and
monitored in branch network. He guided
and lead the finance team to bring about
the Bank’s Annual Report to a competitive
standard, resulting local and international
acclaims upon the Bank with numerous
Awards.
Being the Chief Financial Officer cum
Deputy General Manager (Corporate and
Offshore Banking), Mr Fonseka currently
is of service of dissemination of his
specialised knowledge in preparation
and launching of the Bank’s Corporate
Plans, maintaining and controlling of the
Bank’s funds, monitoring of corporate and
offshore banking activities and keeping a
good rapport with Bank’s customer base.
Mr D P K GunasekeraDeputy General Manager
(International, Treasury and Investment)
Appointment to the Corporate
Management: February 2013
Directorships in Group of Companies:
BOC Management & Support Services
(Private) Limited
Skills and Experience:
Mr Gunasekera carries more than 39 years
of banking experience in different business
operations in the Bank.
He is a Bachelor of Science (Business
Administration) Graduate of the University
of Sri Jayewardenepura, Sri Lanka and
holds a Postgraduate Diploma in Business
and Finance Administration from the
Institute of Chartered Accountants of
Sri Lanka. He has also obtained Master’s
of Business Administration from the
University of Southern Queensland,
Australia. Mr Gunasekera is an Associate
Member of the Institute of Bankers
of Sri Lanka and has completed the
Management Development Programme
conducted by the Postgraduate Institute of
Management (PIM), University of
Sri Jayewardenepura, Sri Lanka.
Positions Held in Corporate
Management:
Deputy General Manager (Retail Banking) –
From February to May 2013
Deputy General Manager (Corporate and
Offshore Banking) – From May 2013 to
March 2018

32 Bank of Ceylon | Annual Report 2018
Deputy General Manager (International,
Treasury and Investment) – Since March
2018
Other Positions Held During the Year:
Mr Gunasekera serves as a Director on
the Board of Lanka Securities (Private)
Limited and also a member of the Special
Standing Cabinet Appointed Procurement
Committee of the Ceylon Petroleum
Corporation.
Career Milestones:
Mr Gunasekera joined the Bank in 1980
and commenced his career in retail
banking, obtaining a vast experience in
branch network. He later served in Central
Cash and Accounts Departments as
well. He has also gathered an extensive
knowledge in treasury and money market
operations locally as a Dealer and globally
as the Head of Treasury at Bank of Ceylon
Chennai Branch and at the Bank of Ceylon
London Branch, Dealing Room.
Mr Gunasekara has also served as the
Deputy Manager, Chennai Branch from
2008-2010.
He was the first Chief Dealer in Ceybank
Securities Limited and also one of the
pioneer members in setting up the middle
office of the Bank of Ceylon Treasury
Division. Mr Gunasekera also held the
positions of Assistant General Manager
(Overseas Branches) and Assistant
General Manager (Corporate Relations)
prior to being appointed to the Corporate
Management.
Mr K E D SumanasiriDeputy General Manager
(Human Resource)
Appointment to the Corporate
Management: May 2013
Directorships in Group of Companies:
Ceybank Holiday Homes (Private) Limited,
Koladeniya Hydropower (Private) Limited
Skills and Experience:
Mr Sumanasiri possesses 29 years of
rich and diversified experience in retail
banking, microfinance, corporate finance
and human resource development.
He graduated from the University of
Sri Jayewardenepura, Sri Lanka with a
Bachelor of Science (Hons.) Degree in
Business Administration and possesses
an Associate Membership of the
Institute of Bankers of Sri Lanka. He
has followed a “Special Management
Course for Higher Management and
Public Policy for Business Leaders” and a
“Management Development Programme
for Key Management Personnel”, both
conducted by the Postgraduate Institute
of Management (PIM), University of
Sri Jayewardenepura, Sri Lanka and a
Leadership course at the Harvard Business
School of Harvard University, USA.
CORPORATE MANAGEMENT
Positions Held in Corporate Management:
Deputy General Manager
(Recovery) – May 2013 to April 2014/
February 2015 to December 2016
Deputy General Manager
(Human Resource) – April 2014 to February
2015/ December 2016 to Present
Other Positions Held During the Year:
Mr Sumanasiri serves as an Alternate
Director of the Governing Board of Institute
of Bankers of Sri Lanka (IBSL).
Career Milestones:
Commencing his banking career in 1990,
Mr Sumanasiri held several key positions
while serving in the branch network. He
had been a Faculty Member at the Bank’s
Training Institute, holding the position
of Manager (Training). He was fervent
in enhancing the knowledge of the staff
and was very instrumental in their career
development. Before being appointed to
the Corporate Management, he held the
position of Assistant General Manager
(Northern Province) playing a leading role
in uplifting of livelihood of the resettled
people and contributing immensely to the
boom of the economy of the Northern
Province.

33
Ms Janaki Senanayake SiriwardaneSecretary, Bank of Ceylon/ Secretary to
the Board
Appointment to the Corporate
Management: October 2010
Skills and Experience:
Ms Siriwardane counts over 23 years of
experience in the Bank specialising in
company secretarial work and Corporate
Governance practices.
She is an Attorney-at-Law by profession
and holds a Bachelor’s Degree in Law. She
also holds a Master’s Degree in Business
Administration with a merit pass from the
University of Colombo, Sri Lanka.
Other Positions Held During the Year:
She serves as the Company Secretary of
Ceybank Holiday Homes (Private) Limited
and BOC Management and Support
Services (Private) Limited.
Career Milestones:
Ms Siriwardane joined the Bank in January
1996 as its Assistant Secretary to the
Board and was appointed as the Secretary
to the Board/ Secretary, Bank of Ceylon in
November 2005.
She also serves as the Secretary to all
the Subcommittees of the Board and
also facilitates Bank’s compliance with
the Corporate Governance rules and
practices.
Prior to joining the Bank of Ceylon, she
practiced as an Attorney-at-Law in the
private Bar and thereafter worked in a
group of companies, handling company
secretarial work including IPOs, mergers
etc. along with legal and HR work.
She was also a visiting Lecturer in
Commercial and Industrial Law at the
Industrial Management Department of the
University of Kelaniya, Sri Lanka.
Mr D N L FernandoChief Risk Officer
Appointment to the Corporate
Management: December 2015
Directorships in Group of Companies:
Merchant Bank of Sri Lanka & Finance
PLC, Alternate Director in Property
Development PLC
Skills and Experience:
Mr Fernando possesses over 33 years
of remarkable service with Bank of
Ceylon gathering specialised knowledge
and experiences in diversified banking
operations of the Bank.
He graduated from the University of
Colombo, Sri Lanka with a Bachelor of
Science Degree in Mathematics and holds
an Associate Membership of the Institute
of Bankers of Sri Lanka.
Career Milestones:
Commencing the banking career,
Mr Fernando first served in branch network
mainly in Central and Uva Provinces
acquiring comprehensive knowledge and
experience in retail banking operations of
the Bank. He later served in Recovery, and
Product and Development Banking Units
where he was instrumental in introducing
some innovative products and services. He
has also gained splendid experiences in
overseas banking operations while serving
at Bank of Ceylon (UK) Limited for one
year in 1995 and three years in Karachi
Branch of the Bank in Pakistan.
Being in the capacities of Assistant
General Manager (Western Province South)
for four years and the Chief Executive
Officer of Bank of Ceylon (UK) Limited
for three years, Mr Fernando immensely
contributed in stimulating and facilitating
his staff in reaching towards Bank’s
interests. On his return to Sri Lanka, he
was appointed the Chief Risk Officer of the
Bank.
As the Chief Risk Officer, he has been
pioneered in changing the risk culture of
the Bank, widening of the scope of Risk
Management Division and overhauling
the reporting on the Bank’s risk profile at
various levels.

34 Bank of Ceylon | Annual Report 2018
Mr M M Luxaman PereraHead of Information Technology
Appointment to the Corporate
Management: August 2013
Skills and Experience:
Mr Perera counts over 33 years of
experience in the Bank and has gained a
wide range of experience in ICT in different
capacities.
He is a Science Graduate from the
University of Colombo, Sri Lanka and
holds a Master of Science in Computer
Science and also a Master of Business
Administration from the University of
Colombo, Sri Lanka. He is a Fellow
Member of the Computer Society of
Sri Lanka and a Member of the British
Computer Society as well.
Other Positions Held During the Year:
Mr Perera served as the Chairman of
Banks’ CIO Forum and a member of the
FINCSIRT Steering Committee.
Career Milestones:
Mr Perera joined the Bank in 1986 as
a Systems Analyst Programmer and
commenced his services with Core
Banking Application Systems. His
experience was enriched through his
active involvement in multiple ICT projects.
Prior to being appointed to the Corporate
Management he held the position of
Assistant Director Information Technology
(Application Systems).
He has also served at the Standard Bank
of South Africa during the period from
1996-1997.
Ms Gaya JayasingheChief Legal Officer
Appointment to the Corporate
Management: June 2016
Directorships in Group of Companies:
BOC Management & Support Services
(Private) Limited, BOC Travels (Private)
Limited
Skills and Experience:
Ms Jayasinghe counts more than 35
years of experience in the legal field and
possesses over 32 years of experience at
Bank of Ceylon. She is an Attorney-at-Law
and Notary Public with a Post-Attorney
Diploma in International Trade Law. She is
also a member of the Bar Association of
Sri Lanka and a Member of the Executive
Committee of the Association of Corporate
Lawyers of Sri Lanka.
She has significant experience in credit
documentation and banking law. She has
also undergone international training in
the fields of Advance Loan Documentation
and Law and Practice of Guarantees and
Stand- by Letters of Credit in International
Trade in Singapore and Hong Kong
conducted by Euro Money Training Asia
Pacific.
Career Milestones:
She joined the Bank in July 1986 as an
Assistant Legal Officer and commenced
her career in the Legal Department. She
got the opportunity to serve in several
Provincial Legal Units and acquired wide
experience in credit and recovery fields,
all aspects of Banking Law and other laws
relating to commercial transactions.
She contributed tremendously to the
Corporate Division as the Senior Legal
Officer from 2005 to 2012 where she
gained immense knowledge in legal
work relating to syndicate facilities, ship
mortgages and trade finance activities of
the Bank. She served as the Deputy Chief
Legal Officer (Credit), from 2012 to 2016
prior to being appointed as the Chief Legal
Officer.
Ms Jayasinghe also serves as a visiting
Lecturer on Commercial and Banking Law
at the Central Bank Training Institute.
Mr C AmarasingheDeputy General Manager
(Sales and Channel Management)
Appointment to the Corporate
Management: July 2016
Directorships in Group of Companies:
Alternate Director in BOC Property
Development & Management (Private)
Limited, Merchant Bank of Sri Lanka &
Finance PLC and BOC Travels (Private)
Limited
Skills and Experience:
Mr Amarasinghe possesses over 29 years
of outstanding service with the Bank,
acquiring a profound knowledge and vast
experience in branch banking, corporate
and offshore banking and sales and
channel management operations of the
Bank.
He graduated from the University of
Sri Jayewardenepura, Sri Lanka with a
Bachelor of Science (Special) Degree
in Public Administration and holds a
CORPORATE MANAGEMENT

35
Master of Science Degree in Management
from the same university. He is also an
Associate Member of the Institute of
Bankers of Sri Lanka.
Positions Held in Corporate
Management:
Deputy General Manager (Retail Banking-
Range II) – From July 2016 to March 2018
Deputy General Manager (Sales and
Channel Management) – Since March 2018
Other Positions Held During the Year:
Mr Amarasinghe serves as a Director
of the Institute of Bankers of Sri Lanka
(IBSL) and as an Alternate Director of
Credit Information Bureau of Sri Lanka
(CRIB). He has also been serving as the
Vice President of the Association of the
Professional Bankers of Sri Lanka.
Career Milestones:
Joining the Bank in 1990 and commencing
the banking career as a Management
Trainee, Mr Amarasinghe first obtained his
hands-on experiences in retail banking
and then in every aspect of corporate and
offshore banking segments of the Bank
with his assignment to the Corporate and
Offshore Banking Division.
Mr Amarasinghe was well instrumental
in enriching business operations and
elevating the performance of corporate
and offshore banking operations when
he was spearheading the Division in the
capacities of Assistant General Manager
(Offshore Banking) and Assistant General
Manager (Corporate Relations) prior
to being appointed to the Corporate
Management.
Being the Deputy General Manager
(Sales and Channel Management),
Mr Amarasinghe presently contributes with
his splendid insights for providing tech-
savvy and digitised banking experience to
Bank’s customers keeping in line with the
Bank’s digitisation journey.
Mr M J P SalgadoDeputy General Manager
(Product and Banking Development)
Appointment to the Corporate
Management: July 2016
Skills and Experience:
Mr Salgado carries over 29 years of
profound experience with the Bank
specialising in retail banking, province
sales management and product and
banking development.
He graduated from the University of
Sri Jayewardenepura, Sri Lanka with a
Bachelor of Commerce (Special) Degree
and holds an Associate Membership of the
Institute of Bankers of Sri Lanka. He is a
Member of the Association of Accounting
Technicians of Sri Lanka and a Licentiate
Certificate Holder of the Institute of
Chartered Accountants of Sri Lanka as
well.
Other Positions Held During the Year:
Mr Salgado serves as a Director on the
Board of Regional Development Bank.
Career Milestones:
Mr Salgado joined the Bank in January
1990 as a Management Trainee and
commenced his career in retail banking.
Serving in different banking segments
and in various capacities, Mr Salgado
has obtained an in-depth knowledge,
especially in domestic banking and credit
card operations of the Bank.
Mr Salgado immensely contributed with
his astounding knowledge and skills in
implementing and supervising of various
projects and operational units of the
Bank such as, ISSP Implementation Unit,
Special Project, BoC Contact Centre, BoC
Premier, BoC Assurance Department and
“Wenasa” Transformation Project, while
being the Assistant General Manager
(Province Sales Management).
Serving as the Deputy General Manager
(Product and Banking Development) and
overseeing the operations of Organisation
Transformation Unit as well, Mr Salgado
presently supervise the Electronic Banking
Centre, Central Back Office, Product
Development and Business Process Re-
Engineering Project and amply contributes
for providing of ultra-modern banking
experience to tech-savvy customers
through technologically developed
innovative products and services. Keeping
abreast with Bank’s focus on digitisation,
he was instrumental in bringing about
Bank’s recent ‘one of its kinds’ products
and services such as BoC DIGI, Kiosk
and etc. and is striving to find new means
and avenues for thriving the business
operations of the Bank.

36 Bank of Ceylon | Annual Report 2018
CORPORATE MANAGEMENT
Mr R M D Vipula Jayabahu Deputy General Manager
(Finance and Planning)
Appointment to the Corporate
Management: November 2016
Chairmanships Held in Group of
Companies:
Transnational Lanka Records Solutions
(Private) Limited.
Directorships in Group of Companies:
Merchant Bank of Sri Lanka & Finance
PLC, Alternate Director in Koladeniya
Hydropower (Private) Limited.
Skills and Experience:
Mr Jayabahu carries more than 29 years
of service with Bank of Ceylon, acquiring
both the percipient knowledge and
extensive experience, specialising in
finance, corporate and strategic planning
operations of the Bank.
He graduated from the University of
Kelaniya, Sri Lanka with a Bachelor of
Commerce (Special Degree) and obtained
Master’s of Business Administration in
Finance from the University of Southern
Queensland, Australia. Mr Jayabahu holds
a Postgraduate Diploma in Business and
Financial Administration from the Institute
of Chartered Accountants of Sri Lanka
and has successfully completed the
Management Development Programme
conducted by the Postgraduate Institute
of Management (PIM), University of
Sri Jayewardenepura, Sri Lanka.
Career Milestones:
Joining the Bank as a Management
Trainee in 1990, Mr Jayabahu embarked
his banking career with rural and retail
banking operations. Thereafter, he served
in online core-banking implementation
project until his assignment to the Finance
and Planning Division of the Bank.
Throughout his tenure with the Bank,
Mr Jayabahu has extended his services
for numerous projects of the Bank such
as, Implementation of ‘on-line real time
Core-banking solution’, ‘IFRS Project’,
‘Core-banking system upgrading project’
‘Transfer Pricing System Implementation’
and several other system implementation
projects, guiding and imparting his
knowledge and experiences with team
members. He has been a resource person
for many training programmes conducted
by the Central Training Institute as well.
At present, he oversees the functions
of Central Cash Department, Central
Accounting and Tax Unit, Financial
Accounting Unit, General Ledger
Balancing Unit, Management Information
System, Treasury Back Office, Research
and Development Division and
Sustainability Unit of the Bank. He is a
member of many management committees
of the Bank and serves as the Chairman
of Bank’s Non Performing Advance
Management Committee.
Mr Jayabahu has been leading and
guiding the Finance team for conducting
of several Corporate Plans and Bank-
wide Performance Reviews, as well as
publishing of sophisticated Annual Reports
that brought local and international fame
and several Awards to the Bank.
Mr D M L B DassanayakeDeputy General Manager
(Retail Banking – Range I and Range II)
Appointment to the Corporate
Management: December 2016
Skills and Experience:
Mr Dassanayake counts over 36 years
of extensive experience in the Bank,
gaining both local and overseas exposure,
especially in the areas of retail banking,
corporate financing and international
operations.
He graduated from the University of
Peradeniya, Sri Lanka with Bachelor of
Arts (Economic Special) Degree and has
obtained his Master’s Degree in Business
Administration from the Mahatma Gandhi
University, India. He is an Associate
Member of the Institute of Bankers of
Sri Lanka and holds a Postgraduate
Diploma in Business and Financial
Administration from the Institute of
Chartered Accountants of Sri Lanka as
well.
Positions Held in Corporate
Management:
Country Manager (Malé Branch) –
December 2016 to February 2017
Deputy General Manager (Retail Banking
– Range I) - from February 2017 to March
2018
Deputy General Manager (Retail Banking –
Range 1 and Range II)- Since March 2018

37
Career Milestones:
Commencing his banking career in
1982, Mr Dassanayake has gained
overall experience in banking business
specialising in corporate banking and
International operations with nine years
in key positions in overseas branches.
He has served as a Relationship Officer,
Relationship Manager and subsequently as
the Assistant General Manager (Corporate
Credit) at the Corporate Banking Division.
From 2000 to 2003, he served as the In-
Charge of Trade Finance Operations at the
Bank of Ceylon (UK) Limited, a subsidiary
of Bank of Ceylon.
He also rendered his duties as the Country
Manager of Malé Branch before being
appointed to the Corporate Management
in 2016.
Ms W I HettihewaDeputy General Manager
(Support Services)
Appointment to the Corporate
Management: August 2018
Directorships in Group of Companies:
Alternate Director in Hotels Colombo
(1963) Limited
Skills and Experience:
Ms Hettihewa possesses over 35 years of
hands on experience in various business
and management operations in the
Bank along with 28 years of extensive
experience in branch network, specialising
in both retail and corporate banking
operations.
She graduated from the University of
Sri Jayewardenepura, Sri Lanka with a
Bachelor of Science (Special) Degree in
Chemistry and also with Bachelor’s Degree
in Law from the Open University
Sri Lanka. Ms Hettihewa is an Attorney-at-
Law and a Member of the Bar Association
of Sri Lanka as well. She is also an
Associate Member of the Institute of
Bankers of Sri Lanka.
Career Milestones:
She joined the Bank in December 1983 as
a Management Trainee and commenced
her career in branch banking, gathering a
vast experience in retail banking.
Gradually rising up her career ladder,
Ms Hettihewa held several key positions
of the Bank and she played a major role in
corporate banking segment while she was
spearheading the Metropolitan Branch.
Prior to being appointed to the Corporate
Management, Ms Hettihewa held the
positions of Assistant General Manager
(Metropolitan), Assistant General Manager
(Administrative Services) and Assistant
General Manager (Southern Province) of
the Bank.
Mr E M JayaratneDeputy General Manager
(Recovery Provinces)
Appointment to the Corporate
Management: August 2018
Skills and Experience:
With a splendid career spanning over 36
years with Bank of Ceylon, Mr Jayaratne
has acquired immense knowledge and
gained astounding experiences in both
domestic and overseas banking operations
in diversified banking segments of the
Bank.
Mr Jayaratne holds a Master’s Degree
in Business Administration from the
Wayamba University, Sri Lanka and a
Post Graduate Executive Diploma in Bank
Management from the Institute of Bankers
Sri Lanka. He is also an Associate Member
of the Institute of Bankers of Sri Lanka.
Career Milestones
Mr Jayaratne commenced his career with
the Bank in 1982 and first served in the
branch network obtaining a significant
exposure in retail banking and later on,
taking-up various positions in carrying
out different assignments in both local
and international banking operations. He
played an impressive role being the Senior
Credit Manager of BoC Malé Branch for
three consecutive years rendering his
service and guiding the staff with his
specialised knowledge in credits.
He represented the Executive
Management of the Bank in the capacities
of Assistant General Manager (North
Western Province) and Assistant General
Manager (Province Sales Management)
during the period from February 2014 to
August 2018 prior to being appointed to
the Corporate Management of the Bank.

38 Bank of Ceylon | Annual Report 2018
CORPORATE MANAGEMENT
Mr W N P SurawimalaDeputy General Manager
(Recovery Corporate)
Appointment to the Corporate
Management: August 2018
Skills and Experience:
In an illustrious career spanning over 27
years in Bank of Ceylon, Mr Surawimala
has gained extensive experience in
both local and international banking
arenas, entailing all facets of commercial
banking operations in diversified banking
landscapes with his unique ability to deal
with intricate banking challenges.
Mr Surawimala holds a Bachelor’s
(Special) Degree in Public Administration
and Master of Science (M.Sc) in
Management specialising in Banking
and Finance, both from the University
of Sri Jayewardenepura, Sri Lanka. He
is an Associate Member of the Institute
of Bankers of Sri Lanka and has also
successfully completed the Management
Development Programme for Key
Management Personnel conducted by the
Post Graduate Institute of Management
(PIM), University of Sri Jayewardenepura,
Sri Lanka.
Career Milestones:
Mr Surawimala commenced his career
with the Bank in 1991 as a Management
Trainee and has worked in various
operational segments of the Bank,
including retail banking, corporate
banking, offshore banking and recovery.
With his assignment to Chennai Branch
as its Country Manager, during the period
from 2014 to 2017, Mr Surawimala
rendered a splendid service to transform
the Chennai Branch to the status of
‘Excellent’, uplifting its performance mainly
with his eminent blend of industry and
people management skills. He was also an
Executive Committee Member of India-
Asia-Sri Lanka Chamber of Commerce
and Industry in Chennai during the years
2015/17.
Prior to his elevation as the Deputy
General Manager (Recovery Corporate),
Mr Surawimala was spearheading the
Offshore Banking activities of the Bank as
an Assistant General Manager. Aligning
with Bank’s endeavoring aspiration of
maintaining a healthy Balance Sheet,
Mr Surawimala as the Deputy General
Manager (Recovery Corporate), has taken
pioneering initiatives for managing of
Non-Performing Loan portfolio of the Bank
and is striving for future achievements as
well with his sustained focus on Bank’s
interests.
Dr Indunil LiyanageChief Marketing Officer
Appointment to the Corporate
Management: September 2012
Skills and Experience:
Having served for many organisations
in the field of marketing since 1989,
Dr Liyanage counts over 29 years of
experience in financial services industry,
Fast Moving Consumer Goods (FMCG),
electronics and agriculture sectors in
Sri Lanka.
Dr Liyanage professionally and
academically qualified in three
different disciplines namely Marketing,
Management and Finance. He holds
a Doctor of Philosophy (PhD) from the
Faculty of Graduate Studies (FGS),
University of Colombo, Sri Lanka, Master
of Science (MSc) in Management from
the University of Sri Jayewardenepura,
Sri Lanka and a Postgraduate Diploma
in Marketing from the Chartered Institute
of Marketing (UK) and is a Certified
Management Accountant of ICMA (CMA)
Australia.
Dr Liyanage is a Chartered Marketer
since 1997, attached to the first batch of
Chartered Marketers in Sri Lanka and a
Fellow Member of the Chartered Institute
of Marketing (FCIM) and a Fellow Member
of the Sri Lanka Institute of Marketing
(FSLIM). He is a Member of the Chartered
Institute of Marketing (UK) since 1995 and
a member of the Certified Management
Accountants (CMA) Australia since 2017.
He has participated in many international
training programmes including Strategic

39
Management Executive Programme which
was held at the National University of
Singapore (NUS) in 2009.
Career Milestones:
Prior to joining Bank of Ceylon
Dr Liyanage has served as the Assistant
Vice President – Head of Marketing at
National Development Bank PLC,
Sri Lanka. He has also held senior
positions previously in multinationals
and local organisations in the capacity of
Product/ Brand Manager and Marketing
Manager. Throughout his marketing career,
he has built several key international and
local brands/ products in the country.
Dr Liyanage was awarded with prestigious
National APEX Award 2016 (Pinnacle
Award 2016) for Marketing by the
Organisation of Professional Associations
of Sri Lanka (OPA). He was honoured in
the “Most Influential Marketing Leaders
Listing” at the World Marketing Congress
2015 in Mumbai, India and also honoured
with the “50 Most Talented CMOs Award”
at the Golden Globe Tiger Awards 2013,
World Marketing Summit held in Malaysia
and was the first Sri Lankan selected for
the “Intercultural Education for Global
Managers” Programme at the Japan-
America Institute of Management Science
(JAIMS) in Hawaii, USA. He was awarded
a full scholarship by the Fujitsu Foundation
of Japan to complete this programme, in
recognition of his academic excellence
and potential contribution to international
understanding and goodwill in 1996.
Mr P M Liyanage
Chief Internal Auditor
Appointment to the Corporate
Management: December 2014
Skills and Experience:
Mr Liyanage is a Fellow Member of the
Institute of Chartered Accountants of
Sri Lanka with 19 years of post-qualified
experience and also holds a Bachelor of
Science (Special) Degree in Accountancy
and Financial Management from the
University of Sri Jayewardenepura,
Sri Lanka. He is also a member of the
Certified Information Systems Auditors
(CISA) of ISACA – USA.
Career Milestones:
Prior to joining Bank of Ceylon as the
Chief Internal Auditor, he has served at
the Commercial Credit and Finance PLC
and Pan Asia Bank in the same capacity.
Mr Liyanage has also served at Bank of
Ceylon in the capacity of an Assistant
General Manager during the period from
2006 to 2008 as the Internal Auditor.
Mr Liyanage’s exposure also includes
LankaClear (Private) Limited (National
Cheque Clearing House) in the capacity of
Finance and Administration Manager and
Ernst & Young as a Qualified Assistant.

40 Bank of Ceylon | Annual Report 2018
EXECUTIVE MANAGEMENTEXECUTIVE MANAGEMENT
01
04
07
08
02
05
03
06
01. G A Jayashantha - Assistant General Manager - Offshore Banking
02. A De S Pinnaduwage - Assistant General Manager - Compliance
03. K T A E De Silva - Assistant General Manager - Electronic Banking Centre
04. D S Muthukudaarachchi - Country Manager - Chennai
05. B Nanthakumar - Assistant General Manager - Support Services
06. Y A Jayathilaka - Assistant General Manager - Central Province
07. A R F John Pulle - Assistant General Manager - Risk Management
08. G R De Silva - Assistant General Manager - Investigation

41
09
12
15
13
16
14
10 11
09. H M M B Herath - Assistant General Manager - Sabaragamuwa Province
10. W B P Rathnayake - Assistant General Manager - Corporate Credit
11. J C A Kurundukumbura - Assistant Director - IT (Operations/Technical Support)
12. M D A Karunaratne - Assistant Director - IT (Delivery Channels)
13. H M C M Maldeni - Assistant Director - IT (Application Systems)
14. D M K S Dissanayake - Assistant General Manager - Eastern Province
15. M H S Mala - Assistant General Manager - Development Banking
16. M J Prabaharan - Assistant General Manager - Northern Province

42 Bank of Ceylon | Annual Report 2018
EXECUTIVE MANAGEMENT
17
20
23
24
18
21
19
22
17. H P K Silva - Assistant General Manager - Western Province North
18. A M R D Subasinghe - Assistant General Manager - Pettah Branch
19. P P M Wijesekara - Assistant General Manager - Marketing
20. B K Gurusinghe - Country Manager - Malé
21. A D S Indrani - Assistant General Manager - Training and Development
22. M P Ruwan Kumara - Assistant General Manager - Budget, Strategic Planning and MIS
23. W Ranjith - Assistant General Manager - North Central Province
24. A G Sirinimal - Assistant General Manager - Uva Province

43
25
28
31
32
30
29
26
27
25. S T K Hewage - Deputy Chief Legal Officer - Recovery
26. M D C Nilantha - Chief Executive Officer - Bank of Ceylon (UK) Limited
27. L J Dissanayake - Country Manager - Seychells
28. K G C Deepal - Assistant General Manager - Information Systems Audit
29. J Gnanasambanthan - Assistant General Manager - Investment Banking
30. P N Gomes - Assistant General Manager - Superannuation Schemes
31. T Perera - Assistant General Manager - Branch Credit - Range I
32. L A R Seneviratne - Assistant General Manager - Credit, Province and Branch Audit

EXECUTIVE MANAGEMENT
44 Bank of Ceylon | Annual Report 2018
33. R M M Weerasekera - Assistant General Manager - Metropolitan Branch
34. R M K S M Ratnayake - Deputy Chief Legal Officer - Credit
35. M M R P Fernando - Assistant General Manager - Trade Services
36. M T Karunaratne - Assistant General Manager - Recovery Corporate
37. K P Mallika - Assistant General Manager - Treasury Back Office
38. I S N Perera - Assistant General Manager - Western Province South
39. M R N Rohana Kumara - Assistant General Manager - Recovery Provinces
40. K A P K Samarakoon - Assistant General Manager - Overseas Branches
33
36
34
37
39
35
38
40

45
41. S P C K Fernando - Assistant General Manager - Corporate Relations
42. R M N Jeewantha - Assistant General Manager - Treasury
43. P D S Liyanage - Assistant General Manager - North Western Province
44. Zeena Ruwais - Assistant General Manager - Product Development and Business Process Re-Engineering Project
45. S Sivanjan - Assistant General Manager - International
46. K A D Wijayawardhena - Assistant General Manager - Human Resources Operations
47. G K G M Bandara - Assistant General Manager - Administrative Services
48. D R C S Udayakumari - Assistant General Manager - Southern Province
41
42 43
46
44
45
47
48


Children are the creators and shapers of the future.
We are committed to nurture and guide our future
generations towards the right path by spearheading
many initiatives that empower and motivate them to
tap into their boundless energy, zeal and enthusiasm. We believe these initiatives will have the power to transform our nation towards
greater heights of success.

48 Bank of Ceylon | Annual Report 2018
Business Verticals
APPROACH TO VALUE CREATION
Value Creation Model
Manufactured Capital
Social and Relationship
Capital
Intellectual Capital
NaturalCapital
Shareholders’ funds: LKR 121.4 billion
Customer deposits: LKR 1.8 trillion
Borrowings: LKR 350.0 billion
BoC brand LKR 42.9 billion
Tacit knowledge
Systems and processes
Electricity consumption: 21,134.6 MWh
Water usage: 501,229.3 m3s
Fuel consumption: 732,101.1 Litres
13.4 million customers
Deep community relationships
Business partners: Over 850
correspondent relationships
Customer contact points: 1,721
Property, plant and equipment:LKR 24.2 billion
Digital infrastructure LKR 2.0 billion
Page
137
Page
142
Page
147
Page
156
Page
160
Page
171
Employees: 8,724
Female representation rate: 60%
Employees with over 10 years’ experience: 2,860
Retail Banking
Page 126
Corporate and
Offshore Banking
Page 131
CapitalInputs
Value CreatingActivities
Str
ateg
ic P
rio
riti
es
Valu
es
Presence
Cus
tom
er c
entr
icity
Good governance ethics and risk
Cus
tom
er C
are
and
tan
gib
ility
Cre
dit
qua
lity
and
cultu
re
Agility and innovation
Ethics
Risk Management (Page 102)
Trends in theOperating Landscape (Page 52)
HumanCapital
Bankers
FinancialCapital

49
Business Verticals
Shareholders/Providers
of financial capital
Customers
Employees
Business partners
Community
Environmental Impacts
Page 137
Page 147
Page 167
Page 67 and 160
Page 171
Gross Loan disbursements: LKR 1.5 trillionInterest paid to depositors: LKR 112.1 billionNew products launched: 03Enhanced service delivery by 132 new Customer touch points
Investment in customer education: LKR 21.9 million
International, Treasury
Investment and Overseas
Page 134
Group functions
Page 141
Outputs Outcomes
Value CreatingActivities
to t
he
Nati
on
Valu
es
Str
ateg
ic P
rio
riti
es
IT and cyber security
Hum
an C
apac
ity
bui
ldin
g
Res
pec
ting
div
ersi
ty
Pro
cess
str
eam
line
and
inno
vatio
n
Brand and sustainable business
Being Accountable
Governance and professionalism
Corporate Governance (Page 71)
Net Interest Income (NII)
29.6%
Net fee and commission income
3.8%
Net Profit for the year
8.8%
Taxes
10%
Operating expenses
14.7%
Impairment charges
6.8%
Other income
6.8%
StakeholderConcerns (Page 50)
Dividends: LKR 4.8 billion
Tax contribution: LKR 19.3 billion
Interest paid on borrowings: LKR 7.1 billion
Total payments to employees: LKR 18.9 billion
Investment in training: LKR 338.0 million
Promotions: 174
Retention rate: 98%
Value created to suppliers: LKR 6.7 billion
Investment in community development: LKR 30.4 millionEconomic value added to community: LKR 16,433 million
Reduction in paper use 7 million A4 sheets
Carbon footprint: 13,255.6 tons (CO2 Eqv)
As a % of income
Page 137 and 160

50 Bank of Ceylon | Annual Report 2018
STAKEHOLDER ENGAGEMENT
Given the size, depth and reach of
the Bank’s operations, it is critical to
proactively identify and respond to the
diverse expectations of its substantial
stakeholder base. The Bank selects and
engages with the stakeholders who are
likely to be most impacted by its decisions
and who in turn have the most significant
impact on its value creation. Engagement
is facilitated through numerous formal
and informal platforms and the feedback
thus obtained forms a vital input in our
corporate planning process.
Employees Customers Government and egulators Investors Business partners Communities
Who
the
y ar
e
The BoC Team comprises of 8,724 employees across the island, with an average length of service of over nine years.
The Bank caters to over 13.4 million customers island-wide.
The GOSL is the Bank’s sole shareholder while the primary regulator is the CBSL.
The Bank’s investors are primarily parties who invest in our debentures
Our value creation process is supported by an extensive network of business partners across the entire value chain.
The Bank’s extensive geographical reach has allowed it to nurture meaningful relationships with communities across the island.
Ho
w w
e en
gag
e
∫ Employee engagement surveys (periodic)
∫ Trade union engagement (frequently)
∫ Open door culture (on going)∫ Multi-level staff meetings
(frequently)∫ Grievance handling mechanism
(on going)∫ Work life balance initiatives∫ Performance Management
System (PMS) (bi annually)∫ Whistle Blowing policy
∫ Engagement through branch managers and relationship managers (continues)
∫ Customer Satisfaction surveys (periodic)
∫ Customer hotline-1975 (365*24)
∫ Marketing, advertising and promotions (frequently)
∫ Financial literacy Programmes (frequently)
∫ Meetings on matters relating to performance and compliance (periodic)
∫ Annual Report (annually)
∫ Regulatory and compliance reporting (periodic)
∫ Industry forums and meetings (frequently)
∫ Financial Publications (quarterly)
∫ One to one meetings with large investors (periodic)
∫ Investor presentations and roadshows (periodic)
∫ Engagement through market intermediaries (continues)
∫ Compliance reporting as per CSE regulations (quarterly)
∫ Written communication (frequently)
∫ Regular meetings (frequently)
∫ Bidding process (periodic)
∫ Quarterly publications on Financial statements and the Annual Reports
∫ Engagement through branches (continues)
∫ CSR activities and sponsorships (frequently)
∫ Press releases and media campaigns (frequently)
Top
ics
iden
tified
∫ Opportunities for career and skill development
∫ Freedom of association
∫ Equal opportunity in remuneration and promotions
∫ Performance-oriented organisational culture
∫ A safe working environment
∫ Retirement Benefits
∫ Ease of transaction/ convenience
∫ Accessibility
∫ Customer care and service quality
∫ Providing access to finance
∫ Transparent pricing
∫ Inclusive communication
∫ Maintaining confidence within the financial sector
∫ Fulfilling funding needs of the GOSL
∫ Alignment of national development agenda to Bank’s strategy
∫ Strong governance and risk management practices
∫ Facilitating financial inclusion
∫ Returns commensurate with the risks assumed
∫ Clarity in terms and conditions
∫ Transparent and timely reporting on the Bank’s performance and outlook
∫ Ease of transacting and transparent pricing, terms and conditions
∫ Timely payments
∫ Secure and predictable demand
∫ Contribution towards community development projects
∫ Responsible business practices
∫ Financial inclusion and empowerment
∫ Employment generation
Our
res
po
nse
People Development is a key pillar of the Bank’s Corporate Plan (2018-2020) and our employee value proposition for the year was centred on providing opportunities for developing technical competencies and soft skills.
The Bank has placed strategic emphasis on enhancing customer experience through providing accessible channels, innovative products and superior customer service.
The Bank is a key facilitator in GOSL’s economic development agenda and our strategic aspirations are aligned to those of the national development.
We maintain transparent and ongoing communication with our investors with balanced updates on performance, emerging risks and opportunities and outlook
Clearly defined policy frameworks and operating procedures ensure equitable treatment to all business partners and mutually rewarding relationships.
We have developed long-term relationships with the communities we operate in and adopt a strategic and meaningful approach towards contributing to community development.
Str
ateg
ic r
elev
ance People Development
Page 153 for further information
Customer centricity
Multi-channel strategy
Digitisation
Pages 160 to 166 for further information
Governance and sustainability
Economic contribution
Pages 64 to 67 and 71 to 88 for further information
Governance and sustainability
Pages 71 to 88 and 58 to 62 for further information
Business partners
Page 167 for further information
Social and Relationship Capital
Pages 160 to 170 for further information
Identify
needs Preserving
brand
Support
growth
aspirations
Nurture
relationships
Why we engage with stakeholders

51
Employees Customers Government and egulators Investors Business partners Communities
Who
the
y ar
e
The BoC Team comprises of 8,724 employees across the island, with an average length of service of over nine years.
The Bank caters to over 13.4 million customers island-wide.
The GOSL is the Bank’s sole shareholder while the primary regulator is the CBSL.
The Bank’s investors are primarily parties who invest in our debentures
Our value creation process is supported by an extensive network of business partners across the entire value chain.
The Bank’s extensive geographical reach has allowed it to nurture meaningful relationships with communities across the island.
Ho
w w
e en
gag
e
∫ Employee engagement surveys (periodic)
∫ Trade union engagement (frequently)
∫ Open door culture (on going)∫ Multi-level staff meetings
(frequently)∫ Grievance handling mechanism
(on going)∫ Work life balance initiatives∫ Performance Management
System (PMS) (bi annually)∫ Whistle Blowing policy
∫ Engagement through branch managers and relationship managers (continues)
∫ Customer Satisfaction surveys (periodic)
∫ Customer hotline-1975 (365*24)
∫ Marketing, advertising and promotions (frequently)
∫ Financial literacy Programmes (frequently)
∫ Meetings on matters relating to performance and compliance (periodic)
∫ Annual Report (annually)
∫ Regulatory and compliance reporting (periodic)
∫ Industry forums and meetings (frequently)
∫ Financial Publications (quarterly)
∫ One to one meetings with large investors (periodic)
∫ Investor presentations and roadshows (periodic)
∫ Engagement through market intermediaries (continues)
∫ Compliance reporting as per CSE regulations (quarterly)
∫ Written communication (frequently)
∫ Regular meetings (frequently)
∫ Bidding process (periodic)
∫ Quarterly publications on Financial statements and the Annual Reports
∫ Engagement through branches (continues)
∫ CSR activities and sponsorships (frequently)
∫ Press releases and media campaigns (frequently)
Top
ics
iden
tified
∫ Opportunities for career and skill development
∫ Freedom of association
∫ Equal opportunity in remuneration and promotions
∫ Performance-oriented organisational culture
∫ A safe working environment
∫ Retirement Benefits
∫ Ease of transaction/ convenience
∫ Accessibility
∫ Customer care and service quality
∫ Providing access to finance
∫ Transparent pricing
∫ Inclusive communication
∫ Maintaining confidence within the financial sector
∫ Fulfilling funding needs of the GOSL
∫ Alignment of national development agenda to Bank’s strategy
∫ Strong governance and risk management practices
∫ Facilitating financial inclusion
∫ Returns commensurate with the risks assumed
∫ Clarity in terms and conditions
∫ Transparent and timely reporting on the Bank’s performance and outlook
∫ Ease of transacting and transparent pricing, terms and conditions
∫ Timely payments
∫ Secure and predictable demand
∫ Contribution towards community development projects
∫ Responsible business practices
∫ Financial inclusion and empowerment
∫ Employment generation
Our
res
po
nse
People Development is a key pillar of the Bank’s Corporate Plan (2018-2020) and our employee value proposition for the year was centred on providing opportunities for developing technical competencies and soft skills.
The Bank has placed strategic emphasis on enhancing customer experience through providing accessible channels, innovative products and superior customer service.
The Bank is a key facilitator in GOSL’s economic development agenda and our strategic aspirations are aligned to those of the national development.
We maintain transparent and ongoing communication with our investors with balanced updates on performance, emerging risks and opportunities and outlook
Clearly defined policy frameworks and operating procedures ensure equitable treatment to all business partners and mutually rewarding relationships.
We have developed long-term relationships with the communities we operate in and adopt a strategic and meaningful approach towards contributing to community development.
Str
ateg
ic r
elev
ance People Development
Page 153 for further information
Customer centricity
Multi-channel strategy
Digitisation
Pages 160 to 166 for further information
Governance and sustainability
Economic contribution
Pages 64 to 67 and 71 to 88 for further information
Governance and sustainability
Pages 71 to 88 and 58 to 62 for further information
Business partners
Page 167 for further information
Social and Relationship Capital
Pages 160 to 170 for further information

52 Bank of Ceylon | Annual Report 2018
Market Opportunities and Risks
Despite a moderation in economic growth
in 2018 significant improvement has been
made on the macroeconomic front over
the years, particularly in Government
finances, curtail inflation and exchange
rate management.
The widening role of digitisation in financial
services have transformed customer
interactions and heightened customer
expectations on convenience and
accessibility. Digital adoption has occurred
at an unprecedented phase and is likely
to accelerate further over the medium to
long-term.
Customer expectations are changing rapidly with increased demand for personalised services, instant accessibility and convenience. The wider use of digital platforms has also led to reduced brand loyalty and financial institutions which are unable to respond to these emerging expectations and customer preferences are likely to be at risk.
Financial institutions in Sri Lanka have
seen increased stringency of the regulatory
framework, as the CBSL seeks to
strengthen the soundness and stability of
the financial system. Regulatory changes
in 2018 included restrictions on loan-
to-value ratios on leasing facilities and
higher cash margins on vehicle imports.
In addition, the Basel III guidelines and
adoption of SLFRS 9 Financial Instruments
will require banks to strengthen their
capital positions.
Widening inequalities, geopolitical
tensions and changing political
landscapes have resulted in significant
socio-economic challenges across the
world. Environmental risks have also
worsened with increasing implications of
climate change seen both domestically
and globally. Against this backdrop,
financial institutions and banks of our
nature are expected to play a central role
in facilitating access to finance, driving
financial literacy and combating climate
change.
EconomicTrends
Technology
Customer Expectations
Regulations
Sustainability Considerations
Agriculture
Services
Industry
4.7%0.9%
4.8%
0 100 200 300 400 500 600
Credit cardtransaction value
Internet paymentstransaction value
Mobile banking transaction value
Digital Payments-Industry Growth
2017 Q3
2018 Q3
LKR billion
43
9
600
526
61
49
Source: Payments Bulletin, CBSL
STRATEGIC REPORT
0 50 100
2017
2012
Channel Preferences PWC 2012-2017
Omni Channel (only Digital)
Human Interaction Channels
Omni Channel (both Digitaland Human Interaction)
46% 44%
57%27%
10%
16%
Source: PWC,2017

53
Opportunities Strategic outlook for 2019Risks
• Policy emphasis on driving productivity enhancements across the economy
• More connectivity with international forums in terms of investment inflows
• Policy inconsistency
• Impact of rupee devaluation on the country’s debt
• Future customers are more focused towards digital channel
• Driving process efficiencies and stronger risk management practices
• Propagating digital banking practices in rural communities
• Increase in customers demanding for personalised services
• Increase in customers who are demanding digital platforms
• Technological disruption by new entrants and fintech organisations
• Increasing competitive intensity
• Reduced brand loyalty due to rapidly changing customer expectations
• Cybersecurity and IT risks
• Preserving data confidentiality in the digital age
• IT resilience and continuity
• Vendor and third-party risk
• Strengthen capital position and credit quality
• Positive impacts on customers, industry and other stakeholders
• More concern an green businesses, energy efficient technologies
• Government prioritising on developing access to finance for all
• Impacts of climate change on agriculture sector lending
• Short-term impact on profitability
• Increased cost of compliance
• Increasing complexity of regulations
• Growth prospects are constrained by capital requirements
Although macro-economic pressures are
likely to persist in the short-term, the Bank
will continue to maintain focus on driving
economic activity through increased
lending to the country’s SME sector,
particularly through the Enterprise
Sri Lanka loan scheme
Strategic focus on further enhancing our
digital channels with a view attracting and
retaining a millennial while driving process
efficiencies and enhancing the customer
experience
Provide customer-centric service across
all touch points while further strengthening
the Bank’s digital proposition
Balancing our growth aspirations with the
minimum capital requirements of BASEL III
will be an area of key management focus
in 2019, particularly given that the Bank’s
restriction in raising capital
Facilitate reducing resource consumption by integrating sustainability considerations to corporate strategy
The CSR framework has also been refined to broadly align with the SDGs
Propagating sustainable lending through adopting social and environmental screening criteria and offering Green lending products
Facilitating financial inclusion through leveraging on our extensive network

54 Bank of Ceylon | Annual Report 2018
Material Matters
This integrated report is anchored by the Bank’s material topics, which represent the
issues that are most relevant to the organisation and its’ stakeholders. The topics listed
below have been determined following a detailed materiality assessment and consider
trends in the operating landscape, stakeholder concerns and strategic value priorities.
They direct the focus of our corporate planning process, management priorities and
corporate reporting. In enhancing the relevance of our report, this year we have widened
the scope of our material topics to include industry and Bank-specific factors beyond
those prescribed by GRI.
STRATEGIC REPORT
Extended the scope of material topics beyond GRI
Determining materialityIdentify Determine
importancePrioritise Reporting
Feedback from stakeholder
engagements
Strategicaspirations
Government agenda and macro-economic policy
Regulatory requirements
Market risks and opportunities
Materiality map
Influ
ence
on
stak
ehol
der
dec
isio
ns
Significance of impacts
3
6, 15 9, 11, 14
1, 2, 4, 5,7, 8, 10,12,
13,16
L
L
M
H
M H

55
Stakeholder group Relevant material topic GRI indicator ESG guidance: CSE
Employees
1. Talent management
2. Industrial peace and labour management relations
3. Diversity and equal opportunity
GRI 401: Employment
GRI 402: Labour/ Management relations
GRI 403: Occupational health and safety
GRI 404: Training and education
GRI 405: Diversity and equal opportunity
GRI 407: Freedom of association and
collective bargaining
Employment
Training and education
Occupational health and
safety
Workforce diversity and
equal treatment
Customers
4. Customer experience
5. Customer privacy and data security
6. Responsible banking practices
GRI 417: Marketing and labelling
GRI 418: Customer privacy
Government/
Regulators
7. Financial performance
8. Socio-economic contribution
9. Financial inclusion
10. Governance and compliance
GRI 201: Economic performance
GRI 202: Market presence
GRI 413: Local communities
GRI 203: Indirect economic impacts
GRI 419: Socio economic compliance
GRI 307: Environmental compliance
Compliance
Business Partners
11. Responsible procurement
12. Bribery and anti-corruption
13. Labour rights (outsourced/contract)
GRI 204: Procurement practices
GRI 205: Anti-corruption
GRI 406: Non-discrimination
GRI 408: Child labour
GRI 409: Forced or compulsory labour
Other Factors
14. Digitisation and technology
15. Environmental footprint
16. Brand reputation
GRI 302: Energy
GRI 305: Emissions
Energy intensity
Direct and indirect emissions
• Refer pages 451 to 456 for relevant GRI disclosures on material topics.

56 Bank of Ceylon | Annual Report 2018
Our Strategy (2018-2020)
Unprecedented changes in technology, customer sophistication, competitive intensity and regulatory requirements are
compelling banks to adopt bold strategies. BoC adopts a systematic and holistic approach towards strategy formulation, with
a three-year rolling over Corporate Plan clearly outlining strategic priorities and action plans to drive our aspirations. The plan is
reviewed regularly in view of changes in the operating environment to ensure that it remains relevant and feasible.
The Corporate Plan for 2018-2020 was centred on the theme “Refine and define the Bank for future” and set out several areas of
focus. The section below provides a high-level overview of the Bank’s performance against its strategic priorities in 2018.
Customer Care and TangibilityKey objectives include upgrading service standards and quality levels while delivering consistent service levels across all touch points to offer a uniform banking experience to all customers.
Improve Credit Quality and CultureEmphasis has been placed on preserving portfolio quality across all business verticals while maintaining customer relationships. Given the weakening macro-economic conditions and the requirements of SLFRS 9 maintaining credit quality was paramount in 2018.
Expand Geographical ReachThe Bank intends to pursue innovative business models, improved processes and a multi-channel delivery strategy to enhance customer accessibility.
Technology and Cyber SecurityThe digital revolution in financial services has presented numerous opportunities to transform the customer experience and enhance internal processes. BoC will seek to serve the increasingly sophisticated needs of its young customers while ensuring that cyber and IT risks are managed appropriately.
Progress in 2018
Conducted customer satisfaction surveys on comparative service levels to identify gaps in service levels.
Strengthened the digital proposition to customers through establishing smart zones and other digital products.
Page 165
Skills and knowledge enhancement on credit evaluation.
Strengthened credit policy guidelines.
Implemented an island-wide recovery drive.
Page 109
Widen the self-service channels.
Launch of online loan applications.
Upgrade network infrastructure.
Strengthened cyber security framework.
Page 164
Launch of several digital products including BoC DIGI centres.
Expanded the network of smart zones.
Upgraded and relaunched the online banking platform.
Expanded the number of Branch on wheels.
Tie up with Western Union and another money remitting agent.
Page 142
STRATEGIC REPORT

57
Process Streamline and InnovationIdentification of system and process bottlenecks and adopting remedial action to enhance efficiency and effectiveness is a key pillar of the Bank’s three-year strategy.
Sustainable BusinessOur sustainability initiatives during the year spread across all aspects of the triple bottom line and all our strategies are directed towards generating optimal profits while improving our environment and social performance.
Governance and EthicsThe Bank continues to evolve its governance practices to align with emerging global best practices.
Brand DevelopmentConsistently ranked as Sri Lanka’s No.1 brand, the BoC brand is a key source of competitive strength and we will continue to drive enhanced brand recognition through unique stakeholder propositions, targeted marketing and innovative offerings.
People DevelopmentOur main focus in people development is grooming up diverse and talented pool of Bankers who are well competent to face the future Banking with right attitudes and right skills. Hence, our people development programmes are focused on six major areas,
• Education
• Training (current job role, personal development, service offering and delivery)
• Multidisciplinary Exposure
• Specialisation and continuous professional development
• Attitude, Orientation and organisation culture
• Supportive Infrastructure
Progress in 2018
11,768 programmes of training offered.
Management Development programme in partnership with PIM for KMPs.
Performance Feedback offered to 97.7% of employees via PMS.
Page 153
Reviewed and revised policy frameworks.
Implementation of Environmental and Social screening criteria for the development banking portfolio.
Converted 27 branches to solar.
Initiated GHG assessment programme in complying to ISO 14064-1.
Page 60
Formalised an action plan for reputational risk management.
Numerous customer engagement initiatives.
Page 157
Reviewed and revised policy frameworks.
New Board Subcommittee- ICT Committee.
Adherence to new regulations imposed by regulators.
Page 71
Automation of some of the major workflows via Document management system (DMS).
Adoption of video conferencing technology for all provinces.
Automated customer complaint handling mechanism.
Page 145

58 Bank of Ceylon | Annual Report 2018
SUSTAINABILITY AT BoC
Management approach for sustainable business of BoC consists of corporate values, stakeholder engagement, Identifying impacts, risks and opportunities, policy coverage, management and governance, and management and disclosure.
Corporate values refer to the operating philosophy of the bank which caters to the public/ community. Stakeholder engagement decides how the bank engages with its stakeholders in the operating environment. Identifying impacts, risks and opportunities are critical to analyse risks and opportunities faced by the bank and mitigate those risks. Policy coverage provides the process of establishing bank’s commitment to implement accountability as a corporate citizen. Management and governance also leads to maintain good governance
Corporate values Stakeholder engagement Identifying impact, risks and opportunities
Policy coverage Management and Governance
Management and disclosure
The operating philosophy of the Bank that cater to the public/ community
How the Bank engage with its stakeholders
The detailed analysis of risks and opportunities
faced by the Bank
Process of establishing Bank’s commitment to
accountability
Good Governance and Management
accountability
Performance management and information to
stakeholders
• Relevancy of values
• Communicating values
• Sustainability strategy
• Identifying stakeholders
• Interacting with stakeholders
• Assessing stakeholder feedback
• Responding
• Identifying impact
• Identifying risks and opportunities
• Assessing risks and opportunities
• Monitoring and review
• Sustainability Policy (Economic, social, environment)
• HR policy
• Communication policy
• Internal
1. Board approved Governance policies
2. Sustainability Governance Procedure
• External
1. Governance regulations issued by regulators
2. Other external charters
• Measuring sustainability performance
• Global standards for reporting
• External assurance
Sustainable, Accountable and Responsible Business
Management approach for sustainable business
Approach and Governance
In recent years, BoC has sought to refine its approach to sustainability by formalising
a policy and integrating its sustainability strategy to its Corporate Plan. The Bank’s
Sustainability Policy has been aligned to the United Nations’ Sustainable Development
Goals (SDG) and provides guidance on CSR project selection and implementation. Clear
action plans and defined responsibilities ensure the coverage of all 17 goals, either by the
core business or corporate philanthrophic projects.
and management accountability for its stakeholders; Management and disclosures provides transparency of performance management and information to stakeholders. This sustainability outline of BoC clearly reflects sustainable, accountable and responsible business within its operating environment.

59
Sustainability Committee
A dedicated Committee chaired by
the General Manager, represented by
the several Deputy General Managers
is responsible for driving the Bank’s
sustainability strategy. During the year,
the Bank widened the representation
of the Committee by including Chief
Risk Officer and the Deputy General
Manager Corporate and Offshore Banking.
The Committee meets on a quarterly
basis and reports to the Board on the
progress. The Bank also has a dedicated
Sustainability Unit, which is responsible for
implementing the projects approved by the
Sustainability Committee. During the year,
we strengthened the Sustainability Unit by
more recruits to the team.
Precautionary Principle
The Bank adopts a precautionary
approach to its’ strategic business
decisions with due consideration given to
environmental and social criteria. Prior to
engaging in new ventures/ investments
potential environmental and social
risks are assessed through robust risk
management processes.
Key sustainability initiatives launched during the year are listed below; detailed
information is available in the relevant chapters in subsequent sections of this
Report.
Launched an Employee Sustainability pledge encouraging employees to
demonstrate their commitment towards being environmentally, socially and
economically sustainable.
Implemented Environment and Social Management System (ESMS) screening
criteria for the development banking portfolio.
Revised CSR evaluation model.
Eight new CSR projects initiated by Provinces.
Conducted training for branch administration staff on green house gas
assessment process.
Progress in 2018
Work
with communities to Be ethical in all my activities Maintain the integrity in
Pro
mot
e te
am s
pirit
u
plift th
eir living standards all m
y activities
Respect nature, environment Update and share knowledge
and all living beings among all stakeholders
Be inno
vativ
e an
d ag
ile
Avoid use of
Active
ly
Actively
usage of paper
Polythene and
engag
e in
ene
rgy
water c
onservation
was
te s
egre
gatio
n
engage in
printing and reduce
of material
Plastics as m
uch as
possible conser
vatio
n
Actively engage in
Pra
ctic
e pr
oper
reducing fuel usage
Avoid unnecessary
Reduce consumption
As aBank of Ceylon
EmployeePledge to
Be exemplary to your fellow countrymen,specially to the children in honouring this pledge

60 Bank of Ceylon | Annual Report 2018
Our ContributionSri Lankan Context
Our Commitment to the SDGs
The SDGs provide universal agreement on development priorities, mobilising global efforts towards eradicating poverty, preserving the
planet and achieving prosperity. The 17 goals, 169 targets and 244 indicators provide established measures and objectives to address the
critical economic, social and environmental issues faced by the world today. As Sri Lanka’s largest and most impactful Bank, we believe
we can make a significant contribution the country’s achievement of SDGs.
BoC’s micro-financing scheme “Mithuru” is aimed towards empowering the grassroots which do not typically have access to affordable financing.
• Disbursements under Mithuru: LKR 189.0 million
• New groups formed: 209
Population living below poverty line:
3.8%
Population covered by social protection systems:
34%
Through loan schemes such as “Ran Aswanu” and “Govi Navoda” targeting the Agriculture sector, BoC contributes to the country’s food security.
• Outstanding portfolio to the agriculture and fisheries sector: LKR 97.7 billion
• No. of Ran Aswanu and Govi Navoda loans disbursed by the Bank during 2018: 1,840
• Facilities provided to Paddy Marketing Board
Prevalence of food insecurity in population:
9.2%
Stunting of children below age 5
17.3%
Proportion of women in managerial positions:
28%
Women married before 18 years:
9.8%
We are an equal opportunity employer and do not practice gender-based discrimination in selection, determining remuneration or promotions.
• Female representation at management grade: 58% Overall: 60%
• Return to work after parental leave: 358
Participation rate in organised learning:
97.7%
Youth and adults with ICT skills:
27.6%
Providing opportunities for training is a core part of our employee value proposition. We also conduct several education-focused CSR initiatives on an ongoing basis.
• Investment in employee training: LKR 338.0 million
• Beneficiaries of Grade 5 scholarships: 2,000
• Beneficiaries of 18+ scholarships for A/L high achievers: 562
• CSR expenses on Education: LKR 89.2 million
Maternal mortality rate:
26.8per 100,000 births
Death rate due to road traffic injuries:
13.4per 100,000 population
• CSR expenditure on health LKR 3.0 million
• Comprehensive medical assistance scheme for our employees
SUSTAINABILITY AT BoC

61
Our ContributionSri Lankan Context
Rural population living with 2KM of an all-season road:
95.6%
Small scale industries in total value added:
27%
The Bank is a key lender to GOSL’s infrastructure development projects which facilitate better transportation and build better infrastructure.
• Lending to such infrastructure development projects: LKR 139.3 billion
Growth rate of household expenditure in the bottom 40%
7.8%
Proportion living 50% below median income:
13.5%
The Bank specialised loan products to vulnerable and underserved communities, driving financial inclusion and empowerment.
• Disbursements under youth loan scheme: LKR 193.0 million
• Senior citizens deposit portfolio: LKR 207.7 billion
• Customer contact points in underserved communities: 112
Urban population living in slums or inadequate housing:
0.8%
Through its corporate unit the Bank disburses funds for Government infrastructure development/housing projects in urban areas.
• Lending towards housing and infrastructures projects: LKR 338.8 billion
• Funding to large waste-to-energy projects: LKR 2.0 billion
Population using safely managed water systems:
81%
We are a major lender to projects of the National Water Supply and Drainage Board and the Mahaweli Authority which are instrumental in providing access to clean water.
• Funding to water projects during the year: LKR 4.7 billion
• CSR expenditure on water projects: LKR 4.0 million
Population with access to electricity:
87%
We provide funding for numerous renewable energy projects, particularly for mini hydro, solar and wind power projects. The ongoing in-house solar project has resulted in the generation of 1 MW renewable energy for the national grid while reducing our dependence on fossil fuels.
• Funding to renewable energy projects: LKR 3.6 billion
• Branches converted to solar: 27
• Contribution to national grid: 1 MW
Unemployment rate:
4.6%
We offer our employees attractive remuneration and opportunities for skill development in a fair and conducive work environment.
• Total payments to employees: LKR 18.9 billion
• Promotions: 174
• New recruits during the year : 1,622

62 Bank of Ceylon | Annual Report 2018
Our ContributionSri Lankan Context
Information not tracked at a national level
The Bank has adopted organisation-wide efforts to reduce the consumption of paper, water and energy while engaging in the responsible disposal of waste.
• Paper savings from digital initiatives: 7 million of A4 Sheets
• Reduction in GHG emission due to solar installations - 756.8 tons of (CO2 eqv)
• Responsible disposal of e-waste
National data not available
The Bank’s lending to renewable energy projects contributes to reducing the country’s carbon footprint. Ongoing efforts are also made to reduce the Bank’s carbon footprint.
• Lending to renewable energy projects: LKR 3.6 billion
Green Pasikuda CSR Project in partnership with Marine Environment Project Authority kicked off
National data not available
National data not available
• Green net project initiated in Southern Province
• Kumbuk Arana Project for flood mitigation in Kalu Ganga River Banks
• Twin tree project - A tree for each new born, initiated in North Western Province
• No of trees planted under those initiatives accounted to 12,634
Context Number of intentional homicide per 100,000 population
2.5
Population subject to physical/psychological or sexual violence: per 100,000 of population
As a systemically important financial institution we have a responsibility to preserve public interest and maintain confidence in the financial system. The Bank’s operations are underpinned by a robust governance and risk management framework which ensures regulatory compliance and aligned to global best practices.
Policies: Whistle Blowing Policy
Anti corruption and Anti Bribery Policy
We have nurtured deep linkages with numerous Government organisations, funding partners and international organisations in driving common objectives and mutual value creation. Hence we are working closely : With ADB, World Bank, Biodiversity Sri Lanka, Ceylon Chamber of Commerce, Government of Sri Lanka etc,.
Our Commitment to the SDGs
National data not available
62.6
SUSTAINABILITY AT BoC

63
As Bankers to the Nation, BoC’s growth strategy is closely aligned to
that of the country’s development
agenda and it is a growth partner
in the country’s socio-economic
development.
ECONOMIC CONTRIBUTION

64 Bank of Ceylon | Annual Report 2018
Bank of Ceylon has maintained its undisputed market leadership position in
Sri Lanka’s financial services sector, commanding the largest asset base,
deposit base and advances over many long years, and largest
Profit generating single entity in the country.
ECONOMIC CONTRIBUTION
The No.
BANK
22%of Industry
assets
24%of Industry Deposits
17%of Industry
profit-after-tax
22%of Industry loans and advances
Our market position

65
Significant contributor to Government revenue
The Bank is one of the largest contributors
to national revenue and its value creation to
the Government takes the form of income
tax, financial VAT, NBT, Debt Repayment Levy
(DRL) as well as dividend payments. In 2018
total value creation to Government amounted
to LKR 24.2 billion.
Lender to large scale national development projects
As a key lender to the
Government, we continue to
finance large scale infrastructure
projects with long gestation
periods undertaken by the
Government of Sri Lanka.
LKR 31.7 billionfor road development
LKR 3.6 billion for power generation projects
LKR 4.7 billion for water generation projects
Entrepreneurship development
The Bank is a participatory financial institution in 20
credit schemes aimed towards developing micro,
small and medium entrepreneurs. In 2018, BoC
disbursed LKR 64.4 million to the micro and SME
sectors. Loans channelled to the North and Eastern
provinces accounts to LKR 5,268.1 million.
New SME and Micro Finance Schemes supported during the year
è Erabuma
è Green Loan
è Smallholder Agribusiness Partnerships
LKR 13.6 billion disbursed under Enterprise Sri Lanka
LKR 189.0 million disbursed under BoC Mithuru for Micro Enterprise Development
0
5
10
15
20
25
30
35
2014 2015 2016 2017 2018
Value Creation to the Government
l Taxes on Financial Servicesl Income Taxl Dividend paid to the Government
LKR
bill
ion
4.1
4.8
6.6
7.2
9.6
5.6 10
.0 6.5
8.9
9.86.8
6.3
17.3
12.3
4.8
Promoting financial inclusion
BoC is often the first bank to establish a presence in rural areas, attesting to its commitment
to drive financial inclusion across the country. The Bank operates the most extensive network
of customer contact points in Sri Lanka, with a total reach of 1,721 direct contact points by
end-December 2018.
577 Branches 442 Branches outside Western Province
15 SME Centres 1,373 School savings units

66 Bank of Ceylon | Annual Report 2018
ECONOMIC CONTRIBUTION
Investments in Government Securities
The Bank has invested on
Government securities, which inturn
fulfils the funding requirement of
the Government. In 2018 total
Government security investments
amounted to LKR 551.5 billion or 24%
of its total assets.
Sri Lanka’s local international bank
We seek to position the Bank as
Sri Lanka’s first local international
bank through widening our footprint
in regional economies, strengthening
our international relationships and
positioning the Bank as a preferred
financial partner among the global
business community.
03 International branches
859 Correspondent relationships
LKR 580.1 billion Remittances facilitated
USD 1,714.8 million Raised through
international markets36%
16%
43%
5%
Investment in Government Securities
l Treasury Bills - GOSLl Treasury Bonds - GOSL
l Sri Lanka Development Bondsl Others

67
Value Added StatementAn analysis of the Bank’s value creation and allocation of value among the key stakeholder groups is depicted below:
2018 2017 ChangeLKR millon LKR millon %
Value Added Income earned by providing banking services 217,238 185,427 17 Cost of services (125,760) (102,502) 23 Value added by banking services 91,478 82,925 10 Non - banking income 3,894 3,784 3 Impairment charges for loans and other losses (15,041) (9,341) 61 Value addition 80,331 77,368 4
Value Allocation
To EmployeesSalaries, wages and other benefits 18,875 16,996 11
To GovernmentDividends paid to Government of Sri Lanka 4,846 12,346 (61)Income tax 9,724 8,929 9 Taxes on financial services 9,588 7,249 32
24,158 28,524 (15)
To CommunitySocial responsibility projects 108 128 (16)To Providers of External FundsInterest on other borrowings 12,512 15,714 (20)Interest on debt issued 5,154 5,014 3
17,667 20,728 (15)
To Expansion and GrowthRetained profit 14,632 8,966 63 Depreciation and amortisation 2,200 1,925 14 Deferred taxation 2,690 101 2,556
19,523 10,992 78 80,331 77,368 4
Economic Value Added (EVA)
Economic Value Added (EVA) indicates the true economic profit of an organisation. EVA is an estimate of the amount by which earnings exceed or
fall short of required minimum return for shareholders at comparable risks.
2018 2017 Change
LKR millon LKR millon %
Invested CapitalAverage Shareholders' funds 116,299 102,002 14 Add: Cumulative impairment Provision for loan losses and other losses 81,852 57,179 43
198,150 159,181 24
Return on Invested CapitalProfit after taxation 19,479 21,312 (9)Add: Impairment provision for loan losses and other losses 15,041 9,341 61 Less: Loans written off (35) (1,181) (97)Total return on invested capital 34,485 29,472 17
Opportunity cost of invested capital* (18,052) (16,003) 13 Economic Value Added 16,433 13,469 22
*Calculated based on weighted average 12 months Treasury bill rate 2018 - 9.11% (2017 - 10.05%)


Customer-centricity forms the core of our business.
Our personalised service is a unique differentiator.
By re-inventing our customer relationships continuously, our team serves our customers with ingenuity and passion to create a unique
banking experience at every interaction.

Pre
serv
ing
ValueCORPORATE GOVERNANCE

71
CORPORATE GOVERNANCE
Message from Chairman
Strong governance practices underpin the delivery of our strategic aspirations and play a fundamental role in creating long
term value for our customers, employees, shareholder and the country’s economy. The Board of Directors is therefore fully
committed to ensuring that the principles of good governance are embedded into the thinking and processes in all spheres of
the Bank and its operations.
A new Board was appointed in February 2019 with Directors combining a diverse mix of skills, perspectives and industry
experience. (Refer Board profiles on pages 25 to 27). The Board convenes regularly and during the year 2018 it has had 23
Board meetings. Main areas of focus includes strategy formulation, IT and cyber security, risk management and preserving
portfolio quality. A dedicated Information and Communication Technology Subcommittee was established during the year with
the objective of assisting the Board in fulfilling its responsibilities regarding the deployment of technology and the digitisation
process within the Bank. The Board also reviewed and revised several key policies with due consideration to emerging best
practices, changes in the operating landscape and regulatory developments.
Even in the absence of a Board, until the new appointments were made with the changes that happened in the political arena,
the Bank functioned smoothly indicating the sound governance practice in place in the Bank with approved policies and
guidelines which gave the management the guidance to function with minimum negative impact to its operations.
This Report sets out our approach to governance in practice and how the Board works. It also demonstrates the status of
compliance with the corporate governance directions under the Banking Act Direction No 11 of 2007 for Licensed Commercial
Banks. The Bank has also voluntarily adopted the revised Code of Best Practice on Corporate Governance issued by the
Institute of Chartered Accountants of Sri Lanka (CA Sri Lanka) in December 2017.
There is a Code of Ethics for Directors and a separate Code of Ethics for employees and annual declarations are obtained on
compliance with them. I confirm that I am not aware of any material violations of any of the provisions set out in the Bank’s
Code of Ethics by Key Management Personnel of BoC.
Ronald C Perera PCChairman
3 April 2019
Changes to the
BoardSet up the Board ICT
Subcommittee providing
oversight over the
Bank’s digital strategy
Introduction of the Anti-bribery
and Anti-corruption Policy
Reviewed and revised
Corporate Plan for the
next 3 years 2019-2021
Highlights of 2018

72 Bank of Ceylon | Annual Report 2018
Governance Framework
The Bank’s comprehensive governance
framework prescribes mechanisms
for implementing robust governance
practices and provides clear direction
for strategic decision-making across the
organisation. Given the Bank’s industry
dominance, systemic importance and
state-ownership, the framework has been
designed to address long-term and short-
term outcomes to manage expectations
of the Bank’s diverse stakeholder groups.
Extending beyond mere compliance,
the Bank views corporate governance
as an enabler which leads to greater
transparency, accountability, robust risk
management and effective leadership. Key
external and internal steering instruments
on which the Bank’s governance
framework is based is presented
alongside.
Governance Structure
A well-defined governance
structure comprising of multi-level
governance bodies, specific roles and
responsibilities and clear reporting lines
ensure accountability and judicious
empowerment. The Board of Directors
serves as the apex governing body
and custodian of the Bank’s corporate
governance. Day-to-day management
of the Bank has been delegated to the
management team led by the General
Manager. The Board has also delegated
CORPORATE GOVERNANCE
specific responsibilities to five (5)
Subcommittees of the Board, thereby
allowing it to dedicate adequate time
and resources to matters reserved for
the Board including setting strategy,
formulating policy frameworks and
guidelines and forward-looking agenda
items.
(Refer page 73 for the Bank’s governance
structure)
Company Secretary
The Secretary to the Board/ Secretary,
Bank of Ceylon, Ms Janaki Senanayake
Siriwardane is an Attorney-at-Law and
was appointed to her position in 2005.
Her credentials/ qualifications are in
compliance with the requirements of the
Banking Act and relevant amendments. All
Directors have access to the services of
the Secretary and she provides guidance
to the Board on the discharge of its
responsibilities and ensures all relevant
procedures are followed in complying with
statutory requirements and industry best
practice. The Secretary regularly reviews
the Bank’s governance framework in view
of emerging best practices, regulatory
changes and stakeholder interests.
Steering Instruments
External
l Bank of Ceylon Ordinance
No.53 of 1938 (referred to as
“Ordinance”) and its subsequent
amendments
l Banking Act No.30 of 1988 and
subsequent amendments
l Banking Act Direction No.11 of
2007 on Corporate Governance
for Licensed Commercial Banks
l Circulars applicable to the Bank
issued by the Government
l Continuing listing requirements
of the Colombo Stock Exchange
l Code of Best Practice on
Corporate Governance issued
by the Institute of Chartered
Accountants of Sri Lanka in
December 2017
Internal
l Board Charter
l Subcommittee Charters
l Codes of Ethics
l Comprehensive policies and
procedures
l Subsidiary Management Charter
l Customer Charter

73
Governance Structure
Board Subcommittees
Each Board Subcommittee operates
within a defined mandate as outlined in
the Committee Charters. The Committee
chairpersons are responsible for the
effective functioning of the Committees.
They report and make recommendations
to the Board on the respective activities.
When determining the composition of the
Committees, the Board considers skills,
industry expertise and experience of its
members.
Executive Committees
The management of the day-to-day
operations have been delegated to the
Corporate Management team led by the
General Manager. Several executive level
committees have been established with
specific responsibilities and clearly defined
mandates.
Shareholder(The Government of Sri Lanka)
Board of Directors
BoardSubcommittees
Audit Committee
Human Resources and Remuneration
Committee
Integrated Risk
Management Committee
Nomination and Corporate Governance Committee
Information and
Communication Technology Committee
General Manager
Corporate Management and the Executive Management Team
Board Secretariat
Internal Audit
Auditor General
Risk Management
Compliance
Executive CommitteesAppointment flow
Reporting flow

74 Bank of Ceylon | Annual Report 2018
CORPORATE GOVERNANCE
Subcommittees and Executive Committees
Mandate
Board subcommittees
Audit Committee Reviews the Bank’s financial reporting process including internal controls, internal and external audit
Integrated Risk Management Committee
Oversight responsibility for all areas of risk management including credit, market, operational, liquidity, cyber/ IT and strategic risks and ensures compliance with the entirety of the risk management policy framework and compliance with laws and regulations.
Human Resources and Remuneration Committee
Oversight responsibility for determining the Remuneration policy, setting objectives and evaluating performance of the General Manager and Key Management Personnel (KMP) and determining the Bank’s HR policy.
Nomination and Corporate Governance Committee
Implementing of procedures to select/ appoint Senior Management persons and evaluating their suitability, review codes of ethics, improve corporate governance practices.
Information and Communication Technology Committee
Oversight responsibility for monitoring of IT products, services, policies, practices and infrastructure.
Executive Committees
Asset and Liability Management Committee (ALCO)
Reviews the funding strategy, Liquidity management, assets mismatch as well as market risk exposures, management of liquidity risk and interest rate risks as primary objectives and manages various financial risks of the Bank.
Branches Division Credit Committee
Provides quality and quick service to the customers by expediting the process of entertaining requests of high net-worth customers and streamlining the credit administration and minimising of credit risk.
Business Continuity Coordinating Committee (BCCC)
Managing and coordinating all aspects of the Business Continuity Management (BCM) process of the Bank.
Business ContinuityImplementationCommittee (BCIC)
Effective implementation of Business Continuity Plan (BCP) of the Bank.
Business Continuity Management Alternative Committee (BCMAC)
Serves temporarily, immediately after any disaster, until the other Business Continuity Management committees are established.
Committee Dealing with Forged Cheques and Frauds
Makes recommendation to the respective authorities for writing off unrecoverable balances on Forged Cheques and Frauds after considering all possible ways of recovering the same.
Corporate Information Security Committee (CISC)
Provides direction and support for the Information Security initiatives. Accordingly, the Committee is expected to ensure the application of processes and procedures specified in the Information Security Policy (ISP), review and communicate the Information security plans, conduct investigations of security breaches and drive the Information security of the Bank.
Corporate Management Committee
Corporate Management Committee is the highest management level Committee in the Bank. Overall purpose of the Committee is to make vital decisions of the Bank, which do not fall under the purview of the other management committees. This Committee also intends to review the entire performance of the Bank, with a view to formulating strategies and issuing directions to manage deviations.
Corporate Strategies Review Committee
The objective of the Committee is to assist the management to streamline the process of planning, implementing and monitoring of corporate strategies of the Bank.
Credit Committee Formulates, reviews and revises policies and procedures for granting credit facilities, to be submitted for the approval of the Board of Directors whilst ensuring compliance with all statutory and regulatory requirements. It also approves, declines or ratifies credit proposals submitted by the line management under its delegated authority limits or makes appropriate recommendations to the Board of Directors. It also monitors, reviews and renews portfolio exposure and concentration risk to ensure that the Bank maintains a well diversified and healthy credit portfolio. Further it monitors the remedial action taken in respect of non-performing advances.

75
Subcommittees and Executive Committees
Mandate
Executive Committees
Damage Assessment and Restoration Committee (DARC)
Assesses damage to Bank Property and Restoration.
Human Resource Policy Committee (HRPC)
Formulates, reviews and revises policies and procedures relating to HR Management and makes recommendations to the Board of Directors where necessary. It also approves/ recommends to the Board on proposals relating to the HR functions such as recruitment, promotion, rewarding and compensation, industrial relations, terminations etc.
Idle Asset Committee Assists in the management and monitoring of the process of disposal of properties vested in the Bank as per rules stipulated in Bank of Ceylon Ordinance, Bank of Ceylon Act, Debt Recovery Act and Office Instruction Circulars.
Internal Capital Adequacy Assessment Process Steering Committee
The ICAAP Steering Committee is the principal management committee responsible for the development and implementation of a sound Internal Capital Adequacy Assessment Process across the Bank to assess, quantify and monitor risk in addition to regulatory compliance.
Investment Committee Its primary objective is to assist the Board of Directors to discharge its statutory duties and its oversight responsibilities in relation to investment activities of the Bank excluding investments in equity of subsidiaries and Government securities. The Committee intends to ensure safety of the principal of overall investments while maintaining the return at a reasonable level.
Committee for Investment in Government Securities
The primary objective of this Committee is to assist the management to in the discharge of its statutory duties and its oversight responsibilities in relation to investment activities in Government securities.
IT Steering Committee Recommends to the Board, the annual Information Technology Plan. Assists in the implementation of initiatives, formation of teams and monitoring of processes and their progress. It also reviews policies relating to IT operations and recommends adoptions to the Board of Directors. Further it monitors and controls the progress of IT Projects and provides necessary support from business and other support units.
Marketing Committee Provides strategic direction to the Bank in terms of planning appropriate marketing strategies, positioning the Bank and products/ services, identifying opportunities in the market to maximize the Bank’s turnover and provides the a forum to champion innovation/ novel marketing concepts, planning and executing corporate social responsibility programmes and creating an effective communication platform to build the Bank’s corporate image.
Non-Performing Assets Review Committee (NPAC)
Its objective is to assist the management to minimize NPLs of the Bank by periodically reviewing the NPL status and making suitable recommendations to improve the asset quality or expedite the recovery of existing NPAs.
Operational Risk Management Executive Committee
This is the principal committee for all operational risk management matters of the Bank. This Committee reinforces the fact that governance of the risk management program is the responsibility of senior management; it provides the forum for addressing cross-functional risk issues with a view to maintaining the highest operational standards for the Bank whilst minimizing risk.
Reward and Recognition Policy Committee (RRPC)
Recognises the employees who have contributed to the enhancement of productivity and the advancement of the organisation beyond expectation and appreciating/ rewarding such employees/ teams for their contributions.
Scholarship Programme Selection Committee (Review Committee)
The overall purpose of this Committee is to select the appropriate/ suitable and required overseas programmes for the Bank.
Scholarships Committee The overall purpose of this Committee is to select the appropriate training programmes seminar/ workshops/ visits and nominate suitable participants for overseas training/ seminar/ workshops/ visits etc.
Sustainability Committee Assists in integrating sustainability into key business decisions, processes and initiatives to become a responsible corporate citizen by operating the business in an environmentally responsible, socially equitable and economically sound manner. The committee would is to evaluate, develop, promote, implement and monitor sustainability principles and practices through the organization which will deliver values to the stakeholders.
Technical and Operational Committee (TOC)
Assists in taking appropriate measures to mitigate losses that may arise due to disruptions to operations.

76 Bank of Ceylon | Annual Report 2018
CORPORATE GOVERNANCE
Board Composition
The Board of the Bank can have six (6)
Non-Executive Directors. The Board
composition is clearly set out in the
Ordinance and relevant amendments.
Independence of Directors is assessed
based on the criteria set out in the
Banking Act Direction No.11 of 2007 on
Corporate Governance. Directors are
appointed by the relevant Minister to
whom state banks are assigned and a
representative of the Ministry of Finance
holds an Ex-officio position on the Board.
Directors are appointed from luminaries
in their respective fields, bringing varying
perspectives to Board discussions
enabling them to constructively challenge
the Management team. This ensures an
appropriate balance of power, enhancing
the effectiveness of the decision-making
process.
Presently the Bank has four Directors
appointed and their details are given on
pages 25 to 27. The process of appointing
the balance Directors is still on-going with
the change that happened in the political
arena.
Skills and Expertise
The Board was and is quantitatively
and qualitatively diverse in terms of
experience and skills. Their collective
background provides for a well-balanced
mix of attributes that enable the effective
discharge of responsibilities. There was
and is sufficient financial acumen on
the Board. In the year 2018 there were
Directors holding memberships in
professional accountancy bodies. The
Directors who are on the Board have the
necessary financial acumen from their
professional experience. Their profiles
are on pages 25 to 27. Details pertaining
to Directors of 2018 are given on pages
79 to 85.
Board Responsibilities
The Board Charter clearly outlines the responsibilities and the powers reserved for the
Board. The mandate includes setting strategic direction, establishing robust governance
and risk management practices, ensuring regulatory compliance, safeguarding the
Bank’s reputation and presenting a balanced and fair assessment of the Bank’s financial
performance and position. The Board Charter is reviewed regularly and revised to ensure
relevance to strategic aspirations and value creation.
Board of Directors
Role of Chairman/ General Manager
The role of the Chairman is separate from that of the Chief Executive Officer (referred to as
the General Manager in the Bank of Ceylon) ensuring an appropriate balance of authority
and power. As clearly defined in the Board Charter, the Chairman is an Independent Non
Executive Director (INED) while the General Manager who is the Chief Executive Officer of
the Bank is appointed by the Board and does not hold a Board position. The major role/
responsibilities of the Chairman and General Manager are given below;
Div
isio
n o
f R
esp
ons
ibili
ties
Chairman
• Leading the Board and ensuring its effectiveness
• Facilitating effective participation of all Board members
• Maintaining effective communication with the shareholder,
the Government of Sri Lanka
• Ensures that adequate information is available to all Directors
• Setting the ethical tone at the top
General Manager
• Execution of the strategic agenda set out in the Bank’s
Corporate Plan in line with the financial and non-financial
targets set by the Board
• Monitoring and reporting the Bank’s performance to the
Board
• Ensuring that the Bank operates within the approved risk
appetite
Appointments and Resignations
As a state-owned bank, appointments to the Board are made by the Government of
Sri Lanka through the Minister responsible for state banks. The Central Bank of Sri Lanka
approves the appointments made if the required criteria for fitness and propriety are met.
Director resignations and removals are also referred to the same Minister while the Central
Bank of Sri Lanka and the Colombo Stock Exchange are kept duly informed of any such
changes to the Board.

77
Board Induction
On appointment, Directors are provided
with all the information pertaining to the
Bank’s governance including the Bank of
Ceylon Ordinance, governance structures,
statutory and regulatory requirements,
Board and Subcommittee Charters as
well as any other relevant legislation and
policies. The General Manager conducts
a comprehensive presentation detailing
the Bank’s history, business model,
Board focus in 2018
Regular updates
• Financial reports on performance and financial stability
• Recommendations and highlights from Subcommittees
• Subsidiary performance updates
• Compliance Reports
Strategy
• Strategic planning session (a day away) to provide inputs on the Bank’s Corporate Plan 2019-2021
Risk Management
• Approval of risk appetite
• Review and approval of the risk management framework
• Cybersecurity
• Preserving credit quality and managing Non Performing Loans
• Compliance to BASEL III status
• Appointment of a Chief Information Security Officer
• Risk reports with dashboards
Financial matters
• 2019 budget• 2018 performance review• Dividend approval• Funding and liquidity plans• Capital status
Technology
• Implementation of the Data Centre modernisation project.
• Establishment of a Board Information and Communication Technology Committee
Policy frameworks
• New policies introduced
(1) Dividend Policy (2) Anti-bribery and Anti-
corruption Policy
• Reviewed and updated the
(1) Whistleblowing Policy(2) Policy on Directors Access to Independent
Professional Advice (3) Asset and Liability
Management Policy (4) Marketing Policy (5) Liquidity Risk Management
Policy (6) Group Risk Management
Policy Board focus
in 2018
organisational structure, business verticals and support functions. One-on-one meetings
and departmental visits are scheduled to familiarise Directors with the Bank’s operations.
Access to Information
Directors are provided with all information and support to effectively discharge their
responsibilities. Opportunities are also provided for external input at the Bank’s expense in
line with the policy for Directors’ Access to Independent Professional Advice. An electronic
board paper system is used to provide access to board papers and relevant information is
circulated via this system allowing adequate time for Directors to prepare for the meetings.
Management team is on stand by at Board Meetings to provide any resources required to
facilitate decision making.

78 Bank of Ceylon | Annual Report 2018
CORPORATE GOVERNANCE
Board Activities
The Board meets around twice a month and meetings were convened 23 times in 2018.
The Secretary, BoC/ Secretary to the Board ensures that all procedures are duly followed
in setting meeting agendas, circulating information, conducting board meetings and
maintaining minutes. Efforts are made to ensure that the Board dedicates adequate time
to consider matters critical to the Bank such as corporate planning, risk management,
compliance and governance matters.
• Calendar is set for Board meetings and Subcommittee meetings and notice is given to Directors through an Annual Calendar
• Board papers are prepared and electronically circulated to Directors through a secure portal at least seven days prior to the meeting. This ensures sufficient time to review matters which are to be discussed and to seek additional clarifications if required
• Board meetings have certain standard items such as performance updates, compliance reports and recommendations from Subcommittees
• Members of the Management Team are invited for Board meetings to provide additional clarifications if required
• The Secretary, BoC/ Secretary to the Board sets the agenda under the authority delegated by the Chairman
• Directors are free to submit proposals to the agenda for discussion at Board meetings
• Matters arising from internal/ external developments are added to the agenda where necessary
• The Secretary, BoC/ Secretary to the Board prepares the minutes and circulates among Directors through a secure e-Solution within 10 days of the meeting
• Draft minutes are circulated to the Senior Management team the day following the meeting
• Minutes are adopted at the subsequent Board meeting
• Follow up action is taken on outstanding matters
Start ofthe year
Board paper
compilation and
circulation
AgendaBoard
MeetingPost-
meeting

79
Name of Director
Date appointed and Date of Resignation Qualification/s Experience
Name/s of Entities in which the respective Director functioned as at the last date of their Board position in BoC
Board Subcommittees of the Bank on which they have served
Mr Ronald C Perera PC
ChairmanIndependent Non-Executive Director
28 January 2015 - 18 November 2018 (Reappointed w.e.f. 12 February 2019)
• Bachelor of Laws Degree, University of Colombo, Sri Lanka.
• Master of Laws (LL.M) in International Trade Law, Northumbria University, United Kingdom.
• Attorney-at-Law (President’s Counsel).
1. Served as a Director on the Boards of Bank of Ceylon, Mireka Capital Land (Private) Limited, Mireka Homes (Private) Limited and as the Chairman of Merchant Bank of Sri Lanka & Finance PLC.
2. An experienced lawyer with a wide practice in the original courts as well as in the Court of Appeal and the Supreme Court.
3. Wide experience in civil and criminal litigation, negotiation, drafting of commercial and transport contracts and agreements and commercial arbitration.
4. Specialised in Commercial Law, Banking Law, Industrial Law, Injunctions, Defamation, Election Petitions, Civil Appeals, Revision Applications Writ Applications and Fundamental Rights Cases.
1. Chairman, Bank of Ceylon (UK) Limited.
2. Acting Chairman, Hotels Colombo (1963) Limited.
1. Chairman, Board Nomination and Corporate Governance Committee
2. Member, Board Human Resources and Remuneration Committee
Mr S R Attygalle
Non-Independent Non-Executive Ex-officio Director
27 April 2016 -25 November 2018
• Master of Science (MSc.) in Economics, Warwick University, United Kingdom.
• Bachelor of Science (BSc) in Physical Science, University of Colombo, Sri Lanka.
1. Director and Acting Chairman, National Savings Bank.
2. Director of Bank of Ceylon, Regional Development Bank, Board of Investment of Sri Lanka, Ports Authority and Airport and Aviation Services (Sri Lanka) Limited.
3. Director General, Department of Fiscal Policy and Department of Public Enterprises, Ministry of Finance.
4. Contributing towards the formulation of the Annual Budget and leading the technical team for the Free Trade Agreement (FTA) with China.
5. Assistant Governor – Central Bank of Sri Lanka (presently a Deputy Governor).
6. Deputy Secretary to the Treasury, Ministry of Finance.
1. Commission Member - Securities and Exchange Commission of Sri Lanka.
1. Member, Board Audit Committee
2. Member, Board Integrated Risk Management Committee
3. Member, Board Human Resources and Remuneration Committee
Board of Directors in 2018
The complementary skills and depth of diverse insights on our Board has enabled the Bank to effectively respond to emerging risks and opportunities in the operating landscape.

80 Bank of Ceylon | Annual Report 2018
Name of Director
Date appointed and Date of Resignation Qualification/s Experience
Name/s of Entities in which the respective Director functioned as at the last date of their Board position in BoC
Board Subcommittees of the Bank on which they have served
Mr Ranel T Wijesinha
Independent Non-Executive Director
09 February 2015 -31 July 2018
• Master’s Degree in Business Administration, University of Pittsburgh, USA.
• Studied Multinational Corporations and Political Risk Analysis at the University’s Graduate School of Public and International affairs.
• Fellow Member of the Institute of Chartered Accountants of Sri Lanka (CA Sri Lanka).
1. Independent international Management Consultant, with over 36 years experience.
2. Advisory roles for the Government of Sri Lanka over the last two and a half decades.
3. Advisory work in the public sector for Foreign Governments on behalf of multilateral development partners such as the Asian Development Bank.
4. Director, Business Development, John Keells Holdings Group.
5. Director, John Keells Hotels PLC/ Chairman of the Board Audit Committee.
6. Director, Hotels Colombo (1963) Limited.
7. Manager, Deloitte, Bahamas.
8. Partner and Head of Consulting and Financial Advisory Services, M/s PricewaterhouseCoopers, Chartered Accountants, Sri Lanka.
9. Chairman, Ayojana Fund Management (Private) Limited.
10. Director, Lanka Ventures Limited.
11. Commission Member, Securities & Exchange Commission of Sri Lanka.
12. Chairman, Monitoring and Advisory Committee of the Ministry of Power and Energy.
13. Member, Governing Council, National Institute of Business Management.
14. Member, Board of Management, Post Graduate Institute of Management.
15. Advisor, SAARC Chamber of Commerce and Industry.
16. Member, Main Committee, Ceylon Chamber of Commerce.
17. Advisor, Federation of Chambers of Commerce and Industry of Sri Lanka.
1. Commission Member -Securities and Exchange Commission of Sri Lanka (Presently its Chairman).
2. Director, Koladeniya Hydropower (Private) Limited.
1. Chairman, Board Audit Committee.
18. Past President, Institute of Chartered Accountants of Sri Lanka.
19. Past President, 23 Nation Confederation of Asian and Pacific Accountants.
20. Member, Consumer Affairs Council under the first Consumer Affairs Authority Act.
21. Member, Sri Lanka Accounting & Auditing Standards Monitoring Board.
CORPORATE GOVERNANCE

81
Name of Director
Date appointed and Date of Resignation Qualification/s Experience
Name/s of Entities in which the respective Director functioned as at the last date of their Board position in BoC
Board Subcommittees of the Bank on which they have served
Mr H P Ajith Gunawardana
Independent Non-Executive Director
06 November 2015 - 20 July 2018
• Diploma in Business Administration.
• Chartered Financial Analyst – Part II.
1. Director/ Chief Executive Officer, Janashakthi Securities Limited.
2. Director, Kshatriya Holdings PLC.
3. Director, First Capital Holdings PLC.
4. Director, Kelsey Homes PLC.
5. Director, Merchant Bank of Sri Lanka & Finance PLC.
6. Director, Kotmale Holdings PLC.
7. Assistant General Manager, Ceylinco Shriram Securities Limited.
8. Executive/ Assistant General Manager, Ceylinco Shriram Capital Management Service Limited.
9. Executive, Bartleet Stock Brokers Limited.
10. Executive, Ceylinco Trading Company Limited.
1. Director, Lanka Securities (Private) Limited.
1. Chairman, Board Human Resources and Remuneration Committee
2. Member, Board Integrated Risk Management Committee
3. Member, Board Nomination and Corporate Governance Committee
Mr Samantha Rajapaksa
Independent Non-Executive Director
25 July 2017-25 November 2018
• Master of Business Administration, University of Sri Jayawardanapura, Sri Lanka.
• Fellow Member of the Chartered Institute of Management Accountants, London, United Kingdom.
• Fellow Member of the Institute of Chartered Accountants, Sri Lanka (CA Sri Lanka).
• Member of the Chartered Institute of Marketing, United Kingdom.
1. Senior Staff Accountant/ Consultant, M/S Ernst & Young, Chartered Accountants, Colombo, Sri Lanka.
2. Director/ General Manager, Informatics International (Private) Limited, Colombo, Sri Lanka.
3. Director/ Chief Executive Officer, CF Venture Fund Limited.
4. Director, Central Finance Company PLC Colombo, Sri Lanka.
5. Senior Project Manager, Global - AT & T – New Jersey, USA.
6. Group Finance and Business Development Director, Kshatriya Holdings PLC.
7. Director/ Chief Executive Officer, Softlogic Communications Services (Private) Limited.
1. Chairman/ Director - Kitra Holdings (Private) Limited.
2. Director - Asiri Hospital Holdings PLC.
3. Director - Asiri Surgical Hospitals PLC.
4. Director - Rakuen Group of Hotels.
5. Director - Colombo Archery School (Private) Limited.
1. Chairman, Board Integrated Risk Management Committee
2. Member (From 11 August 2017- 26 July 2018) and subsequently the Chairman, Board Audit Committee of the Bank (From 26 July 2018 - 25 November 2018)

82 Bank of Ceylon | Annual Report 2018
Name of Director
Date appointed and Date of Resignation Qualification/s Experience
Name/s of Entities in which the respective Director functioned as at the last date of their Board position in BoC
Board Subcommittees of the Bank on which they have served
Continuation of Mr Samantha Rajapaksa
8. Director, Business Development of Softlogic Holdings PLC.
9. Chairman, Softlogic Credit PLC.
10. Director, Softlogic Finance PLC.
11. Director, Central Hospitals PLC.
12. Director, Softlogic Capital PLC.
13. Group Managing Director, Associated Mortorways (Private) Limited (AMW).
14. Director of AMW Capital Leasing and Finance PLC, Associated Property Development Limited, Associated Autoways (Private) Limited, Associated Motor (Lanka) Company Limited, Associated Global Trading (Private) Limited, Associated Rubber Industries Limited, Associated Universal (Private) Limited and Al-Futtaim Logistics (Private) Limited.
6. Director- National Apprentice and Industrial Training Authority.
Mr Mohan Wijesinghe
Independent Non-Executive Director
24 November 2017 - 02 July 2018
• Master’s Degree in International Legal Cooperation, University of Vrije, Brussels.
• Solicitor of the Supreme Court of England and Wales.
• Solicitor and Barrister of the Supreme Court of the Australian Capital Territory.
• Barrister of the High Court of Australia.
• Attorney-at-Law of the Supreme Court of Sri Lanka.
1. Director, People’s Bank.
2. Group Personnel Manager, Maharajah Group of Companies.
3. Assistant Director, Superannuation Commission of Australia.
4. Director General, Sri Lanka Institute of Advance Technical Education.
5. Executive Director, National Lotteries Board.
1. General Manager - Legal-Colombo International Container Terminals Limited.
2. Director - Maga Neguma Consultancy and Project Management Services Company (Private) Limited.
3. Director - Interocean Services Limited.
4. Senior Overseas Advisor - China Merchants Ports Holdings Company Limited.
CORPORATE GOVERNANCE

83
Name of Director
Date appointed and Date of Resignation Qualification/s Experience
Name/s of Entities in which the respective Director functioned as at the last date of their Board position in BoC
Board Subcommittees of the Bank on which they have served
With the reconstitution of the Board in November 2018.
Mr Neil A Umagiliya
ChairmanIndependent Non-Executive Director
19 November 2018 - 20 December 2018
• Fellow Member of the Institute of Chartered Management Accountants, United Kingdom.
• Member of the British Institute of Management.
1. Director, Salu Sala Limited.
2. Director, Sri Lanka Export Development Board.
3. Director, Information and Communication Technology Agency (ICTA) in Sri Lanka.
4. Member of the Monetary Board of the Central Bank of Sri Lanka.
5. Member of the Textile Quota Board.
6. Member of the Board of Governors of the Sri Lanka Institute of Textile and Apparel.
1. Director, Dial Textile Industries (Private) Limited.
2. Director, Vijaya Kumaratunge Memorial Hospital.
3. Member of the Sri Lanka German Business Council.
1. Chairman, Board Integrated Risk Management Committee
2. Chairman, Board Human Resource and Remuneration Committee
Ms Visakha Amarasekere
Non-Independent Non-Executive Ex-officio Director
26 November 2018 - 27 February 2019
• Bachelor of Science (Hons) Degree in Economics and Management, University of London, United Kingdom.
• Master of Arts Degree in Development Economics, Vanderbilt University, United States of America.
• Member of the Chartered Institute of Management Accountants, United Kingdom.
• Chartered Public Finance Accountant.
1. Overseeing matters related to Finance, Debt Management, Capital Markets and State-owned Enterprises at the General Treasury, Ministry of Finance and Planning since 2002 in the following capacities;
a. Director, Department of External Resources.
b. Director/ Deputy Director, Department of Public Enterprises .
c. Assistant Director, Department of Public Enterprises.
d. Assistant Director, Department of Public Finance.
2. Director, Ceylon Electricity Board.
3. Director, Ceylon Petroleum Corporation.
4. Director, People’s Bank.
1. Director, Department of External Resources of the General Treasury of the Ministry of Finance and Economic Affairs.
1. Member, Board Audit Committee
2. Member, Board Integrated Risk Management Committee
3. Member, Board Human Resource and Remuneration Committee
4. Chairperson, Board Nomination and Corporate Governance Committee

84 Bank of Ceylon | Annual Report 2018
Name of Director
Date appointed and Date of Resignation Qualification/s Experience
Name/s of Entities in which the respective Director functioned as at the last date of their Board position in BoC
Board Subcommittees of the Bank on which they have served
Mr P Lalith P Withana
Independent Non-Executive Director
26 November 2018 - 20 December 2018
• Master of Business Administration (MBA) Degree, University of Sri Jayewardenepura.
• Bachelor of Arts (BA) (Hons), University of Manchester Metropolitan, United Kingdom (UK).
• Fellow Member of the Chartered Institute of Management Accountants (FCMA), UK.
• Fellow Member of the Institute of Chartered Accountants of Sri Lanka (FCA).
• Project Management Professional at the Project Management Institute (PMI), USA.
1. Over 25 years’ experience at Senior Management positions in many organisations including Brandix Group, M/s Ernst & Young, Amsterdam Rotterdam (Amro) Bank, IBM World Trade Corporation, Carson Cumberbatch PLC, MJF Group, Yamaha Corporation in United States of America and SriLankan Airlines.
2. Director on the Board of Bank of Ceylon.
3. Director, Dankotuwa Porcelain PLC.
4. Director, Merchant Bank of Sri Lanka & Finance PLC.
5. Director, Ceylease Limited.
6. Director, Seylan Bank PLC.
7. Commissioner, Telecommunication Regulatory Commission.
8. Co-Chairman, the Finance Committee of the National Olympic Committee of Sri Lanka.
9. Vice President, Project Management Institute, Sri Lanka Chapter.
1. Chief Executive Officer, Sri Lankan Catering Limited.
2. Member of the Advisory Board for the School of Apparel Merchandising and Management, California State Polytechnic University, Pomona, USA.
1. Chairman, Board Audit Committee
2. Member, Board Information and Communication Technology Committee
Ms A V K Madhavie Herath
Independent Non-Executive Director
26 November 2018 - 20 December 2018
• Master of Philosophy (M. Phil) Degree in Economics, University of Peradeniya.
• Bachelor of Arts (Honours) Degree, University of Peradeniya.
1. Chairperson, Kandurata Development Bank.
2. Executive Director, Regional Development Bank.
1. Senior Lecturer in Economics and Statistics, University of Peradeniya.
1. Member, Board Audit Committee
2. Member, Board Integrated Risk Management Committee
Mr H Isuru Balapatabendi
Independent Non-Executive Director
26 November 2018 - 20 December 2018
• Master of Law (LL.M), University of Pittsburgh School of Law, Pittsburgh, Pennsylvania, United States of America.
• Attorney-at-Law of the Supreme Court of Sri Lanka.
1. State Counsel, Attorney General’s Department of Sri Lanka.
2. Diplomat and Head of Chancery, Embassy of Sri Lanka in The Hague, Netherlands.
3. Director, Sri Lanka Insurance Corporation Limited.
4. Director, Seylan Bank PLC.
5. Director, Blue Diamonds Jewellery Worldwide PLC.
1. Member of the Board Human Resource and Remuneration Committee
2. Member, Board Nomination and Corporate Governance Committee
3. Member, Board Information and Communication Technology Committee
CORPORATE GOVERNANCE

85
Name of Director
Date appointed and Date of Resignation Qualification/s Experience
Name/s of Entities in which the respective Director functioned as at the last date of their Board position in BoC
Board Subcommittees of the Bank on which they have served
Mr G Harsha Wijayawardhana
Independent Non-Executive Director
26 November 2018 - 20 December 2018
• Bachelor of Science Degree majoring in Biochemistry and Chemistry and Minor in Mathematics, University of Miami, United States of America.
• Professional Fellow of the British Computer Society (FBCS).
1. Has been involved in Government ICT projects and has designed and implemented Government networks such as Ministry of Foreign Affairs and Information Department of Sri Lanka.
2. Responsible for setting up of the Software Development Unit (SDU) of University of Colombo.
3. Responsible for some of the major national level software projects such as the Birth, Marriage and Death Certificate issuance system and House Holder List set up at every Divisional Secretariat.
4. ICT Consultant to the Telecommunication Regulatory Commission (TRCSL) of Sri Lanka.
5. Director, Lanka Government Infrastructure Interchange, Information and Communication Technology Agency of Sri Lanka (ICTA).
6. Founder President of ISOC LK Chapter.
7. Co-Chair of Sinhala Generation Panel of ICANN.
1. Director, LK Domain Registry.
2. Director, Amsoft Technologies (Private) Limited.
1. Chairman, Board Information and Communication Technology Committee
2. Member, Board Audit Committee
3. Member, Board Integrated Risk Management Committee
4. Member, Board Nomination and Corporate Governance Committee
8. Chief Operating Officer/ Chief Technical Officer, Theekshana (an associate company of the University of Colombo School of Computing).
9. Consultant / Head of Software Development Unit, University of Colombo School of Computing.
(In February 2019, a new Board was constituted and their profiles are appearing on pages 25 to 27)

86 Bank of Ceylon | Annual Report 2018
CORPORATE GOVERNANCE
Board calendar and attendance
Quarter 1 Quarter 2 Quarter 3 Quarter 4
Assessing Board Effectiveness
The effectiveness of the Board is assessed
annually through a self-appraisal, the
criteria of which has been designed in
line with the regulatory requirements.
Each Director is required to complete a
05 January 2018
05 January 2018 (Spl)
19 January 2018
07 February 2018
15 February 2018
20 February 2018
08 March 2018
09 July 2018
13 July 2018
26 July 2018
10 August 2018
23 August 2018
07 September 2018
19 September 2018
04 October 2018
17 October 2018
27 November 2018
06 December 2018
02 April 2018
17 April 2018
02 May 2018
06 June 2018
29 June 2018
performance evaluation form, subsequent
to which responses are aggregated
and presented to the Board. The
Subcommittees also carry out a similar
evaluation.
Since there were changes to the Board
in November 2018 and the Directors
so appointed also resigned before
end December 2018 except for the
representative from the Ministry of
Finance, the annual evaluations for the
year ended 2018 were not conducted. The
practice of carrying out these evaluations
will be continued in the future.
Name of Director BoardAudit
Committee HRRC IRMC NCGC *ICTC
Mr Ronald C Perera, PC - Chairman (Resigned w.e.f. 18 November 2018) (Reappointed w.e.f. February 2019) 19/21 N/A 1/1 N/A 2/2 N/A
Mr S R Attygalle - Ex-officio Director (Ceased to be a Director w.e.f. 25 November 2018) 19/21 7/9 0/1 5/6 0/2 N/A
Mr Ranel T Wijesinha - Director (Resigned w.e.f 31 July 2018) 14/14 6/6 N/A N/A N/A N/A
Mr H P Ajith Gunawardana - Director (Resigned w.e.f 20 July 2018) 13/14 N/A 1/1 5/5 2/2 N/A
Mr Samantha Rajapaksa - Director (Ceased to be a Director w.e.f. 25 November 2018) 20/21 9/9 N/A 6/6 N/A N/A
Mr Mohan Wijesinghe - Director (Resigned w.e.f 02 July 2018) 12/12 N/A N/A N/A N/A N/A
Mr K A Vimalenthirarajah - Alternate Director to Ex-officio Director (Ceased to be the Alternate Director w.e.f. 25 November 2018) (Reappointed as Ex-officio Director w.e.f. February 2019) - 1/1 - 1/1 - N/A
Mr Neil A Umagiliya - Chairman (Appointed w.e.f. 19 November 2018 and Resigned w.e.f. 20 December 2018) 2/2 N/A N/A N/A N/A N/A
Ms Visakha Amarasekere Ex-officio Director (Appointed w.e.f. 26 November 2018 and ceased to be a Director w.e.f. 27 February 2019) 2/2 1/1 N/A N/A N/A N/A
Mr P Lalith P Withana - Director* 2/2 1/1 N/A N/A N/A 1/1
Mr H Isuru Balapatabendi - Director* 2/2 N/A N/A N/A N/A 1/1
Ms A V K Madhavie Herath - Director* 1/2 1/1 N/A N/A N/A N/A
Mr G Harsha Wijayawardhana - Director* 2/2 1/1 N/A N/A N/A 1/1
Total No of Meetings 23 10 1 6 2 1
*All appointed w.e.f. 26 November 2018 and resigned w.e.f. 20 December 2018.

87
Appraisal of the General Manager (GM)
Performance of the General Manager
and Key Management Personnel (KMP)
are evaluated by the Board annually,
based on the financial and non-financial
targets outlined in the Corporate Plan. The
Nomination and Corporate Governance
Subcommittee supports the Board in this
endeavour. The criteria are agreed with the
General Manager/ KMPs at the beginning
of the year, ensuring clarity in the Board’s
expectations. The appraisal takes into
consideration dynamics in the operating
landscape as well as feedback received
from the appraisee.
Director and Executive Remuneration
Approach and Policy
The Bank’s remuneration philosophy for
Directors and Key Management Personnel
reflects its broader commitments to
its stakeholders and strives to reward
sustainable performance on a long-
term basis. Directors’ Remuneration is
determined by the Directors’ Remuneration
Policy which reflects the particulars
of the circulars and letters issued by
the Government of Sri Lanka and the
particulars of the Ordinance and its
amendments. No Director is involved in
determining his/ her remuneration.
Remuneration for the General Manager
and KMP is based on the Board-
approved Remuneration Policy for Key
Management Personnel. Compensation
practices consider achievement of agreed
deliverables with the aim of nurturing a
performance-driven culture. The Board
Human Resources and Remuneration
Committee makes recommendations to
the Board on the General Manager/ KMP
remuneration, based on which the Board
approves and provides feedback to the
relevant Minister who grants final approval
in accordance with the provisions of the
Ordinance and its amendments. The
remuneration of the General Manager and
KMP are reviewed every three years.
Remuneration Structure
BoC’s reward structures are designed to
offer fair and reasonable remuneration.
Due consideration is given to achieving
the optimal mix between fixed and
variable pay depending on the role and
responsibilities. Key elements of the
Bank’s remuneration composition are
given below;
Please refer to page 236 for details on Director Remuneration and page 426 for KMP
Remuneration.
Report of the Board HRRC is available on the Committee report on pages 96 to 97.
Fixed Remuneration
Base salary and other fixed components- determined on role, and employee grade
Variable Remuneration
Incentive bonus
Other non-cash benefits
Post-employment benefits
Loans under special
schemes
Credit Cards

88 Bank of Ceylon | Annual Report 2018
CORPORATE GOVERNANCE
Risk Management and Internal Controls
The Board of Directors hold apex responsibility for safeguarding the Bank’s assets through effective risk management and internal control systems. BoC’s risk management framework has been designed to achieve an optimal risk-reward balance given the Bank’s national role, systemic importance and stakeholder expectations while ensuring compliance with applicable laws and regulations. In monitoring the Bank’s risk profile and internal control systems, the Board regularly assesses the principal risks facing the Bank and the adequacy of risk mitigation tools. The Board is supported by the Integrated Risk Management Committee (IRMC) and Audit Committee in the discharge of its risk management and internal control responsibilities respectively. The scope of both Committees is clearly outlined in the
respective Committee charters.
Please refer to pages 89 to 95 respectively
for the IRMC and Audit Committee
Reports.
Code of Ethics
The Board of Directors led by the
Chairman set the ethical tone for the
Bank and are bound by the Director’s
Code of Ethics which propagates a strong
culture of integrity, transparency and
anti-corruption. Directors are thereby
committed to acting in the best interests
of the Bank without undue personal
conflicts of interest and submit an annual
confirmation on their compliance with
the provisions of the Code. Directors
also submit a Declaration of Assets and
Liabilities annually to the relevant Ministry.
All employees are also bound by the
Employee Code of Ethics which clearly
sets out the Bank’s expectations in dealing
with internal and external stakeholders,
behaviour, bribery and corruption.
An annual confirmation on compliance
is obtained from employees. The Board
Nomination and Corporate Governance
Committee reviews these codes regularly.
Whistleblowing
A Board-approved Whistleblowing Policy
encourages employees or non-employees
to report complaints pertaining to
suspected theft/ fraud, corruption, misuse
of Bank’s assets or any other actions
that are considered unethical or illegal.
Complaints are directed and overseen by
the Chief Internal Auditor while complaints
made against employees of the Deputy
General Manager grade or above are
submitted to the Chairman of the Audit
Committee.
Anti-corruption
It is the Bank’s policy to conduct all
its operations in an honest and ethical
manner. The Bank takes a zero-tolerance
approach to Bribery and Corruption and
is committed to acting professionally,
fairly and with integrity in all its business
dealings and relationships wherever the
Bank operates and implementing and
enforcing effective systems to counter
bribery. The Bank upholds all laws relevant
to countering bribery and corruption in all
the jurisdictions in which it operates.
Stakeholder Communication
The Bank’s Communication Policy
provides guidance on maintaining effective
and relevant communication with internal
and external stakeholders, nurturing open
and sustainable relationships. The Policy is
reviewed by the Nomination and Corporate
Governance Committee. Platforms through
which the Bank maintains communication
with its stakeholders is briefly outlined
below;
Shareholders: The Bank’s sole shareholder
is the Government of Sri Lanka and
ongoing engagement is maintained
through the permanent representative
on the Board as the Ex- officio Director
appointed from the Ministry of Finance.
The Annual Report is presented to the
Parliament through the relevant Ministry.
Employees: The Bank maintains an
open-door policy with all employees while
engagement is also facilitated through
cordial relations with trade unions, multi-
level staff meetings, grievance handling
mechanisms and a year-round calendar
of cultural, entertainment and sporting
events.
Customers: Engagement with customers
is maintained through branches,
relationship managers and multi
faceted digital channels while customer
satisfaction surveys are also conducted on
a regular basis.
Subsidiary Governance
The Bank’s Subsidiary Management
Charter ensures the consistent
application of sound governance and
risk management practices across the Bank’s ten direct and indirect subsidiaries. Regular performance updates and risk dashboards are presented to the parent entity to evaluate potential losses/risks stemming from subsidiaries and recommend corrective action. The Board through IRMC reviews the subsidiary risk management dashboards on a periodic basis, ensuring that the risk profiles are maintained within the defined parameters. BoC’s Compliance Officer looks after the compliance of the subsidiaries. Bank representatives also typically hold at least one Board position in the subsidiary boards, ensuring that the parent entity’s interests are preserved.
Please refer to pages 401 to 427 for further information on the Bank’s compliance to the Banking Act Direction No. 11 of 2007
and pages 394 to 400 for compliance to
the Code of Best Practice on Corporate
Governance 2017 issued by CA Sri Lanka.

89
BOARD SUBCOMMITTEE REPORTS
Audit Committee ReportChairman’s Statement
Audit Committee Charter
The Terms of Reference of the Audit
Committee are governed by the Audit
Committee Charter, approved and adopted
by the Board.
New developments relating to the
functions of the Audit Committee are
considered in reviewing the Audit
Committee Charter which was last
reviewed in 2018.
The Committee also ensures that the
scope and coverage of its functions
addresses the requirements of the
Banking Act Direction No. 11 of 2007
on “Corporate Governance for Licensed
Commercial Banks in Sri Lanka” and its
subsequent amendments issued by the
Central Bank of Sri Lanka.
Principal Focus
The Audit Committee primarily focuses on
assisting the Board in fulfilling its duties by
providing an independent and objective
review of the Bank’s financial reporting
process.
Medium of Reporting
The proceedings of the Audit Committee
meetings are tabled at the meetings of
the Board, where all key issues, concerns,
action taken, outcomes achieved or
pending, and follow-up initiated, are
clarified, discussed and Board approval
obtained thereof.
Composition
In 2018
During the year under review, the Audit
Committee comprised the following Non-
Executive Directors:
• Mr Ranel T Wijesinha
Chairman/ Independent Non-Executive
Director
(until his resignation from the Board of
Bank of Ceylon on 31 July 2018)
• Mr S R Attygalle
Member/ Non-Executive Ex-officio
Director
• Mr Samantha Rajapaksa
Member, Independent Non-Executive
Director
Pursuant to the resignation of
Mr Wijesinha, from the Board of Bank of
Ceylon on 31 July 2018, the Committee
comprised of the following Non-Executive
Directors:
• Mr Samantha Rajapaksa
Chairman/ Independent Non-Executive
Director
(Until his resignation from the Board of
Bank of Ceylon on 25 November 2018)
• Mr S R Attygalle
Member/ Non-Executive Ex-officio
Director
(Until he ceased to be a Director w.e.f.
25 November 2018, with him assuming
duties of a higher position in the
Ministry of Finance)
Pursuant to the reconstitution of the Board
that took place in November 2018, the
Committee comprised of the following
members-
• Mr P Lalith P Withana
Chairman/ Independent Non-Executive
Director
• Ms Visakha Amarasekere
Member/ Non-Executive Ex-officio
Director
• Ms A V K Madhavi Herath
Member/ Independent Non-Executive
Director
• Mr G Harsha Wijayawardhana
Member/ Independent Non-Executive
Director
Mr Withana, Ms Herath, and
Mr Wijayawardhana resigned from the
Board of Bank of Ceylon on 25 November
2018 and Ms Amarasekere ceased to be
a Director with the appointment of a new
Ex officio Director with effect from 27
February 2019.
The members of the Committee held the
requisite financial acumen, experience,
competencies, backgrounds and the
appropriate levels of independence to be
members of this Committee.
Brief profiles of the members of the
Audit Committee during 2018 are given
on pages 79 to 85 under the Corporate
Governance Report.
In 2019
With the change that took place in the
Government, the Board of the Bank was
reconstituted in February 2019 and at the
time of reporting vacancies are expected
to be filled. In the interim, the Board has
decided to constitute the Audit Committee
with the following members-
Mr Kumar Mayadunne
Chairman/ Independent Non-Executive
Director
Mr K A Vimalenthirarajah
Member/ Non-Executive Ex-officio Director
Mr P A Schaffter
Member/ Independent Non-Executive
Director
Profiles of the above members are given
on pages 26 to 27.

90 Bank of Ceylon | Annual Report 2018
BOARD SUBCOMMITTEE REPORTS
Secretary to the Audit Committee
The Secretary, Bank of Ceylon/Secretary
to the Board who is an Attorney-at-Law
and a Deputy General Manager, functions
as the Secretary to the Committee.
Committee Meetings
The Committee met on ten occasions
during the year under review. The
frequency and the duration of the meetings
enabled the Committee to fulfil its
responsibilities effectively. The attendance
of the Committee members is provided in
the table on page no 86.
The quorum of the Committee is two.
The Audit for the Consolidated Financial
Statements of Bank of Ceylon and its
subsidiaries for the year ended 31.12.2018
was conducted by the Auditor General
and the Committee has had ongoing
interaction with the representative of the
Auditor General who is based at the Bank
on a full time basis, throughout the year.
In addition to the regular meetings, the
Committee communicated with the
representatives of the Auditor General (the
external auditor of the Bank), as and when
the need arose.
Participation at Meetings
The following management personnel
attended each of the Audit Committee
meetings on a regular basis:
• Chief Internal Auditor
• Chief Risk Officer
• Compliance Officer
• Assistant General Manager (Province/
Branch and Credit Audit)
• Assistant General Manager
(Investigations)
• Assistant General Manager
(Information Systems Audit)
• Assistant General Manager (Risk
Management)
• Internal Auditor
• IT Risk Officer
• Representatives of the Auditor General
(the External Auditor of the Bank)
The members of the management, who
attended by invitation only, are as follows:
• General Manager
• Chief Financial Officer
• Deputy General Manager (Finance and
Planning)
The Heads of Divisions had been invited
to the meetings of the Audit Committee at
various times during the year in order to
seek clarification where necessary.
Activities Performed in Year 2018
Financial Reporting
• Reviewed the monthly, quarterly and
annual unaudited/audited Financial
Statements to ensure that they are
prepared and published in accordance
with the requirements prescribed
by the supervisory and regulatory
authorities and applicable Accounting
Standards.
• Prior to the release of quarterly
financial statements, an analytical
review has been conducted of the
overall performance of the Bank and
performance of the business units in
relation to budgets, annual strategic
plans, the banking industry and
competitive environment.
• Significant judgements, estimates,
accounting policies and disclosures in
relation to the financial reporting of the
Bank have been reviewed.
• Special attention was drawn regarding
the implementation of SLFRS 9 on
‘Financial Instruments’ which became
effective from 1 January 2018. The
Committee closely monitored the
transition processes in consultation
with Messrs. Ernst & Young, the
consultant for implementation of
SLFRS 9 in the Bank. The Committee
also reviewed the appropriateness of
impairment provision under SLFRS 9
and its impact to the Bank.
Regulatory Compliance
• Reviewed compliance with mandatory
banking and other statutory
requirements.
• Reviewed the progress of action taken
in relation to the findings of the
statutory examinations carried out by
regulators.
• Reviewed the Internal Capital
Adequacy and Capital Augmentation
Plan and implementation thereof.
• Considered the report on Related Party
Transactions.
• Reviewed the position in regard to
implementation of Basel III.
• Reviewed the exposure to
Government/ private sector and to
economic sectors, sub-sectors and
borrowers and followed up on the
implementation of appropriate risk
minimisation and mitigation measures.
• Ensured that the compliance with
mandatory legal and regulatory
requirements are also checked by the
Internal Audit Department as part of its
regular audits.
Audit Committee Report

91
Internal Controls
• Reviewed the adequacy and
effectiveness of the internal control
mechanism of the Bank in line with
Section 3(8) (ii)(b) of the Banking Act
Direction No.11 of 2007 through the
Internal Control Matrix updated for
2018.
• On a regular basis and when
specific events or cases warranted,
conducted root cause analysis and
made improvements to the systems,
procedures and internal controls.
• Continuously strengthened the
oversight over and monitoring of debt
service by customers of concern and
designed measures to prevent/ pre-
empt potential loan losses.
• Continued to guide and assist
the Human Resource Department
to design and implement skill
enhancement to ensure quality credit
administration of the Branch network
for the staff engaged in credit function.
The Statement by the Directors on Internal
Control and the Auditor General’s Report
thereon are provided on pages 188 to 190.
Accordingly, the Committee is of the view
that necessary checks and balances are in
place to provide reasonable assurance that
the Bank’s assets are safeguarded and
that the financial position and the results
disclosed in the Financial Statements are
free from any material misstatements.
Internal Audit
• Reviewed the independence,
objectivity and performance of the
internal audit function as well as
the adequacy of the Department’s
resources, with particular reference to
the:
• Province/ Branch and Credit Audit
• Information Systems Audit
• Head Office, Subsidiaries and
Overseas Branches Audit
• Investigations
• Reviewed the Internal Audit Charter
which defines mission and scope of
work, accountability, responsibility and
authority of the Chief Internal Auditor
to provide an independent audit
function.
• Approved the Internal Audit Plan and
reviewed the effectiveness of the
implementation of the Plan throughout
the year.
• Reviewed the Internal Audit Policy of
Overseas Branches where the audits
are carried out based on the policy.
• Reviewed the Internal Audit Manual for
the year 2018.
• Reviewed significant internal audit
findings and management’s responses
thereto, with a view to taking timely
corrective action.
• Perused the follow up internal audit
reports of Head Office Units with the
Action Plan and time line for rectifying
the issues identified.
• Recommended appointment of a new
concurrent Auditor for the Chennai
Branch.
• Recommended the adoption of Internal
Audit Policy of Chennai Branch for
2018/2019.
Supervision and Audit of Subsidiaries and Associates of Bank of Ceylon
• Reviewed the audits carried out on
subsidiaries in terms of the policy
on the internal audit of subsidiaries
and this has enhanced accountability
and oversight over subsidiaries and
associates of the Bank.
• Reviewed the performance of
subsidiaries and associates.
External Audit
The Committee’s role in relation to the
external audit function of the Bank is as
follows;
• The external audit of the Bank is
carried out by the Auditor General
in terms of the Constitution of the
country. The Committee ensured
that the external audit is carried out
effectively and independently and
maintained a continuous rapport with
the representatives of the Auditor
General in relation to the audit
approach and procedure.
• The Committee has held a “Closed
door” meeting during the year under
review with the previous auditors,
appointed by the Auditor General,
M/s KPMG, Chartered Accountants
pertaining to the audit of the financial
year 2017. With regard to the 2018
Audit, the Committee also has offered
a “closed door” meeting to the Auditor
General’s representatives.
• Reviewed and followed up on audit
issues identified by the previous
Auditors appointed by the Auditor
General, Messrs KPMG, Chartered
Accountants pertaining to the audit for
the year 2017.
• Reviewed the Report of the Auditor
General to the Parliament of Sri
Lanka on the accounts of the Bank
for the year ended 31 December
2017, the Management Letter and the
Management’s responses thereto and
followed up on corrective measures
taken by the Bank together with time
bound action plan to rectify issues of
concern and progress on rectification.

92 Bank of Ceylon | Annual Report 2018
BOARD SUBCOMMITTEE REPORTS
• Reviewed and discussed the key
reports from the Auditor General’s
Department and action has been
initiated where deemed necessary.
• Discussed all relevant matters arising
from the audit with the representatives
of the Auditor General.
Governance
The Committee has reviewed the manner
in which good corporate governance
practices were adopted in the Bank with
particular reference to the:
• Auditor General’s report of factual
findings of Bank of Ceylon in terms of
Section 3(8) (ii)(g) of the Banking Act
Direction No.11 of 2007 on Corporate
Governance issued by the Central
Bank of Sri Lanka.
Procedure for Complaints - Whistle Blowing Policy
The Bank has a long established “Policy of
Whistle Blowing” in respect of procedures
for the receipt, retention and treatment of
complaints. The complaints may relate
to but are not limited to, questionable
accounting, internal control weaknesses,
bribery and/or accepting commissions,
falsifying records, insider dealing, money
laundering, theft and fraud, misuse of the
Bank’s assets, misrepresentation or false
statements and any other actions that are
considered unethical, illegal or contrary
to proper corporate governance and
stewardship policies which will be harmful
to the financial health or reputation of
the Bank. This policy has been reviewed
during the year under review.
The Chief Internal Auditor acts as the
complaint overseer while the complaints
against the employees in the grades of
Deputy General Manager and above are to
be submitted to the Chairman of the Board
Audit Committee.
Employees are encouraged to raise
any legitimate concerns promptly, and
are entitled to remain anonymous or to
request that their identity not be disclosed.
Customers and concerned members
of the general public are entitled to
submit complaints anonymously and in
confidence to the complaint overseer who
is required to investigate complaints within
periods stipulated in the Policy and report
to the Audit Committee where necessary.
Committee Evaluation
An evaluation of the effectiveness of
the Committee is annually conducted
and results are communicated to the
Board. However, in respect of year 2018,
an evaluation with regard to the Audit
Committee has not been conducted
consequent to the changes that took
place in the Board during the latter part
of year 2018 as a result of the volatile
political situation of the country. The new
Committee will evaluate its performance as
has been the practice.
The Committee wishes to record an
appreciation for the Chairmen and
members of the Audit Committee who
functioned in year 2018 for the valuable
service that has been rendered by them.
The Committee wishes to draw attention
to the fact that none of the members
currently serving on the Committee
were present during the period covered
by this report, i.e., the year ended 31st
December 2018. The report, therefore,
is based on records, the authenticity of
which has been verified and established
beyond doubt. The present Committee,
therefore, is completely convinced that
this report is accurate and free of material
misstatements.
Kumar Mayadunne
Chairman
Audit Committee
3 April 2019
Colombo
Audit Committee Report

93
Integrated Risk Management Committee ReportChairman’s Statement
Role of the Committee
The main role and responsibility of the
Committee is to assist the Board in fulfilling
its oversight responsibilities for all aspects
of risk management. In this connection
the Committee focuses on and reviews
risks such as credit, market, liquidity,
operational, reputational and strategic risks
through appropriate risk indicators and
management information.
In addition to the above, the Committee
is responsible for reviewing and/ or
recommending the following which are
identified in the Charter of the Integrated
Risk Management Committee:
• Policies, programmes and
Management Committee Charters
relating to risk management and
compliance.
• Risk limits and policies that establish
appetite for credit, market, liquidity,
operational and other risks, as
recommended by the Chief Risk
Officer.
• Adequacy and effectiveness of all
Management Level Committees such
as the Credit Committee and Assets
and Liability Management Committee
to address specific risks and to
manage those risks within quantitative
and qualitative risk limits as specified
by the Committee.
• Risk management reports on the risk
profile of the Bank, as well as current
market and regulatory risks and actions
undertaken to identify, measure,
monitor and control such risks.
• Corrective action to mitigate the effects
of specific risks in case such risks are
beyond the prudent levels decided
by the Committee on the basis of the
Bank’s policies and regulatory and
supervisory requirements.
• Appropriate actions against the
officers responsible for failing to
identify specific risks and take prompt
corrective action as directed by
the Director of Bank Supervision or
otherwise.
• Adequacy and effectiveness of
risk identification, measurement,
monitoring and mitigation relating to
credit, market, liquidity, operational
and compliance risks.
Composition and Quorum
The members of the Committee during the
year under review were as follows:
• Mr Samantha Rajapaksa
Chairman/ Independent Non–Executive
Director – served on the Committee
until 25 November 2018
• Mr H P Ajith Gunawardana
Member/ Independent Non-Executive
Director - served on the Committee
until 20 July 2018
• Mr S R Attygalle
Member/ Non-Executive Ex-officio
Director - served on the Committee
until 25 November 2018
With the reconstitution of the Board in
November 2018:
• Mr Neil A Umagiliya
Chairman/ Independent Non–Executive
Director – From 27 November 2018 to
20 December 2018
• Ms Visakha Amarasekere
Member/ Non-Executive Ex-officio
Director - From 27 November 2018 to
27 February 2019
• Ms A V K Madhavie Herath
Member/ Independent Non-Executive
Director – From 27 November 2018 to
20 December 2018
• Mr G Harsha Wijayawardhana
Member/ Independent Non-Executive
Director – From 27 November 2018 to
20 December 2018
Brief profiles of the Directors who were
members of this Committee in 2018 are
given on pages 79 to 85 of this Annual
Report.
New Committee for 2019
Pursuant to the reconstitution of the Board
in February 2019:
• Mr Kumar Mayadunne
Chairman/ Independent Non-Executive
Director - Appointed w.e.f. 19 March
2019
• Mr K A Vimalenthirarajah
Member/ Non-Executive Ex-officio
Director - Appointed w.e.f. 19 March
2019
• Mr P A Schaffter
Member/ Independent Non-Executive
Director – Appointed w.e.f. 19 March
2019
Profiles of the new members are given on
page 26 to 27.

94 Bank of Ceylon | Annual Report 2018
Permanent Management representatives
on the Committee
• Mr D M Gunasekara
General Manager – served on the
Committee until 21 February 2018
• Mr Senarath Bandara
General Manager – serves on the
Committee from 22 February 2018
• Mr D N L Fernando
Chief Risk Officer
The quorum of the Committee is two
members.
The Secretary, Bank of Ceylon/ Secretary
to the Board functions as the Secretary to
the Committee. The Chief Financial Officer
and the Chief Internal Auditor are invited
to be present at the meetings. Other
members of the staff are invited to attend
the meetings when the Committee requires
their presence.
Meetings and Activities
The Committee met six times during the
year under review. The attendance of
Committee members at each of these
meetings is given in the table on page 86
of this Annual Report.
Activities carried out by the Committee
during the year under review in discharging
its responsibilities are summarised below:
• Reviewed and/ or recommended the
following policies based on which the
risk profile of the Bank is assessed:
a. Stress Testing Policy
b. Liquidity Risk Management Policy
c. Policies on Prevention of Money
Laundering (ML) and Combating
Financing of Terrorism (CFT) for
Seychelles Branch and Sri Lankan
operations.
d. Anti-Bribery and Anti-Corruption
Policy
e. Group Risk Management Policy
f. Credit Policy Manual of Chennai
Branch
g. Internal Capital Adequacy
Assessment Process 2018
h. Integrated Risk Management Policy
i. Business Continuity Management
Policy and Business Continuity
Plan 2017
j. Compliance Policies for the Male’
Branch and Sri Lankan operations.
k. Cyber Risk Management Policy
and Cyber Security Policy for the
Chennai Branch for 2017-2018
l. Information Technology Risk
Management Policy
• The risks of the Bank were assessed
on a monthly basis by the Independent
Integrated Risk Management Division
of the Bank and summarised reports
were submitted to the Committee
who reviewed them and subsequently
submitted its recommendation to the
Board by way of the meeting minutes
and specific recommendations.
• Risk Appetite and Limit Setting for
2018 were established.
• Monitored quantitative and qualitative
risks which have gone beyond
their limits and made necessary
recommendations.
• Reviewed the comprehensive
Compliance Reports submitted by
the Compliance Officer to assess
the extent of compliance with the
regulatory requirements.
• Reviewed the Subsidiary Risk
Management Dashboards to support
the subsidiaries to manage the
risk functions effectively. Further, a
team from the Risk Management
Division has been appointed to assist
subsidiaries in their risk matters.
• Monitored the Key Risk Indicators in
the Branch network, critical businesses
and support divisions.
• Monitored the Business Continuity
Plan (BCP) drills conducted.
• Monitored the stress testing results on
a quarterly basis.
• Special emphasis was placed on IT
Risk and associated Cyber Security
Risk and initiated follow-up on various
measures to safeguard the Bank from
Cyber-attacks (such as the IT Security
Network Infrastructure of the Bank, the
Enterprise Immune System etc.).
• Revisited the existing operational
procedure and formulated a
comprehensive operational manual for
the Islamic Banking Unit.
• Monitored the development of a
new Third Party Risk Assessment
Methodology.
• Recommended and executed
the appointment of a new Chief
Information Security Officer to manage
IT risk related issues.
• Reviewed the proposal for the Data
Centre Modernization Project at the
Head Office.
• Monitored the identification and
implementation of the unused modules
of the Core-Banking System.
BOARD SUBCOMMITTEE REPORTS
Integrated Risk Management Committee Report

95
• Monitored the progress of the
implementation of the Anti-Money
Laundering System and resolving of
issues arising therein.
• Reviewed the insurance cover for
risks due to the infidelity of employees
which is due to be incorporated into
the next review of the Insurance
policies of the Bank.
• Reviewed the issues identified in the
Information Security Review carried
out by M/s PricewaterhouseCoopers,
Chartered Accountants.
• Followed up on the implementation of
the Data Loss Prevention Project.
• Monitored the progress of reviewing
of the existing borrower rating models
currently used by the users in the
Corporate Segment and Branch
network of the Bank to rate Corporate
and Mid Corporate borrowers.
• Monitored the progress of the
automation of the Assets and Liability
Management (ALM) Module.
• Adoption of an Action Plan approved
by the Credit Committee to prevent
unauthorised Temporary Overdrafts.
• Monitored the progress of the
procurement of the Enterprise Wide
Fraud Management Software.
• Followed up on the proposed new
fully-fledged Disaster Recovery site.
• Finalised a Compliance Checklist for
Non-Financial Subsidiaries.
• Monitored the progress of the
Vulnerability Assessment Report
findings and the issues identified
during the Penetration testing carried
out.
• Conducted a gap analysis of the online
platforms of the Bank and formulated a
roadmap on the Bank’s way forward to
improving its online platforms.
• Reviewed and/ or recommended the IT
procurements and the IT Agreements
of the Bank.
• Commenced a Credit Rating Index/
Matrix in the Bank.
The Committee reported to the
Board by way of minutes giving its
recommendations. All minutes of the
Committee meetings are tabled and
ratified at meetings of the Board and
approval of the Board is obtained for
implementation of the recommendations
made by the Committee. Follow up action
is taken on outstanding matters on a
regular basis.
Conclusion
The Committee continually reviews the
various risks encountered by the Bank
and strives to promote a robust risk
governance framework, a well-developed
and explicit risk management policy
covering determination of risk appetite,
application of up-to-date methodologies
for measuring financial risks, developing
in-house expertise and ensuring that Risk
reporting accurately communicates risk
exposures and results of stress tests or
scenario analyses, data analytics and peer
bank analysis.
The Committee is cognisant of the fact
that it needs to be vigilant and attuned
to its risk combat strategy with the
advancement of technology, increased
vulnerability with macroeconomic shocks
and volatility and as banking frauds and
Cybercrimes begin to pose a greater
challenge.
The Committee wishes to thank the
members of the Committee in the year
2018 for the valuable contributions made
by them.
The Committee wishes to draw attention
to the fact that none of the members
currently serving on the Committee
were present during the period covered
by this report, i.e., the year ended 31st
December 2018. The report, therefore,
is based on records, the authenticity of
which has been verified and established
beyond doubt. The present Committee,
therefore, is completely convinced that
this report is accurate and free of material
misstatements.
On behalf of the Integrated Risk
Management Committee,
Kumar Mayadunne
Chairman
Integrated Risk Management Committee
3 April 2019
Colombo

96 Bank of Ceylon | Annual Report 2018
BOARD SUBCOMMITTEE REPORTS
Human Resources and Remuneration Committee ReportChairman’s Statement
Role of the Committee
The main responsibilities of the Committee,
which are mainly based on the Banking
Act Direction No. 11 of 2007 on Corporate
Governance for Licensed Commercial
Banks in Sri Lanka issued by the Central
Bank of Sri Lanka, are as follows:
• Determining the Remuneration Policy
(salaries, allowances and other
financial payments) relating to Key
Management Personnel (KMP) of the
Bank.
• Setting goals and targets for the
General Manager (GM) and KMP.
• Evaluating the performance of the GM
and KMP against the set targets and
goals periodically and determining
the basis for revising remuneration,
benefits and other payments of
performance based incentives.
• Reviewing staff matters referred to it by
the Board.
• Determining the Human Resource
Policy and Organisational Structure of
the Bank.
Composition and Quorum during the year
The members of the Committee, during the
year under review, were as follows:
• Mr H P Ajith Gunawardana
Chairman/ Independent Non-Executive
Director - (Until his resignation from
the Board of Bank of Ceylon on
20 July 2018)
• Mr Ronald C Perera PC
Member/ Independent Non-Executive
Director - From 27 February 2015 to
18 November 2018
• Mr S R Attygalle
Member/ Non Independent
Non-Executive Ex-officio Director -
From 11 May 2016 to 18 November
2018
Pursuant to the reconstitution of the Board
that took place in November 2018, the
Committee comprised of the following
members-
• Mr Neil A Umagiliya
Chairman/ Independent Non-Executive
Director
• Ms Visakha Amarasekere
Member/ Non Independent Non-
Executive Ex-officio Director
• Mr H Isuru Balapatabendi
Member/ Independent Non-Executive
Director
Mr Neil A Umagiliya and Mr Isuru
Balapatabendi resigned from the Board of
Bank of Ceylon on 20 December 2018 and
Ms Visakha Amarasekere ceased to be
Director w.e.f. 27 February 2019.
Brief profiles of the Directors who were
members in the year 2018 are given on
page 79 to 85 of this Annual Report.
New Committee for 2019
Pursuant to the reconstitution of the Board
in February 2019, the following Directors
were appointed to the Human Resources
and Remuneration Committee w.e.f.
19 March 2019:
• Mr K A Vimalenthirarajah
Chairman/ Non-Independent
Non-Executive Ex-officio Director
• Mr Kumar Mayadunne
Member/ Independent Non-Executive
Director
• Mr P A Schaffter
Member/ Independent Non-Executive
Director
Profiles of the new members are given on
pages 25 to 27.
The quorum of the Committee is two
members. The General Manager is present
at all meetings except when matters
relating to the General Manager are
discussed. The Deputy General Manager
(Human Resource) and other members
of the staff are invited to attend the
meetings when the Committee requires
their presence. The Secretary,
Bank of Ceylon/ Secretary to the Board
functions as Secretary to the Committee.
Meetings and Activities
The Human Resources and Remuneration
Committee meets whenever it is required
by the Board of Directors and/ or, when
the Chairman of the Committee deems
it necessary, by law or applicable rules
and regulations in accordance with the
Committee’s Charter. The Committee
has met only once during the year under
review due to changes to the Board of
Bank of Ceylon that took place in 2018
resulting in lesser number of members
being on the Committee. The attendance
of members at the meeting is given on
page 86. The minutes of the Committee
meetings are tabled and ratified at
meetings of the Board and approval of the

97
Board thus is obtained for implementation
of the recommendations made by the
Committee. Follow-up action is taken on
outstanding matters.
According to the aforesaid Banking Act
Direction No. 11 of 2007, this Committee
has to determine the Remuneration Policy
relating to Directors. However, in the case
of Bank of Ceylon, the remuneration of
Directors is determined in accordance
with the circulars and instructions issued
by the Government of Sri Lanka, the sole
shareholder of the Bank. The provisions
in the Bank of Ceylon Ordinance No. 53
of 1938 and its amendments, are also
taken into consideration in this regard. The
Bank has a Remuneration Policy in place,
prepared, based on the above, which is
reviewed as and when new regulations are
issued by the Government. The details of
the remuneration given to Directors, are
disclosed in the Annual Report on a yearly
basis.
The goals and targets for the General
Manager and Deputy General Managers
(DGMs) are embodied in the rolling
Corporate Plan and Action Plan. The
General Manager is responsible for the
implementation of the Corporate Plan
through the Deputy General Managers.
Based on the Action Plan prepared
according to the Corporate Plan, the
Assistant General Managers are given
targets by the respective Deputy General
Managers.
The Committee has undertaken the
following activities during the year under
review-
• Performance evaluation of the Key
Management Personnel (KMP)
including the General Manager for the
year ended 2017 based on the targets
set at the commencement of the year
in line with the Corporate Plan. The
performance of the Assistant General
Managers is evaluated through the
evaluation carried out on them by their
superiors, viz DGMs.
• The Committee evaluated its annual
performance for the year 2017 as per
the Committee’s Charter.
The Board has directly undertaken the
following activities due to the changes to
the composition of the Committee which
took place during the year, resulting in a
lesser number of members on the Board
and consequently on the Committee.
• Salaries of KMP which is revised once
in three years were revised for the
period 2018-2020, with the approval
of the Ministry in charge of the Bank
as per the provisions of the Bank of
Ceylon Ordinance.
• Mid-year performance review of KMPs
were carried out against the targets set
at the beginning of the year in line with
the Corporate Plan.
Conclusion
The Committee wishes to record its
appreciation to the previous members of
the Committee.
The Committee will continue to take
responsibility for making recommendations
to the Board on all matters coming under
its purview. It would continue to assist the
Board to fulfil its oversight responsibilities
as per the terms of reference of the
Charter of the Human Resources and
Remuneration Committee and encourage
the adoption of best practices in human
resource management.
The Committee wishes to draw attention
to the fact that none of the members
currently serving on the Committee
were present during the period covered
by this report, i.e., the year ended 31st
December 2018. The report, therefore,
is based on records, the authenticity of
which has been verified and established
beyond doubt. The present Committee,
therefore, is completely convinced that
this report is accurate and free of material
misstatements.
On behalf of the Human Resources and
Remuneration Committee.
K A Vimalenthirarajah
Chairman
Human Resources and
Remuneration Committee
3 April 2019
Colombo

98 Bank of Ceylon | Annual Report 2018
BOARD SUBCOMMITTEE REPORTS
Nomination and Corporate Governance Committee ReportChairman’s Statement
Role of the Committee
The Nomination and Corporate
Governance Committee is mainly
responsible for the following:
• Implementing procedures to select/
appoint the General Manager (GM) and
Key Management Personnel (KMP).
• Setting the criteria such as
qualifications, experience and key
attributes for eligibility to be considered
for appointment or promotion to the
post of General Manager and the key
management positions.
• Ensuring that the General Manager and
KMP are fit and proper persons to hold
office as specified in the criteria given
in Direction No. 3 (3) of the Banking Act
Direction No. 11 of 2007 on Corporate
Governance for Licensed Commercial
Banks in Sri Lanka issued by the
Central Bank of Sri Lanka and as set
out in the statutes.
• Considering and recommending,
from time to time, the requirements
of additional/ new expertise and
succession arrangements for KMP.
• Determining the methods and
execution of the annual evaluations
of the Board and each Board
Committee’s effectiveness and
supporting the annual performance
evaluation process.
• Reviewing the Bank’s Codes of Ethics.
• Determining the level of compliance
with the Corporate Governance
principles.
The Composition of the Committee
The members of the Committee during the
year under review were as follows:
• Mr Ronald C Perera PC
Chairman/ Independent Non-Executive
Director - served on the Committee
until 18 November 2018
• Mr H P Ajith Gunawardana
Member/ Independent Non-Executive
Director - served on the Committee
until 20 July 2018
• Mr S R Attygalle
Member/ Non-Independent Non-
Executive Ex-officio Director – served
on the Committee until 25 November
2018
With the reconstitution of the Board in
November 2018:
• Ms Visakha Amarasekere
Chairman/ Non-Executive Ex-officio
Director – From 27 November 2018
until 27 February 2019
• Mr H Isuru Balapatabendi
Member/ Independent Non-Executive
Director – From 27 November 2018 to
20 December 2018
• Mr G Harsha Wijayawardhana
Member/ Independent Non-Executive
Director – From 27 November 2018 to
20 December 2018
Brief profiles of the Directors who were
members of this Committee in 2018 are
given on pages 79 and 85 of this Annual
Report.
New Committee for 2019
Pursuant to the reconstitution of the Board
in February 2019:
• Mr Ronald C Perera PC
Chairman/ Independent Non-Executive
Director - Appointed w.e.f. 19 March
2019
• Mr K A Vimalenthirarajah
Member/ Non-Executive Ex-officio
Director - Appointed w.e.f. 19 March
2019
• Mr P A Schaffter
Member/ Independent Non-Executive
Director - Appointed w.e.f. 19 March
2019
Profiles of the new members are given on
pages 25 to 27.
The General Manager attends the
meetings by invitation. Other members
of staff are invited to attend the meetings
when the Committee requires their
presence. The Secretary, Bank of Ceylon/
Secretary to the Board functions as the
Secretary to the Committee.
Meetings
The Committee met twice during the
year under review. The attendance of the
Committee members at each of these
meetings is given in the table on page 86
of the Annual Report.
Reporting to the Board
All minutes of the Committee meetings
are tabled and ratified at meetings of
the Board and approval of the Board
is thus obtained for implementation
of the recommendations made by the
Committee. Follow up action is taken on
outstanding matters on a regular basis.

99
Appointments made to the Board
According to the aforesaid Banking Act
Direction No. 11 of 2007, this Committee
has to implement a procedure to select/
appoint new Directors. However, in the
case of Bank of Ceylon, which is fully-
owned by the Government of Sri Lanka,
the appointment of Directors is carried
out by the Minister under whose purview
the Bank falls, as provided in the Bank
of Ceylon Ordinance No. 53 of 1938 and
its amendments. As such this Committee
does not play any role in connection with
the appointment of Directors.
Activities performed during the year under
review
• Reviewed and recommended the
following:
o The Policy on Director’s Access to
Independent Professional Advice.
o The Succession Plan for Corporate
Management and Executive
Management (KMP).
• Ensured that KMP are fit and proper
persons to hold their offices when
officers were promoted or appointed
as KMP.
• Evaluated the performance of the
Committee for the previous year.
Conclusion
The Committee will endeavour to maintain
and enhance the good Corporate
Governance practices of the Bank.
The Committee wishes to thank the
Directors who functioned as members of
the Committee during the year 2018.
The Committee wishes to draw attention
to the fact that only one of the members
currently serving on the Committee (i.e.,
Director/Chairman Ronald C Perera who
served from 01.01.2018 to 18.11.2018)
was present during the period covered
by this report, i.e., the year ended 31st
December 2018. The report, therefore,
is based on records, the authenticity of
which has been verified and established
beyond doubt. The present Committee,
therefore, is completely convinced that
this report is accurate and free of material
misstatements.
On behalf of the Nomination and
Corporate Governance Committee.
Ronald C Perera
Chairman
Nomination and Corporate Governance
Committee
3 April 2019
Colombo

100 Bank of Ceylon | Annual Report 2018
BOARD SUBCOMMITTEE REPORTS
Information and Communication Technology Committee Report
Chairman’s Statement
Role of the Committee
The Information and Communication
Technology (ICT) Committee is mainly
responsible for the following:
• Monitoring key IT products and
services of the Bank, evaluating
the manner in which they are being
assessed and managed and reviewing
benchmarks set and major functional
exposures for such IT products and
services.
• Ensuring that appropriate policies
and procedures are in place for the
smooth and uninterrupted functioning
of existing and future IT products and
services.
• Monitoring and evaluating checks and
balances to manage the Bank’s IT
exposures.
• Reviewing and making
recommendations to the Board for its
final approval for IT Procurements.
• Ensuring that the Bank’s IT products,
services and infrastructure are aligned
with the Bank’s IT Road map.
• Providing a critical assessment of the
Bank’s business strategies and plans
from an enterprise IT perspective.
• Reviewing and monitoring the Bank’s
IT products and services with key
statutory and regulatory requirements.
• Reviewing and making
recommendations to the Board on
Disaster Recovery facilities of the
Bank.
• Reviewing and making
recommendations on all IT security
related strategies and implementations.
The Composition of the Committee
The first members of the Committee were
as follows:
• Mr G Harsha Wijayawardhana
Chairman/ Independent Non-Executive
Director - From 27 November 2018 to
20 December 2018
• Mr P Lalith P Withana
Member/ Independent Non-Executive
Director - From 27 November 2018 to
20 December 2018
• Mr H Isuru Balapatabendi
Member/ Independent Non-Executive
Director - From 27 November 2018 to
20 December 2018
Brief profiles of the Directors who were
members of this Committee are given on
pages 79 and 85 of this Annual Report.
New Committee for 2019
Pursuant to the reconstitution of the Board
in February 2019:
• Mr P A Schaffter
Chairman/ Independent Non-Executive
Director - Appointed w.e.f. 19 March
2019
• Mr Kumar Mayadunne
Member/ Independent Non-Executive
Director - Appointed w.e.f. 19 March
2019
• Mr K A Vimalenthirarajah
Member/ Non-Executive Ex-officio
Director - Appointed w.e.f. 19 March
2019
Profiles of the new members are given on
pages 25 to 27.
The General Manager, Head of Information
Technology, Deputy General Manager
(Product and Banking Development) and
Chief Risk Officer attend the meetings
by invitation. Other members of staff are
invited to attend the meetings when the
Committee requires their presence. The
Secretary, Bank of Ceylon/ Secretary to
the Board functions as the Secretary to the
Committee.
Meetings
The decision to establish this Committee
was taken on 09 July 2018. However,
the members were appointed to the
Committee on 27 November 2018 and it
met once during the year under review.
The attendance of the Committee
members at this meeting is given in the
table on page 86 of the Annual Report.
Reporting to the Board
The minutes of the Committee meetings
are tabled and ratified at meetings of
the Board and approval of the Board
is thus obtained for implementation
of the recommendations made by the
Committee. Follow up action will be taken
on outstanding matters on a regular basis.
Activities performed during the year under
review

101
• Reviewed the adequacy of the Charter
for the Information and Communication
Technology Committee and
recommended changes.
• Reviewed the time bound IT Plan of
the Bank setting out the Strategic Plan
for the Information Technology Division
for the period 2019 to 2021 together
with the Action Plan indicating the time
lines based on the Corporate Plan for
2019 to 2021.
Conclusion
The ICT Committee of the Bank was
established by the Board of Directors in
recognition of the beneficial and growing
role of an ICT Committee in the current
business environment. The Committee
whilst recognising that its role is evolving,
serves to formulate technological
strategies, ensure effective and secure
utilisation of technology within the Bank,
evaluate, and advise with respect to the
direction of the Bank’s technological
development and recommend technology,
policies and procedures to meet the
Bank’s financial and regulatory obligations
and assist the Board in its functions.
An appreciation is also recorded for
the members who served on the ICT
Committee of the Bank during 2018.
The Committee wishes to draw attention
to the fact that none of the members
currently serving on the Committee
were present during the period covered
by this report, i.e., the year ended 31st
December 2018. The report, therefore,
is based on records, the authenticity of
which has been verified and established
beyond doubt. The present Committee,
therefore, is completely convinced that
this report is accurate and free of material
misstatements.
On behalf of the Information and
Communication Technology Committee.
Prakash A Schaffter
Chairman
Information and Communication
Technology Committee
3 April 2019
Colombo

102 Bank of Ceylon | Annual Report 2018
RISK MANAGEMENT
The Bank adopts a holistic and systematic approach towards the management of risk and return, with the aim of being resilient through economic cycles and internal/external challenges. BoC’s comprehensive risk management framework consists of clearly defined governance structures, Board-approved policy frameworks and a culture of risk awareness which ensure the consistent management of risks across the Bank.
Highlights of 2018
Jan-
18
Feb
-18
Mar
-18
Ap
r-18
May
-18
Jun-
18
Jul-
18
Aug
-18
Sep
-18
Oct
-18
Nov
-18
Dec
-18
Total Bank VaR
Total Bank VaR Risk Appetite
0
100,000,000
200,000,000
300,000,000
400,000,000
500,000,000
LKR
Liquid Asset Ratio
Risk Appetite (%) Regulatory Minimum (%)Liquid Asset Ratio (%)
0
5
10
15
20
25
30
35
Jan-
18
Feb
-18
Mar
-18
Ap
r-18
May
-18
Jun-
18
Jul-
18
Aug
-18
Sep
-18
Oct
-18
Nov
-18
Dec
-18
Leverage Ratio
2017 (%) Norm (%)2018 (%)
0.0
0.5
1.0
1.5
2.0
2.5
3.0
3.5
4.0
4.5
5.0
March June September December
14.6%Capital Adequacy Ratio
2018
2017
l Deposit l Borrowings l Equity
Funding Composition
78%
6%
16%
6%
14%
80%

103
Emerging Risks
As a systemically important bank, BoC faces an assortment of external pressures that
have an impact on its risk profile. We strive to proactively identify and respond to these
emerging risks by consistently monitoring our risk landscape to navigate uncertainty and
empower conscious risk taking. A brief overview of these risks is listed below and should
be read in conjunction with the chapter on Market Opportunities and Risks on page 52 of
this Report. The risks presented below are those that arise from the increasingly uncertain
operating landscape given unprecedented advances in technology, increasing customer
sophistication, demographic changes as well as social and environmental challenges.
Traditional risks arising from the Bank’s business model and internal causal factors are
discussed in detail in subsequent sections of this Report.
IT and Cyber Risks
Risks arising from the inability to acquire and maintain robust and secure technology in line with customer expectations and competition. Cyber risks stem from cyber attacks or breaches to systems, networks or databases resulting in loss of customer data, disruption to operations or reputational damages.
Mitigating factors
• Strong IT governance including a robust IT Security policy and clearly defined responsibilities
• Regular IT vulnerability assessments
• Ongoing investments in upgrading hardware and software
• IT audits by independent parties
People Related
Difficulties in acquiring and retaining the right talent to the organisation and risks arising from employees’ inability to deliver customer expectations and drive the Bank’s strategy.
Mitigating factors
• Substantial investments in developing skills and competencies
• Organisational culture which encourages mentoring and knowledge sharing
• Recognition Programmes which value employee contributions
Information Risks
Reputational damages or disruptions to operations arising from inaccurate data and inability to preserve customer information.
Mitigating factors
• Framework of robust IT controls
• Ongoing employee training on information protection

104 Bank of Ceylon | Annual Report 2018
RISK MANAGEMENT
Competitive Pressures
Smaller, more agile competitors are adept at embracing market changes at a faster pace. Intensifying competition from non-traditional operators such as fintech companies which offer flexible, speedy and accessible solutions can lead to an erosion of the Bank’s competitive edge.
Mitigating factors
• Unique competitive advantage based on trust, stability, state-ownership and established track record
• Digitisation strategy to drive improved customer convenience and accessibility
Government Policy
Implications of Government policy such as changes to the tax regime, import restrictions, monetary policy revisions and concessionary loan schemes have a direct impact on the Bank’s operations and its risk profile.
Mitigating factors
• Benchmark banking practices with international best practices
• Identify plausible events through Stress Testing and Scenario Analysis
Changing Customer Expectations
Unprecedented advances in technology are transforming customer expectations with customers increasingly demanding instant solutions through platforms which suit their needs. Inability to effectively respond to these dynamics will lead to an erosion of competitive position, particularly among the younger/millennial customer base.
Mitigating factors
• Digital strategy driving self-service and multi-channel model
• Innovative solutions targeting the younger customer segment
• Communication strategy centred on digitalisation
Risk Management Framework
Risk Governance
Board of Directors
Audit Committee, IRMC
Risk policies, procedures, standards and internal controls
RiskManagement
Division
Three lines of defence model
Components
2nd lineIIRMD
Risk reporting
1st lineBusiness
Units
Riskuniverse
Riskappetite
3rd lineAudit/
Assurance
Stress testing
Riskculture

105
Risk Management Governance Structure
The Bank’s risk governance structure clearly defines responsibilities for the identification,
measurement, management, monitoring and reporting of risks. The mandates of risk-
related governance committees at both Board and executive level ensure accountability
for all types of risk across the organisation, facilitating a holistic and systematic approach
to risk management. The risk governance structure comprising Board and executive
functions is graphically illustrated below;
Board of Directors
The Board of Directors hold ultimate responsibility for
ensuring that the Bank’s risks are managed in a manner
that aptly balances risk return dynamics. In discharging
these duties, the Board is responsible for defining the
Bank’s risk appetite, formulating the risk management
framework, formulating policies and procedures to
ensure the consistent treatment of risks and consistently
monitoring the risk profile against the defined risk
appetite. IRMC, Audit Committee and the recently formed
Board Information and Communication Technology
Committee (ICTC) support the Board in the discharge of
its risk related responsibilities.
Integrated Risk
ManagementCommittee
Audit Committee
Information and
CommunicationTechnologyCommittee
Board of Directors
Risk related Board subcommittee General Manager and ManagementLevel committees
Credit risk
Market risk
Operational risk
IIRMD headed by CRO
AGM-Risk Chief Information Security Officer

106 Bank of Ceylon | Annual Report 2018
RISK MANAGEMENT
Integrated Risk Management Committee (IRMC)
The IRMC assists the Board in fulfilling its
oversight responsibilities for all aspects of
risk management including the following;
l Reviewing policies, programmes and
committee charters relating to risk
management
l Set risk limits and define risk appetite
for all key risk exposures
l Review the effectiveness of risk-related
management level committees
l Review the adequacy and
effectiveness of risk identification,
measurement, monitoring and
mitigation tools
l Review Capital requirement of the
Bank in line with the Internal Capital
Adequacy Assessment Process
(ICAAP)
l Review periodical stress testing to
identify vulnerabilities and propose risk
mitigants
l Review the Bank’s Business Continuity
Plan (BCP)
Independent Integrated Risk Management Division (IIRMD)
The IIRMD is headed by the Chief Risk
Officer (CRO) and operates independently
of the revenue generating Strategic
Business Units. The Division carry out
independent risk assessments and assists
the IRMC in fulfilling its mandate. Key
responsibilities of the IIRMD include,
l Regular stress testing using a range
of stressed scenarios to gauge the
potential impact on capital and
earnings
l Preparation of a comprehensive ICAAP
l Formulation of the risk appetite with
specific key risk indicators, range and
limits for approval by the Board of
Directors
l Support the identification, monitoring
and reporting of risks by the first line of
defence
l Introduce and implement risk mitigants
l Ensuring the effective implementation
of the Business Continuity Plan
l Risk assessments of the Bank’s new
products and processes
l Nurture a culture of risk awareness and
risk consciousness through internal
engagement, communication and
training programmes
Policy Framework
A comprehensive suite of Board-approved
policies ensure that risks are identified,
measured, mitigated and reported in
a consistent and systematic manner
across all levels of the organisation. The
policies are regularly reviewed and revised
to ensure alignment with industry best
practices and relevance in addressing
emerging risks. During the year the Bank
introduced an Anti-Bribery and Anti-
Corruption Policy, clearly setting out
guidelines on preventing and combating
any form of bribery. Key risk-related
policies in place are listed alongside;
Charter for Integrated Risk Management Committee
Integrated Risk Management Policy
Group Risk Management Policy
Stress Testing Policy
ICAAP Policy
Committee Charters
Major Policies which governs overall risks
Policies for specific risk categories
Credit Risk policies
Market Risk policies
Liquidity Risk policies
Operational Risk policies
IT /Information Security policies

107
Three Lines of Defence Model
The Bank adopts the globally accepted
three lines of defence model which
provides a clear division of responsibilities
thereby ensuring transparency and
accountability in the identification and
management of risks. The model also
allows for the nurturing of specialised skills
through segregation of roles.
Risk ownership bybusiness units
Risk taking and risk ownership
Day to day management of risk
Act in accordance with risk policies
Application of internal controls and risk responses
Risk management by IIRMD
Develop risk management framework
Provide guidance
Monitoring, reporting and risk control
Ensuring 1st line (business units) takes
risk ownership
Assurance by the audit function
Independent and
objective assurance
to the Board on the
effectiveness of the
1st and 2nd lines of
defence
line ofdefence
line ofdefence
line ofdefence
Risk Culture
The Bank promotes a culture of risk
awareness where all employees are
responsible for the identification,
management and escalation of risks.
Employees are also expected to
demonstrate behaviour which is in line with
the Bank’s Code of Ethics with emphasis
on doing the right business, the right
way. The three lines of defence model
has also facilitated the propagation of a
strong risk culture through clear allocation
of risk related responsibilities. Regular
training programmes, awareness on
whistle-blowing procedures and reinforcing
the Bank’s values and ethics through
employee engagement platforms has
also contributed towards nurturing a risk
culture.
Stress Testing
Stress testing is used to evaluate the
sensitivity of the Bank’s risk profile to
macro-economic trends or other plausible
events. It supports several business
processes including corporate planning,
capital planning and management, defining
the risk appetite, risk mitigating actions
such as changing limits and revising
exposures and supporting stakeholder
communication on risk related issues.
Routine stress testing is carried out in
accordance with the Board approved
stress testing policy and potential impacts
are assessed on capital, liquidity and
profitability.
Risk Reporting
Regular risk reporting is an integral part of
the Bank’s risk management framework
and dedicated teams are in place to
proactively communicate material financial
and non-financial risks. The risk exposures
and risk profile against the defined
appetite is reported to the Board on a
regular basis classified at various levels
across the Bank such as product lines,
geographical regions and business units.
The IRMC receives a comprehensive risk
report including a risk indicator dashboard
on a monthly basis and as and when
required .
Risk Profile in 2018
Risk Appetite
The Risk appetite demonstrates the
quantum of risk the Bank is willing to take
in the pursuit of its strategic agenda and
is expressed in the form of a Risk Appetite
Statement (RAS), approved by the Board.
In formulating the RAS due consideration
is given to the Bank’s Corporate Plan and
the desired balance between risk and
return. The statement typically includes
risk appetite triggers and tolerance limits
ensuring that corrective management
action is taken. The RAS is reviewed and
revised by the Board on an annual basis or
as and when required.

108 Bank of Ceylon | Annual Report 2018
RISK MANAGEMENT
Risk Universe
The Bank’s key risk exposures are summarised in the diagram below;
Risks arising from the Bank’s business model, operations and processes
Activity Lend Fund Trade CompeteOperations and
processes
Operate in a regulated
industry
Risk exposure Credit Risk Liquidity Risk Market Risk Strategic RiskOperational
RiskCompliance
Risk
External factors affecting the bank
Policy changes, Geopolitical changes, Macro-economic changes, Climate changes
Credit Risk
Credit risk is defined as potential
losses arising due to a counterparty
to a credit transaction failing to meet
his/her obligations in accordance with
agreed terms. Credit risk can take the
form of default risk, concentration of
counterparties, geographical regions or
industry sectors.
With approximately accounting for 91% of
risk weighted assets, credit risk is one of
the Bank’s key risk exposures. In addition
to direct lending activities reflected on
the balance sheet, off-balance sheet
transactions such as financial guarantees,
letters of credit and acceptances issued
give rise to credit risk.
Credit Risk Governance
The Bank’s credit risk management is
governed in accordance with its Credit
Risk Management Policy and relies on
individual responsibility and collective
oversight. The policy clearly sets out the
principles under which the credit risk is to
be assumed and defines the framework for
the consistent identification, management
and reporting of credit risk across the
organisation. Credit risk is managed through
the Credit Committee headed by the
General Manager and the IRMC at Board
level. The responsibilities of the Credit
Committee include formulating, reviewing
and implementing credit risk appetite
limits, approving credit up to authorised
limits, ensuring regulatory compliance in
the Bank’s risk policies and guidelines and
monitoring risk concentrations. The primary
responsibility for credit risk management
lies with the business units, supported by
independent review by the Credit Risk Unit
of the IIRMD.
Credit Risk Management Framework
Key elements of the Bank’s credit risk
management framework are presented
alongside;
Policy framework
The Bank’s credit risk policy framework
comprises a suite of Board-approved
policies relating to risk rating, portfolio
management and loan review among
others. Key aspects include segregation
of duties, comprehensive credit appraisal
mechanisms, delegated authority limits
and prudential limits. Policies are reviewed
and regularly updated by the Board of
Directors to ensure relevance to market
conditions and alignment to evolving best
practices.
Robustpolicy
framework
Collateral management
Credit ratings
Culture of responsible
lending
Segregation of duties

109
Segregation of duties
The responsibility for pre-disbursement
appraisal and post-sanction monitoring
is clearly segregated, allowing for
effective and objective implementation
of appraisal guidelines. New credit,
extension of existing credit and material
changes to existing facilities are subject
to the approval of the appropriate
delegated authority. Meanwhile, facilities
above a certain threshold are reviewed
independently by the Chief Risk Officer.
Collateral management
Collateral is obtained as a secondary
wayout against a possible default and
usually takes the form of cash, gold,
properties, fixed assets, letters of credit,
debtors and receivables among others.
Collateral is valued regularly to ensure
adequate coverage against the facility
provided. Non-financial collateral is valued
by independent third-party valuers.
Credit ratings
Risk rating models which use transaction
and borrower specific factors are used
in evaluating corporate exposures and
estimating the probability of default. The
borrower risk rating system categorises
all performing corporate credits into eight
grades depending on the underlying credit
quality. Tailor-made credit scorecards
are used in evaluating retail exposures.
We have been progressing towards
implementation of the Internal Rating
Based Approach under Basel II.
Culture of responsible lending
Ongoing training programmes, workshops
and web-based learning modules on
credit evaluation as well as a mentoring
and knowledge sharing culture have
contributed towards nurturing a culture
of risk awareness and responsible
lending. During the year, we focused on
enhancing the credit evaluation skills of
the operational level staff through a range
of training initiatives.
Credit Risk Management Process
Pre-credit sanctioning
• Structured credit appraisal mechanisms and defined credit criteria
• Multiple levels of approval authority
• Risk rating and scoring systems
• Prudential limits for concentration risk
• Independent review by CRO
Post-credit monitoring
• Robust credit review mechanism
• Portfolio evaluation
• Review of selected exposures
• Identifying customers of concerns
• Stress testing and scenario analyses
Risk monitoring and Reporting
Policy Framework/ Procedures, Model development and Validation
Credit risk governance
l Developed industry-specific credit policy guidelines
l Refined and enhanced credit score cards for retail lending to reflect industry
best practice and emerging market conditions
l Widened the scope of the Credit Quality Assurance Unit
l Implementation of rating-based lending
l Introducing risk based pricing
l Training programmes and workshops aimed at strengthening the credit
evaluation skills of our operational staff
l Develop web portal for all credit-related procedure manuals
Key Areas of focus/ Development in 2018
Credit Risk Review 2018
Default Risk
The tightening economic conditions during the year had an industry-wide impact on
portfolio quality with an increase in impairments seen across the industry. While the bank’s
loans and advances grew by 24%, the Bank’s impairment charges increased by 48%
during the year. Having identified the weakening trend in industry credit quality, the Bank
took immediate and long-term measures to curtail the influx of NPLs as listed alongside.
The Bank adopted a cautious approach in lending to certain industries, customers and
market segments while ongoing focus was placed on monitoring the loan aging analysis
and movements.

110 Bank of Ceylon | Annual Report 2018
RISK MANAGEMENT
Preserving portfolio quality
Short-term: Island-wide dedicated
recovery drives.
Reviewed and tightened credit
risk appetite.
Long-term: Strengthen credit
policy guidelines and underwriting
standards.
Enhanced the credit culture
through training on credit
evaluation.
Concentration Risk
Concentration risk arises from high
lending exposure to a counterparty/group,
sector, product or region. Herfindahl-
Hirschman Index (HHI) is used in
measuring concentration risk. The IIRMD,
Credit Committee and IRMC consistently
monitors this risk against exposure limits
defined in the risk appetite statement
such as name, geographical, sectors and
products. These limits are reviewed and
modified regularly to ensure relevance
to emerging trends in the operating
landscape.
35%
13%
47%
5%
Loan Portfoilo Classifiedby Risk Rating
l High Gradel Standard Gradel Sub - Standardl Unrated
Name Concentration: Large exposures to specific individual borrowers give rise to ‘Name
Concentration’ risk and is monitored through the single borrower limit and the HHI. There
is no significant name concentration in private sector lending activities.
As a state bank which is strategically aligned to the national development agenda BoC is
one of the key lenders to the Government and State Owned Enterprises (SOEs). However,
these facilities generally do not expose the Bank to significant credit risk as they carry an
explicit guarantee from the Government Treasury.
Product Concentration
In terms of product-wise exposures, the Bank maintains a well-diversified portfolio with
the largest exposure of term loans accounting for 21% of total advances, followed by
overdrafts and personal loans.
l Trade Finance l Ran Surakuml Leasingl Staff Loansl Loans under Schemesl Overdraftsl Housing Loansl Foreign Currency Loansl Term Loansl BoC Personal Loansl Pledge Loansl Money Market Loansl Loans Others
6%
4%3%
3%
2%
20%
1%
2%
11%
14%
21%
9%
Product wise Concentration
4%
Sector Concentration
The industry classification of BoC’s total assets exposure also reflects its tilt towards
Government lending, with Sovereign and Direct Government exposure amounting to
35% of the total loan book. Excluding this sector (which does not entail credit risk), the
Bank’s portfolio is well diversified with the highest exposure stemming from Housing,
Construction and Infrastructure (15%), Consumption (15%) and Commercial Trade (9%) in
2018. All exposures were maintained within the risk appetite limits during the year.
l Agriculture and Fisheries
l Banks, Financial, Insurance and Business Services
l Hotels Travels and Services
l Housing, Construction and Infrastructure
l Manufacturing
l Commercial Trade
l Sovereign and Direct Government
l Transportation and Logistics Services
l Other Commercial Services
l Consumption and other
5%
15%
4%
3%
9%
15%
7%
2%
35%
Sector Concentration
5%

111
Collateral Exposure
In 2018, 62% of the Bank’s lending
was secured by collateral- mainly by
Government securities/guarantees and
properties.
Cross Border Exposure
Cross-border risks arise from actions by
foreign Governments which restrict the
Bank’s ability to obtain payment from
customers. BoC’s cross-border exposure
stems from its overseas operations in
India, Maldives, Seychelles and the United
Kingdom and accounted for 5% of the
Bank’s total assets as at end-December
2018. All overseas branches operate
with pre-defined credit limits and country
limits which are monitored regularly by the
Board.
Market Risk
Market risk can be defined as the potential
losses arising from changes in earnings,
market or future cash flows of a portfolio
of financial instruments resultant from
adverse movements in market variables
such as interest rates, foreign exchange
rates, share prices and commodity prices.
The Bank is exposed to 3 different types
of market risks;
l Interest rate risk arising from the
Bank’s trading and non-trading books
l Foreign exchange risk stemming from
foreign currency denoted transactions
l Equity risk- losses from volatilities in
equity prices
Market Risk Exposure
The Bank’s main market risk exposure
stems from the interest rate risk of
its trading and banking books which
collectively accounted for 90% of total
assets. Foreign exchange risk exposure is
moderate as total forex exposure and gold
position as a proportion of capital funds
amounted to 0.02% during the year. The
Bank’s exposure to equity risk is limited, as
the proprietary trading portfolio amounted
to just 0.2% of the balance sheet.
Market Risk Governance
The IRMC is responsible for providing
recommendations to the Board on the
Bank’s Market Risk Management Policy
as well as other policies related to market
risk. At an executive level, the Asset
and Liability Management Committee
(ALCO) is vested with the responsibility of
implementing the market risk management
framework and monitoring maturity
mismatches, advances and deposits to
ensure that the market risk exposure is
within the defined risk appetite.
The treasury middle office operates
independently from the Treasury Unit and
monitors treasury transactions which
can generally give rise to significant
market risks. The middle office operates
in accordance with the Middle Office
Operations Manual approved by the
Board.
Approach to Market Risk Management
The Bank’s market risk management
framework is underpinned on the
following;
Comprehensive framework of policies
In addition to the holistic Market Risk
Management Policy, the Bank’s market
risk management is governed by the
Asset and Liability Management Policy,
Limit Management Framework, Foreign
Exchange Risk Management Policy and
Middle Office Operations Manual. These
policies and procedures collectively
provide guidance for the effective
monitoring of treasury operations, setting
risk limiting thresholds on treasury
operations and managing potential
impacts stemming from market dynamics.
The policies are reviewed and updated
regularly in view of emerging market risks.
Risk limits
Based on the recommendations of the
ALCO, the Board defines risk limits for a
range of treasury and investment related
activities which can give rise to market
risk; these include foreign currency
open position limits, counterparty limits,
stop loss limits and dealer limits. Actual
performance against these limits is
monitored on a regular basis and reported
to the Board. The limits are regularly
reviewed and revised by IIRMD with the
recommendation of ALCO in line with
market dynamics.
5% 4%
5%
38%
9%
21%
18%
Collateral Exposure
l Cashl Goldl GoSL Securities/Guaranteesl Movables
l Propertyl Othersl Unsecured

112 Bank of Ceylon | Annual Report 2018
RISK MANAGEMENT
Risk monitoring
IIRMD consistently monitors maturity mismatches, interest
margins and funding requirements in line with the Bank’s lending
and funding strategies. Tools such as Value at Risk (VaR), Price
Value for Basis Point (PVBP), duration gap analysis, stress testing
and sensitivity analysis are utilised to monitor interest rate risk of
the Bank’s balance sheet. Exchange rate risk is monitored through
VaR, limits and net open positions.
l Strengthened monitoring through widening the scope
of market risk indicators
l Enhanced the limit monitoring mechanism
l Widened the scope of the stress testing mechanism
to include a broader range of variables
l Enhanced reporting components in the daily and
monthly risk reports
Key Areas of focus/ Development in 2018
Market Risk Review 2018
Interest Rate Risk
The Bank’s exposure to interest rate risk (IRR) arises from its
lending portfolio, trading securities and deposit liabilities, the
values of which fluctuate in interest rate volatilities and credit
spreads.
Interest Rate Risk Management
The Board approved policy framework is in place to manage IRR,
which clearly sets out prudential limits, interest gaps and VaR.
Given the inherent mismatch between the Bank’s asset and liability
maturities, IIRMD consistently monitor maturities in time buckets
in order to assess the duration gap and overall exposure to IRR.
Regular stress testing on the IRR exposures of the banking and
trading book ensures that we remain aware of the potential impact
of changing economic indicators on the Bank’s profitability and
capital position.
The Bank also conducts VaR calculations and stress testing on the
portfolios subject to forex risk.
Jan-
18
Feb
-18
Mar
-18
Ap
r-18
May
-18
Jun-
18
Jul-
18
Aug
-18
Sep
-18
Oct
-18
Nov
-18
Dec
-18
PVBP Tbill
PVBP Tbill PVBP Limit Tbill
0
100,000
200,000
300,000
400,000
500,000
600,000
700,000
LKR
Jan-
18
Feb
-18
Mar
-18
Ap
r-18
May
-18
Jun-
18
Jul-
18
Aug
-18
Sep
-18
Oct
-18
Nov
-18
Dec
-18
PVBP Tbond
PVBP Tbond PVBP Limit Tbond
0
200,000
400,000
600,000
800,000
1,000,000
1,200,000
1,400,000
LKR
-15 -10 -5 0 5 10 15 20 25 30
Sensitivity Analysis of Assets and Liabilities
■ GAP (%) ■ Rate Sensitive Liabilities (%)
Over 5 Years
4-5 Years
3-4 Years
2-3 Years
1-2 Years
6-12 Months
3-5 Months
1-3 Months
Upto 1 Month
■ Rate Sensitive Assets (%)

113
Jan-
18
Feb
-18
Mar
-18
Ap
r-18
May
-18
Jun-
18
Jul-
18
Aug
-18
Sep
-18
Oct
-18
Nov
-18
Dec
-18
Tbill VaR
Tbill VaR Risk Appetite
0
5,000,000
10,000,000
15,000,000
20,000,000
25,000,000
LKR
Jan-
18
Feb
-18
Mar
-18
Ap
r-18
May
-18
Jun-
18
Jul-
18
Aug
-18
Sep
-18
Oct
-18
Nov
-18
Dec
-18
Open Position
Open Position Amount Open Position Risk Appetite
-10,000,000
-5,000,000
0
5,000,000
10,000,000
15,000,000
20,000,000
US
D m
illio
n
Jan-
18
Feb
-18
Mar
-18
Ap
r-18
May
-18
Jun-
18
Jul-
18
Aug
-18
Sep
-18
Oct
-18
Nov
-18
Dec
-18
Gold VaR
Gold VaR Risk Appetite
0
20,000,000
40,000,000
60,000,000
80,000,000
100,000,000
120,000,000
LKR
Equity Risk
Equity risks are losses arising from price fluctuations in equity
investments held by the Bank. BoC’s equity exposure stem from
its trading portfolios and excludes strategic investments. The
Bank’s exposure to equity risk is relatively limited as investments
in equity shares amounted to just 0.3% of the Bank’s total assets
as at end-December 2018.
Equity Risk Management
At executive level, the Investment Committee is responsible for
ensuring that the Bank’s investment risks are managed in line with
the Board’s defined risk appetite. Meanwhile, trends that could
potentially impact share market prices, including broad macro-
economic conditions are monitored by the Investment Committee
on a regular basis.
Jan-
18
Feb
-18
Mar
-18
Ap
r-18
May
-18
Jun-
18
Jul-
18
Aug
-18
Sep
-18
Oct
-18
Nov
-18
Dec
-18
Equity VaR
Equity VaR Risk Appetite
50,000,000
100,000,000
150,000,000
200,000,000
250,000,000
300,000,000
350,000,000
LKR
-15 -10 -5 0 5 10 15 20 25 30
Maturity Analysis of Assets and Liabilities
■ Inflow (%) ■ Outflow (%)
Over 5 Years
3-5 Years
1-3 Years
9-12 Months
6-9 Months
3-6 Months
2-3 Months
0-1 Months
■ Cumulative Gap (%)

114 Bank of Ceylon | Annual Report 2018
RISK MANAGEMENT
Liquidity Risk
Liquidity risk is the potential loss to
earnings and/or capital due to the inability
to meet the Bank’s contractual obligations
as and when they are due.
Given the short-term maturities of the
Bank’s deposit liabilities and the longer-
term maturities of its lending portfolio,
banks are inevitably vulnerable to liquidity
risks and the management of such risks
critical to preserving financial stability.
Liquidity Risk Management
The Board approved Liquidity Risk
Management Framework provides
clear guidance on the maintenance of
an adequate liquidity buffer to meet
the Bank’s contractual obligations as
and when they fall due. The ALCO
is responsible for overseeing the
management of liquidity risks and
continuously monitors the Bank’s
liquidity position to ensure compliance
to regulatory requirements and internal
targets. Regular reporting to the IRMC and
the Board ensures that liquidity indicators
are maintained within the parameters
defined in the risk appetite.
Janu
ary
Feb
ruar
y
Mar
ch
Ap
ril
May
June
July
Aug
ugst
Sep
tem
ber
Oct
ober
Nov
emb
er
Dec
emb
er
Unencumbered Securities
2018 2017
80,000
130,000
180,000
230,000
280,000
330,000
LKR
mill
ion
Approach to Liquidity Risk Management
Policy framework
The Liquidity Risk Management Policy and Asset Liability Management Policy provide
guidance on the management of liquidity risks across the organisation. These policies
also clearly define the measurement methods, stress testing methodologies, contingency
funding arrangements and mitigation measures to ensure that liquidity indicators are
maintained at comfortable levels.
Liquidity measurement
In evaluation of liquidity risk, the Bank adopts both flow and fund approaches. Under flow
approach bank measures liquidity risk through analysing the mismatch between inflows
and outflows in various time bands based on the maturity of assets and liabilities. Set
of key indicators/ ratios such as liquid assets ratio, liquidity coverage ratio, net stable
funding ratio and loans to deposit ratio are the measures used under fund approach.
Contingency funding plan
The Contingency Funding Plan (CFP) is in place to protect stakeholder interests and
maintain public confidence in the event of liquidity stress. The plan defines specific trigger
points and action plans with specific responsibilities allocated to the relevant authorities.
Liquidity Risk Review 2018
The Bank maintained a comfortable liquidity buffer during the year with indicators well
within the limits defined by the risk appetite statement and in compliance with all relevant
regulatory requirements. The liquidity position is also upheld by the Bank’s diversified
funding portfolio which allows the Bank to source from a range of sources depending on
market conditions and liquidity requirements. Deposits account for 78% for the Bank’s
funding portfolio, followed by borrowings 16% and shareholders funds 6%. Meanwhile,
unencumbered securities available for funding amounted to LKR 221,723 million as at
end-December 2018.

115
Liquidity Coverage Ratio
Risk Appetite (%) Regulatory Minimum (%)Liquidity Coverage Ratio (%)
0
20
40
60
80
100
120
140
Jan-
18
Feb
-18
Mar
-18
Ap
r-18
May
-18
Jun-
18
Jul-
18
Aug
-18
Sep
-18
Oct
-18
Nov
-18
Dec
-18
31 March 2018
30 June 2018
30 September 2018
31 December 2018
Credit Deposit Ratio 75.0% 76.5% 80.5% 83.3%
Statutory Liquid Asset Ratio 30.44% 26.13% 23.79% 24.47%
Net Stable Funding Ratio 140.41% 138.29% 127.37% 128.68%
Liquidity Coverage Ratio 102.04% 113.48% 99.77% 114.99%
Operational Risk
Operational risk is the loss resulting from inadequate or failed internal processes, people
and systems or from external events. Operational risk includes legal risk but excludes
strategic and reputational risk.
Operational risk originates from both the Bank’s business and support units and is an
inevitable element of the natural course of business activities, products and processes.
OperationalRisk
Business processes
Employee competence & Integrity
External events
Systems and
technology
Operational Risk Governance
The Board of Directors supported by the
IRMC hold oversight responsibility for
managing the Bank’s operational risk
exposures and ensuring the robustness
of the operational risk management
framework. At an executive level, the
Operational Risk Management Executive
Committee (ORMEC) and the Fraud Risk
Management Committee (FRMC), together
with the IIRMD is responsible for the
implementation of the framework. The
pervasive nature of operational risk renders
the identification and management of it,
an organisation-wide responsibility. The
branches and business units, which are
the ‘First line of Defence’ are responsible
for the identification of risks at the point
of origination. The IIRMD (the second
line) is responsible for implementing
the framework and monitoring risk
performance against the defined appetite.
Meanwhile, audit and compliance
provides assurance to the Board on the
effectiveness on the operational risk
management processes in place.
Approach to Operational Risk Management
Policy framework
The Board approved Operational
Risk Management Policy provides
clear direction on the identification,
assessment, mitigation and monitoring
of operational risks. In addition, the
Fraud Risk Management Policy and the
IT Risk Management Policy support the
Bank’s operational risk management
objectives. The policy framework also
defines obligations and responsibilities
of the Board, executive committees,
management teams and risk owners in
implementing the Bank’s operational risk
management framework.

116 Bank of Ceylon | Annual Report 2018
RISK MANAGEMENT
Risk identification and measurement
Identification of operational risks occurs at
the First Line of Defence level through Risk
and Control Self-Assessments (RCSA)
which are administered to all key business
units by the IIRMD. Tools such as Key
Risk Indicators, internal loss data and root
cause analysis are also used across the
organisation to evaluate the exposure to
operational risk. These findings are inputs
in devising actions plans for identified
gaps and are reported by the IIRMD to the
ORMEC, IRMC and ultimately the Board.
Risk mitigation
The following risk mitigation tools ensure
that the severity of the impact or the
probability of occurrence is reduced.
(1) Re-engineering processes to address
the identified operational lacunas
(2) Alerting relevant business and support
units regarding emerging operational
vulnerabilities
(3) Advocating to avoid risks which
are unacceptable to the Bank’s risk
appetite
(4) Business Continuity Plans: All critical
business units and support functions
have developed business continuity
plans; these plans are tested regularly
to ensure effectiveness
(5) Disaster Recovery Centre established
outside the Colombo city limits
(6) Obtaining Insurance to mitigate high
severity non-controllable risks
Reporting and monitoring
The IIRMD provides regular updates to
the IRMC and the Board on operational
risk events/ losses and control failures. A
database of operational losses and near
misses are also maintained, allowing the
identification of trends and root causes.
Meanwhile the IIRMD plays a proactive
l Streamlined the Bank’s cash management system
l Enhanced the risk transferring strategy through revisiting Bank’s Insurance
Policy
l Strengthened the security of the SWIFT operations and streamlined the
electronic payment balancing mechanism
l Strengthened IT risk management by investing in employee development
l Strengthened disaster recovery ability
Key Areas of focus/ Development in 2018
role in propagating lessons learnt through a timely alert to all employees in the event of a
substantial operational risk exposure.
Operational Risk Review 2018
The Bank’s operational losses continued to be below the defined internal limits.
Vulnerabilities have been identified through root cause analysis and appropriate strategies
have been deployed to address the lacunas during the year. Operational losses for two
consecutive years are presented alongside.
Loss Data Analysis
2018 2017
l Internal Fraudsl External Frauds
l Clients, Products and Business Practices
l Execution, Delivery and Process Management
25%
21%
54%
53%
38%
9%
Technology Risk
Technology risk is the risks associated with the ownership, use, operation, involvement and
adoption of IT within the Bank. This includes breakdowns and failures in IT systems, cyber-
attacks, technological obsolescence, erosion of competitive position due to falling behind
competitors and inadequate infrastructure to support business volumes among others.
Technology has transformed the banking sector’s operations and business models in recent
years with organisations relying heavily on technology to drive operational efficiencies,
handle customer information and strengthen the customer value proposition. For BoC,
given its strategic focus on digitalisation and ongoing investments in enhancing IT
infrastructure, technology risks have emerged as a key exposure. Having recognised the
vital importance of effective IT risk management, the Board set up a dedicated Information
and Communication Technology Committee (ICTC) during the year to ensure the effective
implementation of the Board’s IT strategy.

117
Technology Risk Review 2018
l Created the position of ‘Chief
Information Security Officer’ (CISO)
l Embarked on setting up a Security
Operations Centre
l Conducted vulnerability assessments
l Initiated the process to obtain the ISO
27001 certification
l Strengthening network security
l Improve system availability and
reduced the downtime of critical
systems
Legal Risk
Legal risks are the potential losses to
earnings and reputational damage arising
from non-compliance with regulatory/
statutory provisions, uncertainty due
to legal actions or uncertainty in the
applicability or interpretation of relevant
laws or regulation applicable to the bank.
The Bank’s operations are guided by a
comprehensive suite of policies, standards
and internal procedures ensuring that
legal risk exposures are mitigated as
much as possible. Clearly defined
processes are also in place to ensure
that all legally binding agreements are
reviewed and approved by the compliance
and legal functions of the Bank. Periodic
assessments are carried out by IIRMD to
evaluate the legal risk of the bank.
Compliance Risk
Compliance risk is the potential loss in
earnings and/or impact on the Bank’s
reputation due to non-compliance with
applicable laws, regulations, codes of
conduct and standards of good practice.
A dedicated Compliance unit headed by
the Compliance Officer, reporting directly
to the Board, ensures that the Bank
is compliant with all relevant external
regulations and internal guidelines.
Meanwhile, a Board-approved Compliance
Policy is in place, specifying how
compliance risks are identified, monitored
and managed by the Bank in a systematic
and holistic manner.
Key responsibilities of the Compliance
function;
l Advise the Board of Directors
and Senior Management team on
changes to the regulatory landscape
and provide recommendations on
implementing such changes
l Raise employee awareness on
compliance
l Assessment of new products, business
practices and/or relationships for
potential compliance risks
l Liaise with the regulator on all
compliance related matters
During the year, there were no material
instances of non-compliance pertaining to
guidelines and/or any social environmental
regulations.
Strategic Risk
Strategic risk is the potential losses arising
from the possible flaws in the Bank’s future
business plans and the possibilities of
strategies being inadequate.
The Bank adopts a systematic and
thorough approach towards strategy
formulation with a revolving three year
corporate plan designed, based on
the inputs of corporate and executive
management. The Board approves the
corporate plan subsequent to extensive
discussions with the management
team. Objectives and action plans are
cascaded to all business units and
branches and implementation of the plan
is monitored against defined targets. The
Bank’s dedicated Research Department
consistently provides economic and
political developments, customer feedback
and industry outlook. IIRMD based on
these reports, assess the strategic risk and
cascade them to relevant business units.
A comprehensive score card is used to
measure and monitor the Bank’s strategic
risk and is included in the annual ICAAP.
Reputational Risk
Reputational risks arise from the loss of
confidence and negative perception of
the Bank which can adversely impact
earnings, assets, capital position and/or
brand value.
l As a financial institution, public trust
is pivotal, hence IIRMD continuously
monitors and manages events related
to reputational risk. The bank maintains
it’s reputational risk at minimum level,
evidenced by the following: Strength of
the BoC brand: BoC has consistently
been ranked as the country’s No.1
brand by local and international
independent branding organisations.
l Brand attributes of trust and stability
l Established track record of nearly eight
decades
l Numerous awards and accolades
A comprehensive score card is used
to measure and monitor the Bank’s
reputational risk and is included in the
annual ICAAP.

118 Bank of Ceylon | Annual Report 2018
RISK MANAGEMENT
Internal Capital Adequacy Assessment Process (ICAAP)
The ICAAP allows the Bank to assess its capital requirement based on its risk profile,
ensuring that adequate capital is maintained to deliver its strategic agenda. Aligned with
the Pillar II requirements, the Bank’s ICAAP takes into consideration the key risks of
credit, market, operational, liquidity, Interest Rate Risk in the banking book, reputational,
compliance and strategic risk. The ICAAP Steering Committee which is headed by the
General Manager is responsible for identifying these material risks as well as designing
and implementing stress testing scenarios.
Stress testing is an important element of Pillar II (Supervisory Review Process) and
showcases the sensitivity of the Bank’s risk profile to a range of variables. The Board
of Directors is responsible for ensuring that stress testing is conducted regularly and
effectively in line with the Board-approved Stress Testing Policy. In addition to providing
direction on capital allocation, the stress testing exercise facilitates the setting of risk
appetite triggers, tolerance limits and formulation of contingency plans. During the year,
we further strengthened our stress testing process in view of the challenging macro-
economic front; accordingly, new stress scenarios and stress limits were introduced.
Capital Position
An equity injection of LKR 5.0 billion by the GoSL in 2018 further strengthened BoC’s
balance sheet, bringing the share capital to LKR 25.0 billion by end-December 2018.
Frequent equity infusions by the principal shareholder in recent years have strengthened
the Bank’s capital base in line with the increased capital requirements for licensed
commercial banks under Basel III. The Banking Act Direction No. 1 of 2016 introduced
minimum capital requirements for licensed commercial banks, with time lines provided
to gradually increase minimum capital ratios to be implemented in by January 2019. As
demonstrated in the table below, the Bank is currently on track to meet the minimum
capital requirement targets set by the CBSL.
Minimum capital
requirement prescribed by
CBSL (January 2019))
BoC as at end-
December 2018
Tier 1 CAR 10% 10.31%
Total CAR 14% 14.58%

Dri
ving
Str
ateg
y th
roug
h
ECONOMIC AND INDUSTRY OVERVIEW
OPERATIONAL REVIEW
Business Lines

120 Bank of Ceylon | Annual Report 2018
Economic ReviewGlobal Economy
The International Monetary Fund estimates global growth to be
3.5% in 2018 (2017:3.8%). Activity slowed during the second
half of the year and was less synchronized across regions and
countries. Economic activity in several advanced economies
moderated due to global trade tensions, policy uncertainty and
tighter financial conditions while the growth in emerging markets
remained relatively unchanged over the previous year.
l Euro area - slower export growth
l UK - weather related disruptions and
uncertainty arising from BREXIT
l US - robust growth buoyed by a sizable fiscal stimulus
l India - domestic demand-led pick up
l China - activity moderated but growth remains robust
l Fuel exporting economies - higher oil prices
led to buoyant growth
l Latin America - subdued recovery
Global trade tensions have escalated with the US imposing global
and country specific tariffs on several trading partners, resulting in
retaliatory actions and leading to a slowdown in trade growth. The
US, with a large trade deficit with China, is seeking to reduce the
imbalance of trade, and has imposed tariffs on imports of USD 250
billion with further tariffs on USD 267 billion pending negotiations.
China has also retaliated with tariffs on USD 110 billion of US
imports. The increase in oil prices contributed to higher growth for
oil exporting countries, other than those experiencing domestic
strife, geopolitical tensions or macroeconomic collapse, while oil
importers were negatively affected. Global financial conditions also
tightened and the growth differential between the US and other
advanced economies have contributed to a US dollar appreciation.
Increasing US interest rates have led to reversal of capital flows
from emerging markets and the resultant depreciation of emerging
market currencies.
Pace of expansion in investment is projected to ease in 2018 and
2019 compared with 2017, with a more notable decline in trade
growth. Meanwhile, rising trade tensions and policy uncertainty
raise concerns about global economic prospects and weaker trade
growth. Accordingly, the IMF revised its growth forecast for the
year downwards to 3.5% in 2019 and 3.6% in 2020.
ECONOMIC AND INDUSTRY OVERVIEW
2017
3.8%
2018
3.5%
2019
3.5%
GDP Growth 2018
Advanced economies 2.3%
Emerging market and developing economies 4.6%IMF
Expansion in global growth is less synchronised
Reversal of capital flows from emerging markets
Rising trade tensions
Tapering investment growth
Higher oil prices
Forc
esat
pla
y
Impact on Sri Lanka
Reversal of capital flows - depreciation of currency
Increased export revenues
Rising oil prices - inflated import costs
Interest rates and currency depreciation effect on external borrowings
Global GDP Growth
World Economic Outlook (January 2019)-IMF

121
Sri Lankan Economy
Sri Lanka faced a challenging economic environment in 2018 reflecting cascading effects
of global dynamics, rising oil prices, subdued investor and consumer sentiments and
political instability towards the latter part of the year. Accordingly, GDP growth for the year
amounted to 3.2%, upheld by a rebound in the agricultural sector 4.8% and broad-based
expansion of the services sector 4.7%. Industrial Sector growth however slowed to 0.9%
mainly due to contraction in the construction sub-sector.
Financial Services Sector - 2018
Fiscal Policy
Over the past 2 years the Government implemented a series of tax reforms with the
objective of driving fiscal consolidation. Accordingly, a new Inland Revenue Act came
into effect from 1 April 2018 introducing broad based reforms aimed at broadening the
direct tax. The rise in international oil prices resulted in weaker financial performance of
state-owned energy affiliates in 2017 compelling the Government to implement a strategic
pricing mechanism for fuel pricing in May 2018 in line with global trend.
The outcome of the Government’s fiscal consolidation efforts has been mixed. Lower than
expected revenue collection is likely to challenge the achievement of the targeted budget
deficit for 2018. However, the primary balance, which excludes expenditure on interest, is
expected to record a surplus for the second consecutive year in 2018; the third time since
1955.
GDP Growth
2017
3.4%
2018
3.2%
2019
4.0%
Forces at Play
Contribution to GDP
7.3%
Sector growth
11.8%
External debt
Depreciationof rupee
Political uncertainties
High oil prices - increased import bill
Increase in FDI
Revenue based fiscal
consolidation
Increase inexports
Downgrading of sovereign rating
+ -
8%
8%
57% 27%
Composition of GDP - 2018
l Agriculturel Industryl Servicesl Taxes less subsidies

122 Bank of Ceylon | Annual Report 2018
ECONOMIC AND INDUSTRY OVERVIEW
Monetary Policy
The Central Bank navigated its monetary
policy in a challenging global and
domestic environment. Manageable
inflation levels and subpar growth signaled
the end of the tight monetary policy stance
taken by the Central Bank since end 2015
and in early April 2018, the upper bounds
of policy interest rates were reduced. The
sustained high deficits of rupee liquidity
in the domestic money market compelled
the Central Bank to reduce the Statutory
Reserve Ratio (SRR) applicable on all
rupee deposits of commercial banks by
150 bps up to 6% in November 2018,
while increasing policy interest rates by
75 bps up to 8% neutralise the impact on
interest rates. This cautious approach was
followed with the broad aim of stabilising
inflation at mid-single digit levels and
anchoring inflation expectations to enable
the economy to reach its potential in the
medium term.
Inflation - 2018
0
1
2
3
4
5
6
7
Janu
ary
Feb
ruar
y
Mar
ch
Ap
ril
May
June
July
Aug
ust
Sep
tem
ber
Oct
ober
Nov
emb
er
Dec
emb
er
CCPI (%) NCPI (%)
5.8
4.54.2
3.8 4.04.4
5.45.9
4.3
3.1 3.32.8
5.4
3.2
2.8
1.62.1
2.5
3.4
2.5
0.90.1
1.0
Total Revenue and Government Expenditure
0
500
1,000
1,500
2,000
2,500
3,000
3,500
2015 2016 2017 2018
n Revenue and grants n Government expenditure Tax revenue
1,46
0
1,69
4
1,83
9
1,56
5
2,30
4
2,35
2
2,58
5
3,01
1
1,356LKR
bill
ion
1,4641,670
1,280
Composition of Tax Revenue
0
10
20
30
40
50
60
70
80
90
100
2015 2016 2017 2018
n Income tax (%) n VAT (%) n Excise taxes (%) n Import duties (%) n Others (%)
18
10
37
16
19
31
19
18
28
27
16
29
27
18
21
11 8 6
21 20

123
Exchange Rate
The rupee depreciated sharply by 16.4%
(2017 – 2.87%), especially during the
latter part of the year, to end at a USD/
LKR exchange rate of LKR 182.75 as at
31 December 2018. Continued tightening
of monetary policy in the US with several
rate hikes during the year, together with
a strengthening US dollar, saw a surge in
capital outflows, increasing pressure on Sri
Lanka’s current account. A widening trade
deficit added to the rupee’s woes. The
Central Bank largely allowed demand and
supply forces to determine the level and
direction of the exchange rate of the rupee
in the foreign exchange market, intervening
only to prevent disorderly adjustments.
External Sector
Growth in exports was outpaced by higher
than expected imports resulting in a
considerable widening of the trade deficit.
The trade deficit reached 11.9% of GDP
in September 2018 (2017-11% of GDP).
Export growth of 4.7% (January-November
2018) was helped by the restoration of
the EU’s GSP+ facility, higher commodity
prices, conducive external trade policies
and the flexible exchange rate policy
followed by the Central Bank. Import
expenditure which increased by 6% during
the same period was driven by a surge in
fuel imports due to both volume and higher
international oil prices, vehicle imports and
textile imports.
The balance of payments which
experienced immense pressure on account
of foreign exchange outflows, caused by
tightening global financial conditions and
the strengthening of the US dollar, was
cushioned to an extent through earnings
from tourism and debt related inflows.
Sri Lanka’s external debt position
remains high and the real challenge in
debt settlements will begin in 2019, with
several international sovereign bonds
(ISBs) and syndicate loan settlements
coming together. The Active Liability
Management Act was enacted in March
2018 to help manage medium term
external debt settlements. Under this Act,
the Government is permitted to raise funds
over and above the Parliament approved
annual borrowing limit. The funds
raised can be kept aside for future debt
settlements in order to lower refinancing
risks.
Exports, Imports and the Trade Balance
-2,000
-1,000
0
1,000
2,000
3,000
4,000
n Exports n Imports n Trade Balance
2015 2016 2017 2018
LKR
bill
ion
1,43
1
1,50
1
1,73
2
1,93
3
2,57
2
2,79
4
3,19
9
3,60
7
(1,1
41)
(1,2
93)
(1,4
67)
(1,6
74)
The Government’s continued commitment towards fiscal consolidation, such as
measures to improve revenue generation, rationalize expenditure and streamline
debt management is important on several footings. It will help in an overall
improvement to the fiscal sector in the medium term and be essential for the
success of Central Bank’s move to adopt Flexible Inflation Targeting. The widened
trade deficit is likely to weaken the performance of the external current account
in 2018. However, policy measures initiated to curtail the expansion in import
expenditure complemented by the adjustment of the exchange rate and expected
to improve the external current account performance in 2019. The successful
implementation of growth strategies already laid out by the Government in a
consistent and coordinated manner with active private sector participation will
gradually support improvement in growth in the medium term. In the backdrop of
tightening policy spaces in the monetary, fiscal and external fronts amidst subdued
economic performance, it is important to facilitate private sector led growth with
prudent, consistent and far reaching reforms that support increased productivity in
the economy.
Outlook

124 Bank of Ceylon | Annual Report 2018
ECONOMIC AND INDUSTRY OVERVIEW
Industry Overview
The Banking sector experienced a year of mixed fortunes in 2018; loan growth was healthy for most part of the year and the rising interest rate scenario allowed for a widening of interest margins. On the other hand, a sharp escalation in impairment charges given weakening macro-economic conditions and the implementation of SLFRS-9 affected the Sector’s profitability.
Growth: The sector’s total assets grew by 15% in 2018 led
by 20% expansion in loans and advances given relatively
strong credit demand during the first half of the year. However,
macroprudential measures including import restrictions, a
slowdown in the construction sector and political instability
towards the latter part of the year led to moderating credit growth.
In terms of products, growth was driven by strong expansion of
overdraft facilities as well as term loans, pawning and leasing
to a lesser extent. Investments and cash and cash equivalent
grew by a respective 5% and 4% resulting in the Sector’s asset
composition tilting more towards credit assets which accounted
for 64% of total assets by end- December 2018 (compared to
62% the year before)
Sector Performance: The Sector’s interest income increased
by 14% supported by loan growth and the prevalent high interest
rate scenario while the expansion in net interest income (NII)
amounted to 16% reflecting a broadening of net interest margins
(NIM). Operating expenses increased by 24% during the year
driven mainly by staff costs while the Sector’s cost-to-income ratio
clocked in at 48.5% compared to 45.2% the year before. Sector
profitability was also affected by a sharp escalation in impairment
charges by 104% due to the broad-based weakening of
portfolio quality as well as the implementation of SLFRS-9 which
necessitated an increase in provisioning. Resultantly, the Sector’s
pre-tax profit remained relatively unchanged at LKR 194.7 billion
during the year. Sector corporate tax increased by 23% resulting
in profit after tax declining by 9% during the year. Return on equity
(ROE) and Return on Assets (ROA) resultantly declined to 13.2%
(from 17.6%) and 1.8% (from 2.0%) by end-December 2018.
Asset quality: There was a broad-based deterioration in portfolio
quality during the year with the sector NPAs increasing by 64%
while the gross NPA ratio rose to 3.4% from 2.5% in 2017. Most
players sought preserve portfolio quality by adopting a cautious
approach to lending and strengthening collection and recovery
efforts. Provision coverage declined to 57.4% from 69.9% in 2017.
Capital and funding: Customer deposits grew by 15% during
the year supported by the relatively high interest rate scenario;
deposits were the main source for funding. Loans growth
accounting for 64% of the Sector’s total assets. Banks sought
to strengthen capital in line with BASEL III regulations and
borrowings increased by 10% following the issue of BASEL III
compliant debentures. The common equity ratio and total capital
ratio amounted to 12.0% and 15.1% respectively by December
2018; however, given market conditions and the higher tax
requirements banks are likely to face challenges in raising funds to
meet enhanced capital needs under the Basel III requirements.
2014 2015 2016 2017 20180
2,000
4,000
6,000
8,000
10,000
12,000
14,000
0
5
10
15
20
Banking Sector-Growth
n Total Assets n Total Capital Growth (Y-O-Y) (%)
LK
R b
illio
n
11,7
94
10,2
92
9,04
7
8,07
7
6,97
2
568
637
707
867
1,03
0
1514
12
1617
2014 2015 2016 2017 20180
50
100
150
200
250
300
0
1
2
3
4
5
Trends in Portfolio Quality
n Gross NPAs Gross NPA ratio (%)
LK
R b
illio
n
263
161
142
153
165
3.4
2.52.6
3.2
4.2

125
Operational ReviewThe Bank’s operations are broadly classified into three business lines as illustrated below;
the subsequent section of this Report provides a high-level overview of strategy and
factors that shaped performance of each business cluster during the year.
Treasury Operations
International and Correspondent Banking
Investment Portfolio
Overseas Branches
State-owned Enterprises
Offshore Operations
Corporate Customers
Retail Banking (pages 126 to 130)
Government
Business Clusters
International, Treasury,
Investment and Overseas
BranchOperations
(pages 134 to 135)
Corporate and Offshore Banking(pages 131 to 133)
Retail Customers

126 Bank of Ceylon | Annual Report 2018
RETAIL BANKING
Performance Highlights 2018
LKR million 2018 2017 Change
y-o-y
Net interest income 37,158 28,650 30%
Operating income 44,472 36,075 23%
Impairment charges 6,134 1,831 235%
Operating profit 16,486 15,415 7%
Total assets 690,007 632,146 9%
Total liabilities 653,062 596,145 10%
Through the Retail cluster, the Bank provides a range of
investment, lending and transactional banking solutions to the
diverse customer base including individuals, start-up ventures
and SMEs. The cluster’s competitive edge is underpinned on its
extensive range of affordable products, unmatched geographical
reach and superior customer service.
Operating Environment
The operating environment presented numerous challenges for the
cluster due to the following;
l Moderating macro-economic growth and cautious investor
sentiments
l Political instability towards the latter part of the year
l Slowdown in the construction sector
l Import restrictions imposed by the Government
l Increased indebtedness in the micro-financing sector
l Adverse weather condition
Refer to pages 120 to 125 for more detailed information on the
Operating Environment
Strategy and Performance
The Retail cluster delivered a year of strong performance,
maintaining its growth momentum and profitability despite
challenges in the operating landscape. Net interest income grew
by 30.0% supported by a loan expansion of 13.0% upheld by
strong growth in development loans (primarily through scheme
loans,) over draft and pawning. Understandability credit quality
was pressured during the year resulting in a near tripling of
impairment charges to LKR 6.1 billion. Resultantly, the cluster’s
operating profit growth was contained to 7.0%, amounting to
LKR 16.5 billion during the year.
2014 2015 2016 2017 20180
200
400
600
800
0
5
10
15
20
Retail Segment Performance
n Assets PBT
LK
R b
illio
n LKR
billion
690.
0
632.
1
562.
8
478.
1
389.
1
16.515.4
12.3
5.9
3.2
Contribution to Operating Income
l Retail l Other
51% 51%
2018 2017
50% 51%
50% 49%
Contribution to Assets
l Retail l Other
51% 51%
2018 2017
32%
66%68%
34%
Capital Value Creation
Social and Relationship
Capital
Intellectual Capital
NaturalCapital
HumanCapital
Attractive rewards, investment in training and opportunities for career progression
Affordable financing to customers across the island
Launch of new products to widen our product portfolio
Green lending towards environmentally friendly projects

127
Product map
Personal loans
Housing loans
Commercial loans
Development loans
Micro-credit
Pawning
Leasing facilities
Lend
ing
pro
duc
ts
Retirement schemes
Time deposits
Senior citizens savings
Minor savings
Youth savings
Savings for ladies
Inve
stm
ent
pro
duc
ts
Current accounts
Credit cards
Debit cards
ATM cards
Internet banking
Mobile banking
Travel cardsTran
sact
iona
l pro
duc
ts
Loans and Advances
The cluster’s credit portfolio mainly comprises of personal loans, housing loans,
commercial/development lending, leasing, overdrafts and pawning. Supporting the
SME sector was a key focus during the year and BoC sought to acquire a new base of
customers through the Enterprise Sri Lanka loan scheme. The Bank disbursed around
LKR 13.6 billion through this scheme, constituting more than 45% of total facilities granted
through Enterprise Sri Lanka by the Banking sector. The Pawning portfolio also saw
strong expansion, growing by 12.5% during the year supported by conducive gold prices.
Housing and Personal loans grew by a respective 17% and 18.4% during the year.
Portfolio Quality
Preserving portfolio quality was a key challenge during the year as the entire industry
witnessed an influx of NPLs due to moderating macro-economic conditions, liquidity
crunch in the construction sector and adverse weather conditions in the Eastern and North
Eastern provinces. The cluster took proactive measures to stem the influx of new NPLs
while placing parallel importance on strengthening monitoring and collection mechanisms.
These initiatives are listed below;
l Introduced a work-flow for recoveries thereby enhancing efficiency and accuracy
l Introduced collection efficiency KPIs to the performance management framework
l Automated NPA alerts systems
l Capacity building programmes for new recruits on recoveries
As a result of these measures, the cluster was able to curtail the weakening of portfolio
quality to a certain degree; the cluster NPA ratio clocked in at 3.8%, compared to 3.2% the
year before.
Deposits
The Retail cluster is the main deposit mobiliser for the Bank, contributing 68% to the
total deposit base. Our deposit proposition is underpinned by our unparalleled network of
customer contact points, trust and stability associated with the brand and convenience
offered through our enhanced digital platforms. During the year the deposit base grew by
14% to LKR 1.2 trillion supported by the relatively high interest rate environment. Deposit
expansion during the year was supported by several innovative deposit mobilisation
campaigns, the Bank’s branch-on-wheels initiative and the expanding network of CRMs
across the island. However, due to given high interest rate scenario CASA ratio decline to
44%.
5%
3%
4%
3%
1%
7%
0%
2%
5%
70%
Composition of Loan Portfolio
l Overdrafts
l Scheme Loan -Commercial
l Housing Loan
l Personal Loan
l Leasing
l Pawning
l Trade Finance
l Other Term Loan
l Vehicle Loan
l Other
Deposit Composition
l CASAl Other
2018
2017
44%
56%
49%
51%

128 Bank of Ceylon | Annual Report 2018
Nurturing a savings culture
The Bank operates an extensive, island-wide network of school saving units which
enables it to enhance its presence while nurturing a savings culture among the next
generation. By end-December 2018, BoC operated 1,373 Sansada units and 628 mobile
school units across the island, the provincial breakdown of which is presented alongside;
We also launched several innovative deposit campaigns during the year in a bid to further
strengthen our CASA ratio.
l Children’s Account Opening Campaign for Grade one entrants/ pre-school entrants
l Minor account opening campaign in line with the Little Picasso competition
l Account opening campaign under World Women’s Day
l Children’s Account opening campaign in line with Sinhala and Hindu New Year
l Upadina Samata Ginumak campaign
RETAIL BANKING
Transactional Banking Products
In line with the Bank’s digitisation strategy
we have continued to drive the use of
debit and credit cards. During the year
we issued a further 852,401 debits cards,
bringing the total to 4.5 million by end-
December 2018. Meanwhile credit and
debit cards in issue also increased by 9%
and 15% respectively during the year.
The growth of the value of the debit cards
transactions increased by 3% during the
year up to LKR 65 billion and value of
credit card transactions increased by 5%
up to LKR 10.4 billion. Digital adoption
of the Bank is 65.5% and we hope to
increase this to 90% by 2020. Cashless
transactions accounts to 4.6% of the total
transactions and the digital drive is aim
towards increased in this precantage
Development Lending
The SME sector has been long-since
been identified as Sri Lanka’s engine of
economic growth and vehicle of socio-
economic empowerment. The Bank is a
key lender to the SME sector, facilitating
affordable financing through an array of
schemes catering to the economy’s most vital industry sectors. As at end-December
2018, the Bank’s outstanding SME loan portfolio (including micro-financing lending)
amounted to LKR 64.4 billion constituting over 550,000 facilities. As a state-bank we
are also aligned with the Government’s national development agenda and are an active
participant of the Enterprise Sri Lanka loan scheme which aims to empower aspiring
entrepreneurs through concessionary funding schemes. In 2018 BoC disbursed over
10,507 facilities under Enterprise Sri Lanka, with a total value of LKR 13.6 billion by
end-December 2018.
l Central Province
l Northern Province
l North Western Province
l Southern Province
l Western Province
10%
16%
15%
4%
8%
12%
16%
7%
12%
Province Distribution ofSchool Sansada
l Eastern Province
l North Central Province
l Sabaragamuwa Province
l Uva Province
Growth in Debit Card Transactions
2014 2015 2016 2017 2018
Nos
’000
0
10,000
20,000
30,000
40,000
50,000
60,000
70,000
80,000
n Growth in Debit Card transactions
71.6
40
70,1
95
66,6
19
52,7
20
34,4
77
Growth in Credit Card Transactions
2014 2015 2016 2017 2018
Nos
’000
0
500
1,000
1,500
2,000
2,500
n Growth in Credit card transactions
2,07
5
1,91
3
1,65
6
1,43
4
1,27
1

129
Enterprise Sri Lanka
Micro Financing
The Bank’s micro-financing initiative is
aimed at fulfilling both its commercial and
social sustainability objectives through
channeling funds to the grassroots of
the economy which often lacks access
to affordable funding. The ‘Mithuru’
micro financing programme is a group
lending initiative through which funds
are disbursed to ‘Mithuru’ Groups and
Societies; the initiative is targeted towards
fostering entrepreneurship and driving
socio-economic empowerment in rural
Sri Lanka. As at end-December 2018,
the Bank’s micro-finance loan portfolio
amounted to LKR 8.7 billion, constituting
over 496,000 facilities. The Bank also
conducts financial literacy programmes for
its micro-finance customers with the aim of
nurturing financial discipline.
10,507 FacilitiesLKR 13.6 billion
outstanding Portfolio
Largest lender under Enterprises Sri Lanka
Less than 1% NPL Ratio
BOC Mithuru
No. of
societies: 195
No. of financial
literacy
programmes: 20
Beneficiaries of
financial literacy
programmes: 1,452
No. of Groups
18,459
Funds disbursed
to members:
LKR 189.0 million
Provinces
covered: 09
Provinces
l Agriculturel Animal husbandry and Aqua culturel Other
75%
24%
1%
Development Lending Portfolio

130 Bank of Ceylon | Annual Report 2018
The Retail cluster will continue to pursue growth in key lending products with
focus on development lending and pawning. We see numerous opportunities for
supporting the country’s SME sector and driving entrepreneurial activity through
development lending and we hope to drive increased penetration in this segment.
Preserving portfolio quality will also be key priority in 2019 as we maintain focus on
the initiatives that were launched in 2018 to curtail NPLs and strengthen collections.
While challenges may persist in the short-term, the medium to long-term outlook
remains positive and the cluster is positioned to directly contribute to the country’s
economic prosperity by aligning with the Government’s development agenda.
Way Forward
During the year the Bank launched three new loan schemes targeting the SME/ Micro sectors;
To extend financial assistance to
young graduates for business
start-ups.
Financial assistance for
manufacturing bags/ packaging
material using biodegradable
material and assistance for tourism
related small scale homestay
owners.
To purchase farm equipment,
machinery and working
capital requirements of
agricultural projects
RETAIL BANKING
Erambuma Green LoanSmallholder
Agribusiness Partnerships

131
CORPORATE AND OFFSHORE BANKING
Performance Highlights 2018
LKR million 2018 2017 Change
y-o-y
Net interest income 17,327 19,819 (13%)
Operating income 25,426 22,871 11%
Impairment charges 8,231 7,781 6%
Operating expenses 5,219 4,110 20%
Operating profit 11,975 10,980 9%
Total assets 833,652 601,742 39%
Total liabilities 789,016 567,473 39%
The cluster is engaged in providing long-term, medium and short term financing to corporate clients, the Government, state-owned enterprises and large-scale projects, playing a key role in facilitating economic activity across the country. Expanding the private sector corporate clientele by offering better pricing, and superior customer service has been a key focus, enabling the Bank to build a competitive edge in this rival market segment.
Operating Environment
Macro-economic conditions remained challenging for most part of
the year characterized by,
l Subdued investor sentiments
l Increase in net foreign assets of Offshore Banking Units
(OBUs) during the first nine months of the year
l Moderate credit growth in credit to private sector due to
moderately high interest rate scenario and slow consumption
due to weakening of rupee
l Rising non-performing loans
l New tax regulations
(Further details on the Operating Environment available on pages
120 to 125)
Strategy and Performance
Corporate loans and advances grew by 35% during the year
upheld by new client acquisition, expansion of syndicated loans
and improving service quality. The cluster adopted a volume-
driven strategy with a view to growing market share offering
competitive rates to attract new customers; accordingly, the NIM
contracted during the year with NII decreasing by 13%. Meanwhile
focus on a relatively more credit-worthy customer segment
enabled the cluster to curtail the increase in impairment charges
to 6% during the year. Overall the Sector’s operating profit halved
to LKR 11.8 billion during the year. Meanwhile total assets grew by
39%, reflecting continued expansion of the loan portfolio.
Contribution to Operating Income
l Corporate l Other
51% 51%
2018 2017
71% 69%
29%31%
Contribution to Assets
l Corporate l Other
51% 51%
2018 2017
38%
68%
62%
32%
Social and Relationship
Capital
Intellectual Capital
NaturalCapital
Opportunities for training and development to all employees
Driving entrepreneurship and economic activity
Environmental and social screening for lending facilities

132 Bank of Ceylon | Annual Report 2018
Corporate Banking
The Bank continued to make inroads in
growing its’ expanding its presence in
the private sector with lending to private
corporates increasing by 23% during
the year. New private sector clients were
added to the Bank’s corporate client base
at relatively lower margins; however, this
enabled the optimisation of the cluster’s
risk-return dynamics as credit quality was
preserved given the good credit profile of
customers. Continuously strengthening
our relationships with customers,
improving service quality and standards
were key components of our overall
strategy. Engagement initiatives such as
customer felicitation events, provision
of advisory services and rescheduling
loans and advances to revitalise troubled
businesses enabled the nurturing of strong
relationships creating additional value to
customers during the year.
BoC is a key lender to the Government
of Sri Lanka. Lending to state-owned-
enterprises and the GOSL increased by
45% during the year comprising 60% of
the total corporate loan book.
Project Lending
BoC has directly contributed to the
country’s infrastructure development
financing numerous Government and
private sector projects in recent years.
During the year the Bank finance several
large-scale projects in renewable energy,
waste-to-energy and hotel projects in
Male. Government sector projects financed
during the year included water projects
via Waters Supply and Drainage Board,
Highway construction projects, Harbour
development projects etc.
CORPORATE AND OFFSHORE BANKING
Corporate Segment Performance
0
200
400
600
800
1,000
0
4
8
12
16
2014 2015 2016 2017 2018
LK
R b
illio
n
LKR
billion
n Assets PBT
833.
7
601.
7
505.
6
429.
7
411.
2
11.0 12.0
4.6
9.2
6.2
l Infastructure projectsl Manufacturingl Tradersl Constructionl Transportl Agriculture and Fishing
2%
1%
5%
5%
9%
8%
23%
34%
Corporate Loan Portfolio
4%
4%
1%
l Financial Businessesl Consumptionl Other servicesl New economyl Tourism
Sector Exposure of the Corporate Segment
l Government and SOEl Private sector
2018
2017
60%
40%
56%
44%

133
Trade Finance Division
The trade finance division offers a wide range of products to facilitate imports and exports
and provides consultancy services to the Government, corporate clients and industry
associations. This division maintains close engagement with the Export Development
Board (EDB), Sri Lanka Export Credit Insurance Corporation (SLECIC) and the Ministry
of Commerce and identifies new export markets and exporters and providing advisory
services that includes banking procedures related to export markets. Trade finance
workshops are conducted by the division for branch staff periodically and external
workshops are also conducted at the EDB to educate/raise awareness of trade finance
procedures. Trade finance lending increased by 18% to LKR 54.3 billion during the year.
With the largest network of correspondent relationships and its strong brand recognition
the reputation of the Trade Finance division of very strong.
Offshore Banking Division
The Bank has continued to strengthen its position in syndicated lending, financing
USD 38.8 million worth projects in partnership with other commercial banks for several
projects in India and Singapore during the year. BoC was also the lead arranger for a
USD 22 million syndicated loan in Maldives for a Hotel project. The division has financed
LKR 10.3 billion worth export oriented projects of national importance and LKR 27.0 billion
to Government of Sri Lanka.
Our focus in the coming year will be on project lending with a specialised unit
created to cater to the specific requirements of this segment. We will continue to
strengthen our relationships and grow our private sector corporate portfolio to
achieve balance as we serve our nation by funding the Government and state-
owned enterprises. Success of partnering in syndicated loan facilities will have BoC
pursuing further opportunities in syndicated loan facilities either as a lead or as a
partner. Trade finance will be looking at niche markets to canvass its products while
adding value to its customers by investing in digital solutions enabling processing of
Letters of Credit online.
Way Forward
Composition of Trade Related Income
l Free Based Incomel Interest Income
2018
2017
25%
75%
25%
75%

134 Bank of Ceylon | Annual Report 2018
Performance Highlights 2018
LKR million 2018 2017 Change
y-o-y
Net interest income 10,914 9,657 13%
Operating income 18,077 14,340 26%
Operating expenses 4,953 4,216 17%
Operating profit 12,737 10,424 22%
Total assets 643,024 621,866 3%
Total liabilities 608,595 586,451 4%
The Division plays a vital role in facilitating diverse activities across
the Bank through the International, Treasury, Investment Overseas
Division. The International Division mainly engages in foreign
currency related transactions, facilitating remittances, issuing
foreign currency travel cards and offering foreign currency deposit
products among others. The Treasury plays a vital role in managing
the Bank’s liquidity position in Rupee and Foreign Currency, asset
and liability management and exposure to forex and interest rate
risks. Investment division provides portfolio management services,
trustee and custodian services and is involved in the structuring of
investments such as debentures, Securitised Papers.
Operating Environment
Key trends in the operating landscape which affected the Division’s
performance in 2018 were;
l Monetary policy direction: Reduction of the upbound of the
policy interest rate corridor in 2018 followed by the reduction in
the SRR by 150 bps in November 2018.
l Interest rates: Deposit and lending rates recorded an
increasing trend towards the latter part of the year
l Exchange rate: The Rupee depreciated sharply by 20% against
the US Dollar in 2018
(Refer to pages 120 to 125 for further information on the Operating
Environment)
Strategy and Performance
The Division delivered another year of strong performance
recording 26% operating income of increase in 2018. Performance
was upheld by strong expansion in foreign exchange income,
investment income and healthy profit generation from the Bank’s
overseas branches. The Division generated 21% of the Bank’s
total operating income in 2018.
INTERNATIONAL, TREASURY, INVESTMENT AND OVERSEAS OPERATIONS
Contribution to Operating Income
l ITI and Overseas l Other
51% 51%
2018 2017
79% 80%
21% 20%
Contribution to Assets
l ITI and Overseas l Other
51% 51%
2018 2017
30%
66%
70%
34%

135
International Division
The International Division marked several important milestones in 2018, maintaining its market leadership position in inward remittances. Strategic emphasis was placed on maintaining market share of over 40% in this competitive segment through expanding our network, deepening relationships with existing exchange houses/ banks, streamlining and simplifying processes and acquiring new customers. We will also aim to enhance commission income by launching a digital remittance platform linked to the Bank’s website to attract untapped customer segments in Europe, USA, Canada and UK. The Division also strengthened its offering at the BIA counters by driving process efficiencies and staff productivity with a view to providing an excellent customer service. The Division continues to broaden its product portfolio.
Treasury Division
The Treasury Division generated significant contributions to the Division’s profitability through enhancing its forex income and optimising the Government securities portfolio to maximise investment returns. The Division strengthened relationships with exchange houses and expanded its treasury business through dealing operations to drive increased forex income. The Division also plays a vital
role in optimising the Bank’s NIM by astutely managing lending rates and the funding structure, based on economic and market dynamics. Treasury ensures that the Bank maintains adequate liquidity levels while delivering its strategic growth agenda through implementing a comprehensive liquidity management framework. The Division also consistently monitors the asset and liability maturity mismatches to ensure that sufficient liquidity levels are maintained at all times. During the year strategic focus was also placed on increasing interest income and capital gains generated from the Government securities portfolio through timely investment decisions. Among the division’s key achievements for the year was the successful settlement of the 2nd International Bond of USD 500 million in April 2018.
Investment Banking Division
The Bank sought to strengthen its position in Investment Banking by expanding its investment offering, nurturing stronger relationships with financial intermediaries and increasing penetration in the structuring/ managing of corporate debt and equity issuances. We also expanded discretionary portfolio management services to high net worth individuals, institutional investors and funds. During the year, the Division successfully arranged an unlisted debenture of LKR 12.0 billion attesting to our capabilities in this line of business.
Overseas Operations
In 2018 the Bank widened its international presence further by opening its 2nd branch in Maldives in order to capitalise on opportunities presented by a growing tourism industry. We continue to pursue expansion of regional touch points, particularly in emerging markets through forming partnerships with established financial institutions and enhancing the BoC brand. Driving improved profitability and growth of the overseas branches was a key priority during the year and we sought to refine our product offering, streamline performance management frameworks and incentive schemes and improve delivery channels to enhance the customer experience though digitisation. As a result of these initiatives, overseas branches contributed LKR 2.3 billion in earnings during the year. We also placed emphasis on streamlining the credit administration functions of the overseas branches and nurturing a credit-risk conscious culture.
As the macro-economic conditions are expected to be more conducive the cluster
will maintain focus on its strategic priorities in 2019. The International Division will
strive to maintain its market leadership position while strengthening engagement
with correspondent banks. Development of employee competencies and a wider
product portfolio is expected to support the profitability of the Investment Banking
Division while Treasury will maintain focus on managing the Bank’s liquidity, NIM and
ensure the effective management of market risk exposures.
Way Forward
International, Treasury and Investment andOverseas Segment Performance
0
100
200
300
400
500
600
700
0
5
10
15
20
25
2014 2015 2016 2017 2018
LK
R b
illio
n
LKR
billion
n Assets PBT
643.
0
621.
9
520.
5
599.
6
469.
5
12.910.4
21.4
13.811.9

CAPITAL MANAGEMENT REPORTS
Our Capitals
Cre
atin
g v
alue
th
roug
h

137
Financial Capital
The Bank’s financial capital is vital in ensuring the Bank’s ability to sustain its market position, drive its strategic aspirations and generate sustainable stakeholder value. As a systemically important financial institution, we source and utilise financial capital in a manner that balances diverse stakeholder interests while aptly managing risk considerations.
Strategic Priorities in 2018
Increasing exposure
to development and
SME lending
Balancing growth
aspirations with
capital requirements
Managing interest
margin at optimum
level
Focus on preserving
portfolio quality
• Increased SME lending under the Enterprise Sri Lanka Loan scheme
• Strengthening collection and monitoring mechanisms to preserve
portfolio quality
• Timely repricing decisions
• Automating financial reporting in-line with SLFRS 9 requirements
• Crossed LKR 2.0 trillion milestone in assets
• Achieved all set targets for the year 2018 (except NPL)
• Net interest income growth of 12%
• Total operating income growth of 20%
• Cost to income ratio of 38%
• Pre-tax profit growth of 5%
• Loan portfolio growth of 24%
• Gross NPL ratio maintained at 3.6%
• Duly complied with newly introduced capital and financial reporting
regulatory requirements
• Ensuring that strategic growth targets are met while maintaining
capital requirements
• Preserving portfolio quality
• Process automation
Initiatives in 2018
How wePerformed in 2018
Priorities for 2019
LKR
1,765.0 billionCustomer deposits
LKR
350.0 billionBorrowings
LKR
121.4 billion
Shareholders’ funds
AA+(lka) StableFitch Ratings Lanka (SL)
AAA Stable
ICRA Lanka Limited
B2 Stable
Moody’s
Investors
Services
B Stable
Fitch Ratings
CAPITAL MANAGEMENT REPORTSFinancialCapital

138 Bank of Ceylon | Annual Report 2018
Financial Capital
BoC delivered another year of strong performance, demonstrating resilience against numerous external challenges to deliver pre-tax profit and asset growth of 5% and 16% respectively in 2018. In a year symptomatic of weakening portfolio quality and tapering credit growth, the Bank continued to deliver on its shareholder commitments while preserving portfolio quality and achievingabove average loan growth.
Financial Performance
Net Interest Income
Healthy loan growth of 24% together with the relatively high interest rate scenario which
prevailed for most part of the year, enabled the Bank to record a 14% increase in interest
income to LKR 195.4 billion in 2018. Interest income generated from loans and advances
accounted for 74% of the Bank’s interest income, followed by income on debt and other
instruments. Meanwhile, the Bank’s interest expenses increased by 15% to
LKR 129.8 billion stemming primarily from customer deposits; despite the wider interest
rate differential between time and savings deposits the Bank successfully grew its CASA
base by 4% attesting to the strength of its deposit franchise. Overall the Bank’s Net
Interest Income (NII) grew by 12% to LKR 65.6 billion in 2018. The Net Interest Margin
(NIM) narrowed marginally to 3.1% from 3.2% the year before as the Bank sought to
maintain its lending rates despite the uptick in market rates. At consolidated level, the
Group’s NII increased by 12% to LKR 68.7 billion during the year.
Non-Interest Income
Non-Interest Income comprises primarily of net fee and commission income, trading
gains and other operating income. During the year, net fee and commission increased by
11% to LKR 8.4 billion upheld by growth in credit and debit card related income 23% and
guarantees and related services 21% among others. The key driver of non-interest income
during the year was other operating income which nearly tripled to LKR 12.1 billion due to
exchange gains generated on the Bank’s foreign currency balances. Overall, the Bank’s
non-interest income widened by 47% to LKR 23.5 billion during the year.
Total Operating Income
Healthy growth in NII together with the
strong expansion in other operating
income enabled the Bank to record a 20%
growth in total Operating Income to
LKR 89.0 billion in 2018. Fund and
fee-based sources contributed a
respective 74% and 26% to total operating
income during the year. The Group’s total
operating income increased by 19% to
LKR 94.0 billion.
Impairment Charges
The moderating economic conditions
during the year led to an industry wide
escalation in impairment charges for loans
and advances. The Bank’s impairment
charges increased by 48% to LKR 14.3
billion in 2018, although at a relatively
slower pace than the industry’s 104%
growth given ongoing focus on enhancing
collection and monitoring mechanisms.
The increase in impairment charges
also reflect compliance to SLFRS 9 and
the resultant adoption of the Expected
Credit Loss method to compute loan loss
provisioning; however, in preparation for
full implementation of SLFRS-9 the Bank
had adopted a phased approach resulting
in the gradual increase of the impairment
provision over the last few years.
Trends NII
0
10
20
30
40
50
60
70
80
90
100
0
1.0
2.0
3.0
4.0
2014 2015 2016 2017 2018
n Net interest income n Non-interest income NIM (%)
LKR
bill
ion
65.6
58.4
54.0
46.3
38.5
3.13.23.33.33.1
19.2
23.5
16.0
19.4
18.8
9%
74% 3%
14%
Composition ofOperating Income
l Net interest incomel Net fee and commission incomel Other operating incomel Gains from trading and Financial invstments
CAPITAL MANAGEMENT REPORTS

139
The Bank’s gross NPL ratio (computed as
per regulatory norms) increased to 3.6%
from 2.8% the year before. The industry
NPL ratio stood at 3.4%.
Cost Management
Total operating expenses increased by
19% to LKR 32.5 billion during the year
mainly due to an escalation in personnel
cost 11% and other expenses 35%. The
increase in personnel cost reflect the
recruitment of 1,622 new employees to the
Bank and revisions to remuneration scales
based on collective agreement. Meanwhile
growth in other expenses stemmed
primarily from fixed assets maintenance
expenses and office administration and
establishment expenses. The Bank’s
cost-to-income ratio clocked in at 38%
during the year, significantly lower
than the industry average of 47% and
attesting to the Bank’s ongoing focus on
driving cost efficiencies and productivity
improvements.
Taxation
The Bank’s value creation to the
Government in the form of taxes consists
of VAT and NBT on financial services,
Debt Repayment Levy (DRL) and income
tax. In 2018, the Bank’s tax contribution
increased by 19% to LKR 19.3 billion
mainly due to the introduction of the DRL
which amounted to LKR 1.4 billion in 2018
and a 9% increase in income tax. Income
tax expenses amounted to LKR 9.7 billion
translating to an effective tax rate of 39%
in 2018 compared to 30% the year before.
Trends in Operating Costs
0
10,000
20,000
30,000
40,000
34
36
38
40
42
44
46
2014 2015 2016 2017 2018
n Operating expenses Cost to income ratio (%)
LKR
mill
ion
32,4
93
27,4
08
30,0
23
28,0
13
24,2
60
44.0
38.138.4
43.0
44.7
Profitability
0
5000
10,000
15,000
20,000
25,000
30,000
2014 2015 2016 2017 2018
n PBT n PAT
LKR
mill
ion
31,8
92
30,3
43
31,1
89
25,2
79
20,2
91
19,4
79
21,3
12
24,7
91
17,3
57
13,5
74
ROAA and ROAE
0
1
2
0
20
40
2014 2015 2016 2017 2018
ROAA (%) ROAE (%)
1.61.7
1.9
1.7
1.5
20.522.2
28.4
20.9
16.8
Profitability
Despite numerous challenges presented by the operating landscape, the Bank delivered a
pre-tax profit of LKR 31.9 billion in 2018 an increase of 5% compared to the previous year.
Meanwhile profit attributable to equity shareholders recorded a decline of 9% to
LKR 19.5 billion due to the increase in income tax expenses during the year. The Bank
maintained its position as the single largest profit-making entity in the country, cementing
its position as the leading financial services provider. At a Group level, attributable profit
declined by 9% to LKR 19.5 billion during the year. Meanwhile Return on Average Assets
(ROAA) declined marginally to 1.5% (from 1.7% the year before).

140 Bank of Ceylon | Annual Report 2018
Financial Stability
Asset Growth
In 2018, the Bank marked a key
achievement in its journey of growth
surpassing the LKR 2.0 trillion milestone
in assets. Total assets grew by 16% to
LKR 2.3 trillion by end-December 2018
fuelled primarily by healthy growth in
loans and advances 24% as the Bank
pursued broad-based expansion across
all business lines. Key lending products
which drove growth included overdraft
facilities 64%, scheme loan 16% and term
loans 25% which reflect the Bank’s focus
on SME and development lending during
the year. In terms of business lines, both
Retail and Corporate grew by a respective
9% and 39% during the year. (Please
refer to Business line reviews from pages
126 to 135 for more detailed information).
Lending to the Government sector
also increased by 36% during the year
primarily for infrastructure development
projects such as road construction
and water projects among others. The
Bank’s investment portfolio comprises
primarily of Government securities, quoted
equities, unquoted equities and debt
securities. Following the healthy loan
growth during the year, the Bank’s asset
composition tilted more towards credit
assets, accounting for 63% of total assets
compared to 60% the year before.
Funding position
The Bank’s funding profile strengthened
during the year following an equity infusion
of LKR 5.0 billion and relatively healthy
deposit growth. Total liabilities grew by
17%, led by deposit growth of 14% as
well as increased exposure to REPO
borrowings 119% and foreign currency
borrowings 7%. BoC continues to lead the
industry in deposit mobilisation supported
by the strength of its brand and extensive
geographical reach. Deposits continue
to be the Bank’s main funding source,
accounting for 78% of total assets as at
end-December 2018.
As the cost of deposits increased in line
with the uptick in market interest rates
Total Assets
0
500
1,000
1,500
2,000
2,500
2014 2015 2016 2017 2018
n Total Assets
LKR
bill
ion
1,32
9
1,56
8
1,66
9
1,95
2
2,26
8
Financial Capital
90%
10%
Asset Composition
2018
l Interest earning assest l Non interest earning assets
2017
89%
11%
CAPITAL MANAGEMENT REPORTS
6%
16%
78%
Funding Profile
l Customer depositsl Borrowingsl Shareholders’ funds

141
Shareholders’ Funds
The Bank also augmented its capital position during the year following an equity infusion
of LKR 5.0 billion by the Government. Given the limited avenues available for the Bank
to enhance its capital base, we were compelled to curtail the dividend pay out to 25%,
thereby allowing the shoring up of internally generated funds during the year. Resultantly,
the Bank’s shareholders’ funds widened by 9% to LKR 121.4 billion as at end-December
2018. The Bank’s Common Equity Tier 1 Capital ratio clocked in at 10.3% (compared
to the minimum requirement of 8.875%) while the total capital ratio stood at 14.6%
(minimum requirement of 12.875%) as at end-2018. Following the implementation of the
BASEL III guidelines and SLFRS-9 the Bank will be required to carefully balance its growth
aspirations with the regulatory capital requirements while pursuing alternative avenues to
further strengthen its capital position.
Liquidity
Despite achieving strong portfolio growth BoC maintained a comfortable liquidity position
during the year. Strong loan growth during the year resulted in a slight moderation of the
Bank’s liquidity position, although it remained well within the regulatory requirements.
Accordingly, the Bank’s loans to deposit ratio increased to 86% from 79% the year before.
Meanwhile the Statutory liquid asset ratio clocked in at 24.47% by end-December 2018,
comfortably above the regulatory requirement of 20% and in line with the industry level of
24.5%.
Key liquidity ratios are given below;
2018 2017
Liquid asset ratio (domestic) 24.47 27.22
Liquidity coverage ratio (LKR) 143.51 141.46
Liquidity coverage ratio (All currency) 114.99 105.04
Group Performance
The Bank has 10 subsidiaries and four
associate companies which are involved in
diverse operations ranging from financial
services, property management services
and hydropower generation among
others. The Bank is the largest entity
within the Group, accounting for 98% of
consolidated assets.
Despite the relatively minute contribution
of the Group companies, the subsidiaries
are managed under a subsidiary
management charter that includes
an annual comprehensive subsidiary
performance review. The financial
and operational performance of the
subsidiaries are monitored by the Bank
on a regular basis while risk dashboards
are shared with the Bank’s Chief Risk
Officer to ensure that risks are managed
within acceptable levels in line with the
Group’s overall risk appetite. Meanwhile
a representative from the Bank typically
holds a Board position to ensure that
subsidiary and associate operations are
conducted in line with the expectations of
the parent entity.
during the year, the Bank sought to fund its loan growth through increased exposure
to other borrowings. Accordingly, borrowings increased by 32% to LKR 350.0 billion
reflecting a near doubling of REPO borrowings, the issue of an LKR 12.0 billion unlisted
debenture and an increase in foreign currency borrowings. Overall, borrowings funded
15% of the Bank’s balance sheet.

142 Bank of Ceylon | Annual Report 2018
Manufactured Capital
The Bank operates the industry’s most extensive network of customer contact points across the island and in several international locations providing access to financial services and facilitating financial inclusion. In recent years, BoC has also placed strategic emphasis on widening its digital self-service channels with increased investments in CRMs, self-banking kiosks, DIGI-Centres and online and mobile applications.
Island-wide Network 577 Branches spreading across all 9 provinces
52 limited service branches
14 RLCs 15 SME centres
284Smart Zones
06Brancheson Wheels
776 ATMs 163 CDMs118 CRMs49 bill payment KIOSKs
Online/Mobile banking platforms
Strategic Priorities in 2018
Enhancing our
digital proposition to
attract and retain the
millennial customers
Streamlining and
innovating processes
and systems to drive
increased efficiency
and productivity
Reduce the carbon
footprint of the
Bank’s direct
operations through
reducing electricity
consumption and
construction of
Green branches
• DIGI Centres featuring automated and self-serving touch points
• NFC enabled ATMs
• NFC cards and MPOS payment facilities enabled
• Introduced new digital banking solutions
Reviewed our digital offerings and re-launched with new product frills
• Ongoing workflow automations via DMS
• IT infrastructure developments- major upgrade in the network
infrastructure
• Branch density: 2.93 BoC branches per 100,000 persons
• ATM density: 4.17 ATM machines per 100,000 persons
• 65% of digital adoption (2017: 60%)
• 885,238 kWh Renewable energy generated by branches
• Another branch recognised as a green certified branch
• Re-launched SMART online banking platforms
• Launched IOS version of the SMART Passbook
• Introduce new Fintec products
• Expanding the Bank’s physical presence - 10 branches in the pipeline
• Re-branding branches with SMART zones
• A branch on wheels for each province
• Increase digital adoption up to 75% of the total transaction
Initiatives in 2018
How weperformed in 2018
Priorities for 2019
CAPITAL MANAGEMENT REPORTS
Manufactured Capital

143
Digital Infrastructure
The digital revolution in financial services
is transforming the way customers interact
with banks and the overall customer
experience. Customers are increasingly
demanding ubiquitous channels such
as online and mobile banking channels
which allows them to conduct their
transactions where and when they want.
In Sri Lanka widening computer and digital
literacy rates along with the increased
sophistication of customers has driven the
demand for digital, self service channels
and banks which are unable to respond to
these dynamics are likely to see an erosion
of competitive edge over time.
At BoC, a key element of our strategy
focuses on acquiring and retaining the
millennial customer- those who have
grown up in an evolving world of digital
technology, and social media. To capture
and retain the ‘digital’ customer, BoC
has embarked on a journey of digital
transformation which encompasses
transforming the customer experience and
brand attributes. By leveraging technology
to build new channels, BoC has strived
to enhance customer experience while
improving accessibility and convenience.
Resources allocated to develop Manufactured Capital in 2018
Investment in digitisationinfrastructure:
LKR 2.0 billion
Investment in physical infrastructure:
LKR 1.5 billion
Appeal of brand to
both millennials and
legacy customers
A highly
satisfied customer
experience
Training arising
from digitisation
Reduce resource
consumption by
adapting Green
building concept
Driving financial
inclusion through rural
branch network and
branch on wheels
Medium to long term
impact on financial capital
Computer Literacy
Digital Literacy
Internet Usage
Sri Lanka
2017 28.6 40.1 22.7
2016 27.6 33.8 16.4
By Age Group in 2017
15 to 19 63.0 73.4 38.7
20 to 24 56.9 74.5 55.4
25 to 29 46.7 67.1 49.2
30 to 34 35.2 55.1 37.0
35 to 39 26.6 44.1 28.1
40 to 49 19.8 32.7 18.9
50 to 59 11.0 17.5 9.5
Source: Computer Literacy Statistics-2017, Department of Census and Statistics
Capital Linkages and Trade-offs

144 Bank of Ceylon | Annual Report 2018
Manufactured Capital
Significant Investments in Our Journey of Digital Transformation
Mobile banking applications such as BApp and SMART passbook
BoC DIGI Centres featuring automated and self-serving touch points
SMART zones that feature ATM, CDM and CRM machines
SMART online banking
NFC cards and MPOS payment facilities
Ongoing process
automations such as
the Human Capital
Management (HCM)
system
Automation of the
Central Back Office
functions including
state of art inward
clearing mechanism
Encouraging
a paperless
environment
through the work
flow automation
by Document
Management
System (DMS),
e-audit, BoardPAC
etc.
Online banking
and self-serving
kiosks can be used
to apply for new
account openings
and initial loan
applications
Use of data analytics
in performance
dashboards
CU
ST
OM
ER
OFF
ER
ING
SIN
TE
RN
AL
PR
OC
ES
SE
S
PR
OC
ES
S E
FFIC
IEN
CIE
S
Value created: Widening access, minimum branch visits, 24/7 cash
deposits and withdrawals, increased
convenience
Value created: Time and cost savings,
reduced human error due to automation, less customers and queuing at branches, quicker customer turnover
time at branches
CAPITAL MANAGEMENT REPORTS

145
A successful digital transformation requires strong leadership and a cultural shift in the
organisation. A dedicated IT Steering Committee provides broad oversight and guidance
in achieving the strategic priorities in our digitisation journey. Developing employee IT
skills has been a key area of focus and numerous training programmes on information
systems, break through technological advancement and IT risk management and cyber
security were carried out during the year. Our research department has also contributed by
carrying out research that assisted us in resolving initial teething problems of B-App post
its launch in January 2018. Parallel to these investments we have also deployed resources
towards ensuring the robustness, security and stability of the technology we use. Further
information on the Bank’s IT and Cyber security risk management framework is given on
pages 116 to 117 of this Report.
Leveraging on Our Digital Reach
The Bank currently operates 776 ATMs, 163 CDMs and 118 CRMs across the island,
which is the largest digital network in the banking industry. Out of our total ATM
net work 67% are installed outside the Western province. Our strategic emphasis on
shifting customers towards digital self service channels has begun to bear fruit in 2018,
there were around 65% in digital adoption.
Document Management System – Achievements
in 2018
Automation of several workflows
including personal, home loan
and business loan processing
Online loan applications
– significant utilisation by
professionals
Automated and centralised
customer experience
management module which
handle customer complaints and
correspondence. Also includes
a “Tell us online” feature in the
Bank’s website
CASA account openings
automation with modifications in
the Bank website
Monitoring of NPL – early warning
system for vulnerable loans
127,404 A4 sheets of paper
savings from DMS
Digital adoption
2018 2017 2016
Percentage (%) 65.5 60.5 51.2
Physical Infrastructure
With a total of 1,721 direct customer contact points across the island, BoC operates the
country’s most extensive banking network. This geographical footprint has enabled the
Bank to achieve a 62% penetration, facilitating access to finance to all Sri Lankans. During
the year we opened one new branch and modernised 80 branches. In addition, the Bank
also has a presence in 111 Government offices and 2,001 schools across the island.
Average per day transaction volumes
ATM Transactions 168,317
Core Banking System 1.6 million
CDM Transactions 43,760
Credit card Transactions 8,645
Debit card Transactions 196,275
POS Transactions 54,469

146 Bank of Ceylon | Annual Report 2018
Manufactured Capital
Driving Financial Inclusion
The Bank plays a critical role in facilitating the Government’s financial inclusion agenda,
through offering lending, investment and transactional products to the country’s most
underserved segments. Of the total branches 77% are in areas outside the Western
Province with 27% in economically vulnerable provinces. The Bank also operates 06
mobile units (Branch on Wheels) offering all major banking services to the marginalized
communities living in the areas which are difficult to reach by conventional modes of
banking. (Refer page 22 for further information)
Greening Our Network
Since 2015, BoC has converted 27 of its branches to solar power thereby reducing
the direct environmental impact of its operations while contributing 1000kw (1MW) of
renewable energy to the national grid. Meanwhile two of our branches, Trincomalee and
Kekirawa have also respectively been awarded the Platinum and Gold status of Green
Building by the Green Building Council of Sri Lanka (Refer page 173 for further information)
Contribution to Sustainable Development
Progress in 2018Areas of focus
Added four new “Branch on Wheels” during the year
No. of solar installed branches: 27
Investment in solar: LKR 146.0 million
Renewable energy generated to the national grid: 1,000 kW
No. of Green Building certified branches: Two
Customers using e-statements: 382,188
Paper savings via digital initiatives: 7 million A4 sheets
Customer contact points in underserved communities
Green buildings, branches converted to solar power
Saving paper through digitalisation
CAPITAL MANAGEMENT REPORTS

147
Human Capital
BoC’s human capital is represented by 8,724 diverse and committed employees who are a key source of competitive edge and are vital in driving the Bank’s strategic aspirations.
8,724Employees
Strategic Priorities in 2018
Capacity building – to
enhance the skills, and
knowledge to sustain
and thrive in a fast-
changing business
environment
Build multi-disciplinary
exposure
Attitude, orientation and
Organisational culture
Specialisation and
continues professional
development
Strengthen supportive
physical infrastructure
Fully fledged Human
Capital Management
System
• Introduce employee pledge
• Comprehensive training to improve IT skills and knowledge of new era
technologies in line with the Bank’s digital transformation
• Special outbound training to enhance leadership qualities among the staff
• New programmes introduced for the training prospect on the annual
training schedule
Initiatives in 2018
How weperformed in 2018
Priorities for 2019
60%Female
representation
LKR
338.0 millionInvestment intraining anddevelopment
1,622New recruits
• Value created to employees: LKR 18.9 billion
• Retention rate: 98%
• Number of new recruits: 1,622
• 98% received performance appraisals
• 174 employees were promoted
• Investment in training per employee: LKR 38,071.0
• Zero work stoppage due to industrial disputes
• Reward 219 employees from the best branch competition.
• Reward 4,689 employees via century score card rewarding scheme
• 145 employees were recognised by commendation letters
• 20 employee were recognise by appreciation letters
• No of working days for the year: 239
• Introducing new courses for the training prospects on the annual training
schedule.
• Upgrading holiday home facilities
• Focusing on continuous professional development of our employees
• Transforming intrinsic values
• Continuous automation of HR workflows through the HCM system.
Average servicelength of
09years
HumanCapital

148 Bank of Ceylon | Annual Report 2018
Our Team
The Bank is powered by a diverse
team of 8,724 employees who
facilitate our customer experience,
live the Bank’s corporate values and
are the catalyst in driving our strategic
agenda. A strong reputation for
employee development, opportunities
for career progression and a conducive
work environment has enabled the
Bank to emerge as one of the sector’s
most preferred employers.
Employees by Employment Contract - Gender GRI 102-8 (a)
Male Female Total
2018 2017 2018 2017 2018 2017
Permanent 3,467 3,237 5,257 4,350 8,724 7,587
Outsourced 1,356 1,363 42 36 1,398 1,399
Contract 152 151 2 7 154 158
Total 4,975 4,751 5,301 4,393 10,276 9,144
Human Capital
Sudarshana Kelum GajanayakaChief Manager- Kandy Super Grade Branch
I joined Bank of Ceylon as a
Management Trainee in 2003
and my first appointment was
to the Pemaduwa Branch in
the Anuradhapura District. My
commitment to BoC was rewarded
as I gradually progressed in the Bank,
being promoted to Manager, Senior
Manager and Chief Manager grades
over the last 15 years. It has been
CASEIN POINT
Resources allocated to develop Human Capital in 2018
Total payments to
employees
LKR 18.9 billion
Investment in
training
and development
LKR 338.0 million
Investment in
HCM system
LKR 17.2 million
Capital Linkages and
Trade-offs
Staff training that relates
to all other capitals - IT
related knowledge and
skills, ESMS guidelines,
customer service and
others
Investment in HCM
system automation and
other HR infrastructure
Nurturing a unique base
of organizational capital
CAPITAL MANAGEMENT REPORTS

149
Employees by Employment Contract – Regional GRI 102-8 (b)
Permanent Contract
Province 2018 2017 2018 2017
Western 3,902 3,459 71 75
Southern 746 631 18 18
Sabaragamuwa 571 481 11 11
Uva 480 401 6 6
North Western 708 606 6 7
Central 728 583 16 17
North Central 588 542 10 9
Eastern 470 412 7 7
Northern 531 472 9 8
Total 8,724 7,587 154 158
Employees by Employment Type - Gender GRI 102-8 (c)
Male Female
2018 2017 2018 2017
Corporate Management 12 14 3 2
Executive Management 29 35 17 13
Chief Managers 56 65 43 39
Senior Managers 90 98 86 86Branch Managers and Assistant
Managers 409 475 658 620Management Trainees and other Officer
Grades 929 715 1,853 1,537
Staff Assistants and Allied Grades 1,520 1,312 2,581 2,037
Office Assistants and Allied Grades 422 523 16 16
Total 3,467 3,237 5,257 4,350
E PremarajanSenior Manager- Jaffna Super Grade Branch
My career at BoC began in November
1982 when I joined the Bank as a
Development Assistant. Since then I
was promoted numerous times and
received the opportunity to work in
several branches specially served as
manager at Thirunelvely, Jaffna second
Point Pedro, Manipay branches and
as Area Manager at Wanni Area office
and Jaffna Area office. In November
2018 I was appointed as acting Chief
Manager of the Jaffna Supra Grade
branch. Serving BoC for over 37 years
has been a great honour and I’m proud
to say that the Bank has nurtured every
aspect of my personal and professional
life and moulded me to what I am today.
The Bank has played a key role in
overcoming all the financial hardships
faced by my family to achieve the living
standards we enjoy today.
CASEIN POINT
CASEIN POINT
Shakeela NashaatSenior Manager- Wellawatta Super Grade Branch
I joined the Bank as a Junior Clerk/
Assistant Cashier in 1991 and after
several promotions currently hold the
position of Senior Manager.
My journey with the Bank has allowed
me to improve both professionally
and personally with the support of my
colleagues and superiors. I am thankful
to the Bank and all the wonderful people
I have met, as I have achieved almost
all my career goals and am leading a
successful and happy life with my family.
I also had the opportunity of serving as
a faculty member in the Bank’s central
training institute and I’m happy I could
contribute to the development of the
Bank’s human capital. I look forward to
many more fulfilling, years in the Bank.
a great privilege to serve the Bank
and I am extremely grateful for all
the training and career development
opportunities that have been given
to me. In addition to ensuring the
financial stability of my family, my
career at BoC has allowed me to
grow as a person, widening my social
networks and improving my skills.

150 Bank of Ceylon | Annual Report 2018
HR Governance and Management Approach
The Bank’s approach to managing talent is clearly
articulated through a comprehensive suite of policies
covering all Human Resource (HR) related aspects. A
dedicated HR Policy Committee chaired by the General
Manager is responsible for formulating and recommending
policies for Board approval. HR Policy committee has held
48 meetings during the year. The Board is assisted by the
Human Resource and Remuneration Subcommittee in
governing the Bank’s Human Resource. Bank’s HR strategy
is developed via the Corporate Plan and implemented
and driven by the HR department. HR policy covers;
recruitments, cessation, leave entitlements, salaries and
other emoluments offered to employees. Shop and office
ordinance controls the Bank in terms of the labour practice
and decent work. Agreements and contracts includes
human rights. Also each employee is entitle to receive equal
treatments under equal opportunity irrespective of cast,
gender or race.
Board of Directors
General Manager
HR Department
HR and Remuneration Committee
HR Policy Committee
Attraction Administration
Recruitment Policy
Equal Opportunity Policy
HR Policy
Leave
Code of conduct and the
Disciplinary procedure
Staff welfare
Retention
Training and Development
Employee benefits
(Salary and non-salary)
Promotion
Talent Attraction and Retention
As the country’s leading brand and the
financial sector’s market leader, the
Bank is in a strong position to attract
employees. Job applications by the
thousands are common for BoC for entry
level positions such as staff trainees and
management trainees. The Bank follows a
structured and clearly defined recruitment
process. Divisional requirements for staff
are recommended by the HR Policy
Committee to the Board of Directors
to approve. Once approved, vacancies
are advertised to the public through
newspapers in all three languages and
on the Bank’s website. Candidates are
selected based on their performance at
a written examination and an interview
with an interview panel determined by
the General Manager. All new employees
undergo a comprehensive induction
programme. In 2018/ 2017 a major
recruitment process took place after
four years. The recruitment process is
usually bit prolonged as we as a state
enterprise are compelled to follow the
above mentioned structured procedure
in recruitments. However, it improved
transparency. Although the recruitment
process is prolonged, the Bank always
ensures smooth operations of Bank by
efficient management and optimum use of
its human resources.
1,622Recruitmentsin 2018
20Managementtrainees
12Other
1,590Banking Assistants
Human Capital
CAPITAL MANAGEMENT REPORTS

151
Recruitments in 2018 - GRI 401-1
Employee Turnover 2018 - GRI 401-1
Employee Retention
The Bank’s employee turnover rates have
been consistently low over the years and
was 0.9% (excluding retirement) in 2018.
This attests to our unique employee value
proposition, characterised by significant
investment in training and development,
opportunities for career progression,
cordial union relations, a robust grievance
mechanism and a high level of employee
engagement (including a range of welfare
activities such as holiday homes, lunch
time seminars on work-life balance etc)- all
of which have contributed towards building
an organisational culture that employees
value. During the year also special lectures
on common health issues and a medical
camp on breast cancer were conducted.
Total participation to those events were
around 500 employees during the year.
Male
503
Female
1,119
By
Gen
der
By
Ag
e<30 years
1,612
30-50
10
>50 years
0
By
Reg
ion
Western 666
Southern 139
Sabaragamuwa 120
Uva 113
North Western 112
Central 143
North Central 103
Eastern 113
Northern 113
Male
210
Female
175
By
Gen
der
By
Ag
e
<30 years
39
30-50
35
>50 years
311
By
Reg
ion
Western 225
Southern 29
Sabaragamuwa 18
Uva 13
North Western 20
Central 31
North Central 18
Eastern 10
Northern 21

152 Bank of Ceylon | Annual Report 2018
Staff Welfare
- Holiday homes made available to
staff 11
- No. of staff who has availed the
facility 7,305.
- No. of staff who has used welfare
vehicles 6,000
- No. of staff who has membership in
Gym, Yoga etc. 55 per month
- Staff loans offered at concessionary
rates, LKR 29.9 million
Rewards and Recognition
The Bank offers an attractive compensation
plan that includes gross salary, employer
provident and trust fund contributions,
medical assistance schemes, pension
scheme, Widow, widower and orphanage
fund (eligibility criteria apply), discretionary
bonus and incentives. The Bank
contributes 12% and 3% to BoC Provident
Fund and ETF respectively, Employees also
qualify for housing loans, vehicle loans,
also they get computer loans, solar power
loans, investment loans and unified general
loans at concessionary rates, education
assistance and professional subscription
re-imbursements (eligibility criteria apply).
Compensation which includes salary and
non-salary benefits is based on collective
agreement between state sector Bank
management with unions which are
negotiated every three years.
A structured performance management
system is in place ensuring the equitable
treatment of all employees in determining
increments and promotions. KPIs are
cascaded from the Bank’s corporate
strategy and around 97% of permanent
employees are under performance
appraisals at least on an annual basis.
Career progression is guided by a
transparent and clearly communicated
promotions policy. Employees are eligible
to apply for a promotion once they have
completed the required service in the
current position. During the year, 174
employees were promoted while all
vacancies were filled internally except for
the entry level position. Written succession
plans for Key Management Personnel
(AGMs/ DGMs) has also been carried out.
The success of BoC’s development of its
employees is demonstrated through 100%
of all positions being filled through internal
promotions or transfers except for three
positions in senior management. External
recruitments are carried out only for
specialist roles for which the skills are not
available within the organisation.
The BoC Spirit awards are conducted
annually to recognise outstanding
performance by employees. High-
performing branches and employees are
recognised through cash and non-cash
rewards such as foreign tours, local trips,
commendation marks etc.
Diversity
BoC is an equal opportunity employer
and does not discriminate on gender, age
or ethnicity in recruitments, promotions
or when determining remuneration. The
Bank’s overall female representation
of 60% is amongst the highest in the
industry while the age profile ranges
from 21 to 60 years. The Bank offers a
conducive work environment for women,
as reflected in the Bank’s high return-to-
work ratios. Meanwhile, the ratio of basic
salary between women and men is 1:1.
Our recruitment policy also mandates a
quota of up to 1% for differently-abled
employees.
Parental Leave 2018 - GRI 401 - 3
Male Female
Employees:
Entitled to parental leave 5,257
Took parental leave 383
Returned to work after leave 358
Number of employees still employed after 12 months of their
return to work after parental leave 242
Return to work rate of employees taking parental leave 93.2%
Retention rate of employees taking parental leave 99.4%
Human Capital
Reasons for Turnover
Reason No. of
Employees
New Opportunity 25
Personal Reason 17
Migration 14
Higher Education 5
Due to bad health 3
Other 10
Retirement 311
Total 385
CAPITAL MANAGEMENT REPORTS

153
Employee Diversity 2018
Age Group
<30
years
30-50
years
>50
years
Total
Corporate Management - 15 15
Executive Management - 18 28 46
Chief Managers - 53 46 99
Senior Managers - 125 51 176
Branch Managers and Assistant Managers - 875 192 1,067
Management Trainees and other Officer Grades 510 2,083 189 2,782
Staff Assistants and Allied Grades 3,027 919 155 4,101
Office Assistants and Allied Grades 75 288 75 438
Total 8,724
Special Training Programmes Conducted
with the third Party Institutions.
Training program Participants
Asia Pacific Regional
Rural Credit
Programme 10
PIM Glo-Bus
Simulation 24
Outbound training
with SL Army 1,847
Training and Development
Ongoing opportunities for training and
development is a key aspect of the
Bank’s employee value proposition and
we continue to invest in nurturing the
technical and soft skills of our team. All
new recruits undergo a comprehensive
induction programme while a dedicated
training centre located in Maharagama
offers in-house training and ensures that
organizational knowledge is passed on.
We also supported employees’ life-long
learning through providing opportunities for
Toastmaster/ Speech craft programmes.
The Bank also has a management
development programme structured to
cater to the different managerial levels.
Bank has in-house training centre with
seven faculty members and 132 associate
faculty members. This centre also has
facilities for residential training up to 315
participants.
Out bound Training for Trainee Staff Assistants

154 Bank of Ceylon | Annual Report 2018
Human Capital
Total Training Hours
Programme Hours
In-house Local Training Overseas Training Total
2018 6,218 2,134 3,416 11,768
2017 4,087 2,997 4,800 11,884
Employee Engagement
A year-round activity calendar consisting of sports, cultural and religious activities are
conducted to drive employee motivation and nurture a sense of camaraderie. An overview
of some of the engagements conducted during the year are listed below.
Industrial Relations
BoC is cognisant of its employees’ rights
to freedom of association and does not in
any way restrict its employees from joining
trade unions. Almost 92% of the Bank’s
employees are represented by one of the
seven trade unions, and seven employees
are permanently released for union work.
Accredited employee representatives of
the different trade unions are given the
opportunity to engage in union activities
and are supported with facilities and
funding for such initiatives. We maintain
cordial and co-operative relationships with
trade union representatives, ensuring that
only significant issues are raised to the
Bank’s management.
In 2018 collective agreements with all the
trade unions were reviewed and signed
off. 77% of total workforce is covered by
the collective agreement. There were also
no disruptions to work during the year
due to industrial disputes. 06 months’
notice is provided to employees prior
to the implementation of any significant
operational changes that could affect
them. The notice period and provisions for
consultation and negotiation are specified
in the relevant collective agreements.
Average Training Hours
Male Female
Corporate Management 13 11
Executive Management 10 8
Senior Management (CM/ SM/ BM) 3 3
Executives (AM/EO/ Officer Trainee/ JEO) 2 1
Banking Trainees and other 1 1
CAPITAL MANAGEMENT REPORTS
0
100
200
300
400
500
Investment in Training
2016 2017 2018
l Investment in Training
LKR
mill
ion
299
322
338
One day ‘Sil observing’ programme organised by the Buddhist society of the Bank
Ceremonies in celebration of Wesak festival

155
Comprehensive medical
insurance schemes for all
confirmed employees and their
close families
Availability of an in-house
doctor, nurse and a pharmacy
for any medical emergencies at
the Head Office
Gymnasium, yoga and aerobics
facilities at the Head Office
Specialised training and security
for employees engaged in the
transportation of cash
Annually fire drill is conducted at
Head Office
Employee value creation in 2018
Progress in 2018Areas of focus
LKR 18.9 billion
LKR 338.0 million
58%
60%
358
LKR 6.8 billion (provision for the year)
Total payments to employees
Investment in training including IT related skills and knowledge
Female representation:
Managerial level
Overall
Return to work after parental leave
Non-contributory pension on retirement provided 10 years of service had been completed
Health and Safety
Although the work environment within the Bank does not give
rise to major health and safety risks, we give priority to employee
wellness and safety. Health and safety topics covered in collective
agreements include, employee entitlements under the medical
assistance scheme. Initiatives in place to deliver the Bank’s health
and safety goals are given below;
Christmas carols by staff in celebration of Christmas A special Hindu Pooja ceremony to mark the 79th Anniversary of the Bank
Iftar ceremony during the Ramadan fasting period 2018

156 Bank of Ceylon | Annual Report 2018
Intellectual Capital
BoC’s Intellectual Capital represents one of its most important strategic assets, enabling the Bank to sustain its competitive edge, drive customer acquisition, enhance brand equity and remain relevant in a rapidly changing environment.
LKR 42.9 billion
Capacity for innovation
Corporate values
Strategic Priorities in 2018
Enhancing digital
proposition to attract
and retain the millennial
customers
Emphasis on good
governance, ethics and
robust risk management
Branding initiatives
aimed at attracting
the next generation
customers while
retaining our legacy
customers
• Developing innovative digital products
• Focused training on ethics, integrity and governance
• Automation and process improvements
• Brand promotions for digital offerings
• Maintained position as Sri Lanka’s No.1 brand for the 10th
consecutive year- Brand Finance
• 6% growth in brand value to LKR 42.9 billion as recognised by
Brand Finance Lanka
• Sri Lanka’s Strongest Bank: The Asian Banker Magazine
• Among the top 1000 banks in the Banker Magazine UK
• Maintained market leadership position
• Recognised as the ‘People’s Service Brand of the Year’ by SLIM –
Nielsen Peoples Awards 2018
• 272,975 customers on boarded to mobile banking applications
during the year
• Development of brand policy
• Continued investment in brand development
• Materialise virtual banking concept
• Enhance data analytic capabilities through Big data analytics
• Innovation lab to enhance capabilities for innovation
Initiatives in 2018
How weperformed in 2018
Priorities for 2019
81,627Cumulative
service experienceof staff
Tacit knowledge
CAPITAL MANAGEMENT REPORTS
Brand
Intellectual Capital

157
Corporate Values
The Bank’s corporate values reflect the
essence of its identity, shaping its culture
and providing clarity to both internal and
external stakeholders regarding what the
organisation values. As a Bank whose
mission extends beyond profit generation
to encompass social and public interest
objectives, BoC’s corporate values
act to clearly define the philosophies,
beliefs and principles which underpin
its value creation. The corporate values
are introduced to all employees at the
induction programme and regularly
reaffirmed through engagement and
communication. Our values have also
enabled the Bank to nurture and reinforce
strong business relationships while guiding
employees to conduct themselves in a
responsible and ethical manner.
Investment
in brand
development:
LKR 1.2 billion
Investment in
digital
solutions:
LKR 2.0 billion
Investment in
employee training
and development:
LKR 338.0 million
Being customer centric
Respecting all forms of diversity
Being accountable for all
our actions
Focusing towards agility
and innovation
Committing towards high
level of ethics, governance
and professionalism
Our Brand
The BoC brand has consistently been ranked as
Sri Lanka’s No.1 brand by independent domestic
and international branding agencies. The brand
is associated with attributes of stability, trust and
confidence which have supported lower customer
acquisition costs and high retention. In 2018, the
Bank placed strategic emphasis on strengthening
the branding of its digital offerings such as
BoC DIGI, Smart Zones, B App, Smart Passbook
and Smart Online Banking among others.
No. 1 brand
in Sri Lanka for the 10th Consecutive yearBrand Finance Sri Lanka
Strongest bank in Sri LankaThe Asian Banker
Among the World’s top 1000 banks since 2012The Banker Magazine UK
2014 2015 2016 2017 2018
BoC Brand Value
20
25
30
35
40
45
30.8
38.1
41.4 40.6
42.9
LKR
bill
ion
Capital Linkages and
Trade-offs
Enhanced customer
value proposition
through digital
offerings
Quality of human
capital strengthened
through nurturing
organisational capital
Investments in digital
technology will have
short term as well as
long term implications
on financial capital
Resources allocated to develop Intellectual Capital in 2018

158 Bank of Ceylon | Annual Report 2018
Tacit Knowledge
A 79-year heritage of working with
an unparalleled base of customers
across market segments and managing
the industry’s largest portfolios has
allowed BoC to nurture a unique base
of organisational capital. This tacit
knowledge is shared across divisions and
generations of employees through defined
learning structures, supportive leadership
teams and learning processes which are
embedded into work-flows. An average
retention rate of over 98% combined with
the addition of young recruits mainly via
Management Trainees and Trainee Banking
Assistants in general has enabled BoC
to build one of the industry’s most widely
represented, experienced and talented
teams.
Intellectual Capital
Cross-functional promotions:
174
Cumulative service experience of employees:
81,627 years
Employees with service of over 20 years:
1,055Average retention rate:
98%
Training coverage ratio:
95%
Capacity for Innovation
The Bank is cognisant of the need to
continuously innovate its offering to
compete effectively in today’s dynamic
banking environment. Adopting technology
to reduce complexity and drive increased
agility for both customers and employees
has been a key focus for the Bank and
we have made significant investments
in modifying processes, simplifying
workflows and expanding self-service
channels.
Customers Internal processes Employees
• Enhancing virtual banking proposition with new fintec products.
• Products to facilitate cashless banking
• New virtual banking back-end
• Centralised data warehouse with a Big data analytics tool
• Continue work flow automation target at paperless banking culture
• Innovation lab for the bank
• Complete HCM system allowing fully automated HR management System.
• BoC 360: Performance management app
Major focus for future
CAPITAL MANAGEMENT REPORTS

159
No 01 Brand in Sri Lanka
• No. 01 Best Banking Brand -
Brand Finance
• No. 01 Most Valuable Consumer
Brand - Brand Finance
(No. 01 Brand for the 10th consecutive year)
• People’s Service Brand of the Year -
SLIM – NIELSEN People’s Awards
Excellence in Performance
• Strongest Bank in Sri Lanka -
The Asian Banker
• Top 1000 Banks in the World -
The Bankers Magazine (UK)
• Swabhimani Honours Award - Service
Excellence Awards Ceremony (Seychelles)
Annual Report Awards
• Gold Award for State Bank Category
CA Sri Lanka Annual Report Awards
• Winner- Public sector Banking SAFA Award 2017
• ARC Awards (International Bank Category)
- Financial Data – Gold
- Written Text – Gold
- Traditional Annual Report - Gold
Awards for Sustainability/ CSR
• Top Ten Best Corporate Citizens – Best
Corporate Citizen Sustainability Awards –
2018 by Ceylon Chamber of Commerce
• Green Building Platinum Award –
Trincomalee Super Grade Branch – Annual
Green Building Awards by Green Building
Council of Sri Lanka (GBCSL)
Human Resources Awards
• Best HR Organization to work for - Global
HR Excellence Awards 2018
• The Asia’s Best Employer Brand 2018 -
Employer Branding Institute India
• Sri Lanka’s Best Employer Brand 2018 -
Employer Branding Institute India
Awards for Technological and Digital Initiatives
• Best Use of Mobile in Financial Sector SLT
ZERO One Award
• Technovation Awards for
- Overall Winner in Excellence in interbank
payments
- Winner - Most Popular Electronic
Payment Product (B App)
- Winner - Best Common ATM Acquirer (A)
for the year
- Winner - Best Acquirer for US Dollar
Online Payments
- Winner - Bank of the Year for Financial
Inclusivity (A)
- Runner Up – Best Bank for Retail
Payments
Awards and Accolades

160 Bank of Ceylon | Annual Report 2018
Social and Relationship Capital
We believe that strong and mutually beneficial relationships with our core stakeholders are key to our continued commercial success and social relevance. The Bank is therefore committed to systematically identifying and addressing the concerns of its stakeholders through strategic action.
Business partners who support our
value creation
Spent for customer Education and
capacity building Spent for CSR
Customers benefited via
customer education programmes
Customerrelationships
13.4million
Strategic Priorities in 2018
Speedy service via
Multi-channel delivery
Financial inclusion via
digitisation
Youth penetration
supported by BoC’s
digitisation strategy
Customer community
engagement
Enhancing Service
Standards
• Conducted customer satisfaction surveys covering all provinces
to gauge customer perception on service and comparative service
levels
• Strengthened digital proposition to customers
• Ongoing investment in financial literacy and capacity building
• Streamlined CSR projects to drive strategic sustainability objectives
• 113 financial literacy and capacity building sessions for customers
• 24% growth in lending
• 21% increase in interest paid to depositors
• 2 new relationship tie-ups with global money transfer agencies
(Western Union, G S Cash Line)
• LKR 6,670.3 million payments to suppliers
• LKR 30.4 million investment in community via CSR and
sponsorships
• LKR 89.2 million spent for child education
• Revise communication strategy to enhance customer perception on
efficiency, innovation and digital solutions
• Formulating supplier guidelines to conduct supplier audits
• Engage in strategic CSR projects aligned to the SDGs
• Further enhance the digital and cashless banking service channels
to customers.
• Expanding our presence to new geographies aiming to serve more
expatriates.
Initiatives in 2018
How wePerformed in 2018
Priorities for 2019
9,72221.9
million 108.0million
14,580Over
LKR
LKR
CAPITAL MANAGEMENT REPORTS
Social and Relationship
Capital

161
CustomersThe Bank serves 62% of the country’s population with deep penetration across customer segments, industry sectors and geographies. In order to maintain our market position, we recognise the need to offer a unique customer value proposition founded on our fundamental strengths of trust and stability while adapting to emerging customer preferences and technology-driven competition. In 2018, we also placed emphasis on increasing penetration among the youth, supported by several specific products and digital solutions.
13.4 million customers
80% outside the Western Province
l Western Provincel Southern Provincel Central Provincel Northern Provincel Eastern Province
12%
12%
9%
7%
10%
20%
10%
9%
11%
Customers Province WiseDistribution- 2018
l North Central Provincel North Western Province l Sabaragamuwa Provincel Uva Province
49%
l Malel Female
51%
Customer Gender WiseDistribution - 2018
CASEIN POINT
CASEIN POINT
CASEIN POINT
Sri Rahula College Anuradhapura
Sri Rahula College Anuradhapura is one of the most popular private schools in the Anuradhapura District, consistently recording above average pass rates and building a strong reputation for high quality education. BoC has been a vital partner in the school’s success, providing several facilities at favourable rates at a time the school was seeking to expand its infrastructure and facilities. Through these facilities, BoC has directly contributed towards providing opportunities for quality education in the Anuradhapura district. The Bank committed its support to the proprietor of the school, Mr Roshan who had initially found it challenging to obtain funding for expansion. Following the school’s strong track record, the Government has come forward in providing text books free of charge and contributing towards paying teachers’ salaries. The proprietor of the school, Mr Roshan aspires to further enhance the standards of the school in developing it to be in par with Sri Lanka’s leading private schools. An indoor swimming and a sports stadium are to be constructed for which BoC has already committed its support. Funding this project has enabled the Bank to meet both it’s commercial and social sustainability by supporting the provision of high quality, affordable education to a community which typically lacks access to services of that nature.
Vaakarai Community Project
In the war affected community of Vakarai, Batticaloa, BoC partnered a group of young farmers to provide funding to commence the cultivation of cucumber. These communities had previously engaged in fishing, however following the Tsunami and subsequent natural disasters their livelihoods were threatened due to long-term impacts on marine life. The cucumber project commenced in partnership with a leading agricultural exporting company, which provided the required seeds, fertilizer and technical knowledge to engage in cultivation with clearly defined buyback arrangements in place. Following the granting of these facilities by BoC, the project has been expanded to over 150 farmers who now generate a secure source of income from the sale of cucumbers for export. BoC also supported these individuals by providing financial literacy training and inculcating savings habits. This project is an extremely successful example of a public/ private partnership which has fostered scio - economics empowerment enabling communities to gradually lift themselves out of poverty while generating foreign exchange income to the country.
CANE Project
Ms Gnanawathy from the Monaragela district owns and operates a successful cane based product manufacturing business. She commenced this venture in the year 2000 after providing training to 12 neighbouring women who started producing a range of cane items. BoC approached her during the initial stages of her business, offering
LKR 100,000 to purchase equipment needed to expand her business. She subsequently obtained several more facilities from BoC which allowed her to increase production, generate more employment and even purchase a three-wheeler to transport her goods. Recently, Ms Gnanwathi received the opportunity to obtain LKR 1.5 million under the Enterprise Sri Lanka loan scheme which has allowed her to employ nearly 60 women and expand production significantly. She has obtained international training on manufacturing cane items and now produces a range of high-quality products. She has maintained close relations with the officials of BoC and is extremely grateful for the Bank for partnering her success over the years. Through this project, the Bank has demonstrated its commitment towards fostering female entrepreneurship and empowerment, a critical social sustainability issue of recent times.

162 Bank of Ceylon | Annual Report 2018
Social and Relationship Capital
Trust and Stability
Market dominance along with the state
ownership and an established track record
of over seven decades has enabled the
Bank to build a strong brand founded on
trust and stability. This is a key source of
competitive edge for the Bank, enabling
it to attract and retain customers at a
relatively low acquisition cost. Our new
customer acquisition average is around
600,000 per year.
Products and Services
BoC offers a wide array of deposit,
investment and lending products targeting
the diverse needs of its large customer
base. Our deep understanding of customer
behaviour garnered through extensive
customer relationships enable us to design
products, services and solutions which
help customers fulfil their goals.
Trust and stability
Products and services
Customer experience
Responsible banking
Propagating sustainable practises
Capital Linkages and Trade-offs
Driving increased penetration of digital
platforms require corresponding
investments in IT security and
development.
We support our clients through
periods of financial stress by
rescheduling/ restructuring facilities.
Despite delays in repayment,
this leads to stronger customer
relationships and eliminates the need
for costly legal action.
Total payments to suppliers LKR 6.7 billion
Investment in customer engagement: LKR 325.5 million
CSR investments: LKR 107.9 million
Resources allocated to develop Social and Relationship Capital in 2018
CAPITAL MANAGEMENT REPORTS
The Bank has build its relationship with the customers, based on the following
fundamentals. All our strategies are directed towards improving performance under
following areas.

163
Customer Experience
In order to retain and strengthen our
market position, we understand that
the Bank’s customer proposition
should address heightened customer
expectations for ease of access,
convenience and personalisation. BoC’s
branch infrastructure is the most extensive
in the industry, with 1,721 customer
contact points. Expanding the digital self-
service channels has been a key priority
in recent years and the Bank expanded
Smart Zones in 2018, bringing the total
count to 284 by end-2018. Smart Zones
consist of ATMs, CDMs, CRMs and bill
payment kiosks allowing customers to
perform a range of transactions instantly
without queuing in branches. Omni-
channels include the Bank’s mobile and
online banking platforms.
Our Network
2018 2017
Branches 577 578
Limited service
branches 52 48
Mobile branches 6 2
ATMs 776 764
CDMs 163 168
CRMs 118 -
SME Centres 15 15
Regional Loan Centres 14 14
Purpose Individuals SMEsCorporates and Financial institutions
Government institutions
Invest and save excess funds Time deposits, other investment products and debentures
Savings Accounts
Transact with and manage funds
Current accounts for the payment of daily transactions
Cash management solutions
Lending solutions Personal loans
Home loans
Education Loan
Overdrafts and leasing facilities
Commercial loans including Project loans
Syndicate funding
Term loans and trade finance
Payment solutions Debit/ Credit/ Travel Cards
Mobile Banking, Online Banking facilities
International services Inward and outward remittances
Correspondent banking
We have seen accelerated adoption
of self-service channels among our
customers; in 2018 total digital adoption
of the Bank accounted for 65% of the
Bank’s total allowable digital transactions,
compared to 60% the year before.
Among total transactions value of the
Bank 13% are digital transactions. The
Smart Zone concept has also contributed
towards taking digital banking to the
country’s peripheries driving increased
use of technology among the grass-root
communities. Nearly 200 (70%) BoC Smart
Zones are located outside the Western
Province.
We are also working towards driving
service excellence by empowering
employees to provide a consistent and
personalised experience across all
branches. Time taken to perform over
the counter transactions at branches are
monitored allowing for the identification
of process bottlenecks and remedial
action taken to improve turnaround times.
Meanwhile, the conversion of all branches
to 5S has led to a reduction in wastage
and better management of workspaces.

164 Bank of Ceylon | Annual Report 2018
Efficiency Improvement via DMS
Manual
Process
Automated
Process
Loan Account Creation 10 minutes 1 Minute
Data retrieval from Core Banking System for Loan
appraisal 1 Minute 15 seconds
Debit Card issuance 1 Minute 15 seconds
Mobile Alert Registration 1 Minute 15 seconds
Memo creation for accounts 1 Minute 15 seconds
Responsible Banking
The Bank adopts the CBSL Customer Charter which clearly defines customer obligations
and standards for fair banking practices. Relevant information such as interest rates,
maturity periods and other terms and conditions are clearly communicated to customers
in the language of their preference. During the year there were no incidences of non-
compliance to regulations/ voluntary codes pertaining to marketing and product labelling.
We continue to invest in strengthening our IT and cyber security framework to ensure that
confidential customer data is safeguarded. Controls in place include regular IT vulnerability
assessments, network upgrades, IT audits by third parties and ongoing employee training
on IT security aspects. In 2018, there were no complaints concerning losses of customer
data. 1.2 million customers have registered for in stand SMS facility in their transactions
and the Bank keeps on promoting this among customers as a security feature.
Propagating Sustainable Practices
We work closely with our customers to encourage sustainable practices and facilitate
economic activities that drive shared prosperity. We have introduced processes which
allow us to systematically identify how the Bank can support customers in reducing their
negative economic, social and environmental impacts by adopting new business models
and technology, thereby propagating sustainable practices. A few highlights of the year are
presented alongside.
Migration to e-statements: 382,188 Customers
Migrated to SmartGen Accounts 309,624
Facilities screened for ESMS criteria 508
Financial inclusion and capacity building
As a state-owned bank we have a
responsibility towards partnering the
Government’s national economic agenda.
Driving socio-economic growth through
financial inclusion has been a priority of
successive Governments and given its
geographical reach and strong funding
profile, BoC has played a vital role in
facilitating affordable funding across the
island. The Bank adopts multiple platforms
and products to drive financial inclusion as
summarised below;
Participatory Financial Institution (PFI) in numerous credit schemes
BoC is a PFI in over 50 credit schemes
which channel funds to underserved
segments of society. These include
schemes catering to SMEs that have
previously not borrowed from a bank
(SMELoC), women-led SMEs, agriculture,
fishery and dairy sector SMEs.
LKR 12,477.6 millionDisbursements through participatory
funding schemes
32,460 Total beneficiaries
CAPITAL MANAGEMENT REPORTS
Time Taken for over the Counter Transactions
0
5
10
15
20
25
30
Savingsaccountopening
Timeaccountopening
Cash deposits/withdrawals
Cash backedfacilities
Pawning
l Current position l Previous position
Min
utes
10 10 45 105 301025
Social and Relationship Capital

165
Customer contact points in economically disadvantaged areas
The Bank’s well spreaded network of
branches places it in a unique position
to support the unbanked segments of
the market through lending and deposits
products. The Branch on Wheels concept
features a mobile banking unit which
allows rural customers to perform a range
of banking transactions without visiting a
branch.
06 Branch on Wheels to serve
marginalised communities
99 Branches in economically
disadvantage areas
112 Customer contact points in
economically disadvantaged areas
Micro-finance lending
The Bank has partnered with several
Government institutions and other
agencies in channelling funds to the
country’s micro sector through credit
schemes. The Mithuru micro-financing
programmes is the Bank’s own initiative,
through which Mithuru groups and
societies are formed for mutually
guaranteed lending. Funds are disbursed
primarily for entrepreneurial ventures and
are aimed towards communities which
otherwise do not have access to formal
funding. The Bank also supports these
enterprises through facilitating market
linkages to sell their products through
organising ‘Mithuru pola’ markets.
Total Microfinance Portfolio :
LKR 8.7 billion
LKR 189.0 million disbursed to 18,459
Groups and 195 Societies through the
Mithuru Scheme
Our Response:
Revised communication strategy
to focus on Bank’s self-service/
digital solutions, Introduced a
dedicated meeter greeter at each
branch, consider finding in strategic
decision making
Listening and Responding to Our Customers
The Bank’s dedicated Research Unit
conducted a comprehensive customer
survey during the year, with an island-
wide coverage of over 10,000 customers
to identify customer perceptions and
satisfaction levels. We also conducted
surveys to assess the effectiveness of the
Bank’s marketing communications and
a competitor analysis on comparative
service levels. Findings of these
engagements (summarised below) formed
an important input to the Bank’s Corporate
planning exercise.
• Over-crowding
at branches
• Need for an
inquiry counter
• Limited parking
facilities
• Perception of
trust associated
with the brand
• Financial stability
• State ownership
Financial literacy and capacity building
As industry leader and an organisation
committed to responsible banking,
we believe we have a role to play in
nurturing financial discipline and literacy
in communities. BoC conducts several
ongoing financial literacy Programmes and
progress made in 2018 is given below;
• 150 (75 for students and 75 for
parents) seminars conducted in
outstations under the Hapana seminar
series for 27,662 students sitting the
Grade five Scholarship examination
and 20,830 parents
• 74 workshops for individuals pursuing
foreign employment (particularly
housemaids) on topics such as foreign
currency and remittances- 10,790
beneficiaries.
• Six ‘You are a Leader’ programmes
for school students conducted in
partnership with Neth FM aims to
inculcate leadership skills through
residential programmes held across
the island
• Three “Vyaaparika Hamuwa” sessions
for the SME sector facilitating
networking and knowledge sharing-
600 beneficiaries
• 20 “BoC Mithuru” Financial Literacy
Awareness Programmes on SME
Customers – 1,452 beneficiaries
• 10 Regional programmes to uplift
SMEs in the country- 409 beneficiaries

166 Bank of Ceylon | Annual Report 2018
Social and Relationship Capital
Customer value creation in 2018
CAPITAL MANAGEMENT REPORTS
Disbursements for starting/ expanding entrepreneurial ventures 2018
Dedicated savings products for female customers
Lending committed to support people in buying/ constructing houses
Supporting the country’s agriculture and fisheries sector
Nurturing a culture of savingsDeposits we hold on behalf of customers
LKR 3.2 billion
Kantha Ran Ginum (with 0.5% additional interest)
LKR. 66.8 billion
LKR. 68.0 billion
LKR 1,627.0 billion
Progress in 2018Areas of focus

167
Business Partners
The Bank values the mutually-beneficial relationships it has nurtured with its business
partners and strives to create shared value through ethical conduct, transparent operating
procedures and fair and timely pricing. These relationships ensure the smooth continuity of
operations and are a vital part of our supply chain. BoC’s ecosystem of business partners
are graphically illustrated below;
Growth partners
Suppliers
Sup
po
rt s
ervi
ces/
Out
sour
cing
p
artn
ers
Merchantsandfranchisepartners
• Correspondent banks
• Exchange houses
• State Institutions
• Utility service providers
• Security and other service providers
• Franchise partners
(VISA, Master, Union
Pay CUP)
• Merchants
• Software/ hardware suppliers
• Fixed Asset suppliers
• Material suppliers
Procurement Approach and Governance
The Bank’s procurement processes are governed by the National Procurement Guidelines.
A Central Procurement Committee and an Executive Procurement Committee are in place
to ensure that the relevant guidelines are followed when selecting suppliers. (The process
adopted when selecting suppliers is illustrated alongside).
Supplier Screening
In addition to price and product quality
considerations the Bank’s evaluation
criteria includes social and environmental
considerations. These include compliance
to environmental certifications and Central
Environmental Authority (CEA) regulations,
risks of child labour and forced labour
among others. During the year, we did
not identify any supplier/ operation which
had a significant risk of child/ forced or
compulsory labour.
Request fromuser division
Detailed evaluation by TEC
Final decision by CPC/ EPC
Board approval
Prepare RFP
Call for tender Approved by the
CPC/ EPC
Technical requirements finalised by Technical committee (TEC)

168 Bank of Ceylon | Annual Report 2018
Social and Relationship Capital
Correspondent Banks
With over 758 correspondent relationships,
BoC has the largest correspondent
banking network. Through these
relationships, the Bank facilitates a range
of international transactions including
wire transfers, trade transactions and
acceptance of deposits on behalf of its
clients.
Participation in Industry Forums
As the country’s largest bank, the Bank’s
representatives play an active role
in industry associations and forums,
contributing towards creating a conducive
operating environment and resolving
industry challenges.
Asia Pacific Rural and Agricultural
Credit Association (APRACA)
Association of Banking Sector
Risk Professionals, Sri Lanka
Institute of Bankers of Sri Lanka
International Chamber of
Commerce, Sri Lanka
The National Chamber of
Commerce, Sri Lanka
Sri Lanka Banks Association
(Guarantee) Limited
Sri Lanka Law Library
The Ceylon Chamber of
Commerce
Bio Diversity Sri Lanka
The Financial Ombudsman of
Sri Lanka (Guarantee) Limited
Association of Compliance
Officers of Banks, Sri Lanka
Bar Association of Sri Lanka
Community Engagement
Management Approach
In 2018 the Bank refined its approach to Corporate Social Responsibility (CSR),
implementing a branch-wide CSR evaluation model in which all 10 administrative
provinces were guided to initiate projects that are broadly aligned to the Sustainable
Development Goals. Commencing from 2019, the Bank will engage in long-term, strategic
CSR projects that will drive meaningful change in the communities it operates in. In 2018,
the Bank’s approach to CSR was as follows;
BoC’s approach to CSR
Normal course of business Strategic philanthropy
Infrastructure and
Livelihood development
Driving economic empowerment
through entrepreneurship
support Education Culture
and
Heritage
Environmental Conservation
Social Development
CAPITAL MANAGEMENT REPORTS

169
You’re a Leader Programme
Is an ongoing programme, aimed at
nurturing future leaders BoC partnered
with the Asset Radio Broadcasting (Private)
Limited (Neth FM Radio station) for a
comprehensive leadership development
programme named ‘You are a Leader’.
The Programme was conducted in six
schools across several provinces during
the year. Total programme consist of four
separate segments:
• One-day general programme for
around 300 children from the selected
school
• 2-day special residential workshops for
100 selected students from the same
school
• Separate training programme for
parents
• Special teacher training programme for
all teachers in the school
Beneficiary schools in 2018 were Udawalawa Maha Vidyalaya – Udawalawa, Basthiyan
Silva Maha Vidyalaya – Kekirawa, Akuressa Maha Vidyalaya – Akuressa, Sri Pada
College – Hatton, Badulla Central College- Badulla and Mahinda Rajapaksha College -
Homagama.
Nanajaya Scholarships 2017
The BoC Nana Jaya Scholarships aim
to support high-performing Sri Lankan
youth in pursuing their higher education
through a monthly endowment. In 2018,
562 such scholarships were awarded
to 18+ account holders who obtained
highest markets in the 2016 and 2017
A/L examination in the streams of
Science, Mathematics, Commerce, Arts,
Engineering technology, Bio-technology
and Common. 150 Students who
received island ranks were awarded merit
scholarships worth LKR 48,000 while
the other 412 students were selected
based on their district rank were awarded
scholarships worth LKR 36,000.Conducted similar to the Mahapola Scheme, the Bank has engaged in this initiative since
2003 providing assistance to cover higher educational expenses up to four years (for merit
scholarships) and up to three years (for regular scholarships) to A/L completed students.
To date, the Bank has granted 1,894 such scholarships worth LKR 61.8 million.
Education
6 Programmes 8,421 Beneficiaries
Progress in 2018 562 BeneficiariesTotal funds disbursed:
LKR 22.0 million
Progress in 2018

170 Bank of Ceylon | Annual Report 2018
Social and Relationship Capital
Grade Five Scholarships 2018
Conducted as an ongoing initiative since
2002, the Bank offers 2,000 scholarships
annually to high-performers at the Grade
five scholarship examination. Each eligible
student receives a scholarship worth LKR
15,000, a certificate of recognition, a gold
medal and a valuable gift pack. Meanwhile
students who obtain the top three ranks
at national level are awarded special cash
prizes. Meanwhile all eligible Ran Kekulu
account (RKG) holders who pass the
scholarship examination also receive a
valuable complementary gift pack with a
certificate. The Bank also commenced a
programme to support differently abeled
students through which 25 students
receive a scholarship of LKR 15,000 and a
monthly allowance of LKR 1,000 until he/
she faces O/L examination.
The students who have obtained national 1st, 2nd and 3rd places were specially
recognised via offering LKR 150,000, LKR 100,000 and LKR 75,000 cash prices
respectively. The Bank has being continuing this programme since 2002.
This project aims at developing the aesthetic skills of school children and providing a
platform for the talented students to be recognised and showcase their talents.
Little Picasso Art Competition
BoC in partnership with the Ministry of
Education organised the Little Picasso
art competition for the 2nd successful
year. The exhibition took place at the
Bandaranaike Memorial International
Conference Hall on the 12th and 13th of
October 2018. Over 300,000 students took
part in the competition and 64 schools
were awarded a total of LKR 1.3 million
while the winning students obtained
rewards amounting to LKR 6.5 million.
2,000 Beneficiaries
No. of Schools rewarded 64
CAPITAL MANAGEMENT REPORTS
Progress in 2018
Progress in 2018
Total funds disbursed: LKR 30.0 million
No. of students rewarded 780

171
NaturalCapital
Natural Capital
5%Reduction in
electricity usage
02Green Building
Certified branches
7 millionA4 sheets
saved via digital initiatives
1MWof electricity
transferred to national grid via solar installation
LKR 6.3billion
Green Lending
The Bank’s impact on natural capital is primarily through energy and water usage, materials, waste disposal and generation of emissions as well as through our lending portfolio; as the country’s largest lender, we are cognisant of the role we can play in propagating sustainable businesses through responsible lending practices.
Strategic Priorities in 2018
Reducing dependence
on fossil fuels by
shifting to renewable
energy sources such as
solar power
Engage in organisation-
wide greenhouse gas
assessment
Enhancing employee
engagement towards
environmental
sustainability
• Initiated operationalisation of ESMS
• Awareness creation among employees on sustainability and CSR
• Further expand the solar installation project
• Policy decision to construct all new branches as per the green
building concept
• Total GHG emission 13,255.6 tCO2e
• Renewable energy generated: 885,238 Kwh
• 7 million A4 sheets of paper saved through digital initiatives
• Trincomalee branch awarded the GREENS platinum rating
• 508 Customers screened for environmental criteria
• LKR 6.3 billion green lending
• Introduced employee pledge
• Reduction in energy and water consumption by further
investments on Green Building
• Reach up to 2 MW of total renewable electricity supplied to the
national grid via solar installation
• Continue facilitating environmental sustainability through the
lending portfolio
• Expand our commitment towards improving environmental
conservation via CSR initiatives
Initiatives in 2018
How weperformed in 2018
Priorities for 2019

172 Bank of Ceylon | Annual Report 2018
Management Approach
The Bank’s approach for managing its natural capital impacts is clearly set out in
its Sustainability Policy, which has been aligned to the United Nation’s Sustainable
Development Goals (please refer page 58 to 62 for further details). The approach is
centred on minimising the environmental impact of our direct operations while contributing
towards the preservation of natural resources through responsible lending practices
and supplier evaluations. In minimising the direct environmental footprint, our areas of
focus include increasing reliance on renewable energy, water and paper savings and the
responsible disposal of waste. The Bank has also obtained the ISO 14064 - 1 certification
demonstrating its commitment towards GHG emission management. BoC is the first state
Bank to receive this certification. Compliance to all environmental laws and regulations
are assessed through the support services division and during the year there were no
incidents of non-compliance pertaining to any such regulations.
VERIFICATIONSTATEMENT
This certificate and brand marks (SFG and its associated logos and brand names) remain the property of The Sustainable Future Group (Pvt) Ltd [SFG] , and is bound by the conditions of contract. The certification is maintained and held in force through annual review and verification.
The Sustainable Future Group (Pvt) Ltd is registered in Sri Lanka under company number PV3474 with its registered office at 05, Templer's Road, Mount Lavinia (www.sustainablefuturegroup.com).
SFG is accredited for ISO 14065:2013 and ISO 14066:2011 by the Sri Lanka Accreditation Board, which is a member of the International Accreditation Forum (Accreditation Number GHG 002-01).
has been verified in accordance with ISO14064-3: 2006 as meeting the requirements of
ISO 14064-1:2006CERTIFICATION PERIOD01st April 2019 to 31st March 2021
SCOPE OF THE ASSERTIONOperational Activities (Scope 1 & 2 emissions sources only)
Direct Emissions2,901.73 tonnes of CO2e
Indirect Emissions10,353.83 tonnes of CO2e
Total Direct & Indirect Emissions13,255.57 tonnes of CO2e
STATEMENT NUMBERSFG/GHG/ISO14064/014
Bank of CeylonNAME OF CLIENT
AUTHORISED DIGITAL COPY AUTHORISED DIGITAL COPY
AUTHORISED DIGITAL COPY
AUTHORISED DIGITAL COPY AUTHORISED DIGITAL COPY
AUTHORISED DIGITAL COPY
AUTHORISED DIGITAL COPY AUTHORISED DIGITAL COPY
AUTHORISED DIGITAL COPY
AUTHORISED DIGITAL COPY AUTHORISED DIGITAL COPY
AUTHORISED DIGITAL COPY
AUTHORISED DIGITAL COPY AUTHORISED DIGITAL COPY
AUTHORISED DIGITAL COPY This Statement is not valid without the full verification scope, objectives, criteria and Conclusion available on pages 2 to 6 of this Statement. Page 1 of 6
l Purchased Electricityl Fugitive Emission l Bank Vehiclesl On site Energy
78%
10%
9%
3%
Scope 1 and Scope 2GHG Emissionsource Breakdownof Bank of Ceylon
CAPITAL MANAGEMENT REPORTS
Natural Capital

173
Efficient use of Energy
The Bank’s direct energy consumption
is significant given its extensive branch
reach. Our primary energy sources are
purchased electricity, fuel and renewable
energy generated through our solar-
powered branches. Our approach to
managing energy consumption centers on
reducing dependence on fossil fuel-based
energy sources and inculcating energy-
conscious behaviour among employees.
For instance, the Bank’s employees are
consciously reminded and encouraged to
adopt basic energy saving habits such as
switching off lights and computers when
not in use.
At head office, energy managers have
been assigned to each floor who hold
responsibility for minimising unnecessary
wastage. Notices throughout the Bank’s
network on reducing water and energy
usage serves as a reminder to employees.
Conventional lighting in the Bank’s head
office is gradually being converted to
energy-efficient LED lighting with motion
sensors in its conference rooms and wash
rooms.
The Bank further widened its green
building concept and the solar conversion
project during the year as special initiatives
aimed at reducing the environmental
impacts of its operations.
Solar Power
In 2015, the Bank launched an ambitious
project to convert its branches to solar
power and since then it has made steady
progress in reducing its dependence on
fossil fuels across its network. The first two
branches converted were Tissamaharama
and Kilinochchi following which we
have steadily progressed to converting
27 branches to solar energy by end-
December 2018. Total investment in solar
during 2018 were LKR 146.0 million. This
initiative has resulted in Bank supplying
1 MW electricity to national grid generated
via renewable sources. This conversion
is estimated to have off-set the Bank’s
carbon footprint by 756.8 tCO2e.
Green Buildings
The Bank’s Trincomalee branch was
awarded the GREENS Platinum rating
in 2018 by Green Building Council Sri
Lanka. A special features of this branch
includes vertical green garden that
helps to maintain a comfortable internal
temperature, structures which improves
air quality and green gardens which
are maintained by rain water obtained
through a rain water harvesting system.
The Kekirawa branch was awarded the
GREENS Gold rating in 2017. This branch
was refurbished using environmentally
sustainable materials. There are two other
branches which are under construction
according to the Green Building guidelines.
Several branches built on the principles of
green building use green walls that help
to reduce the thermal impact. The Beliatta
branch relies entirely on solar tubes for its
lighting requirements and does not utilise
artificial lighting of any sort.
Capital Linkages and Trade-offs
Key staff trained on ESMS guidelines
strengthens our human capital
Upholding the employee pledge to the
environment
Stakeholders’ perception of the Bank as
an environmentally conscious corporate
strengthens social and relationship
capital
Investment in green buildings and
renewable energy impact on financial
capital
Resources allocated to develop Natural Capital in 2018
Investment in solar power:
LKR 146.0 million
Investment in green buildings:
LKR 1.5 billion
Expanding the capacity of the
sustainability unit:

174 Bank of Ceylon | Annual Report 2018
Natural Capital
GREENSL® RATING SYSTEMGreen rating system is developed
through an open, consensus-based
process under the supervision of
the Green Environmental Rating and
Life Cycle Assessment Committee
which is composed of a diverse
group of practitioners and experts
representing a cross-section of the
construction industry and addresses
the following aspects for built
environments.
• Management
• Sustainable Sites
• Energy and Atmosphere
• Materials and Resources
• Indoor Environmental Quality
• Innovation and Design Process
• Social and Cultural Awareness
The Bank also strives to reduce its fuel consumption by optimising its vehicle fleet
and suitably timing the purchase and disposal of new vehicles. The use of Document
Management System, video conferencing facilities and training delivered via e learning has
significantly reduced travelling requirements of branch personnel to head office and the
central training institute and thereby contributing towards reducing the fuel usage.
Other Environmental Initiatives
Saving Paper
The Bank’s digitisation strategy and resultant customer thrust towards digital channels
have contributed towards a reduction in its paper consumption. Also many internal
process efficiencies carried out during the year have resulted in significant reduction in
paper use.
A4 sheets saved
7 million
SMART GEN account SMART passbook e-statement
SMART online
banking platforms
Digitalinitiativestowards
reduction in paper saving
Process automation
via DMS
Boardpac for the
Board meeting and
Executive Committee
meetings
CAPITAL MANAGEMENT REPORTS
Waste Disposal
Key types of waste generated by the
Bank’s operations are used paper and
e-waste. Paper savings are encouraged
throughout the organisation and used
paper is collected and disposed through
registered recyclers. E-waste is also
disposed responsibly through third
party recyclers approved by the Central
Environmental Authority. During the year
the Bank has disposal 447 units of
e-waste via such approved recyclers and
have recycled 43,118 Kg’s of waste paper.
Sustainable Lending Practices
Given the breadth and depth of the
Bank’s operations, we believe our most
significant environmental impacts are to be
accrued through our lending portfolio. This
includes direct lending for environmentally-
friendly projects as well as the inclusion
of environmental considerations as
part of our credit appraisal criteria. The
Bank jointly with the Ministry of Finance
offers dedicated credit products for the
installation of solar panels and developing
environmental friendly packing materials
using biodegradable products waste-to-
energy projects and lends to wind power
projects and the construction of green
buildings. During the year, total lending
towards such ‘green’ purposes amounted
to LKR 6.3 billion. The Bank has also
funded two large waste to energy projects
during the year. We also seek to propagate
environmentally friendly business practices
among our clients by encouraging them
to pursue sustainable practices such as
energy conservation, waste management
and recycling.
Environmental Screening
Environmental and Social Management
system (ESMS) of the Bank came into
operationalisation since 2018 and
since then Bank has been screening all
development lending via ADB special credit

175
line based on the ESMS guidelines. However, Bank-wide training has been conducted for
Branch Managers and Credit Officers on the ESMS and the Bank is in the process of full
implementation of ESMS for its entire loan portfolio.
Environmental Assessments of Suppliers
The Bank assesses whether the suppliers adhere to National Environmental Laws and
labour regulations when supplier contracts are offered. Compliance to labour regulations
are also assessed and included to the service contracts of the suppliers of outsource staff.
Green CSR
‘Kumbuk Arana’ Project
‘Kumbuk Arana’ Project is a special project implemented
as a Flood mitigation solution for low elevation areas in
the Sabaragamuwa Province. Under this project Bank
aims to plant 10,000 Kumbuk trees in scientifically
identified locations. The project has wider stakeholder
participation including Forest Department, Agrarian
Department, farmer societies, school children, Survey
Department, Divisional secretariat, etc. The forest
Department is in the process of nurturing 4,000 Kumbuk
plants which to be planted in identified locations early
2019.
Twin Tree Project
This project aims to promote tree planting among the
general public through a concept, linking tree planting
with the child birth. Joining hands with relevance
stakeholders in health sector the Bank has distributed
6,240 trees among new parents in the North western
Province. The project is connected to two base hospitals
in Kurunegala and Puttalam Districts.
Green Net
Green Net CSR project is done in the Southern Province
of the country to connect the entire province through
a ‘Green Net’ by planting trees in identified locations.
So far with the help of school children Bank has
planted 2,394 trees. At present four plant nurseries
are functioning to develop more sapling to be planted.

176 Bank of Ceylon | Annual Report 2018
Natural Capital
CAPITAL MANAGEMENT REPORTS
Environmental Impact Report
Unit 2018 2017 GRI
References
Energy 302
Energy Consumption within the organisation 302-1
Non-renewable sources
Electricity consumed Mwh 21,135 22,325
Fuel consumed Litre 732,101 444,180
Renewable sources Mwh 885 493
Total energy
Water 303
Water withdrawal by source N/A N/A 303-1
Municipal water supplies m3 501,229 489,560
Rainwater harvested directly N/A N/A
Groundwater N/A N/A
Total water m3 501,229 489,560
Emissions 305
Direct CO2 emissions (GHG Scope 1) (Gas, Fuel oil) tCo2e 2,902 N/A 305-1
Indirect CO2 emissions (GHG Scope 2) (Electricity, Steam) tCo2e 10,354 N/A 305-2
GHG emissions intensity ratio tCo2e/Total
employee
1.5 N/A 305-4
CO2 emissons reduced (direct result of reduction initiatives) tCo2e 757 422 305-5
Waste by type and disposal method 306-2
Recycle
Paper Kg 43,118 -
Electronic equipment Units 447 -
Progress in 2018Areas of focus
Lending towards renewable energy
No. of branches converted to Solar power
Lending towards water/ irrigation projects during the year
Ongoing focus towards reducing the Bank’s energy and water footprints
Recycled waste paper
Partnering with customers and suppliers in propagating environmentally - friendly practices
LKR 3.6 billion
27 branches
LKR 4.7 billion
Reduction in Electricity usage 5%
43,118 Kg’s
508 customers screened
under ESMS criteria

FinancialReports
Annual Report of the Directors
on the State of Affairs of Bank of Ceylon • 179
Directors’ Interest in Contracts • 185
Directors’ Statement on Internal Control over
Financial Reporting • 188
Independent Assurance Report • 190
Directors’ Responsibility for Financial Reporting • 191
Report of the Auditor General • 192
Statement of Profit or Loss • 196
Statement of Comprehensive Income • 197
Statement of Financial Position • 198
Statement of Changes in Equity • 200
Statement of Cash Flows • 204
Notes to the Financial Statements • 206


179
ANNUAL REPORT OF THE DIRECTORS ON THE STATE OF AFFAIRS OF BANK OF CEYLON
1. General
The Board of Directors of Bank of
Ceylon take pleasure in presenting
their report on the affairs of the Bank
together with the Audited Consolidated
Financial Statements for the year ended
31 December 2018 of the Bank and
the Group and the Auditor General’s
Report on those Financial Statements,
conforming to the requirements of the
Bank of Ceylon Ordinance No. 53 of 1938
and Banking Act No. 30 of 1988 and
amendments thereto. The Report also
includes certain disclosures laid down
by the Colombo Stock Exchange Listing
Rules and certain disclosures required to
be made under the Banking Act Direction
No. 11 of 2007 on Corporate Governance
for licensed commercial banks issued
by the Central Bank of Sri Lanka and
subsequent amendments thereto. The
Directors reviewed and approved the
Financial Statements on 19 March 2019.
Bank of Ceylon is a licensed commercial
bank under the Banking Act No. 30 of
1988 and amendments thereto and was
duly incorporated on 1 August 1939
under Bank of Ceylon Ordinance No. 53
of 1938. The Bank is wholly owned by the
Government of Sri Lanka. The unsecured
subordinated redeemable debentures
issued by the Bank are listed on the
Colombo Stock Exchange.
2. Review of the Business
2.1 Principal Activities of the Bank
The principal activities of the Bank during
the year were personal banking, corporate
banking, development banking, off-shore
banking, trade financing, lease financing,
primary dealing, investment banking and
treasury operations, correspondence
banking and money remittances, islamic
banking, bancassurance, pawning, credit
card facilities, foreign currency operations
and other financial services.
2.2 Subsidiaries and Associates
The principal activities of subsidiaries and
associates are given under Notes to the
Financial Statements on page 206 and
207. There were no significant changes in
the nature of the principal activities of the
Bank and the Group during the year under
review, other than changes mentioned
under Accounting Policies.
2.3 Changes to the Group Structure
During the year, the structure of the Group
has not undergone any change and, notes
to the Financial Statements No. 30 and 31
on pages from 287 to 294 of this Annual
Report give details about the Group.
2.4 Vision, Mission and Corporate Conduct
The Bank’s Vision and Mission are given
on Inner Front Cover of this Annual
Report. The Bank maintains high ethical
standards in its activities whilst pursuing
the objectives stated under ‘Vision’,
‘Mission’ and ‘Value Statements’.
2.5 Review of the Year’s Performance
The Chairman’s Message on pages 10 to
13 deals with the year’s performance of
the Bank/ Group and on the Sri Lankan
economy. The General Manager’s Review
on pages 14 to 17 provides a detailed
description of the operations of the Bank
during the year under review. The section
titled “Financial Capital” on pages 137
to 141 provides a detailed analysis of
business operations of the Bank. These
reports that provide a fair review of the
Bank’s affairs form an integral part of the
Annual Report.
2.6 Branch Expansion
The Bank extended its services through
the addition of one new local branch and
one new BoC DIGI branch opened during
the period under review. The network was
further expanded enhancing customer
convenience. The Bank installed 12 ATMs,
9 CDMs, 104 CRMs and 150 School
Service Units during the year across the
island bringing out the totals to 776, 163,
118 and 1,373 respectively. This number
does not include peer banks’ ATMs
through which customers of Bank of
Ceylon can transact.
2.7 Corporate Donations
The Bank has not granted donations
for the year 2018 but the Bank has
contributed LKR 107.9 million to facilitate
Corporate Social Responsibility (CSR)
activities during the period under review.
2.8 Directors’ Responsibilities for Financial Reporting
The Directors are responsible for the
preparation of Financial Statements that
will reflect a true and fair view of the
state of affairs. The Directors are of the
view that these Financial Statements
have been prepared in conformity
with the requirements of the Sri Lanka
Accounting Standards, Banking Act No.
30 of 1988 and its amendments, Bank of
Ceylon Ordinance No. 53 of 1938 and its
amendments and the Listing Rules of the
Colombo Stock Exchange. In the case
of subsidiaries, the Financial Statements
are prepared also in accordance with
the provisions of the Companies Act No.
07 of 2007. The Statement of Directors’
Responsibility for Financial Reporting is
given on page 191 of this Annual Report
and forms an integral part of this Report
of the Directors.

180 Bank of Ceylon | Annual Report 2018
ANNUAL REPORT OF THE DIRECTORS ON THE STATE OF AFFAIRS OF BANK OF CEYLON
2.9 Auditor’s Report
The Auditor General is the Auditor of
Bank of Ceylon in terms of the provisions
of Article 154 of the Constitution of the
Democratic Socialist Republic of Sri
Lanka.
Report of the Auditor General on the
Financial Statements of the Bank and
the Consolidated Financial Statements
of the Bank and its subsidiaries as at 31
December 2018 is given on pages 192 to
195 of this Annual Report.
2.10 Accounting Policies
The Group and the Bank prepared their
Financial Statements in accordance with
Sri Lanka Accounting Standards (LKASs)
and Sri Lanka Financial Reporting
Standards (SLFRSs).
The accounting policies adopted in the
preparation of Financial Statements are
given on pages 206 to 392. The Bank
has prepared its Financial Statements
for the year ended 31 December 2018 in
accordance with the SLFRS 9. The net
impact due to the transition to the Bank
is Rs. 7,393.5 million (Group Rs. 8,174.0
million) of which more details are given on
pages 370 to 375 of this Annual Report.
3. Planned Developments
An overview of the developments planned
by the Bank for the future is presented
in the Chairman’s Message on pages 10
to 13 and General Manager’s Review on
pages 14 to 17 of this Annual Report.
4. Total Income
The total income of the Group for the year
2018 was LKR 229,461.6 million as against
LKR 197,013.0 million in the previous year.
The Bank’s total income accounted for
96.4% (2017 – 96.0%) of the total income
of the Group. The main income of the
Group is interest income, which comprises
87.9% of the total income.
5. Dividends and Reserves
5.1 Profit and Appropriations
The Bank has recorded a profit before tax of LKR 31,892.2 million in 2018 reflecting an
increase of 5.1%, compared to LKR 30,343.0 million recorded for the previous year.
After deducting LKR 12,413.4 million (2017 – LKR 9,030.7 million) for income tax, the
profit after tax (PAT) for the year 2018 amounted to LKR 19,478.7 million, which is a 8.6%
decrease compared to LKR 21,312.3 million PAT reported in 2017.
The decrease is due to interest income earned from Sri Lanka Development Bond
investment is taxed at normal tax rate with effect from 1 April 2018. The total Impact on
PAT was approximately LKR 1,479 million.
Details of the profit relating to the Bank and the Group are given in the table below:
Bank Group
For the year ended 31 December 2018 2017 2018 2017
LKR million LKR million LKR million LKR million
Profit for the year after payment of all
expenses, providing for depreciation,
amortisation, impairment on loans and
other losses, contingencies and before
taxes 41,480 37,592 42,246 38,195
Taxes on financial services (9,588) (7,249) (9,818) (7,431)
Share of profits/ (losses) of associate
companies net of tax - - 9 52
Profit before income tax 31,892 30,343 32,437 30,816
Income tax expense (12,413) (9,031) (12,922) (9,329)
Profit for the year 19,479 21,312 19,515 21,487
Other comprehensive income for the
year, net of tax (1,952) 4,340 (1,669) 4,833
Total comprehensive income for the year 17,527 25,652 17,846 26,320
Appropriations
Transfers to permanent reserve fund (2,463) (2,431) (2,463) (2,431)
Transfers to statutory reserve – Other - - - (22)
Dividends (4,846) (12,346) (4,846) (12,346)
The profit before tax of the Group also increased from LKR 30,815.6 million to LKR
32,437.2 million, an increase of 5.3% in comparison to the previous year. After deducting
LKR 12,922.0 million for income tax (2017 – LKR 9,328.9 million) the profit after tax for the
year of the Group is LKR 19,515.2 million in (2017- LKR 21,486.6 million.)
5.2 Dividends
The Bank pays dividends to its sole shareholder the Government of Sri Lanka, as per
the Dividend Policy of the Bank in consultation with the Government, prudently based
on profits after deduction of tax, loan loss provision and any such portion for reserves.
Accordingly, a sum of LKR 4,846.4 million has been paid out by the Bank as dividends
for the year 2018 (2017 – LKR 12,346.4 million).

181
5.3 Reserves
The total reserves of the Group stood at LKR 106,445.5 million as at 31 December 2018
(2017 – LKR 101,399.1 million). The Group reserves consist of the following:
As at 31 December 2018 2017
LKR million LKR million
Permanent reserve fund 12,890 10,427
Revaluation reserve 18,747 18,681
Free reserve 367 367
Exchange translation reserve 3,157 1,703
Available-for-sale reserve - 4,761
FVTOCI reserve 2,474 -
Statutory reserve 359 359
Retained earnings 68,452 65,101
Total 106,446 101,399
6. Property, Plant and Equipment
The total capital expenditure incurred by the Group on the acquisition of Property, Plant
and Equipment, leasehold properties and intangible assets during the year amounted to
LKR 4,360.3 million (2017 – LKR 3,963.8 million) the details of which are given in Notes
33 to 35 of Financial Statements on pages 297 to 315 of this Annual Report.
7. Value of Freehold Properties
The value of freehold properties owned by the Group as at 31 December 2018 is
included in Note 33 of the Financial Statements at LKR 21,655.1 million (2017 – LKR
21,470.2 million).
8. Stated Capital and Shareholding
8.1 Stated Capital
The total issued and fully paid up capital of the Bank as at 31 December 2018 was LKR
20,000 million (2017 – LKR 15,000 million).
During the year 2018, the Bank received LKR 5,000 million from the Government of Sri
Lanka, the second phase of the total amount of LKR 10,000 million allocated to the Bank
under National Budget 2018. This allocation is reported under capital pending allotment
as at 31 December 2018. The Bank is making arrangements to issue five million ordinary
shares at LKR 1,000 each to the Government of Sri Lanka and thereby will transfer the
capital pending allotment to the share capital during the year 2019.
8.2 Shareholding
The Government of Sri Lanka is the sole shareholder of the Bank.
9. Issue of Subordinated Debentures
The Group issued unlisted unsecured
subordinated redeemable debentures
with non-viability write-down features,
amounting to LKR 12,000 million during
the year ended 31 December 2018 (2017
– LKR 10,000 million). The proceeds of
these debentures were utilised to expand
the Bank’s loan book in the ordinary
course of business. This would enable
the Bank to achieve the following, on
allotment:
� Increase the Tier 2 capital of the
Bank in order to enhance the Capital
Adequacy Ratio and Single Borrower
Limit to facilitate expansion of the loan
book.
� Minimise and manage the gap
exposure in the Bank’s assets and
liability portfolios.
� Strengthen the Bank’s liquidity
position and to increase the asset
base.
The details of debentures outstanding
as at the date of Statement of Financial
Position are given in Note 48 of the
Financial Statements on pages 335 to 337.
10. Share Information
The basic earnings per share and net
assets value per share of the Group
were LKR 1,047.68 and LKR 6,574.13
respectively, for the period under review.
11. Corporate Sustainability and Responsibility
The programmes carried out
under Corporate Sustainability and
Responsibility (CSR) are detailed on
pages 58 to 62 under the section titled
‘Sustainability at BoC’.

182 Bank of Ceylon | Annual Report 2018
12. Directors
Details of Directors who held the office
during the year 2018 and Directors who
are holding the office as of the sign-off
date of this Annual Report is given in
the table below. As at year end date, viz
31 December 2018 there was no Board
due to the change of Government that
took place (The Government being the
major shareholder, appoints the Directors
through the Ministry in charge of the
Bank). However, a Board was appointed
during February 2019 and as of the
Annual Report sign-off date, the number
of Directors holding office is four (4).
During the year 2018 the Board consisted
of the following members-
12.1 List of Directors
Mr Ronald C Perera, PCIndependent Non-Executive
Director/ Chairman
(Resigned w.e.f. 18 November 2018 and
Re-appointed w.e.f. 12 February 2019 and
assumed duties on 14 February 2019)
Mr Sajith R AttygalleNon-Executive Ex-officio Director
(Ceased to be a Director w.e.f. 25
November 2018)
Mr Ranel T WijesinhaIndependent Non-Executive Director
(Resigned w.e.f. 31 July 2018)
Mr H P Ajith GunawardanaIndependent Non-Executive Director
(Resigned w.e.f. 20 July 2018)
Mr Samantha RajapaksaIndependent Non-Executive Director
(Resigned w.e.f. 25 November 2018)
Mr Mohan WijesingheIndependent Non-Executive Director
(Resigned w.e.f. 02 July 2018)
Mr Neil A UmagiliyaIndependent Non-Executive
Director/Chairman
(Appointed w.e.f. 19 November 2018 and Resigned w.e.f. 20 December 2018)
Ms M T I V AmarasekereNon-Executive Ex-Officio Director
(Appointed w.e.f. 26 November 2018 and Ceased to be a Director w.e.f. 27 February 2019)
Mr P Lalith P WithanaIndependent Non-Executive Director
(Appointed w.e.f. 26 November 2018 and Resigned w.e.f. 20 December 2018)
Mr H I BalapatabendiIndependent Non-Executive Director
(Appointed w.e.f. 26 November 2018 and Resigned w.e.f. 20 December 2018)
Ms A V K M HerathIndependent Non-Executive Director
(Appointed w.e.f. 26 November 2018 and Resigned w.e.f. 20 December 2018)
Mr G H WijayawardhanaIndependent Non-Executive Director
(Appointed w.e.f. 26 November 2018 and Resigned w.e.f. 20 December 2018)
The Board Composition as of the date of Financial Statement sign-off is as follows;
Name of the Director Executive/Non-Executive Status Status of Independence
Mr Ronald C Perera Non-Executive Independent
Mr K A Vimalenthirarajah Non-Executive Ex-officio Non-Independent
Mr D W K Mayadunne Non-Executive Independent
Mr Prakash Anand Schaffter Non-Executive Independent
The Directors are classified as Independent Directors on the basis given in Banking Act
Direction No. 11 of 2007 on Corporate Governance for licensed commercial banks issued
by the Central Bank of Sri Lanka.
12.2 Board Subcommittees
The Board has formed five subcommittees complying with the aforesaid Banking Act
Direction No. 11 of 2007 to ensure oversight control over affairs of the Bank. During the
year a new Board subcommittee named “Information and Communication Technology
Committee” was formed to oversee the information technology aspect of the Bank. The
subcommittee composition is given under Subcommittee Reports on pages 89 to 101 of
this Annual Report.
ANNUAL REPORT OF THE DIRECTORS ON THE STATE OF AFFAIRS OF BANK OF CEYLON

183
12.3 Directors’ Meetings
Attendance of Directors at Board and
subcommittee meetings are given on
page 86 of this Annual Report.
12.4 Directors’ Interests in Contracts
Directors’ interests in contracts with the
Bank, both direct and indirect are given
on pages 185 to 187. These interests have
been declared at meetings of the Board
of Directors. Except for the contracts
given therein the Directors do not have
any direct or indirect interest in other
contracts or proposed contracts with the
Bank.
12.5 Directors’ Interests in Debentures Issued by the Bank/Group
There were no debentures registered in
the name of any Director.
12.6 Directors’ Allowances/ Fees
The allowances/ fees payable to the
Board of Directors are made in terms
of the provisions/ contents in the Public
Enterprises Circular No. PED 3/2015 dated
17 June 2015, issued by the Department
of Public Enterprises of the Ministry of
Finance and Bank of Ceylon Ordinance
No. 53 of 1938 and its amendments. The
Directors’ remuneration in respect of the
Group and the Bank for the financial year
ended 31 December 2018 are given in
Note 16 on page 236.
13. Risk Management and System of Internal Controls
13.1 Risk Management
The Board of Directors assumes overall
responsibility for managing risks. The
specific measures taken by the Bank in
mitigating the risks are detailed on pages
102 to 118 of this Annual Report.
13.2 Internal Control
The Board of Directors has ensured
the implementation of an effective
and comprehensive system of internal
controls in the Bank through the Audit
Committee. The Audit Committee helps
the Board of Directors to discharge their
fiduciary responsibilities. The Report of
the Chairman of the Audit Committee
is contained on pages 89 to 92 of this
Annual Report. The Directors are satisfied
with the effectiveness of the system of
internal controls during the year under
review and up to the date of the Annual
Report and the Financial Statements.
The Board has issued a statement on the
internal control mechanism of the Bank
as per Direction No. 3 (8) (ii) (b) of Banking
Act Direction No. 11 of 2007 on Corporate
Governance for licensed commercial
banks. The above report is given on pages
188 and 189 of this Annual Report. The
Board has confirmed that the financial
reporting system has been designed to
provide reasonable assurance regarding
the reliability of financial reporting
and that the preparation of Financial
Statements for external reporting
purposes has been done in accordance
with relevant accounting principles and
regulatory requirements.
The Board has obtained an Assurance
Report from the Auditor General on
Directors’ Statement on Internal Control
and it is given on page 190 of this Annual
Report.
14. Corporate Governance
The Board of Directors is committed
towards maintaining an effective
corporate governance structure and
process. The financial, operational and
compliance functions of the Bank are
directed and controlled effectively within
corporate governance practices. These
procedures and practices that are in
conformity with Corporate Governance
Directions issued by the Central Bank of
Sri Lanka under Banking Act Direction No.
11 of 2007 and the Code of Best Practice
on Corporate Governance issued by the
Institute of Chartered Accountants of Sri
Lanka, are described in the section titled
“Corporate Governance” appearing on
pages 71 to 88 of this Annual Report. The
Board has obtained a report from the
Auditor General on the compliance with
the provisions of the above mentioned
Direction No. 11 of 2007.
15. Human Resources
One of the most valuable assets of the
Bank is its employees and it is important
for the Bank to develop them. Several
measures were taken to strengthen the
much valued human capital in order to
optimise their contribution towards the
achievement of corporate objectives. The
Bank’s human resource management
policies and practices are detailed in the
section titled “Human Capital” on pages
147 to 155 of this Report.
16. Compliance with Laws and Regulations
The Directors, to the best of their
knowledge and belief confirm that the
Group has not engaged in any activities
contravening the laws and regulations
Details of the Bank’s compliance with
laws and regulations are given on
pages 394 to 447 under the section
titled “Compliance Annexes” which
forms an integral part of this Report.
Further, the Bank has complied with
the Transfer Pricing Regulations issued
by the Department of Inland Revenue
and the Directors certify that the Bank
has complied with the Transfer Pricing
Regulations issued under Section 104 of

184 Bank of Ceylon | Annual Report 2018
the Inland Revenue Act No. 10 of 2006.
Certificate of the Directors on Transfer
Pricing is given in page 448.
17. Outstanding Litigation
In the opinion of the Directors and as
confirmed by the Bank’s lawyers the
litigation currently pending against the
Bank will not have a material impact on
the reported financial results or future
operations of the Bank.
18. Statutory Payments
The Board confirms that all statutory
payments due to the Government and in
relation to employees have been made on
time.
19. Environmental Protection
The Bank has not engaged in any activity,
which has caused detriment to the
environment. Further, precautions taken
to protect the environment are given in the
section titled “Natural Capital” on pages
171 to 176.
ANNUAL REPORT OF THE DIRECTORS ON THE STATE OF AFFAIRS OF BANK OF CEYLON
20. Post-Balance Sheet Events
The Directors are of the view that no
material events have arisen in the interval
between the end of the financial year and
the date of this Report that would require
adjustments or disclosures.
21. Going Concern
The Directors are confident that the
resources of the Bank are adequate to
continue its operations. Therefore, it
has applied the going concern basis in
preparing the Financial Statements.
By order of the Board,
Janaki Senanayake SiriwardaneSecretary
Bank of Ceylon/ Secretary to the Board
19 March 2019
Colombo.

185
DIRECTORS’ INTEREST IN CONTRACTS
Related party disclosures as required by the the Sri Lanka Accounting Standard - LKAS 24 on “Related Party Disclosures” are detailed
in Note 59 to the Financial Statements on pages 351 to 357.
In addition, the transactions that have been carried out in the ordinary course of business in an arm's length basis with entities where
the Chaiman or a Director of the Bank is the Chaiman or a Director of such entities, are detailed below:
As at the year end date, 31 December 2018, there was no Board. However, a Director Board was appointed during February 2019 and
for the better disclosure purpose, Directors' interest in contracts are disclosed as follows,
- for the Directors who held the office during the year 2018, interest in contracts have been shown as of the year end 2018/ resigned date.
- for the current Directors, interest in contracts have been shown as of sign-off date of these Financial Statements.
Company Relationship Nature of Transactions Limit
’000
Balance/ Amount
outstanding ’000**
Balance/ Amount outstanding as at
31.12.2017 ’000
Directors' Interest In Contracts - Current Board
Mr Ronald C Perera PC
(Mr Ronald C Perera resigned during 2018 and re-appointed
as the Chairman of Bank of Ceylon w.e.f. 12 February 2019)
**(Exposures as at 31 December 2018)
Bank of Ceylon (UK) Limited Chairman Current accounts USD 602 USD 4,881
(Nostro accounts) *110,015 *746,084
GBP 66 GBP 232
*15,303 *47,684
EURO 687 EURO 1,017
*143,578 *185,588
Placements USD 8,000 USD 8,000
*1,461,999 *1,222,838
GBP 127,900 GBP 55,300
*29,665,393 *11,366,152
EURO 1,000 EURO 1,000
*208,993 *182,486
Hotels Colombo (1963) Limited Acting Savings accounts - 6,046
Chairman Current accounts 5,338 12,563
Time deposits 166,896 152,278
Loans - 5,243
Other receivables 81,126 47,050
Mr Prakash Anand Schaffter
(Mr Prakash Anand Schaffter appointed as a Director of
Bank of Ceylon w.e.f. 26 February 2019)
**(Exposures as at 19 March 2019)
Janashakthi Insurance PLC Chairman Current accounts 12
Janashakthi PLC Director Current accounts 4,544
Loans 107,604

186 Bank of Ceylon | Annual Report 2018
Company Relationship Nature of Transactions Limit
’000
Balance/ Amount
outstanding ’000**
Balance/ Amount outstanding as at
31.12.2017 ’000
Orient Finance PLC Director Overdrafts 50,000 10,941
Loans 794,222
Pan Nippon Development (Private) Ltd Director Current accounts 47
Directors' Interest In Contracts - Previous Boards
Mr Ranel T Wijesinha
(Mr Ranel T Wijesinghe resigned on 31 July 2018)
**(Exposures as at 31 December 2018)
Koladeniya Hydropower (Private) Limited Director Current accounts 1,271 2,551
Time Deposits 221,715 237,165
Repo 5,020 6,103
Mr H P Ajith Gunawardana
(Mr H P Ajith Gunawardana resigned on 20 July 2018)
**(Exposures as at 31 December 2018)
Lanka Securities (Private) Limited Director Current accounts 9,902 10,835
Time Deposits 233,334 231,400
Overdrafts 50,000 - -
Repo 26,005 77,037
Mr Samantha Rajapaksa
(Mr Samantha Rajapaksha resigned on 25 November 2018)
Associated Motorways (Private) Limited Director Savings accounts 71,849
(As at the date of retirement, Mr Samantha Rajapaksha was Savings accounts USD 3,306
not a Director of Associated Motorways (Private) Limited) *505,274
Current accounts 119,592
Time Deposits USD 156
*23,904
Shipping Guarantee 250,000 20,709
Letter of Credit 1,000,000 822,239
Hypothecation Loan 200,000 -
Acceptance 9,960
Letter of Guarantee 100,000 36,267
Export Collections 15,124
Import Bills 234
Associated Autoways (Private) Limited Director Current accounts 1,946
(As at the date of retirement, Mr Samantha Rajapaksha was Letter of guarantee 1,000 -
not a Director of Associated Autoways (Private) Limited) Shipping guarantee 6,000 -
Letter of credit 6,000 -
Hypothecation loan 8,000 -
DIRECTORS’ INTEREST IN CONTRACTS

187
Company Relationship Nature of Transactions Limit
’000
Balance/ Amount
outstanding ’000**
Balance/ Amount outstanding as at
31.12.2017 ’000
Associated Motor (Lanka) Company Limited Director Current accounts 249
(As at the date of retirement, Mr Samantha Rajapaksha was Letter of credit 90,000 -
not a Director of Associated Motor (Lanka) Company Limited) Shipping guarantee 120,000 -
Hypothecation loan 19,975 -
Letter of guarantee 5,000 -
AMW Capital Leasing and Finance PLC Director Savings accounts 4,700
(As at the date of retirement, Mr Samantha Rajapaksha was Current accounts 15,523
not a Director of AMW Capital Leasing and Finance PLC)
**(Exposures as at 30 November 2018)National Apprentice and Industrial Training Authority Director Current accounts 9
Mr. Mohan Wijesinghe
(Mr Mohan Wijesinghe resigned on 2 July 2018)
Lanka Hospitals PLC Director Savings accounts USD 235
(As at the date of retirement, Mr Mohan Wijesinghe was *35,944
not a Director of Lanka Hospitals PLC) Current accounts 53,555
Time deposits USD 6,301
*963,159
**(Exposures as at 31 July 2018)Maga Naguma Consultancy and Project Director Current accounts
2,172
2,864
Management Services Company (Pvt) Limited
Mr.G H Wijayawardhana
(Mr G H Wijayawardhana resigned on 20 December 2018)
**(Exposures as at 31 December 2018)
LK Domain Registry Director Current accounts 122
Time Deposits 70,000
* LKR equivalent amount
Note: Currencies not specifically mentioned are in LKR

188 Bank of Ceylon | Annual Report 2018
DIRECTORS’ STATEMENT ON INTERNAL CONTROL OVER FINANCIAL REPORTING
ResponsibilityIn line with the Banking Act Direction No.
11 of 2007, section 3(8)(ii)(b), the Board of
Directors presents this report on Internal
Control over Financial Reporting.
The Board of Directors (“Board”) is
responsible for the adequacy and
effectiveness of the internal control
mechanism in place at Bank of Ceylon,
(“the Bank”). In considering such
adequacy and effectiveness, the Board
recognises that the business of banking
requires reward to be balanced with risk
on a managed basis and as such the
internal control systems are primarily
designed with a view to highlighting any
deviations from the limits and indicators
which comprise the risk appetite of the
Bank. In this light, the system of internal
controls can only provide reasonable, but
not absolute assurance, against material
misstatement of financial information
and records or against financial losses or
fraud.
The Board has established an ongoing
process for identifying, evaluating and
managing the significant risks faced
by the Bank and this process includes
enhancing the system of internal control
over financial reporting as and when there
are changes to business environment
or regulatory guidelines. The process
is regularly reviewed by the Board and
is in accordance with the guidance for
Directors of banks on the directors’
statement on internal control issued by
the Institute of Chartered Accountants of
Sri Lanka. The Board has assessed the
internal control over financial reporting
taking into account principles for the
assessment of internal control system as
given in that guidance.
The Board is of the view that the system
of internal controls over financial reporting
in place is sound and adequate to provide
reasonable assurance regarding the
reliability of financial reporting, and that
the preparation of Financial Statements
for external purposes is in accordance
with relevant accounting principles and
regulatory requirements.
The management assists the Board in the
implementation of the Board’s policies
and procedures on risk and control
by identifying and assessing the risks
faced, and in the design, operation and
monitoring of suitable internal controls to
mitigate and control these risks.
Key features of the process adopted in
reviewing the design and effectiveness of
the internal control system over financial
reporting
The key processes that have been
established in reviewing the adequacy
and integrity of the system of internal
controls with respect to financial reporting
include the following:
• Various committees are established
by the Board to assist the Board in
ensuring the effectiveness of bank’s
daily operations and that the Bank’s
operations are in accordance with
the corporate objectives, strategies
and the annual budget as well as the
policies and business directions that
have been approved.
• The Internal Audit Division of the
Bank checks for compliance with
policies and procedures and the
effectiveness of the internal control
systems on an ongoing basis using
samples and rotational procedures
and highlights significant findings
in respect of any noncompliance.
Audits are carried out on all units and
branches, the frequency of which
is determined by the level of risk
assessed, to provide an independent
and objective report. The annual
audit plan is reviewed and approved
by the Board Audit Committee.
Findings of the Internal Audit Division
are submitted to the Board Audit
Committee for review at their periodic
meetings.
• The Board Audit Committee of
the Bank reviews internal control
issues identified by the Internal
Audit Division, the external auditors,
regulatory authorities and the
management, and evaluates the
adequacy and effectiveness of
the risk management and internal
control systems. They also review the
internal audit functions with particular
emphasis on the scope of audits and
quality of the same. All minutes of
the Board Audit Committee meetings
are forwarded to the Board. Further
details of the activities undertaken
by the Audit Committee of the Bank
are set out in the Audit Committee
Report on pages 89 to 92.
• In assessing the internal control
system over financial reporting,
identified officers of the Bank collated
all procedures and controls that are
connected with significant accounts
and disclosures of the Financial
Statements of the Bank. These in turn
were observed and checked by the
Internal Audit Division for suitability
of design and effectiveness on an
ongoing basis.
• The Bank adopted the new Sri Lanka
Accounting Standards comprising
LKAS and SLFRS in 2012. The
processes and procedures initially
applied to adopt the aforementioned
accounting standards were further
strengthened during the subsequent
years based on the feedback
received from internal and external
auditors, regulators and the Board
Audit Committee.

189
• The Bank adopted the Sri Lanka
Accounting Standard – SLFRS
9 on ‘Financial Instruments’ with
effect from 1 January 2018 for the
calculation of impairment of loans
and advances. The transition from
previously used LKAS 39 (Financial
Instruments – Recognition and
Measurement) to SLFRS 9 was
carefully monitored, in particular the
introduction of a forward looking
expected credit loss model rather than
the incurred loss model used under
LKAS 39. A consultant (Messrs. Ernst
& Young) was appointed to facilitate
the transition whereas the inputs of
the external auditors, regulators and
the Board Audit Committee were also
considered.
• The preliminary assessment of Day 1
impact from the application of
SLFRS 9 has been calculated and
necessary procedural changes have
been made in order to successfully
adopt the SLFRS 9. A steering
committee composing various
disciplines of the Bank monitored
and coordinated the entire transition
process.
• The Bank is continuously updating
procedures inter-alia relating to
impairment of loans and advances
of the Bank and foreign branches,
financial statement disclosures,
risk management, related party
transactions and all other significant
banking activities based on the
changing regulatory and market
conditions. The Bank has taken
initiatives to introduce an automated
financial reporting process in order
to comply with the requirements
of recognition, measurement,
classification and disclosure of the
financial instruments more effectively
and efficiently and to facilitate the
“Financial Statement Closure”
process. The assessment did not
include subsidiaries of the Bank.
• The comments made by the
external auditors in connection
with internal control system over
financial reporting in previous years
were reviewed during the year and
appropriate steps have been taken to
rectify them. The recommendations
made by the external auditors in 2018
in connection with the internal control
system over financial reporting will be
addressed in the future.
ConfirmationBased on the above processes, the Board
confirms that the financial reporting
system of the Bank has been designed to
provide a reasonable assurance regarding
the reliability of financial reporting and
the preparation of financial statements
for external purposes and has been done
in accordance with Sri Lanka Accounting
Standards and regulatory requirements of
Central Bank of Sri Lanka.
By order of the Board,
Chairman
Audit Committee
Chairman
Director
Colombo, Sri Lanka
27 March 2019

190 Bank of Ceylon | Annual Report 2018
INDEPENDENT ASSURANCE REPORT
Independent Assurance Report of the Auditor General to the Board of Directors on the Directors’ Statement on Internal Control of Bank of Ceylon.
Introduction
This report is to provide assurance on the
Directors’ Statement on Internal Control
over Financial Reporting (“Statement”)
of Bank of Ceylon included in the annual
report for the year ended 31 December
2018.
Management’s Responsibility
Management is responsible for the
preparation and presentation of the
Statement in accordance with the
“Guidance for Directors of Banks on the
Directors’ Statement on Internal Control”
issued in compliance with section 3(8)
(ii)(b) of the Banking Act Direction No.
11 of 2007, by the Institute of Chartered
Accountants of Sri Lanka.
My Responsibility and Compliance with SLSAE 3050
My responsibility is to issue a report to
the Board of Directors on the Statement
based on the work performed.
I conducted my engagement in
accordance with Sri Lanka Standard on
Assurance Engagements SLSAE 3050 –
Assurance Report for Banks on Directors’
Statement on Internal Control issued by
the Institute of Chartered Accountants of
Sri Lanka.
Summary of work performed
My engagement has been conducted
to assess whether the Statement
is supported by the documentation
prepared by or for Directors; and
appropriately reflected the process the
Directors have adopted in reviewing the
system of internal control over financial
reporting of the Bank.
The procedures performed were limited
primarily to inquiries of bank personnel
and the existence of documentation on a
sample basis that supported the process
adopted by the Board of Directors.
SLSAE 3050 does not require me to
consider whether the Statement covers
all risks and controls or to form an opinion
on the effectiveness of the Bank’s risk
and control procedures. SLSAE 3050
also does not require me to consider
whether the processes described to deal
with material internal control aspects of
any significant problems disclosed in the
annual report will, in fact, remedy the
problems.
Conclusion
Based on the procedures performed,
nothing has come to my attention
that causes me to believe that the
Statement included in the annual report
is inconsistent with my understanding
of the process the Board of Directors
has adopted in the review of the design
and effectiveness of internal control over
financial reporting of the Bank.
H M Gamini Wijesinghe
Auditor General
The Chairman
Bank of Ceylon

191
DIRECTORS’ RESPONSIBILITY FOR FINANCIAL REPORTING
Directors’ Responsibility for Financial ReportingThis Statement by the Board of Directors is made especially to distinguish the respective responsibilities of the Directors and Auditors in relation to financial reporting. The responsibility of Directors in relation to financial reporting of the Bank of Ceylon and the Group is set out in the following statement.
Financial StatementsIn terms of the provisions of Bank of Ceylon Ordinance No. 53 of 1938 and its amendments read with the Banking Act No. 30 of 1988 and its amendments and Directions, the Directors of the Bank are responsible for ensuring that the Bank maintains proper books of accounts, which disclose with reasonable accuracy at any time, the financial position of the Bank and prepares proper Financial Statements for each financial year, giving a true and fair view of the state of affairs of the Bank.
The Directors affirm that in preparing the Financial Statements for the year 2018 presented in this Annual Report, the most appropriate accounting policies have been used and applied consistently supported by judgments and estimates that are reasonable and prudent. Material departures, if any, have been disclosed and explained.
The Financial Statements for the year 2018 presented in this Annual Report, are in conformity with the requirements of the Bank of Ceylon Ordinance No. 53 of 1938 and its amendments, Banking Act No. 30 of 1988 and its amendments and Directions issued under it, the Sri Lanka Accounting Standards and other regulatory requirements. These Financial Statements reflect a true and fair view of the state of affairs of the Bank of Ceylon and the Group as at 31 December 2018.
Going ConcernThe Directors are of the view that the Bank and the Group have adequate resources to continue in business in
the foreseeable future. Accordingly, they have continued to adopt the going concern basis in preparing the Financial Statements.
Internal Controls, Risk Management and ComplianceThe Directors are also responsible for the system of internal financial controls and risk management and place considerable importance on maintaining a strong control environment to protect and safeguard the Bank’s assets and prevent fraud and mismanagement. Whilst inherent and residual risks cannot be completely eliminated, the Bank endeavours to minimise them by ensuring that appropriate infrastructure, controls, systems and ethical behaviour are applied and practiced within predetermined procedures and limits/ boundaries.
A report by the Directors on the Bank’s internal control mechanism, confirming that the financial reporting system has been designed to provide reasonable assurance regarding the reliability of financial reporting, is given on page 188 and 189 of this Annual Report.
The Directors and Management have put in place, risk management policies and guidelines. Management committees have been established to monitor and manage material risks. Arrangements are in place to ensure that reports on risk are submitted to the Integrated Risk Management Committee on a quarterly basis for discussion. Compliance with applicable laws, regulations, rules, directives and guidelines are monitored by the Independent Integrated Risk Management Division and reported to the Board.
The Audit Committee and Integrated Risk Management Committee, on an ongoing basis, have acted to strengthen the effectiveness of internal controls and risk management procedures. The reports of the Audit Committee and Integrated Risk Management Committee are included on page 89 to 95 respectively of this Annual Report.
Audit ReportPursuant to provisions of Article 154 of the Constitution of the Democratic Socialist Republic of Sri Lanka, the Auditor General is the Auditor of the Bank and issues the final opinion on the Financial Statements of the Bank. The responsibilities of the Auditor in relation to the Financial Statements are set out in the Report of the Auditor General on pages 192 to 195 of this Annual Report. The Auditor General’s certification on the effectiveness of the Bank’s internal control mechanism is given on page 190 of this Annual Report.
ComplianceThe Directors to the best of their knowledge and belief, are satisfied that all statutory payments, in relation to all relevant regulatory and statutory authorities, which were due and payable by the Bank and its subsidiaries as at the Statement of Financial Position date, have been paid or where relevant provided for.
The Directors are of the view that they have discharged their responsibilities as set out in this statement.
By order of the Board,
Janaki Senanayake SiriwardaneSecretary – Bank of Ceylon/Secretary to
the Board
19 March 2019
Colombo

192 Bank of Ceylon | Annual Report 2018
REPORT OF THE AUDITOR GENERAL
Report of the Auditor General on the
Financial Statements and Other Legal and
Regulatory Requirements of the Bank of
Ceylon and its subsidiaries for the year
ended 31 December 2018 in terms of
Section 12 of the National Audit Act, No. 19
of 2018.
1. Financial Statements
1.1 Opinion
The audit of the Financial Statements of
the Bank of Ceylon (the “Bank”) and the
Consolidated Financial Statements of
the Bank and its subsidiaries (“Group”)
for the year ended 31 December 2018
comprising the statement of financial
position as at 31 December 2018 and
the statement of profit or loss, statement
of comprehensive income, statement of
changes in equity and statement of cash
flow for the year then ended, and notes
to the Financial Statements, including
a summary of significant accounting
policies, was carried out under my
direction in pursuance of provisions in
Article 154(1) of the Constitution of the
Democratic Socialist Republic of Sri
Lanka read in conjunction with provisions
of the National Audit Act No. 19 of 2018.
The Bank has been exempted from
the provisions of Part II of the Finance
Act, No. 38 of 1971 by an Order of then
Minister of Finance published in the
Government Gazette
No. 715 of 14 May 1992 by virtue of
powers vested in him by Sections 5(1)
of the said Finance Act. My report to
Parliament in pursuance of provisions in
Article 154 (6) of the Constitution will be
tabled in due course.
In my opinion, the accompanying Financial
Statements of the Bank and the Group
give a true and fair view of the financial
position of the Bank and the Group as at
31 December 2018, and of their financial
performance and their cash flows for the
year then ended in accordance with Sri
Lanka Accounting Standards.
1.2 Basis for Opinion
I conducted my audit in accordance with
Sri Lanka Auditing Standards (SLAuSs).
My responsibilities, under those standards
are further described in the Auditor’s
Responsibilities for the Audit of the
Financial Statements section of my report.
I believe that the audit evidence I have
obtained is sufficient and appropriate to
provide a basis for my opinion.
1.3 Key Audit Matters
Key audit matters are those matters
that, in my professional judgment, were
of most significance in my audit of the
Financial Statements of the Bank and
the Consolidated Financial Statements
of the Group of the current period. These
matters were addressed in the context of
my audit of the Financial Statements of
the Bank and the Consolidated Financial
Statements of the Group as a whole, and
in forming my audit opinion thereon, and
I do not provide a separate opinion on
these matters.
The Chairman
Bank of Ceylon

193
Key Audit Matter How my audit addressed the key audit matter
a. Bank's Complex Information Technology related applications, controls and impact of those on the financial reporting process
Bank's operations have been automated using complex and multiple IT Systems and applications. Such IT infrastructure has provided platform for various internal and external reporting in terms of providing required information. Impact of IT over the financial reporting process considered to be high. As a result, preparation of Financial Statements inclusive of required disclosures are heavily dependent on the output of such IT applications. Ensuring the integrity of information generated through these applications is significant, since it provides the platform for the purpose of audit.
My audit procedures on this area included the following among the others,
• I have identified the main business processes in the bank and the key manual and automated controls exerted on such processes, which would have an impact on the financial reporting process.
• I have involved specialists to obtain comfort over the Information Technology general computer controls and to understand and evaluate design and operating effectiveness of such other automated IT application controls. This includes performing walkthroughs, test of controls, test checking of reports generating functionalities and other required validation checks.
Therefore, I considered automated and manual controls surrounding the preparation and presentation of Financial Statements as a significant area of my audit and accordingly considered as key audit matter.
• Based on the outcome of the above procedures we have also performed additional substantive audit procedures wherever necessary.
b. Impairment allowance for loans and advances including Group’s transition to SLFRS 9:
My audit considered impairment allowance for loans and advances as a key audit matter. The materiality of the reported amounts for loans and advances (and impairment allowance thereof), the subjectivity associated with management’s impairment estimation and transition to Sri Lanka Financial Reporting Standard 9: Financial Instruments (SLFRS 9) underpinned my basis for considering it as a Key Audit Matter.
As at 31 December 2018, 63% of its total assets of the Group consisted of loans and advances amounting to LKR 1,460 Billion (Note 27.1), net of impairment allowance of LKR 84 Billion (Note 27.2). The impact on transition to SLFRS 9 on the Group’s Financial statements has been quantified and presented in Note 62 of the Financial statements.
The estimation of impairment allowance for loans and advances involved complex manual calculations.
To assess the reasonableness of the impairment allowance, my audit procedures (among others) were designed to obtain sufficient and appropriate audit evidences, included the following,
• I evaluated design, implementation and operative effectiveness of controls over estimation of impairment of loans and advances, which included assessing the level of oversight, review and approval of impairment policies by the Board Audit Committees and management.
• I test-checked the underlying calculations and data.
• In addition to the above, following focused procedures were performed:
For loans and advances - individually assessed for impairment:
• I assessed the main criteria used by the management for determining whether an impairment event had occurred, including the management estimation of impairment of loans and advances in industries with elevated risk of credit loss;
• Where impairment indicators existed, I assessed the reasonableness of management’s estimated future recoveries including the expected future cash flows, discount rates and the valuation of collateral held. I also compared the actual recoveries against previously estimated amounts of future recoveries.

194 Bank of Ceylon | Annual Report 2018
REPORT OF THE AUDITOR GENERAL
1.4 Responsibilities of Management and Those Charged with Governance for the Financial Statements
Management is responsible for the
preparation of Financial Statements that
give a true and fair view in accordance
with Sri Lanka Accounting Standards, and
for such internal control as management
determine is necessary to enable the
preparation of Financial Statements that
are free from material misstatement,
whether due to fraud or error.
In preparing the Financial Statements,
management is responsible for assessing
the Group’s ability to continue as a
going concern, disclosing, as applicable,
matters related to going concern
and using the going concern basis of
accounting unless management either
intend to liquidate the Group or to cease
operations, or has no realistic alternative
but to do so.
Those charged with governance are
responsible for overseeing the Bank’s and
the Group’s financial reporting process.
As per Section 16(1) of the National Audit
Act No. 19 of 2018, the Group is required
to maintain proper books and records of
all its income, expenditure, assets and
liabilities, to enable annual and periodic
Financial Statements to be prepared of
the Group.
1.5 Auditor’s Responsibilities forthe Audit of the Financial Statements
My objective is to obtain reasonable
assurance about whether the Financial
Statements as a whole are free from
material misstatement, whether due to
fraud or error, and to issue an auditor’s
report that includes my opinion.
Reasonable assurance is a high level
of assurance, but is not a guarantee
that an audit conducted in accordance
with Sri Lanka Auditing Standards will
always detect a material misstatement
when it exists. Misstatements can arise
from fraud or error and are considered
material if, individually or in the aggregate,
they could reasonably be expected to
influence the economic decisions of users
taken on the basis of these Financial
Statements.
As part of an audit in accordance with
Sri Lanka Auditing Standards, I exercise
professional judgment and maintain
professional scepticism throughout the
audit. I also:
• Identify and assess the risks of
material misstatement of the Financial
Statements, whether due to fraud
or error, design and perform audit
procedures responsive to those risks,
and obtain audit evidence that is
sufficient and appropriate to provide
a basis for my opinion. The risk of not
detecting a material misstatement
Key Audit Matter How my audit addressed the key audit matter
Significant estimates and assumptions used by the management in such calculations, its sensitivities and the basis for impairment allowance are disclosed in Note 27.
• Where loans and advances granted to customers with a higher risk of credit loss, I assessed the main criteria used by the management for determining whether an impairment event had occurred and the reasonableness of management estimation of such additional impairment.
For loans and advances- collectively assessed for impairment:
• I tested the completeness, relevance and accuracy of the underlying information in loans and advances used in the impairment calculations by agreeing details to the Group’s source documents and information in IT systems and re-performing the calculations.
• I also considered reasonableness of macro-economic and other factors used by management in their judgemental overlays for various types of loan portfolios, by comparing them with publicly available data and information sources.
• I assessed the adequacy of the related Financial Statement disclosures as set out in Note 27.
• I also assessed the adequacy of the Group’s disclosure on the impact of the initial adoption of SLFRS 9 as set out in Note 62. This included testing of the quantitative impact of the transition.

195
resulting from fraud is higher than for
one resulting from error, as fraud may
involve collusion, forgery, intentional
omissions, misrepresentations, or the
override of internal control.
• Obtain an understanding of internal
control relevant to the audit in order
to design audit procedures that are
appropriate in the circumstances, but
not for the purpose of expressing an
opinion on the effectiveness of the
Group’s internal control.
• Evaluate the appropriateness of
accounting policies used and the
reasonableness of accounting
estimates and related disclosures
made by the management.
• Conclude on the appropriateness
of the management’s use of the
going concern basis of accounting
and based on the audit evidence
obtained, whether a material
uncertainty exists related to events or
conditions that may cast significant
doubt on the Group’s ability to
continue as a going concern. If I
conclude that a material uncertainty
exists, I am required to draw
attention in my auditor’s report to the
related disclosures in the Financial
Statements or, if such disclosures are
inadequate, to modify my opinion. My
conclusions are based on the audit
evidence obtained up to the date of
my auditor’s report. However, future
events or conditions may cause the
Group to cease to continue as a
going concern.
• Evaluate the overall presentation,
structure and content of the
Financial Statements, including
the disclosures, and whether the
Financial Statements represent
the underlying transactions and
events in a manner that achieves fair
presentation.
I communicate with those charged with
governance regarding, among other
matters, significant audit findings,
including any significant deficiencies in
internal control that I identify during my
audit.
2. Report on Other Legal and Regulatory Requirements
National Audit Act, No. 19 of 2018
includes specific provisions for following
requirements.
• I have obtained all the information
and explanation that required for
the audit and as far as appears from
my examination, proper accounting
records have been kept by the Bank
as per the requirement of section
12 (a) of National Audit Act, No. 19 of
2018.
• The Financial Statements presented
is consistent with the preceding year
as per the requirement of section 6 (1)
(d) (iii) of the National Audit Act, No.
19 of 2018.
• The Financial Statements presented
includes all the recommendations
made by me in the previous year as
per the requirement of section 6 (1) (d)
(iv) of the National Audit Act, No. 19
of 2018.
Based on the procedures performed and
evidence obtained were limited to matters
that are material, nothing has come to my
attention;
• to state that any member of the
governing body of the Bank has
any direct or indirect interest in any
contract entered into by the Bank
which are out of the normal cause of
business as per the requirement of
section 12 (d) of the National Audit
Act, No. 19 of 2018;
• to state that the Bank has not
complied with any applicable written
law, general and special directions
issued by the governing body of
the Bank as per the requirement of
section 12 (f) of the National Audit
Act, No. 19 of 2018;
• to state that the Bank has not
performed according to its powers,
functions and duties as per the
requirement of section 12 (g) of the
National Audit Act, No. 19 of 2018;
• to state that the resources of the
Bank had not been procured and
utilized economically, efficiently and
effectively within the time frames and
in compliance with the applicable
laws as per the requirement of
section 12 (h) of the National Audit
Act, No. 19 of 2018.
H.M. Gamini Wijesinghe
Auditor General

196 Bank of Ceylon | Annual Report 2018
STATEMENT OF PROFIT OR LOSS
Bank Group
For the year ended 31 December 2018 2017 Change 2018 2017 Change
Note LKR ’000 LKR ’000 % LKR ’000 LKR ’000 %
Total income 7 221,131,178 189,211,395 16.9 229,461,622 197,012,961 16.5
Interest income 195,393,970 171,343,888 14.0 201,809,401 177,746,357 13.5
Less : Interest expenses 129,835,996 112,987,696 14.9 133,119,922 116,256,255 14.5
Net interest income 8 65,557,974 58,356,192 12.3 68,689,479 61,490,102 11.7
Fee and commission income 10,699,565 9,465,330 13.0 11,088,043 9,723,455 14.0
Less : Fee and commission expenses 2,280,728 1,883,302 21.1 2,294,839 1,972,374 16.3
Net fee and commission income 9 8,418,837 7,582,028 11.0 8,793,204 7,751,081 13.4
Net gains/ (losses) from trading 10 3,431,822 2,802,048 22.5 3,468,191 2,822,168 22.9
Net fair value gains/ (losses) from financial instruments at fair value through profit or loss 11 (681,365) - - (717,194) - -
Net gains/ (losses) from financial investments 11.1 - 905,527 (100.0) - 925,733 (100.0)
Net gains/ (losses) from derecognition of financial assets 12 152,029 - - 153,240 - -
Net other operating income 13 12,135,157 4,694,602 158.5 13,659,941 5,795,248 135.7
Total operating income 89,014,454 74,340,397 19.7 94,046,861 78,784,332 19.4
Less : Impairment charge/ (reversal) for loans and other losses 14 15,040,961 9,340,658 61.0
15,176,472 9,884,889 53.5
Net operating income 73,973,493 64,999,739 13.8 78,870,389 68,899,443 14.5
Less : Operating expenses
Personnel expenses 15 18,875,397 16,996,176 11.1 20,600,778 18,723,550 10.0
Depreciation and amortisation expenses 2,200,294 1,925,002 14.3 2,813,469 2,542,480 10.7
Other expenses 16 11,417,336 8,486,795 34.5 13,210,221 9,438,372 40.0
Total operating expenses 32,493,027 27,407,973 18.6 36,624,468 30,704,402 19.3
Operating profit before taxes on financial services 41,480,466 37,591,766 10.3 42,245,921 38,195,041 10.6
Less : Taxes on financial services 17.1 9,588,312 7,248,786 32.3 9,818,020 7,431,502 32.1
Operating profit after taxes on financial services 31,892,154 30,342,980 5.1 32,427,901 30,763,539 5.4
Share of profits/ (losses) of associate companies, net of tax 18 - - - 9,269 52,024 (82.2)
Profit before income tax 31,892,154 30,342,980 5.1 32,437,170 30,815,563 5.3
Less : Income tax expense 17.2 12,413,425 9,030,696 37.5 12,922,017 9,328,918 38.5
Profit for the year 19,478,729 21,312,284 (8.6) 19,515,153 21,486,645 (9.2)
Profit attributable to :
Equity holder of the Bank 19,478,729 21,312,284 (8.6) 19,532,862 21,470,163 (9.0)
Non-controlling interest - - - (17,709) 16,482 207.4
Profit for the year 19,478,729 21,312,284 (8.6) 19,515,153 21,486,645 (9.2)
Earnings per share:
Basic earnings per share (LKR) 19.1 1,044.78 1,856.56 (43.7) 1,047.68 1,870.31 (44.0)
Diluted earnings per share (LKR) 19.2 915.02 1,414.36 (35.3) 917.57 1,424.84 (35.6)
Dividend per share (LKR) 19.3 259.95 1,075.52 (75.8) 259.95 1,075.52 (75.8)
The Notes to the Financial Statements from pages 206 to 392 form an integral part of these Financial Statements.

197
STATEMENT OF COMPREHENSIVE INCOME
Bank Group
For the year ended 31 December 2018 2017 Change 2018 2017 Change
LKR ’000 LKR ’000 % LKR ’000 LKR ’000 %
Profit for the year 19,478,729 21,312,284 (8.6) 19,515,153 21,486,645 (9.2)
Other Comprehensive income, net of taxItems that will be reclassified to the profit or loss
Exchange differences on translation of foreign operations 1,110,869 361,375 207.4 1,453,215 643,365 125.9
Net gains/ (losses) on investments in debt instruments measured at fair value through other comprehensive income (271,351) - - (285,389) - -
Net gains/ (losses) on remeasuring available for sale financial investments - (595,034) (100.0) - (619,591) (100.0)
Deferred tax effect on gains/ (losses) on remeasuring available for sale financial investments - (177,006) (100.0) - (177,006) (100.0)
Net (gains)/ losses on investment in financial assets at fair value through other comprehensive income/ available for sale reclassification to profit or loss (15,232) 3,385 (550.0) (15,232) 3,385 (550.0)
Share of other comprehensive income of Associate companies, net of tax - - - 3,464 (6,600) (152.5)
Total items that will be reclassified to the profit or loss 824,286 (407,280) (302.4) 1,156,058 (156,447) (838.9)
Items that will not be reclassified to profit or loss
Change in fair value on investments in equity instruments designated at fair value through other comprehensive income (410,168) - - (823,954) - -
Deferred tax effect on change in fair value on investments in equity instruments designated at fair value through other comprehensive income (6,711) - - (6,711) - -
Changes in revaluation surplus/ (deficit) (337,522) 6,059,715 (105.6) 147,397 6,406,248 (97.7)
Deferred tax effect on changes in revaluation surplus/ (deficit) 94,506 (4,094,358) (102.3) (41,271) (4,191,387) (99.0)
Net actuarial gains/ (losses) on defined benefit plans (2,119,340) 2,789,929 (176.0) (2,090,789) 2,766,683 (175.6)
Deferred tax effect on net actuarial gains/ (losses) on defined benefit plans 3,050 (8,400) (136.3) (9,530) 8,363 (214.0)
Total items that will not be reclassified to the profit or loss (2,776,185) 4,746,886 (158.5) (2,824,858) 4,989,907 (156.6)
Total other comprehensive income for the year, net of tax (1,951,899) 4,339,606 (145.0) (1,668,800) 4,833,460 (134.5)
Total comprehensive income for the year 17,526,830 25,651,890 (31.7) 17,846,353 26,320,105 (32.2)
Attributable to:
Equity holder of the Bank 17,526,830 25,651,890 (31.7) 17,866,780 26,270,244 (32.0)
Non-controlling interest - - - (20,427) 49,861 (141.0)
Total comprehensive income for the year 17,526,830 25,651,890 (31.7) 17,846,353 26,320,105 (32.2)
The Notes to the Financial Statements from pages 206 to 392 form an integral part of these Financial Statements.

198 Bank of Ceylon | Annual Report 2018
STATEMENT OF FINANCIAL POSITION
Bank Group
As at 31 December 2018 2017 Change 2018 2017 Change
Note LKR ’000 LKR ’000 % LKR ’000 LKR ’000 %
Assets
Cash and cash equivalents 21 78,447,577 72,843,108 7.7 78,558,031 78,005,362 0.7
Balances with Central Banks 22 65,680,371 68,689,012 (4.4) 65,680,371 68,689,012 (4.4)
Placements with banks 23 40,450,089 8,067,490 401.4 41,681,910 5,319,602 683.6
Securities purchased under resale agreements 24 - 18,455,555 (100.0) 1,436,068 19,872,247 (92.8)
Derivative financial instruments 25 1,205,657 1,618,823 (25.5) 1,205,657 1,618,823 (25.5)
Financial assets recognised through profit or loss measured at fair value/ Held for trading 26 9,277,298 8,359,274 11.0 9,583,327 8,596,548 11.5
Financial assets at amortised cost
Loans and advances 27 1,429,107,181 1,163,160,914 22.9 1,460,618,588 1,194,294,394 22.3
Debt and other instruments 28 551,839,449 - - 551,956,734 - -
Financial investments - Loans and receivables 28.3 - 213,167,048 (100.0) - 214,349,624 (100.0)
Financial investments - Held to maturity 28.4 - 308,256,082 (100.0) - 308,750,317 (100.0)
Financial assets measured at fair value through OCI/ Available for sale 29 16,699,582 17,921,170 (6.8) 20,415,199 22,552,292 (9.5)
Investment in subsidiary companies 30 6,513,048 6,513,048 - - - -
Investment in associate companies 31 92,988 92,988 - 441,226 446,793 (1.2)
Investment properties 32 2,765,856 2,882,928 (4.1) 120,182 123,773 (2.9)
Property, Plant and Equipment 33 24,178,155 23,046,114 4.9 37,762,509 36,608,919 3.2
Leasehold properties 34 98,899 101,481 (2.5) 130,500 134,441 (2.9)
Intangible assets 35 1,238,186 810,730 52.7 1,456,630 1,074,436 35.6
Deferred tax assets 36 - - - 3,052 8,621 (64.6)
Other assets 37 40,560,058 37,818,188 7.3 41,872,891 38,964,979 7.5
Total assets 2,268,154,394 1,951,803,953 16.2 2,312,922,875 1,999,410,183 15.7
Liabilities
Due to banks 38 2,402,468 2,203,199 9.0 2,515,998 2,194,266 14.7
Securities sold under repurchase agreements 39 97,399,359 44,487,462 118.9 97,423,302 44,628,686 118.3
Derivative financial instruments 40 509,018 70,715 619.8 509,018 70,715 619.8
Financial liabilities at amortised cost
Due to depositors 41 1,765,025,970 1,546,832,036 14.1 1,783,975,493 1,566,376,418 13.9
Other borrowings 42 201,792,174 178,191,089 13.2 207,053,674 184,330,181 12.3
Debt securities issued 43 - - - 4,105,681 5,667,514 (27.6)
Current tax liabilities 44 3,922,189 1,877,342 108.9 4,039,380 2,051,020 96.9
Deferred tax liabilities 36 5,073,526 5,820,329 (12.8) 7,762,214 8,625,219 (10.0)
Insurance provision - Life 45.1 - - - 575,625 547,026 5.2
Insurance provision - Non-life 45.2 - - - 366,618 430,093 (14.8)
Other liabilities 46 19,760,429 18,596,249 6.3 21,970,739 19,936,478 10.2
Subordinated liabilities 48 50,827,239 42,570,457 19.4 50,484,487 42,226,067 19.6
Total liabilities 2,146,712,372 1,840,648,878 16.6 2,180,782,229 1,877,083,683 16.2

199
Bank Group
As at 31 December 2018 2017 Change 2018 2017 Change
Note LKR ’000 LKR ’000 % LKR ’000 LKR ’000 %
Equity
Share capital 49 25,000,000 20,000,000 25.0 25,000,000 20,000,000 25.0
Permanent reserve fund 50 12,890,000 10,427,000 23.6 12,890,000 10,427,000 23.6
Retained earnings 51 67,333,879 63,472,250 6.1 68,451,746 65,100,871 5.1
Other reserves 52 16,218,143 17,255,825 (6.0) 25,103,751 25,871,254 (3.0)
Total equity attributable to equity holder of the Bank 121,442,022 111,155,075 9.3 131,445,497 121,399,125 8.3
Non-controlling interest 53 - - - 695,149 927,375 (25.0)
Total equity 121,442,022 111,155,075 9.3 132,140,646 122,326,500 8.0
Total liabilities and equity 2,268,154,394 1,951,803,953 16.2 2,312,922,875 1,999,410,183 15.7
Contingent liabilities and commitments 55 508,306,808 496,477,278 2.4 513,192,419 497,617,834 3.1
Net assets value per share (LKR) 49 6,072.10 7,410.34 (18.1) 6,574.13 8,093.28 (18.8)
The Notes to the Financial Statements from pages 206 to 392 form an integral part of these Financial Statements.
These Financial Statements give a true and fair view of the state of affairs of Bank of Ceylon and the Group as at 31 December 2018
and its profit for the year then ended.
W P Russel Fonseka
Chief Financial Officer
The Board of Directors is responsible for the preparation and presentation of these Financial Statements.
Approved and signed for and on behalf of the Board,
Ronald C Perera K A Vimalenthirarajah Senarath Bandara
Chairman Director General Manager
19 March 2019
Colombo

200 Bank of Ceylon | Annual Report 2018
Bank
Other Reserves
Capital
Share Pending Permanent Available for FVTOCI Other Revaluation Retained
Note Capital Allotment Reserve Fund Sale Reserve reserve Reserves Reserve Earnings Total Equity
LKR ’000 LKR ’000 LKR ’000 LKR ’000 LKR ’000 LKR ’000 LKR ’000 LKR ’000 LKR ’000
Balance as at 1 January 2017 10,000,000 5,000,000 7,996,000 4,487,181 - 1,209,435 10,002,294 54,154,685 92,849,595
Total comprehensive income for the year
Profit for the year - - - - - - - 21,312,284 21,312,284
Other comprehensive income, net of tax - - - (768,655) - 361,375 1,965,357 2,781,529 4,339,606
Total comprehensive income for the year - - - (768,655) - 361,375 1,965,357 24,093,813 25,651,890
Transactions with equity holder, recognised directly in equity
Dividends for 2017 19.3 - - - - - - - (12,346,410) (12,346,410)
Transfers to share capital 49.1 5,000,000 (5,000,000) - - - - - - -
Capital infusion during the year 49.1 - 5,000,000 - - - - - - 5,000,000
Transfers to permanent reserve fund 50 - - 2,431,000 - - - - (2,431,000) -
Revaluation surplus of disposed property - - - - - - (1,162) 1,162 -
Total transactions with equity holder 5,000,000 - 2,431,000 - - - (1,162) (14,776,248) (7,346,410)
Balance as at 31 December 2017 15,000,000 5,000,000 10,427,000 3,718,526 - 1,570,810 11,966,489 63,472,250 111,155,075
Balance as at 1 January 2018 15,000,000 5,000,000 10,427,000 3,718,526 - 1,570,810 11,966,489 63,472,250 111,155,075
Impact of adopting SLFRS 9 as at 1 January 2018 - - - (3,718,526) 2,541,656 - - (9,562,471) (10,739,341)
Deferred tax on transitional adjustment - - - - - - - 3,345,868 3,345,868
Restated opening balance as at 1 January 2018 15,000,000 5,000,000 10,427,000 - 2,541,656 1,570,810 11,966,489 57,255,647 103,761,602
Total comprehensive income for the year
Profit for the year - - - - - - - 19,478,729 19,478,729
Other comprehensive income, net of tax - - - - (703,462) 1,110,869 (243,016) (2,116,290) (1,951,899)
Total comprehensive income for the year - - - - (703,462) 1,110,869 (243,016) 17,362,439 17,526,830
Transactions with equity holder, recognised directly in equity
Dividends for 2018 19.3 - - - - - - - (4,846,410) (4,846,410)
Transfers to share capital 49.1 5,000,000 (5,000,000) - - - - - - -
Capital infusion during the year 49.1 - 5,000,000 - - - - - - 5,000,000
Transfers to permanent reserve fund 50 - - 2,463,000 - - - - (2,463,000) -
Revaluation surplus of disposed property - - - - - - (25,203) 25,203 -
Total transactions with equity holder 5,000,000 - 2,463,000 - - - (25,203) (7,284,207) 153,590
Balance as at 31 December 2018 20,000,000 5,000,000 12,890,000 - 1,838,194 2,681,679 11,698,270 67,333,879 121,442,022
The Notes to the Financial Statements from pages 206 to 392 form an integral part of these Financial Statements.
STATEMENT OF CHANGES IN EQUITY

201
Bank
Other Reserves
Capital
Share Pending Permanent Available for FVTOCI Other Revaluation Retained
Note Capital Allotment Reserve Fund Sale Reserve reserve Reserves Reserve Earnings Total Equity
LKR ’000 LKR ’000 LKR ’000 LKR ’000 LKR ’000 LKR ’000 LKR ’000 LKR ’000 LKR ’000
Balance as at 1 January 2017 10,000,000 5,000,000 7,996,000 4,487,181 - 1,209,435 10,002,294 54,154,685 92,849,595
Total comprehensive income for the year
Profit for the year - - - - - - - 21,312,284 21,312,284
Other comprehensive income, net of tax - - - (768,655) - 361,375 1,965,357 2,781,529 4,339,606
Total comprehensive income for the year - - - (768,655) - 361,375 1,965,357 24,093,813 25,651,890
Transactions with equity holder, recognised directly in equity
Dividends for 2017 19.3 - - - - - - - (12,346,410) (12,346,410)
Transfers to share capital 49.1 5,000,000 (5,000,000) - - - - - - -
Capital infusion during the year 49.1 - 5,000,000 - - - - - - 5,000,000
Transfers to permanent reserve fund 50 - - 2,431,000 - - - - (2,431,000) -
Revaluation surplus of disposed property - - - - - - (1,162) 1,162 -
Total transactions with equity holder 5,000,000 - 2,431,000 - - - (1,162) (14,776,248) (7,346,410)
Balance as at 31 December 2017 15,000,000 5,000,000 10,427,000 3,718,526 - 1,570,810 11,966,489 63,472,250 111,155,075
Balance as at 1 January 2018 15,000,000 5,000,000 10,427,000 3,718,526 - 1,570,810 11,966,489 63,472,250 111,155,075
Impact of adopting SLFRS 9 as at 1 January 2018 - - - (3,718,526) 2,541,656 - - (9,562,471) (10,739,341)
Deferred tax on transitional adjustment - - - - - - - 3,345,868 3,345,868
Restated opening balance as at 1 January 2018 15,000,000 5,000,000 10,427,000 - 2,541,656 1,570,810 11,966,489 57,255,647 103,761,602
Total comprehensive income for the year
Profit for the year - - - - - - - 19,478,729 19,478,729
Other comprehensive income, net of tax - - - - (703,462) 1,110,869 (243,016) (2,116,290) (1,951,899)
Total comprehensive income for the year - - - - (703,462) 1,110,869 (243,016) 17,362,439 17,526,830
Transactions with equity holder, recognised directly in equity
Dividends for 2018 19.3 - - - - - - - (4,846,410) (4,846,410)
Transfers to share capital 49.1 5,000,000 (5,000,000) - - - - - - -
Capital infusion during the year 49.1 - 5,000,000 - - - - - - 5,000,000
Transfers to permanent reserve fund 50 - - 2,463,000 - - - - (2,463,000) -
Revaluation surplus of disposed property - - - - - - (25,203) 25,203 -
Total transactions with equity holder 5,000,000 - 2,463,000 - - - (25,203) (7,284,207) 153,590
Balance as at 31 December 2018 20,000,000 5,000,000 12,890,000 - 1,838,194 2,681,679 11,698,270 67,333,879 121,442,022
The Notes to the Financial Statements from pages 206 to 392 form an integral part of these Financial Statements.

202 Bank of Ceylon | Annual Report 2018
Group
Attributable to Equity Holder of the Bank
Other Reserves
Share Pending Permanent Available for FVTOCI Other Revaluation Retained Non Controlling
Note Capital Allotment Reserve Fund Sale Reserve reserve Reserves Reserve Earnings Interest Total Equity
LKR ’000 LKR ’000 LKR ’000 LKR ’000 LKR ’000 LKR ’000 LKR ’000 LKR ’000 LKR ’000 LKR ’000
Balance as at 1 January 2017 10,000,000 5,000,000 7,996,000 5,562,266 - 1,763,963 16,494,059 55,659,003 879,445 103,354,736
Total comprehensive income for the year
Profit for the year - - - - - - - 21,470,163 16,482 21,486,645
Other comprehensive income, net of tax - - - (801,650) - 643,365 2,188,368 2,769,998 33,379 4,833,460
Total comprehensive income for the year - - - (801,650) - 643,365 2,188,368 24,240,161 49,861 26,320,105
Transactions with equity holders, recognised directly in equity
Dividends for 2017 19.3 - - - - - - - (12,346,410) - (12,346,410)
Subsidiary dividends to non controlling interest - - - - - - - - (1,931) (1,931)
Transfer to share capital 49.1 5,000,000 (5,000,000) - - - - - - - -
Capital infusion during the year 49.1 - 5,000,000 - - - - - - - 5,000,000
Transfers to permanent reserve fund 50 - - 2,431,000 - - - - (2,431,000) - -
Revaluation surplus of disposed property - - - - - - (1,162) 1,162 - -
Transfer to other reserves - - - - - 22,045 - (22,045) - -
Total transactions with equity holders 5,000,000 - 2,431,000 - - 22,045 (1,162) (14,798,293) (1,931) (7,348,341)
Balance as at 31 December 2017 15,000,000 5,000,000 10,427,000 4,760,616 - 2,429,373 18,681,265 65,100,871 927,375 122,326,500
Balance as at 1 January 2018 15,000,000 5,000,000 10,427,000 4,760,616 - 2,429,373 18,681,265 65,100,871 927,375 122,326,500
Impact of adopting SLFRS 9 as at 1 January 2018 - - - (4,760,616) 3,583,746 - - (10,369,633) (276,422) (11,822,925)
Deferred tax on transitional adjustments - - - - - - - 3,571,637 77,317 3,648,954
Balance as at 1 January 2018 15,000,000 5,000,000 10,427,000 - 3,583,746 2,429,373 18,681,265 58,302,875 728,270 114,152,529
Total comprehensive income for the year
Profit for the year - - - - - - - 19,532,862 (17,709) 19,515,153
Other comprehensive income, net of tax - - - - (1,109,292) 1,453,215 90,647 (2,100,652) (2,718) (1,668,800)
Total comprehensive income for the year - - - - (1,109,292) 1,453,215 90,647 17,432,210 (20,427) 17,846,353
Transactions with equity holders, recognised directly in equity
Dividends for 2018 19.3 - - - - - - - (4,846,410) - (4,846,410)
Subsidiary dividends to non controlling interest - - - - - - - - (12,694) (12,694)
Transfer to share capital 49.1 5,000,000 (5,000,000) - - - - - - - -
Capital infusion during the year 49.1 - 5,000,000 - - - - - - - 5,000,000
Transfers to permanent reserve fund 50 - - 2,463,000 - - - - (2,463,000) - -
Revaluation surplus of disposed property - - - - - - (25,203) 25,203 - -
Reversal of unclaimed dividend - - - - - - - 868 - 868
Total transactions with equity holders 5,000,000 - 2,463,000 - - - (25,203) (7,283,339) (12,694) 141,764
Balance as at 31 December 2018 20,000,000 5,000,000 12,890,000 - 2,474,454 3,882,588 18,746,709 68,451,746 695,149 132,140,646
The Notes to the Financial Statements from pages 206 to 392 form an integral part of these Financial Statements.
STATEMENT OF CHANGES IN EQUITY

203
Group
Attributable to Equity Holder of the Bank
Other Reserves
Share Pending Permanent Available for FVTOCI Other Revaluation Retained Non Controlling
Note Capital Allotment Reserve Fund Sale Reserve reserve Reserves Reserve Earnings Interest Total Equity
LKR ’000 LKR ’000 LKR ’000 LKR ’000 LKR ’000 LKR ’000 LKR ’000 LKR ’000 LKR ’000 LKR ’000
Balance as at 1 January 2017 10,000,000 5,000,000 7,996,000 5,562,266 - 1,763,963 16,494,059 55,659,003 879,445 103,354,736
Total comprehensive income for the year
Profit for the year - - - - - - - 21,470,163 16,482 21,486,645
Other comprehensive income, net of tax - - - (801,650) - 643,365 2,188,368 2,769,998 33,379 4,833,460
Total comprehensive income for the year - - - (801,650) - 643,365 2,188,368 24,240,161 49,861 26,320,105
Transactions with equity holders, recognised directly in equity
Dividends for 2017 19.3 - - - - - - - (12,346,410) - (12,346,410)
Subsidiary dividends to non controlling interest - - - - - - - - (1,931) (1,931)
Transfer to share capital 49.1 5,000,000 (5,000,000) - - - - - - - -
Capital infusion during the year 49.1 - 5,000,000 - - - - - - - 5,000,000
Transfers to permanent reserve fund 50 - - 2,431,000 - - - - (2,431,000) - -
Revaluation surplus of disposed property - - - - - - (1,162) 1,162 - -
Transfer to other reserves - - - - - 22,045 - (22,045) - -
Total transactions with equity holders 5,000,000 - 2,431,000 - - 22,045 (1,162) (14,798,293) (1,931) (7,348,341)
Balance as at 31 December 2017 15,000,000 5,000,000 10,427,000 4,760,616 - 2,429,373 18,681,265 65,100,871 927,375 122,326,500
Balance as at 1 January 2018 15,000,000 5,000,000 10,427,000 4,760,616 - 2,429,373 18,681,265 65,100,871 927,375 122,326,500
Impact of adopting SLFRS 9 as at 1 January 2018 - - - (4,760,616) 3,583,746 - - (10,369,633) (276,422) (11,822,925)
Deferred tax on transitional adjustments - - - - - - - 3,571,637 77,317 3,648,954
Balance as at 1 January 2018 15,000,000 5,000,000 10,427,000 - 3,583,746 2,429,373 18,681,265 58,302,875 728,270 114,152,529
Total comprehensive income for the year
Profit for the year - - - - - - - 19,532,862 (17,709) 19,515,153
Other comprehensive income, net of tax - - - - (1,109,292) 1,453,215 90,647 (2,100,652) (2,718) (1,668,800)
Total comprehensive income for the year - - - - (1,109,292) 1,453,215 90,647 17,432,210 (20,427) 17,846,353
Transactions with equity holders, recognised directly in equity
Dividends for 2018 19.3 - - - - - - - (4,846,410) - (4,846,410)
Subsidiary dividends to non controlling interest - - - - - - - - (12,694) (12,694)
Transfer to share capital 49.1 5,000,000 (5,000,000) - - - - - - - -
Capital infusion during the year 49.1 - 5,000,000 - - - - - - - 5,000,000
Transfers to permanent reserve fund 50 - - 2,463,000 - - - - (2,463,000) - -
Revaluation surplus of disposed property - - - - - - (25,203) 25,203 - -
Reversal of unclaimed dividend - - - - - - - 868 - 868
Total transactions with equity holders 5,000,000 - 2,463,000 - - - (25,203) (7,283,339) (12,694) 141,764
Balance as at 31 December 2018 20,000,000 5,000,000 12,890,000 - 2,474,454 3,882,588 18,746,709 68,451,746 695,149 132,140,646
The Notes to the Financial Statements from pages 206 to 392 form an integral part of these Financial Statements.

204 Bank of Ceylon | Annual Report 2018
STATEMENT OF CASH FLOWS
Bank Group
For the year ended 31 December 2018 2017 2018 2017
Note LKR ’000 LKR ’000 LKR ’000 LKR ’000
Cash Flows from Operating Activities
Profit before income tax 31,892,154 30,342,980 32,437,170 30,815,563
Adjustments for:
Net interest income 8 (65,557,974) (58,356,192) (68,689,479) (61,490,102)
Dividend income on trading securities 10 (101,877) (111,783) (113,255) (120,214)
Dividends from subsidiaries and associates 13 (309,685) (76,680) - -
Share of (profits)/ losses of associate companies, net of tax 18 - - (9,269) (52,024)
Change in operating assets 54.1 (279,608,836) (176,623,016) (285,248,074) (177,474,266)
Change in operating liabilities 54.2 276,164,812 304,162,970 282,302,977 306,329,345
Other non-cash items included in profit before tax 54.3 6,773,377 10,872,287 7,494,037 12,102,838
Other net gains from investing activities 529,336 (905,527) 563,954 (925,733)
(30,218,693) 109,305,039 (31,261,939) 109,185,407
Contribution paid from defined benefit plans (7,667,801) (6,976,625) (7,715,221) (6,994,516)
Interest received 133,563,506 120,744,703 140,171,940 126,994,502
Interest paid (116,192,643) (85,565,050) (118,562,407) (88,311,449)
Dividends received 101,877 111,783 113,255 120,214
Net cash from/ (used in) operating activities before income tax (20,413,754) 137,619,850 (17,254,372) 140,994,158
Income tax paid (5,376,538) (2,580,454) (5,703,009) (2,683,837)
Net cash from/ (used in) operating activities (25,790,292) 135,039,396 (22,957,381) 138,310,321
Cash Flows from Investing Activities
Net increase in financial investments at amortised cost (30,883,224) - (29,323,684) -
Net increase in financial investments - Held to maturity - (65,055,871) - (65,470,538)
Net (increase)/ decrease in financial investments recognised fair value through OCI (292,866) - (4,151,530) -
Net increase in financial investments - Available for sale - (7,716,838) - (6,571,920)
Net increase in financial investments - Loans and receivables - (21,292,409) - (22,365,555)
Purchase of Property, Plant and Equipment and leasehold properties (3,399,832) (3,080,752) (3,569,916) (3,199,778)
Purchase of intangible assets (783,598) (528,565) (790,386) (764,014)
Proceeds from sale of Property, Plant and Equipment 101,050 62,457 216,988 69,101
Dividends received 598,053 649,270 325,908 592,796
Interest received 46,327,625 40,578,598 46,696,256 41,088,070
Net cash from/ (used in) investing activities 11,667,208 (56,384,110) 9,403,636 (56,621,838)

205
Bank Group
For the year ended 31 December 2018 2017 2018 2017
Note LKR ’000 LKR ’000 LKR ’000 LKR ’000
Cash Flows from Financing Activities
Net increase/ (decrease) in other borrowings 24,715,392 (49,653,199) 21,670,556 (52,901,368)
Proceeds from issue of shares 5,000,000 5,000,000 5,000,000 5,000,000
Proceeds from issue of debentures 12,000,000 10,000,000 12,000,000 12,000,000
Payments on redemption of debentures (4,090,400) (9,501,723) (5,650,894) (10,867,381)
Dividends paid to equity holder of the Bank (4,846,410) (12,346,410) (4,846,410) (12,346,410)
Dividends paid to non-controlling interest - - (12,694) (1,931)
Interest payments on borrowings and debt securities (12,795,159) (17,320,884) (13,920,739) (18,093,765)
Net cash from/ (used in) financing activities 19,983,423 (73,822,216) 14,239,819 (77,210,855)
Net increase/ (decrease) in cash and cash equivalents during the year 5,860,338 4,833,070 686,075 4,477,628
Cash and cash equivalents at the beginning of the year 71,731,508 66,898,438 76,902,695 72,425,067
Cash and cash equivalents at the end of the year 77,591,846 71,731,508 77,588,770 76,902,695
Analysis of Cash and Cash Equivalents
Cash and cash equivalents 21 78,447,577 72,843,108 78,558,031 78,005,362
Bank overdrafts 38 (855,731) (1,111,600) (969,261) (1,102,667)
Cash and cash equivalents at the end of the year 77,591,846 71,731,508 77,588,770 76,902,695
The Notes to the Financial Statements from pages 206 to 392 form an integral part of these Financial Statements.

206 Bank of Ceylon | Annual Report 2018
NOTES TO THE FINANCIAL STATEMENTS
1. Reporting Entity1.1 Corporate Information
Bank of Ceylon (“The Bank”)
is a Government-owned bank
domiciled in Sri Lanka, duly
incorporated on 1 August
1939 under the Bank of Ceylon
Ordinance No. 53 of 1938. It
is a licensed commercial bank
established under the Banking Act
No. 30 of 1988 and amendments
thereto. The Registered Office
of the Bank is situated at No. 01,
“BOC Square”, Bank of Ceylon
Mawatha, Colombo 01, Sri
Lanka. The debentures issued
by the Bank are listed on the
Colombo Stock Exchange. The
staff strength of the Bank as at 31
December 2018 was 8,724 (2017
– 7,587).
1.2 Consolidated Financial Statements
The Consolidated Financial
Statements are prepared as at and
for the year ended 31 December
2018 comprise the Bank (“Parent”),
its Subsidiaries (together referred
to as the “Group” and individually
as “Group Entities”) and the
Group’s interests in its Associate
companies. The Financial
Statements of the companies
in the Group have a common
financial year which ends on 31
December, except the Associate
companies, Transnational Lanka
Records Solutions (Private) Limited
and Ceybank Asset Management
Limited. The Bank is the ultimate
parent of the Group.
1.3 Principal Activities
1.3.1 Bank
The principal activities of the Bank during the year were, personal banking,
corporate banking, development banking, off-shore banking, trade financing,
lease financing, primary dealing, investment banking and wealth management,
treasury operations, correspondent banking and money remittances, Islamic
banking, bancassurance, pawning, credit card facilities, foreign currency
operations and other financial services.
1.3.2 Subsidiaries
The principal activities of the Subsidiaries of the Bank are as follows:
Name of the Company Principal Business Activities
Property Development PLC Own, maintain and manage, develop and sustain the
utility and value of the Bank of Ceylon head office
building.
Merchant Bank of Sri Lanka &
Finance PLC
Leasing, hire purchase, corporate and retail
credit facilities, corporate advisory services,
capital market operations, margin trading,
micro-financing, agricultural credit facilities,
real estate, pawning, Islamic finance and accepting
deposits.
BOC Management & Support
Services (Private) Limited
Not in operation and in the process of liquidation.
BOC Property Development &
Management (Private) Limited
Renting of office space of BOC Merchant Tower in
Colombo 03 and Ceybank House in Kandy.
BOC Travels (Private) Limited Engages in travel related services.
Hotels Colombo (1963) Limited Provides hotel services.
Ceybank Holiday Homes
(Private) Limited
Managing, operating and maintaining of travel rests/
hotels/ rest houses/ guest houses.
MBSL Insurance Company
Limited
Carrying on insurance business, both life and
non-life insurance.
Koladeniya Hydropower
(Private) Limited
Hydropower generation.
Bank of Ceylon (UK) Limited Authorised commercial bank by the
Prudential Regulation Authority and regulated by the
Financial Conduct Authority in England and Wales,
engages in retail and corporate
banking, treasury operations, correspondent
banking services and trade financing activities.

207
1.3.3 Associates
The principal activities of the Associates of the Bank are as follows:
Name of the Company Principal Business Activities
Ceybank Asset Management
Limited
Management of unit trust funds and other
institutional and private portfolios.
Lanka Securities (Private) Limited Registered stock broker, trading in equity and
debt securities, equity debt security brokering
and undertaking placement of equity and debt
securities.
Transnational Lanka Records
Solutions (Private) Limited
Renting buildings and hiring other assets.
Southern Development Financial
Company Limited.
Not in operation and in the process
of liquidation.
There were no significant changes in the nature of principal activities of the Bank,
Subsidiaries and Associates during the year under review. BOC Management &
Support Services (Private) Limited (MSS) has not carried out its core business
activities since 2007 and the Board of Directors of the Bank has granted the
approval to wind-up the company. Southern Development Financial Company
Limited (SDFCL) is also not in operations. The Board of Directors of SDFCL has
decided to wind-up the company and it is in the process of liquidation.
2. Directors’ Responsibility for Financial Statements2.1 Preparation and Presentation of the Financial Statements
The Board of Directors is responsible for the preparation and presentation of
the Financial Statements of the Bank and its Subsidiaries and Associates in
compliance with the requirements of the Bank of Ceylon Ordinance No. 53 of
1938 and its amendments, Banking Act No. 30 of 1988 and its amendments
thereto and Sri Lanka Accounting Standards (SLFRSs and LKASs).
These Financial Statements comprise
• Statement of Profit or Loss
• Statement of Comprehensive Income
• Statement of Financial Position
• Statement of Changes in Equity
• Statement of Cash Flows
• Notes to the Financial Statements
2.2 Approval of Financial Statements
The Financial Statements for the year ended 31 December 2018 were authorised
for issue on 19 March 2019 by the Board of Directors.
3. Basis of Preparation
3.1 Statement of Compliance
The Consolidated Financial
Statements of the Group and the
separate Financial Statements
of the Bank have been prepared
in accordance with Sri Lanka
Accounting Standards comprising
of Sri Lanka Financial Reporting
Standards (SLFRSs) and Sri Lanka
Accounting Standards (LKASs) laid
down by the Institute of Chartered
Accountants of Sri Lanka (together
referred to as SLFRSs in these
Financial Statements).
The preparation and presentation
of these Financial Statements
are in compliance with the
requirements of the Bank of
Ceylon Ordinance No. 53 of 1938,
the Banking Act No. 30 of 1988
and the Companies Act No. 07
of 2007. The Group has prepared
Financial Statements which
comply with SLFRSs applicable for
the year ended 31 December 2018,
together with the comparative year
data as at and for the year ended
31 December 2017, as described
in the accounting policies.
The formats used in the
preparation and presentation of
the Financial Statements and the
disclosures made therein also
comply with the specified formats
prescribed by the Central Bank of
Sri Lanka (CBSL) in the Circular
No. 02 of 2019 on “Publication of
Annual and Quarterly Financial
Statements and Other Disclosures
by Licensed Banks”.
3.2 Basis of Measurement
The Financial Statements have
been prepared on the basis of
historical cost convention and no

208 Bank of Ceylon | Annual Report 2018
NOTES TO THE FINANCIAL STATEMENTS
adjustments have been made for
inflationary factors which has been
applied on a consistent basis,
except for the following:
• Derivative financial
instruments are measured at
fair value (Notes 25 and 40)
• Financial assets recognised
through profit or loss -
measured at fair value/ Held
for trading (Note 26)
• Financial assets at amortised
cost - Loans and Advances/
Financial assets at amortised
cost - Debt and Other
Instruments/ Financial
Investments - Loans and
receivables/ Financial
Investments - Held to maturity
(Note 27 and 28)
• Financial assets measured
at fair value through OCI /
Available for sale (Note 29)
• Owner-occupied freehold land
and buildings and buildings on
leasehold lands are measured
at revalued amount less any
subsequent accumulated
depreciation and impairment
losses (Note 33)
• Financial liabilities at
amortised cost
(Note 41, 42,43 and 48)
• Defined benefit obligations
are actuarially valued and
recognised at the present
value of the defined benefit
obligation less total of the fair
value of plan assets (Note 47)
3.3 Presentation of Financial Statements
Items in the Statement of Financial
Position of the Bank and the
Group are grouped by nature of
such item and presented broadly
in order of their relative liquidity
and maturity pattern. An analysis
regarding recovery or settlement
within 12 months after the
Reporting date (current) and more
than 12 months after the Reporting
date (non-current) is presented
in Note 58 - "Maturity Analysis of
Assets and Liabilities".
3.3.1 Functional and Presentation Currency
Items included in the Financial
Statements are measured and
presented in Sri Lankan Rupees
(“LKR”) which is the functional
currency of the primary economic
environment in which the Bank
operates.
3.3.2 Accrual Basis of Accounting
The Financial Statements, except
for information on Statement of
Cash Flows have been prepared
following the accrual basis of
accounting.
3.3.3 Offsetting
Financial assets and financial
liabilities are generally reported
gross in the Statement of Financial
Position. They are only offset and
reported net when, in addition to
having an unconditional legally
enforceable right to offset the
recognised amounts without being
contingent on a future event, the
parties also intend to settle on
a net basis in all of the following
circumstances:
• The normal course of
business.
• The event of default.
• The event of insolvency
or bankruptcy of the
Bank/ Group and/or its
counterparties.
Income and expenses are not
offset in the Statement of Profit or
Loss unless required or permitted
by any accounting standard or
interpretation and as specifically
disclosed in the accounting
policies of the Group.
3.3.4 Comparative Information
The comparative information
is provided in narrative and
descriptive nature, if it is relevant
to understand the current
period’s Financial Statements and
reclassified wherever necessary
to conform to the current year’s
presentation. However, the Group
has not restated comparative
information for 2017 for financial
instruments within the scope of
SLFRS 9- “Financial Instruments”.
Therefore, the comparative
information for 2017 is reported
under LKAS 39- “Financial
Instruments: Recognition and
Measurement” and is not
comparable to the information
presented for 2018. Differences
arising from the adoption of
SLFRS 9 have been recognised
directly in equity as at 1 January
2018 and are disclosed in
Transition disclosures (Note 62).
3.3.5 Materiality and Aggregation
In compliance with LKAS
1 – “Presentation of Financial
Statements”, each material class
of similar items are presented
separately in the Financial
Statements. Items of dissimilar
nature or functions are presented
separately unless they are
immaterial.
3.3.6 Rounding
The amounts in the Financial
Statements have been rounded-off
to the nearest Rupees thousands,

209
except where otherwise indicated
as permitted by the LKAS 1-
“Presentation of Financial
Statements”.
3.3.7 Statement of Cash Flow
The Statement of Cash Flow is
prepared by using the “Indirect
Method” in accordance with the
LKAS 7- “Statement of Cash
Flows” whereby the profit is
adjusted to derive the cash flows
from operating activities. Cash and
cash equivalents comprise cash
in hand, other short term highly
liquid investments with maturity
less than seven days from date of
acquisition and bank overdrafts.
3.3.8 Use of Significant Accounting Judgements, Estimates and Assumptions
The preparation of the Financial
Statements requires management
to exercise judgements, estimates
and assumptions that affect the
application of accounting policies
and the reported amounts of
assets, liabilities, income and
expenses. Actual results may
differ from these estimates.
The judgements, estimates
and assumptions are based
on historical experience and
various other factors that are
believed to be reasonable under
the circumstances and reviewed
on an ongoing basis. Revisions
to accounting estimates are
recognised in the period in which
the estimates are revised and/
or in future periods if the revision
affects future periods too.
In the process of applying the
Group’s accounting policies,
management has made the
following judgements, estimates
and assumptions, which have
the most significant effect on
the amounts recognised in
the Financial Statements. The
accounting policies which are
most sensitive to the use of
judgements, estimates and
assumptions are specified below.
3.3.8.1 Going Concern
The Management has made
an assessment on the Group’s
ability to continue as a going
concern and is satisfied that it
has the resources to continue
in business for the foreseeable
future. Furthermore, management
is not aware of any material
uncertainties that may cast
significant doubt upon the
Group’s ability to continue as a
going concern. Therefore, the
Financial Statements continue to
be prepared on the going concern
basis.
3.3.8.2 Commitment and Contingent Liabilities
All discernible risks are accounted
for in determining the amount
of all known and measurable
liabilities. Contingent liabilities
are possible obligations whose
existence will be confirmed only by
uncertain future events or present
obligations where the transfer of
economic benefit is not probable
or cannot be reliably measured.
Contingent liabilities are not
recognised in the Statement
of Financial Position but are
disclosed unless its considered
remote that the Group will be liable
to settle the possible obligation.
3.3.8.3 Fair Value of Financial Instruments
Fair value is the price that would
be received to sell an asset or paid
to transfer a liability in an orderly
transaction between market
participants at the measurement
date.
Where the classification of a
financial asset or liability results
in it being measured at fair value,
wherever possible, the fair value
is determined by reference to the
quoted bid or offer price in the
most advantageous active market
to which the Group has immediate
access. An adjustment for credit
risk is also incorporated into the
fair value as appropriate.
Fair value for a net open position
that is a financial liability quoted
in an active market is the current
offer price, and for a financial
asset the bid price, multiplied
by the number of units of the
instrument held or issued.
Where no active market exists
for a particular asset or liability,
the Group uses a valuation
technique that include the use of
mathematical models to arrive at
the fair value, including the use
of transaction prices obtained in
recent arm’s length transactions,
discounted cash flow analysis,
option pricing models and other
valuation techniques based on
market conditions and risks
existing at Reporting date. In doing
so, fair value is estimated using
a valuation technique that makes
maximum use of observable
market inputs and places minimal
reliance upon entity-specific
inputs.
The best evidence of the fair
value of a financial instrument
at initial recognition is the

210 Bank of Ceylon | Annual Report 2018
NOTES TO THE FINANCIAL STATEMENTS
transaction price (i.e. the fair
value of the consideration given
or received) unless the fair value
of that instrument is evidenced by
comparison with other observable
current market transactions in
the same instrument (i.e. without
modification or repackaging) or
based on a valuation technique
whose variables include only data
from observable markets. When
such evidence exists, the Group
recognises the difference between
the transaction price and the fair
value in Profit or Loss on initial
recognition (i.e. on day one). The
valuations of financial instruments
are described comprehensively in
Note 61.
3.3.8.4 Impairment Charge for Loans and Advances
The measurement of impairment
charge both under SLFRS 9 and
LKAS 39 requires judgement by
management in identification and
estimation of the amount and
timing of future cash flows when
determining an impairment charge
for loans and advances.
Accordingly, the Group reviews
its individually significant loans
and advances at each Reporting
date to assess whether an
impairment charge should be
provided in the Statement of
Profit or Loss. In particular, the
Management’s judgement is
required in identification and
estimation of the amount and
timing of future cash flows when
determining the impairment loss.
In estimating these cash flows,
the Group makes judgements
about the borrower’s financial
position, the net realisable value of
collateral and other related factors.
These estimates are based on
assumptions about a number of
factors and actual results may
differ, resulting in future changes
to the impairment allowance.
A collective impairment provision
is established for the groups of
homogeneous loans and advances
that are not considered individually
significant and groups of loans
that are individually significant
but that were not found to be
individually impaired. A collective
assessment of impairment takes
into account the data from loan
portfolio (such as credit quality,
levels of arrears, credit utilization,
etc.), concentrations of risk and
economic data (including levels
of Unemployment, Inflation, GDP
growth rate and Country rating)
and the Performance of different
individual group.
The new impairment requirements
in SLFRS 9 are based on an
Expected Credit Loss (ECL)
model and it is reflected the
general pattern of deterioration,
or improvement, in the credit
quality of financial instruments.
The Group calculates ECLs either
on a collective or an individual
basis. The amount of ECLs
recognised as a loss allowance or
provision depends on the extent
of credit deterioration since initial
recognition and measured under
following bases:
• 12-month ECLs (stage 1),
which apply to all items as
long as there is no significant
deterioration in credit risk.
• Lifetime ECLs (stages 2 and 3),
which apply when a significant
increase in credit risk has
occurred on an individual or
collective basis.
Further, the Group makes
additional judgements and
estimates with regard to the
following under ECL model.
• The Group’s criteria for
assessing if there has been a
significant increase in credit
risk and so impairment for
financial assets should be
measured on a Lifetime ECL
basis.
• Development of ECL models,
including various formula and
the choice of inputs.
• Determination of association
between macro-economic
inputs, such as GDP
growth, inflation, interest
rates, exchange rates and
unemployment with the effect
on Probability of Default (PDs),
Exposure At Default (EAD) and
Loss Given Default (LGD).
• Selection of forward-looking
macro-economic scenarios
and their probability weightings
to derive the economic inputs
into the ECL model.
As per LKAS 39, the collective
provision for groups of
homogeneous loans is established
using statistical methods (such
as, net flow rate methodology)
or, a formula approach based on
historical loss rate experience,
using the statistical analysis of
historical data on delinquency
to estimate the amount of loss.
Management applies judgement

211
to ensure that the estimate of loss
arrived at, on the basis of historical
information is appropriately
adjusted to reflect the economic
conditions and portfolio factors
as at the Reporting date. The
loss rates are regularly reviewed
against actual loss experience.
It has been the Group’s policy to
regularly review its model in the
context of actual loss experience
and adjust when necessary. The
accuracy of the provision depends
on the model assumptions and
parameters used in determining
the impairment. Details of
impairment losses on loans and
advances are given in Note 14.
3.3.8.5 Impairment of Investment in Subsidiaries, Other Financial Assets and Non-Financial Assets
The Group and the Bank follow
the guidance of LKAS 36 –
“Impairment of Assets” and
SLFRS 9 - "Financial Instruments"
in determining whether an
investment or a financial asset
is impaired. Determination and
identification of impairment
indicators require the Group and
the Bank to evaluate duration and
extent to which the fair value of an
investment for a financial asset is
less than its cost and the financial
stability of the near term business
outlook of the investment or the
financial asset, considering the
factors such as performance of the
sector and industry, technology
and operational environmental
changes along with future cash
flows. This process involves with
significant judgement in aforesaid
areas and details are given under
respective Notes.
3.3.8.6 Defined Benefit Obligation
The cost of the defined benefit
pension plans and other post-
employment benefit plans are
determined using an actuarial
valuation. An actuarial valuation
involves making various
assumptions determining the
discount rates, expected rates
of return on assets, future salary
increases, mortality rates and
future pension increases. Due
to the long-term nature of these
plans, such estimates are subject
to significant uncertainty.
In determining the appropriate
discount rate, the Group considers
the interest rates of Sri Lanka
Government Bonds with maturities
corresponding to the expected
duration of the Defined Benefit
Obligation. The mortality rate
is based on publicly available
mortality tables. Future salary
increases and pension increases
are based on expected future
inflation rate and expected future
salary increase rates of the Group.
All assumptions are reviewed
at each Reporting date and
assumptions used in the year are
given in Note 47.
3.3.8.7 Fair Value of Land and Buildings
The freehold land and buildings
and the buildings on leasehold
land of the Group are reflected
at fair value less accumulated
depreciation. The Group engaged
independent valuation specialists
to determine fair value of such
properties in terms of the
SLFRS 13 – “Fair Value
Measurement”. The details of
valuation of freehold land and
buildings and the buildings on
leasehold land are given in Note 33.
3.3.8.8 Useful Life of the Property, Plant and Equipment and Intangible Assets
The Group reviews the residual
values, useful lives and methods
of depreciation of Property, Plant
and Equipment and intangible
assets at each Reporting date.
Judgement of the management
is exercised in the estimation
of these values, rates, methods
and hence they are subject to
uncertainty. The details of the
depreciation methods and rates
used for each assets category are
given in Note 33.
3.3.8.9 Classification of Investment Properties
Management is required to
use its judgement to determine
whether a property qualified as an
investment property. A property
that is held to earn rentals or for
capital appreciation or both and
which generates cash flows largely
independently of the other assets
held by the Group are accounted
for as investment properties. On
the other hand, properties that
are used for operations or for the
process of providing services or
for administration purposes and
which do not directly generate
cash flows as stand-alone assets
are accounted as Property, Plant
and Equipment.
3.3.8.10 Determination of control over investees
The Management applies its
judgements to determine whether
the control indicators set out in

212 Bank of Ceylon | Annual Report 2018
NOTES TO THE FINANCIAL STATEMENTS
Notes 30 and 31 indicates that the
Bank controls over it's investees.
3.3.8.11 Taxation
The Group is subject to income
tax, Value Added Tax (VAT),
Nation Building Tax (NBT), Debt
Repayment Levy (DRL) and other
applicable taxes.
A judgement is required to
determine the total provision for
current, deferred and other taxes
due to the uncertainties that exists
with respect to the interpretation
of the applicable tax laws at the
time of preparing these Financial
Statements. The details on the
applicable tax rates and other
information are given under Notes
4.9, 17 and 36.
The Group is subject to transfer
pricing regulations and it is
necessitated using management
judgement to determine the
impact of transfer pricing
regulations. Accordingly, critical
judgements and estimates were
used in applying the regulations
in aspects including but not
limited to identifying associated
undertakings, estimation of the
respective arm’s length prices and
selection of appropriate pricing
mechanism.
The current tax charge is
subject to such judgements.
Differences between estimated
income tax charge and actual
payable may arise as a result of
variances between Management’s
interpretation and application of
tax regulation.
4. Significant Accounting PoliciesThe significant accounting
policies applied by the Bank
and the Group in preparation
of its Financial Statements are
included below and have been
consistently applied to all periods
presented in these Financial
Statements of the Group and the
Bank, unless otherwise indicated.
A more detailed description of
policies adopted are set out in the
respective notes, where relevant.
4.1 New/ Amendments to Accounting Standards effective from 1 January 2018
In these financial statements, the
Group has applied SLFRS 9 -
“Financial Instruments”, SLFRS 7 –
“ (Revised) Financial Instruments:
Disclosure” and SLFRS 15-
“Revenue from Contracts with
Customers”, which are effective
for the annual Reporting periods
beginning on or after 1 January,
2018, for the first time. The
Group has not early adopted any
other standard, interpretation or
amendment that has been issued
but not effective.
4.1.1 SLFRS 9 – “Financial Instruments”
SLFRS 9 issued in December
2014 replaced LKAS 39 and is
applicable for annual Reporting
periods beginning on or after
1 January 2018. SLFRS 9 brought
about significant changes to the
classification and measurement
of financial instruments and
impairment assessment pertaining
to such instruments. These
changes are discussed in Notes
4.1.1.1 and 4.1.1.2 to the financial
statements.
4.1.1.1 Changes to Classification and Measurement
To determine their classification
and measurement category,
SLFRS 9 requires all financial
assets, except equity instruments
and derivatives, to be assessed
based on a combination of
the entity’s business model
for managing the assets and
the instruments’ cash flow
characteristics.
Classification and measurement
categories of financial assets, as
specified in LKAS 39 (fair value
through profit or loss (FVTPL),
available for sale (AFS), Held to
maturity (HTM) and Loans and
receivables - amortised cost) have
been replaced by;
• Financial assets at amortised
cost
• Financial assets measured
at Fair value through other
comprehensive income
(FVTOCI)
• Financial assets measured
at Fair value through profit or
loss (FVTPL)
SLFRS 9 largely retains the
existing requirements in LKAS 39
for the classification of financial
liabilities. However, under
LKAS 39, all fair value changes
of liabilities designated under the
fair value option were recognised
in Profit or Loss. Under SLFRS 9,

213
fair value changes are generally
presented as follows:
• The amount of change in the
fair value that is attributable
to changes in the credit risk
of the liability is presented in
Other Comprehensive Income
(OCI); and
• The remaining amount of
change in the fair value is
presented in profit or loss.
Note 4.5.2.2 provides an
explanation on how the Bank
classifies financial liabilities under
SLFRS 9.
Under SLFRS 9, derivatives
embedded in a host financial
asset are no longer treated as
separate derivatives. Instead such
financial instruments are classified
based on the business model
and their contractual terms, as
explained in Notes 4.5.5 and 4.5.6.
The accounting treatment for
derivatives embedded in financial
liabilities and non-financial host
contracts has not changed. The
Group’s accounting policies for
embedded derivatives are set out
in Notes 25 and 40.
The classification and
measurement of financial assets
are made on the basis of the facts
and circumstances given below.
• The determination of the
business model within which a
financial asset is held.
• The designation and
revocation of previous
designations of certain
financial assets and financial
liabilities as measured at
FVTPL.
• The designation of certain
investments in equity
instruments not held for
trading as at FVTOCI.
• For financial liabilities
designated at FVTPL, the
determination of whether
presenting the effects of
changes in the financial
liability’s credit risk in OCI
would create or enlarge an
accounting mismatch in profit
or loss.
The Group’s classification of its
financial assets and liabilities
is given in Notes 4.5.2.1 and
4.5.2.2. The quantitative impact of
applying SLFRS 9 as at 1 January
2018 is disclosed in Note 62.
4.1.1.2 Changes to the Impairment calculation
The adoption of SLFRS 9 has
fundamentally changed the
Group’s accounting for loan
impairment charge by replacing
the incurred loss approach under
LKAS 39 with a forward looking
expected credit loss (ECL)
approach. SLFRS 9 requires the
Group to record an allowance for
ECLs for all loans and other debt
financial assets not held at FVTPL,
together with loan commitments
and financial guarantee contracts
but not to equity investments.
Under SLFRS 9 credit impairment
charge are recognised earlier than
under LKAS 39.
The allowance is based on
the ECLs associated with the
Probability of Default (PD) in the
next twelve months unless there
has been a significant increase
in credit risk since origination.
Lifetime ECL is provided for
financial assets for which
the credit risk has increased
significantly from initial recognition
and the credit impaired assets
subsequent to initial recognition.
If the financial asset meets
the definition of purchased or
originated credit impaired (POCI),
the allowance is based on the
change in the ECLs over the life of
the asset.
If a debt security had low credit
risk at the date of initial application
of SLFRS 9, then the Group
has assumed that credit risk
on the asset had not increased
significantly since its initial
recognition.
Details of the Group’s credit
impairment method are disclosed
in Note 27.
4.1.2 SLFRS 7 (Revised) – Financial Instruments: Disclosures
The Group adopted SLFRS 7
together with SLFRS 9, effective
from 1 January 2018 to reflect the
differences between
SLFRS 9 and LKAS 39. Changes
including transition disclosures
as shown in Note 62 together
with detailed qualitative and
quantitative information about
the ECL calculations such as the
assumptions and inputs used are
disclosed as per the requirements
of the Standards in Note 27.
Movements during the year in the
ECL allowances are presented in
Note 27.

214 Bank of Ceylon | Annual Report 2018
NOTES TO THE FINANCIAL STATEMENTS
4.1.3 SLFRS 15 – “Revenue from Contracts with Customers”
SLFRS 15 became effective for
financial periods beginning on or
after 1 January 2018. The core
principle of SLFRS 15 is that an
entity has to recognise revenue
to depict the transfer of promised
goods or services to customers.
This core principle is delivered in
a five-step model framework as
disclosed below.
• Identify the contract(s) with a
customer
• Identify the performance
obligations in the contract
• Determine the transaction
price
• Allocate the transaction
price to the performance
obligations in the contract
• Recognise revenue when the
entity satisfies a performance
obligation
Application of this guidance
will depend on the facts and
circumstances present in a
contract with a customer and will
require the exercise of judgment.
The Group did not have any
material impact on its fee and
commission income with the
adoption of SLFRS 15 for the year
beginning 1 January 2018.
4.2 Basis of Consolidation
The Group’s Financial Statements
comprise consolidation of the
Financial Statements of the Bank
and its Subsidiaries in terms
of SLFRS 10 – “Consolidated
Financial Statements” and
LKAS 27 – "Separate Financial
Statements” and the proportionate
share of the profit or loss and
net assets of its Associates in
terms of the Sri Lanka Accounting
Standard LKAS 28 – “Investments
in Associates and Joint Ventures”.
The Bank’s Financial Statements
comprise the amalgamation
of the Financial Statements of
the Domestic Banking Unit, the
Off-shore Banking Unit and the
Overseas Operations of the Bank.
The detailed accounting policies
pertaining to the consolidation of
Subsidiaries and Associates are
given in the Notes 30 and 31.
4.2.1 Business Combinations
The Group determines whether
a transaction or other event
is a business combination by
applying the definition in SLFRS
3 – “Business Combination”,
which requires that the assets
acquired and liabilities assumed
constitute a business. Business
combinations are accounted for
using the acquisition method.
As of the acquisition date, the
amount of non controlling interest
is measured either at fair value or
at the non-controlling interests’
proportionate share of the
acquirer’s identifiable net assets.
Acquisition related cost are
costs the acquirer incurs to
effect a business combination.
Those costs include finder’s
fees, advisory, legal, accounting,
valuation, other professional
consulting fees, general
administrative costs including the
cost of maintaining an Internal
Acquisition Department and cost
of registering and issuing debt and
equity securities.
Acquisition related costs, other
than those associated with the
issue of debt or equity securities
are expensed in the periods in
which the costs are incurred and
the services are received. The
Group elects on a transaction
by transaction basis whether
to measure non-controlling
interests at its fair value or
at its proportionate share of
the recognised amount of the
identifiable net assets, at the
acquisition date. Transaction
costs, other than those associated
with the issue of debt or equity
securities that the Group incurs
in connection with a business
combination are expensed as
incurred.
4.2.2 Loss of Control
When the Group loses control
over a Subsidiary, it derecognises
the assets and liabilities of the
Subsidiary, and any related Non
Controlling Interest (NCI) and
other components of equity.
Any resulting gain or loss is
recognised in profit or loss. Any
interest retained in the former
Subsidiary is measured at fair
value when control is lost. Further,
the Bank’s share of components
previously recognised in Other
Comprehensive Income (OCI) is
reclassified to Profit or Loss or
retained earnings as appropriate.
Any surplus or deficit arising on
the loss of control is recognised
in the Profit or Loss. If the
Group retains any interest in the
previous Subsidiary, then such
interest is measured at fair value
at the date that control is lost.

215
Subsequently, it is accounted for
as an equity-accounted investee
or in accordance with the Group’s
accounting policy for financial
instruments depending on the
level of influence retained.
4.3 Foreign Currency Translations
4.3.1 Foreign Currency Transactions and Balances
At the initial recognition,
transactions in foreign currency
are translated into the functional
currency of the operation which
is Sri Lankan Rupees (LKR) at the
spot exchange rate at the date of
the transaction. Monetary assets
and liabilities denominated in
foreign currency at the Reporting
date are retranslated into the
functional currency at the spot
exchange rate at that date and all
differences arising on non-trading
activities are taken to “Net other
operating income” (Note 13) in the
Statement of Profit or Loss.
Non-monetary assets and
liabilities that are measured in
terms of historical cost in a foreign
currency are translated using
the exchange rate at the date
of the initial recognition. Non-
monetary assets and liabilities
denominated in foreign currency
that are measured at fair value are
retranslated into the functional
currency at the spot exchange
rate including any exchange
gain or loss component at the
date on which the fair value is
determined. Gain or loss on a non-
monetary item including exchange
component is recognised in Other
Comprehensive Income.
Forward exchange contracts are
valued at the forward market rates
ruling on the Reporting date and
resulting net unrealised gains
or losses are dealt within the
Statement of Profit or Loss.
4.3.2 Foreign Operations
The results and financial position
of foreign operations, whose
functional currencies are not Sri
Lankan Rupees, are translated into
Sri Lankan Rupees as follows:
The assets and liabilities of foreign
operations are translated into Sri
Lankan Rupees at spot exchange
rate as at the Reporting date.
The income and expenses of
foreign operations are translated
at average rate for the period.
Foreign currency differences
on the translation of foreign
operations are recognised in Other
Comprehensive Income .
When a foreign operation is
disposed off, the relevant amount
in the translation reserve is
transferred to the Profit or Loss
as part of the Profit or loss on
disposal in other operating income
or other operating expenses.
4.4 Classification of Financial Instruments between Debt and Equity
Classification of financial
instruments between debt and
equity depends on following
characteristics of such
instruments:
• Name or labels given to the
instruments
• Presence or absence of a
fixed maturity date
• Life of the instrument
• Source of payments
• Right to enforce payments
• Rights to participate in
management
• Risk involved in the
instruments
• Volatility of cash flows
• Securities given as collaterals
4.5 Financial Assets and Financial Liabilities
4.5.1 Recognition and de-recognition of financial instruments
All financial assets and liabilities
are initially recognised on the
settlement date, i.e. the date
that the Group becomes a party
to the contractual provisions of
the instrument. This includes;
“regular way trades”. Regular way
trade means purchases or sales
of financial assets that require
delivery of assets within the
time frame generally established
by regulation or convention in
the market place. Loans and
receivables are recognised when
cash is advanced (or settled) to
the borrowers. Financial assets
at fair value through profit or loss
are recognised initially at fair
value. All other financial assets
are recognised initially at fair
value plus directly attributable
transaction costs.
The Group derecognises
a financial asset when the
contractual cash flows from the
asset expire or it transfers its
rights to receive contractual cash
flows on the financial asset in a
transaction in which substantially
all the risks and rewards of

216 Bank of Ceylon | Annual Report 2018
NOTES TO THE FINANCIAL STATEMENTS
ownership are transferred. Any
interest in transferred financial
assets that is created or retained
by the Group is recognised as a
separate asset or liability.
A financial liability is derecognised
when the obligation under the
liability is discharged or cancelled
or expired. Where an existing
financial liability is replaced by
another from the same lender on
substantially different terms, or
the terms of an existing liability
are substantially modified, such
an exchange or modification is
treated as a derecognition of the
original liability and the recognition
of a new liability. The difference
between the carrying value of the
original financial liability and the
consideration paid is recognised in
the Statement of Profit or Loss.
4.5.2 Classification of Financial Assets and Financial Liabilities
As per SLFRS 9, the classification
depends on the Group’s business
model for managing financial
assets and the contractual terms
of the financial assets’ cash flows.
The following diagram depicts how
the Bank classifies the financial
assets.
4.5.2.1 At the Inception, the Financial Assets are classified in one of the following categories:
• Financial assets measured at
fair value through profit or loss
(Note 4.5.7 and 26)
• Financial assets at amortised
cost
- Financial assets at
amortised cost - loans and
advances (Note 27)
- Financial assets at amortised
cost - debt and other
instruments (Note 4.5.8 and 28)
• Financial assets measured
at fair value through Other
Comprehensive Income (Note
4.5.9 and 29)
4.5.2.2 At the Inception, the Financial Liabilities are classified in one of the following categories:
• Financial liabilities at amotised
cost
- Financial liabilities at
amortisd cost – due to
depositors (Note 41)
- Financial liabilities
at amortised cost-
other borrowings and
subordinated instruments
(Note 42 and 48 )
4.5.3 Initial Measurements of Financial Instruments
Financial assets and liabilities are
initially measured at their fair value
plus transaction cost, except in
the case of financial assets and
liabilities recorded at fair value
through profit or loss. Transaction
cost in relation to financial assets
and liabilities at fair value through
profit or loss are dealt with in the
Statement of Profit or Loss.
Derivative Instrument
Debt Instrument
Held for trading
Elected the irrecoverable option of OCI?
Fair value through other
comprehensive income
Fair value through
profit or lossAmortised cost
Held to
collect
cash flow
Held to collect cash
flows and for sale
Held for trading
Equity Instrument
Yes
Yes
Yes
Yes
NoNo
No
Fair value option elected ?
Solely Payments of Principle and Interest (SPPI) ?
No

217
4.5.4 “Day One” Profit or Loss
When the transaction price
differs from the fair value
of other observable current
market transactions in the same
instrument or based on a valuation
technique whose variables
include only data from observable
markets, the Group immediately
recognises the difference between
the transaction price and fair
value (a “Day One” Profit or Loss)
in the Statement of Profit or
Loss. In cases where fair value
is determined using data which
is not observable, the difference
between the transaction price and
model value is only recognised
in the Statement of Profit or Loss
over the life of the instrument.
4.5.5 Business model assessment
With effect from 1 January 2018,
as per SLFRS 9, the Group
classifies all of its financial assets
based on the business model
and makes an assessment of the
objective of a business model
in which an asset is held at a
portfolio level and not assessed
on instrument-by- instrument
basis because this best reflects
the way the business is managed
and information is provided to
management. The information
considered includes:
• The stated policies and
objectives for the portfolio and
the operation of those policies
in practice. In particular,
whether management’s
strategy focuses on earning
contractual interest revenue,
maintaining a particular
interest rate profile, matching
the duration of the financial
assets to the duration of the
liabilities that are funding
those assets or realising cash
flows through the sale of the
assets;
• How the performance of
the portfolio is evaluated
and reported to the Bank’s
management;
• The risks that affect the
performance of the business
model (and the financial
assets held within that
business model) and how
those risks are managed;
• How managers of the
business are compensated
– e.g. whether compensation
is based on the fair value
of the assets managed or
the contractual cash flows
collected; and
• The frequency, volume
and timing of sales in prior
periods, the reasons for such
sales and its expectations
about future sales activity.
However, information
about sales activity is not
considered in isolation, but as
part of an overall assessment
of how the Bank’s stated
objective for managing the
financial assets is achieved
and how cash flows are
realised.
The business model assessment
is based on reasonably expected
scenarios without taking ‘worst
case’ or ‘stress case’ scenarios
into account. If cash flows after
initial recognition are realised in
a way that is different from the
Bank’s original expectations,
the Bank does not change the
classification of the remaining
financial assets held in that
business model, but incorporates
such information when assessing
newly originated or newly
purchased financial assets going
forward.
4.5.6 Assessment of whether contractual cash flow characteristics are met the Solely Payments of Principal and Interest (SPPI test)
As a second step of assets
classification process, the Group
assesses the contractual terms of
financial assets to identify whether
they meet the SPPI test.
For the purposes of this
assessment, “principal” is defined
as the fair value of the financial
asset on initial recognition and
may change over the life of the
financial asset (for example, if
there are repayments of principal
or amortisation of the premium/
discount).
“Interest” is defined as
consideration for the time value
of money and for the credit risk
associated with the principal
amount outstanding during a
particular period of time and for
other basic lending risks and
costs, as well as profit margin.
In contrast, contractual terms that
introduce a more than deminimise
exposure to risks or volatility in
the contractual cash flows that
are unrelated to a basic lending
arrangement do not give rise to
contractual cash flows that are
solely payments of principal and
interest on the principal amount

218 Bank of Ceylon | Annual Report 2018
NOTES TO THE FINANCIAL STATEMENTS
outstanding. In such cases, the
financial asset is required to be
measured at fair value through
profit and loss.
In assessing whether the
contractual cash flows are
solely payments of principal
and interest on principal
amount outstanding, the Group
considers the contractual terms
of the instrument. This includes
assessing whether the financial
asset contains a contractual term
that could change the timing
or amount of contractual cash
flows such that it would not meet
this condition. In making the
assessment, the Group considers:
• Contingent events that would
change the amount and timing
of cash flows;
• Leverage features;
• Prepayment and extension
terms;
• Terms that limit the Group’s
claim to cash flows from
specified assets; and
• Features that modify
consideration of the time
value of money
4.5.7 Financial assets measured at fair value through profit or loss
Items at fair value through profit or
loss comprise:
• Items held for trading
purpose;
• Items specifically designated
as fair value through profit or
loss on initial recognition; and
• Debt instruments with
contractual terms that do not
represent solely payments of
principal and interest.
Financial instruments held at fair
value through profit or loss are
initially recognised at fair value,
with transaction costs recognised
in the Statement of Profit or Loss
as incurred. Subsequently, they
are measured at fair value and any
gains or losses are recognised in
the Statement of Profit or Loss as
they arise.
Where a financial asset is
measured at fair value, a credit
valuation adjustment is included
to reflect the credit worthiness of
the counterparty, representing the
movement in fair value attributable
to changes in credit risk.
4.5.7.1 Financial instruments held for trading purpose
A financial instrument is classified
as held for trading if it is acquired
or incurred principally for the
purpose of selling or repurchasing
in the near term, or forms part of
a portfolio of financial instruments
that are managed together and
for which there is evidence of
short-term profit taking, or it is a
derivative not in a qualifying hedge
relationship.
Trading derivatives and trading
securities are classified as held
for trading and recognised at fair
value in the Statement of Financial
Position. Changes in fair value
are recognised in "Net gains/
(losses) from trading" (Note 10)
and "Net fair value gains/ (losses)
from financial instruments at fair
value through profit or loss" (Note
11). Interest income from financial
instruments held for trading
is recorded under net interest
income (Note 8) while dividend
income is recorded in net gains/
(losses) from trading (Note 10)
when the right to payment has
been established.
4.5.7.2 Financial instruments designated and measured at fair value through profit or loss
Upon initial recognition, financial
instruments may be designated
and measured at fair value through
profit or loss. A financial asset may
only be designated at fair value
through profit or loss if doing so
eliminates or significantly reduces
measurement or recognition
inconsistencies (i.e. eliminates an
accounting mismatch) that would
otherwise arise from measuring
financial assets or liabilities on a
different basis.
A financial liability may be
designated at fair value through
profit or loss if it eliminates
or significantly reduces an
accounting mismatch or:
• If a host contract contains
one or more embedded
derivatives; or
• If financial assets and
liabilities are both managed
and their performance
evaluated on a fair value
basis in accordance with a
documented risk management
or investment strategy.
Where a financial liability is
designated at fair value through
profit or loss, the movement in
fair value attributable to changes
in the Group’s own credit quality
is calculated by determining the
changes in credit spreads above
observable market interest rates

219
and is presented separately in
other comprehensive income.
4.5.7.3 Debt instruments with contractual terms that do not represent the solely payments of principal and interest
Financial debt instruments which
are not meet solely payments of
principal and interest test will be
classified as fair value through
profit or loss.
4.5.8 Financial assets measured at amortised cost-debt instruments
Investments in debt instruments
are measured at amortised cost
where they have:
• Contractual terms that give
rise to cash flows on specified
dates, that represent solely
payments of principal and
interest on the principal
amount outstanding; and
• Are held within a business
model whose objective is
achieved by holding to collect
contractual cash flows.
These debt instruments are initially
recognised at fair value plus
directly attributable transaction
costs and subsequently
measured at amortised cost
using Effective Interest Rate
(EIR). The measurement of credit
impairment is based on the three-
stage expected credit loss model
described below in Note 4.5.11
Impairment of financial assets.
4.5.9 Financial assets measured at fair value through Other Comprehensive Income
4.5.9.1 Debt instruments
Investments in debt instruments
are measured at fair value through
Other Comprehensive Income
where they have:
• Contractual terms that give
rise to cash flows on specified
dates, that represent solely
payments of principal and
interest on the principal
amount outstanding; and
• Are held within a business
model whose objective is
achieved by both collecting
contractual cash flows and
selling financial assets.
These debt instruments are initially
recognised at fair value plus
directly attributable transaction
costs and subsequently measured
at fair value. Gains and losses
arising from changes in fair
value are included in Other
Comprehensive Income within a
separate component of equity.
Impairment losses or reversals,
interest revenue and foreign
exchange gains and losses are
recognised in Profit or Loss. Upon
disposal, the cumulative gain
or loss previously recognised in
Other Comprehensive Income
is reclassified from Other
Comprehensive Income to Profit
or Loss.
The measurement of credit
impairment is based on the three-
stage expected credit loss model
as applied to financial assets at
amortised cost. The expected
credit loss model is described
below in Note 4.5.11 Impairment of
financial assets.
4.5.9.2 Equity instruments
Investment in equity instruments
that are neither held for trading
nor contingent consideration
recognised by the Group in a
business combination to which
SLFRS 3- “Business Combination”
applies, are measured at fair value
through Other Comprehensive
Income, where an irrevocable
election has been made by
management. For portfolios
where management does not
consider an irrevocable election
of adopting fair value through
other comprehensive income, by
default such investments shall be
measured at fair value through
profit or loss.
Upon de-recognition, the
cumulative gain or loss recognised
in Other Comprehensive Income
are not transferred to Profit or
Loss. However, cumulative gain or
loss recognised full derecognition
will be transferred from Other
Comprehensive Income reserve to
retained earnings within the equity.
Dividends on such investments are
recognised in "Net other operating
income" (Note 13) in the Profit or
Loss.
4.5.10 Reclassification of Financial Assets
The Group reclassifies its financial
assets when, and only when, the
Group changes its business model
for managing financial assets. If
the Group reclassifies financial
assets which were measured
at amortised cost, fair value
through other comprehensive
income or fair value through profit
or loss, the Group applies the
reclassification prospectively from
the reclassification date. The Group
does not re-state any previously
recognised gains, losses (including
impairment losses) or interest.

220 Bank of Ceylon | Annual Report 2018
NOTES TO THE FINANCIAL STATEMENTS
The table below summarises the treatment of gains and losses on reclassification.
Initial Measurement
Measurement after
reclassification Treatment on reclassification
Fair value through
profit or loss
Amortised cost Fair value at the reclassification date
becomes its new gross carrying amount.
The effective interest rate is calculated on
the basis of that amount. For the purpose of
applying the impairment requirements, the
reclassification date is treated as the date of
initial application.
Fair value through
profit or loss
Fair value through
other comprehensive
income
The fair value of the financial asset at the
reclassification date becomes its new carrying
amount and the effective interest rate is de-
termined on the basis of the fair value of the
asset at the reclassification date.
Fair value through
other comprehensive
income
Amortised cost The cumulative gain or loss previously
recognised in Other Comprehensive Income
is removed from equity and adjusted against
the fair value of the financial asset at the
reclassification date. The effective interest
rate and the measurement of expected credit
losses are not adjusted as a result of the
reclassification.
Fair value through
other comprehensive
income
Fair value through
profit or loss
The fair value of the financial asset at the
reclassification date becomes its new
carrying amount. The cumulative gain
or loss previously recognised in Other
Comprehensive Income is reclassified from
equity to Profit or Loss as a reclassification
adjustment at the reclassification date.
Amortised cost Fair value through
profit or loss
Any gain or loss arising from a difference
between the previous amortised cost of
the financial asset and fair value at the
reclassification date is recognised in Profit or
Loss.
Amortised cost Fair value through
other comprehensive
income
Any gain or loss arising from a difference
between the previous amortised cost of
the financial asset and fair value at the
reclassification date is recognised in Other
Comprehensive Income. The effective interest
rate and the measurement of expected credit
losses are not adjusted as a result of the
reclassification.
4.5.11 Impairment of Financial Assets
The Group applies a three-stage approach in measuring Expected Credit Loss
(ECL) for the following categories of financial assets that are not measured at fair
value through profit or loss:
• Debt instruments measured at
amortised cost and fair value
through other comprehensive
income;
• Loan commitments; and
• Financial guarantee contracts.
No ECL is recognised on equity
investments.
The Group performs an
assessment at the end of each
Reporting period, of whether a
financial instrument’s credit risk
has increased significantly since
initial recognition, by considering
the change in the risk of default
occurring over the remaining life
of the financial instrument. Based
on this process financial assets
migrate through the following three
stages based on the change in
credit risk since initial recognition:
4.5.11.1 Stage 1: 12-months ECL
For exposures where there has
not been a significant increase in
credit risk since initial recognition
and that are not credit impaired
upon origination, the portion
of the lifetime ECL associated
with the probability of default
events occurring within the next
12 months is recognised. The
Bank determines 12 months ECL
from customers whom are not
significantly credit deteriorated.
4.5.11.2 Stage 2: Lifetime ECL For exposures where there has
been a significant increase in
credit risk since initial recognition
but are not credit impaired, a
lifetime ECL (i.e. reflecting the
remaining lifetime of the financial
asset) is recognised.

221
4.5.11.3 Stage 3: Lifetime ECL
Exposures are assessed as
credit impaired when one or more
events that have a detrimental
impact on the estimated future
cash flows of that asset have
occurred. For exposures that have
become credit impaired, a lifetime
ECL is recognised and interest
revenue is calculated by applying
the effective interest rate to the
amortised cost (net of provision)
rather than the gross carrying
amount.
4.5.11.4 Calculation of ECL
The Group calculates ECL
based on a three probability-
weighted scenarios to measure
the expected cash shortfalls,
discounted at an approximation
to the Effective Interest Rate (EIR).
A cash shortfall is the difference
between the cash flows that are
due to an entity in accordance
with the contract and the cash
flows that the entity expects to
receive.
The mechanics of the ECL
calculations of the Group are
outlined below and the key
elements are, as follows:
• Probability of Default (PD)
PD is an estimate of the
likelihood of default over a
given time horizon. A default
may only happen at a certain
time over the assessed
period, if the facility has not
been previously recognised
and is still in the portfolio.
The concept of PDs is further
explained in Note 27.
• Exposure At Default (EAD)
EAD is an estimate of the
exposure at a future default
date, taking into account
expected changes in the
exposure after the Reporting
date, including repayments of
principal and interest, whether
scheduled by contract
or otherwise, expected
drawdowns on committed
facilities, and accrued interest
from missed payments. The
EAD is further explained in
Note 27.
• Loss Given Default (LGD)
LGD is an estimate of the loss
arising in the case where a
default occurs at a given time.
It is based on the difference
between the contractual cash
flows due and those that
the lender would expect to
receive, including from the
realisation of any collateral.
It is usually expressed as a
percentage of the EAD. The
LGD is further explained in
Note 27.
4.5.11.5 Determining the stage for impairment
At each Reporting date, the
Group assesses whether there
has been a significant increase
in credit risk for exposures since
initial recognition by comparing
the risk of default occurring over
the expected life between the
Reporting date and the date of
initial recognition. The Group
considers reasonable and
supportable information that is
relevant and available without
undue cost or effort for this
purpose. This includes quantitative
and qualitative information and
also, forward-looking analysis.
An exposure will migrate through
the ECL stages as asset quality
deteriorates. If, in a subsequent
period, asset quality improves
and also reverses any previously
assessed significant increase
in credit risk since origination,
then the provision for doubtful
debts reverts from lifetime ECL to
12-months ECL. Exposures that
have not deteriorated significantly
since origination, or where the
deterioration remains within the
Group’s investment grade criteria,
or which are less than 30 days
past due, are considered to have
a low credit risk. The impairment
provision for these financial assets
is based on a 12-months ECL.
The Group assesses whether
the credit risk on an exposure
has increased significantly on
an individual or collective basis.
For the purposes of a collective
evaluation of impairment, financial
instruments are grouped on
the basis of shared credit risk
characteristics, taking into
account of instrument type, credit
risk ratings, collateral type, date of
initial recognition, remaining term
to maturity, industry, geographical
location of the borrower and other
relevant factors.
4.5.11.6 Measurement of ECL
ECL is derived from unbiased and
probability-weighted estimates of
expected loss, and are measured
as follows:

222 Bank of Ceylon | Annual Report 2018
NOTES TO THE FINANCIAL STATEMENTS
• Financial assets that are
not credit-impaired at the
Reporting date: as the present
value of all cash shortfalls
over the expected life of the
financial asset discounted by
the effective interest rate. The
cash shortfall is the difference
between the cash flows due
to the Group in accordance
with the contract and the cash
flows that the Group expects
to receive.
• Financial assets that are
credit-impaired at the
Reporting date: as the
difference between the gross
carrying amount and the
present value of estimated
future cash flows discounted
by the effective interest rate.
• Undrawn loan commitments:
as the present value of the
difference between the
contractual cash flows that
are due to the Group if the
commitment is drawn down
and the cash flows that the
Group expects to receive.
• Financial guarantee contracts:
as the expected payments
to reimburse the holder less
any amounts that the Group
expects to recover.
ECL is recognised in the
Statement of Profit or Loss. In
the case of debt instruments
measured at fair value through
Other Comprehensive Income,
the measurement of ECL is based
on the three-stage approach
as applied to financial assets at
amortised cost.
4.6 Impairment of Non-Financial Assets
The Group assesses at each
Reporting date whether there is
an indication that an asset may be
impaired. If any indication exists,
or when annual impairment testing
for an asset is required, the Bank
estimates the asset’s recoverable
amount. An asset’s recoverable
amount is the higher of an asset’s
fair value less costs to sell or its
value in use. Where the carrying
amount of an asset exceeds its
recoverable amount, the asset is
considered impaired and is written
down to its recoverable amount.
In assessing the value in use,
the estimated future cash flows
are discounted to their present
value using a pre-tax discount
rate that reflects current market
assessments of the time value of
money and the risks specific to
the asset. In determining fair value
less costs to sell, an appropriate
valuation model is used. These
calculations are corroborated
by valuation multiples, quoted
share prices for publicly-traded
subsidiaries or other valuable fair
value indicators.
4.7 Fiduciary Services
The Group provides fiduciary
services to third parties that
result in holding of the assets on
behalf of its customers. Assets
held in fiduciary capacity are
not recognised in the Financial
Statements, as the Group is not
the beneficial owner or does not
control such assets.
4.8 Provisions
A provision is recognised as
a result of a past event, when
the Group has a present (legal
or constructive) obligation that
can be estimated reliably and
it is probable that an outflow
of economic benefits will be
required to settle the obligation.
The amount recognised is the
best estimate of the consideration
required to settle the present
obligation at the Reporting date,
taking into account the risks and
uncertainties surrounding the
obligation at that date. Where a
provision is measured using the
cash flows estimated to settle the
present obligation, its carrying
amount is determined based on
the present value of those cash
flows. A provision for onerous
contracts is recognised when the
expected benefits to be derived
by the Group from a contract are
lower than the unavoidable cost
of meeting its obligations under
the contract. The provision is
measured as the present value of
the lower of the expected cost of
terminating the contract and the
expected net cost of continuing
with the contract.
4.9 Income Tax Expense and Other Taxes
4.9.1 Income Tax Expense
Income tax expense comprises
current and deferred tax. More
details are given in Note 17.
4.9.2 Value Added Tax (VAT) on Financial Services
The base for Value Added
Tax computation is arrived by
aggregating the accounting
profit before income tax and
emoluments of employees, which
is adjusted for the depreciation
computed on prescribed rates.

223
During the year, the Group’s total
value addition was subjected to
15% (2017– 15%) VAT as per the
Value Added Tax Act No. 14 of
2002 and amendments thereto.
Also the Group is following value
attributable method to compute
VAT on financial services.
4.9.3 Withholding Tax (WHT) on Dividends
• Withholding tax on dividends
distributed by the Bank.
No withholding tax is paid
by the Bank, since Bank
distributes dividend to its sole
shareholder, the Government
of Sri Lanka.
• Withholding tax on dividends
distributed by the Subsidiaries
and Associates.
Dividend distributed out
of taxable profit of the
Subsidiaries and Associate
companies attracts a 14%
deduction at source after
1 April 2018. (10% up to 31
March 2018)
4.9.4 Economic Service Charge (ESC)
As per provisions of the Economic
Service Charge (ESC) Act No.13 of
2006 and amendments thereafter,
ESC is payable at 0.5% on Bank’s
liable turnover and is deductible
from income tax payable.
4.9.5 Crop Insurance Levy (CIL)
As per the provisions of the
Finance Act No. 12 of 2013, the
CIL was introduced with effect
from 1 April 2013 and is payable
1% of the profit after tax to the
National Insurance Trust Fund
Board.
4.9.6 Nation Building Tax (NBT) on Financial Services
NBT on financial services is
calculated in accordance with
Nation Building Tax (NBT) Act
No. 9 of 2009 and subsequent
amendments. NBT on financial
services is calculated at 2% of
the value addition used for the
purpose of VAT on Financial
Services.
4.9.7. Debt Repayment Levy (DRL) on Financial Services
As per the Finance Act No. 35 of
2018, DRL shall be charged from
every financial institution with
effect from 1 October 2018. DRL is
calculated at the rate of 7% on the
value addition attributable to the
financial services.
5. Insurance Business5.1 Reinsurance
The Group cedes insurance
risk in the normal course of
business for all of its businesses.
Reinsurance assets represent
balances due from reinsurance
companies. Amounts recoverable
from reinsurers are estimated
in a manner consistent with the
outstanding claims provision or
settled claims associated with
the reinsurer’s policies and are
in accordance with the related
reinsurance contract.
Reinsurance assets are reviewed
for impairment at each Reporting
date or more frequently when
an indication of impairment
arises during the Reporting
year. Impairment occurs when
there is objective evidence as a
result of an event that occurred
after initial recognition of the
reinsurance asset that the Group
may not receive all outstanding
amounts due under the terms of
the contract and the event has
a reliably measurable impact on
the amounts that the Group will
receive from the reinsurer. The
impairment loss is recorded in the
Statement of Profit or Loss.
Premiums and claims are
presented on a gross basis for
reinsurance. Reinsurance assets
or liabilities are derecognised
when the contractual rights are
extinguished or expire or when the
contract is transferred to another
party.
5.2 Insurance Receivables
Insurance receivables are
recognised when due and
measured on initial recognition at
the fair value of the consideration
receivable. The carrying value of
insurance receivables is reviewed
for impairment whenever events
or circumstances indicate that
the carrying amount may not be
recoverable, with the impairment
loss recorded in the Statement of
Profit or Loss.
5.3 Deferred Expenses
5.3.1 Deferred Acquisition Costs (DAC)
The costs of acquiring new
businesses including commission,
underwriting, marketing and
policy issue expenses which
vary with and directly related to

224 Bank of Ceylon | Annual Report 2018
NOTES TO THE FINANCIAL STATEMENTS
production of new businesses
and/or investment contracts
with Discretionary Participation
Features (DPF), are deferred
to the extent that these costs
are recoverable out of future
premiums. All other acquisition
costs are recognised as
an expense when incurred.
Subsequent to initial recognition,
DAC for general insurance is
amortised over the period on
the basis unearned premium is
amortised. The reinsurances’
share of deferred acquisition
cost is amortised in the same
manner as the underlying assets
amortisation is recorded in the
Statement of Profit or Loss.
Changes in the expected useful
life or the expected pattern of
consumption of future economic
benefits embodied in the assets
are accounted for by changing
the amortisation period and
are treated as a change in an
accounting estimate. DAC are
derecognised when the related
contracts are either expired or
cancelled.
5.4 Reinsurance Commissions
Commissions receivable on
outwards reinsurance contracts
are deferred and amortised over
the period of reinsurance.
5.5 Investment Contract Liabilities
Investment contracts are classified
between contracts with and
without DPF. The accounting
policies for investment contract
liabilities with DPF are the same
as those for life insurance contract
liabilities.
Investment contract liabilities
without DPF are recognised when
contracts are entered into and
premiums are charged. These
liabilities are initially recognised
at fair value being the transaction
price excluding any transaction
costs directly attributable to the
issue of the contract. Subsequent
to initial recognition, investment
contract liabilities are measured at
fair value through profit or loss.
Deposits and withdrawals are
recorded directly as an adjustment
to the liability in the Statement
of Financial Position. Fair value
adjustments are performed at
each Reporting date and are
recognised in the Statement
of Profit or Loss. Fair value is
determined through the use of
prospective discounted cash flow
techniques. For unitised contracts,
fair value is calculated as the
number of units allocated to the
policyholder in each unit linked
fund multiplied by the unit price
of those funds at the Reporting
date. The fund assets and fund
liabilities used to determine the
unit prices at the Reporting date
are valued on a basis consistent
with their measurement basis in
the Statement of Financial Position
adjusted to take account of the
effect on the liabilities of the
deferred tax on unrealised gains
on assets in the fund. Non-utilised
contracts are subsequently carried
at fair value, which is determined
by using valuation techniques
such as discounted cash flows
and stochastic modelling. Models
are validated, calibrated and
periodically reviewed by an
independent qualified person.
The liability is derecognised
when the contract expires, is
discharged or is cancelled. For
a contract that can be cancelled
by the policyholder, the fair value
cannot be less than the surrender
value. When contracts contain
both a financial risk component
and a significant insurance risk
component and the cash flows
from the two components are
distinct and can be measured
reliably, the underlying amounts
are unbundled. Any premiums
relating to the insurance risk
component are accounted for on
the same bases as insurance.
5.6 Discretionary Participation Features (DPF)
A DPF is a contractual right
that gives holders of these
contracts the right to receive
as a supplement to guaranteed
benefits, significant additional
benefits which are based on the
performance of the assets held
within the DPF portfolio. Under the
terms of the contract, surpluses in
the DPF funds can be distributed
to policyholders and shareholders
on a 90/10 basis. The Group has
the discretion over the amount and
timing of the distribution of these
surpluses to policyholders. All DPF
liabilities including unallocated
surpluses, both guaranteed and
discretionary, at annually are held
within insurance or investment
contract liabilities as appropriate.
5.7 Unearned Premium Reserve
Unearned premium reserve
represents the portion of the
premium written in the year but
relating to the unexpired term of
coverage. Unearned premiums are
calculated on the 1/24th basis.

225
6. New Accounting Standards Issued But Not Effective as at the Reporting DateThe following Sri Lanka
Accounting Standard was issued
by the Institute of Chartered
Accountants of Sri Lanka which
is not yet effective as at 31
December 2018. Accordingly,
these Accounting Standard has
not been applied in the preparation
of the Financial Statements for the
year ended 31 December 2018.
We have identified following
Standard where this applies to the
Group and further details are set
out below:
6.1 SLFRS 16 – “Leases”
SLFRS 16 eliminates the current
dual accounting model for lessees
which distinguishes between
On-Balance Sheet finance leases
and Off-Balance Sheet operating
leases. Instead there will be a single
On-Balance Sheet accounting
model that is similar to current
finance lease accounting. This
Standard will be replaced LKAS 17
– “Leases”, IFRIC 4 – “Determining
whether an Arrangement Contains
a Lease”, SIC 15 – “Operating
Leases – Incentives” and
SIC 27 – “Evaluating the Substance
of Transactions Involving the
Legal Form of a Lease”. SLFRS
16 is effective for annual periods
beginning on or after 1 January
2019. The Group is assessing the
potential impact on its Financial
Statements resulting from the
application of SLFRS 16.

226 Bank of Ceylon | Annual Report 2018
NOTES TO THE FINANCIAL STATEMENTS
7 Total Income Accounting Policy
Revenue is recognised to the extent that it is probable that the economic benefits will flow to the Bank/ Group and the revenue
can be reliably measured.
Bank Group
For the year ended 31 December 2018 2017 2018 2017
LKR ’000 LKR ’000 LKR ’000 LKR ’000
Interest income [Note 8.1] 195,393,970 171,343,888 201,809,401 177,746,357
Fee and commission income [Note 9.1] 10,699,565 9,465,330 11,088,043 9,723,455
Net gains/ (losses) from trading [Note 10] 3,431,822 2,802,048 3,468,191 2,822,168
Net fair value gains/ (losses) from financial instruments at fair value through profit or loss [Note 11] (681,365) - (717,194) -
Net gains/ (losses) from financial investments [Note 11.1] - 905,527 - 925,733
Net gains/ (losses) from derecognition of financial assets [Note 12] 152,029 - 153,240 -
Net other operating income [Note 13] 12,135,157 4,694,602 13,659,941 5,795,248
Total income 221,131,178 189,211,395 229,461,622 197,012,961
8 Net Interest Income Accounting Policy
Interest income and expense are recognised in the Statement of Profit or Loss using the Effective Interest Rate (EIR).
Interest income and expense presented in the Statement of Profit or Loss include interest on;
Financial assets and financial liabilities at Amortised Cost (AC)
Financial assets recognised through Profit or Loss (FVTPL)
Financial assets measured at Fair Value Through Other Comprehensive Income (FVTOCI)
Effective Interest Rate (EIR)
The ‘EIR’ is the rate that exactly discounts the estimated future cash payments and receipts throughout the expected life of
the financial asset or financial liability (or, where appropriate, a shorter period) to the carrying amount of the financial asset
or financial liability. When calculating the EIR, the Group estimates future cash flows, considering all contractual terms of the
financial instruments.
The calculation of the EIR includes any discount or premium on acquisition of financial instrument, transaction costs and fees
paid or received that are an integral part of the EIR. Transaction costs include incremental costs that are directly attributable to
the acquisition or issue of a financial asset or financial liability.
For impaired financial assets, adjusted EIR is calculated using estimated future cash flows.

227
8.1 Interest Income
Bank Group
For the year ended 31 December 2018 2017 2018 2017
LKR ’000 LKR ’000 LKR ’000 LKR ’000
Cash and cash equivalents 637,183 716,983 729,559 794,400
Placements with banks 735,748 623,881 910,847 688,805
Securities purchased under resale agreements 1,277,297 1,082,293 1,275,316 1,059,185
Financial assets recognised through profit or loss measured at fair value/ Held for trading 575,655 585,342 575,809 586,073
Financial assets at amortised cost 190,735,241 167,580,587 196,834,925 173,620,948
Loans and advances 145,549,687 124,890,681 151,330,837 130,663,714
Debt and other instruments 45,185,554 - 45,504,088 -
Financial investments - Loans and receivable - 11,540,713 - 11,661,827
Financial investments - Held to maturity - 31,149,193 - 31,295,407
Financial assets measured at fair value through OCI/ Available for sale 1,432,846 754,802 1,482,945 996,946
Total interest income 195,393,970 171,343,888 201,809,401 177,746,357
Interest income on loans and advances includes interest on credit impaired assets LKR 1,052.6 million for the year 2018
(2017 : LKR 1,258.7 million).
8.2 Interest Expenses
Bank Group
For the year ended 31 December 2018 2017 2018 2017
LKR ’000 LKR ’000 LKR ’000 LKR ’000
Due to banks 113,325 30,262 115,735 33,853
Securities sold under repurchase agreements 5,379,122 5,464,801 5,414,844 5,495,603
Financial liabilities at amortised cost
Due to depositors 112,056,160 92,229,110 114,352,230 94,518,371
Other borrowings 7,132,964 10,249,478 7,673,665 10,510,630
Debt securities issued - 399,087 531,478 1,147,939
Subordinated liabilities 5,154,425 4,614,958 5,031,970 4,549,859
Total interest expenses 129,835,996 112,987,696 133,119,922 116,256,255
Net interest income 65,557,974 58,356,192 68,689,479 61,490,102
8.3 Net Interest Income from Sri Lanka Government Securities
Bank Group
For the year ended 31 December 2018 2017 2018 2017
LKR ’000 LKR ’000 LKR ’000 LKR ’000
Interest income 35,393,676 32,623,129 35,544,149 32,823,130
Less : Interest expenses 5,379,122 5,464,801 5,414,844 5,495,603
Net interest income from Sri Lanka Government securities 30,014,554 27,158,328 30,129,305 27,327,527

228 Bank of Ceylon | Annual Report 2018
NOTES TO THE FINANCIAL STATEMENTS
8.4 Notional Tax Credit on Secondary Market Transactions
In terms of the Section 137 of the Inland Revenue Act No. 10 of 2006 and the amendments thereto, a company which derives
interest income from the secondary market transactions in Government Securities would be entitled to a notional tax credit
(being one ninth (1/9) of the net interest income), provided such interest income forms a part of statutory income of the company
for that year of assessment. Accordingly, the net interest earned by the Bank and the Group on secondary market transactions
in Government securities for the 3 months ended 31 March 2018 has been grossed up in the Financial Statements and the
resulting notional tax credit amounted to a sum of LKR 793.5 million (2017 : LKR 2,165.0 million) for the Bank and
LKR 804.6 million (2017 : LKR 2,206.4 million) for the Group. The Bank discontinued this practice after 31 March 2018, since
similar provision is not available under the new Inland Revenue Act No. 24 of 2017. According to provisions of the Inland Revenue
Act No. 24 of 2017 effect from 1 April 2018, Government Securities are excluded from WHT and the Bank was discontinued
claim of notional tax credit with implementation of new Inland Revenue Act No. 24 of 2017.
9 Net Fee and Commission Income Accounting Policy
Fee and commission income comprises with the fee and commission earned by the group, providing diverse range of services.
Those can be divided into following two main categories.
(i) Fee and commission income earned from services that are provided over a certain period of time
Fees earned for the provision of services over a period of time are accrued over that period. These fees include commission
income and private wealth and asset management fees, custody and other management and advisory fees.
(ii) Fee and commission income from providing transaction services and earned on the execution of a specific act
Fees and commission arising from negotiating or participating in the negotiation of a transaction for a third party, such
as the arrangement/ participation or negotiation of the acquisition of shares or other securities, or the purchase or sale of
businesses, are recognised on completion of the underlying transaction. Fees or components of fees that are linked to a
certain performance are recognised after fulfilling the corresponding criteria.
Fees and commission expenses relating to transactions are expensed as the services are received and are recognised on an
accrual basis.
9.1 Fee and Commission Income
Bank Group
For the year ended 31 December 2018 2017 2018 2017
LKR ’000 LKR ’000 LKR ’000 LKR ’000
Trade services 1,958,791 2,017,427 2,117,990 2,157,147
Debit and credit cards 3,244,546 2,646,648 3,244,546 2,646,648
Travel and remittances services 1,337,082 1,182,437 1,337,082 1,182,437
Custodial services 118,866 65,514 118,866 65,514
Retail banking services 2,290,705 2,128,212 2,299,838 2,137,580
Guarantees and related services 1,477,438 1,220,235 1,478,440 1,221,301
Other financial services 272,137 204,857 491,281 312,828
Total fee and commission income 10,699,565 9,465,330 11,088,043 9,723,455

229
9.2 Fee and Commission Expenses
Bank Group
For the year ended 31 December 2018 2017 2018 2017
LKR ’000 LKR ’000 LKR ’000 LKR ’000
Trade services 94,307 95,306 94,307 95,306
Debit and credit cards 1,817,643 1,448,287 1,817,643 1,448,287
Travel and remittances services 97,898 105,762 97,898 105,762
Retail banking services 247,327 216,860 248,858 227,999
Guarantees and related services 10,275 8,562 10,275 8,562
Other financial services 13,278 8,525 25,858 86,458
Total fee and commission expenses 2,280,728 1,883,302 2,294,839 1,972,374
Net fee and commission income 8,418,837 7,582,028 8,793,204 7,751,081
10 Net Gains/ (Losses) from Trading Accounting Policy
Net gains/ (losses) from trading comprise foreign exchange gain or losses arising from trading activities, gains or losses arising
from changes in fair value of derivative financial instruments and dividend income from trading equities.
Dividend income is recognised when the Group’s right to receive the dividend is established.
Bank Group
For the year ended 31 December 2018 2017 2018 2017
LKR ’000 LKR ’000 LKR ’000 LKR ’000
Foreign exchange
From banks 4,291 1,479 19,168 20,403
From other customers 3,325,654 2,709,355 3,335,768 2,721,536
Government Securities
Gains/ (Losses) on marked to market valuation - 75,448 - 75,448
Gains/ (Losses) on sale - 48,276 - 48,276
Equities
Gains/ (Losses) on marked to market valuation - (174,510) - (170,717)
Gains/ (Losses) on sale - 30,217 - 7,008
Dividend income 101,877 111,783 113,255 120,214
Net gains/ (losses) from trading 3,431,822 2,802,048 3,468,191 2,822,168

230 Bank of Ceylon | Annual Report 2018
NOTES TO THE FINANCIAL STATEMENTS
11 Net Fair Value Gains/ (Losses) from Financial Instruments at Fair Value through Profit or Loss
Accounting Policy
Net gains/ (losses) on financial assets at fair value through profit or loss includes unrealised gains or losses from investment in
equities and debt instruments classified as fair value through profit or loss due to changes in fair value of such instruments.
Bank Group
For the year ended 31 December 2018 2017 2018 2017
LKR ’000 LKR ’000 LKR ’000 LKR ’000
Gains/ (Losses) on marked to market valuation of
Fixed income securities (10,268) - (10,268) -
Equities (226,795) - (259,736) -
Unit Trust (444,302) - (447,190) -
Net fair value gains/ (losses) on financial instruments at fair value through profit or loss (681,365) - (717,194) -
11.1 Net Gains/ (Losses) from Financial Investments
Accounting Policy
Net gains/ (losses) from financial investments include profit or loss on sale of financial investments and dividend income of
financial investments classified as available for sale. Dividend income is recognised when the Group’s right to receive the
dividend is established.
Bank Group
For the year ended 31 December 2018 2017 2018 2017
LKR ’000 LKR ’000 LKR ’000 LKR ’000
Financial investments - Available for sale
Gains/ (Losses) on sale of Government securities - 332,937 - 332,937
Dividend income - 572,590 - 592,796
Net gains/ (losses) from financial investments - 905,527 - 925,733
12 Net Gains/ (Losses) From Derecognition of Financial Assets Net gains/ (losses) from derecognition of financial assets include profit or loss on sale of debt instruments classified as fair value
through profit or loss, amortised cost and fair value through other comprehensive income.
Bank Group
For the year ended 31 December 2018 2017 2018 2017
LKR ’000 LKR ’000 LKR ’000 LKR ’000
Recognised at:
Fair value through profit or loss 56,612 - 57,823 - Amortised cost - - - - Fair value through other comprehensive income 95,417 - 95,417 -
Net gains/ (losses) from derecognition of financial assets 152,029 - 153,240 -

231
13 Net Other Operating Income Accounting Policy
Dividend Income
Dividend income is recognised when the Bank’s right to receive the dividend is established.
Gains/ (Losses) from Disposal of Non-Financial Assess
Net gains or losses arising from the disposal of Property, Plant and Equipment and other non current assets including
investments in subsidiaries and associates are accounted for in the Statement of Profit or Loss after deducting the carrying
amount of such assets and the related selling expenses from the proceeds on disposal.
Foreign Exchange Income
Foreign currency positions are revalued at each Reporting date. Gains/ (Losses) arising from changes in fair value are included
in the Statement of Profit or Loss in the period in which they arise.
Rental Income
Rental income is recognised on an accrual basis. This includes rent recovered from the Bank’s premises, quarters, safety
lockers and lease rent recovered form branch premises etc..
Service Income
Service income is recognised on an accrual basis and includes income earned through documentation charges recovered from
loans and leases, CRIB charges, legal fees, correspondent banking services charges and automated cheque clearing etc..
Gross Insurance Premium
Gross recurring premiums on life and investment contracts with Discretionary Participation Features (DPF) are recognised as
revenue when receivable from the policyholder. For single premium business, revenue is recognised on the date on which the
policy is effective.
Gross general insurance written premiums comprise the total premiums receivable for the whole period of cover provided by
contracts entered in to during the accounting period and are recognised on the date on which the policy commences.
Bank Group
For the year ended 31 December 2018 2017 2018 2017
LKR ’000 LKR ’000 LKR ’000 LKR ’000
Dividend income from Financial assets measured at fair value through OCI 284,383 - 321,923 -
Dividend income from subsidiaries and associates 309,685 76,680 - - Dividend income from units in unit trust 3,985 - 3,985 - Gains/ (Losses) on revaluation of foreign exchange 7,622,372 701,621 7,622,372 701,621 Gains/ (Losses) on sale of Property, Plant and Equipment 31,014 55,105 121,350 59,399 Gains/ (Losses) on sale of foreclosed properties 73,605 70,866 73,605 70,866 Rental income 284,632 250,454 352,529 329,905 Service income 1,864,650 1,627,798 2,098,355 1,987,792 Profit from sale of gold bullion 8,951 15,342 8,951 15,342 Miscellaneous income 1,427,447 1,683,766 2,735,465 1,785,250 Gross insurance premium - - 96,973 632,103 Net income from Islamic banking [Note 13.1] 224,433 212,970 224,433 212,970
Net other operating income 12,135,157 4,694,602 13,659,941 5,795,248

232 Bank of Ceylon | Annual Report 2018
NOTES TO THE FINANCIAL STATEMENTS
13.1 Net Income from Islamic Banking
Bank/ Group
For the year ended 31 December 2018 2017
LKR ’000 LKR ’000
Income from Islamic banking operations 393,762 364,126
Less : Profit paid to investors 169,329 151,156
Net income from Islamic banking 224,433 212,970
14 Impairment Charge/ (Reversal) for Loans and Other Losses Accounting Policy
The Bank and Group recognise the changes in the impairment provisions for financial instruments, which are assessed as
per Sri Lanka Accounting Standard - SLFRS 9 - “Financial Instruments”. Details are given under Financial assets at amortised
cost - loans and advances (Note 27). Further, the Bank/ Group recognises an impairment loss when the carrying amount of a
non financial asset exceeds the estimated recoverable amount of that asset as per Sri Lanka Accounting Standard - LKAS 36 -
“Impairment of Assets”.
The table below shows the provision made during the year on identified Expected Credit Losses (ECL) on financial instruments
for the year recorded in the Statement of Profit or Loss.
Bank Group
For the year ended 31 December 2018 2018
Stage 1 Stage 2 Stage 3 Total Stage 1 Stage 2 Stage 3 Total
LKR ’000 LKR ’000 LKR ’000 LKR ’000 LKR ’000 LKR ’000 LKR ’000 LKR ’000
Cash and cash equivalents (3,793) - - (3,793) (3,795) - - (3,795)
Placements with banks 22,720 - - 22,720 22,452 - - 22,452
Financial assets measured at amortised cost - loans and advances 2,010,203
(2,123,633)
14,377,860
14,264,430 2,038,648 (2,116,443) 14,476,548
14,398,753
Financial assets measured at amortised cost - debt instruments 731,392 - 26,212 757,604 732,850 - 26,212 759,062
Other Investments - - - - - - - -
Total 2,760,522 (2,123,633) 14,404,072 15,040,961 2,790,155 (2,116,443) 14,502,760 15,176,472

233
The table below shows the impairment charges recorded in the Statement of Profit or Loss under Sri Lanka accounting
Standard LKAS 39 “ Financial instruments: Recognition and Measurement" during the year 2017:
Bank Group
For the year ended 31 December 2017 2017
Individual impairment
and other provision
Collectiveimpairment
Total
Individual impairment
and other provision
Collectiveimpairment
Total
LKR ’000 LKR ’000 LKR ’000 LKR ’000 LKR ’000 LKR ’000
Individually Significant Loans 9,631,746 - 9,631,746 9,676,575 - 9,676,575
Retail Loans - 8,912 8,912 - 208,314 208,314
Other investments (300,000) - (300,000) - - -
Total on balance sheet items 9,331,746 8,912 9,340,658 9,676,575 208,314 9,884,889
Off balance sheet items - - - - - -
Total 9,331,746 8,912 9,340,658 9,676,575 208,314 9,884,889
15 Personnel Expenses Accounting Policy
Personnel expenses include staff emoluments, contribution to defined contribution/ benefits plans and other related expenses.
Short term employee benefit obligations are measured on an undiscounted basis and are expensed as the related service is
provided. A liability is recognised for the amount expected to be paid under short term cash bonus, if the Group has a present
legal or constructive obligation to pay this amount as a result of past service provided by the employee and the obligation can
be estimated reliably.
Employees are eligible for contribution to defined contribution/ benefit plans in accordance with the respective internal and
external statutes and regulations.
Defined benefit plan contributions and provisions for accumulated leave are recognised in the Statement of Profit or Loss based
on actuarial valuations carried out in accordance with Sri Lanka Accounting Standard - LKAS 19 on “Employee Benefits”.
Bank Group
For the year ended 31 December 2018 2017 2018 2017
LKR ’000 LKR ’000 LKR ’000 LKR ’000
Staff emoluments 15,153,102 13,142,117 16,593,168 14,335,669
Contributions to defined contribution plans [Note 15.1] 1,293,232 1,032,383 1,432,572 1,167,164
Contributions to defined benefit plans [Note 15.2] (132,434) 495,125 (24,931) 562,159
Other personnel expenses 2,561,497 2,326,551 2,599,969 2,658,558
Total personnel expenses 18,875,397 16,996,176 20,600,778 18,723,550

234 Bank of Ceylon | Annual Report 2018
NOTES TO THE FINANCIAL STATEMENTS
15.1 Contributions to Defined Contribution Plans
A Defined Contribution Plan (DCP) is a post-employment benefit plan under which an entity pays fixed contributions into a
separate entity and will have no legal or constructive obligation to pay further amounts. Obligations for contributions to defined
contribution plans are recognised as an expense in the Statement of Profit or Loss when they are due in respect of service
rendered before the end of the Reporting period. Prepaid contributions are recognised as an asset to the extent that a cash
refund or a reduction in future payments is available. Contributions to a DCP that is due more than 12 months after the end of
the Reporting period in which the employees render the service are discounted to their present value at the Reporting date.
Bank of Ceylon Provident Fund
All employees of the Bank are members of the “Bank of Ceylon Provident Fund” to which the Bank contributes 12% of
employee’s monthly gross salary while employees contribute 8%. This fund is an approved fund, which is independently
administered.
Employees Provident Fund
The subsidiaries and their employees (other than Bank of Ceylon and its employees) contribute 12% (15% by Property
Development PLC) and 8% (10% by Property Development PLC’s employees) respectively on monthly gross salary of each
employee to Employees’ Provident Fund, in terms of the Employees’ Provident Fund Act No. 15 of 1958 and subsequent
amendments thereto. The respective fund is managed by the Central Bank of Sri Lanka.
Employees’ Trust Fund
All employees of the Bank and its subsidiaries are members of the Employees’ Trust Fund to which the Bank and the Group
contributes 3% of the employee’s monthly gross salary, in terms of Employees’ Trust Fund Act No.46 of 1980.
Bank Group
For the year ended 31 December 2018 2017 2018 2017
LKR ’000 LKR ’000 LKR ’000 LKR ’000
Employers' contribution to:
Bank of Ceylon/ Employees' Provident Fund 1,036,063 827,212 1,148,216 938,876
Employees' Trust Fund 257,169 205,171 284,356 228,288
Total contributions to defined contribution plans 1,293,232 1,032,383 1,432,572 1,167,164
15.2 Contributions to Defined Benefit Plans
A Defined Benefit Plan (DBP) is a post-employment benefit plan other than a DCP. The Group’s net obligation in respect of DBP
is calculated separately for each plan by estimating the amount of future benefit that employees have earned in return for their
service in the current and prior periods and discounting that benefit to determine its present value and then deducting the fair
value of any plan assets. The discount rate is the yield at the Reporting date on long-term treasury bond rate for discount rates
actually used that have maturity dates approximating the terms of the Group’s obligations. The calculation is performed by a
qualified actuary using the Projected Unit Credit method.
The Group recognises all actuarial gains and losses arising from DBP in the OCI and the expenses related to DBP under
personnel expenses in the Statement of Profit or Loss. Details of defined benefit plans are given in “Employee Retirement
Benefit Plans” (Note 47).

235
Bank Group
For the year ended 31 December 2018 2017 2018 2017
LKR ’000 LKR ’000 LKR ’000 LKR ’000
Net expenses recognised in the profit or loss
Bank of Ceylon Pension Trust Fund [Note 47.1.1] 539,185 936,596 539,185 936,596
Bank of Ceylon Widows’/ Widowers’ and Orphans' Pension Fund [Note 47.2.1] (955,403) (830,309) (955,403) (830,309)
Terminal gratuity [Note 47.3] 47,536 41,964 107,503 101,498
Bank of Ceylon Pension Fund - 2014 [Note 47.4.1] 188,251 137,767 188,251 137,767
Provision for encashment of medical leave 47,997 209,107 47,997 209,107
Pension fund - Bank of Ceylon (UK) Limited - - 47,536 7,500
Total contributions to defined benefit plans (132,434) 495,125 (24,931) 562,159
16 Other Expenses Accounting Policy
Other expenses have been recognised in the Statement of Profit or Loss as they are incurred in the period to which they relate.
All expenditure incurred in the operation of the business and in maintaining the capital assets in a state of efficiency has been
charged to revenue in arriving at the Group’s profit for the year. Provisions in respect of other expenses are recognised when
the Group has a present obligation (legal or constructive) as a result of a past event, it is probable that an outflow of resources
embodying economic benefits will be required to settle the obligation and a reliable estimate can be made of the amount of the
obligation.
Deposit Insurance Premium
As per the Sri Lanka Deposit Insurance and Liquidity Support Scheme introduced under the Banking Act Direction No.05 of
2010, the Bank is required to make quarterly payments of 0.1% or 0.125% on the eligible deposit liabilities, from 1 October 2010.
The premium rate depends on the Capital Adequacy Ratio (CAR) of the immediate preceeding Audited Financial Statements.
Reinsurance Premium, Claims and Other Benefits
Gross benefits and claims for life insurance contracts and for investment contracts with Discretionary Participation Features
(DPF) include the cost of all claims arising during the year including internal and external claims handling costs that are directly
related to the processing and settlement of claims and policyholder bonuses declared on DPF contracts, as well as changes in
the gross valuation of insurance and investment contract liabilities with DPF. Death claims and surrenders are recorded on the
basis of notifications received. Maturities and annuity payments are recorded when due. Interim payments and surrenders are
accounted at the time of settlement.
General insurance include all claims occurring during the year, whether reported or not, related internal and external claims
handling costs that are directly related to the processing and settlement of claims, a reduction for the value of salvage and other
recoveries, and any adjustments to claims outstanding from previous years.
Claims expenses and liabilities for outstanding claims are recognised in respect of direct and inward reinsurance business. The
liability covers claims reported but not yet paid, Incurred But Not Reported (IBNR) claims and the anticipated direct and indirect
costs of settling those claims. Claims outstanding are assessed by review of individual claim files and estimating changes in
the ultimate cost of settling claims. The provision in respect of IBNR is actuarially valued on an annual basis to ensure a more
realistic estimation of the future liability based on past experience and trends.

236 Bank of Ceylon | Annual Report 2018
NOTES TO THE FINANCIAL STATEMENTS
While the Directors consider that the provision for claims is fairly stated on the basis of information currently available, the
ultimate liability will vary as a result of subsequent information and events. This may result in adjustment to the amounts
provided. Such amounts are reflected in the Financial Statements for that period. The methods used and the estimates made are
reviewed regularly.
Reinsurance claims are recognised when the related gross insurance claim is recognised according to the terms of the relevant
contract.
Bank Group
For the year ended 31 December 2018 2017 2018 2017
LKR ’000 LKR ’000 LKR ’000 LKR ’000
Directors' emoluments 4,700 6,255 72,380 14,229
Auditors' remuneration
Audit fees 21,657 15,145 40,264 28,220
Non-audit fees - - 774 127
Deposit insurance premium 1,482,361 1,615,314 1,511,220 1,643,869
Professional and legal expenses 179,349 136,301 256,187 197,102
Net revaluation loss on buildings - 44,661 10,515 52,820
Fixed assets maintenance expenses 4,862,972 4,588,624 4,022,345 4,061,002
Fair value adjustment on gold in hand (317,972) (3,306,545) (317,972) (3,306,545)
Reinsurance premium, claims and other benefits - - 247,424 446,723
Office administration and establishment expenses 5,184,269 5,387,040 7,367,084 6,300,825
Total other expenses 11,417,336 8,486,795 13,210,221 9,438,372

237
17 Taxes17.1 Taxes on Financial Services
Taxes on financial services includes Value Added Tax (VAT), Nation Building Tax (NBT) and Debt Repayment Levy (DRL)
calculated based on the value addition made on financial services.
Bank Group
For the year ended 31 December 2018 2017 2018 2017
LKR ’000 LKR ’000 LKR ’000 LKR ’000
Value Added Tax 7,254,211 6,395,758 7,456,591 6,554,377
Nation Building Tax 967,206 853,028 994,534 877,125
Debt Repayment Levy* 1,366,895 - 1,366,895 -
Total taxes on financial services 9,588,312 7,248,786 9,818,020 7,431,502
* In accordance with Section 36 of Finance Act No. 35 of 2018, Debt Repayment Levy is charged and levied for every month
commencing from October 2018 till December 2021 from every financial institution at the rate of 7% on the value addition
attributable to the supply of financial services.
17.2 Income Tax Expense
Current tax and deferred tax are recognised in the Statement of Profit or Loss except to the extent that it relates to items
recognised directly in Equity or in Other Comprehensive Income (OCI).
Current Taxation
Current tax is the expected tax payable or receivable on the taxable income or loss for the year, using tax rates enacted or
substantively enacted at the Reporting date and any adjustment to tax payable in respect of previous years. The amount of
current tax receivable or payable is the best estimate of the tax amount expected to be paid or received that reflects uncertainty
related to income taxes if any.
Accordingly, provision for taxation is made on the basis of the accounting profit for the year, as adjusted for taxation purposes,
in accordance with the provisions of the Inland Revenue Act No. 10 of 2006 and amendments thereto up to 31 March 2018 and
with effect from 1 April 2018 Inland Revenue Act No. 24 of 2017.
Provision for taxation on the overseas operations is made on the basis of the accounting profit for the year, as adjusted for
taxation purposes, in accordance with the provisions of the relevant laws and regulations in those countries, using the tax rates
enacted or substantively enacted as at the Reporting date.
Deferred Taxation
Details are given in Note 36.
Following details are provided as required by the Sri Lanka Accounting Standard – LKAS 12 - “Income Taxes”.

238 Bank of Ceylon | Annual Report 2018
NOTES TO THE FINANCIAL STATEMENTS
17.2.1 Components of Income Tax Expense
Bank Group
For the year ended 31 December 2018 2017 2018 2017
LKR ’000 LKR ’000 LKR ’000 LKR ’000
Current Tax Expense
Income tax on profits for the year 8,626,425 8,068,543 8,858,379 8,268,754
Adjustments in respect of prior years 1,097,090 860,873 1,329,632 876,874
Deferred Tax Expense
Charge/ (Reversal) of deferred tax expense [Note 36] 2,689,910 101,280 2,734,006 183,290
Income tax expense for the year 12,413,425 9,030,696 12,922,017 9,328,918
17.2.2 Reconciliation of Accounting Profit and Income Tax Expense
Bank Group
For the year ended 31 December 2018 2017 2018 2017
LKR ’000 LKR ’000 LKR ’000 LKR ’000
Accounting profit before income tax 31,892,154 30,342,980 32,437,170 30,815,563
Add : Dividend income from subsidiaries and associates - - 309,685 76,680
31,892,154 30,342,980 32,746,855 30,892,243
Add : Disallowable expenses 25,111,053 24,093,557 26,423,772 27,755,668
57,003,207 54,436,537 59,170,627 58,647,911
Less: Allowable expenses 14,134,254 9,198,542 15,593,182 12,690,036
Less: Tax exempt income 12,395,215 19,405,951 12,413,645 19,463,696
Taxable income 30,473,738 25,832,044 31,163,800 26,494,179
Current tax at rate of 28% (2017- 28%) 8,532,647 7,232,972 8,725,864 7,418,370
Effect of different tax rates in the Group - - 858 7,694
Effect of different tax rates in other countries 93,778 835,571 93,778 835,571
10% withholding tax on inter company dividends - - 37,879 7,120
Adjustment in respect of prior years 1,097,090 860,873 1,329,632 876,873
Charge/ (Reversal) of deferred tax [Note 36] 2,689,910 101,280 2,734,006 183,290
Total Income tax expense 12,413,425 9,030,696 12,922,017 9,328,918
The effective income tax rate (%) 38.9 29.8 39.8 30.3

239
17.2.3 The Tax Liabilities of resident companies are computed at the standard rate of 28% (2017 : 28%) except following Bank operations and companies which enjoy full or partial exemptions and concessions.
For the year ended 31 December 2018 2017
From Up to
01.04.2018 31.03.2018
% % %
Tax rates applicable on local operations
BOC Travels (Private) Limited 28.0 12.0 12.0
Hotels Colombo (1963) Limited* 14.0 12.0 12.0
Ceybank Holiday Homes (Private) Limited 28.0 12.0 12.0
Koladeniya Hydropower (Private) Limited** 10.0 10.0 10.0
For the year ended 31 December 2018 2017
% %
Tax rates applicable on foreign operations
Banking operations in Male 25.0 25.0
Banking operations in Chennai 43.0 43.0
Banking operation in Seychelles
Up to SCR 1,000,000 25.0 25.0
Balance 33.3 33.3
Bank of Ceylon (UK) Limited 20.0 19.0
* Investment income of the Hotels Colombo (1963) Limited and Koladeniya Hydropower (Private) Limited is subject to 28%.
** In accordance with the agreement with the Board of Investment of Sri Lanka (BOI), Koladeniya Hydropower (Private) Limited
is entitled to a tax exemption period of five years from the year in which the company commences to make profits or not
later than two years from the date of commencement of commercial operations, whichever is earlier as may be specified in a
certificate issued by the Board of Investment. The tax holiday ended on 31 December 2016.
After the tax exemption period, the company is liable to tax on its trading profit at a concessionary rate of 10% for 2 years
and at 20% thereafter.

240 Bank of Ceylon | Annual Report 2018
NOTES TO THE FINANCIAL STATEMENTS
18 Share of Profits/ (Losses) of Associate Companies, Net of TaxThe aggregate of the Group’s share of profit or losses of associates is shown in the Statement of Profit or Loss under the equity
method of accounting.
Group
For the year ended 31 December 2018 2017
LKR ’000 LKR ’000
Ceybank Asset Management Limited 4,920 26,600
Lanka Securities (Private) Limited (14,602) 1,362
Transnational Lanka Records Solutions (Private) Limited 18,951 24,062
Total share of profits/ (losses) of associate companies, net of tax 9,269 52,024
19 Earnings Per Share and Dividend Per Share19.1 Basic Earnings Per Share
In accordance with the Sri Lanka Accounting Standard - LKAS 33 “Earnings Per Share”, basic earnings per share is calculated by
dividing the profit or loss attributable to ordinary shareholder of the Bank (the numerator) by the weighted average number of ordinary
shares in issue (the denominator) during the year.
Bank Group
For the year ended 31 December 2018 2017 2018 2017
Profit attributable to ordinary shareholder of the Bank (LKR '000) 19,478,729 21,312,284 19,532,862 21,470,163
Weighted average number of ordinary shares in issue [Note 19.1.1] 18,643,836 11,479,452 18,643,836 11,479,452
Basic earnings per share (LKR) 1,044.78 1,856.56 1,047.68 1,870.31
19.1.1 Weighted Average Number of Ordinary Shares in Issue
Bank Group
2018 2017 2018 2017
Number of ordinary shares in issue as at 1 January 15,000,000 10,000,000 15,000,000 10,000,000
Weighted average number of ordinary shares issued during the year 3,643,836 1,479,452 3,643,836 1,479,452
Weighted average number of ordinary shares in issue as at 31 December 18,643,836 11,479,452 18,643,836 11,479,452

241
19.2 Diluted Earnings Per Share
Diluted earnings per share is calculated by dividing the profit or loss attributable to ordinary shareholder of the Bank (the
numerator) by the weighted average number of ordinary shares in issue during the year after adjusting for effect of all dilutive
potential ordinary shares (the denominator).
Bank Group
For the year ended 31 December 2018 2017 2018 2017
Profit attributable to ordinary shareholders of the Bank (LKR '000) 19,478,729 21,312,284 19,532,862 21,470,163
Weighted average number of ordinary shares after adjusting for dilution [Note 19.2.1] 21,287,672 15,068,493 21,287,672 15,068,493
Diluted earnings per share (LKR) 915.02 1,414.36 917.57 1,424.84
19.2.1 Weighted Average Number of Ordinary Shares After Adjusting for Dilution
Bank Group
For the year ended 31 December 2018 2017 2018 2017
Weighted average number of ordinary shares in issue [Note 19.1.1] 18,643,836 11,479,452 18,643,836 11,479,452
Weighted average number of potential ordinary shares under pending allotment during the year 2,643,836 3,589,041 2,643,836 3,589,041
Weighted average number of ordinary shares after adjusting for dilution 21,287,672 15,068,493 21,287,672 15,068,493
19.3 Dividend Per Share
Dividend per share is calculated by dividing the total dividend allocated to shareholder (the numerator) by the weighted average
number of ordinary shares in issue (the denominator) during the year.
Bank Group
For the year ended 31 December 2018 2017 2018 2017
Total dividend allocated to shareholder during the year (LKR ’000) 4,846,410 12,346,410 4,846,410 12,346,410
Weighted average number of ordinary shares in issue [Note 19.1.1] 18,643,836 11,479,452 18,643,836 11,479,452
Dividend per share (LKR) 259.95 1,075.52 259.95 1,075.52

242 Bank of Ceylon | Annual Report 2018
NOTES TO THE FINANCIAL STATEMENTS
20 Analysis of Financial Instruments by Measurement Basis
All financial assets and liabilities are measured under the following headings as per the SLFRS 9 - “ Financial Instruments”
20.1 Bank
As at 31 December 2018
Fair value through
profit or loss Fair value through OCI
Amortised cost
Total
LKR ’000 LKR ’000 LKR ’000 LKR ’000
Financial Assets
Cash and cash equivalents - - 78,447,577 78,447,577
Balances with Central Banks - - 65,680,371 65,680,371
Placements with banks - - 40,450,089 40,450,089
Securities purchased under resale agreements - - - -
Derivative financial instruments 1,205,657 - - 1,205,657
Loans and advances - - 1,429,107,181 1,429,107,181
Debt instruments 6,769,790 12,315,777 551,839,449 570,925,016
Equity instruments 2,507,508 4,383,805 - 6,891,313
Total financial assets 10,482,955 16,699,582 2,165,524,667 2,192,707,204
As at 31 December 2018
Fair value through
profit or loss Amortised cost
Total
LKR ’000 LKR ’000 LKR ’000
Financial Liabilities
Due to banks - 2,402,468 2,402,468
Securities sold under repurchase agreements - 97,399,359 97,399,359
Derivative financial instruments 509,018 - 509,018
Financial liabilities at amortised cost
Due to depositors - 1,765,025,970 1,765,025,970
Other borrowings - 201,792,174 201,792,174
Subordinated liabilities - 50,827,239 50,827,239
Total financial liabilities 509,018 2,117,447,210 2,117,956,228

243
All financial assets and liabilities are measured under the following headings as per the LKAS 39 - “Financial Instruments:
Recognition and Measurement”
As at 31 December 2017
Fair value through
profit or loss Fair value through OCI
Amortised cost
Total
LKR ’000 LKR ’000 LKR ’000 LKR ’000
Financial Assets
Cash and cash equivalents - - 72,843,108 72,843,108
Balances with Central Banks - - 68,689,012 68,689,012
Placements with banks - - 8,067,490 8,067,490
Securities purchased under resale agreements - - 18,455,555 18,455,555
Derivative financial instruments 1,618,823 - - 1,618,823
Financial instruments - Held for trading 8,359,274 - - 8,359,274
Loans and advances to customers - - 1,163,160,914 1,163,160,914
Financial investments - Loans and receivables - - 213,167,048 213,167,048
Financial investments - Held to maturity - - 308,256,082 308,256,082
Financial investments - Available for sale - 17,921,170 - 17,921,170
Total financial assets 9,978,097 17,921,170 1,852,639,209 1,880,538,476
As at 31 December 2017
Fair value through
profit or loss Amortised cost
Total
LKR ’000 LKR ’000 LKR ’000
Financial Liabilities
Due to banks - 2,203,199 2,203,199
Securities sold under repurchase agreements - 44,487,462 44,487,462
Derivative financial instruments 70,715 - 70,715
Due to depositors - 1,546,832,036 1,546,832,036
Other borrowings - 178,191,089 178,191,089
Subordinated liabilities - 42,570,457 42,570,457
Total financial liabilities 70,715 1,814,284,243 1,814,354,958

244 Bank of Ceylon | Annual Report 2018
NOTES TO THE FINANCIAL STATEMENTS
All financial assets and liabilities are measured under the following headings as per the SLFRS 9 “ Financial Instruments”
20.2 Group
As at 31 December 2018
Fair value through
profit or loss Fair value through OCI
Amortised cost
Total
LKR ’000 LKR ’000 LKR ’000 LKR ’000
Financial Assets
Cash and cash equivalents - - 78,558,031 78,558,031
Balances with Central Banks - - 65,680,371 65,680,371
Placements with banks - - 41,681,910 41,681,910
Securities purchased under resale agreements - - 1,436,068 1,436,068
Derivative financial instruments 1,205,657 - - 1,205,657
Loans and advances - - 1,460,618,588 1,460,618,588
Debt instruments 6,802,836 15,077,415 551,956,734 573,836,985
Equity instruments 2,780,491 5,337,784 - 8,118,275
Total financial assets 10,788,984 20,415,199 2,199,931,702 2,231,135,885
As at 31 December 2018
Fair value through
profit or loss Amortised cost
Total
LKR ’000 LKR ’000 LKR ’000
Financial Liabilities
Due to banks - 2,515,998 2,515,998
Securities sold under repurchase agreements 97,423,302 97,423,302
Derivative financial instruments 509,018 - 509,018
Financial liabilities at amortised cost
Due to depositors - 1,783,975,493 1,783,975,493
Other borrowings - 207,053,674 207,053,674
Debt securities issued - 4,105,681 4,105,681
Subordinated liabilities - 50,484,487 50,484,487
Total financial liabilities 509,018 2,145,558,635 2,146,067,653

245
All financial assets and liabilities are measured under the following headings as per the LKAS 39 - “ Financial Instruments:
Recognition and Measurement”.
As at 31 December 2017
Fair value through
profit or loss Fair value through OCI
Amortised cost
Total
LKR ’000 LKR ’000 LKR ’000 LKR ’000
Financial Assets
Cash and cash equivalents - - 78,005,362 78,005,362
Balances with Central Banks - - 68,689,012 68,689,012
Placements with banks - - 5,319,602 5,319,602
Securities purchased under resale agreements - - 19,872,247 19,872,247
Derivative financial instruments 1,618,823 - - 1,618,823
Financial instruments - Held for trading 8,596,548 - - 8,596,548
Loans and advances to customers - - 1,194,294,394 1,194,294,394
Financial investments - Loans and receivables - - 214,349,624 214,349,624
Financial investments - Held to maturity - - 308,750,317 308,750,317
Financial investments - Available for sale - 22,552,292 - 22,552,292
Total financial assets 10,215,371 22,552,292 1,889,280,558 1,922,048,221
As at 31 December 2017
Fair value through
profit or loss Amortised cost
Total
LKR ’000 LKR ’000 LKR ’000
Financial Liabilities
Due to banks - 2,194,266 2,194,266
Securities sold under repurchase agreements - 44,628,686 44,628,686
Derivative financial instruments 70,715 - 70,715
Due to depositors - 1,566,376,418 1,566,376,418
Other borrowings - 184,330,181 184,330,181
Debt securities issued - 5,667,514 5,667,514
Subordinated liabilities - 42,226,067 42,226,067
Total financial liabilities 70,715 1,845,423,132 1,845,493,847

246 Bank of Ceylon | Annual Report 2018
NOTES TO THE FINANCIAL STATEMENTS
21 Cash and Cash Equivalents Accounting Policy
Cash and cash equivalents include local and foreign currency notes and coins in hand, unrestricted balances held with central
banks, balances with other banks and highly liquid financial assets with original maturities of less than seven days, which are
subject to insignificant risk of changes in their fair value and are used by the Group to manage its short-term commitments.
Cash and cash equivalents are carried at amortised cost. The losses arising from impairment are recognised in “Impairment
charge/ (reversal) for loans and other losses” (Note 14) in the Statement of Profit or Loss.
There were no cash and cash equivalents held by the Group that were not available for use by the Group.
Bank Group
As at 31 December 2018 2017 2018 2017
LKR ’000 LKR ’000 LKR ’000 LKR ’000
Local currency in hand 35,957,753 40,267,119 36,143,018 40,459,621
Foreign currency in hand 2,425,261 1,507,867 2,432,289 1,516,294
Balances with banks 12,137,568 12,429,737 12,286,500 11,798,422
Money at call and short notice 27,934,107 18,638,385 27,703,345 24,231,025
Gross cash and cash equivalents 78,454,689 72,843,108 78,565,152 78,005,362
Less: Accumulated impairment [Note 21.1] 7,112 - 7,121 -
Total cash and cash equivalents 78,447,577 72,843,108 78,558,031 78,005,362
21.1 Movement of Impairment During the Period
Bank Group
2018 2018
LKR ’000 LKR ’000
Stage 1
Opening balance as at 1 January 10,905 10,916
Charge/ (Reversal) during the year (3,793) (3,795)
Closing balance as at 31 December 7,112 7,121

247
22 Balances with Central Banks Accounting Policy
Balances with Central Banks are carried at amortised cost in the Statement of Financial Position.
Bank Group
As at 31 December 2018 2017 2018 2017
LKR ’000 LKR ’000 LKR ’000 LKR ’000
Statutory balances with Central Banks
Central Bank of Sri Lanka [Note 22.1] 59,405,543 64,800,808 59,405,543 64,800,808
Other Central Banks [Note 22.2] 6,274,828 3,888,204 6,274,828 3,888,204
Total balances with central banks 65,680,371 68,689,012 65,680,371 68,689,012
22.1 Central Bank of Sri Lanka (CBSL)
In terms of the provisions of Section 93 of the Monetary Law Act No. 58 of 1949, the Bank is required to maintain a cash reserve
with Central Bank of Sri Lanka. The minimum cash reserve requirement as of 31 December 2018 was 6% (2017 : 7.5%) of Sri
Lankan rupee deposit liabilities. There is no reserve requirement for foreign currency deposit liabilities maintained by domestic
branches and the deposit liabilities of the Off-shore Banking Division in Sri Lanka (2017 : Nil).
22.2 Balances with other Central Banks
22.2.1 Reserve Bank of India (RBI)
In terms of the provisions of Section 42 (1) of the Reserve Bank of India (RBI) Act No. 02 of 1934, the branch in Chennai is
required to maintain a cash reserve with RBI. The minimum cash reserve as of 31 December 2018 was 4% on its demand and
term deposit liabilities (2017 : 4%).
22.2.2 Maldives Monetary Authority (MMA)
In accordance with the prevailing regulations of Maldives Monetary Authority (MMA), the branch in Maldives is required to
maintain a reserve deposit based on 10% of the branch’s commercial deposits and liabilities to the public in the Maldives in
Maldivian Rufiyaa and United States Dollar separately (2017 : 10%).
22.2.3 Central Bank of Seychelles (CBS)
In accordance with the regulations of Central Bank of Seychelles, the branch in Seychelles is required to maintain a reserve
deposit based on 13% of the branch’s commercial deposits liabilities to the public in Seychelles (2017 : 13%).

248 Bank of Ceylon | Annual Report 2018
NOTES TO THE FINANCIAL STATEMENTS
23 Placements with Banks Accounting Policy
“Placements with banks” includes balances with other banks with original maturities of more than seven days which are non-
derivative financial assets with fixed or determinable payments that are not quoted in an active market, other than:
- Those that intends to sell immediately or in the near term and those that the Bank, upon initial recognition, designates as at
fair value through profit or loss
- Those that upon initial recognition, designates as fair value through other comprehensive income
- Those for which may not recover substantially all of its initial investment, other than due to credit deterioration
Placement with banks are initially measured at fair value. After initial measurement, they are subsequently measured at
amortised cost using the Effective Interest Rate (EIR), less allowance for impairment. Interest income from placement with banks
is included in “Interest income” (Note 8.1) in the Statement of Profit or Loss. The losses arising from impairment are recognised
in “Impairment Charge/ (Reversal) for Loans and Other Losses” (Note 14) in the Statement of Profit or Loss. Certain placements
with banks are written off when they are determined to be uncollectible.
Bank Group
As at 31 December 2018 2017 2018 2017
LKR ’000 LKR ’000 LKR ’000 LKR ’000
Within Sri Lanka 1,108,583 4,399,062 1,781,548 4,399,062
Outside Sri Lanka 39,364,814 3,668,428 39,923,748 920,540
Gross placements with banks 40,473,397 8,067,490 41,705,296 5,319,602
Accumulated impairment [Note 23.1] 23,308 - 23,386 -
Total placements with banks 40,450,089 8,067,490 41,681,910 5,319,602
23.1 Movement in Impairment During the Year
Bank Group
2018 2018
LKR ’000 LKR ’000
Stage 1
Opening balance as at 1 January 588 934
Charge/ (Reversal) during the year 22,720 22,452
Closing balance at 31 December 23,308 23,386

249
24 Securities Purchased Under Resale Agreements Accounting Policy
Securities purchased under resale agreements (Reverse Repos) are purchase of securities with the agreement to sell them at a higher
price at a specific future date. The consideration paid and accrued interest (measured by using the EIR) are recorded in the Statement
of Financial Position, reflecting the transaction’s economic substance as an advance granted by the Group. The difference between the
purchase price and resale price is recognised as “Interest income” (Note 8.1) and amortise over the life of the agreement.
Bank Group
As at 31 December 2018 2017 2018 2017
LKR ’000 LKR ’000 LKR ’000 LKR ’000
With Banks - 15,157,328 143,398 15,195,040
With Customers - 3,298,227 1,292,670 4,677,207
Total securities purchased under resale agreements - 18,455,555 1,436,068 19,872,247
25 Derivative Financial Instruments Accounting Policy
Derivatives are financial instruments that derive their value in response to changes in interest rates, financial instrument prices,
commodity prices, foreign exchange rates, credit risk, indices etc. Derivatives are categorised as trading unless they are
designated as hedging instruments. All derivatives are initially recognised and subsequently measured at fair value, with all
revaluation gains or losses recognised in the Statement of Profit or Loss under “Net gains/ (losses) from trading “ (Note 10).
Derivatives are recorded at fair value and carried as assets when their fair value is positive and as liabilities when their fair value
is negative. Fair value is determined using the forward market rates ruling on the Reporting date.
Bank Group
As at 31 December 2018 2017 2018 2017
LKR ’000 LKR ’000 LKR ’000 LKR ’000
Foreign Currency Derivatives
Forward exchange contracts 28,897 4,288 28,897 4,288
Currency SWAPs 1,176,760 1,614,535 1,176,760 1,614,535
Total derivative financial instruments 1,205,657 1,618,823 1,205,657 1,618,823
26 Financial Assets Recognised Through Profit or Loss - Measured at Fair Value/ Held for Trading
Accounting Policy
Financial instruments are classified as financial assets measured at fair value through profit or loss if they have been acquired
principally for the purpose of selling or repurchasing in the near term or holds as a part of a portfolio that is managed together
for short term profit or position taking. Further as per SLFRS 9, financial assets recognised through profit or loss includes all
financial assets other than those classified under FVTOCI and amortised cost.

250 Bank of Ceylon | Annual Report 2018
NOTES TO THE FINANCIAL STATEMENTS
All financial assets under this category are initially and subsequently measured at fair value. Upon initial recognition, transaction
cost are directly attributable to the acquisition are recognised in the Statement of Profit or Loss. Changes in fair value are
recognised in “Net fair value gains/ (losses) from financial instruments at fair value through profit or loss” (Note 11) and dividend
are recognised in “Net gains/ (losses) from trading” (Note 10). Interest income is recorded in ‘Interest income’ (Note 8.1)
according to the terms of the contract.
Bank Group
As at 31 December 2018 2017 2018 2017
LKR ’000 LKR ’000 LKR ’000 LKR ’000
Measured at fair value
Sri Lanka Government Securities
Treasury bills 3,533,195 4,749,058 3,533,195 4,749,058
Treasury bonds 632,810 682,169 632,810 682,169
Sri Lanka sovereign bonds* - 166,863 - 166,863
Quoted equities [Note 26.2] 2,507,508 2,761,184 2,780,491 2,993,845
Quoted Debt Securities [Note 26.3] - - 1,715 4,613
Units in unit trusts** [Note 26.4] 2,603,785 - 2,635,116 -
Total financial assets recognised through profit or loss - measured at fair value/ Held for trading 9,277,298 8,359,274 9,583,327 8,596,548
* Sri Lanka sovereign bonds previously classified under held for trading and measured at fair value, now classified under
Financial Assets at Amortised Cost - Debt and Other Instruments in line with change of business model and meeting the
criteria in SPPI test.
** Units in unit trust were classified under Financial investments - Available for sale in previous years and with the
implementation of SLFRS 9-“Financial Instruments”, units in unit trust are classified under Financial assets recognised
through profit or loss as these investments do not meet the criteria of being classified as Financial assets measured at fair
value through OCI.
26.1 By Currency
Bank Group
As at 31 December 2018 2017 2018 2017
LKR ’000 LKR ’000 LKR ’000 LKR ’000
Sri Lankan Rupee 9,277,298 8,192,411 9,583,327 8,429,685
United State Dollar - 166,863 - 166,863
Total 9,277,298 8,359,274 9,583,327 8,596,548

251
26.2 Quoted Equities
26.2.1 Sector Wise Composition of Quoted Equities
As at 31 December 2018 2017
Cost of investment
Market Value
Sector wise composition of market value
Cost of investment
Market Value
Sector wise composition of market value
LKR ’000 LKR ’000 % LKR ’000 LKR ’000 %
Bank [Note 26.2.2]
Bank, Finance and Insurance 13,982 13,152 0.5 13,872 15,190 0.6 Beverage, Food and Tobacco 443,337 515,638 20.6 443,439 423,214 15.3 Chemical and Pharmaceuticals 261,945 82,403 3.3 261,945 112,586 4.1 Construction and Engineering 205,814 52,192 2.1 205,814 83,247 3.0 Diversified Holdings 1,301,219 846,374 33.8 1,334,634 877,614 31.7 Footwear and Textiles 23,668 12,713 0.5 23,668 16,141 0.6 Health Care 30,545 18,804 0.7 30,545 26,017 0.9 Hotels and Travels 719,579 280,829 11.2 718,505 319,581 11.6 Investment Trusts 168,781 48,921 2.0 168,781 62,854 2.3 Land and Property 24,815 15,804 0.6 24,815 16,857 0.6 Manufacturing 647,413 301,685 12.0 647,413 446,308 16.2 Motors 148,098 67,662 2.7 149,185 78,812 2.9 Oil Palms 83,965 24,460 1.0 83,965 25,104 0.9 Plantations 142,052 51,714 2.1 142,099 61,102 2.2 Power and Energy 213,036 92,994 3.7 206,555 101,505 3.7 Services 22,759 13,136 0.5 22,759 13,486 0.5 Stores and Supplies 21,923 10,840 0.4 21,923 12,054 0.4 Telecommunications 7,496 5,008 0.2 7,496 6,099 0.2 Trading 142,914 53,179 2.1 142,914 63,413 2.3 Total 4,623,341 2,507,508 100.0 4,650,327 2,761,184 100.0
Group [Note 26.2.3]
Bank, Finance and Insurance 161,708 121,513 4.4 145,778 117,828 3.9 Beverage, Food and Tobacco 482,259 538,583 19.4 471,658 438,292 14.6 Chemical and Pharmaceuticals 265,958 85,016 3.1 263,571 113,903 3.8 Construction and Engineering 215,351 55,906 2.0 213,559 86,250 2.9 Diversified Holdings 1,334,509 870,513 31.3 1,359,384 895,941 29.9 Footwear and Textiles 32,812 18,905 0.7 25,983 17,974 0.6 Health Care 31,045 19,160 0.7 31,045 26,432 0.9 Hotels and Travels 784,857 319,023 11.5 782,318 354,199 11.8 Information Technology - - - 120 89 0.0 Investment Trusts 185,811 59,903 2.1 183,093 72,399 2.4 Land and Property 29,944 19,839 0.7 27,706 19,365 0.6 Manufacturing 696,607 337,142 12.1 688,467 477,670 16.1 Motors 148,098 67,662 2.4 151,210 80,762 2.7 Oil Palms 83,965 24,460 0.9 83,965 25,104 0.8 Plantations 144,478 53,341 1.9 143,595 62,512 2.1 Power and Energy 222,425 101,460 3.6 213,851 107,853 3.6 Services 24,015 13,888 0.5 23,775 14,265 0.5 Stores and Supplies 21,923 10,840 0.4 21,923 12,054 0.4 Telecommunications 8,246 5,766 0.2 7,496 6,099 0.2
Trading 148,251 57,571 2.1 144,655 64,854 2.2
Total 5,022,262 2,780,491 100.0 4,983,152 2,993,845 100.0

252 Bank of Ceylon | Annual Report 2018
NOTES TO THE FINANCIAL STATEMENTS
26.2.2 Quoted Equities - Bank
Bank
As at 31 December 2018 2017
No. of ordinary shares
Cost of investment
Market price per share
Market value
No. of ordinary shares
Cost of investment
Market price per share
Market value
LKR ’000 LKR LKR ’000 LKR ’000 LKR LKR ’000
Bank, Finance and Insurance
Hatton National Bank PLC 61,459 13,982 214.00 13,152 61,005 13,872 249.00 15,190
13,982 13,152 13,872 15,190
Beverage, Food and Tobacco
Bairaha Farms PLC 119,942 31,789 124.70 14,957 119,942 31,789 147.30 17,667
Cargills (Ceylon) PLC 1,484,120 267,267 200.00 296,824 1,298,613 267,368 199.90 259,593
Ceylon Tobacco Company PLC 143,177 137,100 1,415.00 202,595 143,178 137,101 1,004.50 143,822
HVA Foods PLC 20,000 905 4.40 88 20,000 905 6.10 122
Lucky Lanka Milk Processing PLC - Voting 1,000,000 6,000 1.10 1,100 1,000,000 6,000 1.90 1,900
Lucky Lanka Milk Processing PLC - Non- voting 91,900 276 0.80 74 91,900 276 1.20 110
443,337 515,638 443,439 423,214
Chemical and Pharmaceuticals
Chemanex PLC 100,000 16,685 49.50 4,950 100,000 16,685 51.50 5,150
CIC Holdings PLC - Voting 770,657 124,284 39.60 30,518 770,657 124,284 62.00 47,781
CIC Holdings PLC - Non voting 416,189 40,011 30.00 12,486 416,189 40,011 47.40 19,727
Haycarb PLC 251,067 48,262 130.00 32,639 251,067 48,262 147.50 37,032
Lankem Ceylon PLC 72,400 32,703 25.00 1,810 72,400 32,703 40.00 2,896
261,945 82,403 261,945 112,586
Construction and Engineering
Access Engineering PLC 162,000 3,859 14.10 2,284 162,000 3,859 23.50 3,807
Colombo Dockyard PLC 897,622 201,955 55.60 49,908 897,622 201,955 88.50 79,440
205,814 52,192 205,814 83,247
Diversified Holdings
Aitken Spence PLC 2,596,230 360,512 47.80 124,100 2,596,230 360,512 54.60 141,754
Browns Capital PLC 200,000 991 3.50 700 200,000 991 3.20 640
Browns Investments PLC 3,073,412 13,317 1.90 5,839 3,073,412 13,317 2.60 7,991
Carson Cumberbatch PLC 313,352 141,328 170.20 53,333 313,352 141,328 176.00 55,150
Expolanka Holdings PLC 1,716,193 15,964 4.00 6,865 1,716,193 15,964 5.30 9,096
Hayleys PLC 68,097 21,556 187.00 12,734 68,097 21,556 241.00 16,411
John Keells Holdings PLC 3,299,637 575,620 159.70 526,952 3,299,657 575,620 148.50 489,999
Richard Pieris and Company PLC 6,889,225 90,662 10.50 72,337 6,889,225 90,662 13.00 89,560
Softlogic Holdings PLC - - - - 1,696,191 33,415 12.50 21,202
The Colombo Fort Land & Building PLC 149,500 10,307 15.00 2,243 149,500 10,307 19.00 2,841
Vallibel One PLC 2,427,704 70,962 17.00 41,271 2,427,704 70,962 17.70 42,970
1,301,219 846,374 1,334,634 877,614

253
Bank
As at 31 December 2018 2017
No. of ordinary shares
Cost of investment
Market price per share
Market value
No. of ordinary shares
Cost of investment
Market price per share
Market value
LKR ’000 LKR LKR ’000 LKR ’000 LKR LKR ’000
Footwear and Textiles
Hayleys Fabric PLC 774,098 14,343 9.10 7,044 774,098 14,343 13.50 10,450
ODEL PLC 222,295 9,325 25.50 5,669 222,295 9,325 25.60 5,691
23,668 12,713 23,668 16,141
Health Care
Singhe Hospitals PLC 4,000,000 10,000 1.40 5,600 4,000,000 10,000 1.70 6,800
The Lanka Hospital Corporation PLC 309,949 20,545 42.60 13,204 309,949 20,545 62.00 19,217
30,545 18,804 30,545 26,017
Hotels and Travels
Aitken Spence Hotel Holdings PLC 2,547,422 232,670 27.00 68,780 2,547,422 232,670 29.50 75,149
Amaya Leisure PLC 593,110 53,019 40.00 23,724 569,845 53,019 51.30 29,233
Asian Hotels & Properties PLC 2,367,741 225,781 42.90 101,576 2,367,741 225,781 52.80 125,017
Citrus Leisure PLC 100,000 10,112 4.80 480 100,000 10,112 7.50 750
Eden Hotel Lanka PLC 775,550 41,864 13.50 10,470 775,550 41,864 14.20 11,013
Galadari Hotels (Lanka) PLC 37,280 566 6.90 257 61,030 927 8.00 488
Jetwing Symphony PLC 179,627 2,694 12.00 2,156 - - - -
John Keells Hotels PLC 893,487 14,553 7.80 6,969 893,487 14,553 8.80 7,863
Marawila Resorts PLC 100,000 782 1.80 180 100,000 782 1.90 190
Tal Lanka Hotels PLC 447,400 30,043 13.00 5,816 447,400 30,043 15.90 7,114
Tangerine Beach Hotels PLC 50,000 5,056 36.40 1,820 50,000 5,056 52.00 2,600
The Fortress Resorts PLC 1,461,100 50,506 9.10 13,296 1,461,100 50,506 9.30 13,588
The Kingsbury PLC 224,166 3,526 15.20 3,407 304,166 4,785 13.50 4,106
Trans Asia Hotels PLC 477,200 48,407 87.80 41,898 477,200 48,407 89.00 42,470
719,579 280,829 718,505 319,581
Investment Trusts
Ambeon Holdings PLC 385,000 23,271 11.10 4,274 385,000 23,271 12.10 4,659
Ceylon Guardian Investment Trust PLC 107,847 32,747 66.10 7,129 107,847 32,747 85.00 9,167
Ceylon Investment PLC 446,203 73,124 39.00 17,402 446,203 73,124 44.70 19,945
Renuka Holdings PLC 1,211,821 39,639 16.60 20,116 1,211,821 39,639 24.00 29,083
168,781 48,921 168,781 62,854
Land and Property
Overseas Realty (Ceylon) PLC 957,792 24,815 16.50 15,804 957,792 24,815 17.60 16,857
24,815 15,804 24,815 16,857

254 Bank of Ceylon | Annual Report 2018
NOTES TO THE FINANCIAL STATEMENTS
Bank
As at 31 December 2018 2017
No. of ordinary shares
Cost of investment
Market price per share
Market value
No. of ordinary shares
Cost of investment
Market price per share
Market value
LKR ’000 LKR LKR ’000 LKR ’000 LKR LKR ’000
Manufacturing
Abans Electricals PLC 196,303 26,807 57.70 11,327 196,303 26,807 84.50 16,588
ACL Cables PLC 1,005,246 45,924 37.00 37,194 1,005,246 45,924 42.40 42,622
ACME Printing & Packaging PLC 1,078,700 35,020 4.20 4,531 1,078,700 35,020 6.60 7,119
Central Industries PLC 62,560 2,575 28.10 1,758 62,560 2,575 41.00 2,565
Ceylon Grain Elevators PLC 612,498 60,754 59.50 36,444 612,498 60,754 66.10 40,486
Chevron Lubricants Lanka PLC 837,966 154,550 72.80 61,004 837,966 154,550 119.00 99,718
Kelani Tyres PLC 1,016,213 75,060 35.90 36,482 1,016,213 75,060 44.40 45,120
Lanka Cement PLC 7,265,828 63,576 2.50 18,165 7,265,828 63,576 5.70 41,415
Lanka Tiles PLC 973,200 130,512 73.10 71,141 973,200 130,512 115.00 111,918
Orient Garments PLC 82,150 2,568 7.00 575 82,150 2,568 7.00 575
Piramal Glass Ceylon PLC 3,288,600 32,322 3.80 12,497 3,288,600 32,322 5.80 19,074
Royal Ceramics Lanka PLC 1,399 165 74.60 104 1,399 165 114.50 160
Sierra Cables PLC 329,525 1,090 2.10 692 329,525 1,090 2.50 824
Swisstek (Ceylon) PLC 161,929 11,283 41.00 6,639 161,929 11,283 62.00 10,040
Tokyo Cement Company (Lanka) PLC - Voting 36,669 1,807 25.20 924 36,669 1,807 66.00 2,420
Tokyo Cement Company (Lanka) PLC - Non - voting 96,000 3,400 23.00 2,208 96,000 3,400 59.00 5,664
647,413 301,685 647,413 446,308

255
Bank
As at 31 December 2018 2017
No. of ordinary shares
Cost of investment
Market price per share
Market value
No. of ordinary shares
Cost of investment
Market price per share
Market value
LKR ’000 LKR LKR ’000 LKR ’000 LKR LKR ’000
Motors
C M Holdings PLC 50,857 17,422 45.00 2,289 50,857 17,422 73.00 3,713
Diesel & Motor Engineering PLC 77,935 84,514 343.50 26,771 77,935 84,514 490.00 38,188
Sathosa Motors PLC 13,195 5,111 534.50 7,053 16,000 6,198 335.10 5,362
United Motors Lanka PLC 404,478 41,051 78.00 31,549 404,478 41,051 78.00 31,549
148,098 67,662 149,185 78,812
Oil Palms
Bukit Darah PLC 119,257 83,965 205.10 24,460 119,257 83,965 210.50 25,104
83,965 24,460 83,965 25,104
Plantations
Agalawatte Plantations PLC 45,600 4,608 14.00 638 45,600 4,608 20.00 912
Balangoda Plantations PLC 30,000 2,184 12.70 381 30,000 2,184 30.20 906
Horana Plantations PLC 513,000 43,752 15.00 7,695 513,000 43,752 26.00 13,338
Kahawatte Plantations PLC 757,436 30,638 39.90 30,222 758,536 30,683 38.90 29,507
Kegalle Plantations PLC 50,600 13,703 55.00 2,783 50,600 13,703 70.00 3,542
Kotagala Plantations PLC 729,997 34,709 6.70 4,891 486,665 34,711 12.20 5,937
Namunukula Plantations PLC 80,000 12,458 63.80 5,104 80,000 12,458 87.00 6,960
142,052 51,714 142,099 61,102
Power and Energy
Laugfs Gas PLC - Voting 168,727 4,688 18.70 3,155 168,727 4,688 23.50 3,965
Laugfs Gas PLC - Non-voting 3,420,538 142,754 15.40 52,676 3,420,538 142,754 20.00 68,411
Lotus Hydro Power PLC 173,194 1,427 4.50 779 173,194 1,427 5.80 1,005
LVL Energy Fund PLC 648,100 6,481 8.40 5,444 - - - -
Panasian Power PLC 1,029,200 6,407 3.00 3,088 1,029,200 6,407 2.70 2,779
Resus Energy PLC 1,117,700 45,609 21.10 23,583 1,117,700 45,609 18.20 20,342
Vallibel Power Erathna PLC 667,050 5,670 6.40 4,269 667,050 5,670 7.50 5,003
213,036 92,994 206,555 101,505
Services
John Keells PLC 250,200 22,759 52.50 13,136 250,200 22,759 53.90 13,486
22,759 13,136 22,759 13,486

256 Bank of Ceylon | Annual Report 2018
NOTES TO THE FINANCIAL STATEMENTS
Bank
As at 31 December 2018 2017
No. of ordinary shares
Cost of investment
Market price per share
Market value
No. of ordinary shares
Cost of investment
Market price per share
Market value
LKR ’000 LKR LKR ’000 LKR ’000 LKR LKR ’000
Stores and Supplies
Hunters & Company PLC 27,100 21,923 400.00 10,840 27,100 21,923 444.80 12,054
21,923 10,840 21,923 12,054
Telecommunications
Sri Lanka Telecom PLC 214,000 7,496 23.40 5,008 214,000 7,496 28.50 6,099
7,496 5,008 7,496 6,099
Trading
Brown & Company PLC 809,616 133,026 61.00 49,387 809,616 133,026 70.50 57,078
Ceylon & Foreign Trades PLC 830,100 8,533 3.20 2,656 830,100 8,533 6.20 5,147
C. W. Mackie PLC 25,812 1,355 44.00 1,136 25,812 1,355 46.00 1,188
142,914 53,179 142,914 63,413
Total quoted equities 4,623,341 2,507,508 4,650,327 2,761,184

257
26.2.3 Quoted equities - Group
Group
As at 31 December 2018 2017
No. of ordinary shares
Cost of investment
Market price per share
Market value
No. of ordinary shares
Cost of investment
Market price per share
Market value
LKR ’000 LKR LKR ’000 LKR ’000 LKR LKR ’000
Banks, Finance and Insurance
Amana Takaful PLC - - - - 500,000 450 0.80 400
Arpico Insurance PLC 8,900 165 18.30 163 - - - -
Asia Asset Finance PLC 1,139,289 1,623 0.90 1,025 639,289 1,023 1.40 895
Central Finance Company PLC 50,970 6,291 88.70 4,521 46,331 5,842 92.30 4,276
Citizens Development Business Finance PLC - Non-voting 9,233 824 70.00 646 44,733 3,992 56.00 2,505
Commercial Bank of Ceylon PLC - Voting 15,000 1,759 115.00 1,725 - - - -
Commercial Bank of Ceylon PLC - Non-voting 53,179 5,410 95.00 5,052 40,000 4,202 105.00 4,200
Commercial Credit and Finance PLC 22,500 1,498 28.50 641 22,500 1,498 43.00 968
DFCC Bank PLC 120,000 24,993 93.00 11,160 120,000 24,993 122.80 14,736
First Capital Holdings PLC 25,000 775 28.80 720 - - - -
Hatton National Bank PLC - Voting 61,459 13,982 214.00 13,152 61,005 13,872 249.00 15,190
Hatton National Bank PLC - Non-voting 10,000 1,820 168.50 1,685 - - - -
Janashakthi Insurance Company PLC 35,000 1,043 30.00 1,050 669,893 12,975 15.70 10,517
Lanka Orix Leasing Company PLC 32,500 3,431 89.90 2,922 - - - -
LOLC Finance PLC 200,000 775 3.40 680 - - - -
LB Finance PLC 12,500 1,645 123.00 1,538 12,500 1,645 122.10 1,526
Multi Finance PLC 20,000 280 13.90 278 - - - -
National Development Bank PLC 99,374 18,797 106.80 10,613 74,286 16,253 136.40 10,133
Nations Trust Bank PLC 205,492 19,546 89.20 18,330 210,032 20,657 78.00 16,382
Orient Finance PLC 80,000 1,191 15.50 1,240 - - - -
Pan Asia Banking Corporation PLC 80,000 1,341 14.80 1,184 30,000 516 15.70 471
People`s Merchant Finance PLC 2,500 27 11.40 29 - - - -
Sanasa Development Bank PLC 93,368 9,258 75.00 7,003 18,152 1,829 101.90 1,850
Seylan Bank PLC - Voting 141,233 13,846 78.00 11,016 137,789 13,846 87.20 12,015
Seylan Bank PLC - Non-voting 354,984 17,834 44.50 15,797 341,439 17,845 56.00 19,121
Softlogic Finance PLC 67,215 3,532 26.60 1,788 60,515 3,340 36.40 2,203
Sinhaputhra Finance PLC 5,000 45 8.80 44 - - - -
The Finance Company PLC - Non-voting 200,000 1,000 1.10 220 200,000 1,000 2.20 440
Union Bank of Colombo PLC 662,828 8,977 11.00 7,291 - - - -
161,708 121,513 145,778 117,828

258 Bank of Ceylon | Annual Report 2018
NOTES TO THE FINANCIAL STATEMENTS
Group
As at 31 December 2018 2017
No. of ordinary shares
Cost of investment
Market price per share
Market value
No. of ordinary shares
Cost of investment
Market price per share
Market value
LKR ’000 LKR LKR ’000 LKR ’000 LKR LKR ’000
Beverage, Food and Tobacco
Bairaha Farms PLC 144,942 35,752 124.70 18,074 144,942 35,752 147.30 21,350
Cargills (Ceylon) PLC 1,495,784 269,569 200.00 299,157 1,298,613 267,368 199.90 259,593
Ceylon Tobacco Company PLC 143,177 137,100 1,415.00 202,595 143,178 137,101 1,004.50 143,822
Distilleries Company Of Sri Lanka PLC 55,000 1,048 16.10 886 - - - -
HVA Foods PLC 36,850 988 4.40 162 45,000 1,060 6.10 275
Keells Food Products PLC 39,058 6,240 134.00 5,234 27,672 4,746 140.00 3,874
Lion Brewery Ceylon PLC 7,999 4,574 570.00 4,559 672 370 540.00 363
Lucky Lanka Milk Processing PLC - Voting
3,514,546 20,958 1.10 3,866
3,657,487 21,808 1.90 6,949
Lucky Lanka Milk Processing PLC - Non-voting 91,900 276 0.80 74 91,900 276 1.20 110
Renuka Agri Foods PLC 1,697,738 5,266 2.10 3,565 752,274 3,177 2.60 1,956
Renuka Foods PLC 29,535 488 13.90 411 - - - -
482,259 538,583 471,658 438,292
Chemicals and Pharmaceuticals
Chemanex PLC 100,000 16,685 49.50 4,950 100,000 16,685 51.50 5,150
CIC Holdings PLC - Voting 798,657 125,814 39.60 31,627 772,657 124,427 62.00 47,905
CIC Holdings PLC - Non-voting 466,333 42,494 30.00 13,990 441,353 41,494 47.40 20,920
Haycarb PLC 251,067 48,262 130.00 32,639 251,067 48,262 147.50 37,032
Lankem Ceylon PLC 72,400 32,703 25.00 1,810 72,400 32,703 40.00 2,896
265,958 85,016 263,571 113,903
Construction and Engineering
Access Engineering PLC 196,950 4,445 14.10 2,777 162,000 3,859 23.50 3,807
Colombo Dockyard PLC 902,622 202,255 55.60 50,186 897,622 201,955 88.50 79,440
Lankem Developments PLC 275,000 1,900 4.10 1,128 - - - -
MTD Walkers PLC 165,000 6,751 11.00 1,815 130,000 7,745 23.10 3,003
215,351 55,906 213,559 86,250

259
Group
As at 31 December 2018 2017
No. of ordinary shares
Cost of investment
Market price per share
Market value
No. of ordinary shares
Cost of investment
Market price per share
Market value
LKR ’000 LKR LKR ’000 LKR ’000 LKR LKR ’000
Diversified Holdings
Aitken Spence PLC 2,706,230 371,623 47.80 129,358 2,706,230 371,623 54.60 147,760
Browns Capital PLC 200,000 991 3.50 700 200,000 991 3.20 640
Browns Investments PLC 4,373,412 17,322 1.90 8,309 3,823,412 15,799 2.60 9,941
Carson Cumberbatch PLC 313,352 141,328 170.20 53,333 313,352 141,328 176.00 55,150
Dunamis Capital PLC - - - - 27,500 719 23.40 644
Expolanka Holdings PLC 2,441,193 19,512 4.00 9,765 1,716,193 15,964 5.30 9,096
Hayleys PLC 68,097 21,556 187.00 12,734 68,597 21,697 241.00 16,532
Hemas Holdings PLC 12,500 1,176 88.80 1,110 - - - -
John Keells Holdings PLC 3,331,028 580,499 159.70 531,965 3,336,028 581,139 148.50 495,400
Melstacorp PLC 7,756 465 50.30 390 5,000 305 59.50 298
Richard Pieris and Company PLC 6,919,225 90,975 10.50 72,652 6,889,225 90,662 13.00 89,560
Softlogic Holdings PLC 50,000 1,030 21.50 1,075 1,696,191 33,415 12.50 21,202
Sunshine Holdings PLC 60,712 3,531 53.80 3,266 35,211 2,119 57.00 2,007
Taprobane Holdings PLC 250,000 1,283 4.00 1,000 30,000 180 5.50 165
The Colombo Fort Land & Building PLC 194,299 11,531 15.00 2,914 194,299 11,531 19.00 3,692
Vallibel One PLC 2,467,189 71,687 17.00 41,942 2,477,704 71,912 17.70 43,854
1,334,509 870,513 1,359,384 895,941
Footwear and Textiles
Ceylon Leather Products PLC - - - - 8,000 615 60.40 483
Hayleys Fabric PLC 1,454,506 23,487 9.10 13,236 874,098 16,043 13.50 11,800
ODEL PLC 222,295 9,325 25.50 5,669 222,295 9,325 25.60 5,691
32,812 18,905 25,983 17,974
Health Care
Ceylon Hospitals PLC 5,000 500 71.10 356 5,000 500 83.00 415
Singhe Hospital PLC 4,000,000 10,000 1.40 5,600 4,000,000 10,000 1.70 6,800
The Lanka Hospital Corporation PLC 309,949 20,545 42.60 13,204 309,949 20,545 62.00 19,217
31,045 19,160 31,045 26,432

260 Bank of Ceylon | Annual Report 2018
NOTES TO THE FINANCIAL STATEMENTS
Group
As at 31 December 2018 2017
No. of ordinary shares
Cost of investment
Market price per share
Market value
No. of ordinary shares
Cost of investment
Market price per share
Market value
LKR ’000 LKR LKR ’000 LKR ’000 LKR LKR ’000
Hotels and Travels
Aitken Spence Hotel Holdings PLC 2,610,641 238,463 27.00 70,487 2,610,641 238,463 29.50 77,014
Asian Hotels & Properties PLC 2,375,782 226,206 42.90 101,921 2,367,741 225,781 52.80 125,017
Amaya Leisure PLC 593,110 53,019 40.00 23,724 569,845 53,019 51.30 29,233
Bensei Royal Resorts Hikkaduwa PLC - - - - 100,000 100 0.80 80
Beruwala Resorts PLC 200,000 180 0.70 140 - - - -
Citrus Leisure PLC 100,000 10,112 4.80 480 100,000 10,112 7.50 750
Eden Hotel Lanka PLC 890,888 45,184 13.50 12,027 903,293 45,541 14.20 12,827
Galadari Hotels (Lanka) PLC 37,280 566 6.90 257 61,030 927 8.00 488
Jetwing Symphony PLC 179,627 2,694 12.00 2,156 - - - -
John Keells Hotels PLC 1,093,487 16,888 7.80 8,529 968,487 15,728 8.80 8,523
Marawila Resorts PLC 100,000 782 1.80 180 100,000 782 1.90 190
Palm Garden Hotels PLC 147,472 10,928 21.40 3,156 147,472 10,928 26.10 3,849
Tal Lanka Hotels PLC 447,400 30,043 13.00 5,816 447,400 30,043 15.90 7,114
Tangerine Beach Hotels PLC 50,000 5,056 36.40 1,820 50,000 5,056 52.00 2,600
The Fortress Resorts PLC 1,461,100 50,506 9.10 13,296 1,461,100 50,506 9.30 13,588
The Kingsbury PLC 2,161,893 45,359 15.20 32,861 2,241,893 46,619 13.50 30,266
Trans Asia Hotels PLC 477,200 48,407 87.80 41,898 477,200 48,407 89.00 42,470
Waskaduwa Beach Resort PLC 110,000 464 2.50 275 50,000 306 3.80 190
784,857 319,023 782,318 354,199
Information Technology
E-Channelling PLC - - - - 15,000 120 5.90 89
- - 120 89

261
Group
As at 31 December 2018 2017
No. of ordinary shares
Cost of investment
Market price per share
Market value
No. of ordinary shares
Cost of investment
Market price per share
Market value
LKR ’000 LKR LKR ’000 LKR ’000 LKR LKR ’000
Investment Trusts
Ambeon Holdings PLC 1,085,000 32,634 11.10 12,044 885,000 30,165 12.10 10,709
Ceylon Guardian Investment Trust PLC 107,847 32,747 66.10 7,129 107,847 32,747 85.00 9,167
Ceylon Investment PLC 511,930 79,535 39.00 19,965 511,933 79,536 44.70 22,883
Guardian Capital Partners PLC 18,472 1,006 24.00 443 18,472 1,006 30.10 556
Lanka Realty Investments PLC 10,000 250 20.60 206 - - - -
Renuka Holdings PLC 1,211,821 39,639 16.60 20,116 1,211,821 39,639 24.00 29,084
185,811 59,903 183,093 72,399
Land and Property
Cargo Boat Development Company PLC 9,984 899 73.00 729 9,984 899 84.00 839
City Housing & Real Estate CO. PLC 35,935 178 4.90 176 - - - -
Colombo Land & Development Company PLC 2,700 96 15.00 41 2,700 96 19.80 53
Commercial Development Company PLC 4,649 451 70.10 326 4,649 451 70.00 325
East West Properties PLC 45,000 768 13.00 585 8,000 120 11.30 90
Kelsey Developments PLC 2,000 70 30.40 61 - - - -
Overseas Realty (Ceylon) PLC 957,792 24,815 16.50 15,804 957,792 24,815 17.60 16,858
Property Development PLC 8,532 1,057 119.20 1,017 - - - -
R I L Property PLC - - - - 25,000 200 7.20 180
Seylan Developments PLC 100,000 1,610 11.00 1,100 - - - -
Serendib Land PLC - - - - 75,000 1,125 13.60 1,020
29,944 19,839 27,706 19,365
Manufacturing
Abans Electricals PLC 202,720 27,449 57.70 11,697 201,303 27,327 84.50 17,010
ACL Cables PLC 1,065,246 45,924 37.00 39,414 1,055,246 48,791 42.40 44,742
ACME Printing & Packaging PLC 1,078,700 35,020 4.20 4,531 1,078,700 35,020 6.60 7,119
Alufab PLC 60,000 1,660 16.50 990 60,000 1,660 23.00 1,380
Alumex PLC 80,000 1,386 13.50 1,080 - - - -
Central Industries PLC 62,560 2,575 28.10 1,758 62,560 2,575 41.00 2,565
Ceylon Grain Elevators PLC 672,498 64,940 59.50 40,014 672,498 64,940 66.10 44,452
Chevron Lubricants Lanka PLC 875,394 158,380 72.80 63,729 872,966 159,206 119.00 103,883
Dankotuwa Porcelain PLC 9,100 64 6.50 59 - - - -
Kelani Tyres PLC 1,131,213 84,083 35.90 40,611 1,131,213 84,083 44.40 50,226
Lanka Cement PLC 7,265,828 63,576 2.50 18,165 7,265,828 63,576 5.70 41,415
Lanka Tiles PLC 973,200 130,512 73.10 71,141 973,200 130,512 115.00 111,918

262 Bank of Ceylon | Annual Report 2018
NOTES TO THE FINANCIAL STATEMENTS
Group
As at 31 December 2018 2017
No. of ordinary shares
Cost of investment
Market price per share
Market value
No. of ordinary shares
Cost of investment
Market price per share
Market value
LKR ’000 LKR LKR ’000 LKR ’000 LKR LKR ’000
Orient Garments PLC 82,150 2,568 7.00 575 82,150 2,568 7.00 575
Piramal Glass Ceylon PLC 3,288,600 32,322 3.80 12,497 3,288,600 32,322 5.80 19,074
Richard Pieris Exports PLC 2,000 470 214.90 430 2,000 470 177.00 354
Royal Ceramics Lanka PLC 88,399 10,722 74.60 6,595 69,722 8,905 114.50 7,983
Sierra Cables PLC 1,719,525 7,247 2.10 3,611 1,719,525 7,247 2.50 4,299
Swisstek (Ceylon) PLC 176,674 11,924 41.00 7,244 161,929 11,283 62.00 10,040
Teejay Lanka PLC 250,000 8,343 32.50 8,125 75,000 2,775 34.00 2,550
Tokyo Cement Company (Lanka) PLC -Voting 36,669 1,807 25.20 924 36,669 1,807 66.00 2,420
Tokyo Cement Company (Lanka) PLC -Non voting 171,833 5,635 23.00 3,952 96,000 3,400 59.00 5,665
696,607 337,142 688,467 477,670
Motors
C M Holdings PLC 50,857 17,422 45.00 2,289 50,857 17,422 73.00 3,713
Diesel & Motor Engineering PLC 77,935 84,514 343.50 26,771 77,935 84,514 490.00 38,188
Sathosa Motors PLC 13,195 5,111 534.50 7,053 16,000 6,198 335.10 5,362
United Motors Lanka PLC 404,478 41,051 78.00 31,549 429,478 43,076 78.00 33,499
148,098 67,662 151,210 80,762
Oil Palms
Bukit Darah PLC 119,257 83,965 205.10 24,460 119,257 83,965 210.50 25,104
83,965 24,460 83,965 25,104

263
Group
As at 31 December 2018 2017
No. of ordinary shares
Cost of investment
Market price per share
Market value
No. of ordinary shares
Cost of investment
Market price per share
Market value
LKR ’000 LKR LKR ’000 LKR ’000 LKR LKR ’000
Plantations
Agalawatte Plantations PLC 45,600 4,608 14.00 638 45,600 4,608 20.00 912
Balangoda Plantations PLC 30,000 2,184 12.70 381 30,000 2,184 30.20 906
Elpitiya Plantations PLC 50,000 1,496 19.80 990 50,000 1,496 28.20 1,410
Horana Plantations PLC 513,000 43,752 15.00 7,695 513,000 43,752 26.00 13,338
Kahawatte Plantations PLC 757,436 30,638 39.90 30,222 758,536 30,683 38.90 29,507
Kegalle Plantations PLC 50,600 13,703 55.00 2,783 50,600 13,703 70.00 3,542
Kotagala Plantations PLC 729,997 34,709 6.70 4,891 486,665 34,711 12.20 5,937
Malwatte Valley Plantations PLC 64,634 353 4.10 265 - - - -
Namunukula Plantations PLC 80,000 12,458 63.80 5,104 80,000 12,458 87.00 6,960
Watawala Plantations PLC 19,498 577 19.10 372 - - - -
144,478 53,341 143,595 62,512
Power and Energy
Laugfs Gas PLC - Voting 240,171 6,256 18.70 4,491 243,727 6,650 23.50 5,728
Laugfs Gas PLC - Non voting 3,445,538 143,705 15.40 53,061 3,445,538 143,705 20.00 68,911
Lotus Hydro Power PLC 173,194 1,427 4.50 779 173,194 1,427 5.80 1,005
LVL Energy Fund PLC 648,100 6,481 8.40 5,444 - - - -
Panasian Power PLC 1,529,200 7,957 3.00 4,588 1,029,200 6,407 2.70 2,779
Resus Energy PLC 1,290,437 49,016 21.10 27,228 1,290,737 49,020 18.20 23,490
Vallibel Power Erathna PLC 917,050 7,583 6.40 5,869 792,050 6,642 7.50 5,940
222,425 101,460 213,851 107,853
Services
Ceylon Tea Brokers PLC 114,778 556 2.80 321 114,778 556 4.30 494
John Keells PLC 250,200 22,759 52.50 13,136 250,200 22,759 53.90 13,486
Paragon Ceylon PLC - - - - 50,000 288 4.50 225
Renuka Capital PLC 113,500 700 3.80 431 13,500 172 4.50 60
24,015 13,888 23,775 14,265
Stores and Supplies
Hunters & Company PLC 27,100 21,923 400.00 10,840 27,100 21,923 444.80 12,054
21,923 10,840 21,923 12,054

264 Bank of Ceylon | Annual Report 2018
NOTES TO THE FINANCIAL STATEMENTS
Group
As at 31 December 2018 2017
No. of ordinary shares
Cost of investment
Market price per share
Market value
No. of ordinary shares
Cost of investment
Market price per share
Market value
LKR ’000 LKR LKR ’000 LKR ’000 LKR LKR ’000
Telecommunications
Dialog Axiata PLC 75,000 750 10.10 758 - - - -
Sri Lanka Telecom PLC 214,000 7,496 23.40 5,008 214,000 7,496 28.50 6,099
8,246 5,766 7,496 6,099
Trading
Brown & Company PLC 881,625 138,363 61.00 53,779 828,677 134,637 70.50 58,422
Ceylon & Foreign Trades PLC 830,100 8,533 3.20 2,656 830,100 8,533 6.20 5,146
C. W. Mackie PLC 25,812 1,355 44.00 1,136 25,812 1,355 46.00 1,186
Tess Agro PLC - - - - 100,000 130 1.00 100
148,251 57,571 144,655 64,854
Total quoted equities 5,021,880 2,780,491 4,983,152 2,993,845
26.3 Quoted Debt Securities
Group
As at 31 December 2018 2017
No. of ordinary shares
Cost of investment
Market price per share
Market value
No. of ordinary shares
Cost of investment
Market price per share
Market value
LKR ’000 LKR LKR ’000 LKR ’000 LKR LKR ’000
Listed Debentures
Commercial Credit and Finance PLC - - - - 20,000 2,141 116.25 2,325
Hatton National Bank PLC 17,500 1,600 98.00 1,715 26,000 2,377 88.00 2,288
Total quoted debt securities 1,600 1,715 4,518 4,613

265
26.4 Units in Unit Trusts
As at 31 December 2018 2017*
No. ofunits
Cost ofinvestment
Market value
No. ofunits
Cost of investment
Market value
LKR ’000 LKR ’000 LKR ’000 LKR ’000
Bank
Ceybank Unit Trust 111,307,627 1,738,215 2,159,368 120,986,551 1,889,364 2,650,815
Ceybank Century Growth Fund 7,539,256 132,952 444,364 8,284,896 146,101 554,839
Ceybank High Yield Fund - - - 29,763,086 300,000 300,164
Ceybank Surekum Gilt Edged Fund 4,921 50 53 11,389,982 114,148 120,666
Total units in unit trusts 1,871,217 2,603,785 2,449,613 3,626,484
Group
Ceybank Unit Trust 111,307,627 1,738,215 2,159,368 120,986,551 1,889,364 2,650,815
Ceybank Century Growth Fund 7,539,256 132,952 444,364 8,284,896 146,101 554,839
Ceybank High Yield Fund - - - 29,763,086 300,000 300,164
Ceybank Surekum Gilt Edged Fund 4,921 50 53 11,389,982 114,148 120,666
Comtrust Money Market Fund 163,821 1,500 1,225 163,821 1,500 2,458
First Capital Asset Management Limited 25,932 29,350 30,106 25,932 29,350 31,760
Total units in unit trusts 1,902,067 2,635,116 2,480,463 3,660,702
* In the year 2017, Units in Unit Trusts have been presented under ‘Financial Investments - Available for Sale’ (Note 29).
27 Financial Assets at Amortised Cost - Loans and Advances Accounting Policy
“Loans and advances” include non-derivative financial assets with fixed or determinable payments that are not quoted in an
active market, other than:
- Those that the Bank intends to sell immediately or in the near term and those that the Bank, upon initial recognition,
designates as at fair value through profit or loss
- Those that the Bank, upon initial recognition, designates as fair value through OCI
- Those for which the Bank may not recover substantially all of its initial investment, other than due to credit deterioration
“Loans and advances” are initially measured at fair value and subsequently measured at amortised cost using the Effective
Interest Rate (EIR), less allowance for impairment. Amortised cost is calculated by taking into account any discount or premium
on acquisition and fees and costs that are an integral part of the EIR. The amortisation is included in “Interest income” (Note 8.1)
in the Statement of Profit or Loss. The losses arising from impairment are recognised in “Impairment charge/ (reversal) for loans
and other losses” (Note 14) in the Statement of Profit or Loss.

266 Bank of Ceylon | Annual Report 2018
NOTES TO THE FINANCIAL STATEMENTS
Write-off of Loans and Receivables
Loans together with the associated allowance are written off when there is no realistic prospect of future recovery and all
collateral has been realised. If a write-off is later recovered, the recovery is recognised in the “Net other operating income”
(Note 13).
Collateral Valuation
The Group seeks to use collateral, where possible, to mitigate its risks on financial assets. The collateral comes in various
forms such as cash, gold, securities, letters of credit/ guarantees, real estate, inventories, other non-financial assets and credit
enhancements such as netting arrangements. The fair value of collateral is generally assessed, at a minimum, at inception and
based on the guidelines issued by Central Bank of Sri Lanka, there on.
Non-financial collaterals, including immovable and movables, are valued based on data provided by the independent
professional valuers and Audited Financial Statements.
Collaterals Repossessed
The Group’s policy is to dispose of repossessed properties through parate execution or fiscal conveys (Foreclosed properties)
in an orderly fashion. The proceeds are used to reduce or repay the outstanding claim. In general, the Group does not occupy
repossessed properties for business use.
Renegotiated Loans
Where possible, the Group seeks to renegotiate loans rather than take possession of collateral. This may involve extending
the payment arrangements and agreement of new loan conditions. Once the terms have been renegotiated, any impairment
is measured using the original EIR as calculated before the modification of terms. The management continously reviews
renegotiated loans to ensure that all criteria are met and that future payments are likely to occur. The loans continue to be
subject to an individual or collective impairment assessment, calculated using the loan’s original EIR.
Expected Credit Loss (ECL)
The Bank’s impairment provisioning method has fundamentally changed due to the adoption of SLFRS 9 by replacing LKAS 39
incurred loss approach with forward looking expected loss approach as mentioned in Note 4.1.1.2 to this Financial Statements.
Accordingly, the Bank has recorded an expected credit loss allowance in 2018 for all loans and other debt financial assets
except which are held for FVTPL, together with loan commitments and financial guarantee contracts which are commonly
referred to as “financial instruments”.
The ECL allowance is based on the credit losses expected to arise over the life of the asset, the Lifetime Expected Credit Loss
(LTECL) as outline in Notes 4.5.11.2 and 4.5.11.3, if there has been no significant increase in credit risk since origination, in
which case, the allowance is based on the 12 months’ expected credit loss (12mECL) as outlined in Note 4.5.11.1 to the financial
statements. The Bank’s policies for determining whether there has been a significant increase in credit risk are set out in this
note.
Both LTECLs and 12mECLs are calculated either on an individual basis or on collective basis, depending on the nature and size
of the underlying portfolio of financial instruments. The Bank’s policy for grouping financial instruments measured on a collective
basis is explained in Note 4.5.11.5.
The Bank has established a policy to perform an assessment, at the end of each Reporting period, of whether a financial
instrument’s credit risk has increased significantly since initial recognition, by considering the change in the risk of default
occurring over the remaining life of the financial instrument.

267
Based on the above process, the Bank grouped its loans into Stage 1, Stage 2, Stage 3 as described in Notes 4.5.11.1 to 4.5.11.3
to this Financial Statements.
For financial assets in respect of which the Bank has no reasonable expectations of recovering either the entire outstanding
amount, or a proportion thereof, the gross carrying amount of the financial asset is reduced.
The components of the ECL calculation is outlined under Note 4.5.11.4 to this Financial Statements and when estimating the
ECLs, the Bank considers three economic scenarios (base - case, best - case and worst - case). Each of these scenarios are
associated with different loss rates.
For all products, the Bank considers the maximum period over which the credit losses are determined is the contractual life of
the financial instrument.
Impairment losses and reversals are accounted for and disclosed separately from modification losses or gains that are
accounted for as an adjustment of the financial asset’s gross carrying value.
The methodology of the ECL are summarised below:
Stage 1 The 12mECL is calculated as the portion of LTECLs that represent the ECLs that result from default events on a
financial instrument that are possible within the 12 months after the Reporting date. The Bank calculates the 12mECL
allowance based on the expectation of a default occurring in the 12 months following the Reporting date. These
expected 12-month default probabilities are applied to a forecasted EAD and multiplied by the expected LGD and
discounted by an approximation to the original EIR.
Stage 2 When a loan has shown a significant increase in credit risk since origination, the Bank records an allowance for the
LTECLs. The mechanics are similar to those explained above, including the use of multiple scenarios, but PDs and
LGDs are based over the lifetime of the facility.
Stage 3 For loans considered credit-impaired, the Bank recognises LTECLs. The method is similar to that of Stage 2, but PD is
considered as 100%.
Loan Commitments and Letters of Credit When estimating LTECLs for undrawn loan commitments, the Bank estimates the expected portion of the loan commitment that will
be drawn down over its expected life. The ECL is then based on the present value of the expected shortfalls in cash flows if the loan is
drawn down, based on a probability-weighting of the three scenarios. The expected cash shortfalls are discounted at an approximation
to the expected EIR on the loan. For credit cards and revolving facilities, that include both a loan and an undrawn commitment, ECLs
are calculated and presented together with the loan, loan commitments, letters of credit, guarantees and acceptances.
Financial Guarantee Contracts
The Bank’s liability under each guarantee is measured at the higher of the amount initially recognised less cumulative
amortisation recognised in the Statement of Profit or Loss, and the ECL provision. For this purpose, the Bank estimates ECLs
based on the present value of the expected payments to reimburse the holder for a credit loss that it incurs. The shortfalls are
discounted by the risk adjusted interest rate relevant to the exposure. The calculation is made using a probability-weighting of
the three scenarios.

268 Bank of Ceylon | Annual Report 2018
NOTES TO THE FINANCIAL STATEMENTS
Debt Instruments Measured at Fair Value Through OCI
The ECLs for debt instruments measured at FVTOCI do not reduce the carrying amount of these financial assets in the
Statement of Financial Position, which remains at fair value. Instead, an amount equal to the allowance that would arise if the
assets were measured at amortised cost is recognised in OCI as an accumulated impairment amount, with a corresponding
charge to Profit or Loss. The accumulated loss recognised in OCI is recycled to the Profit or Loss upon derecognition of the
assets.
Revolving Facilities
The Bank’s product offering includes a variety of corporate and retail overdraft and credit card facilities, in which the Bank has
the right to cancel and/ or reduce the facilities with one day’s notice. The Bank does not limit its exposure to credit losses to
the contractual notice period, but, instead calculates ECL over a period that reflects the Bank’s expectations of the customer
behaviour, its likelihood of default and the Bank’s future risk mitigation procedures, which could include reducing or canceling
the facilities.
The ongoing assessment of whether a significant increase in credit risk has occurred for revolving facilities is similar to other
lending products. This is based on shifts in the customer’s delinquency.
The calculation of ECLs, including the estimation of the expected period of exposure and discount rate is made on an individual
basis for individually significant loans and on a collective basis for other loans. The collective assessments are made separately
for portfolios of facilities with similar homogeneous characteristics.
Forward Looking Information
In its ECL models, the Bank relies on a broad range of forward looking information as economic inputs, such as:
- GDP growth
- Interest rate
- Inflation
- Exchange rate
- Unemployment rates
- Average Loan to Value
- Government policies, status of the industry and impact of regulatory changes etc.
Impairment Assessment Definition of Default upgrade
The Bank considers a financial instrument defaulted and therefore assessed in Stage 3 (as credit-impaired) for ECL calculations
in all cases when the borrower becomes 90 days past due on its contractual payments or the credit facility/ customer is
classified as a non performing advance in accordance with Central Bank of Sri Lanka (CBSL) directions.
As a part of a qualitative assessment of whether a customer is in default, the Bank also considers a variety of instances that may
indicate unlikeliness to pay. When such events occur, the Bank carefully considers whether the event should result in treating the
customer as defaulted and therefore assessed as Stage 3 for ECL calculations or whether Stage 2 is appropriate. Such events
include:

269
- Reduction/ downgrading of internal rating of the borrower indicating default or near-default
- Modifications of terms resulting in concessions, including extensions, deferment of payments, waiver of covenants etc.
(restructuring)
- The borrower having past due liabilities to other financial institutions
- Existing or forecast adverse changes in business operations including geographical locations or natural catastrophes,
financial or economic condition that are expected to cause significant change in the borrower’s ability to meet it’s obligation
- A material decrease in the underlying collateral value where the recovery of the loan is expected from the sale of the
collateral
- A material decrease in the borrower’s operating results or the loss of a major customer
- Customer is significantly subject to litigation, that seviourly affects the performance of the credit facility
- An actual or expected significant adverse change in the regulatory, economic or technological environment of the borrower
that result in a significant change in the borrower’s ability to meet the debt obligation
- Significant changes such as reduction in financial support from a parent entity or other affiliate or an actual or expected
reductions in borrowers economic incentives to make scheduled contractual payments
- Delay in the commencement of business operations/ projects by more than two years from the originally agreed date
deteriorating the credit worthiness of the customer
It is the Bank’s policy to consider a financial instrument as “upgraded” and therefore re-classified out of Stage 3 when none
of the default criteria is no longer present. The decision whether to classify an asset as Stage 2 or Stage 1 once upgraded
depends on the updated credit grade, at the time of the upgrade, and whether there has been a significant increase in credit
risk compared to initial recognition. Further restructured facilities are considered as “upgraded” once a satisfactory performing
period of a minimum 90 days subsequent to the first capital and/ or interest installment post-restructure is in place, while
upgrading of rescheduled facilities are carried out in accordance with the Banking Act Directions No. 3 and 4 of 2008 on
“Classification of Loans and Advances, Income Recognition and Provisioning”.
Probability of Default Estimation Process
The Bank estimates the Probability of Default (PD) based on historical information with regard to delinquency of loans and
advances. In this process, historical information pertaining to 3-5 years have been used depending on the nature of the product.
Exposure At Default
The Exposure At Default (EAD) represents the gross carrying amount of the financial instruments subject to the impairment
calculation, addressing both the client’s ability to increase its exposure while approaching default and potential early
repayments too.
To calculate the EAD for a Stage 1 loan facilities, the Bank assesses the possible default events within 12 months in the
calculation of the 12mECL. For Stage 2, Stage 3 and Purchased or Originated Credit Impaired (POCI) financial assets, the
exposure at default is considered for events over the lifetime of the instruments.
The Bank determines EADs by modeling the range of possible exposure outcomes at various points in time. PDs are then
assigned to the EAD so derived.

270 Bank of Ceylon | Annual Report 2018
NOTES TO THE FINANCIAL STATEMENTS
Loss Given Default
The Bank segments its lending portfolio into homogeneous portfolios, based on key characteristics that are relevant to the
estimation of future cash flows. The loss given default is estimated based on historically collected loss data.
Significant Increase in Credit Risk
The Bank continuously monitors all assets subject to ECLs. In order to determine whether an instrument or a portfolio of
instruments is subject to 12mECL or LTECL, the Bank assesses whether there has been a significant increase in credit risk
since initial recognition. The Bank considers an exposure to have significantly increased in credit risk when the borrower
becomes 30 days past due from the contractual due date.
The Bank also applies a secondary qualitative method for triggering a significant increase in credit risk for an asset, such as
moving a customer/ facility to the watch list, or reschedulement or restructure. Regardless of the change in credit grades, if
contractual payments are more than 30 days past due, the credit risk is deemed to have increased significantly since initial
recognition.
When estimating ECLs on a collective basis for a group of similar assets, the Bank applies the same principles for assessing
whether there has been a significant increase in credit risk since initial recognition.
Grouping Financial Assets Measured on an Individual Basis/ Collective Basis
ECLs are calculated either on a collective or an individual basis depends on the following factors.
The Bank calculates ECL on an individual basis for corporate & SME exposures identified as individually significant loans
and investments in debt securities. All other exposures other than the above together with individually significant exposures
not attracting an ISL provision are assessed for ECL on a collective basis. The Bank groups these exposures into smaller
homogeneous portfolios, based on product type, sector and customer segment.
27.1 Financial Assets at Amortised Cost - Loans and Advances
Bank Group
As at 31 December 2018 2017 2018 2017
LKR ’000 LKR ’000 LKR ’000 LKR ’000
Gross loans and advances 1,510,534,078 1,219,914,481 1,544,355,486 1,252,363,356
Stage 1 1,294,790,735 - 1,319,427,641 -
Stage 2 78,528,007 - 82,329,469 -
Stage 3 137,215,336 - 142,598,376 -
Less : Accumulated impairment 81,426,897 56,753,567 83,736,898 58,068,962
Stage 1 [Note 27.2.1] 10,091,396 - 10,437,278 -
Stage 2 [Note 27.2.1] 10,140,798 - 10,383,179 -
Stage 3 [Note 27.2.1] 61,194,703 - 62,916,441 -
Allowance for individual impairment [Note 27.2.2] - 29,085,605 - 29,562,684
Allowance for collective impairment [Note 27.2.2] - 27,667,962 - 28,506,278
Net loans and advances 1,429,107,181 1,163,160,914 1,460,618,588 1,194,294,394

271
27.1.1 Analysis of Gross Loans and Advances - by Product
Bank
As at 31 December 2018 2017
Local currency loans
Foreign currency
loans
Total Local currency loans
Foreign currency
loans
Total
LKR ’000 LKR ’000 LKR ’000 LKR ’000 LKR ’000 LKR ’000
Term loans 332,813,980 299,677,694 632,491,674 272,136,979 246,534,672 518,671,651
Loans under schemes 68,916,645 - 68,916,645 59,211,404 48,022 59,259,426
Housing loans 67,516,430 259,951 67,776,381 57,331,605 170,674 57,502,279
Trade finance 53,171,938 37,391,521 90,563,459 46,910,127 31,728,812 78,638,939
Personal loans 207,143,891 - 207,143,891 191,248,298 - 191,248,298
Overdrafts 269,901,138 26,993,663 296,894,801 169,123,476 11,801,933 180,925,409
Credit cards 4,345,178 - 4,345,178 3,840,479 - 3,840,479
Lease rental receivables [Note 27.4] 47,746,892 215,693 47,962,585 48,199,691 236,682 48,436,373
Pawning 57,873,578 - 57,873,578 51,540,743 - 51,540,743
Foreclosed properties 1,283,378 625,879 1,909,257 1,097,220 523,495 1,620,715
Staff loans 16,774,028 12,426 16,786,454 16,000,936 9,865 16,010,801
Other 14,831,527 3,038,648 17,870,175 10,280,817 1,938,551 12,219,368
1,142,318,603 368,215,475 1,510,534,078 926,921,775 292,992,706 1,219,914,481
Group
As at 31 December 2018 2017
Local currency loans
Foreign currency
loans
Total Local currency loans
Foreign currency
loans
Total
LKR ’000 LKR ’000 LKR ’000 LKR ’000 LKR ’000 LKR ’000
Term loans 337,897,738 302,527,377 640,425,115 280,115,396 249,119,989 529,235,385
Loans under schemes 69,873,066 - 69,873,066 60,128,216 48,022 60,176,238
Housing loans 68,751,323 259,951 69,011,274 58,476,885 170,674 58,647,559
Trade finance 53,342,440 37,391,521 90,733,961 46,945,217 31,728,812 78,674,029
Personal loans 211,868,476 - 211,868,476 193,784,315 - 193,784,315
Overdrafts 269,522,956 27,088,774 296,611,730 169,120,155 11,989,037 181,109,192
Credit cards 4,345,178 - 4,345,178 3,840,479 - 3,840,479
Lease rental receivables [Note 27.4] 65,073,155 215,693 65,288,848 64,287,980 236,682 64,524,662
Pawning 59,349,689 - 59,349,689 52,240,377 - 52,240,377
Foreclosed properties 1,283,378 625,879 1,909,257 1,097,220 523,495 1,620,715
Staff loans 17,047,122 21,595 17,068,717 16,273,604 17,433 16,291,037
Other 14,831,527 3,038,648 17,870,175 10,280,817 1,938,551 12,219,368
1,173,186,048 371,169,438 1,544,355,486 956,590,661 295,772,695 1,252,363,356

272 Bank of Ceylon | Annual Report 2018
NOTES TO THE FINANCIAL STATEMENTS
27.1.2 Analysis of Gross Loans and Advances - By Currency
Bank Group
As at 31 December 2018 2017 2018 2017
LKR ’000 LKR ’000 LKR ’000 LKR ’000
Sri Lankan Rupees 1,142,318,603 926,921,775 1,173,186,048 956,590,661
United States Dollar 349,705,155 277,669,866 349,705,155 277,669,866
Great Britain Pound 487,348 441,083 3,441,311 3,221,072
Maldevian Rufiyaa 7,885,935 7,730,018 7,885,935 7,730,018
Euro 619,114 434,709 619,114 434,709
Indian Rupee 8,219,428 5,589,102 8,219,428 5,589,102
Seychellois Rupee 1,229,463 798,159 1,229,463 798,159
Other 69,032 329,769 69,032 329,769
Gross total 1,510,534,078 1,219,914,481 1,544,355,486 1,252,363,356
27.2 Movement in Provision for Impairment during the year
27.2.1 Movement in Provision for Impairment during the year under SLFRS 9
Bank Group
2018 2017 2018 2017
LKR ’000 LKR ’000 LKR ’000 LKR ’000
Stage 1
Opening balance as at 1 January 8,033,120 - 8,350,557 -
Charge/ (Reversal) during the year 2,010,203 - 2,038,648 -
Exchange rate variance on foreign currency impairment 48,073 - 48,073 -
Amount written-off during the year - - - -
Other movements - - - -
Closing balance as at 31 December 10,091,396 - 10,437,278 -

273
Bank Group
2018 2017 2018 2017
LKR ’000 LKR ’000 LKR ’000 LKR ’000
Stage 2
Opening balance as at 1 January 11,950,472 - 12,185,663 -
Charge/ (Reversal) during the year (2,123,633) - (2,116,443) -
Exchange rate variance on foreign currency impairment 310,827 - 310,827 -
Amount written-off during the year - - - -
Other movements 3,132 - 3,132 -
Closing balance as at 31 December 10,140,798 - 10,383,179 -
Bank Group
2018 2017 2018 2017
LKR ’000 LKR ’000 LKR ’000 LKR ’000
Stage 3
Opening balance as at 1 January 46,458,951 - 48,304,169 -
Charge/ (Reversal) during the year 18,844,621 - 18,943,309 -
Amount recovered during the year (4,466,761) - (4,466,761) -
Exchange rate variance on foreign currency impairment 323,523 - 323,523 -
Amount written-off during the year (35,064) - (35,064) -
Other movements 69,433 - (152,735) -
Closing balance as at 31 December 61,194,703 - 62,916,441 -
Bank Group
2018 2017 2018 2017
LKR ’000 LKR ’000 LKR ’000 LKR ’000
Movement in Total Impairment
Opening balance as at 1 January 66,442,543 - 68,840,389 -
Charge/ (Reversal) during the year 18,731,191 - 18,865,514 -
Amount recovered during the year (4,466,761) - (4,466,761) -
Exchange rate variance on foreign currency impairment 682,423 - 682,423 -
Amount written-off during the year (35,064) - (35,064) -
Other movements 72,565 - (149,603) -
Closing balance as at 31 December 81,426,897 - 83,736,898 -

274 Bank of Ceylon | Annual Report 2018
NOTES TO THE FINANCIAL STATEMENTS
27.2.2 Movement in Provision for Individual and Collective Impairment during the year under LKAS 39
Bank Group
2018 2017 2018 2017
LKR ’000 LKR ’000 LKR ’000 LKR ’000
Individual Impairment
Opening balance as at 1 January - 19,375,172 - 19,776,777
Charge/ (Reversal) during the year - 11,713,536 - 11,758,365
Amount recovered during the year - (2,081,790) - (2,081,790)
Exchange rate variance on foreign currency impairment - 143,324 - 143,324
Amount written-off during the year - (26,944) - (37,546)
Other movements - (37,693) - 3,554
Closing balance as at 31 December - 29,085,605 - 29,562,684
Bank Group
2018 2017 2018 2017
LKR ’000 LKR ’000 LKR ’000 LKR ’000
Collective impairment
Opening balance as at 1 January - 27,731,944 - 28,407,266
Charge/ (Reversal) during the year - 8,912 - 208,314
Exchange rate variance on foreign currency impairment - 15,815 - 15,815
Amount written-off during the year - (1,153,687) - (1,153,687)
Other movements - 1,064,978 - 1,028,570
Closing balance as at 31 December - 27,667,962 - 28,506,278
Total impairment as at 31 December - 56,753,567 - 58,068,962

275
27.3 Sensitivity Factors Used to Calculating Impairment Provisions
Sensitivity
Sensitivity Effect on Impairment Provisions
LKR’000
Change in Loss Given Default (LGD) 1% 2,469,252
-1% (2,469,252)
Change in Economic Factor Adjustment (EFA)
Worst case degrades by 5% 364,579
Worst case upgrades by 5% (172,549)
Change in deemed closed periodAdvanced by one year 874,549
Deferred by one year (663,411)
27.4 Lease Rentals Receivable
Accounting Policy
Assets leased to customers, which transfer substantially all the risks and rewards associated with ownership, other than
legal title, are classified as finance leases. Amounts receivable under finance leases are classified as lease and hire purchase
receivables and presented within loans and receivables to customers in the Statement of Financial Position, after deduction
of unearned lease income and the impairment for rentals doubtful of recovery. Lease receivables are collectively assessed for
impairment to the Financial Statements.
Bank Group
As at 31 December 2018 2017 2018 2017
LKR ’000 LKR ’000 LKR ’000 LKR ’000
Gross Lease Rentals Receivable
Less than one year 24,184,301 22,288,103 24,184,301 30,913,316
One to five years 33,098,757 35,433,813 54,871,750 47,343,619
More than five years 398,055 135,059 398,055 135,059
Total lease rentals receivables 57,681,113 57,856,975 79,454,106 78,391,994
Less : Unearned finance income 9,718,528 9,420,602 14,165,258 13,867,332
Gross lease rentals receivable 47,962,585 48,436,373 65,288,848 64,524,662
Less : Provision for impairment losses 643,537 872,631 1,522,041 1,300,106
Net lease rentals receivable 47,319,048 47,563,742 63,766,807 63,224,556

276 Bank of Ceylon | Annual Report 2018
NOTES TO THE FINANCIAL STATEMENTS
28 Financial Assets at Amortised Cost - Debt and Other Instruments
Accounting Policy
Financial assets measured at amortised cost - debt and other instruments are initially measured at fair value. After initial
measurement, subsequently measured at amortised cost using the Effective Interest Rate (EIR) less impairment. Amortised cost
is calculated by taking into account any discount or premium on acquisition and fees that are an integral part of the EIR. The
amortisation is included in “Interest income” (Note 8.1) in the Statement of Profit or Loss. The losses arising from impairment
of such investments are recognised in the Statement of Profit or Loss under “ Impairment charge/ (reversal) for loans and other
losses” (Note 14).
Bank Group
As at 31 December 2018 2018
LKR ’000 LKR ’000
Government securities
Treasury bills 82,811,177 82,827,270
Treasury bonds 242,438,336 242,600,418
Sri Lanka sovereign bonds 7,098,782 7,098,782
Sri Lanka Development Bonds [Note 28.5] 195,282,304 195,282,304
Government of Sri Lanka Restructuring Bonds [Note 28.6] 8,968,474 8,968,474
Debentures [Note 28.7] 7,491,679 7,367,880
Trust certificates [Note 28.8] 676,557 676,557
Government securities - Other countries 8,857,014 8,857,014
Other Investments - 65,142
Gross financial assets at amortised cost - debt and other instruments 553,624,323 553,743,841
Less: Accumulated impairment (Note 28.2) 1,784,874 1,787,107
Total financial assets at amortised cost - debt and other instruments 551,839,449 551,956,734
28.1 By Currency
As at 31 December Bank Group
2018 2018
LKR ’000 LKR ’000
Sri Lankan Rupee 342,386,223 342,505,741
United States Dollar 204,374,309 204,374,309
Maldivian Rufiyaa 6,863,791 6,863,791
Total 553,624,323 553,743,841
28.2 Movement in Impairment During the Year
Bank Group
2018 2018
LKR ’000 LKR ’000
Stage 1
Opening balance as at 1 January 1,038,872 1,039,648
Charge/ (Reversal) during the year 731,392 732,850
Exchange rate adjustments and other movements (11,602) (11,603)
Closing balance as at 31 December 1,758,662 1,760,895

277
Bank Group
2018 2018
LKR ’000 LKR ’000
Stage 3
Opening balance as at 1 January - -
Charge/ (Reversal) to income statement 26,212 26,212
Closing balance as at 31 December 26,212 26,212
Bank Group
2018 2018
LKR ’000 LKR ’000
Total
Opening balance as at 1 January 1,038,872 1,039,648
Charge/ (Reversal) to income statement 757,604 759,062
Exchange rate adjustments and other movements (11,602) (11,603)
Closing balance as at 31 December 1,784,874 1,787,107
28.3 Financial Investments - Loans and Receivables
Bank Group
As at 31 December 2017 2017
LKR ’000 LKR ’000
Sri Lanka Development Bonds [Note 28.5] 185,337,468 185,337,468
Government of Sri Lanka Restructuring Bonds [Note 28.6] 8,968,474 8,968,474 Debentures [Note 28.7] 5,641,373 5,486,875 Trust certificates [Note 28.8] 768,799 768,799 Government securities - Local 5,709,127 5,709,127 Government securities - Other countries 6,741,807 6,741,807 Other investments - 1,337,074 Total financial investments - Loans and receivables 213,167,048 214,349,624
28.4 Financial Investments - Held to Maturity
Bank Group
As at 31 December 2017 2017
LKR ’000 LKR ’000
Government Securities
Treasury Bills 105,225,107 105,239,979
Treasury Bonds 202,562,239 203,041,602 Sovereign Bonds 468,736 468,736 Total Financial investments - Held to maturity 308,256,082 308,750,317

278 Bank of Ceylon | Annual Report 2018
NOTES TO THE FINANCIAL STATEMENTS
28.5 Sri Lanka Development Bonds (US Dollar Bonds)
Bank/ Group
As at 31 December 2018 2017
Date of Cost of Amortised Cost of Amortised
maturity investment cost investment cost
LKR ’000 LKR ’000 LKR ’000 LKR ’000
Fixed Rate
Sri Lanka Development Bonds - Fixed Rate 5.25% 01.05.2021 126,790,053 127,908,229 - -
Sri Lanka Development Bonds - Fixed Rate 5.70% 01.05.2022 913,750 922,492 - -
Sri Lanka Development Bonds - Fixed Rate 5.75% 01.05.2022 913,750 922,568 - -
Sri Lanka Development Bonds - Fixed Rate 5.80% 01.05.2022 913,750 922,644 - -
Sri Lanka Development Bonds - Fixed Rate 5.85% 01.05.2022 913,750 922,720 - -
Sri Lanka Development Bonds - Fixed Rate 5.90% 01.05.2022 913,750 922,796 - -
Sri Lanka Development Bonds - Fixed Rate 5.75% 01.05.2023 913,750 922,568 - -
Floating Rate
6 months LIBOR plus 300 basis points 21.01.2018 - - 3,821,370 3,898,799
6 months LIBOR plus 425 basis points 21.01.2018 - - 7,642,740 7,790,539
6 months LIBOR plus 435 basis points 21.01.2018 - - 3,821,370 3,897,006
6 months LIBOR plus 375 basis points 16.03.2018 - - 4,585,644 4,656,260
6 months LIBOR plus 430 basis points 28.03.2018 - - 3,821,370 3,864,512
6 months LIBOR plus 435 basis points 28.03.2018 - - 3,821,370 3,865,011
6 months LIBOR plus 435 basis points 30.04.2018 - - 1,528,548 1,539,918
6 months LIBOR plus 440 basis points 30.04.2018 - - 1,528,548 1,540,048
6 months LIBOR plus 415 basis points 01.07.2018 - - 107,467,624 110,542,609
6 months LIBOR plus 325 basis points 30.01.2019 4,568,748 4,682,037 3,821,370 3,898,627
6 months LIBOR plus 335 basis points 30.01.2019 4,568,747 4,683,995 3,821,370 3,900,266
6 months LIBOR plus 345 basis points 30.01.2019 4,568,748 4,685,953 3,821,370 3,901,905
6 months LIBOR plus 330 basis points 17.03.2019 5,482,497 5,576,639 4,585,644 4,649,581
6 months LIBOR plus 335 basis points 17.03.2019 5,482,497 5,577,436 4,585,644 4,650,249
6 months LIBOR plus 340 basis points 17.03.2019 4,875,767 4,960,909 4,078,166 4,136,216
6 months LIBOR plus 370 basis points 17.03.2020 4,568,748 4,652,513 3,821,370 3,879,106
6 months LIBOR plus 375 basis points 17.03.2020 5,482,497 5,583,813 4,585,644 4,655,595
6 months LIBOR plus 380 basis points 17.03.2020 913,750 930,768 764,274 776,043
6 months LIBOR plus 360 basis points 01.04.2020 4,568,748 4,640,590 3,821,370 3,870,952
6 months LIBOR plus 370 basis points 01.04.2020 4,568,748 4,641,740 3,821,370 3,871,916
6 months LIBOR plus 350 basis points 22.01.2022 913,750 938,642 - -
6 months LIBOR plus 355 basis points 22.01.2022 913,750 938,849 - -
6 months LIBOR plus 365 basis points 22.01.2022 913,750 939,261 - -
6 months LIBOR plus 375 basis points 22.01.2022 913,750 939,673 - -
6 months LIBOR plus 380 basis points 16.03.2022 913,750 930,930 - -
6 months LIBOR plus 385 basis points 16.03.2022 913,750 931,064 - -
6 months LIBOR plus 385 basis points 17.03.2022 1,827,491 1,861,802 1,528,548 1,552,310
6 months LIBOR plus 370 basis points 22.01.2023 913,750 939,467 - -
6 months LIBOR plus 375 basis points 22.01.2023 913,750 939,674 - -
6 months LIBOR plus 390 basis points 16.03.2023 913,750 931,199 - -
6 months LIBOR plus 395 basis points 16.03.2023 913,750 931,333 - -
Total Sri Lanka Development Bonds 192,887,039 195,282,304 181,094,724 185,337,468

279
28.6 Government of Sri Lanka Restructuring Bonds
Bank/ Group
As at 31 December 2018 2017
Rate
Date of Issue
Date of Maturity
Cost of Investment
CarryingValue
Cost of Investment
CarryingValue
% LKR ’000 LKR ’000 LKR ’000 LKR ’000
For recapitalisation purposes 12.00 24.03.1993 24.03.2023 4,780,000 5,015,714 4,780,000 5,015,714
For settlement of loans 12.00 24.03.1993 24.03.2023 3,767,000 3,952,760 3,767,000 3,952,760
Total Government of Sri Lanka Restructuring Bonds 8,547,000 8,968,474 8,547,000 8,968,474
28.7 Debentures
BankAs at 31 December 2018 2017
Date of Maturity
Coupon Rate %
No. ofDebentures
Cost of Investment
Amortised Cost
No. ofDebentures
Cost of Investment
Amortised Cost
LKR ’000 LKR ’000 LKR ’000 LKR ’000
Access Engineering PLC 18.11.2020 10.25 2,000,000 200,000 202,369 2,000,000 200,000 202,370
Citizen Development Business Finance PLC 03.06.2021 12.75 500,000 50,000 50,483 500,000 50,000 50,492
Citizen Development Business Finance PLC 27.03.2023 14.20 2,000,000 200,000 221,284 - - -
Commercial Bank of Ceylon PLC 08.03.2021 10.75 1,000,000 100,000 103,326 1,000,000 100,000 103,326
Commercial Bank of Ceylon PLC 27.10.2021 12.00 779,600 77,960 79,579 779,600 77,960 79,568
Commercial Credit and Finance PLC 01.06.2020 10.50 530,519 53,052 54,454 530,519 53,052 54,450
Commercial Credit and Finance PLC 10.12.2020 10.40 3,665,600 366,560 368,702 3,665,600 366,560 368,702
Commercial Leasing & Finance PLC 21.07.2020 9.75 750,000 75,000 82,336 750,000 75,000 82,302
DFCC Bank PLC 18.03.2019 10.63 2,500,000 250,000 270,733 2,500,000 250,000 270,729
DFCC Bank PLC 10.06.2020 9.40 332,100 33,210 34,913 332,100 33,210 34,916
DFCC Bank PLC 09.11.2021 12.15 1,892,800 189,280 192,388 1,892,800 189,280 192,391
DFCC Bank PLC 29.03.2025 13.00 2,250,000 225,000 246,866 - - -
First Capital Treasuries PLC 05.02.2020 9.50 500,000 50,000 54,726 500,000 50,000 54,727
Hatton National Bank PLC 28.03.2021 11.25 1,000,000 100,000 108,455 1,000,000 100,000 108,456
Hatton National Bank PLC 01.11.2023 13.00 193,300 19,330 19,722 193,300 19,330 19,722
Hayleys PLC 31.05.2019 12.35 1,000,000 100,000 101,297 1,000,000 100,000 100,844
Hayleys PLC 31.07.2023 12.50 2,500,000 250,000 263,026 - - -
HDFC Bank of Sri Lanka 20.11.2020 10.50 2,000,000 200,000 202,307 2,000,000 200,000 202,308
Hemas Holdings PLC 29.04.2019 11.00 173,500 17,350 17,828 173,500 17,350 17,826
Kotagala Plantations PLC 26.05.2018 14.25 - - - 165,975 16,598 17,797
Kotagala Plantations PLC 26.05.2019 14.50 165,975 16,598 17,816 165,975 16,598 17,815
Kotagala Plantations PLC 26.05.2020 14.75 165,975 16,598 17,834 165,975 16,598 17,832
Kotagala Plantations PLC 26.05.2021 15.00 165,975 16,598 17,853 165,975 16,598 17,852
Lanka Orix Leasing Company PLC 24.11.2019 9.00 1,000,000 100,000 102,264 1,000,000 100,000 102,257
Lanka Orix Leasing Company PLC 30.07.2022 13.00 2,500,000 250,000 263,621 2,500,000 250,000 263,662
LB Finance PLC 28.11.2018 15.00 - - - 445,200 44,520 51,098
LB Finance PLC 11.12.2022 12.75 2,500,000 250,000 251,761 2,500,000 250,000 251,280
Merchant Bank of Sri Lanka & Finance PLC 27.03.2018 16.70 - - - 938,600 93,860 97,815
Merchant Bank of Sri Lanka & Finance PLC 12.11.2019 9.00 1,135,200 113,520 123,799 1,135,200 113,520 123,760
MTD Walkers PLC 30.09.2018 9.75 - - - 500,000 50,000 51,207

280 Bank of Ceylon | Annual Report 2018
NOTES TO THE FINANCIAL STATEMENTS
BankAs at 31 December 2018 2017
Date of Maturity
Coupon Rate %
No. ofDebentures
Cost of Investment
Amortised Cost
No. ofDebentures
Cost of Investment
Amortised Cost
LKR ’000 LKR ’000 LKR ’000 LKR ’000
MTD Walkers PLC 30.09.2019 11.75 254,784 25,477 26,212 - - -
National Development Bank PLC 19.12.2018 13.00 - - - 542,700 54,270 57,834
National Development Bank PLC 24.06.2020 9.40 534,500 53,450 58,492 534,500 53,450 58,469
Nawaloka Hospitals PLC 30.09.2019 14.15 1,000,000 100,000 106,227 1,000,000 100,000 109,459
Orient Finance PLC 26.12.2019 9.05 500,000 50,000 52,414 500,000 50,000 50,073
Pan Asia Banking Corporation PLC 29.09.2019 10.00 486,112 48,611 49,827 486,112 48,611 49,818
People's Leasing & Finance PLC 23.09.2018 9.63 - - - 73,500 7,350 8,061
People's Leasing & Finance PLC 12.11.2019 9.60 945,000 94,500 95,672 945,000 94,500 95,672
People's Leasing & Finance PLC 16.11.2021 12.60 2,000,000 200,000 203,028 2,000,000 200,000 203,032
People's Leasing & Finance PLC 18.04.2023 12.80 2,500,000 250,000 272,037 - - -
Regional Development Bank 29.01.2020 9.00 4,250,000 425,000 463,107 4,250,000 425,000 463,115
Sampath Bank PLC 14.12.2019 8.25 1,000,000 100,000 108,276 1,000,000 100,000 108,265
Sampath Bank PLC 18.11.2020 9.90 898,400 89,840 90,876 898,400 89,840 90,881
Sampath Bank PLC 10.06.2021 12.75 1,500,000 150,000 160,400 1,500,000 150,000 160,400
Sampath Bank PLC 21.12.2022 12.50 2,270,000 227,000 242,232 - - -
Sampath Bank PLC 20.03.2023 12.50 2,500,000 250,000 258,703 - - -
Sanasa Development Bank PLC 31.12.2020 10.30 1,500,000 150,000 157,864 1,500,000 150,000 157,836
Sanasa Development Bank PLC 31.12.2020 10.00 1,500,000 150,000 157,635 1,500,000 150,000 157,608
Senkadagala Finance PLC 09.11.2018 13.25 - - - 320,000 32,000 32,578
Senkadagala Finance PLC 10.12.2018 15.00 - - - 817,653 81,765 82,327
Senkadagala Finance PLC 10.11.2019 13.25 320,000 32,000 32,578 320,000 32,000 32,546
Seylan Bank PLC 22.12.2019 8.60 1,500,000 150,000 150,270 1,500,000 150,000 150,271
Seylan Bank PLC 15.07.2021 13.00 451,600 45,160 47,870 451,600 45,160 47,870
Seylan Bank PLC 29.03.2023 12.85 2,500,000 250,000 258,133 - - -
Singer Finance PLC 06.04.2020 12.00 1,000,000 100,000 102,784 1,000,000 100,000 102,784
Singer (Sri Lanka) PLC 07.06.2018 8.60 - - - 500,000 50,000 52,170
Singer (Sri Lanka) PLC 14.03.2019 10.50 2,500,000 250,000 257,699 2,500,000 250,000 257,746
Singer (Sri Lanka) PLC 17.06.2020 9.95 309,300 30,930 34,022 309,300 30,930 34,010
Siyapatha Finance PLC 20.09.2019 13.00 1,000,000 100,000 103,472 1,000,000 100,000 103,475
Softlogic Finance PLC 29.08.2019 10.00 190,900 19,090 19,572 190,900 19,090 19,569
Sri Lanka Telecom PLC 19.04.2028 12.75 5,000,000 500,000 512,535 - - -
Total debentures 7,161,114 7,491,679 5,414,000 5,641,373

281
GroupAs at 31 December 2018 2017
Date of Maturity
Coupon Rate %
No ofDebentures
Cost of Investment
Amortised Cost
No ofDebentures
Cost of Investment
Amortised Cost
LKR ’000 LKR ’000 LKR ’000 LKR ’000
Access Engineering PLC 18.11.2020 10.25 2,000,000 200,000 202,369 2,000,000 200,000 202,370
Citizen Development Business Finance PLC 03.06.2021 12.75 500,000 50,000 50,483 500,000 50,000 50,492
Citizen Development Business Finance PLC 27.03.2023 14.20 2,000,000 200,000 221,284 - - -
Commercial Bank of Ceylon PLC 08.03.2021 10.75 1,000,000 100,000 103,326 1,000,000 100,000 103,326
Commercial Bank of Ceylon PLC 27.10.2021 12.00 779,600 77,960 79,579 779,600 77,960 79,568
Commercial Credit and Finance PLC 01.06.2020 10.50 530,519 53,052 54,454 530,519 53,052 54,450
Commercial Credit and Finance PLC 10.12.2020 10.40 3,665,600 366,560 368,702 3,665,600 366,560 368,702
Commercial Leasing & Finance PLC 21.07.2020 9.75 750,000 75,000 82,336 750,000 75,000 82,302
DFCC Bank PLC 18.03.2019 10.63 2,500,000 250,000 270,733 2,500,000 250,000 270,729
DFCC Bank PLC 10.06.2020 9.40 332,100 33,210 34,913 332,100 33,210 34,916
DFCC Bank PLC 09.11.2021 12.15 1,892,800 189,280 192,388 1,892,800 189,280 192,391
DFCC Bank PLC 29.03.2025 13.00 2,250,000 225,000 246,866 - - -
First Capital Treasuries PLC 05.02.2020 9.50 500,000 50,000 54,726 500,000 50,000 54,727
Hatton National Bank PLC 28.03.2021 11.25 1,000,000 100,000 108,455 1,000,000 100,000 108,456
Hatton National Bank PLC 01.11.2023 13.00 193,300 19,330 19,722 193,300 19,330 19,722
Hayleys PLC 31.05.2019 12.35 1,000,000 100,000 101,297 1,000,000 100,000 100,844
Hayleys PLC 31.07.2023 12.50 2,500,000 250,000 263,026 - - -
HDFC Bank of Sri Lanka 20.11.2020 10.50 2,000,000 200,000 202,307 2,000,000 200,000 202,308
Hemas Holdings PLC 29.04.2019 11.00 173,500 17,350 17,828 173,500 17,350 17,826
Kotagala Plantations PLC 26.05.2018 14.25 - - - 165,975 16,598 17,797
Kotagala Plantations PLC 26.05.2019 14.50 165,975 16,598 17,816 165,975 16,598 17,815
Kotagala Plantations PLC 26.05.2020 14.75 165,975 16,598 17,834 165,975 16,598 17,832
Kotagala Plantations PLC 26.05.2021 15.00 165,975 16,598 17,853 165,975 16,598 17,852
Lanka Orix Leasing Company PLC 24.11.2019 9.00 1,000,000 100,000 102,264 1,000,000 100,000 102,257
Lanka Orix Leasing Company PLC 30.07.2022 13.00 2,500,000 250,000 263,621 2,500,000 250,000 263,662
LB Finance PLC 28.11.2018 15.00 - - - 445,200 44,520 51,098
LB Finance PLC 11.12.2022 12.75 2,500,000 250,000 251,761 2,500,000 250,000 251,280
MTD Walkers PLC 30.09.2018 9.75 - - - 500,000 50,000 51,207
MTD Walkers PLC 30.09.2019 11.75 254,784 25,487 26,212 - - -
National Development Bank PLC 19.12.2018 13.00 - - - 542,700 54,270 57,834
National Development Bank PLC 24.06.2020 9.40 534,500 53,450 58,492 534,500 53,450 58,469
Nawaloka Hospitals PLC 30.09.2019 14.15 1,000,000 100,000 106,227 1,000,000 100,000 109,459
Orient Finance PLC 26.12.2019 9.05 500,000 50,000 52,414 500,000 50,000 50,073
Pan Asia Banking Corporation PLC 29.09.2019 10.00 486,112 48,611 49,827 486,112 48,611 49,818
People's Leasing & Finance PLC 26.03.2018 17.00 - - - 500,000 50,000 50,104
People's Leasing & Finance PLC 23.09.2018 9.63 - - - 73,500 7,350 8,061
People's Leasing & Finance PLC 12.11.2019 9.60 945,000 94,500 95,672 945,000 94,500 95,672
People's Leasing & Finance PLC 16.11.2021 12.60 2,000,000 200,000 203,028 2,000,000 200,000 203,032

282 Bank of Ceylon | Annual Report 2018
NOTES TO THE FINANCIAL STATEMENTS
GroupAs at 31 December 2018 2017
Date of Maturity
Coupon Rate %
No ofDebentures
Cost of Investment
Amortised Cost
No ofDebentures
Cost of Investment
Amortised Cost
LKR ’000 LKR ’000 LKR ’000 LKR ’000
People's Leasing & Finance PLC 18.04.2023 12.80 2,500,000 250,000 272,037 - - -
Regional Development Bank 29.01.2020 9.00 4,250,000 425,000 463,107 4,250,000 425,000 463,115
Sampath Bank PLC 14.12.2019 8.25 1,000,000 100,000 108,276 1,000,000 100,000 108,265
Sampath Bank PLC 18.11.2020 9.90 898,400 89,840 90,876 898,400 89,840 90,881
Sampath Bank PLC 10.06.2021 12.75 1,500,000 150,000 160,400 1,500,000 150,000 160,400
Sampath Bank PLC 21.12.2022 12.50 2,270,000 227,000 242,232 - - -
Sampath Bank PLC 20.03.2023 12.50 2,500,000 250,000 258,703 - - -
Sanasa Development Bank PLC 31.12.2020 10.00 1,500,000 150,000 157,864 1,500,000 150,000 157,608
Sanasa Development Bank PLC 31.12.2020 10.30 1,500,000 150,000 157,635 1,500,000 150,000 157,836
Senkadagala Finance PLC 09.11.2018 13.25 - - - 320,000 32,000 32,578
Senkadagala Finance PLC 10.12.2018 15.00 - - - 817,653 81,765 82,327
Senkadagala Finance PLC 10.11.2019 12.50 320,000 32,000 32,578 320,000 32,000 32,546
Seylan Bank PLC 21.02.2018 15.50 - - - 150,000 15,000 16,973
Seylan Bank PLC 22.12.2019 8.60 1,500,000 150,000 150,270 1,500,000 150,000 150,271
Seylan Bank PLC 15.07.2021 13.00 451,600 45,160 47,870 451,600 45,160 47,870
Seylan Bank PLC 29.03.2023 12.85 2,500,000 250,000 258,133 - - -
Singer Finance PLC 06.04.2020 12.00 1,000,000 100,000 102,784 1,000,000 100,000 102,784
Singer (Sri Lanka) PLC 07.06.2018 8.60 - - - 500,000 50,000 52,170
Singer (Sri Lanka) PLC 14.03.2019 10.50 2,500,000 250,000 257,699 2,500,000 250,000 257,746
Singer (Sri Lanka) PLC 17.06.2020 9.95 309,300 30,930 34,022 309,300 30,930 34,010
Siyapatha Finance PLC 20.09.2019 13.00 1,000,000 100,000 103,472 1,000,000 100,000 103,475
Softlogic Finance PLC 29.08.2019 10.00 190,900 19,090 19,572 190,900 19,090 19,569
Sri Lanka Telecom PLC 19.04.2028 12.75 5,000,000 500,000 512,535 - - -
Total debentures 7,047,604 7,367,880 5,271,620 5,486,875

283
28.8 Trust Certificates
Bank/ Group
As at 31 December 2018 2017
Cost of Investment
LKR ’000
Amortised Cost LKR ’000
Cost of Investment LKR ’000
Amortised Cost LKR ’000
LOLC Finance PLC 147,334 186,257 314,611 360,317
People's Leasing & Finance PLC - - 239,200 277,506
Sanasa Development Bank PLC - - 111,846 130,976
Citizen Development Bank 285,000 296,874 - -
Softlogic Finance PLC 188,500 193,426 - -
Total trust certificates 620,834 676,557 665,657 768,799
29 Financial Assets Measured at Fair Value Through OCI (FVTOCI)/ Available for SaleFinancial assets measured at FVTOCI include equity instruments which are elected FVTOCI option at the initial recognition
and debt instruments which contractual terms that give rise to cash flows on specified dates, that represent solely payments of
principal and interest on the principal amount outstanding; and are held within a business model whose objective is achieved by
both collecting contractual cash flows and selling financial assets.
All financial assets measured at FVTOCI are initially and subsequently measured at fair value. Unrealised gains and losses are
recognised directly in equity in the “FVTOCI reserve” through Other Comprehensive Income. When the debt instrument under
FVTOCI is disposed off, the cumulative gain or loss previously recognised in OCI reserve is recognised in the Statement of Profit
or Loss and reflected in “Net gains/ (losses) from derecognition of financial assets” (Note 12). When the equity instrument under
FVTOCI is disposed off, the cumulative gain or loss previously recognised in OCI reserve is not recognised in the Statement of
Profit or Loss. Interest earned whilst holding financial assets measured at FVTOCI is reported as “Interest income” (Note 8.1) .
Dividends earned whilst holding financial assets measured at FVTOCI are recognised in the Statement of Profit or Loss under in
“Net Other Operating Income” (Note 13) when the right of the payment has been established.

284 Bank of Ceylon | Annual Report 2018
NOTES TO THE FINANCIAL STATEMENTS
Bank Group
As at 31 December 2018 2017 2018 2017
LKR ’000 LKR ’000 LKR ’000 LKR ’000
Government Securities
Treasury bills 4,550,469 4,044,815 5,718,800 4,236,635
Treasury bonds 6,178,278 4,153,858 6,695,168 4,945,270
In other countries 1,587,030 1,478,870 2,663,447 3,718,590
Quoted equities [Note 29.2] 3,142,087 3,687,567 4,050,702 5,009,964
Units in unit trusts * [Note 26.4] - 3,626,484 - 3,660,702
Unquoted Equities [Note 29.3] 1,241,718 929,576 1,287,082 981,131
Total finanacial assets measured at FVTOCI/ AFS 16,699,582 17,921,170 20,415,199 22,552,292
* Units in unit trusts have been reclassified to FVTPL in 2018 as per provisions of SLFRS 9 Financial Instruments. Refer note 26.
29.1 By Currency
Bank Group
As at 31 December 2018 2017 2018 2017
LKR ’000 LKR ’000 LKR ’000 LKR ’000
Sri Lankan Rupee 14,100,141 15,740,421 16,739,342 18,131,843
United States Dollar 1,012,411 701,859 1,012,411 701,859
Great Britain Pound - - 1,076,416 2,239,720
Indian Rupee 1,587,030 1,478,870 1,587,030 1,478,870
Total 16,699,582 17,921,170 20,415,199 22,552,292

285
29.2 Quoted Equities
Bank
As at 31 December 2018 2017
No. of Cost of Market No. of Cost of Market Ordinary Investment Value Ordinary Investment Value
Shares LKR ’000 LKR ’000 Shares LKR ’000 LKR ’000
National Development Bank PLC 17,587,570 867,596 1,878,385 16,995,471 787,207 2,318,182
People’s Leasing & Finance PLC 11,453,600 206,165 186,694 11,453,600 206,165 194,711
Seylan Bank PLC 13,507,800 523,736 1,077,008 13,471,025 493,427 1,174,674
Total quoted equities 1,597,497 3,142,087 1,486,799 3,687,567
Group
As at 31 December 2018 2017
No. of Cost of Market No. of Cost of Market Ordinary Investment Value Ordinary Investment Value
Shares LKR ’000 LKR ’000 Shares LKR ’000 LKR ’000
National Development Bank PLC 17,587,570 867,556 1,878,385 16,995,471 787,207 2,318,182
People’s Leasing & Finance PLC 11,453,600 206,165 186,694 11,453,600 206,165 194,711
Seylan Bank PLC 13,807,800 523,736 1,077,008 13,471,025 493,427 1,174,674
The Lanka Hospital Corporation PLC 21,329,000 213,290 908,615 21,329,000 213,290 1,322,397
Total quoted equities 1,810,747 4,050,702 1,700,089 5,009,964
29.3 Unquoted Equities
Bank
As at 31 December 2018 2017
No. of Cost of Market No. of Cost of Market Ordinary Investment Value Ordinary Investment Value
Shares LKR ’000 LKR ’000 Shares LKR ’000 LKR ’000
Credit Information Bureau of Sri Lanka 46,800 43,132 43,132 46,600 41,542 41,542
Fitch Ratings Lanka Limited 62,500 625 625 62,500 625 625
LankaClear (Private) Limited 2,100,000 21,000 21,000 2,100,000 21,000 21,000
Lanka Financial Services Bureau Limited 225,000 2,250 2,250 225,000 2,250 2,250
Magpek Exports Limited 300,000 4,355 - 300,000 4,355 -
MasterCard Incorporated 17,200 - 591,946 17,200 - 397,941
Regional Development Bank 16,448,448 162,300 162,300 16,448,448 162,300 162,300
Visa Inc. 17,438 - 420,465 17,438 - 303,918
233,662 1,241,718 232,072 929,576
Fair value adjustment 1,012,411 701,859
Provision for impairment [Note 29.4] (4,355) (4,355)
Total unquoted equities 1,241,718 1,241,718 929,576 929,576

286 Bank of Ceylon | Annual Report 2018
NOTES TO THE FINANCIAL STATEMENTS
Group
As at 31 December 2018 2017
No. of Cost of Market No. of Cost of Fair
Ordinary Investment Value Ordinary Investment Value
Shares LKR ’000 LKR ’000 Shares LKR ’000 LKR ’000
Ceylinco Investment Company Limited 500,000 5,000 - 500,000 5,000 -
Credit Information Bureau of Sri Lanka 47,340 43,185 43,185 47,140 41,596 41,596
Fitch Ratings Lanka Limited 62,500 625 625 62,500 625 625
LankaClear (Private) Limited 2,100,000 21,000 21,000 2,100,000 21,000 21,000
Lanka Financial Services Bureau Limited 225,000 2,250 2,250 225,000 2,250 2,250
LVL Energy Fund (Private) Limited 2,500,000 20,000 21,420 2,500,000 20,000 26,500
Magpek Export Limited 300,000 4,355 - 300,000 4,355 -
MasterCard Incorporated 17,200 - 591,946 17,200 - 397,941
Mega Containers Limited 1,000,000 10,000 22,601 1,000,000 10,000 23,794
Regional Development Bank 16,448,448 162,300 162,300 16,448,448 162,300 162,300
Ranwan Industries (Private) Limited 165,790 3,600 - 165,790 3,600 -
San Michele Limited 50,000 500 - 50,000 500 -
UB Finance Company Limited 2,506,562 17,546 1,290 2,506,562 17,546 1,207
Visa Inc. 17,438 - 420,465 17,438 - 303,918
290,361 1,287,082 288,772 981,131
Fair value adjustment 1,026,432 722,153
Provision for impairment [Note 29.4] (29,711) (29,794)
Total unquoted equities 1,287,082 1,287,082 981,131 981,131
29.4 Movement in Impairment during the year
Bank Group
2018 2017 2018 2017
LKR ’000 LKR ’000 LKR ’000 LKR ’000
Stage 1
Opening balance as at 1 January 4,355 4,355 29,794 30,236
Charge/ (Reversal) during the year - - (83) (442)
Closing balance as at 31 December 4,355 4,355 29,711 29,794

287
30 Investment in Subsidiary Companies
Accounting Policy
Subsidiaries are entities that are controlled by the Bank. Control is achieved when the Bank is exposed, or has rights, to variable
returns from its involvement with the investee and has the ability to affect the returns of those investees through its power over
the investee. Specifically, the Bank controls an investee if, and only if, the Bank has:
- power over the investee
- exposure or rights to variable returns from its involvement with the investee
- the ability to use its power over the investee to affect its returns
The Financial Statements of Subsidiaries are included in the Consolidated Financial Statements from the date that control
commences until the date that control ceases. The Bank reassesses whether it has control if there are changes to one or more
of the elements of control. A change in the ownership interest of a Subsidiary, without loss of control, is accounted for as an
equity transaction. If the Group loses control over a Subsidiary, it derecognises the related assets (including goodwill), liabilities,
Non-Controlling Interest (NCI) and other components of equity, while any resultant gain or loss is recognised in Profit or Loss.
Any investment retained is recognised at fair value at the date of loss of control.
The Consolidated Financial Statements are prepared for the common financial year end of 31 December and have been
prepared using uniform accounting policies for like transactions and other events in similar circumstances.
All intra group balances, income and expenses (except for foreign currency translation gains or losses) arising from intra group
transactions are eliminated on consolidation. Unrealised gains and losses resulting from transactions between the Group and
its associates are also eliminated on consolidation to the extent of the Group’s interests in the associates. Unrealised losses are
eliminated in the same way as unrealised gains, but only to the extent that there is no evidence of impairment.
There are no significant restrictions on the ability of Subsidiaries to transfer funds to the parent in the form of cash dividends
or to repay loans and advances. All Subsidiaries of the Bank have been incorporated in Sri Lanka except for Bank of Ceylon
(UK) Limited, which is incorporated in the United Kingdom. A list of the Bank’s Subsidiaries is given in note 30.5 to the Financial
Statements.
Bank
As at 31 December 2018 2017
LKR ’000 LKR ’000
Investment in quoted subsidiaries [Note 30.3] 3,114,952 3,114,952
Investment in unquoted subsidiaries [Note 30.4] 3,798,096 3,798,096
Total investment in subsidiaries 6,913,048 6,913,048
Less : Provision for impairment of investment in subsidiaries [Note 30.2] 400,000 400,000
Carrying value of investment in subsidiary companies 6,513,048 6,513,048

288 Bank of Ceylon | Annual Report 2018
NOTES TO THE FINANCIAL STATEMENTS
30.1 Movement in Investment in Subsidiary Companies
2018 2017
LKR ’000 LKR ’000
Balance as at 1 January 6,913,048 6,913,048
Increase/ (Decrease) in investments - -
Balance as at 31 December 6,913,048 6,913,048
30.2 Provision for Impairment of Investment in Subsidiaries *
2018 2017
LKR ’000 LKR ’000
Balance as at 1 January 400,000 700,000
Impairment charge/ (reversal) during the year - (300,000)
Balance as at 31 December 400,000 400,000
* The Bank has made the provision of impairment for investment in Bank of Ceylon (UK) Limited.
30.3 Investment in Quoted Subsidiaries
Bank
As at 31 December 2018 2017
Cost Market Value Cost Market Value
LKR ’000 LKR ’000 LKR ’000 LKR ’000
Property Development PLC 860,270 7,517,343 860,270 6,120,211
(63,064,957 Ordinary shares )
Merchant Bank of Sri Lanka & Finance PLC 2,254,682 1,186,198 2,254,682 1,668,091
(123,562,267 Ordinary shares )
Total investment in quoted subsidiaries 3,114,952 8,703,541 3,114,952 7,788,302
30.4 Investment in Unquoted Subsidiaries
Bank
As at 31 December 2018 2017
CostDirectors’Valuation Cost
Directors’Valuation
LKR ’000 LKR ’000 LKR ’000 LKR ’000
BOC Management & Support Services (Private) Limited 1,000 1,000 1,000 1,000
(99,996 Ordinary shares)
BOC Property Development & Management (Private) Limited 1,010,000 1,010,000 1,010,000 1,010,000
( 100,999,998 Ordinary shares)
BOC Travels (Private) Limited 2,500 2,500 2,500 2,500
( 250,004 Ordinary shares )
Bank of Ceylon (UK) Limited 2,683,859 2,283,859 2,683,859 2,283,859
(15,000,000 Ordinary shares)
Hotels Colombo (1963) Limited 100,737 100,737 100,737 100,737
(10,073,667 Ordinary shares )
Total investment in unquoted subsidiaries 3,798,096 3,398,096 3,798,096 3,398,096

289
30.5 Information Relating to Subsidiaries of the Bank
Ownership interest held by the Bank
As at 31 December 2018 2017
% %
Quoted subsidiaries
Property Development PLC (PDL) 95.55 95.55
Merchant Bank of Sri Lanka & Finance PLC (MBSL) 74.49 74.49
Unquoted subsidiaries
BOC Management & Support Services (Private) Limited (MSS)** 100.00 100.00
BOC Property Development & Management (Private) Limited (PDML) 100.00 100.00
BOC Travels (Private) Limited (TRAVELS) 100.00 100.00
Hotels Colombo (1963) Limited (HCL) 99.99 99.99
Ceybank Holiday Homes (Private) Limited (HH) * 100.00 100.00
MBSL Insurance Company Limited (MBSL INS)* 62.66 62.66
Koladeniya Hydropower (Private) Limited (KHP)* 95.55 95.55
Bank of Ceylon (UK) Limited (BOC UK) 100.00 100.00
* Ceybank Holiday Homes (Private) Limited, MBSL Insurance Company Limited and Koladeniya Hydropower (Private) Limited
are indirect subsidiaries of the Bank.
** Not in operation and in the process of liquidation.
30.6 Non-Controlling Interest (NCI) of Subsidiaries
2018
PDL MBSL MBSL INS KHP HCL
Equity interest held by the NCI (%) 4.45 25.51 37.34 4.45 0.01
Profit/ (Loss) allocated during the year (LKR ’000) 22,152 39,895 (67,383) 1,763 (3)
Accumulated balance of NCI as at 31 December (LKR ’000) 165,212 561,889 (57,265) 25,299 14
Dividends paid to NCI (LKR ’000) (10,280) - - 2,414 -
2017
PDL MBSL MBSL INS KHP HCL
Equity interest held by the NCI (%) 4.45 25.51 37.34 4.45 0.01
Profit/ (Loss) allocated during the year (LKR ’000) 21,278 26,045 (24,705) 2,562 (4)
Accumulated balance of NCI as at 31 December (LKR ’000) 166,381 722,238 12,788 25,947 19
Dividends paid to NCI (LKR ’000) - - - - -

290 Bank of Ceylon | Annual Report 2018
NOTES TO THE FINANCIAL STATEMENTS
30.7 Summarised Financial Information of Subsidiaries
For the year ended 31 December 2018
PDL MBSL MSS PDML TRAVELS
LKR ’000 LKR ’000 LKR ’000 LKR ’000 LKR ’000
Statement of Profit or Loss
Total income 1,040,710 6,549,905 - 400,337 1,231,265
Profit/ (Loss) after tax 497,794 156,390 - 190,033 30,253
Other comprehensive income (414,054) 882 - (44) -
Total comprehensive income 83,740 157,272 - 189,989 30,253
Statement of Financial Position
Total assets 3,900,467 35,638,974 1,470 1,814,305 347,618
Total liabilities 569,348 33,331,466 472 91,614 91,569
Net assets 3,331,119 2,307,508 998 1,722,691 256,049
Dividends paid 231,000 - - 101,000 4,500
Statement of Cash Flows
Operating cash flows 264,817 (3,835,271) - 144,728 (15,390)
Investing cash flows 106,789 1,878,702 - (35,423) 1,622
Financing cash flows (229,114) 1,445,713 - (101,000) (6,733)
Net increase/ (decrease) in cash and cash equivalents 142,492 (510,856) - 8,305 (20,501)
For the year ended 31 December 2017
PDL MBSL MSS PDML TRAVELS
LKR ’000 LKR ’000 LKR ’000 LKR ’000 LKR ’000
Statement of Profit or Loss
Total income 961,666 6,402,825 793 387,617 996,606
Profit/ (Loss) after tax 478,147 104,218 274 181,612 21,755
Other comprehensive income (65,991) 26,454 - (65) 240
Total comprehensive income 412,156 130,672 274 181,547 21,995
Statement of Financial Position
Total assets 4,073,519 35,694,695 1,130 1,749,624 304,363
Total liabilities 596,008 32,450,534 318 115,223 75,494
Net assets 3,477,511 3,244,161 812 1,634,401 228,869
Dividends paid - - 9,000 50,500 5,000
Statement of Cash Flows
Operating cash flows 457,345 2,052,584 (118) 129,781 21,468
Investing cash flows (382,011) (1,038,885) 10,036 (69,268) (237)
Financing cash flows (982,782) (905,114) (9,000) (50,500) (7,350)
Net increase/ (decrease) in cash and cash equivalents (907,448) 108,585 918 10,013 13,881

291
For the year ended 31 December 2018
HCL HH MBSL-INS KHP BoC UK
LKR ’000 LKR ’000 LKR ’000 LKR ’000 LKR ’000
Statement of Profit or Loss
Total income 207,064 72,538 207,731 115,920 599,206
Profit/ (Loss) after tax (31,087) (1,651) (180,459) 39,610 18,433
Other comprehensive income 1,289 - (3) 77 342,346
Total comprehensive income (29,798) (1,651) (180,462) 39,687 360,779
Statement of Financial Position
Total assets 297,083 36,878 1,278,366 486,288 36,707,727
Total liabilities 152,284 35,817 1,431,728 47,721 33,605,300
Net assets 144,799 1,061 (153,362) 438,567 3,102,427
Dividends paid 4,332 - - 54,250 -
Statement of Cash Flows
Operating cash flows (17,234) 2,223 28,320 44,203 29,910
Investing cash flows (6,962) (591) 12,907 4,496 (4,869)
Financing cash flows (1,300) - - (54,250) -
Net increase/ (decrease) in cash and cash equivalents (25,496) 1,632 41,227 5,551 25,041
For the year ended 31 December 2017
HCL HH MBSL-INS KHP BoC UK
LKR ’000 LKR ’000 LKR ’000 LKR ’000 LKR ’000
Statement of Profit or Loss
Total income 188,612 79,145 800,359 113,692 463,616
Profit/ (Loss) after tax (39,671) 2,382 (66,163) 57,584 3,552
Other comprehensive income - - 8,256 (148) 280,354
Total comprehensive income (39,671) 2,382 (57,907) 57,436 283,906
Statement of Financial Position
Total assets 298,187 39,180 1,366,270 491,817 20,414,678
Total liabilities 107,866 36,157 1,332,029 38,687 17,673,031
Net assets 190,321 3,023 34,241 453,130 2,741,647
Dividends paid - - - 43,400 -
Statement of Cash Flows
Operating cash flows (13,081) 2,095 (165,261) 39,494 (17,471)
Investing cash flows (6,082) (772) 189,797 28,820 (14,593)
Financing cash flows (1,300) - - (43,400) -
Net increase/ (decrease) in cash and cash equivalents (20,463) 1,323 24,536 24,914 (32,064)

292 Bank of Ceylon | Annual Report 2018
NOTES TO THE FINANCIAL STATEMENTS
31 Investment in Associate CompaniesAssociates are those entities in which the Bank has significant influence, but not control, over the financial and operating
policies. Investments in associate entities are accounted for using the equity method (equity-accounted investees) and are
recognised initially at cost. The cost of the investment includes transaction costs.
The Consolidated Financial Statements include the Bank’s share of the profit or loss and other comprehensive income, after
adjustments to align the accounting policies with those of the Group, from the date that significant influence commences until
the date that significant influence ceases.
When the Bank’s share of losses exceeds its interest in an equity accounted investee, the carrying amount of that interest,
including any long term investments, is reported at nil and the recognition of further losses is discontinued except to the
extent that the Group has an obligation or has made payments on behalf of the investee. If the associate subsequently reports
profits, the Bank resumes recognising its share of those profits only after its share of the profits equals the share of losses not
recognised.
A list of the Bank’s associates is shown in note 31.4 to the Financial Statements
The Bank discontinues the use of the Equity Method from the date that it ceases to have significant influence over an associate
and accounts for such investments in accordance with the Sri Lanka Accounting Standard, SLFRS 9 - “Financial Instruments”.
Upon loss of significant influence over the associate, the Bank measures and recognises any retained investment at its fair
value. Any difference between the carrying amount of the associate upon loss of significant influence and the fair value of the
retained investment and proceeds from disposal is recognised in Profit or Loss.
31.1 Unquoted Associates
Bank Group
As at 31 December 2018 2017 2018 2017
Cost Directors’ valuation Cost
Directors’ valuation
Equityvalue
Directors’ valuation
Equityvalue
Directors’ valuation
LKR ’000 LKR ’000 LKR ’000 LKR ’000 LKR ’000 LKR ’000 LKR ’000 LKR ’000
Ceybank Asset Management Limited (1,240,002 ordinary shares )
31,048 31,048 31,048 31,048 224,367 224,367 225,282 225,282
Lanka Securities (Private) Limited (3,594,857 Ordinary shares )
41,940 41,940 41,940 41,940 119,885 119,885 134,490 134,490
Southern Development Financial Company Limited (2,500,001 ordinary shares)
25,000 - 25,000 - - - - -
Transnational Lanka Records Solutions (Private) Limited (2,000,000 ordinary shares )
20,000 20,000 20,000 20,000 96,974 96,974 87,021 87,021
Total investment in unquoted associates 117,988 92,988 117,988 92,988 441,226 441,226 446,793 446,793
Provision for impairment of investments in associates (Note 31.3) (25,000) - (25,000) - - - - -
Net investment in unquoted associates 92,988 92,988 92,988 92,988 441,226 441,226 446,793 446,793

293
31.2 Movement in Investment in Associate Companies
Bank Group
Cost Equity value
2018 2017 2018 2017
LKR ’000 LKR ’000 LKR ’000 LKR ’000
Balance as at 1 January 117,988 117,988 446,793 420,669
Share of profit/ (loss), net of tax - - 9,269 52,024
Share of other comprehensive income, net of tax - - 3,464 (6,600)
Share of dividends - - (18,300) (19,300)
Balance as at 31 December 117,988 117,988 441,226 446,793
31.3 Movement in Provision for Impairment of Investment in Associate Companies
Bank
2018 2017
LKR ’000 LKR ’000
Balance as at 1 January 25,000 25,000
Impairment charge/ (reversal) during the year - -
Balance as at 31 December 25,000 25,000
31.4 Share Holding Structure of Associate Companies
Equity interest % Shareholding structure
Name of the Company 2018 2017 Name Holding %
Ceybank Asset Management Limited (CAML) 43.36 43.36 Bank of Ceylon 43.36
Sri Lanka Insurance Corporation 26.57
Unit Trust of India 17.48
Carson Cumberbatch PLC 12.59
Lanka Securities (Private) Limited (LSL) 41.60 41.60 First Capital Securities Corporation Limited 51.00
Merchant Bank of Sri Lanka & Finance PLC 29.00
Bank of Ceylon 20.00
(Bank of Ceylon indirectly hold 21.6%)
Transnational Lanka Records Solutions 24.69 24.69 Transnational (Pte) Ltd - Singapore 62.96
(Private) Limited (TLRS) Bank of Ceylon 24.69
Seylan Bank PLC 12.35
Southern Development Financial Company 41.67 41.67 Bank of Ceylon 41.67
Limited (SDFC) * People’s Bank 41.67
Southern Development Authority of Sri Lanka 16.66
* SDFC is not in operation and in the process of liquidation.

294 Bank of Ceylon | Annual Report 2018
NOTES TO THE FINANCIAL STATEMENTS
31.5 Summarised Financial Information of Associates
For the year ended 31 December 2018
CAMLLKR ’000
LSLLKR ’000
TLRSLKR ’000
Statement of Profit or Loss
Total income 132,829 84,394 83,723
Profit/ (Loss) before tax 38,456 (30,618) 112,512
Profit/ (Loss) after tax 27,600 (30,618) 84,549
Other comprehensive income (8,819) - -
Total comprehensive income 18,781 (30,618) 84,549
Statement of Financial Position
Current assets 307,709 343,056 69,236
Total assets 556,755 349,875 605,079
Current liabilities 14,490 62,242 5,891
Total liabilities 39,302 61,690 212,315
Net assets 517,453 288,185 392,764
Dividends paid 21,450 - 40,500
Dividends received to the Bank (net) 8,004 - 9,000
For the year ended 31 December 2017
CAMLLKR ’000
LSLLKR ’000
TLRSLKR ’000
Statement of Profit or Loss
Total income 170,234 121,062 72,154
Profit/ (Loss) before tax 73,499 3,557 110,500
Profit/ (Loss) after tax 58,912 3,273 103,459
Other comprehensive income (20,115) 5,101 -
Total comprehensive income 38,797 8,374 103,459
Statement of Financial Position
Current assets 296,552 578,740 27,723
Total assets 562,591 615,545 609,533
Current liabilities 20,052 263,100 41,306
Total liabilities 43,029 292,259 257,071
Net assets 519,562 323,286 352,462
Dividends paid 21,450 - 40,500
Dividends received to the Bank (net) 8,004 - 9,000

295
32 Investment Properties Accounting Policy
Recognition
Investment property is a property held either to earn rental income or for capital appreciation or for both, but not for sale in the
ordinary course of business, use in the production or supply of goods or services or for administrative purposes.
Measurement
Investment property is accounted for under Cost Model in the Financial Statements. Accordingly, after initial recognition as an asset,
the property is carried at its cost, less accumulated depreciation and impairment losses.
If any property is reclassified to investment property due to changes in its use, fair value of such property at the date of reclassification
becomes its cost for subsequent accounting.
Depreciation
Depreciation is provided on a straight-line basis over the estimated life of the class of asset from the date of purchase up to the
date of disposal. Provision for depreciation is made over the period of 20 years at the rate of 5% per annum using the straight-
line method for buildings classified as investment property. Land is not depreciated under normal circumstances.
Derecognition
Investment properties are derecognised when they are disposed of, or permanently withdrawn from use since no future
economic benefits are expected. Transfers are made to and from investment property only when there is a change in use.
When the use of a property changes such that it is reclassified as Property, Plant and Equipment, its fair value at the date of
reclassification becomes its cost for subsequent accounting.
Bank Group
2018 2017 2018 2017
LKR ’000 LKR ’000 LKR ’000 LKR ’000
Cost
Balance as at 1 January 3,000,000 3,000,000 149,094 150,085
Disposals during the year - - (685) (991)
Transfers from Property, Plant and Equipment - - - -
Balance as at 31 December 3,000,000 3,000,000 148,409 149,094
Less : Accumulated Depreciation
Balance as at 1 January 117,072 - 25,321 22,415
Charge for the year 117,072 117,072 2,906 2,906
Disposal/ Transfer - - - -
Balance as at 31 December 234,144 117,072 28,227 25,321
Net investment properties 2,765,856 2,882,928 120,182 123,773

296 Bank of Ceylon | Annual Report 2018
NOTES TO THE FINANCIAL STATEMENTS
32.1 Unobservable Inputs Considered in Measuring Fair Value.
Significant unobservable inputs Range of estimates for unobservable inputs Sensitivity of fair value to unobservable inputs
Estimated value per perch LKR 12.0 million - LKR 16.0 million Positive correlated sensitivity
32.2 Investment Properties Held by Bank and Group
32.2.1 Bank
As at 31 December 2018 2017
Extent Cost Fair value Cost Fair value
Building of Land Land Building Total Total Total Total
(sq.ft) (Perches) LKR ’000 LKR ’000 LKR ’000 LKR ’000 LKR ’000 LKR ’000
York street building, No.02, York Street, Colombo 01 261,610 181.85 2,414,640 585,360 3,000,000 3,000,000 3,000,000 3,000,000
Total 2,414,640 585,360 3,000,000 3,000,000 3,000,000 3,000,000
32.2.2 Group
As at 31 December 2018 2017
Extent Cost Fair value Cost Fair value
Building of Land Land Building Total Total Total Total
(sq.ft) (Perches) LKR ’000 LKR ’000 LKR ’000 LKR ’000 LKR ’000 LKR ’000
Nos. 64 and 66, Nonagama Road, Pallegama, Embilipitiya - 16.61 1,751 - 1,751 30,000 1,751 30,000
No. 385/1, Kotte Road, Pittakotte 2,896 19.01 2,958 1,730 4,688 5,298 4,688 5,298
No. 116/4,116/7,116/26,116/27,116/29 1st Cross Street, Colombo 01 - 12.35 1,249 - 1,249 2,602 1,249 2,602
No. 102 and 104, Dam Street, Colombo 12 20,368 50.70 17,970 11,989 29,959 233,000 29,959 233,000
Kumbuththukuliya watte, Bangadeniya Road, Puttalam - 320.00 600 - 600 3,400 600 3,400
Mirissawelawatta hena, Thekkawatta Dambadeniya - 188.00 162 - 162 600 162 600
No. 50/21, Old Kesbawa Road, Raththanapitiya, Boralesgamuwa 54,826 364.35 65,604 44,396 110,000 298,015 110,000 298,015
No. 64, Gabadawa Estate, Pitipana, Homagama - 10.00 - - - - 685 1,394
Total 90,294 58,115 148,409 574,300 149,094 574,309

297
Note : The fair value of the investment properties as at 31 December 2018 was based on market valuations carried out in the year
2013,2014 and 2016 by Mr D N Dhammika Baranage [RICS (UK), DIV AIS (SL)] and Mr H A W Perera [BSc Estate Management
and Valuation (Special)], Mr Samantha Kumara Madawan Arachchi [BSc Estate Management and Valuation (Special), City
Planning (JP), Dip(UPM)NI, AIREV] and Mr. A G Gunarathne [BSc Estate Mgt. & Valuation, F.I.V (Sri Lanka)], Mr L G T Thungasiri
[(AIV) F.I.V (Sri Lanka), Dip. in Valuation (SLTC)], who are independent valuers not connected with the companies. The Directors
have reviewed values of the investment properties as at 31 December 2018 and concluded that there was no impairment.
33 Property, Plant and Equipment Recognition
Property, Plant and Equipment (PPE) are recognised if it is probable that future economic benefits associated with the assets
will flow to the Group and the cost of the asset can be reliably measured.
Measurement
Cost of Property, Plant and Equipment includes expenditures that are directly attributable to the acquisition of the asset. The
cost of self-constructed assets includes the cost of materials and direct labour, any other costs directly attributable to bringing
the assets to a working condition for their intended use, the costs of dismantling and removing the items and restoring the site
on which they are located. Purchased software that is integral to the functionality of the related equipment is capitalised as part
of that equipment.
Items of Property, Plant and Equipment are measured at cost less accumulated depreciation and accumulated impairment
losses. Revaluation model is applied for entire class of freehold land and buildings and buildings on leasehold lands. The Market
participant’s ability to generate economic benefits by using the asset in its highest and best use or by selling it to another market
participant that would use the asset in its highest and best use are taken into account in measuring the fair value.
Properties that carried at revaluation amount being their fair value at the date of revaluation, less any subsequent accumulated
depreciation and subsequent accumulated impairment losses. Freehold land and building of the Group are revalued every
three to five years or more frequently if the fair values are substantially different from their carrying amounts to ensure that
the carrying amounts do not differ from the fair values at the Reporting date. Any surplus arising on revaluation of an asset is
accumulated under the Revaluation Reserve in Equity through Other Comprehensive Income. However, if there is any revaluation
deficit of the same asset previously recognised on profit or loss, revaluation surplus is recognised on Profit or Loss to the extent
it reverse such deficit. Any deficit arising on revaluation of a assets is recognised on Profit or Loss and such deficit is recognised
in Other Comprehensive Income to the extend of any credit balance existing in the revaluation reserve in respect of that asset.
Accumulated depreciation as at revaluation date is eliminated against the gross carrying amount of assets and the net amount
restated to the revalued amount of the assets. Where the carrying value of the Property, Plant and Equipment are reviewed for
impairment, when an event or changes in circumstances indicate that the carrying value may not be recoverable.
When parts of an item of Property, Plant and Equipment have different useful lives, they are accounted for as separate items
(major components) of Property, Plant and Equipment.
Subsequent Costs
The cost of replacing a part of an item of PPE is recognised in the carrying amount of the item if it is probable that the future
economic benefits embodied within the part will flow to the Group and its cost can be measured reliably. The costs of the day to
day servicing of Property, Plant and Equipment are recognised in the Statement of Profit or Loss in ‘ Other expenses’ (Note 16)
as incurred.

298 Bank of Ceylon | Annual Report 2018
NOTES TO THE FINANCIAL STATEMENTS
Capital Work in Progress
Capital work in progress is stated at cost. These are expenses of a capital nature directly incurred in the construction of
buildings, awaiting capitalisation.
Borrowing Costs
Borrowing costs directly attributable to the acquisition, construction or production of an asset that necessarily takes a
substantial period of time to get ready for its intended use or sale are capitalised as part of the cost of the asset. All other
borrowing costs are expensed in the period in which they occur. Borrowing costs consist of interest and other costs that the
Bank incurs in connection with the borrowing of funds.
Depreciation
Depreciation is recognised in Statement of Profit or Loss on a straight line basis over the estimated useful lives of each part of
an item of Property, Plant and Equipment since this method most closely reflects the expected pattern of consumption of the
future economic benefits embodied in the asset. Leased assets under finance leases are depreciated over the shorter of the
lease term and their useful lives. Land is not depreciated. Further, cost of expansion and major renovations on the building are
depreciated over the remaining useful lives of the original buildings.
Provisioning for depreciation of PPE is made on pro rata basis.
The Group’s estimated useful lives for the current and comparative periods are as follows:
Freehold buildings 40 - 60 years
Office equipment 08 years
Furniture and fittings 08 years
Computer equipment 05 years
Motor vehicles 04 years
Power plant 20 years
Depreciation methods, useful lives and residual values are reassessed at each financial year end and adjusted if appropriate.
Useful Life and Residual Values
Residual value is the amount that Group could receive for an asset at the Reporting date if the asset was already at the age and
in the condition that it will be in when the Group expects to dispose it.
The residual and useful life of an asset are reviewed at least at each Reporting date, changes in the residual value and useful life
are accounted for prospectively as a change in an accounting estimate only if the residual value is material.
Derecognition
The carrying amount of an item of Property, Plant and Equipment is derecognised on disposal, replacement or when no future
economic benefits are expected from its use. The gain or loss arising from the derecognition of an item of Property, Plant and
Equipment is included in the “Net Other operating income” (Note 13) “Other expenses” (Note 16) in the Statement of Profit or
Loss in the year the item is derecognised.

299
Reclassification as Investment Property
When the use of property changes such that is reclassified as investment property, its fair value at the date of reclassification
becomes its cost for subsequent accounting. Any gain arising on re-measurement is recognised in the Statement of Profit or
Loss to the extent that it reverses a previous impairment loss on the specific property, with any remaining gain recognised
in Other Comprehensive Income and presented in revaluation reserve in equity. Any loss is recognised immediately in the
Statement of Profit or Loss.
33.1 Bank
Freehold Freehold Buildings on Equipment Motor Leasehold Capital 2018 2017
land building leasehold
land[Note
33.12.1]vehicles motor
vehicleswork in
progressTotal Total
LKR ’000 LKR ’000 LKR ’000 LKR ’000 LKR ’000 LKR ’000 LKR ’000 LKR ’000 LKR ’000
Cost or valuation
As at 1 January 12,692,206 3,202,731 2,136,202 12,845,291 1,573,466 43,317 157,984 32,651,197 24,760,674
Additions during the year
Acquisitions 528,521 60,907 44,265 2,077,458 263,844 - 424,837 3,399,832 3,078,288
Capitalisations - 118,918 226,225 - - - (345,143) - -
Changes in revaluation surplus/ (deficit) (219,304) (20,764) (97,454) - - - - (337,522) 6,015,054
Transfer of accumulated depreciation on asset revaluation - - - - - - - - (986,187)
Disposals during the year (34,139) (3,500) - (250,572) (137,296) - - (425,507) (228,671)
Impairment to profit/ loss - - - - - - - - (711)
Exchange rate adjustments - - - 29,178 2,061 - - 31,239 12,750
Transfers/ adjustments - 22,477 146,636 (172,615) - - 5,062 1,560 -
As at 31 December 12,967,284 3,380,769 2,455,874 14,528,740 1,702,075 43,317 242,740 35,320,799 32,651,197
Accumulated depreciation
As at 1 January - 849 104 8,508,989 1,051,824 43,317 - 9,605,083 9,278,511
Charge for the year - 107,424 68,371 1,308,439 215,804 - - 1,700,038 1,523,783
Transfer of accumulated depreciation on assets revaluation - - - - - - - - (986,187)
Disposals during the year - (525) - (245,373) (109,573) - - (355,471) (221,319)
Exchange rate adjustments - - - 24,690 1,494 - - 26,184 10,295
Transfers/ adjustments 22,476 146,636 (2,302) - - - 166,810 -
As at 31 December - 130,224 215,111 9,594,443 1,159,549 43,317 - 11,142,644 9,605,083
Net book value as at 31 December 2018 12,967,284 3,250,545 2,240,763 4,934,297 542,526 - 242,740 24,178,155 -
Net book value as at 31 December 2017 12,692,206 3,201,882 2,136,098 4,336,302 521,642 - 157,984 - 23,046,114

300 Bank of Ceylon | Annual Report 2018
NOTES TO THE FINANCIAL STATEMENTS
33.2 Group
Freehold Freehold Buildings on Equipment Motor Leasehold Capital 2018 2017
land building leasehold
land[Note
33.12.2]vehicles motor
vehicleswork in
progressTotal Total
LKR ’000 LKR ’000 LKR ’000 LKR ’000 LKR ’000 LKR ’000 LKR ’000 LKR ’000 LKR ’000
Cost or Valuation
As at 1 January 15,575,074 6,299,246 9,874,476 14,337,783 1,719,374 55,894 214,236 48,076,083 39,265,407
Additions during the year
Acquisitions 528,521 63,544 51,960 2,172,539 281,339 18,790 453,223 3,569,916 3,197,313
Capitalisations - 118,918 226,225 - - - (345,143) - -
Changes in revaluation surplus/ (deficit) (219,304) (40,725) 396,911 - - - - 136,882 6,353,428
Transfer of accumulated depreciation on asset revaluation - - - - - - - - (1,328,330)
Disposals during the year (44,100) (6,443) (4,849) (310,527) (137,296) (7,991) (6,755) (517,961) (265,933)
Impairment to profit/ loss - - - - - - - - (711)
Exchange rate adjustments 38,174 39,492 - 35,810 2,061 - - 115,537 80,758
Transfers/ adjustments - (8,957) (165,609) (172,608) - - 5,061 (342,113) 774,151
As at 31 December 15,878,365 6,465,075 10,379,114 16,062,997 1,865,478 66,693 320,622 51,038,344 48,076,083
Accumulated Depreciation
As at 1 January - 404,150 491,731 9,386,381 1,130,104 54,798 - 11,467,164 10,065,371
Charge for the year - 291,366 419,892 1,430,276 230,024 4,612 - 2,376,170 2,197,107
Transfer of accumulated depreciation on assets revaluation - - - - - - - - (1,328,330)
Disposals during the year - (593) (3,347) (300,819) (110,362) (7,202) - (422,323) (257,613)
Exchange rate adjustments - 4,133 - 27,849 1,494 - - 33,476 15,395
Transfers/ adjustments - (10,740) (165,609) (2,303) - - - (178,652) 775,234
As at 31 December - 688,316 742,667 10,541,384 1,251,260 52,208 - 13,275,835 11,467,164
Net book value as at 31 December 2018 15,878,365 5,776,759 9,636,447 5,521,613 614,218 14,485 320,622 37,762,509 -
Net book value as at 31 December 2017 15,575,074 5,895,096 9,382,745 4,951,402 589,270 1,096 214,236 - 36,608,919

301
33.3 Title Restriction on Property, Plant and Equipment
There were no restrictions that existed in the title of the Property, Plant and Equipment of the Bank and the Group as at the
Reporting date.
33.4 Property, Plant and Equipment Pledged as Security for Liabilities
No freehold Property, Plant and Equipment have been pledged as security for any liability.
33.5 Compensation from Third Parties for Items of Property, Plant and Equipment
There were no compensation received/ receivable from third parties for items of Property, Plant and Equipment which were
impaired or given up.
33.6 Fully Depreciated Property, Plant & Equipment
The initial cost of fully depreciated Property, Plant and Equipment which are still in use are as follows:
Bank Group
As at 31 December 2018 2017 2018 2017
LKR ’000 LKR ’000 LKR ’000 LKR ’000
Motor vehicles 801,143 854,835 854,026 889,474
Computer equipments 3,025,018 2,694,496 3,253,241 2,832,713
Equipment, furniture, and fittings 1,473,627 1,292,375 1,654,837 1,422,797
Buildings on leasehold lands 28,079 23,093 28,079 23,093
Plant and machinery 1,182,280 1,120,447 1,182,556 1,120,723
Total 6,510,147 5,985,246 6,972,739 6,288,800
33.7 Temporarily Idle Property, Plant and Equipment
There were no temporarily idle Property, Plant and Equipment as at the Reporting date.
33.8 Property, Plant and Equipment Retired from Active Use
The Group held no Property, Plant and Equipment retired from active use and which were not classified as held for sale in
accordance with SLFRS 5 - “Non-current assets held for sale and discontinued operations”.

302 Bank of Ceylon | Annual Report 2018
NOTES TO THE FINANCIAL STATEMENTS
33.9 Freehold Properties
The carrying value of freehold properties, that would have been recognised in the Financial Statements, if they were carried at
cost less accumulated depreciation is as follows:
33.9.1 Bank
As at 31 December 2018 2017
Cost Accumulated Net book value Cost Accumulated Net book value
depreciation depreciation
LKR ’000 LKR ’000 LKR ’000 LKR ’000 LKR ’000 LKR ’000
Land 1,372,277 - 1,372,277 877,895 - 877,895
Building 1,694,375 (574,675) 1,119,700 1,518,050 (532,316) 985,734
Total 3,066,652 (574,675) 2,491,977 2,395,945 (532,316) 1,863,629
33.9.2 Group
As at 31 December 2018 2017
Cost Accumulated Net book value Cost Accumulated Net book value
depreciation depreciation
LKR ’000 LKR ’000 LKR ’000 LKR ’000 LKR ’000 LKR ’000
Land 1,396,238 - 1,396,238 901,856 - 901,856
Building 2,816,439 (1,030,826) 1,785,613 2,640,420 (960,415) 1,680,005
Total 4,212,677 (1,030,826) 3,181,851 3,542,276 (960,415) 2,581,861
33.10 Revaluation of Leasehold/ Freehold Properties - Group
The following buildings on leasehold/ freehold lands of the subsidiaries were revalued during the year by professionally qualified
independent valuers.
Leasehold Building
2018
Details of properties Valuer Basis of valuation Carrying value Revalued amount of
building
Surplus/(Loss)
of building
LKR ’000 LKR ’000 LKR ’000
Property Development PLC Bank of Ceylon Head Office Building “BOC Square”, Colombo 01 (Revalued as at 31 December 2018)
M/s P B Kalugalagedara& Associates
Market valuemethod
6,441,619
6,914,200
472,581
BOC Property Development & Management (Private) Limited Bank of Ceylon - Ceybank house No. 86, Sri Dalada Veediya, Kandy (Revalued as at 31 December 2018)
M/s P B Kalugalagedara & Associates
Market value method
460,615 482,400 21,785

303
Freehold Land
2018
Details of properties Valuer Basis of valuation Carrying value Revalued amount of
building
Surplus/(Loss)
of building
LKR ’000 LKR ’000 LKR ’000
Merchant Bank of Sri Lanka & Finance PLC No. 470, Hendala Road, Wattala (Revalued as at 31 December 2017)
Mr.S.A.N.A.Perera Market valuemethod
9,961 75,200 65,239
Merchant Bank of Sri Lanka & Finance PLC Kurunduwatta Ekala (Revalued as at 31 December 2017)
Mr.D.N. Dhammika Baranage
Market valuemethod
14,000
95,000
81,000
Freehold Buildings
2018
Details of properties Valuer Basis of valuation Carrying value Revalued amount of
building
Surplus/(Loss)
of building
LKR ’000 LKR ’000 LKR ’000
BOC Property Development & Management (Private) Limited Bank of Ceylon - Merchant Tower St. Micheal’s Road, Colombo 03 (Revalued as at 31 December 2018)
M/s P B Kalugalagedara & Associates
Market valuemethod
1,966,461 1,946,500 (19,961)
Merchant Bank of Sri Lanka & Finance PLC No. 470, Hendala Road, Wattala (Revalued as at 31 December 2017)
Mr.S.A.N.A.Perera
Market valuemethod
1,190
4,200
3,010
33.11 Unobservable Inputs Considered in Measuring Fair Value The following table depicts information about significant unobservable inputs used in measuring fair value of the assets
categorised under Level 3 of the fair value hierarchy.
33.11.1 Bank2018
Type of asset Fair value as at31.12.2018
LKR ’000
Valuation technique Significantunobservableinputs
Range ofestimates forunobservableinputs
Sensitivity of fairvalue to unobservableinputs
Freehold land 12,967,284 Market comparable method
Estimated cost per perch
LKR 24,500 -LKR 14,493,000
Positively correlated sensitivity
Freehold buildings 3,250,545 Market comparable method
Estimated cost per square feet
LKR 400 - LKR 55,400
Positively correlated sensitivity
Buildings on leasehold lands 2,240,763 Rental value basis Estimated rental value per square feet
LKR 110 - LKR 11,250
Positively correlated sensitivity
Expected market rental growth p.a 5%
Positively correlated sensitivity
Anticipated maintenance cost 40%
Positively correlated sensitivity
Discount rate 5.50%Negatively correlated sensitivity

304 Bank of Ceylon | Annual Report 2018
NOTES TO THE FINANCIAL STATEMENTS
33.11.2 Group2018
Type of asset Fair value as at31.12.2018
LKR ’000
Valuation technique Significantunobservableinputs
Range ofestimates forunobservableinputs
Sensitivity of fairvalue to unobservableinputs
Freehold land 15,878,365 Market comparable method
Estimated cost per perch
LKR 24,500 - LKR 14,493,000
Positively correlated sensitivity
Freehold buildings 5,776,759 Market comparable method
Estimated cost per square feet sensitivity
LKR 400 - LKR 55,400
Positively correlated sensitivity
Buildings on leasehold lands 9,636,447 Rental value basis Estimated rental value per square feet
LKR 110 - LKR 6,426
Positively correlated sensitivity
Expected market rental growth p.a 5%
Positively correlated sensitivity
Anticipated maintenance cost 40%
Positively correlated sensitivity
Discount rate 5.5% - 8.0%Negatively correlated sensitivity
33.12 Equipment
33.12.1 Bank
Computer
Equipment Furniture and
Fittings Office
Equipment 2018Total
2017Total
LKR ’000 LKR ’000 LKR ’000 LKR ’000 LKR ’000
Cost
Balance as at 1 January 6,556,220 3,533,470 2,755,601 12,845,291 11,107,522
Additions during the year 1,318,870 644,143 114,445 2,077,458 1,891,028
Transfers/ adjustments (170,241) (4,513) 2,139 (172,615) -
Disposals during the year (115,496) (83,548) (51,528) (250,572) (164,893)
Impairment to profit or loss - - - - (711)
Exchange rate adjustments 24,588 2,300 2,290 29,178 12,345
Balance as at 31 December 7,613,941 4,091,852 2,822,947 14,528,740 12,845,291
Accumulated Depreciation
Balance as at 1 January 4,315,645 2,339,509 1,853,835 8,508,989 7,523,805
Charge for the year 801,993 296,480 209,966 1,308,439 1,136,960
Transfers/ adjustments (1,996) (306) - (2,302) -
Disposals during the year (113,871) (80,960) (50,542) (245,373) (161,658)
Exchange rate adjustments 21,800 1,485 1,405 24,690 9,882
Balance as at 31 December 5,023,571 2,556,208 2,014,664 9,594,443 8,508,989
Net book value as at 31 December 2018 2,590,370 1,535,644 808,283 4,934,297 -
Net book value as at 31 December 2017 2,240,575 1,193,961 901,766 - 4,336,302

305
33.12.2 Group
Computer Furniture Office Power 2018 2017
Equipment and Equipment Plant Total Total
Fittings
LKR ’000 LKR ’000 LKR ’000 LKR ’000 LKR ’000 LKR ’000
Cost
Balance as at 1 January 7,013,731 4,168,284 2,856,770 298,998 14,337,783 12,518,143
Additions during the year 1,331,951 724,869 115,719 - 2,172,539 1,982,539
Disposals during the year (119,906) (138,327) (52,294) - (310,527) (183,592)
Impairment to profit/ loss - - - - - (711)
Exchange rate adjustments 26,482 7,039 2,289 - 35,810 16,951
Transfers/ Adjustments (170,241) 53,662 (56,029) - (172,608) 4,453
Balance as at 31 December 8,082,017 4,815,527 2,866,455 298,998 16,062,997 14,337,783
Accumulated Depreciation
Balance as at 1 January 4,621,292 2,792,249 1,888,492 84,348 9,386,381 8,290,717
Charge for the year 846,399 357,065 211,862 14,950 1,430,276 1,260,285
Disposals during the year (118,280) (131,901) (50,638) - (300,819) (179,980)
Exchange rate adjustments 23,169 3,276 1,404 - 27,849 12,201
Transfers/ Adjustments (1,996) (1,268) 961 - (2,303) 3,158
Balance as at 31 December 5,370,584 3,019,421 2,052,081 99,298 10,541,384 9,386,381
Net book value as at 31 December 2018 2,711,433 1,796,106 814,374 199,700 5,521,613 -
Net book value as at 31 December 2017 2,392,439 1,376,035 968,278 214,650 - 4,951,402

306 Bank of Ceylon | Annual Report 2018
NOTES TO THE FINANCIAL STATEMENTS
Name of Premises Extent (Perches)
Building (Square
Feet)
Date of Valuation
Revalued Amount of
Land
Revalued Amount of Buildings
Total Value Accumulated Depreciation
Written Down Value
LKR ’000 LKR ’000 LKR ’000 LKR ’000 LKR ’000
Central Province
Galaha Branch 59/37, Deltota Road, Galaha 15.00 5,353 30.09.2017 15,000 19,693 34,693 475 34,218
Gampola Branch 44, Kadugannawa Road, Gampola 175.00 9,677 30.09.2017 105,000 31,000 136,000 775 135,225
Galewela Land 158, Dhambulla Road, Galewela 47.00 - 24.03.2017 97,759 - 97,759 - 97,759
Hatton Branch and Staff Quarters 46, Circular Road, Hatton 139.50 15,359 30.09.2017 97,000 43,500 140,500 1,740 138,760
Kandy 2nd City Branch 22, Dalada Veediya, Kandy 42.81 27,081 30.09.2017 428,000 27,000 455,000 1,350 453,650
Kandapola BranchNuwara Eliya Road, Kandapola 14.10 4,284 11.07.2018 37,109 7,750 44,859 16 44,843
Maskeliya Branch66, Upcot Road, Maskeliya 42.05 6,130 30.09.2017 25,000 15,000 40,000 600 39,400
Nawalapitiya Branch106, Gampola Road, Nawalapitiya 21.92 5,534 30.09.2017 33,000 17,134 50,134 426 49,708
Nuwara Eliya Branch43, Lawson Street, Nuwara Eliya 133.50 9,713 30.09.2017 667,500 38,436 705,936 961 704,975
Nuwara Eliya Staff Quarters14,19, Hill Street, Nuwara Eliya 75.70 7,562 30.09.2017 98,400 13,519 111,919 534 111,385
Nuwara Eliya Property Ladies staff Quarters12, Hill Street, Nuwara Eliya 82.53 4,638 30.09.2017 7,495 2,507 10,002 251 9,751
Rikillagaskada BranchNo. 38, Dimbulkubura Road, Rikillagaskada 19.60 4,450 26.07.2017 30,199 11,500 41,699 319 41,380
Thalawakelle Branch23,25,29, Hatton Road, Talawakelle 25.30 7,332 30.09.2017 33,520 17,119 50,639 461 50,178
Thalawakelle Staff QuartersThalawakelle Estate Plantation 160.00 4,898 30.09.2017 10,400 11,635 22,035 291 21,744
1,685,382 255,793 1,941,175 8,199 1,932,976
33.13 The details of Freehold land and building held by the bank as at 31 December 2018 are as follows:

307
Name of Premises Extent (Perches)
Building (Square
Feet)
Date of Valuation
Revalued Amount of
Land
Revalued Amount of Buildings
Total Value Accumulated Depreciation
Written Down Value
LKR ’000 LKR ’000 LKR ’000 LKR ’000 LKR ’000
Eastern Province
Batticaloa Branch 21 & 21 1/1 Govington Road, Batticaloa 64.85 7,774 30.09.2017 48,500 19,000 67,500 543 66,957
Mutur Branch (New) Ward No. 7, Main street, Mutur 71.00 7,566 30.09.2017 15,585 41,600 57,185 1,040 56,145
Potuvil BranchMain Street, Pottuvil 10.70 4,077 30.09.2017 17,000 13,000 30,000 325 29,675
Trincomalee Branch28, Inner Harbour Road, Trincomalee 90.00 10,810 30.09.2017 72,000 25,149 97,149 3,144 94,005
Trincomalee City Branch09, Main Street, Trincomalee 21.90 2,670 30.09.2017 35,000 4,800 39,800 1,950 37,850
Valachchenai BranchMain Street, Valachchenai 47.34 6,621 30.09.2017 30,500 14,500 45,000 725 44,275
218,585 118,049 336,634 7,727 328,907
Northern Province
Jaffna Area Office & Branch56, Stanley Road, Jaffna 166.25 21,393 30.11.2014 249,500 37,083 286,583 7,337 279,246
Karainagar BranchPost Office View, Karainagar 63.22 5,720 30.11.2014 3,300 5,850 9,150 1,159 7,991
Mannar Manager and Staff Quarters52, Pallimunai Road, Grand Bazaar, Mannar 162.04 7,661 30.11.2014 9,500 9,627 19,127 1,727 17,400
Nelliadi BranchThikkam Road, Karaveddy, Nelliady 22.11 2,718 30.11.2014 17,750 34,694 52,444 3,051 49,393
280,050 87,254 367,304 13,274 354,030

308 Bank of Ceylon | Annual Report 2018
NOTES TO THE FINANCIAL STATEMENTS
Name of Premises Extent (Perches)
Building (Square
Feet)
Date of Valuation
Revalued Amount of
Land
Revalued Amount of Buildings
Total Value Accumulated Depreciation
Written Down Value
LKR ’000 LKR ’000 LKR ’000 LKR ’000 LKR ’000
North Western Province
Alawwa Branch64, Giriulla Road, Alawwa 30.80 7,011 30.09.2017 46,000 23,000 69,000 575 68,425
Bingiriya Land Wariyapola Road, Bingiriya 40.00 - 02.05.2017 21,199 - 21,199 - 21,199
Chilaw BranchRadaguru Edmund Peiris Mawatha, Chilaw 38.25 8,248 30.09.2017 66,000 24,000 90,000 600 89,400
Dankotuwa Land88A, Kahatagahawatte, Negombo Road, Dankotuwa 32.90 - 03.08.2017 49,973 - 49,973 - 49,973
Dummalasooriya Branch227, Kuliyapitiya - Madampe Road, Dummalasuriya 41.68 5,611 30.09.2017 30,000 16,000 46,000 533 45,467
Kurunegala Province Office, AGM’s Quarters & CM Quarters18, Mihindu mawatha, Kurunegala 225.00 19,437 30.09.2017 560,000 40,000 600,000 1000 599,000
Kurunegala Super Grade BranchCommercial Complex, Kurunegala - 12,242 30.09.2017 - 135,920 135,920 3,363 132,557
Kurunegala 2nd City Branch34, Colombo Road, Kurunegala 46.80 16,677 30.09.2017 234,000 18,616 252,616 3,747 248,869
Madampe Branch10, Station Road, Madampe 86.10 7,260 30.09.2017 38,000 19,000 57,000 475 56,525
Madurankuliya Branch66 , Colombo Road, Madurankuliya 46.00 6,083 30.09.2017 60,000 36,000 96,000 900 95,100
Malsiripura Branch (proposed) 254, Dambulla Road, Malsiripura 46.20 - 06.06.2015 46,799 - 46,799 - 46,799
Marawila Land85, Negombo Road, Marawila 35.00 - 03.04.2018 48,879 - 48,879 - 48,879
Narammala Branch139, Negombo Road, Narammala 117.50 7,190 30.09.2017 87,000 39,500 126,500 988 125,512
Nattandiya Land115, Marawila Road, Nattandiya 67.50 - 18.01.2017 47,399 - 47,399 - 47,399
Waikkal LandPuttalam Road, Thoppuwa, Waikkal 36.00 - 05.03.2017 44,799 - 44,799 - 44,799
Wariyapola LandMakaduwapitiyewatte, Vilakatupotha, Wariyapola 40.80 - 26.09.2017 90,699 - 90,699 - 90,699
1,470,747 352,036 1,822,783 12,181 1,810,602

309
Name of Premises Extent (Perches)
Building (Square
Feet)
Date of Valuation
Revalued Amount of
Land
Revalued Amount of Buildings
Total Value Accumulated Depreciation
Written Down Value
LKR ’000 LKR ’000 LKR ’000 LKR ’000 LKR ’000
Sabaragamuwa Province -
Balangoda Branch137, Main Street, Balangoda 14.50 3,202 30.09.2017 40,000 60,971 100,971 364 100,607
Dehiowita Branch62 Main Street, Dehiowita 38.60 3,818 30.09.2017 15,180 2,568 17,748 514 17,234
Kegalle Branch110, Colombo Road, Kegalle 120.00 14,680 30.09.2017 146,000 36,000 182,000 1,440 180,560
Ratnapura Branch6, Dharmapala Mawatha, Ratnapura 99.70 9,808 30.09.2017 82,000 31,000 113,000 775 112,225
Rathnapura (Land)58, Main Street, Ratnapura 31.69 - 30.09.2017 85,000 - 85,000 - 85,000
368,180 130,539 498,719 3,093 495,626
Southern Province
Ambalangoda Branch274, Main Street, Ambalangoda 58.00 7,575 30.09.2017 203,000 25,500 228,500 638 227,862
Ambalantota Branch11 Wanduruppa Road, Ambalantota 38.00 5,410 30.09.2017 36,200 15,800 52,000 432 51,568
Ahangama LandMathara Road, Ahangama 33.35 - 21.02.2017 20,007 - 20,007 - 20,007
Beliatta Branch67, Walasmulla Road, Beliatta 53.02 6,200 30.09.2017 59,000 40,500 99,500 1,012 98,488
Galle Province Office2, Light House Street, Fort, Galle 32.63 14,250 30.09.2017 228,000 25,489 253,489 1,007 252,482
Galle Branch2, Gamini Road, Galle 31.50 10,800 30.09.2017 236,000 21,000 257,000 840 256,160
Hakmana BranchBeliatta Road, Hakmana 36.70 3,400 30.09.2017 36,700 8,800 45,500 251 45,249
Imaduwa BranchAhangama Road, Imaduwa 83.50 3,300 30.09.2017 58,500 8,724 67,224 247 66,977
Karapitiya Land105, Hirimbura Cross Road, Karapitiya, Galle 35.00 - 01.02.2017 62,599 - 62,599 - 62,599
Matara Branch11, Kumaratunga Mawatha, Matara 104.40 15,905 30.09.2017 261,000 25,331 286,331 5,026 281,305
Matara Bazzar BranchGunawardena Mawatha, Matara 49.25 7,105 30.09.2017 123,500 41,500 165,000 1,038 163,962
Nagoda BranchNagoda 40.00 2,985 30.09.2017 16,000 12,000 28,000 300 27,700
Tangalle Branch145/147, Sea Street, Tangalle 21.05 5,370 30.09.2017 26,500 31,500 58,000 788 57,212
Weeraketiya BranchBelliatta Road, Weeraketiya 36.87 4,480 30.09.2017 42,600 25,900 68,500 648 67,852
Weligama Branch239 Main Street, Weligama 97.75 8,110 30.09.2017 73,300 22,914 96,214 650 95,564
Walasmulla Land453, Walasmulla South, Walasmulla 38.00 - 09.12.2016 32,717 - 32,717 - 32,717
1,515,623 304,958 1,820,581 12,877 1,807,704

310 Bank of Ceylon | Annual Report 2018
NOTES TO THE FINANCIAL STATEMENTS
Name of Premises Extent (Perches)
Building (Square
Feet)
Date of Valuation
Revalued Amount of
Land
Revalued Amount of Buildings
Total Value Accumulated Depreciation
Written Down Value
LKR ’000 LKR ’000 LKR ’000 LKR ’000 LKR ’000
Uva Province
Badulla Uva Province OfficeBank Road, Badulla 118.75 7,366 30.11.2014 11,750 12,228 23,978 1,015 22,963
Bandarawela Branch230, Badulla Road, Bandarawela 10.60 7,731 30.09.2017 33,000 15,000 48,000 375 47,625
Ettampitiya Branch23, Nuwara Eliya Road, Ettampitiya 20.35 3,729 30.09.2017 10,105 9,956 20,061 249 19,812
Haputale Branch (Browns)20, Station Road, Haputale 158.70 7,361 30.09.2017 36,000 11,000 47,000 440 46,560
Monaragala Branch Manager Quarters & Staff Quarters401, Wellawaya Road, Moneragala 160.00 15,000 30.11.2014 50,000 31,650 81,650 3,174 78,476
Siyabalanduwa BranchSiyabalanduwa 28.00 5,564 01.11.2017 21,699 22,500 44,199 422 43,777
162,554 102,334 264,888 5,675 259,213
Western Province North
Borella Branch71, Danister de Silva Mawatha, Borella 48.65 20,173 30.09.2017 307,000 74,000 381,000 1,850 379,150
Borella Branch (Car Park) Borella 6.65 - 06.01.2013 50,000 - 50,000 - 50,000
City Office41, Bristol Street, Colombo 1 39.50 31,443 30.09.2017 495,000 55,000 550,000 1,833 548,167
Grand Pass Branch703, Sirimavo BandaranaikeMawatha, Grandpass 20.12 6,210 30.09.2017 120,720 24,280 145,000 759 144,241
Gampaha Land170, Colombo Road, Gampaha 34.06 - 30.09.2017 85,000 - 85,000 - 85,000
Ja Ela Branch19, Negombo Road, Ja-ela 40.64 8,090 30.09.2017 121,920 20,000 141,920 800 141,120
Kadawatha Branch469, Ragama Road, Kadawatha 30.71 6,138 30.09.2017 92,130 17,500 109,630 700 108,930
Kiribathgoda Branch (proposed)Kandy Road, Kiribathgoda 43.70 - 21.06.2018 249,963 - 249,963 - 249,963
Negombo Branch118, Rajapakse Broadway, Negombo 97.25 16,760 30.11.2014 171,160 41,915 213,075 6,582 206,493
Negombo City75,77, Main Street, Negombo 10.76 8,355 07.06.2017 46,998 57,000 103,998 2,153 101,845
Pettah Branch212/63, Gas Work Street, Colombo 11 28.29 25,222 30.09.2017 410,000 48,477 458,477 1,375 457,102
Dematagoda Land45, 47, Kolonnawa Road, Colombo 38.14 - 30.09.2017 205,000 - 205,000 - 205,000
2,354,891 338,172 2,693,063 16,052 2,677,011

311
Name of Premises Extent (Perches)
Building (Square
Feet)
Date of Valuation
Revalued Amount of
Land
Revalued Amount of Buildings
Total Value Accumulated Depreciation
Written Down Value
LKR ’000 LKR ’000 LKR ’000 LKR ’000 LKR ’000
Western Province South
Aluthgama Branch267, Galle Road, Aluthgama 36.60 7,914 30.09.2017 62,220 26,550 88,770 885 87,885
Bambalapitiya Branch10, Unity Plaza Building, Galle Road, Colombo 04 - 7,776 30.09.2017 - 204,000 204,000 5,100 198,900
Beruwala Branch165A, Galle Road, Beruwala 21.50 5,937 30.09.2017 48,375 11,497 59,872 766 59,106
Bulathsinhala Branch40, Horana Road, Athura, Bulathsinhala 53.85 7,190 30.09.2017 40,388 24,276 64,664 945 63,719
Dehiwala Branch207, Galle Road, Dehiwela 22.00 12,422 30.09.2017 99,000 34,000 133,000 971 132,029
Horana Branch87, Anguruwathota Road, Horana 70.02 10,611 30.09.2017 245,063 32,531 277,594 1,301 276,293
Idama Branch707, Galle Road, Moratuwa 61.12 8,272 30.09.2017 150,000 13,400 163,400 1,340 162,060
Kalutara Branch218, Galle Road, Kalutara South, Kalutara 45.86 11,436 30.09.2017 88,720 34,266 122,986 789 122,197
Maharagama Branch & Central Training Institute88, Highlevel Road, Maharagama 179.21 82,121 30.09.2017 507,380 187,509 694,889 8,364 686,525
Matugama Branch72, Agalawatte Road, Matugama 9.50 4,158 30.09.2017 33,250 4,250 37,500 425 37,075
Nugegoda Branch174, Highlevel Road, Nugegoda 67.50 45,584 30.09.2017 337,500 564,190 901,690 12,923 888,767
Panadura Branch4, Super Grade Branch, Susantha Mawatha, Panadura 80.00 10,509 30.09.2017 140,000 25,870 165,870 647 165,223
Panadura City Branch (proposed)17/3D, Jayathilake Mawatha, Panadura 36.00 - 30.09.2017 36,000 - 36,000 - 36,000
Wadduwa Branch (proposed) 557A, Galle Road, Wadduwa 29.00 - 30.09.2017 40,600 - 40,600 - 40,600
Wellawatte Branch149, Galle Road, Colombo 06 51.25 15,832 30.09.2017 281,875 39,125 321,000 1,778 319,222
2,110,371 1,201,464 3,311,835 36,234 3,275,601

312 Bank of Ceylon | Annual Report 2018
NOTES TO THE FINANCIAL STATEMENTS
Name of Premises Extent (Perches)
Building (Square
Feet)
Date of Valuation
Revalued Amount of
Land
Revalued Amount of Buildings
Total Value Accumulated Depreciation
Written Down Value
LKR ’000 LKR ’000 LKR ’000 LKR ’000 LKR ’000
Holiday Homes & Rests
Badulla Fernham Bungalow & Property 153, Spring Valley Road, Badulla 222.25 - 30.11.2012 20,000 - 20,000 - 20,000
Bandarawela Holiday HomeBandarawela 115.00 3,028 30.09.2017 14,400 7,300 21,700 209 21,491
Dickoya Upper Glencarn BunglowDickoya 189.65 8,665 30.09.2017 7,400 23,000 30,400 920 29,480
Dickoya lower Glencarn BunglowDickoya 100.00 5,925 30.09.2017 6,000 18,880 24,880 750 24,130
Haputale Woodland BungalowHaputale 135.00 3,010 30.09.2017 14,862 6,600 21,462 264 21,198
Jaffna Bank Rest34-34/3, Rasavinthoddam road, Jaffna 166.25 - 30.11.2014 86,250 - 86,250 - 86,250
Kandy Holiday Home18/5, Dangolla Road, Getambe 39.00 3,600 07.10.2016 48,999 8,200 57,199 342 56,857
Lindula Ridge Holiday HomeLindula 175.00 3,010 30.09.2017 4,300 12,130 16,430 197 16,233
Nuwara Eliya Holiday Home16, Hill Street, Nuwara Eliya 35.27 3,388 30.09.2017 53,000 9,800 62,800 653 62,147
Cey Bank Rest Nuwara Eliya (Phase 1)12, Hill Street, Nuwara Eliya 67.54 3,820 30.09.2017 91,000 15,000 106,000 370 105,630
346,211 100,910 447,121 3,705 443,416
Others
Colombo 7 - GM’s Bangalow75, Ananda KumaraswamyMawatha, Colombo 7 79.80 6,380 30.09.2017 798,000 12,760 810,760 751 810,009
Colombo Darly Road Stores Browns Building481, T B Jayah Mawatha, Colombo 10 151.00 28,777 30.09.2017 1,200,000 25,000 1,225,000 1,667 1,223,333
Colombo World Trade Centre08, 8-2/1, Bank of CeylonMawatha, Colombo 01 - 6,345 30.09.2017 - 351,500 351,500 8,789 342,711
Walker’s & Sons28, St. Michael’s Road, Cololmbo 03 57.00 - 30.09.2017 456,690 - 456,690 - 456,690
2,454,690 389,260 2,843,950 11,207 2,832,743
Grand Total 12,967,284 3,380,769 16,348,053 130,224 16,217,829

313
34 Leasehold Properties Accounting Policy
The determination of whether an arrangement is a lease or contains, a lease is based on the substance of the arrangement at
the inception date. The arrangement is assessed for whether fulfillment of the arrangement is dependent on the use of a specific
asset/ assets or the arrangement conveys a right to use the asset/ assets, even if that right is not explicitly specified in an
arrangement.
Group as a Lessee
Finance leases that transfer substantially all the risks and benefits incidental to ownership of the leased item to the Group, are
capitalised at the commencement of the lease at the lower of fair value of the leased property or present value of the minimum
lease payments. Lease payments are apportioned between finance charges and reduction of the lease liability so as to achieve
a constant rate of interest on the remaining balance of the liability. Finance charges are recognised in the Statement of Profit or
Loss.
A leased asset is depreciated over the useful life of the asset. However, if there is no reasonable certainty that the Group will
obtain ownership by the end of the lease term, the asset is depreciated over the shorter of the estimated useful life of the asset
or the lease term.
Operating lease payments are recognised as an operating expense in the Statement of Profit or Loss on a straight line basis over
the lease term.
Bank Group
2018 2017 2018 2017
LKR ’000 LKR ’000 LKR ’000 LKR ’000
Cost
Balance as at 1 January 129,179 126,715 195,412 192,948
Additions during the year - 2,464 - 2,464
Balance as at 31 December 129,179 129,179 195,412 195,412
Accumulated Amortisation
Balance as at 1 January 27,698 24,876 60,972 56,793
Amortisation during the year 2,582 2,822 3,940 4,178
Balance as at 31 December 30,280 27,698 64,912 60,971
Net book value as at 31 December 98,899 101,481 130,500 134,441
Leasehold properties represent the leasehold interest in the lands held for own use. The value of buildings situated in the
leasehold land is shown seperately under Property, Plant and Equipment. The interest on leasehold land is stated at cost less
accumulated amortisation.

314 Bank of Ceylon | Annual Report 2018
NOTES TO THE FINANCIAL STATEMENTS
35 Intangible Assets Accounting Policy Basis of Recognition
An intangible asset is recognised if it is probable that the future economic benefits that are attributable to the asset will flow to the Group and the cost of the asset can be measured reliably. An intangible asset is initially measured at cost.
Intangible assets represent the value of computer application software and licenses, other than software applied to the operating software system of computers.
MeasurementIntangible assets acquired by the Group are stated at cost less accumulated amortisation and accumulated impairment losses. Subsequent expenditure incurred on intangible assets is capitalised only when it increases the future economic benefits embodied in the specific asset to which it relates. All other expenditure is expensed as incurred.
Amortisation and ImpairmentAmortisation is recognised in the Statement of Profit or Loss on a straight line basis over the estimated useful lives of the intangible assets, from the date that it is available for use since this most closely reflects the expected pattern of consumption of the future economic benefits embodied in the asset. The estimated useful life of intangible assets is five years or the best estimate of its useful economic life whichever is lower. The intangible assets with infinite lives are reviewed for impairment whenever there is an indication for impairment and recognised as expenses in the Statement of Profit or Loss to the extent that they are no longer probable of being recovered from the expected future benefits. Amortisation methods, useful lives and residual values are reviewed at each Reporting date and adjusted if appropriate.
DerecognitionIntangible assets are derecognised when it reveals that they will not generate economic benefits or circumstances indicate that the carrying value is impaired.
Gains or losses arising from derecognition of an intangible assets are measured as the difference between the net disposal
proceeds and the carrying amount of the assets and are recognised in Statement of Profit or Loss.
Bank Group
2018 2017 2018 2017
LKR ’000 LKR ’000 LKR ’000 LKR ’000
Cost
Balance as at 1 January 3,037,229 2,508,841 3,598,518 2,832,758
Additions during the year 783,598 528,566 790,386 764,014
Derecognised during the year (477,745) (178) (477,745) (178)
Exchange rate adjustment - - 18,613 14,441
Adjustments/ Transfers - - - (12,517)
Balance as at 31 December 3,343,082 3,037,229 3,929,772 3,598,518
Accumulated Amortisation
Balance as at 1 January 2,226,499 1,945,351 2,524,082 2,177,128
Amortisation during the year 393,687 281,326 448,020 338,289
Derecognised during the year (477,745) (178) (477,745) (178)
Exchange rate adjustment - - 16,330 11,846
Adjustments/ Transfers - - - (3,003)
Balance as at 31 December 2,142,441 2,226,499 2,510,687 2,524,082
Computer software under development 37,545 - 37,545 -
Net book value as at 31 December 1,238,186 810,730 1,456,630 1,074,436

315
35.1 Fully Amortised Intangible Assets
The initial cost of fully amortised intangible assets which are still in use are as follows:
Bank Group
As at 31 December 2018 2017 2018 2017
LKR ’000 LKR ’000 LKR ’000 LKR ’000
Computer software 1,412,467 1,632,796 1,423,422 1,716,848
1,412,467 1,632,796 1,423,422 1,716,848
Note: The Bank has derecognised Rs. 477.7 million fully amortised computer software during the year.
36 Deferred Tax (Assets)/ LiabilitiesDeferred tax is recognised in respect of temporary differences between the carrying amounts of assets and liabilities for
financial reporting purposes and the amounts used for taxation purposes. Deferred tax is not recognised for the following
temporary differences:
- The initial recognition of goodwill.
- The initial recognition of assets or liabilities in a transaction that is not a business combination and that affects neither
accounting nor taxable profit or loss.
- Differences relating to investments in subsidiaries to the extent that it is probable that they will not reverse in the foreseeable
future.
Deferred tax is measured at the tax rates that are expected to be applied to the temporary differences when they reverse, based
on the laws that have been enacted or substantively enacted by the Reporting date. Deferred tax assets and liabilities are offset
if there is a legally enforceable right to offset current tax liabilities against current tax assets and they relate to income taxes
levied by the same tax authority on the same taxable entity, or on different tax entities, but they intend to settle current tax
liabilities and assets on a net basis or their tax assets and liabilities will be realised simultaneously.
A deferred tax asset is recognised for unused tax losses, tax credits and deductible temporary differences to the extent that it is
probable that future taxable profits will be available against which they can be utilised. Deferred tax assets are reviewed at each
Reporting date and are reduced to the extent that it is no longer probable that the related tax benefit will be realised.
The following table shows deferred tax recorded in the Statement of Financial Position and charge/ (reversal) recorded in the
income tax expense (Note 17.2 ).

316 Bank of Ceylon | Annual Report 2018
NOTES TO THE FINANCIAL STATEMENTS
36.1 Bank
As at 31 December
2018 2017
Deferred TaxAssets
Deferred TaxLiabilities
Impact to Retained Earnings
Statement of Profit or Loss
OtherComprehensiveIncome/ Equity
Deferred TaxAssets
Deferred TaxLiabilities
Statement of Profit or Loss
OtherComprehensiveIncome/ Equity
LKR ’000 LKR ’000 LKR ’000 LKR ’000 LKR ’000 LKR ’000 LKR ’000 LKR ’000 LKR ’000
Retirement benefits - (74,496) - (13,310) (3,050) - (58,136) (11,750) 8,400
Impairment allowance for loans and advances - - - 890,683 - - (890,683) - -
Revaluation of Property, Plant and Equipment - 4,474,240 - - (94,506) - 4,568,746 - 4,094,358
Investment in financial instruments - 315,271 - - 6,711 - 308,560 - 177,006
Temporary difference for impairment - (3,462,277) (3,345,868) (116,409) - - - - -
Other temporary differences - 3,820,788 - 1,928,946 - - 1,891,842 113,030 -
- 5,073,526 (3,345,868) 2,689,910 (90,845) - 5,820,329 101,280 4,279,764
36.2 Group
As at 31 December
2018 2017
Deferred TaxAssets
Deferred TaxLiabilities
Impact to Retained Earnings
Statement of Profit or Loss
OtherComprehensiveIncome/ Equity
Deferred TaxAssets
Deferred TaxLiabilities
Statement of Profit or Loss
OtherComprehensiveIncome/ Equity
LKR ’000 LKR ’000 LKR ’000 LKR ’000 LKR ’000 LKR ’000 LKR ’000 LKR ’000 LKR ’000
Retirement benefits (6,088) (152,302) - (101,164) 9,530 (6,525) (60,231) (370) (8,363)
Impairment allowance for loans and advances - - - 890,683 - - (890,683) - -
Revaluation of Property, Plant and Equipment - 7,257,061 - - 41,271 - 7,215,790 - 4,191,387
Investment in financial instruments - 315,271 - - 6,711 - 308,560 - 177,006
Temporary difference for impairment - (3,728,208) (3,648,954) (79,254) - - - - -
Other temporary differences 3,036 4,070,392 - 2,023,741 - (2,096) 2,051,783 183,660 -
(3,052) 7,762,214 (3,648,954) 2,734,006 57,512 (8,621) 8,625,219 183,290 4,360,030

317
37 Other Assets
Pre Paid Staff Cost
Staff loans are initially recognised at fair value according to Sri Lanka Accounting Standard - SLFRS 9 - “Financial Instruments”.
The difference between granted amount and its fair value is treated as pre paid staff cost and amortised over the loan period.
Gold Stock in Hand
The gold inventory is valued at lower of cost or net realisable value. Cost includes all cost of purchase, cost of conversion and
other costs incurred in bringing the inventory to its present location and condition. Net realisable value is the estimated selling
price in the ordinary course of business less the estimated cost necessary to make the sale.
Employee Benefit Asset
Employee benefit assets represents net retirement benefit assets of Bank of Ceylon Pension Fund-2014. For more details, refer
Note 47.
Bank Group
As at 31 December 2018 2017 2018 2017
LKR ’000 LKR ’000 LKR ’000 LKR ’000
Consumable stock in hand 747,383 536,938 795,588 629,075
Prepaid staff cost 13,133,342 11,472,036 13,133,342 11,492,621
Cheques in transit - Local 1,592,004 1,233,167 1,592,004 1,233,167
Cheques in transit - Foreign 17,948 30,933 17,948 30,933
Tax recoverable - - 10,876 13,783
Gold bullion and coins in hand 123,688 18,316 123,688 18,316
Gold stock in hand 300 843,950 300 843,950
Net Employee benefit asset [Note 47] 2,763,718 2,096,019 2,763,718 2,096,019
Other 22,181,675 21,586,829 23,435,427 22,607,115
Total other assets 40,560,058 37,818,188 41,872,891 38,964,979
38 Due to Banks Accounting Policy
Due to banks represents credit balances in Nostro Accounts and short- term borrowings from banks. These are initially
recognised at fair value. Subsequent to initial recognition, these are measured at their amortised cost using the Effective Interest
Rate (EIR) method. Amortised cost is calculated by taking into account any transaction costs that are an integral part of the EIR.
The EIR amortisation is included in “Interest expenses” (Note 8.2) in the Statement of Profit or Loss.
Bank Group
As at 31 December 2018 2017 2018 2017
LKR ’000 LKR ’000 LKR ’000 LKR ’000
Deposits from other banks 1,546,737 1,091,599 1,546,737 1,091,599
Bank overdrafts 855,731 1,111,600 969,261 1,102,667
Total due to banks 2,402,468 2,203,199 2,515,998 2,194,266

318 Bank of Ceylon | Annual Report 2018
NOTES TO THE FINANCIAL STATEMENTS
39 Securities Sold Under Repurchase Agreements Accounting Policy
Securities sold under repurchase agreements at a specified future date are not derecognised from the Statement of Financial
Position as the Group retains substantially all of the risks and rewards of ownership. The corresponding cash received is
recognised in the Statement of Financial Position as an asset with a corresponding obligation to return it, including accrued
interest as a liability within “Other Borrowings” (Note 42), reflect the transaction’s economic substance as a borrowing to the
Group. The difference between the sale and repurchase prices is treated as interest expense and amortised over the life of
agreement using EIR.
Bank Group
As at 31 December 2018 2017 2018 2017
LKR ’000 LKR ’000 LKR ’000 LKR ’000
With Banks 54,017,168 1,547,501 54,041,111 437,672
With Customers 43,382,191 42,939,961 43,382,191 44,191,014
Total Securities sold under repurchase agreements 97,399,359 44,487,462 97,423,302 44,628,686
40 Derivative Financial Instruments Accounting Policy
Derivative financial instruments include contracts which are entered by the Bank that are not designated as hedging instruments
in hedge relationships as per the Sri Lanka Accounting Standard - SLFRS 9 - “Financial Instruments”.
Derivatives are recorded at fair value and carried as liabilities when their fair value is negative. Changes in the fair value of
derivatives are included in “Net gains/ (losses) from trading” (Note 10) in the Statement of Profit or Loss.
Bank Group
As at 31 December 2018 2017 2018 2017
LKR ’000 LKR ’000 LKR ’000 LKR ’000
Foreign Currency Derivatives
Forward exchange contracts 31,736 2,584 31,736 2,584
Currency SWAPs 477,282 68,131 477,282 68,131
Total derivative financial instruments 509,018 70,715 509,018 70,715
41 Financial Liabilities at Amortised Cost - Due to Depositors Accounting Policy
Financial liabilities at amortised cost - due to depositors include non - interest bearing deposits, savings deposits, term
deposits, deposits payable at call and certificate of deposits, which are initially recognised at fair value. Subsequent to initial
recognition, deposits are measured at their amortised cost using the Effective Interest Rate (EIR) method, except where the
Group designates liabilities at fair value through profit or loss. The EIR amortisation is included in “Interest expenses” (Note 8.2)
in the Statement of Profit or Loss.

319
41.1 By Product
Bank Group
As at 31 December 2018 2017 2018 2017
LKR ’000 LKR ’000 LKR ’000 LKR ’000
Local Currency Deposits
Demand deposits 110,943,266 113,404,221 110,865,510 113,047,717
Savings deposits 365,545,986 352,068,521 366,430,640 352,930,501
Time deposits 864,655,976 739,171,377 881,549,571 757,236,651
Certificates of deposit 2,315 2,315 6,835 7,048
Other deposits 3,407,037 2,828,892 3,407,037 2,828,892
Total local currency deposits 1,344,554,580 1,207,475,326 1,362,259,593 1,226,050,809
Foreign Currency Deposits
Demand deposits 26,779,911 22,344,522 27,531,733 22,893,509
Savings deposits 97,655,512 88,397,442 98,041,252 88,725,067
Time deposits 294,842,690 227,389,171 294,949,638 227,481,458
Other deposits 1,193,277 1,225,575 1,193,277 1,225,575
Total foreign currency deposits 420,471,390 339,356,710 421,715,900 340,325,609
Total deposits 1,765,025,970 1,546,832,036 1,783,975,493 1,566,376,418
41.2 By Currency
Bank Group
As at 31 December 2018 2017 2018 2017
LKR ’000 LKR ’000 LKR ’000 LKR ’000
Sri Lankan Rupee 1,344,554,580 1,207,475,326 1,362,259,593 1,226,050,809
United States Dollar 358,314,513 255,968,922 358,326,657 255,978,377
Great Britain Pound 32,367,504 29,361,033 33,591,422 30,313,899
Maldivian Rufiyaa 5,791,464 30,511,710 5,791,464 30,511,710
Seychellois Rupee 1,539,912 1,583,668 1,539,912 1,583,668
Euro 8,168,732 7,191,167 8,177,180 7,197,745
Australian Dollar 7,482,861 6,862,385 7,482,861 6,862,385
Indian Rupee 4,812,562 3,779,151 4,812,562 3,779,151
Other 1,993,842 4,098,674 1,993,842 4,098,674
Total deposits 1,765,025,970 1,546,832,036 1,783,975,493 1,566,376,418
Note : The maturity analysis of deposits is given in Note 58.

320 Bank of Ceylon | Annual Report 2018
NOTES TO THE FINANCIAL STATEMENTS
42 Financial Liabilities at Amortised Cost - Other Borrowings Accounting Policy
Financial liabilities at amortised cost - Other borrowings represent Standing Lending Facility, Senior notes, Term borrowings
from banks in abroad and Sri Lanka, Term borrowings from other financial institutions in Sri Lanka and refinance borrowings
which are initially recognised at fair value. Subsequent to initial recognition, these borrowings are measured at their amortised
cost, using the Effective Interest Rate (EIR) method. Amortised cost is calculated by taking into account any discount or
premium on the issue and costs that are an integral part of the EIR. The EIR amortisation is included in “Interest expenses”
(Note 8.2) in the Statement of Profit or Loss.
Bank Group
As at 31 December 2018 2017 2018 2017
LKR ’000 LKR ’000 LKR ’000 LKR ’000
Standing Lending Facility 10,569,000 - 10,569,000 -
Senior note [Note 42.1] - 77,253,833 - 77,253,833
Call borrowings from banks and other financial institutions in Sri Lanka 4,751,162 3,439,502 8,937,963 3,439,502
Term borrowings from banks abroad 154,639,903 64,760,742 155,114,428 68,280,063
Term borrowings from banks and other financial institutions in Sri Lanka 27,642,383 29,325,247 28,242,557 31,945,018
Refinance borrowings 4,189,726 3,411,765 4,189,726 3,411,765
Total other borrowings 201,792,174 178,191,089 207,053,674 184,330,181
42.1 Senior Notes
Senior note represents worth of USD 500 million which was listed in Singapore Stock Exchange and redeemed during the year
2018. Interest paid semi-annually, based on fixed coupon rate.
Bank Group
As at 31 December 2018 2017 2018 2017
Issued Date Maturity Date Coupon Rate % LKR ’000 LKR ’000 LKR ’000 LKR ’000
Senior Note 16.04.2013 16.04.2018 5.3250 - 77,253,833 - 77,253,833
Total Senior Notes - 77,253,833 - 77,253,833
43 Debt Securities Issued Accounting Policy
Debt securities issued represent funds borrowed for long-term funding purposes where the substance of the contractual
arrangement results in the Group having an obligation either to deliver cash or another financial asset to the holder, or to
satisfy the obligation other than by the exchange of a fixed amount of cash or another financial asset for a fixed number of own
equity shares. Debt securities are initially recognised at fair value. Subsequent to initial recognition these are measured at their
amortised cost using the Effective Interest Rate (EIR) method. Amortised cost is calculated by taking into account any discount
or premium on the issue and costs that are an integral part of the EIR. The EIR amortisation is included in “Interest expenses”
(Note 8.2) in the Statement of Profit or Loss.

321
Bank Group
As at 31 December 2018 2017 2018 2017
LKR ’000 LKR ’000 LKR ’000 LKR ’000
Issued by the Bank - - - -
Issued by other subsidiaries - - 4,105,681 5,667,514
Total debt securities issued - - 4,105,681 5,667,514
Note: The maturity analysis of debt securities issued is given in note 58.
43.1 Senior Debentures
Bank Group
As at 31 December 2018 2017 2018 2017
LKR ’000 LKR ’000 LKR ’000 LKR ’000
Listed Debentures
Unsecured, redeemable debentures of LKR 100 each - - 4,105,681 5,667,514
Unlisted Debentures
Unsecured, redeemable debentures of LKR 100 each (private placement) - - - -
Total debt securities issued - - 4,105,681 5,667,514
43.2 Movement in Senior Debentures
Bank Group
2018 2017 2018 2017
LKR ’000 LKR ’000 LKR ’000 LKR ’000
Balance as at 1 January - 3,427,058 5,667,514 8,360,333
Issued during the year - - - 2,000,000
Redemptions - (3,427,058) (1,560,494) (4,797,781)
Amortisation adjustments - - (1,339) 104,962
Balance as at 31 December - - 4,105,681 5,667,514

322 Bank of Ceylon | Annual Report 2018
NOTES TO THE FINANCIAL STATEMENTS
43.3 Senior Debentures
Coupon rate Amount as at 31 December
Bank Group
Notes Interest payable frequency
Issue date Maturity date
2018
%
2017
%
2018
LKR ’000
2017
LKR ’000
2018
LKR ’000
2017
LKR ’000
Fixed Interest Rate
Unsecured, redeemable debentures (a) Annually 28.03.2013 27.03.2018 - 17.50 - - - 735,857
Unsecured, redeemable debentures (a) Quarterly 28.03.2013 27.03.2018 - 16.70 - - - 655,844
Unsecured, redeemable debentures (a) Monthly 28.03.2013 27.03.2018 - 16.50 - - - 168,793
Unsecured, redeemable debentures (a) Annually 13.11.2014 12.11.2019 9.00 9.00 - - 868,112 867,739
Unsecured, redeemable debentures (a) Annually 13.11.2014 12.11.2019 8.75 8.75 - - 1,131,011 1,132,445
Unsecured, redeemable debentures (a) Annually 04.05.2017 03.05.2022 15.00 15.00 - - 884,964 884,335
Unsecured, redeemable debentures (a) Semi-annually 04.05.2017 03.05.2022 14.50 14.50 - - 1,220,562 1,221,467
Unsecured, redeemable debentures (a) Semi-annually 04.05.2017 03.05.2022 13.89 13.89 - - 1,032 1,034
Total debt securities issued - - 4,105,681 5,667,514
Notes : (a) Debentures that are listed in Colombo Stock Exchange.
44 Current Tax LiabilitiesBank Group
2018 2017 2018 2017
LKR ’000 LKR ’000 LKR ’000 LKR ’000
Opening balance as at 1 January 1,877,342 (6,048) 2,051,020 253,020
Current tax expense 9,723,515 8,929,416 9,918,315 9,145,628
Payments during the year (10,136,932) (6,023,773) (10,389,879) (6,214,419)
Adjustments 2,458,264 (1,022,253) 2,459,924 (1,133,209)
Closing balance as at 31 December 3,922,189 1,877,342 4,039,380 2,051,020

323
45 Insurance Contract Liabilities Accounting Policy
Life Insurance Contract Liabilities
These liabilities are measured by using the gross premium valuation method as prescribed by the Regulation of Insurance
Industry Act, No. 43 of 2000. The liability is determined as the discounted value of the expected contractual cash outflows less
the discounted value of the expected premiums. Valuation assumptions are derived based on the best estimate experience with
a prescribed risk margin to allow for adverse deviations.
At each Reporting date, an assessment is made of whether the recognised life insurance liabilities are adequate, by using a
liability adequacy test.
Liability Adequacy Test (LAT)
At each Reporting date, an assessment is made of whether the recognised life insurance liabilities are adequate by using an
existing liability adequacy test as laid out under SLFRS 4. The liability value is adjusted to the extent that it is adequate to meet
future benefits and expenses.
Any deficiency is recognised in the Statement of Profit or Loss by setting up a provision for liability adequacy.
Non-Life Insurance Contract Liabilities
Non-life insurance contract liabilities are recognised when contracts are entered into and premiums are charged. These
liabilities are known as the outstanding claims provision, which are based on the estimated ultimate cost of all claims incurred
but not settled at the Reporting date, whether reported or not, together with related claims handling costs and reduction for the
expected value of salvage and other recoveries. Delays can be experienced in the notification and settlement of certain types
of claims, therefore the ultimate cost of these cannot be known with certainty at the Reporting date. The liability is calculated
at the Reporting date using a range of standard actuarial claim projection techniques, based on empirical data and current
assumptions that may include a margin for adverse deviation. The liability is not discounted for the time value of money. No
provision for equalisation or catastrophe reserves is recognised. The liabilities are derecognised when the contract expires, is
discharged or is cancelled.
Liability Adequacy Test (LAT)
The provision for unearned premiums represents premiums received for risks that have not yet expired. Generally the reserve
is released over the term of the contract and is recognised as premium income. At each Reporting date the Company reviews
its unexpired risk and a liability adequacy test is performed to determine whether there is any overall excess of expected claims
and deferred acquisition costs over unearned premiums.
This calculation uses current estimates of future contractual cash flows after taking account of the investment return expected to
arise on assets relating to the relevant non-life insurance technical provisions. If these estimates show that the carrying amount
of the unearned premiums (less related deferred acquisition costs) is inadequate, the deficiency is recognised in the Statement
of Comprehensive Income by setting up a provision for liability adequacy.

324 Bank of Ceylon | Annual Report 2018
NOTES TO THE FINANCIAL STATEMENTS
45.1 Insurance Provision - Life
Group
2018 2017
LKR ’000 LKR ’000
Balance as at 1 January 547,026 514,675
Increase/ (Decrease) in life fund (19,736) 15,436
Fair value reserve 1,285 1,285
Unclaimed benefits 47,050 15,630
Balance as at 31 December 575,625 547,026
45.2 Insurance Provision - Non life
Group
As at 31 December 2018 2017
LKR ’000 LKR ’000
Provision for reported claims by policy holders 430,093 356,018
Provision for claims on Incurred But Not Reported (IBNR) 44,064 39,792
Outstanding claims provision 474,157 395,810
Provision for unearned premiums 172 31,819
Deferred acquisition (107,711) 2,464
Total insurance provision - Non-life 366,618 430,093
46 Other LiabilitiesBank Group
As at 31 December 2018 2017 2018 2017
LKR ’000 LKR ’000 LKR ’000 LKR ’000
Cheques sent on clearing 524,452 272,383 524,452 272,383
Lease creditors
Within 12 months - - 8,245 4,526
Later than 12 months - - 12,360 7,851
Net employee benefit liabilities [Note 47] 5,028,513 3,146,728 5,359,107 3,488,193
Other 14,207,464 15,177,138 16,066,575 16,163,525
Total other liabilities 19,760,429 18,596,249 21,970,739 19,936,478
47 Employee Retirement Benefit Plans Accounting Policy
The Bank has the pension schemes established under an Industrial Award which are solely funded by the Bank. There is also a
Widows’/Widowers’ and Orphans’ Pension Scheme established by the members who joined the Bank before 1 January 1996.
The assets of these three plans are held independently of the Bank’s assets and administered by Boards of Trustees/ Managers,
representing the management and the employees, as provided in the Trust Deed/ Rules of the respective funds.
These funds are subject to annual audits independent to the audit of the Bank, by a firm/s of Chartered Accountants appointed
by the members and actuarial valuations are carried out as per the rules governing these funds.

325
Bank Group
As at 31 December 2018 2017 2018 2017
LKR ’000 LKR ’000 LKR ’000 LKR ’000
Net Employee Benefit Liabilities
Bank of Ceylon Pension Trust Fund [Note 47.1] 4,270,747 2,521,730 4,270,747 2,521,730
Provision for terminal gratuity [Note 47.3] 266,057 207,627 596,651 549,092
Provision for encashment of medical leave 491,709 417,371 491,709 417,371
Total net employee benefit liabilities 5,028,513 3,146,728 5,359,107 3,488,193
Net Employee Benefit Assets
Bank of Ceylon Widows'/ Widowers' and Orphans' Pension Fund [Note 47.2] - - - -
Bank of Ceylon Pension Fund-2014 [Note 47.4] 2,763,718 2,096,019 2,763,718 2,096,019
Total net employee benefit assets 2,763,718 2,096,019 2,763,718 2,096,019
47.1 Bank of Ceylon Pension Trust Fund
The “Bank of Ceylon Pension Trust Fund” is a funded, non - contributory, defined retirement benefit plan, operated for the
payment of pensions until death of the permanent employees who have completed a minimum of ten years of continuous service
with the Bank, at their retirement on reaching the retirement age on or after 55 years or on medical grounds, before reaching
retirement age. The pension is computed as a percentage of the last drawn salary excluding certain allowances.
Contributions to the Pension Trust Fund are made monthly, based on the advice of a qualified actuary, currently at 56.8%
of gross salary. The Fund is valued by a qualified actuary annually. This fund has been approved by the Government and
administrated independently. The subsidiaries and associate companies of the Group do not have pension funds.
An actuarial valuation of the Pension Trust Fund as at 31 December 2018 was carried out by Messrs Actuarial & Management
Consultant (Pvt) Limited.
The valuation has been done using the “Projected Unit Credit Method”, which is recommended in the Sri Lanka Accounting
Standard - LKAS 19 - “Employee Benefits”. The benefit is available to all permanent employees who have joined the Bank prior
to 1 January 1996. The results of the actuarial valuation of the Pension Trust Fund is summarised as follows:

326 Bank of Ceylon | Annual Report 2018
NOTES TO THE FINANCIAL STATEMENTS
47.1.1 Net Benefit Expense (Recognised Under Personnel Expenses)
Bank/ Group
For the year ended 31 December 2018 2017
LKR ’000 LKR ’000
Current service cost 261,795 314,507
Net interest expenses 277,390 622,089
Net benefit expense 539,185 936,596
47.1.2 Amount recognised in Other Comprehensive Income
Bank/ Group
For the year ended 31 December 2018 2017
LKR ’000 LKR ’000
Actuarial gains/ (losses) on the defined benefit obligation 3,319,591 (3,777,610)
Actuarial gains/ (losses) on plan assets (5,397,253) 6,793,826
Net actuarial gains/ (losses) recognised in other comprehensive income (2,077,662) 3,016,216
47.1.3 Net Retirement Benefit Liability
Bank/ Group
As at 31 December 2018 2017
LKR ’000 LKR ’000
Fair value of plan assets [Note 47.1.4] 58,455,386 62,827,692
Defined benefit obligation [Note 47.1.5] 62,726,133 65,349,422
Net retirement benefit liability 4,270,747 2,521,730
47.1.4 Changes in Fair Value of Plan Assets
Bank/ Group
2018 2017
LKR ’000 LKR ’000
Opening fair value of plan assets 62,827,692 55,033,729
Expected return 6,911,046 6,328,879
Contribution by employer 867,830 808,121
Benefits paid (6,753,929) (6,136,863)
Actuarial gains/ (losses) (5,397,253) 6,793,826
Closing fair value of plan assets 58,455,386 62,827,692

327
47.1.5 Changes in the Present Value of the Defined Benefit Obligation
Bank/ Group
2018 2017
LKR ’000 LKR ’000
Opening defined benefit obligation 65,349,422 60,443,202
Interest cost 7,188,436 6,950,968
Current service cost 261,795 314,507
Benefits paid (6,753,929) (6,136,865)
Due to change in assumptions (4,510,296) 2,303,936
Actuarial losses on obligation 1,190,705 1,473,674
Closing defined benefit obligation 62,726,133 65,349,422
The present value of the Defined Benefit Obligation as of the valuation date with respect to active employees and pensioners are
LKR 8,290.7 million (2017: 10,035.4 million) and LKR 54,435.4 million (2017: 55,314.1 million) respectively.
47.1.6 Plan Assets Consist of the Following
Bank/ Group
As at 31 December 2018 2017
LKR ’000 LKR ’000
Fixed deposits 21,859,550 23,975,252
Treasury bonds 6,837,474 9,725,639
Debentures 24,120,556 21,225,141
Investment in shares 5,215,001 6,827,937
Others 422,805 1,073,723
Total plan assets 58,455,386 62,827,692
47.1.7 Actuarial Assumptions
Bank/ Group
2018 2017
% %
Future salary increment rate 6.5 p.a 6.5 p.a
Increase in future Cost of Living Allowance (COLA) 5.5 p.a 5.5 p.a
Increase in pension in payment (basic) Nil Nil
Discount rate 12.0 p.a 11.0 p.a
Attrition rate Nil Nil
The Bank uses IALM (2006-2008) Ultimate Mortality Table issued by the Institute of Actuaries of India.

328 Bank of Ceylon | Annual Report 2018
NOTES TO THE FINANCIAL STATEMENTS
Increase/ decrease in the following assumptions will change the present value of defined benefit obligation as illustrated below;
Bank/ Group
0.5% increase 0.5% decrease
LKR ’000 LKR ’000
Discount rate 60,666,758 64,919,547
Salary increment 62,797,719 62,655,833
Cost of Living Allowance 64,051,205 61,477,682
Further, the remaining years of benefit payments are expected to be 7.6 years.
The following payments are expected from the Pension Trust Fund in future years.
Bank/ Group
As at 31 December 2018 2017
LKR ’000 LKR ’000
Within the next 12 months 6,813,882 6,441,698
Between 1 and 5 years 25,271,940 25,057,110
Between 5 and 10 years 15,117,999 15,732,887
Beyond 10 years 15,522,312 18,117,727
Total expected payments 62,726,133 65,349,422
47.2 Bank of Ceylon Widows’/ Widowers’ and Orphans’ Pension Fund
The Bank is liable for and guarantees the payments to the beneficiaries of the “Bank of Ceylon Widows’/ Widowers’ and
Orphans’ Pension Fund” to which the Bank’s employees monthly contribute 8% of their gross salary. The Bank’s liability towards
the beneficiaries of the employees arises when an employee who has contributed to the fund for five continuous years dies
while in service or on the death of a pensioner where the Bank will be liable to pay Widows’ and Orphans’ Pension to his/ her
beneficiaries monthly. The pension to the beneficiaries of an employee who dies while in service is based on the last drawn
salary excluding certain allowances.
An actuarial valuation of the Widows’/ Widowers’ and Orphans’ Pension Fund as at 31 December 2018 was carried out by
Messrs Actuarial & Management Consultant (Pvt) Limited. Funding would be done in consultation with the Actuary, trustees and
beneficiaries.
This fund has been approved by the Government and administered independently .

329
The valuation has been done using the “Projected Unit Credit Method”, which is recommended in the Sri Lanka Accounting
Standard -LKAS 19 - “Employee Benefits”. The results of the actuarial valuation of the Widows’/ Widowers’and Orphans’ Pension
Fund is summarised as follows:
47.2.1 Net Benefit Expense (Recognised Under Personnel Expenses)
Bank/ Group
For the year ended 31 December 2018 2017
LKR ’000 LKR ’000
Current service cost 23,970 34,952
Net interest income (979,373) (865,261)
Net benefit expense (955,403) (830,309)
47.2.2 Amount Recognised in Other Comprehensive Income
Bank/ Group
For the year ended 31 December 2018 2017
LKR ’000 LKR ’000
Actuarial gains/ (losses) on the defined benefit obligation 1,459,920 (1,215,098)
Actuarial gains/ (losses) on plan assets (1,159,445) 1,214,884
Actuarial gains/ (losses) on actuarial valuation 300,475 (214)
Derecognition of plan asset (300,475) 214
Net actuarial gains/ (losses) recognised in other comprehensive income - -
47.2.3 Retirement Benefit Assets
Bank/ Group
As at 31 December 2018 2017
LKR ’000 LKR ’000
Fair value of plan assets [Note 47.2.4] 23,758,826 22,692,572
Defined benefit obligation [Note 47.2.5] (13,031,024) (13,789,177)
Retirement benefit assets * 10,727,802 8,903,395
* The Bank does not have direct control over the above Fund as it is administered separately with specific rules and regulations
of the Fund. Therefore, the above surplus has not been recognised in the Financial Statements as the existing arrangements
prevent the recognition of assets.

330 Bank of Ceylon | Annual Report 2018
NOTES TO THE FINANCIAL STATEMENTS
47.2.4 Changes in Fair Value of Plan Assets
Bank/ Group
2018 2017
LKR ’000 LKR ’000
Opening fair value of plan assets 22,692,572 19,471,795
Expected return 2,496,182 2,239,256
Contribution paid in to plan 112,529 93,287
Actual employer contribution 456,000 456,000
Benefits paid (839,012) (782,650)
Actuarial gains/ (losses) on plan asset (1,159,445) 1,214,884
Closing fair value of plan assets 23,758,826 22,692,572
47.2.5 Changes in the Present Value of the Defined Benefit Obligation
Bank/ Group
2018 2017
LKR ’000 LKR ’000
Opening defined benefit obligation 13,789,177 11,947,782
Interest cost 1,516,809 1,373,995
Current service cost 23,970 34,952
Benefits paid (839,012) (782,650)
Actuarial (gains)/ losses on obligation (51,055) 492,833
Due to change in assumptions (1,408,865) 722,265
Closing defined benefit obligation 13,031,024 13,789,177
The present value of the Defined Benefit Obligation as of the valuation date with respect to active employees, pensioners and
family pensioners who are receiving benefits are LKR 756.2 million (2017: 1,083.3 million), LKR 4,388.9 million (2017: 4,558.8
million) and LKR 7,885.9 million (2017: 8,147.1 million) respectively.
47.2.6 Plan Assets Consist of the Following
Bank/ Group
As at 31 December 2018 2017
LKR ’000 LKR ’000
Fixed deposits 20,807,604 18,859,654
Treasury bonds 641,352 1,766,231
Debentures 2,309,492 2,032,273
Others 378 34,414
Total plan assets 23,758,826 22,692,572

331
47.2.7 Actuarial Assumptions
Bank/ Group
2018 2017
% %
Future salary increment rate 6.5 p.a 6.5 p.a
Increase in future Cost of Living Allowance (COLA) 5.5 p.a 5.5 p.a
Increase in widows'/ widowers' and orphans' pension in payment (Basic) Nil Nil
Discounting rate 12.0 p.a 11.0 p.a
Attrition rate Nil Nil
The Bank uses IALM (2006-2008) Ultimate Mortality Table issued by the Institute of Actuaries of India.
Increase/ decrease in the following assumptions will have an impact on the present value of defined benefit obligation as
illustrated below;
Bank/ Group
0.5% increase 0.5% decrease
LKR ’000 LKR ’000
Discount rate 12,410,210 13,707,370
Salary increment 13,034,127 13,027,973
Cost of Living Allowance 13,541,273 12,557,582
Further, the remaining years of benefit payments are expected to be 11.1 years.
The following payments are expected from the fund in future years.
Bank/ Group
As at 31 December 2018 2017
LKR ’000 LKR ’000
Within the next 12 months 857,510 812,415
Between 1 and 5 years 3,762,278 3,630,427
Between 6 and 10 years 2,941,954 2,955,764
Beyond 10 years 5,469,282 6,390,571
Total expected payments 13,031,024 13,789,177
47.3 Provision for Terminal Gratuity
In compliance with the Payment of Gratuity Act No. 12 of 1983, provision is made in the accounts from the first year of service
for gratuity payable to employees who has not completed ten years of service as they are not in pensionable service of the
Bank. Provision has not been made in the Financial Statements for retirement gratuity for the employees who are eligible for the
retirement benefits under the pension schemes in force. However, employees whose services are terminated after five years
other than by retirement are eligible to receive a terminal gratuity under the Payment of Gratuity Act No. 12 of 1983, at the rate
of one half of the basic or consolidated wage or salary, cost of living and all other allowances applicable to the last month of the
financial year, for each year of continuous service.

332 Bank of Ceylon | Annual Report 2018
NOTES TO THE FINANCIAL STATEMENTS
In terms of Sri Lanka Accounting Standard - LKAS 19 - “Employee Benefits”, the Bank and its Subsidiaries have calculated
the post employment benefit obligations, based on the actuarial valuation method recommended in the standard. The gratuity
liabilities are not externally funded.
An actuarial valuation of the Gratuity Fund as at 31 December 2018 was carried out by Messrs Actuarial & Management
Consultants (Pvt) Limited.
The valuation has been done using the “Projected Unit Credit Method”, which is recommended in the Sri Lanka Accounting
Standard -LKAS 19 - “Employee Benefits”.
Bank Group
2018 2017 2018 2017
LKR ’000 LKR ’000 LKR ’000 LKR ’000
Balance as at 1 January 207,627 195,663 549,092 480,009
Provision charge/ (reversal) during the year 47,536 41,964 107,503 101,498
Actuarial (gain)/ losses 28,840 25,678 289 48,924
Payment made during the year (17,946) (55,678) (63,409) (77,653)
Adjustment/ transfers - - 3,176 (3,686)
Balance as at 31 December 266,057 207,627 596,651 549,092
The principal actuarial assumptions used in the valuation were as follows :
Bank/ Group
2018 2017
% %
Future salary increment rate 6.5 p.a 6.5 p.a
Increase in future Cost of Living Allowance (COLA) 5.5 p.a 5.5 p.a
Discount rate 12.0 p.a 11.5 p.a
The Bank uses IALM (2006-2008) Ultimate Mortality Table issued by the Institute of Actuaries of India. Further, the remaining
year of benefit payments are expected to be 9.8 years.
Increase/ decrease in the following assumptions will change the present value of defined benefit obligation as illustrated below:
Bank Group
0.5% increase 0.5% decrease 0.5% increase 0.5% decrease
LKR ’000 LKR ’000 LKR ’000 LKR ’000
Discount rate 254,871 278,118 571,740 623,889
Salary increment 275,179 257,551 617,296 577,752

333
47.4 Bank of Ceylon Pension Fund - 2014
Under the directions of the Ministry of Finance and Planning, this pension scheme was approved by the Board of Directors of the
Bank with effect from 16 December 2014 for the employees recruited to the Bank on or after 1 January 1996. Minimum period of
120 months uninterrupted active service in the Bank at the time of retirement is required to be eligible for any retirement benefit
under this pension scheme. Further, the beneficiaries under this pension scheme will not be entitled for rights and privileges
under the current service gratuity scheme of the Bank except death gratuity payment. Contribution to this pension scheme
is made monthly, based on the advice of a qualified actuary, currently at 12% of gross salary. The liability under this pension
scheme has been valued by a qualified actuary at the year-end.
An actuarial valuation of this fund as at 31 December 2018 was carried out by Messrs Actuarial & Management Consultants (Pvt)
Limited.
The valuation has been done using the “Projected Unit Credit Method”, which is recommended in the Sri Lanka Accounting
Standard -LKAS 19 - “Employee Benefits”. The results of the actuarial valuation of this Pension Fund is summarised as follows:
47.4.1 Net Benefit Expense (Recognised Under Personnel Expenses)
Bank/ Group
For the year ended 31 December 2018 2017
LKR ’000 LKR ’000
Current service cost 429,293 352,548
Net interest (income)/ expenses (241,042) (214,781)
Net benefit expense 188,251 137,767
47.4.2 Amount Recognised in Other Comprehensive Income
Bank/ Group
For the year ended 31 December 2018 2017
LKR ’000 LKR ’000
Actuarial gains/ (losses) on the defined benefit obligation (232,450) (278,904)
Actuarial gains/ (losses) on plan assets 311,792 78,295
Net actuarial gains/ (losses) recognised in other comprehensive income 79,342 (200,609)
47.4.3 Retirement Benefit Assets
Bank/ Group
As at 31 December 2018 2017
LKR ’000 LKR ’000
Fair value of plan assets [Note 47.4.4] 7,138,966 5,429,485
Defined benefit obligation [Note 47.4.5] (4,375,248) (3,333,466)
Net retirement benefit assets 2,763,718 2,096,019

334 Bank of Ceylon | Annual Report 2018
NOTES TO THE FINANCIAL STATEMENTS
47.4.4 Changes in Fair Value of Plan Assets
Bank/ Group
2018 2017
LKR ’000 LKR ’000
Opening fair value of plan assets 5,429,485 4,203,634
Expected return 624,391 504,436
Actual employer contribution 776,608 644,551
Benefits paid (3,310) (1,431)
Actuarial gains/ (losses) on plan asset 311,792 78,295
Closing fair value of plan assets 7,138,966 5,429,485
47.4.5 Changes in The Present Value of the Defined Benefit Obligation
Bank/ Group
2018 2017
LKR ’000 LKR ’000
Opening defined benefit obligation 3,333,466 2,413,790
Interest cost 383,349 289,655
Current service cost 429,293 352,548
Benefits paid (3,310) (1,431)
Actuarial (gains)/ losses on obligation 800,879 (78,125)
(Gains)/ losses due to change in assumptions (568,429) 357,029
Closing defined benefit obligation 4,375,248 3,333,466
47.4.6 Plan Assets Consist of the Following
Bank/ Group
As at 31 December 2018 2017
LKR ’000 LKR ’000
Treasury bonds 318,517 -
Fixed deposits 3,559,898 2,872,880
Debentures 3,260,325 2,555,352
Others 226 1,253
Total plan assets 7,138,966 5,429,485
47.4.7 Actuarial Assumptions
Bank/ Group
2018 2017
% %
Future salary increment rate 6.5 p.a 6.5 p.a
Increase in future Cost of Living Allowance (COLA) 5.5 p.a 5.5 p.a
Increase in pension in payment (Basic) Nil Nil
Discounting rate 12.0 p.a 11.5 p.a
Attrition rate Nil Nil

335
The Bank uses IALM (2006-2008) Ultimate Mortality Table issued by the Institute of Actuaries of India.
Increase/ decrease in the following assumptions will have an impact on the present value of defined benefit obligation as
illustrated below;
Bank/ Group
0.5% Increase 0.5% Decrease
LKR ’000 LKR ’000
Discount rate 3,859,541 4,922,328
Salary increment 4,621,507 4,106,882
Cost of Living Allowance 4,468,144 4,246,847
Further, the remaining years of benefit payments are expected to be 27.1 years.
The following payments are expected from the Pension Fund in future years.
Bank/ Group
As at 31 December 2018 2017
LKR ’000 LKR ’000
Within the next 12 months 4,142 3,132
Between 1 and 5 years 75,527 49,944
Between 6 and 10 years 243,881 162,867
Beyond 10 years 4,051,698 3,117,523
Total expected payments 4,375,248 3,333,466
48 Subordinated Liabilities Accounting Policy
Subordinated liabilities include funds borrowed for long term funding purposes which are subordinated to other claims. These
are initially recognised at fair value. Subsequent to initial recognition subordinated liabilities are measured at their amortised
cost, using the Effective Interest Rate (EIR) method. Amortised cost is calculated by taking into account any discount or
premium on the issue and costs that are an integral part of the EIR. The EIR amortisation is included in “Interest expenses”
(Note 8.2) in the Statement of Profit or Loss.
Bank Group
As at 31 December 2018 2017 2018 2017
LKR ’000 LKR ’000 LKR ’000 LKR ’000
Listed Debentures
Unsecured, subordinated, redeemable debentures of LKR 100 each 28,448,484 32,563,940 28,105,732 32,219,550
Unlisted Debentures
Unsecured, subordinated, redeemable debentures of LKR 100 each (private placement) 22,378,755 10,006,517 22,378,755 10,006,517
Total subordinated liabilities 50,827,239 42,570,457 50,484,487 42,226,067

336 Bank of Ceylon | Annual Report 2018
NOTES TO THE FINANCIAL STATEMENTS
48.1 The Movement in Subordinated Liabilities
Bank Group
2018 2017 2018 2017
LKR ’000 LKR ’000 LKR ’000 LKR ’000
Balance as at 1 January 42,570,457 38,645,546 42,226,067 38,295,318
Issued during the year 12,000,000 10,000,000 12,000,000 10,000,000
Redemptions (4,090,400) (6,074,665) (4,090,400) (6,069,600)
Amortisation adjustments 347,182 (424) 348,820 349
Balance as at 31 December 50,827,239 42,570,457 50,484,487 42,226,067
48.2 Types of Debentures
Coupon rate Amount as at 31 December
Bank Group
Interest payable frequency
Maturity date
2018 2017 2018 2017 2018 2017
Notes Issue date % % LKR ’000 LKR ’000 LKR ’000 LKR ’000
Fixed Interest Rate
Unsecured, subordinated, redeemable debentures Annually 25.10.2013 24.10.2018 - 13.00 - 3,869,827 - 3,869,827
Unsecured, subordinated, redeemable debentures Semi annually 25.10.2013 24.10.2018 - 12.60 - 220,369 - 220,369
Unsecured, subordinated, redeemable debentures Annually 25.10.2013 24.10.2021 13.25 13.25 1,226,594 1,226,594 1,226,594 1,226,594
Unsecured, subordinated, redeemable debentures Annually 25.10.2013 24.10.2022 13.25 13.25 1,227,617 1,227,617 1,227,617 1,227,617
Unsecured, subordinated, redeemable debentures * Annually 25.10.2013 24.10.2023 13.75 13.75 1,638,142 1,638,142 1,638,142 1,638,142
Unsecured, subordinated, redeemable debentures Annually 22.09.2014 21.09.2019 8.00 8.00 5,234,969 5,234,969 5,234,969 5,234,969
Unsecured, subordinated, redeemable debentures Quarterly 22.09.2014 21.09.2019 7.75 7.75 216,182 216,182 216,182 216,182
Unsecured, subordinated, redeemable debentures Annually 22.09.2014 21.09.2022 8.25 8.25 1,873,793 1,873,793 1,873,793 1,873,793
Unsecured, subordinated, redeemable debentures Annually 06.10.2015 05.10.2020 8.25 8.25 293,991 293,991 293,991 293,991
Unsecured, subordinated, redeemable debentures Quarterly 06.10.2015 05.10.2020 8.00 8.00 12,449 12,449 12,449 12,449
Unsecured, subordinated, redeemable debentures Annually 06.10.2015 05.10.2023 9.50 9.50 1,205,580 1,205,580 1,205,580 1,205,580
Unsecured, subordinated, redeemable debentures Annually 29.12.2016 28.12.2021 13.25 13.25 8,003,631 8,003,631 7,993,621 7,993,622
Unsecured, subordinated, redeemable debentures Annually 29.12.2016 28.12.2024 12.75 12.75 784 784 784 784
Unsecured, subordinated, redeemable debentures Annually 29.12.2017 28.12.2022 12.50 12.50 5,003,228 5,003,228 5,003,228 5,003,228
Unsecured, subordinated, redeemable debentures Annually 29.12.2017 28.12.2025 12.75 12.75 5,003,289 5,003,289 5,003,289 5,003,289
Unsecured, subordinated, redeemable debentures Annually 31.07.2018 30.07.2026 12.00 - 7,025,960 - 7,025,960 -

337
Coupon rate Amount as at 31 December
Bank Group
Interest payable frequency
Maturity date
2018 2017 2018 2017 2018 2017
Notes Issue date % % LKR ’000 LKR ’000 LKR ’000 LKR ’000
Unsecured, subordinated, redeemable debentures Annually 03.12.2018 02.12.2023 12.00 - 5,346,278 - 5,346,278 -
Total fixed interest rate subordinated debentures 43,312,487 35,030,445 43,302,477 35,020,436
Floating Interest Rate
Unsecured, subordinated, redeemable debentures (6 months TB rate (gross) plus 100 basis points) (a) Semi annually 25.10.2013 24.10.2018 - 11.13 - 204 - 204
Unsecured, subordinated, redeemable debentures (6 months TB rate (gross) plus 100 basis points) (a) Semi annually 25.10.2013 24.10.2021 9.52 11.13 1,019 1,020 1,019 1,020
Unsecured, subordinated, redeemable debentures (6 months TB rate (gross) plus 50 basis points) (a) Semi annually 22.09.2014 21.09.2019 9.97 10.43 845,442 848,392 512,700 514,011
Unsecured, subordinated, redeemable debentures (6 months TB rate (gross) plus 50 basis points) (a) Semi annually 22.09.2014 21.09.2022 9.97 10.43 31 31 31 31
Unsecured, subordinated, redeemable debentures (6 months TB rate (gross) plus 125 basis points) (a) ** Semi annually 06.10.2015 05.10.2020 10.72 11.34 4,580,255 4,595,440 4,580,255 4,595,440
Unsecured, subordinated, redeemable debentures (6 months TB rate (gross) plus 125 basis points) (a) Semi annually 06.10.2015 05.10.2023 10.72 11.34 2,086,964 2,093,885 2,086,964 2,093,885
Unsecured, subordinated, redeemable debentures (6 months TB rate (gross) plus 125 basis points) (a) Semi annually 29.12.2016 28.12.2021 11.24 10.47 1,021 1,020 1,021 1,020
Unsecured, subordinated, redeemable debentures (6 months TB rate (gross) plus 125 basis points) (a) Semi annually 29.12.2016 28.12.2024 11.24 10.47 20 20 20 20
Total floating interest rate subordinated debentures 7,514,752 7,540,012 7,182,010 7,205,631
Total subordinated debentures 50,827,239 42,570,457
50,484,487 42,226,067
Notes :
Debentures that are listed in the Colombo Stock Exchange. Some of these have been traded in the Colombo Stock Exchange.
* 2013/2023 - (Highest Price - LKR. 101.50, Lowest Price - LKR. 100.82, Last transaction price - LKR. 101.50)
** 2015/2020 - (Highest Price - LKR. 98.00, Lowest Price - LKR. 94.00, Last transaction price - LKR. 97.00)
a) Weighted average six months Treasury Bill interest rate before deducting relevant withholding tax at the primary quotations as announced by the Central Bank of Sri Lanka, at the preceding week of the interest resetting date.

338 Bank of Ceylon | Annual Report 2018
NOTES TO THE FINANCIAL STATEMENTS
49 Share Capital49.1 Ordinary Shares
Bank Group
As at 31 December 2018 2017 2018 2017
LKR ’000 LKR ’000 LKR ’000 LKR ’000
Authorised
50,000,000 ordinary shares 50,000,000 50,000,000 50,000,000 50,000,000
Issued and fully paid
Balance as at 1 January [15,000,000 (2017: 10,000,000) ordinary shares] 15,000,000 10,000,000 15,000,000 10,000,000
Share issued during the year [5,000,000 ordinary shares] 5,000,000 5,000,000 5,000,000 5,000,000
Balance as at 31 December [20,000,000 (2017: 15,000,000) ordinary shares] 20,000,000 15,000,000 20,000,000 15,000,000
Assigned capital *
Capital infusion during the year 5,000,000 5,000,000 5,000,000 5,000,000
Balance as at 31 December 25,000,000 20,000,000 25,000,000 20,000,000
* Assigned Capital
During the year 2017, the Bank issued five million ordinary shares at LKR 1,000 each to the Government of Sri Lanka and
transferred LKR 5,000 million prevailed under assigned capital at the end of 2017. Further, the Bank received LKR 5,000
million from the Government of Sri Lanka, the second phase of the total amount of LKR10,000 million allocated to the Bank
under the National Budget 2018. This amount has been reported under capital pending allotment as of 31 December 2018.
The Bank is making arrangement to issue five million ordinary shares at LKR 1,000 each to the Government of Sri Lanka and
thereby will transfer the assign capital to share capital during the year 2019.
49.2 Net Assets Value Per Share
Bank Group
As at 31 December 2018 2017 2018 2017
Amount used as the Numerator
Total equity attributable to equity holder of the bank (LKR ’000) 121,442,022 111,155,075 131,445,497 121,399,125
Number of ordinary shares used as denominator
Total number of ordinary shares issued 20,000,000 15,000,000 20,000,000 15,000,000
Net asset value per share (LKR) 6,072.10 7,410.34 6,574.13 8,093.28

339
50 Permanent Reserve FundBank Group
2018 2017 2018 2017
LKR ’000 LKR ’000 LKR ’000 LKR ’000
Balance as at 1 January 10,427,000 7,996,000 10,427,000 7,996,000
Transfers during the year 2,463,000 2,431,000 2,463,000 2,431,000
Balance as at 31 December 12,890,000 10,427,000 12,890,000 10,427,000
The permanent reserve fund is maintained as required by Bank of Ceylon Ordinance (Chapter 397) whereby the Bank must,
out of net profit after taxation, but before any dividend is declared, transfer to a reserve, a sum equivalent to not less than 20%
of such profit, until the reserve is equivalent to 50% of the issued and paid-up capital and thereafter, an appropriate amount
determined at 2% per annum in terms of section 20(1) and (2) of the Banking Act No. 30 of 1988 until the reserve is equal to the
paid-up capital.
In order to meet the requirement, an amount of LKR 2,463.0 million was transferred to the permanent reserve during the year
2018. (2017 : LKR 2,431.0 million).
The balance in the permanent reserve fund will be used only for the purposes specified in the Section 20 (2) of the Banking Act
No. 30 of 1988.
51 Retained EarningsBank Group
2018 2017 2018 2017
LKR ’000 LKR ’000 LKR ’000 LKR ’000
Balance as at 1 January 63,472,250 54,154,685 65,100,871 55,659,003
Impact of adopting SLFRS 9 as at 1 January 2018 (9,562,471) - (10,369,633) -
Deferred tax on transitional adjustments 3,345,868 - 3,571,637 -
Total comprehensive income for the year 17,362,439 24,093,813 17,432,210 24,240,161
Net Transfers between reserves (2,437,797) (2,429,838) (2,436,929) (2,451,883)
Dividend (4,846,410) (12,346,410) (4,846,410) (12,346,410)
Balance as at 31 December 67,333,879 63,472,250 68,451,746 65,100,871

340 Bank of Ceylon | Annual Report 2018
NOTES TO THE FINANCIAL STATEMENTS
52 Other ReservesBank Group
As at 31 December 2018 2017 2018 2017
LKR ’000 LKR ’000 LKR ’000 LKR ’000
Revaluation reserve [Note 52.1] 11,698,270 11,966,489 18,746,709 18,681,265
Free reserve 169,067 169,067 366,644 366,644
Exchange translation reserve [Note 52.2] 2,512,612 1,401,743 3,157,000 1,703,785
Available for sale reserve [Note 52.3.1] - 3,718,526 - 4,760,616
Fair value through OCI reserve [Note 52.3.2] 1,838,194 - 2,474,454 -
Statutory reserve - Other - - 358,944 358,944
Total other reserves 16,218,143 17,255,825 25,103,751 25,871,254
52.1 Revaluation Reserve
Bank Group
2018 2017 2018 2017
LKR ’000 LKR ’000 LKR ’000 LKR ’000
Balance as at 1 January 11,966,489 10,002,294 18,681,265 16,494,059
Changes in revaluation surplus/ (deficit) (337,522) 6,059,715 147,397 6,406,248
Deferred tax effect on changes in revaluation surplus/ (deficit) 94,506 (4,094,358) (41,271) (4,191,387)
Revaluation surplus of disposed property (25,203) (1,162) (25,203) (1,162)
Transferred to non-controlling interest - - (15,479) (26,493)
Balance as at 31 December 11,698,270 11,966,489 18,746,709 18,681,265
The revaluation reserve represents the surpluses arising on the revaluation of freehold properties which are still in use.
According to the Basel III regulatory directives, issued by Central Bank of Sri Lanka, the Bank can consider the revaluation
surplus as supplimentary capital in computing capital adequacy ratio, once in every three years.

341
52.2 Exchange Translation Reserve
Bank Group
2018 2017 2018 2017
LKR ’000 LKR ’000 LKR ’000 LKR ’000
Balance as at 1 January 1,401,743 1,040,368 1,703,785 1,060,420
Exchange differences on translation of foreign operations 1,110,869 361,375 1,453,215 643,365
Balance as at 31 December 2,512,612 1,401,743 3,157,000 1,703,785
This represents the exchange differences arising from translating investments made in the capital and net exchange movement
arising on the translation of net equity of Bank of Ceylon (UK) Limited and foreign branches and also exchange differences
arising from translation of the results of foreign branches for this year from the average rate to the exchange rate ruling at the
year end.
52.3 Fair Value Reserves
52.3.1 Available for Sale Reserve
Bank Group
2018 2017 2018 2017
LKR ’000 LKR ’000 LKR ’000 LKR ’000
Balance as at 1 January 3,718,526 4,487,181 4,760,616 5,562,266
Impact of adopting SLFRS 9 as at 1 January 2018 (3,718,526) - (4,760,616) -
Net gains/ (losses) on remeasuring available for sale financial investments - (595,034) - (619,591)
Deferred tax on effect on net gains/ (losses) on remeasuring available for sale financial investments - (177,006) - (177,006)
Realised (gains)/ losses on available for sale financial investments transferred to profit or loss - 3,385 - 3,385
Transferred to non-controlling interest - - - (8,438)
Balance as at 31 December - 3,718,526 - 4,760,616

342 Bank of Ceylon | Annual Report 2018
NOTES TO THE FINANCIAL STATEMENTS
52.3.2 Fair Value Through OCI Reserve
Bank Group
2018 2017 2018 2017
LKR ’000 LKR ’000 LKR ’000 LKR ’000
Balance as at 1 January - - - -
Impact of adopting SLFRS 9 as at 1 January 2018 2,541,656 - 3,583,746 -
Net gains/ (losses) on investments in debt instruments measured at FVTOCI (271,351) - (285,389) -
Net (gains)/ losses on investment in debt instruments at FVTOCI reclassification to profit or loss (15,232) - (15,232) -
Change in fair value on investments in equity instruments designated at FVTOCI (410,168) - (823,954) -
Deferred tax effect on above (6,711) - (6,711) -
Transferred to non-controlling interest - - 21,994 -
Balance as at 31 December 1,838,194 - 2,474,454 -
53 Non-Controlling InterestGroup
As at 31 December 2018 2017
LKR ’000 LKR ’000
Property Development PLC 165,212 166,381
Merchant Bank of Sri Lanka & Finance PLC 561,889 722,238
MBSL Insurance Company Limited (57,265) 12,788
Hotels Colombo (1963) Limited 14 19
Koladeniya Hydropower (Private) Limited 25,299 25,949
Total non-controlling interest 695,149 927,375

343
54 Notes to the Statement of Cash Flows54.1 Change in Operating Assets
Bank Group
For the year ended 31 December 2018 2017 2018 2017
LKR ’000 LKR ’000 LKR ’000 LKR ’000
Change in deposits with regulatory authorities 3,008,641 (12,301,271) 3,008,641 (12,301,271)
Loans and advances to customers (273,084,476) (167,274,301) (274,766,771) (171,623,297)
Net (increase)/ decrease in financial instruments - Held for trading (2,307,941) 1,091,495 (2,376,696) 1,184,827
Net (increase)/ decrease in securities purchased under resale agreements (13,927,044) (12,946,763) (17,926,129) (9,909,540)
Net (increase)/ decrease in derivative financial instruments 413,166 3,682,021 413,166 3,682,021
Change in other operating assets 6,288,818 11,125,803 6,399,715 11,492,994
Total (279,608,836) (176,623,016) (285,248,074) (177,474,266)
54.2 Change in Operating Liabilities
Bank Group
For the year ended 31 December 2018 2017 2018 2017
LKR ’000 LKR ’000 LKR ’000 LKR ’000
Net Increase/ (decrease) in deposits from banks 455,138 (143,370) 455,138 (143,370)
Net Increase/ (decrease) in deposits from customers 216,768,242 279,690,784 216,558,100 282,519,404
Net increase/ (decrease) in securities sold under repurchase agreements 52,911,898 (14,937,167) 52,794,616 (14,297,115)
Net increase/ (decrease) in short term borrowings (189,627) 32,824,007 1,977,577 33,195,860
Net increase/ (decrease) in derivative financial instruments 438,303 (100,948) 438,303 (100,948)
Change in other operating liabilities 5,780,858 6,829,664 10,079,243 5,155,514
Total 276,164,812 304,162,970 282,302,977 306,329,345
54.3 Other Non-Cash Items Included in Profit Before Tax
Bank Group
For the year ended 31 December 2018 2017 2018 2017
LKR ’000 LKR ’000 LKR ’000 LKR ’000
Exchange revaluation (7,622,372) (701,621) (7,622,372) (701,621)
Contribution paid to defined benefit plans (132,434) 281,914 (70,992) 340,747
Impairment charges 15,040,961 9,340,658 15,176,472 9,884,889
Depreciation of investment property 117,072 117,072 2,906 2,906
Depreciation of Property, Plant and Equipment 1,686,954 1,523,783 2,358,603 2,197,108
Amortisation of intangible assets and leasehold properties 396,268 284,148 451,960 342,466
Accrual for expenses and other non cash items (2,713,072) 26,333 (2,802,540) 36,343
Total 6,773,377 10,872,287 7,494,037 12,102,838

344 Bank of Ceylon | Annual Report 2018
NOTES TO THE FINANCIAL STATEMENTS
55 Contingent Liabilities and CommitmentsContingent liabilities are possible obligations whose existence will be confirmed only by uncertain future events or present obligations where the transfer of economic benefit is not probable or cannot be readily measured as defined in the Sri Lanka Accounting Standard – LKAS 37 on “Provisions, Contingent Liabilities and Contingent Assets”.
In the normal course of business, the Bank undertakes commitments and incurs contingent liabilities with legal recourse to its customers to accommodate the financial and investment needs of clients, to conduct trading activities and to manage its own exposure to risk. These consist of financial guarantees, letters of credit and other undrawn commitments to lend. Letters of credit and guarantees (including standby letters of credit) commit the Bank to make payments on behalf of customers in the event of a specific act, generally related to the import or export of goods. Guarantees and standby letters of credit carry a similar credit risk to loans. Operating lease commitments of the Bank (as a lessor and as a lessee) and pending legal claims against the Bank also form part of commitments of the Bank.
Contingent liabilities are not recognised in the Statement of Financial Position but are disclosed unless they are remote. These financial instruments generate interest or fees and carries elements of credit risk in excess of those amounts recognised as assets and liabilities in the Statement of Financial Position. However no material losses are anticipated as a result of these transactions.
These commitments and contingencies are quantified below :
Bank Group
As at 31 December 2018 2017 2018 2017
LKR ’000 LKR ’000 LKR ’000 LKR ’000
Contingent liabilities [Note 55.1] 373,074,988 323,104,305 377,523,369 324,229,150
Undrawn and undisbursed facilities [Note 55.2] 121,561,219 160,067,768 121,825,818 160,067,786
Capital commitments [Note 55.3] 11,053,804 11,184,205 11,214,075 11,187,521
Lease commitments [Note 55.4] 2,616,797 2,121,000 2,629,157 2,133,377
Total contingent liabilities and commitments 508,306,808 496,477,278 513,192,419 497,617,834
55.1 Contingent Liabilities
Bank Group
As at 31 December 2018 2017 2018 2017
LKR ’000 LKR ’000 LKR ’000 LKR ’000
Acceptances and documentary credit 225,582,120 147,887,385 225,672,891 147,963,606
Bills for collection 21,553,898 6,812,882 21,553,898 6,812,882
Forward exchange contracts 15,801,742 39,125,183 15,801,742 39,125,183
Guarantees 100,715,102 83,593,855 100,941,300 83,794,517
Other commitments [Note 55.1.1] 9,422,126 45,685,000 13,553,538 46,532,962
Total contingent liabilities 373,074,988 323,104,305 377,523,369 324,229,150
55.1.1 Other Commitments
Bank Group
As at 31 December 2018 2017 2018 2017
LKR ’000 LKR ’000 LKR ’000 LKR ’000
Forward Exchange contract with Financial institutions 284,631 81,500 284,631 81,500
Currency Swaps 9,137,495 45,603,500 12,327,890 45,603,500
Other commitments - - 941,017 847,962
Total other commitments 9,422,126 45,685,000 13,553,538 46,532,962

345
55.2 Undrawn and Undisbursed Facilities
The unutilised value of irrevocable commitments, which cannot be withdrawn at the discretion of the Bank, without risk of
incurring significant penalties or expenses are as follows:
Bank Group
As at 31 December 2018 2017 2018 2017
LKR ’000 LKR ’000 LKR ’000 LKR ’000
Undisbursed amount of loans 36,230,934 31,942,266 36,370,051 31,942,266
Undrawn limits of overdrafts 41,749,673 78,612,709 41,875,155 78,612,719
Undrawn limits of credit cards 8,496,914 7,964,314 8,496,914 7,964,314
Undrawn limits of letters of credit 14,732,300 22,215,383 14,732,300 22,215,391
Undrawn limits of letters of guarantee 20,351,398 19,333,096 20,351,398 19,333,096
Total undrawn and undisbursed facilities 121,561,219 160,067,768 121,825,818 160,067,786
55.3 Capital Commitments
Capital expenditure approved by the Directors, for which, no provision has been made in the Financial Statements, amounts to:
55.3.1 Capital Commitments in Relation to Property, Plant and Equipment
Bank Group
As at 31 December 2018 2017 2018 2017
LKR ’000 LKR ’000 LKR ’000 LKR ’000
Approved and contracted for 2,992,528 2,431,828 3,140,225 2,433,822
Approved but not contracted for 4,145,165 3,914,797 4,145,165 3,914,797
Total capital commitments in relation to Property Plant and Equipment 7,137,693 6,346,625 7,285,390 6,348,619
55.3.2 Capital Commitments in Relation to Intangible Assets
Bank Group
As at 31 December 2018 2017 2018 2017
LKR ’000 LKR ’000 LKR ’000 LKR ’000
Approved and contracted for 2,311,147 1,961,567 2,323,721 1,962,889
Approved and not contracted for 1,604,964 2,876,013 1,604,964 2,876,013
Total capital commitments in relation to intangible assets 3,916,111 4,837,580 3,928,685 4,838,902
Total capital commitments 11,053,804 11,184,205 11,214,075 11,187,521

346 Bank of Ceylon | Annual Report 2018
NOTES TO THE FINANCIAL STATEMENTS
55.4 Lease Commitments
55.4.1 Operating Lease Commitments
Future minimum lease payments under non-cancellable operating leases, where the Bank is the lessee, are as follows;
Bank Group
As at 31 December 2018 2017 2018 2017
LKR ’000 LKR ’000 LKR ’000 LKR ’000
Not later than 1 year 1,032,633 1,178,812 1,032,633 1,178,812
Later than 1 year and not later than 5 years 1,283,406 858,822 1,283,406 858,822
Later than 5 years 300,758 83,366 300,758 83,366
Total operating lease commitments 2,616,797 2,121,000 2,616,797 2,121,000
55.4.2 Finance Lease Commitments
Future minimum lease payments under non-cancellable finance leases, where the Bank is the lessee, are as follows;
Bank Group
As at 31 December 2018 2017 2018 2017
LKR ’000 LKR ’000 LKR ’000 LKR ’000
Not later than 1 year - - 7,514 4,526
Later than 1 year and not later than 5 years - - 4,846 7,851
Later than 5 years - - - -
Total finance lease commitments - - 12,360 12,377
Total lease commitments 2,616,797 2,121,000 2,629,157 2,133,377
55.5 Litigation
Litigations are anticipated in the context of business operations due to the nature of the transactions involved. The Bank and
the Group’s companies are involved in various such legal actions and the controls have been established to deal with such legal
claims. There are pending litigations existing as at the end of the Reporting period against the Bank, resulting through normal
business operations.
Litigations against the Bank have been assessed in terms of the probability of any claims or damages arising against the
Bank, which require provisions to be made in the Financial Statements as per LKAS 37- “Provisions, Contingent Liabilities and
Contingent Assets”.
As of 31 December 2018, claims for the legal actions against the Bank approximately amount to LKR 12,414.4 million (2017:
LKR 3,431.2 million), nevertheless the Bank has no impact over such claims whatsoever affecting to the business, operations or
image of the Bank.

347
56 Assets Pledged as SecurityThe securities sold under repurchase agreement, debentures and debt securities issued by the Bank and the Group and details
of assets pledged by the Bank and the Group, to secure those liabilities are given below:
Bank Group
As at 31 December 2018 2017 2018 2017
LKR ’000 LKR ’000 LKR ’000 LKR ’000
Borrowings :
Securities sold under repurchase agreements 97,399,359 44,487,462 97,423,302 44,628,686
97,399,359 44,487,462 97,423,302 44,628,686
Secured by ;
Treasury bills 9,619,113 - 9,619,113 -
Treasury bonds 92,774,829 52,186,541 92,800,854 52,327,765
Total assets pledged as securities 102,393,942 52,186,541 102,419,967 52,327,765
57 Events After the Reporting DateEvents after the Reporting period are those events, favourable and unfavourable, that occur between the Reporting date and
the date the Financial Statements are authorised for issue. There are no events occurring after the Reporting date which require
adjustments to or disclosure in the Financial Statements.

348 Bank of Ceylon | Annual Report 2018
NOTES TO THE FINANCIAL STATEMENTS
58 Maturity Analysis Of Assets And Liabilities The analysis of total assets and liabilities of the Bank and the Group into relevant maturity groupings based on the remaining
period as at 31 December 2018 in to the contractual maturity date, is given in the table below:
Bank Group
Within After Within After
As at 31 December 2018 12 months 12 months Total 12 months 12 months Total
LKR ’000 LKR ’000 LKR ’000 LKR ’000 LKR ’000 LKR ’000
Assets
Cash and cash equivalents 78,447,577 - 78,447,577 78,558,031 - 78,558,031
Balances with Central Banks 65,680,371 - 65,680,371 65,680,371 - 65,680,371
Placements with banks 36,298,153 4,151,936 40,450,089 37,529,974 4,151,936 41,681,910
Securities purchased under resale agreements - - - 1,436,068 - 1,436,068
Derivative financial instruments 1,205,657 - 1,205,657 1,205,657 - 1,205,657
Financial assets measured at fair value through profit or loss 9,277,298 - 9,277,298 9,583,327 - 9,583,327
Financial assets measured at amortised cost - loans and advances 621,542,807 807,564,374 1,429,107,181 627,922,972 832,695,616 1,460,618,588
Financial assets measured at amortised cost - debt instruments 208,601,166 343,238,283 551,839,449 209,775,793 342,180,941 551,956,734
Financial assets measured at fair value through OCI 16,699,582 - 16,699,582 20,415,199 - 20,415,199
Investment in subsidiary companies - 6,513,048 6,513,048 - - -
Investment in associate companies - 92,988 92,988 - 441,226 441,226
Investment properties - 2,765,856 2,765,856 - 120,182 120,182
Property, Plant and Equipment - 24,178,155 24,178,155 - 37,762,509 37,762,509
Leasehold properties - 98,899 98,899 - 130,500 130,500
Intangible assets - 1,238,186 1,238,186 - 1,456,630 1,456,630
Deferred tax assets - - - - 3,052 3,052
Other assets 25,666,791 14,893,267 40,560,058 26,940,016 14,932,875 41,872,891
Total assets 1,063,419,402 1,204,734,992 2,268,154,394 1,079,047,408 1,233,875,467 2,312,922,875
Percentage (%) 46.9 53.1 100.0 46.7 53.3 100.0

349
Bank Group
Within After Within After
As at 31 December 2018 12 months 12 months Total 12 months 12 months Total
LKR ’000 LKR ’000 LKR ’000 LKR ’000 LKR ’000 LKR ’000
Liabilities
Due to banks 2,402,468 - 2,402,468 2,515,998 - 2,515,998
Securities sold under repurchase agreements 97,399,359 - 97,399,359 97,423,302 - 97,423,302
Derivative financial instruments 509,018 - 509,018 509,018 - 509,018
Financial liabilities at amortised cost - due to depositors 1,730,973,379 34,052,591 1,765,025,970 1,741,712,979 42,262,514 1,783,975,493
Financial liabilities at amortised cost - other borrowings 201,792,174 - 201,792,174 200,794,306 6,259,368 207,053,674
Debt securities issued - - - 2,789,727 1,315,954 4,105,681
Current tax liabilities 3,922,189 - 3,922,189 4,039,380 - 4,039,380
Deferred tax liabilities - 5,073,526 5,073,526 - 7,762,214 7,762,214
Insurance provision - Life - - - 575,625 - 575,625
Insurance provision - Non life - - - 366,618 - 366,618
Other liabilities 15,235,112 4,525,317 19,760,429 16,768,125 5,202,614 21,970,739
Subordinated liabilities 6,993,714 43,833,525 50,827,239 6,660,972 43,823,515 50,484,487
Equity 1,838,194 119,603,828 121,442,022 2,474,454 129,666,192 132,140,646
Total liabilities and Equity 2,061,065,607 207,088,787 2,268,154,394 2,076,630,504 236,292,371 2,312,922,875
Percentage (%) 90.9 9.1 100.0 89.8 10.2 100.0
Net gap (997,646,205) 997,646,205 - (997,583,096) 997,583,096 -

350 Bank of Ceylon | Annual Report 2018
NOTES TO THE FINANCIAL STATEMENTS
The analysis of total assets and liabilities of the Bank and the Group into relevant maturity groupings based on the remaining period as
at 31 December 2017 in to the contractual maturity date, is given in the table below:
Bank Group Within After Within After As at 31 December 2017 12 months 12 months Total 12 months 12 months Total
LKR ’000 LKR ’000 LKR ’000 LKR ’000 LKR ’000 LKR ’000
AssetsCash and cash equivalents 72,843,108 - 72,843,108 78,005,362 - 78,005,362 Balances with Central Banks 68,689,012 - 68,689,012 68,689,012 - 68,689,012 Placements with banks 4,462,929 3,604,561 8,067,490 5,319,602 - 5,319,602 Securities purchased under resale agreements 18,455,555 - 18,455,555 19,872,247 - 19,872,247 Derivative financial instruments 1,618,823 - 1,618,823 1,618,823 - 1,618,823 Financial instruments - Held for trading 8,359,274 - 8,359,274 8,596,548 - 8,596,548 Financial investments - Loans and receivables 150,674,377 62,492,671 213,167,048 151,522,089 62,827,535 214,349,624 Loans and advances to customers 485,754,236 677,406,678 1,163,160,914 497,372,906 696,921,488 1,194,294,394 Financial investments - Available for sale 17,921,170 - 17,921,170 22,552,292 - 22,552,292 Financial investments - Held to maturity 130,516,236 177,739,846 308,256,082 130,951,274 177,799,043 308,750,317 Investment in subsidiary companies - 6,513,048 6,513,048 - - - Investment in associate companies - 92,988 92,988 - 446,793 446,793 Investment properties - 2,882,928 2,882,928 - 123,773 123,773 Property, Plant and Equipment - 23,046,114 23,046,114 - 36,608,919 36,608,919 Leasehold properties - 101,481 101,481 - 134,441 134,441 Intangible assets - 810,730 810,730 - 1,074,436 1,074,436 Deferred tax assets - - - - 8,621 8,621 Other assets 24,251,340 13,566,848 37,818,188 38,929,343 35,636 38,964,979
Total assets 983,546,060 968,257,893 1,951,803,953 1,023,429,498 975,980,685 1,999,410,183
Percentage (%) 50.4 49.6 100.0 51.2 48.8 100.0
LiabilitiesDue to banks 2,203,199 - 2,203,199 2,194,266 - 2,194,266 Securities sold under repurchase agreements 44,487,462 - 44,487,462 44,628,686 - 44,628,686 Derivative financial instruments 70,715 - 70,715 70,715 - 70,715 Due to depositors 1,497,427,661 49,404,375 1,546,832,036 1,512,555,634 53,820,784 1,566,376,418 Other borrowings 170,562,796 7,628,293 178,191,089 173,772,117 10,558,064 184,330,181 Debt securities issued - - - 3,409,462 2,258,052 5,667,514 Current tax liabilities 1,877,342 - 1,877,342 2,051,020 - 2,051,020 Deferred tax liabilities - 5,820,329 5,820,329 2,369,044 6,256,175 8,625,219 Insurance provision - Life - - - - 547,026 547,026 Insurance provision - Non life - - - - 430,093 430,093 Other liabilities 16,226,541 2,369,708 18,596,249 16,912,525 3,023,953 19,936,478 Subordinated liabilities 4,090,400 38,480,057 42,570,457 3,746,010 38,480,057 42,226,067 Equity 3,825,318 107,329,757 111,155,075 3,831,895 118,494,605 122,326,500
Total liabilities and Equity 1,740,771,434 211,032,519 1,951,803,953 1,765,541,374 233,868,809 1,999,410,183
Percentage (%) 89.2 10.8 100.0 88.3 11.7 100.0
Net gap (757,225,374) 757,225,374 - (742,111,876) 742,111,876 -

351
59 Related Party DisclosuresThe Bank has entered in to transactions with the parties who are defined as related parties in Sri Lanka Accounting Standard
- LKAS 24 -” Related Party Disclosures”. i.e. significant investors, Subsidiary and Associate companies, post employment
benefit plans for the Bank’s employees, Key Management Personnel (KMPs), Close Family Members (CFMs) of KMPs and other
related entities. Those transactions include lending activities, acceptance and placements, off-balance sheet transactions and
provision of other banking and financial services that are carried out in the ordinary course of business on an arm’s length basis
at commercial rates, except for the transactions that KMPs have availed under schemes uniformly applicable to all the staff at
concessionary rates.
59.1 Parent and the Ultimate Controlling Party
Bank of Ceylon is a Government owned bank.
59.2 Key Management Personnel (KMPs) and their Close Family Members (CFMs)
59.2.1 Compensation to Key Management Personnel (KMPs) and their Close Family Members (CFMs)
As per the Sri Lanka Accounting Standard -LKAS 24 - “Related Party Disclosures”, the KMPs include those who are having
authority and responsibility for planning, directing and controlling the activities of the Bank. Accordingly, the Board of Directors
and selected key members of the Corporate Management are identified as KMPs who meet the above criteria.
CFMs are defined as family members who may be expected to influence or be influenced by, that KMP in their dealings with the
entity, i.e. spouse, children under 18 years of age and dependants of KMPs. Dependant is defined as anyone who depends on
the respective KMP for more than 50% of his or her financial needs.
Compensation to KMPs of the Bank
Bank Group
For the year ended 31 December 2018 2017 2018 2017
LKR ’000 LKR ’000 LKR ’000 LKR ’000
Short-term employment benefits 20,749 20,220 21,646 21,302
Post employment benefits 4,867 4,832 4,867 4,832
Total 25,616 25,052 26,513 26,134
In addition to the above, the Bank/ Group has also provided non cash benefits to the KMPs in line with the approved benefit
plans of the Bank/ Group.
59.2.2 Transactions, Arrangements and Agreements Involving Key Management Personnel (KMPs) and their Close Family Members (CFMs).
(a) Items in Statement of Profit or Loss
KMPs & CFMs
For the year ended 31 December 2018 2017
LKR ’000 LKR ’000
Interest income 732 888
Interest expenses 3,555 5,587

352 Bank of Ceylon | Annual Report 2018
NOTES TO THE FINANCIAL STATEMENTS
(b) Items in Statement of Financial Position
KMPs & CFMs
As at 31 December 2018 2017
LKR ’000 LKR ’000
Assets
Loans 4,462 16,010
Credit cards 88 221
4,550 16,231
Liabilities
Due to depositors 14,347 55,369
14,347 55,369
(c ) Off Balance Sheet Items
KMPs & CFMs
As at 31 December 2018 2017
LKR ’000 LKR ’000
Undrawn facilities 662 2,429
662 2,429
(d) Average Accommodations/ Due to Depositors Balances
KMPs & CFMs
For the year ended 31 December 2018 2017
LKR ’000 LKR ’000
Loans 9,693 10,637
Overdrafts - 81
Due to depositors 48,281 31,223
59.3 Transactions with Group Related Parties
The Group related parties include the Subsidiaries and Associates of the Bank.
59.3.1 Transactions with Subsidiaries and Associate Companies of the Bank
The aggregate amount of income and expenses arising from the transactions during the year and amount due to and due from
the relevant related parties and total contract sum of off balance sheet transactions at the year end are summarised below:

353
(a) Items in Statement of Profit or Loss
Subsidiary Companies Associate Companies
For the year ended 31 December 2018 2017 2018 2017
LKR ’000 LKR ’000 LKR ’000 LKR ’000
Interest income 192,455 120,402 26,902 28,413
Interest expenses 331,339 333,993 24,334 25,525
Other income 344,756 137,440 18,300 19,300
Other expenses 907,613 887,733 37,732 32,074
(b) Items in Statement of Financial Position
Subsidiary Companies Associate Companies
As at 31 December 2018 2017 2018 2017
LKR ’000 LKR ’000 LKR ’000 LKR ’000
Assets
Loans 1,521,365 316,175 175,012 224,365
Overdrafts 423,292 3,411 - -
Investments in debts 123,789 221,576 - -
Placements 31,326,385 12,771,476 - -
Other receivables 747,290 1,382,733 - -
34,142,121 14,695,371 175,012 224,365
Liabilities
Due to depositors 3,130,848 3,264,273 272,036 256,333
Securities sold under repurchase agreements 142,952 296,448 26,005 86,241
Debentures 343,036 344,390 - -
Other liabilities 2,933 8,043 - -
3,619,769 3,913,154 298,041 342,574
(c ) Off Balance Sheet Items
Subsidiary Companies Associate Companies
As at 31 December 2018 2017 2018 2017
LKR ’000 LKR ’000 LKR ’000 LKR ’000
Guarantees 5,850 10,380 114 -
Undrawn facilities 202,695 1,560,226 10,000 30,000
208,545 1,570,606 10,114 30,000
(d) Average Accommodations/ Due to Depositors Balances
Subsidiary Companies Associate Companies
As at 31 December 2018 2017 2018 2017
LKR ’000 LKR ’000 LKR ’000 LKR ’000
Loans 1,080,754 811,294 196,208 213,016
Overdrafts 106,442 45,606 136 97
Due to depositors 2,833,259 2,472,637 255,057 209,099

354 Bank of Ceylon | Annual Report 2018
NOTES TO THE FINANCIAL STATEMENTS
59.3.2 Transactions with Subsidiaries and Associate Companies of the Group
In addition to the transactions between the Bank and its Subsidiaries and Associate companies, transactions which were
taken place between the Subsidiaries and Associate companies are also included in the section below:
(a) Items in Statement of Profit or Loss
Subsidiary Companies Associate Companies
For the year ended 31 December 2018 2017 2018 2017
LKR ’000 LKR ’000 LKR ’000 LKR ’000
Interest income 238,339 147,319 29,126 29,858
Interest expense 379,447 367,059 24,334 25,525
Other income 537,948 307,312 484,715 24,004
Other expenses 1,566,798 1,057,145 38,155 32,534
(b) Items in Statement of Financial Position
Subsidiary Companies Associate Companies
As at 31 December 2018 2017 2018 2017
LKR ’000 LKR ’000 LKR ’000 LKR ’000
Assets
Loans 1,810,807 393,626 175,012 224,365
Overdrafts 423,292 3,411 - -
Investments in debts 123,789 221,576 - -
Placements 31,326,385 12,771,476 - -
Other receivable 749,398 1,462,663 15,143 26,885
34,433,671 14,852,752 190,155 251,250
Liabilities
Due to depositors 3,193,405 3,343,388 272,036 282,879
Securities sold under repurchase agreements 142,952 296,448 26,005 86,241
Debentures 343,036 344,390 - -
Other liabilities 247,069 86,486 - 162
3,926,462 4,070,712 298,041 369,282
(c ) Off Balance Sheet Items
Subsidiary Companies Associate Companies
As at 31 December 2018 2017 2018 2017
LKR ’000 LKR ’000 LKR ’000 LKR ’000
Guarantees 5,850 10,380 114 -
Undrawn facilities 202,695 1,560,226 10,000 30,000
208,545 1,570,606 10,114 30,000

355
(d) Average Accommodations/ Due to Depositors Balances
Subsidiary Companies Associate Companies
As at 31 December 2018 2017 2018 2017
LKR ’000 LKR ’000 LKR ’000 LKR ’000
Loans 1,080,754 811,294 196,208 213,016
Overdrafts 106,442 45,606 136 97
Due to depositors 2,833,259 2,472,637 255,057 209,099
59.4 Transactions with the Significant Investors having Significant Influence Over the Bank and the Post Employment Benefit Plans for Bank’s Employees
Significant investor of the Bank is the Government as it is a state owned entity. The Government refers to the Government
of Sri Lanka, Government Corporations, Provincial Councils, Local Government bodies, other Government entities and their
subsidiaries.
Post employment benefit plans are arrangements made by the Bank to provide post employment benefits for its employees.
Transactions and arrangements entered in to by the Bank with the Government and Government controlled entities (significant
investor) and post employment benefit plans which are individually significant and for other transactions that are collectively, but
not individually significant are as follows:
59.4.1 Transactions which are Collectively Significant
(a) Items in Statement of Profit or Loss
Significant Investor Post Employment Benefit Plans
For the year ended 31 December 2018 2017 2018 2017
LKR ’000 LKR ’000 LKR ’000 LKR ’000
Interest income 85,557,414 74,417,323 191 -
Other income 779,941 766,497 2,684 -
Interest expenses 19,781,347 23,323,315 7,920,439 5,707,049
Dividends paid 4,846,410 12,346,410 - -
Contribution made - - 808,095 286,018

356 Bank of Ceylon | Annual Report 2018
NOTES TO THE FINANCIAL STATEMENTS
(b) Items in Statement of Financial Position
Significant Investor Post Employment Benefit Plans
As at 31 December 2018 2017 2018 2017
LKR ’000 LKR ’000 LKR ’000 LKR ’000
Assets
Loans and advances 562,326,026 393,893,128 - -
Investment in securities and bonds 551,493,826 535,202,370 - -
Investment in equity instruments 2,314,096 1,250,715 - -
1,116,133,948 930,346,213 - -
Liabilities
Due to depositors 205,973,794 215,416,321 52,068,600 56,728,098
Securities sold under repurchase agreements 89,458,909 39,329,807 709,373 596,000
Debentures 17,855,880 9,276,330 26,978,890 14,673,825
313,288,583 264,022,458 79,756,863 71,997,923
(c ) Off Balance Sheet Items
Significant Investor
As at 31 December 2018 2017
LKR ’000 LKR ’000
Letters of credit 75,222,871 77,113,154
Bills and acceptances 100,117,751 34,102,659
Guarantees 5,033,214 3,596,209
Forward exchange contracts 9,137,495 45,856,440
189,511,331 160,668,462
(d) Other Transactions
Significant Investor
For the year ended 31 December 2018 2017
LKR ’000 LKR ’000
Gross foreign exchange transactions
- Sales 218,146,217 159,658,969
- Purchases 175,716,180 291,870,422

357
(e) Average Accommodations/ Due to Depositors Balances
Significant Investor Post Employment Benefit Plans
For the year ended 31 December 2018 2017 2018 2017
LKR ’000 LKR ’000 LKR ’000 LKR ’000
Loans and advances 358,655,760 338,872,282 - -
Due to depositors 194,035,460 161,598,781 48,476,463 37,306,762
Off balance sheet facilities 182,860,088 176,208,846 - -
59.4.2 Transactions which are Individually Significant
The Bank uses internal assessment methodology in order to identify significance of the transactions with the Government
and Government related entities. Accordingly, the transactions which have been considered in normal day to day business
operations which are carried on normal market conditions are considered as individually significant transactions.
The Government has issued Treasury Guarantees of LKR 276,405 million and Comfort Letters of LKR 33,416 million as of
31.12.2018 against the loan facilities granted to State Owned Enterprises (SOEs).
During the year the Bank received LKR 5,000 million from Government of Sri Lanka.
59.4.3 Transactions with the Significant Investor - Group
Other than the transactions carried out by the Bank and balances held by the Bank with the Government, Subsidiaries of the
group have carried out following transactions with the Government and balances held with the Government as follows:
Significant Investor
As at 31 December 2018 2017
LKR ’000 LKR ’000
Investment in securities and bonds 1,863,397 1,002,447
Nostro balance with Central Bank of Sri Lanka 208,065 184,439
Income from investments in securities and bonds 122,142 211,097
Apart from the transactions listed above, the Group carried out transactions with the Government of Sri Lanka and other
Government related entities in the form of providing services, investments in shares for trading purpose and other financial
service transactions including inter bank placements during the year ended 31 December 2018 on comparable terms, which are
applicable to transactions between the Group and its unrelated customers.

358 Bank of Ceylon | Annual Report 2018
NOTES TO THE FINANCIAL STATEMENTS
60 Financial Reporting by SegmentSegmental information is presented in respect of Group business distinguishing the component of the Group that is engaged in different business segments or operations within a particular economic environment, which is subject to risk and returns that are different from those of other segments.
60.1 Primary Segment Information - Operating Segments - Group “An operating segment is a component of the Group that engages in business activities, from which it may earn revenues and incur expenses, including revenues and expenses that relating to transactions with any of the Group’s other components, whose operating results are reviewed by the management to make decision about resource allocation to each segment and assess its performance.”
The Group comprises the following major business segments: Retail banking, Corporate banking, International, Treasury and Investments, other non-banking and Group functions.
The management monitors the operating results of its business segments separately for the purpose of making decisions about resources allocation and performance assessment. Segment performance are evaluated based on their operating profits or losses. VAT, NBT and Income Tax are managed on a Group basis and are not allocated to operating segments.
Retail Banking Corporate Banking International, Treasury and
InvestmentGroup Function Unallocated Total
For the year ended 31 December 2018 2017 2018 2017 2018 2017 2018 2017 2018 2017 2018 2017
LKR ’000 LKR ’000 LKR ’000 LKR ’000 LKR ’000 LKR ’000 LKR ’000 LKR ’000 LKR ’000 LKR ’000 LKR ’000 LKR ’000
Revenue from external customers:
Net interest income 37,158,489 28,650,109 17,326,817 19,819,345 10,914,352 9,657,261 3,131,505 3,132,158 158,316 231,229 68,689,479 61,490,102
Net fee and commission income 4,150,452 3,620,346 2,704,421 2,535,209 997,846 810,323 374,367 169,053 566,118 616,150 8,793,204 7,751,081
Other income 3,162,668 3,804,986 5,394,397 516,404 6,164,808 3,872,203 2,949,301 2,344,850 (1,106,996) (995,294) 16,564,178 9,543,149
Total operating income 44,471,609 36,075,441 25,425,635 22,870,958 18,077,006 14,339,787 6,455,173 5,646,061 (382,562) (147,915) 94,046,861 78,784,332
Impairment (charge)/ reversal for loans and other losses (6,134,067) (1,830,794) (8,231,449) (7,780,736) (387,174) 300,000 (156,644) (294,420) (267,138) (278,939) (15,176,472) (9,884,889)
Other operating expenses (21,851,590) (18,829,578) (5,218,986) (4,109,781) (4,952,962) (4,215,509) (4,831,923) (4,046,207) 230,993 496,673 (36,624,468) (30,704,402)
Total expenses (27,985,657) (20,660,372) (13,450,435) (11,890,517) (5,340,136) (3,915,509) (4,988,567) (4,340,627) (36,145) 217,734 (51,800,940) (40,589,291)
Operating profit before taxes on financial services 16,485,952 15,415,069 11,975,200 10,980,441 12,736,870 10,424,278 1,466,606 1,305,434 (418,707) 69,819 42,245,921 38,195,041
Taxes on financial services - - - - - - - - - - (9,818,020) (7,431,502)
Operating profit after taxes on financial services - - - - - - - - - - 32,427,901 30,763,539
Share of profit/ (loss) of associate companies, net of tax - - - - - - 9,269 52,024 - - 9,269 52,024
Profit/ (loss) before income tax 16,485,952 15,415,069 11,975,200 10,980,441 12,736,870 10,424,278 1,475,875 1,357,458 (418,707) 69,819 32,437,170 30,815,563
Income tax expense - - - - - - - - - - (12,922,017) (9,328,918)
Profit for the year - - - - - - - - - - 19,515,153 21,486,645
Total assets 690,006,676 632,145,758 833,652,006 601,742,151 643,023,673 621,865,981 80,509,176 64,420,266 65,731,344 79,236,027 2,312,922,875 1,999,410,183
Total liabilities 653,062,187 596,145,109 789,016,428 567,472,984 608,594,758 586,450,764 69,357,319 52,417,323 60,751,537 74,597,503 2,180,782,229 1,877,083,683
Cash flows from/ (used in) operating activities (12,419,101) 64,442,987 (5,790,965) 44,579,858 (3,647,792) 21,722,177 (1,046,611) 7,045,195 (52,912) 520,104 (22,957,381) 138,310,321
Cash flows from/ (used in) investing activities 5,087,022 (26,381,837) 2,372,053 (18,250,218) 1,494,182 (8,892,681) 428,705 (2,884,180) 21,674 (212,922) 9,403,636 (56,621,838)
Cash flows from/ (used in) financing activities 4,264,290 (24,521,481) 5,152,028 (23,342,099) 3,973,932 (24,122,720) 452,881 (2,156,103) 396,688 (3,068,452) 14,239,819 (77,210,855)
Capital expenditure to non current assets - - - - - - - - - - 4,360,302 3,963,792
Depreciation and amortisation expenses 669,363 623,465 808,710 593,479 623,785 613,327 269,497 275,335 442,114 436,874 2,813,469 2,542,480
Being the major customer of the Bank, “Government & State Owned Enterprises (SOEs)’ represents 17% of revenue of the bank,
(2017 : 16%) and included under Retail and Corporate segments. More details are given in the Note 59 - “Related Party Disclosures”.

359
Retail Banking Corporate Banking International, Treasury and
InvestmentGroup Function Unallocated Total
For the year ended 31 December 2018 2017 2018 2017 2018 2017 2018 2017 2018 2017 2018 2017
LKR ’000 LKR ’000 LKR ’000 LKR ’000 LKR ’000 LKR ’000 LKR ’000 LKR ’000 LKR ’000 LKR ’000 LKR ’000 LKR ’000
Revenue from external customers:
Net interest income 37,158,489 28,650,109 17,326,817 19,819,345 10,914,352 9,657,261 3,131,505 3,132,158 158,316 231,229 68,689,479 61,490,102
Net fee and commission income 4,150,452 3,620,346 2,704,421 2,535,209 997,846 810,323 374,367 169,053 566,118 616,150 8,793,204 7,751,081
Other income 3,162,668 3,804,986 5,394,397 516,404 6,164,808 3,872,203 2,949,301 2,344,850 (1,106,996) (995,294) 16,564,178 9,543,149
Total operating income 44,471,609 36,075,441 25,425,635 22,870,958 18,077,006 14,339,787 6,455,173 5,646,061 (382,562) (147,915) 94,046,861 78,784,332
Impairment (charge)/ reversal for loans and other losses (6,134,067) (1,830,794) (8,231,449) (7,780,736) (387,174) 300,000 (156,644) (294,420) (267,138) (278,939) (15,176,472) (9,884,889)
Other operating expenses (21,851,590) (18,829,578) (5,218,986) (4,109,781) (4,952,962) (4,215,509) (4,831,923) (4,046,207) 230,993 496,673 (36,624,468) (30,704,402)
Total expenses (27,985,657) (20,660,372) (13,450,435) (11,890,517) (5,340,136) (3,915,509) (4,988,567) (4,340,627) (36,145) 217,734 (51,800,940) (40,589,291)
Operating profit before taxes on financial services 16,485,952 15,415,069 11,975,200 10,980,441 12,736,870 10,424,278 1,466,606 1,305,434 (418,707) 69,819 42,245,921 38,195,041
Taxes on financial services - - - - - - - - - - (9,818,020) (7,431,502)
Operating profit after taxes on financial services - - - - - - - - - - 32,427,901 30,763,539
Share of profit/ (loss) of associate companies, net of tax - - - - - - 9,269 52,024 - - 9,269 52,024
Profit/ (loss) before income tax 16,485,952 15,415,069 11,975,200 10,980,441 12,736,870 10,424,278 1,475,875 1,357,458 (418,707) 69,819 32,437,170 30,815,563
Income tax expense - - - - - - - - - - (12,922,017) (9,328,918)
Profit for the year - - - - - - - - - - 19,515,153 21,486,645
Total assets 690,006,676 632,145,758 833,652,006 601,742,151 643,023,673 621,865,981 80,509,176 64,420,266 65,731,344 79,236,027 2,312,922,875 1,999,410,183
Total liabilities 653,062,187 596,145,109 789,016,428 567,472,984 608,594,758 586,450,764 69,357,319 52,417,323 60,751,537 74,597,503 2,180,782,229 1,877,083,683
Cash flows from/ (used in) operating activities (12,419,101) 64,442,987 (5,790,965) 44,579,858 (3,647,792) 21,722,177 (1,046,611) 7,045,195 (52,912) 520,104 (22,957,381) 138,310,321
Cash flows from/ (used in) investing activities 5,087,022 (26,381,837) 2,372,053 (18,250,218) 1,494,182 (8,892,681) 428,705 (2,884,180) 21,674 (212,922) 9,403,636 (56,621,838)
Cash flows from/ (used in) financing activities 4,264,290 (24,521,481) 5,152,028 (23,342,099) 3,973,932 (24,122,720) 452,881 (2,156,103) 396,688 (3,068,452) 14,239,819 (77,210,855)
Capital expenditure to non current assets - - - - - - - - - - 4,360,302 3,963,792
Depreciation and amortisation expenses 669,363 623,465 808,710 593,479 623,785 613,327 269,497 275,335 442,114 436,874 2,813,469 2,542,480
Being the major customer of the Bank, “Government & State Owned Enterprises (SOEs)’ represents 17% of revenue of the bank,
(2017 : 16%) and included under Retail and Corporate segments. More details are given in the Note 59 - “Related Party Disclosures”.

360 Bank of Ceylon | Annual Report 2018
NOTES TO THE FINANCIAL STATEMENTS
60.2 Secondary Segment Information - Geographical Segments
Geographical segments provide products or services within a particular economic environment where risk and returns are
different from those of other economic environments.
These segment comprise domestic operations, Offshore Banking Division and Overseas Banking Units.
Bank Group
2018 2017 2018 2017
LKR ’000 % LKR ’000 % LKR ’000 % LKR ’000 %
Assets
Domestic Banking Unit 1,958,935,723 86.4 1,664,741,312 85.3 1,966,996,477 85.1 1,691,932,690 84.6
Offshore Banking Division 259,302,812 11.4 247,929,200 12.7 259,302,812 11.2 247,929,200 12.4
Overseas Banking Units 49,915,859 2.2 39,133,441 2.0 86,623,586 3.7 59,548,293 3.0
Total assets 2,268,154,394 100.0 1,951,803,953 100.0 2,312,922,875 100.0 1,999,410,183 100.0
Total Income
Domestic Banking Unit 194,208,778 87.8 167,072,299 88.3 201,940,015 88.1 174,410,229 88.6
Offshore Banking Division 21,218,379 9.6 17,029,578 9.0 21,218,379 9.2 17,029,578 8.6
Overseas Banking Units 5,704,021 2.6 5,109,518 2.7 6,303,228 2.7 5,573,154 2.8
Total income 221,131,178 100.0 189,211,395 100.0 229,461,622 100.0 197,012,961 100.0
Profit Before Tax
Domestic Banking Unit 22,234,212 69.7 23,545,936 77.6 22,760,796 70.2 24,014,865 78.0
Offshore Banking Division 7,110,700 22.3 4,328,111 14.3 7,110,700 21.9 4,328,111 14.0
Overseas Banking Units 2,547,242 8.0 2,468,933 8.1 2,565,674 7.9 2,472,587 8.0
Total profit before tax 31,892,154 100.0 30,342,980 100.0 32,437,170 100.0 30,815,563 100.0
Profit After Tax
Domestic Banking Unit 12,133,428 62.3 16,562,681 77.7 12,151,420 62.3 16,733,388 77.9
Offshore Banking Division 5,119,704 26.3 3,116,240 14.6 5,119,704 26.2 3,116,240 14.5
Overseas Banking Units 2,225,597 11.4 1,633,363 7.7 2,244,029 11.5 1,637,017 7.6
Total profit after tax 19,478,729 100.0 21,312,284 100.0 19,515,153 100.0 21,486,645 100.0

361
61 Fair Values of Assets and Liabilities Accounting Policy
“Fair value” is the price that would be received to sell an asset or paid to transfer a liability (exit price) in an orderly transaction
between market participants at the measurement date in the principal or, in its absence, the most advantageous market to which
the Group has access at that date. The fair value of a liability reflects its non-performance risk.
The fair value measurement is based on the presumption that the transaction to sell the asset or transfer the liability takes place
either:
- in the principal market for the asset or liability or
- in the absence of a principal market, in the most advantageous market for the asset or liability.
All assets and liabilities for which fair value is measured or disclosed in the Financial Statements are categorised within the fair
value hierarchy, described as follows, based on the lowest level input that is significant to the fair value measurement as a whole:
Level 1 - Valuation technique using quoted market price:
Financial instruments with quoted prices for identical instruments in active markets
Level 2 - Valuation technique using observable inputs:
Financial instruments with quoted prices for similar instruments in active markets or quoted prices for identical or
similar instruments in inactive markets and financial instruments valued using models where all significant inputs
are observable.
Level 3 - Valuation technique with significant unobservable inputs:
Financial instruments valued using valuation techniques where one or more significant inputs are unobservable.
For all financial instruments where fair values are determined by referring to externally quoted prices or observable pricing inputs
to models, independent price determination or validation is obtained. In an inactive market, direct observation of a traded price
may not be possible. In these circumstances, the Bank uses alternative market information to validate the financial instrument’s
fair value, with greater weight given to information that is considered to be more relevant and reliable.
61.1 Assets and Liabilities Measured at Fair Value
Derivative Financial Instruments
All Derivative financial instruments are classified as Held for trading are valued using a valuation technique with market
observable and market unobservable inputs. The most frequently applied valuation technique include forward foreign exchange
spot and forward premiums.

362 Bank of Ceylon | Annual Report 2018
NOTES TO THE FINANCIAL STATEMENTS
Financial Assets Measured at Fair Value through Profit or Loss
Financial instruments are classified as fair value through profit or loss consists Government securities, Quoted debt securities,
Units in units trusts and Quoted equities. Government securities are valued using yield curve published by the Central Bank of
Sri Lanka and the Bank uses quoted market prices in the active market for the valuation of quoted equities and quoted debt
securities as at the Reporting date.Units in units trusts are valued using management buying price of such asset management
company since it is the most relevant exit price of such assets.
Financial Assets Measured at Fair Value through OCI
Financial investments are classified as fair value through OCI consists Government securities, Quoted equities and Unquoted
equities.
- Government securities are valued using yield curve published by the Central Bank of Sri Lanka as at the Reporting date.
- The Bank uses quoted market prices in the active market for the valuation of quoted equities and quote debt securities as at
the Reporting date.
- Unquoted equites are carried at cost except Regional Development Bank investment in shares since it is the most
reasonable value available to represents the price of such securities. Fair value of Regional Development Bank derived using
an internal management valuation technique which details are given in note 61.1.3
Property, Plant and Equipment
Free hold lands and buildings and buildings on leasehold lands are carried at revalued amount less any subsequent
accumulated depreciation and impairment losses.

363
61.1.1 Assets Measured at Fair Value - Fair Value Hierarchy
Bank Group
As at 31 December 2018 Level 1 Level 2 Level 3 Total Level 1 Level 2 Level 3 Total
LKR ’000 LKR ’000 LKR ’000 LKR ’000 LKR ’000 LKR ’000 LKR ’000 LKR ’000
Financial Assets
Derivative Financial Instruments
Forward exchange contracts - 28,897 - 28,897 - 28,897 - 28,897
Currency SWAPs - - 1,176,760 1,176,760 - - 1,176,760 1,176,760
- 28,897 1,176,760 1,205,657 - 28,897 1,176,760 1,205,657
Financial Assets Recognised Through Profit or Loss Measured at Fair Value
Treasury bills 3,533,195 - - 3,533,195 3,533,195 - - 3,533,195
Treasury bonds 632,810 - - 632,810 632,810 - - 632,810
Quoted equities 2,507,508 - - 2,507,508 2,780,491 - - 2,780,491
Other debt securities - - - - 1,715 - - 1,715
Units in unit trusts - 2,603,785 - 2,603,785 - 2,635,116 - 2,635,116
6,673,513 2,603,785 - 9,277,298 6,948,211 2,635,116 - 9,583,327
Financial Assets Measured at Fair Value Through OCI
Quoted investments
Government securities
Treasury bills 4,550,469 - - 4,550,469 5,718,800 - - 5,718,800
Treasury bonds 6,178,278 - - 6,178,278 6,695,168 - - 6,695,168
Other countries 1,587,030 - - 1,587,030 2,663,447 - - 2,663,447
Equities 3,142,087 - - 3,142,087 4,050,702 - - 4,050,702
Unquoted Investments
Equities - 1,012,411 229,306 1,241,717 - 1,012,411 274,671 1,287,082
15,457,864 1,012,411 229,306 16,699,581 19,128,117 1,012,411 274,671 20,415,199
Total financial assets 22,131,377 3,645,093 1,406,066 27,182,536 26,076,328 3,676,424 1,451,431 31,204,183
Non Financial Assets
Property, Plant and Equipment - - 18,458,592 18,458,592 - - 31,291,571 31,291,571
Total Non financial assets - - 18,458,592 18,458,592 - - 31,291,571 31,291,571
Total 22,131,377 3,645,093 19,864,658 45,641,128 26,076,328 3,676,424 32,743,002 62,495,754
Financial Liabilities
Derivative Financial Instruments
Forward exchange contracts - 31,736 - 31,736 - 31,736 - 31,736
Currency SWAPs - - 477,282 477,282 - - 477,282 477,282
Total financial liabilities - 31,736 477,282 509,018 - 31,736 477,282 509,018

364 Bank of Ceylon | Annual Report 2018
NOTES TO THE FINANCIAL STATEMENTS
Bank Group
As at 31 December 2017 Level 1 Level 2 Level 3 Total Level 1 Level 2 Level 3 Total
LKR ’000 LKR ’000 LKR ’000 LKR ’000 LKR ’000 LKR ’000 LKR ’000 LKR ’000
Financial Assets
Derivative Financial Instruments
Forward exchange contracts - 4,288 - 4,288 - 4,288 - 4,288
Currency SWAPs - - 1,614,535 1,614,535 - - 1,614,535 1,614,535
- 4,288 1,614,535 1,618,823 - 4,288 1,614,535 1,618,823
Financial Instruments - Held for Trading
Treasury bills 4,749,058 - - 4,749,058 4,749,058 - - 4,749,058
Treasury bonds 680,380 1,789 - 682,169 680,380 1,789 - 682,169
Sri Lanka sovereign bonds 166,863 - - 166,863 166,863 - - 166,863
Quoted equities 2,761,184 - - 2,761,184 2,993,845 - - 2,993,845
Other debt securities - - - - 4,613 - - 4,613
8,357,485 1,789 - 8,359,274 8,594,759 1,789 - 8,596,548
Financial Investments - Available for Sale
Quoted Investments
Government securities
Treasury bills 4,044,815 - - 4,044,815 4,236,635 - - 4,236,635
Treasury bonds 4,153,858 - - 4,153,858 4,945,270 - - 4,945,270
In other countries 1,478,870 - - 1,478,870 3,718,590 - - 3,718,590
Quoted equities 3,687,567 - - 3,687,567 5,009,964 - - 5,009,964
Unquoted Investments
Units in unit trusts - 3,626,484 - 3,626,484 - 3,660,702 - 3,660,702
Unquoted Equities - 701,859 227,717 929,576 - 701,859 279,272 981,131
13,365,110 4,328,343 227,717 17,921,170 17,910,459 4,362,561 279,272 22,552,292
Total financial assets 21,722,595 4,334,420 1,842,252 27,899,267 26,505,218 4,368,638 1,893,807 32,767,663
Non-Financial Assets
Property, Plant and Equipment - - 18,030,186 18,030,186 - - 30,852,915 30,852,915
- - 18,030,186 18,030,186 - - 30,852,915 30,852,915
Total 21,722,595 4,334,420 19,872,438 45,929,453 26,505,218 4,368,638 32,746,722 63,620,578
Financial Liabilities
Derivative Financial Instruments
Forward exchange contracts - 2,584 - 2,584 - 2,584 - 2,584
Currency SWAPs - - 68,131 68,131 - - 68,131 68,131
Total - 2,584 68,131 70,715 - 2,584 68,131 70,715

365
61.1.2 Movements in Level 3 Assets Measured at Fair Value
The following table shows a reconciliation of the opening and closing amounts of level 3 assets and liabilities which are
recorded at fair value.
Bank Group
As at 1 January
2018
Total Gains/ (losses)
Recorded in Profit or
Loss
Total Gains/ (losses)
Recorded in OCI
Purchases / (Sales)
and Other Adjustments
As at 31 December
2018
As at 1 January
2018
Total Gains/(losses)
Recorded in Profit or
Loss
Total Gains/(losses)
Recorded in OCI
Purchases / (Sales)
and Other Adjustments
As at 31 December
2018
LKR ’000 LKR ’000 LKR ’000 LKR ’000 LKR ’000 LKR ’000 LKR ’000 LKR ’000 LKR ’000 LKR ’000
Financial Assets
Derivative Financial Instruments
Currency SWAPs 1,614,535 - - (437,775 ) 1,176,760 1,614,535 - - (437,775 ) 1,176,760
Financial Assets Measured at Fair Value Through OCI
Unquoted Investments
Unquoted equities 227,717 - - 1,589 229,306 279,272 - (6,190) 1,589 274,671
Total Level 3 financial assets 1,842,252 - - (436,186) 1,406,066 1,893,807 - (6,190) (436,186) 1,451,431
Non Financial Assets
Property, Plant and Equipment 18,030,186 (175,795) (337,522) 941,723 18,458,592
30,852,915 (721,771) 147,397 1,013,030 31,291,571
Total Level 3 assets 19,872,438 (175,795) (337,522) 505,537 19,864,658 32,746,722 (721,771) 141,207 576,844 32,743,002
Financial Liabilities
Currency SWAPs 68,131 - - 409,151 477,282 68,131 - - 409,151 477,282
Total Level 3 financial liabilities 68,131 - - 409,151 477,282 68,131 - - 409,151 477,282
Net Level 3 financial assets 1,774,121 - - (845,337) 928,784 1,825,676 - (6,190) (845,337) 974,149

366 Bank of Ceylon | Annual Report 2018
NOTES TO THE FINANCIAL STATEMENTS
The following table shows a reconciliation of the opening and closing amounts of level 3 assets and liabilities which are
recorded at fair value.
Bank Group
As at 1 January
2017
Total Gains/ (losses)
Recorded in Profit or
Loss
Total Gains/ (losses)
Recorded in OCI
Purchases / (Sales)
and Other Adjustments
As at 31 December
2017
As at 1 January
2017
Total Gains/(losses)
Recorded in Profit or
Loss
Total Gains/(losses)
Recorded in OCI
Purchases / (Sales)
and Other Adjustments
As at 31 December
2017
LKR ’000 LKR ’000 LKR ’000 LKR ’000 LKR ’000 LKR ’000 LKR ’000 LKR ’000 LKR ’000 LKR ’000
Financial Assets
Derivative Financial Instruments
Currency SWAPs 5,291,781 - - (3,677,246) 1,614,535 5,291,781 - - (3,677,246) 1,614,535
Financial investments - available for sale
Unquoted Investments
Unquoted equities 227,717 - - - 227,717 269,027 10,245 - - 279,272
Total Level 3 financial assets 5,519,498 - - (3,677,246) 1,842,252 5,560,808 10,245 - (3,677,246) 1,893,807
Non Financial Assets
Property, Plant and Equipment 11,219,722 (168,343) 6,059,715 919,092 18,030,186
24,164,115 (701,807) 6,406,248 984,359 30,852,915
Total Level 3 assets 16,739,220 (168,343) 6,059,715 (2,758,154) 19,872,438 29,724,923 (691,562) 6,406,248 (2,692,887) 32,746,722
Financial Liabilities
Currency SWAPs 163,453 - - (95,322) 68,131 163,453 - - (95,322) 68,131
Total Level 3 financial liabilities 163,453 - - (95,322) 68,131 163,453 - - (95,322) 68,131
Net Level 3 financial assets 5,356,045 - - (3,581,924) 1,774,121 5,397,355 10,245 - (3,581,924) 1,825,676

367
61.1.3 Unobservable Inputs Used in Measuring Fair Value of Level 3
The table below sets out information about significant unobservable inputs used as at 31 December 2018 in measuring financial
instruments categorised as level 3 in the fair value hierarchy.
Type of Financial Instrument Fair Value As at 31
December 2018
LKR’000
Valuation Technique
Significant Unobservable Inputs
Range of Estimates (Weighted Average) for Unobservable Inputs
Fair Value Measurement Sensitivity to Unobservable Inputs
Derivative Financial Instruments
Currency SWAPs 1,176,760 Forward pricing model
Foreign exchange forward rate.
Negative 0.01 to positive 0.01 basis point.
Unfavourable or favourable impact on derivative assets value of LKR 1.2 million respectively.
Discount for counterparty credit risk.
Financial Assets Measured at Fair Value Through OCI
Unquoted Equity Shares
Regional Development Bank 162,300 Discounted Cash Flow method
Constant Dividend model
Decreased by 5% and increased by 5% for existing cost of capital.
Impact to the fair value will be within negative and positive LKR 8.1 million no significant impact to the investment.
Credit Information Bureau of Sri Lanka
43,131 Value at cost* * Fair value cannot be reliably measured. These are investments in mutual entities that provide transaction processing and transaction services to members on a pricing basis intended to recover the entities operating cost.
Fitch Ratings Lanka Limited 625 Value at cost*
LankaClear (Private) Limited 21,000 Value at cost*
Lanka Financial Services Bureau Limited
2,250 Value at cost*

368 Bank of Ceylon | Annual Report 2018
NOTES TO THE FINANCIAL STATEMENTS
61.2 Fair Value of Assets and Liabilities not Carried at Fair Value
The following table summarised the fair value for assets and liabilities which are not already recorded at fair value in the Financial
Statement.
As at 31 December 2018
Bank Group
Fair Value Carrying
value Fair ValueCarrying
value
Level 1 Level 2 Level 3 Total Level 1 Level 2 Level 3 Total
LKR ’000 LKR ’000 LKR ’000 LKR ’000 LKR ’000 LKR ’000 LKR ’000 LKR ’000 LKR ’000 LKR ’000
Assets
Financial assets at amortised cost
- Debt and Other Instruments
335,143,660 7,444,961 213,772,945 556,361,616 551,839,449
335,321,834 7,324,233 213,828,138 556,474,205 551,956,734
Investment Properties - - 3,000,000 3,000,000 2,765,856 - - 574,309 574,309 120,182
Total 335,143,660 7,444,961 216,772,945 559,361,616 554,605,305 335,321,834 7,324,233 214,402,447 557,048,514 552,076,916
Liabilities
Other borrowings - - 201,792,174 201,792,174 201,792,174 - - 207,053,674 207,053,674 207,053,674
Debt securities issued - - - - - - - 4,105,681 4,105,681
4,105,681
Subordinated liabilities - 38,688,492 11,992,500 50,680,992 50,827,239 - 38,427,596 11,992,500 50,420,096 50,484,487
Total - 38,688,492 213,784,674 252,473,166 252,619,413 - 38,427,596 223,151,855 261,579,451 261,643,842
As at 31 December 2017
Bank Group
Fair Value Carrying
value Fair ValueCarrying
value
Level 1 Level 2 Level 3 Total Level 1 Level 2 Level 3 Total
LKR ’000 LKR ’000 LKR ’000 LKR ’000 LKR ’000 LKR ’000 LKR ’000 LKR ’000 LKR ’000 LKR ’000
Assets
Financial investments- Loans and receivables - 5,580,979 206,818,389 212,399, 368 213,167,048 - 5,426,481 208,155,463 213,581,944 214,349,624
Financial investments- Held to maturity 310,076,948 - - 310,076,948 308,256,082 310,571,183 - - 310,571,183 308,750,317
Investment Properties - - 3,000,000 3,000,000 2,882,928 - - 574,309 574,309 123,773
Total 310,076,948 5,580,979 209,818,389 525,476,316 524,306,058 310,571,183 5,426,481 208,729,772 524,727,436 523,223,714
Liabilities
Other borrowings 77,571,805 - 100,937,256 178,509,061 178,191,089 77,571,805 - 107,076,348 184,648,153 184,330,181
Debt securities issued - - - - - - - 5,667,514 5,667,514 5,667,514
Subordinated liabilities - 32,403,624 10,006,517 42,410,141 42,570,457 - 32,219,550 10,006,517 42,226,067 42,226,067
Total 77,571,805 32,403,624 110,943,773 220,919,202 220,761,546 77,571,805 32,219,550 122,750,379 232,541,734 232,223,762

369
The following describes the methodologies and assumptions used to determine fair values for those assets and liabilities which
are not already recorded at fair value in the Financial Statements.
Financial Assets Measured at Amortised Cost
Financial assets measured at amortised cost comprise Sri Lanka Development Bonds, Government and Corporate debt
securities.
Sri Lanka Development Bonds are variable rate instruments which are re-pricing semi-annually. Hence it is assumed that the
carrying amounts approximate their fair value. Listed corporate debt securities are valued using quoted market price as of the
Reporting date, quoted government debt securities are valued using yield curve published by the Central Bank of Sri Lanka.
and fair value of unquoted corporate debt securities and Government securities are estimated as the present value of future
cash flows expected to be received from such investments calculated based on interest rates at the Reporting date for similar
instruments.
Investment Properties
Investment properties are valued by the independent professional valuers and more details are given in note 33.
Financial Liabilities at Amortised Cost - Other Borrowings
Financial liabilities at amortised cost - other borrowings represent, Term borrowings from banks and other financial institutions
in Sri lanka and abroad and Refinance borrowings.
Fair value of term borrowings and refinance borrowings are estimated by the discounting the future cash flows using effective
interest rates of similar instruments.
Debt Securities Issued
Fair value of debt securities issued are estimated as the present value of future cash flows expected to be paid from such
investments calculated based on interest rates at the Reporting date for similar instruments.
Subordinated Liabilities
Subordinated liabilities are listed in the Colombo Stock Exchange and valued using quoted market price as of the Reporting date.
61.3 Assets and Liabilities for which Fair Value Approximates Carrying Value
For financial assets and liabilities that have a short term maturity, it is assumed that the carrying amounts approximate
their fair value. For certain instruments which have contractual maturity of more than one year, the fair value is determined
using reasonable basis. Given below is the bases adopted by the Bank in order to establish the fair values of such financial
instruments.
Financial Assets at Amortised Cost - Loans and Advances
More than 40% of the total portfolio of loans and advances to customers have a remaining contractual maturity of less than
one year and 95% of balance loans are granted at floating rate. Therefore, fair value of loans and advances to customers
approximates to their carrying value as at the Reporting date.
Financial Liabilities at Amortised Cost - Due to Depositors
More than 90% of the customer deposits are either repayable on demand or have a remaining contractual maturity of less than
one year. Customer deposits with a contractual maturity of more than one year are subject to pre mature upliftment. Amounts
paid to customers in the event of pre mature upliftment would not be materially different to its carrying value as at date.
Therefore fair value of customer deposits approximates to their carrying value as at the Reporting date.

370 Bank of Ceylon | Annual Report 2018
NOTES TO THE FINANCIAL STATEMENTS
As at 31 December 2018 2017
Carrying Amount
Fair Value CarryingAmount
Fair Value
LKR ’000 LKR ’000 LKR ’000 LKR ’000
Bank
Financial Assets
Cash and cash equivalents 78,447,577 78,447,577 72,843,108 72,843,108
Balances with central banks 65,680,371 65,680,371 68,689,012 68,689,012
Placements with banks 40,450,089 40,450,089 8,067,490 8,067,490
Securities purchased under resale agreements - - 18,455,555 18,455,555
Financial assets at amortised cost loans and advances 1,429,107,181 1,429,107,181 1,163,160,914 1,163,160,914
Total financial assets 1,613,685,218 1,613,685,218 1,331,216,079 1,331,216,079
Financial Liabilities
Due to banks 2,402,468 2,402,468 2,203,199 2,203,199
Securities sold under repurchase agreements 97,399,359 97,399,359 44,487,462 44,487,462
Due to depositors 1,765,025,970 1,765,025,970 1,546,832,036 1,546,832,036
Total financial liabilities 1,864,827,797 1,864,827,797 1,593,522,697 1,593,522,697
Group
Financial Assets
Cash and cash equivalents 78,558,031 78,558,031 78,005,362 78,005,362
Balances with central banks 65,680,371 65,680,371 68,689,012 68,689,012
Placements with banks 41,681,910 41,681,910 5,319,602 5,319,602
Securities purchased under resale agreements 1,436,068 1,436,068 19,872,247 19,872,247
Financial assets at amortised cost loans and advances 1,460,618,588 1,460,618,588 1,194,294,394 1,194,294,394
Total financial assets 1,647,974,968 1,647,974,968 1,366,180,617 1,366,180,617
Financial Liabilities
Due to banks 2,515,998 2,515,998 2,194,266 2,194,266
Securities sold under repurchase agreements 97,423,302 97,423,302 44,628,686 44,628,686
Due to depositors 1,783,975,493 1,783,975,493 1,566,376,418 1,566,376,418
Total financial liabilities 1,883,914,793 1,883,914,793 1,613,199,370 1,613,199,370
61.4 Reclassification of Financial Assets and Financial Liabilities
There have been no reclassification during the year 2018.
62 Transition DisclosuresWhen adopting the SLFRS 9, the Bank has applied modified retrospective method in preparing the Annual Financial Statements
for the year ended 31 December 2018. Accordingly, comparative information for the year 2017 has not been restated for financial
instruments within the scope of SLFRS 9. The comparative information for 2017 is reported under LKAS 39 for the relevant
balances.
The impact of adopting SLFRS 9 at transition date, i.e. 1 January 2018 has been adjusted to the opening retained earnings for
the year 2018 and the below note presents the impact having on the financial position as at 1 January 2018.

371
62.1 Reconciliation between the Carrying Amounts under LKAS 39 to the Balances Reported Under SLFRS 9 as at 1 January 2018
Bank
Note
LKAS 3931 December 2017 Reclassification Remeasurement
SLFRS 9 1 January 2018
Category Amount ECL Other Amount Category
LKR ’000 LKR ’000 LKR ’000 LKR ’000 LKR ’000
Financial Assets
Cash and cash equivalents L&R 72,843,108 - (10,905) - 72,832,203 AC
Balances with central banks L&R 68,689,012 - - - 68,689,012 AC
Placements with banks L&R 8,067,490 - (588) - 8,066,902 AC
Securities purchased under resale agreements L&R 18,455,555 - - - 18,455,555 AC
Derivative financial instruments HFT 1,618,823 - - - 1,618,823 FVTPL
Financial assets recognised through profit or loss HFT 8,359,274 3,459,621 - - 11,818,895 FVTPL
From: AFS A - 3,626,484 - - -
To: AC B - (166,863) - - -
Financial assets at amortised cost
- Loans and advances L&R 1,163,160,914 - (9,688,976) - 1,153,471,938 AC
- Debt instruments - 521,589,993 (1,038,872) - 520,551,121 AC
From: FVTPL B - 166,863 - - -
From: L&R C - 213,167,048 - - -
From: HTM D - 308,256,082 - - -
Financial investments - Loans and receivables L&R 213,167,048 (213,167,048) - - -
To: AC C - (213,167,048) - - -
Financial investments - Held to maturity HTM 308,256,082 (308,256,082) - - -
To: AC D - (308,256,082) - - -
Financial assets measured at fair value through other comprehensive income - 14,294,686 - - 14,294,686 FVTOCI
From: AFS E - 14,294,686 - - -
Financial investments - Available for sale AFS 17,921,170 (17,921,170) - - -
To: FVTPL A - (3,626,484) - - -
To: FVTOCI E - (14,294,686) - - -
Non Financial Assets
Investment in subsidiary companies N/A 6,513,048 - - - 6,513,048 N/A
Investment in associate companies N/A 92,988 - - - 92,988 N/A
Investment properties N/A 2,882,928 - - - 2,882,928 N/A
Property, Plant and Equipment N/A 23,046,114 - - - 23,046,114 N/A
Leasehold properties N/A 101,481 - - - 101,481 N/A
Intangible assets N/A 810,730 - - - 810,730 N/A
Other assets N/A 37,818,188 - - - 37,818,188 N/A
Total assets 1,951,803,953 - (10,739,341) - 1,941,064,612

372 Bank of Ceylon | Annual Report 2018
NOTES TO THE FINANCIAL STATEMENTS
Bank
Note
LKAS 3931 December 2017 Reclassification Remeasurement
SLFRS 9 1 January 2018
Category Amount ECL Other Amount Category
LKR ’000 LKR ’000 LKR ’000 LKR ’000 LKR ’000
Financial Liabilities
Due to banks AC 2,203,199 - - - 2,203,199 AC
Securities sold under repurchase agreements AC 44,487,462 - - - 44,487,462 AC
Derivative financial instruments HFT 70,715 - - - 70,715 FVTPL
Financial liabilities at amortised cost
- due to depositers AC 1,546,832,036 - - - 1,546,832,036 AC
- due to debt securities holders AC - - - - - AC
- due to other borrowers AC 178,191,089 - - - 178,191,089 AC
Subordinated liabilities AC 42,570,457 - - - 42,570,457 AC
Non Financial Liabilities
Current tax liabilities N/A 1,877,342 - - - 1,877,342 N/A
Deferred tax liabilities N/A 5,820,329 - (3,345,868) - 2,474,461 N/A
Other liabilities N/A 18,596,249 - - - 18,596,249 N/A
Total liabilities 1,840,648,878 - (3,345,868) - 1,837,303,010
Equity
Share capital N/A 20,000,000 - - - 20,000,000 N/A
Permanent reserve fund N/A 10,427,000 - - - 10,427,000 N/A
OCI reserve N/A - 2,541,656 - - 2,541,656 N/A
From: AFS reserve E - 2,541,656 - - -
Available for sale reserve N/A 3,718,526 (3,718,526) - - - N/A
To: OCI reserve E - (2,541,656) - - -
To: Retained earnings A - (1,176,870) - - -
Retained earnings N/A 63,472,250 1,176,870 (7,393,473) - 57,255,647 N/A
From: AFS reserve A - 1,176,870 - - -
Other reserves N/A 13,537,299 - - - 13,537,299 N/A
Total equity 111,155,075 - (7,393,473) - 103,761,602
Total liabilities and equity 1,951,803,953 - (10,739,341) - 1,941,064,612
L&R - Loans & Receivables, HFT - Held for Trading, AFS - Available for Sale, HTM - Held to Maturity, AC - Amortised cost, FVTPL - Fair
value through P&L, FVTOCI - Fair Value through Other Comprehensive Income, N/A - Not Applicable.

373
Group
Note
LKAS 3931 December 2017 Reclassification Remeasurement
SLFRS 9 1 January 2018
Category Amount ECL Other Amount Category
LKR ’000 LKR ’000 LKR ’000 LKR ’000 LKR ’000
Financial Assets Cash and cash equivalents L&R 78,005,362 - (10,916) - 77,994,446 ACBalances with central banks L&R 68,689,012 - - - 68,689,012 ACPlacements with banks L&R 5,319,602 - (934) - 5,318,668 ACSecurities purchased under resale agreements L&R 19,872,247 - - - 19,872,247 ACDerivative financial instruments HFT 1,618,823 - - - 1,618,823 FVTPLFinancial assets recognised through profit or loss HFT 8,596,548 3,459,621 - - 12,056,169 FVTPL
From: AFS A - 3,626,484 - - - To: AC B - (166,863) - - -
Financial assets at amortised cost - Loans and advances L&R 1,194,294,394 - (10,771,427) - 1,183,522,967 AC- Debt instruments - 523,266,804 (1,039,648) - 522,227,156 ACFrom: FVTPL B - 166,863 - - - From: L&R C - 214,349,624 - - - From: HTM D - 308,750,317 - - -
Financial investments - Loans and receivables L&R 214,349,624 (214,349,624) - - -
To: AC C - (214,349,624) - - Financial investments - Held to maturity HTM 308,750,317 (308,750,317) - - -
To: AC D - (308,750,317) - - - Financial assets measured at fair value through other comprehensive income - 18,925,808 - - 18,925,808 FVTOCI
From: AFS E - 18,925,808 - - - Financial investments - Available for sale AFS 22,552,292 (22,552,292) - - -
To: FVTPL A - (3,626,484) - - - To: FVTOCI E - (18,925,808) - - -
Non Financial Assets Investment in subsidiary companies N/A - - - - - N/AInvestment in associate companies N/A 446,793 - - - 446,793 N/AInvestment properties N/A 123,773 - - - 123,773 N/AProperty, Plant and Equipment N/A 36,608,919 - - - 36,608,919 N/ALeasehold properties N/A 134,441 - - - 134,441 N/AIntangible assets N/A 1,074,436 - - - 1,074,436 N/ADeferred tax assets N/A 8,621 - - - 8,621 N/A
Other assets N/A 38,964,979 - - - 38,964,979 N/A
Total assets 1,999,410,183 - (11,822,925) - 1,987,587,258

374 Bank of Ceylon | Annual Report 2018
NOTES TO THE FINANCIAL STATEMENTS
Group
Note
LKAS 3931 December 2017 Reclassification Remeasurement
SLFRS 9 1 January 2018
Category Amount ECL Other Amount Category
LKR ’000 LKR ’000 LKR ’000 LKR ’000 LKR ’000
Financial Liabilities
Due to banks AC 2,194,266 - - - 2,194,266 AC
Securities sold under repurchase agreements AC 44,628,686 - - - 44,628,686 AC
Derivative financial instruments HFT 70,715 - - - 70,715 FVTPL
Financial liabilities at amortised cost
- due to depositers AC 1,566,376,418 - - - 1,566,376,418 AC
- due to debt securities holders AC - - - - - AC
- due to other borrowers AC 184,330,181 - - - 184,330,181 AC
Debt securities issued AC 5,667,514 - - - 5,667,514 AC
Subordinated liabilities AC 42,226,067 - - - 42,226,067 AC
Non Financial Liabilities
Current tax liabilities N/A 2,051,020 - - - 2,051,020 N/A
Deferred tax liabilities N/A 8,625,219 - (3,648,954) - 4,976,265 N/A
Insurance provision - Life N/A 547,026 - - - 547,026 N/A
Insurance provision - Non life N/A 430,093 - - - 430,093 N/A
Other liabilities N/A 19,936,478 - - - 19,936,478 N/A
Total liabilities 1,877,083,683 - (3,648,954) - 1,873,434,729
Equity
Share capital N/A 20,000,000 - - - 20,000,000 N/A
Permanent reserve fund N/A 10,427,000 - - - 10,427,000 N/A
OCI reserve N/A - 3,583,746 - - 3,583,746 N/A
From: AFS reserve E - 3,583,746 - - -
Available for sale reserve N/A 4,760,616 (4,760,616) - - - N/A
To: OCI reserve E - (3,583,746) - - -
To: Retained earnings A - (1,176,870) - - -
Retained earnings N/A 65,100,871 1,176,870 (7,974,866) - 58,302,875 N/A
From: AFS reserve A - 1,176,870 - - -
Other reserves N/A 21,110,638 - - - 21,110,638 N/A
Non controlling interest N/A 927,375 - (199,105) - 728,270 N/A
Total equity 122,326,500 - (8,173,971) - 114,152,529
Total liabilities and equity 1,999,410,183 - (11,822,925) - 1,987,587,258
L&R - Loans & Receivables, HFT - Held for Trading, AFS - Available for Sale, HTM - Held to Maturity, AC - Amortised Cost, FVTPL - Fair
Value Through P&L, FVTOCI - Fair Value through Other Comprehensive Income, N/A - Not Applicable.

375
A. Investments in unit trusts previously classified under available for sale category have been reclassified under financial assets
fair value through profit or loss since the unit trusts are not met the “Solely Payments of Principal and Interest” (SPPI) criterion.
Accordingly, fair value gain recognosed through mark to market of unit trust so far under AFS reserve was transfrred to retained
earnings.
B. Financial investments in soverign bond previously classified as held for trading have been reclassified as debt instruments at
amortised cost in line with change in the business model. These instruments met the “Solely Payments of Principal and Interest”
(SPPI) criterion and they were held with the intention to collect contractual cash flows.
C/D. Financial assets previously classified as financial investments - loans and receivables and financial investments - held to maturity
have been reclassified as debt instruments at amortised cost. These instruments met the “Solely Payments of Principal and
Interest” (SPPI) criterion and they were held with the intention to collect contractual cash flows and without the intention to sell.
E. Financial assets Government securities, quoted and unquoted equities previously classified under available for sale category
have been reclassified as financial assets fair value through other comprehensive income (FVOCI). Accordingly, mark to market
gain recognised under AFS reserve was transferred to OCI reserve.
63 Risk Management63.1 Introduction
63.1.1 Overview
Risk is inherent in the Bank’s activities and mainly exposed to following risks from engage in financial transactions:
- Credit risk
- Market risk
- Operational risk
- Liquidity risk
The management of risk is done through a process of identification, measurement and monitoring subject to risk limits.Financial
risk together with other material risks faced by the bank including stretegic, reputational,compliance and legal risks are managed
and overseen as a part of the Bank’s corporate governance and Risk Management Frame work. Information presented in this
note is about the exposures to risks given above and the processes of measuring and managing such risks.
63.1.2 Group Risk Management
Bank of Ceylon group consist of 10 financial and non financial subsidiaries and four associate companies.The principal activities
of the group is spread over diverse range. The affairs of subsidiaries & associates do not have significant impact to the risk
management due to size of the balance sheet of them.
Albeit the Bank is managing the strategic risk through comprehensive review of group activities on a quarterly basis which
are oversean by the IRMC. The Bank closely involves in risk and audit affairs of subsidiaries by appointing memebrs of senior
management of the Bank as members of the boards of such companies. On special circumstances Internal Auditor of the Bank
carry out audits in subsidiaries.

376 Bank of Ceylon | Annual Report 2018
NOTES TO THE FINANCIAL STATEMENTS
63.1.3 Risk Management Framework
Risk management governance structure of the Bank begins with oversight by the Board of Directors, which assures the
performance of overall risk management framework. The Risk Management Policies and Risk Appetite of the Bank establish the
strategic direction and a holistic approach to overall risk management of the Bank.
The Bank’s Independent Integrated Risk Management Division (IIRMD) is headed by the Chief Risk Officer (CRO), who directly
reports to the Integrated Risk Management Committee (IRMC), which is a subcommittee of the Board. CRO is also a member of
management level committees such as Credit Committee, Asset and Liability Management Committee (ALCO), Operational Risk
Management Executive Committee (ORMEC), IT Steering Committee, Fraud Risk Management Committee and Non Performing
Advances Monitoring Committee, which assist in managing various risks that the Bank is exposed to.
The Internal Audit function of the Bank independently monitors and evaluates the risk management function of the Bank and
provides their views on risk management to the Audit Committee.
63.1.4 Risk Measurement, Reporting and Mitigation
Risks are measured using various rigorous methods and tools with respect to credit, market, operational and liquidity.
Measurement methods make use of probabilities derived from historical experience, adjusted to reflect the real environment. The
Bank also carry out stress testing based on worst-case scenarios which are plausible.
In addition, the Internal Capital Adequacy Assessment Process (ICAAP) sets out the framework for the Bank’s internal capital
planning and the process provides an assurance that the Bank has adequate capital to support all risks as per the business
profile.
As a part of its overall risk management, the Bank uses several mitigation techniques and strategies to reduce the risk. In
managing credit risk, the Bank uses comprehensive pre sanctioning and post sanctioning techniques. Collaterals are used to
further mitigate losses. Market risk is mitigated using derivative instruments in limited context. Strong internal control mechanism
is in place to manage operational risks and insurance is used as an operational risk transfer strategy where necessary.
63.2 Credit Risk
Credit risk is defined as potential losses arising due to a counterparty to a credit transaction failing to meet his/ her obligations in
accordance with agreed terms. Credit risk can take the form of default and concentration.
63.2.1 Management of Credit Risk
Credit risk management policy lays down the conditions and guidelines for granting, maintenance, monitoring and management
of credit at both the transaction and portfolio levels. Credit risk management function is independent from business divisions and
credit decision standards, processes and principles are consistently applied in corporate segment and retail segment. In order to
get rid of concentration risk a diversified credit portfolio is maintained by assessing and managing borrower and industry specific
concentration against risk appetite. The Bank has a range of strategies and processes to actively mitigate credit risks.
The Bank has a well established process for approving new credit and for the renewal of existing credit. All the potential credit
exposures of the bank are first evaluated by transaction originators who are the risk owners of the credit mechanism. Credit
proposals exceeding a certain threshold are independently reviewed by the Chief Risk Officer.
Rating models are a key input by which the credit risk in portfolios is managed, measured and monitored. The Bank uses a range of credit risk rating models across the corporate and mid corporate portfolios covering the different industries the customers are in. Retail exposures are managed through number of retail score cards.
Procedures are also in place to identify the credit exposures for which there may be an increased risk of loss at an early stage.

377
In order to reduce potential credit losses and to increase the recovery of obligations credit risk mitigants are applied. Post sanctioning review of large credit exposures is carried out periodically to ensure proper documentation, adherence to the covenants imposed and quality of the loan book.
Collateral is used for credit risk mitigation purposes and minimises losses that would otherwise be incurred. Collateral may take various forms depending on the type of borrower, the assets available, the structure and the term of credit obligations. Collateral is subject to regular valuation as prescribed in the relevant governing policies and standards.
According to the SLFRS 9, the incurred losses, as well as the expected credit losses need to be taken into consideration when providing for credit risk.
63.2.1.1 Calculation of Expected Credit Losses Expected credit loss (ECL) represents the default events over an expected life time of the financial assets. Expected Credit Losses (ECLs) are calculated using three main components, i.e. a Probability of Default (PD), a Loss Given Default (LGD) and Exposure at Default (EAD). These parameters are generally derived from internally developed statistical models combined with historical, current and forward-looking customer and macro-economic data.
SLFRS 9 introduces a three stage model for impairment of financial assets that are performing at the stage of origination or purchase. Three stage model for impairment is based on the changes in the credit quality since initial recognition. At initial recognition, financial assets which are not credit impaired are reflected in stage 1. If there is a significant increase in the credit risk, such financial assets are transferred to stage 2. Significant increase in the credit risk is defined using pre-determined credit risk indicators which are stated in the bank’s impairment policy. In case of a default, financial assets are classified as stage 3.
63.2.1.2 Incorporation of Forward-looking InformationThe Bank has established an expert panel who considers a range of relevant forward-looking macro-economic assumptions for the determination of unbiased general industry adjustments and any related specific industry adjustments, that support the calculation of ECLs.
63.2.2 Maximum Exposure to Credit Risk63.2.2.1 Collateral and Other Credit Enhancements
The Bank obtains different types of collaterals from the counterparties as a credit risk mitigant. The amount and the types of the collateral required depend on credit risk assessment of the counterparty. The acceptability of the collateral and valuation is determined based on the guidelines issued by the regulator and the Bank’s policy. The main types of collateral obtained are:
- For commercial lending - charges over movable and immovable properties
- For personal lending - mortgages over movable and immovable properties, cash & cash equivalents and gold articles
- For Government & State Owned Enterprises - Government guarantees
- For reverse repurchase transactions - Government securities

378 Bank of Ceylon | Annual Report 2018
NOTES TO THE FINANCIAL STATEMENTS
The Bank monitors the market value of collateral and will request additional collateral in accordance with the underlying agreement. It is the Bank’s policy to dispose of repossessed properties in an orderly fashion. The proceeds are used to reduce or repay the outstanding claim. In general, the Bank does not occupy repossessed properties for business use. The following table shows the maximum exposure to credit risk, total fair value of collateral, any surplus collateral and the net
exposure to credit risk.
63.2.2.2 Type of Collateral or Credit Enhancements
31st December 2018
Fair value of collateral and credit enhancements held
Maximum exposure to
credit risk
Cash Gold GoSLSecurities /Guarantees
Movables Property Others SurplusCollateral
Net Collateral
Netexposure
LKR ’000 LKR ’000 LKR ’000 LKR ’000 LKR ’000 LKR ’000 LKR ’000 LKR ’000 LKR ’000 LKR ’000
Cash and cash equivalents 78,447,577 38,383,013 - - - - - - 38,383,013 40,064,564
Balances with Central Banks 65,680,371 65,680,371 - - - - - - 65,680,371 -
Placements with banks 40,450,089 - - - - - - - - 40,450,089
Derivative financial instruments 1,205,657 - - - - - - - - 1,205,657
Financial assets recognised through profit or loss/ Held for trading - measured at fair value 9,277,298 - - 4,166,005 - - - - 4,166,005 5,111,293
Financial assets at amortised cost - loans and advances
1,510,534,078 82,885,527 61,523,186 348,318,695 149,613,014 287,858,492 80,344,939
(111,864,107) 898,679,746 611,854,332
Less : Impairment (81,426,897) - - - - - - - - (81,426,897)
Financial assets at amortised cost - debt and other instruments 553,624,323 - - 545,456,087 - - - - 545,456,087 8,168,236
Less : Impairment (1,784,874) - - - - - - - - (1,784,874)
Financial assets measured at fair value through OCI/ Available for sale 16,699,582 - - 9,677,543 - - - - 9,677,543 7,022,039
Total 2,192,707,204 186,948,911 61,523,186 907,618,330 149,613,014 287,858,492 80,344,939 (111,864,107) 1,562,042,765 630,664,439

379
31st December 2017
Fair value of collateral and credit enhancements held
Maximum exposure to
credit risk
Cash Gold GoSLSecurities /Guarantees
Movables Property Others SurplusCollateral
Net Collateral
Netexposure
LKR ’000 LKR ’000 LKR ’000 LKR ’000 LKR ’000 LKR ’000 LKR ’000 LKR ’000 LKR ’000 LKR ’000
Cash and cash equivalents 72,843,108 41,774,986 - - - - - - 41,774,986 31,068,122
Balances with Central Banks 68,689,012 68,689,012 - - - - - - 68,689,012 -
Placements with banks 8,067,490 - - - - - - - - 8,067,490
Derivative financial instruments 1,618,823 - - - - - - - - 1,618,823
Securities purchased under resale agreements 18,455,555 - - 18,455,555 - - - - 18,455,555 -
Financial assets - Held for trading 8,359,274 - - 5,598,090 - - - - 5,598,090 2,761,184
Financial investments - Loans and receivable 213,167,048 - - 206,756,877 - - - - 206,756,877 6,410,171
Loans and advances to customers
1,219,914,481 66,872,015 49,660,188 310,703,980 108,434,274 213,153,077 66,655,828 (97,502,880) 717,976,482 501,937,999
Less : Impairment (56,753,567) - - - - - - - - (56,753,567)
Financial investments - Available for sale 17,921,170 - - 9,677,543 - - - - 9,677,543 8,243,627
Financial investments - Held to maturity 308,256,082 - - 256,069,541 - - - - 256,069,541 52,186,541
Total 1,880,538,476 177,336,013 49,660,188 807,261,586 108,434,274 213,153,077 66,655,828 (97,502,880) 1,324,998,086 555,540,390
63.2.3 Credit quality by class of financial assets
Based on the credit quality, the financial assets can be classified mainly into three categories i.e. neither past due nor impaired,
past due but not individually impaired and individually impaired.
The table below shows the credit quality by class of asset for all financial assets exposed to credit risk. High grade consist of
assets and advances granted to GoSL and loans and advances granted to corporate borrowers whose internal credit ratings are
AAA, AA or A. Standard grade consists of loans and advances to corporate borrowers whose internal credit ratings are BBB, BB
or B. Substandard grade includes corporate borrowers whose credit ratings are C or D.

380 Bank of Ceylon | Annual Report 2018
NOTES TO THE FINANCIAL STATEMENTS
Credit quality by class of financial assets
As at 31 December 2018
Neither past due/ Nor impaired Past due but not individually impaired Individually impaired
Total
High grade Standard grade Sub-standard grade Grades not allocated/ Un rated
LKR ’000 LKR ’000 LKR ’000 LKR ’000 LKR ’000 LKR ’000 LKR ’000
Stage 1 Stage 2 Stage 3 Stage 1 Stage 2 Stage 3 Stage 1 Stage 2 Stage 3 Stage 1 Stage 2 Stage 3 Stage 1 Stage 2 Stage 3 Stage 3
Cash and cash equivalents 50,520,582 - - - - - - - - 27,934,107 - - - - - - 78,454,689
Less : Impairment - - - - - - - - - - - - - - - - (7,112)
Balances with Central Banks 59,405,543 - - - - - - - - 6,274,828 - - - - - - 65,680,371
Placements with banks 1,108,583 - - - - - - - - 39,364,814 - - - - - - 40,473,397
Less : Impairment - - - - - - - - - - - - - - - - (23,308)
Derivative financial instruments
1,205,657 - - - - - - - - - - - - - - - 1,205,657
Financial assets recognised through profit or loss/ Held for trading - measured at fair value
4,166,005 - - - - - - - - 5,111,293 - - - - - - 9,277,298
Financial assets at amortised cost - loans and advances
354,752,816 17,556,991 10,473,463 121,895,086 16,809,553 5,562,062 40,292,350 14,288,377 3,627,545 503,223,258 12,578,941 2,947,153 274,627,225 17,294,145 19,401,017 95,204,096 1,510,534,078
Less : Impairment - - - - - - - - - - - - - - - - (81,426,897)
Financial assets at amortised cost - debt and other instruments
545,456,087 - - - - - - - - 8,168,236 - - - - - - 553,624,323
Less : Impairment - - - - - - - - - - - - (1,784,874)
Financial assets measured at fair value through OCI/ Available for sale
12,315,778 - - - - - - - - 4,383,804 - - - - - - 16,699,582
Total 1,028,931,051 17,556,991 10,473,463 121,895,086 16,809,553 5,562,062 40,292,350 14,288,377 3,627,545 594,460,340 12,578,941 2,947,153 274,627,225 17,294,145 19,401,017 95,204,096 2,192,707,204
Age analysis of past due (i.e. facilities in arrears of 1 day and above) but not impaired loans by class of Financial Assets
Age analysis of past due but not impaired loans
Past due but not impaired
Less than30 days
LKR ’000
30 to 60days
LKR ’000
60 to 90days
LKR ’000
90 to 180 days
LKR ’000
180 daysand overLKR ’000
TotalLKR ’000
Loans and advances to customers 131,638,901 127,257,253 12,542,122 6,555,227 33,328,884 311,322,387
Representation of stage 1 assets amount to 91% of Bank's total assets and high grade assets amount to 47% of total assets.

381
Credit quality by class of financial assets
As at 31 December 2018
Neither past due/ Nor impaired Past due but not individually impaired Individually impaired
Total
High grade Standard grade Sub-standard grade Grades not allocated/ Un rated
LKR ’000 LKR ’000 LKR ’000 LKR ’000 LKR ’000 LKR ’000 LKR ’000
Stage 1 Stage 2 Stage 3 Stage 1 Stage 2 Stage 3 Stage 1 Stage 2 Stage 3 Stage 1 Stage 2 Stage 3 Stage 1 Stage 2 Stage 3 Stage 3
Cash and cash equivalents 50,520,582 - - - - - - - - 27,934,107 - - - - - - 78,454,689
Less : Impairment - - - - - - - - - - - - - - - - (7,112)
Balances with Central Banks 59,405,543 - - - - - - - - 6,274,828 - - - - - - 65,680,371
Placements with banks 1,108,583 - - - - - - - - 39,364,814 - - - - - - 40,473,397
Less : Impairment - - - - - - - - - - - - - - - - (23,308)
Derivative financial instruments
1,205,657 - - - - - - - - - - - - - - - 1,205,657
Financial assets recognised through profit or loss/ Held for trading - measured at fair value
4,166,005 - - - - - - - - 5,111,293 - - - - - - 9,277,298
Financial assets at amortised cost - loans and advances
354,752,816 17,556,991 10,473,463 121,895,086 16,809,553 5,562,062 40,292,350 14,288,377 3,627,545 503,223,258 12,578,941 2,947,153 274,627,225 17,294,145 19,401,017 95,204,096 1,510,534,078
Less : Impairment - - - - - - - - - - - - - - - - (81,426,897)
Financial assets at amortised cost - debt and other instruments
545,456,087 - - - - - - - - 8,168,236 - - - - - - 553,624,323
Less : Impairment - - - - - - - - - - - - (1,784,874)
Financial assets measured at fair value through OCI/ Available for sale
12,315,778 - - - - - - - - 4,383,804 - - - - - - 16,699,582
Total 1,028,931,051 17,556,991 10,473,463 121,895,086 16,809,553 5,562,062 40,292,350 14,288,377 3,627,545 594,460,340 12,578,941 2,947,153 274,627,225 17,294,145 19,401,017 95,204,096 2,192,707,204
Age analysis of past due (i.e. facilities in arrears of 1 day and above) but not impaired loans by class of Financial Assets
Age analysis of past due but not impaired loans
Past due but not impaired
Less than30 days
LKR ’000
30 to 60days
LKR ’000
60 to 90days
LKR ’000
90 to 180 days
LKR ’000
180 daysand overLKR ’000
TotalLKR ’000
Loans and advances to customers 131,638,901 127,257,253 12,542,122 6,555,227 33,328,884 311,322,387
Representation of stage 1 assets amount to 91% of Bank's total assets and high grade assets amount to 47% of total assets.

382 Bank of Ceylon | Annual Report 2018
NOTES TO THE FINANCIAL STATEMENTS
Credit quality by class of financial assets
As at 31 December 2017
Neither past due/Nor impaired
High grade
LKR ’000
Standardgrade
LKR ’000
Sub-standardgrade
LKR ’000
Grades notallocated/ Un
ratedLKR ’000
Past due butnot individually
impairedLKR ’000
Individuallyimpaired
LKR ’000
Total
LKR ’000
Cash and cash equivalents 54,204,723 - - 18,638,385 - - 72,843,108
Balances with Central Banks 68,689,012 - - - - - 68,689,012
Placements with banks 8,067,490 - - - - - 8,067,490
Securities purchased under resale agreements 18,455,555 - - - - - 18,455,555
Derivative financial instruments 1,618,823 - - - - - 1,618,823
Financial assets - Held for trading 5,598,090 - - 2,761,184 - - 8,359,274
Financial investments - Loans and receivable 206,756,877 - - 6,410,171 - - 213,167,048
Loans and advances to customers 314,509,110 104,311,326 34,810,132 463,277,623 239,218,214 63,788,076 1,219,914,481
Less : Impairment - - - - - - (56,753,567)
Financial investments - Available for sale 9,677,543 - - 8,243,627 - - 17,921,170
Financial investments - Held to maturity 256,069,541 - - 52,186,541 - - 308,256,082
Total 943,646,764 104,311,326 34,810,132 551,517,531 239,218,214 63,788,076 1,880,538,476

383
Aging analysis of past due (i.e. facilities in arrears of 1 day and above) but not impaired loans by class of financial assets
Age analysis of past due but not impaired loans
Past due but not individually impaired
Less than30 days
LKR ’000
30 to 60days
LKR ’000
60 to 90days
LKR ’000
90 to 180 days
LKR ’000
180 daysand overLKR ’000
TotalLKR ’000
Loans and advances to customers 124,756,928 74,175,997 6,216,779 2,644,976 31,423,534 239,218,214
63.2.4 Analysis of Risk Concentration
Concentration risk in credit portfolios arises due to an uneven distribution of bank loans to individual borrowers, industry,
sector or geographical regions. In managing the concentration risk the bank uses the Herfindahl-Harischman Index (HHI) as a
measurement tool. The Bank has established appropriate limits to maintain concentration risk at an acceptable level.
Country wise exposure
The Bank has established branches in three countries i.e. India, Maldives, and Seychelles through which the bank mainly
maintains exposures outside Sri Lanka. Bank also has a fully owned subsidiary operating in United Kingdom (UK). All overseas
branches are operating with pre-set limits (credit limits as well as country limits) which are approved by the Board of Directors.
Exposures in other countries include placements with banks and nostro account balances with correspondent banks whose
risks are managed through Board approved limits.

384 Bank of Ceylon | Annual Report 2018
NOTES TO THE FINANCIAL STATEMENTS
Country Wise Exposure
31st December 2018 Sri Lanka UK Maldives India USA Seychelles
Other Countries Total
LKR ’000 LKR ’000 LKR ’000 LKR ’000 LKR ’000 LKR ’000 LKR ’000 LKR ’000
Financial Assets
Cash and cash equivalents 41,535,889 309,411 8,984,693 91,690 8,393,595 34,515 19,097,784 78,447,577
Balances with Central Banks 58,989,444 - 5,626,366 752,166 - 312,395 - 65,680,371
Placements with banks 1,108,583 39,341,506 - - - - - 40,450,089
Securities purchased under resale agreements - - - - - - - -
Derivative financial instruments 1,205,657 - - - - - - 1,205,657
Financial assets recognised through profit or loss/ measured at fair value 9,277,298 - - - - - - 9,277,298
Financial assets at amortised cost - loans and advances
1,394,444,291 - 25,186,543 7,932,346 - 1,544,001 -
1,429,107,181
Financial assets at amortised cost - debt and other instruments 542,982,435 - 8,857,014 - - - - 551,839,449
Financial assets measured at fair value through OCI 15,112,551 1,587,031 16,699,582
Total 2,064,656,148 39,650,917 48,654,616 10,363,233 8,393,595 1,890,911 19,097,784 2,192,707,204
Financial Liabilities
Due to banks 1,395,256 - - 1,007,212 - - - 2,402,468
Securities sold under repurchase agreements 97,399,359 - - - - - - 97,399,359
Derivative financial instruments 509,018 - - - - - - 509,018
Financial liabilities at amortised cost ‘- due to depositors
1,717,499,151 - 39,167,235 6,028,423 - 2,331,161 -
1,765,025,970
Financial liabilities at amortised cost ‘- other borrowings 201,792,174 - - - - - - 201,792,174
Debt securities issued - - - - - - -
Subordinated liabilities 50,827,239 - - - - - - 50,827,239
Total liabilities 2,069,422,197 - 39,167,235 7,035,635 - 2,331,161 - 2,117,956,228

385
31st December 2017 Sri Lanka UK Maldives India USA Seychelles
Other Countries Total
LKR ’000 LKR ’000 LKR ’000 LKR ’000 LKR ’000 LKR ’000 LKR ’000 LKR ’000
Financial Assets
Cash and cash equivalents 40,187,549 13,988,645 8,448,677 85,582 6,870,236 77,092 3,185,327 72,843,108
Balances with Central banks 64,800,808 - 3,239,492 165,035 - 483,677 - 68,689,012
Placements with banks 4,399,061 3,037,776 - 630,653 - - - 8,067,490
Securities purchased under resale agreements 18,455,555 - - - - - - 18,455,555
Derivative financial instruments 1,618,823 - - - - - - 1,618,823
Financial instruments - Held for trading 8,359,274 - - - - - - 8,359,274
Financial investments - Loans and receivable 206,448,353 - 6,718,695 - - - - 213,167,048
Loans and advances to customers 1,133,450,152 - 21,525,646 6,967,240 - 1,217,876 -
1,163,160,914
Financial investments - Available for sale 16,442,300 - - 1,478,870 - - - 17,921,170
Financial investments - Held to maturity 308,256,082 - - - - - - 308,256,082
Total assets 1,802,417,957 17,026,421 39,932,510 9,327,380 6,870,236 1,778,645 3,185,327 1,880,538,476
Financial Liabilities
Due to depositors 1,583,334 - - 619,865 - - - 2,203,199
Securities sold under resale agreements 44,487,462 - - - - - - 44,487,462
Derivative financial instruments 70,715 - - - - - - 70,715
Due to depositors 1,510,562,066 - 30,301,978 4,368,004 - 1,599,988 -
1,546,832,036
Other borrowings 36,176,514 - - 13,171 - - 142,001,404 178,191,089
Debt securities issued - - - - - - - -
Subordinated liabilities 42,570,457 - - - - - - 42,570,457
Total 1,635,450,548 - 30,301,978 5,001,040 - 1,599,988 142,001,404 1,814,354,958

386 Bank of Ceylon | Annual Report 2018
NOTES TO THE FINANCIAL STATEMENTS
The Bank’s portfolio is well diversified with in the sectors and all exposures were maintained within the set HHI during the year.
Sector Wise Exposure
31 December 2018 Agriculture
andFisheries
BankingFinance and
Insurance
HotelsTravels and
Services
Housing,Construction
and Infrastructure Manufacturing
CommercialTrade
Sovereign And Direct
Government
Transportationand
Logistics
OtherCommercial
Services
Consumptionand
Others Total
LKR ’000 LKR ’000 LKR ’000 LKR ’000 LKR ’000 LKR ’000 LKR ’000 LKR ’000 LKR ’000 LKR ’000 LKR ’000
Cash and cash equivalents - 12,137,568 - - - - - - - 66,310,009 78,447,577
Balances with central banks - - - - - - 65,680,371 - - - 65,680,371
Placements with banks - 40,450,089 - - - - - - - - 40,450,089
Securities purchased under resale agreements - - - - - - - - - - -
Derivative financial instruments - 1,205,657 - - - - - - - - 1,205,657
Financial assets recognised through profit or loss - measured at fair value 76,174 2,665,858 280,829 67,996 301,685 142,914 4,088,980 67,662 204,381 1,380,819 9,277,298
Financial assets at amortised cost - loans and advances 97,665,643 49,554,107 80,010,561 338,744,805 74,048,479 193,122,916 219,760,013 140,006,311 48,335,126 269,286,117 1,510,534,078
Less : Impairment - - - - - - - - - - (81,426,897)
Financial assets at amortised cost - debt and other instruments - 676,557 - - - 7,491,679 543,671,213 - - - 551,839,449
Financial assets measured at fair value through OCI - 3,142,087 - - - 1,241,718 12,315,777 - - - 16,699,582
97,741,817 109,831,923 80,291,390 338,812,801 74,350,164 201,999,227 845,516,354 140,073,973 48,539,507 336,976,945 2,192,707,204
31 December 2017 Agriculture
andFisheries
BankingFinance and
Insurance
HotelsTravels and
services
Housing,Construction
and infrastructure Manufacturing
Commercialtrade
Sovereign and direct
government
Transportationand
logistics
Othercommercial
services
Consumptionand
others Total
LKR ’000 LKR ’000 LKR ’000 LKR ’000 LKR ’000 LKR ’000 LKR ’000 LKR ’000 LKR ’000 LKR ’000 LKR ’000
Cash and cash equivalents - 12,429,737 - - - - - - - 60,413,371 72,843,108
Balances with central banks - - - - - - 68,689,012 - - - 68,689,012
Placements with banks - 8,067,490 - - - - - - - - 8,067,490
Securities purchased under resale agreements - - - - - - 18,455,555 - - - 18,455,555
Derivative financial instruments - 1,618,823 - - - - - - - - 1,618,823
Financial instruments - Held to trading 86,206 78,045 333,067 100,104 1,099,754 889,668 5,598,090 84,911 89,429 - 8,359,274
Financial investments - Loans and receivable - 5,641,373 - - - 768,799 206,756,876 - - - 213,167,048
Loans and advances to customers 91,074,381 31,480,730 53,637,678 262,592,679 70,781,133 209,406,599 108,058,736 89,891,385 31,716,190 271,274,970 1,219,914,481
Less : Impairment - - - - - - - - - - (56,753,567)
Financial investments - Available for sale - 8,243,627 - - - - 8,198,673 - - 1,478,870 17,921,170
Financial investments - Held to maturity - - - - - - 308,256,082 - - - 308,256,082
91,160,587 67,559,825 53,970,745 262,692,783 71,880,887 211,065,066 724,013,024 89,976,296 31,805,619 333,167,211 1,880,538,476
* This excludes exposure to state owned enterprises.

387
Sector Wise Exposure
31 December 2018 Agriculture
andFisheries
BankingFinance and
Insurance
HotelsTravels and
Services
Housing,Construction
and Infrastructure Manufacturing
CommercialTrade
Sovereign And Direct
Government
Transportationand
Logistics
OtherCommercial
Services
Consumptionand
Others Total
LKR ’000 LKR ’000 LKR ’000 LKR ’000 LKR ’000 LKR ’000 LKR ’000 LKR ’000 LKR ’000 LKR ’000 LKR ’000
Cash and cash equivalents - 12,137,568 - - - - - - - 66,310,009 78,447,577
Balances with central banks - - - - - - 65,680,371 - - - 65,680,371
Placements with banks - 40,450,089 - - - - - - - - 40,450,089
Securities purchased under resale agreements - - - - - - - - - - -
Derivative financial instruments - 1,205,657 - - - - - - - - 1,205,657
Financial assets recognised through profit or loss - measured at fair value 76,174 2,665,858 280,829 67,996 301,685 142,914 4,088,980 67,662 204,381 1,380,819 9,277,298
Financial assets at amortised cost - loans and advances 97,665,643 49,554,107 80,010,561 338,744,805 74,048,479 193,122,916 219,760,013 140,006,311 48,335,126 269,286,117 1,510,534,078
Less : Impairment - - - - - - - - - - (81,426,897)
Financial assets at amortised cost - debt and other instruments - 676,557 - - - 7,491,679 543,671,213 - - - 551,839,449
Financial assets measured at fair value through OCI - 3,142,087 - - - 1,241,718 12,315,777 - - - 16,699,582
97,741,817 109,831,923 80,291,390 338,812,801 74,350,164 201,999,227 845,516,354 140,073,973 48,539,507 336,976,945 2,192,707,204
31 December 2017 Agriculture
andFisheries
BankingFinance and
Insurance
HotelsTravels and
services
Housing,Construction
and infrastructure Manufacturing
Commercialtrade
Sovereign and direct
government
Transportationand
logistics
Othercommercial
services
Consumptionand
others Total
LKR ’000 LKR ’000 LKR ’000 LKR ’000 LKR ’000 LKR ’000 LKR ’000 LKR ’000 LKR ’000 LKR ’000 LKR ’000
Cash and cash equivalents - 12,429,737 - - - - - - - 60,413,371 72,843,108
Balances with central banks - - - - - - 68,689,012 - - - 68,689,012
Placements with banks - 8,067,490 - - - - - - - - 8,067,490
Securities purchased under resale agreements - - - - - - 18,455,555 - - - 18,455,555
Derivative financial instruments - 1,618,823 - - - - - - - - 1,618,823
Financial instruments - Held to trading 86,206 78,045 333,067 100,104 1,099,754 889,668 5,598,090 84,911 89,429 - 8,359,274
Financial investments - Loans and receivable - 5,641,373 - - - 768,799 206,756,876 - - - 213,167,048
Loans and advances to customers 91,074,381 31,480,730 53,637,678 262,592,679 70,781,133 209,406,599 108,058,736 89,891,385 31,716,190 271,274,970 1,219,914,481
Less : Impairment - - - - - - - - - - (56,753,567)
Financial investments - Available for sale - 8,243,627 - - - - 8,198,673 - - 1,478,870 17,921,170
Financial investments - Held to maturity - - - - - - 308,256,082 - - - 308,256,082
91,160,587 67,559,825 53,970,745 262,692,783 71,880,887 211,065,066 724,013,024 89,976,296 31,805,619 333,167,211 1,880,538,476
* This excludes exposure to state owned enterprises.

388 Bank of Ceylon | Annual Report 2018
NOTES TO THE FINANCIAL STATEMENTS
63.2.5 Commitments and Guarantees
The Bank enters into various irrevocable commitments and contingent liabilities to meet the financial needs of customers. They
do contain credit/ default risk even though these obligations are not recognised in the statement of financial position as on
balance sheet assets.
The table below shows the Bank’s maximum credit risk exposure for commitments and guarantees.
Bank
As at 31 December 2018 2017
LKR ’000 LKR ’000
Acceptances and documentary credit 225,582,120 147,887,385
Forward exchange contracts 15,801,742 39,125,183
Guarantees 100,715,102 83,593,855
342,098,964 270,606,423
63.3 Liquidity Risk and Funding Management
The Bank’s Liquidity Management Frame work is in place to ensure that the payment obligations of the bank are made in a
timely manner.
ALCO being the main management committee for managing liquidity and market risk, the Bank’s funding plan is reviewed
regularly and remedial measures are proposed to rectify any material mis-matches between assets and liabilities.
The table below presents the contractual undiscounted maturity of the bank’s financial liabilities as at 31 December 2018.
31 December 2018 On demand Less than 3
months3 to 12 months
1 to 5 years Over 5 years Total
LKR ’000 LKR ’000 LKR ’000 LKR ’000 LKR ’000 LKR ’000
Due to banks - 2,402,468 - - - 2,402,468
Securities sold under resale agreements - 99,743,183 7,916,047 - - 107,659,230
Derivative financial instruments 509,018 - - - 509,018
Due to depositors 602,471,424 351,046,714 406,728,184 19,978,975 333,342,257 1,713,567,554
Other borrowings and subordinated liabilities - 114,522,099 91,859,927 29,451,146 19,095,666 254,928,838
Total 602,471,424 568,223,482 506,504,158 49,430,121 352,437,923 2,079,067,108

389
31 December 2017 On demand Less than 3
months3 to 12 months
1 to 5 years Over 5 years Total
LKR ’000 LKR ’000 LKR ’000 LKR ’000 LKR ’000 LKR ’000
Due to banks - 2,203,199 - - - 2,203,199
Securities sold under resale agreements - 33,391,992 11,095,470 - - 44,487,462
Derivative financial instruments - 70,715 - - - 70,715
Due to depositors 577,306,304 253,262,616 367,570,527 19,513,724 274,445,855 1,492,099,026
Other borrowings and subordinated liabilities - 91,247,400 81,925,579 18,204,672 29,383,895 220,761,546
Total 577,306,304 380,175,922 460,591,576 37,718,396 303,829,750 1,759,621,948
63.4 Market Risk
Market risk is the risk that the fair value of the future cash flows of financial instruments will fluctuate due to changes in market
variables such as interest rates, foreign exchange rates, equity prices and commodity prices. The Bank classifies exposures
into either trading or non-trading portfolios and manages each of these portfolios separately. The market risk for the foreign
exchange and equity trading portfolios are managed and monitored based on a Value at Risk (VaR) methodology that reflects
the interdependency between risk variables. Interest rate risk of the trading portfolio is managed through Price Value per Basis
Point (PVBP) and duration gap analysis. Trading and non trading portfolios are managed and monitored using sensitivity analysis
and stress testing.
63.4.1 Currency Risk
Currency risk is the risk of fluctuation of the value of financial instruments due to changes in foreign exchange rates. The Bank
carries moderate level of open positions. Profit over foreign currency trading transactions prove uptick during the year due
to year on year rupee depriciation of around 20%. A detailed limit structure along with VaR limits prescribed by the Board
approved policy govern the foreign exchange risk. Currently bank uses Historical VaR methodology to monitor foreign exchange
risk. Foreign exchange VaR as at 31 December 2018 LKR 60.9 million.

390 Bank of Ceylon | Annual Report 2018
NOTES TO THE FINANCIAL STATEMENTS
Foreign Exchange Position as at 31 December
2018 2017
Net Overall Long LKR ’000
Net Overall ShortLKR ’000
Net Overall LongLKR ’000
Net Overall ShortLKR ’000
Currency
United States Dollar 524,547 - 877,195 -
Great Britain Pound 1,909 - - (3,974)
Euro 21,815 - 1,331 -
Japanese Yen 3,568 - - (5,263)
Australian Dollar - (10,620) - (582)
Canadian Dollar 1,166 - - (410)
Swiss Franc 1,937 - - (386)
Singapore Dollar 967 - - (930)
Hong Kong Dollar - (1,056) - (1,562)
Sub Total 555,909 (11,676) 878,526 (13,107)
Other Currencies 5,538 (1,786) 12,090 (3,489)
Grand Total 561,447 (13,462) 890,616 16,596
Higher of Long or Short 561,447 16,596
Impact on Statement of Profit or Loss due to Exchange Rate Shocks
2018 2017
Exchange Rate Shocks %
Net Open Position (After Rate Shocks)
Impact on Statement of Porfit or
Loss as at 31 December 2018
Net Open Position (After Rate Shocks)
Impact on Statement of Porfit or Loss as at 31
December 2017
LKR ’000 LKR ’000 LKR ’000 LKR ’000
5% 533,375 (28,072) (15,766) 830
10% 505,303 (56,145) (14,936) 1,660
-5% 589,520 28,072 (17,426) (830)
-10% 617,592 56,145 (18,256) (1,660)

391
63.4.2 Interest rate risk
Interest rate risk is the possibility that the future cash flows or the fair value of financial instruments fluctuate as a result of an
unexpected changes in interest rates.
PVBP and Duration analysis are monitored daily basis to assess the impact of interest rate changes on Bank’s trading portfolios
of treasury bonds and bills which are rate sensitive instruments.
2018
LKR ’0002017
LKR ’000
PVBP
Investment in Tresury Bills (Rs.) 12,779 32,201
Investment in Tresury Bonds (Rs.) 290,243 58,835
Duration
Investment in Tresury Bills 0.2 Years 0.5 Years
Investment in Tresury Bonds 2.4 Years 0.9 Years
Sensitivity analysis of interest sensitive assets and liabilities is carried out to monitor interest rate risk in the banking book by
placing those assets and liabilities in pre-determined maturity buckets considering its residual time to maturity and setting and
monitoring gap limits and the repricing profile.
2018
Upto 1 Month
1-3 Months 3-6 Months 6-12 Months
1-2 Years 2-3 Years 3-4 Years 4-5 Years Over 5 Years
% % % % % % % % %
Rate sensitive assets 11.9 15.1 12.0 16.3 9.9 9.9 4.9 4.9 15.1
Rate sensitive liabilities 13.6 18.0 11.7 18.0 3.6 3.6 3.6 3.6 24.2
GAP (1.7) (2.9) 0.3 (1.7) 6.3 6.3 1.3 1.3 (9.1)
2017
Upto 1 Month
1-3 Months 3-6 Months 6-12 Months
1-2 Years 2-3 Years 3-4 Years 4-5 Years Over 5 Years
% % % % % % % % %
Rate sensitive assets 9.1 17.1 6.3 22.2 9.3 9.3 5.0 5.0 16.7
Rate sensitive liabilities 8.8 15.1 16.8 18.2 4.5 4.5 4.0 4.0 24.2
GAP 0.3 2.0 (10.5) 4.0 4.8 4.8 1.0 1.0 (7.5)

392 Bank of Ceylon | Annual Report 2018
NOTES TO THE FINANCIAL STATEMENTS
63.4.3 Equity risk
Equity risk is the risk of deteriorating fair value of equity portfolio due to a change in the level of equity indices and individual
stocks. Equity risk is monitored by stipulating overall portfolio limits and use of VaR methodology. Equity VaR is well within the
risk appetite limit for year 2018.
Equity VaR 2018 2017
LKR ’000 LKR ’000
Highest 117,494 263,051
Lowest 81,305 87,841
Average 97,540 144,906
31 December 115,030 89,852
63.5 Operational Risk
Operational risk is the risk of loss resulting from inadequate or failed internal processes, people and systems or from external
events. Even though the capital allocated for operational risk as per the Basic Indicator Approach (BIA) was significant, the
actual operational loss was far below the allocated capital.
63.6 Capital Management
The primary objective of Capital Management is to ensure maintenance of minimum regulatory capital requirement. The Bank
ensures that adequate capital has been allocated to achieve strategic objectives and within the risk appetite of the Bank.
63.6.1 Capital Adequacy
The Capital Adequacy Ratio (CAR) is a measurement of the Bank’s available capital expressed as a percentage of risk-weighted
assets of credit, market and operational aspects of the banking business. It is a measure of financial strength of the Bank which
indicates its ability to maintain adequate capital to face with unforeseen scenarios. It is used to protect depositors and promote
the stability and efficiency of financial system.
Central Bank of Sri Lanka (CBSL) plays a vital role in defining minimum requirements and monitoring CAR to ensure that banks
are not participating in business activities that increase the risk of default and banks have enough capital to sustain operating
losses and thereby maintaining confidence in the banking system.
The Bank calculates CAR based on CBSL guidelines stemming from International Convergence of Capital Measurement and
Capital Standards, revised framework. IIRMD actively and continuously monitor the CAR, while stressing rigorously for worst
possible scenarios. ICAAP factors out all possible risks such as reputational risk, strategic risk, compliance risk, concentration
risk, & interest rate risk on banking book.

ComplianceAnnexes
Compliance with Code of Best Practice on
Corporate Governance 2017 by CA
Sri Lanka • 394
Compliance Requirements as per Banking
Act Direction No. 11 of 2007 • 401
Compliance Requirements Enforced by
Colombo Stock Exchange • 428
Compliance Requirements Enforced by the
Central Bank of Sri Lanka • 430
Capital Adequacy • 434
Certificate of the Directors on Transfer
Pricing • 448

394 Bank of Ceylon | Annual Report 2018
COMPLIANCE WITH CODE OF BEST PRACTICE ON CORPORATE GOVERNANCE 2017 ISSUED BY CA SRI LANKASections
referred to in
the code
Compliance status
A. Directors
A.1 The Board
The Board of Bank of Ceylon comprises of six directors as per the Bank of Ceylon Ordinance. Details of Directors during the
year 2018 are given on pages 79 to 85. Details of present Board of Directors are given on pages 24 to 27. Political changes that
occurred in 2018 led to changes being made to the Board composition. The appointing authority, the Ministry of Finance is in
the process of completing the appointments to the Board. The Board members who have skills and experience as indicated in
the details about them, direct and lead the Bank with effective controls.
A.1.1 Board Meetings
The Board meetings are held on fortnightly basis and special meetings are scheduled as and when the need arises. The
schedule of meetings is in place by the beginning of a year and the structure of submitting information to the Board has been
agreed upon. Necessary information is submitted as agreed to enable decision making. During the year under review the
Board met 23 times and attendance at meetings is summarised on page 86.
A.1.2 Role and responsibilities of the Board
The role and responsibilities of the Board are incorporated in the Board Charter which was last reviewed in the year 2017.
A.1.3 To act in accordance with the laws of the country
The Bank is regulated as per the Bank of Ceylon Ordinance no. 53 of 1938 and its amendments and the Banking Act no. 30 of
1988 and its amendments. Additionally, directions issued by the regulators viz., the Central Bank of Sri Lanka, Securities and
Exchange Commission of Sri Lanka and Colombo Stock Exchange apply to Bank of Ceylon. The Board acts in accordance
with the applicable laws.
Access to Independent Professional Advice
A Policy on Directors’ Access to Independent Professional Advice is in place whereby Directors are able to seek independent
professional advice on a needs basis at the Bank's expense which was reviewed during the year under review.
A.1.4 Advice and services of the Company Secretary
The members of the Board have access to the advice and services of the Secretary to the Board/ Secretary, Bank of Ceylon
who is an Attorney-at-Law. The Secretary to the Board is responsible for ensuring that Board procedures are followed and
compliance with applicable rules and regulations, directions and statutes and keeping and maintaining minutes and relevant
records.
Any question of the removal of the Secretary to the Board/ Secretary, Bank of Ceylon is a matter for the full Board.
A.1.5 Independent judgement
The Board of Bank of Ceylon bring independent judgement to bear in discharging their duties and responsibilities on matters
relating to the Board including strategy, performance, resource allocation, risk management, compliance and standards of
business conduct.

395
Sections
referred to in
the code
Compliance status
A.1.6 Dedicating adequate time and effort to matters of the Board and the Bank
The agenda and Board memoranda are circulated among the Board members seven days prior to the meeting through
a secure e-Solution enabling them to dedicate sufficient time before a meeting to review Board memoranda and call for
additional information and clarification.
A.1.7 Calling of Resolution
The Board members can individually submit proposals to the Board when they feel that they are in the best interests of the
Bank and a resolution can be presented to the Board.
A.1.8 Training for Directors
When first appointed to the Board, the Directors undergo an induction programme covering the applicable regulatory
requirements, Bank’s history, organisational structure, details of subsidiaries and associates, products and services and
Directors’ responsibilities and are provided with an Induction pack and access to the Bank’s electronic support system.
Directors are encouraged to attend relevant training programmes and be apprised of the latest developments in the Bank and
external environment by members of the Corporate Management or through external resource personnel.
A.2 Division of responsibilities between the Chairman and Chief Executive Officer (CEO)
The positions of the Chairman and the Chief Executive Officer (referred to as the “General Manager” in the Bank) are held by
two separate individuals. The Chairman is a Non –Executive Director. There is a clear division of responsibilities between the
Chairman and the General Manager and the Board Charter adopted by the Bank clearly defines these responsibilities.
A.3 Chairman’s Role
The Chairman of Bank of Ceylon provides leadership to the Board, preserves order and facilitates the effective discharge of
the Board’s functions. The agenda for Board meetings is prepared by the Secretary, Bank of Ceylon/ Secretary to the Board
under the authority delegated by the Chairman based on the memoranda submitted through the General Manager and any
other relevant matters proposed by a Director/s. The agenda covers matters relating to strategy, performance, resource
allocation, risk management and compliance. Sufficiently detailed information on matters included in the agenda is circulated
to Directors seven days prior to the meetings through a secure e-Solution.
All Directors are informed of their duties and responsibilities (which are enshrined in the Board Charter) and the Board
Subcommittee structure of the Bank which assists the Board in discharging its responsibilities.
The Board of Bank of Ceylon consists entirely of Non-Executive Directors and they effectively contribute within their respective
capabilities, for the benefit of the Bank.
Directors are encouraged to seek information considered necessary to discuss matters on the agenda of meetings and to
request inclusion of matters of corporate concern on the agenda.
The views of Directors on issues under consideration are ascertained and a record of such deliberations are reflected in the
minutes in detail.
A.4 Financial acumen
The Directors have sufficient financial acumen and knowledge to guide the Bank which they have acquired through the
businesses/ professions in which they are involved and from qualifications held.

396 Bank of Ceylon | Annual Report 2018
COMPLIANCE WITH CODE OF BEST PRACTICE ON CORPORATE GOVERNANCE 2017 ISSUED BY CA SRI LANKA
Sections
referred to in
the code
Compliance status
A.5 Board Balance
The Board of Bank of Ceylon is always comprised of Non-Executive Directors. When Alternate Directors are appointed, it is
also ensured that they are Non-Executive.
A.6 Provision of timely information
The agenda and Board memoranda required for a Board/ Subcommittee Meeting are provided to Directors through the
available e-Solution seven days in advance of the meeting for them to review the memoranda in advance and come up with
questions and discussion points and to request for additional information if necessary.
The members of the Corporate Management are available if the Directors wish to obtain further information or for any
clarification. Board meeting minutes are made available to the Directors within 10 days from the meeting.
A.7 Appointments to the Board
Appointments to the Board are made by the Government of Sri Lanka, through the Minister under whose purview the Bank
falls. The requisite regulatory requirements relating to appointment of new Directors are complied with.
A.8 Re-appointment
Every Director appointed shall hold office for a period of three years, unless he is removed from office earlier or he vacates
his office in terms of the Bank of Ceylon Ordinance no. 53 of 1938 and its amendments. In either case, he is eligible to be
reappointed.
Resignation
An appointed Director may resign from his directorship by a letter addressed to the Minister under whose purview the Bank
falls and any director who vacates office by ending the term is eligible for re-appointment. If it is due to a special reason, it is
indicated in their resignation letter.
A.9 Appraisal of Board and its subcommittees
An annual self-evaluation of its own performance is undertaken by the Board and Board Subcommittees to ensure that
Board’s and that of its subcommittees responsibilities are satisfactorily discharged. The collective outcome is reviewed and
addressed by the Board. Due to Board changes that took place in December 2018, these evaluations were not carried out.
A.10 Disclosure of information in respect of Directors in the Annual Report
The following information pertaining to Directors are included in the Annual Report-
i. Profile of the Directors covering name, qualifications, nature of expertise and whether Executive/ Non Executive indicated
on pages 24 to 27 *
ii. Related party information indicated on page 351 and 352
iii. Directorships in other companies indicated on pages 24 to 27 *
iv. Membership of Subcommittees * and the number of Board and Subcommittee meetings attended during the year are
indicated on page no 86
* Summary information of Directors in 2018 are given on pages 79 to 85
A.11 Appraisal of the Chief Executive Officer/ Genaral Manager
The performance evaluation of the General Manager is carried out annually based on the targets set at the commencement of
the fiscal year in line with Corporate Plan by the Board Human Resource and Remuneration Committee and the final report is
submitted to the Board. At the end of year 2018, due to the changes done to the Board subsequent to political changes, this
evaluation was not carried out in the agreed manner, but the performance was discussed in Corporate Plan formulating session.

397
Sections
referred to in
the code
Compliance status
B Directors’ Remuneration
B.1 There is a formal Remuneration Policy in place for the Chairman and Board of Directors (all Non-Executive). The above policy
is formulated based on the circulars issued by the Government, the shareholder, from time to time and other applicable
legislation.
B.2 The Bank’s Human Resource and Remuneration Committee accordingly has no role in deciding the remuneration of Directors.
(It however recommends remuneration of senior executives)
B.3 Disclosure of Remuneration
Statement of Remuneration Policy for the Chairman and the Directors is contained in pages 96 to 97 of this Annual Report.
Details of remuneration paid to the Board as a whole is indicated on page no 236
The composition of the Human Resource and Remuneration Committee appears on pages 96 to 97
C Relations with Shareholders
C.1 The Government of Sri Lanka being the sole shareholder of the Bank, the Bank’s communication to the shareholder happens in
various forms. A Government representative (an officer from the Ministry of Finance) is on the Board, directly representing the
shareholder, and the Annual Report is placed before the Parliament of Sri Lanka and is open to question by the Parliament.
C.2 A Board approved Communication Policy is in place.
Major issues and concerns of the shareholder viz. Government of Sri Lanka are discussed during the Board meetings with
the participation of the direct Government representative on the Board and elevated to the Ministry or higher levels as may be
necessary.
C.3 Further to complying with requirements of the Bank of Ceylon Ordinance no. 53 of 1938, the Banking Act no. 30 of 1988,
Securities and Exchange Commission of Sri Lanka Act and their amendments and the Listing Rules of the Colombo Stock
Exchange; as applicable, Directors disclose to the relevant Ministry/ Ministries all proposed major and material transactions
the Bank wishes to enter into.
There were no transactions which would materially affect the Bank's performance or net asset base nor related party
transactions during the year other than what is disclosed under notes to the financial statements on page 351 and 352

398 Bank of Ceylon | Annual Report 2018
Sections
referred to in
the code
Compliance status
D Accountability and Audit
D.1 Financial and Business Reporting (The Annual Report)
All measures are taken to ensure that the Annual Report presents a balanced assessment of the Bank’s financial position,
performance, business model, governance structure, risk management, internal controls and challenges, opportunities and
prospects in an easily comprehensible manner.
The Bank’s financial statements presented in the Annual Report are balanced and understandable and prepared in
accordance with the relevant laws and regulations and any deviation being clearly explained and portray a true and fair view.
It also ensures that a balanced and understandable assessment extends to interim and other price-sensitive public reports
and reports to regulators, as well as to information required to be presented to meet statutory requirements.
The Chief Financial Officer and the General Manager of the Bank give a statement indicating that the financial statements
provide a true and fair view of the state of affairs of the Bank of Ceylon and its Group. The financial statements are reviewed
and deliberated by the Board Audit Committee before recommending to the Board for its approval for publication. When no
Audit Committee was functioning due to changes to the Board, the financial statements were directly approved by the Board
after deliberations.
For the purpose of fulfilling the disclosure requirements, the following statements are included in the Annual Report -
i. Annual Report of the Directors on the State of Affairs of the Bank on pages 182 to 184
ii. Directors’ Statement on Internal Control over Financial Reporting on page 188 and 189
iii. Management Discussion and Analysis on pages 120 to 176
iv. Report on Related Party Transactions that have been carried out by the Key Management Personnel and their Close Family
Members appearing on page 351 and 352
v. Statement of Directors’ Responsibility for Financial Reporting on page 191
vi. Report of the Auditor General on pages 192 to 195
D.2 Bank’s existing process on Risk Management and Internal Controls
The Board is responsible for determining the nature and extent of the principal risks that it is willing to take in achieving its
strategic objectives and the Board Integrated Risk Management Committee is there to facilitate the Board in fulfilling their
oversight responsibilities in regard to the existence, operation and effectiveness of the Risk Management Programs, Policies
and practices employed by the Bank to manage various types of risks, including compliance programs.
The Board Audit Committee assists the Board in achieving the objective of the Bank's system of internal controls including
operational, financial and compliance among other responsibilities of the Committee.
The Board monitors the Bank’s risk management and internal control systems through the Integrated Risk Management
Committee and Audit Committee respectively and carries out a review of the said Committees’ effectiveness annually.
The Bank of Ceylon has a well-equipped Internal Audit Department to carry out the internal audit function of the Bank. The
Auditor General is the External Auditor of the Bank.
COMPLIANCE WITH CODE OF BEST PRACTICE ON CORPORATE GOVERNANCE 2017 ISSUED BY CA SRI LANKA

399
Sections
referred to in
the code
Compliance status
D.3 Audit Committee
The Board Audit Committee comprised exclusively of Non-Executive Directors during the year under review. The Chairmen of
the Committee during the year under review were Independent Non- Executive Directors. The Chairmen and the members of
the Audit Committee had relevant experience in financial reporting and control.
The Board Audit Committee assists the Bank’s Board in fulfilling its oversight responsibilities.
The Board Audit Committee ensures the carrying out of the reviews of the processes and effectiveness of risk management
and internal controls and audit reports are submitted to the Committee. The role and responsibilities of the Audit Committee is
disclosed in the Audit Committee Report appearing on pages 90 to 92 of this Annual Report.
The Audit Committee has a written Terms of Reference which clearly defines its role and responsibilities. The activities
performed by the Committee during the year under review appears on pages 90 to 92 of this Annual Report.
D.4 Related Party Transactions
The Bank has a Board approved Policy on Related Party Transactions in place covering related parties, their transactions
and restrictions on offering non favorable treatment to related parties in order for the Board members to avoid any conflict of
interest in this regard.
Report on Related Party Transactions that have been carried out by the Key Management Personnel and their Close Family
Members appear on page 351 and 352 of this Annual Report.
D.5 Code of Business Conduct and Ethics
The Bank maintains a Code of Ethics for the employees of the Bank and a separate Code of Ethics for the Directors and an
acknowledgement is obtained for affirmation of compliance with the Codes.
D.6 Corporate Governance Disclosures
The Corporate Governance Report which is appearing on pages 71 and 88 discloses the extent of compliance with the
provisions of the Code of Best Practice on Corporate Governance.
F.1 and F.2 Shareholder
The Government of Sri Lanka is the sole shareholder of the Bank.

400 Bank of Ceylon | Annual Report 2018
Sections
referred to in
the code
Compliance status
G Internet of things and Cybersecurity
The Bank has a process in place to identify as to how the Bank’s business model, IT devices within and outside the Bank can
connect to the Bank’s network to send and receive information and the consequent cyber security risks that may affect the
business.
A Board approved Information Security Policy is in place which provides the management direction and support to ensure
protection of the Bank's information assets.
The Board Information and Communication Technology Committee was established in year 2018 to assist the Board
of Directors in fulfilling its oversight responsibilities related to information and communication technology and provide
appropriate advice and recommendations to facilitate decision making by the Board.
In addition, the Integrated Risk Management Committee assists the Board in ensuring that the Bank is protected from Cyber
Security threats by recommending and following up on vulnerability assessments and reporting to the Board. Processes to
identify and manage cyber security risks are included in the Risk Management Report of this Annual Report on pages 116 to 117
The Bank has appointed a Chief Information Security Officer, in order to implement the Cyber Security Risk Management
Policy.
H Environment, Society and Governance (ESG)
The ESG Report appears in pages 160 to 176 of this Annual Report.
COMPLIANCE WITH CODE OF BEST PRACTICE ON CORPORATE GOVERNANCE 2017 ISSUED BY CA SRI LANKA

401
COMPLIANCE REQUIREMENTS AS PER BANKING ACT DIRECTION NO. 11 OF 2007
Section Principle Level of Compliance during the Year 2018
3 (1) The Responsibilities of the Board
3 (1) (i) The Board shall strengthen the safety and soundness
of the bank by ensuring the implementation of the
following:
a. Approve and oversee the bank’s strategic objectives
and corporate values and ensure that these are
communicated throughout the bank;
Complied with.
Strategic objectives and values are formulated at sessions held at an off-
site location with the participation of the Board and the top management.
Corporate values were revamped in 2018 and they were incorporated in
the Board approved Corporate Plan for the period 2018-2020. These were
communicated to staff up to Branch Manager level at an off-site location
where the Corporate Plan was launched and reinforced by the Corporate
Management Team. All other levels of staff were informed through regular
briefing sessions and at meetings.
In addition, Corporate values are included in the intranet. The Board
approved Corporate Plan for 2019-2021 formulated in a similar manner is
in place.
b. Approve the overall business strategy of the bank,
including the overall risk policy and risk management
procedures and mechanisms with measurable goals,
for at least the next three years;
Complied with.
The Bank’s overall Business Strategy is included in the rolling Corporate
Plan and the related Action Plan for the same period which was approved
by the Board. The risk appetite, risk management framework and
mechanisms have also been approved by the Board in line with the
strategic plan. Measurable goals for the Bank as a whole have been set
and performance is measured in line with these goals.
c. Identify the principal risks and ensure
implementation of appropriate systems to manage
the risks prudently;
Complied with.
The Board has appointed a Board Integrated Risk Management
Committee tasked with approving the Bank’s Intergrated Risk
Management Policy, defining the risk appetite, identifying principal risks,
setting governance structures and implementing systems to measure,
monitor and manage the principal risks.
The Bank has implemented a process where the Board members discuss
at length the risks arising out of new strategies and the ways and means
to mitigate such risks.
A Board approved Integrated Risk Management Policy covering all areas
of major risks is in place.
� The following reports also provide further details in this regard:
Risk Management Report on pages 102 to 118
� Integrated Risk Management Committee Report on page 94 and 95
d. Approve implementation of a policy of
communication with all stakeholders, including
depositors, creditors, shareholders and borrowers;
Complied with.
Board has approved and implemented a Communication Policy covering
all stakeholders which is reviewed periodically.

402 Bank of Ceylon | Annual Report 2018
Section Principle Level of Compliance during the Year 2018
e. Review the adequacy and the integrity of the
bank’s internal control systems and management
information systems;
Complied with.
The Board Audit Committee which reports to the Board is tasked with
reviewing the adequacy and the integrity of the Bank’s internal control
system and financial reporting. This Committee reviewed reports from the
Internal Audit Department which reports directly to the Audit Committee
and from the External Auditors in carrying out this task. Internal Audit
Department is tasked with the responsibility of conducting information
systems audits to assess the effectiveness of the Management
Information System (MIS). The Board has reviewed the adequacy of the
MIS and the Internal Control System.
f. Identify and designate Key Management Personnel; Complied with.
In terms of the Central Bank of Sri Lanka guidelines dated 2 December
2015 and Banking Act Determination No. 3 of 2010, the Bank has
identified the General Manager, Deputy General Managers, Assistant
General Managers and officers in allied grades as Key Management
Personnel (KMP) of the Bank for Corporate Governance purposes.
g. Define the areas of authority and key responsibilities
for the Board of Directors themselves and for the
Key Management Personnel;
Complied with.
Areas of authority and key responsibilities have been defined for the
Directors and Key Management Personnel through the Board Charter and
position descriptions respectively. Board Charter was last reviewed in the
year 2017 and is ready for review in 2019.
h. Ensure that there is appropriate oversight of the
affairs of the bank by Key Management Personnel,
that is consistent with Board policy;
Complied with.
Performance against the Bank’s Corporate Plan is reviewed by the Board
based on the Action Plan.
Key Management Personnel make presentations to the Board and
Subcommittees on matters under their purview and are also called in by
the Board as and when needed to explain matters relating to their areas.
i. Periodically assess the effectiveness of the Board
Directors’ own governance practices, including:
(i) the selection, nomination and election of
Directors and Key Management Personnel;
(ii) the management of conflicts of interests; and
(iii) the determination of weaknesses and
implementation of changes where necessary;
Generally, a self-evaluation of the performance of the Board is carried out
annually assessing its own governance practices.
However, consequent to the political changes that took place in the
country, a new Board was appointed in November 2018 and they resigned
before the end of the year. As at year end there was no Board. The
evaluation will be will be continued in 2019.
A Board approved Conflict of Interest is in place and its compliance is
monitored.
j. Ensure that the bank has an appropriate succession
plan for Key Management Personnel;
Complied with.
A Board approved Succession Plan for Key Management Personnel (viz.
for the Corporate and Executive Management) is in place which was
reviewed and revised by the Nomination and Corporate Governance
Committee in year 2018.
COMPLIANCE REQUIREMENTS AS PER BANKING ACT DIRECTION NO. 11 OF 2007

403
Section Principle Level of Compliance during the Year 2018
k. Meet regularly, on a needs basis, with the Key
Management Personnel to review policies, establish
communication lines and monitor progress towards
corporate objectives;
Complied with.
Key Management Personnel regularly present or are called in for
discussions at the meetings of the Board and its Subcommittees
on policy and other matters relating to their areas. The performance
review of the Corporate Plan is carried out at off-site locations with the
participation of the Management.
l. Understand the regulatory environment and ensure
that the bank maintains an effective relationship with
regulators;
Complied with.
On appointment as Directors, they are furnished with all applicable
regulatory requirements. They are also briefed about developments
in the regulatory environment at Board meetings to ensure that their
knowledge is updated regularly to facilitate effective discharge of their
responsibilities. Any relevant communication from a regulator is brought
to the notice of the Board immediately.
Information pertaining to Compliance reports submitted to the Central
Bank of Sri Lanka which includes all returns to regulators are presented
to the Board monthly and monitored by the Board.
m. Exercise due diligence in the hiring and oversight of
External Auditors.
Complied with.
As provided for in the Constitution of the country, the Auditor General is
the External Auditor of the Bank as it is a State-Owned Enterprise.
3 (1) (ii) The Board shall appoint the Chairman and the Chief
Executive Officer and define and approve the functions
and responsibilities of the Chairman and the Chief
Executive Officer in line with Direction 3 (5) of these
Directions.
Complied with when read in conjunction with Direction No. 3 (9) (ii).
The Board appoints the Chief Executive Officer referred to as the General
Manager in the Bank of Ceylon with the approval of the Minister under
whose purview the Bank falls and the Chairman is appointed by the said
Minister in terms of the Bank of Ceylon Ordinance No. 53 of 1938 and its
amendments.
The Board has also approved their functions and responsibilities
maintaining the balance of power between the two roles through the
Board Charter.
3 (1) (iii) The Board shall meet regularly and Board meetings shall
be held at least twelve times a year at approximately
monthly intervals. Such regular Board meetings shall
normally involve active participation in person of a
majority of Directors entitled to be present. Obtaining
the Board’s consent through the circulation of written
resolutions/ papers shall be avoided as far as possible.
Complied with.
Regular fortnightly Board meetings are held and special meetings are
scheduled as and when the need arises. During the year under review the
Board met 23 times.
The Bank has minimised obtaining approval via circular resolutions and
it is done only on an exceptional basis and such resolutions are ratified
by the Board at the next meeting. During the year 2018, seven such
resolutions have been adopted by circulation.

404 Bank of Ceylon | Annual Report 2018
Section Principle Level of Compliance during the Year 2018
3 (1) (iv) The Board shall ensure that arrangements are in place
to enable all Directors to include matters and proposals
in the agenda for regular Board meetings where such
matters and proposals relate to the promotion of
business and the management of risks of the bank.
Complied with.
Meetings are scheduled and the Board is informed at the beginning of
each calendar year to enable submission of proposals to the agenda for
regular meetings.
3 (1) (v) The Board procedures shall ensure that notice of at
least seven days is given of a regular Board meeting to
provide all Directors an opportunity to attend. For all
other Board meetings, reasonable notice may be given.
Complied with.
Notice of meetings are given through an Annual Calendar at the beginning
of the year. Agenda and Board papers for the Board meetings are
circulated to the Directors seven days prior to the meetings through a
secure eSolution.
Reasonable notice is given before any special meeting.
3 (1) (vi) The Board procedures shall ensure that a Director who
has not attended at least two-thirds of the meetings
in the period of 12 months immediately preceding or
has not attended the immediately preceding three
consecutive meetings held, shall cease to be a Director.
Participation at the Directors’ meetings through an
alternate Director shall, however, be acceptable as
attendance.
Complied with.
The Directors are apprised of their attendance in accordance with the
Corporate Governance Code. Details of the Directors’ attendance are set
out on page 86 Directors’ attendance has been in compliance with this
Direction.
3 (1) (vii) The Board shall appoint a Company Secretary who
satisfies the provisions of Section 43 of the Banking
Act No. 30 of 1988, whose primary responsibilities shall
be to handle the secretariat services to the Board and
shareholder meetings and to carry out other functions
specified in the statutes and other regulations.
Complied with.
The Secretary, Bank of Ceylon/ Secretary to the Board is an
Attorney-at-Law, whose credentials/ qualifications are in compliance
with the provisions of Section 43 of the Banking Act No. 30 of 1988 and
its amendments. She is primarily responsible for handling the secretariat
services to the Board and carrying out other functions specified in the
statutes and other regulations.
3 (1) (viii) All Directors shall have access to advice and services
of the Company Secretary with a view to ensuring
that Board procedures and all applicable rules and
regulations are followed.
Complied with.
All members of the Board have the opportunity to obtain the advice
and services of the Secretary to the Board who is an Attorney-at-Law
and who is responsible to the Board for follow-up of Board procedures,
compliance with rules and regulations, directions and statutes.
3 (1) (ix) The Company Secretary shall maintain the minutes of
Board meetings and such minutes shall be open for
inspection at any reasonable time, on reasonable notice
by any Director.
Complied with.
The Secretary, Bank of Ceylon/ Secretary to the Board maintains the
minutes of the Board meetings and circulates same to all Board members
through a secure eSolution.
The minutes are approved at the subsequent Board meeting. Additionally,
the Directors have access to the past Board papers and minutes through
the same eSolution.
COMPLIANCE REQUIREMENTS AS PER BANKING ACT DIRECTION NO. 11 OF 2007

405
Section Principle Level of Compliance during the Year 2018
3 (1) (x) Minutes of Board meetings shall be recorded in
sufficient detail so that it is possible to gather from
the minutes, as to whether the Board acted with
due care and prudence in performing its duties. The
minutes shall also serve as a reference for regulatory
and supervisory authorities to assess the depth of
deliberations at the Board meetings. Therefore, the
minutes of a Board meeting shall clearly contain or refer
to the following:
a. a summary of data and information used by the
Board in its deliberations;
b. the matters considered by the Board;
c. the fact-finding discussions and the issues of
contention or dissent which may illustrate whether
the Board was carrying out its duties with due care
and prudence;
d. the testimonies and confirmations of relevant
executives which indicate compliance with the
Board’s strategies and policies and adherence to
relevant laws and regulations;
e. the Board’s knowledge and understanding of the
risks to which the bank is exposed and an overview
of the risk management measures adopted; and
f. the decisions and Board resolutions.
Complied with.
Minutes of the meetings are kept covering the given criteria.
3 (1) (xi) There shall be a procedure agreed by the Board to
enable Directors, upon reasonable request, to seek
independent professional advice in appropriate
circumstances, at the bank’s expense. The Board shall
resolve to provide separate independent professional
advice to Directors to assist the relevant Director or
Directors to discharge his/her/their duties to the bank.
Complied with.
A Policy for Directors’ Access to Independent Professional Advice is
in place and the Directors are able to obtain independent professional
advice when deemed necessary. It was reviewed in 2018.

406 Bank of Ceylon | Annual Report 2018
Section Principle Level of Compliance during the Year 2018
3 (1) (xii) Directors shall avoid conflicts of interests, or the
appearance of conflicts of interest, in their activities
with, and commitments to, other organisations or
related parties. If a Director has a conflict of interest
in a matter to be considered by the Board, which the
Board has determined to be material, the matter should
be dealt with at a Board meeting, where Independent
Non-Executive Directors [refer to Direction 3 (2) (iv) of
these Directions] who have no material interest in the
transaction, are present. Further, a Director shall abstain
from voting on any Board resolution in relation to which
he / she or any of his / her close relation or a concern,
in which a Director has substantial interest, is interested
and he/she shall not be counted in the quorum for the
relevant agenda item at the Board meeting.
Complied with.
The Directors are conscious of their obligation to deal with a situation
when there is a conflict of interest in accordance with applicable
regulations. A Board approved Policy on Conflict of Interest is in place. As
a practice at every Board Meeting Directors are required to declare any
interest in contracts /new appointments to any other Board or Institution.
Directors abstain from participating in the discussions, voicing their
opinion or approving in situations where there is a conflict of interest.
3 (1) (xiii) The Board shall have a formal schedule of matters
specifically reserved to it for decision to ensure that
the Direction and control of the bank is firmly under its
authority.
Complied with.
Powers Reserved for the Board are included in the Board Charter.
3 (1) (xiv) The Board shall, if it considers that the Bank is, or is
likely to be, unable to meet its obligations or is about to
become insolvent or is about to suspend payments due
to depositors and other creditors, forthwith inform the
Director of Bank Supervision of the situation of the bank
prior to taking any decision or action.
Complied with.
Such a situation has not arisen during the year 2018. Monthly Financial
Statements submitted to the Board assures the Board of the Bank’s
solvency.
3 (1) (xv) The Board shall ensure that the Bank is capitalised at
levels as required by the Monetary Board in terms of the
Capital Adequacy Ratio and other prudential grounds.
Complied with.
The Board ensures that the Bank is capitalised at levels as required by
the Monetary Board in terms of the Capital Adequacy Ratio (CAR) and
other prudential grounds. Capital Augmentation Plan is submitted to the
Board on quarterly basis.
Calculation of CAR is submitted to the Board with the monthly Financial
Statements of the Bank.
3 (1) (xvi) The Board shall publish in the Bank’s Annual Report, an
Annual Corporate Governance Report setting out the
compliance with Direction 3 of these Directions.
Complied with.
These disclosures are part of the Corporate Governance Report in the
Bank’s Annual Report.
3 (1) (xvii) The Board shall adopt a scheme of self-assessment to
be undertaken by each Director annually, and maintain
records of such assessments.
Complied with.
A scheme of self-assessment is adopted. The self-assessment reports
of the Board are maintained by the Secretary, Bank of Ceylon / Secretary
to the Board. However in respect of year 2018, this assessment was not
carried out due to a change in the Directorate in November 2018. (The
Board appointed in November 2018, resigned in December 2018.)
COMPLIANCE REQUIREMENTS AS PER BANKING ACT DIRECTION NO. 11 OF 2007

407
Section Principle Level of Compliance during the Year 2018
3 (2) The Board’s Composition
3 (2) (i) The number of Directors on the Board shall not be less than 7 and not more than 13.
According to the Bank of Ceylon Ordinance No. 53 of 1938 and its amendments the number of Directors permitted on the Board of Bank of Ceylon is six and present Board consists of four Directors. Composition of the Board during 2018 is given under Direction No. 3 (2) (vii) of this compliance report. Details of the present Board are given on pages 24 to 27 in this Annual Report.
Bank has initiated action to amend the said Bank of Ceylon Ordinance to accommodate the said requirement of the Direction.
3 (2) (ii) a. The total period of service of a Director other than a Director who holds the position of Chief Executive Officer shall not exceed nine years, and such period in office shall be inclusive of the total period of service served by such Director up to 1 January 2008.
Complied with.
Present Directors of Bank of Ceylon have been in office for a period less than nine years.
Details of their appointments are given on pages 24 to 27 of this Annual Report.
3 (2) (iii) An employee of a bank may be appointed, elected or nominated as a Director of the bank (hereinafter referred to as an “Executive Director”) provided that the number of Executive Directors shall not exceed one-third of the number of Directors of the Board. In such an event, one of the Executive Directors shall be the Chief Executive Officer of the bank.
Complied with.
Bank of Ceylon Ordinance does not provide for Executive Directors in Bank of Ceylon.
3 (2) (iv) The Board shall have at least three Independent Non-Executive Directors or one-third of the total number of Directors, whichever is higher. This sub-direction shall be applicable from 1 January 2010 onwards.
Complied with.
Only the Director representing the Ministry of Finance is considered Non-Independent since he represents the shareholder, the Government of Sri Lanka.
A Non-Executive Director shall not be considered independent if he/she:
a. has direct and indirect shareholdings of more than 1% of the bank;
b. currently has or had during the period of two years immediately preceding his/her appointment as director, any business transactions with the bank as described in Direction No. 3 (7) hereof, exceeding 10% of the regulatory capital of the bank;
c. has been employed by the bank during the two-year period immediately preceding the appointment as Director;
d. has a close relation who is a Director or Chief Executive Officer or a member of Key Management Personnel or a material shareholder of the bank or another bank. For this purpose, a “close relation” shall mean the spouse or a financially dependant child;
They are identified on pages 24 to 27 with the Profiles of the Directors and also under Direction No. 3 (2) (viii) below.

408 Bank of Ceylon | Annual Report 2018
Section Principle Level of Compliance during the Year 2018
e. represents a specific stakeholder of the bank;
f. is an employee or a Director or a material
shareholder in a Company or business organisation:
i. which currently has a transaction with the
bank as defined in Direction No. 3 (7) of these
Directions, exceeding 10% of the regulatory
capital of the bank; or
ii. in which any of the other Directors of the bank
are employed or are Directors or are material
shareholders; or
iii. in which any of the other Directors of the bank
have a transaction as defined in Direction No.
3 (7) of these Directions, exceeding 10% of
regulatory capital in the bank.
3 (2) (v) In the event an Alternate Director is appointed to
represent an Independent Director, the person so
appointed shall also meet the criteria that applies to the
Independent Director.
Complied with.
No Alternate Director has been appointed to represent any Independent
Director.
3 (2) (vi) Non-Executive Directors shall be persons with credible
track records and/or have necessary skills and
experience to bring an independent judgement to bear
on issues of strategy, performance and resources.
Complied with.
Present Directors’ Profiles appearing on pages 24 to 27 spell out the
necessary information.
3 (2) (vii) A meeting of the Board shall not be duly constituted,
although the number of Directors required to constitute
the quorum at such meeting is present, unless more
than one half of the number of Directors present at such
meeting are Non-Executive Directors. This sub-direction
shall be applicable from 1 January 2010 onwards.
Complied with.
All the Board members of Bank of Ceylon are Non-Executive Directors.
3 (2) (viii) The Independent Non-Executive Directors shall
be expressly identified as such in all corporate
communications that disclose the names of Directors
of the bank. The bank shall disclose the composition of
the Board, by category of Directors, including the names
of the Chairman, Executive Directors, Non-Executive
Directors and Independent Non-Executive Directors in
the Annual Corporate Governance Report.
Complied with.
During the year 2018 the Board consisted of the following members:
� Mr Ronald C Perera, PC
Independent Non-Executive Director/Chairman
(Ceased to be the Chairman/ Director w.e.f. 18 November 2018)
� Mr Sajith R Attygalle
Non-Executive Ex Officio Director
(Ceased to be a Director w.e.f. 25 November 2018)
� Mr Ranel T Wijesinha
Independent Non-Executive Director
(Ceased to be a Director w.e.f. 31 July 2018)
COMPLIANCE REQUIREMENTS AS PER BANKING ACT DIRECTION NO. 11 OF 2007

409
Section Principle Level of Compliance during the Year 2018
� Mr H P Ajith Gunawardana
Independent Non-Executive Director
(Ceased to be a Director w.e.f. 20 July 2018)
� Mr Samantha Rajapaksa
Independent Non-Executive Director
(Ceased to be a Director w.e.f. 25 November 2018)
� Mr Mohan Wijesinghe
Independent Non-Executive Director
(Ceased to be a Director w.e.f. 02 July 2018)
� Mr K A Vimalenthirarajah
(Appointed as the Alternate Director to Mr S R Attygalle
w.e.f. 09 November 2017 and ceased to be his Alternate
w.e.f. 25 November 2018)
� Mr Neil A Umagiliya
Independent Non-Executive Director / Chairman
(Appointed w.e.f. 19 November 2018 and ceased to be a Director
w.e.f. 20 December 2018)
� Ms Visakha Amarasekere
Non-Executive Ex Officio Director
(Appointed w.e.f. 26 November 2018 and ceased to be a Director
w.e.f. 27 February 2019)
� Mr Lalith Withana
Independent Non-Executive Director
(Appointed w.e.f. 26 November 2018 and ceased to be a Director
w.e.f. 20 December 2018)
� Mr H Isuru Balapatabendi
Independent Non-Executive Director
(Appointed w.e.f. 26 November 2018 and ceased to be a Director
w.e.f. 20 December 2018)
� Ms A V K Madhavie Herath
Independent Non-Executive Director
(Appointed w.e.f. 26 November 2018 and ceased to be a Director
w.e.f. 20 December 2018)
� Mr Harsha Wijayawardhana
Independent Non-Executive Director
(Appointed w.e.f. 26 November 2018 and ceased to be a Director
w.e.f. 20 December 2018)
3 (2) (ix) There shall be a formal, considered and transparent
procedure for the appointment of new Directors to the
Board. There shall also be procedures in place for the
orderly succession of appointments to the Board.
Appointments to the Board are made by the shareholder, the Government
of Sri Lanka through the Minister under whose purview the Bank comes in
terms of the provisions of Bank of Ceylon Ordinance No. 53 of 1938 and
its amendments.

410 Bank of Ceylon | Annual Report 2018
Section Principle Level of Compliance during the Year 2018
3 (2) (x) All Directors appointed to fill a casual vacancy shall be
subject to election by shareholders at the first General
Meeting after their appointment.
This does not arise since the relevant Minister appoints Directors.
3 (2) (xi) If a Director resigns or is removed from office, the Board
shall:
a. announce the Director’s resignation or removal and
the reasons for such removal or resignation including
but not limited to information relating to the relevant
Director’s disagreement with the bank, if any; and
Complied with.
The Government of Sri Lanka, the sole shareholder does the
appointments as well as the removals through the Minister under whose
purview the Bank falls. Any resignation is also referred to the same
Minister. The Central Bank of Sri Lanka and the Colombo Stock Exchange
are kept informed of the resignations.
b. issue a statement confirming whether or not there
are any matters that need to be brought to the
attention of shareholders.
The Shareholder of the Bank is the Government and the changes to the
Directorate is carried out by the Government through the subject Minister.
3 (2) (xii) A Director or an employee of a bank shall not be
appointed, elected or nominated as a Director of another
bank except where such bank is a subsidiary company
or an associate company of the first mentioned bank.
Neither Directors nor employees of Bank of Ceylon are Directors of
another Bank, other than for the appointment of a Deputy General
Manager to the Pradeshiya Sanwardana Bank as per the requirements of
the enabling enactments of this Bank (Pradeshiya Sanwardana Bank Act
No. 41 of 2008).
3 (3) Criteria to Assess the Fitness and Propriety of
Directors
3 (3) (i) The age of a person who serves as Director shall not
exceed 70 years.
In this context, the following general exemption shall
apply: A Director who has reached the age of 70 years
as at 1 January 2008 or who would reach the age of
70 years prior to 31 December 2008 may continue
in office for a further maximum period of three years
commencing 1 January 2009.
Complied with.
None of the Directors of the Bank are over 70 years of age.
3 (3) (ii) A person shall not hold office as a Director of more
than 20 companies / entities / institutions inclusive of
subsidiaries or associate companies of the bank.
Complied with.
No Director holds directorships of more than 20 companies/ entities.
3 (4) Management Functions Delegated by the Board
3 (4) (i) The Directors shall carefully study and clearly
understand the delegation arrangements in place.
Complied with.
The Board periodically reviews and approves the delegation
arrangements in place and ensures that the extent of delegation
addresses the needs of the Bank whilst enabling the Board to discharge
their functions effectively.
The provisions in the governing Ordinance are considered in this process.
3 (4) (ii) The Board shall not delegate any matters to a Board
Committee, Chief Executive Officer, Executive Directors
or Key Management Personnel, to an extent that such
delegation would significantly hinder or reduce the
ability of the Board as a whole to discharge its functions.
3 (4) (iii) The Board shall review the delegation processes in
place on a periodic basis to ensure that they remain
relevant to the needs of the bank.
COMPLIANCE REQUIREMENTS AS PER BANKING ACT DIRECTION NO. 11 OF 2007

411
Section Principle Level of Compliance during the Year 2018
3 (5) The Chairman and Chief Executive Officer
3 (5) (i) The roles of Chairman and Chief Executive Officer shall
be separate and shall not be performed by the same
individual.
Complied with.
The positions of the Chairman and the Chief Executive Officer referred
to as the General Manager in Bank of Ceylon are held by two different
individuals.
A Board Charter is in place defining the responsibilities of the Chairman
and the General Manager.
3 (5) (ii) The Chairman shall be a Non-Executive Director and
preferably an Independent Director as well. In the case
where the Chairman is not an Independent Director,
the Board shall designate an Independent Director as
the Senior Director with suitably documented Terms of
Reference to ensure a greater independent element. The
designation of the Senior Director shall be disclosed in
the bank’s Annual Report.
Complied with.
The Chairman of Bank of Ceylon is an Independent Non-Executive
Director and as such the need to appoint a Senior Independent Director
does not arise.
3 (5) (iii) The Board shall disclose in its Corporate Governance
Report, which shall be an integral part of its Annual
Report, the identity of the Chairman and the Chief
Executive Officer and the nature of any relationship
[including financial, business, family or other material/
relevant relationship(s)], if any, between the Chairman
and the Chief Executive Officer and the relationships
among members of the Board.
Complied with.
The identity of the Chairman and the General Manager are disclosed in
the Annual Report on page 25 and 30 There are many references to these
roles throughout.
There were no material, financial, business or family relationships
between the Chairman, General Manager and other members of the
Board who were funtioning in 2018 and also in the current Board.
3 (5) (iv) The Chairman shall: (a) provide leadership to the
Board; (b) ensure that the Board works effectively and
discharges its responsibilities; and (c) ensure that all key
and appropriate issues are discussed by the Board in a
timely manner.
Complied with.
3 (5) (v) The Chairman shall be primarily responsible for drawing
up and approving the agenda for each Board meeting,
taking into account where appropriate, any matters
proposed by the other Directors for inclusion in the
agenda. The Chairman may delegate the drawing up of
the agenda to the Company Secretary.
Complied with.
The Secretary, Bank of Ceylon/ Secretary to the Board draws up the
agenda under the authority delegated by the Chairman based on the
memoranda submitted through the General Manager and any other
relevant items proposed by any Board member.

412 Bank of Ceylon | Annual Report 2018
Section Principle Level of Compliance during the Year 2018
3 (5) (vi) The Chairman shall ensure that all Directors are properly
briefed on issues arising at Board meetings and also
ensure that Directors receive adequate information in a
timely manner.
Complied with.
The Chairman ensures that the Board is adequately briefed. The following
procedures are in place to ensure this:
� Board papers are circulated seven days prior to the Board meetings
through a secured electronic link.
� Relevant members of the management team are on standby for any
explanations and clarifications.
� Management information is provided in agreed formats on a regular
basis to enable Directors to assess the performance and stability of
the Bank.
� Directors are able to seek independent professional advice on a
needs basis at the Bank’s expense.
3 (5) (vii) The Chairman shall encourage all Directors to make a
full and active contribution to the Board’s affairs and
take the lead to ensure that the Board acts in the best
interests of the bank.
Complied with.
3 (5) (viii) The Chairman shall facilitate the effective contribution
of Non-Executive Directors in particular and ensure
constructive relations between Executive and
Non-Executive Directors.
Complied with.
The entire Board consists of Non-Executive Directors.
3 (5) (ix) The Chairman, shall not engage in activities involving
direct supervision of Key Management Personnel or any
other executive duties whatsoever.
Complied with.
Chairman is an Independent Non-Executive Director and does not get
involved in the direct supervision of Key Management Personnel or any
other executive duties.
3 (5) (x) The Chairman shall ensure that appropriate steps
are taken to maintain effective communication with
shareholders and that the views of shareholders are
communicated to the Board.
Complied with.
Effective communication is maintained with the Government of Sri Lanka
who is the sole shareholder. The Ex Officio Director acts as the channel
between the Board and the shareholder.
3 (5) (xi) Chief Executive Officer shall function as the apex
executive-in-charge of the day-to-day management of
the bank’s operations and business.
Complied with.
The day-to-day operations of the Bank is the responsibility of the General
Manager. The Board Charter specifically refers to such authority of the
General Manager.
COMPLIANCE REQUIREMENTS AS PER BANKING ACT DIRECTION NO. 11 OF 2007

413
Section Principle Level of Compliance during the Year 2018
3 (6) Board Appointed Committees
3 (6 ) (i) Each bank shall have at least four Board committees
as set out in Directions 3 (6) (ii), 3 (6) (iii), 3 (6) (iv) and 3
(6) (v) of these Directions. Each committee shall report
directly to the Board. All committees shall appoint a
Secretary to arrange the meetings and maintain minutes,
records, etc., under the supervision of the Chairman of
the committee. The Board shall present a report of the
performance on each committee, on their duties and
roles at the Annual General Meeting.
Complied with.
Four Subcommittees of the Board (viz. Audit, Human Resources and
Remuneration, Nomination and Corporate Governance and Integrated
Risk Management) have been established as required under this Direction
which are reporting directly to the Board.
The Terms of Reference for each Subcommittee is in place and are
reviewed annually.
The Secretary, Bank of Ceylon/ Secretary to the Board serves as
Secretary to all Subcommittees and maintains minutes etc. with oversight
by the respective Chairpersons.
A new Subcommittee, Information and Communication Technology (ICT)
Subcommittee was established in 2018.
The reports of the Subcommittees are included in this Annual Report.
Audit Committee on pages 89 to 92
Integrated Risk Management Committee on pages 93 to 95
Human Resources and Remuneration Committee on page 96 and 97
Nomination and Corporate Governance Committee on page 98 and 99
ICT Committee on page 100 and 101
The Government being the sole shareholder, the Annual Report of the
Bank is submitted to the Parliament of Sri Lanka and to the Ministry in
charge of the Bank.
3 (6) (ii) The following rules shall apply in relation to the Audit
Committee:
a. The Chairman of the Committee shall be an
Independent Non-Executive Director who possesses
qualifications and experience in accountancy and
/ or audit.
Complied with.
During the year 2018, the Chairmen of the Audit Committee were
Independent Non-Executive Director who had required qualifications and
experience as indicated on page 80.
(Presently a new Board is in the process of being constituted and
the appointment of a Director who holds required qualifications and
experience is awaited. A Chairman is in place in the interim. He has
extensive experience as a former senior banker)
b. All members of the Committee shall be Non-
Executive Directors.
Complied with.
All Directors of the Bank are Non-Executive.

414 Bank of Ceylon | Annual Report 2018
Section Principle Level of Compliance during the Year 2018
c. The Committee shall make recommendations on
matters in connection with:
(i) the appointment of the External Auditor for audit
services to be provided in compliance with the
relevant statutes;
(ii) the implementation of the Central Bank
Guidelines issued to Auditors from time to time;
(iii) the application of the relevant accounting
standards; and
(iv) the service period, audit fee and any resignation
or dismissal of the Auditor; provided that the
engagement of the Audit partner shall not
exceed five years, and that the particular Audit
partner is not re-engaged for the audit before
the expiry of three years from the date of the
completion of the previous term.
Complied with.
In accordance with the Terms of Reference, the Audit Committee makes
the following recommendations among many others:
� The implementation of the Central Bank Guidelines issued to Auditors
from time to time.
� The application of the relevant accounting standards.
Since the Auditor General is the External Auditor of the Bank, the
Committee has no role to play in the engagement of the External Auditor.
d. The Committee shall review and monitor the External
Auditor’s independence and objectivity and the
effectiveness of the audit processes in accordance
with applicable standards and best practices
The Bank’s Auditor being the Auditor General, his independence and
effectiveness is guaranteed under the Constitution of Sri Lanka.
COMPLIANCE REQUIREMENTS AS PER BANKING ACT DIRECTION NO. 11 OF 2007

415
Section Principle Level of Compliance during the Year 2018
e. The Committee shall develop and implement a
policy on the engagement of an External Auditor to
provide non-audit services that are permitted under
the relevant statutes, regulations, requirements and
guidelines. In doing so, the Committee shall ensure
that the provision by an External Auditor of non-
audit services does not impair the External Auditor’s
independence or objectivity. When assessing the
External Auditor’s independence or objectivity in
relation to the provision of non-audit services, the
Committee shall consider:
(i) whether the skills and experience of the audit
firm make it a suitable provider of the non-audit
services;
(ii) whether there are safeguards in place to ensure
that there is no threat to the objectivity and/
or independence in the conduct of the audit
resulting from the provision of such services by
the External Auditor; and
(iii) whether the nature of the non-audit services,
the related fee levels and the fee levels
individually and in aggregate relative to the audit
firm, pose any threat to the objectivity and/or
independence of the External Auditor.
This does not arise since the Auditor General is the Auditor of the Bank.
However, the Committee ensures that provision by an audit firm (if
appointed by the Auditor General to assist him in the audit of the
Bank) of non-audit services does not impair that firm’s independence
or objectivity. For the audit of the year 2018 no such firm has been
appointed.
f. The Committee shall, before the audit commences,
discuss and finalise with the External Auditors the
nature and scope of the audit, including:
(i) an assessment of the bank’s compliance with
the relevant Directions in relation to corporate
governance and the management’s internal
controls over financial reporting;
(ii) the preparation of Financial Statements for
external purposes in accordance with relevant
accounting principles and reporting obligations;
and
(iii) the coordination between firms where more than
one audit firm is involved.
The scope and the extent of audit have been determined by the Auditor
General.
Audit Plan for year 2018 was presented and the Committee agreed to it.

416 Bank of Ceylon | Annual Report 2018
Section Principle Level of Compliance during the Year 2018
g. The Committee shall review the financial information
of the bank, in order to monitor the integrity of
the Financial Statements of the bank, its Annual
Report, accounts and quarterly reports prepared
for disclosure, and the significant financial reporting
judgements contained therein. In reviewing the
bank’s Annual Report and accounts and quarterly
reports before submission to the Board, the
Committee shall focus particularly on:
(i) major judgmental areas;
(ii) any changes in accounting policies and
practices;
(iii) significant adjustments arising from the audit;
(iv) the going concern assumption; and
(v) the compliance with relevant accounting
standards and other legal requirements.
Complied with.
There is a continuing process carried out in reviewing monthly,
quarterly and annual financials of the Bank by the Committee and
recommendations are made to the Board.
h. The Committee shall discuss issues, problems
and reservations arising from the interim and final
audits, and any matters the Auditor may wish to
discuss including those matters that may need to
be discussed in the absence of Key Management
Personnel, if necessary.
Complied with.
The Committee discusses issues, problems and reservations arising from
the interim and final audits. The representative of the Auditor General
was present at the Committee meetings throughout. With regard to 2018
audit, the committee offered a close door meeting to the representative of
the Auditor General.
At the beginning of 2018, a ‘closed door’ meeting was held.
i. The Committee shall review the External Auditor’s
Management Letter and the management’s
response thereto.
Complied with.
j. The Committee shall take the following steps with
regard to the internal audit function of the bank:
(i) Review the adequacy of the scope, functions
and resources of the Internal Audit Department,
and satisfy itself that the Department has the
necessary authority to carry out its work;
Complied with.
The Audit Committee reviews and makes necessary recommendations
with regard to the adequacy of the scope, functions and resources of the
Internal Audit Department.
(ii) Review the internal audit programme and
results of the internal audit process and, where
necessary, ensure that appropriate actions are
taken on the recommendations of the Internal
Audit Department;
Complied with.
The Committee reviews the internal audit programme and results of the
internal audit procedures and ensures that appropriate actions are taken
for improvements.
COMPLIANCE REQUIREMENTS AS PER BANKING ACT DIRECTION NO. 11 OF 2007

417
Section Principle Level of Compliance during the Year 2018
(iii) Review any appraisal or assessment of the
performance of the head and senior staff members
of the Internal Audit Department;
Complied with.
Performance appraisal of Chief Internal Auditor and the work process
and results of the internal audit function are generally evaluated by the
Audit Committee. Performance evaluation of senior staff is carried out
according to the Board approved evaluation process by the Chief Internal
Auditor and is tabled before the Audit Committee. This year in view of
Board changes at the latter part of 2018, the evaluations for year 2018
were not carried out.
iv) Recommend any appointment or termination of the
head, senior staff members and outsourced service
providers to the internal audit function;
Complied with.
(v) Ensure that the Committee is appraised of
resignations of senior staff members of the Internal
Audit Department including the Chief Internal
Auditor and any outsourced service providers, and
to provide an opportunity to the resigning senior
staff members and outsourced service providers to
submit reasons for resigning;
Complied with.
Such a situation has not arisen during the year.
(vi) Ensure that the internal audit function is independent
of the activities it audits and that it is performed with
impartiality, proficiency and due professional care.
Complied with.
According to the organisation structure of the Bank, the Chief Internal
Auditor reports directly to the Board through the Audit Committee and he
is independent of any operations of the Bank.
k. The Committee shall consider the major findings of
internal investigations and management’s responses
thereto.
Complied with.
The Audit Committee has reviewed the major findings of internal
investigations and management responses thereto.
l. The Chief Finance Officer, the Chief Internal Auditor
and a representative of the External Auditors may
normally attend meetings. Other Board members
and the Chief Executive Officer may also attend
meetings upon the invitation of the Committee.
However, at least twice a year, the Committee
shall meet with the External Auditors without the
Executive Directors being present.
Complied with.
The Chief Financial Officer, Chief Internal Auditor, Chief Risk Officer
and Compliance Officer and the representative of the Auditor General
participate at the Committee meetings. The General Manager also
attended the meetings on the invitation of the Committee. The members
of the management are invited for any explanations, if necessary.
A “Closed door” meeting was held with the External Auditors in the
absence of the Management, with the submission of the Management
Letter 2017. A closed door meeting was offered to the Auditor General’s
representative in respect of the audit for the year 2018.

418 Bank of Ceylon | Annual Report 2018
Section Principle Level of Compliance during the Year 2018
m. The Committee shall have:
(i) explicit authority to investigate into any matter
within its terms of reference;
(ii) the resources which it needs to do so;
(iii) full access to information; and
(iv) authority to obtain external professional advice
and to invite outsiders with relevant experience
to attend, if necessary.
Complied with.
n. The Committee shall meet regularly, with due
notice of issues to be discussed and shall record
its conclusions in discharging its duties and
responsibilities.
Complied with.
The Audit Committee has scheduled regular meetings. Additional
meetings are convened when required.
The Committee met ten times during the year. The members of the
Committee are served with due notice of issues to be discussed and the
conclusions in discharging its duties and responsibilities are recorded in
the minutes of the meetings maintained by the Secretary to the Board/
Secretary, Bank of Ceylon.
o. The Board shall disclose in an informative way,
(i) details of the activities of the Audit Committee;
(ii) the number of Audit Committee meetings held in
the year; and
(iii) details of attendance of each individual Director
at such meetings.
Complied with.
Activities of the Committee are reported in Audit Committee Report on
pages 89 to 92
The Committee met ten times during the year 2018 and details of
attendance are given on page 86
p. The Secretary of the Committee (who may be the
Company Secretary or the Head of the Internal Audit
function) shall record and keep detailed minutes of
the Committee meetings.
Complied with.
Minutes are maintained by the Secretary to the Board/Secretary, Bank of
Ceylon who is also the Secretary to the Committee.
q. The Committee shall review arrangements by
which employees of the bank may, in confidence,
raise concerns about possible improprieties in
financial reporting, internal control or other matters.
Accordingly, the Committee shall ensure that
proper arrangements are in place for the fair and
independent investigation of such matters and
for appropriate follow-up action and to act as the
key representative body for overseeing the bank’s
relations with the External Auditor.
Complied with.
A Board approved Whistle-Blowing Policy is in place which covers these
aspects and significant findings are reported to the Audit Committee for
appropriate follow-up action.
The Audit Committee is the key representative body for overseeing the
Bank’s relations with the External Auditor viz the Auditor General in the
case of Bank of Ceylon.
COMPLIANCE REQUIREMENTS AS PER BANKING ACT DIRECTION NO. 11 OF 2007

419
Section Principle Level of Compliance during the Year 2018
3 (6) (iii) The following rules shall apply in relation to the Human
Resources and Remuneration Committee:
a. The Committee shall determine the remuneration
policy (salaries, allowances and other financial
payments) relating to Directors, Chief Executive
Officer (CEO) and Key Management Personnel of the
bank.
Complied with.
The Remuneration for Directors is according to the circulars/ letters
issued by the Government of Sri Lanka through the relevant Ministry and
the Bank of Ceylon Ordinance No. 53 of 1938 and its amendments. The
Bank has adopted a Remuneration Policy based on the said circulars/
Letters and the Ordinance.
The Board approved Remuneration Policy for the Key Management
Personnel is in place.
b. The Committee shall set goals and targets for the
Directors, CEO and the Key Management Personnel.
Complied with.
Directors are Non-Executive Directors and as such specific goals are not
set for them. Goals and targets for KMPs are documented and detailed in
the Action Plan prepared based on the Corporate Plan of the Bank. The
General Manager is responsible for the implementation of the Corporate
Plan through Key Management Personnel (KMPs). Performance on same
is reviewed.
c. The Committee shall evaluate the performance of
the CEO and Key Management Personnel against
the set targets and goals periodically and determine
the basis for revising remuneration, benefits and
other payments of performance-based incentives.
Evaluations for 2017 were carried out at the meeting held in 2018. In view
of changes to the Board that took place in November and December
2018, evaluations for 2018 were not carried out as is usually done.
However, a mid year evaluation and also an evaluation on the targets
and goals set, were carried out prior to formulating the rolling Corporate
Plan for 2019 to 2021 by the Board. Performance of the Assistant General
Managers were evaluated through the evaluation carried out on them by
the respective Deputy General Managers.
d. The CEO shall be present at all meetings of the
Committee, except when matters relating to the CEO
are being discussed.
Complied with.
3 (6) (iv) The following rules shall apply in relation to the
Nomination Committee:
The Bank has established a Nomination and Corporate Governance
Committee. In addition to the duties of the Nomination Committee given
under this Direction, certain other duties pertaining to upholding the
applicable Corporate Governance Principles are included under the
Terms of Reference of this Committee.
a. The Committee shall implement a procedure
to select/ appoint new Directors, CEO and Key
Management Personnel.
Complied with.
The Directors are appointed by the Minister under whose purview
the Bank falls. The General Manager is appointed by the Board with
the approval of the said Minister. There is a Board approved general
procedure/scheme for the appointment of the KMP.
b. The Committee shall consider and recommend
(or not recommend) the re-election of current
Directors, taking into account the performance
and contribution made by the Director concerned
towards the overall discharge of the Board’s
responsibilities.
Does not arise since the Directors are appointed by the relevant Minister.

420 Bank of Ceylon | Annual Report 2018
Section Principle Level of Compliance during the Year 2018
c. The Committee shall set the criteria such as
qualifications, experience and key attributes
required for eligibility to be considered for
appointment or promotion to the post of CEO and
the key management positions.
Complied with.
The General Manager is appointed based on the Bank’s accepted
procedure with the approval of the Board of Directors and the relevant
Minister as specified in the Bank of Ceylon Ordinance No. 53 of 1938 and
its amendments. The Board approved promotion schemes stipulate the
attributes required to be eligible to be selected or promoted to the other
key management positions.
d. The Committee shall ensure that Directors, CEO
and Key Management Personnel are fit and proper
persons to hold office as specified in the criteria
given in Direction 3 (3) and as set out in the statutes.
Complied with.
Annual declarations from Directors ensuring that they are fit and proper
persons to hold office as specified in the criteria given in Direction 3 (3)
and as set out in statutes are sent to CBSL.
Also the Committee ensures that KMPs are fit and proper persons to hold
their offices when they are promoted or appointed as KMPs.
e. The Committee shall consider and recommend
from time to time, the requirements of additional/
new expertise and the succession arrangements for
retiring Directors and Key Management Personnel.
Complied with.
A Board approved Succession Plan for the KMPs is in place. Additional
or new expertise that is needed are either recommended by the Board
Subcommittees or decided by the Board.
f. The Committee shall be chaired by an Independent
Director and preferably be constituted with a
majority of Independent Directors. The CEO may be
present at meetings by invitation.
Complied with.
The Committee was and is chaired by an Independent Non-Executive
Director and majority were and are independent Directors.
Page 98 of this Annual Report provides details in this regard.
3 (6) (v) The following rules shall apply in relation to the
Integrated Risk Management Committee:
a. The Committee shall consist of at least three Non-
Executive Directors, Chief Executive Officer and
Key Management Personnel supervising broad risk
categories, i.e. credit, market, liquidity, operational
and strategic risks. The Committee shall work
with Key Management Personnel very closely
and make decisions on behalf of the Board within
the framework of the authority and responsibility
assigned to the Committee.
Complied with.
The Committee comprises three Non-Executive Directors, General
Manager and the Chief Risk Officer who supervise credit, market,
operational, reputational and strategic risks. The Chief Internal Auditor,
Chief Financial Officer and Compliance Officer participate at all
Committee meetings at the request of the Committee. Any other KMP
and other staff are invited as and when the Committee needs their
presence. The Committee works closely with KMPs within the framework
of authority and responsibility assigned to the Committee.
b. The Committee shall assess all risks, i.e. credit,
market, liquidity, operational and strategic risks to
the bank on a monthly basis through appropriate risk
indicators and management information. In the case
of subsidiary companies and associate companies,
risk management shall be done, both on a bank
basis and group basis.
Complied with.
Independent Integrated Risk Management Division of the Bank assesses
the credit, market, liquidity, operational, strategic and reputational risks
of the Bank based on the policy documents recommended by this
Committee and approved by the Board, on a monthly basis and the
summary reports are submitted to the Committee at its regular meetings
and then to the next immediate Board meeting.
In the case of subsidiaries and associates, a risk management dashboard
has been developed to address the risks and is reported to the Committee.
COMPLIANCE REQUIREMENTS AS PER BANKING ACT DIRECTION NO. 11 OF 2007

421
Section Principle Level of Compliance during the Year 2018
c. The Committee shall review the adequacy and
effectiveness of all management level committees
such as the Credit Committee and the Asset Liability
Committee to address specific risks and to manage
those risks within quantitative and qualitative risk
limits as specified by the Committee.
Integrated Risk Management Division has prepared information
necessary to carryout this review to be submitted to the new committee
when convened (Since there was no Board until February 2019).
d. The Committee shall take prompt corrective action
to mitigate the effects of specific risks in the case
such risks are at levels beyond the prudent levels
decided by the Committee on the basis of the
bank’s policies and regulatory and supervisory
requirements.
Complied with.
Specific quantitative and qualitative risks which go beyond the limits
are monitored by the Chief Risk Officer and reported directly to the
Committee based on the severity of the issues involved.
e. The Committee shall meet at least quarterly to
assess all aspects of risk management including
updated business continuity plans.
Complied with.
During the year, the Committee has had six meetings. Details of meetings
and attendance are given on page 86
f. The Committee shall take appropriate actions
against the officers responsible for failure to identify
specific risks and take prompt corrective actions as
recommended by the Committee, and/or as directed
by the Director of Bank Supervision.
Complied with.
Formal documented disciplinary action procedure is in place in the Bank.
g. The Committee shall submit a risk assessment
report within a week of each meeting to the Board
seeking the Board’s views, concurrence and/or
specific directions.
Complied with.
The minutes of the meetings are submitted to the Board meeting
immediately following the Committee meeting together with the
recommendations and Risk Management Reports.
h. The Committee shall establish a compliance
function to assess the bank’s compliance with laws,
regulations, regulatory guidelines, internal controls
and approved policies on all areas of business
operations. A dedicated Compliance Officer
selected from Key Management Personnel shall
carry out the compliance function and report to the
Committee periodically.
Complied with.
The Bank has established a separate compliance function to assess the
Bank’s compliance with laws, regulations, regulatory guidelines, internal
controls and approved policies on all areas of business operations. This
function is headed by a dedicated Compliance Officer and he submits
quarterly Compliance Reports to the Committee and monthly Compliance
Reports to the Board.
The compliance function also assesses the Bank’s compliance with
Internal Controls and approved policies on all areas of business
operations.

422 Bank of Ceylon | Annual Report 2018
Section Principle Level of Compliance during the Year 2018
3 (7) Related Party Transactions
3 (7) (i) The Board shall take necessary steps to avoid any
conflicts of interest that may arise from any transaction
of the bank with any person, and particularly with the
following
categories of persons shall be considered as “related
parties” for the purposes of this Direction:
a. Any of the bank’s subsidiary companies;
b. Any of the bank’s associate companies;
c. Any of the Directors of the bank;
d. Any of the bank’s Key Management Personnel;
e. A close relation of any of the bank’s Directors or Key
Management Personnel;
f. A shareholder owning a material interest in the bank;
g. A concern in which any of the bank’s Directors or a
close relation of any of the bank’s Directors or any of
its material shareholders has a substantial interest.
Complied with.
There is a Board approved Policy on Related Party Transactions covering
related parties, their transactions, and restrictions on offering more
favourable treatment to related parties in order for the Board members to
avoid any Conflict of Interest in this regard.
Directors who have related party transactions are individually requested
to declare their transactions. Transactions are monitored through an
automated system.
3 (7) (ii) The type of transactions with related parties that shall
be covered by this Direction shall include the following:
a. The grant of any type of accommodation, as defined
in the Monetary Board’s Directions on maximum
amount of accommodation;
b. The creation of any liabilities of the bank in the form
of deposits, borrowings and investments;
c. The provision of any services of a financial or non-
financial nature provided to the bank or received
from the bank;
d. The creation or maintenance of reporting lines and
information flows between the bank and any related
parties which may lead to the sharing of potentially
proprietary, confidential or otherwise sensitive
information that may give benefits to such related
parties.
Complied with.
Information in this regard, is disclosed in Note 59 on page 351 “Related
Party Disclosures” disclosures.
COMPLIANCE REQUIREMENTS AS PER BANKING ACT DIRECTION NO. 11 OF 2007

423
Section Principle Level of Compliance during the Year 2018
3 (7) (iii) The Board shall ensure that the bank does not engage in
transactions with related parties as defined in Direction
No. 3 (7) (i) above, in a manner that would grant such
parties “more favourable treatment” than that accorded
to other constituents of the bank carrying on the same
business. In this context, “more favourable treatment”
shall mean and include treatment, including the:
a. Granting of “total net accommodation” to related
parties, exceeding a prudent percentage of the
bank’s regulatory capital, as determined by the
Board. For purposes of this sub-direction:
(i) “Accommodation” shall mean accommodation
as defined in the banking Act Direction No. 7 of
2007 on Maximum Amount of Accommodation.
(ii) The “total net accommodation” shall be
computed by deducting from the total
accommodation, the cash collateral and
investments made by such related parties in the
bank’s share capital and debt instruments with a
maturity of five years or more.
b. Charging of a lower rate of interest than the bank’s
best lending rate or paying more than the bank’s
deposit rate for a comparable transaction with an
unrelated comparable counterparty;
c. Providing of preferential treatment, such as
favourable terms, covering trade losses and/or
waiving fees / commissions, that extend beyond
the terms granted in the normal course of business
undertaken with unrelated parties;
d. Providing services to or receiving services from a
related-party without an evaluation procedure;
e. Maintaining reporting lines and information flows
that may lead to sharing potentially proprietary,
confidential or otherwise sensitive information
with related parties, except as required for the
performance of legitimate duties and functions.
Complied with.
The Bank has implemented a Board approved process to monitor related
party transactions which is monitored by the Compliance Division
and compliance status is indicated in the monthly Compliance Report
submitted to the Board.
Any non-compliance brought to the notice of the Board is addressed by
the Board.

424 Bank of Ceylon | Annual Report 2018
Section Principle Level of Compliance during the Year 2018
3 (7) (iv) A bank shall not grant any accommodation to any of its
Directors or to a close relation of such Director unless
such accommodation is sanctioned at a meeting of
its Board of Directors, with not less than two-thirds
of the number of Directors other than the Director
concerned, voting in favour of such accommodation.
This accommodation shall be secured by such security
as may from time to time be determined by the Monetary
Board as well.
Complied with.
3 (7) (v) a. Where any accommodation has been granted by a
bank to a person or a close relation of a person or to
any concern in which the person has a substantial
interest, and such person is subsequently appointed
as a Director of the bank, steps shall be taken by
the bank to obtain the necessary security as may be
approved for that purpose by the Monetary Board,
within one year from the date of appointment of the
person as a Director.
Complied with.
b. Where such security is not provided by the period
as provided in Direction 3 (7) (v) (a) above, the
bank shall take steps to recover any amount due
on account of any accommodation, together with
interest, if any, within the period specified at the
time of the grant of accommodation or at the expiry
of a period of eighteen months from the date of
appointment of such Director, whichever is earlier.
c. Any Director who fails to comply with the above
sub-directions shall be deemed to have vacated the
office of Director and the bank shall disclose such
fact to the public.
d. This sub-direction, however, shall not apply to
a Director who at the time of the grant of the
accommodation was an employee of the bank and
the accommodation was granted under a scheme
applicable to all employees of such bank.
3 (7) (vi) A bank shall not grant any accommodation or “more
favourable treatment” relating to the waiver of fees and/
or commissions to any employee or a close relation
of such employee or to any concern in which the
employee or close relation has a substantial interest
other than on the basis of a scheme applicable to the
employees of such bank or when secured by security as
may be approved by the Monetary Board in respect of
accommodation granted as per Direction 3 (7) (v) above.
Complied with.
No favourable treatment/accommodation is provided to any employee
of the Bank on more favourable terms unless under general staff loan
schemes applicable to all employees of the Bank. Circular instructions
have been issued in this regard. Close relations of Bank employees are
also not given any favourable treatment/recommendation.
COMPLIANCE REQUIREMENTS AS PER BANKING ACT DIRECTION NO. 11 OF 2007

425
Section Principle Level of Compliance during the Year 2018
3 (7) (vii) No accommodation granted by a bank under Direction
3 (7) (v) and 3 (7) (vi) above, nor any part of such
accommodation, nor any interest due thereon shall be
remitted without the prior approval of the Monetary
Board and any remission without such approval shall be
void and of no effect.
Complied with.
Such a situation has not arisen during the year 2018.
3 (8) Disclosures
3 (8) (i) The Board shall ensure that:
a. annual Audited Financial Statements and quarterly
Financial Statements are prepared and published
in accordance with the formats prescribed by
the supervisory and regulatory authorities and
applicable accounting standards; and that
b. such statements are published in the newspapers in
an abridged form, in Sinhala, Tamil and English.
Complied with.
3 (8) (ii) The Board shall ensure that the following minimum
disclosures are made in the Annual Report:
a. A statement to the effect that the Annual Audited
Financial Statements have been prepared in line
with applicable accounting standards and regulatory
requirements, inclusive of specific disclosures.
Complied with.
Disclosed in the “Annual Report of the Directors on the State of Affairs of
the Bank” on pages 179 to 184 and Directors’ Responsibility for Financial
Reporting on page 191.
b. A report by the Board on the bank’s internal control
mechanism that confirms that the financial reporting
system has been designed to provide reasonable
assurance regarding the reliability of financial
reporting, and that the preparation of Financial
Statements for external purposes has been done in
accordance with relevant accounting principles and
regulatory requirements.
Complied with.
Disclosed in the “Directors’ Statement on Internal Control” on page 188
and 189 of this Annual Report and Directors’ Responsibility for Financial
Reporting on page 191.
c. The Assurance Report issued by the Auditors under
“Sri Lanka Standard on Assurance Engagements
SLSAE 3050 – Assurance Reports for banks on
Directors’ Statements on Internal Control”.
Complied with.
The Bank has obtained a certificate on the Effectiveness of Internal
Controls over Financial Reporting from the Auditor General which is
published on page 190 of this Annual Report.
d. Details of Directors, including names, fitness and
propriety, transactions with the bank and the total of
fees/remuneration paid by the bank.
Complied with.
Details of Directors are given on pages 24 to 27
Directors’ Interest in Contracts with the Bank are given on pages 185 to 187
Remuneration paid by the Bank are given in Note 16 to the Financial
Statements on page 236

426 Bank of Ceylon | Annual Report 2018
Section Principle Level of Compliance during the Year 2018
e. Total net accommodation as defined in 3 (7) (iii)
granted to each category of related parties. The net
accommodation granted to each category of related
parties shall also be disclosed as a percentage of
the bank’s regulatory capital.
Complied with.
“Total net accommodation” granted to each category of related parties
during the year 2018 as a percentage of the Bank’s regulatory capital is
given below:
LKR ’000 %
Key Management Personnels (KMPs) 79,660 0.05
Subsidiaries 1,928,106 1.25
Associates 185,012 0.12
Government and Government-related
entities (Refer definition in Note 59.4 of
Financial Statements) 1,265,475,303 822.75
f. The aggregate values of remuneration paid by
the Bank to its Key Management Personnel and
the aggregate values of the transactions of the
bank with its Key Management Personnel, set
out by broad categories such as remuneration
paid, accommodation granted and deposits or
investments made in the bank.
Complied with.
The aggregate amount of remuneration paid by the Bank and transactions
with KMPs for the year 2018 are stated below:
LKR ’000
Short-term employment benefits 429,123
Post-employment benefits 111,315
In addition to above, the Bank has also paid non-cash benefits such
as use of vehicles to KMPs in line with the approved benefit plan of the
Bank.
LKR ’000
Loans 450,368
Overdrafts 17,699
Credit cards 11,049
Deposits 506,964
Debentures 2,502
Undrawn facilities 70,587
g. A confirmation by the Board of Directors in its
Annual Corporate Governance Report that all the
findings of the “Factual Finding Reports” of Auditors
issued under “Sri Lanka Related Services Practice
Statement 4750” have been incorporated in the
Annual Corporate Governance Report provided that
Auditors confirm to the Director of Bank Supervision
to this effect.
Complied with.
The Bank has obtained a certificate from the Auditor General in
compliance with the Corporate Governance Direction No. 11 of 2007.
All findings of the Auditors have been incorporated in this Corporate
Governance Report and any recommendations will be dealt with in 2019.
h. A report setting out details of the compliance with
prudential requirements, regulations, laws and
internal controls and measures taken to rectify any
material non-compliances.
Complied with.
The Statement of Directors’ Responsibility for Financial Reporting on
page 191 clearly sets out details regarding compliance with prudential
requirements, regulations, laws and internal controls.
COMPLIANCE REQUIREMENTS AS PER BANKING ACT DIRECTION NO. 11 OF 2007

427
Section Principle Level of Compliance during the Year 2018
i. A statement of the regulatory and supervisory concerns on lapses in the bank’s risk management, or non-compliance with these Directions that have been pointed out by the Director of Bank Supervision, if so directed by the Monetary Board to be disclosed to the public, together with the measures taken by the bank to address such concerns.
Complied with.
There were no lapses which caused supervisory concern on the Bank’s Risk Management Systems or non-compliance with these directions which led to them being pointed out by the Director of Bank Supervision of the Central Bank of Sri Lanka and which have caused the Monetary Board to give directions that they be disclosed to the public. Since there have been no such lapses or instances of non-compliance and since no such directions have been given by the Monetary Board, the issue of measures to be taken does not arise and there is nothing to disclose in this regard.
3 (9) (i) Transitional and Other General Provisions Compliance with this Direction shall commence from 1 January 2008 onwards and all licensed commercial banks shall fully comply with the provisions of this Direction by or before 1 January 2009 except where extended compliance dates have been specifically provided for in this Direction.
Complied with.
3 (9) (ii) In respect of the banks that have been incorporated by specific statutes in Sri Lanka, the Boards as specified in such statutes shall continue to function in terms of the provisions of the respective statutes, provided they take steps to comply with all provisions of this Direction that are not inconsistent with the provisions of the respective statutes.
Complied with.
Bank of Ceylon has taken all possible measures to comply with all applicable provisions of this Direction that are not inconsistent with the provisions of Bank of Ceylon Ordinance No. 53 of 1938 and its amendments, the enabling enactment.
Any instances of non-compliance and where Bank of Ceylon has continued to function in terms of the provisions of the statutes applicable to it has been specifically mentioned above against the relevant sections.
3 (9) (iii) This Direction shall apply to the branches of the foreign banks operating in Sri Lanka to the extent that it is not inconsistent with the regulations and laws applicable in such bank’s country of incorporation. The branch of a foreign bank shall also publish its parent bank’s Annual Corporate Governance Report together with its Annual Report and accounts of the branch operations in Sri Lanka.
Not applicable.
3 (9) (iv) In the event of a conflict between any of the provisions of this Direction and the Articles of Association (or Internal Rules) pertaining to any bank, the provisions of this Direction shall prevail. However, if the Articles of Association of an individual bank set a more stringent standard than that specified in this Direction, such provisions in the Articles of Association may be followed.
Not applicable.
3 (9) (v) If for any reason such as ill health or any incapacity as provided in the Banking Act, the Monetary Board considers that exemptions referred to in Directions 3 (2) (ii) B, 3 (3) (i) A and 3 (3) (ii) A should not be availed of, such ground may be notified to the person by the Monetary Board, and after a hearing, the Monetary Board may limit the period of exemption.
Not applicable.

428 Bank of Ceylon | Annual Report 2018
COMPLIANCE REQUIREMENTS ENFORCED BY COLOMBO STOCK EXCHANGE
Compliance to the Listing Rules on contents of Annual Report, which were applicable to the Bank for the year ended 31 December
2018 enforced by the Colombo Stock Exchange, are summarised below:
Rule No. Requirement Period Date Submitted
7.4 a (i) The Interim Financial Statements prepared on quarterly basis,
approved by the Board of Directors to be submitted to CSE within
45 days from respective quarter ends for the first three quarters
and within two months at the end of 4th quarter.
Quarter 1 ended 31 March 2018 10 May 2018
Quarter 2 ended 30 June 2018 15 August 2018
Quarter 3 ended 30 September 2018 15 November 2018
Quarter 4 ended 31 December 2018 28 February 2019
Rule No. Requirement Compliance
7.4 b (i) Comply with LKAS 34 and disclose Group and Bank separately. Complied with.
7.4 b (ii) Disclose the additional notes and ratios as per Listing Rules. Complied with.
7.4 b (iii) Be signed by two Directors. Complied with.
7.4 b (iv) State whether the Financial Statements are audited or not. Complied with.
7.5 a Annual Report to be submitted to CSE within five months from the
closure of financial year.
The Audited Financial Statements for the year ended 31
December 2018 was submitted on 29 March 2019.
Annual Report for the year 2018 will be submitted before the
deadline.
Rule No. Disclosure Requirement Reference/Comments Page No.
7.6 (i) Names of persons who during the financial year were
Directors of the entity.
Annual Report of the Board of Directors on the
State of Affairs of Bank of Ceylon
182
7.6 (ii) Principal activities of the entity and its subsidiaries during the
year and any changes therein.
Annual Report of the Board of Directors on the
State of Affairs of Bank of Ceylon
Notes to the Financial Statements
179
206
7.6 (iii) The names and the number of shares held by the 20 largest
holders of voting and non-voting shares and the percentage
of such shares held.
Government of Sri Lanka is the sole shareholder
of Bank of Ceylon.
465, 468
7.6 (iv) The public holding percentage. Not applicable.
7.6 (v) A statement of each Director’s holding and Chief Executive
Officer’s holding in shares of the entity at the beginning and
end of each financial year.
Not applicable.
7.6 (vi) Information pertaining to material foreseeable risk factors of
the entity.
Risk Management Report 102 - 118
7.6 (vii) Details of material issues pertaining to employees and
industrial relations of the entity.
No material issues occurred during the year
under review.
7.6 (viii) Extents,locations,valuations and the number of buildings of
the entity’s land holdings and investment properties.
Notes 32 and 33 to the Financial Statements 295 - 312
7.6 (ix) Number of shares representing the entity’s stated capital. Note 49.1 to the Financial Statements 338
7.6 (x) A distribution schedule of the number of holders in each
class of equity securities and percentage of their total
holdings.
Spplymenatary Information 465

429
Rule No. Disclosure Requirement Reference/Comments Page No.
7.6 (xi) Ratios and market price information:
1. Dividend per share, net assets value per share, interest
rate of comparable Government Securities, Debt/equity
ratio, interest cover and liquid asset ratio.
Notes 19 and 49.2 to the Financial Statements. 240, 338
Supplementary Information 464
2. Market information on listed debentures. Note 48 to the Financial Statements. 335 - 337
Supplementary Information 465
3. Any changes in credit rating. Overview of Bank of Ceylon 20 - 21
7.6 (xii) Significant changes in the entity’s or its subsidiaries’ fixed Note 33 to the Financial Statements. 297 - 312
assets and the market value of the land, if the value differs
substantially from the book value.
7.6 (xiii) During the year the entity has raised funds either through Notes 43, 48 and 49 to the 320
a public issue, rights issue and private placement. Financial Statements. 335, 338
7.6 (xiv) Information in respect of each employee share ownership Not applicable.
or stock option scheme.
7.6 (xv) Disclosures pertaining to Corporate Governance practices Exempted under Section 7.10 of Listing Rules
in terms of Rules 7.10.3, 7.10.5 (c) and 7.10.6 (c) since the Bank complies with direction laid
of Section 7 of the Rules. down in the Banking Act Direction No. 11 of
2007 on Corporate Governance.
7.6 (xvi) Related party transactions exceeding 10% of the equity Supplementary Information 468
or 5% of the total assets of the entity as per Audited
Financial Statements, whichever is lower.
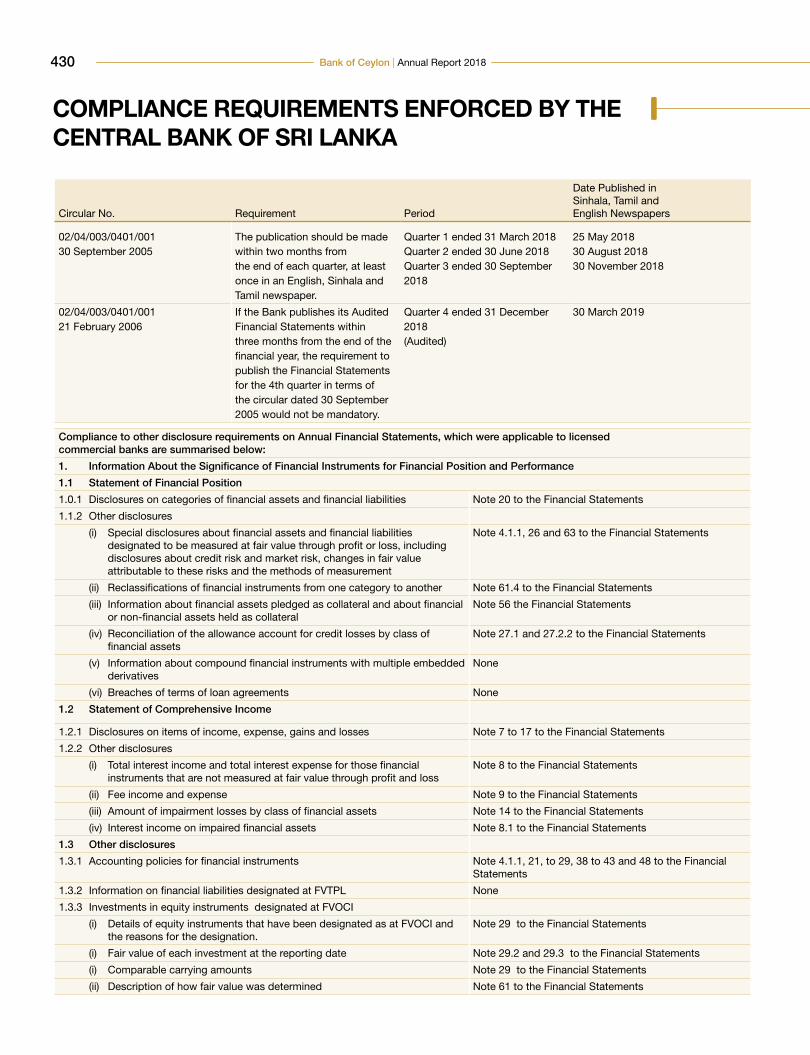
430 Bank of Ceylon | Annual Report 2018
COMPLIANCE REQUIREMENTS ENFORCED BY THE CENTRAL BANK OF SRI LANKA
Circular No. Requirement Period
Date Published inSinhala, Tamil andEnglish Newspapers
02/04/003/0401/00130 September 2005
The publication should be madewithin two months fromthe end of each quarter, at leastonce in an English, Sinhala andTamil newspaper.
Quarter 1 ended 31 March 2018Quarter 2 ended 30 June 2018Quarter 3 ended 30 September2018
25 May 201830 August 201830 November 2018
02/04/003/0401/00121 February 2006
If the Bank publishes its AuditedFinancial Statements within three months from the end of the financial year, the requirement to publish the Financial Statements for the 4th quarter in terms of the circular dated 30 September 2005 would not be mandatory.
Quarter 4 ended 31 December 2018(Audited)
30 March 2019
Compliance to other disclosure requirements on Annual Financial Statements, which were applicable to licensedcommercial banks are summarised below:
1. Information About the Significance of Financial Instruments for Financial Position and Performance
1.1 Statement of Financial Position
1.0.1 Disclosures on categories of financial assets and financial liabilities Note 20 to the Financial Statements
1.1.2 Other disclosures
(i) Special disclosures about financial assets and financial liabilities designated to be measured at fair value through profit or loss, including disclosures about credit risk and market risk, changes in fair value attributable to these risks and the methods of measurement
Note 4.1.1, 26 and 63 to the Financial Statements
(ii) Reclassifications of financial instruments from one category to another Note 61.4 to the Financial Statements
(iii) Information about financial assets pledged as collateral and about financial or non-financial assets held as collateral
Note 56 the Financial Statements
(iv) Reconciliation of the allowance account for credit losses by class of financial assets
Note 27.1 and 27.2.2 to the Financial Statements
(v) Information about compound financial instruments with multiple embedded derivatives
None
(vi) Breaches of terms of loan agreements None
1.2 Statement of Comprehensive Income
1.2.1 Disclosures on items of income, expense, gains and losses Note 7 to 17 to the Financial Statements
1.2.2 Other disclosures
(i) Total interest income and total interest expense for those financial instruments that are not measured at fair value through profit and loss
Note 8 to the Financial Statements
(ii) Fee income and expense Note 9 to the Financial Statements
(iii) Amount of impairment losses by class of financial assets Note 14 to the Financial Statements
(iv) Interest income on impaired financial assets Note 8.1 to the Financial Statements
1.3 Other disclosures
1.3.1 Accounting policies for financial instruments Note 4.1.1, 21, to 29, 38 to 43 and 48 to the Financial Statements
1.3.2 Information on financial liabilities designated at FVTPL None
1.3.3 Investments in equity instruments designated at FVOCI
(i) Details of equity instruments that have been designated as at FVOCI and the reasons for the designation.
Note 29 to the Financial Statements
(i) Fair value of each investment at the reporting date Note 29.2 and 29.3 to the Financial Statements
(i) Comparable carrying amounts Note 29 to the Financial Statements
(ii) Description of how fair value was determined Note 61 to the Financial Statements

431
(iii) Dividends recognised during the period, separately for investments derecognised during the reporting period and those held at the reporting date.
Note 13 to the Financial Statements
(iv) Transfer cumulative gain or loss within equity during the period and the reasons for those transfers
Note 12 to the Financial Statements
(v) If investments in equity instruments measured at FVOCL are derecognised during the reporting period,- Reasons for disposing of the investments- Fair value of the investments at the date of derecognition- The cumulative gain or loss on disposal
1.3.4 Reclassification of financial assets
None
(i) For all reclassifications of financial assets in the current or previous reporting period
- Date of reclassification- Detailed explanation of the change in the business model and a
qualitative description of its effect on the financial statements- The amount reclassified into and out of each category
None
(ii) For reclassifications from FVTPL to amortised cost of FVOCI
- The effective interest rate (EIR) determined on the date of reclassification
- the interest revenue recognised
None
(iii) For reclassifications from FVOCI to amortised cost, or from FVTPL to amortised cost or FVOCI- The fair value of the financial assets at the reporting date- The fair value gain or loss that would have been recognised in profit
or loss or OCI during the reporting period if the financial assets had not been reclassified.
None
1.3.5 Information on hedge accounting None
1.3.6 Information about the fair values of each class of financial asset and financial liability, along with:
(i) Comparable carrying amounts Note 61 to the Financial Statements
(ii) Description of how fair value was determined Note 61 to the Financial Statements
(iii) The level of inputs used in determining fair value Note 61 to the Financial Statements
(iv) a. Reconciliations of movements between levels of fair value measurement hierarchyb. additional disclosures for financial instruments that fair value is
determined using level 3 inputs
None
Note 61.1.3 to the Financial Statements
(v) Information if fair value cannot be reliably measured None
2. INFORMATION ABOUT THE NATURE AND EXTENT OF RISKS ARISING FROM FINANCIAL INSTRUMENTS
2.1 Qualitative disclosures
2.1.1 Risk exposures for each type of financial instrument Risk Report and Note 63 to the Financial Statements
2.1.2 Management’s objectives, policies, and processes for managing those risks. Risk Report
2.1.3 Changes from the prior period Risk Report
2.2 Quantitative disclosures
2.2.1 Summary of quantitative data about exposure to each risk at the reporting date Note 63 to the Financial Statements
2.2.2 Disclosures about credit risk, liquidity risk, market risk, operational risk, interest rate risk and how these risks are managed
Note 63 to the Financial Statements
(i) Credit Risk Note 63.2 to the Financial Statements
(a) Maximum amount of exposure (before deducting the value of collateral), description of collateral, information about credit quality of financial assets that are neither past due nor impaired and information about credit quality of financial assets
Note 63.2.1 to the Financial Statements
(b) For financial assets that are past due or impaired, disclosures on age, factors considered in determining as impaired and the description of collateral on each class of financial asset
Note 63.2.1 to the Financial Statements

432 Bank of Ceylon | Annual Report 2018
(c) Information about collateral or other credit enhancements obtained or called
Note 63.2.1 to the Financial Statements
(d) Credit risk management practices- CRM practices and how they relate to the recognition and
measurement ECL, including the methods, assumptions, and information used to measure ECL
- Quantitative and qualitative information to evaluate the amounts in the Financial Statements arising from ECL, including changes and the reasons for those changes
- How the Bank determines whether the credit risk of financial instruments has increased significantly since initial recognition
- The Bank’s definitions of default for different financial instruments, including the reasons for selecting those definitions
- How instruments are grouped if ECL are measured on a collective basis
- How the bank determines that financial assets are credit – impaired- The Bank’s write – off policy, including the indicators that there is no
reasonable expectation of recovery- How the modification requirements have been applied
Note 27 and 63 to the Financial Statements
(e) ECL calculations- Basis of the inputs, assumptions and the estimation techniques used
when estimating ECL- How forward – looking information has been incorporated into
the determination of ECL including the use of macroeconomic information.
- Changes in estimation techniques or significant assumptions made during the reporting period
Note 27 to the Financial Statements
(f) Amounts arising from ECL- Reconciliation for each class of financial instruments of the opening
balance to the closing balance of the impairment loss allowance
Note 21,23,27,28 to the Financial Statements
(g) Collateral- Bank’s maximum exposure to credit risk at the reporting date - Description of collateral held as security and other credit
enhancements
Note 63.2.1 to the Financial Statements
(h) Written – off assets- Contractual amount outstanding of financial assets written off during
the reporting period that are still subject to enforcement activity.
Note 27 to the Financial Statements
(i) Pillar III disclosures of the Banking Act Directions No 1 of 2016 on Capital requirements under Basel III for licensed banks
Capital Adequacy in Compliance annexes
(ii) Liquidity Risk
(a) A maturity analysis of financial liabilities Note 58 to the Financial Statements
(b) Description of approach to risk management Risk Report and Note 63.3 to the Financial Statements
(c ) Pillar III disclosures of the Banking Act Direction No. 1 of 2016 on Capital requirements under Basel III for Licensed Banks
Capital Adequacy in Compliance annexes
(iii) Market Risk
(a) A sensitivity analysis of each type of market risk to which the entity is exposed
Note 63.4 to the Financial Statements
(b) Additional information, if the sensitivity analysis is not representative of the Bank’s risk exposure
Note 63.4 to the Financial Statements
(c ) Pillar III disclosures of the Banking Act Directions No. 1 of 2016 on Capital requirements under Basel III for Licensed Banks
Capital Adequacy in Compliance annexes
(iv) Operational Risk
Pillar III disclosures of the Banking Act Direction No. 1 of 2016 on Capital requirements under Basel III for Licensed Banks
Capital Adequacy in Compliance annexes
(v) Equity risk in the banking book
(a) Qualitative disclosures
COMPLIANCE REQUIREMENTS ENFORCED BY THE CENTRAL BANK OF SRI LANKA

433
· Differentiation between holdings on which capital gains are expected and those taken under other objectives including for relationship and strategic reasons
Note 26 and 29 to the Financial Statements
· Discussion of important policies covering the valuation and accounting of equity holdings in the banking book
Note 26 and 29 to the Financial Statements
(b) Quantitative disclosures
· Value disclosed in the statement of financial position of investments, as well as the fair value of those investments; for quoted securities, a comparison to publicly quoted share values where the share price is materially different from fair value
Note 26.2, 29.2 and 29.3 to the Financial Statements
· The types and nature of investments Note 26 and 29 to the Financial Statements
· The cumulative realised gains /(losses) arising from sales and liquidations in the reporting period
Note 12 to the Financial Statements
(vi) Interest rate risk in the banking book
(a) Qualitative disclosures
Nature of interest rate risk in the banking book (IRRBB) and key assumptions
Note 63.4.2 to the Financial Statements
(b) Quantitative disclosures
The increase /(decline) in earnings or economic value (or relevant measure used by management) for upward and downward rate shocks according to management’s method for measuring IRRBB, broken down by currency (as relevant)
Note 63.4.1 to the Financial Statements
1.1.3 Information on concentrations of risk Note 63.2.3 to the Financial Statements
3. OTHER DISCLOSURES
3.1 Capital
1.1.1 Capital structure Note 49 to the Financial Statements
3.2 Qualitative disclosures
Summary information on the terms and conditions of the main features of all capital instruments, especially in the case of innovative, complex or hybrid capital instruments
Debt - Note 48 to the Financial StatementsEquity – 49
3.3 Quantitative disclosures
(a) The amount of Tier I capital, with separate disclosure of :
· Paid-up share capital / common stock Capital Adequacy in Compliance Annexes
· Reserves Capital Adequacy in Compliance Annexes
· Non-controlling interests in the equity of subsidiaries Capital Adequacy in Compliance Annexes
· Innovative instruments None
· Other capital instruments None
· Deductions from Tier I capital Capital Adequacy in Compliance Annexes
(b) The total amount of Tier 2 and Tier 3 capital Capital Adequacy in Compliance Annexes
(c) Other deductions from capital Capital Adequacy in Compliance Annexes
(d) Total eligible capital Capital Adequacy in Compliance Annexes
3.4 Capital adequacy
(i) Qualitative disclosures
A summary discussion of the bank’s approach to assessing the adequacy of its capital or support current and future activities
Risk Report and Note 63.6 to the Financial Statements
(ii) Quantitative disclosures
(a) Capital requirements for credit risk, market risk and operational risk Capital Adequacy in Compliance Annexes
(b) Total and Tier 1 capital ratio Capital Adequacy in Compliance Annexes

434 Bank of Ceylon | Annual Report 2018
CAPITAL ADEQUACY
Basel III Regulatory RequirementsBasel III is an internationally agreed set of measures developed by the Basel Committee
on Banking Supervision in response to the financial crisis of 2007-09. The measures aim
to strengthen the regulation, supervision and risk management of banks.
Pillar I
EnhancedMinimumCapitalandLiquidityRequirements
Pillar II
EnhancedSupervisoryReview Process for Firm-wide RiskManagement andCapital Planning
Pillar III
Enhanced RiskDisclosure andMarket Discipline
� Basel III
The three pillars in Basel III have been strengthened than the Basel II, to cater to the
present requirements. while the framework itself was extended with imperative features.
Basel III is an appendage of the Basel II Framework, and introduces new capital and
liquidity standards to strengthen the regulation, supervision, and risk management of the
whole of the banking and finance sector.
The global capital framework and new capital buffers require, financial institutions to hold
more capital and higher quality of capital than under Basel II rules. The new Leverage
Ratio introduces a non-risk based measure to supplement the risk-based minimum
capital requirements. The new liquidity ratios ensure that adequate funding is maintained
in case there are other severe banking crises.
Main Features of the
Basel III• Capital Conservation Buffer - An additional layer of common equity that, when
breached, restricts payouts of earnings to help protect the minimum common equity
requirement.
• Countercyclical Capital Buffer, which places restrictions on participation by banks in
system-wide credit booms with the aim of reducing their losses in credit bursts.
• Additional proposals for domestic systemically important banks (D-SIBs), including
requirements for supplementary capital, augmented contingent capital and
strengthened arrangements for cross-border supervision and resolution. According
to the Central Bank of Sri Lanka, banks with a total asset base of over LKR 500 billion,
in the latest annual audited financial statements will be identified as D-SIBs in the
banking sector.
• Leverage ratio – a minimum amount of loss-absorbing capital, relative to all of
a bank’s assets and off-balance sheet exposures regardless of risk weighting.
Leverage ratio will be implemented in Sri Lanka from 01.01.2019 with observation
period already commenced from 1st
quarter 2017, which will be monitored
by the Central Bank of Sri Lanka.
Commencing 1 January 2019, the
minimum Leverage Ratio for licensed
banks shall be 3%.
• Liquidity requirements - a minimum
liquidity ratio, the liquidity coverage
ratio (LCR), intended to provide
enough cash to cover funding needs
over a 30-day period of stress; and
a longer-term ratio, the net stable
funding ratio (NSFR), intended to
address maturity mismatches over
the entire balance sheet.
The implementation of the Basel III
minimum capital requirements across the
banking sector in Sri Lanka, under the
direction No. 01 of 2016 is now effective
from the 01.07.2017 in transitional phase.
Basel III Transitional phase-in-arrangement of capital requirements for banks with assets of LKR 500 billion and above
Components of
Capital 01.01.2018 01.01.2019
Common Equity
Tier 1 4.50% 4.50%
Capital
Conservation
Buffer 1.875% 2.50%
Surcharge on
Domestic
Systematically
Important
banks(D-SIBs) 1.00% 1.50%
Additional Tier 1
Capital 1.50% 1.50%
Total Tier 1
Capital 8.875% 10.00%
Minimum Total
Capital Ratio +
Capital
Conservation
Buffer +Capital
surcharge on
D-SIBs 12.875% 14.00%

435
Basel III Disclosure Requirements
Key Regulatory Ratios- Capital and Liquidity
Item
31.12.2018
Bank Group
Basel III
Regulatory Capital (LKR’000)
Common Equity Tier 1 108,830,534 115,250,456
Tier 1 Capital 108,830,534 115,250,456
Total Capital 153,811,334 162,065,449
Regulatory Capital Ratios (%)
Common Equity Tier 1 Capital Ratio (Minimum Requirement- 7.375%) 10.31% 10.41%
Tier 1 Capital Ratio (Minimum Requirement- 8.875%) 10.31% 10.41%
Total Capital Ratio (Minimum Requirement- 12.875%) 14.58% 14.64%
Item
31.12.2018
Bank Group
Regulatory Liquidity
Statutory Liquid Assests - Domestic (LKR ’000) 478,549,997 477,892,171
Statutory Liquid Assests - FCBU (USD ’000) 835,941 878,439
Statutory Liquid Assests Ratio (Minimum Requirement- 20%)
Domestic Banking Unit (%) 24.47 27.22
Off -Shore Banking Unit(%) 60.20 21.91
Liquidity Coverage Ratio (%)- Rupee (Minimum Requirement 2018 -90%, 2017 - 80%) 143.51 141.46
LIquidity Coverage Ratio (%)- All Currency (Minimum Requirement 2018-90%, 2017 - 80%) 114.99 105.04
Basel III new guidelines were implemented w.e.f. 01st July 2017
Bank of Ceylon commenced its
preparation towards Basel III by
implementing well formulate strategic
policies from 2015 when CBSL issued
their first consultation paper for Basel
III implementation in April 2015. By
enhancing capital base & applying
risk mitigating techniques, Bank able
to maintain the ratio well above the
regulatory requirements as of 31st December 2018.
Internally generated funds and issuance of Basel III
complied subordinated Debentures during the year has
aggrandize Bank’s capital base, enabled the bank to meet
the enhanced capital adequacy requirements under the
Basel III which is fully, effective from 1st of January 2019.

436 Bank of Ceylon | Annual Report 2018
Basel III Computation of Capital Ratios - 31.12.2018
Item Bank Group
LKR’000 LKR’000
Common Equity Tier 1 ( CET 1) Capital after Adjustments 108,830,534 115,250,456
Common Equity Tier 1 ( CET 1) Capital 114,553,579 117,839,485
Equity Capital ( Stated Capital)/ Assigned Capital 25,000,000 25,000,000
Reserve Fund 12,890,000 12,890,000
Published Retained Earnings/ (Accumulated Retained Losses) 72,878,984 74,582,224
Published Accumulated Other Comprehensive Income(OCI) 1,102,916 1,484,672
General and other Disclosed Reserves 2,681,679 3,882,588
Unpublished current year's profit/ (losses) and gains reflected in OCI - -
Ordinary shares issued by consoloidated banking and financial subsidaries held by third parties -
Total Adjustments to CET 1 Capital 5,723,046 2,589,029
Goodwill (net) - -
Intangible Assests (net) 1,200,640 1,419,084
Revaluation losses of Property, Plant and Equipment 180,879 180,879
Deferred tax assets (net) - 168,989
Investments in the capital of banking and financial institutions where the Bank does not own more than 10% of the issued ordinary share capital of the entity 621,112 612,866
Significant investments in the capital of financial institutions where the Bank owns more than 10% of the issued ordinary share capital of the entity 3,513,204 -
Shortfall of cpital in financial subsidiaries 207,210 207,210
Additional Tier 1 (AT I) Capital after Adjustment - -
Additional Tier 1 (AT I) Capital - -
Qualifying Additional Tier 1 Capital Instruments - -
Instruments issued by Consolidated Banking and Financial Subsidiaries of the Bank and held by third Parties - -
Total Adjustments to AT 1 Capital - -
Investment in Own Shares - -
others ( specify)
Tier 2 Capital after Adjustments 44,980,801 46,814,994
Tier 2 Capital 46,976,379 48,672,067
Qualifying Tier 2 Capital Instruments 33,712,919 35,312,919
Revaluation Gains 6,556,298 6,556,298
General Provisions 6,707,162 6,802,850
Instruments issued by Consolidated Banking and Financial Subsidiaries of the Bank and held by third Parties - -
Total Adjustment to Tier 2 1,995,578 1,857,073
Investment in Own Shares -
Investments in the capital of financial institutions and where the Bank does not own more than 10% of the issued capital carrying voting rights of the issuing entity 1,882,058 1,857,073
Significant investments in the capital of banking and financial institutions where the Bank own more than 10% of the issued ordinary share capital of the entity 113,520 -
CET I Capital 108,830,534 115,250,456
Total Tier 1 Capital 108,830,534 115,250,456
Total Capital 153,811,334 162,065,449
CAPITAL ADEQUACY

437
Item Bank Group
LKR’000 LKR’000
Total Risk Weighted Assets (RWA) 1,055,206,519 1,107,377,275
RWAs for Credit Risk 960,571,917 1,001,547,130
RWAs for Market Risk 7,423,060 7,423,060
RWAs for Operational Risk 87,211,542 98,407,084
CET I Capital Ratio (including Capital Conservation Buffer, Countercyclical Capital Buffer & Surcharge on D-SIBs)(%) 10.31% 10.41%
of which :Capital Conservation Buffer (%) 1.875% 1,875%
of which :Countercyclical Buffer (%) N/A N/A
of which:Capital Surcharge on D- SIBs (%) 1.00% 1.00%
Total Tier 1 Capital Ratio(%) 10.31% 10.41%
Total Capital Ratio ( including Capital Conservation Buffer, Countercyclical Capital Buffer & Surchanrge on D- SIBs)(%) 14.58% 14.64%
of which : Capital Conservation Buffer (%) 1.875% 1.875%
of which: Countercyclical Buffer (%) N/A N/A
of which:Capital Surcharge on D- SIBs (%) 1.00% 1.00%
Basel III computation of Liquidity Coverage Ratio -All Currency (Bank Only)
Amount (LKR’000)
Item 31.12.2018 31.12.2017
Total Un-Weighted
Value
TotalWeighted
Value
Total Un-Weighted
Value
TotalwWeighted
Value
Total Stock of High -Quality Liquid Asset (HQLA) 280,443,872 280,443,872 299,081,569 297,359,897
Total Adjusted Level I Assets 282,611,352 282,611,352 295,987,317 295,987,317
Level 1 Assets 278,177,780 278,177,780 295,568,225 295,568,225
Total Adjusted Level 2A Assets 850,000 722,500 100,000 85,000
Level 2A Assets 850,000 722,500 100,000 85,000
Total Adjusted Level 2B Assets 3,087,184 1,543,592 3,413,344 1,706,672
Level 2B Assets 3,087,184 1,543,592 3,413,344 1,706,672
Total Cash Outflows 2,240,481,512 361,439,798 1,896,131,889 319,951,612
Deposits 1,243,019,339 124,301,934 1,090,725,752 109,072,575
Unsecured Wholesale Funding 496,521,921 209,526,807 428,492,592 185,171,536
Secured Funding Transactions 80,175,016 - 23,782,957 -
Undrawn Portion of Committed (Irrevocable) Facilities and Other Contingent Funding Obligations 420,347,317 27,193,138 353,086,993 25,663,907
Additional Requirements 417,919 417,919 43,595 43,595
Total Cash Inflows 167,479,174 117,552,327 78,429,645 36,858,631
Maturing Secured Lending Transaction Backed by Collateral - - 18,388,000 -
Committed Facilities 5,000,000 - - -
Other Inflows by Counterparty which are Maturing Within 30 Days 162,479,174 117,552,327 46,347,809 36,858,631
Operational Deposits - - 13,693,836 -
Other Cash Inflows - - - -
Liquidity Coverage Ratio (%) (Stock of High quality Liquid Assets/ total Net Cash Outflows over the Next 30 Calender Days)*100% 114.99% 105.04%

438 Bank of Ceylon | Annual Report 2018
Main Features of Regulatory Capital Instruments
Description of the Capital Instrument
Issuer Bank of Ceylon Bank of Ceylon Bank of Ceylon Bank of Ceylon Bank of Ceylon
Unique Identifier LK0357D20462 LK0357D20439 LK0357D20454 LK0357D20470 LK0357D22500
Governing Laws of the Instrument Laws of Sri Lanka Laws of Sri Lanka Laws of Sri Lanka Laws of Sri Lanka Laws of Sri Lanka
Original Date of Issuance 25-Oct-13 25-Oct-13 25-Oct-13 25-Oct-13 22-Sep-14
Par Value of Instrument -LKR 100 100 100 100 100
Issued quantity ( No of Debentures) 11,990,000 10,000 12,000,000 16,000,000 51,256,350
Issued Quantity (LKR’000) 1,199,000 1,000 1,200,000 1,600,000 5,125,635
Perpetual or Dated
Original Maturity Date, if Applicable 24-Oct-21 24-Oct-21 24-Oct-22 24-Oct-23 21-Sep-19
Amount Recognised in Regulatory Capital (in LKR’000 as at the Reporting Date) 719,400 600 960,000 1,600,000 1,025,127
Accounting Classification (equity/ Liability) Liability Liability Liability Liability Liability
Coupons/ Dividends
Fixed or Floating Dividend/ Coupon FIXED FLOATING FIXED FIXED FIXED
Coupon Rate and any Related Index % 13.25 12.99 13.25 13.25 8.00
Non-Cumulative or Cumulative Non-Cumulative Non-Cumulative Non-Cumulative Non-Cumulative Non-Cumulative
Convertible or Non-Convertible Non Convertible Non Convertible Non Convertible Non Convertible Non Convertible
Description of the Capital Instrument
Issuer Bank of Ceylon Bank of Ceylon Bank of Ceylon Bank of Ceylon Bank of Ceylon
Unique Identifier LK0357D22534 LK0357D22526 LK0357D22542 LK0357D22559 LK0357D23201
Governing Laws of the Instrument Laws of Sri Lanka Laws of Sri Lanka Laws of Sri Lanka Laws of Sri Lanka Laws of Sri Lanka
Original Date of Issuance 22-Sep-14 22-Sep-14 22-Sep-14 22-Sep-14 6-Oct-15
Par Value of Instrument -LKR 100 100 100 100 100
Issued quantity ( No of Debentures) 2,157,800 8,250,600 18,334,950 300 2,885,900
Issued Quantity (LKR’000) 215,780 825,060 1,833,495 30 288,590
Perpetual or Dated
Original Maturity Date, if Applicable 21-Sep-19 21-Sep-19 21-Sep-22 21-Sep-22 5-Oct-20
Amount Recognised in Regulatory Capital (in LKR’000 as at the Reporting Date) 43,156 165,012 1,466,796 24 115,436
Accounting Classification (equity/ Liability) Liability Liability Liability Liability Liability
Coupons/Dividends
Fixed or Floting Dividend/Coupon FIXED FLOATING FIXED FLOATING FIXED
Coupon Rate and any Related Index % 7.75 10.43 8.25 10.43 8.25
Non-Cumulative or Cumulative Non-Cumulative Non-Cumulative Non-Cumulative Non-Cumulative Non-Cumulative
Convertible or Non-Convertible Non Convertible Non Convertible Non Convertible Non Convertible Non Convertible
CAPITAL ADEQUACY

439
Description of the Capital Instrument
Issuer Bank of Ceylon Bank of Ceylon Bank of Ceylon Bank of Ceylon Bank of Ceylon
Unique Identifier LK0357D23185 LK0357D23193 LK0357D23177 LK0357D23219 LK0357D23763
Governing Laws of the Instrument Laws of Sri Lanka Laws of Sri Lanka Laws of Sri Lanka Laws of Sri Lanka Laws of Sri Lanka
Original Date of Issuance 6-Oct-15 6-Oct-15 6-Oct-15 6-Oct-15 29-Dec-16
Par Value of Instrument -LKR 100 100 100 100 100
Issued quantity ( No of Debentures) 122,200 44,783,860 11,802,560 20,405,480 79,981,764
Issued Quantity (LKR’000) 12,220 4,478,386 1,180,256 2,040,548 7,998,176
Perpetual or Dated
Original Maturity Date, if Applicable 5-Oct-20 5-Oct-20 5-Oct-23 5-Oct-23 28-Dec-21
Amount Recognised in Regulatory Capital (in LKR’000 as at the Reporting Date) 4,888 1,791,354 1,180,256 2,040,548 4,798,906
Accounting Classification (equity/Liability) Liability Liability Liability Liability Liability
Coupons/ Dividends
Fixed or Floating Dividend/ Coupon FIXED FLOATING FIXED FLOATING FIXED
Coupon Rate and any Related Index % 8.00 13.05 9.50 13.05 13.25
Non-Cumulative or Cumulative Non-Cumulative Non-Cumulative Non-Cumulative Non-Cumulative Non-Cumulative
Convertible or Non-Convertible Non Convertible Non Convertible Non Convertible Non Convertible Non Convertible
Description of the Capital Instrument
Issuer Bank of Ceylon Bank of Ceylon Bank of Ceylon Bank of Ceylon Bank of Ceylon
Unique Identifier LK0357D23797 LK0357D23771 LK0357D23789
Governing Laws of the Instrument Laws of Sri Lanka Laws of Sri Lanka Laws of Sri Lanka Laws of Sri Lanka Laws of Sri Lanka
Original Date of Issuance 29-Dec-16 29-Dec-16 29-Dec-16 29-Dec-17 29-Dec-17
Par Value of Instrument -LKR 100 100 100 100 100
Issued quantity ( No of Debentures) 10,200 7,836 200 50,000,000 10,000,000
Issued Quantity (LKR’000) 1,020 784 20 5,000,000 1,000,000
Perpetual or Dated
Original Maturity Date, if Applicable 28-Dec-21 28-Dec-24 28-Dec-24 28-Dec-25 28-Dec-22
Amount Recognised in Regulatory Capital (in LKR’000 as at the Reporting Date) 612 784 20 5,000,000 800,000
Accounting Classification (equity/ Liability) Liability Liability Liability Liability Liability
Coupons/ Dividends
Fixed or Floating Dividend/ Coupon FLOATING FIXED FLOATING FIXED FIXED
Coupon Rate and any Related Index (%) 12.68 12.75 12.68 12.75 12.50
Non-Cumulative or Cumulative Non-Cumulative Non-Cumulative Non-Cumulative Non-Cumulative Non-Cumulative
Convertible or Non-Convertible Non Convertible Non Convertible Non Convertible Non Convertible Non Convertible

440 Bank of Ceylon | Annual Report 2018
Description of the Capital Instrument
Issuer Bank of Ceylon Bank of Ceylon
Unique Identifier
Governing Laws of the Instrument Laws of Sri Lanka Laws of Sri Lanka
Original Date of Issuance 31-Jul-18 3-Dec-18
Par Value of Instrument -LKR 100 100
Issued quantity ( No of Debentures) 67,000,000 53,000,000
Issued Quantity (LKR’000) 6,700,000 5,300,000
Perpetual or Dated
Original Maturity Date, if Applicable 30-Jul-26 2-Dec-23
Amount Recognised in Regulatory Capital (in LKR’000 as at the Reporting Date) 6,700,000 5,300,000
Accounting Classification (equity/ Liability) Liability Liability
Coupons/ Dividends
Fixed or Floating Dividend/ Coupon FIXED FIXED
Coupon Rate and any Related Index % 12.00 12.00
Non-Cumulative or Cumulative Non-Cumulative Non-Cumulative
Convertible or Non-Convertible Non Convertible Non Convertible
Credit Risk Under Standardised Approach
Credit Risk Exposures and Credit Risk Mitigation (CRM) Effects -Bank
Asset Class Amount (LKR’000) as at 31.12.2018
Exposures before Credit Conversion Factor (CCF)and
CRM Exposures Post CCF and CRM RWA and RWA Density (%)
On Balance Sheet Amount
Off Balance Sheet Amount
On Balance Sheet Amount
Off Balance Sheet Amount RWA
RWA Density (ii) (%)
Claims on Central Government and CBSL 836,590,660 15,585,130 836,590,660 3,117,026 47,702,452 5.68%
Claims on Foreign Sovereigns and their Central Bank 17,919,834 - 17,919,834 - 16,969,389 94.70%
Claims on Public Sector Entities 314,536,270 231,256,251 29,408,186 11,636,980 41,045,166 100.00%
Claim on Official Entities and Multilateral Development Banks - - - - - -
Claims on Banks Exposures 82,874,875 25,244,665 82,874,875 25,244,665 59,509,156 55.04%
Claims on Financial Institutions 16,864,468 - 16,864,468 - 8,728,414 51.76%
Claims on Corporates 272,413,917 107,801,503 242,185,966 42,354,770 272,929,084 95.92%
Retail Claims 416,897,084 57,877,969 378,888,879 - 299,907,436 79.15%
Claims Secured by Gold 53,657,890 - 53,657,890 - 1,006,202 1.88%
Claims Secured by Residential Property 90,685,342 - 90,685,342 - 65,997,243 72.78%
Claims secured by Commercial Real Estate 51,866,696 - 51,866,696 - 51,866,696 100.00%
Non- Performing Assets (NPAs) (i) 14,624,089 - 14,624,089 - 17,664,320 120.79%
Higher - risk Categories 1,145,536 - 1,145,536 - 2,863,840 250.00%
Cash Items and Other Assets 105,784,478 17,203,365 105,784,478 17,203,365 74,382,518 60.48%
Total 2,275,861,139 454,968,883 1,922,496,900 99,556,805 960,571,917 47.50%
CAPITAL ADEQUACY

441
Credit Risk Under Standardised Approach
Credit Risk Exposures and Credit Risk Mitigation (CRM) Effects -Group
Asset Class Amount (LKR’000) as at 31.12.2018
Exposures before Credit Conversion Factor (CCF) and
CRM Exposures Post CCF and CRM RWA and RWA Density (%)
On Balance Sheet Amount
Off Balance Sheet Amount
On Balance Sheet Amount
Off Balance Sheet Amount RWA
RWA Density(II) (%)
Claims on Central Government and CBSL 842,165,659 15,585,130 842,165,659 3,117,026 47,702,452 5.64%
Claims on Foreign Sovereigns and their Central Bank 17,919,834 - 17,919,834 - 16,969,389 94.70%
Claims on Public Sector Entities 349,150,541 231,256,251 29,408,186 11,636,980 41,045,166 100.00%
Claim on Official Entities and Multilateral Development Banks - - - - - -
Claims on Banks Exposures 84,139,926 25,244,665 84,139,926 25,244,665 60,774,207 55.56%
Claims on Financial Institutions 16,864,468 - 16,864,468 - 8,728,414 51.76%
Claims on Corporates 302,299,055 107,801,503 272,071,104 42,354,770 302,814,222 96.31%
Retail Claims 416,897,084 57,877,969 378,888,879 - 299,907,436 79.15%
Claims Secured by Gold 53,657,890 - 53,657,890 - 1,006,202 1.88%
Claims Secured by Residential Property 90,685,342 - 90,685,342 - 65,997,243 72.78%
Claims secured by Commercial Real Estate 51,866,696 - 51,866,696 - 51,866,696 100.00%
Non- Performing Assets (NPAs) (I) 14,624,089 - 14,624,089 - 17,664,320 120.79%
Higher - risk Categories 162,300 - 162,300 - 405,750 250.00%
Cash Items and Other Assets 118,178,046 17,203,365 118,178,046 17,203,365 86,665,632 64.02%
Total 2,358,610,930 454,968,883 1,970,632,420 99,556,805 1,001,547,130 48.38%
Note:
(i) NPAs as per Banking Act Directions on classifications and Advances, Income recognition and provisioning.
(ii) RWA Density - Total RWA/ Exposures Post CCF and CRM

442 Bank of Ceylon | Annual Report 2018
Credit Risk under Standardised Approach : Exposures by Asset Classes and Risk Weights - Bank
Description Amount (LKR’000) as at 31.12.2018 (Post CCF & CRM)
Asset Classes
0% 20% 50% 60% 75% 100% 150% >150% Total Credit Exposures
Amount
Claims on Central Government and Central Bank of Sri Lanka 598,834,484 237,756,176 836,590,660
Claims on Foreign Sovereigns and their Central Bank 1,900,889 16,018,945 17,919,834
Claims on public Sector Entities 29,408,186 29,408,186
Claims on Official Entities and Multilateral Development Banks -
Claims on Banks Exposures 43,057,580 691,305 39,125,990 82,874,875
Claims on Financial Institutions 3,982,000 9,900,907 2,981,561 16,864,468
Claims on Corporates 10,074,485 3,705,958 228,405,523 242,185,966
Retail Claims 690,761 314,820,557 63,377,562 378,888,879
Claims Secured by Gold 48,626,879 5,031,011 53,657,890
Claims Secured by Commercial Residential Property 49,376,197 41,309,145 90,685,342
Claims secured by Commercial Real Estate 51,866,696 51,866,696
Non- Performing Assets (NPAs) 8,543,628 6,080,462 14,624,089
Higher -risk Categories 1,145,536 1,145,536
Cash Item and Other Assets 38,507,002 12,622,904 54,654,572 105,784,478
Total 685,968,364 312,524,156 65,575,256 690,761 314,820,557 535,691,808 6,080,462 1,145,536 1,922,496,900
CAPITAL ADEQUACY
Risk Weight

443
Credit Risk under Standardised Approach : Exposures by Asset Classes and Risk Weights - Group
Description Amount (LKR’000)as at 31.12.2018 (Post CCF & CRM)
Asset Classes
0% 20% 50% 60% 75% 100% 150% >150% Total Credit Exposures
Amount
Claims on Central Government and Central Bank of Sri Lanka 604,409,483 237,756,176 842,165,659
Claims on Foreign Sovereigns and their Central Bank 1,900,889 16,018,945 17,919,834
Claims on public Sector Entities 29,408,186 29,408,186
Claims on Official Entities and Multilateral Development Banks -
Claims on Banks Exposures 43,057,579 691,305 40,391,041 84,139,926
Claims on Financial Institutions 3,982,000 9,900,907 2,981,561 16,864,468
Claims on Corporates 10,074,485 3,705,958 258,290,661 272,071,104
Retail Claims 690,761 314,820,557 63,377,562 378,888,879
Claims Secured by Gold 48,626,879 5,031,011 53,657,890
Claims Secured by Commercial Residential Property 49,376,197 41,309,145 90,685,342
Claims secured by Commercial Real Estate 51,866,696 51,866,696
Non - Performing Assets (NPAs) 8,543,628 6,080,462 14,624,089
Higher - risk Categories 162,300 162,300
Cash Item and Other Assets 38,617,456 12,622,904 66,937,686 118,178,046
Total 691,653,817 312,524,156 65,575,256 690,761 314,820,557 579,125,110 6,080,462 162,300 1,970,632,420
Risk Weight

444 Bank of Ceylon | Annual Report 2018
Market Risk under Standardised Measurement Method
Item
31.12.2018
Bank (LKR’000)
Group (LKR’000)
(a) Capital Charge for Interest Rate Risk 255,555 255,555
General Interest Rate Risk 255,555 255,555
(i) Net Long or Short Position 255,555 255,555
(ii) Horizontal Disallowance - -
(iii) Vertical Disallowance - -
(iv) Options - -
Specific Interest Rate Risk - -
(b) Capital Charge for Equity 611,914 611,914
(i) General Equity Risk 322,842 322,842
(ii) Specific Equity Risk 289,072 289,072
(c) Capital Charge for Foreign Exchange and Gold 88,250 88,250
Total Capital Charge for Market Risk [(a)+(b)+(c)] 955,719 955,719
Total Risk Weighted Amount for Market Risk 7,423,060 7,423,060
Operational Risk under Basic Indicator Approach -Bank
Capital Charge Factor
Fixed Factor
Gross Income (LKR’000)as at 31.12.2018Business Lines
1st Year 2nd Year 3rd Year
The Basic Indicator Approach 15% 70,270,961 68,808,549 85,490,210
Capital Charges for Operational Risk (LKR’000) 11,228,486
Risk Weighted Amount for Operational Risk (LKR’000) 87,211,542
Operational Risk under Basic Indicator Approach -Group
Capital Charge Factor
Fixed Factor
Gross Income (LKR’000)as at 31.12.2018Business Lines
1st Year 2nd Year 3rd Year
The Basic Indicator Approach 15% 76,299,836 80,756,706 96,341,700
Capital Charges for Operational Risk (LKR’000) 12,669,912
Risk Weighted Amount for Operational Risk (LKR’000) 98,407,084
CAPITAL ADEQUACY

445
Item
Amount (LKR’000) as at 31.12.2018
a b c d e
Carrying Values Reported in
Published Financial
Statement
Carrying Values under Scope of Regulatory
Reporting
Subject to Credit Risk Framework
Subject to Market Risk Framework
Not subject to Capital
Requirements or Subject to
Deducation from Capital
Assets 2,268,154,394 2,302,424,962 2,294,924,455 12,849,546 9,600,196
Cash and Cash Equivalents 78,447,577 80,384,177 80,384,177 123,988 -
Balances With Central Bank 65,680,371 65,680,371 65,680,371 - -
Placements with Banks 40,450,089 41,135,016 41,135,016 - -
Securities Purchased under resale agreements - - - - -
Derivative Financial Instruments 1,205,657 - - - -
Financial assets recognized through profit or loss measured at fair value 9,277,298 8,369,905 8,369,905 6,511,640 13,152
Financial assets at amortized cost
Loans and advances 1,429,107,181 1,459,053,657 1,459,053,657 - -
Debt and other instruments 551,839,449 542,135,282 539,179,620 2,955,662
Financial assets - measured at fair value through - - - - -
other comprehensive income / Available for sale 16,699,582 14,417,308 14,417,308 6,213,917 892,201
Investments in Subsidiaries 6,513,048 6,488,048 1,949,507 - 4,538,541
investments in Associates and Joint Ventures 92,988 117,988 117,988 - -
Property, Plant and Equipment 24,277,054 25,508,934 25,508,934 - -
Investment Properties 2,765,856 2,765,856 2,765,856 - -
Goodwill and Intangible Assets 1,238,186 6,304 - - 1,200,640
Deferred Tax Assets - - - - -
Other Assets 40,560,058 56,362,116 56,362,116 - -
On Balance Sheet Liabilities 2,146,712,372 2,172,285,887 - - -
Due to banks 2,402,468 7,955,567 - - -
Securities Sold under resale agreements 97,399,359 107,659,230 - - -
Derivative Financial Instruments 509,018 - - -
Other Financial Liabilities Held For Trading - - - - -
Financial Liabilities Designated at Fair Value Through Profit or Loss - - - - -
Financial Liabilities at amortised cost
Due to Other Customers 1,765,025,970 1,730,988,011 - - -
Other Borrowings 201,792,174 182,006,626 - - -
Debt Securities Issued - - - - -
Current Tax Liabilities 3,922,189 28,785,284 - - -
Deferred Tax Liabilities 5,073,526 9,104,684 - - -
Deferences between Accounting and Regulatory Scopes and Mapping of Financial Statement Categories with Regulatory Risk Categories - Bank only

446 Bank of Ceylon | Annual Report 2018
Item
Amount (LKR’000) as at 31.12.2018
a b c d e
Carrying Values Reported in
Published Financial
Statement
Carrying Values under Scope of Regulatory
Reporting
Subject to Credit Risk Framework
Subject to Market Risk Framework
Not subject to Capital
Requirements or Subject to
Deducation from Capital
Other Provisions - - - - -
Other Liabilities 19,760,429 55,786,485 - - -
Due to Subsidiaries - - - - -
Subordinated Term Debts 50,827,239 50,000,000 - - -
Off-Balance Sheet Liabilities 507,258,821 480,187,559 - - -
Guarantees 48,806,799 65,928,047 65,928,047 - -
Performance Bonds 34,787,056 34,787,056 34,787,056 - -
Letters of Credit 104,675,380 109,566,952 109,566,952 - -
Other Contingent Items 43,212,005 116,015,168 116,015,168 - -
Undrawn Loan Commitment 530,030 530,030 530,030 - -
Other Commitments 275,247,551 153,360,306 128,141,631 - -
Shareholder's Equity 20,000,000 20,000,000 - - -
Equity Capital (Stated Capital)/ Assigned Capital
of which Amount Eligible for CET 1 25,000,000 25,000,000 - - -
of which Amount Eligible FOR AT1 - - - - -
Retained Earnings 67,333,879 80,357,730 - - -
Accumulated Other Comprehensive Income 1,838,194 113,557 - - -
Other Reserves 27,269,949 24,667,787 - - -
Total Shareholder's Equity 121,442,022 130,139,075 - - -
Total On -Balance Sheet Liabilities & Equity Capital and Reserves 2,268,154,394 2,302,424,962 - - -
CAPITAL ADEQUACY
Explanations of Differences between
Accounting and Regulatory Exposure
Amounts
Difference arises due to fair value
adjustments, impairment under expected
loss model on financial instruments and
the classification adjustments between
line items of the financial position under
SLFRSs.
Derivative Financial Instruments
Derivatives are financial instruments that
derive their value in response to changes
in interest rates, financial instrument
prices, commodity prices, foreign
exchange rates, credit risk, indices etc.
Derivative financial instruments are
measured at fair value using forward
pricing models in Published Financial
Statement and more details are given in
Note 25 and Note 40 in this Report.
Loans and Advances to Customers
Allowance for Impairment
Time-based provisions under Central Bank
guide lines have been netted off from the
amortised cost when arriving loans and

447
advances to the customers under
regulatory reporting, however as per
SLFRS 9 “impairment under expected
loss model” have been netted off from
amortised cost when arriving loans
and advances to the customers under
reporting purposes. More details are given
under Note 27.
Day One Difference
When the transaction price differs
from the fair value of other observable
current market transactions in the same
instrument, Bank recognises fair value
of such transactions as per SLFRS 9.
More details are given in Note 4.5.4 and
Note 37. However, Bank recognises cost
of such transactions under regulatory
reporting.
Financial assets – FVTOCI
Financial assets FVTOCI are measured
at fair value under published Financial
Statements and carried at cost for
regulatory reporting purposes. The details
of financial investments – FVTOCI and
the fair valuation of these instruments
are disclosed in Note 29 and Note 61
respectively. The following disclosures are
included in Note 63 on Risk Management
on page 375 to 392.
(i) Summary discussions on adequacy/
meeting current and future capital
requirement.
(ii) Bank risk management approach.
(iii) Risk management related to key risk
exposure.

448 Bank of Ceylon | Annual Report 2018
CERTIFICATE OF THE DIRECTORS ON TRANSFER PRICING
The Commissioner General of Inland Revenue
Department of Inland Revenue,
Colombo 2.
Dear Sir,
Certificate of the Director on Transfer Pricing
It is certified that the Bank of Ceylon has complied with the Transfer Pricing Regulations issued under Section 104 of the
Inland Revenue Act, No. 10 of 2006.The information pursuant to these regulations is given in approved accountant certificate
produced under Section 107(2)(a) of the said Inland Revenue Act. I believe that the record of transactions entered into with
associated undertaking during the period from 1 of January 2017 to 31 December 2017 are at arm’s length, not prejudicial to
the interests of the Bank and not carried out for profit shifting purposes.
Records and information of all transactions have been submitted to the approved accountant who reviewed the transfer
pricing records and no adverse remarks have been made in the certificate done by the approved accountant.
Place;
Bank of Ceylon- Head Office For and on behalf of the Board of Directors
28 November 2018

Milestones • 450
GRI Index • 452
Independent Assurance Report • 457
Statement of Profit or Loss in USD • 459
Statement of Comprehensive Income in USD • 460
Statement of Financial Position in USD • 461
Quarterly Performance • 462
Share and Debenture Information • 465
Ten Year Statistical Summary – Bank • 467
Subsidiaries and Associates • 469
Correspondent Banks by Country • 472
Exchange Companies by Country • 478
Glossary of Financial/ Banking Terms • 480
Corporate Offices and Overseas Branches • 485
Corporate Information • 487
SupplementaryInformation

450 Bank of Ceylon | Annual Report 2018
1939
Bank of Ceylon incorporated as the
nation’s first indigenous bank under the
Bank of Ceylon Ordinance
1941
First branch of the Bank opened in Kandy
1945
The Bank widened into the periphery
by opening branches in Jaffna and
Trincomalee
1946
Foreign department opened in Colombo
Fort to facilitate transactions of foreign
exchange business
1949
First overseas branch opened in London
1953
Mr C Loganathan was appointed as the
first native General Manager
1961
The Bank was nationalised in terms of the
Finance Act No. 65 of 1961
1967
Staff training school established to uplift
employees’ skills
1973
Bank’s sub-branches opened in each
Agricultural Services Centre to enhance
agricultural lending
1978
Non-Resident Foreign Currency (NRFC)
deposits scheme introduced (presently
known as Personal Foreign Currency
accounts (PFC))
1979
Foreign Currency Banking Unit set up to
undertake offshore operations
Introduced service award for employees
who completed 25 years in the Bank
1980
Set up the computer division
1981
Fully fledged branch opened in Maldives
1985
New 32 storey Head Office opened at
Echelon square, the tallest building in
Sri Lanka at the time
1988
Entered into the Electronic Banking Era
with the introduction of Automated Teller
Machines and Cheque Guarantee Cards
1989
Issued the first Credit Card in Sri Lanka to
celebrate the golden jubilee of the Bank in
collaboration with VISA international
1992
First Sri Lankan commercial bank to be
ranked among the best 200 banks in Asia
and 1,000 banks in the world by
“Banker” magazine
MILESTONES

451
1995
Expanded overseas branches with a
branch in Chennai
1999
Bank’s authorised capital raised to
LKR 50,000 million by an Act of Parliament
2004
Introduced International Comprehensive
Banking System (ICBS), an online,
centralised computer system
Introduced Bank of Ceylon Flag
2008
Issued first ever listed, subordinated five
year, Rupee debentures and raised
LKR 4.2 billion
2009
Bank is evaluated as ‘best brand name of
the year’ by Brand Finance Institution BoC
has retained the position to-date
Launched the Islamic Banking Unit with
an island-wide coverage
2010
Converted the London Branch into a
Subsidiary
2011
Fitch Ratings Lanka Ltd upgraded the
Bank’s rating to AA+ (lka) stable outlook
2012
Became the first bank in Sri Lanka to
surpass LKR One trillion asset base
Issued US Dollar denominated 500
million, five year bonds listed in Singapore
Stock Exchange for the first time in
Sri Lankan commercial banking history
Exceeded 1,000 customer service points
Obtained an international rating in par
with sovereign rating
(Fitch = BB-/Stable, Moody’s = B1/Stable)
2013
Issued USD 500 million bond for second
consecutive year
2014
Commemorated 75th anniversary
Entered the African continent by opening
a branch in Seychelles
Obtained the services of Boston
Consulting Group to reshape the business
processes
2015
Became the first bank in Sri Lanka to
surpass LKR One trillion deposit base and
Introduced CDMs
2016
Triple trillion in balance sheet
BoC scored its third trillion in loans and
advances, another unique milestone in its
77 year journey
LKR 31.2 billion Profit Before Tax
Asia Best Employer Brand 2016 conferred
on BoC
2017
Launched B app
Launched Multi-currency pre-paid travel
card
Launched BoC smart passbook
Introduced EMV compliant chip card
issuing facility – ePlus debit cards
Master Brand status by CMO Council Asia
Became the largest CDM network in the
country surpassing 150 CDMs
Capital increased up to LKR 20.0 billion
2018
Opened it’s first DIGI center in
Kandy city center
Reached 1,000 landmark in ATM,
CDM and CRMs
Introduced NFC enabled cards
Be the 1st state Brand to contribute 1 MW
solar energy to the national grid
Establish the first ever Security Operating
Center (SOC) in Sri lankan Banking history

452 Bank of Ceylon | Annual Report 2018
GRI INDEX
GRI Standard Disclosure Location/ Explanation Page number
GRI 101: Foundation 2016 (does not include any disclosures)
General Disclosures
GRI 102: General Disclosures 2016
102-1 Name of Organisation Overview 20
102-2 Activities, brands, products and services Social and Relationship Capital, Retail Banking
127, 163
102-3 Location of headquarters Corporate information 487
102-4 Location of operations Corporate information 487
102-5 Ownership and legal form Corporate information 487
102-6 Markets served Overview 20
102-7 Scale of the organisation Overview, Performance highlights 20, 06
102-8 Information on employees and other workers Human Capital 148,149
102-9 Supply chain Social and Relationship Capital 167
102-10 Significant changes to the organisation and supply chain
Bank of Ceylon Annual Report 2018 04
102-11 Precautionary principle Sustainability at BOC 59
102-12 External initiatives Bank of Ceylon Annual Report 2018 05
102-13 Membership of associations Social and Relationship Capital 168
102-14 Statement from senior decision maker Chairman’s Message 10 - 13
102-16 Values, principles, norms and standards of behaviour
Intellectual Capital 157
102-18 Governance Structure Corporate Governance 73
102-40 List of stakeholder groups Stakeholder engagement 50 - 51
102-41 Collective bargaining agreements Human Capital 154
102-42 Identifying and selecting stakeholders Stakeholder engagement 50 - 51
102-43 Approach to stakeholder engagement Stakeholder engagement 50 - 51
102-44 Key topics and concerns raised Strategic Report 54 - 55
102-45 Entities included in the consolidated financial statements
Notes to the Financial statements 206 - 207
102-46 Defining report content and topic boundary Bank of Ceylon Annual Report 2018 05
102-47 Material topics Material matters 54 - 55
102-48 Restatement of information Bank of Ceylon Annual Report 2018 04
102-49 Changes in reporting Material matters 54 - 55
102-50 Reporting period Bank of Ceylon Annual Report 2018 04
102-51 Date of most recent report Bank of Ceylon Annual Report 2018 04
102-52 Reporting cycle Bank of Ceylon Annual Report 2018 04
102-53 Contact point for questions regarding Report Bank of Ceylon Annual Report 2018 05
102-54 Claims of reporting in accordance with GRI Standards
Bank of Ceylon Annual Report 2018 04
102-55 GRI context index GRI Index 452 - 456
102-56 External assurance Supplementary Information 457 - 458

453
GRI Standard Disclosure Location/ Explanation Page number
Material topics
Economic Performance
GRI 103: Management Approach
103-1 Explanation of material topics and its boundaries Economic contribution 63 - 67
103-2 The Management Approach and its components Economic contribution 63 - 67
103-2 Evaluation of the Management Approach Economic contribution 63 - 67
GRI 201: Economic Performance 2016
201-1 Direct economic value generated and distributed
Economic contribution 67
201-2 Financial implications and other risks and opportunities due climate change
Strategic Report 52 - 53
201-3 Defined benefit plan obligations and other retirement plans
Notes to the Financial statements 324 - 335
Market Presence
GRI 103: Management Approach
103-1 Explanation of material topics and its boundaries Human Capital 147 - 155
103-2 The Management Approach and its components Human Capital 150
103-2 Evaluation of the Management Approach Human Capital 147 - 155
GRI 202: Market Presence 2016
202-2: Proportion of senior management hired from local community
Human Capital 150 - 151
Indirect Economic Impacts
GRI 103: Management Approach
103-1 Explanation of material topics and its boundaries Economic contribution 63 - 67
103-2 The Management Approach and its components Economic contribution 63 - 67
103-2 Evaluation of the Management Approach Economic contribution 63 - 67
GRI 203: Indirect Economic Impacts 2016
203-2: Significant indirect economic impacts Economic contribution 63 - 67
Procurement practices
GRI 103: Management Approach
103-1 Explanation of material topics and its boundaries Social and Relationship Capital 167
103-2 The Management Approach and its components Social and Relationship Capital 167
103-2 Evaluation of the Management Approach Social and Relationship Capital 167
GRI 204: Procurement practices 2016
204-1 Proportion of spending on local suppliers Social and Relationship Capital 07
Anti Corruption
GRI 103: Management Approach
103-1 Explanation of material topics and its boundaries Corporate Governance 88
103-2 The Management Approach and its components Corporate Governance 88
103-2 Evaluation of the Management Approach Corporate Governance 71 - 88
GRI 205: Anti-corruption Communication and training related to anti-corruption policies and procedures
Corporate Governance 88

454 Bank of Ceylon | Annual Report 2018
GRI Standard Disclosure Location/ Explanation Page number
Energy
GRI 103: Management Approach
103-1 Explanation of material topics and its boundaries Natural Capital 172
103-2 The Management Approach and its components Natural Capital 172 - 176
103-3 Evaluation of the Management Approach Natural Capital 172 - 176
GRI 302: Energy 2016 302-1 Energy consumption within the organization Natural Capital 176
302-4 Reduction of energy consumption Natural Capital 176
Emissions
GRI 103: Management Approach
103-1 Explanation of material topics and its boundaries Natural Capital 172
103-2 The Management Approach and its components Natural Capital 172 - 176
103-2 Evaluation of the Management Approach Natural Capital 172 - 176
GRI 305 Emissions: 2016 305-1 Direct greenhouse gas (GHG) emissions Natural Capital 176
305-2 Energy indirect greenhouse gas (GHG) emissions (Scope 2)
Natural Capital 176
305-4 GHG emission intensity Natural Capital 176
Environmental Compliance
GRI 103: Management Approach
103-1 Explanation of material topics and its boundaries Natural Capital 172
103-2 The Management Approach and its components Natural Capital 172 -176
103-2 Evaluation of the Management Approach Natural Capital 172 -176
GRI 307: Environmental Compliance
307-1 Non-compliance with environmental laws and regulations
Natural Capital 172
Employment
GRI 103: Management Approach
103-1 Explanation of material topics and its boundaries Human Capital 147 - 155
103-2 The Management Approach and its components Human Capital 147 - 155
103-2 Evaluation of the Management Approach Human Capital 147 - 155
GRI 401: Employment 2016 401-1 Employee hires and turnover Human Capital 151
401-2 Benefits provided to full time employees that are not provided to temporary or part-time employees
Human Capital 152
401-3 Parental leave Human Capital 153
Labour Management Relations
GRI 103: Management Approach
103-1 Explanation of material topics and its boundaries Human Capital 147 - 155
103-2 The Management Approach and its components Human Capital 147 - 155
103-2 Evaluation of the Management Approach Human Capital 147 - 155
GRI 402: Labour Management Relations 2016
402-1 Minimum notice periods regarding operational changes
Human Capital 154
GRI INDEX

455
GRI Standard Disclosure Location/ Explanation Page number
Occupational health and safety
GRI 103: Management Approach
103-1 Explanation of material topics and its boundaries Human Capital 147 - 155
103-2 The Management Approach and its components Human Capital 147 - 155
103-2 Evaluation of the Management Approach Human Capital 147 - 155
403: Occupational health and safety 2016
403-4 Health and safety topics covered in formal agreements with trade unions
Human Capital 155
Training and education
GRI 103: Management Approach
103-1 Explanation of material topics and its boundaries Human Capital 147 - 155
103-2 The Management Approach and its components Human Capital 147 - 155
103-2 Evaluation of the Management Approach Human Capital 147 - 155
GRI 404: Training and education
404-1 Average hours of training per year per employee Human Capital 154
404-2 Programs for upgrading skills and transition assistance programmes
Human Capital 153 - 154
404-3 Percentage of employees receiving regular performance and career development reviews
Human Capital 152
Diversity and equal opportunity
GRI 103: Management Approach
103-1 Explanation of material topics and its boundaries Human Capital 147 - 155
103-2 The Management Approach and its components Human Capital 147 - 155
103-2 Evaluation of the Management Approach Human Capital 147 - 155
GRI 405: Diversity and equal opportunity 2016
405-2 Ratio of basic salary and remuneration of women to men
Human Capital 152
Child Labour
GRI 103: Management Approach
103-1 Explanation of material topics and its boundaries Social and Relationship Capital 167
103-2 The Management Approach and its components Social and Relationship Capital 167
103-2 Evaluation of the Management Approach Social and Relationship Capital 167
GRI 408: Child Labour 408-1 Operations and suppliers at significant risk for incidents of child labour
Social and Relationship Capital 167
Forced or Compulsory Labour
GRI 103: Management Approach
103-1 Explanation of material topics and its boundaries Social and Relationship Capital 167
103-2 The Management Approach and its components Social and Relationship Capital 167
103-2 Evaluation of the Management Approach Social and Relationship Capital 167
GRI 409: Forced or Compulsory labour
409-1 Operations and suppliers at significant risk for incidents of forced or compulsory labour
Social and Relationship Capital 167

456 Bank of Ceylon | Annual Report 2018
GRI Standard Disclosure Location/ Explanation Page number
Local Communities
GRI 103: Management Approach
103-1 Explanation of material topics and its boundaries Social and Relationship Capital 160 - 170
103-2 The Management Approach and its components Social and Relationship Capital 160 - 170
103-2 Evaluation of the Management Approach Social and Relationship Capital 160 - 170
GRI 413: Local communities 2016
413-1 Operations with local community engagement, impact assessments and development programmes
Social and Relationship Capital 160 - 170
Marketing and labelling
GRI 103: Management Approach
103-1 Explanation of material topics and its boundaries Social and Relationship Capital 160 - 170
103-2 The Management Approach and its components Social and Relationship Capital 160 - 170
103-2 Evaluation of the Management Approach Social and Relationship Capital 160 - 170
GRI 417: Marketing and labelling
417-1 Requirements for product and service labelling Social and Relationship Capital 162 - 164
417-2 Incidents of non-compliance concerning product and service information and labelling
Social and Relationship Capital 162 - 164
417-3 Incidents of non-compliance concerning marketing communications
Social and Relationship Capital 162 - 164
Customer Privacy
GRI 103: Management Approach
103-1 Explanation of material topics and its boundaries Social and Relationship Capital 160 - 170
103-2 The Management Approach and its components Social and Relationship Capital 160 - 170
103-2 Evaluation of the Management Approach Social and Relationship Capital 160 - 170
GRI 418: Customer Privacy 2016
418-1 Total number of substantiated complaints regarding breaches of customer privacy and losses of customer data
Social and Relationship Capital 164
GRI INDEX

457
INDEPENDENT ASSURANCE REPORT
INDEPENDENT ASSURANCE REPORT TO BANK OF CEYLON ON THE SUSTAINABILITY REPORT – 2018
INTRODUCTION AND SCOPE OF THE ENGAGEMENT
The management of Bank of Ceylon
(“the Bank”) engaged us to provide an
independent assurance on the following
elements of the Sustainability Report
2018 (“the Report”).
• Reasonable assurance on the
information on financial performance
as specified on page 67 of the Report.
• Limited assurance on key
performance indicators and other
information presented in the Report
prepared in accordance with Global
Reporting Initiative Standards (GRI
Standards).
RESPONSIBILITY OF THE MANAGEMENT ON THE REPORT
The Management of the Bank is
responsible for the preparation and
presentation of the Report in accordance
with the Bank’s sustainability practices
and policies which are derived from
GRI Standards. These responsibilities
include among other things, identification
of stakeholders and material issues,
determining the sustainable performance
criteria for reporting and establishing
appropriate processes and internal
control systems to measure and report
the sustainability performance criteria.
OUR RESPONSIBILITY
Our responsibility is to perform a
reasonable and limited assurance
engagement and express conclusions
based on the work performed in
accordance with Sri Lanka Standard on
Assurance Engagements (SLSAE 3000):
‘Assurance Engagements other than
Audits or Reviews of Historical Financial
Information’, issued by The Institute of
Chartered Accountants of Sri Lanka (‘CA
Sri Lanka’).
Reasonable assurance is a high level
of assurance. However, reasonable
assurance is not an absolute level of
assurance because there are inherent
limitations of assurance engagement.
A limited assurance engagement is
substantially less in scope than a
reasonable assurance engagement and
consequently does not enable to obtain
assurance that we would become aware
of all significant matters that might be
identified in a reasonable assurance
engagement.
This Report is made solely to the Bank in
accordance with our engagement letter
dated 04th March, 2019. We disclaim
any assumption of responsibility for any
reliance on this Report to any person
other than the Bank or for any purpose
other than that for which it was prepared.
In conducting our engagement, we
have complied with the independence
requirements of the Code of Ethics for
Professional Accountants issued by the
CA Sri Lanka.
ASSURANCE PROCEDURES CARRIED OUT
Financial Information
We reconciled the information on financial
performance as reported on page 67
of the Report with the audited financial
statements of the Bank for the years
ended 31st December, 2017 and 2018.
Key Performance Indicators
We reviewed the reliability of the data/
information on Key Performance
Indicators for the year ended 31st
December, 2018 based on reviews of:
• the systems used to generate,
aggregate and report these
information;
• the information reported by the
relevant business units to corporate
level;
• the information validation processes
at corporate and business level;
• the information trends in discussions
with management; and
• the calculation performed by the
Bank on a sample basis through
recalculation.

458 Bank of Ceylon | Annual Report 2018
INDEPENDENT ASSURANCE REPORT
Other Information
We planned and performed following
assurance procedures on other
information presented in the Report:
• Inquiring relevant Bank’s personnel
to understand the process for
collection, analysis, aggregation and
presentation of information in the
Report.
• Reviewing the system used to
generate, aggregate and report the
information in the Report
• Interviewing the senior management
and relevant staff at corporate level
and selected business unit level and
obtained the evidence concerning
sustainability strategy and policies for
material issues and implementation of
those across operation of the Bank.
• Reviewing and validating the
information contained in the Report.
• Reading the information presented in
the Report to determine whether that
information is in line with our overall
knowledge of, and experience with,
sustainability performance of the
Bank.
• Comparison of the content of the
report against the requirements of GRI
Standards.
CONCLUSION
Based on the procedures performed, as
described above, we conclude that:
• The information on financial
performance as specified on page
67 of the Report is properly derived
from the audited financial statements
of the Bank for the years ended 31st
December, 2017 and 2018.
• Nothing has come to our attention
that causes us to believe that key
performance indicators and other
information presented in the Report
are not presented, in all material
respects, in accordance with the
Bank’s sustainability practices and
policies which are derived from GRI
Standards.
CHARTERED ACCOUNTANTS
Colombo
29th March, 2019
VR/cc

459
STATEMENT OF PROFIT OR LOSS IN USD
Bank Group
For the year ended 31 December 2018 2017 2018 2017
USD ’000 USD ’000 USD ’000 USD ’000
Total income 1,210,021 1,237,851 1,255,605 1,288,890
Interest income 1,069,188 1,120,959 1,104,293 1,162,844 Less : Interest expenses 710,457 739,184 728,427 760,567 Net interest income 358,731 381,775 375,866 402,277 Fee and commission income 58,548 61,924 60,673 63,613 Less : Fee and commission expenses 12,480 12,321 12,557 12,904 Net fee and commission income 46,068 49,603 48,116 50,709 Net gains/ (losses) from trading 18,779 18,331 18,978 18,463
Net fair value gains/ (losses) from financial instruments at fair value through profit or loss (3,728) - (3,924) -
Net gains/ (losses) from financial investments - 5,924 - 6,056
Net gains/ (losses) from derecognition of financial assets 832 - 839 -
Net other operating income 66,403 30,713 74,747 37,913 Total operating income 487,085 486,346 514,622 515,418
Less : Impairment charge/ (reversal) for loans and other losses 82,305 61,108 83,046 64,668
Net operating income 404,780 425,238 431,576 450,750 Less : Operating expenses
Personnel expenses 103,285 111,192 112,727 122,492
Depreciation and amortisation expenses 12,040 12,593 15,395 16,634
Other expenses 62,475 55,522 72,286 61,747
Total operating expenses 177,800 179,307 200,408 200,873
Operating profit before taxes on financial services 226,980 245,931 231,168 249,877
Less : Taxes on financial services 52,467 47,422 53,724 48,618
Operating profit after taxes on financial services 174,513 198,509 177,444 201,259
Share of profits/ (losses) of associate companies, net of tax - - 51 340
Profit before income tax 174,513 198,509 177,495 201,599 Less : Income tax expense 67,926 59,081 70,709 61,031
Profit for the year 106,587 139,428 106,786 140,568
Profit attributable to :
Equity holder of the Bank 106,587 139,428 106,883 140,461
Non-controlling interest - - (97) 107
Profit for the year 106,587 139,428 106,786 140,568
Earnings per share:
Basic earnings per share (LKR) 5.72 12.15 5.73 12.24
Diluted earnings per share (LKR) 5.01 9.25 5.02 9.32
Dividend per share (USD) 1.42 7.04 1.42 7.04
Exchange rate of 1 USD was LKR 182.7499 as at 31 December 2018. (LKR 152.8548 as at 31 December 2017)
The Statement of Profit or Loss given in this page does not form part of the Audited Financial Statements and it is solely for the convenience of the shareholders, investors, bankers and other interested parties of the Financial Statements of the Bank.

460 Bank of Ceylon | Annual Report 2018
STATEMENT OF COMPREHENSIVE INCOME IN USD
Bank Group
For the year ended 31 December 2018 2017 2018 2017
USD ’000 USD ’000 USD ’000 USD ’000
Profit/ (loss) for the year 106,587 139,428 106,786 140,568
Other Comprehensive income, net of taxItems that will be reclassified to the profit or loss
Exchange differences on translation of foreign operations 6,079 2,365 7,952 4,209
Net gains/ (losses) on investments in debt instruments measured at fair value through other comprehensive income (1,485) - (1,562) -
Net gains/ (losses) on remeasuring available for sale financial investments - (3,893) - (4,053)
Deferred tax effect on gains/ (losses) on remeasuring available for sale financial investments - (1,158) - (1,158)
Net (gains)/ losses on investment in financial assets at fair value through other comprehensive income/ available for sale reclassification to profit or loss (83) 22 (83) 22
Share of other comprehensive income of Associate companies, net of tax - - 19 (43)
Total items that will be reclassified to the profit or loss 4,511 (2,664) 6,326 (1,023)
Items that will not be reclassified to profit or loss
Change in fair value on investments in equity instruments designated at fair value through other comprehensive income (2,244) - (4,509) -
Deferred tax effect on change in fair value on investments in equity instruments designated at fair value through other comprehensive income (37) - (37) -
Changes in revaluation surplus/ (deficit) (1,847) 39,644 807 41,911
Deferred tax effect on changes in revaluation surplus/ (deficit) 517 (26,786) (226) (27,421)
Net actuarial gains/ (losses) on defined benefit plans (11,597) 18,252 (11,441) 18,100
Deferred tax effect on net actuarial gains/ (losses) on defined benefit plans 17 (55) (52) 55
Total items that will not be reclassified to the profit or loss (15,191) 31,055 (15,458) 32,645
Total other comprehensive income for the year, net of tax (10,680) 28,391 (9,132) 31,622
Total comprehensive income for the year 95,907 167,819 97,655 172,190
Attributable to:
Equity holder of the Bank 95,907 167,819 97,767 171,864
Non-controlling interest - - (112) 326
Total comprehensive income for the year 95,907 167,819 97,655 172,190
Exchange rate of 1 USD was LKR 182.7499 as at 31 December 2018. (LKR 152.8548 as at 31 December 2017)
The Statement of Comprehensive Income given in this page does not form part of the Audited Financial Statements and it is solely for
the convenience of the shareholders,investors,bankers and other interested parties of the Financial Statements of the Bank.

461
STATEMENT OF FINANCIAL POSITION IN USD
Bank GroupFor the year ended 31 December 2018 2017 2018 2017 USD ’000 USD ’000 USD ’000 USD ’000
AssetsCash and cash equivalents 429,262 476,551 429,866 510,323 Balances with Central Banks 359,400 449,374 359,400 449,374 Placements with banks 221,341 52,779 228,082 34,802 Securities purchased under resale agreements - 120,739 7,858 130,007 Derivative financial instruments 6,597 10,591 6,597 10,591 Financial assets recognized through profit or loss measured at fair value/ Held for trading 50,765 54,688 52,440 56,240 Financial assets at amortized cost
Loans and advances 7,820,016 7,609,581 7,992,445 7,813,261 Debt and other instruments 3,019,643 - 3,020,285 -
Financial investments - Loans and receivables - 1,394,572 - 1,402,309 Financial investments - Held to maturity - 2,016,659 - 2,019,893 Financial assets measured at fair value through OCI/ Available for sale 91,379 117,243 111,711 147,541 Investment in subsidiary companies 35,639 42,609 - - Investment in associate companies 509 608 2,414 2,923 Investment properties 15,135 18,861 658 810 Property, Plant and Equipment 132,302 150,771 206,635 239,501 Leasehold properties 541 664 714 880 Intangible assets 6,775 5,304 7,971 7,029 Deferred tax assets - - 17 56 Other assets 221,944 247,413 229,127 254,914 Total assets 12,411,248 12,769,007 12,656,220 13,080,454
LiabilitiesDue to banks 13,146 14,414 13,767 14,355 Securities sold under repurchase agreements 532,965 291,044 533,096 291,968 Derivative financial instruments 2,785 463 2,785 463 Financial liabilities at amortised cost
Due to depositors 9,658,150 10,119,617 9,761,841 10,247,479 Other borrowings 1,104,199 1,165,754 1,132,989 1,205,917
Debt securities issued - - 22,466 37,078 Current tax liabilities 21,462 12,282 22,103 13,418 Deferred tax liabilities 27,762 38,078 42,475 56,428 Insurance provision - Life - - 3,150 3,579 Insurance provision - Non life - - 2,006 2,814 Other liabilities 108,128 121,660 120,224 130,428 Subordinated liabilities 278,125 278,501 276,250 276,248 Total liabilities 11,746,722 12,041,813 11,933,152 12,280,175
Equity Share capital 136,799 130,844 136,799 130,843 Permanent reserve fund 70,534 68,215 70,534 68,215 Retained earnings 368,448 415,245 374,565 425,900 Other reserves 88,745 112,890 137,366 169,254 Total equity attributable to equity holder of the Bank 664,526 727,194 719,264 794,212 Non-controlling interest - - 3,804 6,067 Total equity 664,526 727,194 723,068 800,279 Total liabilities and equity 12,411,248 12,769,007 12,656,220 13,080,454
Contingent liabilities and commitments 2,781,434 3,318,567 2,808,168 3,255,494 Net assets value per share (USD) 33.23 48.48 35.97 52.95
Exchange rate of 1 USD was LKR 182.7499 as at 31 December 2018. (LKR 152.8548 as at 31 December 2017)
The Statement of Financial Position given in this page does not form part of the Audited Financial Statements and it is solely for the
convenience of the shareholders,investors,bankers and other interested parties of the Financial Statements of the Bank.

462 Bank of Ceylon | Annual Report 2018
QUARTERLY PERFORMANCE
Summary of the Statement of Profir or Loss
2018 2017
For the quarter ended 31-Mar 30-Jun 30-Sep 31-Dec 31-Mar 30-Jun 30-Sep 31-Dec
LKR Million LKR Million LKR Million LKR Million LKR Million LKR Million LKR Million LKR Million
Bank
Net interest income 14,350 15,133 17,558 18,515 13,534 14,856 14,717 15,249
Non interest income 4,731 4,963 6,871 9,172 4,536 4,654 3,890 4,787
Non interest expense (8,130) (8,926) (9,392) (8,325) (6,645) (7,062) (8,107) (7,477)
Impairment (charge)/ reversal for loans and other losses (2,218) (4,824) (4,350) (3,648) (1,790) (4,418) (3,221) 88
Operating profit before Taxes on Financial Services 8,733 6,346 10,687 15,714 9,635 8,030 7,279 12,647
Taxes on financial services (1,947) (1,424) (2,002) (4,216) (1,727) (1,782) (1,424) (2,316)
Profit before income tax 6,786 4,922 8,685 11,498 7,908 6,248 5,855 10,331
Income tax expense (2,017) (2,020) (3,328) (5,048) (2,035) (1,988) (1,613) (3,394)
Profit after income tax 4,769 2,902 5,357 6,450 5,873 4,260 4,242 6,937
Other comprehensive income (11) (556) (470) (915) (345) 602 (478) 4,560
Total comprehensive income 4,758 2,346 4,887 5,535 5,528 4,862 3,764 11,497
Group
Net interest income 15,129 15,888 18,395 19,278 14,207 15,630 15,561 16,092
Non interest income 5,478 4,998 7,553 9,622 4,944 4,812 4,605 4,905
Non interest expense (9,360) (9,703) (10,607) (9,249) (7,537) (7,664) (9,428) (8,048)
Impairment (charge)/ reversal for loans and
other losses (2,451) (4,992) (4,472) (3,262) (1,778) (4,446) (3,403) (258)
Operating profit before Taxes on Financial Services 8,796 6,191 10,869 16,389 9,836 8,332 7,335 12,691
Taxes on financial services (1,976) (1,454) (2,051) (4,337) (1,768) (1,827) (1,468) (2,368)
Operating profit after Taxes on Financial Services 6,820 4,737 8,818 12,052 8,068 6,505 5,867 10,323
Share of profit/ (losses) of associate compa-nies,net of tax 1 17 (1) (7) 6 24 7 14
Profit before income tax 6,821 4,754 8,817 12,045 8,074 6,529 5,874 10,337
Income tax expense (2,059) (2,100) (3,414) (5,349) (2,089) (2,056) (1,640) (3,544)
Profit after income tax 4,762 2,654 5,403 6,696 5,985 4,473 4,234 6,793
Other comprehensive income 135 (920) (629) (275) (360) 824 (438) 4,808
Total comprehensive income 4,897 1,734 4,774 6,421 5,625 5,297 3,796 11,601

463
Summary of the Statement of Financial Position
2018 2017
As at 31-Mar 30-Jun 30-Sep 31-Dec 31-Mar 30-Jun 30-Sep 31-Dec
LKR Million LKR Million LKR Million LKR Million LKR Million LKR Million LKR Million LKR Million
Bank
Assets
Investments 599,254 566,119 553,233 584,422 523,202 488,503 543,637 572,766
Loans and advances to customers 1,186,473 1,208,724 1,294,017 1,429,107 1,050,661 1,112,641 1,114,794 1,163,161
Property, Plant and Equipment 24,596 24,910 24,917 25,515 16,495 17,153 17,599 23,958
Other assets 237,498 186,921 227,511 229,110 201,092 187,826 206,206 191,919
Total assets 2,047,821 1,986,674 2,099,678 2,268,154 1,791,450 1,806,123 1,882,236 1,951,804
Liabilities and Equity
Due to customers 1,624,851 1,617,378 1,648,255 1,765,026 1,323,935 1,386,864 1,475,049 1,546,832
Debt securities and borrowed funds 278,006 228,411 298,165 350,018 345,510 291,176 279,086 265,249
Other liabilities 29,224 24,299 29,958 31,668 24,800 26,016 22,443 28,568
Equity 115,740 116,586 123,300 121,442 97,205 102,067 105,658 111,155
Total liabilities and equity 2,047,821 1,986,674 2,099,678 2,268,154 1,791,450 1,806,123 1,882,236 1,951,804
Group
Assets
Investments 599,616 566,463 553,231 583,832 523,933 490,322 545,897 574,568
Loans and advances to customers 1,217,390 1,240,103 1,326,943 1,460,619 1,079,606 1,143,386 1,146,540 1,194,294
Property , Plant and Equipment 38,360 38,472 38,363 39,350 30,220 30,784 31,361 37,818
Other assets 237,302 190,936 226,549 229,122 202,051 190,473 208,190 192,730
Total assets 2,092,668 2,035,974 2,145,086 2,312,923 1,835,810 1,854,965 1,931,988 1,999,410
Liabilities and Equity
Due to customers 1,642,764 1,636,818 1,668,414 1,783,975 1,341,841 1,406,483 1,496,101 1,566,376
Debt securities and borrowed funds 286,515 239,045 306,953 359,067 355,646 303,570 291,023 276,852
Other liabilities 36,338 32,839 35,827 37,741 30,518 31,810 28,139 33,856
Equity 126,163 126,448 133,060 131,445 106,915 112,176 115,837 121,399
Non controlling interest 888 824 832 695 890 926 888 927
Total liabilities and equity 2,092,668 2,035,974 2,145,086 2,312,923 1,835,810 1,854,965 1,931,988 1,999,410

464 Bank of Ceylon | Annual Report 2018
Summary of the Statement of Financial Position
2018 2017
For the quarter ended 31-Mar 30-Jun 30-Sep 31-Dec 31-Mar 30-Jun 30-Sep 31-Dec
LKR Million LKR Million LKR Million LKR Million LKR Million LKR Million LKR Million LKR Million
Bank
Profitability
Interest margin (%) 2.9 3.0 3.1 3.1 3.1 3.3 3.2 3.2
Return on average assets (before tax) (%) 1.4 1.2 1.3 1.5 1.8 1.6 1.5 1.7
Return on average equity (after tax) (%) 16.8 13.5 14.8 16.7 24.7 20.8 19.3 20.9
Investor Information
Interest cover (times) 2.6 2.4 2.6 2.8 2.2 2.2 2.2 2.5
Net assets value per share (LKR) 7,716 5,829 6,165 6,072 9,720 10,207 7,044 7,410
Capital Adequacy Ratio
Core capital adequacy ratio, % (Tier I) 9.8 9.9 10.0 10.3 8.5 8.3 8.6 10.8
Total capital adequacy ratio, % (Tier I + II) 13.7 13.7 14.0 14.6 12.1 11.8 12.1 14.6
Assets Quality
Gross non - performing advances ratio (%) 3.8 4.5 4.5 3.6 3.2 3.3 3.3 2.9
(Net of interest in suspense)
Net non - performing advances ratio (%) 1.3 2.0 1.7 1.0 0.8 0.7 0.5 0.3
(Net of interest in suspense and provisions)
Regulatory Liquidity
Statutory liquid assets ratio
- Domestic banking unit (%) 30.4 26.1 23.8 24.5 25.2 24.6 26 27.2
- Off shore banking unit (%) 22.9 51.9 61.7 60.2 29.1 22.1 22.3 21.9
Group
Profitability
Interest margin (%) 3.0 3.1 3.2 3.2 3.2 3.3 3.3 3.3
Return on average assets (before tax) (%) 1.3 1.2 1.3 1.5 1.8 1.6 1.5 1.7
Return on average equity (after tax) (%) 15.3 11.9 13.3 15.3 22.7 19.3 17.8 19.0
Investor Information
Net assets value per share (LKR) 8,411 6,322 6,653 6,572 10,692 11,218 7,722 8,093
Capital Adequacy Ratio
Core capital adequacy ratio, % (Tier I) 10.0 10.1 9.9 10.4 8.6* 8.4* 8.9 10.9
Total capital adequacy ratio, % (Tier I +II) 13.8 13.8 13.8 14.6 12.3 12 12.2 14.5
* As per Basel II guidelines issued by the Central Bank of Sri Lanka
QUARTERLY PERFORMANCE

465
SHARE AND DEBENTURE INFORMATION
Share InformationAs at 31 December 2018 2017
Shareholder No. of ordinary shares Holding % No. of ordinary shares Holding %
Government of Sri Lanka 25,000,000* 100 20,000,000* 100
* This includes 5,000,000 numbers of shares in pending allotment.
Debenture InformationThe Bank has issued the following debt securities which are listed on Colombo Stock Exchange (CSE)
Unsecured, Subordinated, Redeemable Type Interest Payable Interest Rate (per annum)
Debentures Frequency
(par value LKR 100)
October 2013/2023 series D Annually 13.25%
E Semi annually 6 months TB rate (gross) plus 100 basis points
F Annually 13.25%
H Annually 13.75%
September 2014/2022 series A Annually 8.00%
B Quarterly 7.75%
C Semi annually 6 months TB ( gross ) rate plus 50 basis points
D Annually 8.25%
E Semi annually 6 months TB ( gross ) rate plus 50 basis points
October 2015/2023 series A Annually 8.25%
B Quarterly 8.00%
C Semi annually 6 months TB ( gross ) rate plus 125 basis points
D Annually 9.50%
E Semi annually 6 months TB ( gross ) rate plus 125 basis points
December 2016/2024 series A Annually 13.25%
B Semi annually 6 months TB ( gross ) rate plus 125 basis points
C Annually 12.75%
D Semi annually 6 months TB ( gross ) rate plus 125 basis points

466 Bank of Ceylon | Annual Report 2018
Trading Information on Listed Debenture
The debentures that have been traded during the year ended 2018 and 2017 are as follows.
as at 31 December 2018 2017
Highest
LKRLowest
LKR
Last traded
LKR
Interest yield *
%
Yield to maturity
* %Highest
LKRLowest
LKR
Last traded
LKR
Interest yield *
%
Yield to maturity
* %
BoC Debentures 2012/2017,
Unsecured, subordinated, redeemable, 5 years, fixed rate (16.0%) N/T N/T N/T N/T N/T N/T N/T N/T N/T N/T
BoC Debentures 2013/2023 ,
Unsecured, subordinated, redeemable, 10 years, fixed rate (13.75%) N/T N/T N/T N/T N/T 101.50 100.82 101.50 13.34 13.55
BoC Debentures 2014/2022 ,
Unsecured, subordinated, redeemable, 5 years, fixed rate (8.0%) N/T N/T N/T N/T N/T N/T N/T N/T N/T N/T
BoC Debentures 2015/2023 ,
Unsecured, subordinated, redeemable, 5 years, floating rate 06 months TB rate (Gross) plus 125 basis points 97.00 94.00 97.00 11.70 11.05 98.00 94.00 94.00 13.96 12.06
* As a date of last trade done.
N/T - Not Traded
SHARE AND DEBENTURE INFORMATION

467
TEN YEAR STATISTICAL SUMMARY – BANK
As at 31 December 2009 2010 2011 2012 2013 2014 2015 2016 2017 2018
LKR million LKR million LKR million LKR million LKR million LKR million LKR million LKR million LKR million LKR million
Assets
Cash and cash equivalents 13,509 14,104 18,671 31,545 24,901 35,583 79,917 67,706 72,843 78,447
Balances with Central Banks 16,263 25,642 30,223 29,963 28,699 30,422 38,940 56,388 68,689 65,680
Placements with banks 45,867 42,709 14,581 19,394 19,315 13,349 27,976 11,675 8,067 40,450
Loans and advances to customers 265,065 368,302 543,149 691,899 725,332 741,348 826,790 1,000,082 1,163,161 1,429,107
Other financial assets 168,481 241,205 195,444 239,089 335,455 438,554 522,762 461,193 567,778 579,022
Investments in subsidiaries and associates 4,037 6,124 7,084 7,636 7,672 7,056 7,056 6,306 6,606 6,606
Investment properties - - - - - - - 3,000 2,883 2,766
Property, Plant and Equipment 5,724 5,621 10,595 11,516 12,089 16,296 16,431 15,584 23,148 24,277
Intangible assets 111 164 343 376 501 385 373 563 811 1,238
Other assets 19,184 16,377 18,183 16,803 39,617 46,027 48,044 46,794 37,818 40,561
Total assets 538,241 720,248 838,273 1,048,221 1,193,581 1,329,020 1,568,289 1,669,291 1,951,804 2,268,154
Liabilities
Due to banks* - 2,215 6,508 10,128 1,166 890 2,630 2,042 2,203 2,402
Due to customers 408,607 530,092 595,774 693,441 842,070 933,966 1,082,337 1,256,589 1,546,832 1,765,026
Debt securities issued and subordinated term debts 18,045 40,115 42,591 47,114 45,326 53,282 39,055 42,072 42,570 50,827
Other borrowings 67,302 105,169 138,389 233,795 235,370 246,736 337,442 254,895 222,679 299,192
Current tax liabilities 190 2,200 1,139 2,208 - - 2,081 - 1,877 3,922
Other liabilities 19,198 10,551 12,518 10,582 11,949 19,340 23,259 20,843 24,488 25,343
Total liabilities 513,342 690,342 796,919 997,268 1,135,881 1,254,214 1,486,804 1,576,441 1,840,649 2,146,712
Equity
Share capital 5,000 5,000 5,000 5,000 5,000 10,000 10,000 15,000 20,000 25,000
Permanent reserve fund 2,650 2,777 3,008 3,286 3,538 3,810 5,210 7,996 10,427 12,890
Retained earnings 15,820 14,564 21,733 27,639 31,419 44,861 51,086 54,155 63,472 67,334
Other reserves 1,429 7,565 11,613 15,028 17,743 16,135 15,189 15,699 17,256 16,218
Total equity 24,899 29,906 41,354 50,953 57,700 74,806 81,485 92,850 111,155 121,442
Total liabilities and equity 538,241 720,248 838,273 1,048,221 1,193,581 1,329,020 1,568,289 1,669,291 1,951,804 2,268,154
Contingent liabilities and commitments 246,245 313,040 409,747 455,181 655,441 721,763 696,857 547,399 496,477 508,307
For the year ended 31 December 2009 2010 2011 2012 2013 2014 2015 2016 2017 2018
LKR million LKR million LKR million LKR million LKR million LKR million LKR million LKR million LKR million LKR million
Operating results
Income 63,461 63,363 70,457 110,138 127,464 126,546 131,502 154,121 189,211 221,131
Interest income 53,077 50,843 61,222 95,022 114,863 107,395 112,745 134,685 171,344 195,394
Interest expenses (38,267) (31,200) (36,216) (59,701) (77,720) (68,945) (66,419) (80,728) (112,988) (129,836)
Net interest income 14,810 19,643 25,006 35,321 37,143 38,450 46,326 53,957 58,356 65,558
Other operating income 10,385 12,515 9,235 15,116 12,601 19,151 18,756 19,437 17,868 25,737
Other operating expenses (17,992) (18,104) (15,241) (27,428) (31,324) (33,258) (34,987) (35,940) (38,632) (49,815)
Operating profit before VAT and NBT 7,203 14,054 19,000 23,009 18,420 24,343 30,095 37,454 37,592 41,480
VAT & NBT on financial services (2,995) (4,001) (2,516) (3,214) (2,711) (4,052) (4,816) (6,265) (7,249) (9,588)
Profit before income tax 4,208 10,053 16,484 19,795 15,709 20,291 25,279 31,189 30,343 31,892
Income tax expense (1,124) (3,688) (4,567) (5,378) (3,622) (6,717) (7,922) (6,398) (9,031) (12,413)
Profit for the year 3,084 6,365 11,917 14,417 12,087 13,574 17,357 24,791 21,312 19,479

468 Bank of Ceylon | Annual Report 2018
TEN YEAR STATISTICAL SUMMARY – BANK
As at 31 December 2009 2010 2011 2012 2013 2014 2015 2016 2017 2018
LKR million LKR million LKR million LKR million LKR million LKR million LKR million LKR million LKR million LKR million
Ratios
Return on average assets (%) 0.8 1.6 2.1 2.1 1.4 1.6 1.7 1.9 1.7 1.5
Return on average equity (%) 12.9 24.0 33.5 31.2 22.2 20.5 22.2 28.4 20.9 16.7
Income growth (%) 5.5 (0.2) 11.2 56.3 15.7 (0.7) 3.9 17.2 22.8 16.9
Capital adequacy ratio (%) ***
- Tier I 11.2 10.3 7.8 8.3 8.4 9.5 9.1 8.7 10.8 10.3
- Tier I + Tier II 14.2 13.7 10.9 11.5 12.1 13.6 13.1 12.3 14.6 14.6
Capital funds to liabilities including contingent liabilities (%) 3.3 3.1 3.4 3.5 3.2 3.8 3.7 4.4 4.8 4.6
Liquidity ratio - domestic (%) 21.1 28.7 23.4 21.8 27.7 30.8 28.2 21.6 27.2 24.5
Cost to income ratio (%) 68.3 53.7 51.1 42.7 49.1 44.0 44.7 43.0 38.4 38.1
Other information
Number of employees 7,538 8,204 8,115 7,790 8,883 8,577 7,980 7,569 7,587 8,724
Number of branches 310 309 318 324 567 573 578 580 578 577
Number of ATMs 329 352 404 451 523 540 549 678 764 776
Number of advances (’000) 2,011 2,261 2,837 3,363 3,193 2,384 2,146 2,122 2,226 2,606
Number of deposits (’000) 8,440 9,321 10,179 10,955 11,606 12,311 12,322 12,706 13,254 13,421
Cash flow from operating activities 100,115 10,271 (42,348) (19,271) 47,051 72,987 127,503 (21,346) 135,039 (25,790)
Cash flow from investing activities (20,775) (59,418) 6,924 (52,965) (51,351) (27,222) (101,988) 83,642 (56,384) 11,667
Cash flow from financing activities (45,144) 46,554 12,476 89,640 (4,377) (29,519) 17,982 (73,927) (73,822) 19,983
Capital expenditure on purchase of Property Plant and Equipment (1,446) (1,168) (1,905) (1,483) (1,682) (1,743) (1,332) (2,053) (3,081) (3,400)
* From 2008 to 2009 Due to banks amount is included in Due to customers and Other borrowings.
** Highlighted information is based on LKASs/ SLFRSs.
***2017 and 2018 figures are as per Basel III guidelines issued by the Central Bank of Sri Lanka.
Disclosure in terms of Section 7.6 (xvi) of the Listing Rules of the Colombo Stock Exchange on related party transactions exceeding 10% of the equity or 5% of the total assets of the Bank The Bank did not carry out any
transactions exceeding 10% of the
equity or 5% of the total assets of the
Bank, whichever is lower, with the related
parties given in Note 59 to the Financial
Statements, except for the transactions
engaged with the Government of Sri
Lanka and Government related entities.
The Government of Sri Lanka, who holds
100% shareholding in Bank of Ceylon and
Government related entities, carry out
transactions with the Bank, in the ordinary
course of business and the aggregate
monetary value of these transactions
exceeded the threshold given in Section
7.6 (xvi) of the Listing Rules of Colombo
Stock Exchange.
These transactions include:
1. Overdraft facility granted to the
Deputy Secretary to the Treasury
2. Foreign currency loans granted to the
Government of Sri Lanka and State-
Owned Enterprises
3. Investment in Sri Lanka Development
Bonds and Restructuring Bonds
issued by the Government of Sri Lanka
4. Extending of trade finance credit and
other related services to facilitate
import transactions of the Government
of Sri Lanka and State-Owned
Enterprises
5. Deposits made by the Government
and Government related entities with
the Bank
Most of these transactions are considered
as recurrent nature transactions and the
outstanding balances as at reporting date
during the year 2018 are given in Note
59.4 to the Financial Statements.

469
SUBSIDIARIES AND ASSOCIATES
Subsidiary Companies Directors
Property Development PLC
19th Floor,
BoC Head Office Building,
“BOC Square”,
No. 01, Bank of Ceylon Mawatha,
Colombo 01.
Tel : 011 2544328
Fax : 011 2544329
e-mail : [email protected]
Mr D M P R K.BandaraNon-Executive Independent Director/ Chairman
Mr K K U WijeyesekeraNon-Executive Independent Director
Mr W T L WeeratneNon-Executive Independent Director
Mr R P HalwalaNon-Executive Independent Director
Representation from Directors Management of BoC
Mr W P Russel FonsekaNon-Executive Non-Independent Director
Alternate
Mr D N L Fernando(To Mr W P Russel Fonseka)
Merchant Bank of Sri Lanka &
Finance PLC
BoC Merchant Tower,
No. 28, St. Michael’s Road,
Colombo 03.
Tel : 011 4711711
: 011 2565636
Fax : 011 2565666
e-mail : [email protected]
Website : www.mbslbank.com
Dr Sujeewa LokuhewaNon- Executive Non-Independent / Chairman
Mr Sunil Nayanasiri DayaratneNon-Executive Independent Director
Mr S P ArsakularatneNon-Executive Independent Director
Representation from Directors Management of BoC
Mr K B S BandaraNon-Executive Non-Independent Director
Mr W P Russel FonsekaNon-Executive Non-Independent Director
Mr R M D Vipula Jayabahu
Non-Executive Non-Independent Director
Mr D N L Fernando
Non-Executive Non-Independent Director
Alternate
Mr C Amarasinghe
(To Mr K B S Bandara)
Mr M P Ruwan Kumara(To Mr W P Russel Fonseka)
Subsidiary Companies Directors
BOC Management & Support
Services (Private) Limited
BoC Head Office Building,
“BOC Square”,
No. 01, Bank of Ceylon Mawatha,
Colombo 01.
Tel : 011 2432680
Mr K B S BandaraNon-Executive Director/ Chairman
Mr D P K Gunasekara
Non-Executive Director
Ms Gaya Jayasinghe
Non-Executive Director
BOC Property Development &
Management (Private) Limited
10th Floor,
BoC Merchant Tower,
No. 28, St. Michael’s Road,
Colombo 03.
Tel : 011 2301911
Fax : 011 2370606
e-mail : [email protected]
Mr M H M FaizerNon-Executive Director/ Chairman
Mr Hameed AshraffNon-Executive Director
Representation from Directors Management of BoC
Mr K B S BandaraNon- Executive Director
Alternate
Mr C Amarasinghe(To Mr K B S Bandara)
BOC Travels (Private) Limited
1st Floor,
BoC Super Grade Branch
Building,
Baseline Road,
Colombo 08.
Tel : 011 2688154-8
Fax : 011 2688175
e-mail : [email protected]
Website : www.boctravels.com
Mr M H K ParanawithanaNon-Executive Director/ Chairman
Mrs F A Rezani AzizNon-Executive Director
Mr P DheerasingheNon-Executive Director
Mr Romel WijewardenaNon-Executive Director
Representation from Directors Management of BoC
Mr K B S BandaraNon-Executive Director
Ms G JayasingheNon-Executive Director
Alternate
Mr C Amarasinghe(To Mr K B S Bandara)

470 Bank of Ceylon | Annual Report 2018
Subsidiary Companies Directors
Hotels Colombo (1963) Limited
No. 02,
York Street,
Colombo 01.
Tel : 011 2320320
011 5221100
Fax : 011 2477640
e-mail : [email protected]
Website : www.grandoriental.com
Mr B M B DodanwelaNon-Executive Director
Mr J C Ratwatte
Non-Executive Director Minority representative
Representation from Directors Management of BoC
Mr Ronald C Perera PCActing Chairman
Mr K B S Bandara
Non-Executive Director
Mr M P Ruwan KumaraNon-Executive Director
Alternate
Ms W I Hettihewa(To Mr K B S Bandara)
Ceybank Holiday Homes
(Private) Limited
12th Floor,
BoC Head Office Building,
“BOC Square”,
No. 01, Bank of Ceylon Mawatha,
Colombo 01.
Tel : 011 2447845
: 011 2204103-4
Fax : 011 2447845
e-mail : [email protected]
Website : www.ceybankholidayhomes.com
Mr K B S BandaraNon- Executive Chairman
Mr K E D Sumanasiri
Non- Executive Director
Mr M P Ruwan Kumara
Non- Executive Director
Mr G K G M BandaraNon- Executive Director
MBSL Insurance Company
Limited
No. 122,
Kew Road,
Colombo 02.
Tel : 011 2304500
Fax : 011 2300499
e-mail : [email protected]
Website : www.mbslinsurance.lk
Dr Sujeewa LokuhewaNon-Executive Non-Independent Director/ Chairman
Mr D M N P KarunapalaNon-Executive Non-Independent Director
Mr P I KandanaarachchiNon-Executive Non-Independent Director
Mr G M J A R GamalathNon-Executive Non-Independent Director
Subsidiary Companies Directors
Koladeniya Hydropower
(Private) Limited
19th Floor,
BoC Head Office Building,
“BOC Square”,
No. 01, Bank of Ceylon Mawatha,
Colombo 01.
Tel : 011 2544328
011 2541113
Fax : 011 2544329
e-mail : [email protected]
Mr D M P R K BandaraNon-Executive Independent Director/ Chairman
Mr N M MusaferNon-Executive Independent Director
Representation from Directors Management of BoC
Mr K B S BandaraNon-Executive Director
Mr K E D SumanasiriNon-Executive Director
Alternate
Mr R M D Vipula Jayabahu(To Mr K B S Bandara)
Bank of Ceylon (UK) Limited
No: 1, Devonshire Square,
London EC2M 4WD,
United Kingdom.
Tel : +44 207 3771 888
Fax : +44 207 3775 430
e-mail : [email protected]
Website : www.bankofceylon.co.uk
Mr W D R SwanneyActing Chairman/ Non- Executive Independent Director
Mr K B S BandaraNon-Executive Non-Independent Director
Mr R EnglandNon-Executive Independent Director
Mr S SabesanChief Operating Officer/ Executive Director
Mr M D C Nilantha Chief Executive Director/ Executive Director (Approval of the Prudential Regulation Authority was obtained on 28 January 2019 )
SUBSIDIARIES AND ASSOCIATES

471
Associates Directors
Lanka Securities (Private)
Limited
No. 228/1,
Galle Road,
Colombo 04.
Tel : 011 4706757
Fax : 011 4706767
e-mail : [email protected]
Website : www.lankasecurities.com
Ms Aamna TaseerNon-Executive Director/ Chairman
Mr Mian Ehsan Ul-HaqNon-Executive Director
Mr Shehryar Ali Taseer
Mr K U D GamageExecutive Director
Representative from MBSL
Mr W P Russel FonsekaNon-Executive Director
Representation from BOC
Mr D P K GunasekaraNon-Executive Director
Alternate
Mr Imran Hafeez(To Ms Aamna Taseer)
Mr Shehryar Ali Taseer(To Mr Mian Ehsan UI-Haq)
Ms Shehrbano Taseer(Mr Shehryar Ali Taseer)
Transnational Lanka Records
Solutions (Private) Limited
No. 55/60,
Vauxhall Lane,
Colombo 02.
Tel : 011 7574574
Fax : 011 4514588
e-mail : [email protected]
Website : www.transnational-grp.com
Mr Daron Kuan Wye LiewNon-Executive Director
Ms Daphne M H LiewNon-Executive Director
Mr Craig R NorwoodNon-Executive Director
Mrs P C DodanwelaNon-Executive Director
Representation from BoC
Mr W P Russel FonsekaNon-Executive Director
Mr R M D Vipula JayabahuNon-Executive Director/ Chairman
Associates Directors
Ceybank Asset
Management Limited
No. 85, York Street,
Colombo 01.
Tel : 011 7602000
Fax : 011 2327203
e-mail : [email protected]
Website : www.ceybank.com
Mr Palitha Srideva Chulakumara
PelpolaNon-Executive Director/ Chairman
Mr Shri Busi Babu RaoNon- Executive Director
Mr Chithrananda SathkumaraCEO/ Executive Director
Mr A P WeeratungeNon-Executive Director
Representation from BOC
Mr K B S BandaraNon-Executive Director
Mr W P Russel FonsekaNon-Executive Director
Alternate
Mr M P Ruwan Kumara(To Mr K B S Bandara)

472 Bank of Ceylon | Annual Report 2018
CORRESPONDENT BANKS BY COUNTRY
Afghanistan1 Afghanistan Bank DA
Albania2 Raiffeisen Bank
Algeria3 Banque Exterieure d’Algerie
Argentina4 Banco Credicoop Cooperativo
Ltd
5 Banco Finansur SA
6 Banco Macro Bansud SA
Armenia7 Ardshininvestment Bank
Australia8 Australia & New Zealand
Banking Group Ltd
9 HSBC Bank Australia Ltd
10 National Australia Bank Limited
11 Westpec Banking Corporation
Austria12 Allgemeine Sparkasse
Oberosterreich
13 Bank Austria Creditanstalt AG UNI Credit Bank Austria AG
14 BAWAG PSK Bank
15 BKS Bank AG
16 Erste Bank DER Oesterreichischen Sparkassen AG
17 ERSTE Group Bank AG
18 Oberbank AG
19 Raiffeisen Bank International AG
20 Raiffeisenlandesbank Oberosterreich Aktiengesellschaft
21 Salzburger Landes - Hypothekenbank AG
22 Volksbank Wien-Baden AG (Osterreichische Volksbanken AG- Name changed as above)
23 Vorarlberger Landes-und Hypothekenbank Aktiengesellschaft
Bahrain24 Ahli United BANK
25 Albaraka Islamic BANK
26 Bahrain Islamic BANK
27 Arab Banking Corporation
28 BBK (Formerly Bank of Bahrain & Kuwait BSC)
29 BMI Bank B S C (C)
30 Gulf International Bank
31 Habib Bank Limited
32 HSBC Bank Middle East
33 National Bank of Bahrain
34 The Arab Investment Company
Bangladesh35 Agrani Bank
36 Bangladesh Krishi Bank
37 BASIC Bank Limited (Banladesh Small Industries & Commerce Bank Ltd)
38 Dutch-Bangla Bank Ltd
39 Janata Bank
40 Prime Bank Ltd
41 Pubali Bank Ltd
42 Sonali Bank
43 The Premier Bank Limited
44 Uttara Bank
Belarus45 Belarus Bank (Formerly
Minskcomplex Bank)
46 Belvnesheconombank
Belgium47 Antwerpse Diamant Bank NV
48 Banca Monte Paschi, Belgio
49 Byblos Bank Europe S A
50 Deutsche Bank SA/NV
51 Fortis Bank NV / SA
52 ING Belgium SA/NV (Formerly Bank Brussels Lambert)
53 KBC Bank NV
Bermuda54 Bank of Bermuda Ltd
Botswana55 Barclays Bank of Botswana
Ltd
Brazil56 Banco ABC Brasil SA
57 Banco Do Brazil
58 Banco Fibra SA
59 Banco Industriel e Commercial SA (Bicbanco)
60 Banco Indusval SA
Bulgaria61 Raiffeisenbank (Bulgaria) EAD
62 Texim Bank
63 Unicredit Bulbank AD (Formerly Bulbank AD)
64 United Bulgarian Bank AD
65 Central Cooperative Bank
66 Investbank PLC
67 Municipal Bank PLC
Cambodia68 ACLEDA Bank PLC
Canada69 Bank of Montreal
70 Bank of Nova Scotia
71 Canadian Imperial Bank of Commerce
72 HSBC Bank Canada (Formerly Credit Lyonnais Canada)
73 Royal Bank of Canada
74 Toronto Dominion Bank
Chile75 Corpbanca
China76 Bank of Changsha
77 Bank of China
78 Bank of Communications
79 Bank of Hangzhou Co Ltd
80 Bank of Jiangsu
81 Bank of Jiujiang Co. Ltd
82 Bank of Nanjing
83 Bank of Shaoxing Co. Ltd
84 Changshu Rural Commercial Bank
85 China Construction Bank
86 China Development Bank Corporation
87 China Everbright Bank
88 Evergrowing Bank
89 Export Import Bank of China
90 OCBC Wing Hang Bank (China) Ltd - W.E.F. 18.07.16 (Former Name - OCBC Bank (China) Ltd)
91 Xian City Commerical Bank Co. Ltd
92 Zhejiang Nanxun Rural Cooperative Bank
93 Zhejiang Xiaoshan Rural Cooperative Bank
Colombia94 Banco Popular
Cook Islands95 WSBC Bank (A/C Closed
on 21.10.2009) (Wall Street Banking Corporation Ltd)
Croatia96 Zagrebacka Banka DD
Cyprus97 Alpha Bank Cyprus Limited
98 Bank of Cyprus Public Company Ltd (Cyprus Popular Bank Public Co.Ltd merged with the above on 06.06.2014).
99 Hellenic Bank Public Company Limited
100 National Bank Of Greece (Cyprus) Ltd
Czech Republic101 Ceska Sporitelna AS
102 Ceskoslovenska Obchodni Banka AS
103 Komercni Banka A S
104 LBBW Bank CZ A.S.
105 Moneta Money Bank A.S. (Name Changed w.e.f. 06.05.2016) (Former Name - GE Money Bank AS )
106 Raiffeisen Bank
107 Unicredit Bank Czech Republic AS
Denmark108 ALS Skiern Bank
109 Danmarks National Bank
110 Danske Bank A/S
111 Jyske Bank AS
112 Nordea Bank Denmark AS
113 Nordjyske Bank AS
114 Rinkjobing Landbobank
115 Skjern Bank
116 Spare Nord Bank
117 Sparebank Vest
118 Sydbank A/S
119 Vestjysk Bank
Ecuador120 Banca International
Produbanco
Egypt121 ABC Egypt (Arab Banking
Corp.)
122 Arab International Bank
123 Bank of Alexandria (Alexbank)
124 Banque Du Carie SAE
125 Banque Misr SAE
126 Central Bank of Egypt
127 Commercial International Bank (Egypt) SAE
128 Credit Agricole Indosuez (Egypt) SAE (Now Calyon Bank Egypt) SAE
129 Egyptian Saudi Finance Bank
130 Faisal Islamic Bank of Egypt Sae
131 Mohandes Bank
132 National Bank of Egypt
133 Suez Canal Bank SAE
Estonia134 SEB Pank

473
Ethiopia135 Commercial Bank of Ethiopia
Fiji136 National Bank of Fiji Limited
(Colonial National Bank)
137 Westpac Banking Corporation
Finland138 Aktia Bank PLC
139 Nordea Bank Finland PLC
140 OKO Osuuspankkien Keskuspankki OYJ
141 OP Corporate Bank PLC (Name Changed w.e.f. 04.04.2016) (Former Name - Pohjola Bank PLC)
142 Sampo Bank PLC
France143 AL Khaliji France S A
144 Bank of India (Paris Branch)
145 Banque BIA
146 Banque De Neuflize, Schlumberger, Mallet, Demachy
147 Banque D›Escompte
148 Banque Federative Du Credit Mutuel
149 Banque Palatine
150 Banque SBA
151 BNP Paribas
152 Calyon
153 CIC Lyonnaise De Banque
154 Credit Agricole
155 Credit Cooperatif
156 Credit Du Nord
157 Credit Industrial Del’ Quest
158 Credit Industrial ET Commercial (CIC)
159 Credit Lyonnais
160 HSBC Private Bank France SA
161 Natixis (Formerly Natexis Banque Populaires)
162 Societe Generale
163 Union De Banques a Paris (UBAF) (Union De Banques Arabes ET Francaises)
164 VTB Bank (France) S A (Formerly Banque Commerciale Pour L’Europe Du Nordeurobank)
Georgia165 Bank of Georgia
Germany166 Baden Wuttenbergische Bank
AG
167 Bankhaus Carlf Plump & Co.
168 Bankhaus Neelmeyer AG
169 Bayerische Landesbank
170 Berenberg Bank
171 Berliner Volksbank EG
172 BHF Bank Aktiengeselschaft
173 Bremer Landesbank
174 Commerzbank AG - (Dusseldorf)
175 Commerzbank AG - (Frankfurt)
176 Degussa Bank
177 Deutsche Bank AG
178 Deutsche Bundesbank
179 Deutsche Postbank AG
180 DVB Bank AG
181 DZ Bank AG Deutsche Zentral - Genossenschaftsbank (New Name w.e.f. 01.08.2016) (Former Name - DZ Bank AG)
182 Frankfurter Volksbank EG
183 Hamburger Sparkasse AG
184 HSBC Trinkaus & Burkhardt KGA
185 ING BHF - Bank AG
186 Kreissparkasse Esslingen-Nurtingen
187 Kreissparkasse Goppingen
188 Kreissparkasse Heilbronn
189 Landesbank Baden-Wurttemberg
190 Landesbank Berlin AG (Merger of Bankgesel-lschaft BerlinAG & Landesbank Berlin AG)
191 Landesbank Hessen Thuringen Girozentrale
192 LRP Landesbank Rheinland PFALZ
193 Mainzer Volksbank EG
194 Nassauische Sparkasse
195 Nordeutsche Landesbank Girozentrale
196 NRW Bank
197 Oldenburgische Landesbank AG
198 Sparkasse Bielefeld
199 Sparkasse Dortmund
200 Sparkasse Duren
201 Sparkasse Essen (Stadtsparkasse Essen)
202 Sparkasse Hannover
203 Sparkasse Herford
204 Sparkasse Pforzheim Calw
205 Stadtsparkasse Dusseldorf
206 Stadtsparkasse Monchengladbach
207 Stadtsparkasse Wuppertal
208 Standard Chartered Bank (Frankfurt)
209 Unicredit Bank AG (Bayerische Hypo-Und Vereinsbank AG)
210 Westlb AG
Ghana211 Ghana Commercial Bank Ltd
Greece212 Alpha Bank
213 Aspis Bank
214 EFG Eurobank Ergasias SA
215 Marfin Egnatia Bank SA (Formerly Egnatia Bank SA)
216 National Bank of Greece
217 Piraeus Bank
Hong Kong218 Bank of East Asia Ltd
219 Cathay Bank
220 Chiyu Banking Corporation Limited
221 Chong Hing Bank Limited (Formerly Liu Chong Hing Bank Ltd)
222 DAH Sing Bank Limited
223 DBS Bank (Hong Kong) Ltd
224 Hang Seng Bank Ltd
225 Hongkong & Shanghai Banking Corporation
226 Industrial and Commercial Bank of China (Asia) Ltd
227 NAN Yang Commercial Bank Ltd
228 Oversea - Chinese Banking Corporation
229 Shanghi Commercial Bank Ltd
230 UBAF (Hong Kong) Ltd Union De Banques Arabes ET Francaises (UBAF)
231 OCBC Wing Hang Bank Ltd (Name changed as above w.e.f.29.09.2014)
Hungary232 Bank of Hungarian Savings
Cooperatives Co Ltd
233 Budapest Credit Development Bank RT
234 Central-European Int’l Bank Ltd (CIC Bank)
235 ERST Bank Hungary NYRT
236 Kereskedelmi ES Hitelbank (K and H Bank NYRT)
237 Magyar Nemzeti Bank
238 Raiffeisen Bank ZRT
239 Unicredit Bank Hungary ZRT
Iceland240 Glitnir Banki HF (Formerly
Islandbanki FBA Ltd)
India241 Allahabad Bank
242 Andhra Bank
243 Axis Bank
244 Bank of Baroda
245 Bank of India (Mumbai)
246 Bank of Maharashtra
247 Canara Bank
248 Central Bank of India
249 Corporation Bank
250 Development Credit Bank Ltd
251 HDFC Bank
252 ICICI Bank Ltd
253 IDBI Bank Ltd
254 Indian Bank
255 Indian Overseas Bank
256 Indusind Bank Ltd
257 Jammu & Kashmir Bank Ltd
258 Karur Vysya Bank
259 Punjab & Sind Bank Ltd
260 Punjab National Bank
261 RBL Bank Ltd
262 Saraswat - Cooperative Bank Ltd
263 State Bank of India
264 State Bank of Hyderabad
265 State Bank of Travancore
266 Syndicate Bank
267 Tamilnad Mercantile Bank Ltd
268 The Bank of Rajastan Ltd
269 UCO Bank
270 Union Bank of India
271 United Bank of India
272 Yes Bank
Indonesia273 Bank Artha Graha
274 Bank International Indonesia
275 Bank Mega
276 PT Bank Bukopin
277 PT Bank Central Asia TBK
278 PT Bank Ekspor Indonesia
279 PT Bank Mandiri (Persero)
280 PT Bank Negara Indonesia TBK
281 PT Bank Pan Indonesia TBK (Panin Bank)
282 PT Bank Permata TBK
283 PT Bank Rabobank International
284 PT Bank Rakyat Indonesia

474 Bank of Ceylon | Annual Report 2018
Ireland285 Allied Irish Bank PLC
Israel286 Bank Hapoalim BM
287 Bank Leumi Le Israel BM
288 Bank of Palestine
289 First International Bank of Israel Ltd
290 Israel Discount Bank
291 Mercantile Discount Bank Ltd
292 Mizrahi Tefahot Bank Ltd
293 Union Bank of Israel Ltd
Italy294 Banca Agricola Mantovana
Spa
295 Banca Antonveneta Spa
296 Banca Carige Spa
297 Banca Delle Marche Spa
298 Banca Popolare DI Cividale SCPA
299 Banca DI Credito Cooperativo DI ALBA
300 Banca Di imola Spa
301 Banca Di Roma
302 Banca Etruria Soc Coop
303 Banca Monte DEI Paschi Di Siena
304 Banca Nazional Del Lavoro Spa (Merged into BNP Paribas)
305 Banco Popolare Soc. Coop (Banc Popolare Di Verona E Novara Scrl) (Including Creito Bergamasco spa,Banca PopolareDi Novara Spa) Verona
306 Banca Popolare - Volksbank (Banca Popolare Dell Alto Adige)
307 Banca Popolare Dell Emilia Romagna
308 Banca Popolare DI Milano
309 Banca Popolare DI Ravenna SPA
310 Banca Popolare DI Sondrio
311 Banca Popolare DI Vicenza Joint Stock Company (Banca Popolare DI Vicenza Scpa - Name Changed - w.e.f. 09.03.2016)
312 Banca Regionale Europea Spa
313 Banca Toscana Spa
314 Banca Ubae Spa
315 Banca Valsabbina SCPA
316 Banco Carim - Cassa DI Risparmio DI Rimini Spa
317 Banco DI Desio E Della Brianza Spa
318 Banco DI Sardegna Spa
319 Banco DI Sicilia
320 BIPOP - Carires
321 Cariparma Spa (Cassa di Risparmio di Parma e Piacenza SPA)
322 Cassa Di Risparmio DI Ascoli Piceno Spa
323 Cassa DI Risparmio DI Bolzano Spa
324 Cassa DI Risparmio DI Carrara Spa
325 Cassa DI Risparmio DI Prato Spa (Cariprato)
326 Cassa DI Risparmio DI San Miniato Spa
327 Credito Valtellinese
328 Deutsche Bank SPA
329 Hipo Alpe - Adria - Bank Spa
330 Intesa Sanpaolo SPA (Formerly Banca Intesa SpA)
331 IW Bank SPA (UBI Banca Private Investment merged into IW Bank SPA) Bbrand Name IW Bank SPA Private Investments SPA ( w.e.f. 25.05.2015)
332 UGF Banca
333 Unicredit Bank AG (Unicredito Italiano SPA)
334 Unipol Banca SPA
Jamaica335 National Commercial Bank of
Jamaica Ltd
Japan336 77 Bank Ltd
337 Aozora Bank Ltd
338 Australia & New Zealand Banking Group Ltd
339 AWA Bank Ltd
340 Bank of Kochi Ltd
341 Bank of Kyoto
342 Bank of Tokyo-Mitsubishi UFJ Ltd
343 Bank of Yokohama Ltd
344 Chiba Kogyo Bank Ltd
345 Chukyo Bank Ltd
346 Chuo Mitsui Trust and Banking Co Ltd
347 Gunma Bank Limited
348 Higashi - Nippon Bank
349 Hokuriku Bank Ltd
350 Kinki Osaka Bank Ltd
351 Kiyo Bank Ltd
352 Kyoto Shinkin Bank
353 Minato Bank Ltd (Formerly Midori Bank Ltd)
354 Mitsubish Trust & Banking Co
355 Mizuho Bank Ltd
356 Nishi Nippon City Bank Ltd
357 Okazaki Shinkim Bank
358 Osaka City Shinking Bank
359 Resona Bank Limited
360 Saitama Resona Bank Ltd
361 SETO Shinkin Bank
362 Shiga Bank Ltd
363 Shinkin Central Bank
364 Shinsei Bank Ltd (Formerly Long Term Credit Bank of Japan)
365 Standard Chartered Bank
366 Sugamo Shinkin Bank
367 Sumitomo Mitsui Banking Corporation
368 The Asahi Shinkin Bank
369 The Ashikaga Bank Ltd
370 The Hokkaido Bank Limited
371 The Shikoku Bank Ltd
372 The Shizuoka Bank Ltd
373 The Yokohama Shinkin Bank
374 Tokushima Bank Ltd
375 Tokyo Tomin Bank Ltd
376 Tomato Bank Ltd
377 Towa Bank Ltd
378 Yamagata Bank Ltd
379 Yamanashi Chuo Bank Ltd
Jordan380 Arab Bank PLC
381 Arab Jordan Investment Bank
382 Bank Al Etihad
383 Bank Audi Sal - Audi Saradar Group
384 Bank of Jordan PLC
385 Cairo Amman Bank
386 Housing Bank For Trade & Finance
387 Investbank (formely jordan Investment & Finance Bank (JIF Bank)
388 Islamic International Arab Bank Ltd
389 Jordan Ahli Bank PLC w.e.f. 12/11/2006 (Formerly Jordan National Bank)
390 Jordan Commercial Bank (Formerly Jordan Gulf Bank)
391 Jordan Dubai Islamic Bank
392 Jordan Kuwait Bank
Kazakstan393 JSC Bank Centercredit
Kenya394 Barclays Bank of Kenya Ltd
395 Kenya Commercial Bank Ltd
Korea396 Citibank Korea INC (Formerly
Koram Bank)
397 Kookmin Bank
398 Korea Development Bank
399 KEB Hana Bank (Merged between Hana Bank & Kores Exchange Bank)
400 Kyongnam Bank
401 Pusan Bank
402 The Kwangju Bank Ltd
403 Woori Bank
Kuwait404 AL Ahli Bank of Kuwait
405 Bank of Kuwait & The Middle East
406 Burgan Bank SAK
407 Commercial Bank of Kuwait SAKP
408 Gulf Bank
409 Kuwait International Bank
410 National Bank of Kuwait SAKP
Kyrgyzstan411 Asia Universal Bank
Latvia412 Parex Bank
413 Rietumu Bank
414 SEB Banka
Lebanon415 AL Ahli International Bank SAL
416 Arab African International Bank
417 Arab Bank PLC (Lebanon Branches Centre) Beirut
418 Audi Private Bank SAL (New Name) (Audi Saradar Private Bank SAL)
419 Bank Audi SAL - Audi Saradar Group
420 Bank Bemo SAL
421 Bankmed SAL
422 Bank of Beirut SAL
423 Banque Libano Francaise
424 BBAC SAL (Formerly Bank of Beirut & the Arab CountriesSAL)
425 BLC Bank SAL (Formerly Banque Libanaise Pour Le Commerce SAL)
426 BLOM Bank SAL
427 Byblos Bank SAL
428 Credit Libanais SAL
429 First National Bank SAL
430 Fransbank SAL
431 IBL Bank
432 Jamal Trust Bank SAL
CORRESPONDENT BANKS BY COUNTRY

475
433 MEAB Bank (Middle East & Africian Bank SAL)
434 Near East Commercial Bank SAL
435 Societe Generale Banque AU Liban SAL (Lebanese Canadian Bank S.A.L merged with Societe Generale Banque Au Liban SAL)
436 Societe Nouvelle De La Banque De Syrie Et Du Liban SAL
Libya437 Gumhoria Bank
438 National Commercial Bank SAL
439 UMMA Bank SAL
440 Wahda Bank
Lithuania441 AB Bankas Hansa Bankas
442 AB Bankas Snoras
443 SEB Bank
444 UKIO Bank AS
Macau445 Banco Weng Hang SA
Madagascar446 Bank of Africa - Madagascar
447 Banque Centrale De Madagascar
Malawi448 National Bank of Malawi
Malaysia449 Alliance Bank Malaysia,
Berhad
450 Ambank Berhad (Formerly Arab-Malaysian Bank - Berhad)
451 Bank Islam Malaysia Berhad
452 CIMB Bank Berhad (Formerly Bumiputra Commerce Bank Berhad)
453 EON Bank Berhad
454 Malayan Banking Berhad (Maybank)
455 OCBC (Malaysia) Berhad
456 Oversea - Chinese Banking Corporation Ltd (Kuala Lumpur)
457 Public Bank Berhad
458 RHB Bank Berhad
459 Royal Bank of Scotland
460 United Overseas Bank (Malaysia) Berhad
Maldives461 Bank of Maldives PLC
462 Habib Bank Limited
Malta463 Bank of Valleta
464 FIM Bank PLC Ltd
465 HSBC Bank Malta PLC
Mauritius466 State Bank of Mauritius Ltd
467 The Mauritius Commercial Bank Ltd
Mexico468 Banco Nacional De Mexico SA
469 Banco Santander Mexicano SPA
470 BBVA Bancomer SA
471 HSBC Mexico SA
Mongolia472 Trade & Development Bank of
Mongolia
Morocco473 Credit Du Marco SA
Mozambique474 Banco International De
Mocambique S A R L
Namibia475 Bank Windhoek Ltd
Nepal476 Himalanyan Bank Ltd
477 Nepal Bank Limited
478 Nepal Credit Commercial Bank
479 Standared Chartered Bank Nepal Ltd
Netherlands480 ABN AMBRO Bank - Royal
Bank of Scotland
481 F VAN Lanschot Bankiers NV
482 Hollandsche Bank - Unie NV
483 ING Bank NV
484 Cooperatieve Rabobank UA (Name Changed w.e.f. 01.01.2016) (Former Name Rabobank Nederland)
485 SNS Bank NV
486 The Economy Bank NV
487 Yapi Ve Kredi Bankasi AS
New Zealand488 ANZ Bank National Bank Ltd
489 ASB International Bank
490 Bank of New Zealand
491 Westpec Banking Corporation
Nigeria492 First Bank of Nigeria PLC
493 Union Bank of Nigeria PLC
Norway494 DNB NOR Bank ASA (Formerly
Den Norske Bank NA)
495 Nordea Bank Norge AS
496 Sparebanken Hedmark
497 Sparebanken More
498 Sparebanken Nord Norge
Oman499 Bank Dhofar SAOG
500 Bank Sohar SAOG
501 Bankmuscat SAOG
502 National Bank of Oman SAOG
503 Oman Arab Bank SAOC
504 Oman International Bank
Pakistan505 Allied Bank of Pakistan
506 Askaribank Limited (Formerly Askari Commercial Bank Ltd)
507 Atlas Bank
508 Bank AL Habib Ltd
509 Bank of Khyber
510 Bank of Panjab
511 Dawood Islamic Bank Ltd
512 Dubai Islamic Bank Pakistand Ltd
513 Faysal Bank Ltd
514 Habib Bank Limited
515 Habib Metropolitian Bank Ltd
516 Bank Islami Pakistan Limited (BIPL) (KASB Bank merged into Bank Islami Pakistan Ltd) (w.e.f. Mid of May 2015)
517 MCB Bank Ltd (Formerely Muslim Commercial Bank)
518 Meezan Bank Ltd
519 Mybank Ltd
520 National Bank of Pakistan
521 Soneri Bank Ltd
522 Standared Chartered Bank (Pakistan) Ltd
523 United Bank Limited
Palestinian Autonomous Areas524 Arab Islamic Bank
Papua New Guinea525 Westpac Banking Corporation
(Westpac Bank PNG Ltd)
Paraguay526 Banco Amambay S A
Peru527 Banco De Credito DEL Peru
Philippines528 Metropolitian Bank & Trust Co
529 Philippine National Bank
Poland530 Bank BGZ
531 Bank Gospodarstwa Krajowego
532 Bank Handlowy Warszawa SA
533 Bank Millennium SA
534 Bank Pekao SA
535 Kredyt Bank SA
536 PKO Bank Polski SA (New name) (Powszechna Kasa Oszczednosci Bank Polski SA) (Former Name Nordea Bank Polska SA)
537 Raiffeisen Bank Polska SA
Portugal538 Banco BPI SA
539 Banco Espirito Santo SA
540 BNP - Banco Portugues De Negocios SA
541 Finibanco SA
542 Millennium BCP (Foremerly Banco Commercial Portugues SA)
Qatar543 Barwa Bank
544 Doha Bank
545 Qatar International Islamic Bank
546 Qatar Islamic Bank SAQ
Romania547 Banca Comerciala Carpatica
548 Banca Commerciala Romana SA
549 Banca Transilvania
550 BRD - Groupe Societe Generale S A
551 Unicredit Bank, SA (New Name .w.e.f 18.08.2015) (Former Unicredit Tiriac Bank)
Russia552 Bank of Moscow
553 Bank for Development & Foreign Economic Affairs (Formerly Bank for Foreign Economic Affairs of the USSR)
554 Bank Jugra
555 BIN Bank
556 International Moscow Bank
557 Khanty - Mansiysk Bank Otkritie (PJSC) - New Name - w.e.f. 22.08.2016 Bank Otkritie Financial Corporation - (JSC) (Otkritie FC Bank) (Former - Nomos - Bank (Novaya Moskva)

476 Bank of Ceylon | Annual Report 2018
558 B and N Bank (Public Joint - Stock Compay) (M D M Bank - Name Changed as above w.e.f. 18.11.2016)
559 ROS Bank
560 Sberbank
561 Trans Credit Bank
562 Vnesheconombank
563 VTB 24 (PJSC) (Public Joint Stock Company) (Formerly JSC VTB Bank - Bank for Foreign Trade (Vneshtorgbank)
Saudi Arabia564 Al Rajhi Bank (Formerly Al
Rajhi Banking & Investment Corporation)
565 Bank Al Bilad
566 Bank Al Jazira
567 Banque Saudi Fransi
568 National Commercial Bank Limited
569 Riyad Bank
570 Samba Financial Group
571 Saudi British Bank
572 Alawwal Bank - (Saudi Hollandi Bank - Name Changed as above w.e.f. 27.11.2016)
573 Arab National Bank
Scotland574 Royal Bank of Scotland
Serbia575 Banca Intesa AD Beograd
Serbia & Montenegro576 National Bank of Serbia
Seychelles577 Seychelles International
Mercantile Banking (NOUVOBNQ)
Singapore578 Bank of India (Singapore)
579 DBS Bank Ltd
580 Dexia Banque Internationale A Luxembourgea
581 Far Eastern Bank Limited
582 Indian Bank
583 Oversea - Chinese Banking Corporation Ltd
584 Skandinaviska Enskilda Banken AB
585 Standard Chartered Bank
586 State Bank of India
587 The B Ank of East Asia Ltd
588 UCO BANK
589 Union De Banques Arabes ET Francaises (UBAF)
590 United Overseas Bank Ltd
591 VTB Bank Europe PLC (Formerly Moscow Narodny Bank Ltd)
Singapore / Malaysia592 ABN Amro
Slovakia593 Ceskoslovenska Obchodni
Banka AS
594 Postova Bank AS
595 Slovenska Sporitelna A S
596 TARTA Bank AS
597 Unicredit Bank Slovakia AS
598 Vseobecna Uverova Bank AS
Slovenia599 Gorenjska Banka
600 Nova Kreditna Banka Maribor D D
601 Nova Ljubljanska Banka DD Ljubljana
602 Abanka VIPA DD
Solomon Islands603 National Bank of Solomon
Islands
Somalia604 Commercial & Savings Bank of
Somalia
South Africa605 ABSA Bank Ltd
606 Firstrand Bank Ltd
607 Nedcor Bank Ltd (NED Bank)
608 Standard Bank of South Africa Ltd
609 The Standard Chartered Bank of South Africa, Johannesburg.
Spain610 Banco Bilbao Vizcaya
Argentaria
611 Banco De Europa SA
612 Banco De Sabadell S.A.
613 Banco De Valencia
614 Banco Guipuzcoano SA
615 Banco Intercontinential Espanol (Bankinter)
616 Banco Pastor SA
617 Banco Santander Central Hispano
618 Caixa’d Estalvis De Catalunya
619 CAJA De Ahorrosy Pensiones De Barcelona LA Caixa
620 CAJA Madrid
Sweden621 Nordbanken AB (PUBL)
622 SEB Merchant Banking
623 Skandinaviska Enskilda Banken AB (PUBL)
624 Svenska Handelsbanken AG (PUBL)
625 Swed Bank
Switzerland626 Banque Cantonale De Geneve
627 Banque Cantonale Vandoise
628 Banque De Commerce Et De Placements
629 BNP Paribas (Suisse) SA
630 BSI SA
631 Credit Agricole (Sussie) SA
632 Credit Sussie
633 Faisal Private Bank (Switzerland) SA
634 Habib Bank AG Zurich
635 Luzerner Kantonal Bank
636 UBS Switzerland AG
637 Zurcher Kantonalbank
Taiwan638 Bank of Taiwan
639 CTBC Bank Co. Ltd (China Trust Commercial Bank Name changed as CTBC Bank Co. Ltd - w.e.f. - 04.06.2013)
640 Chinfon Commercial Bank
641 E-Sun Commercial Bank Ltd
642 First Commercial Bank
643 HUA NAN Commercial Bank
644 Mega International Commercial Bank
645 Shanghi Commercial & Savings Bank Ltd
646 Shin Kong Bank
647 Taipei Fubon Commercial Bank
648 Taiwan Cooperative Bank
649 Union Bank of Taiwan
Tanzania650 NBC Limited (National Bank of
Commerce)
Thailand651 Bangkok Bank Public
Company Ltd
652 Bank of Ayudhya Public Company Ltd
653 Export Import Bank of Thailand
654 Kasikornabank Public Company Ltd (Formerly Thai Farmers Bank)
655 Krung Thai Bank Public Company Limited
656 Siam City Bank Public Company Ltd
657 Siam Commercial Bank PCL
658 Standard Chartered Bank (Thai) Public Company Ltd
659 United Overseas Bank (Thai) Public Co Ltd
Tunis660 Banque Nationale Agricole
Tunisia661 Attijari Bank
662 Societe Tunisienne De Banque
Turkey663 AK Bank TAS
664 Anadolu Bank
665 Arab Turkish Bank
666 ASYA Katilim Bankasi AS (Formerly Asya Finans Kurumu AS)
667 EURO Tekfen AS
668 ING Bank AS
669 Kuvoyt Turk Katilim Bankasi AS
670 Tekstil Bankasi AS
671 Turk Economi Bankasi
672 Turkiye Finance Katilinu Bankasi AS
673 Turkiye Halk Bankasi AS
674 Turkiye Garanti Bankasi AS
675 Turkiye is Bankasi AS
676 Turkiye Vakiflar Bankasi TAO
677 Turkland Bank - T Bank
678 Yapi VE Kredi Bankasi AS
UAE679 Abu Dhabi Commercial Bank
680 Abu Dhabi Islamic Bank
681 Arab Bank for Investment & Foreign Trade
682 Commercial Bank International PLC
683 Commercial Bank of Dubai PSC
684 Dubai Islamic Bank PLC
685 Emirates NBD PJSC
686 First Gulf Bank
687 Mashreqbank PSC
688 Middle East Bank PJSC
689 National Bank of Abu Dhabi
690 National Bank of Fujirah
691 Noor Bank
692 Union National Bank
693 United Arab Bank
Uganda694 Barclays Bank of Uganda Ltd
CORRESPONDENT BANKS BY COUNTRY

477
UK695 AIB Group (Formerly Allied
Irish Bank)
696 Barclays Bank PLC
697 Clydesdale Bank PLC
698 Gulf International Bank (UK) Limited
699 Habib Bank AG Zurich
700 Habibsons Bank Ltd
701 HSBC Bank PLC
702 Investec Bank (UK) Limited
703 Lloyds TSB Bank PLC
704 National Westminster Bank PLC (Metro)
705 Royal Bank of Scotland PLC
706 Standard Bank PLC
707 Standard Chartered Bank
Ukraine708 Ukreximbank (State Export-
Import Bank of Ukrain)
709 Calyon Bank
710 First Ukrainian International Bank - PJSC
711 OTP Bank - Public Joint Stock Company
712 PJSC ‘Alfa - Bank’
713 Prominvest Bank
Uruguay714 The Banco De La Republic
Oriental Del Uruguay
USA715 American Express Bank Ltd
716 Banco Del Pichincha C A
717 Bank of America NA
718 Bank of New York (The Bank of NewYork Mellon) (Merged with Mellon Bank 21.07.08)
719 Bank of Tampa
720 Branch Banking & Trust Co
721 Brown Brothers Harriman & Co
722 CITIBANK NA
723 Cobank ACB
724 Commerce Bank NA
725 Deutsche Bank Trust Company Americas
726 First Hawiian Bank
727 French American Banking CORP
728 Habib American Bank
729 Hibernia National Bank
730 HSBC Bank USA
731 Huntington National Bank
732 Israel Discount Bank of New York
733 JP Morgan Chase Bank (Metro)
734 LA Salle Bank Midwest
735 M & T Bank ( Formerly Allfirst Bank)
736 National City Bank of Indiana
737 National Penn Bank
738 Northern Trust Company
739 PNC Bank NA
740 SAN Diego National Bank
741 Silicon Valley Bank
742 Sovereign Bank
743 Standard Chartered Bank
744 State Street Bank & Trust Co
745 Sun Trust Bank Ltd
746 UMB Bank NA
747 Union Bank of California NA
748 US Bank NA
749 Wells Fargo Bank NA (Wachovia Bank NA merged with Wells Fargo)
Vietnam750 Bank for Foreign Trade of
Vietnam
751 Bank for Investment & Development of Vietnam
Yemen752 National Bank of Yemen
753 Yemen Bank for Reconstruction & Development
754 Yemen Commercial Bank
755 Yemen Kuwait Bank
Yemen Arab Republic756 International Bank of Yemen
YSC
Zambia757 Barclays Bank of Zambia Ltd
Zimbabwe758 Braclays Bank of Zimbabwe
Ltd

478 Bank of Ceylon | Annual Report 2018
Australia
1 Aussie Forex & Finance Pty Ltd
2 Cash Plus Forex Pty Ltd
3 Ceylon Exchange Pty Ltd
4 Kapruka (Pty) Ltd
5 Serendib Financial Pty Ltd
6 SL Money Transfer Pty Ltd
7 PFG Forex
Bahrian
8 Bahrain Financing Company
9 Ezremit Ltd (BFC Bank)
10 National Finance & Exchange Co Wll
11 Zenj Exchange
12 Zenj Exchange Company Wll
(Turbo Cash)
Cyprus
13 Masari Payment Services Ltd
France
14 Tempo - France
Greece
15 International Express Remittance
International Money Transfer Mediation Co.
Hong Kong
16 Orient Exchange (Hk) Ltd
Israel
17 Tifco Logistics & Trade Ltd
Italy
18 Valutrans Spa)
Japan
19 Japan Remit Finance Co. Ltd
20 Unidos Co. Ltd (Kyodai Remittance)
Jordan
21 AL Samhouri Exchange Company
22 ALawaneh Exchange Co
23 Shift Financial Services Ltd
Kuwait
27 Aman Exchange Co. WLL
24 Al Mulla International Exchange Co WLL
25 Al Muzaini Exchange Co Ksc (Closed)
28 Bahrain Exchange Co WLL
29 Citiy International Exchange Co WLL
30 Dollarco Exchange Co Ltd
31 Etemadco Exchange Co WLL
32 International Financial Line Co
33 Joyalukkas Exchange Co. WLL
34 Kuwait Asian International
Exchange Co WLL
35 Kuwait Bahrain International Ex.
36 Kuwait India International Ex.co
37 National Exchange Co WLL
38 National Money Exchange Co WLL
39 Oman Exchange Co Ltd
26 Al Nada International Exchange (Former
Security Exchange Co WLL)
40 Uae Exchange Centre WLL
Lebanon
41 Services Exchange Co
(Imad Al Hariri Trading Co & Partners -
Seco)
Malaysia
42 Merchantrade Asia Sdn Bhd)
Oman
43 Asia Express Exchange
44 Gulf Overseas Exchange Co. LLC
45 Hamdan Exchange
46 Majan Exchange LLC
47 Modern Exchange Co. LLC
48 Musandam Exchange
49 Mustafa Sultan Exchange Co. LLC
50 Oman & Uae Exchange Centre Co. LLC
51 Oman International Exchange LLC
52 Oman United Exchange Co. LLC
53 Purshottam Kanji Exchange Co. LLC
Qatar
54 AL Dar For Exchange Works
55 AL Fardan Exchange Co. WLL
56 AL Mana Exchange WLL
57 AL Sadd Exchange
58 AL Zaman Exchange WLL
59 AL-Mirqab Exchange Co.
60 Arabian Exchange Company WLL
61 City Exchange Co.WLL
62 Eastern Exchange Est
63 Gulf Exchange Company
64 Habib Qatar International Exch.ltd
65 Islamic Exchange
66 National Exchange Co WLL
(Formerly Al Shaibei Exchange Co)
Singapore
67 Hbz International Exchange Co (Metro)
(Singapore) Pvt Ltd
68 Mustafa Foreign Exchange (Metro)
Switzerland
69 Motherhouse Gmbh (Metro)
UAE
70 AL Ahalia Money Exchange Bureau-
Abu Dhabi
71 AL Ansari Exchange Est-
Abu Dhabi
72 AL Fardan Exchange-
Abu Dhabi
73 Al Mona Exchange Co LLC-
Dubai
74 AL Rostamani International Exchange
(Formerly Thomas Cook Al Rostamani
Exch. Co.)-Dubai
75 Delma Exchange - Abu Dhabi
76 Emirates India International
Exchange Company - Dubai
78 Index Exchange Co Llc - Abu Dhabi
77 Hadi Express Exchange - Dubai
79 Joyalukkas Exchange
Dubai
80 Lari Exchange Establishment - Abu Dhabi
81 Lulu International Exchange Llc - Abu
Dhabi
82 National Exchange Co - Abu Dhabi
EXCHANGE COMPANIES BY COUNTRY

479
83 Orient Exchange Co. LLC - Dubai
84 Redha AL-Ansari Exchange Est - Dubai
85 UAE Exchange Centre - Abu Dhabi
86 Wall Street Exchange Centre - Dubai
87 Xpress Money Services Limited - Abu
Dhabi
88 Zareen Exchange - Dubai
Uk
89 3R Telecom Ltd
90 An Express Ltd
91 Currency Exchange Corporation
92 Global Exchange Ltd)
93 INTL FC Stone Ltd (IFL)
94 Sigue Global Services Ltd
(Former Coinstar)
95 Worldremit(Metro)
USA
96 Moneygram
97 Prabhu Group INC
98 RIA Financial Services (Metro)
(Contiental Exchange Solutions Inc)
99 Trans-Fast Remittance LLC
100 Western Union
Cyprus
101 G S Cash Line

480 Bank of Ceylon | Annual Report 2018
GLOSSARY OF FINANCIAL/ BANKING TERMS
AAcceptancesPromise to pay created when the drawee of a time draft stamps or writes the word “accepted” above his signature and a designated payment date.
Accounting PoliciesThe specific principles, bases, conventions, rules and practices adopted by an entity in preparing and presenting Financial Statements.
Accrual BasisTo recognise the effects of transactions and other events as they occur, without waiting for the receipt or payment of related cash or its equivalent.
Actuarial AssumptionsAn entity’s unbiased and mutually compatible best estimates of the demographic and financial variables that will determine the ultimate cost of providing post-employment benefits.
Actuarial Gains and LossesActuarial gains and losses comprise the effects of differences between the previous actuarial assumptions and what has actually occurred and the effects of changes in actuarial assumptions.
Actuarial Present Value of Promised Retirement BenefitsThe present value of the expected payments by a retirement benefit plan to existing and past employees, attributable to the service already rendered.
Actuarial ValuationFund value determined by computing its normal cost, actuarial accrued liability, actuarial value of its assets, and other relevant costs and values.
AmortisationThe systematic allocation of the depreciable amount of an asset over its useful life. In the case of an intangible asset or goodwill, the term “amortisation”
is generally used instead of “depreciation”. Both terms have the same meaning.
Amortised CostThe amount at which a financial asset or liability is measured at initial recognition, minus any repayment of principal, minus any reduction for impairment or uncollectibility, and plus or minus the cumulative amortisation using the effective interest method of the difference between that initial amount and maturity amount.
Anti-Money Laundering (AML)A set of procedures, laws or regulations designed to prevent money laundering. Money laundering is an activity which aims to disguise the ownership of money that has an illegal origin such as trading of drugs, organised crimes, fraud and terrorism.
Associate CompanyA company other than a subsidiary in which a holding company has a participating interest and exercises a significant influence over its operating and financial policies.
Attrition RateA measure of how many employees leave over a certain period of time.
Average Weighted Deposit Rate (AWDR) AWDR is calculated by the Central Bank of Sri Lanka monthly on the weighted average of all outstanding interest bearing deposits of commercial banks and the corresponding interest rates.
Average Weighted Prime Lending Rate (AWPLR)AWPLR is calculated by the Central Bank of Sri Lanka weekly based on commercial banks lending rates offered to their prime customers during the week.
BBASEL IIIThe Basel Committee on Banking Supervision (BCBS) issued the BASEL III rules text, which presents the details of strengthened global regulatory standards on bank capital adequacy and liquidity.
Basis PointsA unit that is equal to 1/100th of 1%. Often used in quotation of spreads between interest rates or to change in yield in securities.
Bills of ExchangeA signed, written unconditional order addressed by one person (the drawer) directing another person (the drawee) to pay a specified sum of money to the order of a third person (the payee). The terms bills of exchange and drafts are often used interchangeably.
CCapital Adequacy Ratio (CAR)The ratio between capital and risk-weighted assets, as defined under the framework of risk-based capital standards developed by the Bank for International Settlements (BIS) and as modified to suit local requirements by Central Bank of Sri Lanka.
Cash EquivalentsInvestments / assets that are readily convertible to cash, subject only to an insignificant risk of change in their value.
Collectively-Assessed Loan Impairment ProvisionsImpairment assessment which carried out on a collective basis for homogeneous groups of loans that are not considered individually significant, in order to cover losses that has been incurred but has not yet been identified at the Reporting date.
Compound Annual Growth Rate (CAGR) The year over year growth rate over a specified period of time.

481
Common Equity Tier 1 (CET 1)Common Equity Tier 1 (CET 1) is a component of Tier 1 capital that consists mostly of Stated Capital. It is a capital measure that was introduced as a precautionary measure to protect the economy from a financial crisis.
Contractual MaturityContractual maturity refers to the final payment date of a loan or other financial instrument,at which point all the remaining outstanding principal will be repaid and interest is due to be paid.
Corporate GovernanceThe process by which corporations are directed and controlled. It is concerned with the rights and responsibilities among stakeholders used to determine and control the strategic directions and performance of the corporation.
Cost / Income RatioOperating expenses excluding impairment charge for loans and other losses, as a percentage of total operating income.
Country RiskThe credit risk associated with lending to borrowers within a particular country, sometimes taken to include sovereign risk.
Credit RiskThe risk of loss due to non-payment of a loan or other line of credit (either the principal or interest or both), by the borrower or a counterparty.
Credit RatingsAn evaluation of a corporate’s ability to repay its obligations or the likelihood of not defaulting carried out by an independent rating agency.
DDealing SecuritiesSecurities acquired and held with the intention of reselling them in the short term.
Debt Equity RatioLong-term borrowings divided by shareholder’s equity.
Deferred TaxationSum set aside for tax in the Financial Statements that will become payable/receivable in a financial year other than the current financial year. It arises because of temporary differences between tax rules and accounting conventions.
Defined Benefit PlansRetirement benefit plans under which amounts to be paid as retirement benefits are determined by reference to a formula usually based on employees’ earning history, tenure of service and age.
DerivativesA financial instrument, the price of which has a strong relationship with an underlying commodity, currency variable or financial instrument.
Documentary Letters of Credit (LC)Written undertakings by a bank on behalf of its customers (typically an importer), authorising a third party (e.g. an exporter) to draw drafts on the Bank up to a stipulated amount under specific terms and conditions. Such undertakings are established for the purpose of facilitating international trade.
Domestic Systemically Important Banks (D-SIBs)Systemically Important Banks (SIBs) are perceived as banks that are “Too Big To Fail”.
D-SIBs are critical for the uninterrupted availability of essential banking services to the country’s real economy even during crisis. The CBSL has designated Licenced Commercial Banks with total assets equal to or greater than Rs. 500 Bn. as D-SIBs
EEquity MethodA method of accounting whereby the investment is initially recorded at cost and adjusted thereafter for the post-acquisition change in the investor’s share of net assets of the invested. The Statement of profit or loss reflects the investor’s share of the results of operations of the invested.
Events After the Reporting DateEvents after the Reporting date are those events, both favourable and unfavourable, that occur between the Reporting date and the date when the financial statements are authorised for issue.
Exchange Company / HouseAn overseas location where the Bank’s representatives provide banking services as a promotional tool.
FFair ValueThe price that would be required to sell an asset or paid to transfer a liability in an orderly transaction between market participants at the measurement date.
Finance LeaseLeases which transfer risks and rewards of ownership. Title may or may not eventually be transferred.
Financing ActivitiesActivities that result in changes in the size and composition of the equity capital and borrowings of the entity.
Financial InstrumentsFinancial instrument is any contract that gives rise to financial asset of one entity and a financial liability or equity instrument of another entity.
Financial Assets Measured at Amortised CostA financial asset is measured at amortised cost if the asset is held within a business model whose objective is to hold assets

482 Bank of Ceylon | Annual Report 2018
GLOSSARY OF FINANCIAL/ BANKING TERMS
to collect contractual cash flows and the contractual terms of the financial asset give rise on specified dates to cash flows that are solely payments of principal and interest on the principal amount outstanding.
Financial Assets Measured at Fair Value through Other Comprehensive Income (FVOCI)FVOCI include debt and equity instruments measured at fair value through other comprehensive income. A debt instrument is measured at FVOCI, if it is held within a business model whose objective is achieved by both collecting contractual cash flows and selling financial assets and the contractual terms of the financial asset give rise on specified dates to cash flows that are solely payments of principal and interest on the principal amount outstanding.
Equity investments may be irrevocably classified as FVOCI when they meet the definition of Equity under LKAS 32 Financial Instruments: Presentation, and are not held for trading.
Financial Assets Measured at Fair Value through Profit or Loss (FVTPL)All financial assets other than those classified at Amortised Cost or FVOCI are classified as measured at FVTPL. These are held for trading or managed and their performance is evaluated on a fair value basis as they are neither held to collect contractual cash flows nor held both to collect contractual cash flows and to sell financial assets.
Foreclosed PropertiesProperties acquired in full or partial settlement of debts, which will be held with the intention of resale at the earliest opportunity.
Foreign Exchange IncomeThe gain recorded when assets or liabilities denominated in foreign currencies are translated into Sri Lankan Rupees on the Reporting date at prevailing rates which differ from
those rates in force at inception or on the previous Reporting date. Foreign exchange income also arises from trading in foreign currencies.
Forward Exchange ContractsAgreements between two parties to exchange one currency for another at a future date at a rate agreed upon today.
GGlobal Reporting Initiatives (GRI)GRI is a leading organisation in the sustainability field. GRI promotes the use of sustainability reporting as a way for organisations to become more sustainable and contribute to sustainable development.
Gross Domestic Product (GDP)The value of all goods and services produced domestically in an economy during a specified period, usually a year. Nominal GDP, adjusted for inflation, gives GDP in real terms.
GuaranteesPrimarily represent irrevocable assurances that a bank will make payments in the event that its customer is unable to perform its financial obligations to third parties. Certain other guarantees represent non-financial undertakings such as bid and performance bonds.
HHistorical Cost ConventionRecording transactions at the actual value received or paid.
IImpairmentThis occurs when recoverable amount of an asset is less than its carrying amount.
Individually Significant Loan Impairment ProvisionsImpairment measured individually for loans that are individually significant to the Group.
Intangible AssetAn identifiable non-monetary asset without physical substance held for use in the production or supply of goods or services, for rental to others, or for administrative purposes.
Interest MarginNet interest income as a percentage of average interest earning assets.
Interest SpreadRepresents the difference between the average interest rate earned on interest earning assets and the average interest rate incurred on interest bearing liabilities.
Investment SecuritiesSecurities acquired and held for yield or capital growth purposes and usually held to maturity.
KKey Management Personnel (KMP)Those persons having authority and responsibility for planning, directing and controlling the activities of the entity, directly or indirectly.
Key Performance Indicators (KPI)KPIs are quantifiable measures that a company users to gauge its performance over time.
LLiquid AssetsAssets that are held in cash or in a form that can be converted to cash readily, such as deposits with other banks, bills of exchange, treasury bills.
Liquid Assets RatioLiquid assets expressed as a percentage of total liabilities other than shareholders’ funds.
Liquidity Coverage Ratio – LCRRefers to highly liquid assets held by Banks to meet short-term obligations. The ratio represents a generic stress scenario that aims to anticipate market-wide shocks.

483
Loss Given Default (LGD)LGD is the percentage of an exposure that a lender expects to lose in the event of default.
MMark to MarketThe practice of periodically revaluing marketable securities to their current market value.
MaterialityThe relative significance of a transaction or an event the omission or misstatement of which could influence the economic decisions of users of financial statements.
Minority InterestThat portion of the profit or loss and net assets of a subsidiary attributable to equity interests that are not owned, directly or indirectly through Subsidiaries, by the Parent.
Mortality RateA measure of the number of deaths in some population, scaled to the size of that population, per unit time.
NNet Asset Value Per ShareShareholders’ equity divided by the number of ordinary shares in issue.
Net Interest IncomeThe difference between what the Bank earns as interest on assets such as loans and securities and what it pays as interest on liabilities such as deposits, refinance funds and interbank borrowings.
Net Realisable ValueThe estimated selling price in the ordinary course of business, less the estimated costs of completion and the estimated costs necessary to make the sale.
Net Stable Funding Ratio (NSFR)NSFR measures the amount of long-term, stable sources of funding employed
by a bank relative to the liquidity profiles of the assets funded and the potential for contingent calls on funding liquidity arising from off-balance sheet commitments and obligations.
Nostro AccountA nostro account is a bank account held in a foreign country by a domestic bank, denominated in the currency of that country.
OOff-Balance Sheet TransactionsTransactions not recognised as assets or liabilities in the Statement of Financial Position but which give rise to contingencies and commitments.
Operating ActivitiesThe principal revenue producing activities of an entity and other activities that are not investing or financing activities.
PPlan Assets of an Employee Benefit PlanAssets held by a long-term employee benefit fund.
Price Value Per Basic Point (PVBP)Estimated change in the value of portfolio due to one basic point change in interest rate.
Primary Dealer Special Risk ReserveReserve maintained in order to strengthen capital base further with development of capital market.
Probability of Default (PD)PD is a financial term describing the likelihood of a default over a particular time horizon. It provides an estimate of the likelihood that a borrower will be unable to meet its debt obligations.
Projected Unit Credit MethodAn actuarial valuation method that sees each period of service as giving rise to an additional unit of benefit entitlement and measures each unit separately to build up the final obligation.
Property, Plant and Equipment (PPE)Tangible assets that:
(a) are held for use in the production or supply of goods or services, for rental to others, or for administrative purposes; and
(b) are expected to be used during more than one period.
PrudenceInclusion of a degree of caution in the exercise of judgement needed in making the estimates required under conditions of uncertainty such that assets or income are not overstated and liabilities or expenses are not understated.
RRedemptionRepayment of principal monies.
Related PartiesTwo parties where one controls the other or exercise significant influence in financial and operating decisions, directly or indirectly.
Repurchase AgreementContracts relating to securities sold to creditors (who lend money for funding purposes), with the intention of buying them back at a set price on a specified future date.
Return On Average Assets (ROAA)Profit before tax expressed as a percentage of average total assets. Used along with ROAE, as a measure of profitability and as a basis of intra industry performance comparison.

484 Bank of Ceylon | Annual Report 2018
Return On Average Equity (ROAE)Profit after tax less preferred share dividends, if any, expressed as a percentage of average ordinary shareholders’ equity.
Revenue ReservesReserves set aside for future distribution and investment.
Risk-Weighted AssetsOn-balance sheet assets and the credit equivalent of off-balance sheet assets multiplied by the relevant risk weighting factors.
SSecurities Purchased Under Resale Agreement The purchase of securities under an agreement to resell at a given price on a specific future date.
Shareholders’ EquityShareholders’ equity consists of issued and fully paid ordinary share capital plus capital and revenue reserves.
Significant InfluenceSignificant influence is the power to participate in the financial and operating policy decisions of an investee but is not controlled or jointly controlled over those policies.
SolvencyThe availability of cash over the long term to meet financial commitments as they fall due.
Subordinated DebentureThe claims of the debenture holders shall in the event of winding up, rank after all the claims of the secured and unsecured creditors and any preferential claims under any statutes, but in priority to and over claims and rights of the shareholders.
SwapsThe simultaneous purchase and sale of foreign exchange or securities, with the purchase executed at once and the sale back to the same party. Carried out on an agreed upon price to be completed at a specified future date. Swaps include interest rate swaps, currency swaps and credit swaps.
Syndicated LoanA large loan by a group of banks to a large multinational firm or government. Syndicated loans allow the participating banks to maintain diversification by not lending too much to a single borrower.
TTier 1 CapitalConsists of the sum total of paid up ordinary shares, non-cumulative, non-redeemable preference shares, share premium, statutory reserve fund, published retained profits, general and other reserves, less intangible assets and other deductions.
Tier 2 CapitalConsists of the sum total of revaluation reserves, general provisions, hybrid capital instruments and approved subordinated debentures.
Total CapitalThe sum of Tier 1 and Tier 2 capital.
UUnit TrustAn undertaking formed to invest in securities under the terms of a trust deed.
UnsecuredRepayment of the principal and interest not being secured by any specific asset.
GLOSSARY OF FINANCIAL/ BANKING TERMS
VValue at Risk (VaR)Estimated maximum loss that the Bank may incur in a given horizon at 99% confidence level.
Vostro AccountA local currency current account maintained with a bank by another bank.

485
CORPORATE OFFICES AND OVERSEAS BRANCHES
Corporate Offices
BoC Card Centre
Issuing and managing VISA and Master
branded Credit Cards. Franchising and
servicing merchants using point of
sales machines
Level - 1, West Tower,
World Trade Centre, Echelon Square,
Colombo 1, Sri Lanka.
Tel : +94 11 2325088, 2395806,
2471618, 2205620, 2205680,
2205621
Fax : +94 11 2325092, 2395807
Email : [email protected], [email protected]
Branch Code : 731
BOC Premier Centre
Dedicated Centre for Private Banking
No. 21, Sir Ernest De Silva Mawatha,
Colombo 7, Sri Lanka
Tel : +94 11 2694282 - 86
Fax : +94 11 2694280
Email : [email protected]
Branch Code : 788
Correspondent Banking Unit
Gateway to global banking and financial
relationships
9th Floor,
Bank of Ceylon Head Office,
“BOC Square”,
No. 1, Bank of Ceylon Mawatha,
Colombo 1, Sri Lanka.
Tel : +94 11 2445791
Fax : +94 11 2445791
Email : [email protected] / [email protected]/
Branch Code : 087
Credit Support Department
Issuing of local and International
Guarantees and documentation of credit
facilities
3rd Floor,
Bank of Ceylon Head Office,
“BOC Square”,
No. 1, Bank of Ceylon Mawatha,
Colombo 1, Sri Lanka.
Tel : +94 11 2541943
Fax : +94 11 2446820
Email : [email protected]
Branch Code : 660
Dealing Room
Providing money market and foreign
exchange related services
7th Floor,
Bank of Ceylon Head Office,
“BOC Square”,
No. 1, Bank of Ceylon Mawatha,
Colombo 1, Sri Lanka.
Tel : +94 11 2445785-7, 2386862
Fax : +94 11 2445788
Email : [email protected]
Branch Code 760
Electronic Banking Unit
Management of ATM Card operations,
facilitator for Internet and Mobile banking
21st Floor,
Bank of Ceylon Head Office,
“BOC Square”,
No. 1, Bank of Ceylon Mawatha,
Colombo 1, Sri Lanka.
Tel : +94 11 2204650 - 63
Fax : +94 11 2447569
Email : [email protected], [email protected]
Branch Code : 777
Ceybank Gold Shop
Supplier of precious gold to the nation
Ground Floor,
Bank of Ceylon Head Office,
“BOC Square”,
No. 1, Bank of Ceylon Mawatha,
Colombo 1, Sri Lanka.
Tel : +94 11 2345420
Fax : +94 11 2345420
Email : [email protected]
Branch Code : 087
Inward Remittances Department
Facilitator in processing inward
remittances to Sri Lanka
8th Floor,
Bank of Ceylon Head Office,
“BOC Square”,
No. 1, Bank of Ceylon Mawatha,
Colombo 1, Sri Lanka.
Tel : +94 11 2445792, 2541933
Fax : +94 11 2344845
Email : [email protected]
Branch Code : 087
Islamic Banking Unit
Brand house for all Islamic Banking
products and services
25th Floor,
Bank of Ceylon Head Office,
“BOC Square”,
No. 1, Bank of Ceylon Mawatha,
Colombo 1, Sri Lanka.
Tel : +94 11 2205030
Fax : +94 11 2205036
Email : [email protected]
Branch Code : 776

486 Bank of Ceylon | Annual Report 2018
CORPORATE OFFICES AND OVERSEAS BRANCHES
Primary Dealer Unit
Buying and selling of Government
Securities
7th Floor,
Bank of Ceylon Head Office,
“BOC Square”,
No. 1, Bank of Ceylon Mawatha,
Colombo 1, Sri Lanka.
Tel : +94 11 2448830, 2203607
Fax : +94 11 2448207
Email : [email protected]
Branch Code : 760
Trade Promotion Department
Service provider for migrant employee
community
7th Floor,
Bank of Ceylon Head Office,
“BOC Square”,
No. 1, Bank of Ceylon Mawatha,
Colombo 1, Sri Lanka.
Tel : +94 11 2447831, 2203626
Fax : +94 11 2346841
Email : [email protected]
Branch Code : 087
Trade Services DepartmentProviding trade finance facilities and
services
2nd Floor,
Bank of Ceylon Head Office,
“BOC Square”,
No. 1, Bank of Ceylon Mawatha,
Colombo 1, Sri Lanka.
Tel : +94 11 2394310, 2203310
Fax : +94 11 2542170
Email : [email protected]
Branch Code : 660
Overseas Branches
Malé Branch
“Aage” 12, Boduthakurufaana Magu,
Henveiru, Male. 20094,
Republic of Maldives.
Tel : +960 3323045, 3314764
Email : [email protected]
SWIFT code : BCEYMVMV
Branch code : 632
Chennai Branch
No. 20/21, Casa Major Road,
New No. 2 (Old No. 11), Zerat Garden,
2 Lane, Egmore, Chennai 600 008,
India
Tel : +91 44 2819 0972,
3951 9913
Email : [email protected]
SWIFT code : BCEYIN5M
Branch code : 758
Seychelles Branch
Oliaji Trade Center, Fransis Rachel Street,
P.O. Bocx 1599, Victoria, Mahe,
Republic of Seychelles.
Tel : +248 461 1880, 461 1889
Email : [email protected]
SWIFT code : BCEYSCSC
Branch code : 807

487
CORPORATE INFORMATION
Name of the Institution
Bank of Ceylon
Legal Form
A banking corporation domiciled in Sri Lanka, duly incorporated on 1 August 1939 under the Bank of Ceylon Ordinance No. 53 of 1938.
A licensed commercial bank established under the Banking Act No. 30 of 1988.
Registered Office
No. 01, ‘BOC Square’,Bank of Ceylon Mawatha,Colombo 01, Sri Lanka.
Tel : +94 11 2203333 (Hotline)
+94 11 2446790-811 (22 lines)
+94 11 2338741-47 (7 lines)
+94 11 2445815-20 (6 lines)
+94 11 2544340-44 (5 lines)
+94 11 2544333-37 (5 lines)
Facsimile : +94 11 2321160
Bank : 7010
SWIFT Code : BCEYLKLX
E-Mail : [email protected], [email protected] : www.boc.lk
Call Centre
Tel : +94 11 2204444Facsimile : +94 11 2320864
24 Hour Service Centre
Travel Counter, Ground Floor,Bank of Ceylon Head Office,No. 01, ‘BOC Square’, Bank of Ceylon Mawatha, Colombo 01, Sri Lanka
Tel : +94 11 2203044/45
Facsimile : +94 11 2445801
Accounting Year End
31 December
Tax Payer Identification Number (TIN)
409000070
VAT Registration Number
409000070-7000
SVAT Registration Number
SVAT002898
Stock Exchange Listing
The Unsecured, Subordinated Redeemable Debentures of October 2013/ October 2023
series, September 2014/ September 2022 series, October 2015/ October 2023 series and December 2016/ December 2024 series with fixed and floating interest rates are listed on Colombo Stock Exchange.
Local Ratings
• National Long-term rating: ‘AA+(lka)’ Outlook Stable
• Subordinated debentures: ‘AA(lka)’ by Fitch Ratings Lanka Limited
• Issuer rating: (SL) AAA Stable by ICRA Lanka Limited
Global Ratings
‘B’ stable by Fitch Ratings and ‘B2’ stable by Moody’s Investors Service
Lawyers
Ms Gaya Jayasinghe
Chief Legal Officer of Bank of Ceylon and her assistants
Tel : +94 11 2445813 +94 11 2321167E-mail : [email protected]
Compliance Officer
Mr A De S Pinnaduwage(Assistant General Manager – Compliance)
Tel : +94 11 2448532Facsimile : +94 11 2544306E-mail : [email protected]
Auditor
The Auditor General,The Auditor General’s Department, 306/72, Polduwa Road,Battaramulla, Sri Lanka
Tel : +94 11 2887028-34 (6 lines)Facsimile : +94 11 2887223E-mail : [email protected]
(Appointed in terms of the provisions of Article 154 of the Constitution of the Democratic Socialist Republic of Sri Lanka)
Registrars to the Debenture Issues
Bank of CeylonInvestment Banking Division,
7th Floor, Bank of Ceylon Head Office,No. 01, ‘BOC Square’, Bank of Ceylon Mawatha, Colombo 01, Sri Lanka
Tel : +94 11 2448348 +94 11 2440081 +94 11 2346845Facsimile : +94 11 2346842
E-mail : [email protected]
Board of Directors
Mr Ronald C Perera PC (Chairman)Mr K A VimalenthirarajahMr Kumar MayadunneMr P A Schaffter
Secretary, Bank of Ceylon/ Secretary to the Board
Ms. Janaki Senanayake Siriwardane
For Clarifications on the Report, Please Contact
Mr R M D Vipula Jayabahu Deputy General Manager(Finance and Planning),
10th Floor, Bank of Ceylon Head Office, No. 01, ‘BOC Square’,Bank of Ceylon Mawatha,Colombo 01, Sri Lanka
Tel : +94 11 2432680 +94 11 2203900Facsimile : +94 11 2448203E-Mail : [email protected]
Audit CommitteeMr Kumar Mayadunne (Chairman) Mr K A Vimalenthirarajah
Mr P A Schaffter
Human Resources and Remuneration Committee
Mr K A Vimalenthirarajah (Chairman) Mr Kumar Mayadunne
Mr P A Schaffter
Nomination and Corporate Governance Committee
Mr Ronald C Perera PC (Chairman)Mr K A VimalenthirarajahMr P A Schaffter
Integrated Risk Management Committee
Mr Kumar Mayadunne (Chairman) Mr K A Vimalenthirarajah Mr P A Schaffter
Information and Communication Technology Committee
Mr P A Schaffter (Chairman)Mr Kumar Mayadunne Mr K A Vimalenthirarajah

NOTES

Our VisionTo be the Nation’s preferred bank with a strong global presence providing customer centric innovative �nancial solutions.
Our MissionTo provide highly ef�cient, customer focused, technologically sophisticated, resilient and innovative �nancial services to the Nation with global access, empowering employees and enhancing value to the stakeholders.
Corporate Value Statement
In achieving our vision to be the Nation’s preferred bank, with a strong global presence, providing customer centric innovative �nancial solutions, we are committed to upholding our core �ve values as follows:
• Being customer centric
• Respecting all forms of diversity
• Committing towards high level of ethics, governance and professionalism
• Focusing towards agility and innovation
• Being accountable for all our actions
Bankers to the Nation

Bank of Ceylon,No. 01, BOC Square,Bank of Ceylon Mawatha,Colombo 01Sri Lanka