
BMP Accounting and Tracking Tool (BATT version 2.1)
52
BMP Accounting and Tracking Tool (BATT version 2.1) User’s Guide Prepared for: The United States Environmental Protection Agency – Region 1 5 Post Office Square Boston, MA 02109 Prepared by: Tetra Tech, Inc. 10306 Eaton Place Fairfax, VA 22030 Version 1: June 28, 2016 Updated by: Paradigm Environmental, Inc. 3911 Old Lee Highway, Suite 41-E Fairfax, VA 22030 Version 2.1: June 30, 2021
-
Upload
khangminh22 -
Category
Documents
-
view
4 -
download
0
Transcript of BMP Accounting and Tracking Tool (BATT version 2.1)
BMP Accounting and Tracking Tool (BATT version 2.1)
User’s Guide
Prepared for: The United States Environmental Protection Agency – Region 1 5 Post Office Square Boston, MA 02109
Prepared by: Tetra Tech, Inc. 10306 Eaton Place Fairfax, VA 22030 Version 1: June 28, 2016
Updated by: Paradigm Environmental, Inc. 3911 Old Lee Highway, Suite 41-E Fairfax, VA 22030 Version 2.1: June 30, 2021
2
Table of Contents
1. Introduction .......................................................................................... 5
2. Getting Started ...................................................................................... 6
2.1 Software Requirement ................................................................................ 6 2.2 Introduction to BMP Accounting and Tracking Tool ................................. 9
3. Add/Edit Project (Manual Input) ........................................................ 10
3.1 New Project ............................................................................................... 12 3.1.1 Add BMP (Structural) ............................................................................... 14 3.1.2 Add BMP (Non-Structural)....................................................................... 20 3.1.3 Add Land Use Conversion ........................................................................ 26
3.2 Edit/Delete Existing Project ...................................................................... 30
4. Import/Export Project (CSV Format) ................................................. 31
5. View/Export Project (Summary Report) ............................................ 37
6. Saving Your Work .............................................................................. 37
7. Applying the BATT for Other Climate Region ................................. 38
7.1 Updating Land Use Loading Rates ........................................................... 38 7.2 Updating BMP Performance Curves ........................................................ 38
8. Appendix A: Design Storage Volume Calculations ........................... 40
9. Appendix B: Project Summary Report ............................................... 43
10. Appendix C: The BATT Pilot Users Comments and Responses ....... 45
3
Figures Figure 1. Trust Center window for Macro Settings ............................................................ 7 Figure 2. Trust Center window for ActiveX Settings ......................................................... 7
Figure 3. Security Warning for Enabling Macros in BATT ............................................... 8 Figure 4. Activate Reference Libraries in BATT ............................................................... 8 Figure 5. BATT Home form ............................................................................................. 10 Figure 6. Add/Edit Project form ....................................................................................... 11 Figure 7. Lookup Table tab of the BATT spreadsheet. .................................................... 12
Figure 8. Add Structural BMP – Land Use Information .................................................. 15 Figure 9. Default (left) and example edited (right) Receiving Water column in Lookup
Table tab of BATT spreadsheet. ....................................................................................... 15 Figure 10. Edit Loading Rates (example – High Density Residential (I) land use type) . 16
Figure 11. Add Structural BMP – BMP Information ....................................................... 17 Figure 12. Calculate Storage Capacity (example – Infiltration Basin) ............................. 18
Figure 13. Edit BMP Efficiencies (example – Infiltration Basin) .................................... 19 Figure 14. Calculate Credit (example – Structural BMP project) .................................... 20
Figure 15. Property Information tab for structural BMPs ................................................. 20 Figure 16. Add Non-Structural BMP – Land Use Information ........................................ 21 Figure 17. Edit Loading Rates (example – Commercial (I) land use type) ...................... 22
Figure 18. Add Non-Structural BMP – BMP Information ............................................... 22 Figure 19. Edit BMP Efficiencies (example – Enhanced Sweeping Program, Vacuum
Assisted, and Weekly) ...................................................................................................... 25 Figure 20. Calculate Credit (example – Non-Structural BMP project) ............................ 25 Figure 21. Owner Information tab for non-structural BMPs ............................................ 26
Figure 22. Add Land Use Conversion – Land Use Condition Before .............................. 27 Figure 23. Edit Loading Rates (example – Forest (P) land use type) ............................... 28
Figure 24. Add Land Use Conversion – Land Use Condition After ................................ 28 Figure 25. Calculate Credit (example – Land Use Change project) ................................. 29
Figure 26. Property Information tab for Land Use Conversion ........................................ 30 Figure 27. Edit/Delete Existing Project ............................................................................ 30 Figure 28. Import/Export Project form ............................................................................. 31
Figure 29. BATT View Project Summary form ............................................................... 37 Figure 30. Land Loading Rates tab of the BATT spreadsheet ......................................... 38 Figure 31. Import Performance Curve Data tab of the BATT spreadsheet ...................... 39
4
Tables Table 1. Crosswalk of MassGIS land use categories to land use groups in the BATT .... 13 Table 2. Land Use types in BATT .................................................................................... 14
Table 3. Hydrologic Soil Group (HSG) options in BATT................................................ 14 Table 4. Structural BMP types in BATT .......................................................................... 18 Table 5. Default infiltration rates for Infiltration Trench and Infiltration Basin in BATT18 Table 6. Non-Structural BMP types in BATT .................................................................. 23 Table 7. Release Rate for Impervious Area Disconnection Through Storage BMP ........ 23
Table 8. Sweeper Technology for Enhanced Sweeping Program .................................... 23 Table 9. Sweeper Frequency for Enhanced Sweeping Program ...................................... 23 Table 10. Structural BMP Project Information ................................................................. 32 Table 11. Non-Structural BMP Project Information......................................................... 33
Table 12. Land Use Conversion Project Information ....................................................... 35
5
1. Introduction The BMP Accounting and Tracking Tool (BATT) of USEPA Region 1 is a spreadsheet-based tool that provides accounting, tracking, and reporting for nutrient load reduction. The BATT uses Microsoft-Excel platforms and is intended to standardize accounting and tracking of a variety of BMP types and their associated nutrient load reductions. The purpose of this tool is to provide permittees and watershed managers means to account for and track over time the nutrient load reductions (total phosphorus (TP) and total nitrogen (TN)) associated with implementing SW and NPS controls, and to track net increases or decreases in nutrient loading associated with changes in land uses within the area of interest (an MS4 area, specific watershed, etc.). This updated version includes functionality for processing and reporting on private property (local or Residual Designation permitting) as well as retains the functionality for municipal accounting. In addition, the tool allows for aggregate, summary reporting (e.g., overall phosphorus reductions) for compliance with MS4 permit requirements for communities by major watershed. Default land use loading rates and SW control credits are consistent with EPA Region 1 issued MS4 (and other stormwater) permits and outputs from this tool can facilitate reporting requirements for those permit holders. The tool provides three primary functions:
• Accounting and Tracking of BMP Implementation - documents nutrient controls implemented and their associated estimated nutrient load reductions for tracking the progress of watershed-based implementation programs, and for demonstrating compliance with permits (e.g., MS4) and/or TMDL nutrient reduction requirements. This portion of the tool includes stormwater and NPS control accounting;
• Accounting and Tracking Changes in Land Use - documents the changes in development and impervious cover within a permitted area or watershed to track net changes more accurately in nutrient loading within an area, recognizing that development or redevelopment may significantly change nutrient loading from a given land area, regardless of nutrient controls being implemented; and
• Reporting - generates reports of accomplished implementation activities and associated nutrient load reductions to document the progress of watershed implementation programs and to assist users in satisfying permit reporting requirements and demonstrating compliance with associated permits and/or TMDL nutrient reduction requirements.
Land Use and HSG Info
MassGIS web portal has the land cover layer with impervious footprints that can be used to track the changes in impervious cover by comparing the land cover layers from two different time periods.
6
Three communities in Massachusetts (Town of Lexington, Town of Medway, and Town of Watertown) piloted the draft version of the updated BATT spreadsheet for tracking and accounting of their existing stormwater controls to control phosphorus. Technical support including demonstrating the tools, inputting data, and answering questions on how to properly use the tool for different stormwater control measures (structural, non-structural, land use change projects) was provided to the pilot users. Appendix C presents the comments received, the responses, and updates made to the BATT.
2. Getting Started
2.1 Software Requirement
The minimum software requirements for BATT are as follows:
• Microsoft Excel 2016 (64-bit)
• Microsoft Word 2016 (64-bit)
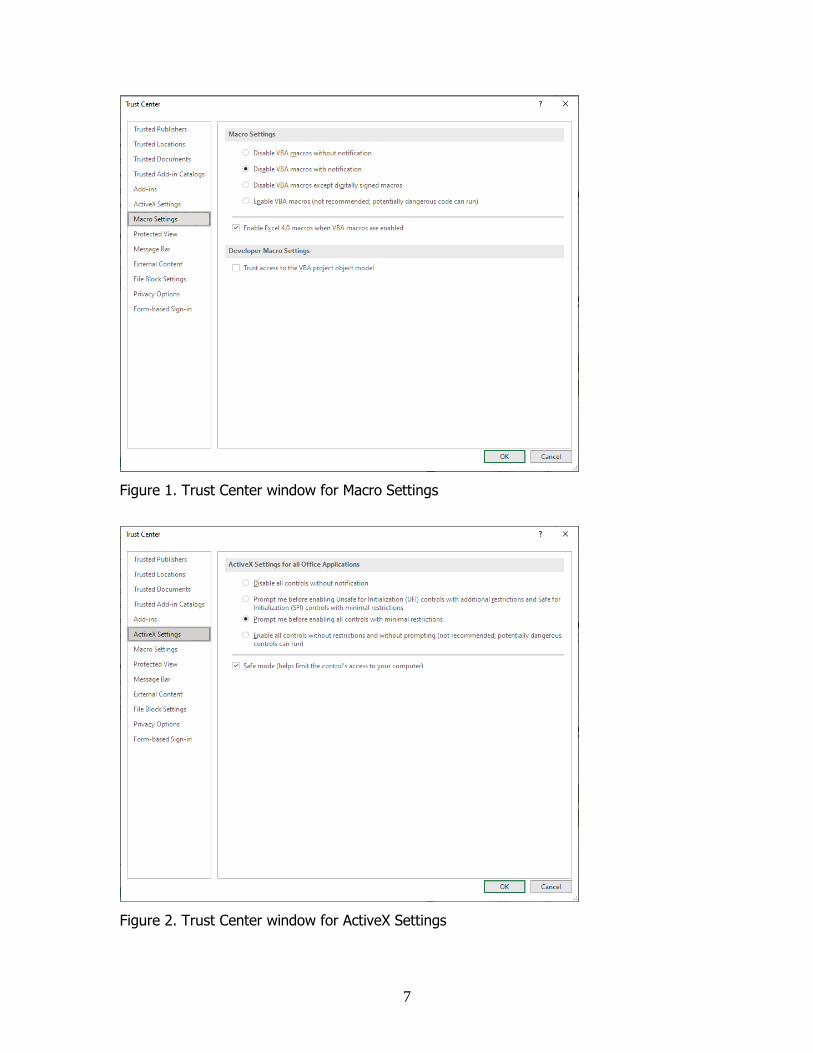
Enable security settings under ‘Trust Center Settings’ as shown in Figure 1 and Figure 2. Those options will prompt a security warning (Figure 3) while opening the BATT spreadsheet and the user must enable macros by clicking on Enable Content to use the BATT spreadsheet. The macros will be enabled only for the current workbook for which the user has accepted the security warning
• Macro Settings (Disable VBA macros with notification)
• ActiveX Settings (Prompt me before enabling all controls with minimal restrictions)
Activate these libraries under the ‘References - VBA Project’ window (Figure 4)
• Microsoft Word 16.0 Object Library
• Microsoft Excel 16.0 Object Library
• Microsoft Office 16.0 Object Library
• Microsoft Forms 2.0 Object Library
Enable Macros in Microsoft Excel 2016 (64-bit) Click the File Button and go to Options. On the left-hand menu select Trust Center and click the button for Trust Center Settings. On the left-hand menu select Macro Settings and ActiveX Settings. Select the options shown in Figure 1 and Figure 2.
Enabling macros with these options will prompt user with a security warning that Macros has been disabled and user must click on Enable content to activate them (see Figure 3).
7
Figure 1. Trust Center window for Macro Settings
Figure 2. Trust Center window for ActiveX Settings

8
Figure 3. Security Warning for Enabling Macros in BATT
Figure 4. Activate Reference Libraries in BATT

9
Activate MS Word 16.0 Object Library
Microsoft Excel 2016 (64-bit) Activate the Visual Basic Editor window (Press Alt + F11) within Excel spreadsheet. Select the current project in the Project Explorer window and choose Tools | References. In the References dialog box, choose the MS Word 16.0 Object Library in the Available References box by clicking the checkbox next to this object library (Figure 4). Click OK to close the Reference dialog box.
2.2 Introduction to BMP Accounting and Tracking Tool
The BATT is launched from the ‘Launch BATT’ button on the Introduction screen that appears when the model spreadsheet is first opened. Figure 5 shows the Home form that appears once BATT has launched. The Home form offers the option to either add/edit project, import/export project, or view/export project summary report. Within BATT, a project is defined as a structural or non-structural BMP or a land use change. The add/edit project function provides the option to create a new project or edit a previously saved project, see Section 3. The import/export project function provides the option to browse for a comma-separated values (CSV) file and then either import or export a project at the municipality level, see Section 4. The view/export project function lists the unique, user-supplied project identifier of each BMP project and summarizes phosphorus, nitrogen, and sediment total load reduction, see Section 5.
MS Excel Locked While Using the BATT Upon initializing BATT, Microsoft Excel files will become locked, this includes files that are already opened as well as instances of Excel opened after launching BATT. Microsoft Word will remain unlocked. To access data while BATT is open, move data to a word document.

10
Figure 5. BATT Home form
3. Add/Edit Project (Manual Input)
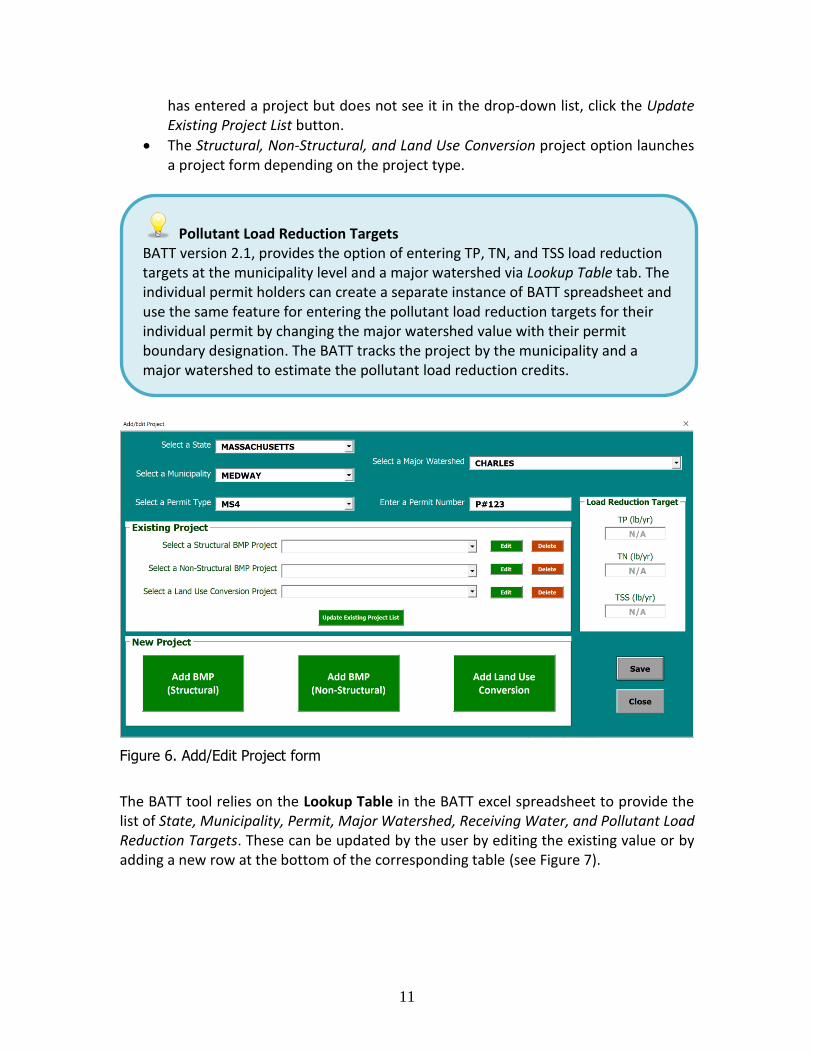
The add/edit project function provides the option to create a new project or edit a previously saved project. A project is defined as an individual structural BMP, non-structural BMP, or land use conversion project (see Figure 6).
This section outlines the process of editing or removing existing projects and adding a new project. The user is required to select a state, municipality, major watershed, and permit type before proceeding to edit or delete an existing project, or create a new project.
• The Municipality option box is populated based on the selected State.
• The Major Watershed option box is populated based on the selected Municipality.
• The Permit option box provides the ability for a user to enter their EPA Permit number if the tool is being used to track permit compliance. In addition, this can be used by private property owners that have a local or EPA issued permit number.
• The Load Reduction Targets for TP, TN, and TSS can only be added via the Lookup Table Tab in the BATT excel spreadsheet (see, Figure 7).
• The Edit option launches a project form containing the BMP project and land use information.
• The Delete option removes the selected project from the project database.
• The Update Existing Project List updates the structural, non-structural, and land use conversion project list after a project is edited, deleted, or added. If the user
11
has entered a project but does not see it in the drop-down list, click the Update Existing Project List button.
• The Structural, Non-Structural, and Land Use Conversion project option launches a project form depending on the project type.
Pollutant Load Reduction Targets BATT version 2.1, provides the option of entering TP, TN, and TSS load reduction targets at the municipality level and a major watershed via Lookup Table tab. The individual permit holders can create a separate instance of BATT spreadsheet and use the same feature for entering the pollutant load reduction targets for their individual permit by changing the major watershed value with their permit boundary designation. The BATT tracks the project by the municipality and a major watershed to estimate the pollutant load reduction credits.
Figure 6. Add/Edit Project form
The BATT tool relies on the Lookup Table in the BATT excel spreadsheet to provide the list of State, Municipality, Permit, Major Watershed, Receiving Water, and Pollutant Load Reduction Targets. These can be updated by the user by editing the existing value or by adding a new row at the bottom of the corresponding table (see Figure 7).
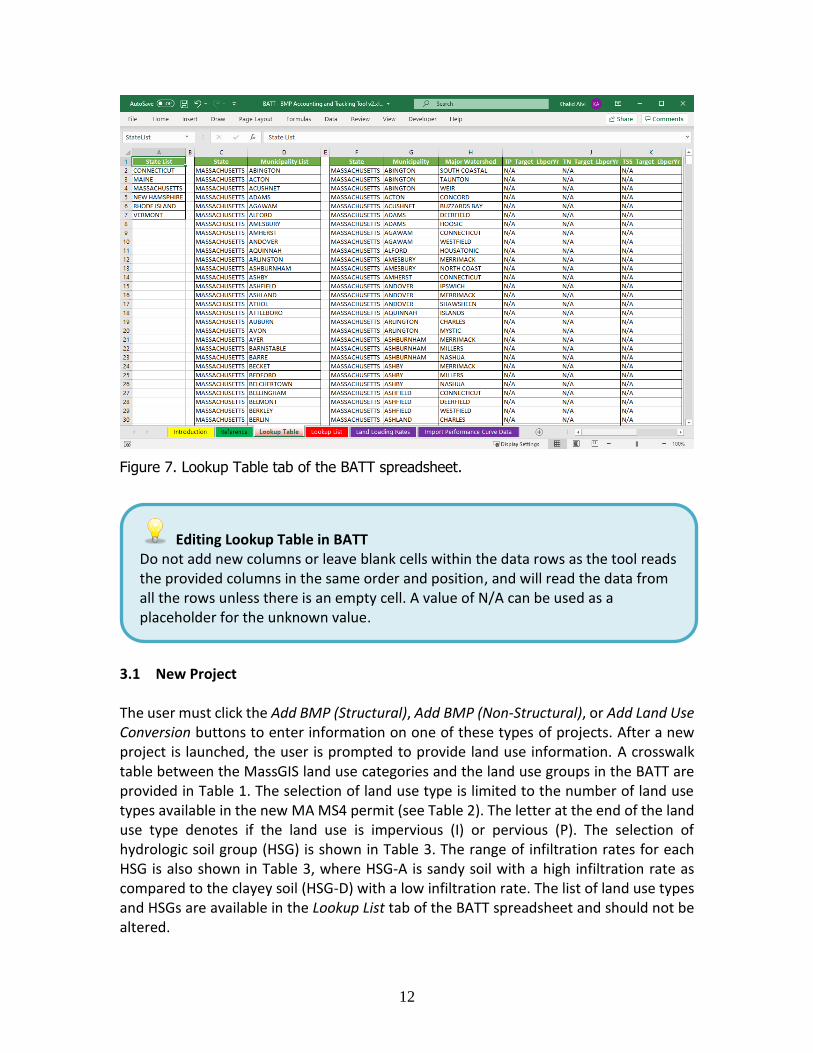
12
Figure 7. Lookup Table tab of the BATT spreadsheet.
Editing Lookup Table in BATT Do not add new columns or leave blank cells within the data rows as the tool reads the provided columns in the same order and position, and will read the data from all the rows unless there is an empty cell. A value of N/A can be used as a placeholder for the unknown value.
3.1 New Project
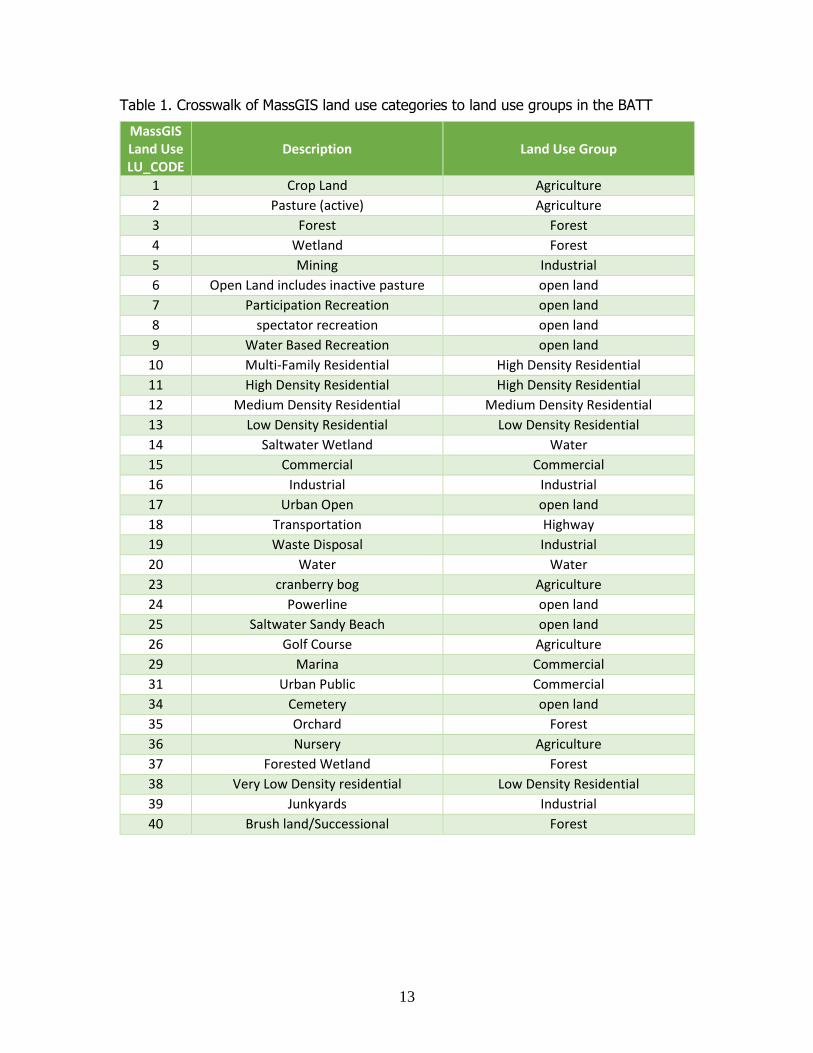
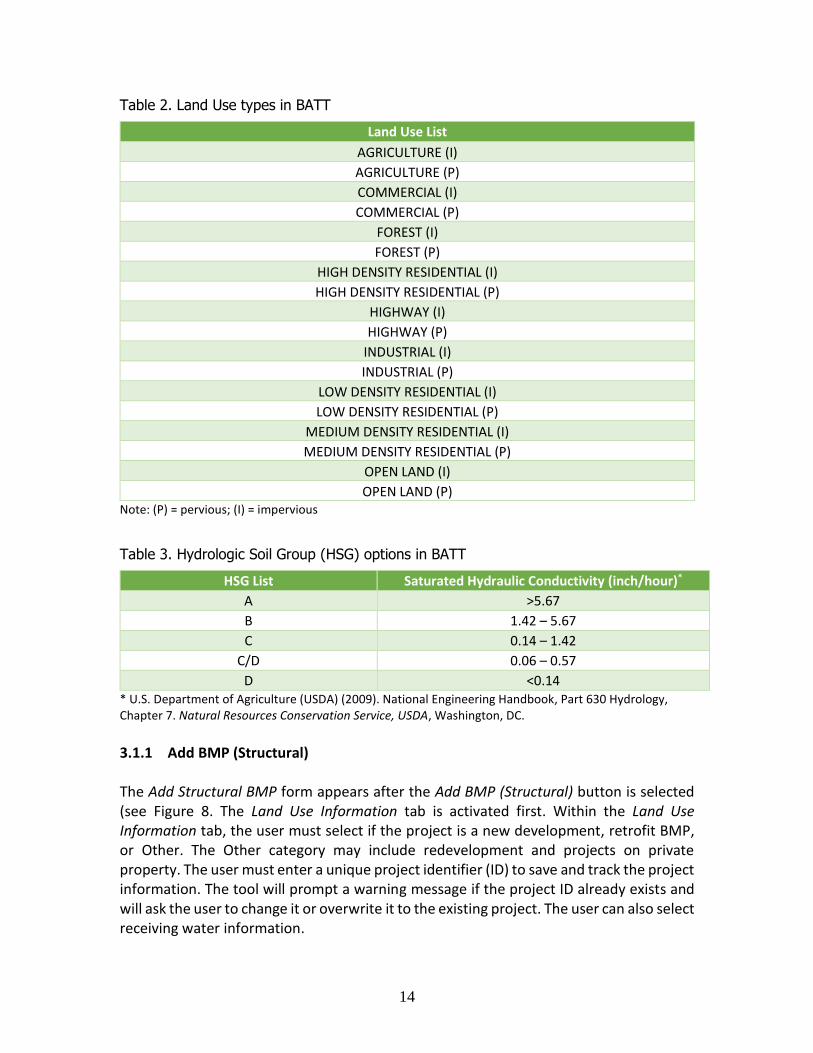
The user must click the Add BMP (Structural), Add BMP (Non-Structural), or Add Land Use Conversion buttons to enter information on one of these types of projects. After a new project is launched, the user is prompted to provide land use information. A crosswalk table between the MassGIS land use categories and the land use groups in the BATT are provided in Table 1. The selection of land use type is limited to the number of land use types available in the new MA MS4 permit (see Table 2). The letter at the end of the land use type denotes if the land use is impervious (I) or pervious (P). The selection of hydrologic soil group (HSG) is shown in Table 3. The range of infiltration rates for each HSG is also shown in Table 3, where HSG-A is sandy soil with a high infiltration rate as compared to the clayey soil (HSG-D) with a low infiltration rate. The list of land use types and HSGs are available in the Lookup List tab of the BATT spreadsheet and should not be altered.
13
Table 1. Crosswalk of MassGIS land use categories to land use groups in the BATT
MassGIS Land Use LU_CODE
Description Land Use Group
1 Crop Land Agriculture
2 Pasture (active) Agriculture
3 Forest Forest
4 Wetland Forest
5 Mining Industrial
6 Open Land includes inactive pasture open land
7 Participation Recreation open land
8 spectator recreation open land
9 Water Based Recreation open land
10 Multi-Family Residential High Density Residential
11 High Density Residential High Density Residential
12 Medium Density Residential Medium Density Residential
13 Low Density Residential Low Density Residential
14 Saltwater Wetland Water
15 Commercial Commercial
16 Industrial Industrial
17 Urban Open open land
18 Transportation Highway
19 Waste Disposal Industrial
20 Water Water
23 cranberry bog Agriculture
24 Powerline open land
25 Saltwater Sandy Beach open land
26 Golf Course Agriculture
29 Marina Commercial
31 Urban Public Commercial
34 Cemetery open land
35 Orchard Forest
36 Nursery Agriculture
37 Forested Wetland Forest
38 Very Low Density residential Low Density Residential
39 Junkyards Industrial
40 Brush land/Successional Forest
14
Table 2. Land Use types in BATT
Land Use List
AGRICULTURE (I)
AGRICULTURE (P)
COMMERCIAL (I)
COMMERCIAL (P)
FOREST (I)
FOREST (P)
HIGH DENSITY RESIDENTIAL (I)
HIGH DENSITY RESIDENTIAL (P)
HIGHWAY (I)
HIGHWAY (P)
INDUSTRIAL (I)
INDUSTRIAL (P)
LOW DENSITY RESIDENTIAL (I)
LOW DENSITY RESIDENTIAL (P)
MEDIUM DENSITY RESIDENTIAL (I)
MEDIUM DENSITY RESIDENTIAL (P)
OPEN LAND (I)
OPEN LAND (P) Note: (P) = pervious; (I) = impervious
Table 3. Hydrologic Soil Group (HSG) options in BATT
HSG List Saturated Hydraulic Conductivity (inch/hour)*
A >5.67
B 1.42 – 5.67
C 0.14 – 1.42
C/D 0.06 – 0.57
D <0.14 * U.S. Department of Agriculture (USDA) (2009). National Engineering Handbook, Part 630 Hydrology, Chapter 7. Natural Resources Conservation Service, USDA, Washington, DC.
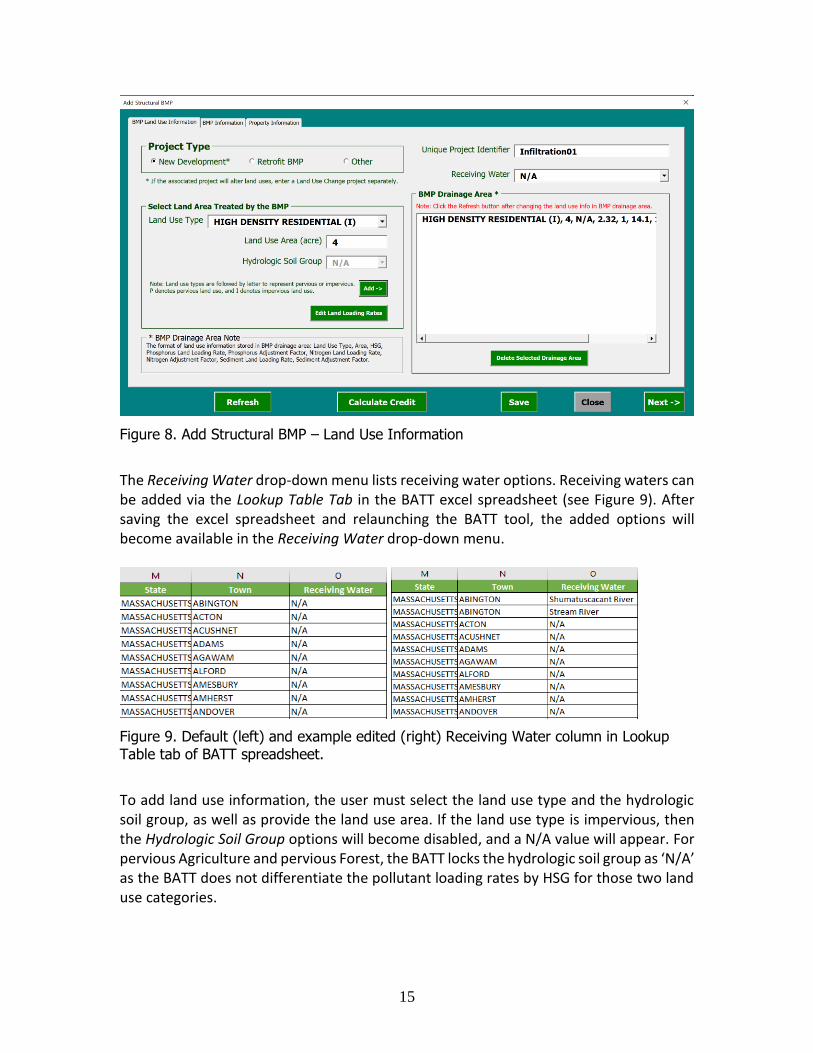
3.1.1 Add BMP (Structural)
The Add Structural BMP form appears after the Add BMP (Structural) button is selected (see Figure 8. The Land Use Information tab is activated first. Within the Land Use Information tab, the user must select if the project is a new development, retrofit BMP, or Other. The Other category may include redevelopment and projects on private property. The user must enter a unique project identifier (ID) to save and track the project information. The tool will prompt a warning message if the project ID already exists and will ask the user to change it or overwrite it to the existing project. The user can also select receiving water information.
15
Figure 8. Add Structural BMP – Land Use Information
The Receiving Water drop-down menu lists receiving water options. Receiving waters can be added via the Lookup Table Tab in the BATT excel spreadsheet (see Figure 9). After saving the excel spreadsheet and relaunching the BATT tool, the added options will become available in the Receiving Water drop-down menu.
Figure 9. Default (left) and example edited (right) Receiving Water column in Lookup Table tab of BATT spreadsheet.
To add land use information, the user must select the land use type and the hydrologic soil group, as well as provide the land use area. If the land use type is impervious, then the Hydrologic Soil Group options will become disabled, and a N/A value will appear. For pervious Agriculture and pervious Forest, the BATT locks the hydrologic soil group as ‘N/A’ as the BATT does not differentiate the pollutant loading rates by HSG for those two land use categories.
16
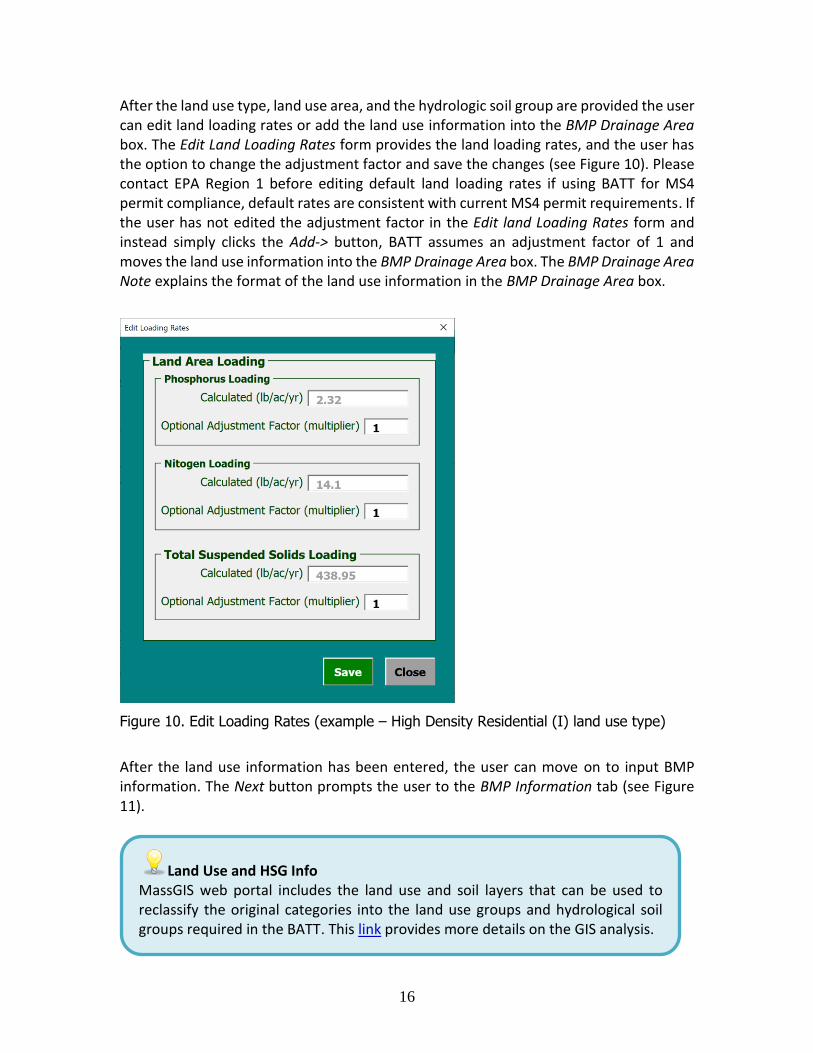
After the land use type, land use area, and the hydrologic soil group are provided the user can edit land loading rates or add the land use information into the BMP Drainage Area box. The Edit Land Loading Rates form provides the land loading rates, and the user has the option to change the adjustment factor and save the changes (see Figure 10). Please contact EPA Region 1 before editing default land loading rates if using BATT for MS4 permit compliance, default rates are consistent with current MS4 permit requirements. If the user has not edited the adjustment factor in the Edit land Loading Rates form and instead simply clicks the Add-> button, BATT assumes an adjustment factor of 1 and moves the land use information into the BMP Drainage Area box. The BMP Drainage Area Note explains the format of the land use information in the BMP Drainage Area box.
Figure 10. Edit Loading Rates (example – High Density Residential (I) land use type)
After the land use information has been entered, the user can move on to input BMP information. The Next button prompts the user to the BMP Information tab (see Figure 11).
Land Use and HSG Info MassGIS web portal includes the land use and soil layers that can be used to reclassify the original categories into the land use groups and hydrological soil groups required in the BATT. This link provides more details on the GIS analysis.
17
.
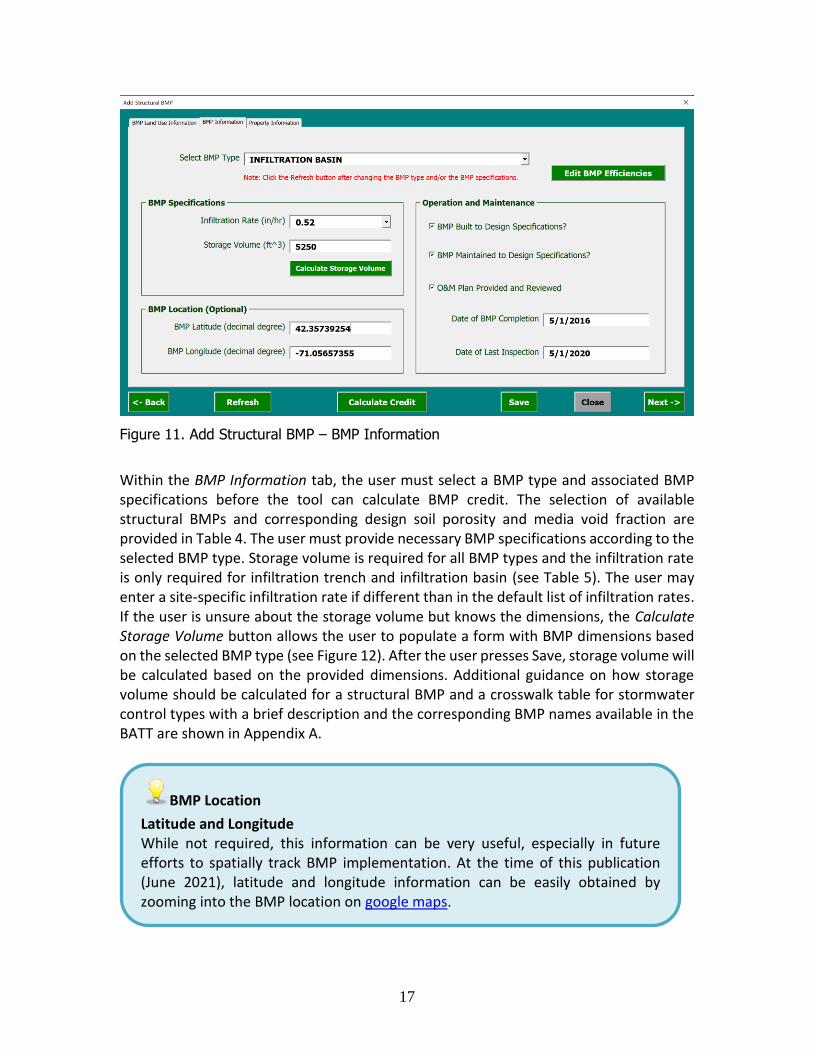
Figure 11. Add Structural BMP – BMP Information
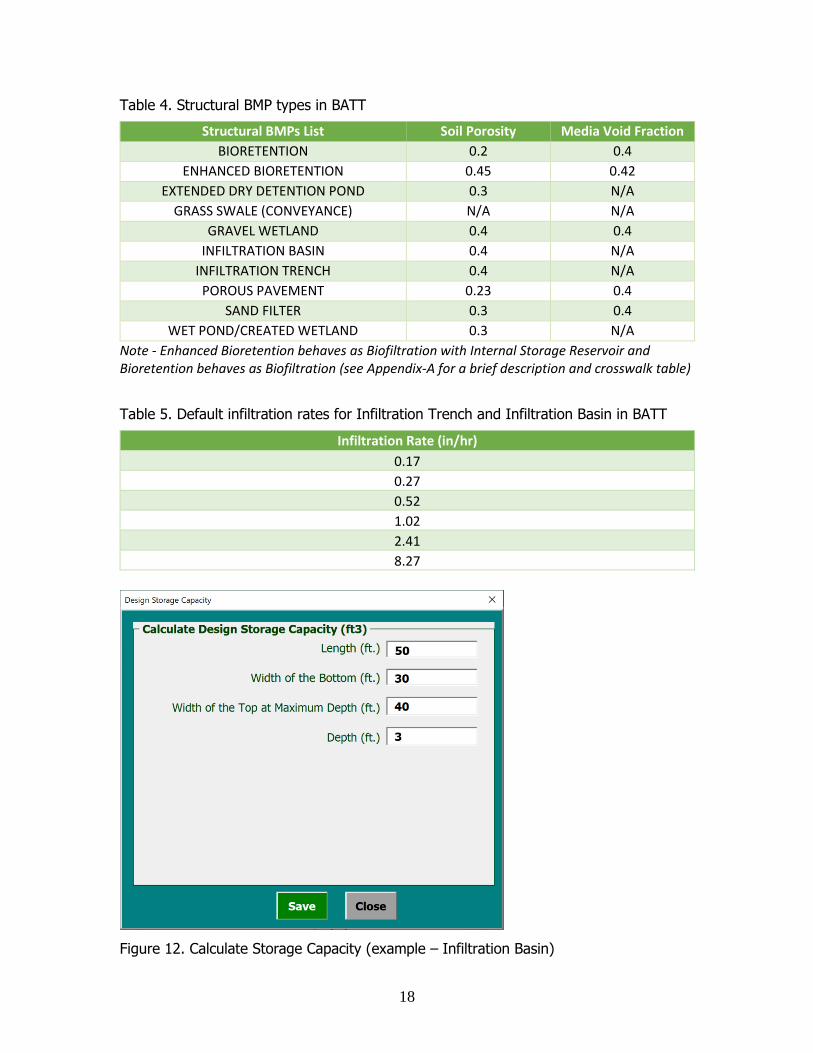
Within the BMP Information tab, the user must select a BMP type and associated BMP specifications before the tool can calculate BMP credit. The selection of available structural BMPs and corresponding design soil porosity and media void fraction are provided in Table 4. The user must provide necessary BMP specifications according to the selected BMP type. Storage volume is required for all BMP types and the infiltration rate is only required for infiltration trench and infiltration basin (see Table 5). The user may enter a site-specific infiltration rate if different than in the default list of infiltration rates. If the user is unsure about the storage volume but knows the dimensions, the Calculate Storage Volume button allows the user to populate a form with BMP dimensions based on the selected BMP type (see Figure 12). After the user presses Save, storage volume will be calculated based on the provided dimensions. Additional guidance on how storage volume should be calculated for a structural BMP and a crosswalk table for stormwater control types with a brief description and the corresponding BMP names available in the BATT are shown in Appendix A.
BMP Location
Latitude and Longitude While not required, this information can be very useful, especially in future efforts to spatially track BMP implementation. At the time of this publication (June 2021), latitude and longitude information can be easily obtained by zooming into the BMP location on google maps
18
Table 4. Structural BMP types in BATT
Structural BMPs List Soil Porosity Media Void Fraction
BIORETENTION 0.2 0.4
ENHANCED BIORETENTION 0.45 0.42
EXTENDED DRY DETENTION POND 0.3 N/A
GRASS SWALE (CONVEYANCE) N/A N/A
GRAVEL WETLAND 0.4 0.4
INFILTRATION BASIN 0.4 N/A
INFILTRATION TRENCH 0.4 N/A
POROUS PAVEMENT 0.23 0.4
SAND FILTER 0.3 0.4
WET POND/CREATED WETLAND 0.3 N/A
Note - Enhanced Bioretention behaves as Biofiltration with Internal Storage Reservoir and Bioretention behaves as Biofiltration (see Appendix-A for a brief description and crosswalk table)
Table 5. Default infiltration rates for Infiltration Trench and Infiltration Basin in BATT
Infiltration Rate (in/hr)
0.17
0.27
0.52
1.02
2.41
8.27
Figure 12. Calculate Storage Capacity (example – Infiltration Basin)
19
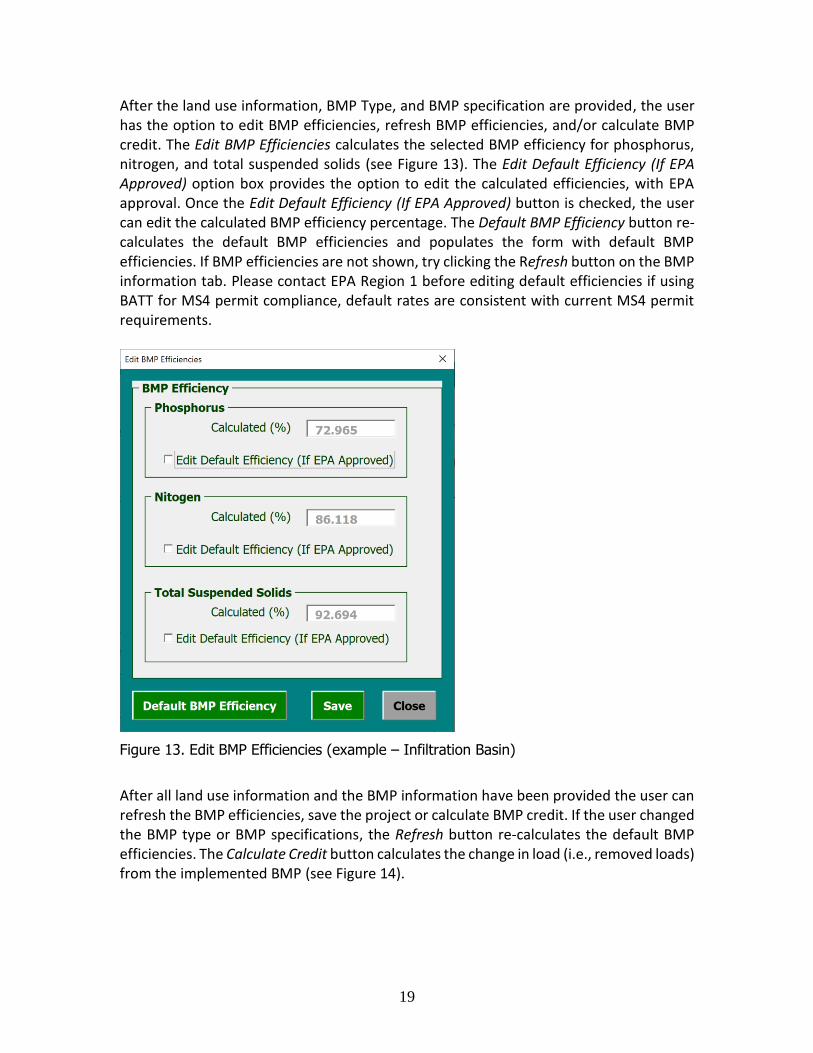
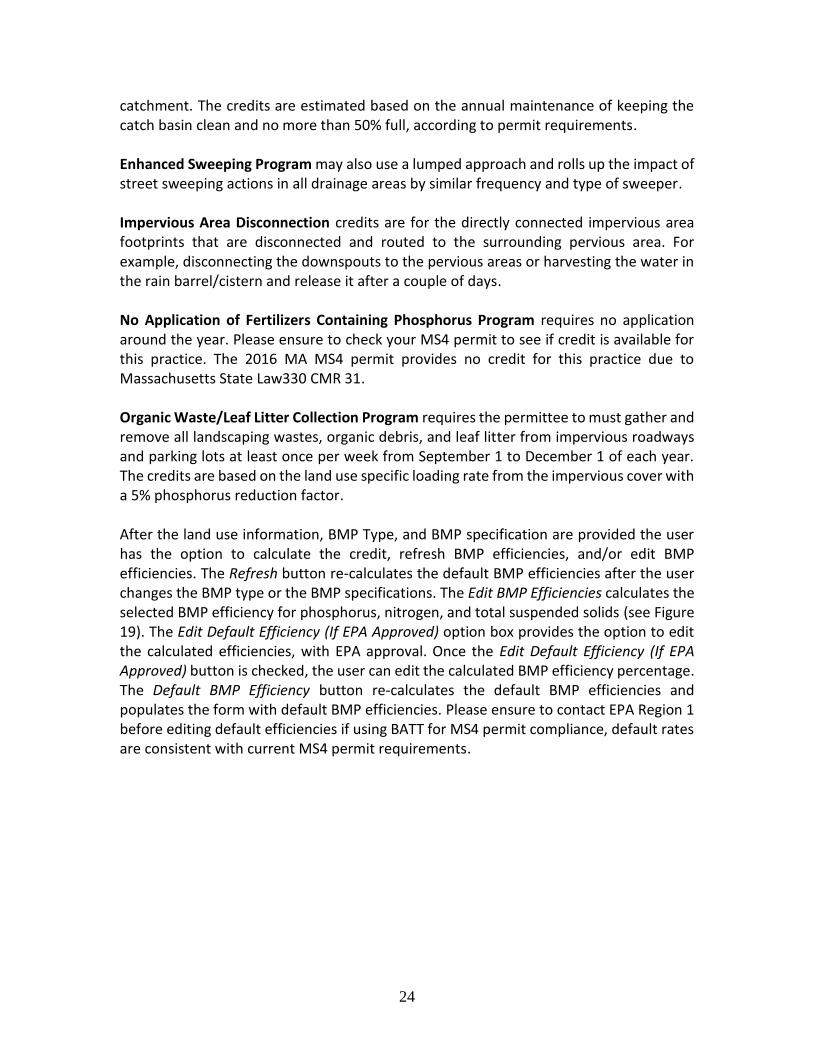
After the land use information, BMP Type, and BMP specification are provided, the user has the option to edit BMP efficiencies, refresh BMP efficiencies, and/or calculate BMP credit. The Edit BMP Efficiencies calculates the selected BMP efficiency for phosphorus, nitrogen, and total suspended solids (see Figure 13). The Edit Default Efficiency (If EPA Approved) option box provides the option to edit the calculated efficiencies, with EPA approval. Once the Edit Default Efficiency (If EPA Approved) button is checked, the user can edit the calculated BMP efficiency percentage. The Default BMP Efficiency button re-calculates the default BMP efficiencies and populates the form with default BMP efficiencies. If BMP efficiencies are not shown, try clicking the Refresh button on the BMP information tab. Please contact EPA Region 1 before editing default efficiencies if using BATT for MS4 permit compliance, default rates are consistent with current MS4 permit requirements.
Figure 13. Edit BMP Efficiencies (example – Infiltration Basin)
After all land use information and the BMP information have been provided the user can refresh the BMP efficiencies, save the project or calculate BMP credit. If the user changed the BMP type or BMP specifications, the Refresh button re-calculates the default BMP efficiencies. The Calculate Credit button calculates the change in load (i.e., removed loads) from the implemented BMP (see Figure 14).
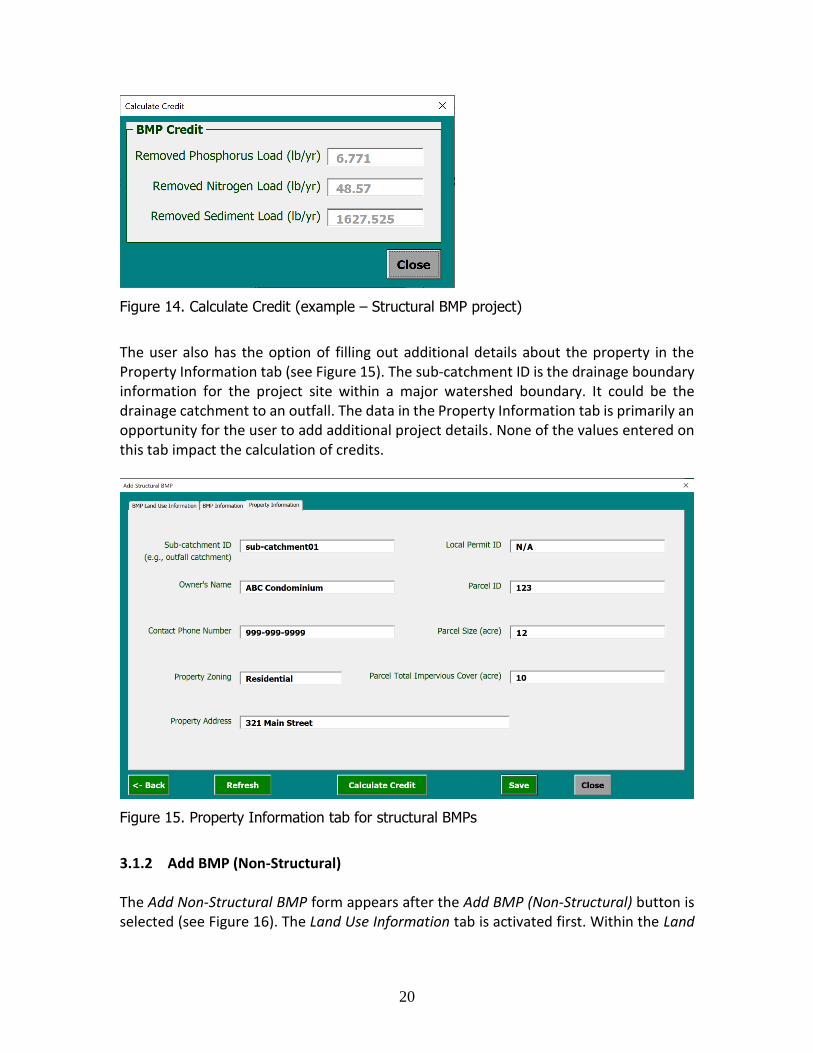
20
Figure 14. Calculate Credit (example – Structural BMP project)
The user also has the option of filling out additional details about the property in the Property Information tab (see Figure 15). The sub-catchment ID is the drainage boundary information for the project site within a major watershed boundary. It could be the drainage catchment to an outfall. The data in the Property Information tab is primarily an opportunity for the user to add additional project details. None of the values entered on this tab impact the calculation of credits.
Figure 15. Property Information tab for structural BMPs
3.1.2 Add BMP (Non-Structural)
The Add Non-Structural BMP form appears after the Add BMP (Non-Structural) button is selected (see Figure 16). The Land Use Information tab is activated first. Within the Land
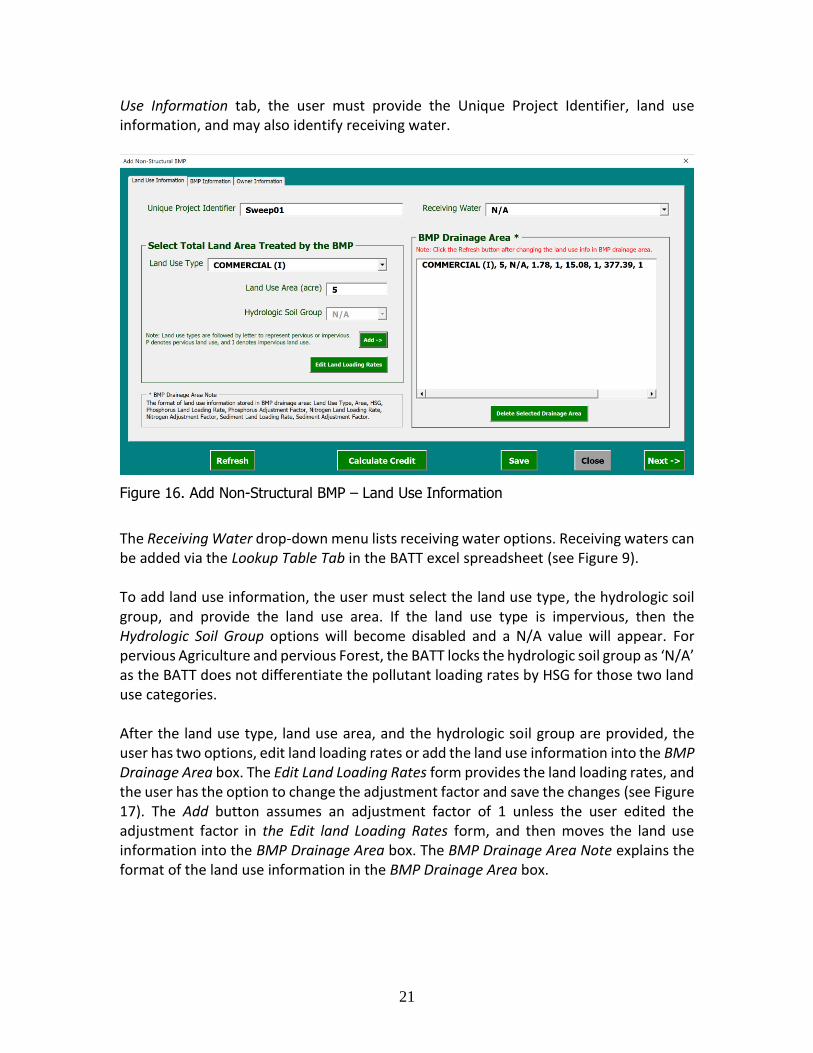
21
Use Information tab, the user must provide the Unique Project Identifier, land use information, and may also identify receiving water.
Figure 16. Add Non-Structural BMP – Land Use Information
The Receiving Water drop-down menu lists receiving water options. Receiving waters can be added via the Lookup Table Tab in the BATT excel spreadsheet (see Figure 9).
To add land use information, the user must select the land use type, the hydrologic soil group, and provide the land use area. If the land use type is impervious, then the Hydrologic Soil Group options will become disabled and a N/A value will appear. For pervious Agriculture and pervious Forest, the BATT locks the hydrologic soil group as ‘N/A’ as the BATT does not differentiate the pollutant loading rates by HSG for those two land use categories.
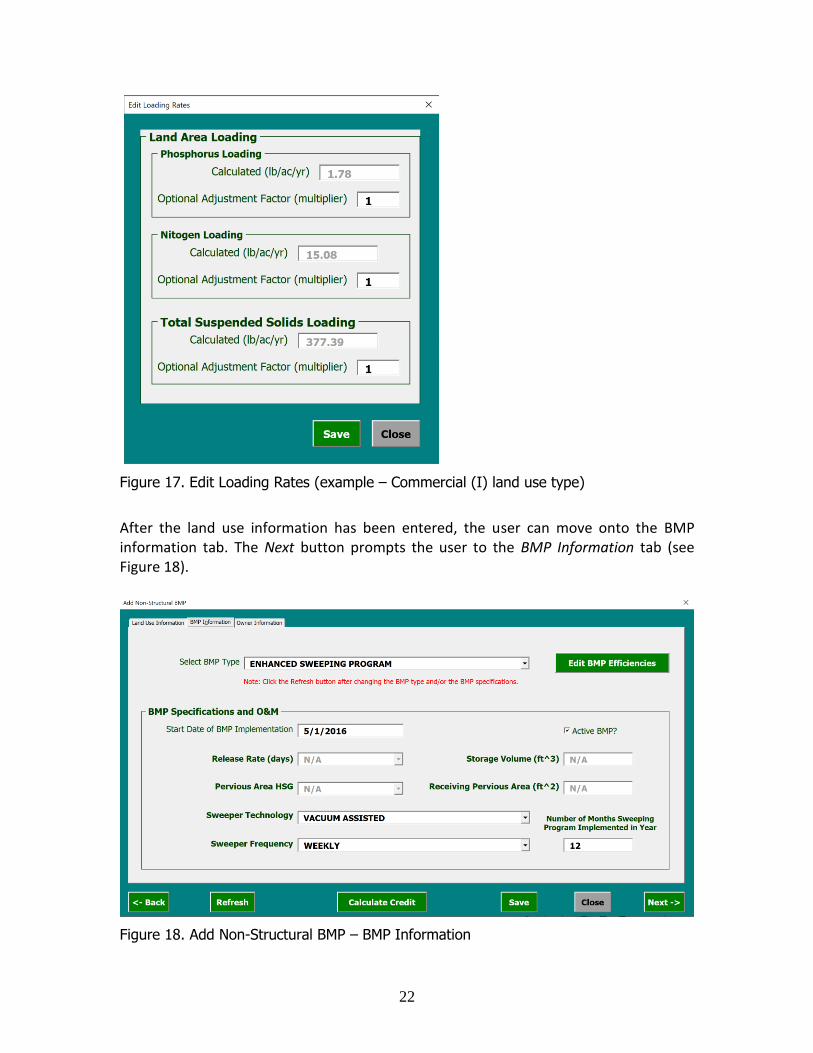
After the land use type, land use area, and the hydrologic soil group are provided, the user has two options, edit land loading rates or add the land use information into the BMP Drainage Area box. The Edit Land Loading Rates form provides the land loading rates, and the user has the option to change the adjustment factor and save the changes (see Figure 17). The Add button assumes an adjustment factor of 1 unless the user edited the adjustment factor in the Edit land Loading Rates form, and then moves the land use information into the BMP Drainage Area box. The BMP Drainage Area Note explains the format of the land use information in the BMP Drainage Area box.
22
Figure 17. Edit Loading Rates (example – Commercial (I) land use type)
After the land use information has been entered, the user can move onto the BMP information tab. The Next button prompts the user to the BMP Information tab (see Figure 18).
Figure 18. Add Non-Structural BMP – BMP Information
23
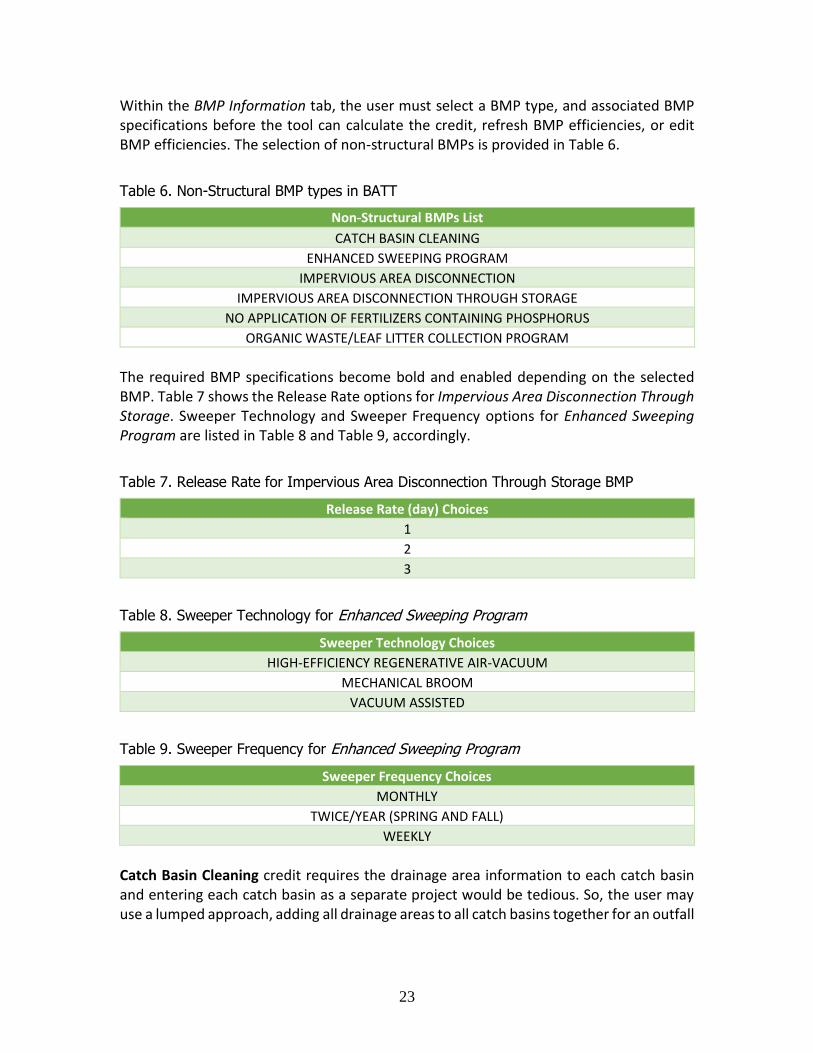
Within the BMP Information tab, the user must select a BMP type, and associated BMP specifications before the tool can calculate the credit, refresh BMP efficiencies, or edit BMP efficiencies. The selection of non-structural BMPs is provided in Table 6.
Table 6. Non-Structural BMP types in BATT
Non-Structural BMPs List
CATCH BASIN CLEANING
ENHANCED SWEEPING PROGRAM
IMPERVIOUS AREA DISCONNECTION
IMPERVIOUS AREA DISCONNECTION THROUGH STORAGE
NO APPLICATION OF FERTILIZERS CONTAINING PHOSPHORUS
ORGANIC WASTE/LEAF LITTER COLLECTION PROGRAM
The required BMP specifications become bold and enabled depending on the selected BMP. Table 7 shows the Release Rate options for Impervious Area Disconnection Through Storage. Sweeper Technology and Sweeper Frequency options for Enhanced Sweeping Program are listed in Table 8 and Table 9, accordingly.
Table 7. Release Rate for Impervious Area Disconnection Through Storage BMP
Release Rate (day) Choices
1
2
3
Table 8. Sweeper Technology for Enhanced Sweeping Program
Sweeper Technology Choices
HIGH-EFFICIENCY REGENERATIVE AIR-VACUUM
MECHANICAL BROOM
VACUUM ASSISTED
Table 9. Sweeper Frequency for Enhanced Sweeping Program
Sweeper Frequency Choices
MONTHLY
TWICE/YEAR (SPRING AND FALL)
WEEKLY
Catch Basin Cleaning credit requires the drainage area information to each catch basin and entering each catch basin as a separate project would be tedious. So, the user may use a lumped approach, adding all drainage areas to all catch basins together for an outfall
24
catchment. The credits are estimated based on the annual maintenance of keeping the catch basin clean and no more than 50% full, according to permit requirements.
Enhanced Sweeping Program may also use a lumped approach and rolls up the impact of street sweeping actions in all drainage areas by similar frequency and type of sweeper.
Impervious Area Disconnection credits are for the directly connected impervious area footprints that are disconnected and routed to the surrounding pervious area. For example, disconnecting the downspouts to the pervious areas or harvesting the water in the rain barrel/cistern and release it after a couple of days.
No Application of Fertilizers Containing Phosphorus Program requires no application around the year. Please ensure to check your MS4 permit to see if credit is available for this practice. The 2016 MA MS4 permit provides no credit for this practice due to Massachusetts State Law330 CMR 31.
Organic Waste/Leaf Litter Collection Program requires the permittee to must gather and remove all landscaping wastes, organic debris, and leaf litter from impervious roadways and parking lots at least once per week from September 1 to December 1 of each year. The credits are based on the land use specific loading rate from the impervious cover with a 5% phosphorus reduction factor.
After the land use information, BMP Type, and BMP specification are provided the user has the option to calculate the credit, refresh BMP efficiencies, and/or edit BMP efficiencies. The Refresh button re-calculates the default BMP efficiencies after the user changes the BMP type or the BMP specifications. The Edit BMP Efficiencies calculates the selected BMP efficiency for phosphorus, nitrogen, and total suspended solids (see Figure 19). The Edit Default Efficiency (If EPA Approved) option box provides the option to edit the calculated efficiencies, with EPA approval. Once the Edit Default Efficiency (If EPA Approved) button is checked, the user can edit the calculated BMP efficiency percentage. The Default BMP Efficiency button re-calculates the default BMP efficiencies and populates the form with default BMP efficiencies. Please ensure to contact EPA Region 1 before editing default efficiencies if using BATT for MS4 permit compliance, default rates are consistent with current MS4 permit requirements.
25
Figure 19. Edit BMP Efficiencies (example – Enhanced Sweeping Program, Vacuum Assisted, and Weekly)
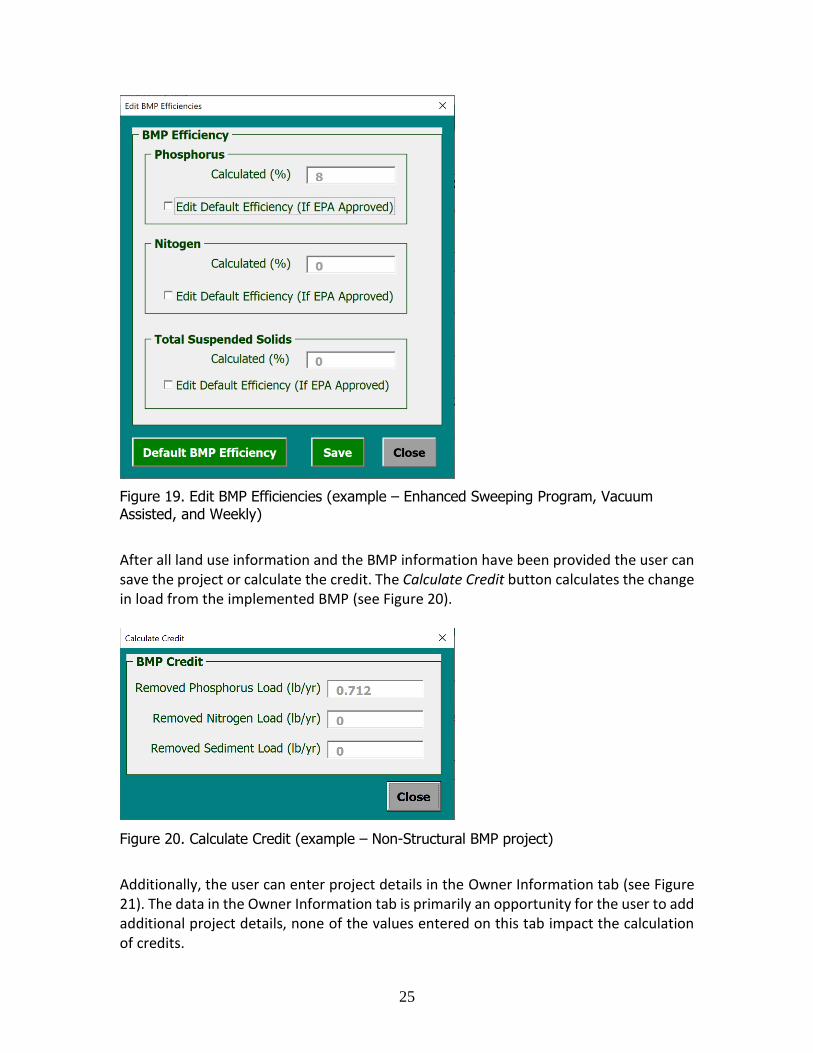
After all land use information and the BMP information have been provided the user can save the project or calculate the credit. The Calculate Credit button calculates the change in load from the implemented BMP (see Figure 20).
Figure 20. Calculate Credit (example – Non-Structural BMP project)
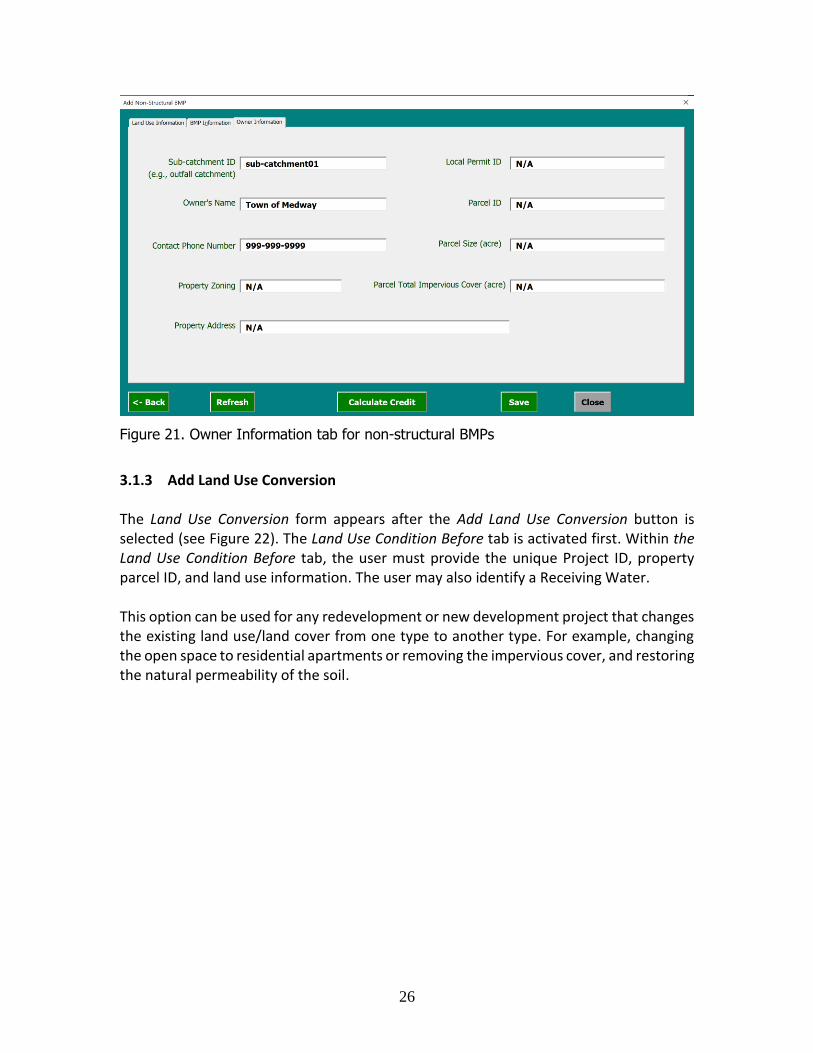
Additionally, the user can enter project details in the Owner Information tab (see Figure 21). The data in the Owner Information tab is primarily an opportunity for the user to add additional project details, none of the values entered on this tab impact the calculation of credits.
26
Figure 21. Owner Information tab for non-structural BMPs
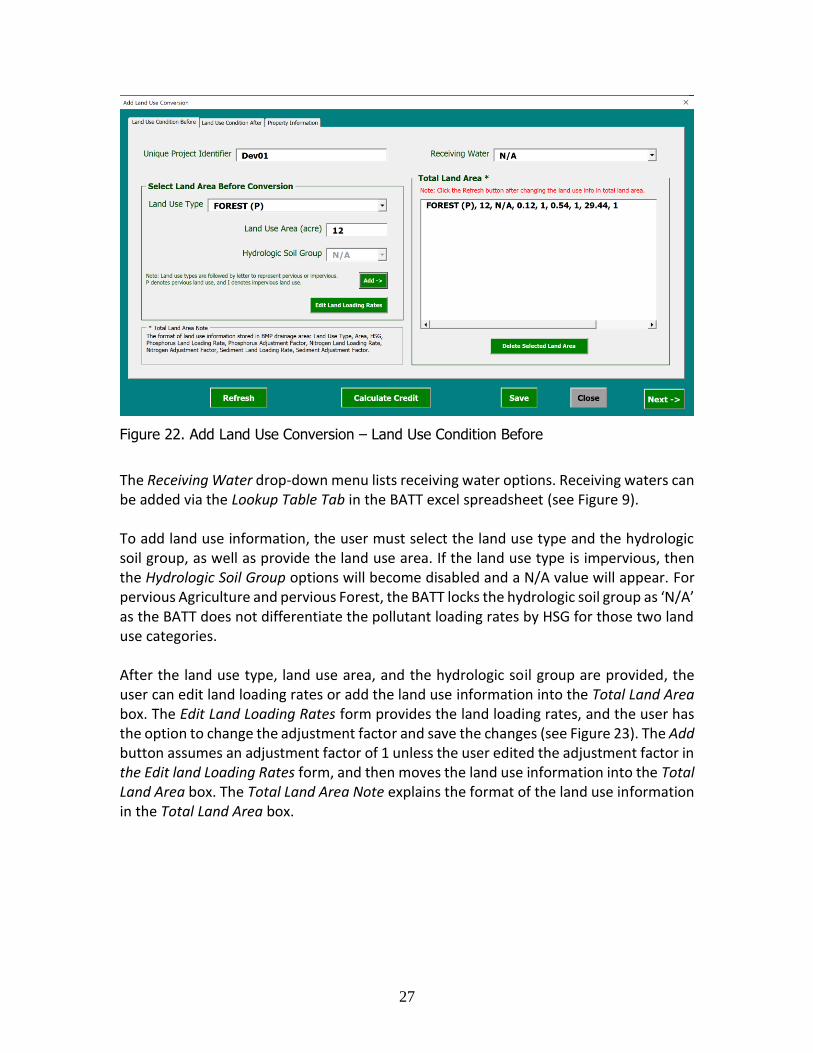
3.1.3 Add Land Use Conversion
The Land Use Conversion form appears after the Add Land Use Conversion button is selected (see Figure 22). The Land Use Condition Before tab is activated first. Within the Land Use Condition Before tab, the user must provide the unique Project ID, property parcel ID, and land use information. The user may also identify a Receiving Water.
This option can be used for any redevelopment or new development project that changes the existing land use/land cover from one type to another type. For example, changing the open space to residential apartments or removing the impervious cover, and restoring the natural permeability of the soil.
27
Figure 22. Add Land Use Conversion – Land Use Condition Before
The Receiving Water drop-down menu lists receiving water options. Receiving waters can be added via the Lookup Table Tab in the BATT excel spreadsheet (see Figure 9).
To add land use information, the user must select the land use type and the hydrologic soil group, as well as provide the land use area. If the land use type is impervious, then the Hydrologic Soil Group options will become disabled and a N/A value will appear. For pervious Agriculture and pervious Forest, the BATT locks the hydrologic soil group as ‘N/A’ as the BATT does not differentiate the pollutant loading rates by HSG for those two land use categories.
After the land use type, land use area, and the hydrologic soil group are provided, the user can edit land loading rates or add the land use information into the Total Land Area box. The Edit Land Loading Rates form provides the land loading rates, and the user has the option to change the adjustment factor and save the changes (see Figure 23). The Add button assumes an adjustment factor of 1 unless the user edited the adjustment factor in the Edit land Loading Rates form, and then moves the land use information into the Total Land Area box. The Total Land Area Note explains the format of the land use information in the Total Land Area box.
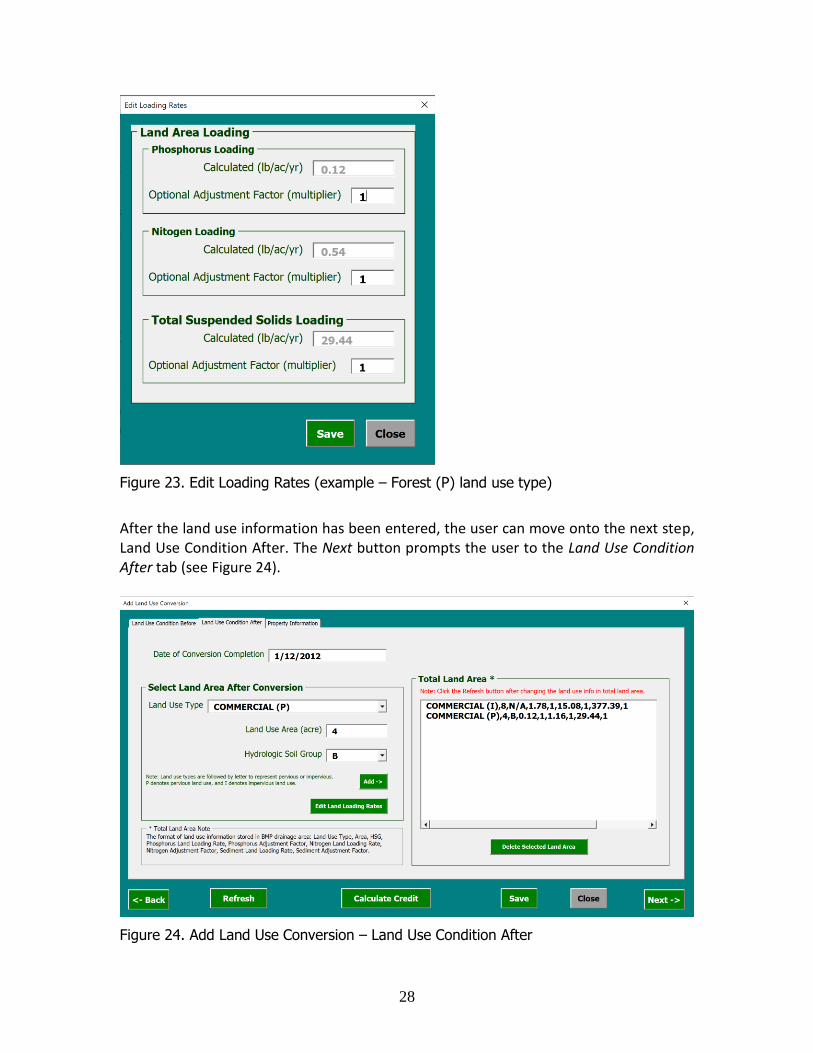
28
Figure 23. Edit Loading Rates (example – Forest (P) land use type)
After the land use information has been entered, the user can move onto the next step, Land Use Condition After. The Next button prompts the user to the Land Use Condition After tab (see Figure 24).
Figure 24. Add Land Use Conversion – Land Use Condition After
29
Within the Land Use After tab, the user must provide the date of conversion completion and the land use information. To add land use information, the user must select the land use type and the hydrologic soil group, as well as provide the land use area. If the land use type is impervious, then the Hydrologic Soil Group options will become disabled and a N/A value will appear.
After the land use type, land use area, and the hydrologic soil group are provided the user can edit land loading rates or add the land use information into the Total Land Area box. The Edit Land Loading Rates form provides the land loading rates, and the user has the option to change the adjustment factor and save the changes. The Add button assumes an adjustment factor of 1 unless the user edited the adjustment factor in the Edit land Loading Rates form, and then moves the land use information into the Total Land Area box. The Total Land Area Note explains the format of the land use information in the Total Land Area box.
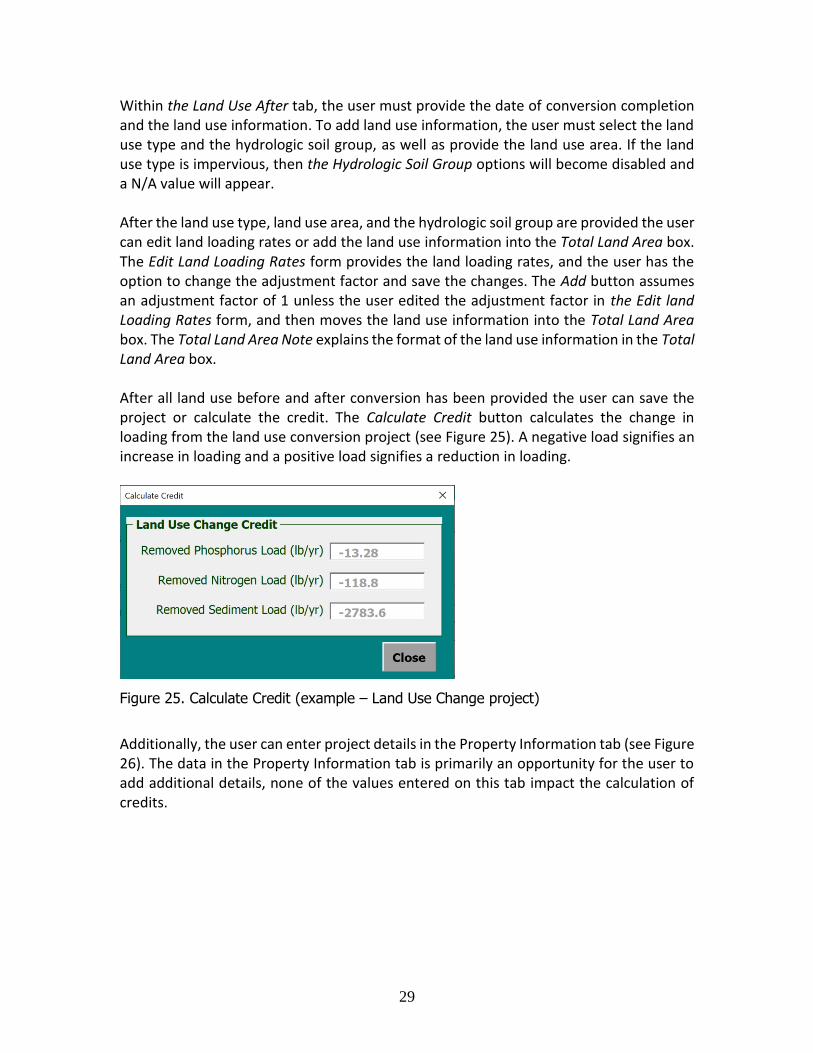
After all land use before and after conversion has been provided the user can save the project or calculate the credit. The Calculate Credit button calculates the change in loading from the land use conversion project (see Figure 25). A negative load signifies an increase in loading and a positive load signifies a reduction in loading.
Figure 25. Calculate Credit (example – Land Use Change project)
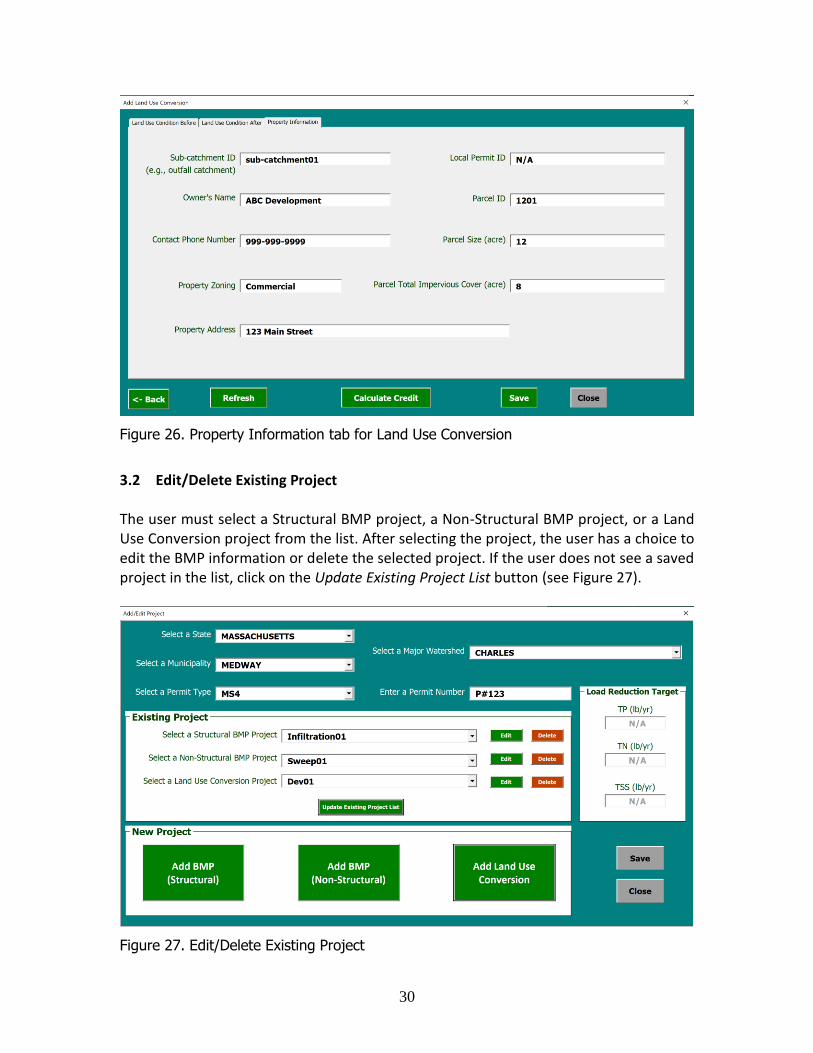
Additionally, the user can enter project details in the Property Information tab (see Figure 26). The data in the Property Information tab is primarily an opportunity for the user to add additional details, none of the values entered on this tab impact the calculation of credits.
30
Figure 26. Property Information tab for Land Use Conversion
3.2 Edit/Delete Existing Project
The user must select a Structural BMP project, a Non-Structural BMP project, or a Land Use Conversion project from the list. After selecting the project, the user has a choice to edit the BMP information or delete the selected project. If the user does not see a saved project in the list, click on the Update Existing Project List button (see Figure 27).
Figure 27. Edit/Delete Existing Project
31
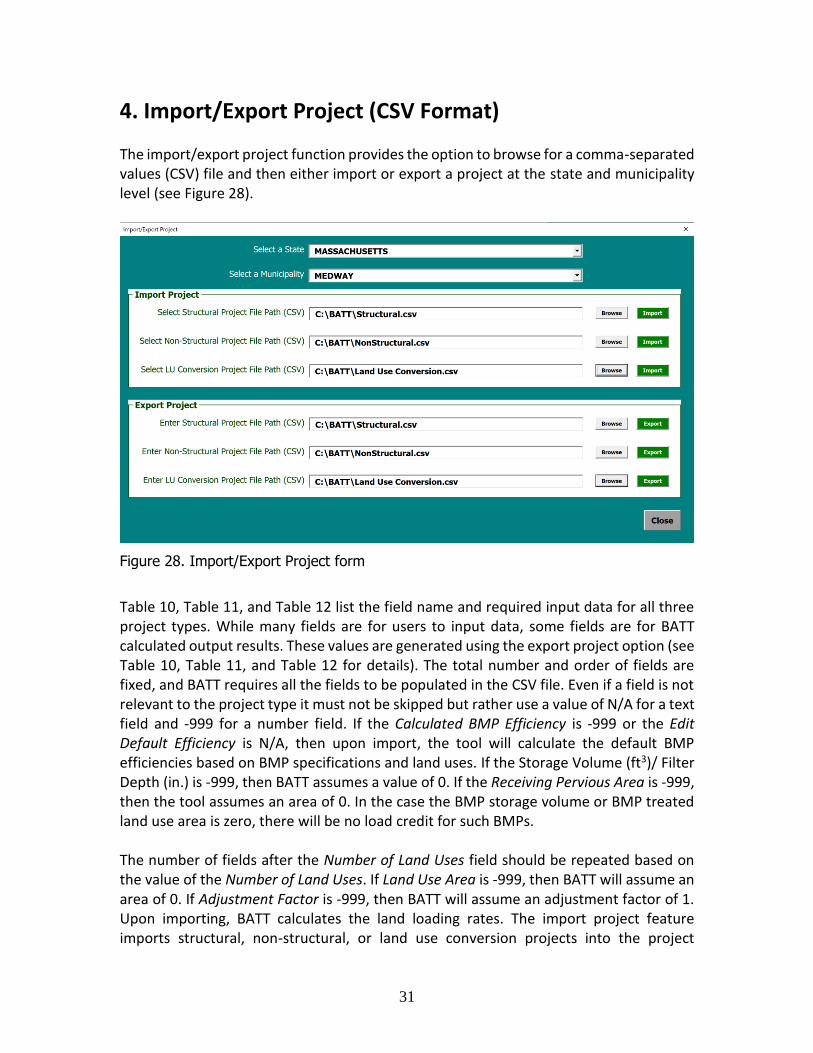
4. Import/Export Project (CSV Format)
The import/export project function provides the option to browse for a comma-separated values (CSV) file and then either import or export a project at the state and municipality level (see Figure 28).
Figure 28. Import/Export Project form
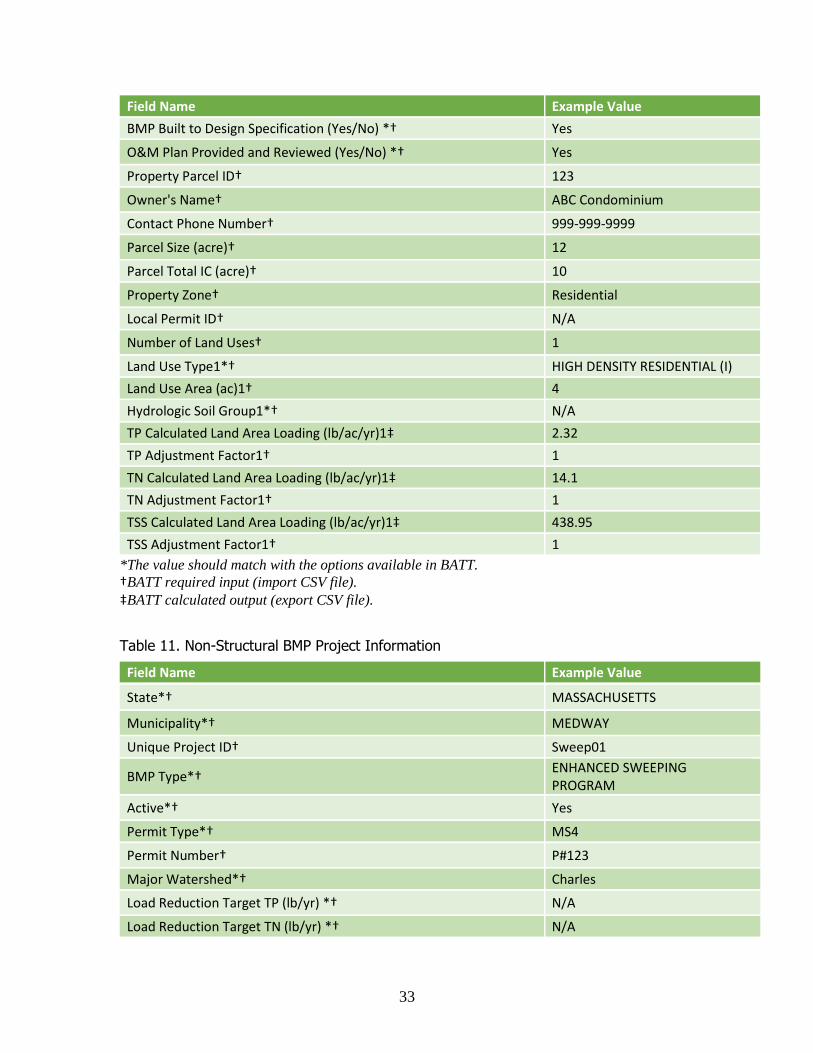
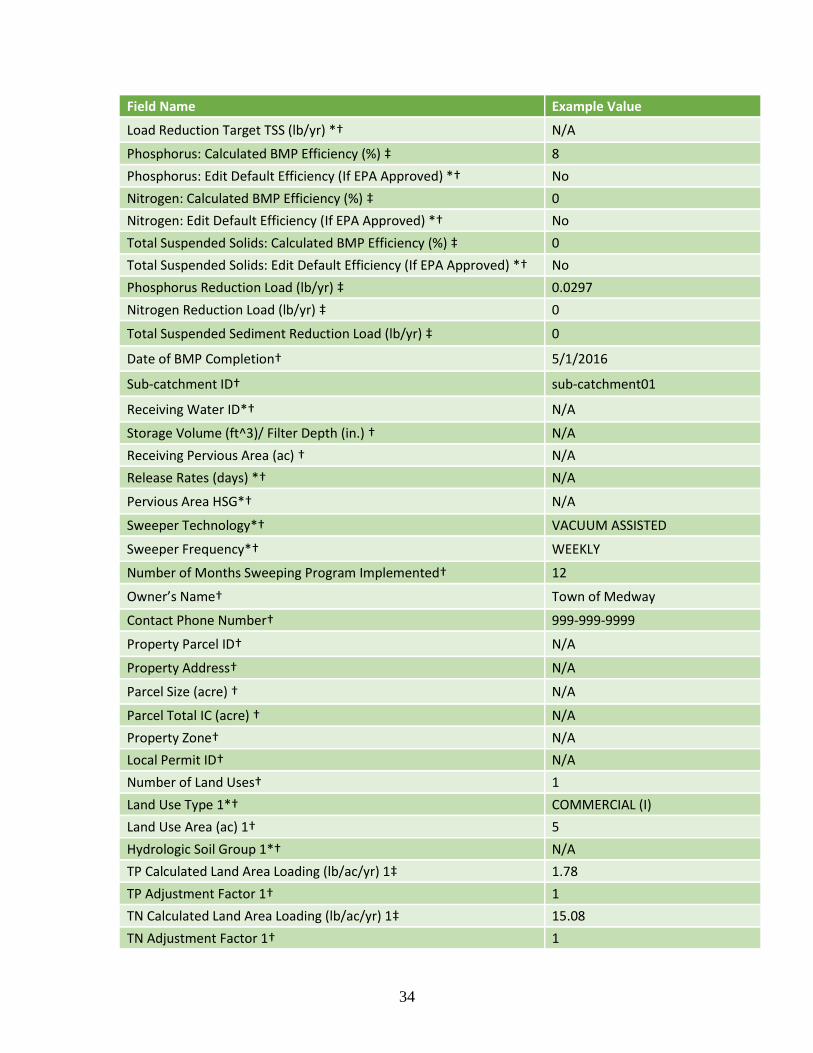
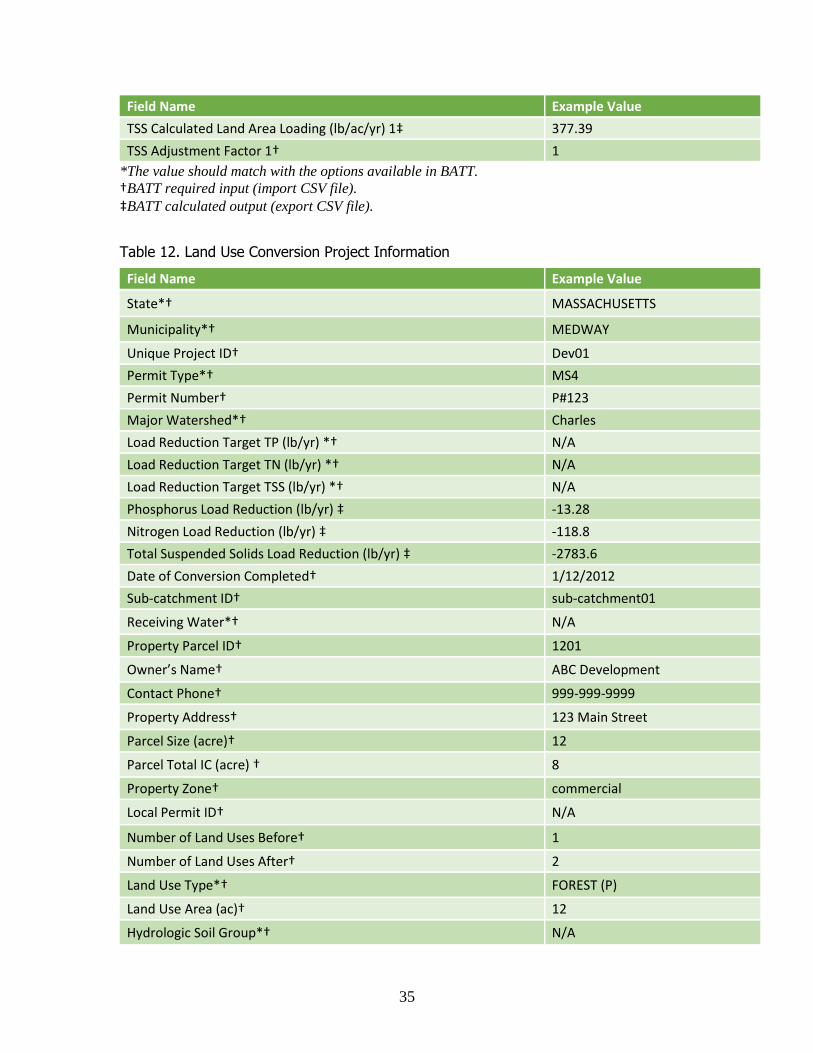
Table 10, Table 11, and Table 12 list the field name and required input data for all three project types. While many fields are for users to input data, some fields are for BATT calculated output results. These values are generated using the export project option (see Table 10, Table 11, and Table 12 for details). The total number and order of fields are fixed, and BATT requires all the fields to be populated in the CSV file. Even if a field is not relevant to the project type it must not be skipped but rather use a value of N/A for a text field and -999 for a number field. If the Calculated BMP Efficiency is -999 or the Edit Default Efficiency is N/A, then upon import, the tool will calculate the default BMP efficiencies based on BMP specifications and land uses. If the Storage Volume (ft3)/ Filter Depth (in.) is -999, then BATT assumes a value of 0. If the Receiving Pervious Area is -999, then the tool assumes an area of 0. In the case the BMP storage volume or BMP treated land use area is zero, there will be no load credit for such BMPs. The number of fields after the Number of Land Uses field should be repeated based on the value of the Number of Land Uses. If Land Use Area is -999, then BATT will assume an area of 0. If Adjustment Factor is -999, then BATT will assume an adjustment factor of 1. Upon importing, BATT calculates the land loading rates. The import project feature imports structural, non-structural, or land use conversion projects into the project
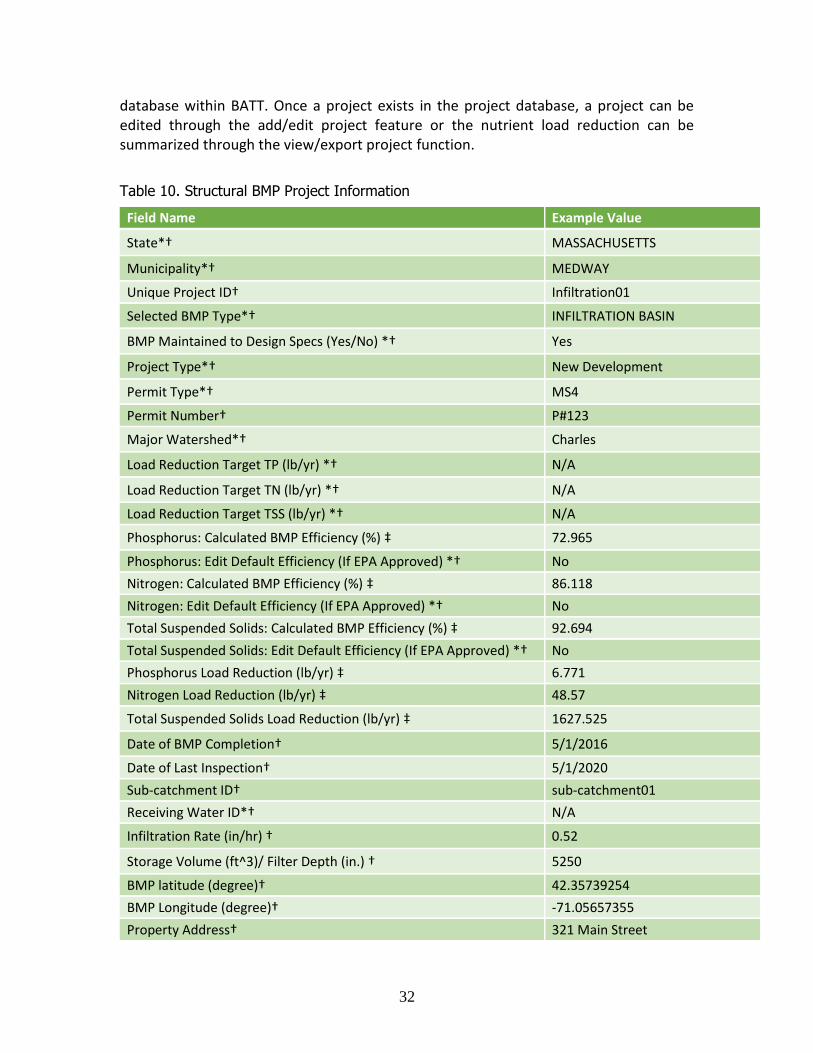
32
database within BATT. Once a project exists in the project database, a project can be edited through the add/edit project feature or the nutrient load reduction can be summarized through the view/export project function.
Table 10. Structural BMP Project Information
Field Name Example Value
State*† MASSACHUSETTS
Municipality*† MEDWAY
Unique Project ID† Infiltration01
Selected BMP Type*† INFILTRATION BASIN
BMP Maintained to Design Specs (Yes/No) *† Yes
Project Type*† New Development
Permit Type*† MS4
Permit Number† P#123
Major Watershed*† Charles
Load Reduction Target TP (lb/yr) *† N/A
Load Reduction Target TN (lb/yr) *† N/A
Load Reduction Target TSS (lb/yr) *† N/A
Phosphorus: Calculated BMP Efficiency (%) ‡ 72.965
Phosphorus: Edit Default Efficiency (If EPA Approved) *† No
Nitrogen: Calculated BMP Efficiency (%) ‡ 86.118
Nitrogen: Edit Default Efficiency (If EPA Approved) *† No
Total Suspended Solids: Calculated BMP Efficiency (%) ‡ 92.694
Total Suspended Solids: Edit Default Efficiency (If EPA Approved) *† No
Phosphorus Load Reduction (lb/yr) ‡ 6.771
Nitrogen Load Reduction (lb/yr) ‡ 48.57
Total Suspended Solids Load Reduction (lb/yr) ‡ 1627.525
Date of BMP Completion† 5/1/2016
Date of Last Inspection† 5/1/2020
Sub-catchment ID† sub-catchment01
Receiving Water ID*† N/A
Infiltration Rate (in/hr) † 0.52
Storage Volume (ft^3)/ Filter Depth (in.) † 5250
BMP latitude (degree)† 42.35739254
BMP Longitude (degree)† -71.05657355
Property Address† 321 Main Street
33
Field Name Example Value
BMP Built to Design Specification (Yes/No) *† Yes
O&M Plan Provided and Reviewed (Yes/No) *† Yes
Property Parcel ID† 123
Owner's Name† ABC Condominium
Contact Phone Number† 999-999-9999
Parcel Size (acre)† 12
Parcel Total IC (acre)† 10
Property Zone† Residential
Local Permit ID† N/A
Number of Land Uses† 1
Land Use Type1*† HIGH DENSITY RESIDENTIAL (I)
Land Use Area (ac)1† 4
Hydrologic Soil Group1*† N/A
TP Calculated Land Area Loading (lb/ac/yr)1‡ 2.32
TP Adjustment Factor1† 1
TN Calculated Land Area Loading (lb/ac/yr)1‡ 14.1
TN Adjustment Factor1† 1
TSS Calculated Land Area Loading (lb/ac/yr)1‡ 438.95
TSS Adjustment Factor1† 1
*The value should match with the options available in BATT.
†BATT required input (import CSV file).
‡BATT calculated output (export CSV file).
Table 11. Non-Structural BMP Project Information
Field Name Example Value
State*† MASSACHUSETTS
Municipality*† MEDWAY
Unique Project ID† Sweep01
BMP Type*† ENHANCED SWEEPING PROGRAM
Active*† Yes
Permit Type*† MS4
Permit Number† P#123
Major Watershed*† Charles
Load Reduction Target TP (lb/yr) *† N/A
Load Reduction Target TN (lb/yr) *† N/A
34
Field Name Example Value
Load Reduction Target TSS (lb/yr) *† N/A
Phosphorus: Calculated BMP Efficiency (%) ‡ 8
Phosphorus: Edit Default Efficiency (If EPA Approved) *† No
Nitrogen: Calculated BMP Efficiency (%) ‡ 0
Nitrogen: Edit Default Efficiency (If EPA Approved) *† No
Total Suspended Solids: Calculated BMP Efficiency (%) ‡ 0
Total Suspended Solids: Edit Default Efficiency (If EPA Approved) *† No
Phosphorus Reduction Load (lb/yr) ‡ 0.0297
Nitrogen Reduction Load (lb/yr) ‡ 0
Total Suspended Sediment Reduction Load (lb/yr) ‡ 0
Date of BMP Completion† 5/1/2016
Sub-catchment ID† sub-catchment01
Receiving Water ID*† N/A
Storage Volume (ft^3)/ Filter Depth (in.) † N/A
Receiving Pervious Area (ac) † N/A
Release Rates (days) *† N/A
Pervious Area HSG*† N/A
Sweeper Technology*† VACUUM ASSISTED
Sweeper Frequency*† WEEKLY
Number of Months Sweeping Program Implemented† 12
Owner’s Name† Town of Medway
Contact Phone Number† 999-999-9999
Property Parcel ID† N/A
Property Address† N/A
Parcel Size (acre) † N/A
Parcel Total IC (acre) † N/A
Property Zone† N/A
Local Permit ID† N/A
Number of Land Uses† 1
Land Use Type 1*† COMMERCIAL (I)
Land Use Area (ac) 1† 5
Hydrologic Soil Group 1*† N/A
TP Calculated Land Area Loading (lb/ac/yr) 1‡ 1.78
TP Adjustment Factor 1† 1
TN Calculated Land Area Loading (lb/ac/yr) 1‡ 15.08
TN Adjustment Factor 1† 1
35
Field Name Example Value
TSS Calculated Land Area Loading (lb/ac/yr) 1‡ 377.39
TSS Adjustment Factor 1† 1
*The value should match with the options available in BATT.
†BATT required input (import CSV file).
‡BATT calculated output (export CSV file).
Table 12. Land Use Conversion Project Information
Field Name Example Value
State*† MASSACHUSETTS
Municipality*† MEDWAY
Unique Project ID† Dev01
Permit Type*† MS4
Permit Number† P#123
Major Watershed*† Charles
Load Reduction Target TP (lb/yr) *† N/A
Load Reduction Target TN (lb/yr) *† N/A
Load Reduction Target TSS (lb/yr) *† N/A
Phosphorus Load Reduction (lb/yr) ‡ -13.28
Nitrogen Load Reduction (lb/yr) ‡ -118.8
Total Suspended Solids Load Reduction (lb/yr) ‡ -2783.6
Date of Conversion Completed† 1/12/2012
Sub-catchment ID† sub-catchment01
Receiving Water*† N/A
Property Parcel ID† 1201
Owner’s Name† ABC Development
Contact Phone† 999-999-9999
Property Address† 123 Main Street
Parcel Size (acre)† 12
Parcel Total IC (acre) † 8
Property Zone† commercial
Local Permit ID† N/A
Number of Land Uses Before† 1
Number of Land Uses After† 2
Land Use Type*† FOREST (P)
Land Use Area (ac)† 12
Hydrologic Soil Group*† N/A
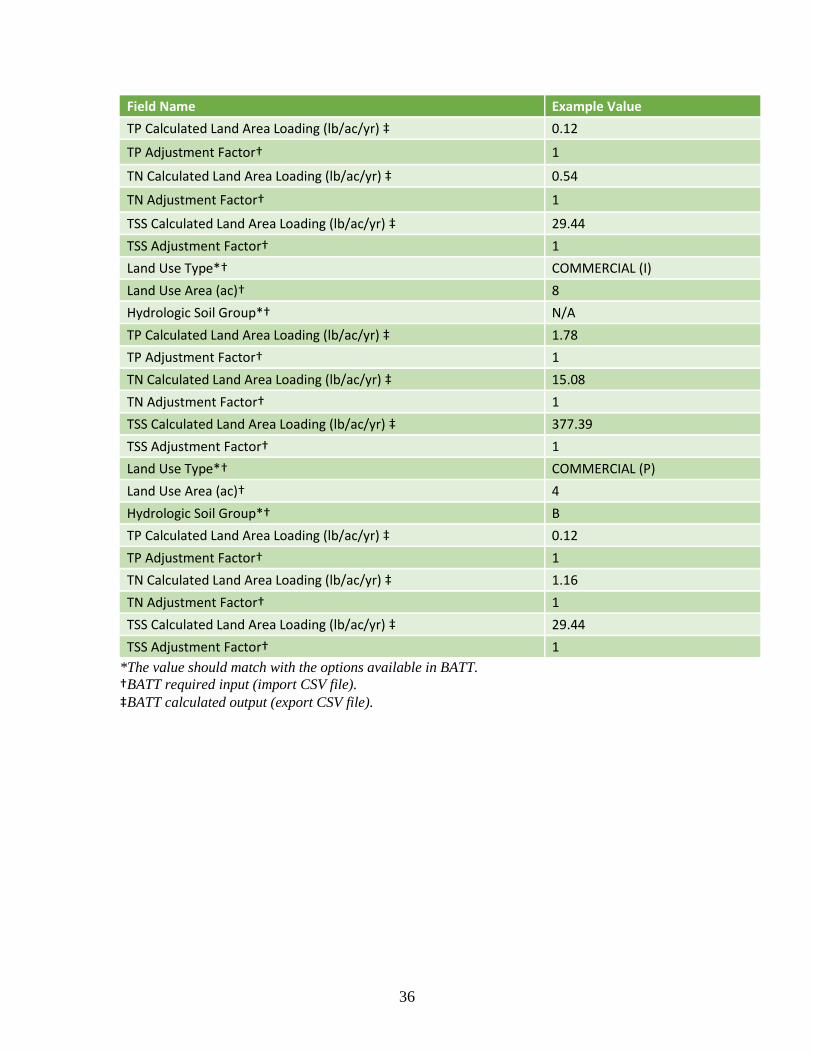
36
Field Name Example Value
TP Calculated Land Area Loading (lb/ac/yr) ‡ 0.12
TP Adjustment Factor† 1
TN Calculated Land Area Loading (lb/ac/yr) ‡ 0.54
TN Adjustment Factor† 1
TSS Calculated Land Area Loading (lb/ac/yr) ‡ 29.44
TSS Adjustment Factor† 1
Land Use Type*† COMMERCIAL (I)
Land Use Area (ac)† 8
Hydrologic Soil Group*† N/A
TP Calculated Land Area Loading (lb/ac/yr) ‡ 1.78
TP Adjustment Factor† 1
TN Calculated Land Area Loading (lb/ac/yr) ‡ 15.08
TN Adjustment Factor† 1
TSS Calculated Land Area Loading (lb/ac/yr) ‡ 377.39
TSS Adjustment Factor† 1
Land Use Type*† COMMERCIAL (P)
Land Use Area (ac)† 4
Hydrologic Soil Group*† B
TP Calculated Land Area Loading (lb/ac/yr) ‡ 0.12
TP Adjustment Factor† 1
TN Calculated Land Area Loading (lb/ac/yr) ‡ 1.16
TN Adjustment Factor† 1
TSS Calculated Land Area Loading (lb/ac/yr) ‡ 29.44
TSS Adjustment Factor† 1
*The value should match with the options available in BATT.
†BATT required input (import CSV file).
‡BATT calculated output (export CSV file).
37
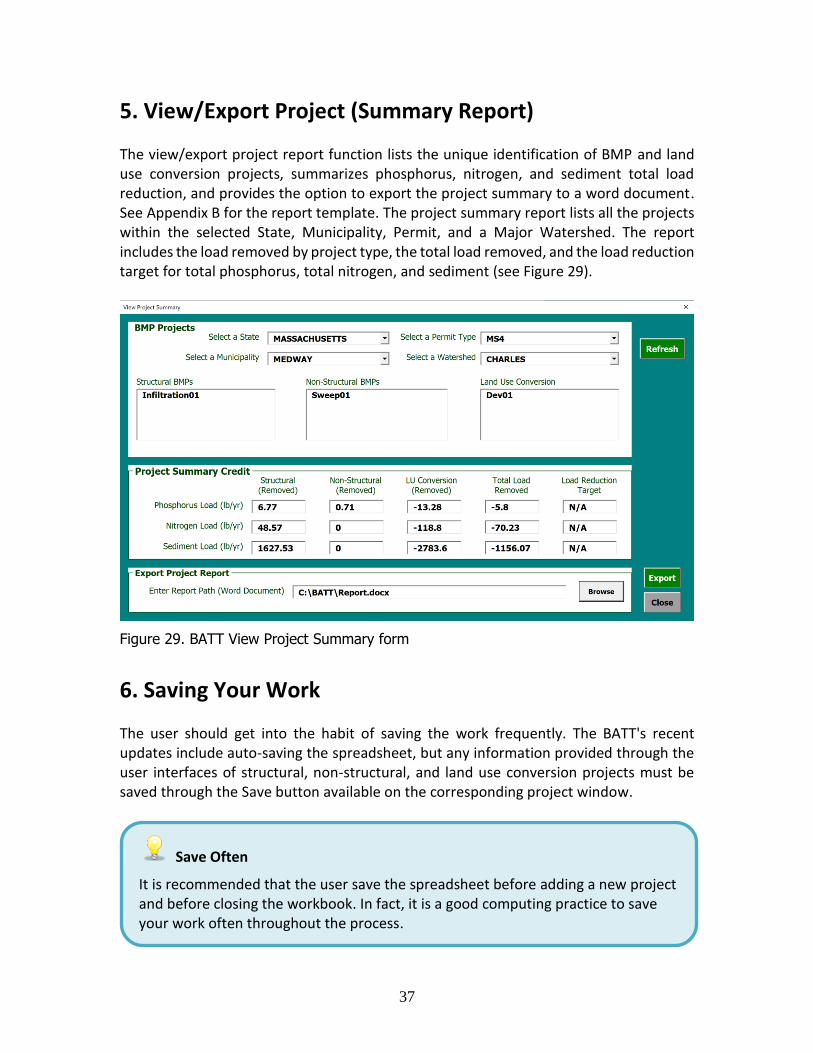
5. View/Export Project (Summary Report)
The view/export project report function lists the unique identification of BMP and land use conversion projects, summarizes phosphorus, nitrogen, and sediment total load reduction, and provides the option to export the project summary to a word document. See Appendix B for the report template. The project summary report lists all the projects within the selected State, Municipality, Permit, and a Major Watershed. The report includes the load removed by project type, the total load removed, and the load reduction target for total phosphorus, total nitrogen, and sediment (see Figure 29).
Figure 29. BATT View Project Summary form
6. Saving Your Work The user should get into the habit of saving the work frequently. The BATT's recent updates include auto-saving the spreadsheet, but any information provided through the user interfaces of structural, non-structural, and land use conversion projects must be saved through the Save button available on the corresponding project window.
Save Often
It is recommended that the user save the spreadsheet before adding a new project and before closing the workbook. In fact, it is a good computing practice to save your work often throughout the process.
38
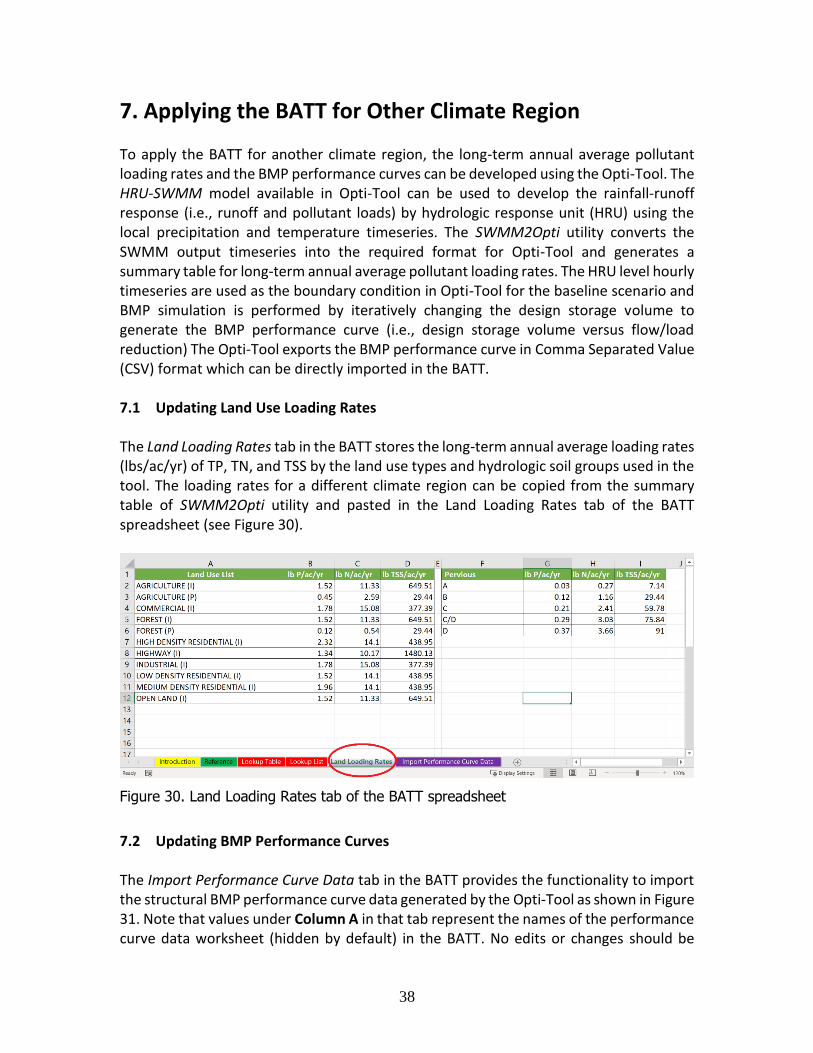
7. Applying the BATT for Other Climate Region
To apply the BATT for another climate region, the long-term annual average pollutant loading rates and the BMP performance curves can be developed using the Opti-Tool. The HRU-SWMM model available in Opti-Tool can be used to develop the rainfall-runoff response (i.e., runoff and pollutant loads) by hydrologic response unit (HRU) using the local precipitation and temperature timeseries. The SWMM2Opti utility converts the SWMM output timeseries into the required format for Opti-Tool and generates a summary table for long-term annual average pollutant loading rates. The HRU level hourly timeseries are used as the boundary condition in Opti-Tool for the baseline scenario and BMP simulation is performed by iteratively changing the design storage volume to generate the BMP performance curve (i.e., design storage volume versus flow/load reduction) The Opti-Tool exports the BMP performance curve in Comma Separated Value (CSV) format which can be directly imported in the BATT.
7.1 Updating Land Use Loading Rates
The Land Loading Rates tab in the BATT stores the long-term annual average loading rates (lbs/ac/yr) of TP, TN, and TSS by the land use types and hydrologic soil groups used in the tool. The loading rates for a different climate region can be copied from the summary table of SWMM2Opti utility and pasted in the Land Loading Rates tab of the BATT spreadsheet (see Figure 30).
Figure 30. Land Loading Rates tab of the BATT spreadsheet
7.2 Updating BMP Performance Curves The Import Performance Curve Data tab in the BATT provides the functionality to import the structural BMP performance curve data generated by the Opti-Tool as shown in Figure 31. Note that values under Column A in that tab represent the names of the performance curve data worksheet (hidden by default) in the BATT. No edits or changes should be
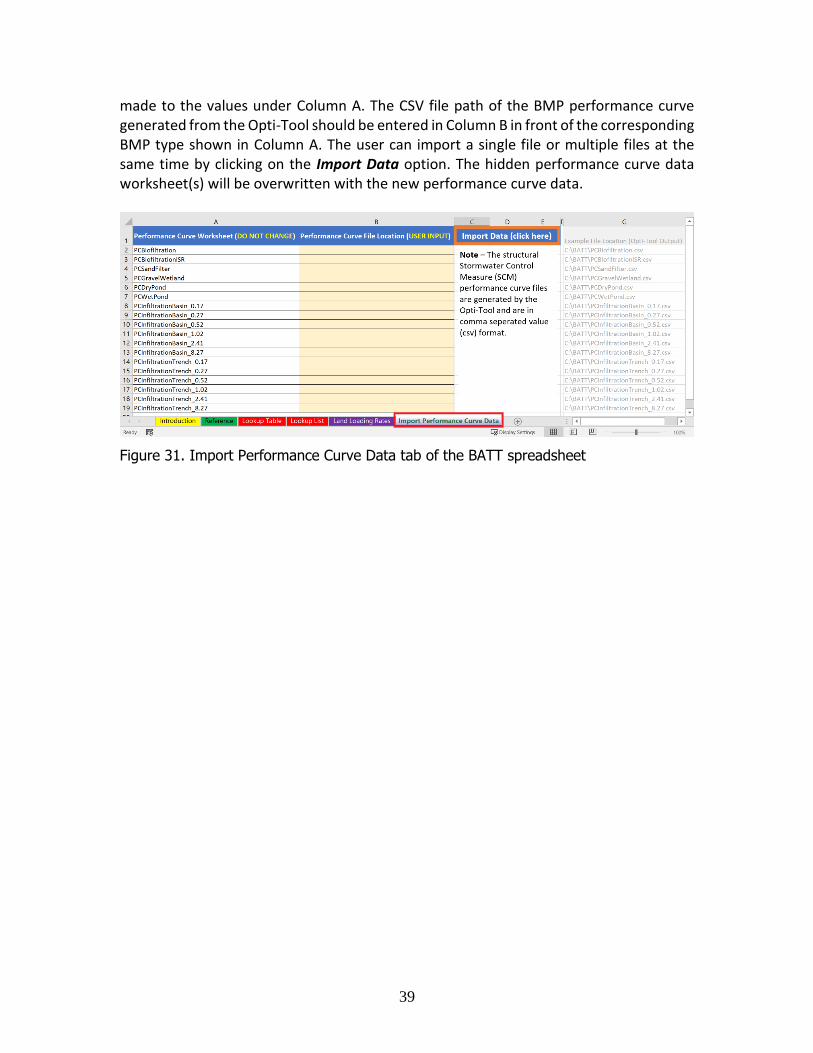
39
made to the values under Column A. The CSV file path of the BMP performance curve generated from the Opti-Tool should be entered in Column B in front of the corresponding BMP type shown in Column A. The user can import a single file or multiple files at the same time by clicking on the Import Data option. The hidden performance curve data worksheet(s) will be overwritten with the new performance curve data.
Figure 31. Import Performance Curve Data tab of the BATT spreadsheet
40
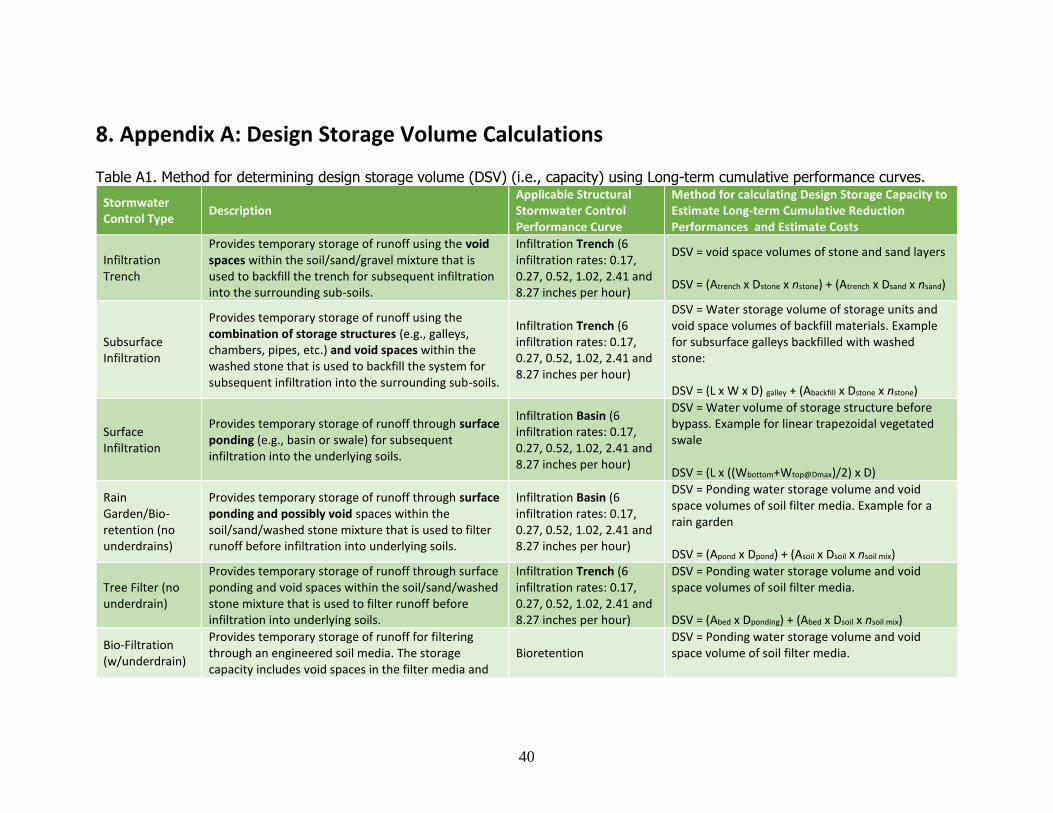
8. Appendix A: Design Storage Volume Calculations Table A1. Method for determining design storage volume (DSV) (i.e., capacity) using Long-term cumulative performance curves.
Stormwater Control Type
Description Applicable Structural Stormwater Control Performance Curve
Method for calculating Design Storage Capacity to Estimate Long-term Cumulative Reduction Performances and Estimate Costs
Infiltration Trench
Provides temporary storage of runoff using the void spaces within the soil/sand/gravel mixture that is used to backfill the trench for subsequent infiltration into the surrounding sub-soils.
Infiltration Trench (6 infiltration rates: 0.17, 0.27, 0.52, 1.02, 2.41 and 8.27 inches per hour)
DSV = void space volumes of stone and sand layers DSV = (Atrench x Dstone x nstone) + (Atrench x Dsand x nsand)
Subsurface Infiltration
Provides temporary storage of runoff using the combination of storage structures (e.g., galleys, chambers, pipes, etc.) and void spaces within the washed stone that is used to backfill the system for subsequent infiltration into the surrounding sub-soils.
Infiltration Trench (6 infiltration rates: 0.17, 0.27, 0.52, 1.02, 2.41 and 8.27 inches per hour)
DSV = Water storage volume of storage units and void space volumes of backfill materials. Example for subsurface galleys backfilled with washed stone: DSV = (L x W x D) galley + (Abackfill x Dstone x nstone)
Surface Infiltration
Provides temporary storage of runoff through surface ponding (e.g., basin or swale) for subsequent infiltration into the underlying soils.
Infiltration Basin (6 infiltration rates: 0.17, 0.27, 0.52, 1.02, 2.41 and 8.27 inches per hour)
DSV = Water volume of storage structure before bypass. Example for linear trapezoidal vegetated swale DSV = (L x ((Wbottom+Wtop@Dmax)/2) x D)
Rain Garden/Bio-retention (no underdrains)
Provides temporary storage of runoff through surface ponding and possibly void spaces within the soil/sand/washed stone mixture that is used to filter runoff before infiltration into underlying soils.
Infiltration Basin (6 infiltration rates: 0.17, 0.27, 0.52, 1.02, 2.41 and 8.27 inches per hour)
DSV = Ponding water storage volume and void space volumes of soil filter media. Example for a rain garden DSV = (Apond x Dpond) + (Asoil x Dsoil x nsoil mix)
Tree Filter (no underdrain)
Provides temporary storage of runoff through surface ponding and void spaces within the soil/sand/washed stone mixture that is used to filter runoff before infiltration into underlying soils.
Infiltration Trench (6 infiltration rates: 0.17, 0.27, 0.52, 1.02, 2.41 and 8.27 inches per hour)
DSV = Ponding water storage volume and void space volumes of soil filter media. DSV = (Abed x Dponding) + (Abed x Dsoil x nsoil mix)
Bio-Filtration (w/underdrain)
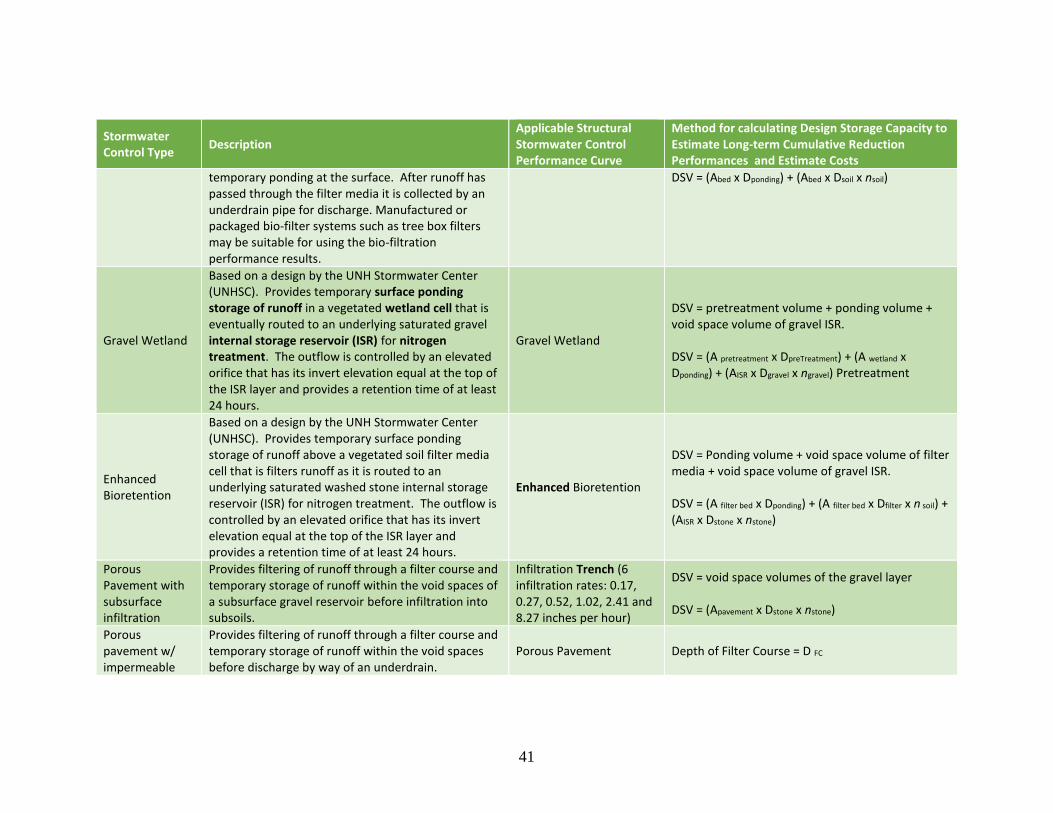
Provides temporary storage of runoff for filtering through an engineered soil media. The storage capacity includes void spaces in the filter media and
Bioretention DSV = Ponding water storage volume and void space volume of soil filter media.
41
Stormwater Control Type
Description Applicable Structural Stormwater Control Performance Curve
Method for calculating Design Storage Capacity to Estimate Long-term Cumulative Reduction Performances and Estimate Costs
temporary ponding at the surface. After runoff has passed through the filter media it is collected by an underdrain pipe for discharge. Manufactured or packaged bio-filter systems such as tree box filters may be suitable for using the bio-filtration performance results.
DSV = (Abed x Dponding) + (Abed x Dsoil x nsoil)
Gravel Wetland
Based on a design by the UNH Stormwater Center (UNHSC). Provides temporary surface ponding storage of runoff in a vegetated wetland cell that is eventually routed to an underlying saturated gravel internal storage reservoir (ISR) for nitrogen treatment. The outflow is controlled by an elevated orifice that has its invert elevation equal at the top of the ISR layer and provides a retention time of at least 24 hours.
Gravel Wetland
DSV = pretreatment volume + ponding volume + void space volume of gravel ISR. DSV = (A pretreatment x DpreTreatment) + (A wetland x Dponding) + (AISR x Dgravel x ngravel) Pretreatment
Enhanced Bioretention
Based on a design by the UNH Stormwater Center (UNHSC). Provides temporary surface ponding storage of runoff above a vegetated soil filter media cell that is filters runoff as it is routed to an underlying saturated washed stone internal storage reservoir (ISR) for nitrogen treatment. The outflow is controlled by an elevated orifice that has its invert elevation equal at the top of the ISR layer and provides a retention time of at least 24 hours.
Enhanced Bioretention
DSV = Ponding volume + void space volume of filter media + void space volume of gravel ISR. DSV = (A filter bed x Dponding) + (A filter bed x Dfilter x n soil) + (AISR x Dstone x nstone)
Porous Pavement with subsurface infiltration
Provides filtering of runoff through a filter course and temporary storage of runoff within the void spaces of a subsurface gravel reservoir before infiltration into subsoils.
Infiltration Trench (6 infiltration rates: 0.17, 0.27, 0.52, 1.02, 2.41 and 8.27 inches per hour)
DSV = void space volumes of the gravel layer DSV = (Apavement x Dstone x nstone)
Porous pavement w/ impermeable
Provides filtering of runoff through a filter course and temporary storage of runoff within the void spaces before discharge by way of an underdrain.
Porous Pavement Depth of Filter Course = D FC
42
Stormwater Control Type
Description Applicable Structural Stormwater Control Performance Curve
Method for calculating Design Storage Capacity to Estimate Long-term Cumulative Reduction Performances and Estimate Costs
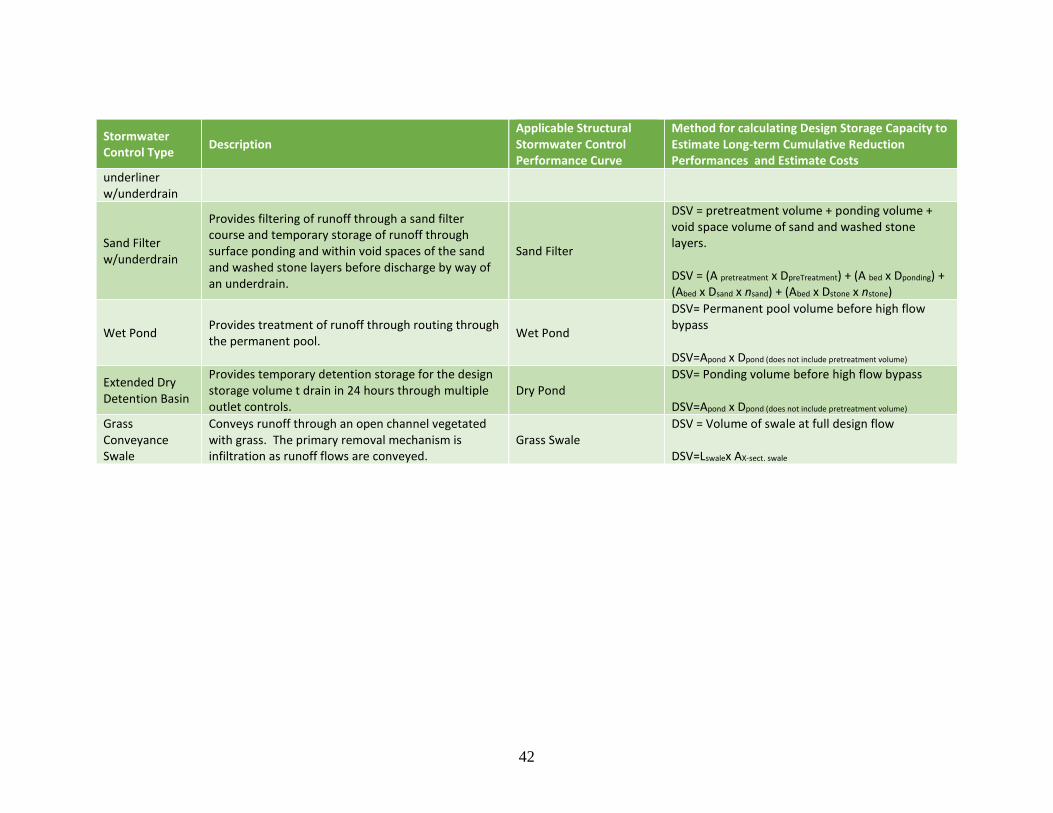
underliner w/underdrain
Sand Filter w/underdrain
Provides filtering of runoff through a sand filter course and temporary storage of runoff through surface ponding and within void spaces of the sand and washed stone layers before discharge by way of an underdrain.
Sand Filter
DSV = pretreatment volume + ponding volume + void space volume of sand and washed stone layers. DSV = (A pretreatment x DpreTreatment) + (A bed x Dponding) + (Abed x Dsand x nsand) + (Abed x Dstone x nstone)
Wet Pond Provides treatment of runoff through routing through the permanent pool.
Wet Pond
DSV= Permanent pool volume before high flow bypass DSV=Apond x Dpond (does not include pretreatment volume)
Extended Dry Detention Basin
Provides temporary detention storage for the design storage volume t drain in 24 hours through multiple outlet controls.
Dry Pond DSV= Ponding volume before high flow bypass DSV=Apond x Dpond (does not include pretreatment volume)
Grass Conveyance Swale
Conveys runoff through an open channel vegetated with grass. The primary removal mechanism is infiltration as runoff flows are conveyed.
Grass Swale DSV = Volume of swale at full design flow DSV=Lswalex AX-sect. swale

43
9. Appendix B: Project Summary Report
State MASSACHUSETTS Municipality MEDWAY Permit Type MS4
Permit Number P#123 Major Watershed CHARLES
TP Load Reduction Target N/A TN Load Reduction Target N/A TSS Load Reduction Target N/A
Table B1. Project Summary Credit for MEDWAY, MASSACHUSETTS
Project Type Removed Phosphorus Load (lb/yr) Removed Nitrogen Load (lb/yr) Removed Sediment Load (lb/yr)
Structural 6.77 48.57 1627.53 Non-Structural 0.71 0 0
Land Use Conversion -13.28 -118.8 -2783.6 Total -5.8 -70.23 -1156.07
44
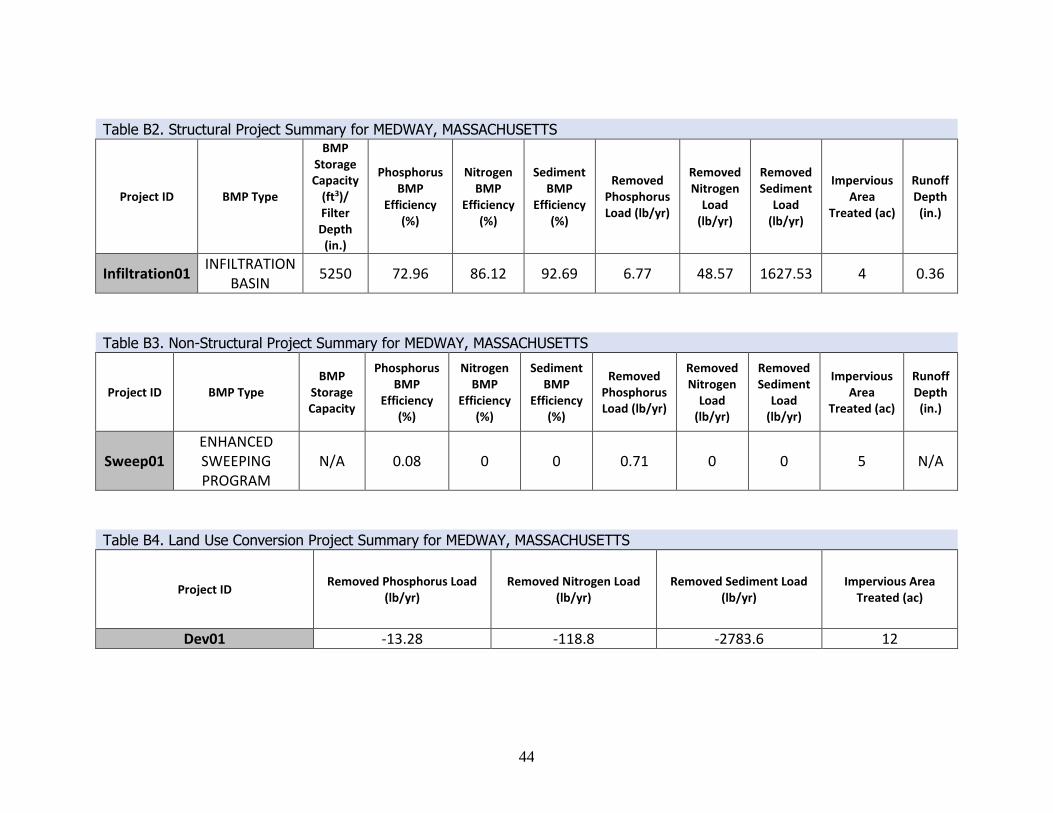
Table B2. Structural Project Summary for MEDWAY, MASSACHUSETTS
Project ID BMP Type
BMP Storage Capacity
(ft3)/ Filter Depth (in.)
Phosphorus BMP
Efficiency (%)
Nitrogen BMP
Efficiency (%)
Sediment BMP
Efficiency (%)
Removed Phosphorus Load (lb/yr)
Removed Nitrogen
Load (lb/yr)
Removed Sediment
Load (lb/yr)
Impervious Area
Treated (ac)
Runoff Depth (in.)
Infiltration01 INFILTRATION
BASIN 5250 72.96 86.12 92.69 6.77 48.57 1627.53 4 0.36
Table B3. Non-Structural Project Summary for MEDWAY, MASSACHUSETTS
Project ID BMP Type BMP
Storage Capacity
Phosphorus BMP
Efficiency (%)
Nitrogen BMP
Efficiency (%)
Sediment BMP
Efficiency (%)
Removed Phosphorus Load (lb/yr)
Removed Nitrogen
Load (lb/yr)
Removed Sediment
Load (lb/yr)
Impervious Area
Treated (ac)
Runoff Depth (in.)
Sweep01 ENHANCED SWEEPING PROGRAM
N/A 0.08 0 0 0.71 0 0 5 N/A
Table B4. Land Use Conversion Project Summary for MEDWAY, MASSACHUSETTS
Project ID Removed Phosphorus Load
(lb/yr) Removed Nitrogen Load
(lb/yr) Removed Sediment Load
(lb/yr) Impervious Area
Treated (ac)
Dev01 -13.28 -118.8 -2783.6 12

45
10. Appendix C: The BATT Pilot Users Comments and Responses
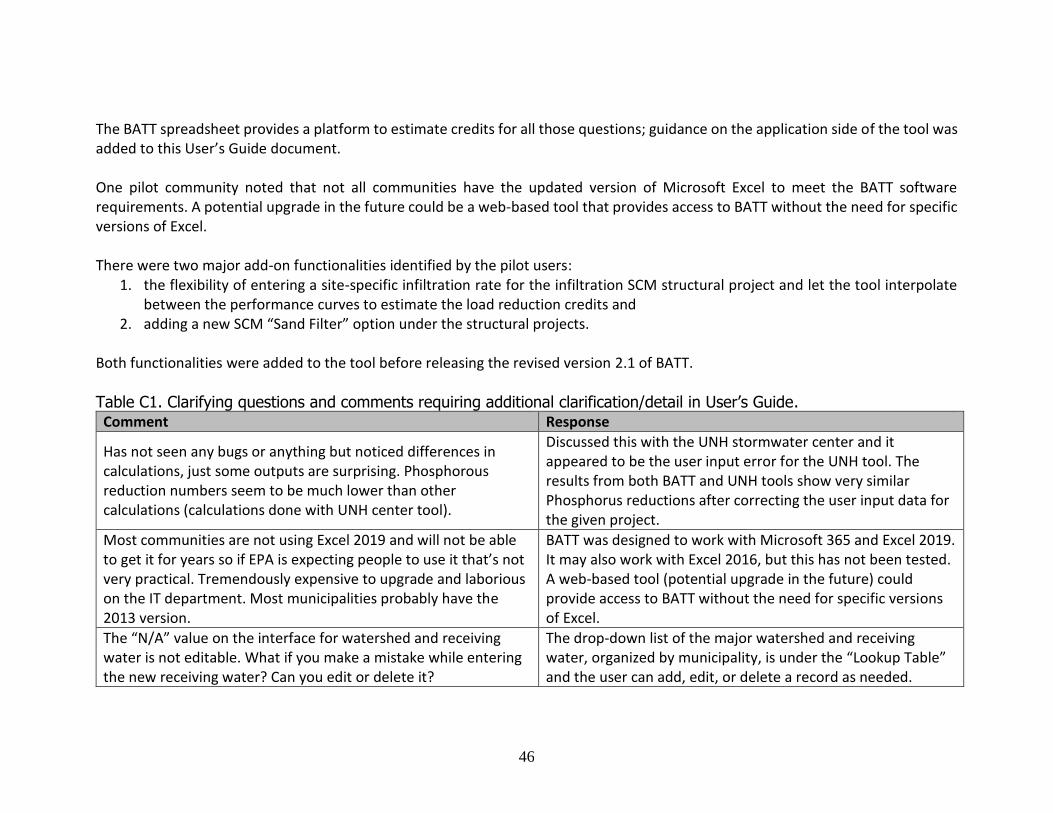
This appendix provides the comments received from the BATT pilot users and responses to those comments for changes made to the BATT spreadsheet and the User’s Guide before the final release of the updated version. Eastern Research Group (ERG) worked closely with EPA Region 1 to identify three pilot communities (Town of Lexington, Town of Medway, and Town of Watertown in Massachusetts) to pilot the draft version of the updated BATT spreadsheet for tracking and accounting of their existing stormwater controls to control phosphorus. Paradigm, in consultation with ERG, demonstrated the use of BATT through virtual meetings and provided technical support on the usability and functionality of BATT. Paradigm and ERG conducted two follow-up meetings with each community to ensure smooth installation and use of the tool. The technical support included the activities such as demonstrating the tools, inputting data, and answering community questions on how to properly use the tool for different stormwater control measures (structural, non-structural, land use change). Table C1, Table C2, and Table C3 below present the comments received from the three communities and the responses from ERG and Paradigm, including any updates made to the tool and User’s Guide. The tables have been organized by theme.
Table C1 presents comments that required clarification and/or additional detail on the application of the tool and were added to the BATT user’s guide. Table C1 also includes comments/questions that were addressed during the technical support meetings but did not require any changes to the BATT or User’s Guide. Table C2 presents comments that required updates to the BATT tool itself, such as improving existing functionality to make it more user-friendly. Table C3 presents comments about adding new functionality to the BATT for better tracking and accounting of the Stormwater Control Measure (SCM) projects, also referred to as Best Management Practices (BMPs).
Most of the comments were related to the application of the tool. These comments included policy questions on accounting credits for certain BMP practices. Examples of these questions include:
• How do you receive credits for not using phosphorous fertilizers;
• How do you track the number of catch basin cleaning and street sweeping operations; and
• What are the practices applicable under impervious area disconnection with and without physical storage?
46
The BATT spreadsheet provides a platform to estimate credits for all those questions; guidance on the application side of the tool was added to this User’s Guide document.
One pilot community noted that not all communities have the updated version of Microsoft Excel to meet the BATT software requirements. A potential upgrade in the future could be a web-based tool that provides access to BATT without the need for specific versions of Excel.
There were two major add-on functionalities identified by the pilot users: 1. the flexibility of entering a site-specific infiltration rate for the infiltration SCM structural project and let the tool interpolate
between the performance curves to estimate the load reduction credits and 2. adding a new SCM “Sand Filter” option under the structural projects.
Both functionalities were added to the tool before releasing the revised version 2.1 of BATT.
Table C1. Clarifying questions and comments requiring additional clarification/detail in User’s Guide. Comment Response
Has not seen any bugs or anything but noticed differences in calculations, just some outputs are surprising. Phosphorous reduction numbers seem to be much lower than other calculations (calculations done with UNH center tool).
Discussed this with the UNH stormwater center and it appeared to be the user input error for the UNH tool. The results from both BATT and UNH tools show very similar Phosphorus reductions after correcting the user input data for the given project.
Most communities are not using Excel 2019 and will not be able to get it for years so if EPA is expecting people to use it that’s not very practical. Tremendously expensive to upgrade and laborious on the IT department. Most municipalities probably have the 2013 version.
BATT was designed to work with Microsoft 365 and Excel 2019. It may also work with Excel 2016, but this has not been tested. A web-based tool (potential upgrade in the future) could provide access to BATT without the need for specific versions of Excel.
The “N/A” value on the interface for watershed and receiving water is not editable. What if you make a mistake while entering the new receiving water? Can you edit or delete it?
The drop-down list of the major watershed and receiving water, organized by municipality, is under the “Lookup Table” and the user can add, edit, or delete a record as needed.
47
Comment Response
However, the list is not editable from the interface window and must be updated under the “Lookup Table” worksheet in BATT.
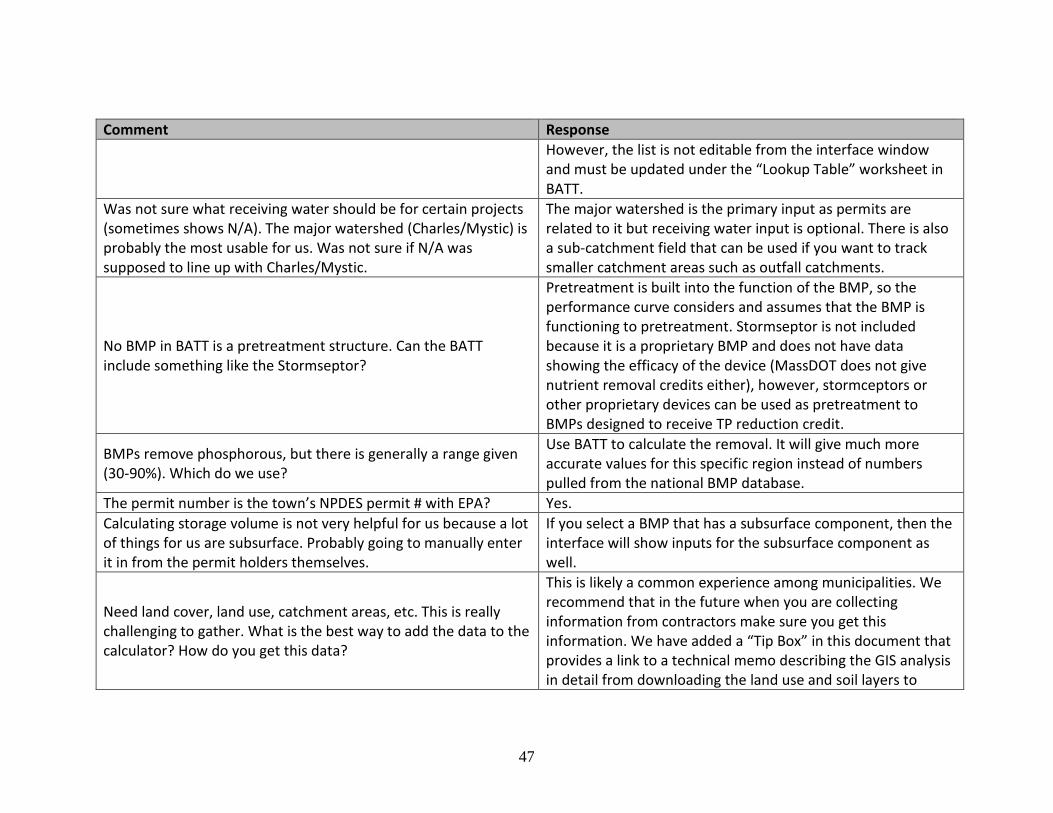
Was not sure what receiving water should be for certain projects (sometimes shows N/A). The major watershed (Charles/Mystic) is probably the most usable for us. Was not sure if N/A was supposed to line up with Charles/Mystic.
The major watershed is the primary input as permits are related to it but receiving water input is optional. There is also a sub-catchment field that can be used if you want to track smaller catchment areas such as outfall catchments.
No BMP in BATT is a pretreatment structure. Can the BATT include something like the Stormseptor?
Pretreatment is built into the function of the BMP, so the performance curve considers and assumes that the BMP is functioning to pretreatment. Stormseptor is not included because it is a proprietary BMP and does not have data showing the efficacy of the device (MassDOT does not give nutrient removal credits either), however, stormceptors or other proprietary devices can be used as pretreatment to BMPs designed to receive TP reduction credit.
BMPs remove phosphorous, but there is generally a range given (30-90%). Which do we use?
Use BATT to calculate the removal. It will give much more accurate values for this specific region instead of numbers pulled from the national BMP database.
The permit number is the town’s NPDES permit # with EPA? Yes.
Calculating storage volume is not very helpful for us because a lot of things for us are subsurface. Probably going to manually enter it in from the permit holders themselves.
If you select a BMP that has a subsurface component, then the interface will show inputs for the subsurface component as well.
Need land cover, land use, catchment areas, etc. This is really challenging to gather. What is the best way to add the data to the calculator? How do you get this data?
This is likely a common experience among municipalities. We recommend that in the future when you are collecting information from contractors make sure you get this information. We have added a “Tip Box” in this document that provides a link to a technical memo describing the GIS analysis in detail from downloading the land use and soil layers to

48
Comment Response
reclassifying the original categories into the required land use groups and hydrologic soil groups for the BATT.
Would be helpful to have some land use definitions in the reference tables (high density, low density, etc.).
Appendix F Attachment 2 of the MA MS4 permit provides a Table 2-2 for Crosswalk of MassGIS land use categories to land use groups for P load calculations. We added that table in the User’s Guide for reference (see Table 1).
Non-structural controls: There is no option for the number of catch basins cleaned in the tool. Street sweeping need to be entered and calculated individually? Is this meant to be calculated on a town-wide basis?
The drainage area to each catch basin would be different and entering each catchbasin as a separate project would be tedious. So, the user may use a lumped approach, adding all drainage areas to all catch-basins together for an outfall catchment. Like catch-basin, street sweeping may use a lumped approach and rolls up the impact of street sweeping actions in all drainage areas by similar frequency and type of sweeper.
Catch basin cleaning frequency: If you clean catch basins twice a year, can you count them twice?
No, the credits are estimated based on the annual maintenance of keeping the catch basin clean and no more than 50% full, according to permit requirements.
Can you take credit for each field that is not fertilized? Can you get credit twice if you stop fertilizing a field that is normally fertilized twice a year?
The credits for no application of fertilizer containing phosphorus are estimated based on no application around the year. Please ensure to check your MS4 permit to see if credit is available for this practice. The 2016 MA MS4 permit provides no credit for this practice due to Massachusetts State Law330 CMR 31.
Organic leaf collection program: Why is there only one start date option? Should this credit be calculated by the amount of material collected?
To earn this credit, the permittee must gather and remove all landscaping wastes, organic debris, and leaf litter from impervious roadways and parking lots at least once per week from September 1 to December 1 of each year. The credits are
49
Comment Response
based on the land use specific loading rate from the impervious cover with a 5% phosphorus reduction factor.
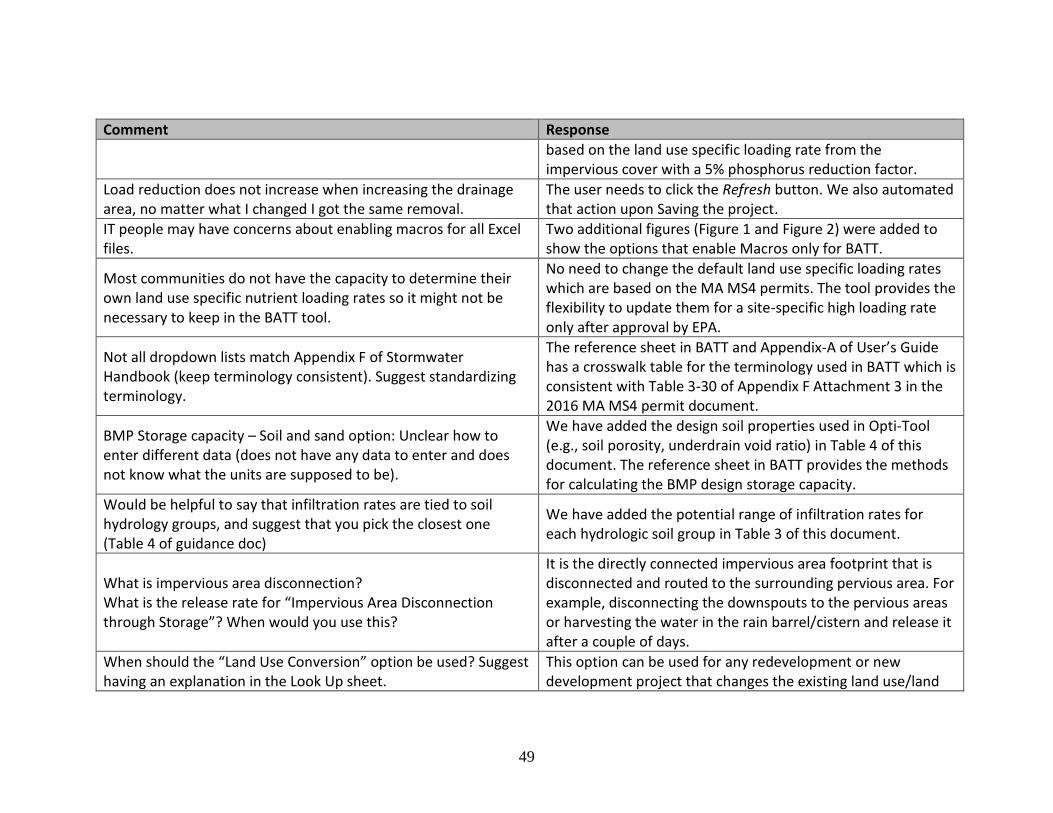
Load reduction does not increase when increasing the drainage area, no matter what I changed I got the same removal.
The user needs to click the Refresh button. We also automated that action upon Saving the project.
IT people may have concerns about enabling macros for all Excel files.
Two additional figures (Figure 1 and Figure 2) were added to show the options that enable Macros only for BATT.
Most communities do not have the capacity to determine their own land use specific nutrient loading rates so it might not be necessary to keep in the BATT tool.
No need to change the default land use specific loading rates which are based on the MA MS4 permits. The tool provides the flexibility to update them for a site-specific high loading rate only after approval by EPA.
Not all dropdown lists match Appendix F of Stormwater Handbook (keep terminology consistent). Suggest standardizing terminology.
The reference sheet in BATT and Appendix-A of User’s Guide has a crosswalk table for the terminology used in BATT which is consistent with Table 3-30 of Appendix F Attachment 3 in the 2016 MA MS4 permit document.
BMP Storage capacity – Soil and sand option: Unclear how to enter different data (does not have any data to enter and does not know what the units are supposed to be).
We have added the design soil properties used in Opti-Tool (e.g., soil porosity, underdrain void ratio) in Table 4 of this document. The reference sheet in BATT provides the methods for calculating the BMP design storage capacity.
Would be helpful to say that infiltration rates are tied to soil hydrology groups, and suggest that you pick the closest one (Table 4 of guidance doc)
We have added the potential range of infiltration rates for each hydrologic soil group in Table 3 of this document.
What is impervious area disconnection? What is the release rate for “Impervious Area Disconnection through Storage”? When would you use this?
It is the directly connected impervious area footprint that is disconnected and routed to the surrounding pervious area. For example, disconnecting the downspouts to the pervious areas or harvesting the water in the rain barrel/cistern and release it after a couple of days.
When should the “Land Use Conversion” option be used? Suggest having an explanation in the Look Up sheet.
This option can be used for any redevelopment or new development project that changes the existing land use/land

50
Comment Response
cover from one type to another type. For example, changing the open space to residential apartments or removing the impervious cover, and restoring the natural permeability of the soil.
Has the EPA decided about Residual Designation (RD) and who it would apply to?
This option is a placeholder in BATT and can be used if an RD permit is issued by EPA in the future.
Explain to people about the saving option (need to export first?) Explain where things are saved and how to find them once they are saved. Lost information/data that was originally saved when I moved the BATT spreadsheet to a different location on the computer.
The Save button will save the information from the user’s input form to the workbook. The user needs to save the workbook before closing it. Next time when you open the workbook, the saved information will be available under the saved projects. Select a project from the existing project pull-down list and click Edit to see the project details saved earlier for the selected project. Moving the excel file should not lose the saved information if it was saved properly.
Could not hit save because it did not have an install date. Would be helpful to save the work without having to put in the completion date.
The date entry is a text field. You may input a note there so you can save it temporarily. You can edit the saved project later and continue adding/updating the information entered previously.
Where do docs go when they are saved? If you save them, do you have to export them? Can you choose a name for the file instead of just exporting it? Would be helpful to either “save as” or have the unique ID part of the file name automatically. Overall file storage could be improved
Saving file names and where to save them on your computer are completely up to the user. There are default naming conventions and save locations, but the user can change them.
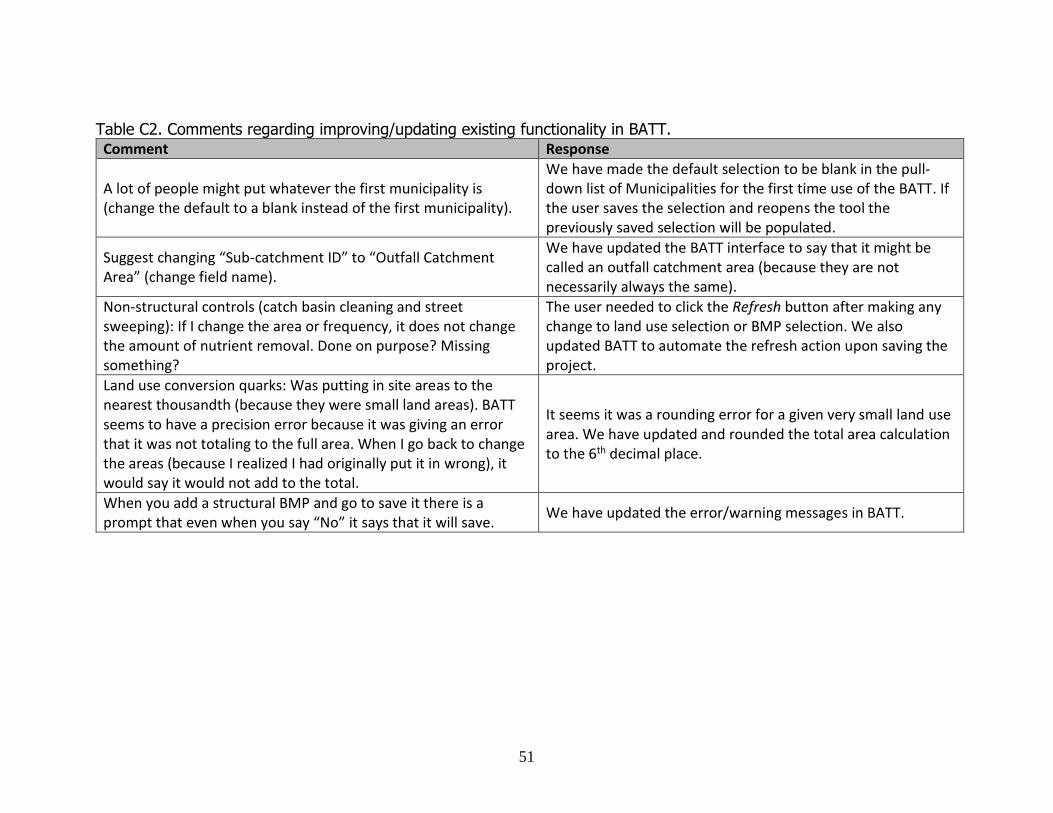
51
Table C2. Comments regarding improving/updating existing functionality in BATT. Comment Response
A lot of people might put whatever the first municipality is (change the default to a blank instead of the first municipality).
We have made the default selection to be blank in the pull-down list of Municipalities for the first time use of the BATT. If the user saves the selection and reopens the tool the previously saved selection will be populated.
Suggest changing “Sub-catchment ID” to “Outfall Catchment Area” (change field name).
We have updated the BATT interface to say that it might be called an outfall catchment area (because they are not necessarily always the same).
Non-structural controls (catch basin cleaning and street sweeping): If I change the area or frequency, it does not change the amount of nutrient removal. Done on purpose? Missing something?
The user needed to click the Refresh button after making any change to land use selection or BMP selection. We also updated BATT to automate the refresh action upon saving the project.
Land use conversion quarks: Was putting in site areas to the nearest thousandth (because they were small land areas). BATT seems to have a precision error because it was giving an error that it was not totaling to the full area. When I go back to change the areas (because I realized I had originally put it in wrong), it would say it would not add to the total.
It seems it was a rounding error for a given very small land use area. We have updated and rounded the total area calculation to the 6th decimal place.
When you add a structural BMP and go to save it there is a prompt that even when you say “No” it says that it will save.
We have updated the error/warning messages in BATT.

52
Table C3. Comments regarding adding new functionality in BATT. Comment Response
Add Refresh button on “BMP Land Use Information” pages for structural and non-structural SCM projects. It would be more helpful to put the refresh button at the bottom of the page.
We have moved the Refresh button at the bottom of the main interface of the structural and non-structural project windows in BATT.
Add Refresh button on “Land Use Condition Before” and “Land Use Condition After” pages for land use conversion project.
We have added a Refresh button at the bottom of the main interface of the project window in BATT.
Would be helpful to have input for our own town’s permit ID so we can keep track of it. Ultimately when you export all the data together you want to see all the BMP types together. Parcel ID does not really help us because we do not file anything by that, and we want to be able to organize them by local permit #. Organizing by local permit number could be very helpful.
We have added a local permit ID for all three project types to the last page of project interfaces in BATT.
Enhanced sweeping program: Say you do this sweeping every 6 months. No option to enter the frequency, even though it is listed as an option in the permit. (Currently only three months). Need to be able to weigh the costs of how often people should go out and clean (how much does this affect phosphorus removal?)
We have added a new user input option for the number of months the street sweeping program was implemented in a year. This is an adjusting factor (a multiplier) to the annual credits for the given sweeping program consistent with the permit requirement.
Would be nice to have input the infiltration rates for the infiltration SCM structural projects.
We have added the functionality to interpolate the two performance curves for estimating the load reductions for a user-defined infiltration rate for structural SCM projects in BATT. The user may enter the site-specific infiltration rates if those are different from the default infiltration rates available in the pull-down list.
No sand filter option in the BMP pull-down list for the structural SCM project.
We have added the “sand filter” structural BMP option in BATT.