Bite of the Cats: Relationships between Functional Integration and Mechanical Performance as...
23
Syst. Biol. 62(6):878–900, 2013 © The Author(s) 2013. Published by Oxford University Press, on behalf of the Society of Systematic Biologists. All rights reserved. For Permissions, please email: [email protected] DOI:10.1093/sysbio/syt053 Advance Access publication August 6, 2013 Bite of the Cats: Relationships between Functional Integration and Mechanical Performance as Revealed by Mandible Geometry PAOLO PIRAS 1,2,∗ ,LEONARDO MAIORINO 1,2 ,LUCIANO TERESI 3,4 ,CARLO MELORO 5 ,FEDERICO LUCCI 2 , TASSOS KOTSAKIS 1,2 , AND PASQUALE RAIA 5 1 Center for Evolutionary Ecology, Largo San Leonardo Murialdo 1, 00146, Rome, Italy; 2 Dipartimento di Scienze, Università Roma Tre, Largo San Leonardo Murialdo 1, 00146, Rome, Italy; 3 LaMS — Modelling & Simulation Lab, Università Roma Tre, Via Corrado Segre, 6 I-00146 Rome, Italy; 4 Dipartimento di Matematica e Fisica, Università Roma Tre, Roma, Italy, Via Corrado Segre, 6 I-00146 Rome, Italy; and 5 Dipartimento di Scienze della Terra, dell’Ambiente e delle Risorse, Università degli Studi Federico II, Largo San Marcellino 10, 80138 Naples, Italy ∗ Correspondence to be sent to: Paolo Piras, Center for Evolutionary Ecology, Largo San Leonardo Murialdo 1, 00146, Rome, Italy; E-mail: [email protected]. Recieved 30 January 2013; reviews returned 14 May 2013; accepted 3 August 2013 Associate Editor: Norm MacLeod Abstract.—Cat-like carnivorous mammals represent a relatively homogeneous group of species whose morphology appears constrained by exclusive adaptations for meat eating. We present the most comprehensive data set of extant and extinct cat-like species to test for evolutionary transformations in size, shape and mechanical performance, that is, von Mises stress and surface traction, of the mandible. Size and shape were both quantified by means of geometric morphometrics, whereas mechanical performance was assessed applying finite element models to 2D geometry of the mandible. Additionally, we present the first almost complete composite phylogeny of cat-like carnivorans for which well-preserved mandibles are known, including representatives of 35 extant and 59 extinct species of Felidae, Nimravidae, and Barbourofelidae. This phylogeny was used to test morphological differentiation, allometry, and covariation of mandible parts within and among clades. After taking phylogeny into account, we found that both allometry and mechanical variables exhibit a significant impact on mandible shape. We also tested whether mechanical performance was linked to morphological integration. Mechanical stress at the coronoid process is higher in sabertoothed cats than in any other clade. This is strongly related to the high degree of covariation within modules of sabertooths mandibles. We found significant correlation between integration at the clade level and per-clade averaged stress values, on both original data and by partialling out interclade allometry from shapes when calculating integration. This suggests a strong interaction between natural selection and the evolution of developmental and functional modules at the clade level. [Comparative methods; felidae mandible; finite element analysis; geometric morphometrics; morphological integration; sabertooth; structural performance] Understanding phenotypic evolution is a central topic in evolutionary biology. Phenotypes reflect multiple selective pressures that operate at multiple scales: from the individual to the species (e.g., developmental and mechanical constraints, key innovations). The term “phenotype” may refer to the morphology of biological structures, to their mechanical performance, or to the organization of their constitutive parts, that is, morphological integration. These three attributes define how phenotypes come about, change through a lineage’s history, and work, in the light of adaptation and as conditioned by phylogenetic effects. In this regard, the mammalian mandible has received great interest for its obvious role in a primary organismal function (feeding) (Herring 1980, 1993). From an adaptationist perspective, mandibular geometry should just reflect its performance in chewing and grappling of food. However, early attempts to explain the variation in mandible geometry among mammals suggest that evolutionary changes among major clades explain more variation than does niche differentiation per se (Crusafont-Pairó and Truyols-Santonja 1956, 1957, 1958). This has been recently confirmed for two different mammalian groups: Carnivora (Meloro et al. 2008; Meloro and O’Higgins 2011) and Ungulates (Raia et al. 2010). Although a phenotype’s value as an adaptation must be studied in terms of its performance, this was rarely applied to the mammalian mandible (cf. Therrien 2005a,b; Wroe et al. 2007; Tseng and Binder 2009). In this article, we studied the relationships between morphological variation in mandible geometry, the mandible’s structural performance in response to bite solicitation, and its morphological integration as conditioned by phylogenetic effects. Our study model includes all the cat-like carnivorans: members of the suborder Feliformia (the subfamilies Felinae and Machairodontinae, within Felidae), and of the families Nimravidae and Barbourofelidae. Cats are and always were unambiguously strict meat eaters (Ewer 1973; Therrien 2005b; Van Valkenburgh 2007; Christiansen 2008; Slater and Van Valkenburgh 2008; Van Valkenburg and Wayne 2010; Meloro and Slater 2012). The homogeneity in cat-like carnivorans feeding habitus is reflected in their dentition, which is optimally designed for slicing meat and severing tendons. The lower carnassial (m1) shows a reduction in the posterior cusps (hypo and entoconid). The lower premolar row is generally short and separated from the canine by a diastema. Interestingly, these adaptations (which occurred iteratively among hypercarnivorous carnivorans, Holliday and Steppan 2004) did not prevent ecomorphological differentiation 878 at Universita di Napoli on November 24, 2013 http://sysbio.oxfordjournals.org/ Downloaded from
Transcript of Bite of the Cats: Relationships between Functional Integration and Mechanical Performance as...

[12:28 28/9/2013 Sysbio-syt053.tex] Page: 878 878–900
Syst. Biol. 62(6):878–900, 2013© The Author(s) 2013. Published by Oxford University Press, on behalf of the Society of Systematic Biologists. All rights reserved.For Permissions, please email: [email protected]:10.1093/sysbio/syt053Advance Access publication August 6, 2013
Bite of the Cats: Relationships between Functional Integration andMechanical Performance as Revealed by Mandible Geometry
PAOLO PIRAS1,2,∗, LEONARDO MAIORINO1,2, LUCIANO TERESI3,4, CARLO MELORO5, FEDERICO LUCCI2,TASSOS KOTSAKIS1,2, AND PASQUALE RAIA5
1Center for Evolutionary Ecology, Largo San Leonardo Murialdo 1, 00146, Rome, Italy;2Dipartimento di Scienze, Università Roma Tre, Largo San Leonardo Murialdo 1, 00146, Rome, Italy;
3LaMS — Modelling & Simulation Lab, Università Roma Tre, Via Corrado Segre, 6 I-00146 Rome, Italy;4Dipartimento di Matematica e Fisica, Università Roma Tre, Roma, Italy, Via Corrado Segre, 6 I-00146 Rome, Italy; and
5Dipartimento di Scienze della Terra, dell’Ambiente e delle Risorse, Università degli Studi Federico II, Largo San Marcellino 10, 80138 Naples, Italy∗Correspondence to be sent to: Paolo Piras, Center for Evolutionary Ecology, Largo San Leonardo Murialdo 1, 00146, Rome, Italy;
E-mail: [email protected].
Recieved 30 January 2013; reviews returned 14 May 2013; accepted 3 August 2013Associate Editor: Norm MacLeod
Abstract.—Cat-like carnivorous mammals represent a relatively homogeneous group of species whose morphology appearsconstrained by exclusive adaptations for meat eating. We present the most comprehensive data set of extant and extinctcat-like species to test for evolutionary transformations in size, shape and mechanical performance, that is, von Mises stressand surface traction, of the mandible. Size and shape were both quantified by means of geometric morphometrics, whereasmechanical performance was assessed applying finite element models to 2D geometry of the mandible. Additionally, wepresent the first almost complete composite phylogeny of cat-like carnivorans for which well-preserved mandibles areknown, including representatives of 35 extant and 59 extinct species of Felidae, Nimravidae, and Barbourofelidae. Thisphylogeny was used to test morphological differentiation, allometry, and covariation of mandible parts within and amongclades. After taking phylogeny into account, we found that both allometry and mechanical variables exhibit a significantimpact on mandible shape. We also tested whether mechanical performance was linked to morphological integration.Mechanical stress at the coronoid process is higher in sabertoothed cats than in any other clade. This is strongly related to thehigh degree of covariation within modules of sabertooths mandibles. We found significant correlation between integrationat the clade level and per-clade averaged stress values, on both original data and by partialling out interclade allometryfrom shapes when calculating integration. This suggests a strong interaction between natural selection and the evolution ofdevelopmental and functional modules at the clade level. [Comparative methods; felidae mandible; finite element analysis;geometric morphometrics; morphological integration; sabertooth; structural performance]
Understanding phenotypic evolution is a central topicin evolutionary biology. Phenotypes reflect multipleselective pressures that operate at multiple scales: fromthe individual to the species (e.g., developmental andmechanical constraints, key innovations). The term“phenotype” may refer to the morphology of biologicalstructures, to their mechanical performance, or tothe organization of their constitutive parts, that is,morphological integration. These three attributes definehow phenotypes come about, change through a lineage’shistory, and work, in the light of adaptation and asconditioned by phylogenetic effects.
In this regard, the mammalian mandible has receivedgreat interest for its obvious role in a primary organismalfunction (feeding) (Herring 1980, 1993). From anadaptationist perspective, mandibular geometry shouldjust reflect its performance in chewing and grappling offood. However, early attempts to explain the variationin mandible geometry among mammals suggest thatevolutionary changes among major clades explainmore variation than does niche differentiation per se(Crusafont-Pairó and Truyols-Santonja 1956, 1957, 1958).This has been recently confirmed for two differentmammalian groups: Carnivora (Meloro et al. 2008;Meloro and O’Higgins 2011) and Ungulates (Raia et al.2010). Although a phenotype’s value as an adaptation
must be studied in terms of its performance, this wasrarely applied to the mammalian mandible (cf. Therrien2005a,b; Wroe et al. 2007; Tseng and Binder 2009).
In this article, we studied the relationships betweenmorphological variation in mandible geometry, themandible’s structural performance in response tobite solicitation, and its morphological integrationas conditioned by phylogenetic effects. Our studymodel includes all the cat-like carnivorans: membersof the suborder Feliformia (the subfamilies Felinae andMachairodontinae, within Felidae), and of the familiesNimravidae and Barbourofelidae.
Cats are and always were unambiguously strict meateaters (Ewer 1973; Therrien 2005b; Van Valkenburgh2007; Christiansen 2008; Slater and Van Valkenburgh2008; Van Valkenburg and Wayne 2010; Meloro andSlater 2012). The homogeneity in cat-like carnivoransfeeding habitus is reflected in their dentition, whichis optimally designed for slicing meat and severingtendons. The lower carnassial (m1) shows a reductionin the posterior cusps (hypo and entoconid). Thelower premolar row is generally short and separatedfrom the canine by a diastema. Interestingly, theseadaptations (which occurred iteratively amonghypercarnivorous carnivorans, Holliday and Steppan2004) did not prevent ecomorphological differentiation
878
at Universita di N
apoli on Novem
ber 24, 2013http://sysbio.oxfordjournals.org/
Dow
nloaded from

[12:28 28/9/2013 Sysbio-syt053.tex] Page: 879 878–900
2013 PIRAS ET AL.—FUNCTIONAL INTEGRATION IN CAT-LIKE CARNIVORANS 879
among cats: some species developed extremely longupper canines (Turner and Antón 1997; Feranec 2008)allowing for the occupation of a distinct (and nowextinct) predatory niche: the sabertooth. Therrien(2005b) and Christiansen (2008) showed that thesabertooth mandible is unique in shape. It has shorterramii, longer diastema, and deep mandibular flanges(Prevosti et al. 2010) as compared with the mandibleof conical toothed cats. These adaptations are relatedto the elongation of the upper canines, and allow awide jaw gape (Andersson et al. 2011; Figueirido et al.2011). Although the sabertooth’s ecomorphology (andhow it differs from conical-toothed cats) has attractedso much interest, it is still unclear how the two majorcat-like carnivoran morphotypes (i.e. conical-toothedcats and sabertooth) differ in ecomorphology, and if theconvergence of different lineages on sabertoothednessdid lead to truly equivalent performances. For instance,Therrien (2005b) argued that sabertooths delivereda strong and powerful bite, whereas McHenry et al.(2007), by applying finite element analysis (FEA) toskulls, suggested that bite force in Smilodon (the epitomeof sabertoothedness) was lower than in a similarlysized lion. Furthermore, the famed sabertooth caninesoccur in either one of two different kinds, the shorterdirk-tooth with crenulations on the margins, as in thegenus Homotherium, and the overly long canines of catssuch as Smilodon, which have smooth margins (Turnerand Antón 1997).
Recent advancements in the study of skull geometryand biomechanical modelling (Pierce et al. 2008) suggestthat combining geometric morphometrics (GM) andFEA provides the best insight about the mechanicalperformance of skeletal elements in relation to theirgeometry (Piras et al. 2012b). Additionally, Klingenberg(2010), Monteiro and Nogueira (2010) and especiallyMeloro et al. (2011) and Meloro and Slater (2012)introduced a new way to interpret interspecific shapevariation by looking at functional covariation betweenanatomical districts, such as the corpus and the ramusin the mandible, or the rostrum and the braincase in theskull.
Several works focused on mandible morphologyand/or integration in a number of different species(Prevosti et al. 2010; Meloro et al. 2011; Meloroand Slater 2012). Others focused on the structuralperformance of cranio-mandibular structures (McHenryet al. 2007; Christiansen 2011). However, few studieshave linked integration to mechanical performancein mandibles. Doing so would allow a test of thehypothesis that morphological integration varies asa response to mechanical solicitations (Monteiro andNogueira 2010). We hypothesized that morphologicalintegration between distinct mandibular parts (thecorpus that holds the teeth and the ramus wheremasticatory muscles attach) is stronger in the more“extreme” phenotypes (e.g. taxa showing a relativelylonger upper canine, the sabertooths) in order toface stronger mechanical solicitations. We combinedGM and FEA to study the most comprehensive
data set of cat-like species mandibles (inclusive ofextant and extinct species) ever assembled, in orderto test if and how mechanical performance betweenconical and sabertoothed species differs. We alsoprovide a deeper look into the sabertooth morphology,testing quantitatively if sabertooths represent a singleecomorphology (Meachen-Samuels 2012), or they arebetter ascribed to distinct ecomorphologies (Martinet al. 2000). As sabertoothedness evolved in differentlineages of Carnivora, we tested if phylogeneticsignal in mandible shape is present in our mandibledata set. We predicted lower signal in groups withhigher morphological integration and mechanicalperformance. To test these hypotheses, we introduce anew comprehensive phylogeny of cat-like carnivorans,including nearly all of the extant felids and mostextinct cat-like carnivorans for which sufficiently well-preserved mandibles were available.
MATERIALS AND METHODS
MaterialWe collected digital pictures of hemi-mandibles in
lateral view, belonging to 726 different individuals,from both original photographs and publishedpictures. Online Appendix I (available from Dryaddata repository; doi:10.5061/dryad.kp8t3) reports thespecimen list and the number of individuals per species.We used a standard protocol to take pictures at adistance of 2 m, in order to minimize distortion due toparallax (cf. Mullin and Taylor 2002; Meloro et al. 2008;Meloro et al. 2011). Our sample includes 94 species:35 extant and 59 extinct. Out of 37 extant felids, 35were included in our study. The two species we missedare Pardofelis badia and Leopardus jacobita. For extinctFelidae, we included every extinct species assigned tothe families Barbourofelidae and Nimravidae for whichat least one complete mandible was available in themuseum collections we visited, or in the literature (fulllist in Online Appendix I available from Dryad datarepository; doi:10.5061/dryad.kp8t3 ).
GMWe recorded 10 landmarks and 27 semilandmarks
on the hemi-mandible of each specimen using thesoftware tpsDig 2.16 (Rohlf 2010a) (Fig. 1). Thelandmark digitalization was performed by one ofus (L.M.) to minimize interobserver error whereasintraindividual digitalization error was assessed usingstandard protocols (Cardini and Tongiorgi 2003; Meloro2011). Measurement error for interlandmark distanceswas always lower than 5%, on original, as wellas on published, pictures. The semilandmarks wereautomatically recorded at equal distances along curvesthat we drew on the pictured specimens by usingtpsDig 2.16. Semilandmarks are useful to depict theshape of curved lines where landmarks cannot bedetected. It is assumed that contours are homologous
at Universita di N
apoli on Novem
ber 24, 2013http://sysbio.oxfordjournals.org/
Dow
nloaded from

[12:28 28/9/2013 Sysbio-syt053.tex] Page: 880 878–900
880 SYSTEMATIC BIOLOGY VOL. 62
FIGURE 1. Landmarks and semilandmark configuration applied to a Panthera leo left hemimandible. Landmark definitions: 1) anterior tip ofcanine alveolus; 2) posterior tip of canine alveolus; 3) posterior of p4 alveolus; 4) spine of p4 alveolus; 5) posterior tip of p4 alveolus; 6) posteriortip of m1 alveolus; 7) posterior tip of coronoid process; 8) maximum curvature between articular process and ascending ramus; 9) posterior tipof condyloid process; 10) posterior tip of angular process. The two mandibular modules (the corpus and the ramus) are identified by dotted line.The white scale bar is 5 cm long.
among specimens, whereas their individual points neednot be (MacLeod 1999; Bookstein 1997; Bookstein et al.2002).
Generalized procrustes analysis (GPA; Bookstein 1991,Goodall 1991) was used to extract shape variables fromthe raw landmark and semilandmark coordinates. GPArotates, aligns, and scales landmark configurations tounit centroid size (CS = the square root of the sumof squared distances of a set of landmarks from theircentroid; Bookstein 1986) so that shape differencesbetween specimens are not due to rotation, position, andsize (Rohlf and Slice 1990).
As semilandmarks differ from landmarks, thesepoints, in addition to being optimally translated, rotated,and scaled, are slid along the contour until they match, asmuch as possible, the positions of corresponding pointsalong the contour in the reference configuration (Adamset al. 2004; Perez-Bernal et al. 2006). All GM analyses wereperformed using the R package “Morpho,” Schlager(2013). This package minimizes the Bending Energyduring the sliding process.
After GPA, Procrustes coordinates of differentindividuals belonging to a single species were averagedas to obtain 94 different coordinates, taken as the shapevariables. Principal component analysis (PCA) wasperformed on Procrustes coordinates to find orthogonalaxes of maximal variation. This is a common procedurein geometric morphometric studies (Adams et al. 2004;Claude 2008; Figueirido et al. 2010).
PhylogenyWe built a composite phylogeny (using Mesquite 2.73,
Maddison and Maddison 2010) that included all speciespresent in our data set. The phylogeny is based onpublished cladistic analyses of extinct and extant taxa,
and on their stratigraphic range. The phylogenetictree adopted in our study is presented in Figure 2.Five monophyletic groups of cat-like carnivorans aretraditionally identified: 1) Barbourofelidae, 2) Felinae,3) Machairodontinae and a distinct clade including4) Hyperailurictis+Nimravides within Felidae, and 5)Nimravidae (Peigné 2003; Morlo et al. 2004; Werdelinet al. 2010). We followed Peigné (2003) for the affinitiesbetween Nimravidae and the Felidae+Barbourofelidaegroup, and for the phylogenetic relationships withinNimravidae. Geraads and Güleç (1997), Morlo et al.(2004), Tseng et al. (2010), and Werdelin et al. (2010)were considered for the phylogenetic relationshipswithin Barbourofelidae. Haplogale media and Proailuruslemanensis are considered basal taxa to Barbourofelidaeand Felidae, respectively, in keeping with Werdelinet al. (2010). For the phylogenetic relationships withinHyperailurictis+Nimravides, we followed de Beaumont(1990), Rothwell (2003), and Werdelin et al. (2010).Pseudaelurus quadridentatus is herein considered abasal machairodont (Werdelin et al. 2010), whereasthe relationships within machairodonts are based onKurtén and Anderson (1980), Werdelin and Lewis(2001), Andersson and Werdelin (2005), Werdelin andPeigné (2010), and Werdelin et al. (2010). Styriofelisis the sister group to Felinae (Werdelin et al. 2010).Inner phylogenetic relationships within Felinae followJohnson et al. (2006) and Werdelin et al. (2010). Wepartially had to recalibrate the branch lengths in themolecular phylogeny proposed by Johnson et al. (2006)after adding some extinct taxa (e.g., Pristifelis attica, Felischristoli, Miracinonyx spp., and Panthera spp.). Furtherdetails about the systematics arguments upon which webuilt our phylogeny, and additional literature sources areavailable as Online Appendix II (available from Dryaddata repository; doi:10.5061/dryad.kp8t3).
at Universita di N
apoli on Novem
ber 24, 2013http://sysbio.oxfordjournals.org/
Dow
nloaded from

[12:28 28/9/2013 Sysbio-syt053.tex] Page: 881 878–900
2013 PIRAS ET AL.—FUNCTIONAL INTEGRATION IN CAT-LIKE CARNIVORANS 881
FIGURE 2. Phylogenetic tree comprehensive of all species considered in this work. Thicker lines indicate the observed stratigraphic range oftaxa.
at Universita di N
apoli on Novem
ber 24, 2013http://sysbio.oxfordjournals.org/
Dow
nloaded from

[12:28 28/9/2013 Sysbio-syt053.tex] Page: 882 878–900
882 SYSTEMATIC BIOLOGY VOL. 62
Morphological IntegrationSeveral studies have examined morphological
integration within the mammalian mandible (Atchleyet al. 1982; Atchley and Hall 1991; Cheverud et al.1991, 1997, 2004; Atchley 1993; Badyaev and Foresman2000, 2004; Klingenberg and Leamy 2001; Klingenberget al. 2001, 2003, 2004; Leamy et al. 2002; Ehrich et al.2003; Cheverud 2004; Badyaev et al. 2005; Polly 2005;Márquez 2008; Klingenberg 2009; Zelditch et al. 2009)by exploring different modular hypotheses. Here weadopt the same modular hypothesis of Meloro et al.(2011) in order to compare, among clades, the degree ofmorphological integration between the corpus, whichhouses the teeth and provides attachment for someof the jaw-closing muscles, and the ramus, whicharticulates with the cranium and provides attachmentsites for the most prominent jaw-closing muscles.Although this distinction is clearly functional, it alsoreflects the pattern of aggregation of mesenchymalcells during embryonic development, which condenseto form the morphogenetic units of the developingmandible (Atchley and Hall 1991).
We used the RV coefficient (Escoufier 1973) as a metricof covariation between the various sets of shape variables(calculated using the function RV.rtest() in R package“ade4,” Dray and Dufur 2007). This coefficient wasoriginally proposed by Escoufier (1973) as a measureof the association between two multivariate sets ofdata. The RV coefficient is analogous to the R-squarein the univariate case (Claude 2008). The equationfor calculating RV therefore represents the amount ofcovariation scaled by the amount of variation withinthe two sets of variables, which is analogous to thecalculation of the correlation coefficient between twovariables (Klingenberg 2009). RV may take any valuefrom 0 to 1.
First, we explored global morphological integration,pooling the entire sample. Partial least square (PLS)analysis was also employed to visualize the covariationbetween corpus and ramus at the macroevolutionaryscale (cf. Meloro et al. 2011; Meloro and Slater 2012). Thisexploratory technique identifies the vectors (SingularWarps) that maximise co-variation between two blocksof multivariate data (Rohlf and Corti 2000) that in ourcase are represented by shape variables of the corpusand ramus modules, respectively. We then repeated theanalysis of morphological integration (RV coefficient)by multiplying shape variables by the inverse of thephylogenetic covariance matrix, in order to factor outdata nonindependence due to phylogeny. We performedthese analyses using the function oscorespls.fit () in Rpackage “pls” (Mevik and Wehrens 2007). A similarprocedure was applied in Piras et al. (2012a).
We also evaluated which modulus is more correlatedwith mechanical stress affecting the entire mandibleby means of multivariate regression, using ProcrustesCoordinates as dependent variables matrix and stressvariables as the independent variable. The RV coefficientwas computed for each of the five main clades in
our phylogeny to relate it with the per-clade averagedbiomechanical variables (see below).
FEAIn order to reconstruct the mandibular geometry,
we used Procrustes coordinates as control pointsto generate a smooth, closed contour by splineapproximation using a Matlab routine available inOnline Appendix III (available from Dryad datarepository; doi:10.5061/dryad.kp8t3). The reconstructedgeometry is then used as a 2D computational domainwhere a structural problem in the plane stress regimeis posed; the problem is solved by means of FEAusing the commercial software COMSOL Multiphysics4.2 (http://www.comsol.com). FEA is a mathematicalframework that provides a quantitative evaluation ofthe strain and stress state within a solid with givenmaterial properties, under appropriate applied loadsand boundary conditions that mimic a particularfunctional or behavioural scenario (Rayfield 2007, 2011).
These results yield a thorough characterization of themechanical state of the structure (see also Richmondet al. 2005; Zienkiewicz et al. 2005). A similar procedure,that is, creating finite element models starting from GMdata, was successfully applied by Young et al. (2010),Pierce et al. (2008, 2009a, 2009b), and Stayton (2009)among others.
Here, we used FEA in a comparative, rather thanvalidative, fashion. One of the key questions inmodern biologically oriented finite element studies isthe reliability of simulation in comparison with realexperimental studies. Many studies (Ross et al. 2005;Strait et al. 2005; Kupczik et al. 2007; Farke 2008;Gröning et al. 2009; Rayfield 2011) focused on thisproblem, demonstrating that incorporating more preciseapproximation in finite element simulations (anisotropicmaterial properties, muscle activation data, etc.)improves the correlation between simulations and realexperimental results. We applied the same comparativeapproach for all finite element models, with our objectiveto compare the mandibular mechanical performance ofspecies in the context of their phylogenetic relationships.Isotropic material properties corresponding to bovinehaversian bone (Young’s modulus: 10 GPa, Poisson’sratio: 0.41, Rayfield et al. 2001) were assumed for all themodels in our study.
Having used Procrustes coordinates to build ourgeometries, we rescaled them to the same size unit,thereby partialling out any evolutionary allometriceffect among species in estimating the mechanicalperformance variables (see below).
Our structural model of the mandible works accordingto a pressure load (i.e., a force per unit area) appliedon the base of the canine alveolus, which simulates biteforce. The mandible model has an elastic constraint atthe ascending ramus. Due to the high morphologicalvariability of the mandible among felids, nimravids,and barbourofelids, two different constraints were
at Universita di N
apoli on Novem
ber 24, 2013http://sysbio.oxfordjournals.org/
Dow
nloaded from

[12:28 28/9/2013 Sysbio-syt053.tex] Page: 883 878–900
2013 PIRAS ET AL.—FUNCTIONAL INTEGRATION IN CAT-LIKE CARNIVORANS 883
in fact considered: The first was placed on theposterior border of the coronoid process, where thetemporalis muscle inserts from the temporalis area,the second was placed on the condyloid process andon the angular process, where the masseter+pterygoidmuscular complex inserts from the zygomatic area.Finally, all the remaining portions of the boundary havea free boundary condition.
Due to the impossibility of applying the dry skullmethod (Thomason 1991) for all our 94 species to obtainbite forces for both extant and extinct species (cf. Wroeet al. 2005; Sakamoto et al. 2010) we used the estimatedbite force of Smilodon fatalis computed by Sakamoto et al.(2010) placed at the canine.
In order to obtain realistic results (in terms of absolutemagnitude), we scaled bite force according to the actualsize of our geometries as obtained from Procrustescoordinates. Due to the purely comparative approachwe applied, scaling has no direct effect on our results.This means that using a different bite force returns justdifferently scaled results.
Figure 3a shows the 2D geometry used to solvethe structural problem, the portion of the boundarywith the applied biting load, and the portion with theelastic constraints. The beam theory, using the theory ofelasticity (Timoshenko 1922), can give a useful estimateof the distribution of the reaction forces along theascending ramus of the mandible. We begin with thesimple scheme in Figure 3b: The bite force f is balancedby a reaction force f , and a reaction torque c= If ,proportional to the distance l between the bite force and
the point we consider at the vertical ramus. Then, theschemes in Figure 3c,d are used to calculate the normalstress � and the shear stress � along the vertical ramus,assuming this ramus to have a simple rectangular crosssection, with height h, width b (in plane-stress analysisit is assumed to be unitarian), and moment of inertia I =bh3/12. Figure 3e shows an actual mandible of an extantfelid (Panthera leo). Beam theory predicts the normalstress � to be linear along the height, and the shear stress� to be quadratic; denoted with y (the vertical coordinateof any geometry). With y=0 at the center of the verticalramus, we may write:
�(y)=c/I y,�(y)=6f/(bh3)(h2/4−y2) (1)
Thus, the normal stress is maximal at the ends, �max =�(h/2)=6c/(bh2), whereas the shear stress is maximalat center, �max =�(0)=3f /(2bh). Fixing the dorsoventralheight of the beam, both formulas yield higher stressvalues for those species having a shorter vertical ramus.
To asses the estimates given by the beam theory,we use FEA to compute the actual stress states in ourmodels. Denoting with x, y the horizontal and verticalcoordinates, the stress tensor S is represented by the 2×2matrix:
S=[
SxSxySxySy
]
The corresponding Von Mises stress is given by:
�M = (S2x +S2
y −SxSy +3S2xy)1/2.
FIGURE 3. Structural model used for our simulations. a) Finite Element Model. b) 1D scheme showing forces acting on the mandible corpus.c) and d) Diffrences in � due to different height of ascending ramus. e) Picture of Panthera leo mandible.
at Universita di N
apoli on Novem
ber 24, 2013http://sysbio.oxfordjournals.org/
Dow
nloaded from

[12:28 28/9/2013 Sysbio-syt053.tex] Page: 884 878–900
884 SYSTEMATIC BIOLOGY VOL. 62
The x and y components of the reaction acting along theascending ramus of the mandible are given by:
tx =Sxnx +Sxyny,ty =Sxynx +Syny,
where nx, ny are the components of the unit normalvector to the boundary.
The beam theory predicts a stress state given by:
S=[
���0
]
with � and � as above; thus, the corresponding Von Misesstress:
�Mbt = (�2 +3�2)1/2 (2)
We can compare the Von Mises stresses �M and �Mbt.Following our model (depicted in Fig. 3a) beam theory
and FEA predict that von Mises stress is positivelyrelated to bite force, and then to the reaction (a surfacetraction), once the dorsoventral height of horizontalramus has been fixed.
In fact, from equation (1) and equation (2) it follows:
�Mbt(x,y)=3/2f /(bh3)[64x2y2 +3(h2 −4y2)2](1/2).
We used global von Mises stress calculated on thewhole mandible area and the maximum surface tractioncalculated along the constrained posterior boundariesas structural variables to be used in subsequentcomparative analyses.
Linear Models and Comparative Methods: PhenotypicDifferences Between Clades
We accounted for the the potential effects of sharedancestry on the interspecific phenotypic variables. First,we tested for significant phylogenetic signal in bothstress variables and in CS by estimating the K statistic(Blomberg et al. 2003), using the function phylosig() inthe R package “phytools” (Revell 2012). Second, we usedfitContinuous() function in “GEIGER” (Harmon et al.2008) in order to find out which evolutionary model ismost supported. The best model’s parameter estimateswere used to transform the tree branch lengths in orderto provide the most appropriate covariance matrix forthe residuals in univariate phylogenetic GLS analyses,and in phylogenetic ANOVAs (Revell 2010, see below).
The seven models tested are Brownian motion whichis a random walk with constant variance; Ornstein-Uhlenbeck (which fits a random walk with a centraltendency with an attraction force proportional to theparameter alpha); Pagel’s lambda (which provides atree branch length transformation as to maximize thefit to Brownian motion); Pagel’s kappa (which tells ifevolution either concentrates at nodes or is proportionalto branch lengths as in the Brownian motion); Pagel’sdelta (which tells if the rate of evolution changes in time);ACDC model (which fits an exponential change to therate of evolution through time); and, finally, the whitenoise model (which assumes no phylogenetic signal is
present in the data). The Akaike Information Criterion(AIC) was used to find the best-fit model for characterevolution.
Shape is multivariate, so we could not estimate Pagel’slambda or Blomberg’s K statistics to test for phylogeneticsignal in the data. Instead, we tested the presence ofa phylogenetic structuring in the data by performing aMantel test between a Procrustes distance matrix and apatristic distances matrix coming from our phylogeny.
Then, we tested for differences in shape, stressvariables and size between the five distinct cladesidentifiable in our tree: Felinae, Barbourofelidae,Machairodontinae, Hyperailurictis+Nimravides andNimravidae. To this aim, we performed phylogeneticANOVA (using stress variables and size as dependentvariables, respectively) and phylogenetic MANOVA(using shape data as dependent variables) using thefive clades as a factor. Pairwise comparisons weremade using “phy.anova” and “phy.manova” functionsavailable in GEIGER R package (Harmon et al. 2008).
Regression Models and PGLSWe accounted for the relationships between shape,
size, and stress variables by using linear modelstaking phylogenetic relationships into account. Weachieved this by adopting the phylogenetic generalizedleast squares (PGLS) regression (Rohlf 2001, 2006).This method is equivalent to the phylogeneticindependent contrasts (PIC) first proposed byFelsenstein (1985). Standard regression methods assumedata independence. Due to phylogenetic relationships,multispecies biological data rarely meet this condition.Taking phylogeny into account in regression allowsreducing standard error due to nonindependencecaused by shared ancestry over a model that neglectsphylogeny (Felsenstein 1985; Garland 1992; Garlandet al. 2005). In order to evaluate the amount of shapeexplained by functional demands (i.e. mechanicalperformance), we regressed shape data (as dependent)on stress variables (as independents).
The influence of allometry on shape or stress datawas also assessed in regression models using shapedata or stress variables as dependents, and size asindependent. All these models were performed by usingPGLS analyses and performed in R using the functiongenpgls() written by one of the authors (PP; it can befound in Online Appendix IV, available from Dryad datarepository; doi:10.5061/dryad.kp8t3). Our stress datawere calculated using shapes scaled to unit size, thatis, using Procrustes coordinates and by applying thesame loading (=bite force) at canine to all finite elementmodels. Of course, a small domestic cat does not havethe same bite force as a lion but their mandibular shapesare quite similar in comparison with a Smilodon. Thus,evolutionary allometry (=the allometry that occursbetween approximately equally aged individuals ofdifferent species) must be controlled when testing theperformance of different shapes (Dumont et al. 2009;
at Universita di N
apoli on Novem
ber 24, 2013http://sysbio.oxfordjournals.org/
Dow
nloaded from
[12:28 28/9/2013 Sysbio-syt053.tex] Page: 885 878–900
2013 PIRAS ET AL.—FUNCTIONAL INTEGRATION IN CAT-LIKE CARNIVORANS 885
Slater et al. 2009; Slater and Van Valkenburgh 2009).For this reason we used Procrustes coordinates that areall scaled to unit size. However, we verified the impactof scaling by exploring the relationship among stressvariables and between stress variables and shape by re-multiplying stress data by individual-specific CS. Withthis procedure, bite forces are scaled for any individualbody size (i.e. CS). In fact, we statistically confirmedthat standardized bite force scales almost isometricallywith standardized body mass (�=0.93; P = 2.2e−16) asexpected (Wroe et al. 2005; Sakamoto et al. 2010). Weconfirmed this by verifying that for those species forwhich Sakamoto et al. (2010) report mean body mass,our per-species averaged CS predicts species mean bodymass very strongly (R2 =0.94; P = 2.2e−16).
Prior to exploring univariate relationships (i.e.between stress variables and size in ANOVAs and inunivariate PGLS), we transformed the phylogenetic treeaccording to the most supported mode of characterevolution as indicated by applying the fitcontinuous()function. For multivariate data this is not allowed andthe tree was not transformed when shape entered theanalysis (i.e. in MANOVAs and in multivariate PGLS),which means assuming de facto a Brownian motionmodel of evolution (Blankers et al. 2012).
Biomechanical Performance and IntegrationAs pointed out above, von Mises stress is proportional
to surface traction and inversely related to thedorsoventral height of the geometry. On the otherhand, surface traction is inversely related to the heightof constrained boundaries that are placed on theascending ramus. Thus, we first compared the predictedrelationship between von Mises stress and surfacetraction with the observed correlation between thesetwo variables. In fact, mandible geometry varies inboth the height of mandibular corpus and in theheight of the ascending ramus (and consequently inareas). Thus, the two modules vary (and possibly co-vary), and this variation differently constrains bothvon Mises stress and surface traction. We test hereif the variation in mandibular corpus changes thepredicted formal relationship between von Mises stressand surface traction. In order to do this, we performedlinear regressions between observed von Mises stressand surface traction and between von Mises stress andthe areas of the two functional modules defined above(calculated on the polygons identified by Procrustescoordinates of corresponding landmarks—as stressvariables were calculated on these coordinates, ratherthan on original data—). This way we can determine ifany deviation from the predicted relationship betweenvon Mises stress and surface traction is due todifferential, and possibly covarying, changes in themorphology of single modules.
We also test the hypothesis that sabertoothmorphology implies covarying arrangements inthe ascending ramus and mandibular corpus, thus
making the integration between these two subunitsstronger in sabertoothed than in conical-toothed cats.To this aim, we regressed clades’ RVs on the per-cladeaveraged values of the stress variables. This allows us toverify if the morphological integration at the clade levelcan be interpreted as a compensation of the change inbiomechanical performance due to the particular shapeevolved in such group.
Again, allometry could influence such analysis at twolevels. The first level is the intraclade allometry that couldinfluence the calculation of RV coefficient. The secondlevel is the interclade allometry, that is, that due to meansize differences between clades. In order to partial outboth forms of allometries, we re-computed RVs usingresiduals coming from per-clade separated regressionsbetween shape and size and successively tested if per-clade averaged stress data or clades RVs were correlatedwith per-clade averaged size values.
RESULTS
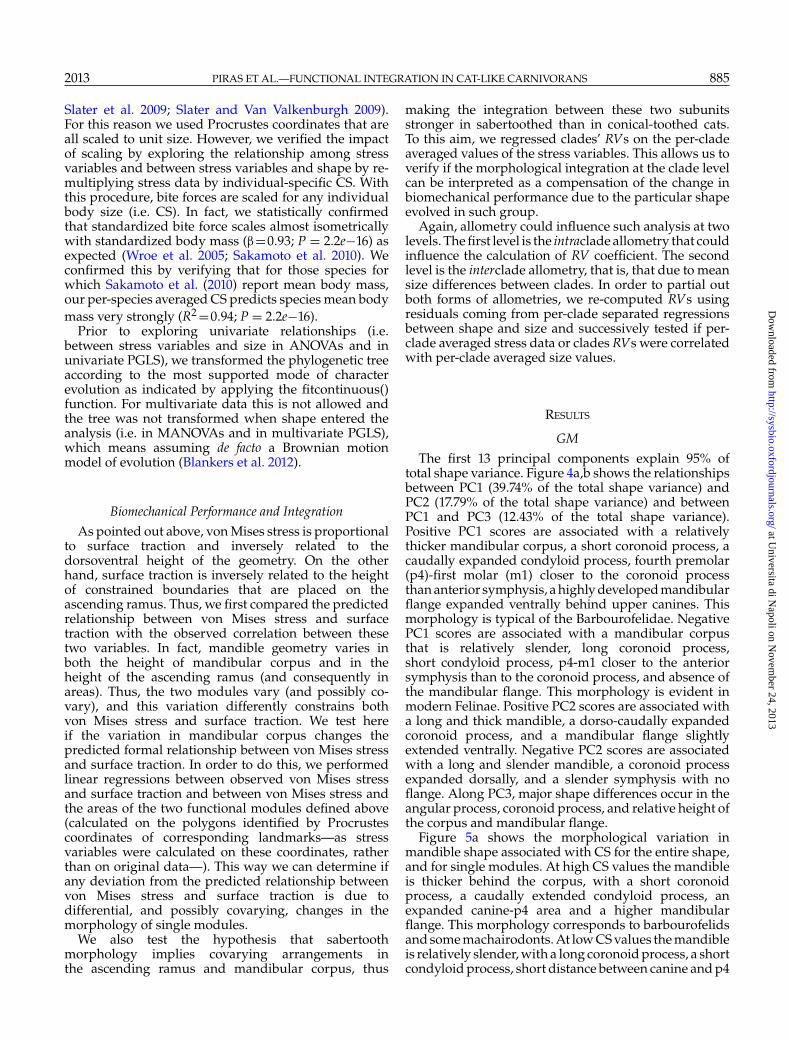
GMThe first 13 principal components explain 95% of
total shape variance. Figure 4a,b shows the relationshipsbetween PC1 (39.74% of the total shape variance) andPC2 (17.79% of the total shape variance) and betweenPC1 and PC3 (12.43% of the total shape variance).Positive PC1 scores are associated with a relativelythicker mandibular corpus, a short coronoid process, acaudally expanded condyloid process, fourth premolar(p4)-first molar (m1) closer to the coronoid processthan anterior symphysis, a highly developed mandibularflange expanded ventrally behind upper canines. Thismorphology is typical of the Barbourofelidae. NegativePC1 scores are associated with a mandibular corpusthat is relatively slender, long coronoid process,short condyloid process, p4-m1 closer to the anteriorsymphysis than to the coronoid process, and absence ofthe mandibular flange. This morphology is evident inmodern Felinae. Positive PC2 scores are associated witha long and thick mandible, a dorso-caudally expandedcoronoid process, and a mandibular flange slightlyextended ventrally. Negative PC2 scores are associatedwith a long and slender mandible, a coronoid processexpanded dorsally, and a slender symphysis with noflange. Along PC3, major shape differences occur in theangular process, coronoid process, and relative height ofthe corpus and mandibular flange.
Figure 5a shows the morphological variation inmandible shape associated with CS for the entire shape,and for single modules. At high CS values the mandibleis thicker behind the corpus, with a short coronoidprocess, a caudally extended condyloid process, anexpanded canine-p4 area and a higher mandibularflange. This morphology corresponds to barbourofelidsand some machairodonts. At low CS values the mandibleis relatively slender, with a long coronoid process, a shortcondyloid process, short distance between canine and p4
at Universita di N
apoli on Novem
ber 24, 2013http://sysbio.oxfordjournals.org/
Dow
nloaded from

[12:28 28/9/2013 Sysbio-syt053.tex] Page: 886 878–900
886 SYSTEMATIC BIOLOGY VOL. 62
FIGURE 4. a) Relationship between PC1 and PC2; b) Relationship between PC1 and PC3. Points dimension is proportional to speciesmean CS.
at Universita di N
apoli on Novem
ber 24, 2013http://sysbio.oxfordjournals.org/
Dow
nloaded from

[12:28 28/9/2013 Sysbio-syt053.tex] Page: 887 878–900
2013 PIRAS ET AL.—FUNCTIONAL INTEGRATION IN CAT-LIKE CARNIVORANS 887
FIGURE 5. a) Morphological changes in mandible shape associated to CS. b) The same relationhip for ascending ramus. c) The samerelationship for mandibular corpus. Points dimension is proportional to species mean CS.
at Universita di N
apoli on Novem
ber 24, 2013http://sysbio.oxfordjournals.org/
Dow
nloaded from

[12:28 28/9/2013 Sysbio-syt053.tex] Page: 888 878–900
888 SYSTEMATIC BIOLOGY VOL. 62
and no mandibular flange. This structural arrangementis typical of modern felids.
Figure 5b,c show allometry related to single modules.The ascending ramus of the mandible was less influencedby CS than the corpus. Table 1 reports R2 and P-values forindividual clades for entire shape and single modules.PGLS was performed only on the pooled data set (i.e. onthe entire phylogeny).
Morphological IntegrationTable 2 reports RV coefficients for the pooled sample
and the five main clades of our phylogeny. All RVsare significant except for the Hyperailurictis+Nimravidesclade. This could be due to the low number oftaxa (only five species) in this clade. Barbourofelidae
TABLE 1. OLS for individual clades and PGLS models for pooleddata set for shape-size relationships
Procrustes coordinates CS
OLSEntire shapeNimravidae R2 =0.038; P=0.79Hyperailurictis+Nimravides R2 =0.20; P=0.48Barbourofelidae R2 = 0.69; P = 0.038Machairodontinae R2 = 0.11; P = 0.03Felinae R2 = 0.18; P = 0.001
Mandibular corpusNimravidae R2 =0.082; P=0.38Hyperailurictis+Nimravides R2 =0.42; P=0.17Barbourofelidae R2 =0.69; P=0.06Machairodontinae R2 = 0.14; P = 0.023Felinae R2 = 0.21; P = 0.001
Ascending ramusNimravidae R2 =0.07; P=0.47Hyperailurictis+Nimravides R2 =0.19; P=0.69Barbourofelidae R2 = 0.57; P = 0.025Machairodontinae R2 =0.03; P=0.66Felinae R2 = 0.08; P = 0.01PGLS (for pooled data sets only)Entire shape P = 2.18e−6Mandibular corpus P = 7.74e−8Ascending ramus P = 0.04
Significant results are shown in bold.
TABLE 2. RV coefficients for the pooled sample and the five mainclades under study
Clade RV P
Pooled sample 0.64 0.001Nimravidae 0.61 0.008Hyperailurictis+Nimravides 0.57 0.27Barbourofelidae 0.85 0.003Machairodontinae 0.49 0.001Felinae 0.25 0.001
Significant results are shown in bold.
appears to be the clade with the highest degree ofmorphological integration, followed by Nimravidae andMachairodontinae. Felinae is the least-integrated clade.Hyperailurictis+Nimravides constitute an outlier in thisdistribution having a RV coefficient slightly larger thanin machairodonts. Pooled RV calculated on phylogenetictransformed data was significant as well (RV = 0.42;P=0.009).
Figure 6 shows the morphological covariation betweenthe two modules identified on the mandible according tonon phylogenetic PLS analysis performed on the pooledsample. The first pair of singular warps (SWs) explains98.9% of total covariance. On positive SW1 scores thecoronoid process is short and massive, the condyloidprocess is extended caudally, and the horizontal ramusis thick with a well-developed mandibular flange, asit can be seen in barbourofelids and sabertoothedmachairodonts. Negative SW1 scores correspond to adorso-caudally expanded, high and slender coronoidprocess, a short condyloid process, a long and slenderhorizontal ramus and no mandibular flange, which istypical of Felinae.
FEAFigure 7a reports the maximum surface traction
experienced by some representative taxa (among the94 analyzed) belonging to the five main clades ofour phylogeny and their von Mises stress patterns.Barbourofelids and derived nimravids appear to havethe smallest von Mises stress and the highest surfacetraction, followed by machairodontines. Felinae showsan opposite pattern in comparison with Barbourofelidae.Figure 7b,c show, respectively, the relationship betweenvon Mises stress and surface traction predicted by beamtheory when fixing beam height and that observed inexperimental data. They are strikingly different given thecovariation of mandible modules depicted in Figure 6.Biomechanical implications of this are described belowand in the section Discussion.
Figure 7d shows the relationship between von Misesstress and surface traction after re-multiplying thesevariables by individual-specific CSs (see below forlinear models results); the relationship is positive andsignificant.
Figure 8a,b,c shows the morphological changesassociated with the relationship between wholemandible shape or module shapes and surface tractionscores. High surface traction corresponds to shortcoronoid process, caudally extended condyloid process,and well-developed mandibular flanges, as seen inbarbourofelids and some nimravids. When surfacetraction is low the mandible is long and slender, andflanges are absent. This condition is typical of modernfelids. The relationship between shape and von Misesstress follows an inverse pattern (Fig. 9a) in comparisonwith surface traction (Fig. 8a). Yet, if von Mises stressand surface traction are both multiplied by originalCS (reintroducing allometric effects), the two variablesbehave the same way (Fig. 9b,c).
at Universita di N
apoli on Novem
ber 24, 2013http://sysbio.oxfordjournals.org/
Dow
nloaded from

[12:28 28/9/2013 Sysbio-syt053.tex] Page: 889 878–900
2013 PIRAS ET AL.—FUNCTIONAL INTEGRATION IN CAT-LIKE CARNIVORANS 889
FIGURE 6. Morphological covariation between the two modules identified on the mandible according to PLS analysis performed on thepooled sample. Points dimension is proportional to species mean CS.
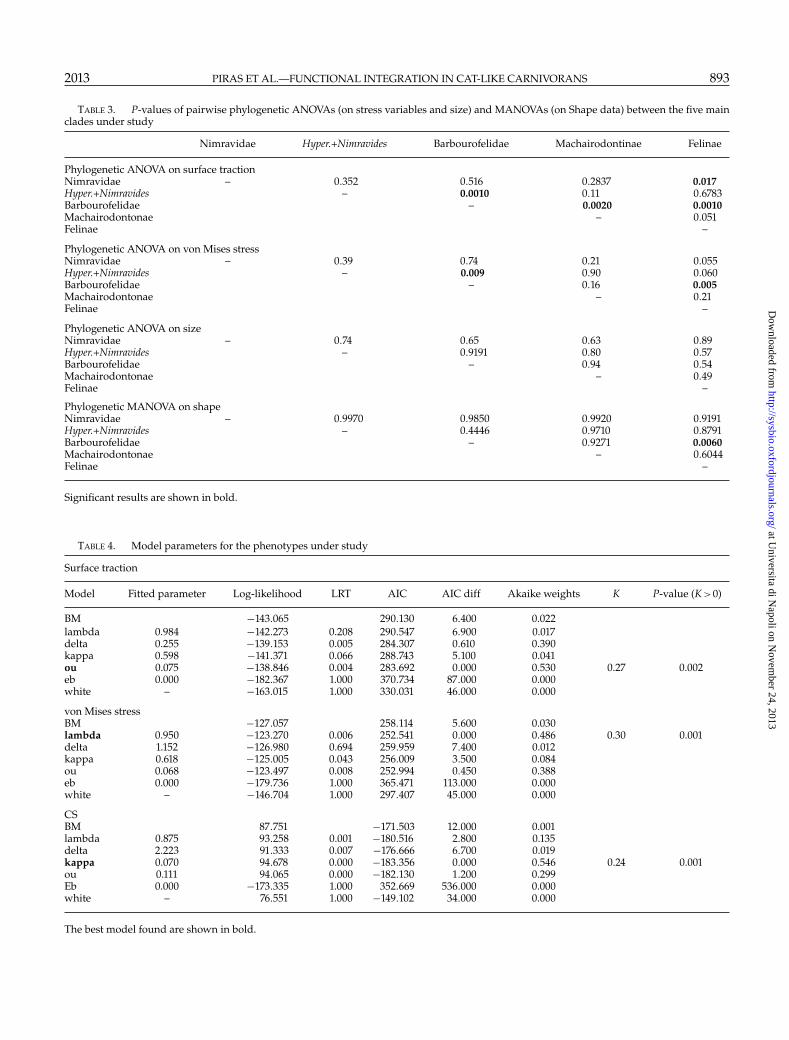
Linear Models and Comparative MethodsTable 3 reports results of phylogenetic ANOVA and
MANOVA. As for stress variables, these proceduresrevealed that Barbourofelidae is the clade differing themost from the others. Size, on the other hand, doesnot seem significantly different among individual cladesonce phylogeny is accounted for. In the phylogeneticMANOVAs, only the Barbourofelidae–Felinae differenceis significant. The Mantel test revealed the presence ofphylogenetic signal in shape (P<0.001). Using phylosig()function we found strong phylogenetic signal in bothstress variables and CS (P<0.001 for all the threevariables).
Seven different evolutionary modes were tested(Table 4). As for surface traction, the best model interms of AIC appears to be Ornstein–Uhlenbeck (OUwith �=0.07). Yet, the analysis of Akaike weightsreveals that the delta transformation proves to be agood alternative model. The fitted delta value (0.255)indicates a slowdown in the evolutionary rate of surfacetraction towards the recent. Both delta and OU modelsare statistically superior to Brownian motion (BM), asjudged by likelihood ratio test (Table 4). The phylogeneticsignal K in surface traction is 0.274, which is significantlydifferent from 0 (i.e. no signal, p=0.002). The evolutionof von Mises stress is best described by lambda, and
secondarily by OU model. Both these models provedstatistically better than BM (Table 4). The phylogeneticsignal in von Mises stress is small (K = 0.300) butsignificant (P=0.001). Finally, the evolution of CS is bestdescribed by kappa, and secondarily by OU and lambdamodels, as assessed by Akaike weights (Table 4). Thephylogenetic signal in CS is 0.241, which is significantlydifferent from zero (P=0.002).
Overall, the OU process is the best descriptor forsurface traction and a good descriptor (albeit not thebest) of von Mises stress and CS, indicating that there isa tendency to evolve towards an adaptive performancepeak in cat-like carnivorans. The strength of selectionof surface traction towards the peak (the fitted valuealpha in OU) is very close to zero (which corresponds,virtually, to Brownian motion, Butler and King 2004).This is consistent with the finding that the phylogeneticsignal is significant for the variables considered, as it isfor CS (cf. Meloro and Raia 2010).
Table 5 shows multivariate regressions between shapedata and stress variables. As for the whole mandible,this relationship is significant under PGLS. Using per-group size-free shape data (i.e. residuals of the per-clade regression between shape and size) we foundsmaller but still significant relationships under PGLS.This indicates that allometry is not responsible for therelationship between entire shape and stress variables.
at Universita di N
apoli on Novem
ber 24, 2013http://sysbio.oxfordjournals.org/
Dow
nloaded from

[12:28 28/9/2013 Sysbio-syt053.tex] Page: 890 878–900
890 SYSTEMATIC BIOLOGY VOL. 62
FIGURE 7. a) Surface traction plotted against y-coordinate of the boundary along which this variable has been measured. One typicalrepresentative of each family/subfamily is shown. b) Relationship predicted by beam theory when keeping dorsoventral height constant. c)Observed relationship between von Mises stress and surface traction. d) Observed relationship when both stress variables are re-multiplied byindividual CS. Dotted line represents linear model interpolation.
at Universita di N
apoli on Novem
ber 24, 2013http://sysbio.oxfordjournals.org/
Dow
nloaded from

[12:28 28/9/2013 Sysbio-syt053.tex] Page: 891 878–900
2013 PIRAS ET AL.—FUNCTIONAL INTEGRATION IN CAT-LIKE CARNIVORANS 891
FIGURE 8. a) Relationship between entire mandible, b) mandibular corpus, and c) ascending ramus shapes and surface traction. Pointsdimension is proportional to species mean CS.
at Universita di N
apoli on Novem
ber 24, 2013http://sysbio.oxfordjournals.org/
Dow
nloaded from

[12:28 28/9/2013 Sysbio-syt053.tex] Page: 892 878–900
892 SYSTEMATIC BIOLOGY VOL. 62
FIGURE 9. a) Regression between von Mises stress and shape; here Felinae appear as the most stressed. b) Regression between von Misesstress rescaled using original individual CS and shape. c) Regression scores for shape in a) versus regression scores for shape in b); they arenegatively correlated.
at Universita di N
apoli on Novem
ber 24, 2013http://sysbio.oxfordjournals.org/
Dow
nloaded from
[12:28 28/9/2013 Sysbio-syt053.tex] Page: 893 878–900
2013 PIRAS ET AL.—FUNCTIONAL INTEGRATION IN CAT-LIKE CARNIVORANS 893
TABLE 3. P-values of pairwise phylogenetic ANOVAs (on stress variables and size) and MANOVAs (on Shape data) between the five mainclades under study
Nimravidae Hyper.+Nimravides Barbourofelidae Machairodontinae Felinae
Phylogenetic ANOVA on surface tractionNimravidae – 0.352 0.516 0.2837 0.017Hyper.+Nimravides – 0.0010 0.11 0.6783Barbourofelidae – 0.0020 0.0010Machairodontonae – 0.051Felinae –
Phylogenetic ANOVA on von Mises stressNimravidae – 0.39 0.74 0.21 0.055Hyper.+Nimravides – 0.009 0.90 0.060Barbourofelidae – 0.16 0.005Machairodontonae – 0.21Felinae –
Phylogenetic ANOVA on sizeNimravidae – 0.74 0.65 0.63 0.89Hyper.+Nimravides – 0.9191 0.80 0.57Barbourofelidae – 0.94 0.54Machairodontonae – 0.49Felinae –
Phylogenetic MANOVA on shapeNimravidae – 0.9970 0.9850 0.9920 0.9191Hyper.+Nimravides – 0.4446 0.9710 0.8791Barbourofelidae – 0.9271 0.0060Machairodontonae – 0.6044Felinae –
Significant results are shown in bold.
TABLE 4. Model parameters for the phenotypes under study
Surface traction
Model Fitted parameter Log-likelihood LRT AIC AIC diff Akaike weights K P-value (K >0)
BM −143.065 290.130 6.400 0.022lambda 0.984 −142.273 0.208 290.547 6.900 0.017delta 0.255 −139.153 0.005 284.307 0.610 0.390kappa 0.598 −141.371 0.066 288.743 5.100 0.041ou 0.075 −138.846 0.004 283.692 0.000 0.530 0.27 0.002eb 0.000 −182.367 1.000 370.734 87.000 0.000white – −163.015 1.000 330.031 46.000 0.000
von Mises stressBM −127.057 258.114 5.600 0.030lambda 0.950 −123.270 0.006 252.541 0.000 0.486 0.30 0.001delta 1.152 −126.980 0.694 259.959 7.400 0.012kappa 0.618 −125.005 0.043 256.009 3.500 0.084ou 0.068 −123.497 0.008 252.994 0.450 0.388eb 0.000 −179.736 1.000 365.471 113.000 0.000white – −146.704 1.000 297.407 45.000 0.000
CSBM 87.751 −171.503 12.000 0.001lambda 0.875 93.258 0.001 −180.516 2.800 0.135delta 2.223 91.333 0.007 −176.666 6.700 0.019kappa 0.070 94.678 0.000 −183.356 0.000 0.546 0.24 0.001ou 0.111 94.065 0.000 −182.130 1.200 0.299Eb 0.000 −173.335 1.000 352.669 536.000 0.000white – 76.551 1.000 −149.102 34.000 0.000
The best model found are shown in bold.
at Universita di N
apoli on Novem
ber 24, 2013http://sysbio.oxfordjournals.org/
Dow
nloaded from

[12:28 28/9/2013 Sysbio-syt053.tex] Page: 894 878–900
894 SYSTEMATIC BIOLOGY VOL. 62
TABLE 5. PGLS models for shape-stress variables relationships
Procrustes coordinates von Mises stress Surface traction
PGLSEntire shape P = 3.17e−15 P = 2.2e−16Mandibular corpus P = 2.2e−16 P = 0.0012Ascending ramus P = 1.97e−6 P = 2.2e−16
Size free shape dataPGLSEntire shape P = 2.85e−8 P = 2.2e−16Mandibular corpus P = 1.04e−9 P = 0.0002Ascending ramus P = 0.0017 P = 1.67e−12
Significant results are shown in bold.
All relationships were significant also for single modulesunder PGLS, even using size-free shape data.
Observed von Mises stress is negatively related toobserved surface traction (R2 =0.045; Fig. 7c), contraryto what is predicted by beam theory (Fig. 7b), whenkeeping beam height constant. This relationship issignificant under PGLS (P=0.0059). Von Mises stress isnegatively correlated with the area of mandibular corpus(R2 =0.44; PGLS P = 3.5e−05) and positively correlated(albeit weakly) with the area of ascending ramus (R2 =0.048; PGLS P=0.00013). Conversely, surface tractionis positively related to the area of mandibular corpus(R2 =0.59; PGLS P = 2e−16) and negatively to the areaof ascending ramus (R2 =0.53; PGLS P = 2.3e−08). Whenvon Mises stress and surface traction are re-multiplied bythe original CSs their relationship becomes positive andsignificant under PGLS (R2 =0.26; PGLS P = 1.8e−14;Fig. 7d). This suggests that the negative relationshipbetween von Mises stress and surface traction is due toallometric effects.
Table 6 shows results for linear-model regressionsbetween clade RVs, per-clade averaged stress values, andper-clade averaged size values. Relationships betweenstress variables and RVs (Fig. 10) are always significanteven using RVs calculated on size-free shape data, thussuggesting that intraclade allometry did not impacton this relationship. The relationships between per-clade averaged size values and clades RVs or stressvariables are not significant, indicating no impact ofinterclade allometry. This could be read together withthe results of PLS analysis and relationships betweenvon Mises stress and mandibular modules areas. Ourinterpretation is that there is a strong associationbetween the degree of morphological integration andthe biomechanical performance due to a structuralcompensation of mandibular corpus in response to thedramatic morphological changes in the posterior partof the mandible of sabertoothed cats (see discussionbelow). Neither relationship between surface tractionand size nor the relationship between von Mises stressand size is significant under PGLS. Together with resultsreported above, the negative relationship between vonMises stress and size explains why stress variables scaledat unit size show a pattern inverse to that predicted by
beam theory. This is definitively a consequence of thecovariation between the two submodules, and of theincrease of mandibular corpus area (thus increasing thedenominator of the mean von Mises stress) which istypical of the sabertooth mandible.
DISCUSSION
The combined use of GM and FEA provides a powerfulmethodological tool to interpret macroevolutionarytransformation in mandible size, shape, and mechanicalperformance. We applied this ensemble of methodsto study morphological variation in the mandible ofcat-like carnivores.
In recent years several works focused on the cranio-facial morphological variation in this group (Martin1980; Van Valkenburgh 2007; Meloro et al. 2008, 2011among others), and in cat-like species in particular(Samuels and Van Valkenburg 2009; Sakamoto et al.2010; Slater and Van Valkenburgh 2008, 2009; Prevostiet al. 2010; Lencastre-Sicuro and Oliveira 2010; Meloroand Slater 2012). Most of these papers addressed theprofound functional differences between modern catsand extinct sabertooths. This issue has been debatedsince the very first discoveries of sabertooths (Warren1853; Riggs 1934; Simpson 1941)—a highly distinctivemorphology that occurs independently multiple timesin mammals (i.e. within Felidae, Barbourofelidae,Nimravidae, Creodonta, and even Marsupialia). Ourresults demonstrate that cat-like carnivorans evolvedfairly conservative mandibular morphology withindistinct clades (Meloro and Raia 2010). The regressionbetween size and shape of the pooled sample suggeststhe presence of a strong evolutionary allometric signalin mandibular morphology. Felinae and Barbourofelidaeare the clades showing the strongest allometric effects,whereas no allometric effects are apparent in nimravidmandibles. This result confirms recent findings by Slaterand Van Valkenburgh (2009) and Meloro and Slater(2012).
Allometry significantly impacts Felinae because highbody size variation in this group probably representedthe most “rapid” way of differentiating niches within ayoung and morphologically very homogeneous groupsuch as true cats. This agrees with previous findingsabout the evolutionary tempo and mode of carnassialsize evolution in Carnivora as a whole (Meloro and Raia2010). Sabertooths are less variable in body size thanother felines, and are generally large. Ecomorphologicaldifferentiation among sabertooths took place throughthe relative elongation of the upper canines andincludes two distinct morphotypes: the saber- and thedirk-toothed cats. Meloro and Slater (2012) recentlyhighlighted that relative canine length has a stronginfluence on morphological integration of the skull inlong-canine cats. This likely is the case for the mandibleas well. We found that morphological integrationwas strongest in Barbourofelidae, which is the most“extreme” dirk-toothed clade.
at Universita di N
apoli on Novem
ber 24, 2013http://sysbio.oxfordjournals.org/
Dow
nloaded from

[12:28 28/9/2013 Sysbio-syt053.tex] Page: 895 878–900
2013 PIRAS ET AL.—FUNCTIONAL INTEGRATION IN CAT-LIKE CARNIVORANS 895
One of the most interesting results of this study is thesignificant relationship between functional integrationand stress data. In the particular context of ourstudy, this relationship indicates that the dramatictemporo-mandibular modifications of the sabertoothedmorphology required a strengthening of functionalcovariation between mandible submodules. We foundmandibles were more stressed in sabertooths, mainlyin the ascending ramus, than in modern felids (inkeeping with McHenry et al. 2007) under the samescale (unit size) and loading conditions. This happensbecause of the strong covariation of the mandibularcorpus with the posterior part of the mandible impliesstrong dorsoventral buttressing in sabertooths. Naturalselection is expected to mould shapes according tofunctional demands. The more demanding is thefunction, the more tightly body structures involvedin the function must be integrated. Modularity andintegration are flip sides of the same coin. Theyinvolve the organization of whole structures in partiallyindependent morpho-genetic and functional modules(Klingenberg 2009, 2010, rephrased). As rigid solids,bones are subjected to physical forces. So variation inshape produces variation in bone’s ability to achieve aparticular mechanical function in response to externalstresses. This variation is constrained by the mechanicallimits of the bone material. The fact that the OUmodel describes well the evolution of surface tractionshows that species tend to converge towards optimalstress values. In our view, the tight link betweenintegration and stress loadings evolved to overcomesuch a constraint. Sabertooths, for example, had togape their mouth wide, in order to use the longcanines (Christiansen 2011). This is ubiquitous amongsabertooths, and comes at the cost of higher stressin the ascending ramus (McHenry et al. 2007, thisstudy). This cost is partly counteracted by improving themorphological integration of the mandible as a whole.
Few works related morphological integration andfunction (Young and Badayev 2006; Klingenberg2010; Monteiro and Nogueira 2010; Piras et al. 2010;Klingenberg 2010 for a review). As meaningfullysynthesized by Klingenberg et al. (2010), functionalmodules are those parts that perform specific functions
irrespectively of morphogenetic (developmental)modular organization. Functional and developmentalintegration could or could not coincide. On the basis ofdifferent works carried out at different taxonomic levels,it seems that their concordance may be dependent on theevolutionary scale of observation. In fact, investigation ofintegration (functional and developmental; Klingenberget al. 2010) within single species has shown thatdevelopmental modules do not match functionalmodules. Conversely, within genus (between species)analyses (Young and Badayev 2006) show a strongconcordance between developmental and functionalmodules. Monteiro and Nogueira (2010), in studyingphyllostomid bats, found that functional integrationis decoupled from developmental integration inspecialized, but not in generalist species.
Our study belongs to the main stream of researchin this field. Yet, it differs from previous studies fora number of reasons: first, we compared species andgenera belonging to different families within a largeand ancient clade, thus greatly increasing the taxonomicscale of investigation; second, we included extinctspecies even at the base of our phylogeny thus increasingthe temporal scale of observation; third, we didnot compare functional and morphogenetic modules,thereby testing if they concide, but rather we comparedan a priori defined functional organization betweenclades; finally, we quantitatively defined function in termof structural stress.
We suggest that the importance of constraints imposedby genetic expression, natural selection and sharedancestry on modular organization varies according totaxonomic and temporal scales of observation. Patternsof developmental integration within individuals (orspecies, at the best) can be determined by relativelyenvironment-independent selection for developmentalhomeostasis, whereas patterns among species (andeven more so for genera and families) reveal therelative importance of current selection regimes, thusmaking integration more readily investigated in terms offunctional demands. A future challenge could be testingif the functional modular organization we exploredhere coincides with developmental modularity. It wouldbe desirable to test this at the same observational
TABLE 6. Relationships between morphological integration, per-clade averaged stress variables and per-clade averaged size values
Using RVs calculated on original shape variables
�, R2, permutation P−value �, R2, permutation P−value �, R2, permutation P−value
von Mises stress Surface traction Per clade averaged size valuesRVs –2.4e−7; 0.94; 0.02 1.39e−7; 0.81; 0.03 0.02; 0.37; 0.29Per clade averaged size values 9.6e5; 0.11; 0.6 –7.9e5; 0.19; 0.4
�, R2, permutation P−value �, R2, permutation P−value �, R2, permutation P−value
Using RVs calculated on size free shape variables
RVs –2.15e−7; 0.95; 0.008 1.51e−7; 0.90; 0.03 0.018; 0.16; 0.52
Significant results are shown in bold.
at Universita di N
apoli on Novem
ber 24, 2013http://sysbio.oxfordjournals.org/
Dow
nloaded from

[12:28 28/9/2013 Sysbio-syt053.tex] Page: 896 878–900
896 SYSTEMATIC BIOLOGY VOL. 62
FIGURE 10. Relationships between per-clade averaged stress variables and RV coefficients.
(taxonomic-phylogenetic) scale of our study. Ecologicalfactors and the selection gradients on the fitnesslandscape of the adaptive radiation are important forunderstanding the evolutionary integration of complexmorphological structures (Monteiro and Nogueira 2010).
A result apparently in contradiction with previousstudies deserves special attention: at unit sizes vonMises stress of the whole mandible diminishes insabertoothed species because of the increase indorsoventral buttressing of the mandibular corpus,whereas it is much less related to the area of posterior
part. That causes the observed relationship betweenvon Mises stress and surface traction in Figure 7c. Thismust be contextualized in the “equal scaling” strategyunder which we calculated our stress variables. In fact,our results regarding structural performance seem toalternatively agree (as for surface traction) or disagree (asfor von Mises stress) to those obtained by McHenry et al.(2007). McHenry et al. (2007) compared one specimenof Panthera leo to one specimen of Smilodon fatalis.They applied a sophisticated 3D FEA simulation to amandible with an articulated skull. They also estimated
at Universita di N
apoli on Novem
ber 24, 2013http://sysbio.oxfordjournals.org/
Dow
nloaded from

[12:28 28/9/2013 Sysbio-syt053.tex] Page: 897 878–900
2013 PIRAS ET AL.—FUNCTIONAL INTEGRATION IN CAT-LIKE CARNIVORANS 897
bite forces for the two species and found that S. fatalis hadsmaller bite force, higher von Mises stress and smallerstructural resistance as compared with P. leo. There aresignificant differences between the present study andthat of McHenry et al. McHenry et al. (2007) used a3D model of both skull and mandible and they did notscale shapes at common size (as in our simulations).The lion in our sample presents a larger mandibular CSthan Smilodon. Still, they did not assess statistically thestructural behaviour of a large cat-like sample speciesand simulated muscle insertions and contractions ratherthan imposing a constant bite force. Here, we specificallywanted to compare several shapes at a common sizeand under equal loadings. Our surface traction resultsindicate just what McHenry et al. (2007) stated aboutthe concentration of a large component of the stress incorrespondence to the coronoid process: sabertoothedspecies show a surface traction that is larger thanin conical forms. This is clearly illustrated in Fig. 8athat, structurally, suggests a pattern similar to whatMcHenry et al. (2007) found. By contrast, we contendthat, at equal scale, mean von Mises stress diminishes insabertooths because of the mandible-enlarged anteriorarea (the buttressing), which increases the denominatorin mean von Mises integration. This enlargement isclearly visible in Fig. 5c and in Fig. 6 showing thecovariation between the two modules. When von Misesstress is re-scaled using the original CSs, even thisvariable agrees the general suggestion of McHenry et al.(2007) that sabertoohed mandibles had to withstandhigher stress loads (Fig. 7d).
3D models are reliable in terms of validative powerof results and of inner morphology and materialproperties. However, it is impossible to apply thismethodology to the data set we presented here.
A final argument regarding mandible abductionshould be addressed. Christiansen (2011), studying 14species of extinct and extant felids, pointed out thatsabertooths could open their mouth at particularly largeangles. This implies a rearrangement of both muscleinsertions on the mandible and of the global shape ofthe cranium itself. During the bite a sabertooth had tofill the difference in gape angle with a conical-toothedspecies by progressively closing its jaws. As the bitestarted, the orthogonal component of bite force wassmaller in sabertooths due to the large gape angle.However, the angle between the temporomandibularjoint and the theoretical force output is always larger inderived sabercats than in extant felids at any gape angleover occlusion. This is due to the covarying geometricarrangement of mandible and skull (Christiansen2011, figure 2). In fact, it was very likely that jawabduction starting from extreme gape angles wasachieved by head depression rather than by the forceof jaw adductors. We integrated these results withthose related to the higher morphological integrationin derived sabertoothed species in comparison withnonsabertoothed forms. This, rather than an adaptationto higher bite force, could be interpreted as a responseto the stress affecting the mandible (as explained above)
caused by a higher surface traction along the mandibleposterior margin. In fact, under static conditions, thesurface traction increases because of the reduction in theheight of the coronoid process. This is counteracted bythe posterior shifting of the mandibular condyle thatincreases the inlever moment arm for the temporalismuscle, as pointed out by Bryant and Russell (1995) andChristiansen (2011).
Possible refinement of our study could come fromdynamic simulations and from expanding our data setto complete skulls, in order to study the covariationbetween mandible and skull. However, for many speciesof our data set the skull is not known. Moreover, asstated in Online Appendix II (available from Dryaddata repository; doi:10.5061/dryad.kp8t3), significantchanges in the phylogeny (but presumably not smallchanges deep in the topology) could change the resultsof our PGLS analyses.
SUPPLEMENTARY MATERIAL
Supplementary material, inlcuding online-onlyappendices, is available at http://datadryad.org in theDryad data repository: doi:10.5061/dryad.kp8t3.
FUNDING
Carlo Meloro museum visits were supported bythe European Community’s program ‘Structuring theEuropean Research Area’ under Synthesys at the MuseoNacional de Ciencias Naturales (ES-TAF 858), MuséumNational d’Histoire Naturelle (FR-TAF 1680) for theproject ‘The evolution of feeding habits in extinctEuropean carnivores’ while the visit at the RoyalMuseum for Central Africa was supported by the project‘Ecomorphology of extant African carnivores’ (BE-TAF4901).
ACKNOWLEDGMENTS
We are grateful to many museum institutions andmembers of staff for allowing us access to thecollection in their care. The Governments of Kenyaand Tanzania kindly provided permission to CarloMeloro to study fossil collection at the Kenya NationalMuseum (Nairobi) supported by the LeverhulmeTrust project “Taxon-Free Palaeontological Methods forReconstructing Environmental Change” (F/00 754/C).We also thank Stefano Gabriele, Valerio Varano,and Gabriele Sansalone for useful discussions duringmanuscript preparation. We are grateful to RonaldDeBry, Frank (Andy) Anderson, Norm MacLeod, andthree anonymous reviewers for the kind and insightfulreview of this manuscript.
REFERENCES
Adams D.C., Rohlf F.J., Slice D.E. 2004. Geometric morphometrics: tenyears of progress following the ‘revolution’. Ital. J. Zool. 71:5–16.
at Universita di N
apoli on Novem
ber 24, 2013http://sysbio.oxfordjournals.org/
Dow
nloaded from
[12:28 28/9/2013 Sysbio-syt053.tex] Page: 898 878–900
898 SYSTEMATIC BIOLOGY VOL. 62
Andersson K., Werdelin L. 2005. Carnivora from the Late Miocene ofLantian, China. Vert. Pal. 43(4):256–271.
Andersson K., Norman D., Werdelin L. 2011. Sabretoothed carnivoresand the killing of large prey. PlosOne. 6:e24971.
Atchley W.R. 1993. Genetic and developmental aspects of variabilityin the mammalian mandible. In: Hanken J., Hall B.K., editors. Theskull, vol. 1: development. Chicago: University of Chicago Press.p. 207–247.
Atchley W.R., Hall B.K. 1991. A model for development and evolutionof complex morphological structures. Biol. Rev. Cambr. Phil. Soc.66:101–157.
Atchley W.R., Nordheim E.V., Gunsett F.C., Crump P.L. 1982. Geometricand probabilistic aspects of statistical distance functions. Syst. Zool.31:445–460.
Beaumont G. de. 1990. Contribution a l’étude du genre NimravidesKITTS (Mammalia, Carnivora, Felidae). L’espéce N. pedionomus(MACDONALD). Arch. Sci. Genéve. 43:125–157.
Badyaev A.V., Foresman K.R. 2000. Extreme environmental changeand evolution: stress-induced morphological variation is stronglyconcordant with patterns of evolutionary divergence in shrewmandibles. Proc. R. Soc. B. Biol. Sci. 267:371–377.
Badyaev A.V., Foresman K.R. 2004. Evolution of morphologicalintegration. I. Functional units channel stress–induced variation inshrew mandibles. Amer. Nat. 163(6):868–879.
Badyaev A.V., Foresman K.R., Young R.L. 2005. Evolution ofmorphological integration. II. Developmental accommodation ofstress-induced variation in shrew mandibles. Am. Nat.166:382–395.
Blankers T., Adams D.C., Wiens J.J. 2012. Ecological radiation withlimited morphological diversification in salamanders. J Evol Biol25: 634–646.
Blomberg S.P., Garland Jr. T., Ives A.. 2003. Testing for phylogeneticsignal in comparative data: behavioral traits are more labile.Evolution 57(4):717–745.
Bookstein F.L. 1986. Size and shape spaces for landmark data in twodimensions. Stat. Sci. 1:181–242.
Bookstein F.L. 1991. Morphometric tools for landmark data: geometryand biology. Cambridge: Cambridge University Press.
Bookstein F.L.1997, Landmark methods for forms without landmarks:morphometrics of group differences in outline shape. Med. Image.Anal. 1:225–243.
Bookstein F.L., Streissguth A.P., Sampson P.D., Connor P.D., BarrH.H. 2002. Corpus callosum shape and neuropsychological deficitsin adult males with heavy fetal alcohol exposure. NeuroImage.15:233–251.
Bryant H.N., Russell A.P. 1995. Carnassial functioning in nimravid andfelid sabertooths: theoretical basis and robustness of inferences.In: Thomason J.J., editor. Functional morphology in vertebratepaleontology, Cambridge University Press. p. 116–135.
Cardini A., Tongiorgi P. 2003. Yellow-bellied marmots (Marmotaflaviventris) ‘in the shape space’ (Rodentia, Sciuridae):sexual dimorphism, growth and allometry of the mandible.Zoomorphology. 122:11–23.
Cheverud J.M. 2004. Modular pleiotropic effects of quantitative traitloci on morphological traits. In: Schlosser G., Wagner G.P., editors.Modularity in development and evolution. Chicago: University ofChicago Press. p. 132–153.
Cheverud J.M., Hartman S.E., Richtsmeier J.T., Atchley W.R. 1991. Aquantitative genetic analysis of localized morphology in mandiblesof inbred mice using finite element scaling analysis. J. Craniofac.Genet. Dev. Biol. 11:122–137.
Cheverud J.M., Leamy L.J., Routman E.J. 1997. Pleiotropic effectsof individual gene loci on mandibular morphology. Evolution.51:2004–2014.
Cheverud J.M., Ehrich T.H., Vaughn T.T., Koreishi S.F., Linsey R.B.,Pletscher L.S. 2004. Pleiotropic effects on mandibular morphologyII: differential epistasis and genetic variation in morphologicalintegration. J. Exp. Zool. B: Molec. Develop. Evol. 302B:424–435.
Christiansen P. 2008. Evolution of skull and mandible shape in cats(Carnivora: Felidae). PlosOne. 3:e2807.
Christiansen P. 2011. A dynamic model for the evolution of sabrecatpredatory bite mechanics. Zool. J. Linn. Soc. 162:220–242.
Claude J. 2008. Morphometrics with R. New York: Springer.
Crusafont-Pairó M., Truyols-Santonja J. 1956. A biometric study ofevolution of fissiped carnivores. Evolution. 10:314–332.
Crusafont-Pairó M., Truyols-Santonja J. 1957. Estudios masterométricosen la evolución Fisípedos. I. Los módulos angulares a y b. II. Losparámetros lineales P, C, y T. Bol. Inst. Geol. Min. España. 68:1–140.
Crusafont-Pairó M., Truyols-Santonja J. 1958. A quantitative study ofstasigenesis in fissipede carnivores. Nature. 181:289–290.
Dray S., Dufour, A.B. 2007. The ade4 package: implementing the dualitydiagram for ecologists. J. Stat. Soft. 22: 1–20.
Dumont E.R., Grosse I.R., Slater G. 2009. Requirements for comparingthe performance of finite element models of biological structures. J.Theoret. Biol. 256:96–103.
Ehrich T.H., Vaughn T.T., Koreishi S.F., Linsey R.B., Pletscher L.S.,Cheverud J.M. 2003. Pleiotropic effects on mandibular morphologyII. Developmental morphological integration and differentialdominance. J. Exp. Zool. B: Molec. Develop. Evol. 296B:58–79.
Escoufier Y. 1973. Le traitement des variables vectorielles. Biometrics.29:751–760.
Ewer R.F. 1973. The carnivores. Cornell University Press, New York.Farke A.A. 2008. Frontal sinuses and head-butting in goats: a finite
element analysis. J. Exp. Biol. 211:3085–3094.Felsenstein J. 1985. Phylogenies and the comparative method. Am. Nat.
125:1–15.Feranec R.S. 2008. Growth differences in the saber-tooth of three felid
species. Palaios. 23:566–569.Figueirido B., Serrano-Alarcón F. J., Slater G. J., Palmqvist P.. 2010.
Shape at the cross-roads: homoplasy and history in the evolutionof the carnivoran skull towards herbivory. Journal of Evol. Biol. 23:2579–2594.
Figueirido B., MacLeod N., Krieger J., De Renzi M., Pérez-Claros J.A.,Palmqvist P. 2011. Constraint and adaptation in the evolution ofcarnivoran skull shape. Paleobiology 37: 490–518.
Garland T.Jr. 1992. Rate tests for phenotypic evolution usingphylogenetically independent contrasts. Am. Nat. 140:509–519.
Garland T.Jr., Bennett A.F., Rezende E.L. 2005. Phylogenetic approachesin comparative physiology. J. Exp. Biol. 208:3015–3035.
Geraads D., Güleç E. 1997. Relationships of Barbourofelis piveteaui(OZANSOY, 1965), a Late Miocene nimravid (Carnivora, Mammalia)from Central Turkey. J. Vert. Pal. 17(2):370–375.
Goodall C. 1991. Procrustes methods in the statistical analysis of shape.J. R. Statist. Soc. B. 53:285–339.
Gröning F., Liu J., Fagan M.J., O’Higgins P. 2009. Validating a voxel-based finite element model of a human mandible using digitalspeckle pattern interferometry. J. Biomech. 42:1224–1229.
Harmon L.J., Weir J., Brock C, Glor R.E., Challenger W. 2008. GEIGER:investigating evolutionary radiations. Bioinformatics 24:129–131.
Herring S.W. 1980. The ontogeny of mammalian mastication. Amer.Zool. 25(2):339–350.
Herring S.W. 1993. Functional Morphology of MammalianMastication. Amer. Zool. 33(3):289–299.
Holliday J.A., Steppan S.J. 2004. Evolution of hypercarnivory: theeffect of specialization on morphological and taxonomic diversity.Paleobiology. 30:108–128.
Johnson W.E., Eizirik E., Pecon-Slatter J., Murphy W.J., Antunes A.,Teeling E., O’Brien S.J. 2006. The late Miocene radiation of modernFelidae: a genetic assessment. Science. 311:73–77.
Klingenberg C. P. 2009. Morphometric integration and modularityin configurations of landmarks: Tools for evaluating a-priorihypotheses. Evol. Dev. 11:405–421.
Klingenberg C. P. 2010. Evolution and development of shape:integrating quantitative approaches. Nat. Rev. Gen. 11:623–635.
Klingenberg C.P., Barluenga M., Meye A. 2003. Body shape variationin cichlid fishes of the Amphilophus citrinellus species complex. Biol.J. Linn. Soc. 80:397–408.
Klingenberg C.P., V. Debat, Roff D.A. 2010. Quantitative genetics ofshape in cricket wings: developmental integration in a functionalstructure. Evolution. 64:2935–2951.
Klingenberg C.P., Leamy L.J. 2001. Quantitative genetics of geometricshape in the mouse mandible.Evolution. 55:2342–2352.
Klingenberg C.P., Leamy L.J., Cheverud J.M. 2004. Integration andmodularity of quantitative trait locus effects on geometric shapein the mouse mandible. Genetics. 166:1909–1921.
at Universita di N
apoli on Novem
ber 24, 2013http://sysbio.oxfordjournals.org/
Dow
nloaded from

[12:28 28/9/2013 Sysbio-syt053.tex] Page: 899 878–900
2013 PIRAS ET AL.—FUNCTIONAL INTEGRATION IN CAT-LIKE CARNIVORANS 899
Klingenberg C.P., Leamy L.J., Routman E.J., Cheverud J.M. 2001.Genetic architecture of mandible shape in mice: effects ofquantitative trait loci analyzed by geometric morphometrics.Genetics. 157: 785–802.
Kupczik K., Dobson C.A., Fagan M.J., Crompton R.H., Oxnard C.E.,O’Higgins P. 2007. Assessing mechanical function of the zygomaticregion in macaques: validation and sensitivity testing of finiteelement models. J. Anat. 210:41–53.
Kurtén B., Anderson E. 1980. Pleistocene mammals of North America.New York: Columbia University Press.
Leamy L.J., Routman E.J., Cheverud J.M. 2002. An epistatic geneticbasis for fluctuating asymmetry of mandible size in mice. Evolution.56:642–653.
Lencastre-Sicuro F., Oliveira L.F.B. 2010. Skull morphology andfunctionality of extant Felidae (Mammalia: Carnivora): aphylogenetic and evolutionary perspective. Zool. J. Linn. Soc.161:414–462.
MacLeod N. 1999, Generalizing and extending the eigenshape methodof shape visualization and analysis. Paleobiology 25:107–138.
Maddison W..P, Maddison D.R. 2010. Mesquite: A modular system forevolutionary analysis. Version 2.73.
Márquez E.J. 2008. A statistical framework for testing modularity inmultidimensional data. Evolution. 62:2688–2708.
Martin L.D. 1980. Functional morphology and the evolution of cats.Trans. Nebr. Acad. Sci. 8:141–154.
Martin L.D., Babiarz J.P., Naples V.L., Hearst J. 2000. Three ways to bea saber-toothed cat. Naturwissenschaften. 87:41–44.
McHenry C.R., Wroe S., Clausen P.D., Moreno K., Cunningham E.2007. Supermodeled sabercat, predatory behavior in Smilodon fatalisrevealed by high-resolution 3D computer simulation. Proc. Nat.Acad. Sci. 104:16010–16015.
Meachen-Samuels, J. A. 2012. Morphological convergence of the prey-killing arsenal of sabertooth predators. Paleobiology 38:1–14.
Meloro C. 2011. Feeding habits of Plio-Pleistocene large carnivores asrevealed by the mandibular geometry. J. Vert. Pal. 31:428–446.
Meloro C., Raia P. 2010. Cats and dogs down the tree: the tempoand mode of evolution in the lower carnassial of fossil and livingcarnivore. Evol. Biol. 37:177–186.
Meloro C., O’Higgins P. 2011. Ecological Adaptations of mandibularform in fissiped carnivore. J. Mammal. Evol. 18:185–200.
Meloro C., Slater G.J. 2012. Covariation in the skull modules ofcats: the challenge of growing saber-like canines. J. Vert. Pal. 32:677–685.
Meloro C., Raia P., Piras P., Barbera C., O’Higgins P. 2008. The shapeof the mandibular corpus in large fissiped carnivores: allometry,function and phylogeny. Zool. J. Linn. Soc. 154:832–845.
Meloro C., Raia P., Carotenuto F., Cobb S.N. 2011. Phylogenetic signal,function and integration in the subunits of the carnivoran mandible.Evol. Biol. 38:465–475.
Mevik B.H., Wehrens R. 2007. The pls Package: Principal Componentand Partial Least Squares Regression in R; J. Stat.Soft. 18:1–24.
Monteiro L.R., Nogueira M.R. 2010. Adaptive radiations, ecologicalspecialization, and the evolutionary integration of complexmorphological structures. Evolution 64:724–744.
Morlo M., Peigné S., Nagel D. 2004. A new species of Prosansanosmilus:implications for the systematic relationships of the familyBarbourofelidae new rank (Carnivora, Mammalia). Zool. J. Linn.Soc. 140:43–61.
Mullin, S.K., Taylor, P.J. 2002. The effects of parallax on geometricmorphometric data. Comp. Biol. Med. 32:455–464.
Peigné S. 2003. Systematic review of European Nimravinae(Mammalia, Carnivora, Nimravidae) and the phylogeneticrelationships of Palaeogene Nimravidae. Zool. Scripta.32(3):199–229.
Perez S.I., Bernal V., Gonzalez P.N. 2006. Differences between slidingsemi-landmark methods in geometric morphometrics, with anapplication to human craniofacial and dental variation. J. Anat.208:769–784.
Pierce S.E., Angielczyk K.D., Rayfield E.J. 2008. Patterns ofmorphospace occupation and mechanical performance in extantcrocodilian skulls: a combined geometric morphometric and finiteelement modelling approach. J. Morphol. 269:840–864.
Pierce S.E., Angielczyk K.D., Rayfield E.J. 2009a. Shape and mechanicsin thalattosuchian (Crocodylomorpha) skulls: implications forfeeding behaviour and niche partitioning. J. Anat. 215:555–576.
Pierce S.E., Angielczyk K.D., Rayfield E.J. 2009b. Morphospaceoccupation in thalattosuchian crocodylomorphs: skullshape variation, species delineation, and temporal patterns.Palaeontology. 52:1057–1097.
Piras P., Maiorino L., Raia P., Marcolini F., Salvi D., Vignoli L., KotsakisT. 2010. Functional and phylogenetic constraints in Rhinocerotinaecraniodental morphology. Evol. Ecol. Res.12:897–928.
Piras P., Marcolini F., Claude J., Ventura J., Kotsakis T., Cubo J. 2012a.Ecological and functional correlates of molar shape variation inEuropean populations of Arvicola (Arvicolinae, Rodentia). Zool.Anz. 251:335–343.
Piras P., Sansalone G., Teresi L., Kotsakis T., Colangelo P., Loy, A. 2012b.Testing convergent and parallel adaptations of talpids humeralmechanical performance by means of Geometric Morphometricsand Finite Element Analysis. J. Morph. 273:696–711.
Polly P.D. 2005. Development and phenotypic correlations: theevolution of tooth shape in Sorex araneus. Evol. Develop. 7:29–41.
Prevosti F.J., Turazzini G.F., Chemisquy M.A. 2010. Morfologíacraneana en tigres dientes de sable: alometría, función y filogenia.Ameghiniana 47:239–256.
Raia P., Carotenuto F., Meloro C., Piras P., Pushkina D. 2010. The shapeof contention. adaptation, history and contingency in ungulatemandibles. Evolution. 64:1489–1503.
Rayfield E.J. 2007. Finite element analysis and understanding thebiomechanics and evolution of living and fossil organisms. Annu.Rev. Earth Planet. Sci. 35:541–576.
Rayfield E.J. 2011. Strain in the ostrich mandible during simulatedpecking and validation of specimen-specific finite element models.J. Anat. 218:47–58.
Rayfield E.J., Norman D.B., Horner C.C., Horner J.R., May Smith P.,Thomason J.J., Upchurch P. 2001. Cranial design and function in alarge theropod dinosaur. Nature. 409:1033–37.
Revell L. J. 2010. Phylogenetic signal and linear regression on speciesdata. Methods Ecol. Evol. 1:319–329.
Revell L. J. 2012, phytools: an R package for phylogenetic comparativebiology (and other things). Meth. Ecol. Evol. 3:217–223.
Richmond B.G., Wright B.W., Grosse I., Dechow P.C., Ross C.F.,Spencer M.A., Strait D.S. 2005. Finite element analysis in functionalmorphology. Anat. Rec. A Discov. Mol. Cell. Evol. Biol. 283:259–274.
Riggs E.S. 1934. A new marsupial saber-tooth from the Pliocene ofArgentina and its relationships to other South American predaciousmarsupials. Trans. Amer. Phil. Soc. 24(1):1–32.
Rohlf F.J. 2001. Comparative methods for the analysis of continuousvariables: geometric interpretations. Evolution. 55:2143–2160.
Rohlf F.J. 2006. A comment on phylogenetic corrections. Evolution.60:1509–1515.
Rohlf F.J. 2010a. tpsDig, Digitize Landmarks and Outlines. Version 2.16.Department of Ecology and Evolution, State University of New Yorkat Stony Brook.
Rohlf F.J., Slice D. E. 1990. Extensions of the procrustes method for theoptimal superimposition of landmarks. Syst. Biol. 39:40–59.
Rohlf F.J, Corti, M. 2000. Use of two-block partial leastsquares to studycovariation in shape. Syst. Biol. 49:740–753.
Ross C.F., Patel B.A., Slice D.E., Strait D.S., Dechow P.C., RichmondB.C., Spencer M.A. 2005. Modeling masticatory muscle force in finiteelement analysis: sensitivity analysis using principal coordinatesanalysis. Anat. Rec. 283A:288–299.
Rothwell T. 2003. Phylogenetic systematics of North AmericanPseudaelurus (Carnivora: Felidae). Am. Mus. Nov. 3403:1–64.
Sakamoto M., Lloyd G.T., Benton M.J. 2010. Phylogenetically structuredvariance in felid bite force: the role of phylogeny in the evolution ofbiting performance. J. Evol. Biol. 23:463–478.
Schlager S. 2013. Morpho: Calculations and visualizations relatedto Geometric Morphometrics. R package version 0.23.3. http://CRAN.R-project.org/package=Morpho
Samuels J.M., Van Valkenburg B. 2009. Craniodental indicators of preysize preference in the Felidae. Biol. J. Linn. Soc. 96:784–799.
Simpson G.G. 1941. The function of saber-like canines in carnivorousmammals. Am. Mus. Novit. 1130:1– 12.
at Universita di N
apoli on Novem
ber 24, 2013http://sysbio.oxfordjournals.org/
Dow
nloaded from

[12:28 28/9/2013 Sysbio-syt053.tex] Page: 900 878–900
900 SYSTEMATIC BIOLOGY VOL. 62
Slater G.J., Van Valkenburgh B. 2008. Long in the tooth: evolution ofsabertooth cat cranial shape. Paleobiology. 34(3):403–419.
Slater G. J., Van Valkenburgh B. 2009. Allometry and performance:the evolution of skull form and function in felids. J. Evol. Biol.22:2278–2287.
Slater G. J., Dumont, E. R., Van Valkenburgh, B. 2009. Implications ofpredatory specialization for cranial form and function in canids.J. Zool. Lond. 278: 181–188.
Stayton C.T. 2009. Application of thin-plate spline transformations tofinite element models, or, how to turn a bog turtle into a spottedturtle to analyze both. Evolution. 63:1348–1355.
Strait D.S., Wang Q., Dechow P.C., Ross C.F., Richmond B.G., SpencerM.A., Patel B.A. 2005. Modeling elastic properties in finite elementanalysis: how much precision is needed to produce an accuratemodel? Anat. Rec. 283A:275–287.
Therrien F. 2005a. Mandibular force profiles of extant carnivorans andimplications for the feeding behaviour of extinct predators. J. Zool.London. 267:249–270.
Therrien F. 2005b. Feeding behaviour and bite force of sabretoothedpredators. Zool. J. Linn. Soc. 145:393–426.
Timoshenko, S. P., 1922, On the transverse vibrations of bars of uniformcross-section, Phil. Mag. p. 125.
Thomason, J.J. 1991. Cranial strength in relation to estimated bitingforces in some mammals. Can. J. Zool., 69: 2326-2333.
Tseng Z.J., Binder W.J. 2009. Mandibular biomechanics of Crocutacrocuta, Canis lupus, and the late Miocene Dinocrocuta gigantea(Carnivora, Mammalia). Zool. J. Linn. Soc. 158(3):683–696.
Tseng Z.J., Takeuchi G.T., Wang X. 2010. Discovery of the upperdentition of Barbourofelis whitfordi (Nimravidae, Carnivora) and anevaluation of the genus in California. J. Vert. Pal. 30(1):244–254.
Turner A., Antón M. 1997. The big cats and their fossil relatives.Columbia University Press, New York.
Van Valkenburgh B. 2007. Déjà vu: the evolution of feedingmorphologies in the Carnivora. Integr. Comp. Biol. 47:147–163.
Van Valkenburgh B., Wayne, R.K. 2010. Carnivores. Curr. Biol.20:R915–R919.
Warren J.C. 1853. Remarks on Felis smylodon. Proc. Boston Soc. Nat.Hist. 4:256–258.
Werdelin L., Lewis M.E. 2001. A revision of the genus Dinofelis(Mammalia, Felidae). Zool. J. Linn. Soc. 132:147–258.
Werdelin L., Peigné S. 2010. Carnivora. In: Werdelin L., Sanders W.J.,editors. Cenozoic mammals of Africa. University of CaliforniaPress. p. 603–657.
Werdelin L., Yamaguchi N., Johnson W.E., O’Brien S. J. 2010. Phylogenyand evolution of cats. In: MacDonald D.W., Loveridge A.J., editors.Biology and conservation of wild felids. New York: OxfordUniversity Press. p. 59–82.
Wroe S., McHenry C., Thomason J.J. 2005. Bite club: comparativebite force in big biting mammals and the prediction ofpredatory behaviour in fossil taxa. Proc. R. Soc. Lond. B 272:619–625.
Wroe S., Moreno K., Clausen P., McHenry C., Curnoe D. 2007. High-resolution three dimensional computer simulation of hominidcranial mechanics. Anat. Rec. 290:1248–1255.
Young R.L., Badyaev A.V.2006. Evolutionary persistence ofphenotypic integration: Influence of developmental andfunctional relationships on evolution of complex trait. Evolution.60:1291–1299.
Young M.T., Brusatte S.L., Ruta M., Andrade M.B. 2010. The evolutionof Metriorhynchoidea (mesoeucrocodylia, thalattosuchia): anintegrated approach using geometric morphometrics, analysis ofdisparity, and biomechanics. Zool. J. Linn. Soc. 158:801–859.
Zelditch M.L., Wood A.R., Swiderski, D.L. 2009. Buildingdevelopmental integration into functional systems: function-induced integration of mandibular shape. Evol. Biol. New York.36:71–87.
Zienkiewicz O.C., Taylor R.L., Zhu J.Z. 2005. The finite element method:its basis and fundamentals. IXth Edition. Elsevier.
at Universita di N
apoli on Novem
ber 24, 2013http://sysbio.oxfordjournals.org/
Dow
nloaded from