Birds and powerlines in Italy: an assessment
15
Bird Conservation International (2005) 15:131–145. BirdLife International 2005 doi:10.1017/S0959270904000000 Printed in the United Kingdom Birds and powerlines in Italy: an assessment DIEGO RUBOLINI, MARCO GUSTIN, GIUSEPPE BOGLIANI and ROBERTO GARAVAGLIA Summary Summary Summary Summary Summary Powerlines may pose severe threats to bird populations. We assessed the significance of powerlines as a source of avian mortality within the Italian electric transmission and distribu- tion system. We reviewed data from 11 mortality censuses and compiled a list of species that were found among powerline victims in Italy, based on over 1,300 reported individual casualties. Overall, 95 species of birds were reported among powerline victims (19% of Italy’s total species). The number of recorded species was compared with the number of species in the Italian list, after grouping species based on morphology and ecology. Some groups (e.g. raptors, herons, storks and allies) were highly affected, while others (e.g. passerines and allies) appeared to be poorly represented among species involved in powerline accidents. Furthermore, we evaluated the validity of a published discriminant model for the classification of bird species as collision or electrocution victims according to body measurements. The application of the avail- able model classified 54.7–73.5% of Italian species correctly (depending on the species included), compared with 88.6% of the original dataset. Two new discriminant models based on Italian powerline casualties classified 80.9–81.1% of species correctly. This approach can be a useful tool in assessing collision and electrocution risk for species in different geographical areas. While we recognize the need for a general preventive approach for reducing the bird–powerline conflict, our review highlights once more the importance of local situations, where powerlines may have a strong impact on avian communities. Introduction Introduction Introduction Introduction Introduction Man-made alterations to natural habitat and landscape increased greatly during the twentieth century, leading to an ever-growing impact on wildlife. Among animals, birds have been forced to confront two main man-made structures: roads and over- head wires (powerlines, fences, telegraph wires, TV-towers, wind-power plants, etc.) (Hodson and Snow 1965, Janss and Ferrer 1999a, Erickson et al. 2001). In developed countries in particular, the spread and profusion of powerlines (e.g. an average 2.6 km of powerline/km 2 in Italy; Garavaglia and Rubolini 2000) make them a potential threat for a wide range of bird species, including up to 7% of the SPEC (Species of European Conservation Concern; Tucker and Heath 1994). Mortality due to powerlines may occur in two ways: collision and electrocution. Different species are vulnerable to each of these two causes of death: death due to collisions affects mainly night migrants and birds with low flight manoeuvrability (low aspect ratio), with heavy body and short wings; electrocution affects mainly raptors and storks (Bevanger 1998). The probability of electrocution for a given species is directly related to its behaviour and size, larger birds being more easily electrocuted than smaller ones (Bevanger 1998, Janss 2000). Preventing electrocution BCI58511.pmd 3/11/05, 4:26 PM 131
-
Upload
independent -
Category
Documents
-
view
1 -
download
0
Transcript of Birds and powerlines in Italy: an assessment
Bird Conservation International (2005) 15:131–145. BirdLife International 2005doi:10.1017/S0959270904000000 Printed in the United Kingdom
Birds and powerlines in Italy: an assessmentDIEGO RUBOLINI, MARCO GUSTIN, GIUSEPPE BOGLIANI andROBERTO GARAVAGLIA
SummarySummarySummarySummarySummary
Powerlines may pose severe threats to bird populations. We assessed the significance ofpowerlines as a source of avian mortality within the Italian electric transmission and distribu-tion system. We reviewed data from 11 mortality censuses and compiled a list of speciesthat were found among powerline victims in Italy, based on over 1,300 reported individualcasualties. Overall, 95 species of birds were reported among powerline victims (19% of Italy’stotal species). The number of recorded species was compared with the number of species in theItalian list, after grouping species based on morphology and ecology. Some groups (e.g. raptors,herons, storks and allies) were highly affected, while others (e.g. passerines and allies) appearedto be poorly represented among species involved in powerline accidents. Furthermore, weevaluated the validity of a published discriminant model for the classification of bird species ascollision or electrocution victims according to body measurements. The application of the avail-able model classified 54.7–73.5% of Italian species correctly (depending on the species included),compared with 88.6% of the original dataset. Two new discriminant models based on Italianpowerline casualties classified 80.9–81.1% of species correctly. This approach can be a usefultool in assessing collision and electrocution risk for species in different geographical areas. Whilewe recognize the need for a general preventive approach for reducing the bird–powerlineconflict, our review highlights once more the importance of local situations, where powerlinesmay have a strong impact on avian communities.
IntroductionIntroductionIntroductionIntroductionIntroduction
Man-made alterations to natural habitat and landscape increased greatly during thetwentieth century, leading to an ever-growing impact on wildlife. Among animals,birds have been forced to confront two main man-made structures: roads and over-head wires (powerlines, fences, telegraph wires, TV-towers, wind-power plants, etc.)(Hodson and Snow 1965, Janss and Ferrer 1999a, Erickson et al. 2001). In developedcountries in particular, the spread and profusion of powerlines (e.g. an average 2.6 kmof powerline/km2 in Italy; Garavaglia and Rubolini 2000) make them a potentialthreat for a wide range of bird species, including up to 7% of the SPEC (Species ofEuropean Conservation Concern; Tucker and Heath 1994).
Mortality due to powerlines may occur in two ways: collision and electrocution.Different species are vulnerable to each of these two causes of death: death due tocollisions affects mainly night migrants and birds with low flight manoeuvrability(low aspect ratio), with heavy body and short wings; electrocution affects mainlyraptors and storks (Bevanger 1998). The probability of electrocution for a givenspecies is directly related to its behaviour and size, larger birds being more easilyelectrocuted than smaller ones (Bevanger 1998, Janss 2000). Preventing electrocution
BCI58511.pmd 3/11/05, 4:26 PM131
132D. Rubolini et al.
on powerlines is possible, mainly with the installation of electrocution-safe poles orother power-insulating devices (Bevanger 1994, Janss and Ferrer 1999b, Lehmannet al. 1999). Collisions can be reduced, but not eliminated unless wires are buriedunderground (e.g. Morkill and Anderson 1991, Alonso and Alonso 1994, Brown andDrewien 1995, Janss and Ferrer 1998). Many studies have tried to assess the impact ofpowerlines on bird populations, and some general conclusions can be drawn. Mortalitydue to collisions seems to be of little biological significance on a large ecological scale(Alonso and Alonso 1999) but can have deleterious effect at a local scale (e.g. Heijnis1980, Janss and Ferrer 2000) and, coupled with other unnatural causes of death (e.g.poaching or hunting), may seriously affect population dynamics of some species (fora case study on tetraonids see Bevanger 1995). On the other hand, mortality due toelectrocution can have significant effects on populations of some groups of species(raptors and storks). It has directly affected population structure and been among thecauses of decline in White Stork Ciconia ciconia, Spanish Imperial Eagle Aquilaadalberti and Bonelli’s Eagle Hieraaetus fasciatus (Rieger and Winker 1971, Fiedlerand Wissner 1980, Crivelli et al. 1988, Ferrer and Hiraldo 1992, Mañosa and Real2001, Real et al. 2001).
In this study we present an overview of bird–powerline interactions in Italy, acountry where research on this subject has been largely neglected until recently(Garavaglia and Rubolini 2000, Rubolini et al. 2001). First, we review data from 11mortality censuses (both collision and electrocution), and derive a minimum mortalityrate for the investigated powerline sections. Then, based on over 1,300 reported casu-alties from all over the country, we compile a check-list of species found amongpowerline victims, in order to identify which groups of species among Italian birds aremost affected. Finally, we use this sample of species to validate the discriminant func-tions proposed by Janss (2000) for the separation of collision and electrocution victimsbased on species-specific morphological characters.
Materials and methodsMaterials and methodsMaterials and methodsMaterials and methodsMaterials and methods
Avian mortality censuses and mortality rates
The census of birds found dead under powerlines presents several methodologicalproblems (removal of carcasses by scavengers, crippling bias, observer detection bias)that may add considerable variability to the estimates (Bevanger et al. 1994, Bevanger1999). Due to these possible pitfalls, the calculation of true strike or electrocution ratesis very difficult to achieve (Bevanger 1999).
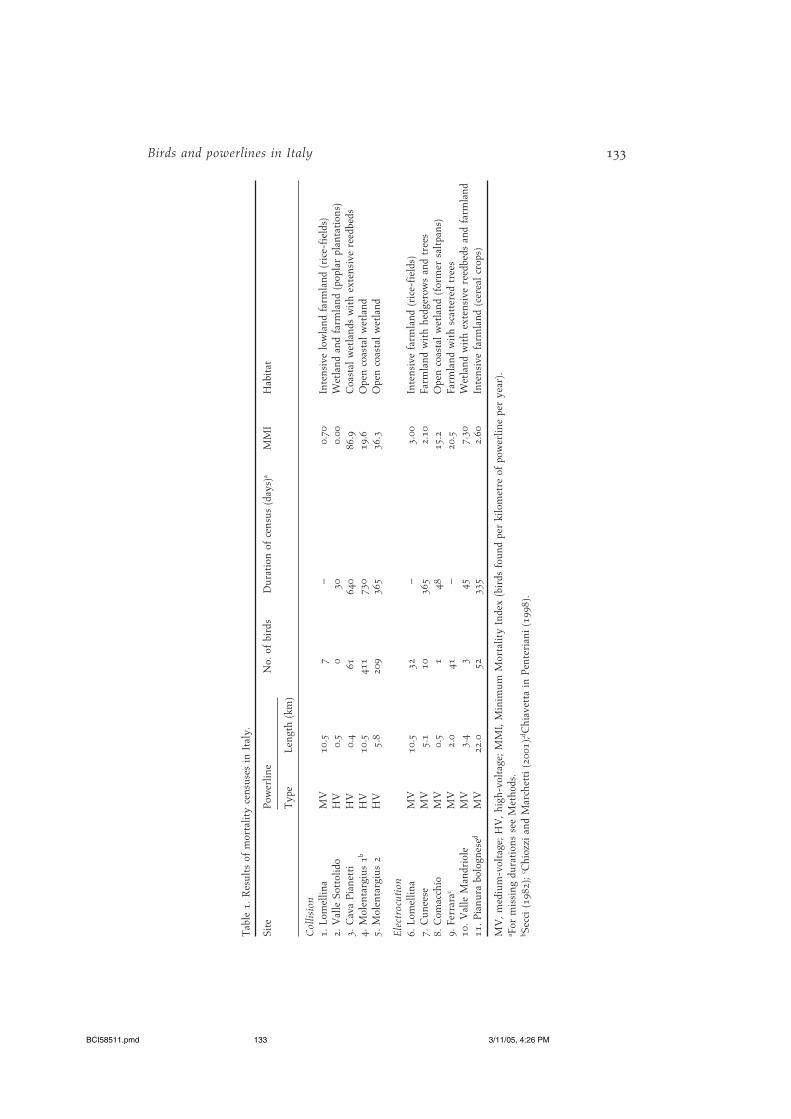
Mortality censuses analysed in this study were carried out mainly by LIPU andCESI staff, while other data refer to published studies. Both high-voltage (HV, 40–380 kV) and medium-voltage (MV, 1–40 kV) powerlines were censused, and in oneinstance both collision and electrocution accidents were recorded along the same line(Lomellina; see Table 1). The base of power poles was carefully searched for electro-cuted birds, whereas the ground section under aerial cables was scanned for collisionaccidents (Bevanger 1999). For each census we calculated a minimum mortality index(MMI), expressed as the estimated number of birds found dead per kilometre ofpowerline per year. As the number of reported casualties could not be corrected forpossible biases, results should be taken as a minimum estimate. Although mortalityrates may be affected by the application of correction factors, these were not availablefor our study sites.
1
BCI58511.pmd 3/11/05, 4:26 PM132
133Birds and powerlines in Italy
Tab
le 1
. R
esul
ts o
f m
orta
lity
cens
uses
in
Ital
y.
Site
Pow
erlin
eN
o. o
f bi
rds
Dur
atio
n of
cen
sus
(day
s)a
MM
IH
abit
at
Typ
eLe
ngth
(km
)
Col
lisio
n1.
Lom
ellin
aM
V10
.57
–0.
70In
tens
ive
low
land
far
mla
nd (
rice
-fie
lds)
2. V
alle
Sot
tolid
oH
V0.
50
300.
00W
etla
nd a
nd f
arm
land
(po
plar
pla
ntat
ions
)3.
Cav
a Pi
anet
tiH
V0.
461
640
86.9
Coa
stal
wet
land
s w
ith
exte
nsiv
e re
edbe
ds4.
Mol
enta
rgiu
s 1b
HV
10.5
411
730
19.6
Ope
n co
asta
l w
etla
nd5.
Mol
enta
rgiu
s 2
HV
5.8
209
365
36.3
Ope
n co
asta
l w
etla
nd
Elec
troc
utio
n6.
Lom
ellin
aM
V10
.532
–3.
00In
tens
ive
farm
land
(ri
ce-f
ield
s)7.
Cun
eese
MV
5.1
1036
52.
10Fa
rmla
nd w
ith
hedg
erow
s an
d tr
ees
8. C
omac
chio
MV
0.5
148
15.2
Ope
n co
asta
l w
etla
nd (
form
er s
altp
ans)
9. F
erra
rac
MV
2.0
41–
20.5
Farm
land
wit
h sc
atte
red
tree
s10
. Val
le M
andr
iole
MV
3.4
345
7.30
Wet
land
wit
h ex
tens
ive
reed
beds
and
far
mla
nd11
. Pia
nura
bol
ogne
sed
MV
22.0
5233
52.
60In
tens
ive
farm
land
(ce
real
cro
ps)
MV
, med
ium
-vol
tage
; HV
, hig
h-vo
ltag
e; M
MI,
Min
imum
Mor
talit
y In
dex
(bir
ds f
ound
per
kilo
met
re o
f po
wer
line
per
year
).a F
or m
issi
ng d
urat
ions
see
Met
hods
.b S
ecci
(19
82);
c Chi
ozzi
and
Mar
chet
ti (
2001
);d Chi
avet
ta i
n Pe
nter
iani
(19
98).
BCI58511.pmd 3/11/05, 4:26 PM133
134D. Rubolini et al.
Visits were carried out at variable intervals (usually monthly, at least for the long-lasting censuses). For the Lomellina and Ferrara censuses (see Table 1) the estimationof MMI was done at a single visit per line in late autumn–winter, by recording all thecarcasses and remains that were judged to be dead within the current year of census(for a detailed discussion on the reasons why the data from a single visit can beextended to the previous part of the year see Garavaglia and Rubolini 2000 andChiozzi and Marchetti 2001).
List of bird species involved in powerline accidents
Records were obtained from a wide range of published and unpublished sources,mostly from between the late 1970s and 2001. Unpublished data were collectedthrough a request for information widely circulated among professional and amateurornithologists, local sections of bird conservation societies and wildlife services. Toanalyse whether some bird groups were more affected than others in terms of speciesnumber, we established eight broad species categories, according to morphology andecological requirements (abbreviations in parentheses): waterfowl and allies (WAT)(orders Gaviiformes, Anseriformes, Podicipediformes, Pelecaniformes), heronsand allies (HER) (Ciconiiformes, Phoenicopteriformes), waders and gulls (WAD)(Charadriiformes), cranes and allies (CRA) (Galliformes, Gruiformes), diurnal raptors(RAP) (Falconiformes, Accipitriformes), owls (OWL) (Strigiformes), passerines andallies (PAS) (including Passeriformes, Apodiformes, Piciformes, Columbiformes,Caprimulgiformes) and others (all other orders than those indicated). The proportionof species reported among powerline casualties for each group was compared with theexpected number of species for each group based on the Italian list (Brichetti andMassa 1998), by means of a x2 test.
Type of mortality and body size
Based on available data, we determined whether a species was an electrocution victimor a collision victim. Species recorded as victims of both collision and electrocutionwere assigned to a mixed group, following Janss (2000). For a limited number ofspecies we could not obtain information on the exact cause of death: these wereassigned to a given category based on morphological and behavioural similarity witha categorized species (see Appendix). We aimed at validating the discriminant modelproposed by Janss (2000) for predicting the likelihood that a given species belongs toone of these groups based on four body measurements (body, wing and tail length,body mass). The original discriminant function model (hereafter the Spanish model)was built on a sample of 44 species, for which the author provided observed mortalityand mortality risk due to powerlines (collision and electrocution) from a detailedpowerline survey in central Spain (Janss 2000). Species in the Spanish sample wereassigned to categories based on observed casualties or according to species of similarmorphology, if they were observed along powerlines but not recorded among casual-ties (see Janss 2000). To classify our species sample according to the Spanish model,we first recorded body, wing and tail length (cm) and body mass (g) for all species(taken from Cramp 1998 and other unpublished sources). Data were ln-transformed(except tail length) (see Janss 2000). Then, we recalculated the Spanish discriminantfunction, using data presented in Janss (2000) and the original data used for that study
2
BCI58511.pmd 3/11/05, 4:26 PM134
135Birds and powerlines in Italy
(courtesy of G. F. E. Janss): this was necessary in order to apply it to our set of speciesand compare predicted mortality type based on the model with observed mortalityin Italy. Assignment of species in our sample to one of the three groups was based onBayes’ rule, using SPSS 10.0 software (see Norusis 1992 for details).
ResultsResultsResultsResultsResults
Mortality censuses
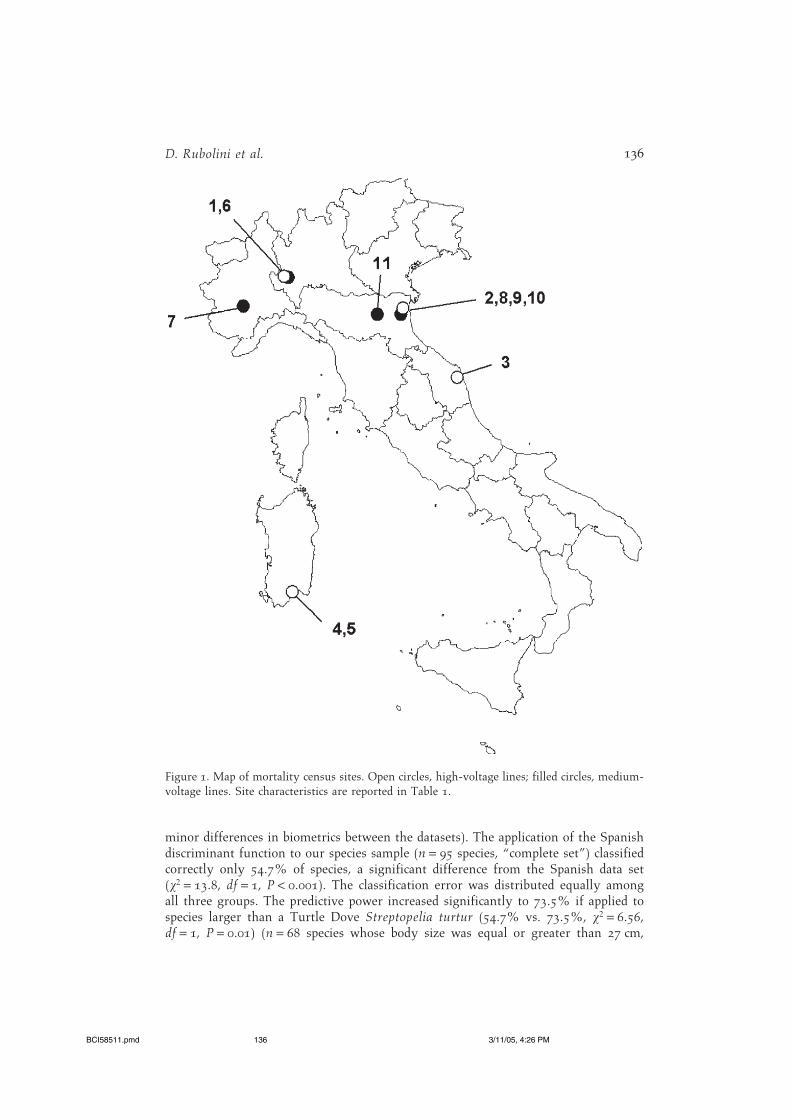
Censuses were carried out at 10 sites (Table 1, Figure 1) and a total of 827 birds wasfound. Mortality rates (MMI) were extremely variable, ranging from 0.00 to 86.9dead birds per kilometre of powerline per year in the case of collision censuses, andfrom 2.10 to 20.5 dead birds per kilometre per year for electrocution censuses. Whileit seems meaningless to produce a mean value for collision censuses, median electro-cution rate for the surveyed lines (excluding the Ferrara census) was 3.0 dead birds perkilometre per year or 0.15 dead birds per pole per year (assuming one pole each 50 mof MV powerline; Garavaglia and Rubolini 2000).
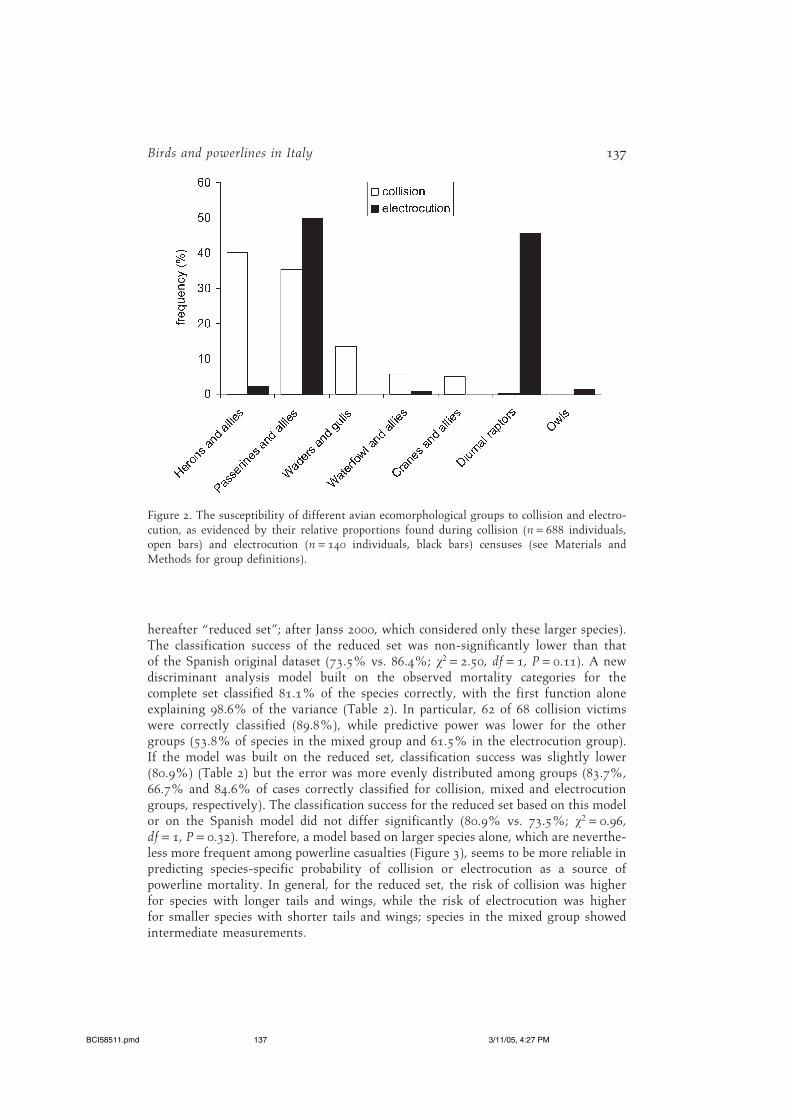
The species composition of electrocution and collision censuses differed consider-ably according to eco-morphological groups (Figure 2; x2 = 423, df = 6, P < 0.0001). Inparticular, electrocution affected mainly corvids (PAS) and diurnal raptors (RAP),while collision affected mainly herons (HER, mainly Greater Flamingo Phoenicop-terus ruber) and passerines (PAS, mainly Starling Sturnus vulgaris). The speciescomposition varied considerably between sites, probably in accordance with varyingenvironmental conditions and to the species’ local relative abundance (see Garavagliaand Rubolini 2000 for details).
List of powerline casualties
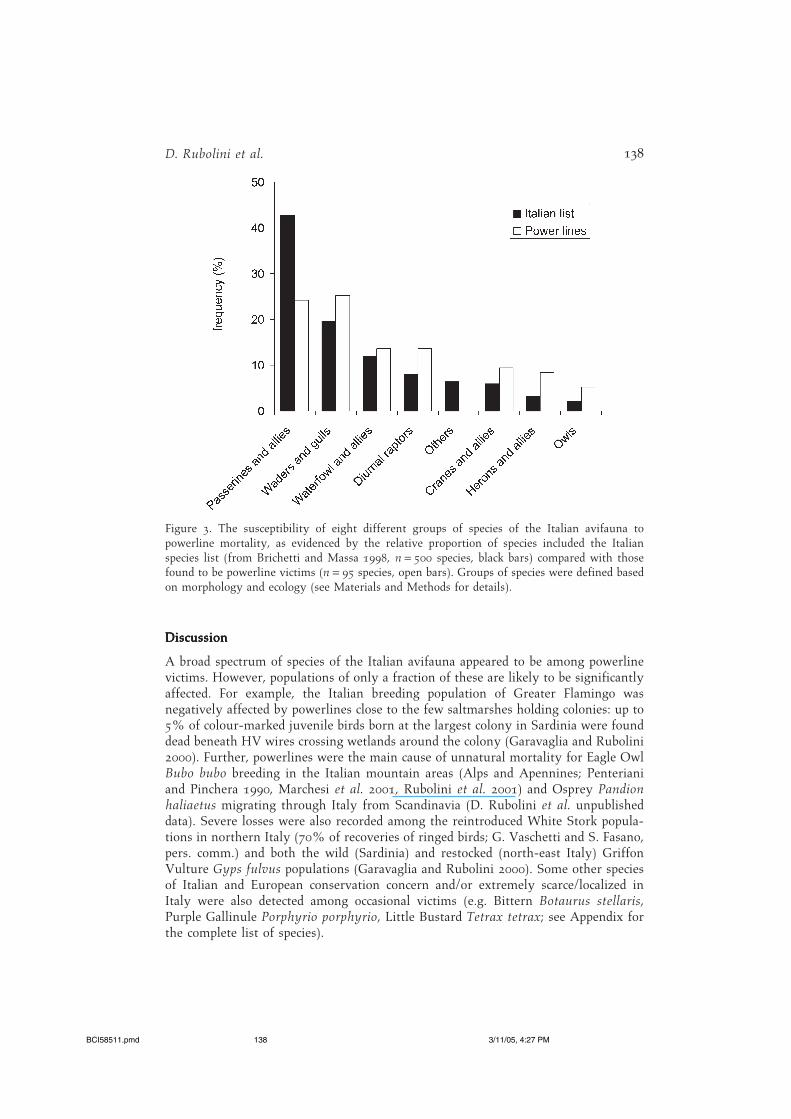
A total of 1,315 individual powerline casualties of 95 species (19% of the Italianavifauna) was detected in the published literature or reported after the request forinformation (see list in Appendix). As the data were gathered from different sourcesand mainly refer to occasional observations (53.2% unpublished data, 45.2% pub-lished studies, 1.7% local bird reports), we cannot directly compare the relative abun-dance at the species level. In any case, a comparison in terms of species number foreach of the groups revealed that species from some groups were over-representedamong powerline casualties compared with the Italian list (Figure 3; x2 = 27.6, df = 7,P = 0.0002). In particular, the most widely affected groups were OWL and HER (50%of Italian species affected), followed by RAP–CRA (32% and 30% of species respec-tively) and WAD–WAT (24.5% and 22%, respectively). Within the PAS group, only10.7% of species was found among powerline victims (Figure 2).
Type of mortality and body size
The recalculation of the Spanish model yielded a discriminant function that correctlyclassified 86.4% of the Spanish species’ sample (the classification success reported inthe original study was 88.6%): thus, compared with the data presented in Janss(2000), a single species was misclassified, and we are therefore confident that therecalculation of the discriminant function was successful (the difference resulted from
BCI58511.pmd 3/11/05, 4:26 PM135
136D. Rubolini et al.
minor differences in biometrics between the datasets). The application of the Spanishdiscriminant function to our species sample (n = 95 species, “complete set”) classifiedcorrectly only 54.7% of species, a significant difference from the Spanish data set(x2 = 13.8, df = 1, P < 0.001). The classification error was distributed equally amongall three groups. The predictive power increased significantly to 73.5% if applied tospecies larger than a Turtle Dove Streptopelia turtur (54.7% vs. 73.5%, x2 = 6.56,df = 1, P = 0.01) (n = 68 species whose body size was equal or greater than 27 cm,
Figure 1. Map of mortality census sites. Open circles, high-voltage lines; filled circles, medium-voltage lines. Site characteristics are reported in Table 1.
BCI58511.pmd 3/11/05, 4:26 PM136
137Birds and powerlines in Italy
Figure 2. The susceptibility of different avian ecomorphological groups to collision and electro-cution, as evidenced by their relative proportions found during collision (n = 688 individuals,open bars) and electrocution (n = 140 individuals, black bars) censuses (see Materials andMethods for group definitions).
hereafter “reduced set”; after Janss 2000, which considered only these larger species).The classification success of the reduced set was non-significantly lower than thatof the Spanish original dataset (73.5% vs. 86.4%; x2 = 2.50, df = 1, P = 0.11). A newdiscriminant analysis model built on the observed mortality categories for thecomplete set classified 81.1% of the species correctly, with the first function aloneexplaining 98.6% of the variance (Table 2). In particular, 62 of 68 collision victimswere correctly classified (89.8%), while predictive power was lower for the othergroups (53.8% of species in the mixed group and 61.5% in the electrocution group).If the model was built on the reduced set, classification success was slightly lower(80.9%) (Table 2) but the error was more evenly distributed among groups (83.7%,66.7% and 84.6% of cases correctly classified for collision, mixed and electrocutiongroups, respectively). The classification success for the reduced set based on this modelor on the Spanish model did not differ significantly (80.9% vs. 73.5%; x2 = 0.96,df = 1, P = 0.32). Therefore, a model based on larger species alone, which are neverthe-less more frequent among powerline casualties (Figure 3), seems to be more reliable inpredicting species-specific probability of collision or electrocution as a source ofpowerline mortality. In general, for the reduced set, the risk of collision was higherfor species with longer tails and wings, while the risk of electrocution was higherfor smaller species with shorter tails and wings; species in the mixed group showedintermediate measurements.
BCI58511.pmd 3/11/05, 4:27 PM137
138D. Rubolini et al.
Figure 3. The susceptibility of eight different groups of species of the Italian avifauna topowerline mortality, as evidenced by the relative proportion of species included the Italianspecies list (from Brichetti and Massa 1998, n = 500 species, black bars) compared with thosefound to be powerline victims (n = 95 species, open bars). Groups of species were defined basedon morphology and ecology (see Materials and Methods for details).
DiscussionDiscussionDiscussionDiscussionDiscussion
A broad spectrum of species of the Italian avifauna appeared to be among powerlinevictims. However, populations of only a fraction of these are likely to be significantlyaffected. For example, the Italian breeding population of Greater Flamingo wasnegatively affected by powerlines close to the few saltmarshes holding colonies: up to5% of colour-marked juvenile birds born at the largest colony in Sardinia were founddead beneath HV wires crossing wetlands around the colony (Garavaglia and Rubolini2000). Further, powerlines were the main cause of unnatural mortality for Eagle OwlBubo bubo breeding in the Italian mountain areas (Alps and Apennines; Penterianiand Pinchera 1990, Marchesi et al. 2001, Rubolini et al. 2001) and Osprey Pandionhaliaetus migrating through Italy from Scandinavia (D. Rubolini et al. unpublisheddata). Severe losses were also recorded among the reintroduced White Stork popula-tions in northern Italy (70% of recoveries of ringed birds; G. Vaschetti and S. Fasano,pers. comm.) and both the wild (Sardinia) and restocked (north-east Italy) GriffonVulture Gyps fulvus populations (Garavaglia and Rubolini 2000). Some other speciesof Italian and European conservation concern and/or extremely scarce/localized inItaly were also detected among occasional victims (e.g. Bittern Botaurus stellaris,Purple Gallinule Porphyrio porphyrio, Little Bustard Tetrax tetrax; see Appendix forthe complete list of species).
BCI58511.pmd 3/11/05, 4:27 PM138
139Birds and powerlines in Italy
As in previous studies (e.g. Ferrer et al. 1991, Bevanger 1998, Janss 2000, Janss andFerrer 2001), some groups were more affected than others: in particular, collisionaffected large species characterized by a low flight manoeuvrability (cranes, heronsand allies), while many diurnal and nocturnal raptors and corvids were affected byelectrocution. Passerine species and allies were relatively less affected by powerlinemortality than other groups, probably due to their generally small body size and highflight manoeuvrability (Bevanger 1998, Janss 2000).
The discriminant model proposed by Janss (2000) for predicting the probability of agiven species being among electrocution or collision victims based on morphologyperformed fairly well with Italian data, classifying a maximum of 73.5% of speciescorrectly. This discrepancy may be related to differences in species categorization inthe two studies: Janss’ (2000) categorization was based both on observed casualties andon a priori morphological groups potentially differing in susceptibility to powerlines,whilst our classification was based on observed mortality alone. Therefore, in Janss’sstudy, a few waders, which tend to have thin, small wings compared with body sizeand, according to Bevanger (1998), may be theoretically susceptible to both collisionand electrocution, were assigned to the mixed group, while in our study they wererecorded among collision victims only, and this may explain the low predictive powerof the Spanish functions when applied to the Italian dataset. Moreover, a cautionarynote on the discriminant model approach should be added: the models do not performwell if small species, mainly recorded as collision victims, are included, as shown bythe low classification success of the Spanish model on the complete Italian set ofspecies. Anyway, our study confirms that predictive discriminant models can provide
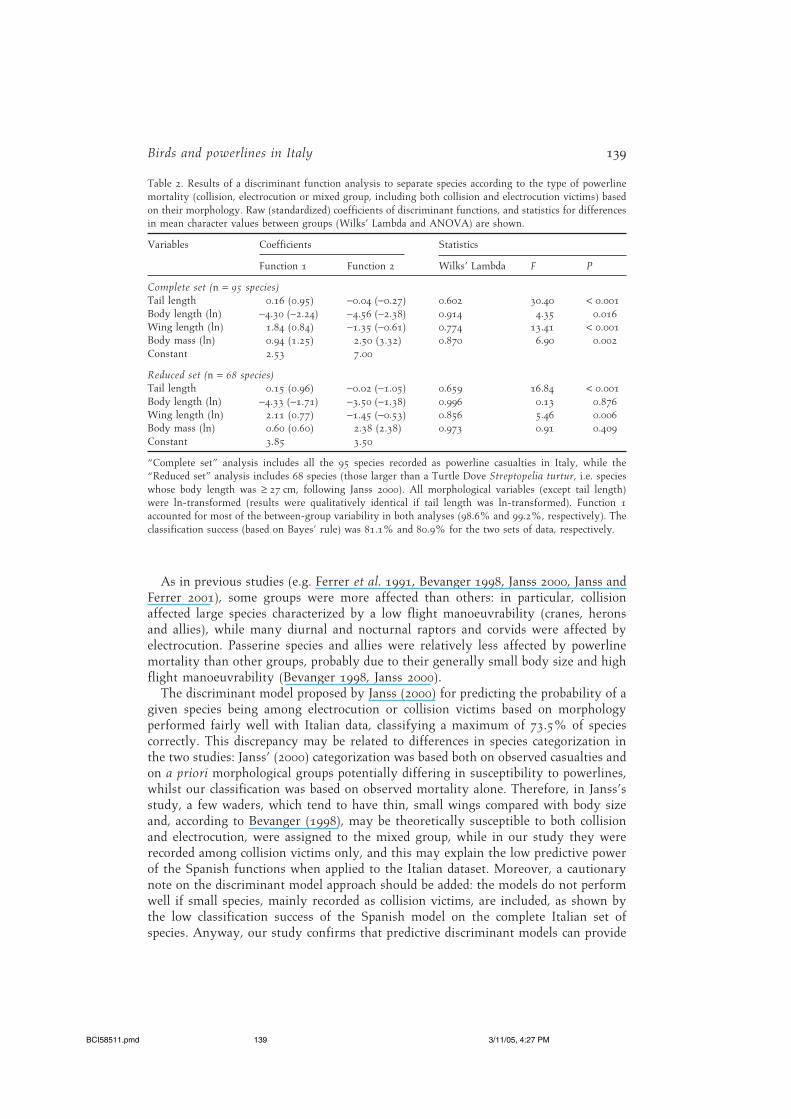
Table 2. Results of a discriminant function analysis to separate species according to the type of powerlinemortality (collision, electrocution or mixed group, including both collision and electrocution victims) basedon their morphology. Raw (standardized) coefficients of discriminant functions, and statistics for differencesin mean character values between groups (Wilks’ Lambda and ANOVA) are shown.
Variables Coefficients Statistics
Function 1 Function 2 Wilks’ Lambda F P
Complete set (n = 95 species)Tail length 0.16 (0.95) −0.04 (−0.27) 0.602 30.40 < 0.001Body length (ln) −4.30 (−2.24) −4.56 (−2.38) 0.914 4.35 0.016Wing length (ln) 1.84 (0.84) −1.35 (−0.61) 0.774 13.41 < 0.001Body mass (ln) 0.94 (1.25) 2.50 (3.32) 0.870 6.90 0.002Constant 2.53 7.00
Reduced set (n = 68 species)Tail length 0.15 (0.96) −0.02 (−1.05) 0.659 16.84 < 0.001Body length (ln) −4.33 (−1.71) −3.50 (−1.38) 0.996 0.13 0.876Wing length (ln) 2.11 (0.77) −1.45 (−0.53) 0.856 5.46 0.006Body mass (ln) 0.60 (0.60) 2.38 (2.38) 0.973 0.91 0.409Constant 3.85 3.50
“Complete set” analysis includes all the 95 species recorded as powerline casualties in Italy, while the“Reduced set” analysis includes 68 species (those larger than a Turtle Dove Streptopelia turtur, i.e. specieswhose body length was ≥ 27 cm, following Janss 2000). All morphological variables (except tail length)were ln-transformed (results were qualitatively identical if tail length was ln-transformed). Function 1accounted for most of the between-group variability in both analyses (98.6% and 99.2%, respectively). Theclassification success (based on Bayes’ rule) was 81.1% and 80.9% for the two sets of data, respectively.
BCI58511.pmd 3/11/05, 4:27 PM139
140D. Rubolini et al.
a useful tool for analysing objectively the susceptibility of a given species to collisionor electrocution risk. This may be especially useful in developing countries withincreasing levels of electrification and high levels of avian biodiversity for predicting,and therefore reducing, the impacts of powerlines on local avifaunas (Bevanger 1998,Janss 2000).
Mortality rates derived for Italian powerlines showed a high variability, mainlyrelated to site-specific characteristics and technical properties of powerlines, as mortal-ity due to powerlines appears to be heavily influenced by surrounding landscapefeatures (Bevanger 1990, Janss and Ferrer 2001). Censused sections were not distrib-uted at random within the electric system: they can be considered “worst-casestudies”, which are of limited statistical and general value, and ultimately cannot beused to derive estimates of powerline mortality over the whole Italian transmissionand distribution network (Bevanger 1999). Most collision censuses were carried out onmarshlands, where birds are more concentrated, hence potentially inflating the overallcollision rate (e.g. Hejniis 1980). On the other hand, electrocution censuses werecarried out in cultivated farmland, a typical and widespread situation of the country’slandscape crossed by MV distribution powerlines. Although data from other studiesare difficult to compare (Janss and Ferrer 1999c), some estimates of electrocution ratesare available from selected powerlines in both Spain and the United States: our esti-mate (0.15 dead birds per pole per year) is in line with the recent Spanish calculations(0.21 dead birds per pole per year; Janss and Ferrer 1999c), while it is generally lowerthan that recorded in the United States (0.15–5.2 dead birds per pole per year; seereferences in Janss and Ferrer 1999c). This may be related to an overall low density ofsome species considered to be vulnerable to the powerline risk in the Italian territory,and a lower diversity of large diurnal raptors (compared with North America), raptorsbeing among the main victims of electrocution. The estimated minimum number ofelectrocuted birds may be considerably altered by the application of a correction factorfor carcass removal by avian and mammalian scavengers. True mortality rate may beup to 60% higher for a mortality census carried out at monthly intervals, dependingon, for example, the species concerned, frequency of visits, density of scavengers andsite characteristics (Ferrer et al. 1991, Bevanger 1995, Alonso and Alonso 1999, Janssand Ferrer 2001).
While it may be tempting to infer that mortality due to powerlines is of little over-all biological significance in Italy (e.g. Alonso and Alonso 1999), it is clear that not allspecies are equally involved, and that raptors and other slow-reproducing, long-livedand large-sized (k-selected) species, many of which are considered of high conserva-tion priority, are over-represented among casualties. For rare and localized raptors,the regular death of even a few adults and dispersing juveniles may have markedconsequences on population structure, increasing turnover rates of territories and theproportion of immature breeders, and ultimately leading to a decreased reproductiveoutput and population declines (e.g. Ferrer and Hiraldo 1992, Mañosa and Real 2001).Furthermore, deleterious effects were recorded in local situations, where hugenumbers of raptors may congregate due to increased food availability (Chiozzi andMarchetti 2001), and considerable damage was also recorded among restockingprojects of endangered large birds (storks and vultures).
In conclusion, a degree of avian mortality appears to be intrinsic in the aerial elec-tric system, and efforts by power companies should be concentrated on implementingstrategies of mitigating actions, perhaps based on targeted measures at high-priority
BCI58511.pmd 3/11/05, 4:27 PM140
141Birds and powerlines in Italy
sites (in the case of collision) and modification of dangerous power pylons, rather thanimplementing large-scale mitigation actions which may be ineffective in reducingpowerline mortality (e.g. Mañosa 2001). Locally, the impact of powerlines is evidentand can be of serious conservation concern for local populations of a species and forspecies with a restricted distribution. Future efforts to reduce avian mortality bypower companies should include a larger use of the widely available electrocution-safestructures on distribution MV powerlines, and careful siting through a preliminaryevaluation of alternative tracks for HV transmission lines: in particular, the localiza-tion of new HV lines in areas known to be hosting high-priority species at elevatedcollision risk should be carefully avoided, with particular reference to areas wherereintroduction and/or restocking projects of large species are under way.
AcknowledgementsAcknowledgementsAcknowledgementsAcknowledgementsAcknowledgements
Mortality censuses were carried out by S. Fasano and G. Vaschetti (Cuneese), M.Costa (V. Sottolido, V. Mandriole, Comacchio), M. Grussu (Molentargius) and P. F.Micheloni (C. Pianetti). We thank all the people, institutions and organizations thatreported powerline accidents, and especially L. Ruggieri, M. Sighele and EBN Italiamembers for support. We also thank the Editor, Dr S. Buckton, and Dr J. Ekstrom fortheir comments on the manuscript. G. Janss kindly agreed to let us check her originaldata. The Italian Ministry for Industry and Trade provided financial support for thisresearch (D.M. MICA 26-01-2000).
ReferencesReferencesReferencesReferencesReferences
Alonso, J. A. and Alonso, J.C. (1994) Mitigation of bird collisions with transmission linesthrough groundwire marking. Biol. Conserv. 67: 129–134.
Alonso, J. A. and Alonso, J. C. (1999) Collision of birds with overhead transmission linesin Spain. Pp. 57–82 in G. F. E. Janss and M. Ferrer, eds. Birds and powerlines. Collision,electrocution and breeding. Madrid: Quercus.
Bevanger, K. (1990) Topographic aspects of transmission wire collision hazards to game birds inthe central Norwegian coniferous forest. Cinclus 13: 11–18.
Bevanger K. (1994) Bird interactions with utility structures: collision and electrocution, causesand mitigating measures. Ibis 136: 412–425.
Bevanger, K. (1995) Estimates and population consequences of tetraonid mortality caused bycollisions with high tension power lines in Norway. J. Appl. Ecol. 32: 745–753.
Bevanger, K. (1998) Biological and conservation aspects of bird mortality caused by electricitypower lines: a review. Biol. Conserv. 86: 67–76.
Bevanger, K. (1999) Estimating bird mortality caused by collision and electrocution with powerlines: a review of methodology. Pp. 29–56 in G. F. E. Janss and M. Ferrer, eds. Birds and powerlines. Collision, electrocution and breeding. Madrid: Quercus.
Bevanger, K., Bakke, Ø. and Engen, S. (1994) Corpse removal experiment with WillowPtarmigan (Lagopus lagopus) in power-line corridors. Ökol. Vögel 16: 597–607.
Brichetti, P. and Massa, B. (1998) Check-list degli uccelli italiani aggiornata a tutto il 1997. Riv.Ital. Orn. 68: 129–152.
Brown, W. M. and Drewien, R. C. (1995) Evaluation of two power line markers to reduce craneand waterfowl collision mortality. Wildl. Soc. Bull. 23: 217–227.
Chiozzi, G. and Marchetti, G. (2001) Elevata mortalità di poiane Buteo buteo lungo una lineaelettrica. Riv. Ital. Orn. 70: 125–126.
BCI58511.pmd 3/11/05, 4:27 PM141
142D. Rubolini et al.
Crivelli A. J., Jerrentrup, H. and Mitchev, T. (1988) Electric power lines: a cause of mortalityin Pelecanus crispus Bruch, a world endangered bird species, in Porto-Lago, Greece. Col.Waterbirds 11: 301–305.
Erickson, W. P., Johnson, G. D., Strickland, M. D., Young, D. P., Sernka, K. J. and Good, R. E.(2001) Avian collisions with wind turbines: a summary of existing studies and comparisonsto other sources of avian collision mortality in the United States. Washington, D.C.: NWCCResource Document.
Ferrer, M. and Hiraldo, F. (1992) Man-induced sex-biased mortality in the Spanish imperialeagle. Biol. Conserv. 60: 57–60.
Ferrer, M., de la Riva, M. and Castroviejo, J. (1991) Electrocution of raptors on power lines inSouthwestern Spain. J. Field Ornithol. 62: 181–190.
Fiedler, G. and Wissner, A. (1980) Freileitungen als tödliche Gefahr für Störche Ciconia ciconia.Ökol. Vögel 2 (Sonderheft): 59–109.
Garavaglia, R.and Rubolini, D.(2000) Rapporto “Ricerca di Sistema” – Progetto BIODIVERSA –L’impatto delle linee elettriche sull’avifauna. Milan: CESI-AMB04/005, CESI.
Heijnis, R. (1980) Vogeltod durch Drahtanflüge bei Hochspannungsleitungen. Ökol. Vögel 2(Sonderheft): 111–129.
Hodson, N. L. and Snow, D. W. (1965) The road deaths enquiry, 1960–1961. Bird Study 12:90–99.
Janss, G. F. E. (2000) Avian mortality from power lines: a morphologic approach of aspecies-specific mortality. Biol. Conserv. 95: 353–359.
Janss, G. F. E. and Ferrer, M. (1998) Rate of bird collision with power lines: effects ofconductor-marking and static-wire marking. J. Field Ornithol. 69: 8–17.
Janss, G. F. E. and Ferrer, M. (1999a) Birds and power lines. Collision, electrocution andbreeding. Madrid: Quercus.
Janss, G. F. E. and Ferrer, M. (1999b) Mitigation of raptor electrocution on steel power poles.Wildl. Soc. Bull. 27: 263–273.
Janss, G. F. E. and Ferrer, M. (1999c) Avian electrocution on power poles: European experiences.Pp. 145–164 in G. F. E. Janss and M. Ferrer, eds. Birds and power lines. Collision, electrocu-tion and breeding. Madrid: Quercus.
Janss, G. F. E. and Ferrer, M. (2000) Common crane and great bustard collision with power lines:collision rate and risk exposure. Wildl. Soc. Bull. 28: 675–680.
Janss, G. F. E. and Ferrer, M. (2001) Avian electrocution mortality in relation to pole design andadjacent habitat in Spain. Bird Conserv. Int. 11: 3–12.
Lehman, R. N., Ansell, A. R., Garret, M. G., Miller, A. D. and Olendorff, R. R. (1999) Suggestedpractices for raptor protection on power lines: the American story. Pp. 125–144 in G. F. E.Janss and M. Ferrer, eds. Birds and power lines. Collision, electrocution and breeding. Madrid:Quercus.
Mañosa, S. (2001) Strategies to identify dangerous electricity pylons for birds. Biodiv. Conserv.10: 1997–2012.
Mañosa, S. and Real, J. (2001) Potential negative effects of collisions with transmission lines ona Bonelli’s Eagle population. J. Raptor Res. 35: 247–252.
Marchesi, L., Pedrini, P., Sergio, F. and Garavaglia, R. (2001) Impatto delle linee elettriche suuna popolazione di Gufo reale Bubo bubo. Avocetta 25: 130.
Morkill, A. E. and Anderson, S. H. (1991) Effectiveness of marking powerlines to reduceSandhill Crane collisions. Wildl. Soc. Bull. 19: 442–449.
Norusis, M. J. (1992). SPSS/PC+ User’s Guide. Advanced Statistics. Chicago: SPSS, Inc.Penteriani, V. (1998). L’impatto delle linee elettriche sull’avifauna. Serie Scientifica — N. 4.
Rome: WWF Italia.Penteriani, V. and Pinchera, F. (1990) Declino del Gufo reale Bubo bubo in tre aree montane dell
’Appennino abruzzese dal 1960 al 1989. Suppl. Ric. Biol. Selvaggina XVII: 351–356.
BCI58511.pmd 3/11/05, 4:27 PM142
143Birds and powerlines in Italy
Real, J., Grande, J. M., Mañosa, S. and Sanchez-Zapata, J. A. (2001) Causes of death in differentareas for Bonelli’s Eagle Hieraaetus fasciatus in Spain. Bird Study 48: 221–228.
Rieger, M. and Winkel, W. (1971) Über Todesursachen beim Weisstorch (Ciconia ciconia) anHand von Ringfundangaben. Vogelwarte 26: 128–135.
Rubolini, D., Bassi, E., Bogliani, G., Galeotti, P. and Garavaglia, R. (2001) Eagle Owl Bubo buboand power line interactions in the Italian Alps. Bird Conserv. Int. 11: 319–324.
Secci, A. (1982) Dati sulla mortalità accidentale degli uccelli nello stagno di Molentargius(Cagliari) negli anni 1977, 1978 e 1979. Uccelli d’Italia 7: 79–92.
Tucker, G. M. and Heath, M. F. (1994) Birds in Europe. Their conservation status. Cambridge,U.K.: BirdLife International.
DIEGO RUBOLINI* and GIUSEPPE BOGLIANIDipartimento di Biologia Animale, Università di Pavia, piazza Botta 9, 27100 Pavia, Italy
MARCO GUSTINLIPU, Lega Italiana Protezione Uccelli, Dipartimento Conservazione, via Trento 49, 43100
Parma, Italy
ROBERTO GARAVAGLIACESI, Centro Elettrotecnico Sperimentale Italiano G. Motta, via R. Rubattino 54, 20134 Milan,
Italy
*Author for correspondence; e-mail: [email protected]
Received 4 September 2003; revision accepted 2 November 2004
BCI58511.pmd 3/11/05, 4:27 PM143
144D. Rubolini et al.
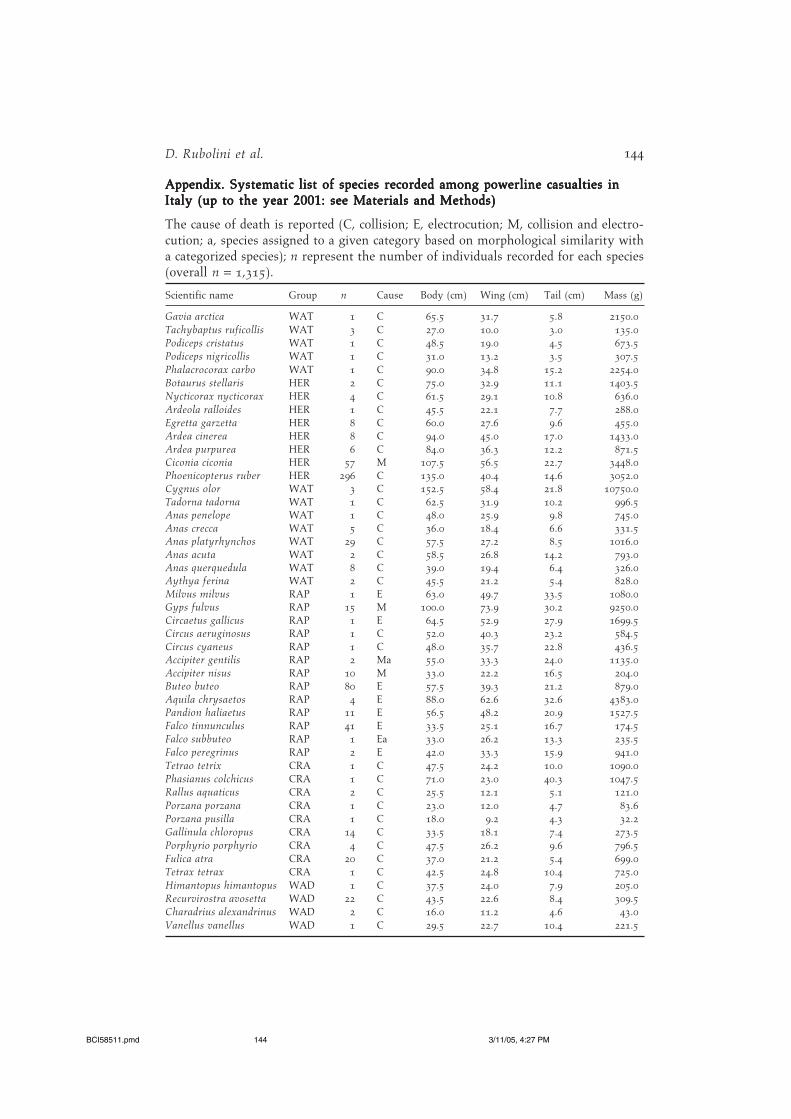
Appendix. Systematic list of species recorded among powerline casualties inAppendix. Systematic list of species recorded among powerline casualties inAppendix. Systematic list of species recorded among powerline casualties inAppendix. Systematic list of species recorded among powerline casualties inAppendix. Systematic list of species recorded among powerline casualties inItaly (up to the year 2001: see Materials and Methods)Italy (up to the year 2001: see Materials and Methods)Italy (up to the year 2001: see Materials and Methods)Italy (up to the year 2001: see Materials and Methods)Italy (up to the year 2001: see Materials and Methods)
The cause of death is reported (C, collision; E, electrocution; M, collision and electro-cution; a, species assigned to a given category based on morphological similarity witha categorized species); n represent the number of individuals recorded for each species(overall n = 1,315).
Scientific name Group n Cause Body (cm) Wing (cm) Tail (cm) Mass (g)
Gavia arctica WAT 1 C 65.5 31.7 5.8 2150.0Tachybaptus ruficollis WAT 3 C 27.0 10.0 3.0 135.0Podiceps cristatus WAT 1 C 48.5 19.0 4.5 673.5Podiceps nigricollis WAT 1 C 31.0 13.2 3.5 307.5Phalacrocorax carbo WAT 1 C 90.0 34.8 15.2 2254.0Botaurus stellaris HER 2 C 75.0 32.9 11.1 1403.5Nycticorax nycticorax HER 4 C 61.5 29.1 10.8 636.0Ardeola ralloides HER 1 C 45.5 22.1 7.7 288.0Egretta garzetta HER 8 C 60.0 27.6 9.6 455.0Ardea cinerea HER 8 C 94.0 45.0 17.0 1433.0Ardea purpurea HER 6 C 84.0 36.3 12.2 871.5Ciconia ciconia HER 57 M 107.5 56.5 22.7 3448.0Phoenicopterus ruber HER 296 C 135.0 40.4 14.6 3052.0Cygnus olor WAT 3 C 152.5 58.4 21.8 10750.0Tadorna tadorna WAT 1 C 62.5 31.9 10.2 996.5Anas penelope WAT 1 C 48.0 25.9 9.8 745.0Anas crecca WAT 5 C 36.0 18.4 6.6 331.5Anas platyrhynchos WAT 29 C 57.5 27.2 8.5 1016.0Anas acuta WAT 2 C 58.5 26.8 14.2 793.0Anas querquedula WAT 8 C 39.0 19.4 6.4 326.0Aythya ferina WAT 2 C 45.5 21.2 5.4 828.0Milvus milvus RAP 1 E 63.0 49.7 33.5 1080.0Gyps fulvus RAP 15 M 100.0 73.9 30.2 9250.0Circaetus gallicus RAP 1 E 64.5 52.9 27.9 1699.5Circus aeruginosus RAP 1 C 52.0 40.3 23.2 584.5Circus cyaneus RAP 1 C 48.0 35.7 22.8 436.5Accipiter gentilis RAP 2 Ma 55.0 33.3 24.0 1135.0Accipiter nisus RAP 10 M 33.0 22.2 16.5 204.0Buteo buteo RAP 80 E 57.5 39.3 21.2 879.0Aquila chrysaetos RAP 4 E 88.0 62.6 32.6 4383.0Pandion haliaetus RAP 11 E 56.5 48.2 20.9 1527.5Falco tinnunculus RAP 41 E 33.5 25.1 16.7 174.5Falco subbuteo RAP 1 Ea 33.0 26.2 13.3 235.5Falco peregrinus RAP 2 E 42.0 33.3 15.9 941.0Tetrao tetrix CRA 1 C 47.5 24.2 10.0 1090.0Phasianus colchicus CRA 1 C 71.0 23.0 40.3 1047.5Rallus aquaticus CRA 2 C 25.5 12.1 5.1 121.0Porzana porzana CRA 1 C 23.0 12.0 4.7 83.6Porzana pusilla CRA 1 C 18.0 9.2 4.3 32.2Gallinula chloropus CRA 14 C 33.5 18.1 7.4 273.5Porphyrio porphyrio CRA 4 C 47.5 26.2 9.6 796.5Fulica atra CRA 20 C 37.0 21.2 5.4 699.0Tetrax tetrax CRA 1 C 42.5 24.8 10.4 725.0Himantopus himantopus WAD 1 C 37.5 24.0 7.9 205.0Recurvirostra avosetta WAD 22 C 43.5 22.6 8.4 309.5Charadrius alexandrinus WAD 2 C 16.0 11.2 4.6 43.0Vanellus vanellus WAD 1 C 29.5 22.7 10.4 221.5
BCI58511.pmd 3/11/05, 4:27 PM144
145Birds and powerlines in Italy
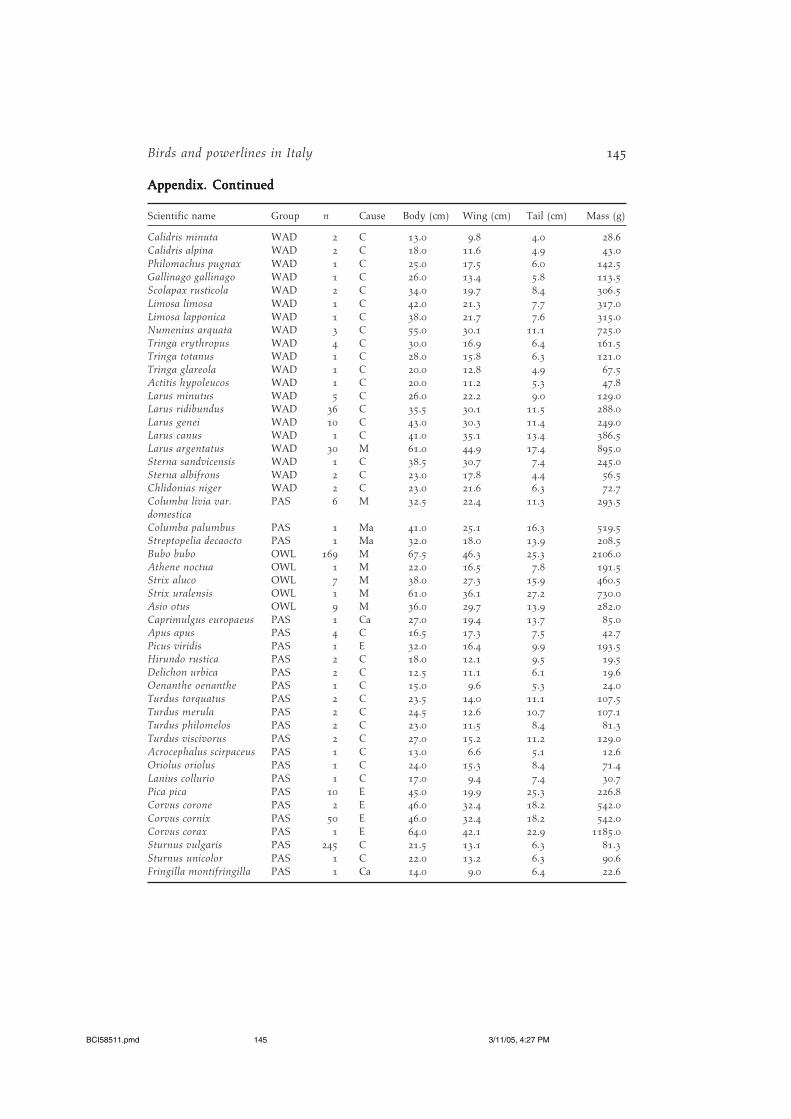
Appendix. ContinuedAppendix. ContinuedAppendix. ContinuedAppendix. ContinuedAppendix. Continued
Scientific name Group n Cause Body (cm) Wing (cm) Tail (cm) Mass (g)
Calidris minuta WAD 2 C 13.0 9.8 4.0 28.6Calidris alpina WAD 2 C 18.0 11.6 4.9 43.0Philomachus pugnax WAD 1 C 25.0 17.5 6.0 142.5Gallinago gallinago WAD 1 C 26.0 13.4 5.8 113.5Scolapax rusticola WAD 2 C 34.0 19.7 8.4 306.5Limosa limosa WAD 1 C 42.0 21.3 7.7 317.0Limosa lapponica WAD 1 C 38.0 21.7 7.6 315.0Numenius arquata WAD 3 C 55.0 30.1 11.1 725.0Tringa erythropus WAD 4 C 30.0 16.9 6.4 161.5Tringa totanus WAD 1 C 28.0 15.8 6.3 121.0Tringa glareola WAD 1 C 20.0 12.8 4.9 67.5Actitis hypoleucos WAD 1 C 20.0 11.2 5.3 47.8Larus minutus WAD 5 C 26.0 22.2 9.0 129.0Larus ridibundus WAD 36 C 35.5 30.1 11.5 288.0Larus genei WAD 10 C 43.0 30.3 11.4 249.0Larus canus WAD 1 C 41.0 35.1 13.4 386.5Larus argentatus WAD 30 M 61.0 44.9 17.4 895.0Sterna sandvicensis WAD 1 C 38.5 30.7 7.4 245.0Sterna albifrons WAD 2 C 23.0 17.8 4.4 56.5Chlidonias niger WAD 2 C 23.0 21.6 6.3 72.7Columba livia var. PAS 6 M 32.5 22.4 11.3 293.5domesticaColumba palumbus PAS 1 Ma 41.0 25.1 16.3 519.5Streptopelia decaocto PAS 1 Ma 32.0 18.0 13.9 208.5Bubo bubo OWL 169 M 67.5 46.3 25.3 2106.0Athene noctua OWL 1 M 22.0 16.5 7.8 191.5Strix aluco OWL 7 M 38.0 27.3 15.9 460.5Strix uralensis OWL 1 M 61.0 36.1 27.2 730.0Asio otus OWL 9 M 36.0 29.7 13.9 282.0Caprimulgus europaeus PAS 1 Ca 27.0 19.4 13.7 85.0Apus apus PAS 4 C 16.5 17.3 7.5 42.7Picus viridis PAS 1 E 32.0 16.4 9.9 193.5Hirundo rustica PAS 2 C 18.0 12.1 9.5 19.5Delichon urbica PAS 2 C 12.5 11.1 6.1 19.6Oenanthe oenanthe PAS 1 C 15.0 9.6 5.3 24.0Turdus torquatus PAS 2 C 23.5 14.0 11.1 107.5Turdus merula PAS 2 C 24.5 12.6 10.7 107.1Turdus philomelos PAS 2 C 23.0 11.5 8.4 81.3Turdus viscivorus PAS 2 C 27.0 15.2 11.2 129.0Acrocephalus scirpaceus PAS 1 C 13.0 6.6 5.1 12.6Oriolus oriolus PAS 1 C 24.0 15.3 8.4 71.4Lanius collurio PAS 1 C 17.0 9.4 7.4 30.7Pica pica PAS 10 E 45.0 19.9 25.3 226.8Corvus corone PAS 2 E 46.0 32.4 18.2 542.0Corvus cornix PAS 50 E 46.0 32.4 18.2 542.0Corvus corax PAS 1 E 64.0 42.1 22.9 1185.0Sturnus vulgaris PAS 245 C 21.5 13.1 6.3 81.3Sturnus unicolor PAS 1 C 22.0 13.2 6.3 90.6Fringilla montifringilla PAS 1 Ca 14.0 9.0 6.4 22.6
BCI58511.pmd 3/11/05, 4:27 PM145