Biotransformation and Genotoxic Biomarkers in Mullet Species ( LIZA SP.) From a Contaminated Coastal...
21
Environmental Monitoring and Assessment (2005) 107: 133–153 DOI: 10.1007/s10661-005-5308-z c Springer 2005 BIOTRANSFORMATION AND GENOTOXIC BIOMARKERS IN MULLET SPECIES (LIZA SP.) FROM A CONTAMINATED COASTAL LAGOON (RIADE AVEIRO, PORTUGAL) M. PACHECO ∗ , M. A. SANTOS, M. TELES, M. OLIVEIRA, J. E. REBELO and L. POMBO Biology Department, University of Aveiro, Aveiro, Portugal (*author for correspondence, e-mail: [email protected]) (Received 1 December 2003; accepted 19 August 2004) Abstract. The aim of the present study was to assess liver ethoxyresorufin-O-deethylase (EROD) activity and erythrocytic nuclear abnormalities (ENA) frequency in three mullet species, as biotrans- formation and genotoxicity biomarkers, respectively, for monitoring aquatic ecosystems. Specimens of Liza aurata, Liza ramada and Liza saliens were caught bimonthly, between May 2000 and March 2001, at nine stations in the Ria de Aveiro (Portugal), a polluted coastal lagoon. The survey revealed two critical areas (Vagos and Carregal) where it was observed elevated EROD activity and ENA frequency, comparing to the reference sites. The results often reflect a contamination by a mixture of pollutants, from point and non-point sources. Nevertheless, the responses observed at Vagos are probably attributable to high polycyclic aromatic hydrocarbon (PAH) water levels measured at that station. All species were able to detect inter-site differences; however L. aurata seems to be the most appropriate bio-indicator due to its larger geographical distribution and abundance during the whole year. The adopted biomarkers, applied to mullet species, can be successfully employed for biomonitoring anthropogenic contamination in both Atlantic and Mediterranean European coastal waters. Keywords: ENA, EROD, genotoxicity, Liza sp., PAHs, Ria de Aveiro (Portugal) 1. Introduction Ria de Aveiro is a coastal lagoon (47 km 2 of maximum surface area) permanently connected to the sea, located in northern west region of Portugal surrounded by sev- eral urban aggregates and industrial centres. Historically, this lagoon has been the main receptor of anthropogenic discharges resulting mainly from chlor-alkali and pulp/paper plants, harbour and dry-dock activities as well as municipal and domes- tic effluents. Consequently, there are some critical areas revealing the imperative need of an effective biomonitoring programme. Biomarkers represent toxicant-induced changes in biological systems that can serve as linkers between environmental contamination (cause) and its effects, pro- viding therefore unique information on the ecosystem health (Bucheli and Font, 1995). The best-studied biomarker is, probably, the cytochrome P450 1A (CYP1A) induction, measured either by immunodetection or through its catalytic activity (Bucheli and Font, 1995). Hence, ethoxyresorufin-O-deethylase (EROD) activity
-
Upload
independent -
Category
Documents
-
view
1 -
download
0
Transcript of Biotransformation and Genotoxic Biomarkers in Mullet Species ( LIZA SP.) From a Contaminated Coastal...

Environmental Monitoring and Assessment (2005) 107: 133–153DOI: 10.1007/s10661-005-5308-z c© Springer 2005
BIOTRANSFORMATION AND GENOTOXIC BIOMARKERS INMULLET SPECIES (LIZA SP.) FROM A CONTAMINATED COASTAL
LAGOON (RIA DE AVEIRO, PORTUGAL)
M. PACHECO∗, M. A. SANTOS, M. TELES, M. OLIVEIRA, J. E. REBELOand L. POMBO
Biology Department, University of Aveiro, Aveiro, Portugal(*author for correspondence, e-mail: [email protected])
(Received 1 December 2003; accepted 19 August 2004)
Abstract. The aim of the present study was to assess liver ethoxyresorufin-O-deethylase (EROD)activity and erythrocytic nuclear abnormalities (ENA) frequency in three mullet species, as biotrans-formation and genotoxicity biomarkers, respectively, for monitoring aquatic ecosystems. Specimensof Liza aurata, Liza ramada and Liza saliens were caught bimonthly, between May 2000 and March2001, at nine stations in the Ria de Aveiro (Portugal), a polluted coastal lagoon. The survey revealedtwo critical areas (Vagos and Carregal) where it was observed elevated EROD activity and ENAfrequency, comparing to the reference sites. The results often reflect a contamination by a mixtureof pollutants, from point and non-point sources. Nevertheless, the responses observed at Vagos areprobably attributable to high polycyclic aromatic hydrocarbon (PAH) water levels measured at thatstation. All species were able to detect inter-site differences; however L. aurata seems to be themost appropriate bio-indicator due to its larger geographical distribution and abundance during thewhole year. The adopted biomarkers, applied to mullet species, can be successfully employed forbiomonitoring anthropogenic contamination in both Atlantic and Mediterranean European coastalwaters.
Keywords: ENA, EROD, genotoxicity, Liza sp., PAHs, Ria de Aveiro (Portugal)
1. Introduction
Ria de Aveiro is a coastal lagoon (47 km2 of maximum surface area) permanentlyconnected to the sea, located in northern west region of Portugal surrounded by sev-eral urban aggregates and industrial centres. Historically, this lagoon has been themain receptor of anthropogenic discharges resulting mainly from chlor-alkali andpulp/paper plants, harbour and dry-dock activities as well as municipal and domes-tic effluents. Consequently, there are some critical areas revealing the imperativeneed of an effective biomonitoring programme.
Biomarkers represent toxicant-induced changes in biological systems that canserve as linkers between environmental contamination (cause) and its effects, pro-viding therefore unique information on the ecosystem health (Bucheli and Font,1995). The best-studied biomarker is, probably, the cytochrome P450 1A (CYP1A)induction, measured either by immunodetection or through its catalytic activity(Bucheli and Font, 1995). Hence, ethoxyresorufin-O-deethylase (EROD) activity

134 M. PACHECO ET AL.
has been widely used as a biomarker for wildlife exposure, including fish, to sub-stances that bind to the aryl hydrocarbon (Ah) receptor (Petrulis et al., 2001). Feralfish caught in waters contaminated predominantly by polychlorinated biphenyls(PCBs) (Jedamski-Grymlas et al., 1995), polycyclic aromatic hydrocarbon (PAHs)(Addison et al., 1994) or by complex mixtures (Kosmala et al., 1998) presentedliver EROD induction.
Genotoxicity biomarkers have received particular attention and a variety ofmethodologies have been developed in recent years, with an increased attentiontowards the use of piscine micronuclei (MN) and erythrocytic nuclear abnormalities(ENA) assays. The ENA assay, based on the detection of micronuclei and othernuclear anomalies, has been regarded as a simple, rapid, inexpensive and sensitivetest, applied with success in different fish species such as Anguilla anguilla (Pachecoand Santos, 1997; 2001a,b), Dicentrarchus labrax (Gravato and Santos, 2002)and Oncorhynchus mykiss (Ayllon and Garcia-Vasquez, 2001), exposed to variousclasses of genotoxins.
The fish species selected for the present study – Liza aurata, L. ramada andL. saliens – are common European mugilide widely distributed in both Atlanticand Mediterranean coastal waters. Their feeding behaviour is characterized by aregular contact with the sediment being often extensive to the whole water column.Therefore, they are good candidates as bio-indicator species for monitoring watercontamination by organic xenobiotics within a large lipophilicity range.
The current work is the first biomonitoring program, concerning fish, carriedout in the Aveiro lagoon system, designed with the following main goals:
– The assessment of the toxicological risk for ichthyic populations in Ria de Aveirodue to anthropogenic chemicals;
– The evaluation of liver EROD and ENA assays suitability, applied to mulletspecies under field situations, as biomarkers for monitoring coastal and fresh-water ecosystems;
– The selection of a suitable bio-indicator species and the comparison of the re-sponse patterns in different species belonging to the same genus.
2. Materials and Methods
2.1. SAMPLING – ANIMALS AND STATIONS
The sampling was carried out bimonthly, between May 2000 and March 2001,during low tide using a traditional beach-seine net named “chincha”. Three feralmullet species were collected: golden grey mullet (Liza aurata), thin-lipped greymullet (Liza ramada), and leaping mullet (Liza saliens).
The sampling sites in Ria de Aveiro (Figure 1) were selected on a geographicdistribution basis along the main channels and at the lagoon entrance, taking into

BIOTRANSFORMATION AND GENOTOXIC BIOMARKERS IN MULLET SPECIES 135
Figure 1. Map of the sampling stations (�) in the Ria de Aveiro.
account the various types and sources of contamination as well as the selection of(theoretically) unpolluted reference points. The sampling sites were: S. Jacinto(SJA) as a reference point, close to the lagoon entrance and far from the mainpolluting sources; Torreira (TOR) is an intermediate region of the longest channel(S. Jacinto-Ovar channel); Carregal (CAR) is located at the end of the previouschannel, receiving municipal and domestic wastewaters; Laranjo (LAR) close toa chlor-alkali plant, an important source of heavy metals contamination (mainlyHgCl2); Rio Novo do Principe (RIO) located at the terminal area of the Vougariver and the main lagoons’ fresh water source, 6 km distant from a pulp/papermill effluent outlet, that was exposed during nearly five decades to its discharges;Gafanha (GAF) situated in the vicinity of a deep-sea fishing port and dry-docks;Vagos (VAG) at the terminal part of the Ilhavo channel, receiving municipal anddomestic effluents; Barra (BAR) at the initial part of the Mira channel, close to

136 M. PACHECO ET AL.
the sea-side lagoon entrance and subjected to a considerable naval traffic; Areao(ARE) at the terminal part of the previous channel, also chosen as “hypothetical”reference site.
Juvenile fish specimens were selected on the basis of their size. Immediatelyafter catching, fish were sacrificed and blood smears were prepared. Fish livers’were then removed, frozen in liquid nitrogen, and later stored at −80 ◦C until furtheranalysis. Biometrical measurements, such as fish weight and length, were carriedout in the laboratory (Tables I–III).
Hydrological abiotic parameters such as temperature and salinity were measured(Table IV). Water samples were also collected for PAHs analysis.
2.2. SCORING GENOTOXIC DAMAGE
The blood smears were fixed with methanol during 10 min and stained with Giemsa(5%) during 30 min. ENAs were scored in 1000 mature erythrocytes sample per fish,according to the criteria of Schmid (1976), Carrasco et al. (1990) and Smith (1990)as adapted by Pacheco and Santos (1996), considering the following nuclear lesionscategories: micronuclei (M), lobed nuclei (L), dumbbell shaped or segmentednuclei (S) and kidney shaped nuclei (K). In addition, notched nuclei (N) were alsoscored as suggested by Ayllon and Garcia-Vasquez (2001). The final result, in eachgroup, was expressed as the mean value (o/oo) of the sums (M + L + S + K + N)for all the individual lesions observed.
2.3. LIVER MICROSOMES PREPARATION AND EROD ASSAY
Liver microsomes were obtained according to the methods of Lange et al. (1993)and Monod and Vindimian (1991), adapted by Pacheco and Santos (1998). HepaticEROD activity was measured as described by Burke and Mayer (1974). Resultswere expressed as picomoles/minute/milligram of microsomal protein. Microsomalprotein concentration was determined according to the Biuret method (Gornallet al., 1949), using bovine serum albumin (E. Merck-Darmstadt, Germany) as astandard.
2.4. ANALYSIS OF PAHS IN THE WATER
The PAHs were analysed by gas chromatography/mass spectrometry (GC/MS) in10-L concentrated samples. The eight following PAHs were measured: phenan-threne (Ph), fluoranthene (Fl), pyrene (Py), benzo(a)anthracene (B(a)A), chry-sene + triphenylene (Ch + Tri), benzo(a)pyrene (B(a)Py), benzo(ghi)perylene(B(ghi)Pe), and naphthalene (N), being among the sixteen PAHs on the US EPA’spriority pollutant list (Smith et al., 1989). Analyses were carried out by the NavyHydrographic Institute, Ministry of National Defence.

BIOTRANSFORMATION AND GENOTOXIC BIOMARKERS IN MULLET SPECIES 137
TABLE IAverage weight and length of Liza aurata collected at the Ria de Aveiro
Month Station n Weight (g) Length (cm)
May SJA 3 35.65 ± 3.04 16.17 ± 0.1
BAR 5 28.62 ± 14.95 15.38 ± 2.63
VAG 4 18.13 ± 6.50 13.12 ± 1.41
ARE 4 17.23 ± 5.80 12.28 ± 1.21
RIO 3 29.97 ± 17.61 15.17 ± 2.79
LAR 6 17.65 ± 4.41 12.50 ± 0.92
CAR 4 37.80 ± 11.37 16.68 ± 2.25
TOR 7 27.13 ± 9.91 14.73 ± 1.86
July SJA 3 11.40 ± 5.66 10.89 ± 1.68
BAR 5 35.03 ± 21.19 15.18 ± 3.18
VAG 5 30.74 ± 9.83 15.28 ± 1.47
ARE 3 14.65 ± 0.21 11.00 ± 0.02
RIO 4 22.13 ± 7.34 13.80 ± 1.71
LAR 7 27.51 ± 10.45 14.07 ± 2.13
CAR 5 14.40 ± 5.62 11.20 ± 2.38
September BAR 6 13.32 ± 9.76 8.82 ± 3.42
VAG 4 9.83 ± 0.21 8.28 ± 1.12
ARE 6 9.63 ± 1.37 7.60 ± 1.93
RIO 3 9.03 ± 0.28 6.07 ± 0.64
LAR 6 17.01 ± 11.35 11.84 ± 2.45
CAR 3 17.00 ± 4.10 8.97 ± 0.88
TOR 5 13.10 ± 1.82 11.37 ± 0.45
November GAF 4 22.17 ± 15.58 11.72 ± 0.93
SJA 8 13.75 ± 2.62 11.83 ± 0.73
BAR 8 27.68 ± 1.41 15.31 ± 0.41
VAG 9 10.96 ± 5.00 10.92 ± 1.57
ARE 5 11.24 ± 5.41 9.94 ± 2.24
RIO 5 9.66 ± 5.28 10.46 ± 1.84
LAR 6 12.95 ± 1.24 11.63 ± 0.49
CAR 4 15.23 ± 8.44 12.24 ± 2.88
TOR 8 12.48 ± 2.33 11.56 ± 0.66
January GAF 4 35.81 ± 16.13 15.98 ± 4.40
SJA 6 16.27 ± 19.96 9.71 ± 5.72
BAR 8 14.05 ± 8.31 9.05 ± 4.00
RIO 5 9.59 ± 6.85 7.42 ± 3.07
LAR 8 16.10 ± 9.15 9.99 ± 4.92
CAR 3 36.45 ± 11.03 16.46 ± 2.99
TOR 5 14.16 ± 3.70 9.00 ± 1.56
March SJA 9 12.13 ± 2.43 11.86 ± 0.87
BAR 8 19.20 ± 1.55 13.49 ± 1.34
ARE 3 9.37 ± 1.76 10.08 ± 0.99
CAR 4 16.31 ± 5.21 12.64 ± 2.16
TOR 4 10.02 ± 2.11 11.78 ± 0.89
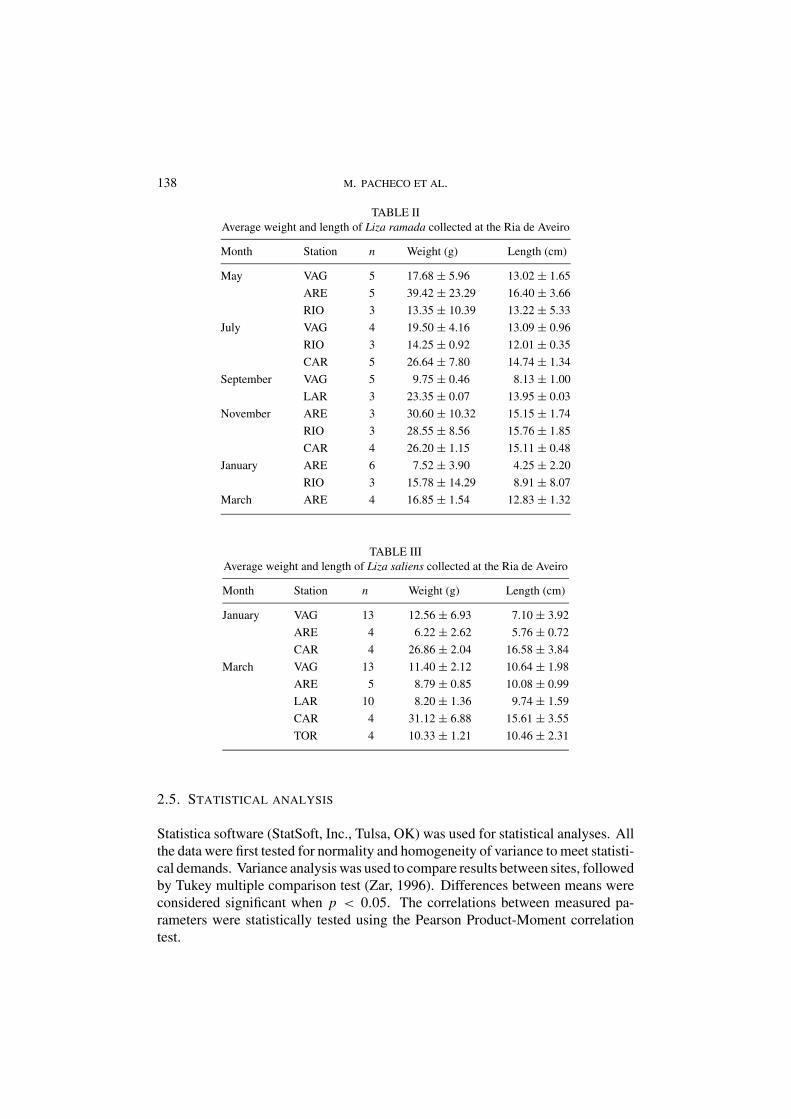
138 M. PACHECO ET AL.
TABLE IIAverage weight and length of Liza ramada collected at the Ria de Aveiro
Month Station n Weight (g) Length (cm)
May VAG 5 17.68 ± 5.96 13.02 ± 1.65
ARE 5 39.42 ± 23.29 16.40 ± 3.66
RIO 3 13.35 ± 10.39 13.22 ± 5.33
July VAG 4 19.50 ± 4.16 13.09 ± 0.96
RIO 3 14.25 ± 0.92 12.01 ± 0.35
CAR 5 26.64 ± 7.80 14.74 ± 1.34
September VAG 5 9.75 ± 0.46 8.13 ± 1.00
LAR 3 23.35 ± 0.07 13.95 ± 0.03
November ARE 3 30.60 ± 10.32 15.15 ± 1.74
RIO 3 28.55 ± 8.56 15.76 ± 1.85
CAR 4 26.20 ± 1.15 15.11 ± 0.48
January ARE 6 7.52 ± 3.90 4.25 ± 2.20
RIO 3 15.78 ± 14.29 8.91 ± 8.07
March ARE 4 16.85 ± 1.54 12.83 ± 1.32
TABLE IIIAverage weight and length of Liza saliens collected at the Ria de Aveiro
Month Station n Weight (g) Length (cm)
January VAG 13 12.56 ± 6.93 7.10 ± 3.92
ARE 4 6.22 ± 2.62 5.76 ± 0.72
CAR 4 26.86 ± 2.04 16.58 ± 3.84
March VAG 13 11.40 ± 2.12 10.64 ± 1.98
ARE 5 8.79 ± 0.85 10.08 ± 0.99
LAR 10 8.20 ± 1.36 9.74 ± 1.59
CAR 4 31.12 ± 6.88 15.61 ± 3.55
TOR 4 10.33 ± 1.21 10.46 ± 2.31
2.5. STATISTICAL ANALYSIS
Statistica software (StatSoft, Inc., Tulsa, OK) was used for statistical analyses. Allthe data were first tested for normality and homogeneity of variance to meet statisti-cal demands. Variance analysis was used to compare results between sites, followedby Tukey multiple comparison test (Zar, 1996). Differences between means wereconsidered significant when p < 0.05. The correlations between measured pa-rameters were statistically tested using the Pearson Product-Moment correlationtest.

BIOTRANSFORMATION AND GENOTOXIC BIOMARKERS IN MULLET SPECIES 139
TABLE IVWater temperature and salinity from the Ria de Aveiro sampling points
Month Station Temp. (◦C) Salin. (o/oo)
May GAF 17.3 19
SJA 17.5 25
BAR 18.0 20
VAG 18.0 2
ARE 16.5 0
RIO 16.0 0
LAR 18.7 5
CAR 20.6 7
TOR 17.5 6
July GAF 22.0 34
SJA 23.0 35
BAR 21.5 35
VAG 22.0 24
ARE 25.0 20
RIO 23.0 11
LAR 23.5 32
CAR 25.0 27
TOR 23.0 33
September GAF 19.0 35
SJA 19.0 35
BAR 19.3 34
VAG 21.8 33
ARE 24.0 14
RIO 20.0 20
LAR 21.0 34
CAR 21.0 35
TOR 19.5 36
November GAF 12.0 25
SJA 9.5 28
BAR 10.5 23
VAG 11.5 6
ARE 11.5 4
RIO 11.0 0
LAR 12.0 12
CAR 12.5 20
TOR 12.0 20
(Continued on next page)

140 M. PACHECO ET AL.
TABLE IV(Continued)
Month Station Temp. (◦C) Salin. (o/oo)
January GAF 13.0 19
SJA 12.0 27
BAR 13.0 20
VAG 13.5 4
ARE 13.0 0
RIO 12.5 0
LAR 13.0 12
CAR 13.0 15
TOR 13.0 16
March GAF 15.0 5
SJA 15.0 15
BAR 14.0 10
VAG 14.5 0
ARE 15.0 0
RIO nm nm
LAR 14.0 0
CAR 14.0 4
TOR 15.0 5
nm = not measured.
3. Results
3.1. LIZA AURATA RESPONSES (FIGURE 2)
L. aurata was captured in all sampling months revealing also a distribution by theentire lagoon.
This species displayed a significant liver EROD induction at Vagos station inMay and September compared to the reference sites – S. Jacinto and Areao – aswell as to other sampling sites. In July, fish caught at Vagos showed a significantEROD activity increase as compared to that from Barra and Laranjo. In March, anelevation in liver EROD activity was observed at Carregal compared to S. Jacintoand Torreira stations.
In terms of ENA frequency, the highest frequency was measured in May atCarregal, being significantly different from Areao (reference) and Torreira sites.In July, Vagos revealed a significant ENA elevation compared to Laranjo, as wellas in September compared either to the reference (Areao) or to all other samplingpoints.
The most pronounced significant increments in the assayed biomarkers wereobserved in September at Vagos site where liver EROD activity was 130 times

BIOTRANSFORMATION AND GENOTOXIC BIOMARKERS IN MULLET SPECIES 141
Figure 2. Liver ethoxyresorufin O-deethylase (EROD) activity and erythrocytic nuclear abnormalities(ENA) frequency in Liza aurata collected at different sites in the Ria de Aveiro. Values represent themeans (±S.D.). Statistically significant differences (p < 0.05) between sampling stations are: a vsARE; b vs SJA; c vs BAR; d vs RIO; e vs LAR; f vs CAR; g vs TOR. nc = not collected.

142 M. PACHECO ET AL.
higher than at Areao; ENA frequencies at Vagos were also 5.1 and 8.3 times higherthan at Areao and Rio Novo do Principe, respectively.
3.2. LIZA RAMADA RESPONSES (FIGURE 3)
L. ramada appeared in 5 of the 9 sampling selected sites, during the whole year butin a discontinuous way. In July and September it was not captured in any of thepre-defined reference points.
The only significant alteration concerns liver EROD induction in May at Va-gos compared to the reference station (Areao), presenting a 29 times increment.However, L. ramada liver EROD activity was clearly reduced in all stations duringNovember, January and March coinciding with low water temperatures.
3.3. LIZA SALIENS RESPONSES (FIGURE 4)
This species exhibited an occurrence limited to a maximum of five sites and twomonths a year (January and March).
Liver EROD activity was significantly increased (8.3 times) in January at Vagoscompared to Areao (reference) station. Though in March a statistical significantliver EROD induction was not found, a similar increasing tendency was observed.ENA frequencies did not reveal any inter-site significant difference.
3.4. PAHS IN THE WATER (TABLE V)
In May, the highest total (� 8 compounds) PAH water level was found at Vagos,followed by Barra station. In July, the highest total value was measured at Torreira,manly due to the elevated concentration of Ch + Tri; the highest B(a)Py levelswere found at Vagos and Barra stations. Surprisingly, in September and March,the highest PAH concentrations were found in a proposed reference site – Areao.In November and January, Vagos was, once more, the most contaminated site.
Among the measured PAHs, N and B(a)Py were clearly the most abundantchemicals. Total PAH levels were markedly affected by the B(a)Py concentration,displaying a maximum value at Vagos station in May. Though, N was the mostabundant PAH in 65% of the collected water samples, followed by B(a)Py (31%).A temporal analysis reveals that the highest PAH concentrations were detected inthe spring/summer period, i.e. in May, July and September.
3.5. CORRELATIONS BETWEEN BIOLOGICAL RESPONSES
AND WATER PAH LEVELS
No significant correlations were detected between EROD activity and ENA fre-quency concerning all stations at one time, as well as each station as a function

BIOTRANSFORMATION AND GENOTOXIC BIOMARKERS IN MULLET SPECIES 143
Figure 3. Liver ethoxyresorufin O-deethylase (EROD) activity and erythrocytic nuclear abnormalities(ENA) frequency in Liza ramada collected at different sites in the Ria de Aveiro. Values representthe means (±S.D.). Statistically significant differences (p < 0.05) between sampling stations are: avs ARE. nc = not collected.

144 M. PACHECO ET AL.
Figure 4. Liver ethoxyresorufin O-deethylase (EROD) activity and erythrocytic nuclear abnormalities(ENA) frequency in Liza saliens collected at different sites in the Ria de Aveiro. Values represent themeans (±S.D.). Statistically significant differences (p < 0.05) between sampling stations are: a vsARE. nc = not collected.
of time. Additionally, no correlations were observed between the two previousbiological responses and PAH water concentration.
4. Discussion
4.1. HEPATIC EROD ACTIVITY
Liver EROD activity revealed to be the most responsive biomarker in the presentstudy since it exhibited significant inter-site differences in all the adopted bio-indicator species.
Despite the absence of statistical correlations between EROD activity and waterPAH concentration, at Vagos site there are some obvious parallelisms, such as thecoincidence between either the highest B(a)Py or total PAH concentrations (� 8PAHs) and the maximum EROD induction observed in May for the two capturedspecies (L. aurata and L. ramada), as well as in January for L. saliens. Similarly,in July there was a coincidence between the highest B(a)Py concentration and themaximum EROD induction for L. aurata.
The EROD induction determined for L. aurata at Carregal, in March, should beattributable to other class(es) of Ah receptor ligands rather than PAHs, since theirwater concentration were low.

BIOTRANSFORMATION AND GENOTOXIC BIOMARKERS IN MULLET SPECIES 145
TAB
LE
VPA
Hs
conc
entr
atio
nsin
wat
er(n
g/m
l)fr
omth
eR
iade
Ave
iro
sam
plin
gpo
ints
Mon
thSi
teN
PhFl
PyB
(a)A
Ch
+T
riB
(a)P
yB
(ghi
)Pe
�
May
GA
F0.
0080
0.00
080.
0004
0.00
050.
0004
0.00
100.
0010
0.00
030.
0124
SJA
0.00
800.
0009
0.00
050.
0004
0.00
030.
0007
0.00
100.
0006
0.01
24B
AR
0.00
600.
0010
0.00
050.
0006
0.00
020.
0003
0.18
000.
0003
0.18
89V
AG
0.00
600.
0020
0.00
100.
0008
0.00
020.
0040
0.81
000.
0003
0.82
43A
RE
0.00
600.
0009
0.00
050.
0003
<0.
0001
<0.
0001
0.00
030.
0003
0.00
83R
IO0.
0060
0.00
100.
0009
0.00
070.
0010
0.00
100.
0150
0.00
100.
0266
LA
R0.
0060
0.00
090.
0005
0.00
040.
0005
0.00
070.
0010
0.00
080.
0108
CA
R0.
0050
0.00
080.
0005
0.00
03<
0.00
01<
0.00
010.
0060
0.00
020.
0128
TO
R0.
0080
0.00
080.
0006
0.00
040.
0006
0.00
090.
0006
0.00
090.
0128
July
GA
F0.
0050
0.00
100.
0008
0.00
070.
0003
0.00
030.
0030
0.00
040.
0115
SJA
0.00
600.
0030
0.00
200.
0008
0.00
030.
0006
0.00
200.
0003
0.01
50B
AR
0.00
600.
0010
0.00
070.
0006
<0.
0001
<0.
0001
0.11
000.
0005
0.11
88V
AG
0.00
500.
0008
0.00
040.
0006
<0.
0001
<0.
0001
0.24
000.
0003
0.24
71A
RE
0.00
600.
0020
0.00
100.
0006
0.00
020.
0010
0.00
030.
0003
0.01
14R
IO0.
0050
0.00
070.
0004
0.00
03<
0.00
01<
0.00
010.
0300
0.00
010.
0365
LA
R0.
0020
0.00
100.
0008
0.00
06<
0.00
01<
0.00
010.
0020
0.00
010.
0065
CA
R0.
0100
0.00
200.
0020
0.00
08<
0.00
01<
0.00
01<
0.00
01<
0.00
010.
0148
TO
R0.
0100
0.00
100.
0009
0.00
06<
0.00
010.
5100
<0.
0001
0.00
030.
5228
Sept
embe
rG
AF
0.00
700.
0008
0.00
030.
0002
0.00
020.
0001
0.00
05<
0.00
010.
0091
SJA
0.00
900.
0020
0.00
050.
0003
<0.
0001
<0.
0001
<0.
0001
<0.
0001
0.01
18B
AR
0.00
600.
0010
0.00
050.
0006
0.00
030.
0002
0.25
00<
0.00
010.
2586
VA
G0.
0060
0.00
100.
0002
0.00
02<
0.00
01<
0.00
010.
1100
<0.
0001
0.11
74A
RE
0.00
600.
0010
0.00
040.
0004
0.00
030.
0004
0.47
00<
0.00
010.
4785
RIO
0.00
700.
0010
0.00
030.
0002
<0.
0001
<0.
0001
0.00
02<
0.00
010.
0087
LA
R0.
0080
0.00
100.
0003
0.00
03<
0.00
01<
0.00
010.
1700
<0.
0001
0.17
96C
AR
0.00
600.
0009
0.00
030.
0002
<0.
0001
<0.
0001
0.00
03<
0.00
010.
0077
TO
R0.
0060
0.00
090.
0003
0.00
03<
0.00
01<
0.00
010.
0003
<0.
0001
0.00
78
(Con
tinu
edon
next
page
)

146 M. PACHECO ET AL.
TAB
LE
V(C
onti
nued
)
Mon
thSi
teN
PhFl
PyB
(a)A
Ch
+T
riB
(a)P
yB
(ghi
)Pe
�
Nov
embe
rG
AF
0.00
700.
0005
0.00
020.
0003
<0.
0001
<0.
0001
<0.
0001
<0.
0001
0.00
80SJ
A0.
0060
0.00
070.
0003
0.00
080.
0004
0.00
030.
0020
<0.
0001
0.01
05B
AR
0.00
600.
0008
0.00
020.
0003
<0.
0001
<0.
0001
0.00
60<
0.00
010.
0133
VA
G0.
0050
0.00
060.
0008
0.00
03<
0.00
01<
0.00
010.
0080
<0.
0001
0.01
47A
RE
0.00
600.
0010
0.00
030.
0004
<0.
0001
<0.
0001
<0.
0001
<0.
0001
0.00
77R
IO0.
0010
0.00
01<
0.00
01<
0.00
01<
0.00
01<
0.00
01<
0.00
01<
0.00
010.
0011
LA
R0.
0070
0.00
100.
0003
0.00
04<
0.00
01<
0.00
01<
0.00
01<
0.00
010.
0087
CA
R0.
0040
0.00
080.
0005
0.00
050.
0003
0.00
02<
0.00
01<
0.00
010.
0063
TO
R0.
0060
0.00
070.
0003
0.00
06<
0.00
01<
0.00
010.
0002
<0.
0001
0.00
78Ja
nuar
yG
AF
0.00
500.
0008
<0.
0001
<0.
0001
0.00
030.
0001
<0.
0001
<0.
0001
0.00
62SJ
A0.
0050
0.00
070.
0002
0.00
030.
0003
<0.
0001
<0.
0001
<0.
0001
0.00
65B
AR
0.00
500.
0009
0.00
020.
0003
0.00
030.
0001
<0.
0001
<0.
0001
0.00
68V
AG
0.00
600.
0009
0.00
010.
0002
0.00
020.
0001
0.05
00<
0.00
010.
0575
AR
E0.
0060
0.00
100.
0003
0.00
020.
0003
0.00
01<
0.00
01<
0.00
010.
0079
RIO
0.00
600.
0010
0.00
020.
0003
0.00
03<
0.00
01<
0.00
01<
0.00
010.
0078
LA
R0.
0050
0.00
090.
0002
0.00
030.
0003
0.00
02<
0.00
01<
0.00
010.
0069
CA
R0.
0060
0.00
070.
0003
0.00
050.
0003
0.00
03<
0.00
01<
0.00
010.
0081
TO
R0.
0050
0.00
100.
0007
0.00
100.
0010
0.00
070.
0008
0.00
010.
0103
Mar
chG
AF
<0.
0001
0.00
080.
0000
0.00
02<
0.00
01<
0.00
01<
0.00
01<
0.00
010.
0010
SJA
<0.
0001
0.00
080.
0002
0.00
02<
0.00
01<
0.00
01<
0.00
01<
0.00
010.
0012
BA
R0.
0080
0.00
200.
0002
0.00
03<
0.00
01<
0.00
01<
0.00
01<
0.00
010.
0105
VA
G0.
0070
0.00
200.
0001
0.00
01<
0.00
01<
0.00
01<
0.00
01<
0.00
010.
0092
AR
E0.
0040
0.00
060.
0002
0.00
010.
0002
0.00
010.
0300
<0.
0001
0.03
52R
IOnm
nmnm
nmnm
nmnm
nmnm
LA
R0.
0000
0.00
100.
0002
0.00
03<
0.00
01<
0.00
010.
0200
0.00
030.
0218
CA
R0.
0080
0.00
100.
0003
0.00
05<
0.00
010.
0003
<0.
0001
<0.
0001
0.01
01T
OR
0.00
800.
0005
0.00
030.
0004
0.00
020.
0002
<0.
0001
<0.
0001
0.00
96
N=
naph
thal
ene;
Ph=
phen
anth
rene
;Fl=
fluor
anth
ene;
Py=
pyre
ne;B
(a)A
=be
nzo(
a)an
thra
cene
;Ch
+T
ri=
chry
sene
+tr
iphe
nyle
ne;
B(a
)Py
=be
nzo(
a)py
rene
;B(g
hi)P
e=
benz
o(gh
i)pe
ryle
ne;n
m=
notm
easu
red.

BIOTRANSFORMATION AND GENOTOXIC BIOMARKERS IN MULLET SPECIES 147
The lack of significant liver EROD responses seems to be unexpected in somesituations, since high or moderated PAHs levels were detected. However, when fishare exposed to mixtures of contaminants and subjected to all field variables, thedata interpretation cannot be simplified. The authors believe that the interpretationof the current data must keep in mind, mainly, the occurrence of chemicals able toimpair EROD activity. Moreover, as stated by Petrulis et al. (2001), mixtures caninduce lower EROD activity than each isolated compound, and much less activitythan would be expected on the basis of additivity.
Laranjo area is recognized as highly polluted by heavy metals, namely mercury,as a result of an effluent discharge from a chlor-alkali plant (Pereira et al., 1997).Previous studies have shown that Anguilla anguilla, Platichthys flesus and Dicen-trarchus labrax captured at that location are contaminated by industrial mercury(Lucas et al., 1986; Abreu et al., 2000). Hence, considering that heavy metals arerecognized as potent cytochrome P450 inhibitors in fish (Fent and Stegeman, 1993)resulting in the EROD activity impairment (Viarengo et al., 1997; Oliveira et al.,2003), its inhibition should be expected at that location. Nevertheless, the resultsdo not allow us to confirm that inhibitory effect.
The non-appearance of any significant response at Gafanha station is in agree-ment with a previous caging study carried out in the same area with Anguillaanguilla (Pacheco and Santos, 2001a). In that study, the presence of xenobioticsthat inhibit or inactivate monooxygenase activity was suggested and supported bythe prior detection of important levels of heavy metals (Lucas et al., 1986; Hallet al., 1988) and organometallics such as tributyltin (TBT) (Barroso et al., 2000),in the water and sediment.
It was previously found that liver EROD activity in fish is direct and stronglyinfluenced by water temperature Lange et al. (1998). The temperature influence onthe present liver EROD data is best discussed considering L. aurata responses, due toits more regular distribution during the year, compared to the other two species. Anattempt to define a baseline level supported by liver EROD values at reference sitesreveals that a response pattern correlated to the water temperature is not obvious. Onthe other hand, the highest levels and most significant responses were observed inL. aurata during the warmest period (from March to September). Nevertheless, thisfact could not be explained only by a direct temperature effect, since the maximumwater PAH concentrations were also detected during that period. Thus, temperatureshould be mostly regarded as an additive factor on liver EROD activation.
4.2. ENA FREQUENCY
Taking into consideration the overall ENA results, it is pertinent to highlight thatENA appearance was restricted to one species (L. aurata) and two sites (Vagosand Carregal). This fact may be an indication that the surveyed species haveeffective protection mechanisms, namely an intense phase II conjugation of reactivemetabolites.

148 M. PACHECO ET AL.
Considering Vagos site, the elevated total PAH and B(a)Py levels found in Julyand September should be presented as an important cause for the ENA induction inL. aurata. However, in May no ENA increase was found for the collected species,despite the elevated water PAH concentration. In September, a maximum ENAinduction was found in L. aurata despite the PAH concentration was lower than inMay.
The genotoxicity determined in May at Carregal, for L. aurata, was probablyinduced by chemicals exported from the sediment to the water, as a consequenceof a bottom-dragging process carried out between April and October (2000). Nev-ertheless, this genotoxic effect did not persist in the following months.
Several fish studies have reported B(a)Py mutagenicity (Pacheco and Santos,1997; Maria et al., 2002) and carcinogenicity (Hendricks et al., 1985; Hawkins etal., 1990). Although the confirmation of the B(a)Py genotoxicity as ENA inducer,Pacheco and Santos (2002a) stated that ENA assay may be inadequate for situationsof intense contamination since some disturbances of genotoxicity expression mayoccur. These disturbances were confirmed to depend on the balance between anincreased splenic erythrocytic catabolism and reduced erythropoiesis rate. This mayexplain the absence of genotoxicity expression at Vagos in May, either in L. aurataor L. ramada, in the presence of an elevated B(a)Py concentration. Moreover, a 3.4and 7.4 times B(a)Py concentration decrease, occurring respectively in July andSeptember comparing to May, seems to diminish or abolish the ENA blockage,allowing the genotoxicity expression in L. aurata.
Taking into account the current ENA results, serious risks to fish populations atVagos and Carregal areas are predicable. However, the circumstantial absence ofsignificant ENA induction in other areas should be interpreted with some precaution.
Water temperature may influence cell replication rates and DNA repair of poik-ilothermal organisms (Venier et al., 1997). In this context, Brunetti et al. (1992)suggested a considerable influence of temperature on MN frequency. Analysingthe current temporal pattern of ENA frequency is not discernible a clear influence oftemperature on its expression. Thus, the explanation presented for the temperatureinfluence on EROD activity may be also applicable to ENA response.
4.3. MULLET SPECIES AS SENTINEL ORGANISMS
To the author’s knowledge, this is the first time that the current biological responses– EROD activity and ENA frequency – were measured in these mullet species. Theywere chosen as bio-indicators considering their ecological relevance, abundance anddistribution, as well as easy capture and handling. Despite the eventual seasonalmigrations, these mullets present a reduced mobility radius, which also representsa favourable characteristic as a bio-indicator. Additionally, as eurialine fish, thepresent survey confirmed that they are well adapted to water salinities ranging from0 up to 35(o/oo). This attribute is very important when it is intended to biomonitorcoastal ecosystems within a wide range of water salinity.

BIOTRANSFORMATION AND GENOTOXIC BIOMARKERS IN MULLET SPECIES 149
Comparing the three adopted species, L. aurata revealed to be the most abundant,presenting the larger geographical distribution and the most regular occurrencealong the year. In addition, the majority of inter-site differences detected in thisstudy concerns L. aurata. The lower abundance of L. ramada, preventing thesampling in the same month at reference and contaminated sites, may be the causeof the scarcity of significant differences.
A comparative analysis of liver EROD and ENA responses exhibited by eachspecies, reveals some sporadic differences, i.e., L. aurata was able to express a sig-nificant EROD induction at Carregal, in March, while L. saliens did not display anysignificant alteration. L. aurata is the only species displaying significant inter-siteENA induction differences. Furthermore, it is noticeable that L. aurata presentedregularly higher ENA frequencies than L. ramada in May, July and September atVagos station demonstrating species differences.
L. aurata seems to be the most appropriate species considering the whole lagoonbiomonitoring, whereas the usefulness of L. saliens seems to be limited since it wascaught only at five stations in two months. However, in January and March L. salienswas the only species collected at Vagos, where a significant liver EROD induction(in January) was found compared to the reference site – Areao. Thus, the choiceof “the best bio-indicator species” became difficult since the adoption of more thanone species appeared more adequate, when the biomonitoring of an ecosystem withsuch variety of features, is intended.
4.4. GENERAL STATEMENTS
Present data discussion has the subjacent hypothesis that liver CYP1A induction,measured as increased EROD activity, plays an important role in the activation ofenvironmental contaminants, producing metabolites able to induce ENAs. Nev-ertheless, the correlation between EROD and ENA responses, statistically tested,demonstrated that ENA frequencies do not follow the EROD activity pattern. Thismay be in agreement with Flammarion et al. (2002) who also found that ERODinduction levels did not parallel DNA damage measured as single-strand breaks(comet-assay). Furthermore, Pacheco and Santos (2002a) stated that genotoxicityis not obligatorily associated with a preceding or simultaneous EROD inductionsince it does not depend on a very high biotransformation activity.
The lack of significant correlations between water PAH levels and fish biolog-ical responses was not unexpected concerning the whole lagoon scenario and theoccurrence of other contaminants, released from both point and non-point sources.The decision to measure PAHs in the current study resulted from the absence ofavailable data concerning the Ria de Aveiro contamination by this important classof contaminants. The elevated PAH concentrations detected at Vagos are probablydue to municipal effluent treatment plant discharges, which is the most regularsource of contamination in that area.

150 M. PACHECO ET AL.
The current study confirmed the unquestionable usefulness of biomarkers onthe assessment of aquatic contamination since they reflect exposures to a varietyof anthropogenic stressors. The adopted biomarkers, representing two biologicalresponse levels, revealed its suitability as pollution indicators. However, in order toavoid misinterpretations, resulting mainly from inhibitory actions, multibiomarkerbatteries complemented by water, sediment and fish tissues contaminant analysesare strongly recommended.
The evaluation of the current strategy efficiency (biomarkers and bio-indicatorspecies combination) must take into consideration that the detection of significanteffects at the most critical areas was disturbed by the lack of unquestionable refer-ence sites. The presumed reference sites, Areao and S. Jacinto, revealed a poorerwater quality than previously expected. In particular, the PAH levels detected inSeptember and March at Areao were surprisingly high, enhancing the difficulty onthe selection of pristine reference sites in field studies.
Flammarion et al. (1999) found that Gobio gobio caught in a highly contami-nated site, exhibiting high EROD activities, needed a two-month depuration periodto decrease this activity to baseline levels. Transposing these previous findingsto the present study, in two months (the interval between samplings), even withlow mobility, fish can shift from a polluted to a clean site and vice versa. Thisproblem seems to assume less importance when we consider ENA frequency in-duction, since it was demonstrated that it can return to the control level in a few days(Pacheco and Santos, 2002b) or even hours (Teles et al., 2003). The previous state-ments denunciate the crucial influence of the exposure history to EROD or ENAinducers/inhibitors, reinforcing the difficulty in field data understanding. Froman ecotoxicological point of view, only field studies based on the capture of feralspecimens can provide a definitive indication about the environment state and theichthyic population’s health. Thus, despite all the difficulties on field data interpre-tation its replacement by other biomonitoring approaches should not be cogitated.Nevertheless, the simultaneous combination of survey studies with in situ cagingexperiments can offer an ideal strategy for biomonitoring purposes, providing anadditional mechanistic interpretation of fish toxicological responses.
Finally, the chemical pollution and the biological responses detected on thisstudy may play a primary role in fish resources and biodiversity loss reported inthis ecosystem by Pombo and Rebelo (2000).
5. Conclusion
In conclusion it can be stated that:
– The tested biomarkers might be proposed for large scale monitoring of toxico-logical effects caused by contamination from different origins; though, in orderto avoid misinterpretations, it should be complemented by water and sedimentchemical analyses;

BIOTRANSFORMATION AND GENOTOXIC BIOMARKERS IN MULLET SPECIES 151
– The usefulness of field studies was confirmed; however, in situ caging and lab-oratory experiments are recommended for field data corroboration;
– Liza aurata can be successfully employed as a sentinel fish for monitoring bio-logical effects of anthropogenic contaminants in both Atlantic and MediterraneanEuropean coastal waters, despite the clear suggestion towards the adoption ofmore than one bio-indicator species; this species can be particularly appropriatefor monitoring heterogeneous ecosystems;
– The results often reflect a contamination by a mixture of pollutants, from pointand non-point sources. Two critical areas were identified – Carregal and Vagos.
Acknowledgments
Support for this research work was provided by the Aveiro University ResearchInstitute/CESAM.
References
Abreu, S. N., Pereira, E., Vale, C. and Duarte, A. C.: 2000, ‘Accumulation of mercury in sea bassfrom a contaminated lagoon (Ria de Aveiro, Portugal)’, Mar. Pollut. Bull. 40, 293–297.
Addison, R. F., Willis, D. E. and Zinck, M. E.: 1994, ‘Liver microsomal mono-oxygenase inductionin winter flounder (Pseudopleuronectes americanus) from a gradient of sediment PAH concen-trations at Sydney Harbour, Nova Scotia’, Mar. Environ. Res. 37, 283–296.
Ayllon, F. and Garcia-Vazquez, E.: 2001, ‘Micronuclei and other nuclear lesions as genotoxicityindicators in rainbow trout Oncorhynchus mykiss’, Ecotoxicol. Environ. Saf. 49, 221–225.
Barroso, C. M., Moreira, M. H. and Gibbs, P. E.: 2000, ‘Comparison of imposex and intersexdevelopment in four prosobranch species for TBT monitoring of a southern European estuarinesystem (Ria de Aveiro, NW Portugal)’, Mar. Ecol. Prog. Ser. 201, 221–232.
Brunetti, R., Gabriele, M., Valerio, P. and Fumagalli, O.: 1992, ‘The micronucleus test: Tempo-ral pattern of base-line frequency in Mytilus galloprovincialis’, Mar. Ecol. Prog. Ser. 83, 75–78.
Bucheli, T. D. and Font, K.: 1995, ‘Induction of cytochrome-P450 as a biomarker for environmentalcontamination in aquatic ecosystems’, Crit. Rev. Environ. Sci. Technol. 25, 201–268.
Burke, M. D. and Mayer, R. T.: 1974, ‘Ethoxyresorufin: Direct fluorometric assay of a microsomal-O-deethylation which is preferentially inducible by 3-methylcholanthrene’, Drug Metab. Dispos.2, 583–588.
Carrasco, K. R., Tilbury, K. L. and Myers, M. S.: 1990, ‘Assessment of the piscine micronuclei testas an in situ biological indicator of chemical contaminant effects’, Can. J. Fish. Aquatic Sci. 47,2123–2136.
Fent, K. and Stegeman, J. J.: 1993, ‘Effects of tributyltin in vivo on hepatic cytochrome P450 formsin marine fish’, Aquatic Toxicol. 24, 219–240.
Flammarion, P., Fortier, V., Migeon, B., Morfin, P. and Garric, J.: 1999, ‘Cytochrome P450 1Ainduction in gudgeon (Gobio gobio): Laboratory and field studies’, Biomarkers 4, 59–71.
Flammarion, P., Devaux, A., Nehls, S., Migeon, B., Noury, P. and Garric, J.: 2002, ‘Multibiomarkerresponses in fish from the Moselle River (France)’, Ecotoxicol. Environ. Saf. 51, 145–153.
Gornall, A. C., Bardawill, C. J. and David, M. M.: 1949, ‘Determination of serum proteins by meansof the biuret reaction’, J. Biol. Chem. 177, 751–766.

152 M. PACHECO ET AL.
Gravato, C. and Santos, M. A.: 2002, ‘Juvenile sea bass liver P450, EROD induction, and erythrocyticgenotoxic responses to PAH and PAH-like compounds’, Ecotoxicol. Environ. Saf. 51, 115–127.
Hall, A., Duarte, A. C., Caldeira, M. M. and Lucas, M. B.: 1988, ‘Sources and sinks of mercury inthe coastal lagoon of Aveiro’, Sci. Total Environ. 64, 75–87.
Hawkins, W. E., Walker, W. W., Overstreet, R. M., Lytle, J. S. and Lytle, T. F.: 1990, ‘Carcino-genic effects of some polycyclic aromatic hydrocarbons on the Japanese medaka and guppy inwaterborne exposures’, Sci. Total Environ. 94, 155–167.
Hendricks, J. D., Meyers, T. R., Shelton, D. W., Casteel, J. L. and Bailey, G. S.: 1985, ‘Hepatocarcino-genicity of benzo(a)pyrene to rainbow trout by dietary exposure and intraperitoneal injection’,J. Natl. Cancer Inst. 74, 839–850.
Jedamski-Grymlas, J., Kammann, U., Tempelmann, A., Karbe, L. and Siebers, D.: 1995, ‘Biochem-ical responses and environmental contaminants in breams (Abramis brama L.) caught in the riverElbe’, Ecotoxicol. Environ. Saf. 31, 49–56.
Kosmala, A., Migeon, B., Flammarion, P. and Garric, J.: 1988, ‘Impact assessment of a wastewatertreatment plant effluent using the fish biomarker ethoxyresorufin-O-deethylase: Field and on-siteexperiments’, Ecotoxicol. Environ. Saf. 41, 19–28.
Lange, U., Danischewski, D. and Siebers, D.: 1993, ‘Regional Variability and Sexual Differencesin Ethoxyresorufin O-deethylase Activities and Cytochrome P450 Concentrations in the Liver ofMature Dab (Limanda limanda L.) in the German Bight’, in T. Braumbeck, W. Hunke and H.Segner (eds), Fish Ecotoxicology and Ecophysiology, VCH Verlag Chemie, Weinheim, Germany.
Lange, U., Saborowski, R., Siebers, D., Buchholz, F. and Karbe, L.: 1998, ‘Temperature as a key factordetermining the regional variability of the xenobiotic-inducible ethoxyresorufin-O-deethylaseactivity in the liver of dab (Limanda limanda)’, Can. J. Fish. Aquatic Sci. 55, 328–338.
Lucas, M. F., Caldeira, M. T., Hall, A., Duarte, A. C. and Lima, C.: 1986, ‘Distribution of mercuryin the sediments and fishes of the lagoon of Aveiro, Portugal’, Water Sci. Technol. 18, 141–148.
Maria, V. L., Correia, A. C. and Santos, M. A.: 2002, ‘Benzo[a]pyrene and β-naphthoflavone mu-tagenic activation by European eel (Anguilla anguilla L.) S9 liver fraction’, Ecotoxicol. Environ.Saf. 53, 81–85.
Monod, G. and Vindimian, E.: 1991, ‘Effect of storage conditions and subcellular fractionation of fishand cytochrome P-450-dependent enzymatic activities used for the monitoring of water pollution’,Water Res. 25, 173–177.
Oliveira, M., Santos, M. A., Gravato, C. and Pacheco, M.: 2003, ‘Chromium effects on Anguillaanguilla L. liver organ culture’, Fresenius Environ. Bull. 12, 349–352.
Pacheco, M. and Santos, M. A.: 1996, ‘Induction of micronuclei and nuclear abnormalities in theerythrocytes of Anguilla anguilla L. exposed either to cyclophosphamide or to bleached kraft pulpmill effluent’, Fresenius Environ. Bull. 5, 746–751.
Pacheco, M. and Santos, M. A.: 1997, ‘Induction of EROD activity and genotoxic effects by polycyclicaromatic hydrocarbons and resin acids on the juvenile eel (Anguilla anguilla L.)’, Ecotoxicol.Environ. Saf. 38, 252–259.
Pacheco, M. and Santos, M. A.: 1998, ‘Anguilla anguilla L. liver EROD and erythrocytic nuclearabnormalities induction by cyclophosphamide and PAHs’, Ecotoxicol. Environ. Saf. 40, 71–76.
Pacheco, M. and Santos, M. A.: 2001a, ‘Biotransformation, endocrine and genetic responses ofAnguilla anguilla L. to petroleum distillate products and environmental contaminated waters’,Ecotoxicol. Environ. Saf. 49, 64–75.
Pacheco, M. and Santos, M. A.: 2001b, ‘Tissue distribution and temperature-dependence of Anguillaanguilla L. EROD activity following exposure to model inducers and relationship with plasmacortisol, lactate and glucose levels’, Environ. Int. 26, 149–155.
Pacheco, M. and Santos, M. A.: 2002a, ‘Biotransformation, genotoxic and histopathological effectsof environmental contaminants in European eel (Anguilla anguilla L.)’, Ecotoxicol. Environ. Saf.53, 331–347.

BIOTRANSFORMATION AND GENOTOXIC BIOMARKERS IN MULLET SPECIES 153
Pacheco, M. and Santos, M. A.: 2002b, ‘Naphthalene and β-naphthoflavone effects on Anguillaanguilla L. hepatic metabolism and erythrocytic nuclear abnormalities’, Environ. Int. 28, 285–293.
Pereira, M. E., Duarte, A. C., Millward, G. E., Abreu, S. N. and Reis, M. C.: 1997, ‘Distribution ofmercury and other heavy metals in the Ria de Aveiro’, Quımica Analıtica 16 (Suppl. 1), S31–S35.
Petrulis, J. R., Chen, G., Benn, S., LaMarre, J. and Bunce, N. J.: 2001, ‘Application of theethoxyresorufin-O-deethylase (EROD) assay to mixtures of halogenated aromatic compounds’,Environmen. Toxicol. 16, 177–184.
Pombo, L. and Rebelo, J. E.: 2000, ‘Ria de Aveiro ichthyofauna: Diversity in space and time’,Revista Biol. 18, 69–81 (Lisboa) (in Portuguese).
Schmid, W.: 1976, ‘The Micronucleus Test for Cytogenetic Analysis’, in A. Hollaender (ed.),Chemical Mutagen, Vol. 4, pp. 31–53, Plenum Press, New York.
Smith, I. R.: 1990, ‘Erythrocytic micronuclei in wild fish from Lakes Superior and Ontario that havepollution-associated neoplasia’, J. Great Lakes Res. 16, 139–142.
Smith, J. R., Nakles, D. V., Sherman, D. F., Neuhauser, E. F. and Loehr, R. C.: 1989, ‘EnvironmentalFate Mechanisms Influencing Biological Degradation of Coal-tar Derived Polynuclear AromaticHydrocarbons in Soil Systems’, in The Third International Conference on New Frontiers forHazardous Waste Management, U. S. Environmental Protection Agency, Washington, DC, pp.397–405.
Teles, M., Pacheco, M. and Santos, M. A.: 2003, ‘Anguilla anguilla L. liver EROD, GST, ery-throcytic nuclear abnormalities and endocrine responses to naphthalene and β-naphthoflavone’,Ecotoxicol. Environ. Saf. 55, 98–107.
Venier, P., Maron, S. and Canova, S.: 1997, ‘Detection of micronuclei in gill cells and haemocytesof mussels exposed to benzo(a)pyrene’, Mutat. Res. 390, 33–44.
Viarengo, A., Bettella, E., Fabbri, R., Burlando, B. and Lafaurie, M.: 1997, ‘Heavy metal inhibitionof EROD activity in liver microsomes from the Bass Dicentrarchus labrax exposed to organicxenobiotics: Role of GSH in the reduction of heavy metal effects’, Mar. Environ. Res. 44, 1–11.
Zar, J. H.: 1996, Biostatistical Analysis, 3rd ed., Prentice Hall International, Inc., USA.