Bioremediation Treatability Study for Remedial Action at Popile, Inc., Site
90
ERDC/EL TR-00-13 Bioremediation Treatability Study for Remedial Action at Popile, Inc., Site, El Dorado, Arkansas Phase II. Pilot-Scale Evaluation Lance Hansen, Catherine Nestler, Michael Channell, David Ringelberg, Herb Fredrickson, Scott Waisner September 2000 Environmental Laboratory Approved for public release; distribution is unlimited.
-
Upload
independent -
Category
Documents
-
view
0 -
download
0
Transcript of Bioremediation Treatability Study for Remedial Action at Popile, Inc., Site
ER
DC
/EL
TR
-00-
13
Bioremediation Treatability Study forRemedial Action at Popile, Inc., Site,El Dorado, Arkansas
Phase II. Pilot-Scale EvaluationLance Hansen, Catherine Nestler, Michael Channell,David Ringelberg, Herb Fredrickson, Scott Waisner
September 2000
En
viro
nm
en
tal
La
bo
rato
ry
Approved for public release; distribution is unlimited.
PRINTED ON RECYCLED PAPER
The contents of this report are not to be used for advertising,publication, or promotional purposes. Citation of trade namesdoes not constitute an official endorsement or approval of the useof such commercial products.
The findings of this report are not to be construed as an officialDepartment of the Army position, unless so designated by otherauthorized documents.
ERDC/EL TR-00-13September 2000
Bioremediation Treatability Study forRemedial Action at Popile, Inc., Site,El Dorado, Arkansas
Phase II. Pilot-Scale Evaluation
by Lance Hansen, Catherine Nestler, Michael Channell,David Ringelberg, Herb Fredrickson, Scott Waisner
Environmental LaboratoryU.S. Army Engineer Research and Development Center3909 Halls Ferry RoadVicksburg, MS 39180-6199
Final report
Approved for public release; distribution is unlimited
Prepared for U.S. Army Engineer District, New OrleansThe Foot of Prytania StreetNew Orleans, LA 70160
Engineer Research and Development Center Cataloging-in-Publication Data
Bioremediation treatability study for remedial action at Popile, Inc., site, El Dorado, Arkansas. Phase II, Pilot-scale evaluation / by Lance Hansen ... [et al.] ; prepared for U.S. Army Engineer District, New Orleans.88 p. : ill. ; 28 cm. -- (ERDC/EL ; TR-00-13)Includes bibliographic references.1. Soils -- Leaching -- Arkansas. 2. Polycyclic aromatic hydrocarbons -- Arkansas. 3. Bioremediation --
Arkansas. I. Hansen, Lance. II. United States. Army. Corps of Engineers. New Orleans District. III. EngineerResearch and Development Center (U.S.) IV. Environmental Laboratory (U.S.) V. Series: ERDC/EL TR ;00-13.TA7 E8 no.ERDC/EL TR-00-13
iii
Contents
Preface.................................................................................................................... vii
1–Introduction...........................................................................................................1
Site History.........................................................................................................1Objectives of Study............................................................................................1
2–Literature Review .................................................................................................3
Contaminants of Interest ....................................................................................3Pentachlorophenol (PCP) .............................................................................3Polycyclic aromatic hydrocarbons (PAH) ....................................................3Benzo(a)pyrene (BaP) equivalents ...............................................................4
Landfarming .......................................................................................................5
3–Experimental Design ............................................................................................7
Land Treatments Units (LTU) ...........................................................................7LTU design ...................................................................................................7Experimental design .....................................................................................8
Metabolic Analysis.............................................................................................8Abbreviations .....................................................................................................8
4–Materials and Methods .........................................................................................9
LTU Construction ..............................................................................................9Secondary containment system.....................................................................9Primary containment system and LTUs .......................................................9
Sample Collection ........................................................................................... 11Soil sample collection................................................................................ 11Respiration analysis ................................................................................... 11Cultivation ................................................................................................. 12
Sample Analysis.............................................................................................. 13Physical analysis ........................................................................................ 13Leachability................................................................................................ 13Chemical analysis ...................................................................................... 13Metabolic analysis ..................................................................................... 14
Data Analysis .................................................................................................. 14
iv
Chemical data ............................................................................................ 14Microbiological data .................................................................................. 15
5–Results and Discussion...................................................................................... 16
Physical Characteristics of Popile Soil........................................................... 16Atterberg limits .......................................................................................... 16Particle size distribution (PSD)................................................................. 16Soil moisture and field moisture capacity................................................. 17LTU leaching ............................................................................................. 19Leachability test ......................................................................................... 19
Chemical Characteristics of Popile Soil ......................................................... 20Nutrients and TOC..................................................................................... 20Metals......................................................................................................... 21pH............................................................................................................... 21Contaminants ............................................................................................. 22BaP Equivalents......................................................................................... 24
Metabolic Characteristics of Popile Soil ........................................................ 25Biomass...................................................................................................... 25Community composition ........................................................................... 26Respiration gas analysis............................................................................. 30
Data Analysis .................................................................................................. 33Contaminant reduction .............................................................................. 33Degradation kinetics .................................................................................. 33
6–Summary and Conclusions ................................................................................ 35
7–Recommendations ............................................................................................. 36
References.............................................................................................................. 37
Appendix A: Contaminant Structures .................................................................A1
Appendix B: LTU Data.........................................................................................B1
Appendix C: Leachability Data ...........................................................................C1
SF 298
List of Figures
Figure 1. Design of primary and secondary containment systems ......................7
Figure 2. Construction of secondary containment system................................ 10
Figure 3. Construction of primary containment system and LTUs .................. 11

v
Figure 4. LTU random sampling grid ............................................................... 12
Figure 5. Conceptual dry well design ............................................................... 12
Figure 6. Particle size distribution .................................................................... 17
Figure 7. LTU 1. Relationship between soil moisture and fieldmoisture capacity ............................................................................... 18
Figure 8. LTU 2. Relationship between soil moisture and fieldMoisture capacity............................................................................... 18
Figure 9. LTU 1. Results of SBLT................................................................... 19
Figure 10. LTU 2. Results of SBLT................................................................... 20
Figure 11. LTU 1. Relationship between soil pH and PCP concentration ....... 22
Figure 12. LTU 2. Relationship between soil pH and CPC concentration ....... 22
Figure 13. A comparison of PAH and PCP concentrations in LTU 1 and 2...... 23
Figure 14. LTU 1. A comparison of PAH and PCP concentrations. The number of rings composing each compound is indicatedat beginning of name ......................................................................... 23
Figure 15. LTU 2. A comparison of PAH and PCP concentrations. The number of rings composing each compound is indicatedat beginning of each name................................................................. 24
Figure 16. LTU 1 and 2. Comparison of total BaP equivalents ........................ 24
Figure 17. LTU 1. The BaP-equivalent compounds.......................................... 25
Figure 18. LTU 2. The BaP-equivalent compounds.......................................... 25
Figure 19. Coefficients of variation for LTU viable microbial biomass ............ 27
Figure 20. Microbial biomass in LTU 1 and LTU 2........................................... 27
Figure 21. Relative abundance of Gram-negative bacteria ................................ 28
Figure 22. Relative abundance of Gram-positive bacteria ................................. 28
Figure 23. Microbial community composition in both LTUs at Day 168.......... 29
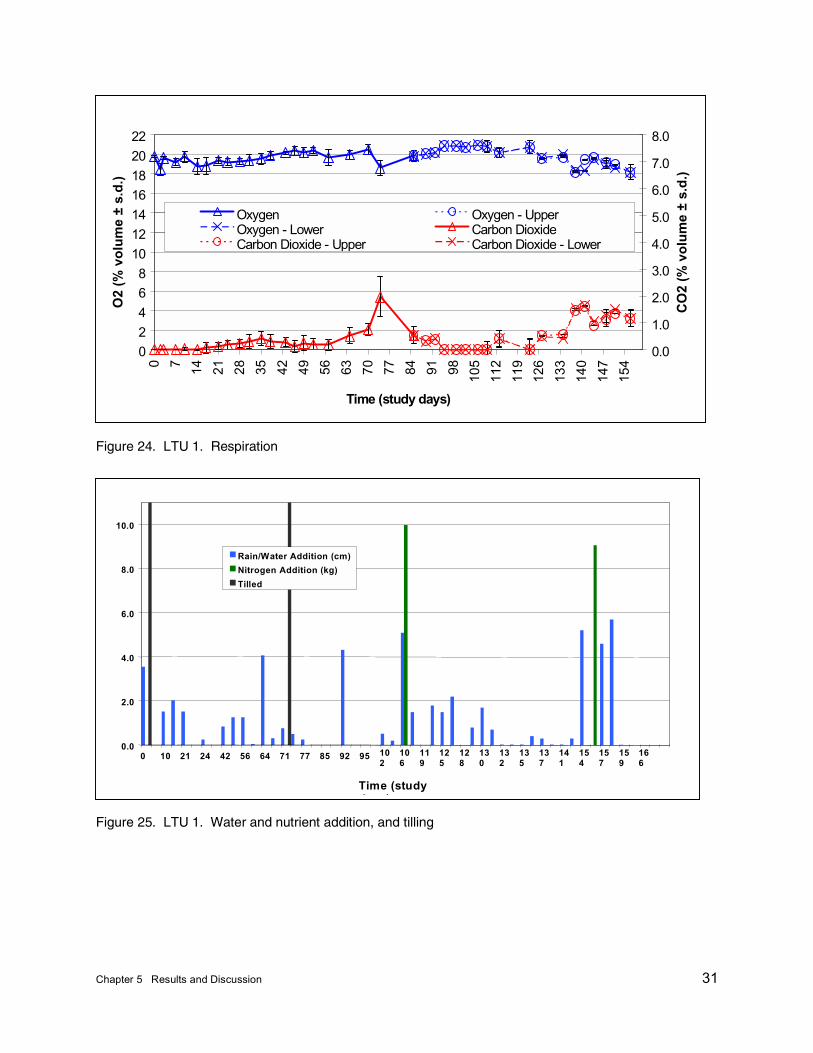
Figure 24. LTU 1. Respiration ........................................................................... 31
vi
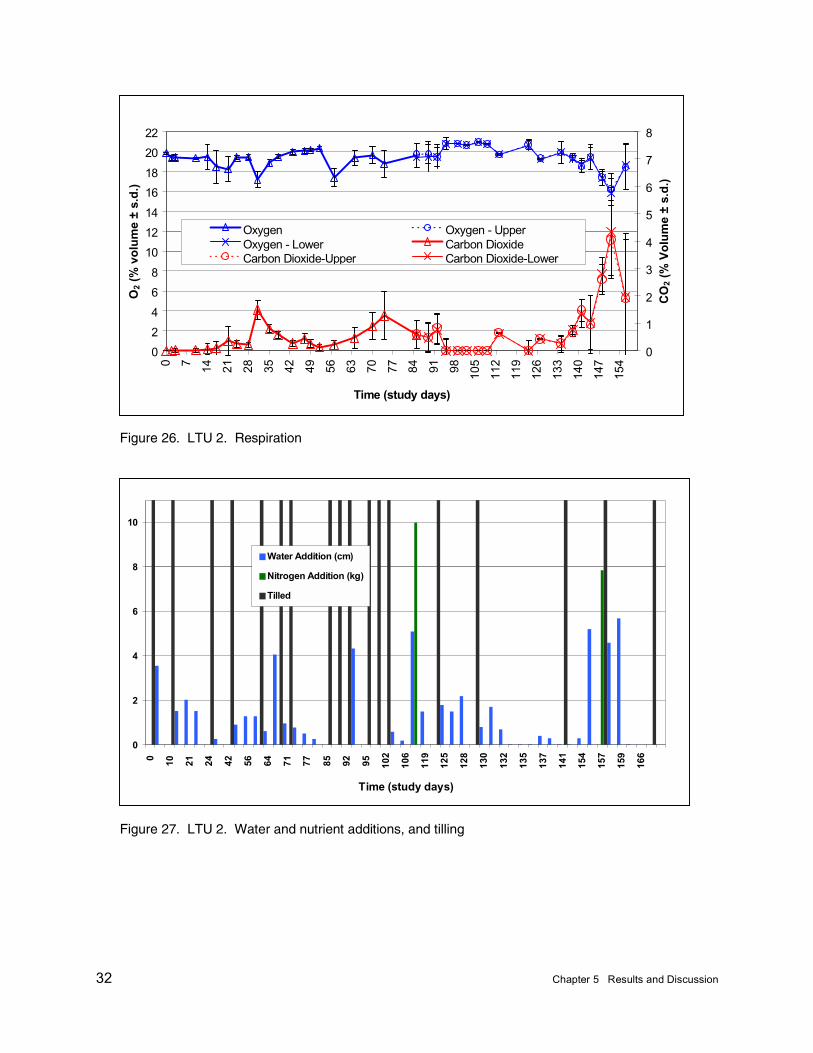
Figure 25. LTU 1. Water and nutrient additions, and tilling............................. 31
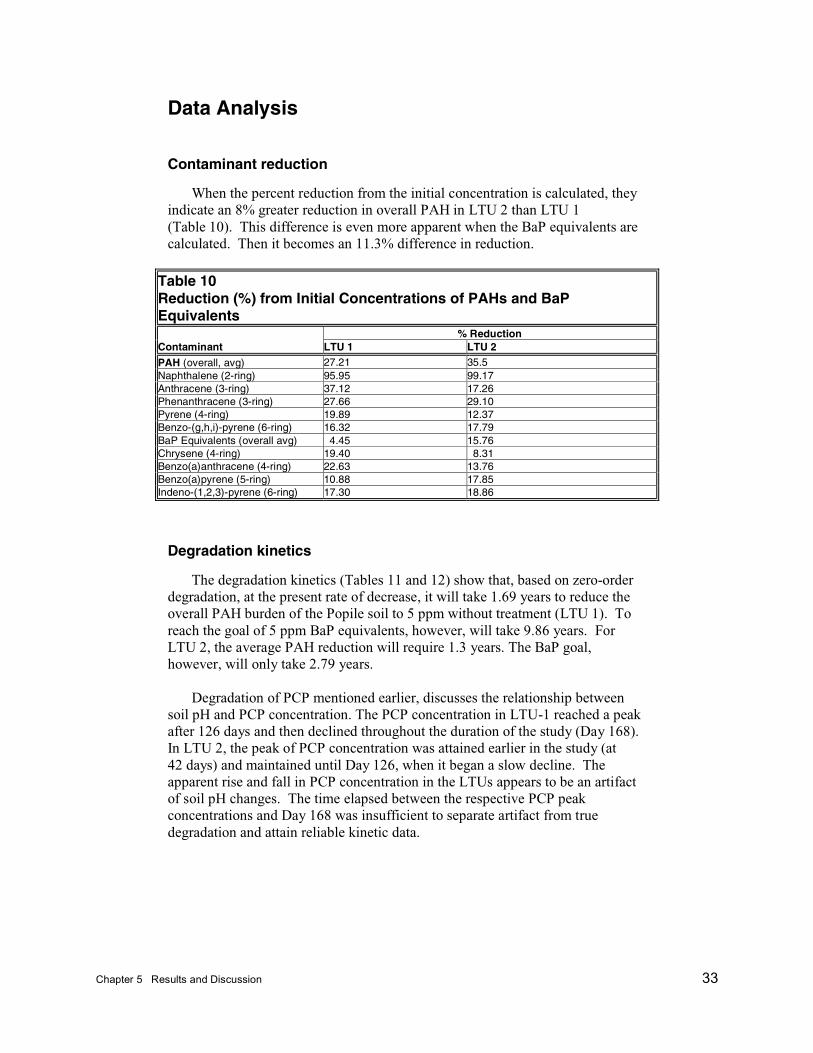
Figure 26. LTU 2. Respiration ........................................................................... 32
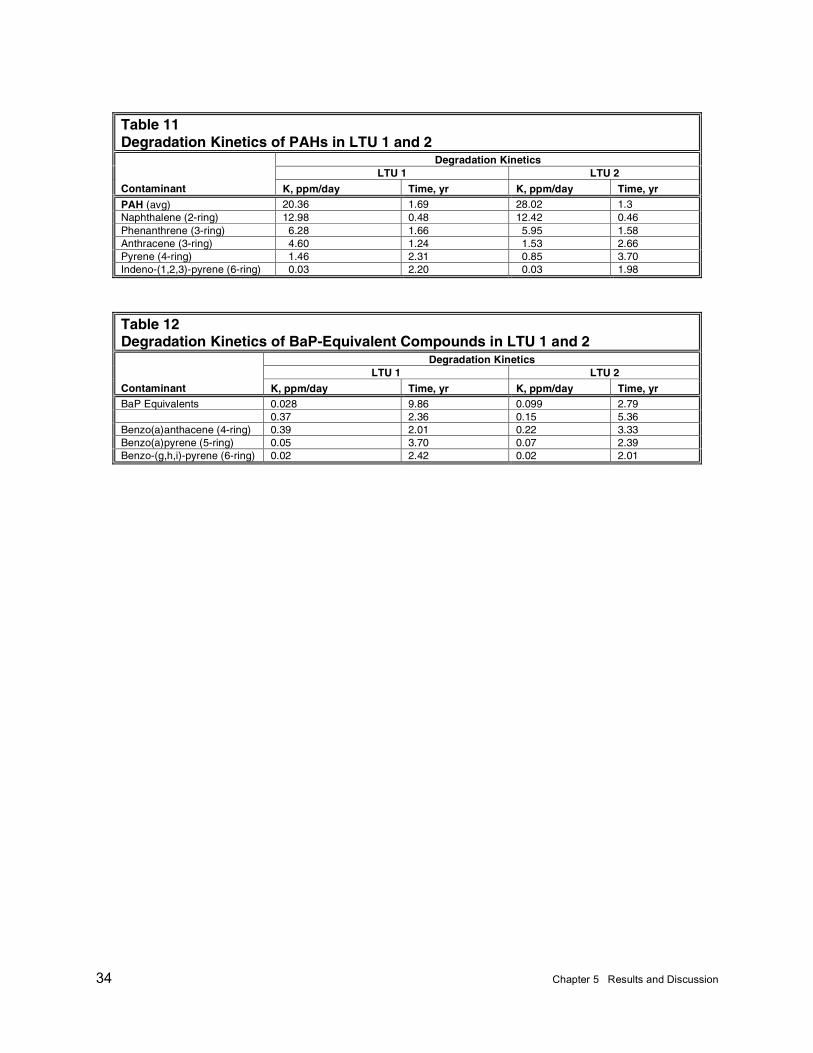
Figure 27. LTU 2. Water and nutrient additions, and tilling............................. 32
List of Tables
Table 1. Toxic Equivalency Factors (TEFs) for Environmental PAHs..............5
Table 2. Sample Analysis Plan ...........................................................................8
Table 3. Atterberg Limits................................................................................. 16
Table 4. Concentrations of Contaminants in LTU Leachate........................... 19
Table 5. Synthetic Precipitate Leaching Procedure Test Results ................... 20
Table 6. Initial Nutrient Analysis .................................................................... 21
Table 7. Metal Concentrations in Popile Soil ................................................. 21
Table 8. Microbial Biomass and Community Composition............................ 26
Table 9. Microbial Biomass and Community Compositionin LTU 1 and 2................................................................................... 28
Table 10. Reduction (%) from Initial Concentrations of PAHsand BaP Equivalents.......................................................................... 33
Table 11. Degradation Kinetics of PAHs in LTU 1 and 2 ................................ 34
Table 12. Degradation Kinetics of BaP-Equaivalent Compoundsin LTU 1 and 2................................................................................... 34
vii
Preface
The work reported herein was conducted for the U.S. Army Engineer District,New Orleans (USAEDNO). Funding for this project was provided through theUSAEDNO by U.S. Environmental Protection Agency (EPA), Region 6.
This report is the second in a multiphase project. The first report , “Landfarming bioremediation treatability studies for the Popile, Inc., Site, El Dorado,Arkansas,” detailed a study conducted to evaluate contaminant degradation at amicrocosm-scale level. This report details work conducted to evaluate designinformation applicable to the full-scale remediation of the process area soil fromthe Popile site.
This report was prepared by Messrs. Lance Hansen, Michael Channell, DavidRingelberg, and Scott Waisner, Dr. Herb Frederickson, and Ms. CatherineNestler, Environmental Restoration Branch (ERB), Environmental Laboratory(EL), U.S. Army Engineer Research and Development Center (ERDC),Vicksburg, MS. Chemical analyses were performed by the EnvironmentalChemistry Branch, ERDC. Physical analyses were performed by theGeotechnical Laboratory, ERDC. We gratefully acknowledge the specialassistance provided by Messrs. Karl Konecny and Fred Ragan, EL, samplingassistance provided by Messrs. Demetrick Banks and Samuel Tucker, and Ms.Lynn Vaughn, EL, as well as the participation of students of the Science andEngineering Apprentice Program, George Washington University.
This study was conducted at ERDC under the direct supervision ofMr. Daniel E. Averett, Chief, ERB, and Mr. Norman R. Francingues, Chief,Environmental Engineering Division, and under the general supervision ofDr. John Keeley, Director, EL.
At the time of publication of this report, Dr. James R. Houston was Directorof ERDC, and COL James S. Weller, EN, was Commander.
viii
This report should be cited as follows:
Hansen, Lance D., Nestler C., Channell, M., Ringelberg, D.,Fredrickson, H., and Waisner, S. (1999). “BioremediationTreatability Study for Remedial Action at Popile, Inc., ElDorado, Arkansas. Phase II: Pilot-scale Evaluation Plan.”ERDC/EL TR-00-13, U.S. Army Engineer Research andDevelopment Center, Vicksburg, MS.
The contents of this report are not to be used for advertising, publication, orpromotional purposes. Citation of trade names does not constitute an officialendorsement or approval of the use of such commercial products.
Chapter 1 Introduction 1
1 Introduction
Site History
The Popile, Inc., site is a former wood-treatment facility located inEl Dorado, AR. The primary contaminants found at the site includepentachlorophenol (PCP) and creosote compounds associated with woodtreatment, including polycyclic aromatic hydrocarbons (PAH). The site waspurchased by Popile, Inc. Wood-treatment operations ceased in July 1982. In1984, Popile consolidated three impoundment ponds into one. This closureactivity was administered by the Arkansas Department of Pollution Control andEcology. In 1988 and 1989, an Environmental Protection Agency (EPA) fieldinvestigation revealed contaminated soils, sludges, and groundwater at the site.EPA determined that an emergency removal action was necessary. This wasconducted from September 1990 to August 1991. The emergency actionconsisted of modifying the site drainage, placing and seeding topsoil, andsolidifying and placing sludges into an onsite, soil-holding cell.
The EPA's design contractor, Camp, Dresser and McKee, Federal Programs,was tasked with the development of the Remedial Investigation/Feasibility Studyfor the Popile site. The remedy that was approved involves the excavation andtreatment of approximately 126,142.5 cu m (165,000 cu yd) of contaminatedsoils and sludges in onsite land treatment units (LTUs). Indigenousmicroorganisms were expected to break down the target contaminants to lessharmful and less mobile constituents.
Two types of contaminated soils exist on the site. The first is the soil-holding-cell material, consisting of soils stabilized with rice hulls and fly ash (pHapproximately 10) under previous emergency remedial activities. The second isthe process area which consists of soils that were contaminated by spills, leaks,and open air drying during wood-treatment activities. Results of Phase Iindicated it unlikely that material from the soil cell could be successfully treatedusing landfarming techniques. Therefore, the Phase II evaluation was conductedon contaminated material only from the process area.
2 Chapter 1 Introduction
Objectives of Study
The objectives of the Phase II study were to:
a. Determine if the treatment goals specified in the Record of Decision(ROD) are achievable for the process area soil through land farmingtechnology (these goals are: 5 ppm benzo(a)pyrene (BaP) equivalents and3 ppm PCP).
b. Evaluate the contaminant degradation kinetics associated with thelandfarming treatment.
c. Evaluate the leaching potential of the treated soil.
Chapter 2 Literature Review 3
2 Literature Review
Contaminants of Interest
Pentachlorophenol (PCP)
Because of its potency as a biocide and its persistence in the environment,PCP has been widely used as an insecticide, fungicide, and disinfectant. It’s nowa restricted-use pesticide, and although it’s no longer available for residential use,PCP is still a common component of industrial wood preservative for power linepoles, railroad ties, and fence posts (Appendix A). PCP is not a particularlyvolatile chemical. It will undergo photolysis, especially in surface water. It isrelatively hydrophobic and tends to adsorb onto soil particles, but the strength ofthe bond depends on the pH of the soil. At lower pH, it may dissociate into thewater, leaching through contaminated soil and entering the groundwater in thatmanner. PCP and several of its breakdown intermediates ( i.e., tetrachloro-p-hydroquinone) are considered possible carcinogens (ATSDR 1994).
Polycyclic aromatic hydrocarbons (PAH)
Polycyclic aromatic hydrocarbons are multiringed, organic compounds,characteristically nonpolar, neutral, and hydrophobic. PAHs have two or morefused benzene rings in a linear, stepped, or cluster arrangement (Appendix A).PAHs occur naturally as components of incompletely burned fossil fuels and theyare also manufactured. A few of these are used in medicines, dyes, andpesticides, but most are found in coal tar, roofing tar, and creosote, a commonlyused wood preservative. The Popile site is contaminated with highconcentrations of a wide range of PAHs, including the recalcitrant, highermolecular weight PAHs. Some lower molecular weight PAHs are volatile,readily evaporating into the air. Others will undergo photolysis. Because theyare hydrophobic and neutral in charge, PAHs are strongly adsorbed into soilparticles, especially clays. Park et al. (1990) studied the degradation of 14 PAHsin two soils. They found air-phase transfer (volatilization) an important means ofcontaminant reduction only for naphthalene and 1-methylnaphthalene (the two-ring compounds). Abiotic mechanisms accounted for up to 20% of the totalreduction, but only involved two- and three-ring compounds. Biotic mechanismshandled reduction of PAHs over three-ring compounds. The persistence of PAHsin the environment, coupled with their hydrophobicity, gives them a high
4 Chapter 2 Literature Review
potential for bioaccumulation. PAHs are considered to be both mutagenic andcarcinogenic (ATSDR 1995).
Benzo(a)pyrene (BaP) equivalents
Different PAHs each have different toxic potencies that vary widely. SomePAHs appear to be nontoxic, while others have been classified as probable orpossible carcinogens. BaP is often used as an indicator for risk assessment ofhuman exposure, because it is highly carcinogenic, persistent in the environment,and is toxicologically well understood. This level of knowledge doesn’t exist formost of the other PAH compounds.
Because PAHs generally occur in mixtures, toxic equivalency factors (TEF)were proposed. These factors were similar to those used in the risk assessment ofmixtures of polychlorinated biphenyls (PCB). The U.S. EnvironmentalProtection Agency (USEPA) took the first step in 1984 by separating the PAHsinto carcinogenic and noncarcinogenic compounds. All of the PAHs were rated,using BaP as a reference and giving it a value of 1.00. However, this method ledto an overestimation of exposure risk since the carcinogenicity of the compoundswas unknown. In an attempt to overcome this liability, Nisbet and LaGoy (1992)developed a new method based on the response of the compounds while testingone, or more, PAHs concurrently with BaP in the same assay system (usuallylung or skin cell carcinoma). BaP remained the reference carcinogen assignedthe value of 1.00. Sixteen other PAHs were ranked in comparison to BaPcarcinogenicity.
This system was tested by Petry, Schmid, and Shlatter (1996) who assessedthe health risk of PAHs to coke plant workers. There are drawbacks to anysystem that uses equivalency factors. The uncertainties in this case ariseprimarily from dealing with inconsistent mixtures. Carcinogenic potency couldbe affected by differences in bioavailability, a competition for binding sites,co-carcinogenic action, or the effects of metabolism. Nevertheless, Petry and hisco-workers found that the BaP equivalents developed by Nisbet and LaGoy werevalid markers for PAH health risk assessment.
Environmental risk assessment, in a slight contrast to human health risk,looks at the PAHs that usually occur in contaminated environmental systems andthat have the highest TEFs (by the Nisbet and LaGoy system). This gives sevenPAHs, listed in Table 1, with the highest environmental risk: benzo(a)anthracene,chrysene, benzo(b)fluoranthene, benzo(k)fluoranthene, benzo(a)pyrene,indeno(1,2,3-cd)pyrene, and dibenzo(a,h)anthracene. Because BaP wasstipulated in the ROD, this method was used to evaluate the effectiveness ofcontaminant degradation.

Chapter 2 Literature Review 5
Table 1Toxic Equivalency Factors (TEFs) for Environmental PAHsCompound (abbreviation) TEF (after Nisbet and LaGoy 1992)
Benzo(a)anthracene (BAANTHR) 0.1Chrysene (CHRYSE) 0.01Benzo(b)fluoranthene (BBFLANT) 0.1Benzo(k)fluoranthene (BKFLANT) 0.1Benzo(a)pyrene (BAP) 1.0Indeno(1,2,3-c,d)pyrene (I123PYR) 0.1Dibenzo(a,h,)anthracene (DBAHANT) 1.0
Landfarming
According to the Federal Remediation Technologies Roundtable (1998),there are several EPA-accepted processess to remediate the waste from wood-treatment sites. These treatment technologies include thermal desorption,incineration, landfarming, and bioremediation. The choice of remediationtechnology is based on the concentration of the contaminants, cost, intended useof the land after remediation, and other factors. With the current “land ban” onhazardous waste disposal and the restrictive regulations on incineration,landfarming as a way of treating waste has become increasingly attractive(USEPA 1995) and was selected as the technology to remediate the Popile site.
Generally, during landfarming, the degradation process will destroy theorganic contaminants in place without the high cost of excavation and materialhandling. The release of volatile contaminants into the air is minimized. The siteis monitored on a continuous basis so the potential for hazardous waste leakage isreduced. The costs associated with landfarming are generally much lower thanex situ treatment alternatives. In most instances, the treatment is accepted by thecommunity and the site can be put to other uses when the treatment is complete(USEPA 1995). This last point has become increasingly important in the 1990’swith the EPA Superfund policy changes towards “brownfields” development.
Successful bioremediation through landfarming has to meet these threecriteria:
a. There must be a loss of the contaminant over time.
b. There must be a demonstrated ability of the indigenous microorganisms todegrade the contaminant over time.
c. There must be evidence that this biodegradation potential is expressed inthe field.
Landfarming technology remediates contaminated soil in an abovegroundsystem using conventional soil mangement practices. The contaminant isconverted to a less toxic or nontoxic form either abiotically (ex. photolysis) orbiotically, through the metabolism of the indigenous microbial population
6 Chapter 2 Literature Review
(Golueke and Diaz 1989, Harmsen 1991). Landfarming as a form of appliedbioremediation is the cultivation of contaminated soil at properly engineered sitesto stimulate the naturally ocurring microorganisms to degrade the organiccontaminants. The landfarming operational goal, then, is to manage theparameters that optimize conditions for microbial activity. Typically, theseinclude the soil carbon to nitrogen ratio, soil moisture, pH and oxygen content,temperature and cultivation frequency. The type of soil being remediated, andthe type and concentration of contaminant, are also factors that shapelandfarming management. The rate of biodegradation can be monitored throughthe rate of CO2 production and release and by chemical analysis of thehydrocarbons (King 1992, Reisinger 1995).
When weighing treatment options, however, the disadvantages oflandfarming must be considered. It is land and management intensive. Animproperly designed system could lead to adverse environmental effects such asgroundwater contamination. Air and odor emissions may also be hazardous, orsimply a nuisance. Airborne particles could be a problem. Finally, landfarmingis not suitable for all kinds of hazardous wastes (e.g., radioactive wastes).
Because landfarming involves a biological system, the limits to thisbiological system are also limits to landfarming. The bacteria found most oftenassociated with successful landfarming are either obligate or facultative aerobes,therefore the soil oxygen content is an important parameter. The tilling(cultivation) frequency is an important aspect of maintaining the oxygen level aswell as exposing the bacteria to renewed sources of the contaminant. Most of themicrobial communities involved with landfarming are mesophilic. The pH rangethat will support their growth is relatively narrow, usually in the 6.0 to 7.5 range.They prefer a moisture level that is 30 to 90 percent of the water-holding capacityof the soil. Also, most hazardous wastes are nutrient deficient. Some kinds ofwastes are lethal (heavy metals), or inhibitory (in high concentrations) to themicrobial communities. The degradation process should be studied in thelaboratory to determine that it doesn’t produce intermediates or end products thatare as harmful as the contaminants being remediated. However, all of theselimitations to landfarming can be overcome, with the exception of the presenceof heavy metals and/or radioisotopes in the contaminant mixture (Golueke andDiaz 1989, USEPA 1995).
Landfarming of soils contaminated with PAHs and PCP has been studiedseveral times but not usually at the concentrations found at the Popile site. TheGRACE DaramendTM SITE evaluation report (USEPA 1996) cites initialconcentrations of 352 mg/kg total of chlorinated phenols (TCP) and 1,710 mg/kgof total PAH reduced in 254 days to 43mg/kg and 98 mg/kg, respectively. Clarkand Michael (1996) used “enhanced” landfarming to achieve degradation goals in15 months. The study of “aged” PCP (McGinnis et al. 1994) found thatconcentrations up to 300 mg/kg weren’t inhibitory to the bacteria if soilphosphorus and oxygen concentration levels were maintained. Hurst et al.(1997) have found microbial activity in soil containing up to 500 mg/kg PCP.Again, the oxygen concentration in the soil was a significant factor in successfuldegradation, although anaerobic degradation of PCP has been reported (Frisbieand Nies 1997).
Chapter 3 Experimental Design 7
3 Experimental Design
Land Treatment Units
LTU Design
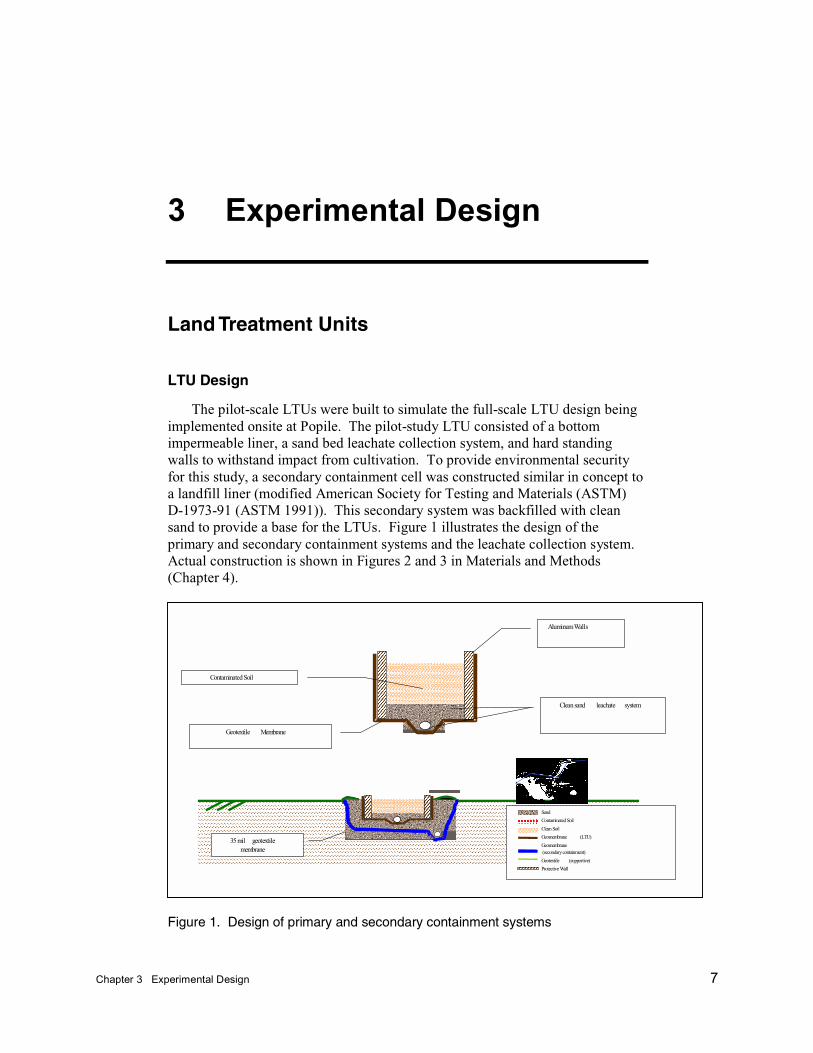
The pilot-scale LTUs were built to simulate the full-scale LTU design beingimplemented onsite at Popile. The pilot-study LTU consisted of a bottomimpermeable liner, a sand bed leachate collection system, and hard standingwalls to withstand impact from cultivation. To provide environmental securityfor this study, a secondary containment cell was constructed similar in concept toa landfill liner (modified American Society for Testing and Materials (ASTM)D-1973-91 (ASTM 1991)). This secondary system was backfilled with cleansand to provide a base for the LTUs. Figure 1 illustrates the design of theprimary and secondary containment systems and the leachate collection system.Actual construction is shown in Figures 2 and 3 in Materials and Methods(Chapter 4).
Figure 1. Design of primary and secondary containment systems
Aluminum Walls
Geotextile Membrane
Contaminated Soil
Clean sand leachate system
35 mil geotextilemembrane
Sand
Contaminated Soil
Clean Soil
Geomembrane (LTU)
Geomembrane (secondary containment)
Geotextile (supportive)
Protective Wall
8 Chapter 3 Experimental Design
Experimental design
The study was designed to evaluate two cultivation management strategies.LTU 1 was cultivated on an oxygen dependent basis. When the oxygenconcentration in the pore space was reduced to 5 percent, the lift was to be tilled.LTU 2 was cultivated on a fixed schedule, every 2 weeks, independent of theoxygen concentration.
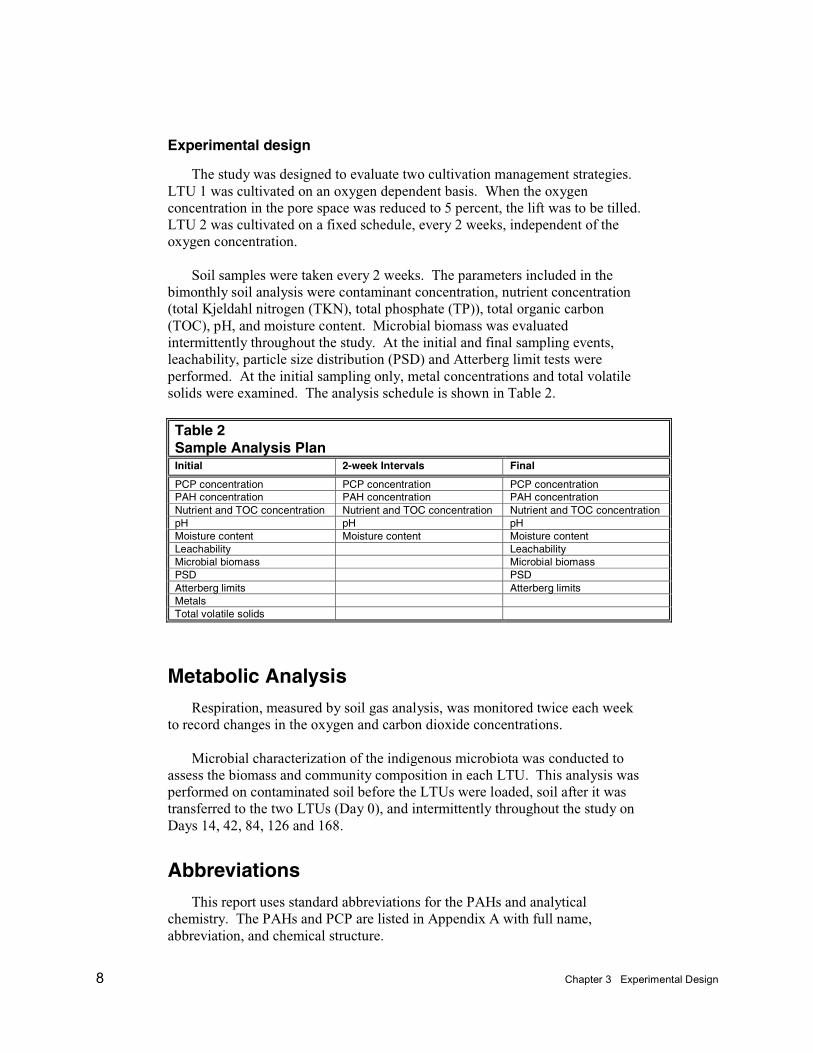
Soil samples were taken every 2 weeks. The parameters included in thebimonthly soil analysis were contaminant concentration, nutrient concentration(total Kjeldahl nitrogen (TKN), total phosphate (TP)), total organic carbon(TOC), pH, and moisture content. Microbial biomass was evaluatedintermittently throughout the study. At the initial and final sampling events,leachability, particle size distribution (PSD) and Atterberg limit tests wereperformed. At the initial sampling only, metal concentrations and total volatilesolids were examined. The analysis schedule is shown in Table 2.
Table 2Sample Analysis PlanInitial 2-week Intervals Final
PCP concentration PCP concentration PCP concentrationPAH concentration PAH concentration PAH concentrationNutrient and TOC concentration Nutrient and TOC concentration Nutrient and TOC concentrationpH pH pHMoisture content Moisture content Moisture contentLeachability LeachabilityMicrobial biomass Microbial biomassPSD PSDAtterberg limits Atterberg limitsMetalsTotal volatile solids
Metabolic Analysis
Respiration, measured by soil gas analysis, was monitored twice each weekto record changes in the oxygen and carbon dioxide concentrations.
Microbial characterization of the indigenous microbiota was conducted toassess the biomass and community composition in each LTU. This analysis wasperformed on contaminated soil before the LTUs were loaded, soil after it wastransferred to the two LTUs (Day 0), and intermittently throughout the study onDays 14, 42, 84, 126 and 168.
Abbreviations
This report uses standard abbreviations for the PAHs and analyticalchemistry. The PAHs and PCP are listed in Appendix A with full name,abbreviation, and chemical structure.
Chapter 4 Materials and Methods 9
4 Materials and Methods
LTU Construction
Secondary containment system
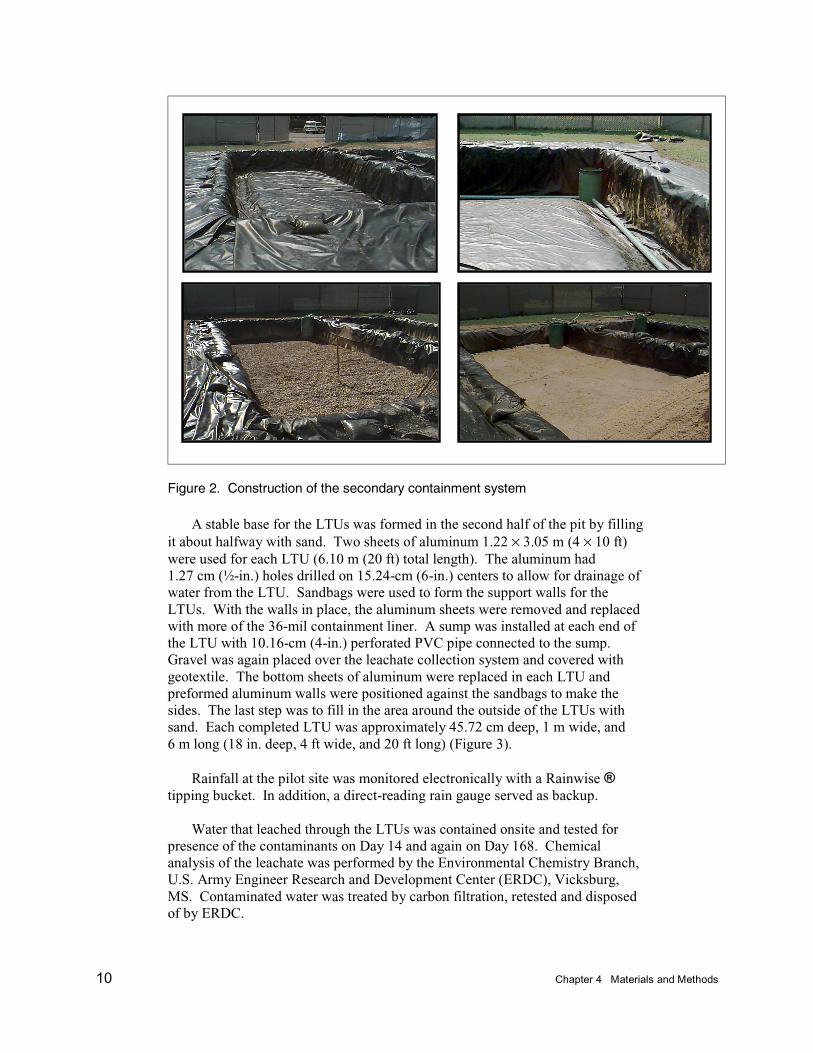
A backhoe was used to excavate a pit measuring approximately 9.14 × 9.14× 0.91 m (30 × 30 × 3 ft). It was subdivided into two sections using a row ofsandbags. One side of the pit area was used for the LTUs and the other side forthe leachate collection containers. The 36-mil liner, used for both sides of thepit, was molded into the corners, over the divider, and extended beyond the edgeof the pit (Figure 2). The Cooley Coolguard® secondary containment liner waspurchased from Colorado Lining, International.
A leachate collection system consisting of 10.2-cm (4-in.-) diameterperforated PVC pipe was placed on top of the liner and connected to a sump.This system was similar for both sides of the pit. A ½-hp sump pump wasinstalled in each sump to move the leachate into the storage container. Next,25.4 cm (10 in.) of washed gravel was placed in each side. A geotextile fabricwas placed on top of the gravel to keep sand from filtering down and plugging upthe leachate collection system. The half of the pit that supports the tanks wasfilled with sand and covered with another layer of the geotextile.
Primary containment system and LTUs
The primary containment leachate collection system also employed the36-mil Cooley Coolguard® liner and standard ½-hp sump pumps. The LTUwalls and bottom were constructed from 0.64-cm- (¼-in.-) thick aluminumsheets. Sandbags were used as structural supports, separating the twocontainment areas.
10 Chapter 4 Materials and Methods
Figure 2. Construction of the secondary containment system
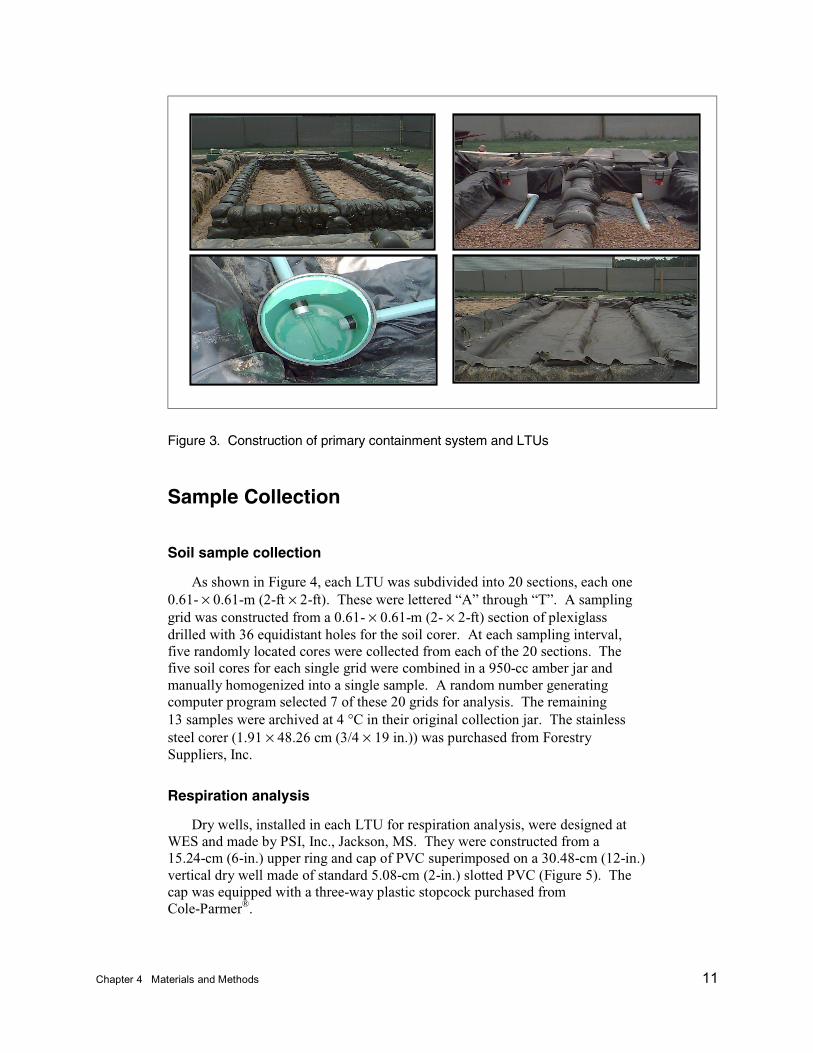
A stable base for the LTUs was formed in the second half of the pit by fillingit about halfway with sand. Two sheets of aluminum 1.22 × 3.05 m (4 × 10 ft)were used for each LTU (6.10 m (20 ft) total length). The aluminum had1.27 cm (½-in.) holes drilled on 15.24-cm (6-in.) centers to allow for drainage ofwater from the LTU. Sandbags were used to form the support walls for theLTUs. With the walls in place, the aluminum sheets were removed and replacedwith more of the 36-mil containment liner. A sump was installed at each end ofthe LTU with 10.16-cm (4-in.) perforated PVC pipe connected to the sump.Gravel was again placed over the leachate collection system and covered withgeotextile. The bottom sheets of aluminum were replaced in each LTU andpreformed aluminum walls were positioned against the sandbags to make thesides. The last step was to fill in the area around the outside of the LTUs withsand. Each completed LTU was approximately 45.72 cm deep, 1 m wide, and6 m long (18 in. deep, 4 ft wide, and 20 ft long) (Figure 3).
Rainfall at the pilot site was monitored electronically with a Rainwise ®tipping bucket. In addition, a direct-reading rain gauge served as backup.
Water that leached through the LTUs was contained onsite and tested forpresence of the contaminants on Day 14 and again on Day 168. Chemicalanalysis of the leachate was performed by the Environmental Chemistry Branch,U.S. Army Engineer Research and Development Center (ERDC), Vicksburg,MS. Contaminated water was treated by carbon filtration, retested and disposedof by ERDC.
Chapter 4 Materials and Methods 11
Figure 3. Construction of primary containment system and LTUs
Sample Collection
Soil sample collection
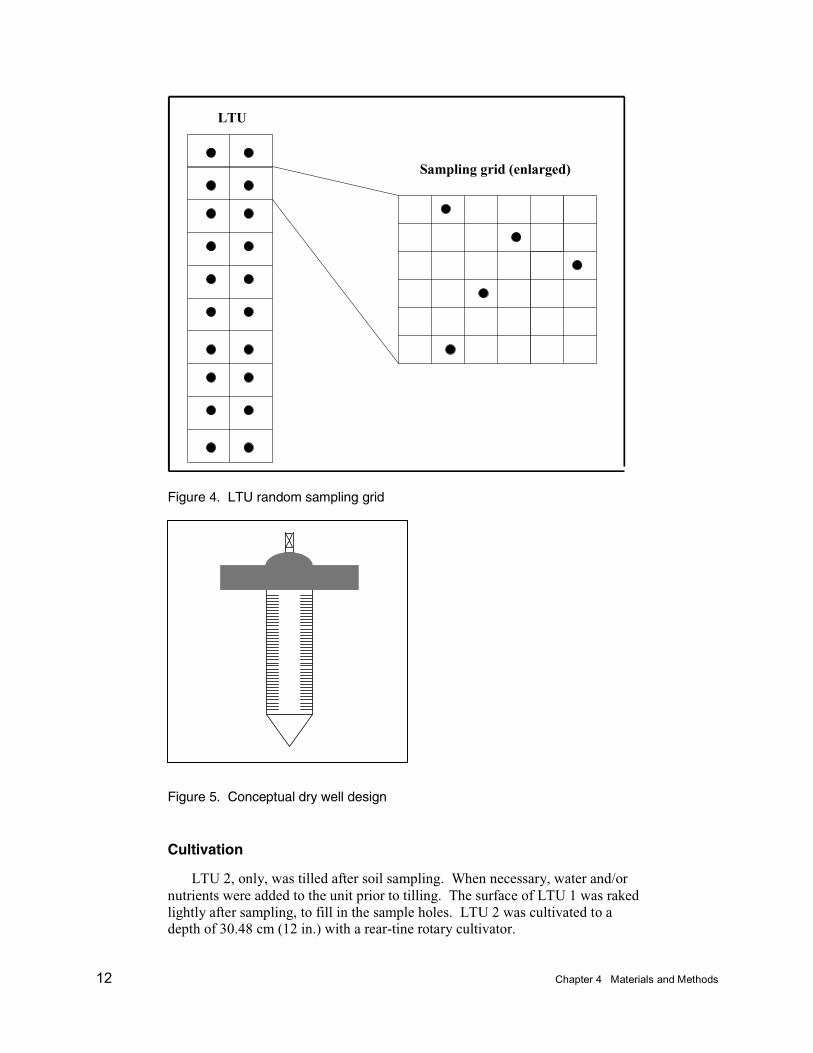
As shown in Figure 4, each LTU was subdivided into 20 sections, each one0.61- × 0.61-m (2-ft × 2-ft). These were lettered “A” through “T”. A samplinggrid was constructed from a 0.61- × 0.61-m (2- × 2-ft) section of plexiglassdrilled with 36 equidistant holes for the soil corer. At each sampling interval,five randomly located cores were collected from each of the 20 sections. Thefive soil cores for each single grid were combined in a 950-cc amber jar andmanually homogenized into a single sample. A random number generatingcomputer program selected 7 of these 20 grids for analysis. The remaining13 samples were archived at 4 °C in their original collection jar. The stainlesssteel corer (1.91 × 48.26 cm (3/4 × 19 in.)) was purchased from ForestrySuppliers, Inc.
Respiration analysis
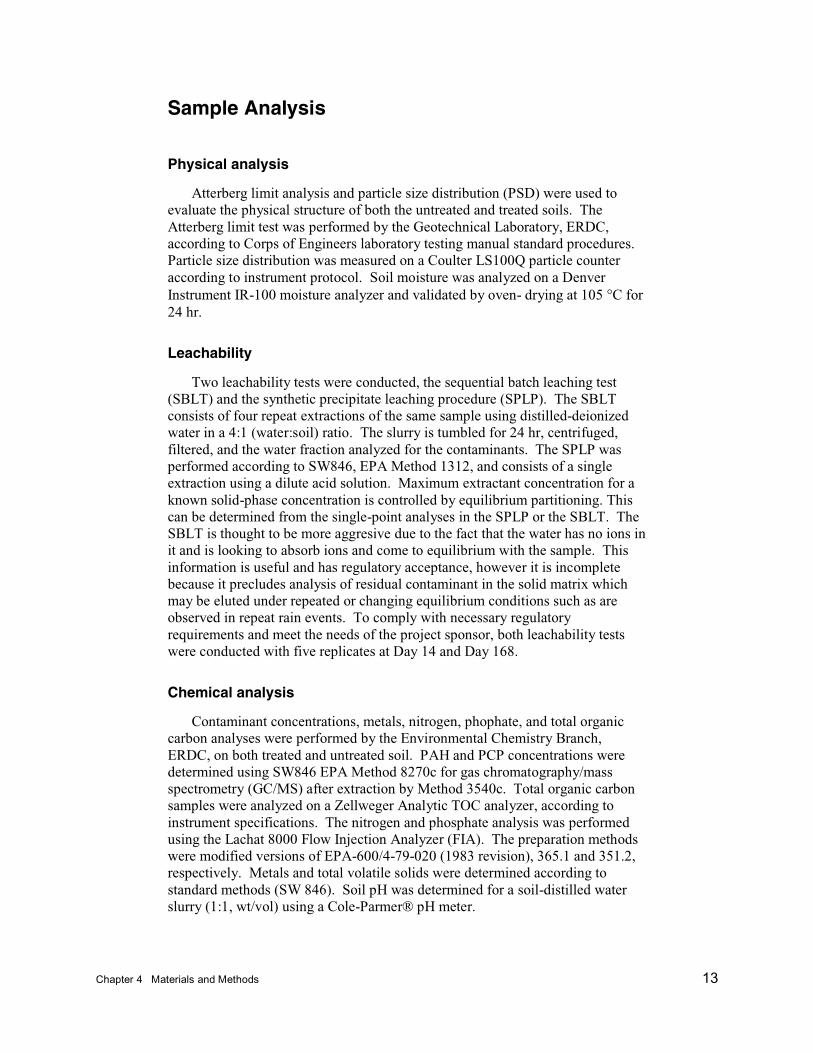
Dry wells, installed in each LTU for respiration analysis, were designed atWES and made by PSI, Inc., Jackson, MS. They were constructed from a15.24-cm (6-in.) upper ring and cap of PVC superimposed on a 30.48-cm (12-in.)vertical dry well made of standard 5.08-cm (2-in.) slotted PVC (Figure 5). Thecap was equipped with a three-way plastic stopcock purchased fromCole-Parmer®.
12 Chapter 4 Materials and Methods
Figure 4. LTU random sampling grid
Figure 5. Conceptual dry well design
Cultivation
LTU 2, only, was tilled after soil sampling. When necessary, water and/ornutrients were added to the unit prior to tilling. The surface of LTU 1 was rakedlightly after sampling, to fill in the sample holes. LTU 2 was cultivated to adepth of 30.48 cm (12 in.) with a rear-tine rotary cultivator.
LTU
Sampling grid (enlarged)
Chapter 4 Materials and Methods 13
Sample Analysis
Physical analysis
Atterberg limit analysis and particle size distribution (PSD) were used toevaluate the physical structure of both the untreated and treated soils. TheAtterberg limit test was performed by the Geotechnical Laboratory, ERDC,according to Corps of Engineers laboratory testing manual standard procedures.Particle size distribution was measured on a Coulter LS100Q particle counteraccording to instrument protocol. Soil moisture was analyzed on a DenverInstrument IR-100 moisture analyzer and validated by oven- drying at 105 °C for24 hr.
Leachability
Two leachability tests were conducted, the sequential batch leaching test(SBLT) and the synthetic precipitate leaching procedure (SPLP). The SBLTconsists of four repeat extractions of the same sample using distilled-deionizedwater in a 4:1 (water:soil) ratio. The slurry is tumbled for 24 hr, centrifuged,filtered, and the water fraction analyzed for the contaminants. The SPLP wasperformed according to SW846, EPA Method 1312, and consists of a singleextraction using a dilute acid solution. Maximum extractant concentration for aknown solid-phase concentration is controlled by equilibrium partitioning. Thiscan be determined from the single-point analyses in the SPLP or the SBLT. TheSBLT is thought to be more aggresive due to the fact that the water has no ions init and is looking to absorb ions and come to equilibrium with the sample. Thisinformation is useful and has regulatory acceptance, however it is incompletebecause it precludes analysis of residual contaminant in the solid matrix whichmay be eluted under repeated or changing equilibrium conditions such as areobserved in repeat rain events. To comply with necessary regulatoryrequirements and meet the needs of the project sponsor, both leachability testswere conducted with five replicates at Day 14 and Day 168.
Chemical analysis
Contaminant concentrations, metals, nitrogen, phophate, and total organiccarbon analyses were performed by the Environmental Chemistry Branch,ERDC, on both treated and untreated soil. PAH and PCP concentrations weredetermined using SW846 EPA Method 8270c for gas chromatography/massspectrometry (GC/MS) after extraction by Method 3540c. Total organic carbonsamples were analyzed on a Zellweger Analytic TOC analyzer, according toinstrument specifications. The nitrogen and phosphate analysis was performedusing the Lachat 8000 Flow Injection Analyzer (FIA). The preparation methodswere modified versions of EPA-600/4-79-020 (1983 revision), 365.1 and 351.2,respectively. Metals and total volatile solids were determined according tostandard methods (SW 846). Soil pH was determined for a soil-distilled waterslurry (1:1, wt/vol) using a Cole-Parmer® pH meter.
14 Chapter 4 Materials and Methods
Metabolic analysis
Gas analysis in the landfarming units was accomplished using an LMSxMultigas Analyzer® from Columbus Instruments. Oxygen, carbon dioxide, andmethane concentrations in the soil were monitored. The drywells were labeledand centered in each LTU grid section. Following gas sampling, the drywellswere lifted from LTU 2, soil samples were taken, the soil was tilled, and thedrywells were reinserted in the appropriate section. The drywells remained inplace in LTU 1.
Microbial biomass was determined at Days 0, 14, 42, 84, 126, and 168during the study. Two grams (wet weight) of soil /sample were subjected to anorganic solvent extraction to quantitatively recover bacterial membrane lipidbiomarkers (ester-linked phospholipid fatty acids or PLFA) as outlined by Whiteand Ringelberg (1998).
Data Analysis
Chemical data
The chemical analytical data were reduced to develop average sums of theconcentrations of total PAH, individual PAH compounds, and total PCP. Tocalculate the magnitude of reduction and the rate of degradation of thesecontaminants, the initial and final concentration values were used. Zero order(concentration independent) removal rates were assumed due to the highconcentrations of the contaminants (Shane 1994). Contaminant concentrationand physical data values are significant (n = 7) at the 95% confidence level.
The total % PAH and total % PCP reductions were calculated usingEquation 1:
% Rcontaminant = ([Cinitial] - [Cfinal]) / [Cinitial] × 100 (1)
where
%Rcontaminant = removal of contaminant, % of initial
[Cinitial] = average initial contaminant concentration in the LTU
[Cfinal] = average final contaminant concentration in the LTU
The rate of elimination (k) of the contaminants was calculated as aconcentration-dependent, zero-order reaction
k=- dC/dt (2)
k = -(C1 – C2 )/ (t2 – t1) (3)
Chapter 4 Materials and Methods 15
where
k = concentration change / time
C1 = concentration at Day 0
C2 = concentration at Day 168
t1 = 0
t2 = 168
The time required to acheive the ROD goals can be calculated by substitutingthe goal (5 ppm for PAH) for the final concentration(C2), and solving for “t2.”
Because t1 = 0, this simplifies to,
T2 = (C2 – C1)/k (4)
Microbiological data
The microbiological data was subjected to a Tukey hierarchal significantdifference (HSD) to determine if there was a significance to the differencesbetween the data for the two LTUs, taking into account that more than twosamples were taken (Ringelberg et al. 1989). The hierarchal cluster analysis wasused because there was no a priori hypothesis tested. It attempts to minimize thethe sum of squares of any two clusters found at each step of an algorithim. It wasused to try to determine if a significant relationship existed between sets of datafor the two LTUs (Ringelberg et al. 1997).
16 Chapter 5 Results and Discussion
5 Results and Discussion
Physical Characteristics of the Popile Soil
Atterberg limits
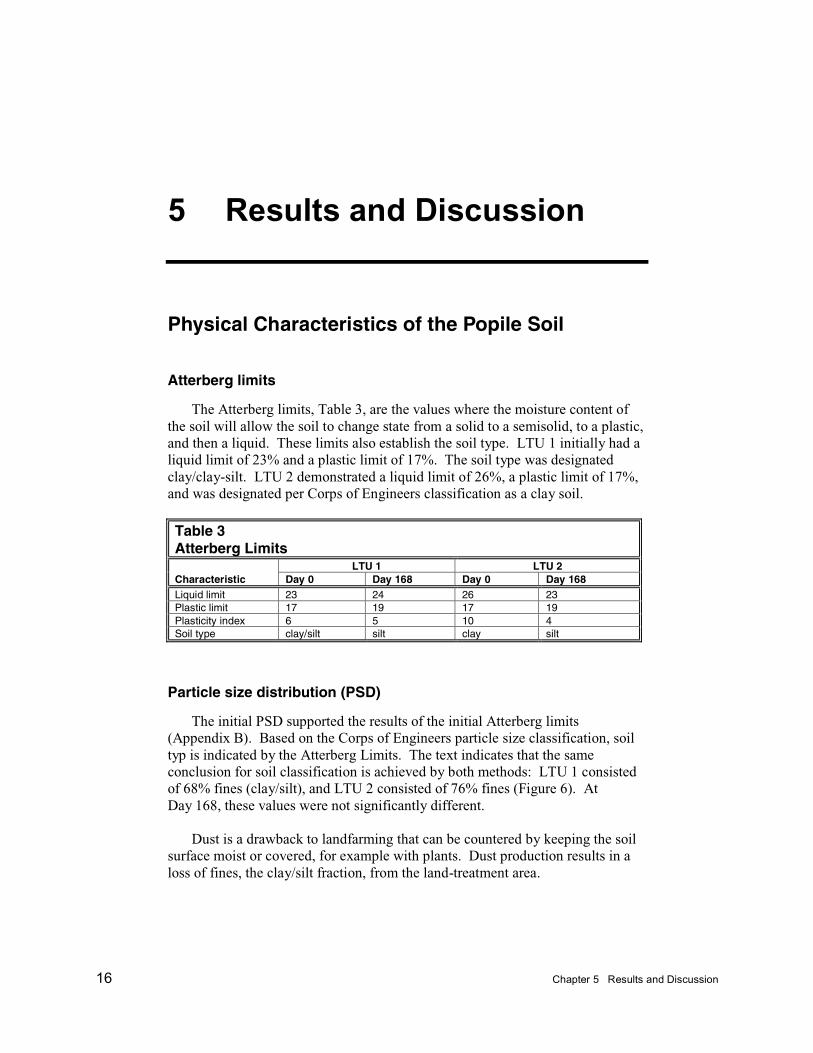
The Atterberg limits, Table 3, are the values where the moisture content ofthe soil will allow the soil to change state from a solid to a semisolid, to a plastic,and then a liquid. These limits also establish the soil type. LTU 1 initially had aliquid limit of 23% and a plastic limit of 17%. The soil type was designatedclay/clay-silt. LTU 2 demonstrated a liquid limit of 26%, a plastic limit of 17%,and was designated per Corps of Engineers classification as a clay soil.
Table 3Atterberg Limits
LTU 1 LTU 2Characteristic Day 0 Day 168 Day 0 Day 168Liquid limit 23 24 26 23Plastic limit 17 19 17 19Plasticity index 6 5 10 4Soil type clay/silt silt clay silt
Particle size distribution (PSD)
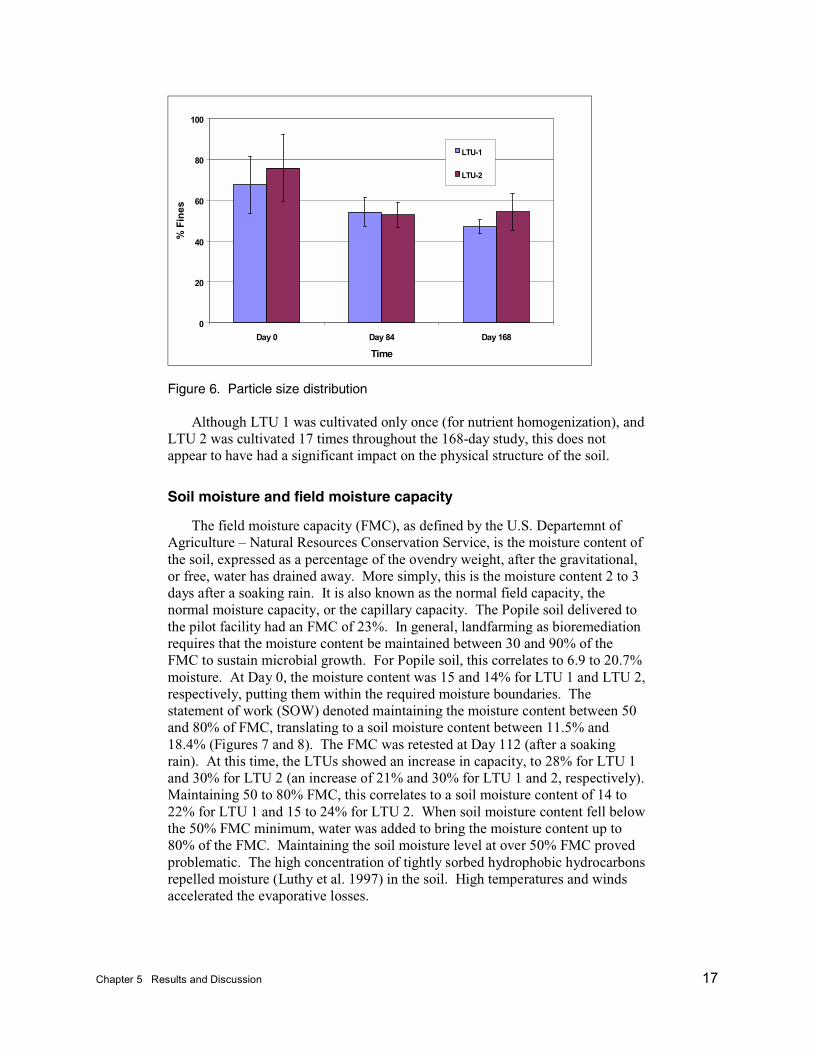
The initial PSD supported the results of the initial Atterberg limits(Appendix B). Based on the Corps of Engineers particle size classification, soiltyp is indicated by the Atterberg Limits. The text indicates that the sameconclusion for soil classification is achieved by both methods: LTU 1 consistedof 68% fines (clay/silt), and LTU 2 consisted of 76% fines (Figure 6). AtDay 168, these values were not significantly different.
Dust is a drawback to landfarming that can be countered by keeping the soilsurface moist or covered, for example with plants. Dust production results in aloss of fines, the clay/silt fraction, from the land-treatment area.
Chapter 5 Results and Discussion 17
0
20
40
60
80
100
Day 0 Day 84 Day 168
Time
% F
ines
LTU-1
LTU-2
Figure 6. Particle size distribution
Although LTU 1 was cultivated only once (for nutrient homogenization), andLTU 2 was cultivated 17 times throughout the 168-day study, this does notappear to have had a significant impact on the physical structure of the soil.
Soil moisture and field moisture capacity
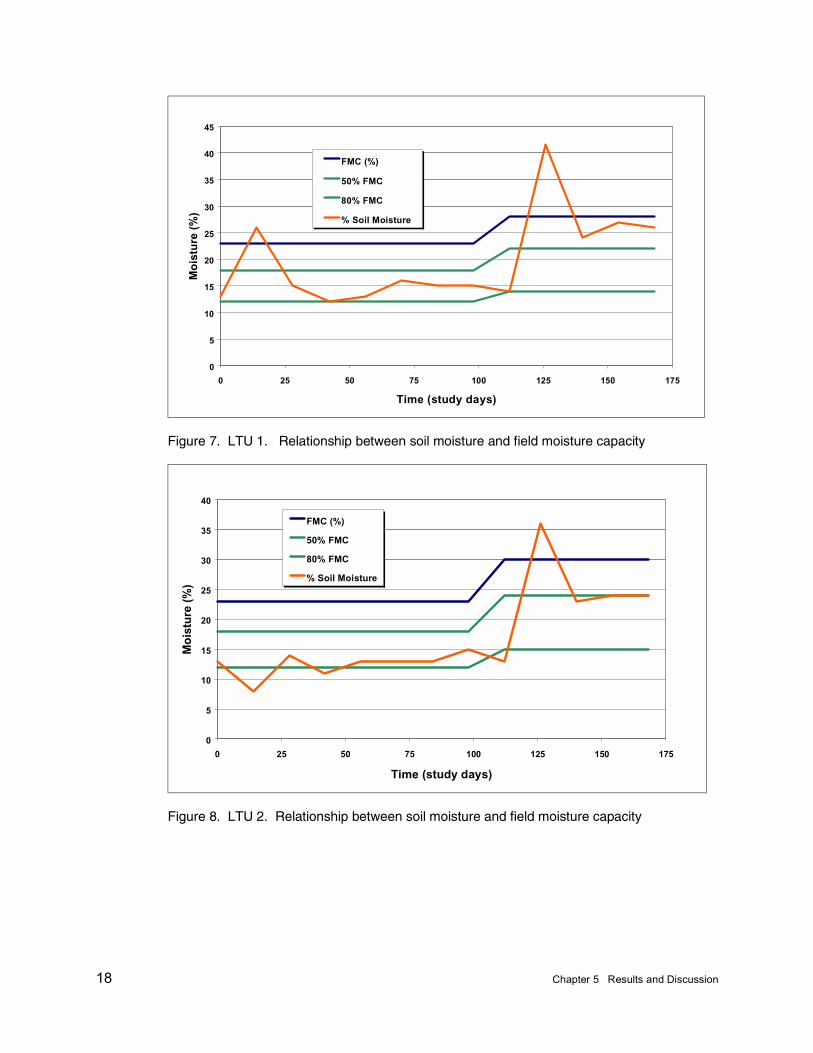
The field moisture capacity (FMC), as defined by the U.S. Departemnt ofAgriculture – Natural Resources Conservation Service, is the moisture content ofthe soil, expressed as a percentage of the ovendry weight, after the gravitational,or free, water has drained away. More simply, this is the moisture content 2 to 3days after a soaking rain. It is also known as the normal field capacity, thenormal moisture capacity, or the capillary capacity. The Popile soil delivered tothe pilot facility had an FMC of 23%. In general, landfarming as bioremediationrequires that the moisture content be maintained between 30 and 90% of theFMC to sustain microbial growth. For Popile soil, this correlates to 6.9 to 20.7%moisture. At Day 0, the moisture content was 15 and 14% for LTU 1 and LTU 2,respectively, putting them within the required moisture boundaries. Thestatement of work (SOW) denoted maintaining the moisture content between 50and 80% of FMC, translating to a soil moisture content between 11.5% and18.4% (Figures 7 and 8). The FMC was retested at Day 112 (after a soakingrain). At this time, the LTUs showed an increase in capacity, to 28% for LTU 1and 30% for LTU 2 (an increase of 21% and 30% for LTU 1 and 2, respectively).Maintaining 50 to 80% FMC, this correlates to a soil moisture content of 14 to22% for LTU 1 and 15 to 24% for LTU 2. When soil moisture content fell belowthe 50% FMC minimum, water was added to bring the moisture content up to80% of the FMC. Maintaining the soil moisture level at over 50% FMC provedproblematic. The high concentration of tightly sorbed hydrophobic hydrocarbonsrepelled moisture (Luthy et al. 1997) in the soil. High temperatures and windsaccelerated the evaporative losses.
18 Chapter 5 Results and Discussion
0
5
10
15
20
25
30
35
40
45
0 25 50 75 100 125 150 175
Time (study days)
Mo
istu
re (
%)
FMC (%)
50% FMC
80% FMC
% Soil Moisture
Figure 7. LTU 1. Relationship between soil moisture and field moisture capacity
0
5
10
15
20
25
30
35
40
0 25 50 75 100 125 150 175
Time (study days)
Mo
istu
re (
%)
FMC (%)
50% FMC
80% FMC
% Soil Moisture
Figure 8. LTU 2. Relationship between soil moisture and field moisture capacity
Chapter 5 Results and Discussion 19
LTU leaching
Natural rain events and watering to maintain the soil moisture resulted inleachate from the LTUs. Table 4 shows the results of the initial and finalleachate analysis. The primary contaminant of the leachate was PCP.
Table 4Concentrations of Contaminants in LTU Leachate
Concentration, mg/lContaminant Day 14 Day 168PCP 197.0Phenol 3.132-methyl phenol 1.82 (estimated)4-methyl phenol 5.3Naphthalene 1.0 (estimated)Dibenzofuran 1.28 (estimated)
Note: Blank spaces indicate values below detection limit.
Leachability test
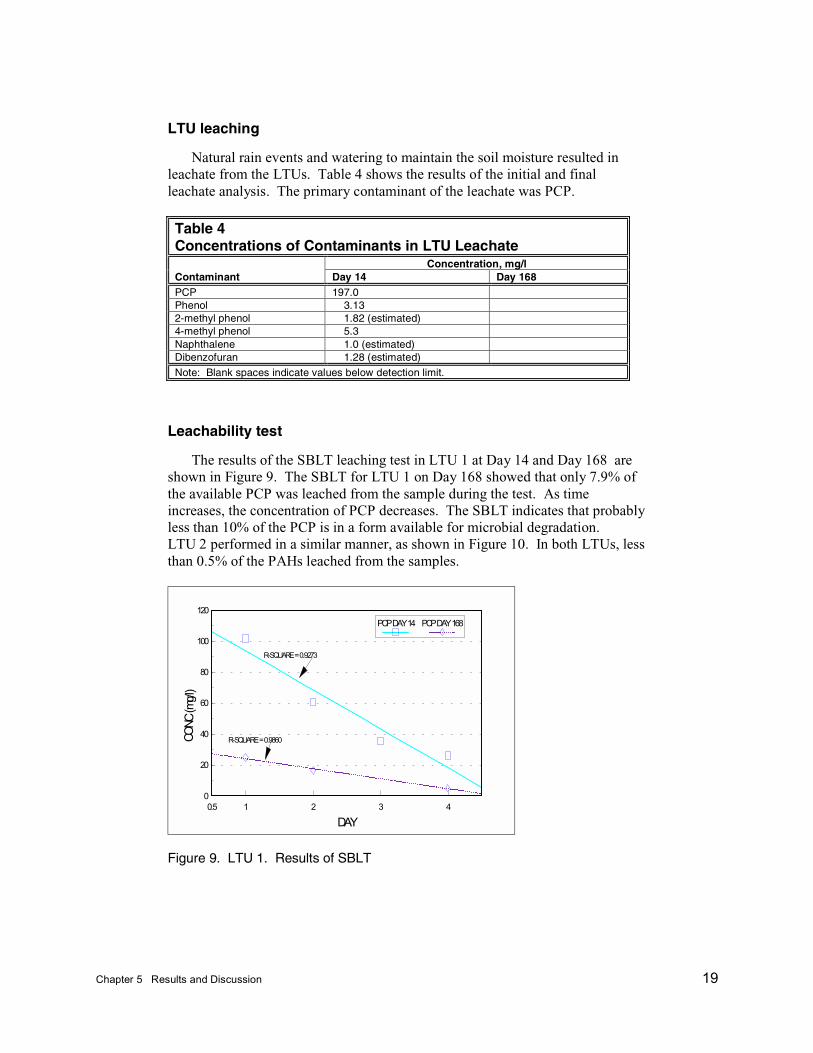
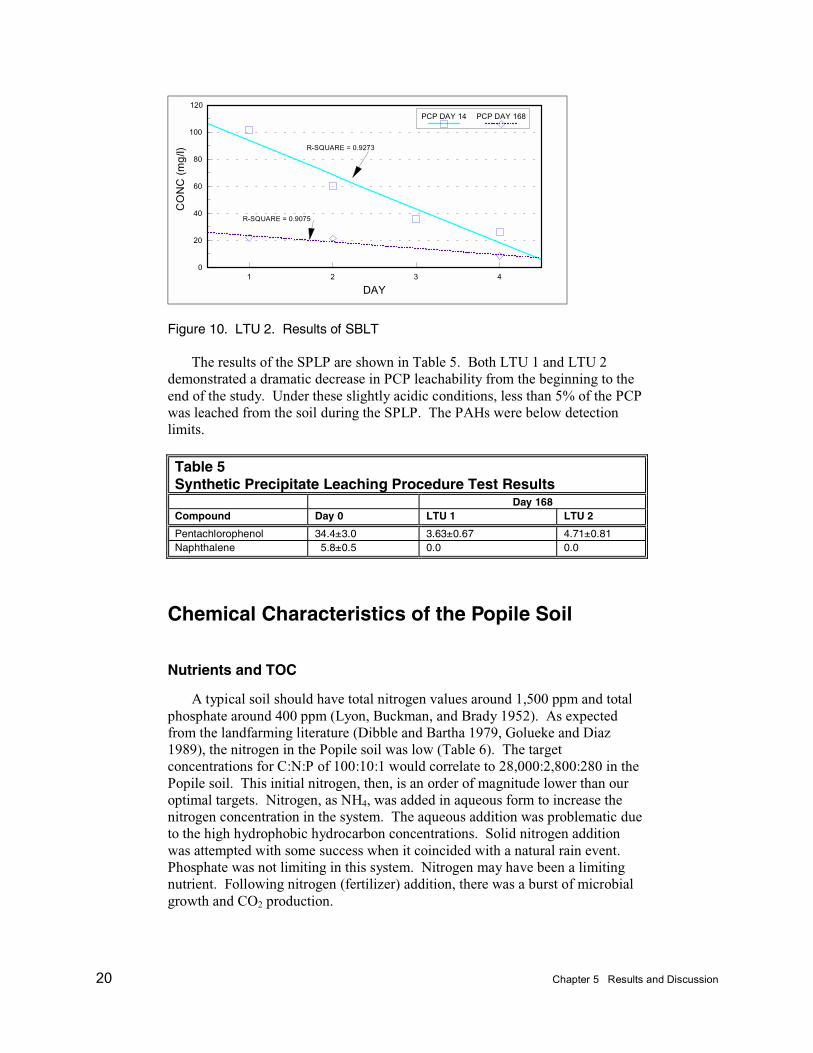
The results of the SBLT leaching test in LTU 1 at Day 14 and Day 168 areshown in Figure 9. The SBLT for LTU 1 on Day 168 showed that only 7.9% ofthe available PCP was leached from the sample during the test. As timeincreases, the concentration of PCP decreases. The SBLT indicates that probablyless than 10% of the PCP is in a form available for microbial degradation.LTU 2 performed in a similar manner, as shown in Figure 10. In both LTUs, lessthan 0.5% of the PAHs leached from the samples.
0.5 1 2 3 40
20
40
60
80
100
120
DAY
CONC
(mg/
l)
PCP DAY 14 PCP DAY 168
R-SQUARE = 0.9273
R-SQUARE = 0.9860
Figure 9. LTU 1. Results of SBLT
20 Chapter 5 Results and Discussion
1 2 3 40
20
40
60
80
100
120
DAY
CO
NC
(m
g/l)
PCP DAY 14 PCP DAY 168
R-SQUARE = 0.9273
R-SQUARE = 0.9075
Figure 10. LTU 2. Results of SBLT
The results of the SPLP are shown in Table 5. Both LTU 1 and LTU 2demonstrated a dramatic decrease in PCP leachability from the beginning to theend of the study. Under these slightly acidic conditions, less than 5% of the PCPwas leached from the soil during the SPLP. The PAHs were below detectionlimits.
Table 5Synthetic Precipitate Leaching Procedure Test Results
Day 168Compound Day 0 LTU 1 LTU 2
Pentachlorophenol 34.4±3.0 3.63±0.67 4.71±0.81Naphthalene 5.8±0.5 0.0 0.0
Chemical Characteristics of the Popile Soil
Nutrients and TOC
A typical soil should have total nitrogen values around 1,500 ppm and totalphosphate around 400 ppm (Lyon, Buckman, and Brady 1952). As expectedfrom the landfarming literature (Dibble and Bartha 1979, Golueke and Diaz1989), the nitrogen in the Popile soil was low (Table 6). The targetconcentrations for C:N:P of 100:10:1 would correlate to 28,000:2,800:280 in thePopile soil. This initial nitrogen, then, is an order of magnitude lower than ouroptimal targets. Nitrogen, as NH4, was added in aqueous form to increase thenitrogen concentration in the system. The aqueous addition was problematic dueto the high hydrophobic hydrocarbon concentrations. Solid nitrogen additionwas attempted with some success when it coincided with a natural rain event.Phosphate was not limiting in this system. Nitrogen may have been a limitingnutrient. Following nitrogen (fertilizer) addition, there was a burst of microbialgrowth and CO2 production.
Chapter 5 Results and Discussion 21
Table 6Initial Nutrient AnalysisNutrient Concentration (mg/kg)
Total Kejldahl Nitrogen (TKN) 158.5±18.13NO2-N 1.88 *estimated valueNO3-N 17±3.5NH3-N 4±1.1Total Phosphate (TP) 456±89OPO4 32±10Total Organic Carbon (TOC) 28,671.5±3,244.5
Metals
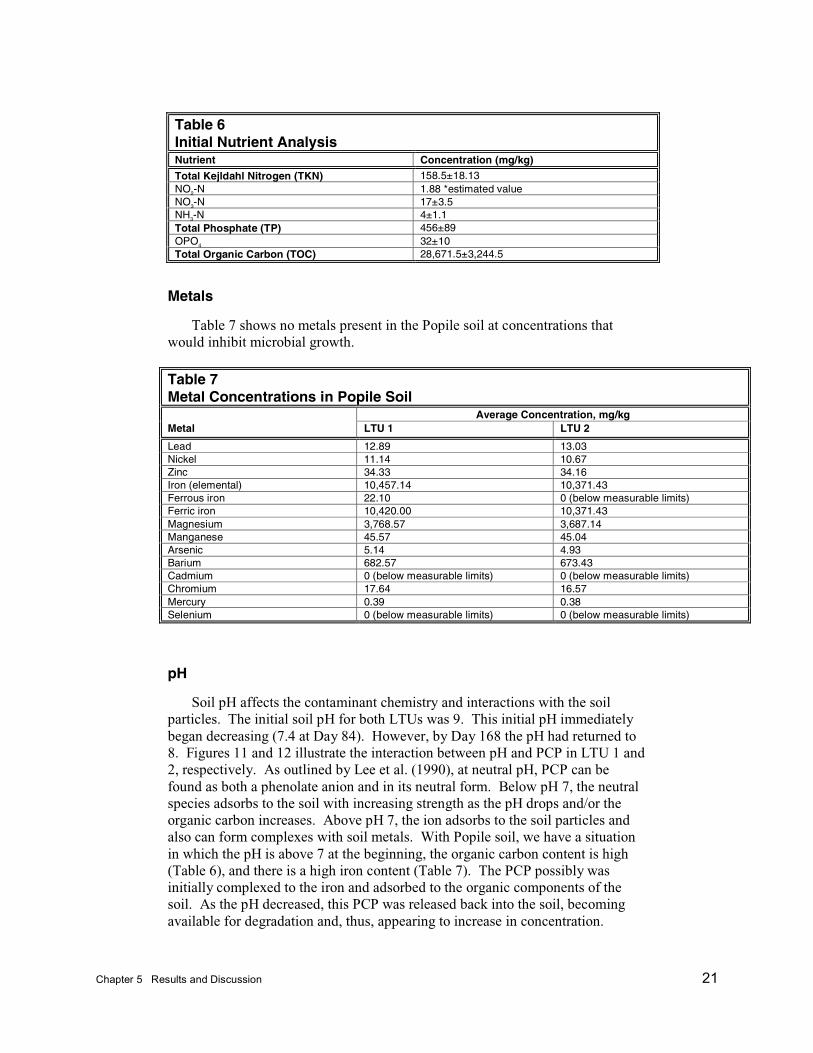
Table 7 shows no metals present in the Popile soil at concentrations thatwould inhibit microbial growth.
Table 7Metal Concentrations in Popile Soil
Average Concentration, mg/kgMetal LTU 1 LTU 2
Lead 12.89 13.03Nickel 11.14 10.67Zinc 34.33 34.16Iron (elemental) 10,457.14 10,371.43Ferrous iron 22.10 0 (below measurable limits)Ferric iron 10,420.00 10,371.43Magnesium 3,768.57 3,687.14Manganese 45.57 45.04Arsenic 5.14 4.93Barium 682.57 673.43Cadmium 0 (below measurable limits) 0 (below measurable limits)Chromium 17.64 16.57Mercury 0.39 0.38Selenium 0 (below measurable limits) 0 (below measurable limits)
pH
Soil pH affects the contaminant chemistry and interactions with the soilparticles. The initial soil pH for both LTUs was 9. This initial pH immediatelybegan decreasing (7.4 at Day 84). However, by Day 168 the pH had returned to8. Figures 11 and 12 illustrate the interaction between pH and PCP in LTU 1 and2, respectively. As outlined by Lee et al. (1990), at neutral pH, PCP can befound as both a phenolate anion and in its neutral form. Below pH 7, the neutralspecies adsorbs to the soil with increasing strength as the pH drops and/or theorganic carbon increases. Above pH 7, the ion adsorbs to the soil particles andalso can form complexes with soil metals. With Popile soil, we have a situationin which the pH is above 7 at the beginning, the organic carbon content is high(Table 6), and there is a high iron content (Table 7). The PCP possibly wasinitially complexed to the iron and adsorbed to the organic components of thesoil. As the pH decreased, this PCP was released back into the soil, becomingavailable for degradation and, thus, appearing to increase in concentration.
22 Chapter 5 Results and Discussion
0
5 0 0
1 0 0 0
1 5 0 0
2 0 0 0
2 5 0 0
3 0 0 0
0 2 5 5 0 7 5 1 0 0 1 2 5 1 5 0 1 7 5
T im e (d a y s )
Co
nce
ntr
atio
n (
mg
/kg
)
7 .0
7 .5
8 .0
8 .5
9 .0
pH
P C P
R e g re s s io n
p H
Figure 11. LTU 1. Relationship between soil pH and PCP concentration
0
500
100 0
150 0
200 0
250 0
300 0
0 25 50 75 100 125 150 175
Tim e (days)
Co
nce
ntr
atio
n (
mg
/kg
)
7
7 .5
8
8.5
9
pH
P C P
R eg ress ion
p H
Figure 12. LTU 2. Relationship between soil pH and PCP concentration
Contaminants
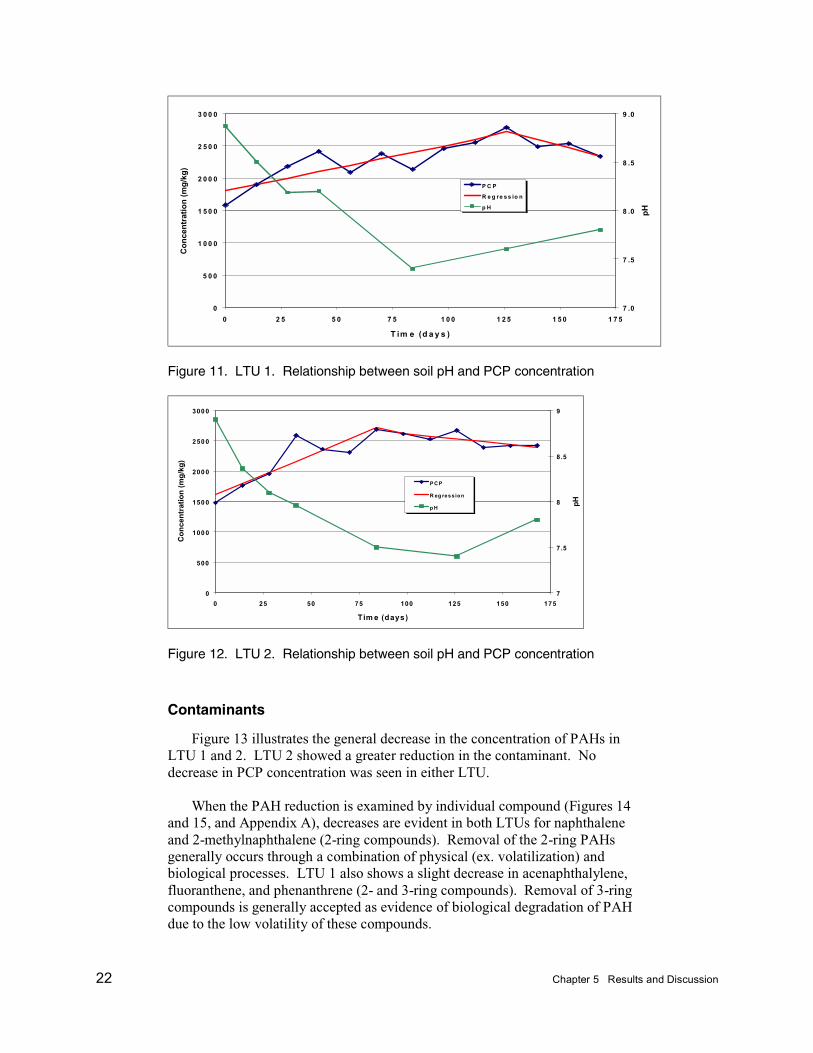
Figure 13 illustrates the general decrease in the concentration of PAHs inLTU 1 and 2. LTU 2 showed a greater reduction in the contaminant. Nodecrease in PCP concentration was seen in either LTU.
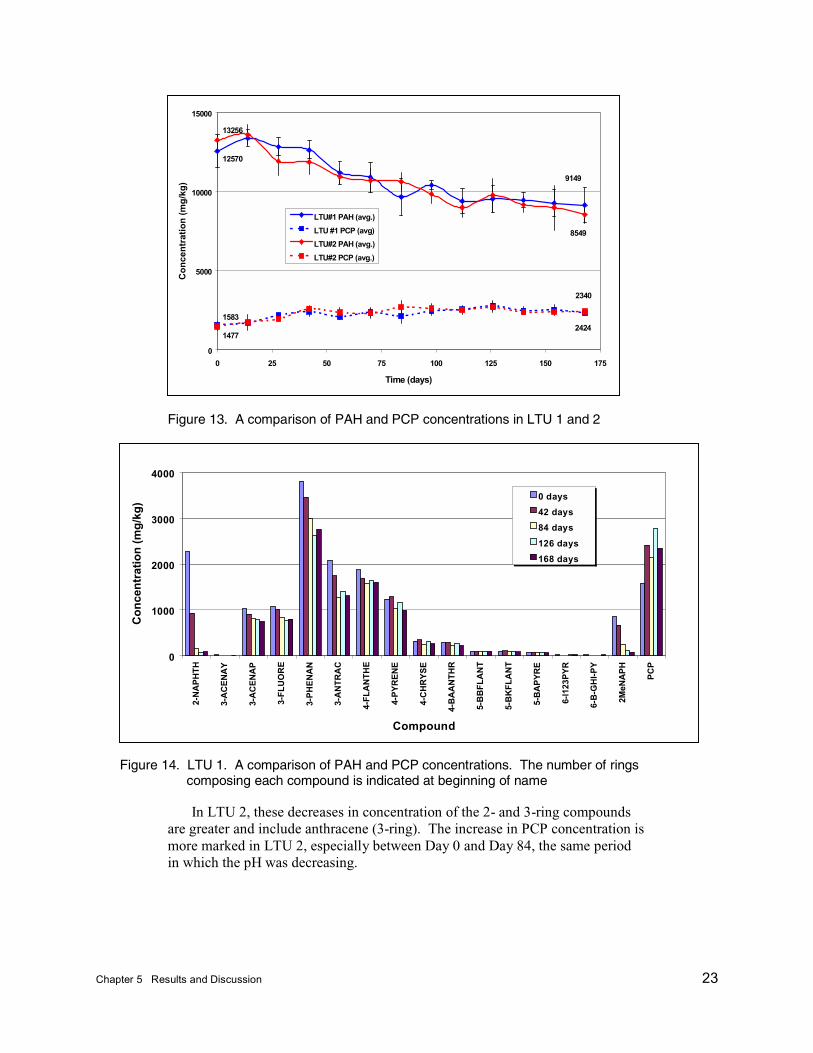
When the PAH reduction is examined by individual compound (Figures 14and 15, and Appendix A), decreases are evident in both LTUs for naphthaleneand 2-methylnaphthalene (2-ring compounds). Removal of the 2-ring PAHsgenerally occurs through a combination of physical (ex. volatilization) andbiological processes. LTU 1 also shows a slight decrease in acenaphthalylene,fluoranthene, and phenanthrene (2- and 3-ring compounds). Removal of 3-ringcompounds is generally accepted as evidence of biological degradation of PAHdue to the low volatility of these compounds.
Chapter 5 Results and Discussion 23
Figure 13. A comparison of PAH and PCP concentrations in LTU 1 and 2
Figure 14. LTU 1. A comparison of PAH and PCP concentrations. The number of rings composing each compound is indicated at beginning of name
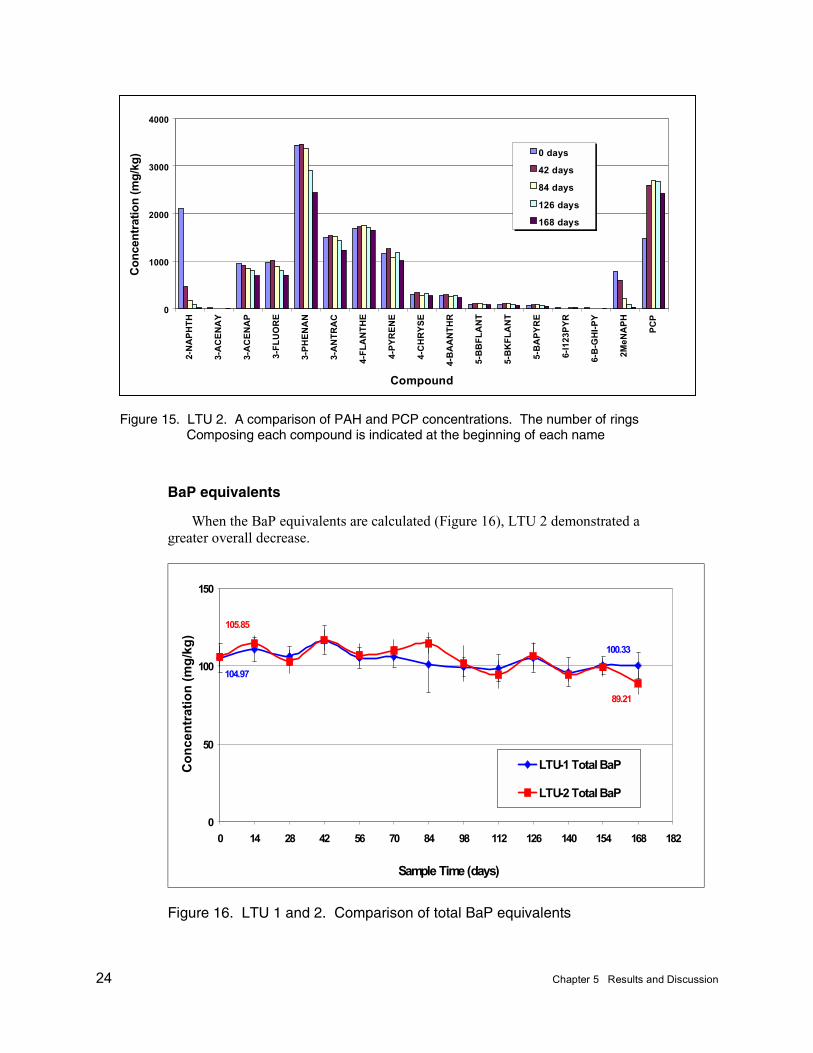
In LTU 2, these decreases in concentration of the 2- and 3-ring compoundsare greater and include anthracene (3-ring). The increase in PCP concentration ismore marked in LTU 2, especially between Day 0 and Day 84, the same periodin which the pH was decreasing.
0
1000
2000
3000
4000
2-N
AP
HT
H
3-A
CE
NA
Y
3-A
CE
NA
P
3-F
LU
OR
E
3-P
HE
NA
N
3-A
NT
RA
C
4-F
LA
NT
HE
4-P
YR
EN
E
4-C
HR
YS
E
4-B
AA
NT
HR
5-B
BF
LA
NT
5-B
KF
LA
NT
5-B
AP
YR
E
6-l1
23P
YR
6-B
-GH
I-P
Y
2MeN
AP
H
PC
P
Compound
Co
nce
ntr
atio
n (
mg
/kg
) 0 days
42 days
84 days
126 days
168 days
9149
12570
2340
1583
8549
13256
14772424
0
5000
10000
15000
0 25 50 75 100 125 150 175
Time (days)
Co
nce
ntr
atio
n (
mg
/kg
)
LTU#1 PAH (avg.)
LTU #1 PCP (avg)
LTU#2 PAH (avg.)
LTU#2 PCP (avg.)
24 Chapter 5 Results and Discussion
Figure 15. LTU 2. A comparison of PAH and PCP concentrations. The number of rings Composing each compound is indicated at the beginning of each name
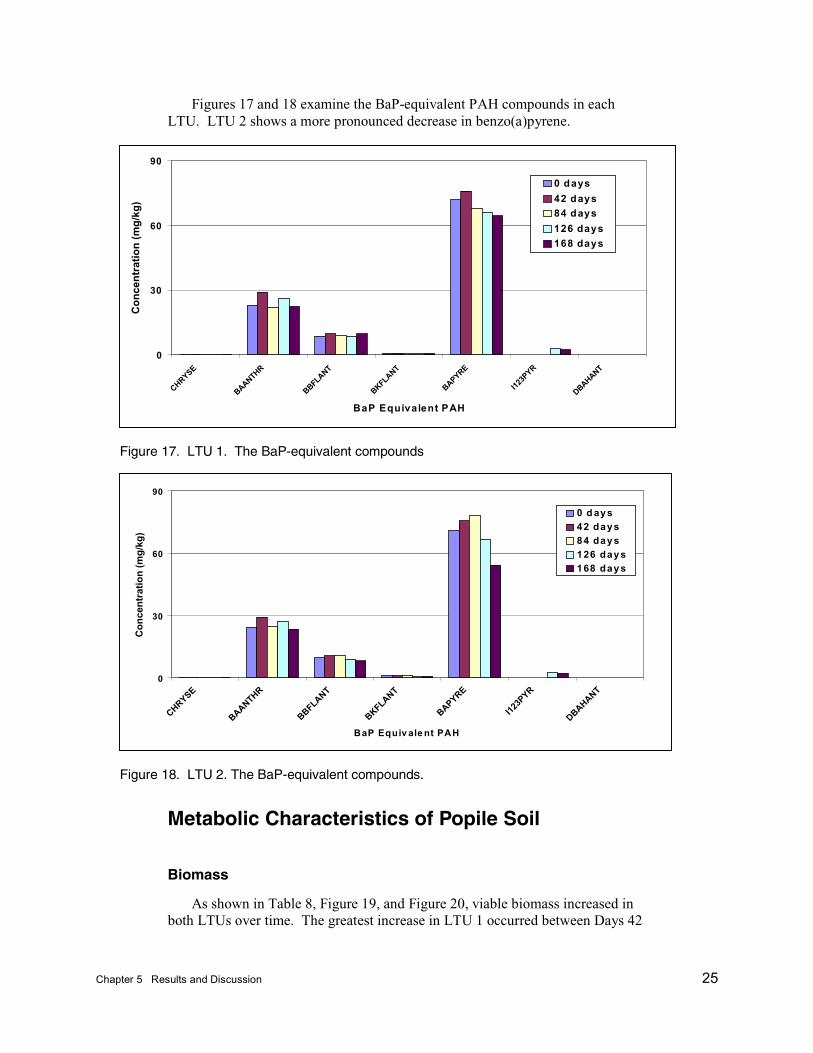
BaP equivalents
When the BaP equivalents are calculated (Figure 16), LTU 2 demonstrated agreater overall decrease.
100.33
104.97
89.21
105.85
0
50
100
150
0 14 28 42 56 70 84 98 112 126 140 154 168 182
Sample Time (days)
Co
nce
ntr
atio
n (
mg
/kg
)
LTU-1 Total BaP
LTU-2 Total BaP
Figure 16. LTU 1 and 2. Comparison of total BaP equivalents
0
1000
2000
3000
4000
2-N
AP
HT
H
3-A
CE
NA
Y
3-A
CE
NA
P
3-F
LU
OR
E
3-P
HE
NA
N
3-A
NT
RA
C
4-F
LA
NT
HE
4-P
YR
EN
E
4-C
HR
YS
E
4-B
AA
NT
HR
5-B
BF
LA
NT
5-B
KF
LA
NT
5-B
AP
YR
E
6-l1
23P
YR
6-B
-GH
I-P
Y
2MeN
AP
H
PC
P
Compound
Co
nce
ntr
atio
n (m
g/k
g) 0 days
42 days
84 days
126 days
168 days
Chapter 5 Results and Discussion 25
Figures 17 and 18 examine the BaP-equivalent PAH compounds in eachLTU. LTU 2 shows a more pronounced decrease in benzo(a)pyrene.
Figure 17. LTU 1. The BaP-equivalent compounds
Figure 18. LTU 2. The BaP-equivalent compounds.
Metabolic Characteristics of Popile Soil
Biomass
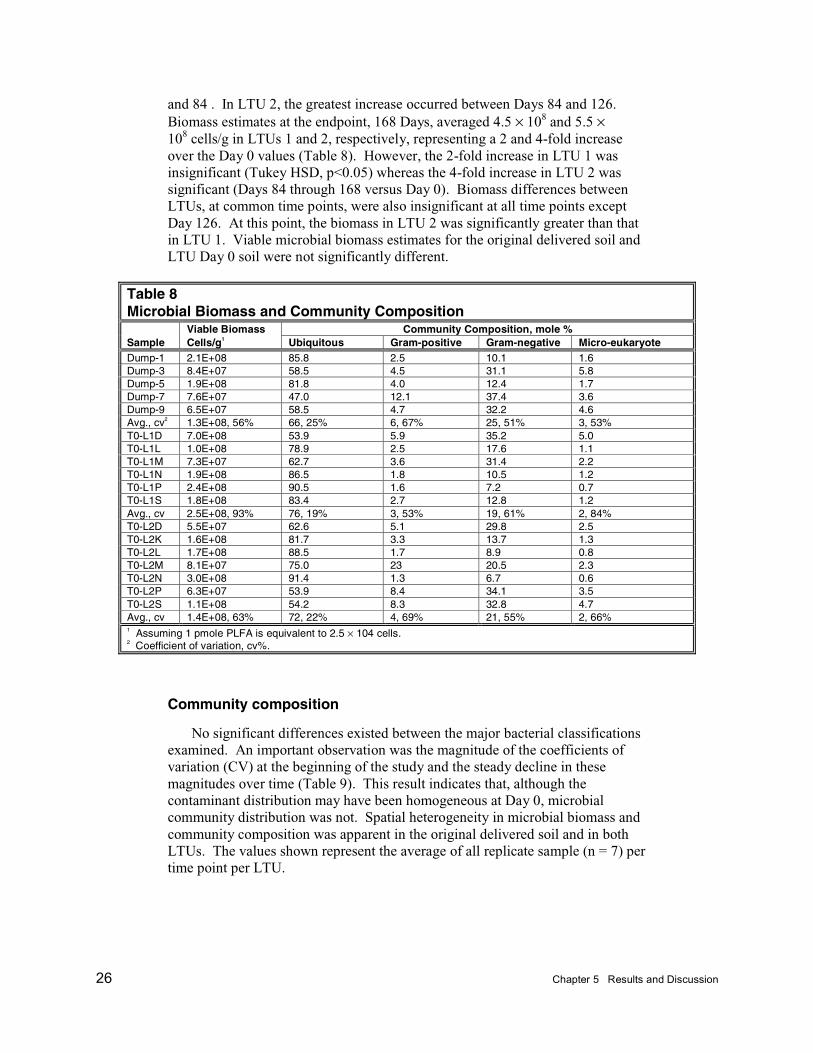
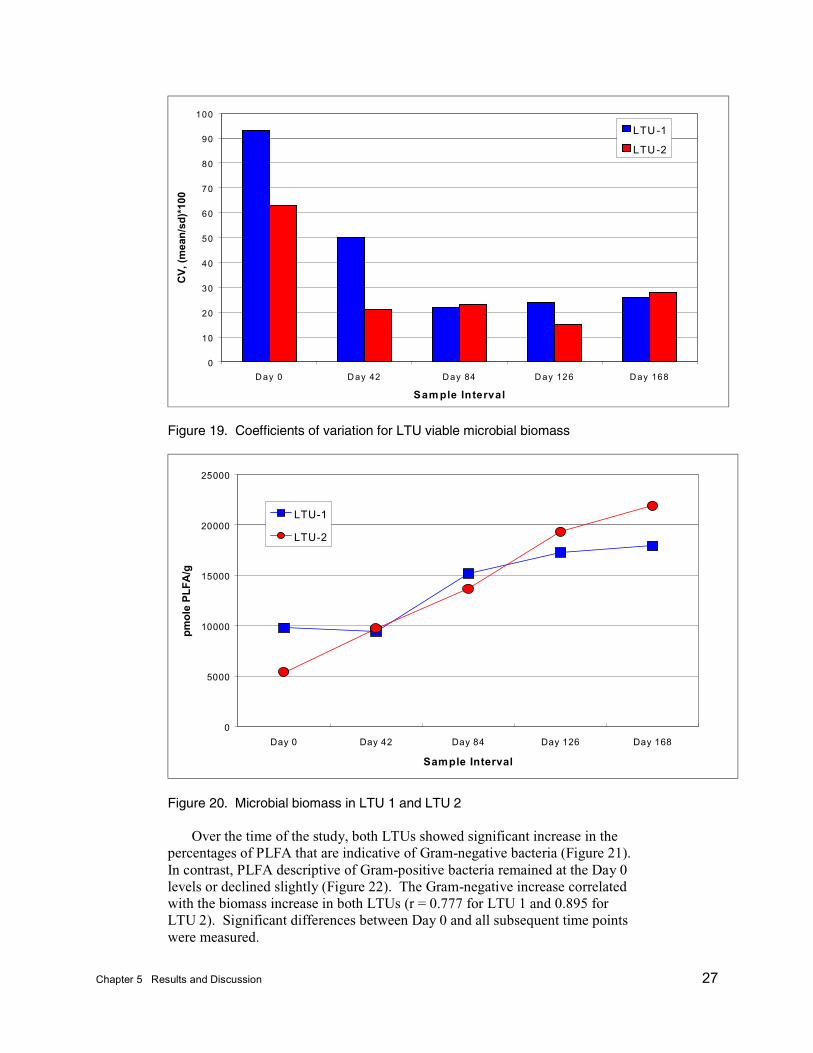
As shown in Table 8, Figure 19, and Figure 20, viable biomass increased inboth LTUs over time. The greatest increase in LTU 1 occurred between Days 42
0
30
60
90
CHRYSE
BAANTHR
BBFLANT
BKFLANT
BAPYRE
I123P
YR
DBAHANT
BaP Equivalent PAH
Co
nce
ntr
atio
n (
mg
/kg
)
0 days
42 days84 days
126 days168 days
0
30
60
90
CHRYSE
BAANTHR
BBFLANT
BKFLANT
BAPYRE
I123P
YR
DBAHANT
BaP Equiv ale nt PAH
Co
nce
ntr
atio
n (
mg
/kg
)
0 d ays42 days84 days126 days168 days
26 Chapter 5 Results and Discussion
and 84 . In LTU 2, the greatest increase occurred between Days 84 and 126.Biomass estimates at the endpoint, 168 Days, averaged 4.5 × 10⁸ and 5.5 ×10⁸ cells/g in LTUs 1 and 2, respectively, representing a 2 and 4-fold increaseover the Day 0 values (Table 8). However, the 2-fold increase in LTU 1 wasinsignificant (Tukey HSD, p<0.05) whereas the 4-fold increase in LTU 2 wassignificant (Days 84 through 168 versus Day 0). Biomass differences betweenLTUs, at common time points, were also insignificant at all time points exceptDay 126. At this point, the biomass in LTU 2 was significantly greater than thatin LTU 1. Viable microbial biomass estimates for the original delivered soil andLTU Day 0 soil were not significantly different.
Table 8Microbial Biomass and Community Composition
Viable Biomass Community Composition, mole %Sample Cells/g1 Ubiquitous Gram-positive Gram-negative Micro-eukaryoteDump-1 2.1E+08 85.8 2.5 10.1 1.6Dump-3 8.4E+07 58.5 4.5 31.1 5.8Dump-5 1.9E+08 81.8 4.0 12.4 1.7Dump-7 7.6E+07 47.0 12.1 37.4 3.6Dump-9 6.5E+07 58.5 4.7 32.2 4.6Avg., cv2 1.3E+08, 56% 66, 25% 6, 67% 25, 51% 3, 53%T0-L1D 7.0E+08 53.9 5.9 35.2 5.0T0-L1L 1.0E+08 78.9 2.5 17.6 1.1T0-L1M 7.3E+07 62.7 3.6 31.4 2.2T0-L1N 1.9E+08 86.5 1.8 10.5 1.2T0-L1P 2.4E+08 90.5 1.6 7.2 0.7T0-L1S 1.8E+08 83.4 2.7 12.8 1.2Avg., cv 2.5E+08, 93% 76, 19% 3, 53% 19, 61% 2, 84%T0-L2D 5.5E+07 62.6 5.1 29.8 2.5T0-L2K 1.6E+08 81.7 3.3 13.7 1.3T0-L2L 1.7E+08 88.5 1.7 8.9 0.8T0-L2M 8.1E+07 75.0 23 20.5 2.3T0-L2N 3.0E+08 91.4 1.3 6.7 0.6T0-L2P 6.3E+07 53.9 8.4 34.1 3.5T0-L2S 1.1E+08 54.2 8.3 32.8 4.7Avg., cv 1.4E+08, 63% 72, 22% 4, 69% 21, 55% 2, 66%1 Assuming 1 pmole PLFA is equivalent to 2.5 × 10⁴ cells.2 Coefficient of variation, cv%.
Community composition
No significant differences existed between the major bacterial classificationsexamined. An important observation was the magnitude of the coefficients ofvariation (CV) at the beginning of the study and the steady decline in thesemagnitudes over time (Table 9). This result indicates that, although thecontaminant distribution may have been homogeneous at Day 0, microbialcommunity distribution was not. Spatial heterogeneity in microbial biomass andcommunity composition was apparent in the original delivered soil and in bothLTUs. The values shown represent the average of all replicate sample (n = 7) pertime point per LTU.
Chapter 5 Results and Discussion 27
0
10
20
30
40
50
60
70
80
90
100
D ay 0 D ay 42 D ay 84 D ay 126 D ay 168
Sam ple Interval
CV
, (m
ean
/sd
)*10
0
LTU -1
LTU -2
Figure 19. Coefficients of variation for LTU viable microbial biomass
0
5000
10000
15000
20000
25000
Day 0 Day 42 Day 84 Day 126 Day 168
Sample Interval
pm
ole
PL
FA
/g
LTU-1
LTU-2
Figure 20. Microbial biomass in LTU 1 and LTU 2
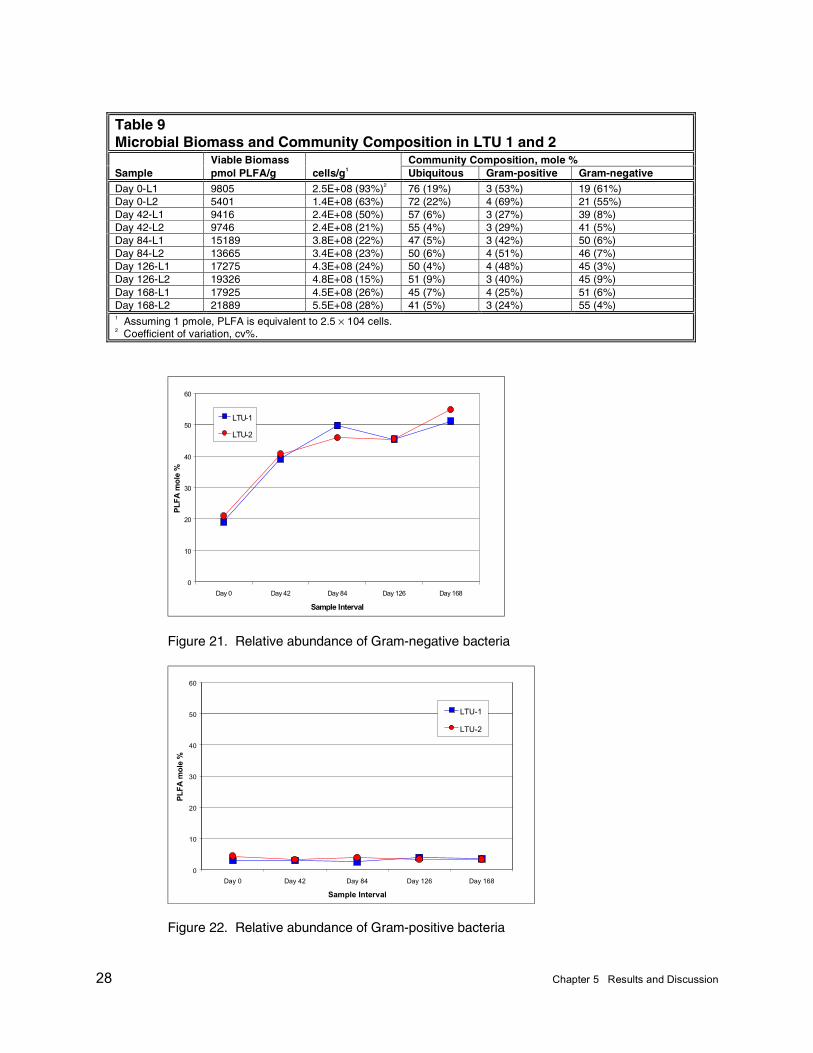
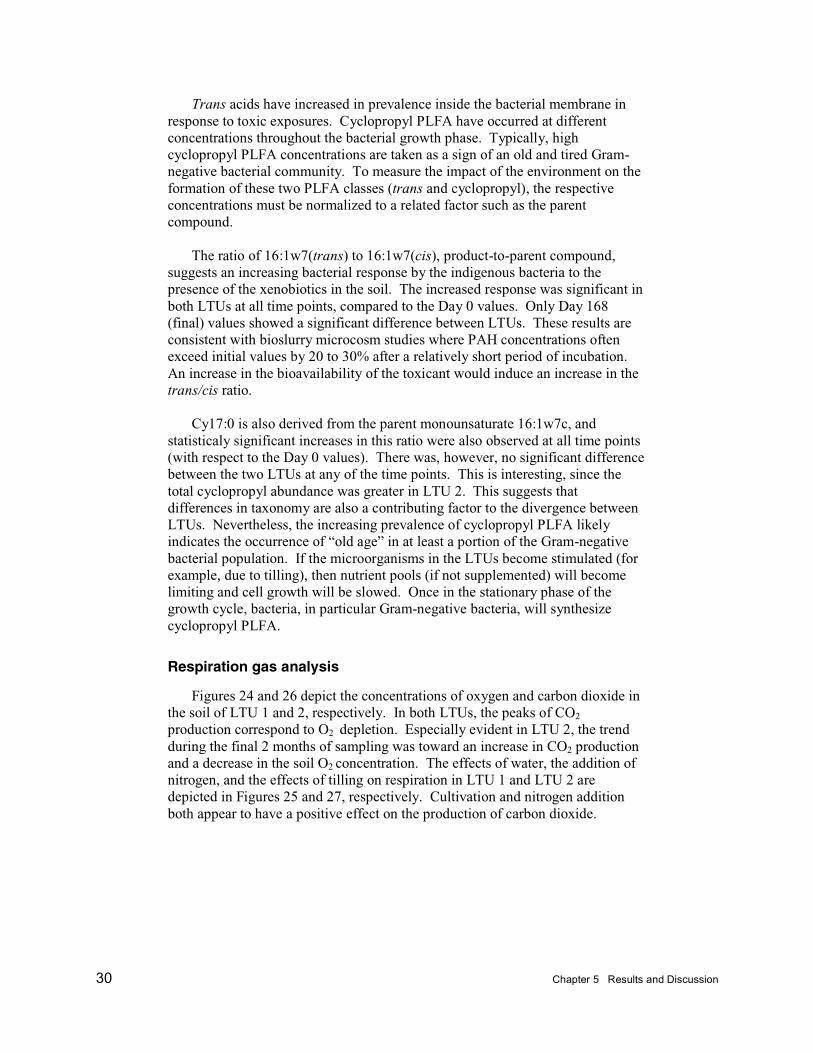
Over the time of the study, both LTUs showed significant increase in thepercentages of PLFA that are indicative of Gram-negative bacteria (Figure 21).In contrast, PLFA descriptive of Gram-positive bacteria remained at the Day 0levels or declined slightly (Figure 22). The Gram-negative increase correlatedwith the biomass increase in both LTUs (r = 0.777 for LTU 1 and 0.895 forLTU 2). Significant differences between Day 0 and all subsequent time pointswere measured.
28 Chapter 5 Results and Discussion
Table 9Microbial Biomass and Community Composition in LTU 1 and 2
Viable Biomass Community Composition, mole %Sample pmol PLFA/g cells/g1 Ubiquitous Gram-positive Gram-negativeDay 0-L1 9805 2.5E+08 (93%)2 76 (19%) 3 (53%) 19 (61%)Day 0-L2 5401 1.4E+08 (63%) 72 (22%) 4 (69%) 21 (55%)Day 42-L1 9416 2.4E+08 (50%) 57 (6%) 3 (27%) 39 (8%)Day 42-L2 9746 2.4E+08 (21%) 55 (4%) 3 (29%) 41 (5%)Day 84-L1 15189 3.8E+08 (22%) 47 (5%) 3 (42%) 50 (6%)Day 84-L2 13665 3.4E+08 (23%) 50 (6%) 4 (51%) 46 (7%)Day 126-L1 17275 4.3E+08 (24%) 50 (4%) 4 (48%) 45 (3%)Day 126-L2 19326 4.8E+08 (15%) 51 (9%) 3 (40%) 45 (9%)Day 168-L1 17925 4.5E+08 (26%) 45 (7%) 4 (25%) 51 (6%)Day 168-L2 21889 5.5E+08 (28%) 41 (5%) 3 (24%) 55 (4%)1 Assuming 1 pmole, PLFA is equivalent to 2.5 × 10⁴ cells.2 Coefficient of variation, cv%.
0
10
20
30
40
50
60
Day 0 Day 42 Day 84 Day 126 Day 168
Sample Interval
PLF
A m
ole
%
LTU-1
LTU-2
Figure 21. Relative abundance of Gram-negative bacteria
0
10
20
30
40
50
60
Day 0 Day 42 Day 84 Day 126 Day 168
Sample Interval
PLF
A m
ole
%
LTU-1
LTU-2
Figure 22. Relative abundance of Gram-positive bacteria

Chapter 5 Results and Discussion 29
The community composition showed signs of divergence from Day 84onward. The divergence was first identified by hierarchial cluster analysis.Using the results of this analysis, five of the seven replicate subsamples fromeach LTU were identified which showed a definable similarity (i.e., all werelinked at a euclidean distance of 2.0 or less). PLFA profiles of the five replicatesamples are presented in Figure 23 which shows only the Day 168 endpointanalysis, since the community differences identified at Day 84 were alsoidentified at Day 168 with only the magnitude of the divergence changing (i.e.,increasing). Six PLFA differed significantly between the two LTUs. Within theubiquitous PLFA classification, normal saturated 14:0 or myristic acid and 18:0or stearic acid were identified. Within the Gram-negative classification, twocyclopropyl PLFA (cy17:0 and cy19:0) and two trans monounsaturated PLFA(16:1w7t and 18:1w7t) were identified. Since none of the PLFA within theGram-positive classification differed significantly between LTUs, it can beassumed that the input of these organisms (Gram-positive) to the overallfunctioning of the LTUs is negligible. The Gram-negative input was, however,highly significant.
0
5
10
15
20
25
30
35
40
45
n14:
0
n15:
0
n16:
0
n17:
0
n18:
0
i15:
0
a15:
0
i16:
0
i17:
0
a17:
0
n16:
1w7c
n16:
1w7t
cy17
:0
n18:
1w9c
n18:
1w7c
n18:
1w7t
cy19
:0
PLFA
PL
FA
mo
l %
LTU-1
LTU-2
** *
*
*
*
ubiquitous
Gram-positive
Gram-negative
Figure 23. Microbial community composition in both LTUs at Day 168
Increased percentages of myristic and trans PLFA in LTU 1 are conducive tothe presence of the Pseudomonas sp. of bacteria. Pseudomonas sp. areconsistently isolated from PAH contaminated sites, and a number of species havebeen demonstrated to have the capacity to mineralize some of these compounds.The increased percentages of cyclopropyl PLFA in LTU 2 is also conducive tothe presence of Pseudomonas species but reflects a physiological response tochanging environmental conditions. In fact, both trans and cyclopropyl PLFAare synthesized by Gram-negative bacteria in response to changingenvironmental conditions, and the divergence seen with the analyses describedabove likely incorporates this phenomenon as well as any taxonomic differences.
30 Chapter 5 Results and Discussion
Trans acids have increased in prevalence inside the bacterial membrane inresponse to toxic exposures. Cyclopropyl PLFA have occurred at differentconcentrations throughout the bacterial growth phase. Typically, highcyclopropyl PLFA concentrations are taken as a sign of an old and tired Gram-negative bacterial community. To measure the impact of the environment on theformation of these two PLFA classes (trans and cyclopropyl), the respectiveconcentrations must be normalized to a related factor such as the parentcompound.
The ratio of 16:1w7(trans) to 16:1w7(cis), product-to-parent compound,suggests an increasing bacterial response by the indigenous bacteria to thepresence of the xenobiotics in the soil. The increased response was significant inboth LTUs at all time points, compared to the Day 0 values. Only Day 168(final) values showed a significant difference between LTUs. These results areconsistent with bioslurry microcosm studies where PAH concentrations oftenexceed initial values by 20 to 30% after a relatively short period of incubation.An increase in the bioavailability of the toxicant would induce an increase in thetrans/cis ratio.
Cy17:0 is also derived from the parent monounsaturate 16:1w7c, andstatisticaly significant increases in this ratio were also observed at all time points(with respect to the Day 0 values). There was, however, no significant differencebetween the two LTUs at any of the time points. This is interesting, since thetotal cyclopropyl abundance was greater in LTU 2. This suggests thatdifferences in taxonomy are also a contributing factor to the divergence betweenLTUs. Nevertheless, the increasing prevalence of cyclopropyl PLFA likelyindicates the occurrence of “old age” in at least a portion of the Gram-negativebacterial population. If the microorganisms in the LTUs become stimulated (forexample, due to tilling), then nutrient pools (if not supplemented) will becomelimiting and cell growth will be slowed. Once in the stationary phase of thegrowth cycle, bacteria, in particular Gram-negative bacteria, will synthesizecyclopropyl PLFA.
Respiration gas analysis
Figures 24 and 26 depict the concentrations of oxygen and carbon dioxide inthe soil of LTU 1 and 2, respectively. In both LTUs, the peaks of CO2
production correspond to O2 depletion. Especially evident in LTU 2, the trendduring the final 2 months of sampling was toward an increase in CO2 productionand a decrease in the soil O2 concentration. The effects of water, the addition ofnitrogen, and the effects of tilling on respiration in LTU 1 and LTU 2 aredepicted in Figures 25 and 27, respectively. Cultivation and nitrogen additionboth appear to have a positive effect on the production of carbon dioxide.
Chapter 5 Results and Discussion 31
Figure 24. LTU 1. Respiration
Figure 25. LTU 1. Water and nutrient addition, and tilling
02468
10121416182022
0 7 14 21 28 35 42 49 56 63 70 77 84 91 98 105
112
119
126
133
140
147
154
Time (study days)
O2
(% v
olu
me
± s.
d.)
0.0
1.0
2.0
3.0
4.0
5.0
6.0
7.0
8.0
CO
2 (%
vo
lum
e ±
s.d
.)
Oxygen Oxygen - UpperOxygen - Lower Carbon DioxideCarbon Dioxide - Upper Carbon Dioxide - Lower
0.0
2.0
4.0
6.0
8.0
10.0
0 10 21 24 42 56 64 71 77 85 92 95 102
106
119
125
128
130
132
135
137
141
154
157
159
166
Time (studyd )
Rain/Water Addition (cm)
Nitrogen Addition (kg)
Tilled
32 Chapter 5 Results and Discussion
Figure 26. LTU 2. Respiration
Figure 27. LTU 2. Water and nutrient additions, and tilling
0
2
4
6
8
10
12
14
16
18
20
22
0 7 14 21 28 35 42 49 56 63 70 77 84 91 98 105
112
119
126
133
140
147
154
Time (study days)
O2
(% v
olu
me
± s.
d.)
0
1
2
3
4
5
6
7
8
CO
2 (%
Vo
lum
e ±
s.d
.)
Oxygen Oxygen - UpperOxygen - Lower Carbon DioxideCarbon Dioxide-Upper Carbon Dioxide-Lower
0
2
4
6
8
10
0 10 21 24 42 56 64 71 77 85 92 95 102
106
119
125
128
130
132
135
137
141
154
157
159
166
Time (study days)
Water Addition (cm)
Nitrogen Addition (kg)
Tilled
Chapter 5 Results and Discussion 33
Data Analysis
Contaminant reduction
When the percent reduction from the initial concentration is calculated, theyindicate an 8% greater reduction in overall PAH in LTU 2 than LTU 1(Table 10). This difference is even more apparent when the BaP equivalents arecalculated. Then it becomes an 11.3% difference in reduction.
Table 10Reduction (%) from Initial Concentrations of PAHs and BaPEquivalents
% ReductionContaminant LTU 1 LTU 2
PAH (overall, avg) 27.21 35.5Naphthalene (2-ring) 95.95 99.17Anthracene (3-ring) 37.12 17.26Phenanthracene (3-ring) 27.66 29.10Pyrene (4-ring) 19.89 12.37Benzo-(g,h,i)-pyrene (6-ring) 16.32 17.79BaP Equivalents (overall avg) 4.45 15.76Chrysene (4-ring) 19.40 8.31Benzo(a)anthracene (4-ring) 22.63 13.76Benzo(a)pyrene (5-ring) 10.88 17.85Indeno-(1,2,3)-pyrene (6-ring) 17.30 18.86
Degradation kinetics
The degradation kinetics (Tables 11 and 12) show that, based on zero-orderdegradation, at the present rate of decrease, it will take 1.69 years to reduce theoverall PAH burden of the Popile soil to 5 ppm without treatment (LTU 1). Toreach the goal of 5 ppm BaP equivalents, however, will take 9.86 years. ForLTU 2, the average PAH reduction will require 1.3 years. The BaP goal,however, will only take 2.79 years.
Degradation of PCP mentioned earlier, discusses the relationship betweensoil pH and PCP concentration. The PCP concentration in LTU-1 reached a peakafter 126 days and then declined throughout the duration of the study (Day 168).In LTU 2, the peak of PCP concentration was attained earlier in the study (at42 days) and maintained until Day 126, when it began a slow decline. Theapparent rise and fall in PCP concentration in the LTUs appears to be an artifactof soil pH changes. The time elapsed between the respective PCP peakconcentrations and Day 168 was insufficient to separate artifact from truedegradation and attain reliable kinetic data.
34 Chapter 5 Results and Discussion
Table 11Degradation Kinetics of PAHs in LTU 1 and 2
Degradation KineticsLTU 1 LTU 2
Contaminant K, ppm/day Time, yr K, ppm/day Time, yr
PAH (avg) 20.36 1.69 28.02 1.3Naphthalene (2-ring) 12.98 0.48 12.42 0.46Phenanthrene (3-ring) 6.28 1.66 5.95 1.58Anthracene (3-ring) 4.60 1.24 1.53 2.66Pyrene (4-ring) 1.46 2.31 0.85 3.70Indeno-(1,2,3)-pyrene (6-ring) 0.03 2.20 0.03 1.98
Table 12Degradation Kinetics of BaP-Equivalent Compounds in LTU 1 and 2
Degradation KineticsLTU 1 LTU 2
Contaminant K, ppm/day Time, yr K, ppm/day Time, yrBaP Equivalents 0.028 9.86 0.099 2.79
0.37 2.36 0.15 5.36Benzo(a)anthacene (4-ring) 0.39 2.01 0.22 3.33Benzo(a)pyrene (5-ring) 0.05 3.70 0.07 2.39Benzo-(g,h,i)-pyrene (6-ring) 0.02 2.42 0.02 2.01
Chapter 6 Summary and Conclusions 35
6 Summary and Conclusions
Based on the objectives of treatment goals, kinetics, and leaching potential,this study suggests:
a. ROD treatment goals will not be met using a 6-month lift design in alandfarming system.
b. ROD treatment goals for BaP may be met by extending the duration ofeach lift treatment. The duration of the study was too short todemonstrate conclusive biodegradation of PCP.
c. Cultivation associated with landfarming did not increase the leachabilityof contaminants in the Popile soil. The leach data supports thegroundwater model showing that the contaminant is not moving from thesite under these test conditions. However, in time some change couldoccur that would render the contaminant mobile and it could migrate tothe groundwater.
Beyond meeting the stated objectives of the study, the following pertinentobservations were made. The high concentration of hydrophobic contaminantsinhibited aqueous phase nutrient additions. Slow-release nutrients applied in asolid form should be a more effective method of maintaining appropriate C:N:R:ratios. The increase in microbial biomass and the change in community makeupin LTU 2 by the end of the study suggest biodegradation of the more recalcitrantPAHs, since LTU 2 saw a greater reduction in benzo(a)pyrene and other 4- and5-ring PAHs. Cultivation had a positive impact on the degradation kineticsshown by the greater overall decrease in contaminant in LTU 2 over LTU 1.
36 Chapter 7 Recommendations
7 Recommendations
The U.S. Engineer Research and Development Center (ERDC) recommendsthat the U.S. Army Engineer District, New Orleans (USAEDNO), considercontinued leveraged funding of Popile, Phase III, pilot-scale activities. TheERDC is the center of the Federal Integrated Biotreatment Research Consortium(FIBRC), a research and development project of the Strategic EnvironmentalResearch and Development Project (SERDP). Remediation of PAH-contaminated material is a thrust of FIBRC. Dr. Hap Pritchard, Naval ResearchLaboratory (NRL), is the Thrust Area Leader. Dr. Pritchard has observed thedevelopment of pilot-scale landfarming expertise between ERDC and theUSAEDNO. This has resulted in a request for a collaborative continuationbetween ERDC, FIBRC, and USAEDNO of the Popile study.
The FIBRC plan is to innoculate the treated Popile soil with known PAH-degrading bacteria from NRL. These microorganisms have been isolated andcultured as part of the SERDP-FIBRC effort. The FIBRC will contribute to thecost of this effort.
The benefit to USAEDNO, EPA, and the State of Arkansas, Department ofEnvironmental Quality, is a potential treatment protocol that will meet the RODgoals and further develop an emerging technology consistent with the objectivesof the USACE Innovative Technology Advocate Initiative.
References 37
References
Agency for Toxic Substance and Disease Registry (ATSDR). (1994).“Toxicological profile for pentachlorophenol (update),” U.S. Department ofHealth and Human Services, Public Health Service, Atlanta, GA.
__________. (1995). “Toxicological profile for polycyclic aromatichydrocarbons,” U.S. Department of Health and Human Services, PublicHealth Service, Atlanta, GA.
American Society for Testing and Materials. (1991). “Standard guide for designof a liner system for containment of wastes,” ASTM D-1973-91,Philadelphia, PA.
Clark, A. J., and Michael, J. (1996). “Regulatory programs enhance use ofbioremediation for contaminated environmental media,” J.Soil Contam. 5(3),243-261.
Dibble, J. T., and Bartha, R. (1979). “Effect of environmental parameters on thebiodegradation of oil sludge,” Appl. Environ. Micro. 37(4), 729-739.
Environmental Protection Agency (EPA). (1984). “Health effects assessmentfor polycyclic aromatic hydrocarbons (PAH),” EPA 549/1-86-013,Environmental Criteria and Assessment Office, Cincinnati, OH.
Federal Remediation Technologies Roundtable. (1998). “Remediationtechnologies screening matrix and reference guide.”http://www.frtr.gov/matrix/section1/toc.html.
Frisbie, A., and Nies, L. (1997). “Aerobic and anaerobic biodegradation of agedpentachlorophenol by indigenous microorganisms,” BioremediationJournal 1, 65-75.
Gillette, J. S., Luthy, R. G., Clemett, S. J., and Zare, R. N. (1999). “Directobservation of polycyclic aromatic hydrocarbons on geosorbents at thesubparticle scale,” Environmental Science and Technol. 33(8), 1185-1192.
Golueke, Clarence G., and Diaz, Luis F. (1989). “Biological treatment forhazardous wastes,” Biocycle, 58-63.
38 References
Harmsen, Joop. (1991). “Possibilities and limitations of landfarming forcleaning contaminated soils in on-site bioreclamation.” Processes forxenobiotic and hydrocarbon treatment. R.E. Hinchee and R.F. Olfenbuttel,ed., Battelle Memorial Institute, Butterworth-Heinemann, Stoneham, MA,255-272.
Hurst, C. J., Sims, R. C., Sims, J. L., Sorensen, D. L., McLean, J. E. and Huling,S. (1997). “Soil gas oxygen tension and pentachlorophenol biodegradation,”J. Environ. Eng. 4, 364-370.
King, B. (1992). “Applied bioremediation-An overview.” Practicalenvironmental bioremediation. Lewis Publishing, Ann Arbor, MI, 11-27.
Lee, L. S., Rao, P. S. C., Nkedi-Kizza, P., and Defino, J. J. (1990). “Influence ofsolvent and sorbent characteristics on distribution of pentachlorophenol inoctanol-water and soil-water systems,” Environ. Sci. Technol. 24, 654-661.
Luthy, R. G., Aiken, G. R., Brusseau, M. L., Cunningham, S. D., Gschwend,P. M., Pignatello, J. J., Reinhard, M., Traina, S. J., Weber, W. J, Jr., andWestall, J. C. (1997). “Sequestration of hydrophobic organic contaminantsby geosorbents,” Environ. Sci. Technol. 31(12), 3341-3347.
Lyon, T. L., Buckman, H. O., and Brady, N. C. (1952). The nature andproperties of soils. McMillan, New York.
McGinnis, G. D., Borazjani, H., Hannigan, M., Hendrix, F., McFarland, L., Pope,D., Strobel, D. and Wagner, J. (1991). J. Haz. Mat. 28, 145-158.
McGinnis, G. D., Dupont, R. R., Everhart, K., and St. Laurent, G. (1994).“Evaluation and management of field soil pile bioventing systems for theremediation of PCP contaminated surface soils,” Environ.Technol. 15(8),729-740.
Nisbet, C., and LaGoy, P. (1992). “Toxic equivalency factors (TEFs) forpolycyclic aromatic hydrocarbons (PAHs). Reg.” Toxicol. Pharmacol. 16,290-300.
Park, K. S., Sims, R. C., Dupont, R. R., Doucette, W. J., and Matthews, J. E.(1990). “Fate of PAH compounds in two soil types: Influence ofvolatilization, abiotic loss and biological activity,” Environ. Toxicol. Chem.9, 187-195.
Petry, Thomas, Schmid, Peter, and Schlatter, Christian. (1996). “The use oftoxic equivalency factors in assessing occupational and environmental healthrisk associated with exposure to airborne mixtures of polycyclic aromatichydrocarbons (PAHs),” Chemosphere 32(4), 639-648.
Reisinger, H. J. (1995). “Hydrocarbon bioremediation-An overview.” Appliedbioremediation of petroleum hydrocarbons. R. E. Hinchee, J. A. Kittel, H. J.Reisinger, ed., Battelle Press, Columbus, Ohio, 1-9.
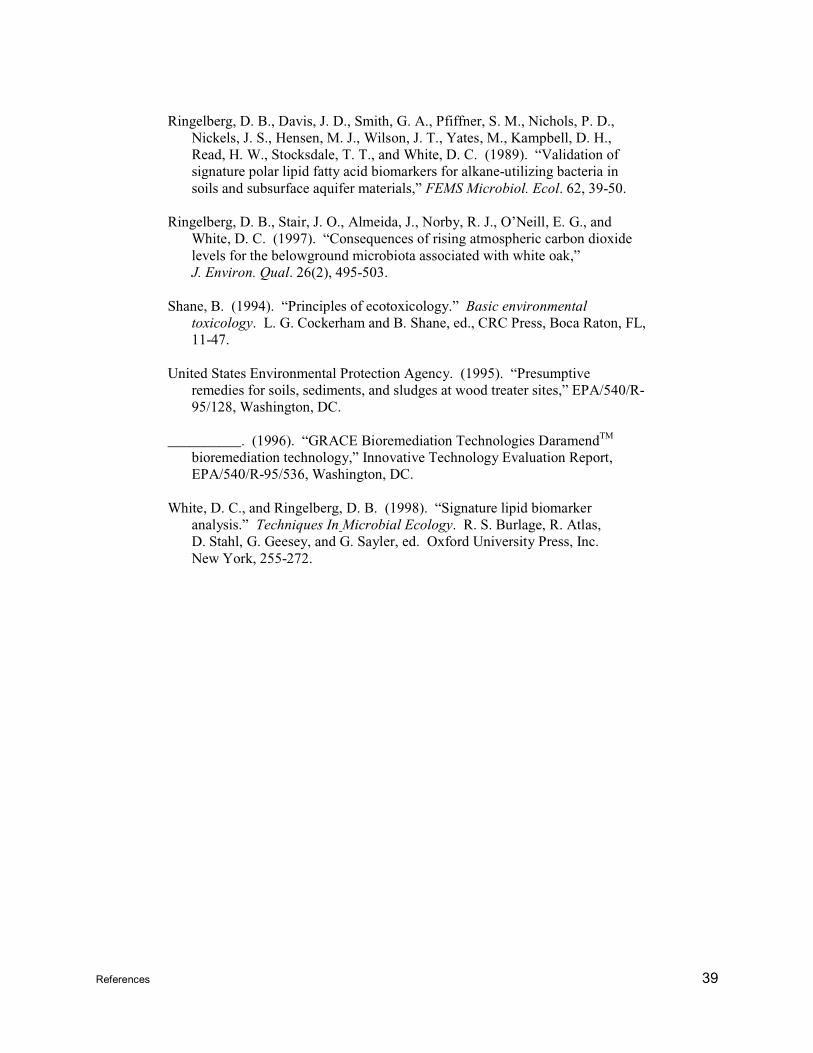
References 39
Ringelberg, D. B., Davis, J. D., Smith, G. A., Pfiffner, S. M., Nichols, P. D.,Nickels, J. S., Hensen, M. J., Wilson, J. T., Yates, M., Kampbell, D. H.,Read, H. W., Stocksdale, T. T., and White, D. C. (1989). “Validation ofsignature polar lipid fatty acid biomarkers for alkane-utilizing bacteria insoils and subsurface aquifer materials,” FEMS Microbiol. Ecol. 62, 39-50.
Ringelberg, D. B., Stair, J. O., Almeida, J., Norby, R. J., O’Neill, E. G., andWhite, D. C. (1997). “Consequences of rising atmospheric carbon dioxidelevels for the belowground microbiota associated with white oak,”J. Environ. Qual. 26(2), 495-503.
Shane, B. (1994). “Principles of ecotoxicology.” Basic environmentaltoxicology. L. G. Cockerham and B. Shane, ed., CRC Press, Boca Raton, FL,11-47.
United States Environmental Protection Agency. (1995). “Presumptiveremedies for soils, sediments, and sludges at wood treater sites,” EPA/540/R-95/128, Washington, DC.
__________. (1996). “GRACE Bioremediation Technologies DaramendTM
bioremediation technology,” Innovative Technology Evaluation Report,EPA/540/R-95/536, Washington, DC.
White, D. C., and Ringelberg, D. B. (1998). “Signature lipid biomarkeranalysis.” Techniques In Microbial Ecology. R. S. Burlage, R. Atlas,D. Stahl, G. Geesey, and G. Sayler, ed. Oxford University Press, Inc.New York, 255-272.
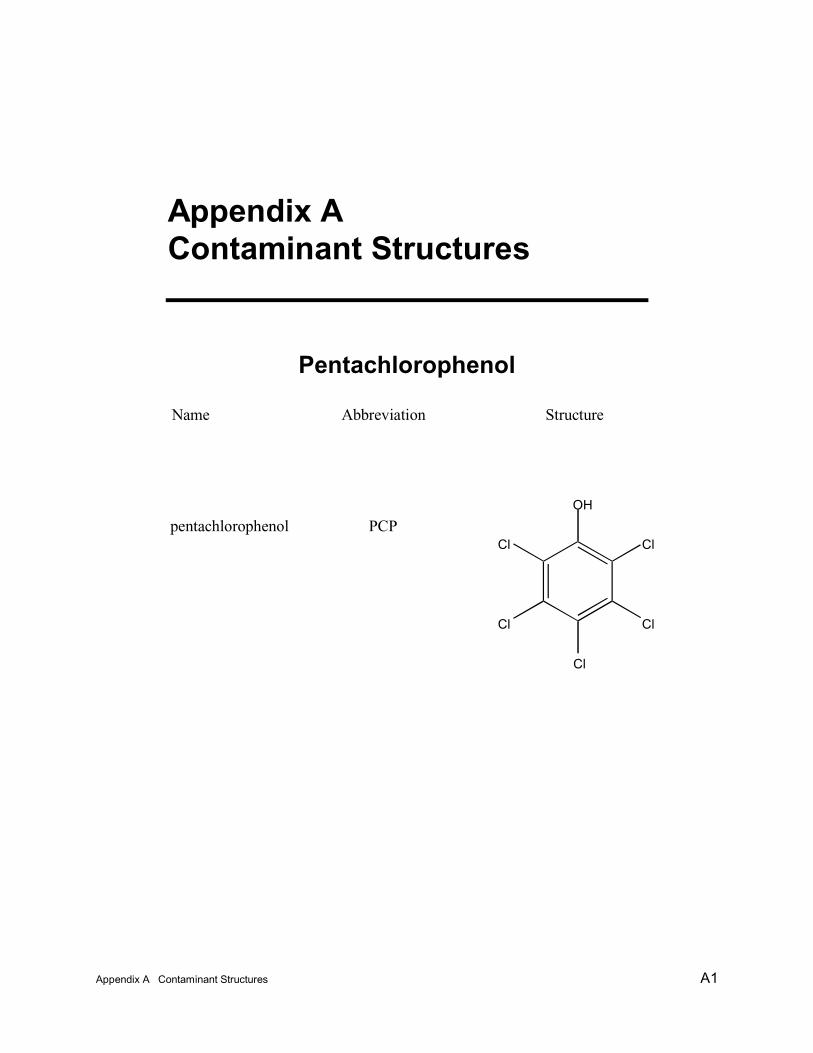
Appendix A Contaminant Structures A1
Appendix AContaminant Structures
Pentachlorophenol
Name Abbreviation Structure
pentachlorophenol PCPOH
Cl
Cl
Cl
Cl
Cl
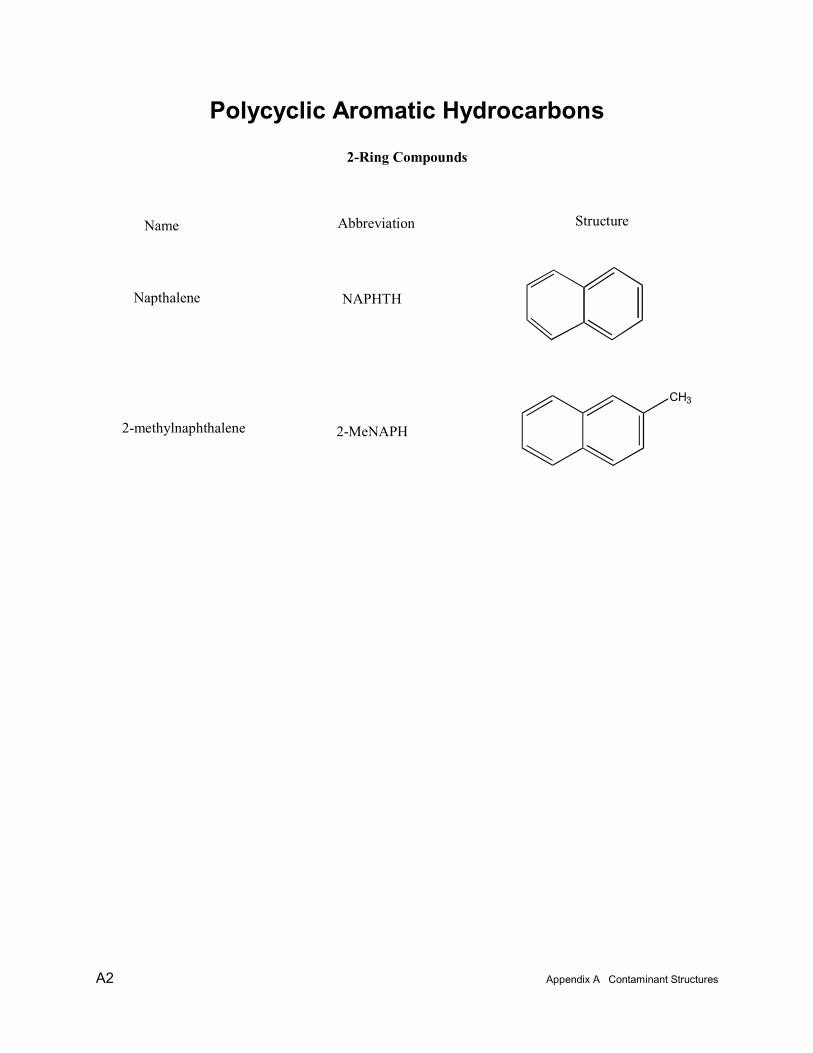
A2 Appendix A Contaminant Structures
Polycyclic Aromatic Hydrocarbons
2-Ring Compounds
Name Abbreviation Structure
Napthalene NAPHTH
2-methylnaphthalene 2-MeNAPH
CH3

Appendix A Contaminant Structures A3
3-Ring Compounds
Acenaphthylene ACENAY
Acenaphthene ACENAP
Fluorene FLUORE
Phenanthrene PHENAN
Anthracene ANTRAC
A4 Appendix A Contaminant Structures
4-Ring Compounds
Name Abbreviation Structure
Benzo(a)anthracene BAANTHR
Fluoranthene FLANTHE
Pyrene PYRENE
Chrysene CHRYSE
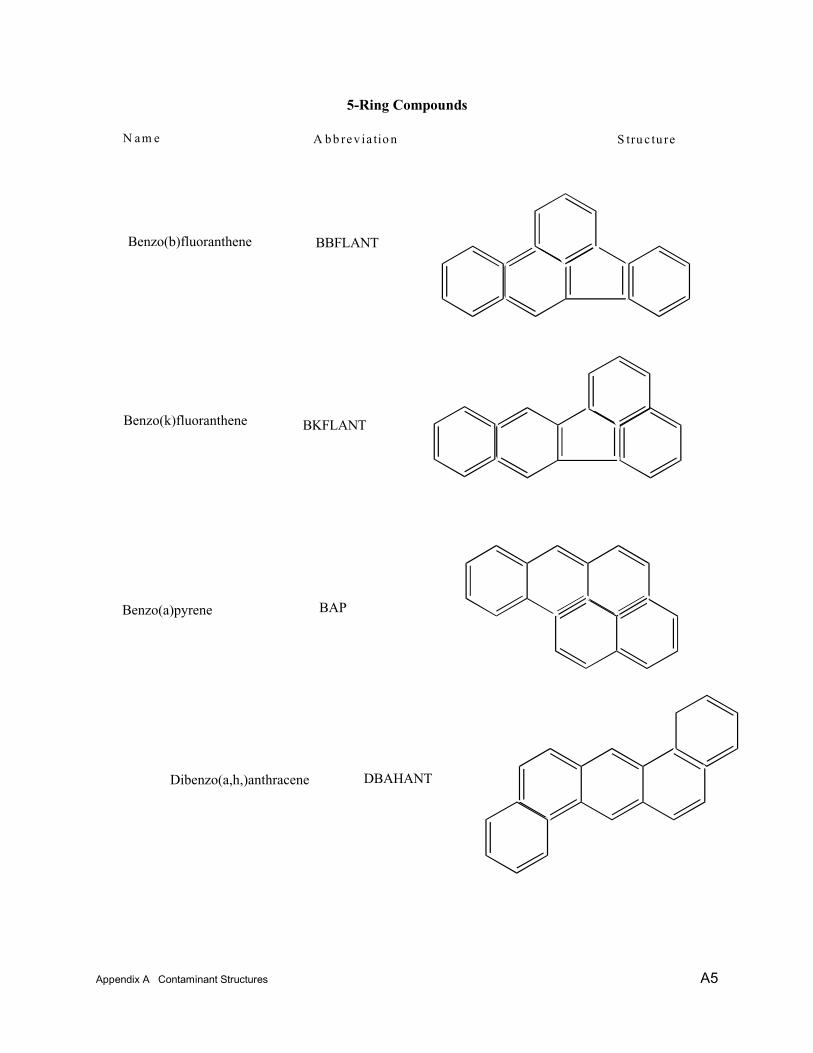
Appendix A Contaminant Structures A5
5-Ring Compounds
N am e A bb rev ia tio n S tru c tu re
Dibenzo(a,h,)anthracene DBAHANT
Benzo(b)fluoranthene BBFLANT
Benzo(k)fluoranthene BKFLANT
Benzo(a)pyrene BAP
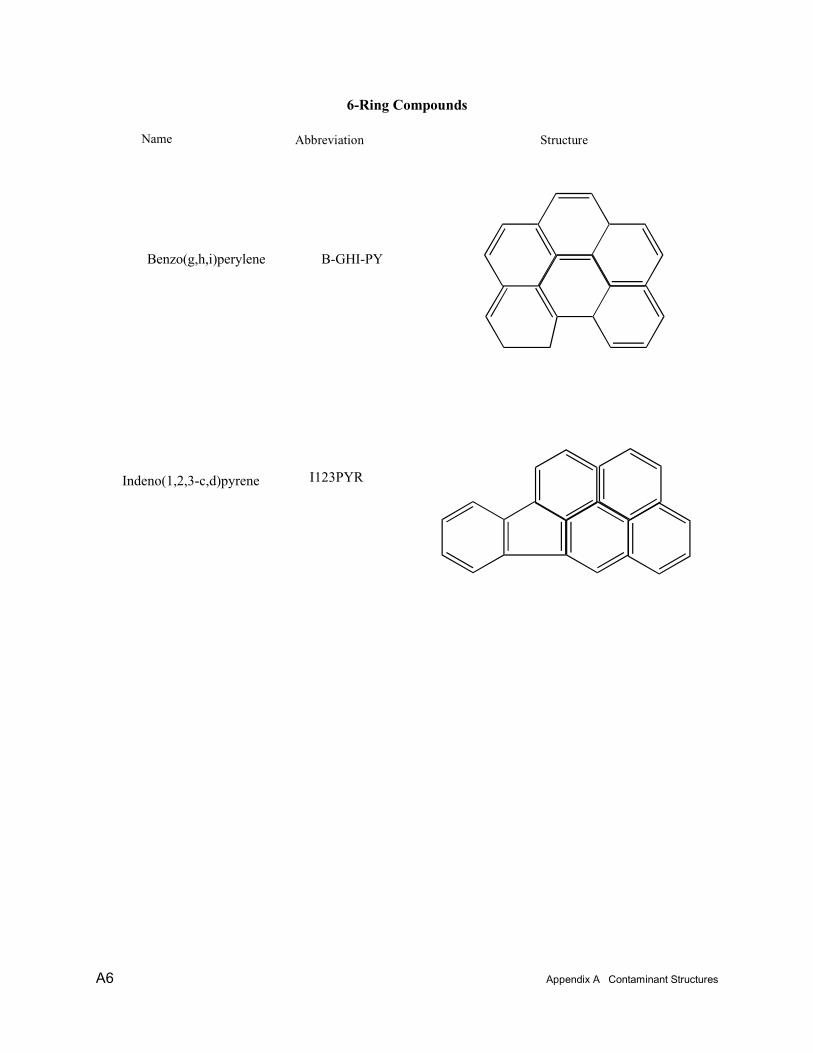
A6 Appendix A Contaminant Structures
6-Ring Compounds
Name Abbreviation Structure
Benzo(g,h,i)perylene B-GHI-PY
Indeno(1,2,3-c,d)pyrene I123PYR
Appendix B LTU Data B1
Appendix BLTU Data

B2 Appendix B LTU Data
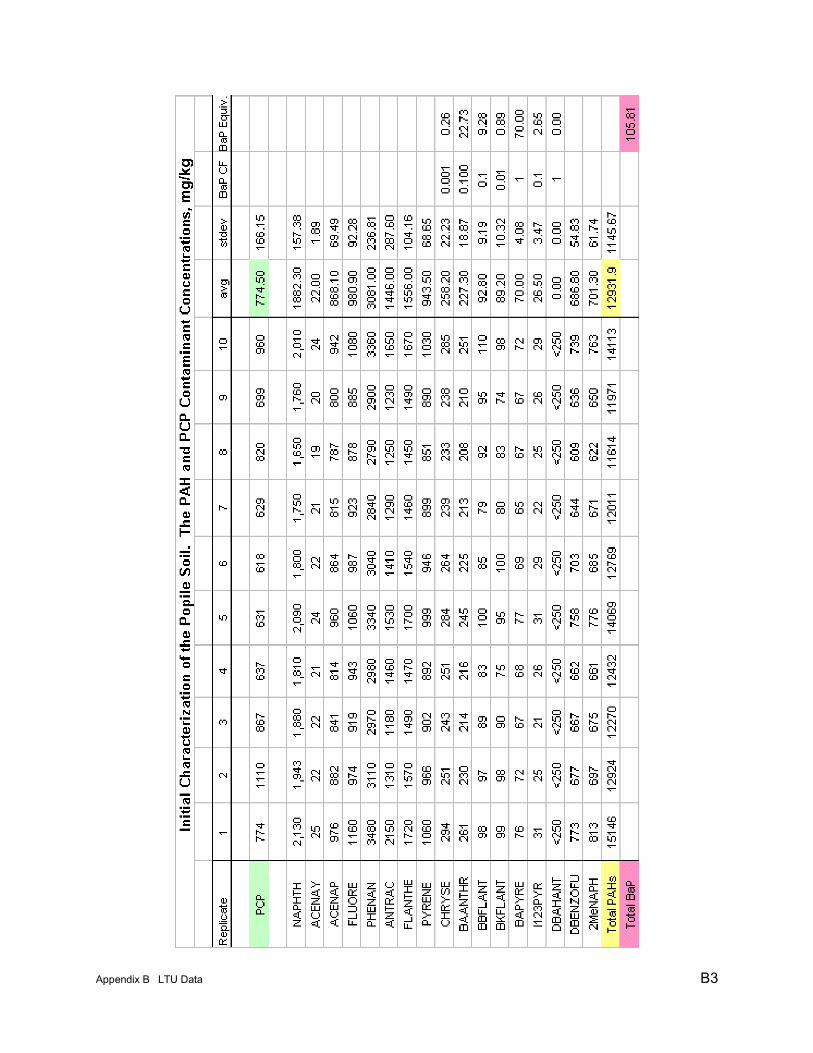
Appendix B LTU Data B3
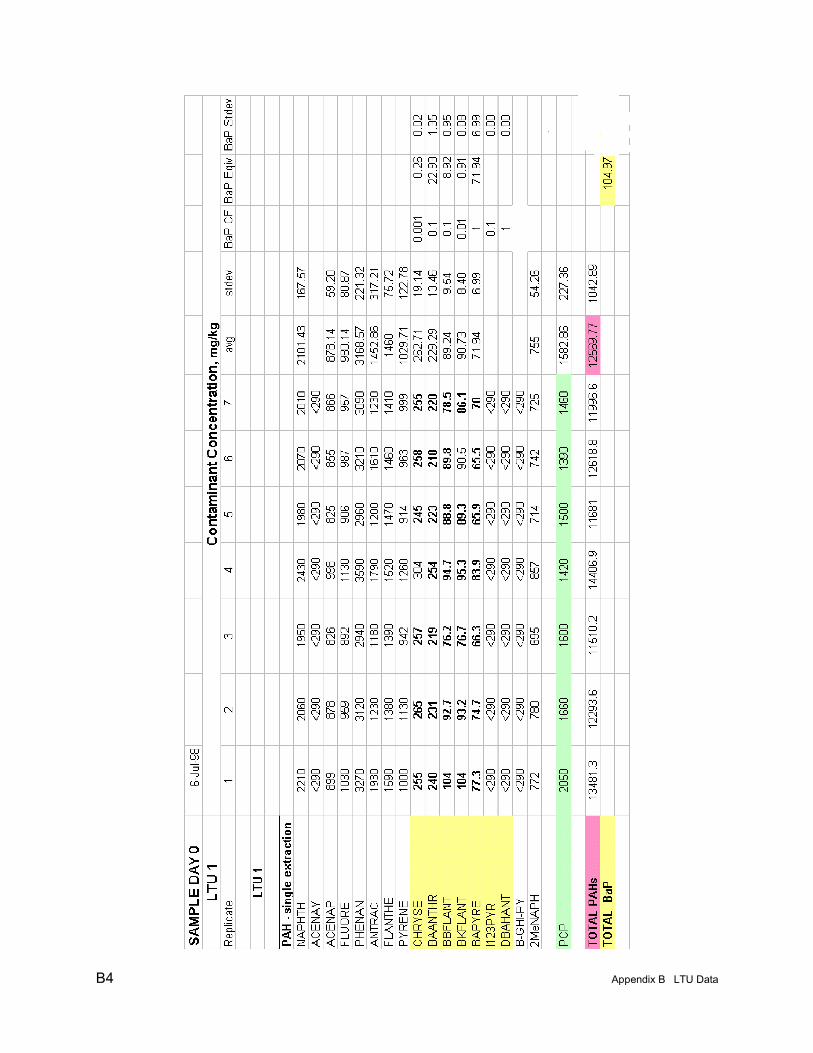
B4 Appendix B LTU Data
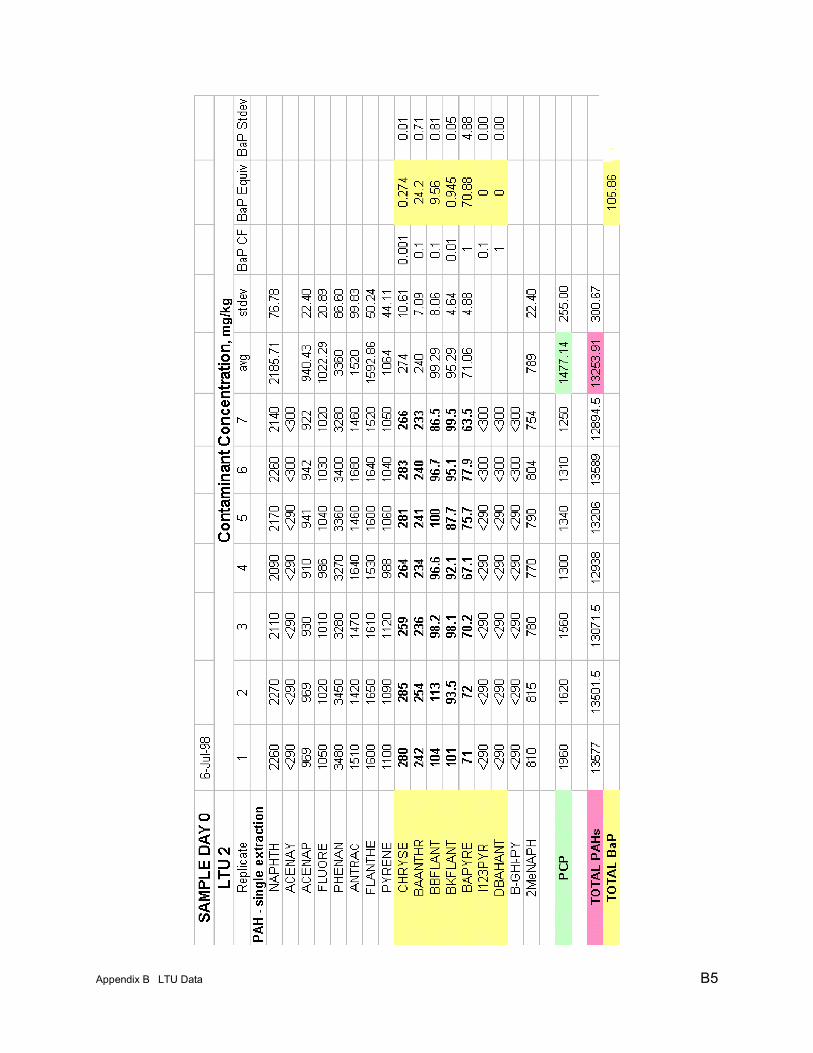
Appendix B LTU Data B5
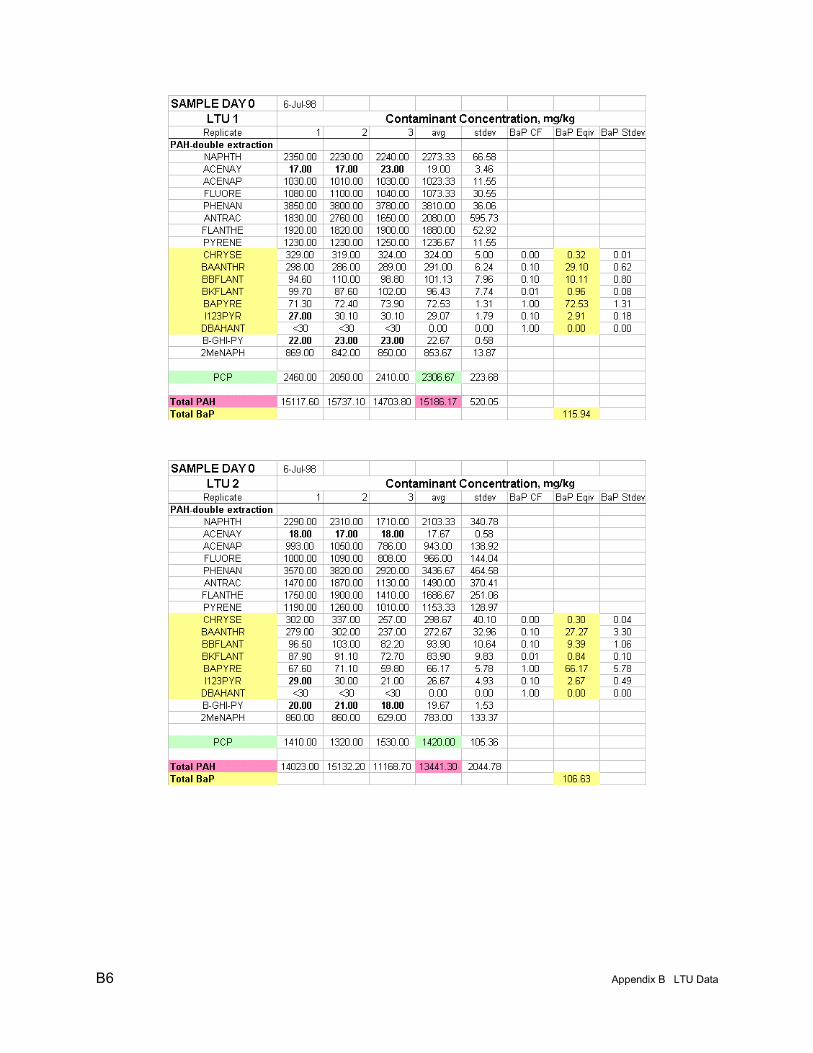
B6 Appendix B LTU Data
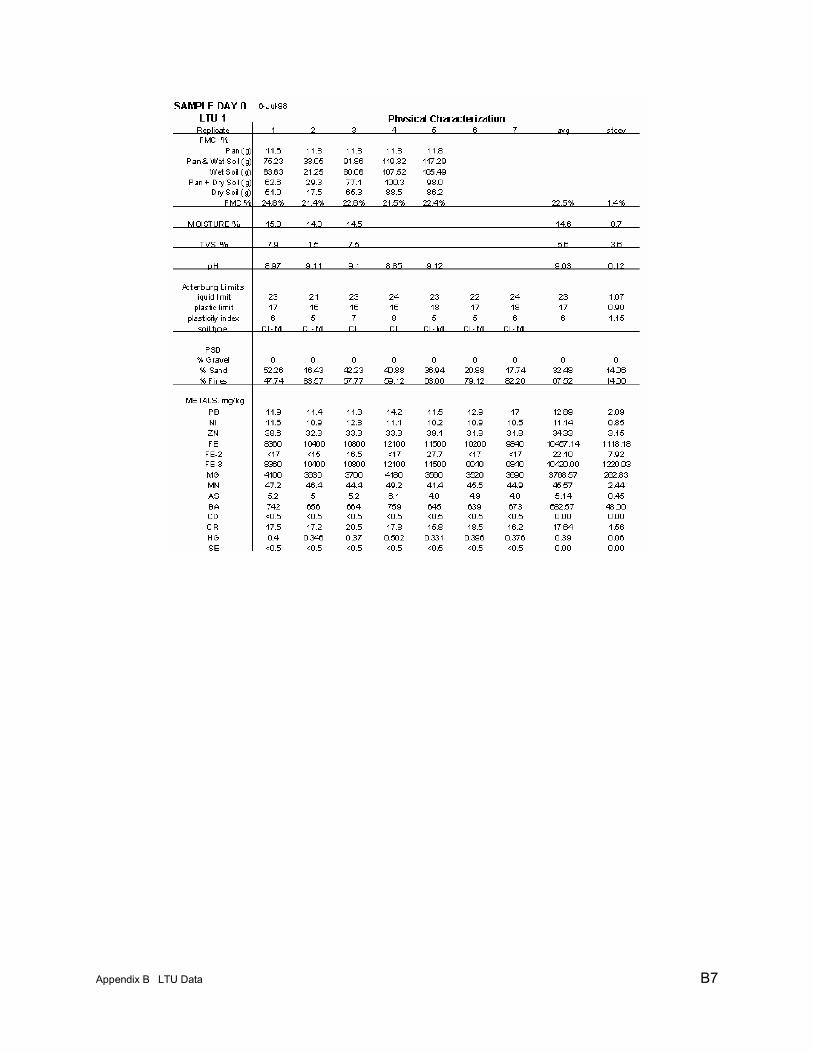
Appendix B LTU Data B7
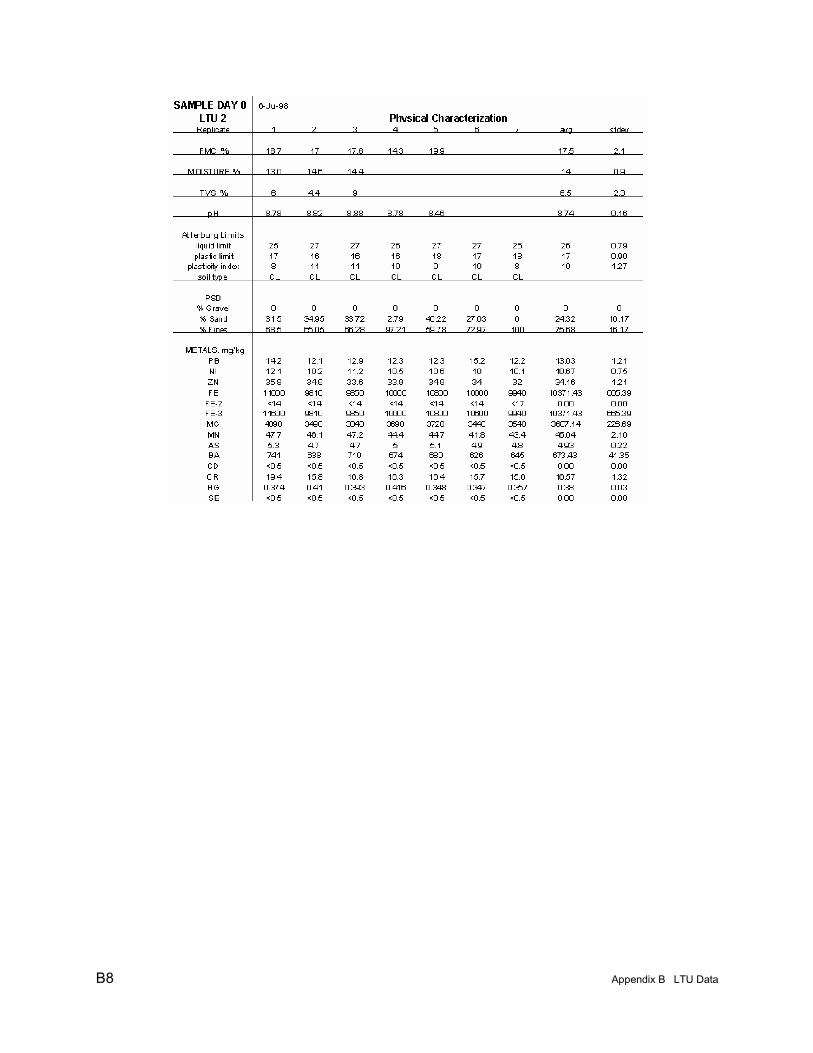
B8 Appendix B LTU Data
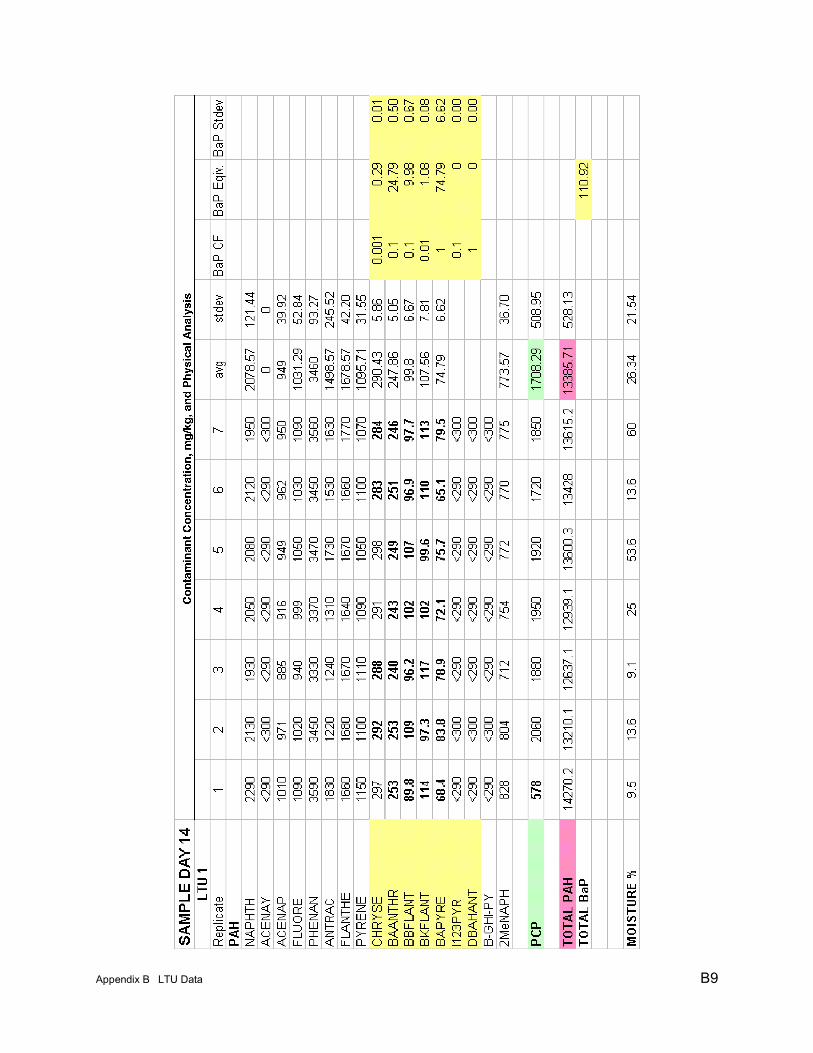
Appendix B LTU Data B9
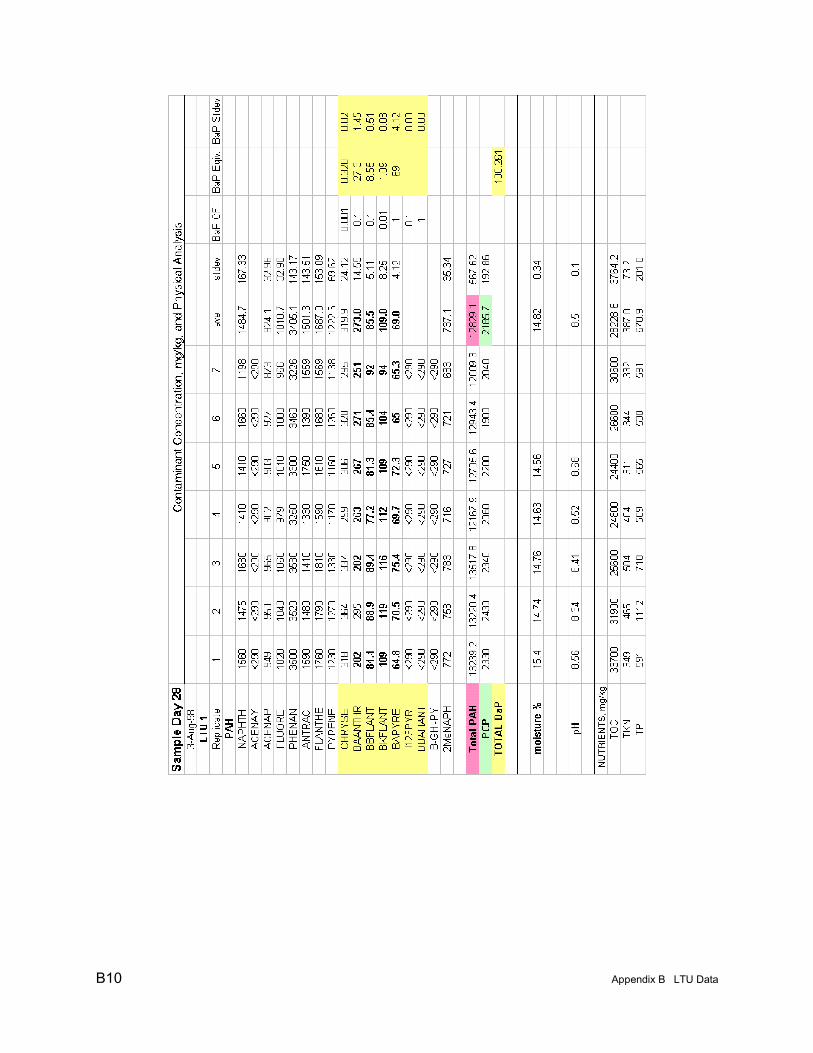
B10 Appendix B LTU Data
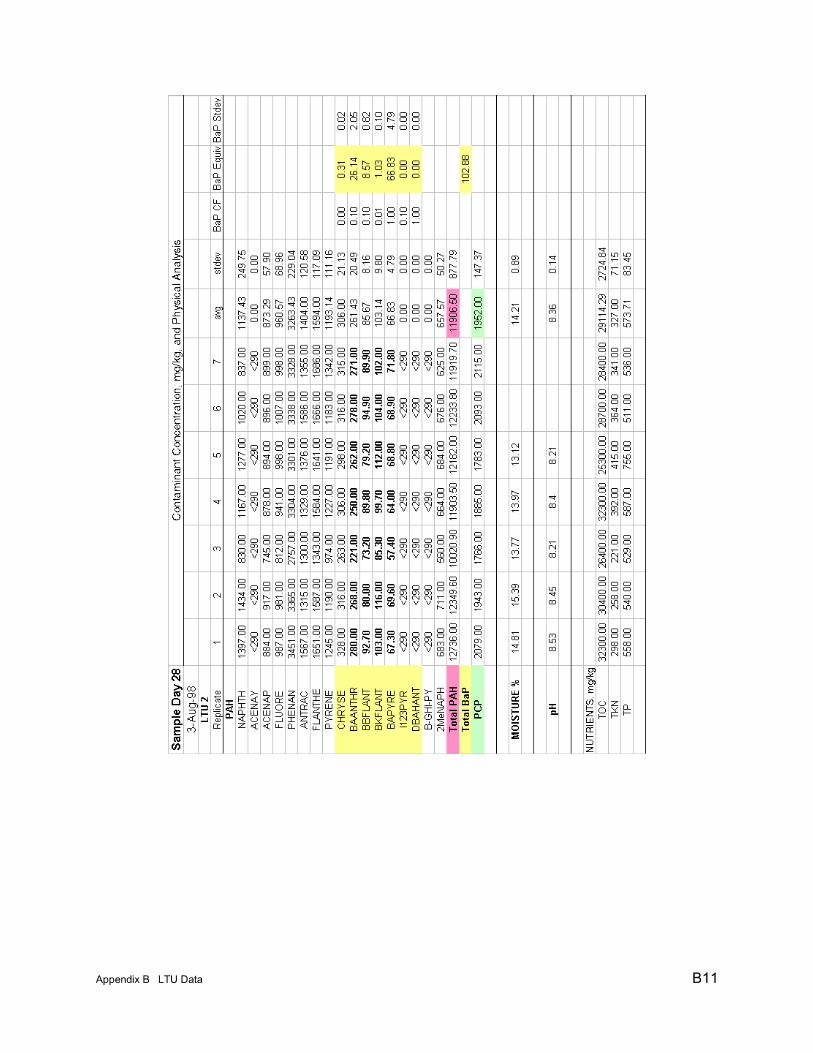
Appendix B LTU Data B11
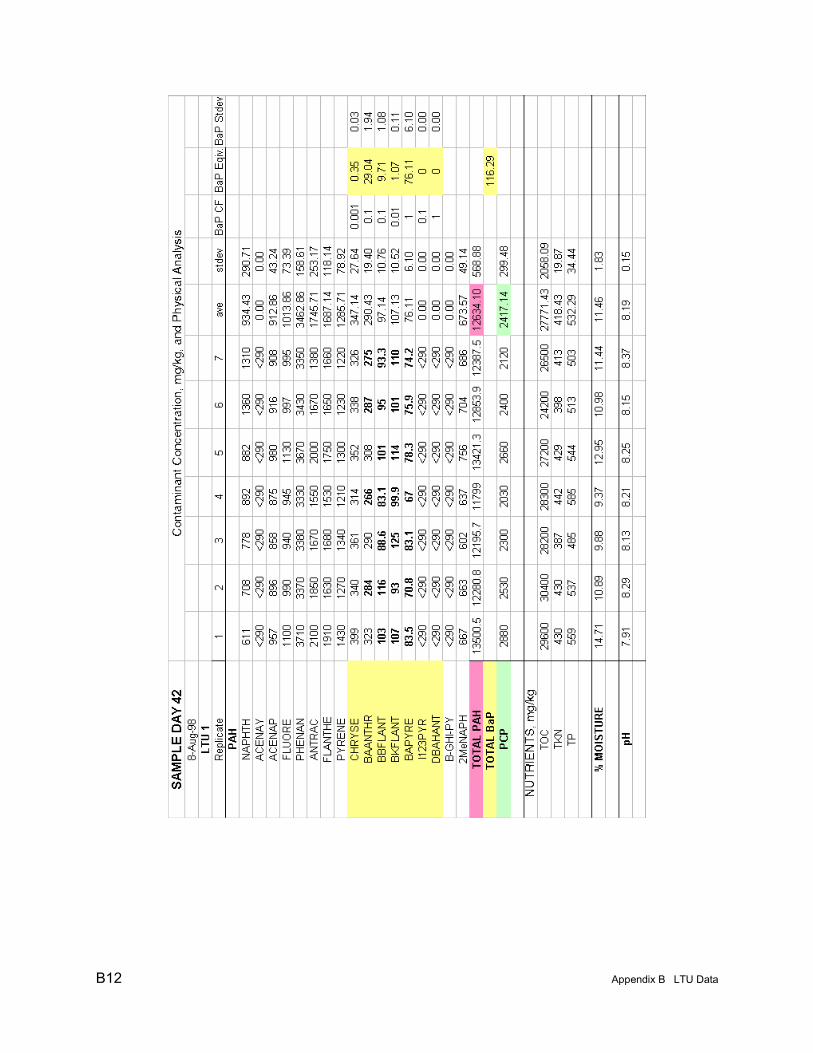
B12 Appendix B LTU Data
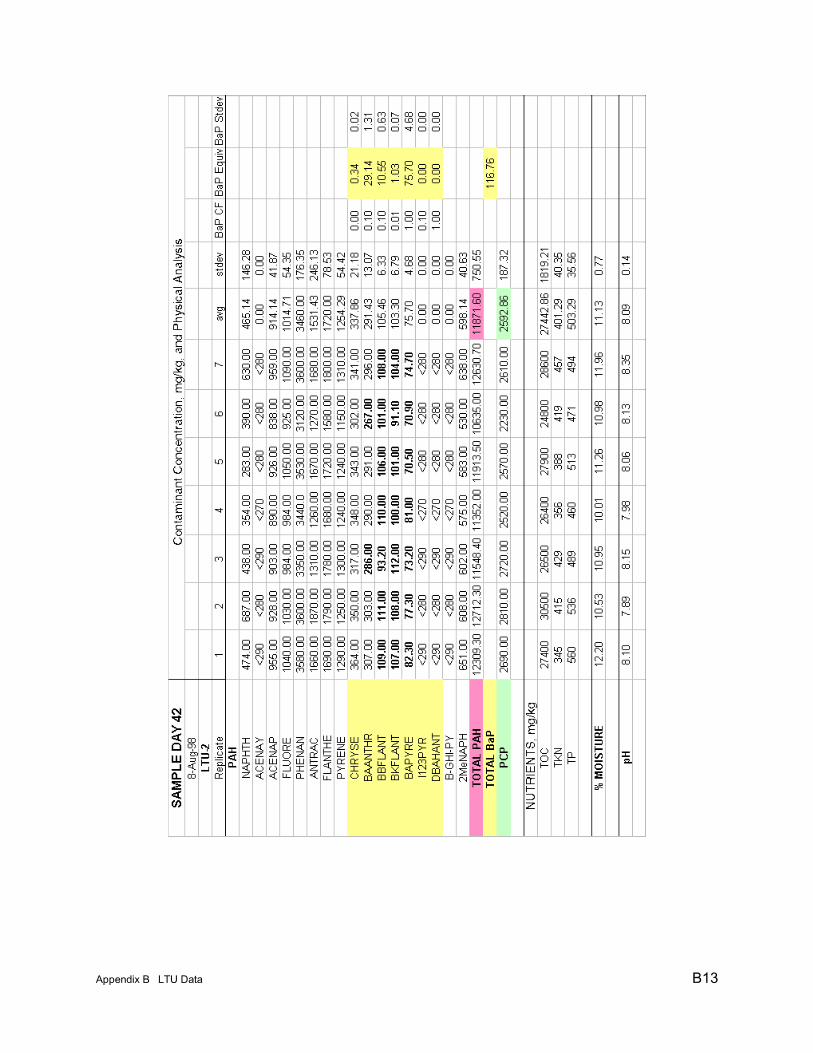
Appendix B LTU Data B13
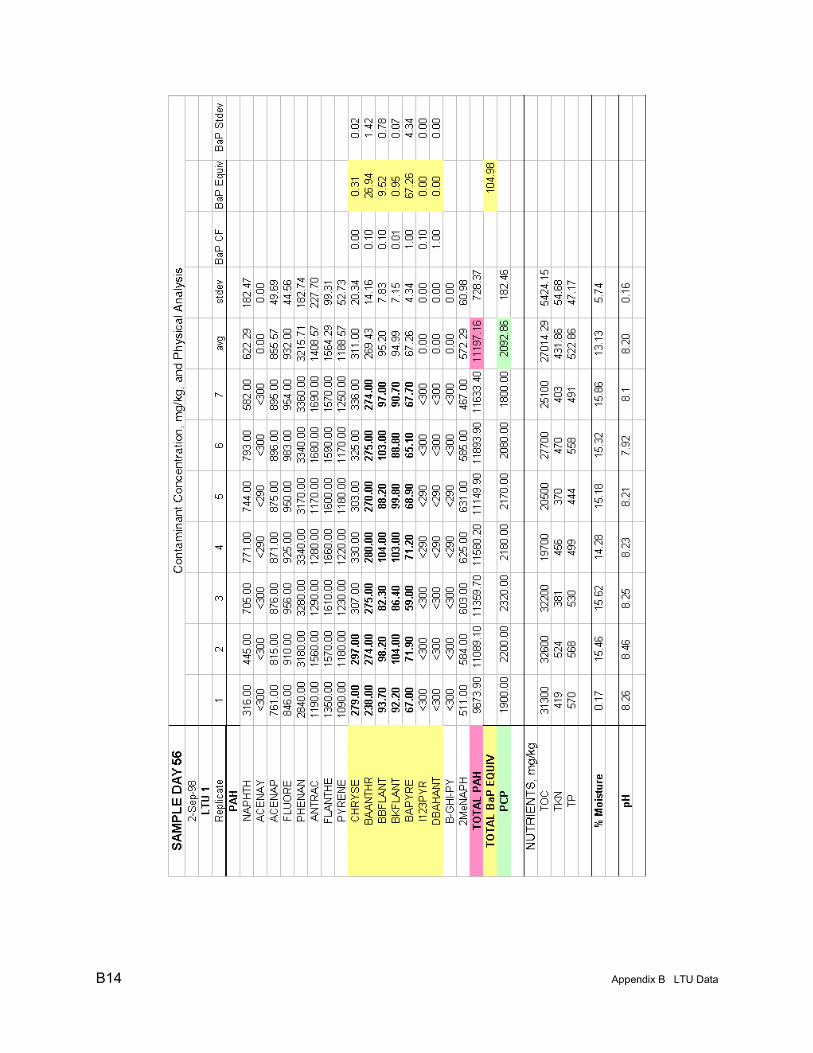
B14 Appendix B LTU Data
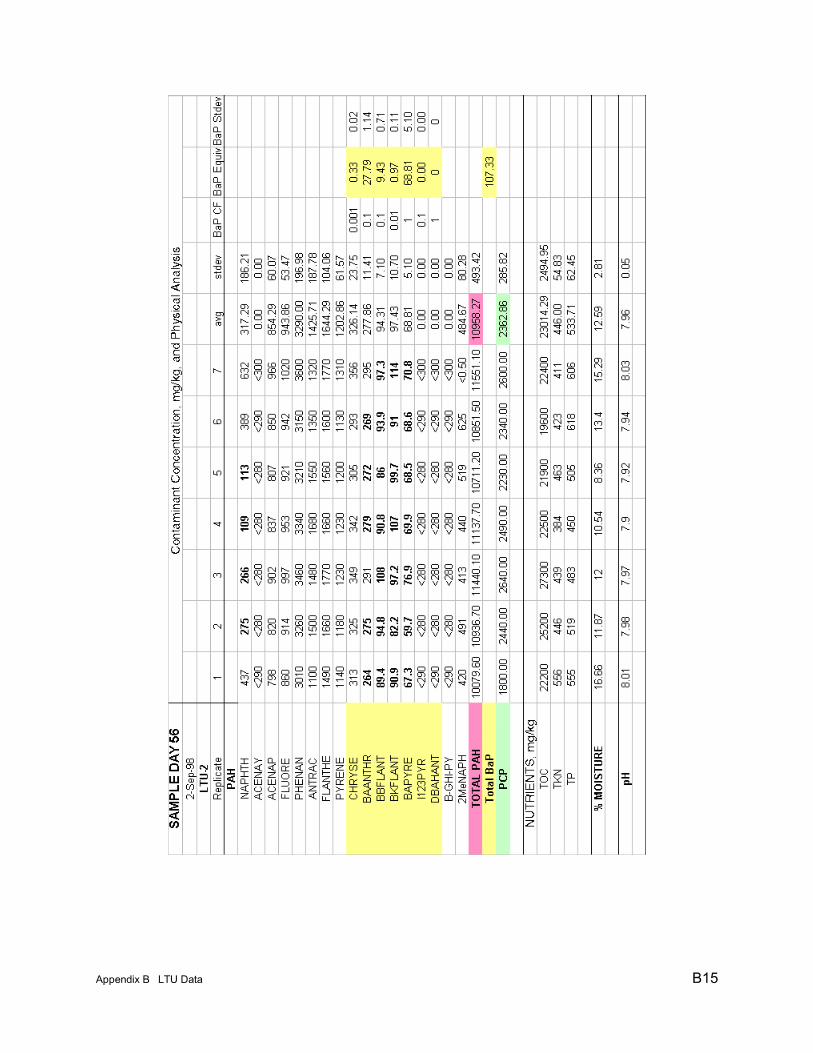
Appendix B LTU Data B15
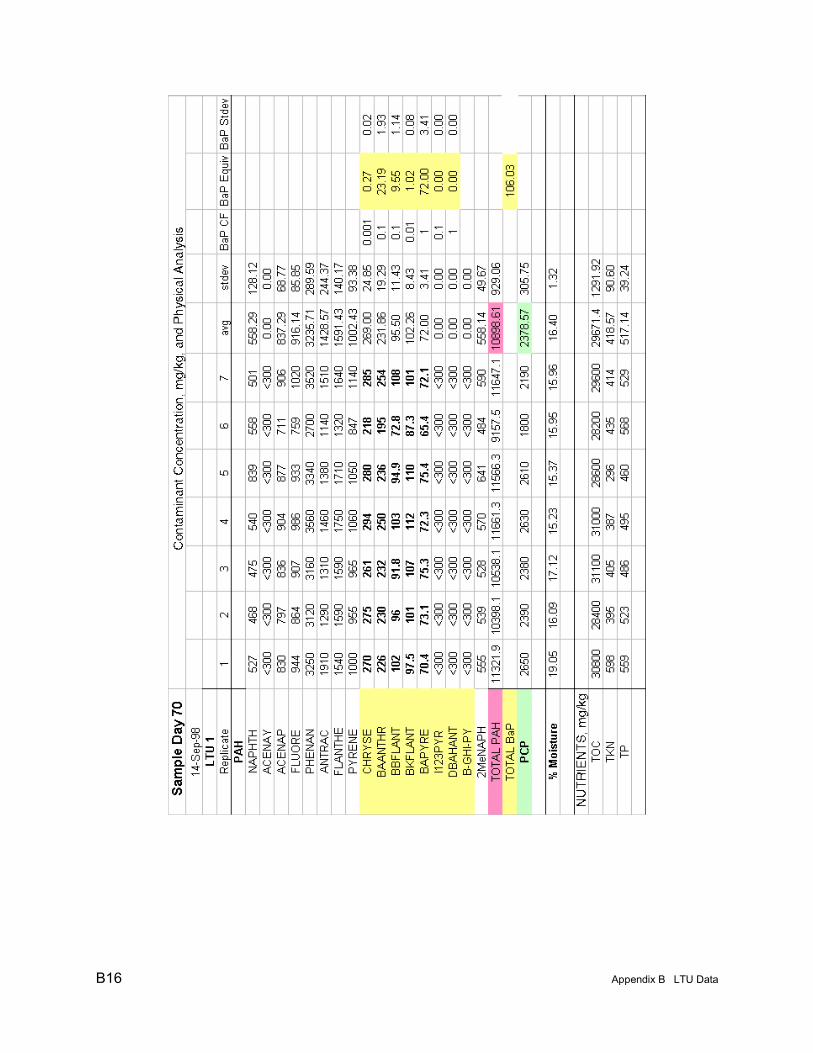
B16 Appendix B LTU Data
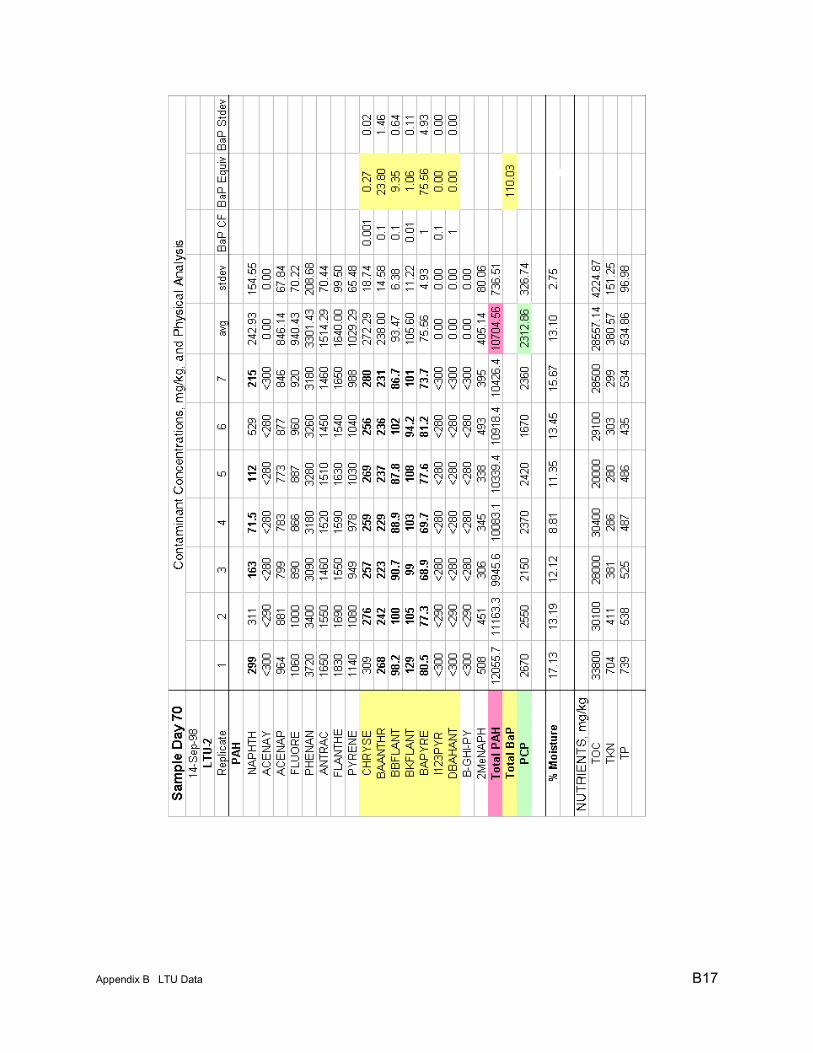
Appendix B LTU Data B17
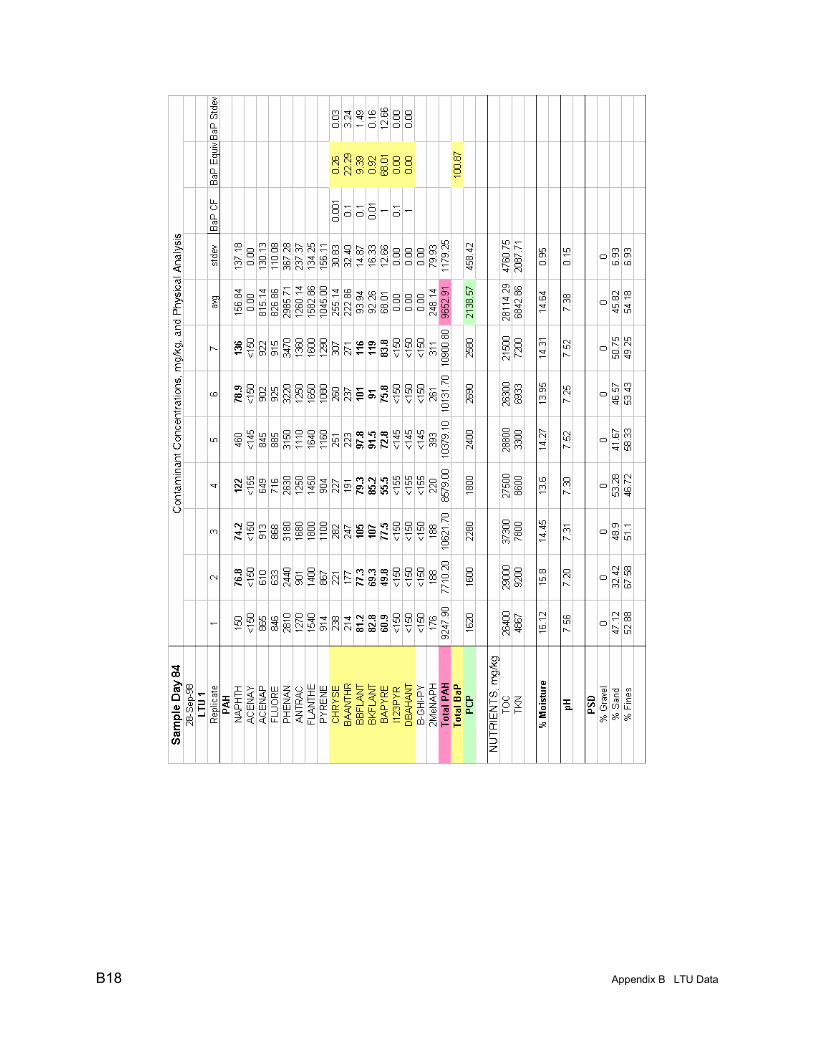
B18 Appendix B LTU Data
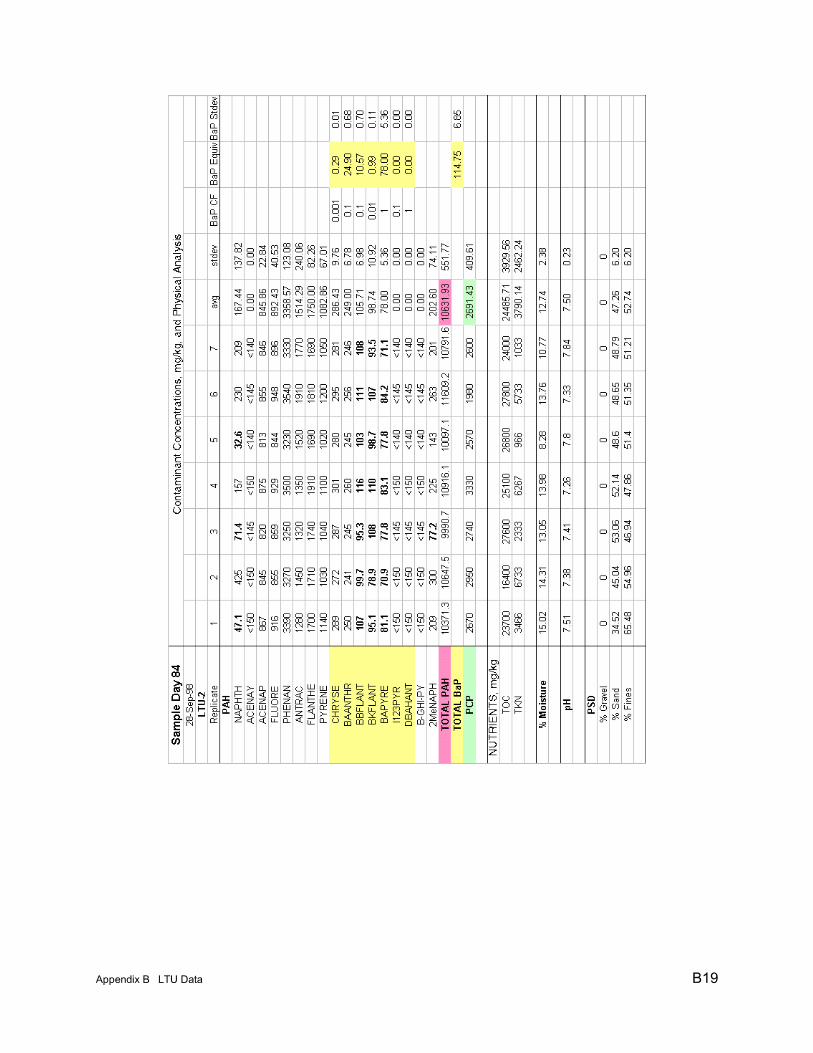
Appendix B LTU Data B19
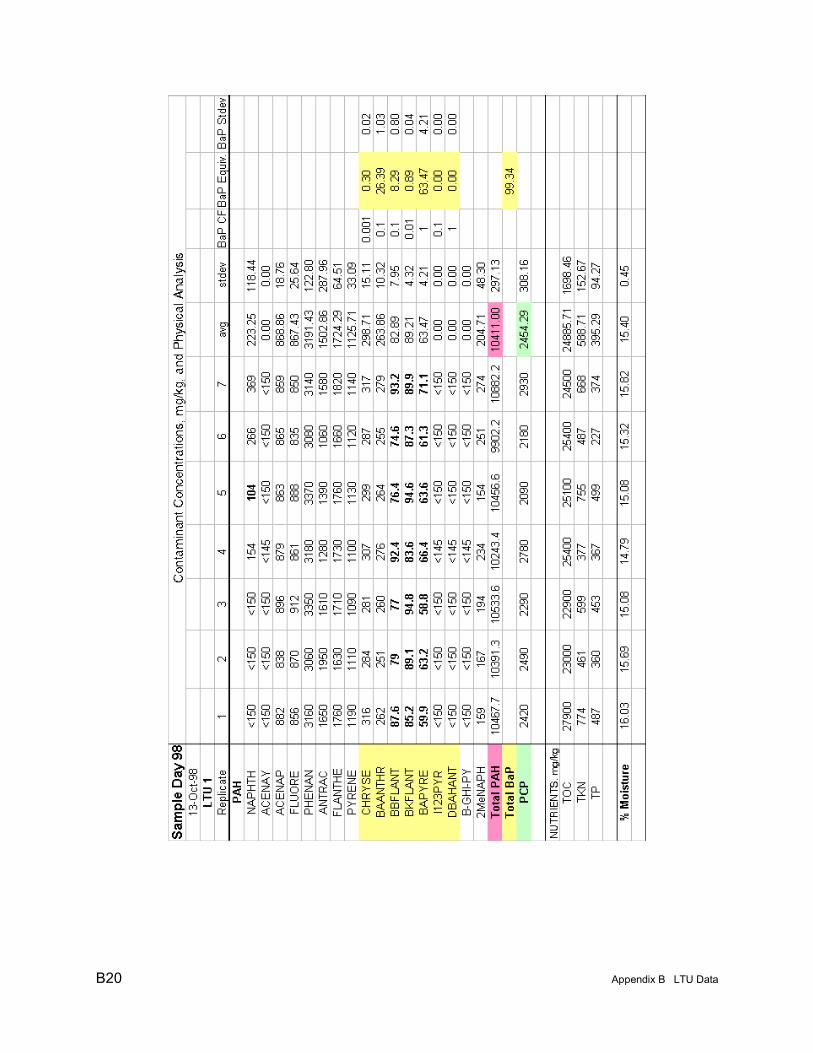
B20 Appendix B LTU Data
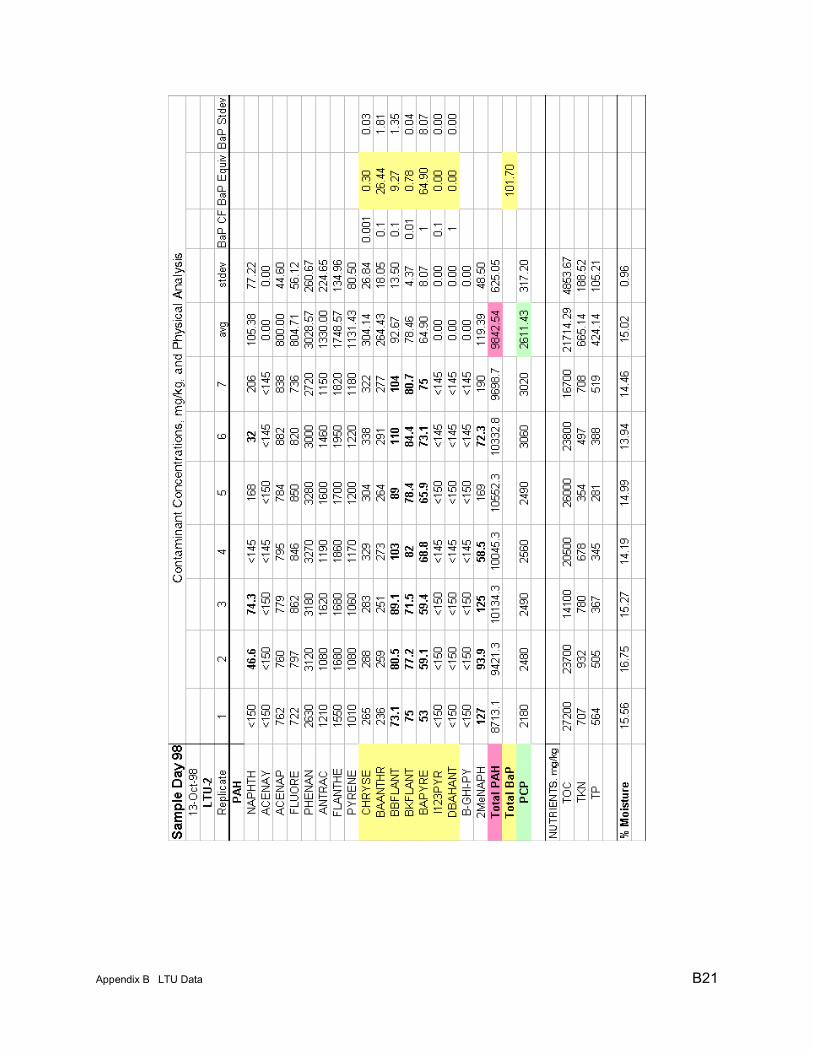
Appendix B LTU Data B21
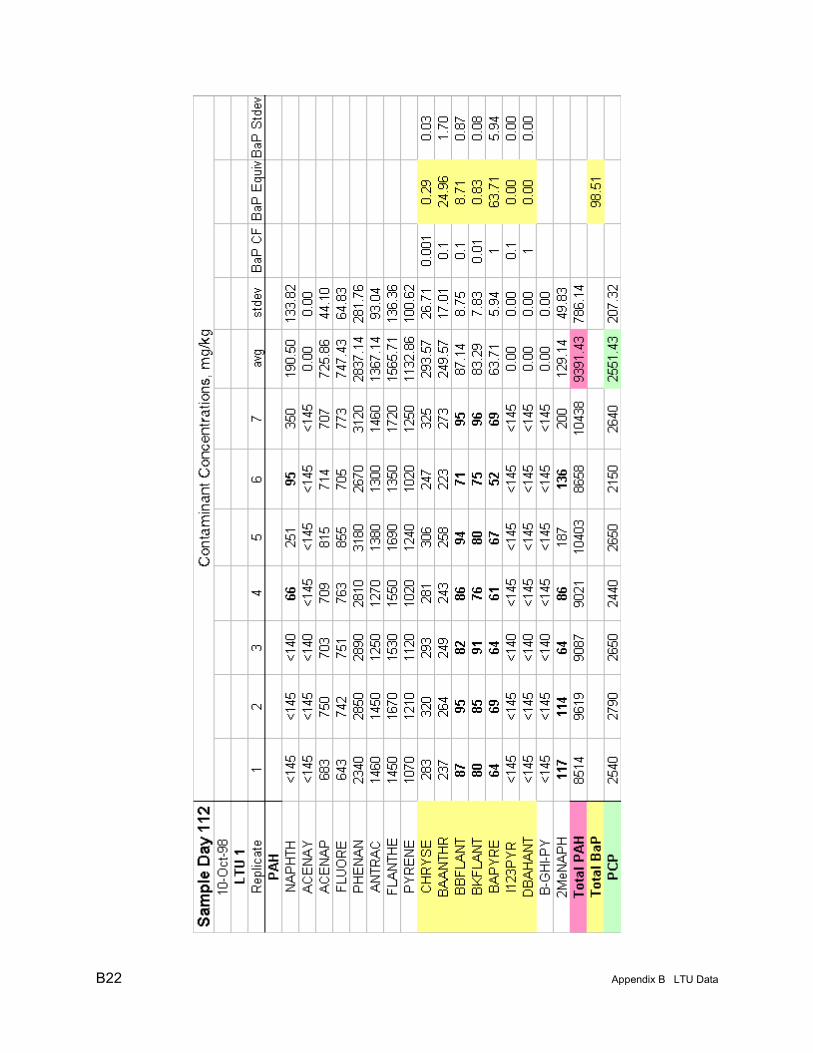
B22 Appendix B LTU Data
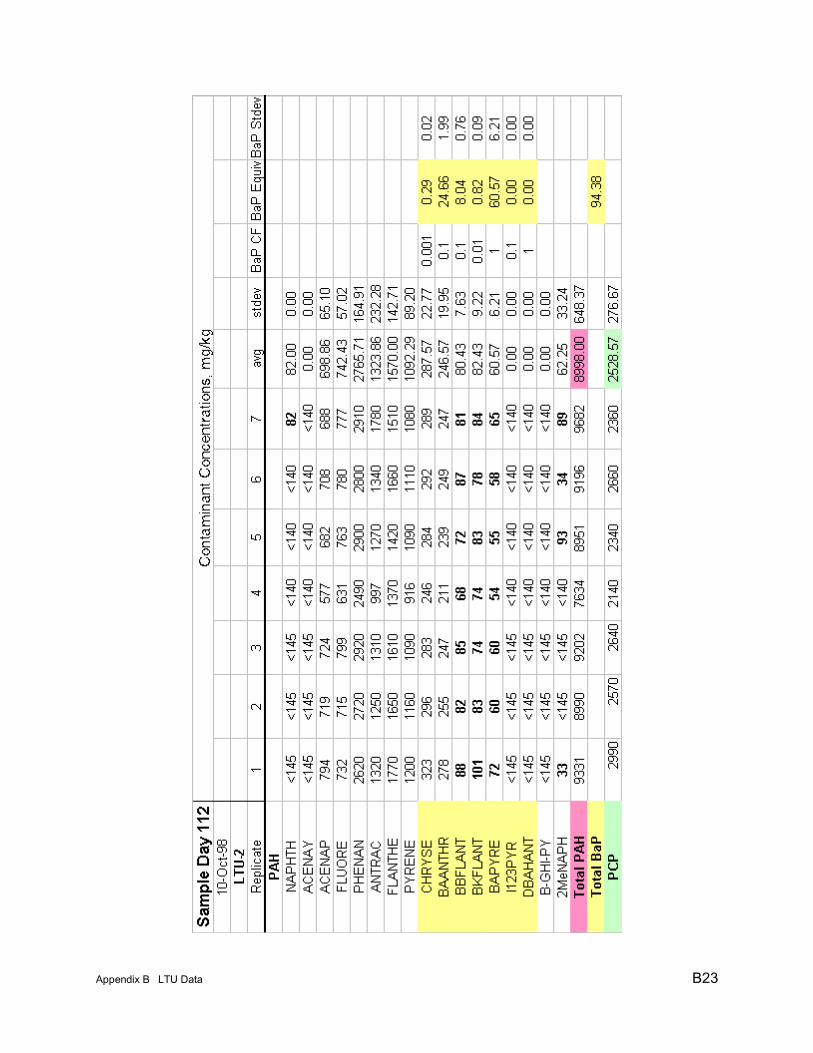
Appendix B LTU Data B23

B24 Appendix B LTU Data
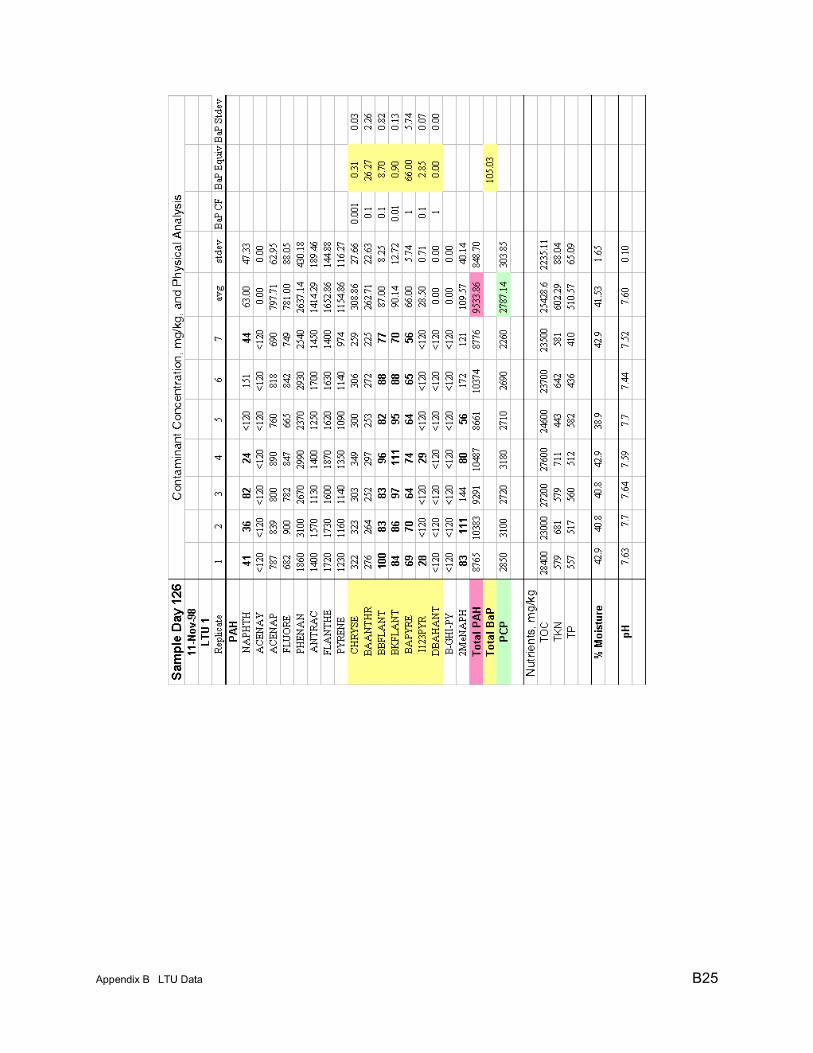
Appendix B LTU Data B25

B26 Appendix B LTU Data
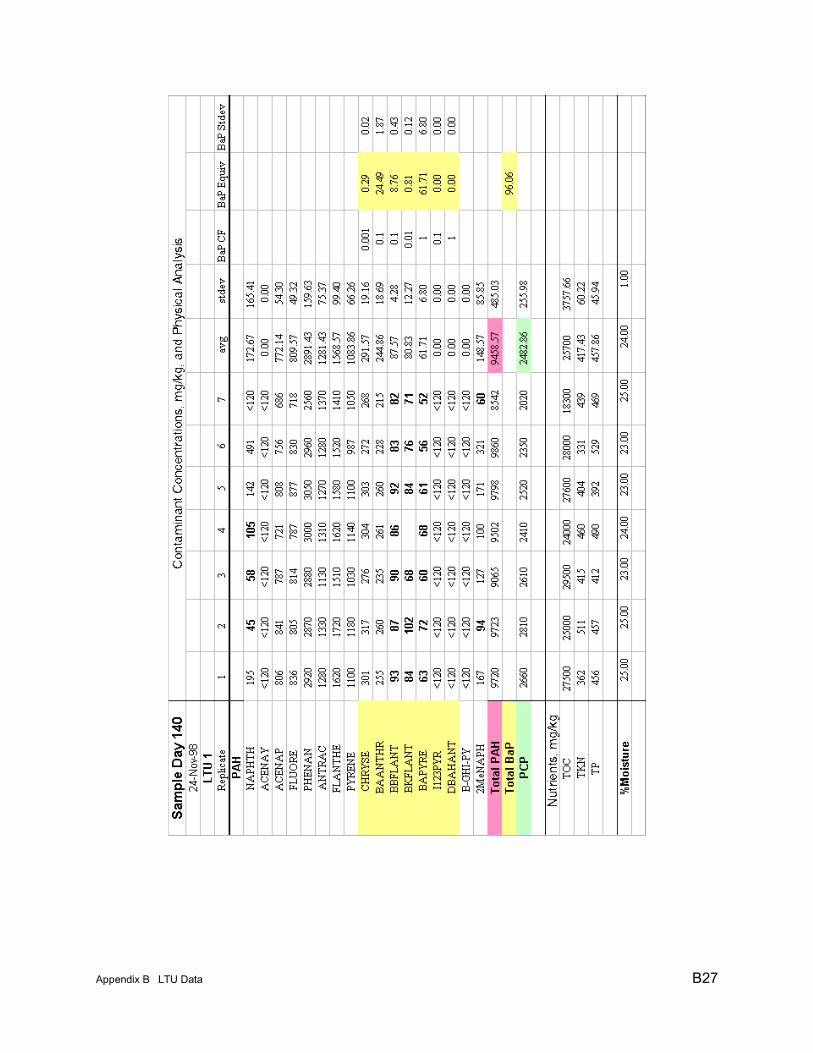
Appendix B LTU Data B27
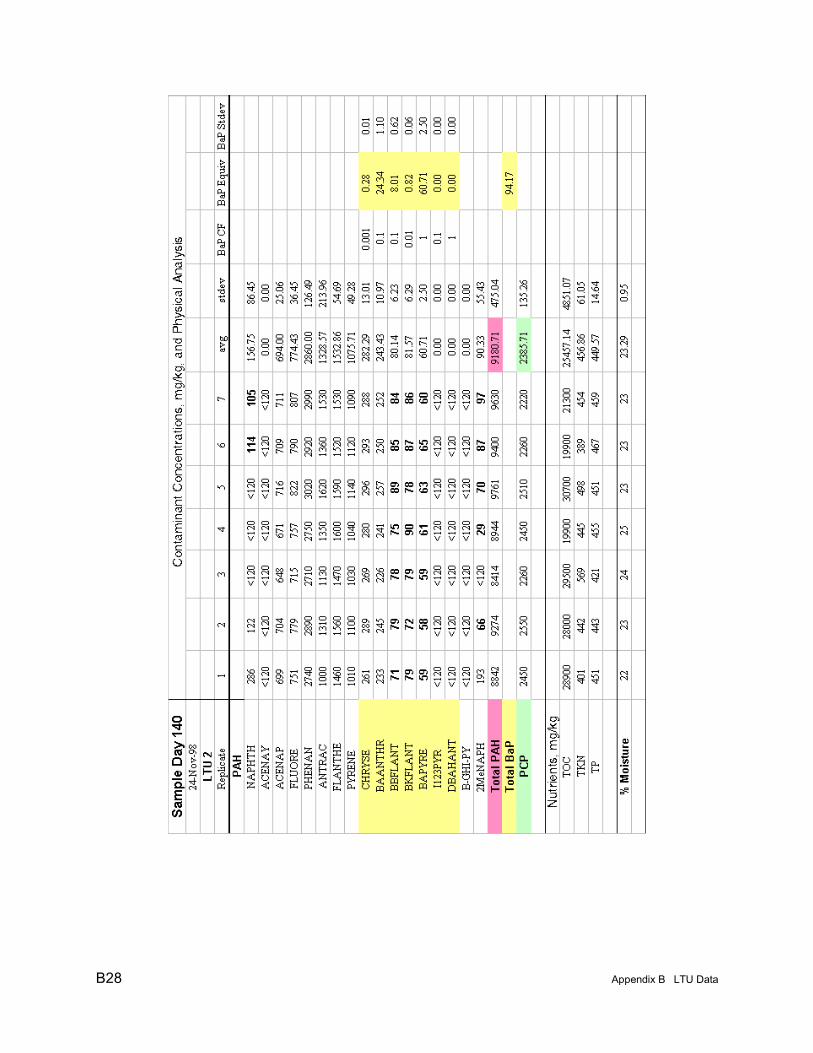
B28 Appendix B LTU Data
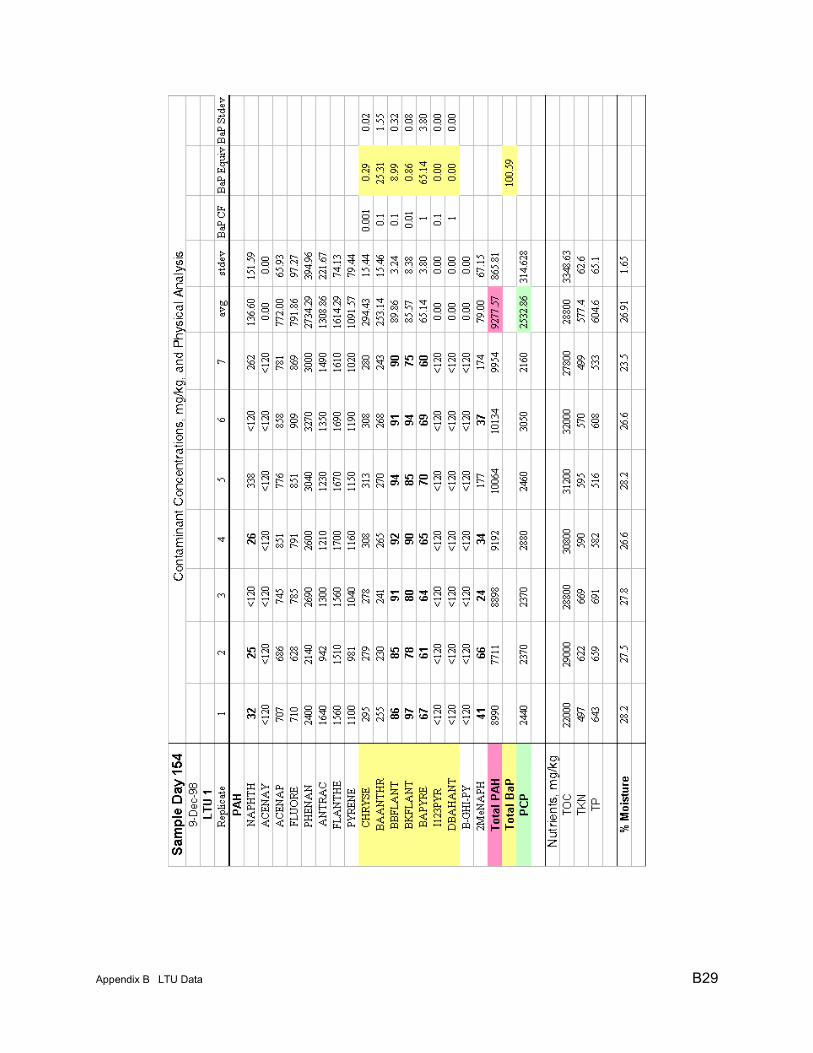
Appendix B LTU Data B29
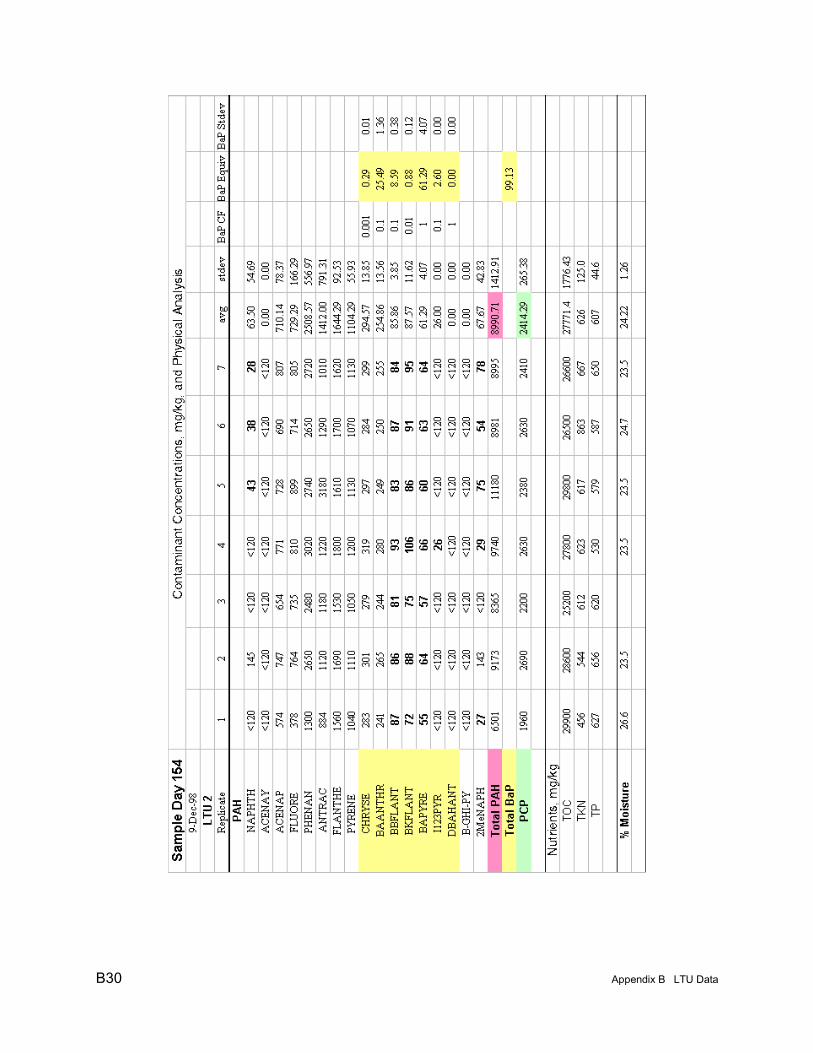
B30 Appendix B LTU Data
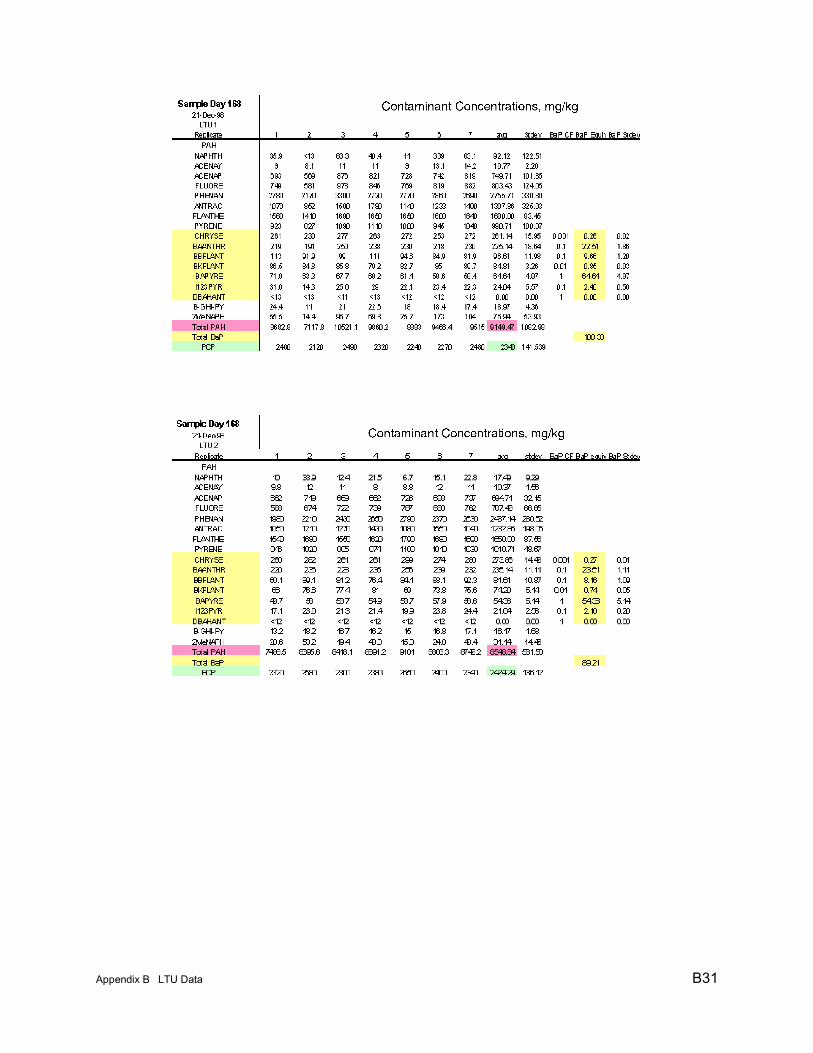
Appendix B LTU Data B31
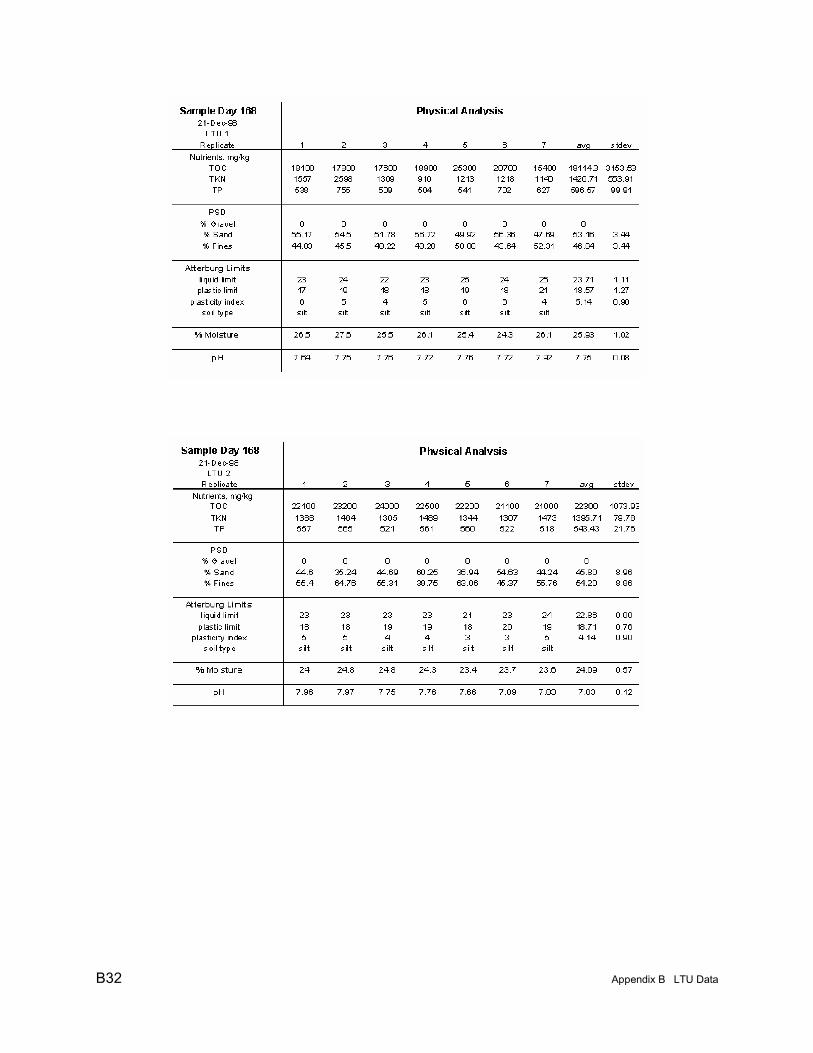
B32 Appendix B LTU Data
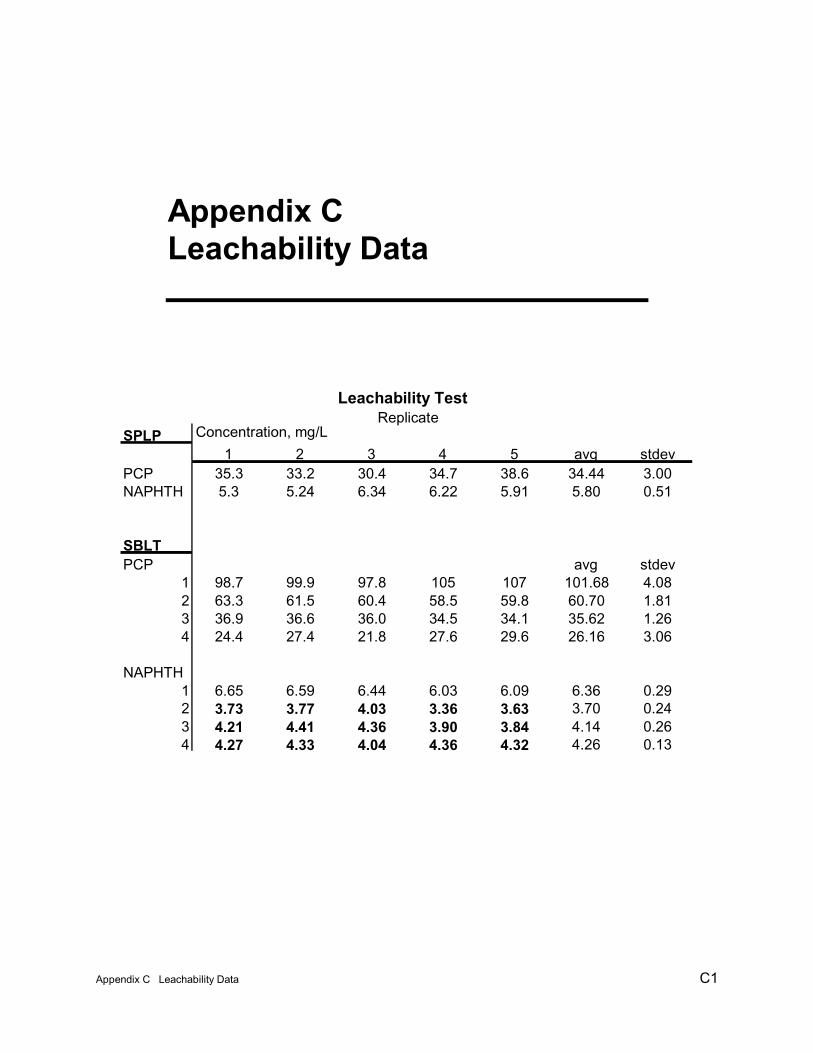
Appendix C Leachability Data C1
Appendix CLeachability Data
SPLP1 2 3 4 5 avg stdev
PCP 35.3 33.2 30.4 34.7 38.6 34.44 3.00NAPHTH 5.3 5.24 6.34 6.22 5.91 5.80 0.51
SBLTPCP avg stdev
1 98.7 99.9 97.8 105 107 101.68 4.082 63.3 61.5 60.4 58.5 59.8 60.70 1.813 36.9 36.6 36.0 34.5 34.1 35.62 1.264 24.4 27.4 21.8 27.6 29.6 26.16 3.06
NAPHTH1 6.65 6.59 6.44 6.03 6.09 6.36 0.292 3.73 3.77 4.03 3.36 3.63 3.70 0.243 4.21 4.41 4.36 3.90 3.84 4.14 0.264 4.27 4.33 4.04 4.36 4.32 4.26 0.13
Leachability TestReplicate
Concentration, mg/L
REPORT DOCUMENTATION PAGEForm Approved
OMB No. 0704-0188Public reporting burden for this collection of information is estimated to average 1 hour per response, including the time for reviewing instructions, searching existing data sources, gathering and maintaining thedata needed, and completing and reviewing this collection of information. Send comments regarding this burden estimate or any other aspect of this collection of information, including suggestions for reducingthis burden to Department of Defense, Washington Headquarters Services, Directorate for Information Operations and Reports (0704-0188), 1215 Jefferson Davis Highway, Suite 1204, Arlington, VA 22202-4302. Respondents should be aware that notwithstanding any other provision of law, no person shall be subject to any penalty for failing to comply with a collection of information if it does not display a currentlyvalid OMB control number. PLEASE DO NOT RETURN YOUR FORM TO THE ABOVE ADDRESS.
1. REPORT DATE (DD-MM-YYYY) September 2000
2. REPORT TYPE Final report
3. DATES COVERED (From - To)
5a. CONTRACT NUMBER
5b. GRANT NUMBER
4. TITLE AND SUBTITLE Bioremediation Treatability Study for Remedial Action at Popile, Inc., Site, El Dorado, Arkansas; Phase II. Pilot-Scale Evaluation
5c. PROGRAM ELEMENT NUMBER
6. AUTHOR(S) Lance Hansen, Catherine Nestler, Michael Channell, David Ringelberg, Herb Fredrickson
5d. PROJECT NUMBER
Scott Waisner 5e. TASK NUMBER
5f. WORK UNIT NUMBER
7. PERFORMING ORGANIZATION NAME(S) AND ADDRESS(ES) 8. PERFORMING ORGANIZATION REPORT NUMBER
U.S. Army Engineer Research and Development Center Environmental Laboratory 3909 Halls Ferry Road Vicksburg, MS 39180-6199
ERDC/EL TR-00-13
9. SPONSORING / MONITORING AGENCY NAME(S) AND ADDRESS(ES) 10. SPONSOR/MONITOR’S ACRONYM(S) U.S. Army Engineer District, New Orleans The Foot of Prytania Street New Orleans, LA 70160 11. SPONSOR/MONITOR’S REPORT
NUMBER(S)
12. DISTRIBUTION / AVAILABILITY STATEMENT
Approved for public release, distribution unlimited.
13. SUPPLEMENTARY NOTES
14. ABSTRACT A pilot-scale study of traditional landfarming techniques was conducted to evaluate the treatment requirements directed in theComprehensive Environmental Remediation Compensation and Liability Act (CERCLA) Record of Decision (ROD) from EPA Region 6for this site. The study was conducted to: (a) determine if treatment goals specified in the ROD were achievable for site soils (5-ppmbenzo(a)pyrene [BaP] equivalents and 3-ppm pentachlorophenol [PCP]; (b) evaluate contaminant degradation kinetics; and (c) evaluateleaching potential of treated soil. Initial soil characterization (physical, chemical, biological) indicated a clay/silt soil (based on Atterberg limits and particle sizedistribution) with high contamination (polycyclic aromatic hydrocarbons [PAH] ≅ 13,000 ppm, PCP ≅ 775 ppm, BaP eq ≅ 105 ppm), andan indigenous biological community (approximately 107 cells/g as determined by ester linked polar lipid fatty acid (PLFA) analysis).Intermittently scheduled experimental analysis included contaminant concentration, nutrient concentration, pH, moisture, in situ respiration,and microbial community/biomass analysis.
(continued)15. SUBJECT TERMS Bioremediation, CERCLA Remediation, Creosote, Landfarming, PAH, PCP, Pentachlorophenol, Polycyclic aromatic hydrocarbons, Super fund site, Wood treatment facility16. SECURITY CLASSIFICATION OF: 17. LIMITATION
OF ABSTRACT18. NUMBEROF PAGES
19a. NAME OF RESPONSIBLE PERSON
a. REPORT
UNCLASSIFIED
b. ABSTRACT
UNCLASSIFIED
c. THIS PAGE
8819b. TELEPHONE NUMBER (include areacode)
Standard Form 298 (Rev. 8-98)Prescribed by ANSI Std. 239.18

14. ABSTRACT (Concluded)
The pilot-scale site consisted of a modified RCRA secondary containment system that contained two, 3-cu yd land-treatment units(LTUs) designed to simulate field conditions. LTU 1 was cultivated on an oxygen-dependent basis. LTU 2 was cultivated on a fixedschedule. Soil moisture was maintained between 50% and 80% of field moisture capacity. A novel in situ respiration analysistechnique was developed using a custom fabricated dry well and an in-line O2, CO2, CH4 analyzer to evaluate aerobic biologicalactivity. Before and after treatment leachability analyses were conducted using the Sequential Batch Leachate Test (SBLT) and theSynthetic Precipitate Leaching Procedure (SPLP) to evaluate the groundwater implications of the underlying aquifer when the treatedmaterial is placed back onsite. Using a zero-order degradation model, contaminant analysis indicated that BaP treatement goals could be met in 9.6 years for LTU1 and 2.7 years for LTU 2. PCP was not degraded appreciably in either LTU. Respiration analysis, coupled with statisticallysignificant reduction in heavy PAHs (4-, 5-, and 6-ring), demonstrated significant biological activity even at the unusually highcontaminant concentrations observed. PLFA analysis showed continuous increase in biomass and divergence of communitycomposition between LTU 1 and LTU 2. LTU 2 showed an increase in the relative percentage of gram negative bacteria. Pre- andpostleachability analysis indicates that the treated material will not serve as a source of groundwater contamination if placed backonsite.