Draft Remedial Investigation Report for OU8, April 2012
127
April 2012 Operable Unit 8 Libby Asbestos National Priorities List Site Libby, Montana DRAFT Remedial Investigation Report
-
Upload
khangminh22 -
Category
Documents
-
view
1 -
download
0
Transcript of Draft Remedial Investigation Report for OU8, April 2012
9” 8.5”
Ap
ril 2
01
2
Operable Unit 8 Libby Asbestos National Priorities List Site
Libby, Montana DRAFT Remedial Investigation Report
DRAFT Remedial Investigation Report
Operable Unit 8 Local and State Highways in Libby and Troy Libby Asbestos National Priorities List Site
Libby, Montana
April 2012
Prepared for US Environmental Protection Agency
by
HDR Engineering, Inc. and
TechLaw, Inc.
Draft RI Report i OU8 Libby Asbestos Site
TABLE OF CONTENTS
EXECUTIVE SUMMARY .......................................................................................................... 1
1.0 INTRODUCTION....................................................................................................... 1-1
1.1 OVERVIEW AND REPORT ORGANIZATION ........................................................ 1-1
1.2 NPL SITE LOCATION & TOPOGRAPHY ................................................................ 1-2
1.3 NPL SITE HISTORY.................................................................................................... 1-3
1.4 REGULATORY HISTORY ......................................................................................... 1-4
1.5 PREVIOUS INVESTIGATIONS & REPORTS........................................................... 1-4
2.0 SITE CHARACTERISTICS...................................................................................... 2-1
2.1 CLIMATE ..................................................................................................................... 2-1
2.2 GEOLOGY .................................................................................................................... 2-1
2.3 HYDROLOGY AND HYDROGEOLOGY ................................................................. 2-2
3.0 SAMPLING AND ANALYSIS .................................................................................. 3-1
3.1 SAMPLE TYPES AND COLLECTION PROCEDURES ........................................... 3-1
3.1.1 Soil Samples........................................................................................................... 3-2
3.1.2 Air Samples ............................................................................................................ 3-3
3.1.3 Quality Control Samples ........................................................................................ 3-5
3.2 SAMPLE PREPARATION AND ANALYSIS ............................................................ 3-6
3.2.1 Soil ......................................................................................................................... 3-6
3.2.2 Air .......................................................................................................................... 3-8
4.0 DATA RECORDING, DATA QUALITY ASSESSMENT, AND DATA SELECTION ............................................................................................................... 4-1
4.1 DATA RECORDING ................................................................................................... 4-1
4.2 DATA QUALITY ASSESSMENT .............................................................................. 4-2
4.3 DATA SELECTION ..................................................................................................... 4-2
5.0 NATURE AND EXTENT OF LA ............................................................................. 5-1
5.1 CONTAMINANTS OF CONCERN ............................................................................. 5-1
5.2 LA IN SOIL .................................................................................................................. 5-1
5.3 LA IN AIR .................................................................................................................... 5-3
6.0 CONTAMINANT FATE AND TRANSPORT ........................................................ 6-1
Draft RI Report ii OU8 Libby Asbestos Site
7.0 HUMAN HEALTH RISK ASSESSMENT ............................................................... 7-1
7.1 OVERVIEW.................................................................................................................. 7-1
7.2 EXPOSURE ASSESSMENT ........................................................................................ 7-2
7.2.1 Conceptual Site Model ........................................................................................... 7-2
7.2.1.1 Exposed Populations ...................................................................................... 7-2 7.2.1.2 Exposure Routes and Pathways ...................................................................... 7-2
7.2.2 Approach for Characterizing Exposure ................................................................. 7-3
7.3 TOXICITY ASSESSMENT ......................................................................................... 7-4
7.3.1 Non-Cancer Effects ................................................................................................ 7-5
7.3.1.1 Asbestosis........................................................................................................ 7-5 7.3.1.2 Pleural Abnormalities..................................................................................... 7-5 7.3.1.3 Other Non-Cancer Effects .............................................................................. 7-6 7.3.1.4 Observations of Non-Cancer Effects in People Exposed to LA ..................... 7-6
7.3.2 Cancer Effects ........................................................................................................ 7-7
7.3.2.1 Lung Cancer ................................................................................................... 7-7 7.3.2.2 Mesothelioma.................................................................................................. 7-7 7.3.2.3 Other Cancers................................................................................................. 7-7 7.3.2.4 Observations of Cancer in People Exposed to LA ......................................... 7-8
7.3.3 Role of Fiber Type and Size in Adverse Health Effects ........................................ 7-8
7.4 QUANTIFICATION OF EXPOSURE AND RISK ................................................... 7-11
7.4.1 Non-Cancer Risk .................................................................................................. 7-11
7.4.2 Cancer Risk .......................................................................................................... 7-12
7.4.4 Exposure Parameters ............................................................................................ 7-14
7.5 RISK CHARACTERIZATION (Pending finalization of toxicity values for LA) ...... 7-14
7.5.1 Risk to Adult Maintenance Workers .................................................................... 7-15
7.5.2 Hazard to Adult Maintenance Workers ............................................................... 7-15
7.5.3 Risks to Child, Adolescent and Adult Recreational ATV Users ......................... 7-15
7.5.4 Hazard to Child, Adolescent and Adult Recreational ATV Users ....................... 7-15
7.5.5 Risks from Outdoor Ambient Air ........................................................................ 7-15
7.5.6 Summary and Conclusions .................................................................................. 7-15
7.6 UNCERTAINTY ANALYSIS .................................................................................... 7-15
7.6.1 Uncertainty in LA Levels in Soil ......................................................................... 7-15
7.6.2 Uncertainty in LA Concentrations in Inhaled Air ................................................ 7-16
7.6.3 Uncertainty Arising from Use of an Indirect Preparation Technique .................. 7-16
Draft RI Report iii OU8 Libby Asbestos Site
7.6.4 Lack of an Approved Non-Cancer Inhalation RfC .............................................. 7-17
7.6.5 Uncertainty in Human Exposure Patterns ............................................................ 7-17
7.6.6 Uncertainty in the Cancer Exposure-Response Relationship .............................. 7-18
7.6.7 Uncertainty Associated with Cumulative Exposures ........................................... 7-18
8.0 CONCLUSIONS ......................................................................................................... 8-1
9.0 REFERENCES ............................................................................................................ 9-1
LIST OF TABLES
3-1 Sampling Events Relevant to OU8
7-1 Exposure Pathways and Parameters Used in the Quantitative Evaluation
7-2 Exposure Point Concentration Calculation for Maintenance Worker – Grass Cutting
7-3 Exposure Point Concentration Calculation for Maintenance Worker – Brush Hogging
7-4 Exposure Point Concentration Calculation for Maintenance Worker - Rotomilling
7-5 Exposure Point Concentration Calculation for Recreational ATV Users
7-6 Maintenance Worker Inhalation of Asbestos in Air Cancer Risk Calculations (Upper Range) Pending finalization of toxicity values for LA.
7-7 Maintenance Worker Inhalation of Asbestos in Air Cancer Risk Calculations (Central Tendency) Pending finalization of toxicity values for LA.
7-8 Maintenance Worker Inhalation of Asbestos in Air Hazard Calculations (Upper Range) Pending finalization of toxicity values for LA.
7-9 Maintenance Worker Inhalation of Asbestos in Air Cancer Risk Calculations (Central Tendency) Pending finalization of toxicity values for LA.
7-10 Recreational ATV User Inhalation of Asbestos in Air Cancer Risk Calculations (Upper Range) Pending finalization of toxicity values for LA.
7-11 Recreational ATV User Inhalation of Asbestos in Air Cancer Risk Calculations (Central Tendency) Pending finalization of toxicity values for LA.
7-12 Recreational ATV User Inhalation of Asbestos in Air Hazard Calculations (Upper Range) Pending finalization of toxicity values for LA.
Draft RI Report iv OU8 Libby Asbestos Site
7-13 Recreational ATV User Inhalation of Asbestos in Air Hazard Calculations (Central Tendency) Pending finalization of toxicity values for LA.
7-14 OU-8 Risk and Hazard Summary Pending finalization of toxicity values for LA.
LIST OF FIGURES
1-1 OU Boundaries
1-2 Limits of OU8
3-1 OU8 Sampling Locations
3-2 Inner and Outer Perimeter Air Sampling Locations
5-1 LA in Surface Soil - PLM Results
5-2 Visible Vermiculite in Surface Soils
5-3 ABS Air Results for ATV Riding, Brush Hogging and Grass Cutting
5-4 ABS Air Results for Rotomilling
5-5 Inner Perimeter (ABS) Rotomilling Air Results
5-6 Outer Perimeter (Ambient Air) Results
7-1 Conceptual Site Model for Inhalation Exposures to Libby Amphibole Asbestos at OU8
7-2 Comparison of Direct and Indirect TEM Results for 31 Air Samples from Libby
APPENDICES
Appendix A – Data Quality Assessment
Appendix B – EPA Scribe Database
Appendix C – Asbestos Analysis Methods and Data Reduction Techniques
Draft RI Report v OU8 Libby Asbestos Site
LIST OF ACRONYMS
ABS Activity-Based Sampling AM Amosite ATSDR Agency for Toxic Substances and Disease Registry ATV All Terrain Vehicle bgs below ground surface CSF Close Support Facility COC Chain of Custody CSM Conceptual Site Model DQA Data Quality Assessment DQOs Data Quality Objectives ED Exposure Duration EDD’s Electronic Data Deliverables EF Exposure frequency EPA U.S. Environmental Protection Agency EPC Exposure point concentration ERT Emergency Response Team ESAT Environmental Services Assistance Team ET Exposure Time FSDS Field sample data sheet Ft Feet Ft/day Feet per day HAEC Human Airway Epithelial Cells HHRA Human Health Risk Assessment HI Hazard Index HQ Hazard Quotient IRIS Integrated Risk Information System ISO International Organization for Standardization IUR Inhalation Unit Risk LA Libby Amphibole MCE Mixed Cellulose Ester MDOT Montana Department of Transportation NAS National Academy of Sciences ND Non-Detect NPL National Priority List OUs Operable Units PCM Phase Contrast Microscopy PCME Phase Contrast Microscopy Equivalent PLM Polarized light microscopy PLM-VE Polarized Light Microscopy – Visual Estimation QAPP Quality Assurance Project Plan RfC Reference Concentration RI Remedial Investigation ROW Right-Of-Way s/cc structures per cubic centimeter

Draft RI Report vi OU8 Libby Asbestos Site
SAP Sampling and Analysis Plan SERAS Scientific, Engineering, Response and Analytical Services Program SH2 State Highway 2 SH37 State Highway 37 SOPs Standard Operating Procedures TEM Transmission Electron Microscopy TWF Time Weighting Factor UCL Upper confidence limit μm micrometer
Draft RI Report ES-1 OU8 Libby Asbestos Site
EXECUTIVE SUMMARY
Overview
This Remedial Investigation (RI) Report describes the nature and extent of Libby amphibole (LA) asbestos and associated human health risks at Operable Unit 8 (OU8) of the Libby Asbestos National Priority List (NPL) Site (the Site).
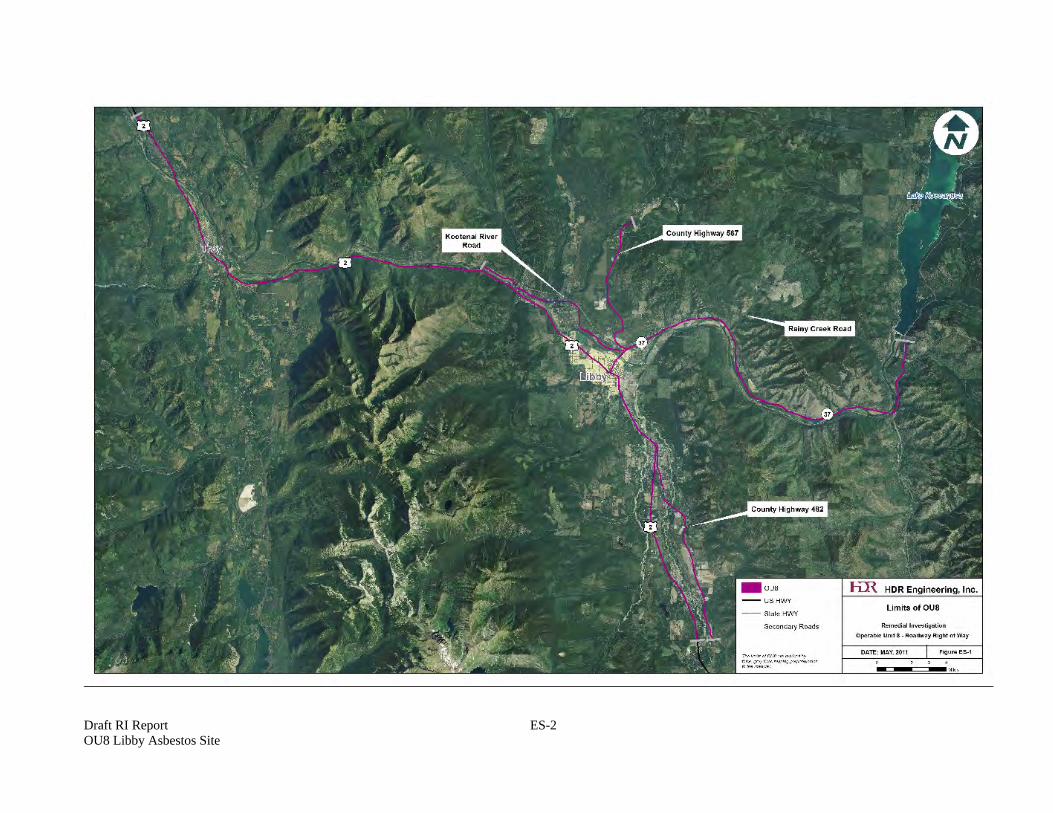
Operable Unit 8 is also referred to as state and local highways and includes segments of roadway right-of-way (ROW) in and within 30 miles of Libby (Figure ES-1).
Asbestos found at the Libby mine contains a variety of different amphibole types. Because there are presently insufficient toxicological data to distinguish between the different forms, the Environmental Protection Agency (EPA) evaluates all of the mine-related amphibole asbestos types together. This mixture is referred to as LA. Most of the mining operations in Libby were not focused on asbestos, as it was not particularly valuable. However, vermiculite, the main ore extracted and processed at the mine, often contained asbestos and therefore, vermiculite mining acted as a carrier to spread asbestos throughout Libby. Raw vermiculite ore was estimated to contain up to 26% LA.
Asbestos exposure in humans may cause both cancer and non-cancer effects. Among them are:
Non-Cancer Effects:
Asbestosis
Pleural Abnormalities
Cancer Effects:
Lung cancer
Mesothelioma
People who visit or work at OU8 may be exposed to LA by incidental ingestion of contaminated soil or dust and by inhalation of air that contains LA fibers. Of these two pathways, inhalation exposure is considered to be of greater concern.
The amount of LA fibers released to air will vary depending upon the level of LA in the source material (e.g., outdoor soil) and the intensity and duration of the disturbance activity. Because of this, predicting LA levels in air associated with disturbance activities based only on measured LA levels in source material is extremely difficult. Therefore, the most direct way to determine potential exposures from inhalation is to measure, through sampling and analysis, the concentration of LA in air during a specific activity that disturbs a source material. For convenience, this is referred to as activity-based sampling (ABS).
Draft RI Report ES-2 OU8 Libby Asbestos Site
Draft RI Report ES-3 OU8 Libby Asbestos Site
Site Investigations
Investigations of portions of roadway ROW were conducted by EPA in 2003 and 2005, prior to the establishment of OU8. The most relevant investigations included collection of soil samples along US Highway 2 between Libby and Rainy Creek Road (Figure ES-1). Once OU8 was established in 2009, EPA conducted extensive sampling of soil and air during 2010 and 2011 including the following media-specific sampling:
Soils Surface – composite samples collected from as much as 6-inches below ground
surface.
Air Personal air samples – collected using a sampling pump and filter located in the
breathing zone of an individual (or mounted on equipment) while performing various outdoor activities.
Stationary air samples – collected using a stationary sampling pump and filter placed in a location that acts as a surrogate for a personal air sample.
Soil samples were collected and analyzed for LA in order to determine the distribution of LA (and visible vermiculite) along roadway ROWs. This information was used to, among other things, determine whether ABS sampling was performed over a range of LA levels and visible vermiculite conditions.
In most cases, one composite soil sample was created from ten aliquots collected for every 1,000 ft of ROW. A total of 485 field (non-QC) composite soil samples was collected from July 7 to September 10, 2010. Of these, 397 contained no detectable LA and the remaining 88 samples contained trace levels of LA.
Visible vermiculite was not observed in composite soil samples with the exception of those collected along the far eastern end of State Highway 37 (Figure ES-1). In this area, more than ten samples contained visible vermiculite. However, polarized light microscopy results for these samples were non-detect to trace for LA, which is typical of the rest of the OU. It is not clear why vermiculite was noted by visual inspection but LA was not detected by laboratory analyses.
ABS air samples were collected in association with the following activities:
Recreational Activities
Riding all terrain vehicles (ATV) with a lead and following ATV.
Montana Department of Transportation (MDOT) Maintenance Activities
Rotomilling of asphalt pavement
Grass cutting and brush hogging in ROWs.
Draft RI Report ES-4 OU8 Libby Asbestos Site
All ATV, brush hogging and grass cutting ABS sampling during the 2010-2011 OU8 Field Program was conducted along Hwy 37 between Libby and Rainy Creek Road (Figure ES-1). This portion of roadway was selected for ABS based on the presence of LA and visible vermiculite in surface soils as determined during investigations in 2003 and 2005. Samplers were mounted on the front and back of the grass cutting and brush hogging equipment as well as on the “following” ATV.
Rotomilling ABS sampling was performed along Hwy 37 in downtown Libby as part of regularly scheduled maintenance work conducted by the MDOT. The general area of interest (California Ave.) was selected because one of several core samples collected in California Ave. in March 2010 contained a trace (0.1%) of LA.
Rotomilling ABS consisted of samplers mounted on the moving rotomill as well as on a small front-end loader. In addition, stationary samplers were positioned on the sidewalk adjacent to the street where rotomilling operations were conducted. These samplers comprised the “inner perimeter” sampling stations.
In addition to the ABS sampling, several stationary air samplers were placed at various locations within downtown Libby but remote from the rotomilling operations. Samples collected from these locations are representative of ambient conditions and are referred to as “outer perimeter” samples.
Sample results are summarized below:
Of the 34 ABS air samples associated with ATV riding, brush hogging and grass cutting, LA was detected in 8 samples. Of those, 7 were associated with brush hogging and one was found in association with ATV riding.
Of the 10 ABS air samples collected from rotomilling equipment, no LA was detected.
Of the 51 air samples collected from the inner perimeter, only one contained detectable LA.
Of the 25 ambient air samples collected around downtown Libby, none contained detectable LA.
Risk Assessment
This risk assessment uses available data to estimate the current and future health risks to people who may inhale asbestos fibers while performing maintenance or recreational activities along the roads and highways in OU8, based on current conditions. The value of the exposure point concentration term is based on measurements of asbestos concentration levels in air.
Methods used to evaluate human health risks from asbestos are in basic accord with EPA guidelines for evaluating risks at Superfund sites, including recent guidance that has been specifically developed to support evaluations of exposure and risk from asbestos.

Draft RI Report ES-5 OU8 Libby Asbestos Site
EPA has collected sufficient data to allow evaluation of exposure pathways that are thought to be most likely of potential concern in OU8. These pathways are the main focus of the risk assessment and include:
Road construction activities include rotomilling and asphalt work.
Maintenance activities adjacent to the roadways include grass cutting, road sweeping, ditch cleaning and brush hogging.
ATV riders who may be exposed to asbestos fibers via inhalation along roadways.
Cancer risk and non-cancer hazard estimates for each site receptor are pending finalization of toxicity values for LA.
An ecological risk assessment is being developed for the mine site (OU3). EPA will build upon the information gathered during that ecological risk assessment to identify potential pathways and receptors to evaluate ecological risk at OU8. If ecological exposure pathways are identified at OU8 an ecological risk assessment will be performed.
Draft RI Report 1-1 OU8 Libby Asbestos Site
1.0 INTRODUCTION
1.1 OVERVIEW AND REPORT ORGANIZATION
This Remedial Investigation (RI) Report describes the nature and extent of Libby amphibole (LA) asbestos and associated human health risks at Operable Unit 8 (OU8) of the Libby Asbestos National Priority List (NPL) Site (the Site). LA occurrence throughout the Site resulted from long time mining activities and the use and handling of materials which contained LA.
U.S. Environmental Protection Agency (EPA) has had a presence in Libby since 1999 and has completed a number of sampling activities and removal efforts. EPA determined there was imminent and substantial endangerment to public health from asbestos contamination in various types of source materials in and around Libby.
In light of evidence of human asbestos exposure and associated increase in health risks, it was recommended that EPA take appropriate steps to reduce or eliminate exposure pathways to these materials to protect area residents and workers. In 2002, Libby was classified as a NPL Site which, due to its large size, has been divided into eight Operable Units (OUs):
OU1 – Former Export Plant
OU2 – Former Screening Plant
OU3 – Mine Site
OU4 – Residential and commercial properties in and around Libby
OU5 – Former Stimson Lumber Mill
OU6 – Rail Line
OU7 – Residential and commercial properties in and around Troy
OU8 – US and Montana State highways and secondary highways in the vicinity of Libby and Troy, Montana.
Figure 1-1 presents a map showing the entire NPL area and boundaries of all OUs. This RI addresses OU8, which includes various State and local highways in the vicinity of Libby and Troy, Montana.
As determined by previous investigations conducted at the Site, LA is present in multiple environmental media. During 2003 and 2005 soil samples were collected along portions of State Highway 37 and were found to contain LA and visible vermiculite (CDM, 2005). During 2006 and 2007, soil and air samples were collected during routine maintenance activities performed by the Montana Department of Transportation (MDOT). LA was detected in some of those samples. In March 2010, five asphalt core samples were taken from California Street and US Highway 2 (in downtown Libby) and analyzed for asbestos. In one of the core samples, a trace (0.1%) of LA
Draft RI Report 1-2 OU8 Libby Asbestos Site
was detected indicating LA may be embedded in the roads in and around Libby (Lockheed Martin, 2010a). Based on this evidence, EPA established OU8 and began planning for the RI described in this report.
The RI Report is organized into the following major sections:
Section 1 – Introduction – This section describes the purpose of the RI and summarizes prior work and NPL Site history.
Section 2 – Site Characteristics – This section provides a brief description of Site setting, climate, geology, hydrogeology, and surface water hydrology.
Section 3 – Sampling and Analyses – This section discusses sample types and collection methods and analytical techniques.
Section 4 – Data Recording, Data Quality Assessment, and Data Selection – This section discusses the Libby database, quality control measures and how data were selected to produce the final OU8 data set used to describe the nature and extent of contamination and for calculation of health risk estimates.
Section 5 – Nature and Extent of LA – This section provides a description of the current type and extent of LA in surface soils and outdoor air.
Section 6 – Contaminant Fate and Transport – This section provides a qualitative discussion of LA contaminant migration routes and persistence in the environment.
Section 7 – Human Health Risk Assessment – This section presents the human health risk assessment.
Section 8 – Conclusions – This section presents general conclusions.
Section 9 – References – This section provides full references for all citations in the body of the report.
1.2 NPL SITE LOCATION & TOPOGRAPHY
The City of Libby, Montana is located in the northwest corner of the state, 35 miles east of Idaho and 65 miles south of the Canadian border (Figure 1-1). It is at an elevation of approximately 2,580 feet above mean sea level (msl). The source of LA, Vermiculite Mountain, is located approximately 7 miles northwest of Libby. The city has a total area of 1.3 square miles and lies in a valley carved by the Kootenai River and bounded by the Cabinet Mountains to the south.
Draft RI Report 1-3 OU8 Libby Asbestos Site
Operable Unit No. OU8 consists of the right-of-way of the following State and local highway segments (See Figure 1-2):
Montana State Highway 37 (SH37)
Montana State Highway 2 (SH2)
Kootenai River Road
County Highway 482 (Farm to Market Road)
County Highway 567 (Pipe Creek Road)
1.3 NPL SITE HISTORY
Libby is located near a large open-pit vermiculite mine on Vermiculite Mountain. Vermiculite is a mica-like mineral that can be processed for use as an insulating material or soil amendment and has been mined in Libby since 1919. It is estimated that the Libby mine was the source of over 70 percent of all vermiculite sold in the U.S. from 1919 to 1990. Over its lifetime, it employed more than 1,900 people. W. R. Grace bought the mine and processing facility in 1963 and operated it until 1990 (EPA, 2010a).
Vermiculite from this mine contains varying levels of amphibole asbestos, consisting primarily of winchite and richterite, with lower levels of tremolite, magnesioriebeckite, and possibly actinolite. Because existing toxicological data are not sufficient to distinguish differences in toxicity among these different forms, EPA does not believe that it is important to attempt to distinguish among these various amphibole types. Therefore, EPA simply refers to the mixture as Libby Amphibole asbestos. Historic mining, milling, and processing operations, as well as bulk transfer of mining-related materials, tailings, and waste to locations throughout Libby Valley are known to have resulted in releases of vermiculite and LA to the environment. This has caused a range of adverse health effects in exposed people, including individuals who did not work at the mine or processing facilities.
EPA has been working in Libby since 1999 when an Emergency Response Team was sent to investigate local concern and news articles about asbestos-contaminated vermiculite. Since that time, EPA has been working closely with the community to clean up contamination and reduce risks to human health.
Based on health risks associated with asbestos, which include asbestosis, lung cancer and mesothelioma, EPA placed the Libby Asbestos Site on the NPL in October 2002.
Libby, Montana, which is the Lincoln County seat, has a population of less than 3,000, and 12,000 people live within a ten-mile radius. While Libby’s economy is still largely supported by natural resources such as logging and mining, there are also many tourist and recreational opportunities in the area.
Draft RI Report 1-4 OU8 Libby Asbestos Site
1.4 REGULATORY HISTORY
The following is a brief chronological summary of major regulatory actions taken at the Site.
1999 – Local concern alerts EPA to investigate asbestos in and around Libby, Montana
2002 – Libby Asbestos Site proposed for the NPL
2002 – Libby Asbestos Site formally added to the NPL
2009 – Operable Unit No. 8 added to the Site.
EPA has not entered into any enforcement agreements or issued any orders for investigation, removal, or remedial work at any part OU8. However, EPA has addressed some parts of OU8 along with the remedial actions for other OUs. EPA addressed the portion of Highway 37 adjacent to OU2 as part of the OU 2 removal and remedial actions. EPA will address the portion of Highway 37 adjacent to OU1 as part of the OU1 remedial action. These actions were not pursuant to any enforcement agreement or order. They were funded with special account money under the settlement EPA entered into with the only known Potentially Responsible Party for OUs 1, 2, and 8, W. R. Grace, in 2008. That agreement provided for a cash settlement of past and future response costs owed by W.R. Grace for the entire Libby NPL Site except OU3, the mine site.
1.5 PREVIOUS INVESTIGATIONS & REPORTS
Prior to the designation of OU8 as a Site Operable Unit, several investigations generated data from areas that lie within current OU8 boundaries. In addition, OU8-specific investigations were conducted in 2010 and 2011. Planning documents for these investigations and associated reports (if prepared) are listed below:
Sampling and Analysis Plans
Sampling and Analysis Plan/Quality Assurance Project Plan for Activity-Based Outdoor/Air Exposures, Operable Unit 8, Libby Asbestos Site, Libby, Montana, 2010 Sampling Events. Prepared by TechLaw. Revision Date July 15, 2010.
Sampling Investigation Results Reports (pre-OU8 designation) Containing Data Relevant to OU8
Contaminant Screening Study, Libby Asbestos Site, Operable Unit 4, Libby, Montana. Final Summary Report for the J. Neils Park and Montana State Highway 37 Investigations, Revision 1. Prepared By CDM. December 2005.
Report of Findings, Potentially Asbestos-Containing Soil in MTD Rights-of-Way, Traction Sand and Road Aggregate Sources, Collected Road Sweepings, and Sampled
Draft RI Report 1-5 OU8 Libby Asbestos Site
Worker Air Space During Routine Maintenance Activities, Libby, Montana. Prepared By Tetra Tech, Inc., February 21, 2007.
Report of Findings, Sampled Worker Air Space during Routine Maintenance Activities, Libby, Montana. Prepared By Tetra Tech, Inc., July 19, 2007.
Sampling Investigation Results Reports Specific to OU8 (post-OU8 designation)
Verification Summary Report for Operable Unit 8, Libby Asbestos Superfund Site (Based on Scribe database provided on 1/27/11), Prepared by SRC. February 1, 2011.
Trip Report (on ABS activities), Libby Asbestos Site, Libby, Montana. Prepared by Lockheed Martin Scientific, Engineering, Response and Analytical Services. November 1, 2010.
Trip Report (on Rotomilling ABS Activities and Ambient Air Sampling), Libby Asbestos Site, Libby, Montana. Prepared by Lockheed Martin Scientific, Engineering, Response and Analytical Services. June 24, 2011.
Draft RI Report 2-1 OU8 Libby Asbestos Site
2.0 SITE CHARACTERISTICS
Operable Unit 8 encompasses a large geographic area but is constrained to roadway rights-of-way (ROW). Therefore, an OU-specific detailed discussion of many site characteristics, such as geology, is impractical for linear features such as a roadway. In addition, the investigation of LA in OU8 is restricted to surface soil and air. Therefore, subsurface conditions are not relevant to the RI. As a result, the following discussion of Site characteristics is based on conditions in and around Libby where such information has been developed as a part of work in other OUs.
2.1 CLIMATE
Annual average precipitation in Libby is 24.7 inches, with an annual average of 105 inches of snowfall (WRCC, 2010). Precipitation and humidity in Libby are greatest during the winter months due to the presence of temperature-regulating Pacific air masses. In December and January, average temperatures range between 25-30 ºF. Occasionally, dry continental air masses occupy the Libby area for short periods of time during the winter, creating cold and less-humid conditions (CDM, 2009).
Fog is common in Libby during winter months and in early morning throughout the year. Summer months are drier than winter and are warm with occasional rainfall. The average July temperature ranges between 56-70 ºF, with an average high of 80 ºF (CDM, 2009).
Prevailing winds are from the west north-west and average approximately 6-7 miles per hour. Wind direction and velocities fluctuate depending on temperature variances caused by vertical relief in the area. Inversions often trap stagnant air in the Libby valley (CDM, 2009).
2.2 GEOLOGY
Regional geology in the Libby valley is comprised of lacustrine deposits underlain by Precambrian rocks. Surrounding mountains are formed by Precambrian rocks. Cliffs along the lower portion of the valley are formed by glacial lake bed deposits. The Kootenai River and Libby Creek cut through lacustrine and alluvial deposits and form a discontinuous sequence of gravel, sand, silt, and clay (EPA, 2010b).
Alluvial deposits extend from the surface to 190 feet (ft) below ground surface (bgs) and are comprised of sand, gravel, silt, clay and cobbles. Glacial till, which consists primarily of silt and clay with varying amounts of sand and gravel, underlies alluvial deposits. Deposits of glacial till are believed to be quite deep, occurring at depths exceeding 500 ft bgs (EPA, 2010b).
Draft RI Report 2-2 OU8 Libby Asbestos Site
Soils in the Libby area typically are loamy soil composed of sand and silt with minor amounts of clay. Soil was formed by erosion of Precambrian rocks, downstream transport of clays by rivers and creeks, and organic matter from historically forested areas (CDM, 2009).
Site soils are a combination of historical soil modified in areas by human activities. These activities may include addition of vermiculite as a soil amendment, soil reworking for building construction, road and railroad operation, vermiculite processing and transport, and general site work.
2.3 HYDROLOGY AND HYDROGEOLOGY
Within OU8, portions of SH 2 and SH 37 follow the Kootenai River and runoff from these roadways discharges to the river. In addition, the portion of SH 2 south of Libby parallels Libby Creek. The Kootenai River originates in British Columbia, Canada, and flows through Montana and Idaho before returning to Canada and flowing into the Columbia River. Flows in the Kootenai River and Libby Creek are tied to runoff from the mountains surrounding Libby. Runoff peaks in spring when high-elevation snow begins to melt. Stream flow decreases in summer due to low precipitation and snowmelt flow moderation by high elevation lakes (CDM, 2009).
Based on investigations at the Libby Groundwater Site (a separate NPL Site within the Libby Asbestos NPL Site), the hydrogeology in the southeast portion of Libby consists of saturated alluvial deposits extending from the surface to approximately 190 ft bgs. These deposits have been sorted into three classifications: upper aquifer, intermediate zone, and lower aquifer. The upper aquifer contains high hydraulic conductivity material including silty gravel and sand with occasional interbedded clayey, silty deposits. It is unconfined and extends from the water table (5 to 30 ft bgs) to approximately 70 ft bgs. Hydraulic conductivity ranges from 100 to 1,000 feet per day (ft/day). The inferred groundwater flow direction is north-northwest towards the Kooteni River (EPA, 2010b).
The intermediate zone is comprised of low permeability deposits similar to the upper aquifer, but with a higher percentage of fine-grained material. Acting as a confining layer, the intermediate zone is 40 to 60 ft thick, extending from approximately 60-70 ft bgs to 110 ft bgs. The hydraulic conductivity of this layer is much lower than the upper aquifer at approximately 1 ft/day.
The lower aquifer extends from approximately 100 ft bgs to 190 ft bgs, and contains more low-permeability silt and clay layers than the upper aquifer. It is confined and under pressure, so water in wells screened in this aquifer rises to 14-26 ft bgs. Hydraulic conductivity of the lower aquifer ranges from 50 to 200 ft/day. The inferred groundwater flow direction is north-northwest towards the Kooteni River (EPA, 2010b).
Draft RI Report 3-1 OU8 Libby Asbestos Site
3.0 SAMPLING AND ANALYSIS
Most analytical and other data relevant to OU8 were collected during 2010 and 2011, after OU8 was established. However, some data relevant to OU8 were collected prior to 2010 as part of the investigation of other OUs or Site-wide investigations. Table 3-1 summarizes all sampling events that generated data relevant to OU8.
The following sections describe sample types, sample collection and analytical methods. All sample media and associated analytical results are discussed in this section. However, certain data are excluded from the discussion of nature and extent of LA occurrence (Section 5) including:
Data that were deemed irrelevant to the assessment of risk to human health. These include certain indoor dust and outdoor ambient air samples and street sweepings.
Occupational Safety and Health Administration compliance monitoring data collected during field activities as part of field worker health and safety.
This was done to simplify and focus the description of nature and extent of LA occurrence to those measurements most relevant to the estimation of human health risks.
3.1 SAMPLE TYPES AND COLLECTION PROCEDURES
As shown in Table 3-1, the following media-specific sampling was conducted:
Soils Surface – composite samples collected from as much as 6-inches bgs.
Air Personal air samples – collected using a sampling pump and filter located in the
breathing zone of an individual (or mounted on equipment) while performing various outdoor activities.
Stationary air samples – collected using stationary sampling pump and filter placed in a location that acts as a surrogate for a personal air sample.
Samples were collected, documented, and handled in accord with standard operating procedures (SOPs) as specified in the respective Sampling and Analysis Plans (SAPs) prepared for the various investigations summarized on Table 3-1. Additional details on the 2010 and 2011 Remedial Investigation Field Programs including the study design and data quality objectives (DQOs) is provided in the Quality Assurance Project Plan (QAPP; Lockheed Martin, 2010a).
Data documenting sample type, location, collection method, and collection date were recorded both in a field log book maintained by the field sampling team and on a field sample data sheet (FSDS) designed to facilitate data entry into the Libby site database, as described in Section 4.1.
Draft RI Report 3-2 OU8 Libby Asbestos Site
All samples collected in the field were maintained under chain of custody during sample handling, preparation, shipment, and analysis.
3.1.1 Soil Samples
Composite soil samples were collected along both sides of the ROW from the following roadways in OU8 (See Figure 3-1):
Montana State Highway 37 (SH37)
Montana State Highway 2 (SH2)
Kootenai River Road
County Highway 482 (Farm to Market Road)
County Highway 567 (Pipe Creek Road)
The soil samples were collected and analyzed for LA in order to determine the distribution of LA (and visible vermiculite) along roadway ROWs. This information was used to, among other things, determine whether air sampling (activity-based sampling (ABS); See section 3.1.2) was performed over a range of surface soil LA levels and visible vermiculite conditions.
In general, one soil aliquot was collected for every 100 feet (ft) of ROW. The aliquots were originally to be collected in locations of visible vermiculite. However, this biased sampling was not performed in most areas due to the absence of visible vermiculite in all locations except for Hwy 37 from Rainy Creek Road to the dam.
In most cases, one composite soil sample was created from the ten aliquots collected for every 1,000 ft of ROW. However, composite samples were created from as many as 30 to as few as 3 aliquots in sections of ROW where hard surfaces comprise much of the ROW. A total of 485 field (non-QC) composite soil samples were collected from July 7 to September 10, 2010.
Soil sample locations were recorded at the midpoint of each 1,000 foot segment of ROW from which each composite sample was collected. The locations of all composite samples are shown on Figure 3-1.
In addition to soil samples collected during 2010, composite samples consisting of three aliquots were collected in 2003 and 2005 (CDM, 2005) and referred to as “Legacy Data” throughout the remainder of this report. The Legacy Data were collected only between Libby and Rainy Creek Road along SH 37 and are not shown on Figure 3-1. However, the analytical results from these samples are presented and discussed in Section 5.0.
Draft RI Report 3-3 OU8 Libby Asbestos Site
3.1.2 Air Samples
All air samples were collected by drawing a sample through a filter that traps asbestos and other particulate material on the face of the filter. Two main categories of air samples were collected:
1. Personal Air Samples - Sampling equipment worn by a person or affixed to operating equipment/vehicle.
2. Stationary Air Samples - Sampling equipment placed on a motionless surface.
Personal air sampling involved a variety of activities performed by the sampler generally involving operation of recreational or roadway maintenance equipment/vehicles. Such sampling is referred to in the remainder of this report as Activity-Based Sampling (ABS).
Air sampling for asbestos was conducted using Emergency Response Team (ERT) SOP #2015, Asbestos Sampling. The sampling train consisting of 0.8-micron (~m), 25-millimeter (mm) mixed cellulose ester (MCE) filter cassette connected to a sampling pump (Lockheed Martin, 2010b). For personal ABS sampling, participants were fitted with the appropriate sampling pump with the cassettes secured near the operator's breathing zone.
ABS Sampling
For the 2010 and 2011 OU8 RI field program, these activities included:
Recreational Activities
Riding ATVs with a lead and following ATV.
MDOT Maintenance Activities
Rotomilling of asphalt pavement
Grass cutting and brush hogging in rights-of-way
All ABS sampling during the 2010-2011 OU8 Field Program was conducted along Hwy 37 between Libby and Rainy Creek Road (See Figure 3-1). This portion of roadway was selected for ABS (excluding rotomilling) based on the presence of LA and visible vermiculite in surface soils as determined during investigations conducted in 2003 and 2005 (CDM, 2005).
Rotomilling ABS sampling was performed along Hwy 37 as part of regularly scheduled maintenance work conducted by MDOT. The general area of interest (California Ave.) was selected because one of several core samples collected in California Ave. in March 2010 contained a trace (0.1%) of LA (Lockheed Martin, 2010a).
All ABS sampling other than rotomilling was performed in September or October in order to make measurements during the time of year where conditions are drier than most other months.
Draft RI Report 3-4 OU8 Libby Asbestos Site
The effects of seasonal soil moisture has no effect on the results of asphalt rotomilling ABS sampling.
A summary of the ABS sampling procedures implemented during the 2010-2011 OU8 field program is provided below. Further details are provided in a QAPP (Lockheed Martin, 2010a) and ABS Trip Reports (Lockheed Martin, 2010b and 2011).
Brush Hogging
Brush hogging activities took place over three days in September 2010. A total of seven activities (scenarios) took place at seven locations at a rate of two to three per day. Each scenario was between approximately 60 and 200 minutes. During each scenario four air samples were collected at varying air flow rates. Two samples were collected at the front of the unit (tractor and implement) and two samples were collected on the back of the unit. In addition, a 30-point composite soil sample was collected to represent the seven locations where the brush hogging ABS was performed.
Grass Cutting
One grass cutting activity (scenario) was conducted at two locations over the course of two days in September 2010. Each scenario was approximately 150 minutes and involved the collection of four air samples. Two samples were collected at the front of the unit (tractor and implement) and two samples were collected on the back of the unit (at varying air flow rates). In addition, a 30-point composite soil sample was collected to represent the two locations where the grass cutting ABS was performed.
ATV Riding
Eight ATV riding activities (scenarios) took place at four locations over the course of four days in September 2010. Each scenario involved a lead and following ATV and was performed twice at each location during approximately 120 minutes. The ATVs maintained their relative positions at a distance of approximately 50 to 75 feet throughout each scenario. Two sampling pumps were placed on the lead ATV and two sampling pumps were placed on the following ATV resulting in the collection of four samples per scenario (32 samples total). In addition, a 30-point composite soil sample was collected to represent the three locations where the off-road ATV ABS was performed. One of the ATV scenarios involved riding on a paved surface and no soil sample was collected for that event.
Rotomilling
Rotomilling activities took place over three days in April 2011. Personal air samples were limited to those collected from the moving rotomill and skid steer (a small front end loader).
Draft RI Report 3-5 OU8 Libby Asbestos Site
A total of 10 field personal air samples were collected. Eight were collected from the rotomilling machine and two were collected from the skid steer.
Additional samples associated with rotomilling were stationary and are discussed below.
Stationary Air Samples:
Stationary sampling included ambient air proximal to a person or piece of equipment conducting ABS activities. Such stationary air samples were collected to represent conditions in the breathing zone as a surrogate for a personal air sample. These are referred to as perimeter samples and typically monitor the perimeter of an ABS activity involving equipment operation that mobilizes dust into the air.
For the 2011 OU8 Field Program the following types of stationary air sampling were conducted:
At fixed locations on both sides of the street where rotomilling operations were conducted. The samplers formed an inner perimeter around the rotomill spaced about a block (approximately 300 feet) apart.
At selected locations up to 1,000 feet from California Ave., comprising an outer perimeter (also referred too as ambient air samples in the QAPP; Lockheed Martin, 2010a). These outer perimeter samples were initiated at the beginning of the day and completed at the end of each work day.
Overall, 76 stationary field air samples were collected at 38 locations (See Figure 3-2).
3.1.3 Quality Control Samples
Quality control samples type and collection frequency included:
Soil Samples
Field duplicate soil samples were collected at a rate of one duplicate sample per 20 soil samples collected.
Soil sample field blanks (blank sand) were collected at a rate of one field blank sample per 20 soil samples.
Air Samples
One lot blank was analyzed for each new lot of MCE filter cassettes.
One field blank was collected and submitted for analysis for each day of sampling for the duration of the ABS and rotomilling activities.
Four perimeter field duplicates were collected and analyzed for each day of sampling (two collected at the high flow rate and two at the low flow rate).
Draft RI Report 3-6 OU8 Libby Asbestos Site
One ambient air field duplicate was collected over an 8-hour period at the high flow rate and analyzed each day for the duration of the rotomilling project.
An assessment of data quality is summarized in Section 4 and the full Data Quality Assessment Report is provided as Appendix A.
3.2 SAMPLE PREPARATION AND ANALYSIS
3.2.1 Soil
Polarized Light Microscopy (PLM)
Soil samples collected as part of the OU8 sampling programs were prepared for analysis in accord with SOP ISSI-LIBBY-01 as specified in the CDM Close Support Facility (CSF) Soil Preparation Plan (CDM, 2004). In brief, each soil sample is dried and sieved through a ¼ inch screen. Particles retained on the screen (if any) are referred to as “coarse” fraction. Particles passing through the screen are referred to as fine fraction, and this fraction is ground by passing it through a plate grinder. Resulting material is referred to as “fine ground” fraction. The fine ground fraction is split into four equal aliquots; one aliquot is submitted for analysis and the remaining aliquots are archived at the CSF.
Soil samples are analyzed using PLM whereby the analyst estimates the amount of asbestos in the sample (expressed as percent by weight) based on visual estimation techniques and by comparison to reference materials.
The coarse fractions were examined using stereomicroscopy, and any particles of asbestos (confirmed by PLM) were removed and weighed in accord with SRC-LIBBY-01 (referred to as “PLM-Grav”). Fine ground aliquots were analyzed using a Libby-specific PLM method using visual area estimation, as detailed in SOP SRC-LIBBY-03. For convenience, this method is referred to as “PLM-VE.”
PLM-VE is a semi-quantitative method that utilizes site-specific LA reference materials to allow assignment of fine ground samples into one of four “bins,” as follows:
Bin A (ND): non-detect
Bin B1 (Trace): detected at levels lower than the 0.2% LA reference material
Bin B2 (<1%): detected at levels lower than the 1% LA reference material but higher than the 0.2% LA reference material
Bin C: LA detected at levels greater than or equal to the 1% LA reference material
Visual Inspection
For soil samples, field teams also provide a semi-quantitative estimate of visible vermiculite present at soil sampling point(s). Visual inspection data can be used to characterize the level of
Draft RI Report 3-7 OU8 Libby Asbestos Site
vermiculite (and presumptive LA contamination) in an area and considers both frequency and level of vermiculite. This is achieved by assigning a weighting factor to each level, where weighting factors are intended to represent relative levels of vermiculite in each category.
As presented in SOP CDM-LIBBY-06, guidelines for assigning levels are as follows:
None – No flakes of vermiculite observed within the soil sample.
Low – A maximum of a few flakes of vermiculite observed within the soil sample.
Moderate – Vermiculite easily observed throughout the soil sample, including the surface and contains <50% vermiculite.
High – Vermiculite easily observed throughout the soil sample, including the surface and contains 50% or more vermiculite.
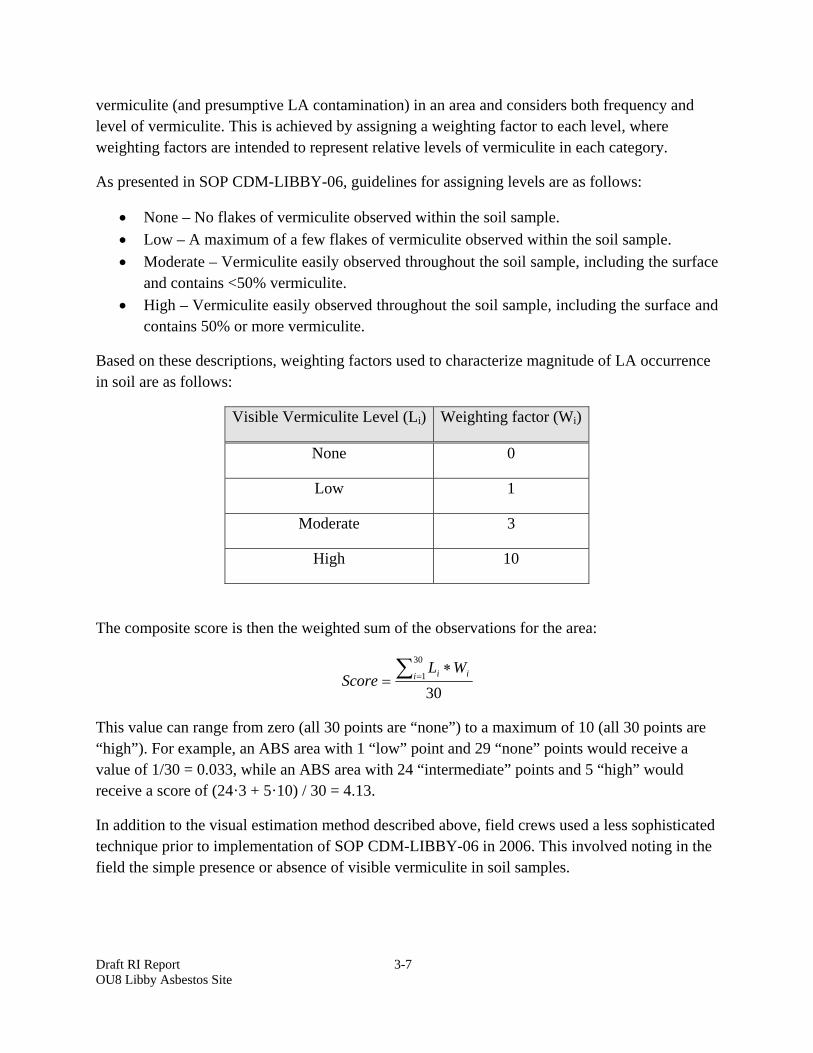
Based on these descriptions, weighting factors used to characterize magnitude of LA occurrence in soil are as follows:
Visible Vermiculite Level (Li) Weighting factor (Wi)
None 0
Low 1
Moderate 3
High 10
The composite score is then the weighted sum of the observations for the area:
30
30
1
i ii WLScore
This value can range from zero (all 30 points are “none”) to a maximum of 10 (all 30 points are “high”). For example, an ABS area with 1 “low” point and 29 “none” points would receive a value of 1/30 = 0.033, while an ABS area with 24 “intermediate” points and 5 “high” would receive a score of (24·3 + 5·10) / 30 = 4.13.
In addition to the visual estimation method described above, field crews used a less sophisticated technique prior to implementation of SOP CDM-LIBBY-06 in 2006. This involved noting in the field the simple presence or absence of visible vermiculite in soil samples.
Draft RI Report 3-8 OU8 Libby Asbestos Site
3.2.2 Air
In the past, the most common technique for measuring asbestos in air was phase contrast microscopy (PCM). In this technique, air is drawn through a filter and airborne particles become deposited on the face of the filter. All structures that have a length greater than 5 micrometers (um) and have an aspect ratio (the ratio of length to width) of 3:1 or more are counted as PCM fibers. The limit of resolution of PCM is about 0.25 um, so particles thinner than this are generally not observable.
A key limitation of PCM is that particle discrimination is based only on size and shape. Because of this, it is not possible to classify asbestos particles by mineral type, or even to distinguish between asbestos and non-asbestos particles. For this reason, nearly all samples of air collected in Libby are analyzed by transmission electron microscopy (TEM).
This method operates at higher magnification (typically about 20,000x) and hence is able to detect structures much smaller than can been seen by PCM. In addition, TEM instruments are fitted with accessories that allow each particle to be classified according to mineral type.
Air samples filters were directly prepared for analysis by TEM in accord with preparation methods provided in International Organization for Standardization (ISO) 10312 (ISO, 1995). In the case where filter cassettes were found to be overloaded, the filters were prepared for analysis in accordance with SOP EPA-Libby-08 (indirect prep). This indirect preparation method was employed for three samples associated with brush hogging and two samples associated with rotomilling. A discussion measurement uncertainty associated with indirect sample preparation is provided in Section 7.6.3.
Sample analysis was by TEM in basic accord with counting and recording rules specified in ISO 10312, and certain project-specific counting rule modifications including changing the recording rule to include structures with an aspect ratio ≥ 3:1.
For each countable structure particle identified, the analyst records structure-specific information (e.g., length, width, asbestos mineral type) which is then used to calculate air concentration in LA structures per cubic centimeter (s/cc).

Draft RI Report 4-1 OU8 Libby Asbestos Site
4.0 DATA RECORDING, DATA QUALITY ASSESSMENT, AND DATA SELECTION
4.1 DATA RECORDING
All analytical results are stored and maintained in the OU8 Scribe Database. A copy of the database is available through EPA Region 8 records center (See Appendix B).
Standardized data entry spreadsheets (electronic data deliverables or EDDs) have been developed specifically for the Libby project to ensure consistency between laboratories in the presentation and submittal of analytical data. In general, a unique EDD has been developed for each type of analytical method. Each EDD provides the analyst with a standardized laboratory bench sheet and accompanying data entry form for recording analytical data. Data entry forms contain a variety of built-in quality control functions that improve accuracy of data entry and help maintain data integrity. These spreadsheets also perform automatic computations of analytical input parameters (e.g., sensitivity, dilution factors, and concentration), thus reducing the likelihood of analyst calculation errors.
Asbestos analytical data (soil and air) was reported by the analytical laboratory in the form of an EDD and a pdf of the Data Report via email. All asbestos analytical data was then uploaded into the OU8 Scribe Database by the Environmental Services Assistance Team (ESAT) Data Manager.
Hard copies of all analytical reports are stored in the Scientific, Engineering, Response and Analytical Services (SERAS) Program Central Files and electronic copies are stored on SERAS Local Area Network.
All sampling location identification numbers were given to EPA’s ERT by ESAT prior to the sampling event. Field sampling data were recorded for each sample collected by ERT personnel on a sample log sheet and loaded into the OU8 Scribe Database. All samples and copies of sample log sheets were delivered to the EMSL/Libby laboratory. ERT/SERAS prepared all chain of custody forms prior to delivery of the samples to the laboratory.
Hard copies of all FSDSs, field log books, and chain of custody forms generated during the OU8 sampling program were transferred to the Sample Receiving Coordinator at CDMs Libby Montana Project Office.
Draft RI Report 4-2 OU8 Libby Asbestos Site
4.2 DATA QUALITY ASSESSMENT
Data quality assessment (DQA) is the process of reviewing existing data to establish the quality of the data and to determine how any data quality limitations may influence data interpretation (EPA, 2006). The full DQA is provided as Appendix A and a summary is provided below.
A verification of a minimum of 10% of the TEM results was performed based on the OU8 Scribe Database provided by ESAT on 1/27/11 in accord with SOP EPA-LIBBY-09 (rev 1). No discrepancies were discovered upon review of the original hand-written laboratory bench sheets to determine if the raw structure data were recorded in accord with ISO 10312 counting rules and SAP stopping rules. In addition, no errors were discovered when checks were performed to ensure that the data from the bench sheet were transferred into the OU8 Scribe Database without error or omission.
A verification of a minimum of 10% of the PLM-VE results was performed based on the OU8 Scribe Database provided by ESAT on 1/27/11 in accord with draft Standard Operating Procedures for PLM verification. A review of the original laboratory PLM bench sheets and verification of the transfer of results from the bench sheets into the OU8 Scribe Database was performed. Because the issues identified are not likely to impact data interpretation, no future verification of PLM-VE results was recommended.
A verification of FSDS information for all 62 analyses selected for PLM-VE and TEM verification was performed based on the OU8 Scribe Database provided by ESAT on 1/27/11. Several issues were discovered, some with the potential to impact data interpretation. The main issues involve discrepancies in the visible vermiculite information (number of aliquots vs. number of visible vermiculite observations) and sample date as well as omission of detailed pump information.
Discrepancies in the number of aliquots associated with visible vermiculite observations were limited to 4 samples out of 508. These visible vermiculite results (associated with sample HW-00129, HW-00130, HW-00133 and HW-0082) have been omitted from the remainder of the RI report.
In addition, the data quality assessment explains that detailed pump information was examined on the original FSDS and that the issue was limited to the lack pump information in the OU8 Scribe Database.
4.3 DATA SELECTION
Raw data for samples utilized in describing the occurrence of LA in OU8 soils and air (Section 5) as well as for use in the risk assessment (Section 7) were obtained via a subscription to the OU8 Scribe Database through Scribe.net. A copy of this database was obtained by HDR, Inc. on

Draft RI Report 4-3 OU8 Libby Asbestos Site
December 16, 2012. A copy of the database is available through EPA Region 8 records center (See Appendix B).
Scribe queries were written to sort data by media, analytical method and to exclude quality control samples. The data set resulting from execution of the queries (excepting the four visible vermiculite results discussed in Section 4.2) was used to describe the nature and extent of LA occurrence and for calculation of human health risk estimates.
Draft RI Report 5-1 OU8 Libby Asbestos Site
5.0 NATURE AND EXTENT OF LA
5.1 CONTAMINANTS OF CONCERN
The contaminant of concern at the Libby Site is asbestos. Asbestos is the generic name for the fibrous form of a broad family of naturally occurring poly-silicate minerals. Based on crystal structure, asbestos minerals are usually divided into two groups - serpentine and amphibole.
Serpentine - The only asbestos mineral in the serpentine group is chrysotile. Chrysotile is the most widely used form of asbestos, accounting for about 90% of the asbestos used in commercial products (IARC, 1977). There is no evidence that chrysotile occurs in the Libby vermiculite deposit, although it may be present in some types of building materials in Libby.
Amphibole – Five minerals in the amphibole group that occur in the asbestiform habit have found limited use in commercial products (IARC, 1977), including actinolite, amosite, anthophyllite, crocidolite, and tremolite.
At the Libby Site, the form of asbestos that is present in the vermiculite deposit is amphibole asbestos that for many years was classified as tremolite/actinolite (McDonald et al., 1986a, Amandus and Wheeler, 1987). More recently, the U.S. Geological Service performed electron probe micro-analysis and X-ray diffraction analysis of 30 samples obtained from asbestos veins at the mine (Meeker et al., 2003). Using mineralogical naming rules recommended by Leake et al. (1997), the results indicate that asbestos at Libby includes a number of related amphibole types. The most common forms are winchite and richterite, with lower levels of tremolite, magnesioriebeckite and possibly actinolite.
Because mineralogical name changes that have occurred over the years do not alter the asbestos material that is present in Libby, and because EPA does not find that there are toxicological data to distinguish differences in toxicity among these different forms, the EPA does not believe that it is important to attempt to distinguish among these various amphibole types. Therefore, EPA simply refers to the mixture as LA.
5.2 LA IN SOIL
Surface Soil
Figure 5-1 illustrates LA occurrence in OU8 surface soils based on PLM results. A 4-color scheme is used to indicate the amount of LA present in a sample (additional detail on analytical reporting is provided in Appendix C):
green = Bin A (non-detect)

Draft RI Report 5-2 OU8 Libby Asbestos Site
yellow = Bin B1 (trace)
orange = Bin B2 (< 1%)
red = Bin C (≥ 1%)
In this figure, composite samples collected during the 2010 field program are plotted as circles. Composite samples collected in 2003 and 2005 and referred to as “Legacy Data” are plotted as triangles (CDM, 2005). The Legacy Data was collected only between Libby and Rainy Creek Road along SH 37.
Of the 485 non-QC field composite samples, one (HW-00376) has no geographic information associated with it. Therefore, it is excluded from Figure 5-1. This sample contained no detectable LA.
Figure 5-2 illustrates vermiculite occurrence in surface soils based on visible vermiculite observations which utilized a semi-quantitative approach. Results are shown as squares and are color-coded based on the visible score (see Section 3.2.1):
green = score of 0 (no visible vermiculite detected)
yellow = score < 0.1
orange = score 0.1 to < 0.3
red = score > 0.3
One potential limitation to the approach for presenting visible score data is that the choice of cut-offs for use in color-coding is arbitrary. If other cut-offs were chosen, the appearance of the figures would be different. For example, the cutoff for red is 0.3 out of a possible score of 10. Nevertheless, the figures do provide a useful indication of the degree to which there is variation across OU8 and locations where higher than average levels have been observed.
Soil PLM results are generally non-detect to trace except between Libby and Rainy Creek Road where results are trace to <1% with a few non-detects. Relatively higher levels of LA in surface soils between Libby and the Rainy Creek Road is expected as ore trucks traveled this route during operation of the mine.
Visible vermiculite is limited to the eastern-most section of SH 37. This result is somewhat unexpected given that the occurrence of LA by PLM in soil in this area is typical of most of OU8. As discussed above, the cutoff for red as an indicator of the presence of visible vermiculite is arbitrary. In the case of the red colored results on the figure, most samples contained 10 aliquots, with a “low-level” of vermiculite noted in each aliquot.
The lack of visible vermiculite in surface soils between Libby and Rainy Creek Road is also unexpected given the presence of LA in these soils as measured by PLM (Figure 5-1). Further, vermiculite was observed in surface soils along this portion SH 37 in 2003 and 2005 (CDM,
Draft RI Report 5-3 OU8 Libby Asbestos Site
2005). However, it is almost certain that the soils samples inspected in 2003, 2005 and 2010 were not co-located. Therefore, spatial variability in the occurrence of vermiculite in surface soils may account for some of the differences in field inspection results across sample events. Other differences likely arise from the inherently subjective nature of the vermiculite level category assignments, as well as variations in site conditions between rounds (e.g., cloud cover vs. sunshine, amount of ground cover, soil moisture, etc.).
5.3 LA IN AIR
ABS Air
As discussed in Section 7.2.1.2, the amount of LA fibers released to air will vary depending upon the level of LA in the source material (e.g., outdoor soil) and the intensity and duration of the disturbance activity. Because of this, predicting the LA levels in air associated with disturbance activities based only on measured LA levels in the source material is extremely difficult. Therefore, ABS is considered to be the most direct way to estimate potential exposures from inhalation of asbestos. ABS results for ATV riding, brush hogging and grass cutting are presented on Figure 5-3. ABS results for rotomilling are presented on Figure 5-4.
As seen on Figure 5-3, LA was not detected in air during grass cutting activities. However, LA was detected during ATV riding and brush hogging. Concentrations associated with these activities ranged between <0.0020 LA s/cc to 0.0180 s/cc. As discussed in Section 3.1.1, the area over which these ABS activities were performed was selected based on the presence of LA and visible vermiculite in surface soils during the 2003 and 2005 sample event (CDM, 2005).
As seen on Figure 5-4, LA was not detected in air samples collected from the rotomilling machine and skid steer (small front-end loader). Detection limits ranged from 0.0216 s/cc to 0.0025 s/cc.
Based on the surface soil PLM results (Section 5.2), the ABS air sampling was performed in that portion of OU8 with the highest levels of LA in soil. This suggests that the ABS air samples discussed in this section represents the worst case condition in the entire OU.
Human health risk estimates based on these measurements are provided in Section 7.
Stationary Air
As discussed in Section 3.1.2, stationary sampling included ambient air proximal to a person or piece of equipment conducting ABS activities. Such stationary air samples were collected to represent conditions in the breathing zone as a surrogate for a personal air sample (e.g., a person walking on the sidewalk during rotomilling operations on the adjacent street).
Draft RI Report 5-4 OU8 Libby Asbestos Site
For the 2011 OU8 Field Program the following types of stationary air sampling were conducted:
At fixed locations on both sides of the street where rotomilling operations were conducted. The samplers formed an inner perimeter around the rotomill spaced about a block (approximately 300 feet) apart.
At selected locations up to 1,000 feet from California Ave., comprising an outer perimeter (also referred too as ambient air samples in the QAPP; Lockheed Martin, 2010a).
As seen on Figure 5-5, LA was detected in 1 of 52 inner perimeter field samples at a concentration of 0.0030 s/cc. Detection limits ranged from 0.0017 s/cc to 0.0247 s/cc.
As seen on Figure 5-6, LA was not detected in any outer perimeter (ambient) sample. Detection limits ranged from 0.0007 S/cc to 0.0.0010 s/cc.
Human health risk estimates based on these measurements are provided in Section 7.
Draft RI Report 6-1 OU8 Libby Asbestos Site
6.0 CONTAMINANT FATE AND TRANSPORT
The source for LA detected in surface soils and an air sample associated with rotomilling may include:
Vermiculite ore released from ore trucks by wind or other means during transport along state and local highways.
Imported fill containing vermiculite mine wastes used during earthwork for roadway construction or maintenance.
Naturally occurring LA (at background levels) in native soils in roadway ROW.
Aggregate containing vermiculite mine wastes used to manufacture asphalt.
Naturally occurring LA (at background levels) in aggregate used to manufacture asphalt.
Natural background levels of LA at the Site have not been established, although a study is underway that attempts to do this. Nevertheless, the relatively low levels and uniform distribution of LA in soils in roadway ROWs (excepting the portion of SH 37 between Libby and Rainy Creek Road), precludes elimination of natural background conditions as responsible for some of the LA detected in OU8.
The fate and transport of asbestos containing fibers is dependent on the type of host media (soil, water, air, etc.), land use, and site characteristics. Asbestos fibers (both serpentine and amphibole) are indefinitely persistent in the environment. According to the Agency for Toxic Substances and Disease Registry (ATSDR):
“Asbestos fibers are nonvolatile and insoluble, so their natural tendency is to settle out of air and water, and deposit in soil or sediment (EPA 1977, 1979c). However, some fibers are sufficiently small that they can remain in suspension in both air and water and be transported long distances. For example, fibers with aerodynamic diameters of 0.1–1 μm can be carried thousands of kilometers in air (Jaenicke 1980), and transport of fibers over 75 miles has been reported in the water of Lake Superior (EPA 1979c).” In addition, “they are resistant to heat, fire, and chemical and biological degradation” (ATSDR, 2001).
The primary transport mechanisms for asbestos and asbestos containing material include:
Suspension in air and transport via dispersion
Suspension in water and transport downstream
Asbestos can become suspended in air when asbestos or asbestos containing material is disturbed. Wind, recreational activities, construction, and site work can disturb material outdoors.
Draft RI Report 6-2 OU8 Libby Asbestos Site
Asbestos residence time in the air is determined primarily by particulate thickness; however it is influenced by other factors such as length and static charge. The average thickness of LA particles is 0.4 µm and ranges from approximately 0.1 to 1.0 µm. The suspension of LA in air is measured in “half times” which is the amount of time it will take 50% of LA particles to settle out of the air column. A particle with a thickness of 0.5 µm has a half time of approximately two hours, assuming the source of disturbance has been removed (CDM, 2009).
Larger particles will settle faster; a particle of 1 µm has a half time of about 30 minutes. Smaller LA particles may stay suspended for significantly longer. The typical half time for a 0.15 particle is close to 40 hours (CDM, 2009)
Activity-specific testing found that the half-time of LA suspended by dropping vermiculite on the ground was about 30 minutes. LA suspended from disturbing vermiculite insulation settled within approximately 24 hours (CDM, 2009).
Once suspended, LA moves by dispersion through air. LA concentration will be highest near the source and will decrease with increasing distance. In outdoor air, wind speed will determine direction and velocity of LA particle transport. Wind can cause the rapid dispersal of LA from the source of release.
In water, LA particles can be transported downstream with the current. As in air, larger particles tend to settle to the bottom more rapidly than smaller particles. Settled particles may be transported downstream with sediment (CDM, 2009).
LA is insoluble and therefore transport in solution will not occur in surface water, groundwater or from soils to water. Further, as a particle, LA is not expected to be mobilized from surface or near surface soils vertically through the soil column to the water table.
Draft RI Report 7-1 OU8 Libby Asbestos Site
7.0 HUMAN HEALTH RISK ASSESSMENT
7.1 OVERVIEW
This section presents the human health risk assessment (HHRA) for OU8. Operable Unit 8 consists of state and local roadways in and near Libby and Troy, Montana. The roadways include Highway 37 between Rainy Creek Road and the Koocanusa Dam, Highway 2, and secondary Highways 260, 482, and 567.
As discussed previously, vermiculite from the Libby mine contains varying concentrations of LA. Releases of LA (in association with vermiculite) to the environment is known to have caused a range of adverse health effects in exposed populations, including workers at the mine and processing facilities (Amandus and Wheeler, 1987; McDonald et al., 1986a, 1986b, 2004; Whitehouse, 2004; Sullivan, 2007), and residents of Libby (Peipins et al., 2003; Noonan et al., 2006; Whitehouse et al., 2008).
This risk assessment uses available data to estimate the current and future health risks to people who may inhale asbestos fibers in the air while performing road construction and routine maintenance activities along the roads and highways or participating in recreational activities in OU8, based on current conditions. The road construction activities include rotomilling and asphalt work. Maintenance activities adjacent to the roadways include lawn mowing, road sweeping, ditch cleaning and brush hogging. The airborne dust generated from these activities may be contaminated with LA; therefore, persons performing the rotomilling and maintenance work and the residents of Libby may be exposed to LA through inhalation of ambient air, which could pose a risk of cancer and/or non-cancer health effects. Additionally, ATV users may be exposed to asbestos fibers via inhalation during recreational activities along the roadways and highways monitored during this investigation. The methods used to evaluate human health risks from asbestos are in accordance with EPA guidelines for evaluating risks at NPL sites (EPA, 1989), including recent guidance (EPA, 2008, 2009a, 2011a, 2011c) that has been specifically developed to support evaluations of exposure and risk from asbestos.
People exposed to asbestos at OU8 may also be exposed to asbestos at other locations in and around Libby, MT. While this HHRA focuses exclusively on risks related to road construction, routine maintenance, and ATV recreational activities at OU8, the cumulative risks from multiple exposure pathways and source areas that may occur throughout the Site will be addressed in the future.
An ecological risk assessment is being developed for the mine site (OU3). EPA will build upon the information gathered during that ecological risk assessment to identify potential pathways and receptors to evaluate ecological risk at OU8. If ecological exposure pathways are identified at OU8, an ecological risk assessment will be performed.
Draft RI Report 7-2 OU8 Libby Asbestos Site
7.2 EXPOSURE ASSESSMENT
7.2.1 Conceptual Site Model
Figure 7-1 presents the Conceptual Site Model that summarizes how humans might be exposed to LA at OU8. The sections below discuss the exposed populations and exposure routes and pathways.
7.2.1.1 Exposed Populations
Based on the current and potential future land use at OU8, human receptors exposed on a regular basis include:
Current/future adult maintenance workers (e.g. MDOT worker) conducting routine maintenance activities (e.g., mowing the grass, brush hogging, or rotomilling along roadways).
Current/future child, adolescent, and adult recreational ATV users.
Given that OU8 consists of state and local roadways in and around Libby and Troy, Montana, buildings are not present and indoor exposure pathways are not applicable. Also, while automobiles drive on OU8 roadways, automobiles are not quantitatively evaluated in this HHRA. Automobile drivers and passengers traveling on roadways are anticipated to be minimally exposed to LA in air because typical automobile activity/traffic exposure durations are minimal. Finally, residents are not evaluated at OU8 since residences are not located within the OU8 boundaries and land use is not anticipated to change in the future.
7.2.1.2 Exposure Routes and Pathways
Human receptors that conduct maintenance work within, or otherwise access OU8, may be exposed to LA by incidental ingestion of contaminated media (e.g., soil, dust) and by inhalation of air that contains LA fibers. However, of these exposure pathways, inhalation exposure is the primary route of exposure. To the extent that incidental ingestion of LA may occur, the added risk from this pathway is expected to be insignificant compared to risks associated with the inhalation pathway; currently, toxicological criteria are not available to quantify ingestion exposure.
LA fibers may become airborne in a number of ways. This may include natural mechanisms such as entrainment of contaminated soil/dust in ambient air due to wind erosion or human activities that disturb contaminated sources such as indoor dust or outdoor soil. However, at OU8 indoor exposures are not applicable; only outdoor exposures are quantitatively evaluated. The amount of LA potentially inhaled varies depending on the concentration and fiber size of LA in the source, the intensity and duration of the disturbing force, and the activity level of
Draft RI Report 7-3 OU8 Libby Asbestos Site
potentially exposed populations. For the purposes of this risk evaluation a conservative adult inhalation rate of 20 m3/day is assumed for all populations, including children and adolescents, and tailored to the exposure period, consistent with USEPA’s RAGS, Part F: Supplemental Guidance for Inhalation Risk Assessment (USEPA, 2009a). Therefore, inhalation exposures focus on an evaluation based on the source material and disturbance activity. The exposures of concern for each of the exposed populations are as follows:
Current or future maintenance workers working along roadways. Inhalation of LA in ambient air by adult maintenance workers may occur during routine maintenance activities along highway ROWs. LA may be released from the disturbance of outdoor soil from activities such as mowing the grass and brush hogging or from asphalt surfaces during rotomilling.
Current or future recreational ATV users riding along roadways. Inhalation of LA in ambient air by child, adolescent, and adult recreational users may occur during ATV use due to disturbance of contaminated outdoor soil or dust along roadways. The associated risk evaluation assumes that children may ride ATVs with an accompanying parent.
Additionally, all individuals working in the vicinity of any roadwork may be exposed to ambient air. For example, those working in the town of Libby in local businesses along Highways 2 or 37 may be exposed to ambient air during road construction activities along these highways, as well as general bystanders. However, it is important to note that exposure assumptions for routine maintenance workers conducting ongoing work are more stringent than for intermittent exposures of local indoor business workers and general bystanders along OU8 roadways. Refer to Section 7.6, Uncertainty Analysis, for a discussion of uncertainties associated with exclusion of additional receptors from the quantitative evaluation.
The risk evaluation contained herein is predicated on the most relevant and conservative assessment basis applicable to OU8. Exposures associated with other receptor populations not specifically addressed in this assessment, such as people who visit OU8 on a less frequent basis (e.g., out-of-town visitors) will be lower than the exposures for the populations described above.
7.2.2 Approach for Characterizing Exposure
The amount of LA fibers released to ambient air at OU8 will vary depending upon the level of LA in outdoor soil (i.e., source material) and the intensity and duration of the disturbance activity. For outdoor exposures, a variety of meteorological (e.g., relative humidity, wind direction and speed) and source material conditions (e.g., soil moisture, vegetative cover) will also influence entrainment of dust and releases to air. Therefore, predicting LA levels in ambient air associated with disturbance activities based only on measured LA levels in source material is extremely difficult. The most direct way to determine potential exposures from inhalation is to measure the concentration of LA in air in association with a specific activity that disturbs the
Draft RI Report 7-4 OU8 Libby Asbestos Site
source material. The collection of ABS samples is essential in properly characterizing the level of airborne asbestos exposure which may be expected to occur when source material is disturbed (EPA, 2008).
EPA performed several ABS studies at the OU8 site in 2010 and 2011 to investigate the levels of LA in ambient air associated with a variety of activities under current conditions, including:
Maintenance workers mowing the grass, brush hogging and rotomilling along OU8 roadways
ATV users riding along OU8 roadways
Specifically, ABS data for ATV riding, grass mowing, and brush hogging were collected along a segment of Highway 37 between Libby and the intersection with Rainy Creek Road (Figure 5-3). ABS data for rotomilling (including ambient air sampling) were collected on Highway 37 between Highway 2 and East 2nd Street (Figures 5-4 thru 5-6). ABS data collection locations were determined based on visible vermiculite in surface soil (Figure 5-2) and PLM soil sampling results (Figure 5-1), as well as proximity to the town of Libby and actual locations of site activities (e.g., brush hogging, grass cutting, rotomilling, ATV riding).
Because it is cost prohibitive to evaluate risks by conducting outdoor ABS sampling along all segments/roadways in OU8, it is necessary to use the ABS data from limited portions of OU8 roadways to draw risk conclusions about areas that have not been studied by ABS. This was achieved by assessing the degree to which soil results from other areas are similar to the soil results for areas with ABS data. While ABS samples were not collected along the entirety of OU8, the locations that were sampled and their results represent a conservative estimate of potential source area concentrations and are appropriate for use in a conservatively-biased assessment of OU8 activity-based exposures.
A detailed description of the study design and DQOs for the ABS studies are provided in the Sampling and Analysis Plan/Quality Assurance Project Plan for Activity-Based Outdoor Air Exposures, Operable Unit 8, Libby Asbestos Superfund Site, Libby, Montana dated July 2010. Additional discussion of sample collection is provided in Section 3.
7.3 TOXICITY ASSESSMENT
The adverse effects of asbestos exposure in humans have been the subject of a large number of studies and publications. The following section provides a brief overview of the primary types of adverse health effects that have been observed in humans. More detailed reviews of the literature are provided in International Agency for Research on Cancer (IARC, 1977), World Health Organization (WHO, 2000), and Agency of Toxic Substances and Disease Registry (ATSDR, 2001, 2004).
Draft RI Report 7-5 OU8 Libby Asbestos Site
7.3.1 Non-Cancer Effects
7.3.1.1 Asbestosis
Asbestosis is a chronic pneumoconiosis associated with inhalation exposure to asbestos. It is characterized by the gradual formation of scar tissue in the lung parenchyma. Initially the scarring may be minor and localized within the basal areas, but as the disease develops, the lungs may develop extensive diffuse alveolar and interstitial fibrosis (American Thoracic Society, 1986).
Build-up of scar tissue in the lung parenchyma results in a loss of normal elasticity in the lung which can lead to the progressive loss of lung function. The initial symptoms of asbestosis are shortness of breath, particularly during exertion. People with fully developed asbestosis tend to have increased difficulty breathing that is often accompanied by coughing or rales. In severe cases, impaired respiratory function can lead to death.
Asbestosis generally takes a long time to develop, with a latency period from 10 to 20 years.
Mossman and Churg (1998) suggest that latency is inversely proportional to exposure level. The disease may continue to progress long after exposure has ceased (ATSDR, 2001). The progression of the disease after cessation of exposure also appears to be related to the level and duration of exposure (American Thoracic Society, 2004).
7.3.1.2 Pleural Abnormalities
Exposure to asbestos may induce several types of abnormality in the pleura (the membrane surrounding the lungs).
- Pleural effusions are areas where excess fluid accumulates in the pleural space. Most pleural effusions last several months, although they may be recurrent.
- Pleural plaques are acellular collagenous deposits, often with calcification. Pleural plaques are the most common manifestations of asbestos exposure (ATSDR, 2001; American Thoracic Society, 2004).
- Diffuse pleural thickening is a non-circumscribed fibrous thickening of the visceral pleura with areas of adherence to the parietal pleura. Diffuse thickening may be extensive and cover a whole lobe or even an entire lung. Infolding of thickened visceral pleura may result in collapse of the intervening lung parenchyma (rounded atelectasis). Genevois et al. (1998) and Schwartz et al. (1991) report that diffuse pleural thickening may occur as a result of pleural effusions.
Pleural effusions and plaques are generally asymptomatic, although rarely they may be associated with decreased ventilatory capacity, fever, and pain (e.g., Bourbeau et al., 1990).
Draft RI Report 7-6 OU8 Libby Asbestos Site
Diffuse pleural thickening can cause decreased ventilatory capacity (Baker et al., 1985; Churg 1986; Jarvholm and Larsson, 1988). Severe effects are rare, although Miller et al. (1983) reported on severe cases of pleural thickening that lead to death.
The latency period for pleural abnormalities is usually about 10 to 40 years (American Thoracic Society, 2004), although pleural effusions may occasionally develop as early as one year after first exposure (Epler and Gaensler, 1982).
7.3.1.3 Other Non-Cancer Effects
Some epidemiological studies provide evidence that chronic exposure to asbestos can increase the risk of several other types of non-cancer effects including cor pulmonale (right-sided heart failure), retroperitoneal fibrosis (a fibrous mass in the back of the abdomen that blocks the flow of urine from the kidneys to the bladder), depressed cell-mediated immunity (ATSDR, 2001), and autoimmune disease (Pfau et al., 2005; Noonan et al., 2006).
7.3.1.4 Observations of Non-Cancer Effects in People Exposed to LA
A number of studies have been performed to characterize the types of non-cancer effects that occur in people who have been exposed to LA. These studies are summarized below.
Amandus and Wheeler (1987), McDonald et al. (1986a, 1986b, 2004), and Sullivan (2007) studied the cause of death in workers exposed to LA while working at the vermiculite mine and mill at Libby. Each of these researchers reported that Libby workers were more likely to die of non-malignant respiratory disease (i.e., asbestosis, chronic obstructive pulmonary disease, pneumonia, tuberculosis and emphysema) compared to white males in the general U.S. population, supporting the conclusion that exposure to LA increases risk of non-malignant lung disease.
Armstrong et al. (1988), McDonald et al. (1986b) and Amandus et al. (1987) evaluated the prevalence of chest radiographic changes in workers exposed to LA while working at the vermiculite mine and mill at Libby. These researchers observed increased prevalence in pleural changes, including pleural calcification, pleural thickening and profusion of small opacities among exposed workers.
Rohs et al. (2007) studied the prevalence of pleural changes in the lungs of workers exposed to LA while working at a facility in Marysville, Ohio expanding Libby vermiculite for use as an inert carrier for lawn care products. Rohs et al. (2007) observed an increased incidence of pleural plaques, diffuse pleural thickening and interstitial changes (irregular opacities) in exposed workers. In addition, studies by Peipins et al. (2003), Muravov et al. (2005), and Whitehouse (2004) also observed increased incidence in pleural abnormalities of not only workers, but also household contacts of former employees of the Libby mine and residents of
Draft RI Report 7-7 OU8 Libby Asbestos Site
Libby, MT environmentally exposed to LA. These findings support the conclusion that exposure to LA can induce pleural abnormalities.
7.3.2 Cancer Effects
Many epidemiological studies have reported increased mortality from cancer in asbestos workers, especially from lung cancer and mesothelioma. Based on these findings, and supported by extensive carcinogenicity data from animal studies, EPA has classified asbestos as a known human carcinogen (EPA, 1993).
7.3.2.1 Lung Cancer
Exposure to asbestos is associated with increased risk of developing all major histological types of lung carcinoma (adenocarcinoma, squamous cell carcinoma, and oat-cell carcinoma) (ATSDR, 2001). The latency period for lung cancer generally ranges from about 10 to 40 years (ATSDR, 2001). Early stages are generally asymptomatic, but as the disease develops, patients may experience coughing, shortness of breath, fatigue, and chest pain. Most lung cancer cases result in death. The risk of developing lung cancer from asbestos exposure is substantially higher in smokers than in non-smokers (Selikoff et al., 1968; Doll and Peto, 1985; ATSDR, 2001; NTP, 2005).
7.3.2.2 Mesothelioma
Mesothelioma is a tumor of the thin membrane that covers and protects the internal organs of the body including the lungs and chest cavity (pleura), and the abdominal cavity (peritoneum).
Exposure to asbestos is associated with increased risk of developing mesothelioma (ATSDR, 2001).
The latency period for mesothelioma is typically around 20-40 years (Lanphear and Buncher, 1992; ATSDR, 2001; Mossman et al., 1996; Weill et al., 2004). By the time symptoms appear, the disease is most often rapidly fatal (British Thoracic Society, 2001).
7.3.2.3 Other Cancers
A number of studies suggest asbestos exposure may increase risk of cancer at various gastrointestinal sites (EPA, 1986). National Academy of Sciences (NAS, 2006) reviewed evidence regarding the role of asbestos in gastrointestinal cancers primarily following occupational exposures (these are assumed to be primarily by the inhalation route). NAS concluded that data are “suggestive but insufficient” to establish that asbestos exposure causes stomach or colorectal cancer. Data on esophageal cancer are mixed and were regarded as “inadequate to infer the presence or absence of a causal relationship to asbestos exposure”.
Draft RI Report 7-8 OU8 Libby Asbestos Site
Data on risks of gastrointestinal cancer following ingestion-only exposure are more limited.
Some researchers (e.g., Conforti et al., 1981; Kjaerheim et al., 2005) have reported a significant correlation between oral exposure to asbestos in drinking water and the risk of gastrointestinal cancer. However, WHO (1996) concluded that data are not adequate to support the hypothesis that an increased cancer risk is associated with the ingestion of asbestos in drinking water.
NAS (2006) reviewed available data on the relationship between asbestos exposure and laryngeal cancer and concluded that the data were “sufficient to infer a causal relationship between asbestos and laryngeal cancer.” NAS (2006) concluded that data are “suggestive but not sufficient to infer a causal relationship between asbestos exposure and pharyngeal cancer.”
Excess deaths from kidney cancer among persons with known exposure to asbestos have been reported by a number of researchers (e.g., Selikoff et al., 1979; Enterline et al., 1987; Puntoni et al., 1979). A review by Smith et al. (1989) evaluated these studies and concluded that asbestos should be regarded as a probable cause of human kidney cancer.
7.3.2.4 Observations of Cancer in People Exposed to LA
Amandus and Wheeler (1987), Amandus et al. (1987), McDonald et al. (1986a, 1986b, 2004), and Sullivan (2007) studied the cause of death in workers exposed to LA while working at the vermiculite mine and mill at Libby. All of these groups of researchers reported an increased incidence of lung cancer and mesothelioma in exposed workers, strongly supporting the conclusion that LA can cause increased risk of respiratory cancer when inhaled.
7.3.3 Role of Fiber Type and Size in Adverse Health Effects
All types of asbestos have been shown to induce asbestos-related disease in humans and animals; however, a number of researchers have proposed that not all forms of asbestos are equally toxic. Current research has focused on two key variables: mineral type (chrysotile versus various types of amphibole asbestos), and fiber size (length and width). Several researchers have used available human epidemiological data to investigate the relative potency of asbestos as a function of mineral type, and there is on-going debate regarding whether there is a difference in the relative cancer potencies of the various mineral types and sizes.
In particular, the carcinogenic potential of chrysotile asbestos relative to amphibole asbestos is a controversial issue. Various researchers (e.g., Hodgson and Darton, 2000; Mossman et al., 1990, McDonald and McDonald, 1997) propose that amphibole fibers are more potent inducers of mesothelioma and potentially lung cancer than chrysotile, based on lung burden studies, mechanistic studies, and various epidemiological data.
Studies on the importance of fiber size on toxicity come mainly from investigations in animals, particularly experiments conducted by Davis et al. (1978, 1980, 1985, 1986a, 1986b) and Davis
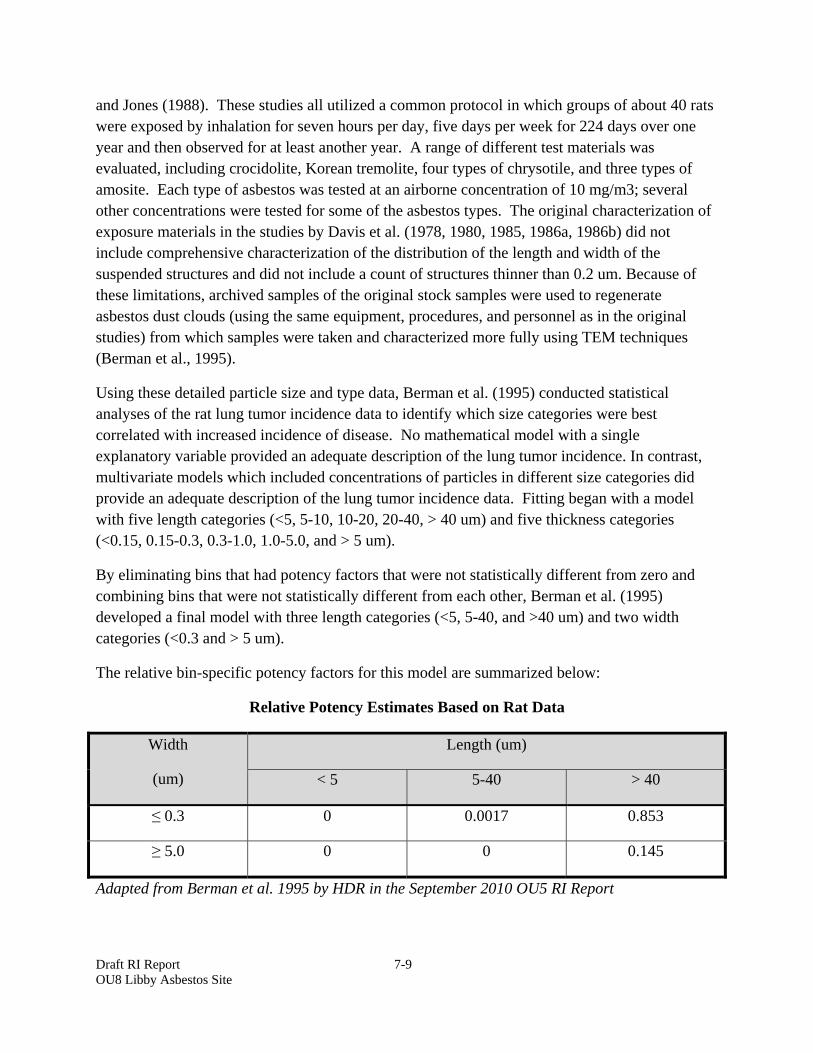
Draft RI Report 7-9 OU8 Libby Asbestos Site
and Jones (1988). These studies all utilized a common protocol in which groups of about 40 rats were exposed by inhalation for seven hours per day, five days per week for 224 days over one year and then observed for at least another year. A range of different test materials was evaluated, including crocidolite, Korean tremolite, four types of chrysotile, and three types of amosite. Each type of asbestos was tested at an airborne concentration of 10 mg/m3; several other concentrations were tested for some of the asbestos types. The original characterization of exposure materials in the studies by Davis et al. (1978, 1980, 1985, 1986a, 1986b) did not include comprehensive characterization of the distribution of the length and width of the suspended structures and did not include a count of structures thinner than 0.2 um. Because of these limitations, archived samples of the original stock samples were used to regenerate asbestos dust clouds (using the same equipment, procedures, and personnel as in the original studies) from which samples were taken and characterized more fully using TEM techniques (Berman et al., 1995).
Using these detailed particle size and type data, Berman et al. (1995) conducted statistical analyses of the rat lung tumor incidence data to identify which size categories were best correlated with increased incidence of disease. No mathematical model with a single explanatory variable provided an adequate description of the lung tumor incidence. In contrast, multivariate models which included concentrations of particles in different size categories did provide an adequate description of the lung tumor incidence data. Fitting began with a model with five length categories (<5, 5-10, 10-20, 20-40, > 40 um) and five thickness categories (<0.15, 0.15-0.3, 0.3-1.0, 1.0-5.0, and > 5 um).
By eliminating bins that had potency factors that were not statistically different from zero and combining bins that were not statistically different from each other, Berman et al. (1995) developed a final model with three length categories (<5, 5-40, and >40 um) and two width categories (<0.3 and > 5 um).
The relative bin-specific potency factors for this model are summarized below:
Relative Potency Estimates Based on Rat Data
Width
(um)
Length (um)
< 5 5-40 > 40
≤ 0.3 0 0.0017 0.853
≥ 5.0 0 0 0.145
Adapted from Berman et al. 1995 by HDR in the September 2010 OU5 RI Report
Draft RI Report 7-10 OU8 Libby Asbestos Site
As seen, fibers longer than 40 um accounted for 99.8% of the total potency, with most of that (85%) being contributed by fibers ≤ 0.3 um in diameter. Only a small contribution (<0.2%) was provided by fibers 5-40 um in length, and fibers less than 5 um did not contribute any observable potency. Further analysis of the available data in the context of the best-fitting model could not discern a difference in the lung-cancer-inducing potency of chrysotile and amphibole. Statistical analysis of the mesothelioma data indicated that amphibole potency was greater than chrysotile potency for equivalent size and shape particles (Berman et al., 1995).
More recently, research on “respirable” size fraction of asbestos particles to the overall toxicity of asbestos has been conducted although this is considered a data gap in the field of asbestos research (NIOSH, 2011). The amphibole class of asbestiform materials has a wide range of particle size distribution and the deposition of both spherical and elongate particles in the lung is size-dependent, with smaller particles having a greater probability of depositing in distal airways of the lung. Duncan et al. (2010) studied the cellular stress responses induced in primary human airway epithelial cells (HAEC) in vitro when exposed to a respirable size-fraction (≤2.5 um) of Libby amphibole (LA 2.5) to a similar size fraction of a reference amphibole sample amosite (AM
2.5). Unfractionated LA and amphibole AM, as well as the relative toxicity of a smaller size fraction with aerodynamic diameter (Dac) of ≤ 2.5 um of each of the amphibole samples were also investigated. The responses were measured by gene expression changes of IL-8, COX-2, heme oxygenase (HO)-1, along with 84 other genes involved in cellular stress-responsive pathways. Results of the study indicated that small size fractions of LA and AM, which are believed to penetrate deeper into the lung, induced comparable epithelial cell production of pro-inflammatory cytokines as unfractionated LA and AM. Further, exposure to AM 2.5 resulted in a 4-10 fold greater induction in pro-inflammatory mediators compared to LA 2.5 after 24 hours of exposure.
The difference in observed toxicity for the size-fractionated samples could not be attributed to differences in mineral contamination between the two samples, total surface area, or oxidant generation. The study demonstrated that small amphibole particles could be taken up by HAEC and concluded that results of the investigation provide evidence of the ability of LA to induce epithelial injury and inflammation compared to well-characterized amphibole samples.
Studies on the importance of asbestos fiber dimension (length, width) on toxicity in humans are limited. Stayner et al. (2007) evaluated the role of fiber dimension on cancer and non-cancer disease in workers exposed to chrysotile. Both lung cancer and asbestosis were most strongly associated with exposure to thin fibers (< 0.25 um). Exposure to long fibers (> 10 um) was found to be a strong predictor of increased lung cancer risk, while results for asbestosis were inconsistent. No studies of this type have been located for workers exposed to amphibole.
However, Berman and Crump (2008) performed mathematical modeling of human exposure response data to a range of different asbestos types, and concluded that fibers < 10 um in length

Draft RI Report 7-11 OU8 Libby Asbestos Site
have very low carcinogenic potency compared to fibers longer than 10 um in length. Based on limited data on fiber width from either animal or human studies, Berman and Crump (2008) stated that the effect of fiber width on potency remains unclear although it is likely that fiber width will affect lung cancer and mesothelioma differently.
In addition to length and width, the impact of aspect ratio (length:width) on toxicity and health effects is an area of research that is still being investigated (NIOSH, 2011). Strum (2009) used a stochastic lung model to predict the deposition of variably shaped asbestos fibers in the human respiratory tract. The model focused on the computation of appropriate dynamic shape factors and resulting aerodynamic diameters of fibers with different aspect ratios. The aerodynamic diameter concept was implemented into a stochastic particle transport and deposition model which had previously been validated under numerous processes (Koblinger et al., 1990). Various deposition scenarios of fibers were computed and their values for estimation of health hazards were presented. The study indicated that the fiber aspect ratio (ß) had an insignificant influence on total deposition; and fibers with ß = 10 and ß = 100 differed by 2 to 10 percent (%). In contrast, for regional deposition the fiber diameter represented a controlling factor with fibrous particles with cylindrical diameter (dp) = 0.1 um preferentially deposited in the bronchioles and alveoli, whereas fibers with dp = 10 um exclusively accumulated in the extrathoracic region. Depositional behavior of fibers with dp = 1 um was more complex, since the model indicated particle fractions deposited in all compartments of the lung. Results of the theoretical approach suggest that thin fibers with variable length tend to deposit in the pulmonary region of the lung, where they represent a risk for mesothelioma. The model indicated that thick fibers preferentially accumulate in the proximal bronchi, where they may induce bronchial lung cancer (adenocarcinoma).
7.4 QUANTIFICATION OF EXPOSURE AND RISK
The following section details the methodology by which the toxicity (i.e., constituent-specific dose-response information) and exposure (i.e., projected intake) assessments are integrated in the development of quantitative point estimates of carcinogenic risk and noncarcinogenic hazard.
7.4.1 Non-Cancer Risk
The basic equation for characterizing risk of a non-cancer effect from inhalation exposure to asbestos is as follows:
HQ = CE / RfC
where:
HQ = Hazard Quotient
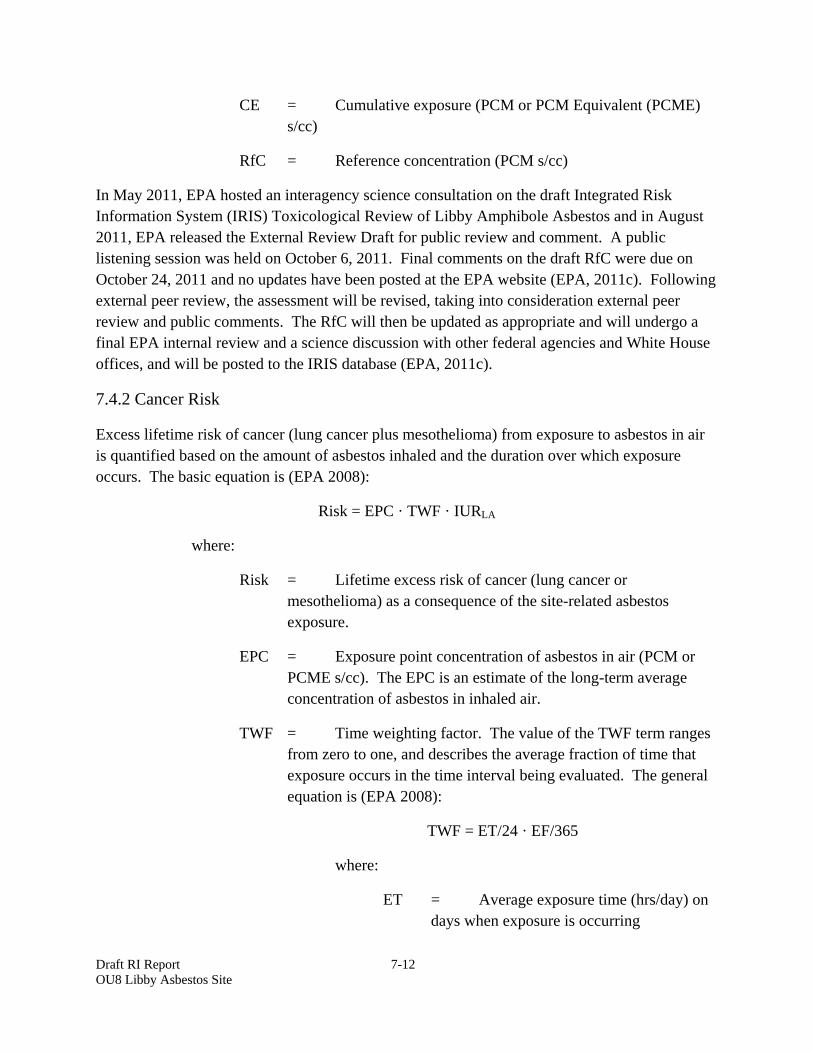
Draft RI Report 7-12 OU8 Libby Asbestos Site
CE = Cumulative exposure (PCM or PCM Equivalent (PCME) s/cc)
RfC = Reference concentration (PCM s/cc)
In May 2011, EPA hosted an interagency science consultation on the draft Integrated Risk Information System (IRIS) Toxicological Review of Libby Amphibole Asbestos and in August 2011, EPA released the External Review Draft for public review and comment. A public listening session was held on October 6, 2011. Final comments on the draft RfC were due on October 24, 2011 and no updates have been posted at the EPA website (EPA, 2011c). Following external peer review, the assessment will be revised, taking into consideration external peer review and public comments. The RfC will then be updated as appropriate and will undergo a final EPA internal review and a science discussion with other federal agencies and White House offices, and will be posted to the IRIS database (EPA, 2011c).
7.4.2 Cancer Risk
Excess lifetime risk of cancer (lung cancer plus mesothelioma) from exposure to asbestos in air is quantified based on the amount of asbestos inhaled and the duration over which exposure occurs. The basic equation is (EPA 2008):
Risk = EPC · TWF · IURLA
where:
Risk = Lifetime excess risk of cancer (lung cancer or mesothelioma) as a consequence of the site-related asbestos exposure.
EPC = Exposure point concentration of asbestos in air (PCM or PCME s/cc). The EPC is an estimate of the long-term average concentration of asbestos in inhaled air.
TWF = Time weighting factor. The value of the TWF term ranges from zero to one, and describes the average fraction of time that exposure occurs in the time interval being evaluated. The general equation is (EPA 2008):
TWF = ET/24 · EF/365
where:
ET = Average exposure time (hrs/day) on days when exposure is occurring
Draft RI Report 7-13 OU8 Libby Asbestos Site
EF = Average exposure frequency (days/year) in years when exposure is occurring
IURLA = Inhalation unit risk (PCM s/cc)-1 for LA, which represents the upper-bound excess lifetime cancer risk estimated to result from continuous exposure at a concentration of 1 sLA/cc in air.
7.4.3 Exposure Point Concentrations
The value of the EPC term is based on TEM measurements of asbestos concentration levels in air (expressed as PCME LA s/cc) at the location of concern and for the exposure scenario of concern. Ideally, the EPC would be the true average concentration of LA in breathing zone air, averaged across the exposure period. However, the true average exposure concentration can only be approximated from a finite set of measurements, and the sample mean might be either higher or lower than the true mean.
To minimize the chances of underestimating the true amount of exposure and risk, EPA generally recommends that risk calculations be based on the 95% upper confidence limit (95UCL) of the sample mean (EPA, 1992), and has developed a software application (ProUCL) to assist with the calculation of 95UCL values (EPA, 2007a). However, the equations and functions in ProUCL are not designed for asbestos concentration data sets and application of ProUCL to asbestos data sets is not recommended (EPA, 2008). EPA is presently working to develop a new software application that will be appropriate for use with asbestos data sets, but the application is not yet available for use.
Because the 95UCL cannot presently be calculated with confidence, risk calculations presented in this report utilize the sample mean only (EPA, 2008). Because the sample mean may be either higher or lower than the true mean, the risk estimates presented here may be either higher or lower than the true risks.
In cases where the underlying data set for the EPC calculation is all non-detect, the calculated sample mean is zero. While a data set of this type provides good evidence that the true concentration is low, it is reasonable to assume the true mean value is not actually zero, although there is no reliable method for estimating what the true value might be (EPA, 2008).
Draft RI Report 7-14 OU8 Libby Asbestos Site
It is important to note that rotomilling data collected from rotomilling equipment were all non-detect. These samples are indicative of exposures to a maintenance worker conducting rotomilling operations (i.e., a rotomill operator). However, while these data were non-detect, to be conservative, a maintenance worker/rotomiller was quantitatively evaluated in the HHRA using ABS data collected in the inner perimeter of the rotomilling study area. These data are representative of exposures to bystanders and other workers working in the study area and included some detections of LA in air.
The rotomilling EPC was calculated using inner perimeter ABS data only. Worker exposure assumptions were used to quantify risk and hazard for rotomilling activities.
7.4.4 Exposure Parameters
Not all individuals within a group will have equal exposures to asbestos. This is because different individuals will have differing values for exposure time (ET), exposure frequency (EF), and exposure period. To account for this variability, the HHRA evaluates a more realistic exposure scenario predicated on central tendency exposure parameter estimates, as well as an upper range exposure scenario for each site receptor.
Table 7-1 presents the exposure pathways and parameters used in the HHRA for each exposure scenario. The exposure parameters for recreational ATV users were based on professional judgment. The exposure parameters for outdoor maintenance workers were based on default values (EPA, 1991b, 2002, 2003), but were adjusted to focus on both a central tendency estimate and an upper range estimate. The rationale for the selected exposure parameters are provided in Table 7-1, as well as other HHRA tables.
7.5 RISK CHARACTERIZATION
The level of cancer risk that is of concern is a matter of personal, community, and regulatory judgment. In general, the EPA considers excess cancer risks that are below about 1E-06 (one in a million) to be so small as to be negligible, and risks above 1E-04 (one in ten thousand) to be sufficiently large that remediation or qualitative corrective action (e.g., land use restrictions) is desirable. Excess cancer risks that range between 1E-04 and 1E-06 are generally considered to be acceptable (EPA, 1991a), although this is evaluated on a case-by-case basis, considering the degree of conservatism and level of uncertainty inherent in the quantitative and qualitative assessments that comprise the risk evaluation. EPA may determine that risks lower than 1E-04 are not sufficiently protective and warrant remedial action. EPA has expressed a preference for cleanups achieving the protective end of the risk management range and considers 1E-06 as the point of departure for remedial decisions (EPA, 1991a). As noted previously, the risks calculated refer only to exposures that are assumed to occur in OU8. EPA will perform a risk assessment at a later date that considers cumulative risks from all site-related exposure pathways.
Draft RI Report 7-15 OU8 Libby Asbestos Site
For noncancer health impacts risk is expressed as a Hazard Quotient (HQ), which is an indicator of the probability of potential risk of noncancer adverse health effects. The Hazard Index (HI) is equal to the sum of the HQs. Because LA is the only chemical evaluated at OU8, the HQ and HI are the same. An HI less than 1 indicates that it is unlikely for even sensitive populations to experience adverse health effects; an HI greater than 1 requires evaluation for potential risk management measures (EPA, 1989).
7.5.1 Risk to Adult Maintenance Workers
Pending finalization of toxicity values for LA.
7.5.2 Hazard to Adult Maintenance Workers
Pending finalization of toxicity values for LA.
7.5.3 Risks to Child, Adolescent and Adult Recreational ATV Users
Pending finalization of toxicity values for LA.
7.5.4 Hazard to Child, Adolescent and Adult Recreational ATV Users
Pending finalization of toxicity values for LA.
7.5.5 Risks from Outdoor Ambient Air
Pending finalization of toxicity values for LA.
7.5.6 Summary and Conclusions
Pending finalization of toxicity values for LA.
7.6 UNCERTAINTY ANALYSIS
There are a number of uncertainties that arise during the process of estimating human exposure and risk to asbestos. Such uncertainties limit the confidence in the estimated risks to recreational ATV users or roadway maintenance workers at OU8. The primary sources of uncertainty associated with this risk assessment are discussed below.
7.6.1 Uncertainty in LA Levels in Soil
As discussed previously, characterization of LA levels in soil is difficult. At present, the best available techniques are PLM-VE and visible inspection for vermiculite. However, both methods are subjective and are only semi-quantitative, and both tend to be somewhat variable between repeat analyses. Thus, the results of PLM or visible inspections analyses are inherently uncertain. In addition, because the relationship between LA levels in soil do not easily translate
Draft RI Report 7-16 OU8 Libby Asbestos Site
to air concentrations. Therefore, soil LA concentrations should not be relied upon for evaluating acute and chronic risks to receptors. Hence, the ABS approach was used to estimate potential health risk.
7.6.2 Uncertainty in LA Concentrations in Inhaled Air
Concentrations of LA in air are inherently variable, so estimates of mean exposure concentrations are subject to uncertainty arising from random variation between individual samples. This problem is especially marked for ABS samples, where very wide variability (3-4 orders of magnitude) may be observed within and between data sets. This high variability means that it is usually necessary to collect a large number of samples to ensure that the data are representative.
However, as noted above, only a limited number of ABS values are available for each ABS area, and these values may not be representative of the true long term average exposure concentration for soil disturbances in the OU. Consequently, the observed sample mean concentration may be either higher or lower than the true mean.
This uncertainty is further compounded by the effect of analytical measurement error. That is, for each air sample collected, the measured concentration value is a random variable that is characterized by the Poisson distribution:
Cobserved ~ POISSON (Ctrue · Volume Analyzed) / Volume Analyzed
As a consequence, the total variability (and hence uncertainty) in the measured concentration values is greater than the variability due to sampling variation alone. Consequently, risks calculated based on the mean may be either higher or lower than the true risk, but the magnitude of the potential error cannot be estimated because appropriate statistical methods are not yet available to calculate the 95UCL.
7.6.3 Uncertainty Arising from Use of an Indirect Preparation Technique
During TEM analysis of the ABS air samples, the analytical laboratory noted that some of the air filters were significantly overloaded with particulates. As a result, these samples were analyzed using an indirect preparation method after ashing in accordance with the Supplemental Remedial Investigation Quality Assurance Project Plan (EPA, 2005). For chrysotile asbestos, indirect preparation often tends to increase structure counts due to dispersion of bundles and clusters (Hwang and Wang, 1983; HEI-AR, 1991; Breysse 1991). For amphibole asbestos, the effects of indirect preparation are generally much smaller (Bishop et al., 1978; Sahle and Laszlo, 1996; Harris 2009). Based on this information, it is expected that the effect of indirect preparation on estimates of LA concentrations in air is likely to be minor.
Draft RI Report 7-17 OU8 Libby Asbestos Site
This expectation is supported by a Libby-specific study conducted in 2005. This study compared the results for 31 samples analyzed for LA using both direct and indirect preparation methods (EPA, 2007b). Figure 7-2 presents the paired results from this study. For total LA (Panel A), some samples were statistically lower, some were not statistically different, and some were statistically higher when analyzed by an indirect method compared to a direct method. Although the difference was 10- to15-fold in a few samples, the average across all samples was about 3.3.
A similar pattern is observed when results are expressed as PCME s/cc (Panel B), although the differences tend to be smaller. In this case, the average ratio of indirect to direct concentration estimates is about 1.5. Based on these considerations, it is concluded that analysis of samples for
LA using an indirect preparation method may tend to overestimate exposure and risk somewhat, but that the magnitude of the error is not likely to exceed a factor of about 1.5-3.
7.6.4 Lack of an Approved Non-Cancer Inhalation RfC
Studies of former workers at the vermiculite mine and residents of Libby (Armstrong et al., 1988; McDonald et al., 1986a, 1986b; Amandus et al., 1987; Peipins et al., 2003; Muravov et al., 2005; Whitehouse 2004) provide strong evidence that exposure to LA results in an increased incidence of non-cancer adverse effects, and that these effects occur in some individuals who appear to have relatively low exposures. Similar results have been observed in workers at a plant in Ohio that utilized vermiculite from Libby to make lawn care products (Lockey et al. 1984, Rohs et al.2008).
While EPA has not yet developed national guidance for evaluating the risk of non-cancer effects from inhalation exposure to asbestos, EPA released a draft RfC for LA in May 2011. Using the draft RfC in the risk assessment could overestimate or underestimate hazard.
7.6.5 Uncertainty in Human Exposure Patterns
Risk from asbestos is strongly dependent not only on the level of exposure, but also on the time and frequency of exposure and on the age when exposure begins and ends. Exposure parameters for site users are based on profession judgment or EPA default values. There is some uncertainty with these exposure parameters, which may overestimate or underestimate uncertainty. To reduce uncertainty, risk and hazard estimates for each site receptor were determined using exposure parameters representative of upper range exposure and exposure parameters representative of a more central tendency exposure scenario.
Draft RI Report 7-18 OU8 Libby Asbestos Site
7.6.6 Uncertainty in the Cancer Exposure-Response Relationship
Although the IRIS method is currently the only approach approved by EPA for estimating cancer risks from inhalation of asbestos (EPA 2008), there are some uncertainties and potential limitations to the use of this method, as follows:
The potency factors derived by EPA (1986) are based on measures of exposure expressed as PCM fibers, without any distinction of mineral type (chrysotile, amphibole). However, there are a number of studies which suggest that mineral type may be an important determinant of potency, at least for mesothelioma. Because the potency factors are consensus values that are derived from studies that include occupational exposures to chrysotile alone, amphibole alone, and a mixture of amphibole and chrysotile, it is expected that the IRIS potency factors are intermediate between the values for amphibole and chrysotile. To the extent that amphibole is more potent that chrysotile, use of the IRIS potency factors may tend to underestimate risks in Libby, where the mineral form of concern is amphibole.
To the extent that the particle size distributions vary between workplaces (i.e., the ratio is not constant between the concentration of PCM fibers and the concentrations of other size ranges with differing potencies), the IRIS approach cannot account for these differences, and may either underestimate or overestimate risk.
The IRIS values are based on observations in workers, and may not address differences in susceptibility between different types of populations (e.g., children, the elderly).
The IRIS values represent the central tendency estimates of the potency factors, not an upper bound on the values. Thus, the true potency factors might be either higher or lower than the values selected.
The unit risks derived by EPA (1986) are based on mortality statistics from the 1970s. Thus, they may not be applicable to populations that are exposed to asbestos today. In particular, as life expectancy has increased, risks from asbestos exposure also tend to increase. Thus, risk estimates based on the IRIS method may be somewhat low.
7.6.7 Uncertainty Associated with Cumulative Exposures
People who live or work in Libby may be exposed to LA by a number of different pathways. Because this risk assessment evaluates only some of these pathways, the risk estimates presented here are likely to underestimate the total risks to site receptors. However, until risk assessments are completed for all potentially significant exposure pathways, the magnitude of the risks cannot be reliably estimated.
Draft RI Report 8-1 OU8 Libby Asbestos Site
8.0 CONCLUSIONS
The RI reached the following general conclusions:
1. Approximately 80% of PLM results for surface soil samples collected as part of the OU8 remedial investigation field program are non-detect with the remainder containing trace amounts of LA. Some soil samples collected prior to the establishment of OU8 (legacy data) between the Libby Mine (Rainy Creek Road) and the town of Libby contained LA at levels between trace and 1%. Relatively higher levels of LA in surface soils between Libby and the Rainy Creek Road are expected as ore trucks traveled this route during operation of the mine.
2. Visible vermiculite is limited to the eastern-most section of SH 37. This result is somewhat unexpected given that the occurrence of LA by PLM in soil in this area is typical of most of OU8.
3. Predicting LA levels in air associated with disturbance activities based only on measured LA levels in soil is extremely difficult. Therefore, ABS is considered to be the most direct way to estimate potential exposures from inhalation of asbestos.
4. Exposure pathways that are thought to be most likely of potential concern in OU8 include exposure of ATV riders along roadway ROW and exposure of outdoor roadway maintenance workers performing grass cutting, brush hogging and rotomilling.
5. ABS air sampling was conducted to assess exposure to roadway maintenance workers and ATV riders. Air sampling pumps were affixed to ATVs and maintenance equipment during ABS sample events.
6. Air sampling associated with rotomilling also involved fixed sampling stations on both sides of the street where rotomilling operations were conducted (forming an inner perimeter). In addition, stationary air samples were collected at various locations up to 1,000 feet from the rotomill, comprising an outer perimeter.
7. Cancer risk estimates based on measured LA concentrations in air are pending finalization of toxicity values for LA.
8. Non-cancer health impacts are expressed as a Hazard Quotient (HQ), which indicates the potential for adverse health effects. HQs are pending finalization of toxicity values for LA.
9. An ecological risk assessment is being developed for the mine site (OU3). EPA will build upon the information gathered during that ecological risk assessment to identify potential

Draft RI Report 8-2 OU8 Libby Asbestos Site
pathways and receptors to evaluate ecological risk at OU8. If ecological exposure pathways are identified at OU8, an ecological risk assessment will be performed.
Draft RI Report 9-1 OU8 Libby Asbestos Site
9.0 REFERENCES
Amandus HE, Wheeler R. 1987. The Morbidity and Mortality of Vermiculite Miners and Millers Exposed to Tremolite-Actinolite: Part II. Mortality. Am. J. Ind. Med. 11:15-26.
Amandus HE, Althouse R, Morgan WKC, et al. 1987. The Morbidity and Mortality of Vermiculite Miners and Millers Exposed to Tremolite-Actinolite: Part III. Radiographic Findings. American Journal of Industrial Medicine, 11: 27-37.
American Thoracic Society. 1986. The diagnosis of nonmalignant diseases related to asbestos. American Review Respiratory Disease. 134: 363-368.
American Thoracic Society. 2004. Diagnosis and initial management of nonmalignant diseases related to asbestos. Am. J. Respir. Crit. Care Med. 170: 691-715.
Armstrong BK, DeKlerk NH, Musk AW, et al. 1988. Mortality in miners and millers of crocidolite in Western Australia. British Journal of Industrial Medicine. 45: 5-13.
ATSDR. 2001. Toxicological Profile for Asbestos. Atlanta, GA: Agency for Toxic Substances and Disease Registry, U.S. Department of Health and Human Services, Public Health Service. September 2001. http://www.atsdr.cdc.gov/toxprofiles/tp61.html
ATSDR. 2004. Toxicological Profile for Synthetic Vitreous Fibers. Atlanta, GA: Agency for Toxic Substances and Disease Registry, U.S. Department of Health and Human Services, Public Health Service. http://www.atsdr.cdc.gov/toxpro2.html#bookmark05
Baker EL, Dagg T, Greene RE. 1985. Respiratory illness in the construction trades. I. The significance of asbestos-associated pleural disease among sheet metal workers. J Occup Med 27:483-489.
Berman DW, Crump KS, Chatfield EJ, Davis JM, Jones AD. 1995. The sizes, shapes, and mineralogy of asbestos structures that induce lung tumors or mesothelioma in AF/HAN rats following inhalation. Risk Anal 15(2):181-95.
Berman DW, Crump KS. 2008. A Meta-Analysis of Asbestos-Related Cancer Risk That Addresses Fiber Size and Mineral Type. Crit. Rev. Tox. 38(S1):49–73.
Bishop K, Ring S, Suchanek R, Gray D. 1978. Preparation Losses and Size Alterations for Fibrous Mineral Samples. Scanning Electron Microsc. I:207.
Bourbeau J, Ernst P, Chrome J, et al. 1990. The relationship between respiratory impairment and asbestos-related pleural abnormality in an active work force. Am Rev Respir. Dis. 142:837-842.
Draft RI Report 9-2 OU8 Libby Asbestos Site
Breysse PN. 1991. Electron Microscopic Analysis of Airborne Asbestos Fibers. Crit. Rev. Analyt.
British Thoracic Society. 2001. British Thoracic Society Standards of Care Committee. Statement on malignant mesothelioma in the United Kingdom. Thorax 56:250-65.
CDM. 2004. Close Support Facility, Soil Preparation Plan, Libby Montana Asbestos Project Sample Processing. March 2004.
CDM, 2005. Contaminant Screening Study, Libby Asbestos Site, Operable Unit 4, Libby, Montana, Final Summary Report for the J. Neils Park and Montana State Highway 37 Investigations, Revision 1. December 2005
CDM, 2009. Former Export Plant Site Final Remedial Investigation Report, Operable Unit 1, Libby Asbestos Site, Libby, MT;–. August 3, 2009.
Churg A. 1986. Nonneoplastic asbestos-induced disease. Mt Sinai J Med 53:409-415.
Conforti PM, Kanarek MS, Jackson LA, et al. 1981. Asbestos in drinking water and cancer in the San Francisco Bay Area: 1969-1974 incidence. J Chronic Dis 34:211-224.
Davis JM, Addison J, Bolton RE, et al. 1985. Inhalation studies on the effects of tremolite and brucite dust in rats. Carcinogenesis. 6: 667-674.
Davis JM, Addison J, Bolton RE. 1986a. The pathogenicity of long versus short fibre samples of amosite asbestos administered to rats by inhalation and intraperitoneal injection. Br J Exp Pathol. 67: 415-430.
Davis JM, Addison J, Bolton RE, Donaldson K, Jones AD. 1986b. Inhalation and injection studies in rats using dust samples from chrysotile asbestos prepared by a wet dispersion process. Br J Exp Pathol 67:113-129.
Davis JM, Beckett ST, Bolton RE, Collings P, Middleton AP. 1978. Mass and number of fibers in the pathogenesis of asbestos-related lung disease in rats. Br J Cancer. 37:673-688.
Davis JM, Beckett ST, Bolton RE, et al. 1980. A comparison of the pathological effects in rats of the UICC reference samples of amosite and chrysotile with those of amosite and chrysotile collected from the factory environment. IARC Sci Publ 30:285-292
Davis JM, Jones AD. 1988. Comparisons of the pathogenicity of long and short fibers of Doll R, Peto J. 1985. Asbestos: Effects on health of exposure to asbestos. A report to the Health and Safety Commission. London, England, Her Majesty's Stationery Office.
Doll, R., and J. Peto. 1985. Asbestos: Effects on health of exposure to asbestos. A report to the Health and Safety Commission. London, England, Her Majesty's Stationery Office.
Draft RI Report 9-3 OU8 Libby Asbestos Site
Duncan, K. E., A. J. Ghio, L.A. Dailey, A. M. Bern, E. A. Gibbs-Flournoy, D. J. Padilla-Carlin, V.L. Roggi and R. B. Devlin. 2010. Toxicity of amosite and Libby amphibole. Toxicological Sciences. Oxford University Press. September 2010.
Enterline PE, Hartley J, Henderson V. 1987. Asbestos and cancer: A cohort followed up to death. Br J Ind Med 44:396-401.
EPA. 1986. Airborne Asbestos Health Assessment Update. U.S. Environmental Protection Agency, Office of Health and Environmental Assessment. EPA 600/8-84/003F. June 1986. http://cfpub.epa.gov/ncea/cfm/recordisplay.cfm?deid=35551
EPA. 1989. Risk Assessment Guidance for Superfund (RAGS). Volume I. Human Health Evaluation Manual (Part A). U.S. Environmental Protection Agency, Office of Emergency and Remedial Response. EPA/540/1-89/002. December.
EPA. 1991a. Role of the Baseline Risk Assessment in Superfund Remedy Selection Decisions. Washington, DC. OSWER Directive #9355.0-30. http://www.epa.gov/oswer/riskassessment/baseline.htm
EPA. 1991b. Risk Assessment Guidance for Superfund. Volume I. Human Health Evaluation Manual. Supplemental Guidance: “Standard Default Exposure Factors”. U.S. Environmental Protection Agency, Office of Emergency and Remedial Response. OSWER Directive 9285.6-03. Interim Final. March 25, 1991.
EPA. 1992. U.S. Environmental Protection Agency, Office of Solid Waste and Emergency Response. Supplemental Guidance to RAGS: Calculating the Concentration Term. Publication #9285.7-081. http://www.deq.state.or.us/lq/pubs/forms/tanks/UCLsEPASupGuidance.pdf
EPA. 1993. Carcinogenicity Assessment for Asbestos. Integrated Risk Information System (IRIS).
EPA. 2002. Supplemental Guidance for Developing Soil Screening Levels for Superfund Sites. U.S. Environmental Protection Agency, Office of Solid Waste and Emergency Response. OSWER 9355.4-24. December 2002.
EPA. 2003. Libby Asbestos Site, Residential/Commercial Cleanup Action Level and Clearance Criteria Technical Memorandum. Draft Final. U.S. Environmental Protection Agency, Region 8. December 15, 2003.
EPA. 2005. Supplemental Remedial Investigation Quality Assurance Project Plan for Libby, Montana. Revision 1. U.S. Environmental Protection Agency, Region 8. August 5.
EPA, 2006. Data Quality Assessment: A Reviewer’s Guide. EPA QA/G-9R. US EPA, Office of Environmental Information. EPA/240/B-06/002. February.
Draft RI Report 9-4 OU8 Libby Asbestos Site
EPA. 2007a. ProUCL Version 4.00.02 User Guide. U.S. Environmental Protection Agency, Office of Research and Development, National Exposure Research Laboratory. EPA/600/R-07/038. April 2007. http://www.epa.gov/esd/tsc/TSC_form.htm
EPA. 2007b. Effect of Indirect Preparation on LA Structure Count in Air Samples from Libby, MT, Appendix 3.1 of the Summary Report for Data Collected Under the Supplemental Remedial
EPA. 2008. Framework for Investigating Asbestos-Contaminated Sites. Report prepared by the Asbestos Committee of the Technical Review Workgroup of the Office of Solid Waste and Emergency Response, U.S. Environmental protection Agency. OSWER Directive #9200.0-68. http://epa.gov/superfund/health/contaminants/asbestos/pdfs/framework_asbestos_guidance.pdf
EPA. 2009a. Risk Assessment Guidance for Superfund (RAGS). Volume I. Human Health Evaluation Manual (Part F), Supplemental Guidance for Inhalation Risk Assessment. EPA-540-R-070-002. January 2009.
EPA. 2009b. Summary of Outdoor Ambient Air Monitoring for Asbestos at the Libby Asbestos Site, Libby, Montana (October 2006 to June 2008). Prepared by U.S. Environmental Protection Agency, Region 8, with technical support from SRC, Inc. February 9, 2009.
EPA, 2010a. Libby Asbestos, Region 8, US EPA. Website. Retrieved April 2010 from the World Wide Web: www.epa.gov/libby/, January 2010.
EPA, 2010b. Region 8, Fourth Five Year Review Report for Libby Groundwater Contamination Superfund Site; City of Libby, Lincoln County, Montana. March 2010.
EPA. 2011a. Public Meeting at Libby, Montana. Presentation on Toxicity and Risk Assessment by Dr. Deborah McKean, Toxicologist, USEPA Region 8. May 2011.
EPA. 2011b. Personal Communication with David Berry, Ph.D., Senior Toxicologist, USEPA Region 8. Libby Asbestos Technical Working Group (LATWG) Protocol update.
EPA. 2011c. Integrated Risk Information System (IRIS) Toxicological Review of Libby Amphibole Asbestos (External Review Draft). U.S. Environmental Protection Agency, Washington, DC, EPA/635/R-11/002A, 2011.
Epler GR, Gaensler EA. 1982. Prevalence of asbestos pleural effusion in a working population. JAMA. 247: 617-622.
Genevois PA, de Maertaeler V, Madani A, WInant C, Sergent G, De Vuyst P. 1998. Asbestosis, pleural plaques and diffuse pleural thickening: three distinct benign responses to asbestos exposure. Eur. Respire. J. 11: 1021-1027.
Draft RI Report 9-5 OU8 Libby Asbestos Site
Harris. 2009. TEM Observations of Amphiboles from El Dorado Hills Study. Geological Society of America Abstracts with Programs, October 21, 2009. Vol. 41, No. 7, p. 703.
HEI-AR (Health Effects Institute – Asbestos Research). 1991. Asbestos in Public and Commercial Buildings: A Literature Review and Synthesis of Current Knowledge. Health Effects Institute – Asbestos Research. Cambridge, Massachusetts.
Hodgson JT, Darnton A. 2000. The Quantitative Risks of Mesothelioma and Lung Cancer in Relation to Asbestos Exposure. Ann. Occup. Hyg. 44:565–601.
Hwang and Wang. 1983. Comparison of Methods of Assessing Fiber Concentrations. Arch. Environ. Health 38:5-10.
IARC. 1977. Monographs on the Evaluation of Carcinogenic Risks to Man. Volume 14. International Agency for Research on Cancer. IARC Scientific Publications. Lyon, France.
ISO. 1995. International Organization for Standardization Ambient Air. Determination of asbestos fibres – Direct-transfer transmission electron microscopy method. ISO 10312:1995(E).
Jarvholm B, Larsson S. 1988. Do pleural plaques produce symptoms? A brief report. J Occup Med. 30:345-347.
Kjaerheim K, Ulvestad B, Martinsen JI, Andersen A. 2005. Cancer of the gastrointestinal tract and exposure to asbestos in drinking water among lighthouse keepers (Norway). Cancer Causes and Control. 16:593–598.
Koblinger, L., W. Hofmann. 1990. Monte Carlo modeling of aerosol deposition in human lungs. Part I: simulation of particle transport in a stochastic lung structure. J. Aerosol Sci 1990; 21:661-74.
Leake, B.E., Woolley, A.R., Arps, C.E.S., Birch, W.D., Gilbert, M.C., Grice, J.D., Hawthorne, F.C., Kato, A., Kisch, H.J., Krivovichev, V.G., Linthout, K., Laird, J., Mandarino, J.A., Maresch, W.V., Nickel, E.H., Rock, N.M.S., Schumacher, J.C., Smith, D.C., Stephenson, N.C.N., Ungaretti, L., Whittaker, E.J.W., and Youshi, G., 1997, Nomenclature of amphiboles: Report of the subcommittee on amphiboles of the International Mineralogical Association, Commission on new minerals and mineral names: American Mineralogist, v. 82, p. 1019–1037.
Lockheed Martin. 2011, Trip Report Libby Asbestos Site, Libby, MT, Work Assignment No.: SERAS-084 - Lockheed Martin Scientific, Engineering, Response and Analytical Services. June 24, 2011.
Lockheed Martin. 2010a, Quality Assurance Project Plan Libby Asbestos Site, Libby, MT, Work Assignment No.: SERAS-084 - Lockheed Martin Scientific, Engineering, Response and Analytical Services. August 23, 2010.

Draft RI Report 9-6 OU8 Libby Asbestos Site
Lockheed Martin. 2010b, Trip Report Libby Asbestos Site, Libby, MT, Work Assignment No.: SERAS-084 - Lockheed Martin Scientific, Engineering, Response and Analytical Services. November 1, 2010.
Lanphear BP, Buncher CR. 1992. Latent period for malignant mesothelioma of occupational origin. J Occup Med 34:718-721.
Lockey JE, Brooks SM, Jarabek AM, Khoury PR, McKay RT, Carson A, Morrison JA, Wiot JF and Spitz HB. 1984. Pulmonary Changes After Exposure to vermiculite Contaminated With Fibrous Tremolite. Am. Rev. Respir. Dis. 129:952-958.
McDonald JC, McDonald AD, Armstrong B, Sebastien P. 1986a. Cohort study of mortality of vermiculite miners exposed to tremolite. Brit. J. Ind. Med. 43:436-444.
McDonald JC, Armstrong B, Sebastien P. 1986b. Radiological Survey of Past and Present Vermiculite Miners Exposed to Tremolite. Brit. J. Ind. Med. 43: 445-449.
McDonald JC, McDonald AD. 1997. Chrysotile, tremolite and carcinogenicity. Annals of Occupational Hygiene. 41(6): 699–705.
McDonald JC, Harris J, Armstrong B. 2004. Mortality in a cohort of vermiculite miners exposed to fibrous Amphibole in Libby, Montana. Occup. Environ. Med. 61:363-366.
Meeker, G.P., Bern, A.M., Brown, I.K., Lowers, H.A., Sutley, S.J., Hoefen, T.M., and Vance, J.S.. 2003. The composition and morphology of amphibole from the Rainy Creek Complex, near Libby, Montana. American Mineralogist, 88, 1955.1969.
Miller A, Teirstein AS, Selikoff I. 1983. Ventilatory failure due to asbestos pleurisy. Am J Med 75:911-919.
Mossman BT, Bignon J, Corn M, et al. 1990. Asbestos: scientific developments and implications for public policy. Science. 247:294-301.
Mossman BT, Kamp DW, Weitzman, SA. 1996. Mechanisms of carcinogenesis and clinical features of asbestos-associated cancers. Cancer Invest. 14: 466-480
Mossman BT, Churg A. 1998. Mechanisms in the pathogenesis of asbestosis and silicosis. Am. J. Respir. Crit. Care Med. 157: 1666-1680.
Muravov OI, Kaye WE, Lewin M, et al. 2005. The Usefulness of Computed Tomography in Detecting Asbestos-Related Pleural Abnormalities in People who had Indeterminate Chest Radiographs: The Libby, MT Experience. International Journal of Hygiene and Environmental Health, 208: 87-99.
Draft RI Report 9-7 OU8 Libby Asbestos Site
National Academy of Sciences (NAS). 2006. Asbestos: Selected Cancers. Committee on Asbestos: Selected Health Effects. Board on Population Health and Public Health Practices.
National Institute for Occupational Safety and Health (NIOSH). 2011. Current Intelligence Bulletin 62. Asbestos Fibers and Other Elongate Mineral Particles: State of the Science and Roadmap for Research. Revised Edition. Department of Health and Human Services, Centers for Disease Control and Prevention. DHHS (NIOSH) Publication No. 2011-159. April.
National Toxicology Program (NTP). 2005. Report on Carcinogens, Eleventh Edition. National Toxicology Program. United States Department of Health and Human Services, Public Health Service, 31 January 2005. http://ntp-server.niehs.nih.gov/ntp/roc/toc11.html
Noonan CW, Pfau JC, Larson TC, Spence MR. 2006. Nested cased-control study of autoimmune disease in an asbestos-exposed population. Environ. Health Perspect. 114:1243-1247.
Peipins LA, Lewin M, Campolucci S, Lybarger JA, Miller A, Middleton D, et al. 2003. Radiographic abnormalities and exposure to asbestos-contaminated vermiculite in the community of Libby, Montana, USA. Environ. Health Perspect. 111:1753-1759.
Pfau J, Sentissi J, Weller G, Putnam E. 2005. Assessment of Autoimmune Responses Associated with Asbestos Exposure in Libby, Montana, USA. Env. Health Persp. 113:25-30.
Puntoni R, Vercelli M, Merlo F, Valerio F., Santi L. 1979. Mortality among shipyard workers in Genoa, Italy. Ann NY Acad Sci. 330: 353-355.
Rohs AM, Lockey JE, Dunning KK, Shulka R, Fan H, Hilbert T, Borton E, Wiot J, Meyer C, Shipley RT, LeMasters GK, Kapol V. 2007. Low level Fiber Induced Radiographic Changes Caused by Libby Vermiculite: A 25 year Follow-up Study. Am J Respiratory and Critical Care Medicine. Published online December 6, 2007 as doi:10.1164/rccm.200706-814OC.
Rohs, A.; Lockey, J.; Dunning, K.; Shukla, R.; Fan, H.; Hilbert, T.; Borton, E.; Wiot, J.; Meyer, C.; Shipley, R.; LeMasters, G.; and Kapil, V. 2008. Low-level fiber induced radiographic changes caused by Libby vermiculite. Am J Respir Crit Care Med 177:630-637.
Sahle W and Laszlo I. 1996. Airborne Inorganic Fibre Monitoring by Transmission Electron Microscope (TEM): Comparison of Direct and Indirect Sample Transfer Methods. Ann. Occup. Hyg. 40:29-44.
Schwartz DA, Glavin JR, Burmeister LF, Merchant RK, Dayton CS, Merchant JA, Hunninghake GW. 1991. The clinical utility and reliability of asbestos bodies in bronchoalveolar fluid. Am. Rev. Respir. Dis. 144: 684-688.
Draft RI Report 9-8 OU8 Libby Asbestos Site
Selikoff IJ, Hammond EC, Churg J. 1968. Asbestos exposure, smoking and neoplasia. JAMA 204:104-110.
Selikoff IJ, Hammond EC, Seidman H. 1979. Mortality experience of insulation workers in the United States and Canada, 1943-1976. Ann NY Acad Sci 330:91-116.
Smith AH, Shearn VI, Wood R. 1989. Asbestos and kidney cancer: The evidence supports a causal association. Am J Ind Med 16:159-166.
Stayner L, Kuempel E, Gilbert S, Hein M, Dement J. 2007. An epidemiological study of the role of chrysotile asbestos fibre dimensions in determining respiratory disease risk in exposed workers. Occup Environ Med. 65:613-619.
Strum, R. 2009. A theoretical approach to the deposition of cancer-inducing asbestos fibers in the human respiratory tract. The Open Lung Cancer Journal. Volume 2:2-11.
Sullivan PA. 2007. Vermiculite, respiratory disease, and asbestos exposure in Libby, Montana: update of a cohort mortality study. Environ. Health Perspect. 115:579-585.
Tetra Tech. 2007a. Report of Findings, Potentially Asbestos-Containing Soil in MDT Rights of Way, Traction Sand and Road Aggregate Sources, Collected Road Sweepings, and Sampled Worker Air Space During Routine Maintenance Activities, Libby Montana. February 21, 2007.
Tetra Tech. 2007b. Report of Findings, Sampled Worker Air Space During Routine Maintenance Activities, Libby Montana. July 19, 2007.
Weill H, Hughes JM, Churg AM. 2004. Changing trends in US mesothelioma incidence. Occupational Environmental Medicine 61:438-41.
Western Regional Climate Center (WRCC). Accessed April 23, 2010. http://www.wrcc.dri.edu/cgi-bin/cliMAIN.pl?mt5000
Whitehouse AC. 2004. Asbestos-related pleural disease due to tremolite associated with progressive loss of lung function: serial observations in 123 miners family members, and residents of Libby, Montana. Am. J. Ind. Med. 46:219-225.
Whitehouse AC, Black CB, Heppe MS, Ruckdeschel J, Levin SM. 2008. Environmental exposure to Libby asbestos and mesotheliomas. Am. J. Ind. Med. 51:877-880.
World Health Organization (WHO). 1996. Guidelines for Drinking Water Quality, Volume 2. World Health Organization, Geneva. P. 167.
WHO. 2000. Air Quality Guidelines. 2nd edition. WHO Regional Office for Europe, Copenhagen, Denmark.

Tables
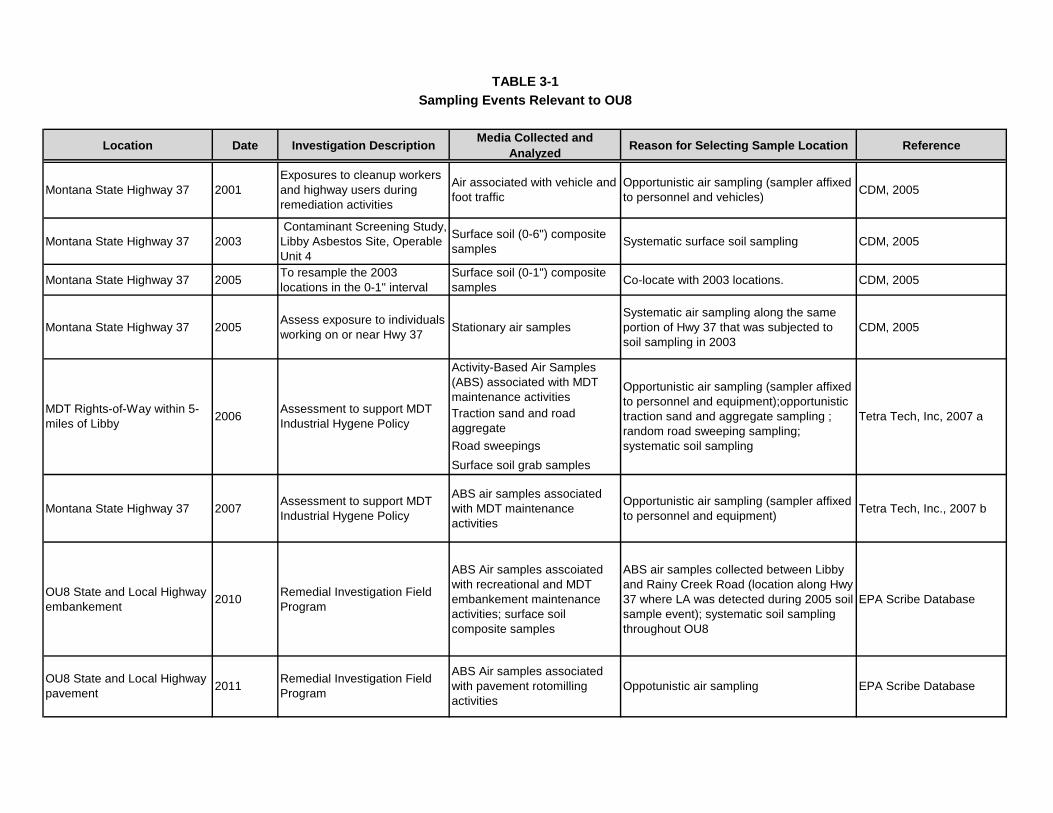
Location Date Investigation Description Media Collected and Analyzed Reason for Selecting Sample Location Reference
Montana State Highway 37 2001Exposures to cleanup workers and highway users during remediation activities
Air associated with vehicle and foot traffic
Opportunistic air sampling (sampler affixed to personnel and vehicles) CDM, 2005
Montana State Highway 37 2003 Contaminant Screening Study, Libby Asbestos Site, Operable Unit 4
Surface soil (0-6") composite samples Systematic surface soil sampling CDM, 2005
Montana State Highway 37 2005 To resample the 2003 locations in the 0-1" interval
Surface soil (0-1") composite samples Co-locate with 2003 locations. CDM, 2005
Montana State Highway 37 2005 Assess exposure to individuals working on or near Hwy 37 Stationary air samples
Systematic air sampling along the same portion of Hwy 37 that was subjected to soil sampling in 2003
CDM, 2005
Activity-Based Air Samples (ABS) associated with MDT maintenance activitiesTraction sand and road aggregateRoad sweepingsSurface soil grab samples
Montana State Highway 37 2007 Assessment to support MDT Industrial Hygene Policy
ABS air samples associated with MDT maintenance activities
Opportunistic air sampling (sampler affixed to personnel and equipment) Tetra Tech, Inc., 2007 b
OU8 State and Local Highway embankement 2010 Remedial Investigation Field
Program
ABS Air samples asscoiated with recreational and MDT embankement maintenance activities; surface soil composite samples
ABS air samples collected between Libby and Rainy Creek Road (location along Hwy 37 where LA was detected during 2005 soil sample event); systematic soil sampling throughout OU8
EPA Scribe Database
TABLE 3-1Sampling Events Relevant to OU8
Tetra Tech, Inc, 2007 a
EPA Scribe Database
2006MDT Rights-of-Way within 5-miles of Libby
Assessment to support MDT Industrial Hygene Policy
Opportunistic air sampling (sampler affixed to personnel and equipment);opportunistic traction sand and aggregate sampling ; random road sweeping sampling; systematic soil sampling
Remedial Investigation Field Program2011OU8 State and Local Highway
pavement
ABS Air samples associated with pavement rotomilling activities
Oppotunistic air sampling
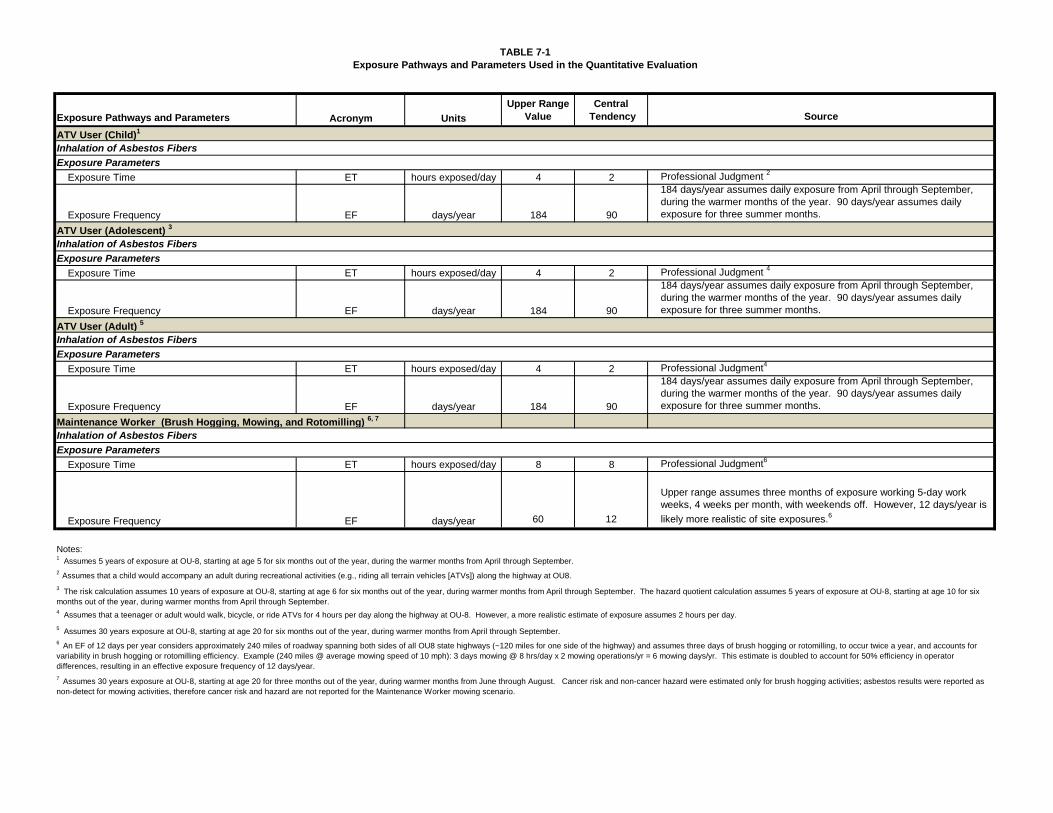
TABLE 7-1Exposure Pathways and Parameters Used in the Quantitative Evaluation
Acronym UnitsUpper Range
ValueCentral
Tendency Source
ATV User (Child)1
Inhalation of Asbestos FibersExposure Parameters
Exposure Time ET hours exposed/day 4 2 Professional Judgment 2
Exposure Frequency EF days/year 184 90
184 days/year assumes daily exposure from April through September, during the warmer months of the year. 90 days/year assumes daily exposure for three summer months.
ATV User (Adolescent) 3
Inhalation of Asbestos FibersExposure Parameters
Exposure Time ET hours exposed/day 4 2 Professional Judgment 4
Exposure Frequency EF days/year 184 90
184 days/year assumes daily exposure from April through September, during the warmer months of the year. 90 days/year assumes daily exposure for three summer months.
ATV User (Adult) 5
Inhalation of Asbestos FibersExposure Parameters
Exposure Time ET hours exposed/day 4 2 Professional Judgment4
Exposure Frequency EF days/year 184 90
184 days/year assumes daily exposure from April through September, during the warmer months of the year. 90 days/year assumes daily exposure for three summer months.
Maintenance Worker (Brush Hogging, Mowing, and Rotomilling) 6, 7
Inhalation of Asbestos FibersExposure Parameters
Exposure Time ET hours exposed/day 8 8 Professional Judgment6
Exposure Frequency EF days/year 60 12
Upper range assumes three months of exposure working 5-day work weeks, 4 weeks per month, with weekends off. However, 12 days/year is likely more realistic of site exposures.6
Notes:1 Assumes 5 years of exposure at OU-8, starting at age 5 for six months out of the year, during the warmer months from April through September.2 Assumes that a child would accompany an adult during recreational activities (e.g., riding all terrain vehicles [ATVs]) along the highway at OU8.
4 Assumes that a teenager or adult would walk, bicycle, or ride ATVs for 4 hours per day along the highway at OU-8. However, a more realistic estimate of exposure assumes 2 hours per day.
7 Assumes 30 years exposure at OU-8, starting at age 20 for three months out of the year, during warmer months from June through August. Cancer risk and non-cancer hazard were estimated only for brush hogging activities; asbestos results were reported as non-detect for mowing activities, therefore cancer risk and hazard are not reported for the Maintenance Worker mowing scenario.
Exposure Pathways and Parameters
5 Assumes 30 years exposure at OU-8, starting at age 20 for six months out of the year, during warmer months from April through September.
3 The risk calculation assumes 10 years of exposure at OU-8, starting at age 6 for six months out of the year, during warmer months from April through September. The hazard quotient calculation assumes 5 years of exposure at OU-8, starting at age 10 for six months out of the year, during warmer months from April through September.
6 An EF of 12 days per year considers approximately 240 miles of roadway spanning both sides of all OU8 state highways (~120 miles for one side of the highway) and assumes three days of brush hogging or rotomilling, to occur twice a year, and accounts for variability in brush hogging or rotomilling efficiency. Example (240 miles @ average mowing speed of 10 mph): 3 days mowing @ 8 hrs/day x 2 mowing operations/yr = 6 mowing days/yr. This estimate is doubled to account for 50% efficiency in operator differences, resulting in an effective exposure frequency of 12 days/year.
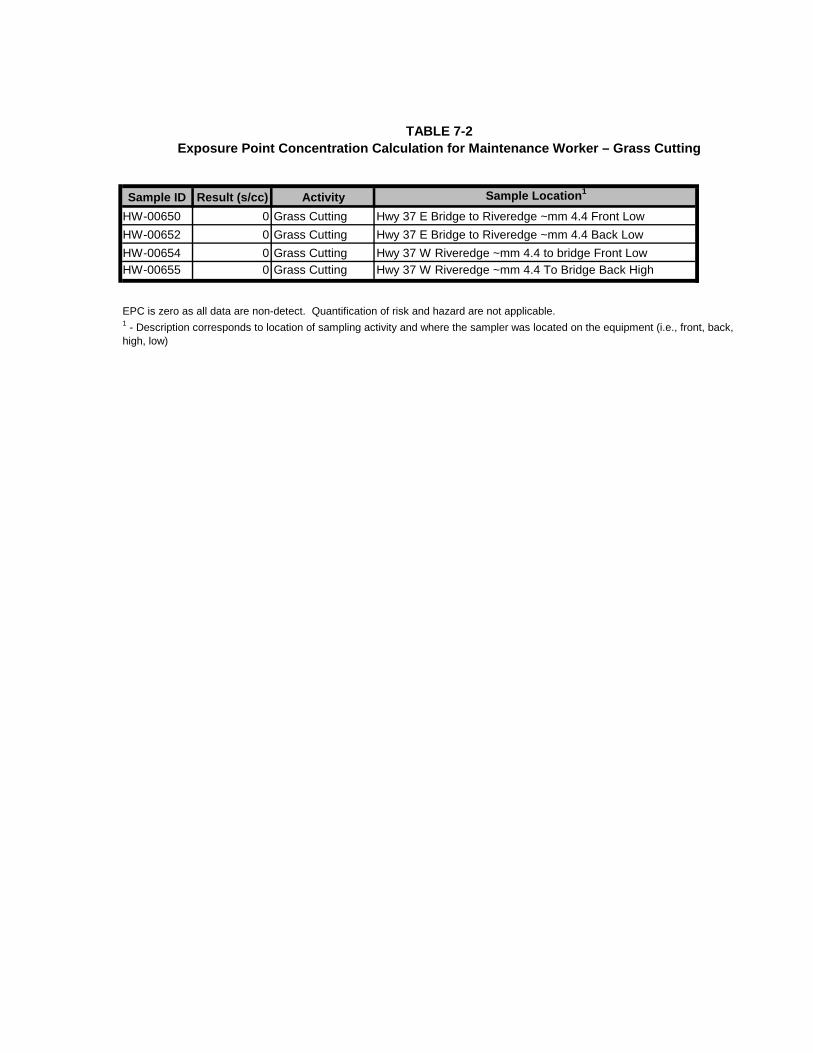
TABLE 7-2Exposure Point Concentration Calculation for Maintenance Worker – Grass Cutting
Sample ID Result (s/cc) Activity Sample Location1
HW-00650 0 Grass Cutting Hwy 37 E Bridge to Riveredge ~mm 4.4 Front LowHW-00652 0 Grass Cutting Hwy 37 E Bridge to Riveredge ~mm 4.4 Back LowHW-00654 0 Grass Cutting Hwy 37 W Riveredge ~mm 4.4 to bridge Front LowHW-00655 0 Grass Cutting Hwy 37 W Riveredge ~mm 4.4 To Bridge Back High
EPC is zero as all data are non-detect. Quantification of risk and hazard are not applicable.1 - Description corresponds to location of sampling activity and where the sampler was located on the equipment (i.e., front, back, high, low)
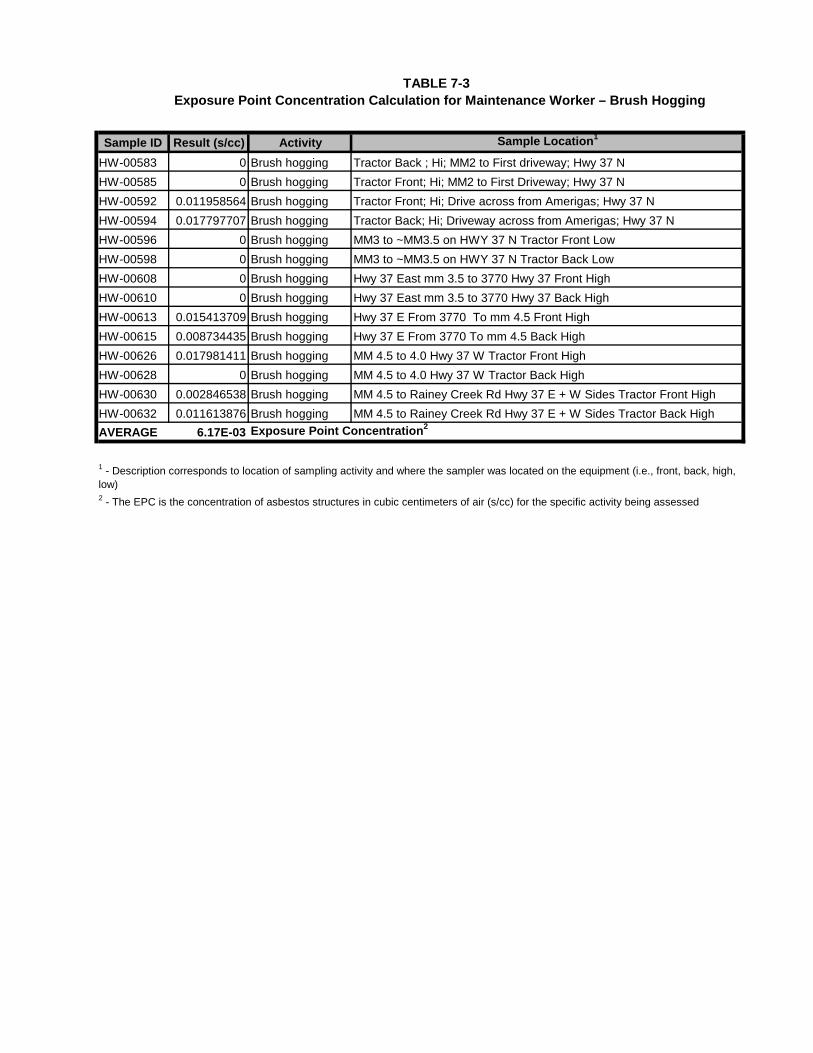
TABLE 7-3 Exposure Point Concentration Calculation for Maintenance Worker – Brush Hogging
Sample ID Result (s/cc) Activity Sample Location1
HW-00583 0 Brush hogging Tractor Back ; Hi; MM2 to First driveway; Hwy 37 NHW-00585 0 Brush hogging Tractor Front; Hi; MM2 to First Driveway; Hwy 37 NHW-00592 0.011958564 Brush hogging Tractor Front; Hi; Drive across from Amerigas; Hwy 37 NHW-00594 0.017797707 Brush hogging Tractor Back; Hi; Driveway across from Amerigas; Hwy 37 NHW-00596 0 Brush hogging MM3 to ~MM3.5 on HWY 37 N Tractor Front LowHW-00598 0 Brush hogging MM3 to ~MM3.5 on HWY 37 N Tractor Back LowHW-00608 0 Brush hogging Hwy 37 East mm 3.5 to 3770 Hwy 37 Front HighHW-00610 0 Brush hogging Hwy 37 East mm 3.5 to 3770 Hwy 37 Back HighHW-00613 0.015413709 Brush hogging Hwy 37 E From 3770 To mm 4.5 Front HighHW-00615 0.008734435 Brush hogging Hwy 37 E From 3770 To mm 4.5 Back HighHW-00626 0.017981411 Brush hogging MM 4.5 to 4.0 Hwy 37 W Tractor Front HighHW-00628 0 Brush hogging MM 4.5 to 4.0 Hwy 37 W Tractor Back HighHW-00630 0.002846538 Brush hogging MM 4.5 to Rainey Creek Rd Hwy 37 E + W Sides Tractor Front HighHW-00632 0.011613876 Brush hogging MM 4.5 to Rainey Creek Rd Hwy 37 E + W Sides Tractor Back HighAVERAGE 6.17E-03 Exposure Point Concentration2
2 - The EPC is the concentration of asbestos structures in cubic centimeters of air (s/cc) for the specific activity being assessed
1 - Description corresponds to location of sampling activity and where the sampler was located on the equipment (i.e., front, back, high, low)
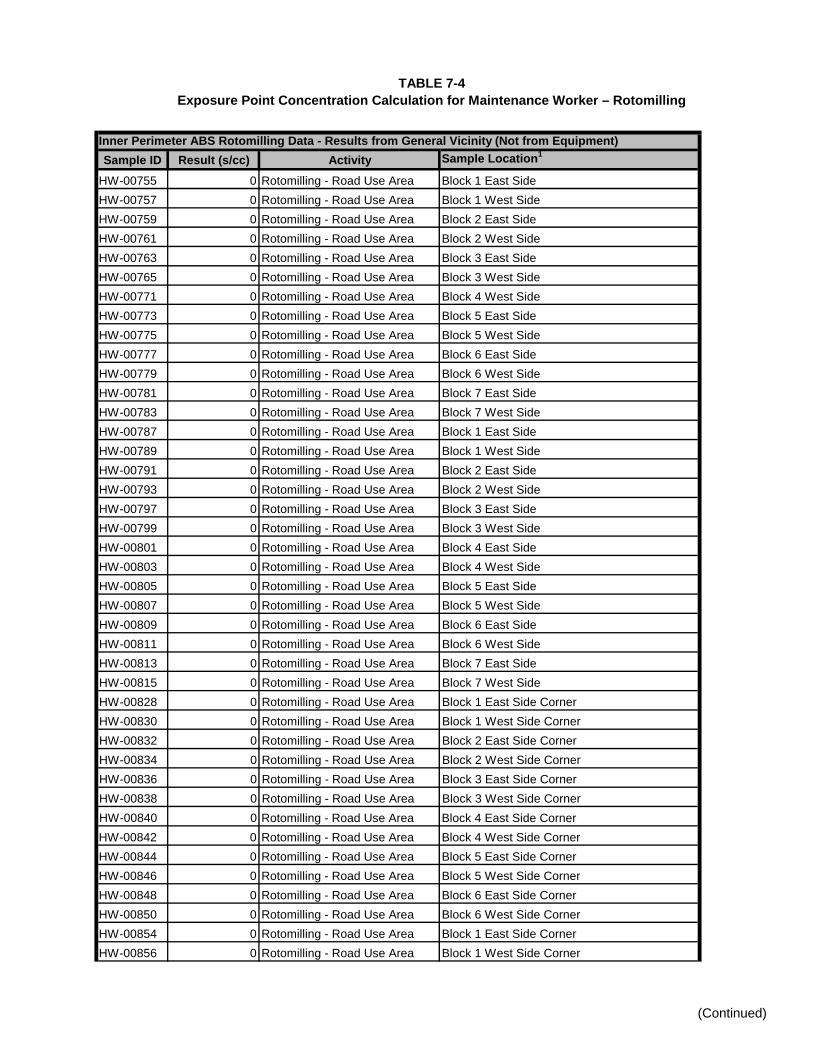
TABLE 7-4Exposure Point Concentration Calculation for Maintenance Worker – Rotomilling
(Continued)
Inner Perimeter ABS Rotomilling Data - Results from General Vicinity (Not from Equipment)Sample ID Result (s/cc) Activity Sample Location1
HW-00755 0 Rotomilling - Road Use Area Block 1 East SideHW-00757 0 Rotomilling - Road Use Area Block 1 West SideHW-00759 0 Rotomilling - Road Use Area Block 2 East SideHW-00761 0 Rotomilling - Road Use Area Block 2 West SideHW-00763 0 Rotomilling - Road Use Area Block 3 East SideHW-00765 0 Rotomilling - Road Use Area Block 3 West SideHW-00771 0 Rotomilling - Road Use Area Block 4 West SideHW-00773 0 Rotomilling - Road Use Area Block 5 East SideHW-00775 0 Rotomilling - Road Use Area Block 5 West SideHW-00777 0 Rotomilling - Road Use Area Block 6 East SideHW-00779 0 Rotomilling - Road Use Area Block 6 West SideHW-00781 0 Rotomilling - Road Use Area Block 7 East SideHW-00783 0 Rotomilling - Road Use Area Block 7 West SideHW-00787 0 Rotomilling - Road Use Area Block 1 East SideHW-00789 0 Rotomilling - Road Use Area Block 1 West SideHW-00791 0 Rotomilling - Road Use Area Block 2 East SideHW-00793 0 Rotomilling - Road Use Area Block 2 West SideHW-00797 0 Rotomilling - Road Use Area Block 3 East SideHW-00799 0 Rotomilling - Road Use Area Block 3 West SideHW-00801 0 Rotomilling - Road Use Area Block 4 East SideHW-00803 0 Rotomilling - Road Use Area Block 4 West SideHW-00805 0 Rotomilling - Road Use Area Block 5 East SideHW-00807 0 Rotomilling - Road Use Area Block 5 West SideHW-00809 0 Rotomilling - Road Use Area Block 6 East SideHW-00811 0 Rotomilling - Road Use Area Block 6 West SideHW-00813 0 Rotomilling - Road Use Area Block 7 East SideHW-00815 0 Rotomilling - Road Use Area Block 7 West SideHW-00828 0 Rotomilling - Road Use Area Block 1 East Side CornerHW-00830 0 Rotomilling - Road Use Area Block 1 West Side CornerHW-00832 0 Rotomilling - Road Use Area Block 2 East Side CornerHW-00834 0 Rotomilling - Road Use Area Block 2 West Side CornerHW-00836 0 Rotomilling - Road Use Area Block 3 East Side CornerHW-00838 0 Rotomilling - Road Use Area Block 3 West Side CornerHW-00840 0 Rotomilling - Road Use Area Block 4 East Side CornerHW-00842 0 Rotomilling - Road Use Area Block 4 West Side CornerHW-00844 0 Rotomilling - Road Use Area Block 5 East Side CornerHW-00846 0 Rotomilling - Road Use Area Block 5 West Side CornerHW-00848 0 Rotomilling - Road Use Area Block 6 East Side CornerHW-00850 0 Rotomilling - Road Use Area Block 6 West Side CornerHW-00854 0 Rotomilling - Road Use Area Block 1 East Side CornerHW-00856 0 Rotomilling - Road Use Area Block 1 West Side Corner
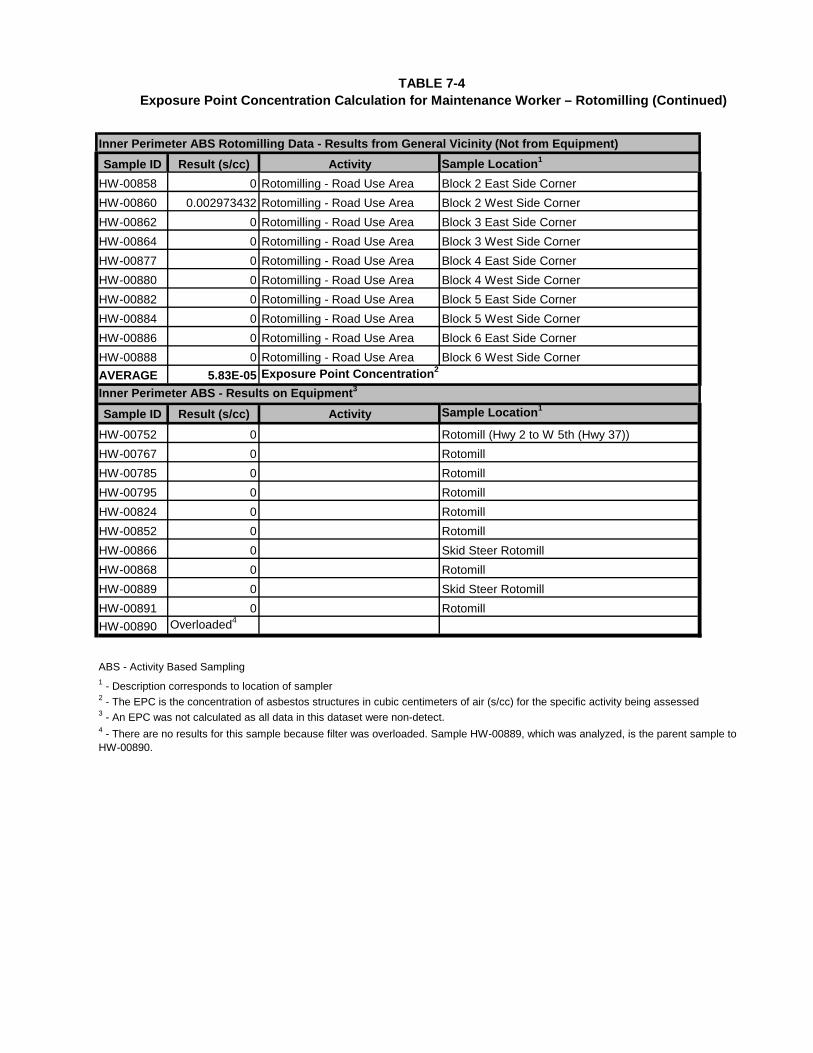
TABLE 7-4 Exposure Point Concentration Calculation for Maintenance Worker – Rotomilling (Continued)
Inner Perimeter ABS Rotomilling Data - Results from General Vicinity (Not from Equipment)Sample ID Result (s/cc) Activity Sample Location1
HW-00858 0 Rotomilling - Road Use Area Block 2 East Side CornerHW-00860 0.002973432 Rotomilling - Road Use Area Block 2 West Side CornerHW-00862 0 Rotomilling - Road Use Area Block 3 East Side CornerHW-00864 0 Rotomilling - Road Use Area Block 3 West Side CornerHW-00877 0 Rotomilling - Road Use Area Block 4 East Side CornerHW-00880 0 Rotomilling - Road Use Area Block 4 West Side CornerHW-00882 0 Rotomilling - Road Use Area Block 5 East Side CornerHW-00884 0 Rotomilling - Road Use Area Block 5 West Side CornerHW-00886 0 Rotomilling - Road Use Area Block 6 East Side CornerHW-00888 0 Rotomilling - Road Use Area Block 6 West Side CornerAVERAGE 5.83E-05 Exposure Point Concentration2
Inner Perimeter ABS - Results on Equipment3
Sample ID Result (s/cc) Activity Sample Location1
HW-00752 0 Rotomill (Hwy 2 to W 5th (Hwy 37))HW-00767 0 RotomillHW-00785 0 RotomillHW-00795 0 RotomillHW-00824 0 RotomillHW-00852 0 RotomillHW-00866 0 Skid Steer RotomillHW-00868 0 RotomillHW-00889 0 Skid Steer RotomillHW-00891 0 RotomillHW-00890 Overloaded4
ABS - Activity Based Sampling
2 - The EPC is the concentration of asbestos structures in cubic centimeters of air (s/cc) for the specific activity being assessed3 - An EPC was not calculated as all data in this dataset were non-detect.
1 - Description corresponds to location of sampler
4 - There are no results for this sample because filter was overloaded. Sample HW-00889, which was analyzed, is the parent sample to HW-00890.
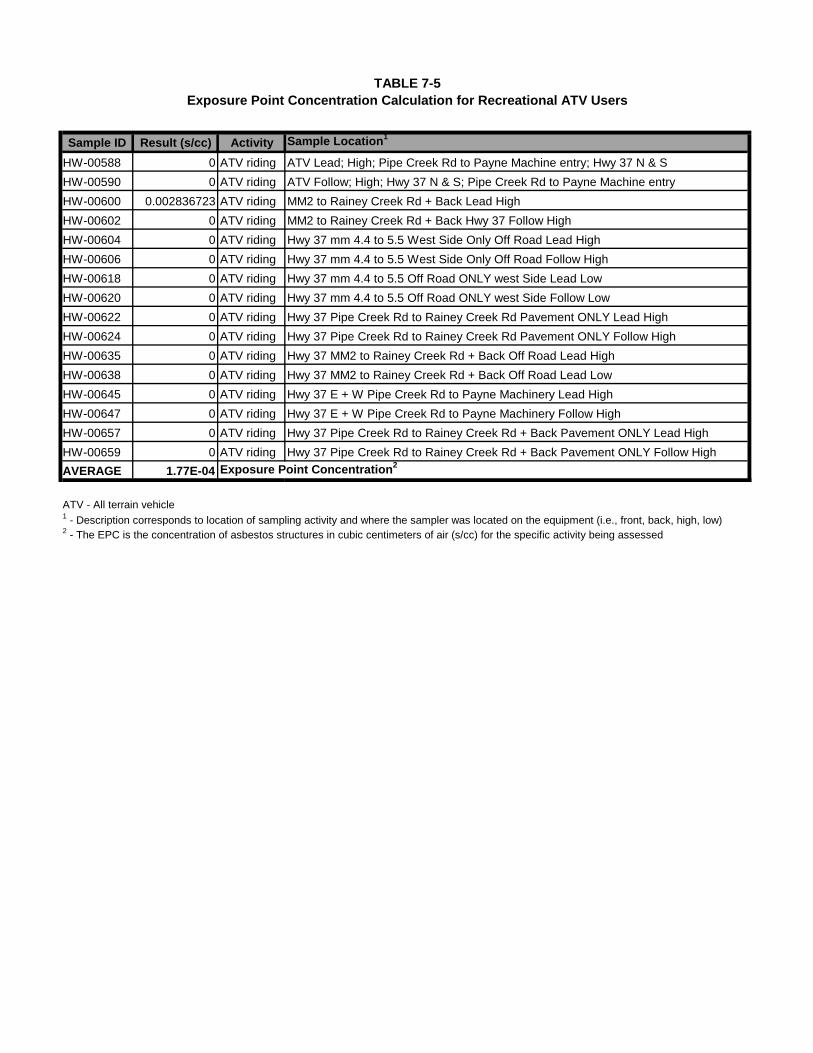
TABLE 7-5Exposure Point Concentration Calculation for Recreational ATV Users
Sample ID Result (s/cc) Activity Sample Location1
HW-00588 0 ATV riding ATV Lead; High; Pipe Creek Rd to Payne Machine entry; Hwy 37 N & SHW-00590 0 ATV riding ATV Follow; High; Hwy 37 N & S; Pipe Creek Rd to Payne Machine entryHW-00600 0.002836723 ATV riding MM2 to Rainey Creek Rd + Back Lead HighHW-00602 0 ATV riding MM2 to Rainey Creek Rd + Back Hwy 37 Follow HighHW-00604 0 ATV riding Hwy 37 mm 4.4 to 5.5 West Side Only Off Road Lead HighHW-00606 0 ATV riding Hwy 37 mm 4.4 to 5.5 West Side Only Off Road Follow HighHW-00618 0 ATV riding Hwy 37 mm 4.4 to 5.5 Off Road ONLY west Side Lead LowHW-00620 0 ATV riding Hwy 37 mm 4.4 to 5.5 Off Road ONLY west Side Follow LowHW-00622 0 ATV riding Hwy 37 Pipe Creek Rd to Rainey Creek Rd Pavement ONLY Lead HighHW-00624 0 ATV riding Hwy 37 Pipe Creek Rd to Rainey Creek Rd Pavement ONLY Follow HighHW-00635 0 ATV riding Hwy 37 MM2 to Rainey Creek Rd + Back Off Road Lead HighHW-00638 0 ATV riding Hwy 37 MM2 to Rainey Creek Rd + Back Off Road Lead LowHW-00645 0 ATV riding Hwy 37 E + W Pipe Creek Rd to Payne Machinery Lead HighHW-00647 0 ATV riding Hwy 37 E + W Pipe Creek Rd to Payne Machinery Follow HighHW-00657 0 ATV riding Hwy 37 Pipe Creek Rd to Rainey Creek Rd + Back Pavement ONLY Lead HighHW-00659 0 ATV riding Hwy 37 Pipe Creek Rd to Rainey Creek Rd + Back Pavement ONLY Follow HighAVERAGE 1.77E-04 Exposure Point Concentration2
ATV - All terrain vehicle
2 - The EPC is the concentration of asbestos structures in cubic centimeters of air (s/cc) for the specific activity being assessed
1 - Description corresponds to location of sampling activity and where the sampler was located on the equipment (i.e., front, back, high, low)

TABLE 7-6Maintenance Worker Inhalation of Asbestos in Air Cancer Risk Calculations (Upper Range)
Pending finalization of toxicity values for LA

TABLE 7-7Maintenance Worker Inhalation of Asbestos in Air Cancer Risk Calculations (Central Tendency)
Pending finalization of toxicity values for LA

TABLE 7-8Maintenance Worker Inhalation of Asbestos in Air Hazard Calculations (Upper Range)
Pending finalization of toxicity values for LA

TABLE 7-9Maintenance Worker Inhalation of Asbestos in Air Hazard Calculations (Central Tendency)
Pending finalization of toxicity values for LA

TABLE 7-10Recreational ATV User Inhalation of Asbestos in Air Cancer Risk Calculations (Upper Range)
Pending finalization of toxicity values for LA

TABLE 7-11Recreational ATV User Inhalation of Asbestos in Air Cancer Risk Calculations (Central Tendency)
Pending finalization of toxicity values for LA

TABLE 7-12Recreational ATV User Inhalation of Asbestos in Air Hazard Calculations (Upper Range)
Pending finalization of toxicity values for LA

TABLE 7-13Recreational ATV User Inhalation of Asbestos in Air Hazard Calculations (Central Tendency)
Pending finalization of toxicity values for LA

OU-8 Risk and Hazard SummaryTABLE 7-14
Pending finalization of toxicity values for LA

Figures
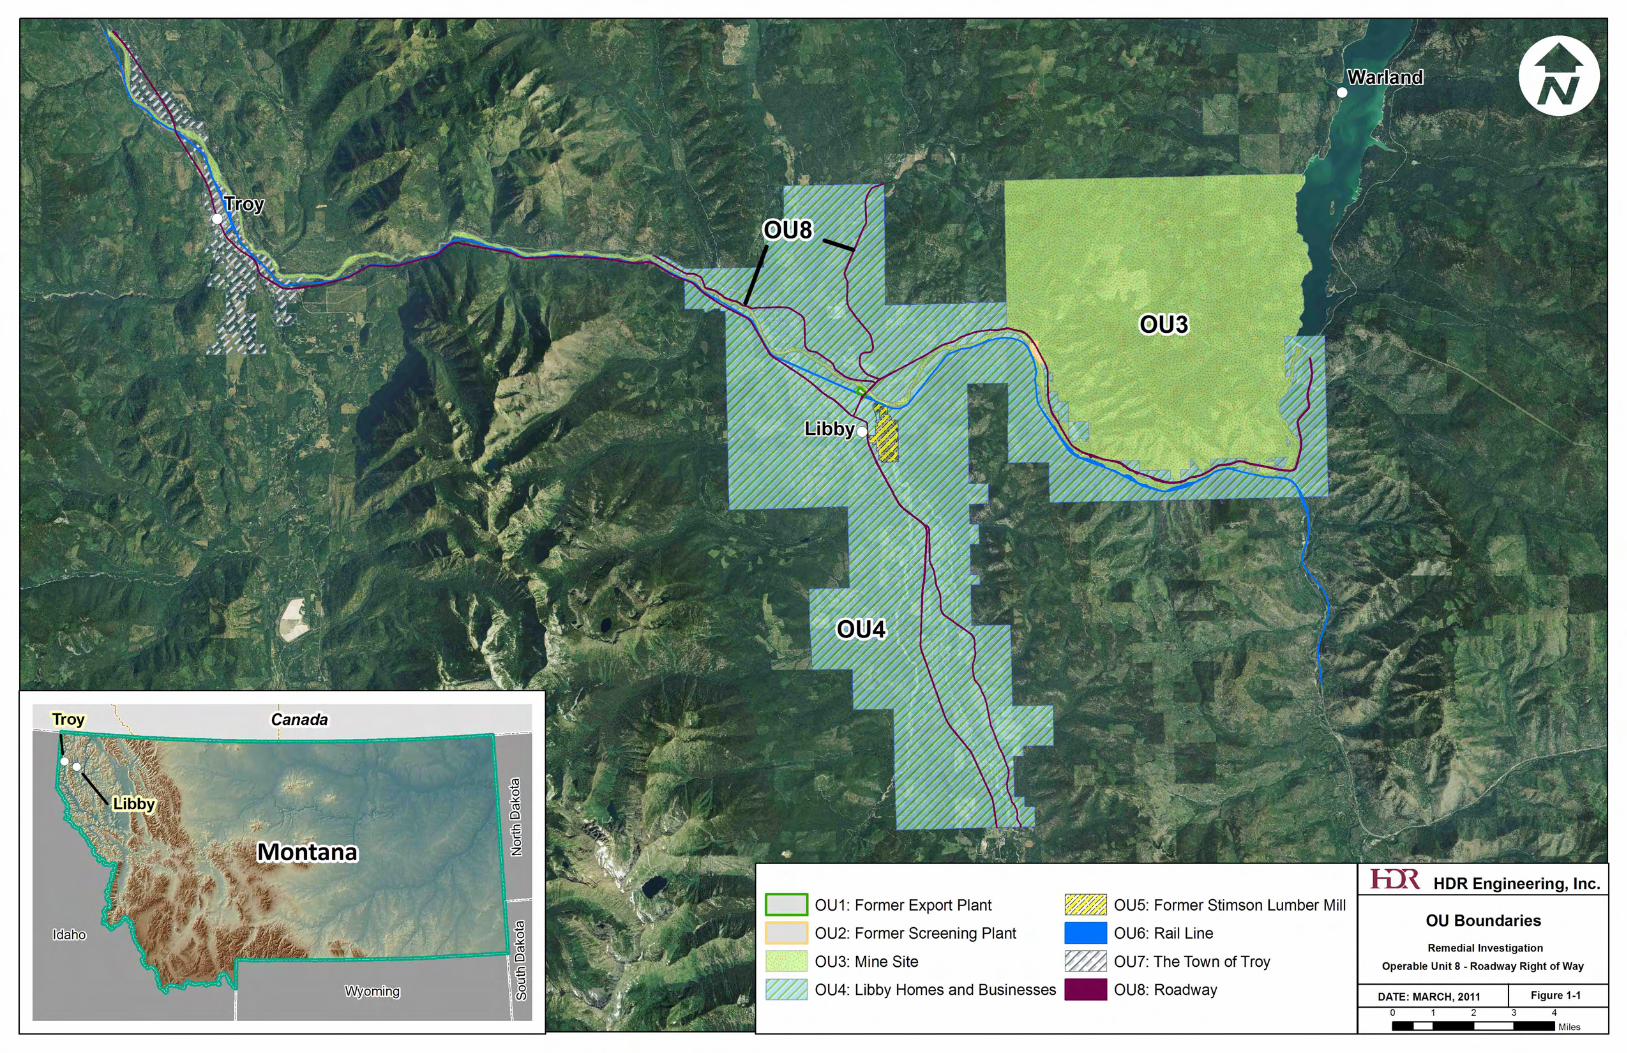
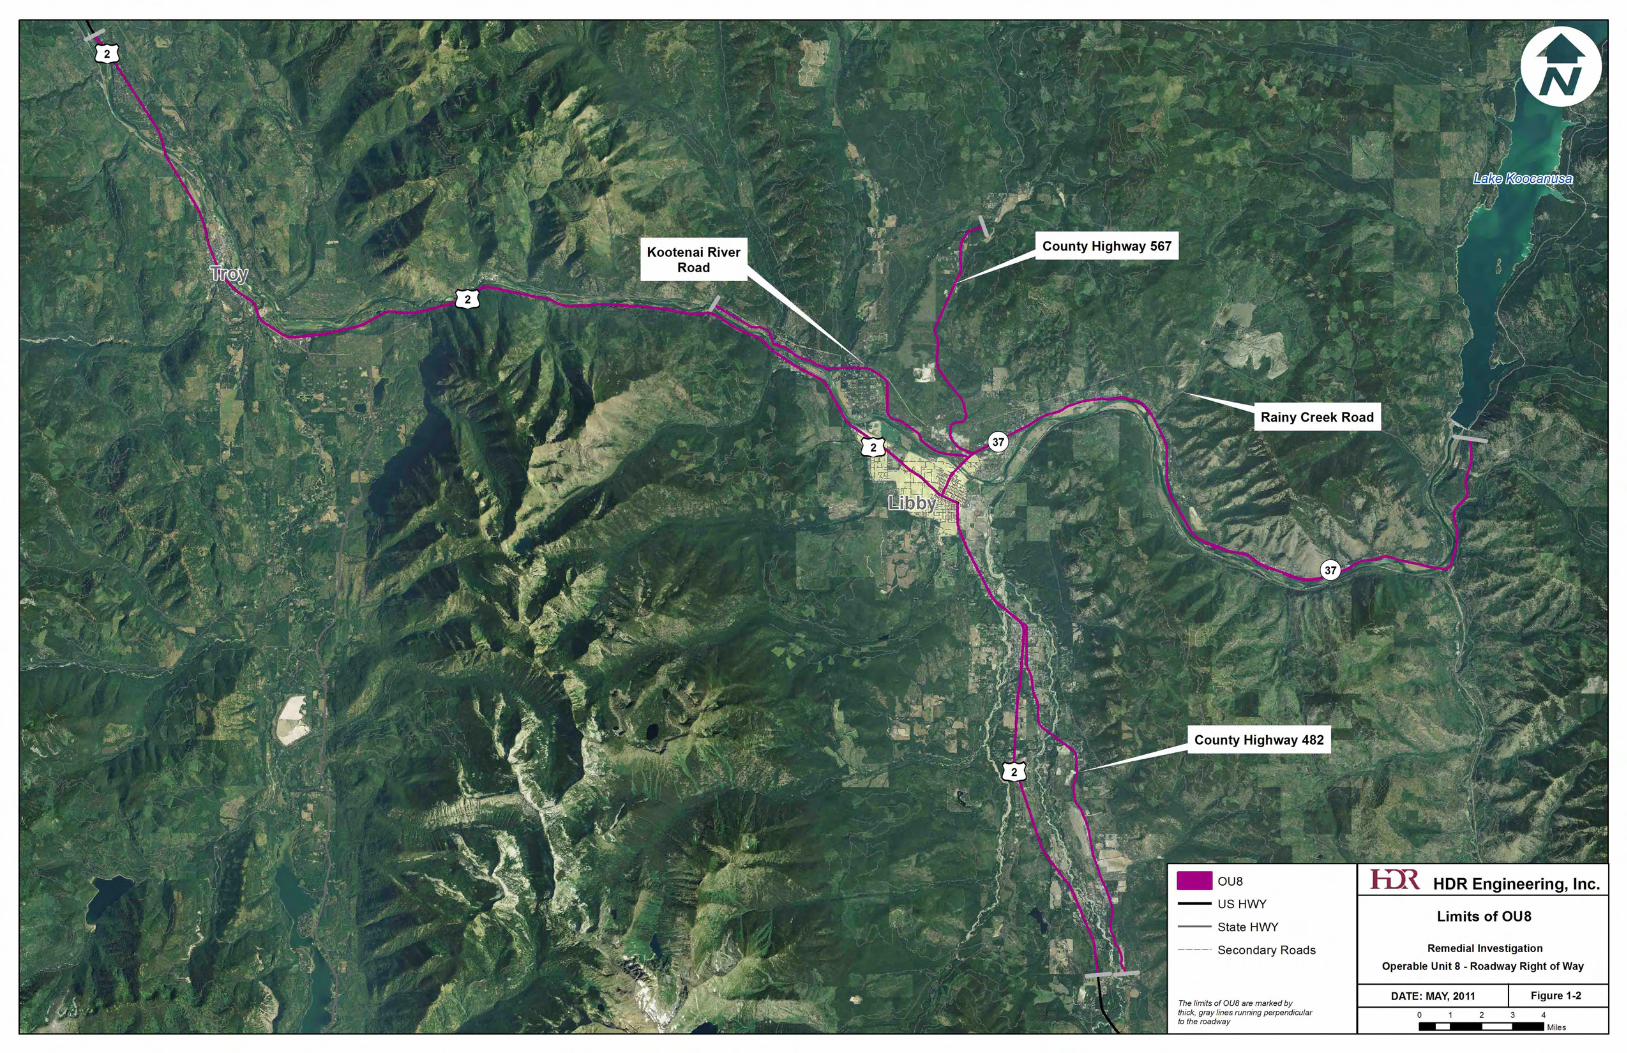
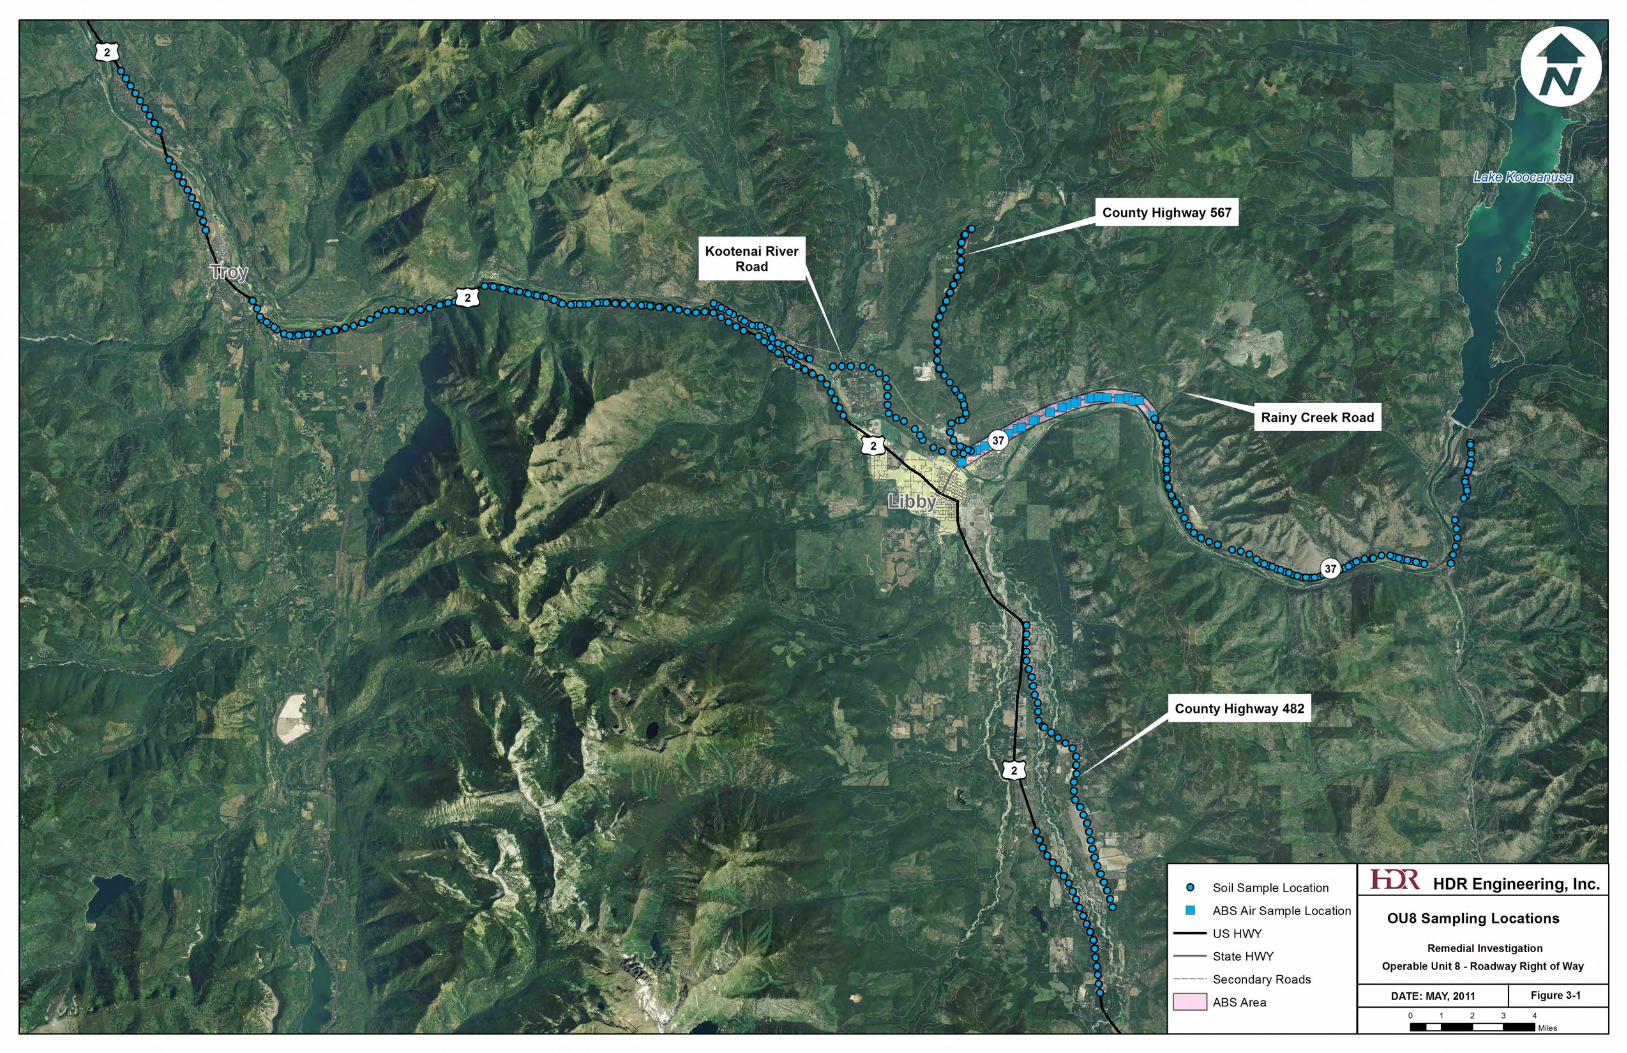
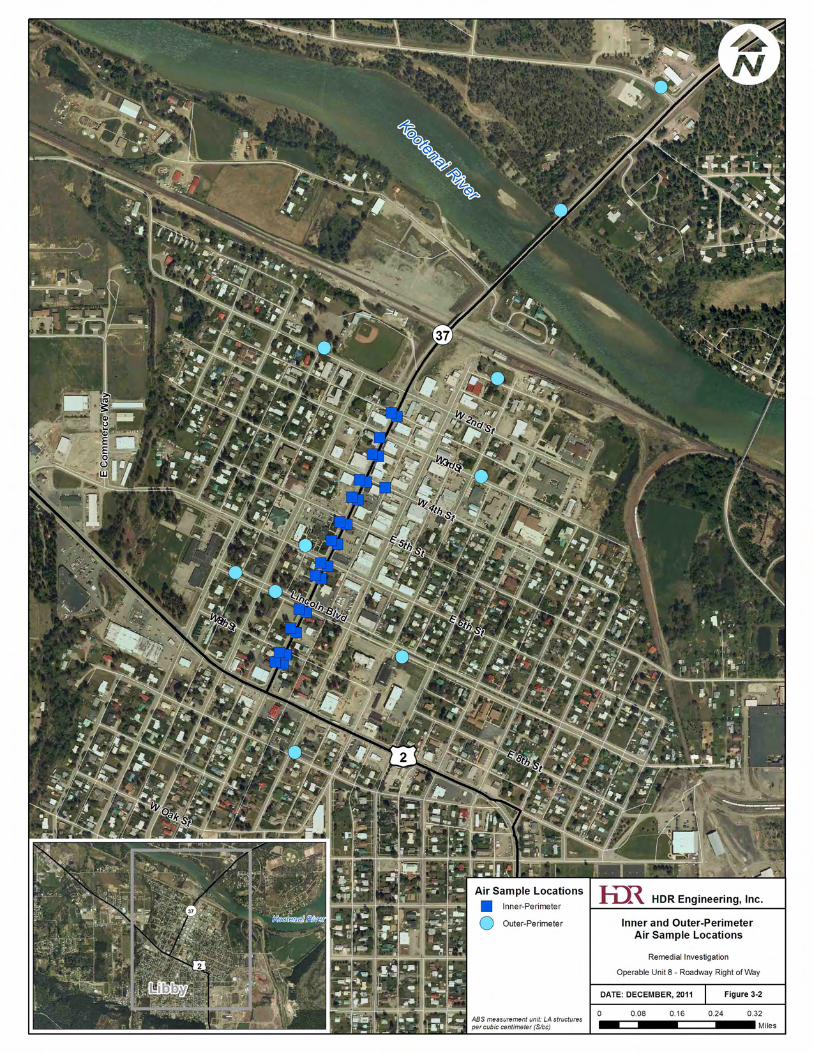
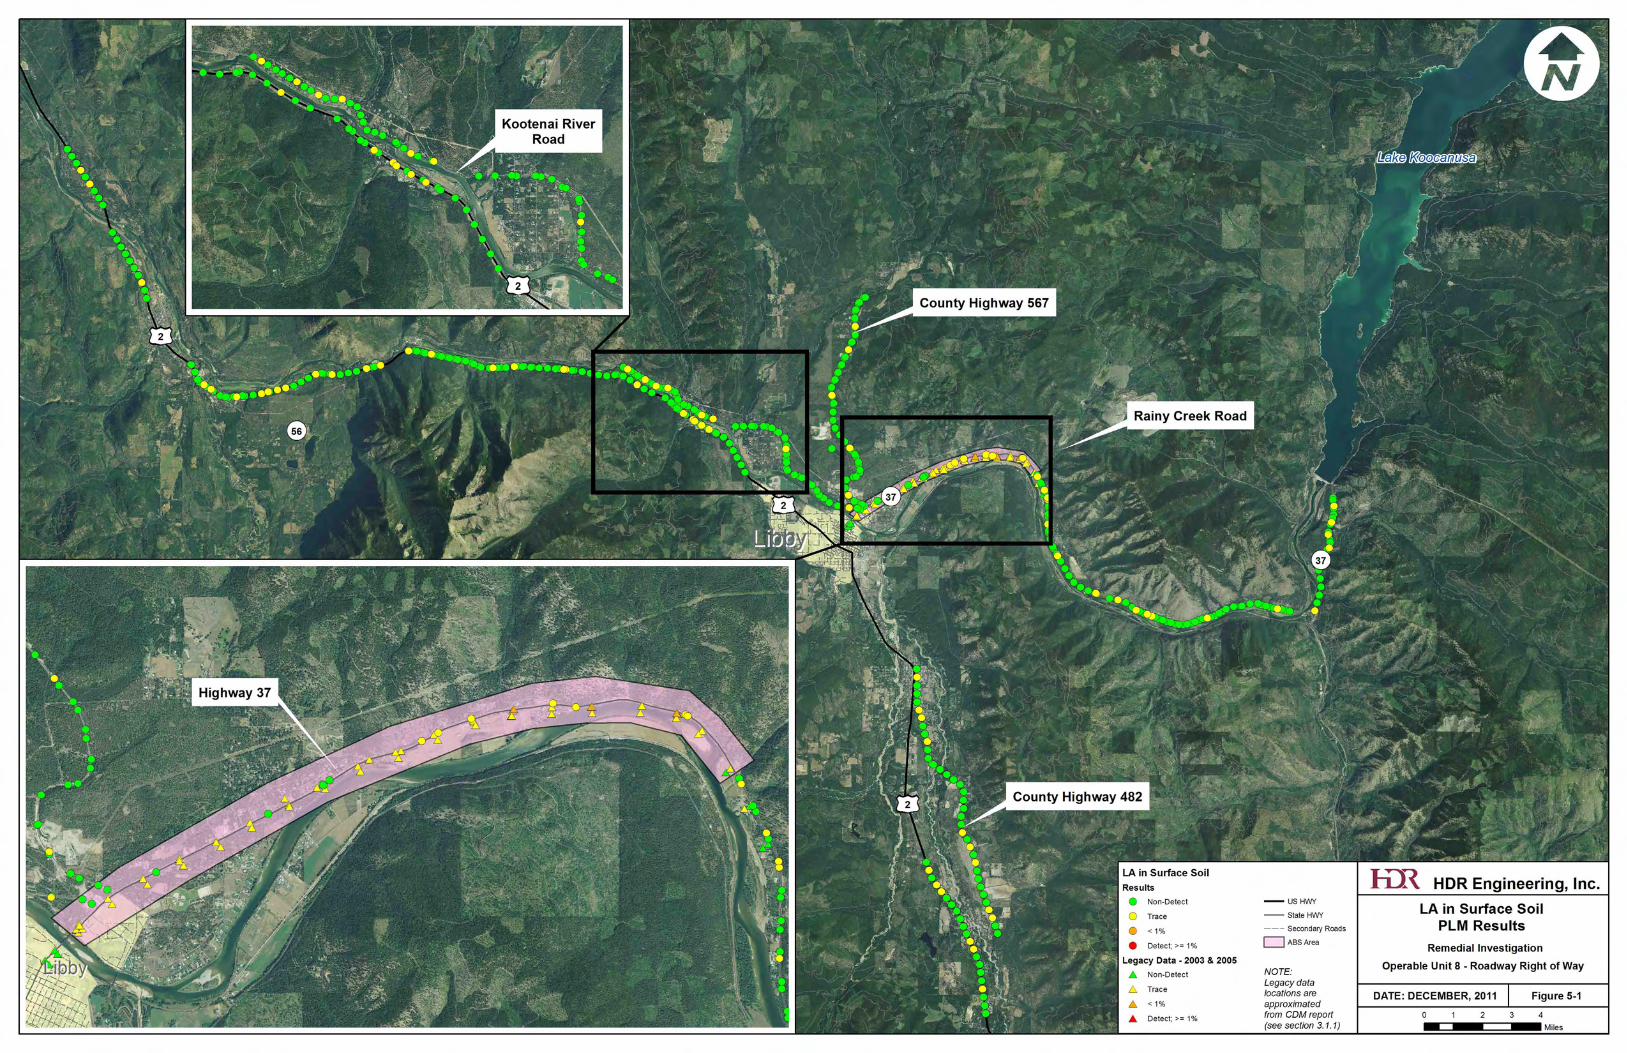
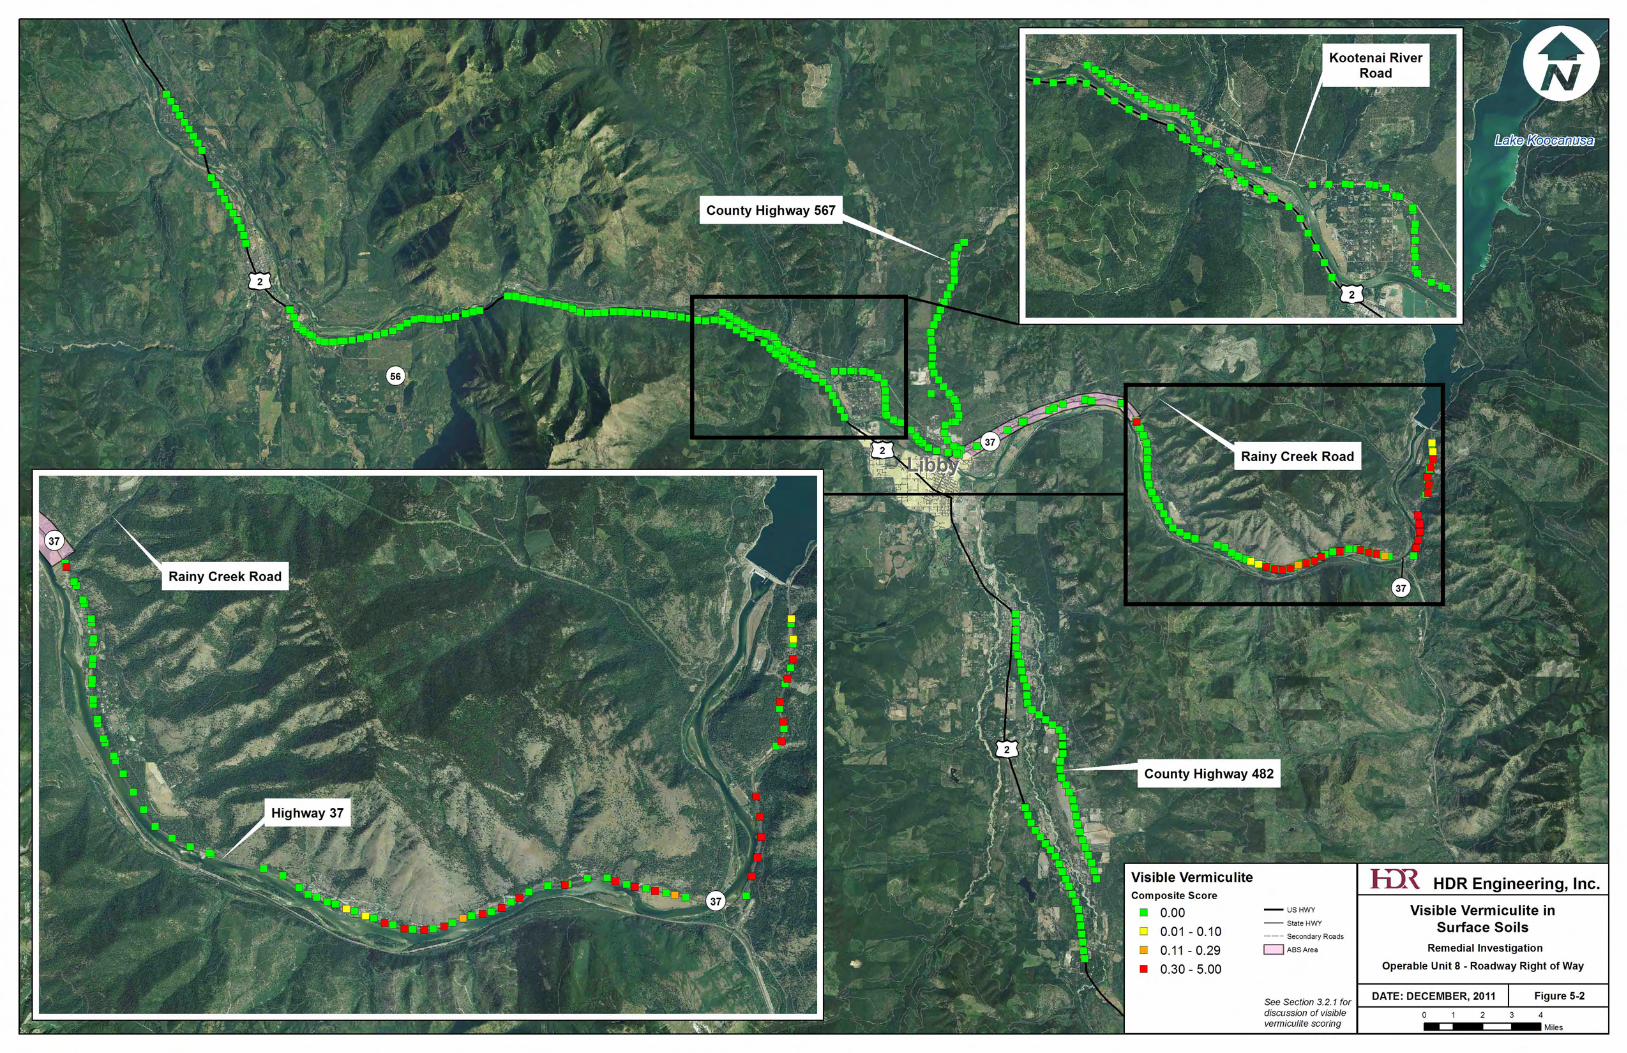
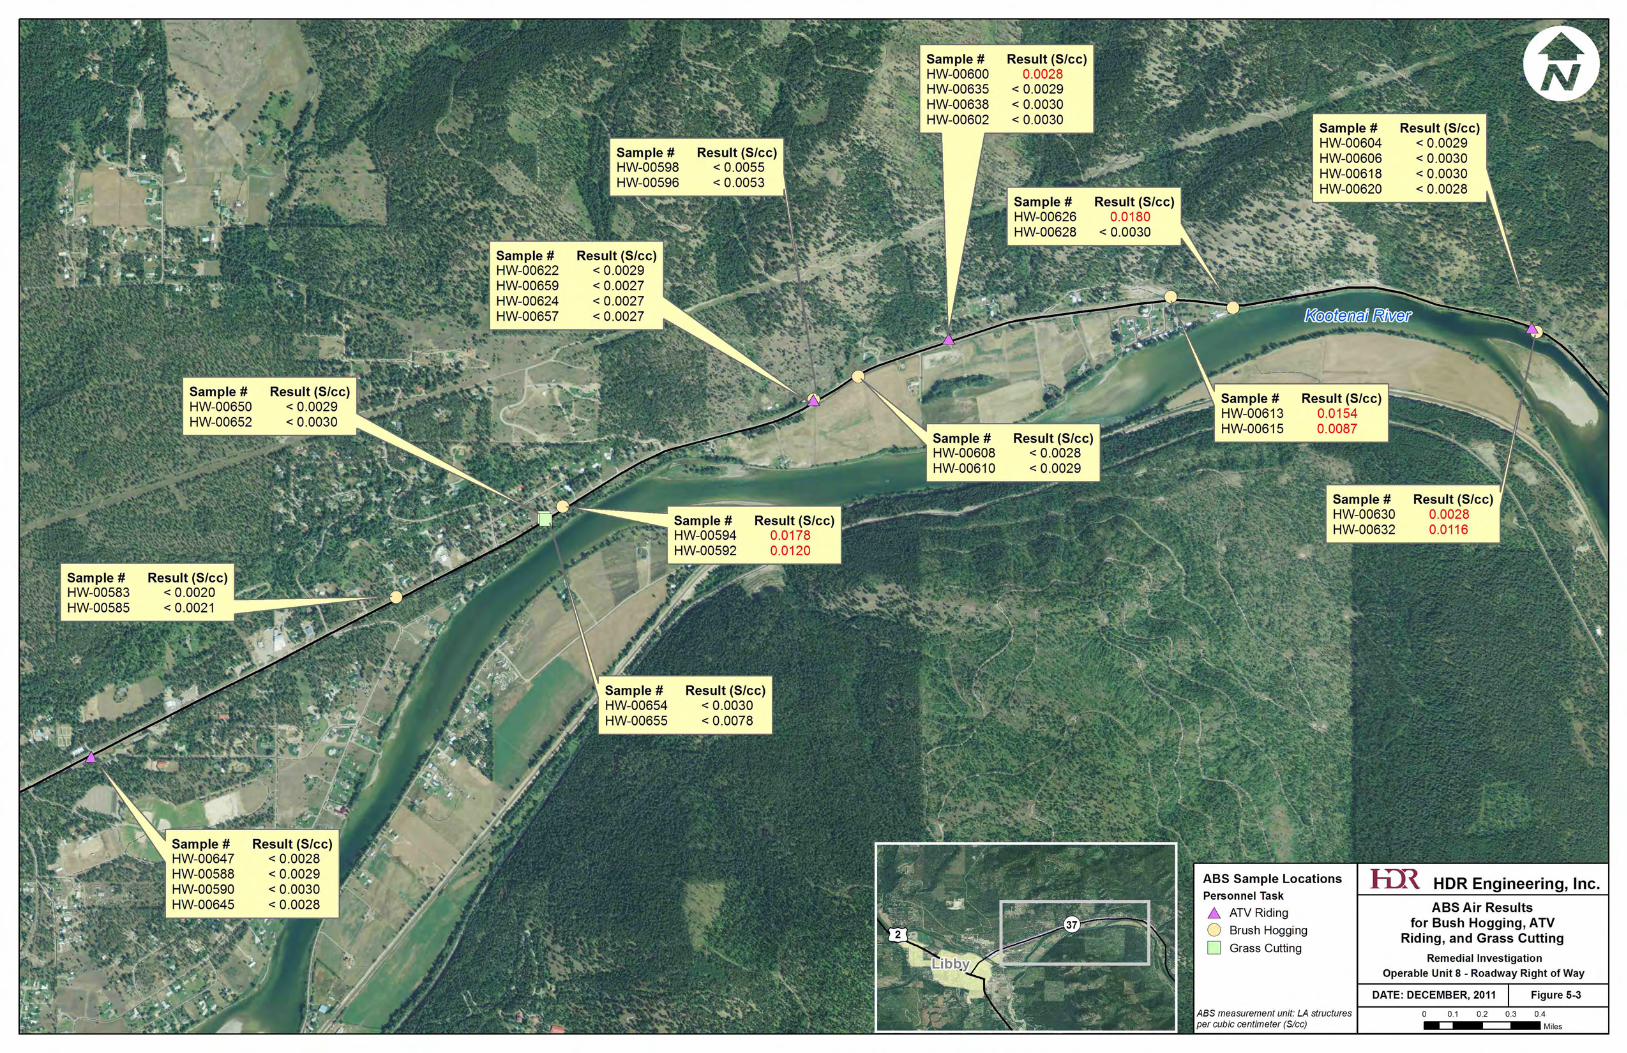
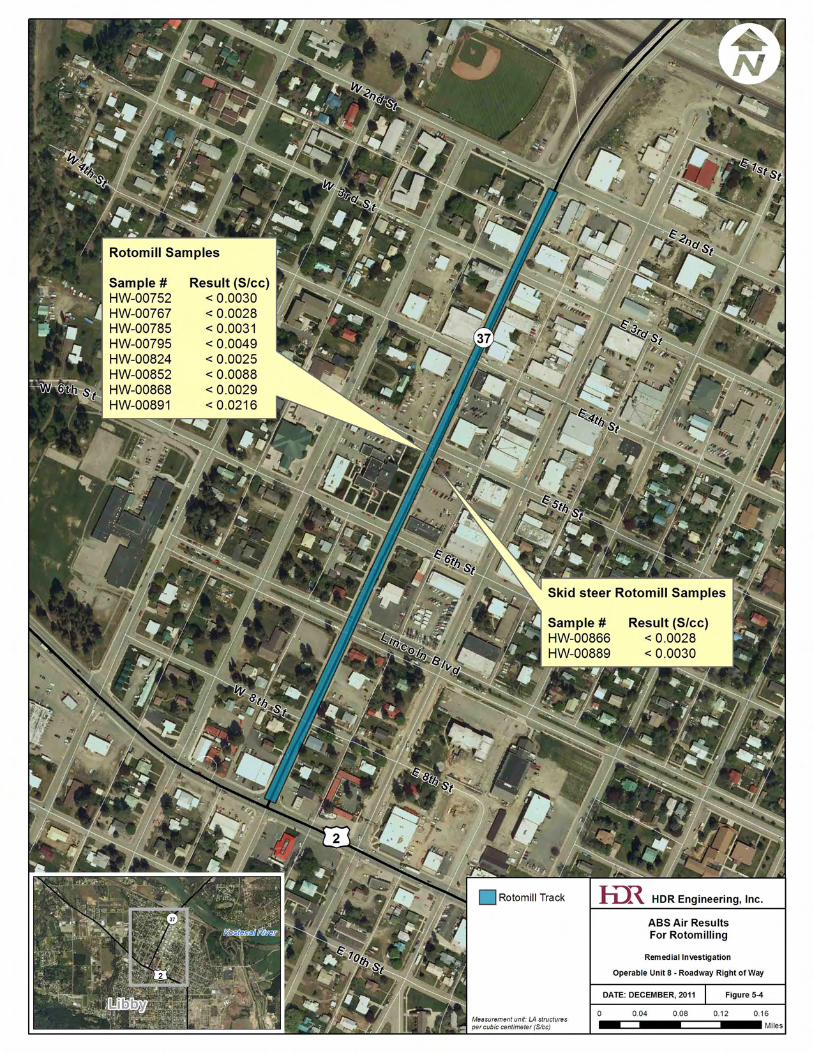
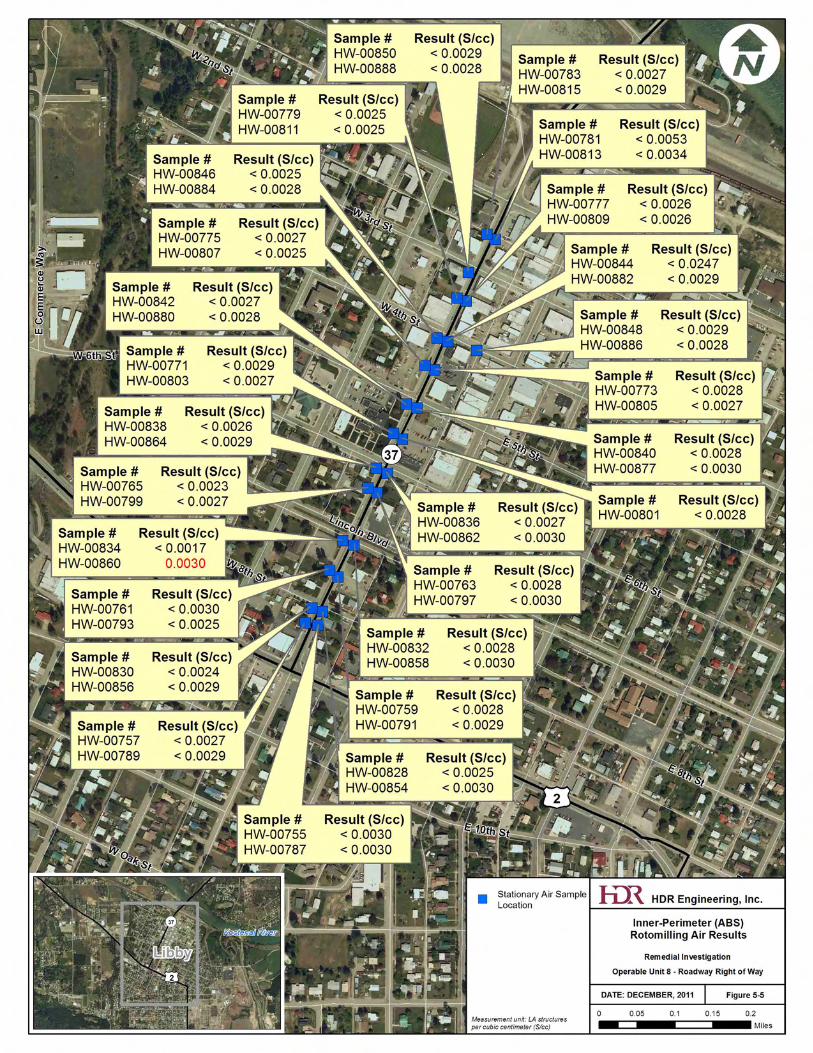
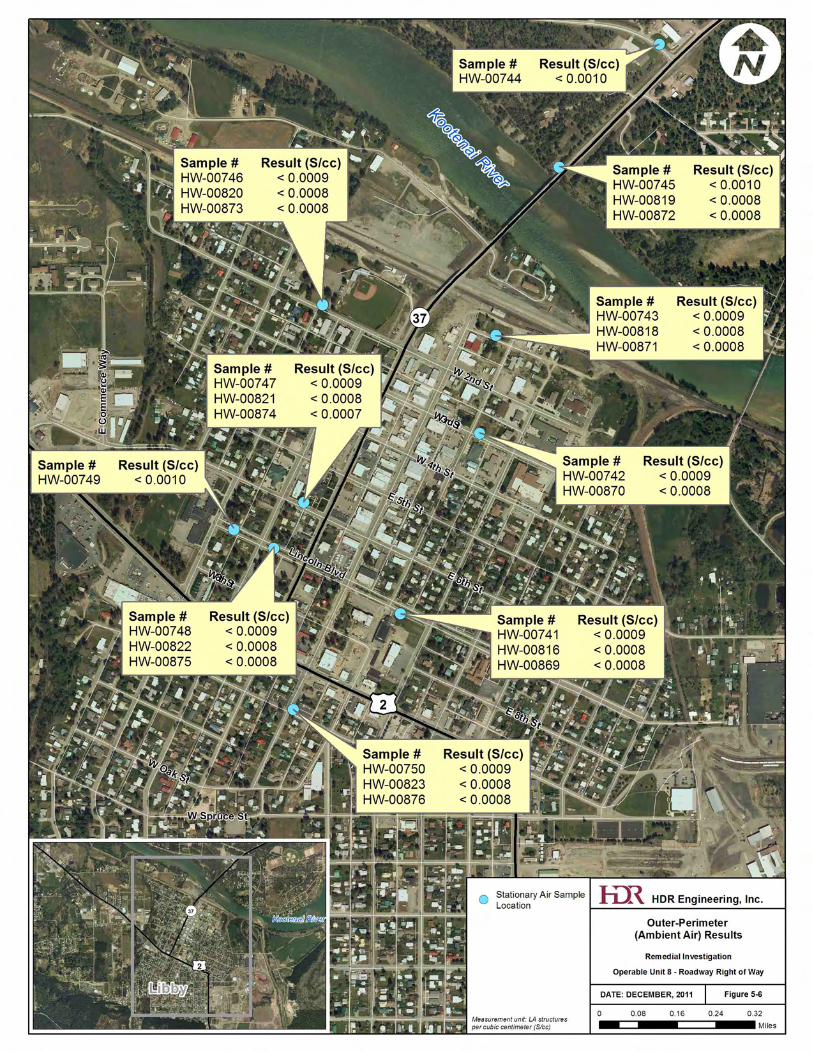
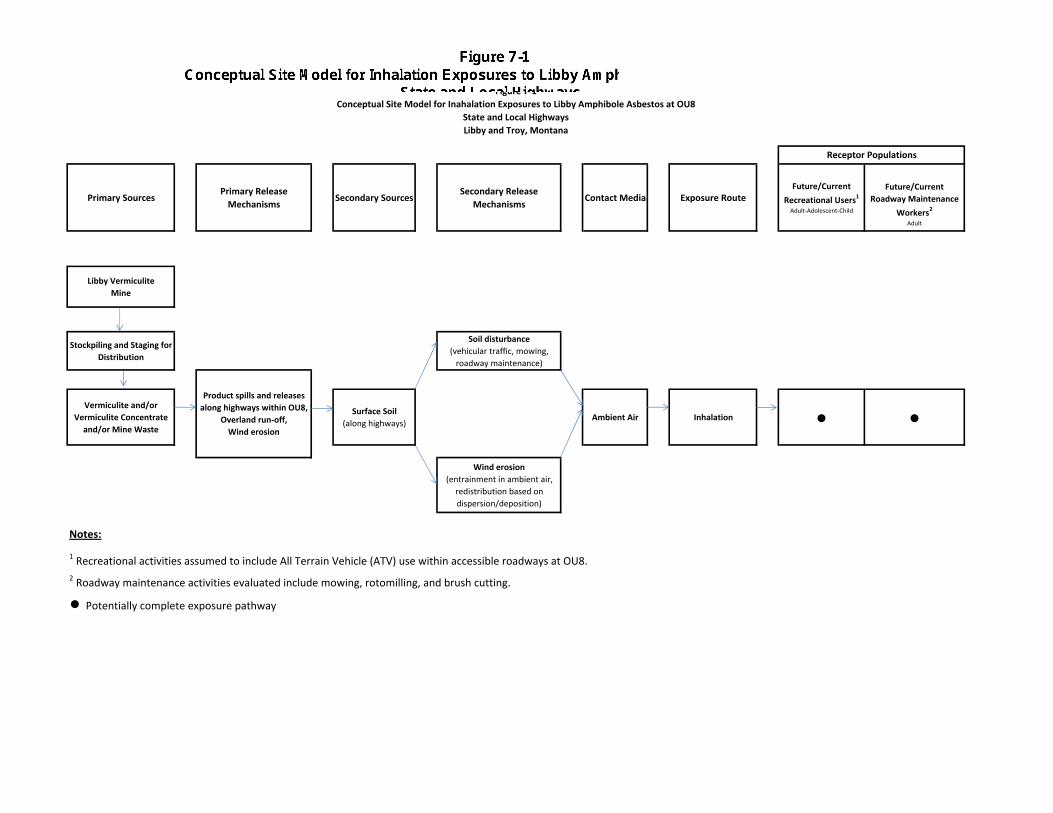
Primary SourcesPrimary Release Mechanisms
Secondary SourcesSecondary Release
MechanismsContact Media Exposure Route
Future/CurrentRecreational Users1Adult‐Adolescent‐Child
Future/CurrentRoadway Maintenance
Workers2Adult
Libby VermiculiteMine
Stockpiling and Staging for Distribution
Soil disturbance(vehicular traffic, mowing, roadway maintenance)
Vermiculite and/or Vermiculite Concentrate and/or Mine Waste
Surface Soil(along highways)
Ambient Air Inhalation ● ●
Wind erosion(entrainment in ambient air, redistribution based on dispersion/deposition)
Notes:
1 Recreational activities assumed to include All Terrain Vehicle (ATV) use within accessible roadways at OU8.2 Roadway maintenance activities evaluated include mowing, rotomilling, and brush cutting.
● Potentially complete exposure pathway
Product spills and releases along highways within OU8,
Overland run‐off,Wind erosion
Figure 7‐1Conceptual Site Model for Inahalation Exposures to Libby Amphibole Asbestos at OU8
State and Local HighwaysLibby and Troy, Montana
Receptor Populations
dvelasqu
Text Box
dvelasqu
Text Box
Figure 7-1 Conceptual Site Model for Inhalation Exposures to Libby Amphibole Asbestos at OU8 State and Local Highways Libby and Troy, Montana
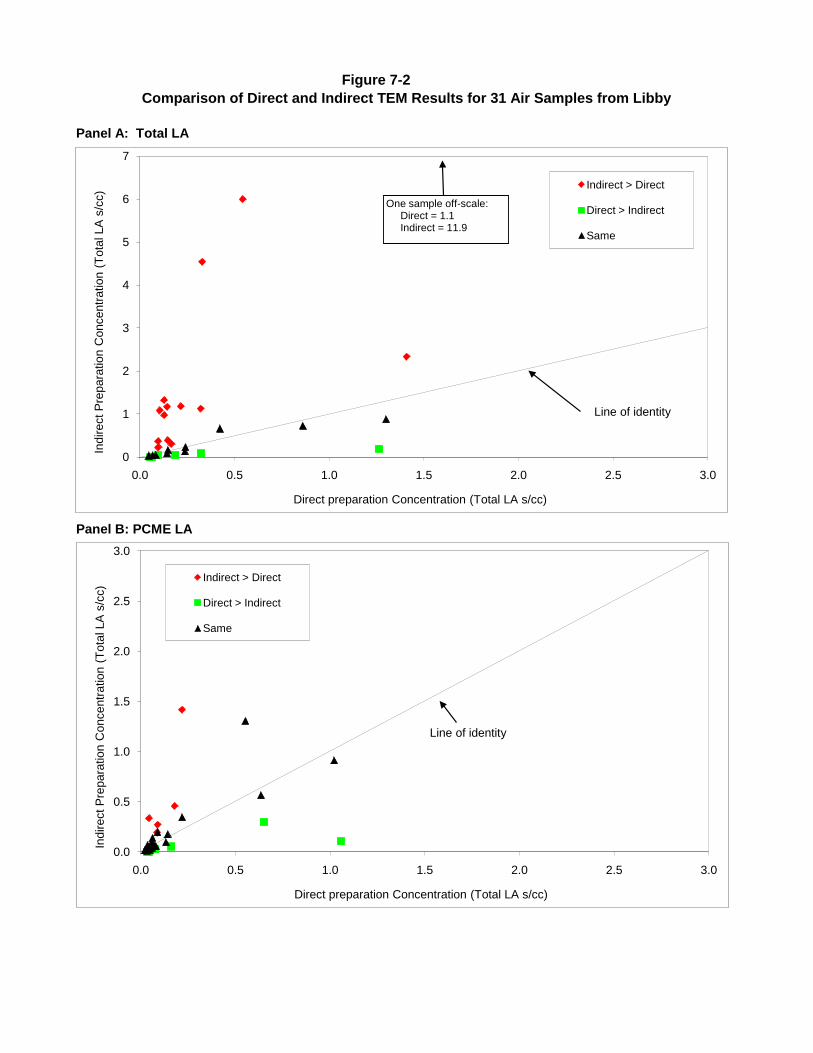
Panel A: Total LA
Panel B: PCME LA
Figure 7-2Comparison of Direct and Indirect TEM Results for 31 Air Samples from Libby
0
1
2
3
4
5
6
7
0.0 0.5 1.0 1.5 2.0 2.5 3.0
Indi
rect
Pre
para
tion
Con
cent
ratio
n (T
otal
LA
s/cc
)
Direct preparation Concentration (Total LA s/cc)
Indirect > Direct
Direct > Indirect
Same
One sample off-scale:Direct = 1.1Indirect = 11.9
Line of identity
0.0
0.5
1.0
1.5
2.0
2.5
3.0
0.0 0.5 1.0 1.5 2.0 2.5 3.0
Indi
rect
Pre
para
tion
Con
cent
ratio
n (T
otal
LA
s/cc
)
Direct preparation Concentration (Total LA s/cc)
Indirect > Direct
Direct > Indirect
Same
Line of identity

Appendices

Appendix A Data Quality Assessment
VERIFICATION SUMMARY REPORT
FOR OPERABLE UNIT 8
LIBBY ASBESTOS SUPERFUND SITE
(Based on Scribe database provided on 1/27/11)
Prepared for:
U.S. Environmental Protection Agency Region 8
1595 Wynkoop Street
Denver, Colorado 80202
Prepared by:
SRC, Inc.
Denver, CO
February 1, 2011
CONTENTS
TEM Consistency Review and Data Transfer Verification Report PLM Consistency Review and Data Transfer Verification Report FSDS Data Transfer Verification Report
ATTACHMENTS
Attachment 1a TEM Verification (Analytical and Results Information)
Attachment 1b TEM Verification (Raw Structure Information)
Attachment 2 PLM-VE Verification
Attachment 3a Air FSDS Verification
Attachment 3b Air FSDS Verification (Pump Information)
Attachment 3c Soil FSDS Verification
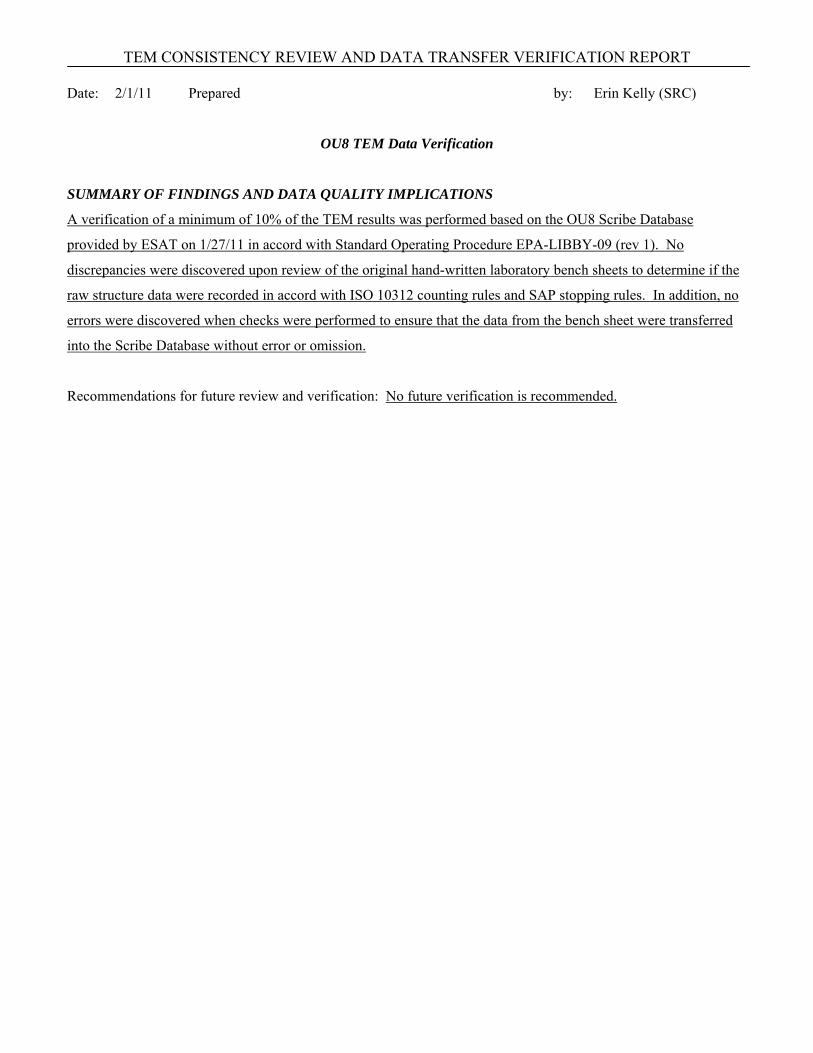
TEM CONSISTENCY REVIEW AND DATA TRANSFER VERIFICATION REPORT
Date: 2/1/11 Prepared by: Erin Kelly (SRC)
OU8 TEM Data Verification
SUMMARY OF FINDINGS AND DATA QUALITY IMPLICATIONS
A verification of a minimum of 10% of the TEM results was performed based on the OU8 Scribe Database
provided by ESAT on 1/27/11 in accord with Standard Operating Procedure EPA-LIBBY-09 (rev 1). No
discrepancies were discovered upon review of the original hand-written laboratory bench sheets to determine if the
raw structure data were recorded in accord with ISO 10312 counting rules and SAP stopping rules. In addition, no
errors were discovered when checks were performed to ensure that the data from the bench sheet were transferred
into the Scribe Database without error or omission.
Recommendations for future review and verification: No future verification is recommended.
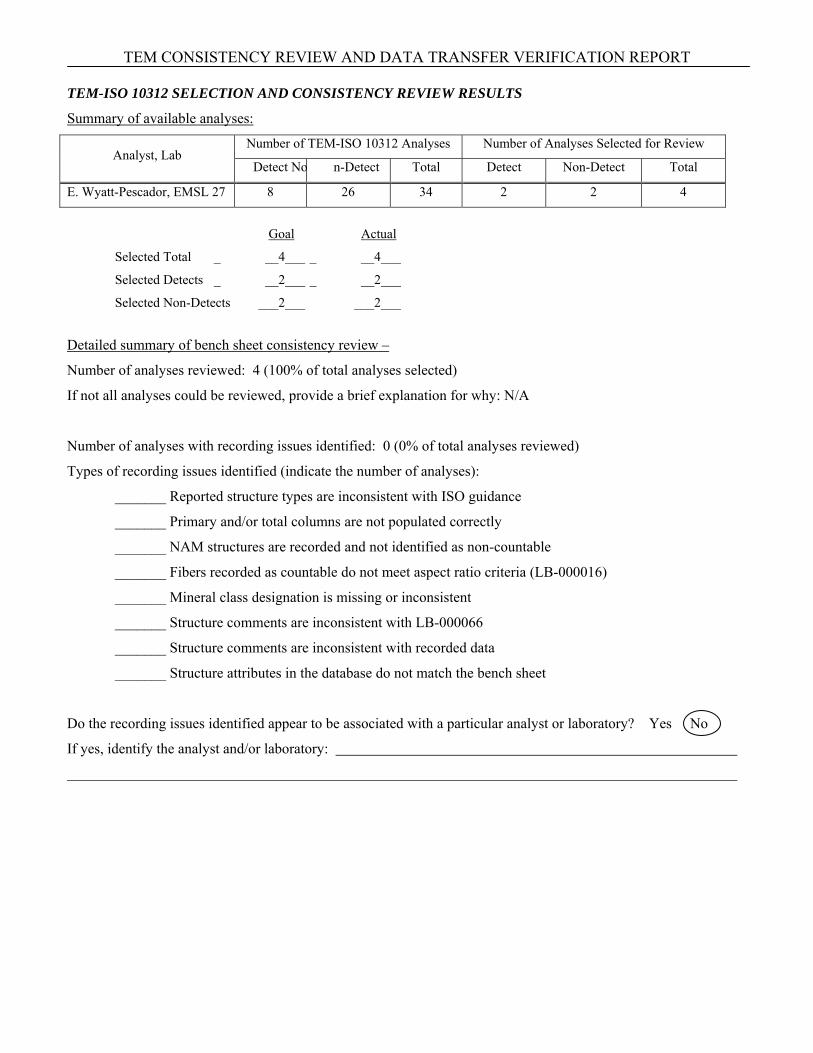
TEM CONSISTENCY REVIEW AND DATA TRANSFER VERIFICATION REPORT
TEM-ISO 10312 SELECTION AND CONSISTENCY REVIEW RESULTS
Summary of available analyses:
Analyst, Lab Number of TEM-ISO 10312 Analyses Number of Analyses Selected for Review
Detect No n-Detect Total Detect Non-Detect Total
E. Wyatt-Pescador, EMSL 27 8 26 34 2 2 4
Goal Actual
Selected Total _ __4___ _ __4___
Selected Detects _ __2___ _ __2___
Selected Non-Detects ___2___ ___2___
Detailed summary of bench sheet consistency review –
Number of analyses reviewed: 4 (100% of total analyses selected)
If not all analyses could be reviewed, provide a brief explanation for why: N/A
Number of analyses with recording issues identified: 0 (0% of total analyses reviewed)
Types of recording issues identified (indicate the number of analyses):
_______ Reported structure types are inconsistent with ISO guidance
_______ Primary and/or total columns are not populated correctly
_______ NAM structures are recorded and not identified as non-countable
_______ Fibers recorded as countable do not meet aspect ratio criteria (LB-000016)
_______ Mineral class designation is missing or inconsistent
_______ Structure comments are inconsistent with LB-000066
_______ Structure comments are inconsistent with recorded data
_______ Structure attributes in the database do not match the bench sheet
Do the recording issues identified appear to be associated with a particular analyst or laboratory? Yes No
If yes, identify the analyst and/or laboratory:

TEM CONSISTENCY REVIEW AND DATA TRANSFER VERIFICATION REPORT
DATA TRANSFER VERIFICATION RESULTS
Number of analyses verified1: 4 (100% of total analyses selected)
Number of analyses with data transfer issues identified: 0 (0% of total analyses reviewed)
Types of data transfer issues identified:
_______ Incorrect/missing information on analysis details (e.g., lab job number, analysis date, filter status)
_______ F-factor calculation is incorrect or inputs are missing
_______ Air volume or dust area reported by laboratory is inconsistent with field value
_______ Number of grid openings counted is incorrect
_______ Sensitivity calculation is incorrect or inputs are missing
_______ Total number of countable LA structures is incorrect
Do the data transfer issues identified appear to be associated with a particular analyst or laboratory? Yes No
If yes, identify the analyst and/or laboratory:
Comments: No errors were discovered in the verification process.
ISSUE RESOLUTION AND STATUS
No resolutions are required. Attachments 1a and 1b contain the analyses that were verified and the information that
was verified. Attachment 1a contains the analytical and results information and Attachment 1b contains the raw
structure information.
1 Only those analyses that have passed the bench sheet consistency review are included in the data transfer verification.

PLM CONSISTENCY REVIEW AND DATA TRANSFER VERIFICATION REPORT
Date: 2/1/11 Prepared by: Erin Kelly (SRC)
OU8 PLM-VE Data Verification
SUMMARY OF FINDINGS AND DATA QUALITY IMPLICATIONS
A verification of a minimum of 10% of the PLM-VE results was performed based on the OU8 Scribe Database
provided by ESAT on 1/27/11 in accord with draft Standard Operating Procedure for PLM verification. A review
of the original laboratory PLM bench sheets and verification of the transfer of results from the bench sheets into the
Scribe Database was performed.
Recommendations for future review and verification: Because the issues identified are not likely to impact data
interpretation, no future verification is recommended.
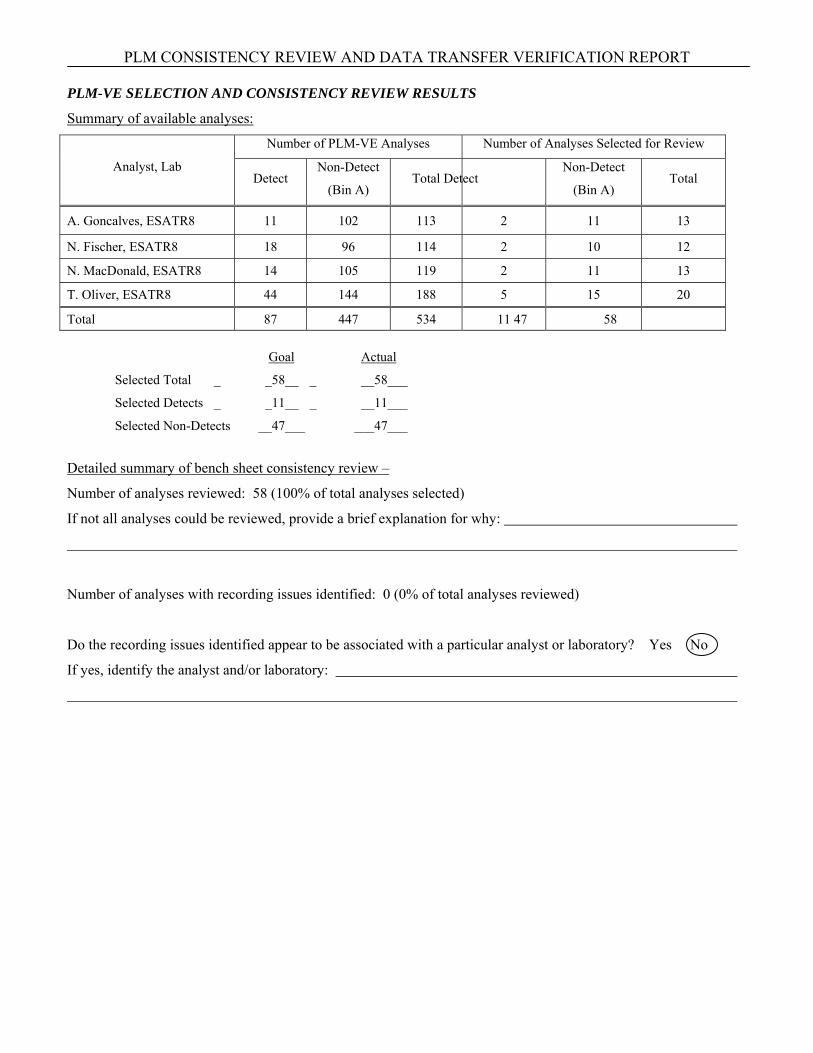
PLM CONSISTENCY REVIEW AND DATA TRANSFER VERIFICATION REPORT
PLM-VE SELECTION AND CONSISTENCY REVIEW RESULTS
Summary of available analyses:
Analyst, Lab
Number of PLM-VE Analyses Number of Analyses Selected for Review
Detect Non-Detect
(Bin A) Total Detect
Non-Detect
(Bin A) Total
A. Goncalves, ESATR8 11 102 113 2 11 13
N. Fischer, ESATR8 18 96 114 2 10 12
N. MacDonald, ESATR8 14 105 119 2 11 13
T. Oliver, ESATR8 44 144 188 5 15 20
Total 87 447 534 11 47 58
Goal Actual
Selected Total _ _58__ _ __58___
Selected Detects _ _11__ _ __11___
Selected Non-Detects __47___ ___47___
Detailed summary of bench sheet consistency review –
Number of analyses reviewed: 58 (100% of total analyses selected)
If not all analyses could be reviewed, provide a brief explanation for why:
Number of analyses with recording issues identified: 0 (0% of total analyses reviewed)
Do the recording issues identified appear to be associated with a particular analyst or laboratory? Yes No
If yes, identify the analyst and/or laboratory:
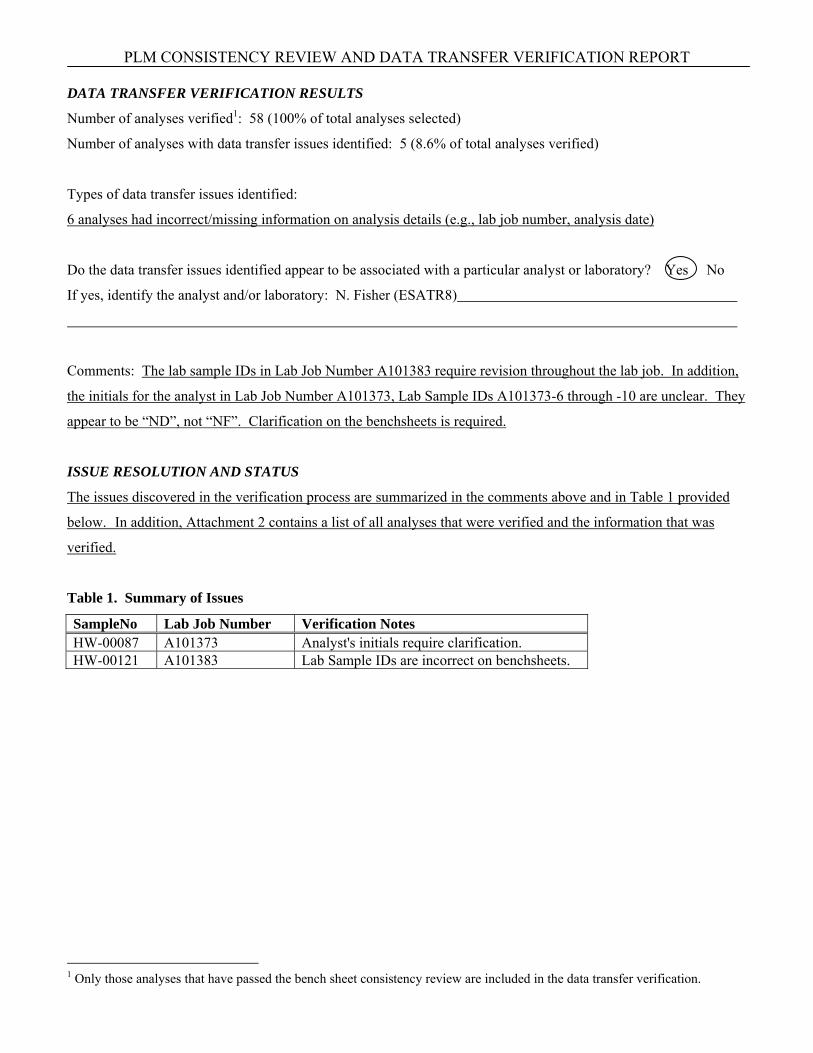
PLM CONSISTENCY REVIEW AND DATA TRANSFER VERIFICATION REPORT
DATA TRANSFER VERIFICATION RESULTS
Number of analyses verified1: 58 (100% of total analyses selected)
Number of analyses with data transfer issues identified: 5 (8.6% of total analyses verified)
Types of data transfer issues identified:
6 analyses had incorrect/missing information on analysis details (e.g., lab job number, analysis date)
Do the data transfer issues identified appear to be associated with a particular analyst or laboratory? Yes No
If yes, identify the analyst and/or laboratory: N. Fisher (ESATR8)
Comments: The lab sample IDs in Lab Job Number A101383 require revision throughout the lab job. In addition,
the initials for the analyst in Lab Job Number A101373, Lab Sample IDs A101373-6 through -10 are unclear. They
appear to be “ND”, not “NF”. Clarification on the benchsheets is required.
ISSUE RESOLUTION AND STATUS
The issues discovered in the verification process are summarized in the comments above and in Table 1 provided
below. In addition, Attachment 2 contains a list of all analyses that were verified and the information that was
verified.
Table 1. Summary of Issues
SampleNo Lab Job Number Verification Notes HW-00087 A101373 Analyst's initials require clarification. HW-00121 A101383 Lab Sample IDs are incorrect on benchsheets.
1 Only those analyses that have passed the bench sheet consistency review are included in the data transfer verification.
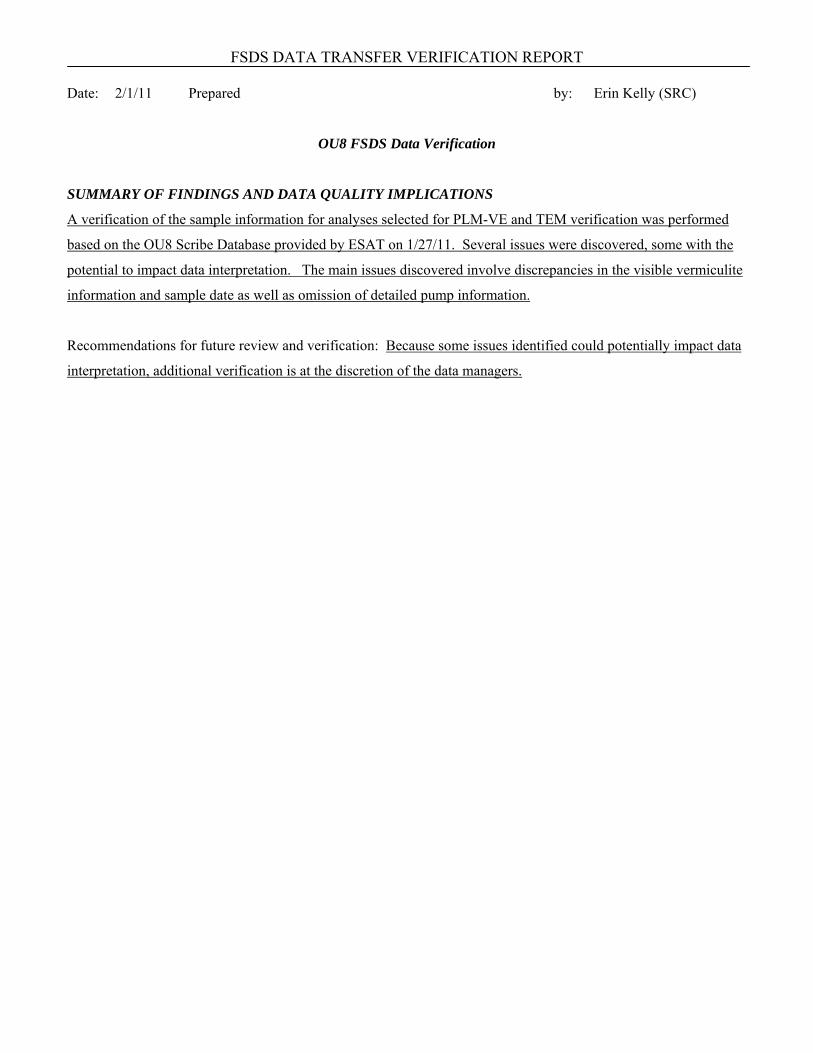
FSDS DATA TRANSFER VERIFICATION REPORT
Date: 2/1/11 Prepared by: Erin Kelly (SRC)
OU8 FSDS Data Verification
SUMMARY OF FINDINGS AND DATA QUALITY IMPLICATIONS
A verification of the sample information for analyses selected for PLM-VE and TEM verification was performed
based on the OU8 Scribe Database provided by ESAT on 1/27/11. Several issues were discovered, some with the
potential to impact data interpretation. The main issues discovered involve discrepancies in the visible vermiculite
information and sample date as well as omission of detailed pump information.
Recommendations for future review and verification: Because some issues identified could potentially impact data
interpretation, additional verification is at the discretion of the data managers.
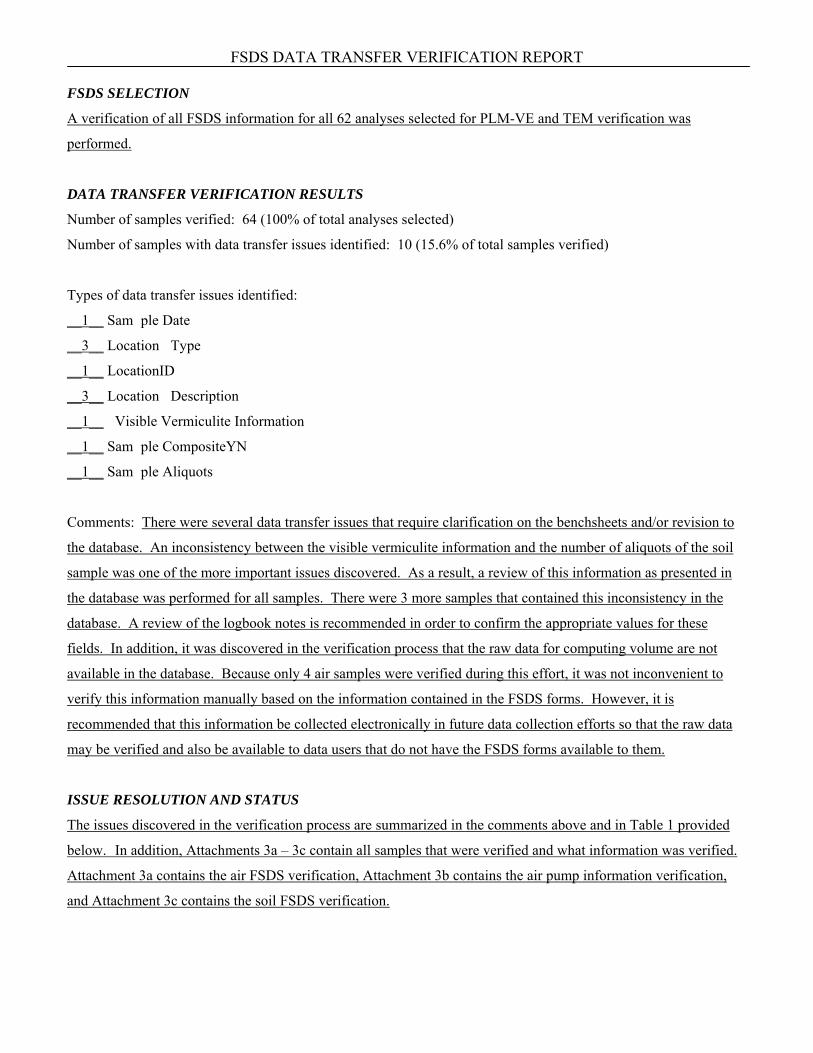
FSDS DATA TRANSFER VERIFICATION REPORT
FSDS SELECTION
A verification of all FSDS information for all 62 analyses selected for PLM-VE and TEM verification was
performed.
DATA TRANSFER VERIFICATION RESULTS
Number of samples verified: 64 (100% of total analyses selected)
Number of samples with data transfer issues identified: 10 (15.6% of total samples verified)
Types of data transfer issues identified:
__1__ Sam ple Date
__3__ Location Type
__1__ LocationID
__3__ Location Description
__1__ Visible Vermiculite Information
__1__ Sam ple CompositeYN
__1__ Sam ple Aliquots
Comments: There were several data transfer issues that require clarification on the benchsheets and/or revision to
the database. An inconsistency between the visible vermiculite information and the number of aliquots of the soil
sample was one of the more important issues discovered. As a result, a review of this information as presented in
the database was performed for all samples. There were 3 more samples that contained this inconsistency in the
database. A review of the logbook notes is recommended in order to confirm the appropriate values for these
fields. In addition, it was discovered in the verification process that the raw data for computing volume are not
available in the database. Because only 4 air samples were verified during this effort, it was not inconvenient to
verify this information manually based on the information contained in the FSDS forms. However, it is
recommended that this information be collected electronically in future data collection efforts so that the raw data
may be verified and also be available to data users that do not have the FSDS forms available to them.
ISSUE RESOLUTION AND STATUS
The issues discovered in the verification process are summarized in the comments above and in Table 1 provided
below. In addition, Attachments 3a – 3c contain all samples that were verified and what information was verified.
Attachment 3a contains the air FSDS verification, Attachment 3b contains the air pump information verification,
and Attachment 3c contains the soil FSDS verification.
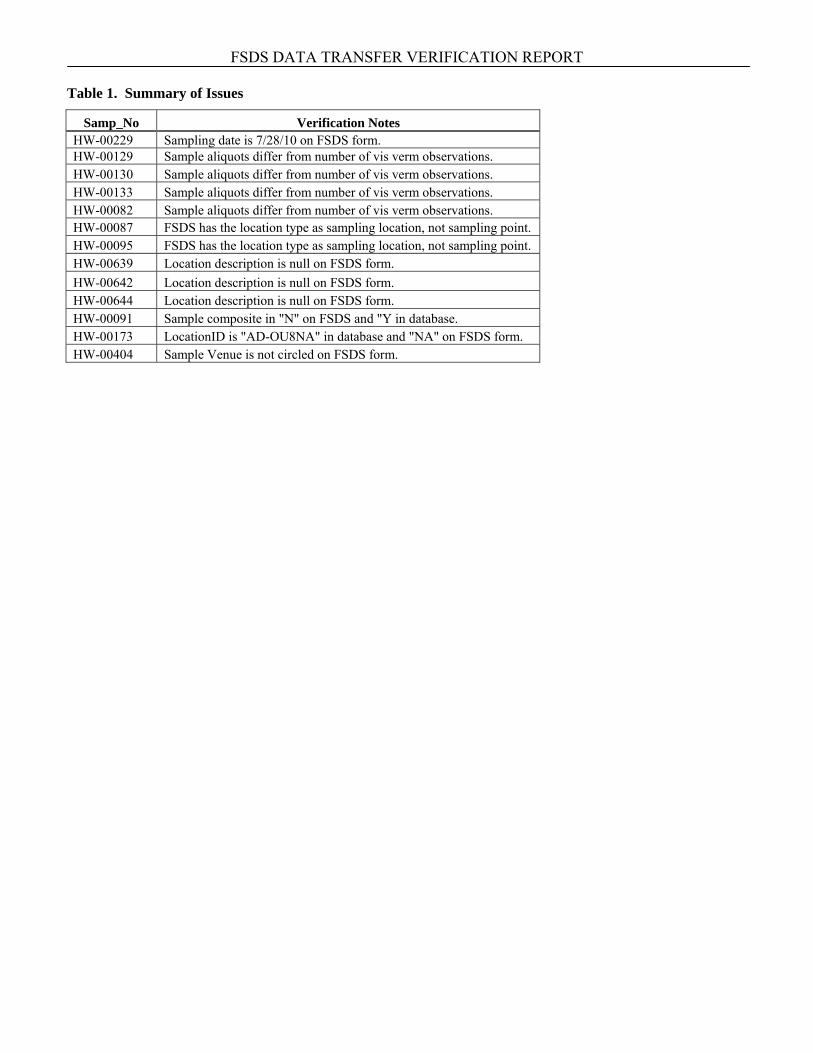
FSDS DATA TRANSFER VERIFICATION REPORT
Table 1. Summary of Issues
Samp_No Verification Notes HW-00229 Sampling date is 7/28/10 on FSDS form. HW-00129 Sample aliquots differ from number of vis verm observations. HW-00130 Sample aliquots differ from number of vis verm observations. HW-00133 Sample aliquots differ from number of vis verm observations. HW-00082 Sample aliquots differ from number of vis verm observations. HW-00087 FSDS has the location type as sampling location, not sampling point. HW-00095 FSDS has the location type as sampling location, not sampling point. HW-00639 Location description is null on FSDS form. HW-00642 Location description is null on FSDS form. HW-00644 Location description is null on FSDS form. HW-00091 Sample composite in "N" on FSDS and "Y in database. HW-00173 LocationID is "AD-OU8NA" in database and "NA" on FSDS form. HW-00404 Sample Venue is not circled on FSDS form.
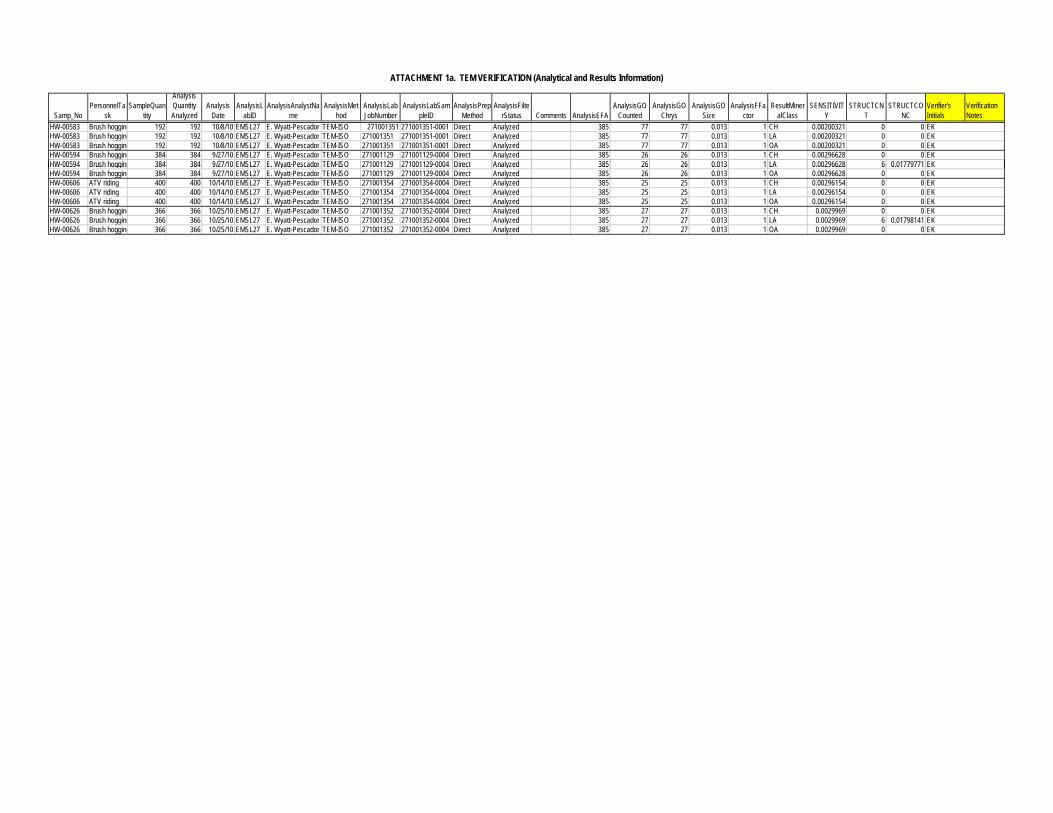
Samp_NoPersonnelTa
skSampleQuan
tity
Analysis Quantity Analyzed
Analysis Date
AnalysisLabID
AnalysisAnalystName
AnalysisMethod
AnalysisLabJobNumber
AnalysisLabSampleID
AnalysisPrepMethod
AnalysisFilterStatus Comments AnalysisEFA
AnalysisGOCounted
AnalysisGOChrys
AnalysisGOSize
AnalysisFFactor
ResultMineralClass
SENSITIVITY
STRUCTCNT
STRUCTCONC
Verifier's Initials
Verification Notes
HW-00583 Brush hogging 192 192 10/8/10 EMSL27 E. Wyatt-Pescador TEM-ISO 271001351 271001351-0001 Direct Analyzed 385 77 77 0.013 1 CH 0.00200321 0 0 EKHW-00583 Brush hogging 192 192 10/8/10 EMSL27 E. Wyatt-Pescador TEM-ISO 271001351 271001351-0001 Direct Analyzed 385 77 77 0.013 1 LA 0.00200321 0 0 EKHW-00583 Brush hogging 192 192 10/8/10 EMSL27 E. Wyatt-Pescador TEM-ISO 271001351 271001351-0001 Direct Analyzed 385 77 77 0.013 1 OA 0.00200321 0 0 EKHW-00594 Brush hogging 384 384 9/27/10 EMSL27 E. Wyatt-Pescador TEM-ISO 271001129 271001129-0004 Direct Analyzed 385 26 26 0.013 1 CH 0.00296628 0 0 EKHW-00594 Brush hogging 384 384 9/27/10 EMSL27 E. Wyatt-Pescador TEM-ISO 271001129 271001129-0004 Direct Analyzed 385 26 26 0.013 1 LA 0.00296628 6 0.01779771 EK
ATTACHMENT 1a. TEM VERIFICATION (Analytical and Results Information)
HW 00594 Brush hogging 384 384 9/27/10 EMSL27 E. Wyatt Pescador TEM ISO 271001129 271001129 0004 Direct Analyzed 385 26 26 0.013 1 LA 0.00296628 6 0.01779771 EKHW-00594 Brush hogging 384 384 9/27/10 EMSL27 E. Wyatt-Pescador TEM-ISO 271001129 271001129-0004 Direct Analyzed 385 26 26 0.013 1 OA 0.00296628 0 0 EKHW-00606 ATV riding 400 400 10/14/10 EMSL27 E. Wyatt-Pescador TEM-ISO 271001354 271001354-0004 Direct Analyzed 385 25 25 0.013 1 CH 0.00296154 0 0 EKHW-00606 ATV riding 400 400 10/14/10 EMSL27 E. Wyatt-Pescador TEM-ISO 271001354 271001354-0004 Direct Analyzed 385 25 25 0.013 1 LA 0.00296154 0 0 EKHW-00606 ATV riding 400 400 10/14/10 EMSL27 E. Wyatt-Pescador TEM-ISO 271001354 271001354-0004 Direct Analyzed 385 25 25 0.013 1 OA 0.00296154 0 0 EKHW-00626 Brush hogging 366 366 10/25/10 EMSL27 E. Wyatt-Pescador TEM-ISO 271001352 271001352-0004 Direct Analyzed 385 27 27 0.013 1 CH 0.0029969 0 0 EKHW-00626 Brush hogging 366 366 10/25/10 EMSL27 E. Wyatt-Pescador TEM-ISO 271001352 271001352-0004 Direct Analyzed 385 27 27 0.013 1 LA 0.0029969 6 0.01798141 EKHW-00626 Brush hogging 366 366 10/25/10 EMSL27 E. Wyatt-Pescador TEM-ISO 271001352 271001352-0004 Direct Analyzed 385 27 27 0.013 1 OA 0.0029969 0 0 EK

StructureID Samp_No AnalysisID Grid GridOpeningStructure
TypeMineral Class Primary Total Length Width AR
StructureComment
Verifier's Initials
Verification Notes
271001351-0001_ISO_D-1 HW-00583 271001351-0001_ISO_D A1 E2 ND EK271001351-0001_ISO_D-2 HW-00583 271001351-0001_ISO_D A1 E4 ND EK271001351-0001_ISO_D-3 HW-00583 271001351-0001_ISO_D A1 E6 ND EK271001351-0001_ISO_D-4 HW-00583 271001351-0001_ISO_D A1 E8 ND EK271001351-0001_ISO_D-5 HW-00583 271001351-0001_ISO_D A1 E10 ND EK271001351-0001_ISO_D-6 HW-00583 271001351-0001_ISO_D A1 F1 ND EK271001351-0001_ISO_D-7 HW-00583 271001351-0001_ISO_D A1 F3 ND EK271001351-0001 ISO D-8 HW-00583 271001351-0001 ISO D A1 F5 ND EK
ATTACHMENT 1b. TEM VERIFICATION (Raw Structure Information)
271001351-0001_ISO_D-8 HW-00583 271001351-0001_ISO_D A1 F5 ND EK271001351-0001_ISO_D-9 HW-00583 271001351-0001_ISO_D A1 F7 ND EK271001351-0001_ISO_D-10 HW-00583 271001351-0001_ISO_D A1 F9 ND EK271001351-0001_ISO_D-11 HW-00583 271001351-0001_ISO_D A1 G2 ND EK271001351-0001_ISO_D-12 HW-00583 271001351-0001_ISO_D A1 G4 ND EK271001351-0001_ISO_D-13 HW-00583 271001351-0001_ISO_D A1 G6 ND EK271001351-0001_ISO_D-14 HW-00583 271001351-0001_ISO_D A1 G8 ND EK271001351-0001_ISO_D-15 HW-00583 271001351-0001_ISO_D A1 G10 ND EK271001351-0001_ISO_D-16 HW-00583 271001351-0001_ISO_D A1 H1 ND EK271001351-0001_ISO_D-17 HW-00583 271001351-0001_ISO_D A1 H3 ND EK271001351-0001_ISO_D-18 HW-00583 271001351-0001_ISO_D A1 H5 ND EK271001351-0001_ISO_D-19 HW-00583 271001351-0001_ISO_D A1 H7 ND EK271001351-0001_ISO_D-20 HW-00583 271001351-0001_ISO_D A1 H9 ND EK271001351-0001_ISO_D-21 HW-00583 271001351-0001_ISO_D A1 I2 ND EK271001351-0001_ISO_D-22 HW-00583 271001351-0001_ISO_D A1 I4 ND EK271001351-0001_ISO_D-23 HW-00583 271001351-0001_ISO_D A1 I6 ND EK271001351-0001_ISO_D-24 HW-00583 271001351-0001_ISO_D A1 I8 ND EK271001351-0001_ISO_D-25 HW-00583 271001351-0001_ISO_D A1 I10 ND EK271001351-0001_ISO_D-26 HW-00583 271001351-0001_ISO_D A2 B2 ND EK271001351-0001_ISO_D-27 HW-00583 271001351-0001_ISO_D A2 B4 ND EK271001351-0001_ISO_D-28 HW-00583 271001351-0001_ISO_D A2 B6 ND EK271001351-0001_ISO_D-29 HW-00583 271001351-0001_ISO_D A2 B8 ND EK271001351-0001_ISO_D-30 HW-00583 271001351-0001_ISO_D A2 B10 ND EK271001351 0001 ISO D 31 HW 00583 271001351 0001 ISO D A2 C1 ND EK271001351-0001_ISO_D-31 HW-00583 271001351-0001_ISO_D A2 C1 ND EK271001351-0001_ISO_D-32 HW-00583 271001351-0001_ISO_D A2 C3 ND EK271001351-0001_ISO_D-33 HW-00583 271001351-0001_ISO_D A2 C5 ND EK271001351-0001_ISO_D-34 HW-00583 271001351-0001_ISO_D A2 C7 ND EK271001351-0001_ISO_D-35 HW-00583 271001351-0001_ISO_D A2 C9 ND EK271001351-0001_ISO_D-36 HW-00583 271001351-0001_ISO_D A2 D2 ND EK271001351-0001_ISO_D-37 HW-00583 271001351-0001_ISO_D A2 D4 ND EK271001351-0001_ISO_D-38 HW-00583 271001351-0001_ISO_D A2 D6 ND EK271001351-0001_ISO_D-39 HW-00583 271001351-0001_ISO_D A2 D8 ND EK271001351-0001_ISO_D-40 HW-00583 271001351-0001_ISO_D A2 D10 ND EK271001351-0001_ISO_D-41 HW-00583 271001351-0001_ISO_D A2 E1 ND EK271001351-0001_ISO_D-42 HW-00583 271001351-0001_ISO_D A2 E3 ND EK271001351 0001_ISO_D 42 HW 00583 271001351 0001_ISO_D A2 E3 ND EK271001351-0001_ISO_D-43 HW-00583 271001351-0001_ISO_D A2 E5 ND EK271001351-0001_ISO_D-44 HW-00583 271001351-0001_ISO_D A2 E7 ND EK271001351-0001_ISO_D-45 HW-00583 271001351-0001_ISO_D A2 E9 ND EK271001351-0001_ISO_D-46 HW-00583 271001351-0001_ISO_D A2 F2 ND EK271001351-0001_ISO_D-47 HW-00583 271001351-0001_ISO_D A2 F4 ND EK271001351-0001_ISO_D-48 HW-00583 271001351-0001_ISO_D A2 F6 ND EK271001351-0001_ISO_D-49 HW-00583 271001351-0001_ISO_D A2 F8 ND EK271001351-0001_ISO_D-50 HW-00583 271001351-0001_ISO_D A2 F10 ND EK271001351-0001_ISO_D-51 HW-00583 271001351-0001_ISO_D A2 G1 ND EK271001351-0001_ISO_D-52 HW-00583 271001351-0001_ISO_D A2 G3 ND EK271001351-0001_ISO_D-53 HW-00583 271001351-0001_ISO_D A2 G5 ND EK2 10013 1 0001 ISO D 4 HW 00 83 2 10013 1 0001 ISO D A2 G ND271001351-0001_ISO_D-54 HW-00583 271001351-0001_ISO_D A2 G7 ND EK271001351-0001_ISO_D-55 HW-00583 271001351-0001_ISO_D A2 G9 ND EK271001351-0001_ISO_D-56 HW-00583 271001351-0001_ISO_D A3 F9 ND EK271001351-0001_ISO_D-57 HW-00583 271001351-0001_ISO_D A3 F7 ND EK271001351-0001_ISO_D-58 HW-00583 271001351-0001_ISO_D A3 F5 ND EK271001351-0001_ISO_D-59 HW-00583 271001351-0001_ISO_D A3 F3 ND EK271001351-0001_ISO_D-60 HW-00583 271001351-0001_ISO_D A3 F1 ND EK271001351-0001_ISO_D-61 HW-00583 271001351-0001_ISO_D A3 E10 ND EK271001351-0001_ISO_D-62 HW-00583 271001351-0001_ISO_D A3 E8 ND EK271001351-0001_ISO_D-63 HW-00583 271001351-0001_ISO_D A3 E6 ND EK271001351-0001_ISO_D-64 HW-00583 271001351-0001_ISO_D A3 E4 ND EK271001351-0001 ISO D-65 HW-00583 271001351-0001 ISO D A3 E2 ND EK271001351-0001_ISO_D-65 HW-00583 271001351-0001_ISO_D A3 E2 ND EK271001351-0001_ISO_D-66 HW-00583 271001351-0001_ISO_D A3 D9 ND EK271001351-0001_ISO_D-67 HW-00583 271001351-0001_ISO_D A3 D7 ND EK271001351-0001_ISO_D-68 HW-00583 271001351-0001_ISO_D A3 D5 ND EK271001351-0001_ISO_D-69 HW-00583 271001351-0001_ISO_D A3 D3 ND EK271001351-0001_ISO_D-70 HW-00583 271001351-0001_ISO_D A3 D1 ND EK271001351-0001_ISO_D-71 HW-00583 271001351-0001_ISO_D A3 C10 ND EK271001351-0001_ISO_D-72 HW-00583 271001351-0001_ISO_D A3 C8 ND EK271001351-0001_ISO_D-73 HW-00583 271001351-0001_ISO_D A3 C6 ND EK271001351-0001_ISO_D-74 HW-00583 271001351-0001_ISO_D A3 C4 ND EK271001351-0001_ISO_D-75 HW-00583 271001351-0001_ISO_D A3 C2 ND EK271001351-0001_ISO_D-76 HW-00583 271001351-0001_ISO_D A3 B9 ND EK271001351-0001_ISO_D-77 HW-00583 271001351-0001_ISO_D A3 B7 ND EK271001129-0004_ISO_D-1 HW-00594 271001129-0004_ISO_D B5 H9 ND EK271001129-0004_ISO_D-2 HW-00594 271001129-0004_ISO_D B5 H7 ND EK271001129-0004_ISO_D-3 HW-00594 271001129-0004_ISO_D B5 H5 F LA 1 1 40.1 3.25 12.3384615 NaK; WRTA; EK271001129-0004_ISO_D-4 HW-00594 271001129-0004_ISO_D B5 H3 ND EK271001129-0004_ISO_D-5 HW-00594 271001129-0004_ISO_D B5 H1 ND EK271001129-0004_ISO_D-6 HW-00594 271001129-0004_ISO_D B5 D9 F LA 2 2 84.5 1 84.5 NaK; WRTA; EK271001129-0004_ISO_D-7 HW-00594 271001129-0004_ISO_D B5 D7 ND EK
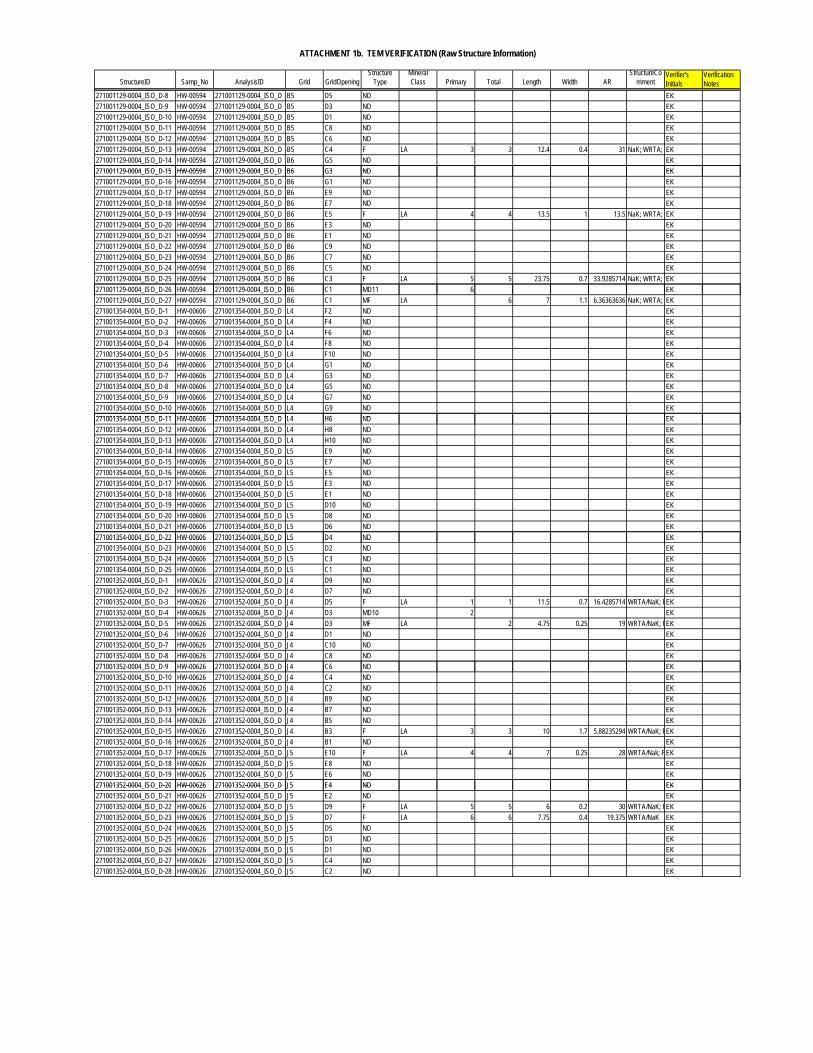
StructureID Samp_No AnalysisID Grid GridOpeningStructure
TypeMineral Class Primary Total Length Width AR
StructureComment
Verifier's Initials
Verification Notes
ATTACHMENT 1b. TEM VERIFICATION (Raw Structure Information)
271001129-0004_ISO_D-8 HW-00594 271001129-0004_ISO_D B5 D5 ND EK271001129-0004_ISO_D-9 HW-00594 271001129-0004_ISO_D B5 D3 ND EK271001129-0004_ISO_D-10 HW-00594 271001129-0004_ISO_D B5 D1 ND EK271001129-0004_ISO_D-11 HW-00594 271001129-0004_ISO_D B5 C8 ND EK271001129-0004_ISO_D-12 HW-00594 271001129-0004_ISO_D B5 C6 ND EK271001129-0004_ISO_D-13 HW-00594 271001129-0004_ISO_D B5 C4 F LA 3 3 12.4 0.4 31 NaK; WRTA; EK271001129-0004_ISO_D-14 HW-00594 271001129-0004_ISO_D B6 G5 ND EK271001129-0004 ISO D-15 HW-00594 271001129-0004 ISO D B6 G3 ND EK271001129-0004_ISO_D-15 HW-00594 271001129-0004_ISO_D B6 G3 ND EK271001129-0004_ISO_D-16 HW-00594 271001129-0004_ISO_D B6 G1 ND EK271001129-0004_ISO_D-17 HW-00594 271001129-0004_ISO_D B6 E9 ND EK271001129-0004_ISO_D-18 HW-00594 271001129-0004_ISO_D B6 E7 ND EK271001129-0004_ISO_D-19 HW-00594 271001129-0004_ISO_D B6 E5 F LA 4 4 13.5 1 13.5 NaK; WRTA; EK271001129-0004_ISO_D-20 HW-00594 271001129-0004_ISO_D B6 E3 ND EK271001129-0004_ISO_D-21 HW-00594 271001129-0004_ISO_D B6 E1 ND EK271001129-0004_ISO_D-22 HW-00594 271001129-0004_ISO_D B6 C9 ND EK271001129-0004_ISO_D-23 HW-00594 271001129-0004_ISO_D B6 C7 ND EK271001129-0004_ISO_D-24 HW-00594 271001129-0004_ISO_D B6 C5 ND EK271001129-0004_ISO_D-25 HW-00594 271001129-0004_ISO_D B6 C3 F LA 5 5 23.75 0.7 33.9285714 NaK; WRTA; EK271001129-0004_ISO_D-26 HW-00594 271001129-0004_ISO_D B6 C1 MD11 6 EK271001129-0004_ISO_D-27 HW-00594 271001129-0004_ISO_D B6 C1 MF LA 6 7 1.1 6.36363636 NaK; WRTA; EK271001354-0004_ISO_D-1 HW-00606 271001354-0004_ISO_D L4 F2 ND EK271001354-0004_ISO_D-2 HW-00606 271001354-0004_ISO_D L4 F4 ND EK271001354-0004_ISO_D-3 HW-00606 271001354-0004_ISO_D L4 F6 ND EK271001354-0004_ISO_D-4 HW-00606 271001354-0004_ISO_D L4 F8 ND EK271001354-0004_ISO_D-5 HW-00606 271001354-0004_ISO_D L4 F10 ND EK271001354-0004_ISO_D-6 HW-00606 271001354-0004_ISO_D L4 G1 ND EK271001354-0004_ISO_D-7 HW-00606 271001354-0004_ISO_D L4 G3 ND EK271001354-0004_ISO_D-8 HW-00606 271001354-0004_ISO_D L4 G5 ND EK271001354-0004_ISO_D-9 HW-00606 271001354-0004_ISO_D L4 G7 ND EK271001354-0004_ISO_D-10 HW-00606 271001354-0004_ISO_D L4 G9 ND EK271001354 0004 ISO D 11 HW 00606 271001354 0004 ISO D L4 H6 ND EK271001354-0004_ISO_D-11 HW-00606 271001354-0004_ISO_D L4 H6 ND EK271001354-0004_ISO_D-12 HW-00606 271001354-0004_ISO_D L4 H8 ND EK271001354-0004_ISO_D-13 HW-00606 271001354-0004_ISO_D L4 H10 ND EK271001354-0004_ISO_D-14 HW-00606 271001354-0004_ISO_D L5 E9 ND EK271001354-0004_ISO_D-15 HW-00606 271001354-0004_ISO_D L5 E7 ND EK271001354-0004_ISO_D-16 HW-00606 271001354-0004_ISO_D L5 E5 ND EK271001354-0004_ISO_D-17 HW-00606 271001354-0004_ISO_D L5 E3 ND EK271001354-0004_ISO_D-18 HW-00606 271001354-0004_ISO_D L5 E1 ND EK271001354-0004_ISO_D-19 HW-00606 271001354-0004_ISO_D L5 D10 ND EK271001354-0004_ISO_D-20 HW-00606 271001354-0004_ISO_D L5 D8 ND EK271001354-0004_ISO_D-21 HW-00606 271001354-0004_ISO_D L5 D6 ND EK271001354-0004_ISO_D-22 HW-00606 271001354-0004_ISO_D L5 D4 ND EK271001354 0004_ISO_D 22 HW 00606 271001354 0004_ISO_D L5 D4 ND EK271001354-0004_ISO_D-23 HW-00606 271001354-0004_ISO_D L5 D2 ND EK271001354-0004_ISO_D-24 HW-00606 271001354-0004_ISO_D L5 C3 ND EK271001354-0004_ISO_D-25 HW-00606 271001354-0004_ISO_D L5 C1 ND EK271001352-0004_ISO_D-1 HW-00626 271001352-0004_ISO_D J4 D9 ND EK271001352-0004_ISO_D-2 HW-00626 271001352-0004_ISO_D J4 D7 ND EK271001352-0004_ISO_D-3 HW-00626 271001352-0004_ISO_D J4 D5 F LA 1 1 11.5 0.7 16.4285714 WRTA/NaK; PEK271001352-0004_ISO_D-4 HW-00626 271001352-0004_ISO_D J4 D3 MD10 2 EK271001352-0004_ISO_D-5 HW-00626 271001352-0004_ISO_D J4 D3 MF LA 2 4.75 0.25 19 WRTA/NaK; PEK271001352-0004_ISO_D-6 HW-00626 271001352-0004_ISO_D J4 D1 ND EK271001352-0004_ISO_D-7 HW-00626 271001352-0004_ISO_D J4 C10 ND EK271001352-0004_ISO_D-8 HW-00626 271001352-0004_ISO_D J4 C8 ND EK271001352-0004_ISO_D-9 HW-00626 271001352-0004_ISO_D J4 C6 ND EK271001352-0004_ISO_D-10 HW-00626 271001352-0004_ISO_D J4 C4 ND EK271001352-0004_ISO_D-11 HW-00626 271001352-0004_ISO_D J4 C2 ND EK271001352-0004_ISO_D-12 HW-00626 271001352-0004_ISO_D J4 B9 ND EK271001352-0004_ISO_D-13 HW-00626 271001352-0004_ISO_D J4 B7 ND EK271001352-0004_ISO_D-14 HW-00626 271001352-0004_ISO_D J4 B5 ND EK271001352-0004_ISO_D-15 HW-00626 271001352-0004_ISO_D J4 B3 F LA 3 3 10 1.7 5.88235294 WRTA/NaK; PEK271001352-0004_ISO_D-16 HW-00626 271001352-0004_ISO_D J4 B1 ND EK271001352-0004_ISO_D-17 HW-00626 271001352-0004_ISO_D J5 E10 F LA 4 4 7 0.25 28 WRTA/Nak; PEK271001352-0004_ISO_D-18 HW-00626 271001352-0004_ISO_D J5 E8 ND EK271001352-0004_ISO_D-19 HW-00626 271001352-0004_ISO_D J5 E6 ND EK271001352-0004 ISO D-20 HW-00626 271001352-0004 ISO D J5 E4 ND EK271001352-0004_ISO_D-20 HW-00626 271001352-0004_ISO_D J5 E4 ND EK271001352-0004_ISO_D-21 HW-00626 271001352-0004_ISO_D J5 E2 ND EK271001352-0004_ISO_D-22 HW-00626 271001352-0004_ISO_D J5 D9 F LA 5 5 6 0.2 30 WRTA/NaK; PEK271001352-0004_ISO_D-23 HW-00626 271001352-0004_ISO_D J5 D7 F LA 6 6 7.75 0.4 19.375 WRTA/NaK EK271001352-0004_ISO_D-24 HW-00626 271001352-0004_ISO_D J5 D5 ND EK271001352-0004_ISO_D-25 HW-00626 271001352-0004_ISO_D J5 D3 ND EK271001352-0004_ISO_D-26 HW-00626 271001352-0004_ISO_D J5 D1 ND EK271001352-0004_ISO_D-27 HW-00626 271001352-0004_ISO_D J5 C4 ND EK271001352-0004_ISO_D-28 HW-00626 271001352-0004_ISO_D J5 C2 ND EK
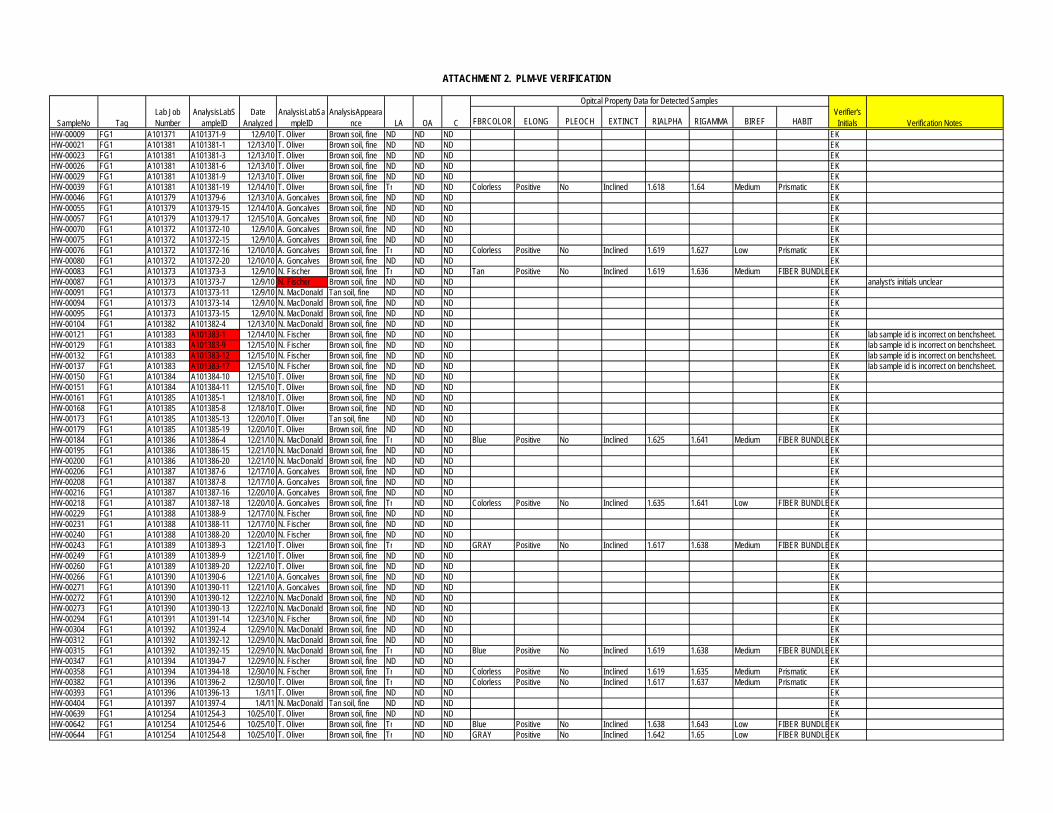
FBRCOLOR ELONG PLEOCH EXTINCT RIALPHA RIGAMMA BIREF HABITHW-00009 FG1 A101371 A101371-9 12/9/10 T. Oliver Brown soil, fine ND ND ND EKHW-00021 FG1 A101381 A101381-1 12/13/10 T. Oliver Brown soil, fine ND ND ND EKHW-00023 FG1 A101381 A101381-3 12/13/10 T. Oliver Brown soil, fine ND ND ND EKHW-00026 FG1 A101381 A101381-6 12/13/10 T. Oliver Brown soil, fine ND ND ND EKHW-00029 FG1 A101381 A101381-9 12/13/10 T. Oliver Brown soil, fine ND ND ND EKHW-00039 FG1 A101381 A101381-19 12/14/10 T. Oliver Brown soil, fine Tr ND ND Colorless Positive No Inclined 1.618 1.64 Medium Prismatic EKHW-00046 FG1 A101379 A101379-6 12/13/10 A. Goncalves Brown soil, fine ND ND ND EKHW-00055 FG1 A101379 A101379-15 12/14/10 A. Goncalves Brown soil, fine ND ND ND EKHW-00057 FG1 A101379 A101379-17 12/15/10 A. Goncalves Brown soil, fine ND ND ND EKHW-00070 FG1 A101372 A101372-10 12/9/10 A. Goncalves Brown soil, fine ND ND ND EKHW-00075 FG1 A101372 A101372-15 12/9/10 A. Goncalves Brown soil, fine ND ND ND EKHW-00076 FG1 A101372 A101372-16 12/10/10 A. Goncalves Brown soil, fine Tr ND ND Colorless Positive No Inclined 1.619 1.627 Low Prismatic EKHW-00080 FG1 A101372 A101372-20 12/10/10 A. Goncalves Brown soil, fine ND ND ND EKHW-00083 FG1 A101373 A101373-3 12/9/10 N. Fischer Brown soil, fine Tr ND ND Tan Positive No Inclined 1.619 1.636 Medium FIBER BUNDLEEKHW-00087 FG1 A101373 A101373-7 12/9/10 N. Fischer Brown soil, fine ND ND ND EK analyst's initials unclearHW-00091 FG1 A101373 A101373-11 12/9/10 N. MacDonald Tan soil, fine ND ND ND EKHW-00094 FG1 A101373 A101373-14 12/9/10 N. MacDonald Brown soil, fine ND ND ND EKHW-00095 FG1 A101373 A101373-15 12/9/10 N. MacDonald Brown soil, fine ND ND ND EKHW-00104 FG1 A101382 A101382-4 12/13/10 N. MacDonald Brown soil, fine ND ND ND EKHW-00121 FG1 A101383 A101383-1 12/14/10 N. Fischer Brown soil, fine ND ND ND EK lab sample id is incorrect on benchsheet.HW-00129 FG1 A101383 A101383-9 12/15/10 N. Fischer Brown soil, fine ND ND ND EK lab sample id is incorrect on benchsheet.HW-00132 FG1 A101383 A101383-12 12/15/10 N. Fischer Brown soil, fine ND ND ND EK lab sample id is incorrect on benchsheet.HW-00137 FG1 A101383 A101383-17 12/15/10 N. Fischer Brown soil, fine ND ND ND EK lab sample id is incorrect on benchsheet.HW-00150 FG1 A101384 A101384-10 12/15/10 T. Oliver Brown soil, fine ND ND ND EKHW-00151 FG1 A101384 A101384-11 12/15/10 T. Oliver Brown soil, fine ND ND ND EKHW-00161 FG1 A101385 A101385-1 12/18/10 T. Oliver Brown soil, fine ND ND ND EKHW-00168 FG1 A101385 A101385-8 12/18/10 T. Oliver Brown soil, fine ND ND ND EKHW-00173 FG1 A101385 A101385-13 12/20/10 T. Oliver Tan soil, fine ND ND ND EKHW-00179 FG1 A101385 A101385-19 12/20/10 T. Oliver Brown soil, fine ND ND ND EKHW-00184 FG1 A101386 A101386-4 12/21/10 N. MacDonald Brown soil, fine Tr ND ND Blue Positive No Inclined 1.625 1.641 Medium FIBER BUNDLEEKHW-00195 FG1 A101386 A101386-15 12/21/10 N. MacDonald Brown soil, fine ND ND ND EKHW-00200 FG1 A101386 A101386-20 12/21/10 N. MacDonald Brown soil, fine ND ND ND EKHW-00206 FG1 A101387 A101387-6 12/17/10 A. Goncalves Brown soil, fine ND ND ND EKHW-00208 FG1 A101387 A101387-8 12/17/10 A. Goncalves Brown soil, fine ND ND ND EKHW-00216 FG1 A101387 A101387-16 12/20/10 A. Goncalves Brown soil, fine ND ND ND EKHW-00218 FG1 A101387 A101387-18 12/20/10 A. Goncalves Brown soil, fine Tr ND ND Colorless Positive No Inclined 1.635 1.641 Low FIBER BUNDLEEKHW-00229 FG1 A101388 A101388-9 12/17/10 N. Fischer Brown soil, fine ND ND ND EKHW-00231 FG1 A101388 A101388-11 12/17/10 N. Fischer Brown soil, fine ND ND ND EKHW-00240 FG1 A101388 A101388-20 12/20/10 N. Fischer Brown soil, fine ND ND ND EKHW-00243 FG1 A101389 A101389-3 12/21/10 T. Oliver Brown soil, fine Tr ND ND GRAY Positive No Inclined 1.617 1.638 Medium FIBER BUNDLEEKHW-00249 FG1 A101389 A101389-9 12/21/10 T. Oliver Brown soil, fine ND ND ND EKHW-00260 FG1 A101389 A101389-20 12/22/10 T. Oliver Brown soil, fine ND ND ND EKHW-00266 FG1 A101390 A101390-6 12/21/10 A. Goncalves Brown soil, fine ND ND ND EKHW-00271 FG1 A101390 A101390-11 12/21/10 A. Goncalves Brown soil, fine ND ND ND EKHW-00272 FG1 A101390 A101390-12 12/22/10 N. MacDonald Brown soil, fine ND ND ND EKHW-00273 FG1 A101390 A101390-13 12/22/10 N. MacDonald Brown soil, fine ND ND ND EKHW-00294 FG1 A101391 A101391-14 12/23/10 N. Fischer Brown soil, fine ND ND ND EKHW-00304 FG1 A101392 A101392-4 12/29/10 N. MacDonald Brown soil, fine ND ND ND EKHW-00312 FG1 A101392 A101392-12 12/29/10 N. MacDonald Brown soil, fine ND ND ND EKHW-00315 FG1 A101392 A101392-15 12/29/10 N. MacDonald Brown soil, fine Tr ND ND Blue Positive No Inclined 1.619 1.638 Medium FIBER BUNDLEEKHW-00347 FG1 A101394 A101394-7 12/29/10 N. Fischer Brown soil, fine ND ND ND EKHW-00358 FG1 A101394 A101394-18 12/30/10 N. Fischer Brown soil, fine Tr ND ND Colorless Positive No Inclined 1.619 1.635 Medium Prismatic EKHW-00382 FG1 A101396 A101396-2 12/30/10 T. Oliver Brown soil, fine Tr ND ND Colorless Positive No Inclined 1.617 1.637 Medium Prismatic EKHW-00393 FG1 A101396 A101396-13 1/3/11 T. Oliver Brown soil, fine ND ND ND EKHW-00404 FG1 A101397 A101397-4 1/4/11 N. MacDonald Tan soil, fine ND ND ND EKHW-00639 FG1 A101254 A101254-3 10/25/10 T. Oliver Brown soil, fine ND ND ND EKHW-00642 FG1 A101254 A101254-6 10/25/10 T. Oliver Brown soil, fine Tr ND ND Blue Positive No Inclined 1.638 1.643 Low FIBER BUNDLEEKHW-00644 FG1 A101254 A101254-8 10/25/10 T. Oliver Brown soil, fine Tr ND ND GRAY Positive No Inclined 1.642 1.65 Low FIBER BUNDLEEK
Verification NotesLab Job Number
AnalysisAppearance
Opitcal Property Data for Detected Samples
SampleNo TagAnalysisLabS
ampleIDDate
AnalyzedAnalysisLabSa
mpleID
ATTACHMENT 2. PLM-VE VERIFICATION
LA OA CVerifier's Initials
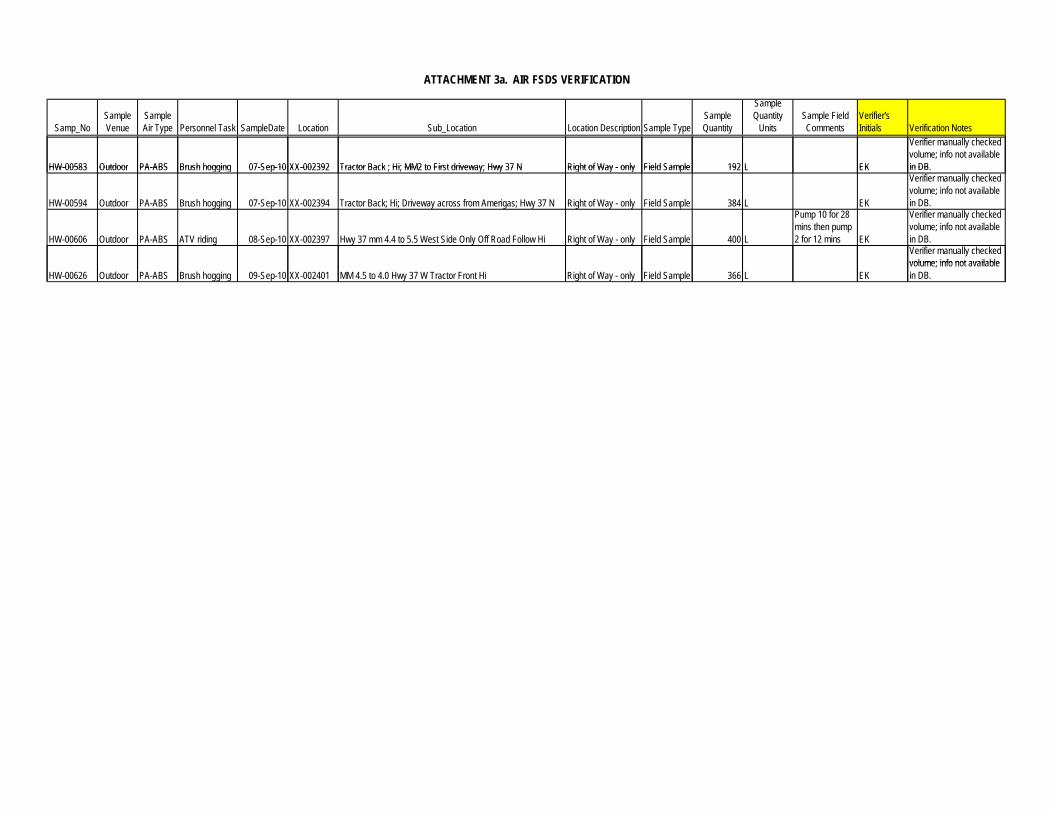
Samp_NoSample Venue
Sample Air Type Personnel Task SampleDate Location Sub_Location Location Description Sample Type
Sample Quantity
Sample Quantity
UnitsSample Field Comments
Verifier's Initials Verification Notes
HW-00583 Outdoor PA-ABS Brush hogging 07-Sep-10 XX-002392 Tractor Back ; Hi; MM2 to First driveway; Hwy 37 N Right of Way - only Field Sample 192 L EK
Verifier manually checked volume; info not available in DB
ATTACHMENT 3a. AIR FSDS VERIFICATION
HW-00583 Outdoor PA-ABS Brush hogging 07-Sep-10 XX-002392 Tractor Back ; Hi; MM2 to First driveway; Hwy 37 N Right of Way - only Field Sample 192 L EK in DB.
HW-00594 Outdoor PA-ABS Brush hogging 07-Sep-10 XX-002394 Tractor Back; Hi; Driveway across from Amerigas; Hwy 37 N Right of Way - only Field Sample 384 L EK
Verifier manually checked volume; info not available in DB.
HW-00606 Outdoor PA-ABS ATV riding 08-Sep-10 XX-002397 Hwy 37 mm 4.4 to 5.5 West Side Only Off Road Follow Hi Right of Way - only Field Sample 400 L
Pump 10 for 28 mins then pump 2 for 12 mins EK
Verifier manually checked volume; info not available in DB.Verifier manually checked volume; info not available
HW-00626 Outdoor PA-ABS Brush hogging 09-Sep-10 XX-002401 MM 4.5 to 4.0 Hwy 37 W Tractor Front Hi Right of Way - only Field Sample 366 L EKvolume; info not available in DB.
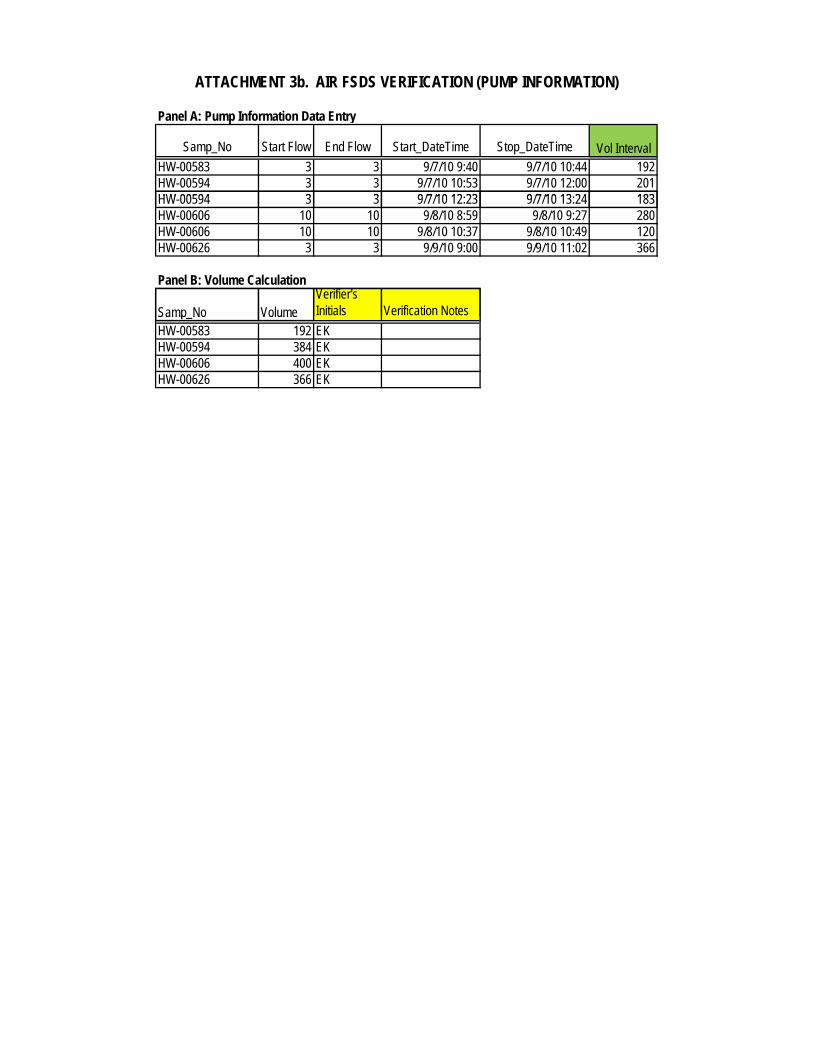
Panel A: Pump Information Data Entry
Samp_No Start Flow End Flow Start_DateTime Stop_DateTime Vol IntervalHW-00583 3 3 9/7/10 9:40 9/7/10 10:44 192HW-00594 3 3 9/7/10 10:53 9/7/10 12:00 201HW 00594 3 3 9/7/10 12 23 9/7/10 13 24 183
ATTACHMENT 3b. AIR FSDS VERIFICATION (PUMP INFORMATION)
HW-00594 3 3 9/7/10 12:23 9/7/10 13:24 183HW-00606 10 10 9/8/10 8:59 9/8/10 9:27 280HW-00606 10 10 9/8/10 10:37 9/8/10 10:49 120HW-00626 3 3 9/9/10 9:00 9/9/10 11:02 366
Panel B: Volume Calculation
Samp_No VolumeVerifier's Initials Verification NotesSamp_No Volume
HW-00583 192 EKHW-00594 384 EKHW-00606 400 EKHW-00626 366 EK
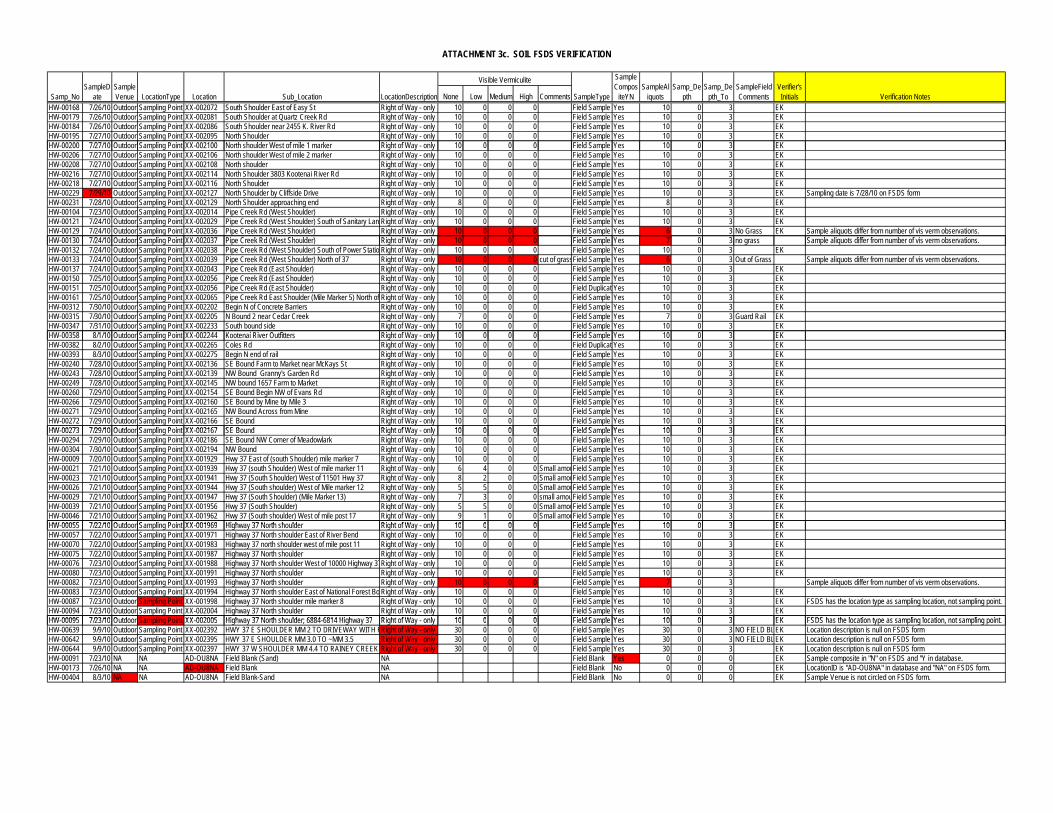
None Low Medium High CommentsHW-00168 7/26/10 Outdoor Sampling Point XX-002072 South Shoulder East of Easy St Right of Way - only 10 0 0 0 Field Sample Yes 10 0 3 EKHW-00179 7/26/10 Outdoor Sampling Point XX-002081 South Shoulder at Quartz Creek Rd Right of Way - only 10 0 0 0 Field Sample Yes 10 0 3 EKHW-00184 7/26/10 Outdoor Sampling Point XX-002086 South Shoulder near 2455 K. River Rd Right of Way - only 10 0 0 0 Field Sample Yes 10 0 3 EKHW-00195 7/27/10 Outdoor Sampling Point XX-002095 North Shoulder Right of Way - only 10 0 0 0 Field Sample Yes 10 0 3 EKHW 00200 7/27/10 O td S li P i t XX 002100 N th h ld W t f il 1 k Ri ht f W l 10 0 0 0 Fi ld S l Y 10 0 3 EK
Verification Notes
SampleCompos
iteYNSampleAl
iquotsSamp_De
pthSamp_De
pth_ToSampleFieldComments
Verifier's Initials
Visible Vermiculite
ATTACHMENT 3c. SOIL FSDS VERIFICATION
Samp_NoSampleD
ateSampleVenue LocationType Location Sub_Location LocationDescription SampleType
HW-00200 7/27/10 Outdoor Sampling Point XX-002100 North shoulder West of mile 1 marker Right of Way - only 10 0 0 0 Field Sample Yes 10 0 3 EKHW-00206 7/27/10 Outdoor Sampling Point XX-002106 North shoulder West of mile 2 marker Right of Way - only 10 0 0 0 Field Sample Yes 10 0 3 EKHW-00208 7/27/10 Outdoor Sampling Point XX-002108 North shoulder Right of Way - only 10 0 0 0 Field Sample Yes 10 0 3 EKHW-00216 7/27/10 Outdoor Sampling Point XX-002114 North Shoulder 3803 Kootenai River Rd Right of Way - only 10 0 0 0 Field Sample Yes 10 0 3 EKHW-00218 7/27/10 Outdoor Sampling Point XX-002116 North Shoulder Right of Way - only 10 0 0 0 Field Sample Yes 10 0 3 EKHW-00229 7/29/10 Outdoor Sampling Point XX-002127 North Shoulder by Cliffside Drive Right of Way - only 10 0 0 0 Field Sample Yes 10 0 3 EK Sampling date is 7/28/10 on FSDS formHW-00231 7/28/10 Outdoor Sampling Point XX-002129 North Shoulder approaching end Right of Way - only 8 0 0 0 Field Sample Yes 8 0 3 EKHW-00104 7/23/10 Outdoor Sampling Point XX-002014 Pipe Creek Rd (West Shoulder) Right of Way - only 10 0 0 0 Field Sample Yes 10 0 3 EKHW-00121 7/24/10 Outdoor Sampling Point XX-002029 Pipe Creek Rd (West Shoulder) South of Sanitary Lan Right of Way - only 10 0 0 0 Field Sample Yes 10 0 3 EKHW-00129 7/24/10 Outdoor Sampling Point XX-002036 Pipe Creek Rd (West Shoulder) Right of Way - only 10 0 0 0 Field Sample Yes 6 0 3 No Grass EK Sample aliquots differ from number of vis verm observations.HW 00130 7/24/10 O td S li P i t XX 002037 Pi C k Rd (W t Sh ld ) Ri ht f W l 10 0 0 0 Fi ld S l Y 7 0 3 S l li t diff f b f i b tiHW-00130 7/24/10 Outdoor Sampling Point XX-002037 Pipe Creek Rd (West Shoulder) Right of Way - only 10 0 0 0 Field Sample Yes 7 0 3 no grass Sample aliquots differ from number of vis verm observations.HW-00132 7/24/10 Outdoor Sampling Point XX-002038 Pipe Creek Rd (West Shoulder) South of Power Statio Right of Way - only 10 0 0 0 Field Sample Yes 10 0 3 EKHW-00133 7/24/10 Outdoor Sampling Point XX-002039 Pipe Creek Rd (West Shoulder) North of 37 Right of Way - only 10 0 0 0 cut of grassField Sample Yes 6 0 3 Out of Grass Sample aliquots differ from number of vis verm observations.HW-00137 7/24/10 Outdoor Sampling Point XX-002043 Pipe Creek Rd (East Shoulder) Right of Way - only 10 0 0 0 Field Sample Yes 10 0 3 EKHW-00150 7/25/10 Outdoor Sampling Point XX-002056 Pipe Creek Rd (East Shoulder) Right of Way - only 10 0 0 0 Field Sample Yes 10 0 3 EKHW-00151 7/25/10 Outdoor Sampling Point XX-002056 Pipe Creek Rd (East Shoulder) Right of Way - only 10 0 0 0 Field Duplicat Yes 10 0 3 EKHW-00161 7/25/10 Outdoor Sampling Point XX-002065 Pipe Creek Rd East Shoulder (Mile Marker 5) North of Right of Way - only 10 0 0 0 Field Sample Yes 10 0 3 EKHW-00312 7/30/10 Outdoor Sampling Point XX-002202 Begin N of Concrete Barriers Right of Way - only 10 0 0 0 Field Sample Yes 10 0 3 EKHW-00315 7/30/10 Outdoor Sampling Point XX-002205 N Bound 2 near Cedar Creek Right of Way - only 7 0 0 0 Field Sample Yes 7 0 3 Guard Rail EKHW-00347 7/31/10 Outdoor Sampling Point XX-002233 South bound side Right of Way - only 10 0 0 0 Field Sample Yes 10 0 3 EKHW 00358 8/1/10 O td S li P i t XX 002244 K t i Ri O tfitt Ri ht f W l 10 0 0 0 Fi ld S l Y 10 0 3 EKHW-00358 8/1/10 Outdoor Sampling Point XX-002244 Kootenai River Outfitters Right of Way - only 10 0 0 0 Field Sample Yes 10 0 3 EKHW-00382 8/2/10 Outdoor Sampling Point XX-002265 Coles Rd Right of Way - only 10 0 0 0 Field Duplicat Yes 10 0 3 EKHW-00393 8/3/10 Outdoor Sampling Point XX-002275 Begin N end of rail Right of Way - only 10 0 0 0 Field Sample Yes 10 0 3 EKHW-00240 7/28/10 Outdoor Sampling Point XX-002136 SE Bound Farm to Market near McKays St Right of Way - only 10 0 0 0 Field Sample Yes 10 0 3 EKHW-00243 7/28/10 Outdoor Sampling Point XX-002139 NW Bound Granny's Garden Rd Right of Way - only 10 0 0 0 Field Sample Yes 10 0 3 EKHW-00249 7/28/10 Outdoor Sampling Point XX-002145 NW bound 1657 Farm to Market Right of Way - only 10 0 0 0 Field Sample Yes 10 0 3 EKHW-00260 7/29/10 Outdoor Sampling Point XX-002154 SE Bound Begin NW of Evans Rd Right of Way - only 10 0 0 0 Field Sample Yes 10 0 3 EKHW-00266 7/29/10 Outdoor Sampling Point XX-002160 SE Bound by Mine by Mile 3 Right of Way - only 10 0 0 0 Field Sample Yes 10 0 3 EKHW-00271 7/29/10 Outdoor Sampling Point XX-002165 NW Bound Across from Mine Right of Way - only 10 0 0 0 Field Sample Yes 10 0 3 EKHW-00272 7/29/10 Outdoor Sampling Point XX-002166 SE Bound Right of Way - only 10 0 0 0 Field Sample Yes 10 0 3 EKHW 00273 7/29/10 O td S li P i t XX 002167 SE B d Ri ht f W l 10 0 0 0 Fi ld S l Y 10 0 3 EKHW-00273 7/29/10 Outdoor Sampling Point XX-002167 SE Bound Right of Way - only 10 0 0 0 Field Sample Yes 10 0 3 EKHW-00294 7/29/10 Outdoor Sampling Point XX-002186 SE Bound NW Corner of Meadowlark Right of Way - only 10 0 0 0 Field Sample Yes 10 0 3 EKHW-00304 7/30/10 Outdoor Sampling Point XX-002194 NW Bound Right of Way - only 10 0 0 0 Field Sample Yes 10 0 3 EKHW-00009 7/20/10 Outdoor Sampling Point XX-001929 Hwy 37 East of (south Shoulder) mile marker 7 Right of Way - only 10 0 0 0 Field Sample Yes 10 0 3 EKHW-00021 7/21/10 Outdoor Sampling Point XX-001939 Hwy 37 (south Shoulder) West of mile marker 11 Right of Way - only 6 4 0 0 Small amouField Sample Yes 10 0 3 EKHW-00023 7/21/10 Outdoor Sampling Point XX-001941 Hwy 37 (South Shoulder) West of 11501 Hwy 37 Right of Way - only 8 2 0 0 Small amouField Sample Yes 10 0 3 EKHW-00026 7/21/10 Outdoor Sampling Point XX-001944 Hwy 37 (South shoulder) West of Mile marker 12 Right of Way - only 5 5 0 0 Small amouField Sample Yes 10 0 3 EKHW-00029 7/21/10 Outdoor Sampling Point XX-001947 Hwy 37 (South Shoulder) (Mile Marker 13) Right of Way - only 7 3 0 0 small amouField Sample Yes 10 0 3 EKHW-00039 7/21/10 Outdoor Sampling Point XX-001956 Hwy 37 (South Shoulder) Right of Way - only 5 5 0 0 Small amouField Sample Yes 10 0 3 EKHW-00046 7/21/10 Outdoor Sampling Point XX-001962 Hwy 37 (South shoulder) West of mile post 17 Right of Way - only 9 1 0 0 Small amouField Sample Yes 10 0 3 EKHW 00055 7/22/10 O td S li P i t XX 001969 Hi h 37 N th h ld Ri ht f W l 10 0 0 0 Fi ld S l Y 10 0 3 EKHW-00055 7/22/10 Outdoor Sampling Point XX-001969 Highway 37 North shoulder Right of Way - only 10 0 0 0 Field Sample Yes 10 0 3 EKHW-00057 7/22/10 Outdoor Sampling Point XX-001971 Highway 37 North shoulder East of River Bend Right of Way - only 10 0 0 0 Field Sample Yes 10 0 3 EKHW-00070 7/22/10 Outdoor Sampling Point XX-001983 Highway 37 north shoulder west of mile post 11 Right of Way - only 10 0 0 0 Field Sample Yes 10 0 3 EKHW-00075 7/22/10 Outdoor Sampling Point XX-001987 Highway 37 North shoulder Right of Way - only 10 0 0 0 Field Sample Yes 10 0 3 EKHW-00076 7/23/10 Outdoor Sampling Point XX-001988 Highway 37 North shoulder West of 10000 Highway 37Right of Way - only 10 0 0 0 Field Sample Yes 10 0 3 EKHW-00080 7/23/10 Outdoor Sampling Point XX-001991 Highway 37 North shoulder Right of Way - only 10 0 0 0 Field Sample Yes 10 0 3 EKHW-00082 7/23/10 Outdoor Sampling Point XX-001993 Highway 37 North shoulder Right of Way - only 10 0 0 0 Field Sample Yes 7 0 3 Sample aliquots differ from number of vis verm observations.HW-00083 7/23/10 Outdoor Sampling Point XX-001994 Highway 37 North shoulder East of National Forest Bo Right of Way - only 10 0 0 0 Field Sample Yes 10 0 3 EKHW-00087 7/23/10 Outdoor Sampling Point XX-001998 Highway 37 North shoulder mile marker 8 Right of Way - only 10 0 0 0 Field Sample Yes 10 0 3 EK FSDS has the location type as sampling location, not sampling point. HW-00094 7/23/10 Outdoor Sampling Point XX-002004 Highway 37 North shoulder Right of Way - only 10 0 0 0 Field Sample Yes 10 0 3 EKHW 00095 7/23/10 O tdoor Sampling Point XX 002005 High a 37 North sho lder 6884 6814 High a 37 Right of Wa onl 10 0 0 0 Field Sample Yes 10 0 3 EK FSDS has the location t pe as sampling location not sampling point HW-00095 7/23/10 Outdoor Sampling Point XX-002005 Highway 37 North shoulder; 6884-6814 Highway 37 Right of Way - only 10 0 0 0 Field Sample Yes 10 0 3 EK FSDS has the location type as sampling location, not sampling point. HW-00639 9/9/10 Outdoor Sampling Point XX-002392 HWY 37 E SHOULDER MM 2 TO DRIVEWAY WITH RRight of Way - only 30 0 0 0 Field Sample Yes 30 0 3 NO FIELD BL EK Location description is null on FSDS formHW-00642 9/9/10 Outdoor Sampling Point XX-002395 HWY 37 E SHOULDER MM 3.0 TO ~MM 3.5 Right of Way - only 30 0 0 0 Field Sample Yes 30 0 3 NO FIELD BL EK Location description is null on FSDS formHW-00644 9/9/10 Outdoor Sampling Point XX-002397 HWY 37 W SHOULDER MM 4.4 TO RAINEY CREEK Right of Way - only 30 0 0 0 Field Sample Yes 30 0 3 EK Location description is null on FSDS formHW-00091 7/23/10 NA NA AD-OU8NA Field Blank (Sand) NA Field Blank Yes 0 0 0 EK Sample composite in "N" on FSDS and "Y in database.HW-00173 7/26/10 NA NA AD-OU8NA Field Blank NA Field Blank No 0 0 0 EK LocationID is "AD-OU8NA" in database and "NA" on FSDS form.HW-00404 8/3/10 NA NA AD-OU8NA Field Blank-Sand NA Field Blank No 0 0 0 EK Sample Venue is not circled on FSDS form.
Appendix B EPA Scribe Database
(A copy of the Database may be requested by contacting
the Region 8 EPA Records Center)
Appendix C Asbestos Analysis Methods and Data Reduction
Techniques
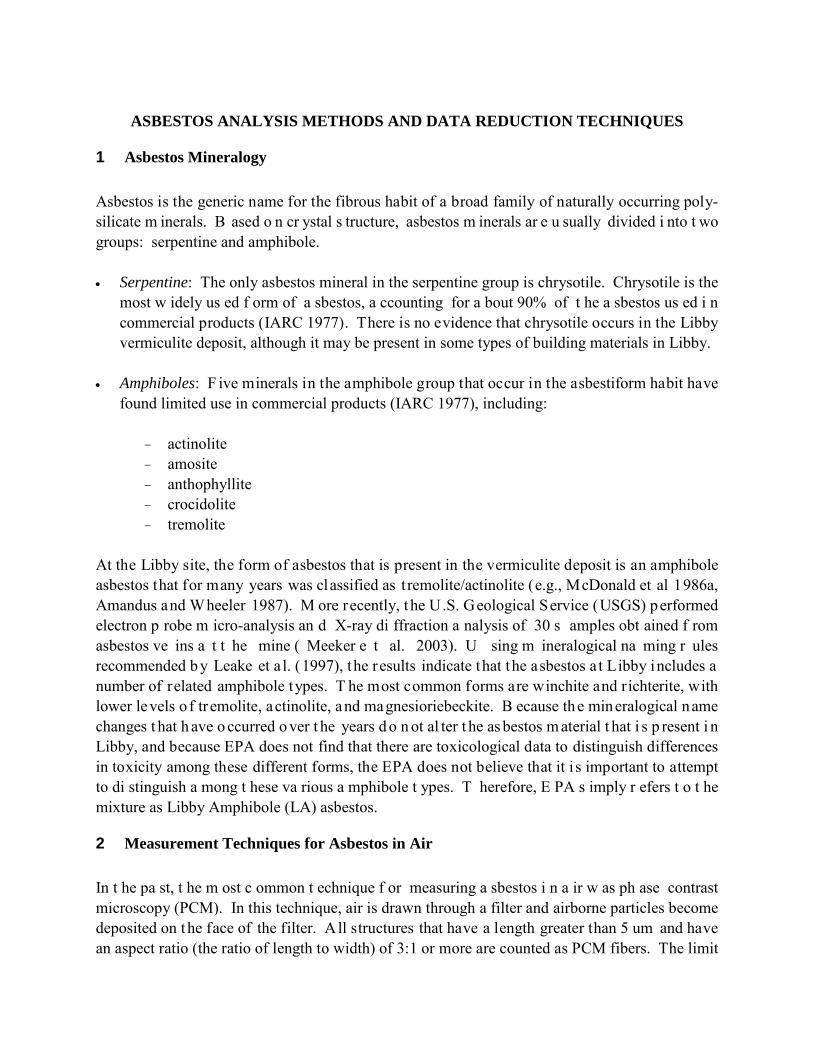
ASBESTOS ANALYSIS METHODS AND DATA REDUCTION TECHNIQUES
1 Asbestos Mineralogy Asbestos is the generic name for the fibrous habit of a broad family of naturally occurring poly-silicate m inerals. B ased o n cr ystal s tructure, asbestos m inerals ar e u sually divided i nto t wo groups: serpentine and amphibole. • Serpentine: The only asbestos mineral in the serpentine group is chrysotile. Chrysotile is the
most w idely us ed f orm of a sbestos, a ccounting for a bout 90% of t he a sbestos us ed i n commercial products (IARC 1977). There is no evidence that chrysotile occurs in the Libby vermiculite deposit, although it may be present in some types of building materials in Libby.
• Amphiboles: F ive minerals in the amphibole group that occur in the asbestiform habit have
found limited use in commercial products (IARC 1977), including:
- actinolite - amosite - anthophyllite - crocidolite - tremolite
At the Libby site, the form of asbestos that is present in the vermiculite deposit is an amphibole asbestos that for many years was classified as t remolite/actinolite (e.g., McDonald et al 1986a, Amandus and Wheeler 1987). M ore recently, t he U.S. Geological Service (USGS) performed electron p robe m icro-analysis an d X-ray di ffraction a nalysis of 30 s amples obt ained f rom asbestos ve ins a t t he mine ( Meeker e t al. 2003). U sing m ineralogical na ming r ules recommended b y Leake et a l. (1997), the results indicate that the asbestos a t Libby includes a number of related amphibole types. T he most common forms are winchite and richterite, with lower levels o f tr emolite, actinolite, and magnesioriebeckite. B ecause the mineralogical name changes t hat h ave o ccurred o ver t he years d o n ot al ter t he as bestos m aterial t hat i s p resent i n Libby, and because EPA does not find that there are toxicological data to distinguish differences in toxicity among these different forms, the EPA does not believe that it i s important to attempt to di stinguish a mong t hese va rious a mphibole t ypes. T herefore, E PA s imply r efers t o t he mixture as Libby Amphibole (LA) asbestos.
2 Measurement Techniques for Asbestos in Air In t he pa st, t he m ost c ommon t echnique f or measuring a sbestos i n a ir w as ph ase contrast microscopy (PCM). In this technique, air is drawn through a filter and airborne particles become deposited on the face of the filter. A ll structures that have a length greater than 5 um and have an aspect ratio (the ratio of length to width) of 3:1 or more are counted as PCM fibers. The limit
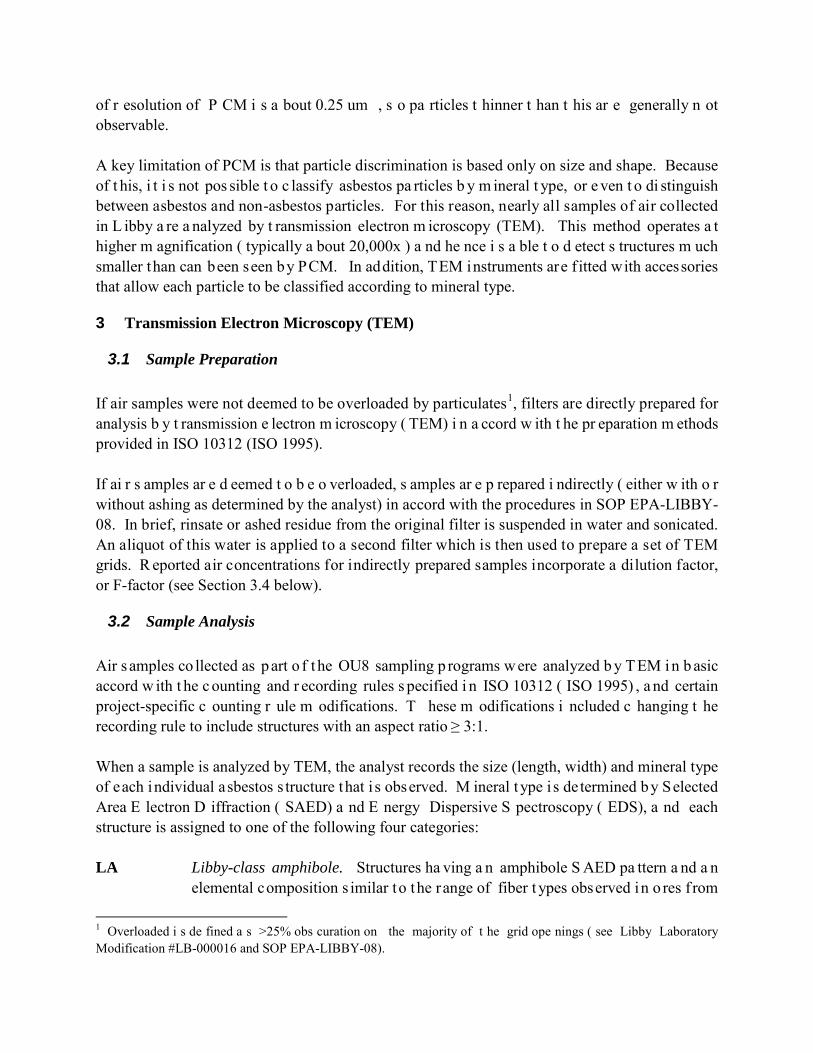
of r esolution of P CM i s a bout 0.25 um , s o pa rticles t hinner t han t his ar e generally n ot observable. A key limitation of PCM is that particle discrimination is based only on size and shape. Because of t his, i t i s not pos sible t o c lassify asbestos pa rticles b y m ineral t ype, or e ven t o di stinguish between asbestos and non-asbestos particles. For this reason, nearly all samples of air collected in L ibby a re a nalyzed by t ransmission electron m icroscopy (TEM). This method operates a t higher m agnification ( typically a bout 20,000x ) a nd he nce i s a ble t o d etect s tructures m uch smaller than can been seen by PCM. In addition, TEM instruments are f itted with accessories that allow each particle to be classified according to mineral type.
3 Transmission Electron Microscopy (TEM)
3.1 Sample Preparation If air samples were not deemed to be overloaded by particulates1
, filters are directly prepared for analysis b y t ransmission e lectron m icroscopy ( TEM) i n a ccord w ith t he pr eparation m ethods provided in ISO 10312 (ISO 1995).
If ai r s amples ar e d eemed t o b e o verloaded, s amples ar e p repared i ndirectly ( either w ith o r without ashing as determined by the analyst) in accord with the procedures in SOP EPA-LIBBY-08. In brief, rinsate or ashed residue from the original filter is suspended in water and sonicated. An aliquot of this water is applied to a second filter which is then used to prepare a set of TEM grids. R eported air concentrations for indirectly prepared samples incorporate a dilution factor, or F-factor (see Section 3.4 below).
3.2 Sample Analysis Air s amples co llected as part o f t he OU8 sampling p rograms w ere analyzed b y TEM i n b asic accord w ith t he c ounting and r ecording rules s pecified i n ISO 10312 ( ISO 1995) , a nd certain project-specific c ounting r ule m odifications. T hese m odifications i ncluded c hanging t he recording rule to include structures with an aspect ratio ≥ 3:1. When a sample is analyzed by TEM, the analyst records the size (length, width) and mineral type of each individual asbestos s tructure that i s observed. M ineral t ype i s de termined by Selected Area E lectron D iffraction ( SAED) a nd E nergy Dispersive S pectroscopy ( EDS), a nd each structure is assigned to one of the following four categories: LA Libby-class amphibole. Structures ha ving a n amphibole S AED pa ttern a nd a n
elemental composition s imilar to the range of fiber t ypes observed in o res f rom
1 Overloaded i s de fined a s >25% obs curation on the majority of t he grid ope nings ( see Libby Laboratory Modification #LB-000016 and SOP EPA-LIBBY-08).
the Libby min e ( Meeker e t a l. 2 003). T his is a s odic tr emolitic s olid s olution series o f min erals in cluding a ctinolite, tr emolite, w inchite, a nd r ichterite, w ith lower amounts of magnesio-arfedsonite and edenite/ferro-edenite.
OA Other amphibole-type asbestos fibers. Structures ha ving a n amphibole S AED
pattern and an elemental composition that is not s imilar to fiber t ypes f rom the Libby mine. E xamples include crocidolite, amosite, and anthophyllite. T here is presently no evidence that these fibers are associated with the Libby mine.
C Chrysotile fibers. Structures having a serpentine SAED pattern and an elemental
composition characteristic of chrysotile. There is presently no evidence that these fibers are associated with the Libby mine.
NAM Non-asbestos material. These m ay i nclude non -asbestos m ineral f ibers s uch as
gypsum, glass, or clay, a nd m ay also i nclude va rious t ypes of or ganic a nd synthetic fibers derived from carpets, hair, etc.
For the purposes of this report, air concentrations are based on countable LA structures only (i.e., results for other amphibole-type asbestos and chrysotile are not discussed).
3.3 Estimation of PCME For the purposes of computing r isk estimates, it is necessary to utilize the results from a TEM analysis to estimate what would have been detected had the sample been analyzed by PCM. This is because available toxicity information is usually based on workplace studies that utilized PCM as the primary method for analysis. For convenience, structures detected under TEM that meet the recording rules for PCM (i.e., length > 5 um, width ≥ 0.25 um, aspect ratio ≥ 3:1) are referred to as PCM-equivalent (PCME) structures. There are two alternative approaches available for expressing units of PCME s/cc. The first (and most di rect) a pproach i s to ex press t he co ncentration o f each s ample i n t erms o f t he P CME structures observed in that sample. The second approach is to express the concentration of LA in each sample in terms of the total LA in that sample, and then multiply the total LA concentration by a v alue that represents the average fraction of total LA structures that meet PCME counting rules. For this evaluation, the first approach was followed. In this document, all air concentrations will be reported in units of PCME LA s/cc.
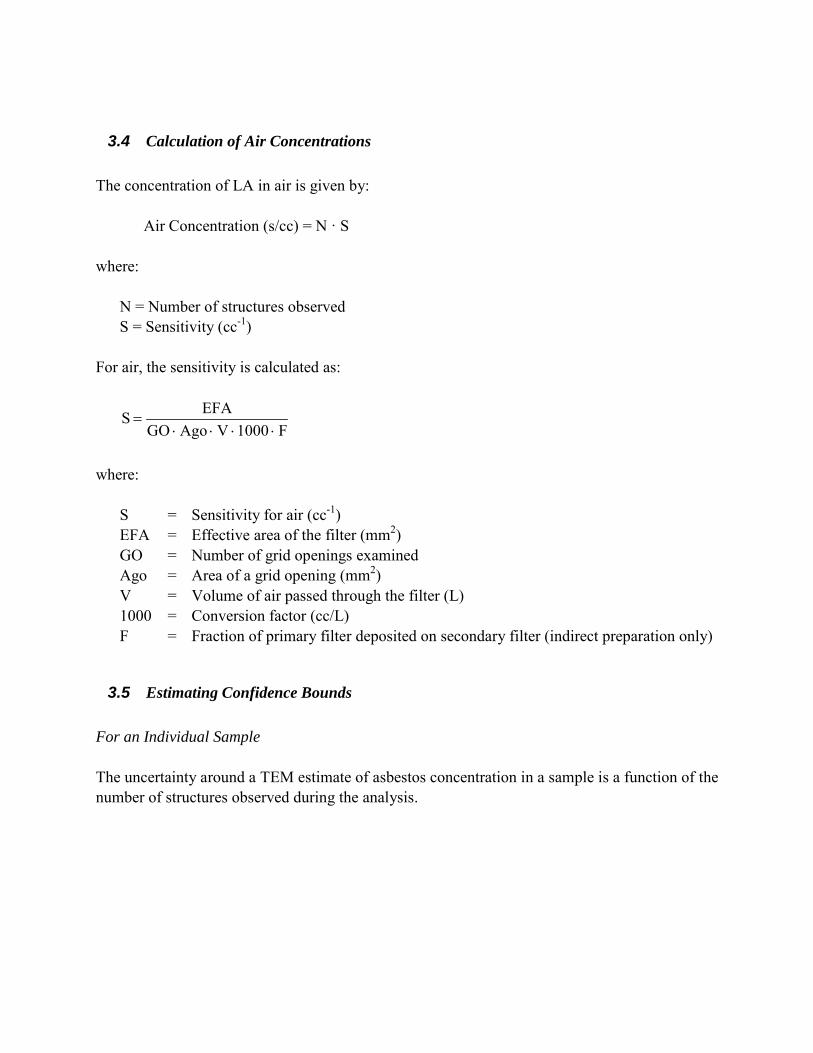
3.4 Calculation of Air Concentrations The concentration of LA in air is given by:
Air Concentration (s/cc) = N · S where: N = Number of structures observed S = Sensitivity (cc-1) For air, the sensitivity is calculated as:
F1000VAgoGO
EFAS⋅⋅⋅⋅
=
where: S = Sensitivity for air (cc-1) EFA = Effective area of the filter (mm2) GO = Number of grid openings examined Ago = Area of a grid opening (mm2) V = Volume of air passed through the filter (L) 1000 = Conversion factor (cc/L) F = Fraction of primary filter deposited on secondary filter (indirect preparation only)
3.5 Estimating Confidence Bounds For an Individual Sample The uncertainty around a TEM estimate of asbestos concentration in a sample is a function of the number of structures observed during the analysis.
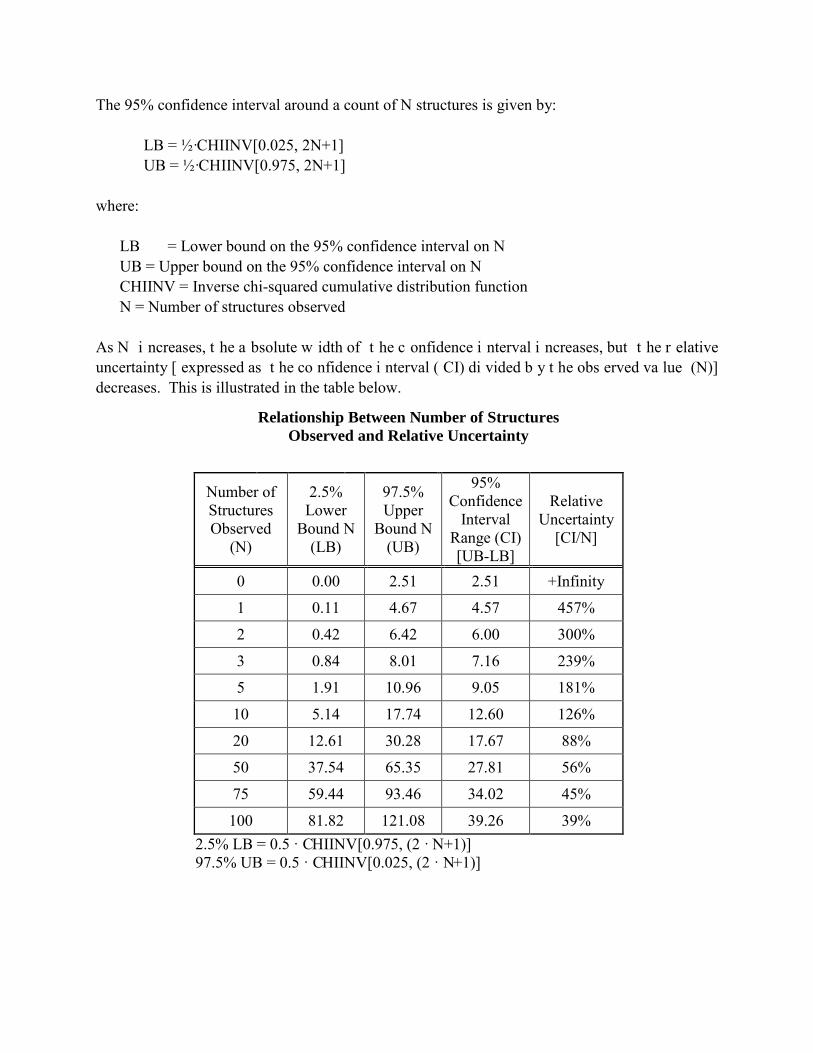
The 95% confidence interval around a count of N structures is given by:
LB = ½·CHIINV[0.025, 2N+1] UB = ½·CHIINV[0.975, 2N+1]
where: LB = Lower bound on the 95% confidence interval on N UB = Upper bound on the 95% confidence interval on N CHIINV = Inverse chi-squared cumulative distribution function N = Number of structures observed As N i ncreases, t he a bsolute w idth of t he c onfidence i nterval i ncreases, but t he r elative uncertainty [ expressed as t he co nfidence i nterval ( CI) di vided b y t he obs erved va lue (N)] decreases. This is illustrated in the table below.
Relationship Between Number of Structures Observed and Relative Uncertainty
Number of Structures Observed
(N)
2.5% Lower
Bound N (LB)
97.5% Upper
Bound N (UB)
95% Confidence
Interval Range (CI) [UB-LB]
Relative Uncertainty
[CI/N]
0 0.00 2.51 2.51 +Infinity
1 0.11 4.67 4.57 457%
2 0.42 6.42 6.00 300%
3 0.84 8.01 7.16 239%
5 1.91 10.96 9.05 181%
10 5.14 17.74 12.60 126%
20 12.61 30.28 17.67 88%
50 37.54 65.35 27.81 56%
75 59.44 93.46 34.02 45%
100 81.82 121.08 39.26 39% 2.5% LB = 0.5 · CHIINV[0.975, (2 · N+1)] 97.5% UB = 0.5 · CHIINV[0.025, (2 · N+1)]
Using t his approach, t he e quation f or c alculation of t he uppe r a nd l ower bounds on the a ir concentration of asbestos structures is: Air Concentration (s/cc) = (LB or UB) · S where: LB or UB = Number of structures based on lower bound (LB) or upper bound (UB) S = Sensitivity (cc-1 for air) Across Multiple Samples Calculation of the unc ertainty bounds a round t he a verage of a group of a sbestos s amples i s complicated by the fact that the between-sample variability in the measured concentration values includes t he b etween-sample v ariability th at a rises f rom b oth a nalytical me asurement error i n individual s amples and f rom be tween-sample temporal o r spatial variability. E PA has not yet developed a method for calculating uncertainty bounds around the mean of asbestos data sets, so no uncertainty bounds are provided in this report for mean values (EPA, 20082
4 Polarized Light Microscopy Analysis (PLM)
). However, it is important to recognize that the values are uncertain, and that actual values might be either higher or lower than reported.
4.1 Sample Preparation Soil s amples co llected as part of t he O U8 sampling pr ograms w ere pr epared for a nalysis i n accord w ith S OP ISSI-LIBBY-01 a s s pecified in th e C DM C lose S upport Facility (CSF) S oil Preparation Plan (SPP) (CDM, 2004). In brief, each soil sample is dried and sieved through a ¼ inch s creen. P articles retained o n t he s creen ( if an y) are r eferred t o as the “co arse” f raction. Particles passing through the screen are referred to as the fine fraction, and this fraction is ground by passing it th rough a plate grinder. T he resulting material is referred to as the “fine ground” fraction. T he fine ground fraction is split into four equal aliquots; one aliquot is submitted for analysis and the remaining aliquots are archived at the CSF.
4.2 Sample Analysis Soil samples collected at the Libby Site are analyzed using polarized l ight microscopy (PLM). The co arse f ractions w ere examined u sing s tereomicroscopy, an d any p articles o f asbestos (confirmed by PLM) were removed and weighed in accord with SRC-LIBBY-01 (referred to as
2 EPA. 2008. F ramework for I nvestigating Asbestos-Contaminated S ites. R eport pr epared by t he Asbestos Committee o f t he T echnical Review W orkgroup o f t he O ffice o f S olid W aste an d E mergency Response, U .S. Environmental protection Agency. OSWER Directive #9200.0-68.
“PLM-Grav”). Of the 508 soil field samples collected during these OU8 sampling program, only 4 samples had a coarse fraction. The fine ground a liquots were analyzed using a Libby-specific P LM method using v isual ar ea estimation, as detailed in SOP SRC-LIBBY-03. For convenience, this method is referred to as “PLM-VE”. PLM-VE is a semi-quantitative method that utilizes site-specific LA reference materials to allow assignment of fine ground samples into one of four “bins”, as follows:
• Bin A (ND): non-detect • Bin B1 (Trace): detected at levels lower than the 0.2% LA reference material • Bin B2 (<1%): detected at l evels l ower t han t he 1 % L A r eference m aterial b ut h igher
than the 0.2% LA reference material • Bin C: LA detected at levels greater than or equal to the 1% LA reference material
5 Soil Visual Inspection At the time of soil sample collection for PLM analysis, the sampling team performed a v isual inspection o f the d isplaced soil a t each sampling point to determine if v isible vermiculite was present i n a ccord w ith S OP C DM-LIBBY-06. A s emi-quantitative e stimate ( none, l ow, medium3
, high) of the amount of visible vermiculite present was noted for each sampling point. For c omposite s amples, a count of t he num ber of s ampling poi nts a ssigned t o each vi sible vermiculite r anking w as r ecorded o n t he Field S ample D ata S heet (FSDS) i n t he s ample comments (e.g., 18 none [X], 6 low [L], 4 medium [M], 2 high [H]).
There are several alternative ways that this visual inspection data can be used to characterize the level of vermiculite contamination (and presumptive LA contamination) in an area.
Option 1: Present/Absent
The simplest strategy classifies an area either as “Vis –“ if all sampling points in the composite were assigned a va lue o f “ none”, or as ” Vis + ” i f one or m ore of t he sampling poi nts w ere assigned a value of “low”, “medium”, or “high”. A potential limita tion to th is r anking s trategy is that it d oes not account for d ifferences in the amount or frequency of visible vermiculite detections. For example, an area with 1 “low” point
3 The v isual inspection SOP C DM-LIBBY-06 u ses t he t erminology “intermediate” t o r efer t o t he “medium” classification. F or t he p urposes o f th is d ocument, the te rm “medium” i s r etained t o co rrespond with t he accompanying field documentation.
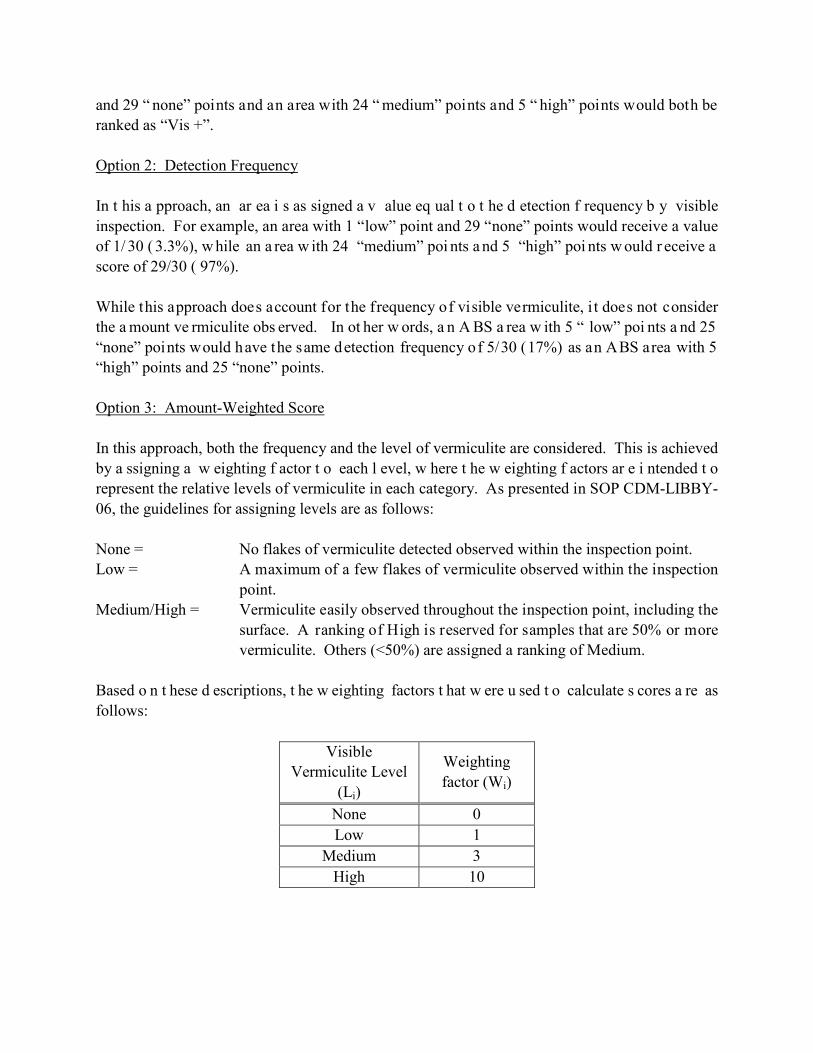
and 29 “ none” points and an area with 24 “ medium” points and 5 “ high” points would both be ranked as “Vis +”.
Option 2: Detection Frequency
In t his a pproach, an ar ea i s as signed a v alue eq ual t o t he d etection f requency b y visible inspection. For example, an area with 1 “low” point and 29 “none” points would receive a value of 1/ 30 ( 3.3%), w hile an a rea w ith 24 “medium” poi nts a nd 5 “high” poi nts w ould r eceive a score of 29/30 ( 97%). While this approach does account for the frequency of visible vermiculite, i t does not consider the a mount ve rmiculite obs erved. In ot her w ords, a n A BS a rea w ith 5 “ low” poi nts a nd 25 “none” points would have the same detection frequency of 5/30 (17%) as an ABS area with 5 “high” points and 25 “none” points.
Option 3: Amount-Weighted Score
In this approach, both the frequency and the level of vermiculite are considered. This is achieved by a ssigning a w eighting f actor t o each l evel, w here t he w eighting f actors ar e i ntended t o represent the relative levels of vermiculite in each category. As presented in SOP CDM-LIBBY-06, the guidelines for assigning levels are as follows: None = No flakes of vermiculite detected observed within the inspection point. Low = A maximum of a few flakes of vermiculite observed within the inspection
point. Medium/High = Vermiculite easily observed throughout the inspection point, including the
surface. A ranking of High is reserved for samples that are 50% or more vermiculite. Others (<50%) are assigned a ranking of Medium.
Based o n t hese d escriptions, t he w eighting factors t hat w ere u sed t o calculate s cores a re as follows:
Visible Vermiculite Level
(Li)
Weighting factor (Wi)
None 0 Low 1
Medium 3 High 10
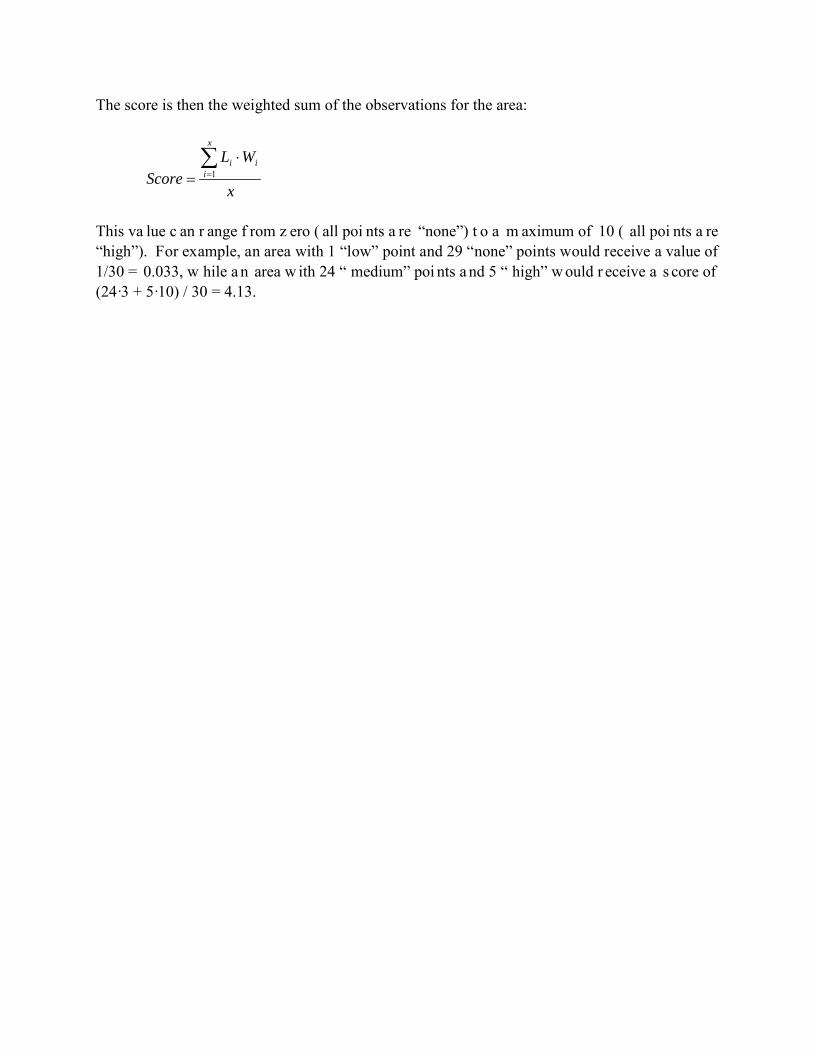
The score is then the weighted sum of the observations for the area:
x
WLScore
x
iii∑
=
⋅= 1
This va lue c an r ange f rom z ero ( all poi nts a re “none”) t o a m aximum of 10 ( all poi nts a re “high”). For example, an area with 1 “low” point and 29 “none” points would receive a value of 1/30 = 0.033, w hile a n area w ith 24 “ medium” poi nts a nd 5 “ high” w ould r eceive a s core of (24·3 + 5·10) / 30 = 4.13.
9” 8.5”
Operable Unit 8 Libby Asbestos National Priorities List Site
DRAFT Remedial Investigation Report
April 2012
303 East 17th Avenue Suite 700 Denver, CO 80203 p. (303) 764 - 1520 f. (303) 860 - 7139 2060 Briargate Parkway Suite 120 Colorado Springs, CO 80920 p. (719) 272 - 8800 f. (719) 272 - 8801 419 Canyon Blvd. Suite 316 Fort Collins, CO 80524 p. (970) 419 - 4388 f. (970) 419 - 4389
dvelasqu
Rectangle
dvelasqu
Rectangle
dvelasqu
Rectangle
dvelasqu
Rectangle