April 2007
110
April 2007 April 2007 Financial Stability Report
-
Upload
khangminh22 -
Category
Documents
-
view
1 -
download
0
Transcript of April 2007

www.bok.or.kr
April 2007
Ap
ril 20
07
Financial S
tability Report

Financial Stability ReportApril 2007

The Bank of Korea publishes Financial Stability Report to
encourage lively discussion among market participants on
financial stability by providing comprehensive analysis and
assessment of the current state of the domestic financial
system and potential risk factors therein.

Ⅰ. Overview 1
Ⅱ. Changes in the environment for financial stability 13
1. Economic outlook at home and abroad 13
2. Debt servicing capacity of the household sector 20
3. Debt servicing capacity of the business sector 24
4. Real estate market 28
Ⅲ. Stability of the financial market 35
1. Lending market 35
2. Bond market 45
3. Stock market 48
4. Foreign exchange market 52
Ⅳ. Soundness of financial institutions 59
1. Soundness of banks 59
Credit risk 59
Interest rate risk and market risk 64
Profitability 68
Capital adequacy 75
2. Soundness of non-bank institutions 77
Securities companies 77
Credit specialized financial companies 84
Ⅴ. Changes in the financial infrastructure 91
1. Payment and settlement systems 91
Settlement risk trends 91
Improvements of payment and settlement systems 93
2. Domestic financial system 97
CONTENTS

Ⅱ- 1. Special characteristics of supply and demand and the price 32mechanism in asset markets
Ⅲ- 1. The effects of the increase in installment mortgage loans 39
Ⅲ- 2. The meltdown of the US subprime mortgage market and 42its effects
Ⅲ- 3. Interest rate arbitrage exploiting gaps between the swap rate 56and the interest rate differential, and its effects on the financialmarket
Ⅳ- 1. Why Korean commercial banks must seek overseas expansions, 71and how they should go about it
Ⅳ- 2. Securities companies’ CMA sales 81
Ⅳ- 3. Factors behind and implications of GE Capital’s growth 88
BOXES

- 1 -
� The stability of the Korean financial system
as a whole appears to be strengthening,
thanks to solidly-based economic growth at
home and abroad and the favorable
profitability of domestic banks. However,
major potential risks are seen to be present in
the household sector, which with mounting
debts is becoming more vulnerable to shocks
such as declines in housing prices, and in
international financial markets, which have
seen a heightening of volatility that could give
rise to domestic financial market instability.
� The domestic economy continues on a
moderate upward trend, while the world
economy shows healthy growth.
The US economy slowed down during the
second half of 2006, affected by the cooling
housing market, but the Chinese economy
continued very strong growth at above the
10% level. The Japanese and Euro-area
economies remained on a recovery course,
Ⅰ. Overview
Ⅰ. Overview
1
Economic growth and outlook of selected economies
12
10
8
6
4
2
0
-2
12
10
8
6
4
2
0
-2
(%) (%)
1998 2000 2002 2004 2006 2007e
US Euro area Japan
Source : IMF, World Economic Outlook (April 2007)
China World

- 2 -
driven by brisk exports. This world economic
growth is expected to continue in 2007, with
the US, Japanese and Euro-area economies
all growing at the 2% level, and the Chinese
economy at around the 10% level.
Risk premiums in international financial
markets remain narrow, but investors seem to
have become more sensitive to potential risk
factors including the persistent global
imbalances, the possible unwinding of the
yen-carry trade, and asset price corrections.
In May 2006, after the Fed had hinted at the
possibility of further interest rate hikes, global
stock prices underwent a correction and
credit spreads temporarily widened,
particularly in emerging markets. Global stock
markets fell back sharply again in February
2007, dragged downward by the deterioration
of the US subprime mortgage market and the
possibility of further tightening by the Chinese
authorities. US long-term market interest
rates have shown downward movements and
stayed below the policy rate since July 2006,
as market concerns about a US economic
slowdown have heightened and investors
Financial Stability Report April 2007
개요2
Credit spread trends
800
600
400
200
0
300
200
100
0
(bp) (bp)
2003 2004 2005 2006 2007
EMBI+ (LHS)
Junk bonds1) (LHS)
Note: 1) Figures for junk bonds refer to the average of corporate bondswith credit rating of BB+ or lower.
Source: Bloomberg
AAA US corporate bonds (RHS)
- 3 -
have displayed an increased preference for
safe assets.
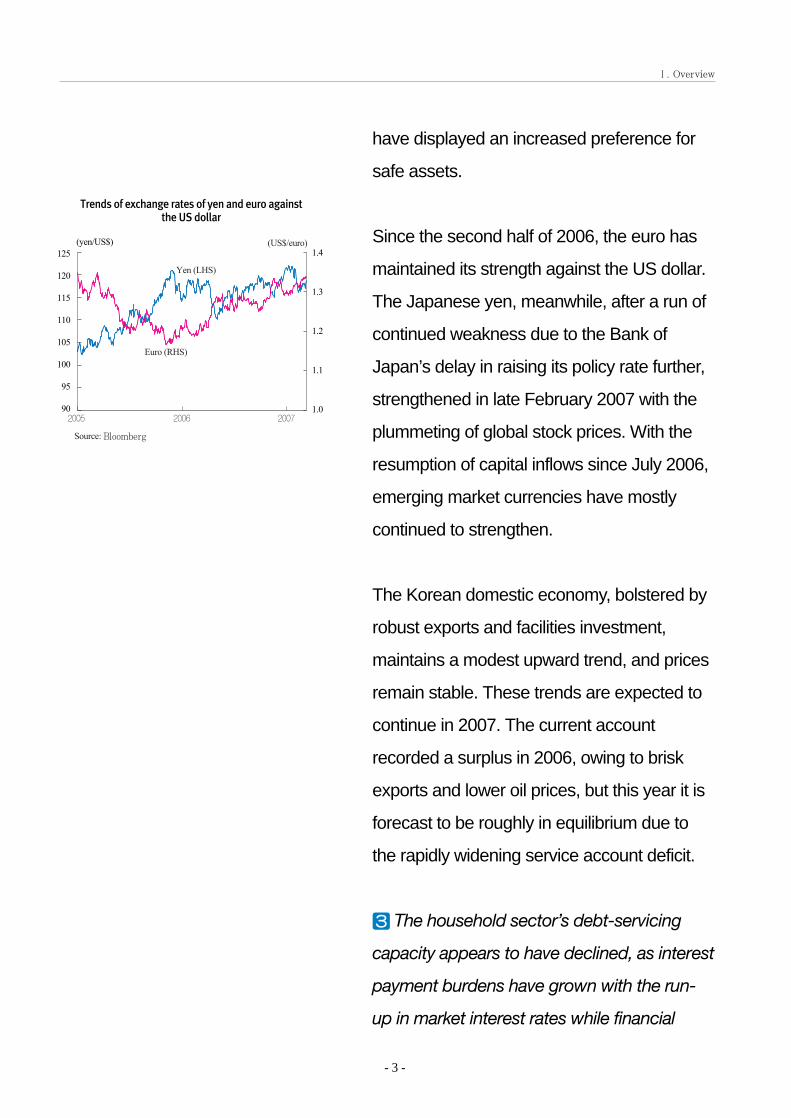
Since the second half of 2006, the euro has
maintained its strength against the US dollar.
The Japanese yen, meanwhile, after a run of
continued weakness due to the Bank of
Japan’s delay in raising its policy rate further,
strengthened in late February 2007 with the
plummeting of global stock prices. With the
resumption of capital inflows since July 2006,
emerging market currencies have mostly
continued to strengthen.
The Korean domestic economy, bolstered by
robust exports and facilities investment,
maintains a modest upward trend, and prices
remain stable. These trends are expected to
continue in 2007. The current account
recorded a surplus in 2006, owing to brisk
exports and lower oil prices, but this year it is
forecast to be roughly in equilibrium due to
the rapidly widening service account deficit.
� The household sector’s debt-servicing
capacity appears to have declined, as interest
payment burdens have grown with the run-
up in market interest rates while financial
Ⅰ. Overview
(yen/US$)
개요3
Trends of exchange rates of yen and euro against the US dollar
125
120
115
110
105
100
95
90
1.4
1.3
1.2
1.1
1.02005 2006 2007
Yen (LHS)
Euro (RHS)
Source: Bloomberg
(US$/euro)

- 4 -
liabilities have increased, led mainly by
housing finance loans.
The ratio of household financial liabilities to
financial assets rose from 43.2% in 2005 to
44.4% in 2006, and the ratio of household
financial liabilities to disposable income also
increased during this period.
Meanwhile, the household sector’s ability to
absorb shocks is assessed as being only
weak, since most household assets are held
in the form of illiquid real estate. Given the low
level of the net personal savings rate of
between 3% and 5%, improvement of the
sector’s debt servicing capacity is foreseen to
take some time.
� Despite its declining profitability, the
Korean corporate sector shows
comparatively healthy overall debt-servicing
capacity, with sound financial status and
ample liquidity.
Listed companies posted lower operating
profits-to-sales ratios in 2006, due to
increases in raw material prices and to the
strength of the Korean won. The ratio of
Financial Stability Report April 2007
개요4
Trends of household financial asset and liability growth and capital gearing ratios
40
30
20
10
0
-10
-20
50
45
40
35
30
(%) (%)
1996 1998 2000 2002 2004 2006
Financial debtgrowth rate (LHS)
Capital gearing ratio (RHS)
Financial asset growthrate (LHS)
Note: 1) Year-end basisSource: The Bank of Korea
개요5
Corporate profitability and financial soundness
150
120
90
60
30
0
12
9
6
3
0
(%) (%)
Current ratio (LHS)
Operating profit-to-salesratio (RHS)
Ratio of stockholders’ equity to total assets (LHS)
2001 2002 2003 2004 2005 2006
Sources: KIS-Value, The Bank of Korea
- 5 -
stockholders’ equity to total assets has
improved, and cash flow is also assessed as
favorable. Nevertheless the proportion of
companies unable to cover net financial
expenses from operating income has not
declined, while the degree of these firms’
dependency on external borrowings has been
on the rise.
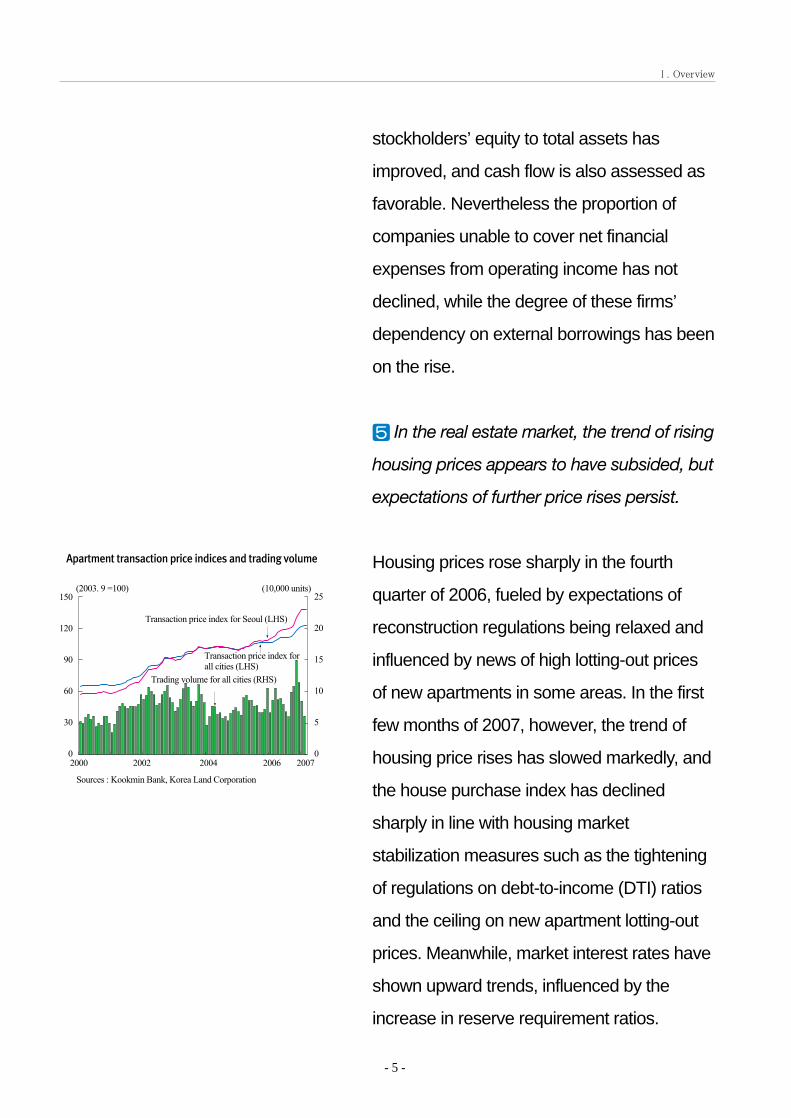
� In the real estate market, the trend of rising
housing prices appears to have subsided, but
expectations of further price rises persist.
Housing prices rose sharply in the fourth
quarter of 2006, fueled by expectations of
reconstruction regulations being relaxed and
influenced by news of high lotting-out prices
of new apartments in some areas. In the first
few months of 2007, however, the trend of
housing price rises has slowed markedly, and
the house purchase index has declined
sharply in line with housing market
stabilization measures such as the tightening
of regulations on debt-to-income (DTI) ratios
and the ceiling on new apartment lotting-out
prices. Meanwhile, market interest rates have
shown upward trends, influenced by the
increase in reserve requirement ratios.
Ⅰ. Overview
개요6
Apartment transaction price indices and trading volume
150
120
90
60
30
0
25
20
15
10
5
0
(10,000 units)(2003. 9 =100)
2000 2002 2004 2006 2007
Transaction price index for Seoul (LHS)
Trading volume for all cities (RHS)
Transaction price index forall cities (LHS)
Sources : Kookmin Bank, Korea Land Corporation

- 6 -
Provided the real-estate policies put in place
over the last year or so are applied
consistently, there appears no great likelihood
of a renewed sharp rise in housing prices.
� In the lending market, corporate lending
rose sharply led mainly by lending to SMEs,
as financial institutions competed fiercely to
expand their asset scales.
The booming real estate market of the last
few years has led to a big increase in lending
to construction and real estate businesses.
Household lending, concentrated particularly
on housing finance loans, has also continued
on an upward path. However, the scale of its
increase has declined compared to that of
corporate lending, under the influence of the
regulations imposed upon it.
The maturity and redemption structures of the
housing finance loans extended by domestic
banks have been changing, with a
lengthening of average maturities and a
gradual shift from bullet-type redemptions
toward regular amortizations of the principal
plus interest payments. This trend toward
monthly repayment of principal and interest
Financial Stability Report April 2007
개요7
Distribution of domestic banks’ mortgage loans by repayment method
100
80
60
40
20
0
10
8
6
4
2
0
(%) (years)
Averagematurity(RHS)
Proportion of installment loansin total mortgages (LHS)
Proportion of balloon paymentloans in total mortgages (LHS)
2003 2004 2005 2006
Notes: Based on six major domestic banks (end-period basis)Source: The Bank of Korea

- 7 -
may lead to further outflows of cash from
household balance sheet for a times, but it is
expected to reduce the potential risk to the
financial system entailed by the maturing
every year of outstanding large-value loans.
� In the bond market, long- and short-term
interest rates show different patterns of
movements, and the flattening-out of the
yield curve continues.
Short-term interest rates have risen
comparatively rapidly, reflecting increases of
the policy rate in 2006 and the tightening of
reserve-requirement management policy
beginning from the latter half of December
2006. In contrast, long-term market rates
have declined, due to foreign bank branches’
increasing appetite for Treasury bonds and
concerns about slowing economic growth. As
a result, the spreads between long- and
short-term interest rates have narrowed, and
in early 2007 the yield curve inverted for a
while with short-term interest rates higher
than long-term rates.
Meanwhile, the issuance and trading volumes
of both Treasury and financial bonds are
Ⅰ. Overview
개요8
Long-and short-term market Interest rates and volatility
6
5
4
3
2
1
0
3.0
2.5
2.0
1.5
1.0
0.5
0.0
(annual %) (%, annualized rate)
Treasury bond yield-to-maturity(3 years) (LHS)
Treasury bond yield-to-maturity volatility (RHS)
CD yield-to-maturity(91days) (LHS)
2004 2005 2006 2007
Sources: The Bank of Korea, KOSCOM

- 8 -
rising steadily, while those of corporate bonds
continue to fall. As a result, the corporate
bond market remains subdued.
� In the stock market, stock prices have
maintained a generally upward trend, despite
sharp corrections in May-to-June 2006 and
February 2007.
The volatility index (VIX) has dropped since
March 2007, concurrently with an increase in
stock trading volumes, indicating improved
investor confidence.
After recording a net selling position in 2005,
foreign investors in the Korean stock market
expanded the volume of their net selling in
2006. These net sales by foreigners are seen
as having been absorbed by net purchases
on the part of domestic institutional investors,
boosted by the increasing cash inflows to
equity-type funds and the building up of
pension funds’ stock portfolios.
� In the foreign exchange market, the
preponderance of supply over demand
resulting from current-account transactions
has slowed down with the narrowing of the
Financial Stability Report April 2007
개요9
Stock prices and volatility
1600
1200
800
400
0
90
75
60
45
30
15
0
(index, million shares) (%, annualized rate)
KOSPI (LHS)
KOSPI volatility (RHS)
Daily trading volume (LHS)
2004.1 7 2005.1 7 2006.1 7 2007.1
Sources: Bank of Korea, Korea Exchange

- 9 -
goods account surplus, but there have been
increased capital inflows arising from financial
transactions such as banks’ short-term
foreign borrowings.
Banks have greatly increased their external
borrowings, engaging in interest rate
arbitrage to exploit gaps between interest rate
differential and swap rate and also borrowing
to fund their foreign currency lending
activities. In consequence, there has been a
sharp rise in their short-term external debts
and long-term interest rates have fallen
excessively, which may have a negative
impact on the financial markets.
The won/dollar exchange rate continued on a
downward trend in 2006, but rebounded in
2007 on the back of non-residents’ purchases
of non-deliverable forwards (NDFs) and
increasing overseas securities investment by
residents. It has so far this year showed a
pattern of mild fluctuations around the 930
won per dollar level.
� The banking sector continues to present a
favorable picture, with very strong profitability
and steadily improving asset soundness.
Ⅰ. Overview
개요10
Balance of payments and won-dollar exchange rate
200
150
100
50
0
-50
-100
1200
1100
1000
900
800
(US $ hundred millions) (won)
Current account + capitalaccount (LHS)
Other investment (LHS)
Won/dollar exchangerate (RHS)
2004 2005 2006 2007
Source: Bank of Korea

- 10 -
Banks’ credit risk does not look high,
considering that delinquency rates remain low
and loan-to-value (LTV) ratios continue on a
downward course, despite the greatly
increased real estate-related exposure by
way of housing finance loans and lending to
construction and real estate businesses.
However, the possibility of a worsening of
credit risk cannot be altogether ruled out,
given that delinquency rates tend to trail the
trends of lending growth rates with a one- or
two-year time lag and that real-estate markets
may also contract.
Interest rate risk has risen slightly as a result
of a widening of the interest rate sensitivity
gap, but its level is still low compared to that
of major foreign banks. Market risk remains at
a low level, as well, thanks to the reduced
proportions of bond investments and of stock
investments held for trading.
Banks continue to post strong profitability,
supported by increased profits from loans and
the disposal of shares acquired in debt for
equity swaps. In terms of capital adequacy,
Korean commercial banks’ BIS capital ratios
remain at healthy levels compared to those of
Financial Stability Report April 2007
개요11
Changes in ROA of commercial banks
4
3
2
1
0
-1
-2
4
3
2
1
0
-1
-2
(%) (%)
Average ROA ofcommercial banks
2002 2003 2004 2005 2006
Source: Banks’ call reports

- 11 -
large foreign banks, although they have
declined moderately due to sustained
competition among banking institutions for
asset scale expansion.
Banks’ net profits are expected to continue to
grow for quite some time, bolstered by their
increasing non-interest incomes such as fees
and commissions and the expansion of their
business volume. If they continue to focus
business operations mainly on expanding
their shares of the domestic market, however,
banks may face limits to growth in the
medium and longer term. Also, with funding
costs in their core deposit markets expected
to rise owing to intensified competition with
non-bank financial institutions, and with the
increasing penetration of their domestic
market by foreign financial institutions,
domestic banks face the possibility of a
decline in their business base.
Ⅰ. Overview
개요12
Comparison of BIS capital ratio between foreign and Korean banks
16
15
14
13
12
11
10
9
8
BIS capital ratio (%)
At end of 2006 (average ofKorean commercial banks)
At end of 2005 (average ofKorean commercial banks)
BIS tier I capital ratio (%)
6 7 8 9 10 11 12 13 14
Notes : 1) ◆ : The world’s top 30 banks based on tier I capital size 2) Figures for foreign bank are for 2005
Source: Banks’ call reports, Bankscope

Financial Stability Report April 2007

- 13 -
Ⅱ. Changes in the environment for financial stability
1. Economic outlook at home andabroad
World economy continues solid growth
Despite slowdown in the US economy, growth in the
world economy as a whole remains at around 5%,
thanks to the very strong growth of the Chinese
economy and to steady economic recoveries in both
Japan and the Euro area.
While the US economy has enjoyed favorable
consumption, supported by stable employment, GDP
growth has dropped to the 2% level due to the slump in
housing construction from the second half of 2006,
affected by the cooling of housing markets. The Euro-
area economy, on the back of robust exports, has
continued to recover and posted growth in 2006 of
2.6%, its highest since 2000. In Japan, the pace of
economic recovery has picked up with the help of
facilities investment and exports, while in China the
economy is maintaining strong growth at above the
10% level. This solid global economic growth is
expected to continue in 2007, with the US, Japanese
and Euro-area economies all growing at the 2% level,
and the Chinese economy at around the 10% level.
However, there remains a downside risk stemming
from the slowing US housing market. After continuing
on a downturn since the fourth quarter of 2005, the US
housing market appears to have shrunken further in
early 2007 owing to defaults on subprime mortgage
Ⅱ. Changes in the environment for financial stability
<Figure II- 1>
Economic growth and outlook of selected economies
12
10
8
6
4
2
0
-2
12
10
8
6
4
2
0
-2
(%) (%)
1998 2000 2002 2004 2006 2007e
US Euro area Japan
Source : IMF, World Economic Outlook (April 2007)
China World
<Figure II- 2>
US housing market trends
25
20
15
10
5
0
-5
-10
-15
-20
9
8
7
6
5
4
3
2
1
0
(%) (%)
2000 2002 2004 2006 2007
Rate of change in housingprices1) (LHS)
Rate of change in housing sales1) (LHS)
Mortgage(30 year)rates (RHS)
Note: 1) Based on existing houses (year-on-year)Source : Bloomberg

loans1). Should the deterioration in credit quality of
subprime mortgage loans spill over to other mortgage
markets, we cannot rule out the possibility of the US
economy growing at a lower rate than expected
currently, since the depressed housing market will
bring about a decline in consumption.
Risk appetite in international financial markets
marginally lower
Credit spreads in the international financial markets
have kept contracting while asset prices have risen
persistently since 2003, demonstrating that investors
maintain a very strong appetite for risky assets. It
appears, however, that investors’ risk appetite has
weakened somewhat in the process of global liquidity
tightening driven by interest rate hikes in major
economies, as seen in investors’ more sensitive
responses recently to market instabilities.
The credit spreads on US junk bonds and emerging
market sovereign bonds (based on EMBI+) remain
very tight, as investors continue to search for high
yields. The spreads widened temporarily, however, in
the wake of the Fed’s May 2006 announcement of a
rate increase with the hint of additional future hikes to
curb inflationary pressures. They widened sharply
again in February 2007, when the problem of US
subprime mortgage loans surfaced and as global
investors reacted nervously to the possibility of
monetary tightening by the Chinese government to
restrain speculative asset markets.
- 14 -
Financial Stability Report April 2007
1) Subprime mortgage loans are made to borrowers unable to qualify forloans under traditional criteria due to their limited credit histories. Asof end-2006, they made up around 13% of all US mortgage loans, andthe delinquency (over 30 days) rate on them currently approached14%.
<Figure II- 3>
Credit spread trends
800
600
400
200
0
300
200
100
0
(bp) (bp)
2003 2004 2005 2006 2007
EMBI+ (LHS)
Junk bonds1) (LHS)
Note: 1) Figures for junk bonds refer to the average of corporate bondswith credit ratings of BB+ or lower.
Source : Bloomberg
AAA US corporate bonds (RHS)

- 15 -
Ⅱ. Changes in the environment for financial stability
Stock prices (in terms of MSCI) have continued their
upward trend, both in the G7 countries and in emerging
markets, although their sensitivity to global liquidity
contraction now appears higher. Global stock markets
underwent a sharp correction in May and June 2006,
particularly in emerging markets that suffered large
foreign capital outflows. They also tumbled, albeit only
briefly, in February 2007 with the sudden plunge in
Chinese stocks2).
Yields on 10-year US Treasury bonds, which had
shown an upward trend since the second half of 2005
tracking the continuing hikes in the Fed’s target rate,
reversed to a downturn in July 2006, as the cooling of
the US housing market heightened the likelihood of
economic slowdown. They resumed their downward
movement in February 2007 and drifted well below the
policy rate, as market concerns about US economic
slowdown reemerged and investors displayed higher
preference for safe assets.
The exchange rates of major currencies have shown
different movements. The euro has remained
moderately strong against the US dollar since the
second half of 2006, reflecting the possibility of
additional policy rate increases by the European
Central Bank (ECB). The Japanese yen, however, has
been weak vis-a-vis the dollar since May 2006, with
the Bank of Japan defying market anticipations and
delaying increases in its policy rate. The yen has
strengthened since February 2007, however, in line
with the plummeting of global stock prices at that time,
2) MSCI in the G7 countries and emerging markets fell by 11.0% and24.5%, respectively, at their low points during the May-June 2006period, and by 5.9% and 10.2%, respectively, between February andMarch in 2007.
<Figure II- 4>
Trends of stock prices in major economies
260
220
180
140
100
60
260
220
180
140
100
60
(2005.1.1=100)
2005.1 7 2006.1 7 2007.1
Nikkei of JapanDJ STOXX50(Euro)Emerging markets(MSCI)Shanghai composite index of ChinaDow Jones of the US
Source : Bloomberg
<Figure II- 5>
Trends of yields of government bonds1) in major countries
6
5
4
3
2
1
0
6
5
4
3
2
1
0
(%) (%)
2003 2004 2005 2006 2007
Note : 1) Based on 10-year bondsSource : Bloomberg
US
Federal funds rate Germany
Japan
(yen/US$) (US$/euro)
<Figure II- 6>
Trends of exchange rates of yen and euro against US dollar
125
120
115
110
105
100
95
90
1.4
1.3
1.2
1.1
1.02005.1 7 2006.1 7 2007.1
Yen (LHS)
Euro (RHS)
Source : Bloomberg

- 16 -
Financial Stability Report April 2007
to stay at around the 117 yen/dollar level. The
currencies of emerging economies have as a whole
shown continued strengthening trends since July 2006,
with the resurgence of foreign capital inflows into their
markets.
Risk premiums in the international financial market
remain narrow as of the beginning of 2007. Investors
seem, however, to have become more sensitive to
potential market instabilities that include the persistent
global imbalances and excessive yen carry trades.
Given the US current account deficit reaching 6.4% of
GDP, the income account balance that had helped
sustain it for a considerable time turned from surplus to
deficit in 2006, and the volume of capital inflows to the
US is also contracting, partly because of a decline in
purchases of US Treasury bonds.3) Pressure for
correction of the global imbalances thus seems to be
rising. Moreover, a rapid unwinding of the yen-carry
trade, that is believed to have swollen greatly against
the recent backdrop of low Japanese interest rates,
remains a continuing possibility should the yen
strengthen sharply or any unexpected shocks to the
financial markets occur.4)
Nevertheless, considering the favorable world
economic conditions, the sound financial statuses of
3) US Current and Capital Accounts
Source: US Bureau of Economic Analysis
4) In October 1998, when LTCM collapsed, the yen appreciated 13% inone week and the yen-carry trade unwound sharply, even though theshort-term interest rate differential between the US and Japan exceeded5 percentage points at that time.
(billion dollars)2002 2003 2004 2005 2006
Current a/c -472 -528 -665 -792 -857
Capital a/c 507 537 580 771 719
(Treasury) (161) (276) (366) (271) (148)
<Figure II- 7>
Trends of exchange rates of currencies of emergingmarkets against US dollar
110
100
90
80
70
110
100
90
80
70
(2003.1.1=100)
2003 2004 2005 2006 2007
Source : Federal Reserve Bulletin
IndiaTaiwanTailandChinaSingapore
<Figure II- 8>
Trends of US current account and income account
40
30
20
10
0
-10
0
-1
-2
-3
-4
-5
-6
-7
(billion $) (%)
1999 2001 2003 2005 2006
Income account (LHS)
Current account/GDP (RHS)
Source : US Bureau of Economic Analysis
<Figure II- 9>
Trends of international raw material prices
2400
2200
2000
1800
1600
1400
100
80
60
40
20
0
(1931.9.18=100) (US $/barrel)
2004.1 7 2005.1 7 2006.1 7 2007.1
International oil prices(Brend oil)(RHS)
Reuters commodity priceindex(LHS)
Source : Bloomberg, Reuters
- 17 -
Ⅱ. Changes in the environment for financial stability
financial institutions and corporations,5) and the
strengthened risk management capabilities of the
policy authorities, it appears unlikely that international
financial market stability will deteriorate significantly
for the time being.
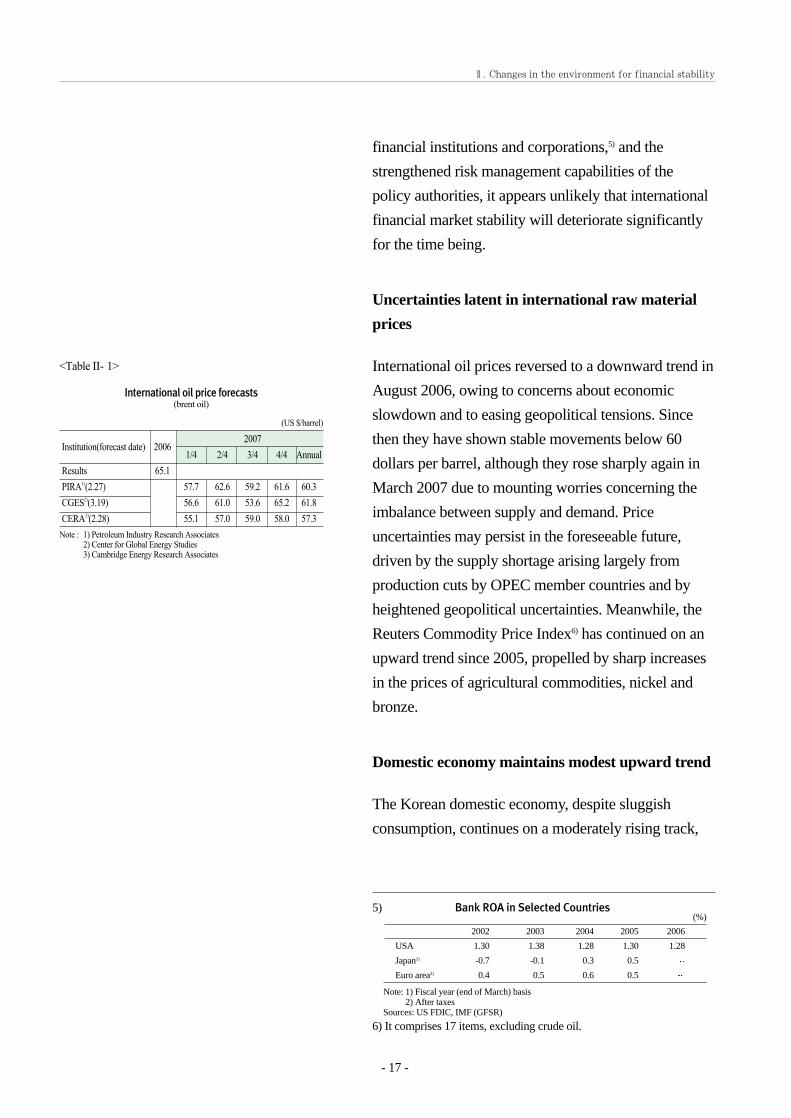
Uncertainties latent in international raw material
prices
International oil prices reversed to a downward trend in
August 2006, owing to concerns about economic
slowdown and to easing geopolitical tensions. Since
then they have shown stable movements below 60
dollars per barrel, although they rose sharply again in
March 2007 due to mounting worries concerning the
imbalance between supply and demand. Price
uncertainties may persist in the foreseeable future,
driven by the supply shortage arising largely from
production cuts by OPEC member countries and by
heightened geopolitical uncertainties. Meanwhile, the
Reuters Commodity Price Index6) has continued on an
upward trend since 2005, propelled by sharp increases
in the prices of agricultural commodities, nickel and
bronze.
Domestic economy maintains modest upward trend
The Korean domestic economy, despite sluggish
consumption, continues on a moderately rising track,
5) Bank ROA in Selected Countries
Note: 1) Fiscal year (end of March) basis2) After taxes
Sources: US FDIC, IMF (GFSR)
6) It comprises 17 items, excluding crude oil.
(%)
2002 2003 2004 2005 2006
USA 1.30 1.38 1.28 1.30 1.28
Japan1) -0.7 -0.1 0.3 0.5
Euro area2) 0.4 0.5 0.6 0.5
2007Institution(forecast date) 2006
1/4 2/4 3/4 4/4 Annual
Results 65.1
PIRA1)(2.27) 57.7 62.6 59.2 61.6 60.3
CGES2)(3.19) 56.6 61.0 53.6 65.2 61.8
CERA3)(2.28) 55.1 57.0 59.0 58.0 57.3
<Table II- 1>
International oil price forecasts(brent oil)
(US $/barrel)
Note : 1) Petroleum Industry Research Associates2) Center for Global Energy Studies3) Cambridge Energy Research Associates

thanks to briskness in exports and in facilities
investment. It is expected to maintain a rate of growth
close to its potential, with a continuing of these
favorable export and facilities investment trends.
Prices remained stable throughout 2006, helped by the
appreciation of the won and the fall of international oil
prices, and are expected to stay at a generally stable
level in 2007. The possibility remains, however, that
unstable movements in the price of raw materials
including crude oil and agricultural commodities may
lead to pressure for inflation.
The current account balance, despite a service account
deficit resulting mainly from increased overseas travel
expenditures, recorded a surplus in 2006 thanks to
robust exports and lower international oil prices.
Although the volume of the goods account surplus may
continue to expand modestly in 2007, the current
account is forecast to remain at a balanced level due to
the rising service account deficit.
The North Korean nuclear weapon test on October 9,
2006 was thought likely to pose a considerable burden
to domestic financial system stability. Now that burden
appears to have been noticeably reduced, as the six-
party talks reached agreement in February 13, 2007 on
progressive measures7) to disable North Korea’s nuclear
- 18 -
Financial Stability Report April 2007
7) The agreement is summarized here as follows. As an initial step, within60 days, the other parties will supply North Korea with 50 thousandtons of heavy oil, North Korea will shut down its nuclear facilities andinvite International Atomic Energy Agency (IAEA) inspectors toreturn, and the six parties will set up and operate a working group oneconomic and energy cooperation. As the second step, after 60 days,North Korea will disable its nuclear facilities, and the other parties willprovide it with 950 thousand tons of heavy oil assistance. The final stepwill include convening a six-party foreign ministers’ meeting for thepurpose of implementing security cooperation in North East Asia, andestablishing a special forum among the countries directly concerned toconclude a permanent peace agreement on the Korean Peninsula.
<Figure II-10>
GDP, consumption and investment in Korea1)
12
9
6
3
0
-3
-6
12
9
6
3
0
-3
-6
(%) (%)
2002.I III 03.I III 04.I III 05.I III 06.I III
Facilities investment
GDP
Private consumption
Note: 1) Real, year-on-year figuresSource: The Bank of Korea

facilities. Although uncertainties regarding
implementation of the agreement remain, the
geopolitical risk now seems far lower than before
October 2006.
- 19 -
Ⅱ. Changes in the environment for financial stability

2. Debt servicing capacity of thehousehold sector
Decrease in debt servicing capacity continues
Households’ financial debts increased by 11.6 percent
in 2006, mainly led by housing finance loans8). While
households’ financial assets rose owing to increases in
deposits and in pension and insurance policies, due to
the sluggish stock market their rate of growth (8.6
percent) was lower than that of households’ debts.
Thus, households’ capital gearing ratio (financial debt
divided by financial assets), which measures
households’ ability to service their debts without sales
of non-financial assets, rose to 44.4 percent at the end
of 2006, from 43.2 percent a year earlier.
The debt-to-disposable income ratio, an indicator of
households’ capacity to service their debts with
disposable income, continued its rising trend in 2006,
as disposable income increased by only 5.6 percent,
almost half the rate for financial debt. The income
gearing ratio (interest payments divided by disposable
income) rose substantially, in line with the increases in
both financial debt and interest rates. Both of these
ratios are higher than those in the United States and
Japan.
The household sector’s debt-servicing capacity appears
to have declined, as financial liabilities have expanded
- 20 -
Financial Stability Report April 2007
8) The figures cited in this section were compiled in accordance with the1993 SNA standards. However, those for the period prior to year-end2002 (for growth rates prior to year-end 2003), which have not yetbeen officially updated by the Bank of Korea, are scaled based onyear-end 2002 for convenience. The figures stated herein may thusdiffer from the statistics quoted in the related reports published in thepast.
<Figure II-11>
Trends of household financial asset and liability growth and capital gearing ratios
40
30
20
10
0
-10
-20
50
45
40
35
30
(%) (%)
1996 1998 2000 2002 2004 2006
Financial asset growth rate (LHS)
Capital gearing ratio (RHS)Financial debt growth rate (LHS)
Notes: 1) Year-end basis2) Trade credits and non-interest-bearing assets and debts such
as miscellaneous financial assets and debts are excluded.Source: Bank of Korea
<Figure II-12>
Household financial debt-to-disposable income ratio trends
1.5
1.3
1.1
0.9
0.7
1.5
1.3
1.1
0.9
0.7
(times) (times)
1997 1999 2001 2003 2005 2006
Japan
Korea
US
Notes: 1) Year-end basis2) Trade credits and non-interest-bearing debts such as
miscellaneous financial debts are excluded. series for Japanand the United States are updated using the same standard asin Korea.
Sources: National accounts and flow of funds statistics of therespective countries

faster than both disposable income and financial assets,
while financial market interest rates have also risen.
The increase in financial liabilities since 2005, centered
around housing finance loans, is estimated to have
financed purchases of non-financial assets such as
houses by the medium- and high-income classes with
relatively strong debt repayment capacities, leading to
an increase in total household assets as well. However,
the household sector’s ability to absorb shocks such as
decreases in income or unemployment is assessed as
low, since their capital gearing ratio is higher than
those of households in the United States (31.6 percent
as of the end of 2006) and Japan (22.7 percent as of the
third quarter 2006), and since the bulk of their assets
comprises housing and other real estate whose liquidity
is regarded as low. The net personal savings rate has
also remained in the low range of 3 to 5 percent since
2003, a fact which suggests improvement in the
household sector’s debt servicing capacity is likely to
take some time.
Credit standing of low-income households improves
moderately
The debt burden of low-income households seems to
have eased modestly in 2006, thanks to the increased
effectiveness of debt rescheduling and cancellation for
credit delinquents, while low-income household
balances improved and the number of persons wanting
additional hours of work9) fell.
- 21 -
Ⅱ. Changes in the environment for financial stability
9) Referring to workers employed less than 18 hours per week, owing toeconomic reasons such as shortage of jobs or weak business, and whowish to work longer hours
<Figure II-13>
Household income gearing ratio trends
11
9
7
5
3
11
9
7
5
3
(%) (%)
1997 1999 2001 2003 2005 2006
Korea
Japan
US
Notes: 1) Financial intermediary services indirectly measured (FISIM)are excluded from interest payments.
2) Series for Japan and the United States are updated using thesame standard as in Korea.
Sources: National accounts of the respective countries
(million won, %)
Notes: 1) As of the end of May 20062) Figures in parentheses are the composition ratios in total assets /
liabilities.Source: National Statistical Office
<Table II- 2>
Household total assets and liabilities
Household House-owning Non-house-owning average households households
281.1 384.3 232.8(100.0) (100.0) (100.0)
45.7 57.5 47.6(16.3) (15.0) (20.5)216.0 311.5 130.8(76.8) (81.1) (56.2)127.6 189.0 -(45.4) (49.2) ( -. )19.4 15.3 54.4(6.9) (4.0) (23.4)
39.5 52.1 39.0(100.0) (100.0) (100.0)
28.8 36.5 36.0(73.0) (70.0) (92.4)10.7 15.6 2.9
(27.0) (30.0) (7.6)
7.1 7.4 6.0
Total assets (A)
Savings
Real estate
(Houses)
Rent deposits plus miscellaneous assets
Total liabilities (B)
Liabilities
Tenant deposits
Ratio (A / B)
<Figure II-14>
Savings rate and economic growth rate trends
25
20
15
10
5
0
-5
-10
25
20
15
10
5
0
-5
-10
(%) (%)
1998 2000 2002 2004 2006
Corporate savings rate
Net individual savings rate
Source: Bank of Korea
Real GDP growth rate

Looking at urban worker real household balances in
2006, the gap between high-income and low-income
households10) increased marginally from the previous
year. While the deficit of the lowest decile of the
household income spectrum narrowed slightly, the
surpluses of the second and third lowest deciles
widened moderately. Thus, low-income households’
balances are evaluated as moderately improved.
However, the effects of this turn-around in their
balances in improving households’ effective ability to
service their debts is evaluated as less than might be
expected, since substantial portions of both low-income
and middle-income households bearing financial
debts11) were in deficit.
The unemployment rate fell moderately in 2006, while
labor market employment indicators associated with
low-income households, such as the number of persons
abandoning job search efforts and the number of those
wanting to work for longer hours, improved slightly
compared with 2005. The quality of employment in the
labor market also seemed to get better, with a decline in
the portion12) of non-regular employees such as
temporary or part-time workers, whose job security,
- 22 -
Financial Stability Report April 2007
10) The lowest three deciles, the middle four deciles, and the highest threedeciles of the income spectrum are classified as low-income,middle-income, and high-income households, respectively.
11) In the 2005 household survey, households paying more than 50thousand Korean won per year in interest (1,452 of the total samplesize of 3,846 households) were classified as the debt-bearing sample.
12) Trends of non-regular workers(surveyed in August of each year)
Note: 1) Figures represent the share of non-regular job workers in total salaried workers.Source: National Statistical Office
2001 2002 2003 2004 2005 2006
Number of employees 3,635 3,839 4,606 5,394 5,483 5,457
Portion1) 26.8 27.4 32.6 37.0 36.6 35.5
(thousand persons, %)
<Figure II-15>
Household balance trends by income decile
200
150
100
50
0
-50
200
150
100
50
0
-50
(10 thousand won) (10 thousand won)
2000 2002 2004 2006
Notes: 1) Series represent the balances of urban worker households,which are three-quarter moving averaged after deflation bythe consumer price index (2005 = 100).
2) Series for the middle- and high-income brackets are simplyaveraged -- over the fourth to seventh deciles and the eighthto tenth deciles, respectively.
Source: National Statistical Office
1st decile 2nd decile3rd decile Middle-income bracketHigh-income bracket
0 50 100 150 200 250
<Figure II-16>
Indebted households’ incomes and balances
160
120
80
40
0
-40
-80
(household balance, million won)
(annual income, million won)
Note: Annual incomes and balances of households paying more than 50thousand won in interest annually
Source: National Statistical Office; computed by the Bank of Korea

wages and fringe benefits are less than those of regular-
job workers13).
In 2006, the number of persons having their debts
rescheduled or cancelled by appealing to the Credit
Counseling and Recovery Service or the civil courts
declined for the second consecutive year, by 22.0
percent. In contrast, individual resuscitations and
bankruptcy filings increased substantially, due to their
greater debt alleviation effects than those of the credit
recovery (workout) program14). Rehabilitation support
programs such as individual resuscitations and
bankruptcy filings help financial debtors to recover
economically. Some debtors may abuse these programs
to escape their financial obligations, however, taking
advantage of the incomplete system that prevents
debtors’ assets and/or income from being fully
identified and surveyed.
- 23 -
Ⅱ. Changes in the environment for financial stability
13) The wages of involuntary and total non-regular job workers remainedat 53.9 and 71.0 percent, respectively, those of regular job workers.
14) The average amount involved in cases appealed to the CreditCounseling and Recovery Service was 23.57 million won in 2006.Most delinquencies fell into the small case category, as shown by the76.4 percent proportion of cases in which the amount dishonored wasless than 30 million won. Individual resuscitation and bankruptcyfiling cases involved substantially larger amounts of financial debts,however. A survey carried out by the Korea Development Institute, atthe request of the Court Administration Office, showed the averageand median amounts involved in individual resuscitations andbankruptcy filing cases in 2005 to have been 90.45 million won and83.93 million won, respectively.
<Figure II-18>
Trends of debt rescheduling cases
300
250
200
150
100
50
0
300
250
200
150
100
50
0
(thousand cases) (thousand cases)
2002 2003 2004 2005 2006
Individual resuscita-tionsBankruptcy filingsCredit recoveries(workouts)
Note: Individual resuscitations and bankruptcy filings are based upon courtapprovals.
Sources: Republic of Korea Supreme Court, Credit Counseling and RecoveryService
<Figure II-17>
Trends of unemployment and underemployment indicators
9
7
5
3
240
180
120
60
(%) (thousand persons)
2000 2002 2004 2006
Unemployment rate, seasonally adjusted (LHS)Youth unemployment rate (LHS)Number of persons wanting additional work (RHS)Number of persons giving up job searches (RHS)
Note: Three-quarter moving averages except for the unemployment rateSource: National Statistical Office

- 24 -
Financial Stability Report April 2007
3. Debt servicing capacity of thebusiness sector
Decline in corporate profitability continues
In 2006, the operating income-to-sales ratio of listed
firms15) slipped to 6.3%, from 7.5% in 2005. This
decline was mainly attributable to increases in prices of
raw materials and to the strength of the local currency,
the Korean won.
Large businesses registered more noticeable decreases
in their operating income-to-sales ratios than did small
and medium-sized enterprises (SMEs). This was due to
the declines in operating income of large businesses in
the iron and electronics industries, stemming from
increased prices for raw materials and for info-
communications products, respectively. As a result, the
gap in profitability between large businesses and SMEs
continued to narrow. Comparing domestic market-
oriented businesses with export-oriented businesses16),
the operating income-to-sales ratio dropped more
sharply for export-oriented businesses which were
more directly influenced than were domestic market-
oriented businesses by the appreciation of the Korean
won and the decreases in heavy and chemical industry
export product prices.
With corporate profitability weakening and market
interest rates rising, the percentage of large businesses
15) Those listed on the Korea Exchange (based on KIS-Value data as ofMarch 31, 2007), with financial institutions excluded
16) “Export-oriented businesses” are those whose exports account for halfor more of their total sales. Other businesses are referred to as“domestic market-oriented businesses” here.
<Figure II-20>
Net interest compensation ratio trends by business size
100
80
60
40
20
0
100
80
60
40
20
0
(%) (%)
2002 2004 2006 2002 2004 2006
Operating loss Less than 100%Higher than 100% Excess of interest revenue over financial expenses
Sources : KIS-Value, The Bank of Korea
Large businesses SMEs
<Figure II-19>
Operating profit-to-sales ratio trends
12
9
6
3
0
12
9
6
3
0
(%) (%)
2001 2003 2005 2006
Sources : KIS-Value, The Bank of Korea
Export-oriented businesses
Domestic market-oriented businesses
Large businesses SMEs

- 25 -
Ⅱ. Changes in the environment for financial stability
and SMEs unable to cover their net financial
expenses17) with operating profits rose by 23.7% and
41.5%18), respectively.
Looking at the distribution of profitability, companies
in the top 1 and 5 percents in operating incomes
generated 58.7% and 86.8%, respectively, of total
operating incomes, while the remaining companies
recorded results at around break-even levels. This
demonstrates that the polarization of profitability has
not yet been alleviated.
Financial conditions and liquidity remain healthy
Considering the ratios of stockholders’ equity to total
assets, which indicate companies’ capacities to
withstand sales depression or deteriorating profitability,
the debt servicing capacity of the business sector
remained healthy in 2006. The ratio of stockholders’
equity to total assets19) of large businesses continued to
pick up, recording the level of 54.0%. For SMEs, the
trend of continual increase in their ratio of
stockholders’ equity to total assets since the Asian
financial crisis came to an end in 2006, as the ratio
dropped slightly. At 59.6%, however, it still remained
high.
The financial soundness of businesses has been due to
their switch to conservative investment activities in line
with corporate governance changes, and to a trend of
17) Net financial expenses = financial expenses - interest revenue18) Net interest coverage ratio = operating income / (financial expenses -
interest revenue)19) Ratio of stockholders’ equity to total assets = stockholders’ equity /
total assets
FY 2004FY 2005FY 2006
<Figure II-21>
Distribution of operating profits
80
60
40
20
0
-20
80
60
40
20
0
-20
(weights in total operating profits, %)
(weights in total operating profits, %)
0~30 31~60 61~70 71~80 81~90 91~95 96~99 100(percentile groupings of firms (ranked by operating profits), %)
Sources : KIS-Value, The Bank of Korea
<Figure II-22>
Stockholders’ equity-to-total assets ratios and current ratios by business size
180
150
120
90
60
30
0
180
150
120
90
60
30
0
(%) (%)
2001 2003 2005 2006
Sources : KIS-Value, The Bank of Korea
Current ratio (Large businesses)
Current ratio (SMEs)
Stockholders’ equity-to-total assets ratio (Large businesses)
Stockholders’ equity-to-total assets ratio (SMEs)

- 26 -
Financial Stability Report April 2007
increased precautionary cash reserve holdings and
avoidance of borrowing by firms.
Business liquidity stayed at a high level overall in
2006, but that of SMEs slipped somewhat. While large
businesses having sufficient liquidity reduced their
borrowings, the dependence of SMEs on borrowings20)
rose, due to increased demand for working capital and
to the influence of aggressive competition among
banks to increase their market shares. Especially, the
dependence on borrowings of SMEs with net interest
coverage ratios less than 100 (indicating low
profitability) rose to 29.7% in 2006, up from 27.3% the
year before.
Considering the operating income-to-sales ratio, the
stockholders’ equity-to-total assets ratio, and the
liquidity ratio all together, the debt servicing capacities
of businesses with net interest coverage ratios greater
than 100 seem favorable. However, the proportion of
businesses which are regarded as having fragile debt
servicing capacities, in other words those with net
interest coverage ratios less than 100, has increased.
Moderate increase in high risk businesses
Analysis using the credit risk assessment model of
Norges Bank, the central bank of Norway21), shows that
the proportion of high risk businesses in Korea
increased in line with the weakened profitability in
2006, despite the favorable financial soundness and
liquidity conditions.
20) Dependence on borrowings = total borrowings / total assets21) To estimate business sector credit risk, Norges Bank has measured the
debt servicing ratios of businesses by their profitability and financialstructures as reflected in their financial statements.
<Figure II-23>
Dependence on borrowings
40
30
20
10
40
30
20
10
(%) (%)
2001 2003 2005 2006
Large businesses
SMEs
Sources : KIS-Value, The Bank of Korea
<Figure II-24>
Comparison of businesses based on net interest coverage ratios
100
75
50
25
0
-25
Adjusted current ratio(%)
Operating profit-to-sales ratio Stockholders’ equity-to-total assets ratio
Businesses with net interest coverage ratios of 100 or greater
Businesses with net interest coverage ratios below 100
Notes: 1) Based on the end of 20062) Adjusted current ratio = (current assets-current liabilities) /
current liabilitiesSources: KIS-Value, The Bank of Korea
Low risk
<Figure II-25>
Distribution of large businesses by credit risk rating
100
80
60
40
20
0
100
80
60
40
20
0
(%) (%)
2001 2003 2005 2006
Sources: KIS-Value, The Bank of Korea
High risk Medium risk

- 27 -
Ⅱ. Changes in the environment for financial stability
The transition matrixes show SMEs with a higher
probability of shifting into a higher risk bracket than a
lower risk bracket. Large businesses, meanwhile,
owing to reduced profitability, had a greater chance of
transiting from a low risk bracket to a medium risk
bracket.
Despite their declining profitability, businesses’ overall
capacity to service their short-term debts is evaluated
as not having fallen, based upon their solid cash-flow
conditions. However, if business profitability continues
to drop and this comes to negatively affect financial
conditions and liquidity, there is a chance of debt
servicing capacity ultimately weakening. Especially,
considering that the proportions of businesses
recording operating losses or having net interest
coverage ratios of less than 100 have not yet decreased,
and that market interest rates are going up, the debt
service burdens of high risk businesses seem to be
gradually increasing.
Low risk
<Figure II-26>
Distribution of SMEs by credit risk rating
100
80
60
40
20
0
100
80
60
40
20
0
(%) (%)
2001 2003 2005 2006
Sources : KIS-Value, The Bank of Korea
High risk Medium risk
(%)(large businesses)
<Table II- 3>
Transition matrix
High risk Medium risk Low risk
High risk 76.7 22.6 0.7
Medium risk 21.5 72.2 6.3
Low risk 0.9 21.2 77.9
20062005
High risk Medium risk Low risk
High risk 81.6 16.6 1.9
Medium risk 32.9 62.7 4.4
Low risk 11.5 25.4 63.1
20062005
(%)(SMEs)
Sources: KIS-Value, The Bank of Korea

- 28 -
Financial Stability Report April 2007
4. Real estate market
Rise in housing prices slows
The trend of rising housing prices slowed down from
June 2006, due to government measures including
hikes in taxes on both holding and transfer of houses
and strengthening of regulations on housing finance
loans. During the fourth quarter of 2006, however,
housing prices returned to a rapid increase because of
anticipations of deregulation related to reconstruction
of old apartments and news of high lotting-out prices of
new apartments in some areas. Since January 2007, the
upward trend has slowed markedly. The average
monthly rate of apartment price increases in the Seoul
Metropolitan Area fell to 0.7% during the first quarter
of 2007, from 4.2% for the last quarter of 2006. House
trading volume has also shown a sharp decline since
December 2006.
The current slowdown in the rise of housing prices is
mainly due to decreased investment-related demand
and weakened expectations of housing price rises,
following the government’s November 15 2006
unveiling of a new series of housing market
stabilization measures including tightening of
regulations on debt-to-income (DTI) ratios for housing
finance loans and the ceiling on new apartment lotting-
out prices, in combination with the increase in market
interest rates following the BOK’s raising of the
reserve requirement ratios. Accordingly, the house
purchase index has declined sharply, and the volume of
houses offered for sale has grown.
In many cases so far, the government’s unveiling of
housing market stabilization measures has resulted in
<Figure II-28>
Indices of houses offered for sale and purchased
160
120
80
40
0
0
40
80
120
1602005.7 2006.1 7 2007.1
11.15 market stabilization measures
Houses purchased (LHS)
Number of houses offered for sale (RHS)
Note : 1) If the house purchase index is greater (smaller) than 100, thenumber of buyers is greater (smaller) than that of sellers. Ifthe number of houses offered for sale index is greater(smaller) than 100, the number decreases (increases)
Source : www.drapt.com
<Figure II-27>
Apartment transaction price indices and trading volume
150
120
90
60
30
0
25
20
15
10
5
0
(ten thousands units)(2003.9=100)
2000 2002 2004 2006 2007
Seoul apartmenttransaction price index (LHS)
All city trading volume (RHS)
All city apartmenttransaction price index (LHS)
Sources : Kookmin Bank, Korea Land Corporation
- 29 -
Ⅱ. Changes in the environment for financial stability
only short-term slowdown in housing price increases,
and they have shifted back soon to sharp upward trend.
This may be attributed mainly to demand-supply and
pricing mechanism differences from that of the
commodities and housing markets, and to doubt about
the feasibility of government housing market
stabilization measures. It is therefore felt that if the
government maintains consistency in its measures,
there is no great likelihood of a renewed sharp rise in
housing prices.
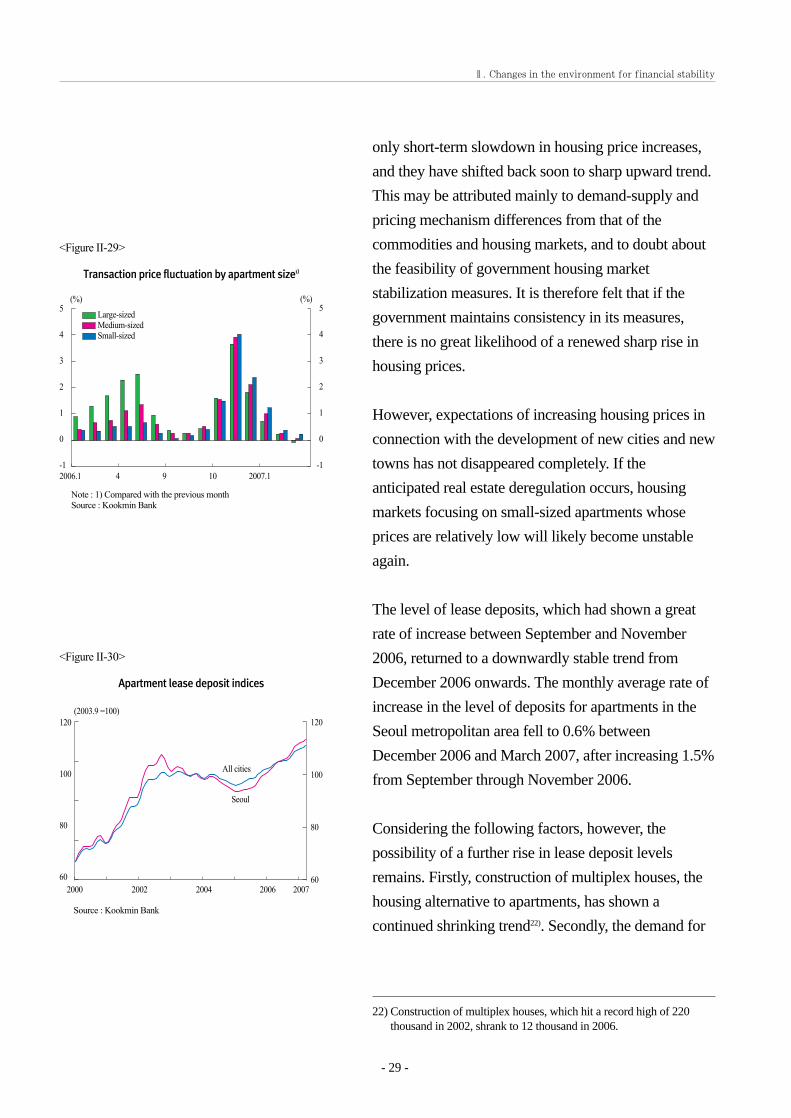
However, expectations of increasing housing prices in
connection with the development of new cities and new
towns has not disappeared completely. If the
anticipated real estate deregulation occurs, housing
markets focusing on small-sized apartments whose
prices are relatively low will likely become unstable
again.
The level of lease deposits, which had shown a great
rate of increase between September and November
2006, returned to a downwardly stable trend from
December 2006 onwards. The monthly average rate of
increase in the level of deposits for apartments in the
Seoul metropolitan area fell to 0.6% between
December 2006 and March 2007, after increasing 1.5%
from September through November 2006.
Considering the following factors, however, the
possibility of a further rise in lease deposit levels
remains. Firstly, construction of multiplex houses, the
housing alternative to apartments, has shown a
continued shrinking trend22). Secondly, the demand for
22) Construction of multiplex houses, which hit a record high of 220thousand in 2002, shrank to 12 thousand in 2006.
<Figure II-29>
Transaction price fluctuation by apartment size1)
5
4
3
2
1
0
-1
5
4
3
2
1
0
-1
(%)(%)
2006.1 4 9 10 2007.1
Large-sizedMedium-sizedSmall-sized
Note : 1) Compared with the previous monthSource : Kookmin Bank
<Figure II-30>
Apartment lease deposit indices
120
100
80
60
120
100
80
60
(2003.9 =100)
2000 2002 2004 2006 2007
All cities
Seoul
Source : Kookmin Bank

- 30 -
Financial Stability Report April 2007
apartment leases might increase due to anticipation of
falling new a partment sales prices and the planned
change of the housing lottery program. Finally, some
part of the property holding tax increase could be
passed on to the lease deposits. If some of these
potentially destabilizing factors materialize, the level of
lease deposits could show an upward rising trend.
Land prices remain unstable
The rate of increase in nationwide land prices
accelerated to 5.6% (annual rate) in 2006, from 5.0% in
2005. However it has shown a downward trend since
the beginning of 2007.
By region, land prices in Seoul and the surrounding
metropolitan area are still rising at a higher rate than
the nationwide average, mostly due to the impact of the
“New Town Project.” In contrast, land prices in North
and South Chungcheong Provinces, which had shown a
high rate of increase owing to the development of an
administrative complex city, are now recording rates
much lower than the nationwide average.
By use of land, the rates of increase in land for
residential, commercial, and industrial purposes, which
had risen rapidly with heightened demand in the Seoul
metropolitan area related to development projects
including the New Town Project, has slackened greatly.
The rates of increase in land prices in green zones,
administrative zones23) and agricultural and forestry
zones are showing mild downward trends.
23) Under the Law Pertaining to the Planning and Use of National Land,some areas are designated as administrative zones for the promotionof the agricultural/forestry industries, the conservation of the naturalenvironment and forests, or systematic management foraccommodation of the populations and industries in urbanareas.highest figure since 2003.
<Figure II-32>
Land price fluctuations by usage1)
18
15
12
9
6
3
0
18
15
12
9
6
3
0
(%) (%)
2001.Ⅰ02.Ⅰ03.Ⅰ04.Ⅰ05.1 4 7 10 06.1 4 7 10 07.1
Residential zones Commercial zonesIndustrial zones Administrative zonesGreen zones Agricultural and forestry zones
Note : 1) Annunalized increase ratios compared to the previous quarte(until the end of 2004) and previous months (from 2005)
Source : Korea Land Corporation
<Figure II-31>
Land price fluctuation by region1)
30
25
20
15
10
5
0
-5
30
25
20
15
10
5
0
-5
(%) (%)
2001.Ⅰ02.Ⅰ03.Ⅰ04.Ⅰ05.1 4 7 10 06.1 4 7 10 07.1
All cities Seoul North chungcheong South chungcheong South jeolla
Note : 1) Anunalized increase ratios compared to the previous quarters(until the end of 2004) and the previous months (from 2005)
Source : Korea Land Corporation
- 31 -
Ⅱ. Changes in the environment for financial stability
Meanwhile, a possibility is seen that land prices in
green zones, administrative zones, and agricultural and
forestry zones will experience upward pressures in line
with the progress of development of innovation cities
and company towns.
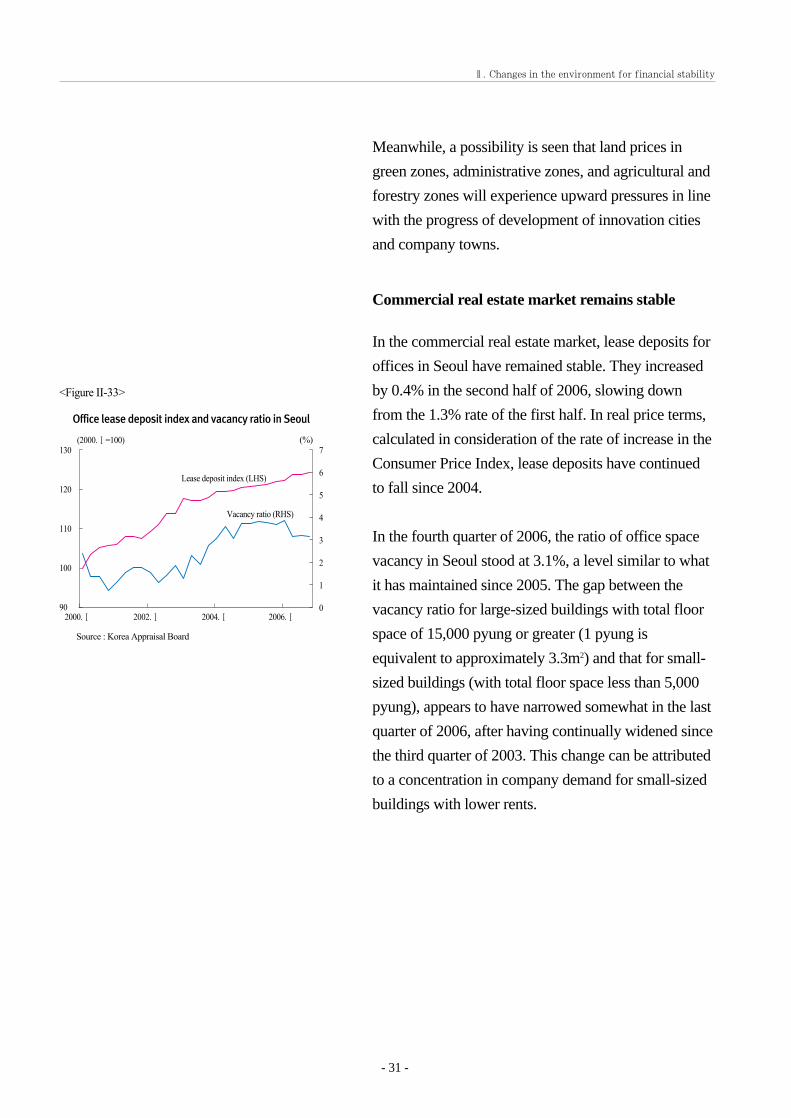
Commercial real estate market remains stable
In the commercial real estate market, lease deposits for
offices in Seoul have remained stable. They increased
by 0.4% in the second half of 2006, slowing down
from the 1.3% rate of the first half. In real price terms,
calculated in consideration of the rate of increase in the
Consumer Price Index, lease deposits have continued
to fall since 2004.
In the fourth quarter of 2006, the ratio of office space
vacancy in Seoul stood at 3.1%, a level similar to what
it has maintained since 2005. The gap between the
vacancy ratio for large-sized buildings with total floor
space of 15,000 pyung or greater (1 pyung is
equivalent to approximately 3.3m2) and that for small-
sized buildings (with total floor space less than 5,000
pyung), appears to have narrowed somewhat in the last
quarter of 2006, after having continually widened since
the third quarter of 2003. This change can be attributed
to a concentration in company demand for small-sized
buildings with lower rents.
<Figure II-33>
Office lease deposit index and vacancy ratio in Seoul
130
120
110
100
90
7
6
5
4
3
2
1
0
(2000.Ⅰ=100) (%)
2000.Ⅰ 2002.Ⅰ 2004.Ⅰ 2006.Ⅰ
Lease deposit index (LHS)
Vacancy ratio (RHS)
Source : Korea Appraisal Board

- 32 -
Financial Stability Report April 2007
<Box II- 1>
Special characteristics of supply and demand and the price mechanism in assetmarkets
In terms of the factors affecting their supply and demand, and the mechanism determining their prices, markets
for assets like real estate or stocks are distinct from markets for goods like clothing or electronics.
First, unlike the case in goods markets, existing inventories such as existing houses or outstanding stocks
account for the predominant share of the transaction volume in asset markets and have a decisive impact on
housing prices. In the Korean housing market, existing apartment transactions represented nearly 73% of all
apartment transactions (existing apartment transactions + new apartment supply) in 2006, while, in the stock
market, transactions in outstanding shares accounted for 99.5% of all transactions (secondary market sales
proceeds + proceeds from new share issuance). In the asset markets, while supply of new assets can affect
prices over the long term by increasing total stocks, short-term price changes are mostly affected by
transactions in existing assets in the secondary markets.
A second difference is that supply of and demand for existing houses and outstanding shares can be more
decisively influenced by anticipated future prices than by current prices, which is not true of general goods.
Stocks are assets for investment aimed at capital gains in addition to dividend income. Houses have
characteristics both of investment assets and of consumer goods providing housing service to their occupants.
Because the annual depreciation of a house is negligible owing to its very long useful life, when housing prices
go up overall during the period of its use the residual value of a house can be higher than its original purchase
price. Therefore, anticipations of further housing price rises might lead to a greater number of persons wanting
to purchase houses in the market. This is in contrast to the case in the general goods market, where an increase
in price reduces demand. At the same time, expectations of future price increases encourage sellers to wait
before putting property up for sale, which often leads to a shrinking of supply. In other words, classical supply
and demand law, whereby rising prices decrease demand and increase supply, while declining prices have the
reverse effects, may not be fully applicable to the asset markets, whose supply and demand relationships are
chiefly influenced by price expectations.
A third point is that supply of new stocks and houses is inelastic to price changes, unlike what we see in the
general goods markets, where production tends to increase when prices go up. Issuance of new stocks is
generally determined by the amount of funds available in a company and its future funding needs, rather than
by stock prices. Likewise, new house supply is more greatly influenced by factors other than prices, due to the
non-elasticity of supply caused by land use restrictions, and to the time lag existing between the start and the
completion of new house construction. According to the World Bank and other empirical studies, the price
elasticity of new housing supply ranges between 0.1 and 0.4, which means that it is inelastic. In Korea, since
the 1998 liberalization of lotting-out prices of new apartments developed by the private sector, while new

- 33 -
Ⅱ. Changes in the environment for financial stability
apartment sales prices have climbed continuously along with those of already-existing apartments, supply has
remained generally static with only minor fluctuations. Meanwhile, in the stock market, there is little
correlation between new stock supply and movements of the Korea composite stock price index.
In addition, because they are very heterogeneous, there is imperfect substitution among houses, a high degree
of asymmetric information, and various non-price factors that have great influence on housing demand. In the
meantime, exogenous factors like borrowing costs and loan restrictions also heavily influence house demand,
as most house purchases are financed through long-term loans. This may be one of the reasons why the
housing market has great susceptibility to price distortions and why adjustment of supply and demand
imbalances through the price mechanism is ineffective.
KOSPI and stock issuance1)
60
50
40
30
20
10
0
1,500
1,200
900
600
300
0
(trillion won)
1990 1992 1994 1996 1998 2000 2002 2004 2006
Stok issuance (LHS)
KOSPI (RHS)
Note : 1) Sum of IPO and issue of new shares to be purchased
New apartment sales prices and supply
500
400
300
200
100
0
1,500
1,200
900
600
300
0
(1,000 units) (10 thousand won/pyung)
1990 1992 1994 1996 1998 2000 2002 2004 2006
Supply of new apartments in Seoul and surrounding area (LHS)Supply of new apartments in Seoul (LHS)Average new apartment sales price by pyung (approximately to 3.3m2) in Seoul (RHS)Average existing apartment sales price by pyung (approximately to 3.3m2) in Seoul(RHS)

- 34 -
Financial Stability Report April 2007
Given all of these factors, if the government is to accomplish its policy goals of expanding supply and
stabilizing prices in the housing market, an approach distinct from those that would work in the goods market
seems called for. Specifically, in order to expand the supply of houses, easing of construction-related
regulations and an increase in residential land supply may be more effective than raising new apartment sales
prices. Meanwhile, to stabilize prices, efforts to reduce market uncertainties by enhancing policy consistency
and the reliability of information appear essential measures for improving the balance between supply and
demand.

- 35 -
Ⅲ. Stability of the financial market
1. Lending market
Corporate lending increases significantly
Corporate lending increased by 68.9 trillion won in
2006, recording its highest rate of growth at 16.2%
since 2000. Broken down by type of financial
institution, commercial and specialized banks increased
their corporate loans by 14.5% and non-banking
financial institutions by 20.7%. Notably, both rates
were above the rates of increase in household lending
by these institutions.
By type of borrower, the rate of increase in lending to
SMEs by commercial and specialized banks rose
significantly in 2006. This was attributable to such
factors as banks’ fierce competition to expand their
asset scales, and the increase in qualified loan applicant
companies due to upgrades in their credit ratings.
However, the share of banks’ lending to large
enterprises declined in 2006, reflecting such factors as
enterprises’ favorable liquidity conditions and their
increased issuance of privately placed bonds1).
Accordingly, the share in banks’ total corporate
portfolios of loans to SMEs continued the previous
year’s increase in 2006.
Ⅲ. Stability of the financial market
1) The outstanding amount of privately placed bonds underwritten bydomestic banks (excluding the KDB and KEXIM) has been increasinggreatly since the fourth quarter of 2005, with the net balanceoutstanding climbing from 14.7 trillion won at the end of 2005 to 31.4trillion won at year-end 2006.
<Figure III- 1>
Corporate lending
45
25
5
-15
-35
500
400
300
200
(trillion won) (trillion won)
2002 1H 2003 1H 2004 1H 2005 1H 2006 1H
Corporate loan balance outstanding (RHS)
Changes in corporate lending by commercialand specialized banks (LHS)Changes in corporate lending by non-bankfinancial institutions (LHS)
Source: The Bank of Korea
<Figure III- 2>
Distribution of corporate loans by company size
95
85
75
65
25
20
15
10
5
0
(%) (%)
SMEs (LHS)
Large enterprises (RHS)
Note: 1) Proportions of corporate loans of commercial and specializedbanks
Source: The Bank of Korea
2002.I 2003.I 2004.I 2005.I 2006.I

By type of industry, the rate of growth in lending by all
financial institutions to the construction and the real
estate and renting businesses is rising sharply, due to
factors such as the expanding demand for loans for
purchasing land for housing and for construction funds.
Lending to the manufacturing sector, meanwhile, is
increasing at a low rate. Thus, the share of banks’ loans
to the construction and the real estate and renting
business sectors is rising, while that of bank lending to
manufacturers continues to decline.
Banks’ lending rates on loans to SMEs (based on
newly-extended loans) fell temporarily in the second
half of 2006, due to heightened competition among
financial institutions to expand their market shares.
They for the most part remained on an upward trend,
however, in accordance with the increase in market
interest rates.
In the meantime, the rate of increase in corporate
lending had until recently shown procyclicality,
moving in line with the trend of nominal GDP. Since
2006, however, notwithstanding the sluggishness of
nominal GDP growth, the rate has continued to rise. In
light of the lowered corporate profitability, the burdens
of financial institutions, which continue to expand their
lending to SMEs, are likely to increase if these trends
continue.
Household lending continues to increase
Household lending increased by 57 trillion won
(11.5%) in 2006, led mainly by both banks’ and mutual
credit facilities’ housing finance loans. While this was
a faster pace of growth than in the preceding year, it
was below that of corporate lending, as the share of
household loans in financial institutions’ total lending,
- 36 -
Financial Stability Report April 2007
<Figure III- 3>
Distribution of corporate loans by industry
(%)
2002.I 2004.I 2006.I
Note: 1) Commercial and specializedbanks and non-bank financialinstitutions (Money andBanking Statistics)
Source: The Bank of Korea
Source: The Bank of Korea
Manufacturing
Construction,and real estate,rentingbusinesses
Manufacturing
Construction, and real estate, renting, businesses
Wholesale and retail trade,and hotels and restaurants
60
50
40
30
20
10
0
-10
60
50
40
30
20
10
0
-10
80
60
40
20
02002.I 2004.I 2006.I
80
60
40
20
0
<Rate of increase> <Share of lending by industry>
(%)(%)(%)
Wholesale and retailtrade, and hotels andrestaurants
14
11
8
5
2
<Figure III- 4>
Corporate loan interest rates
14
11
8
5
2
(annual %) (annual %)
2004.1 2005.1 2006.1 2007.1
Bill discount rates of mutual savings banksInterest rates on commercial banks' SME loansInterest rates on commercial banks' loans to large enterprises Bill discount rates of merchant banking institutions
Notes: 1) Based on new loans extendedSource: The Bank of Korea
<Figure III- 5>
Domestic bank lending and nominal GDP growth
30
20
10
0
-10
30
20
10
0
-10
(%) (%)
1998.I 2000.I 2002.I 2004.I 2006.I
Changes in domestic banks’corporate lending
Changes innominal GDP
Note: 1) Compared with the same period of the previous yearSource: The Bank of Korea

- 37 -
Ⅲ. Stability of the financial market
which had been on the rise since 2000, registered a
slight decrease.
Banks’ interest rates on (newly-extended) household
loans continued the previous year’s increase in 2006.
Rates on housing finance loans, which account for the
bulk of household loans, showed a similar trend to
those on household loans overall. However, interest
rates on mortgage loans have been at relatively low
levels, as bank branch managers have been given
greater scope for deciding lending rates.
However, the interest rate differentials between
housing finance loans and other household loans have
narrowed greatly since December 2006, in reflection of
the stricter risk management guidance on housing
finance loans.
In the meantime, against the backdrop of increasing
credit card issuance owing to factors such as improved
credit card company profitability and falling
delinquency rates, the rate of growth of merchandise
credit in the credit card company sector is rising
drastically, moving in line with the increase in private
consumption.
Currently, the volume of merchandise credit
outstanding is not high compared to the period before
the 2003 credit card crisis. However, it is likely to
increase further in the near term, given the growing
number of credit cards issued recently.
The maturity and redemption structures of housing
finance loans extended by domestic banks have been
shifting from mainly short-term bullet-type
redemptions toward long-term regular amortizations of
the principal plus interest payments, as the average
<Figure III- 6>
Household lending
550
450
350
250
150
(trillion won) (trillion won)
2002 1H 2003 1H 2004 1H 2005 1H 2006 1H
Source: The Bank of Korea
40
30
20
10
0
-10
-20
Changes in household lending by commercial and specialized banks (LHS)Changes in household lending by non-bank financial institutions (LHS)
Household lending balanceoutstanding (RHS)
<Figure III- 7>
Household loan interest rates
10
9
8
7
6
5
(annual %) (annual %)
2004.1 7 2005.1 7 2006.1 7 2007.1
Notes: 1) Based on newly extended loansSource: The Bank of Korea
10
9
8
7
6
5
Interest rates on general loans of credit unionsInterest rates on general loans of mutual credit facilitiesInterest rates on household loans of banksInterest rates on housing finance loans of banks

- 38 -
Financial Stability Report April 2007
maturities of mortgage loans are lengthening and the
share of installment loans in total mortgages is rising.
This trend toward monthly repayment of principal and
interest may for a time lead to further outflows of cash
from household balance sheets, but it is expected to
reduce the potential risk to the financial system entailed
by the maturing every year of outstanding large-value
loans.
Concerns about deterioration of Korean housing
finance loans have also been raised since the defaults in
the US subprime mortgage market in February 2007.
However, the loan-to-value ratios (LTVs) on domestic
financial institutions’ housing finance loans are much
lower than those in the US, while the loan delinquency
rate in Korea is also at an insignificant level. The
likelihood of loan defaults, therefore, does not seem
great.
<Figure III- 9>
Distribution of domestic banks' mortgage loans by repayment method
100
80
60
40
20
0
10
8
6
4
2
0
(%) (years)
2003 2004 2005 2006
Averagematurity (RHS)
Note: 1) Based on six major domestic banks (end-period basis)Source: The Bank of Korea
Proportion of installment loans in total mortgages (LHS)Proportion of balloon payment loans in total mortgages (LHS)
<Figure III- 8>
Merchandise credit of credit card companies, and number of credit cards issued
110
100
90
80
70
12
8
4
0
-4
60
40
20
0
-20
-40
-60
(millions of cards) (RHS2, %)(RHS1, %)
2002.3 2003.3 2004.3 2005.3 2006.3
Note: 1) Compared with the same period of the previous yearSource: The Bank of Korea
Number of credit cards issued(outstanding basis) (LHS)
Changes in merchandise credit (RHS1)
Changes in privateconsumption (RHS2)

- 39 -
Ⅲ. Stability of the financial market
<Box III- 1>
The effects of the increase in installment mortgage loans
Under the active encouragement of the policy authorities, housing finance loans extended by Korean banks
have been shifting recently from mainly short-term balloon repayment mortgages toward long-term installment
loans. In line with this trend, the average maturity of housing finance loans increased from 4.7 years at the end
of 2003 to 9.4 years at the end of 2006. The volume of installment loans also grew massively over the same
period, from 22.1 trillion won (14.7% of all housing finance loans) to 115.2 trillion won (53.7% of all housing
finance loans). If this pace persists, the volume of installment loans is likely to rise to 173.7 trillion won
(81.0% of all housing finance loans) by the end of 2010. Meanwhile, 88.9% of all installment loans offer
borrowers grace periods during which no principal repayments are required. The grace periods* for the
majority (57.5%) of these loans are between two and three years.
Based upon the volume of installment mortgage loans outstanding and taking into consideration their
distribution according to grace period, one can estimate the amount of the same type of lending in forthcoming
years and the annual amounts of principal repayment burden to be shouldered by borrowers, as follows:
About 20 trillion won in installment mortgage loans are expected to reach the ends of their grace periods every
year. In 2009, however, this amount is likely to surge temporarily to 48.6 trillion won, as a consequence of
loans issued in 2006 coming to the ends of their grace periods, since lending of this type increased massively
during 2006. Accordingly, the aggregate principal and interest repayment burden will also gradually rise, from
13.2 trillion won in 2006 to 13.7 trillion won in 2007 and 14.4 trillion won in 2008.
No grace period
11.1%
1 year or less
11.3%
1~2 year
1.4%
2~3 year
57.5%
3~4 year
1.1%
4~5 year
14.2%
Over 5 year
3.4%
Total
100.0%
Estimated principal and interest repayment burdens1) of housing finance loans
Notes: 1) Since most housing finance loans using balloon repayment methods are either granted an extensions or refinanced at maturity, calculation of thecash-flow burdens borne by borrowers includes only the interest payments.
2) For this estimation, the annual interest rate for housing finance loans was set at 6.0%. The estimation also assumes, for installment loans, thatprincipal repayments are made in equal amounts over a maturity period of 20 years (The principal and interest repayment burden for 2006 wascalculated based upon the volume of housing finance loans at the end of 2006 and the grace period distribution.)
(trillion won)
2006 2007 2008 2009 2010
Mortage loans outstanding 214.5 214.5 214.5 214.5 214.5
Balloon repayments 99.3 84.9 69.4 53.8 40.8
Installment repayments 115.2 129.6 145.1 160.7 173.7
Post-grace period installment loans 19.5 21.8 48.6 15.9
Principal and interest repayment burdens2) 13.2 13.7 14.4 15.6 16.7
Balloon repayments 6.0 5.5 4.6 3.7 2.8
Installment repayments 7.2 8.2 9.8 11.9 13.8
Grace periods of installment mortgage loans outstanding of 6~7 largest Korean banks (as of year-end 2006)
ㆍㆍ
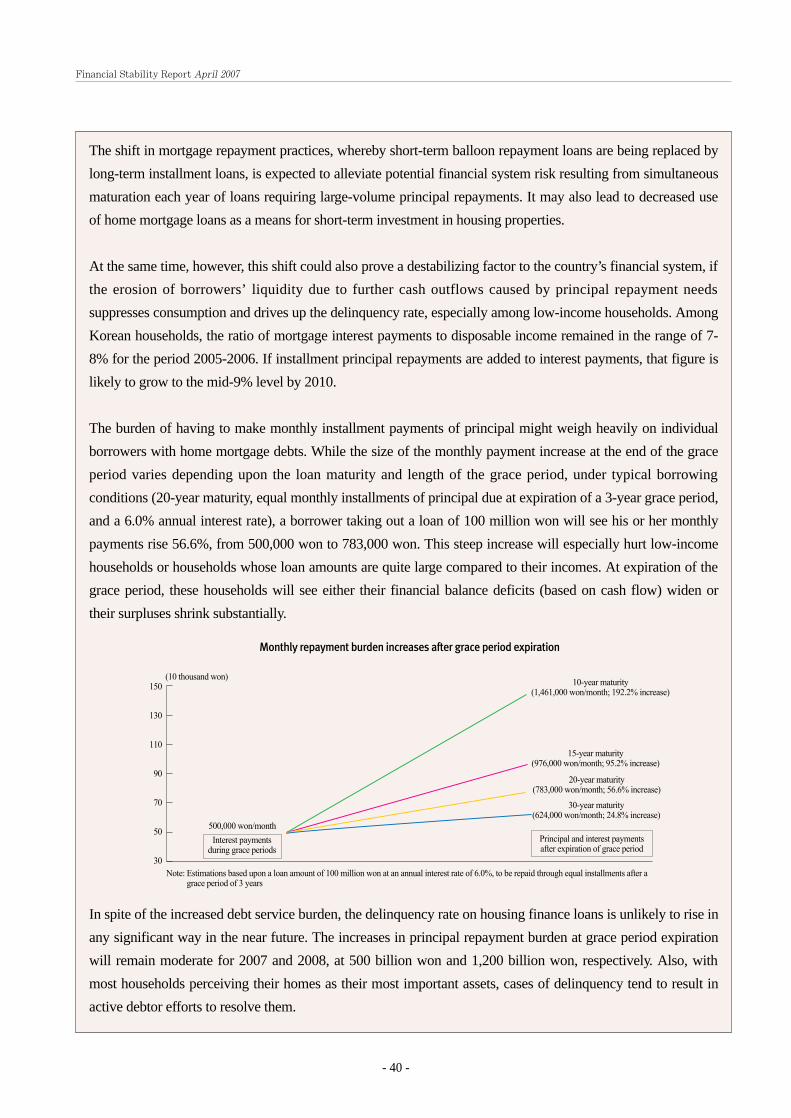
- 40 -
Financial Stability Report April 2007
The shift in mortgage repayment practices, whereby short-term balloon repayment loans are being replaced by
long-term installment loans, is expected to alleviate potential financial system risk resulting from simultaneous
maturation each year of loans requiring large-volume principal repayments. It may also lead to decreased use
of home mortgage loans as a means for short-term investment in housing properties.
At the same time, however, this shift could also prove a destabilizing factor to the country’s financial system, if
the erosion of borrowers’ liquidity due to further cash outflows caused by principal repayment needs
suppresses consumption and drives up the delinquency rate, especially among low-income households. Among
Korean households, the ratio of mortgage interest payments to disposable income remained in the range of 7-
8% for the period 2005-2006. If installment principal repayments are added to interest payments, that figure is
likely to grow to the mid-9% level by 2010.
The burden of having to make monthly installment payments of principal might weigh heavily on individual
borrowers with home mortgage debts. While the size of the monthly payment increase at the end of the grace
period varies depending upon the loan maturity and length of the grace period, under typical borrowing
conditions (20-year maturity, equal monthly installments of principal due at expiration of a 3-year grace period,
and a 6.0% annual interest rate), a borrower taking out a loan of 100 million won will see his or her monthly
payments rise 56.6%, from 500,000 won to 783,000 won. This steep increase will especially hurt low-income
households or households whose loan amounts are quite large compared to their incomes. At expiration of the
grace period, these households will see either their financial balance deficits (based on cash flow) widen or
their surpluses shrink substantially.
In spite of the increased debt service burden, the delinquency rate on housing finance loans is unlikely to rise in
any significant way in the near future. The increases in principal repayment burden at grace period expiration
will remain moderate for 2007 and 2008, at 500 billion won and 1,200 billion won, respectively. Also, with
most households perceiving their homes as their most important assets, cases of delinquency tend to result in
active debtor efforts to resolve them.
Note: Estimations based upon a loan amount of 100 million won at an annual interest rate of 6.0%, to be repaid through equal installments after agrace period of 3 years
150
130
110
90
70
50
30
(10 thousand won)
Monthly repayment burden increases after grace period expiration
500,000 won/month
Interest paymentsduring grace periods
Principal and interest paymentsafter expiration of grace period
10-year maturity (1,461,000 won/month; 192.2% increase)
15-year maturity(976,000 won/month; 95.2% increase)
20-year maturity(783,000 won/month; 56.6% increase)
30-year maturity(624,000 won/month; 24.8% increase)
- 41 -
Ⅲ. Stability of the financial market
As of end-2006, the average loan-to-value (LTV) ratio of outstanding housing finance loans remained at 49.3%,
which suggests that the incidence of foreclosure due to delinquency will be rather low in the future.
Furthermore, as some banks offer opportunities to extend grace periods, borrowers with higher principal and
interest repayment burdens may utilize such arrangements. To meet additional needs for funds, households can
always take out personal loans from banks or borrow from non-bank financial institutions or, if necessary, even
from lenders not subject to LTV or DTI-related restrictions. Accordingly, it will take some time before the
deterioration of balance sheets among households produces echoes in the form of rising numbers of
delinquencies.
To minimize any potential threats to financial system stability arising from installment mortgage loan practices,
the government needs to encourage lending banks to gradually cease offering grace periods or to offer only
short ones. Specifically, the authorities need to use supervisory tools like loan loss provision ratios, risk
weighting and LTV ratios, discriminately, applying more stringent standards for long-term loans with grace
periods, which are riskier than short-term loans with no grace periods. In the US, in September 2006, the
Federal Reserve Board classified mortgage loans with grace periods prior to principal repayment as
‘nontraditional mortgage products’, to distinguish them from less risky loans without such grace periods, and
asked lending institutions to strengthen their risk management related to such loans by taking into account the
effects of the increased monthly payments on the borrowers’ debt servicing capacities at the time of loan
review, as well as establishing an early warning system for detecting signs of trouble and conducting stress
tests. In addition to similar measures, the Korean government also needs to consider limiting the grace periods
of housing finance loans eligible for tax deduction (currently loans with maturities of 15 years or over with
grace periods of three years or less) to one year or less.
The soundness of loan quality should also be closely monitored to prevent any sudden rise in delinquencies in
the event of a sharp decline in housing prices or economic recession, or deterioration of other financial
conditions. Banks should also make efforts toward early detection of potential credit problems by taking into
consideration, during delinquency rate analysis, whether the loans involved came with grace periods and
whether the delinquencies occurred during or after the grace periods, and should reflect the findings from these
analyses in setting their grace period-related lending policies thereafter.
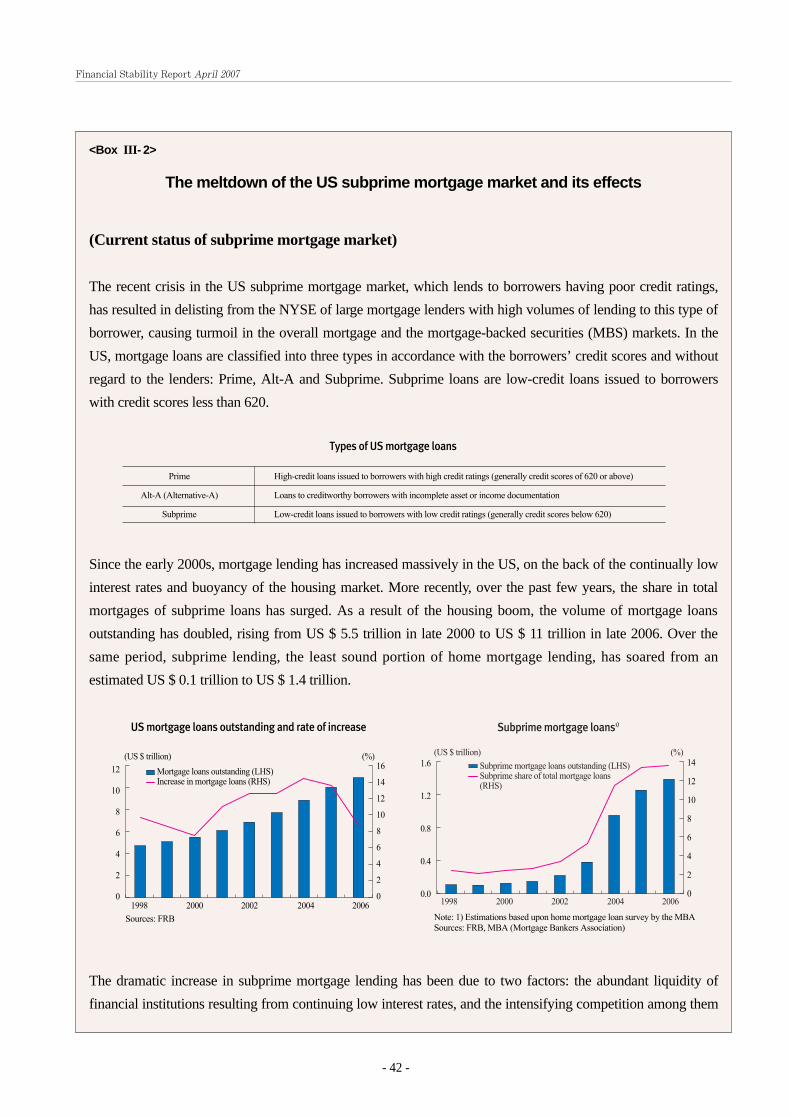
- 42 -
Financial Stability Report April 2007
<Box III- 2>
The meltdown of the US subprime mortgage market and its effects
(Current status of subprime mortgage market)
The recent crisis in the US subprime mortgage market, which lends to borrowers having poor credit ratings,
has resulted in delisting from the NYSE of large mortgage lenders with high volumes of lending to this type of
borrower, causing turmoil in the overall mortgage and the mortgage-backed securities (MBS) markets. In the
US, mortgage loans are classified into three types in accordance with the borrowers’ credit scores and without
regard to the lenders: Prime, Alt-A and Subprime. Subprime loans are low-credit loans issued to borrowers
with credit scores less than 620.
Since the early 2000s, mortgage lending has increased massively in the US, on the back of the continually low
interest rates and buoyancy of the housing market. More recently, over the past few years, the share in total
mortgages of subprime loans has surged. As a result of the housing boom, the volume of mortgage loans
outstanding has doubled, rising from US $ 5.5 trillion in late 2000 to US $ 11 trillion in late 2006. Over the
same period, subprime lending, the least sound portion of home mortgage lending, has soared from an
estimated US $ 0.1 trillion to US $ 1.4 trillion.
The dramatic increase in subprime mortgage lending has been due to two factors: the abundant liquidity of
financial institutions resulting from continuing low interest rates, and the intensifying competition among them
Types of US mortgage loans
Prime High-credit loans issued to borrowers with high credit ratings (generally credit scores of 620 or above)
Alt-A (Alternative-A) Loans to creditworthy borrowers with incomplete asset or income documentation
Subprime Low-credit loans issued to borrowers with low credit ratings (generally credit scores below 620)
Sources: FRB
12
10
8
6
4
2
0
16
14
12
10
8
6
4
2
0
Mortgage loans outstanding (LHS)Increase in mortgage loans (RHS)
US mortgage loans outstanding and rate of increase
1998 2000 2002 2004 2006
(%)(US $ trillion)
Note: 1) Estimations based upon home mortgage loan survey by the MBASources: FRB, MBA (Mortgage Bankers Association)
1.6
1.2
0.8
0.4
0.0
14
12
10
8
6
4
2
0
Subprime mortgage loans1)
1998 2000 2002 2004 2006
Subprime mortgage loans outstanding (LHS)Subprime share of total mortgage loans (RHS)
(%)(US $ trillion)

- 43 -
Ⅲ. Stability of the financial market
which has led them to embark on high-risk, high-return home lending through a variety of variable rate loans
offering low principal repayment burdens during their initial periods. The phenomenon was also helped greatly
by progress in financial engineering and growth of the MBS market, which enabled mortgage firms, although
they are not deposit-taking institutions, to borrow money cheaply by granting put-back options* to MBS
investors or by issuing variable-rate MBSs.
* MBS investors are frequently granted the option of putting back the securities they have purchased to the issuer whenthe delinquency rate in mortgages used as collateral exceeds a certain level. Such exercise of put-back options by MBSinvestors, while it enables issuers to lower their coupon rates, can also plunge mortgage-issuing financial institutionsinto liquidity crisis in the event of a general deterioration of conditions, for example a surge in the delinquency rate.
(Impacts and implications)
Concerns about rising defaults are expected to drastically reduce new subprime lending in the US,* possibly
causing a slowdown in the housing market and dampening household consumption. Also, if institutional
investors respond to the subprime woes by demanding buyback of massive volumes of MBSs, this will mire
mortgage firms in liquidity crises, cutting their cash pipelines. This can have severe repercussions on the
financial market, and a wave of foreclosures aimed at recovering debts could hit the nation, causing social
unrest.
* The recent stiffening of mortgage lending rules by the USsupervisory authorities such as the FRB, and the decision todiscontinue subprime loan products by government-sponsoredlenders like Freddie Mac, are also factors that may contribute toshrinking of the US housing market.
However, the share of subprime mortgage lending in total
mortgage lending is still quite moderate at about 13%, and
the delinquency rate in the healthier prime sector remains at
the mid-2% level. Hence, most observers consider it
unlikely that the subprime mortgage crisis will have
negative repercussions across the entire home mortgage
market or on the US or global financial markets.
Lending to low-credit borrowers also appears to have accounted for a sizeable portion of housing finance loans
in Korea, where non-bank financial institutions are the primary issuers of such loans. However, the probability
of low-credit housing finance loans having destabilizing effects on the country’s overall financial system
appears rather small. The delinquency rate on housing finance loans underwritten by Korean banks was a mere
0.6% at the end of 2006, significantly lower than the 2.2% figure among large US banks. The average LTV
ratios of Korean banks and non-bank financial institutions stood at 50% and 55%, respectively, also at the end
of 2006, which was drastically lower than the 80% of US banks.* Finally, in Korea, unlike in the US with its
Sources: MBA (Mortgage Bankers Association)
US home mortgage delinquency rates
16
12
8
4
0
16
12
8
4
0
Total mortgages
Subprime mortgages
Prime mortgages
1999 2000 2001 2002 2003 2004 2005 2006
(%) (%)

- 44 -
Financial Stability Report April 2007
developed securitized mortgage market, most financial institutions use their own funds for making loans. This
delays the exposure to liquidity risks of Korean financial institutions, should financial and economic conditions
worsen, and reduces the chances of liquidity risks spreading to other financial institutions.
* According to the Federal Housing Finance Board and First American Loan Performance, 37% of all residential loansissued by US banks, as of the end of 2006, had LTV ratios of 90% or greater. Their research also found that thedelinquency rates of these high-LTV loans tend to spike quickly.
Nevertheless, should drastic changes occur in financial and economic conditions, for example plummeting
housing prices or spiraling market interest rates, it is undeniable that non-bank financial institutions, that are
more extensively engaged in low-credit residential mortgage lending than banks, will be at greater risk. Hence,
oversight of non-bank institutions needs to be stepped up so as to monitor their compliance with LTV and DTI-
related lending rules, their housing finance loan delinquency rates, their levels of loan loss reserves, etc., to
ensure their financial soundness.

2. Bond market
Treasury bond yields decline
In spite of the three upward adjustments of the call rate
target in 2006, yields on Treasury bonds (three-year
Treasury bonds here and hereafter) gradually declined
for most of the year, influenced by the increased
demand mainly from domestic branches of foreign
banks. With the improvement of economic indicators,
they shifted upward from October 2006, however,
before reverting to a downward trend again in February
2007 amid deepening concerns about economic
slowdown among bond market participants. Bond
market volatility (based on EWMA)2), while generally
declining, rose moderately in November as a result of
the temporary increase in bond yields.
While the net issuance of Treasury bonds will decrease
significantly in 2007, due among other things to the
reduced ceiling on Treasury bond issuance, the
predominance of demand in the market is expected to
continue, as demand from pension funds and domestic
branches of foreign banks will remain strong.
The spreads between long- and short-term interest rates
(the yield on Treasury bonds with three-year maturity -
- 45 -
Ⅲ. Stability of the financial market
2) The EWMA (exponentially weighted moving average) improves onthe simple mean of volatility by assigning greater weight to morerecent volatility in terms of volatility assumptions. More specifically,the weights decline exponentially as time recedes. Under this method,variation ( ) is set as . Present variance is fixedby yesterday’s variance and the new shock ( ) in today’s market.Here, the weighted value ( ) applied to yesterday’s variance is a kindof shock delay factor ranging from 0 to 1 (0.97 is generally used fordaily data). EWMA volatility is an annualized figure, converted fromthe standard deviation of daily data with this method.
<Table III- 1>
Net issuance of Treasury bonds
2006 60.7 24.4 36.3
2007 50.61) 27.92) 22.7Notes : 1) Annual ceiling on new issuance of bonds
2) Sum of redemption at maturity and ceiling on buybacks (KRW7 trillion)
Sources : The Bank of Korea, Ministry of Finance and Economy
(trillion won)
Issuance Redemption Net issuance
<Figure III-10>
Treasury bond yields and volatility1)
6
5
4
3
2
1
0
3.0
2.5
2.0
1.5
1.0
0.5
0.0
(annual %) (%, annualized rate)
2004.1 4 7 10 2005.1 4 7 10 2006.1 4 7 10 2007.1
Volatility of yields on 3-yearTreasury bonds (RHS)
Yields on 3-year Treasurybonds (LHS)
Note: 1) Volatility is calculated using the EWMA (exponentiallyweighted moving average) method.
Sources: The Bank of Korea, KOSCOM

the yield on 91-day CDs) have continually narrowed
since 2006, as higher call rate targets have sent short-
term market interest rates up. Short-term rates have
risen particularly sharply since November 2006, under
the influence of the stricter reserve requirements. In the
meantime, long-term rates have been on the opposite
course since February 2007, and the flattening of the
yield curve continues.
However, a faster-than-expected pace of economic
recovery could send long-term market interest rates
soaring, widening the spreads between long- and short-
term rates.
Corporate bond credit spreads widen moderately
Corporate bond credit spreads (the yield on corporate
bonds minus the yield on three-year Treasury bonds)
have been steadily narrowing since 2005, owing to the
decline in issuance. In November 2006, they hit their
lowest level since the full-fledged introduction of
mark-to-market valuation (in July 2000), at 19bp
(based on AA- corporate bonds).
Starting from December, however, a moderate
widening of credit spreads was observed under the
influence of downward credit rating adjustments for
some low-rated bonds and increased issuance of bank
bonds3). Credit spreads are seen as unlikely to widen
significantly in the foreseeable future, as corporate
sector credit risks remain generally low.
- 46 -
Financial Stability Report April 2007
3) The average monthly net issuance of bank bonds, which was 0.5billion won for the period September to October 2006, increased to 2.4trillion won over the November 2006 to March 2007
6
5
4
3
2
1
0
(%p) (%p)
2004.1 2005.1 2006.1 2007.1
Notes: 1) Average of mark-to-market base yields estimated by 3 bondappraisal companies
2) Average for the period October 20, 2000 to March 30, 2007Source: KOSCOM
Corporate bonds (3 years, BBB-) - Treasury bonds (3 years)
Long term average of corporate bonds (3 years, BBB-) - Treasury bond (3 years)2)
<Figure III-12>
Credit spreads on corporate bonds1)
<Figure III-11>
Long-and short-term lnterest rate spreads1)
2.5
2.0
1.5
1.0
0.5
0.0
-0.5
-1.0
2.5
2.0
1.5
1.0
0.5
0.0
-0.5
-1.0
(%p) (%p)
2005.1 4 7 10 2006.1 4 7 10 2007.1
Note: 1) The dotted line indicates the long-term (January 1999through March 2007) average of yields on 3-year Treasurybonds minus overnight call rates.
Sources: The Bank of Korea, KOSCOM
Treasury bonds (3years)-MonetaryStabilization bonds (364days)Treasury bonds (3years)- Call (overnight)Treasury bonds (3years)-CD (91days)
6
5
4
3
2
1
0
Corporate bonds (3 years, BBB-) -Corporate bonds (3 years, AA-)
Corporate bonds (3 years, AA-)- Treasury bonds (3 years)

Mediocre performance of the corporate bond
market
In contrast to the case with Treasury bonds and
financial bonds (including Monetary Stabilization
Bonds), both corporate bond issuance and trading have
continued to decline.
While the share of Treasury bonds in overall bond
issuance has remained steadily in the 15% range since
2004, trading activity in government debt instruments
remains vigorous and their share in overall bond
market trading volume spiked to the level of 60% in
2006.
Issuance of financial bonds has also been increasing
steadily, to account for 66% of all new bond issues and
38% of overall trading volume in 2006.
In comparison, issuance of corporate bonds has been
on a consistently downward trend ever since 2002, and
accounted for a mere 4.9% of overall bond issuance in
2006 with a share in trading volume in the 2% range.
The liquidity and depth of the corporate bond market
therefore remain poor.
The prolonged mediocre corporate bond market
activity can act as an impediment to balanced growth
of the overall bond market, and hinder its function as
the capital market for corporate borrowers. Since
2006, a great number of small and medium-sized
companies have been raising funds through borrowing
from financial institutions. This could increase
corporate sector vulnerability to any unexpected
external shocks that shrink the lending market.
- 47 -
Ⅲ. Stability of the financial market
Treasury bonds Financial bondsCorporate bonds Other bonds
<Figure III-13>
Issuance and secondary trading by bond type
100
80
60
40
20
0
100
80
60
40
20
0
<Primary market> <Secondary market>
00 02 04 06
Sources: The Korea Securities Depository, KOSCOM
00 02 04 06
(%)(%)

3. Stock market
Stock prices on the rise
Stock prices have shown an upward trend overall,
although the stock market experienced large-scale
corrections from May to June of 2006 and in February
2007.
The KOSPI, the Korean composite stock index, fell
steeply to a yearly record-low of 1,203.9 in around
mid-May 2006, in the course of portfolio rebalancing
due to fears of additional US policy rate hikes and
deepening uncertainties about the world economy.
However, it has shifted to a rising movement since
June 2006, in line with the exuberance of stock markets
in major countries. The KOSPI showed a drop again in
early 2007, influenced by stock market corrections in
China and the US. However, it has reverted to an
upward movement since March.
The VIX (Volatility Index)4), which measures the
degree of risk aversion among stock investors, has
fallen, after surging sharply at the end of February
2007. At the same time, stock trading volumes have
steadily increased. The HHR (Hui Heubel Ratio)5), an
indicator of stock market liquidity as well as the
volatility of stock prices, has also declined since March
of this year, indicating that the stock market has
become more resilient.
- 48 -
Financial Stability Report April 2007
4) The VIX for the KOSPI was calculated by borrowing the VIXcalculation method used in the Chicago Mercantile Exchange. A highVIX implies a heightening degree of risk aversion in stock investment.
5) HHR={(highest price - lowest price) / lowest price} / (trading value) /(total market capitalization)
<Figure III-14>
Stock prices and volatility1)
1600
1200
800
400
0
90
75
60
45
30
15
0
(index, million shares) (%, annualized rate)
2004.1 7 2005.1 7 2006.1 7 2007.1
KOSPI (LHS)
Daily trading volume (LHS)
Note: 1) Volatility calculated by the EWMA (exponentiallyweighted moving average) method
Sources: The Bank of Korea, Korea Exchange
KOSPI volatility (RHS)
<Figure III-15>
VIX1)
30
26
22
18
14
10
30
26
22
18
14
102006.1 4 7 10 2007.1
Note: 1) Stock price volatility index for underlying assets of KOSPI200Sources: The Bank of Korea, Korea Exchange

Stock prices climbed at a slower pace in Korea than in
other countries during 2006. The KOSPI rose only
4.0% for the year, due to a decline in business sector
profits and a considerable net outflow of foreigners’
stock investment funds. This was drastically lower than
the average rate of increase of 22.0% among four other
major Asian economies - Japan, Hong Kong,
Singapore and Taiwan - and was in sharp contrast to
2005, when the KOSPI soared 54.0% to substantially
exceed the 16.3% average rate of increase for these
four other countries. In 2007, meanwhile, the KOSPI
has risen at a rate similar to the four-country average.
In the meantime, the net value of stock supply from
businesses6) has declined continuously, owing to
reduced corporate financing through initial public
offerings and rights offerings, coupled with an increase
in treasury stock purchases intended to support stock
prices and defend management rights. While total
financing through initial public offerings and rights
offerings (stock market basis) amounted to 3.5 trillion
won in 2006, a 50.6% increase from the previous year
(2.3 trillion won), net purchases of treasury stocks
jumped to 5.5 trillion won, up 177.4% from 2005 (2.0
trillion won).
Share of foreign-owned stocks shrinks
After shifting to net sales of 3.0 trillion won (stock
market basis) in 2005, foreign investors recorded more
than three times that amount in net sales at 10.8 trillion
won in 2006. While they have reversed to a moderate
net buying trend in 2007, the ratio of foreign-owned
stocks to total market capitalization in Korea has fallen
- 49 -
Ⅲ. Stability of the financial market
6) Net value of stock supply = initial public offerings and rights offerings- net purchases of treasury stocks
<Figure III-16>
HHR1) of stock market
6
5
4
3
2
1
0
6
5
4
3
2
1
02004.1 7 2005.1 7 2006.1 7 2007.1
Note: 1) Based on the KOSPI, 10-day moving average of daily HHRsSources: The Bank of Korea, Korea Exchange
Average since 2000
<Figure III-17>
Rates of stock price increase in major Asian countries
60
50
40
30
20
10
0
60
50
40
30
20
10
0
(%) (%)
Sources: Korea Exchange, Bloomberg
<Figure III-18>
Stock market financing and net stock supply1)
10
8
6
4
2
0
(%)
2002 2003 2004 2005 2006
Note: 1) Net stock supply ratio = [(IPOs and paid-in capital increases -net treasury stock purchases) / annual average marketcapitalization (based on stock market)] × 100
Sources: Financial Supervisory Service, Korea Exchange
Stock market (LHS)KOSDAQ market (LHS) Net ratio of stock supply to the stock market (RHS)
(trillion won)
2003 2004 2005 2006
KoreaJapanSingapore
Hong KongTaiwan
5
4
3
2
1
0
-1
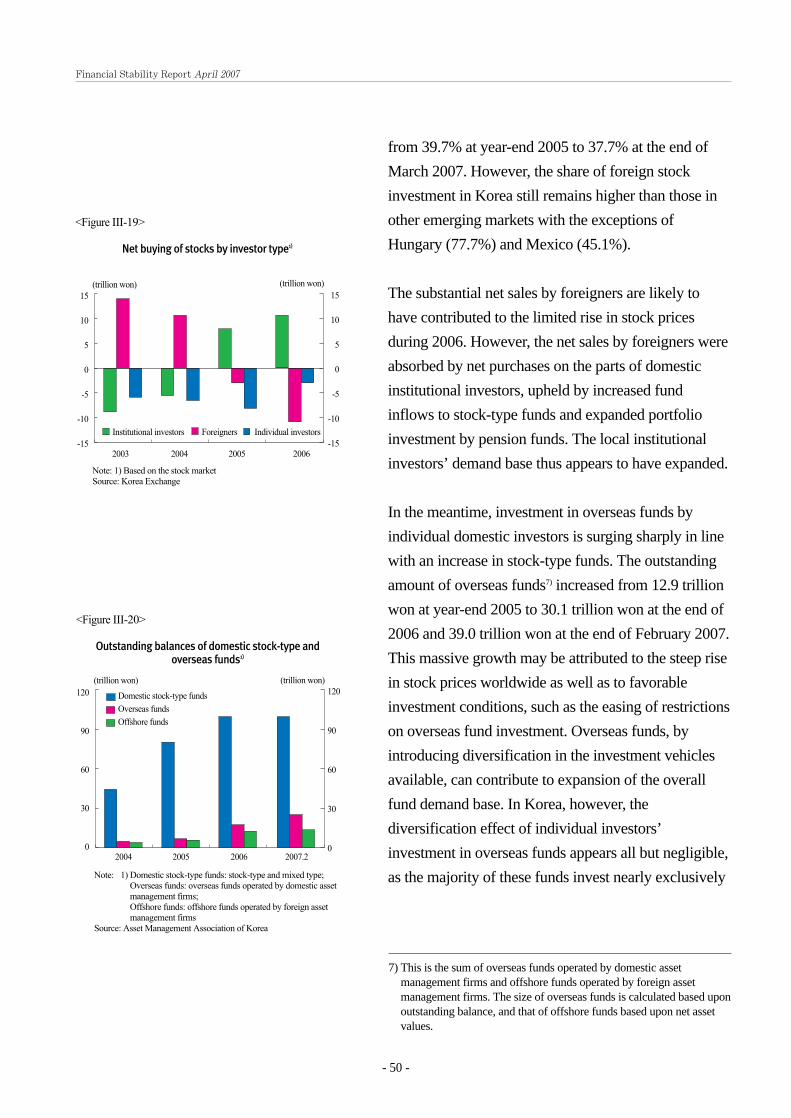
- 50 -
Financial Stability Report April 2007
from 39.7% at year-end 2005 to 37.7% at the end of
March 2007. However, the share of foreign stock
investment in Korea still remains higher than those in
other emerging markets with the exceptions of
Hungary (77.7%) and Mexico (45.1%).
The substantial net sales by foreigners are likely to
have contributed to the limited rise in stock prices
during 2006. However, the net sales by foreigners were
absorbed by net purchases on the parts of domestic
institutional investors, upheld by increased fund
inflows to stock-type funds and expanded portfolio
investment by pension funds. The local institutional
investors’ demand base thus appears to have expanded.
In the meantime, investment in overseas funds by
individual domestic investors is surging sharply in line
with an increase in stock-type funds. The outstanding
amount of overseas funds7) increased from 12.9 trillion
won at year-end 2005 to 30.1 trillion won at the end of
2006 and 39.0 trillion won at the end of February 2007.
This massive growth may be attributed to the steep rise
in stock prices worldwide as well as to favorable
investment conditions, such as the easing of restrictions
on overseas fund investment. Overseas funds, by
introducing diversification in the investment vehicles
available, can contribute to expansion of the overall
fund demand base. In Korea, however, the
diversification effect of individual investors’
investment in overseas funds appears all but negligible,
as the majority of these funds invest nearly exclusively
7) This is the sum of overseas funds operated by domestic assetmanagement firms and offshore funds operated by foreign assetmanagement firms. The size of overseas funds is calculated based uponoutstanding balance, and that of offshore funds based upon net assetvalues.
(trillion won) (trillion won)
<Figure III-19>
Net buying of stocks by investor type1)
15
10
5
0
-5
-10
-15
15
10
5
0
-5
-10
-152003 2004 2005 2006
Note: 1) Based on the stock marketSource: Korea Exchange
Institutional investors Foreigners Individual investors
(trillion won) (trillion won)
<Figure III-20>
Outstanding balances of domestic stock-type and overseas funds1)
120
90
60
30
0
120
90
60
30
02004 2005 2006 2007.2
Note: 1) Domestic stock-type funds: stock-type and mixed type;Overseas funds: overseas funds operated by domestic assetmanagement firms; Offshore funds: offshore funds operated by foreign assetmanagement firms
Source: Asset Management Association of Korea
Domestic stock-type fundsOverseas fundsOffshore funds

- 51 -
Ⅲ. Stability of the financial market
in emerging market countries8) like China, India or
Vietnam. Meanwhile, an explosive growth of
investment in overseas funds can also reduce the
inflow of funds into domestic stock-type funds.
8) As of the end of 2006, emerging market countries were the destinationsfor 70% of all overseas fund investment.

- 52 -
Financial Stability Report April 2007
4. Foreign exchange market
Short-term foreign borrowings increase
considerably
While the preponderance of supply over demand
resulting from current-account transactions has slowed
down with the narrowing of the goods account surplus,
capital inflows arising from financial transactions, such
as banks’ short-term borrowings, have increased
considerably.
The current account surplus narrowed to US $ 6.09
billion in 2006 from US $ 14.98 billion the previous
year, due to a decline in the trade surplus and an
expanded service account deficit reflecting increased
travel expenditures. In the capital account, the other
investment account9) surplus surged to US $ 47.68
billion, from US $ 6.81 billion in 2005, owing mainly
to short-term foreign borrowings by deposit money
banks. In contrast, the direct investment and portfolio
investment accounts both shifted from surplus in 2005
to deficit, owing to a net outflow of funds caused by
residents’ investment overseas and foreigners’
withdrawals of stock investment funds.
The dramatic expansion of short-term foreign debt can
be attributed to banks’ increased borrowings for
positional adjustment following large-scale exporters’
sales of forward contracts10), and for funding sources in
response to growing demand for foreign currency
9) This includes foreign trade credits, loans (borrowings), and cash & duefrom banks (deposits).
10) In 2006, domestic businesses’ net selling of forward exchangecontracts totaled $ 49.3 billion, a 68.8% increase compared to 2005(29.2 billion).
<Figure III-21>
Balance of payments
120
90
60
30
0
-30
-60
-90
120
90
60
30
0
-30
-60
-90
(100 million dollars) (100 million dollars)
2004.1 7 2005.1 7 2006.1 7 2007.1
Source : The Bank of Korea
Capital account Current account Direct investment + Portfolio investmentOther investment
<Figure III-22>
Short-and long-term foreign currency debt
1,600
1,200
800
400
60
50
40
30
(100 million dollars) (%)
Long-term foreign currency debt (LHS)Short-term foreign currency debt (LHS)Weight of short-term debt (RHS)
Source: The Bank of Korea
2002 2003 2004 2005 2006

- 53 -
Ⅲ. Stability of the financial market
loans11), in the midst of one-sided expectations of local
currency appreciation on the part of market
participants. Consequently, the share of short-term debt
in total external debt climbed to 43.1% as of the end of
2006, from 35.1% at the end of 2005.
Despite the sharp increase in short-term external debt,
the Korean economy’s external debt structure does not
appear to be a serious concern, given the soundness of
overseas borrowing conditions and external payment
capacity. Premiums on Foreign Exchange Stabilization
Fund Bonds have declined since the second half of
2006 and those on foreign-currency borrowings have
remained at low levels. In addition, the ratios to foreign
exchange reserves of short-term external debt and of
floating external debt12) at year-end 2006 were 47.6%
and 58.2%, respectively, meaning maintenance of
liquidity indices within the stable levels13)
recommended by the IMF. However, when external
conditions deteriorate with a change in economic
environment, a surge in short-term foreign debt can
lead to lowering of external credibility and emergence
of negative effects such as increased liquidity risk and
expanded foreign exchange volatility.
Examining the maturity gap between foreign currency-
denominated assets and liabilities of domestic banks,
the maturity gap ratios14) for maturities of not more than
one year showed asset surpluses and those for
11) The balance of foreign currency loans made by domestic banksincreased from 41.1 trillion won at the end of 2005 to 55.8 trillionwon at the end of 2006.
12) Short-term debt + long-term debt with maturities of one year andbelow
13) Less than 60 percent and less than 100 percent, respectively, areconsidered stable.
14) [(Foreign currency assets - foreign currency liabilities)/Foreigncurrency assets] ×100
<Figure III-23>
Interest rate spreads on foreign exchange stabilization fund bonds and EMBI+
100
80
60
40
700
500
300
100
(bp) (bp)
Foreign exchange stabilizationfund bonds (year 2013) (LHS)
EMBI+ (for all emerging markets) (RHS)
Sources: JP Morgan, Bloomberg
2004.1 7 2005.1 7 2006.1 7 2007.1
<Table III- 2>
Interest rate spreads on short-term borrowings by domestic banks1)
2004.12 2005.12 2006.6 9 12 2007.1 3
16 9 7 5 7 5 5
Note : 1) Spread on Libor; period-average basisSource: The Bank of Korea
(bp)
<Figure III-24>
Maturity gaps between foreign currency-denominated assets and liabilities of domestic banks1)
30
20
10
0
-10
-20
-30
-40
30
20
10
0
-10
-20
-30
-40
(%) (%)
2002.6 12 2003.6 12 2004.6 12 2005.6 12 2006.6 12
Note : 1) Banking accounts of domestic banksSource: Banks' call reports
less than 3 months3 months ~ 1yearmore than 1year
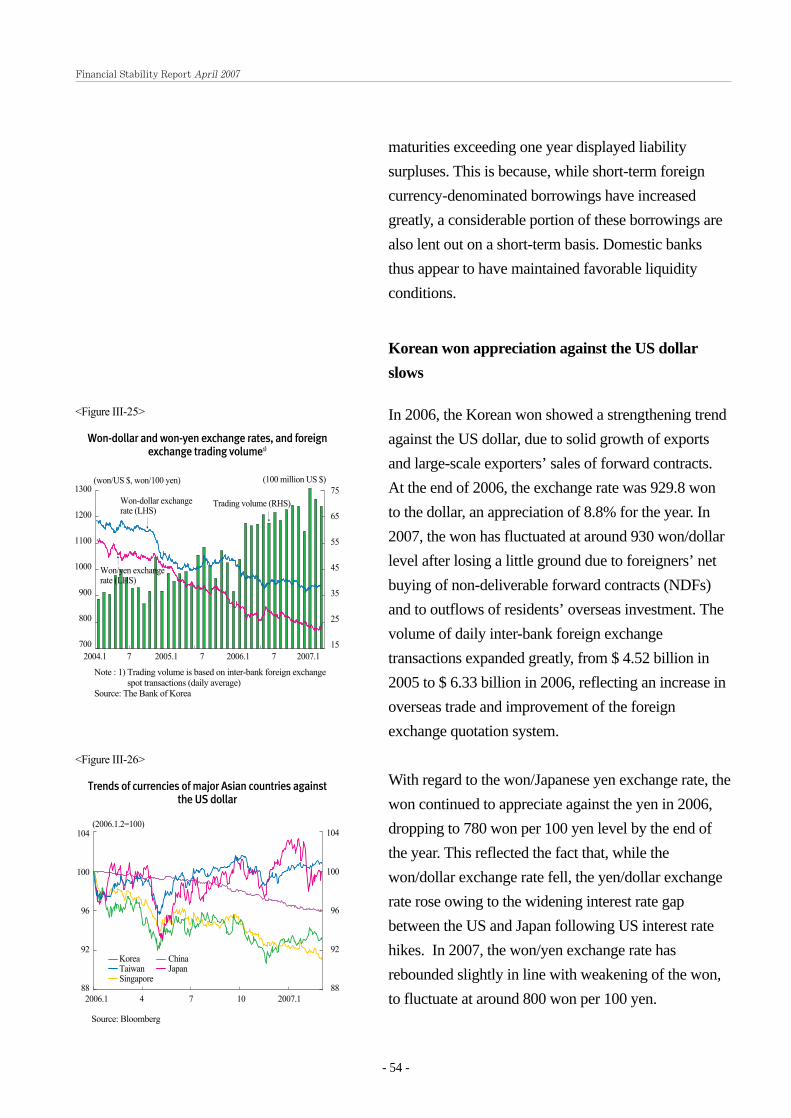
- 54 -
Financial Stability Report April 2007
maturities exceeding one year displayed liability
surpluses. This is because, while short-term foreign
currency-denominated borrowings have increased
greatly, a considerable portion of these borrowings are
also lent out on a short-term basis. Domestic banks
thus appear to have maintained favorable liquidity
conditions.
Korean won appreciation against the US dollar
slows
In 2006, the Korean won showed a strengthening trend
against the US dollar, due to solid growth of exports
and large-scale exporters’ sales of forward contracts.
At the end of 2006, the exchange rate was 929.8 won
to the dollar, an appreciation of 8.8% for the year. In
2007, the won has fluctuated at around 930 won/dollar
level after losing a little ground due to foreigners’ net
buying of non-deliverable forward contracts (NDFs)
and to outflows of residents’ overseas investment. The
volume of daily inter-bank foreign exchange
transactions expanded greatly, from $ 4.52 billion in
2005 to $ 6.33 billion in 2006, reflecting an increase in
overseas trade and improvement of the foreign
exchange quotation system.
With regard to the won/Japanese yen exchange rate, the
won continued to appreciate against the yen in 2006,
dropping to 780 won per 100 yen level by the end of
the year. This reflected the fact that, while the
won/dollar exchange rate fell, the yen/dollar exchange
rate rose owing to the widening interest rate gap
between the US and Japan following US interest rate
hikes. In 2007, the won/yen exchange rate has
rebounded slightly in line with weakening of the won,
to fluctuate at around 800 won per 100 yen.
<Figure III-25>
Won-dollar and won-yen exchange rates, and foreign exchange trading volume1)
1300
1200
1100
1000
900
800
700
75
65
55
45
35
25
15
(100 million US $)
2004.1 7 2005.1 7 2006.1 7 2007.1
Note : 1) Trading volume is based on inter-bank foreign exchangespot transactions (daily average)
Source: The Bank of Korea
Won-dollar exchange rate (LHS)
Won/yen exchange rate (LHS)
Trading volume (RHS)
(won/US $, won/100 yen)
<Figure III-26>
Trends of currencies of major Asian countries againstthe US dollar
104
100
96
92
88
104
100
96
92
88
(2006.1.2=100)
2006.1 4 7 10 2007.1
Source: Bloomberg
Korea ChinaTaiwan JapanSingapore

- 55 -
Ⅲ. Stability of the financial market
After expanding temporarily in May 2006, due to sharp
exchange rate fluctuations reflecting large-scale foreign
investment fund flows, the volatility of the won/dollar
exchange rate then declined as the rate itself fell slowly
from June 2006. In early 2007, however, the Japanese
yen showed increased volatility, owing to worries
about unwinding of the yen-carry trade. The volatility
of the won-dollar exchange rate is thus likely to be
influenced by future movements of the yen-dollar rate.
<Figure III-27>
Volatilities of the won-dollar, yen-dollar, and dollar-euro exchange rates1)
16
14
12
10
8
6
4
2
16
14
12
10
8
6
4
22004.1 2005.1 2006.1 2007.1
Note: 1) Volatility is calculated by the EWMA (exponentially weighted moving average) method
Source: The Bank of Korea
Yen-dollar exchange rateDollar-euro exchange rate
Won-dollar exchange rate
(%, annualized rate) (%, annualized rate)

- 56 -
Financial Stability Report April 2007
<Box III- 3>
Interest rate arbitrage exploiting gaps between the swap rate and the interest ratedifferential, and its effects on the financial market
When cross-border movements of capital are free and there are no associated transaction costs, the interest rate
differential between two currencies generally coincides with the swap rate - which is the difference between
the forward and spot exchange rates for the same pair of currencies, divided by the spot rate. However, in
situations such as a state of imbalance between supply and demand in the foreign exchange market or when
there is a deterioration in foreign currency conditions, a significant gap may occur between the swap rate for a
currency pair and their interest rate differential, and this provides opportunities for interest rate arbitrage.*
For example, when the swap rate falls below the interest rate differential, an investor can profit by borrowing
money in the foreign currency and investing it in assets denominated in the local currency. Conversely, when
the swap rate surges above the interest rate differential, profits can be realized by borrowing money in the local
currency and investing it in assets denominated in the foreign currency.
* This relationship, in interest rate parity theory, expresses itself as follows: domestic interest rate (i) = foreign interest rate(i*) + swap rate ((forward exchange rate - spot rate)/spot rate). Accordingly, an investor can realize a risk-free profit bycomparing the return on domestic asset investment (i) with that on foreign asset investment (i* + swap rate), andborrowing money in the lower-return currency to invest it in assets denominated in the higher-return one.
Since 2006, there have been multiple factors encouraging interest rate arbitrage in the Korean foreign exchange
market. Amid predominantly bullish sentiment about the won, exporters including shipbuilders and heavy-
industrial firms have sold massive quantities of forward exchange contracts to banks in attempts to hedge their
foreign exchange risk,* which has caused forward exchange rates to tumble. Banks have then sold spots to
adjust their foreign exchange positions, increasing the downward pressure on spot rates. Importers, meanwhile,
have held off buying forwards. This situation creates an imbalance between supply and demand in the forward
2005.1 7 2006.1 7 2007.1
(%) (%)0.9
0.4
-0.1
-0.6
-1.1
-1.6
0.9
0.4
-0.1
-0.6
-1.1
-1.6
Note: 1) The annualized rate of difference between the NDF rate (3-month) and the spot rate, divided by the spot rate2) Domestic interest rate: CDs (91-day); foreign interest rate: Libor (3-month)
Swap rate1) and interest rate differential2)
Interest rate differential
Swap rate

- 57 -
Ⅲ. Stability of the financial market
market, also causing forward rates to drop more drastically than spot rates. As a result, swap rates have dipped
to levels far below the corresponding interest rate differentials, and maintained their levels until recently.
* While export orders received by Korean shipbuilders totaled US $ 22.1 billion in 2006, up 24.9% over 2005 (US $ 17.7billion), domestic businesses’ net selling of forwards amounted to US $ 49.3 billion, a 68.8% increase over 2005 (US $29.2 billion).
As swap rate remains persistently below interest rate differential, this situation has encouraged banks to
actively engage in arbitrage. Domestic banks and local branches of foreign banks are borrowing short-term
funds in the international financial markets and converting them into won through currency swaps, consisting
in selling of spots and buying of forwards to invest in domestic bonds or other domestic assets. Interest rate
arbitrage, although it provides financial institutions with means of improving their profitability, has negative
effects on the domestic financial market.
First of all, the continuously high volume of arbitrage has resulted in a massive increase of short-term
borrowings in foreign currency, sending foreign debt to record
levels and causing a deterioration of foreign debt-related
financial soundness indicators. At the end of 2006, short-term
foreign debt stood at US $ 113.6 billion, almost twice its
amount at the end of 2005 (US $ 65.9 billion). The share of
short-term debt jumped as well, from 35.1% at the end of 2005
to 43.1% at the end of 2006.
A second negative impact of interest rate arbitrage has been the
decline in long-term interest rates to record abnormal lows.
Arbitrage trades by local branches of foreign banks have
increased the demand for domestic bonds, putting downward
pressure on long-term interest rates. Net buying of Treasury
Bonds and Monetary Stabilization Bonds by local branches of
foreign banks amounted to 16 trillion won in 2006, over five
times their amount in 2005 (2.9 trillion won). For January
through February 2007, the figure stood at 8.6 trillion won. The
three successive policy rate increases effected during 2006,
while helping to keep short-term interest rates on an upward
course, failed to boost long-term rates and brought them down
instead. As a result, the spreads between long- and short-term
interest rates are gradually narrowing. The effects of interest rate
arbitrage, therefore, appear restrictive to monetary policy
effectiveness.
6
5
4
3
2
6
5
4
3
2
Long-and short-term interest rates
CDs (91-day)Monetary Stabilization Bonds (1-year)Treasury Bonds (3-year)Call rate target
2005.1 2006.1 2007.1
Interest rate arbitrage transaction structure
Intermationalfinancial market
Bank Swap market
Domestic bondmarket
Receive swap rate
(A) Borrowmoney inforeigncurrency
(C) Investin domesticbonds
Pay interest
Receive interest
(B) Spot sale/forward purchase

Financial Stability Report April 2007

- 59 -
Ⅳ. Soundness of financial institutions
1. Soundness of banks
Credit risk
Corporate exposure increases considerably
In 2006, banks’ exposure1) to the corporate sector, and
to SMEs in particular, increased 23.6% from the end of
the year before. While banks’ fund operations in the
household sector were restricted owing to tightened
regulations on housing finance loans, given the low
delinquency rate in the corporate sector banks
continued easing their SME lending policies.2)
By sector, loans to construction and real estate
businesses increased sharply, led mainly by project
financing for construction companies. The share of
construction and real estate companies in banks’ total
corporate sector exposure jumped by 3.1 percentage
points, from 18.0% at the end of 2005 to 21.1% at
year-end 2006. If housing finance loans are included,
Ⅳ. Soundness of financial institutions
1) The concept of “exposure” includes loans (won or foreign currencyloans, advances for payment on loss compensation related to paymentguarantees, foreign bills bought, credit card receivables, and privateplacement bonds), CP (including guaranteed notes), acceptances andguarantees outstanding, trust account loans, and merchant bank accountloans.
2) Trend of corporate DI1) for banks’ credit standards
Note:1) Diffusion index (DI) = {(percentage of respondents indicating a ‘substantialrelaxation’ of credit standards×1.0) + (percentage of respondents indicating a‘modest relaxation’×0.5)} - {(percentage of respondents indicating a ‘substantialstrengthening’×1.0) + (percentage of respondents indicating a ‘modeststrengthening’×0.5)}. DI is measured on a scale with a minimum of -100 and amaximum of 100.
Source: Bank of Korea
2005.Ⅳ 2006.Ⅰ 2006.Ⅱ 2006.Ⅲ 2006.Ⅳ 2007.Ⅰ
Large companies 9 12 19 3 6 0
SMEs 21 32 31 16 22 25
<Figure IV- 2>
Changes in banks' exposure to industrial sectors1)
60
50
40
30
20
10
0
60
50
40
30
20
10
0
(%) (%)
2003 2004 2005 2006
Note: 1) End of period basisSource: Banks ' call reports
ManufacturingConstruction & real estateServices
40.4 41.0 41.0 40.1 40.6 40.0 38.0 39.4
21.118.017.517.4
<Figure IV- 1>
Banks' exposure to the corporate sector1)
400
350
300
250
200
150
100
50
0
40
35
30
25
20
15
10
5
0
(trillion won)
Exposure to the corporate sector (LHS)Weight of exposure to large corporations (RHS)
(%)
2002.Ⅰ Ⅲ 03.Ⅰ Ⅲ 04.Ⅰ Ⅲ 05.Ⅰ Ⅲ 06.Ⅰ Ⅲ
Note : 1) End of period basisSource : Banks' call reports

exposure to the real estate sector grew sharply
compared to the past. However, the ratio of
substandard and below loans extended to construction
and real estate businesses remained at 1.1%, similar to
that to the corporate sector overall (1.0%).
Although loans to SMEs showed a high rate of increase
from the beginning of 2006, they remained at a low
level compared to the years 2002~2003, right after the
period of rapid expansion of household sector credit
(2001~2002). The ratio of substandard and below loans
to the corporate sector remained at around the 1% level
in 2006, and the dishonored bill ratio also stayed at a
low level, amid a downward trend in the SME
delinquency rate during the year. Considering these
points, the credit risk of the corporate sector does not
appear to be at a high level.
In the future, it is anticipated that banks will be willing
to maintain their strategies of expanding their SME
loans, as an alternative means of fund operation owing
to the regulations on household sector lending.
However, given the tendency of the corporate
delinquency rate to follow the corporate lending
increase rate,3) there is a possibility that the delinquency
rate will increase in case of an economic slowdown.
Moreover, as SMEs’ profitability declines, there is also
a possibility of their weakness in debt servicing
- 60 -
Financial Stability Report April 2007
3) Analysis of the coefficient of correlation between corporate lendingincrease and delinquency rates reveals a reliable level of positivecorrelation, having a time lag of approximately one year.
Coefficient of correlation between the corporate lendingincrease and delinquency rates1)
(1999.Q1~2006.Q4)
Note: 1) Coefficient of correlation between the corporate lending increase rate for quarter kand the delinquency rate for quarter k ± i
Lags -2Q -1Q 0 +1Q +2Q +3Q +4Q +5Q
Coefficient of 0.06 0.02 -0.03 0.14 0.24 0.31 0.42 0.37correlation
<Table IV- 1>
Ratio of substandard and below loans by industry
(%)
Notes: 1) End of year basis2) Excluding real estate
Source: Banks' call reports
2003 2004 2005 2006
2.7 1.7 1.1 1.1
2.6 2.4 1.8 1.1
3.1 2.2 1.7 0.9
4.6 1.9 1.3 0.7
2.8 3.7 4.1 2.8
2.9 4.3 4.4 3.1
2.9 2.0 1.5 1.0
ManufacturingConstruction& real estate Services1)
(Wholesale & retail trade)(Lodging & restaurants)(Other personal services)
All industries
<Figure IV- 3>
Rates of increase/decrease1) in loansto households and SMEs
70
60
50
40
30
20
10
0
-10
(%) (%)
2000.1 01.1 02.1 03.1 04.1 05.1 06.1
Note: 1) Year-on-year basisSource: Banks' call reports
Changes in SME lending
Changes in household lending
70
60
50
40
30
20
10
0
-10
<Figure IV- 4>
Dishonored bill ratio1) and corporate delinquency rates2)
0.20
0.15
0.10
0.05
0
(%) (%)
2002.1 03.1 04.1 05.1 06.1 07.1
Notes: 1) Amount basis, including electronic-based payments2) Three-month moving average
Sources: The Bank of Korea, banks' call reports
Dishonored bill ratio (LHS)
SME delinquency rate (RHS)
Corporate delinquencyrate (RHS)
4.0
3.0
2.0
1.0
0

- 61 -
Ⅳ. Soundness of financial institutions
capacity causing burdens to banks’ credit risk
management.
Possibility of household sector credit risk increases
Although banks’ exposure to the household sector rose
by a relatively high rate of 11.9% compared to the end
of 2005, led mainly by housing finance loans, indices
related to household sector credit risk maintained stable
movements in 2006.
The delinquency rate of the household sector fell below
1% and the LTV ratio of housing finance loans4), which
make up more than 60% of all household loans, has
been on a continuous decline. The share of loans to
households with good credit ratings has also increased.5)
What is more, the share of credit card receivables in
total household exposure dropped to 5.1% at the end of
2006, from 6.0% at year-end 2005, and the delinquency
rates on them also fell to the 2% level.
However, as household sector financial debt increased
faster than incomes or financial assets, households’
debt servicing capacities seem to have declined. If real
estate prices were to drop sharply and interest rates to
keep on rising in the future, household sector
vulnerability could materialize owing to the rise in
households’ principal and interest repayment burdens.
4) The average LTV ratio for banks’ housing finance loans decreased to49.3%, 2.5 percentage points lower than at the end of 2005.
LTV ratios of banks’ housing finance loans1)
(%)
Note: 1) Including 6 banks (KB, Woori, SC First, Shinhan, Hana, NACF)2) End of period basis
5) The share of loans to households with good credit ratings(ranking 1~3)was 51.9%, a 1.3 percentage point rise from the end of 2005.
2005.12 2006.3 6 9 11 12
51.8 51.9 51.0 50.6 49.7 49.3
<Figure IV- 5>
Banks' exposure to the household sector
100
80
60
40
20
0
(trillion won) (%)
2002.Ⅰ Ⅲ 2003.Ⅰ Ⅲ 2004.Ⅰ Ⅲ 2005.Ⅰ Ⅲ 2006.Ⅰ Ⅲ
Source: Banks' call reports
Exposure to household sector (LHS)Weight of credit cards (RHS)Weight of housing finance loans (RHS)
350
300
250
200
150
100
50
0
<Figure IV- 6>
Household sector delinquency rates1)
18
16
14
12
10
8
6
4
2
0
18
16
14
12
10
8
6
4
2
0
(%) (%)
2002.1 03.1 04.1 05.1 06.1 07.1
Credit card delinquency rate
Household loan delinquency rate
Note: 1) Three-month moving averagesSource: Banks' call reports

- 62 -
Financial Stability Report April 2007
Banks’ asset quality improves steadily
The scale of commercial banks’ substandard and below
loans has continued to shrink, registering 5.8 trillion
won at the end of 2006, a 1.2 trillion won drop from
the end of 2005. The amount of new bad debts declined
to 9 trillion won during the year, from 11.3 trillion won
in 2005. The volume of bad debts disposed of through
write-off or redemption reached 10.2 trillion won, an
amount greater than that of new bad loans.
Consequently, the ratio of substandard and below loans
stood at 0.90% as of the end of 2006, down 0.38 of a
percentage point from the end of the previous year. By
sector, the ratios of loans classified as substandard and
below in the corporate and household sectors fell 0.45
and 0.34 of a percentage point, respectively. In
particular, the ratio of substandard and below loans in
the credit card sector continued to decline, dropping
0.95 of a percentage point.
Korean commercial banks’ proportion of bad
loans(based on non-performing loans) fell to 0.76% at
the end of 2006, similar to the average NPL ratio of US
commercial banks.6)
In spite of the decrease in new NPLs, banks’ loan loss
provisions rose sharply at the end of 2006, affected by
6) The average NPL ratio of US commercial banks was 0.79% at the endof 2006.
NPL ratio of US commercial banks1)2)
(End of 2006)
(%)
Note : 1) Based on banks insured with the FDIC (Federal Deposit InsuranceCorporation)
2) End of 2006 basisSource : FDIC
By asset volumeTotal Less than 0.1 0.1~1 billion More than 1
billion dollars dollars billion dollars0.79 0.94 0.71 0.79
<Table IV- 2>
Increase/decrease in banks' substandard and below loans
(trillion won)
Source : Banks' call reports
2004 2005 2006
20.2 11.3 9.0
24.2 14.3 10.2(6.2) (5.5) (4.1)(12.0) (4.6) (2.9)(3.5) (3.3) (1.3)
-4.0 -3.1 -1.2
10.0 7.0 5.8
New loans
Disposed(Redeemed)(Write-offs)(Sold)
Net increase
Term-end balance
<Figure IV- 7>
Substandard and below loan ratios
20
16
12
8
4
0
15
12
9
6
3
0
(trillion won) (%)
2003.Ⅰ Ⅲ 2004.Ⅰ Ⅲ 2005.Ⅰ Ⅲ 2006.Ⅰ Ⅲ
Source: Banks' call reports
Substandard and below loans (LHS)Corporate sector (RHS)Household sector (RHS)Total loans (RHS)Credit cards (RHS)

- 63 -
Ⅳ. Soundness of financial institutions
the Financial Supervisory Service’s measures to raise
the loan loss provision ratios7). The ratio of loan loss
provisions to NPLs(the coverage ratio) stood at 188.7%
at the end of 2006, up 44.8 percentage points from a
year earlier. Consequently, the ratio of loan loss
provisions of domestic banks exceeded that of US
commercial banks for the first time. This indicates that
Korean banks have become stronger in their abilities to
absorb external shocks.
7) At the end of 2006, the Financial Supervisory Service strengthened theloan loss provision standards by raising the loan loss reserverequirements for normal loans(0.5~1.0%→0.7~1.5%) and forprecautionary loans (2.0~12.0%→7.0~15.0%), and makingprecautionary and below contracted loans which are unused alsosubject to loan loss provision requirements. Banks’ loan loss provisionsregistered 2.9 trillion won during 2006, 200 billion won more than in2005.
<Figure IV- 9>
Comparison of coverage ratios1) in Korea and the US
200
180
160
140
120
100
80
60
40
200
180
160
140
120
100
80
60
40
(%) (%)
2002.Ⅰ Ⅲ 2003.Ⅰ Ⅲ 2004.Ⅰ Ⅲ 2005.Ⅰ Ⅲ 2006.Ⅰ Ⅲ
US
Korea
Note: 1) Coverage ratio = (loan loss provisions/amount of NPLs) X 100Source: Banks' call reports
<Figure IV- 8>
NPL ratios of Korean and world's 30 largest banks1)
7
6
5
4
3
2
1
0
7
6
5
4
3
2
1
0
(%) (%)
2002 2003 2004 2005 2006
(19) (19) (20) (19)
Note: 1) In terms of core capital2) ▲ : Average of Korean banks3) Excluding Chinese and Japanese banks that have high NPL
ratios4) Figures in parentheses represent the numbers of banks with
data available during the relevant years.Sources: Banks' call reports, The Banker

Interest rate risk and market risk
Interest rate risk increases
At the end of 2006, the difference between commercial
banks’interest rate sensitive assets and liabilities (their
repricing gap8)) had expanded, so that compared to
year-end 2005, there was a higher positive (asset
sensitive) gap in short-term assets and a higher
negative (liability sensitive) gap in long-term liabilities.
The positive gap stood at 131.2 trillion won for the up
to 3-month repricing cycles, an increase of 23.3 trillion
won over the year before. For the over 1-year repricing
cycles, meanwhile, the negative gap stood at 48.9
trillion won, an increase of 22.3 trillion won.
These changes were caused chiefly by the fact that, on
the asset side, banks had massively increased their
extension of adjustable rate housing finance loans9)
with short interest rate repricing cycles, while, on the
funding side, expanding their issuance of financial
bonds10) with repricing cycles of over one year.
The increase of the repricing gap exposed to the risks
associated with interest rate fluctuations appears to
have in turn increased banks’ interest rate VaR11), from
3.6 trillion won at the end of 2005 to 4.8 trillion won at
the end of 2006. The ratio of VaR to BIS capital also
- 64 -
Financial Stability Report April 2007
8) Rate sensitive assets (RSA) minus rate sensitive liabilities (RSL) ineach time bucket
9) In 2006, home mortgage loans issued by banks increased by 24.1trillion won, accounting for 74.7% of the increase in overall householdlending (32.3 trillion won).
10) In 2006, the value of the outstanding balance of financial bondsissued by banks increased by 20.3 trillion won. The outstandingbalance of bonds with interest rate repricing cycles greater than oneyear amounted to 15.9 trillion won.
11) As measured by the BIS standard methodology. [For the methodologyconcerning VaR measurement, refer to the Apr. 2006 FinancialStability Report, (Vol. 7), p. 57].
<Figure IV-10>
Trends of repricing gap1)2)
(Based on the local currency)
200
150
100
50
0
-50
-100
200
150
100
50
0
-50
-100
(trillion won) (trillion won)
2003.12 2004.6 12 2005.6 12 2006.6 12
Notes : 1) Assets and liabilities belonging to “up to 1 year” includethose belonging to “up to 3 months”.
2) Rate-sensitive assets(RSA) minus Rate-sensitiveliabilities(RSL)
3) Data from Dec. 2005 and thereafter are based on the newly-made call report.
Source: Banks’ call reports
Up to 3 months Up to 1 year Over 1 year
<Table IV- 3>
Repricing gap schedule(As of the end of 2006/Based on the local currency)
(trillion won)
Notes : 1) + and - signs in ( ) indicate the directions of the gap. (+) meansan asset sensitive gap, and(-), a liability sensitive gap.
2) Figures in < > refer to changes in repricing gap from the end ofDec. 2005.
Source: The Bank of Korea
0-3 months 3-6 months 6-12 months Over 1 year
Interest-bearing assets (a) 448.6 71.9 75.1 113.6
Interest-bearing liabilities (b) 317.4 89.3 134.5 162.5
131.2(+) 17.4(-) 59.4(-) 48.9(-)Repricing Gap (a-b)
<23.3> <-1.4> <-0.3> <22.3>

rose for the year to 6.4%, up 0.9 percentage points
from year-end 2005. This level, however, is well below
the maximum ratio of 20% recommended by the BIS.
Interest rate risks borne by Korean banks appear
moderate, however, when compared to large US
banks.12) The interest rate VaR-to-BIS capital ratio of
9.5% among large US banks is significantly higher
than the corresponding figure for Korean banks. The
repricing gap-to-assets ratio of 56% among large US
banks is also far above the 36.2% of Korean banks.
Those differences can be explained by two factors.
Firstly, the level of interest rate volatility is much
higher in the US than in Korea, and US banks, in
efforts to maximize revenue, frequently use short-term
funds to finance long-term, fixed-rate loans. However,
as US banks manage these interest rate risks quite
aggressively, making use of interest rate derivatives or
asset securitization,13) the actual interest rate risk
exposures of large US banks are likely to be much less
substantial. Secondly, unlike the case in Korea, interest
rate risk is not transferred to households but borne by
banks in the US. It is thus assessed that by taking on
these interest rate risks instead of households, along
with enhancing their profitability large US banks play a
beneficial role as risk-managing institutions.
Slight decrease in market risk of bond investment
At the end of 2006, banks’ investment in securities
- 65 -
Ⅳ. Soundness of financial institutions
12) The five largest US commercial banks: BOA, JP Morgan Chase,Citibank, Wachovia and Wells Fargo
13) The value of derivatives trading is about 26.5 times total assets amonglarge US banks and only 0.8 times total assets for Korean banks.While the share of securitized assets in total loans among large USbanks stands in the range of 25%, the corresponding figure for Koreanbanks is only 2.4%.
<Table IV- 4>
Interest rate VaR
(trillion won)
Notes: 1) Calculated by using BIS methodology2) Figures in ( ) refer to percentage ratios to large US banks
(based on the end of Jun. 2006 data).Source: The Bank of Korea
Dec. 2004 Dec. 2005 Dec. 2006 b-a(a) (b)
VaR(A)1) 5.1 3.6 4.8 1.2
BIS Capital (B) 54.1 64.6 75.5 10.9
A/B(%) 9.4 5.5 6.4(9.5)2) -
<Table IV- 5>
Comparison between Korean banks and large US banks
(trillion won, billion US dollar, %)
Note: data based on the end of 2006 for Korean banks, data based on theend of Jun. 2006 for large US banks
Source: The Bank of Korea
0-3 months 3-12 months 1-3 years Over 3 years Total
Korean Repricing gap 131.3 76.8 27.2 21.6 256.9Banks Gap to assets 18.5 10.8 3.8 3.1 36.2
ratioLarge Repricing gap 56.8 651.3 160.2 814.0 1,682.3US Banks Gap to assets 1.9 21.7 5.3 27.1 56.0
ratio

amounted to 152 trillion won, an increase of 0.2 trillion
won from the end of 2005. However, due to the
massive increase in lending volume, driven by small
and medium-size business loans and housing finance
loans, the share of securities in total investment assets
fell 2.2 percentage points from the end of 2005, to
17.4%. Investment in trading securities and marketable
available-for-sale securities totaled 102.5 trillion won,
2 trillion won less than at the end of 2005, indicating a
diminishing investment in securities exposed to market
risks.
Market risks associated with bond investment
decreased slightly, as the VaR of banks’ won-
denominated bonds shrank by 0.12 trillion won from
the end of 2005, and the share of bonds on hand with
maturities of one year or longer declined,14) leading to a
reduction in the overall duration of bonds on hand.
This owed mainly to the decrease in risk exposure
related to bond investment15) and to the slow downward
trend in Treasury bond yields, which is reducing
interest rate volatility.
Although banks’ stock investment for trading
amounted to 1.1 trillion won, an increase of 0.5 trillion
won during 2006, market risks associated with stock
investment appear negligible, as stocks comprise a
mere 0.12% of their total investment assets.
Meanwhile, stock price volatility dropped sharply from
August through the end of the year, bringing price
volatility risk down to an insignificant level.
- 66 -
Financial Stability Report April 2007
14) The share of long-term bonds in banks’ overall bonds on handamounted to 49.9% at the end of 2006, down 2.8% from the end of2005.
15) This was primarily due to the reduction in banks’ investment inDeposit Insurance Fund bonds by 6.5 trillion won (based on tradingand marketable bonds), as a consequence of the net redemption of16.6 trillion won that occurred during 2006.
<Table IV- 6>
VaR of won-denominated bonds held by commercial banks
(trillions won)
Notes: 1) 10-day holding period, Confidence level of 99% 2) Treasury bonds (3 years), EWMA-based daily volatility (bp)
Source: The Bank of Korea
End of 2004 End of 2005 End of 2006 b-a(a) (b)
VaR1) 0.32 0.39 0.27 -0.12
(Exposure) 92.3 102.6 95.9 -6.7
(Interest rate volatility)2) 3.3 5.6 3.5 -2.1
<Figure IV-12>
Duration and maturity distribution of won-denominated bonds
60
40
20
0
2.5
2.0
1.5
1.0
0.5
0.0
(%) (years)
2004.12 2005.6 2005.12 2006.6 2006.12
Source: The Bank of Korea, Banks’ call reports
Up to 1 year (LHS)Over 3 years (LHS)
1 to 3 years (LHS)Modified duration (RHS)
<Figure IV-11>
Volume of securities investment
180
160
140
120
100
80
60
40
20
0
25
20
15
10
5
0
(trillion won) (%)
2002.12 2003.6 12 2004.6 12 2005.6 12 2006.6 12
Weight of securities in assets (RHS)
Note: Bank accounts based on closing balanceSource: Banks’call reports
Other non-marketable available-for-sale securities and held-to-maturitybonds (LHS)Marketable and non-marketable available-for-sale securities (LHS)Short-term trading securities (LHS)

Derivatives trading risk remains moderate
At the end of 2006, banks’ outstanding balance in
derivative products stood at 711.8 trillion won, up
46.9% from the year before (484.7 trillion). This raised
the ratio of derivatives outstanding in total assets of
Korean banks from 0.63 at the end of 2005 to 0.81.
By type of transaction, amid a dramatic increase in
swap transactions aimed at hedging interest rate risk in
conjunction with issuance of structured notes, trading
volumes grew particularly in forward contracts used to
hedge exchange rate risk and in currency swaps
targeting interest rate arbitrage by domestic branches of
foreign banks.
Derivatives trading, while increasing steadily in
volume, appears to entail little direct risk for banks,
since most transactions are aimed at hedging or
conducted in view of zero-risk arbitrage trading.
However, as short-term funds procured through
currency swaps are frequently used to finance long-
term investments, the resulting discrepancy in
maturities may prove a problem in the end. The sharp
increase in demand for long-term Treasury bonds may
also serve as a factor contributing to excessive
flattening of yield curves.
- 67 -
Ⅳ. Soundness of financial institutions
<Figure IV-13>
Trading volume of derivatives and their share of total assets1)
1,400
1,200
1,000
800
600
400
200
0
1.0
0.8
0.6
0.4
0.2
0.0
(trillion won) (times)
2003.6 12 2004.6 12 2005.6 12 2006.6 12
Note: 1) Total assets are based on closing balancesSource: The Bank of Korea, Banks’ call reports
Balance of derivatives (LHS)Half-year derivative trading volume (LHS)Ratio to total assets (RHS)
<Figure IV-14>
Derivatives trading by product type
500
400
300
200
100
0
500
400
300
200
100
0
(trillions won) (trillions won)
Interest rate derivatives Currency derivatives Stock derivatives
Source: Banks’ call reports
Jun. 2005Dec. 2005Jun. 2006Dec. 2006

Profitability
(Net income increases)
In 2006, commercial banks’ net before-tax income rose
10.9% over the previous year, from 10.9 trillion won to
12.1 trillion won. This improvement came despite
increases in loan loss provisions and shrinking net
interest margins, as banks’ business expansion
initiatives helped boost their revenues from loans. The
increase in proceeds from sales of stocks received from
Daewoo Engineering & Construction, Hyundai
Engineering and Construction and Hynix, in the
context of debt-to-equity conversion programs, also
contributed to banks’ expansion of net income.
Return on assets (ROA) fell slightly from the previous
year to 1.05%, as banks’ asset sizes grew in line with
their drives to expand market share. All banks posted
profits for the third straight year, however, with ROAs
still at high levels compared to large foreign banks. The
profitability of domestic banks is therefore assessed as
remaining strong.
(Net interest margin shrinks)
Commercial banks’ nominal net interest margin on
interest-earning assets stood at 2.29% in 2006, a
decrease of 0.11 percentage points from 2005. The
nominal net interest margin shrank in spite of an
improvement in asset soundness and the resulting
increase in interest income, as intensifying competition
among banks led to narrowing gaps between deposit
and lending interest rates16). The real net interest
- 68 -
Financial Stability Report April 2007
16) The spread between interest rates on newly extended deposits andloans decreased to 1.58 percentage points in 2006, from 1.97percentage points a year earlier.
<Figure IV-15>
Structural changes in banks’ income before tax
14
12
10
8
6
4
2
0
-2
-4
14
12
10
8
6
4
2
0
-2
-4
(trillion won) (trillion won)
2003 2004 2005 2006
Source: Banks’ call reports
Loans (excluding credit card loans)Credit cardsMarketable securitiesOthers
<Figure IV-16>
Changes in ROA
4
3
2
1
0
-1
-2
4
3
2
1
0
-1
-2
(%) (%)
Average ROA of commercial banks
2002 2003 2004 2005 2006
Source: Banks’ call reports

margin, which takes into consideration the cost-to-asset
and loan loss provision ratios, also fell slightly, as the
loan loss provisions burden, after having declined
greatly due to a reduction in non-performing loans,
shifted back to a modest increase.
The dwindling of the nominal net interest margin may
be considered a positive development, in that it eases
the financial cost burdens of businesses and
households. However, it can also be seen as a result of
domestic commercial banks’ flight-to-quality, rather
than performing their financial intermediation function
by actively taking in or managing risks, despite their
greater ability to absorb financial shocks due to their
increased net incomes. In other words, they have
preferred safe assets like housing finance loans or loans
to low-risk businesses with high credit ratings, instead
of developing new clients or lending to high-risk
businesses.
(Strong profitability expected to continue)
The upturn in profitability among commercial banks is
expected to continue for the foreseeable future.
Although the shrinking net interest margin and the hike
in the Credit Guarantee Fund contribution rate will
weigh on banks’ short-term earnings, factors like their
steadily-expanding business sizes and buoyancy in
sales of beneficiary certificates and bancassurance
products are likely to boost their fee incomes,
improving their overall earnings. Income from sales of
debt-converted stocks is also expected to continue to
grow for some time to come.
However, if domestic commercial banks continue to
focus on the domestic market as they are doing now,
they may hit growth ceilings in the medium and long
- 69 -
Ⅳ. Soundness of financial institutions
<Figure IV-17>
ROA comparison of top 30 world banks1) and Korean banks
3.0
2.5
2.0
1.5
1.0
0.5
2006, (%)
2005, (%)
0.0 0.5 1.0 1.5 2.0 2.5 3.0
Notes: 1) Based on the size of tier 1 capital 2) ▲ : Top 4 Korean banks based on asset size 3) ROA of foreign banks based on 2004 and 2005 data
Sources: Banks' call reports, The Banker
(%) (%)
Nominal net interest margin ratio2)
Loan loss provision ratio3)
Cost-to-asset ratio4)
Real NIM5)
<Figure IV-18>
Net interest margin (NIM)1)
3.5
2.5
1.5
0.5
-0.5
-1.5
3.5
2.5
1.5
0.5
-0.5
-1.52002 2003 2004 2005 2006
Notes: 1) Excluding credit card sector2) (Interest income - Interest cost)/Interest earning assets 3) Net bad debt expense/ Interest earning assets4) (Severance and retirement benefits+Expenses+Depreciation
and amortization)/Total assets5) Nominal net interest margin ratio - Loan loss reserve ratio -
Cost-to-asset ratioSource: Banks' call reports

- 70 -
Financial Stability Report April 2007
term and eventually see weakening of their revenue
base. The race for bigger shares of the domestic
lending market, most particularly in home mortgages
and small and medium-size business lending, is likely
to result in a continuous decline in net interest rate
margins. Meanwhile, the intensifying competition with
non-bank financial institutions might put an end to the
supply of low-interest funds, driving up interest rates in
core deposit markets and eroding banks’ earnings. The
advancement of domestic financial market opening is
expected to intensify competition with foreign financial
institutions, as well.

- 71 -
Ⅳ. Soundness of financial institutions
<Box IV- 1>
Why Korean commercial banks must seek overseas expansions, and how they shouldgo about it
The continuous efforts at business region expansion by multinational banks like HSBC, Citi, UBS and ABN
AMRO, targeting not just developed but also emerging market countries, have helped them to grow into some
of the world’s most competitive financial groups. By adding new overseas branches, taking over foreign banks
and increasing the shares of their overseas-invested assets, these banks have vastly improved their global asset
rankings.
In comparison, Korean banks, although growing in size through a wave of mergers and acquisitions following
the 1997 foreign currency crisis, have held steadfastly to their domestic market-oriented business models. With
a high level of concentration giving 50% of its financial market to the country’s top three banks, Korea has
experienced repeated herd behavior by its commercial banks, which operate their assets with excessive
concentration in housing finance or SME loans due to the intensifying competition among them for business
expansion.
Given the modest size of the domestic market and the heated competition taking place in it, there seems little
potential left for further growth by means of mergers and acquisitions. As banks’ performances are swayed
almost exclusively by domestic economic conditions, it is difficult to expect their revenues to remain stable.
Overseas expansion could not only provide banks with additional sources of revenue, but also help them to
disperse their risks associated with over-concentration of domestic assets, and build up the kind of
competitiveness needed in the globalized financial market.
1. Level of internationalization of Korean banks
As of the end of 2006, Korean banks operated 113 overseas offices in 28 countries, most of which were
branches. The assets of their overseas offices, amounting to US $ 32 billion, represent a mere 2.3% of Korean
banks’ total assets. Moreover, their categories of clients are limited to overseas affiliates or branches of Korean
companies and Koreans living overseas.
Meanwhile, the shares of foreign in total assets among top
banking groups of key developed countries range from 30%
to 90%. These banks do business not only with their own
countries’ companies having local presences in the foreign
countries, but also with local firms and banking customers
there. The ratios of foreign assets-to-GDP exceed 100% in
Foreign asset-to-GDP ratios1) of selected banks(as of 2005)
(%)
Notes: 1) Foreign assets/ Current price GDPSource: Banks’annual reports, OECD
38.7 5.2 111.7 33.2 386.0 3.5
Korean BankAverage
UBS(Switzerland)
DeutscheBank
(Germany)
ABNAMRO
(Netherlands)
Citi(US)
HSBC(UK)

- 72 -
Financial Stability Report April 2007
the cases of UBS and ABN AMRO, in striking contrast to the corresponding average among Korean banks of
a mere 3.5%.
The TNI (transnationality index)*, a measurement of internationalization, reports scores of 60 and above for
UBS, Deutsche Bank and ABN AMRO, while for Korean banks for the year 2005 this score was only a small
fraction of that at 3.4.
* TNI = {[(foreign assets/total assets) + (foreign income/total income) + (foreign employees/total employees)] / 3} × 100
2. Feasibility of overseas expansion
Large banks of developed countries realized early that overseas expansion was the only way to circumvent the
growth limits they would inevitably face in their home markets, and their aggressive efforts in this direction
made them the global banks that they are today. Since the late 1990s, European banking heavyweights like
UBS and ABN AMRO, for example, actively sought to expand their competitive arenas from their home
markets to the global marketplace. Meanwhile, big Australian and Spanish banks began forays into foreign
markets from the late 1980s and late 1990s, respectively, by taking over local banks.
Acquiring foreign financial institutions does not seem
beyond the reach of the large Korean banks. The sizes of
capital (tier 1 capital at the end of 2005) of multinational
giants surveyed, including Citi, are 2.2 to 6.9 times that of
the largest Korean bank. However, Australia’s ANZ Group
and Singapore’s DBS are both smaller in capital size than the
largest Korean bank, and only slightly larger than the second and third largest Korean banks. The tier 1 capital
of Standard Chartered Bank at the time it acquired Korea First Bank (end of 2004) was US$8 billion, roughly
the same as that of the biggest Korean bank at that time (US$7.8 billion). Standard Chartered’s total asset
value, meanwhile, at US$141.7 billion, was substantially less than that of the biggest Korean bank (US$176.6
billion).
Financing takeovers of foreign financial institutions should not be a difficult problem. Recent cases of
multinational banks’ acquisitions of equity in other financial institutions and of mergers and acquisitions by
domestic Korean banks indicate there is a sufficient availability of financing options. In 2006, while UBS
bought Banco Pactual, a Brazilian bank specialized in investment banking and asset management, for US$2.5
billion, the Shinhan Financial Group paid US$7.2 billion (6.7 trillion won) to take over LG Card.
Tier 1 capital global ranking of selected banks(as of end of 2005)
Source: The Banker, Jul. 2006
DBS ANZ Kookmin Woori Shinhan Bank Bank Bank
Tier 1 capital78.8 115.4 115.7 71.7 71.6
(100 US $ million )
World ranking 74 52 51 87 88

- 73 -
Ⅳ. Soundness of financial institutions
3. Strategy
(Acquisition of foreign financial institutions)
Both banks with extensive experience in foreign markets like HSBC and Citi, and those with relatively short
histories in this area like UBS and ABN AMRO set out starting from the 1990s to take over foreign financial
institutions, aiming to establish footholds in local markets around the globe and create worldwide business
networks.
Since the early 2000s, many multinational banks have been establishing presences in emerging market
countries in Asia, Central and South America and Eastern Europe, as growing numbers of countries in these
regions have begun allowing foreign equity participation in domestic financial institutions, in bids to attract
foreign capital as well as promote transfers into their markets of advanced management knowledge.
It is high time also for Korean banks to look into acquiring foreign financial institutions to make inroads into
overseas markets, as this will expand their bases for growth, help diversify their risks and build up their
international competitiveness.
(A strategic approach to individual target markets)
Seasoned multinational banks like HSBC and Citi, with long histories of overseas business, have usually begun
by setting up branches in countries near their target markets, with which they are familiar. Using these
countries as beachheads, they have gradually expanded their presences in regional markets. Latecomers from
Spain, Australia and Singapore have also initiated their efforts at foreign expansion by acquiring financial
institutions in neighboring countries or countries with cultural or linguistic kinships to their own countries.
Some European banks, such as UBS, Deutsche Bank and ABN AMRO, have taken different tacks. By
acquiring financial institutions in the US or Europe, they have sought to first create global names for
themselves.
A good strategy for Korean banks would be to start out in regional markets that are both geographically and
culturally close to Korea, such as China or Southeast Asia, where their strengths in IT and retail banking can be
best utilized. Such moves might be combined with strategies to leverage their names and images in developed
country markets by acquiring mid-sized banks there.
4. Future directions
To draw up well thought-out strategies for acquiring foreign financial institutions, Korean banks must step up
their efforts at gathering information on potential target markets, in order to keep abreast of high-growth

- 74 -
Financial Stability Report April 2007
business segments, economic conditions, the levels of financial market development, market entry restrictions
and M&A case studies.
Also key is the building up of capabilities in the areas of human resources and management systems, to support
operation of the foreign financial institutions acquired. Risk management in particular may prove a crucial area
of competence, as the levels of economic volatility are much higher in emerging market countries that interest
Korean banks, than they are in developed countries. Restrictive financial regulations common in these
countries are another factor making stronger risk management imperative.
Meanwhile, the financial supervisory authorities, when reviewing banks’ applications for approval of their
foreign operation plans, should ease regulations on target markets and on opening new foreign branches. At the
same time, they should make rules to prevent excessive competition between domestic banks in certain
specific regions of the world, while also stepping up oversight to monitor the financial healths of banks,
including their degrees of overseas exposure

- 75 -
Ⅳ. Soundness of financial institutions
Capital adequacy
(BIS capital adequacy ratio declines)
At the end of 2006, commercial banks’ BIS capital
adequacy ratio stood at 12.31%, down 0.12 percentage
points from a year earlier. This result is attributable to
the massive increase of risk-weighted assets reflecting
competition for asset scale expansion, in spite of a
sharp growth in capital size owing to strong net income
and increased loan loss reserves17). As of the end of
2006, 100 percent risk-weighted assets accounted for
52.5% of total assets, up 1.3 percentage points from the
end of the previous year. The ratio of capital-to-total
assets, however, increased 0.23 percentage points from
the end of 2005 to 6.66 %.
Amid continued favorable net income, BIS capital
adequacy ratios are likely to stabilize in 2007, as banks
are expected to tone down their drives for business
expansion somewhat in line with their more
conservative business approaches.
(BIS tier 1 capital ratio falls slightly)
Due to the sharp increase in loan loss reserves, the
proportion of BIS tier 1 capital to equity capital
dropped slightly year-on-year in 2006, to 69.2%. The
BIS tier 1 capital ratio also fell, from 8.7% a year
earlier to 8.5%.
However, Korean commercial banks’ BIS capital
17) The intensified race for business expansion among the three banksranked number two to four in size contributed to a decline in BIScapital adequacy ratio for these banks to 11.68% at the end of 2006,down 0.61% points from a year earlier.
<Figure IV-19>
BIS capital adequacy ratio1)
700
600
500
400
300
200
100
0
14
12
10
8
6
4
2
0
(trillion won) (%)
2003.Ⅰ Ⅲ 2004.Ⅰ Ⅲ 2005.Ⅰ Ⅲ 2006.Ⅰ Ⅲ
Note: 1) The calculation takes into account credit and market risk.Source: Banks' call reports
BIS capital (LHS)Risk-weighted assets (LHS)BIS capital adequacy ratio (RHS)Simple capital adequacy ratio (RHS)
<Figure IV-20>
Shares of 100% risk-weighted assets to total assetsand capital adequacy ratios
55
54
53
52
51
50
49
48
30
25
20
15
10
5
0
(%) (%)
2003.Ⅰ Ⅲ 2004.Ⅰ Ⅲ 2005.Ⅰ Ⅲ 2006.Ⅰ Ⅲ
Notes: 1) book value basis2) year-on-year figures
Source: Banks' call reports
Share of 100% risk-weightedassets to total assets1) (LHS) Equity capital
growth rate2) (RHS)
Source: Banks' call reports
<Figure IV-21>
BIS equity capital structure
Others5.4%
Others5.3%Subordinated
liabilities withmaturity 15.3%
Subordinatedliabilitieswith maturity 15.6%
Loan loss provisions8.9%
Loan lossprovisions9.9%Tier 1 capital
70.3%
Tier 1 capital69.2%
End of 2005 End of 2006

- 76 -
Financial Stability Report April 2007
adequacy ratio (12.3%) and BIS Tier 1 capital ratio
(8.5%), although slightly declined from 2005, are still
at healthy levels compared to the 30 largest banks in
the world.
<Figure IV-22>
Comparison of BIS ratio between foreign and Korean banks
16
15
14
13
12
11
10
9
8
BIS capital ratio (%)
AT end of 2006 (Average of Korean banks)
AT end of 2005 (Average of Korean banks)
BIS Tier 1 capital ratio (%)
6 7 8 9 10 11 12 13 14
Notes: 1) ◆: The world’s top 30 banks based on tier 1 capital size 2) Figures for foreign banks are for 2005
Sources: Banks’ call reports, Bankscope

- 77 -
Ⅳ. Soundness of financial institutions
2. Soundness of non-bank institutions
Securities companies
Total assets expand
At the end of 2006, securities companies’ total assets
amounted to 86.1 trillion won, an increase of 17.9
trillion won (26.2%) from a year earlier. Two factors
contributed to this result. First, securities companies
experienced favorable growth in deposits, bolstered by
expanded sales of CMA18) products and securities sold
under repurchase agreements (RPs). Meanwhile, their
purchases of securities such as Monetary Stabilization
Bonds and financial debentures, and their investments
in structured securities19) all increased sharply during
2006.
Thanks to relatively high returns offered on CMAs and
new financial services like transfers between accounts,
securities companies have been experiencing a sharp
increase in inflows of surplus cash from individual
investors. The outstanding amount of CMAs, which
stood at just 1.4 trillion won at the end of 2005, jumped
to 8.1 trillion won at the end of 2006, an almost six-
fold increase. Provided this trend continues, CMAs are
18) In 2006, in a bid to diversify their business lines and broaden theirrevenue bases, securities companies started offering CMA productswith a variety of payment options. As of the end of 2006, theoutstanding amount of CMAs exceeded 8 trillion won and accountedfor 20% of total deposits.
19) Structured securities refer to equity-linked securities (ELSs),equity-linked warrants (ELWs) and other similar financial productsthat bundle a variety of derivative products with stock price- orcomposite stock price index-linked security, interest rate, or foreigncurrency products.
<Figure IV-23>
Securities companies’ total assets and sources and uses of funds
100
80
60
40
20
0
40
30
20
10
02002.3 2003.3 2004.3 2005.3 2006.3 2006.12
RP sales + Deposits in CMAs (RHS)
Current securities (RHS)
Total assets (LHS)
Source: Financial Supervisory Service
(trillion won) (trillion won)
<Figure IV-24>
Securities companies’ outstanding CMAs
10
8
6
4
2
0
30
25
20
15
10
5
02004 2005 2006.3 6 9 12
CMAs share of totaldeposits1) (RHS)
Outstanding CMAs (LHS)
Note: 1) Customers’ deposits +RP sales + CMA sales + Structuredsecurities + Note issuance (merchant bank account)
Source: Bank of Korea
(trillion won) (%)

likely to help improve the income structure of
securities companies, which has hitherto been
concentrated on brokerage commissions. The income
stream from CMAs, including interest margins and
commissions and fees, is more stable than that from
brokerage commissions. This is because CMA
customers, who will engage in securities trades and
fund sales, are also likely to become customers for
securities companies. However, securities companies
may also be exposed to liquidity and interest rate risk
in endeavoring to meet CMA customers’ withdrawal
demands. They may also shoulder credit risk associated
with the potential deterioration of portfolio assets.
Although steadily expanding over the years, the asset
scale of Korean securities firms remains rather modest
compared to their foreign counterparts. Average total
assets among Korea’s top five securities companies is
less than 1% of the corresponding average for large US
securities firms. The average equity capital scale of the
same five firms is also less than 5% that of their US
counterparts.
Net income shrinks
Securities firms’ net income during the first three
quarters (April to December) of fiscal year 2006 stood
at 1.5 trillion won, 0.7 trillion won (-32.5%) less than
in the same period of 2005 (2.2 trillion won). As the
sharp growth of stock prices slowly tapered off from
the beginning of 2006, and indirect investments
increased, the stock trading volume also shrank. In
addition, as securities firms’ competition to increase
their asset scales has intensified, brokerage
commissions have declined.
- 78 -
Financial Stability Report April 2007
Note: 1) Based on fiscal-year closing data for Korean and US firmsclosing in March and November or December, respectively
Source: Bank of Korea
<Table IV- 7>
Total assets and equity capital1) of large Korean andUS securities companies
(US $ 100 million, %)
2004 2005 2006
Top 5 Korean securities firms (I) 34.3 43.9 65.4
Assets Top 3 US securities firms (II) 6,356.0 7,621.1 9,333.8
(I/II) 0.5 0.6 0.7
Top 5 Korean securities firms (III) 12.1 13.9 17.7
Capital Top 3 US securities firms (IV) 282.2 309.3 367.3
(III/IV) 4.3 4.5 4.8
<Figure IV-25>
Securities companies’ net income
7
6
5
4
3
2
1
0
-1
-2
0.25
0.20
0.15
0.10
0.05
0.00
(trillion won) (%)
2002.3 2003.3 2004.3 2005.3 2006.3 2006.12
Source: Financial Supervisory Service
Current-period net income (LHS)Average daily stock trading value (LHS)
Brokerage commission rate (RHS)
<Figure IV-26>
Composition of securities companies’ net revenues
4
3
2
1
0
-1
4
3
2
1
0
-1
(trillion won) (trillion won)
2001 2002 2003 2004 2005 2006.12
Source: Financial Supervisory Service
Brokerage trading Proprietary tradingCorporate finance Fund sales
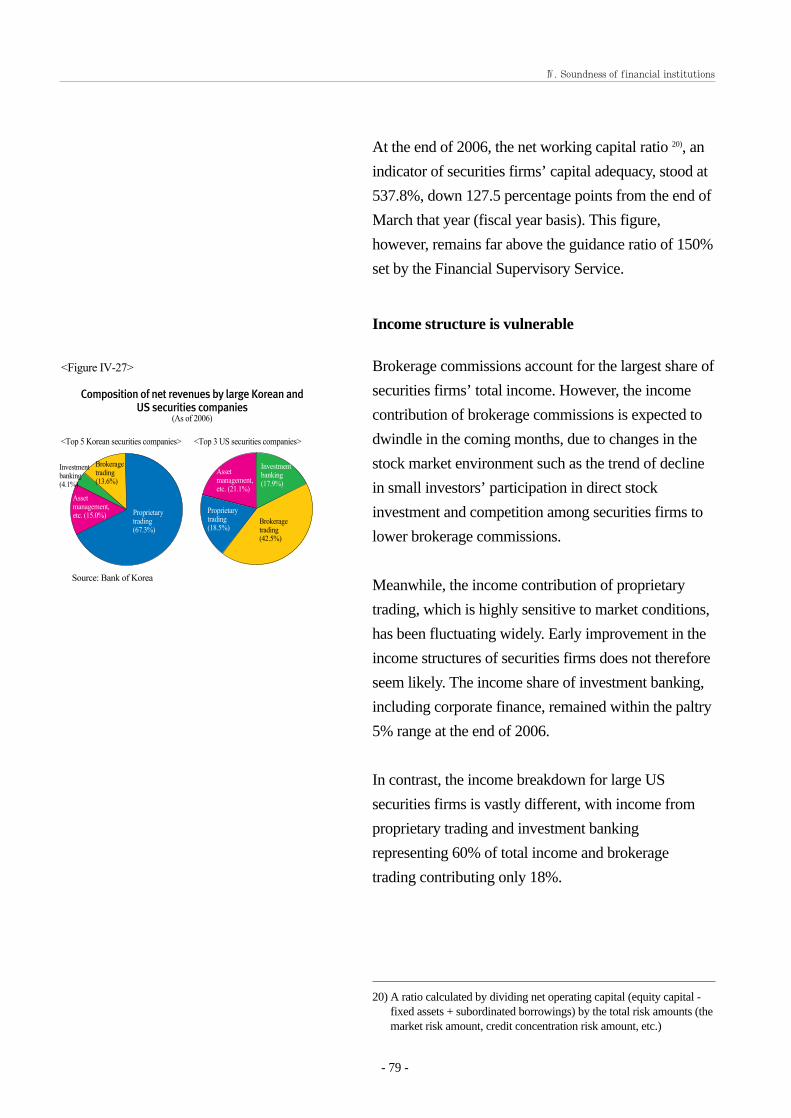
At the end of 2006, the net working capital ratio 20), an
indicator of securities firms’ capital adequacy, stood at
537.8%, down 127.5 percentage points from the end of
March that year (fiscal year basis). This figure,
however, remains far above the guidance ratio of 150%
set by the Financial Supervisory Service.
Income structure is vulnerable
Brokerage commissions account for the largest share of
securities firms’ total income. However, the income
contribution of brokerage commissions is expected to
dwindle in the coming months, due to changes in the
stock market environment such as the trend of decline
in small investors’ participation in direct stock
investment and competition among securities firms to
lower brokerage commissions.
Meanwhile, the income contribution of proprietary
trading, which is highly sensitive to market conditions,
has been fluctuating widely. Early improvement in the
income structures of securities firms does not therefore
seem likely. The income share of investment banking,
including corporate finance, remained within the paltry
5% range at the end of 2006.
In contrast, the income breakdown for large US
securities firms is vastly different, with income from
proprietary trading and investment banking
representing 60% of total income and brokerage
trading contributing only 18%.
- 79 -
Ⅳ. Soundness of financial institutions
20) A ratio calculated by dividing net operating capital (equity capital -fixed assets + subordinated borrowings) by the total risk amounts (themarket risk amount, credit concentration risk amount, etc.)
<Figure IV-27>
Composition of net revenues by large Korean and US securities companies
(As of 2006)
<Top 5 Korean securities companies>
Proprietarytrading (67.3%)
Brokeragetrading(13.6%)
Investmentbanking(4.1%)
Assetmanagement,etc. (15.0%)
Assetmanagement,etc. (21.1%)
Investmentbanking(17.9%)
Proprietarytrading (18.5%)
Brokeragetrading(42.5%)
<Top 3 US securities companies>
Source: Bank of Korea

However, the share of income from fund sales, which
stood at a modest 18% in Korea at the end of 2006
(15% for the top five securities firms), is expected to
progressively increase, as the rising interest in both
domestic and overseas funds has been expanding the
scale of fund subscription.
Meanwhile, as of end-February 2007, over 8,500 funds
are offered on the market. The plethora of funds makes
it difficult for securities firms to verify the soundness
and profitability of each of the products they sell. This
situation may increase customers’ risk of investment
loss and damage securities firms’ reputations. The
market may also have to contend with conflicts of
interest between holding companies or their securities
firms and their subsidiaries or affiliated asset
management firms, for example when a securities
company subsidiary sells funds operated by the asset
management company subsidiary without properly
assessing or managing the potential risk.
- 80 -
Financial Stability Report April 2007
Note: Period-end basis Source: Asset Management Association of Korea
<Table IV- 8>
Changes in number of funds operated by domestic asset management firms
(number of funds)
2003 2004 2005 2006 2007.2
6,875 6,554 7,383 8,239 8,515
Note: As of end of 2006Source: Securities companies and asset management firms
<Table IV- 9>
Links between domestic securities companies and asset management firms
(number of companies)
Subsidiary of Subsidiary of a financial a large Others Totalholding company business group
Securities 5 5 6 16companies
Asset management 5 5 7 17firms

- 81 -
Ⅳ. Soundness of financial institutions
<Box IV- 2>
Securities companies’ CMA sales
Increasingly sensitive to interest rates, individual investors have in recent years shown growing interest in
high-yield financial products, despite their somewhat greater degree of investment risk. To capitalize on this
changing investment demand, starting since late 2006, securities firms have been releasing CMA-based hybrid
financial products, which offer high yields and come with additional financial service options. The spread of
CMAs, although expected to contribute to expanding the income base for securities firms, is also likely to have
a significant impact on these firms’ risk management practices.
(Structure of CMAs and their sales volume)
CMAs are dividend products, introduced pursuant to the Merchant Banks Act (Aug. 1984), through which
money deposited by investors is invested in assets like commercial paper and marketable securities, and the
investment profits are distributed to the investors. CMA products issued by merchant banks are treated as
deposit products protected under the Depositor Protection Act and are currently insured for up to 50 million
won per account holder. These products are commonly used by merchant banks as a funding source and
guarantee fixed yields which vary depending upon the length of the deposit.
The CMAs introduced by securities firms, starting from January 2004, differ from those issued by merchant
banks in that they have additional features making them closely resemble asset management products. This
type of CMA is commonly referred to as a “Merrill Lynch-type CMA.” Money deposited by customers is
automatically invested in high-yield assets like securities sold under repurchase agreements (RPs), MMFs, etc.
When money is invested in RPs, securities firms generally guarantee a fixed yield, which is pre-agreed on with
the customer. With MMF-invested assets, customers receive dividends based upon the performance of the asset
management firm. Yields from CMAs are therefore significantly higher than interest earnings from bank
deposits. At the end of October 2006, interest rates on CMAs were running in the range of 3.80 ~ 4.25% – 3.60
~ 4.15 percentage points above the going rates on non-term bank deposits like checking accounts. One
disadvantage of this type of CMA sold by securities firms is that it is not covered by deposit insurance. On the
other hand, CMA customers can benefit from a range of bank account-linked services. They can, for instance,
conveniently deposit or withdraw funds from their accounts using CD or ATM machines. Fund transfer, direct
deposit of paychecks, bill payment and payment through non-bank credit cards are among the additional
services offered to CMA customers.
The combination of high yields with value-added services has proved to be an attractive proposition for
individual investors. The number of CMA subscribers has been growing steadily, increasing the flow of funds
to securities firms. At the end of 2006, the outstanding amount of CMAs in Korea was 8.1 trillion won, and the
number of active accounts came to 1.5 million. These were six-fold and three-fold jumps, respectively, from
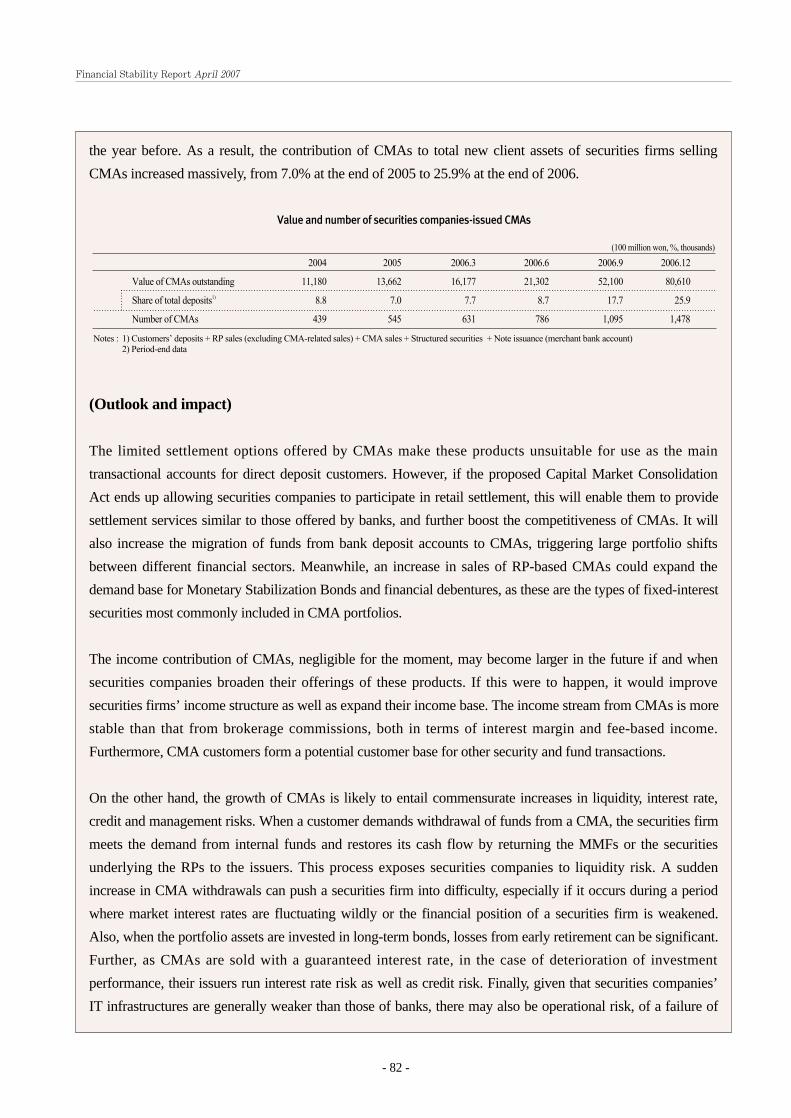
- 82 -
Financial Stability Report April 2007
the year before. As a result, the contribution of CMAs to total new client assets of securities firms selling
CMAs increased massively, from 7.0% at the end of 2005 to 25.9% at the end of 2006.
(Outlook and impact)
The limited settlement options offered by CMAs make these products unsuitable for use as the main
transactional accounts for direct deposit customers. However, if the proposed Capital Market Consolidation
Act ends up allowing securities companies to participate in retail settlement, this will enable them to provide
settlement services similar to those offered by banks, and further boost the competitiveness of CMAs. It will
also increase the migration of funds from bank deposit accounts to CMAs, triggering large portfolio shifts
between different financial sectors. Meanwhile, an increase in sales of RP-based CMAs could expand the
demand base for Monetary Stabilization Bonds and financial debentures, as these are the types of fixed-interest
securities most commonly included in CMA portfolios.
The income contribution of CMAs, negligible for the moment, may become larger in the future if and when
securities companies broaden their offerings of these products. If this were to happen, it would improve
securities firms’ income structure as well as expand their income base. The income stream from CMAs is more
stable than that from brokerage commissions, both in terms of interest margin and fee-based income.
Furthermore, CMA customers form a potential customer base for other security and fund transactions.
On the other hand, the growth of CMAs is likely to entail commensurate increases in liquidity, interest rate,
credit and management risks. When a customer demands withdrawal of funds from a CMA, the securities firm
meets the demand from internal funds and restores its cash flow by returning the MMFs or the securities
underlying the RPs to the issuers. This process exposes securities companies to liquidity risk. A sudden
increase in CMA withdrawals can push a securities firm into difficulty, especially if it occurs during a period
where market interest rates are fluctuating wildly or the financial position of a securities firm is weakened.
Also, when the portfolio assets are invested in long-term bonds, losses from early retirement can be significant.
Further, as CMAs are sold with a guaranteed interest rate, in the case of deterioration of investment
performance, their issuers run interest rate risk as well as credit risk. Finally, given that securities companies’
IT infrastructures are generally weaker than those of banks, there may also be operational risk, of a failure of
Notes : 1) Customers’ deposits + RP sales (excluding CMA-related sales) + CMA sales + Structured securities + Note issuance (merchant bank account) 2) Period-end data
Value and number of securities companies-issued CMAs
(100 million won, %, thousands)
2004 2005 2006.3 2006.6 2006.9 2006.12
Value of CMAs outstanding 11,180 13,662 16,177 21,302 52,100 80,610
Share of total deposits1) 8.8 7.0 7.7 8.7 17.7 25.9
Number of CMAs 439 545 631 786 1,095 1,478

- 83 -
Ⅳ. Soundness of financial institutions
internal systems or of a network disturbance that interrupts the connection between securities companies and
banks.
To manage these risks, securities companies should consider placing safe ceilings on their CMA-linked RPs
and setting maximum maturities for the bonds included in the portfolios. Upgrading their IT infrastructures is
of course also important.

Credit specialized financial companies
Asset size increases
The currency crisis and the credit card crisis that
ensued were severe setbacks for Korea’s credit
specialized financial companies (hereinafter “credit
companies”.21) However, since the completion of
restructuring in 2005, the sector has been on track
towards recovery. At the end of 2006, the total assets of
credit companies stood at 35.9 trillion won, up 26.1%
from the end of 2005. By asset type, the assets of credit
companies broke down to 12.8 trillion in general loans
(35.6%), 9.4 trillion won in leases, 5.9 trillion in
installment financing and 0.7 trillion won in new
technology financing.
Credit companies’ lending grew by 52.8% (4.4 trillion
won) over the end of 2005, driven by expansion of
automobile and other consumer loans and small and
medium-sized business loans. Meanwhile, housing
finance loans (including home installment financing),
increased by just 0.9 trillion won, held back by more
restrictive LTV and DTI ratios.
The share of lease assets, which has been steadily
expanding since 2004 thanks to the upturn in the auto
lease segment and the recovery of facilities investment,
increased from 16.9% at the end of 2003 to 26.2% as
of year-end 2006. Helped by the buoyancy in auto
leases, the volume of installment financing jumped
27.1% (1.3 trillion won), although its share in total
- 84 -
Financial Stability Report April 2007
21) This term refers to financial institutions engaged in credit cardlending, installment financing, facilities leasing and new technologyproject financing, pursuant to the Credit Specialized FinancialBusiness Act. For the purposes of this report, however, the term“credit companies” will be understood as including all of theabove-mentioned types of institutions except credit card companies.
Source: Credit companies’ call reports
<Figure IV-28>
Total assets and number of credit specialized financial companies
60
50
40
30
20
10
0
60
50
40
30
20
10
0
(trillion won) (number of companies)
1998 2000 2004 2005 2006
Total assets (LHS) Number of companies (RHS)
<Figure IV-29>
Credit companies’ composition of assets by business segment1)
70
60
50
40
30
20
10
0
70
60
50
40
30
20
10
0
(trillion won) (trillion won)
1998 2003 2004 2005 2006
Note : 1) The general loan asset figure for 1998 includes ‘other assets’.Source: Credit companies’call reports
Installment financing assets Leased assetsNew technology financing assets General loan assetsOther assets

assets fell short of the peak level seen at the end of
2003.
Meanwhile, being non-deposit- taking institutions,
credit companies’ main funding sources remain
corporate bonds and CP22), together with borrowings in
Korean won. As their credit ratings have been
improving since the recent round of restructuring,23)
long-term vehicles like corporate bonds24) account for a
growing share of credit companies’ funding.
Asset quality and profitability improved
Thanks to the restructuring in 2003-2004, during which
much of their bad debts were written off or sold, and to
the enforcement of stricter loan review procedures, the
asset quality of credit companies has improved
dramatically. The ratio of substandard and below loans
fell from 13.0% at the end of 2002 to 2.4% at the end
of 2006. Due to the large loan loss provision
requirements, credit companies had posted losses until
2004. They returned to the black in 2005, however, and
then recorded a substantial profit of 982.5 billion won
in 2006.
By business segment, interest income and lease income
increased over the end of 2005 by 26% and 37%,
respectively, in 2006. Income from installment
financing, meanwhile, which had been 19.5% in 2002,
fell to 12.4% in 2006 owing to the downturn in the
- 85 -
Ⅳ. Soundness of financial institutions
22) The cap on the maximum value of corporate bond issuance is set atten times equity capital for credit companies, pursuant to the CreditSpecialized Financial Business Act. This is much higher than the capof four times equity capital that applies to general corporations.
23) The number of credit companies rated “BBB” and above (based onnon-secured corporate bonds) rose from 10 at the end of 2003 to 17 atthe end of 2006.
24) The share of long-term funds increased from 51.3% at the end of2003 to 60.5% at the end of 2006.
<Figure IV-30>
Credit companies’ funding sources
50
40
30
20
10
0
50
40
30
20
10
0
(trillion won) (trillion won)
2003 2004 2005 2006
Source: Credit companies’ call reports
Corporate bonds/CPs Borrowings in won Borrowings in foreign currencies Equity capital Others

segment and to the decline in interest rates on
installment financing products25).
Business regulations eased and prudential
regulations strengthened
The business performance of credit companies is
sound. However, their growth potential is expected to
remain limited. Credit companies’ business structure is
heavily focused on automobile-related financing, and
there is a limit on the extent to which new car sales can
expand.26) In addition, as their other business lines like
installment financing and loans are services also
offered by credit card companies and banks, credit
companies’ special revenue base is likely to be
vulnerable. They also face competition from money
lenders, who are engaged in similar business lines and
target similar categories of customers but are only
lightly regulated, and who have been quickly building
up their market share. Credit companies have therefore
not benefited greatly from the strengthening of banking
sector regulations, such as the rules on household
loans27) and LTV and DTI-related restrictions on
housing mortgage loans and installment financing.
It may, therefore, be necessary for the financial
authorities to substantially ease the business regulations
- 86 -
Financial Stability Report April 2007
25) The share of installment financing assets in credit companies’ totalassets fell from 22.4% at the end of 2002 to 16.5% at the end of 2006.The interest rate (average balance of installment income divided byinstallment receivables) on installment financing products offered bythe top ten credit companies dropped from 16.08% in 2004 to 9.75%in 2006.
26) While the share of automobile-related financing products in creditcompanies’ total operating assets (excluding current assets, securitiesand fixed assets) reached 48.8% at the end of 2006, domesticautomobile sales increased by only 2.6% during 2006.
27) Household lending by credit companies is currently limited toinstallment financing and leases, in other words, types of loansassociated with this sector only.
<Figure IV-31>
Changes in credit companies’ net incomes
3
2
1
0
-1
-2
50
40
30
20
10
0
(trillion won) (%)
2000 2001 2003 2005 2006
Source: Credit companies’ call reports
Loan loss provision (LHS)Net income (LHS)Ratio of substandard and below loans (RHS)

applying to credit companies, by for instance
expanding the list of equipment and facilities28) eligible
for leasing, so that these companies may tap into niche
markets to achieve growth. This should be coupled
with measures to curb credit risk inherent to credit
companies, as businesses dealing chiefly with small
consumer credit. Credit companies should tighten their
loan review-related rules and strengthen their risk
management capabilities to prevent any future wave of
defaults like the one they experienced several years
back. In the meantime, the authorities should keep
closer oversight on their financial soundness to ensure
that they maintain sound loss-absorption capabilities.29)
GE Capital, a leading US financial firm having a
business model similar to those of Korea’s credit
companies, sets a useful precedent in linking financing
to product sales by affiliated manufacturing companies
to thus fuel growth with the synergy created from this
arrangement. In the long-term, Korea’s credit
companies may be able to grow into general financial
service providers by learning from the successful
models of overseas financial firms.
- 87 -
Ⅳ. Soundness of financial institutions
28) The list of equipment and facilities for which leasing is currentlyallowed, comprising machinery and equipment, vehicles, boats,aircraft and real estate properties directly related to their lease, couldbe expanded to include, for instance, property leasing for small andmedium-sized businesses.
29) In April 2007, to prevent credit companies’ household loan credit riskfrom expanding further, the financial supervisory authorities stiffenedthe asset classification criteria and raised the loan loss provision ratio.However, the prudential guidance standard for the adjusted capitalratio(7%) and the ratio for reflecting asset-backed securities(ABSs)included in adjusted total assets(10%) also need to be adjustedupward, as business conditions among credit companies have beenimproving
<Figure IV-32>
Share of automobile-related operating assets in credit companies’ total operating assets1)
35
30
25
20
15
10
5
0
10
5
0
-5
-10
-15
-20
-25
(trillion won) (%)
2003 2004 2005 2006
Note: 1) Total assets minus current assets, securities and fixed assets 2) The figures in ( ) are the percentage shares in total operating
assets Source: Korea Automobile Manufacturers Association, Korea
Automobile Importers and Distributors Association, CreditFinance Association
Automobile-related operating assets (LHS)Other operating assets (LHS)Domestic automobile sales increase (RHS)
(35.0)
(65.0)
(39.4)
(60.6)
(50.7)
(48.8)
(51.2)(49.3)

- 88 -
Financial Stability Report April 2007
<Box IV- 3>
Factors behind and implications of GE Capital’s growth
The GE group, a US business group founded through the 1892 merger between the Edison General Electric
Co. and the Thomson-Houston Electric Co., was engaged in manufacturing only until 1932, when it forayed
into the financial sector through GE Credit Corp., an installment financing company. Since then, led by GECS
(GE Capital Services), its intermediary financial holding company, the group has gradually expanded its
business areas and currently provides a nearly complete spectrum of financial services excluding deposit-
taking and securities investment, including corporate financing, installment financing, leasing, mortgage
lending, credit cards and insurance. Since the late 1990s, the group has been engaged in the banking business
in foreign markets such as the U.K., and Asian and Eastern European countries
Up until the early 1980s, the growth of the GE Group was driven by its manufacturing division, which made
products such as home appliances, power generation equipment, plastics and health and medical equipment.
After Jack Welch took the helm of GE in 1981, however, its financial service division underwent rapid growth
and reached US $ 564.7 billion in total assets by the end of 2006, raising the division’s share in total group
assets from 50.3% at the end of 1980 to 81.0%. Meanwhile, the financial division’s net income, which had
stood at a mere US $ 100 million in 1980, jumped to US $ 10.9 billion by 2006. This was 51.2% of the group’s
total net income and marked a significant expansion of the financial sector’s contribution to the Group.
GE Capital’s stunning growth owes foremost to the synergy created from linking its financial services with the
group’s manufacturing businesses. GE, the parent company rated “AAA,” has helped its financial service
subsidiaries also obtain and maintain “AAA” long-term credit ratings, by, for instance, extending payment
guarantees on their corporate bonds or making capital commitments when their capital-to-debt ratios drop. As
a result, GE Capital’s credit rating has remained consistently higher than those of large US financial groups
like Citigroup (AA-) and Goldman Sachs (A+). GE has provided its financial subsidiaries with easy access to
low-interest funds, when issuing corporate bonds and CPs, and transmitted to them its management know-how
and best practices accumulated through its long history in the manufacturing business. In this way, it has
supported them in their M&A activities and assisted the overall financial service division in becoming the
competitive division that it is today.
GE Capital’s key business lines
Segment Business lines
General corporate loans, commercial property-related lending, commercial equipment purchase financing and leases, M&A consulting and other corporate financial services, issuance of bonds such as ABS, aviation-relatedfinancial services including sales, leases and payment guarantee services, health and medical equipment-relatedloans and leases
Insurance General non-life insurance, reinsurance, guarantee insurance, mortgage insurance
Consumer loans Installment financing, credit cards, mortgage loans
Equipment lease and management Ships, trains, trailers and other transportation equipment-related loans and leases
Others Private equity investment, satellite communications service
Corporate financing

- 89 -
Ⅳ. Soundness of financial institutions
Meanwhile, GE Capital and other group financial service subsidiaries have contributed to sales growth in the
manufacturing division by offering financing services for purchase of the division’s products, rather than
directly extending them loans. Using their abundant funds, acquired at low interest rates thanks to the support
of the parent company, these firms have provided customers purchasing GE affiliates’ products with
installment financing or lease programs at competitive interest rates. They also help the manufacturing division
meet business financing needs and manage financial risks through derivative financial products and other
advanced financial techniques, while providing financing for M&As and financial consulting for the entire
group.
Another factor contributing to GE Capital’s success is the group’s simple cross-ownership structure, coupled
with a transparent accounting system, which has earned it market trust and makes its corporate information
highly accessible. By creating an intermediary holding company (GE Capital Services) through 100% equity
participation by GE, the parent company, the group has made its financial service arms into indirect
subsidiaries. There is, therefore, no cross-ownership between the group’s financial service firms and
manufacturing companies that are the direct subsidiaries of the parent company. This structure protects the GE
Group’s financial division from the effects of any business downturns in the manufacturing division. In the
meantime, the GE Group, in addition to the consolidated financial statements for the entire group, provides
separate financial statements for its financial and non-financial divisions, while also disclosing transactions
between the two divisions in full detail and in an easy-to-understand presentation, cementing investors’ and
market participants’ confidence in the group.
GE’s financial division, applying a business model similar to those of Korea’s credit companies, has
successfully achieved synergy with the group’s manufacturing division, by linking its financial services with
the latter’s product sales. By learning from such foreign examples of success, Korea’s credit companies could
in turn look into ways to grow over the long run into general financial service institutions, offering services like
feasibility analysis for corporate M&As, management of financial portfolios, and fund financing/risk
management for manufacturing businesses.
GE’s business diagram
GE(Parent holding company)
Manufacturing sector
Health care Home appliances& lighting
NBC Universal
GE Capital Services(Intermediary holding company for the financial sector)
Corporate finance Consumer financeInfrastructure

Financial Stability Report April 2007

- 91 -
Ⅴ. Changes in the financial infrastructure
1. Payment and settlement systems
Settlement risk trends
In 2006, payments and settlements via the Korean won
payment systems and the CLS (Continuous Linked
Settlement) system grew sharply, both in volume and
value. In spite of the massive expansion in the volume
of transactions, the payment and settlement systems
operated stably, and settlement risks were managed
appropriately.
BOK-Wire, operated by the Bank of Korea,
experienced an improvement in system stability and
efficiency. No instances of delay in settlement caused
by system disturbance were recorded in 2006, while
the incidence of settlement delays due to lack of funds
on the part of participating banks fell dramatically,
especially among domestic branches of foreign banks.
However, the share of settlements during the period
after 4:00PM, near system closing time, climbed to
50.4% from 48.7% the year before, somewhat
increasing the likelihood of settlement delay and
gridlock during this period.
As of the end of 2006, institutions participating in the
retail payment systems operated by the Korea Financial
Telecommunications and Clearings Institute (KFTC)
had deposited 5.2 trillion won in securities with the
Bank of Korea as collateral to guarantee execution of
net settlement. This total is well in excess of what
would be needed to complete all net settlement
Ⅴ. Changes in the financial infrastructure
<Table V- 1>
Settlement volume by payment instrument(daily average)
(thousand transactions, trillion won, %)
6.9 7.9 8.4 5.813,599 14,089 15,146 7.53,489 3,283 3,263 -0.63,714 3,753 4,008 6.86,396 7,053 7,875 11.6
13,606 14,097 15,155 7.5
107.8 120.7 128.7 6.728.0 29.7 33.3 12.014.8 14.4 14.9 3.60.5 0.5 0.5 9.0
12.7 14.8 17.8 20.3
135.9 150.3 162.0 7.7
BOK-wireRetail payment system
Bill clearing systemGiro systemInterbank networks
Total
BOK-wireRetail payment system
Bill clearing systemGiro systemInterbank network
Total
Vol
ume
Val
ue
2004 2005 2006 Change(A) (B) (B-A)/A
<Table V- 2>
Settlement volume via CLS
(100 million dollars, transactions)
2005 2006
Volume 289,789 930,089<daily average> 1,159 3,750
Value 9,523.9 25,028.1<daily average> 38.1 100.9
Source: Bank of Korea
Source: Bank of Korea

requirements (the 2006 peak was 2.7 trillion won), in a
situation where the two banks with the largest netting
obligations failed to meet them. It easily satisfies the
international best practice proposed by the BIS.
Meanwhile, the volume of settlements made via the
DVP (Delivery versus Payment) System, jointly
operated by the Bank of Korea and the Korea
Securities Depository, also increased steadily,
contributing to a reduction in securities settlement risk
associated with the occurrence on different days of the
two legs involved: the delivery of securities and the
payment for them. The increase in the share of foreign
exchange transaction settlements made through the
CLS system operated by CLS Bank was particularly
sharp, resulting in a marked reduction of foreign
currency settlement risk arising from mismatches
between currencies sold and bought at settlement time.
- 92 -
Financial Stability Report April 2007
<Figure V- 1>
Volume of settlements via BOK-wire during one-hour period before closing time and incidence of delays
80
70
60
50
40
40
30
20
10
0
(%)Share of settlement volume during one-hour period before closing time (LHS)
Incidence of delays (RHS)(value basis)
(%)
2000 2002 2004 2006
Source: Bank of Korea
Notes: 1) Top two banks in terms of the value of net exchangepayments made on the day with the highest net exchangepayments, in the reference month for morning net settlements
Source: Bank of Korea
<Figure V- 2>
Settlement obligations of top two banks1) and total value of settlement collateral
6
4
2
0
6
4
2
0
(trillion won)
Value of settlement collateral deposited by all banks
Settlement obligations of top two banks
(trillion won)
2006.1 3 5 7 9 11 12

- 93 -
Ⅴ. Changes in the financial infrastructure
Improvements of payment andsettlement systems
Oversight of payment and settlement systems
strengthened
In 2006, the Bank of Korea assessed the safety and
efficiency of BOK-Wire, the systemically important
payment system it operates, and of the Over-the-
Counter Bond Market Settlement System. The
assessment found that both systems met the relevant
international standards, although there were a few
minor details on which improvement was needed.
Recommendations for improvement were issued to the
institution operating the Over-the-Counter Bond
Market Settlement System and the department of the
Bank of Korea overseeing BOK-Wire. For the Over-
the-Counter Bond Market Settlement System, the
assessment results were reported to the policymakers
and supervisory authorities concerned.
For systematic exercise of payment and settlement
system oversight in compliance with the relevant
international standards, the framework for assessing
them was comprehensively overhauled. The
classification of payment systems, for instance, was
changed from the three-tier model consisting of
‘systemically important,’ ‘major’ and ‘others’ to a two-
tier model recommended by the BIS consisting only of
the ‘systemically important’ and ‘others’ categories.
The number of systemically important payment
systems was also expanded from seven to nine. Finally,
assessment of systemically important payment systems
is now conducted biannually instead of annually.
<Table V- 3>
Payment systems subject to oversight by the Bank of Korea
Category System operator
BOK-Wire Bank of Korea
Bill Clearing System
Interbank Interbank Funds Transfer
Networks Electronic Banking
Over-the-Counter Bond Market Korea SecuritiesSettlement System Depository
Securities Market Settlement System
KOSDAQ Market Settlement System Korea Exchange
Futures Market Settlement System
CLS Bank International
Giro System
CD
CMS
B2C e-commerce
B2B e-commerce
e-Money
Debit Cards
Local Banks
BC Card Settlement System BC Card
Korea Exchange Bank,Kookmin Bank
Source: Bank of Korea
Systemicallyimportantpaymentsystems
(9)
Otherpaymentsystems
(10)
KFTCInterbank
Networks
CLS System
Domestic Interbank Foreign Currency Funds Transfer System
KFTC

- 94 -
Financial Stability Report April 2007
Safety and efficiency of payment systems enhanced
‘The Electronic Financial Transaction Act’, which was
enacted in April 2006 and came into force in January
2007, grants the Bank of Korea the right to demand
records and documents from electronic financial
service providers and the right to require the Financial
Supervisory Service to examine, either on its own or
jointly with the central bank of businesses whose
transaction practices are deemed to warrant such
action. Subsequently, in order to efficiently reinforce its
oversight duties related to electronic financial
transactions, the Bank of Korea established (in Jan.
2007) the ‘Regulation on Bank of Korea Requests for
Electronic Financial Transaction-related Records and
Documents.’
Prior to this, in accordance with the “Act on Debtor
Rehabilitation and Bankruptcy”, in effect from April
2006, a new set of rules was established by the
‘Regulation on Designation of Payment Systems
Whose Settlement Finality Is Guaranteed’ (Mar. 2006).
BOK-Wire operated by the Bank of Korea, the
Interbank CD/Interbank Funds Transfer System and
Electronic Banking System operated by the KFTC, and
the CLS System were designated as payment systems
whose settlement finality should be guaranteed (Aug.
2006). This means that fund transfer instructions and
settlements placed and made through these payment
systems are guaranteed under the relevant legislation to
be final, even in the event of failure of the financial
institutions involved.
Furthermore, to enhance the safety of the retail
payment systems, the Bank of Korea modified its
methods of valuation and management of securities
deposited with it as collateral to guarantee net
<Table V- 4>
Settlement finality-guaranteed payment systems
Source: Bank of Korea
System operator Name of system Date effective
Bank of Korea BOK-Wire Aug. 21, 2006 09:30
Interbank CD Network Aug. 21, 2006 07:00
Interbank Funds Transfer Network
Electronic Banking Network Aug. 21, 2006 07:00
CLS BankInternational
KFTC
CLS System Aug. 21, 2006 09:30
Aug. 21, 2006 09:30

- 95 -
Ⅴ. Changes in the financial infrastructure
settlements. Collateral securities deposited by
institutions participating in the net settlement system,
whose value was previously assessed once every
quarter, are now assessed daily. When the assessed
value falls short of the amount required, the securities
deposited must be replaced or additional securities
collateral must be posted. These changes allow the
Bank of Korea to manage securities collateral on a
mark-to-market basis.
Concerning the CLS System, the Bank of Korea
launched an initiative to remedy the low level of
participation by domestic branches of foreign banks,
which had hindered use of the system by domestic
banks who are their transaction counterparts. The Bank
of Korea will collaborate with the Financial
Supervisory Service (FSS) to step up the management
of foreign currency settlement risk at domestic
branches of foreign banks. In the meantime, to reduce
the costs associated with CLS System participation, a
decision was made, with the approval of domestic
banks, to waive the special participation fee for local
branches of foreign banks joining the KFTC’s CLS
network.
To reduce the daily need for settlement funds among
institutions participating in BOK-Wire, and to curb the
concentration of settlements during the period shortly
preceding the system’s closing time, the Bank of Korea
is now at work building the next-generation BOK-Wire
system, in a project scheduled for completion in the
first half of 2009. The basic architecture for this hybrid
payment system, closely adapted to the Korean
financial markets, was designed and system details
provisionally finalized by gathering the opinions of
participating institutions and external experts.
Source: Bank of Korea
<Table V- 5>
Changes in valuation method for collateral securities
Before After
Valuation cycle Once quarterly Once daily
Business day immediately Reference date preceding the date
of valuation
Information manually Method of retrieved fromobtaining market specialized bond price information valuation organizations
(3 organizations)
Deadline for Last business day covering collateral of the valuation shortfalls month
Day of valuation
Automatically obtainedfrom the Bond MarketInformation System(BOMIS)
15th of the first monthof each quarter

Finally, to alleviate the workloads of participant
institutions and enhance the accuracy and safety of
business handling, a decision was reached to link the
Bank of Korea’s servers with BOK-Wire members’
servers through a direct access method. This
connection method will be first implemented for banks
and other large institutions participating in the system.
- 96 -
Financial Stability Report April 2007

2. Domestic financial system
Adjustment of bank reserve requirement ratios
Effective December 23, 2006, the Bank of Korea made
an upward adjustment of the reserve requirement ratios
for banks’ Korean won and foreign currency deposits.
This decision was aimed at improving interest rate
policy effectiveness in a situation where, in spite of five
consecutive raises of the call rate target since October
2005, the share of current assets in financial
institutions’ total assets had increased massively due to
sustained inflows of foreign funds and other factors,
which was causing the loan supply to continually
expand.
While the reserve requirement ratio for long-term
savings deposits was lowered from 1% to 0%, that for
short-term deposits like demand deposits and money
market deposit accounts (MMDAs) was raised from
5% to 7%, widening the reserve requirement ratio
spread between long-term and short-term deposits.
Meanwhile, the reserve requirement ratio for foreign
currency deposits having the character of demand
deposits was also raised from 5% to 7%, only for those
deposits.
Changes in financial institutions’ credit guarantee
organization contribution requirements
On January 30, 2007, the government announced a
legislative initiative to revise both the scope of loans
and the list of financial institutions subject to
requirements of contribution to the Credit Guarantee
Fund, the Technology Credit Guarantee Fund and the
- 97 -
Ⅴ. Changes in the financial infrastructure
<Table V- 6>
Adjustment of the reserve requirement ratios
(%)
Previous Current
Long-term time and savings deposits1) 1.0 0.0Time deposits, installment savings deposits, mutual installment deposits, 2.0 2.0
Korean housing installment deposits and won certificates of deposit (CD)
Other deposits including demand deposits and money market deposits 5.0 7.0accounts (MMDA)
Foreign currency deposits of 1.0 1.0special entities2)
Foreign Time and savings foreign currency currency deposits and negotiable certificates of 2.0 2.0
foreign currency deposit Foreign currency demand deposits 5.0 7.0
Notes: 1) Long Term Housing Savings Deposits, Worker’s PreferentialSavings Deposits, Long Term Savings Deposits for Household,Worker’s Asset Formation Deposits, Worker’s Long TermSavings Deposits and Worker’s Housing Savings Deposits.
2) External accounts, overseas emigrant accounts and residentaccounts which are opened by foreign exchange banks, andnegotiable certificates of deposit held by those eligible to opensuch accounts.
Source: Bank of Korea

Agriculture, Forestry and Fishery Credit Guarantee
Fund.
Foreign currency loans and subrogation of payment
guarantees, together with private placement bonds,
were added to the list of loans on which contributions
are required, that previously consisted of Korean won
loans and subrogation of payment guarantees only.
Meanwhile, facility loans and loans secured with
guarantees issued by financial institutions under
consignment agreements with the credit guarantee
funds were excluded from the list. Further, for the sake
of fairness among financial institutions, the Export-
Import Bank of Korea was added to the list of financial
institutions required to contribute to the credit
guarantee organizations. The National Agricultural
Cooperative Federation and National Federation of
Fisheries Cooperatives, which contribute to the
Agriculture, Forestry and Fishery Credit Guarantee
Fund, and non-banking institutions that deal little if at
all in loans secured with credit guarantees, will
continue to be exempt from the requirement.
Meanwhile, to alleviate the burdens on financial
institutions due to the expanded scope of loans subject
to contributions, the rates of contribution to the Credit
and Technology Credit Guarantee Funds were
downward adjusted. At the same time, to ensure greater
fairness the rates of contribution to the Agriculture,
Forestry and Fishery Credit Guarantee Fund applying
to the National Agricultural Cooperative Federation
and National Federation of Fisheries Cooperatives
were raised to a level closer to the rates in force for
general financial institutions.
- 98 -
Financial Stability Report April 2007
<Table V- 7>
Changes in types of loan subject to contribution requirement
Before
- Loans in Koreanwon1)
- Subrogation ofguaranteepayments inKorean won
After
- Loans in Korean won1)
- Subrogation of guarantee payments in Korean won
<Added>- Loans in foreign currency- Subrogation of guarantee payments in foreign
currency- Private placement corporate bonds- Bills bought in Korean won- Factoring receivables- Loans issued by the export-import bank
<Removed >- Loans for facilities- Loans on guarantee issued by financial institutions
under consignment agreements with the CreditGuarantee Funds
Note: 1) Excludes loans to households and interbank loans Source: Ministry of Finance and Economy
Source: Ministry of Finance and Economy
<Table V- 8>
Changes in contribution ratio
(%)
Before After
Credit guarantee fund 0.25 0.225
Technology credit guarantee fund 0.15 0.135
Agriculture, forestry and fishery credit guarantee fund 0.3 0.362

Changes in loan loss provision rules, etc.
On December 31, 2006, in an effort to strengthen
banks’ capability to absorb credit losses, the Financial
Supervisory Service (FSS) revised the loan loss
provision rules. The new minimum loan loss provision
ratios for precautionary-rated loans, calculated via the
expected loss estimation method under the New Basel
Capital Accord, was raised to 7.0% from 2.0% for
corporate loans, to 10.0% from 8.0% for household
loans, and to 15.0% from 12.0% for credit card loans.
However, the minimum loan loss provision ratios for
substandard-and-below loans were left unchanged. For
greater compliance with the New Basel Capital Accord
in expected loss calculation, meanwhile, provision
requirements, which were previously limited to
standard-classified unused commitments, have now
been extended to cover all unused commitments
including estimated losses.
Effective January 1, 2007, the FSS also revised the
loan delinquency criteria, thereby improving their
rationality greatly. The current principal-based criteria,
whereby a loan is deemed delinquent only when
delinquency occurs on principal repayments, were
replaced by new principal and interest-based criteria
whereby a loan is regarded as delinquent when
delinquency occurs on either principal or interest
repayment. The method for calculating the delinquency
rate has also been changed accordingly. Delinquencies
considered in the calculation are now principal and
interest repayments overdue for one month or longer,
in place of the previous principal repayments overdue
for one day or longer. Out of concern for protecting
financial service consumers, however, the delinquency
- 99 -
Ⅴ. Changes in the financial infrastructure
Note: 1) Minimum loan loss provision ratios for substandard and belowloans are left unchanged.
Source: Financial Supervisory Service
<Table V- 9>
Upward adjustment of minimum loan loss provision ratios1)
(%)
Before After
Corporate loansStandard 0.5 0.7Precautionary 2.0 7.0
Household loansStandard 0.75 1.0Precautionary 8.0 10.0
Credit card loansStandard 1.0 1.5Precautionary 12.0 15.0
<Table V-10>
Changes in the scope of application of loan loss provision requirement
Before After
Corporate Standard-classified unused All unused commitments loans commitments (standard to estimated loss)
Household Standard-classified unused All unused commitmentsloans commitments (standard to estimated loss)
Standard-classified unused All unused commitments commitments <excludes accounts (standard to estimated loss)that have been inactive during the <including accounts that have past one-year period> been inactive during the past
one-year period>
Note: 1) Unused share of credit lines granted to clients for financialproducts such as overdrafts and credit loans.
Source: Financial Supervisory Service
Credit cardloans
<Table V-11>
Changes in delinquency criteria
Before After
Delinquency criteria Principal basis Principal or interest basis
Overdue principal The following day payments of the due date
Upon the lapse of The following day of one month1) from the due date for the due date interest payment
Overdue installment payments
Note: 1) 14 days for corporate loans Source: Financial Supervisory Service
Delinquencyinitial date
Same as before
Second misseddue date2)
The following day of the first missed due date
Overdue interestpayments

criteria used for calculating late fees remain the current
principal-based ones1).
Effective January 1, 2007, the Financial Supervisory
Commission (FSC) also revised the capital adequacy
rule so as to extend application of the BIS capital ratio
requirement to bank holding companies. The new rule
requires bank holding companies to maintain their BIS
capital ratios, on a consolidated basis, at 8% or above.
Meanwhile, the FSS postponed introduction of the
advanced approaches2) agreed on under the New Basel
Capital Accord, from January 2008 to January 2009.
However, the FSS will go ahead with the plan to
implement the standardized and basic internal ratings-
based approaches in January 2008, as scheduled.
Notwithstanding this, banks in need of further
preparation will be offered the option of maintaining
the current standards3) during the first year of
implementation.
Implementing measures to strengthen housing
finance loan risk management
On November 15, 2006, the financial supervisory
authorities announced measures to strengthen risk
management practices related to housing finance loans,
in a move to reduce the inflow of funds to the real
estate market and help improve soundness of the
financial institutions and household sector.
- 100 -
Financial Stability Report April 2007
1) Interest is charged on overdue interest payments if delinquencyconcerns the interest, and on overdue principal payments ifdelinquency concerns the principal.
2) The advanced internal ratings-based approach (for credit risk) andadvanced measurement approach (for operational risk)
3) The option to maintain the current standards is also granted in EUcountries, for the period leading up to introduction of the advancedapproaches (in January 2008)
<Table V-12>
Schedule for implementation of the New Basel Capital Accord1) in selected countries
2007 2008 2009 2010Standardized approach EU KoreaBasic internal Japan Australia - China2)
ratings-based Hong Kong Singaporeapproach Thailand
AustraliaAdvanced internal Singapore Korearatings-based - EU US -approach Hong Kong Thailand
Japan
Notes: 1) Credit risk basis 2) Basic internal ratings-based approach

The highlights of the measures include abolishment of
the special loan-to-value (LTV) ratio applied to certain
banks and insurance companies, downward adjustment
of the LTV ratio for non-bank institutions, and
extended application of the debt-to-income (DTI) ratio
requirement, previously imposed only on loans for
purchases of apartments worth 600 million won or
more located in ‘speculative zones,’ to include
‘overheatedly speculative zones’ in the Seoul
metropolitan area.
On January 11, 2007, supplementary measures were
issued to complement the existing risk management
rules on housing finance loans. From now on, a
borrower holding two or more mortgages on
apartments located within speculative zones will be
allowed to extend the maturity on only one of the
loans. Also, restrictions on provision of multiple
loans4) to the same borrower, which had previously
applied only to banks, insurance companies and mutual
savings banks, were extended to all financial
institutions. Meanwhile, to strengthen the supervisory
authority’s guidance and oversight of financial
institutions and ensure proper assessment by lending
institutions of their borrowers’ debt repayment
capabilities, best practices5) were developed jointly by
the supervisory authority and the banks.
- 101 -
Ⅴ. Changes in the financial infrastructure
4) Restrictions on multiple loans include the following:1. No more than one loan per borrower on apartments located in
speculative zones (based on new loan contracts); 2. A DTI ratio cap of 40% for loans on apartments within speculative
zones to married borrowers already carrying mortgage loans or tounmarried borrowers aged 29 or younger;
3. Prohibition of residential mortgage lending to minors; and4. Restriction on maturity extension for borrowers with two or more
loans on apartments located in speculative zones. 5) This relates to financial institutions’ internal loan review systems for
adequate assessment of borrowers’ repayment capabilities, as opposedto direct regulations like DTI ratio requirements.

Korea-US FTA highlights related to the financial
sector
On April 2, 2007, Korea concluded a free trade
agreement with the US. While the items negotiated that
concerned the financial sector were few, since efforts to
open this sector had been actively pursued for years
already, issues such as the conditions for allowing new
financial services6), the range of authorized cross-
border financial services7) and the scope of
government-owned financial institutions exempt from
FTA rule application were at the fore of debate.
With regard to further opening of the Korean financial
market, the two sides agreed to approve market
participation by means of setting up of local branches
or subsidiaries, while allowing opening through cross-
border trade to a limited extent. They further agreed
that either country’s authorities may resort to prudential
measures when necessary to protect financial
consumers, sustain financial institution soundness and
ensure stability of the financial system.
Concerning the above-mentioned issues, several
agreements were reached. First, resident financial
institutions are now permitted to provide new financial
services in the host country, on the condition that they
obtain approval of the host country’s financial
supervisory authorities or accept being monitored and
regulated by them in regard to their financial
soundness. Cross-border financial services, meanwhile,
- 102 -
Financial Stability Report April 2007
6) New financial services that are not provided in the home country, butonly in the host country
7) Cross-border financial services provided via the internet or telephoneby suppliers who do not own a local branch or subsidiary in thedestination country
<Table V-13>
Korea-US FTA highlights related to financial sector
Category Description
New financial services - Allowed for resident financial institutions - Selected cross-border services, including asset management and non-life insurance,permitted
- Five state-owned financial institutions exempted from national treatment obligations
- Commitment to strengthen prudentialsupervision of postal insurance
Safeguards in an - Financial authorities’ use of short-termeconomic crisis safeguard measures permitted
Cross-border financial services
Public financial institutions

are only allowed for pre-agreed-upon types of trade8),
so that the financial authorities’ ability to supervise the
related transactions is not interfered with.
With regard to financial institutions excluded from the
FTA commitments, five government-owned
institutions including the Korea Development Bank,
the Industrial Bank of Korea, the National Agricultural
Cooperative Federation, the National Federation of
Fisheries Cooperatives and the Korea Housing Finance
Corporation were exempted from national treatment
obligations9). Also agreed was the stepping up of
financial soundness supervision on postal insurance to
the level applied to private-sector insurance companies.
The right to impose temporary safeguard measures,
enabling temporary control of in- and outflows of
foreign currency in the event of natural disaster or
economic crisis, has been maintained.
- 103 -
Ⅴ. Changes in the financial infrastructure
8) Asset management, maritime, aviation and disaster insurance services,and auxiliary insurance services such as actuarial and claim adjustmentservices and insurance consulting were included among authorizedcross-border financial services.
9) ’National treatment,’ in this case, means that the governments of thetwo FTA party countries treat each other’s financial institutions withcommercial presences in their territories in the same ways they treattheir own financial institutions, without discrimination.

Financial Stability Report is published twice a year and also posted on
the web-site of the Bank of Korea (http://www.bok.or.kr).
Please contact Financial Stability Analysis Team, Financial System Stability
Department, the Bank of Korea for any inquiries
(Tel : +82-2-750-6855, Fax : +82-2-750-6892, e-mail : [email protected]).
ISSN 1975-7042

www.bok.or.kr
April 2007
Ap
ril 20
07
Financial S
tability Report