Seismotectonic Model of the Kraljevo 3 November 2010 Mw 5.4 Earthquake Sequence
Upload
ingenieria110Category
view
5download
0
Seismological Research Letters Volume 78, Number 6 November/December 2007 635
INTRODUCTION
An inslab earthquake occurred below Atoyac, Guerrero, Mexico, on 13 April 2007 (Mw 5.9) at a depth of 37 km. It was strongly felt in Acapulco (Δ ~65 km) and Mexico City (Δ ~270 km); the peak ground accelerations (PGAs) at soft sites in these two cities were as high as 200 cm/s2 and 12 cm/s2, respectively. This was the first significant earthquake in Mexico since the recent strengthening of strong-motion and broadband networks in the country. This was also the first moderate event for which ground-motion maps for Mexico City were produced and dis-tributed without human intervention in near real time. In this paper, we report on the source characteristics and the tectonic implications of the earthquake and the ground motions that it produced. We also discuss the performance of the seismic alert system (SAS) and near real-time generation and distribution of expected ground-motion maps for Mexico City during the earthquake.
DATA AND ANALYSIS
Our analysis of the Atoyac earthquake is based on broadband seismograms and accelerograms from stations operated by the National Seismological Service (SSN) of the Instituto de Geofísica (IG) at the Universidad Nacional Autónoma de México (UNAM), and the Instituto de Ingeniería (II), UNAM. We also used data from an accelerograph operated by the Centro Nacional de Prevención de Desastres (CENAPRED) in Acapulco.
About 35 aftershocks with M ≥ 3.4 were reported by SSN in the first four days of the earthquake, the largest being one of magnitude 5.3. The SSN network is sparse. However, the accelerograph network operated by the II is relatively dense in
Guerrero (Anderson et al. 1994) where a mature seismic gap has been identified (Singh et al. 1981). Merged data from both networks permit reliable location of earthquakes in the region. As the accelerograms from the II network are not available in real time, two field crews were sent to retrieve them. Much of this report is based on the data collected up to 17 April 2007. We also analyze two events that occurred after 17 April.
The mainshock and the largest aftershock were well-re-corded by the networks. The accerelograph at Atoyac (ATYC), which is located in the epicentral region (figure 1), also recorded many of the smaller aftershocks. However, only four aftershocks triggered three or more II accelerographs. Here we analyze the mainshock and these four aftershocks (table 1). We also con-sider six other events that occurred in the region (table 2), as they have some relevance to this study.
All earthquakes were located using the crustal model of Campillo et al. (1996) and the Seisan program of Lienart and Havskov (1995). For the mainshock and three of the four aftershocks, we inverted the near-source displacement traces (obtained by integration of acceleration or velocity records) at ATYC and Cayaco (CAIG) stations for focal mechanism and seismic moment. The inversion assumes that the events may be approximated by a point-source shear dislocation. Synthetic seismograms include near- and intermediate-field contributions (Singh et al. 2000). The effect of free surface is approximately taken into account by multiplying the infinite-space synthetics by two. This approximation is acceptable if the epicentral distance, Δ, is smaller than the depth, h. Figure 2 shows the fit between the observed and synthetic seismo-grams. The focal mechanisms and the moments are listed in table 1. The source parameters of the mainshock obtained from near-source seismograms and those reported in the Global Centroid Moment Tensor (CMT) catalog are very similar. The fit between observed and synthetic P wave on the Z component for the mainshock at ATYC, however, is poor. ATYC is nearly nodal for the P wave. The observed P pulse is negative for about 1 s and then becomes positive, while the synthetic P wave, as expected, is unipolar (positive). One possible explanation for the change in the polarity of the P wave is a change in the focal mechanism during rupture so that the first motion at ATYC changes from dilatational to compressional.
A Report on the Atoyac, Mexico, Earthquake of 13 April 2007 (Mw 5.9)S. K. Singh, M. Ordaz, J. F. Pacheco, L. Alcántara, A. Iglesias, S. Alcocer, D. García, X. Pérez-Campos, C. Valdes, and D. Almora
S. K. Singh,1,2 M. Ordaz,2 J. F. Pacheco,1 L. Alcántara,2 A. Iglesias,1 S. Alcocer,2 D. García,1 X. Pérez-Campos,1 C. Valdes,1 and D. Almora2
with contributions by L. A. Aguilar,2 M. Ambriz,2 J. G. Anderson,3 M. Ayala,2 C. Cárdenas,1 G. Castro,2 J. L. Cruz,1 R. Delgado,2 L. Domínguez,4 J. Estrada,1 S. I. Franco,1 L. E. Flores,4 C. Gutierrez,4 M. A. Macías,2 I. Molina,2 C. Morquecho,4 J. Ortíz,1 M. A. Pacheco-Martínez,4 A. Quezada,1 R. Quaas,4 L. Quintanar,1 C. Pérez,2 J. Perez,1 A. L. Ruiz,2 H. Sandoval,2 M. Torres,2 R. Vázquez,2 J. M. Velasco,2 J. Velázquez,2 and M. Velázquez2
1. Instituto de Geofísica, Universidad Nacional Autónoma de México, C.U., Coyoacán 04510, Mexico City, Mexico
2. Instituto de Ingeniería, Universidad Nacional Autónoma de México, C.U., Coyoacán 04510, Mexico City, Mexico
3. Seismological Laboratory, Mackay School of Mines, University of Nevada, Reno, Nevada 89557
4. Centro Nacional de Prevención de Desastres, Delfin Madrigal 665, Coyoacán 04360, Mexico City, Mexico

636 Seismological Research Letters Volume 78, Number 6 November/December 2007
0 50 100
km
Figure 1. ▲ (A) Locations and focal mechanisms of Mw ≥ 4.0 earthquakes in the Guerrero region relevant to this study. M denotes Atoyac mainshock and 1, 3, and 4 refer to the aftershocks (table 1). Letters associated with the events are keyed to table 2. Except for events a, b, and f, all others occurred between 31 March and 30 April 2007. Rectangle: accelerographic station, triangle: broadband station. Some critical stations are identified. (B) Section along AA’. Dashed line indicates plate interface. Locations, focal mechanisms and associated stress axes of inslab earthquakes are indicated. Atoyac mainshock and its aftershocks (h ~ 37 km) represent downdip compression. The earthquakes that occur below this zone of compression exhibit downdip tension. The stress axis of a typical such event is taken from Pacheco and Singh (2007).
−60
−40
−20
0
0 40 80 120 160 200 240 280
Trench CoastMEIG PLIG
km
km

Seismological Research Letters Volume 78, Number 6 November/December 2007 637
For the largest aftershock, which occurred on 13 April at 08:43 (event 1, table 1), and all earthquakes listed in table 2, we performed a regional moment tensor analysis following the pro-cedure of Randall et al. (1995). The method uses a time-domain moment-tensor inversion scheme described by Langston (1981). The inversion is performed on bandpass filtered seismograms over a time window that begins with the P wave and includes surface waves. Synthetic seismograms are computed using the reflection-matrix method of Kennett (1983) and Randall (1994). The best centroid depth is obtained through grid search.
The locations and the focal mechanisms of the earthquakes are plotted in figure 1(A). Figure 1(B) illustrates a vertical sec-tion along the direction of relative convergence of the Cocos and North America (NOAM) plates (N36°E) passing through Atoyac. We note that one of the nodal planes of the Atoyac earth-quake sequence is nearly vertical (table 1). The same is true for
two other earthquakes that occurred near Atoyac in 2001 (events a and b, table 2; figure 1A), as well as events c and d whose epicen-ters are close to Acapulco (table 2; figure 1A). All of these events have similar depths (~35–43 km) and occur in the subducted Cocos plate immediately below the plate interface. It is important to note that these events reveal downdip compression. Shallow-angle thrust earthquakes occur on the plate interface at depths of less than about 25 km, updip of this inslab zone of compression (Pacheco and Singh 2007). As the vertical section in figure 1(B) illustrates, just below the zone of downdip compression there occur normal-faulting earthquakes in the slab whose stress axes show downdip tension. The plate interface above these zones of downdip tension and compression may define the downdip edge of the seismogenic, shallow-dipping thrust zone (e.g., Tichelaar and Ruff 1993). The aftershocks of large/great earthquakes may not extend below this edge (although the seismic slip during large/
TABLE 1Source parameters of the 13 April, 2007 Atoyac earthquake (Mw 5.9) and four of its aftershocks
Event Date; Hr:MinLat(°N)
Long (°W)
Depth (km)
M0(N-m) Mw Strike Dip Rake Source
Mainshock M 07/04/13; 05:42 17.4117.219
—
100.21100.351
—
38.937.5—
9.9 × 10¹⁷
8.4 × 10¹⁷
8.9 × 10¹⁷
5.95.95.9
284°278°
—
73°75°—
91°85°—
Global CMT1
This study2,3
This study4
Aftershock 1 07/04/13; 08:43 17.217——
100.304——
36.5——
1.2 × 10¹⁷
9.0 × 10¹⁶
1.2 × 10¹⁷
5.35.25.3
289°117°
—
83°84°—
77°–100°
—
This study2,3
This study5
This study4
Aftershock 2 07/04/13; 09:26 17.225 100.340 35.1 3.96 — — — This study2
Aftershock 3 07/04/13; 22:20 17.203 100.341 37.4 2.2 × 10¹⁵ 4.2 300° 75° 60° This study2,3
Aftershock 4 07/04/14; 03:58 17.201 100.334 37.5 1.6 × 10¹⁵ 4.1 307° 74° 70° This study2,3
1. Preliminary Global CMT solution2. Location from local and regional data3. M0 and focal mechanism from inversion of near-source displacement traces4. M0 from S-wave spectra of local recordings5. M0 and focal mechanism from regional moment tensor inversion6. Local magnitude ML.
TABLE 2Source parameters of some earthquakes in the region that are relevant to this study
Event Date; Hr:MinLat(°N)
Long (°W)
Depth (km)
M0(N-m) Mw Strike Dip Rake Source
a 01/03/05; 10:17 17.136 100.093 37.3 4.0 × 10¹⁶ 5.1 250° 16° –132° This study1,2
b 01/03/06; 21:57 17.139 100.093 36.7 3.0 × 10¹⁶ 5.0 340° 40° –50° This study1,2
c 07/03/31; 06:18 16.992 99.841 42.7 1.26 × 10¹⁶ 4.7 314° 86° 119° This study1,3
d 07/04/28; 13:56 16.999 99.836 39.9 4.41 × 10¹⁶ 5.0 307° 75° 118° This study1,3
e 07/04/19; 10:02 17.343 –101.181 25.1 3.5 × 10¹⁶ 5.0 359° 29° 169° This study1,2
f 05/05/26, 15:55 17.961 –99.971 58.2 9.0 × 10¹⁵ 4.6 289° 34° –76° This study1,2
1. Location from local and regional data2. M0 and focal mechanism from regional moment tensor inversion3. M0 from S-wave spectra of local recordings

638 Seismological Research Letters Volume 78, Number 6 November/December 2007
great earthquakes might). If so, then the aftershock area should not extend inland much beyond 10 km from the coast. A bound on downdip extent of rupture during large/great earthquakes in Guerrero is of critical importance in hazard estimation.
Seismicity in the slab is nonexistent beyond this zone until about 180 km from the coast, where the occurrence of normal-faulting events (indicating downdip tension) resumes. These earthquakes occur at a depth of ~ 50 km over a small lateral extent (<10 km). Further inland, the inslab seismicity completely ceases and the seismic identity of the subducted plate is lost. We note that inslab downdip compression has also been reported in sub-duction zones of Peru and central Chile (Lemoine et al. 2002).
The seismicity pattern and state of the stress in the region can be explained by the initial bending of the Cocos plate at a shallow angle as its subduction at the middle America trench commences. The plate begins to unbend about 10 km landward from the coast, which gives rise to earthquakes with downdip compression in the upper part of the slab (like those of the Atoyac earthquake sequence) and downdip tension immedi-ately below it. Beyond this point the plate becomes subhorizon-tal, reaching a depth of 50 km about 180 km from the coast where the plate again bends down. This bending is reflected in
normal-faulting earthquakes with downdip tension. Thus, the inslab seismicity is mostly confined to regions of unbending and bending. The state of the stress in the slab is almost neutral in the portion that is subhorizontal. This model is similar to those proposed earlier (e.g., Suarez et al. 1990; Singh and Pardo 1993) but is now much better constrained from improved earthquake locations and focal mechanisms (Pacheco and Singh, in prepara-tion) and from receiver function analysis using data from a lin-ear, portable seismograph array deployed from Acapulco in the south up to 400 km in the north (Pérez-Campos et al. 2007).
Inslab earthquakes with downdip compression also occur ~10 km north of Acapulco (Pacheco and Singh 2007). Indeed, events c and d (table 2) are such earthquakes. The largest such event so far identified is the 10 December 1994 earthquake, which occurred about 41 km north of Zihuatanejo (Cocco et al. 1997).
Table 3 lists the types of seismic sources in the vicinity of Acapulco and other coastal towns in Guerrero. The table also gives observed maximum Mw in Mexico of each type of event. For the purpose of seismic hazard estimation, it will be desirable to split the instrumental seismicity catalog by different types of sources. This, of course, is a very difficult task.
Figure 2. ▲ Observed (continuous) and synthetic (dashed) displacement seismograms of the Atoyac mainshock and three of its after-shocks at stations ATYC and CAIG (figure 1A). Observed seismograms have been inverted for seismic moments and focal mechanisms (see text).

Seismological Research Letters Volume 78, Number 6 November/December 2007 639
SOURCE SPECTRUM AND STRESS DROP
We estimated source displacement and acceleration spectra, &M 0( f ) and f 2 &M 0( f ), of the mainshock and the largest after-
shock of the Atoyac earthquake from the analysis of the S-wave group recorded at hard sites within a hypocentral distance of 165 km (19 stations). The Fourier acceleration spectral ampli-tude of the intense part of the ground motion at a station, under far-field, point-source approximation, may be written as
A(f,R) = Cf 2 &M 0( f )G(R)e–πfR / βQ( f ) (1)
where
C = FPRθϕ(2π)2/(4πρβ3). (2)
In the equations above, &M 0( f ) is the moment rate spectrum so that &M 0( f ) → M0 as f → 0, R = hypocentral distance, Rθϕ = aver-age radiation pattern (0.55), F = free surface amplification (2.0), P takes into account the partitioning of energy in the two horizontal components (1 2/ ), β = shear-wave veloc-ity at the source (3.95 km/s), ρ = density in the focal region (2.9 kg/m3), and Q( f ) = quality factor, which includes both anelastic absorption and scattering. The appropriate geometri-cal spreading term, G(R), for inslab Mexican earthquakes is R–1 and the corresponding Q( f ) is 251f 0.58 (García et al. 2004). Taking logarithms of equation 1 we obtain
log , log log ( ) log ( )A f R C G R f M f( ) = + + 2
0
−1 36.
( ).
f RQ fβ
(3)
We solved equation (3) in the least-squares sense to obtain log [ f 2 &M 0( f )].
The source displacement and acceleration spectra of the mainshock and the largest aftershock are shown in figure 3. We interpret these spectra within the framework of a ω2-source model and obtain an estimation of the seismic moment (M0) and corner frequency ( fc ). The stress drop (∆σ) is computed using the Brune (1970) model. The source spectra of the main-shock and the aftershock in figure 3 can be fit by M0 and ∆σ of 8.9 × 10¹⁷ N-m and 47 MPa ( fc = 0.727 Hz), and 1.2 × 10¹⁷ N-m and 29 MPa ( fc = 1.19 Hz), respectively. We note that the stress drop of the mainshock is somewhat higher than the median ∆σ of 30 MPa reported by García et al. (2004) for inslab normal-faulting Mexican earthquakes.
RADIATED SEISMIC ENERGY AND APPARENT STRESS
We estimated radiated seismic energy, ER, of the mainshock from regional data by a) using aftershocks as empirical Green’s functions (for details of the method see, e.g., Venkataraman et al. 2002; Singh et al. 2004), and b) direct integration of squared velocity spectra (Singh and Ordaz 1994). We also estimated ER from teleseismic data following the method of Boatwright and Choy (1986). For brevity, the details are omit-ted here. Estimates of ER from the three methods are 2.5, 1.6, and 0.87 × 10¹⁴ J, respectively. We consider ER = 2.5 × 10¹⁴ J, obtained from the empirical Green’s function (EGF) tech-nique, to be the best estimate. This yields ER/M0 of 2.5 × 10⁻⁴ and, with μ = 4.5 × 10⁴ MPa, an apparent stress σa = μ ER/M0 of ~11 MPa. If, however, we allow ER to be in the range of 1 to 3 × 10¹⁴ J, then we get ER/M0 of 1 to 3 × 10⁻⁴ and σa of 4.5 to 13.5 MPa.
Choy and Kirby (2004) studied the behavior of σa of nor-mal-faulting subduction earthquakes from a worldwide data-base. These authors found that the highest σa for inslab events occurred at 35–70 km depth, in proximity to zones of intense deformation such as sharp bends in the slab. The apparent
TABLE 3Seismic sources in the vicinity of Acapulco and other towns in Guerrero, and observed maximum Mw of each type of
earthquake in Mexico
Source description
Depth range,
km
Observed maximum
Mw
Region and date (yyyy/mm/dd) of the largest event of the type
Interplate, shallow thrust 15–25 8.2 Jalisco, 1932/06/03Interplate, shallow thrust, slow, near trench 10–15 7.1 Off the coast of Oaxaca,1 1996/02/25Inslab, normal-faulting, downdip tension, below the seismogenic plate interface
30–45 7.1 Michoacan, 1997/01/11
Inslab, normal-faulting, downdip tension, downdip from the seis-mogenic plate interface
40–55 7.4 Oaxaca, 1999/09/30
Normal-faulting, shallow, crustal 6–10 5.8 Coyuca, Guerrero 2001/10/08Inslab, normal- or thrust-faulting, below the edge of the seis-mogenic plate interface, downdip compression
35–45 6.4 Guerrero-Michoacan, 1994/12/10
1. Colima-Jalisco earthquake of 9 October 1995 (Mw 8) may also be of this type: the source was slow and the rupture extended up to the trench.

640 Seismological Research Letters Volume 78, Number 6 November/December 2007
stresses of these events were up to 5 MPa, significantly higher than for the interplate thrust earthquakes. Inslab earthquakes in Mexico are also significantly more energetic than interplate events (García et al. 2004). The fact that σa of the Atoyac earth-quake is higher than those reported by Choy and Kirby (2004) for such events probably reflects the discrepancy between tele-seismic and local estimates of the radiated energy.
PEAK GROUND MOTIONS
Figure 4 shows the quadratic mean horizontal components of peak ground acceleration (PGA) and peak ground velocity (PGV) as a function of R. These plots show data from hard sites. For Acapulco, however, we also include data from soft sites (tri-angles). The predicted PGA and PGV from a regression analysis of García et al. (2005) are shown in the figures. The observed values, generally, exceed those predicted by the model, which is based on inslab, normal-faulting Mexican earthquakes. This is consistent with the relatively large stress drop of the Atoyac event mentioned before. We recall that higher ground motions are expected in the epicentral area of inslab earthquakes in compari-son with interplate events in Mexico (e.g., García et al. 2005).
PGA and, especially, PGV in figure 4 show a somewhat slower decay than that predicted by the model, which cannot be explained as a source effect. This results in PGAs > 1 cm/s2
and PGVs > 0.1 cm/s even at R > 300 km.
GROUND MOTIONS IN ACAPULCO
PGAs recorded in Acapulco during the Atoyac earthquake and its major aftershock (Δ ~ 60–75 km) are listed in tables 4 and 5. The locations of the stations are shown in figure 5. Generally, PGAs during the mainshock at soft sites were about 100 cm/s2,
although it reached 200 cm/s2 at Diana (ACAD). At hard sites (ACAJ and VNTA), the PGA was about 35 cm/s2.
As mentioned earlier, an earthquake of characteristics simi-lar to the Atoyac event could occur near Acapulco. The magni-tude of such an earthquake could easily reach Mw 6.5. It is of practical importance to estimate ground motions in Acapulco from postulated Mw 6.0 and 6.5 earthquakes of this type. An appropriate ground-motion prediction equation is not available for this type of earthquake. Thus, we use recordings of events c and d (table 1) in Acapulco as empirical Green’s functions and apply a technique proposed by Ordaz et al. (1995) to synthe-size expected ground motions. The focal mechanisms, depths, and magnitudes of events c and d qualify them as acceptable EGFs. The method assumes an ω2-source model. Apart from the seismic moments of the EGF and the target event, the only other needed parameters are their stress drops, which we take as 20 MPa. The results are not very sensitive to reasonable choice of this parameter. Synthesized PGA at ACAJ and ACAD as a function of Mw is shown in figure 6. The figure indicates that an Atoyac-type Mw 6.5 earthquake could cause horizontal PGA of ~ 1/2 g at soft sites such as the Acapulco Diana.
DAMAGE
The earthquake caused damage in some municipalities in the state of Guerrero, mainly in Atoyac de Álvarez, Coyuca de Benítez, and Benito Juárez. Horizontal PGA in the first two municipalities was 215 cm/s2 and 128 cm/s2, respectively. By 22 April, at least some damage had been reported at a total of 750 houses. A quick reconnaissance of the area showed that 97% of damaged houses had been built with adobe or bahareque (rammed earth) while the remainder were built with timber, cardboard, or more durable materials such as brick and block.
Figure 3. ▲ Average source displacement, &M 0(f ), and acceleration, f 2 &M 0(f ), spectra (mean and ±1 standard deviation curves). (Left) main-
shock, (right) largest aftershock. Superimposed on the spectra are predicted curves from an ω2 source model (smooth curves).

Seismological Research Letters Volume 78, Number 6 November/December 2007 641
Damaged adobe houses in the most affected municipalities (Benito Juárez and Atoyac de Álvarez) were between 5% and 6% of the total number of houses.
In general, damage in dwellings was characterized by verti-cal cracking at wall intersections, inclined cracking above door and window lintels, and wall-inclined cracking. Few partial collapses of roofs and tile sliding occurred. The type of dam-age and the known high vulnerability of adobe and rammed-earth houses again calls attention to the need to improve the earthquake performance of these houses through effective, yet inexpensive, rehabilitation techniques.
No damage to roads and bridges was recorded, except for a nine-ton rock that fell on a road in Atoyac de Álvarez.
As has occurred in other earthquakes, the population of Acapulco and Mexico City overreacted to the real intensity of the earthquake. It has been observed that even a moderate earthquake triggers fear and anxiety among people who imme-diately recall the consequences of the devastating 19 and 21 September 1985 earthquakes.
PERFORMANCE OF THE SEISMIC ALERT SYSTEM FOR MEXICO CITY
The seismic alert system (SAS) for Mexico City takes advan-tage of the fact that the city is located more than 300 km from the foci of potentially damaging earthquakes. The system con-sists of 15 accelerometers located along the coast of Guerrero. An algorithm estimates magnitude of an event from the near-source accelerograms and issues public and restricted alerts for M ≥ 6 and 5 ≤ M < 6, respectively (Espinosa-Aranda and Rodríguez 2003). An evaluation of the SAS’s performance by Iglesias et al. (2007) for the period 1991–2004 reveals a sur-prisingly high failure rate. This poor performance results from an inadequate detection algorithm and the limited area covered by the SAS. Iglesias et al. (2007) propose an alternative strategy for detecting potentially damaging earthquakes to Mexico City. One month of seismic activity in the Guerrero region, begin-ning 31 March, 2007, provides a further test of the present SAS algorithm and the proposed alternative strategy.
Figure 4. ▲ Horizontal quadratic mean PGA (top) and PGV (bottom) at hard sites as a function of hypocentral distance. Superimposed are predicted curves (mean and ±1 standard deviation) for normal-faulting Mexican inslab earthquakes (García et al. 2005). Triangles: soft sites in Acapulco.

642 Seismological Research Letters Volume 78, Number 6 November/December 2007
A restricted alert was issued by the SAS for the earthquake of 31 March, which was located near Acapulco (Mw 4.7; event c in table 2). This was a false alert since the magnitude was less than 5. The alert caused annoyance to the alert subscribers since the earthquake was felt by very few people in the city. A pub-lic alert was issued for the Atoyac mainshock. In a strict sense, this alert was also a failure, since Mw was less than 6. However, since the earthquake was widely felt in the city, it clearly mer-ited a public alert. In this context, we also note that the initial estimate of the magnitude by the SSN was 6.3. The SAS cor-rectly issued a restricted alert for the largest aftershock (Mw 5.3, event 1, table 1). Although the 19 April earthquake near Petatlan qualified for a restricted alert (Mw 5.0, event e, table 2), none was issued by SAS. Since Mw of the earthquake of 28 April near Acapulco was 5.0 (event d, table 2) the SAS should have issued a restricted alert but did not. More important, it is not clear why SAS did not issue a restricted alert for this event
while it did for the 19 March earthquake (Mw 4.7). The events were located very near each other, the 28 April earthquake was greater, and it gave rise to larger accelerations at near-source sta-tions, including those in Acapulco.
In the alternative strategy proposed by Iglesias et al. (2007), the alert is based on expected peak acceleration at station CU, Ared, which is computed from root-mean-square acceleration (Arms) at near-source stations using the relation
A A eR
Rred rms
R R S
CU
CU S= −( ). .554 005
where RS and RCU are hypocentral distances to near-source sta-tions and station CU, respectively. CU is located in the hill zone of Mexico City. This station has been in continuous operation since 1964. The equation is based on extensive strong-motion
TABLE 4PGA in Acapulco during Atoyac earthquake of 13 April 2007, 05:42 (Mw 5.9)
Station Location R (km)PGA, NS(cm/s2)
PGA, EW(cm/s2)
PGA, Z(cm/s2)
ACAC1 Acapulco Centro Cultural 77 99.6 93.9 64.2ACAD1 Acapulco Escuela Diana 74 202.9 175.8 74.7ACAR1 Acapulco Renacimiento 75 88.7 117.9 67.8ACAZ1 Acapulco La Zanja 85 75.7 87.7 43.7ACP21 Acapulco Preparatoria No. 2 73 98.0 97.6 50.1VNTA2 La Venta 77 25.3 24.6 17.1ACAJ2 Telmex Office 74 35.2 31.1 26.8SIS1 Punta Diamante 85 65.83 98.04 49.6
1. Soft site2. Hard site3. The orientation is N30°E4. The orientation is S60°W
TABLE 5PGA in Acapulco during Atoyac aftershock of 13 April 2007, 08:43 (Mw 5.3)
Station LocationR
(km) PGA, NS
(cm/s2)PGA, EW(cm/s2)
PGA, Z(cm/s2)
ACAC1 Acapulco Centro Cultural 73 37.4 46.9 27.8ACAD1 Acapulco Escuela Diana 70 59.1 65.9 27.9ACAR1 Acapulco Renacimiento 72 43.5 55.6 21.4ACAZ1 Acapulco La Zanja 81 36.1 47.0 26.6ACP21 Acapulco Preparatoria No. 2 69 44.4 33.1 20.2VNTA2 La Venta 72 13.8 12.6 9.3ACAJ2 Telmex Office 70 13.1 10.9 11.4SIS1 Punta Diamante 84 22.13 38.34 21.6
1. Soft site2. Hard site3. The orientation is N30°E4. The orientation is S60°W

Seismological Research Letters Volume 78, Number 6 November/December 2007 643
Figure 5. ▲ Location of strong-motion stations in Acapulco. VNTA and ACAJ are situated on hard sites, while all other stations are located on soft sites.
Figure 6. ▲ Simulated PGA at ACAJ (hard site) and ACAD (soft site) in Acapulco for postulated 5.5 ≤ Mw ≤ 6.5 events of the same type as the Atoyac earthquake. Solid symbols: event c (table 2) used as EGF, open symbol: event d (table 2) used as EGF. Predicted PGA is greater when event d is used as EGF. Note that data at ACAD for event d was not available.

644 Seismological Research Letters Volume 78, Number 6 November/December 2007
recordings available at CU. In the above equation, Arms is com-puted over a 10-s window on bandpass-filtered (0.2–1.0 Hz) accelerograms. Ared is the expected maximum acceleration at CU in the same frequency band. Experience shows that if observed peak acceleration in CU, Acu, is ≥ 2 cm/s2, then the earthquake is widely felt and may cause damage in the city. Iglesias et al. (2007) propose a single level of alert and suggest this should occur when Acu ≥ 2 cm/s2. If we require that the probability of missed alert at this threshold be 1% and that of false alert be 30%, then the alert would have to be issued if Ared ≥ 0.8 cm/s2.
Figure 7 shows Ared and ACU for the five earthquakes discussed above, along with data from previous earthquakes (Iglesias et al. 2007). During the earthquake sequence under consideration the Atoyac mainshock is the only event for which Ared ≥ 0.8 cm/s2.
NEAR REAL-TIME GROUND-MOTION MAP FOR MEXICO CITY
Since mid-2006, a new system has been put in operation to pro-duce, in automatic fashion, the expected ground-motion map for Mexico City during earthquakes.
The system, presently in its first stage, relies on recordings of a single station. It is triggered by the detection of an earth-
quake at the station CU. As mentioned in the previous section, this station, located in the hill zone of Mexico City, has been in operation since the 1960s and has been used as a reference site to compute spectral amplifications of all the other instru-mented sites throughout the city (see figure 8).
Once the end of the motion is detected, the system com-putes the response spectra (pseudoaccelerations, 5% damp-ing) of the horizontal components and decides, based on their absolute size and the ratio between the spectral ordinates at 1 s and the corresponding PGA, whether it is a significant event or not.
If the system decides that it is dealing with a significant event, a process starts to compute estimated average horizontal response spectra at the nodes of a grid of 1,600 points with sep-aration of approximately 500 m, using response spectral transfer functions that are precomputed and stored in the system. These transfer functions have been obtained using those computed from previous earthquakes at the approximately 100 strong-motion stations of the Mexico City Accelerographic Network (figure 8) and a Bayesian interpolation scheme that uses the transfer functions at instrumented sites, plus information from about 2,500 points in which the predominant site period has been measured. Previous studies have shown that the response
0.01
0.1
1
10
100
0111.0
False alert
Missed alert
A (gal)red
A(g
al)
CU
M
1
ed
c
Figure 7. ▲ Observed PGA (ACU) versus expected PGA (Ared) at station CU. ACU and Ared are based on bandpass-filtered CU and near-source recordings, respectively (see text). The plot includes data since the early 1960s and forms the basis of an alternative seismic alert algorithm for Mexico City (Iglesias et al. 2007). In the proposed scheme, an alert will be issued if the expected PGA at CU, estimated from near-source recording, is ≥ 2 cm/s2. If we require that the probability of missed alert at ACU ≥ 2 cm/s2 be 1% and that of false alert be 30%, then an alert must be triggered if Ared ≥ 0.8 cm/s2. The data for 30 March–30 April 2007 sequence (tables 1 and 2) are shown by dots. Only the Atoyac mainshock merits an alert.

Seismological Research Letters Volume 78, Number 6 November/December 2007 645
spectra thus estimated at sites in the Valley of Mexico are very close to the exact response spectra (e.g., Ordaz et al. 1988).
Once the average horizontal response spectra are com-puted at the 1,600 points, maps of spectral accelerations at four periods (0 s, 0.2 s, 1 s, and 2 s) are produced. These maps, along with key parameters of the ground motion, are: 1) uploaded to an Internet site (http://aplicaciones.iingen.unam.mx/webSAPS/Defaultsn.aspx); 2) sent by e-mail to a list of city officials and interested persons; 3) sent by cellular phone to the same list of persons; and 4) sent by radio links to the Civil Protection City Authority (still in a test phase).
As an example, figure 9 shows two spectral acceleration maps of the 19 September 1985 earthquake. These maps, of course, have been recreated, a posteriori, using the recordings obtained at station CU at that time.
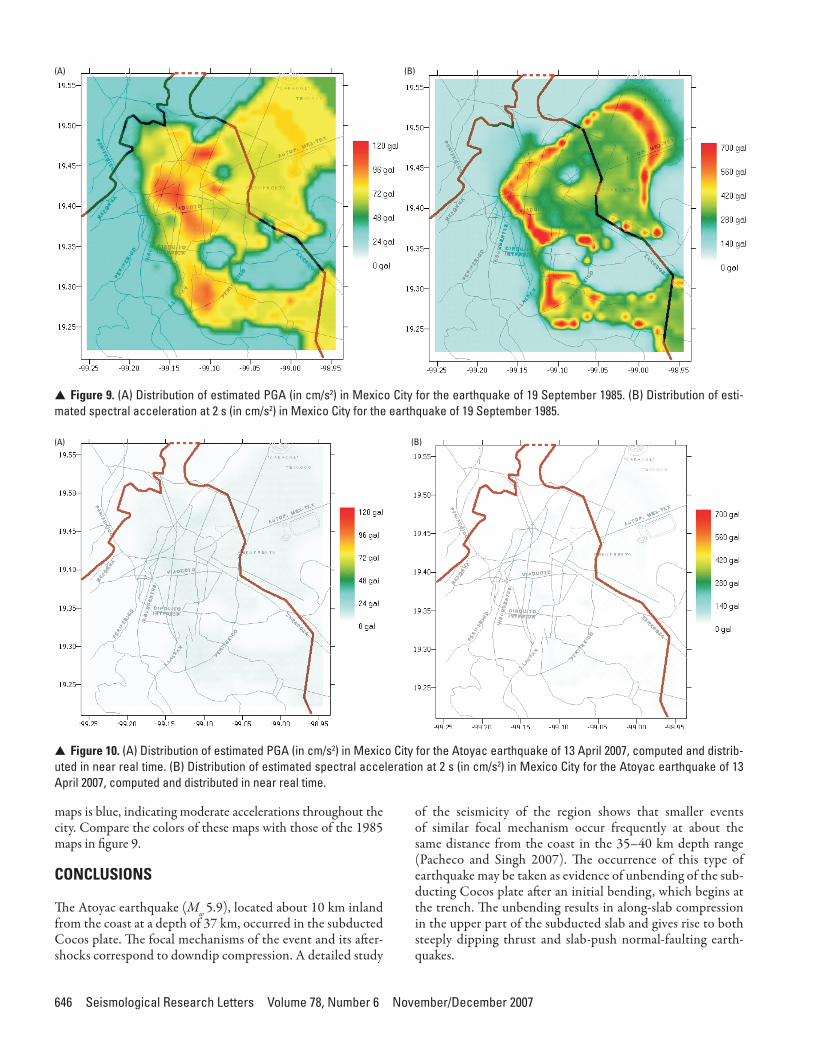
Although the system had been triggered by several minor events, the earthquake of 13 April 2007 was the first moderate event for which ground-motion maps were produced without human intervention. The total time employed by the system was seven minutes after it first detected the motion. In figure 10 we present the maps corresponding to PGA and the spectral acceleration response at 2 s. Note that the general color of the
Figure 8. ▲ Map of Mexico City showing its geotechnical subdivision in hill, transition, and lake-bed zones. Rectangles, dots, and triangles are accelerographic stations operated by three different institutions. Relative spectral amplifications of these sites with respect to CU (large dot) are known. Interpolated relative spectral amplifications are available at 2,500 grid points. Real-time accelerograms at CU are used to generate expected ground-motion maps of the city via random vibration theory.
646 Seismological Research Letters Volume 78, Number 6 November/December 2007
maps is blue, indicating moderate accelerations throughout the city. Compare the colors of these maps with those of the 1985 maps in figure 9.
CONCLUSIONS
The Atoyac earthquake (Mw 5.9), located about 10 km inland from the coast at a depth of 37 km, occurred in the subducted Cocos plate. The focal mechanisms of the event and its after-shocks correspond to downdip compression. A detailed study
of the seismicity of the region shows that smaller events of similar focal mechanism occur frequently at about the same distance from the coast in the 35–40 km depth range (Pacheco and Singh 2007). The occurrence of this type of earthquake may be taken as evidence of unbending of the sub-ducting Cocos plate after an initial bending, which begins at the trench. The unbending results in along-slab compression in the upper part of the subducted slab and gives rise to both steeply dipping thrust and slab-push normal-faulting earth-quakes.
Figure 10. ▲ (A) Distribution of estimated PGA (in cm/s2) in Mexico City for the Atoyac earthquake of 13 April 2007, computed and distrib-uted in near real time. (B) Distribution of estimated spectral acceleration at 2 s (in cm/s2) in Mexico City for the Atoyac earthquake of 13 April 2007, computed and distributed in near real time.
(A) (B)
(A)
Figure 9. ▲ (A) Distribution of estimated PGA (in cm/s2) in Mexico City for the earthquake of 19 September 1985. (B) Distribution of esti-mated spectral acceleration at 2 s (in cm/s2) in Mexico City for the earthquake of 19 September 1985.
(B)

Seismological Research Letters Volume 78, Number 6 November/December 2007 647
Shallow-dipping thrust events on the plate interface cease to occur at a depth of ~25 km, just above the zone of Atoyac-type earthquakes. This may define the downdip edge of the seismogenic, shallow-dipping thrust zone. It has been suggested that aftershocks of large/great earthquakes may not extend any farther below this edge. If so, then the aftershock area should not extend inland much beyond 10 km from the coast. A bound on downdip extent of rupture during large/great earthquakes is of critical importance to seismic hazard estimation in Guerrero.
The source spectrum of the earthquake is reasonably well-fit by the ω2-source model along with a stress drop of 47 MPa. This stress drop is somewhat larger than the median value of 30 MPa estimated for inslab normal-faulting Mexican earth-quakes. This relatively large stress drop also explains larger than predicted PGA and PGV recorded during the earthquake.
Radiated seismic energy, ER, during the earthquake was in the range of 1 to 3 × 10¹⁴ J. This yields ER/M0 of 1 to 3 × 10⁻⁴ and apparent stress of 4.5 to 13.5 MPa. These values are higher than those reported for inslab earthquakes in subduction zones using teleseismic data (σa < 5 MPa). The difference probably reflects systematic error in teleseismic estimation of ER.
The damage in the epicentral region was minor and limited to adobe houses.
Synthesis of ground motion in Acapulco from a postulated Atoyac-type Mw 6.5 earthquake suggests that such an event might give rise to a horizontal PGA of ~1/2 g at soft sites such as the Acapulco Diana.
The performance of the seismic alert system (SAS) dur-ing a one-month period beginning 31 March 2007 was mixed. Public and restricted alerts for the Atoyac mainshock (Mw 5.9) and its largest aftershock (Mw 5.3), respectively, may be consid-ered successes. The system, however, issued a false restricted alert for the Acapulco earthquake of 31 March (Mw 4.7) and missed restricted alerts for the earthquakes of 19 and 28 April (Mw 5.0). We tested a recently proposed alternative strategy for SAS (Iglesias et al, 2007) on the same earthquake sequence and found that it performed well. We think that this alternative strategy merits serious consideration.
Estimated ground-motion maps for Mexico City were automatically generated and distributed in seven minutes after an accelerograph at CU, a station in the hill zone of the city, first detected the earthquake. Presently in the first stage of its development, this project will provide quick and reliable assess-ment of possible damage in the city.
The Atoyac earthquake demonstrates that permanent seismic instrumentation in some parts of Mexico, especially Guerrero, is reasonably dense for fruitful research in seismol-ogy and earthquake engineering. The near real-time availabil-ity of strong-motion and other geophysical data (e.g., GPS and tide-gauge), however, still remains elusive and a goal to strive for.
ACKNOWLEDGMENTS
The broadband network of SSN and the accelerographic net-work of II are partially funded by Secretaria de Gobernacion,
Mexico. The II network is also partially funded by the National Science Foundation. We thank CENAPRED for providing us with data from its Acapulco station, ACAJ. The research was partly supported by DGAPA (project IN110207) and CONACyT (project 42671-T).
REFERENCES
Anderson, J. G., J. N. Brune, J. Prince, R. Quaas, S. K. Singh, D. Almora, P. Bodin, M. Oñate, R. Vásquez, and J. M. Velasco (1994). The Guerrero accelerograph network. Geofisica International 33, 341–372.
Boatwright, J., and G. L. Choy (1986). Teleseismic estimates of the energy radiated by shallow earthquakes. Journal of Geophysical Research 91, 2,095–2,112.
Brune, J. N. (1970). Tectonic stress and the spectra of seismic shear waves from earthquakes. Journal of Geophysical Research 75, 4,997–5,009.
Campillo, M., S. K. Singh, N. Shapiro, J. Pacheco, and R. B. Hermann (1996). Crustal structure of the Mexican volcanic belt, based on group velocity dispersion. Geophysical Journal International 35, 361–370.
Choy, G. L., and S. H. Kirby (2004). Apparent stress, fault maturity and seismic hazard for normal-fault earthquakes at subduction zones. Geophysical Journal International 159, 991–1012.
Cocco, M., J. F. Pacheco, S. K. Singh, and F. Courboulex (1997). The Zihuatanejo, Mexico earthquake of December 10, 1994 (M=6.6): Source characteristics and tectonic implications. Geophysical Journal International 131, 135–145.
Espinosa-Aranda, J. M., and F. H. Rodríguez (2003). The seismic alert sys-tem of Mexico City. In International Handbook of Earthquake and Engineering Seismology, ed. W. H. K. Lee, 1,253–1,259 (chapter 76). Amsterdam and Boston: Academic Press.
García, D., S. K. Singh, M. Herraiz, J. F. Pacheco, and M. Ordaz (2004). Inslab earthquakes of Central Mexico: Q, source spectra and stress drop. Bulletin of the Seismological Society of America 94, 789–802.
García, D., S. K. Singh, M. Herraiz, M. Ordaz, and J. F. Pacheco (2005). Inslab earthquakes of Central Mexico: peak ground-motion param-eters and response spectra. Bulletin of the Seismological Society of America 95, 2,272–2,282.
Iglesias, A., S. K. Singh, M. Ordaz, M. A. Santoyo, and J. F. Pacheco (2007). The seismic alert system for Mexico City: An evaluation of its performance and a strategy for its improvement. Bulletin of the Seismological Society of America 97(5), 1,718–1,729.
Kennett, B. L. N. (1983). Seismic Wave Propagation in Stratified Media. Cambridge: Cambridge University Press, 342 pps.
Langston, C. (1981). Source inversion of seismic waveforms: The Koyna, India, earthquake of 13 September, 1967. Bulletin of the Seismological Society of America 71, 1–24.
Lemoine, A., R. Madariaga, and J. Campos (2002). Slab-pull and slab-push earthquakes in the Mexican, Chilean and Peruvian subduction zones. Physics of the Earth and Planetary Interiors 132, 157–175.
Lienart, B. R., and J. Haskov (1995). A computer program for locating earthquakes both locally and globally. Seismological Research Letters 66, 26–36.
Ordaz, M., J. Arboleda, and S. K. Singh (1995). A scheme of random sum-mation of an empirical Green’s function to estimate ground motions from future large earthquakes. Bulletin of the Seismological Society of America 85, 1,635–1,647.
Ordaz, M., S. K. Singh, E. Reinoso, J. Lermo, J. M. Espinosa, and T. Domínguez (1988). Estimation of response spectra in the lake bed zone of the Valley of Mexico. Earthquake Spectra 4, 815–834.
Pacheco, J. F., and S. K. Singh (2007). Seismicity and state of stress in the subduction zone of Guerrero, Mexico. Jt. Assem. Suppl., Abstract: S43B-01, EOS—Transactions of the American Geophysical Union 88, 23.
Pérez-Campos, X., R. W. Clayton, A. Iglesias, A. Husker, and C. M. Valdés-González (2006). MASE: A seismological perspective of the

648 Seismological Research Letters Volume 78, Number 6 November/December 2007
sub-horizontal subduction of the Cocos Plate under North America, Jt. Assem. Suppl., Abstract: T13F-0,. EOS—Transactions of the American Geophysical Union 87, 52.
Randall, G. E. (1994). Efficient calculation of composite differential seismograms for laterally homogeneous Earth models. Geophysical Journal International 118, 255–259.
Randall, G. E., C. J. Ammon, and T. J. Owens (1995). Moment tensor esti-mation using regional seismograms from a Tibetan plateau portable network deployment. Geophysical Research Letters 22, 1,665–1,668.
Singh, S. K., J. Havskov, and L. Astiz (1981). Seismic gaps and recurrence periods of large earthquakes along the Mexican subduction zone. Bulletin of the Seismological Society of America 71, 827–843.
Singh, S. K., and M. Ordaz (1994). Seismic energy release in Mexican subduction zone earthquakes. Bulletin of the Seismological Society of America 84, 1,533–1,550.
Singh, S. K., M. Ordaz, J. F. Pacheco, and F. Courboulex (2000). A simple source inversion scheme for displacement seismograms recorded at short distances. Journal of Seismology 4, 267–284.
Singh, S. K., J. F. Pacheco, B. K. Bansal, X. Pérez-Campos, R. S. Dattatrayam, and G. Suresh (2004). A source study of the Bhuj, India, earthquake
of 26 January 2001 (Mw 7.6). Bulletin of the Seismological Society of America 94, 1,195–1,206.
Singh, S. K., and M. Pardo (1993). Geometry of the Benioff zone and state of stress in the overriding plate in central Mexico. Geophysical Research Letters 20, 1,483–1,486.
Suárez, G., T. Monfret, G. Wittlinger, and C. David (1990). Geometry of subduction and depth of the seismogenic zone in the Guerrero gap, Mexico. Nature 345, 336–338.
Tichelaar, B. and L. J. Ruff (1993). Depth of seismic coupling along sub-duction zones. Journal of Geophysical Research 98, 2,017–2,037.
Venkataraman, A., L. Rivera, and H. Kanamori (2002). Radiated energy from 16 October 1999 Hector Mine earthquake; regional and tele-seismic estimates. Bulletin of the Seismological Society of America 92, 1,256–1,265.
Instituto de GeofísicaUniversidad Nacional Autónoma de México
C.U. 04510. México [email protected]
(S. K. S.)
Copyright © 2022 FDOKUMEN