Biophysical characterization of human breast tissues by photoluminescence excitation-emission...
10
Journal of Research in Physics Vol. 36, No. 1, 53 - 62 (2012) doi:10.2478/v10242-012-0013-z Biophysical characterization of human breast tissues by photoluminescence excitation-emission spectroscopy Tatjana Drami´ canin, Lea Lenhardt, Ivana Zekovi´ c and Miroslav D. Drami´ canin ∗ Vinca Institute of Nuclear Sciences, University of Belgrade, P.O. Box 522, 11001 Belgrade, Serbia Received: March 15, 2013 Abstract Fluorescence excitation-emission spectroscopy was used to investigate speci- mens of normal and malignant human breast tissues. Measurements were per- formed in two spectral regions: in the excitation range from 335 nm to 400 nm and emission range from 430 nm to 625 nm, and in the excitation range from 400 nm to 470 nm and emission range from 500 nm to 640 nm. It was found that fluorescence spectra are composed mainly of the emissions of extracellular proteins and that the differences in the intensity of their emissions reveal the changes in the tissue structure and morphology. These differences could be best observed in the emission spectra excited with 370 nm, 425 nm and 455 nm radiation. Statistical analysis revealed several spectral subregions that exhib- ited extremely significant statistical difference between normal and malignant breast tissues. The origin of these differences was elaborated, and prospects for optical diagnostics of breast cancer was discussed. Key words: Molecular spectroscopy, photoluminescence spectroscopy, cancer 1. Introduction The links between biophysics and human diseases have been the subject of consider- able scientific research effort for a number of decades. Among novel biophysical methods assessed for medical diagnostics, optical spectroscopy and imaging are of particular im- portance. These techniques are capable of detection and spectral description of diverse metabolic and pathological phenomena in normal tissue, premalignant lesions or frank neoplasia. Fluorescence can indicate certain biophysical and biochemical changes, and these often precede the morphological changes observed in histology. Progress in the development and application of medications and medical procedures for the treatment of malignant disease did not diminish the importance of early diagnosis of cancerous and precancerous changes as the most powerful weapon in the fight against this severe disease. Because of that, to increase the volume of the population covered by ∗ Corresponding author Email address: [email protected] Unauthenticated Download Date | 6/16/16 10:59 PM
-
Upload
independent -
Category
Documents
-
view
0 -
download
0
Transcript of Biophysical characterization of human breast tissues by photoluminescence excitation-emission...
Journal of Research in Physics Vol. 36, No. 1, 53 - 62 (2012)
doi:10.2478/v10242-012-0013-z
Biophysical characterization of human breast tissues byphotoluminescence excitation-emission spectroscopy
Tatjana Dramicanin, Lea Lenhardt, Ivana Zekovic and Miroslav D. Dramicanin∗
Vinca Institute of Nuclear Sciences, University of Belgrade,P.O. Box 522, 11001 Belgrade, Serbia
Received: March 15, 2013
Abstract
Fluorescence excitation-emission spectroscopy was used to investigate speci-mens of normal and malignant human breast tissues. Measurements were per-formed in two spectral regions: in the excitation range from 335 nm to 400 nmand emission range from 430 nm to 625 nm, and in the excitation range from400 nm to 470 nm and emission range from 500nm to 640nm. It was foundthat fluorescence spectra are composed mainly of the emissions of extracellularproteins and that the differences in the intensity of their emissions reveal thechanges in the tissue structure and morphology. These differences could bebest observed in the emission spectra excited with 370 nm, 425 nm and 455 nmradiation. Statistical analysis revealed several spectral subregions that exhib-ited extremely significant statistical difference between normal and malignantbreast tissues. The origin of these differences was elaborated, and prospectsfor optical diagnostics of breast cancer was discussed.
Key words: Molecular spectroscopy, photoluminescence spectroscopy, cancer
1. Introduction
The links between biophysics and human diseases have been the subject of consider-able scientific research effort for a number of decades. Among novel biophysical methodsassessed for medical diagnostics, optical spectroscopy and imaging are of particular im-portance. These techniques are capable of detection and spectral description of diversemetabolic and pathological phenomena in normal tissue, premalignant lesions or frankneoplasia. Fluorescence can indicate certain biophysical and biochemical changes, andthese often precede the morphological changes observed in histology.
Progress in the development and application of medications and medical proceduresfor the treatment of malignant disease did not diminish the importance of early diagnosisof cancerous and precancerous changes as the most powerful weapon in the fight againstthis severe disease. Because of that, to increase the volume of the population covered by
∗Corresponding authorEmail address: [email protected]
UnauthenticatedDownload Date | 6/16/16 10:59 PM
54 Tatjana Dramicanin, Lea Lenhardt, Ivana Zekovic and Miroslav D. Dramicanin
early screening for malignant disease has become an important task of all modern societiesfrom the medical, sociological and economic aspects.
Breast cancer is the leading cause of death in women in the world [1] and the first causeof deaths, before cardiovascular diseases, in Serbia. If diagnosed on time, breast cancermay increase survival time, including good percentage of the full recovery. Today, physicalexamination and mammography are the most frequently used screening methods for breastcancer detection. Although most useful and widely used, they have some weaknesses. Thesmall tumors can be difficult to detect by physical examination, and mammography givesfalse positive results [2].
Modern medicine is constantly looking for more accurate diagnostic techniques. Thosebased on optical spectroscopy, called “optical biopsy”, had made a giant step on the fieldof early cancer detection [3-5]. Very important properties of these techniques are speed,non invasiveness, reliability and high sensitivity. Between them, fluorescence spectroscopyand fluorescence imaging techniques have a significant place based on volume investigationand application of results [6].
The tissue has a large number of endogenous fluorophores to fluoresce in the UV/VISspectral range, and the most important are NADH, FAD, collagen, elastin, lipids, aromaticacids and porphyrins [6]. In heterogeneous systems such as tissue, the fluorescence is dueto all present tissue fluorophores. However, on the fluorescence of tissue is not affected onlyby the concentration and distribution of present fluorophores, but also by biochemical andbiophysical changes in their environment. During the malignant transformations in cell,such changes occur that are reflected in fluorescent properties of the tissue. Today, thefluorescent techniques are able to detect and characterize the metabolic and pathologicalchanges in precancerous and cancerous tissues compared to the normal tissue. Recently,fluorescence spectroscopy has been used in cancer detection of different tissues: colon [7,8],lung [9] head and neck [10,11], skin [12], etc.
First luminescence measurements of malignant and normal breast tissues were madeby Alfano et al. [13]. Later, several ex vivo investigations were performed to evaluatethe feasibility of luminescence spectroscopy for breast cancer detection [14-20]. In theseinvestigations emission or excitation spectroscopy, and more recently excitation-emissionmatrices (EEM), were used. EEM is a series of emission spectra, each to be recorded fordifferent excitation wavelengths, covering in that manner the excitation region of inter-est. Using these matrices it is possible to determine excitation energy for which emissionspectra show the best specificity in distinguishing malignant and normal tissues.
Dramicanin et al [21,22] have established criteria for discrimination between normaland malignant breast tissues based on three-dimensional total synchronous luminescencespectroscopy and performed their statistical analysis. The basic idea of this paper is toselect the appropriate excitation wavelengths for the measurements of emission spectra ofbreast tissues in the way that they are sufficiently informative to provide tissue discrimi-nation in rapid optical screening of breast cancer.
2. Materials and Methods
Breast tissue samples were obtained from female patients of the Institute of Oncologyand Radiology of Serbia. Tumor and normal tissues were collected from the same patients.The samples were collected soon after the surgical resection, identified and stored at -80 0Cuntil fluorescence measurements were performed. Samples had different size and shapes,
UnauthenticatedDownload Date | 6/16/16 10:59 PM
Biophysical characterization of human breast tissues by photoluminescence ... 55
varying from 0.2×0.5×0.5 cm to 0.3×1.0×1.5 cm. All study participants gave a writtenconsent.
The breast tissue samples were defrosted and mounted between two quartz plates andplaced in the sample holder compartment. Emission luminescence spectra were recordedat room temperature using a Perkin Elmer LS45 Fluorescence Spectrophotometer. Thespectra were taken in two spectral ranges: a) excitation range from 335 nm to 400 nmand emission range from 430 nm to 625 nm (EEM1) and b) excitation range from 400 nmto 470 nm and emission range from 500 nm to 640 nm (EEM2). Data were recorded ata 150 nm/min scan rate. Xenon discharge lamp was used for illumination, and a gatedred sensitive R928 photomultiplier operating up to 900 nm was used for detection. Thesystem performed automatic normalization of spectra on excitation power using a built-inphotodiode.
All spectra were normalized in such way that the maximal luminescence intensity hada value of 100. After that, one spectrum was obtained for all normal and one for allmalignant breast tissues averaging from 21 sample spectra. The reason that spectra werepresented in the form of contour graphs (“normal malignant”) is a better understandingof differences in spectral property of breast tissues (Figure 1A and 1B). The EEM contourgraph gave the opportunity to choose emission spectra which gather the most information.The areas under normalized spectral curves are calculated numerically, and the data wereused in statistical analysis. Statistical analysis was performed using Origin 7.0 and Matlab6.5 software packages.
3. Results
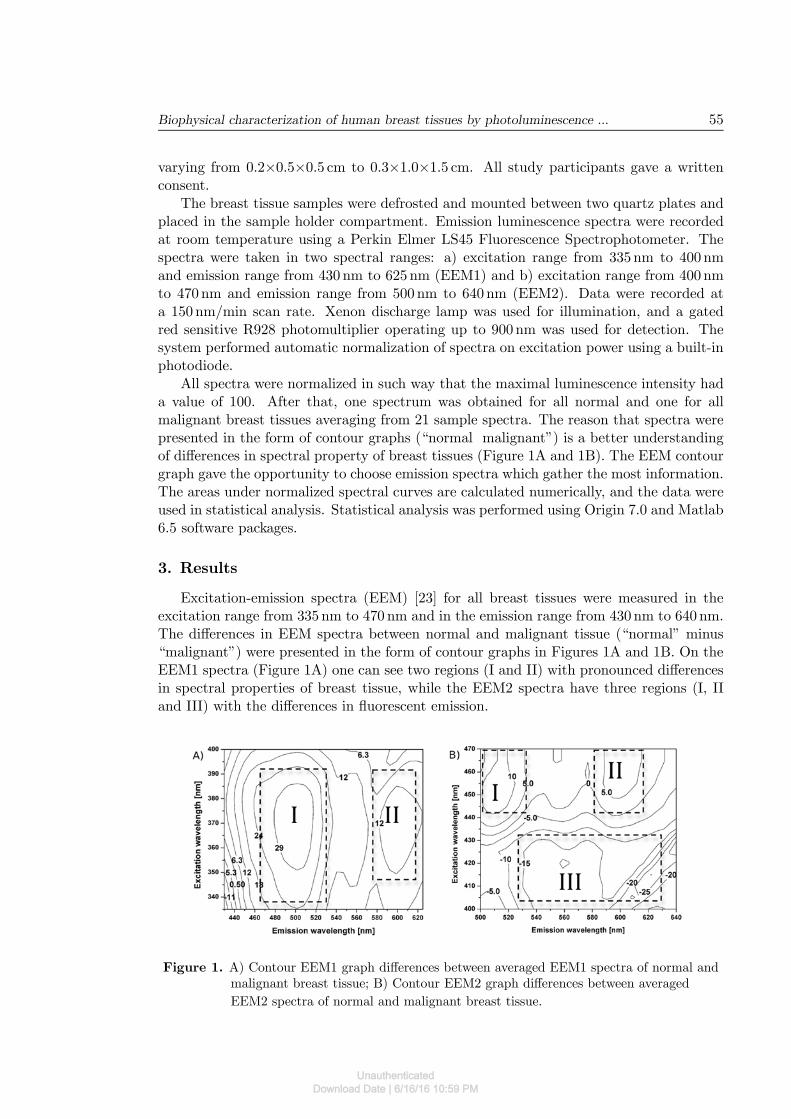
Excitation-emission spectra (EEM) [23] for all breast tissues were measured in theexcitation range from 335 nm to 470 nm and in the emission range from 430 nm to 640 nm.The differences in EEM spectra between normal and malignant tissue (“normal” minus“malignant”) were presented in the form of contour graphs in Figures 1A and 1B. On theEEM1 spectra (Figure 1A) one can see two regions (I and II) with pronounced differencesin spectral properties of breast tissue, while the EEM2 spectra have three regions (I, IIand III) with the differences in fluorescent emission.
Figure 1. A) Contour EEM1 graph differences between averaged EEM1 spectra of normal andmalignant breast tissue; B) Contour EEM2 graph differences between averaged
EEM2 spectra of normal and malignant breast tissue.
UnauthenticatedDownload Date | 6/16/16 10:59 PM

56 Tatjana Dramicanin, Lea Lenhardt, Ivana Zekovic and Miroslav D. Dramicanin
Based on the differences of EEM spectra between “normal” and “malignant” breasttissue, three emission spectra with significant differences in spectral properties were se-lected. The most informative emission spectra were those excited on 370 nm (Figure 2),425 nm (Figure 3) and 455 nm (Figure 4).
In order to quantify these differences and further investigate whether they are suitablefor the tissue discrimination in optical biopsy applications, it was necessary to define twosmaller emission wavelength subregions. These were labeled “subregion a” and “subregionb” in Figure 2, and have emission ranges from 430 nm to 452 nm, and 452 nm to 625 nm,respectively. The statistical analysis of the areas and their ratios for both regions arepresented in Tables 1 and 2.
Figure 2. Emission spectra at 370 nm excitation; lines represent the average of spectra of 21normal breast samples and the average of spectra of 21 malignant breast samples;
full lines stand for additionally normalized spectra and dashed lines for raw spectra.
Statistical analysis reveals statistically extremely significant (ES) spectral differencesbetween the normal and the malignant breast tissue samples: spectral area S370a, S370b,and the spectral area ratio S370a/S370b. These spectral features can be used as criteria fordiscrimination between the tissues.
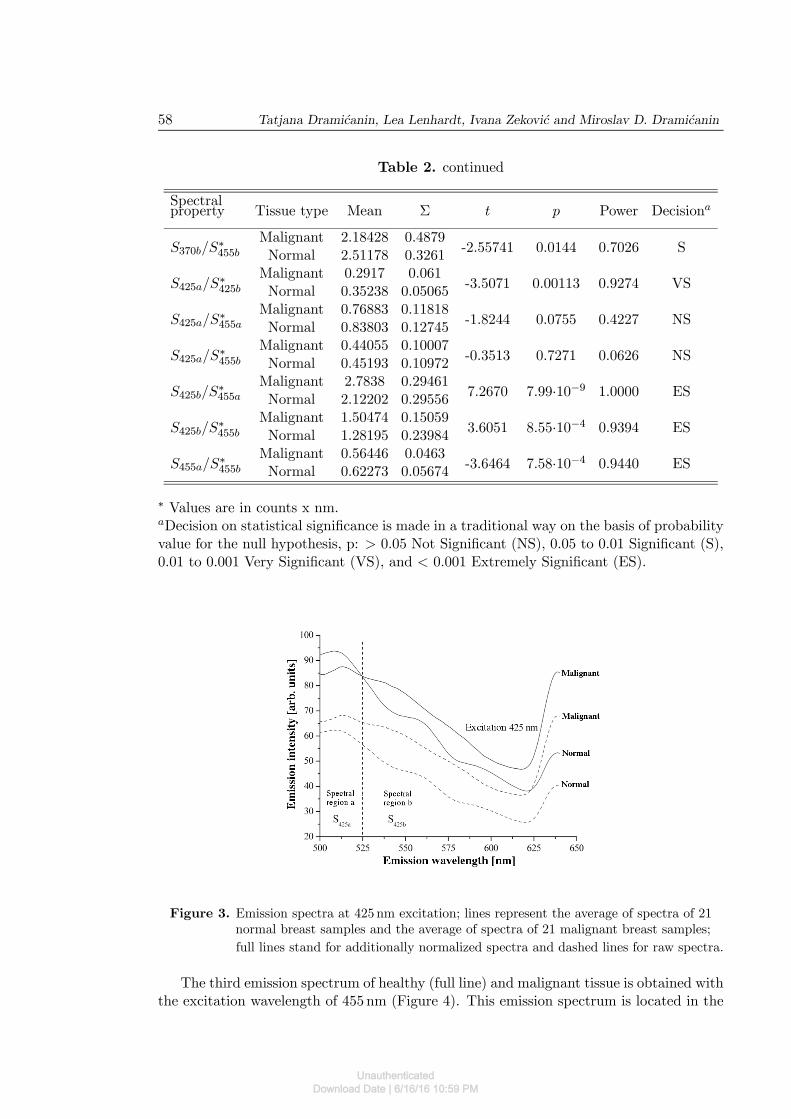
The second emission spectrum, which is more informative, was obtained with 425 nmexcitation (Figure 3). This emission spectrum is located in region III of the EEM2 spectra(Figure 1B). Emission fluorescence of the malignant tissues was stronger in the excitationrange from 423 to 428 nm and the emission range from 625 to 640 nm, and representedas negative value contours in the EEM2 graph. The differences in the emission of bothtissues are visible in the emission spectrum at 425 nm excitation. In order to quantify thedifferences, the emission spectra were divided in two subregions: “subregion a” from 500to 525 nm and “subregion b” from 525 to 640 nm (Figure 3). The area under normalized(full line) spectra was calculated, and statistical data were presented in Tables 1 and 2.For a statistical analysis “subregion a” was not interesting, but “subregion b” revealsstatistically significant (ES) differences in the fluorescence tissues. The statistical analysis
UnauthenticatedDownload Date | 6/16/16 10:59 PM
Biophysical characterization of human breast tissues by photoluminescence ... 57
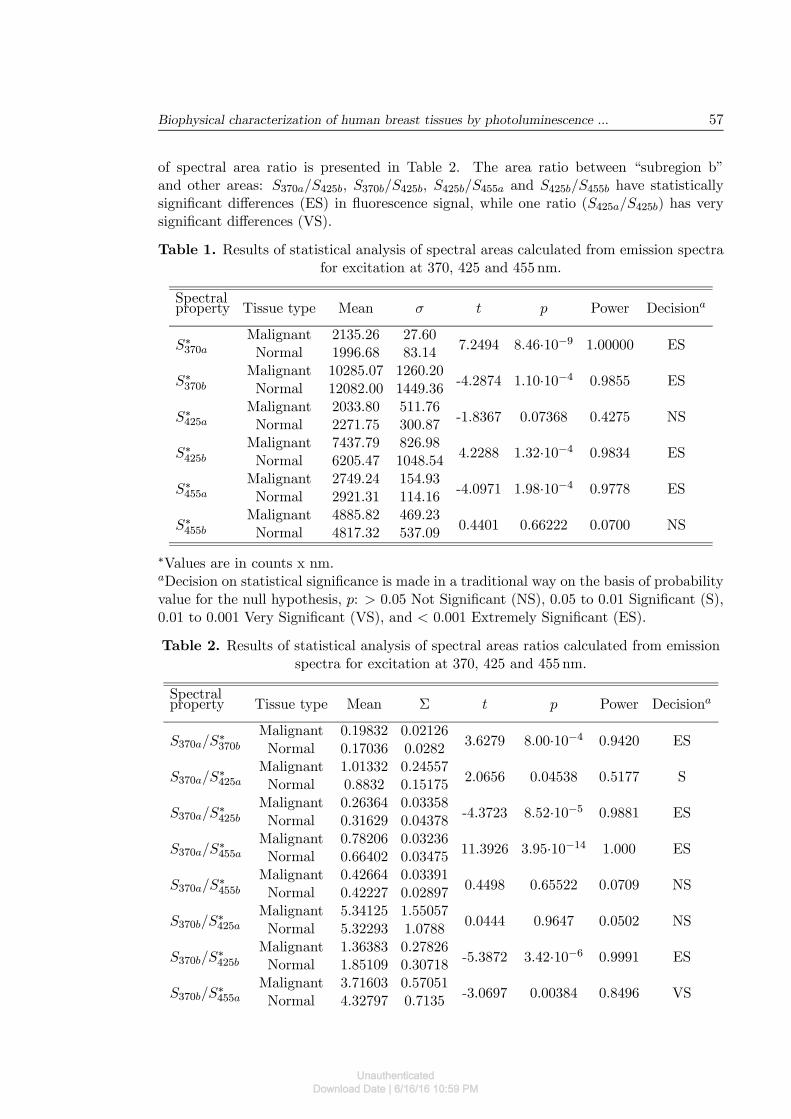
of spectral area ratio is presented in Table 2. The area ratio between “subregion b”and other areas: S370a/S425b, S370b/S425b, S425b/S455a and S425b/S455b have statisticallysignificant differences (ES) in fluorescence signal, while one ratio (S425a/S425b) has verysignificant differences (VS).
Table 1. Results of statistical analysis of spectral areas calculated from emission spectrafor excitation at 370, 425 and 455 nm.
Spectralproperty Tissue type Mean σ t p Power Decisiona
Malignant 2135.26 27.60S∗370a Normal 1996.68 83.14
7.2494 8.46·10−9 1.00000 ES
Malignant 10285.07 1260.20S∗370b Normal 12082.00 1449.36
-4.2874 1.10·10−4 0.9855 ES
Malignant 2033.80 511.76S∗425a Normal 2271.75 300.87
-1.8367 0.07368 0.4275 NS
Malignant 7437.79 826.98S∗425b Normal 6205.47 1048.54
4.2288 1.32·10−4 0.9834 ES
Malignant 2749.24 154.93S∗455a Normal 2921.31 114.16
-4.0971 1.98·10−4 0.9778 ES
Malignant 4885.82 469.23S∗455b Normal 4817.32 537.09
0.4401 0.66222 0.0700 NS
∗Values are in counts x nm.aDecision on statistical significance is made in a traditional way on the basis of probabilityvalue for the null hypothesis, p: > 0.05 Not Significant (NS), 0.05 to 0.01 Significant (S),0.01 to 0.001 Very Significant (VS), and < 0.001 Extremely Significant (ES).
Table 2. Results of statistical analysis of spectral areas ratios calculated from emissionspectra for excitation at 370, 425 and 455 nm.
Spectralproperty Tissue type Mean Σ t p Power Decisiona
Malignant 0.19832 0.02126S370a/S
∗370b Normal 0.17036 0.0282
3.6279 8.00·10−4 0.9420 ES
Malignant 1.01332 0.24557S370a/S
∗425a Normal 0.8832 0.15175
2.0656 0.04538 0.5177 S
Malignant 0.26364 0.03358S370a/S
∗425b Normal 0.31629 0.04378
-4.3723 8.52·10−5 0.9881 ES
Malignant 0.78206 0.03236S370a/S
∗455a Normal 0.66402 0.03475
11.3926 3.95·10−14 1.000 ES
Malignant 0.42664 0.03391S370a/S
∗455b Normal 0.42227 0.02897
0.4498 0.65522 0.0709 NS
Malignant 5.34125 1.55057S370b/S
∗425a Normal 5.32293 1.0788
0.0444 0.9647 0.0502 NS
Malignant 1.36383 0.27826S370b/S
∗425b Normal 1.85109 0.30718
-5.3872 3.42·10−6 0.9991 ES
Malignant 3.71603 0.57051S370b/S
∗455a Normal 4.32797 0.7135
-3.0697 0.00384 0.8496 VS
UnauthenticatedDownload Date | 6/16/16 10:59 PM
58 Tatjana Dramicanin, Lea Lenhardt, Ivana Zekovic and Miroslav D. Dramicanin
Table 2. continued
Spectralproperty Tissue type Mean Σ t p Power Decisiona
Malignant 2.18428 0.4879S370b/S
∗455b Normal 2.51178 0.3261
-2.55741 0.0144 0.7026 S
Malignant 0.2917 0.061S425a/S
∗425b Normal 0.35238 0.05065
-3.5071 0.00113 0.9274 VS
Malignant 0.76883 0.11818S425a/S
∗455a Normal 0.83803 0.12745
-1.8244 0.0755 0.4227 NS
Malignant 0.44055 0.10007S425a/S
∗455b Normal 0.45193 0.10972
-0.3513 0.7271 0.0626 NS
Malignant 2.7838 0.29461S425b/S
∗455a Normal 2.12202 0.29556
7.2670 7.99·10−9 1.0000 ES
Malignant 1.50474 0.15059S425b/S
∗455b Normal 1.28195 0.23984
3.6051 8.55·10−4 0.9394 ES
Malignant 0.56446 0.0463S455a/S
∗455b Normal 0.62273 0.05674
-3.6464 7.58·10−4 0.9440 ES
∗ Values are in counts x nm.aDecision on statistical significance is made in a traditional way on the basis of probabilityvalue for the null hypothesis, p: > 0.05 Not Significant (NS), 0.05 to 0.01 Significant (S),0.01 to 0.001 Very Significant (VS), and < 0.001 Extremely Significant (ES).
Figure 3. Emission spectra at 425 nm excitation; lines represent the average of spectra of 21normal breast samples and the average of spectra of 21 malignant breast samples;
full lines stand for additionally normalized spectra and dashed lines for raw spectra.
The third emission spectrum of healthy (full line) and malignant tissue is obtained withthe excitation wavelength of 455 nm (Figure 4). This emission spectrum is located in the
UnauthenticatedDownload Date | 6/16/16 10:59 PM
Biophysical characterization of human breast tissues by photoluminescence ... 59
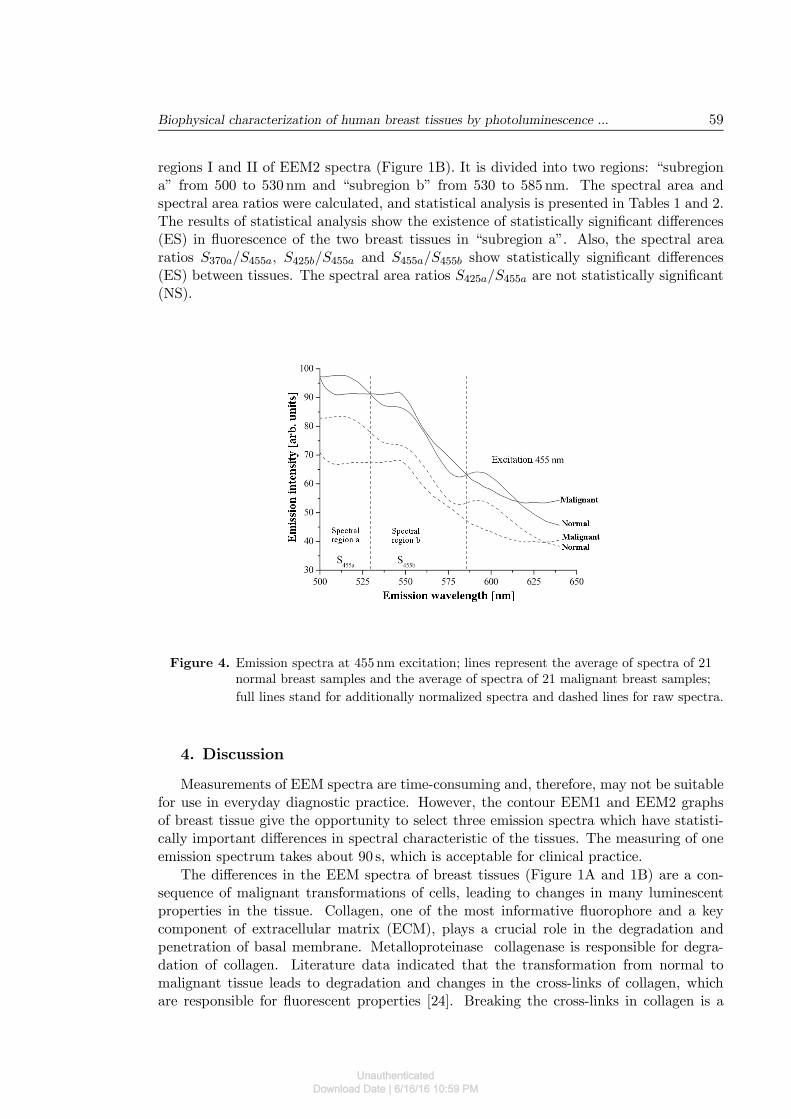
regions I and II of EEM2 spectra (Figure 1B). It is divided into two regions: “subregiona” from 500 to 530 nm and “subregion b” from 530 to 585 nm. The spectral area andspectral area ratios were calculated, and statistical analysis is presented in Tables 1 and 2.The results of statistical analysis show the existence of statistically significant differences(ES) in fluorescence of the two breast tissues in “subregion a”. Also, the spectral arearatios S370a/S455a, S425b/S455a and S455a/S455b show statistically significant differences(ES) between tissues. The spectral area ratios S425a/S455a are not statistically significant(NS).
Figure 4. Emission spectra at 455 nm excitation; lines represent the average of spectra of 21normal breast samples and the average of spectra of 21 malignant breast samples;
full lines stand for additionally normalized spectra and dashed lines for raw spectra.
4. Discussion
Measurements of EEM spectra are time-consuming and, therefore, may not be suitablefor use in everyday diagnostic practice. However, the contour EEM1 and EEM2 graphsof breast tissue give the opportunity to select three emission spectra which have statisti-cally important differences in spectral characteristic of the tissues. The measuring of oneemission spectrum takes about 90 s, which is acceptable for clinical practice.
The differences in the EEM spectra of breast tissues (Figure 1A and 1B) are a con-sequence of malignant transformations of cells, leading to changes in many luminescentproperties in the tissue. Collagen, one of the most informative fluorophore and a keycomponent of extracellular matrix (ECM), plays a crucial role in the degradation andpenetration of basal membrane. Metalloproteinase collagenase is responsible for degra-dation of collagen. Literature data indicated that the transformation from normal tomalignant tissue leads to degradation and changes in the cross-links of collagen, whichare responsible for fluorescent properties [24]. Breaking the cross-links in collagen is a
UnauthenticatedDownload Date | 6/16/16 10:59 PM
60 Tatjana Dramicanin, Lea Lenhardt, Ivana Zekovic and Miroslav D. Dramicanin
consequence of the increased presence of collagenase in the tumor cells. Modulation of theECM is a common characteristic of invading tumour cells and usually involves increasedproduction of collagenases by the tumour cells or stromal fibroblasts [25]. In “subregiona” of the spectra presented in Figure 2, there is a collagen emission peak displacement inthe malignant tissue (max. 440 nm) to a lower wavelength compared to the normal tissuepeak (max. 460 nm), resulting from the changes in the structure of collagen. The part ofthe emission spectrum from 450 - 500 nm, (Figure 2) shows a decrease in the concentrationof collagen in malignant tissue compared to normal breast tissue, which is in agreementwith data from the literature [24].
In the spectral “subregion b”, the peak at about 515 nm is present in the spectrum ofmalignant tissues, and it corresponds to the emission of NAD(P)H. Coenzymes NADPHand NADH are two prominent fluorophores responsible for the shape of fluorescence spec-trum of the breast tissue and other tissue types. Modifications of the fluorescent spectrumof NAD(P)H points out to further transformation from a premalignant to the malignantstage. This is in concordance with the fact that these coenzymes play a vital role in ametabolic oxidation-reduction processes. The changes in the metabolic status of tissueobviously have influence on the variation in concentrations of the both coenzymes. Gener-ally, a shift from aerobic to anaerobic metabolism, together with damaged mitochondrialmetabolism caused by malignant alterations, leads to increased concentrations of electroncarriers such as NADH. It has been established that in a high grade malignant tissueappear increased levels of these coenzymes [24,26]. Statistical analysis of the area underemission spectra (S370a and S370b) at 370 nm excitation, shown in Table 1, confirms signif-icant differences (ES) in fluorescent characteristics of normal and malignant breast tissuein the whole emission range.
The vascularity of the tissue has an influence on the appearance of the fluorescencespectrum. Because malignant tissues have better vascularity, one may expect an increasedfluorescence intensity in the part of the spectra where porphyrin IX emission takes place.In the emission spectrum at 425 nm excitation (Figure 3), spectral “subregion b” wasstatistically significant (ES). In this part of the spectrum, important emission is observedwith a maximum at about 630 nm, which originates from the porphyrin. Here, one cansee that the intensity of the porphyrin emission in malignant tissue is much higher thanin normal breast tissue.
The third emission spectrum measured at 455 nm excitation in “subregion a” (Figure 4,spectral area S455a) shows statistically significant differences (ES) in fluorescent responseof tissues (Table 1). The differences originate from the difference in emission of FAD.Malignant breast tissues have lower emissions of FAD compared to normal tissue.
At the end, it is crucial to say that the three selected emission spectra can give a realpicture of the transformation stage of the tissue. Emission fluorescence spectroscopy ofbreast tissue already had a successful application for diagnostic purposes [17-19]. Theapplication of neural networks to data obtained from the EEM spectra [27] could providethe establishment of the diagnosis without individuals subjective attitude.
5. Conclusion
Fluorescence excitation-emission spectra of human normal and malignant breast tissuescontain parts which exhibit statistically significant differences. The variation in fluores-cence is a consequence of the changes in the concentration of extracellular proteins and
UnauthenticatedDownload Date | 6/16/16 10:59 PM
Biophysical characterization of human breast tissues by photoluminescence ... 61
their microenvironments. The decrease in the concentration of collagen in the malignanttissue compared to normal breast tissue is observed along with collagen emission peak shiftin malignant tissue (max. 440 nm) to a lower wavelength compared to the normal tissue(max. 460 nm). Fluorescence measurements further showed an increased concentrationof NADH and porphyrin IX, and lower concentrations of FAD in malignant specimenscompared to the normal ones. The differences in the emission spectra are best observedwhen excited with 370 nm, 425 nm and 455 nm radiation. Statistical analysis of these datarevealed several spectral characteristics that can be used for optical diagnostics of breastcancer.
Acknowledgments
The authors acknowledge the support of the Ministry of Education, Science and Techno-logical Development of the Republic of Serbia through Projects No. 173049 and 45020.
References
[1] http://www.komen.org/bci (accessed 2013).
[2] J. R. Harris, M. E. Lippman, M. Morrow, C. K. Osborne, Diseases of the breast,(Lippicott Williams & Wilkins, 2ed. Philadelphia, 2000).
[3] N. Ramanujam, Fluorescence spectroscopy in vivo, p. 20, (John Willey & Sons: Ltd.Chichester, New York, 2000).
[4] S. K. Gayen, R.R. Alfano, Opt. Photon News 7, 17 (1996).
[5] L. Avramaov, E. Borisova, P.D. Townsend, L.A. Valberg, Mater. Sci. Forum 480, 411(2005).
[6] R. Richards-Kortum, E. Sevick-Muraca, Annu. Rev. Phys. Chem. 47, 555 (1996).
[7] S. Brad, H. Stepp, T. Ochsenkuhu, R. Baumgartner, G. Baretton, J. Holl, Int. J.Colorect. Dis. 14, 63 (1999).
[8] B. Mayinger, M. Jordan, P. Horner, C. Gerlach, S. Muehldorfer, B. R. Bittorf, J.Photochem. Photobiol. B: Biology 70, 13 (2003).
[9] B. Palcic, S. Lam, J. Hung, Chest 99, 742 (1991).
[10] C. S. Betz, M. Mehlmann, K. Rick, H. Stepp, G. Grevers, R. Baumgartner, LasersSurg. Med. 25, 323 (1999).
[11] S. K. Majumder, A. Uppal, P. K. Gupta, Lasers Life. Sci. 8, 211 (1999).
[12] H. J. C. M. Sterenborg, M. Motamedi, R. F. Wagner, S. Thomsen, S. L. Jacques,Lasers Med. Sci. 9, 191 (1994).
[13] R. R. Alfano, G. C. Tang, A. Pradhan, W. Lam, D. S. J. Choy, E. Orpher, IEEE J.Quantum Electron 23, 1806 (1987).
UnauthenticatedDownload Date | 6/16/16 10:59 PM
62 Tatjana Dramicanin, Lea Lenhardt, Ivana Zekovic and Miroslav D. Dramicanin
[14] R. R. Alfano, A. Pradhan, G. C. Tang, S. J. Wahl, J. Opt. Soc. Amer. B (Opt. Phys.)6, 1015 (1989).
[15] Y. Yang, A. Katz, E. J. Celmer, M. Zurawska-Szezepaniak, R. R. Alfano, Lasers LifeSci. 7, 115 (1996).
[16] Y. Yang, A. Katz, E. J. Celmer, M. Zurawska-Szezepaniak, R. R. Alfano, Photochem.Photobiol. 66, 518 (1997).
[17] Y. Yuanlong, E. J. Celmer, M. Zurawska-Szezepaniak, R. R. Alfano, Lasers Life Sci.7, 249 (1997).
[18] P. K. Gupta, S. K. Majumder, A. Uppal, Lasers Surg. Med. 21(5), 417 (1997).
[19] G. M. Palmer and N. Ramanujam, Med. Laser Appl. 18, 233 (2003).
[20] R. Hage, P. R. Galhanone, R. A. Zangaro, K. C. Rodrigues, M. T. T. Pacheco, A. A.Martin, Lasers Med. Sci. 18, 171 (2003).
[21] T. Dramicanin, M.D. Dramicanin, V. Jokanovic, D. Nikolic-Vukosavljevic, B. Dim-itrijevic, Photochem. Photobiol. 81, 1554 (2005).
[22] T. Dramicanin, M.D. Dramicanin, B. Dimitrijevic, V. Jokanovic, S. Lukic, Acta Chim.Slov. 53, 444 (2006).
[23] T. Dramicanin, M.D. Dramicanin, B. Dimitrijevic, Zbornik radova (44. Savetovanjesrpskog hemijskog drutva) 70 3 (2006).
[24] I. Georgakoudi, B.C. Jacobson, M.G. Muller, E.E. Sheets, K. Badizadegan, D.L.Carr-Locke, Cancer Res. 62, 682 (2002).
[25] G. Fenhalls, D.M. Dent, M.I. Parker, Br. J. Cancer 81, 142 (1999).
[26] A. Uppal and P. K. Gupta, Biotechnol. Appl. Biochem. 37, 45 (2003).
[27] T. Dramicanin, I. Zekovic, B. Dimitrijevic, S. Ribar, M. D. Dramicanin, Acta Phys.Pol. A 116(4), 690 (2009).
UnauthenticatedDownload Date | 6/16/16 10:59 PM