Biomarkers of pollution effects in the bivalves Mytilus edulis and Macoma balthica collected from...
14
MARINE ECOLOGY PROGRESS SERIES Mar Ecol Prog Ser Vol. 322: 155–168, 2006 Published September 20 INTRODUCTION Assessment and monitoring of the state of contami- nation of the marine environment has traditionally been almost entirely based on measurements of con- centrations of well-known harmful substances in sea- water, sediments and/or biota. However, with the cur- rently enormous and continuously increasing number of potentially toxic substances present in and released into world seas, this approach alone can no longer be considered practical, cost-effective or even possible. Besides the obvious technical and economical con- straints, the most important fact is that by using merely chemical measurements the biological effects of both single pollutants and the combined effect of a number of compounds in marine organisms remain unresolved; therefore, the true environmental hazards of contami- nation are insufficiently assessed. During the past decades, molecular, biochemical, cytological, immuno- logical and physiological techniques for the detection of effects of pollutants in marine organisms, the so- called biomarkers, have been under dynamic develop- © Inter-Research 2006 · www.int-res.com *Email: [email protected] Biomarkers of pollution effects in the bivalves Mytilus edulis and Macoma balthica collected from the southern coast of Finland (Baltic Sea) Kari K. Lehtonen 1, *, Sari Leiniö 1 , Rolf Schneider 2 , Mirja Leivuori 1 1 Finnish Institute of Marine Research, PO Box 2, 00561, Helsinki, Finland 2 Baltic Sea Research Institute, Department of Biological Oceanography, Seestrasse 15, 18119 Rostock-Warnemünde, Germany ABSTRACT: Levels of selected biomarkers in 2 bivalve species, the hard-bottom filter-feeder Mytilus edulis and the infaunal deposit/suspension-feeder Macoma balthica were measured in 2 areas (Tvär- minne and Turku Archipelago) in the southern coast of Finland. The bivalves were collected for the measurement of acetylcholinesterase (AChE), glutathione-S-transferase (GST) and catalase (CAT) activities, and for the determination of metallothionein (MT) content. The content of organochlorines (8 PCB congeners, DDE, DDD, DDT, HCH, HCB, dieldrin) and selected heavy metals (Cd, Cu, Hg, Zn) were measured in the soft tissues. In M. balthica collected from the Turku Archipelago region, biomarker gradients were observed in MT, GST and CAT, mostly coinciding with the tissue concen- trations of total PCBs, DDTs and selected metals. In M. edulis the biomarker responses were less con- sistent with regard to tissue pollutant concentrations. In the Tvärminne region no marked biomarker gradients were observed. The levels of all biomarkers varied significantly between the two species. The integrated biomarker response (IBR) index showed good accordance with the observed high tis- sue levels of organochlorines at the northern Airisto station in both species. This study is the first of its kind performed in the coastal waters of Finland, and the results clearly demonstrate the usefulness of the multibiomarker approach. Moreover, the use of 2 sessile species with markedly differing feed- ing modes and living habitats is considered a rational strategy for assessing the pollution status of coastal sea areas. KEY WORDS: Biomarkers · Baltic Sea · Bivalves · Macoma balthica · Mytilus edulis · Organo- chlorines · Heavy metals Resale or republication not permitted without written consent of the publisher
-
Upload
independent -
Category
Documents
-
view
1 -
download
0
Transcript of Biomarkers of pollution effects in the bivalves Mytilus edulis and Macoma balthica collected from...
MARINE ECOLOGY PROGRESS SERIESMar Ecol Prog Ser
Vol. 322: 155–168, 2006 Published September 20
INTRODUCTION
Assessment and monitoring of the state of contami-nation of the marine environment has traditionallybeen almost entirely based on measurements of con-centrations of well-known harmful substances in sea-water, sediments and/or biota. However, with the cur-rently enormous and continuously increasing numberof potentially toxic substances present in and releasedinto world seas, this approach alone can no longer beconsidered practical, cost-effective or even possible.
Besides the obvious technical and economical con-straints, the most important fact is that by using merelychemical measurements the biological effects of bothsingle pollutants and the combined effect of a numberof compounds in marine organisms remain unresolved;therefore, the true environmental hazards of contami-nation are insufficiently assessed. During the pastdecades, molecular, biochemical, cytological, immuno-logical and physiological techniques for the detectionof effects of pollutants in marine organisms, the so-called biomarkers, have been under dynamic develop-
© Inter-Research 2006 · www.int-res.com*Email: [email protected]
Biomarkers of pollution effects in the bivalvesMytilus edulis and Macoma balthica collected from
the southern coast of Finland (Baltic Sea)
Kari K. Lehtonen1,*, Sari Leiniö1, Rolf Schneider2, Mirja Leivuori1
1Finnish Institute of Marine Research, PO Box 2, 00561, Helsinki, Finland2Baltic Sea Research Institute, Department of Biological Oceanography, Seestrasse 15, 18119 Rostock-Warnemünde,
Germany
ABSTRACT: Levels of selected biomarkers in 2 bivalve species, the hard-bottom filter-feeder Mytilusedulis and the infaunal deposit/suspension-feeder Macoma balthica were measured in 2 areas (Tvär-minne and Turku Archipelago) in the southern coast of Finland. The bivalves were collected for themeasurement of acetylcholinesterase (AChE), glutathione-S-transferase (GST) and catalase (CAT)activities, and for the determination of metallothionein (MT) content. The content of organochlorines(8 PCB congeners, DDE, DDD, DDT, HCH, HCB, dieldrin) and selected heavy metals (Cd, Cu, Hg,Zn) were measured in the soft tissues. In M. balthica collected from the Turku Archipelago region,biomarker gradients were observed in MT, GST and CAT, mostly coinciding with the tissue concen-trations of total PCBs, DDTs and selected metals. In M. edulis the biomarker responses were less con-sistent with regard to tissue pollutant concentrations. In the Tvärminne region no marked biomarkergradients were observed. The levels of all biomarkers varied significantly between the two species.The integrated biomarker response (IBR) index showed good accordance with the observed high tis-sue levels of organochlorines at the northern Airisto station in both species. This study is the first ofits kind performed in the coastal waters of Finland, and the results clearly demonstrate the usefulnessof the multibiomarker approach. Moreover, the use of 2 sessile species with markedly differing feed-ing modes and living habitats is considered a rational strategy for assessing the pollution status ofcoastal sea areas.
KEY WORDS: Biomarkers · Baltic Sea · Bivalves · Macoma balthica · Mytilus edulis · Organo-chlorines · Heavy metals
Resale or republication not permitted without written consent of the publisher
Mar Ecol Prog Ser 322: 155–168, 2006
ment. More recently, a strong emphasis on their fur-ther development and application in marine monitor-ing programmes has emerged within the EuropeanUnion (e.g. OSPAR and MEDPOL related activities andthe pan-European BEEP project [Biological Effects ofEnvironmental Pollution on Marine Coastal Eco-systems, www.beep.u-bordeaux1.fr]). This topic needsurgent attention, particularly within the Baltic Seaarea, where this approach has been largely neglected,e.g. in the HELCOM monitoring programme (Lehto-nen & Schiedek 2006).
Sessile benthic organisms are universally acceptedas very suitable bioindicators of environmental conta-mination (e.g. Rainbow & Phillips 1993). In the poor-di-versity northern Baltic Sea, the hard-bottom filter-feeding mussel Mytilus edulis and the infaunaldeposit/suspension-feeding clam Macoma balthica areamong the very few benthic species available for envi-ronmental monitoring. The aims of the study were(1) to look at selected biomarkers in field conditions inbivalves from a northern Baltic Sea coastal marine en-vironment with suspected pollution gradients; (2) toapply an integrated multibiomarker index; and (3) tocompare the biomarker signals with concentrations ofselected pollutants in the bivalve tissues. The nature ofpollution in the investigated areas was largely un-known. Thus, biomarkers were chosen to representdifferent types of biological responses to elucidate thepollutant groups present in the environment that maycause effects. Of the selected biomarkers, acetyl-cholinesterase (AChE) activity is an indicator of synap-tic neurotoxic effects (e.g. Day & Scott 1990, Bocquené& Galgani 1998); metallothionein (MT) content is usedto indicate exposure to heavy metals (e.g. George &Olsson 1994, Viarengo et al. 1999); glutathione-S-transferase (GST) is a Phase II enzyme involved in thedetoxification of organic xenobiotics (e.g. Habig et al.1974, Lee et al. 1988); and an increase in catalase(CAT) activity signifies oxidative stress caused by ex-cessive oxyradical formation in the metabolism of vari-ous compounds (Claiborne 1985, Di Giulio et al. 1989).
MATERIALS AND METHODS
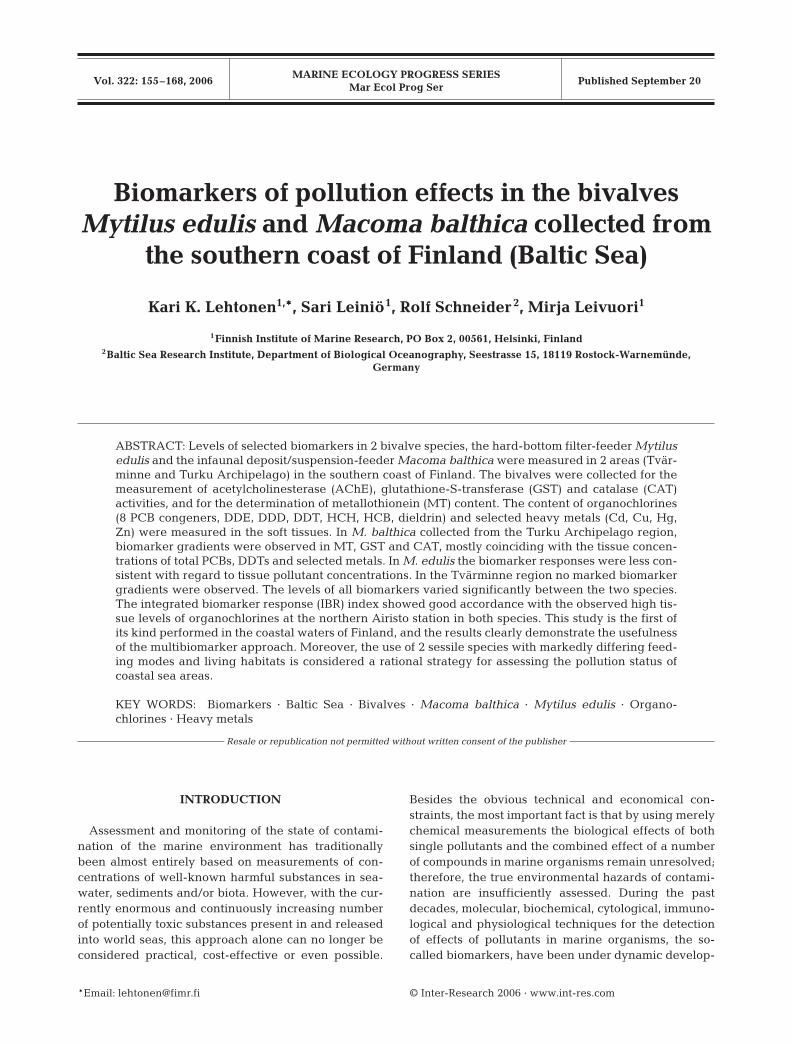
Sampling. Mytilus edulis and Macoma balthica werecollected in 2 regions on the southern coast of Finland.In the archipelago area close to Tvärminne ZoologicalStation of the University of Helsinki (hereafter called‘Tvärminne region’), 4 sampling sites (A1 to A4)extending from the vicinity of the Koverhar steel fac-tory towards the outer archipelago were sampled(Fig. 1). In the archipelago area close to the city ofTurku (‘Turku region’) the 3-station sampling transect(B1 to B3) started from northern Airisto, close to a for-
156
KOVERHAR
TVÄRMINNE
A1
A2
A3
A4
HANKO PENINSULA
Gulf of Finland
B
SEILI
B1
Airisto
B2
B3
RYMÄTTYLÄ
Aura RiverC
Gulf of Finland
ESTONIA RUSSIA
The Baltic
Proper
Gulf of Bothnia
FINLAND
Archipelago Sea
Tvärminne region
Turku Helsinki
TallinnSt. Petersburg
A
Turkuregion
Fig. 1. Sampling stations of the present study. (A) SouthernFinland and the Gulf of Finland, (B) Tvärminne Archipelago,(C) Turku Archipelago. s: Mytilus edulis stations; D: Macoma
balthica stations
Lehtonen et al.: Biomarkers in Baltic Sea bivalves
mer dumping site of harbour dredging waste, andended in a presumably less-polluted area near theArchipelago Sea Research Station (on Seili Island).Because of habitat differences, the exact samplinglocations of M. edulis and M. balthica differed slightlyat each station, but together they represented a distinctarea. Samples were taken in spring 2001, in the Turkuregion on 8 May and in the Tvärminne region on 15 to17 May. M. edulis were collected by scuba diving, andM. balthica with the van Veen grab or by bottomtrawling.
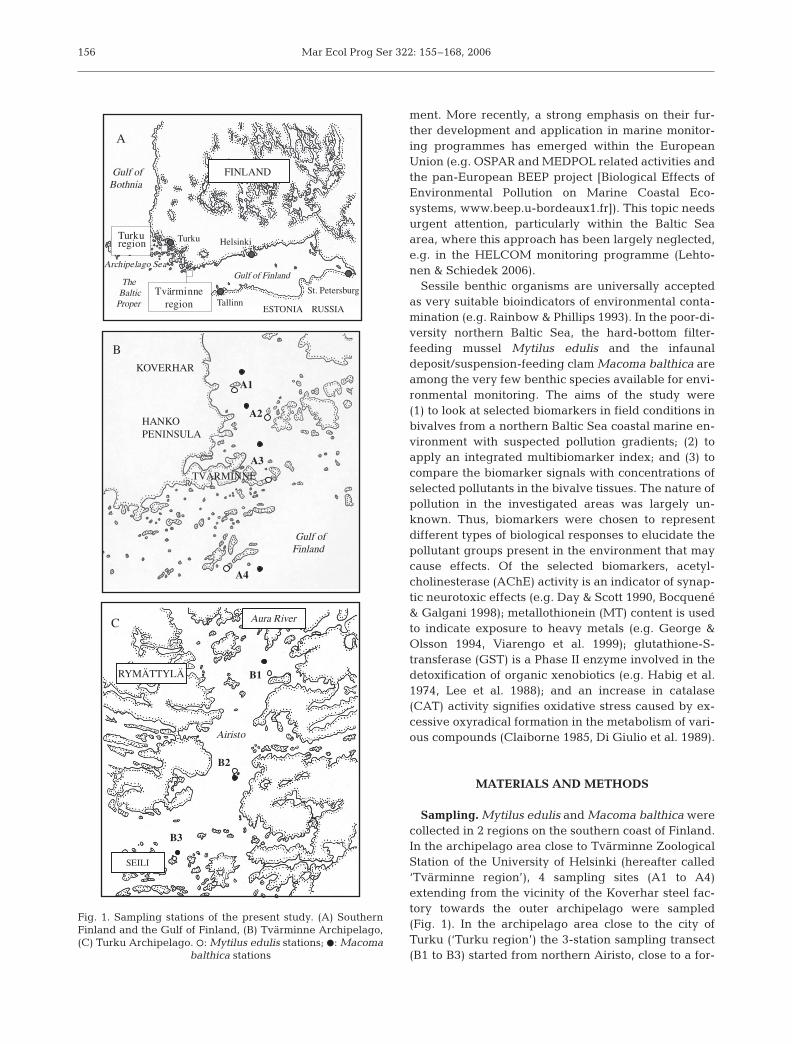
Hydrography. At the Macoma balthica stations, awater sample was obtained from ca. 1 m above the bot-tom and measured for dissolved oxygen concentrationusing the Winkler method (Grasshoff 1983) (Table 1).From the same sample, near-bottom temperature andsalinity were measured with a YSI instrument. In con-nection with the sampling of Mytilus edulis, tempera-ture and salinity were determined from the surfacewater (1 m). Water transparency was recorded using aSecchi disk (Tvärminne region) or estimating divingvisibility (Turku region).
Sample preparation. For biomarker analyses, thebivalves collected from the Tvärminne region weredissected the same day as sampled. The specimenscollected from the Turku region were kept overnight ina cold room (6ºC) in water buckets containing waterfrom the sampling site, and they were dissected thenext day. To minimise the differences in laboratorymaintenance time, the dissecting of bivalve groups col-lected from different stations was always performed inthe same order as the sampling in the field was done.Bivalves collected for pollutant analyses were keptovernight in ambient water for gut purging.
For AChE, gill pairs (Mytilus edulis) or foot tissue(Macoma balthica) from 5 individuals were pooled in 1Eppendorf tube, with 10 tubes from each station. ForMT, the digestive glands of 5 specimens were pooledin 1 tube, with 10 tubes per station. The digestiveglands of 10 individuals were stored separately for theanalysis of GST and CAT. Each sample was deposited
in liquid nitrogen immediately after dissection andstored at –80°C until analysis.
For pollutant analyses the bivalves were storedwhole (with shells) at –80°C until analysis. For heavymetal analyses 19 to 35 individuals were taken, whilefor the measurement of organochlorine levels theamount of specimens was up to 100, depending on theavailability of animals. During dissection of soft bodiesfrom the shells, all precautions were taken to avoidsample contamination. In 2 cases adequate numbers ofbivalves could not be obtained for pollutant analyses.
Biomarker measurements. AChE activity: Analyses(6 replicates) were performed essentially as describedin Bocquené & Galgani (1998). Tissues were homog-enised in 1:2 w/v 0.02 M phosphate buffer (pH 7.0)with 0.1% Triton X. Homogenates were centrifuged at10 000 × g for 20 min, and the supernatants (S9) wereused for AChE measurement. A BioRad Benchmark96-well microplate reader (BioRad) was used for thespectrophotometric determination of the Ellman reac-tion (Ellman et al. 1961). Tissue protein concentrationwas determined using the Bradford (1976) method,using bovine serum albumin (BSA) as the protein stan-dard. AChE activity values are expressed as equiva-lents of acetylthiocholine (ACTC) hydrolysed (nmolesACTC min–1 mg–1 protein), with 1 unit change in opti-cal density (ΔOD) corresponding to the hydrolysis of75 nmol of ACTC.
MT content: Analyses (5 replicates) were carried outaccording to the method of Viarengo et al. (1997).Tissues were homogenised in reducing conditions(0.05 M sucrose TRIS buffer, pH 8.6, containing 0.01%β-mercaptoethanol). Homogenates were centrifugedat 30 000 × g for 20 min. S9 were collected, andethanol/chloroform fractionation was used to obtainthe partially purified metalloprotein fraction. The MTconcentration was then measured by spectrophotomet-ric determination of –SH groups using Ellman’sreagent (DTNB).
GST and CAT activity: Measurements were per-formed on 10 individuals from each study station,
157
Station Station name: Date Depth (m): M. Temp. (°C): Salinity (psu): Secchi depth/ O2 (ml l–1)code M. balthica/M. edulis (2001) balthica/M. edulis bottom/surface bottom/surface visibility (m) at bottom
A1 Koverhar 15–17 May 30/4 4.2/7.7 4.2/5.1 3.5/– 6.55A2 Kummeli 15–17 May 32/5 4.1/8.3 5.6/5.0 3.5/– 6.86A3 Storfjärden/Sundholmen 15–16 May 33/5 4.4/7.6 4.9/5.1 4.0/– 6.24A4 Långskär/ Granbusken 15–16 May 36/4 4.4/8.1 6.2/5.1 6.0/– 6.96B1 N. Airisto 8 May 23/2 4.7/11.5 5.7/4.9 –/0.5 9.27B2 Grangrundet 8 May 22/5 5.2/9.1 5.0/5.1 –/1.0 9.86B3 Högholmen 8 May 32/4 4.8/7.8 5.4/5.4 –/1.5 9.53
Table 1. Hydrographic data recorded at the study stations during the sampling of Mytilus edulis and Macoma balthica. –: not measured
Mar Ecol Prog Ser 322: 155–168, 2006
determining both enzymatic rates from the samehomogenate. Pieces of digestive gland (>15 mg) werehomogenised (1:3 w/v) for 2 min in cold 100 mM potas-sium phosphate buffer (pH 7.0) using a Kontes pelletpestle. The homogenate was centrifuged at 10 000 × gfor 20 min. The S9 were diluted with cold buffer (seebelow) and kept on ice for analyses of enzyme activi-ties, performed within 3 h. The measurements wereperformed in a 1 cm quartz cuvette with total reactionvolumes of 1275 (GST) and 1350 µl (CAT) in buffersolution kept at room temperature (20 to 22°C).
The GST assay was performed using a modifiedmethod based on Habig et al. (1974). Dilutions of 1:10(Mytilus edulis) and 1:40 (Macoma balthica) were pre-pared. 20 mM chlorodinitrobenzene (CDNB) was usedas the substrate and 20 mM glutathione (GSH) as theco-substrate. GST activity was estimated by measuringthe formation rate of conjugated substrate (CDNB–GSH). CAT activity was measured as the disappear-ance rate of hydrogen superoxide (H2O2) from thereaction solution according to Claiborne (1985). S9dilutions of 1:10 (M. edulis) and 1:25 (M. balthica) wereprepared for the test, and H2O2 was applied as a60 mM solution. All the reagents (except the buffersolution) were prepared daily immediately prior to themeasurements.
Following addition of sample (supernatant) enzy-matic reactions were monitored for 60 s using a Perkin-Elmer Lambda 2 spectrophotometer using the Time-drive mode of WinLab software. GST conjugates weremeasured at 340 nm, and the reduction of H2O2 bycatalase at 240 nm. The reaction speed was afterwardsevaluated between 0 and 30 s, which showed a betterlinearity and slightly higher rates. Blank readings forspontaneous conjugate formation (GST) and H2O2
hydrolysation (CAT) were subtracted from the sampleactivity measurements. Protein in the S9 was deter-mined on microplates using the Bradford (1976)method and a BSA standard.
Pollutant levels in tissues. Organochlorines: Beforeand after freeze-drying with a Christ-Alpha 1–4, thepooled samples of bivalve soft bodies were weighed toallow for calculations of wet-weight-based data. Sam-ples were vigorously ground to a homogenous powder,from which lipids were extracted for 8 h in a Soxhletapparatus using a mixture of 20% acetone in n-hexane. The extracts were concentrated in tared flasksusing a rotary evaporator, and total lipids gravimetri-cally estimated. Clean-up and fractionation oforganochlorine compounds were carried out by alu-mina and silica column chromatography within theguidelines of Holden & Marsden (1969), and as speci-fied by Schneider (1982). The gas chromatographemployed for the estimation of organochlorines was aFISONS instrument, GC 8000, equipped with an AS
800 auto-sampler for automatic on-column sampleinjection and an ECD 800 electron capture detector. Itwas fitted with a J&W DB-35 30 m × 0.32 mm fusedsilica capillary column for separation and a J&W 5 m× 0.53 mm untreated fused silica capillary column asa retention gap (pre-column). The carrier gas, hy-drogen, was adjusted to a flow rate of 2 ml min–1 at40°C. N2 was used as detector make-up gas. TheGC oven temperature programme was as follows:1 min 40ºC isothermal, 40ºC min–1 to 160ºC, 10 min160ºC isothermal, 4ºC min–1 to 290ºC and 10 min 290ºCisothermal.
Mixed pesticide standard (α-, β-, γ-HCH, dieldrin,o,p ’- and p,p ’-isomers of DDE, DDD and DDT) andPCB congener standard (PCB 52, 101, 105, 118, 138,149, 153, and 180) solutions at (individual compound)concentrations of 5, 10, 15, 20, 50, 100 and 150 pg µl–1
were applied for calibration. As an internal standard,20 pg µl–1 of PCB 198 was added to each standard andsample solution. The analytical quality of organochlo-rine estimation in bivalves was repeatedly checked bytriplicate analysis of IAEA reference materials (IAEA1980, 1988; copepod and mussel homogenates), result-ing in typical standard deviations between 3 and 5%,as well as by frequent participation in QUASIMEMElaboratory performance studies.
Heavy metals: One pooled sample from each speciesand station was analysed for selected heavy metals(Cd, Cu, Hg and Zn). The soft tissue was removed fromthe shells, refrozen and freeze-dried for 30 h with anEdwards Super Modulyo freeze dryer. Samples werehomogenised in a Fritsch planetary mill (Pulverisette5) with grinding bowls and balls made of zirconiumoxide. Aliquots (0.25 g) were digested in Teflon bombswith 2 ml H2O and 5 ml HNO3 in a microwave oven.Samples were heated with pressure regulation at150 psi for 60 min. After cooling, samples were dilutedwith Milli-Q water up to the 25 ml mark in a volumet-ric plastic flask, transferred to plastic storage bottlesand stored at room temperature until analysis. Heavy-metal determinations were done with an atomicadsorption spectrophotometer (Perkin-Elmer AAS5100 ZL). These measurements were made with theflameless method, with matrix modification and plat-form techniques. Commercial certified sediment refer-ence materials BCR-422 and DORM-2 (NRCC) wereused to control analytical reliability. For the elementsstudied, nearly 100% recoveries (80 to 110%) wereobtained for both reference materials.
Statistical treatment of data. Single-biomarker vari-ability between the stations within each of the 2 studyareas was investigated using a standard ANOVA andpost-hoc Tukey’s test. To study the relations betweenbiological responses and tissue contaminant levelsjointly in both species and study areas, the biomarker
158
Lehtonen et al.: Biomarkers in Baltic Sea bivalves
and tissue contaminant data from both species andstudy areas were combined by calculating normalisedparameter values (between 0 and 1) for each species ateach study station. The normalised values of singlebiomarkers or the sums of all 4 of them, now combinedfor both species, were analysed for linear regressionsagainst normalised values of tissue levels of totalorganochlorines, ΣPCBs, ΣDDTs, single heavy metalsor their sum recorded for both species. SYSTAT™ 9.0software was used for all statistical analyses.
To assess the ’pollution status’ of each location, anintegrated biomarker response (IBR) index was calcu-lated for each species using all the 4 biomarkers stud-ied. A simple starplot graphic tool (Microsoft Excel)was applied to the data to visualise the results. The IBRmethod of Beliaeff & Burgeot (2002) is brieflydescribed here. For each biomarker: (1) Calculation ofmean and SD for each station. (2) Standardisation ofdata for each station: xi’ = (xi – mean x)/s. Result: vari-ance = 1, mean = 0. (3) Using standardised data, addi-tion of the value obtained for each station to theabsolute (= non-negative) value of the minimum valuein the data set: B = xi’ + ⏐xmin⏐. Result: adjusts the low-est value in the set to zero. For all the biomarkerstreated this way: calculation of starplot areas by multi-plication of the obtained value of each biomarker (Bi)with the value of the next biomarker, arranged as a set,dividing each calculation by 2 and summing-up of allvalues: {[(B1 × B2)/2] + [(B2 × B3)/2] + … + [(Bn–1 ×Bn)/2]}. Result: IBR (average of different arrangementsof biomarkers in the set).
Tissue concentrations of organochlorines and heavymetals were also standardised this way, to obtainindices for both total organochlorines and total heavymetal loads in the bivalve tissues at the different studystations. From all the standardised organochlorinesand heavy metals, a mean value was calculated to rep-resent the ‘general load’ of these pollutant groups atthe different study stations.
RESULTS
Spatial variability in biomarker responses
AChE
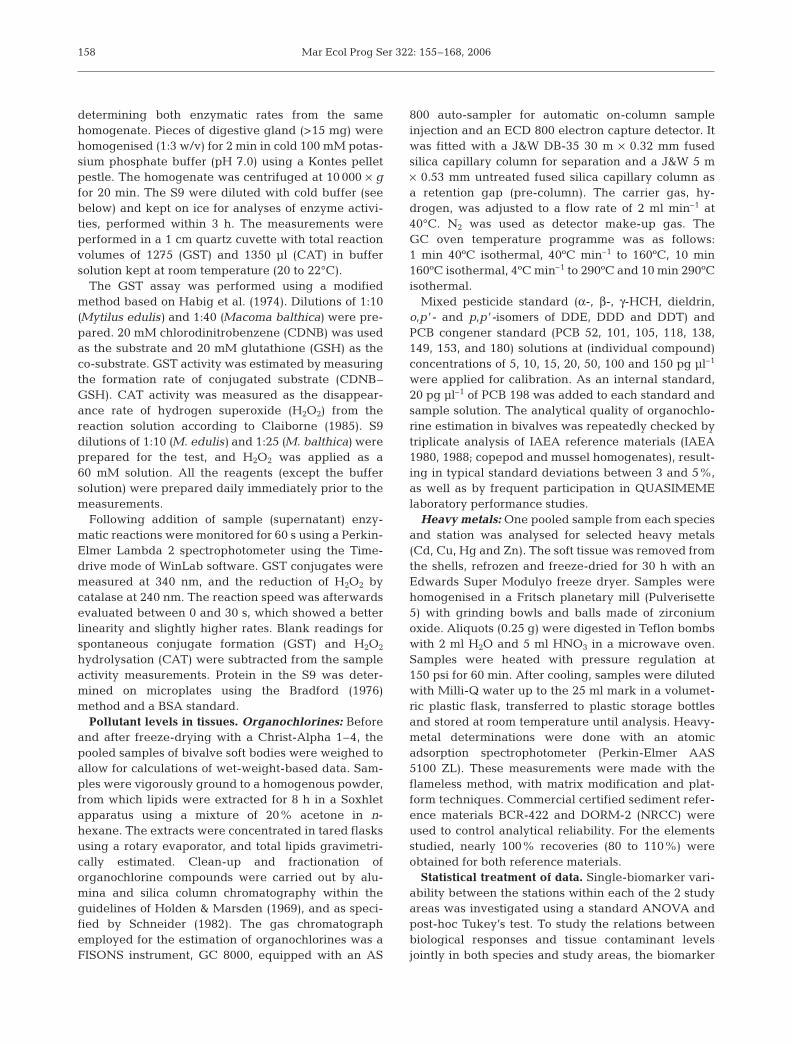
In both bivalve species, AChE activities were rela-tively homogenous over the regions and stations, andno significant differences could be noted (Fig. 2,Table 2). In the gill tissue of Mytilus edulis the AChEactivity ranged from 19.3 to 25.9 nmol ACTC min–1
mg–1 protein, being lower in the foot tissue of Macomabalthica with values between 17.7 and 21.8 nmolACTC min–1 mg–1 protein.
MT
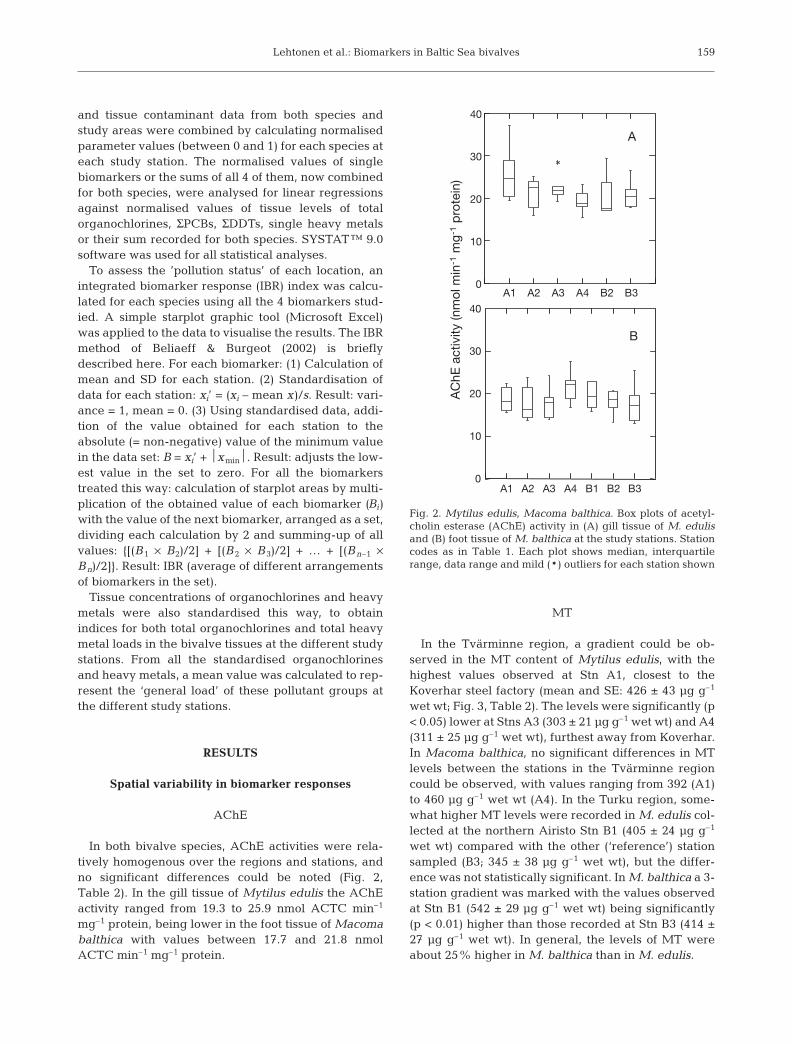
In the Tvärminne region, a gradient could be ob-served in the MT content of Mytilus edulis, with thehighest values observed at Stn A1, closest to theKoverhar steel factory (mean and SE: 426 ± 43 µg g–1
wet wt; Fig. 3, Table 2). The levels were significantly (p< 0.05) lower at Stns A3 (303 ± 21 µg g–1 wet wt) and A4(311 ± 25 µg g–1 wet wt), furthest away from Koverhar.In Macoma balthica, no significant differences in MTlevels between the stations in the Tvärminne regioncould be observed, with values ranging from 392 (A1)to 460 µg g–1 wet wt (A4). In the Turku region, some-what higher MT levels were recorded in M. edulis col-lected at the northern Airisto Stn B1 (405 ± 24 µg g–1
wet wt) compared with the other (‘reference’) stationsampled (B3; 345 ± 38 µg g–1 wet wt), but the differ-ence was not statistically significant. In M. balthica a 3-station gradient was marked with the values observedat Stn B1 (542 ± 29 µg g–1 wet wt) being significantly(p < 0.01) higher than those recorded at Stn B3 (414 ±27 µg g–1 wet wt). In general, the levels of MT wereabout 25% higher in M. balthica than in M. edulis.
159
A1 A2 A3 A4 B2 B30
10
20
30
40
0
10
20
30
40
A1 A2 A3 A4 B1 B2 B3
A
B
AC
hE a
ctiv
ity (n
mol
min
-1 m
g-1
pro
tein
)
Fig. 2. Mytilus edulis, Macoma balthica. Box plots of acetyl-cholin esterase (AChE) activity in (A) gill tissue of M. edulisand (B) foot tissue of M. balthica at the study stations. Stationcodes as in Table 1. Each plot shows median, interquartilerange, data range and mild (*) outliers for each station shown
Mar Ecol Prog Ser 322: 155–168, 2006
GST
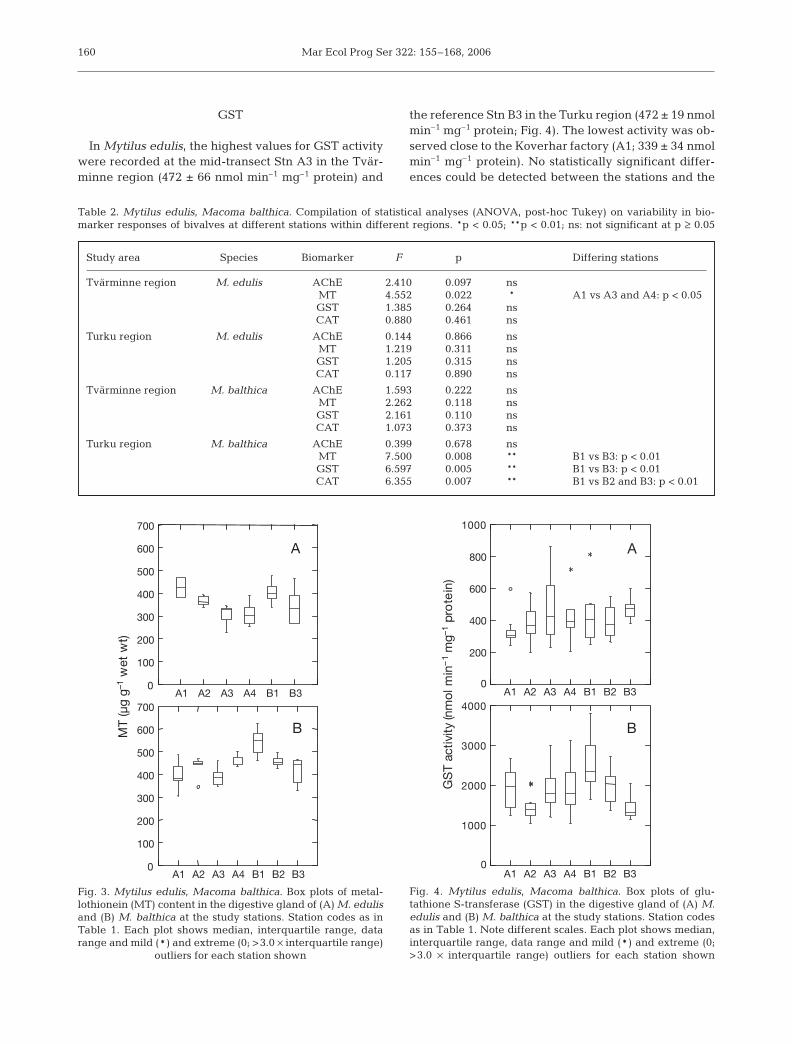
In Mytilus edulis, the highest values for GST activitywere recorded at the mid-transect Stn A3 in the Tvär-minne region (472 ± 66 nmol min–1 mg–1 protein) and
the reference Stn B3 in the Turku region (472 ± 19 nmolmin–1 mg–1 protein; Fig. 4). The lowest activity was ob-served close to the Koverhar factory (A1; 339 ± 34 nmolmin–1 mg–1 protein). No statistically significant differ-ences could be detected between the stations and the
160
A1 A2 A3 A4 B1 B30
100
200
300
400
500
600
700
0
100
200
300
400
500
600
700
A1 A2 A3 A4 B1 B2 B3
A
BMT
(µg
g–1 w
et w
t)
Study area Species Biomarker F p Differing stations
Tvärminne region M. edulis AChE 2.410 0.097 nsMT 4.552 0.022 * A1 vs A3 and A4: p < 0.05GST 1.385 0.264 nsCAT 0.880 0.461 ns
Turku region M. edulis AChE 0.144 0.866 nsMT 1.219 0.311 nsGST 1.205 0.315 nsCAT 0.117 0.890 ns
Tvärminne region M. balthica AChE 1.593 0.222 nsMT 2.262 0.118 nsGST 2.161 0.110 nsCAT 1.073 0.373 ns
Turku region M. balthica AChE 0.399 0.678 nsMT 7.500 0.008 ** B1 vs B3: p < 0.01GST 6.597 0.005 ** B1 vs B3: p < 0.01CAT 6.355 0.007 ** B1 vs B2 and B3: p < 0.01
Table 2. Mytilus edulis, Macoma balthica. Compilation of statistical analyses (ANOVA, post-hoc Tukey) on variability in bio-marker responses of bivalves at different stations within different regions. *p < 0.05; **p < 0.01; ns: not significant at p ≥ 0.05
Fig. 3. Mytilus edulis, Macoma balthica. Box plots of metal-lothionein (MT) content in the digestive gland of (A) M. edulisand (B) M. balthica at the study stations. Station codes as inTable 1. Each plot shows median, interquartile range, datarange and mild (*) and extreme (0; >3.0 × interquartile range)
outliers for each station shown
A1 A2 A3 A4 B1 B2 B30
200
400
600
800
1000
A1 A2 A3 A4 B1 B2 B30
1000
2000
3000
4000
A
B
GS
T ac
tivity
(nm
ol m
in–
1 m
g–1 p
rote
in)
Fig. 4. Mytilus edulis, Macoma balthica. Box plots of glu-tathione S-transferase (GST) in the digestive gland of (A) M.edulis and (B) M. balthica at the study stations. Station codesas in Table 1. Note different scales. Each plot shows median,interquartile range, data range and mild (*) and extreme (0;>3.0 × interquartile range) outliers for each station shown
Lehtonen et al.: Biomarkers in Baltic Sea bivalves
regions (Table 2). In Macoma balthica, the values weresimilar at all stations of the Tvärminne region transect(1852 to 1926 nmol min–1 mg–1 protein), except for theslightly lower activities recorded at Stn A2 (1467 ±110 nmol min–1 mg–1 protein). In the Turku region, adistinct gradient in GST activity was observed, withenzyme rates recorded at Stn B1 (3078 ± 543 nmol min–1
mg–1 protein) twice as high compared with the refer-ence Stn B3 (1416 ± 86 nmol min–1 mg–1 protein, p <0.01). On average, the GST activity in M. balthica wasca. 5-fold higher compared with M. edulis.
CAT
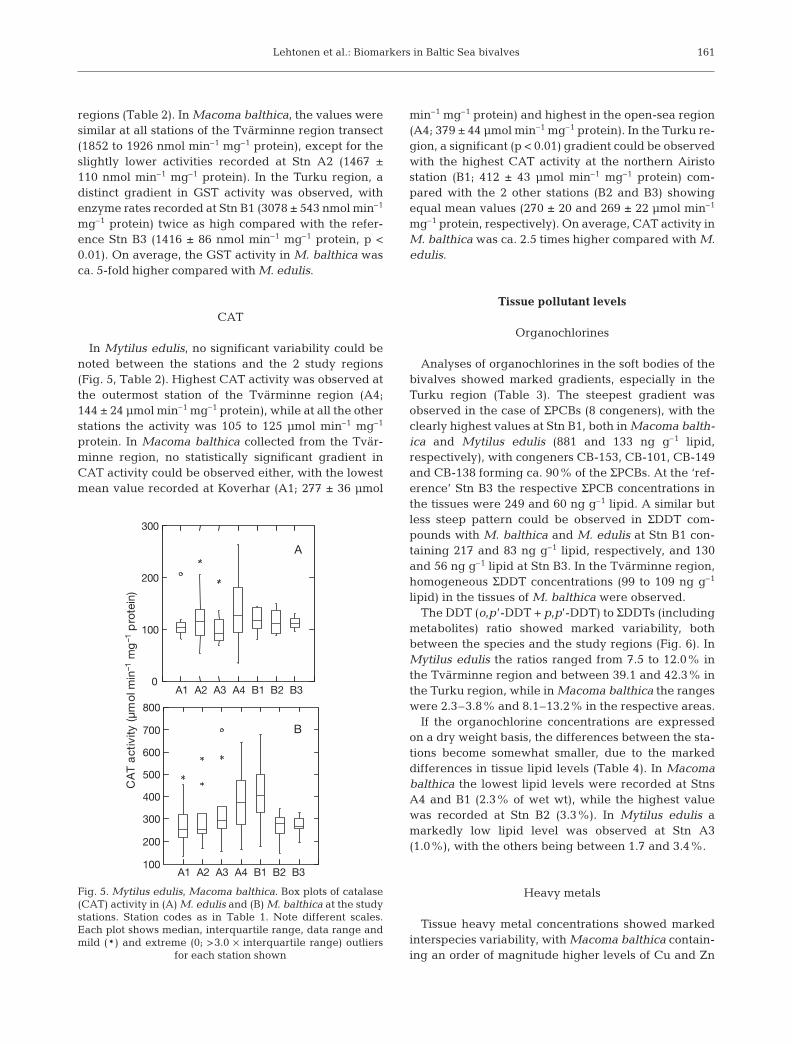
In Mytilus edulis, no significant variability could benoted between the stations and the 2 study regions(Fig. 5, Table 2). Highest CAT activity was observed atthe outermost station of the Tvärminne region (A4;144 ± 24 µmol min–1 mg–1 protein), while at all the otherstations the activity was 105 to 125 µmol min–1 mg–1
protein. In Macoma balthica collected from the Tvär-minne region, no statistically significant gradient inCAT activity could be observed either, with the lowestmean value recorded at Koverhar (A1; 277 ± 36 µmol
min–1 mg–1 protein) and highest in the open-sea region(A4; 379 ± 44 µmol min–1 mg–1 protein). In the Turku re-gion, a significant (p < 0.01) gradient could be observedwith the highest CAT activity at the northern Airistostation (B1; 412 ± 43 µmol min–1 mg–1 protein) com-pared with the 2 other stations (B2 and B3) showingequal mean values (270 ± 20 and 269 ± 22 µmol min–1
mg–1 protein, respectively). On average, CAT activity inM. balthica was ca. 2.5 times higher compared with M.edulis.
Tissue pollutant levels
Organochlorines
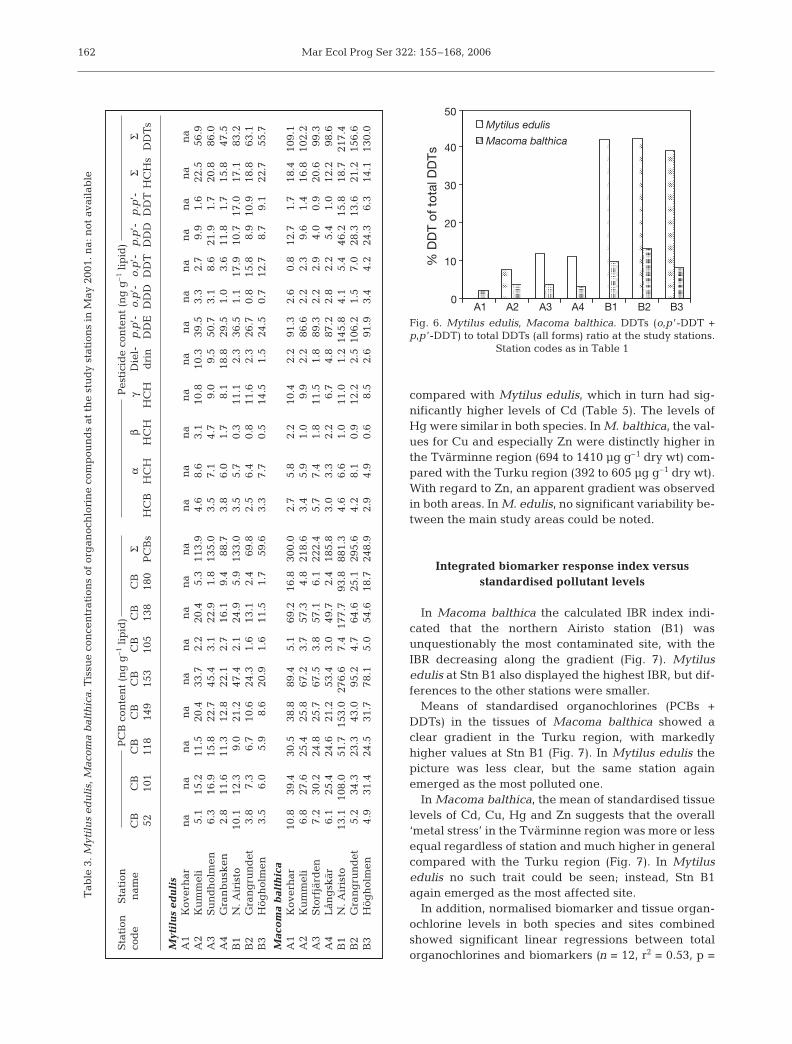
Analyses of organochlorines in the soft bodies of thebivalves showed marked gradients, especially in theTurku region (Table 3). The steepest gradient wasobserved in the case of ΣPCBs (8 congeners), with theclearly highest values at Stn B1, both in Macoma balth-ica and Mytilus edulis (881 and 133 ng g–1 lipid,respectively), with congeners CB-153, CB-101, CB-149and CB-138 forming ca. 90% of the ΣPCBs. At the ‘ref-erence’ Stn B3 the respective ΣPCB concentrations inthe tissues were 249 and 60 ng g–1 lipid. A similar butless steep pattern could be observed in ΣDDT com-pounds with M. balthica and M. edulis at Stn B1 con-taining 217 and 83 ng g–1 lipid, respectively, and 130and 56 ng g–1 lipid at Stn B3. In the Tvärminne region,homogeneous ΣDDT concentrations (99 to 109 ng g–1
lipid) in the tissues of M. balthica were observed.The DDT (o,p’-DDT + p,p’-DDT) to ΣDDTs (including
metabolites) ratio showed marked variability, bothbetween the species and the study regions (Fig. 6). InMytilus edulis the ratios ranged from 7.5 to 12.0% inthe Tvärminne region and between 39.1 and 42.3% inthe Turku region, while in Macoma balthica the rangeswere 2.3–3.8% and 8.1–13.2% in the respective areas.
If the organochlorine concentrations are expressedon a dry weight basis, the differences between the sta-tions become somewhat smaller, due to the markeddifferences in tissue lipid levels (Table 4). In Macomabalthica the lowest lipid levels were recorded at StnsA4 and B1 (2.3% of wet wt), while the highest valuewas recorded at Stn B2 (3.3%). In Mytilus edulis amarkedly low lipid level was observed at Stn A3(1.0%), with the others being between 1.7 and 3.4%.
Heavy metals
Tissue heavy metal concentrations showed markedinterspecies variability, with Macoma balthica contain-ing an order of magnitude higher levels of Cu and Zn
161
A1 A2 A3 A4 B1 B2 B3
A1 A2 A3 A4 B1 B2 B30
100
200
300
100
200
300
400
500
600
700
800
A
B
CA
T a
ctiv
ity (
µmol
min
–1 m
g–1
pro
tein
)
Fig. 5. Mytilus edulis, Macoma balthica. Box plots of catalase(CAT) activity in (A) M. edulis and (B) M. balthica at the studystations. Station codes as in Table 1. Note different scales.Each plot shows median, interquartile range, data range andmild (*) and extreme (0; >3.0 × interquartile range) outliers
for each station shown
Mar Ecol Prog Ser 322: 155–168, 2006
compared with Mytilus edulis, which in turn had sig-nificantly higher levels of Cd (Table 5). The levels ofHg were similar in both species. In M. balthica, the val-ues for Cu and especially Zn were distinctly higher inthe Tvärminne region (694 to 1410 µg g–1 dry wt) com-pared with the Turku region (392 to 605 µg g–1 dry wt).With regard to Zn, an apparent gradient was observedin both areas. In M. edulis, no significant variability be-tween the main study areas could be noted.
Integrated biomarker response index versusstandardised pollutant levels
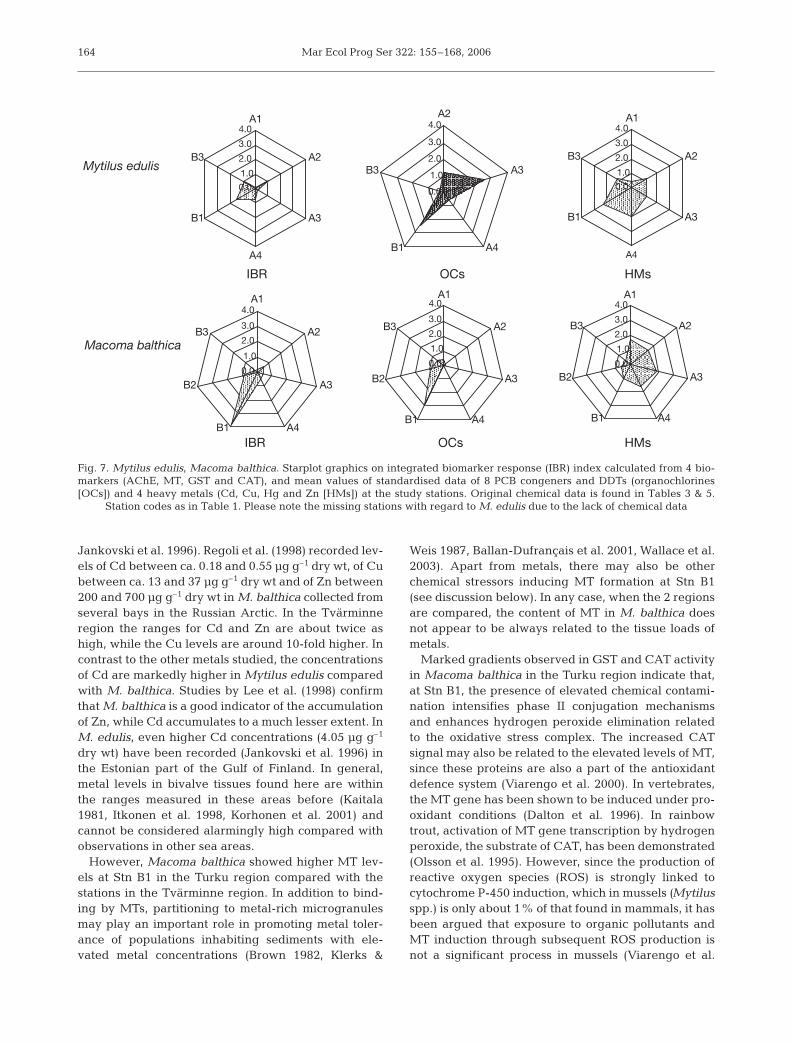
In Macoma balthica the calculated IBR index indi-cated that the northern Airisto station (B1) wasunquestionably the most contaminated site, with theIBR decreasing along the gradient (Fig. 7). Mytilusedulis at Stn B1 also displayed the highest IBR, but dif-ferences to the other stations were smaller.
Means of standardised organochlorines (PCBs +DDTs) in the tissues of Macoma balthica showed aclear gradient in the Turku region, with markedlyhigher values at Stn B1 (Fig. 7). In Mytilus edulis thepicture was less clear, but the same station againemerged as the most polluted one.
In Macoma balthica, the mean of standardised tissuelevels of Cd, Cu, Hg and Zn suggests that the overall‘metal stress’ in the Tvärminne region was more or lessequal regardless of station and much higher in generalcompared with the Turku region (Fig. 7). In Mytilusedulis no such trait could be seen; instead, Stn B1again emerged as the most affected site.
In addition, normalised biomarker and tissue organ-ochlorine levels in both species and sites combinedshowed significant linear regressions between totalorganochlorines and biomarkers (n = 12, r2 = 0.53, p =
162
Sta
tion
Sta
tion
PC
B c
onte
nt
(ng
g–
1li
pid
)P
esti
cid
e co
nte
nt
(ng
g–
1li
pid
)co
de
nam
eC
BC
BC
BC
BC
BC
BC
BC
BΣ
αβ
γD
iel-
p.p
’-o.
p’-
o.p
’-p
.p’-
p.p
’-Σ
Σ52
101
118
149
153
105
138
180
PC
Bs
HC
BH
CH
HC
HH
CH
dri
nD
DE
DD
DD
DT
DD
DD
DT
HC
Hs
DD
Ts
Myt
ilu
s ed
uli
sA
1K
over
har
na
na
na
na
na
na
na
na
na
na
na
na
na
na
na
na
na
na
na
na
na
A2
Ku
mm
eli
5.1
15.2
11.5
20.4
33.7
2.2
20.4
5.3
113.
94.
68.
63.
110
.810
.339
.53.
32.
79.
91.
622
.556
.9A
3S
un
dh
olm
en6.
316
.915
.822
.745
.43.
122
.91.
813
5.0
3.5
7.1
4.7
9.0
9.5
50.7
3.1
8.6
21.9
1.7
20.8
86.0
A4
Gra
nb
usk
en2.
811
.611
.312
.822
.12.
716
.19.
488
.73.
86.
01.
78.
118
.829
.51.
03.
611
.81.
715
.847
.5B
1N
. Air
isto
10.1
12.3
9.0
21.2
47.4
2.1
24.9
5.9
133.
03.
55.
70.
311
.12.
336
.51.
117
.910
.717
.017
.183
.2B
2G
ran
gru
nd
et3.
87.
36.
710
.624
.31.
613
.12.
469
.82.
56.
40.
811
.62.
326
.70.
815
.88.
910
.918
.863
.1B
3H
ögh
olm
en3.
56.
05.
98.
620
.91.
611
.51.
759
.63.
37.
70.
514
.51.
524
.50.
712
.78.
79.
122
.755
.7
Mac
om
a b
alth
ica
A1
Kov
erh
ar10
.839
.430
.538
.889
.45.
169
.216
.830
0.0
2.7
5.8
2.2
10.4
2.2
91.3
2.6
0.8
12.7
1.7
18.4
109.
1A
2K
um
mel
i6.
827
.625
.425
.867
.23.
757
.34.
821
8.6
3.4
5.9
1.0
9.9
2.2
86.6
2.2
2.3
9.6
1.4
16.8
102.
2A
3S
torf
järd
en7.
230
.224
.825
.767
.53.
857
.16.
122
2.4
5.7
7.4
1.8
11.5
1.8
89.3
2.2
2.9
4.0
0.9
20.6
99.3
A4
Lån
gsk
är6.
125
.424
.621
.253
.43.
049
.72.
418
5.8
3.0
3.3
2.2
6.7
4.8
87.2
2.8
2.2
5.4
1.0
12.2
98.6
B1
N. A
iris
to13
.110
8.0
51.7
153.
027
6.6
7.4
177.
793
.888
1.3
4.6
6.6
1.0
11.0
1.2
145.
84.
15.
446
.215
.818
.721
7.4
B2
Gra
ng
run
det
5.2
34.3
23.3
43.0
95.2
4.7
64.6
25.1
295.
64.
28.
10.
912
.22.
510
6.2
1.5
7.0
28.3
13.6
21.2
156.
6B
3H
ögh
olm
en4.
931
.424
.531
.778
.15.
054
.618
.724
8.9
2.9
4.9
0.6
8.5
2.6
91.9
3.4
4.2
24.3
6.3
14.1
130.
0
Tab
le 3
. Myt
ilu
s ed
uli
s,M
acom
a b
alth
ica.
Tis
sue
con
cen
trat
ion
s of
org
anoc
hlo
rin
e co
mp
oun
ds
at t
he
stu
dy
stat
ion
s in
May
200
1. n
a: n
ot a
vail
able
0
10
20
30
40
50
A1 A2 A3 A4 B1 B2 B3
% D
DT
of t
otal
DD
Ts
Mytilus edulis
Macoma balthica
Fig. 6. Mytilus edulis, Macoma balthica. DDTs (o,p ’-DDT +p,p ’-DDT) to total DDTs (all forms) ratio at the study stations.
Station codes as in Table 1
Lehtonen et al.: Biomarkers in Baltic Sea bivalves
0.008), ΣPCBs and biomarkers (n = 12, r2 = 0.58, p =0.004), total organochlorines and GST activity andΣPCBs and GST activity (n = 13, r2 = 0.64, p = 0.001,both cases). For heavy metals, Cd showed weaker butsignificant relationships with GST (n = 13, r2 = 0.32, p =0.045) and CAT activities (n = 13, r2 = 0.33, p = 0.041).
DISCUSSION
Chemical pollution and biomarker responses in thestudy regions
The high proportion of parent DDTs (DDT to ΣDDTsratio) in tissues of both bivalve species collected from
the Turku region indicates more recent inputs com-pared with the Tvärminne region. It is apparent thatalthough not in active use anymore DDT is still circu-lating in the marine environment of this area and cantherefore be found in unmetabolised and metabolisedforms in both the sediments and the water phase, sub-sequently bioaccumulating in organisms. In the case ofthe Tvärminne region, the ratios of DDT to ΣDDTsshow that, at present, DDT released into the environ-ment decades ago is substantially ‘used up’ andincreasingly found in the environment in metabolisedforms, as DDDs and DDEs. However, with regard tobiological effects, the poor correlations observedbetween biomarker responses and tissue levels ofDDTs suggest that there is no direct relationship. Withregard to PCBs, despite the fact that elevated levelswere observed especially at Stn B1, some other,unmeasured anthropogenic substances potentiallypresent at this station situated close to a former dump-ing site of harbour dredging waste can play a part inthe impacts observed. Thus, the levels of organochlo-rines measured here should rather be taken as proxiesof the level of general anthropogenic pollution at thedifferent sites, not necessarily as the direct causes ofthe observed responses.
Macoma balthica from the Tvärminne region con-tains markedly higher amounts of Cd, Cu and Zn com-pared with those inhabiting the Turku region. Theimpact of the large Koverhar steel factory, presentsince the 1950s, although with significantly reducedpollutant release in recent years, can still be observedin terms of high levels of certain metals in the tissues ofclams. Tissue concentration of Zn at the Koverhar sta-tion (1440 µg g–1 dry wt) was strikingly high comparedwith other observations in the Baltic Sea (e.g.
163
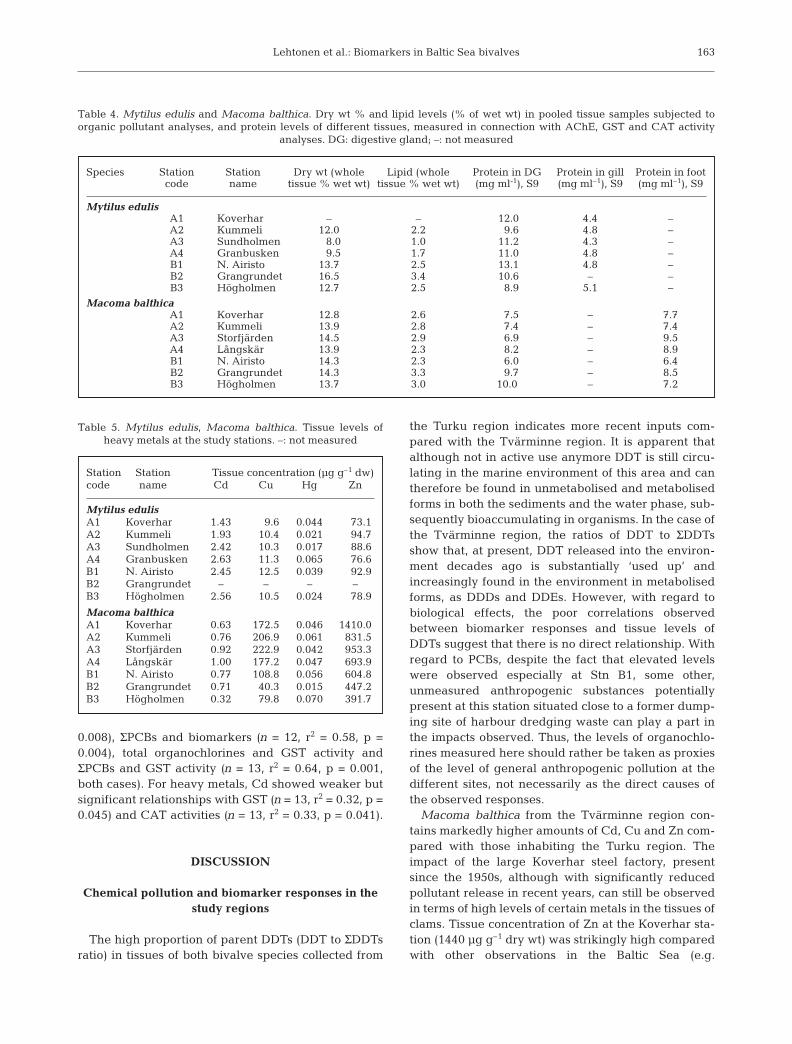
Species Station Station Dry wt (whole Lipid (whole Protein in DG Protein in gill Protein in footcode name tissue % wet wt) tissue % wet wt) (mg ml-1), S9 (mg ml–1), S9 (mg ml–1), S9
Mytilus edulisA1 Koverhar – – 12.0 4.4 –A2 Kummeli 12.0 2.2 9.6 4.8 –A3 Sundholmen 8.0 1.0 11.2 4.3 –A4 Granbusken 9.5 1.7 11.0 4.8 –B1 N. Airisto 13.7 2.5 13.1 4.8 –B2 Grangrundet 16.5 3.4 10.6 – –B3 Högholmen 12.7 2.5 8.9 5.1 –
Macoma balthicaA1 Koverhar 12.8 2.6 7.5 – 7.7A2 Kummeli 13.9 2.8 7.4 – 7.4A3 Storfjärden 14.5 2.9 6.9 – 9.5A4 Långskär 13.9 2.3 8.2 – 8.9B1 N. Airisto 14.3 2.3 6.0 – 6.4B2 Grangrundet 14.3 3.3 9.7 – 8.5B3 Högholmen 13.7 3.0 10.0 – 7.2
Table 4. Mytilus edulis and Macoma balthica. Dry wt % and lipid levels (% of wet wt) in pooled tissue samples subjected toorganic pollutant analyses, and protein levels of different tissues, measured in connection with AChE, GST and CAT activity
analyses. DG: digestive gland; –: not measured
Station Station Tissue concentration (µg g–1 dw)code name Cd Cu Hg Zn
Mytilus edulisA1 Koverhar 1.43 9.6 0.044 73.1A2 Kummeli 1.93 10.4 0.021 94.7A3 Sundholmen 2.42 10.3 0.017 88.6A4 Granbusken 2.63 11.3 0.065 76.6B1 N. Airisto 2.45 12.5 0.039 92.9B2 Grangrundet – – – –B3 Högholmen 2.56 10.5 0.024 78.9
Macoma balthicaA1 Koverhar 0.63 172.5 0.046 1410.0A2 Kummeli 0.76 206.9 0.061 831.5A3 Storfjärden 0.92 222.9 0.042 953.3A4 Långskär 1.00 177.2 0.047 693.9B1 N. Airisto 0.77 108.8 0.056 604.8B2 Grangrundet 0.71 40.3 0.015 447.2B3 Högholmen 0.32 79.8 0.070 391.7
Table 5. Mytilus edulis, Macoma balthica. Tissue levels of heavy metals at the study stations. –: not measured
Mar Ecol Prog Ser 322: 155–168, 2006
Jankovski et al. 1996). Regoli et al. (1998) recorded lev-els of Cd between ca. 0.18 and 0.55 µg g–1 dry wt, of Cubetween ca. 13 and 37 µg g–1 dry wt and of Zn between200 and 700 µg g–1 dry wt in M. balthica collected fromseveral bays in the Russian Arctic. In the Tvärminneregion the ranges for Cd and Zn are about twice ashigh, while the Cu levels are around 10-fold higher. Incontrast to the other metals studied, the concentrationsof Cd are markedly higher in Mytilus edulis comparedwith M. balthica. Studies by Lee et al. (1998) confirmthat M. balthica is a good indicator of the accumulationof Zn, while Cd accumulates to a much lesser extent. InM. edulis, even higher Cd concentrations (4.05 µg g–1
dry wt) have been recorded (Jankovski et al. 1996) inthe Estonian part of the Gulf of Finland. In general,metal levels in bivalve tissues found here are withinthe ranges measured in these areas before (Kaitala1981, Itkonen et al. 1998, Korhonen et al. 2001) andcannot be considered alarmingly high compared withobservations in other sea areas.
However, Macoma balthica showed higher MT lev-els at Stn B1 in the Turku region compared with thestations in the Tvärminne region. In addition to bind-ing by MTs, partitioning to metal-rich microgranulesmay play an important role in promoting metal toler-ance of populations inhabiting sediments with ele-vated metal concentrations (Brown 1982, Klerks &
Weis 1987, Ballan-Dufrançais et al. 2001, Wallace et al.2003). Apart from metals, there may also be otherchemical stressors inducing MT formation at Stn B1(see discussion below). In any case, when the 2 regionsare compared, the content of MT in M. balthica doesnot appear to be always related to the tissue loads ofmetals.
Marked gradients observed in GST and CAT activityin Macoma balthica in the Turku region indicate that,at Stn B1, the presence of elevated chemical contami-nation intensifies phase II conjugation mechanismsand enhances hydrogen peroxide elimination relatedto the oxidative stress complex. The increased CATsignal may also be related to the elevated levels of MT,since these proteins are also a part of the antioxidantdefence system (Viarengo et al. 2000). In vertebrates,the MT gene has been shown to be induced under pro-oxidant conditions (Dalton et al. 1996). In rainbowtrout, activation of MT gene transcription by hydrogenperoxide, the substrate of CAT, has been demonstrated(Olsson et al. 1995). However, since the production ofreactive oxygen species (ROS) is strongly linked tocytochrome P-450 induction, which in mussels (Mytilusspp.) is only about 1% of that found in mammals, it hasbeen argued that exposure to organic pollutants andMT induction through subsequent ROS production isnot a significant process in mussels (Viarengo et al.
164
0.0
1.0
2.0
3.0
4.0A1
A2
A3
A4B1
B2
B3
0.0
1.0
2.0
3.0
4.0A2
A3
A4B1
B3
0.0
1.0
2.0
3.0
4.0A1
A2
A3
A4B1
B2
B3
0.0
1.0
2.0
3.0
4.0A1
A2
A3
A4
B1
B3
0.0
1.0
2.0
3.0
4.0A1
A2
A3
A4
B1
B3
0.0
1.0
2.0
3.0
4.0A1
A2
A3
A4B1
B2
B3
Mytilus edulis
Macoma balthica
IBR OCs HMs
IBR OCs HMs
Fig. 7. Mytilus edulis, Macoma balthica. Starplot graphics on integrated biomarker response (IBR) index calculated from 4 bio-markers (AChE, MT, GST and CAT), and mean values of standardised data of 8 PCB congeners and DDTs (organochlorines[OCs]) and 4 heavy metals (Cd, Cu, Hg and Zn [HMs]) at the study stations. Original chemical data is found in Tables 3 & 5.
Station codes as in Table 1. Please note the missing stations with regard to M. edulis due to the lack of chemical data
Lehtonen et al.: Biomarkers in Baltic Sea bivalves
1999). Nevertheless, other ROS-producing detoxifica-tion pathways not mediated by P-450s may be in oper-ation. In this study, the data on organic contaminantsin the soft tissues of M. balthica with marked gradientsin PCBs and DDTs in the Turku region correspondswell with the gradients observed in the levels of GST,CAT and MT in the same area. This implies that detox-ification reactions and metabolic responses to oxida-tive stress may be caused by the catabolism of organicxenobiotics.
The observed interspecies differences, with Macomabalthica expressing 3- to 4-fold (CAT) and 7- to 8-fold(GST) higher enzyme activities in comparison withMytilus edulis, most likely do not only represent spe-cies-characteristic ecological levels but also mirror theobserved tissue loads of organic contaminants, whichin the sediment-dwelling M. balthica are on average 2-fold (DDTs) or 3-fold (PCBs) higher than in M. edulis.Compared with M. edulis, M. balthica showedmarkedly higher tissue accumulation of Cu, Zn, PCBsand DDTs, whereas the levels of Cd were higher in M.edulis. Interspecies variability in MT levels was appar-ent, with 1.5-fold lower values in M. edulis comparedwith M. balthica, as observed by Lehtonen & Leiniö(2003). This is probably due to the fact that M. balthicalives within soft sediments and is mostly a depositfeeder, thus being constantly exposed to pollutantsdeposited in organic particles of sediments that it feedson, as well as soluble pollutants in interstitial water.Being a suspension feeder, M. edulis is exposed to con-siderably lower levels of pollutants in the suspendedparticulate matter or soluble compounds present inseawater. Besides biological differences in uptakekinetics, the difference may be due to the sediment-dwelling lifestyle of M. balthica, which raises its expo-sure to, for example, bioavailable metals in both theirphysical environment (hypoxic/anoxic sediment lay-ers, pore water) and food items. In addition, metabolicdifferences between the species could also play animportant role in the observed differences in tissuepollutant levels between the species.
Finally, with regard to the observed homogeneity inthe levels of AChE activity the results obtained hereconfirm the view that organophosphate/carbamatepesticides are not an environmental problem inFinnish coastal waters. Other chemical stressors thatcan cause AChE-coupled neurotoxic effects do notappear to be present in effective concentrations.
Application of biomarkers in the Baltic Sea
Among many other specific characteristics of theBaltic Sea, the constant low-salinity environment (<6.5in Finnish coastal waters) creates physiological stress
to marine species that may affect biomarker responses.Thus, basic information on the levels of biomarkerresponses and their natural variations is needed priorto the application of these techniques and use of thesespecies in monitoring of pollutant-induced biologicaleffects in the Baltic Sea ecosystem. Information isneeded not only on the effects of potentially confound-ing factors such as eutrophication and the resultinghypoxic conditions in the near-bottom waters (com-monly observed e.g. in the Gulf of Finland), but also onthe physiological adaptations of species inhabitingthese areas.
Mytilus edulis is a marine species able to penetrateinto brackish environments; however, many of itsphysiological, morphological and growth characteris-tics are distinctively modified in the Baltic Sea (e.g.Kautsky et al. 1990, Tedengren et al. 1990). The low-salinity stress is extreme in the northern part of theBaltic, where the distribution of M. edulis comes to anend at salinities <4.5 (Lassig 1965). Therefore, con-cerning this species some precautions should be takenin the interpretation of biomarker data when compar-ing the responses observed in northern Baltic Sea pop-ulations to those inhabiting more saline southern re-gions (up to ca. 15) or fully marine environments. Withregard to Macoma balthica, populations thrive in theBaltic Sea down to a salinity of 2 (Lassig 1965) if othermain environmental factors such as sediment type,dissolved oxygen content of near-bottom water, foodsupply and water depth are suitable. Compared withmussels, M. balthica is physiologically much better ad-apted to the conditions prevailing, for example, in theGulf of Finland, and the responses observed in the pre-sent study are thus more comparable with those mea-sured in other areas of the species’ wide distribution.
Salinity can have an effect on the ‘baseline’ levels ofbiomarkers, as potentially is the case with MT. InMytilus edulis, a gradient in MT levels was observed inthe Tvärminne region, while the average levels did notdiffer from those recorded in the Turku region. No gra-dients could be observed in the tissue levels of metals,nor were the mean levels different between the areas.When examined together with the results obtainedduring the Baltic Sea component of the BEEP project,the mean MT level in M. edulis was observed to ele-vate by about 2-fold towards the north, seeminglyalong the salinity gradient (Leiniö & Lehtonen 2005,Bar$iene· et al. 2006, Kopecka et al. 2006, Schiedek etal. 2006, this study). Concerning Macoma balthica, theonly data available on MT levels in the southern BalticSea also suggest salinity-related signal levels: a meanof ca. 300 µg g–1 wet wt in spring in the Gulf of Gda?sk(BEEP project, unpubl. data) is markedly lower com-pared with the average value of 442 µg g–1 wet wtobtained in the present study. The higher MT levels
165
Mar Ecol Prog Ser 322: 155–168, 2006
might be connected to chemical speciation of certainmetals resulting in higher bioavailability in low-salineenvironments (e.g. M. balthica: Lee et al. 1998). On theother hand, in the Russian Arctic no significant effectof salinity on the MT level of either species could beobserved (Amiard-Triquet et al. 1998). In some cases,changes in general protein metabolism caused by nat-ural factors have been shown to modulate MT contentmore than metal accumulation in tissues (Legras et al.2000). Since MT levels exhibit a marked natural oscil-lation during the year in both species in the studyregion (Leiniö & Lehtonen 2005) and also elsewhere(e.g. Bordin et al. 1997), food conditions and reproduc-tive stage must also be considered when interpretingthe data (e.g. Mourgaud et al. 2002). The extensiveseasonal variability in temperature in the northernBaltic Sea also affects the reproductive cycle of marineorganisms, potentially having a marked effect on vari-ous biomarker responses (Leiniö & Lehtonen 2005).Regardless of the cause, the level of the MT inductionwas highest in the present study area compared with-the other Baltic Sea areas studied.
Integrated biomarker response approach
The use of integrated biomarker indices is a relativelynew approach in the marine ecotoxicological context(Adams et al. 1993, Narbonne et al. 1999, Beliaeff & Bur-geot 2002, Chèvre al. 2003a,b, Broeg & Lehtonen 2006).Integrating the numerical measures of a set of biologicalsignals that reflect malfunctions or, potentially, a de-creased performance in organisms into a single indexhas advantages considering the rough evaluation of the‘pollution status’ of marine populations or environmentswhich they inhabit. Chemical analyses can only showthe concentrations of single contaminants in the environ-ment, while an integrated biomarker index demonstratesalso their bioavailability, interactive effect and combinedeffects. Since comparing areas with highly differing en-vironmental characteristics that govern bioavailabilityand biological effects of different pollutants usually al-lows only very limited conclusions, a rational way is totreat the systems as a whole, i.e. using integrated re-sponse approaches that demonstrate more complex insitu signals in populations at each particular site. The IBRindex used in this study merged the comparative infor-mation obtained from 4 biomarkers, and the value ob-tained this way related distinctively to the concentrationsof tissue organochlorine residues measured at the mostcontaminated site in comparison with the other sites. Theuse of an integrated biological measure is of practicalimportance when examining, for example, temporaldevelopments along different suspected pollutiongradients or comparing different geographical regions.
As our results show, this approach also has high potentialin detecting biological effects along comparativelysmall-range contamination gradients.
CONCLUSIONS
The results obtained indicate a pollution gradient inthe Turku region, identified both by measurements ofselected biomarker responses in bivalves and by con-centrations of selected pollutants in their tissues. Thegradient was clearly indicated in the sediment-dwelling Macoma balthica, while the suspension-feed-ing Mytilus edulis showed a more ambiguous distribu-tion of tissue pollutants and biomarker responses. Inthe Tvärminne region such an obvious gradient wasnot detected, although variability in pollutant levelsand biomarker signals between the stations wasobserved. Overall, the Turku region appears to bemuch more affected by organic anthropogenic pollu-tants, while the Tvärminne region is characterised by ahigher load of heavy metals.
This study is the first of its kind performed in thecoastal waters of Finland. The results obtained demon-strate the usefulness of the multibiomarker approach,including the integrated biomarker response index.Using 2 sessile species with markedly differing feedingmodes, living habitats and, therefore, routes of expo-sure to environmental pollutants is considered a ratio-nal strategy for assessing the pollution status of coastalsea areas. Using an integrated response measure, onecan detect possible synergistic effects of different com-pound groups (e.g. organochlorines and heavy metals)that might remain hidden if only one biomarker wasused. Regarding the species studied, the infaunal, soft-sediment clam Macoma balthica appears an increas-ingly promising organism for biological-effects moni-toring in the northern Baltic Sea.
Acknowledgements. Tvärminne Zoological Station (Univer-sity of Helsinki) and Archipelago Research Station (Universityof Turku) are thanked for assistance in sampling. Dr. P. Mora(University of Bordeaux I) is thanked for advice on GST andCAT activity measurements and Ms. M. Kronholm for testingof the protocols in the early phase of the project. U. Karlström(MSc) assisted in the analyses. Ms. S. Lage and Mr. J. Riiko-nen skilfully executed the organochlorine and metal analyses,respectively. We thank Dr. D. Schiedek for editorial sugges-tions on the final version of the manuscript.
LITERATURE CITED
Adams SM, Brown AM, Goede RW (1993) A quantitativehealth assessment index for rapid evaluation of fish condi-tion in the field. Trans Am Fish Soc 122:63–73
166
Lehtonen et al.: Biomarkers in Baltic Sea bivalves
Amiard-Triquet C, Rainglet F, Larroux C, Regoli F, Hummel H(1998) Metallothioneins in Arctic bivalves. Ecotoxicol Env-iron Saf 41:96–102
Ballan-Dufrançais C, Jeantet AY, Geffard A, Amiard JC, Ami-ard-Triquet C (2001) Cellular and tissular distribution ofcopper in an intrasedimentary bivalve, the Baltic clamMacoma balthica, originating from a clean or a metal-richsite. Can J Fish Aquat Sci 58:1964–1974
Bar$iene· J, Lehtonen KK, Koehler A, Broeg K and 9 others(2006) Biomarker responses in flounder (Platichthys flesus)and mussel (Mytilus edulis) in the Klaipe· da-Bu– tinge· area(Baltic Sea). Mar Pollut Bull (in press)
Beliaeff B, Burgeot T (2002) Integrated biomarker response(IBR): a useful graphical tool for ecological risk assess-ment. Environ Toxicol Chem 21:1316–1322
Bocquené G, Galgani F (1998) Biological effects of contami-nants: cholinesterase inhibition by organophosphate andcarbamate compounds. ICES Tech Mar Environ Sci 22.ICES, Copenhagen
Bordin G, McCourt J, Cordeiro Raposo F, Rodriguez AR(1997) Metallothionein-like metalloproteins in the Balticclam Macoma balthica: seasonal variations and inductionupon metal exposure. Mar Biol 129:453–463
Bradford MM (1976) A rapid and sensitive method for quanti-tation of microgram quantities of protein utilizing the prin-ciple of protein dye binding. Anal Biochem 72:248–254
Broeg K, Lehtonen KK (2006) Indices for the assessment of envi-ronmental pollution of the Baltic Sea coasts: integrated assess-ment of a multi-biomarker approach. Mar Pollut Bull (in press)
Brown BE (1982) The form and function of metal-containing‘granules’ in invertebrate tissues. Biol Rev 57:621–667
Chèvre N, Gagné F, Blaise C (2003a) Development of a bio-marker-based index for assessing the ecotoxic potential ofaquatic sites. Biomarkers 8:287–298
Chèvre N, Gagné F, Gagnon P, Blaise C (2003b) Applicationof rough sets analysis to identify polluted aquatic sitesbased on a battery of biomarkers: a comparison with clas-sical methods. Chemosphere 51:13–23
Claiborne A (1985) Catalase activity. In: Greenwald RA (eds)Handbook of methods for oxygen radical research. CRCPress, Boca Raton, FL, p 283–284
Dalton TP, Li Q, Bittel D, Liang L, Andrews GK (1996) Oxida-tive stress activates metal-responsive transcription factor-1 binding activity. J Biol Chem 271:26233–26241
Day KE, Scott IM (1990) Use of acetylcholinesterase activity todetect sublethal toxicity in stream invertebrates exposedto low concentrations of organophosphate insecticides.Aquat Toxicol 18:101–114
Di Giulio RT, Wasburn PC, Wenning RJ, Winston GW, JewellCS (1989) Biochemical responses in aquatic animals: areview of determinants of oxidative stress. Environ ToxicolChem 8:1103–1123
Ellman GL, Courtney KO, Andrres V, Featherstone RM (1961)A new and rapid colorimetric determination of acetyl-cholinesterase activity. Biochem Pharmacol 7:88–95
George SG, Olsson PE (1994) Metallothioneins as indicatorsof trace metal pollution. In: Kramer KJM (ed) Biomonitor-ing of coastal waters and estuaries. CRC Press, BocaRaton, FL, p 151–178
Grasshoff K (1983) Methods of seawater analysis, 2nd edn.Verlag Chemie, Weinheim
Habig WH, Pabst MJ, Jakoby B (1974) Glutathione-S-trans-ferase. The first enzymatic step in mercapturic acid forma-tion. J Biol Chem 249:7130–7139
Holden AV, Marsden K (1969) Single-stage clean up of animaltissue extracts for organochlorine residue analysis. J Chro-matogr 44:481–492
IAEA (Innternational Atomic Energy Agency) (1980) Progressreport on intercalibration of organochlorine compoundmeasurements in marine environmental samples. ReportNo. 2, International Laboratory of Marine Radioactivity,Musée Oceanographique, Monaco
IAEA (Innternational Atomic Energy Agency) (1988) Finalreport om the intercomparison of organochlorine com-pounds in shrimp homogenate (MA-A-3/OC) and on fishhomogenate (MA-B-3/OC). Report No. 37, InternationalLaboratory of Marine Radioactivity, Musée Oceano-graphique, Monaco
Itkonen A, Vahteri P, Wright J, Vuorinen I (1998) Ruop-pausmassojen läjittämisen vaikutukset vesistöön ja ka-latalouteen Pohjois-Airistolla. Raportti vuonna 1997tehdyistä tutkimuksista. Archipelago Research Institute,University of Turku (in Finnish)
Jankovski H, Simm M, Roots O (1996) Harmful substances inthe ecosystem of the Gulf of Finland. Part I. Trace metals.EMI Rep Ser 4:1–158
Kaitala S (1981) Simpukoiden raskasmetallipitoisuuksistaSuomen rannikkovesissä. Meri 9:120–146 (in Finnish)
Kautsky N, Johannesson K, Tedengren M (1990) Genotypicand phenotypic differences between Baltic and North Seapopulations of Mytilus edulis evaluated through recipro-cal transplantations. I. Growth and morphology. Mar EcolProg Ser 59:203–210
Klerks PL, Weis JS (1987) Genetic adaptation to heavy metalsin aquatic organisms: a review. Environ Pollut 45:173–205
Kopecka J, Lehtonen KK, Bar$ienò J, Broeg K, Vuorinen PJ,Gercken J, Balk L, Pempkowiak J (2006) Measurements ofbiomarker levels in flounder (Platichthys flesus) and bluemussel (Mytilus trossulus) from the Gulf of Gda?sk (South-ern Baltic). Mar Pollut Bull (in press)
Korhonen M, Verta M, Backström V (2001) Harmful sub-stances. In: Kauppila P, Bäck S (eds) The state of Finnishcoastal waters in the 1990s. The Finnish Environment 472.Finnish Environment Institute, Helsinki
Lassig J (1965) The distribution of marine and brackish-waterlamellibranchs in the northern Baltic area. CommentatBiol 28:1–41
Lee BG, Wallace WG, Luoma SN (1998) Uptake and losskinetics of Cd, Cr and Zn in the bivalves Potamocorbulaamurensis and Macoma balthica: effects of size and salin-ity. Mar Ecol Prog Ser 175:177–189
Lee RF, Keeran WS, Pickwell GV (1988) Marine invertebrateglutathione-S-transferase: purification, characterisationand induction. Mar Environ Res 24:97–100
Legras S, Mouneyrac C, Amiard JC, Amiard-Triquet C, Rain-bow PS (2000) Changes in metallothionein concentrationsin response to variation in natural factors (salinity, sex,weight) and metal contamination in crabs from a metal-rich estuary. J Exp Mar Biol Ecol 246:259–279
Lehtonen KK, Leiniö S (2003) Effects of exposure to copperand malathion on metallothionein levels and acetyl-cholinesterase activity of the mussel Mytilus edulis andthe clam Macoma balthica from the northern Baltic Sea.Bull Environ Contam Toxicol 71:489–496
Lehtonen KK, Schiedek D (2006) Monitoring biological effectsof pollution in the Baltic Sea: neglected—but still wanted?Mar Pollut Bull (in press)
Leiniö S, Lehtonen KK (2005) Seasonal variability in biomark-ers in the bivalves Mytilus edulis and Macoma balthicafrom the northern Baltic Sea. Comp Biochem Physiol C140:408–421
Mourgaud Y, Martinez E, Geffard A, Andral B, StanisiereJY, Amiard JC (2002) Metallothionein concentration inthe mussel Mytilus galloprovincialis as a biomarker of
167
Mar Ecol Prog Ser 322: 155–168, 2006
response to metal contamination: validation in the field.Biomarkers 7:479–490
Narbonne JF, Daubeze M, Clerandeau C, Garrigues P (1999)Scale of classification based on biochemical markers inmussels: application to pollution monitoring in Europeancoasts. Biomarkers 4:415–424
Olsson PE, Kling P, Erkell LJ, Kille P (1995) Stuctural and func-tional analysis of the rainbow trout (Oncorrhynchus mykiss)metallothionein-A gene. Eur J Biochem 230:344–349
Rainbow PS, Phillips DJH (1993) Cosmopolitan biomonitors oftrace metals. Mar Pollut Bull 26:593–601
Regoli F, Hummel H, Amiard-Triquet C, Larroux C, SukhotinA (1998). Trace metals and variations of antioxidantenzymes in Arctic bivalve populations. Arch Environ Con-tam Toxicol 35:594–601
Schiedek D, Broeg K, Bar$ienò J, Lehtonen KK and 7 others(2006) Biomarker responses and indication of contaminanteffects in blue mussel (Mytilus edulis) and eelpout(Zoarces viviparus) from the western Baltic Sea. Mar Pol-lut Bull (in press)
Schneider R (1982) Polychlorinated biphenyls in cod tissuesfrom the Western Baltic: significance of equilibrium parti-
tioning and lipid composition in the bioaccumulation oflipophilic pollutants in gill-breathing animals. Meeres-forschung 29:69–79
Tedengren M, Andre C, Johannesson K, Kautsky N (1990)Genotypic and phenotypic differences between Baltic andNorth Sea populations of Mytilus edulis evaluatedthrough reciprocal transplantations. III. Physiology. MarEcol Prog Ser 59:221–227
Viarengo A, Ponzano E, Dondero F, Fabbri R (1997) A simplespectrophotometric method for metallothionein evaluationin marine organisms: an application to Mediterranean andAntarctic molluscs. Mar Environ Res 44:69–84
Viarengo A, Burlano B, Dondero F, Marro A, Fabbro R (1999)Metallothionein as a tool in biomonitoring programmes.Biomarkers 4:455–466
Viarengo A, Burlando B, Ceratto N, Panfoli I (2000) Antioxi-dant role of metallothioneins: a comparative overview.Cell Mol Biol 46:407–417
Wallace WG, Lee BG, Luoma SN (2003) Subcellular compart-mentalization of Cd and Zn in two bivalves. I. Significanceof metal-sensitive fractions (MSF) and biologically detoxi-fied metal (BDM). Mar Ecol Prog Ser 249:183–197
168
Editorial responsibility: Otto Kinne (Editor-in-Chief),Oldendorf/Luhe, Germany
Submitted: June 2, 2004; Accepted: March 2, 2006Proofs received from author(s): August 30, 2006