Biol. Pharm. Bull. 40(8): 1199-1206 (2017) - J-Stage
8
Vol. 40, No. 8 1199 Biol. Pharm. Bull. 40, 1199–1206 (2017) © 2017 The Pharmaceutical Society of Japan Regular Article Selected Physicochemical and Biological Properties of Ethyl Ascorbic Acid Compared to Ascorbic Acid Iwona Golonka, a Monika Oleksy, b,c Adam Junka, c Agnieszka Matera-Witkiewicz, b Marzenna Bartoszewicz, c and Witold Musiał* ,a a Department of Physical Chemistry, Silesian Piasts Wrocław Medical University; Borowska 211A, 50–556 Wroclaw, Poland: b Screening Laboratory of Biological Activity Test and Collection of Biological Material, Silesian Piasts Wrocław Medical University; Borowska 211A, 50–556 Wroclaw, Poland: and c Department of Pharmaceutical Microbiology and Parasitology, Silesian Piasts Wrocław Medical University; Borowska 211A, 50–556 Wroclaw, Poland. Received December 9, 2016; accepted March 30, 2017 The aim of the work was the evaluation of selected biological and physicochemical, applicative proper- ties of ethylated ascorbic acid (AAE) compared to ascorbic acid (AA). Thermogravimetry (TG), differential thermogravimetry (DTG), and differential thermal analysis (DTA) were conducted, followed by the evalua- tion of AAE decomposition by the UV-Vis spectroscopic method including the influence of temperature and pH. Scavenging, antimicrobial activity and cytotoxicity against L929 fibroblasts were also performed. The difference in mass loss between AA and AAE was 30% via TG. DTA revealed characteristic exothermic and endothermic effects. The AAE solution was more thermally stable than AA. The calculated zero-order rate constants of free-radical scavenging kinetics for AAE were in the range of 4.9×10 −3 –1.35×10 −2 s −1 . The acti- vation energy for the process was 11,2281 kJ/mol. AAE was active against Staphylococcus (S.) aureus and En- terococcus (E.) faecalis and acted stronger against Candida (C.) albicans than AA. The concentrations of AA ≥2.5% were cytotoxic, whereas in the case of AAE, a 10% concentration was considered cytotoxic. DTG en- ables the detailed differentiation between AA and AAE. AAE in aqueous solution is more stable compared to AA. The antioxidant activity of AAE is significant. However, the reaction with 2,2-diphenyl-1-picrylhydrazyl (DPPH) indicates prolonged activity compared to AA. Variability in the antimicrobial activity of AAE may find practical application in the pharmaceutical and cosmetic industries. The potential for applicative aims may be supported by the relatively low in vitro toxicity of AAE. Key words ethyl ascorbic acid; stability; antioxidant; antimicrobial; cytotoxicity Ascorbic acid (AA) plays an important role as a co-factor for several enzymes. It is active in various processes, such as the post-translational hydroxylation of collagen, carnitine biosynthesis, conversion of dopamine to norepinephrine, peptide amidation, and the metabolism of tyrosine. AA regu- lates gastrointestinal uptake of iron ions and stabilizes iron- binding proteins. 1,2) Dried AA may be stored for several years. However, in the aqueous environment, it is very sensitive to increased temperature, light, oxygen, and pH changes, and it is easily decomposed, losing its biological properties. The dissociation rate exponent of AA is approximately 4.04. The oxidation process involves the elimination of two protons at pH 1–4 and one proton at pH values over 5. Up to 8.4, the dissociation rate remains almost constant. 3,4) The composi- tion of the product may influence AA oxidation as a result of limited exposure to atmospheric oxygen. 5) Various authors have supported and evaluated the idea of antimicrobial activ- ity of AA. 6,7) Some researchers reported the beneficial activity of high doses of ascorbic acid in Escherichia coli endotoxin- induced hyporeactivity to acetylcholine in the human fore- arm, 8) which may be connected to the effect of Escherichia coli endotoxin on AA transport in cells. 9) AA is widely used in cosmetics because of its powerful antioxidant activity and ability to scavenge free radicals, linking it to prevention of the aging process. The wider use of AA is hindered mainly by its low stability. Among the new derivatives of AA with higher stability and lower tendency to degrade, there is an ethylated derivative of AA (AAE), and its structure, along with the AA structure, is presented in Fig. 1. Based on the available literature, the lipophilic and hydro- philic groups of AAE present a stable structure 10) and possess interesting biological properties, including an influence on skin aging, and may be considered for application in dermato- logical products. 11) The aim of this study was to compare se- lected physical and chemical properties, including antioxidant properties, and to probe the cytotoxicity of AA and its deriva- tive AAE. MATERIALS AND METHODS Materials The following reagents were used in the pres- ent study: ascorbic acid (AA, Pharma Cosmetic, Kraków, * To whom correspondence should be addressed. e-mail: [email protected] Fig. 1. The Structure of AA (A) and AAE (B)
-
Upload
khangminh22 -
Category
Documents
-
view
0 -
download
0
Transcript of Biol. Pharm. Bull. 40(8): 1199-1206 (2017) - J-Stage

Vol. 40, No. 8 1199Biol. Pharm. Bull. 40, 1199–1206 (2017)
© 2017 The Pharmaceutical Society of Japan
Regular Article
Selected Physicochemical and Biological Properties of Ethyl Ascorbic Acid Compared to Ascorbic AcidIwona Golonka,a Monika Oleksy,b,c Adam Junka,c Agnieszka Matera-Witkiewicz,b Marzenna Bartoszewicz,c and Witold Musiał*,a
a Department of Physical Chemistry, Silesian Piasts Wrocław Medical University; Borowska 211A, 50–556 Wroclaw, Poland: b Screening Laboratory of Biological Activity Test and Collection of Biological Material, Silesian Piasts Wrocław Medical University; Borowska 211A, 50–556 Wroclaw, Poland: and c Department of Pharmaceutical Microbiology and Parasitology, Silesian Piasts Wrocław Medical University; Borowska 211A, 50–556 Wroclaw, Poland.Received December 9, 2016; accepted March 30, 2017
The aim of the work was the evaluation of selected biological and physicochemical, applicative proper-ties of ethylated ascorbic acid (AAE) compared to ascorbic acid (AA). Thermogravimetry (TG), differential thermogravimetry (DTG), and differential thermal analysis (DTA) were conducted, followed by the evalua-tion of AAE decomposition by the UV-Vis spectroscopic method including the influence of temperature and pH. Scavenging, antimicrobial activity and cytotoxicity against L929 fibroblasts were also performed. The difference in mass loss between AA and AAE was 30% via TG. DTA revealed characteristic exothermic and endothermic effects. The AAE solution was more thermally stable than AA. The calculated zero-order rate constants of free-radical scavenging kinetics for AAE were in the range of 4.9×10⁻³–1.35×10⁻² s−1. The acti-vation energy for the process was 11,2281 kJ/mol. AAE was active against Staphylococcus (S.) aureus and En-terococcus (E.) faecalis and acted stronger against Candida (C.) albicans than AA. The concentrations of AA ≥2.5% were cytotoxic, whereas in the case of AAE, a 10% concentration was considered cytotoxic. DTG en-ables the detailed differentiation between AA and AAE. AAE in aqueous solution is more stable compared to AA. The antioxidant activity of AAE is significant. However, the reaction with 2,2-diphenyl-1-picrylhydrazyl (DPPH) indicates prolonged activity compared to AA. Variability in the antimicrobial activity of AAE may find practical application in the pharmaceutical and cosmetic industries. The potential for applicative aims may be supported by the relatively low in vitro toxicity of AAE.
Key words ethyl ascorbic acid; stability; antioxidant; antimicrobial; cytotoxicity
Ascorbic acid (AA) plays an important role as a co-factor for several enzymes. It is active in various processes, such as the post-translational hydroxylation of collagen, carnitine biosynthesis, conversion of dopamine to norepinephrine, peptide amidation, and the metabolism of tyrosine. AA regu-lates gastrointestinal uptake of iron ions and stabilizes iron-binding proteins.1,2) Dried AA may be stored for several years. However, in the aqueous environment, it is very sensitive to increased temperature, light, oxygen, and pH changes, and it is easily decomposed, losing its biological properties. The dissociation rate exponent of AA is approximately 4.04. The oxidation process involves the elimination of two protons at pH 1–4 and one proton at pH values over 5. Up to 8.4, the dissociation rate remains almost constant.3,4) The composi-tion of the product may influence AA oxidation as a result of limited exposure to atmospheric oxygen.5) Various authors have supported and evaluated the idea of antimicrobial activ-ity of AA.6,7) Some researchers reported the beneficial activity of high doses of ascorbic acid in Escherichia coli endotoxin-induced hyporeactivity to acetylcholine in the human fore-arm,8) which may be connected to the effect of Escherichia coli endotoxin on AA transport in cells.9) AA is widely used in cosmetics because of its powerful antioxidant activity and ability to scavenge free radicals, linking it to prevention of the aging process. The wider use of AA is hindered mainly by its low stability. Among the new derivatives of AA with higher stability and lower tendency to degrade, there is an ethylated derivative of AA (AAE), and its structure, along with the AA
structure, is presented in Fig. 1.Based on the available literature, the lipophilic and hydro-
philic groups of AAE present a stable structure10) and possess interesting biological properties, including an influence on skin aging, and may be considered for application in dermato-logical products.11) The aim of this study was to compare se-lected physical and chemical properties, including antioxidant properties, and to probe the cytotoxicity of AA and its deriva-tive AAE.
MATERIALS AND METHODS
Materials The following reagents were used in the pres-ent study: ascorbic acid (AA, Pharma Cosmetic, Kraków,
* To whom correspondence should be addressed. e-mail: [email protected]
Fig. 1. The Structure of AA (A) and AAE (B)
1200 Vol. 40, No. 8 (2017)Biol. Pharm. Bull.
Poland) conforming to the European Pharmacopoeia, the AA derivative ethyl ascorbic acid (AAE, Protec Ingredia, War-saw, Poland), the stable radical 2,2-diphenyl-1-picrylhydrazyl (DPPH, Sigma-Aldrich, Poznan, Poland), and ethyl alcohol (Polmos, Warsaw, Poland). The pH of the solution was sta-bilized using Na2HPO4–citric×H2O buffer (pH range 3–8, Chempur, Piekary Śląskie, Poland) and phosphoric buffer (pH 6.7, POCH, Gliwice, Poland). The bacterial strains Staphylo-coccus (S.) aureus ATCC 6538, Pseudomonas (P.) aeruginosa ATCC 15442, Candida (C.) albicans ATCC 10231, and En-terococcus (E.) faecalis ATCC 29212 were used for evaluation of the antimicrobial activity of AA and AAE. Murine immor-talized L929 fibroblasts (ATCC CCL-1) were used for assess-ment of the cytotoxicity of AA and AAE.
METHODS
Thermogravimetric Assay The thermobalance (TG 209 F1 Libra, Netzsch, Selb, Germany) with an automatic sample changer (ASC, Netzsch, Selb, Germany) was applied. Micron-ized in mortar samples of 5.85 mg AA and 5.82 mg AAE were assessed in an inert nitrogen atmosphere, with flow of 25 mL of N2 per min. The heating rate of 20 K per min was applied in this research. Standard thermogravimetric (TG) plots, differential thermogravimetry (DTG) plots, and differential thermal analysis (DTA) plots were generated for further inter-pretation. The applied reference substance was Al2O3.
Thermal Stability of Solutions of AA and AAE at In-creasing Temperatures The stability and antioxidant prop-erties of AA and AAE solutions were determined over time at increasing temperatures between 25 and 55°C in UV-Vis spectrometer (Halo DB-20S Dynamica, Newport Pagnell, United Kingdom) and recorded on a connected PC. The de-composition kinetics of AA and AAE in water were measured at an initial solution concentration of 1.17×10⁻⁴ mol·L−1. The maxima of absorbance were determined using the recorded spectra. The absorbance was recorded for 11 min, from the start of the reaction and at every two seconds, both for the AA solution and AAE solution.
The Influence of pH on the Stability of AAE The effect of pH was assessed only for the AAE, as there is available bibliography dealing with the influence of pH on AA decom-position.12) The stability of the substance at pH values between 3-8 was evaluated via measurement of the absorbance of the solution immediately after preparation and after 24 h. The measurements were carried out in five repetitions.
Antioxidant Properties via IC50 The antioxidant prop-erties were evaluated via determination of the IC50 value. Sets of test tubes with DPPH solution (3.99×10⁻⁵ mol·L−1), AA with DPPH solution (3.77×10⁻⁵–4.04×10⁻⁶ mol·L−1 of AA and 3.99×10⁻⁵ mol·L−1 of DPPH), and AAE with DPPH solution (1.26×10⁻⁴ to 5.04×10⁻⁵ mol·L−1 of AAE and 3.99×10⁻⁵ mol·L−1 of DPPH) were incubated for 10 min directly after preparation. The absorbance at the initial stage and after incubation was measured at 517 nm. The DPPH free radical scavenging activity was calculated according to the formula:
0.5
50( )
IC−
=A ba
(1)
where IC50 reflects the removal of 50% of the DPPH free
radicals, A0.5 is the half-absorbance of the control sample, and a and b are the coefficients of the linear function y=ax+b, reflecting the absorbance as a function of the concentration of AA or AAE.
Kinetics of Free Radical Scavenging Capability The method was based on the spectrophotometric evaluation of the reaction of DPPH radicals with AA or AAE as in the available literature.13–15) The measurements were performed in quartz cuvettes with a path length of 1.0 cm at 25–55°C in a total volume of 3.0 mL. Increasing quantities (30, 40, 50, 60, 70 or 80 µL) of freshly prepared aqueous solutions of AA or AAE at a concentration of 2×10⁻² mol×dm−3 were added to 3.0 mL of a freshly prepared ethanolic solution of DPPH at a concentration of 8×10⁻⁵ mol×dm−3, and the absorption of DPPH was measured at 517 nm. The relative concentration of DPPH, expressed in mol×l−1 (CDPPH), was calculated from the respective calibration curve, and it was found to be CDPPH=6.9802×10⁻⁵×ADPPH (r2=0.9948), where A is the absorbance of the DPPH solution at wavelength λ=517 nm. The first-order rate constant (k1) and the second-order rate constant (k2) were determined with the antioxidant concentration [AN] in large excess as compared with the radical concentration [FR] fol-lowing the equation:
10 1 2 0[ ] [ ] [ ]k tFR FR e k k AN= = (2)
The activation energy was calculated on the basis of the Ar-rhenius equation, where k is the rate constant for the reaction, z is a proportionality constant, Ea is the activation energy for the reaction, R is the ideal gas constant, and T is the temperature:
a( / )E RTk z e−= × (3)
Antimicrobial Activity of AA and AAE A total of 100 µL of the microbial solutions with a density of 1×10⁵ cfu×mL−1 was placed into wells of a test plate, to-gether with the respective evaluated entity AA or AAE in 12 concentrations between 0.15% and 10.00 mg×mL−1. The absorbance of the solutions was measured immediately using specialized spectrophotometer (Thermo Scientific Multiskan GO, Waltham, U.S.A.) at 580 nm. The plate was incubated for 24 h at 37°C in a shaker, and the absorbance measurement was repeated. All experiments were completed in triplicate. The control samples were solutions of AA or AAE, solutions of microbes, sterile medium, and sterile medium with AA or AAE. The relative number of microbial cells (RNM) was cal-culated on the basis of the equation:
100%
TRNM 100%= ×
AA
(4)
where A100% and AT are the absorbance of the control sample and tested sample, respectively.
Cytotoxicity of AA and AAE A total of 100 µL of 106 cells per 1 mL of L929 fibroblasts was cultured in wells of the test plate and incubated in minimal essential medium (MEM) for 24 h at 37°C in 5% CO2. After MEM was removed, AA and AAE solutions were introduced for 24 h of contact time and followed by replacement with fresh MEM. A cytotox-icity assay was performed using 0.2 mL of 0.5 mg×mL−1 (3-[4,5-dimethylthiazol-2-yl]-2,5-diphenyltetrazolium bromide (MTT); thiazolyl blue) solution. The plate was incubated for 3 h, and 0.1 mL of dimethyl sulfoxide (DMSO) was introduced

Vol. 40, No. 8 (2017) 1201Biol. Pharm. Bull.
into the wells. The absorbance was measured using a wave-length of 530 nm. L9292 cells incubated in medium were used as a control. The RNM was calculated using the equation above. The concentration of AA or AAE that led to a decrease in the cell number of greater than 25% was considered cyto-toxic. All experiments were repeated 6 times.
RESULTS
Thermogravimetric Studies In this study, samples of AA and AAE powders were assessed using dynamic thermo-gravimetry, and respective thermogravimetric (TG) plots were obtained. They are shown in Fig. 2. Shown in the recorded TG curves, dry solid AA and its derivative AAE are thermal stable, and their decomposition started at 185.8°C for AA and at 162.2°C for AAE.
As a result of the differential thermogravimetric analysis (DTG), plots of the first derivative of mass loss vs. time were obtained, as shown in Fig. 3A for AA and Fig. 3B for AAE. The total mass loss of the sample is represented by the peak area in these plots. For the AA sample, the weight loss was found to be 68.35%, and for AAE, it was 97.02%.
Figures 4A and B present the TG-DTA plots. In the case of the AAE TG-DTA plot, the first peak was endothermic and observed at 146.6°C. During melting, which started at 185.8°C, a carbonaceous residue was formed, and on the TG-DTA plot, an endothermic peak at 192.0°C was observed. The results indicate that AA began to decompose. The TG-DTG plot showed an initial mass loss upon melting at 185.8°C. At the much higher temperature of 240.1°C, an exothermic peak occurred.
In the case of AAE, four endothermic peaks at tempera-tures of 88.7, 113.3, 292.4 and 399.0°C were observed, where-as two exothermic peaks were present at temperatures of 134.1 and 317.8°C.
Stability of AA and AAE in Aqueous Solutions The re-sults of the spectrophotometric measurements of AA solutions performed at 25, 35, 45 and 55°C are shown in Figs. 5A–C. According to Fig. 5A, the maximum absorbance, assessed at a fixed wavelength, decreased with time. The decrease was very fast in the case of the AA solution. Initially, the absorbance decreased rapidly, while after a longer time, it entered into the plateau phase. The plateau phase increased at 25°C after approximately 3 h, whereas in the case of 55°C, the plateau phase was observed after less than 20 min.
The results fit to first-order kinetics and are presented in Fig. 5C. The calculated values of the decomposition rate
Fig. 2. The Relationship between Mass Loss (%) and Increasing Tem-perature over Time (min) for AA (Dotted Line) and AAE (Solid Line) Samples
Fig. 3. Standard DTG (Dotted Lines) and TG (Solid Lines) Plots for AA (A, Left) and for AAE (B, Right)
Fig. 4. DTA Curves of AA (Left, A): DTA (Dotted Line) and TG (Solid Line), DTA of AAE (Right, B): DTA (Dotted Line) and TG (Solid Line), the Units [arb] on the DTA Axis Are Arbitral and Reflect the Recorded Temperature Change in Kelvins

1202 Vol. 40, No. 8 (2017)Biol. Pharm. Bull.
constants are 2.6×10⁻⁴ (±2.5×10⁻⁶) s−1 at 25°C, 9.2×10⁻⁴ (±1.5×10⁻⁵) s−1 at 35°C, 1.6×10⁻³ (±3.0×10⁻⁵) s−1 at 45°C, and 1.9×10⁻³ (±9.5×10⁻⁵) s−1 at 55°C. The slopes of the straight lines reflect the variability of the degradation pro-cess, which increases with increased temperature. According to Figs. 5B and D, AAE was stable over time, through 3 h, at 25–55°C in the aqueous solution, and thus 3-O-methyl ascorbic acid exhibits a substantially greater thermal stability, stability to light than AAs.
Effect of pH on the Stability of AAE The influence of pH on the AAE solution absorbance assessed in various buffers is shown in Fig. 6.
The results obtained in the first and second series of evalu-ations were compared using Student’s t-test for two groups. Taking into account the accuracy of the spectrophotometric
device (0.002), the data indicate a statistically significant absorbance decrease at pH values 6, 7 and 8, with errors of 2×10⁻⁸, 2×10⁻⁷, and 4×10⁻¹⁰, respectively.
IC50 of AA and AAE The respective IC50 values are pre-sented in Fig. 7.
The aqueous solution of AAE at 25°C showed a promi-nent IC50 value of 6.805×10⁻⁵ mol×L−1, which was approxi-mately three times higher than AA, with an IC50 value of 2.421×10⁻⁵ mol×L−1. The error bars indicate the standard de-viations, which were between 4.49×10⁻⁷ and 1.59×10⁻⁶ in the case of AAE. For the case of AA the standard deviations were between 3.85×10⁻⁷ and 6.18×10⁻⁷.
Kinetics of Free Radical Scavenging Capability Kinetic studies of DPPH scavenging in the presence of AAE were performed at various temperatures between 25 and 55°C. The
Fig. 5. The Dependence of the Maximum Absorbance versus Time for AA (A) and AAE (B) Solutions at Increased Temperatures, and Plots of the AA (C) and AAE (B) Decrease Expressed as ln(At)/(A0)·100%, as a Function of Storage Time, At—Absorbance at Defined Time, A0—Initial Absor-bance
For A–C: 25°C—○, 35°C—□, 45°C—△, and 55°C—●.
Fig. 6. The Absorbance of AAE Measured at a Wavelength of 244 nm Directly after Preparation of the Solution (Black Column) and after 24 h (White-Gray Column)
Fig. 7. The Antioxidant Activity of AAE (White Columns) and AA (Dotted Columns) Expressed as the Ability to Scavenge 50% of the Free Radical DPPH (IC50)

Vol. 40, No. 8 (2017) 1203Biol. Pharm. Bull.
reaction of AA proceeded very rapidly, and it was not possible to observe the time dependence of the decrease in the amount of radical DPPH. The calculated rate constants for AAE are presented in Table 1. According to the Arrhenius equation, the activation energy, 11 kJ×mol−1, of the reaction was calculated.
Influence of AA and AAE on Microbial Growth The re-sults obtained in this study show that AA inhibits the growth of the tested microorganisms. AA was the most efficient against S. aureus. Application of the low tested concentrations of AA, namely 0.15 and 0.31%, correlated with growth de-creases of 90%, whereas the higher concentrations diminished the number of bacteria by 95%. Similar results were obtained in the case of E. faecalis. Concentrations between 0.15 and 0.31% diminished the number of cells by 84%, whereas higher concentrations did so up to 91%. In case of one of the leading opportunistic pathogens, P. aeruginosa, application of AA concentrations below 0.31% was non-bacteriostatic. However, the 0.31% concentration was a breakpoint, and it corresponded with an 86% decrease in growth. The higher concentrations of AA, 0.625–10%, led to a 95% decrease of P. aeruginosa growth. AA caused relatively weak bacteriostatic activity against C. albicans, and the 0.16% concentration led to only a 20% decrease in growth. The concentration in the range of 0.3125–0.625% resulted in a 45–50% decrease in growth. Even at the higher concentrations between 1.25 and 10%, up to 25% of the microorganisms were able to survive.
AAE was weaker than AA with regard to S. aureus and E. faecalis. In the case of S. aureus, AAE concentrations of 7.5–10% displayed an effect that was similar to AA. The difference between number of cells observed in the medium
without AA or AAE and number of cells in the solution with AA or AAE may be presented as percentage of growth inhi-bition. Surprisingly, AAE acted stronger against C. albicans than AA and inhibited its growth at a level of 35–69%-text in bold. For P. aeruginosa, a 1.25% concentration of AAE was needed to strongly inhibit the growth of this bacterium by 76%. A 2.5% concentration of AAE caused a 70% decrease in the bacterial cell number, whereas 5–10% concentrations impeded growth by 90% (Table 2).
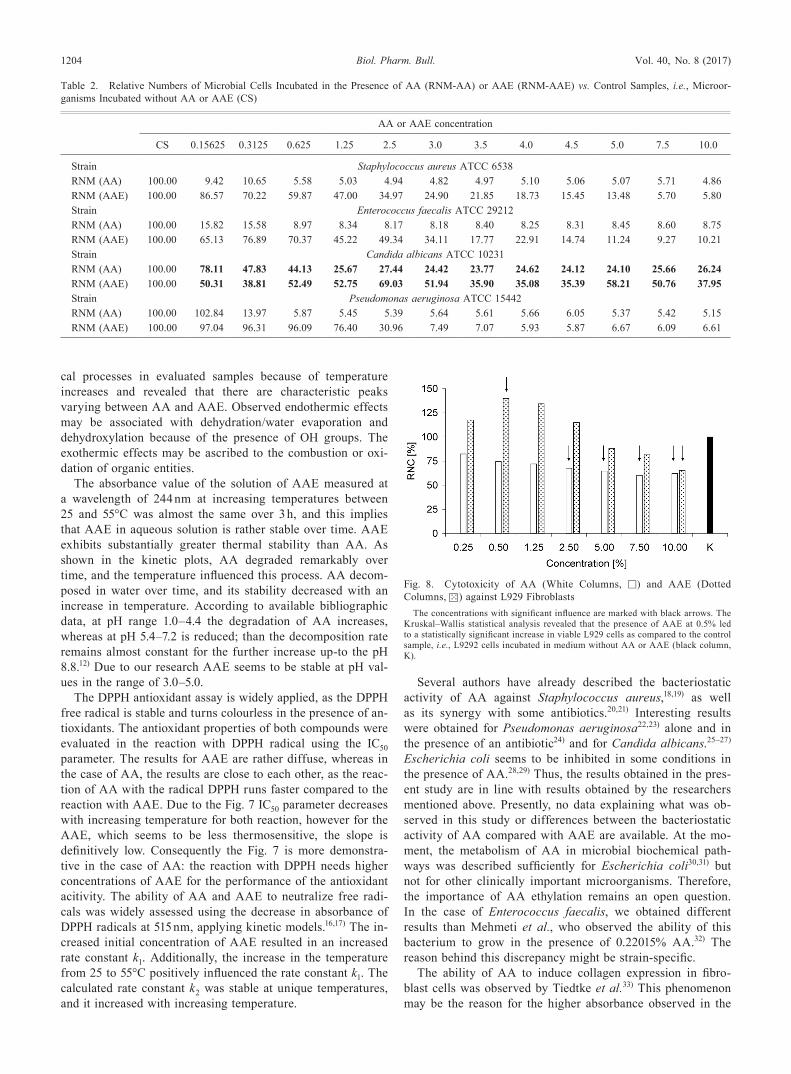
Cytotoxicity against Fibroblasts Interestingly, as shown in Fig. 8, AA was more cytotoxic to fibroblasts than AAE. The ≥2.5% concentrations of AA were cytotoxic, whereas in the case of AAE, a 10% concentration could be considered cytotoxic. An interesting phenomenon was observed for AAE. The use of 0.25–2.5% concentrations led to an increase in the fibroblast number, as compared to the control samples K (>100%). In the case of the 0.5% concentration, this result was statistically significant (Kruskal–Wallis test, p<0.05) (Fig. 8).
DISCUSSION
Thermogravimetric study enables the recording of changes in the mass of the test substance depending on a temperature increase during phase transitions, such as evaporation and sublimation, as well as combustion and oxidation. We also performed DTG in parallel to improve the readability of the TG assay. According to the TG and DTG data, there is an almost 30% difference in mass loss between AA and AAE. The DTA plots enabled a more detailed insight into the chemi-
Table 1. Energy of Activation (Ea) of the Degradation Process of AAE, with Respective First Order (k1) and Second Order (k2) Degradation Rates of AAE at Various Temperature
T [°C] VAAE [µL] k1 [s−1] S.D. r2 S.D. k2 [mol−1·s−1] S.D. r2 S.D. Ea [kJ·mol−1]
25 30 4.90·10−3 1.40·10−4 0.9914 9.40·10−3 3.4330 0.1029 0.9000 0.0005 11.228140 6.30·10−3 3.50·10−4 0.9676 2.33·10−2
50 7.00·10−3 3.20·10−4 0.9781 2.14·10−2
60 7.50·10−3 2.00·10−4 0.9920 1.36·10−2
70 9.10·10−3 3.00·10−4 0.9880 2.04·10−2
80 9.60·10−3 3.50·10−4 0.9877 2.38·10−2
35 30 5.50·10−3 1.60·10−4 0.9920 1.04·10−2 22.0250 0.9945 0.7504 0.000940 7.00·10−3 2.40·10−4 0.9891 1.54·10−2
50 7.40·10−3 3.10·10−4 0.9839 1.98·10−2
60 9.00·10−3 4.70·10−4 0.9762 2.94·10−2
70 9.60·10−3 4.80·10−4 0.9782 3.03·10−2
80 1.04·10−2 4.90·10−4 0.9877 3.09·10−2
45 30 7.10·10−3 2.50·10−3 0.9891 1.57·10−2 28.6980 1.4331 0.9877 0.001330 9.00·10−3 2.10·10−4 0.9324 2.00·10−2
40 1.07·10−2 5.00·10−4 0.9808 3.15·10−2
50 1.13·10−2 5.90·10−4 0.9815 2.73·10−2
60 1.25·10−2 3.00·10−4 0.9053 5.34·10−2
70 1.33·10−2 8.70·10−4 0.9713 4.02·10−2
80 8.00·10−3 3.30·10−4 0.9850 2.06·10−2
55 30 8.50·10−3 3.20·10−4 0.9162 3.12·10−2 28.9260 1.5570 0.9857 0.001440 8.70·10−2 3.70·10−4 0.9854 2.04·10−2
50 1.25·10−3 9.60·10−4 0.9705 6.06·10−2
60 1.30·10−2 5.00·10−4 0.8934 2.85·10−2
70 1.35·10−2 6.00·10−4 0.9495 2.32·10−2
80 4.90·10−3 1.40·10−4 0.9914 9.40·10−3
T—temperature, VAAE—volume of applied solution of AAE, S.D.—standard deviation, r2—Pearson’s coefficient.
1204 Vol. 40, No. 8 (2017)Biol. Pharm. Bull.
cal processes in evaluated samples because of temperature increases and revealed that there are characteristic peaks varying between AA and AAE. Observed endothermic effects may be associated with dehydration/water evaporation and dehydroxylation because of the presence of OH groups. The exothermic effects may be ascribed to the combustion or oxi-dation of organic entities.
The absorbance value of the solution of AAE measured at a wavelength of 244 nm at increasing temperatures between 25 and 55°C was almost the same over 3 h, and this implies that AAE in aqueous solution is rather stable over time. AAE exhibits substantially greater thermal stability than AA. As shown in the kinetic plots, AA degraded remarkably over time, and the temperature influenced this process. AA decom-posed in water over time, and its stability decreased with an increase in temperature. According to available bibliographic data, at pH range 1.0–4.4 the degradation of AA increases, whereas at pH 5.4–7.2 is reduced; than the decomposition rate remains almost constant for the further increase up-to the pH 8.8.12) Due to our research AAE seems to be stable at pH val-ues in the range of 3.0–5.0.
The DPPH antioxidant assay is widely applied, as the DPPH free radical is stable and turns colourless in the presence of an-tioxidants. The antioxidant properties of both compounds were evaluated in the reaction with DPPH radical using the IC50 parameter. The results for AAE are rather diffuse, whereas in the case of AA, the results are close to each other, as the reac-tion of AA with the radical DPPH runs faster compared to the reaction with AAE. Due to the Fig. 7 IC50 parameter decreases with increasing temperature for both reaction, however for the AAE, which seems to be less thermosensitive, the slope is definitively low. Consequently the Fig. 7 is more demonstra-tive in the case of AA: the reaction with DPPH needs higher concentrations of AAE for the performance of the antioxidant acitivity. The ability of AA and AAE to neutralize free radi-cals was widely assessed using the decrease in absorbance of DPPH radicals at 515 nm, applying kinetic models.16,17) The in-creased initial concentration of AAE resulted in an increased rate constant k1. Additionally, the increase in the temperature from 25 to 55°C positively influenced the rate constant k1. The calculated rate constant k2 was stable at unique temperatures, and it increased with increasing temperature.
Several authors have already described the bacteriostatic activity of AA against Staphylococcus aureus,18,19) as well as its synergy with some antibiotics.20,21) Interesting results were obtained for Pseudomonas aeruginosa22,23) alone and in the presence of an antibiotic24) and for Candida albicans.25–27) Escherichia coli seems to be inhibited in some conditions in the presence of AA.28,29) Thus, the results obtained in the pres-ent study are in line with results obtained by the researchers mentioned above. Presently, no data explaining what was ob-served in this study or differences between the bacteriostatic activity of AA compared with AAE are available. At the mo-ment, the metabolism of AA in microbial biochemical path-ways was described sufficiently for Escherichia coli30,31) but not for other clinically important microorganisms. Therefore, the importance of AA ethylation remains an open question. In the case of Enterococcus faecalis, we obtained different results than Mehmeti et al., who observed the ability of this bacterium to grow in the presence of 0.22015% AA.32) The reason behind this discrepancy might be strain-specific.
The ability of AA to induce collagen expression in fibro-blast cells was observed by Tiedtke et al.33) This phenomenon may be the reason for the higher absorbance observed in the
Fig. 8. Cytotoxicity of AA (White Columns, □) and AAE (Dotted Columns, ) against L929 Fibroblasts
The concentrations with significant influence are marked with black arrows. The Kruskal–Wallis statistical analysis revealed that the presence of AAE at 0.5% led to a statistically significant increase in viable L929 cells as compared to the control sample, i.e., L9292 cells incubated in medium without AA or AAE (black column, K).
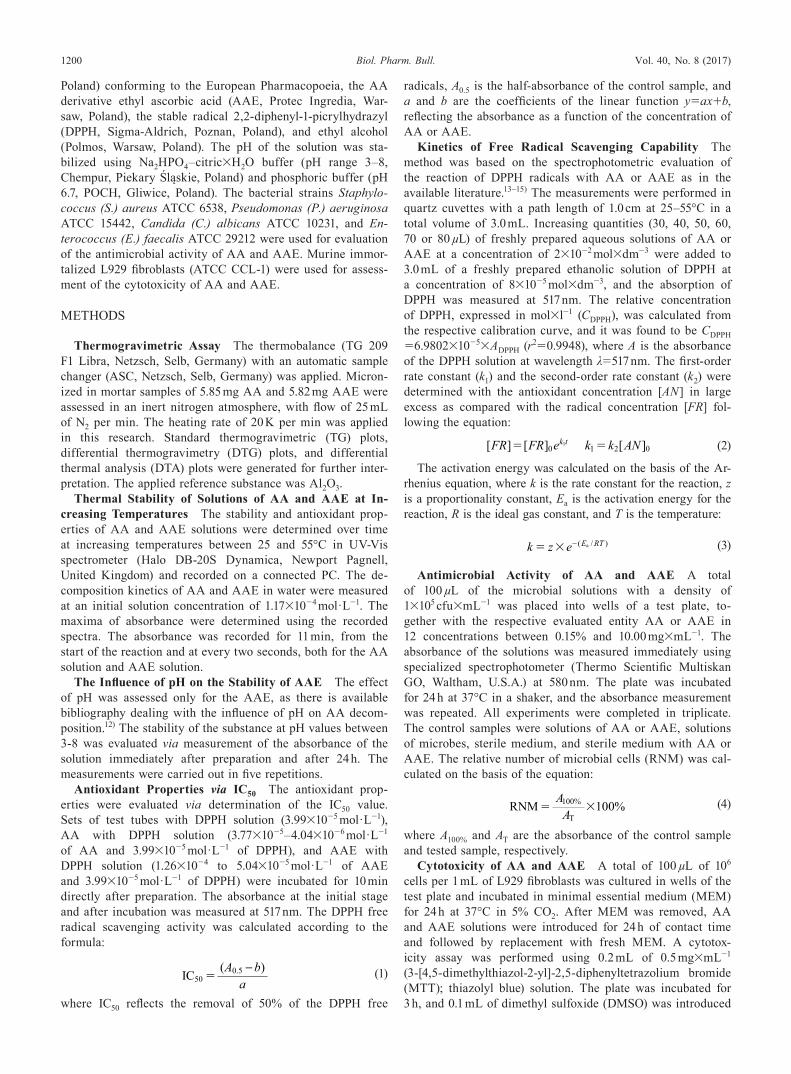
Table 2. Relative Numbers of Microbial Cells Incubated in the Presence of AA (RNM-AA) or AAE (RNM-AAE) vs. Control Samples, i.e., Microor-ganisms Incubated without AA or AAE (CS)
AA or AAE concentration
CS 0.15625 0.3125 0.625 1.25 2.5 3.0 3.5 4.0 4.5 5.0 7.5 10.0
Strain Staphylococcus aureus ATCC 6538RNM (AA) 100.00 9.42 10.65 5.58 5.03 4.94 4.82 4.97 5.10 5.06 5.07 5.71 4.86RNM (AAE) 100.00 86.57 70.22 59.87 47.00 34.97 24.90 21.85 18.73 15.45 13.48 5.70 5.80Strain Enterococcus faecalis ATCC 29212RNM (AA) 100.00 15.82 15.58 8.97 8.34 8.17 8.18 8.40 8.25 8.31 8.45 8.60 8.75RNM (AAE) 100.00 65.13 76.89 70.37 45.22 49.34 34.11 17.77 22.91 14.74 11.24 9.27 10.21Strain Candida albicans ATCC 10231RNM (AA) 100.00 78.11 47.83 44.13 25.67 27.44 24.42 23.77 24.62 24.12 24.10 25.66 26.24RNM (AAE) 100.00 50.31 38.81 52.49 52.75 69.03 51.94 35.90 35.08 35.39 58.21 50.76 37.95Strain Pseudomonas aeruginosa ATCC 15442RNM (AA) 100.00 102.84 13.97 5.87 5.45 5.39 5.64 5.61 5.66 6.05 5.37 5.42 5.15RNM (AAE) 100.00 97.04 96.31 96.09 76.40 30.96 7.49 7.07 5.93 5.87 6.67 6.09 6.61

Vol. 40, No. 8 (2017) 1205Biol. Pharm. Bull.
cytotoxicity assay when a 0.5% concentration of AAE was applied. The overexpression of collagen forming extracellular matrix may lead to increased adherence of fibroblasts to the bottom of the well of the plate. Subsequently, a decreased level of de-attachment is observed, which occurs during wash-ing and rinsing procedures required for the cytotoxicity assay. Therefore, further experiments are required. They should be performed to directly evaluate collagen expression in fibro-blasts subjected to incubation with AAE.
CONCLUSION
Differential thermogravimetry studies enabled the detailed differentiation between AA and AAE because of the presence of characteristic peaks, resulting from respective endother-mic and exothermic processes in the samples. The stability of AAE in aqueous solution is remarkably higher compared to the stability of AA, and both are temperature dependent. The stability of the aqueous solution of AAE depends on pH, and at pH values over 5, it decreases. The antioxidant activ-ity of AAE is significant. However, the reaction with DPPH indicates rather prolonged activity compared to the antioxidant activity of AA. Interesting variability in the antimicrobial activity of AAE is an issue that should be further investigated and may have practical application in the pharmaceutical and cosmetic industries. Its future applications are supported by the relatively low in vitro toxicity of AAE.
Acknowledgments Spectrophotometric and thermogravi-metric measurements were performed in the Laboratory of Elemental Analysis and Structural Research of the Pharma-ceutical Faculty of Wroclaw Medical University. AAE was ob-tained from Protec Ingredia, Poland. The work was supported by grant ST-847 of Wroclaw Medical University.
Conflict of Interest The authors declare no conflict of interest.
REFERENCES
1) Hacişevki A. An overview of ascorbic acid biochemistry. J. Fac. Pharm. Ankara, 38, 233–255 (2009).
2) Padh H. Cellular functions of ascorbic acid. Biochem. Cell Biol., 68, 1166–1173 (1990).
3) Jeney-Nagymate E, Fodor P. The stability of vitamin C in different beverages. Br. Food J., 110, 296–309 (2008).
4) Lee SH, Labuza TP. Destruction of ascorbic acid as a function of water activity. J. Food Sci., 40, 370–373 (1975).
5) Iwase H, Ono I. Determination of ascorbic acid in food by column liquid chromatography with electrochemical detection using eluent for pre-run sample stabilization. J. Chromatogr. A, 806, 361–364 (1998).
6) Ericsson Y, Lundbeck H. Antimicrobial effect in vitro of the ascor-bic acid oxidation. II. Influence of various chemical and physical factors. Acta Pathol. Microbiol. Scand., 37, 507–527 (1955).
7) Thomas WR, Holt PG. Vitamin C and immunity: an assessment of the evidence. Clin. Exp. Immunol., 32, 370–379 (1978).
8) Pleiner J, Mittermayer F, Schaller G, MacAllister RJ, Wolzt M. High doses of vitamin C reverse Escherichia coli endotoxin-induced hyporeactivity to acetylcholine in the human forearm. Cir-culation, 106, 1460–1464 (2002).
9) Garcia R, Municio AM. Effect of Escherichia coli endotoxin on ascorbic acid transport in isolated adrenocortical cells. Proc. Soc.
Exp. Biol. Med., 193, 280–284 (1990).10) Jin S, Miao X. 3-O-Ethyl-l-ascorbic acid. Acta Crystallogr. Sect. E
Struct. Rep. Online, 64, o860 (2008).11) Wathoni N, Panji Luhur M. Effect of iontophoresis and propylene
glycol on the in vitro diffusion of ethyl vitamin C cream. Res. J. Pharm. Appl. Sci. Int. Res. J. Pharm. Appl. Sci. Vol-II, 2, 31–34 (2012).
12) Golubitskii GB, Budko EV, Basova EM, Kostarnoi AV, Ivanov VM. Stability of ascorbic acid in aqueous and aqueous-organic solutions for quantitative determination. J. Anal. Chem., 62, 742–747 (2007).
13) Floegel A, Kim D-O, Chung S-J, Koo SI, Chun OK. Comparison of ABTS/DPPH assays to measure antioxidant capacity in popular antioxidant-rich U.S. foods. J. Food Compos. Anal., 24, 1043–1048 (2011).
14) Thaipong K, Boonprakob U, Crosby K, Cisneros-Zevallos L, Hawkins Byrne D. Comparison of ABTS, DPPH, FRAP, and ORAC assays for estimating antioxidant activity from guava fruit extracts. J. Food Compos. Anal., 19, 669–675 (2006).
15) Brand-Williams W, Cuvelier ME, Berset C. Use of a free radical method to evaluate antioxidant activity. LWT-. Food Sci. Technol., 28, 25–30 (1995).
16) Molyneux P. The use of the stable free radical diphenylpicryl–hydrazyl (DPPH) for estimating antioxidant activity. Songklana-karin J. Sci. Technol., 26, 211–219 (2004).
17) Kedare SB, Singh RP. Genesis and development of DPPH method of antioxidant assay. J. Food Sci. Technol., 48, 412–422 (2011).
18) Kallio J, Jaakkola M, Mäki M, Kilpeläinen P, Virtanen V. Vitamin C Inhibits Staphylococcus aureus growth and enhances the in-hibitory effect of quercetin on growth of Escherichia coli in vitro. Planta Med., 78, 1824–1830 (2012).
19) Mishra A, Sarkar D. Qualitative and quantitative proteomic analysis of vitamin C induced changes in Mycobacterium smegmatis. Front. Microbiol., 6, 451 (2015).
20) Mal P, Dutta S, Bandyopadhyay D, Dutta K, Basu A, Bishayi B. Gentamicin in combination with ascorbic acid regulates the severity of Staphylococcus aureus infection-induced septic arthritis in mice. Scand. J. Immunol., 76, 528–540 (2012).
21) Belicová A, Dobias J, Ebringer L, Krajcovic J. The effect of ascor-bic acid on the antibacterial activity of selected antibiotics and syn-thetic chemotherapeutic agents in in vitro conditions. Ceska Slov. Farm., 49, 134–138 (2000).
22) Rawal BD. Bactericidal action of ascorbic acid on Psuedomonas aeruginosa: alteration of cell surface as a possible mechanism. Che-motherapy, 24, 166–171 (1978).
23) El-Mowafy SA, Shaaban MI, Abd El Galil KH. Sodium ascorbate as a quorum sensing inhibitor of Pseudomonas aeruginosa. J. Appl. Microbiol., 117, 1388–1399 (2014).
24) El-Gebaly E, Essam T, Hashem S, El-Baky RA. Effect of levofloxa-cin and vitamin C on bacterial adherence and preformed biofilm on urethral catheter surfaces. J. Microb. Biochem. Technol., 4, 131–136 (2012).
25) Ojha R, Manzoor N, Khan LA. Ascorbic acid modulates patho-genecity markers of Candida albicans. Int. J. Microbiol. Res. Publ. Int. J. Microbiol. Res., 1, 19–24 (2009).
26) Van Hauwenhuyse F, Fiori A, Van Dijck P. Ascorbic acid inhibition of Candida albicans Hsp90-mediated morphogenesis occurs via the transcriptional regulator Upc2. Eukaryot. Cell, 13, 1278–1289 (2014).
27) Huh W-K, Kim S-T, Kim H, Jeong G, Kang S-O. Deficiency of D-erythroascorbic acid attenuates hyphal growth and virulence of Candida albicans. Infect. Immun., 69, 3939–3946 (2001).
28) Burnham JA, Kendall PA, Sofos JN. Ascorbic acid enhances de-struction of Escherichia coli O157:H7 during home-type drying of apple slices. J. Food Prot., 64, 1244–1248 (2001).
29) Tajkarimi M, Ibrahim SA. Antimicrobial activity of ascorbic acid alone or in combination with lactic acid on Escherichia coli

1206 Vol. 40, No. 8 (2017)Biol. Pharm. Bull.
O157:H7 in laboratory medium and carrot juice. Food Contr., 22, 801–804 (2011).
30) Zhang Z, Aboulwafa M, Smith MH, Saier MH Jr. The ascorbate transporter of Escherichia coli. J. Bacteriol., 185, 2243–2250 (2003).
31) Yew WS, Gerlt JA. Utilization of L-ascorbate by Escherichia coli K-12: assignments of functions to products of the yjf-sga and yia-sgb operons. J. Bacteriol., 184, 302–306 (2002).
32) Mehmeti I, Solheim M, Nes IF, Holo H. Enterococcus faecalis grows on ascorbic acid. Appl. Environ. Microbiol., 79, 4756–4758 (2013).
33) Tiedtke J, Marks O, Morel J. “Stimulation of Collagen Production in Human Fib Rob Lasts.”: ‹https://pl.scribd.com/document/76654395/Stimulation-of-Collagen-Production-in-Human-Fib-Rob-Lasts›, cited 6 November, 2016.