Bioconversion of hybrid poplar to ethanol and co-products using an organosolv fractionation process:...
11
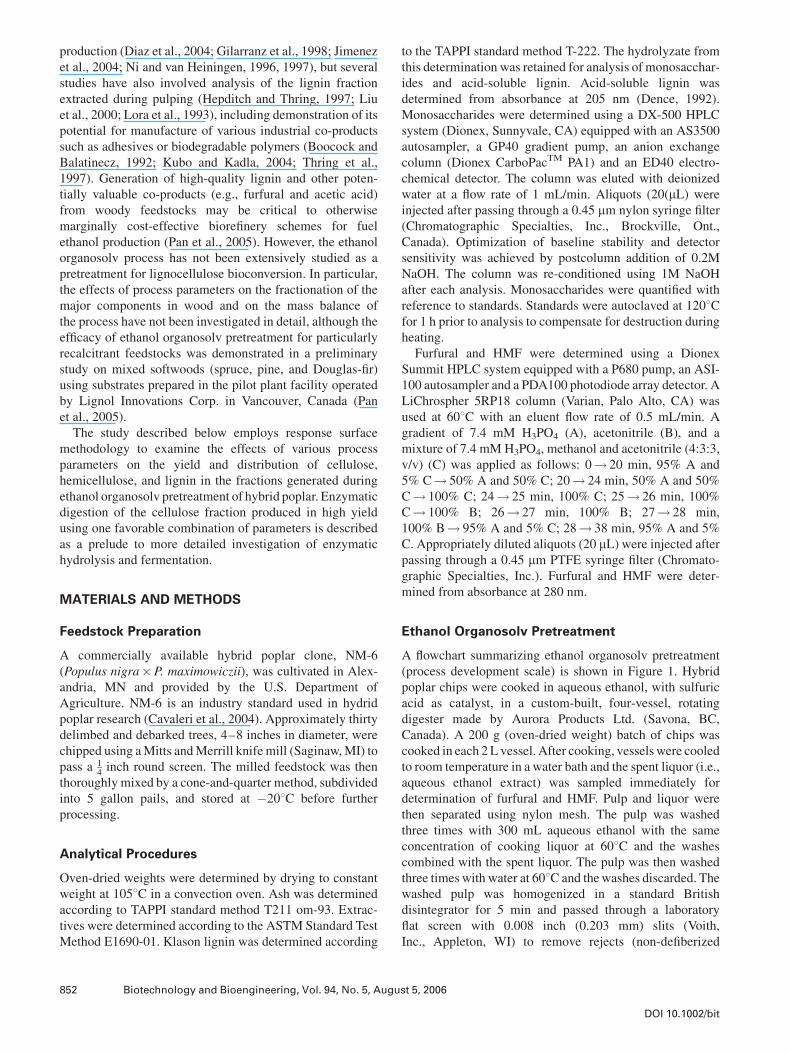
Bioconversion of Hybrid Poplar to Ethanol and Co-Products Using an Organosolv Fractionation Process: Optimization of Process Yields Xuejun Pan, 1 Neil Gilkes, 1 John Kadla, 1 Kendall Pye, 2 Shiro Saka, 3 David Gregg, 1 Katsunobu Ehara, 3 Dan Xie, 1 Dexter Lam, 1 Jack Saddler 1 1 Department of Wood Science, University of British Columbia, 2424 Main Mall, Vancouver, BC, Canada V6T 1Z4; telephone: 604-822-6775; fax: 604-822-9104; e-mail: [email protected] 2 Lignol Innovations Corp., 3650 Wesbrook Mall, Vancouver, British Columbia, Canada V6S 2L2 3 Graduate School of Energy Science, Kyoto University, Yoshida Hon-machi, Sakyo-ku, Kyoto 606-8501, Japan Received 11 August 2005; accepted 14 February 2006 Published online 7 March 2006 in Wiley InterScience (www.interscience.wiley.com). DOI: 10.1002/bit.20905 Abstract: An organosolv process involving extraction with hot aqueous ethanol has been evaluated for bioconversion of hybrid poplar to ethanol. The process resulted in fractionation of poplar chips into a cellulose- rich solids fraction, an ethanol organosolv lignin (EOL) fraction, and a water-soluble fraction containing hemicellulosic sugars, sugar breakdown products, degraded lignin, and other components. The influence of four independent process variables (temperature, time, catalyst dose, and ethanol concentration) on product yields was analyzed over a broad range using a small composite design and response surface methodology. Center point conditions for the composite design (1808C, 60 min, 1.25% H 2 SO 4 , and 60% ethanol), yielded a solids fraction containing 88% of the cellulose present in the untreated poplar. Approximately 82% of the total cellulose in the untreated poplar was recovered as monomeric glucose after hydrolysis of the solids fraction for 24 h using a low enzyme loading (20 filter paper units of cellulase/g cellulose); 85% was recovered after 48 h hydrolysis. Total recovery of xylose (soluble and insolu- ble) was equivalent to 72% of the xylose present in untreated wood. Approximately 74% of the lignin in untreated wood was recovered as EOL. Other cooking conditions resulted in either similar or inferior product yields although the distribution of components between the various fractions differed markedly. Data analysis generated regression models that describe process responses for any combination of the four variables. ß 2006 Wiley Periodicals, Inc. Keywords: bioconversion; bioethanol; biorefinery; orga- nosolv; lignocellulose; hybrid poplar INTRODUCTION The development of biorefineries to produce fuels and commodity chemicals from lignocellulosic biomass is viewed as a potential alternative to current reliance on non- renewable resources. The so-called ‘‘sugar platform,’’ involving enzymatic hydrolysis of the cellulose component to glucose, followed by fermentation to fuel-grade ethanol, is a focus of current attention, but ultimately lignocellulose biorefineries could produce a wider range of products, much like today’s petroleum refineries (Kamm and Kamm, 2004; Lynd et al., 1999). Several bioconversion schemes have been demonstrated in laboratory or pilot-scale experiments but full-scale commercial bioconversion of lignocellulosic biomass has yet to be realized. One of the primary challenges for process commercializa- tion is the development of cost-effective pretreatment technologies for lignocellulosic feedstocks (Lynd et al., 2002; Mosier et al., 2005; Wyman et al., 2005). Pretreatment is necessary to increase the accessibility of cellulose in lignocellulosic biomass to facilitate enzymatic hydrolysis. Unlike traditional sources of fermentable sugar, such as starch and sucrose, the cellulose component of lignocellulose is a structural polymer and is protected against enzymatic attack by the surrounding matrix of lignin and hemicellulose. Among the pretreatment technologies currently being evaluated for woody feedstocks is an ethanol organosolv process that was originally designed to produce clean biofuel for turbine generators and later developed by the Canadian pulp and paper industry into the Alcell 1 pulping process for hardwoods (Pye and Lora, 1991; Stockburger, 1993; Williamson, 1988). Historically, the organosolv process has been investigated largely from the perspective of paper ß 2006 Wiley Periodicals, Inc. Correspondence to: X. Pan Contract grant sponsors: Natural Sciences and Engineering Research Council of Canada (NSERC); Natural Resources Canada (NRCan); BIOCAP Canada
-
Upload
independent -
Category
Documents
-
view
2 -
download
0
Transcript of Bioconversion of hybrid poplar to ethanol and co-products using an organosolv fractionation process:...
Bioconversion of Hybrid Poplar to Ethanoland Co-Products Using an OrganosolvFractionation Process: Optimization ofProcess Yields
Xuejun Pan,1 Neil Gilkes,1 John Kadla,1 Kendall Pye,2 Shiro Saka,3 David Gregg,1
Katsunobu Ehara,3 Dan Xie,1 Dexter Lam,1 Jack Saddler1
1Department of Wood Science, University of British Columbia, 2424 Main Mall,Vancouver, BC, Canada V6T 1Z4; telephone: 604-822-6775; fax: 604-822-9104;e-mail: [email protected] Innovations Corp., 3650 Wesbrook Mall, Vancouver, British Columbia,Canada V6S 2L23Graduate School of Energy Science, KyotoUniversity, Yoshida Hon-machi, Sakyo-ku,Kyoto 606-8501, Japan
Received 11 August 2005; accepted 14 February 2006
Published online 7 March 2006 in Wiley InterScience (www.interscience.wiley.com). DOI: 10.1002/bit.20905
Abstract: An organosolv process involving extractionwith hot aqueous ethanol has been evaluated forbioconversion of hybrid poplar to ethanol. The processresulted in fractionation of poplar chips into a cellulose-rich solids fraction, an ethanol organosolv lignin(EOL) fraction, and a water-soluble fraction containinghemicellulosic sugars, sugar breakdown products,degraded lignin, and other components. The influenceof four independent process variables (temperature, time,catalyst dose, and ethanol concentration) on productyields was analyzed over a broad range using a smallcomposite design and response surface methodology.Center point conditions for the composite design (1808C,60 min, 1.25% H2SO4, and 60% ethanol), yielded a solidsfraction containing �88% of the cellulose present in theuntreatedpoplar.Approximately 82%of the total cellulosein the untreated poplar was recovered as monomericglucose after hydrolysis of the solids fraction for 24 husing a low enzyme loading (20 filter paper units ofcellulase/g cellulose); �85% was recovered after 48 hhydrolysis. Total recovery of xylose (soluble and insolu-ble) was equivalent to �72% of the xylose present inuntreated wood. Approximately 74% of the lignin inuntreated wood was recovered as EOL. Other cookingconditions resulted in either similar or inferior productyields although the distribution of components betweenthe various fractions differed markedly. Data analysisgenerated regression models that describe processresponses for any combination of the four variables.� 2006 Wiley Periodicals, Inc.
Keywords: bioconversion; bioethanol; biorefinery; orga-nosolv; lignocellulose; hybrid poplar
INTRODUCTION
The development of biorefineries to produce fuels and
commodity chemicals from lignocellulosic biomass is
viewed as a potential alternative to current reliance on non-
renewable resources. The so-called ‘‘sugar platform,’’
involving enzymatic hydrolysis of the cellulose component
to glucose, followed by fermentation to fuel-grade ethanol, is
a focus of current attention, but ultimately lignocellulose
biorefineries could produce a wider range of products, much
like today’s petroleum refineries (Kamm and Kamm, 2004;
Lynd et al., 1999). Several bioconversion schemes have been
demonstrated in laboratory or pilot-scale experiments but
full-scale commercial bioconversion of lignocellulosic
biomass has yet to be realized.
One of the primary challenges for process commercializa-
tion is the development of cost-effective pretreatment
technologies for lignocellulosic feedstocks (Lynd et al.,
2002; Mosier et al., 2005; Wyman et al., 2005). Pretreatment
is necessary to increase the accessibility of cellulose in
lignocellulosic biomass to facilitate enzymatic hydrolysis.
Unlike traditional sources of fermentable sugar, such as
starch and sucrose, the cellulose component of lignocellulose
is a structural polymer and is protected against enzymatic
attack by the surroundingmatrix of lignin and hemicellulose.
Among the pretreatment technologies currently being
evaluated for woody feedstocks is an ethanol organosolv
process that was originally designed to produce clean biofuel
for turbine generators and later developed by the Canadian
pulp and paper industry into the Alcell1 pulping process for
hardwoods (Pye and Lora, 1991; Stockburger, 1993;
Williamson, 1988). Historically, the organosolv process has
been investigated largely from the perspective of paper
�2006 Wiley Periodicals, Inc.
Correspondence to: X. Pan
Contract grant sponsors: Natural Sciences and Engineering Research
Council of Canada (NSERC); Natural Resources Canada (NRCan);
BIOCAP Canada
production (Diaz et al., 2004; Gilarranz et al., 1998; Jimenez
et al., 2004; Ni and van Heiningen, 1996, 1997), but several
studies have also involved analysis of the lignin fraction
extracted during pulping (Hepditch and Thring, 1997; Liu
et al., 2000; Lora et al., 1993), including demonstration of its
potential for manufacture of various industrial co-products
such as adhesives or biodegradable polymers (Boocock and
Balatinecz, 1992; Kubo and Kadla, 2004; Thring et al.,
1997). Generation of high-quality lignin and other poten-
tially valuable co-products (e.g., furfural and acetic acid)
from woody feedstocks may be critical to otherwise
marginally cost-effective biorefinery schemes for fuel
ethanol production (Pan et al., 2005). However, the ethanol
organosolv process has not been extensively studied as a
pretreatment for lignocellulose bioconversion. In particular,
the effects of process parameters on the fractionation of the
major components in wood and on the mass balance of
the process have not been investigated in detail, although the
efficacy of ethanol organosolv pretreatment for particularly
recalcitrant feedstocks was demonstrated in a preliminary
study on mixed softwoods (spruce, pine, and Douglas-fir)
using substrates prepared in the pilot plant facility operated
by Lignol Innovations Corp. in Vancouver, Canada (Pan
et al., 2005).
The study described below employs response surface
methodology to examine the effects of various process
parameters on the yield and distribution of cellulose,
hemicellulose, and lignin in the fractions generated during
ethanol organosolv pretreatment of hybrid poplar. Enzymatic
digestion of the cellulose fraction produced in high yield
using one favorable combination of parameters is described
as a prelude to more detailed investigation of enzymatic
hydrolysis and fermentation.
MATERIALS AND METHODS
Feedstock Preparation
A commercially available hybrid poplar clone, NM-6
(Populus nigra�P. maximowiczii), was cultivated in Alex-
andria, MN and provided by the U.S. Department of
Agriculture. NM-6 is an industry standard used in hydrid
poplar research (Cavaleri et al., 2004). Approximately thirty
delimbed and debarked trees, 4–8 inches in diameter, were
chipped using aMitts andMerrill knife mill (Saginaw,MI) to
pass a 14inch round screen. The milled feedstock was then
thoroughly mixed by a cone-and-quarter method, subdivided
into 5 gallon pails, and stored at �208C before further
processing.
Analytical Procedures
Oven-dried weights were determined by drying to constant
weight at 1058C in a convection oven. Ash was determined
according to TAPPI standard method T211 om-93. Extrac-
tives were determined according to the ASTM Standard Test
Method E1690-01. Klason lignin was determined according
to the TAPPI standard method T-222. The hydrolyzate from
this determination was retained for analysis of monosacchar-
ides and acid-soluble lignin. Acid-soluble lignin was
determined from absorbance at 205 nm (Dence, 1992).
Monosaccharides were determined using a DX-500 HPLC
system (Dionex, Sunnyvale, CA) equipped with an AS3500
autosampler, a GP40 gradient pump, an anion exchange
column (Dionex CarboPacTM PA1) and an ED40 electro-
chemical detector. The column was eluted with deionized
water at a flow rate of 1 mL/min. Aliquots (20(mL) wereinjected after passing through a 0.45 mm nylon syringe filter
(Chromatographic Specialties, Inc., Brockville, Ont.,
Canada). Optimization of baseline stability and detector
sensitivity was achieved by postcolumn addition of 0.2M
NaOH. The column was re-conditioned using 1M NaOH
after each analysis. Monosaccharides were quantified with
reference to standards. Standards were autoclaved at 1208Cfor 1 h prior to analysis to compensate for destruction during
heating.
Furfural and HMF were determined using a Dionex
Summit HPLC system equipped with a P680 pump, an ASI-
100 autosampler and a PDA100 photodiode array detector. A
LiChrospher 5RP18 column (Varian, Palo Alto, CA) was
used at 608C with an eluent flow rate of 0.5 mL/min. A
gradient of 7.4 mM H3PO4 (A), acetonitrile (B), and a
mixture of 7.4 mM H3PO4, methanol and acetonitrile (4:3:3,
v/v) (C) was applied as follows: 0! 20 min, 95% A and
5% C! 50% A and 50% C; 20! 24 min, 50% A and 50%
C! 100% C; 24! 25 min, 100% C; 25! 26 min, 100%
C! 100% B; 26! 27 min, 100% B; 27! 28 min,
100% B! 95% A and 5% C; 28! 38 min, 95% A and 5%
C. Appropriately diluted aliquots (20 mL) were injected afterpassing through a 0.45 mm PTFE syringe filter (Chromato-
graphic Specialties, Inc.). Furfural and HMF were deter-
mined from absorbance at 280 nm.
Ethanol Organosolv Pretreatment
A flowchart summarizing ethanol organosolv pretreatment
(process development scale) is shown in Figure 1. Hybrid
poplar chips were cooked in aqueous ethanol, with sulfuric
acid as catalyst, in a custom-built, four-vessel, rotating
digester made by Aurora Products Ltd. (Savona, BC,
Canada). A 200 g (oven-dried weight) batch of chips was
cooked in each 2L vessel. After cooking, vessels were cooled
to room temperature in a water bath and the spent liquor (i.e.,
aqueous ethanol extract) was sampled immediately for
determination of furfural and HMF. Pulp and liquor were
then separated using nylon mesh. The pulp was washed
three times with 300 mL aqueous ethanol with the same
concentration of cooking liquor at 608C and the washes
combined with the spent liquor. The pulp was then washed
three times with water at 608C and thewashes discarded. The
washed pulp was homogenized in a standard British
disintegrator for 5 min and passed through a laboratory
flat screen with 0.008 inch (0.203 mm) slits (Voith,
Inc., Appleton, WI) to remove rejects (non-defiberized
852 Biotechnology and Bioengineering, Vol. 94, No. 5, August 5, 2006
DOI 10.1002/bit
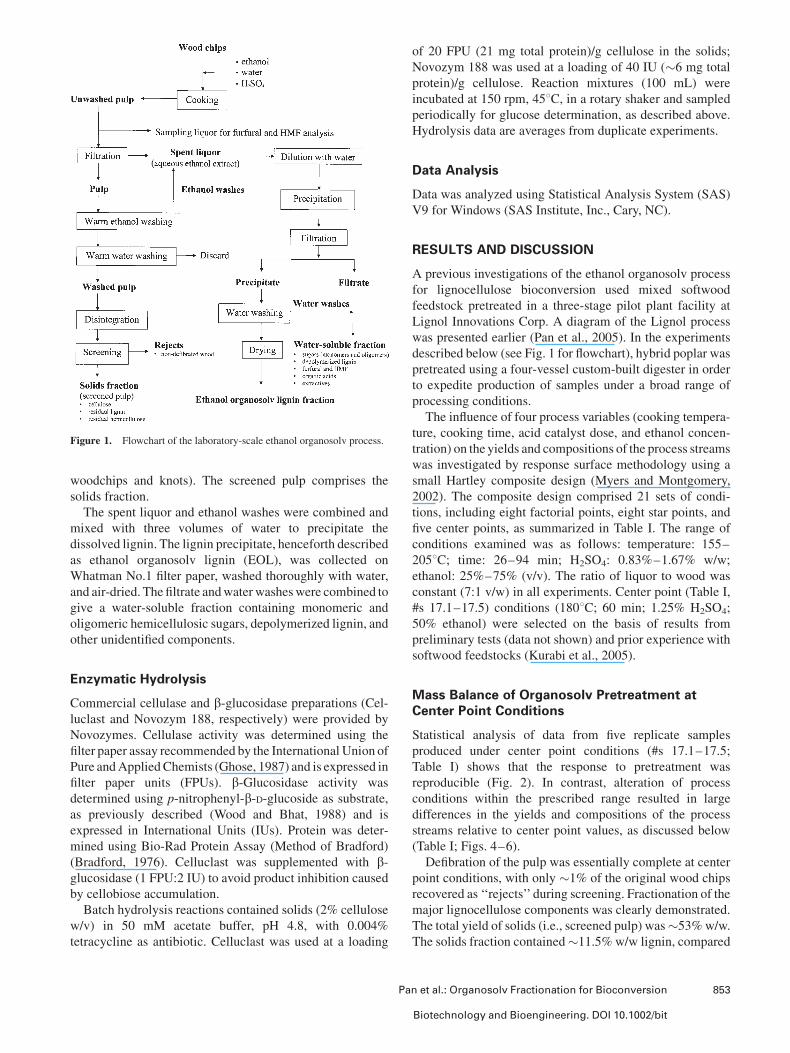
woodchips and knots). The screened pulp comprises the
solids fraction.
The spent liquor and ethanol washes were combined and
mixed with three volumes of water to precipitate the
dissolved lignin. The lignin precipitate, henceforth described
as ethanol organosolv lignin (EOL), was collected on
Whatman No.1 filter paper, washed thoroughly with water,
and air-dried. The filtrate andwaterwasheswere combined to
give a water-soluble fraction containing monomeric and
oligomeric hemicellulosic sugars, depolymerized lignin, and
other unidentified components.
Enzymatic Hydrolysis
Commercial cellulase and b-glucosidase preparations (Cel-luclast and Novozym 188, respectively) were provided by
Novozymes. Cellulase activity was determined using the
filter paper assay recommended by the International Union of
Pure andAppliedChemists (Ghose, 1987) and is expressed in
filter paper units (FPUs). b-Glucosidase activity was
determined using p-nitrophenyl-b-D-glucoside as substrate,
as previously described (Wood and Bhat, 1988) and is
expressed in International Units (IUs). Protein was deter-
mined using Bio-Rad Protein Assay (Method of Bradford)
(Bradford, 1976). Celluclast was supplemented with b-glucosidase (1 FPU:2 IU) to avoid product inhibition caused
by cellobiose accumulation.
Batch hydrolysis reactions contained solids (2% cellulose
w/v) in 50 mM acetate buffer, pH 4.8, with 0.004%
tetracycline as antibiotic. Celluclast was used at a loading
of 20 FPU (21 mg total protein)/g cellulose in the solids;
Novozym 188 was used at a loading of 40 IU (�6 mg total
protein)/g cellulose. Reaction mixtures (100 mL) were
incubated at 150 rpm, 458C, in a rotary shaker and sampled
periodically for glucose determination, as described above.
Hydrolysis data are averages from duplicate experiments.
Data Analysis
Data was analyzed using Statistical Analysis System (SAS)
V9 for Windows (SAS Institute, Inc., Cary, NC).
RESULTS AND DISCUSSION
A previous investigations of the ethanol organosolv process
for lignocellulose bioconversion used mixed softwood
feedstock pretreated in a three-stage pilot plant facility at
Lignol Innovations Corp. A diagram of the Lignol process
was presented earlier (Pan et al., 2005). In the experiments
described below (see Fig. 1 for flowchart), hybrid poplar was
pretreated using a four-vessel custom-built digester in order
to expedite production of samples under a broad range of
processing conditions.
The influence of four process variables (cooking tempera-
ture, cooking time, acid catalyst dose, and ethanol concen-
tration) on the yields and compositions of the process streams
was investigated by response surface methodology using a
small Hartley composite design (Myers and Montgomery,
2002). The composite design comprised 21 sets of condi-
tions, including eight factorial points, eight star points, and
five center points, as summarized in Table I. The range of
conditions examined was as follows: temperature: 155–
2058C; time: 26–94 min; H2SO4: 0.83%–1.67% w/w;
ethanol: 25%–75% (v/v). The ratio of liquor to wood was
constant (7:1 v/w) in all experiments. Center point (Table I,
#s 17.1–17.5) conditions (1808C; 60 min; 1.25% H2SO4;
50% ethanol) were selected on the basis of results from
preliminary tests (data not shown) and prior experience with
softwood feedstocks (Kurabi et al., 2005).
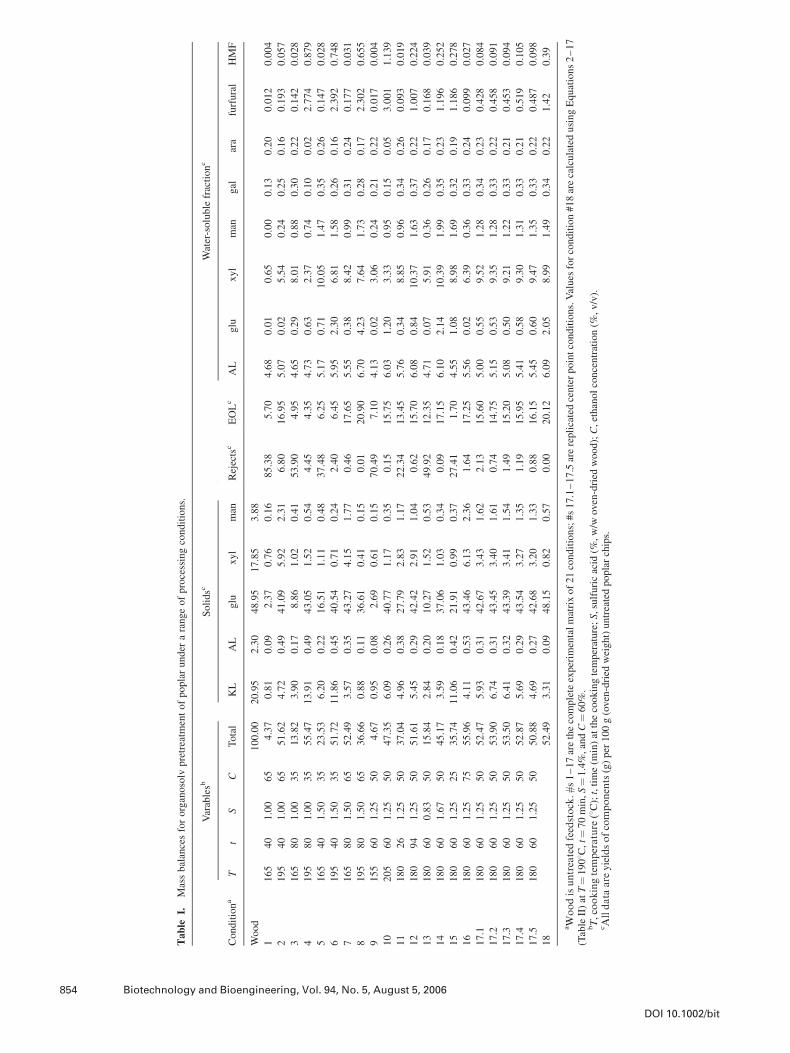
Mass Balance of Organosolv Pretreatment atCenter Point Conditions
Statistical analysis of data from five replicate samples
produced under center point conditions (#s 17.1–17.5;
Table I) shows that the response to pretreatment was
reproducible (Fig. 2). In contrast, alteration of process
conditions within the prescribed range resulted in large
differences in the yields and compositions of the process
streams relative to center point values, as discussed below
(Table I; Figs. 4–6).
Defibration of the pulp was essentially complete at center
point conditions, with only �1% of the original wood chips
recovered as ‘‘rejects’’ during screening. Fractionation of the
major lignocellulose components was clearly demonstrated.
The total yield of solids (i.e., screened pulp) was�53%w/w.
The solids fraction contained�11.5% w/w lignin, compared
Figure 1. Flowchart of the laboratory-scale ethanol organosolv process.
Pan et al.: Organosolv Fractionation for Bioconversion 853
Biotechnology and Bioengineering. DOI 10.1002/bit
Tab
leI.
Massbalancesfororganosolv
pretreatm
entofpoplarunder
arangeofprocessingconditions.
Varablesb
Solidsc
Rejectsc
EOLc
Water-solublefractionc
Conditiona
Tt
SC
Total
KL
AL
glu
xyl
man
AL
glu
xyl
man
gal
ara
furfural
HMF
Wood
100.00
20.95
2.30
48.95
17.85
3.88
1165
40
1.00
65
4.37
0.81
0.09
2.37
0.76
0.16
85.38
5.70
4.68
0.01
0.65
0.00
0.13
0.20
0.012
0.004
2195
40
1.00
65
51.62
4.72
0.49
41.09
5.92
2.31
6.80
16.95
5.07
0.02
5.54
0.24
0.25
0.16
0.193
0.057
3165
80
1.00
35
13.82
3.90
0.17
8.86
1.02
0.41
53.90
4.95
4.65
0.29
8.01
0.88
0.30
0.22
0.142
0.028
4195
80
1.00
35
55.47
13.91
0.49
43.05
1.52
0.54
4.45
4.35
4.73
0.63
2.37
0.74
0.10
0.02
2.774
0.879
5165
40
1.50
35
23.53
6.20
0.22
16.51
1.11
0.48
37.48
6.25
5.17
0.71
10.05
1.47
0.35
0.26
0.147
0.028
6195
40
1.50
35
51.72
11.86
0.45
40.54
0.71
0.24
2.40
6.45
5.95
2.30
6.81
1.58
0.26
0.16
2.392
0.748
7165
80
1.50
65
52.49
3.57
0.35
43.27
4.15
1.77
0.46
17.65
5.55
0.38
8.42
0.99
0.31
0.24
0.177
0.031
8195
80
1.50
65
36.66
0.88
0.11
36.61
0.41
0.15
0.01
20.90
6.70
4.23
7.64
1.73
0.28
0.17
2.302
0.655
9155
60
1.25
50
4.67
0.95
0.08
2.69
0.61
0.15
70.49
7.10
4.13
0.02
3.06
0.24
0.21
0.22
0.017
0.004
10
205
60
1.25
50
47.35
6.09
0.26
40.77
1.17
0.35
0.15
15.75
6.03
1.20
3.33
0.95
0.15
0.05
3.001
1.139
11
180
26
1.25
50
37.04
4.96
0.38
27.79
2.83
1.17
22.34
13.45
5.76
0.34
8.85
0.96
0.34
0.26
0.093
0.019
12
180
94
1.25
50
51.61
5.45
0.29
42.42
2.91
1.04
0.62
15.70
6.08
0.84
10.37
1.63
0.37
0.22
1.007
0.224
13
180
60
0.83
50
15.84
2.84
0.20
10.27
1.52
0.53
49.92
12.35
4.71
0.07
5.91
0.36
0.26
0.17
0.168
0.039
14
180
60
1.67
50
45.17
3.59
0.18
37.06
1.03
0.34
0.09
17.15
6.10
2.14
10.39
1.99
0.35
0.23
1.196
0.252
15
180
60
1.25
25
35.74
11.06
0.42
21.91
0.99
0.37
27.41
1.70
4.55
1.08
8.98
1.69
0.32
0.19
1.186
0.278
16
180
60
1.25
75
55.96
4.11
0.53
43.46
6.13
2.36
1.64
17.25
5.56
0.02
6.39
0.36
0.33
0.24
0.099
0.027
17.1
180
60
1.25
50
52.47
5.93
0.31
42.67
3.43
1.62
2.13
15.60
5.00
0.55
9.52
1.28
0.34
0.23
0.428
0.084
17.2
180
60
1.25
50
53.90
6.74
0.31
43.45
3.40
1.61
0.74
14.75
5.15
0.53
9.35
1.28
0.33
0.22
0.458
0.091
17.3
180
60
1.25
50
53.50
6.41
0.32
43.39
3.41
1.54
1.49
15.20
5.08
0.50
9.21
1.22
0.33
0.21
0.453
0.094
17.4
180
60
1.25
50
52.87
5.69
0.29
43.54
3.27
1.35
1.19
15.95
5.41
0.58
9.30
1.31
0.33
0.21
0.519
0.105
17.5
180
60
1.25
50
50.88
4.69
0.27
42.68
3.20
1.33
0.88
16.15
5.45
0.60
9.47
1.35
0.33
0.22
0.487
0.098
18
52.49
3.31
0.09
48.15
0.82
0.57
0.00
20.12
6.09
2.05
8.99
1.49
0.34
0.22
1.42
0.39
aWoodisuntreatedfeedstock.#s1–17arethecompleteexperim
entalmatrixof21conditions;#s17.1–17.5arereplicatedcenterpointconditions.Values
forcondition#18arecalculatedusingEquations2–17
(TableII)atT¼1908C
,t¼
70min,S¼1.4%,andC¼60%.
bT,cookingtemperature
(8C);t,time(m
in)atthecookingtemperature;S,sulfuricacid
(%,w/w
oven-dried
wood);C,ethanolconcentration(%
,v/v).
cAlldata
are
yieldsofcomponents(g)per
100g(oven-dried
weight)untreatedpoplarchips.
854 Biotechnology and Bioengineering, Vol. 94, No. 5, August 5, 2006
DOI 10.1002/bit
to �23.3% w/w in the untreated wood. Approximately 27%
of the total lignin remained associated with the solids. Most
of the lignin was dissolved during aqueous ethanol extraction
and was recovered as a precipitate after dilution with water
but a portion of lignin remained in the water-soluble fraction
(Fig. 2). The precipitated ethanol organosolv lignin (EOL)
accounted for approximately 74% of the Klason lignin in
untreated wood. The total amount of lignin recovered from
the pulp, EOL, and water soluble fractions at center point
conditionswas�116%of the amount present in the untreated
wood. Part of the apparent excess can be explained by
extensive depolymerization of lignin during organosolv
extraction. Furthermore, the value for acid-soluble lignin in
thewater-soluble fraction is probably inflated by the presence
extractive components (e.g., lignans, tannins, and related
phenolic compounds); these components are routinely
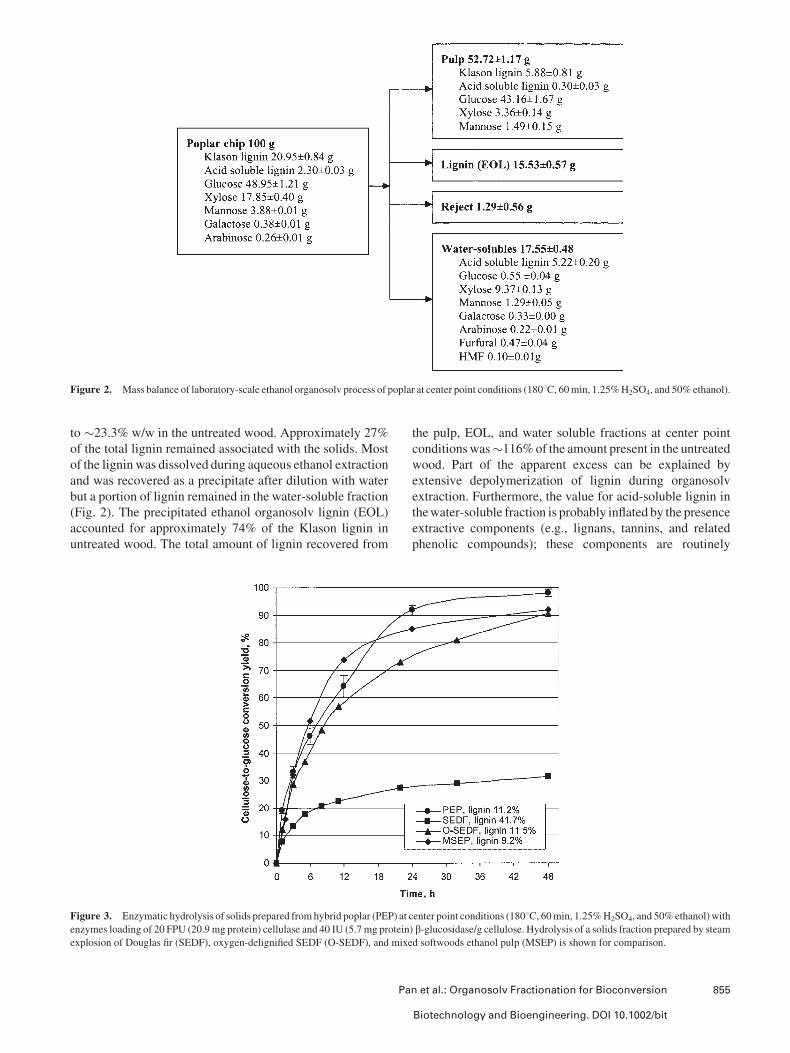
Figure 3. Enzymatic hydrolysis of solids prepared fromhybrid poplar (PEP) at center point conditions (1808C, 60min, 1.25%H2SO4, and 50%ethanol)with
enzymes loading of 20 FPU (20.9 mg protein) cellulase and 40 IU (5.7mg protein) b-glucosidase/g cellulose. Hydrolysis of a solids fraction prepared by steamexplosion of Douglas fir (SEDF), oxygen-delignified SEDF (O-SEDF), and mixed softwoods ethanol pulp (MSEP) is shown for comparison.
Figure 2. Mass balance of laboratory-scale ethanol organosolv process of poplar at center point conditions (1808C, 60min, 1.25%H2SO4, and 50%ethanol).
Pan et al.: Organosolv Fractionation for Bioconversion 855
Biotechnology and Bioengineering. DOI 10.1002/bit
removed prior to compositional analysis of the untreated
wood.
Approximately 88% of the total glucan in untreated wood
was recovered in the solids fraction (calculated from data in
Fig. 2). The small amount of glucose present in the water-
soluble fraction (�1% of total) probably includes material
derived from glucomannan. The occurrence of xylose
(�19% of total) and mannose (�38% of total) in the solids
fraction indicates the presence of some residual polymeric
hemicellulose. However, most of the recovered hemicellu-
losic sugars (�53% total xylose, �33% of total mannose,
�85% of total arabinose, and�87% of total galactose) were
found in the water-soluble fraction. The amounts of
oligomeric and monomeric sugars in the water-soluble
fraction were determined by analysis before and after
incubation in 3% H2SO4 under conditions which hydrolyze
all oligomeric sugars to monomers. At center point condi-
tions, �58% of the water-soluble xylose, and �71% of the
water-soluble mannose was oligomeric.
The extent of xylose recovery in the combined solids and
water-soluble fractions (�72%) indicates significant degra-
dation of this component. Substantial losses of other
monosaccharides were also observed, such that the total
recovery of carbohydrate (solids plus water-soluble fractions
excluding the reject fraction) was �84%. All of the major
monosaccharides found in lignocellulose undergo thermal
decomposition under acidic conditions (Wenzl, 1970). The
water-soluble fraction contained significant levels of HMF
and furfural, degradation products of hexoses and pentoses,
respectively (Wenzl, 1970). However, the total amounts of
HMF and furfural detected account for only a small fraction
of the unrecovered carbohydrate, suggesting further degra-
dation of monosaccharides to unidentified products (Harris
et al., 1963; Sjostrom, 1992). It should also be noted that the
weight contribution of methyl glucoronic acid and acetate
side groups was not determined in these analyses.
Enzymatic Hydrolysis of Solids Fraction
Enzymatic hydrolysis of solids prepared at center point
conditions is shown in Figure 3. Data are the average for five
replicated solids samples (#s 17.1–17.5; Table I) hydrolyzed
at 2% consistency (g cellulose/100 mL liquid) in separate
reactions using cellulase (Celluclast) and b-glucosidase(Novozym 188) at 20 FPU (20.9 mg protein) and 40 IU
(5.7 mg protein) per g cellulose, respectively.
Substantial conversion of the poplar solids (containing
11.2%w/w average residual lignin) was observedwithin 24 h
(�93% hydrolysis of the glucan in the solids fraction
hydrolyzed to glucose). When the hydrolysis was extended
to 48 h, the conversion of cellulose to glucose reached�97%
(Fig. 3). As discussed above, approximately 88% of the
original cellulose was recovered in the solids fraction.
Therefore, the net conversion of cellulose (i.e., glucan in
untreated wood) to glucose in the hydrolyzate was �82%
(88%� 93%) of the theoretical conversion at 24 h or �85%
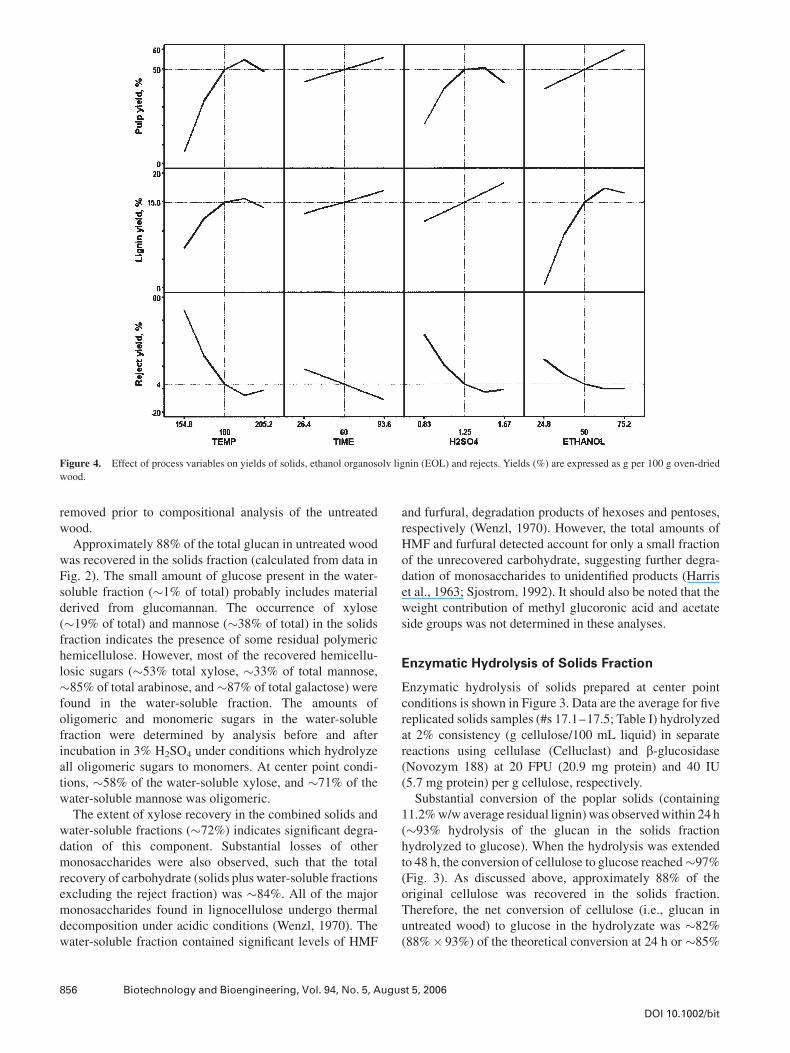
Figure 4. Effect of process variables on yields of solids, ethanol organosolv lignin (EOL) and rejects. Yields (%) are expressed as g per 100 g oven-dried
wood.
856 Biotechnology and Bioengineering, Vol. 94, No. 5, August 5, 2006
DOI 10.1002/bit
(88%� 97%) at 48 h, respectively. In comparison, a solids
fraction containing �42% residual lignin, prepared by SO2-
catalyzed steam explosion of softwood (Douglas-fir),
showed <30% at 24 h and �32% at 48 h hydrolysis of
cellulose to glucose, and �75% at 24 h and �90% at 48 h
hydrolysis after further delignification by oxygen bleaching
(Fig. 3), respectively. The rate of hydrolysis of the poplar
solids was slower during the first 12 h than that of a solids
fraction with a similar lignin content (9.2%) prepared by
organosolv pretreatment ofmixed softwood (Pan et al., 2005)
but the extents of conversion at 24 and 48 h were higher
(Fig. 3). The mechanistic basis for this difference in
hydrolysis kinetics is presently unclear.
Optimization of Sugar Recovery
Mass balance data for other processing conditions, chosen
according to the Hartley small composite design, are
presented in Table I. The yields and compositions of the
solids, EOL, water-soluble, and reject fractions showed
marked differences as cooking conditions were varied within
the experimental range. However, none of the conditions
tested produced a significantly higher yield of solids than the
center point conditions (52.72� 1.17%) (Fig. 2; Table I).
Likewise, none of the conditions resulted in a higher recovery
of cellulose in the solids (43.16� 1.67 g; �88% of total
glucose in untreated wood), or a higher recovery of
insolubleþ soluble xylose (12.73� 0.27 g; �72% of total
xylose in untreated wood).
All other sets of experimental conditions examined in the
small composite design resulted in yields of total solids,
cellulose recoveries, and xylose recoveries that were
comparable (e.g., condition #s 7 and 16) or inferior to those
given by the center point conditions. Nevertheless, examina-
tion of differences in other process responses (e.g., solids
delignification, solubilization of hemicellulose, and produc-
tion of sugar degradation products) indicates the potential for
fine-tuning process performance beyond those achieved at
center point conditions. For example, solids produced under
conditions # 7 and #16 produced solids fractions containing
less lignin and a water-soluble fraction containing less
furfural and HMF, than center point conditions, and a lower
proportion of recovered hemicellulose was solubilized in
both cases.
Further insights into the potential for optimizing process
performance are gained from modeling the effects of
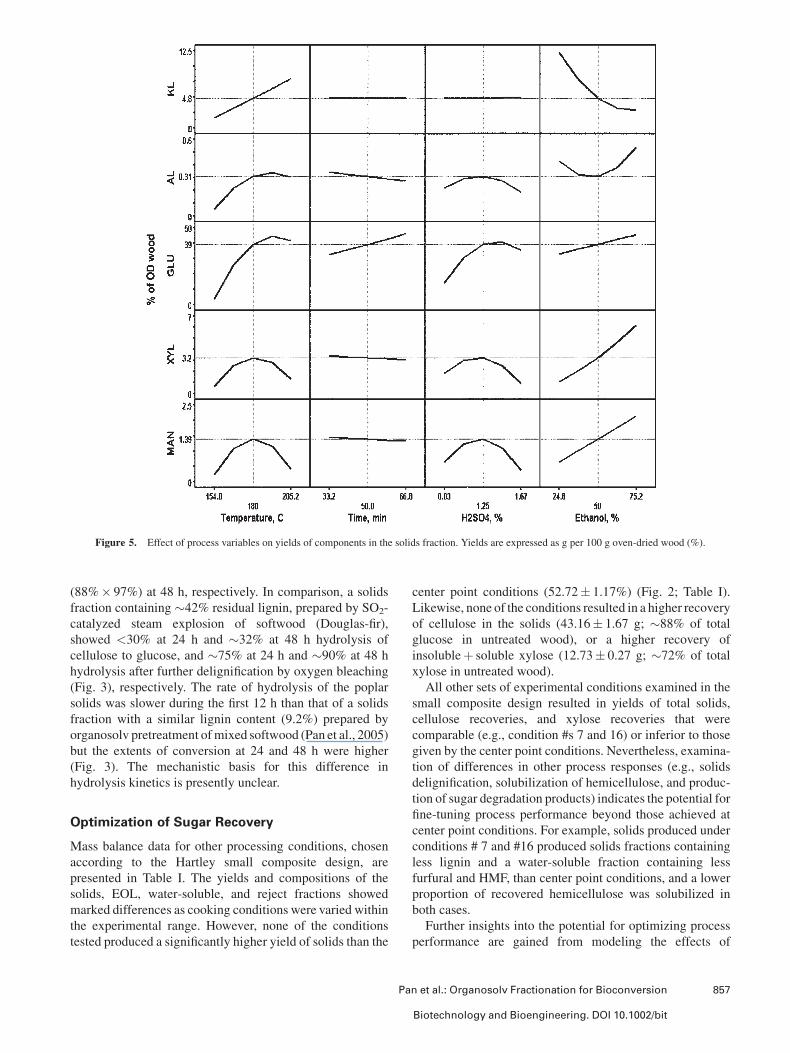
Figure 5. Effect of process variables on yields of components in the solids fraction. Yields are expressed as g per 100 g oven-dried wood (%).
Pan et al.: Organosolv Fractionation for Bioconversion 857
Biotechnology and Bioengineering. DOI 10.1002/bit
changing single process parameters, while others are fixed,
using response surface methodology (Figs. 4–6).
The predicted yields of solids and EOL increase slightly
above 1808C to a maximum at 1958C (Fig. 4). The recovery
of glucose in the solids fraction is highest (Fig. 5), and the
production of rejects lowest, at 1958C (Fig. 4). Reduced
solids yield above 1958C is attributed largely to accelerated
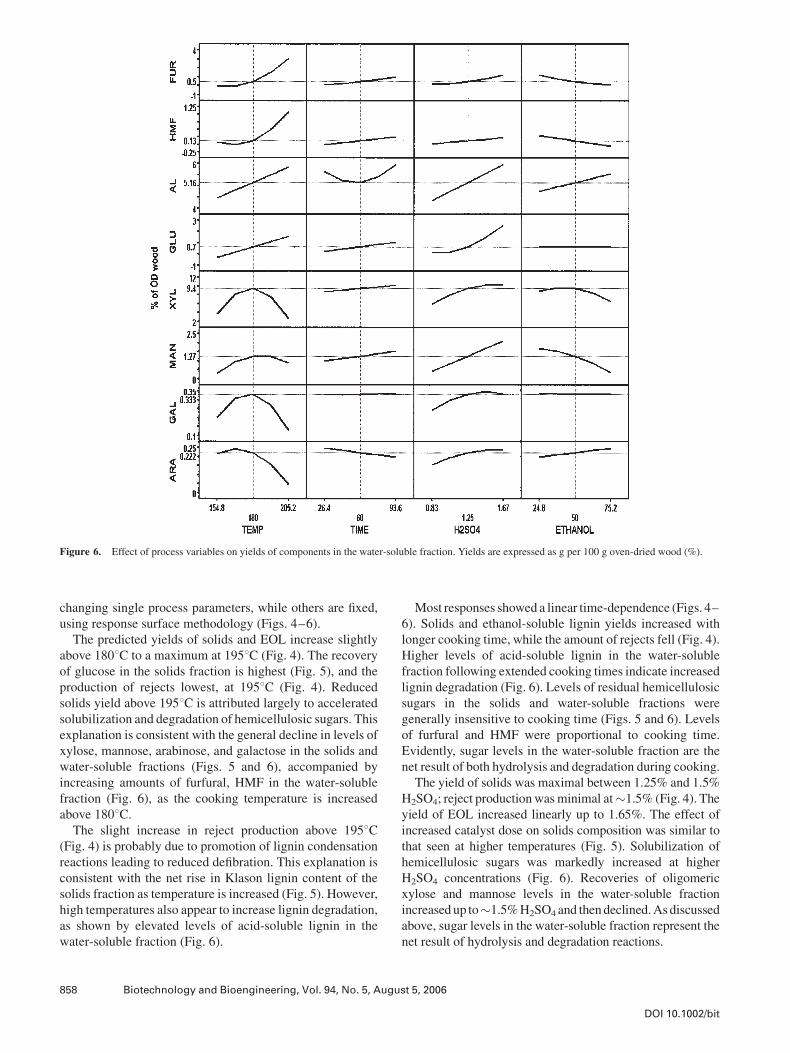
solubilization and degradation of hemicellulosic sugars. This
explanation is consistent with the general decline in levels of
xylose, mannose, arabinose, and galactose in the solids and
water-soluble fractions (Figs. 5 and 6), accompanied by
increasing amounts of furfural, HMF in the water-soluble
fraction (Fig. 6), as the cooking temperature is increased
above 1808C.The slight increase in reject production above 1958C
(Fig. 4) is probably due to promotion of lignin condensation
reactions leading to reduced defibration. This explanation is
consistent with the net rise in Klason lignin content of the
solids fraction as temperature is increased (Fig. 5). However,
high temperatures also appear to increase lignin degradation,
as shown by elevated levels of acid-soluble lignin in the
water-soluble fraction (Fig. 6).
Most responses showed a linear time-dependence (Figs. 4–
6). Solids and ethanol-soluble lignin yields increased with
longer cooking time, while the amount of rejects fell (Fig. 4).
Higher levels of acid-soluble lignin in the water-soluble
fraction following extended cooking times indicate increased
lignin degradation (Fig. 6). Levels of residual hemicellulosic
sugars in the solids and water-soluble fractions were
generally insensitive to cooking time (Figs. 5 and 6). Levels
of furfural and HMF were proportional to cooking time.
Evidently, sugar levels in the water-soluble fraction are the
net result of both hydrolysis and degradation during cooking.
The yield of solids was maximal between 1.25% and 1.5%
H2SO4; reject productionwasminimal at�1.5% (Fig. 4). The
yield of EOL increased linearly up to 1.65%. The effect of
increased catalyst dose on solids composition was similar to
that seen at higher temperatures (Fig. 5). Solubilization of
hemicellulosic sugars was markedly increased at higher
H2SO4 concentrations (Fig. 6). Recoveries of oligomeric
xylose and mannose levels in the water-soluble fraction
increased up to�1.5%H2SO4 and thendeclined.Asdiscussed
above, sugar levels in the water-soluble fraction represent the
net result of hydrolysis and degradation reactions.
Figure 6. Effect of process variables on yields of components in the water-soluble fraction. Yields are expressed as g per 100 g oven-dried wood (%).
858 Biotechnology and Bioengineering, Vol. 94, No. 5, August 5, 2006
DOI 10.1002/bit
Increasing the ethanol concentration above the 50% center
point value produced a small gain in the yield of solids and a
small decline in reject production (Fig. 4). Delignification of
the solids and recovery of EOL were maximal, and the
production of rejects minimal, at �65%. Delignification is
the combined result of lignin degradation and lignin
solubilization: lower ethanol concentrations result in higher
water chemical activity that promote acid-catalyzed cleavage
of a- and b-ether linkages in the lignin (McDonough, 1993)
whereas high ethanol concentrations increase solubilization
of the lignin (Ni andHu, 1995; Sarkanen, 1990). In contrast to
lignin, the recoveries of cellulose (glucose) and residual
hemicellulose (xylose and mannose) in the solids continued
to increase up to 75% ethanol, as reflected in reduced
recoveries of xylose and mannose (particularly as mono-
mers) in the water-soluble fraction and lower production of
furfural and HMF. A similar stabilizing effect to that at high
ethanol concentration has been reported for organosolv
acetic/formic acid pulping (Lehnen et al., 2001). The lower
water chemical activity at high ethanol concentration
probably suppressed the hydrolysis of carbohydrate.
In summary, center point conditions are close to optimum
in terms of solids yield, cellulose recovery in the solids, and
total recoveries of hemicellulosic sugars, but incremental
improvements in these parameters are predicted as a result of
small increases in process severity. However, optimization of
pretreatment in terms of maximizing yields of fermentable
sugars requires more detailed investigation. Yields of co-
productsmay also have significant economic implications. In
general, pretreatment of lignocellulosic biomass at higher
severities improves enzymatic digestibility of the cellulose
component but increases sugar degradation, thereby dimin-
ishing cellulose yield; in turn, sugar degradation products
inhibit fermentation. Therefore, lignocellulose pretreatment
optimization involves a compromise between these factors.
Also, it is currently unclear whether targeting hemicellulose
sugars to the water-soluble fraction during pretreatment
offers advantages over retaining these components in the
solids. The presence of hemicellulose in the solids is thought
to limit cellulose hydrolysis by steric interference but the
benefit of supplementing cellulase preparations with hemi-
cellulase remains to be evaluated.
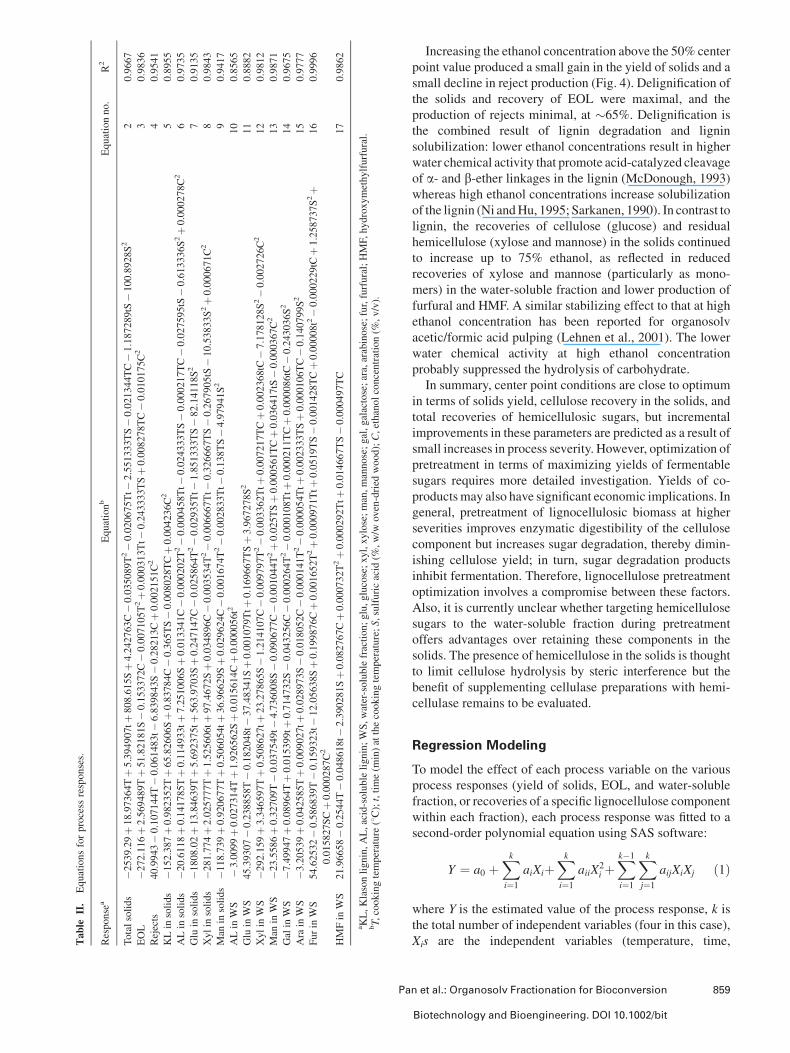
Regression Modeling
To model the effect of each process variable on the various
process responses (yield of solids, EOL, and water-soluble
fraction, or recoveries of a specific lignocellulose component
within each fraction), each process response was fitted to a
second-order polynomial equation using SAS software:
Y ¼ a0 þXk
i¼1
aiXiþXk
i¼1
aiiX2i þ
Xk�1
i¼1
Xk
j¼1
aijXiXj ð1Þ
where Y is the estimated value of the process response, k is
the total number of independent variables (four in this case),
Xis are the independent variables (temperature, time,Tab
leII.
Equationsforprocess
responses.
Response
aEquationb
Equationno.
R2
Totalsolids
�2539.29þ18.97364Tþ5.394907tþ
808.615Sþ4.242763C�0.035089T2�0.020675Tt�
2.551333TS�0.021344TC�1.187289tS�100.8928S2
20.9667
EOL
�272.116þ2.569489Tþ51.82181S�0.153372C�0.007105T2þ0.000313Tt�
0.243333TSþ0.008278TC�0.010175C2
30.9836
Rejects
40.9943�0.107144T�0.061483t�
6.839843S�0.28213Cþ0.002151C2
40.9541
KLin
solids
�152.387þ0.982352Tþ65.82606Sþ0.83784C�0.365TS�0.008028TCþ0.004236C2
50.8955
ALin
solids
�20.6118þ0.141785Tþ0.114933tþ
7.251006Sþ0.013341C�0.000202T2�0.000458Tt�
0.024333TS�0.000217TC�0.027595tS�0.613336S2þ0.000278C2
60.9735
Glu
insolids
�1808.02þ13.84639Tþ5.692375tþ
563.9703Sþ0.247147C�0.025864T2�0.02935Tt�
1.851333TS�82.14118S2
70.9135
Xylin
solids
�281.774þ2.025777Tþ1.525606tþ
97.4672Sþ0.034896C�0.003534T2�0.006667Tt�
0.326667TS�0.267905tS�10.53833S2þ0.000671C2
80.9843
Man
insolids
�118.739þ0.920677Tþ0.506054tþ
36.96629Sþ0.029624C�0.001674T2�0.002833Tt�
0.138TS�4.97941S2
90.9417
ALin
WS
�3.0099þ0.027314Tþ1.926562Sþ0.015614Cþ0.000056t2
10
0.8565
Glu
inWS
45.39307�0.238858T�0.182048t�
37.48341Sþ0.001079Ttþ
0.169667TSþ3.967278S2
11
0.8882
Xylin
WS
�292.159þ3.346597Tþ0.508627tþ
23.27865S�1.214107C�0.009797T2�0.003362Ttþ
0.007217TCþ0.002368tC
�7.178128S2�0.002726C2
12
0.9812
Man
inWS
�23.5586þ0.32709T�0.037549t�
4.736008S�0.090677C�0.001044T2þ0.025TSþ0.000561TCþ0.036417tS�0.000367C2
13
0.9871
Galin
WS
�7.49947þ0.08964Tþ0.015399tþ
0.714732S�0.043256C�0.000264T2�0.000108Ttþ
0.000211TCþ0.000086tC
�0.243036S2
14
0.9675
Ara
inWS
�3.20539þ0.042585Tþ0.009027tþ
0.028973S�0.018052C�0.000141T2�0.000054Ttþ
0.002333TSþ0.000106TC�0.140799S2
15
0.9777
Furin
WS
54.62532�0.586839T�0.159323t�
12.05638Sþ0.199876Cþ0.001652T2þ0.000971Ttþ
0.0519TS�0.001428TCþ0.00008t2�0.000229tC
þ1.258737S2þ
0.015827SCþ0.000287C2
16
0.9996
HMFin
WS
21.96658�0.2544T�0.048618t�
2.390281Sþ0.082767Cþ0.000732T2þ0.000292Ttþ
0.014667TS�0.000497TC
17
0.9862
aKL,Klasonlignin,AL,acid-solublelignin;WS,water-solublefraction;glu,glucose;xyl,xylose;man,mannose;gal,galactose;ara,arabinose;fur,furfural;HMF,hydroxymethylfurfural.
bT,cookingtemperature
(8C);t,time(m
in)atthecookingtemperature;S,sulfuricacid
(%,w/w
oven-dried
wood);C,ethanolconcentration(%
,v/v).
Pan et al.: Organosolv Fractionation for Bioconversion 859
Biotechnology and Bioengineering. DOI 10.1002/bit
catalyst dose, and ethanol concentration), the Xi, X2i , and
XiXj are terms describing linear, quadratic and two-variable
interaction effects, respectively, a0 is a constant and ai, aii,
and aij are linear, quadratic, and interaction coefficients,
respectively. The equations determined for each response
are listed in Table II (Equations 2–17).
These equations can be used to calculate the responses to
all combinations of variables within the range of the small
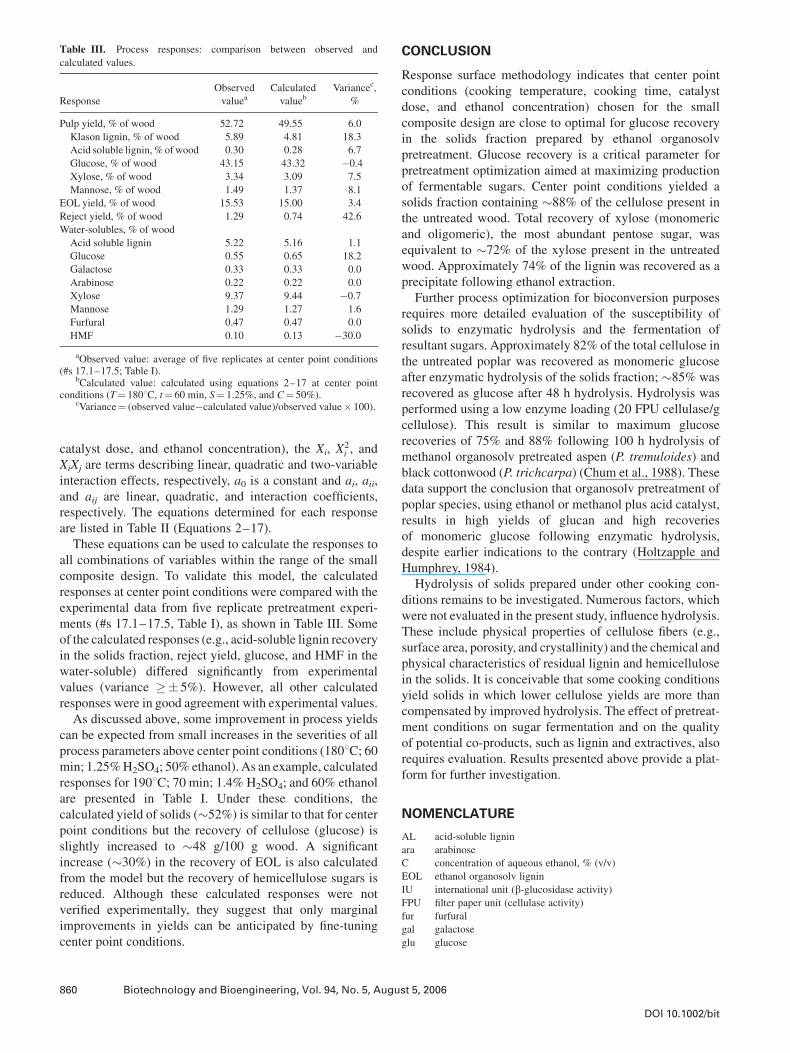
composite design. To validate this model, the calculated
responses at center point conditions were compared with the
experimental data from five replicate pretreatment experi-
ments (#s 17.1–17.5, Table I), as shown in Table III. Some
of the calculated responses (e.g., acid-soluble lignin recovery
in the solids fraction, reject yield, glucose, and HMF in the
water-soluble) differed significantly from experimental
values (variance �� 5%). However, all other calculated
responses were in good agreement with experimental values.
As discussed above, some improvement in process yields
can be expected from small increases in the severities of all
process parameters above center point conditions (1808C; 60min; 1.25%H2SO4; 50% ethanol). As an example, calculated
responses for 1908C; 70 min; 1.4% H2SO4; and 60% ethanol
are presented in Table I. Under these conditions, the
calculated yield of solids (�52%) is similar to that for center
point conditions but the recovery of cellulose (glucose) is
slightly increased to �48 g/100 g wood. A significant
increase (�30%) in the recovery of EOL is also calculated
from the model but the recovery of hemicellulose sugars is
reduced. Although these calculated responses were not
verified experimentally, they suggest that only marginal
improvements in yields can be anticipated by fine-tuning
center point conditions.
CONCLUSION
Response surface methodology indicates that center point
conditions (cooking temperature, cooking time, catalyst
dose, and ethanol concentration) chosen for the small
composite design are close to optimal for glucose recovery
in the solids fraction prepared by ethanol organosolv
pretreatment. Glucose recovery is a critical parameter for
pretreatment optimization aimed at maximizing production
of fermentable sugars. Center point conditions yielded a
solids fraction containing �88% of the cellulose present in
the untreated wood. Total recovery of xylose (monomeric
and oligomeric), the most abundant pentose sugar, was
equivalent to �72% of the xylose present in the untreated
wood. Approximately 74% of the lignin was recovered as a
precipitate following ethanol extraction.
Further process optimization for bioconversion purposes
requires more detailed evaluation of the susceptibility of
solids to enzymatic hydrolysis and the fermentation of
resultant sugars. Approximately 82% of the total cellulose in
the untreated poplar was recovered as monomeric glucose
after enzymatic hydrolysis of the solids fraction; �85% was
recovered as glucose after 48 h hydrolysis. Hydrolysis was
performed using a low enzyme loading (20 FPU cellulase/g
cellulose). This result is similar to maximum glucose
recoveries of 75% and 88% following 100 h hydrolysis of
methanol organosolv pretreated aspen (P. tremuloides) and
black cottonwood (P. trichcarpa) (Chum et al., 1988). These
data support the conclusion that organosolv pretreatment of
poplar species, using ethanol or methanol plus acid catalyst,
results in high yields of glucan and high recoveries
of monomeric glucose following enzymatic hydrolysis,
despite earlier indications to the contrary (Holtzapple and
Humphrey, 1984).
Hydrolysis of solids prepared under other cooking con-
ditions remains to be investigated. Numerous factors, which
were not evaluated in the present study, influence hydrolysis.
These include physical properties of cellulose fibers (e.g.,
surface area, porosity, and crystallinity) and the chemical and
physical characteristics of residual lignin and hemicellulose
in the solids. It is conceivable that some cooking conditions
yield solids in which lower cellulose yields are more than
compensated by improved hydrolysis. The effect of pretreat-
ment conditions on sugar fermentation and on the quality
of potential co-products, such as lignin and extractives, also
requires evaluation. Results presented above provide a plat-
form for further investigation.
NOMENCLATURE
AL acid-soluble lignin
ara arabinose
C concentration of aqueous ethanol, % (v/v)
EOL ethanol organosolv lignin
IU international unit (b-glucosidase activity)FPU filter paper unit (cellulase activity)
fur furfural
gal galactose
glu glucose
Table III. Process responses: comparison between observed and
calculated values.
Response
Observed
valueaCalculated
valuebVariancec,
%
Pulp yield, % of wood 52.72 49.55 6.0
Klason lignin, % of wood 5.89 4.81 18.3
Acid soluble lignin,% ofwood 0.30 0.28 6.7
Glucose, % of wood 43.15 43.32 �0.4
Xylose, % of wood 3.34 3.09 7.5
Mannose, % of wood 1.49 1.37 8.1
EOL yield, % of wood 15.53 15.00 3.4
Reject yield, % of wood 1.29 0.74 42.6
Water-solubles, % of wood
Acid soluble lignin 5.22 5.16 1.1
Glucose 0.55 0.65 18.2
Galactose 0.33 0.33 0.0
Arabinose 0.22 0.22 0.0
Xylose 9.37 9.44 �0.7
Mannose 1.29 1.27 1.6
Furfural 0.47 0.47 0.0
HMF 0.10 0.13 �30.0
aObserved value: average of five replicates at center point conditions(#s 17.1–17.5; Table I).
bCalculated value: calculated using equations 2–17 at center pointconditions (T¼ 1808C, t¼ 60 min, S¼ 1.25%, and C¼ 50%).
cVariance¼ (observed value�calculated value)/observed value� 100).
860 Biotechnology and Bioengineering, Vol. 94, No. 5, August 5, 2006
DOI 10.1002/bit
HMF hydroxymethylfurfural
KL Klason lignin
man mannose
S catalyst (concentrated sulfuric acid) dosage, % on wood chip (w/w)
t time at maximum temperature, min
T maximum temperature, 8CWS water-soluble fraction
xyl xylose
We thank Novozymes for providing enzyme samples.
References
Boocock DGB, Balatinecz JJ. 1992. Alcell lignin modification and use in
adhesives. Abstr Pap Am Chem Soc 203:106.
Bradford MM. 1976. Rapid and sensitive method for quantitation of
microgram quantities of protein utilizing principle of protein-dye
binding. Anal Biochem 72(1–2):248–254.
Cavaleri MA, Gilmore DW, Mozaffari M, Rosen CJ, Halbach TR. 2004.
Hybrid poplar and forest soil response to municipal and industrial
by-products. J Environ Qual 33:1055–1061.
Chum HL, Johnson DK, Black S, Baker J, Grohman K, Sarkanen KV,
Wallace K, Schroeder HA. 1988. Organosolv pretreatment for
enzymatic hydrolysis of poplars: 1. Enzyme hydrolysis of cellulosic
residues. Biotechnol Bioeng 31:643–649.
Dence CW. 1992. The determination of lignin. In: Lin SY, Dence CW,
editors. Methods in lignin chemistry. Berlin: Springer-Verlag. p 33–
61.
Diaz MJ, Alfaro A, Garcia MM, Engenio ME, Ariza J, Lopez F. 2004.
Ethanol pulping from tagasaste (Chamaecytisus proliferus L.F. ssp.
palmensis). A new promising source for cellulose pulp. Ind Eng Chem
Res 43(8):1875–1881.
Ghose TK. 1987. Measurement of cellulase activities. Pure Appl Chem
59:257–268.
Gilarranz MA, Oliet M, Rodriguez F, Tijero J. 1998. Ethanol-water pulping:
Cooking variables optimization. Can J Chem Eng 76(2):253–260.
Harris JF, Saeman JF, Locke EG. 1963.Wood as a chemical rawmaterial. In:
Browning BL, editor. The chemistry of wood. New York: Interscience
Publishers. p 535–585.
Hepditch MM, Thring RW. 1997. Alkaline cupric oxide and nitrobenzene
oxidation of Alcell1 lignin. Can J Chem Eng 75(6):1108–1114.
HoltzappleMT, Humphrey AE. 1984. The effect of organosolv pretreatment
on the enzymatic-hydrolysis of poplar. Biotechnol Bioeng 26(7):670–
676.
Jimenez L, Perez I, Garcia JC, Lopez F, Ariza J. 2004. The influence of the
ethanol pulping ofwheat strawand of the beating of pulp on the resulting
paper sheets. Wood Sci Technol 38(2):127–137.
Kamm B, Kamm M. 2004. Principles of biorefineries. Appl Microbiol
Biotechnol 64:137–145.
Kubo S, Kadla JF. 2004. Poly(ethylene oxide)/organosolv lignin blends:
Relationship between thermal properties, chemical structure, and blend
behavior. Macromolecules 37(18):6904–6911.
Kurabi A, Berlin A, Gilkes N, Kilburn D, Bura R, Robinson J, Markov A,
Gusakov A, Okunev O, Sinitsyn A, et al. 2005. Enzymatic hydrolysis of
steam-exploded and ethanol organosolv-pretreatedDouglas-fir by novel
and commercial fungal cellulases. Appl Biochem Biotechnol 121–124:
219–230.
Lehnen R, Saake B, Nimz HH. 2001. Furfural and hydroxymethylfurfural as
by-products of FORMACELL pulping. Holzforschung 55(2):199–204.
Liu Y, Carriero S, Pye K, Argyropoulos DS. 2000. A comparison of the
structural changes occurring in lignin during Alcell and kraft pulping of
hardwoods and softwoods. Lignin: historical, biological, and materials
perspectives. p 447–464.
Lora JH, Goyal GC, Raskin M. 1993. Characterization of residual lignins
after Alcell Pulping, Beijing. p 327–336.
Lynd LR, Wyman CE, Gerngross TU. 1999. Biocommodity enginering.
Biotechnol Progr 15:777–793.
Lynd LR, Weimer PJ, van Zyl WH, Pretorius IS. 2002. Microbial cellulose
utilization: Fundamentals and biotechnology. Microbiol Mol Biol Rev
66:506–577.
McDonough TJ. 1993. The chemistry of organosolv delignification. TAPPI J
76(8):186–193.
Mosier N,Wyman C, Dale B, Elander R, Lee YY, HoltzappleM, LadischM.
2005. Features of promising technologies for pretreatment of ligno-
cellulosic biomass. Bioresour Technol 96:673–686.
Myers RH,Montgomery DC. 2002. Response surfacemethodology: Process
and product optimization using designed experiments. New York:
J. Wiley. 798p.
Ni Y, HuQ. 1995. Alcell1 lignin solubility in ethanol-watermixtures. JAppl
Polym Sci 57(12):1441–1446.
Ni Y, van Heiningen ARP. 1996. Novel ozone bleaching of Alcell1 pulp.
Abstr Pap Am Chem Soc 211:117.
Ni Y, van Heiningen ARP. 1997. TCF bleaching for the Alcell1 process
including oxygen delignification. Pulp Pap Canada 98(11):38–41.
Pan XJ, Arato C, Gilkes N, Gregg D, Mabee W, Pye K, Xiao ZZ, Zhang X,
Saddler J. 2005. Biorefining of softwoods using ethanol organosolv
pulping: Preliminary evaluation of process streams for manufacture of
fuel-grade ethanol and co-products. Biotechnol Bioeng 90(4):473–481.
Pye EK, Lora JH. 1991. The Alcell process, a proven alternative to kraft
pulping. TAPPI J 74(3):113–118.
Sarkanen KV. 1990. Chemistry of solvent pulping. Tappi J 73(10):215–219.
Sjostrom E. 1992. Wood chemistry. Fundamentals and application. San
Diego: Academic Press, Inc. 230p.
Stockburger P. 1993. An overview of near-commercial and commercial
solvent-based pulping processes. Tappi J 76(6):71–74.
Thring RW, Vanderlaan MN, Griffin SL. 1997. Polyurethanes from Alcell1
lignin. Biomass Bioenerg 13(3):125–132.
Wenzl HFJ. 1970. The chemical technology of wood. New York: Academic
Press. 174p.
Williamson PN. 1988. Repap’s Alcell process—New demonstration facility
shows how pulpmills can be cheaper. Sven Papperstidn 91(7):21–23.
Wood TM, Bhat M. 1988. Methods for measuring cellulase activities. In:
Colowick SP, Kaplan NO, editors. Methods in enzymology, biomass
(part A, cellulose and hemicellulose), Vol. 160. New York: Academic
Press, Inc. p 87–112.
Wyman CE, Dale BE, Elander RT, Holtzapple M, Ladisch MR, Lee YY.
2005. Coordinated development of leading biomass pretreatment
technologies. Biores Technol 96(18):1959–1966.
Pan et al.: Organosolv Fractionation for Bioconversion 861
Biotechnology and Bioengineering. DOI 10.1002/bit