Biochemical processes for Balsamic-styled vinegar engineering
143
1 Biochemical processes for Balsamic-styled vinegar engineering by Ucrecia Faith Hutchinson Thesis submitted in fulfilment of the requirements for the degree Doctor of Engineering: Chemical Engineering In the Faculty of Engineering At the Cape Peninsula University of Technology Supervisors: Prof S.K.O. Ntwampe Dr N.P Jolly Dr H.W. du Plessis Cape Town December 2019 CPUT copyright information The thesis may not be published either in part (in scholarly, scientific or technical journals), or as a whole (as a monograph), unless permission has been obtained from the University
-
Upload
khangminh22 -
Category
Documents
-
view
0 -
download
0
Transcript of Biochemical processes for Balsamic-styled vinegar engineering

1
Biochemical processes for Balsamic-styled vinegar engineering
by
Ucrecia Faith Hutchinson
Thesis submitted in fulfilment of the requirements for the degree
Doctor of Engineering: Chemical Engineering
In the Faculty of Engineering
At the
Cape Peninsula University of Technology
Supervisors:
Prof S.K.O. Ntwampe
Dr N.P Jolly
Dr H.W. du Plessis
Cape Town
December 2019
CPUT copyright information
The thesis may not be published either in part (in scholarly, scientific or technical journals), or as a whole (as a monograph), unless permission has been obtained from the University
2
SUPERVISORS
Prof. Seteno Karabo O. Ntwampe; EngD; HDHET*, Chemical Engineering
HOD/Chair: Chemical Engineering, Cape Peninsula University of Technology, P.O. Box 1906
Bellville, 7535, South Africa
Principal Investigator: Bioresource Engineering Research Group (BioERG) Department of
Biotechnology and Consumer Science, Cape Peninsula University of Technology, P.O. Box 652, Cape
Town, 8000, South Africa
Dr Neil Paul Jolly (PhD Microbiology)
Senior researcher: Agricultural Research Council; Post-Harvest and Agro-Processing Technologies,
ARC Infruitec-Nietvoorbij (The Fruit, Vine and Wine Institute of the Agricultural Research Council),
Private Bag X5026, Stellenbosch, 7599, South Africa
Dr Heinrich Wilbur du Plessis (PhD Wine Biotechnology)
Researcher: Agricultural Research Council; Post-Harvest and Agro-Processing Technologies, ARC
Infruitec-Nietvoorbij (The Fruit, Vine and Wine Institute of the Agricultural Research Council), Private
Bag X5026, Stellenbosch, 7599, South Africa
3
DECLARATION
I, Ucrecia Faith Hutchinson, know the meaning of plagiarism and declare that all the work in this
thesis is my own unaided work, both in concept and execution, apart from the normal guidance of my
supervisors. Furthermore, the thesis represents my own opinions and not necessarily that of the
Agricultural Research Council or that of the Cape Peninsula University of Technology and their
sponsors. Furthermore, this thesis has not been submitted for any degree or examination in any other
university. The intellectual concepts, theories, methodologies and mathematical derivations and model
developments used in this thesis and published in various scientific journals were derived solely by the
candidate and first author of the published manuscripts. Where appropriate, the intellectual property of
others was acknowledged by using appropriate references.
23 December 2019
Signed Date
4
ABSTRACT
The South African wine industry is constantly facing several challenges which affect the quality of
wine, the local/global demand and consequently the revenue generated. These challenges include the
ongoing drought, bush fires, climate change and several liquor amendment bills aimed at reducing
alcohol consumption and alcohol outlets in South Africa. It is therefore critical for the wine industry to
expand and find alternative ways in which sub-standard or surplus wine grapes can be used to prevent
income losses and increase employment opportunities. Traditional Balsamic Vinegar (TBV) is a
geographically and legislative protected product produced only in a small region in Italy. However, the
methodology can be used to produce similar vinegars in other regions. Balsamic-styled vinegar (BSV),
as defined in this thesis, is a vinegar produced by partially following the methods of TBV while applying
process augmentation techniques. Balsamic-styled vinegar is proposed to be a suitable product of sub-
standard quality or surplus wine grapes in South Africa. However, the production of BSV necessitates
the use of cooked (high sugar) grape must which is a less favourable environment to the microorganisms
used during fermentation. Factors that negatively affect the survival of the microorganisms include low
water activity due to the cooking, high osmotic pressure and high acidity. To counteract these effects,
methods to improve the survival of the non-Saccharomyces yeasts and acetic acid bacteria used are
essential.
The primary aim of this study was to investigate several BSV process augmentation techniques such as,
aeration, agitation, cell immobilization, immobilized cell reusability and oxygen mass transfer kinetics
in order to improve the performance of the microbial consortium used during BSV production.
The work for this study was divided into four (4) phases. For all the phases a microbial consortium
consisting of non-Saccharomyces yeasts (n=5) and acetic acid bacteria (n=5) was used. Inoculation of
the yeast and bacteria occurred simultaneously. The 1st phase of the study entailed evaluating the effect
of cells immobilized by gel entrapment in Ca-alginate beads alongside with free-floating cells (FFC)
during the production of BSV. Two Ca-alginate bead sizes were tested i.e. small (4.5 mm) and large
(8.5 mm) beads to evaluate the effects of surface area or bead size on the overall acetification rates. Ca-
alginate beads and FFC fermentations were also evaluated under static and agitated (135 rpm)
conditions. The 2nd phase of the study involved studying the cell adsorption technique for cell
immobilization which was carried-out using corncobs (CC) and oak wood chips (OWC), while
comparing to FFC fermentations. At this phase of the study, other vinegar bioreactor parameters such
as agitation and aeration were studied in contrast to static fermentations. One agitation setting (135 rpm)
and two aeration settings were tested i.e. high (0.3 vvm min−1) and low (0.15 vvm min−1) aeration
conditions. Furthermore, to assess the variations in cell adsorption capabilities among individual yeast
5
and AAB cells, the quantification of cells adsorbed on CC and OWC prior- and post-fermentation was
conducted using the dry cell weight method.
The 3rd phase of the study entailed evaluating the reusability abilities of all the matrices (small Ca-
alginate beads, CC and OWC) for successive fermentations. The immobilized cells were evaluated for
reusability on two cycles of fermentation under static conditions. Furthermore, the matrices used for
cell immobilization were further analysed for structure integrity by scanning electron microscopy
(SEM) before and after the 1st cycle of fermentations. The 3rd phase of the study also involved the
sensorial (aroma and taste) evaluations of the BSV’s obtained from the 1st cycle of fermentation in order
to understand the sensorial effects of the Ca-alginate beads, CC and OWC on the final BSV. The 4th
phase of the study investigated oxygen mass transfer kinetics during non-aerated and aerated BSV
fermentation. The dynamic method was used to generate several dissolved oxygen profiles at different
stages of the fermentation. Consequently, the data obtained from the dynamic method was used to
compute several oxygen mass transfer parameters, these include oxygen uptake rate ( 𝑟𝑟𝑂𝑂2 ), the
stoichiometric coefficient of oxygen consumption vs acid yield (𝑌𝑌𝑂𝑂/𝐴𝐴), the oxygen transfer rate (𝑁𝑁𝑂𝑂2),
and the volumetric mass transfer coefficients (𝐾𝐾𝐿𝐿𝑎𝑎). During all the phases of the study samples were
extracted on weekly intervals to evaluate pH, sugar, salinity, alcohol and total acidity using several
analytical instruments. The 4th phase of the study involved additional analytical tools, i.e. an oxygen
µsensor to evaluate dissolved oxygen and the ‘Speedy breedy’ to measure the respiratory activity of the
microbial consortium used during fermentation.
The data obtained from the 1st phase of the study demonstrated that smaller Ca-alginate beads resulted
in higher (4.0 g L-1 day−1) acetification rates compared to larger (3.0 g L-1 day−1) beads, while freely
suspended cells resulted in the lowest (0.6 g L-1 day−1) acetification rates. The results showed that the
surface area of the beads had a substantial impact on the acetification rates when gel entrapped cells
were used for BSV fermentation. The 2nd phase results showed high acetification rates (2.7 g L-1 day−1)
for cells immobilized on CC in contrast to cells immobilized on OWC and FFC, which resulted in
similar and lower acetification rates. Agitated fermentations were unsuccessful for all the treatments
(CC, OWC and FFC) studied. Agitation was therefore assumed to have promoted cell shear stress
causing insufficient acetification during fermentations. Low aerated fermentations resulted in better
acetification rates between 1.45–1.56 g L-1 day−1 for CC, OWC and FFC. At a higher aeration setting,
only free-floating cells were able to complete fermentations with an acetification rate of 1.2 g L-1 day−1.
Furthermore, the adsorption competence data showed successful adsorption on CC and OWC for both
yeasts and AAB with variations in adsorption efficiencies, whereby OWC displayed a lower cell
adsorption capability compared to CC. On the other hand, OWC were less efficient adsorbents due to
their smooth surface, while the rough surface and porosity of CC led to improved adsorption and,
therefore, enhanced acetification rates.
6
The 3rd phase results showed a substantial decline in acetification rates on the 2nd cycle of fermentations
when cells immobilized on CC and OWC were reused. While cells entrapped in Ca-alginate beads were
able to complete the 2nd cycle of fermentations at reduced acetification rates compared to the 1st cycle
of fermentations. The sensory results showed positive ratings for BSV’s produced using cells
immobilized in Ca-alginate beads and CC. However, BSV’s produced using OWC treatments were
neither ‘liked nor disliked’ by the judges. The SEM imaging results further showed a substantial loss
of structural integrity for Ca-alginate beads after the 1st cycle fermentations, with minor changes in
structural integrity of CC being observed after the 1st cycle fermentations. OWC displayed the same
morphological structure before and after the 1st cycle fermentations which was attributed to their
robustness. Although Ca-alginate beads showed a loss in structural integrity, it was still assumed that
Ca-alginate beads provided better protection against the harsh environmental conditions in contrast to
CC and OWC adsorbents due to the acetification rates obtained on both cycles. The 4th phase data
obtained from the computations showed that non-aerated fermentations had a higher 𝑌𝑌𝑂𝑂/𝐴𝐴, 𝑟𝑟𝑂𝑂2, 𝑁𝑁𝑂𝑂2 and
a higher 𝐾𝐾𝐿𝐿𝑎𝑎 . It was clear that aerated fermentations had a lower aeration capacity due to an
inappropriate aeration system design and an inappropriate fermentor. Consequently, aeration led to
several detrimental biochemical changes in the fermentation medium thus affecting 𝐾𝐾𝐿𝐿𝑎𝑎 and several
oxygen mass transfer parameters which serve as a driving force.
Overall, it was concluded that the best method for BSV production is the use of cells entrapped in small
alginate beads or cells adsorbed on CC under static and non-aerated fermentations. This conclusion was
based on several factors such as cell affinity/cell protection, acetification rates, fermentation period and
sensorial contributions. However, cells entrapped in Ca-alginate beads had the highest acetification
rates. The oxygen mass transfer computations demonstrated a high 𝐾𝐾𝐿𝐿𝑎𝑎 when Ca-alginate beads were
used under static-non-aerated conditions compared to fermentations treated with CC. Therefore, a
fermentor with a high aeration capacity needs to be designed to best suit the two BSV production
systems (Ca-alginate beads and CC). It is also crucial to develop methods which can increase the
robustness of Ca-alginate beads in order to improve cell retention and reduce the loss of structural
integrity for subsequent cycles of fermentation. Studies to define parameters used for upscaling the BSV
production process for large scale productions are also crucial.
Keywords: Aeration, Acetification rates, Adsorbed cells, Agitation, Balsamic styled vinegar (BSV),
Ca-alginate beads, Cell immobilization, Corncobs (CC), Entrapped cells, Oak Wood Chips (OWC),
Oxygen mass transfer.

7
DEDICATION
I dedicate this thesis to my parents who have in many ways defined what it means to love, to be patient and
to be supportive.

8
“Pain is temporary. Eventually it will subside. If I quit,
however, the surrender stays with me.”
9
ACKNOWLEDGEMENTS
It is with immense gratitude that I acknowledge the support of the following institutions and people for
their contribution towards the completion of my Doctor of Engineering degree:
• My supervisors – Associate Professor Seteno Karabo O. Ntwampe and Dr. Neil P. Jolly for their exceptional supervision, leadership, research guidance and for permitting me the opportunity to conduct this investigation under their supervision.
• Dr. Heinrich du Plessis for his dedicated co-supervision and technical advice.
• The Agricultural Research Council for providing all the necessary infrastructure and funding.
• The Department of Chemical Engineering, the Bioresource Engineering Research Group (BioERG) and the Department of Biotechnology at the Cape Peninsula University of Technology.
• Special thanks to all the ARC colleagues, students and interns for providing the best atmosphere to work under.
• Special thanks to the work integrated learning students, Sivuyile Gqozo and Crishe Saulse; thank you for your immeasurable technical assistance.
• To my family and friends, thank you for your support, unconditional love and for understanding my passion. I always had people to encourage me to keep going. Words are simply not enough, to articulate my gratitude.
• And last but not least, I acknowledge the almighty God for always being present and for providing me with strength, guidance, faith, patience and wisdom throughout the course of my PhD.
U.F Hutchinson
December. 2019
10
RESEARCH OUTPUTS The following research outputs represent the contributions by the candidate to scientific knowledge and
development during her doctoral candidacy (2017-2019):
Published
Hutchinson, U.F.; Ntwampe, S.K.O.; Ngongang, M.M.; Du Plessis, H.W.; Chidi, B.S.; Saulse, C.;
and Jolly, N.P, 2018. Cell immobilization by Gel Entrapment in Ca-alginate Beads for
Balsamic-styled Vinegar Production. In Proceedings of the 10th International Conference on
Advances in Science, Engineering, Technology & Healthcare (ASETH-18), Cape Town, South
Africa, 19–20 November 2018. ISBN - 978-81-938365-2-1,
https://doi.org/10.17758/EARES4.EAP1118214
Hutchinson, U.F., Jolly, N.P., Chidi, B.S., Ngongang, M.M. and Ntwampe, S.K.O., 2019. Vinegar
Engineering: a Bioprocess Perspective. Food Engineering Reviews, pp.1-16. (Impact Factor:
4.217)
Hutchinson, U.F., Gqozo, S., Jolly, N.P., Chidi, B.S., Du Plessis, H.W., Mewa-Ngongang, M. and
Ntwampe, S.K., 2019. Aeration, Agitation and Cell Immobilization on Corncobs and Oak
Wood Chips Effects on Balsamic-Styled Vinegar Production. Foods, 8(8), p.303. (Impact
Factor 3.011)
Drafted for publication
Hutchinson, U.F., Ntwampe, S.K.O., Chidi, B.S., Mewa Ngongang, M., du Plessis, H.W. and Jolly,
N.P., 2020. Reusability and sensory effects of immobilized cells for subsequent balsamic-styled vinegar
fermentations.
Hutchinson, U.F., Jolly, N.P., Chidi, B.S., Mewa Ngongang, M., du Plessis, H.W. and Ntwampe,
S.K.O., 2020. Oxygen mass transfer kinetics during balsamic styled vinegar production.

11
LAYOUT OF THESIS
The research work presented in this thesis was conducted at the Agricultural Research Council,
Infruitec-Nietvoorbij (Fruit, Wine and Vine Institute) Stellenbosch, Western Cape, South Africa. The
thesis is presented as a compilation of 9 (nine) chapters, with each chapter being introduced separately.
The CPUT Harvard method of referencing was used and all references are listed at the end of the thesis.
The thesis chapters are as follows:
● Chapter 1: This chapter covers the general introduction, which includes the background of the
research topic, the problem statement, the motivation for conducting the study, the hypothesis,
research questions and the delineation of the study.
● Chapter 2: This chapter is a review of biochemical vinegar engineering methods that can be
applied in several vinegar production systems. This chapter also highlights the gaps in vinegar
engineering applications.
● Chapter 3: This chapter reports on the materials and experimental methods which were
employed in order to achieve the objectives of this study.
● Chapter 4: This chapter focuses on the effects of using cells immobilized by the entrapment
technique in Ca-alginate beads for BSV production.
● Chapter 5: This chapter reports on the effects of using the adsorption technique for BSV
production by using corncobs and oak wood chips. This chapter also covers the effects of
agitation and aeration during BSV production.
● Chapter 6: This chapter reports on the reusability capabilities of cells immobilized using Ca-
alginate beads, corncobs and oak wood chips for successive cycles of fermentation. The effects
of the cell immobilization matrices on the sensorial attributes of the BSV are also given
● Chapter 7: This chapter is centred around the oxygen mass transfer kinetics during BSV
production.
● Chapter 8: An overall summary of the study and future research recommendations are found
in this chapter.
● Chapter 9: This chapter provides a list of all literature consulted in this study.

12
TABLE OF CONTENTS
DECLARATION .................................................................................................................................................... 3
ABSTRACT ........................................................................................................................................................... 4
DEDICATION ....................................................................................................................................................... 7
ACKNOWLEDGEMENTS .................................................................................................................................... 9
RESEARCH OUTPUTS ...................................................................................................................................... 10
LAYOUT OF THESIS ......................................................................................................................................... 11
TABLE OF CONTENTS ..................................................................................................................................... 12
LIST OF FIGURES .............................................................................................................................................. 16
LIST OF TABLES................................................................................................................................................ 18
LIST OF EQUATIONS ........................................................................................................................................ 19
GLOSSARY ......................................................................................................................................................... 20
1 CHAPTER 1 ................................................................................................................................................ 23
GENERAL INTRODUCTION ............................................................................................................................ 23
1.1 Introduction ......................................................................................................................................... 23
1.2 Problem statement. .............................................................................................................................. 25
1.3 Hypothesis ........................................................................................................................................... 25
1.4 Research questions .............................................................................................................................. 25
1.5 Aims and objectives ............................................................................................................................ 26
1.6 Delineation of the study ...................................................................................................................... 27
1.7 Significance of the research ................................................................................................................ 27
1.8 Outcomes, results and contributions to research ................................................................................. 27
2 CHAPTER 2 ................................................................................................................................................ 30
LITERATURE REVIEW ..................................................................................................................................... 30
2.1 Introduction ................................................................................................................................................ 30
2.2 Vinegar engineering: patents and future outlooks ............................................................................... 33
2.3 Vinegar engineering and bioreactors ................................................................................................... 35
2.3.1 Bioreactors: importance and general overview .......................................................................... 35
2.4 Desired features in bioreactors ............................................................................................................ 35
2.4.1 Bioreactor design and configurations ......................................................................................... 36
2.4.2 Overall remarks on bioreactor design for vinegar production .................................................... 41
2.5 Immobilized versus free-floating cells for vinegar fermentation ........................................................ 42
2.5.1 The importance of immobilized cell systems ............................................................................. 42
2.5.2 The choice of a support material: important factors to consider ................................................ 42
2.5.3 Cell immobilization: comparative analysis ................................................................................ 43
2.5.4 Overall remarks on cell immobilization ..................................................................................... 48
2.6 Aeration during vinegar production .................................................................................................... 48
2.6.1 Importance of aeration during vinegar production ..................................................................... 48

13
2.6.2 Influence of volumetric mass transfer coefficient (kLa) ............................................................. 49
2.6.3 Aeration: comparative studies .................................................................................................... 50
2.7 Mathematical computations used for assessing vinegar engineering .................................................. 51
2.8 Summary ............................................................................................................................................. 55
3 CHAPTER 3 ................................................................................................................................................ 58
MATERIALS AND METHODS ......................................................................................................................... 58
3.1 Experimental methods for all phases................................................................................................... 58
3.1.1 Preparation of fermentation medium .......................................................................................... 58
3.1.2 Pre-culture preparation ............................................................................................................... 58
3.2 Phase 1-Chapter 4 methods: Cell immobilization by Gel Entrapment in Ca-alginate Beads for Balsamic-styled Vinegar Production ................................................................................................................ 60
3.2.1 Calcium alginate infused YPD and GM preparation .................................................................. 60
3.2.2 Cell immobilization: Small vs Large beads ................................................................................ 60
3.2.3 Inoculation .................................................................................................................................. 60
3.3 Phase 2-Chapter 5 methods: Aeration, Agitation and Cell Immobilization on Corncobs and Oak Wood Chips Effects on Balsamic-Styled Vinegar Production ......................................................................... 61
3.3.1 Sterilization of Corncobs and Oak Wood Chips ......................................................................... 61
3.3.2 Cell Immobilization on Corncobs and Oak Wood Chips ........................................................... 62
3.3.3 Quantification of Cells Adsorbed on Corncobs and Oak Wood Chips Prior- and Post-Fermentation ................................................................................................................................................ 62
3.3.4 Inoculation .................................................................................................................................. 63
3.3.4.1 Static vs. Agitated Fermentations .......................................................................................... 63
3.3.5 Effect of Aeration ....................................................................................................................... 63
3.4 Phase 3-Chapter 6 methods: Reusability and sensory effects of immobilized cells for subsequent balsamic-styled vinegar fermentations ............................................................................................................. 63
3.4.1 Calcium alginate infused YPD and GM preparation .................................................................. 63
3.4.2 Cell immobilization: gel entrapment .......................................................................................... 63
3.4.3 Cell adsorption on corn cobs and oak wood chips...................................................................... 64
3.4.4 Inoculation procedures ............................................................................................................... 64
3.4.4.1 Ca-alginate beads inoculation ................................................................................................ 64
3.4.4.2 Corncobs and oak wood chips inoculation ............................................................................. 64
3.4.5 Second cycle fermentations ........................................................................................................ 65
3.4.5.1 Ca-alginate beads ................................................................................................................... 65
3.4.5.2 Corncobs and oak wood chips................................................................................................ 65
3.4.6 Evaluation of the integrity of the immobilization matrices ........................................................ 65
3.4.7 Sensory evaluations .................................................................................................................... 65
3.5 Phase 4-Chapter 7 methods: Oxygen mass transfer kinetics during Balsamic-styled vinegar production production ...................................................................................................................................... 66
3.5.1 Bioreactor description and fermentation set up .......................................................................... 66
3.5.2 Dissolved oxygen and microbial respiration rate quantification ................................................ 66
3.5.3 Quantifying microbial respiration using the Speedy Breedy ...................................................... 67
14
3.6 Phase 1, 2, 3 & 4 ................................................................................................................................. 67
3.6.1 Batch fermentation setup and sampling ...................................................................................... 67
3.6.2 Data Handling............................................................................................................................. 67
4 CHAPTER 4 ................................................................................................................................................ 70
Cell immobilization by Gel Entrapment in Ca-alginate Beads for Balsamic-styled Vinegar Production ............ 70
4.1 Introduction ......................................................................................................................................... 70
4.2 Objectives............................................................................................................................................ 70
4.3 Materials and methods ........................................................................................................................ 71
4.4 Results and Discussion ........................................................................................................................ 71
4.4.1 Still vs agitated fermentation kinetics ........................................................................................ 71
4.4.2 Immobilized vs free floating cell fermentation kinetics ............................................................. 74
4.5 Summary ............................................................................................................................................. 74
5 CHAPTER 5 ................................................................................................................................................ 77
Aeration, Agitation and Cell Immobilization on Corncobs and Oak Wood Chips Effects on Balsamic-Styled Vinegar Production ............................................................................................................................................... 77
5.1 Introduction ......................................................................................................................................... 77
5.2 Objectives............................................................................................................................................ 78
5.3 Materials and methods ........................................................................................................................ 78
5.4 Results and discussion......................................................................................................................... 78
5.4.1 Non-Aerated Fermentations ....................................................................................................... 78
5.4.1.1 Static vs. Agitated Fermentations .......................................................................................... 78
5.4.1.2 Effect of the Adsorbents Used ............................................................................................... 81
5.4.2 Aerated Fermentations................................................................................................................ 83
5.4.2.1 Effect of Aeration Rates ......................................................................................................... 83
5.4.2.2 Performance of Adsorbents Used Under Aerated Conditions ................................................ 85
5.4.3 Variations in Cell Adsorption Capabilities among the Yeast/Bacterial Species Used ............... 86
5.4.3.1 Individual Yeast Adsorption on Corncobs and Oak Wood Chips .......................................... 86
5.4.3.2 Individual Bacteria Adsorption on Corncobs and Oak Wood Chips ...................................... 87
5.5 Summary ............................................................................................................................................. 89
6 CHAPTER 6 ................................................................................................................................................ 91
Reusability and sensory effects of immobilized cells for subsequent balsamic-styled vinegar fermentations ..... 91
6.1 Introduction ......................................................................................................................................... 91
6.2 Objectives............................................................................................................................................ 92
6.3 Materials and methods ........................................................................................................................ 93
6.4 Results and discussion......................................................................................................................... 93
6.4.1 Comparative analyses of sugar consumption rates for 1st and 2nd cycle BSV fermentations...... 93
6.4.1.1 1st cycle fermentations............................................................................................................ 93
6.4.1.2 2nd cycle fermentations ........................................................................................................... 93
6.4.2 Comparative analyses of acetification rates for 1st and 2nd cycle BSV fermentations ................ 94
6.4.2.1 1st cycle fermentations............................................................................................................ 94
15
6.4.2.2 2nd cycle fermentations ........................................................................................................... 94
6.4.3 Structural morphology of cell immobilization matrices before and after BSV fermentation ..... 96
6.4.3.1 Ca-alginate beads ................................................................................................................... 96
6.4.3.2 Oak wood chips ...................................................................................................................... 98
6.4.3.3 Corncobs ................................................................................................................................ 99
6.4.4 Sensory attributes of the BSV’s compared to commercial BSV’s............................................ 102
6.5 Summary ........................................................................................................................................... 105
7 CHAPTER 7 .............................................................................................................................................. 107
Oxygen mass transfer kinetics during Balsamic-styled vinegar production ....................................................... 107
7.1 Introduction ....................................................................................................................................... 107
7.2 Objectives.......................................................................................................................................... 109
7.3 Materials and methods ...................................................................................................................... 109
7.3.1 Determination of oxygen mass transfer parameters and mathematical computations .............. 110
7.3.1.1 Determining the oxygen uptake rate .................................................................................... 110
7.3.1.2 Determining the stoichiometric coefficient of oxygen consumption vs acid yield .............. 110
7.3.1.3 Determining the oxygen mass transfer coefficient and oxygen transfer rate ....................... 110
7.4 Results and Discussion ...................................................................................................................... 111
7.4.1 Chemical developments during non-aerated and aerated BSV fermentations. ......................... 111
7.4.2 Oxygen mass transfer kinetics .................................................................................................. 114
7.4.2.1 Oxygen uptake rates ............................................................................................................. 114
7.4.2.2 The relationship between oxygen uptake rate and acetification rates during BSV production 115
7.4.2.3 Stoichiometric coefficient of oxygen consumption .............................................................. 117
7.4.2.4 Volumetric mass transfer coefficient ................................................................................... 118
7.4.2.5 Dissolved oxygen and salinity changes during BSV fermentation ...................................... 120
7.4.2.6 Respiratory activity of free-floating cells during BSV fermentation ................................... 121
7.4.3 Theoretical reasons for the slow acetification rates during aerated BSV fermentations .......... 123
7.5 Summary ........................................................................................................................................... 125
8 CHAPTER 8 .............................................................................................................................................. 127
GENERAL DISCUSSION, SUMMARY AND CONCLUSION ...................................................................... 127
8.1 General discussion, summary and conclusions ................................................................................. 127
8.2 Recommendations for future work .................................................................................................... 130
9 CHAPTER 9 .............................................................................................................................................. 132
REFERENCES ................................................................................................................................................... 132
16
LIST OF FIGURES
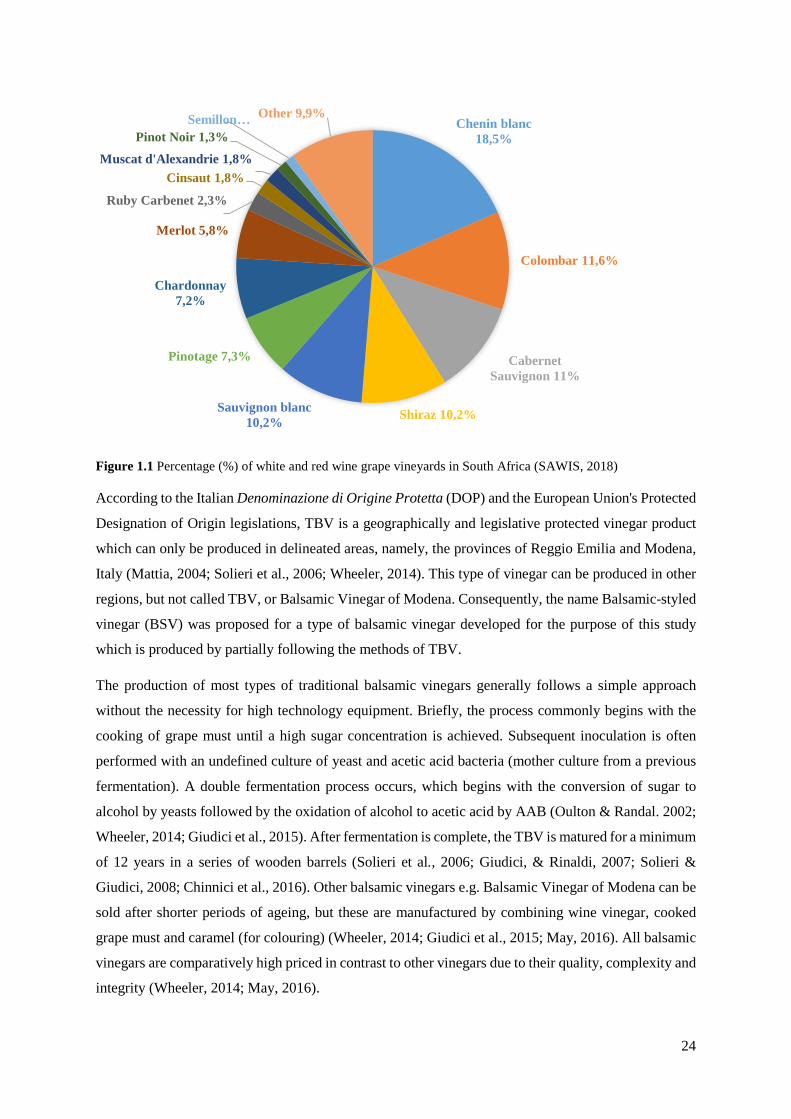
Figure 1.1 Percentage (%) of white and red wine grape vineyards in South Africa (SAWIS, 2018) .. 24
Figure 2.2 Global shares of various vinegars published by the Vinegar Institute in 2005. Adapted from https://versatilevinegar.org/market-trends/. .......................................................................................... 33
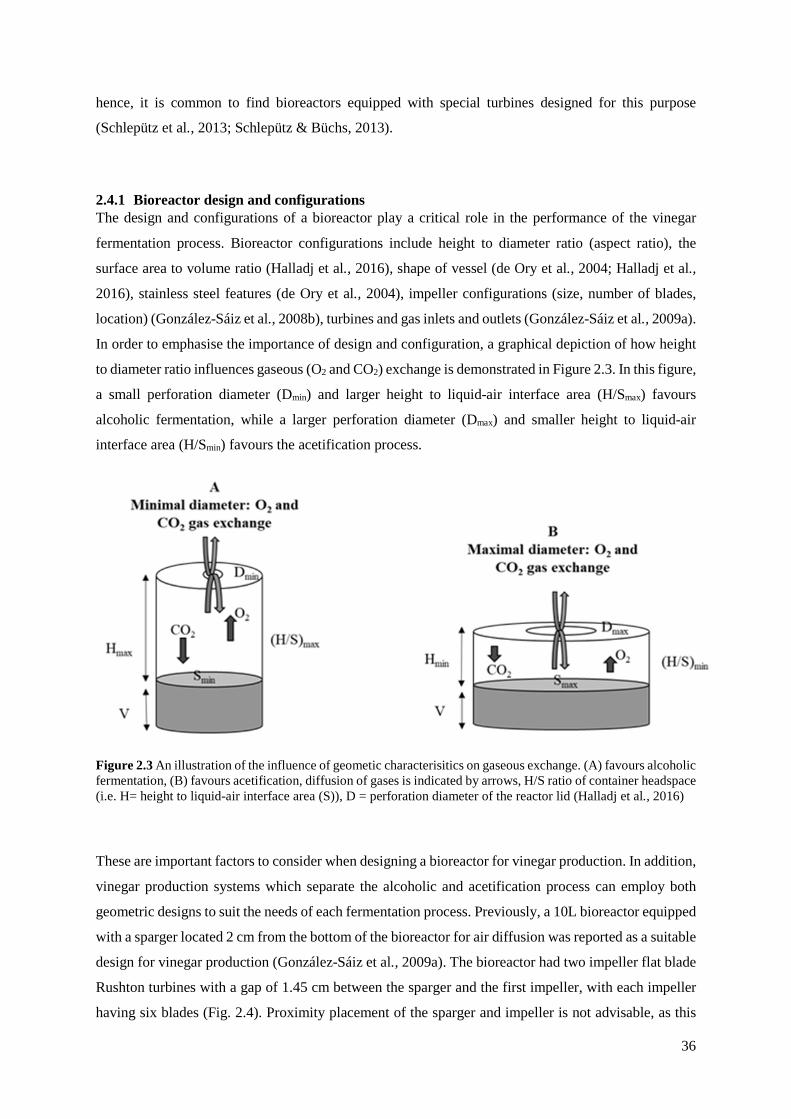
Figure 2.3 An illustration of the influence of geometic characterisitics on gaseous exchange. (A) favours alcoholic fermentation, (B) favours acetification, diffusion of gases is indicated by arrows, H/S ratio of container headspace (i.e. H= height to liquid-air interface area (S)), D = perforation diameter of the reactor lid (Halladj et al., 2016) ...................................................................................................... 36
Figure 2.4 Reproduced scaled-up fermentor design. (1) air outlet and pressure valve; (2) inlet port; (3) sampling port; (4) air inlet; (5) outlet port (González-Sáiz et al., 2009a). ............................................ 37
Figure 2.5 Reprodced charcoal pellet bioreactor (1) medium resevior; (2) peristaltic pump; (3) packed bed bioreactor; (4) broth resevior; (5) water bath (Horiuchi et al., 2000b). .......................................... 38
Figure 2.6 Reproduced continuous onion vinegar bioreactor design, (1) medium reservoir; (2) peristaltic pump; (3) jar fermentor; (4) onion alcohol broth reservoir; (5) charcoal pellet bioreactor ;(6) vinegar broth reservoir (Horiuchi et al., 2000a). ................................................................................... 38
Figure 2.7 Reproduced industrial acetifier (1) reactor, (2) gas recycling pump, (3) expansion tank, (4) air diffusors, (5) heat exchanger, (6) thermostatic bath, (7) oxygen cylinder, (8) electro valve, (9) dissolved oxygen sensor, (10) feed inlet and effluent outlet pump. de Ory et al., (1999) as reported in de Ory et al., (2004). ............................................................................................................................. 39
Figure 2.8 Cell immobilization materials used in vinegar studies. Fig. 2.8A cited from Krusong et al. (2010) .................................................................................................................................................... 43
Figure 3.1 (A) Large beads (8.5 mm) in calcium chloride solution, (B) Small beads (4.5 mm) on a sterile strainer. ....................................................................................................................................... 60
Figure 3.2 Balsamic-styled vinegar fermentations using cooked Chenin blanc grape must. (A) Small and (B) large calcium alginate beads with entrapped yeast and AAB cells, (C) free-floating cell fermentations......................................................................................................................................... 61
Figure 3.3 Corncobs and oak wood chips used in the study, (A) corncobs after autoclaving (B) oak wood chips in cooked grape must. ........................................................................................................ 62
Figure 4.1 Sugar consumption, alcohol and total acid production during the BSV fermentation process. Values are the means of three fermentations. ....................................................................................... 72
Figure 4.2 External surface photographs of agitated and non-agitated Ca-alginate beads after fermentation. (A) Agitated bead at 100x magnification (B), non-agitated bead at 100x magnification, (C), agitated bead at 400x magnification (D), non-agitated bead at 400x magnification. .................... 74
Figure 5.1 Chemical developments under static (A–C) and agitated (D–F) conditions. Sugar (A, D), alcohol (B, E) and total acid (C ,F) developments during fermentation. Oak wood chips, Corncobs, Free-floating cells. Results are the average of three biological repeats accounting for standard deviation. ................................................................................................................................ 81
Figure 5.2 Chemical developments under low (A–C) and high (D–F) aeration. Sugar (A, D), alcohol (B, E) and total acid (C, F) developments during fermentation. Oak wood chips, Corncobs, Free-floating cells. Results are the average of three biological repeats ± standard deviation. ............................................................................................................................................... 85

17
Figure 6.1: Sugar consumption rates for two cycles BSV fermentation using recycled immobilized cells .............................................................................................................................................................. 94
Figure 6. 2: Acetification rates for two cycles BSV fermentation using recycled immobilized cells . 95
Figure 6.3: Scanning electron micrograph pictures of Ca-alginate beads before and after 1st cycle fermentations at several magnifications ie. 1000X (A, B), 5000X (C, D) and 10 000X (E, F). ........... 98
Figure 6.4: Scanning electron micrograph pictures of oak wood chips before and after 1st cycle fermentations at two magnifications ie. 1000X (A, B) and 5000X (C, D). .......................................... 99
Figure 6.5: An image showing the structure of a corncob. ................................................................ 100
Figure 6.6: Scanning electron micrograph pictures of corncobs before and after 1st cycle fermentations at several magnifications. .................................................................................................................... 101
Figure 6.7: Sensory evaluation data for BSV and commercial balsamic vinegars. A) Visual, B) Flavours, C) Acid-sugar balance, D) consumer acceptance/liking rating. All BSV samples were shaded purple (CC: corncobs, OWC: oak wood chips, B: beads), with one wine vinegar being shaded light blue (1W: wine vinegar ............................................................................................................................... 104
Figure 7.1: A diagrammatic description of the oxygen mass transfer process between the gaseous to liquid phase during BSV production ................................................................................................... 109
Figure 7.2: Sugar consumption and total acid formation during BSV fermentation under aerated and non-aerated conditions. Corncobs, Ca-alginate beads. ............................................... 113
Figure 7.3: Oxygen uptake rate during BSV fermentation under aerated and non-aerated conditions. Corncobs, Ca-alginate beads. ..................................................................................... 114
Figure 7.5: Graphical depiction of the determination of the stoichiometric coefficient of oxygen consumption vs acid yield ( 𝒀𝒀𝒀𝒀/𝑨𝑨 ) i.e. oxygen consumption rate over acetification rate for all fermentation treatments. ..................................................................................................................... 118
Figure 7.6: Volumetric mass transfer changes during BSV fermentation. Corncobs, Ca-alginate beads. ..................................................................................................................................... 119
Figure 7.7: Dissolved oxygen and salinity changes during BSV fermentation under aerated and non-aerated conditions. Corncobs, Ca-alginate beads. ...................................................... 120
Figure 7.8: Respiratory activity between day 0 to 4 when using FFC for BSV production. BSV, Temperature ............................................................................................................. 122
Figure 7.9: Respiratory activity between day 5 to 10 when using FFC for BSV production. . BSV, Temperature ............................................................................................................. 122
Figure 7.10: Respiratory activity between day 11 to 15 when using FFC for BSV production. . BSV, Temperature ............................................................................................................. 123
18
LIST OF TABLES Table 2.1: Vinegar production patents .................................................................................................. 34
Table 2.2: Bioreactor application studies in vinegar production .......................................................... 39
Table 2.3: Cell immobilization studies for vinegar production ............................................................ 46
Table 2.4: Effect of varying Po2 on acetification rate (adapted from Ghommidh et al., 1982) ............ 50
Table 2.5: Impact of aeration in vinegar production: comparative analysis ......................................... 51
Table 2.6: Studies entailing mathematical computations in vinegar engineering ................................. 54
Table 3.1 Fermentation working volumes used for each phase of the study. ....................................... 58
Table 3.2. Non-Saccharomyces yeast used in the study. ...................................................................... 59
Table 3.3. Acetic acid bacteria used in the study. ................................................................................. 59
Table 3.4. YPD and GM broth volumes used for inoculum preperation for each phase of the study .. 59
Table 3.5. Size of corncobs and oak wood chips used in the study. ..................................................... 61
Table 3.6: Details of the quantity of matrices used per 350 mL of fermentation medium ................... 64
Table 5.1. A comparison of the performance of immobilized cells in other studies. ........................... 83
Table 5.2. Evaluation of yeast cells adsorbed on corncobs and oak wood chips. ................................. 88
Table 5.3. Evaluation of bacterial cells adsorbed on corncobs and oak wood chips. ........................... 88
Table 6.1: Cell immobilization matrices used in the study and their sale price .................................... 96
Table 6.2: fermentation period for both cycles of fermentation. .......................................................... 96
Table 7.1: Substrate consumption and sugar consumption rates for aerated and non-aerated
fermentations....................................................................................................................................... 112
Table 7.2: Alcohol and total acid changes after respiratory activity monitoring in the Speedy Breedy
............................................................................................................................................................ 123
Table 7.3: Acetification rates at the first 5 days of the BSV fermentation process ............................ 125

19
LIST OF EQUATIONS 𝑟𝑟𝑠𝑠 =
𝑑𝑑𝑑𝑑𝑑𝑑𝑑𝑑
3.1
𝑟𝑟𝑝𝑝 =𝑑𝑑𝑑𝑑𝑑𝑑𝑑𝑑
3.2
Absolute difference = Amount of increase − Reference amount 3.3
Relative difference =Absolute differenceReference amount
× 100 3.4
𝐶𝐶6𝐻𝐻12𝑂𝑂6 → 𝐶𝐶2𝐻𝐻5𝑂𝑂𝐻𝐻 → 𝐶𝐶𝐻𝐻3𝐶𝐶𝑂𝑂𝑂𝑂𝐻𝐻 7.1
𝐶𝐶6𝐻𝐻12𝑂𝑂6 → 𝐶𝐶2𝐻𝐻5𝑂𝑂𝐻𝐻 + 2 𝐶𝐶𝑂𝑂2 7.2
𝐶𝐶2𝐻𝐻5𝑂𝑂𝐻𝐻 + 𝑂𝑂2 → 𝐶𝐶𝐻𝐻3𝐶𝐶𝑂𝑂𝑂𝑂𝐻𝐻 + 2𝐻𝐻2𝑂𝑂 7.3
𝑟𝑟𝑂𝑂2 = 𝑑𝑑𝐶𝐶𝐿𝐿𝑑𝑑𝑑𝑑
7.4
𝑌𝑌𝑂𝑂/𝐴𝐴 = 𝑟𝑟𝑂𝑂2𝑟𝑟𝑎𝑎𝑎𝑎𝑎𝑎𝑎𝑎
7.5
𝑟𝑟𝑎𝑎𝑎𝑎𝑎𝑎𝑑𝑑 =𝑑𝑑[𝑎𝑎𝑎𝑎𝑎𝑎𝑎𝑎]
𝑑𝑑𝑑𝑑 7.6
OTR = 𝐾𝐾𝐿𝐿𝑎𝑎(𝐶𝐶∗ − 𝐶𝐶𝐿𝐿) 7.7
OTR = 𝑑𝑑𝐶𝐶𝐿𝐿𝑑𝑑𝑑𝑑
= 𝐾𝐾𝐿𝐿𝑎𝑎 . (𝐶𝐶∗ − 𝐶𝐶) 7.8
OUR = 𝐾𝐾𝐿𝐿𝑎𝑎(𝐶𝐶∗ − 𝐶𝐶𝐿𝐿) 7.9
𝐾𝐾𝐿𝐿𝑎𝑎 =𝑂𝑂𝑂𝑂𝑂𝑂𝐶𝐶∗ − 𝐶𝐶𝐿𝐿
7.10
𝒅𝒅𝑪𝑪𝑳𝑳𝒅𝒅𝒅𝒅
= 𝐾𝐾𝐿𝐿𝑎𝑎 . (𝐶𝐶∗ − 𝑪𝑪𝑳𝑳) − 𝑞𝑞𝑂𝑂2 .𝐶𝐶𝑋𝑋 7.11
20
GLOSSARY
Abbreviations/Symbols
Definition (units)
°C Degree Celsius
°B Degree brix
A Area (cm2)
AAB Acetic Acid Bacteria
AcOH Acetic acid
ARC Agricultural Research Council
Atm Standard atmosphere
BSV Balsamic-Styled Vinegar
CC Corncobs
Ca Calcium
𝐶𝐶𝐿𝐿 Dissolved oxygen in liquids (g L-1)
Cm Centimetre
𝐶𝐶∗ Dissolved oxygen in gaseous phase (g L-1 h-1)
D Resulting diameter (cm)
EtOH Ethanol
G Grams
H Height (cm)
Hr(s) Hour(s)
HA High aeration
IC Immobilized cells
𝐾𝐾𝐿𝐿𝑎𝑎 Volumetric mass transfer coefficient
L Litre
LA Low aeration
Min Minutes
mL Millilitres
NaCl Sodium Chloride
NCBI National Centre for Biotechnology Information
Nd No date
OTR Oxygen transfer rate (g L-1 h-1)
OUR Oxygen uptake rate (g L-1 h-1)
OWC Oak wood chips
Po2 Oxygen partial pressure
21
𝑟𝑟𝑎𝑎𝑎𝑎𝑎𝑎𝑑𝑑 Rate of acetic acid formation (g L-1 h-1)
𝑟𝑟𝑂𝑂2 Rate of oxygen consumption (g L-1 h-1)
𝑟𝑟𝑠𝑠𝑠𝑠𝑠𝑠𝑎𝑎𝑟𝑟 Rate of sugar consumption (g L-1 h-1)
R Radius (cm)
Rpm Revolutions per minute (rev/min)
rp Product formation (g L-1 day-1)
rs Substrate utilisation rate (g L-1 day-1)
SAWIS South African Wine Industry Information and Systems
SEM Scanning Electron Microscope
T Time
T Temperature (ºC)
TBV Traditional Balsamic Vinegar
V Volume
VVM Vessel Volume per Minute
W Weight (g)
YPD Yeast/Peptone/Dextrose
𝑌𝑌𝑂𝑂/𝐴𝐴 ratio of oxygen consumption vs acid yield

22
CHAPTER 1
GENERAL INTRODUCTION
23
1 CHAPTER 1
GENERAL INTRODUCTION
1.1 Introduction South Africa is currently cultivating approximately 93 021 hectares of land for the production of wine
grapes, with Chenin blanc being the most cultivated grape cultivar (Fig. 1.1) (SAWIS, 2018). Roughly
81% of the harvested wine grapes are exclusively used for wine production by the South African wine
industries (SAWIS, 2018), consequently, these wine grapes are expected to meet strict quality standards
required for wine production. However, the South African wine industry faces several challenges such
as drought, bush fires (Basson, 2016) and climate change (Vink et al., 2009) which are significantly
reducing the quality of wines produced and lowering the revenue. Bush fires not only damage property
and vineyards, but the smoke affects vineyards in close proximity during the fire leading to an off odour
in the resultant wine known as ‘smoke taint’- a major concern for wine producers (Marston, 2016; De
Vries et al., 2016). Climate change with the accompanying higher temperatures can lead to high sugar
concentration in wine grapes thus causing high ethanol content in the wine (Anonymous, nd(a)). Higher
ethanol content is a negative attribute in wines, and it is not desired by consumers. Furthermore, several
anti-alcohol regulations are currently being considered to reduce alcohol consumption due to the high
level of alcohol abuse in South Africa. These include the liquor amendment bill, which intends to
increase the legal drinking age from 18 to 21, and other legislations aimed at reducing the number of
alcohol outlets (Andersen, 2018; Anonymous, 2018). Accordingly, wine producers might have to seek
alternative revenue generating outlets for the sub-standard quality wine grapes and surplus grapes.
Therefore, the production of Balsamic-styled vinegar (BSV) has been deemed fit for this purpose. This
could also be an opportunity to empower small business entrepreneurs (less expensive equipment is
needed to produce vinegar than wine) while improving the economy of the country.
24
Figure 1.1 Percentage (%) of white and red wine grape vineyards in South Africa (SAWIS, 2018)
According to the Italian Denominazione di Origine Protetta (DOP) and the European Union's Protected
Designation of Origin legislations, TBV is a geographically and legislative protected vinegar product
which can only be produced in delineated areas, namely, the provinces of Reggio Emilia and Modena,
Italy (Mattia, 2004; Solieri et al., 2006; Wheeler, 2014). This type of vinegar can be produced in other
regions, but not called TBV, or Balsamic Vinegar of Modena. Consequently, the name Balsamic-styled
vinegar (BSV) was proposed for a type of balsamic vinegar developed for the purpose of this study
which is produced by partially following the methods of TBV.
The production of most types of traditional balsamic vinegars generally follows a simple approach
without the necessity for high technology equipment. Briefly, the process commonly begins with the
cooking of grape must until a high sugar concentration is achieved. Subsequent inoculation is often
performed with an undefined culture of yeast and acetic acid bacteria (mother culture from a previous
fermentation). A double fermentation process occurs, which begins with the conversion of sugar to
alcohol by yeasts followed by the oxidation of alcohol to acetic acid by AAB (Oulton & Randal. 2002;
Wheeler, 2014; Giudici et al., 2015). After fermentation is complete, the TBV is matured for a minimum
of 12 years in a series of wooden barrels (Solieri et al., 2006; Giudici, & Rinaldi, 2007; Solieri &
Giudici, 2008; Chinnici et al., 2016). Other balsamic vinegars e.g. Balsamic Vinegar of Modena can be
sold after shorter periods of ageing, but these are manufactured by combining wine vinegar, cooked
grape must and caramel (for colouring) (Wheeler, 2014; Giudici et al., 2015; May, 2016). All balsamic
vinegars are comparatively high priced in contrast to other vinegars due to their quality, complexity and
integrity (Wheeler, 2014; May, 2016).
Chenin blanc 18,5%
Colombar 11,6%
Cabernet Sauvignon 11%
Shiraz 10,2%Sauvignon blanc 10,2%
Pinotage 7,3%
Chardonnay 7,2%
Merlot 5,8%
Ruby Carbenet 2,3%
Cinsaut 1,8%Muscat d'Alexandrie 1,8%
Pinot Noir 1,3%Semillon … Other 9,9%
25
A previous study (Hutchinson et al., 2019a), showed that the fermentation process for BSV was slower
than what was anticipated leading to increased production times. Longer production times leads to
unwanted increases in production costs, hence it was crucial to formulate an effective method for rapid
fermentations. Consequently, this study was aimed at investigating several techniques to enhance the
vinegar fermentation process with prospects of upscaling.
1.2 Problem statement. Balsamic-styled vinegar is a new type of balsamic vinegar produced using white grape cultivars and
could potentially penetrate the South African food markets. Previous studies showed that the BSV
fermentation process was lengthy (>40 days) when cooked Chenin blanc grape must was used as the
base material. The slow fermentation rates were attributed to the fastidious nature of AAB which require
favourable environmental conditions for optimum microbial activity to be achieved. However, the
problem in the present study is that authentic balsamic vinegar essentially necessitates the use of cooked
grape must as a fermentation medium. Cooked grape must is associated with several environmental
obstacles for the microorganisms used, which include high sugar concentration due to the cooking,
accordingly accompanied by high osmotic pressure, low water activity and moderately high salinity.
Furthermore, during BSV fermentation, the increase in acetic acid concentrations and decrease in pH
also has antagonistic effects on the microbial consortium used. All these factors affect the microbial
growth/activity, microbial survival, dissolved oxygen (DO) availability and could easily render the
microbial consortium non-viable or could result in the entry of the microorganisms in the viable but
non-culturable (VBNC) state. Consequently, it was necessary to employ several bioreactor
modifications for BSV production, as a result, several questions needed to be answered since a study of
this nature has not been conducted before.
1.3 Hypothesis It was hypothesized that cell immobilization techniques will improve microbial activity and shorten the
fermentation period. It was also hypothesized that the cell immobilization matrices used will have a
positive contribution on the sensorial attributes of the final BSV.
1.4 Research questions • Will immobilized cells lead to faster fermentation rates compared to free floating cells?
• Which immobilization matrix is most suitable for BSV production with regards to cell affinity,
cell retention and acetification rates?
• Which immobilization technique (entrapment vs adsorption) is effective for BSV fermentation
26
• Are the immobilized cells reusable/recyclable for subsequent fermentations and can the
immobilized cells retain adequate microbial activity and fermentation rates?
• Are static or agitated more effective for BSV fermentation?
• How will aeration affect the BSV fermentation in contrast to non-aerated fermentations?
• What aeration rate will be most suitable?
• what are the volumetric mass transfer coefficients of the studied BSV fermentations systems?
• What are the differences in oxygen uptake rates and oxygen transfer rates for immobilized cells
under both aerated and non-aerated fermentations?
• What are the differences in the ratios of oxygen consumption vs acid yield for immobilized
cells?
• How do the matrices used for cell immobilization affect the sensory characteristics of the BSV
and consumer perception?
1.5 Aims and objectives The aims and objectives of the study were:
Aim 1, Phase 1: To evaluate the effectiveness of the entrapment technique for cell immobilization for BSV fermentations.
Objective 1: Conducting BSV fermentations using two different sizes of Ca-alginate beads (small vs large) in order to evaluate to effect of bead size and surface area.
Objective 2: Conducting fermentations under static and agitated conditions for Ca-alginate bead fermentations and FFC treatments.
Aim 2, Phase 2: To investigate the effect of the adsorption technique and other bioreactor process augmentation techniques for BSV fermentation.
Objective 1: Comparing the adsorption matrices (CC and OWC) against FFC fermentations.
Objective 2: Testing the effects of aeration and agitation for adsorbed cells and FFC fermentation treatments.
Objective 3: Evaluating the variations in cell adsorption capabilities on CC and OWC for individual yeasts and AAB species.
Aim 3, Phase 3: To test the effectiveness of immobilized cells when they are reused for subsequent cycles of fermentation.
Objective 1: Evaluating the number of cycles the that recycled immobilized cells can complete at desired acetification rates.

27
Objective 2: Evaluating the structural integrity of cell immobilization matrices after being reused using the scanning electron microscope.
Objective 3: Evaluating the final BSV’s for sensorial attributes.
Aim 4, Phase 4: To understand the oxygen mass transfer kinetics during BSV fermentation under aerated and non-aerated conditions
Objective 1: Evaluating the dissolved oxygen profiles during aerated and non-aerated BSV fermentations.
Objective 2: Using the dynamic method to determine and compute oxygen mass transfer parameters during BSV fermentation.
1.6 Delineation of the study This study did not investigate the following:
• The fermentation of BSV using different grape cultivars.
• BSV fermentation in wooden barrels.
• The individual contributions of the selected microorganisms during mixed fermentations.
• Maturation and aging of the BSV.
1.7 Significance of the research
The study contributed to the following
• Broadening our understanding of cell immobilization and the differences in the matrices used
for BSV production.
• Understanding the impacts of different cell immobilization matrices and how they contribute
to the organoleptic properties of BSV.
• Understanding the reusability capabilities of the cell immobilization matrices for successive
BSV fermentations.
• Understanding oxygen mass transfer kinetics during BSV production.
• A laboratory method for BSV production that has the potential of being upscaled for industrial
applications.
1.8 Outcomes, results and contributions to research In this study, valuable information regarding the contributions of cell immobilization, agitation and
aeration were generated for BSV production. Acceptable BSV’s with regards to taste and aroma were
obtained. One conference proceeding, one review article and one full length article were published.
Furthermore, two manuscripts have been drafted for publication in peer reviewed journals. This
28
research also contributes as a prerequisite for the completion of a Doctor of Engineering degree in
Chemical Engineering.
29
CHAPTER 2
LITERATURE REVIEW
Published as: Hutchinson, U.F., Jolly, N.P., Chidi, B.S., Ngongang, M.M. and Ntwampe, S.K.O., 2019. Vinegar Engineering: A Bioprocess Perspective. Food Engineering Reviews, pp.1-16.
30
2 CHAPTER 2
LITERATURE REVIEW
2.1 Introduction
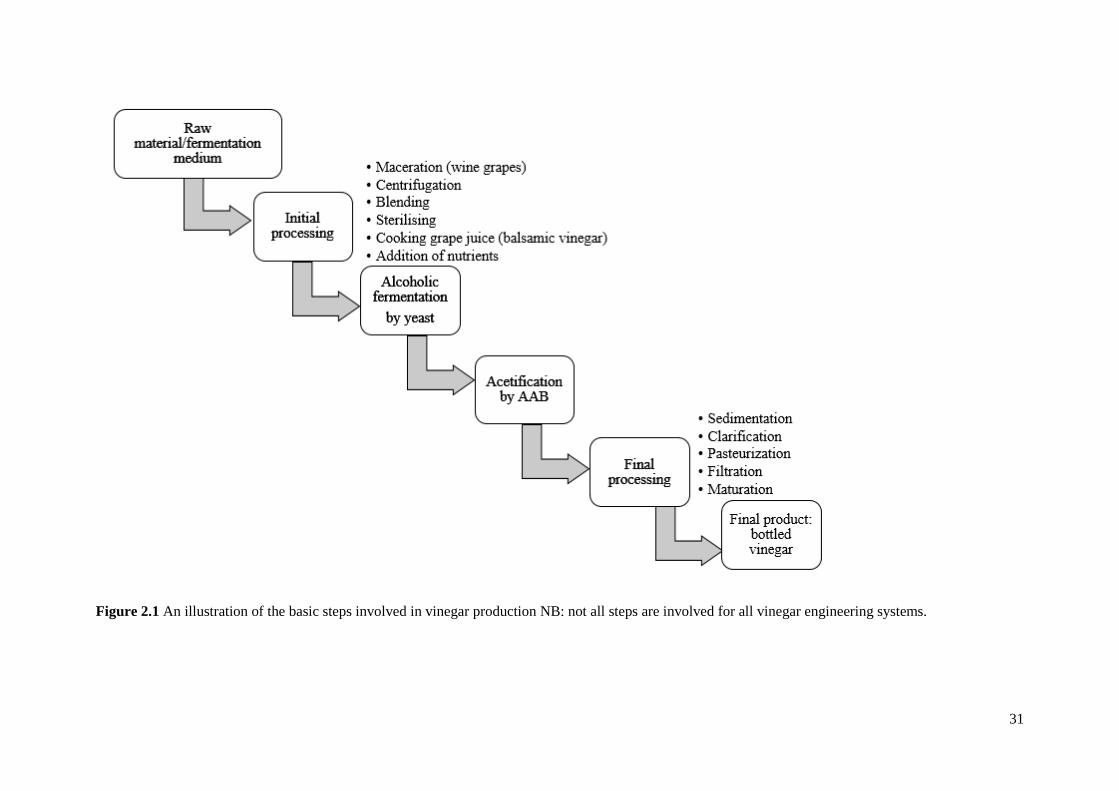
Vinegar is generally defined as a sour or acidic liquid obtained from a two-step fermentation process
(Ebner et al., 2000; Ho et al., 2017; De Leonardis et al., 2018). The fermentation process utilises yeast
for the anaerobic fermentation of sugar to ethanol and acetic acid bacteria (AAB) for the aerobic
oxidation of ethanol to acetic acid (Fig. 2.1) (Solieri & Giudici, 2009; Ho et al., 2017; De Leonardis et
al., 2018). As a key metabolite, acetic acid is an important ingredient in vinegar and its concentration
defines the organoleptic characteristics of vinegars. Typically, vinegar is not generally classified as
food, but as a food-flavouring agent (Solieri & Giudici, 2009; Nie et al., 2013), an important feedstock
in the food industry (Nie et al., 2013) and a food preservative (Johnston & Gaas, 2006; Ghatak & Sen,
2016).
31
Figure 2.1 An illustration of the basic steps involved in vinegar production NB: not all steps are involved for all vinegar engineering systems.

32
Vinegar is made from numerous carbohydrate sources or food products that contain fermentable
(reducible) sugar for yeast to metabolise (Solieri & Giudici, 2009; De Leonardis et al., 2018). Currently,
there are numerous types of vinegars produced globally and most of these are produced from cheap raw
materials, which is why most vinegars are lowly-priced. These raw materials can include by-products
obtained from food processing, low quality fruit, agricultural surpluses and fruit waste (Solieri &
Giudici, 2009; Mazza & Murooka, 2009, Tesfaye et al., 2002; De Leonardis et al., 2018). Some vinegars
are obtained from non-fermentation processes, such as distilling alcohol, which is subsequently oxidised
to acetic acid (Solieri & Giudici, 2009).
There are two distinct production methods for fermentation-based vinegars, namely the traditional and
submerged methods. The traditional method relies on surface culture fermentations, whereby oxygen is
obtained from the air. In simpler terms, this method applies low technological inputs and as a result, the
fermentation period is longer and the vinegars are therefore expensive (Tesfaye et al., 2002; Fernández-
Pérez et al., 2010). These expensive vinegars are usually those made in certain areas with regional and
seasonal input of raw materials. Examples include oxos vinegar from Greece, sherry vinegar from Spain
and the Traditional Balsamic Vinegar (TBV) from the provinces of Reggio Emilia and Modena, Italy
(Solieri & Giudici, 2009). The second method is the submerged tank method, which entails the use of
technologically advanced systems such as the use of spargers, coolers, antifoams, stainless steel
fermentors and automated control systems (Tesfaye et al., 2002; Fernández-Pérez et al., 2010). The
submerged method is typically used by large producers for the production of commercial vinegars,
which are in high demand (Tesfaye et al., 2002). An example of a typical process distinction can be
made between traditional wine vinegar fermentation processes that takes up to 2 months to achieve the
required final product quality concentrations, and the industrial wine vinegar fermentation using the
Frings acetator (submerged method) that only takes up to 20-24 hrs (Budak & Guzel-Seydim, 2010).
For these reasons, the application of biochemical engineering principles in vinegar production is
important for large-scale producers. Not only because vinegar is a food flavouring agent found in
virtually every household (Davis et al., 2015) but also due to its widespread use in the food industry
(Branen et al., 2001; Hyuseinov & Ludwig, 2016; Nair et al, 2017, Wiley, 2017). In the context of this
review, vinegar engineering refers to food, biochemical, bioprocess and chemical reaction engineering
technology in the production of the vinegar. This will bring about an understanding of vinegar
engineering and address some challenges, which customary microbiological and chemistry methods do
not resolve. These parameters include bioreactor selection (design), dissolved oxygen mass transfer
efficiency, effect of fluid mechanics on microorganisms and kinetic modelling of co-, by- and final
products. In this review, some concepts in vinegar engineering system analysis are introduced.
However, the introduction of new technologies can lead to authentication doubts, as some vinegars are
produced following well-defined traditional approaches. Therefore, these new approaches are more
fitting to vinegar production methods, which are not protected by legislation. There is a growing interest
33
in vinegar production utilising a variety of fruit, agricultural waste or raw materials. Some unusual
vinegars include those produced from onion (Horiuchi et al., 2000a; 2004; Cheun et al., 2005; González-
Sáiz et al., 2008a), hawthorn (Wenye et al., 2003; Zheng et al., 2010) and wood (Baimark & Niamsa,
2009; Mun & Ku 2010; Wititsiri 2011).
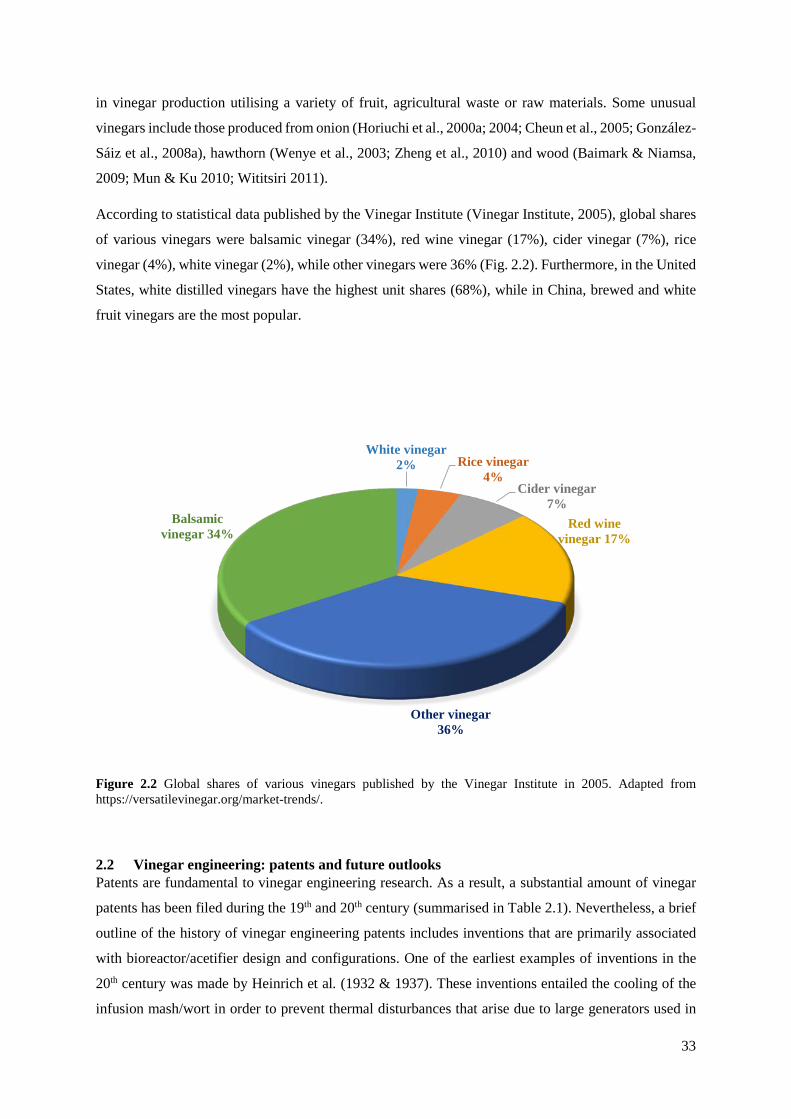
According to statistical data published by the Vinegar Institute (Vinegar Institute, 2005), global shares
of various vinegars were balsamic vinegar (34%), red wine vinegar (17%), cider vinegar (7%), rice
vinegar (4%), white vinegar (2%), while other vinegars were 36% (Fig. 2.2). Furthermore, in the United
States, white distilled vinegars have the highest unit shares (68%), while in China, brewed and white
fruit vinegars are the most popular.
Figure 2.2 Global shares of various vinegars published by the Vinegar Institute in 2005. Adapted from https://versatilevinegar.org/market-trends/.
2.2 Vinegar engineering: patents and future outlooks Patents are fundamental to vinegar engineering research. As a result, a substantial amount of vinegar
patents has been filed during the 19th and 20th century (summarised in Table 2.1). Nevertheless, a brief
outline of the history of vinegar engineering patents includes inventions that are primarily associated
with bioreactor/acetifier design and configurations. One of the earliest examples of inventions in the
20th century was made by Heinrich et al. (1932 & 1937). These inventions entailed the cooling of the
infusion mash/wort in order to prevent thermal disturbances that arise due to large generators used in
White vinegar 2% Rice vinegar
4%Cider vinegar
7%Red wine
vinegar 17%
Other vinegar 36%
Balsamic vinegar 34%
34
the acetifiers. Other inventions entailed the addition of temperature responsive elements in the
bioreactor with the aim of regulating temperature and flow of the wort according to the required
conditions of various vinegar products.
Another critical invention was aimed at preventing yield losses through evaporation by employing vats
made from earthenware, wood and non-corrosive metals in rare cases (Brun, 1945). The latter was
achieved by altering bioreactor designs to include cooling devices on the gas outlets aimed at cooling
and condensing vinegar vapours exiting the exhaust outlets. Further improvements by Ernst (1961) were
made in the submerged methods for vinegar production (continuous system) whereby continuous
aeration using an air dispersing device was used. Bioreactors also contained cooling and heating coils
for temperature control and a rotor for efficient liquid circulation within the system. The super-
oxygenated atmosphere was also created in another invention by controlling oxygen demand in the
production system in the second phase of fermentation according to the system’s oxygen requirements.
Foam accumulation during vinegar fermentations was controlled using rotational mechanical devices
(Wittler & Frings, 1991). This particular invention allowed the accumulated foam to be broken down
into gas and liquid vinegars that are subsequently transferred back into the vinegar broth inside the
bioreactor.
Overall, these aforementioned inventions are evidence that researchers have mostly paid special
attention/focused on bioreactor design-based parameters. Moreover, in vinegar engineering, there are
several areas that can be explored in this regard. Some important inventions and patents not discussed
in this section are also listed in Table 2.1.
Table 2.1: Vinegar production patents Patent name & number Inventor(s)
Method for the production of vinegar acids by oxidative fermentation
of alcohols (US2707683A)
Otto & Heinz (1955)
Process for acetic acid fermentation (US3445245A) Ebner & Frings (1969)
Two stage process for the production of vinegar with high acetic acid
concentration (US4076844A)
Ebner et al. (1978)
Process for the production of vinegar with more than 12 g/100 mL
acetic acid (US4503078A)
Ebner & Frings (1985)
Control arrangement for a vinegar fermentation process
(US4773315A)
Enenkel & Frings (1988)

35
Patent name & number Inventor(s)
Automated method for a semi-solid fermentation used in the
production of ancient quality rice vinegar and/or rice wine
(US4808419A)
Hsu (1989)
2.3 Vinegar engineering and bioreactors 2.3.1 Bioreactors: importance and general overview Bioreactor studies have been conducted for various vinegar production systems using a diverse range
of bioreactors (Table 2.2). Industrial vinegars generally employ the acetators/bioreactors (submerged
approach) for vinegar production, due to the high yields obtained in such systems (Gullo et al., 2014).
The use of bioreactors normally offers a controlled environment, which leads to faster production,
reduced product losses and possibilities for optimisation (Boehme et al., 2014; Yan et al., 2014; van
Noort, 2016). Most bioreactors are normally operated using optimised conditions and parameters. These
include pH, temperature (Dendooven et al., 2000; Gullo et al., 2014), substrate/nutrients concentrations
(Kim et al., 2005; Gullo et al., 2014), airflow rates (Mazutti et al., 2010), agitation and pressure (Garcia-
Ochoa & Gomez, 2009). Optimization of the aforementioned parameters has been extensively studied
for some fermentation systems. However, there is insubstantial research on the optimization of process
parameters for bioreactors used in vinegar production. As bioreactors come in various designs to suit
various biological systems in order to meet the demands of the process (Van't Riet & Tramper, 1991),
they are generally operated using different operational modes, which include batch, fed batch,
resting/immobilized cells and continuous systems (Garcia-Ochoa & Gomez, 2009).
2.4 Desired features in bioreactors The most notable mutual and desired feature in most of the bioreactors used for vinegar production is
the ability to permit high oxygen transfer and sufficient agitation. Agitation should sufficiently
homogenise bioreactor contents and prevent low-oxygen areas, thus preventing dead zones and stuck
fermentations. Additionally, there should be minimal oxygen transfer interruption, as this can slow
down the process or render the AAB non-viable (Schlepütz et al., 2013; Gullo et al., 2014). To serve
this purpose, the most commonly used bioreactor for commercial vinegar production was designed by
Heinrich Frings ‘Frings acetator’ (García-García et al., 2009) and it achieves high product yields (95%)
(Fregapane et al, 1999; Qi et al., 2014). It is recommended because of low energy requirements (400
W/L) compared to other bioreactors and also contains a Frings alkolograph that quantifies alcohol
concentration during fermentation (Qi et al., 2014). Importantly, the acetator also has a self-aspirating
system that replaces system oxygenation by compressed air (García-García et al., 2009). The
homogenous dispersion of very fine air bubbles is also another desired feature in industrial bioreactors;
36
hence, it is common to find bioreactors equipped with special turbines designed for this purpose
(Schlepütz et al., 2013; Schlepütz & Büchs, 2013).
2.4.1 Bioreactor design and configurations The design and configurations of a bioreactor play a critical role in the performance of the vinegar
fermentation process. Bioreactor configurations include height to diameter ratio (aspect ratio), the
surface area to volume ratio (Halladj et al., 2016), shape of vessel (de Ory et al., 2004; Halladj et al.,
2016), stainless steel features (de Ory et al., 2004), impeller configurations (size, number of blades,
location) (González-Sáiz et al., 2008b), turbines and gas inlets and outlets (González-Sáiz et al., 2009a).
In order to emphasise the importance of design and configuration, a graphical depiction of how height
to diameter ratio influences gaseous (O2 and CO2) exchange is demonstrated in Figure 2.3. In this figure,
a small perforation diameter (Dmin) and larger height to liquid-air interface area (H/Smax) favours
alcoholic fermentation, while a larger perforation diameter (Dmax) and smaller height to liquid-air
interface area (H/Smin) favours the acetification process.
Figure 2.3 An illustration of the influence of geometic characterisitics on gaseous exchange. (A) favours alcoholic fermentation, (B) favours acetification, diffusion of gases is indicated by arrows, H/S ratio of container headspace (i.e. H= height to liquid-air interface area (S)), D = perforation diameter of the reactor lid (Halladj et al., 2016)
These are important factors to consider when designing a bioreactor for vinegar production. In addition,
vinegar production systems which separate the alcoholic and acetification process can employ both
geometric designs to suit the needs of each fermentation process. Previously, a 10L bioreactor equipped
with a sparger located 2 cm from the bottom of the bioreactor for air diffusion was reported as a suitable
design for vinegar production (González-Sáiz et al., 2009a). The bioreactor had two impeller flat blade
Rushton turbines with a gap of 1.45 cm between the sparger and the first impeller, with each impeller
having six blades (Fig. 2.4). Proximity placement of the sparger and impeller is not advisable, as this

37
would cause flooding and bubble coalescence. Similarly, if they are too far apart, this would impair
foam mitigation. Temperature control can be maintained with the use of a water jacket and an oxygen
probe must be installed to monitor dissolved oxygen.
Figure 2.4 Reproduced scaled-up fermentor design. (1) air outlet and pressure valve; (2) inlet port; (3) sampling port; (4) air inlet; (5) outlet port (González-Sáiz et al., 2009a).
Mehaia and Cheryan (1991) used a membrane recycle bioreactor for the production of date extract
vinegar. The design of this type of bioreactor included a hollow-fibre module with a polysulphane
membrane, through which sterilized air was sparged at a rate of 0.4 L min-1, achieving a high acetic
acid production rate of 10.8 g L-1 h-1 (Table 2.2). Huang et al. (1998) studied vinegar production with
fructose as a substrate, while using a fibrous-bed bioreactor (Table 2.2). The bioreactor was constructed
using a glass column and contained a spiral-wound terry cloth. The quality and acetic acid concentration
of vinegars are strain, bioreactor- and fermentation type-dependent. Acetic acid production rates for
different types of bioreactors (fed batch and continous systems), including free-floating and
immobilized cells are shown in Table 2.2.
Wine vinegar production, on the other hand, was studied using a non-commercial 100L bubble column
reactor (Table 2.2) (Fregapane et al., 1999). The bioreactor was equipped with a novel gas-liquid
dynamic sparger, which allowed the distribution of fine bubble sizes. This bioreactor showed increased
acetification rates compared to other industrial bioreactors. An acetic acid production rate of 1.8 g L-1
h-1 coupled with a 94% (v/v) yield was achieved. Horiuchi et al. (2000a & b) studied a charcoal pellet
bioreactor (Fig. 2.5) for acetic acid production from ethanol and onion alcohol, respectively, which was
later improved for onion vinegar production (Fig. 2.6). The onion vinegar bioreactor was serially
connected to an ethanol jar fermentor with the onion alcohol being seperately produced in the jar
fermentor while being continuously fed into the charcoal pellet bioreactor whereby acetification took
place (Fig. 2.5), achieving a high acetic acid production rate (Table 2.2).
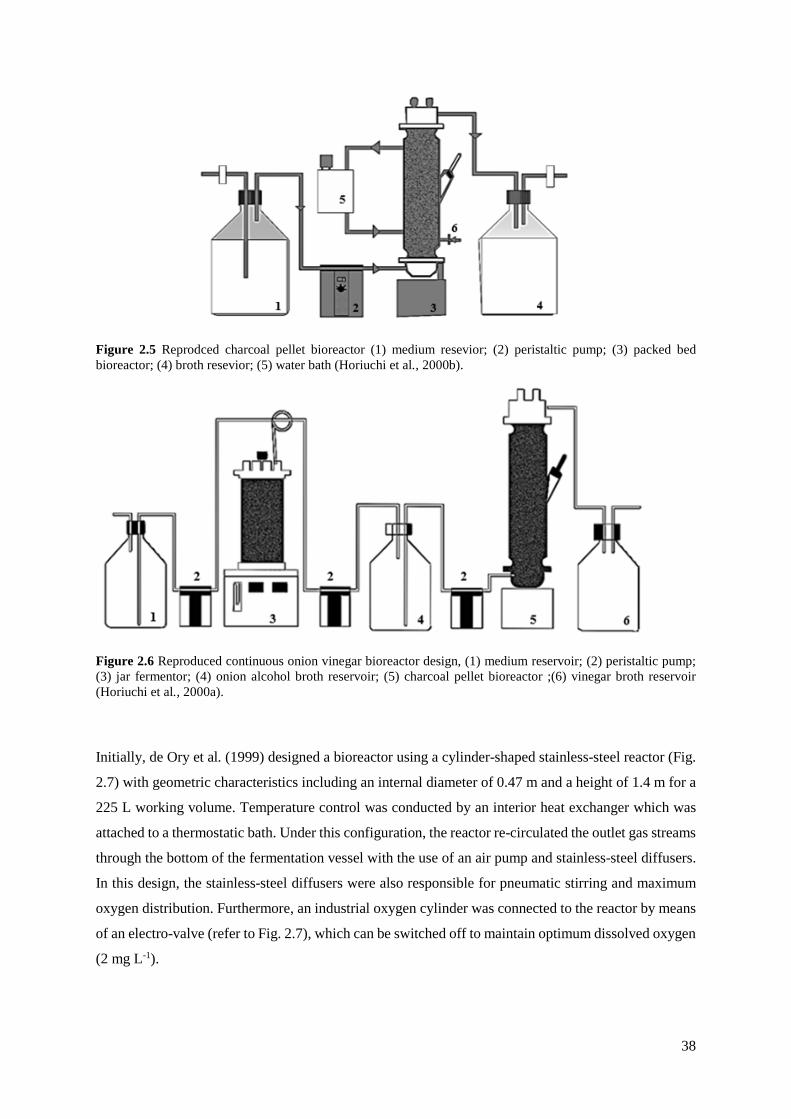
38
Figure 2.5 Reprodced charcoal pellet bioreactor (1) medium resevior; (2) peristaltic pump; (3) packed bed bioreactor; (4) broth resevior; (5) water bath (Horiuchi et al., 2000b).
Figure 2.6 Reproduced continuous onion vinegar bioreactor design, (1) medium reservoir; (2) peristaltic pump; (3) jar fermentor; (4) onion alcohol broth reservoir; (5) charcoal pellet bioreactor ;(6) vinegar broth reservoir (Horiuchi et al., 2000a).
Initially, de Ory et al. (1999) designed a bioreactor using a cylinder-shaped stainless-steel reactor (Fig.
2.7) with geometric characteristics including an internal diameter of 0.47 m and a height of 1.4 m for a
225 L working volume. Temperature control was conducted by an interior heat exchanger which was
attached to a thermostatic bath. Under this configuration, the reactor re-circulated the outlet gas streams
through the bottom of the fermentation vessel with the use of an air pump and stainless-steel diffusers.
In this design, the stainless-steel diffusers were also responsible for pneumatic stirring and maximum
oxygen distribution. Furthermore, an industrial oxygen cylinder was connected to the reactor by means
of an electro-valve (refer to Fig. 2.7), which can be switched off to maintain optimum dissolved oxygen
(2 mg L-1).

39
Figure 2.7 Reproduced industrial acetifier (1) reactor, (2) gas recycling pump, (3) expansion tank, (4) air diffusors, (5) heat exchanger, (6) thermostatic bath, (7) oxygen cylinder, (8) electro valve, (9) dissolved oxygen sensor, (10) feed inlet and effluent outlet pump. de Ory et al., (1999) as reported in de Ory et al., (2004).
Furthermore, an aerated-stirred pilot bioreactor was proposed to be an improvement of existing
fermenters by González-Sáiz et al. (2009a). The study proposed the replacement of plate tops with dish
tops in industrial fermenters while achieving an acetification rate of 13.2 and 11.1 g L-1 h-1 for the batch
and continuous system, respectively.
Table 2.2: Bioreactor application studies in vinegar production Product Type of bioreactor Bacteria used Batch or
continuous
Acetic acid
production
rate (g L-1
h-1)
Reference
Acetic acid
from
ethanol
Three-phase
fluidized-bed
bioreactor using
immobilized cells
Acetobacter
aceti
Continuous 0.051-
0.138
Sun &
Furusaki
(1990)
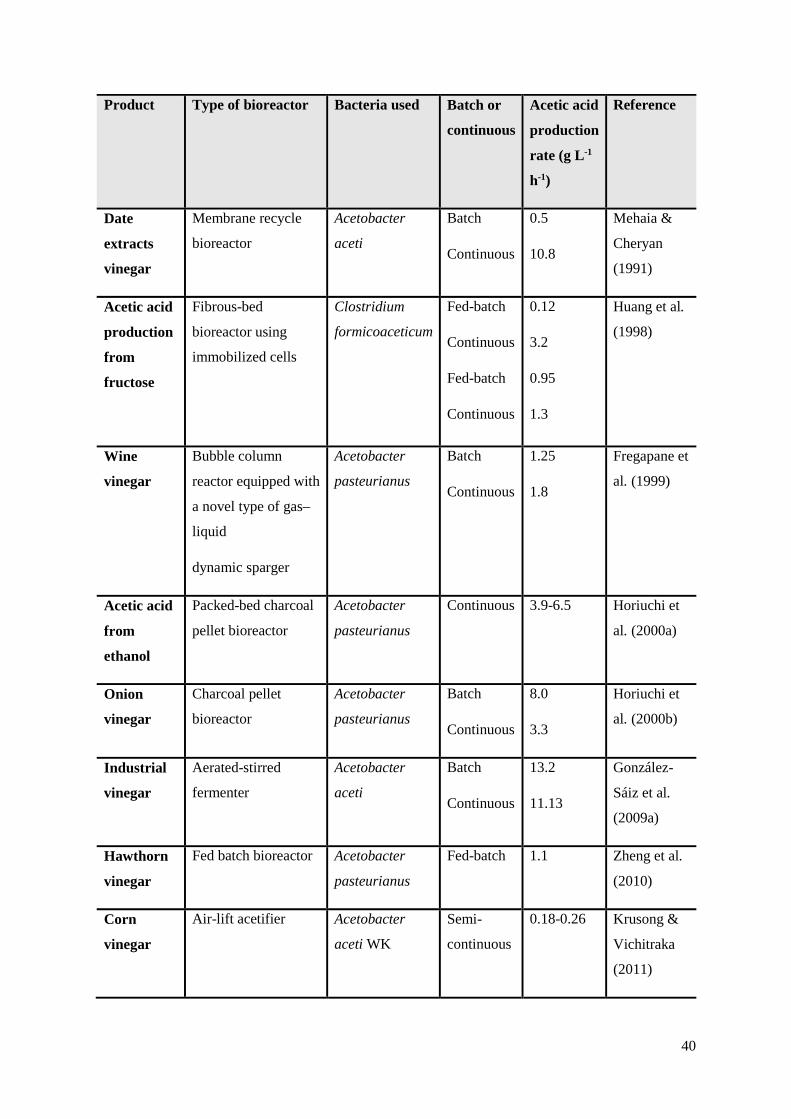
40
Product Type of bioreactor Bacteria used Batch or
continuous
Acetic acid
production
rate (g L-1
h-1)
Reference
Date
extracts
vinegar
Membrane recycle
bioreactor
Acetobacter
aceti
Batch
Continuous
0.5
10.8
Mehaia &
Cheryan
(1991)
Acetic acid
production
from
fructose
Fibrous-bed
bioreactor using
immobilized cells
Clostridium
formicoaceticum
Fed-batch
Continuous
Fed-batch
Continuous
0.12
3.2
0.95
1.3
Huang et al.
(1998)
Wine
vinegar
Bubble column
reactor equipped with
a novel type of gas–
liquid
dynamic sparger
Acetobacter
pasteurianus
Batch
Continuous
1.25
1.8
Fregapane et
al. (1999)
Acetic acid
from
ethanol
Packed-bed charcoal
pellet bioreactor
Acetobacter
pasteurianus
Continuous 3.9-6.5 Horiuchi et
al. (2000a)
Onion
vinegar
Charcoal pellet
bioreactor
Acetobacter
pasteurianus
Batch
Continuous
8.0
3.3
Horiuchi et
al. (2000b)
Industrial
vinegar
Aerated-stirred
fermenter
Acetobacter
aceti
Batch
Continuous
13.2
11.13
González-
Sáiz et al.
(2009a)
Hawthorn
vinegar
Fed batch bioreactor Acetobacter
pasteurianus
Fed-batch 1.1 Zheng et al.
(2010)
Corn
vinegar
Air-lift acetifier Acetobacter
aceti WK
Semi-
continuous
0.18-0.26 Krusong &
Vichitraka
(2011)

41
Product Type of bioreactor Bacteria used Batch or
continuous
Acetic acid
production
rate (g L-1
h-1)
Reference
Acetic acid
from waste
cheese
whey
Multistage
membrane-integrated
hybrid process
Acetobactor
aceti (NCIM-
2116)
Continuous 4.06 Nayak & Pal
(2013)
Acetic acid
from
ethanol
9 L Frings pilot
acetator
Acetobacter
pasteurianus
CICIM B7003-
02
Semi-
continuous
Qi et al.
(2014)
Rice
vinegar
100 L Internal
Venturi injector
bioreactor
Acetobacter
aceti WK
Semi-
continuous
0.38 (high
initial
acetic acid)
0.40 (high
initial
acetic acid)
Krusong et
al. (2015)
Acetic acid
from
cheese
whey
Multi-stage
Membrane-Integrated
Bioreactor
Acetobacter.
aceti (NCIM-
2116)
Continuous 4.1 Nayak et al.
(2015)
Fruit
vinegar
6 L scaled bioreactor
(INFORS, France)
Acetobacter
pasteurianus
KU710511
Batch 0.27 (apple
vinegar)
0.22 (date
vinegar)
Mounir et
al. (2016)
2.4.2 Overall remarks on bioreactor design for vinegar production Despite the large number of vinegars produced worldwide, bioreactors have only been studied for a few
vinegars, and it is evident that there are several designs (geometric characteristics) of bioreactors
depending on the type of vinegar produced and the distinct needs of the fermentation process. However,
some basic conditions need to be defined, such as the bacteria used, optimum stirring speed and
dissolved oxygen transfer rates.
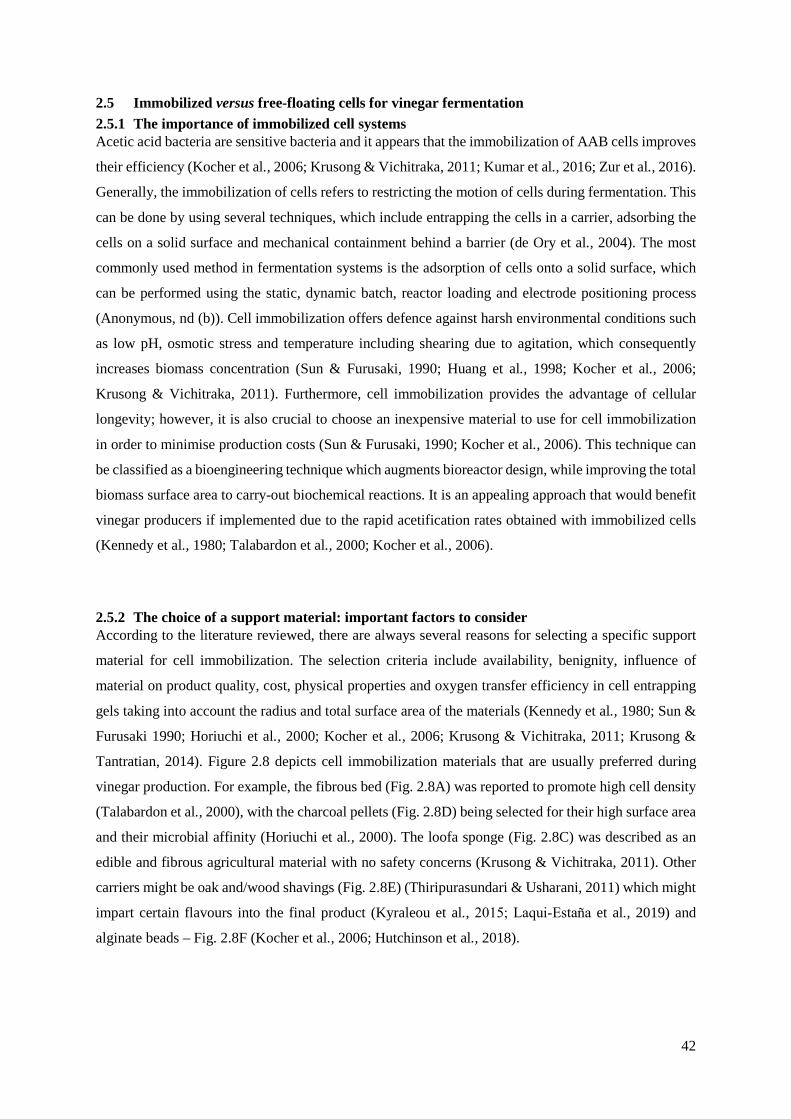
42
2.5 Immobilized versus free-floating cells for vinegar fermentation 2.5.1 The importance of immobilized cell systems Acetic acid bacteria are sensitive bacteria and it appears that the immobilization of AAB cells improves
their efficiency (Kocher et al., 2006; Krusong & Vichitraka, 2011; Kumar et al., 2016; Zur et al., 2016).
Generally, the immobilization of cells refers to restricting the motion of cells during fermentation. This
can be done by using several techniques, which include entrapping the cells in a carrier, adsorbing the
cells on a solid surface and mechanical containment behind a barrier (de Ory et al., 2004). The most
commonly used method in fermentation systems is the adsorption of cells onto a solid surface, which
can be performed using the static, dynamic batch, reactor loading and electrode positioning process
(Anonymous, nd (b)). Cell immobilization offers defence against harsh environmental conditions such
as low pH, osmotic stress and temperature including shearing due to agitation, which consequently
increases biomass concentration (Sun & Furusaki, 1990; Huang et al., 1998; Kocher et al., 2006;
Krusong & Vichitraka, 2011). Furthermore, cell immobilization provides the advantage of cellular
longevity; however, it is also crucial to choose an inexpensive material to use for cell immobilization
in order to minimise production costs (Sun & Furusaki, 1990; Kocher et al., 2006). This technique can
be classified as a bioengineering technique which augments bioreactor design, while improving the total
biomass surface area to carry-out biochemical reactions. It is an appealing approach that would benefit
vinegar producers if implemented due to the rapid acetification rates obtained with immobilized cells
(Kennedy et al., 1980; Talabardon et al., 2000; Kocher et al., 2006).
2.5.2 The choice of a support material: important factors to consider According to the literature reviewed, there are always several reasons for selecting a specific support
material for cell immobilization. The selection criteria include availability, benignity, influence of
material on product quality, cost, physical properties and oxygen transfer efficiency in cell entrapping
gels taking into account the radius and total surface area of the materials (Kennedy et al., 1980; Sun &
Furusaki 1990; Horiuchi et al., 2000; Kocher et al., 2006; Krusong & Vichitraka, 2011; Krusong &
Tantratian, 2014). Figure 2.8 depicts cell immobilization materials that are usually preferred during
vinegar production. For example, the fibrous bed (Fig. 2.8A) was reported to promote high cell density
(Talabardon et al., 2000), with the charcoal pellets (Fig. 2.8D) being selected for their high surface area
and their microbial affinity (Horiuchi et al., 2000). The loofa sponge (Fig. 2.8C) was described as an
edible and fibrous agricultural material with no safety concerns (Krusong & Vichitraka, 2011). Other
carriers might be oak and/wood shavings (Fig. 2.8E) (Thiripurasundari & Usharani, 2011) which might
impart certain flavours into the final product (Kyraleou et al., 2015; Laqui‐Estaña et al., 2019) and
alginate beads – Fig. 2.8F (Kocher et al., 2006; Hutchinson et al., 2018).

43
(A) Corncobs (B) Sugarcane bagasse (C) Sliced loofa sponge
(D) Charcoal pellets (E) Wood shavings (F) Alginate beads
Figure 2.8 Cell immobilization materials used in vinegar studies. Fig. 2.8A cited from Krusong et al. (2010)
2.5.3 Cell immobilization: comparative analysis As aforementioned, cell immobilization techniques vary in terms of which protocols to follow and
materials to use. Table 2.3 lists several studies on the subject of AAB cell immobilization and
acetification rates. Hydrous titanium (IV) oxide and hydrous titanium (IV) chelated cellulose were used
to immobilize two Acetobacter strains for the conversion of ethanol (produced by fermenting wort) into
acetic acid (Kennedy et al., 1980). Improved conversion rates were obtained; however, the performance
of the two bacteria strains varied when using titanium oxide. This was attributed to the fact that one
specie formed a slime (extracellular polysaccharide substances) while the other strain did not form a
slime. The slime forming bacteria resulted in a 67% and a 24% relative difference increase in
acetification rates when immobilized in hydrous titanium (IV) oxide using a small (2.5L) and large
(8.0L) bioreactors, respectively. The non-slime forming bacteria performed better when the cells were
freely floating in contrast to immobilized cells when using the smaller fermenter. In the larger
bioreactors, titanium cellulose chelate was added for the immobilization of cells, and there was a relative
increase in acetification rates compared to free floating cells. Kennedy et al., (1980) showed that
immobilized cells and the aggregation of cells is an efficient strategy compared to free-floating cells for
vinegar production. However, producers interested in employing this method would have to optimise

44
the concentration of titanium salts required and evaluate the residual salts in the final product for quality
and gustatory perception purposes.
Fibrous bed matrices are widely employed for cell immobilization in the vinegar industry due to their
robustness. Additionally, fibrous beds allow efficient mass transfer and do not undergo productivity
reduction when immobilized cells are used repeatedly. Non-active immobilized cells can also be
scraped off from fibrous beds and replaced with active cells instead of re-starting the immobilization
process (Huang et al., 2002). Huang et al., (1998) immobilized Clostridium formicoaceticum cells for
the production of acetic acid using fructose. In this study, the cells were adsorbed in the fibrous matrix
by pumping 25 mL.min-1 of the fermentation broth into the fibrous bed. The cells were immobilized
after 36-48 h of continuous broth pumping. The immobilized cell fermentations were compared to free-
floating cell fermentations in batch, fed-batch and continuous systems and all acetification rates are
shown in Table 2.3. Nonetheless, the highest acetic acid concentration achieved in free cell and
immobilized cell fermentation was 46.4 and 78.2 g L-1, respectively. Here, it was concluded that cell
immobilization by adsorption is one of the most employed cell immobilization techniques due to its
simplicity and it is often cheaper, depending on the material used. Talabardon et al., (2000) also
immobilized AAB cells by adsorption onto a fibrous bed matrix. This was also a comparative study
between free-floating and immobilized cell fermentations for the production of acetic acid from lactose
and milk permeate using Clostridium thermolacticum and Moorella thermoautotrophica. Free-floating
cells resulted in acetification rates of 0.06 and 0.08 g L-1 h-1 using lactose and milk permeate,
respectively. As for the immobilized cells, acetic acid production was increased to 0.54 and 0.30 g L-1
h-1 using lactose and milk permeates respectively. The studies used the adsorption of cells into a fibrous
bed technique for the immobilization of cells, resulting in improved acetification rates.
The cell immobilization by entrapment technique is generally classified as expensive due to the cost of
alginate and the cost of special equipment required to make gel beads (Saudagar et al., 2008).
Nevertheless, this technique was evaluated and was found to compare well with the adsorption
techniques during the production of sugar cane vinegar (Kocher et al., 2006). Acetobacter aceti cells
were entrapped using a 4% (w/v) sodium alginate solution to form a cell paste, followed by expulsion
through a syringe into a 0.2M CaCl2 solution, consequently resulting in the formation of calcium
alginate beads. Cell adsorption can also be employed using three different materials, i.e., corncobs (Fig.
2.8A), bagasse (Fig 2.8B) and wood shavings (Fig 2.8E). Comparative analysis of the gel entrapment
and adsorption method for vinegar production is crucial because, apart from broadening the vinegar
engineering knowledge, it also allows producers to make an informed decision concerning which
technique to employ. Nonetheless, the alginate gel-entrapped and free cell fermentations showed
relatively lower acetification rates compared to adsorbed cell fermentations (Table 2.3), an outcome
that has been reported to occur in various studies (de Ory et al., 2004). In these studies, it was concluded
that the lower acetification rates in entrapped cells were due to the lower surface area available for cell
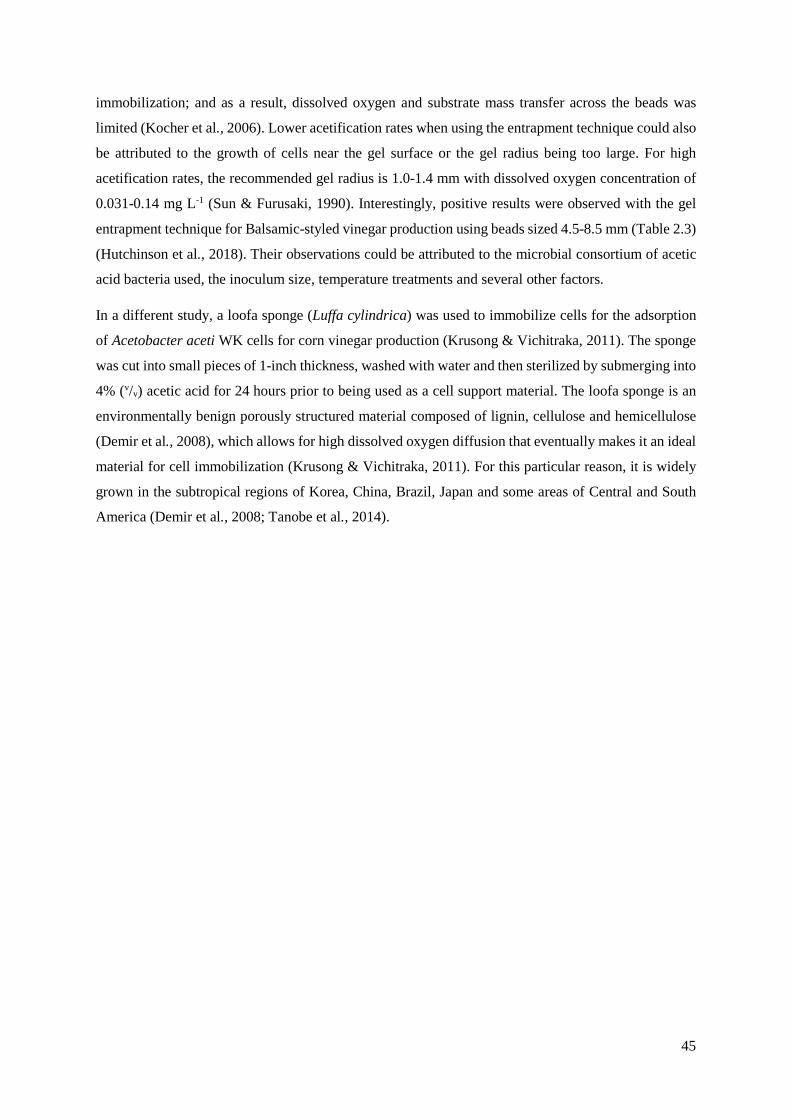
45
immobilization; and as a result, dissolved oxygen and substrate mass transfer across the beads was
limited (Kocher et al., 2006). Lower acetification rates when using the entrapment technique could also
be attributed to the growth of cells near the gel surface or the gel radius being too large. For high
acetification rates, the recommended gel radius is 1.0-1.4 mm with dissolved oxygen concentration of
0.031-0.14 mg L-1 (Sun & Furusaki, 1990). Interestingly, positive results were observed with the gel
entrapment technique for Balsamic-styled vinegar production using beads sized 4.5-8.5 mm (Table 2.3)
(Hutchinson et al., 2018). Their observations could be attributed to the microbial consortium of acetic
acid bacteria used, the inoculum size, temperature treatments and several other factors.
In a different study, a loofa sponge (Luffa cylindrica) was used to immobilize cells for the adsorption
of Acetobacter aceti WK cells for corn vinegar production (Krusong & Vichitraka, 2011). The sponge
was cut into small pieces of 1-inch thickness, washed with water and then sterilized by submerging into
4% (v/v) acetic acid for 24 hours prior to being used as a cell support material. The loofa sponge is an
environmentally benign porously structured material composed of lignin, cellulose and hemicellulose
(Demir et al., 2008), which allows for high dissolved oxygen diffusion that eventually makes it an ideal
material for cell immobilization (Krusong & Vichitraka, 2011). For this particular reason, it is widely
grown in the subtropical regions of Korea, China, Brazil, Japan and some areas of Central and South
America (Demir et al., 2008; Tanobe et al., 2014).
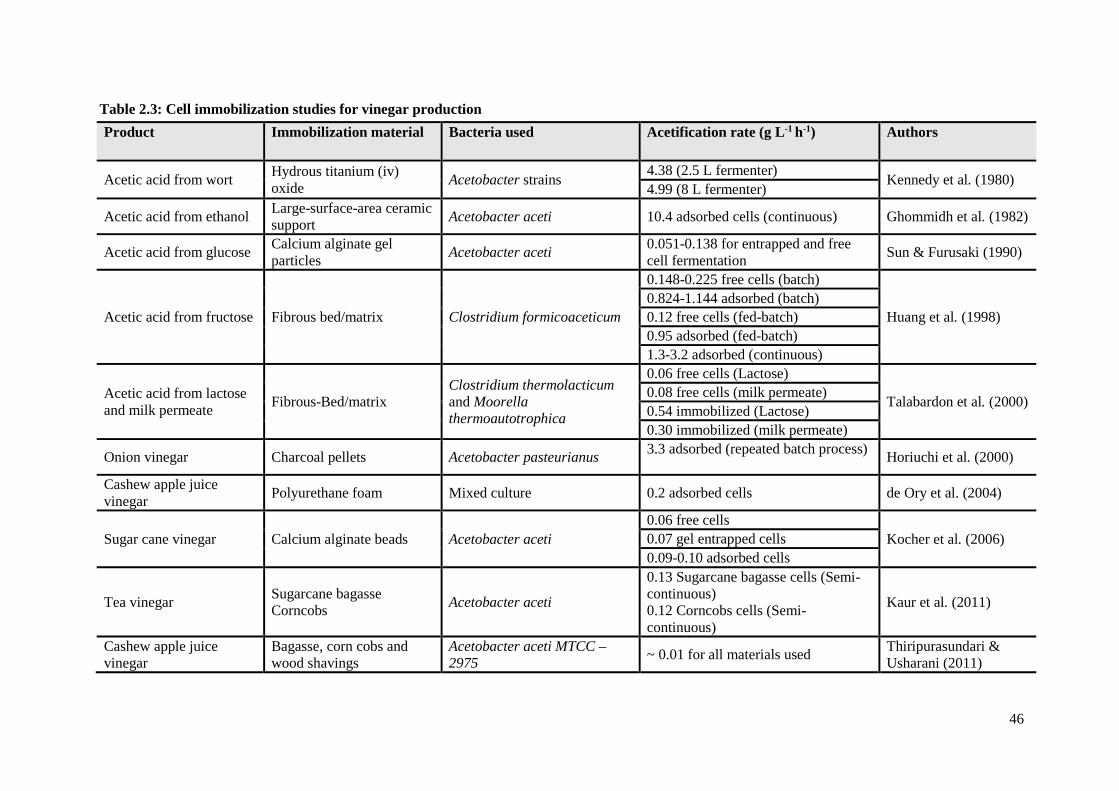
46
Table 2.3: Cell immobilization studies for vinegar production Product Immobilization material Bacteria used Acetification rate (g L-1 h-1) Authors
Acetic acid from wort Hydrous titanium (iv) oxide Acetobacter strains 4.38 (2.5 L fermenter) Kennedy et al. (1980) 4.99 (8 L fermenter)
Acetic acid from ethanol Large-surface-area ceramic support Acetobacter aceti 10.4 adsorbed cells (continuous) Ghommidh et al. (1982)
Acetic acid from glucose Calcium alginate gel particles Acetobacter aceti 0.051-0.138 for entrapped and free
cell fermentation Sun & Furusaki (1990)
Acetic acid from fructose Fibrous bed/matrix Clostridium formicoaceticum
0.148-0.225 free cells (batch)
Huang et al. (1998) 0.824-1.144 adsorbed (batch) 0.12 free cells (fed-batch) 0.95 adsorbed (fed-batch) 1.3-3.2 adsorbed (continuous)
Acetic acid from lactose and milk permeate Fibrous-Bed/matrix
Clostridium thermolacticum and Moorella thermoautotrophica
0.06 free cells (Lactose)
Talabardon et al. (2000) 0.08 free cells (milk permeate) 0.54 immobilized (Lactose) 0.30 immobilized (milk permeate)
Onion vinegar Charcoal pellets Acetobacter pasteurianus 3.3 adsorbed (repeated batch process) Horiuchi et al. (2000)
Cashew apple juice vinegar Polyurethane foam Mixed culture 0.2 adsorbed cells de Ory et al. (2004)
Sugar cane vinegar Calcium alginate beads Acetobacter aceti 0.06 free cells
Kocher et al. (2006) 0.07 gel entrapped cells 0.09-0.10 adsorbed cells
Tea vinegar Sugarcane bagasse Corncobs Acetobacter aceti
0.13 Sugarcane bagasse cells (Semi-continuous) 0.12 Corncobs cells (Semi-continuous)
Kaur et al. (2011)
Cashew apple juice vinegar
Bagasse, corn cobs and wood shavings
Acetobacter aceti MTCC – 2975 ~ 0.01 for all materials used Thiripurasundari &
Usharani (2011)

47
Product Immobilization material Bacteria used Acetification rate (g L-1 h-1) Authors
Corn vinegar Loofa sponge Acetobacter aceti WK 0.18 -0.26 adsorbed cells Krusong & Vichitraka, (2011)
Sugarcane Vinegar Wood shavings Acetobacter aceti AC1 0.24-0.95 adsorbed cells Kocher & Dhillon, 2013
Rice wine vinegar Loofa sponge Acetobacter aceti WK 0.07-0.10 adsorbed cells Krusong & Tantratian (2014)
Barley malt vinegar Calcium alginate beads and agar beads
Gluconobacter oxydans NBRC 3432
0.17 calcium alginate beads Kaushal & Phutela (2017) 0.11 agar beads
Balsamic-styled vinegar Calcium alginate beads Microbial consortium 0.16 Small calcium alginate beads 0.13 Large calcium alginate beads 0.025 Free floating cells
Hutchinson et al. (2018)
48
2.5.4 Overall remarks on cell immobilization Overall, it appears that there are no optimal procedures for the immobilization of AAB cells. However,
it is evident that cell immobilization using adsorption is the most common method. The gel entrapment
method is also common; albeit at a laboratory scale. Additionally, recent studies focusing on cell
immobilization for vinegar engineering are gravely lacking. Based on the reviewed studies, the
immobilization of AAB cells by both entrapment and adsorption improves production rate compared to
free-floating cells, and in most instances, the selection of the materials to use in a fermentation is
important. However, according to most of the reviewed studies, the adsorption of AAB cells to a surface
is more effective compared to gel entrapment. Although the materials or methods for adsorption could
vary, the type of the vinegar being produced and bacteria used is of paramount importance. Employing
cell immobilization for vinegar production also requires an appropriate bioreactor design since
immobilization materials such as alginate beads have a low mechanical strength and can easily be
damaged by impellers and high agitation rates; therefore, this design parameter would have to be taken
into consideration. Ideally, materials used for cell immobilization must be able to resist operating
conditions and mechanical influences. An example is fibrous bed matrices, which have been widely
studied and are well understood in the process engineering industry. Hence, it is reasonable to conclude
that fibrous beds offer a convenient cell immobilization approach.
2.6 Aeration during vinegar production 2.6.1 Importance of aeration during vinegar production Aeration is reasonably recognised and well understood as an important bioreactor performance
parameter for industrial vinegar production. However, this knowledge is frequently directed to a handful
of spirit vinegars and not other varieties. Nonetheless, several studies have reported that oxygen transfer
is the rate-limiting step for vinegar production (Ghommidh et al., 1982; Tesfaye et al., 2002; Qi et al.,
2013; Gullo et al., 2014). This is attributed to AAB being strictly aerobic and requiring high dissolved
oxygen levels to grow optimally and carry-out all the essential activities (Gullo et al., 2014). The
stoichiometry behind the use of oxygen by AAB is that, one mole of oxygen is required for the oxidation
of ethanol to produce one mole of acetic acid (Ghommidh et al., 1982; Qi et al., 2013). This means that,
in most vinegar production processes, a continuous supply of oxygen is a necessity (Garcia-Ochoa &
Gomez, 2009; Garcia-Ochoa et al., 2010). García-García et al., (2009) reported that vinegar
fermentation exhibits an extremely high demand for oxygen to the extent that a 25 m3 vessel at 20°C
with an acetification rate of 2 g L-1 h-1 requires 20 m3 of gaseous oxygen transfer per hour. If the oxygen
concentration is very low, it can slow down the acetification process. Consequently, the oxygen uptake
rate for the AAB used must be known, as this will allow proper control of oxygen in the fermentor. The
primary challenge is the low solubility of oxygen in the fermentation medium during aerobic system
operations such as those used for vinegar fermentation; therefore, it is critical to design a fermentation
49
system that can improve oxygen mass transfer between gaseous and liquid phases (Ghommidh et al.,
1982).
It was also reported that a momentary interruption of oxygen transfer during fermentation could cause
the inhibition of the acetification process. However, at higher acetic acid concentrations above 5%, the
interruption of oxygen transfer was reported to be less detrimental (Gullo et al., 2014), which effectively
highlights the need for adequate oxygen at the initiation of the vinegar engineering process. Schlepütz
et al., (2013) proposed the use of a respiration activity monitoring system (RAMOS) which can assist
in preventing the interruption of oxygen supply. The transfer of oxygen during a fermentation process
requires hydrostatic pressure monitoring and reduced mechanical influences such as stirring speed on
the cells. Other factors to consider when transferring oxygen for vinegar production are the
microorganisms used and their oxygen uptake rate (Schlepütz & Büchs, 2013; Gullo et al., 2014).
2.6.2 Influence of volumetric mass transfer coefficient (kLa) The volumetric mass transfer coefficient (kLa) is an important factor that is generally used to assess the
competency of a bioreactor. Furthermore, kLa is used as an important tool when scaling up for vinegar
production or any aerobic fermentation system (González-Sáiz et al., 2009a). The determination of kLa
depends on several factors such as the geometric parameters of the bioreactor, hydrodynamics, airflow
rates, media properties, morphology of microorganisms used and properties (Moutafchieva et al., 2013).
Several methods are used to determine kLa, these include among others the sodium sulphite oxidation
method and the gassing in method (Sobotka et al., 1982). kLa in shake flasks is determined by the
inclusion of shaking parameters (shaking frequency, shaking diameter) as well as the flask size and
working volume (Seletzky et al., 2007). This means that scaling up from conventional shake flasks to
fermenters is possible. However, several laboratory scale studies for vinegar production often neglect
this factor, subsequently results from these studies are not very useful for industrial scale fermentations
because of the inconsistency of findings when scaling up.
A high value of kLa is one of the primary goals when designing a bioreactor because it is proportional
to the reactor productivity. The aeration capacity of a bioreactor is fundamentally dependent on kLa. For
this reason, several studies have investigated the relationship between airflow rates and kLa during
vinegar production, with Fregapane et al. (1999) reporting improved kLa when airflow rates were
increased for all vessel geometric parameters studied. The highest kLa values of 75-170 h-1 were
obtained when airflow rates of 0.06-0.25 vvm min-1 were employed. Similar correlations were reported
by Krusong et al. (2015), with an airflow rate of 1.1 min-1 in a 25 L bioreactor resulting in a kLa of 106
h-1, while an airflow rate of 3.1 min-1 in a 75 L bioreactor resulting in a kLa of 93 h-1. These studies
accentuate the importance of sufficient airflow rates for high kLa or vice versa, notwithstanding the
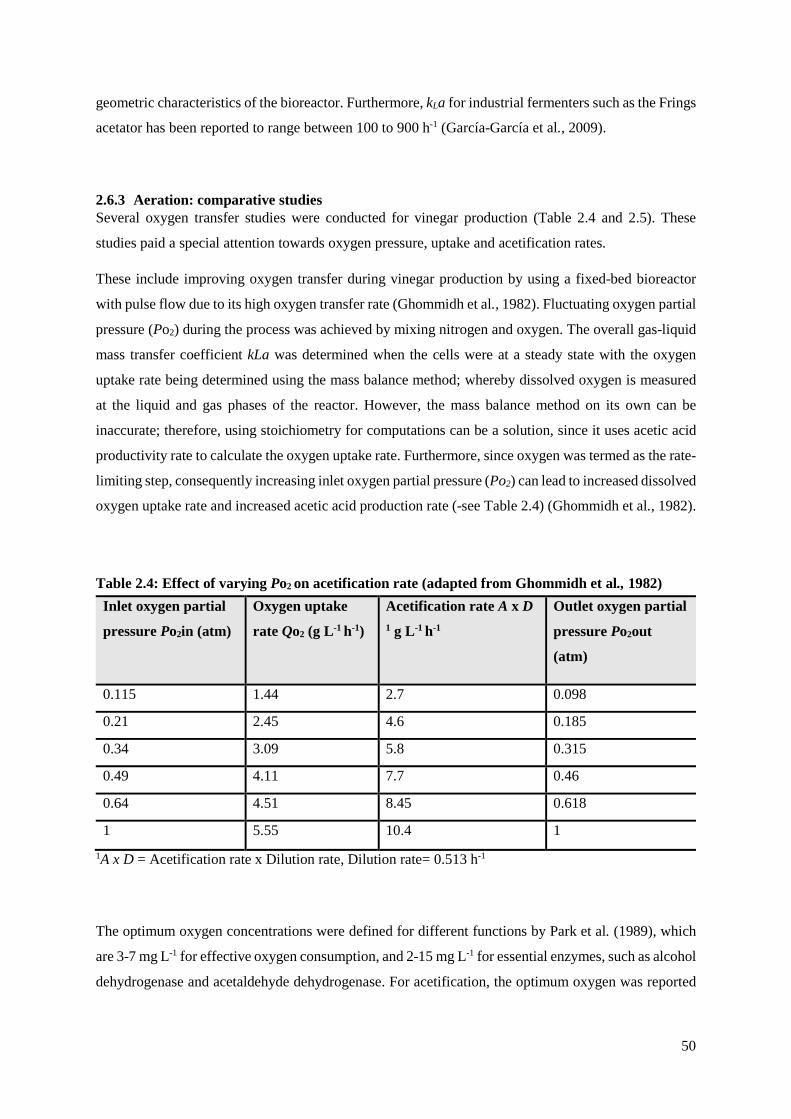
50
geometric characteristics of the bioreactor. Furthermore, kLa for industrial fermenters such as the Frings
acetator has been reported to range between 100 to 900 h-1 (García-García et al., 2009).
2.6.3 Aeration: comparative studies Several oxygen transfer studies were conducted for vinegar production (Table 2.4 and 2.5). These
studies paid a special attention towards oxygen pressure, uptake and acetification rates.
These include improving oxygen transfer during vinegar production by using a fixed-bed bioreactor
with pulse flow due to its high oxygen transfer rate (Ghommidh et al., 1982). Fluctuating oxygen partial
pressure (Po2) during the process was achieved by mixing nitrogen and oxygen. The overall gas-liquid
mass transfer coefficient kLa was determined when the cells were at a steady state with the oxygen
uptake rate being determined using the mass balance method; whereby dissolved oxygen is measured
at the liquid and gas phases of the reactor. However, the mass balance method on its own can be
inaccurate; therefore, using stoichiometry for computations can be a solution, since it uses acetic acid
productivity rate to calculate the oxygen uptake rate. Furthermore, since oxygen was termed as the rate-
limiting step, consequently increasing inlet oxygen partial pressure (Po2) can lead to increased dissolved
oxygen uptake rate and increased acetic acid production rate (-see Table 2.4) (Ghommidh et al., 1982).
Table 2.4: Effect of varying Po2 on acetification rate (adapted from Ghommidh et al., 1982) Inlet oxygen partial
pressure Po2in (atm)
Oxygen uptake
rate Qo2 (g L-1 h-1)
Acetification rate A x D 1 g L-1 h-1
Outlet oxygen partial
pressure Po2out
(atm)
0.115 1.44 2.7 0.098
0.21 2.45 4.6 0.185
0.34 3.09 5.8 0.315
0.49 4.11 7.7 0.46
0.64 4.51 8.45 0.618
1 5.55 10.4 1 1A x D = Acetification rate x Dilution rate, Dilution rate= 0.513 h-1
The optimum oxygen concentrations were defined for different functions by Park et al. (1989), which
are 3-7 mg L-1 for effective oxygen consumption, and 2-15 mg L-1 for essential enzymes, such as alcohol
dehydrogenase and acetaldehyde dehydrogenase. For acetification, the optimum oxygen was reported
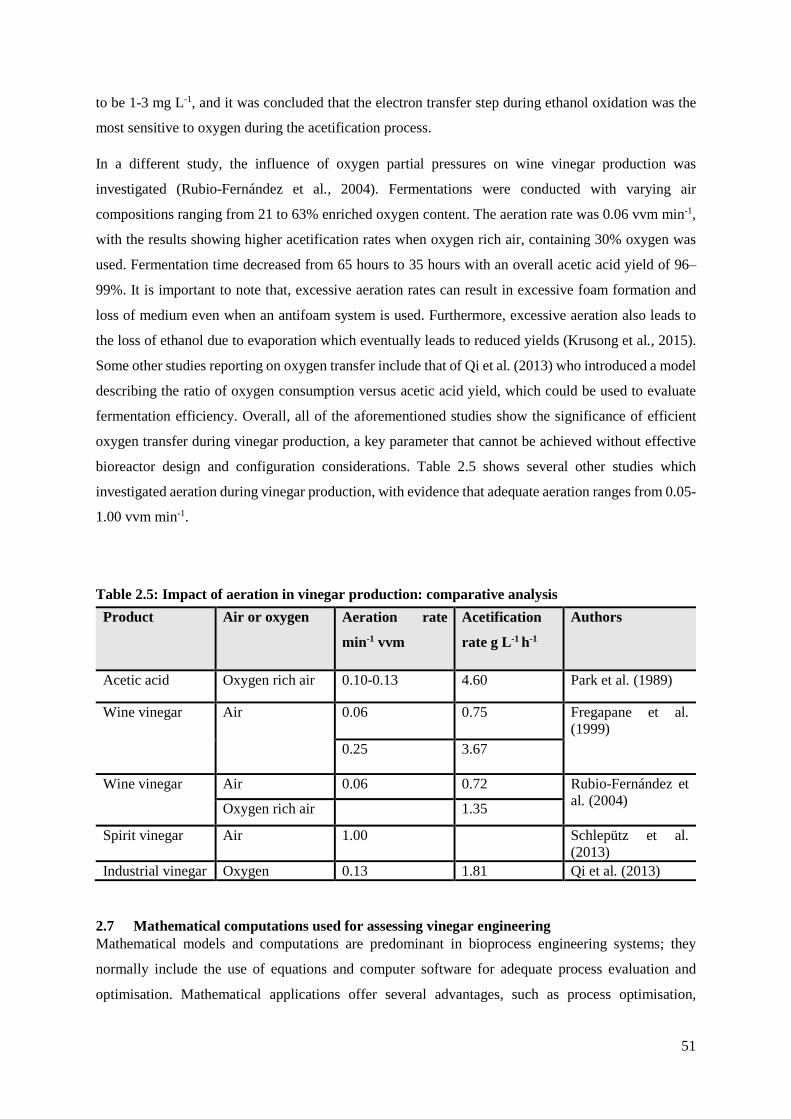
51
to be 1-3 mg L-1, and it was concluded that the electron transfer step during ethanol oxidation was the
most sensitive to oxygen during the acetification process.
In a different study, the influence of oxygen partial pressures on wine vinegar production was
investigated (Rubio-Fernández et al., 2004). Fermentations were conducted with varying air
compositions ranging from 21 to 63% enriched oxygen content. The aeration rate was 0.06 vvm min-1,
with the results showing higher acetification rates when oxygen rich air, containing 30% oxygen was
used. Fermentation time decreased from 65 hours to 35 hours with an overall acetic acid yield of 96–
99%. It is important to note that, excessive aeration rates can result in excessive foam formation and
loss of medium even when an antifoam system is used. Furthermore, excessive aeration also leads to
the loss of ethanol due to evaporation which eventually leads to reduced yields (Krusong et al., 2015).
Some other studies reporting on oxygen transfer include that of Qi et al. (2013) who introduced a model
describing the ratio of oxygen consumption versus acetic acid yield, which could be used to evaluate
fermentation efficiency. Overall, all of the aforementioned studies show the significance of efficient
oxygen transfer during vinegar production, a key parameter that cannot be achieved without effective
bioreactor design and configuration considerations. Table 2.5 shows several other studies which
investigated aeration during vinegar production, with evidence that adequate aeration ranges from 0.05-
1.00 vvm min-1.
Table 2.5: Impact of aeration in vinegar production: comparative analysis Product Air or oxygen Aeration rate
min-1 vvm
Acetification
rate g L-1 h-1
Authors
Acetic acid Oxygen rich air 0.10-0.13 4.60 Park et al. (1989)
Wine vinegar Air
0.06 0.75 Fregapane et al. (1999)
0.25 3.67
Wine vinegar Air 0.06 0.72 Rubio-Fernández et al. (2004) Oxygen rich air 1.35
Spirit vinegar Air 1.00 Schlepütz et al. (2013)
Industrial vinegar Oxygen 0.13 1.81 Qi et al. (2013)
2.7 Mathematical computations used for assessing vinegar engineering Mathematical models and computations are predominant in bioprocess engineering systems; they
normally include the use of equations and computer software for adequate process evaluation and
optimisation. Mathematical applications offer several advantages, such as process optimisation,

52
measuring efficiency, risk assessment, data interpretation, quality assessment and kinetic modelling or
simulation. Table 2.6 lists some mathematical applications in 12 vinegar engineering studies. Virtually
every element of the fermentation system requires the use of mathematics to be properly understood,
and this includes mass transfer (González-Sáiz et al., 2008b, 2009b; Qi et al., 2013), hydrodynamic
effects (González-Sáiz et al., 2009a), chemical developments (Ghosh et al., 2012), microbial growth
(Sun & Furusaki, 1990; González-Sáiz et al., 2008b; Ghosh et al., 2012; Nayak et al., 2015), distillation
(Bakar, 2014), cell immobilization (Sun & Furusaki, 1990), continuous or batch system efficiency
analyses and bioreactor design and configuration. Furthermore, kinetic modelling of a fermentation
process is one of the most common and extensively studied mathematical applications which can be
applied in vinegar engineering; it assists in understanding the behaviour of a fermentation process. The
kinetic models normally simulate and describe the relationship between microbial growth kinetics and
chemical developments in the fermentation vessel over a certain period (Mitchell et al., 2004; González-
Sáiz et al., 2009a).
Modelling microbial growth, substrate consumption and product formation has been done by several
researchers (Sun & Furusaki, 1990; Garrido-Vidal et al., 2003; Pochat-Bohatier et al., 2003; Dobre et
al., 2007; González-Sáiz et al., 2008b; Ghosh et al., 2012; Nayak et al., 2015). However; the models
differ to some degree. For instance, Garrido-Vidal et al., (2003) used quadratic models which included
the stoichiometric rates of oxidation and yield factors for more accurate and realistic process prediction
results. González-Sáiz et al. (2009a) also included stoichiometric coefficients when calculating yield
factors during fermentation. Ghosh et al. (2012) modelled palm juice vinegar using common
mathematical equations such as the Monods and Luedeking-piret models to describe microbial
proliferation during the fermentation process. Some other models include those proposed by
Monteagudo et al. (1997) to model substrate utilization rates. These models are reliable, and they can
easily be rearranged or manipulated to best describe any system, even a continuous fermentation system.
In continuous systems, growth rates, substrate consumption and product formation are modelled or
calculated with the inclusion of dilution rates, substrate feeding and effluent rates (Park et al, 1989; Sun
& Furusaki, 1990; Garrido-Vidal et al., 2003). Additionally, some models on microbial growth include
those developed by Pochat-Bohatier et al. (2003) which can be used to demonstrate mechanical shearing
influences on microbial behaviour.
During industrial vinegar fermentation, stirring is one of the most important mechanical inputs;
however, it can have a positive or detrimental effect. Stirring can affect the microorganisms, while
influencing oxygen transfer during the acetification process. This effect can be studied and
demonstrated, mathematically. This crucial part of the fermentation process has been understudied in
vinegar engineering and the stirring speed (rpm) for vinegar production has not been properly defined.
Thus far, a handful of studies were performed in which mathematical computations were used to
demonstrate the effect of agitation during the fermentation process. González-Sáiz et al. (2009a &

53
2009b) reported on a range of stirring speeds and their effect. The agitation range was between 200 to
1000 rpm. The models showed that maximum microbial growth was achieved at a high agitation speed
of 800 rpm. Additionally, it was reported that agitation higher than 800 rpm caused an inhibitory
shearing effect and cell damage. Heat transferred into the system was calculated while taking into
account the microbial heat generated during ethanol oxidation. It was concluded that the models
proposed in the study could be applied in various aerobic processes with varying agitation systems.
González-Sáiz et al. (2009b) further reported that conditions with very low agitation resulted in failed
fermentations for both experimental and predicted results. In another investigation, Garrido-Vidal et al.
(2003) studied agitation at a much lower range (50 rpm) in comparison to 1000 rpm; quadratic models,
which include agitation, were used and these models showed that agitation, aeration rate and
overpressure have an effect on oxygen transfer. It is also important to note that aeration has been
reported to be more important in increasing oxygen transfer compared to agitation. Additionally,
sparging and very high agitation speeds result in very high economical costs due to high energy inputs
(González-Sáiz et al., 2008b).
Modelling of fermentation processes is normally done using laboratory-scale experiments; however, it
is also crucial to study the scaling-up of the models for large-scale industrial applications. González-
Sáiz et al. (2009a) studied models in a pilot fermenter and the scaling-up of the models for an industrial
fermentation process. The response surfaces generated by the models led to the conclusion that
superficial air velocity, aerated mechanical power input, hydrostatic pressure, temperature and
concentrations of compounds must be similar to the pilot fermentor. Garcia-Ochoa and Gomez (2009)
reported that oxygen transfer rate is the most important parameter for the scaling-up of bioreactors. It
is crucial to ensure homogenous oxygen concentration in the fermentation medium for adequate growth
and acetification rates. Therefore, agitation and aeration are also important parameters in ensuring
homogenous oxygen concentration.
Fortunately, several studies have mathematically studied oxygen mass transfer for vinegar engineering
(Table 2.6). These studies include one by González-Sáiz et al. (2008a) which modelled oxygen transfer
in an oxygen saturated fermentation medium for vinegar production. They described oxygen
concentration using the balance method, which is the balance between the oxygen transferred and the
oxygen uptake rate. Dobre et al. (2007) proposed two models, the first which presumes that acetic acid
formation is influenced by oxygen transfer from the gas to liquid phase, while the other model was
similar to the Monods model, which presumed that acetic acid formation is influenced by substrate
consumption. This study concluded that both models should be used simultaneously. Some other studies
modelled the influence of oxygen transfer on specific growth rate of AAB (Garrido-Vidal et al., 2003).
Another important process parameter to model during vinegar production is the purification of the
product. In most vinegar production processes, pure acetic acid must be obtained at the end of the

54
process. A comprehensive study conducted by Nayak et al., (2015) involved microfiltration and
nanofiltration membranes to purify the product. The models used in this study included the influence
of the filtration methods. Furthermore, the models also incorporated some other important parameters
such as cross flow rates, dilution rates, pH and recycling of materials in correlation with substrate-
product inhibition. It was concluded that the proposed models accurately predicted the performance of
the process.
A unique study conducted by Bakar (2014) entailed the application of mathematical equations to
demonstrate the effect of purifying the fermentation product, using batch distillation columns. The
proposed equations included the calculation of boil-up rate during batch distillation, the average
composition of the total material distilled and component balance for the hold-up tank.
Table 2.6: Studies entailing mathematical computations in vinegar engineering Mathematical and computational assessments undertaken in
vinegar engineering
References
Biomass growth Substrate consumption Product formation Yield factors
Sun & Furusaki (1990); Garrido-
Vidal et al. (2003); Pochat-Bohatier
et al. (2003); Dobre et al. (2007);
González-Sáiz et al. (2008); Ghosh
et al. (2012); Nayak et al. (2015)
Response surface methodology Design of experiment (DOE) software (Matlab 7.3.0.267 R2006b-MathWorks Inc.)
Garrido-Vidal et al. (2003);
González-Sáiz et al. (2008a);
González-Sáiz et al. (2009a); Ghosh
et al. (2012); Bakar (2014)
Oxygen consumption Correlation between gas-liquid transfer and volumetric transfer coefficient Modelling oxygen concentration in an oxygen saturated fermentation medium Modelling volumetric oxygen transfer coefficient Stoichiometric coefficient of oxygen consumption versus acid yield.
Sun & Furusaki (1990); Dobre et al.
(2007); González-Sáiz et al. (2008a
& 2008b); Qi et al. (2013)
Mechanical equations Acid negative influence on bacterial growth
Pochat-Bohatier et al. (2003)
Oxygen flow rate towards wood surface Acetic acid mass balance in packed bed bioreactor Acetic acid mass balance taking into account recycling vessel Acetic acid mass balance without oxygen in liquid phase
Dobre et al. (2007)
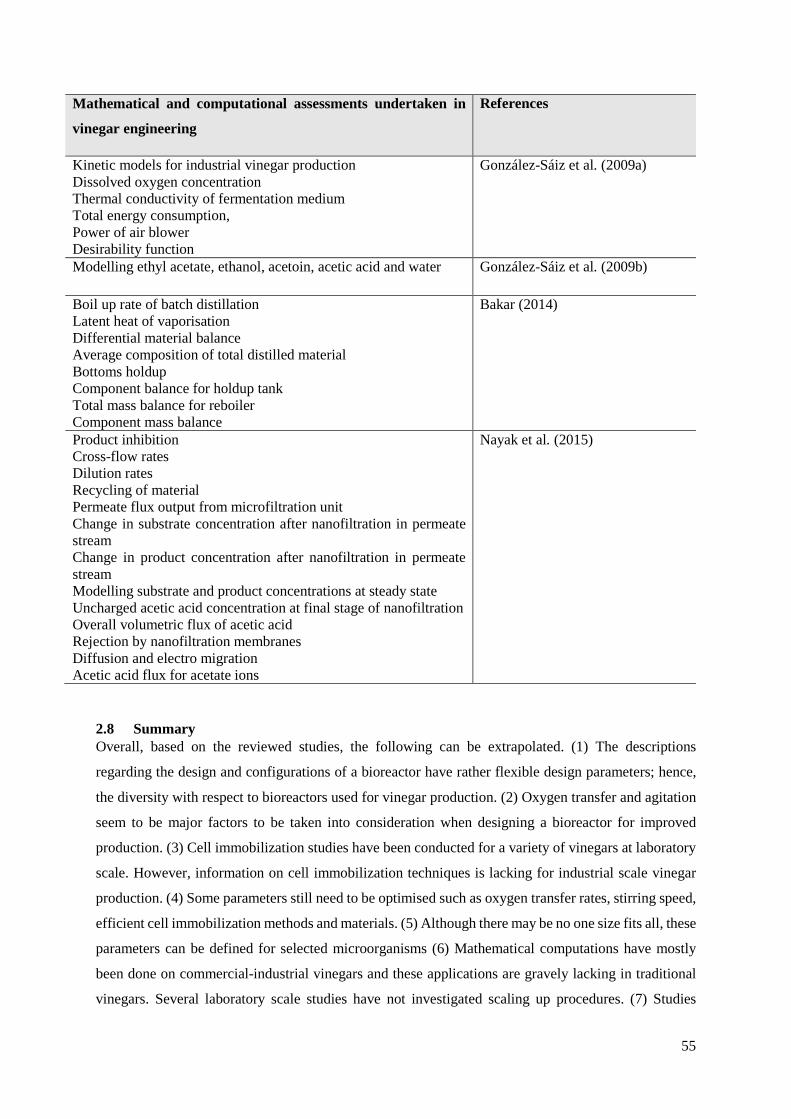
55
Mathematical and computational assessments undertaken in
vinegar engineering
References
Kinetic models for industrial vinegar production Dissolved oxygen concentration Thermal conductivity of fermentation medium Total energy consumption, Power of air blower Desirability function
González-Sáiz et al. (2009a)
Modelling ethyl acetate, ethanol, acetoin, acetic acid and water González-Sáiz et al. (2009b)
Boil up rate of batch distillation Latent heat of vaporisation Differential material balance Average composition of total distilled material Bottoms holdup Component balance for holdup tank Total mass balance for reboiler Component mass balance
Bakar (2014)
Product inhibition Cross-flow rates Dilution rates Recycling of material Permeate flux output from microfiltration unit Change in substrate concentration after nanofiltration in permeate stream Change in product concentration after nanofiltration in permeate stream Modelling substrate and product concentrations at steady state Uncharged acetic acid concentration at final stage of nanofiltration Overall volumetric flux of acetic acid Rejection by nanofiltration membranes Diffusion and electro migration Acetic acid flux for acetate ions
Nayak et al. (2015)
2.8 Summary Overall, based on the reviewed studies, the following can be extrapolated. (1) The descriptions
regarding the design and configurations of a bioreactor have rather flexible design parameters; hence,
the diversity with respect to bioreactors used for vinegar production. (2) Oxygen transfer and agitation
seem to be major factors to be taken into consideration when designing a bioreactor for improved
production. (3) Cell immobilization studies have been conducted for a variety of vinegars at laboratory
scale. However, information on cell immobilization techniques is lacking for industrial scale vinegar
production. (4) Some parameters still need to be optimised such as oxygen transfer rates, stirring speed,
efficient cell immobilization methods and materials. (5) Although there may be no one size fits all, these
parameters can be defined for selected microorganisms (6) Mathematical computations have mostly
been done on commercial-industrial vinegars and these applications are gravely lacking in traditional
vinegars. Several laboratory scale studies have not investigated scaling up procedures. (7) Studies

56
demonstrating the effect of hydrodynamics and mechanical influences/fermentation vessel design
during vinegar production are scanty; therefore, these topics require more attention. Moreover, there is
a necessity for studies, which will define a standard method for the production of different types of
vinegar.
57
CHAPTER 3
MATERIALS AND METHODS

58
3 CHAPTER 3
MATERIALS AND METHODS
3.1 Experimental methods for all phases 3.1.1 Preparation of fermentation medium Frozen Chenin blanc grape must (22°Brix) obtained from the Agricultural Research Council
(Nietvoorbij, Stellenbosch, SA) was thawed at 28°C. After thawing the grape must boiled using a double
jacketed steam pot (S.W.18, Aluminium Plant and Vessel Co. Ltd., London, UK) until a sugar
concentration of 30 °Brix was obtained. The grape must was aliquoted into Erlenmeyer flasks (Table
3.1), covered with cotton wool stoppers, subsequent to autoclaving at 120 °C for 20 min. After
autoclaving, the grape must was analyzed chemically for sugar (°B), pH, alcohol (% v/v) and total
acidity (g L−1) using a density meter (Density meter DMA 35, Anton Paar, Graz, Austria), pH meter
(Metrohm pH meter 632, Herisau, Switzerland), alcolyzer (Anton Paar, Graz, Austria) and minititrator
(Hanna instruments minititrator HI 84502, Johannesburg, South Africa); respectively.
Table 3.1 Fermentation working volumes used for each phase of the study. Volumes (L) Erlenmeyer sizes (L)
Phase 1 0.35 0.5
Phase 2 3.00 3.0
Phase 3 0.35 0.5
Phase 4 1.50 2.0
3.1.2 Pre-culture preparation Cryopreserved non-Saccharomyces yeast (n=5) and acetic acid bacteria (AAB, n=5) (Table 3.2 & 3.3)
cultures were obtained from the ARC Infruitec-Nietvoorbij culture collection. The yeast and bacteria
cultures were individually grown in YPD (Merck, Modderfontein, South Africa) and in GM broth
(glucose 0.8%, mannitol 1.7%, peptone 0.3%, yeast extract 0.5%) (Merck, Modderfontein, South
Africa), respectively. Volumes of YPD and GM broth used for each phase of the study are shown in
Table 3.4. The yeast and bacteria inoculums were incubated at 28 °C for 48 and 72 h respectively, prior
to inoculation.
The non-Saccharomyces yeasts were selected based on a previous screening investigation. The yeast
used in this study were selected due to high acid formation on calcium carbonate agar plates, desired
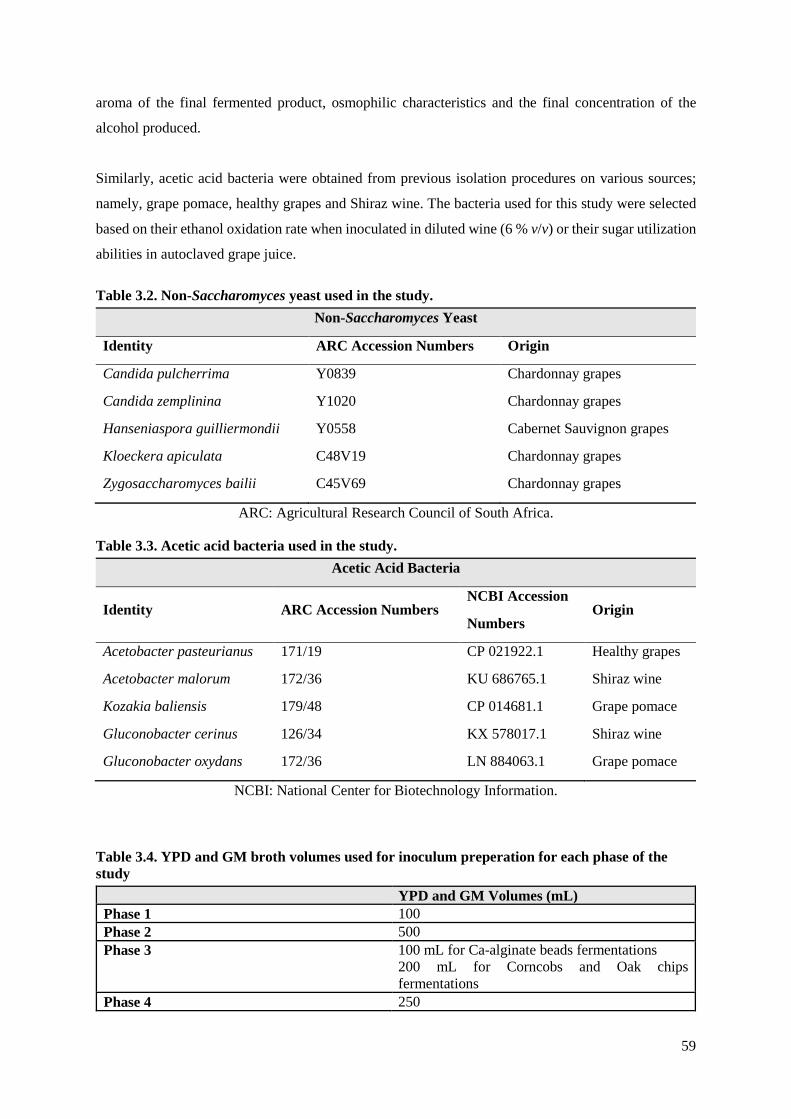
59
aroma of the final fermented product, osmophilic characteristics and the final concentration of the
alcohol produced.
Similarly, acetic acid bacteria were obtained from previous isolation procedures on various sources;
namely, grape pomace, healthy grapes and Shiraz wine. The bacteria used for this study were selected
based on their ethanol oxidation rate when inoculated in diluted wine (6 % v/v) or their sugar utilization
abilities in autoclaved grape juice.
Table 3.2. Non-Saccharomyces yeast used in the study. Non-Saccharomyces Yeast
Identity ARC Accession Numbers Origin
Candida pulcherrima Y0839 Chardonnay grapes
Candida zemplinina Y1020 Chardonnay grapes
Hanseniaspora guilliermondii Y0558 Cabernet Sauvignon grapes
Kloeckera apiculata C48V19 Chardonnay grapes
Zygosaccharomyces bailii C45V69 Chardonnay grapes
ARC: Agricultural Research Council of South Africa.
Table 3.3. Acetic acid bacteria used in the study. Acetic Acid Bacteria
Identity ARC Accession Numbers NCBI Accession
Numbers Origin
Acetobacter pasteurianus 171/19 CP 021922.1 Healthy grapes
Acetobacter malorum 172/36 KU 686765.1 Shiraz wine
Kozakia baliensis 179/48 CP 014681.1 Grape pomace
Gluconobacter cerinus 126/34 KX 578017.1 Shiraz wine
Gluconobacter oxydans 172/36 LN 884063.1 Grape pomace
NCBI: National Center for Biotechnology Information.
Table 3.4. YPD and GM broth volumes used for inoculum preperation for each phase of the study
YPD and GM Volumes (mL) Phase 1 100 Phase 2 500 Phase 3 100 mL for Ca-alginate beads fermentations
200 mL for Corncobs and Oak chips fermentations
Phase 4 250

60
3.2 Phase 1-Chapter 4 methods: Cell immobilization by Gel Entrapment in Ca-alginate Beads for Balsamic-styled Vinegar Production
3.2.1 Calcium alginate infused YPD and GM preparation A volume of 500 mL YPD and GM broths were prepared in a beaker. This was followed by preparing
a 3% (w/v) alginate solution by dissolving 15 g of sodium alginic salt (Biolab, Merck, South Africa)
into the YPD and GM broth solutions, respectively. The alginate infused YPD and GM broth solutions
were autoclaved at 120°C for 20 min.
3.2.2 Cell immobilization: Small vs Large beads Yeast and AAB cells were harvested by centrifugation of the liquid pre-cultures. The yeast and AAB
cells were transferred to 250 mL YPD-alginate and GM-alginate solutions, respectively, and thoroughly
mixed. Small (4.5 mm) beads (Fig. 3.1B) were prepared by extruding the alginate+broth solutions
infused with cells through a 10 mL syringe. The beads were formed when a drop of the solution came
into contact with a 0.9% (w/v) sterile calcium chloride solution (Biolab, Merck, South Africa). The
larger (8.5 mm) beads (Fig. 3.1A) were prepared by extruding the alginate solutions infused with cells
through a large 10 mL plastic pipette tip, which was obtained by cutting off the edge of the tip. Both
small and large beads were allowed to properly solidify for an hour in the calcium chloride solution
(Kocher et al., 2006; Kaushal & Phutela, 2017).
Figure 3.1 (A) Large beads (8.5 mm) in calcium chloride solution, (B) Small beads (4.5 mm) on a sterile strainer.
3.2.3 Inoculation An inoculum size of 2% (v/v) was used for both immobilized and free-floating cell fermentations.
Immobilized cell fermentations were inoculated by dropping 20 mL of yeast and AAB beads,
respectively into the fermentation containers. The YPD and GM alginate solutions contained ~30%
cells and therefore 20 mL of beads in 350 mL fermentation medium, making ~2% inoculum (Fig. 3.2A
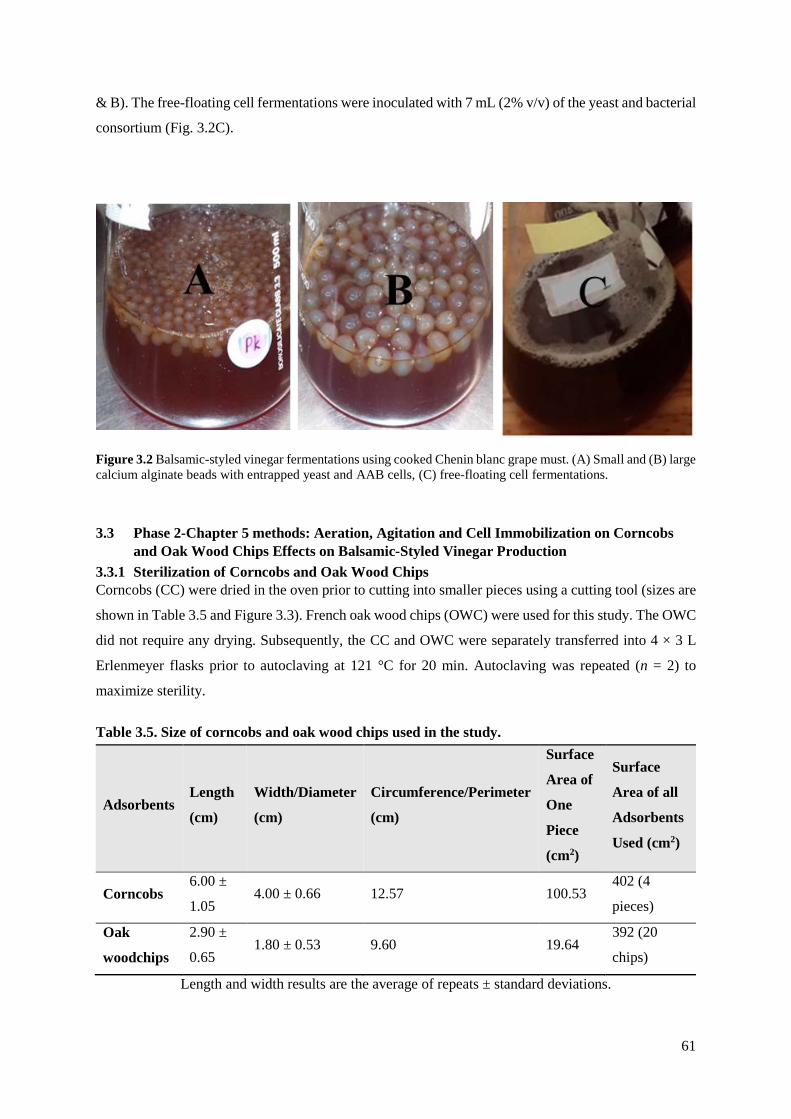
61
& B). The free-floating cell fermentations were inoculated with 7 mL (2% v/v) of the yeast and bacterial
consortium (Fig. 3.2C).
Figure 3.2 Balsamic-styled vinegar fermentations using cooked Chenin blanc grape must. (A) Small and (B) large calcium alginate beads with entrapped yeast and AAB cells, (C) free-floating cell fermentations.
3.3 Phase 2-Chapter 5 methods: Aeration, Agitation and Cell Immobilization on Corncobs and Oak Wood Chips Effects on Balsamic-Styled Vinegar Production
3.3.1 Sterilization of Corncobs and Oak Wood Chips Corncobs (CC) were dried in the oven prior to cutting into smaller pieces using a cutting tool (sizes are
shown in Table 3.5 and Figure 3.3). French oak wood chips (OWC) were used for this study. The OWC
did not require any drying. Subsequently, the CC and OWC were separately transferred into 4 × 3 L
Erlenmeyer flasks prior to autoclaving at 121 °C for 20 min. Autoclaving was repeated (n = 2) to
maximize sterility.
Table 3.5. Size of corncobs and oak wood chips used in the study.
Adsorbents Length
(cm)
Width/Diameter
(cm)
Circumference/Perimeter
(cm)
Surface
Area of
One
Piece
(cm2)
Surface
Area of all
Adsorbents
Used (cm2)
Corncobs 6.00 ±
1.05 4.00 ± 0.66 12.57 100.53
402 (4
pieces)
Oak
woodchips
2.90 ±
0.65 1.80 ± 0.53 9.60 19.64
392 (20
chips)
Length and width results are the average of repeats ± standard deviations.

62
Figure 3.3 Corncobs and oak wood chips used in the study, (A) corncobs after autoclaving (B) oak wood chips in cooked grape must.
Yeast and bacteria were immobilized separately due to their difference in cell size. Furthermore, the
differences in turbidity of the broth after yeast and bacteria cell growth was assumed to be a factor that
might affect cell adsorption between the yeasts and bacteria.
3.3.2 Cell Immobilization on Corncobs and Oak Wood Chips After yeast and bacteria were fully-grown, the inoculums were mixed resulting in a 2 L consortium of
yeast and bacteria (Tables 3.2 and 3.3) (NB: yeast and bacteria consortiums were initially in separate
flasks). Subsequently, 1 L of the yeast consortium was transferred into 3 L Erlenmeyer flasks, one
containing CC and another one containing OWC. The same procedure was performed using the
bacterial consortium. The yeast and bacterial cells were allowed to adsorb onto the surface of CC and
OWC (serving as a solid support surface/bed) overnight at 28 °C.
3.3.3 Quantification of Cells Adsorbed on Corncobs and Oak Wood Chips Prior- and Post-Fermentation
The number of cells adsorbed on the CC and OWC for individual yeasts and bacteria were quantified
using the dry cell weight method adapted from Stone et al. (1992) and Nguyen et al. (2009), with minor
modifications. Prior to this, the yeast and bacterial cell concentration (Tables 3.2 and 3.3) in liquid
suspension were individually quantified following the procedure described in Hutchinson et al. (2019a).
Furthermore, the yeast and bacteria were individually studied to assess the variations in cell adsorption
capabilities. Yeast and bacteria were grown individually following the procedure described in Section
2.2. Subsequently, the yeast and bacteria cells were individually adsorbed onto the CC and OWC
following the procedure described in Section 2.4. CC and OWC were removed from the broth and dried
in an oven set at 40 °C. The adsorbents were weighed daily until a stationery weight was reached.
To assess the quantity of cells adsorbed post fermentation, the CC and OWC were transferred into grape
must and allowed to ferment for 20 days. Subsequently, the adsorbents were extracted and dried at 40
A B

63
°C until a stationery weight was reached. To determine the number of cells adsorbed for the procedures,
the difference of the weight of the adsorbents prior and post adsorption was computed.
3.3.4 Inoculation After the adsorption process, the OWC and CC were extracted from the broth and allowed to dry for 4
h. A 3 L fermentation volume was used for this study. Four pieces of corncobs (2 pieces’ yeast, 2 pieces
Acetic Acid Bacteria) (Table 3.5) were used for inoculation in one flask. Twenty pieces of oak wood
chips (Fig. 3.3B) were used for inoculation in another flask (10 pieces’ yeast, 10 pieces AAB) (Table
3.5).
3.3.4.1 Static vs. Agitated Fermentations Static and agitated fermentations were both incubated at 28 °C with agitated fermentations at 135 rpm.
Agitated fermentations were conducted using an orbital shaker (FMH 200, FMH Instruments, Cape
Town, South Africa). Under both static and agitated conditions, CC, OWC and FFC fermentations were
conducted in triplicate.
3.3.5 Effect of Aeration Air pumps (Resun® AC 9906, Longgang, Shenzhen, China) were used to sparge air into the Erlenmeyer
flasks at different airflow rates, i.e., low aeration (LA = 0.15 vvm min−1) and high aeration (HA = 0.30
vvm min−1). Erlenmeyer flasks were covered with loose cotton wool stoppers and fermentations were
conducted in triplicate.
3.4 Phase 3-Chapter 6 methods: Reusability and sensory effects of immobilized cells for subsequent balsamic-styled vinegar fermentations
3.4.1 Calcium alginate infused YPD and GM preparation Calcium alginate infused YPD and GM solutions were prepared following the protocol described in
3.2.1.
3.4.2 Cell immobilization: gel entrapment The cell entrapment technique was also conducted using a modified method adapted from Hutchinson
et al. (2018). Yeast and AAB cells were harvested by centrifugation and transferred into a YPD-alginate
and GM-alginate solutions (250 mL), respectively, prior to mixing thoroughly. The YPD and GM
alginate solutions infused with cells were mixed to form a single homogenous suspension.
Subsequently, the Ca-alginate beads were formed by extruding the alginate solution infused with cells
through a syringe into a cold 0.9% (w/v.) sodium chloride (NaCl2) solution (Biolab, Merck, South
Africa). Each bead contained both yeast and AAB cells in contrast to the original method described in
3.2.2, whereby yeast and AAB cells were entrapped in separate Ca-alginate beads. The Ca-alginate
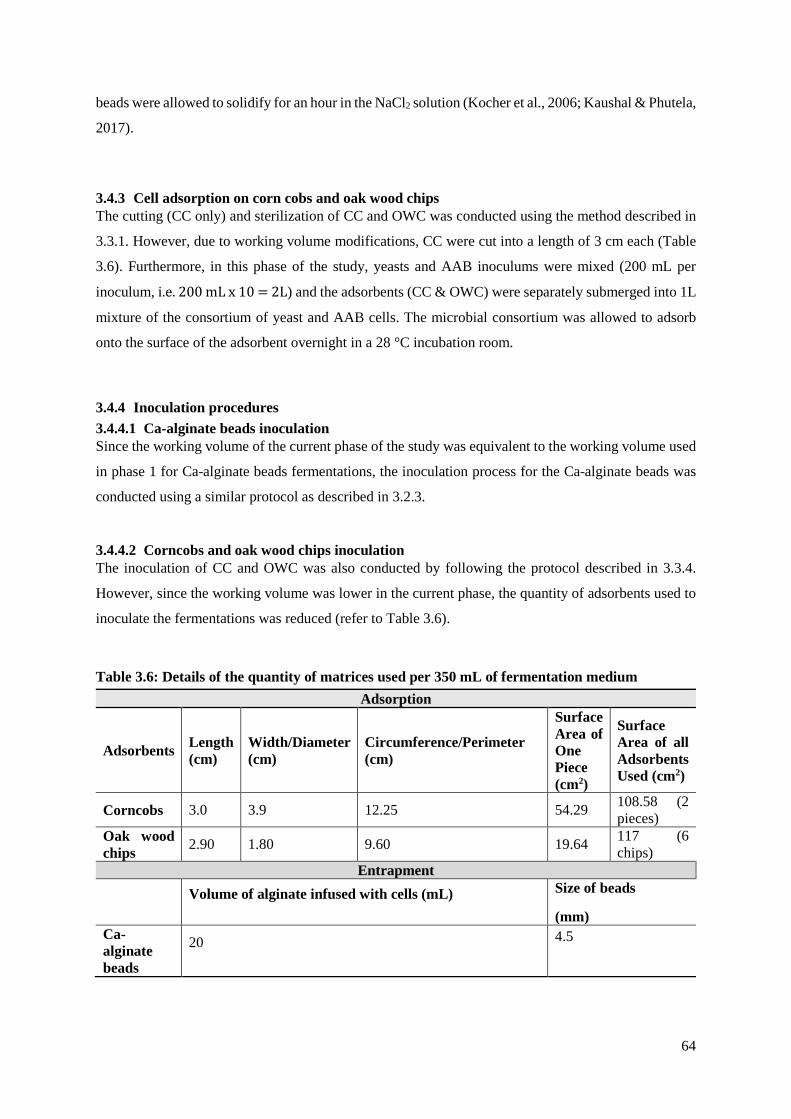
64
beads were allowed to solidify for an hour in the NaCl2 solution (Kocher et al., 2006; Kaushal & Phutela,
2017).
3.4.3 Cell adsorption on corn cobs and oak wood chips The cutting (CC only) and sterilization of CC and OWC was conducted using the method described in
3.3.1. However, due to working volume modifications, CC were cut into a length of 3 cm each (Table
3.6). Furthermore, in this phase of the study, yeasts and AAB inoculums were mixed (200 mL per
inoculum, i.e. 200 mL x 10 = 2L) and the adsorbents (CC & OWC) were separately submerged into 1L
mixture of the consortium of yeast and AAB cells. The microbial consortium was allowed to adsorb
onto the surface of the adsorbent overnight in a 28 °C incubation room.
3.4.4 Inoculation procedures 3.4.4.1 Ca-alginate beads inoculation Since the working volume of the current phase of the study was equivalent to the working volume used
in phase 1 for Ca-alginate beads fermentations, the inoculation process for the Ca-alginate beads was
conducted using a similar protocol as described in 3.2.3.
3.4.4.2 Corncobs and oak wood chips inoculation The inoculation of CC and OWC was also conducted by following the protocol described in 3.3.4.
However, since the working volume was lower in the current phase, the quantity of adsorbents used to
inoculate the fermentations was reduced (refer to Table 3.6).
Table 3.6: Details of the quantity of matrices used per 350 mL of fermentation medium Adsorption
Adsorbents Length (cm)
Width/Diameter (cm)
Circumference/Perimeter (cm)
Surface Area of One Piece (cm2)
Surface Area of all Adsorbents Used (cm2)
Corncobs 3.0 3.9 12.25 54.29 108.58 (2 pieces)
Oak wood chips 2.90 1.80 9.60 19.64 117 (6
chips) Entrapment
Volume of alginate infused with cells (mL)
Size of beads
(mm) Ca-alginate beads
20
4.5
65
3.4.5 Second cycle fermentations 3.4.5.1 Ca-alginate beads After the completion of the 1st fermentation cycle, Ca-alginate beads were removed from the
fermentation flasks using a sterile strainer and carefully rinsed with sterile distilled water. Subsequently,
the Ca-alginate beads were inoculated into 3 x 350 mL cooked grape must (30°Brix) and incubated at
28°C for the second cycle of fermentations.
3.4.5.2 Corncobs and oak wood chips Similarly, CC and OWC were removed from the fermentation flasks using a sterile strainer. The
adsorbents were allowed to dry off any residual liquids from the 1st cycle of fermentation. The
adsorbents were then transferred into 3 x 350 mL cooked grape must (30°Brix) and incubated at 28°C
for the second cycle of fermentations.
3.4.6 Evaluation of the integrity of the immobilization matrices Before and after the 1st cycle of fermentations, all the matrices were evaluated using the scanning
electron microscope (SEM) (Thermo Fisher Nova NanoSEM 230 with a field emission gun (FEG),
Eindhoven, Netherlands,). Ca-alginate beads were transferred into 1.5 mL Eppendorf microtubes
containing 2.5 % glutaraldehyde and kept in a fridge for approximately 8 hrs. Thereafter, glutaraldehyde
was discarded, and the samples underwent a dehydration procedure by submerging the beads through a
series of alcohol concentrations starting from 30%, 40%, 50%, 60%, 70%, 90%, 95% to 100 % (v/v.).
The samples were placed in the alcohol for 5 minutes for each step. Subsequently, samples were air
dried for a few hours before SEM analyses. While CC and OWC were allowed to dry for 24 hrs before
SEM analyses. Ca-alginate beads, CC and OWC were mounted on top of 10 mm aluminium pin stubs
(Agar Scientific, Essex, United Kingdom) coated with carbon glue (Agar Scientific). All samples were
sputter coated with carbon (Agar Scientific) using a vacuum evaporator for 90 seconds. The samples
were then scanned under the SEM using several magnifications at an acceleration voltage of 20 kV.
Additionally, the size of beads was measured using a light microscope (Leica Wild M400, Wetzlar,
Germany) to evaluate bead size reduction.
3.4.7 Sensory evaluations At the end of the 1st cycle fermentations, all cell immobilization matrices were removed from the BSV
products, subsequent to centrifuging the vinegars to remove residual debris. Vinegars were kept at
ambient temperature before organoleptic evaluations were conducted. The vinegars were evaluated by
sixteen judges (male, female, 20-56 years old) from the Agricultural Research Council (South Africa)
who were trained using commercial balsamic vinegars. The commercial vinegars were predominantly
purchased from the major supermarket chains in Stellenbosch (Spar, Checkers, Woolworths, Pick ‘n
Pay) and they include the Balsamic Vinegar of Modena. The “Check All That Applies” (CATA)

66
(Adams et al., 2007; Pramudya & Seo, 2018) method was used to evaluate the vinegars. Evaluated
sensory descriptors were Appearance-Colour; Appearance-Viscosity; Appearance-Clarity; Overall
aroma intensity; Aroma & Flavour description; Taste-sweet/acid; Acid-sugar balance; After taste; After
taste persistence and the Liking rating with 49 sub-categories for all main categories. The data obtained
was compared with 30 commercial balsamic vinegars (identities not disclosed) which were also
evaluated by the same judges (NB: six vinegars were evaluated per day). The aim of using this method
was to compare the produced BSV to commercially available balsamic vinegars in South Africa.
3.5 Phase 4-Chapter 7 methods: Oxygen mass transfer kinetics during Balsamic-styled vinegar production production
3.5.1 Bioreactor description and fermentation set up Fermentations were conducted in triplicate using 2 L batch bioreactors with a working volume of 1.5
L. Both non-aerated and aerated fermentations were carried-out at 28°C. Aerated fermentations were
aerated using air pumps (Resun® AC 9906, Longgang, Shenzhen, China) at an airflow rate of 0.15 vvm
min-1. Non-aerated bioreactors were covered with loose cotton wool stoppers to partially mimic surface
culture methods. Only cells entrapped in Ca-alginate beads and cells adsorbed on CC were studied in
this chapter due to high acetification rates observed in previous phases. Due to the working volume
used in the current study, inoculum sizes were therefore adjusted accordingly.
3.5.2 Dissolved oxygen and microbial respiration rate quantification To quantify DO, an oxygen microsensor (Unisense µsensor Opto F1 UniAmp, Aarhus, Denmark) was
used at 5-day intervals for both aerated and non-aerated fermentations. The dynamic method was used
to measure the respiratory activity/ oxygen uptake rate (OUR) of the microbial consortium of yeasts
and AAB (Garcia-Ochoa et al., 2010). This method was performed by stopping the gaseous oxygen
flow in the inlets of the batch bioreactors for 5 minutes (Tribe et al., 1995; Singh 1996; Garcia-Ochoa
et al., 2010). During that period, the DO was measured using an oxygen microsensor. At this point, the
OUR was determined based on the reduction of oxygen after the oxygen was interrupted (Singh 1996;
Bandyopadhyay et al., 2009, Garcia-Ochoa et al., 2010). Subsequently, the oxygen was reintroduced
into the system while maintaining the same OTR. This method was used with 2 assumptions: (1) the
microbial consortium was not affected during the interruption and maintained the same respiratory
activity, (2) there was no exchange of oxygen between the liquid and gas phase during the interruption
(Garcia-Ochoa et al., 2010).
Furthermore, non-aerated fermentations were also evaluated for respiratory activity with the assumption
that low quantities of dissolved oxygen are constantly introduced into the bioreactor through the loose
cotton wool stoppers. The oxygen probe was inserted into the bioreactor for 5-10 minutes for each
bioreactor to monitor the dissolved oxygen profile/kinetics during several fermentation stages.
67
3.5.3 Quantifying microbial respiration using the Speedy Breedy The Speedy Breedy (BACTEST Ltd, Colchester, United Kingdom) was used as an extra tool to compute
the respiration activity of the microbial consortium used during BSV fermentation. The Speedy Breedy
is a respirometer that measures respiratory activity by recording the changes in pressure as a result of
gaseous exchanges caused by microbial respiration in a closed (aerobic or anaerobic) culture chamber
(Miller, 2019). To monitor the respiratory activity in the current study, free floating cells (FFC) of yeast
and AAB were inoculated into cooked grape must (2 x 1.5 L) using the methods described by
Hutchinson et al. (2018) & (2019b). During fermentation, samples were withdrawn and aliquoted into
the Speedy Breedy chambers (aerobic) for evaluations. The Speedy Breedy was set at conditions similar
to the CC and OWC fermentations. i.e. 28°C and static. Since the Speedy Breedy can only measure
respiratory activity for a maximum of 5 days. Samples were therefore withdrawn from the FFC
fermentations bioreactors at the following stages: the 1st set was evaluated from day 0 to 4, the 2nd set
was day 5 to 10 and the 3rd set was day 11 to 15. This was done in order to evaluate the respiratory
activity at different fermentation stages.
3.6 Phase 1, 2, 3 & 4 3.6.1 Batch fermentation setup and sampling All fermentation treatments (in triplicate) were incubated at 28°C for all phases of the study. Samples
were analysed on a weekly basis (5-7 days intervals) for chemical developments, these include sugar
consumption (°Brix), alcohol fluctuations (% v/v.), total acid formation (g L-1) and pH using a density
meter (Density meter DMA 35, Anton Paar, Graz, Austria), Alcolyzer (Alcolyzer Wine M, Anton Paar,
Graz, Austria), minititrator (Hanna instruments minititrator HI 84502, Johannesburg, South Africa) and
pH meter (Metrohm pH meter 632, Herisau, Switzerland), respectively. All concentrations were
converted to g L-1 for consistency in reporting where applicable.
3.6.2 Data Handling Data was analyzed and computed using Microsoft Excel v2016 (Microsoft, Redmond, Washington, DC,
USA). Substrate (S) (sugar) consumption rates and product (P) (acetic acid) formation rates were
calculated using Equations (3.1) and (3.2) respectively, with an assumption that the initial reaction rate
determines the overall fermentation rate. NB: change in time (t) was expressed as dt for both equations.
Furthermore, relative differences as employed in other studies (Hutchinson et al., 2019a; Saltini &
Akkerman, 2012) were calculated using Equations (3.3) and (3.4) in order to show the significance of
the differences observed under the different conditions studied. The data from the CATA questions
(phase 3) were analysed by correspondence analysis (CA) to produce a bi-dimensional representation
(biplot) of the vinegar samples and the relationship between samples and attributes of the CATA
questions. The CA was performed using XLSTAT (Version 2015.1.03.15485, Addinsoft, Paris). All
68
results are an average of three biological repeats accounting for standard deviations which were
calculated using Microsoft Excel v2016.
𝑟𝑟𝑠𝑠 =𝑑𝑑𝑑𝑑𝑑𝑑𝑑𝑑
Eq.3.1
𝑟𝑟𝑝𝑝 =𝑑𝑑𝑑𝑑𝑑𝑑𝑑𝑑
Eq. 3.2
Absolute difference = Amount of increase− Reference amount Eq.3.3
Relative difference =Absolute differenceReference amount
× 100 Eq. 3.4

69
CHAPTER 4
Cell immobilization by Gel Entrapment in Ca-alginate Beads for Balsamic-styled Vinegar
Production
Published as: Hutchinson, U.F.; Ntwampe, S.K.O.; Ngongang, M.M.; Du Plessis, H.W.; Chidi, B.S.; Saulse, C.; Jolly, N.P. Cell immobilization by Gel Entrapment in Ca-alginate Beads for Balsamic-styled Vinegar Production. In Proceedings of the 10th International Conference on Advances in Science, Engineering, Technology & Healthcare (ASETH-18), Cape Town, South Africa, 19–20
November 2018.

70
4 CHAPTER 4
Cell immobilization by Gel Entrapment in Ca-alginate Beads for Balsamic-styled Vinegar
Production
4.1 Introduction Traditional Balsamic Vinegar (TBV) is produced by fermenting cooked (concentrated) grape must of
the grape varieties of Trebbiano or Lambrusco (Solieri et al., 2006; Giudici & Rinaldi, 2007) in barrels.
The traditional method involves the use of an undefined/spontaneous inoculum by means of surface
culture methods and the vinegar is matured for a minimum of 12 years after fermentation (Solieri et al.,
2006; Giudici & Rinaldi, 2007; Solieri & Giudici, 2008; Chinnici et al., 2016). TBV can only be
produced in Italy, in the provinces of Modena and Reggio Emilia. Therefore, any balsamic vinegar
produced outside the demarcated areas cannot be called TBV. Thus, the term, Balsamic-styled vinegar
(BSV) was adopted for the vinegars in this investigation, where submerged methods such as agitation
and cell immobilization by gel entrapment are investigated. Cell immobilization refers to the physical
confinement or restriction of cells from being mobile or free-floating in the fermentation vessel (De
Ory et al., 2004). Several vinegar studies have reported that cell immobilization reduces microbial
sensitivity to harsh environmental conditions i.e. high acid, low pH, high sugar, low water activity and
osmotic stress in the fermentation vessel, thus improving acetification rates (Kocher et al., 2006;
Krusong & Vichitraka, 2011; Kumar et al., 2016; Żur et al., 2016). Cell immobilization is performed
using various techniques, which include entrapment in a gel/within a porous matrix, flocculation
(natural flocculation/aggregation, artificial flocculation/cross-linking), immobilization on a solid
surface (adsorption on a surface, electrostatic binding on a surface or covalent binding on a surface),
and mechanical containment behind a barrier (microencapsulation, interfacial microencapsulation,
containment between microporous membranes) (Kourkoutas et al., 2004). However, encapsulation
within a gel and adsorption to a surface have been the most studied methods in vinegar fermentation
systems (De Ory et al., 2004). Regardless of the techniques, cell immobilization has never been studied
for any Balsamic vinegar fermentation. Thus, the aim of this study was to immobilize cells by gel
entrapment and to evaluate the effect of bead size/surface area and agitation on acetification.
4.2 Objectives • To investigate two different sizes of Ca-alginate beads (small vs large) for BSV fermentation
in order to understand the effect of bead size and surface area.
• To conducting a comparative analysis between static and agitated conditions for Ca-alginate
fermentations and FFC treatments.
71
4.3 Materials and methods
All materials and methods are described in Chapter 3.
4.4 Results and Discussion
4.4.1 Still vs agitated fermentation kinetics
Traditional Balsamic Vinegar (TBV) fermentation is conducted under non-agitated conditions and not
submerged in contrast to most industrial vinegars. Submerged methods include the use of
technologically advanced systems making use of spargers, stirrers, coolers, antifoams, stainless steel
fermentors, including automated control systems (Fernández-Pérez et al., 2010). Therefore, the present
study introduced submerged techniques in Balsamic-styled vinegar (BSV) production such as agitation
and cell immobilization. Sugar consumption followed a similar trend for both small (4.5 mm) and large
(8.5 mm) sized bead fermentations (Fig. 4.1A, D). The consumed sugar was calculated at the initial
stages of the fermentation (day 0 to 3). It ranged between 161 to 176 g L-1 for all treatments under
agitated conditions, while the sugar consumed for all non-agitated fermentations ranged between 31 to
54 g L-1 (Fig. 4.1A, D). This indicates that the activity of the yeast consortium used was enhanced by
agitation. Alcohol is an intermediary product/substrate in this context and the alcohol kinetics are
difficult to explain, due to formation and consumption occurring simultaneously. Figure 4.1B & E
shows that alcohol production was higher under agitated conditions compared to still conditions. This
phenomenon was also supported by the sugar consumption kinetics (Fig. 4.1A), which is directly
proportional to alcohol formation. Alcohol production during the initial stages (day 0 to 3), for agitated
conditions was between 88 to 112 g L-1, while the alcohol produced for still fermentations was between
7.3 to 7.6 g L-1 for all treatments. Agitated
Static
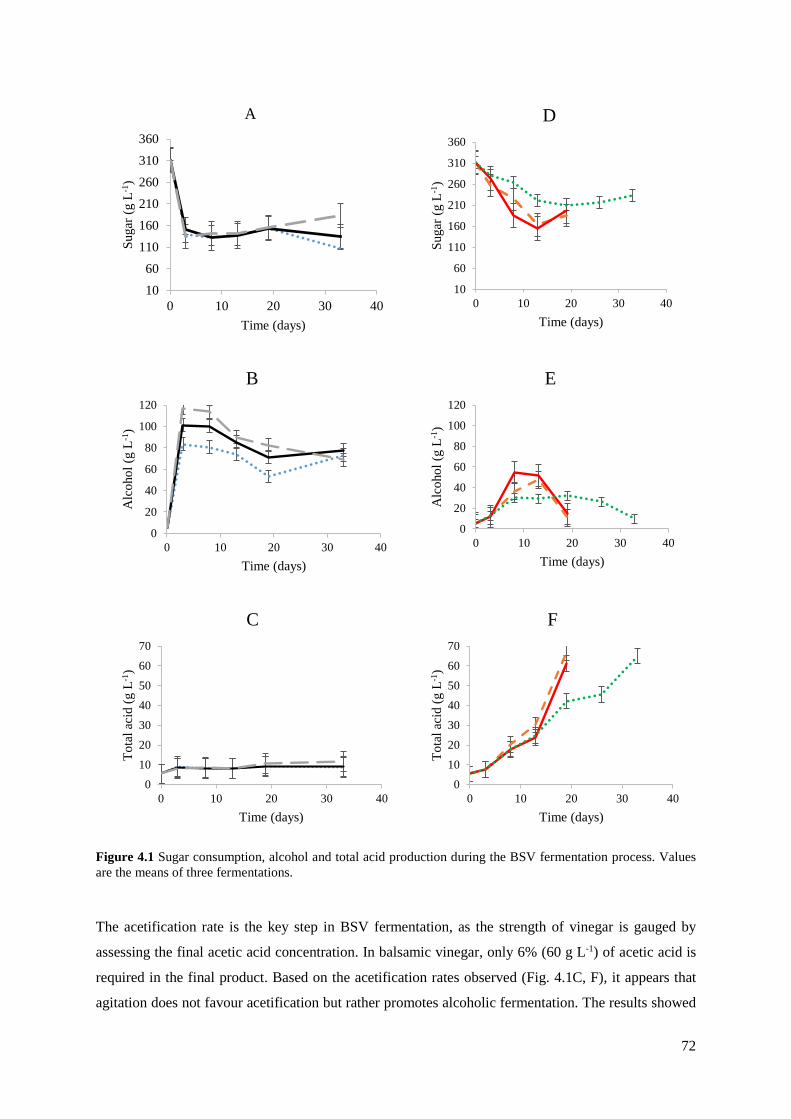
72
Figure 4.1 Sugar consumption, alcohol and total acid production during the BSV fermentation process. Values are the means of three fermentations.
The acetification rate is the key step in BSV fermentation, as the strength of vinegar is gauged by
assessing the final acetic acid concentration. In balsamic vinegar, only 6% (60 g L-1) of acetic acid is
required in the final product. Based on the acetification rates observed (Fig. 4.1C, F), it appears that
agitation does not favour acetification but rather promotes alcoholic fermentation. The results showed
1060
110160210260310360
0 10 20 30 40
Suga
r (g
L-1)
Time (days)
A
10
60
110
160
210
260
310
360
0 10 20 30 40
Suga
r (g
L-1)
Time (days)
D
0
20
40
60
80
100
120
0 10 20 30 40
Alc
ohol
(g L
-1)
Time (days)
B
0
20
40
60
80
100
120
0 10 20 30 40
Alc
ohol
(g L
-1)
Time (days)
E
010203040506070
0 10 20 30 40
Tota
l aci
d (g
L-1
)
Time (days)
C
010203040506070
0 10 20 30 40
Tota
l aci
d (g
L-1
)
Time (days)
F

73
that agitation negatively affected the acetification process (Fig. 4.1C) and it is possible that the high
agitation speed (135 rpm) could have contributed to the reduced acetification profiles. Overall,
acetification rates for both agitated (Fig. 4.1C) and still fermentations (Fig. 4.1F) displayed a rather
constant and/or exponential acid production pattern throughout the fermentation. The acetification rates
for agitated fermentations ranged between 0.1 to 0.2 g L-1 day-1, while the rates were 0.6 to 4.0 g L-1
day-1 for still fermentations. Acetification was negatively affected by agitation (Fig. 4.1C), possibly due
to shear stress and therefore requiring still/static conditions for optimum activity. Another possibility is
that the high rate of alcohol production might have affected the survival/activity of AAB, as they may
have been unable to tolerate high alcohol concentrations. However, Du Toit & Pretorius (2002) reported
that AAB are viable at an ethanol concentration of 10 and 14% (v/v). Gullo & Giudici (2008) found high
strain variability among AAB strains with regard to ethanol tolerance and some AAB strains grew on a
5% (v/v) ethanol medium, while others grew on 10% (v/v). Agitation may not have been appropriate,
using the gel-entrapment immobilization technique, as it causes damage to the beads and perhaps
resulting in cell leakage, although cell leakage can also occur in non-agitated fermentations (Tsen et al.
2004). Photographs of the bead surface also support this hypothesis (Fig. 5.4). This damage (Fig. 4.2A,
C) prevented the re-usage of gel beads for subsequent fermentations. Non-agitated beads (Fig. 4.2B)
appeared smoother with microscopically visible porosity (Fig. 4.2D), than those that were agitated (Fig.
4.2A, C).
Agitated beads Non-agitated beads
A B

74
Figure 4.2 External surface photographs of agitated and non-agitated Ca-alginate beads after fermentation. (A) Agitated bead at 100x magnification (B), non-agitated bead at 100x magnification, (C), agitated bead at 400x magnification (D), non-agitated bead at 400x magnification.
4.4.2 Immobilized vs free floating cell fermentation kinetics Cell immobilization by gel entrapment for BSV fermentations was investigated simultaneously with
free-floating cell fermentations. Based on the results of fermentation kinetics, cell immobilization
improved acetification rates under still conditions (Fig. 4.1F). All the fermentation kinetics were
negatively affected by agitation (Fig. 4.1C) and are therefore not discussed in this section. Sugar
consumption (Fig. 4.1D) followed a similar trend for both small (4.5 mm) and large (8.5 mm) sized
bead fermentations, with less sugar being consumed during free-floating cell fermentations. Sugar
consumption (Fig. 4.1D) was directly proportional to the alcohol produced (Fig. 4.1E). Improved total
acid formation was achieved using immobilized cell fermentations compared to free-floating cells (Fig.
4.1F) while small beads were more efficient (4.0 g L-1 day-1) than large sized beads (3.0 g L-1 day-1) and
free-floating cells (0.6 g L-1 day-1). Furthermore, 60 g L-1 of acetic acid was achieved after 16, 19 and
31 days for small sized, large sized beads and free-floating fermentations, respectively. Kocher et al.
(2006) investigated adsorption on corncobs, bagasse and wood shavings and cell entrapment in 4%
(w/v) sodium alginate for sugar cane vinegar and found that adsorbed cells resulted in relatively higher
acetification rates (0.09-0.10 g L-1 h-1) compared to entrapped cells (0.07 g L-1 h-1) and free-floating
cells (0.06 g L-1 h-1). These authors suggested that lower acetification rates by the entrapped cells may
be caused by a low surface area, which leads to inadequate substrate and dissolved oxygen transfer
rates.
4.5 Summary Based on the current results, agitation of BSV fermentations is disadvantageous for the process system
and optimisation of the agitation settings is necessary. Non-agitated (static) fermentations were
effective, with entrapped cells resulting in higher acetification rates. The surface area of the beads also
C D

75
affects the acetification rates. Therefore, immobilized cells using small beads without agitation are
recommended for BSV production. More research work on the effect of air and oxygen transfer rate
during BSV fermentations is recommended.

76
CHAPTER 5
Aeration, Agitation and Cell Immobilization on Corncobs and Oak Wood Chips Effects on Balsamic-Styled Vinegar
Production
Hutchinson, U.F., Gqozo, S., Jolly, N.P., Chidi, B.S., Du Plessis, H.W., Mewa-Ngongang, M. and
Ntwampe, S.K., 2019. Aeration, Agitation and Cell Immobilization on Corncobs and Oak Wood Chips
Effects on Balsamic-Styled Vinegar Production. Foods, 8(8), p.303.
77
5 CHAPTER 5
Aeration, Agitation and Cell Immobilization on Corncobs and Oak Wood Chips Effects on
Balsamic-Styled Vinegar Production
5.1 Introduction Similar to other vinegars, balsamic vinegar is a food flavouring agent or condiment, which contains
acetic acid as its main ingredient (Solieri & Giudici, 2009). Balsamic vinegar is characterized by its
sour and sweet taste (Giudici et al., 2009) and can be used as a salad dressing, and for soothing sore
throats among other uses (Truta et al., 2009). Balsamic-styled vinegar (BSV) is a term adopted from
Traditional Balsamic vinegar (TBV) of Modena and Reggio-Emilia Italy. BSV is a new type of balsamic
vinegar which has potential for being produced in South Africa using Chenin blanc wine grapes, since
they are the most cultivated grape cultivar in South Africa (SAWIS, 2018).
Cell immobilization generally refers to a technique, which is performed to prevent cells from being
freely suspended in the fermentation medium (De Ory et al., 2004; Kumar et al., 2016; Żur et al., 2016).
Cell immobilization improves biomass growth, increases cell stability, protects cells from the toxic
environment, and provides a reusability option (Kocher et al., 2006). Most fermentations generally
employ the free-floating cell (FFC) method, which is effective in less stressful fermentation systems.
However, during balsamic vinegar fermentation, there are multiple factors that have antagonistic effects
on the microorganisms involved in the fermentation. For instance, the fermentation medium (cooked
grape must) used for Balsamic-styled vinegar has a very high sugar content, low water activity and high
osmotic pressure (Solieri & Giudici, 2008; Gullo & Giudici, 2008; Tofalo et al., 2009). Furthermore,
the high concentrations of acetic acid during fermentations can also have a negative impact on the
microbial consortium used (Sousa et al., 2012; Giudici et al., 2015). These environmental stresses can
cause the microbial consortia to enter the viable but non-culturable state, resulting in reduced microbial
activity (Oliver, 2000; Mamlouk & Gullo, 2013). Consequently, to counteract these effects, cell
immobilization is an ideal approach, which can minimize the impact of stressful conditions on the
microorganisms used.
Various methods are used to perform cell immobilization. These include entrapment in a gel matrix,
immobilization on a solid surface and mechanical containment behind a barrier (Kourkoutas et al.,
2004); however, to date, numerous studies focus on cell immobilization via gel entrapment or
immobilization on a solid surface (adsorption) (De Ory et al., 2004). In Balsamic-styled vinegar
fermentation, cell immobilization has previously been studied using the gel entrapment technique
(Hutchinson et al., 2018), which is generally an expensive technique. However, cell immobilization by

78
adsorption in combination with aeration and agitation effects has never been tested for balsamic vinegar
production. Therefore, in this current study, cell immobilization on corncobs and oak wood chips was
investigated using the adsorption technique, which is commonly classified as a simple and often cost-
effective method depending on the support material used (Kocher et al., 2006).
Corncobs are an inexpensive and abundant agricultural by-product obtained from the corn-milling
process. They are currently used as animal feed, with 80% of their dry matter being comprised of
cellulose and hemicellulose (Inglett, 1970; Vaughan et al., 2001; Sun & Cheng., 2002; Ruengruglikit
& Hang, 2003; Shen et al., 2008). These aforementioned characteristics impart unique attributes that
brand corncobs as an ideal material for cell immobilization. On the other hand, oak wood chips are
abundantly used as an alternative to wooden barrel aging in the wine industry for economic reasons.
They are known to improve the sensorial qualities of the final product due to the flavours they impart
to wines (Gutiérrez Afonso, 2002; Kyraleou et al., 2015; Laqui-Estaña et al., 2019). For this reason, the
current study selected oak wood chips, based on both their cell immobilization properties and potential
impartation of organoleptic characteristics to the BSV. Nevertheless, oak wood chips are usually
imported to South Africa and they cost more than corncobs. Consequently, this study investigated
readily available inert materials which can be obtained at varying cost for cell immobilization, in order
to allow producers to make an informed decision in achieving the desired BSV quality. Furthermore,
the study explored the capabilities of the selected materials for cell affinity to the adsorbents selected
and fermenter performance in both aerated and agitated cultures systems.
5.2 Objectives
• To compare the influences of the adsorption matrices (CC and OWC) selected against FFC
fermentations for cell affinity and acetification rates during BSV fermentation.
• To testing the effects of aeration and agitation on adsorbed cells and FFC during BSV
fermentation.
• To evaluating the variations in cell adsorption capabilities on CC and OWC for individual
yeasts and AAB species.
5.3 Materials and methods All materials and methods are described in Chapter 3.
5.4 Results and discussion 5.4.1 Non-Aerated Fermentations 5.4.1.1 Static vs. Agitated Fermentations TBV fermentation is normally carried-out under static conditions using bacteria. This process is slow
and inexpensive (Giudici et al., 2009); however, a rapid fermentation period for TBV is not a

79
fundamental objective, since TBV is matured for a minimum of 12 years after fermentation (1), while
BSV can be sold without ageing.
Rapid vinegar production is a major goal for industrial processes. BSV can also be produced rapidly if
the conditions are ideal for the microorganisms used. For the purposes of this study, it was important to
evaluate the effects that agitation could have on BSV production in contrast to stationary fermentations.
Agitation is also recommended for spirit industrial vinegar production to generally shorten the
fermentation period (González-Sáiz et al., 2009). In the current study, the sugar consumption rates for
all treatments under agitated conditions ranged between 6.36 and 7.12 g L−1 day−1 whereas 2.68 and
6.10 g L−1 day−1 were observed under static conditions. The relative differences for sugar consumption
between FFC and immobilized cells were calculated to be 14% (OWC and FFC) and 41% (CC and
FFC) under static conditions, while the relative differences under agitated conditions were calculated
to be 5% (OWC and FFC) and 9% (CC and FFC) under static conditions. The ethanol production step
of the process was more effective under agitated conditions, as compared to static conditions (Fig. 5.1A,
D). However, ethanol formation/consumption rates were not calculated, since alcohol is an intermediate
product/substrate which is produced and consumed simultaneously. Furthermore, acetic acid production
was unsatisfactory for all treatments under agitated conditions (Fig. 5.1F). Agitation resulted in
acetification rates ranging from 0.11 to 0.13 g L−1 day−1, with the highest acetic acid concentration of
10.7 g L−1 being achieved at day 35. However, for a successful BSV fermentation, an acetic acid
concentration of at least 50 g L−1 is usually required (Gullo & Giudici, 2008). Hutchinson et al. (2018)
made similar observations when using cell immobilization with calcium alginate beads for BSV
production. It is unclear if these observations were species (acetic acid bacteria) dependent or due to
the agitation settings used. In light of these observations, other vinegar studies have successfully applied
agitation speeds between 100 (Talabardon et al., 2000) and 200 rpm (Horiuchi et al., 2000), with
industrial spirit vinegars successfully employing maximum agitation up to 900 rpm (González-Sáiz et
al., 2009; Park et al., 1989; Pochat-Bohatier et al., 2003). This suggested that the current agitation setting
could not have negatively impacted the microbial activity in the fermentations. Furthermore, most
vinegar production systems generally employ agitation and aeration simultaneously (Pochat-Bohatier
et al., 2003; Schlepütz et al., 2013); therefore, it is important to consider that agitation might only be
beneficial under such settings.
Fig. 5.1C shows successful acetification/alcohol oxidation profiles for all treatments under static
fermentations. Total acid formation rates ranged from 1.46 and 2.70 g L−1 day−1 for all of the treatments
studied. The relative differences for total acid formation between agitated and static fermentations were
93%, 92% and 95% for FFC, OWC and CC, respectively. Furthermore, the low substrate (sugar)
consumption rates (2.68–6.10 g L−1 day−1) resulted in much lower alcohol formation rates (Fig. 5.1B)
but high total acid formation rates (Fig. 5.1C). These observations could mean that the AAB microbial
80
activity was ideal at low alcohol concentrations, suggesting that the agitation speed should be optimized
with the aim of reducing alcohol formation rates, in order to benefit the AAB used. Furthermore, if
agitation is not suitable for BSV fermentations, regardless of the speed, this might benefit producers,
because agitation is energy intensive and the cost input might escalate, not only due to the energy usage
but also due to the mechanical equipment required for agitation.
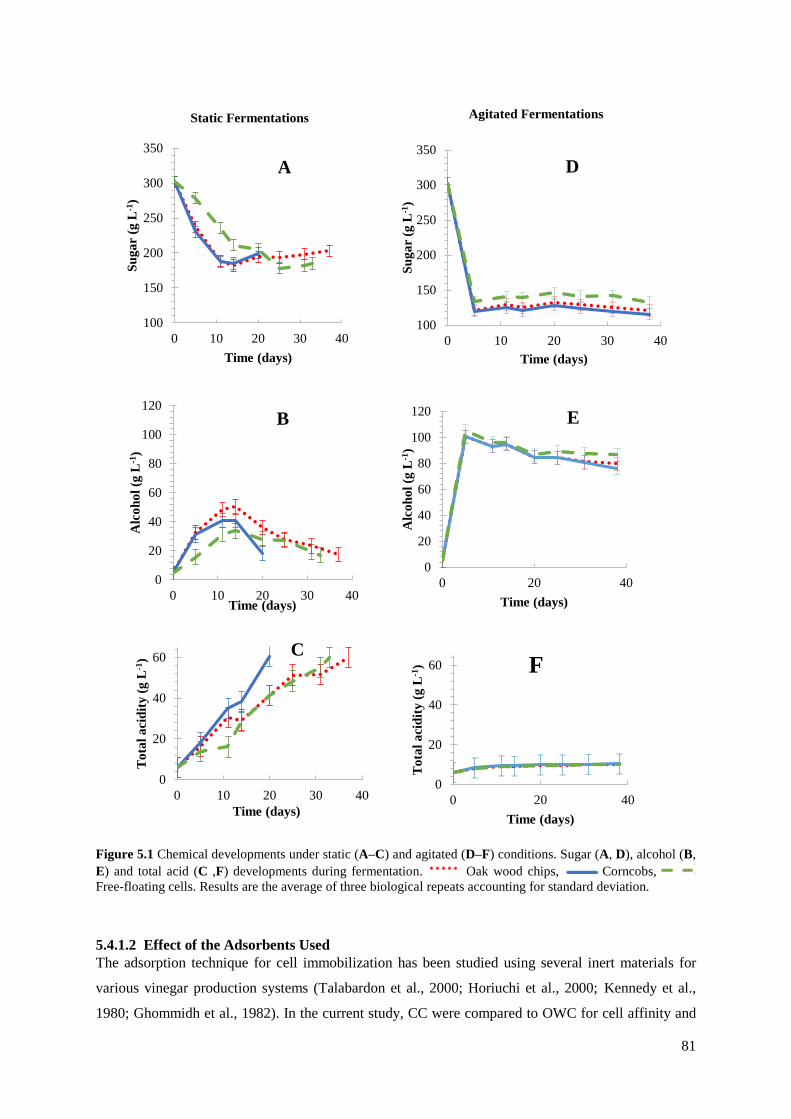
81
Static Fermentations Agitated Fermentations
Figure 5.1 Chemical developments under static (A–C) and agitated (D–F) conditions. Sugar (A, D), alcohol (B, E) and total acid (C ,F) developments during fermentation. Oak wood chips, Corncobs, Free-floating cells. Results are the average of three biological repeats accounting for standard deviation.
5.4.1.2 Effect of the Adsorbents Used The adsorption technique for cell immobilization has been studied using several inert materials for
various vinegar production systems (Talabardon et al., 2000; Horiuchi et al., 2000; Kennedy et al.,
1980; Ghommidh et al., 1982). In the current study, CC were compared to OWC for cell affinity and
100
150
200
250
300
350
0 10 20 30 40
Suga
r (g
L-1
)
Time (days)
A
100
150
200
250
300
350
0 10 20 30 40
Suga
r (g
L-1
)
Time (days)
D
0
20
40
60
80
100
120
0 10 20 30 40
Alc
ohol
(g L
-1)
Time (days)
B
0
20
40
60
80
100
120
0 20 40
Alc
ohol
(g L
-1)
Time (days)
E
0
20
40
60
0 10 20 30 40
Tot
al a
cidi
ty (g
L-1
)
Time (days)
C
0
20
40
60
0 20 40
Tot
al a
cidi
ty (g
L-1
)
Time (days)
F

82
influence on BSV production. These materials differ in terms of their biological composition as they
have different physical and structural attributes, as well as adsorption capacity and surface chemistry.
Since agitated fermentations did not meet the required performance for BSV production, i.e., achieving
60 g L−1 acetic acid, a more comprehensive discussion is provided in this section on the fermentations
that were only conducted under static conditions. Additional reasons attributed to the unsuccessful
agitated fermentations, which were characterized by low acetification rates (0.11 to 0.13 g L−1 day−1)
may be due to the interference of cell adsorption by agitation conditions, which eventually resulted in
freely suspended cells.
Moderately higher sugar consumption rates of 8.14 and 5.14 g L−1 day−1 for OWC and CC, respectively,
were observed at the initial stages (day 0–14) of the fermentation process (Fig. 5.1A). Alcohol formation
rates were also moderately higher for CC and OWC fermentation than FFC fermentations (Fig. 5.1B).
While, total acid formation for cells immobilized on CC was consistently higher throughout the
fermentation process, with total acid formation rates of 2.7 g L−1 day−1 being achieved in the shortest
fermentation period (20 days). Comparatively, FFC and OWC fermentations resulted in lower total acid
formation rates of 1.64 and 1.46 g L−1 day−1 with a longer fermentation period of 33 and 37 days,
respectively. Furthermore, the relative differences between FFC and immobilized cells were 11%
(OWC and FFC) and 39% (CC and FFC). Therefore, it was deduced that cells adsorbed on CC
fermentations led to the highest microbial activity because of the adsorbents’ attributes, i.e., rough
surface and porosity, which improved the adsorption of cells. As a result, the microbial consortium was
able to form a highly effective community when adsorbed onto the CC. Contrarily, the OWC are
relatively smoother than the porous CC, which consequently led to the poor adsorption of cells.
Cell immobilization on CC was also studied for the production of tea vinegar, with acetification rates
of 2.88 g L−1 day−1 being obtained (Kaur et al., 2011). Several studies often use wood shavings for cell
immobilization instead of OWC. For example, Thiripurasundari and Usharani (Thiripurasundari &
Usharani, 2011) and Kocher and Dhillon (2013) reported acetification rates of 0.24 g L−1 day−1 and
5.76–22.8 g L−1 day−1 when using wood shavings for the production of cashew apple vinegar and sugar
cane vinegar, respectively. It is not clear as to the reasons why the acetification rates for these two
studies were different; however, other factors such as substrate availability, bacteria strain used and
other fermentor conditions might have played a role. Furthermore, wood shavings and OWC may not
be comparable materials due to their differentiated physical properties, and thus, differentiated
adsorption capabilities.
Table 5.1 shows a comparison of other studies which investigated the effect of cell immobilization by
adsorption in other vinegar production systems. The current work established a direct relationship
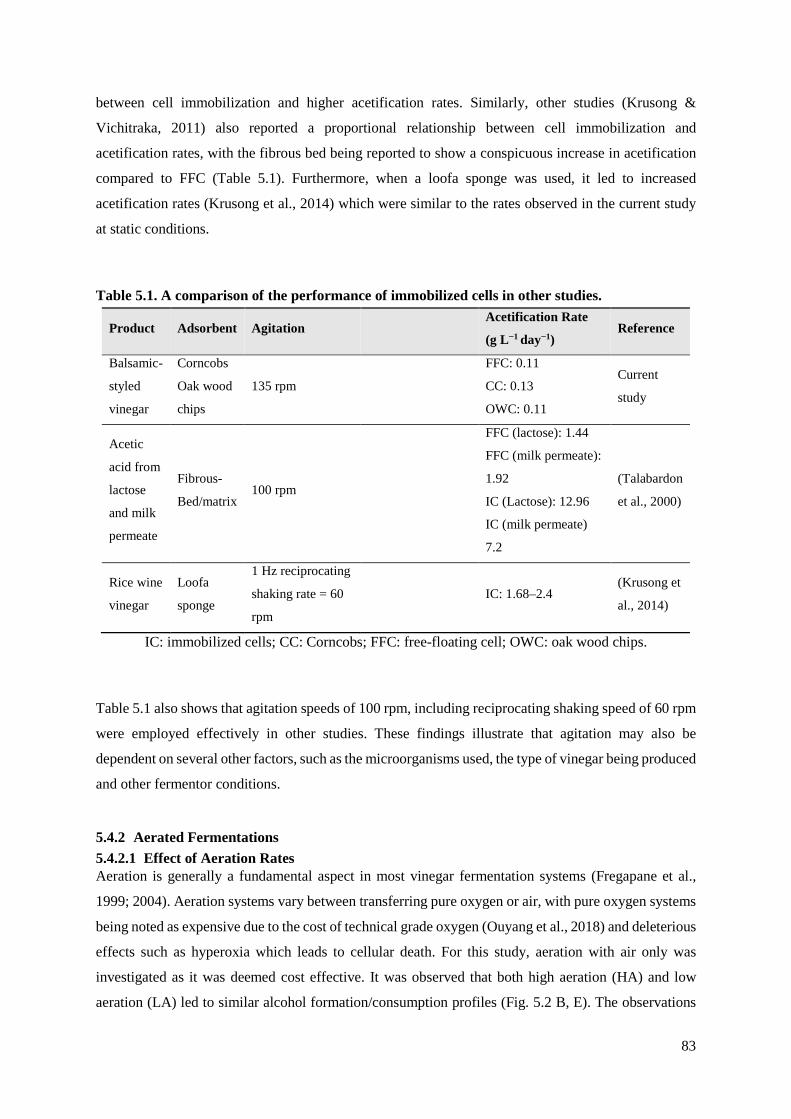
83
between cell immobilization and higher acetification rates. Similarly, other studies (Krusong &
Vichitraka, 2011) also reported a proportional relationship between cell immobilization and
acetification rates, with the fibrous bed being reported to show a conspicuous increase in acetification
compared to FFC (Table 5.1). Furthermore, when a loofa sponge was used, it led to increased
acetification rates (Krusong et al., 2014) which were similar to the rates observed in the current study
at static conditions.
Table 5.1. A comparison of the performance of immobilized cells in other studies.
Product Adsorbent Agitation Acetification Rate
(g L−1 day−1) Reference
Balsamic-
styled
vinegar
Corncobs
Oak wood
chips
135 rpm
FFC: 0.11
CC: 0.13
OWC: 0.11
Current
study
Acetic
acid from
lactose
and milk
permeate
Fibrous-
Bed/matrix 100 rpm
FFC (lactose): 1.44
FFC (milk permeate):
1.92
IC (Lactose): 12.96
IC (milk permeate)
7.2
(Talabardon
et al., 2000)
Rice wine
vinegar
Loofa
sponge
1 Hz reciprocating
shaking rate = 60
rpm
IC: 1.68–2.4 (Krusong et
al., 2014)
IC: immobilized cells; CC: Corncobs; FFC: free-floating cell; OWC: oak wood chips.
Table 5.1 also shows that agitation speeds of 100 rpm, including reciprocating shaking speed of 60 rpm
were employed effectively in other studies. These findings illustrate that agitation may also be
dependent on several other factors, such as the microorganisms used, the type of vinegar being produced
and other fermentor conditions.
5.4.2 Aerated Fermentations 5.4.2.1 Effect of Aeration Rates Aeration is generally a fundamental aspect in most vinegar fermentation systems (Fregapane et al.,
1999; 2004). Aeration systems vary between transferring pure oxygen or air, with pure oxygen systems
being noted as expensive due to the cost of technical grade oxygen (Ouyang et al., 2018) and deleterious
effects such as hyperoxia which leads to cellular death. For this study, aeration with air only was
investigated as it was deemed cost effective. It was observed that both high aeration (HA) and low
aeration (LA) led to similar alcohol formation/consumption profiles (Fig. 5.2 B, E). The observations

84
were surprising since alcoholic fermentation is often performed under anaerobic conditions or low
dissolved oxygen conditions (Bamforth, 2000; Hiralal et al., 2014). Consequently, yeast performance
was expected to also be negatively affected by HA, albeit that yeasts are generally characterized as
facultative anaerobes and some yeasts can still survive or grow under aerobic conditions (Watson et al.,
1978; Bekatorou et al., 2006; Chatre et al., 2014; Boss & Day, 2016). Since only air (with 21% oxygen)
was used, it was also plausible that different alcohol consumption profiles could have been observed if
technical grade oxygen was tested—a condition that can exacerbate hyperoxia.
Low Aeration High Aeration
0
50
100
150
200
250
300
350
0 10 20 30 40 50
Suga
r (g
L-1
)
Time (days)
A
0
50
100
150
200
250
300
350
0 10 20 30 40 50
Suga
r (g
L-1
)
Time (days)
D
0
20
40
60
0 10 20 30 40 50
Alc
ohol
(g L
-1)
Time (days)
B
0
20
40
60
0 10 20 30 40 50
Alc
ohol
(g L
-1)
Time (days)
E
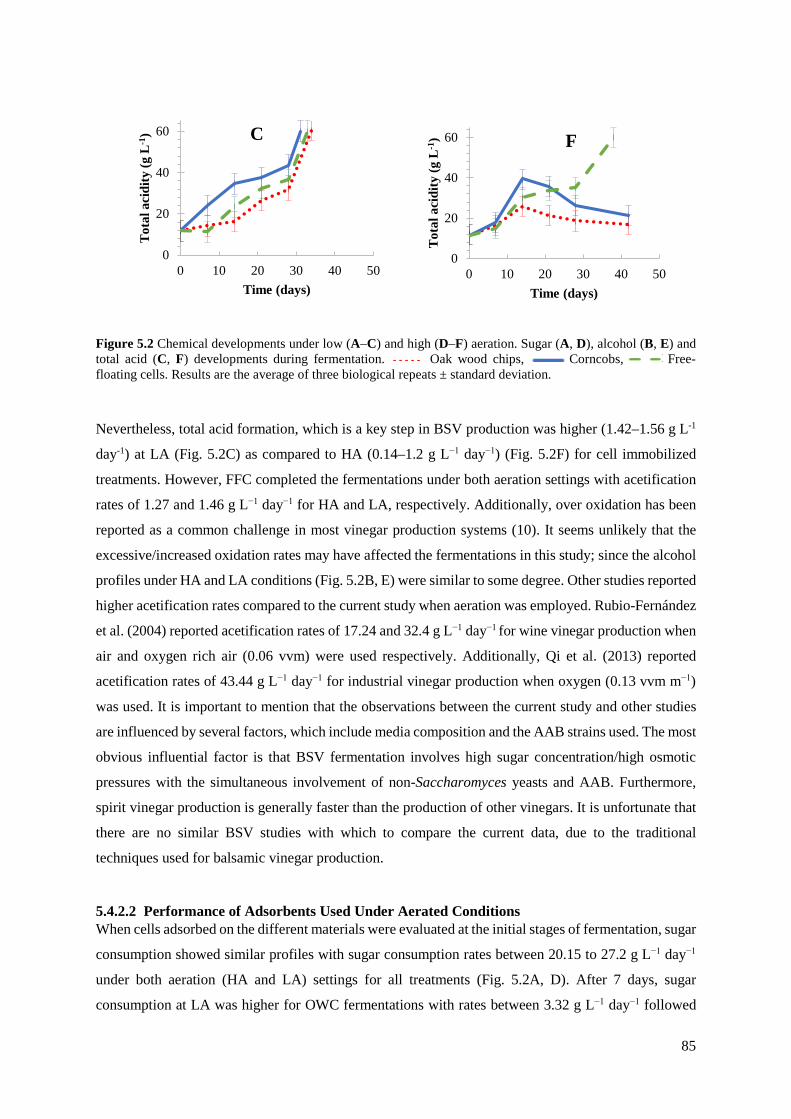
85
Figure 5.2 Chemical developments under low (A–C) and high (D–F) aeration. Sugar (A, D), alcohol (B, E) and total acid (C, F) developments during fermentation. Oak wood chips, Corncobs, Free-floating cells. Results are the average of three biological repeats ± standard deviation.
Nevertheless, total acid formation, which is a key step in BSV production was higher (1.42–1.56 g L-1
day-1) at LA (Fig. 5.2C) as compared to HA (0.14–1.2 g L−1 day−1) (Fig. 5.2F) for cell immobilized
treatments. However, FFC completed the fermentations under both aeration settings with acetification
rates of 1.27 and 1.46 g L−1 day−1 for HA and LA, respectively. Additionally, over oxidation has been
reported as a common challenge in most vinegar production systems (10). It seems unlikely that the
excessive/increased oxidation rates may have affected the fermentations in this study; since the alcohol
profiles under HA and LA conditions (Fig. 5.2B, E) were similar to some degree. Other studies reported
higher acetification rates compared to the current study when aeration was employed. Rubio-Fernández
et al. (2004) reported acetification rates of 17.24 and 32.4 g L−1 day−1 for wine vinegar production when
air and oxygen rich air (0.06 vvm) were used respectively. Additionally, Qi et al. (2013) reported
acetification rates of 43.44 g L−1 day−1 for industrial vinegar production when oxygen (0.13 vvm m−1)
was used. It is important to mention that the observations between the current study and other studies
are influenced by several factors, which include media composition and the AAB strains used. The most
obvious influential factor is that BSV fermentation involves high sugar concentration/high osmotic
pressures with the simultaneous involvement of non-Saccharomyces yeasts and AAB. Furthermore,
spirit vinegar production is generally faster than the production of other vinegars. It is unfortunate that
there are no similar BSV studies with which to compare the current data, due to the traditional
techniques used for balsamic vinegar production.
5.4.2.2 Performance of Adsorbents Used Under Aerated Conditions When cells adsorbed on the different materials were evaluated at the initial stages of fermentation, sugar
consumption showed similar profiles with sugar consumption rates between 20.15 to 27.2 g L−1 day−1
under both aeration (HA and LA) settings for all treatments (Fig. 5.2A, D). After 7 days, sugar
consumption at LA was higher for OWC fermentations with rates between 3.32 g L−1 day−1 followed
0
20
40
60
0 10 20 30 40 50
Tot
al a
cidi
ty (g
L-1
)
Time (days)
C
0
20
40
60
0 10 20 30 40 50
Tot
al a
cidi
ty (g
L-1
)
Time (days)
F
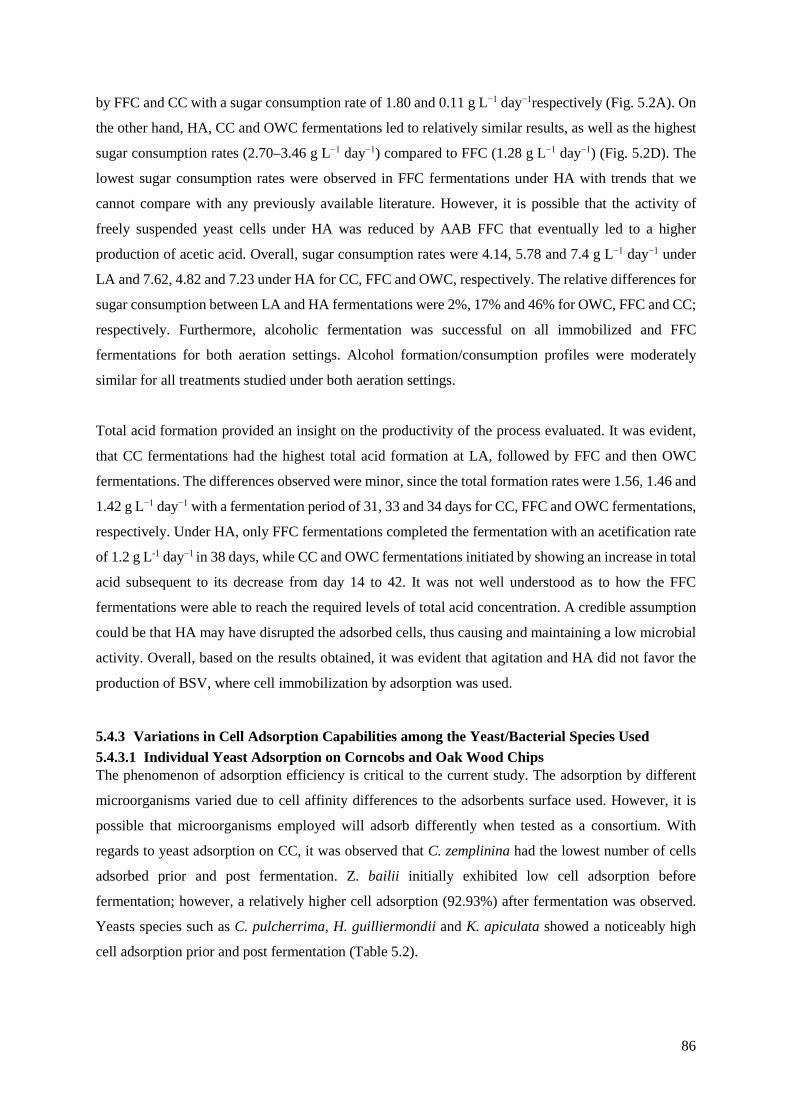
86
by FFC and CC with a sugar consumption rate of 1.80 and 0.11 g L−1 day−1respectively (Fig. 5.2A). On
the other hand, HA, CC and OWC fermentations led to relatively similar results, as well as the highest
sugar consumption rates (2.70–3.46 g L−1 day−1) compared to FFC (1.28 g L−1 day−1) (Fig. 5.2D). The
lowest sugar consumption rates were observed in FFC fermentations under HA with trends that we
cannot compare with any previously available literature. However, it is possible that the activity of
freely suspended yeast cells under HA was reduced by AAB FFC that eventually led to a higher
production of acetic acid. Overall, sugar consumption rates were 4.14, 5.78 and 7.4 g L−1 day−1 under
LA and 7.62, 4.82 and 7.23 under HA for CC, FFC and OWC, respectively. The relative differences for
sugar consumption between LA and HA fermentations were 2%, 17% and 46% for OWC, FFC and CC;
respectively. Furthermore, alcoholic fermentation was successful on all immobilized and FFC
fermentations for both aeration settings. Alcohol formation/consumption profiles were moderately
similar for all treatments studied under both aeration settings.
Total acid formation provided an insight on the productivity of the process evaluated. It was evident,
that CC fermentations had the highest total acid formation at LA, followed by FFC and then OWC
fermentations. The differences observed were minor, since the total formation rates were 1.56, 1.46 and
1.42 g L−1 day−1 with a fermentation period of 31, 33 and 34 days for CC, FFC and OWC fermentations,
respectively. Under HA, only FFC fermentations completed the fermentation with an acetification rate
of 1.2 g L-1 day−1 in 38 days, while CC and OWC fermentations initiated by showing an increase in total
acid subsequent to its decrease from day 14 to 42. It was not well understood as to how the FFC
fermentations were able to reach the required levels of total acid concentration. A credible assumption
could be that HA may have disrupted the adsorbed cells, thus causing and maintaining a low microbial
activity. Overall, based on the results obtained, it was evident that agitation and HA did not favor the
production of BSV, where cell immobilization by adsorption was used.
5.4.3 Variations in Cell Adsorption Capabilities among the Yeast/Bacterial Species Used 5.4.3.1 Individual Yeast Adsorption on Corncobs and Oak Wood Chips The phenomenon of adsorption efficiency is critical to the current study. The adsorption by different
microorganisms varied due to cell affinity differences to the adsorbents surface used. However, it is
possible that microorganisms employed will adsorb differently when tested as a consortium. With
regards to yeast adsorption on CC, it was observed that C. zemplinina had the lowest number of cells
adsorbed prior and post fermentation. Z. bailii initially exhibited low cell adsorption before
fermentation; however, a relatively higher cell adsorption (92.93%) after fermentation was observed.
Yeasts species such as C. pulcherrima, H. guilliermondii and K. apiculata showed a noticeably high
cell adsorption prior and post fermentation (Table 5.2).
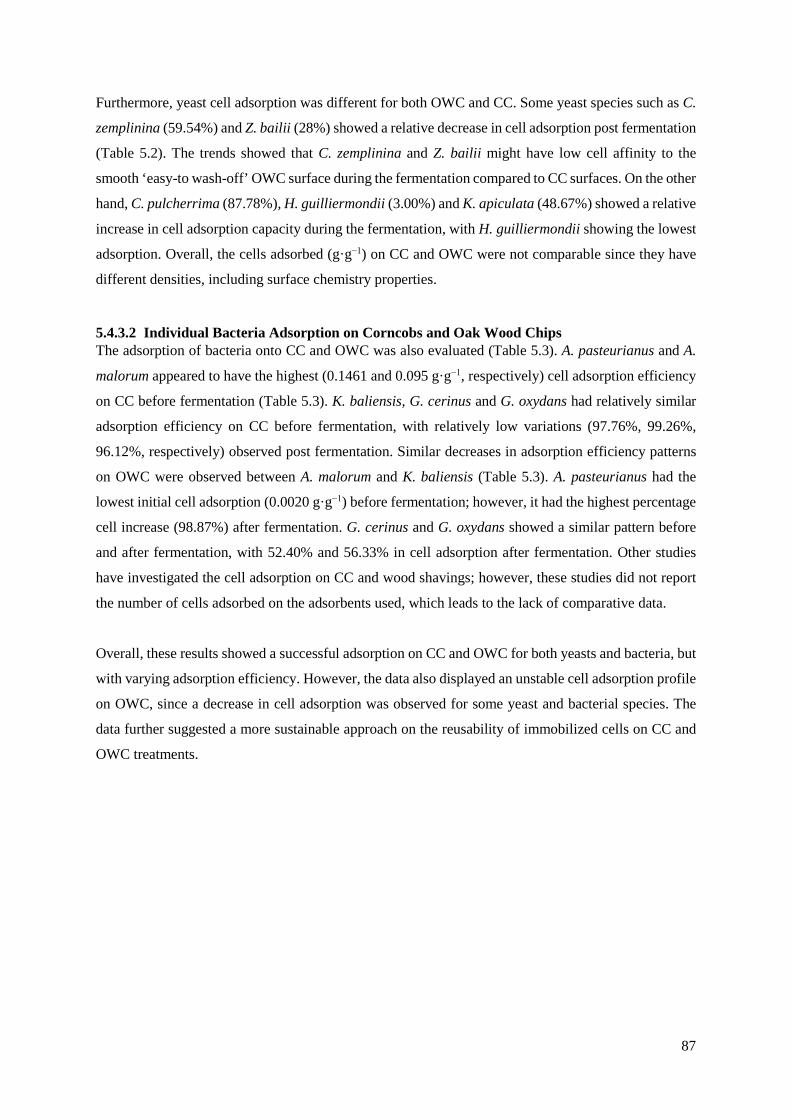
87
Furthermore, yeast cell adsorption was different for both OWC and CC. Some yeast species such as C.
zemplinina (59.54%) and Z. bailii (28%) showed a relative decrease in cell adsorption post fermentation
(Table 5.2). The trends showed that C. zemplinina and Z. bailii might have low cell affinity to the
smooth ‘easy-to wash-off’ OWC surface during the fermentation compared to CC surfaces. On the other
hand, C. pulcherrima (87.78%), H. guilliermondii (3.00%) and K. apiculata (48.67%) showed a relative
increase in cell adsorption capacity during the fermentation, with H. guilliermondii showing the lowest
adsorption. Overall, the cells adsorbed (g·g−1) on CC and OWC were not comparable since they have
different densities, including surface chemistry properties.
5.4.3.2 Individual Bacteria Adsorption on Corncobs and Oak Wood Chips The adsorption of bacteria onto CC and OWC was also evaluated (Table 5.3). A. pasteurianus and A.
malorum appeared to have the highest (0.1461 and 0.095 g·g−1, respectively) cell adsorption efficiency
on CC before fermentation (Table 5.3). K. baliensis, G. cerinus and G. oxydans had relatively similar
adsorption efficiency on CC before fermentation, with relatively low variations (97.76%, 99.26%,
96.12%, respectively) observed post fermentation. Similar decreases in adsorption efficiency patterns
on OWC were observed between A. malorum and K. baliensis (Table 5.3). A. pasteurianus had the
lowest initial cell adsorption (0.0020 g·g−1) before fermentation; however, it had the highest percentage
cell increase (98.87%) after fermentation. G. cerinus and G. oxydans showed a similar pattern before
and after fermentation, with 52.40% and 56.33% in cell adsorption after fermentation. Other studies
have investigated the cell adsorption on CC and wood shavings; however, these studies did not report
the number of cells adsorbed on the adsorbents used, which leads to the lack of comparative data.
Overall, these results showed a successful adsorption on CC and OWC for both yeasts and bacteria, but
with varying adsorption efficiency. However, the data also displayed an unstable cell adsorption profile
on OWC, since a decrease in cell adsorption was observed for some yeast and bacterial species. The
data further suggested a more sustainable approach on the reusability of immobilized cells on CC and
OWC treatments.
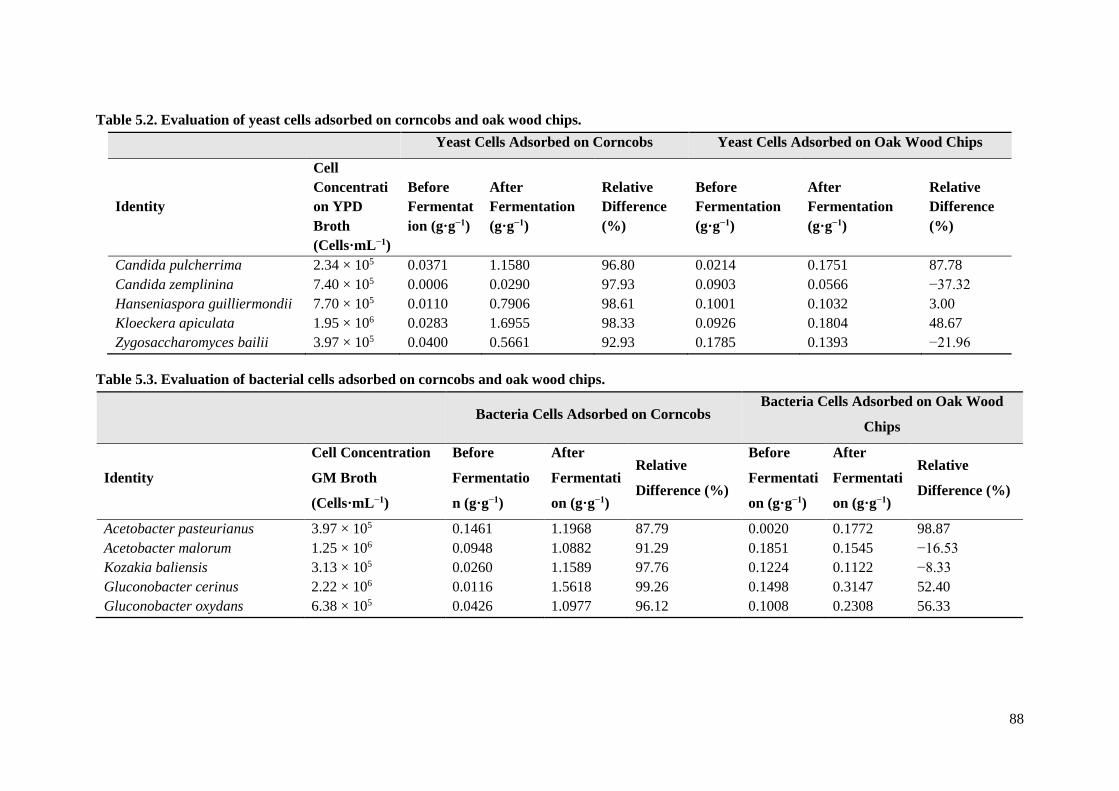
88
Table 5.2. Evaluation of yeast cells adsorbed on corncobs and oak wood chips. Yeast Cells Adsorbed on Corncobs Yeast Cells Adsorbed on Oak Wood Chips
Identity
Cell Concentration YPD Broth (Cells·mL−1)
Before Fermentation (g·g−1)
After Fermentation (g·g−1)
Relative Difference (%)
Before Fermentation (g·g−1)
After Fermentation (g·g−1)
Relative Difference (%)
Candida pulcherrima 2.34 × 10⁵ 0.0371 1.1580 96.80 0.0214 0.1751 87.78 Candida zemplinina 7.40 × 10⁵ 0.0006 0.0290 97.93 0.0903 0.0566 −37.32 Hanseniaspora guilliermondii 7.70 × 10⁵ 0.0110 0.7906 98.61 0.1001 0.1032 3.00 Kloeckera apiculata 1.95 × 10⁶ 0.0283 1.6955 98.33 0.0926 0.1804 48.67 Zygosaccharomyces bailii 3.97 × 10⁵ 0.0400 0.5661 92.93 0.1785 0.1393 −21.96
Table 5.3. Evaluation of bacterial cells adsorbed on corncobs and oak wood chips.
Bacteria Cells Adsorbed on Corncobs Bacteria Cells Adsorbed on Oak Wood
Chips
Identity
Cell Concentration
GM Broth
(Cells·mL−1)
Before
Fermentatio
n (g·g−1)
After
Fermentati
on (g·g−1)
Relative
Difference (%)
Before
Fermentati
on (g·g−1)
After
Fermentati
on (g·g−1)
Relative
Difference (%)
Acetobacter pasteurianus 3.97 × 10⁵ 0.1461 1.1968 87.79 0.0020 0.1772 98.87 Acetobacter malorum 1.25 × 10⁶ 0.0948 1.0882 91.29 0.1851 0.1545 −16.53 Kozakia baliensis 3.13 × 10⁵ 0.0260 1.1589 97.76 0.1224 0.1122 −8.33 Gluconobacter cerinus 2.22 × 10⁶ 0.0116 1.5618 99.26 0.1498 0.3147 52.40 Gluconobacter oxydans 6.38 × 10⁵ 0.0426 1.0977 96.12 0.1008 0.2308 56.33

89
5.5 Summary According to all the results obtained, it is evident that cell immobilization improves acetification
rates during BSV fermentation. However, the highest acetification rates were obtained under static and
non-aerated conditions. Corncobs were observed to be the most suitable material for cell immobilization
presumably due to their physical structure. Consequently, the shortest fermentation period was 20 days
when cells were immobilized on corncobs under static fermentation conditions. A study to investigate
the concurrent optimization of agitation and aeration as well as the effect of corncobs and oak wood
chips on organoleptic properties is recommended. The current study therefore, serves as a foundation
for cell immobilization by adsorption on materials during Balsamic-styled vinegar production.
90
CHAPTER 6
Reusability and sensory effects of immobilized cells for subsequent balsamic-styled vinegar fermentations
Submitted as: Hutchinson, U.F., Ntwampe, S.K.O., Chidi, B.S., Mewa Ngongang, M., du Plessis, H.W. and Jolly, N.P., 2020. Reusability and sensory effects of immobilized cells for subsequent balsamic-styled vinegar fermentations. Submitted in Fermentation.
91
6 CHAPTER 6
Reusability and sensory effects of immobilized cells for subsequent balsamic-styled vinegar
fermentations
6.1 Introduction Balsamic-styled vinegar (BSV) is a derivative form of traditional balsamic vinegar (TBV), which was
specifically developed for this study. The production of TBV follows strict regulations and generally
employs conventional methods, which lead to substantially longer fermentations in contrast to
submerged methods (Tesfaye et al., 2002; Fernández-Pérez et al., 2010). However, other generic
balsamic vinegars do not have to adhere to such strict regulations and conventional methods do not
apply. Therefore; BSV can be successfully produced using numerous techniques including process
performance augmentation strategies such as cell immobilization as demonstrated by Hutchinson et al.
(2018) & (2019b). Since TBV’s are premium quality and highly priced products (Tesfaye et al., 2002;
Fernández-Pérez et al., 2010) which most consumers cannot afford, other forms of balsamic vinegars
for regular usage can be opted for. Therefore, BSV’s can be produced at large scale in order to supply
to a consumer base. Consequently, it is crucial to investigate methods that can improve the quality of
BSV, while optimising the fermentation process for industrial scale operations.
Previously, the effects of cell immobilization using Ca-alginate beads, corncobs (CC) and oak wood
chips (OWC) for BSV production were studied (Hutchinson et al., 2018 & 2019b). However, the
reusability of the immobilized cells was not evaluated, which is the primary focus of the current study
because optimal process performance at low cost input, which results in rapid fermentations, is
fundamental in the commercialisation of BSV. Therefore, if recycled immobilized cells retain a high
microbial activity, while retaining high product formation rates, this can reduce overall input costs with
substantial monetary savings in large scale operations. Furthermore, it is probable that the reusability
and the performance of immobilized cells could vary depending on the immobilization matrix or the
technique that was used to immobilize the cells. In the current study, cells were immobilized using both
adsorption on CC and OWC, and entrapment in Ca-alginate beads. These two cell immobilization
techniques are different and therefore the resultant fermentations were expected to culminate in
differentiated reusability outcomes; albeit, not previously reported for BSV fermentations.
Generally, the materials studied for cell adsorption are not only different with regards to their physical
structure and origin, they could also affect the sensorial attributes of the final BSV. As such,
investigating the organoleptic properties of the vinegars was deemed as a rational procedure.
92
Corncobs are an agricultural by-product obtained from the corn milling process, with 80% of their dry
matter being composed of cellulose and hemicellulose (Vaughan et al., 2001; Sun & Cheng., 2002;
Shen et al., 2008), while OWC are commonly used for flavour improvement in the wine industry to
impart the woody attributes in wine (Kyraleou et al., 2015; Laqui-Estaña et al., 2019). Polymetric
matrices such as Ca- and Na-alginate are made from brown algae extracts and are known for their
viscosifying, gelling and stabilizing properties with diverse applications in the food, beverage,
cosmetics, textile and pharmaceutical industries (Hecht & Srebnik, 2016). Therefore, the data generated
from this study can allow large scale BSV producers to make informed decisions when choosing the
immobilization matrix and technique to optimise production rates, organoleptic attributes and cell
reusability while minimising operational costs.
For high cell retention and fermenter performance, cell immobilization has been frequently reported to
have several advantages, with the option of reusing/recycling the immobilized cells being the prominent
advantage (Park et al., 1999; Kocher et al., 2006; Rahman et al., 2006; Rao et al., 2008; Nigam et al.,
2009, Shyamkumar et al., 2014). However, very limited studies have been done to support the
reusability of immobilized cells, mostly for balsamic vinegar fermentation systems. Furthermore, most
studies reporting on the recycling of immobilized cells are based on one step fermentation systems,
whereby one species converts a single substrate directly into the final product (Park et al., 1999; Rahman
et al., 2006; Rao et al., 2008; Nigam et al., 2009, Shyamkumar et al., 2014). However, BSV fermentation
is a two-step process; whereby sugar serves as the initial substrate for non-Saccharomyces yeast to
ferment to an intermediate product, i.e. alcohol, while the alcohol also serves as a substrate for the
production of acetic acid by acetic acid bacteria (AAB). This means that both the non-Saccharomyces
yeast and AAB immobilized cells must survive the initial cycle of fermentation in order to be reused in
successive fermentations. For this specific reason, this study investigated the reusability of a consortium
of immobilized non-Saccharomyces yeasts and AAB for BSV production. The recycled cells were
entrapped in calcium (Ca)-alginate beads and with adsorption being on corncobs (CC) and oak wood
chips (OWC).
6.2 Objectives • To evaluate the reusability abilities of immobilized cells for subsequent cycles of
fermentation.
• To study the structural integrity of cell immobilization matrices after being reused using the
scanning electron microscope.
• To evaluate the BSV’s for sensorial attributes.

93
6.3 Materials and methods All materials and methods are described in Chapter 3.
6.4 Results and discussion 6.4.1 Comparative analyses of sugar consumption rates for 1st and 2nd cycle BSV fermentations 6.4.1.1 1st cycle fermentations The 1st cycle of the fermentations was successfully completed (Fig. 6.1) with sugar consumption rates
being relatively similar for all fermentations studied. These results are similar to reports of Hutchinson
et al. (2018; 2019b) (Chapter 4 & 5), Fermentations carried-out using cells adsorbed onto OWC had the
highest sugar consumption rates (4.97 g L-1 day-1), followed by Ca-alginate beads and CC resulting in
the lowest sugar consumption rates (Fig. 6.1).
6.4.1.2 2nd cycle fermentations The 2nd cycle fermentations had considerably lower sugar consumption rates compared to the 1st
fermentation cycle (Fig. 6.1). A decline of sugar consumption when immobilized cells were reused was
calculated at relative differences of 94.7%, 56.2%, 31.7% for CC, OWC and Ca-alginate beads,
respectively. Overall, the Ca-alginate beads had the lowest differentiation in sugar consumption rates
when cells entrapped in the beads were reused (Fig. 6.1). Results indicate that Ca-alginate beads serve
as a better matrix for the protection of consortium cells compared to the other matrices studied. A logical
explanation behind this could also be due to the fact that when the entrapment technique is used, cells
are essentially encapsulated and are far more protected from the surrounding environment in contrast
to the CC and OWC. Although the adsorption technique for CC and OWC preparation, prevents cells
from being freely suspended into the fermentation medium; the cells are still exposed to the harsh
fermentation conditions, which in effect can make the cells ineffective in subsequent fermentations. It
is important to also mention that the production of TBV, rice vinegar and some wine vinegars also use
the back-slopping approach, which is similar to re-using microbial cells in the form of a “seed vinegar”.
The seed vinegar, often called “mother vinegar” is basically an undefined starter culture extracted from
the previous vinegar for consistency purposes and not to speed up the process (Gullo & Giudici, 2008;
Bekatorou, 2019). Although cell immobilization has been described by several researchers as suitable
for cell recyclability (Park et al., 1999; Rahman et al., 2006; Rao et al., 2008; Nigam et al., 2009,
Shyamkumar et al., 2014), our results show that cell immobilization does not work as well for BSV
production.
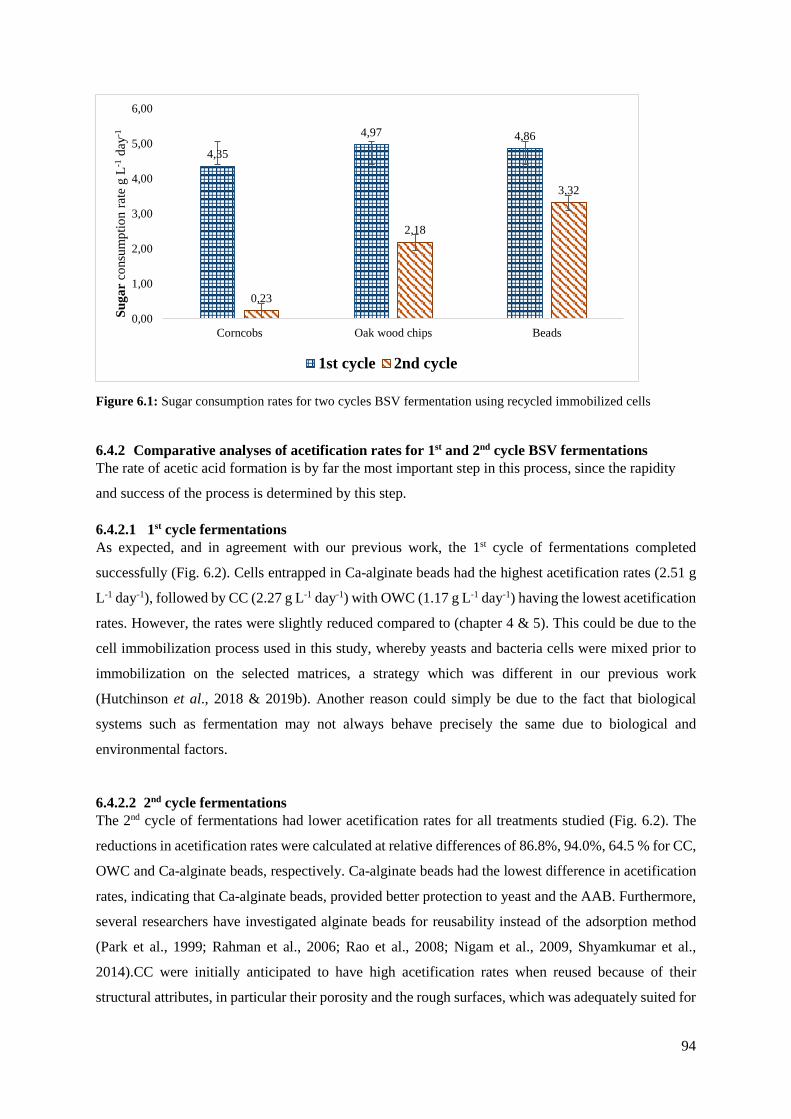
94
Figure 6.1: Sugar consumption rates for two cycles BSV fermentation using recycled immobilized cells
6.4.2 Comparative analyses of acetification rates for 1st and 2nd cycle BSV fermentations The rate of acetic acid formation is by far the most important step in this process, since the rapidity
and success of the process is determined by this step.
6.4.2.1 1st cycle fermentations As expected, and in agreement with our previous work, the 1st cycle of fermentations completed
successfully (Fig. 6.2). Cells entrapped in Ca-alginate beads had the highest acetification rates (2.51 g
L-1 day-1), followed by CC (2.27 g L-1 day-1) with OWC (1.17 g L-1 day-1) having the lowest acetification
rates. However, the rates were slightly reduced compared to (chapter 4 & 5). This could be due to the
cell immobilization process used in this study, whereby yeasts and bacteria cells were mixed prior to
immobilization on the selected matrices, a strategy which was different in our previous work
(Hutchinson et al., 2018 & 2019b). Another reason could simply be due to the fact that biological
systems such as fermentation may not always behave precisely the same due to biological and
environmental factors.
6.4.2.2 2nd cycle fermentations The 2nd cycle of fermentations had lower acetification rates for all treatments studied (Fig. 6.2). The
reductions in acetification rates were calculated at relative differences of 86.8%, 94.0%, 64.5 % for CC,
OWC and Ca-alginate beads, respectively. Ca-alginate beads had the lowest difference in acetification
rates, indicating that Ca-alginate beads, provided better protection to yeast and the AAB. Furthermore,
several researchers have investigated alginate beads for reusability instead of the adsorption method
(Park et al., 1999; Rahman et al., 2006; Rao et al., 2008; Nigam et al., 2009, Shyamkumar et al.,
2014).CC were initially anticipated to have high acetification rates when reused because of their
structural attributes, in particular their porosity and the rough surfaces, which was adequately suited for
4,35
4,97 4,86
0,23
2,18
3,32
0,00
1,00
2,00
3,00
4,00
5,00
6,00
Corncobs Oak wood chips Beads
Suga
rco
nsum
ptio
n ra
te g
L-1
day-1
1st cycle 2nd cycle
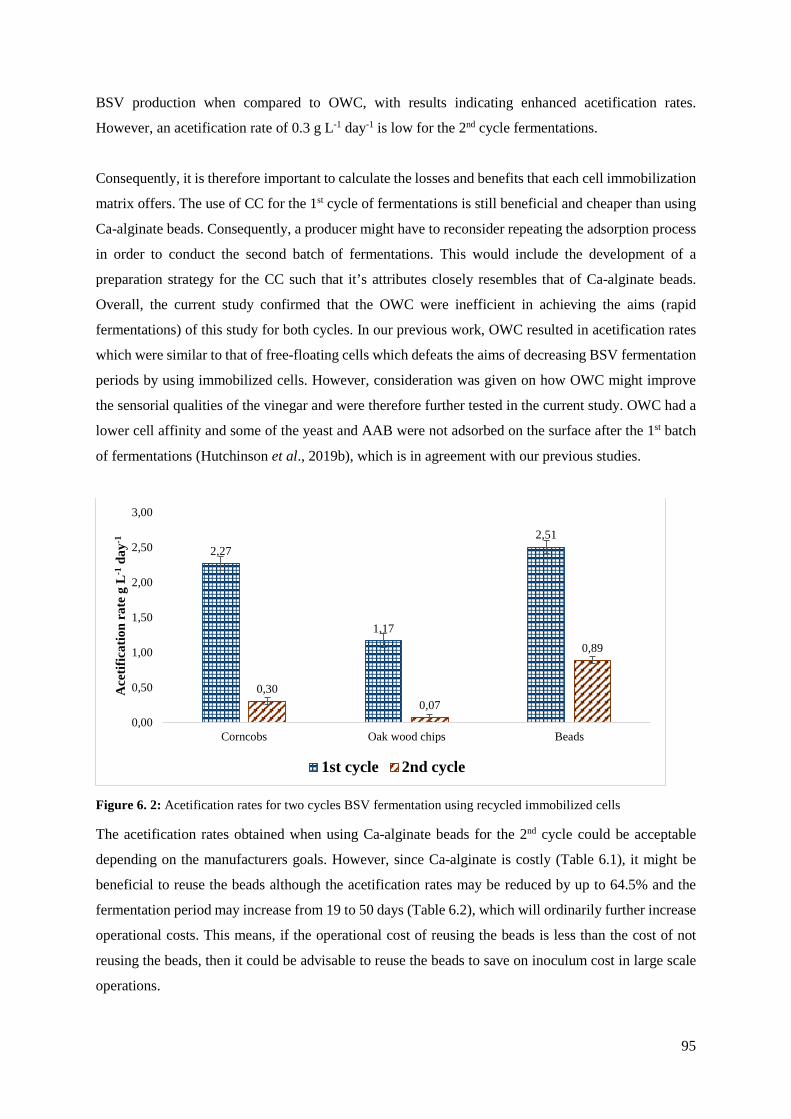
95
BSV production when compared to OWC, with results indicating enhanced acetification rates.
However, an acetification rate of 0.3 g L-1 day-1 is low for the 2nd cycle fermentations.
Consequently, it is therefore important to calculate the losses and benefits that each cell immobilization
matrix offers. The use of CC for the 1st cycle of fermentations is still beneficial and cheaper than using
Ca-alginate beads. Consequently, a producer might have to reconsider repeating the adsorption process
in order to conduct the second batch of fermentations. This would include the development of a
preparation strategy for the CC such that it’s attributes closely resembles that of Ca-alginate beads.
Overall, the current study confirmed that the OWC were inefficient in achieving the aims (rapid
fermentations) of this study for both cycles. In our previous work, OWC resulted in acetification rates
which were similar to that of free-floating cells which defeats the aims of decreasing BSV fermentation
periods by using immobilized cells. However, consideration was given on how OWC might improve
the sensorial qualities of the vinegar and were therefore further tested in the current study. OWC had a
lower cell affinity and some of the yeast and AAB were not adsorbed on the surface after the 1st batch
of fermentations (Hutchinson et al., 2019b), which is in agreement with our previous studies.
Figure 6. 2: Acetification rates for two cycles BSV fermentation using recycled immobilized cells
The acetification rates obtained when using Ca-alginate beads for the 2nd cycle could be acceptable
depending on the manufacturers goals. However, since Ca-alginate is costly (Table 6.1), it might be
beneficial to reuse the beads although the acetification rates may be reduced by up to 64.5% and the
fermentation period may increase from 19 to 50 days (Table 6.2), which will ordinarily further increase
operational costs. This means, if the operational cost of reusing the beads is less than the cost of not
reusing the beads, then it could be advisable to reuse the beads to save on inoculum cost in large scale
operations.
2,27
1,17
2,51
0,300,07
0,89
0,00
0,50
1,00
1,50
2,00
2,50
3,00
Corncobs Oak wood chips Beads
Ace
tific
atio
n ra
te g
L-1
day-1
1st cycle 2nd cycle

96
Table 6.1: Cell immobilization matrices used in the study and their sale price Cell immobilization matrix Price (Rands) per 250g Amount used in the study
for cell immobilization per 350 ml fermentation volume
Calcium alginate 1114 0,56 g (20 mL of alginate solution infused with cells)
Oakwood chips 105 (add weight) 108.58 cm2 Corncobs 0.75 – 2 (generally sold in tons
~ R3000 to 8000 per ton) (add weight) 117 cm2
Another reason that could have affected the 2nd cycle of fermentations is the secondary adaptation
process to the new conditions when the beads are transferred into the 2nd cycle matrix. Although cell
immobilization offers protection for microorganisms, in a system such as BSV the yeast may not survive
when the acetic acid concentration reaches 60 g L-1. Furthermore, it might also be beneficial to consider
reducing the fermentation working volume (grape) for the 2nd cycle of fermentations in order to account
for the cells lost after the 1st cycle. Therefore, an alternate approach would be sequential inoculations
rather than co-inoculations. Immobilized yeast cells can be utilized to perform the alcoholic
fermentation until the desired alcohol concentration is achieved. Thereafter, immobilized AAB cells
can be introduced into the system after transferring the yeast to the next batch. This method could retain
the activity of both yeast and AAB immobilized cells. Other possible modifications that could be used
to improve the reusability of the immobilized cells are the use of other methods of adsorbing the cells
on the surface of the selected matrices. These methods include the dynamic batch, reactor loading and
electrode positioning processes (Hutchinson et al., 2019c).
Table 6.2: fermentation period for both cycles of fermentation. Cell immobilization matrix 1st cycle fermentation period
(days) 2nd cycle fermentation period (days)
Corncobs 21 Incomplete Oak wood chips 40 Incomplete Ca-alginate beads 19 50
NB: Initial grape must before fermentation had 12.7 g L-1 of total acid and fermentations were monitored until an acetic acid concentration of 60 g L-1 was achieved 6.4.3 Structural morphology of cell immobilization matrices before and after BSV fermentation 6.4.3.1 Ca-alginate beads The changes of the cell immobilization matrices in structural morphology after fermentation has a major
impact on the efficacy of the matrices when they are reused. With regard to Ca-alginate beads, it is
evident that the structure of the beads undergoes several alterations during the 1st cycle of fermentation
(Fig. 6.3). Several textures were observed, which varied from rough with bumps, rock texture, smooth
with undulated bumps and crusts including some ridge and furrow like structures. The changes in the
bead structure was initially discovered by measuring the size of the beads whereby a 20% (4.5 to 3.6
mm) reduction in bead size was observed. The effects of size reduction of the beads was also observed
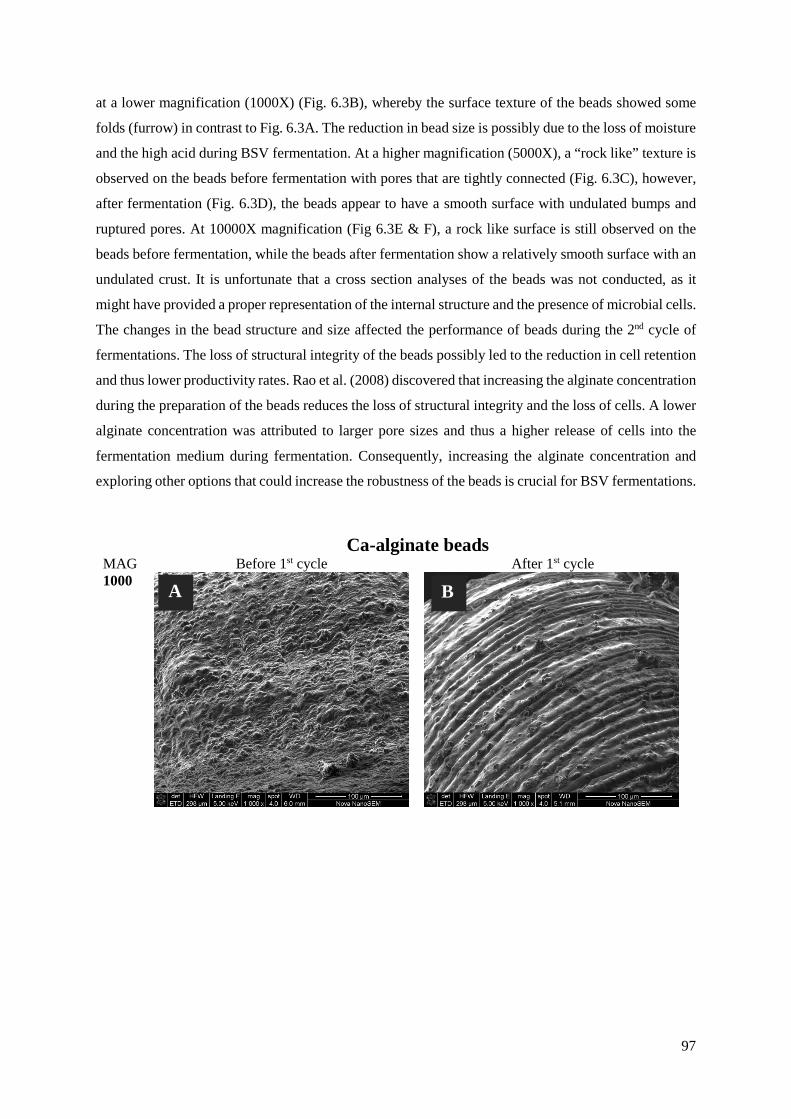
97
at a lower magnification (1000X) (Fig. 6.3B), whereby the surface texture of the beads showed some
folds (furrow) in contrast to Fig. 6.3A. The reduction in bead size is possibly due to the loss of moisture
and the high acid during BSV fermentation. At a higher magnification (5000X), a “rock like” texture is
observed on the beads before fermentation with pores that are tightly connected (Fig. 6.3C), however,
after fermentation (Fig. 6.3D), the beads appear to have a smooth surface with undulated bumps and
ruptured pores. At 10000X magnification (Fig 6.3E & F), a rock like surface is still observed on the
beads before fermentation, while the beads after fermentation show a relatively smooth surface with an
undulated crust. It is unfortunate that a cross section analyses of the beads was not conducted, as it
might have provided a proper representation of the internal structure and the presence of microbial cells.
The changes in the bead structure and size affected the performance of beads during the 2nd cycle of
fermentations. The loss of structural integrity of the beads possibly led to the reduction in cell retention
and thus lower productivity rates. Rao et al. (2008) discovered that increasing the alginate concentration
during the preparation of the beads reduces the loss of structural integrity and the loss of cells. A lower
alginate concentration was attributed to larger pore sizes and thus a higher release of cells into the
fermentation medium during fermentation. Consequently, increasing the alginate concentration and
exploring other options that could increase the robustness of the beads is crucial for BSV fermentations.
Ca-alginate beads MAG Before 1st cycle After 1st cycle 1000
A B
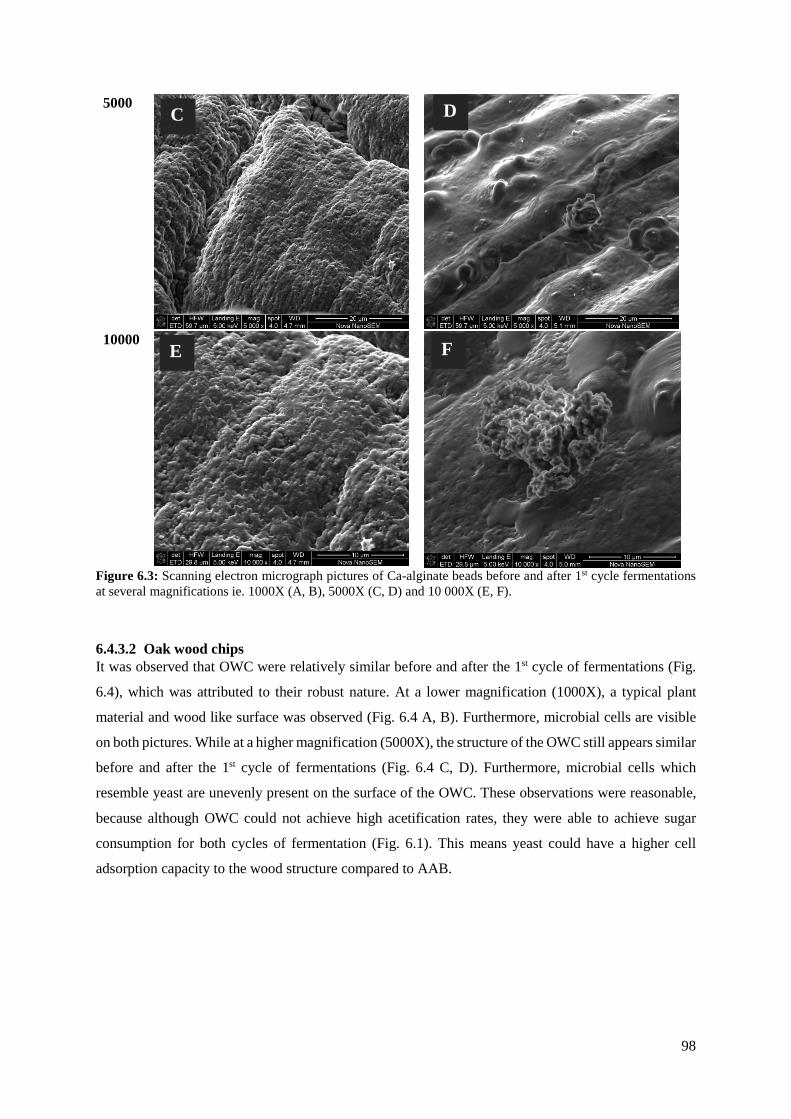
98
5000
10000
Figure 6.3: Scanning electron micrograph pictures of Ca-alginate beads before and after 1st cycle fermentations at several magnifications ie. 1000X (A, B), 5000X (C, D) and 10 000X (E, F).
6.4.3.2 Oak wood chips It was observed that OWC were relatively similar before and after the 1st cycle of fermentations (Fig.
6.4), which was attributed to their robust nature. At a lower magnification (1000X), a typical plant
material and wood like surface was observed (Fig. 6.4 A, B). Furthermore, microbial cells are visible
on both pictures. While at a higher magnification (5000X), the structure of the OWC still appears similar
before and after the 1st cycle of fermentations (Fig. 6.4 C, D). Furthermore, microbial cells which
resemble yeast are unevenly present on the surface of the OWC. These observations were reasonable,
because although OWC could not achieve high acetification rates, they were able to achieve sugar
consumption for both cycles of fermentation (Fig. 6.1). This means yeast could have a higher cell
adsorption capacity to the wood structure compared to AAB.
C
E
D
F
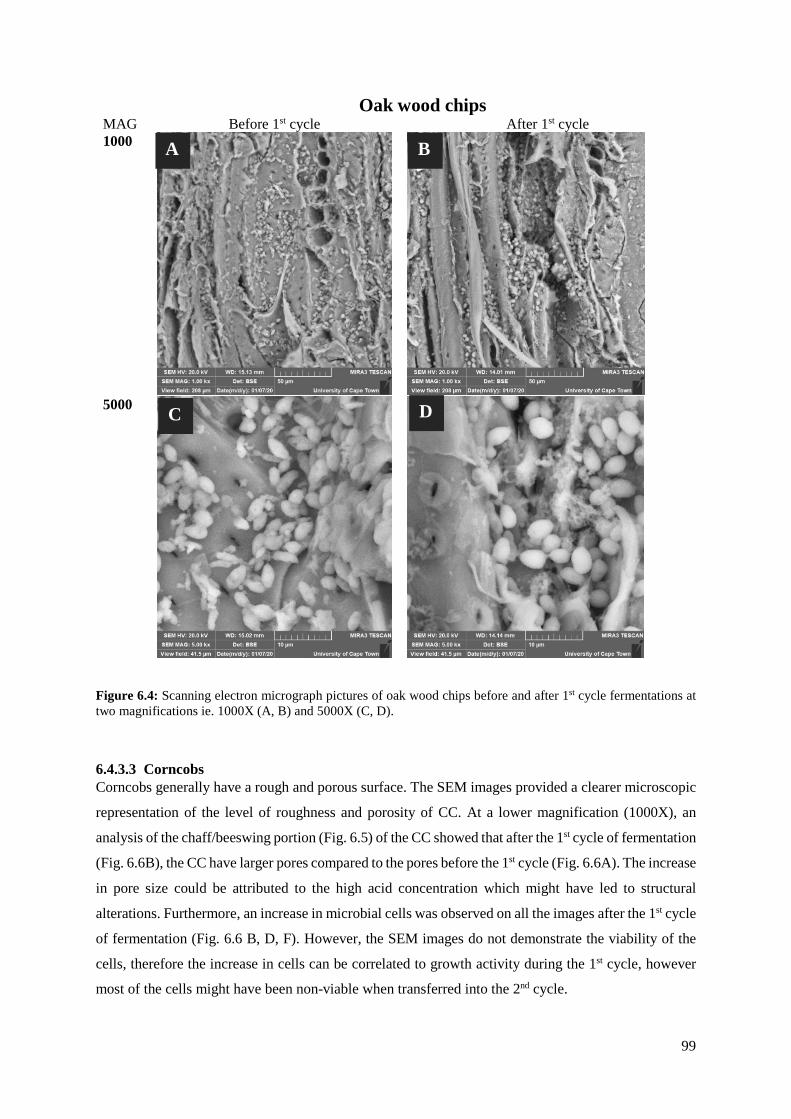
99
Oak wood chips MAG Before 1st cycle After 1st cycle 1000
5000
Figure 6.4: Scanning electron micrograph pictures of oak wood chips before and after 1st cycle fermentations at two magnifications ie. 1000X (A, B) and 5000X (C, D).
6.4.3.3 Corncobs Corncobs generally have a rough and porous surface. The SEM images provided a clearer microscopic
representation of the level of roughness and porosity of CC. At a lower magnification (1000X), an
analysis of the chaff/beeswing portion (Fig. 6.5) of the CC showed that after the 1st cycle of fermentation
(Fig. 6.6B), the CC have larger pores compared to the pores before the 1st cycle (Fig. 6.6A). The increase
in pore size could be attributed to the high acid concentration which might have led to structural
alterations. Furthermore, an increase in microbial cells was observed on all the images after the 1st cycle
of fermentation (Fig. 6.6 B, D, F). However, the SEM images do not demonstrate the viability of the
cells, therefore the increase in cells can be correlated to growth activity during the 1st cycle, however
most of the cells might have been non-viable when transferred into the 2nd cycle.
A
C
B
D

100
Figure 6.5: An image showing the structure of a corncob.
The analyses of the pith and woody ring section (Fig. 6.5) of the CC showed capsule like structures,
which resemble bacteria (Fig. 6.6C, D). The capsule like structure are of a higher number and are more
prominent after the 1st cycle of fermentations (Fig. 6.6D). If the capsule like structures are indeed
bacteria cells, that means that the pith and wood ring section of the CC has a higher cell affinity for
AAB cell adsorption. At a magnification of 1000X, the analyses of the chaff/beeswing portion (Fig.
6.5) of the CC further shows a higher number of microbial cells (predominantly yeasts cells) around the
pores/layers of the beeswing after the 1st cycle of fermentation (Fig. 6.6F). Overall, all these images
demonstrate that during BSV fermentation, the microbial cells multiply on the surface of CC. The SEM
images also prove that CC (Fig. 6.6F) have a higher cell affinity than OWC (Fig. 6.4D), CC appear to
have substantially higher number of microbial cells compared to OWC. Furthermore, the reduction of
productivity rates on the 2nd cycle of fermentations could be attributed to the loss of viability of cells
and not to the loss of cells on the immobilization matrix.
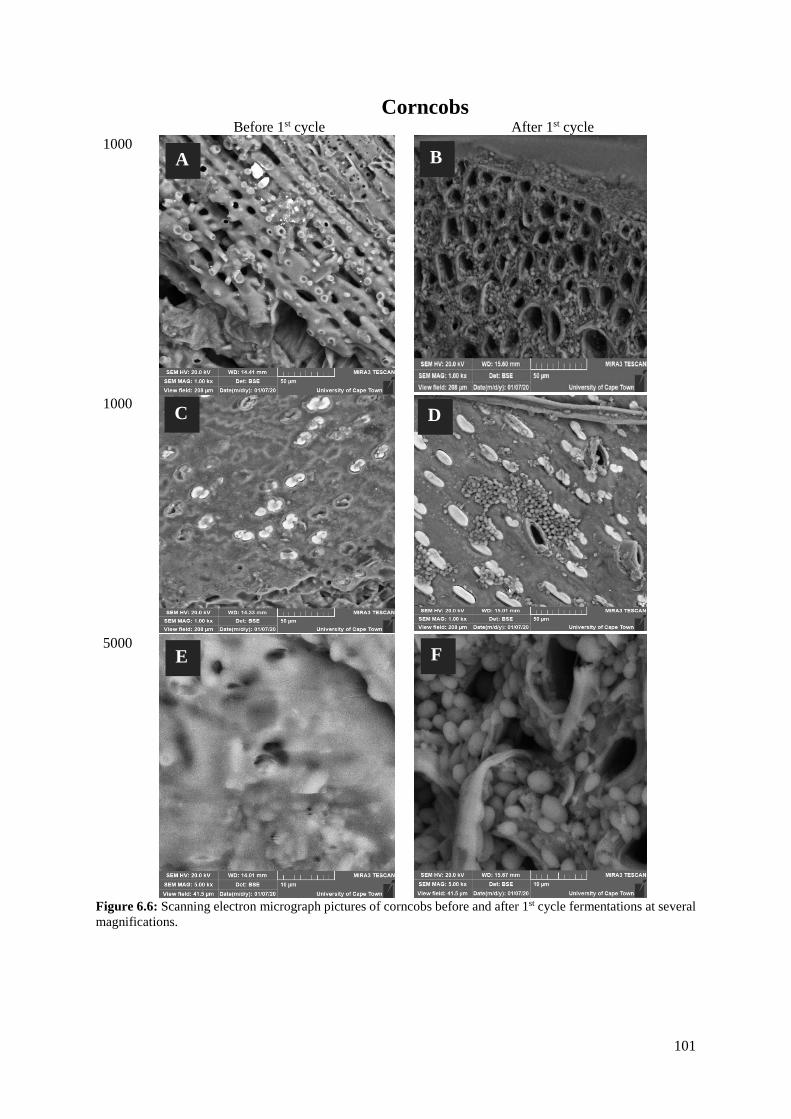
101
Corncobs Before 1st cycle After 1st cycle 1000
1000
5000
Figure 6.6: Scanning electron micrograph pictures of corncobs before and after 1st cycle fermentations at several magnifications.
A B
C D
E F
102
6.4.4 Sensory attributes of the BSV’s compared to commercial BSV’s Only the 1st cycle products were evaluated for sensorial characteristics. For the 2nd cycle fermentations,
only fermentations treated with Ca-alginate beads produced a BSV, while the CC and OWC treatments
did not produce usable samples. Therefore, it was decided not to do any sensory analyses on the 2nd
cycle fermentation samples. The yeast consortium was selected based on the ability to produce acid,
pleasant aroma, their osmophilic characteristics and percentage alcohol production under pre-
determined conditions (data not published). The cell immobilization matrices were selected based on
the knowledge that they are environmentally friendly and do not have any harmful effects on humans
when present in food products. However, as previously mentioned, the studied matrices are different
with regard to biological and structural composition, which makes it possible for the matrices to
contribute positively or negatively to the sensorial qualities of the final BSV by imparting favourable
or unfavourable compounds. It is also possible for the matrices to cause the secretion of off-flavour
compounds by the microorganisms used. Generally, the sensorial qualities of any food product
determines the success of the products research and development including the production process to
be designed. Ideally, the general appearance of acceptable balsamic vinegar is described as dense and
viscous; it resembles the texture of syrup and should be glossy and deep brown in colour. It is not harsh
on the nose and palate such as spirit vinegars. Therefore, a required attribute is that balance is required
between the sweetness and acidity (Giudici, Gullo, Solieri, & Falcone, 2009).
In the current study, a comparative analysis was conducted between BSV’s and 29 commercial balsamic
vinegars obtainable in local South Africa supermarkets. A wine vinegar was also added as an external
reference. The visual appearance of the BSV’s (Fig. 6.7A) were described as light brown with low
viscosity (like water), similar to that of wine vinegar, while the majority of the commercial balsamic
vinegars were described as dark brown or brown-black with medium viscosity. These observations
concurred with what was expected because the BSV’s were evaluated directly post-fermentation with
no maturation, addition of caramel or thickening agents. With regard to flavour (Fig. 6.7B), all the
BSV’s were also grouped together and the judges described all the treatments to have a flavour of
cooked fruit and some saltiness, while they were also described as slightly sweet and less intense. On
the other hand, the commercial balsamic vinegars were described to have diverse attributes as shown
on the PCA plot (CA correspondence analyses) (Fig. 6.7B).
The acid-sugar balance is one of the most important attributes for balsamic vinegar. Most of the
commercial balsamic vinegars were described as balanced with only a few being described as
unbalanced and highly acidic. The BSV’s were described as slightly acidic for the CC and OWC
treatments, while BSV’s fermented with Ca-alginate beads were described as unbalanced and too acidic
(Fig. 6.7C). The reason behind these descriptions is unclear because all the BSV products had similar
acid concentrations. However, it is also possible that this could be due to a low residual sugar content
in the Ca-alginate beads products, which caused the products to be perceived as highly acidic.

103
The consumer acceptance or “likeness rating” is also by far the most important rating. The BSV’s from
the CC and Ca-alginate beads treatments were associated with ‘liked a lot’ by the judges, while the
BSV’s obtained from the OWC treatments were ‘neither liked’ nor ‘disliked’. This was an interesting
observation since most of the commercial balsamic vinegars covered the full spectrum from ‘dislike’ to
‘like a lot’.

104
Figure 6.7: Sensory evaluation data for BSV and commercial balsamic vinegars. A) Visual, B) Flavours, C) Acid-sugar balance, D) consumer acceptance/liking rating. All BSV samples were shaded purple (CC: corncobs, OWC: oak wood chips, B: beads), with one wine vinegar being shaded light blue (1W: wine vinegar
Red brownBlack
Brown/Black
Dark Brown
Light brown
Low viscosity Medium viscosity
High Viscosity
Brigt/Shiny
Dull/Hazy
10B
11B
17B18B19B
1W
21B
22B
2B
30B
31B
32B 33B34B35B
36B37B
38B
39B
3B
40B
41B4B
52B
5B
6B 7B
8B 9B
BCCOWC
-1,5
-1
-0,5
0
0,5
1
1,5
2
2,5
3
-3 -2,5 -2 -1,5 -1 -0,5 0 0,5 1 1,5 2 2,5 3 3,5
F2 (2
1,44
%)
F1 (35,84 %)
A: Visual(axes F1 and F2: 57,29 %)
Attributes Products
less intenseaverage intensity
more intense
Pleasant
UnpleasantSolvent
Volatile acidity
BurntSpicyWood
Cooked Fruit Fresh fruit
Malt
Acetic acid/Vinegar-
like
MolassesLow acidity
Average acidty
High acidity
Slightly Sweet
SweetMetallic
Salty10B
11B
17B
18B
19B
1W
21B
22B2B30B
31B32B
33B
34B
35B
36B
37B
38B
39B
3B
40B
41B
4B
52B
5B
6B 7B8B
9B
BCCOWC
-1,5
-1
-0,5
0
0,5
-1,5 -1 -0,5 0 0,5 1 1,5
F2 (1
6,78
%)
F1 (19,32 %)
B: Flavours(axes F1 and F2: 36,10 %)
Attributes Products
balanced
unbalanced …
Sweet
Slightly acidic Very acidic
Long
Short
10B
11B
17B18B19B
1W21B
22B
2B
30B
31B
32B
33B34B
35B36B
37B38B
39B
3B
40B41B
4B
52B
5B6B
7B8B
9B
BCCOWC
-1
-0,5
0
0,5
1
-1,5 -1 -0,5 0 0,5 1 1,5
F2 (2
5,63
%)
F1 (45,04 %)
C: Acid-sugar balance(axes F1 and F2: 70,67 %)
Attributes Products
Like a lot
Like slightly
Neither
Dislike slightly
Dislike
10B
11B
17B18B 19B
1W
21B22B
2B
30B
31B 32B
33B
34B
35B
36B
37B38B
39B
3B
40B
41B4B
52B
5B
6B
7B
8B
9B
BCC
OWC
-1,5
-1
-0,5
0
0,5
1
1,5
2
-2,5 -2 -1,5 -1 -0,5 0 0,5 1 1,5 2 2,5 3
F2 (2
7,42
%)
F1 (31,63 %)
D: Liking rating(axes F1 and F2: 59,05 %)
Attributes Products

105
6.5 Summary Chemical developments and sensory data showed that CC and Ca-alginate beads are suitable
immobilization matrices with regards to acetification rates and sensorial qualities for the 1st cycle of
fermentations. The reusability of immobilized cells for BSV production led to much slower acetification
rates on the 2nd cycle of fermentations compared to the 1st cycle. Cells immobilized using Ca-alginate
beads resulted in higher acetification rates for the 2nd cycle compared to cells adsorbed on both CC and
OWC. Therefore, for sustainable or quality BSV production it is recommended that a fresh inoculum is
used for new cycles. SEM analyses showed that Ca-alginate beads undergo visible structural alterations
after the 1st cycle of fermentations, while CC and OWC did not show drastic structural modifications
due to their robustness. This data can be useful when choosing a matrix for cell immobilization to
produce BSV. Methods to improve the robustness of alginate beads and a sequential inoculation strategy
are therefore recommended for further stability testing of the immobilized cells when they are reused
for subsequent fermentations.
106
CHAPTER 7
Oxygen mass transfer kinetics during Balsamic-styled vinegar production

107
7 CHAPTER 7
Oxygen mass transfer kinetics during Balsamic-styled vinegar production
7.1 Introduction Generally, the design of a vinegar fermentor must consider high aeration capacity as a vital design
feature in order to achieve ideal oxidation/acetification rates (Schlepütz et al., 2013; Gullo et al., 2014).
This is due to the eminent fact that acetic acid bacteria (AAB) are strictly aerobic bacteria and thus
require high oxygen concentrations for optimal microbial activity. Consequently, oxygen transfer is
considered as the rate limiting step in several vinegar production systems (Ghommidh et al., 1982;
Tesfaye et al., 2002; García-García et al., 2009; Qi et al., 2013; Gullo et al., 2014).
Numerous studies have been conducted for industrial spirit vinegar production systems to improve the
oxygen transfer rate, aeration capacity and the aerobic oxidation reaction carried-out by AAB (Tesfaye
et al., 2002; Qi et al., 2013). These include technical modifications such as the use of pure oxygen,
elevated partial pressure, high broth agitation, and in most cases, the reconstruction of a fermentation
vessel (de Ory et al., 2004; Halladj et al., 2016; Zhou et al., 2017). However, due to the diverse AAB
species, their fragile nature and the diverse vinegar production systems, targeted researches to improve
the productivity of the process are still continuing.
Spirit vinegars are predominantly produced using the semi-continuous fermentation system, which
entails the periodic withdrawal of a portion of culture medium when the concentration of the residual
alcohol is low and subsequently refilling the remaining medium with fresh alcoholic medium to obtain
the required working volume (García-García et al., 2009; Qi et al., 2013 & 2014). However, BSV
fermentation in contrast to industrial vinegars does not employ the use of alcoholic stocks, and the
alcoholic fermentation and oxidation process occur simultaneously in the same vessel (Eq. 7.1)
(Hutchinson et al., 2018, 2019a, b). Habitually, the alcoholic stocks used for industrial vinegar as well
as several other vinegar production systems are obtained from fermentation vessels which are separate
from the acetification vessels (de Ory et al., 2004; García-García et al., 2009; Qi et al., 2013 & 2014).
Consequently, this means that a vinegar production process similar to that of BSV is more complex
with regards to oxygen transfer dynamics due to the presence of yeast and AAB in the same vessel
which happen to have paradoxical oxygen requirements. For this reason, aeration has not been a
fundamental aspect in Traditional Balsamic Vinegar (TBV) production (Solieri and Giudici, 2009;
Giudici et al., 2015). Therefore, this raises the question if submerged techniques such as aeration,
support the anaerobic (alcoholic) (Eq. 7.2) and strictly aerobic oxidation (Eq. 7.3) process during BSV
production?

108
Glucose → 𝐸𝐸𝑑𝑑ℎ𝑎𝑎𝑎𝑎𝑎𝑎𝑎𝑎 → 𝐴𝐴𝐴𝐴𝐴𝐴𝑑𝑑𝐴𝐴𝐴𝐴 𝑎𝑎𝐴𝐴𝐴𝐴𝑑𝑑
𝐶𝐶6𝐻𝐻12𝑂𝑂6 → 𝐶𝐶2𝐻𝐻5𝑂𝑂𝐻𝐻 → 𝐶𝐶𝐻𝐻3𝐶𝐶𝑂𝑂𝑂𝑂𝐻𝐻 Eq. 7.1
Glucose → 𝐸𝐸𝑑𝑑ℎ𝑎𝑎𝑎𝑎𝑎𝑎𝑎𝑎 + 𝐶𝐶𝑎𝑎𝑟𝑟𝐶𝐶𝑎𝑎𝑎𝑎 𝑑𝑑𝐴𝐴𝑎𝑎𝑑𝑑𝐴𝐴𝑑𝑑𝐴𝐴
𝐶𝐶6𝐻𝐻12𝑂𝑂6 → 𝐶𝐶2𝐻𝐻5𝑂𝑂𝐻𝐻 + 2 𝐶𝐶𝑂𝑂2 Eq. 7.2
𝐸𝐸𝑑𝑑ℎ𝑎𝑎𝑎𝑎𝑎𝑎𝑎𝑎 + 𝑂𝑂𝑑𝑑𝑂𝑂𝑂𝑂𝐴𝐴𝑎𝑎 → 𝐴𝐴𝐴𝐴𝐴𝐴𝑑𝑑𝐴𝐴𝐴𝐴 𝑎𝑎𝐴𝐴𝐴𝐴𝑑𝑑 + 𝑊𝑊𝑎𝑎𝑑𝑑𝐴𝐴𝑟𝑟
𝐶𝐶2𝐻𝐻5𝑂𝑂𝐻𝐻 + 𝑂𝑂2 → 𝐶𝐶𝐻𝐻3𝐶𝐶𝑂𝑂𝑂𝑂𝐻𝐻 + 2𝐻𝐻2𝑂𝑂 Eq. 7.3
Nevertheless, oxygen mass transfer is typically a complicated process, as it involves the transfer of
dissolved oxygen (DO) from the gaseous phase through the gaseous-liquid interface to the liquid phase
(García-García et al., 2009) (Fig. 7.1). Oxygen can easily dissolve in the air; however, the composition
of the liquid phase can significantly influence the DO content (Pittoors et al., 2014). With regards to
BSV production, the fermentation medium (cooked grape must) has several environmental factors that
could significantly affect the transfer of DO between the gaseous and liquid phase, these include the
temperature of the fermentation medium, relatively high salinity, high osmotic pressure and low pH
(Atkinson et al., 2007; Hanmante et al., 2014; Irvine, 2017; Braga et al., 2018). AAB are also known to
form extracellular polysaccharides during fermentation which also negatively affects the oxygen mass
transfer kinetics (Garcia-Ochoa et al., 2010; Sengun, 2017; Lynch et al., 2019). Another challenging
factor is that the yeasts, which are part of the BSV microbial consortium produce CO2 (Eq. 7.2) during
alcoholic fermentation which could also affect the DO content in the fermentation medium (Cheng,
2001).
Yeast
Yeast
AAB
AAB
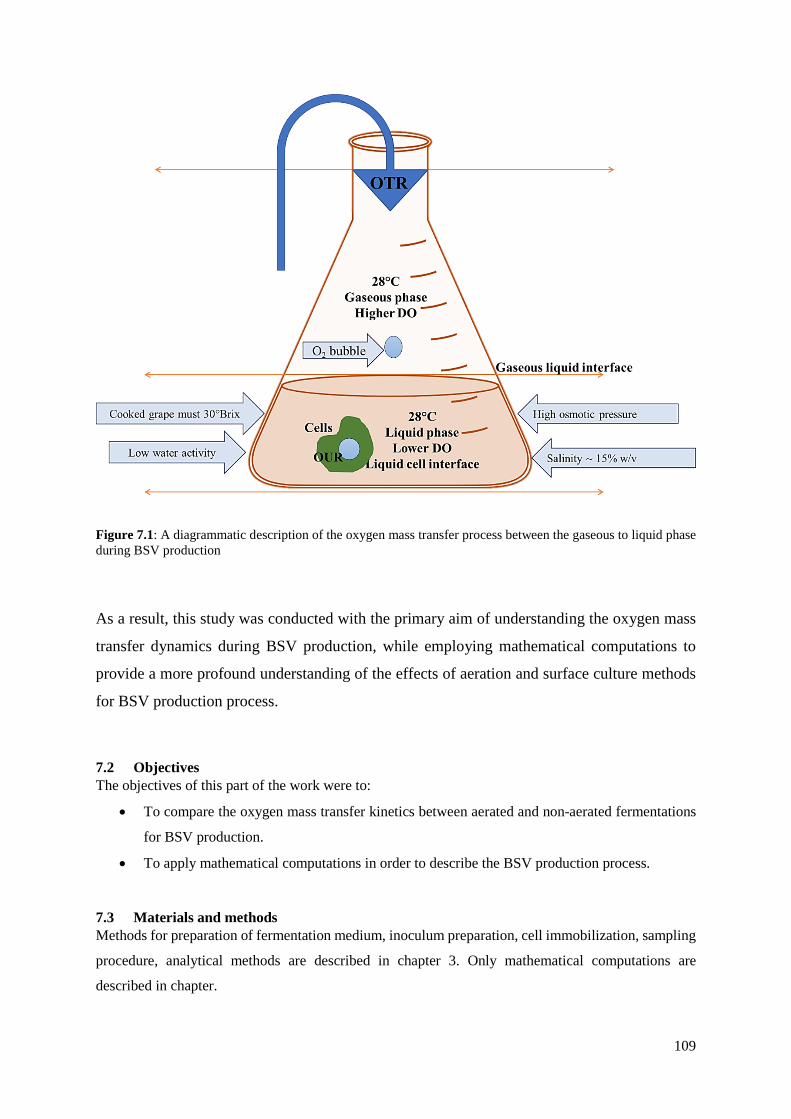
109
Figure 7.1: A diagrammatic description of the oxygen mass transfer process between the gaseous to liquid phase during BSV production
As a result, this study was conducted with the primary aim of understanding the oxygen mass
transfer dynamics during BSV production, while employing mathematical computations to
provide a more profound understanding of the effects of aeration and surface culture methods
for BSV production process.
7.2 Objectives The objectives of this part of the work were to:
• To compare the oxygen mass transfer kinetics between aerated and non-aerated fermentations
for BSV production.
• To apply mathematical computations in order to describe the BSV production process.
7.3 Materials and methods Methods for preparation of fermentation medium, inoculum preparation, cell immobilization, sampling
procedure, analytical methods are described in chapter 3. Only mathematical computations are
described in chapter.

110
7.3.1 Determination of oxygen mass transfer parameters and mathematical computations Several valuable oxygen mass transfer parameters were evaluated using the data obtained from the
dynamic method. These include the oxygen uptake rate (OUR also expressed as 𝑟𝑟𝑂𝑂2), the stoichiometric
coefficient of oxygen consumption vs acid yield (𝑌𝑌𝑂𝑂/𝐴𝐴), the oxygen transfer rate (OTR also expressed
as 𝑁𝑁𝑂𝑂2), the volumetric mass transfer coefficients (𝐾𝐾𝐿𝐿𝑎𝑎).
7.3.1.1 Determining the oxygen uptake rate To determine the oxygen uptake rate (OUR), the data generated from the dynamic method was used to
compute 𝑟𝑟𝑂𝑂2 by using the DO concentrations profiles generated during biotransformation while aeration
was interrupted. Eq. 7.4 was used to compute 𝑟𝑟𝑂𝑂2 where 𝑑𝑑𝐶𝐶𝐿𝐿 represents the change in DO concentration
in the BSV fermentation medium, while dt represents the change in time (Zhou et al., 2017).
𝑟𝑟𝑂𝑂2 = 𝑑𝑑𝐶𝐶𝐿𝐿𝑑𝑑𝑑𝑑
Eq. 7.4
7.3.1.2 Determining the stoichiometric coefficient of oxygen consumption vs acid yield To determine the ratio of oxygen consumption vs acid yield, Eq. 7.5 was used. Where 𝑟𝑟𝑂𝑂2 (g O2 L-1 hr-
1) represented the oxygen consumption rate. While 𝑟𝑟𝑎𝑎𝑎𝑎𝑎𝑎𝑑𝑑 (g AcOH L-1 h-1) represents the acetification
rate determined at different stages of the BSV fermentation, which is calculated by using Eq. 7.6 (Qi et
al., 2013 & 2014).
𝑌𝑌𝑂𝑂/𝐴𝐴 = 𝑟𝑟𝑂𝑂2𝑟𝑟𝑎𝑎𝑎𝑎𝑎𝑎𝑎𝑎
Eq. 7.5
𝑟𝑟𝑎𝑎𝑎𝑎𝑎𝑎𝑑𝑑 = 𝑑𝑑[𝑎𝑎𝑎𝑎𝑎𝑎𝑎𝑎]
𝑑𝑑𝑑𝑑 Eq. 7.6
7.3.1.3 Determining the oxygen mass transfer coefficient and oxygen transfer rate Since biomass concentration was not quantified during BSV fermentation, the oxygen mass transfer
parameters were determined using the dynamic method with the exclusion of biomass concentration
while assuming ‘steady state’ conditions during the interruption (∴ 𝑂𝑂𝑂𝑂𝑂𝑂 = 𝑂𝑂𝑂𝑂𝑂𝑂) . In most batch
systems, OUR changes rapidly over time due to biomass growth and substrate depletion. However, in
a process as slow as BSV fermentation, relatively steady state conditions were assumed due to the short
time interval for aeration interruption and long fermentation period. OUR can be considered constant,
thus leading to the combination of both kinetics in a reactor, i.e., 𝑂𝑂𝑂𝑂𝑂𝑂 = 𝑂𝑂𝑂𝑂𝑂𝑂. Consequently, 𝐾𝐾𝐿𝐿𝑎𝑎 was
determined using a biological system equation with the inclusion of OUR. Thus 𝐾𝐾𝐿𝐿𝑎𝑎 (hr-1) was
determined using the estimated OUR from the DO concentrations profile generated during aeration
interruption. Therefore Eq. 7.7 was used to determine 𝐾𝐾𝐿𝐿𝑎𝑎 , Where C* is the DO concentration at the
gaseous phase, while CL is the DO concentration at the liquid phase (Sudjarwadi, 2019).

111
OTR = 𝐾𝐾𝐿𝐿𝑎𝑎(𝐶𝐶∗ − 𝐶𝐶𝐿𝐿) Eq. 7.7
However, OTR can also be expressed as
OTR = 𝑑𝑑𝐶𝐶𝐿𝐿𝑑𝑑𝑑𝑑
= 𝐾𝐾𝐿𝐿𝑎𝑎 . (𝐶𝐶∗ − 𝐶𝐶) Eq. 7.8
Since 𝑂𝑂𝑂𝑂𝑂𝑂 = 𝑂𝑂𝑂𝑂𝑂𝑂 under steady state conditions, Eq. 7.4 and Eq. 7.8 result in Eq. 7.9 written as:
OUR = 𝐾𝐾𝐿𝐿𝑎𝑎(𝐶𝐶∗ − 𝐶𝐶𝐿𝐿) Eq. 7.9
∴ Eq. 7.9 can be written as Eq. 7.10 to calculate 𝐾𝐾𝐿𝐿𝑎𝑎
𝐾𝐾𝐿𝐿𝑎𝑎 = 𝑂𝑂𝑂𝑂𝑂𝑂𝐶𝐶∗−𝐶𝐶𝐿𝐿
Eq. 7.10
With the use of Eq. 7.10, 𝐾𝐾𝐿𝐿𝑎𝑎 was determined at different stages using OUR and (𝐶𝐶∗ − 𝐶𝐶𝐿𝐿) values.
From these data, the oxygen transfer rate was therefore calculated using Eq. 7.7 and the 𝐾𝐾𝐿𝐿𝑎𝑎 values
obtained from Eq. 7.10.
7.4 Results and Discussion To properly understand the oxygen mass transfer kinetics during BSV production, several parameters
were used to assess the correlation between oxygen mass transfer and chemical developments during
fermentation. For consistency purposes when using mathematical computations, all units were
converted to g L-1 and rates are represented in g L-1 h-1 and not g L-1 day-1 as compared to the other
chapters.
7.4.1 Chemical developments during non-aerated and aerated BSV fermentations. Chemical developments were extensively discussed in other chapters of this study, therefore, the
chemical developments are only briefly discussed and used for correlation to oxygen mass transfer
parameters. Nevertheless, sugar consumption profiles obtained from the data generated showed that
aerated fermentations resulted in higher sugar consumption rates (𝑟𝑟𝑠𝑠𝑠𝑠𝑠𝑠𝑎𝑎𝑟𝑟) at the initial stages of the
fermentation process in contrast to non-aerated fermentations for both CC and Ca-alginate beads
fermentations (Table 7.1 A, B; Fig. 7.2). While acetification rates (𝑟𝑟𝑎𝑎𝑎𝑎𝑎𝑎𝑑𝑑) were higher for both CC and
Ca-alginate beads fermentations when non-aerated conditions were used compared to aerated
conditions (Fig. 7.1 E, F). In previous studies (Hutchinson et al., 2019b; Chapter 5), similar sugar
consumption and total acid production profiles were observed when aeration was studied on cells
immobilized on CC. However, aeration was not studied on cells immobilized on Ca-alginate beads and
dissimilar profiles were therefore anticipated.

112
Table 7.1: Substrate consumption and sugar consumption rates for aerated and non-aerated fermentations.
Rate of sugar consumption (𝑟𝑟𝑠𝑠𝑠𝑠𝑠𝑠𝑎𝑎𝑟𝑟) (g L-1 h-1)
Rate of acid formation (𝑟𝑟𝑎𝑎𝑎𝑎𝑎𝑎𝑑𝑑) (g L-1 h-1)
Non-aerated fermentations
Corncobs
0.33
0.08
Ca-alginate beads 0.41
0.10
Aerated fermentations Corncobs
0.82 0.05
Ca-alginate beads 0.78 0.04
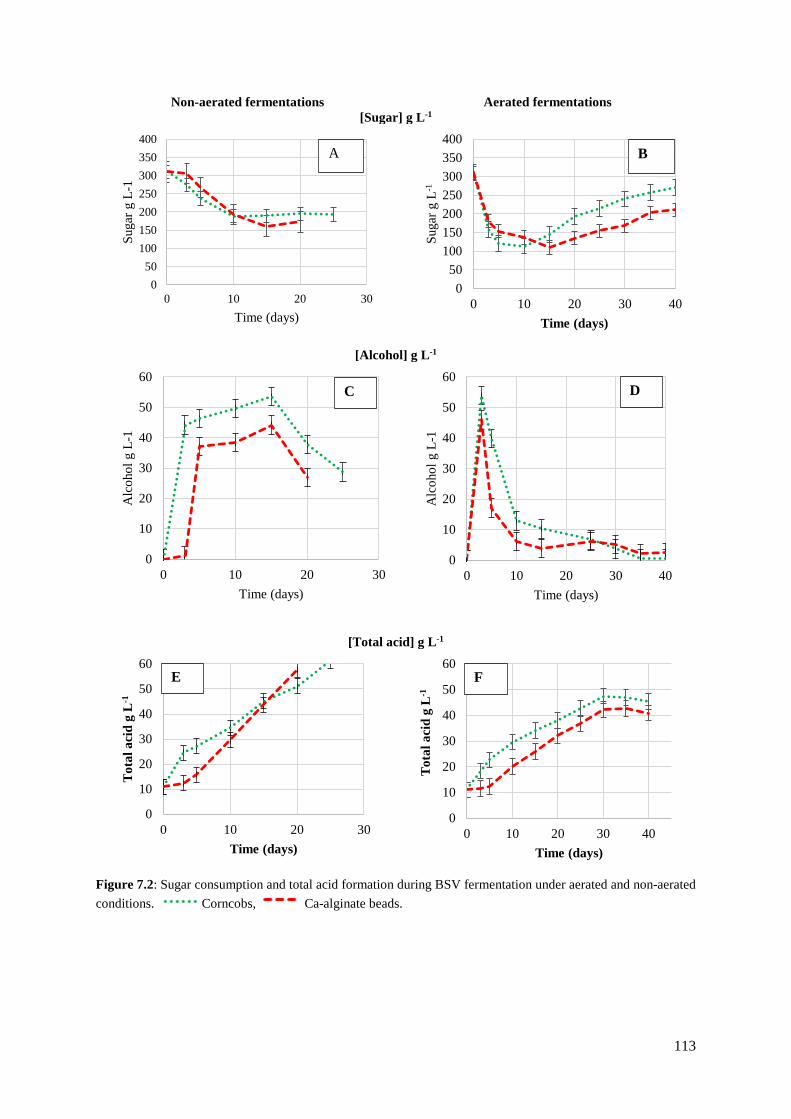
113
Non-aerated fermentations Aerated fermentations [Sugar] g L-1
[Alcohol] g L-1
[Total acid] g L-1
Figure 7.2: Sugar consumption and total acid formation during BSV fermentation under aerated and non-aerated conditions. Corncobs, Ca-alginate beads.
050
100150200250300350400
0 10 20 30
Suga
r g L
-1
Time (days)
050
100150200250300350400
0 10 20 30 40
Suga
r g L
-1
Time (days)
B
0
10
20
30
40
50
60
0 10 20 30
Alc
ohol
g L
-1
Time (days)
C
0
10
20
30
40
50
60
0 10 20 30 40
Alc
ohol
g L
-1
Time (days)
D
0
10
20
30
40
50
60
0 10 20 30
Tot
al a
cid
g L
-1
Time (days)
E
0
10
20
30
40
50
60
0 10 20 30 40
Tot
al a
cid
g L
-1
Time (days)
F
A
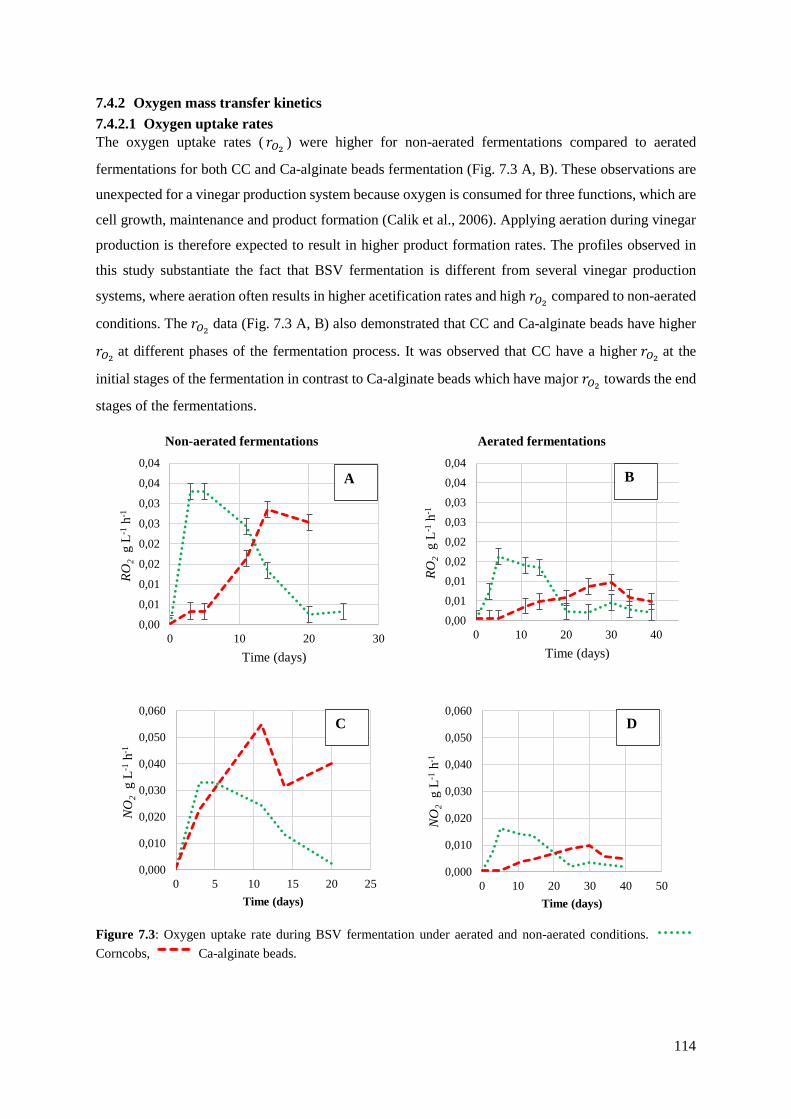
114
7.4.2 Oxygen mass transfer kinetics 7.4.2.1 Oxygen uptake rates The oxygen uptake rates ( 𝑟𝑟𝑂𝑂2 ) were higher for non-aerated fermentations compared to aerated
fermentations for both CC and Ca-alginate beads fermentation (Fig. 7.3 A, B). These observations are
unexpected for a vinegar production system because oxygen is consumed for three functions, which are
cell growth, maintenance and product formation (Calik et al., 2006). Applying aeration during vinegar
production is therefore expected to result in higher product formation rates. The profiles observed in
this study substantiate the fact that BSV fermentation is different from several vinegar production
systems, where aeration often results in higher acetification rates and high 𝑟𝑟𝑂𝑂2 compared to non-aerated
conditions. The 𝑟𝑟𝑂𝑂2 data (Fig. 7.3 A, B) also demonstrated that CC and Ca-alginate beads have higher
𝑟𝑟𝑂𝑂2 at different phases of the fermentation process. It was observed that CC have a higher 𝑟𝑟𝑂𝑂2 at the
initial stages of the fermentation in contrast to Ca-alginate beads which have major 𝑟𝑟𝑂𝑂2 towards the end
stages of the fermentations.
Non-aerated fermentations Aerated fermentations
Figure 7.3: Oxygen uptake rate during BSV fermentation under aerated and non-aerated conditions. Corncobs, Ca-alginate beads.
0,00
0,01
0,01
0,02
0,02
0,03
0,03
0,04
0,04
0 10 20 30
RO2
g L-1
h-1
Time (days)
A
0,000,010,010,020,020,030,030,040,04
0 10 20 30 40
RO2
g L-1
h-1
Time (days)
B
0,000
0,010
0,020
0,030
0,040
0,050
0,060
0 5 10 15 20 25
NO
2g
L-1h-1
Time (days)
C
0,000
0,010
0,020
0,030
0,040
0,050
0,060
0 10 20 30 40 50
NO
2g
L-1h-1
Time (days)
D
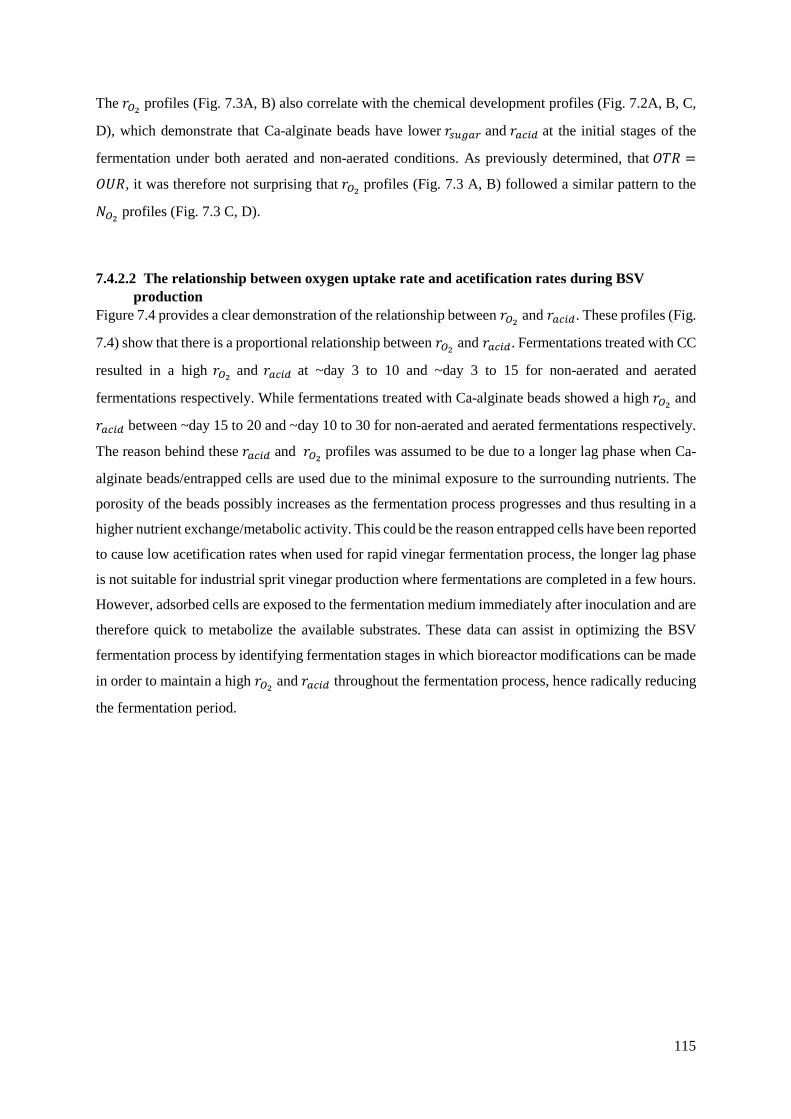
115
The 𝑟𝑟𝑂𝑂2 profiles (Fig. 7.3A, B) also correlate with the chemical development profiles (Fig. 7.2A, B, C,
D), which demonstrate that Ca-alginate beads have lower 𝑟𝑟𝑠𝑠𝑠𝑠𝑠𝑠𝑎𝑎𝑟𝑟 and 𝑟𝑟𝑎𝑎𝑎𝑎𝑎𝑎𝑑𝑑 at the initial stages of the
fermentation under both aerated and non-aerated conditions. As previously determined, that 𝑂𝑂𝑂𝑂𝑂𝑂 =
𝑂𝑂𝑂𝑂𝑂𝑂, it was therefore not surprising that 𝑟𝑟𝑂𝑂2 profiles (Fig. 7.3 A, B) followed a similar pattern to the
𝑁𝑁𝑂𝑂2 profiles (Fig. 7.3 C, D).
7.4.2.2 The relationship between oxygen uptake rate and acetification rates during BSV production
Figure 7.4 provides a clear demonstration of the relationship between 𝑟𝑟𝑂𝑂2 and 𝑟𝑟𝑎𝑎𝑎𝑎𝑎𝑎𝑑𝑑. These profiles (Fig.
7.4) show that there is a proportional relationship between 𝑟𝑟𝑂𝑂2 and 𝑟𝑟𝑎𝑎𝑎𝑎𝑎𝑎𝑑𝑑. Fermentations treated with CC
resulted in a high 𝑟𝑟𝑂𝑂2 and 𝑟𝑟𝑎𝑎𝑎𝑎𝑎𝑎𝑑𝑑 at ~day 3 to 10 and ~day 3 to 15 for non-aerated and aerated
fermentations respectively. While fermentations treated with Ca-alginate beads showed a high 𝑟𝑟𝑂𝑂2 and
𝑟𝑟𝑎𝑎𝑎𝑎𝑎𝑎𝑑𝑑 between ~day 15 to 20 and ~day 10 to 30 for non-aerated and aerated fermentations respectively.
The reason behind these 𝑟𝑟𝑎𝑎𝑎𝑎𝑎𝑎𝑑𝑑 and 𝑟𝑟𝑂𝑂2 profiles was assumed to be due to a longer lag phase when Ca-
alginate beads/entrapped cells are used due to the minimal exposure to the surrounding nutrients. The
porosity of the beads possibly increases as the fermentation process progresses and thus resulting in a
higher nutrient exchange/metabolic activity. This could be the reason entrapped cells have been reported
to cause low acetification rates when used for rapid vinegar fermentation process, the longer lag phase
is not suitable for industrial sprit vinegar production where fermentations are completed in a few hours.
However, adsorbed cells are exposed to the fermentation medium immediately after inoculation and are
therefore quick to metabolize the available substrates. These data can assist in optimizing the BSV
fermentation process by identifying fermentation stages in which bioreactor modifications can be made
in order to maintain a high 𝑟𝑟𝑂𝑂2 and 𝑟𝑟𝑎𝑎𝑎𝑎𝑎𝑎𝑑𝑑 throughout the fermentation process, hence radically reducing
the fermentation period.
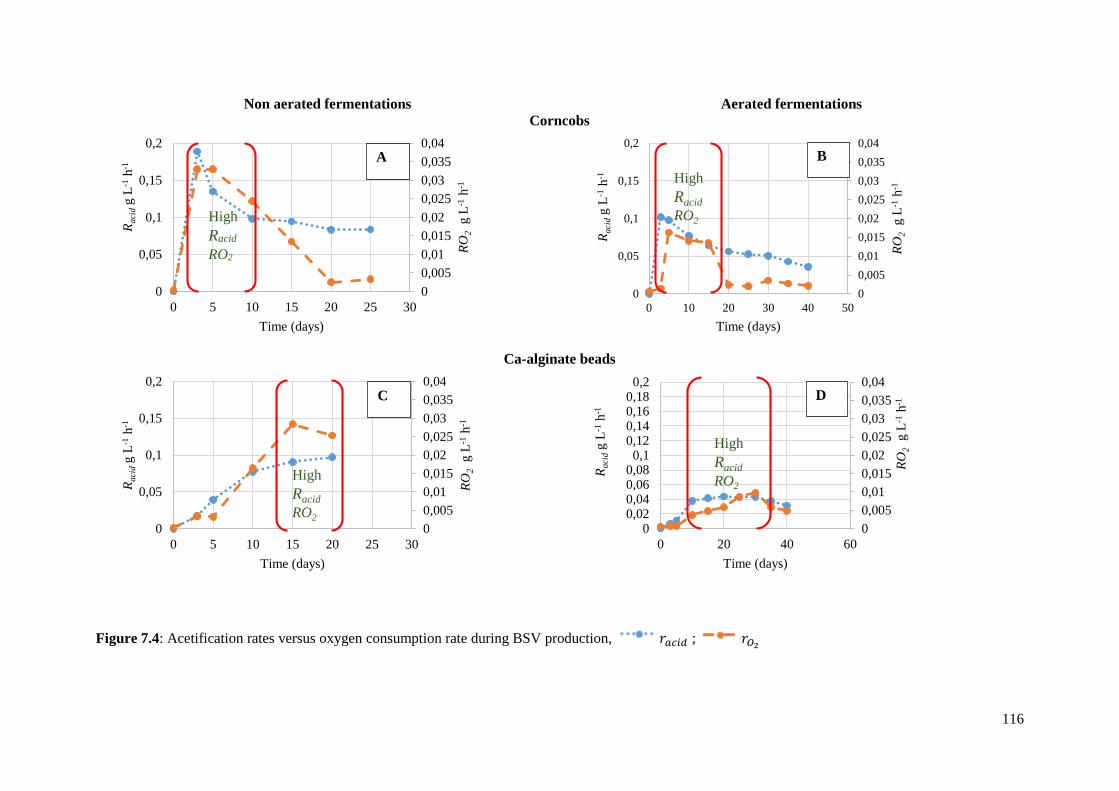
116
Non aerated fermentations Aerated fermentations Corncobs
Ca-alginate beads
Figure 7.4: Acetification rates versus oxygen consumption rate during BSV production, 𝑟𝑟𝑎𝑎𝑎𝑎𝑎𝑎𝑑𝑑 ; 𝑟𝑟𝑂𝑂2
00,0050,010,0150,020,0250,030,0350,04
0
0,05
0,1
0,15
0,2
0 5 10 15 20 25 30
RO2
g L-1
h-1
R aci
dg
L-1h-1
Time (days)
A
00,0050,010,0150,020,0250,030,0350,04
0
0,05
0,1
0,15
0,2
0 10 20 30 40 50
RO2
g L-1
h-1
R aci
dg
L-1h-1
Time (days)
BHighRacidRO2
00,0050,010,0150,020,0250,030,0350,04
0
0,05
0,1
0,15
0,2
0 5 10 15 20 25 30
RO2
g L-1
h-1
R aci
dg
L-1h-1
Time (days)
C
HighRacidRO2
00,0050,010,0150,020,0250,030,0350,04
00,020,040,060,08
0,10,120,140,160,18
0,2
0 20 40 60
RO2
g L-1
h-1
R aci
dg
L-1h-1
Time (days)
D
HighRacid RO2
High Racid
RO2
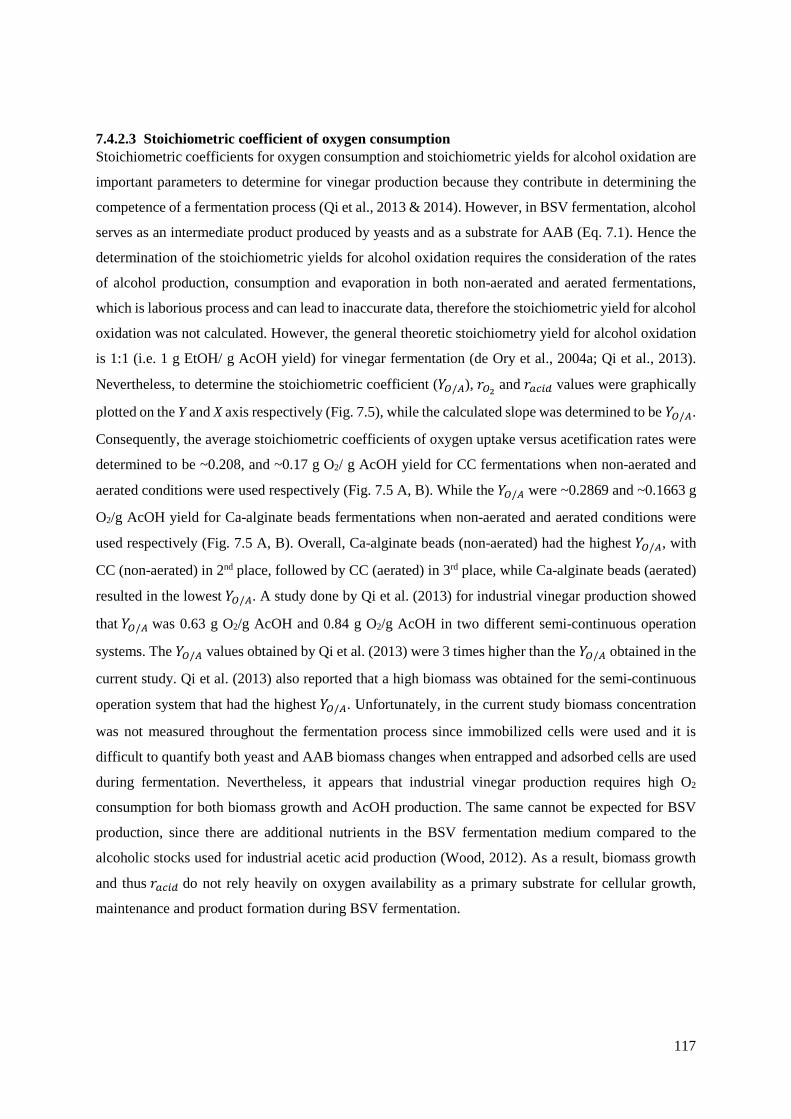
117
7.4.2.3 Stoichiometric coefficient of oxygen consumption Stoichiometric coefficients for oxygen consumption and stoichiometric yields for alcohol oxidation are
important parameters to determine for vinegar production because they contribute in determining the
competence of a fermentation process (Qi et al., 2013 & 2014). However, in BSV fermentation, alcohol
serves as an intermediate product produced by yeasts and as a substrate for AAB (Eq. 7.1). Hence the
determination of the stoichiometric yields for alcohol oxidation requires the consideration of the rates
of alcohol production, consumption and evaporation in both non-aerated and aerated fermentations,
which is laborious process and can lead to inaccurate data, therefore the stoichiometric yield for alcohol
oxidation was not calculated. However, the general theoretic stoichiometry yield for alcohol oxidation
is 1:1 (i.e. 1 g EtOH/ g AcOH yield) for vinegar fermentation (de Ory et al., 2004a; Qi et al., 2013).
Nevertheless, to determine the stoichiometric coefficient (𝑌𝑌𝑂𝑂/𝐴𝐴), 𝑟𝑟𝑂𝑂2 and 𝑟𝑟𝑎𝑎𝑎𝑎𝑎𝑎𝑑𝑑 values were graphically
plotted on the Y and X axis respectively (Fig. 7.5), while the calculated slope was determined to be 𝑌𝑌𝑂𝑂/𝐴𝐴.
Consequently, the average stoichiometric coefficients of oxygen uptake versus acetification rates were
determined to be ~0.208, and ~0.17 g O2/ g AcOH yield for CC fermentations when non-aerated and
aerated conditions were used respectively (Fig. 7.5 A, B). While the 𝑌𝑌𝑂𝑂/𝐴𝐴 were ~0.2869 and ~0.1663 g
O2/g AcOH yield for Ca-alginate beads fermentations when non-aerated and aerated conditions were
used respectively (Fig. 7.5 A, B). Overall, Ca-alginate beads (non-aerated) had the highest 𝑌𝑌𝑂𝑂/𝐴𝐴, with
CC (non-aerated) in 2nd place, followed by CC (aerated) in 3rd place, while Ca-alginate beads (aerated)
resulted in the lowest 𝑌𝑌𝑂𝑂/𝐴𝐴. A study done by Qi et al. (2013) for industrial vinegar production showed
that 𝑌𝑌𝑂𝑂/𝐴𝐴 was 0.63 g O2/g AcOH and 0.84 g O2/g AcOH in two different semi-continuous operation
systems. The 𝑌𝑌𝑂𝑂/𝐴𝐴 values obtained by Qi et al. (2013) were 3 times higher than the 𝑌𝑌𝑂𝑂/𝐴𝐴 obtained in the
current study. Qi et al. (2013) also reported that a high biomass was obtained for the semi-continuous
operation system that had the highest 𝑌𝑌𝑂𝑂/𝐴𝐴. Unfortunately, in the current study biomass concentration
was not measured throughout the fermentation process since immobilized cells were used and it is
difficult to quantify both yeast and AAB biomass changes when entrapped and adsorbed cells are used
during fermentation. Nevertheless, it appears that industrial vinegar production requires high O2
consumption for both biomass growth and AcOH production. The same cannot be expected for BSV
production, since there are additional nutrients in the BSV fermentation medium compared to the
alcoholic stocks used for industrial acetic acid production (Wood, 2012). As a result, biomass growth
and thus 𝑟𝑟𝑎𝑎𝑎𝑎𝑎𝑎𝑑𝑑 do not rely heavily on oxygen availability as a primary substrate for cellular growth,
maintenance and product formation during BSV fermentation.
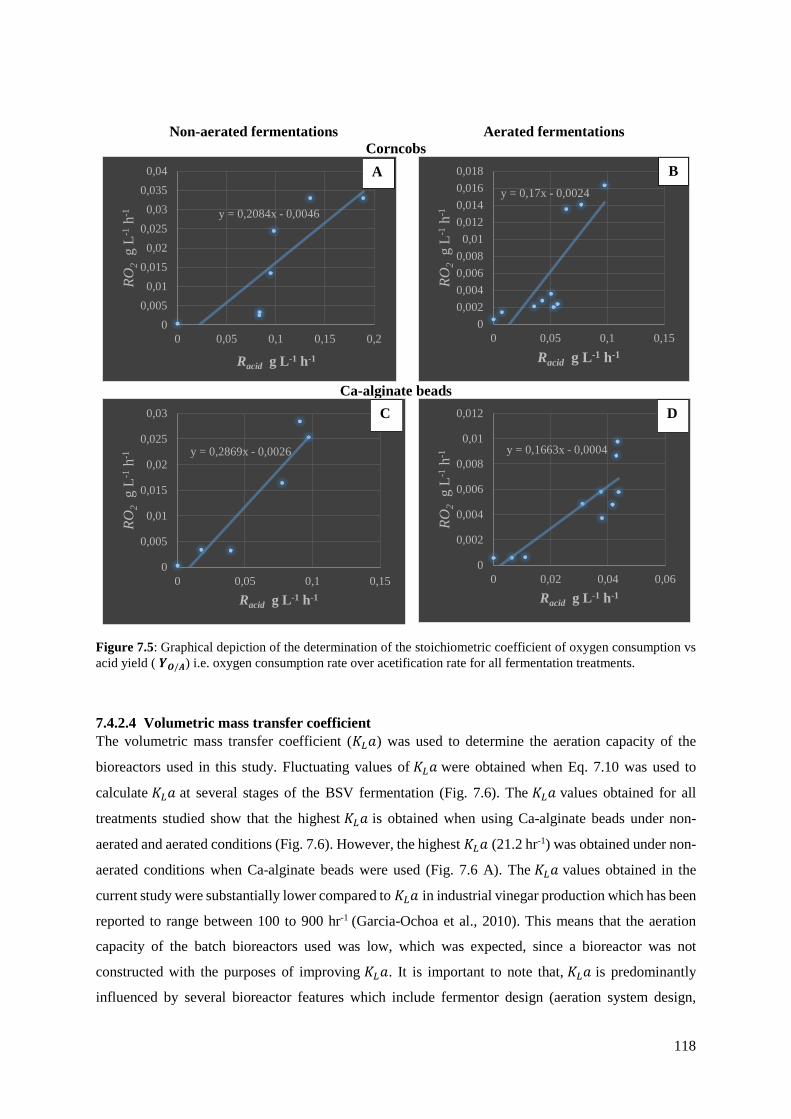
118
Non-aerated fermentations Aerated fermentations Corncobs
Ca-alginate beads
Figure 7.5: Graphical depiction of the determination of the stoichiometric coefficient of oxygen consumption vs acid yield ( 𝒀𝒀𝒀𝒀/𝑨𝑨) i.e. oxygen consumption rate over acetification rate for all fermentation treatments.
7.4.2.4 Volumetric mass transfer coefficient The volumetric mass transfer coefficient (𝐾𝐾𝐿𝐿𝑎𝑎) was used to determine the aeration capacity of the
bioreactors used in this study. Fluctuating values of 𝐾𝐾𝐿𝐿𝑎𝑎 were obtained when Eq. 7.10 was used to
calculate 𝐾𝐾𝐿𝐿𝑎𝑎 at several stages of the BSV fermentation (Fig. 7.6). The 𝐾𝐾𝐿𝐿𝑎𝑎 values obtained for all
treatments studied show that the highest 𝐾𝐾𝐿𝐿𝑎𝑎 is obtained when using Ca-alginate beads under non-
aerated and aerated conditions (Fig. 7.6). However, the highest 𝐾𝐾𝐿𝐿𝑎𝑎 (21.2 hr-1) was obtained under non-
aerated conditions when Ca-alginate beads were used (Fig. 7.6 A). The 𝐾𝐾𝐿𝐿𝑎𝑎 values obtained in the
current study were substantially lower compared to 𝐾𝐾𝐿𝐿𝑎𝑎 in industrial vinegar production which has been
reported to range between 100 to 900 hr-1 (Garcia-Ochoa et al., 2010). This means that the aeration
capacity of the batch bioreactors used was low, which was expected, since a bioreactor was not
constructed with the purposes of improving 𝐾𝐾𝐿𝐿𝑎𝑎. It is important to note that, 𝐾𝐾𝐿𝐿𝑎𝑎 is predominantly
influenced by several bioreactor features which include fermentor design (aeration system design,
y = 0,2084x - 0,0046
00,0050,01
0,0150,02
0,0250,03
0,0350,04
0 0,05 0,1 0,15 0,2
RO2
g L-1
h-1
Racid g L-1 h-1
Ay = 0,17x - 0,0024
00,0020,0040,0060,0080,01
0,0120,0140,0160,018
0 0,05 0,1 0,15
RO2
g L-1
h-1
Racid g L-1 h-1
B
y = 0,2869x - 0,0026
0
0,005
0,01
0,015
0,02
0,025
0,03
0 0,05 0,1 0,15
RO2
g L-1
h-1
Racid g L-1 h-1
C
y = 0,1663x - 0,0004
0
0,002
0,004
0,006
0,008
0,01
0,012
0 0,02 0,04 0,06
RO2
g L-1
h-1
Racid g L-1 h-1
D

119
geometric configurations), chemical-physical factors (viscosity, liquid composition), biomass
concentration, hydrodynamic attributes of the liquid phase (air bubble size, airflow rate) (AlAhmady,
2011; Pittoors et al., 2014). For this reason, properly designed bioreactors/ fermentors have a high 𝐾𝐾𝐿𝐿𝑎𝑎.
However, in this study, 2 L batch bioreactors were sparged with air without the use of other bioreactor
features, while the non-aerated fermentations were covered with loose cotton wool stoppers. The data
obtained shows that applying aeration on its own does not guarantee a high 𝐾𝐾𝐿𝐿𝑎𝑎, because 𝐾𝐾𝐿𝐿𝑎𝑎 was
determined while considering 𝐶𝐶∗ , 𝐶𝐶𝐿𝐿 and 𝑟𝑟𝑂𝑂2 . While these parameters were also influenced by the
design of the BSV aeration system, airflow rate, bubble size, BSV medium composition, medium
viscosity and biomass concentration. Furthermore, it was observed that fermentations treated with CC
resulted in low 𝐾𝐾𝐿𝐿𝑎𝑎 under both aerated and non-aerated conditions. This means that, the presence of
CC in the bioreactor has an influence on the aeration capacity of the bioreactor, probably due to added
matter in the liquid medium. Therefore, if a fermentor with a high aeration capacity would be
constructed for CC fermentations, the 𝑟𝑟𝑎𝑎𝑎𝑎𝑎𝑎𝑑𝑑 would also be increased substantially. Overall, these data
demonstrate that aeration led to lower 𝑟𝑟𝑎𝑎𝑎𝑎𝑎𝑎𝑑𝑑 due o the low aeration capacity of the bioreactors.
Non-aerated fermentations Aerated fermentations
Figure 7.6: Volumetric mass transfer changes during BSV fermentation. Corncobs, Ca-alginate beads.
0,2
9,6
4,66,3
1,30,3
6,6
10,3
14,6
21,2
0,0
5,0
10,0
15,0
20,0
25,0
0 10 20 30
KLa
Hr-1
Time (days)
A
0,4
2,44,2
2,8 3,0 1,54,4
2,7
1,40,70,2
0,1
0,6 0,9
11,48,5
8,5
2,5
0,0
5,0
10,0
15,0
20,0
25,0
0 20 40 60
KLa
h-1
Time (days)
B
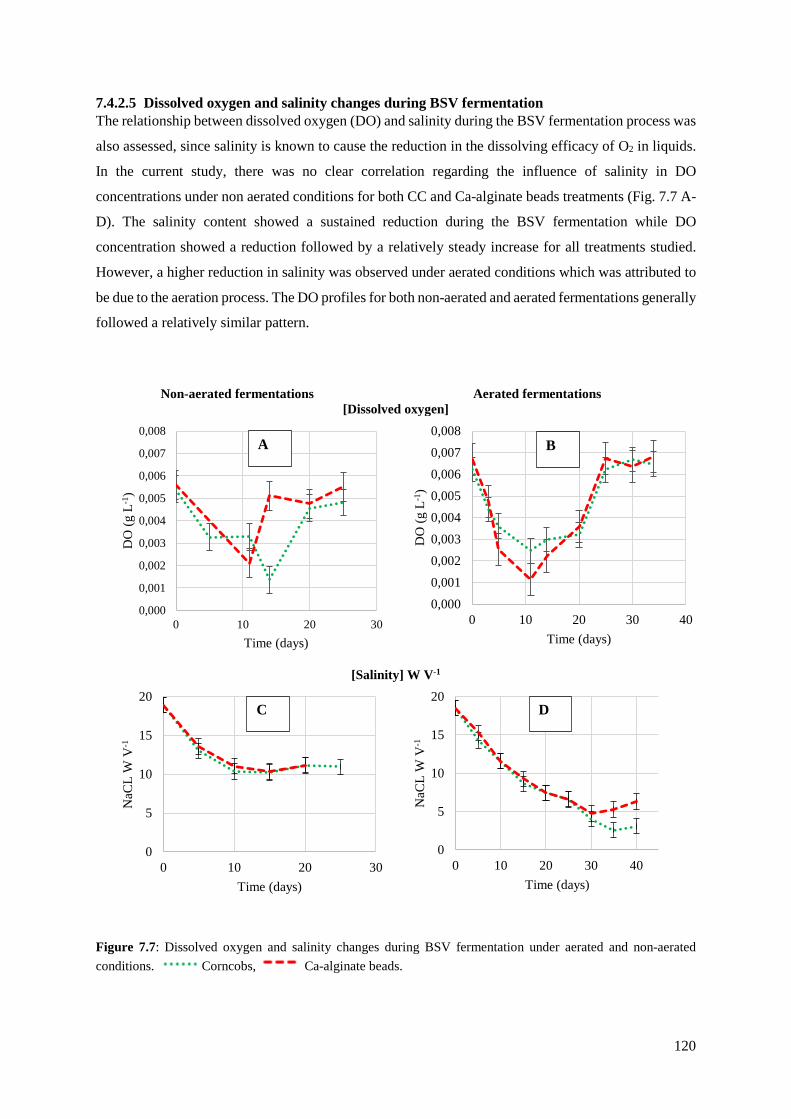
120
7.4.2.5 Dissolved oxygen and salinity changes during BSV fermentation The relationship between dissolved oxygen (DO) and salinity during the BSV fermentation process was
also assessed, since salinity is known to cause the reduction in the dissolving efficacy of O2 in liquids.
In the current study, there was no clear correlation regarding the influence of salinity in DO
concentrations under non aerated conditions for both CC and Ca-alginate beads treatments (Fig. 7.7 A-
D). The salinity content showed a sustained reduction during the BSV fermentation while DO
concentration showed a reduction followed by a relatively steady increase for all treatments studied.
However, a higher reduction in salinity was observed under aerated conditions which was attributed to
be due to the aeration process. The DO profiles for both non-aerated and aerated fermentations generally
followed a relatively similar pattern.
Non-aerated fermentations Aerated fermentations [Dissolved oxygen]
[Salinity] W V-1
Figure 7.7: Dissolved oxygen and salinity changes during BSV fermentation under aerated and non-aerated conditions. Corncobs, Ca-alginate beads.
0,000
0,001
0,002
0,003
0,004
0,005
0,006
0,007
0,008
0 10 20 30
DO
(g L
-1)
Time (days)
A
0,0000,0010,0020,0030,0040,0050,0060,0070,008
0 10 20 30 40
DO
(g L
-1)
Time (days)
B
0
5
10
15
20
0 10 20 30
NaC
L W
V-1
Time (days)
C
0
5
10
15
20
0 10 20 30 40
NaC
L W
V-1
Time (days)
D
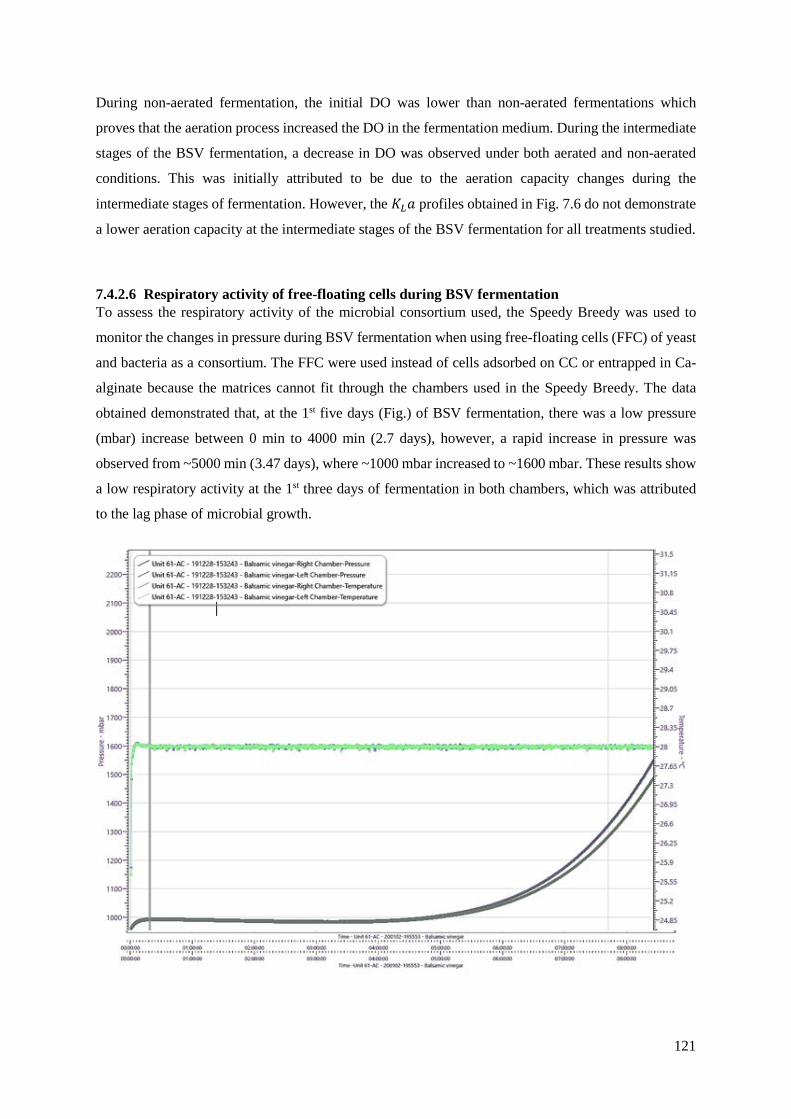
121
During non-aerated fermentation, the initial DO was lower than non-aerated fermentations which
proves that the aeration process increased the DO in the fermentation medium. During the intermediate
stages of the BSV fermentation, a decrease in DO was observed under both aerated and non-aerated
conditions. This was initially attributed to be due to the aeration capacity changes during the
intermediate stages of fermentation. However, the 𝐾𝐾𝐿𝐿𝑎𝑎 profiles obtained in Fig. 7.6 do not demonstrate
a lower aeration capacity at the intermediate stages of the BSV fermentation for all treatments studied.
7.4.2.6 Respiratory activity of free-floating cells during BSV fermentation To assess the respiratory activity of the microbial consortium used, the Speedy Breedy was used to
monitor the changes in pressure during BSV fermentation when using free-floating cells (FFC) of yeast
and bacteria as a consortium. The FFC were used instead of cells adsorbed on CC or entrapped in Ca-
alginate because the matrices cannot fit through the chambers used in the Speedy Breedy. The data
obtained demonstrated that, at the 1st five days (Fig.) of BSV fermentation, there was a low pressure
(mbar) increase between 0 min to 4000 min (2.7 days), however, a rapid increase in pressure was
observed from ~5000 min (3.47 days), where ~1000 mbar increased to ~1600 mbar. These results show
a low respiratory activity at the 1st three days of fermentation in both chambers, which was attributed
to the lag phase of microbial growth.

122
Figure 7.8: Respiratory activity between day 0 to 4 when using FFC for BSV production. BSV, Temperature
The results obtained between day 5 to 10 (Fig. 7.9) showed an exponential increase in pressure after
1000 min (0.69 days), the pressure increased from 1240 (at 1000 min) to ~1640 mbar. The exponential
increase in pressure was attributed to the exponential growth phase of the microbial consortium when
assuming that respiratory activity is proportional to biomass growth.
Figure 7.9: Respiratory activity between day 5 to 10 when using FFC for BSV production. . BSV, Temperature
During day 11 to 15 (Fig. 7.10), a substantial decrease in respiratory activity was observed. A sudden
pressure decrease from ~980 mbar to ~800 mbar was observed. The data obtained in Fig. 7.8, 7.9 &
7.10 demonstrate that the respiratory activity obtained during this period was mainly due to yeast
microbial activity when assuming that respiratory activity was proportional to product formation. The
decline in respiratory activity in Figure 7.10 also demonstrates that the respiratory activity could have
been yeast, because yeasts are probable to have a lower respiratory activity after the production of
alcohol. Table 7.2 also provides details regarding the chemical developments of the Speedy Breedy
samples, whereby yeasts produced high levels of alcohol in both chambers, while AAB produced
minimal levels of total acid. These data demonstrate that it is difficult to measure the respiration of both
yeasts and AAB when they are used as a mixed inoculum due to the different metabolic processes.

123
Figure 7.10: Respiratory activity between day 11 to 15 when using FFC for BSV production. . BSV, Temperature
Table 7.2: Alcohol and total acid changes after respiratory activity monitoring in the Speedy Breedy
Days 4 10 15 Chamber 1: [Alcohol] g L-1 4.10 33.50 47.20 Chamber 2: [Alcohol] g L-1 4.10 31.60 48.70 Chamber 1: [Total acid] g L-1 12.40 14.40 15.22 Chamber 2: [Total acid] g L-1 12.50 14.80 15.57
7.4.3 Theoretical reasons for the slow acetification rates during aerated BSV fermentations This part of the study provided a reflective understanding concerning oxygen mass transfer kinetics
during BSV production. However, there are several reasons that were assumed to cause the lower 𝑟𝑟𝑎𝑎𝑎𝑎𝑎𝑎𝑑𝑑
observed under aerated conditions. These reasons include but are not limited to EtOH evaporation, CO2
production, loss of nutrients, loss of moisture and reduction in DO. The application of aeration during
BSV production causes several complications. As observed in (Fig. 7.2 B, E). Aeration visibly led to
the production of EtOH, while a high rate of EtOH disappearance was also observed in contrast to non-
aerated fermentations. However, due to the low 𝑟𝑟𝑎𝑎𝑎𝑎𝑎𝑎𝑑𝑑, it was therefore discernible that the disappearance
of EtOH under aerated conditions was not due to the biological oxidation of EtOH by AAB but rather
due to evaporation which was enhanced by the aeration process. The evaporation of EtOH also leads to
low stoichiometric yields for alcohol oxidation, instead of the theoretical 100% (i.e, 1:1), the
evaporation of alcohol substantially decreases the ratio in practical fermentations. Alcohol evaporation
124
generally occurs in both non-aerated and aerated conditions, however, the aeration process is known
for causing higher evaporation rates (Qi et al., 2014; Schlepütz, & Büchs, 2014; Gullo et al., 2014),
since the speed at which air flows above the surface or in liquid causes several molecules in the liquid
to dissipate into the air (Moghiman & Joudat, 2007; He et al., 2019). For this reason, aeration also
caused the loss of moisture and H2O in the fermentation medium. BSV fermentation is generally lengthy
compared to industrial vinegar fermentation. Therefore, when aeration was applied for >20 days, this
resulted in a substantial reduction (± 40%) of the fermentation working volume and consequently the
water activity was also reduced which is detrimental for AAB (Solieri & Giudici, 2008; Tofalo et al.,
2009). It is also possible that aeration could have caused the reduction/evaporation of other nutrients
that are chemically bonded to H2O and are important for the survival and activity of AAB. Furthermore,
aeration also caused a higher reduction in saline (Fig, 7.5D) compared to non-aerated fermentation (Fig.
7.5C). The reduction of saline could not have been due to evaporation, because although salt dissolves
in liquid, it is not actually chemically bonded to the liquid, consequently, when H2O evaporates, the salt
remains in the residual liquid (Akridge, 2008).
The production of CO2 during fermentation might have had detrimental effects on the AAB. According
to the 𝑟𝑟𝑠𝑠𝑠𝑠𝑠𝑠𝑎𝑎𝑟𝑟 profiles, yeasts are clearly not affected under both non-aerated and aerated conditions, thus
a higher 𝑟𝑟𝑠𝑠𝑠𝑠𝑠𝑠𝑎𝑎𝑟𝑟 and 𝑟𝑟𝑎𝑎𝑎𝑎𝑎𝑎𝑎𝑎ℎ𝑎𝑎𝑎𝑎 is observed under aerated fermentations in contrast to non-aerated
fermentations (Table 7.1, Fig. 7.2 C, D). The presence of high CO2 might have lowered the metabolic
activity, or had lethal effects on the AAB (Cheng, 2001), thus lowering 𝑟𝑟𝑎𝑎𝑎𝑎𝑎𝑎𝑑𝑑. Furthermore, although
the alcoholic and acetification process is separated during industrial vinegar production systems, the
problem of CO2 build up is also a common occurrence (García-García et al., 2009; Garcia-Ochoa et al.,
2010). For this reason, it may be useful to employ special devices CO2 extraction in the fermentation
vessels.

125
Fundamentally, the long fermentation period during BSV fermentation could be the major reason for
aeration being unsuitable for the process, because the longer the fermentation length, the better the
chance of aeration to make alterations to the fermentation medium that are unsuitable for the microbial
consortium. The 𝑟𝑟𝑎𝑎𝑎𝑎𝑎𝑎𝑑𝑑 were also calculated at the first 5 days of the fermentation period (Table 7.2),
which served as initial 𝑟𝑟𝑎𝑎𝑎𝑎𝑎𝑎𝑑𝑑. The data (Table: 7.2) obtained showed that CC treatments had relatively
similar 𝑟𝑟𝑎𝑎𝑎𝑎𝑎𝑎𝑑𝑑 for both non-aerated and aerated conditions, while Ca-alginate beads also had relatively
similar 𝑟𝑟𝑎𝑎𝑎𝑎𝑎𝑎𝑑𝑑 for both non-aerated and aerated conditions at the initial stages of the fermentation.
However, when the fermentation progresses, the 𝑟𝑟𝑎𝑎𝑎𝑎𝑎𝑎𝑑𝑑 rates decrease due to the high evaporation of
alcohol (Fig. 7.3 C, D), which resulted in very low concentrations of alcohol during the late stage of the
fermentation, as a result, the overoxidation of AcOH to CO2 and H2O occurred.
Table 7.3: Acetification rates at the first 5 days of the BSV fermentation process Initial rate of acid formation (𝑟𝑟𝑎𝑎𝑎𝑎𝑎𝑎𝑑𝑑)
(g L-1 h-1) Initial rate of acid formation (𝑟𝑟𝑎𝑎𝑎𝑎𝑎𝑎𝑑𝑑) (g L-1 day-1)
Non-aerated corncobs 0.061 2.72
Aerated corncobs 0.097 2.34
Non-aerated Ca-alginate beads
0.11 0.25
Aerated Ca-alginate beads 0.01 0.26
Similar challenges are experienced with industrial spirit vinegar production, however the short
fermentation period (20-24 hrs) (Budak & Guzel-Seydim, 2010) lessens the severity of the aeration
effects. In other words, although AAB are strictly aerobic and require high DO concentrations for
optimal activity, it seems that applying aeration during BSV fermentation is more detrimental than
beneficial due to the aforementioned reasons.
7.5 Summary Studying the oxygen mass transfer kinetics during BSV production provided a more reflective
understanding of the BSV fermentation system used. Non-aerated fermentations had higher
Stoichiometric coefficients for oxygen consumption vs acid yield, for both CC and Ca-alginate beads
treatments. Ca-alginate beads have a longer lag phase in contrast to CC treatments for both aerated and
non-aerated conditions. The volumetric mass transfer coefficients demonstrated that aerated
fermentations had a low aeration capacity compared to non-aerated fermentations. Fermentations
carried out with CC had a lower aeration on both non-aerated and aerated conditions. While Ca-alginate
beads fermentation had the highest aeration capacity. This data demonstrates that the use of CC could
result in considerably higher acetification rates if a suitable bioreactor that improves 𝐾𝐾𝐿𝐿𝑎𝑎 could be
constructed. Overall, the kinetics prove that aeration is not a necessary addition for BSV fermentation,
unless extra technical modifications are made.

126
CHAPTER 8
GENERAL DISCUSSION, CONCLUSIONS AND RECOMMENDATIONS
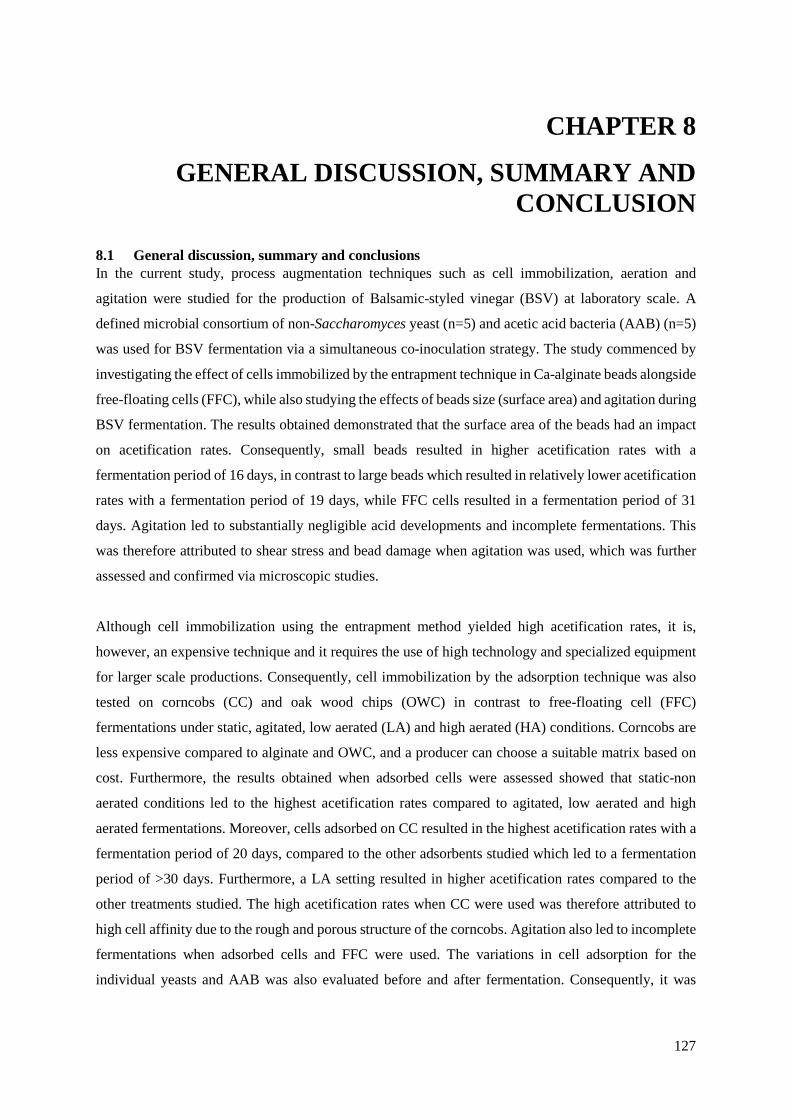
127
8 CHAPTER 8
GENERAL DISCUSSION, SUMMARY AND CONCLUSION
8.1 General discussion, summary and conclusions In the current study, process augmentation techniques such as cell immobilization, aeration and
agitation were studied for the production of Balsamic-styled vinegar (BSV) at laboratory scale. A
defined microbial consortium of non-Saccharomyces yeast (n=5) and acetic acid bacteria (AAB) (n=5)
was used for BSV fermentation via a simultaneous co-inoculation strategy. The study commenced by
investigating the effect of cells immobilized by the entrapment technique in Ca-alginate beads alongside
free-floating cells (FFC), while also studying the effects of beads size (surface area) and agitation during
BSV fermentation. The results obtained demonstrated that the surface area of the beads had an impact
on acetification rates. Consequently, small beads resulted in higher acetification rates with a
fermentation period of 16 days, in contrast to large beads which resulted in relatively lower acetification
rates with a fermentation period of 19 days, while FFC cells resulted in a fermentation period of 31
days. Agitation led to substantially negligible acid developments and incomplete fermentations. This
was therefore attributed to shear stress and bead damage when agitation was used, which was further
assessed and confirmed via microscopic studies.
Although cell immobilization using the entrapment method yielded high acetification rates, it is,
however, an expensive technique and it requires the use of high technology and specialized equipment
for larger scale productions. Consequently, cell immobilization by the adsorption technique was also
tested on corncobs (CC) and oak wood chips (OWC) in contrast to free-floating cell (FFC)
fermentations under static, agitated, low aerated (LA) and high aerated (HA) conditions. Corncobs are
less expensive compared to alginate and OWC, and a producer can choose a suitable matrix based on
cost. Furthermore, the results obtained when adsorbed cells were assessed showed that static-non
aerated conditions led to the highest acetification rates compared to agitated, low aerated and high
aerated fermentations. Moreover, cells adsorbed on CC resulted in the highest acetification rates with a
fermentation period of 20 days, compared to the other adsorbents studied which led to a fermentation
period of >30 days. Furthermore, a LA setting resulted in higher acetification rates compared to the
other treatments studied. The high acetification rates when CC were used was therefore attributed to
high cell affinity due to the rough and porous structure of the corncobs. Agitation also led to incomplete
fermentations when adsorbed cells and FFC were used. The variations in cell adsorption for the
individual yeasts and AAB was also evaluated before and after fermentation. Consequently, it was
128
observed that there were variations in cell adsorption capabilities for yeast and AAB cells, however, a
lower cell adsorption capability was observed on OWC.
The reusability of immobilized cells is one of the prominent advantages of cell immobilization. It was
therefore rational to test the reusability of Ca-alginate entrapped cells and cells adsorbed on CC and
OWC. However, the acetification rates obtained on the 2nd cycle fermentations were substantially lower
than the 1st cycle. Only Ca-alginate beads were able to produce BSV during the 2nd cycle, while the
adsorbed cells (CC and OWC) could not produce a BSV within an anticipated time frame. The scanning
electron microscope was used to assess the structural integrity of the matrices used for cell
immobilization before and after the 1st cycle. The images showed a visible loss of structural integrity
for Ca-alginate beads after the 1st cycle of fermentation. While CC showed minimal structural changes
and OWC chips retained their structure, these observations were attributed to the robustness of the
OWC and CC. Taking all of aforementioned in consideration, it is therefore not recommended to reuse
any of the immobilized cells without making modifications.
The BSV’s obtained from the 1st cycle of fermentations were evaluated for sensory attributes using the
‘check all that applies’ (CATA) method. The sensory data showed that BSV’s fermented with cells
adsorbed on CC and cells entrapped in Ca-alginate were ‘liked’ by the judges, while BSV’s produced
using cells adsorbed on OWC were neither ‘liked nor disliked’. Overall, the data obtained on the 1st
three phases of the study showed consistency with regards to the matrices that yield the highest
acetification rates. Ca-alginate beads and CC resulted in higher acetification rates on all phases of the
study in contrast to OWC fermentation and free-floating cells. Furthermore, agitation and aeration
resulted in lower acetification rates for all treatments studied during all the phases of this study.
Therefore, to further understand and to provide a more profound comparative analysis of the effect of
aeration in contrast to non-aeration, oxygen mass transfer studies were conducted.
Only CC and Ca-alginate beads were tested for oxygen mass transfer kinetic studies due to the
sustainable high acetification rates when tested during the other phases of the study. Several oxygen
mass transfer parameters were computed, which include oxygen uptake rate, the stoichiometric
coefficient of oxygen consumption vs acid yield, the oxygen transfer rate and the volumetric mass
transfer coefficients. The data generated from oxygen mass transfer computations showed that the
volumetric mass transfer coefficient is undoubtedly the most important parameter to focus on in order
to improve the BSV production system. The data demonstrated that the aeration capacity of the selected
bioreactors was low under aerated conditions. This was assumed to be caused by the improper design
of the bioreactor and the design of the aeration system used. The aeration system used had detrimental
effects on the fermentation medium, oxygen uptake rate, biomass formation and consequently the
aeration capacity was affected. Nonetheless, the primary aims of reducing the BSV fermentation period
129
from >40 days were achieved, and all the questions asked at the commencement of the study were
answered. Furthermore, an effective and relatively basic protocol for BSV production using
immobilized cells has been formulated at laboratory scale. Overall, based on the data obtained, cells
adsorbed on CC or cells entrapped in Ca-alginate beads are recommended for BSV production under
static and non-aerated conditions. This conclusion was made based on fermentation periods,
acetification rates, cell affinity/cell protection and sensorial contributions. However, the best method
with regards to cost is the use of CC instead of CA-alginate beads.

130
8.2 Recommendations for future work It is recommended that further process augmentation techniques be investigated and implemented for
BSV production. These separation of the alcoholic and acetous fermentation processes by using a
sequential inoculation process could be investigated and implemented. This could ascertain the
reusability of the immobilized cells for successive fermentations and probably for several cycles, thus
lowering the production cost. The design of a suitable fermentation system is crucial, whereby the
aeration capacity will be increased by including a fine bubble aeration system and suitable geometric
configurations. However, these technical additions for BSV production are costly. Another important
aspect is the further ageing of the vinegars. Here techniques to shorten the ageing should be investigated.
This study focused on the production process and chemical changes that occurred during BSV
production, but more sensory research is needed to improve the organoleptic properties of BSV.
131
CHAPTER 9
REFERENCES
132
9 CHAPTER 9
REFERENCES
Adams, J., Williams, A., Lancaster, B. and Foley, M., 2007, August. Advantages and uses of check-all-that-apply response compared to traditional scaling of attributes for salty snacks. In 7th Pangborn Sensory Science Symposium (Vol. 16).
Al-Ahmady, K., 2011. Mathematical model for calculating oxygen mass transfer coefficient in diffused air systems. AL-Rafdain Engineering Journal (AREJ), 19(4): 43-54.
Akridge, D.G., 2008. Methods for calculating brine evaporation rates during salt production. Journal of Archaeological Science, 35(6): 1453-1462.
Andersen, N., 2018. Liquor Products Amendment Bill: All the likely changes to SA’s alcohol laws. https://www.thesouthafrican.com/news/liquor-products-amendment-bill-all-sa-alcohol-laws/ [Accessed September 2019].
Anonymous, no date (a). Effects on Wineries from Global Warming and Climate Change. https://www.climateandweather.net/global-warming/climate-change-and-wine.html [Accessed September 2019]
Anonymous, no date (b). Enzyme immobilization methods and applications (Biotechnology notes). https://www.easybiologyclass.com/enzyme-cell-immobilization-techniques/ Accessed 11 April 2019.
Anonymous, 2018. New legal drinking age for South Africa is one step closer. https://businesstech.co.za/news/lifestyle/228829/new-legal-drinking-age-for-south-africa-is-one-step-closer/ [Accessed September 2019].
Atkinson, C.A., Jolley, D.F. and Simpson, S.L., 2007. Effect of overlying water pH, dissolved oxygen, salinity and sediment disturbances on metal release and sequestration from metal contaminated marine sediments. Chemosphere, 69(9):1428-1437.
Baimark, Y. and Niamsa, N., 2009. Study on wood vinegars for use as coagulating and antifungal agents on the production of natural rubber sheets. Biomass and Bioenergy, 33(6-7): 994-998.
Bakar, F.B., 2014. Modelling and simulation of fermentation product purification for local vinegar using batch distillation. CHEMICA: Jurnal Teknik Kimia, 1(2): 49-55
Bamforth, C.W., 2000. Beer: an ancient yet modern biotechnology. The Chemical Educator, 5(3): 102-112.
Bandyopadhyay, B., Humphrey, A.E. and Taguchi, H., 2009. Dynamic measurement of the volumetric oxygen transfer coefficient in fermentation systems. Biotechnology and Bioengineering, 104(5): 842-853.
Basson, R., 2016. Drought, fires can set back wine farmers severely. https://vinpro.co.za/drought-fires-can-set-back-wine-farmers-severely/ [Accessed September 2019]
Bekatorou, A., 2019. 6 Current Industrial Vinegar Production. Advances in Vinegar Production, 1:83.
133
Bekatorou, A., Psarianos, C. and Koutinas, A.A., 2006. Production of food grade yeasts. Food Technology & Biotechnology, 44(3): 407–415.
Boehme, P., Stellenberger, T., Zhang, W., Schulz, E., Bergmann, T., Jing, L., Grebbing, M., Baiker, A. and Ehrhardt, A., 2014. 88. Feasible and Sufficient Small-Scale Amplification of High-Capacity Adenovirus. Molecular Therapy, 22: 1.
Boss, M.J. and Day, D.W., 2016. Biological risk engineering handbook: infection control and decontamination. CRC Press: Boca Raton, FL, USA.
Braga, E.D.S., Chiozzini, V.G. and Berbel, G.B.B., 2018. Oligotrophic water conditions associated with organic matter regeneration support life and indicate pollution on the western side of Fernando de Noronha Island-NE, Brazil (3° S). Brazilian Journal of Oceanography, 66(1):73-90.
Branen, A.L., Davidson, P.M., Salminen, S. and Thorngate, J., 2001. Food Additives. CRC Press.
Bruno, K.E.J., 1945. Manufacture of vinegar. U.S. Patent 2,390,717
Budak, H.N. and Guzel‐Seydim, Z.B., 2010. Antioxidant activity and phenolic content of wine vinegars produced by two different techniques. Journal of the Science of Food and Agriculture, 90: 2021-2026
Calik, P., Yilgör, P. and Demir, A.S., 2006. Influence of controlled-pH and uncontrolled-pH operations on recombinant benzaldehyde lyase production by Escherichia coli. Enzyme and Microbial Technology, 38(5): 617-627.
Chatre, L. and Ricchetti, M., 2014. Are mitochondria the Achilles’ heel of the kingdom Fungi? Current Opinion in Microbiology, 20: 49-54.
Cheng, A.T.Y., Praxair Technology Inc, 2001. Method of using oxygen to eliminate carbon dioxide poisoning in aerobic fermentation. U.S. Patent 6,280,996.
Cheun, K.S., Kang, S.G., Kang, S.K., Jung, S.T. and Park, Y.K., 2005. Changes of the Flavonoids in Onion Vinegar Fermented with Onion Juice and Ethanol. Korean Journal of Food Preservation, 12(6): 650-655.
Chinnici, F., Durán‐Guerrero, E. and Riponi, C., 2016. Discrimination of some European vinegars with protected denomination of origin as a function of their amino acid and biogenic amine content. Journal of the Science of Food and Agriculture, 96(11): 3762-3771.
Davis, E.A., Wong, W.H. and Harman, W.N., 2015. Distilled white vinegar (5% acetic acid) as a potential decontamination method for adult zebra mussels. Management of Biological Invasions, 6(4): 423-428.
De Leonardis, A., Macciola, V., Iorizzo, M., Lombardi, S.J., Lopez, F. and Marconi, E., 2018. Effective assay for olive vinegar production from olive oil mill wastewaters. Food Chemistry, 240: 437-440.
Demir, H., Top, A., Balköse, D. and Ülkü, S., 2008. Dye adsorption behavior of Luffa cylindrica fibers. Journal of Hazardous Materials, 153(1-2): 389-394.
Dendooven, L., Magaña, I.P. and De la Torre, M., 2000. Optimization of gibberellic acid production by immobilized Gibberella fujikuroi mycelium in fluidized bioreactors. Journal of Biotechnology, 76(2-3):147-155.
134
De Vries, C.J., Buica, A. and McKay, J.B.M., 2016. The impact of smoke from vegetation fires on sensory characteristics of cabernet sauvignon wines made from affected grapes. South African Journal of Enology and Viticulture, 37(1): 22-30.
de Ory, I., Romero, L.E. and Cantero, D., 1999. Maximum yield acetic acid fermenter. Bioprocess Engineering, 21(2): 187-190.
de Ory, I., Romero, L.E. and Cantero, D., 2004a. Operation in semi-continuous with a closed pilot plant scale acetifier for vinegar production. Journal of Food Engineering, 63(1): 39-45.
de Ory, I., Romero, L.E. and Cantero, D., 2004b. Optimization of immobilization conditions for vinegar production. Siran, wood chips and polyurethane foam as carriers for Acetobacter aceti. Process Biochemistry, 39(5): 547-555.
Dobre, T., Sandu, I.U., Stroescu, M. and Stoica, A.N., 2007. Modelling of Acetic Acid Biosynthesis at Low Acid Concentration. Revista de Chimie-Bucharest-Original Edition , 58(2): 251.
Du Toit, W.J. and Pretorius, I.S., 2002. The occurrence, control and esoteric effect of acetic acid bacteria in winemaking. Annals of Microbiology, 52(2): 155-179.
Ebner, H. and Enenkel, A., Frings Heinrich Firma, 1978. Two stage process for the production of vinegar with high acetic acid concentration. U.S. Patent 4,076,844.
Ebner, H., Follmann, H. and Sellmer, S., 2000. Vinegar. Ullmann's Encyclopedia of Industrial Chemistry. vol A27
Ebner, H. and Frings Heinrich Firma, 1969. Process for acetic acid fermentation. U.S. Patent 3,445,245
Ebner, H. and Frings Heinrich Firma, 1985. Process for the production of vinegar with more than 12 gms/100 ml acetic acid. U.S. Patent 4,503,078
Edgar, R.C., Haas, B.J., Clemente, J.C., Quince, C. and Knight, R., 2011. UCHIME improves sensitivity and speed of chimera detection. Bioinformatics, 27(16): 2194-2200.
Enenkel, A. and Frings Heinrich Firma, 1988. Control arrangement for a vinegar fermentation process. U.S. Patent 4,773,315
Ernst, M. and Hunt Foods Inc, 1961 Process for making vinegar. U.S. Patent 2,997,424
Fernández-Pérez, R., Torres, C., Sanz, S. and Ruiz-Larrea, F., 2010. Strain typing of acetic acid bacteria responsible for vinegar production by the submerged elaboration method. Food Microbiology, 27(8): 973-978.
Fregapane, G., Rubio‐Fernández, H., Nieto, J. and Salvador, M.D., 1999. Wine vinegar production using a noncommercial 100‐litre bubble column reactor equipped with a novel type of dynamic sparger. Biotechnology and Bioengineering, 63(2): 141-146.
García-García, I., Santos-Dueñas, I.M., Jiménez-Ot, C., Jiménez-Hornero, J.E. and Bonilla-Venceslada, J.L., 2009. Vinegar engineering. In Vinegars of the World (97-120). Springer, Milan.
Garcia-Ochoa, F. and Gomez, E., 2009. Bioreactor scale-up and oxygen transfer rate in microbial processes: an overview. Biotechnology Advances, 27(2): 153-176.
Garcia-Ochoa, F., Gomez, E., Santos, V.E. and Merchuk, J.C., 2010. Oxygen uptake rate in microbial processes: an overview. Biochemical Engineering Journal, 49(3): 289-307.

135
Garrido‐Vidal, D., Pizarro, C. and González‐Sáiz, J.M., 2003. Study of process variables in industrial acetic fermentation by a continuous pilot fermentor and response surfaces. Biotechnology Progress, 19(5): 1468-1479.
Ghatak, P.D. and Sen, C.K., 2016. 20 Antioxidant Additives in Food Preservation and Human Health. Food Toxicology, 377.
Ghommidh, C., Navarro, J.M. and Messing, R.A., 1982. A study of acetic acid production by immobilized Acetobacter cells: product inhibition effects. Biotechnology and Bioengineering, 24(9): 1991-1999.
Ghosh, S., Chakraborty, R., Chatterjee, G. and Raychaudhuri, U., 2012. Study on fermentation conditions of palm juice vinegar by response surface methodology and development of a kinetic model. Brazilian Journal of Chemical Engineering, 29(3): 461-472.
Giudici, P., Gullo, M., Solieri, L. and Falcone, P.M., 2009. Technological and microbiological aspects of traditional balsamic vinegar and their influence on quality and sensorial properties. Advances in Food and Nutrition Research, 58: 137-182.
Giudici, P., Lemmetti, F. and Mazza, S. 2015. Balsamic vinegars: tradition, technology, trade. Springer: Cham, Germany.
Giudici, P. and Rinaldi, G., 2007. A theoretical model to predict the age of traditional balsamic vinegar. Journal of Food Engineering, 82(2): 121-127.
González-Sáiz, J.M., Esteban-Díez, I., Sánchez-Gallardo, C. and Pizarro, C., 2008a. Monitoring of substrate and product concentrations in acetic fermentation processes for onion vinegar production by NIR spectroscopy: value addition to worthless onions. Analytical and Bioanalytical Chemistry, 391(8): 2937-2947.
González-Sáiz, J.M., Pizarro, C. and Garrido-Vidal, D., 2008b. Modelling gas–liquid and liquid–gas transfers in vinegar production by genetic algorithms. Journal of Food Engineering, 87(1): 136-147.
González-Sáiz, J.M., Garrido-Vidal, D. and Pizarro, C., 2009a. Scale up and design of processes in aerated-stirred fermenters for the industrial production of vinegar. Journal of Food Engineering, 93(1): 89-100.
González-Sáiz, J.M., Garrido-Vidal, D. and Pizarro, C., 2009b. Modelling the industrial production of vinegar in aerated-stirred fermentors in terms of process variables. Journal of Food Engineering, 91(2):183-196.
Gullo, M. and Giudici, P., 2008. Acetic acid bacteria in traditional balsamic vinegar: phenotypic traits relevant for starter cultures selection. International Journal of Food Microbiology, 125(1): 46-53.
Gullo, M., Verzelloni, E. and Canonico, M., 2014. Aerobic submerged fermentation by acetic acid bacteria for vinegar production: process and biotechnological aspects. Process Biochemistry, 49(10): 1571-1579.
Gutiérrez Afonso, V.L., 2002. Sensory descriptive analysis between white wines fermented with oak chips and in barrels. Journal of Food Science, 67(6), pp.2415-2419.

136
Halladj, F., Boukhiar, A., Amellal, H. and Benamara, S., 2016. Optimization of Traditional Date Vinegar Preparation Using Full Factorial Design. Journal of the American Society of Brewing Chemists, 74(2): 137-144.
Hanmante, P., 2014. Dissolved oxygen. https://www.slideshare.net/prafulhanmante/dissolved-oxygen-43061302 [Accessed January 2020
He, Q., Sheng, M., Hu, S. and Qiu, J., 2019. Humidity control strategies for solid-state fermentation: Capillary water supply by water-retention materials and negative-pressure auto-controlled irrigation. Frontiers in Bioengineering and Biotechnology, 7: 263.
Hecht, H. and Srebnik, S., 2016. Structural characterization of sodium alginate and calcium alginate. Biomacromolecules, 17(6): 2160-2167.
Heinrich, F and Frings Heinrich Firma, 1932. Manufacture of vinegar. U.S. Patent 1,880,381
Heinrich, F., Standard Brands Inc, 1937. Apparatus for the production of vinegar. U.S. Patent 2,094,592
Hiralal, L., Olaniran, A.O. and Pillay, B., 2014. Aroma-active ester profile of ale beer produced under different fermentation and nutritional conditions. Journal of Bioscience and Bioengineering, 117(1): 57-64.
Ho, C.W., Lazim, A.M., Fazry, S., Zaki, U.K.H.H. and Lim, S.J., 2017. Varieties, production, composition and health benefits of vinegars: A review. Food Chemistry, 221:1621-1630.
Horiuchi, J.I., Kanno, T. and Kobayashi, M., 2000a. Effective onion vinegar production by a two-step fermentation system. Journal of Bioscience and Bioengineering, 90(3):289-293.
Horiuchi, J.I., Tabata, K., Kanno, T. and Kobayashi, M., 2000b. Continuous acetic acid production by a packed bed bioreactor employing charcoal pellets derived from waste mushroom medium. Journal of Bioscience and Bioengineering, 89(2): 126-130.
Horiuchi, J.I., Tada, K., Kobayashi, M., Kanno, T. and Ebie, K., 2004. Biological approach for effective utilization of worthless onions—vinegar production and composting. Resources, Conservation and Recycling, 40(2): 97-109.
Hsu, EJ, Hsu Edward J, 1989. Automated method for a semi-solid fermentation used in the production of ancient quality rice vinegar and/or rice wine. U.S. Patent 4,808,419
Huang, Y.L., Mann, K., Novak, J.M. and Yang, S.T., 1998. Acetic acid production from fructose by clostridiumformicoaceticum immobilized in a Fibrous‐Bed bioreactor. Biotechnology Progress, 14(5): 800-806.
Huang, Y.L., Wu, Z., Zhang, L., Cheung, C.M. and Yang, S.T., 2002. Production of carboxylic acids from hydrolyzed corn meal by immobilized cell fermentation in a fibrous-bed bioreactor. Bioresource Technology, 82(1): 51-59.
Hutchinson, U.F., Ntwampe, S.K.O., Ngongang, M.M., Chidi, B.S., Hoff, J.W. and Jolly, N.P., 2019a. Product and Microbial Population Kinetics During Balsamic‐Styled Vinegar Production. Journal of Food Science, 84(3): 572-579.
Hutchinson, U.F., Ntwampe, S.K.O., Ngongang, M.M., Du Plessis, H.W., Chidi, B.S., Saulse, C.K.L.N. and Jolly, N.P. 2018. Cell immobilization by Gel entrapment in Ca-alginate beads for balsamic-styled vinegar production. In Proceedings of the 10th International Conference on Advances in
137
Science, Engineering, Technology and Healthcare (ASETH-18) November. 19-20, 2018 Cape Town (South Africa)
Hutchinson, U.F., Gqozo, S., Jolly, N.P., Chidi, B.S., Du Plessis, H.W., Mewa-Ngongang, M. and Ntwampe, S.K., 2019b. Aeration, Agitation and Cell Immobilization on Corncobs and Oak Wood Chips Effects on Balsamic-Styled Vinegar Production. Foods, 8(8): 303.
Hutchinson, U.F., Jolly, N.P., Chidi, B.S., Ngongang, M.M. and Ntwampe, S.K.O., 2019c. Vinegar Engineering: a Bioprocess Perspective. Food Engineering Reviews, 11(4): 290-305.
Hyuseinov, E.E. and Ludwig WP, WTI Inc, 2016. Concentrated natural food additive and methods of preparing the same. U.S. Patent Application 15/177,408
Irvine, K.N., 2017. Teacher Handbook of Water Quality for the Singapore Geography Curriculum.
Inglett, G.E., 1970. Corn: culture, processing, products; major fred and food crops in agriculture and food series (No. Sirsi) i9780870550881).
Johnston, C.S. and Gaas, C.A., 2006. Vinegar: medicinal uses and antiglycemic effect. Medscape General Medicine, 8(2): 61.
Kaur, P., Kocher, G.S. and Phutela, R.P., 2011. Production of tea vinegar by batch and semicontinuous fermentation. Journal of Food Science and Technology, 48(6): 755-758.
Kaushal, N. and Phutela, R.P., 2017. Vinegar production from barley malt using immobilized Gluconobacter oxydans. International Journal of Pure and Applied Bioscience, 5: 264-271.
Kennedy, J.F., Humphreys, J.D., Barker, S.A. and Greenshields, R.N., 1980. Application of living immobilized cells to the acceleration of the continuous conversions of ethanol (wort) to acetic acid (vinegar)—hydrous titanium (IV) oxide-immobilized Acetobacter species. Enzyme and Microbial Technology, 2(3):209-216.
Kim, J.N., Choo, J.S., Wee, Y.J., Yun, J.S. and Ryu, H.W., 2005. Culture medium optimization for acetic acid production by a persimmon vinegar-derived bacterium. Applied Biochemistry and Biotechnology, 123(1-3): 861-869.
Kocher, G.S. and Dhillon, H.K., 2013. Fermentative production of sugarcane vinegar by immobilized cells of Acetobacter aceti under packed bed conditions. Sugar Technology, 15(1): 71-76.
Kocher, G.S., Kalra, K.L. and Phutela, R.P., 2006. Comparative production of sugarcane vinegar by different immobilization techniques. Journal of the Institute of Brewing, 112(3): 264-266.
Kourkoutas, Y., Bekatorou, A., Banat, I.M., Marchant, R. and Koutinas, A.A., 2004. Immobilization technologies and support materials suitable in alcohol beverages production: a review. Food Microbiology, 21(4): 377-397.
Krusong, W., Petch-nom, P. and Pinviset, P., 2010. Semicontinuous production process of corn vinegar in stirred tank reactor using fixation of Acetobacter aceti WK on surface of loffa sponge. Kasetsart Journal of Natural Sciences, 44: 201-207.
Krusong, W. and Tantratian, S., 2014. Acetification of rice wine by Acetobacter aceti using loofa sponge in a low‐cost reciprocating shaker. Journal of Applied Microbiology, 117(5): 1348-1357.
138
Krusong, W. and Vichitraka, A., 2011. An air-lift acetifier with mash recycling system for corn vinegar production by adsorbed cells of Acetobacter aceti WK on surface of loofa sponge. In 2nd International conference on biotechnology and food science IPCBEE (Vol. 7, 86-90).
Krusong, W., Yaiyen, S. and Pornpukdeewatana, S., 2015. Impact of high initial concentrations of acetic acid and ethanol on acetification rate in an internal Venturi injector bioreactor. Journal of Applied Microbiology, 118(3): 629-640.
Kumar, G., Mudhoo, A., Sivagurunathan, P., Nagarajan, D., Ghimire, A., Lay, C.H., Lin, C.Y., Lee, D.J. and Chang, J.S., 2016. Recent insights into the cell immobilization technology applied for dark fermentative hydrogen production. Bioresource Technology, 219:725-737.
Kyraleou, M., Kallithraka, S., Chira, K., Tzanakouli, E., Ligas, I. and Kotseridis, Y., 2015. Differentiation of wines treated with wood chips based on their phenolic content, volatile composition, and sensory parameters. Journal of Food Science, 80(12): C2701-C2710.
Laqui‐Estaña, J., López‐Solís, R., Peña‐Neira, Á., Medel‐Marabolí, M. and Obreque‐Slier, E., 2019. Wines in contact with oak wood: the impact of the variety (Carménère and Cabernet Sauvignon), format (barrels, chips and staves), and aging time on the phenolic composition. Journal of the Science of Food and Agriculture, 99(1): 436-448.
Lynch, K.M., Zannini, E., Wilkinson, S., Daenen, L. and Arendt, E.K., 2019. Physiology of acetic acid bacteria and their role in vinegar and fermented beverages. Comprehensive Reviews in Food Science and Food Safety, 18(3):587-625.
Mamlouk, D. and Gullo, M., (2013). Acetic acid bacteria: physiology and carbon sources oxidation. Indian Journal of Microbiology, 53(4): 377-384.
Marston, C., 2016. Winemakers in South Africa's Stellenbosch Assess Wildfire Damage. https://www.winespectator.com/articles/winemakers-in-south-africas-stellenbosch-assess-wildfire-damage-52667 [Accessed: July 2019].
Mattia, G., 2004. Balsamic vinegar of Modena: from product to market value: competitive strategy of a typical Italian product. British Food Journal, 106(10/11): 722-745.
May, R., 2016 What is Balsamic Vinegar? [Online]. http://gourmetliving.org/about-balsamic-vinegar/what-is-balsamic-vinegar/ [Accessed December 2019]
Mazza, S. And Murooka, Y. 2009. Vinegars through the ages. In Vinegars of the World (17-39). Springer, Milan
Mazutti, M.A., Zabot, G., Boni, G., Skovronski, A., de Oliveira, D., Di Luccio, M., Rodrigues, M.I., Treichel, H. and Maugeri, F., 2010. Kinetics of inulinase production by solid-state fermentation in a packed-bed bioreactor. Food Chemistry, 120(1): 163-173.
Mehaia, M.A. and Cheryan, M., 1991. Fermentation of date extracts to ethanol and vinegar in batch and continuous membrane reactors. Enzyme and Microbial Technology, 13(3): 257-261.
Moghiman, M. and Joudat, A., 2007. Effect of air velocity on water evaporation rate in indoor swimming pools.
Monteagudo, J.M., Rodríguez, L., Rincón, J. and Fuertes, J., 1997. Kinetics of lactic acid fermentation by Lactobacillus delbrueckii grown on beet molasses. Journal of Chemical Technology &
139
Biotechnology: International Research in Process, Environmental AND Clean Technology, 68(3): 271-276.
Mounir, M., Shafiei, R., Zarmehrkhorshid, R., Hamouda, A., Thonart, P., Delvigne, F. and Alaoui, M.I., 2016. Optimization of biomass production of Acetobacter pasteurianus KU710511 as a potential starter for fruit vinegar production. African Journal of Biotechnology, 15(27): 1429-1441.
Moutafchieva, D., Popova, D., Dimitrova, M. and Tchaoushev, S., 2013. Experimental determination of the volumetric mass transfer coefficient. Journal of Chemical Technology and Metallurgy, 48(4): 351-356.
Mun, S.P. and Ku, C.S., 2010. Pyrolysis GC-MS analysis of tars formed during the aging of wood and bamboo crude vinegars. Journal of Wood Science, 56(1): 47-52.
Miller, M.J., 2019. rapid microbiological methods. Pharmaceutical Microbiological Quality Assurance and Control: Practical Guide for Non‐Sterile Manufacturing, 429-458.
Mitchell, D.A., von Meien, O.F., Krieger, N. and Dalsenter, F.D.H., 2004. A review of recent developments in modeling of microbial growth kinetics and intraparticle phenomena in solid-state fermentation. Biochemical Engineering Journal, 17(1): 15-26.
Nair, M., Upadhyaya, I., Amalaradjou, M.R. and Venkitanarayanan, K., 2017. Antimicrobial Food Additives and Disinfectants: Mode of Action and Microbial Resistance Mechanisms. In Om V. Singh ed. Food Borne Pathogens and Antibiotic Resistance. Wiley-Blackwell. 275-301.
Nayak, J., Pal, M. and Pal, P., 2015. Modeling and simulation of direct production of acetic acid from cheese whey in a multi-stage membrane-integrated bioreactor. Biochemical Engineering Journal, 93: 179-195.
Nayak, J. and Pal, P., 2013. Transforming waste cheese-whey into acetic acid through a continuous membrane-integrated hybrid process. Industrial and Engineering Chemistry Research, 52(8): 2977-2984.
Nguyen., D.N., Ton., N.M. and Le, V.V., 2009. Optimization of Saccharomyces cerevisiae immobilization in bacterial cellulose by ‘adsorption-incubation’method. International Food Research Journal, 16, 59–64.
Nie, Z., Zheng, Y., Wang, M., Han, Y., Wang, Y., Luo, J. and Niu, D., 2013. Exploring microbial succession and diversity during solid-state fermentation of Tianjin duliu mature vinegar. Bioresource Technology, 148: 325-333.
Nigam, V.K., Khandelwal, A.K., Gothwal, R.K., Mohan, M.K., Choudhury, B., Vidyarthi, A.S. and Ghosh, P., 2009. Nitrilase-catalysed conversion of acrylonitrile by free and immobilized cells of Streptomyces sp. Journal of Biosciences, 34(1): 21-26.
Oliver, J.D., 2000. The public health significance of viable but nonculturable bacteria. In nonculturable microorganisms in the environment (277-300). Springer: US.
Otto, H. and Heinz, E., 1955. Method for the production of vinegar acids by oxidative fermentation of alcohols. U.S. Patent 2,707,683
Oulton, and Randal, 2002. Balsamic Vinegar. [Online] http://www.cooksinfo.com/balsamic-vinegar; revised 22 July 2012. [Accessed 19 May 2018].
140
Ouyang, P., Wang, H., Hajnal, I., Wu, Q., Guo, Y. and Chen, G.Q., 2018. Increasing oxygen availability for improving poly (3-hydroxybutyrate) production by Halomonas. Metabolic Engineering, 45: 20-31.
Pampulha, M.E. and Loureiro-Dias, M.C., 1989. Combined effect of acetic acid, pH and ethanol on intracellular pH of fermenting yeast. Applied Microbiology and Biotechnology, 31(5-6): 547-550.
Park, J.K., Jin, Y.B. and Chang, H.N., 1999. Reusable biosorbents in capsules from Zoogloea ramigera cells for cadmium removal. Biotechnology and Bioengineering, 63(1): 116-121.
Park, Y.S., Ohtake, H., Fukaya, M., Okumura, H., Kawamura, Y. and Toda, K., 1989. Effects of dissolved oxygen and acetic acid concentrations on acetic acid production in continuous culture of Acetobacter aceti. Journal of Fermentation and Bioengineering, 68(2): 96-101.
Pittoors, E., Guo, Y. and WH Van Hulle, S., 2014. Modeling dissolved oxygen concentration for optimizing aeration systems and reducing oxygen consumption in activated sludge processes: a review. Chemical Engineering Communications, 201(8): 983-1002.
Pochat-Bohatier, C., Bohatier, C. and Ghommidh, C., 2003. Modelling the kinetics of growth of acetic acid bacteria to increase vinegar production: analogy with mechanical modelling. http://www.math.ucsd.edu/~helton/MTNSHISTORY/CONTENTS/2000PERPIGNAN/CDROM/articles/B57.pdf [Accessed: 12 March 2019]
Pramudya, R.C. and Seo, H.S., 2018. Using Check-All-That-Apply (CATA) method for determining product temperature-dependent sensory-attribute variations: a case study of cooked rice. Food Research International, 105: 724-732.
Qi, Z., Yang, H., Xia, X., Xin, Y., Zhang, L., Wang, W. and Yu, X., 2013. A protocol for optimization vinegar fermentation according to the ratio of oxygen consumption versus acid yield. Journal of Food Engineering, 116(2): 304-309.
Qi, Z., Yang, H., Xia, X., Quan, W., Wang, W. and Yu, X., 2014. Achieving high strength vinegar fermentation via regulating cellular growth status and aeration strategy. Process Biochemistry, 49(7): 1063-1070.
Rahman, R.N.Z.A., Ghazali, F.M., Salleh, A.B. and Basri, M., 2006. Biodegradation of hydrocarbon contamination by immobilized bacterial cells. The Journal of Microbiology, 44(3): 354-359.
Rao, C.S., Madhavendra, S.S., Rao, R.S., Hobbs, P.J. and Prakasham, R.S., 2008. Studies on improving the immobilized bead reusability and alkaline protease production by isolated immobilized Bacillus circulans (MTCC 6811) using overall evaluation criteria. Applied Biochemistry and Biotechnology, 150(1): 65-83.
Rubio-Fernández, H., Salvador, M.D. and Fregapane, G., 2004. Influence of fermentation oxygen partial pressure on semicontinuous acetification for wine vinegar production. European Food Research and Technology, 219(4): 393-397.
Ruengruglikit, C. and Hang, Y.D., 2003. L (+)-lactic acid production from corncobs by Rhizopus oryzae NRRL-395. LWT-Food Science and Technology, 36(6): 573-575.
Saltini, R. and Akkerman, R., 2012. Testing improvements in the chocolate traceability system: Impact on product recalls and production efficiency. Food Control, 23(1): 221-226.
141
Saudagar, P.S., Shaligram, N.S. and Singhal, R.S., 2008. Immobilization of Streptomyces clavuligerus on loofah sponge for the production of clavulanic acid. Bioresource Technology, 99(7): 2250-2253.
SAWIS, 2018. SA wine industry 2018 statistics NR 43. file:///C:/Users/Admin/Downloads/2020-01-16%20Book_2018_statistics_year_english_final.pdf (Accessed: December 2019).
Schlepütz, T. And Büchs, J., 2013. Investigation of vinegar production using a novel shaken repeated batch culture system. Biotechnology Progress, 29: 1158-1168
Sengun, I.Y. ed., 2017. Acetic acid bacteria: Fundamentals and food applications. CRC Press.
Schlepütz, T. and Büchs, J., 2014. Scale-down of vinegar production into microtiter plates using a custom-made lid. Journal of Bioscience and Bioengineering, 117(4): 485-496.
Schlepütz, T., Gerhards, J.P. and Büchs, J., 2013. Ensuring constant oxygen supply during inoculation is essential to obtain reproducible results with obligatory aerobic acetic acid bacteria in vinegar production. Process Biochemistry, 48(3): 398-405.
Seletzky, J.M., Noak, U., Fricke, J., Welk, E., Eberhard, W., Knocke, C. and Büchs, J., 2007. Scale‐up from shake flasks to fermenters in batch and continuous mode with Corynebacterium glutamicum on lactic acid based on oxygen transfer and pH. Biotechnology and Bioengineering, 98(4): 800-811.
Shen, Y., Zhang, Y., Ma, T., Bao, X., Du, F., Zhuang, G. and Qu, Y., 2008. Simultaneous saccharification and fermentation of acid-pretreated corncobs with a recombinant Saccharomyces cerevisiae expressing β-glucosidase. Bioresource Technology, 99(11): 5099-5103.
Shyamkumar, R., Moorthy, I.M.G., Ponmurugan, K. and Baskar, R., 2014. Production of L-glutamic Acid with Corynebacterium glutamicum (NCIM 2168) and Pseudomonas reptilivora (NCIM 2598): A Study on Immobilization and Reusability. Avicenna Journal of Medical Biotechnology, 6(3): 163.
Singh, V., 1996. On‐line measurement of oxygen uptake in cell culture using the dynamic method. Biotechnology and Bioengineering, 52(3): 443-448.
Sobotka, M., Prokop, A., Dunn, I.J. and Einsele, A., 1982. Review of methods for the measurement of oxygen transfer in microbial systems. In Annual reports on fermentation processes. Vol. 5, 127-210. Elsevier.
Solieri, L. and Giudici, P., 2009. Vinegars of the World. In Vinegars of the World (1-16). Springer, Milan.
Solieri, L. and Giudici, P., 2008. Yeasts associated to traditional balsamic vinegar: ecological and technological features. International Journal of Food Microbiology, 125(1): 36-45.
Solieri, L., Landi, S., De Vero, L. and Giudici, P., 2006. Molecular assessment of indigenous yeast population from traditional balsamic vinegar. Journal of Applied Microbiology, 101(1): 63-71.
Sousa, M.J., Ludovico, P., Rodrigues, F., Leão, C. and Côrte-Real, M., 2012. Stress and cell death in yeast induced by acetic acid. In Cell Metabolism-Cell Homeostasis and Stress Response. IntechOpen., 73.
142
Stone, K.M., Roche, F.W. and Thornhill, N.F., 1992. Dry weight measurement of microbial biomass and measurement variability analysis. Biotechnology Techniques, 6(3): 207-212.
Sudjarwadi, F., 2019. Microbial Oxygen Uptake Kinetics. https://slideplayer.com/slide/16671100/ [Accessed January 2020]
Sun, Y. and Cheng, J., 2002. Hydrolysis of lignocellulosic materials for ethanol production: a review. Bioresource Technology, 83(1): 1-11.
Sun, Y. and Furusaki, S., 1990. Continuous production of acetic acid using immobilized Acetobacter aceti in a three-phase fluidized bed bioreactor. Journal of Fermentation and Bioengineering, 69(2): 102-110.
Swiegers, J.H. and Pretorius, I.S., 2005. Yeast modulation of wine flavor. Advances in Applied Microbiology, 57: 131-175.
Talabardon, M., Schwitzguébel, J.P., Péringer, P. and Yang, S.T., 2000. Acetic acid production from lactose by an anaerobic thermophilic coculture immobilized in a fibrous‐bed bioreactor. Biotechnology Progress, 16(6): 1008-1017.
Tanobe, V.O., Flores-Sahagun, T.H., Amico, S.C., Muniz, G.I. and Satyanarayana, K.G., 2014. Sponge gourd (Luffa cylindrica) reinforced polyester composites: preparation and properties. Defence Science Journal, 64(3): 273-280.
Tesfaye, W., Morales, M.L., Garcıa-Parrilla, M.C. and Troncoso, A.M., 2002. Wine vinegar: technology, authenticity and quality evaluation. Trends in food science & technology, 13(1): 12-21.
Thiripurasundari, G. and Usharani, G., 2011. Comparative production of vinegar using cashew apple juice by different immobilization techniques. Current Botany, 2(3): 31-33.
Tofalo, R., Chaves-López, C., Di Fabio, F., Schirone, M., Felis, G.E., Torriani, S., Paparella, A. and Suzzi, G., 2009. Molecular identification and osmotolerant profile of wine yeasts that ferment a high sugar grape must. International Journal of Food Microbiology, 130(3): 179-187.
Tribe, L.A., Briens, C.L. and Margaritis, A., 1995. Determination of the volumetric mass transfer coefficient (kLa) using the dynamic “gas out–gas in” method: analysis of errors caused by dissolved oxygen probes. Biotechnology and Bioengineering, 46(4): 388-392.
Truta, D.M., Tofana, M., Socaci, S.A. and Cheleman, R., 2009. Preliminary studies regarding the physicochemical characteristics of some balsamic vinegars. Bulletin of University of Agricultural Sciences and Veterinary Medicine Cluj-Napoca. Agriculture, 66(2): 506–511.
Tsen, J.H., Lin, Y.P. and King, V.A.E., 2004. Fermentation of banana media by using κ-carrageenan immobilized Lactobacillus acidophilus. International Journal of Food Microbiology, 91(2): 215-220.
Van Noort, D., 2016. Bioreactors on a Chip. In Carl-Fredrik Mandenius. ed. Bioreactors: Design, Operation and Novel Applications. Wiley-VCH
Van't Riet, K. and Tramper. J., 1991. Basic bioreactor design. CRC Press
Vaughan, T., Seo, C.W. and Marshall, W.E., 2001. Removal of selected metal ions from aqueous solution using modified corncobs. Bioresource Technology, 78(2): 133-139.
143
Vink, N., Deloire, A., Bonnardot, V. and Ewert, J., 2009, December. Terroir, climate change, and the future of South Africa’s wine industry. In pre-AARES conference workshop on The World’s Wine Markets by (Vol. 2030).
Watson, K., Arthur, H. and Morton, H., 1978. Thermal adaptation in yeast: obligate psychrophiles are obligate aerobes, and obligate thermophiles are facultative anaerobes. Journal of Bacteriology, 136(2): 815-817.
Wenye, Z., Junsong, Z. and Xin, Z., 2003. Study on the technology condition of making hawthorn fruit vinegar by one-step fermentation [J]. Chinese Condiment, 7: 005.
Wheeler, A., 2014. Everything You Need to Know About Balsamic Vinegar [Online]. http://www.seriouseats.com/2014/05/everything-you-need-to-know-guide-to-balsamic-vinegar.html. [Accessed: May 2018]
Wiley, R.C., 2017. Preservation methods for minimally processed refrigerated fruits and vegetables. In Minimally Processed Refrigerated Fruits and Vegetables . Springer US. 187-237.
Wititsiri, S., 2011. Production of wood vinegars from coconut shells and additional materials for control of termite workers, Odontotermes sp. and striped mealy bugs, Ferrisia virgata. Songklanakarin Journal of Science & Technology, 33(3): 349-354.
Wittler, R., Frings Heinrich Firma, 1991. Method and apparatus for controlling foam in a vinegar fermentation process. U.S. Patent 4,997,660.
Wood, B.J., 2012. Microbiology of fermented foods. Springer Science & Business Media.
Yan, Q., Zheng, P., Dong, J.J. and Sun, Z.H., 2014. A fibrous bed bioreactor to improve the productivity of succinic acid by Actinobacillus succinogenes. Journal of Chemical Technology & Biotechnology, 89(11): 1760-1766.
Zheng, Y., Zhang, K., Wang, C., Liu, H., Luo, J. and Wang, M., 2010. Improving acetic acid production of Acetobacter pasteurianus AC2005 in hawthorn vinegar fermentation by using beer for seed culture. International Journal of Food Science & Technology, 45(11): 2394-2399.
Zhou, X., Zhou, X. and Xu, Y., 2017. Improvement of fermentation performance of Gluconobacter oxydans by combination of enhanced oxygen mass transfer in compressed-oxygen-supplied sealed system and cell-recycle technique. Bioresource Technology, 244: 1137-1141.
Żur, J., Wojcieszyńska, D. and Guzik, U., 2016. Metabolic responses of bacterial cells to immobilization. Molecules, 21(7): 958.