A seminal framework of marketing schools: revisited and updated
Upload
independentCategory
view
4download
0
Ž .Biochimica et Biophysica Acta 1379 1998 367–380
High resolution 1H NMR spectroscopic studies on dynamic biochemicalprocesses in incubated human seminal fluid samples
Andrew M. Tomlins a, Peta J.D. Foxall b, Michael J. Lynch b, John Parkinson c,Jeremy R. Everett d, Jeremy K. Nicholson a,)
a Department of Chemistry, Birkbeck College, UniÕersity of London, Gordon House, 29 Gordon Square, London, WC1HOPP, UKb St. Peter’s Hospital, Institute of Urology and Nephrology, UniÕersity College London Medical School, Riding House St.,
London, W1P 7PN, UKc Department of Chemistry, UniÕersity of Edinburgh, King’s Building, West Mains Rd., Edinburgh EHJ 3JJ, UK
d Physical Sciences Department, Pfizer Central Research, Sandwich, Kent CT13 9NJ, UK
Received 15 July 1997; revised 5 September 1997; accepted 15 September 1997
Abstract
High resolution 600 MHz 1H NMR spectroscopy was used to investigate the changes in biochemical composition ofŽ . Ž . Ž .whole human seminal fluid SF and an artificial mixture of prostatic PF and seminal vesicle fluid SVF . A variety of
time-related biochemical changes were monitored simultaneously and non-invasively in SF, including enzymatic hydrolysisof phosphorylcholine to choline and polypeptides to amino acids. The fastest NMR-observable reactions in SF were the
Ž . X Ž . Ž .conversion of phosphorylcholine to choline t (9 min and uridine-5 -monophosphate UMP to uridine t -2 min .1r2 1r2
UMP has not previously been detected in SF because of its rapid hydrolysis. Artificial mixtures of separately obtainedprostatic and SVF showed very similar biochemical changes to those observed in whole SF. Addition of EDTA to SFincubated for 2 min post ejaculation strongly inhibited peptide hydrolysis. Zn2q, present in whole SF was shown to be nonEDTA-chelatable 2 min after ejaculation, whereas after 7 min, a singlet signal from the ethylenic protons of the Zn-EDTA2y
Ž .complex was clearly observed which remained constant after 7 min. This indicates that soon after ejaculation -5 minZn2q is immobilised in a macromolecular complex which is rapidly broken down by proteolytic enzymes, the releasedZn2q then being free to react with EDTA. Mg- and Ca-EDTA2y complexes were observed at 2 min and remained constantŽ .at 1.4 and 2.1 mM, respectively throughout the entire time course of the experiment. These studies cast new light on thetime-related biochemical changes occurring in the post-ejaculatory SF which may have an important role in reproductivefunction. q 1998 Elsevier Science B.V.
Keywords: Seminal fluid; Prostatic fluid; Seminal vesicle fluid; 1H NMR spectroscopy; Zinc; Citrate; Ethylenediaminetetraacetic acid;Ž .Reproduction; Human
) Corresponding author. Fax: q44 171 3807464; E-mail:[email protected]
1. Introduction
Ž .Seminal fluid SF is a highly complex biologicalfluid containing a wide range of organic speciesincluding low MW compounds, peptides, hormones,
0304-4165r98r$19.00 q 1998 Elsevier Science B.V. All rights reserved.Ž .PII S0304-4165 97 00116-5

( )A.M. Tomlins et al.rBiochimica et Biophysica Acta 1379 1998 367–380368
antibodies and high levels of inorganic ions such as2q 2q 2q ŽZn , Mg and Ca present at ca. 2.0, 4.7 and
w x.8.0 mM, respectively 1 . The ejaculate is producedmainly by secretions from the prostate and seminalvesicles and, to a lesser extent, other Wolffian ducts,
w xtestes, and epididymi 2 . Each contribution to theejaculate is biochemically distinct, and on mixing ofthese fluids, as occurs at ejaculation, a series ofchemical and biochemical reactions ensue which giverise to a rapid succession of changing physico-chem-ical and biochemical micro-environments for thespermatozoa. The SF normally becomes coagulatedwithin 3 min and then re-liquefies within about20 min, once the seminal vesicle peptides and pro-teins have been degraded by enzymes, such as
Ž .prostate-specific antigen PSA , to smaller peptidesw xand amino acids 2 . The release of amino acids has
been speculated to be important for reducing viscos-ity, increasing motility, and for providing a metabo-
w xlite pool for future spermatozoon metabolism 2 . TheŽ .prostatic fluid PF contains the proteolytic enzymes
w xwhich are responsible for most of these reactions 3 .The biochemical significance of these processes andtheir contribution to the overall reproductive functionis poorly understood. Futhermore, the complexity ofthe biofluid matrix and its dynamic nature pose manydifficulties in conventional bioanalytical procedures.For this reason we have chosen to investigate SFbiochemistry using a non-invasive and non-destruc-tive 1H NMR spectroscopic approach.
The detailed analysis of human SF by NMR meth-ods has only recently become practical due to ad-
w xvances in high field NMR technology 4 providinginherently more sensitivity and dispersion with in-creased observation frequency. Thus, previously wehave used 600 and 750 MHz 1H NMR spectroscopy
Ž .combined with two-dimensional 2D experiments,Ž .e.g. J-resolved JRES , correlation and total correla-
Ž .tion spectroscopy COSY and TOCSY and HMQCto assign 90% of the peaks in the 1D spectrum of SFw x5,6 . The analysis of the organic components of SFby NMR is complemented by the addition of thewidely used chelating agent, ethylenediaminete-
Ž .traacetic acid EDTA , to each of the samples, whichby integration of the ethylenic proton singlet gives aspecific and quantitative assay for the chelatable Ca2q,
2q 2q w xMg and Zn ions 7 . In the case of blood2q 2q Žplasma, all Ca and Mg irrespective of protein
. w xbinding are EDTA chelatable 8 . The presence ofZn2q in seminal fluid is known to be essential for
w xreproductive function 9 . However, although theZn2q levels in PF and SF are at least 2 orders ofmagnitude greater than any other biofluid, the exactbiochemical functions and speciation of Zn2q are ill
w xdefined 10–13 . Zinc is known to concentrate intrilaminar sub-cellular granules and vesicles which
w xalmost solely originate from the prostate 14 and isalso known to bind to citric acid and glycoproteins in
w xSF 15 .We have now applied high field 1H NMR spec-
troscopy techniques to investigate the major biochem-ical changes occurring in human SF and the interac-tion of metal ions with EDTA. The overall aim ofthis work is to further the understanding of thedynamics of the biochemical interactions occurring inSF and their relationship to reproductive function.
2. Method and materials
2.1. Samples and sample preparation for NMR analy-sis
1H NMR spectra were measured on a VarianVXR600S spectrometer operating at 600.13 MHz anda probe temperature of 258C. SF was obtained from anon-obstructed fertile male and the sample agitatedand then incubated in a water bath at 378C for up to
Ž .4 h. Aliquots 100 ml were removed from the wholeSF at 2, 7, 10, 15, 20, 30, 60, 125 and 240 minpost-ejaculation. These samples were immediatelysnap frozen in liquid N , lyophilised and then stored2
at y408C until NMR measurements were made.Immediately prior to analysis the specimens werere-dissolved in sodium-3-trimethylsilylpropionateŽ . Ž .TSP solution 1 mM in D O , centrifuged at2
10 000 rpm for 1 min at ambient room temperature.The supernatant was immediately transferred to a5 mm NMR tube and spectral measurement was com-menced within 1 min of the sample entering thespectrometer, i.e. the minimum time to achieve anacceptable level of field homogeneity. After initial
Žanalysis, a D O solution of trisodium EDTA 10 ml,2.6 mM, pH 7.5 was added to each of the SF aliquots
which were then shaken and re-analysed by 1H NMR,under the same spectrometer conditions. PF was ob-

( )A.M. Tomlins et al.rBiochimica et Biophysica Acta 1379 1998 367–380 369
tained from a normal male via prostatic massage.Ž .Seminal vesicle fluid SVF was surgically extracted
with informed consent from a different patient whowas undergoing major retropubic surgery, but other-wise had normal reproductive function. The PF and
Ž .SVF were mixed in a 1:1 vol. ratio, correspondingto a total volume of 0.8 ml and a series of 1Hspectroscopic NMR measurements were carried outparalleling those performed on the whole SF.
Relative NMR peak quantification was obtainedvia integration or, in crowded areas of the spectrum,peak height measurements, using free uridine as aninternal marker.
2.2. 1H NMR spectroscopy
Single pulse 1H NMR spectra were recorded atambient temperature and the chemical shift refer-
Ž .enced to internal TSP d 0.00 . For each sample 64Ž .free induction decays FIDs were collected into
32 768 data points with a spectral width of 7000.4 Hz.908 pulses were used with an acquisition time of2.52 s. The water signal was suppressed by applyinga gated, selective, secondary irradiation field at the
Ž .water resonance frequency during the delay 2.0 sbetween pulses. An exponential apodization functionwas applied to the FID, prior to Fourier transforma-tion, resulting in a line broadening of 0.2 Hz. Forcomplete assignment of signals a series of 2D 1H–1H
Ž w xNMR experiments were performed J-RESolved 16 ,w x w x.COSY-45 17 and TOCSY 17,18 on the fully
degraded samples using the following pulse se-quences:
2.2.1. Homonuclear 1H 2D J-ResolÕed spectroscopy( )JRES
2D JRES spectra were collected using the follow-ing pulse sequence:
D–908–t –1808–t –acquire for time t ,1 1 2
where D, the relaxation delay, is 1.40 s and t was1
incremented with increasing delay. A secondary irra-diation field was applied at the water resonancefrequency during delay D, but was gated off duringthe acquisition. Data were collected into 8192 pointsin F using 16 FIDs per increment, with a spectral2
width of 6000 Hz. 128 increments over F were1
collected with a spectral width of 30 Hz, and zero-
filled to 256 data points. Sine bell squared apodiza-tion function was applied in both the t and t1 2
domains prior to Fourier transformation. The spectrawere tilted by 458 to provide orthogonality and subse-quently symmetrised about the F axis. Following a1
magnitude calculation spectra were displayed both inthe form of contour plots and skyline projections.
1 1 ( )2.2.2. H– H correlation spectroscopy COSY2D COSY spectra were acquired with the follow-
ing pulse sequence:
D–908–t –458–acquire for time t ,1 2
where D was 1.8 s and the value of t was incre-1
mented. The F domain was collected into 1034 data2
points using 32 FIDs per increment, with a spectralwidth of 6000 Hz and 512 increments in F were1
zero-filled to 2048 data points. Sine-bell squaredapodisation was applied in both the t and t do-1 2
mains prior to Fourier transformation and magnitudecalculation of the spectrum.
2.2.3. 2D 1H–1H total correlation spectroscopy( )TOCSY
2D TOCSY spectra were acquired using the fol-lowing pulse sequence:
D–908–t – spin lock –acquire FID for time tŽ .1 2
with a delay D of 1.8 s, and spin lock time of 90 msto ensure observation of long range couplings. Thespectra were collected in the phase-sensitive mode
w x w xusing TPPI 18 . The MLEV17 18 pulse sequencewas used for the spin lock. Spectral width was set at6000 Hz with data being collected into 2048 timedomain points. 512 increments of t were measured1
with 16 FIDs per increment, the data being zero-filledto 1024 data points in F prior to Fourier transform.1
A shifted sine-bell squared function was applied inboth time domains FIDs prior to Fourier transforma-tion.
3. Results
3.1. 1D 1H NMR spectroscopy of incubated SF
The NMR spectrum of an SF sample that was snapfrozen 2 min post-ejaculation mainly shows broad

( )A.M. Tomlins et al.rBiochimica et Biophysica Acta 1379 1998 367–380370
signals from peptides and proteins of seminal vesicleŽ .or epididymal origin Fig. 1 . The signals are broad
due to the high viscosity and relatively high molecu-lar weight of the seminal vesicle peptides. With theprogressive break down of the coagulum via hydroly-sis the peptide signals decline in intensity and arereplaced by well-resolved signals from free aminoacids. Signals from citrate, lactate, glucose, pyruvate,
Ž .fructose, phosphorylcholine PC , spermine and N-Ž .acetylated sugar s are also observed in the aliphatic
Ž .region 0.1–4.5 ppm of SF spectrum and thesechange little over the 4 h time course.
The PC quaternary N-methyl NMR signal haspreviously been mis-identified as being from glyc-
Ž . w xerophosphorylcholine GPC 5 which is nearly coin-cident with PC at d 3.23. GPC is stable for several
w xhours in human SF 19 , unlike PC which starts to
Ž .hydrolyse to choline N-methyl singlet, d 3.21 im-mediately after ejaculation, due to action by prostatic
Ž . w xacid phosphatase PAP 19,20 . The closeness inqŽ .chemical shift of the N CH groups of GPC and3 3
PC means that their signals can only be dispersed byusing high frequency 1H measurements in non-viscousŽ .diluted samples. Throughout the incubation timecourse the decreasing PC signal correlates with therise in choline concentration, indicating that cholineis relatively metabolically stable over this timescale.
A series of doublets at d 8.18, 6.00 and 5.98 wereobserved in the sample collected at the 2 min post-ejaculation time point. These signals were ‘‘replaced’’by a set of peaks at d 7.85, 5.92 and 5.90, respec-
Ž .tively, in samples at later time points Fig. 2 . TheŽ .2D NMR experiments Sections 3.3 and 3.4 on the
completely degraded sample allows the complete as-
1 Ž .Fig. 1. A series of 600 MHz H spectra of seminal plasma displaying a section of the low frequency region 0.6–3.1 ppm having beenincubated over a time course of 4 h. The spectra illustrate that many metabolites change in concentration within incubated semen, due tocleavage of peptides by esterases, proteases, peptidases and the aerobic and anaerobic respiration of spermatozoa.

( )A.M. Tomlins et al.rBiochimica et Biophysica Acta 1379 1998 367–380 371
1 Ž . Ž .Fig. 2. A series of 600 MHz H spectra of seminal plasma, displaying a section of the high frequency aromatic region 5.1–9.0 ppm .The series extends over a sampling period of 4 h of incubation and indicates the gradual rise in signal intensity of several amino acids, dueto proteolysis, as well as the consistent levels of uridine after the 7 min time point. There is evidence of minor UMP levels in the 20 and30 min time points due to clumps of proteins which release small volumes of SVF, and hence UMP, after redilution of the freeze driedaliquots. This is an unavoidable phenomenon due to the inhomogeneity of SF and these peaks have not been included in the quantification
Ž . Ž Xprocess. There is a drop in the level of a -N-acetylglucosamine in the spectra taken at 240 min. Key: UMPsuridine-5 -mono.phosphate; Tyrs tyrosine; Hisshistidine; Phesphenylalanine.
( )A.M. Tomlins et al.rBiochimica et Biophysica Acta 1379 1998 367–380372
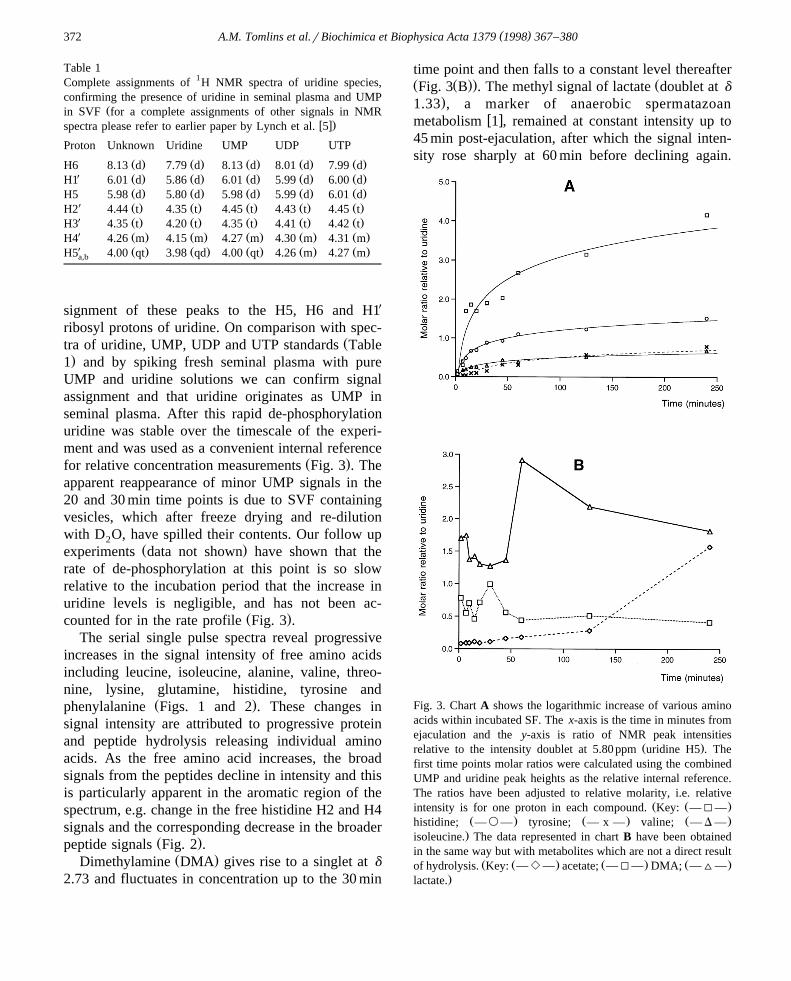
Table 1Complete assignments of 1H NMR spectra of uridine species,confirming the presence of uridine in seminal plasma and UMP
Žin SVF for a complete assignments of other signals in NMRw x.spectra please refer to earlier paper by Lynch et al. 5
Proton Unknown Uridine UMP UDP UTP
Ž . Ž . Ž . Ž . Ž .H6 8.13 d 7.79 d 8.13 d 8.01 d 7.99 dX Ž . Ž . Ž . Ž . Ž .H1 6.01 d 5.86 d 6.01 d 5.99 d 6.00 d
Ž . Ž . Ž . Ž . Ž .H5 5.98 d 5.80 d 5.98 d 5.99 d 6.01 dX Ž . Ž . Ž . Ž . Ž .H2 4.44 t 4.35 t 4.45 t 4.43 t 4.45 tX Ž . Ž . Ž . Ž . Ž .H3 4.35 t 4.20 t 4.35 t 4.41 t 4.42 tX Ž . Ž . Ž . Ž . Ž .H4 4.26 m 4.15 m 4.27 m 4.30 m 4.31 mX Ž . Ž . Ž . Ž . Ž .H5 4.00 qt 3.98 qd 4.00 qt 4.26 m 4.27 ma,b
signment of these peaks to the H5, H6 and H1X
ribosyl protons of uridine. On comparison with spec-Žtra of uridine, UMP, UDP and UTP standards Table
.1 and by spiking fresh seminal plasma with pureUMP and uridine solutions we can confirm signalassignment and that uridine originates as UMP inseminal plasma. After this rapid de-phosphorylationuridine was stable over the timescale of the experi-ment and was used as a convenient internal reference
Ž .for relative concentration measurements Fig. 3 . Theapparent reappearance of minor UMP signals in the20 and 30 min time points is due to SVF containingvesicles, which after freeze drying and re-dilutionwith D O, have spilled their contents. Our follow up2
Ž .experiments data not shown have shown that therate of de-phosphorylation at this point is so slowrelative to the incubation period that the increase inuridine levels is negligible, and has not been ac-
Ž .counted for in the rate profile Fig. 3 .The serial single pulse spectra reveal progressive
increases in the signal intensity of free amino acidsincluding leucine, isoleucine, alanine, valine, threo-nine, lysine, glutamine, histidine, tyrosine and
Ž .phenylalanine Figs. 1 and 2 . These changes insignal intensity are attributed to progressive proteinand peptide hydrolysis releasing individual aminoacids. As the free amino acid increases, the broadsignals from the peptides decline in intensity and thisis particularly apparent in the aromatic region of thespectrum, e.g. change in the free histidine H2 and H4signals and the corresponding decrease in the broader
Ž .peptide signals Fig. 2 .Ž .Dimethylamine DMA gives rise to a singlet at d
2.73 and fluctuates in concentration up to the 30 min
time point and then falls to a constant level thereafterŽ Ž .. ŽFig. 3 B . The methyl signal of lactate doublet at d
.1.33 , a marker of anaerobic spermatazoanw xmetabolism 1 , remained at constant intensity up to
45 min post-ejaculation, after which the signal inten-sity rose sharply at 60 min before declining again.
Fig. 3. Chart A shows the logarithmic increase of various aminoacids within incubated SF. The x-axis is the time in minutes fromejaculation and the y-axis is ratio of NMR peak intensities
Ž .relative to the intensity doublet at 5.80 ppm uridine H5 . Thefirst time points molar ratios were calculated using the combinedUMP and uridine peak heights as the relative internal reference.The ratios have been adjusted to relative molarity, i.e. relative
Ž Ž .intensity is for one proton in each compound. Key: —I—Ž . Ž . Ž .histidine; —`— tyrosine; — x — valine; — D —.isoleucine. The data represented in chart B have been obtained
in the same way but with metabolites which are not a direct resultŽ Ž . Ž . Ž .of hydrolysis. Key: — e — acetate; —I— DMA; —^—
.lactate.

( )A.M. Tomlins et al.rBiochimica et Biophysica Acta 1379 1998 367–380 373
Both of these observations have been quantified rela-Ž Ž ..tive to uridine Fig. 3 B .
The two doublet signals at ca. d 5.2 are from theanomeric protons of a-glucose and a-N-acetyl-galactosamine at d 5.21 and a-N-acetylglucosamine
Ž .at d 5.25 Liu unpublished observations . In the lasttime point, the lower frequency doublet approxi-mately halves in intensity, probably due to de-acety-lation of a-N-acetylglucosamine. The N-acetyl sin-glet at d 2.12 remained constant until the penultimate
Ž .measured time point ts120 min after which it
decreased in intensity with a concomitant rise in thefree acetate signal at d 1.90 indicating an N-acetylhydrolysis process, although signal overlap fromspermine, glutamine, peptides and other acetylatedspecies prevented quantification.
3.2. Signal assignment from 2D NMR experiments onfully degraded SF
1 Ž .In the H 2D JRES spectrum Fig. 4 the complexoverlapped signals, as observed in the single pulse
Fig. 4. 600 MHz JRES 1H NMR spectrum of human SF that had been previously incubated over a period of 240 min, showing contourplot and skyline F2 projection. The skyline plot gives a clear indication of the chemical shift without the complexity of 1H–1H coupling
Ž . Ž . Ž . Ž . Ž . Ž . Ž . Ž . Ž . Ž .patterns. Key: 1 isoleucine; 2 leucine; 3 valine: 4 threonine; 5 lactate; 6 alanine; 7 acetate; 8 N-acetyl; 9 glutamine; 10Ž . Ž . Ž . Ž . Ž . Ž . Ž . Ž .methionine; 11 unknown; 12 pyruvate; 13 unknown; 14 glutamate; 15 citrate; 16 dimethylamine; 17 asparagine; 18
Ž . Ž . Ž . Ž . Ž . Ž . Ž . Ž .aspartate; 19 lysine; 20 creatine; 21 spermine; 22 choline; 23 glycerophosphorylcholine; 24 arginine; 25 taurine; 26Ž . Ž . Ž . Ž . Ž . Ž .myo-inositol; 27 glycine; 28 tyrosine; 29 histidine: 30 phenylalanine; 31 uridine; and 32 formate.

( )A.M. Tomlins et al.rBiochimica et Biophysica Acta 1379 1998 367–380374
spectra, are substantially resolved by dispersing thechemical shift and coupling constant data into twoorthogonal frequency domains. Therefore, completespectral assignment was possible for all major or-ganic species.
Threonine and lactate are completely resolved inŽthe JRES experiment despite the close proximity Dd
.0.008 of the chemical shifts of their methyl doubletsŽ . X Xd 1.32 . The glutamate AA BB signals are complex
due to the magnetically non-equivalent methyleneprotons. Confirmation of the presence of uridine is
obtained from the 2D proton TOCSY. This type ofexperiment relies on the molecule under study havinga clearly resolved resonance which is spin coupled toothers in an unbroken chain of coupling. Thus foruridine complete cross peak couplings are observed
Ž .for all of the uridine signals Fig. 5 except the uracilH5 and H6 protons which are in a different spinsystem. The relatively long mixing time of 90 ms hasensured that all of the ribosyl connectivities are ob-served. The TOCSY spectrum was complemented bythe COSY-45 spectrum in which only short range
Fig. 5. A 90 ms mixing time 600 MHz TOCSY 1H NMR spectrum of human SF having been incubated for 240 min. Uridine is clearlyŽ . X X X X Xassigned - - - displaying the complete spin system for the H1 , H2 , H3 , H4 and H5 non-equivalent protons of the ribose ring, as well
as the connectivities of H5 and H6 protons on the uridyl moeity. Other metabolite connectivities were identified such as the protons in theŽ . Žsaturated alkyl chains of lysine and arginine have been illustrated by the solid line . choscholine, thrs threonine,
.lacs lactate, 3HBs3-hydroxybutyrate, iles isoleucine, leus leucine, valsvaline.

( )A.M. Tomlins et al.rBiochimica et Biophysica Acta 1379 1998 367–380 375
Fig. 6. A series of 1H spectra run at 600 MHz illustrating the similarity of a PFrSVF mixture to SF after incubation at 378C. The spectraw xhave been split into two parts with the intensity of the aromatic magnified by 4-fold for purpose of clarity. Spectrum A : SVF diluted
w x w x Ž .with 90% D O. Spectrum B : Prostatic fluid from a different patient diluted with 60% D O. Spectrum C : A 1:1 by volume in vitro2 2w xmixture of PF and SVF sampled after 30 min incubation at 378C and diluted with 80% D O. Spectrum D : Seminal plasma sampled after2
Ž .30 min of incubation as whole semen. 70% D O dilution.2

( )A.M. Tomlins et al.rBiochimica et Biophysica Acta 1379 1998 367–380376
directly coupled protons are seen, confirming assign-Žment, especially in the aliphatic region spectra not
.shown .
3.3. NMR spectroscopy of PF and SVF mixtures
1 Ž .H NMR spectra of SVF Fig. 6 contain manybroad signals from high molecular weight peptidesand proteins. Signals from lactate, PC, lysine, fruc-tose and UMP are observed in single pulse spectra ofSVF. On incubating SVF with an equal volume of PFthe overall pattern of NMR-monitored biochemicalchanges were essentially the same as seen in incu-bated SF. For example, UMP is rapidly de-phos-phorylated to uridine and PC conversion to choline
Ž .occurs at approximately the same rate Fig. 7 as inSF, but is obviously dependent on the ratios of the PF
Ž .and SVF in the mixtures ex vivo and in vitro . Adirect spectral comparison of the ex vivo and in vitro
Ž Ž . Ž ..systems Fig. 6 C and D reveals that they arealmost identical in chemical composition and the invitro system mimics the ex vivo system closely. For
complete assignment the end time point was alsoanalysed by 2D JRES and TOCSY 1H NMR spec-troscopy which gave rise to similar metabolite pat-
Ž .terns to those seen for incubated SF data not shown .
3.4. Addition of EDTA solution to seminal plasmasamples
After EDTA addition to SF samples incubated for7 min or longer ethylenic 1H signals from the M-
2y Ž . Ž .EDTA complexes of Ca d 2.55 , Mg d 2.71 andŽ . Ž .Zn d 2.88 were observed Fig. 8 . After this time
point the integrals for each of M-EDTA2y peaksŽ .remain in the ratio 1:3:4 Zn:Mg:Ca which compares
favourably with the ratios obtained from previousw xatomic absorption spectroscopy studies 21 . How-
ever, no Zn-EDTA2y signals were observed in thets2 min sample of SF. The intensity of the M-EDTA2y signals did not increase relative to uridineafter the 7 min time point. The addition of EDTA tothe later SF samples also caused a sharpening of the
Fig. 7. A kinetic profile of prostatic acid phosphatase activity in reproductive fluids using the changing relative 1H NMR signal intensityŽ . Ž .of trimethyl singlets from phosphorylcholine I and choline ` at 3.23 and 3.3 ppm, respectively, measured in situ using a continual
Ž . Ž .multiple scan method with intervals of 16 scans 64 s . The sample is an in vitro mixture of seminal vesicle and prostatic fluid 1:1 withthe machine temperature set to 368C.

()
A.M
.Tom
linset
al.rB
iochimica
etB
iophysicaA
cta1379
1998367
–380
377
1 Ž .Fig. 8. 600MHz H NMR spectra of seminal plasma. Spectra of the same samples of seminal plasma after addition of saturated EDTA aq. solution are shown above. Theethylenic protons of the respective dication-EDTA complexes are marked accordingly. Spectrum A: fluid incubated for 2 min, then EDTA added; spectrum B: fluidincubated for 2 min, no EDTA; spectrum C: 7 min incubation post-EDTA addition; spectrum D: 7 min incubation pre-EDTA addition.
( )A.M. Tomlins et al.rBiochimica et Biophysica Acta 1379 1998 367–380378
citrate AB signal, with the half-height line widthŽ . Ž .n changing from 4.5 Hz pre-EDTA to 1.2 Hz1r2Ž .post-EDTA . Spermine signals were shifted to a
Žhigher frequency on addition of EDTA for both 2.and 7 min incubation implying interaction with a
divalent metal species in solution. Upon addition ofEDTA proteolysis of the SF peptides is inhibited, andremains so after 24 h at room temperature. This strongEDTA inhibition of metalloenzymes is evident fromthe constant levels of amino acids in all of the timepoints up to 24 h post-EDTA addition.
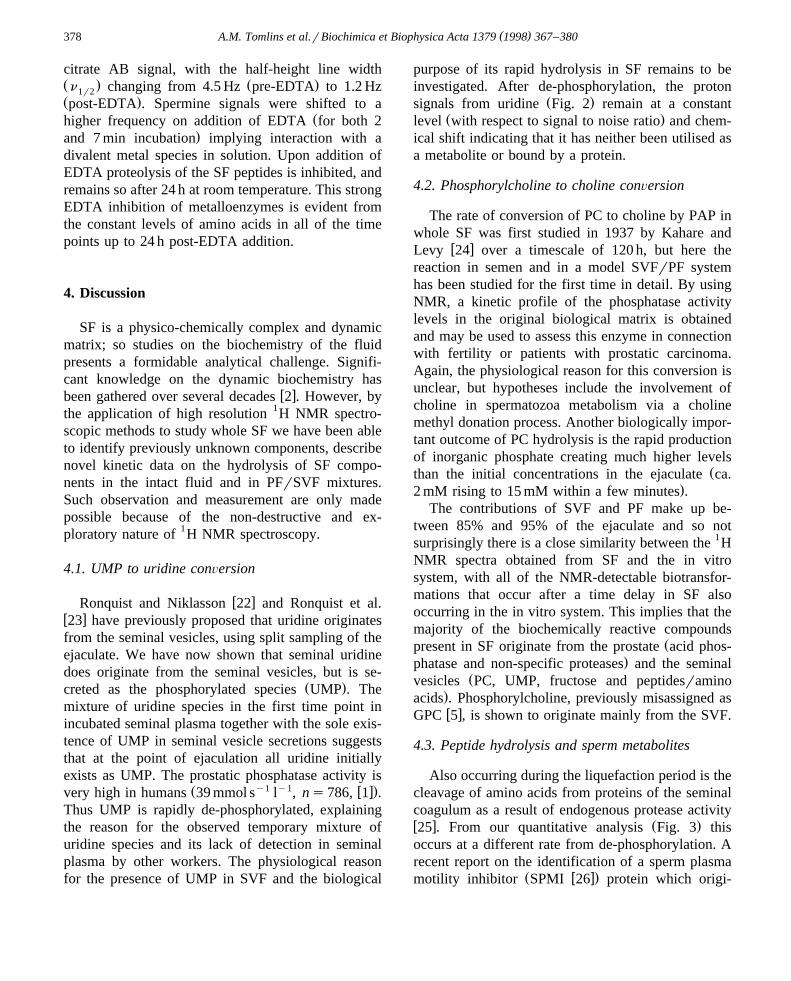
4. Discussion
SF is a physico-chemically complex and dynamicmatrix; so studies on the biochemistry of the fluidpresents a formidable analytical challenge. Signifi-cant knowledge on the dynamic biochemistry has
w xbeen gathered over several decades 2 . However, bythe application of high resolution 1H NMR spectro-scopic methods to study whole SF we have been ableto identify previously unknown components, describenovel kinetic data on the hydrolysis of SF compo-nents in the intact fluid and in PFrSVF mixtures.Such observation and measurement are only madepossible because of the non-destructive and ex-ploratory nature of 1H NMR spectroscopy.
4.1. UMP to uridine conÕersion
w xRonquist and Niklasson 22 and Ronquist et al.w x23 have previously proposed that uridine originatesfrom the seminal vesicles, using split sampling of theejaculate. We have now shown that seminal uridinedoes originate from the seminal vesicles, but is se-
Ž .creted as the phosphorylated species UMP . Themixture of uridine species in the first time point inincubated seminal plasma together with the sole exis-tence of UMP in seminal vesicle secretions suggeststhat at the point of ejaculation all uridine initiallyexists as UMP. The prostatic phosphatase activity is
Ž y1 y1 w x.very high in humans 39 mmol s l , ns786, 1 .Thus UMP is rapidly de-phosphorylated, explainingthe reason for the observed temporary mixture ofuridine species and its lack of detection in seminalplasma by other workers. The physiological reasonfor the presence of UMP in SVF and the biological
purpose of its rapid hydrolysis in SF remains to beinvestigated. After de-phosphorylation, the proton
Ž .signals from uridine Fig. 2 remain at a constantŽ .level with respect to signal to noise ratio and chem-
ical shift indicating that it has neither been utilised asa metabolite or bound by a protein.
4.2. Phosphorylcholine to choline conÕersion
The rate of conversion of PC to choline by PAP inwhole SF was first studied in 1937 by Kahare and
w xLevy 24 over a timescale of 120 h, but here thereaction in semen and in a model SVFrPF systemhas been studied for the first time in detail. By usingNMR, a kinetic profile of the phosphatase activitylevels in the original biological matrix is obtainedand may be used to assess this enzyme in connectionwith fertility or patients with prostatic carcinoma.Again, the physiological reason for this conversion isunclear, but hypotheses include the involvement ofcholine in spermatozoa metabolism via a cholinemethyl donation process. Another biologically impor-tant outcome of PC hydrolysis is the rapid productionof inorganic phosphate creating much higher levels
Žthan the initial concentrations in the ejaculate ca..2 mM rising to 15 mM within a few minutes .
The contributions of SVF and PF make up be-tween 85% and 95% of the ejaculate and so notsurprisingly there is a close similarity between the 1HNMR spectra obtained from SF and the in vitrosystem, with all of the NMR-detectable biotransfor-mations that occur after a time delay in SF alsooccurring in the in vitro system. This implies that themajority of the biochemically reactive compounds
Žpresent in SF originate from the prostate acid phos-.phatase and non-specific proteases and the seminal
Žvesicles PC, UMP, fructose and peptidesramino.acids . Phosphorylcholine, previously misassigned asw xGPC 5 , is shown to originate mainly from the SVF.
4.3. Peptide hydrolysis and sperm metabolites
Also occurring during the liquefaction period is thecleavage of amino acids from proteins of the seminalcoagulum as a result of endogenous protease activityw x Ž .25 . From our quantitative analysis Fig. 3 thisoccurs at a different rate from de-phosphorylation. Arecent report on the identification of a sperm plasma
Ž w x.motility inhibitor SPMI 26 protein which origi-
( )A.M. Tomlins et al.rBiochimica et Biophysica Acta 1379 1998 367–380 379
nates from the seminal vesicles and is rapidly hydrol-Ž .ysed to an inert fragment 52 kD will not directly be
observed by NMR spectroscopy due to the extremelyshort relaxation times of a large protein. However,using NMR as a monitor of small molecule concen-trations it is possible to assess the extent of proteoly-sis and maybe a useful tool for investigating lack ofinhibitor protein degradation.
Variation in the amount of lactate, which is knownw xto fluctuate according to incubation time 1 , is ex-
plained by spermatozoan metabolism. Lactate origi-nates from vesicular secretions in high concentrationsw x2 . However, once fully motile, spermatozoa anaero-bically metabolise fructose and other sugars via theglycolytic pathway to form lactate. This fructolysis isthen followed by aerobic oxidation and lactate isbroken down for energy, via the sperm specific LDH-
w xX enzyme 27 .
4.4. The effects of EDTA addition on NMR spectra ofSF
EDTA additions caused the narrowing of the SFcitrate 1H NMR signals as expected, as citrate isknown to be involved in the complexation of metal
w xions in seminal fluids 28 . There is also a distinctsharpening and change of chemical shift of sperminesignals after the addition of EDTA to the samples.Polyamines have recently been shown to stabilisemetal-citrate complexes by secondary sphere interac-
w xtions 29 and the above results indicate the possibil-ity of a similar type of aggregation which we arecurrently investigating.
A delay in the appearance of the 1H NMR signalfrom the ethylenic protons of Zn-EDTA2y is remark-able considering the high log K of EDTA andeq
2q Ž w x.Zn 13.3 at pH 7.5 30 and the rapidity of thereaction in vitro. This implies that soon after ejacula-tion Zn2q must instantly be present in a componentthat is thermodynamically or kinetically inaccessibleto EDTA, whereas Mg2q and Ca2q are EDTAchelatable. There was no difference in Zn-EDTA2y
signal intensity after the 7 min time point implyingw xcompletion of this dissociative process. Arver 31
w xand Arver and Eliasson 32 have previously reportedevidence of Zn transfer in semen, from citrate of
Ž .prostatic origin to the HMW )80 kD organics,such as glycoproteins, originating from the seminal
vesicles, within 1 h of ejaculation. They also reportedthat a high proportion of zinc was transferred fromHMW compounds to citrate upon the addition ofinorganic phosphate. This could explain our resultsregarding citrate immediately releasing zinc to glyco-proteins and then, within 2 min, with the rapid rise inphosphate concentration, from phosphorylcholinecleavage, a transfer back to LMW organics such ascitrate. The reason for this "double" zinc transferprocess is currently under investigation.
Acknowledgements
We are grateful to Professor John Lindon and Dr.Brian Leaker for assistance with assignment and clin-ical guidance, respectively, and the national highfield NMR centre at Edinburgh University. This re-search was supported by the Biological and Biotech-nological Research Council and Pfizer Central Re-
Ž .search in the form of a CASE studentship AMT .
References
w x Ž .1 C. Lentner Ed. , Ciba-Geigy Scientific Tables 1, Ciba-Giegy, Basle, 1981, pp. 184–193.
w x2 T. Mann, C. Lutwak-Mann, Male Reproductive Functionand Semen, Springer, New York, 1981.
w x Ž . Ž .3 B. Polak, B. Daunter, Int. J. Androl. 12 3 1989 187–194.w x4 J.K. Nicholson, I. Wilson, Prog. NMR Spectroscopy 12
Ž .1989 449–501.w x5 M.J. Lynch, P.J.D. Foxall, D. Thompson, J.C. Lindon, J.K.
Ž . Ž .Nicholson, J. Pharm. Biomed. Anal. 12 1 1994 5–19.w x6 M. Spraul, J.K. Nicholson, M.J. Lynch, J.C. Lindon, J.
Ž . Ž .Pharm. Biomed. Anal. 12 5 1994 613–618.w x7 D.P. Higham, J.K. Nicholson, J. Overnall, P.J. Sadler, Envi-
Ž .ron. Health Perspect. 65 1985 157–165.w x8 J.K. Nicholson, M.J. Buckingham, P.J. Sadler, J. Biochem.
Ž . Ž .211 3 1983 605–615.w x Ž .9 R.S. Bedwal, A. Bahuguna, Experimentia 50 1994 626–
640.w x10 J.L. Marmar, S. Katz, D.E. Praiss, T.J. DeBenedictics,
Ž . Ž .Urology 16 5 1980 478–480.w x Ž .11 J. Rousseaux, R. Rousseaux-Prevost, Biol. Reprod. 52 1995
1066–1072.w x Ž .12 R.J. Siviter, S.M. Cockle, J. Endocrinol. 144 1995 61–66.w x13 D. Canale, M. Bartelloni, A. Negroni, P. Meschini, P.L.
Izzo, B. Bianchi, G.F. Menchini-Fabris, Int. J. Androl. 9Ž .1986 477–480.
w x14 B. Stegmayr, P-O. Berggren, G. Ronquist, B. Hellman,Ž .Scand. J. Nephrol. 16 1982 199–203.
( )A.M. Tomlins et al.rBiochimica et Biophysica Acta 1379 1998 367–380380
w x15 U. Kvist, K. Jellberg, L. Bjorndahl, J.C. Soufir, S. Arver,Ž .Int. J. Androl. 13 1990 245–252.
w x Ž .16 W.P. Aue, J. Karhan, R.R. Ernst, J. Chem. Phys. 64 19764226–4227.
w x17 K. Nagayama, A. Kumar, K. Wuthwich, R.R. Ernst, J.Ž .Magn. Reson. 40 1980 321–334.
w x Ž .18 A. Bax, D.G. Davies, J. Magn. Reson. 65 1985 355–360.w x19 Ed.N. Tietz, Textbook of Clincal Chemistry, 1st ed., Saun-
ders, London, 1986.w x20 J.J. Segalen, J.D. de Certaines, M. le Calve, D. Colleu, J.Y.
Ž .Bansard, M. Rio, J. Reprod. Fertil. 103 1995 181–187.w x21 R.S. Jeyendran, H.H. Van Der Ven, R. Rosecrans, M. Prez
Ž .Pelaz, S. AlHasani, L.J. Zanefeld, Andrologia 21 1989423–428.
w x Ž .22 G. Ronquist, F. Niklasson, Arch. Androl. 13 1984 63–700.w x23 B-E. Persson, M. Sjoman, F. Niklasson, G. Ronquist, Euro.
Ž .Urol. 19 1991 253–256.
w x Ž .24 E. Kahare, J. Levy, Bull. Soc. Chim. Biol. 19 1937 959.´w x25 T. Mann, C. Lutwak-Mann, The Biochemistry of Semen and
of the Male Reproductive Tract, Wiley, New York, 1960.w x Ž . Ž .26 M. Robert, G. Agnon, Hum. Reprod. 10 8 1995 2192–
2197.w x Ž .27 N. Virji, R. Eliasson, Int. J. Androl. 8 1985 84–376.w x28 G.F. Daniels Jr., J.T. Grayhack, Scientific Foundations of
Urology, 3rd ed., Chapter 41, 1989, Heinemann MedicalBooks, Oxford, pp. 351–358.
w x Ž .29 P.J. Sadler, H. Sun, J. Chem. Soc., Dalton Trans. 19951395-1401.
w x30 R.M.C. Dawson, D.C. Elliot, W.H. Elliot, K.M. Jones, Datafor Biochemical Research, 3rd ed., Oxford University Press,New York, 1986.
w x Ž .31 S. Arver, Int. J. Androl. 3 1980 629–642.w x Ž . Ž .32 S. Arver, R. Eliasson, Acta Physiol. Scand. 115 2 1982
217–224.
Copyright © 2022 FDOKUMEN