Bio-economic modeling of water quality improvements using a dynamic applied general equilibrium...
17
Analysis Bio-economic modeling of water quality improvements using a dynamic applied general equilibrium approach Rob Dellink a, b, ⁎, Roy Brouwer a , Vincent Linderhof c , Karin Stone d a Department of Environmental Economics, Institute for Environmental Studies, VU University Amsterdam, De Boelelaan 1087, 1081 HV, Amsterdam, The Netherlands b Environmental Economics and Natural Resources Group, Wageningen University and Research Center, Hollandseweg 1, 6706 KN Wageningen, The Netherlands c LEI, Wageningen University and Research Center, The Hague, The Netherlands d Deltares, Rotterdamseweg 185, Delft, The Netherlands abstract article info Article history: Received 10 February 2011 Received in revised form 9 April 2011 Accepted 3 June 2011 Available online 28 September 2011 JEL classification: C68 O52 Q25 Q28 Keywords: Bio-economic model Applied general equilibrium model Water quality model An integrated bio-economic model is developed to assess the impacts of pollution reduction policies on water quality and the economy. Emission levels of economic activities to water are determined based on existing environmental accounts. These emission levels are built into a dynamic economic model for the Dutch economy and subsequently coupled to a national water quality model. The modular approach has the advantage that the impacts on the economy and water quality are evaluated simultaneously, but each within their own domain based on the appropriate scale and level of detail. The dynamic nature of the economic model allows us to also evaluate a derogated water policy as foreseen in the European Water Framework Directive. The indirect costs of different water quality improvement policy scenarios are at least as high as the direct costs related to investments in pollution abatement technology. The stricter the policy scenario, the more important the role of economic adjustment and restructuring mechanisms at the macro-economic level. Significant water quality improvements can be achieved through stringent domestic emission reductions. However, reaching water quality standards is highly dependent on water quality improvement policy in surrounding river basin countries and climate change. © 2011 Elsevier B.V. All rights reserved. 1. Introduction Methods of analysis to conduct economic evaluation of water policy interventions such as cost-effectiveness and cost–benefit analysis are often ad-hoc and based on a partial economic equilibrium analysis (Brouwer and Hofkes, 2008). The limited number of existing input– output and general equilibrium models addressing water policy issues focuses on the optimization of water resource allocation across different uses, mostly agriculture, or the wider economic impacts of different resource allocation rules (e.g. Strzepek et al., 2008; van Heerden et al., 2008; Velázquez, 2006). Cost–effectiveness analysis of water quality improvements typically focus on the direct cost of policy measures to reduce emission levels of water polluting substances such as nutrients and pesticides (e.g. Gren et al., 1997; Ribaudo et al., 2001; Schleiniger, 1999; van der Veeren and Lorenz, 2002). Studies addressing the impact of these emission reduction measures on water quality, and hence minimizing costs based on water quality objectives, are rare (e.g. Barton et al., 2008; Brouwer and De Blois, 2008). In those cases where emission reduction levels are linked to a water quality model, the economic part consists at most of a partial equilibrium analysis. The only study attempting to estimate the total economic costs of emission reduction water policy scenarios using an applied general equilibrium (AGE) model we are aware of is the one by Brouwer et al. (2008). However, they use a static economic model, with no further details of the impact of the emission reduction scenarios on the national economy and its sectoral components in time. In this paper, we present the results of an extended dynamic AGE model coupled to a water quality model for the Netherlands. The main objective is to illustrate the use and usefulness of a coupled bio- economic model to simultaneously assess the impacts of water policy interventions on the national economy and water quality. The novelty of the model presented here is twofold. First, it is based on a dynamic representation of the (Dutch) economy. Second, the emission levels of nutrients (nitrogen N and phosphorus P) and a number of eco-toxic metals (cadmium Cd, copper Cu, nickel Ni and zinc Zn) associated with specific water polluting economic activities are linked to a spatially explicit water quality model, allowing us to assess the impact of changes in emission levels on water quality conditions in the main water systems in the country. Thus, we are able to dynamically trace the entire chain from economic activity to emissions to changes in water quality in different water systems and the other way around. More specifically, we test to what extent emission reduction policy scenarios, for instance in the context of the European Water Framework Directive (WFD), affect Ecological Economics 71 (2011) 63–79 ⁎ Corresponding author at: Department of Environmental Economics, Institute for Environmental Studies, VU University Amsterdam, De Boelelaan 1087, 1081 HV, Amsterdam, The Netherlands. E-mail address: [email protected] (R. Dellink). 0921-8009/$ – see front matter © 2011 Elsevier B.V. All rights reserved. doi:10.1016/j.ecolecon.2011.06.001 Contents lists available at SciVerse ScienceDirect Ecological Economics journal homepage: www.elsevier.com/locate/ecolecon
-
Upload
wageningen-ur -
Category
Documents
-
view
3 -
download
0
Transcript of Bio-economic modeling of water quality improvements using a dynamic applied general equilibrium...
Ecological Economics 71 (2011) 63–79
Contents lists available at SciVerse ScienceDirect
Ecological Economics
j ourna l homepage: www.e lsev ie r.com/ locate /eco lecon
Analysis
Bio-economic modeling of water quality improvements using a dynamic appliedgeneral equilibrium approach
Rob Dellink a,b,⁎, Roy Brouwer a, Vincent Linderhof c, Karin Stone d
a Department of Environmental Economics, Institute for Environmental Studies, VU University Amsterdam, De Boelelaan 1087, 1081 HV, Amsterdam, The Netherlandsb Environmental Economics and Natural Resources Group, Wageningen University and Research Center, Hollandseweg 1, 6706 KN Wageningen, The Netherlandsc LEI, Wageningen University and Research Center, The Hague, The Netherlandsd Deltares, Rotterdamseweg 185, Delft, The Netherlands
⁎ Corresponding author at: Department of EnvironmEnvironmental Studies, VU University Amsterdam, DAmsterdam, The Netherlands.
E-mail address: [email protected] (R. Dellink).
0921-8009/$ – see front matter © 2011 Elsevier B.V. Aldoi:10.1016/j.ecolecon.2011.06.001
a b s t r a c t
a r t i c l e i n f oArticle history:Received 10 February 2011Received in revised form 9 April 2011Accepted 3 June 2011Available online 28 September 2011
JEL classification:C68O52Q25Q28
Keywords:Bio-economic modelApplied general equilibrium modelWater quality model
An integrated bio-economic model is developed to assess the impacts of pollution reduction policies on waterquality and the economy. Emission levels of economic activities to water are determined based on existingenvironmental accounts. These emission levels are built into a dynamic economic model for the Dutcheconomy and subsequently coupled to a national water quality model. The modular approach has theadvantage that the impacts on the economy and water quality are evaluated simultaneously, but each withintheir own domain based on the appropriate scale and level of detail. The dynamic nature of the economicmodel allows us to also evaluate a derogated water policy as foreseen in the European Water FrameworkDirective. The indirect costs of different water quality improvement policy scenarios are at least as high as thedirect costs related to investments in pollution abatement technology. The stricter the policy scenario, themore important the role of economic adjustment and restructuring mechanisms at the macro-economic level.Significant water quality improvements can be achieved through stringent domestic emission reductions.However, reaching water quality standards is highly dependent on water quality improvement policy insurrounding river basin countries and climate change.
ental Economics, Institute fore Boelelaan 1087, 1081 HV,
l rights reserved.
© 2011 Elsevier B.V. All rights reserved.
1. Introduction
Methods of analysis to conduct economic evaluation of water policyinterventions such as cost-effectiveness and cost–benefit analysis areoften ad-hoc and based on a partial economic equilibrium analysis(Brouwer and Hofkes, 2008). The limited number of existing input–output and general equilibrium models addressing water policy issuesfocuses on the optimization ofwater resource allocation across differentuses, mostly agriculture, or the wider economic impacts of differentresource allocation rules (e.g. Strzepek et al., 2008; van Heerden et al.,2008; Velázquez, 2006). Cost–effectiveness analysis of water qualityimprovements typically focus on the direct cost of policy measures toreduce emission levels of water polluting substances such as nutrientsand pesticides (e.g. Gren et al., 1997; Ribaudo et al., 2001; Schleiniger,1999; van der Veeren and Lorenz, 2002). Studies addressing the impactof these emission reduction measures on water quality, and henceminimizing costs based onwater quality objectives, are rare (e.g. Bartonet al., 2008; Brouwer and De Blois, 2008). In those caseswhere emissionreduction levels are linked to a water quality model, the economic part
consists at most of a partial equilibrium analysis. The only studyattempting to estimate the total economic costs of emission reductionwater policy scenarios using an applied general equilibrium (AGE)model we are aware of is the one by Brouwer et al. (2008). However,theyuse a static economicmodel,withno further details of the impact ofthe emission reduction scenarios on the national economy and itssectoral components in time.
In this paper, we present the results of an extended dynamic AGEmodel coupled to a water quality model for the Netherlands. The mainobjective is to illustrate the use and usefulness of a coupled bio-economic model to simultaneously assess the impacts of water policyinterventions on thenational economyandwater quality. The novelty ofthe model presented here is twofold. First, it is based on a dynamicrepresentation of the (Dutch) economy. Second, the emission levels ofnutrients (nitrogen N and phosphorus P) and a number of eco-toxicmetals (cadmium Cd, copper Cu, nickel Ni and zinc Zn) associated withspecific water polluting economic activities are linked to a spatiallyexplicitwater qualitymodel, allowingus to assess the impact of changesin emission levels onwater quality conditions in themainwater systemsin the country. Thus, we are able to dynamically trace the entire chainfrom economic activity to emissions to changes in water quality indifferentwater systems and the otherwayaround.More specifically,wetest to what extent emission reduction policy scenarios, for instance inthe context of the European Water Framework Directive (WFD), affect
3 The sectors are based on the European nomenclature statistique des activités
64 R. Dellink et al. / Ecological Economics 71 (2011) 63–79
both the national economy and respect or exceed existingwater qualitystandards measured in the Netherlands by a pollutant's maximumpermissible concentration (MPC). The latter are based on eco-toxicological understanding of the risks of adding specific pollutantssuch as nutrients and metals to aquatic ecosystems (lakes, rivers etc.)and are fixed by the Dutch Environmental Assessment Agency.
The effects of six different policy scenarios on the economy andwater quality are assessed: a lenient scenario aiming to reduce 20% ofemission levels in 2000 by 2015 when the environmental objectives ofthe WFD have to be achieved for the first time, a strict scenario aimingfor a 50 percent emission reduction by 2015 compared to emissionlevels in 2000, and a ‘precautionary scenario’ where the necessaryeconomic adaptation is determinedby thenecessaryemission reductionto achieve theWFDwater quality objectives in allwater bodies. Both thelenient and strict scenarios areassessedusing twodifferent assumptionsrelated to the influx of water pollution from neighboring countries. Onewhere these levels remain as they currently are and one where it isassumed that water quality levels at the border are reduced byneighboring countries to MPC level as these neighboring countries toohave to complywith the new environmental water quality objectives inthe WFD. The Netherlands are part of the international river basins ofthe Rhine, Meuse and Scheldt, and as is typical for downstreamtransboundary basins, more than half of all thewater pollution in Dutchwaters is of foreign origin.1 The impacts of a sixth water policy scenarioare also estimated. In this scenario reaching the stringent reduction levelis delayed in time until 2027. This is a possibility provided in theWFD todelay reaching the environmental objectives in time, and the dynamicAGE model is especially suited to investigate the impacts of followingthis option. Finally, the impact of climate change on reaching waterquality standards in Dutch water bodies is investigated.
The remainder of this paper is organized as follows. Section 2describes the integrated bio-economic modeling procedure. Section 3addresses model calibration, while model results are presented inSection 4. Section 5 discusses the direct and indirect economicimpacts of the investigated water quality improvement scenarios.Finally, Section 6 concludes.
2. Model Description
2.1. The Economic Model
The economicmodel is a forward-looking neo-classical growthmodelbased on DEAN (Dellink, 2005).2 This model type has the advantage thatthe specification is fully dynamic: the agents take not only the currentstate of the economy, but also future situations into accountwhenmakingdecisions that affect current and future welfare. Moreover, the transitionpath fromtheoriginal balancedgrowthpath to anewgrowthpath ismoreflexible in a model with an endogenous savings rate (Barro and Sala-i-Martin, 1995). The originalmodel DEAN is adapted to studywater qualityissues. The economic part is described in detail elsewhere (Dellink andVan Ierland, 2005). The main features are briefly summarized here.
Consumption of different goods and environmental services arecombined in a nested CES utility function using the Linear ExpenditureSystem approach. Producer behavior is specified through a nested CESproduction function for domestic supply and through a zero-profitcondition. On the production side, 27 producers of private goods areidentified. There are two consumer groups: private households and thegovernment. The private households have income from the sale of theirendowments of capital goods and labor. The government has threesources of income: sale of the pollution permits, lump sum transfersfrom the private households and tax revenues. The lump sum transfersbetween government and private households are endogenously
1 In 2005, 67% of all metals and 51% of all nutrients in the Dutch water system camefrom abroad (Statistics Netherlands, 2007–2010).
2 Model codes for the core DEAN model are available on www.enr.wur.nl/uk/gams.
adjusted to ensure budget balance for the government. Effective laborsupply grows with an exogenous rate as a combination of demographicdevelopments and increases in labor productivity. Capital formation isbased on an exogenous interest rate and endogenous capital stock. Toaccount for capital stocks after themodel's time horizon, a transversalitycondition is included that ensures that investment to GDP ratios are notdeclining in the last periods.
The Dutch economy is highly dependent on international marketsand the typical small open economy specification is used.Worldmarketprices are exogenously given, and the international market is bigenough to satisfy demand for imports and absorb supply of exports atthese international prices. The response on the markets to changes indomestic prices is specified using the Armington approach by assumingthat domestic and foreign goods are imperfect substitutes. The currentaccount balance is exogenously given and the endogenous exchangerate ensures that equilibrium is attained. Themarket balance conditionsfor produced goods, domestic demand, the capital and labor market aresatisfiedby adjusting relative prices. In linewith the general equilibriumframework, a unique set of equilibrium prices ensures that all marketsare balanced simultaneously.
2.2. Linking the Emission of Water Pollutants to Economic Activities
Production and consumptionprocesses lead to the emissionofwaterpolluting substances. Emission levels are provided in the environmentalaccounts compiled every year by Statistics Netherlands (2007–2010)3
using the Dutch Pollutant Release and Transfer Register. Based on thesedata the emission intensity of different economic activities can beestimated, thereby linking emissions to economic activities. So,essentially sectoral emissions are coupled to the corresponding sector'sproduction levels. Since the relative contribution of each sector to totalemission levels is known, this relationship is used to trace backaggregate emission levels to their economic sector origins. Producersand consumers are able to reduce the emission intensity of theiractivities in two different ways. First, they can take pollution abatementmeasures, either end-of-pipe or process integrated measures. Second,producers and consumers can reduce their productionand consumptionof pollution intensive goods.
Pollution abatement measures are included as ‘goods’ in the modeland provided by a separate producer whose production inputs representthe cost components of the underlying technical measures (cf. Dellink,2005). These costs of the supply of abatement goods consist of abatementcost curves, estimated using detailed technical data of best availabletechniques. A constant elasticity of substitution function is estimated,which determines how much additional abatement effort is needed toreduce pollution by one additional unit. The cost function hence reflectsmarginal abatement costs. An exogenous technical potential to reducepollution through abatement activities, i.e. without economic restructur-ing, provides an absolute upper bound on technical abatement in themodel.
Autonomous pollution efficiency improvements result in a relativedecouplingof economicgrowthandpollution, i.e. emission intensities aredeclining over timeeven in the absenceof newpolicies. Thedevelopmentof abatement possibilities and abatement costs over time is captured viaspecific parameters that govern the changes in technical potential forpollution reduction over time and efficiency improvements in theabatement sector. In the specification of the model, these developmentsin the abatement possibilities and costs, i.e. innovation of new abatementmeasures, are driven by exogenous parameters.4 However, the modelcontains endogenous diffusion of existing abatement technology.
économiques dans la Communauté Européenne (NACE) classification and the UnitedNations international standard industrial classification of all economic activities (ISIC).
4 Technological developments can be introduced and simulated, for example, byincreasing the upper bound on the technical abatement potential in the model.

5 Around 40 possible measures are included in the abatement cost curve to reducenutrient emission levels. The reduction of nutrients focuses primarily on agriculture,industry and sewerage, resulting in a maximum reduction of emission levels of N and Pof around 62%. Van der Woerd et al. (2000) furthermore provide 127 independentoptions to reduce dispersion of toxic substances to water for 1995. With additionalassumptions as described in Hofkes et al. (2004), we construct the abatement costcurve for 2000. The reduction potential is kept constant and proportionally with thelevel of emissions. The abatement costs are corrected for the changes in the consumerprice index between 1995 and 2000.
65R. Dellink et al. / Ecological Economics 71 (2011) 63–79
Instead of buying ‘abatement goods’, producers and consumers arealso able to buy pollution permits. The government sets the environ-mental policy targets exogenously by issuing a limited number ofpollution permits and redistributing the proceeds to private householdsin a lump sum manner. In this way, a market for pollution permits iscreated with boundaries fixed by the environmental objectives, whereprices are determined endogenously by equating demand and supply.Allowances to emit polluting substances to the environment are linkedtoproductionoutput and consumption.Hence, pollutershave the choicebetween paying for their pollution permits or increasing theirexpenditures on pollution abatement. This choice is endogenous inthe model. Polluters will always choose the cheaper of the two.Reducing the production or consumption of pollution intensive goods isthe least cost-option when both the marginal abatement cost and theprice of the permits are higher than the value added foregone inreducing production or utility foregone in reducing consumption.
2.3. Linking the Emission of Water Pollutants to Water Quality
The effect of changes in economic activity on emission levels andsubsequently onwater quality is assessed in two steps. First, the changein emission levels of individual pollutants based on the economicprediction results from the national model DEAN is regionalized usingan existing information system of regional water accounts originallydeveloped by Brouwer et al. (2005). Changes in emission levels atnational level are allocated to different river basins and water bodiesbased on a GIS-weighting procedure described in Brouwer et al. (2008).Theweightingproceduremakes use of the current spatial distribution ofeconomic activities and emissions of different pollutants across regionalriver basins.
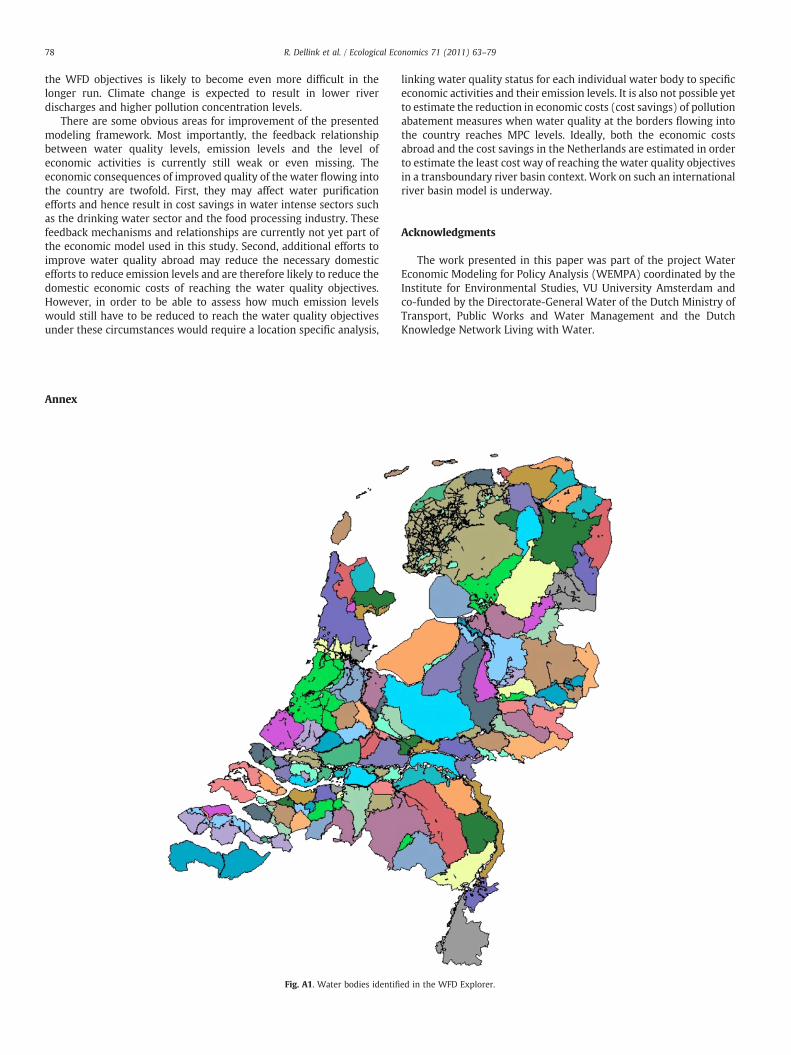
In a second step, the regionalized change in emission levels of thenutrients andmetalsmentioned in the introduction (N, P, Cd, Cu, Ni, Zn)provides the input into thewater qualitymodel operating at the level of154water bodies in theNetherlands. Amap of these 154water bodies isincluded in the Annex to this paper. The water quality model WFDExplorer (Maes et al., 2006), developed to support the implementationof the WFD in the Netherlands, simulates the impact of changes inemission loads (measured in kilograms per year) on the average annualconcentration level of the pollutant in these water bodies (measured inmilligrams per liter for nutrients and micrograms per liter for heavymetals). It does so based on a water and substance balance of the waterbodies within a river basin. The description of the water and substancebalance aims to provide an average seasonal picture for the summer andwinter. This time step is therefore much longer than the time scale inwhich bio-physical and chemical processes, such as water flows, waterlevel fluctuations, sedimentation, break-down of pollutants etc. occur.These processes are averaged out over the time scale under consider-ation, a year, to make them compatible with the economic flows.
The incoming load is allocated across the different water bodiestaking into account upstream–downstream discharge relationshipsbetween individualwater bodies. Based on these relationships pollutantconcentration levels are predicted and compared to the MPC.
3. Model Calibration
The base year forwhich themodelswere calibrated is 2000. The datafor the economicmodel and the data on emissions to surfacewaters arefrom Statistics Netherlands. N and P are expressed in P-equivalents andthe four metals are aggregated into an eco-toxicity potential equivalentindex (see Brouwer et al., 2008 and Dellink, 2005). Concentration levelsof the six pollutants in 2000 across the 154 water bodies are takendirectly from the Pollutant Release and Transfer Register (StatisticsNetherlands, 2007–2010). The MPC levels are taken from the DutchEnvironmental Assessment Agency and differ for each pollutant:0.16 μg/l for Cd, 3.8 μg/l for Cu, 5 μg/l for Ni, 40 μg/l for Zn, 2.2 mg/l fortot-N and 0.15 mg/l for tot-P (RIVM, 2010).
The available economic and environmental data at sector level andthe description of the economy in 2000 and its emission intensity arepresented in the Annex to this paper. A detailed description of theinteraction between economic activities and emission levels to wateris provided in Brouwer et al. (2008). In the dynamic AGE model, thevalues of the most important parameters are derived from trendanalysis over the period 1990–2000. Together with the data for thebase year they constitute the basis for the baseline projection of theeconomy. For a detailed explanation of the parameter values, seeDellink (2005). The growth rate of labor supply equals 2% and a stableannual interest rate of 4% is used. The steady-state relationshipbetween investment and capital is used to calculate a depreciationrate of 3%. The values for the substitution elasticities and the nestingstructure for the production functions, the utility function and theinternational trade functions are taken from Gerlagh et al. (2002) andrepresent adaptation possibilities for the medium term. The inter-temporal elasticity of substitution only had to be calibrated for theprivate households and equals 0.5.
The pollution–abatement–substitution (PAS) elasticities, baselineprice of the emission permits and the technical potential for pollutionreduction are directly derived from the abatement cost curvespresented in Dellink (2005). The growth rate of the technical potentialfor pollution reduction is based on a comparison of the abatement costcurves for 1990 and 2000, presented in Hofkes et al. (2004) andBrouwer et al. (2008).5 The autonomous pollution efficiency im-provements are calibrated using the realized development ofemission levels between 1995 and 2000. The assumption here isthat the effects of current policies such as the implementation of theNitrates Directive and the UrbanWastewater Treatment Directive willfade over time, leading to a stabilization of baseline emissions in thelong run. The autonomous abatement efficiency improvement iscalibrated to 0.5% per year over the model horizon.
4. Model Results
4.1. Baseline Projection and Policy Scenarios
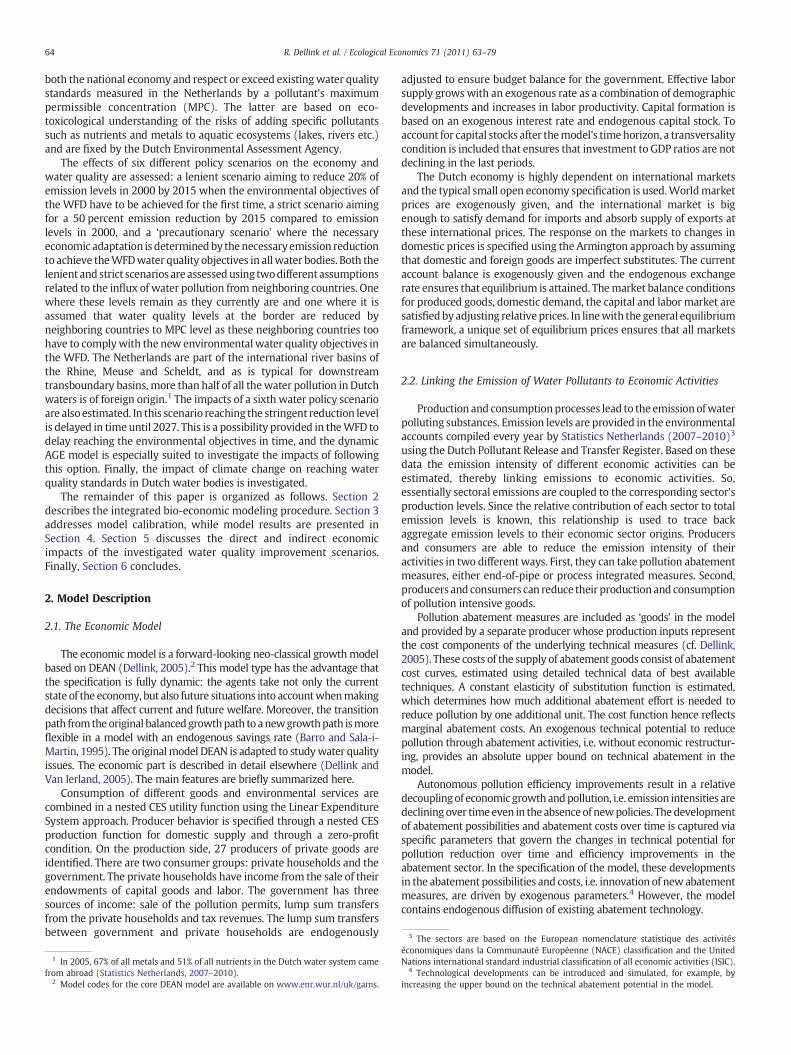
In this section, we contrast future projections that follow fromimplementing specific policy scenarios with a business-as-usualbaseline projection. In the baseline projection, the economy is assumedto be on a balanced growth path, i.e. the production factors (labor andcapital) grow at the same rate, and given the autonomous technologicaldevelopment, economic activities continue to grow at a constant speedof 2% per year over the whole model horizon. The growth rates foremissions are determined by a combination of economic growth andassumed autonomous pollution efficiency improvements. In thebaseline projection, the number of pollution permits issued by thegovernment allows producers and consumers to sustain their currentwater use. Expected water quality in 2015 – when the WFD objectiveshave to be reached – associated with these baseline conditions withoutany additional measures is presented in Fig. 1 for the 6 differentpollutants. The concentration levels are categorized in 5 classesrepresented by different colors. Red, orange and yellow are above theMPC threshold, i.e. are excessively polluted, while blue and green arebelow the MPC threshold value for each pollutant. Most problems arisefor nitrogen, copper, nickel and to some extent phosphorus. Expectedconcentration levels for cadmiumand zinc are higher thanMPC levels in
Cd
Ni
N
Cu
Zn
P
Fig. 1. Expected water quality in 2015 in the baseline situation.
66 R. Dellink et al. / Ecological Economics 71 (2011) 63–79
0
2
4
6
8
10
12
14
2000 2005 2010 2015 2020 2025 2030 2035
2000 2005 2010 2015 2020 2025 2030 2035
mln
. P e
quiv
alen
ts
Baseline Lenient Strict Strict deogated
0
20
40
60
80
100
120
140
mln
. eco
toxi
colo
gica
l equ
ival
ents
Baseline Lenient Strict Strict derogated
A
B
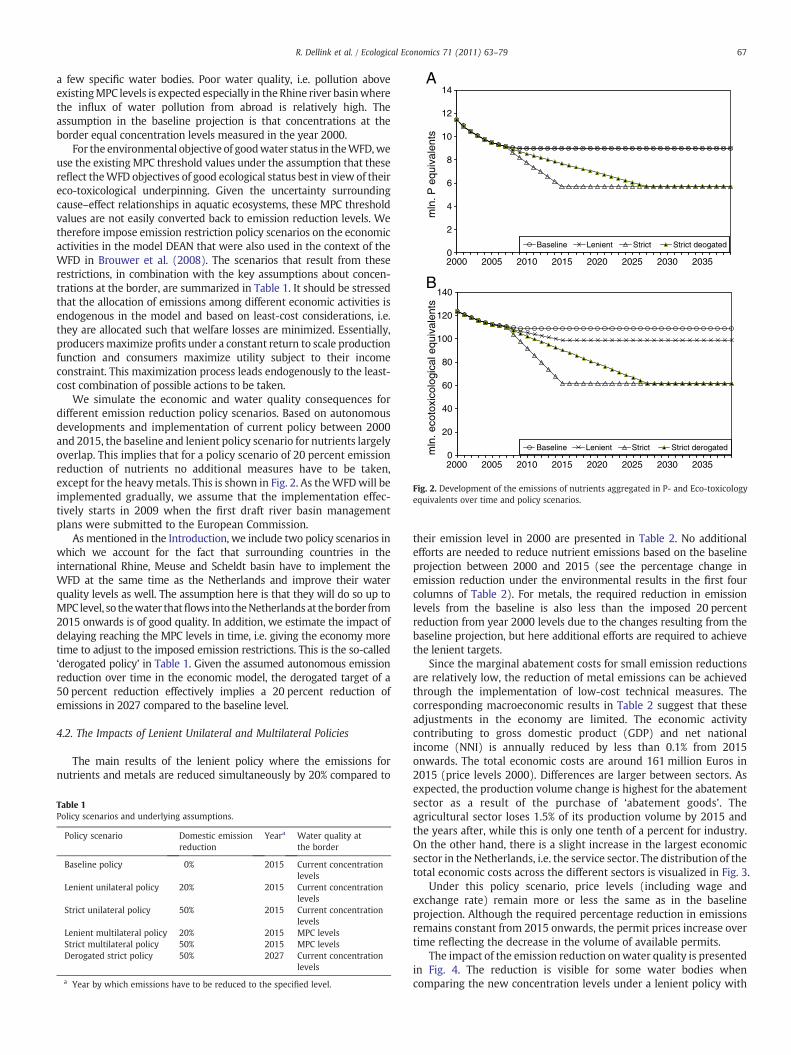
Fig. 2. Development of the emissions of nutrients aggregated in P- and Eco-toxicologyequivalents over time and policy scenarios.
67R. Dellink et al. / Ecological Economics 71 (2011) 63–79
a few specific water bodies. Poor water quality, i.e. pollution aboveexistingMPC levels is expected especially in the Rhine river basinwherethe influx of water pollution from abroad is relatively high. Theassumption in the baseline projection is that concentrations at theborder equal concentration levels measured in the year 2000.
For the environmental objective of goodwater status in theWFD,weuse the existingMPC threshold values under the assumption that thesereflect theWFD objectives of good ecological status best in view of theireco-toxicological underpinning. Given the uncertainty surroundingcause–effect relationships in aquatic ecosystems, these MPC thresholdvalues are not easily converted back to emission reduction levels. Wetherefore impose emission restriction policy scenarios on the economicactivities in the model DEAN that were also used in the context of theWFD in Brouwer et al. (2008). The scenarios that result from theserestrictions, in combination with the key assumptions about concen-trations at the border, are summarized in Table 1. It should be stressedthat the allocation of emissions among different economic activities isendogenous in the model and based on least-cost considerations, i.e.they are allocated such that welfare losses are minimized. Essentially,producersmaximize profits under a constant return to scale productionfunction and consumers maximize utility subject to their incomeconstraint. This maximization process leads endogenously to the least-cost combination of possible actions to be taken.
We simulate the economic and water quality consequences fordifferent emission reduction policy scenarios. Based on autonomousdevelopments and implementation of current policy between 2000and 2015, the baseline and lenient policy scenario for nutrients largelyoverlap. This implies that for a policy scenario of 20 percent emissionreduction of nutrients no additional measures have to be taken,except for the heavymetals. This is shown in Fig. 2. As theWFDwill beimplemented gradually, we assume that the implementation effec-tively starts in 2009 when the first draft river basin managementplans were submitted to the European Commission.
As mentioned in the Introduction, we include two policy scenarios inwhich we account for the fact that surrounding countries in theinternational Rhine, Meuse and Scheldt basin have to implement theWFD at the same time as the Netherlands and improve their waterquality levels as well. The assumption here is that they will do so up toMPC level, so thewater thatflows into theNetherlands at theborder from2015 onwards is of good quality. In addition, we estimate the impact ofdelaying reaching the MPC levels in time, i.e. giving the economy moretime to adjust to the imposed emission restrictions. This is the so-called‘derogated policy’ in Table 1. Given the assumed autonomous emissionreduction over time in the economic model, the derogated target of a50 percent reduction effectively implies a 20 percent reduction ofemissions in 2027 compared to the baseline level.
4.2. The Impacts of Lenient Unilateral and Multilateral Policies
The main results of the lenient policy where the emissions fornutrients and metals are reduced simultaneously by 20% compared to
Table 1Policy scenarios and underlying assumptions.
Policy scenario Domestic emissionreduction
Yeara Water quality atthe border
Baseline policy 0% 2015 Current concentrationlevels
Lenient unilateral policy 20% 2015 Current concentrationlevels
Strict unilateral policy 50% 2015 Current concentrationlevels
Lenient multilateral policy 20% 2015 MPC levelsStrict multilateral policy 50% 2015 MPC levelsDerogated strict policy 50% 2027 Current concentration
levels
a Year by which emissions have to be reduced to the specified level.
their emission level in 2000 are presented in Table 2. No additionalefforts are needed to reduce nutrient emissions based on the baselineprojection between 2000 and 2015 (see the percentage change inemission reduction under the environmental results in the first fourcolumns of Table 2). For metals, the required reduction in emissionlevels from the baseline is also less than the imposed 20 percentreduction from year 2000 levels due to the changes resulting from thebaseline projection, but here additional efforts are required to achievethe lenient targets.
Since the marginal abatement costs for small emission reductionsare relatively low, the reduction of metal emissions can be achievedthrough the implementation of low-cost technical measures. Thecorresponding macroeconomic results in Table 2 suggest that theseadjustments in the economy are limited. The economic activitycontributing to gross domestic product (GDP) and net nationalincome (NNI) is annually reduced by less than 0.1% from 2015onwards. The total economic costs are around 161 million Euros in2015 (price levels 2000). Differences are larger between sectors. Asexpected, the production volume change is highest for the abatementsector as a result of the purchase of ‘abatement goods’. Theagricultural sector loses 1.5% of its production volume by 2015 andthe years after, while this is only one tenth of a percent for industry.On the other hand, there is a slight increase in the largest economicsector in the Netherlands, i.e. the service sector. The distribution of thetotal economic costs across the different sectors is visualized in Fig. 3.
Under this policy scenario, price levels (including wage andexchange rate) remain more or less the same as in the baselineprojection. Although the required percentage reduction in emissionsremains constant from 2015 onwards, the permit prices increase overtime reflecting the decrease in the volume of available permits.
The impact of the emission reduction onwater quality is presentedin Fig. 4. The reduction is visible for some water bodies whencomparing the new concentration levels under a lenient policy with
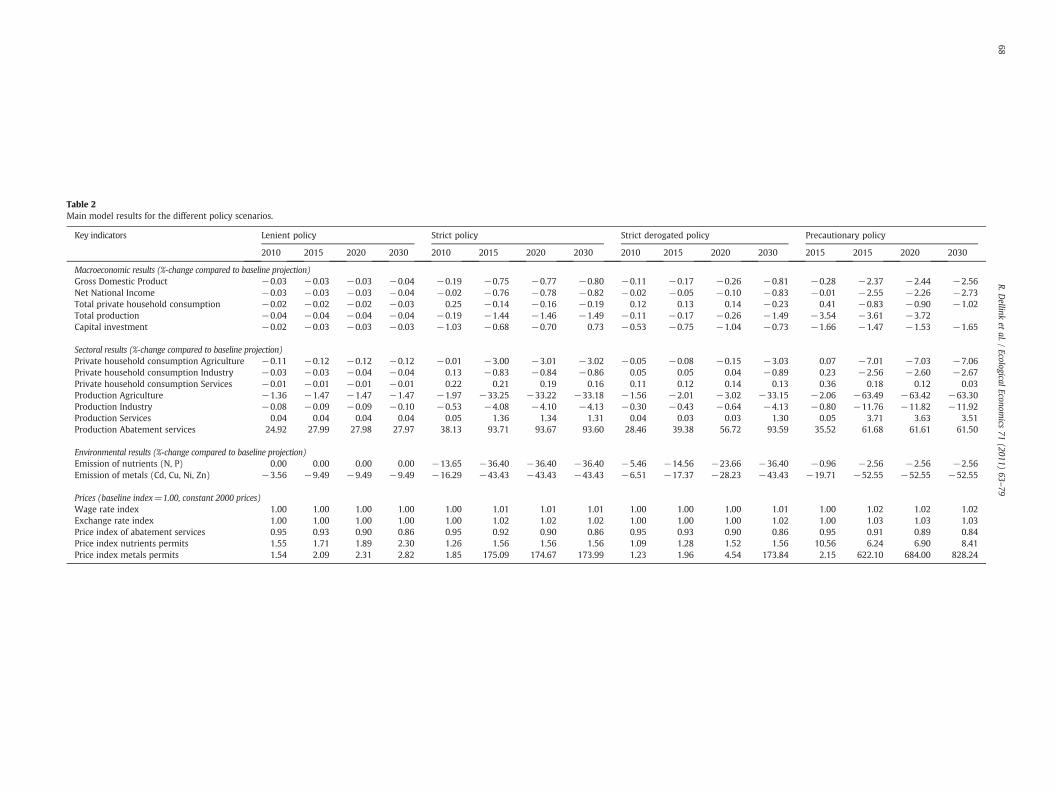
Table 2Main model results for the different policy scenarios.
Key indicators Lenient policy Strict policy Strict derogated policy Precautionary policy
2010 2015 2020 2030 2010 2015 2020 2030 2010 2015 2020 2030 2015 2015 2020 2030
Macroeconomic results (%-change compared to baseline projection)Gross Domestic Product −0.03 −0.03 −0.03 −0.04 −0.19 −0.75 −0.77 −0.80 −0.11 −0.17 −0.26 −0.81 −0.28 −2.37 −2.44 −2.56Net National Income −0.03 −0.03 −0.03 −0.04 −0.02 −0.76 −0.78 −0.82 −0.02 −0.05 −0.10 −0.83 −0.01 −2.55 −2.26 −2.73Total private household consumption −0.02 −0.02 −0.02 −0.03 0.25 −0.14 −0.16 −0.19 0.12 0.13 0.14 −0.23 0.41 −0.83 −0.90 −1.02Total production −0.04 −0.04 −0.04 −0.04 −0.19 −1.44 −1.46 −1.49 −0.11 −0.17 −0.26 −1.49 −3.54 −3.61 −3.72Capital investment −0.02 −0.03 −0.03 −0.03 −1.03 −0.68 −0.70 0.73 −0.53 −0.75 −1.04 −0.73 −1.66 −1.47 −1.53 −1.65
Sectoral results (%-change compared to baseline projection)Private household consumption Agriculture −0.11 −0.12 −0.12 −0.12 −0.01 −3.00 −3.01 −3.02 −0.05 −0.08 −0.15 −3.03 0.07 −7.01 −7.03 −7.06Private household consumption Industry −0.03 −0.03 −0.04 −0.04 0.13 −0.83 −0.84 −0.86 0.05 0.05 0.04 −0.89 0.23 −2.56 −2.60 −2.67Private household consumption Services −0.01 −0.01 −0.01 −0.01 0.22 0.21 0.19 0.16 0.11 0.12 0.14 0.13 0.36 0.18 0.12 0.03Production Agriculture −1.36 −1.47 −1.47 −1.47 −1.97 −33.25 −33.22 −33.18 −1.56 −2.01 −3.02 −33.15 −2.06 −63.49 −63.42 −63.30Production Industry −0.08 −0.09 −0.09 −0.10 −0.53 −4.08 −4.10 −4.13 −0.30 −0.43 −0.64 −4.13 −0.80 −11.76 −11.82 −11.92Production Services 0.04 0.04 0.04 0.04 0.05 1.36 1.34 1.31 0.04 0.03 0.03 1.30 0.05 3.71 3.63 3.51Production Abatement services 24.92 27.99 27.98 27.97 38.13 93.71 93.67 93.60 28.46 39.38 56.72 93.59 35.52 61.68 61.61 61.50
Environmental results (%-change compared to baseline projection)Emission of nutrients (N, P) 0.00 0.00 0.00 0.00 −13.65 −36.40 −36.40 −36.40 −5.46 −14.56 −23.66 −36.40 −0.96 −2.56 −2.56 −2.56Emission of metals (Cd, Cu, Ni, Zn) −3.56 −9.49 −9.49 −9.49 −16.29 −43.43 −43.43 −43.43 −6.51 −17.37 −28.23 −43.43 −19.71 −52.55 −52.55 −52.55
Prices (baseline index=1.00, constant 2000 prices)Wage rate index 1.00 1.00 1.00 1.00 1.00 1.01 1.01 1.01 1.00 1.00 1.00 1.01 1.00 1.02 1.02 1.02Exchange rate index 1.00 1.00 1.00 1.00 1.00 1.02 1.02 1.02 1.00 1.00 1.00 1.02 1.00 1.03 1.03 1.03Price index of abatement services 0.95 0.93 0.90 0.86 0.95 0.92 0.90 0.86 0.95 0.93 0.90 0.86 0.95 0.91 0.89 0.84Price index nutrients permits 1.55 1.71 1.89 2.30 1.26 1.56 1.56 1.56 1.09 1.28 1.52 1.56 10.56 6.24 6.90 8.41Price index metals permits 1.54 2.09 2.31 2.82 1.85 175.09 174.67 173.99 1.23 1.96 4.54 173.84 2.15 622.10 684.00 828.24
68R.D
ellinket
al./Ecological
Economics
71(2011)
63–79

-1500 -1000 -500 0 500 1000 1500 2000 2500
Agriculture
Oil & gas extraction
Other mining
Food & -products industry
Textiles & related industry
Paper & -board industry
Printing industry
Oil refineries
Chemical industry
Rubber & plastics industry
Basic metals industry
Metal products industry
Machine industry
Electromechanical industry
Transport eq. industry
Other industries
Energy distribution
Water distribution
Construction
Trade & related services
Transport by land
Transport by water
Transport by air
Transport services
Commercial services
Non-commercial services
Other goods & services
%-change compared to benchmark
Lenient
Strict
Fig. 3. Estimated costs and benefits across sectors under a lenient and strict water quality policy.
69R. Dellink et al. / Ecological Economics 71 (2011) 63–79
the baseline projections for 2015 in Fig. 2. However, it remainsuncertain whether the emission reduction of 20% for both nutrientsand metals compared to 2000 is sufficient to meet the water qualitytargets in 2015. In most cases the improvements in individual waterquality components are insufficient to induce a significant change inoverall water quality levels. Hence, the lenient domestic policy doesnot seem stringent enough to meet the MPC water quality objectives.
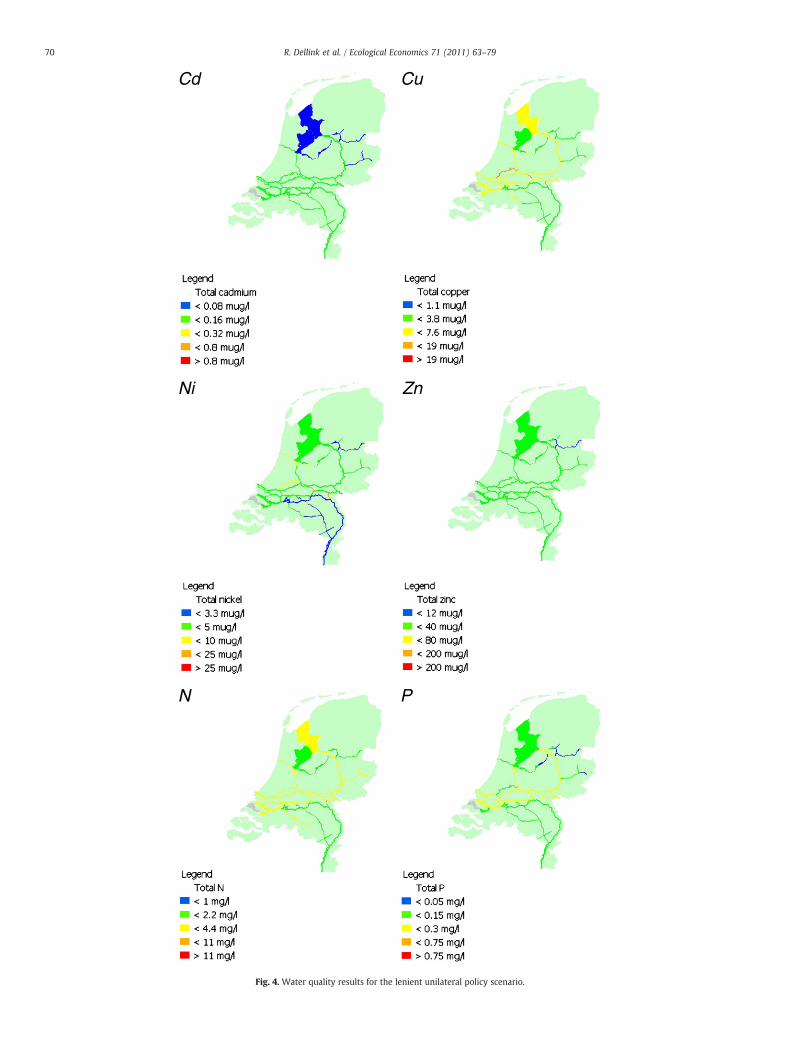
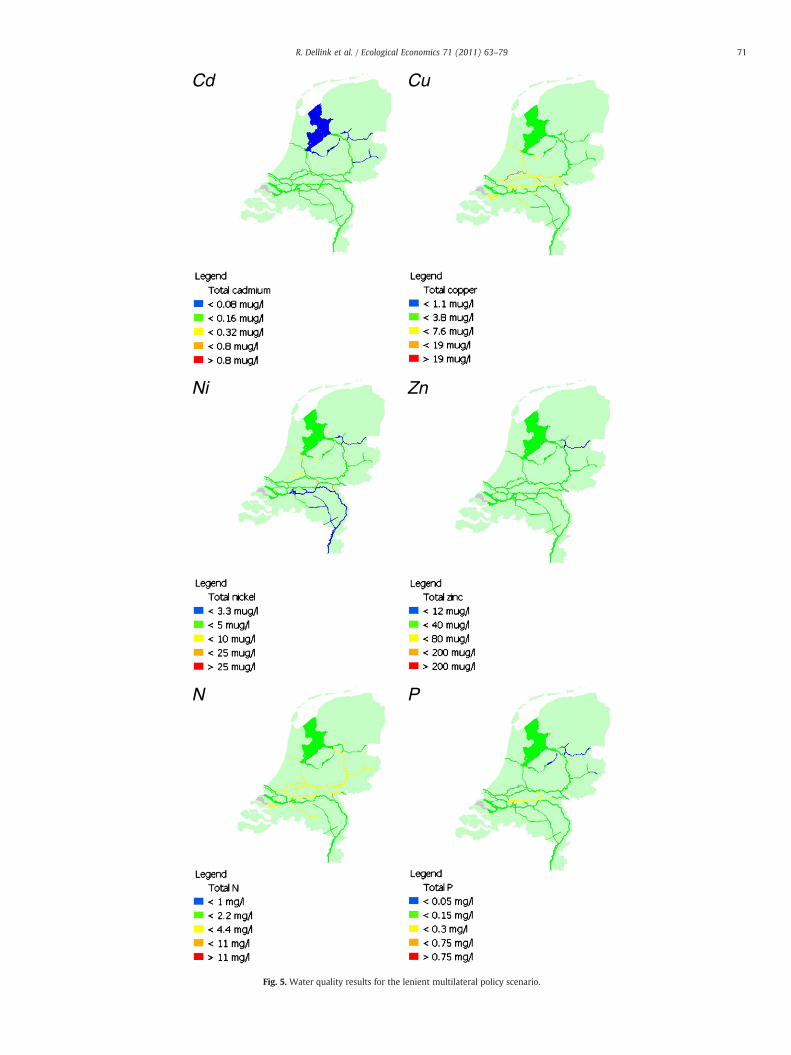
If surrounding countries also improve water quality levels up toMPC levels for all pollutants, this will further improve the waterquality status by 2015. This lenient multilateral scenario is presentedin Fig. 5. The change in water quality status clearly shows howdependent The Netherlands is on the quality of the external inflow.Nonetheless, problems remain in certain water bodies especially fornitrogen, copper and nickel.6
4.3. The Impacts of Strict Unilateral and Multilateral Policies
Table 2 also shows the key results for the more stringent andambitious policy aiming to reduce emission levels by 2015 with 50%compared to emission levels in 2000. For both nutrients and thedispersion ofmetals towater emissionshave to be reduced substantially
6 New research is ongoing developing a wider transboundary river basin approachto analyze optimal pollution control.
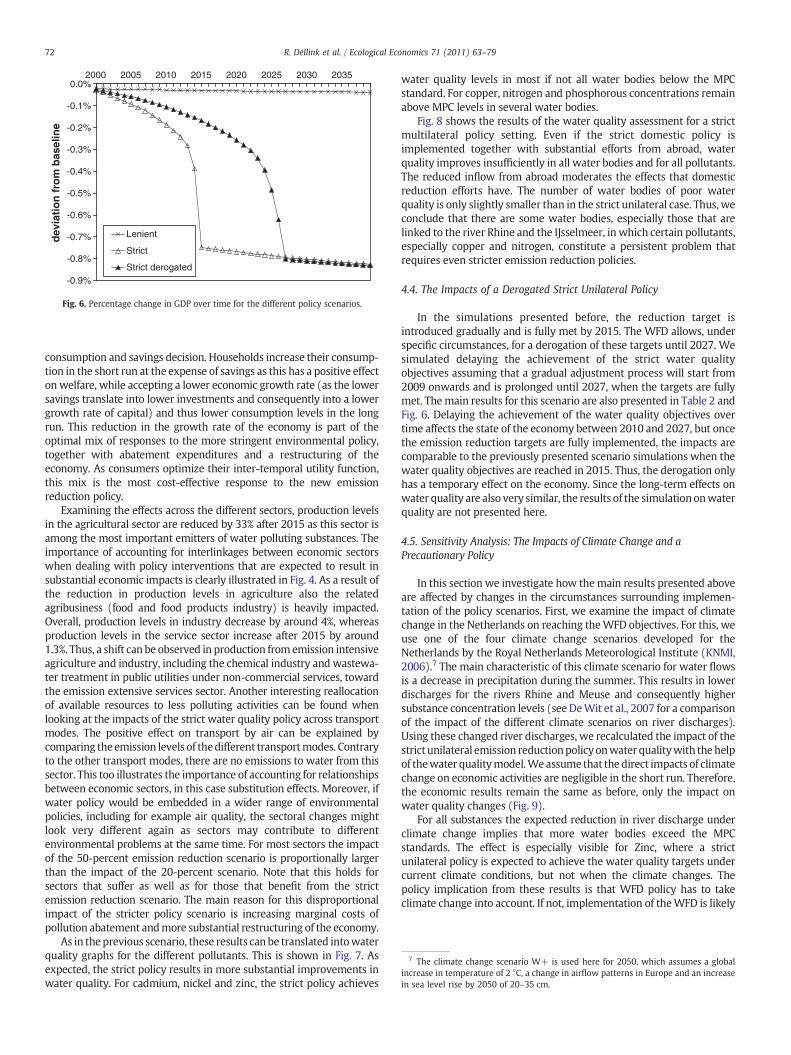
below baseline projection levels from 2015 onwards (by 36 and 43%respectively). As the ambition level of the policy increases, the macro-economic impacts become more visible too: GDP and NNI levelsdecrease from 2015 onwards by almost 1%. In the short run, theeconomic growth rate is reduced below the baseline level of 2%annually. The effect is strongest in 2015when thegrowth rate is reducedto 1.6%. After 2015 the adjustmentprocess stabilizes and thegrowth ratereturns to 2% annually as assumed in the baseline projection. However,the level of GDP and NNI is permanently lower. The decrease in GDP forthe policy scenarios is visualized in Fig. 6.
Fig. 6 shows that limited emission reduction targets can be met atrelatively low economy-wide costs, but the total economic costs ofwater quality improvements increasemore than proportionately as thepolicy becomes more stringent. First the cheapest pollution abatementoptions are implemented, but further reductions can only be realizedthrough more costly adjustments. The costs of this economic adjust-ment increase more than proportionate as consumers prefer to stay asclose as possible to their original consumption bundles. This stimulatesproduction in the abatement service sector. Note thatmost of the resultsfor the years 2020 and 2030 are similar to the results for the year 2015due to the fact that theAGEmodel assumes a balanced growthpath. As aconsequence, also the emissions stabilize after the water qualityobjectives are reached in 2015.
Aggregate production levels are also reduced, but the reduction inconsumption is limited, mainly due to lower savings. This suggests thatin the short run, consumers anticipate the policy by changing their
Cd Cu
Ni Zn
N P
Fig. 4. Water quality results for the lenient unilateral policy scenario.
70 R. Dellink et al. / Ecological Economics 71 (2011) 63–79
Cd Cu
Ni Zn
N P
Fig. 5. Water quality results for the lenient multilateral policy scenario.
71R. Dellink et al. / Ecological Economics 71 (2011) 63–79
-0.9%
-0.8%
-0.7%
-0.6%
-0.5%
-0.4%
-0.3%
-0.2%
-0.1%
0.0%2000 2005 2010 2015 2020 2025 2030 2035
dev
iati
on
fro
m b
asel
ine
Lenient
Strict
Strict derogated
Fig. 6. Percentage change in GDP over time for the different policy scenarios.
7 The climate change scenario W+ is used here for 2050, which assumes a globalincrease in temperature of 2 °C, a change in airflow patterns in Europe and an increasein sea level rise by 2050 of 20–35 cm.
72 R. Dellink et al. / Ecological Economics 71 (2011) 63–79
consumption and savings decision. Households increase their consump-tion in the short run at the expense of savings as this has a positive effectonwelfare, while accepting a lower economic growth rate (as the lowersavings translate into lower investments and consequently into a lowergrowth rate of capital) and thus lower consumption levels in the longrun. This reduction in the growth rate of the economy is part of theoptimal mix of responses to the more stringent environmental policy,together with abatement expenditures and a restructuring of theeconomy. As consumers optimize their inter-temporal utility function,this mix is the most cost-effective response to the new emissionreduction policy.
Examining the effects across the different sectors, production levelsin the agricultural sector are reduced by 33% after 2015 as this sector isamong the most important emitters of water polluting substances. Theimportance of accounting for interlinkages between economic sectorswhen dealing with policy interventions that are expected to result insubstantial economic impacts is clearly illustrated in Fig. 4. As a result ofthe reduction in production levels in agriculture also the relatedagribusiness (food and food products industry) is heavily impacted.Overall, production levels in industry decrease by around 4%, whereasproduction levels in the service sector increase after 2015 by around1.3%. Thus, a shift can be observed in production fromemission intensiveagriculture and industry, including the chemical industry and wastewa-ter treatment in public utilities under non-commercial services, towardthe emission extensive services sector. Another interesting reallocationof available resources to less polluting activities can be found whenlooking at the impacts of the strict water quality policy across transportmodes. The positive effect on transport by air can be explained bycomparing theemission levels of thedifferent transportmodes. Contraryto the other transport modes, there are no emissions to water from thissector. This too illustrates the importance of accounting for relationshipsbetween economic sectors, in this case substitution effects. Moreover, ifwater policy would be embedded in a wider range of environmentalpolicies, including for example air quality, the sectoral changes mightlook very different again as sectors may contribute to differentenvironmental problems at the same time. For most sectors the impactof the 50-percent emission reduction scenario is proportionally largerthan the impact of the 20-percent scenario. Note that this holds forsectors that suffer as well as for those that benefit from the strictemission reduction scenario. The main reason for this disproportionalimpact of the stricter policy scenario is increasing marginal costs ofpollution abatement andmore substantial restructuring of the economy.
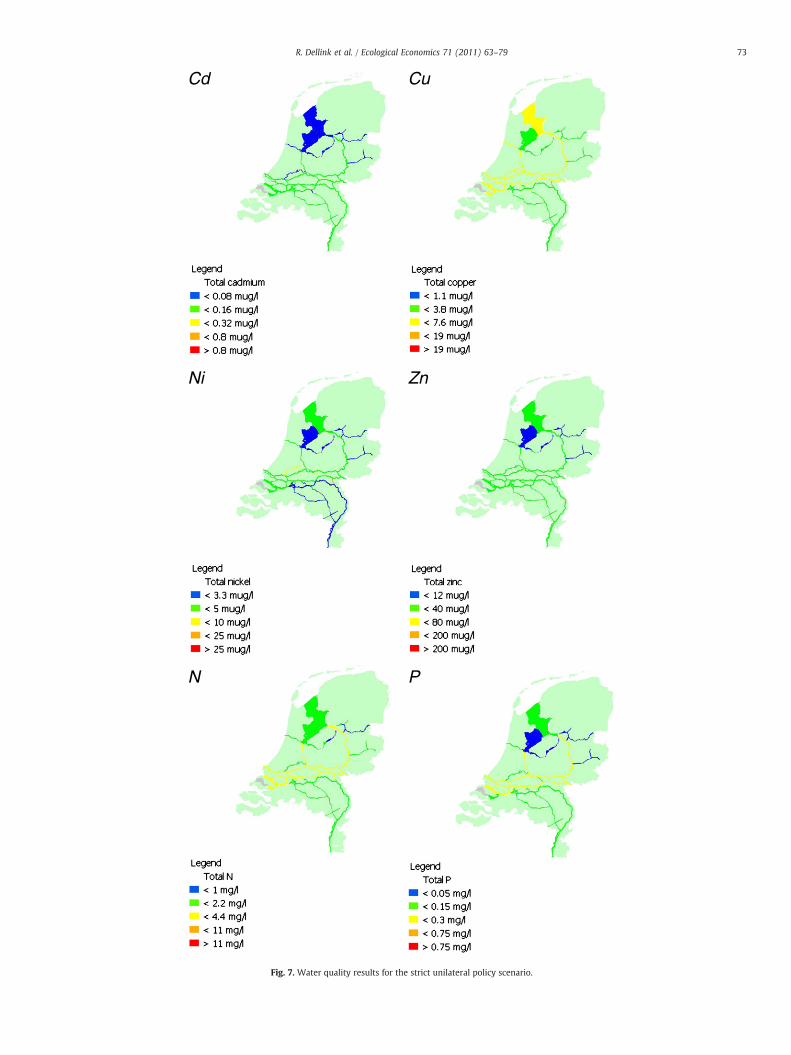
As in the previous scenario, these results can be translated intowaterquality graphs for the different pollutants. This is shown in Fig. 7. Asexpected, the strict policy results in more substantial improvements inwater quality. For cadmium, nickel and zinc, the strict policy achieves
water quality levels in most if not all water bodies below the MPCstandard. For copper, nitrogen and phosphorous concentrations remainabove MPC levels in several water bodies.
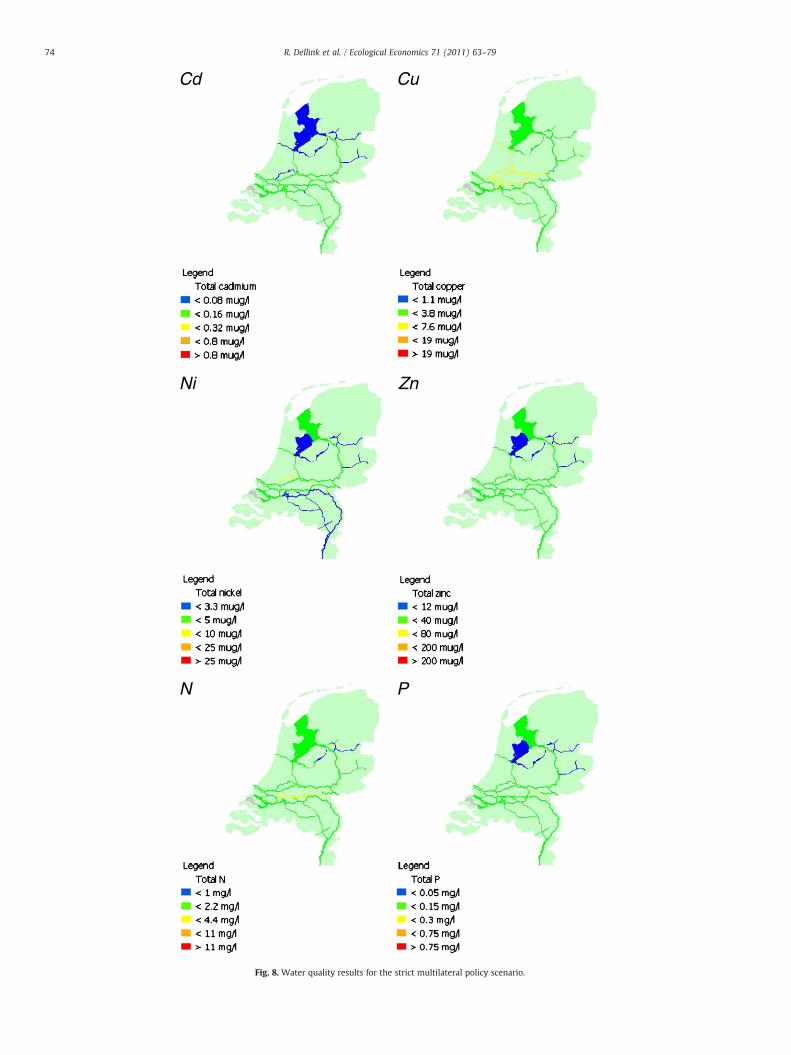
Fig. 8 shows the results of the water quality assessment for a strictmultilateral policy setting. Even if the strict domestic policy isimplemented together with substantial efforts from abroad, waterquality improves insufficiently in all water bodies and for all pollutants.The reduced inflow from abroad moderates the effects that domesticreduction efforts have. The number of water bodies of poor waterquality is only slightly smaller than in the strict unilateral case. Thus, weconclude that there are some water bodies, especially those that arelinked to the river Rhine and the IJsselmeer, in which certain pollutants,especially copper and nitrogen, constitute a persistent problem thatrequires even stricter emission reduction policies.
4.4. The Impacts of a Derogated Strict Unilateral Policy
In the simulations presented before, the reduction target isintroduced gradually and is fully met by 2015. The WFD allows, underspecific circumstances, for a derogation of these targets until 2027. Wesimulated delaying the achievement of the strict water qualityobjectives assuming that a gradual adjustment process will start from2009 onwards and is prolonged until 2027, when the targets are fullymet. Themain results for this scenario are also presented in Table 2 andFig. 6. Delaying the achievement of the water quality objectives overtime affects the state of the economy between 2010 and 2027, but oncethe emission reduction targets are fully implemented, the impacts arecomparable to the previously presented scenario simulations when thewater quality objectives are reached in 2015. Thus, the derogation onlyhas a temporary effect on the economy. Since the long-term effects onwater quality are also very similar, the results of the simulation onwaterquality are not presented here.
4.5. Sensitivity Analysis: The Impacts of Climate Change and aPrecautionary Policy
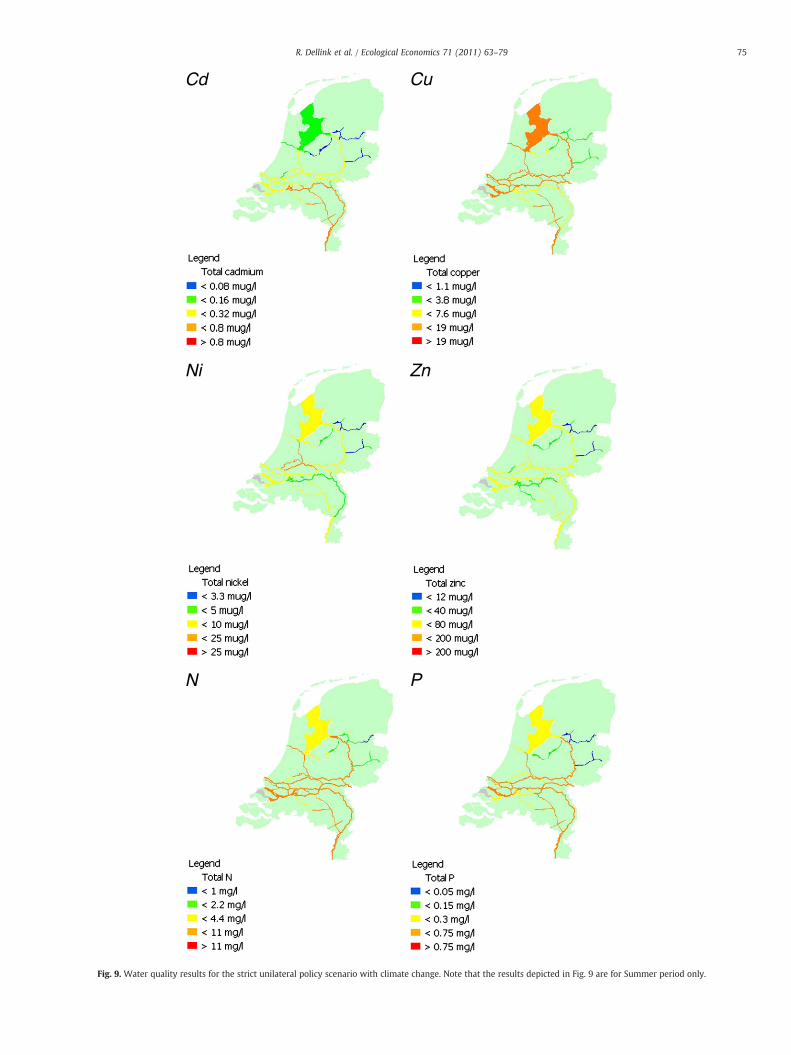
In this section we investigate how themain results presented aboveare affected by changes in the circumstances surrounding implemen-tation of the policy scenarios. First, we examine the impact of climatechange in the Netherlands on reaching theWFD objectives. For this, weuse one of the four climate change scenarios developed for theNetherlands by the Royal Netherlands Meteorological Institute (KNMI,2006).7 The main characteristic of this climate scenario for water flowsis a decrease in precipitation during the summer. This results in lowerdischarges for the rivers Rhine and Meuse and consequently highersubstance concentration levels (see DeWit et al., 2007 for a comparisonof the impact of the different climate scenarios on river discharges).Using these changed river discharges, we recalculated the impact of thestrict unilateral emission reductionpolicyonwater qualitywith thehelpof thewater qualitymodel.We assume that thedirect impacts of climatechange on economic activities are negligible in the short run. Therefore,the economic results remain the same as before, only the impact onwater quality changes (Fig. 9).
For all substances the expected reduction in river discharge underclimate change implies that more water bodies exceed the MPCstandards. The effect is especially visible for Zinc, where a strictunilateral policy is expected to achieve the water quality targets undercurrent climate conditions, but not when the climate changes. Thepolicy implication from these results is that WFD policy has to takeclimate change into account. If not, implementation of theWFD is likely
Cd Cu
Ni Zn
N P
Fig. 7. Water quality results for the strict unilateral policy scenario.
73R. Dellink et al. / Ecological Economics 71 (2011) 63–79
Cd Cu
Ni Zn
N P
Fig. 8. Water quality results for the strict multilateral policy scenario.
74 R. Dellink et al. / Ecological Economics 71 (2011) 63–79
Cd Cu
Ni Zn
N P
Fig. 9. Water quality results for the strict unilateral policy scenario with climate change. Note that the results depicted in Fig. 9 are for Summer period only.
75R. Dellink et al. / Ecological Economics 71 (2011) 63–79
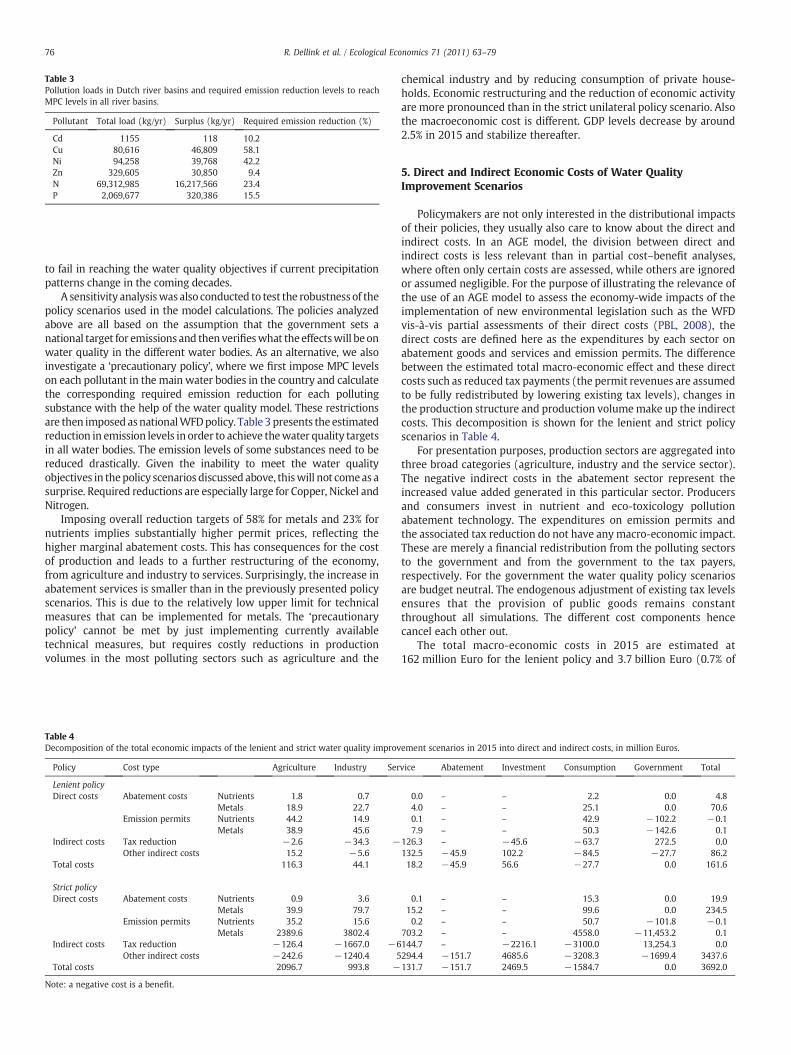
Table 3Pollution loads in Dutch river basins and required emission reduction levels to reachMPC levels in all river basins.
Pollutant Total load (kg/yr) Surplus (kg/yr) Required emission reduction (%)
Cd 1155 118 10.2Cu 80,616 46,809 58.1Ni 94,258 39,768 42.2Zn 329,605 30,850 9.4N 69,312,985 16,217,566 23.4P 2,069,677 320,386 15.5
76 R. Dellink et al. / Ecological Economics 71 (2011) 63–79
to fail in reaching the water quality objectives if current precipitationpatterns change in the coming decades.
A sensitivity analysiswas also conducted to test the robustness of thepolicy scenarios used in the model calculations. The policies analyzedabove are all based on the assumption that the government sets anational target for emissions and thenverifieswhat the effectswill beonwater quality in the different water bodies. As an alternative, we alsoinvestigate a ‘precautionary policy’, where we first impose MPC levelson each pollutant in the main water bodies in the country and calculatethe corresponding required emission reduction for each pollutingsubstance with the help of the water quality model. These restrictionsare then imposed asnationalWFDpolicy. Table 3 presents the estimatedreduction in emission levels in order to achieve thewater quality targetsin all water bodies. The emission levels of some substances need to bereduced drastically. Given the inability to meet the water qualityobjectives in thepolicy scenarios discussed above, thiswill not comeas asurprise. Required reductions are especially large for Copper, Nickel andNitrogen.
Imposing overall reduction targets of 58% for metals and 23% fornutrients implies substantially higher permit prices, reflecting thehigher marginal abatement costs. This has consequences for the costof production and leads to a further restructuring of the economy,from agriculture and industry to services. Surprisingly, the increase inabatement services is smaller than in the previously presented policyscenarios. This is due to the relatively low upper limit for technicalmeasures that can be implemented for metals. The ‘precautionarypolicy’ cannot be met by just implementing currently availabletechnical measures, but requires costly reductions in productionvolumes in the most polluting sectors such as agriculture and the
Table 4Decomposition of the total economic impacts of the lenient and strict water quality improv
Policy Cost type Agriculture Industry Ser
Lenient policyDirect costs Abatement costs Nutrients 1.8 0.7
Metals 18.9 22.7Emission permits Nutrients 44.2 14.9
Metals 38.9 45.6Indirect costs Tax reduction −2.6 −34.3 −
Other indirect costs 15.2 −5.6Total costs 116.3 44.1
Strict policyDirect costs Abatement costs Nutrients 0.9 3.6
Metals 39.9 79.7Emission permits Nutrients 35.2 15.6
Metals 2389.6 3802.4Indirect costs Tax reduction −126.4 −1667.0 −6
Other indirect costs −242.6 −1240.4 5Total costs 2096.7 993.8 −
Note: a negative cost is a benefit.
chemical industry and by reducing consumption of private house-holds. Economic restructuring and the reduction of economic activityare more pronounced than in the strict unilateral policy scenario. Alsothe macroeconomic cost is different. GDP levels decrease by around2.5% in 2015 and stabilize thereafter.
5. Direct and Indirect Economic Costs of Water QualityImprovement Scenarios
Policymakers are not only interested in the distributional impactsof their policies, they usually also care to know about the direct andindirect costs. In an AGE model, the division between direct andindirect costs is less relevant than in partial cost–benefit analyses,where often only certain costs are assessed, while others are ignoredor assumed negligible. For the purpose of illustrating the relevance ofthe use of an AGE model to assess the economy-wide impacts of theimplementation of new environmental legislation such as the WFDvis-à-vis partial assessments of their direct costs (PBL, 2008), thedirect costs are defined here as the expenditures by each sector onabatement goods and services and emission permits. The differencebetween the estimated total macro-economic effect and these directcosts such as reduced tax payments (the permit revenues are assumedto be fully redistributed by lowering existing tax levels), changes inthe production structure and production volumemake up the indirectcosts. This decomposition is shown for the lenient and strict policyscenarios in Table 4.
For presentation purposes, production sectors are aggregated intothree broad categories (agriculture, industry and the service sector).The negative indirect costs in the abatement sector represent theincreased value added generated in this particular sector. Producersand consumers invest in nutrient and eco-toxicology pollutionabatement technology. The expenditures on emission permits andthe associated tax reduction do not have anymacro-economic impact.These are merely a financial redistribution from the polluting sectorsto the government and from the government to the tax payers,respectively. For the government the water quality policy scenariosare budget neutral. The endogenous adjustment of existing tax levelsensures that the provision of public goods remains constantthroughout all simulations. The different cost components hencecancel each other out.
The total macro-economic costs in 2015 are estimated at162 million Euro for the lenient policy and 3.7 billion Euro (0.7% of
ement scenarios in 2015 into direct and indirect costs, in million Euros.
vice Abatement Investment Consumption Government Total
0.0 – – 2.2 0.0 4.84.0 – – 25.1 0.0 70.60.1 – – 42.9 −102.2 −0.17.9 – – 50.3 −142.6 0.1
126.3 – −45.6 −63.7 272.5 0.0132.5 −45.9 102.2 −84.5 −27.7 86.218.2 −45.9 56.6 −27.7 0.0 161.6
0.1 – – 15.3 0.0 19.915.2 – – 99.6 0.0 234.50.2 – – 50.7 −101.8 −0.1
703.2 – – 4558.0 −11,453.2 0.1144.7 – −2216.1 −3100.0 13,254.3 0.0294.4 −151.7 4685.6 −3208.3 −1699.4 3437.6131.7 −151.7 2469.5 −1584.7 0.0 3692.0

77R. Dellink et al. / Ecological Economics 71 (2011) 63–79
GDP) for the strict policy. A remarkable finding is that at the macro-economic level the share of the indirect costs is at least as high as thedirect costs (53% in the lenient policy scenario) and increasesexponentially when moving from a lenient to a strict water policy(93% in the strict policy scenario). This can partially be explained bythe fact that emissions of the pollutants examined here areconcentrated in a relatively few sectors. Hence, rather than investinglarge amounts in abatement technology, especially under the strictemission reduction scenario, it may be less costly to accept lowerproduction levels in these few sectors, especially agriculture, andreduce emissions in that way.8
The direct sectoral costs reflect the shares of the different sectors inemissions. The higher the emission level, the more a sector needs tospend on pollution abatement and buying emission permits. Asindustry is a much larger sector than agriculture, the largest absolutecosts are borne by industry. However, the relative burden onagriculture is much higher. The sectoral indirect costs, without thetax reduction, are negative for agriculture and industry under a strictpolicy, and positive for the services sector. This reflects the tendencythat the optimal response to changes as a result of government policycontains a moderating mechanism to avoid extreme effects. Thisserves to smoothen economic adjustments and minimize the impactsof the policy on consumption patterns. Investment levels decreaseand hence the value added generated from investment. This amountsto indirect costs of almost 2.5 billion Euros. However, this effect isoffset by a tax reduction.
At the level of individual sectors, the effects are more pronounced,especially under the strict policy. As mentioned, the food and food-products industry suffers from the higher costs of agriculturalproduction and this causes substantial indirect costs in this industry(almost 1.5 billion Euro). Substantial indirect costs are also borne bythe non-commercial services under the strict scenario as thesubstitution possibilities between production inputs in this sectorare much more limited than in other sectors due to the specific natureof many of the services produced by this sector. Hence, this sectorcannot respond as flexible to changes in relative prices as othersectors.
Finally, the impacts on consumers are several. First of all,households have to invest in abatement technology and buy emissionpermits in view of the fact that they too contribute substantially to theemission of water polluting substances. Together, these direct costsfalling upon consumers account for 4.7 billion Euro. Secondly,households benefit from lower taxes, especially the lower valueadded tax (more than 3 billion Euro). Adjusting their consumptionpattern as a response to the change in relative prices of consumergoods increases in addition their income with more than 3 billionEuro. In total, private households gain under the strict policy scenariobecause of these effects around 1.6 billion Euro (28 million Euro underthe lenient policy).
6. Discussion and Conclusions
In this paper, an integrated bio-economic model is presented,which has been developed to simultaneously assess the consequencesof water quality improvement policy as foreseen for example in theEuropeanWFD on the economy and ecological status of themain riverbasins in the Netherlands. The novelty of the model presented here isfound in the coupling of emission levels related to economic activities
8 Note that the CGE framework assumes that production factors that becomeavailable by reducing production in one sector will be employed in other sectors. Themacro-economic costs consist of the net effect of lower value added in dirty sectorsand higher value added in other cleaner sectors.
in a dynamic economic computable general equilibrium model to anexisting national water quality model. This link to water qualitymodeling is missing in many existing modeling frameworks andallows for an integrated evaluation of different water policy scenariosin terms of their impact on existing water quality standards acrossdifferent river basins and their direct and indirect economic costs andbenefits at macro level. The existing standards are based on eco-toxicological understanding of the risks of adding specific pollutantssuch as nutrients and metals to aquatic ecosystems. The mostimportant advantage of the modular approach used here is that theimpacts on the economy and water quality are evaluated simulta-neously, but each within their own domain based on the appropriatescale and level of detail. The dynamic nature of the economic modelallows us to evaluate the flow of costs and benefits of water qualityimprovements in time and also assess a derogated water policy asforeseen in the WFD. This means that meeting the water qualityobjectives is delayed in time, by 2027 for instance instead of 2015. Weshow that the derogation only has a temporary effect on the state ofthe economy between 2010 and 2027, but once the emissionreduction targets are fully implemented, the impacts are comparableto the scenario simulations when the water quality objectives arereached in 2015.
At low emission reduction levels, economic agents have theopportunity to adjust to the new circumstances at relatively low costs,investing in low-cost pollution abatement technology. The impact of alenient policy on water quality is, however, also very limited. Amultilateral policy, where water quality flowing into the country atthe border is improved in surrounding river basin countries to respectDutch national water quality standards, helps to solve water qualityproblems in the Dutch river basins, but is insufficient to meet themaximum permissible concentration levels of all pollutants in allbasins. The most important problems are found in the Rhine riverbasin and related to the polluting substances copper, nickel andnitrogen.
Therefore, stricter water quality policies are required. We showthat the stricter the policy scenario, the more important the role ofeconomic adjustment and restructuring mechanisms at the macro-economic level, and hence the need for appropriate macro-economicmodels like the one presented in this paper. The indirect costs ofdifferent water quality improvement policy scenarios are at least ashigh as the direct costs related to investments in pollution abatementtechnology, and potentially much higher. An optimal mix arises fromthe trade-off between the implementation of technical measures, arestructuring of the economy and a temporary slowdown of economicgrowth, such as increasing short-term consumption at the expense ofsavings. Especially emission intensive sectors such as agriculture anda number of industrial sectors suffer from more stringent emissionreduction scenarios. On the other hand, other sectors benefit fromsuch more stringent emission reduction policies due to a reallocationof resources and substitution effects. A strict policy, either imple-mented unilaterally or multilaterally, will improve water quality formost pollutants and most water bodies, but even the strictmultilateral scenario (a 50% reduction in total domestic emissionlevels and an inflow from abroad that does not exceed existing waterquality standards) will not resolve all water pollution problems in theNetherlands. A precautionary scenario based on an estimation of thenecessary emission reduction of substances to adhere to the existingmaximum permissible concentration levels for all pollutants in allbasins implies much higher economic costs. This is partly due tolimited possibilities to implement metal emission abatement tech-nology and the costly restructuring of economic activities required toachieve the water quality standards. Derogation of reaching the targetby 2027 may lead to smaller economic effects in the short term, butare likely to only postpone the economic and water quality impacts ofsuch a derogated policy. A preliminary analysis of the impact ofclimate change in these scenarios furthermore reveals that reaching
78 R. Dellink et al. / Ecological Economics 71 (2011) 63–79
the WFD objectives is likely to become even more difficult in thelonger run. Climate change is expected to result in lower riverdischarges and higher pollution concentration levels.
There are some obvious areas for improvement of the presentedmodeling framework. Most importantly, the feedback relationshipbetween water quality levels, emission levels and the level ofeconomic activities is currently still weak or even missing. Theeconomic consequences of improved quality of the water flowing intothe country are twofold. First, they may affect water purificationefforts and hence result in cost savings in water intense sectors suchas the drinking water sector and the food processing industry. Thesefeedback mechanisms and relationships are currently not yet part ofthe economic model used in this study. Second, additional efforts toimprove water quality abroad may reduce the necessary domesticefforts to reduce emission levels and are therefore likely to reduce thedomestic economic costs of reaching the water quality objectives.However, in order to be able to assess how much emission levelswould still have to be reduced to reach the water quality objectivesunder these circumstances would require a location specific analysis,
Fig. A1. Water bodies identifi
linking water quality status for each individual water body to specificeconomic activities and their emission levels. It is also not possible yetto estimate the reduction in economic costs (cost savings) of pollutionabatement measures when water quality at the borders flowing intothe country reaches MPC levels. Ideally, both the economic costsabroad and the cost savings in the Netherlands are estimated in orderto estimate the least cost way of reaching the water quality objectivesin a transboundary river basin context. Work on such an internationalriver basin model is underway.
Acknowledgments
The work presented in this paper was part of the project WaterEconomic Modeling for Policy Analysis (WEMPA) coordinated by theInstitute for Environmental Studies, VU University Amsterdam andco-funded by the Directorate-General Water of the Dutch Ministry ofTransport, Public Works and Water Management and the DutchKnowledge Network Living with Water.
Annex
ed in the WFD Explorer.
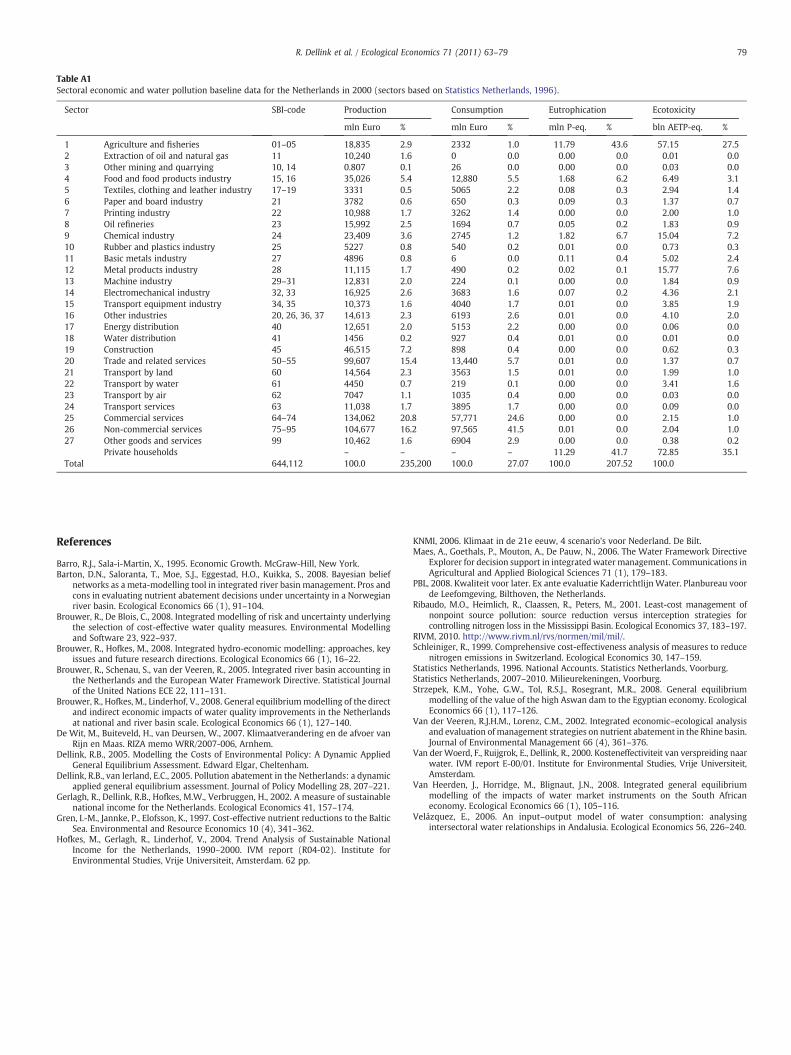
Table A1Sectoral economic and water pollution baseline data for the Netherlands in 2000 (sectors based on Statistics Netherlands, 1996).
Sector SBI-code Production Consumption Eutrophication Ecotoxicity
mln Euro % mln Euro % mln P-eq. % bln AETP-eq. %
1 Agriculture and fisheries 01–05 18,835 2.9 2332 1.0 11.79 43.6 57.15 27.52 Extraction of oil and natural gas 11 10,240 1.6 0 0.0 0.00 0.0 0.01 0.03 Other mining and quarrying 10, 14 0.807 0.1 26 0.0 0.00 0.0 0.03 0.04 Food and food products industry 15, 16 35,026 5.4 12,880 5.5 1.68 6.2 6.49 3.15 Textiles, clothing and leather industry 17–19 3331 0.5 5065 2.2 0.08 0.3 2.94 1.46 Paper and board industry 21 3782 0.6 650 0.3 0.09 0.3 1.37 0.77 Printing industry 22 10,988 1.7 3262 1.4 0.00 0.0 2.00 1.08 Oil refineries 23 15,992 2.5 1694 0.7 0.05 0.2 1.83 0.99 Chemical industry 24 23,409 3.6 2745 1.2 1.82 6.7 15.04 7.210 Rubber and plastics industry 25 5227 0.8 540 0.2 0.01 0.0 0.73 0.311 Basic metals industry 27 4896 0.8 6 0.0 0.11 0.4 5.02 2.412 Metal products industry 28 11,115 1.7 490 0.2 0.02 0.1 15.77 7.613 Machine industry 29–31 12,831 2.0 224 0.1 0.00 0.0 1.84 0.914 Electromechanical industry 32, 33 16,925 2.6 3683 1.6 0.07 0.2 4.36 2.115 Transport equipment industry 34, 35 10,373 1.6 4040 1.7 0.01 0.0 3.85 1.916 Other industries 20, 26, 36, 37 14,613 2.3 6193 2.6 0.01 0.0 4.10 2.017 Energy distribution 40 12,651 2.0 5153 2.2 0.00 0.0 0.06 0.018 Water distribution 41 1456 0.2 927 0.4 0.01 0.0 0.01 0.019 Construction 45 46,515 7.2 898 0.4 0.00 0.0 0.62 0.320 Trade and related services 50–55 99,607 15.4 13,440 5.7 0.01 0.0 1.37 0.721 Transport by land 60 14,564 2.3 3563 1.5 0.01 0.0 1.99 1.022 Transport by water 61 4450 0.7 219 0.1 0.00 0.0 3.41 1.623 Transport by air 62 7047 1.1 1035 0.4 0.00 0.0 0.03 0.024 Transport services 63 11,038 1.7 3895 1.7 0.00 0.0 0.09 0.025 Commercial services 64–74 134,062 20.8 57,771 24.6 0.00 0.0 2.15 1.026 Non-commercial services 75–95 104,677 16.2 97,565 41.5 0.01 0.0 2.04 1.027 Other goods and services 99 10,462 1.6 6904 2.9 0.00 0.0 0.38 0.2
Private households – – – – 11.29 41.7 72.85 35.1Total 644,112 100.0 235,200 100.0 27.07 100.0 207.52 100.0
79R. Dellink et al. / Ecological Economics 71 (2011) 63–79
References
Barro, R.J., Sala-i-Martin, X., 1995. Economic Growth. McGraw-Hill, New York.Barton, D.N., Saloranta, T., Moe, S.J., Eggestad, H.O., Kuikka, S., 2008. Bayesian belief
networks as a meta-modelling tool in integrated river basin management. Pros andcons in evaluating nutrient abatement decisions under uncertainty in a Norwegianriver basin. Ecological Economics 66 (1), 91–104.
Brouwer, R., De Blois, C., 2008. Integrated modelling of risk and uncertainty underlyingthe selection of cost-effective water quality measures. Environmental Modellingand Software 23, 922–937.
Brouwer, R., Hofkes, M., 2008. Integrated hydro-economic modelling: approaches, keyissues and future research directions. Ecological Economics 66 (1), 16–22.
Brouwer, R., Schenau, S., van der Veeren, R., 2005. Integrated river basin accounting inthe Netherlands and the European Water Framework Directive. Statistical Journalof the United Nations ECE 22, 111–131.
Brouwer, R., Hofkes, M., Linderhof, V., 2008. General equilibriummodelling of the directand indirect economic impacts of water quality improvements in the Netherlandsat national and river basin scale. Ecological Economics 66 (1), 127–140.
De Wit, M., Buiteveld, H., van Deursen, W., 2007. Klimaatverandering en de afvoer vanRijn en Maas. RIZA memo WRR/2007-006, Arnhem.
Dellink, R.B., 2005. Modelling the Costs of Environmental Policy: A Dynamic AppliedGeneral Equilibrium Assessment. Edward Elgar, Cheltenham.
Dellink, R.B., van Ierland, E.C., 2005. Pollution abatement in the Netherlands: a dynamicapplied general equilibrium assessment. Journal of Policy Modelling 28, 207–221.
Gerlagh, R., Dellink, R.B., Hofkes, M.W., Verbruggen, H., 2002. A measure of sustainablenational income for the Netherlands. Ecological Economics 41, 157–174.
Gren, I.-M., Jannke, P., Elofsson, K., 1997. Cost-effective nutrient reductions to the BalticSea. Environmental and Resource Economics 10 (4), 341–362.
Hofkes, M., Gerlagh, R., Linderhof, V., 2004. Trend Analysis of Sustainable NationalIncome for the Netherlands, 1990–2000. IVM report (R04-02). Institute forEnvironmental Studies, Vrije Universiteit, Amsterdam. 62 pp.
KNMI, 2006. Klimaat in de 21e eeuw, 4 scenario's voor Nederland. De Bilt.Maes, A., Goethals, P., Mouton, A., De Pauw, N., 2006. The Water Framework Directive
Explorer for decision support in integratedwater management. Communications inAgricultural and Applied Biological Sciences 71 (1), 179–183.
PBL, 2008. Kwaliteit voor later. Ex ante evaluatie Kaderrichtlijn Water. Planbureau voorde Leefomgeving, Bilthoven, the Netherlands.
Ribaudo, M.O., Heimlich, R., Claassen, R., Peters, M., 2001. Least-cost management ofnonpoint source pollution: source reduction versus interception strategies forcontrolling nitrogen loss in the Mississippi Basin. Ecological Economics 37, 183–197.
RIVM, 2010. http://www.rivm.nl/rvs/normen/mil/mil/.Schleiniger, R., 1999. Comprehensive cost-effectiveness analysis of measures to reduce
nitrogen emissions in Switzerland. Ecological Economics 30, 147–159.Statistics Netherlands, 1996. National Accounts. Statistics Netherlands, Voorburg.Statistics Netherlands, 2007–2010. Milieurekeningen, Voorburg.Strzepek, K.M., Yohe, G.W., Tol, R.S.J., Rosegrant, M.R., 2008. General equilibrium
modelling of the value of the high Aswan dam to the Egyptian economy. EcologicalEconomics 66 (1), 117–126.
Van der Veeren, R.J.H.M., Lorenz, C.M., 2002. Integrated economic–ecological analysisand evaluation ofmanagement strategies on nutrient abatement in the Rhine basin.Journal of Environmental Management 66 (4), 361–376.
Van derWoerd, F., Ruijgrok, E., Dellink, R., 2000. Kosteneffectiviteit van verspreiding naarwater. IVM report E-00/01. Institute for Environmental Studies, Vrije Universiteit,Amsterdam.
Van Heerden, J., Horridge, M., Blignaut, J.N., 2008. Integrated general equilibriummodelling of the impacts of water market instruments on the South Africaneconomy. Ecological Economics 66 (1), 105–116.
Velázquez, E., 2006. An input–output model of water consumption: analysingintersectoral water relationships in Andalusia. Ecological Economics 56, 226–240.