BIM-Based Educational and Facility Management of ... - MDPI
28
applied sciences Article BIM-Based Educational and Facility Management of Large University Venues Rubén Muñoz Pavón 1 , Antonio A. Arcos Alvarez 2 and Marcos G. Alberti 1, * 1 Departamento de Ingeniería Civil, Construcción, E.T.S de Ingenieros de Caminos, Canales y Puertos, Universidad Politécnica de Madrid, 28040 Madrid, Spain; [email protected] 2 Departamento de Ingeniería y Morfología del Terreno, E.T.S de Ingenieros de Caminos, Canales y Puertos, Universidad Politécnica de Madrid, 28040 Madrid, Spain; [email protected] * Correspondence: [email protected]; Tel.: +34-91-0674121 Received: 6 October 2020; Accepted: 4 November 2020; Published: 10 November 2020 Abstract: The aim of this paper was to provide a Building Information Modeling (BIM)-based management system for the Civil Engineering School (ETSICCP) at the Universidad Politécnica de Madrid with a long-term development perspective. A Building Information Modeling (BIM) management system for complex infrastructure facilities demands a detailed 3-Dimensional model according to future management requirements. In this study, the infrastructure of the ETSICCP was modeled on various phases and synchronized with not only external educational information but also with facility management (FM) parameters. The methodology followed in this study ranges from the blank paper to a BIM-based detailed FM system oriented to educational scheduling throughout the infrastructure providing real time information synchronized with spreadsheets and a 3-D model. The result of this paper provides multiples future management lines, like COVID-19 BIM-management or synchronization with local public transports’ applications (mainly metro and bus transport systems), through a public accessible Application Programming Interface (API). The significance of this research relies on the generation of an information and management system, based on a BIM model of a university campus. This project was designed for all the agents involved in its operation, students, lecturers, and managers. All these agents have a level of access appropriate to their needs and functions within the institution. Keywords: building information modeling BIM; BIM infrastructure; BIM data management; facility management; monitoring systems 1. Introduction Building Information Modeling (BIM) is defined as a methodology of collaborative scope able to create an application environment that can host all the disciplines involved in a construction project with a great amount of information either ascribed or applicable to the different project stages, i.e., design, construction and service and maintenance management. Under the concept of BIM multiple definitions are collected, such as the one given by ISO 29481-1:2010, which defines BIM as a digital representation of functionalities and characteristics of every built element. Most common research points BIM to a methodology of collaborative scope that hosts all disciplines and related information pertinent to a project development and the required execution phases. Each execution phase requires different types of information. This information can also be useful in future stages of the infrastructure life, using the BIM model as a tool for efficient management with accurate information [1] or even more considering possible future demolition phases [2,3]. This way, in any episode of the project life, a large amount of information is available due Appl. Sci. 2020, 10, 7976; doi:10.3390/app10227976 www.mdpi.com/journal/applsci
-
Upload
khangminh22 -
Category
Documents
-
view
0 -
download
0
Transcript of BIM-Based Educational and Facility Management of ... - MDPI
applied sciences
Article
BIM-Based Educational and Facility Management ofLarge University Venues
Rubén Muñoz Pavón 1 , Antonio A. Arcos Alvarez 2 and Marcos G. Alberti 1,*1 Departamento de Ingeniería Civil, Construcción, E.T.S de Ingenieros de Caminos, Canales y Puertos,
Universidad Politécnica de Madrid, 28040 Madrid, Spain; [email protected] Departamento de Ingeniería y Morfología del Terreno, E.T.S de Ingenieros de Caminos, Canales y Puertos,
Universidad Politécnica de Madrid, 28040 Madrid, Spain; [email protected]* Correspondence: [email protected]; Tel.: +34-91-0674121
Received: 6 October 2020; Accepted: 4 November 2020; Published: 10 November 2020�����������������
Abstract: The aim of this paper was to provide a Building Information Modeling (BIM)-basedmanagement system for the Civil Engineering School (ETSICCP) at the Universidad Politécnicade Madrid with a long-term development perspective. A Building Information Modeling (BIM)management system for complex infrastructure facilities demands a detailed 3-Dimensional modelaccording to future management requirements. In this study, the infrastructure of the ETSICCP wasmodeled on various phases and synchronized with not only external educational information but alsowith facility management (FM) parameters. The methodology followed in this study ranges fromthe blank paper to a BIM-based detailed FM system oriented to educational scheduling throughoutthe infrastructure providing real time information synchronized with spreadsheets and a 3-D model.The result of this paper provides multiples future management lines, like COVID-19 BIM-managementor synchronization with local public transports’ applications (mainly metro and bus transport systems),through a public accessible Application Programming Interface (API). The significance of this researchrelies on the generation of an information and management system, based on a BIM model of auniversity campus. This project was designed for all the agents involved in its operation, students,lecturers, and managers. All these agents have a level of access appropriate to their needs andfunctions within the institution.
Keywords: building information modeling BIM; BIM infrastructure; BIM data management; facilitymanagement; monitoring systems
1. Introduction
Building Information Modeling (BIM) is defined as a methodology of collaborative scope ableto create an application environment that can host all the disciplines involved in a constructionproject with a great amount of information either ascribed or applicable to the different project stages,i.e., design, construction and service and maintenance management.
Under the concept of BIM multiple definitions are collected, such as the one given by ISO29481-1:2010, which defines BIM as a digital representation of functionalities and characteristics ofevery built element. Most common research points BIM to a methodology of collaborative scopethat hosts all disciplines and related information pertinent to a project development and the requiredexecution phases. Each execution phase requires different types of information. This information canalso be useful in future stages of the infrastructure life, using the BIM model as a tool for efficientmanagement with accurate information [1] or even more considering possible future demolitionphases [2,3]. This way, in any episode of the project life, a large amount of information is available due
Appl. Sci. 2020, 10, 7976; doi:10.3390/app10227976 www.mdpi.com/journal/applsci
Appl. Sci. 2020, 10, 7976 2 of 28
to the inclusion of all disciplines involved, making BIM a way to represent the entire reality of theinfrastructure [3,4] using the BIM model as a central information repository [3,5–8].
BIM requires a constant interaction and, therefore, provides an ensured efficiency between thedifferent branches or disciplines affecting the project, starting with a 2-D environment on manyoccasions, and followed by budget activities, scheduling, management, and future maintenance.
This broad framework covers all phases of the project where BIM is involved. The implementationof new technologies, such as the Internet of Things (IoT), stand out for their relevance, especially interms of management, and have become an attractive alternative to traditional tools.
The use of BIM methodology in all project phases involves several advantages, mainly in theearly detection of project errors or mistakes and comprehension of all disciplines related to the project.The advantages of BIM methodology compared with the traditional workflow is clearly shown in thegraphic presentation of MacLeamy curves [9]. The reference shows that if the error detection occurs inearlier moments of the project, significant correction costs in later stages, or even in the constructionphases, can be saved.
Great improvements have been achieved in BIM methodology for every project phase. The existingskills for the in-service management of the infrastructure have special importance but there are alsoimportant progress steps for the construction stage in which the BIM methodology allows a constantlyupdated model of the construction works to be on hand [10]. However, this application entails constantinteraction with the BIM model and continuous information review. Thus, this process demands detailedscheduling in order to achieve a daily updated BIM model. Similarly, the implementation of technologies,such as IoT, permit monitoring heavy loads or dangerous areas during the construction time and creatingautomatic frameworks for information and communication purposes [11]. Regarding the design stage,one of the most important features is the synthesis of the data ascribed to the infrastructure (BIM) inrelation to the environment data Geographic Information System and Internet of Things (GIS and IoT).The combined information allows a more reliable decision-making by the designer, improving theproject location and properties [12].
Further to these examples, the development of a service management system of the infrastructuremust be highlighted. The application of BIM stands out in hospital infrastructure facilities, airports oruniversity campus [13] for space management. This is because most BIM applications are related tonew infrastructure [3,14–18] instead of already existing buildings [19,20]. However, advanced societyrequirements, such as sustainability, have created a new tendency in implementing BIM for existingbuildings [19–24].
Hence, a BIM-based FM system for complex infrastructure facilities demands a detailed3-Dimensional model according to future management requirements. For this study, the infrastructureof the Civil Engineering School (ETSICCP) at Universidad Politécnica de Madrid (UPM) was modeledin various phases and synchronized with not only external educational information but also with themost important management parameters. Beginning with 2-dimensional Computer-Aided Design(CAD) information as a starting point, the modeling process was divided into two different groupsas a function of the level of information (LOI) required. The LOI of the elements were defined as afunction of the future management needs. This was detailed by means of the BIM Execution Plan(BEP) that was performed at the beginning. Following the main points of ISO 19650 [25,26], a higherLOI was selected for accessible public areas and all classrooms in the building while a lower LOI wasconsidered sufficient for spaces where access is restricted, such as technical laboratories or privateoffices. Once the base model was reached, the implementation of information and synchronizingprocess began. Additionally, the implementation of new technologies, such as IoT, was considered,providing the capacity of issuing in real-time data, Geographical Information Systems (GIS) providingUniversal Transverse Mercator (UTM) coordinates to the model or BIG DATA management databasessupporting the entire flow of BIM information. This process provides a global concept of implementingBIM methodology in already existing buildings with no previous BIM information. Modeling fromzero, considering future management needs, made the modeling and information implementation to
Appl. Sci. 2020, 10, 7976 3 of 28
the model much more complex. However, the most important challenge of this project was to provideaccess to all management members who traditionally work with standard management protocols.
This paper shows the beginning of a long-term development system with near future implementationsof the BIM management system. The study is based on the building of the ETSICCP, opened in 1968,that consists of a total area of 38,970.84 m2, of which 32,631.23 m2 are usable space for more than4000 students that are enrolled in Bachelor’s Degrees, Master’s Degrees, and Doctorate programs.This information shows the magnitude of the school model and the important opportunity ofimplementing the existing advances and the benefits of BIM for the service, teaching, and managementstaff, considering the improvements that can be achieved by the use of the BIM methodology, quitedifferent to the traditional methods. The development of a new BIM-based FM system into thementioned infrastructure, could provide real time information in terms of reservation of classrooms orsports facilities. Moreover, real time parameters, such as occupation or availability of spaces, are quiteinteresting for management staff of the building. Future systems to combat COVID-19 could beimplemented and handling spaces and internal movements could be tracked and saved solving theproblem of unknown internal paths with more intensity along the day. Overall, the objective of thisresearch was to provide the first management system tracking real time educational parameters andproviding a BIM model with all the requirements needed to allow it to host new future managementdemands. The management based on BIM of such a complex infrastructure, with more than 50 teachingrooms, 21 laboratories, and 4000 students, can provide multiple benefits. With the BIM-basedmanagement methodology that has been developed, some social barriers can be overcome. For thefirst time, BIM benefits are not only available for the management staff but also for any other entityinvolved in the daily usage of the building. Real-time information, COVID management, facilities,bookings, BIM, and sensor synchronization, as well as university assets location, are now accessiblethrough internet to all users. As a result, a living organism of the infrastructure is obtained withdifferent degrees of accessibility depending on the users, whether they are the students, the teachingstaff, or the managers of the ETSICCP.
2. Literature Review
The BIM model was focused on the infrastructure management of the ETSICCP. In this way, the BIMmodel needed to house a large amount of data [19–21] and to enable the provision of useful informationrelated to updated drawings [3], quality control [27,28], space and energy management [19,29],or emergency situations [20]. Under this scope, BIM enhances its efficiency due to the incorporation ofnew technologies, like IoT, linking, and synchronizing with databases or 3-D scanning informationascribed to the model. Facing the synthesis of methodologies of such unequal nature, it gives rise toontological problems based on the existing incompatibility of the generated information.
2.1. BIM and IoT Management
The development of this binomial status is an important feature to be implemented in the nearfuture. The background records of the union of IoT and BIM models show notorious advantages interms of infrastructure management based on different software developments [10]. The combinationof BIM and IoT permits a large amount of real-time information to be available and this is the core ofwhat is called Smart City [30,31]. Assuming Smart City to be an extension of Digital City, the mainpoint of this concept is the digital environment. In such a sense, a BIM model synchronized with publictransport systems, public parking or climate control applications provides the user with accessibleinformation, not only about the infrastructure, but also about the Smart City in which it is integratedand in a homogeneous way.
Together, BIM and IoT shape a system synthesis applicable to all project phases with outstandingresults, such as those shown for highway maintenance, by leveraging Big Data and BIM [32].For the diffusion and application of this combined technology some common standards have beendeveloped [10] with the goal of creating new beneficiaries of BIM, including the future occupants of
Appl. Sci. 2020, 10, 7976 4 of 28
the infrastructure who are unaware of the full potential of a useful operation of BIM information [33].For that purpose, some standards have been developed in order to obtain different data types so thatthey are useful for future infrastructure management based on simple and intuitive interfaces [34].
The ETSICCP model contemplates the possibility of hosting IoT by means of sensor systems ableto provide real time information to a database getting close to the concept of “Smart Building” [35]with great operation efficiency in terms of information handling [36,37] improving BIM informationwith real time data extremely important in special infrastructure, such as a Campus, airports, or evenhospitals [38,39].
2.2. 3-D Scanning
BIM usage is strongly associated with preconstruction phases, such as predesign, design, or evenconstruction. However, new development points to postconstruction phases have appeared [2,3,19,40–42].Infrastructure management requires big volume of detailed data in order to achieve an efficientmanagement system [1], making capture of data a critical step in order to achieve useful informationfor future managements based on standard frameworks for each management target [43].
If the capture of data supplies insufficient information for initial proposals, obtaining newcomplete data means large economic and time costs [20,44–48]. To avoid this, data capture techniquesare commonly used in existing building with the imaged-based or range-based techniques [4,49],usually executed with a laser scanner, standing out.
Given the progress of laser scanner methodology in the field of Cultural Heritage (CH) it hasbecome an attractive alternative in order to create three-dimensional models from existing buildings orother constructed elements. Some remarkable cases are: the digital model of Pietá of MichelangeloBuonarrotti [50], the implement of a digital model of Nuestra Señora de los Desamparados [51],modeling of Minerva statue [52], the 3-D model of a Terracotta piece [53], and the elevation modelof the lost ruins of the Coliseum in Rome [54]. This technology has been termed as Scan-to-BIM,and it is based on the process of capturing the main features and geometry of existing buildings orinfrastructure in order to create a BIM model without any previous data. The most common technologyused for this purpose is three-dimensional laser scanning.
A great deal of progress has been made by the use different scanning techniques developed inrecent years, ranging from pure CH related techniques [55], focused on architectural, archaeological, andgeological elevations [56], to more detailed ones, as well as aspects, such as point cloud processing [57],improvements of the optical triangulation [58–60], camera calibration as a function of the position [56,57],or the simplification of point-defined surfaces [61].
Highlighting the important evolution of the laser scanner as a source of information for BIM,research points to “scan-to-BIM” developments based on modeling the collected information in anautomated way [4,47,62–64].
The BIM model developed and herein reported was devised based on CAD information but thisdoes not impede the future scanning of the building and the implementation to the model of thecollected information. With the obtained data, point clouds and images will allow the verification ofthe initial CAD files and issue image patterns in the model useful for virtual internal routing.
2.3. BIM and Facility Management
The distinctive concept of this project fully contemplates the techniques and research developedunder the denomination of Facility Management (FM) based on real applications of BIM managementmethodologies in special infrastructure facilities [38,39]. The set-up of the 3-D model is consideredas the database element in which the FM tools will be developed [65,66]. Although the number oftools referred to the infrastructure management database stands out, there are also great advantagesin the implementation of BIM tools at earlier phases [67,68]. The inter-operability between differentdata sources, independently of the original stage or phase [68], is the main objective in the standard
Appl. Sci. 2020, 10, 7976 5 of 28
development, either for modeling or for the information management itself [69], thereby reducing thetypical inter-operation framework in the construction industry [70].
The reason for the existence of the FM tools is based on completing the voids existing between BIMand the infrastructure management [71], providing a much more efficient methodology for buildingmanagement [5,72]. Many compilations of FM techniques [73] or simple guidelines for differentdisciplines or involved entities improve the implementation of BIM in management stages [74,75].
The scope for this research in terms of application of FM tools is based on the Computer Aids Facilitymanagement (CAFM) with software tools in fields, such as firefighting [76], energy management [77],or real visualization and interaction with the model [78].
2.4. Educational Management in Universities
The management of university campuses differs depending on the nature of the institution.The infrastructure of this paper is considered a public institution facility. Thus, previous researchpublished dealing with public infrastructure managements was gathered in this literature review.
Several publications have studied the management of important public institutions focusing onthe FM and highlighting the importance of this. Jensen, in 2011 [79], argued that, while core businessshould add value to external customers, FM must create value for internal customers by supportingthe core business. Another definition of FM is detailed by the Corporate Real Estate [80], assuming itto be an act of aligning the services with the main purpose of the infrastructure.
The exploitation and maintenance of facilities are considered to be the second largest cost ofuniversities, ranging between 5–15% in Europe [81]. Various studies indicate that university facilitiesare designed with large capacity spaces but their utilization rates remain only within a range of from20 to 40% [82–85]. Moreover, most university facilities in Europe were built in the 1960s and the 1970s,resulting in poor technical conditions with outdated designs for 2020.
Smart Campus is the main goal in terms of modern universities. The process comprises of threestages: traditional campus, e-campus, and digital campus as the final phase [86]. The traditionalcampus is based on a classical management where students and faculties need to meet face to faceto share content. Related to FM, the traditional campus mainly relies on paper formats to managespaces or other facilities in the whole campus. To reach the e-campus phase, the use of internet todisseminate the material to be learned should be widespread [86,87]. Digital campus demands atechnical environment with IoT, mobile terminal accessing, radio frequency identification (RFID),and cloud computing.
Many advantages have been published in terms of digital campus profits. Energy management [88]and reductions of electricity cost [89], improving the interaction with other campuses and detailedmanagement of university assets [89] or providing map information of the campus for locationpurposes [89]. All these benefits are attainable thanks to the implementation of technologies, suchas RFID [86,89–95], IoT [86–89,94,96,97], 3-D visualization [98], sensors application [88,89,95,97–99],or web service [94,96,98].
In this context, this paper details the firsts steps to be taken at the ETSICCP and the UPM to approachthe digital campus environment, employing BIM together with the technologies cited previously.
3. Methodology
The staff and teaching facilities of the Civil Engineering School (Escuela Técnica Superior deIngeniería de Caminos, Canales y Puertos in Spanish) were moved in 1968 to the present infrastructurewithin the UPM Campus that today hosts these engineering studies. For more than 50 years,the infrastructure has experienced several changes inside the building, mainly in the use of classroomsand other spaces. These changes, along with the room geometry changes for change of use purposes,have not been recorded or documented. This situation is hardly plausible with a BIM model. The goalfor developing this BIM model is to issue a useful tool for the school management, not only in termsof modifications records [3] but also for the rational use of spaces [19,29]. The idea of unifying static
Appl. Sci. 2020, 10, 7976 6 of 28
information (classroom capacities, existing connections, and fixed equipment) and dynamic information(such as lecture sessions or locker assignments) into the one database allows for totally accessibility forthe staff personnel in charge of the ETSICCP management. However, developing a new managementmethodology implies some risks. New management not only needs to be more efficient than itspredecessor, but it must also be developed by the same professional staff. With this idea as a startingpoint, the complexity and magnitude of the infrastructure also increments the mentioned risk. In thisproject, a total area of 38,971 m2 was considered. More than 50 teaching rooms, 21 laboratories, and morethan 4000 students are managed. This building hosts two doctoral programs, five master’s degrees,and two bachelor’s degrees. The school is one of the oldest civil engineering schools in the world,declared 5th by the Academic Ranking of World Universities 2020 in the field of Civil Engineering [100].In this context, the BIM-based methodology developed in this study brings additional profits:
- Total accessibility to BIM infrastructure model. The BIM methodology allows for the possibilityof accessing the information through internet by all the entities involved. This allows the user toaccess the facilities and environment properties of the infrastructure in one single platform.
- Real data information. The information is accessible and updated. Locker occupation, sports andteaching installation reservations, public transports scheduling, room enumeration, and locationor current space occupation are provided. Graphical visualization of teaching schedules andexam room management is provided by the BIM model hosted on the accessible webpage.
- COVID management. As a new management developed, new availability of all spaces for theacademic course 2020/2021 has been carried out. Real space distribution taking into account allgeometric room characteristics is detailed with the highest level thanks to the BIM model.
- Sensors synchronization. Real time information collected by sensors are linked with SQL databaseswhich, at the same time, are synchronized with the BIM model, providing the user with all theinformation assigned to specific location in the infrastructure and in a graphical way.
- University assets location and registration. The methodology developed provides the UPM withthe possibility of registering all University equipment and its real location.
3.1. BIM-EDU Project
The development of the above cited 3-D BIM model of the ETSICCP has its origin in a broaderproject called BIM-EDU. The BIM-EDU Project objective is the production of a 3-D model of ETSICCPlocated in the campus of UPM and enables the integration of all the information of interest for themanagement staff for the use of the buildings or for educational purposes. This BIM model will help themanagement staff of the school, will improve the academic life of students, will make the teaching workof the lecturers easier, and will integrate the work of the Service and Administration Personnel (PAS).
The project involves a team of students from the module Smart Construction which is part of themaster’s degree in Civil Engineering. Said students were also working on their Final Master Thesis(TFM). The objective is to provide a solution that firstly satisfies all the real needs of this academicinstitution and serves as good training for the developers providing innovative proposals, therebyimproving the quality of teaching. It is, therefore, a project consisting of several stages, starting withcollecting information and generating a large amount of information that would grow or be reduceddepending on the stage. The BIM-EDU Project was developed as a Design-thinking initiative [101].
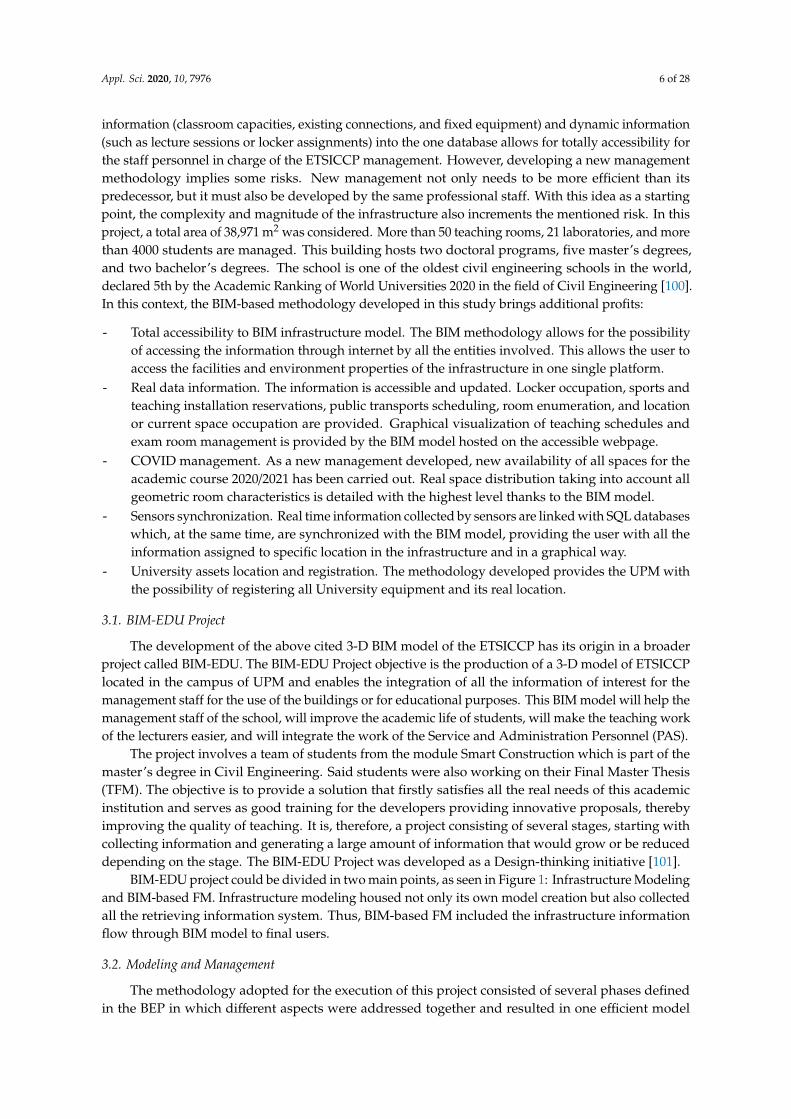
BIM-EDU project could be divided in two main points, as seen in Figure 1: Infrastructure Modelingand BIM-based FM. Infrastructure modeling housed not only its own model creation but also collectedall the retrieving information system. Thus, BIM-based FM included the infrastructure informationflow through BIM model to final users.
3.2. Modeling and Management
The methodology adopted for the execution of this project consisted of several phases definedin the BEP in which different aspects were addressed together and resulted in one efficient model
Appl. Sci. 2020, 10, 7976 7 of 28
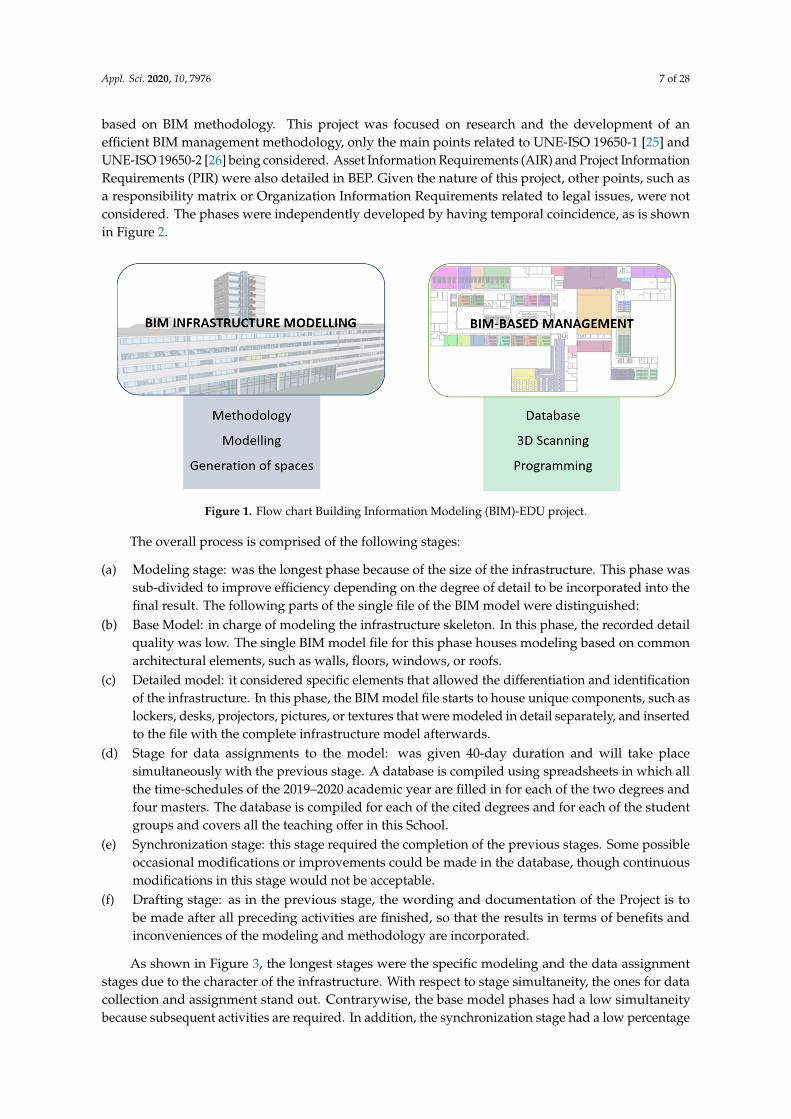
based on BIM methodology. This project was focused on research and the development of anefficient BIM management methodology, only the main points related to UNE-ISO 19650-1 [25] andUNE-ISO 19650-2 [26] being considered. Asset Information Requirements (AIR) and Project InformationRequirements (PIR) were also detailed in BEP. Given the nature of this project, other points, such asa responsibility matrix or Organization Information Requirements related to legal issues, were notconsidered. The phases were independently developed by having temporal coincidence, as is shownin Figure 2.
Appl. Sci. 2020, 10, x FOR PEER REVIEW 7 of 29
Figure 1. Flow chart Building Information Modeling (BIM)-EDU project.
3.2. Modeling and Management
The methodology adopted for the execution of this project consisted of several phases defined in the BEP in which different aspects were addressed together and resulted in one efficient model based on BIM methodology. This project was focused on research and the development of an efficient BIM management methodology, only the main points related to UNE-ISO 19650-1 [25] and UNE-ISO 19650-2 [26] being considered. Asset Information Requirements (AIR) and Project Information Requirements (PIR) were also detailed in BEP. Given the nature of this project, other points, such as a responsibility matrix or Organization Information Requirements related to legal issues, were not considered. The phases were independently developed by having temporal coincidence, as is shown in Figure 2.
Figure 1. Flow chart Building Information Modeling (BIM)-EDU project.
The overall process is comprised of the following stages:
(a) Modeling stage: was the longest phase because of the size of the infrastructure. This phase wassub-divided to improve efficiency depending on the degree of detail to be incorporated into thefinal result. The following parts of the single file of the BIM model were distinguished:
(b) Base Model: in charge of modeling the infrastructure skeleton. In this phase, the recorded detailquality was low. The single BIM model file for this phase houses modeling based on commonarchitectural elements, such as walls, floors, windows, or roofs.
(c) Detailed model: it considered specific elements that allowed the differentiation and identificationof the infrastructure. In this phase, the BIM model file starts to house unique components, such aslockers, desks, projectors, pictures, or textures that were modeled in detail separately, and insertedto the file with the complete infrastructure model afterwards.
(d) Stage for data assignments to the model: was given 40-day duration and will take placesimultaneously with the previous stage. A database is compiled using spreadsheets in which allthe time-schedules of the 2019–2020 academic year are filled in for each of the two degrees andfour masters. The database is compiled for each of the cited degrees and for each of the studentgroups and covers all the teaching offer in this School.
(e) Synchronization stage: this stage required the completion of the previous stages. Some possibleoccasional modifications or improvements could be made in the database, though continuousmodifications in this stage would not be acceptable.
(f) Drafting stage: as in the previous stage, the wording and documentation of the Project is tobe made after all preceding activities are finished, so that the results in terms of benefits andinconveniences of the modeling and methodology are incorporated.
As shown in Figure 3, the longest stages were the specific modeling and the data assignmentstages due to the character of the infrastructure. With respect to stage simultaneity, the ones for datacollection and assignment stand out. Contrarywise, the base model phases had a low simultaneitybecause subsequent activities are required. In addition, the synchronization stage had a low percentage
Appl. Sci. 2020, 10, 7976 8 of 28
of simultaneity. This was caused by the need of having a database structure and a set-up model inorder to keep synchronization between model and data when a change is made.Appl. Sci. 2020, 10, x FOR PEER REVIEW 8 of 29
Figure 2. Modeling process and simultaneity.
The overall process is comprised of the following stages:
(a) Modeling stage: was the longest phase because of the size of the infrastructure. This phase was sub-divided to improve efficiency depending on the degree of detail to be incorporated into the final result. The following parts of the single file of the BIM model were distinguished:
(b) Base Model: in charge of modeling the infrastructure skeleton. In this phase, the recorded detail quality was low. The single BIM model file for this phase houses modeling based on common architectural elements, such as walls, floors, windows, or roofs.
(c) Detailed model: it considered specific elements that allowed the differentiation and identification of the infrastructure. In this phase, the BIM model file starts to house unique components, such as lockers, desks, projectors, pictures, or textures that were modeled in detail separately, and inserted to the file with the complete infrastructure model afterwards.
(d) Stage for data assignments to the model: was given 40-day duration and will take place simultaneously with the previous stage. A database is compiled using spreadsheets in which all
Figure 2. Modeling process and simultaneity.
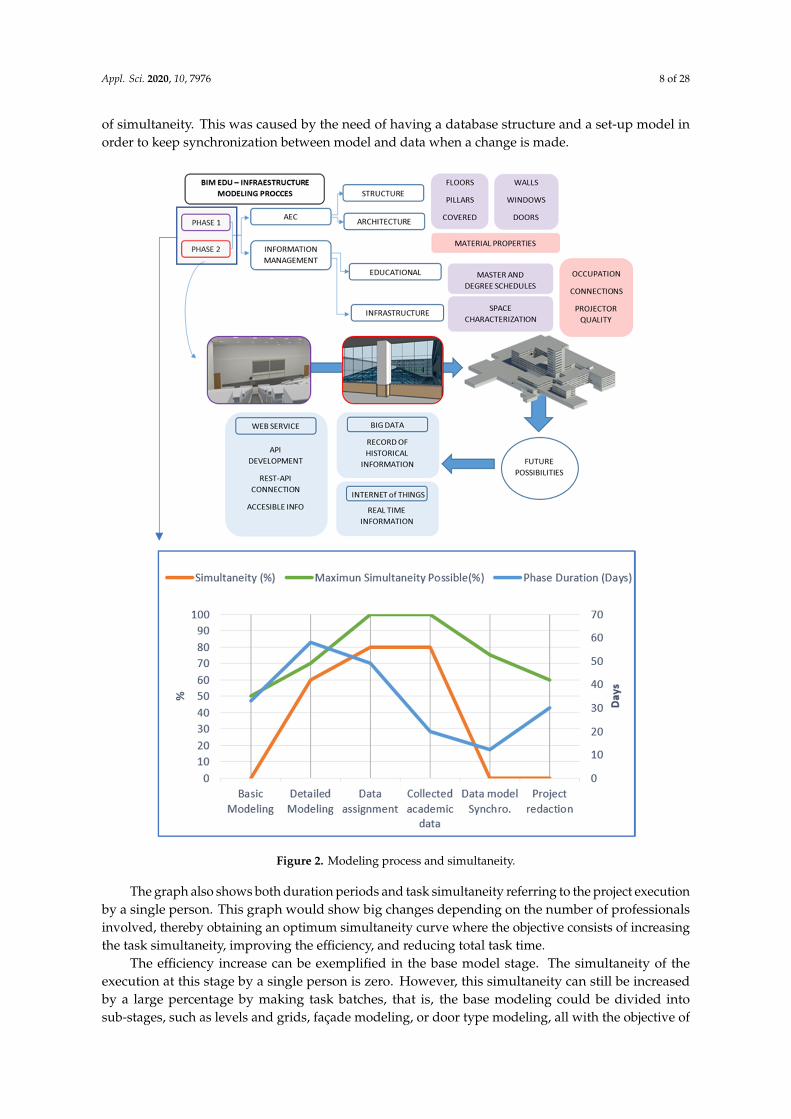
The graph also shows both duration periods and task simultaneity referring to the project executionby a single person. This graph would show big changes depending on the number of professionalsinvolved, thereby obtaining an optimum simultaneity curve where the objective consists of increasingthe task simultaneity, improving the efficiency, and reducing total task time.
The efficiency increase can be exemplified in the base model stage. The simultaneity of theexecution at this stage by a single person is zero. However, this simultaneity can still be increasedby a large percentage by making task batches, that is, the base modeling could be divided intosub-stages, such as levels and grids, façade modeling, or door type modeling, all with the objective of
Appl. Sci. 2020, 10, 7976 9 of 28
creating independent tasks that allow simultaneous work of several persons and so reducing the totalexecution time.
Appl. Sci. 2020, 10, x FOR PEER REVIEW 10 of 29
Figure 3. Flow chart.
CAD and BIM software must be checked. Moreover, BIM software model demands independent CAD information at a high level thus a restructuring of CAD information was developed to achieve the correct insertion of CAD data into BIM environment.
Once CAD information was restructured, it was necessary to create an appropriate level in BIM environment. Moreover, CAD information available only referred to floor plant and sectional dimensions, and were taken in situ, to provide real height to BIM levels completing BIM requirements of Flow chart.
Relating BIM to CAD data link, it was necessary to insert each CAD information and align it according to geometric infrastructure properties individually. Once it has been done, the modeling phase starts.
4. Case Study
In order to reach the main objectives of the case study shown in this paper, two main aspects were addressed. The first one was related to the infrastructure modeling and the development of the 3-D model of the ETSICCP. The second challenge was the implementation of the adequate tools for the management of the infrastructure through use of the BIM model of the building.
4.1. Main Characteristics of the ETSICCP
The total area modeled for the ETSICCP was 38,970.84 m2. Regarding the useful area, it was 32,631.23 m2. The most outstanding were 26 and 27 as shown in Table 1. ETSICCP is used by more than 4000 students of different degree levels: Graduate, Master, and Ph.D. These figures give the idea of the magnitude of the school facilities as well as the excellent opportunity of implementing new management approaches for spaces, maintenance equipment and the relation with the staff, being aware of the impact that can be generated by a BIM methodology implementation.
Table 1 shows the useful area of all the classrooms, with a total surface of 5,289.329 m2. The table was originated from the BIM model by making a constant relationship between the model and either a spreadsheet or any SQL database, so that any information in the model can be reflected instantly in the database and vice-versa.
Figure 3. Flow chart.
3.3. Starting Documentation
The starting point of the modeling stage after the development of BEP is based on documentationin 2-D CAD format. The files did not have a specific date of expedition and possibly included elementsthat were not updated at the time of the model development. In turn, the received documentationconsisted of plan drawings of the building floors at different levels but contained no section or elevationdrawings nor aspects such as the floor height or the distance to the false ceilings. The option was toplot the geometry information and make in-place measurements of the missing data.
3.4. CAD-BIM Linking
With the existing and enhanced information, the modeling with BIM methodology started usingBIM modeling Software. The modeling of different typologies of infrastructure not only differs inthe construction typology but also in the used software and the workflow, which must be adaptedaccording to the available tools. In this case, and with the described initial conditions, the option wasto import files in CAD format referring to the plan views of ten different floor levels having previouslypreceded to the required drawing separation.
The used procedure and the methodology of execution are depicted in Figure 3. Firstly, a CADdata revision must be done searching for possible geometric infrastructure data omission or mistakes.
CAD and BIM software must be checked. Moreover, BIM software model demands independentCAD information at a high level thus a restructuring of CAD information was developed to achievethe correct insertion of CAD data into BIM environment.
Once CAD information was restructured, it was necessary to create an appropriate level inBIM environment. Moreover, CAD information available only referred to floor plant and sectionaldimensions, and were taken in situ, to provide real height to BIM levels completing BIM requirementsof Flow chart.
Relating BIM to CAD data link, it was necessary to insert each CAD information and align itaccording to geometric infrastructure properties individually. Once it has been done, the modelingphase starts.
Appl. Sci. 2020, 10, 7976 10 of 28
4. Case Study
In order to reach the main objectives of the case study shown in this paper, two main aspects wereaddressed. The first one was related to the infrastructure modeling and the development of the 3-Dmodel of the ETSICCP. The second challenge was the implementation of the adequate tools for themanagement of the infrastructure through use of the BIM model of the building.
4.1. Main Characteristics of the ETSICCP
The total area modeled for the ETSICCP was 38,970.84 m2. Regarding the useful area, it was32,631.23 m2. The most outstanding were 26 and 27 as shown in Table 1. ETSICCP is used by morethan 4000 students of different degree levels: Graduate, Master, and Ph.D. These figures give theidea of the magnitude of the school facilities as well as the excellent opportunity of implementingnew management approaches for spaces, maintenance equipment and the relation with the staff,being aware of the impact that can be generated by a BIM methodology implementation.
Table 1. Surface of teaching spaces.
Name Surface Name Surface
José Echegaray Room 69.61 m2 Room 24 101.16 m2
Room 1 238.88 m2 Room 26 329.94 m2
Room 2 115.08 m2 Room 27 330.64 m2
Room 3 117.68 m2 Room 28 57.82 m2
Room 4 238.87 m2 Room 29 59.52 m2
Room 5 57.82 m2 Room 30 58.78 m2
Room 6 59.52 m2 Room 31 58.78 m2
Room 7 58.78 m2 Room 32 57.22 m2
Room 8 58.78 m2 Room 38 100.10 m2
Room 9 57.22 m2 Room 39 100.02 m2
Room 11 54.90 m2 Room 40 58.67 m2
Room 12 56.39 m2 Languages Room 57.26 m2
Room 13 56.39 m2 Room 45 103.25 m2
Room 14 56.39 m2 Room 46 101.16 m2
Room 15 56.39 m2 Ag. Betancourt Room 56.70 m2
Room 16 56.39 m2 CAD Room 55.67 m2
Room 17 56.39 m2 Exam room 1652.12 m2
Room 18 56.39 m2 Computers room 90.56 m2
Room 22 113.49 m2 Turing Room 121.18 m2
Room 23 103.25 m2 Total 5289.32 m2
Table 1 shows the useful area of all the classrooms, with a total surface of 5,289.329 m2. The tablewas originated from the BIM model by making a constant relationship between the model and either aspreadsheet or any SQL database, so that any information in the model can be reflected instantly in thedatabase and vice-versa.
4.2. The Information Model of the ETSICCP
4.2.1. Internal and External Modeling
Thanks to the starting documentation and its adaptation to the new software, the modeling ofeach level could be carried out independently, starting with the floor system modeling and proceedingwith the internal and external partitions modeling associated with each level. This phase was ofgreat importance due to the geometrical character that the wall components give to the infrastructure.Internal and external, or façade, walls determine the skeleton of the internal and external infrastructureaffecting the multiple component properties required by the space management.

Appl. Sci. 2020, 10, 7976 11 of 28
In view of the possibilities of using the model by the School staff for its own management basedon BIM technology, the modeling followed the guidelines established by the developed BEP, therebyallowing for a context and management standards. As a matter of example, Table 2 shows the namingof various types of components in the model.
Table 2. Extract of BIM Execution Plan (BEP) nomenclature.
COMPONENTS
NAME OF THE COMPONENT NAME OF THE VIEW
WALL A_Wall Thickness and UnitsCURTAIN WALL A_Courtain and location
CURTAIN WALL PANEL A_Panel materialPILLARS A_Pillar dimension A × dimension BDOORS A_Door and location
FALSE CEILINGS A_FT and locationWINDOWS Dimension A × Dimension B and units
REST OF THE OBJECTS BIM software name by default
The modeling of the objects associated to each of the floor systems, as well as internal andexternal walls, was included in the base modeling stage described above with a very low percentage ofsimultaneity with respect to other stages. The required engagement for developing this stage was ofgreat relevance for the whole Project.
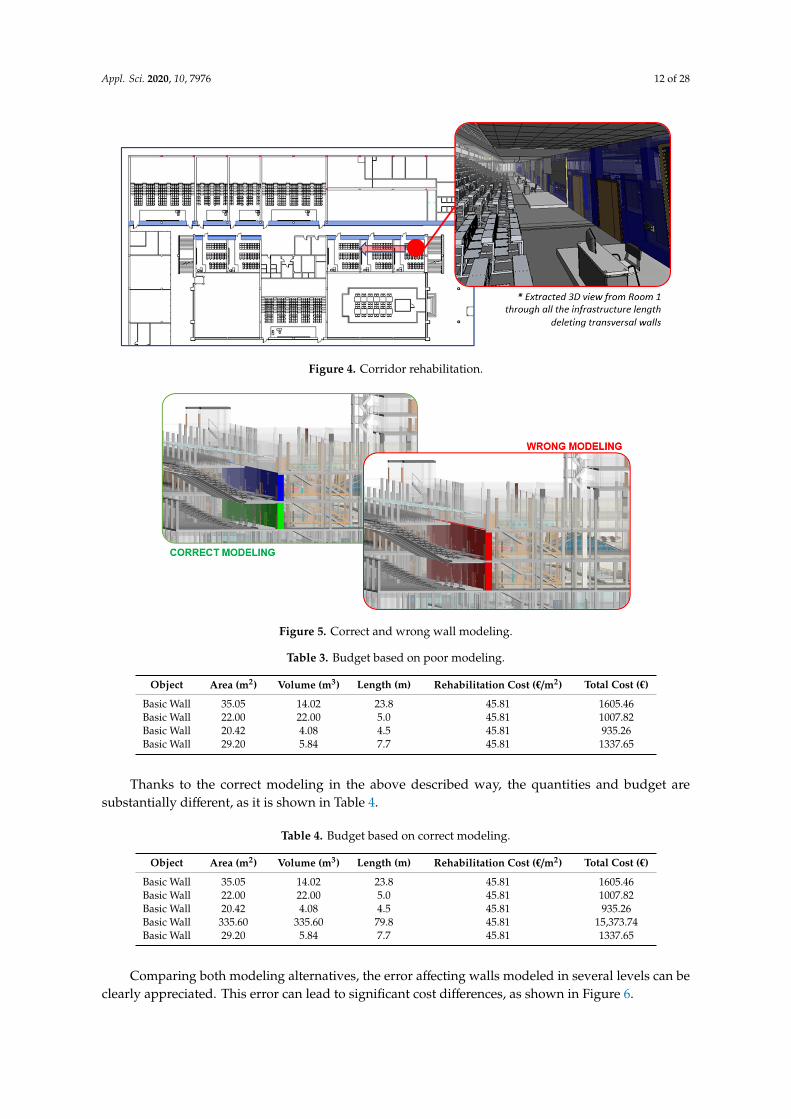
The involved objects included in this base model contained some peculiarities that must berecognized, mainly in the modeling of walls. As commented in previous sections, the modeling wasorganized level by level and this procedure was of critical importance due to the particularities of the“wall” components. The initial temptation is to model walls, especially façades, considering the totalheight that a façade wall creates as beginning at level 0 and ending at level 3. Modeling with thismethodology will lead to errors in terms of material measurements at a level. The origin of this error isthe BIM software for wall accounting, that is, if a reform is intended partially affecting to level 2 of theinfrastructure, the wall starting at level 1 through level 3 will not be accounted for. In order to have itaccounted for by the software, the modeling must be organized level by level, which means having thefaçade modeled in several walls, one from level 0 to level 1, next from level 1 to level 2, and a third onefrom level 2 to level 3. In this way, the accounting will be exact, independently of the level at which thedata is filtered.
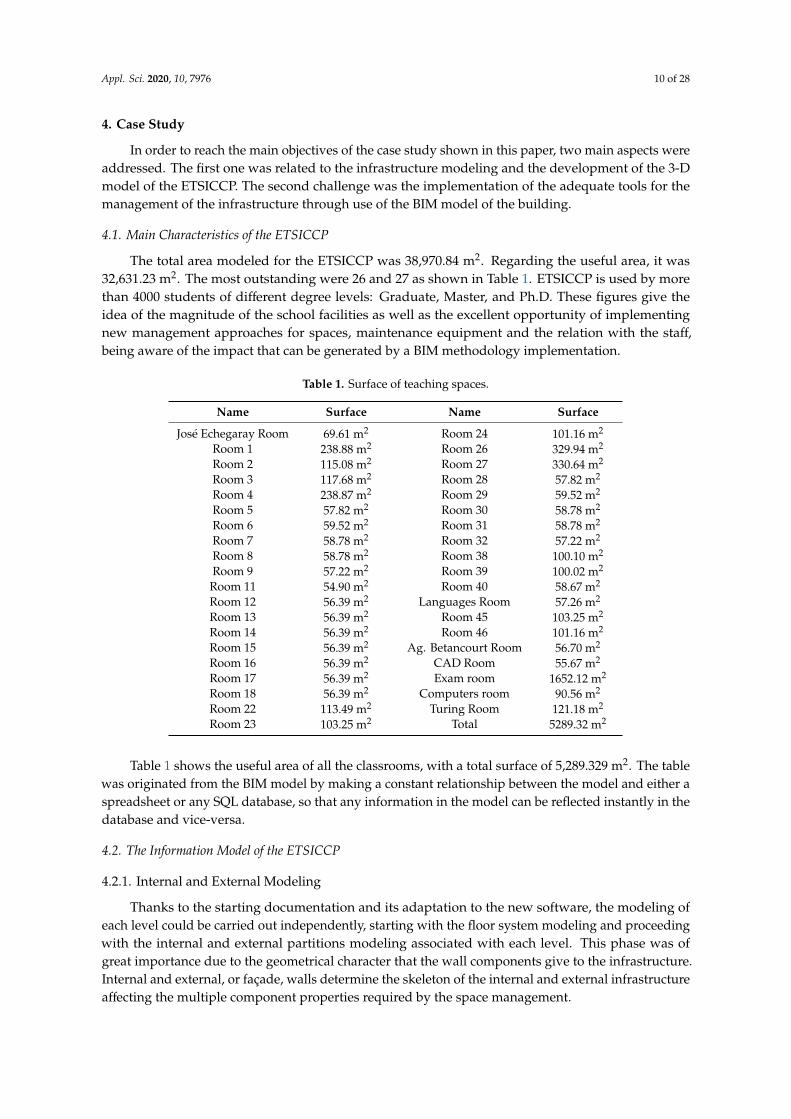
With the objective of supplying the university with a model that can be used not only for spacemanagement but also for budgeting future reforms or changes in the infrastructure, modeling has beendone according to the described methodology to avoid the cited errors. This is of key importance,as shown in the following case, where the error in quantities and budget of a partial reform inthe ETSICCP was shown. The reform is supposed to affect only the first floor, which is level 1.The rehabilitation of the corridors close to classrooms 26 and 27, as shown in Figure 4, is intended.Shaded in blue in Figure 3, the walls affected by this reform are highlighted. In terms of location,the affected wall is similar in level 0 and level 1, having an end in level 2, so that if the wall has beenmodeled from level 0 through level 2, wrong modeling occurs, as is shown in Figure 5. When thedata is filtered by the level and the acting zone, this wall will not be reflected in the quantities list.An example of quantities and budget with a wrong modeling is shown in Table 3. The unit priceadopted for the reform is the one proposed by the official Price Generator of Madrid Community.
Appl. Sci. 2020, 10, 7976 12 of 28
Appl. Sci. 2020, 10, x FOR PEER REVIEW 12 of 29
of simultaneity with respect to other stages. The required engagement for developing this stage was of great relevance for the whole Project.
The involved objects included in this base model contained some peculiarities that must be recognized, mainly in the modeling of walls. As commented in previous sections, the modeling was organized level by level and this procedure was of critical importance due to the particularities of the “wall” components. The initial temptation is to model walls, especially façades, considering the total height that a façade wall creates as beginning at level 0 and ending at level 3. Modeling with this methodology will lead to errors in terms of material measurements at a level. The origin of this error is the BIM software for wall accounting, that is, if a reform is intended partially affecting to level 2 of the infrastructure, the wall starting at level 1 through level 3 will not be accounted for. In order to have it accounted for by the software, the modeling must be organized level by level, which means having the façade modeled in several walls, one from level 0 to level 1, next from level 1 to level 2, and a third one from level 2 to level 3. In this way, the accounting will be exact, independently of the level at which the data is filtered.
With the objective of supplying the university with a model that can be used not only for space management but also for budgeting future reforms or changes in the infrastructure, modeling has been done according to the described methodology to avoid the cited errors. This is of key importance, as shown in the following case, where the error in quantities and budget of a partial reform in the ETSICCP was shown. The reform is supposed to affect only the first floor, which is level 1. The rehabilitation of the corridors close to classrooms 26 and 27, as shown in Figure 4, is intended. Shaded in blue in Figure 3, the walls affected by this reform are highlighted. In terms of location, the affected wall is similar in level 0 and level 1, having an end in level 2, so that if the wall has been modeled from level 0 through level 2, wrong modeling occurs, as is shown in Figure 5. When the data is filtered by the level and the acting zone, this wall will not be reflected in the quantities list. An example of quantities and budget with a wrong modeling is shown in Table 3. The unit price adopted for the reform is the one proposed by the official Price Generator of Madrid Community.
Figure 4. Corridor rehabilitation. Figure 4. Corridor rehabilitation.Appl. Sci. 2020, 10, x FOR PEER REVIEW 13 of 29
Figure 5. Correct and wrong wall modeling.
Table 3. Budget based on poor modeling.
Object Area (m2) Volume (m3) Length (m) Rehabilitation Cost (€/m2) Total Cost (€) Basic Wall 35.05 14.02 23.8 45.81 1605.46 Basic Wall 22.00 22.00 5.0 45.81 1007.82 Basic Wall 20.42 4.08 4.5 45.81 935.26 Basic Wall 29.20 5.84 7.7 45.81 1337.65
Thanks to the correct modeling in the above described way, the quantities and budget are substantially different, as it is shown in Table 4.
Table 4. Budget based on correct modeling.
Object Area (m2) Volume (m3) Length (m) Rehabilitation Cost (€/m2) Total Cost (€) Basic Wall 35.05 14.02 23.8 45.81 1605.46 Basic Wall 22.00 22.00 5.0 45.81 1007.82 Basic Wall 20.42 4.08 4.5 45.81 935.26 Basic Wall 335.60 335.60 79.8 45.81 15,373.74 Basic Wall 29.20 5.84 7.7 45.81 1337.65
Comparing both modeling alternatives, the error affecting walls modeled in several levels can be clearly appreciated. This error can lead to significant cost differences, as shown in Figure 6.
Figure 6. Parameters variations by modeling.
Figure 5. Correct and wrong wall modeling.
Table 3. Budget based on poor modeling.
Object Area (m2) Volume (m3) Length (m) Rehabilitation Cost (€/m2) Total Cost (€)
Basic Wall 35.05 14.02 23.8 45.81 1605.46Basic Wall 22.00 22.00 5.0 45.81 1007.82Basic Wall 20.42 4.08 4.5 45.81 935.26Basic Wall 29.20 5.84 7.7 45.81 1337.65
Thanks to the correct modeling in the above described way, the quantities and budget aresubstantially different, as it is shown in Table 4.
Table 4. Budget based on correct modeling.
Object Area (m2) Volume (m3) Length (m) Rehabilitation Cost (€/m2) Total Cost (€)
Basic Wall 35.05 14.02 23.8 45.81 1605.46Basic Wall 22.00 22.00 5.0 45.81 1007.82Basic Wall 20.42 4.08 4.5 45.81 935.26Basic Wall 335.60 335.60 79.8 45.81 15,373.74Basic Wall 29.20 5.84 7.7 45.81 1337.65
Comparing both modeling alternatives, the error affecting walls modeled in several levels can beclearly appreciated. This error can lead to significant cost differences, as shown in Figure 6.

Appl. Sci. 2020, 10, 7976 13 of 28
Appl. Sci. 2020, 10, x FOR PEER REVIEW 13 of 29
Figure 5. Correct and wrong wall modeling.
Table 3. Budget based on poor modeling.
Object Area (m2) Volume (m3) Length (m) Rehabilitation Cost (€/m2) Total Cost (€) Basic Wall 35.05 14.02 23.8 45.81 1605.46 Basic Wall 22.00 22.00 5.0 45.81 1007.82 Basic Wall 20.42 4.08 4.5 45.81 935.26 Basic Wall 29.20 5.84 7.7 45.81 1337.65
Thanks to the correct modeling in the above described way, the quantities and budget are substantially different, as it is shown in Table 4.
Table 4. Budget based on correct modeling.
Object Area (m2) Volume (m3) Length (m) Rehabilitation Cost (€/m2) Total Cost (€) Basic Wall 35.05 14.02 23.8 45.81 1605.46 Basic Wall 22.00 22.00 5.0 45.81 1007.82 Basic Wall 20.42 4.08 4.5 45.81 935.26 Basic Wall 335.60 335.60 79.8 45.81 15,373.74 Basic Wall 29.20 5.84 7.7 45.81 1337.65
Comparing both modeling alternatives, the error affecting walls modeled in several levels can be clearly appreciated. This error can lead to significant cost differences, as shown in Figure 6.
Figure 6. Parameters variations by modeling.
Figure 6. Parameters variations by modeling.
4.2.2. Generation of Spaces
This is a part of the stage for assigning data to the model. It features the works of basic modelingof the floor systems and internal walls. Before the beginning of this phase, the spaces already exist inthe model. Nevertheless, they have no properties. Thanks to the room component created, the spaceswere given characteristics, and it was possible to assign them some properties that will be fundamentalfor management.
There are multiple properties that can be attributed to the School spaces. Some of them, like area,volume, and location, referring to the floor level, are automatically created. This real information canbe filtered and made exportable to databases.
There is the chance of manually expanding the assignment of data related according to therequirement of the teaching institution. Some examples of new parameters developed and incorporatedto the model are:
(a) Department: to which the space belongs.(b) UPM Code: alphanumeric character string that the UPM uses to register all the spaces owned by
the University.(c) Available connections: with this parameter the connections available to the classroom are assigned
for teaching purposes. Some of the properties of this parameter are the existence of ComputerUSB ports, the type of computerized system, and version which are installed, computer availableand its properties, type of video projector, etc.
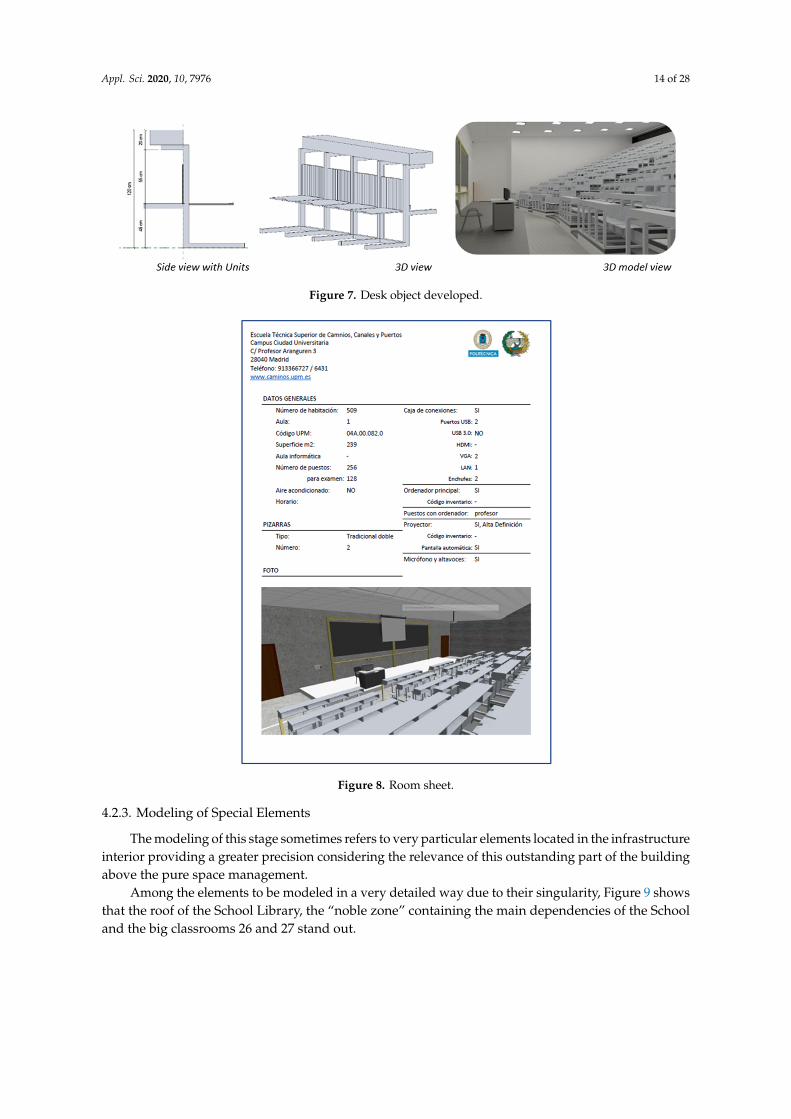
(d) Classroom occupation: this parameter is used to control the actual occupancy of the space and canbe modified according to the nature of the activity occurring in the space. It provides informationon the available seat number for a conventional class or for examination purposes. The parametercan be assigned due to the introduction of the typical seat bench units of the School, shown inFigure 7. By making an independent object for this case it is possible to increase the controlcapacity of these elements and also assign properties to the seat benches, such as functional stateor the above mentioned UPM code.
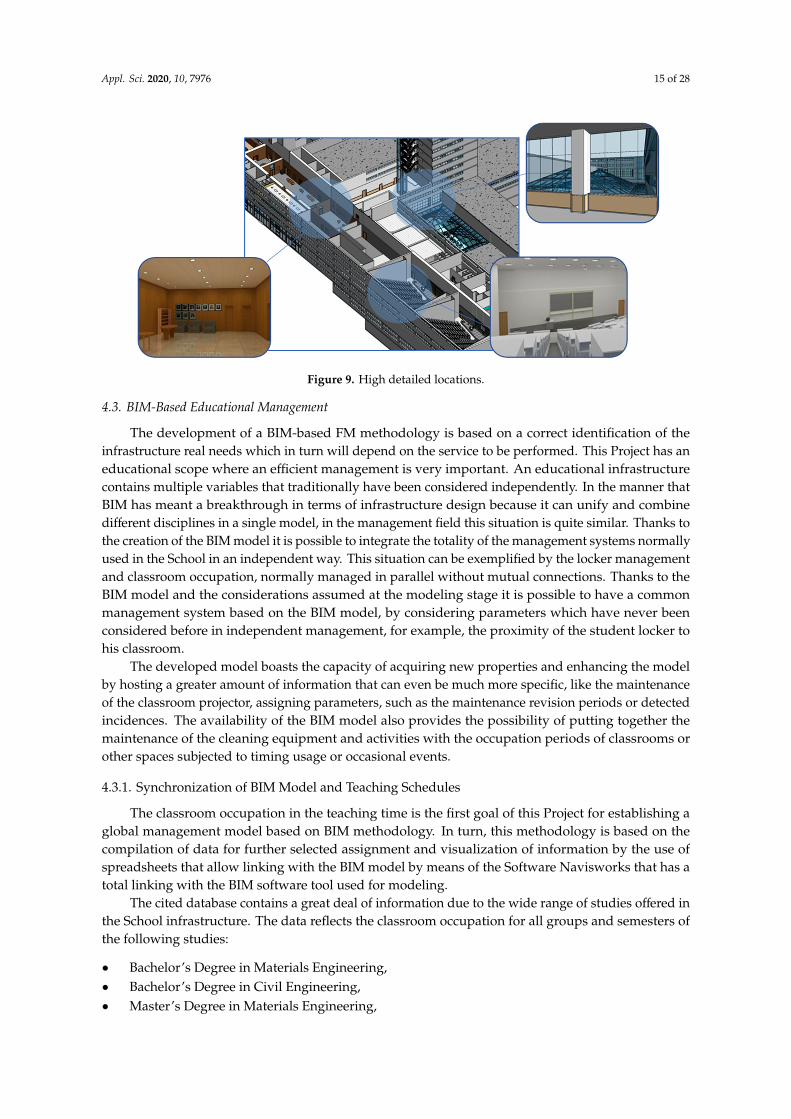
Thanks to these new parameter designs and their properties, it was possible to elaborate datasheets as the one shown in Figure 8, referring to each of the classrooms where the main properties aredepicted. These data sheets will be very useful for the teaching personnel and for the managementstaff. As a matter of sample, a data sheet is shown. It is worth noting the linking of it with themodel because any change in the BIM model will be instantly reflected in the affected data sheet.That information transference is made possible due to the use of spreadsheets connecting the BIMmodel and the data sheets.
Appl. Sci. 2020, 10, 7976 14 of 28
Appl. Sci. 2020, 10, x FOR PEER REVIEW 14 of 29
4.2.2. Generation of Spaces
This is a part of the stage for assigning data to the model. It features the works of basic modeling of the floor systems and internal walls. Before the beginning of this phase, the spaces already exist in the model. Nevertheless, they have no properties. Thanks to the room component created, the spaces were given characteristics, and it was possible to assign them some properties that will be fundamental for management.
There are multiple properties that can be attributed to the School spaces. Some of them, like area, volume, and location, referring to the floor level, are automatically created. This real information can be filtered and made exportable to databases.
There is the chance of manually expanding the assignment of data related according to the requirement of the teaching institution. Some examples of new parameters developed and incorporated to the model are:
(a) Department: to which the space belongs. (b) UPM Code: alphanumeric character string that the UPM uses to register all the spaces owned by
the University. (c) Available connections: with this parameter the connections available to the classroom are
assigned for teaching purposes. Some of the properties of this parameter are the existence of Computer USB ports, the type of computerized system, and version which are installed, computer available and its properties, type of video projector, etc.
(d) Classroom occupation: this parameter is used to control the actual occupancy of the space and can be modified according to the nature of the activity occurring in the space. It provides information on the available seat number for a conventional class or for examination purposes. The parameter can be assigned due to the introduction of the typical seat bench units of the School, shown in Figure 7. By making an independent object for this case it is possible to increase the control capacity of these elements and also assign properties to the seat benches, such as functional state or the above mentioned UPM code.
Figure 7. Desk object developed.
Thanks to these new parameter designs and their properties, it was possible to elaborate data sheets as the one shown in Figure 8, referring to each of the classrooms where the main properties are depicted. These data sheets will be very useful for the teaching personnel and for the management staff. As a matter of sample, a data sheet is shown. It is worth noting the linking of it with the model because any change in the BIM model will be instantly reflected in the affected data sheet. That information transference is made possible due to the use of spreadsheets connecting the BIM model and the data sheets.
Figure 7. Desk object developed.Appl. Sci. 2020, 10, x FOR PEER REVIEW 15 of 29
Figure 8. Room sheet.
4.2.3. Modeling of Special Elements
The modeling of this stage sometimes refers to very particular elements located in the infrastructure interior providing a greater precision considering the relevance of this outstanding part of the building above the pure space management.
Among the elements to be modeled in a very detailed way due to their singularity, Figure 9 shows that the roof of the School Library, the “noble zone” containing the main dependencies of the School and the big classrooms 26 and 27 stand out.
Figure 9. High detailed locations.
Figure 8. Room sheet.
4.2.3. Modeling of Special Elements
The modeling of this stage sometimes refers to very particular elements located in the infrastructureinterior providing a greater precision considering the relevance of this outstanding part of the buildingabove the pure space management.
Among the elements to be modeled in a very detailed way due to their singularity, Figure 9 showsthat the roof of the School Library, the “noble zone” containing the main dependencies of the Schooland the big classrooms 26 and 27 stand out.
Appl. Sci. 2020, 10, 7976 15 of 28
Appl. Sci. 2020, 10, x FOR PEER REVIEW 15 of 29
Figure 8. Room sheet.
4.2.3. Modeling of Special Elements
The modeling of this stage sometimes refers to very particular elements located in the infrastructure interior providing a greater precision considering the relevance of this outstanding part of the building above the pure space management.
Among the elements to be modeled in a very detailed way due to their singularity, Figure 9 shows that the roof of the School Library, the “noble zone” containing the main dependencies of the School and the big classrooms 26 and 27 stand out.
Figure 9. High detailed locations.
Figure 9. High detailed locations.
4.3. BIM-Based Educational Management
The development of a BIM-based FM methodology is based on a correct identification of theinfrastructure real needs which in turn will depend on the service to be performed. This Project has aneducational scope where an efficient management is very important. An educational infrastructurecontains multiple variables that traditionally have been considered independently. In the manner thatBIM has meant a breakthrough in terms of infrastructure design because it can unify and combinedifferent disciplines in a single model, in the management field this situation is quite similar. Thanks tothe creation of the BIM model it is possible to integrate the totality of the management systems normallyused in the School in an independent way. This situation can be exemplified by the locker managementand classroom occupation, normally managed in parallel without mutual connections. Thanks to theBIM model and the considerations assumed at the modeling stage it is possible to have a commonmanagement system based on the BIM model, by considering parameters which have never beenconsidered before in independent management, for example, the proximity of the student locker tohis classroom.
The developed model boasts the capacity of acquiring new properties and enhancing the modelby hosting a greater amount of information that can even be much more specific, like the maintenanceof the classroom projector, assigning parameters, such as the maintenance revision periods or detectedincidences. The availability of the BIM model also provides the possibility of putting together themaintenance of the cleaning equipment and activities with the occupation periods of classrooms orother spaces subjected to timing usage or occasional events.
4.3.1. Synchronization of BIM Model and Teaching Schedules
The classroom occupation in the teaching time is the first goal of this Project for establishing aglobal management model based on BIM methodology. In turn, this methodology is based on thecompilation of data for further selected assignment and visualization of information by the use ofspreadsheets that allow linking with the BIM model by means of the Software Navisworks that has atotal linking with the BIM software tool used for modeling.
The cited database contains a great deal of information due to the wide range of studies offered inthe School infrastructure. The data reflects the classroom occupation for all groups and semesters ofthe following studies:
• Bachelor’s Degree in Materials Engineering,• Bachelor’s Degree in Civil Engineering,• Master’s Degree in Materials Engineering,
Appl. Sci. 2020, 10, 7976 16 of 28
• Master’s Degree in Civil Engineering (for professional capacity of Ingeniero de Caminos, Canalesy Puertos in Spain),
• Master’s Degree in Engineering Structures, Foundations and Materials, and• Master’s Degree in Civil Engineering Systems.
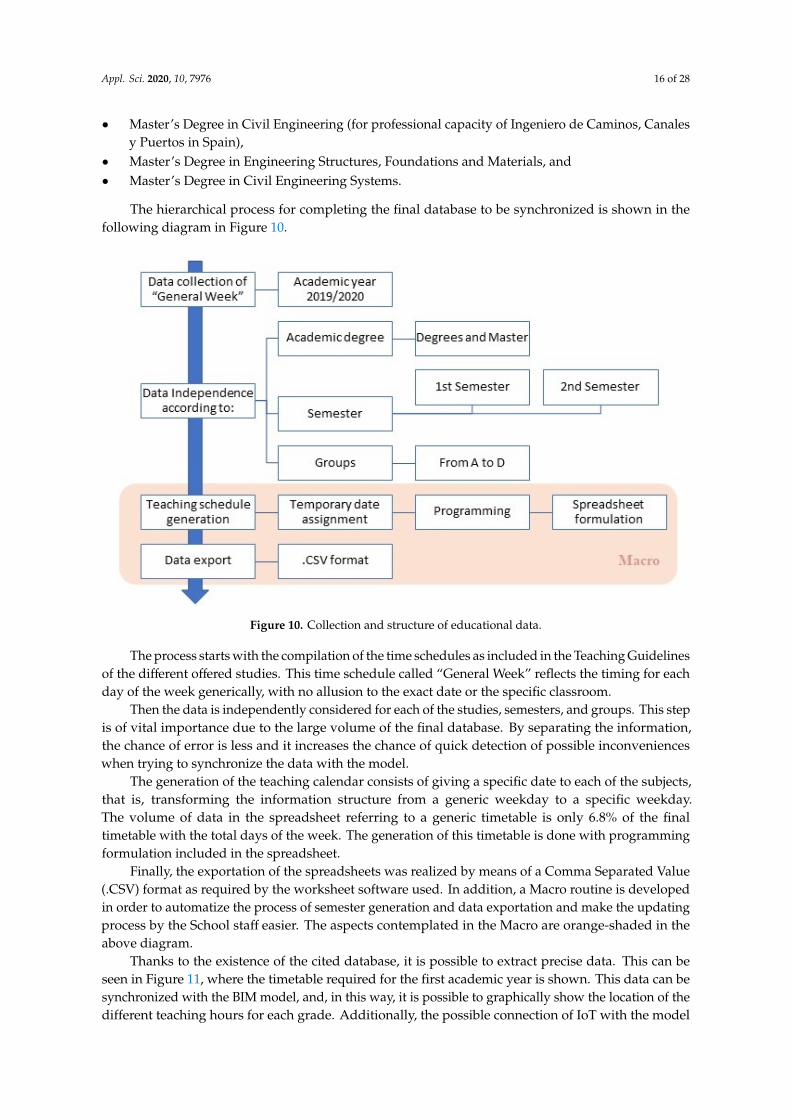
The hierarchical process for completing the final database to be synchronized is shown in thefollowing diagram in Figure 10.Appl. Sci. 2020, 10, x FOR PEER REVIEW 17 of 29
Figure 10. Collection and structure of educational data.
The process starts with the compilation of the time schedules as included in the Teaching Guidelines of the different offered studies. This time schedule called “General Week” reflects the timing for each day of the week generically, with no allusion to the exact date or the specific classroom.
Then the data is independently considered for each of the studies, semesters, and groups. This step is of vital importance due to the large volume of the final database. By separating the information, the chance of error is less and it increases the chance of quick detection of possible inconveniences when trying to synchronize the data with the model.
The generation of the teaching calendar consists of giving a specific date to each of the subjects, that is, transforming the information structure from a generic weekday to a specific weekday. The volume of data in the spreadsheet referring to a generic timetable is only 6.8% of the final timetable with the total days of the week. The generation of this timetable is done with programming formulation included in the spreadsheet.
Finally, the exportation of the spreadsheets was realized by means of a Comma Separated Value (.CSV) format as required by the worksheet software used. In addition, a Macro routine is developed in order to automatize the process of semester generation and data exportation and make the updating process by the School staff easier. The aspects contemplated in the Macro are orange-shaded in the above diagram.
Thanks to the existence of the cited database, it is possible to extract precise data. This can be seen in Figure 11, where the timetable required for the first academic year is shown. This data can be synchronized with the BIM model, and, in this way, it is possible to graphically show the location of the different teaching hours for each grade. Additionally, the possible connection of IoT with the model allows the incorporation of real-time information and gives a permanent updating of the database. IoT in BIM entails real time data information. The data flow starts from IP video cameras, counting entrances and exits of people from each room, as well as reporting humidity and temperature, by sending the captured data to the SQL database, which is in constant synchronization with the BIM model.
Figure 10. Collection and structure of educational data.
The process starts with the compilation of the time schedules as included in the Teaching Guidelinesof the different offered studies. This time schedule called “General Week” reflects the timing for eachday of the week generically, with no allusion to the exact date or the specific classroom.
Then the data is independently considered for each of the studies, semesters, and groups. This stepis of vital importance due to the large volume of the final database. By separating the information,the chance of error is less and it increases the chance of quick detection of possible inconvenienceswhen trying to synchronize the data with the model.
The generation of the teaching calendar consists of giving a specific date to each of the subjects,that is, transforming the information structure from a generic weekday to a specific weekday.The volume of data in the spreadsheet referring to a generic timetable is only 6.8% of the finaltimetable with the total days of the week. The generation of this timetable is done with programmingformulation included in the spreadsheet.
Finally, the exportation of the spreadsheets was realized by means of a Comma Separated Value(.CSV) format as required by the worksheet software used. In addition, a Macro routine is developedin order to automatize the process of semester generation and data exportation and make the updatingprocess by the School staff easier. The aspects contemplated in the Macro are orange-shaded in theabove diagram.
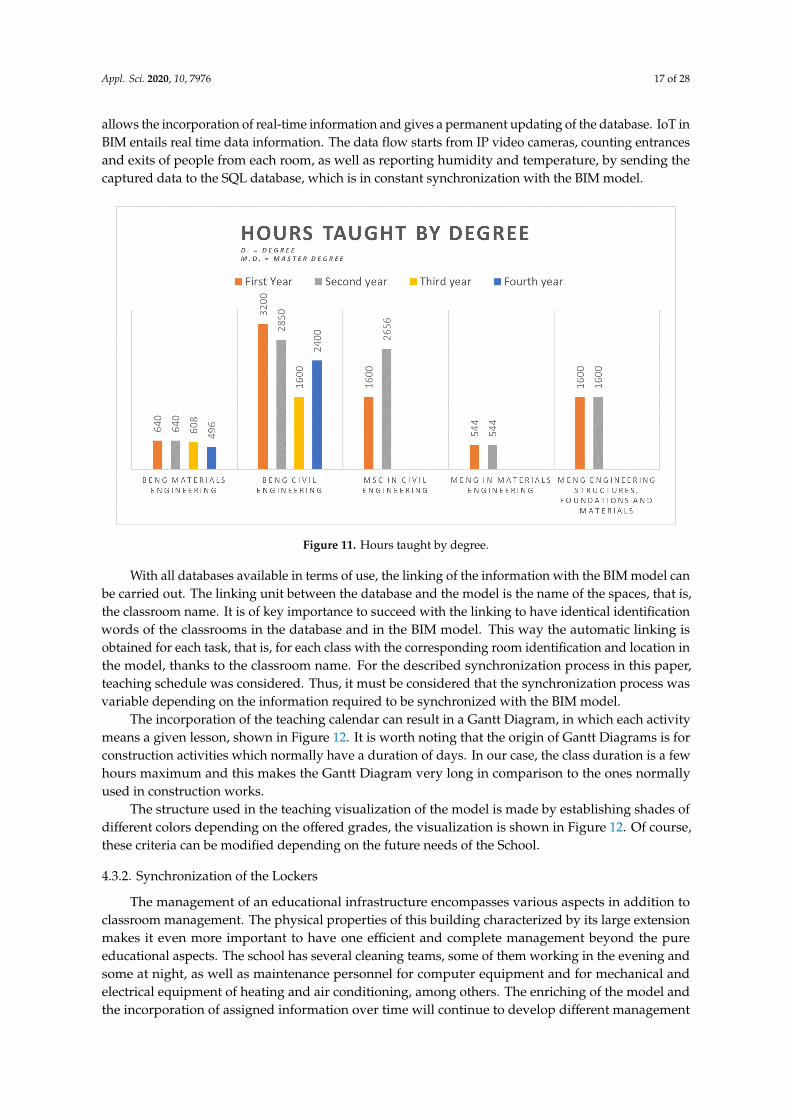
Thanks to the existence of the cited database, it is possible to extract precise data. This can beseen in Figure 11, where the timetable required for the first academic year is shown. This data can besynchronized with the BIM model, and, in this way, it is possible to graphically show the location of thedifferent teaching hours for each grade. Additionally, the possible connection of IoT with the model
Appl. Sci. 2020, 10, 7976 17 of 28
allows the incorporation of real-time information and gives a permanent updating of the database. IoT inBIM entails real time data information. The data flow starts from IP video cameras, counting entrancesand exits of people from each room, as well as reporting humidity and temperature, by sending thecaptured data to the SQL database, which is in constant synchronization with the BIM model.
Figure 11. Hours taught by degree.
With all databases available in terms of use, the linking of the information with the BIM model canbe carried out. The linking unit between the database and the model is the name of the spaces, that is,the classroom name. It is of key importance to succeed with the linking to have identical identificationwords of the classrooms in the database and in the BIM model. This way the automatic linking isobtained for each task, that is, for each class with the corresponding room identification and location inthe model, thanks to the classroom name. For the described synchronization process in this paper,teaching schedule was considered. Thus, it must be considered that the synchronization process wasvariable depending on the information required to be synchronized with the BIM model.
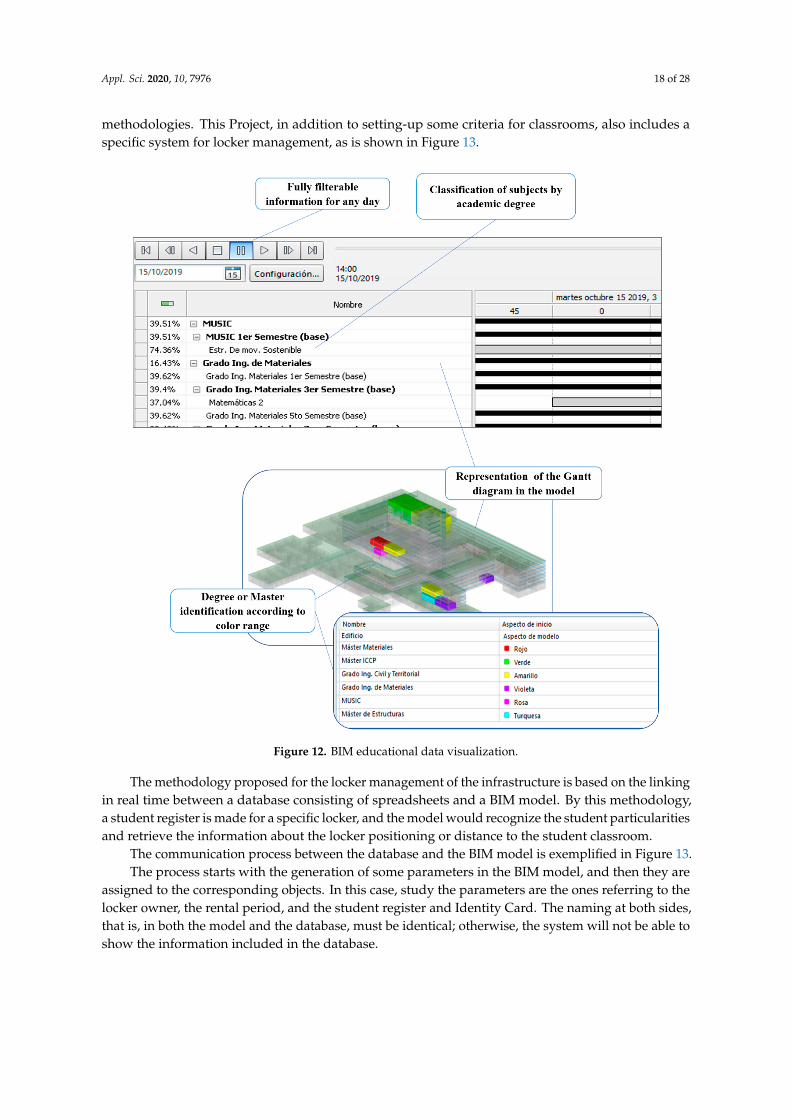
The incorporation of the teaching calendar can result in a Gantt Diagram, in which each activitymeans a given lesson, shown in Figure 12. It is worth noting that the origin of Gantt Diagrams is forconstruction activities which normally have a duration of days. In our case, the class duration is a fewhours maximum and this makes the Gantt Diagram very long in comparison to the ones normallyused in construction works.
The structure used in the teaching visualization of the model is made by establishing shades ofdifferent colors depending on the offered grades, the visualization is shown in Figure 12. Of course,these criteria can be modified depending on the future needs of the School.
4.3.2. Synchronization of the Lockers
The management of an educational infrastructure encompasses various aspects in addition toclassroom management. The physical properties of this building characterized by its large extensionmakes it even more important to have one efficient and complete management beyond the pureeducational aspects. The school has several cleaning teams, some of them working in the evening andsome at night, as well as maintenance personnel for computer equipment and for mechanical andelectrical equipment of heating and air conditioning, among others. The enriching of the model andthe incorporation of assigned information over time will continue to develop different management
Appl. Sci. 2020, 10, 7976 18 of 28
methodologies. This Project, in addition to setting-up some criteria for classrooms, also includes aspecific system for locker management, as is shown in Figure 13.
Figure 12. BIM educational data visualization.
The methodology proposed for the locker management of the infrastructure is based on the linkingin real time between a database consisting of spreadsheets and a BIM model. By this methodology,a student register is made for a specific locker, and the model would recognize the student particularitiesand retrieve the information about the locker positioning or distance to the student classroom.
The communication process between the database and the BIM model is exemplified in Figure 13.The process starts with the generation of some parameters in the BIM model, and then they are
assigned to the corresponding objects. In this case, study the parameters are the ones referring to thelocker owner, the rental period, and the student register and Identity Card. The naming at both sides,that is, in both the model and the database, must be identical; otherwise, the system will not be able toshow the information included in the database.

Appl. Sci. 2020, 10, 7976 19 of 28
Appl. Sci. 2020, 10, x FOR PEER REVIEW 20 of 29
Figure 13. Dynamo lockers parameters programming.
The methodology proposed for the locker management of the infrastructure is based on the linking in real time between a database consisting of spreadsheets and a BIM model. By this methodology, a student register is made for a specific locker, and the model would recognize the student particularities and retrieve the information about the locker positioning or distance to the student classroom.
The communication process between the database and the BIM model is exemplified in Figure 13.
The process starts with the generation of some parameters in the BIM model, and then they are assigned to the corresponding objects. In this case, study the parameters are the ones referring to the locker owner, the rental period, and the student register and Identity Card. The naming at both sides, that is, in both the model and the database, must be identical; otherwise, the system will not be able to show the information included in the database.
The linking in real time of the database and the BIM model is achieved by means of Dynamo programming that allows the possibility of detecting the database, reading the information and
Figure 13. Dynamo lockers parameters programming.
The linking in real time of the database and the BIM model is achieved by means of Dynamoprogramming that allows the possibility of detecting the database, reading the information andassigning it to the pertinent object. The communication is bi-directional so that the modificationsmade in the model are automatically reflected in the database, and vice-versa. Dynamo permitted thesynchronization of the locker information in datasheets with the model. Some further programmingby means of C# and python was performed in order to synchronize other features of the model.
The original idea of the locker management is based on the filling of the database by the competentstaff personnel of the school but there are modifications leading to a higher efficiency of the systemthanks to the database used. The spreadsheet used for the locker registration can be connected to aweb environment accessible to all students, thereby allowing on-line registration that is in real timeand instantly reflected in the BIM model.
Appl. Sci. 2020, 10, 7976 20 of 28
4.3.3. 3-D Scanning
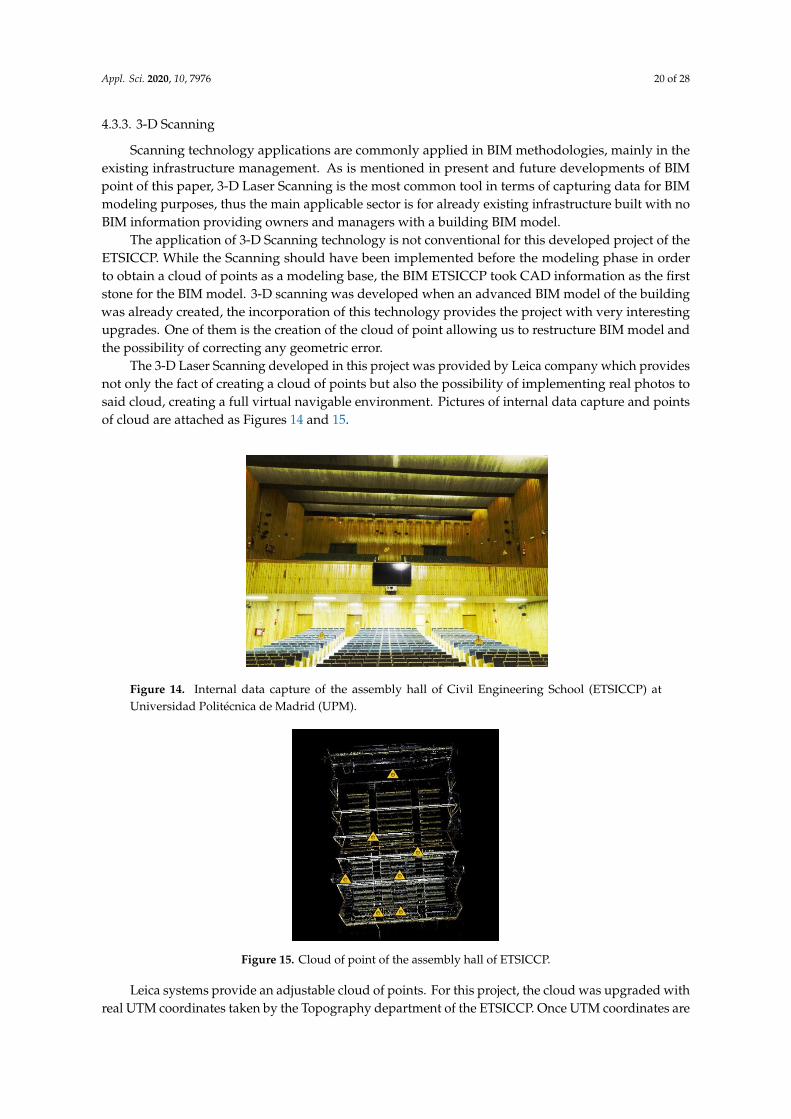
Scanning technology applications are commonly applied in BIM methodologies, mainly in theexisting infrastructure management. As is mentioned in present and future developments of BIMpoint of this paper, 3-D Laser Scanning is the most common tool in terms of capturing data for BIMmodeling purposes, thus the main applicable sector is for already existing infrastructure built with noBIM information providing owners and managers with a building BIM model.
The application of 3-D Scanning technology is not conventional for this developed project of theETSICCP. While the Scanning should have been implemented before the modeling phase in orderto obtain a cloud of points as a modeling base, the BIM ETSICCP took CAD information as the firststone for the BIM model. 3-D scanning was developed when an advanced BIM model of the buildingwas already created, the incorporation of this technology provides the project with very interestingupgrades. One of them is the creation of the cloud of point allowing us to restructure BIM model andthe possibility of correcting any geometric error.
The 3-D Laser Scanning developed in this project was provided by Leica company which providesnot only the fact of creating a cloud of points but also the possibility of implementing real photos tosaid cloud, creating a full virtual navigable environment. Pictures of internal data capture and pointsof cloud are attached as Figures 14 and 15.
Appl. Sci. 2020, 10, x FOR PEER REVIEW 21 of 29
assigning it to the pertinent object. The communication is bi-directional so that the modifications made in the model are automatically reflected in the database, and vice-versa. Dynamo permitted the synchronization of the locker information in datasheets with the model. Some further programming by means of C# and python was performed in order to synchronize other features of the model.
The original idea of the locker management is based on the filling of the database by the competent staff personnel of the school but there are modifications leading to a higher efficiency of the system thanks to the database used. The spreadsheet used for the locker registration can be connected to a web environment accessible to all students, thereby allowing on-line registration that is in real time and instantly reflected in the BIM model.
4.3.3. 3-D Scanning
Scanning technology applications are commonly applied in BIM methodologies, mainly in the existing infrastructure management. As is mentioned in present and future developments of BIM point of this paper, 3-D Laser Scanning is the most common tool in terms of capturing data for BIM modeling purposes, thus the main applicable sector is for already existing infrastructure built with no BIM information providing owners and managers with a building BIM model.
The application of 3-D Scanning technology is not conventional for this developed project of the ETSICCP. While the Scanning should have been implemented before the modeling phase in order to obtain a cloud of points as a modeling base, the BIM ETSICCP took CAD information as the first stone for the BIM model. 3-D scanning was developed when an advanced BIM model of the building was already created, the incorporation of this technology provides the project with very interesting upgrades. One of them is the creation of the cloud of point allowing us to restructure BIM model and the possibility of correcting any geometric error.
The 3-D Laser Scanning developed in this project was provided by Leica company which provides not only the fact of creating a cloud of points but also the possibility of implementing real photos to said cloud, creating a full virtual navigable environment. Pictures of internal data capture and points of cloud are attached as Figures 14 and 15.
Figure 14. Internal data capture of the assembly hall of Civil Engineering School (ETSICCP) at Universidad Politécnica de Madrid (UPM). Figure 14. Internal data capture of the assembly hall of Civil Engineering School (ETSICCP) atUniversidad Politécnica de Madrid (UPM).Appl. Sci. 2020, 10, x FOR PEER REVIEW 22 of 29
Figure 15. Cloud of point of the assembly hall of ETSICCP.
Leica systems provide an adjustable cloud of points. For this project, the cloud was upgraded with real UTM coordinates taken by the Topography department of the ETSICCP. Once UTM coordinates are registered, the UTM coordinate is assigned to different points of the cloud, and the Leica software system automatically autocorrects the position of the total cloud of points, locating all the infrastructure in a real placement. With this implementation, we open the path of incorporating the ETSICCP infrastructure to developed technologies, like Google maps, joining street view with internal infrastructure paths.
5. Discussion
Public institutions make efforts to improve the quality and efficiency of their management. Even traditional techniques based on paper formats are used in many cases. Little improvements implementing technologies, such as identification systems or real time data, have been carried out in the previous years. This BIM-FM system is available and accessible for all infrastructure staff and users. A single management system allows managing rooms, equipment, or climatic conditions. It should be mentioned that the sensors to monitor temperature, humidity and occupation are not still placed in all the rooms, though the BIM-FM has been designed to do so and supports this possibility. This has been achieved and checked through prototypes and the overall implementation depend on future investments of the university. BIM-FM has also solved other problems, such as the interoperability, accessibility, integrity, and high initial investments. This integral solution goes one step beyond the current management techniques.
Smart campus is a general concept, without a single process to reach it. The methodology adopted by this project entailed the BIM implementation. This showed several pros and cons that are discussed in this section.
The paper gathers the first steps of applying several emerging technologies in order to achieve the smart campus category. These steps are the final phase of a process that transforms a traditional campus into an intelligent one. The process has three stages: traditional campus, e-campus, and digital campus as the final phase [86].
The starting point of the project, and according to literature review, is the traditional Campus management systems. Later, in the third phase, the project considers technologies, such as IoT [86–89,94,96,97], RFID [86,89–95], or sensor applications [88,89,95,97–99]. However, the implementation of BIM, together with the mentioned technologies, could notably improve the profits related to other technologies, such as energy management [88], reductions of electricity costs [89], management of university assets [89], or provide an information map of the campus for location purposes [89].
Considering BIM as a virtual representation of all the elements of the infrastructure throughout their lifecycle or BIM as a central point of information storage [3,5–7] and through synchronization with other technologies, it could reach an advanced smart campus concept.
IoT or sensor implementation without BIM may provide real-time information in different databases formats. However, IoT and sensors, together with BIM-FM, can be synchronized and
Figure 15. Cloud of point of the assembly hall of ETSICCP.
Leica systems provide an adjustable cloud of points. For this project, the cloud was upgraded withreal UTM coordinates taken by the Topography department of the ETSICCP. Once UTM coordinates are
Appl. Sci. 2020, 10, 7976 21 of 28
registered, the UTM coordinate is assigned to different points of the cloud, and the Leica software systemautomatically autocorrects the position of the total cloud of points, locating all the infrastructure in a realplacement. With this implementation, we open the path of incorporating the ETSICCP infrastructureto developed technologies, like Google maps, joining street view with internal infrastructure paths.
5. Discussion
Public institutions make efforts to improve the quality and efficiency of their management.Even traditional techniques based on paper formats are used in many cases. Little improvementsimplementing technologies, such as identification systems or real time data, have been carried out inthe previous years. This BIM-FM system is available and accessible for all infrastructure staff and users.A single management system allows managing rooms, equipment, or climatic conditions. It should bementioned that the sensors to monitor temperature, humidity and occupation are not still placed inall the rooms, though the BIM-FM has been designed to do so and supports this possibility. This hasbeen achieved and checked through prototypes and the overall implementation depend on futureinvestments of the university. BIM-FM has also solved other problems, such as the interoperability,accessibility, integrity, and high initial investments. This integral solution goes one step beyond thecurrent management techniques.
Smart campus is a general concept, without a single process to reach it. The methodology adoptedby this project entailed the BIM implementation. This showed several pros and cons that are discussedin this section.
The paper gathers the first steps of applying several emerging technologies in order to achievethe smart campus category. These steps are the final phase of a process that transforms a traditionalcampus into an intelligent one. The process has three stages: traditional campus, e-campus, and digitalcampus as the final phase [86].
The starting point of the project, and according to literature review, is the traditional Campusmanagement systems. Later, in the third phase, the project considers technologies, such as IoT [86–89,94,96,97],RFID [86,89–95], or sensor applications [88,89,95,97–99]. However, the implementation of BIM, togetherwith the mentioned technologies, could notably improve the profits related to other technologies, suchas energy management [88], reductions of electricity costs [89], management of university assets [89],or provide an information map of the campus for location purposes [89].
Considering BIM as a virtual representation of all the elements of the infrastructure throughouttheir lifecycle or BIM as a central point of information storage [3,5–7] and through synchronizationwith other technologies, it could reach an advanced smart campus concept.
IoT or sensor implementation without BIM may provide real-time information in differentdatabases formats. However, IoT and sensors, together with BIM-FM, can be synchronized andprovide real-time information not only in database formats but can also reflect all the informationto each infrastructure element providing the user with a total visualization. Real-time occupationin this project is registered by sensors and the data is sent to a SQL database. With the BIM-FMmethodology, the institution offers the users a range of colors applied to a floor plan to easily locatethis real-time occupation.
Managing the university assets by RFID is one of the most common practices in the universityenvironment. However, the proposal of this study was to manage the university assets throughthe BIM model, showing remarkable benefits. In this case, all assets are located and boast detailedgeometry and special characteristics. Moreover, the visualization of the environment, allowed by themodel, simplifies the use of the tool. This permits interaction with all the infrastructure elements andcharacteristics or the parameters could be consulted.
Additionally, BIM-FM implementation is a complex process that demands the virtual constructionof a BIM model. Moreover, BIM information formats attach multiple problems in terms ofinteroperability and the sector demands international standards, such as the Construction OperationsBuilding Information Exchange (COBIE) standard [3]. Other challenges and drawbacks of the BIM-FM

Appl. Sci. 2020, 10, 7976 22 of 28
implementation are the legal issues related to responsibilities or confidential information in the totalcollaborative environment established in BIM [102,103].
6. Conclusions
This project developed a new BIM-based FM system for ETSICCP. As a result of the research,a complete BIM model was performed, hosting all the parameters associated with day-to-daymanagement tasks. The BIM-FM system enables the management of classrooms, sport facilities,locker assignment, or any location information. This management encompasses the possibility ofmaking reservations, placing academic scheduling, reading temperature and humidity, reveal sittingcapacity, or showing equipment maintenance. For that purpose, new software was developed, allowingthe interaction of the BIM model, through use of sensors and SQL databases. Both the model and itsmanagement software are hosted in a public server with total accessibility through an internet webpage. The BIM-FM system supports the possibility to update real-time information from sensors thatcan monitor temperature, humidity, occupation, and any other information that sensors may providein the future.
The development of this project under the BIM-EDU concept opens up the research path onBIM-based educational management holding concepts related to either pure infrastructure managementor to educational terms. Moreover, implementing a new detailed BIM management system involvesmany challenges in order to achieve the completion with total success. Both the Social implementationprocess which deals with barriers, such as lack of software skills, and the resistance of changing worktraditional methodologies stand out. In this sense, the main purpose of this research was to make theBIM management benefits accessible for all entities involved within the infrastructure management,even without any BIM skills.
As a result of the project, BIM model has been developed considering open mind properties interms of adding new outstanding technologies, such as Big Data and IoT. Synchronizing real time datawith a 3-D model of the infrastructure, as well as the possibility of saving historical information intoa Big database, are the main targets of the project. A huge amount of data to be managed could beexpected not only given the large size of the infrastructure but also given those real-time informationdemands. In that regard, spreadsheets as a database management were not considered efficient enough.Therefore, Big Data technologies, like SQL databases, were used because they allow this possibility.
However, not only social barriers have been found, but programming aspects related to fileformats have also been detected. Furthermore, BIM modeling software boasts many peculiarities interms of object properties that could directly affect the extracted data.
Overcoming those social and computer science challenges could be possible, thanks to BIMmodeling, making the management of educational infrastructure much more efficient. Those detailedfacts are quite common in the literature review for this project. A specific review for BIM environmentis attached to the paper. Starting with standard definitions and applications of BIM provided bypublished research and expanding into the pure management BIM concept and new technologiessynchronized with BIM, such as IoT and GIS.
Overall, literature review and research experience have many common points related to barriersfor BIM implementation. Once those barriers were overcome, BIM management system provides ahighly efficient operation and a more productive information flow for all the members associated withthe infrastructure handling, especially in complex buildings, like university venues. Moreover, futuredevelopments, such as management protocols against COVID-19, could be implemented. Thanks to thenew management tools, management staff could handle all spaces and internal movements, thanks toBIM model and BIG DATA databases.
In this study, BIM-FM was applied in new and broader ways for educational management,showing multiple benefits for future applications. Collecting and registering information in digitalformat is one of the most important gains attained, making the information for users or managementstaff more accessible. Another outstanding advantage is providing the ETSICCP with the BIM model.
Appl. Sci. 2020, 10, 7976 23 of 28
As a living organism where live scheduling information is given graphically, the model provides a greatnumber of possibilities. This allows the management staff to manage the availability of a wide amountof spaces along the building or the cleaning protocols in a more efficient way. The large amount ofdetail in the model of the elements and parameters, i.e., connection box, capacity, air conditioning,or projector characteristics, which are detailed for each space and official documents attached to thewebsite allow the lecturers to select the optimal space considering significantly more variables thanwith the traditional methods. Moreover, with the current COVID situation, digital and real timeinformation can be of greater significance than in previous circumstances. BIM model, as the key pointof the management methodology, provides detailed geometric information and allows the user toshow real time data in a graphical way. Reducing the use of paper format, tracking down energeticconsumption, and online FM were the outstanding points detailed for the management staff. It isimportant to highlight that a BIM methodology implementation demands training in BIM and softwareskills for the staff and the rest of the users. However, in this study, a total accessible internet webpagehosts all BIM information. Thus, no training is required. This turns the proposed methodology intothe first BIM methodology with total accessibility and with the minimum social barriers related toits implementation.
Author Contributions: Conceptualization, M.G.A. and A.A.A.A.; Data curation, R.M.P. and A.A.A.A.; Formalanalysis, R.M.P. and M.G.A.; Funding acquisition, M.G.A. and A.A.A.A.; Investigation, R.M.P., A.A.A.A. andM.G.A.; Methodology, M.G.A.; Project administration, M.G.A. and A.A.A.A.; Resources, M.G.A. and A.A.A.A.;Software, R.M.P. and A.A.A.A.; Supervision, M.G.A.; Validation, M.G.A.; Visualization, R.M.P.; Writing—originaldraft, R.M.P. and A.A.A.A.; Writing—review & editing, M.G.A. All authors have read and agreed to the publishedversion of the manuscript.
Funding: The APC was funded by the UPM through the Educational Innovation Project IE1920.0409.
Acknowledgments: The authors gratefully acknowledge the financial support provided by the Ministry ofEconomy, Industry and Competitiveness of Spain by means of the Research Fund Project PID2019-108978RB-C31.They also offer their gratitude to the “Colegio de Ingenieros de Caminos, Canales y Puertos” by awarding thisFinal Master Thesis as the most innovative project in the national contest of 2019. Authors also acknowledge thesupport provided by the UPM through the Educational Innovation Project IE1920.0409, as well as the support ofthe Leadership Team of the ETSICCP.
Conflicts of Interest: The authors declare no conflict of interest.
References
1. Liu, X.; Eybpoosh, M.; Akinci, B. Developing as-built building information model using construction processhistory captured by a laser scanner and a camera. In Proceedings of the Construction Research Congress2012: Construction Challenges in a Flat World, West Lafayette, IN, USA, 21–23 May 2012; pp. 1232–1241.
2. Akbarnezhad, A.; Ong, K.C.G.; Chandra, L.R. Economic and environmental assessment of deconstructionstrategies using building information modeling. Autom. Constr. 2014, 37, 131–144. [CrossRef]
3. Wang, X. BIM Handbook: A guide to Building Information Modeling for owners, managers, designers,engineers and contractors. Constr. Econ. Build. 2012, 12, 101–102. [CrossRef]
4. Tang, P.; Huber, D.; Akinci, B.; Lipman, R.; Lytle, A. Automatic reconstruction of as-built building informationmodels from laser-scanned point clouds: A review of related techniques. Autom. Constr. 2010, 19, 829–843.[CrossRef]
5. Watson, A. Digital buildings—Challenges and opportunities. Adv. Eng. Inform. 2011, 25, 573–581. [CrossRef]6. Redmond, A.; Hore, A.; Alshawi, M.; West, R. Exploring how information exchanges can be enhanced
through Cloud BIM. Autom. Constr. 2012, 24, 175–183. [CrossRef]7. Donath, D. Bauaufnahme und Planung im Bestand; Vieweg+Teubner: Wiesbaden, Germany, 2009.8. Costin, A.; Adibfar, A.; Hu, H.; Chen, S.S. Building Information Modeling (BIM) for transportation
infrastructure—Literature review, applications, challenges, and recommendations. Autom. Constr. 2018, 94,257–281. [CrossRef]
9. MacLeamy, P. MacLeamy Curve Time/Schedule. In Collaboration, Integrated Information, and the Project Lifecyclein Building Design, Construction and Operation; Construction Users Roundtable (CURT): Cincinnati, OH, USA,2004.
Appl. Sci. 2020, 10, 7976 24 of 28
10. Dave, B.; Buda, A.; Nurminen, A.; Främling, K. A framework for integrating BIM and IoT through openstandards. Autom. Constr. 2018, 95, 35–45. [CrossRef]
11. Dave, B.; Kubler, S.; Främling, K.; Koskela, L. Opportunities for enhanced lean construction managementusing Internet of Things standards. Autom. Constr. 2016, 61, 86–97. [CrossRef]
12. Teizer, J.; Wolf, M.; Golovina, O.; Perschewski, M.; Propach, M.; Neges, M.; König, M. Internet of Things (IoT)for integrating environmental and localization data in Building Information Modeling (BIM). In Proceedingsof the 34th International Symposium on Automation and Robotics in Construction (ISARC 2017), Taipei,Taiwan, 28 June–1 July 2017; pp. 603–609.
13. Adamkó, A.; Kádek, T.; Kósa, M. Intelligent and adaptive services for a smart campus. In Proceedings of the5th IEEE International Conference on Cognitive Infocommunications, Vietri sul Mare, Italy, 5–7 November2014; pp. 505–509.
14. Gray, M.; Gray, J.; Teo, M.; Chi, S.; Cheung, F. Building Information Modelling: An international survey.In Proceedings of the 19th International CIB World Building Congress, Brisbane, Australia, 5–9 May 2013;pp. 5–9.
15. Gu, N.; London, K. Understanding and facilitating BIM adoption in the AEC industry. Autom. Constr. 2010,19, 988–999. [CrossRef]
16. Cerovsek, T. A review and outlook for a “Building Information Model” (BIM): A multi-standpoint frameworkfor technological development. Adv. Eng. Inform. 2011, 25, 224–244. [CrossRef]
17. Wong, J.; Yang, J. Research and application of Building Information Modelling (BIM) in the Architecture,Engineering and Construction (AEC) industry: A review and direction for future research. In Proceedingsof the 6th International Conference on Innovation in Architecture, Engineering and Construction (AEC),Loughborough, UK, 9–11 June 2010; pp. 356–365.
18. Rezgui, Y.; Beach, T.; Rana, O. A governance approach for BIM management across lifecycle and supplychains using mixed-modes of information delivery. J. Civ. Eng. Manag. 2013, 19, 239–258. [CrossRef]
19. Becerik-Gerber, B.; Jazizadeh, F.; Li, N.; Calis, G. Application areas and data requirements for BIM-enabledfacilities management. J. Constr. Eng. Manag. 2012, 138, 431–442. [CrossRef]
20. Arayici, Y. Towards building information modelling for existing structures. Struct. Surv. 2008, 26, 210–222.[CrossRef]
21. Akcamete, A.; Akinci, B.; Garrett, J.H. Potential utilization of building information models for planningmaintenance activities. In Proceedings of the 13th International Conference on Computing in Civil andBuilding Engineering (ICCCBE 2010), Nottingham, UK, 30 June–2 July 2010.
22. Bae, A.; Lee, D.; Park, B. Building information modeling utilization for optimizing milling quantity and hotmix asphalt pavement overlay quality. Can. J. Civ. Eng. 2016, 43, 886–896. [CrossRef]
23. Chong, H.Y.; Lopez, R.; Wang, J.; Wang, X.; Zhao, Z. Comparative analysis on the adoption and use of BIM inroad infrastructure projects. J. Manag. Eng. 2016, 32, 05016021. [CrossRef]
24. Kim, J.U.; Kim, Y.J.; Ok, H.; Yang, S.H. A study on the status of infrastructure BIM and BIM library development.In Proceedings of the 2015 International Conference on Computational Science and Computational Intelligence,Las Vegas, NV, USA, 7–9 December 2015; pp. 857–858.
25. Organization and Digitization of Information about Buildings and Civil Engineering Works, Including BuildingInformation Modelling (bim)—Information Management Using Building Information Modelling. Part I: Concepts andPrinciples; UNE ISO 19650-1; International Organization for Standardization (ISO): Geneva, Switzerland, 2020.
26. Organization and Digitization of Information about Buildings and Civil Engineering Works, Including BuildingInformation Modelling (BIM)—Information Management Using Building Information Modelling. Part II: AssetDevelopment Phase; UNE ISO 19650-2; International Organization for Standardization (ISO): Geneva,Switzerland, 2019.
27. Boukamp, F.; Akinci, B. Automated processing of construction specifications to support inspection andquality control. Autom. Constr. 2007, 17, 90–106. [CrossRef]
28. Akinci, B.; Boukamp, F.; Gordon, C.; Huber, D.; Lyons, C.; Park, K. A formalism for utilization of sensorsystems and integrated project models for active construction quality control. Autom. Constr. 2006, 15,124–138. [CrossRef]
29. Cho, Y.K.; Alaskar, S.; Bode, T.A. BIM-integrated sustainable material and renewable energy simulation.In Proceedings of the Construction Research Congress 2010: Innovation for Reshaping Construction Practice,Banff, AB, Canada, 8–10 May 2010; pp. 288–297.

Appl. Sci. 2020, 10, 7976 25 of 28
30. Anjomshoaa, A. Blending building information with smart city data. In S4SC’14: Proceedings of the FifthInternational Conference on Semantics for Smarter Cities; CEUR-WS.org: Aachen, Germany, 2014.
31. Döllner, J.; Hagedorn, B. Integrating urban GIS, CAD, and BIM data by service-based virtual 3D city models.In Urban and Regional Data Management—UDMS Annual 2007; Taylor & Francis: Milton Park, UK, 2008;pp. 157–170.
32. Aziz, Z.; Riaz, Z.; Arslan, M. Leveraging BIM and Big Data to deliver well maintained highways. Facilities2017, 35, 818–832. [CrossRef]
33. Nguyen, H.T. Integration of BIM and IoT to improve the building performance for occupants’ perspective.J. 3D Inf. Model. 2016, 1, 100. [CrossRef]
34. McGibney, A.; Rea, S.; Ploennigs, J. Open BMS—IoT driven architecture for the internet of buildings.In Proceedings of the IECON Proceedings (Industrial Electronics Conference), Florence, Italy, 24–27 October2016; pp. 7071–7076.
35. Carrillo, E.; Benitez, V.; Mendoza, C.; Pacheco, J. IoT framework for smart buildings with cloud computing.In Proceedings of the 2015 IEEE 1st International Smart Cities Conference (ISC2 2015), Guadalajara, JA,Mexico, 25–28 October 2015.
36. Blackstock, M.; Lea, R. Toward interoperability in a web of things. In Proceedings of the UbiComp 2013Adjunct—Adjunct Publication of the 2013 ACM Conference on Ubiquitous Computing, Zurich, Switzerland,8–12 September 2013; pp. 1565–1574.
37. Framling, K.; Kubler, S.; Buda, A. Universal messaging standards for the IoT from a lifecycle managementperspective. IEEE Internet Things J. 2014, 1, 319–327. [CrossRef]
38. Manning, R.; Messner, J.I. Case studies in BIM implementation for programming of healthcare facilities.Electron. J. Inf. Technol. Constr. 2008, 13, 446–457.
39. Davies, R.; Harty, C. Implementing “site BIM”: A case study of ICT innovation on a large hospital project.Autom. Constr. 2013, 30, 15–24. [CrossRef]
40. Nicolle, C.; Cruz, C. Semantic Building Information Model and multimedia for facility management.In International Conference on Web Information Systems and Technologies; Lecture Notes in Business InformationProcessing; Springer: Berlin, Germany, 2011; Volume 75, pp. 14–29.
41. Sabol, L. Building Information modeling & facility management. In Proceedings of the 29th IFMA’s WorldWorkplace Conference, Dallas, TX, USA, 15–17 October 2008.
42. Lucas, J.; Bulbul, T.; Thabet, W. An object-oriented model to support healthcare facility informationmanagement. Autom. Constr. 2013, 31, 281–291. [CrossRef]
43. Wang, Y.; Wang, X.; Wang, J.; Yung, P.; Jun, G. Engagement of facilities management in design stage throughBIM: Framework and a case study. Adv. Civ. Eng. 2013, 2013. [CrossRef]
44. Valero, E.; Adan, A.; Huber, D.; Cerrada, C. Detection, modeling and classification of moldings for automatedreverse engineering of buildings from 3D data. In Proceedings of the 28th International Symposium onAutomation and Robotics in Construction (ISARC 2011), Seoul, Korea, 29 June–2 July 2011; pp. 546–551.
45. Huber, D.; Akinci, B.; Adan, A.; Anil, E.B.; Okorn, B.; Xiong, X. Methods for automatically modeling andrepresenting as-built building information models. In Proceedings of the NSF Engineering Research andInnovation Conference, Atlanta, GA, USA, 1 January 2011.
46. Xiong, X.; Huber, D. Using context to create semantic 3D models of indoor environments. In Proceedings ofthe British Machine Vision Conference (BMVC 2010), Aberystwyth, UK, 30 August–2 September 2010.
47. Xiong, X.; Adan, A.; Akinci, B.; Huber, D. Automatic creation of semantically rich 3D building models fromlaser scanner data. Autom. Constr. 2013, 31, 325–337. [CrossRef]
48. Hajian, H.; Becerik-Gerber, B. Scan to BIM: Factors affecting operational and computational errors andproductivity loss. In Proceedings of the 27th International Symposium on Automation and Robotics inConstruction (ISARC 2010), Bratislava, Slovakia, 25–27 June 2010; pp. 265–272.
49. Bhatla, A.; Choe, S.Y.; Fierro, O.; Leite, F. Evaluation of accuracy of as-built 3D modeling from photos takenby handheld digital cameras. Autom. Constr. 2012, 28, 116–127. [CrossRef]
50. Bernardini, F.; Rushmeier, H.; Martin, I.M.; Mittleman, J.; Taubin, G. Building a digital model of Michelangelo’sFlorentine Pieta. IEEE Comput. Graph. Appl. 2002, 22, 59–67. [CrossRef]
51. Reig, I.; Boquera, J.; Expresión, P.E.-E. Basílica de Nuestra Señora de los Desamparados. Reconstruccióngráfica: Levantamiento planimétrico. EGA Rev. Expresión Gráfica Arquit. 1999, 5, 168–173.
Appl. Sci. 2020, 10, 7976 26 of 28
52. Fontana, R.; Greco, M.; Materazzi, M.; Pampaloni, E.; Pezzati, L.; Rocchini, C.; Scopigno, R. Three-dimensionalmodelling of statues: The Minerva of Arezzo. J. Cult. Herit. 2002, 3, 325–331. [CrossRef]
53. Lorenzo, A.P. Obtención del Modelo Tridimensional de Una Pieza de Terracota Mediante Tecnología Láser Escáner3D; Universidad Politécnica de Madrid: Madrid, Spain, 2014.
54. Gaiani, M.; Balzani, M.; Uccelli, F. Reshaping the Coliseum in Rome: An integrated data capture andmodeling method at heritage sites. Comput. Graph. Forum 2000, 19, 369–378. [CrossRef]
55. Pavlidis, G.; Koutsoudis, A.; Arnaoutoglou, F.; Tsioukas, V.; Chamzas, C. Methods for 3D digitization ofCultural Heritage. J. Cult. Herit. 2007, 8, 93–98. [CrossRef]
56. Buill, F.; Andrés, M.N. Aplicación del láser escáner terrestre para levantamientos arquitectónicos, arqueológicosy geotécnicos. Mapping 2008, 124, 46–49.
57. Cano, R.A. Técnicas y Herramientas de Procesamiento de Nubes de Puntos Tridimensionales. Bachelor’sThesis, University Carlos III de Madrid, Getafe, Spain, 19 February 2016.
58. Curless, B.; Levoy, M. Better optical triangulation through spacetime analysis. In Proceedings of the IEEEInternational Conference on Computer Vision, Cambridge, MA, USA, 20–23 June 1995; pp. 987–994.
59. Tsai, R.Y. Efficient and accurate camera calibration technique for 3D machine vision. In Proceedings of theCVPR ’86: IEEE Computer Society Conference on Computer Vision and Pattern Recognition, Miami Beach,FL, USA, 22–26 June 1986; pp. 364–374.
60. Bernardini, F.; Rushmeier, H.E. Strategies for registering range images from unknown camera positions.In Proceedings of the Three-Dimensional Image Capture and Applications III, San Jose, CA, USA,24–25 January 2000; pp. 200–206.
61. Garland, M.; Heckbert, P.S. Surface simplification using quadric error metrics. In Proceedings of the 24thAnnual Conference on Computer Graphics and Interactive Techniques, Los Angeles, CA, USA, 3–8 August1997; pp. 209–216.
62. Tzedaki, V.; Kamara, J.M. Capturing as-built information for a BIM environment using 3D laser scanner: Aprocess model. In Proceedings of the Architectural Engineering Conference 2013, State College, PA, USA,3–5 April 2013; pp. 485–494.
63. Reeder, G.D.; Nelson, G.A. Implementation Manual 3D Engineered Models for Highway Construction: The IowaExperience; Iowa State University: Ames, IA, USA, 2015; ISBN 8004574416.
64. Vick, S.M.; Brilakis, I. A Review of linear transportation construction progress monitoring techniques.In Proceedings of the 16th International Conference on Computing in Civil and Building Engineering, Osaka,Japan, 6–8 July 2016; pp. 1106–1113.
65. Gursel, I.; Sariyildiz, S.; Akin, Ö.; Stouffs, R. Modeling and visualization of lifecycle building performanceassessment. Adv. Eng. Inform. 2009, 23, 396–417. [CrossRef]
66. Breunig, M.; Borrmann, A.; Rank, E.; Hinz, S.; Kolbe, T.; Schilcher, M.; Mundani, R.P.; Jubierre, J.R.;Flurl, M.; Thomsen, A.; et al. Collaborative multi-scale 3D city and infrastructure modeling and simulation.In Proceedings of the Tehran’s Joint ISPRS Conferences of GI Research, SMPR and EOEC 2017, Tehran, Iran,7–10 October 2017; pp. 341–352.
67. Abdelwahab, H. Intelligent design (4D,5D and beyond) for road design and construction projects: Two casestudies. IRF Exam. 2017, 12, 21–25.
68. Young, N.W., Jr.; Jones, S.A.; Bernstein, H.M. Interoperability in the Construction Industry; McGraw HillConstruction: Bedford, MA, USA, 2007.
69. Sadrinooshabadi, S.; Taheri, A. Requirement Management in a Life-Cycle Perspective Using Asset InformationModeling Based on ISO 19650-1 and CoClass. Master’s Thesis, Jönköping University, Jönköping, Sweden,2019.
70. Alashwal, A.; Hamzah, A.R. Developing a Conceptual Framework of Fragmentation in Construction. 2014.Available online: https://www.library.auckland.ac.nz/external/finalproceeding/Files/Papers/46530final00176.pdf (accessed on 1 November 2020).
71. Naghshbandi, S.N. BIM for facility management: Challenges and research gaps. Civ. Eng. J. 2016, 2, 679–684.[CrossRef]
72. Shen, W.; Hao, Q.; Mak, H.; Neelamkavil, J.; Xie, H.; Dickinson, J.; Thomas, R.; Pardasani, A.; Xue, H.Systems integration and collaboration in architecture, engineering, construction, and facilities management:A review. Adv. Eng. Inform. 2010, 24, 196–207. [CrossRef]
Appl. Sci. 2020, 10, 7976 27 of 28
73. Talamo, C.; Bonanomi, M. Knowledge Management and Information Tools for Building Maintenance and FacilityManagement; Springer: Berlin, Germany, 2015; ISBN 9783319239590.
74. Volk, R.; Stengel, J.; Schultmann, F. Building Information Modeling (BIM) for existing buildings—Literaturereview and future needs. Autom. Constr. 2014, 38, 109–127. [CrossRef]
75. Xu, J. Research on application of BIM 5D technology in Central Grand Project. Procedia Eng. 2017, 174,600–610. [CrossRef]
76. Amaro, G.G.; Raimondo, A.; Erba, D. Il BIM per il Fire Engineering e per il Safety Management. Ingenio 2017, 51.77. Bottaccioli, L.; Aliberti, A.; Ugliotti, F.; Patti, E.; Osello, A.; Macii, E.; Acquaviva, A. Building Energy
Modelling and Monitoring by Integration of IoT Devices and Building Information Models. In Proceedingsof the 2017 IEEE 41st Annual Computer Software and Applications Conference (COMPSAC), Turin, Italy,4–8 July 2017; pp. 914–922.
78. Milgram, P.; Takemura, H.; Utsumi, A.; Fumio, K. A class of displays on the reality-virtuality continuum.In Proceedings of the Telemanipulator and Telepresence Technologies, Boston, MA, USA, 21 December 1995;Witmer & Singer: Orlando, FL, USA, 1994; Volume 2351, pp. 282–292.
79. Jensen, P.A. Organisation of facilities management in relation to core business. J. Facil. Manag. 2011, 9, 78–95.[CrossRef]
80. Dewulf, G.; Krumm, P.; Jonge, H. Successful Corporate Real Estate Strategies; Arko Publishers: London, UK,2000; pp. 1–13.
81. Den Heijer, A.; Tzovlas, G. The European Campus. Heritage and Challenges; Delft University of Technology:Delft, The Netherlands, 2014; ISBN 9789081728324.
82. Organisation for Economic Co-operation and Development (OECD). How are Countries around the WorldSupporting Students in Higher Education? Organisation for Economic Co-operation and Development (OECD):Paris, France, 2012.
83. University Herald. Study in Georgia System Shows Vast Underutilization of Classrooms. 2013.Available online: http://www.universityherald.com/articles/3327/20130525/study-georgia-system-shows-vast-underutilization-classrooms.htm (accessed on 1 October 2013).
84. Neary, M.; Harrison, A.; Crellin, G.; Parekh, N.; Saunders, G.; Duggan, F.; Williams, S.; Austin, S. LearningLandscapes in Higher Education: Clearing Pathways, Making Spaces, Involving Academics in the Leadership,Governance and Management of Academic Spaces in Higher Education; University of Lincoln, Centre forEducational Research and Development: Lincoln, UK, 2010.
85. Harrison, A.; Hutton, L. Design for the Changing Educational Landscape: Space, Place and the Future of Learning;Routledge: Abingdon, UK, 2013; Volume 9780203762, ISBN 9780203762653.
86. Nie, X. Research on smart campus based on cloud computing and internet of things. Appl. Mech. Mater.2013, 380–384, 1951–1954. [CrossRef]
87. Liu, Y.L.; Zhang, W.H.; Dong, P. Research on the construction of smart campus based on the internet ofthings and cloud computing. Appl. Mech. Mater. 2014, 543–547, 3213–3217. [CrossRef]
88. Alghamdi, A.; Shetty, S. Survey toward a smart campus using the internet of things. In Proceedings of the2016 IEEE 4th International Conference on Future Internet of Things and Cloud (FiCloud), Vienna, Austria,22–24 August 2016; pp. 235–239.
89. CatA, M. Smart university, a new concept in the Internet of Things. In Proceedings of the 2015 14th RoEduNetInternational Conference—Networking in Education and Research (RoEduNet NER), Craiova, Romania,24–26 September 2015; pp. 195–197.
90. Rehman, A.U.; Abbasi, A.Z.; Shaikh, Z.A. Building a smart university using RFID technology. In Proceedingsof the 2008 International Conference on Computer Science and Software Engineering, Wuhan, China,12–14 December 2008; Volume 5, pp. 641–644.
91. Du, S.; Meng, F.; Gao, B. Research on the application system of smart campus in the context of smartcity. In Proceedings of the 2016 8th International Conference on Information Technology in Medicine andEducation (ITME), Fuzhou, China, 23–25 December 2016; pp. 714–718.
92. Malatji, E.M. The development of a smart campus—African universities point of view. In Proceedings of the2017 8th International Renewable Energy Congress (IREC), Amman, Jordan, 21–23 March 2017.
93. Coccoli, M.; Guercio, A.; Maresca, P.; Stanganelli, L. Smarter universities: A vision for the fast changingdigital era. J. Vis. Lang. Comput. 2014, 25, 1003–1011. [CrossRef]
Appl. Sci. 2020, 10, 7976 28 of 28
94. Atif, Y.; Mathew, S.S.; Lakas, A. Building a smart campus to support ubiquitous learning. J. Ambient Intell.Humaniz. Comput. 2015, 6, 223–238. [CrossRef]
95. Al Shimmary, M.K.; Al Nayar, M.M.; Kubba, A.R. Designing Smart University using RFID and WSN. Int. J.Comput. Appl. 2015, 112, 975–8887.
96. Manqele, L.; Dlodlo, M.; Manqle, L.; Coetzee, L.; Williams, Q.; Sibiya, G. Preference-based Internet of Thingsdynamic service selection for smart campus. In Proceedings of the IEEE AFRICON Conference, AddisAbaba, Ethiopia, 14–17 September 2015; Volume 2015.
97. Zhang, Y.; Guo, M. The research of smart campus based on internet of things & cloud computing.In Proceedings of the 11th International Conference on Wireless Communications, Networking and MobileComputing (WiCOM 2015), Shanghai, China, 21–23 September 2015; p. 6.
98. Torres-Sospedra, J.; Avariento, J.; Rambla, D.; Montoliu, R.; Casteleyn, S.; Benedito-Bordonau, M.; Gould, M.;Huerta, J. Enhancing integrated indoor/outdoor mobility in a smart campus. Int. J. Geogr. Inf. Sci. 2015, 29,1955–1968. [CrossRef]
99. Sastra, N.P.; Wiharta, D.M. Environmental monitoring as an IoT application in building smart campus ofUniversitas Udayana. In Proceedings of the 2016 International Conference on Smart Green Technology inElectrical and Information Systems (ICSGTEIS), Bali, Indonesia, 6–8 October 2016; pp. 85–88.
100. Academic Ranking of World Universities. Available online: http://www.shanghairanking.com/
Shanghairanking-Subject-Rankings/civil-engineering.html (accessed on 19 August 2020).101. Brown, T. Desing Thinking. Harv. Bus. Rev. 2009, 86, 9.102. Al-Shalabi, F.A.; Turkan, Y.; Laflamme, S. BrIM Implementation for Documentation of Bridge Element
Condition for Inspection. In Proceedings of the 5th International Construction Specialty Conference of theCanadian Society for Civil Engineering (ICSC), Vancouver, BC, Canada, 8–10 June 2015.
103. Kitsakis, D.; Dimopoulou, E. Addressing public law restrictions within a 3D cadastral context. ISPRS Int. J.Geo-Inf. 2017, 6, 182. [CrossRef]
Publisher’s Note: MDPI stays neutral with regard to jurisdictional claims in published maps and institutionalaffiliations.
© 2020 by the authors. Licensee MDPI, Basel, Switzerland. This article is an open accessarticle distributed under the terms and conditions of the Creative Commons Attribution(CC BY) license (http://creativecommons.org/licenses/by/4.0/).