Instructional Clarity: The Effect of Bilingualism and Instructor's Preparation
Upload
khangminh22Category
view
2download
0
BILINGUALISM, FEEDBACK, COGNITIVE CAPACITY, AND LEARNING
STRATEGIES IN L3 DEVELOPMENT
A Dissertation submitted to the Faculty of the
Graduate School of Arts and Sciences of Georgetown University
in partial fulfillment of the requirements for the degree of
Doctor of Philosophy in Linguistics
By
Hui-Ju Lin, M.S., Ed.M
Washington, D.C.
April 6th, 2009

ii
Copyright 2009 by Hui-Ju Lin
All Rights Reserved

iii
BILINGUALISM, FEEDBACK, COGNITIVE CAPACITY, AND LEARNING
STRATEGIES IN L3 DEVELOPMENT
Thesis Advisor: Cristina Sanz, Ph.D.
ABSTRACT
Part of the Latin Project1, the current study investigates the relationship between
individual differences (Level of Bilingualism) and pedagogical conditions (Types of
Feedback) as it affects L3 development. The design includes working memory (WM)
capacity and learning strategies as moderator variables to explain the effects identified.
This laboratory study looks at 90 L1 Mandarin/L2 English bilinguals as they interact with
a computer lesson on assignment of semantic functions in L3, Latin. Overall, the current
study supports previous studies (e.g., Alanen, 1995; Carroll & Swain, 1993; de Graaff,
1997; DeKeyser, 1995; Ellis, 1993; Nagata, 1993; Nagata & Swisher, 1995) showing that
more explicit feedback is more effective than less explicit, “right” or “wrong” feedback.
The results support Cummins’ Threshold Hypothesis (1976) as they identify a threshold
between the intermediate and beginning L2 levels at which the benefits of the bilingual
experience appear. However, the results also suggest that the appearance of bilingual
advantages depend on the complexity of the tasks performed (Bialystok, 1986, 1988,
1997, 1999, 2001, 2004, 2008). Specifically, the results support Lado (2008) and Sanz,
Anfruns, Lado, Lin, and Medina (2005a) showing that participants at a higher L2 level
outperformed their counterparts only in the less explicit condition, and that more explicit
feedback may level out differences among learners at different L2 levels.
iv
Different results identified by repeated measures ANOVAs and ANCOVAs
revealed a key role for WM capacity and Learning Strategies in L3 development. The
current study supports the more the better hypothesis (Miyake & Friedman, 1998)
according to which, having higher WM capacity helps learning and domain-generality
hypothesis (e.g., Turner & Engle, 1989) , as WM capacity does not seem to be language
dependent. The results also suggest that sentence span, computational span, and speed of
processing tests are more suitable WM measures than non-word recall and digit backward
tests. Lastly, different results identified by repeated measures ANOVAs and ANCOVAs
in the current study revealed a relationship between Learning Strategies and L3
development: Specifically, between Compensation Strategies and L3 development, and
between Metacognitive Strategies and L3 development. Importantly, the results support
previous studies on strategies showing that participants at a higher proficiency level use
strategies more frequently than their counterparts, and extend the findings of Wharton
(2000) and Kemp (2007) to the initial L3 development in a laboratory environment with
participants of different L2 proficiency levels in an EFL context.

v
To My Family
vi
ACKNOWLEDGEMENTS
I would like to thank all who contributed to the completion of this research in any
manner. I very much thank the members of my dissertation committee --- Dr. Cristina
Sanz, Dr. Jeff Connor-Linton, and Dr. Darlene Howard --- for their encouragement and
advice toward the completion of the dissertation. Especially, I am deeply indebt to Dr.
Cristina Sanz, my mentor, whose guidance and encouragement have been invaluable to
me through this process.
I would like to express my gratitude to Dr. Cristina Sanz, again, as well as Harriet
Bowden and Catherine A. Stafford for their development of the Latin Project with
support from Georgetown University Graduate School grants to Sanz and with assistance
from Bill Garr of Georgetown’s UIS/CNDLS. Moreover, I would like to express my
grateful thanks to language teachers who encouraged their students to participate in this
study and to students who spent so much time and effort in learning Latin, which they
may never see again.
I am very thankful to Dr. Rusan Chen for his expertise in the field, and for his
patience and encouragement. I also thank my colleagues at Georgetown University for
their collaboration in the Latin Project, for the papers they have presented, and for the
great time I have enjoyed with them.
I greatly thank Virginia Knuebel, my undergraduate professor and friend, who
inspired me to pursue this career long before I came to Georgetown University. I am also
thankful for her encouragement, her assistance in recruiting students, and her help with
this manuscript.
vii
I also thank my friends in Taiwan and the United States who encouraged me
during this process. Especially, I am greatly thankful to Masako Abe, who has been
supportive of my graduate studies and has kept me focused without distractions during
this process, and Kazunobu Miyagi, who has continuously encouraged me and cheered
me up for the duration of this study. I would like to thank them for the unconditional
friendship they have given me.
Finally, I would like to dedicate this dissertation to my parents, Chang-Chuan Lin
and Hsiu-Hsia Su for their understanding and encouragement of my pursuit of graduate
studies. Wherever I felt frustrated in my study, they always found a way to make me feel
relaxed even when I was so far away from home. In addition to my parents, I am so
thankful for having my sisters in my life. Their love and support has also been a great
contribution to the completion of my study.

viii
TABLE OF CONTENTS
Chapter 1: Overview of the Research Problem .................................................................. 1 Introduction ..................................................................................................................... 5
Sentence Processing and the Competition Model ........................................................... 6
Competition model and language learning ............................................................... 11
Statement of Research Problem ..................................................................................... 12
Definition and Operationalization ................................................................................ 12
Language Processing ................................................................................................. 12
Level of Bilingualism ................................................................................................ 13
L3 development ........................................................................................................ 13
More Explicit and Less Explicit Feedback ............................................................... 13
Task Essentialness ..................................................................................................... 14
Working Memory ...................................................................................................... 14
Phonological Short Term Memory ............................................................................ 14
Learning Strategies .................................................................................................... 14
Chapter 2: Review of the Literature .................................................................................. 16 Introduction ................................................................................................................... 16
Bilingualism ................................................................................................................... 21
Positive Effects .......................................................................................................... 22
No Effects .................................................................................................................. 30
Bialystok’s Model and Cummins’ Hypothesis .......................................................... 32
Latin Project and Cummins’ Threshold Hypothesis .................................................. 37
Feedback ........................................................................................................................ 41
Feedback in SLA studies ........................................................................................... 43
Bilingualism and Feedback ........................................................................................... 47
Working Memory Capacity ........................................................................................... 50
Working Memory Capacity and Working Memory Capacity measurements .......... 51
Working Memory Capacity and SLA studies ............................................................ 57
Working Memory Capacity and L3 studies ............................................................... 63
Effects of Working Memory Capacity on Language acquisition ............................. 65

ix
Learning Strategies ........................................................................................................ 70
Learning Strategies in SLA studies .......................................................................... 72
Learning Strategies in L3 studies .............................................................................. 73
Research Questions ........................................................................................................ 79
Chapter 3: Methodology.................................................................................................... 81 Overview of the Experimental Design .......................................................................... 81
Participants .................................................................................................................... 81
Languages and Target Structures .................................................................................. 83
Group Assignments ....................................................................................................... 86
Materials ........................................................................................................................ 88
Background Questionnaire ........................................................................................ 88
Treatment ................................................................................................................... 88
L3 Vocabulary and Language Tests .......................................................................... 89
Working Memory Span Tests .................................................................................... 95
Sentence Span Test ........................................................................................ 95
Computational Span Test ............................................................................... 97
Digit Backward Span Test ............................................................................. 98
Speed of Processing Test ............................................................................... 99
Nonword Recall Test ..................................................................................... 99
Learning Strategies Measure ................................................................................... 100
Debriefing Questionnaire ......................................................................................... 101
Experimental Design and Procedures .......................................................................... 101
Scoring and Analyses .................................................................................................. 104
L2 Proficiency Test .................................................................................................. 104
Working Memory Span Tests .................................................................................. 104
L3 Language Tests ................................................................................................... 105
Chapter 4: Results ........................................................................................................... 107 Introduction ................................................................................................................. 107
Descriptive Statistics................................................................................................ 107
Overall Language Tests .............................................................................. 107
x
Working Memory Test.............................................................................. 110
Learning Strategies .................................................................................. 110
Reliability Tests ........................................................................................ 111
Level of Bilingualism .................................................................................................. 112
Feedback ...................................................................................................................... 124
Level of Bilingualism and Feedback ........................................................................... 145
Working Memory Capacity ........................................................................................ 173
Computational Span Test ......................................................................................... 176
Speed of Processing Test ......................................................................................... 181
Nonword Recall Test ............................................................................................... 186
Sentence Span Test .................................................................................................. 189
Digit Backward Span Test ....................................................................................... 193
Learning Strategies ...................................................................................................... 197
Memory Strategies ................................................................................................... 199
Cognitive Strategies ................................................................................................. 203
Compensation Strategies.......................................................................................... 207
Metacognitive Strategies.......................................................................................... 213
Affective Strategies.................................................................................................. 218
Social Strategies ....................................................................................................... 221
Chapter 5: Discussion...................................................................................................... 227 Introduction ................................................................................................................. 227
Level of Bilingualism and L3 Development ............................................................... 227
Types of Feedback and L3 Development .................................................................... 232
Level of Bilingualism and Types of Feedback ............................................................ 234
Working Memory Capacity and L3 Development ...................................................... 239
Learning Strategies and L3 Development ................................................................... 246
Conclusions and Implications ...................................................................................... 251
Limitations and Future Research ................................................................................ 253
References ....................................................................................................................... 255 Appendix A ..................................................................................................................... 272

xi
Appendix B ..................................................................................................................... 274 Appendix C ..................................................................................................................... 286 Appendix D ..................................................................................................................... 289 Appendix E ...................................................................................................................... 295 Appendix F ...................................................................................................................... 296 Appendix G ..................................................................................................................... 300 Appendix H .................................................................................................................... 308 Appendix I ....................................................................................................................... 310 Appendix J....................................................................................................................... 312 Appendix K ..................................................................................................................... 316 Appendix L ...................................................................................................................... 318 Appendix M..................................................................................................................... 320 Appendix N ..................................................................................................................... 323 Appendix O ..................................................................................................................... 325 Appendix P ...................................................................................................................... 327 Appendix Q ..................................................................................................................... 330 Appendix R ..................................................................................................................... 332 Appendix S ...................................................................................................................... 334 Appendix T ...................................................................................................................... 337 Appendix U ..................................................................................................................... 339 Appendix V ..................................................................................................................... 341 Appendix W .................................................................................................................... 344 Appendix X ..................................................................................................................... 346 Appendix Y ..................................................................................................................... 348 Appendix Z ...................................................................................................................... 351 Appendix AA .................................................................................................................. 353 Appendix AB................................................................................................................... 355 Appendix AC................................................................................................................... 358 Appendix AD .................................................................................................................. 360 Appendix AE ................................................................................................................... 362 Appendix AF ................................................................................................................... 366 Appendix AG .................................................................................................................. 368 Appendix AH .................................................................................................................. 370 Appendix AI .................................................................................................................... 373 Appendix AJ .................................................................................................................... 375 Appendix AK .................................................................................................................. 377 Appendix AL ................................................................................................................... 380 Appendix AM .................................................................................................................. 382 Appendix AN .................................................................................................................. 384 Footnote ........................................................................................................................... 387

1
CHAPTER 1: OVERVIEW OF THE RESEARCH PROBLEM
Introduction
For the past decades, and as the number of bilinguals has increased, the interest in
bilinguals has greatly increased. Researchers have attempted to understand how
bilinguals are different from monolinguals. Previously, bilingualism was often associated
with negative effects. Until 1962, Peal and Lambert demonstrated that being bilingual has
no negative effects on cognition. After that, studies conducted in laboratory environments
(e.g., Nation & McLaughlin, 1986; McLaughlin & Nayak, 1989; Nayak, Hansen, Krueger,
& McLaughlin, 1990) or in natural environments (e.g., Swain, Lapkin, Rowen, & Hart,
1990; Cenoz & Valencia, 1994; Sanz, 2000) have also demonstrated that bilingualism is
associated with positive effects on L3 acquisition. Despite those results, it is still
unexplained why bilinguals are different from monolinguals.
The goal of the current study is to account for the complexity inherent in language
development by examining internal factors (level of bilingualism, cognitive capacity, and
learning strategies), external conditions (Types of Feedback) and their interaction. It is
hoped to provide support to several constituencies. For researchers who are interested in
bilingualism and third language acquisition, the study attempts to provide empirical
evidence for the Threshold Hypothesis of Cummins (1976), which argues that bilingual
advantages appear only when the bilingual has attained a certain level of proficiency in
both languages. The findings may contribute to the field of second language acquisition
(SLA) to understand the effect of types of feedback on language learning. Examining the
interaction between Level of Bilingualism and Types of Feedback not only helps

2
researchers in understanding the relationship between the two factors but also aids
teachers in language teaching. Moreover, the inclusion of Working Memory Capacity and
Learning Strategies helps the field in understanding the mediating effect that individual
differences (e.g., Working Memory Capacity and Learning Strategies) may have on
language learning. Finally, the findings should be of particular interest for those involved
in language policy and for practitioners involved in decision-making in educational
contexts K-12 through college
In order to achieve these goals, several variables are included in the current study:
prior language experience (Level of Bilingualism), types of feedback, cognitive capacity
(Working Memory Capacity), and Learning Strategies. First, the study examines the
effect of prior language experience on L3 acquisition. Previous studies conducted in
laboratory environments (Klein, 1995; Nation & McLaughlin, 1986; McLaughlin &
Nayak, 1989; Nayak, Hansen, Krueger, & McLaughlin, 1990) or in natural environments
(e.g., Swain, Lapkin, Rowen, & Hart, 1990; Cenoz & Valencia, 1994; Sanz, 2000) have
suggested that bilingualism is associated with positive effects on L3 acquisition, but they
cannot explain what helps multilinguals or bilinguals outperform monolinguals. The
current study attempts to provide empirical evidence to support Cummins’ Hypothesis
(1976), according to which bilingual advantages only appear when a specific level of
bilingual proficiency is reached; the current study also strives to identify where the upper
and lower thresholds lie by including Mandarin speakers at different English levels who
were learning Latin as their L3. Being able to identify the thresholds not only benefits
3
researchers in bilingualism but also helps legislators and educators determine a more
appropriate time to implement educational policies for students to learn another language.
While researchers suggest that bilingualism may play a role in L3 acquisition,
they also point out the influential role of external conditions (e.g., Lado, 2008; Nation &
McLaughlin, 1986; McLaughlin & Nayak, 1989; Nayak, Hansen, Krueger, &
McLaughlin, 1990; Ricciardelli, 1992; Sanz et al, 2004, 2005). The researcher was
motivated to include types of feedback as the external condition and to examine its
interaction with different L2 proficiency levels for several reasons. First, previous studies
have associated bilingualism with greater sensitivity to linguistic, perceptual and
interpersonal feedback (e.g., Ben-Seev, 1977; Cummins & Mulcahy, 1978; Genesee,
Tucker, & Lambert, 1975). Besides, SLA researchers have long been interested in the
role of feedback. For instance, White (1990) suggests learners may require negative
evidence (feedback) to indicate their errors and that may help learners be aware of their
errors. According to the Output Hypothesis, learners are pushed to produce more
accurate, appropriate and complex language with the assistance of feedback. Within the
Interactionist framework (as reviewed by McDonough, 2005), negative feedback
obtained through interaction may contribute to L2 development by informing learners
about their utterances and raising their awareness. In cognitive psychology, feedback has
been linked to hypothesis formation and testing (e.g., Estes, 1989). These proposals
indicate the necessity of feedback in order to draw learners’ attention to the input and
help them in hypothesis formation and testing. To the best of my knowledge, few L3
studies (Lado, 2008; Stafford, 2005, both unpublished dissertations) have directly
4
examined the role of feedback in L3 development, let alone the interaction between Level
of Bilingualism and Types of Feedback. Therefore, it is of interest to examine the
interactive effects of Level of Bilingualism and Types of Feedback on L3 development.
WM capacity and Learning Strategies are two significant factors in individual
differences that were included to explain any results found for the effect of bilingualism
and the feedback and the interactive effect of these two factors on L3 development
because they facilitate or constrain learning. Many researchers (e.g., Robinson, 1995 and
Schmidt, 1990; 1993; 1994; 1995) argue that noticing is crucial to language development
and that noticing occurs in WM. Therefore, it is important to understand the role of WM
capacity. On the other hand, researchers also suggest that Learning Strategies facilitate
learning (e.g., Oxford, 1990). In addition, bilinguals often are considered good language
learners who employ a wider range of strategies with higher frequency (e.g., Kemp,
2007; Wharton, 2000). Being able to identify how they are different from others may help
understand how their processing strategies change as their language proficiency
advances. The inclusion of the two variables (working memory capacity and Learning
Strategies) not only explains the results found in order to contribute to the research field
but also benefits language teachers in identifying how language learners differ.
To summarize, the current study investigated the relationship among the effect of
Levels of bilingualism on L3 development, the effect of Feedback on L3 development,
the interaction between Bilingualism and Types of feedback on L3 development. The
inclusion of measures of WM capacity and Learning Strategies may explain any
5
significant results found. The ultimate goal of the current study is to contribute to
research, pedagogy, and education.
Sentence Processing and the Competition Model
The current study is based on the Competition Model, a psycholinguistic model,
that examines bilingual sentential processing. The Model was first proposed by Bates
and MacWhinney (1981, 1982, 1987), and MacWhinney (1986, 1987) to account for the
processing of normal children and adult L1 speakers. It was later extended to explain L2
acquisition as well as language loss in aphasia. The major concepts in the Competition
Model are: 1) two-level mapping, 2) cue strength and competition, and 3) cue validity, 4)
system interactions between cues, and 5) processing limitations (MacWhinney, 1987).
First, the model includes two levels: a functional and a formal level. The surface
forms or expressive devices in the language are represented in the formal form while the
meanings or intentions are shown in the utterance. For instance, the form of preverbal
position is highly correlated with the function of expressing agent role in English.
Another principle concerns cue strength and competition. Cue strength is related
to the weights at the connection between form and meaning. For instance, the weights of
the form of a preverbal position and the function of an agent role can be viewed as cue
strength. In English, the preverbal position is associated with an agent role in a sentence,
except for in passive sentences. Italian allows more word order variations. Thus, this cue
is more trustworthy in leading to the correct interpretation of English but is less
trustworthy in leading to the correct interpretation of Italian� When discussing cue
validity, three components are included: availability, reliability, and conflict validity. Cue
6
Availability means how often the cue is available when a speaker needs it, while Cue
Reliability is how reliable the cue is to help a speaker correctly interpret a sentence.
Conflict Validity is which cue wins when two or more cues conflict.
Next, there is a systematic way of using cues when learning another language and
that may help learners have success in learning another language or cause them to make
similar errors: this may be positive or negative transfer. In other words, learners may
develop a mixed system: 1) transfer of L1 onto L2, 2) abandonment of L1 for L2, 3)
merger of L1 and L2, or 4) partial attainment of separate L1 and L2 system, as
MacWhinney (1987) proposed.
The last one is processing limitations: the limitations are perceivability and
assignability. Due to these, researchers must examine to what extent a cue can be easily
detected and be learned by speakers.
Competition Model and Language Learning
Since the proposal of this model, various empirical studies have demonstrated the
processing strategies employed by speakers of different languages, such as English,
Italian, Spanish, French, German, Dutch, Serbo-Croatian, Hungarian, Japanese, Chinese,
Warlpiri, Hebrew, Arabic, and Greek. (See a review by Li, Bates, and MacWhinney,
1993; MacWhinney and Bates, 1987) In addition to L1 studies, the model has been
applied to L2 processing (e.g., Gass, 1987; Harrington, 1987; Su, 2001, 2004).
Harrington (1987) was interested in the processing strategies by Japanese native
speakers, English native speakers, and Japanese ESL learners. He recruited 36
participants and divided them into three groups based on the languages. He used 162 test

7
sentences that had two nouns and a third person singular verb. Each sentence had three
possible combinations of word order (NVN, NNV, VNN), three combinations of nouns
(both animate, animate-inanimate, and both inanimate), and three stresses (no stress, the
first noun stress, and the second noun stress). The results showed that the English
participants prefer word order cues, while Japanese speakers favor animacy cues. Across
all stress conditions and languages, the results were similar. Although the Japanese ESL
learners still favor animacy over word order, the strategies of word order cue in English
also emerged. In sum, the processing strategies employed by native English speakers and
Japanese speakers are the same as the model predicted. The English word order cue
began to merge when Japanese speakers began learning English.
Gass (1987) examined the processing strategies of Italian and English. Based on
the Competition Model, word order and animacy cues are both available in Italian and
English, but Italian has freer word order than English does. She included 41 English
speakers studying Italian in a foreign language environment and 31 participants learning
Italian in a second language environment. She also included 31 Italian speakers who were
learning English in a foreign language environment and 18 participants who were
learning Italian in a second language environment. The participants listened to 27
sentences and judged what the subject was in each L2 sentence within 20 seconds. Each
sentence contained two nouns that were animate or inanimate. Additionally, the verb was
in the sentence-initial, sentence-medial, or sentence-final position. The results showed
that all of the groups favored selecting the first noun as the subject, but there was a higher
consistency for Italian speakers to select the first noun. The Italian speakers also showed
8
higher dependence on animacy cues. . Next, inanimate nouns were less chosen as the
subject of a sentence. When examining the interaction between first noun choice, word
order, and animacy in a sentence, all groups preferred an animate noun to an inanimate
noun and preferred the first noun to the second noun. Based on the results, Gass argues
that while Italian speakers are moving from a semantic-dominant language to a syntactic-
dominant one, English speakers are moving in the other direction.
Su (2001) investigated how adult monolinguals of English and Chinese and EFL
learners of Chinese or English learners of Chinese differ when assigning agent role in a
sentence. One hundred and twenty-two participants were included and divided into two
language groups. In each language group, she had one control group and three groups of
different L2 proficiency. The cues tested were word order (verb-medial, verb-initial, and
verb-final), noun animacy (animate-animate, animate-inanimate, and inanimate-
inanimate), and discourse context. There were 27 sentences and each contained two
nouns and one transitive verb. The ANOVA repeated measure analyses showed that
English native speakers preferred word order cues while Chinese native speakers favor
noun animacy. As for the L2 learners, L1 animacy strategies were preferred by beginning
English learners of Chinese. On the other hand, the intermediate learners relied more on
the context cue. In addition, the advanced Chinese EFL learners preferred word order.
Although no statistically significant results were found for the English CFL learners, CFL
learners seem to pay more attention to semantic and contextual information that was
more important in processing their L2, Chinese. Her conclusions suggest that an L2
9
learner become aware of other processing strategies that are not prevailing in their L1
after learning an L2.
The same model has been applied not only to L2 learners but also to bilinguals
(e.g., MacDonald, 1987). MacDonald compared the performance of 9 monolingual
English speakers, 9 monolingual Dutch, 24 English-Dutch bilinguals, and 39 Dutch-
English bilinguals. He asked the participants to identify the agent in each sentence. The
results showed that English speakers used word order to determine the actor; however,
Dutch used the three cues (word order, noun animacy, and case inflection), and case
inflection was demonstrated to be the strongest cue. The English-Dutch bilinguals used
case inflection cues, and their significance increased with second language exposure.
Dutch-English bilinguals also used all of the cues, but their significance decreased with
English exposure.
To sum up, the Competition Model provides a basis to examine bilingual
processing. Unlike other researchers (Lado, 2008; Sanz et al., 2004, 2005; Stafford, 2005)
using English, Spanish, and Latin, Chinese, English, and Latin are chosen for the current
study. As the Competition Model suggests, the similarities or differences between
languages may show positive or negative transfer. Because of this, Lado, Sanz et al. and
Stafford are often questioned about the positive transfer from Spanish to Latin because
Latin has morphological case markings to identify the subject in a sentence. The
differences among these Chinese, English, and Latin may minimize the possible transfers
among languages. When significant results are identified, the conclusions are more valid
and promising.

10
First, the key cue in Chinese is animacy. Because there are two animate nouns in
a Latin sentence, the animacy cue is not reliable to lead to the correct interpretation of a
sentence and Chinese speakers reply on the context or broader discourse context, as Su
(2001a, 2001b, and 2004) suggests. Next, English speakers rely on word order cue to
determine the subject of a sentence. Latin has a free word order, so word order cue is not
reliable to lead to the correct interpretation of a sentence. In addition, while SVO word
order cue is also used in Chinese, Chinese, a topic-prominent language, also allows
frequent omission of a subject. Additionally, the topic of a sentence (even an object) can
be positioned before the subject of a Chinese sentence. In this case, Chinese has freer
word order than English does. Compared with Latin, Chinese is rather poor in case
marking, and the nouns and verbs in Chinese cannot be positioned in a sentence as freely
as those in Latin can. To summarize, the sentences used in the current study comprised
two animate nouns and one transitive verb, and for that reason, the key cue (animacy) is
not available for Chinese speakers to determine who is doing what to whom. Free word
order in Latin also makes it difficult for speakers to transfer the processing strategies
from English to Latin. With a better control of language backgrounds, the current study
hopes to contribute to the findings of Sanz et al. (2005), Stafford (2005), and Lado (2008)
and improves their designs by including Mandarin speakers to further examine the role of
internal variables (prior language experience), an external variable (types of feedback),
and their interaction in L3 learning.
11
Statement of the Research Problem
Since Peal and Lambert (1962), many researchers have suggested that being
bilingual has positive effects on subsequent language learning (Cenoz & Valencia, 1994;
Klein, 1995; Sanz, 2000; Nation & McLaughlin, 1986; McLaughlin & Nayak, 1989;
Nayak, Hansen, Krueger, and McLaughlin, 1990; Thomas, 1998), but some studies show
neither negative nor positive effects (Jung, 1981; Gelderen, Schoonen, Glopper, Hulstijn,
Snellings, Simis, & Stevenson, 2003) Because of the different findings among studies,
the current study aims at providing empirical evidence to support Cummins’ Threshold
Hypothesis (1976) that bilingual advantages only appear when a specific level of
bilingual proficiency is reached. It also attempts to identify where the thresholds lie by
including Mandarin speakers of different English proficiency levels learning Latin as an
L3.
The current study also investigates the relationship between external conditions
and the internal variable (prior language experience) based on several reasons. First,
previous studies have suggested how external conditions may influence the results
(Nation & McLaughlin, 1986; McLaughlin & Nayak, 1989; Nayak, Hansen, Krueger, and
McLaughlin, 1990), but few L3 studies (Lado, 2008; Sanz, Anfruns, Lado, Lin, &
Medina, 2004, 2005; Stafford, 2005) have used types of feedback as one isolated factor.
Moreover, to my knowledge, little evidence (Sanz, Anfruns, Lado, Lin, Medina, 2004,
2005; Lado, 2008 unpublished dissertation) has been provided to understand how
bilinguals at different L2 proficiency levels may react differently with different types of
feedback.

12
Lastly, even though previous studies have showed that prior L2 experience
facilitates L3 acquisition (Cenoz & Valencia, 1994; Klein, 1995; Sanz, 2000; Nation &
McLaughlin, 1986; McLaughlin & Nayak, 1989; Nayak, Hansen, Krueger, and
McLaughlin, 1990; Thomas, 1998), they cannot explain the results. The current study
attempts to explain any evidence found by including two individual variables used in
current models of theoretical interest to adult language acquisition, namely WM capacity
and of pedagogical interest, Learning Strategies.
Definitions and Operationalizations
Language Processing
According to the Competition Model, language processing is defined as the
mapping between two levels (i.e., form and meaning) developed by Bates and
MacWhinney (1981, 1982, 1987), and MacWhinney (1986, 1987, 2005) Languages vary
depending on the relative strength of form function mapping. “Sentence comprehension
is viewed as a process of interactive activation, a form of constraint satisfaction in which
linguist forms or cues compete and converge in order to lead to a particular
interpretation,” say Hernandez, Bates, and Avila (1994, p. 418). In other words, in order
to correctly interpret a sentence during language processing, speakers of each language
rely on cues to different extents based on the cue validity (i.e., how reliable a certain cue
is to lead to the correct interpretation of a sentence and how often the cue is available
when it is needed).
13
Level of Bilingualism
Level of Bilingualism is defined as native speakers of Chinese who have different
English proficiency levels in an EFL context. Their L2 proficiency levels are determined
by their test scores on a standardized English test.
L3 Development
L3 Development is defined by performance scores from four L3 language tests: a
written interpretation test, an aural interpretation test, a grammaticality judgment test, and
a written sentence production test. Additionally, each test consists of two sets of test
items: trained and untrained items. The trained items are those that participants have seen
during the treatment. The untrained items are those that participants have not seen during
the treatment. Moreover, the scores are collected at three different times: pretests,
immediate posttests, and delayed tests.
More Explicit Feedback and Less Explicit Feedback
Similar to Lado (2008), Sanz (2004), and Sanz & Morgan-Short (2004), two types
of feedback are used in the study: more explicit feedback and less explicit feedback. The
more explicit feedback refers to written feedback containing “right” or “wrong” along
with metalinguistic explanations to indicate the source of error. The less explicit feedback
is defined as written feedback that indicates only “right” or “wrong” about the target
form.

14
Task-essential Practice
According to Loschky and Bley-Vroman (1993), learners cannot successfully
complete a task unless they attend to the grammatical structure and the meaning of the
tasks.
Working Memory Capacity
Working memory capacity is defined as a brain system that provides temporary
storage and manipulation of the information necessary for such complex cognitive tasks
as language comprehension, learning, and reasoning. (Baddeley, 1992, p.556)Because
WM capacity is an abstract concept, the operationalization of working memory capacity
is the ability to simultaneously process and store input presented and measured by a
sentence span test, a computational span test, a speed of processing test, and a digit
backward span test.
Phonological Short Term Memory
Following researchers (e.g., Gathercole, Willis, Emslie, & Baddeley, 1992;
Service & Craik, 1993; Williams & Lovatt, 2003), PSTM is operationalized as the ability
to immediately repeat novel phonological sequences as measured by a non-word recall
test.
Learning Strategies
Research by Oxford (1990) and other researchers (e.g., Nyikos & Oxford, 1993)
defined learning strategies as “Learning strategies are operations employed by the learner
to aid the acquisition, storage, retrieval, and use of information” (Oxford, p.8). In other
words, Learning strategies is defined as strategies employed when learning a foreign

15
language and they are assessed by a 50-item Strategy Inventory for Language learning
(SILL) developed by Oxford (1990). SILL comprises six categories: Memory, Cognitive,
Compensation, Metacognitive, Affective, and Social Strategies. According to Oxford
(1990), Memory Strategies includes creating mental linkages, applying images, and
sounds, reviewing well and employing actions (p.38). Cognitive Strategies involve
practicing, receiving and sending messages, analyzing and reasoning, and creating
structure for input and output. (p.43) Compensation Strategies help learners to use a new
language despite their limitation in knowledge, such as guessing intelligently and
overcoming limitations in speaking and writing (p.47-48). Metacognitive Strategies
include centering, arranging, planning and evaluating one’s learning. (p.136). Affective
Strategies refer to lowering one’s anxiety, encouraging yourself, and taking one’s
emotional temperature (p.140). Finally, Social Strategies comprise asking questions,
cooperating with others, and empathizing with others (p.144-145).
16
CHAPTER 2: REVIEW OF THE LITERATURE
Introduction
Previously, bilingualism had been associated with disadvantages in cognitive
development. In 1962, Peal and Lambert demonstrated that bilingual children scored
higher than monolinguals on several verbal and nonverbal tests of cognitive ability with a
better control of several variables (e.g., gender, age, and socioeconomic level) that had
not been well controlled in earlier studies. Since then, several studies conducted in
bilingual contexts (i.e., Swain, Lapkin, Rowen, & Hart, 1990; Cenoz & Valencia, 1994;
Sanz, 2000) and in lab studies (Nation & McLaughlin, 1986; McLaughlin & Nayak, 1989;
Nayak, Hansen, Krueger, & McLaughlin, 1990) have showed that bilinguals performed
better at learning an L3.
To explain the results, some explanations have been proposed by Cummins
(1976).and Bialystok (1986, 1988, 1997, 1999, 2001, 2008). According to Cummins’
Threshold Hypothesis (1976), cognitive advantages only emerge when a certain level of
bilingual proficiency is attained. His Developmental Interdependence Hypothesis also
suggests that the introduction of promotion of L2 can impede L1 development when L1 is
inadequately developed. On the other hand, when L1 is highly developed, the
development of L2 is at no cost of L1. Therefore, Cummins posits that the appearance of
bilingual advantages depends on L1 and L2 proficiency levels. Some empirical studies
conducted to test his hypotheses (e.g., Ricciardelli, 1992) also showed that the
appearance of bilingual advantages depend on the proficiency levels of both languages.
Also Bialystok (1986, 1988, 1997, 1999, 2001, 2008) also posits that being bilingual has

17
positive effects on cognition and suggests the appearance of bilingual advantages may
only be shown on tasks that require a high level of analysis of representational structures
and control of selective attention. After reviewing the studies that compared performance
of monolingual and bilingual children on metalinguistic tasks, Bialystok (2001) showed
that inconsistent results found among studies are due to the task demands of the tests. Her
argument provides a means for reinterpreting the contradicting results among the studies
that reported no differences between bilinguals and monolinguals, and those that
identified bilingual advantages. Both Cummins’ and Bialystok’s explanations may
provide a basis to explain the inconsistent results among the previous studies. The current
study attempts to provide empirical evidence to examine Cummins’ Threshold
Hypothesis and to identify where the thresholds lie for the bilingual advantages to appear.
This study also endeavors to show that the appearance of bilingual advantages may
depend on task demands imposed by the tasks performed.
While the previous studies suggest that Level of Bilingualism may play a role in
L3 acquisition, they also suggest how external conditions may influence the results
(Nation & McLaughlin, 1986; Nayak, Hansen, Krueger, & McLaughlin, 1990; Sanz et al,
2004, 2005). Besides, previous studies suggest the association between bilingualism and
bilinguals’ greater sensitivity to linguistic, perceptual, and interpersonal feedback (e.g.,
Ben-Seev, 1977; Cummins & Mulcahy, 1978; Genesee, Tucker, & Lambert, 1975). The
current study’s choice to use feedback because it is suggested to influence language
development. Moreover, Bialystok (1986, 1988, 1997, 1999, 2001, 2004, 2008) also
indicates how bilingual advantages may appear depending on the tasks. Therefore, it is
18
important to examine the extent to which external conditions interact with internal
variables (prior language experience). Therefore, different tasks are employed to examine
the L3 development.
Feedback has been the focus of interest in SLA studies, but the results contradict
each other. Several studies suggest that the provision of explicit information is beneficial
to second language acquisition (e.g., Alanen, 1995; Carroll & Swain, 1993; de Graaff,
1997; DeKeyser, 1995; Ellis, 1993; Nagata, 1993; Nagata & Swisher, 1995; Robinson,
1996, 1997; Rosa, 1999), but other studies suggest that providing explicit information
does not necessarily facilitate second language learning (e.g., Sanz, 2004; Sanz &
Morgan-Short, 2004). Studies also suggest that not all feedback has the same apparent
effects on individuals (e.g., DeKeyser, 1993; Ferris & Roberts, 2001; Lightbown &
Spada, 1990). Moreover, L2 researchers who are interested in the effect of different
degrees of explicitness in feedback on L2 development (e.g., Carroll & Swain, 1993;
Nagata, 1993; Nagata & Swisher, 1995; Rosa & Leow, 2004; Sanz & Morgan-Short,
2004) have not reached agreement either. While Rosa & Leow (2004) posit that explicit
feedback was more effective than implicit feedback, Sanz & Morgan-Short (2004) argue
that explicit information provided before practice, during practice or at both times, did
not enhance the acquisition of Spanish word order. To examine the different effects of
feedback on language development, feedback in the current study was operationalized as:
1) more explicit feedback: a brief metalinguistic explanation was provided to indicate
errors, and 2) less explicit feedback: participants were told that their answers were right
or wrong.
19
It is of interest to examine the effect of feedback in L3 development because
previous L3 research has shown that bilinguals have higher metalinguistic awareness,
such as syntactic and phonological awareness, even after only a short exposure to the L2
(Yelland, Polland, & Mercuri, 1993). In addition, few L3 researchers have begun to
examine the effects of different types of feedback on L3 development. Bilinguals with
higher L2 proficiency levels are expected to perform better. Moreover, Lado
(unpublished dissertation, 2008), Nation and McLaughlin (1986), Nayak, Hansen,
Krueger, and McLaughlin, (1990), Sanz et al. (2004, 2005) and Stafford (unpublished
dissertation, 2005) indicate that the appearance of bilingual advantages may depend on
tasks performed. It is suspected that bilinguals with higher L2 proficiency perform better
and their advantages may appear in the implicit condition more easily than in the explicit
condition, as shown in Sanz et al. (2005a) and Lado (2008, unpublished dissertation).
In addition to focus on the effects of bilingualism, the effect of the explicitness in
the input, and their interaction on L3 development, previous studies have suggested that
two factors in individual differences that may constrain or enhance learning: working
memory (WM) capacity and Learning Strategies. Working memory is necessary for a
wide range of cognitive activities (see Jarrold & Towse, 2006 for a short review).
Because of the involvement of WM in a variety of cognitive abilities, researchers argue
that it should also have implications for L1 language processing (e.g., Baddeley, 2003;
Engle, Cantor, & Carullo, 1992; Just & Carpenter, 1992; Daneman & Carpenter, 1980;
Caplan & Waters, 1999).
20
SLA researchers are also interested in the role of WM capacity and its effects on
noticing. According to Schmidt (1990; 1993; 1994; 1995, 2001), “noticing is crucial for
subsequent L2 learning and noticing is identified with the contents of a limited capacity
memory system, with a limited capacity information selection system, or with a limited
capacity central executive” (cited in Schmidt, 1990: 135). Similarly, Robinson (1995)
defines noticing as detection plus rehearsal in the short-term memory prior to encoding in
the long-term memory (p. 296). Since noticing occurs in WM and it is necessary for L2
learning to convert input to intake, it is important to include WM in the current study.
The inclusion of WM capacity may be valuable in explaining the outcome of L3 learning
by the participants.
Next, strategies are suggested to facilitate learning (e.g., Oxford, 1990; Chamot,
2005). First, psychological studies suggest that experts use different strategies or
techniques compared to novices in different domains, such as in a chess match.
Psychological studies also indicate that learners use different strategies to organize
information effectively in any complex task. Extending from the arguments in these
domains, second-language learning requires learners to organize information effectively.
In addition, it seems that “once a person has learned several languages, the process of
language learning is easier.” (Nation & McLaughlin, 1986, p. 41) Hence, it is reasonable
to include strategies and understand how they may account for L3 learning.
According to Weinstein & Mayer (1986), Learning Strategies are “behaviors or
thoughts that a learner engages in during learning that are intended to influence the
learner’s encoding process.” (p. 315) Nyikos and Oxford (1993) defined learners’

21
strategies as “steps taken by learners to facilitate the acquisition, storage, retrieval, and
use of information.” (p.11), so they included learning strategies as one of the variables
that help learners transform comprehensible input into comprehensible intake. Other SLA
researchers also have noted the importance of strategies. Skehan (1989) argues that
learning strategies are one of the important factors that account for individual differences
in language learning. Similarly, Ellis (1985) and McLaughlin (1987) also propose to
include learning strategies as one of the processes in their SLA models. Gardner and
McIntyer (1993) suggest that several factors determine second language proficiency and
that learning strategy is one of them. Therefore, it is plausible to include strategies to
examine how learners with different L2 proficiency levels use strategies in learning an
L3.
Bilingualism
Since Peal and Lambert (1962), studies conducted in either a bilingual context or
a lab environment have shown that bilingualism does not have negative effect on L3
acquisition. The following section begins with a review of studies showing the positive
effect of bilingualism on L3 development (Cenoz & Valencia, 1994; Klein, 1995; Sanz,
2000; Nation & McLaughlin, 1986; McLaughlin & Nayak, 1989; Nayak, Hansen,
Krueger, and McLaughlin, 1990; Thomas, 1998). It is followed by those finding no
negative effects (Jung, 1981; Gelderen, Schoonen, Glopper, Hulstijn, Snellings, Simis, &
Stevenson, 2003, Zobl, 1992). Several hypotheses are proposed to explain their
conflicting results. Lastly, studies that have similar focuses as the current study are
reviewed to explain the motivation of the current study.
22
Notably, the studies reviewed are based on contexts that they were conducted.
According to Lambert (1981), when individuals in a minority group learn a second
language, it is likely to replace their first language. In contrast, when individual in the
majority group learn a second language, they become bilinguals. The former is called
subtractive bilingualism and the later is additive bilingualism. The social context results
in either of the two situations. A large number conducted in Canada have supported the
hypothesis (reviewed by Cenoz and Valencia, 1994). Therefore, it is important to
consider the social context where a study is conducted to examine the effect of
bilingualism.
Positive Effects
Bilingualism in a bilingual context.
Previous studies have shown that being bilingual helps acquire an L3 by
comparing monolinguals and bilinguals, or bilinguals and multilinguals in bilingual
contexts (e.g., Cenoz & Valencia, 1994; Klein, 1995; Sanz, 2000; Thomas, 1988). Cenoz
and Valencia (1994) compared the acquisition of English by 320 high school Basque-
Spanish bilinguals and Spanish monolinguals. According to Cenoz and Valencia, the
Basque language was excluded from the public in Spain until 1978. After that, Basque
has been used in education, government services, and mass media, and the increase of
using it represents the respect for this ethnic identity. In the meantime, Spanish is still the
main means of communication and the official language. Basque and Spanish are used
either for the language of instruction or for subjects in Basque schools (p.197). Cenoz and
Valencia measured the participants’ intelligence, socioeconomic status (father’s

23
occupation), attitudes toward the language community, motivation, and exposure to
English. They also assessed participants’ English performance by means of an English
oral interview, a listening comprehension test, a reading test to find relevant information
for performing several tasks, a 250-word English composition, and a section with a
vocabulary and grammar test (three multiple choice tests). The regression results showed
that motivation, intelligence, exposure to the English language and age predicted English
achievement. Bilingualism also contributed to English language achievement. Moreover,
the four factors (motivation, intelligence, exposure to the English language, and age) did
not interact with bilingualism. Therefore, Cenoz and Valencia demonstrated the positive
effects of bilingualism on third language learning and that these effects (intelligence,
motivation, age, and exposure, and bilingualism) were independent from each other.
The findings of Cenoz and Valencia are also supported by Sanz (2000) in another
social-linguistic context. According to Sanz, Catalan is used in Catalonia within Spain.
Although Spanish is the official language, Catalan also has the same official status and is
introduced in public education much earlier than Basque. Sanz replicated Cenoz and
Valencia’s study and compared the acquisition of English of 124 Catalan-Spanish
bilinguals, who were literate in both languages, and 77 Spanish-speaking monolinguals in
Spain. Sanz collected information regarding their background (age, gender, socio-
economic status of both parents), intelligence, exposure to English, motivation to learn
English, attitudes toward the British and US population. Their English proficiency was
assessed by using the vocabulary and structure sections of the CELT English proficiency
test. Having higher control over the language exposure in the monolingual sample, the
24
results of her regression analyses confirms the results of Cenoz and Valencia that
bilingualism as well as motivation and exposure predict L3 proficiency. More
importantly, Sanz’s findings not only confirm the results of Cenoz and Valencia but also
extend the results of bilingual advantages to a different sociolinguistic context involving
different languages and dissimilar measurements.
Thomas (1988) compared 16 bilingual English-Spanish college students learning
French as a third language in a classroom setting with 10 English speakers learning
French as a second language in South Texas, where 51% of the student population is
Hispanic. Particularly, the bilinguals consisted of two groups: English speakers who
received formal training in Spanish (n=10) and who informally learned Spanish (n=6) at
home. She also controlled all the participants’ socio-economic status, amount of exposure
to French, teacher, teaching method and textbook Aptitude measured by the Modern
Language Aptitude Test, and motivation assessed by a modified version of Gardner and
Lambert’s attitude and motivation questionnaire were statistically similar between the
two groups. After one semester of instruction, their L3 acquisition was measured by a
French vocabulary test and a grammar test assessing their knowledge of French. The
vocabulary test consisted of isolated French words, half of which had visual and semantic
cognates in Spanish. The grammar test included partial sentences. The participants had to
complete the sentences from three options and only one option was grammatically
correct. The grammar test assessed their knowledge of word order, subject-verb
agreement, adjectival agreement, and formation of negative sentences. The participants
were also asked to write a composition that was approximately 10 sentences long. Then,
25
the compositions were judged by native French speakers regarding its comprehensibility
of compositions on a scale of one to five, which is comparable to a native speaker.
Statistical results showed that bilinguals significantly outperformed the monolinguals
when learning French vocabulary and grammar. The results also showed that bilinguals
(bi-literate in both languages) receiving formal training in both languages performed
better than those (literate in English only) who received no formal training in Spanish.
Based on the results, she demonstrated the bilingual outperformed monolinguals. In
addition, the fact that the bilinguals receiving formal training outperformed those
receiving no formal training may indicate a conscious awareness of a language and may
provide them with the advantages compared to their counterparts. Her results, however,
need to be interpreted with caution as she only had a small number of participants, and
she did not report the type of analysis conducted or how she controlled the background of
the participants.
While these studies showed bilingual advantages over monolinguals in general
domains of L3 acquisition, Klein (1995) demonstrated bilingual advantages in a specific
language domain based on the UG-parameter-setting model. She tried to control the
background of the participants according to their socioeconomic background and their
experience in learning English up to six months prior to her study. She gave 17
monolinguals (with various L1 backgrounds) studying English as an L2 and 15
multilinguals learning English as a third or fourth language a grammaticality judgment
test, which requires the participants to decide if a sentence is grammatically acceptable.
Almost all of her participants were adolescents and had come to the United States within

26
the three years prior to her study. Additionally, the multilinguals learned their second
languages at a young age in addition to their first languages. For a correction task, the
participants needed to correct a sentence when they considered the sentence was wrong.
Their performance on these sentences was analyzed by the acquisition of specific verbs
(wait for, work for, play with, dance with, talk about, and worry about), prepositional
complements, and preposition stranding. The results showed statistically significant
differences between the two groups. The multilinguals acquired SUBCAT knowledge
(having the SUBCAT knowledge means having acquired a preposition for a particular
verb) and stranding constructions in English in interrogative sentences more than the
monolinguals. Based on the results, she posits that the heightened metalinguistic skills,
enhanced lexical knowledge, or a less conservative learning procedure by multilinguals
may help trigger the setting of UG parameters. Therefore, the results showed that even
though the process was the same from a lack of SUBCAT knowledge to having SUBCAT
knowledge, multilinguals still learned faster compared with monolinguals. Namely, the
input triggered parameter setting faster in multilinguals than in monolinguals. Despite
these significant results, the interpretation of the results is cautioned due to the small
number of participants.
Bilingualism in a laboratory environment.
Other than demonstrating bilingual advantages in bilingual contexts, researchers
suggest better performance of multilinguals in a laboratory environment with a better
control of input (Nation & McLaughlin, 1986; McLaughlin & Nayak, 1989; Nayak,
Hansen, Krueger, and McLaughlin, 1990).
27
Nation and McLaughlin (1986) showed multilingual adults outperformed
monolinguals and bilinguals. They included 14 monolingual, 14 bilingual, and 14
multilingual adults learning a miniature language. They exposed the participants first to
an implicit condition and then an explicit condition, which was conducted 10 days after
the implicit condition. The implicit condition was that the participants only paid attention
to the stimuli. The explicit one was that they searched for rules. Additionally, the stimuli
were presented either structurally or randomly, and the participants were only exposed to
one of the two stimuli conditions. After each treatment, the participants completed a 100-
question grammaticality judgment test and an introspective questionnaire. The ANOVA
results showed that participants who were exposed to structured stimuli performed better
than those who were exposed to randomized stimuli in both conditions. Taking the
conditions into consideration, the performance of the three groups was similar in the
explicit condition. On the other hand, the multilingual participants outperformed the other
two groups in the implicit condition. When examining types of errors made (pattern of
responses, false negatives and false positives, and position errors), Nation and
McLaughlin found multilingual participants performed better than others in implicit
conditions did and that the three groups did not differ in the explicit learning condition.
Based on the results and the answers they collected from the questionnaires, they posit
that the ability of a multilingual to derive abstract structural information from linguistic
stimuli in the implicit condition and their strategies to allocate processing resources more
efficiently may have helped them outperform the other participants. Although they did
not reveal differences between bilingual and monolingual participants, it may be because
28
the tests were not sensitive enough, as they suggest, or because the proficiency was based
on a self-rating scale. As they pointed out, participants’ being exposed to the implicit
condition prior to the explicit condition may also influence the results. .Moreover, it is
difficult to minimize the chances of participants in the implicit condition searching for
rules. Despite these issues, their results still demonstrate that knowing more languages
benefits learning and that the advantages appear in an implicit condition, a more
demanding condition. Moreover, structural presentations of stimuli benefit learning
regardless of prior language experience or conditions. Similar arguments are provided by
McLaughlin and Nayak (1989). From information processing, they summarized a few
studies in domains other than language learning (e.g., physics, arithmetic, algebra, and
geometry) which show that more experienced language learners (participants who know
several languages) are different from novices.
Nayak, Hansen, Krueger, and McLaughlin (1990) were also interested in the
difference between monolinguals and multilinguals. They examined the performance
(accuracy and speed) of 48 undergraduate participants learning the grammar and
vocabulary of an artificial language. During the experiment, they exposed the participants
to two learning conditions: 1) a memory condition: participants only memorized each
sentence presented and 2) a rule-discovery condition: the participants tried to find sets of
rules from the sentences presented. The grammar of the artificial language was based on
Morgan and Newport (1981). Each sentence consisted of phrases that began with words
from certain classes. The vocabulary was according to Archer (1960) and each word was
matched with a referent (symbol). After the learning phase, a vocabulary test to
29
determine whether the participants had learned the words and their referents and a syntax
test to assess whether they had learned the correct syntax of the sentences were used. To
answer these questions, the participants needed to decide whether the word and its
referent were correct and whether the sentences were acceptable. The analyses on
vocabulary tests showed no differences between monolinguals and multilinguals although
they were both more accurate in the memory condition than the rule-search condition.
The results on the syntax test showed that multilingual participants in the rule-discovery
condition outperformed the monolinguals in the same condition. They also found that
simple rules were learned better than complex rules. Their results also suggest that while
the mean of accuracy scores was higher for simpler syntactic rules, the mean of reaction
time for it was longer than the complex rules. In other words, there was a speed-accuracy
tradeoff on the syntactic tests that judgments made for the simple rules were longer than
those that were made for the complex ones.
The studies of Nation and McLaughlin (1986) and Nayak et al. (1990), which
were conducted in a lab environment, both suggest that multilinguals are better than
monolinguals and bilinguals in language learning. According to McLaughlin and Nayak
(1989), multilingual language learners may have greater flexibility and variety in the
strategies they employ compared with novice language learners, measured through using
introspective questionnaires. They also posit that the contradictory results between the
two studies suggest that conditions may hide the bilingual advantages or minimize the
results.
30
Sagasta and Pilar (2003) compared 155 Basque-Spanish bilingual adolescents in
the Basque Country, where Basque is the minority language, Spanish is the majority
taught as a subject 3 to 4 hours a week, and English is a foreign language. Both English
and Spanish were introduced at the age of 8, in grade 3. Being educated through the
medium of Basque is a maintenance program for half of the students while it is an
immersion program for the other half. The results showed that all the students are highly
competent in Basque and Spanish and that the students who used Basque more had higher
scores in the tests of English.
Sanz (2007) included 120 Catalan-Spanish bilinguals learning English in a foreign
language context. She measured the relationship between English achievement with
individual variables (IQ, social-economic status, language use, attitudes, and motivation),
and educational variables (age, order, balance, and exposure). The results showed that
several factors (motivation, exposure to the L3, L1/L2 balance for written skills, attitudes
towards the L3, and frequency use of the minority language) are significant predictors of
English success.
No Effects
Although studies have generally (e.g., Cenoz & Valencia, 1994; McLaughlin &
Nayak, 1989; Nation & McLaughlin, 1986; Nayak, Hansen, Krueger, & McLaughlin,
1990; Sanz, 2000) showed that prior language experience helps acquire an L3 in a
bilingual or in a lab environment, a number of studies comparing bilinguals and
monolinguals have not found such advantages (Jung, 1981; Gelderen, Schoonen,
Glopper, Hulstijn, Snellings, Simis, & Stevenson, 2003) and studies (e.g., Thomas, 1990;

31
Sawyer, 1992; Zobl, 1992) reported by Klein (1995) from the UG parameter-setting
model.
Jung (1981), which is reported by Mägiste (1984), compared 28 immigrant
bilingual students and 28 German monolingual students in their acquisition of English
(copula, passive pronoun, person pronoun and plurals, copula plural) and showed that the
monolingual group had a higher mean percentage of correct answers than the bilingual
group. As Cenoz and Valencia (1994) suggest, the results may be influenced by
psycholinguistic, sociolinguistic and other factors. Thus, more information is needed to
examine his findings.
Gelderen, Schoonen, de Glopper, Hulstijn, Snellings, Simis, and Stevenson
(2003) compared the acquisition of English by 397 bilingual immigrant students who
could speak Dutch and another language (i.e., Berber, Arabic, Turkish, or Sranan Tongo)
and monolingual Dutch students. The majority of bilingual students came from families
with a Turkish, Moroccan, or Surinamic background. The participants completed
multiple choice comprehension questions in a reading text, a vocabulary test to choose
among four synonyms or paraphrases of the stimulus word or translation of the words, a
questionnaire consisting of 80 items about text characteristics, a questionnaire to assess
reading and writing strategies, a word recognition test, and a sentence verification to
decide if each sentence made sense. The results did not show differences between the
groups on the three types of skills: 1) linguistic knowledge (vocabulary and grammar), 2)
speed of processing linguistic knowledge (lexical access and sentence comprehension),
and 3) metacognitive knowledge (of text characteristics and strategies for reading and
32
writing). While the participants in their study are secondary students and the ones in the
current study are adults, the results may not be applicable to the current study.
A few studies (Thomas, 1990; Sawyer, 1992; Zobl, 1992) reported by Klein found
no clear connections between prior language experience and acquisition based on the UG
model of acquisition. For instance, Thomas (1990) found that Chinese-English bilinguals
did not outperform English monolinguals in learning Japanese. Based on the results, they
argue that bilinguals do not have the advantage of setting a parameter.
Bialystok’s Model and Cummins’ Hypotheses
The studies comparing monolinguals, bilinguals, and multilinguals have shown
inconsistent results: Some found positive effects, while others found no negative effects
for being bilinguals. Several explanations have been proposed to explain the conflicting
results (Bialystok, 1986, 1988, 1997, 1999, 2001, 2004, 2008; Cummins, 1976, 1977,
1979, 1991). Bialystok (1986, 1988, 1997, 1999, 2001, 2004, 2008) suggests that the
appearance of bilingual advantages may depend on tasks performed by the bilinguals
(Bialystok, 1986, 1988, 1997, 1999, 2001, 2008). Bialystok (1988) said, “Bilinguals,
irrespective of their degree of bilingualism, may be more advantaged at tasks which place
greater demands on the control of linguistic processing….” (p. 561) She also suggests
that bilinguals who have maintained high levels of proficiency in two languages perform
better on tasks that require a high level of analyzed linguistic knowledge and the control
of selective attention. Bialystok (2008) also posits that selective attention helps
distinguish bilinguals from monolinguals in nonverbal tasks. Extending her results from
non-verbal tasks to verbal tasks performed and her review (2001) on metalinguistic tasks
33
used to compare monolinguals and bilinguals, her explanations may provide a basis to
explain the results among the previous studies (e.g., Nation & McLaughlin, 1986; Nayak,
Hansen, Krueger, and McLaughlin, 1990; Ricciardelli, 1992)
Different models are proposed by Cummins (1976, 1978, 1979, 1989) to account
for the inconsistent results among studies: 1) the Threshold Hypothesis, and 2) the
Developmental Interdependence Hypothesis. The Threshold Hypothesis assumes that a
certain level of proficiency in both languages needs to be attained for the bilingual
advantages to appear. In this hypothesis, there are two thresholds: a lower and an upper
one. When bilingual children only reach the lower threshold in both languages, they
experience negative cognitive effects. Between the two thresholds, there are no positive
or negative effects for being bilingual. When the children reach the higher thresholds in
both languages, the bilingual advantages begin to appear. Cummins also developed the
Developmental Interdependence Hypothesis derived mainly from Skutnabb-Kangas and
Toukomaa (1976) and he said, “The development of skills in a second language is a
function of skills already developed in the first language.” (1978, p.396) In this case, if
the first language is adequately developed, the promotion or introduction of an L2 will
not impede L1 development. It is important to point out that the skills he mentioned are
not limited to linguistic skills. He refers to “ … [a] child’s capacity to represent complex
cognitive operations through his L1 and L2” (1978, p. 398) His two hypotheses are
beneficial in explaining the inconsistent results among studies and the positive effects of
bilingualism on language learning because they suggest that bilinguals are able to transfer
their L1 skills into their L2. In a similar vein, bilinguals are expected to be capable of

34
transferring what they know about language learning to another non-primary language.
Following his hypotheses, goals of the current study is to show that participants with
higher L2 proficiency levels perform better than their counterparts and to identify where
the upper threshold lies as it is not yet been tested by many empirical studies.
Many researchers have attempted to empirically test Cummins’ proposals in order
to examine the effects of different levels of bilingualism on cognition and subsequent
language learning (e.g., Cenoz, 2001; Lado, 2008; Lasagabaster, 1997; Muñoz, 2000;
Ricciardelli, 1992; Sanz, Anfruns, Lado, Lin, Medina, 2004, 2005; Sanz, Lin, Lado,
Bowden, & Stafford, 2009; Stafford, 2005).
Ricciardelli (1992) tested the Threshold Hypothesis by comparing 57 Italian-
English bilingual children and 55 English monolingual children on 5 different
metalinguistic tasks (word discrimination, word length, word print, symbol substitution
and word order correction) as well as tests for nonverbal abilities: Animal House,
Geometric Design, and Block Design. A word reading test was used to assess reading
achievement. Both the monolinguals and the bilinguals were divided into high and low
English proficiency subgroups. The bilingual groups were divided into three subgroups:
1) high proficiency in both languages, 2) high in English and low in Italian, and 3) low in
English and high in Italian. The results are in favor of the bilinguals who are high in both
languages over the other two groups (high English monolinguals, and high English and
low Italian bilinguals). The second comparison showed that monolinguals who were high
in English and bilinguals who were high in English and low in Italian were statistically
comparable. Next, the performance of the groups that were high in English was

35
significantly superior to the low English groups on 11 tests. Ricciardelli’s results are
consistent with the predictions of the Threshold Hypothesis. In addition, she shows the
bilingual advantages in some specific domains, such as grammatical awareness,
perceptual organization and reading achievement.
Muñoz (2000) included 866 Catalan-Spanish bilingual students with different L2
proficiencies from primary and secondary schools and found significant correlations
among their test scores of Catalan, Spanish, and English proficiency. The results
demonstrate that participants with a high level of L1 and L2 also have a higher L3
proficiency. Cenoz (2001) compared the influence of Basque and Spanish on English
(L3) of 90 elementary and secondary school students. The results indicate that
participants with higher L1 and L2 proficiency levels have more positive transfer from
their L1 and L2 to the L3.
Overall, the studies reviewed demonstrate that bilingualism has no negative
effects on cognition and subsequent language learning, which provide support to Peal and
Lambert’s argument that being bilingual has no negative effects on cognition. However,
some key distinctions between the current study and the previous ones need to be
cautioned. The first difference is age. While participants in the previous studies were
children or adolescents, the participants in the current study were adults. Second, the
languages involved are dissimilar. For instance, Sagasta and Pilar had Basque-Spanish
learning English, a foreign language. The current study has Mandarin-English speakers
learning Latin, a natural language only available in the laboratory. Next, the contexts are
not the same: immersion and foreign language context. The L2 in the previous studies
36
were minority languages or languages used in an immersion environment. The L2 used in
the current study is taught as a subject rather than a medium of instruction or a means of
regular communication. Besides, the third language in the current study is not available
outside of an experiment. Fourth, while most of the previous studies are conducted in a
natural environment, the current study is carried out in a lab environment with a control
of input, as some other studies are (Nation & McLaughlin, 1986; McLaughlin & Nayak,
1989; Nayak, Hansen, Krueger, & McLaughlin, 1990.) Namely, the participants in the
current study only received the L3 in a lab environment when the L3 in other studies was
often taught as a subject or used as a medium of instruction in the previous studies. Next,
the measurements are different. For instance, Ricciardelli included nonverbal tests to test
the hypothesis when the current study includes language tests as measures to investigate
the effect of the Level of Bilingualism on L3 acquisition. Some studies examine overall
proficiency or morphosyntax acquisition and others examine different aspects, such as
metalinguistic awareness or cognition tasks. Lastly, the current study is on sentence
processing. Some of the reviewed studies are based on UG parameter setting models
(Klein, 1995).
To sum up, the current study was conducted in a lab setting to control L3 input.
Type of input, amount of exposure to the input, and two types of feedback given were
also controlled. The control of the input allows this study to investigate the interaction
between individual differences and external conditions. Then, the current study included
adult L3 learners whose L1 is Chinese and L2 is English, which is learned in an EFL
environment. The current study not only investigates overall L3 proficiency but also the

37
acquisition of morphosyntax. Although some lab studies also investigate the differences
between novice language learners and expert language learners, the current experiment
uses a natural language (Latin), not an artificial language.
Latin Project and Cummins’ Threshold Hypothesis
The present study is part of the Latin Project (Lado, 2008; Sanz, Anfruns, Lado,
Lin, Medina, 2004, 2005; Stafford, 2005; Sanz, Lin, Lado, Bowden, & Stafford, 2009)
originally developed by Sanz, Bowden, and Stafford to investigate the relationship
between internal and external variables on L3 development.
Sanz, Anfruns, Lado, Lin, and Medina (2004, 2005) recruited adult English native
speakers, ranging from 18 to 30 years old, who were at three different levels of Spanish
proficiency to examine the effect of bilingualism (intermediate, advanced, and near-
native), cognitive capacity (working memory capacity), and different conditions (more
explicit vs. less explicit treatment) on L3 development in two different data-gathering
periods. The results of the more explicit treatment including task-essential practice and
more explicit feedback showed that near-native participants outperformed intermediate
participants on a grammaticality judgment test. In the less explicit treatment, participants
only practice with the target language without receiving grammar lessons before practice.
The results showed different results: 1) the threshold lies between intermediate and
advanced participants for total items and untrained items on the aural interpretation test,
2) the threshold lies between intermediate and advanced participants for the untrained
items on written interpretation, and 3) the threshold lies between intermediate and
advanced or intermediate and near-native for all items and trained items on a written

38
production test. Both treatments provided empirical evidence to the Threshold
Hypothesis. The comparison between the two treatments also suggests that the
appearance of bilingual advantages may depend on the types of treatment and tests
involved as well as the ability to chunk (trained items) and the ability to generate rules
and apply them to untrained contexts (untrained items).
Stafford (2005) was interested in how prior L2 experience, working memory
capacity, and age interact in L3 processing. She included four groups of Spanish-English
speakers: 1) simultaneous bilinguals who learned both languages from birth and were
highly proficient in both languages, 2) pre-adolescent sequential bilinguals who learned
English between 4-12 years old and were highly proficient in both languages, 3) post-
adolescent sequential bilinguals who learned English aged 16 and were proficient in both
languages, and 4) developing sequential bilinguals who learned English after 16 and were
not proficient in English at the time of testing. To measure working memory capacity,
Stafford used a sentence span test asking the participants to make judgments on the
grammaticality and sense of each sentence and to recall sentence-final words in each set.
The results on accuracy showed that developing sequential bilinguals and simultaneous
bilinguals performed better than preadolescent and post-adolescent sequential bilinguals.
The results also demonstrated that the English sentence span test was a significant
predictor of L3 development and prior language experience and age of acquisition were
not significant predictors of L3 development. She did not confirm the Threshold
Hypothesis, but she explained that the treatment consisting of explicit feedback which
had grammar lessons and feedback to indicate the source of errors may level out the

39
individual differences among the groups, as suggested by Bialystok (1988, 2001, 2004,
2008) that bilinguals may be more advantaged at tasks that place greater demands than
other tasks.
Lado (2008) investigated the effect of bilingualism, the effect of feedback, and
their interaction on L3 development. She compared 151 English speakers of four
different Spanish proficiency levels (basic, intermediate, advanced and native-like). She
then divided the participants into two feedback groups, which included task-essentialness
practice with grammatical information as feedback or task-essential practice with only
“right” or “wrong” as feedback. Based on the ANOVA analyses, Lado found the near-
native participants outperformed the other three groups on the aural interpretation,
grammaticality judgment, and written sentence production test in terms of accuracy data.
For the reaction time data, all groups spent less time to correctly answer each question
after the treatment. However, the near-native participants were slower on the
grammaticality judgment. For the written interpretation test, the appearance of bilingual
advantages depends on the type of item (i.e., items that the participants saw during the
treatment and items that they did not see during the treatment) and time (pretests,
immediate posttests, or delayed posttests). Lado also found that more explicit feedback
had an effect on L3 development on the immediate posttest and that the participants were
faster in the less explicit feedback group. For the interaction between the level of
bilingualism and type of feedback, she found a threshold between the near-native group
and the other three groups between the pretest and the posttest on the aural interpretation
when the participants only received implicit feedback. The threshold lies between the
40
basic and the other groups when the participants only received more explicit feedback.
Lastly, comparing the ANOVA results and ANCOVAs, she found that cognitive capacity
shown by aptitude measured by MLAT, WM capacity and L2 PSTM, played a role in the
positive effect that level of bilingualism has on L3 development.
The same as Lado, Sanz et al., and Stafford, the current study tests the Threshold
Hypothesis in L3 development. Differences exist between the current study and others.
First, the current study includes two external conditions (more explicit feedback and less
explicit feedback) to examine the effect of Level of bilingualism on L3 acquisition
because previous research has suggested the influential role of external conditions
(McLaughlin & Nayak, 1989; Nation & Nayak, 1986; Nayak et al., 1990.) Stafford only
had one condition including grammar lessons and practice with explicit feedback given
while Lado included the more and the less explicit feedback as external conditions. The
current study also examined types of feedback (the more explicit and the less explicit
feedback) as one isolated factor as Lado did. Third, Sanz et al., Stafford, and Lado
indicate that participants with different L2 proficiency levels perform differently and
indicate that the appearance of bilingual advantages may be influenced by internal
variables (working memory capacity) and external variables (conditions). The current
study included more types of working memory span tests because of the disagreements
on WM tasks in the literature. Lastly, although their results may be beneficial to the
current study, one criticism identified in their studies is that participants might be able to
transfer their processing skills from Spanish to Latin. To better control the prior language
experience, the current study included participants with L1 in Chinese and L2 in English.
41
The chances of transferring strategies developed in L1 and L2 may be minimized, as
pointed out in the Competition Model, which is discussed in the next section.
Feedback
While the previous studies suggest that bilingualism may play a role in L3
acquisition, they also suggest that external variables may influence the results (e.g.,
Bialystok, 2001, 2004, 2008; Nation & McLaughlin, 1986; McLaughlin & Nayak, 1989;
Nayak, Hansen, Krueger, & McLaughlin, 1990; Ricciardelli, 1992; Sanz et al, 2004,
2005). The current study was motivated to include feedback as one variable for several
reasons. First, previous studies have demonstrated the association between bilingualism
and greater sensitivity to linguistic, perceptual and interpersonal feedback (e.g., Ben-
Seev, 1977; Cummins & Mulcahy, 1978; Genesee, Tucker, & Lambert, 1975). Besides,
SLA researchers have long been interested in the role of feedback. For instance, White
(1990) suggests learners may require negative evidence (feedback) to indicate their errors
and that may help learners be aware of their errors. In the Output Hypothesis, learners are
pushed to produce more accurate, appropriate and complex language with the assistance
of feedback. Within the Interactionist framework, it is argued that negative feedback
obtained through interaction may contribute to L2 development by informing learners
about their utterances and raising their awareness (reviewed by McDonough, 2005). In
cognitive psychology, feedback has been linked to hypothesis formation and testing (e.g.,
Estes, 1989). These proposals indicate the necessity of feedback in order to draw
learners’ attention to the input and help them in hypothesis formation and testing. To the
best of my knowledge, few L3 studies (Lado, 2008) have directly examined the role of

42
feedback in L3 development, let alone the interaction between Level of Bilingualism
(internal variable) and Feedback (external variable). Therefore, it is of interest to examine
the relationship between the interactive effects of feedback and level of bilingualism on
L3 development.
It is acknowledged that feedback provided may focus learners’ attention and help
them detect errors in the production, but it is debatable what type of feedback is
sufficient. Several studies suggest that provision of explicit information is beneficial to
second language acquisition (e.g., Alanen, 1995; Carroll & Swain, 1993; de Graaff, 1997;
DeKeyser, 1995; Ellis, 1993; Nagata, 1993; Nagata & Swisher, 1995; Robinson, 1996,
1997; Rosa, 1999) Other studies suggest that providing explicit information does not
necessarily facilitate second language learning (e.g., Sanz, 2004; Sanz & Morgan-Short,
2004). Some studies also suggest that not all feedback has the same apparent effects on
each individual (DeKeyser, 1993; Lightbown & Spada, 199).
In the current study, feedback is operationalized as: 1) more explicit feedback: the
provision of brief metalinguistic information during the treatment, 2) less explicit
feedback: only “right” or “wrong” is provided as feedback during the treatment. The
review of the literature is limited to studies that compare feedback provided with
metalinguistic information and others do not (Bowles, 2005; Carroll & Swain, 1993;
Lado, 2008; Nagata, 1993; Nagata & Swisher, 1995; Rosa & Leow, 2004; Sanz, 2004;
Sanz & Morgan-Short, 2004).
43
Feedback in SLA Studies
Carroll and Swain (1993) assigned 100 adult Spanish speakers learning English
dative construction to four experimental groups and one control group: 1) participants
were given metalinguistic information as feedback, 2) participants were told their
response was wrong, 3) participants were given a reformulated correct response
whenever they made a mistake, and 4) those were asked if they were sure about their
responses whenever they made a mistake. A control group that did not receive any
feedback was included. The results showed that the participants in the experimental
groups performed significantly better than the control group. Moreover, the group that
received metalinguistic information as feedback outperformed the other groups. Based on
the results, Carol and Swain posit that giving feedback helps language development and
that feedback with metalinguistic information is better than other types of feedback.
Nagata (1993), and Nagata and Swisher (1995) examined whether traditional or
intelligent feedback was more effective at “consciousness-raising” in a computer-assisted
learning study. They divided 32 university students learning Japanese into two groups.
One group received traditional feedback, indicating what was wrong in their answer (e.g.,
a particle was missing). The other group was given “intelligent feedback” indicating what
was wrong in their answers with metalinguistic information. The results showed that
there were no differences between the groups on vocabulary, but the intelligent-feedback
group outperformed the traditional feedback group on sentence-level errors (particles).
What is more interesting is that Nagata and Swisher did not find significance between the
two groups on verbal conjugation. They explained that one of reasons is that Japanese
44
verbs do not need to agree with the nouns in gender or plurality. Based on the results,
they concluded that providing metalinguistic feedback is more helpful when errors are
significantly complicated (i.e., particles). However, information on the types of practice
is not sufficient. It is unknown whether the practice is task-essentialness. According to
Loschky and Bley-Vronman (1993), task-essentialness requires participants to pay
attention to grammatical structures in order to complete a task. Next, because the two
groups both received grammatical metalinguistic information in the feedback, it is
difficult to identify whether metalinguistic information or feedback alone contribute to
the significant results.
Rosa and Leow (2004) examined the role of awareness in different learning
conditions. They randomly assigned 100 native English speakers who were enrolled in a
fifth semester Spanish course to five experimental groups and a control group. The five
experimental groups were exposed to problem-solving tasks while the control group was
not. Additionally, the five experimental groups were also divided by the conditions in
which they did or did not receive metalinguistic information before the task and whether
they received implicit feedback (whether their answer was right or wrong) or explicit
feedback (whether their answer was right or wrong with an explanation). Rosa and Leow
used a multiple-choice test and a controlled production test to measure the students’ L2
performance, and think aloud data to measure awareness. The results showed that a
higher level of awareness was associated with more explicit feedback and was more
effective. They also showed that participants performing without task-essential materials
failed to demonstrate awareness at the level of understanding. Furthermore, when only
45
one source of information (pre-task information or feedback) was available, techniques
(pre-task information or explicit feedback) were more effective than implicit feedback in
developing a higher level of awareness. However, several differences exist between Rosa
and Leow’s study and the current study. They only had two types of tests (a multiple-
choice test and a fill-in-blank production). The measurements, however, were more
controlled compared to the current study (a written interpretation, aural interpretation, a
grammaticality judgment, and a written sentence production test).
Sanz (2004) included 53 beginning Spanish learners, who were native speakers of
English, and divided them into an implicit feedback group and an explicit feedback
group. The explicit feedback group received metalinguistic information to indicate the
source of an error while the implicit feedback group only received “OK” or “Sorry, try
again” as feedback. The results showed that both groups improved shown on the
interpretation test, the sentence completion test, and the video retelling test. The results
suggest that the type of feedback did not have differential effects.
Sanz and Morgan-Short (2004) investigated the effect of explicit information on
the acquisition of Spanish word order by comparing four groups. They divided 69
participants into four groups with a combination of explanations and explicit feedback
(i.e.,+/- explanation with +/-explicit feedback). Their acquisition of Spanish was
measured by their ability to interpret and to produce O-cliticV sentences. For the
interpretation test, there were 15 test items, including 5 distractors. The participants saw
two pictures and had to choose a picture that matched the sentence they heard. The
production test comprised a sentence completion test and a written video-telling test. The

46
participants were presented with two separate pictures and a sentence that described the
first picture. They then were required to provide a sentence that described the second
picture using correct word order. To complete the video-telling task, the participants
viewed a silent video and retold the story. The results showed that all groups improved
significantly, but no significant results were identified for explicit information provided
before, during, or after practice. Thus, Sanz and Morgan-Short concluded that explicit
information provided before practice, during practice, or at both times, did not enhance
the acquisition of word order in Spanish.
Bowles (2005) was interested in the validity and reactivity of think aloud protocol
on L2 problem-solving tasks while combining explicit or implicit feedback. The
participants completed 24 mazes while performing metalinguistic think aloud or non-
metalinguistic think aloud. The results showed that receiving explicit feedback had an
impact on trained and untrained exemplars of grammatical structures on production. The
participants receiving explicit feedback performed better on the immediate posttest.
However, because feedback was given when participants thought aloud, the results may
not only depend on the feedback.
Lado (2008) examined the effects of bilingualism, feedback, and their interaction
on L3 development. She compared 151 English speakers of four different Spanish
proficiency levels (basic, intermediate, advanced and native-like) and divided them into
two feedback groups, one receiving task-essentialness practice with grammatical
information as feedback and the other receiving task-essential practice with only “right”
or “wrong” as feedback. Lado found that the participants being given more explicit

47
feedback outperformed those provided with less explicit feedback on the language tests.
Her results indicate that the provision of more explicit feedback aids participants in
learning an L3.
To sum up, the current study investigates the isolated effect of feedback on
language learning and attempts to examine whether task-essentialness practice combined
with feedback is sufficient for L3 development by including a control group with no
feedback and no practice. This study also attempts to distinguish the differential effect of
different feedback. Similar to Lado (2008), the current study included different types of
feedback: more explicit feedback and less explicit feedback. The more explicit feedback
indicates the errors with grammatical information while the less explicit feedback only
indicates “right” or “wrong” to reinforce or reject the answers. Differing from Lado
(2008), the current study included Mandarin speakers learning English in a foreign
language context. Another non-primary language the participants learned is Latin, which
is only available in the treatment. The choice of languages was based on the Competition
Model, as mentioned earlier. With a better control of prior language experiences, the
current study attempted to investigate the effect of different feedback on L3 development
and its interaction with varying levels of bilingualism, which will be discussed in the next
section.
Bilingualism and Feedback
Studies reviewed in previous sections have shown how bilinguals may differ (e.g.,
Cenoz & Valencia, 1994; Klein, 1995; McLaughlin & Nayak, 1989; Nation &
McLaughlin, 1986; Nayak, Hansen, Krueger, & McLaughlin, 1990; Sanz, 2000; Thomas,
48
1998). The studies have also demonstrated how feedback, an external factor, may
influence language learning (e.g., Bowles, 2005; Carroll & Swain, 1993; Lado, 2008;
Nagata, 1993; Nagata & Swisher, 1995; Rosa & Leow, 2004; Sanz & Morgan-Short,
2004). However, few empirical L3 studies (Lado, 2008; Sanz, Anfruns, Lado, Lin,
Medina, 2004; 2005) have investigated the interactive effects of the two variables.
Moreover, while Cummins’ Threshold Hypothesis suggests that bilingual advantages
appear when a certain proficiency level has been reached in both languages. Bialystok
(2001, 2004, 2008) also posits that the nature of tasks performed may play a role in the
appearance of bilingual advantages. For instance, Bialystok (2001) argues that bilinguals,
regardless of their level of bilingualism, may outperform monolinguals at tasks that place
greater demand on the control of linguistic processing. Bialystok also argues that having
a higher level of proficiency in two languages may help bilinguals perform better on tasks
that require more analyzed linguistic knowledge. Because of these reasons, it is of
interest to explore how bilinguals may respond to feedback and how bilinguals at
different L2 proficiency levels may react to different types of feedback.
Few studies have examined the interaction of both variables (Lado, 2008; Sanz,
Anfruns, Lado, Lin, Medina, 2005a). As reviewed earlier, Sanz et al. (2005a) compared
the results of adult participants in two different conditions. Their results showed that
near-native participants outperformed the intermediate ones when judging the
grammaticality of a sentence presented. In the less explicit treatment, near-native
participants statistically performed better than the intermediate on the total items and
untrained items of the aural interpretation test, and the untrained items on written
49
interpretation. In addition, the intermediate and advanced, or intermediate and near-native
were statistically different for all items and trained items on a written sentence production
test. The comparison between the two treatments showed that explicitness in the input
and types of tests performed may influence the appearance of bilingual advantages.
Notably, the more explicit condition in Sanz et al. was the presentation of grammar
lessons before practice when the less explicit condition did not include the grammar
lessons.
Lado (2008) also found that near-native participants performed statistically better
than other groups on the aural interpretation, the grammaticality judgment test, and the
written sentence production test across the feedback conditions (i.e., more explicit or less
explicit feedback). Lado also found that more explicit feedback had an effect on L3
development as shown by the immediate posttests and that the participants were faster in
the less explicit feedback group. For the more explicit group, the lowest L2 level is
statistically different from the other three higher L2 groups. For the less explicit group,
Lado found a threshold between the near-native group and the other three groups in the
posttest on the aural interpretation when investigating the level of bilingualism and type
of feedback. These two studies working within the Latin Project suggest how bilinguals
may react differently depending on the explicitness in the input.
To conclude, the current study attempts to demonstrate how the interaction
between prior L2 knowledge and exposure to different types of feedback may
differentially affect L3 development. The current study attempts to provide evidence as to
how bilinguals of varying L2 levels may differ. Next, comparing participants in two

50
different feedback groups (more explicit and less explicit feedback) can show which
feedback is more beneficial cross L2 levels. Examining the interaction between
participants with different L2 proficiency levels and types of feedback can demonstrate
whether a certain type of feedback is more effective for participants with a certain L2
proficiency level. Finally, the current study attempts to provide empirical evidence to
examine Sanz et al. and Lado’s results with a better control of languages because they are
often been questioned about the positive transfer between Spanish and Latin by other
researchers. Based on the Competition Model, speakers of Mandarin, English, and Latin
employ different processing strategies. Using these three languages in the current study
can minimize the chances of transferring processing strategies from one to another.
Working Memory
Working memory (WM), a limited capacity system, has been considered
necessary for a wide range of cognitive activities, such as reasoning (see a review in
Richardson, Engle, Hasher, Logie, Stoltzfus, & Zacks, 1996). However, WM is not a
unitary construct. Baddeley and Hitch (1974) first proposed to divide unitary short-term
memory2 into three separable components as part of a unified WM system, serving the
function of facilitating performance on a range of complex tasks. According to Baddeley
(2000), one of the components is the phonological loop, which is concerned with verbal
and acoustic information. Visuospatial sketchpad deals with visual input. The third is the
central executive that is an attention-limited system. Later, the episodic buffer, a fourth
component, has been proposed as a limited capacity system, providing a way of
combining information from different modalities into a single multi-faceted code.
51
Baddeley (2000) explained that the difference between the episodic buffer and the central
executive is that the episodic buffer is principally concerned with the storage of
information and conscious awareness, while the central executive is concerned with
attentional control.
Working Memory and WM Measurements
Although researchers generally agree that the capacity to perform the processing
and storage of input is limited, they have different theoretical perspectives and employ
different measurements. One of the commonly discussed positions is the Resource-
sharing hypothesis proposed by Daneman and Carpenter (1980). Their model emphasizes
that while information is being processed and the products of the processing are stored,
two functions - processing and storage - must compete for the limited capacity in the
WM. The model also argues that performance in WM span tests is a reflection of the
amount of resources one has available after the processing requirement of the tests has
been met. Therefore, if an individual is skilled at reading, the individual will have more
resources available to retain the target memory items.
In one of their experiments, Daneman and Carpenter employed several span tests
(a digit span test, a word span test, and a reading span test) on 20 college students to
measure their WM capacity to examine the relationship between WM and reading
comprehension. The reasons to include different WM measurements will be discussed
later. Daneman and Carpenter found that only a reading span test (i.e., no other span test)
was correlated to reading skills. Based on the results, they posit that WM is related to
three reading comprehension measures, including verbal SAT and tests involving fact

52
retrieval and pronominal reference. In another experiment, they showed that the same
processes that occurred in reading comprehension could occur in listening comprehension
as well. They used the same subjects and correlated their WM scores and scores on
listening comprehension tests. The results showed that WM was related not only to
reading comprehension but also to listening comprehension. Overall, the two experiments
demonstrated the relationship between WM and language comprehension. Since then,
many researchers have used reading span tests to assess WM capacity (e.g., Harrington &
Sawyer, 1992; Waters & Caplan, 2005)
While researchers generally agree that comprehension span tests are better
measures, other researchers support non-linguistic specific tests to emphasize the unitary
nature of WM (e.g., Turner & Engle, 1989). In other words, they favor the domain-
generality view as opposed to the domain-specific view. Turner and Engle (1989)
administered several kinds of WM span tests to investigate whether the nature of the
secondary task and the individual’s skill in that task influence the appearance of
correlations between sentence span tests and reading comprehension. In one of the
experiments, Turner and Engle administered four complex span tests involving different
primary and secondary tasks: 1) Daneman and Carpenter’s reading span test (sentence-
word span test, sentence word): participants read a series of unrelated sentences and
recalled the last word in each sentence; 2) a sentence-digit span test, sentence digit:
subjects remembered the digit following each sentence in the series and recalled the
digits after each series, 3) an operation-word span test, operations word: participants
performed simple arithmetic operations followed by a word and they recalled the words

53
after each series, and 4) an operation-digit span, operation digit: participants performed
simple arithmetic operations followed by digit number and they recalled the digits after
each series. Forty-two stimuli in each of the span tests were presented over the 12 trials.
The number of stimuli in each trial was gradually increased from two to five, with three
trials in each level. The stimuli also included a word span test and a digit test. 132 digits
were presented over 27 trials, and 81 words were presented in the 18 trials. Daneman and
Carpenter correlated the six WM span tests and the test scores on Nelson-Denny
Standardized reading comprehension, verbal SAT scores, and quantitative SAT scores
collected from 243 university students. They found correlations between the four
complex span tests and reading comprehension. The results suggest that comprehension
may be related to WM capacity measured against a background task involving reading or
performing arithmetic problems. They did not find correlations between the digit span
test and the test scores or between the word span test and the test scores. Based on their
results, they proposed a general capacity theory. Other studies similarly indicate that both
the verbally-based task and the numerically-based span tasks correlate with measures of
verbal ability (e.g., Daneman & Hannon, 2001; Hitch, Towse, & Hutton, 2001).
Focusing on resource-sharing model may seem plausible, but some researchers
posit that the difference between participants lies in their capacity to use controlled
processing (e.g., Engle, Kane, & Tuholski, 1999; Tuholski, Engle, & Baylis, 2001). They
explained that “… controlled processing involves the processes of activation and
maintaining goal or task-relevant information, as well as that of actively inhibiting
information that competes for attention and is irrelevant to the goal or task at hand”

54
(Tuholski, Engle, Baylis, 2001). They argue that individuals should differ in their ability
to control their attention. Additionally, the differences should appear when those with
high capacity cannot use their controlled attention or when performing tasks do not
require it. This view has been adopted in language learning (e.g., Bialystok, Craik, Klein,
& Viswanathan, 2004; Bialystok, 2008)
Bialystok, Craik, Klein, and Viswanathan (2004) posit that “bilinguals are better
at controlling selective attention to relevant aspect of problems, inhibition of attention to
misleading information and switching between competing alternatives” (p. 291) In the
first study, they included 40 participants in two age groups. Half of the participants were
younger adults who were 30 to 54 years old and the others were older adults who were 60
to 88 years old. In each age group, half of them were monolinguals and half of them were
Tamil-English bilinguals in India. The participants received several tasks: 1) a language
background questionnaire addressing what percentage of each language was used at
home, at work, with friends, and overall, 2) Peabody picture vocabulary test that is a
standardized test of receptive vocabulary, 3) Raven’s Standard Progressive Matrices that
measure abstract nonverbal reasoning ability, and 4) Simon task that measures the
incompatibility between stimulus and response. The results showed no differences
between age groups or language groups on age, PPVT, and scores on the Raven Matrices.
The results showed that younger adults were faster than the older adults were, that
bilinguals were faster than monolinguals, and that congruent items elicited faster
response than incongruent items did.

55
In their second study, Bialystok et al. replicated their first study and included
different conditions in which the working memory demands were increased to determine
whether the conditions also favor bilinguals. They included 94 participants with two age
groups and two language groups as their first study. They included more tests: 1) PPVT
test, 2) Cattell Culture Fair to test general intelligence, 3) Alpha span task to measure
verbal working memory, 4) a sequencing span test to measure verbal working memory,
and 5) Simon tasks. In condition A, a series of squares that were brown or blue would
appear in the middle of the screen. In condition B, either brown or blue would appear on
either the left or the right side of the screen. Condition C had four colors, and one of the
four colors would appear in the middle of the screen. Condition D had four colors, and
one of the colors would appear on either the left or the right side of the screen. No
significant differences were found for the age and language groups on PPVT and Cattell
scores. Younger participants performed better than older participants on AST and SST,
but there were no differences between languages groups. The reaction data on the Simon
task showed that younger adults were faster than older adults under on all conditions.
Bilinguals were faster than monolinguals on conditions B, C, and D.
Based on this position of control of processing, the current study employed a digit
symbol test from WAIS-III to measure the participants’ processing speed.
Other researchers are more interested in the role of phonological short-term
memory (PSTM) in vocabulary and rule learning (e.g., Baddeley, Papagno, & Vallar,
1988; Ellis & Sinclair, 1996; Thorn & Gathercole, 1999). The most cited example is an
Italian named PV, who had a specific deficit of phonological memory (Papagno & Vallar,

56
1998). PV was unable to make associations between spoken words and non-word,
although he had normal phonological processing of non-word input. Papagno and Vallar
found that PV could learn novel pairs of words in Italian, although he could only repeat
lists of random digits and words minimally. This example demonstrated the role of PSTM
in language learning.
Service and Kohonen (1995) tested 42 Finnish participants who were learning
English. They tested the participants yearly for four years and measured their English
performance by employing their schools’ achievement tests, a communicative test, a
traditional grammar test, and an English vocabulary test. The results showed significant
positive correlations between non-word repetition scores and their performance on school
achievement tests, the communicative test, the traditional grammar test, and the English
vocabulary test.
Because phonological loop has been shown to be predicative of L1 and L2 in
vocabulary and grammar acquisition, a non-word recall test is used to measure PSTM. In
the current study, PSTM is operationalized as the ability to immediately repeat novel
phonological sequences after they are presented.
To summarize, five WM span tests were included in the current study because of
the disagreements on the WM models and the measurements of WM capacity in the
literature. A sentence span test based on the Resource-Sharing and Domain-Specific
Hypothesis, a computation span test based on Resource-Sharing and Domain-generality
Hypothesis, a non-word repetition test because of the role of phonological short-term
memory in vocabulary and grammar learning, and a symbol-digit span test based on the

57
Control-Attention hypothesis were included. A digit-backward span test, which is a
traditional span test, was also included. It is hoped that the inclusion of different WM
measures can provide us with a more complete picture of the role of WM capacity in L3
development and WM capacity can help explain any significant results found.
Working Memory and SLA research
Many researchers have been working within the WM framework to examine the
role of WM in cognitive activities. Researchers have also applied the concept of WM to
language learning because WM is involved in a variety of cognitive activities. Hence, it
should have implications for L1 language processing (e.g., Baddeley, 2003; Engle,
Cantor, & Carullo, 1992; Just & Carpenter, 1992; Daneman & Carpenter, 1980; Caplan
& Waters, 1999) and second language learning (e.g., Abu-Rabia, 2003; Ando, Fukunaga,
Kurahachi, Suto, Nakano, & Kage, 1992; Berquist, 1997; Ellis, 2005; Erlam, 2005;
Harrington & Sawyer, 1992; Juffs, 2003; Lado, 2008; Mackey, Philp, Egi, Fujii, &
Tastumi, 2002; Miyake & Friedman, 1998; Romeo, 2006; Sagarra, 2000; Sáfár and
Kormos, 2008; Stafford, 2005).
SLA researchers are interested in the role of working memory (WM) capacity
because of the relationship between WM capacity and noticing. It is argued that noticing
occurring in WM is necessary for L2 learning in order to convert input to intake.
According to Schmidt (1990, 1993, 1994, 1995), “Noticing is crucial for subsequent L2
learning and noticing is identified with the contents of a limited capacity memory system,
with a limited capacity information selection system, or with a limited capacity central
executive” (cited in Schmidt, 1990, p. 135). Similarly, Robinson (1995) defines noticing
58
as dictation plus rehearsal in short-term memory prior to encoding input in long-term
memory (p. 296). Although noticing has been operationalized differently in SLA (e.g.,
Tomlin & Villa, 1994; Schmidt, 1990, 1993, 1994, 1995; Robinson, 1995), it is
acknowledged that noticing occurs in WM, implying that WM is related to SLA.
A few SLA empirical studies have investigated the role of WM in second
language acquisition (e.g., Abu-Rabia, 2003; Ando, Fukunaga, Kurahachi, Suto, Nakano,
& Kage, 1992; Berquist, 1997; Erlam, 2005; Harrington & Sawyer, 1992; Juffs, 2003;
Mackey, Philp, Egi, Fujii, & Tastumi, 2002; Miyake & Friedman, 1998; Sagarra, 2000;
Sáfár & Kormos, 2008).
Sáfár and Kormos (2008) investigated the relationship between aptitude measured
by the Hungarian version of MLAT, working memory measured by a backward digit
span task, phonological short-term memory capacity assessed by a non-word span test,
and the effect of instruction. Sáfár and Kormos had two groups of participants: one
received a communicative approach with focus-on-form instructions and the other
received no special instructions. The experimental group (n=40) was from a bilingual
secondary school. Many of them did not learn English in primary school and the rest of
them did not reach the elementary level of English in a placement test. The control group
was from a regular secondary school and received 45-minute lessons per week in a
foreign language. Their scores of the Cambridge First Certificate, which consisted of
reading and listening comprehension sections, vocabulary and grammar tests, a
composition test, an interview, a picture description test, and a problem-solving test, were
used to assess their English proficiency levels. Sáfár and Kormos found significant
59
correlations between the aptitude test at Time 1 and Time 2 and proficiency test as well
as correlations between their WM capacity and the aptitude test at Time 1 and Time 2.
The results showed no correlations between the non-word span test and the aptitude
score. Next, the results demonstrated that language learning had a positive effect on the
participants’ performance in the aptitude test and that the experimental group improved
significantly better than the control group. Lastly, regression analyses revealed that WM
memory was a better predictor of language learning success than aptitude did.
Harrington and Sawyer (1992) examined the relationship between WM capacity
and L2 reading comprehension. They gave 34 ESL participants whose L1 was Japanese
digit span tests, word span tests in English and Japanese, and reading span tests in
English and Japanese to measure their WM capacity. They correlated the scores
measured by different WM span tests and the participants’ test scores from the grammar
and reading sections of the TOEFL as well as a cloze test consisting of a 350-word
passage from a textbook on international management to measure their comprehension.
They only found correlations between the L2 English reading span scores and TOEFL
grammar tests, and between the English reading span scores and TOEFL reading tests.
They did not find correlations between the span test (L2 English digit span and word span
test) and the TOEFL or the cloze test. They showed that reading span tests were the
better measures. Although they found correlations between English and Japanese digit
span tests, between English and Japanese word span tests, and between English and
Japanese reading span tests, the correlations between L1 and L2 measures were moderate,

60
suggestive of a relationship between the two but clearly not large enough to interpret.” (p.
34).
Miyake and Friedman (1998) examined the role of WM in second language
proficiency. They studied 59 adult native speakers of Japanese who had spent at least 6
years studying English and asked the participants to complete listening span tests in
Japanese (L1) and English (L2), a syntactic comprehension test, and an English version
of an identification task to assess their cue preferences in L2. The results showed that
WM might influence participants’ ability to acquire native-like sensitivity to linguistic
cues in L2 and to comprehend structurally complex sentences correctly and efficiently.
Notably, both Harrington and Sawyer, and Miyake and Friedman suggest a possibility
that WM may be language independent because of the moderate correlation and strong
correlation between L1 and L2 WM measures, respectively.
Ando, Fukunaga, Kurahachi, Suto, Nakano, and Kage (1992) compared the
communicative approach and grammatical approach when teaching English to 90
Japanese fifth-graders. Grammar was not directly taught or explained in the
communicative approach. On the other hand, grammar was directly taught and frequently
supplemented by some explanations in Japanese in the grammatical approach. They used
Raven Progressive Matrices and a Japanese reading span test adapted from Daneman
(1980). Ando et al. measured the participants’ performance during the treatment,
immediately after the treatment, and two months after the treatment. During the treatment
and immediate post-tests, the participants were required to take notes and received
individual interviews. The purpose of taking notes was to investigate their reading,

61
writing, listening and grammar. The individual interviews were conducted by an English
speaker. After the interview, the participants could ask the native speakers any questions.
Ando et al. examined the relationship between aptitude and each teaching approach. The
correlation analyses showed that the Japanese span test and the Raven Progressive
Matrices were related to performance. The results also showed that the grammatical
approach group performed better in grammar and reading. However, the grammatical
approach group did not do as well as the communicative approach group after two
months. The results indicated that WM was related to their performances. However,
because they could not control the actual amount of input received, they might have
teachers who might not give the same feedback as the researchers require, and other
individual factors may influence the results, the interpretation of their results calls for
attention.
Similarly, Berquist (2002) reported in Mackey et al. found some relationships
between reading span tests and better performance in the native language test (in this
case, French). However, because a composite measure of WM capacity was employed,
their result might not be comparable to those studies that used commonly reported WM
span measures (e.g., comprehension span tests).
Abu-Rabia (2003) was interested in the relationship among reading, creative
writing, and WM capacity. She used Daneman and Carpenter’s reading comprehension
test to measure the WM capacity of 47 high school students and ran a correlation test
between the WM test and a L2 written test consisting of spelling, vocabulary, style, local
sentence, sentence combining, thematic maturity, contextual vocabulary, syntactic
62
maturity, contextual spelling, and contextual style. She found a significant relationship
between the WM measure and reading and writing in English as a second language.
Based on the result, she argues that there is a relationship between WM capacity and L2
writing.
While these studies suggest a relationship between WM capacity and L2
acquisition, some studies have shown that greater WM capacity is favorable to L2
learning (Mackey, Philp, Egi, Fujii, & Tastumi, 2002) while other studies have found no
effects - neither positive nor negative - of WM on L2 development (Sagarra, 2000; Juffs,
2003)
Mackey et al. (2002) investigated the relationship among WM, noticing of
interactional feedback, and L2 development in English question formation by using
ANOVA analysis. Although they did not find a significant relationship between WM
capacity and L2 development, the results revealed an interesting pattern. They found that
learners with higher WM reported more noticing. In addition, the participants with low
WM showed more changes in the immediate posttest, and the participants with high WM
showed more development in the delayed posttest. Although the result seems favorable
for the more is better hypothesis, the results were from a very small data set - 13
participants in immediate post-tests and 7 participants in delayed posttest.
Juffs (2003) investigated the relationship between WM and L2 acquisition. He
included 34 Chinese-speaking learners of ESL, 34 Japanese-speaking learners of ESL,
and 48 Spanish-speaking learners of ESL. He used word span tests and reading span tests
both in the subject’s L1 and in their L2 to measure their WM capacity. Then, he
63
correlated their WM span test scores with the vocabulary and grammar sections of the
Michigan Test of English Language Proficiency scores. He found a weak correlation
between L2 word span and grammar for the Chinese speakers and no significant
correlations for the Japanese speakers. For Spanish speakers, he found weak correlations
between the following tests: a L1 reading span and vocabulary, a L2 reading span and
vocabulary test, a L1 reading span and grammar test, and a L2 reading span and grammar
test. He said, “WM may play a role in language learning, but that role may not be as large
as current interest in SLA would like it to be” (p. 6.)
Sagarra (2000) was interested in the role of WM in L2 syntactic development. She
used Daneman and Carpenter’s reading span test to assess WM capacity. She correlated
the span score with the performance of 110 English speakers on Spanish grammar tests of
the second and the 4th semesters. ANOVA results did not show any effects of WM
capacity on L2 development. Although the results seem to refute the role of WM in L2
development, she cautions that the non-significances found between participants may be
due to the limitations of the grammar tests, the reading span test, and the processing
efficiency hypothesis. Because of the different analyses, positions, and measurement, it is
important to keep the different designs in mind when interpreting their findings.
Working Memory and L3 Studies
Not only L2 researchers but also L3 researchers have shown an interest in the role
of WM capacity in language acquisition (e.g., Abu-Rabia & Siegel, 2002; Bialystok,
2008; Bialystok, Craik, Klein, & Viswanathan, 2004; Da Fontoura & Siegel, 1995; Lado,
2008; Lin, 2005, 2007; Ransdell, Arecco, & Levy, 2001; Ransdell, Barbier, & Niit, 2006;
64
Stafford, 2005). However, most studies included adolescent or children; while only a few
researchers focused on the role of WM in adult L3 acquisition (Sanz et al., 2004, 2005;
Lado, 2008; Lin, 2005, 2007; Stafford, 2005). Sanz et al. working within the Latin
Project used a sentence span test and a computational span test to examine the role of
WM in L3 acquisition in two different treatments, a more explicit one (a grammar lesson
prior to a treatment) and a less explicit one (no grammar prior to a treatment). The
ANOVA analyses showed a positive relationship in the less explicit treatment. The
results seem to suggest that WM is unrelated to L3 acquisition in the explicit treatment,
but Lin (2005, 2007) compared the results conducted by using ANOVA analyses and
those by using correlation analyses. She showed that WM was related to L3 acquisition
by the employment of correlation analyses. Overall, Sanz et al. and Lin’s results suggest
an existing relationship between WM and L3 acquisition.
As reviewed earlier, Stafford (2005) demonstrated that WM measured by a L1
sentence span test was a significant predictor, but prior language experience and age of
acquisition were not significant predictors of L3 development. Stafford’s dissertation is
different from the current study, which is also part of the Latin Project. Stafford included
an explicit treatment that had grammar lessons and more explicit feedback with
grammatical explanations given. As she pointed out, the results may be influenced by the
explicitness of the input. As Bialystok and researchers on the controlled-attention
paradigm pointed out earlier, the bilingual advantages may appear when the tasks place
higher demand on individuals. Hence, only including feedback in the input in the current
65
study may increase the task demands, and the differences between participants of
different L2 proficiency levels may appear.
Lado (2008), reviewed in earlier section, examined the effect of bilingualism,
types of feedback, and their interaction on L3 acquisition. She showed that the effect that
Level of bilingualism had on L3 development was influenced by WM capacity measured
by a sentence span test and a nonword recall test in L2. In other words, WM capacity
measured by the sentence span test and the non-word recall test in L2 is a moderating
variable that influences the positive effects that bilingualism may have on L3
development.
Effect of WM Capacity on Language Acquisition
Although researchers in this paradigm agree that there seems to be a relationship
between WM and language learning, there is less agreement as to how WM capacity may
influence language acquisition. Two hypotheses have been proposed to account for the
effect of WM in language acquisition: the less is more hypothesis (Newport, 1988) and
the more is better hypothesis (Miyake & Friedman, 1998). Based on several L1 studies
(Newport & Supalla, 1990; Newport, Supalla, Singleton, Supalla, & Coulter, 1990, both
cited in Newport 1990) and an L2 study (Johnson & Newport, 1989), Newport (1988)
proposed the less is more hypothesis and argued that the limitation of a young child’s
information processing abilities provides the basis on which successful language
acquisition occurs (p.23). In other words, because children have limited capacity to parts
of the linguistic input, it provides them an opportunity to focus and analyze the
components in the input. In contrast, adults have bigger WM capacity to store the whole

66
complex input, but it is harder for them to locate and analyze each component in the
input. Newport (1988), Newport and Supalla (1990) and Newport, Supalla, Singleton,
Supalla, and Coulter (1990) examined and divided the same 30 participants, each with a
minimum of thirty years of exposure to ASL (American Sign Language), into three
groups based on their age of first exposure to ASL: 1) Native learners, exposed to ASL
from birth by their deaf signing parents and from ages 4-6 by deaf peers at the school for
the deaf; 2) Early learners, exposed to ASL by deaf peers at ages 4-6, when entering the
school for the deaf; and 3) Late learners, exposed to ASL by deaf peers after age 12,
when entering the school for deaf or when meeting friends or married spouses from the
school for deaf. For the assessment, Newport & Supalla (1990) used a production test and
a comprehension test to examine the acquisition of complex morphology of ASL verbs of
motion. Newport et al. used the same production and comprehension test along with 15
other tests to investigate a variety of structures in ASL syntax and morphology, such as
word order and agreement. The results of the three studies showed a strong relationship
between age of exposure and the acquisition of ASL as the first language.
To further examine the results of the three studies above, Johnson and Newport
(1989) tested 46 participants whose first language was Chinese or Korean and whose
second language was English. Johnson and Newport included participants who were
students or faculty at the University of Illinois and controlled their socio-educational
backgrounds and their exposure to English. The ages of the participants at the time of
arrival to the United States varied from 3 to 39 years of age. Johnson and Newport also
included 23 native speakers of English to investigate the role of age in L2 acquisition

67
from early childhood to adulthood. They used a grammaticality judgment test to
investigate the acquisition of 12 rules of English morphology and syntax (e.g., verb tense,
verb agreement, basic word order, definite and indefinite articles, and pronouns). In the
test, the participants listened to 276 simple, short sentences, spoken one at a time at a
moderately slow rate of speech. In addition, half of the sentences were grammatical and
the other half were not. They found that the performance of the participants declined as
the age of arrival increased. They also found that the effects were not attributable to
formal instruction in English, length of experience with English, amount of initial
exposure to English, reported motivation, self-consciousness in English, or identification
with the American culture. Thus, they argue that age of acquisition affects the learner’s
maturational state.
Summarizing the results of the L1 and L2 acquisition studies, Newport (1990)
posits that the more limited cognitive ability a child has may provide an advantage for
tasks that involve componential analysis. She explained, “These differences derive from
differences between adults and children in the way linguistic input is perceived and
stored, and perhaps not from differences in their knowledge of linguistic constraints or in
their abilities to perform linguistic analyses once the input is stored …. If children
perceive and store only component parts of the complex linguistic stimuli to which they
are exposed, while adults more readily perceive and remember the whole complex
stimulus, children may be in a better position to locate the components.” (p.23-24) Based
on the hypothesis, two predictions were made to account for L2 acquisition: 1) older
children, adolescents, or adults with large WM capacities show faster initial learning than
68
younger children (or those with smaller capacities), and 2) the ultimate level of
attainment for the former group may be more severely limited than that of the younger
children. In other words, these results attempt to show why children learn better than
other group (e.g., older children, adolescents, and adults) when they learn a new
language.
Other studies were conducted to test the less is more hypothesis (Elman, 1993;
Kareev, Lieberman, & Lev, 1997). Within a connectionist framework, Elman (1993)
trained a neural network to process a semi-artificial language that resembled human
language. When the network was provided with additional input, it was required to
discover underlying structures and to encode the structures. The results showed that the
training failed when the network was fully formed like an adult-like capacity. On the
other hand, the network succeeded when it began with limited capacity and gradually
matured. Therefore, he explained, “… rather than being a limitation, developmental
restrictions on resources may constitute a necessary prerequisite for mastering certain
complex domains. Specifically, successful learning may depend on starting small” (p. 71)
Kareev, Liberman, and Lev (1997) designed two experiments to test the
hypothesis. In experiment 1, they presented 112 college students with a bag containing
128 envelopes. Each envelope was either red or green and contained a coin marked either
X or O. Participants were asked to draw an envelope and to predict the mark on the coin.
When the prediction was correct, the participants kept the coin. The participants also took
a digit-span test in which they repeated the digits heard in the correct order. To analyze
the participants’ performance, they examined three aspects: 1) the perceived correlation

69
between their predictions and the actual results (i.e., their prediction on the mark of a coin
and the actual results), 2) whether the perceived correlation was more extreme than the
one actually encountered, and 3) how accurate the participant’s perception and how good
their overall performance was. The results showed that participants with lower capacity
made better predictions. For the second experiment, Kereev, Lieberman, and Lev
examined whether the same effect was truly constrained by cognitive capacity, but not by
situations. They included 144 university students and measured their working memory
capacity by using the same digit span test. Different from the first experiment,
participants viewed a sample of cards, and performed one prediction on one additional
item (i.e., the additional part of a horizontal line). The results revealed that the smaller
sample size helped participants make more accurate predictions. Based on the results,
they said, “limited capacity may also be advantageous in that it acts as an amplifier of
relationship, increasing the changes that an organism is quickly altered to the existence of
a contingency when one actually exists” (p. 286). Taking the results of these studies (i.e.,
Elman, 1993; Kareev, 1995; Kareev, Liberman, and Lev, 1997) together, they indicate
the possibility of children having a limited capacity that benefits their detecting
regularities in the input than other age groups (e.g., adults).
In contrast with these predictions, Miyake and Friedman (1998) proposed the
more is better hypothesis by testing 59 native speakers of Japanese who had studied
English as their L2 for at least 6 years before entering college. They used listening span
tests in Japanese (L1) and English (L2), a comprehension test, and an English version of
an identification test to assess cue preferences in L2. The results showed that a learner’s
70
WM capacity might influence his or her ability to acquire structurally complex sentences
correctly and efficiently. Thus, Miyake and Friedman posit that the more WM resources
available the better because adult learners might have to make a small sacrifice and
content themselves with near-native level L2 proficiency (p. 361). Additionally, they
explained, the less is more hypothesis cannot easily be applied to individual differences
in adult WM capacity because even a low-span adult’s WM capacity is probably too large
to promote careful internal analysis, unless it is dramatically reduced within a dual-task
situation (p. 360). Moreover, they argue that the less is more hypothesis is based on L1
acquisition, not L2 acquisition. Thus, the distinction between the two hypotheses is
cautioned.
To summarize, researchers in different disciplines have been interested in WM
capacity for its involvement in cognitive activities and language learning. The inclusion
of WM capacity in the current study may provide us with valuable information about its
role in L3 development. Moreover, including different WM tests may also help us better
understand which WM tests may be more appropriate for us to measure WM capacity in
L3 learning.
Learning Strategies
Many researchers have long been interested in learning strategies because they
may facilitate learning. According to Oxford (1990), learning strategies are “special
actions taken by the learner to make learning easier, faster, more enjoyable, more self-
directed, more effective, and more transferable to new situations” (p.8). In Information
processing theory, learning strategies help learners to convert comprehensible input into
71
comprehensible intake. Chamot (2005) said, “Examining strategies aid researchers gain
insight into the learning processes, such as the metacognitive, cognitive, social, and
affective processes.” (p. 112). Researchers who are interested in bilingualism (e.g.,
Nation & McLaughlin, 1986; Nayak et al., 1990) posit that strategies help identify
characteristics of good language learners. Multilinguals are more experienced language
learners and are often better language learners than monolinguals when learning another
language (see Kemp, 2007 for a short review).
Other researchers have also noted the importance of strategies. For instance,
Skehan (1989) argues that learning strategies is one of the important factors that accounts
for individual differences in language learning. Ellis (1985) and McLaughlin (1987)
propose to include learning strategies as one of the processes in their SLA models.
Gardner and McIntyer (1993) posit that several factors contribute to the achievement of
second language proficiency and learning strategy is one of them.
Overall, researchers acknowledge the important role of strategies in language
learning. However, there is lack of clarity on the operationalization of strategies
(reviewed by Cohen, 1998). Hence, before reviewing the previous studies, it is important
to operationalize learning strategies in the current study. Following Oxford (1990) and
other researchers (e.g., Nyikos & Oxford, 1993), “Learning strategies are operations
employed by the learner to aid the acquisition, storage, retrieval, and use of information”
(p.8)
72
Learning Strategies in SLA Studies
The line of studies in strategies has demonstrated that learners at different
learning stages use strategies differently and showed that more advanced learners used
strategies more effectively and more frequently (e.g., Green & Oxford, 1995; Jiménez,
García, & Pearson, 1995; Nyiko & Oxford, 1993; Oxford, 2003; Oxford & Nyikos, 1989;
Riazi, 2007; reviewed by Wharton, 2000; Yang, 2003)
For instance, Nyikos and Oxford (1993) recruited 1200 university students who
were learning French, Spanish, German, Russian and Italian and examined the
frequencies and types of strategies they used. Nyiko and Oxford employed SILL
(Strategies Inventory for Language Learning), surveys, diaries, interviews, and think-
aloud protocol as elicitation instruments and grouped the strategies into five categories:
1) formal, rule-related practice strategies, 2) functional practice strategies, 3) resourceful,
independent strategies, 4) standard academic strategies, and 5) conversational input
elicitation strategies. They also included a background questionnaire to assess the
participant’s motivation, language use, previous language learning, university major, and
self-rated language proficiency levels. The results showed that certain strategies were
used more than others were. For instance, the participants chose to guess meanings from
situations (formal, rule-related practice strategies) more than asking for help
(conversational input elicitation strategies).
Jiménez, García, and Pearson (1995) compared the reading processes of three six-
graders: a proficient bilingual reader, a marginally proficient bilingual reader, and a
proficient monolingual reader. They used various methods for data collection: 1)

73
promoted think alouds and unprompted think alouds, 2) prior knowledge assessment, and
3) interviews. They employed and promoted think aloud and unprompted think aloud to
examine their internal processes. Three Spanish texts and two English texts were used for
the unprompted think-alouds, and one Spanish text with an English text containing
questions that focused on potential comprehension problems. Before reading the texts,
Jimenez, Garcia, and Pearson required the participants to describe the topic of a text and
its genre. They also interviewed the participants with 4 to 11 questions depending on
their language skills. The results showed that the marginally proficient bilingual readers
used rather limited strategies to approach the text compared with the more proficient
ones. The less proficient ones were also less successful in coordinating strategies on
restating the text, focusing on vocabulary, monitoring, and questioning than the
monolingual reader and the proficient ones.
Riazi (2007) reviewed research on strategies, discussed how some factors may
influence the frequency of use of strategies (e.g., proficiency level, educational
background, and motivation), and investigated the use of strategies by 120 Arabic-
speaking female students majoring in English. The results showed the students had
medium to high frequency of use of strategies. In addition, the frequency ranking of
strategies was metacognitive, cognitive, compensation, social, memory, and affective
strategies, from highest to the lowest, respectively.
Learning Strategies in L3 Studies
SLA researchers have tried to identify what a good language learner is, but few
studies have attempted to examine the strategies used by bilinguals when learning a third

74
language Kemp, 2007; Klein, 1995; McLaughlin & Nayak, 1989; Nation & McLaughlin,
1986; Nayak, Hansen, Krueger, and McLaughlin, 1990; Sanz, Lin, Lado, Bowden, &
Stafford, 2009)
Aforementioned, Klein (1995) examined the performance of 17 adolescent
monolinguals learning English and 15 high-school multilinguals learning English as a
third or fourth language within Universal Grammar parameter setting. Based on the
results, Klein explained that “… prior linguistic knowledge leads to greater metalinguistic
awareness… multilinguals have less conservative learning procedures…” (p. 451), but no
measurements of strategies were included in her study. Despite those problems
mentioned in an earlier section, her study calls attention to examine the strategies used by
learners who have known several languages.
Nation and McLaughlin (1986), which was reviewed earlier, posit that more
experienced language learners (multilinguals) perform better than less experienced
learners (bilinguals and monolinguals) because the former are more able to modify their
decisions than the latter two groups. However, as they pointed out, several problems may
have arisen in their experiments, such as the order of conditions, and problems with self-
rated proficiencies. Importantly, although they posit that “multilinguals possess more
successful higher-order plans for organizing linguist stimuli” (p. 52-53), they only
included an introspective questionnaire to examine their use of strategies. Although the
introspective questionnaire showed that multilinguals “responded intuitively” more than
monolinguals and bilinguals did, the difference was not significant.

75
Nayak, Hansen, Krueger, and McLaughlin (1990) had a similar design as Nation
and McLaughlin and collected verbalization data during the learning phase to elicit
strategies employed by the participants. Verbalization data they recorded showed that
participants used visual cues more in the memory condition and used fewer verbal cues in
the rule-discovery condition. Multilinguals used more mnemonic devices than linguistic
strategies in the memory condition although both groups used linguistic strategies.
Moreover, the difference was significant for the multilingual participants in that they
used a greater variety of strategies in the rule-discovery condition than in the memory
condition. No statistically significant differences were reported for the monolinguals in
both conditions.
Sanz, Lado, Lin, Bowden, and Stafford (2009) were interested in the effect of
thinking aloud on L3 development: a more explicit treatment and a less explicit treatment.
For the analyses, they included both reaction time and accuracy scores. The ANOVA
results showed that thinking aloud might enhance L3 learning. However, the induction of
reactivity varied on the types of tests performed. When examining the thinking aloud data
or answers on the debriefing questionnaire, they found that verbalizing under more
demanding conditions seems to help learners extract more information from the input.
When looking at the performances of participants who scored higher, they found that
review and recalling of rules were the most commonly used strategies. Because the focus
of their study was not on strategies, no measures of strategies were included in their study.
Although the results of Klein, Nation and McLaughlin, Nayak et al., and Sanz et
al. may be applicable to the current study, it is important to point out the differences

76
between their studies and the current study. First, Klein works within UG parameter
setting model, while Nation and McLaughlin, Nayak et al., Sanz et al., and the current
study are within the Information Processing model. Next, their participants were
bilinguals or multilinguals based on a self-rating scale, while the current study used a
unified language test to divide participants into different L2 groups. They used only
introspective questionnaires or verbalization data to elicit strategies used by the
participants. A problem may rise that it is difficult for participants to report their
strategies when they do not need to make effects to exercise them, as pointed out by
Nation and McLaughlin (1986). To compensate for this possible problem, the current
study included SILL (Strategies Inventory for Language Learning) developed by Oxford
(1990).
To conclude, these studies have demonstrated that the use of strategies may vary
depending on external conditions (implicit vs. explicit condition), types of acquisition
(vocabulary vs. grammar), complexity of rules (simple vs. complex), and prior language
experiences (number of languages they know). Although they argue that more
experienced language learners use strategies more than their counterparts do, they do not
include measures of strategies, except for verbalization data. As explained earlier, not all
the strategies can be easily articulated by learners. Only two studies attempted to
understand the relationship between strategies and language experiences (Kemp, 2007;
Wharton, 2000) by including a measure of strategies.
Kemp (2007) investigated the grammar learning strategies of 144 participants
knowing two to twelve languages. He recruited participants aged from 17 to 71 years old
77
who were undergraduate language students, language lecturers, science lecturers,
researchers, and educated learners. The participants self-reported their use of grammar
strategies based on a 5-point Likert scale. The questionnaire consisted of 40 items in six
categories: 1) memory for grammar, 2) thanking about grammar, 3) analysis for
grammar, 4) communicating using grammar, 5) organizing grammar learning, and 6)
using grammar with other people. Correlation results showed that the more languages
learners knew, the greater number of strategies they reported using. Those who knew
more languages also used strategies more frequently.
Wharton (2000) examined the relationship among strategies, motivation, gender,
self-reported L3 proficiency levels, and language studied. He included 678 Singaporean
university students and used the Strategy Inventory for Language Learning (SILL), a self-
reported questionnaire. ANOVA analyses showed a positive relationship between L3
proficiency and strategies: participants with higher proficiency used learning strategies
more frequently. He also found that men used strategies more significantly than women
did.
These two studies are relevant to the current study, but some key differences need
to be made. First, the participants in the current study are EFL students learning an L3 in
a laboratory environment, while those in Wharton were bilingual learners learning a
foreign language in a classroom setting. In addition, Kemp (2007) had participants who
were bilinguals and multilinguals of different ages; the current study only included
undergraduates. Researchers (e.g., Gardner and McIntyer, 1993) have suggested that the
use of different types and the number of strategies used may depend on the kind of
78
learners and settings in which learning occurs. Empirical studies have also demonstrated
that cultural background along with other factors (e.g., language studied, stage of
learning, age, motivation, language learning goals, foreign language settings versus
second language settings, previous language learning experience, language learning
styles, gender, anxiety, lack of inhibition, career, or academic specialization) may
influence the results (see a short review by Wharton, 2000). Unlike Wharton and Kemp,
the current study included participants at a similar age from the same cultural background
and educational background.
Although researchers acknowledge the importance of learning strategies, different
measurements are used to identify strategies, such as interviews, diaries, questionnaires
(e.g., Chamot, 2005; Oxford, 1990). The current study chose to use the Chinese version
of a questionnaire developed by Oxford (1990) because of several advantages suggested
by Cohen (1992) (e.g., easy to measure strategies reported by learners and time saving).
Even so, the classification of strategies is open to debate. Hsiao and Oxford (2002)
compared the classification systems of Rubin (1981), Oxford (1990), and O’Malley and
Chamot (1990). They included 517 university students from Taiwan and tested the
categorization of the strategies. The results showed that Oxford’s 6-factor strategy
taxonomy is more consistent with learner’s strategies used. Hence, the current study used
the six strategy categorizations developed by Oxford (1990). The SILL consists of six
categories of language learning strategies: Memory, Cognitive, Compensation, Meta-
cognitive, Affective, and Social Strategies. Oxford explains each category as follows: the
former three are directly involved with language learning and the latter three are
79
indirectly involved with language learning: 1) Memory Strategies include creating mental
linkages, applying images and sounds, reviewing well, and employing action, 2)
Cognitive Strategies are practicing, receiving and sending messages, analyzing and
reasoning, and creating structure for input and output, 3) Compensation Strategies are
guessing intelligently and overcoming limitations in speaking and writing, 4)
Metacognitive Strategies: centering one’s learning, arranging and planning one’s
learning, and evaluating one’s learning, 5) Affective Strategies: lowering one’s anxiety,
encouraging oneself, and taking one’s emotional temperature, and 6) Social Strategies:
asking questions, cooperating with others, and empathizing with others. In short, the
current study used 50-item self-reported questionnaire developed by Oxford (1990) to
assess learners’ frequency use of the strategies in six categories.
Research Questions
The five research questions of the current study are as follows:
1. Does Level of Bilingualism differentially influence the ability to assign semantic
functions to noun phrases at the sentence level in an L3 (Latin) as measured by a
written interpretation test, an aural interpretation test, a grammaticality judgment
test, and a written sentence production test?
2. Does type of feedback ( more explicit and less explicit feedback) differentially
affect the ability to assign semantic functions to noun phrases at the sentence level
in an L3 (Latin) as measured by a written interpretation test, an aural
interpretation test, a grammaticality judgment test, and a written sentence
production test?

80
3. Is there an interaction between Level of Bilingualism and Type of feedback? Do
participants at higher L2 proficiency levels outperform those at lower L2
proficiency levels under the less explicit condition as measured by a written
interpretation test, an aural interpretation test, a grammaticality judgment test, and
a written sentence production test? In addition, do participants at higher L2
proficiency levels perform similarly to their counterparts in the more explicit
condition?
4. Does Working Memory Capacity ( as measured by a computational span test, a
speed of processing test, a sentence span test, a non-word recall test, and a digit
backward test) influence the effects observed in RQ1, RQ2, and RQ3?
5. Do Learning Strategies (as measured by SILL) influence the effects observed in
RQ1, RQ2, and RQ3?
81
CHAPTER 3: METHODOLOGY
Overview Of The Experimental Design
This study is part of the Latin project originally developed by Sanz, Bowden, and
Stafford, which is granted and reviewed by Internal Review Board with exemption (02-
080 C). The Latin project comprises vocabulary lessons, vocabulary quizzes, treatment
sections (practicing with the target language with different types of feedback provided),
and four language tests. In the current study, the vocabulary and language tests,
vocabulary and grammar lessons, instructions, and debriefing questionnaires were the
same, but they had been adapted to be used for Chinese participants. Appendix A
presents a list of 35 nouns and 11 verbs used in the current study, and the equivalent
Chinese translations are included. Next, the original version of Latin Project, developed
by Sanz et al, is computer-delivered, but practical concerns make this format difficult.
Therefore, the researcher developed paper-and-pencil treatments and tests, and
administered different versions of the language tests in randomized order.
Participants
One hundred and five 18 to 22 year old Mandarin EFL learners aged from 18 to
22 years old in Taiwan participated in the study with a mean age of 18.74 years old. They
were undergraduates from a wide range of majors at several private universities 90 were
in the experimental groups and 15 were in the control group. Of those in the experimental
groups, 32 of them were male and 58 were female.
Many languages are spoken in Taiwan, but Mandarin is the language of
instruction and the official language of Taiwan. Although speakers in Taiwan may speak
82
Taiwanese, Haka, or other languages, they are mostly used at home, with family, or
sometimes between friends. Only around a decade ago, schools started to include classes
to teach children to speak these languages. 78 out of 90 participants reported that their
first language was Mandarin, four chose both Mandarin and Taiwanese as their first
languages, and only nine reported having Taiwanese as their first language. Although
some literature suggests that the participants are immersed in the environment where
other Chinese languages are spoken and some of them are able to speak Mandarin and
other Chinese languages, researchers have suggested that it is literacy skills that have an
impact on L3 acquisition (see a short review by Errasti, 2003). For instance, Swain
Lapkin, Rowen, and Hart (1990) examined the L3 performance of 210 elementary
students who were literate in L1 AND L2 and who were only literate in their L2. Their
results showed that only participants who were literate in their L1 and L2 performed
better than those who were only literate in the L2. On the other hand, their results may
emphasize the importance of literacy skills, but all of the Chinese dialects share the same
writing system. Therefore, it is uncertain to what extent their findings are applicable to
the current study. Because of this reason, a background questionnaire was developed to
elicit the participants’ knowledge about other Chinese dialects and their frequency use of
them. Table 1 summarizes their self-reported frequency of use and fluency of Mandarin,
Taiwanese, and English. No use of other languages was reported by the participants.
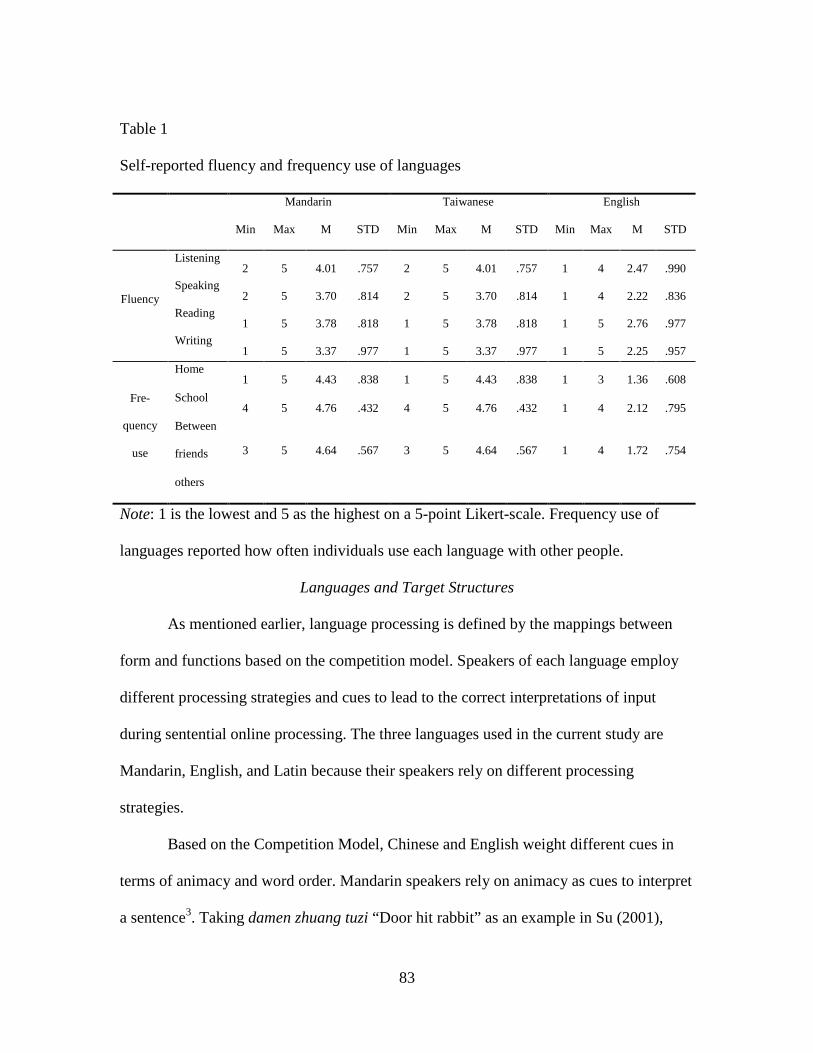
83
Table 1
Self-reported fluency and frequency use of languages
Mandarin Taiwanese English
Min Max M STD Min Max M STD Min Max M STD
Fluency
Listening 2 5 4.01 .757 2 5 4.01 .757 1 4 2.47 .990
Speaking 2 5 3.70 .814 2 5 3.70 .814 1 4 2.22 .836
Reading 1 5 3.78 .818 1 5 3.78 .818 1 5 2.76 .977
Writing 1 5 3.37 .977 1 5 3.37 .977 1 5 2.25 .957
Fre-
quency
use
Home 1 5 4.43 .838 1 5 4.43 .838 1 3 1.36 .608
School 4 5 4.76 .432 4 5 4.76 .432 1 4 2.12 .795
Between
friends 3 5 4.64 .567 3 5 4.64 .567 1 4 1.72 .754
others
Note: 1 is the lowest and 5 as the highest on a 5-point Likert-scale. Frequency use of
languages reported how often individuals use each language with other people.
Languages and Target Structures
As mentioned earlier, language processing is defined by the mappings between
form and functions based on the competition model. Speakers of each language employ
different processing strategies and cues to lead to the correct interpretations of input
during sentential online processing. The three languages used in the current study are
Mandarin, English, and Latin because their speakers rely on different processing
strategies.
Based on the Competition Model, Chinese and English weight different cues in
terms of animacy and word order. Mandarin speakers rely on animacy as cues to interpret
a sentence3. Taking damen zhuang tuzi “Door hit rabbit” as an example in Su (2001),

84
Mandarin speakers think that “tuzi ” can hit the door and “damen” cannot hit the rabbit
because of animacy. Thus, animacy cue is a more reliable cue than word order in
Chinese. In addition, when both nouns are animate, Chinese speaker rely on context cues,
as shown in Su (2001a, 2001b, 2004). When context cues conflict with animacy, Chinese
speakers prefer the animacy cues. . On the other hand, animacy is not a reliable cue for
English speakers. In the same sentence, “Door hit rabbit”, English speakers would choose
“Door” as the doer because of its preverbal position.
The basic word order of Mandarin is SVO (subject-verb-object), but Mandarin
also allows the omission of a subject that is understood from the context. Additionally,
because Chinese is a topic-comment language, more flexible word order is acceptable,
such as mama xi yifu (mother washes clothes) and yifu mama xi (clothes mother washes).
For these examples, both SVO and OSV are grammatical in Chinese. For English, the
basic canonical word order is SVO (subject-verb-object) in sentence processing, and the
preverbal position is associated with the agent role, such as in “he hit a car.”
Additionally, English requires a dummy subject when there is no explicit reference
subject. For instance, in the sentence “it is raining” , “it” is required. Contrarily, Chinese
does not require a subject and only “raining” is needed. Compared with English and
Chinese, Latin has a freer word order and uses a variety of case markings as well as
noun-verb agreement to indicate the agent-patient relationship in a sentence. The input
presented in this study is controlled for animacy cues because each sentence contains two
animate nouns. Therefore, no animacy cue was available to Chinese speakers. Because

85
Latin has rich morphological markings and freer word order, word order is not a reliable
cue for English speakers to correctly interpret Latin sentences.
In the current study, each Latin sentence contains two animate nouns and one
transitive verb. The stem of each noun was used to indicate its gender (masculine or
feminine), number (singular or plural), or function (agent or patient). The stem of each
verb indicated the number of its subject (singular or plural). See the example provided
below.
Parvul-a lauda-t Magistr-am
Noun-female-Singular-Subject Verb–Singular Noun-female-Singular-Object
“The girl praises the teacher”
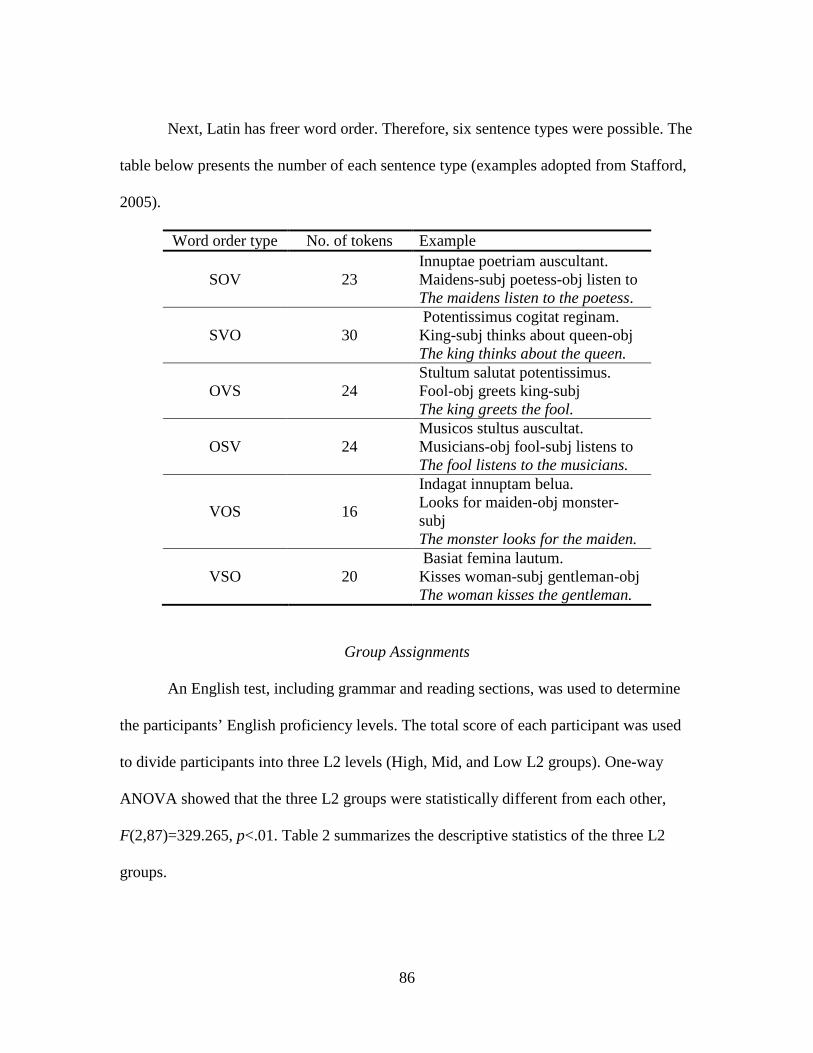
86
Next, Latin has freer word order. Therefore, six sentence types were possible. The
table below presents the number of each sentence type (examples adopted from Stafford,
2005).
Word order type No. of tokens Example
SOV 23 Innuptae poetriam auscultant. Maidens-subj poetess-obj listen to The maidens listen to the poetess.
SVO 30 Potentissimus cogitat reginam. King-subj thinks about queen-obj The king thinks about the queen.
OVS 24 Stultum salutat potentissimus. Fool-obj greets king-subj The king greets the fool.
OSV 24 Musicos stultus auscultat. Musicians-obj fool-subj listens to The fool listens to the musicians.
VOS 16
Indagat innuptam belua. Looks for maiden-obj monster-subj The monster looks for the maiden.
VSO 20 Basiat femina lautum. Kisses woman-subj gentleman-obj The woman kisses the gentleman.
Group Assignments
An English test, including grammar and reading sections, was used to determine
the participants’ English proficiency levels. The total score of each participant was used
to divide participants into three L2 levels (High, Mid, and Low L2 groups). One-way
ANOVA showed that the three L2 groups were statistically different from each other,
F(2,87)=329.265, p<.01. Table 2 summarizes the descriptive statistics of the three L2
groups.
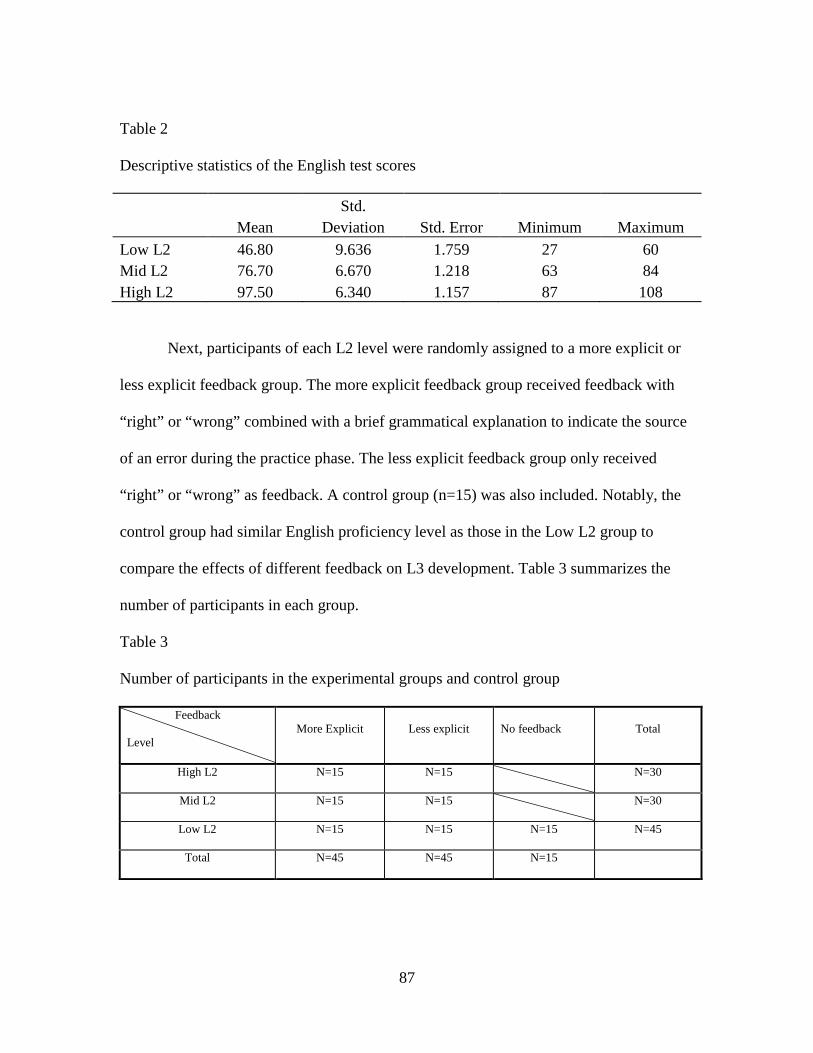
87
Table 2
Descriptive statistics of the English test scores
Mean Std.
Deviation Std. Error Minimum Maximum Low L2 46.80 9.636 1.759 27 60 Mid L2 76.70 6.670 1.218 63 84 High L2 97.50 6.340 1.157 87 108
Next, participants of each L2 level were randomly assigned to a more explicit or
less explicit feedback group. The more explicit feedback group received feedback with
“right” or “wrong” combined with a brief grammatical explanation to indicate the source
of an error during the practice phase. The less explicit feedback group only received
“right” or “wrong” as feedback. A control group (n=15) was also included. Notably, the
control group had similar English proficiency level as those in the Low L2 group to
compare the effects of different feedback on L3 development. Table 3 summarizes the
number of participants in each group.
Table 3
Number of participants in the experimental groups and control group
Feedback
Level More Explicit Less explicit No feedback Total
High L2 N=15 N=15 N=30
Mid L2 N=15 N=15 N=30
Low L2 N=15 N=15 N=15 N=45
Total N=45 N=45 N=15

88
Materials
Background Questionnaire
A background questionnaire was used to elicit the participant’s knowledge of
other Chinese and other foreign languages. The participants also self-rated their
proficiency from 1 to 5 in Chinese and foreign languages. Appendix B provides the
questionnaire in both Chinese and English.
Treatment
The treatment comprised 6 sets of practice with feedback given. Participants at
each L2 level were randomly assigned into two feedback groups: 1) more explicit
feedback group and 2) less explicit feedback group. Both of the groups received “right”
or “wrong” as feedback, but the more explicit feedback group also received
metalinguistic information as part of the feedback.
During the treatment, six different sets of exercises were given: 1) participants
read a Latin sentence and chose one of the two Chinese translations that matched the
Latin sentence, 2) participants read a Latin sentence and chose one of the two pictures
that matched the description, 3) participants read a Latin sentence and chose from two
sentences the one that accurately described the pictures, 4) participants listened to a Latin
sentence and chose one of the two translations that matched the Latin sentence, 5)
participants listened to a Latin sentence and chose from two pictures the one that
matched the description, and 6) participants listened to a Latin sentence and decided
whether the sentence heard matched the pictures presented. The exercises included 10, 9,
10, 9, 9, and 9 items, respectively.

89
Because the treatment was administered to a group of students, each participant
received a booklet that contained exercises presented in the same order. Participants had
only one minute on each practice item. A bell sounded every minute to signal the
participants to turn to the next page of the booklet.
L3 Vocabulary and Language Tests
Four different types of tests were included (a written interpretation test, an aural
interpretation test, a grammaticality judgment test, and a written sentence production test)
because they tap into different types of knowledge (e.g., Robinson, 1995b; Sanz, 1997).
For instance, Sanz (1997) suggests that developing multiple tests provides a more
informative way of investigating the effects of instruction on SLA (p.53). She divided 44
participants into an experimental group and a control group and asked the participants to
complete an interpretation task and three production tasks in oral and written form. Her
results showed that the participants performed better in the written than in the oral mode
and that they were more accurate in the completion of sentences than retelling a story. In
other words, her results indicate that the mode and type of a test determines the type of
knowledge elicited. In the current study, the written interpretation test, the aural
interpretation test, and the written production test require language use while
grammaticality judgment elicits participants’ knowledge of a language. Next, the two
interpretation tests use different delivery modes, aural and visual. Lastly, the written
production test requires participants to produce a sentence rather than choosing correct
pictures based on the sentences presented aurally or visually.
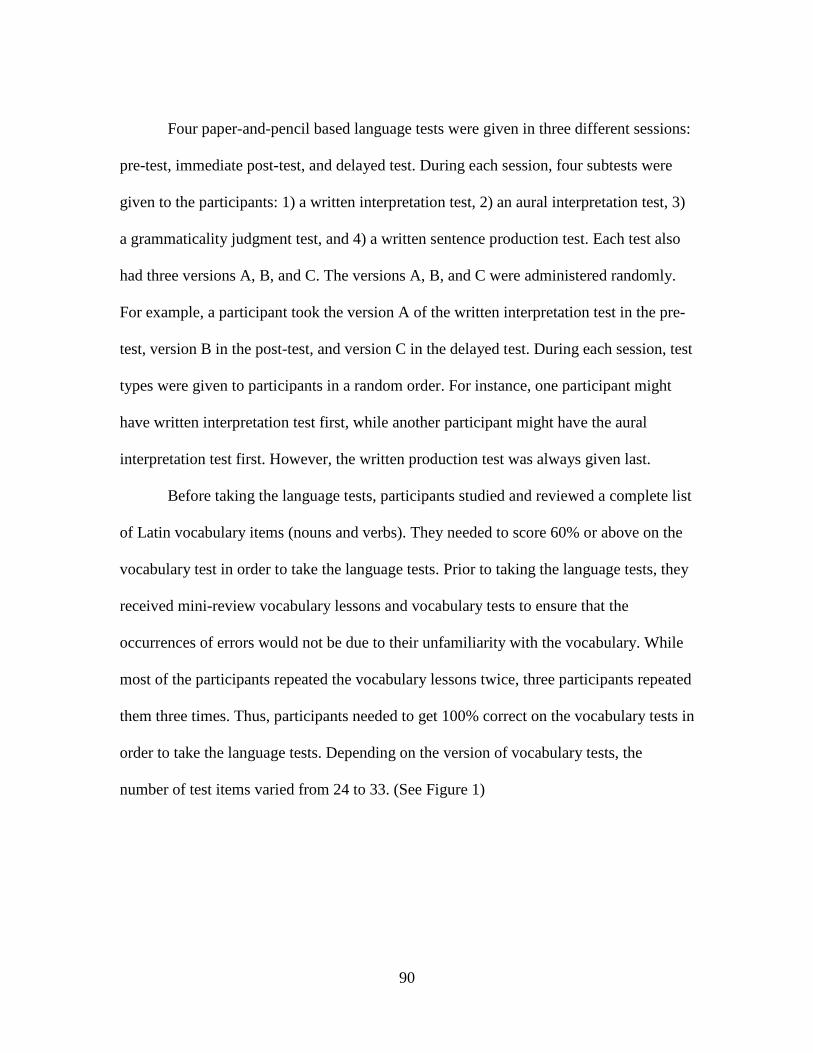
90
Four paper-and-pencil based language tests were given in three different sessions:
pre-test, immediate post-test, and delayed test. During each session, four subtests were
given to the participants: 1) a written interpretation test, 2) an aural interpretation test, 3)
a grammaticality judgment test, and 4) a written sentence production test. Each test also
had three versions A, B, and C. The versions A, B, and C were administered randomly.
For example, a participant took the version A of the written interpretation test in the pre-
test, version B in the post-test, and version C in the delayed test. During each session, test
types were given to participants in a random order. For instance, one participant might
have written interpretation test first, while another participant might have the aural
interpretation test first. However, the written production test was always given last.
Before taking the language tests, participants studied and reviewed a complete list
of Latin vocabulary items (nouns and verbs). They needed to score 60% or above on the
vocabulary test in order to take the language tests. Prior to taking the language tests, they
received mini-review vocabulary lessons and vocabulary tests to ensure that the
occurrences of errors would not be due to their unfamiliarity with the vocabulary. While
most of the participants repeated the vocabulary lessons twice, three participants repeated
them three times. Thus, participants needed to get 100% correct on the vocabulary tests in
order to take the language tests. Depending on the version of vocabulary tests, the
number of test items varied from 24 to 33. (See Figure 1)

91
Figure 1
Example of the vocabulary test
The written interpretation, the aural interpretation, and the grammaticality
judgment tests each comprised 20 test items including eight distractors that consisted of a
verb and a noun in each sentence. Six test items were trained items that they had
practiced with during the treatment, and the other six were untrained items that
participants had not been exposed to during the treatment.
In the written interpretation test, participants read a Latin sentence and chose one
of two corresponding pictures. They also had the third option “不知道” (I don’t know).
(See Figure 2)
請選出正確的字根
a. famula- b. domi- c. medic-

92
Figure 2
Example of the written interpretation test
Uocant Magum Deae
a b
c. 不知道 (I don
�t know)
In the aural interpretation test, participants heard a sentence. They then either
chose a correct answer from two pictures or chose “I don’t know” as the third option.
(See Figure 3)

93
Figure 3
Example of the aural interpretation test
In the grammaticality judgment test, participants read a sentence and decided if
the sentence was grammatical. The participants chose “yes”, “no”, or “I don’t know”
before continuing to the next question. (See Figure 4)
�� ��
�� 不知道

94
Figure 4
Example of a grammaticality judgment test
Unlike the other three tests, the written sentence production test had 15 questions
and 5 of them were distractors. Participants saw a picture and formed a sentence that
correctly described the picture by applying the appropriate inflectional endings to the
roots of the animate nouns and transitive verb provided. For instance, a participant had to
choose the correct endings among “-ae, -t, -i, -os, -nt, -us, -a, -as, -am” and matched them
with the roots “tignari-, coqu-, salute-” to form a correct sentence, “Tignarium salutant
coui which means, “Cooks greet carpenter.” In addition, the three roots were placed in a
different order in each question. For instance, in one question, the order might be NVN
(noun, verb, and noun) while the order might be VNN (verb, noun, and noun) in another
question. Therefore, participants needed to form the sentences in the way that they
thought appropriate. (See Figure 5)
Innuptae cogitant procos
a. 不對 (Wrong) b. 對 (Right)
c. 不知道 (I don’t know)

95
Figure 5
Example of written production item
tignari- coqu- saluta-
Working Memory Span Tests
Because of the disagreement in the literature on which WM span test is an
appropriate measure of WM capacity (e.g., Daneman & Carpenter, 1980; Turner &
Engle, 1989; Waters & Caplan, 1996), different WM tests were included: 1) a sentence
span test, 2) a computational span test, 3) a digit backward span test, 4) a speed of
processing test, and 5) a nonword recall test.
Sentence span test.
The sentence span test was developed in Mandarin, the participants’ L1, by the
researcher. All the sentences were chosen from high school textbooks. Following
Daneman and Carpenter (1980), the sentence span consisted of sets of 3, 4, or 5 sentences
-am -i -os -as
-us -a -ae -um
-t -nt
96
that were presented visually and were chosen from high school textbooks in Taiwan.
Each sentence contained twelve to seventeen Chinese characters.
Participants had to make judgments on each sentence presented to decide whether
each sentence made sense and whether it was grammatical. The reason to include
grammaticality and semantic judgments in the test, which is different from Daneman and
Carpenter, was to impose heavier processing burden on the participants’ WM. The
ungrammatical sentences were sentences that were syntactically incorrect. Within the
ungrammatical sentences, half of them were non-sense sentences formed by replacing the
nouns, with semantically incorrect alternative words. The same applied to the
grammatical sentences. 10 sentences were ungrammatical and non-sense. 11 sentences
were ungrammatical, but they made sense. 10 sentences were grammatical, but they did
not make sense. 11 sentences were grammatical and made sense. At the beginning of the
test, participants were instructed to remember the last character of each sentence in a set.
After each set was presented, a slide of “recall” appeared and the participants wrote down
sentence-final words of each set. They completed all of the test items. Four practice runs
of two sentences each were provided to minimize the unfamiliarity with the task.
An example is provided in Figure 6. When participants saw a sentence “我們還是
要回到現實的水面上來” (we still have to come to the surface of the reality water), they
made decisions on grammaticality and sense. Once “recall” appeared, the participants
wrote down sentence-final characters in each set. Appendix C provides a list of the
sentences used.
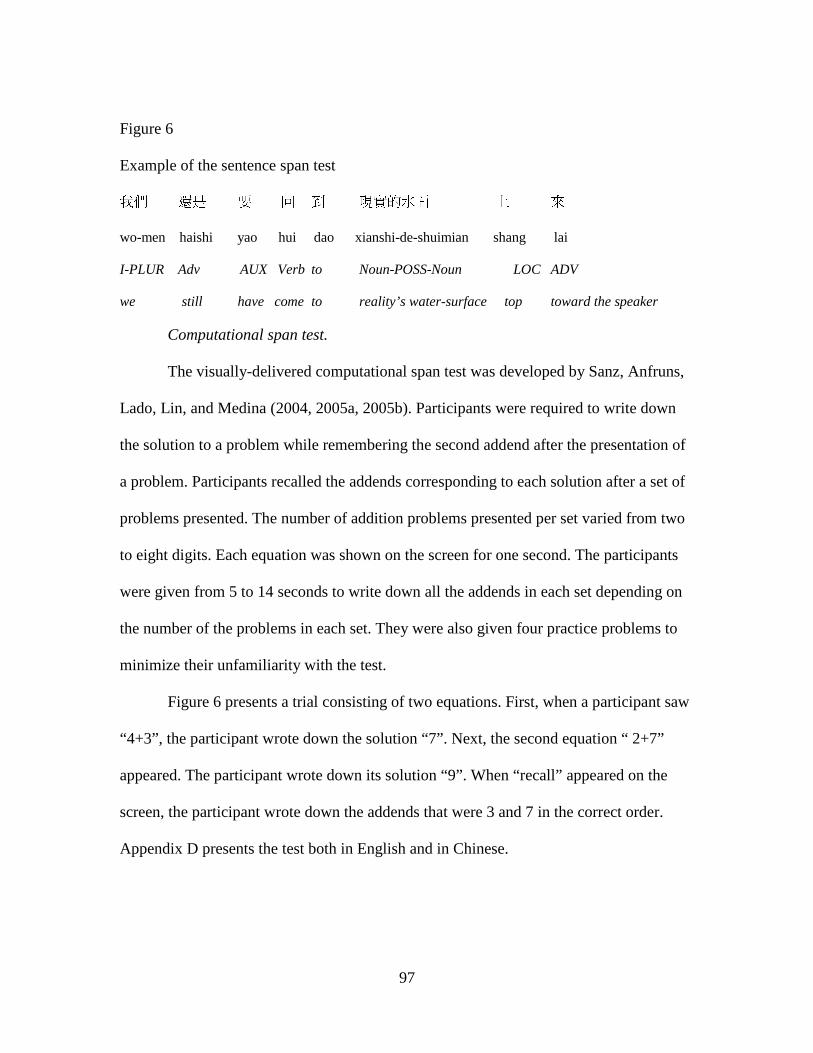
97
Figure 6
Example of the sentence span test 我們 還是 要 回 到 現實的水面 上 來
wo-men haishi yao hui dao xianshi-de-shuimian shang lai
I-PLUR Adv AUX Verb to Noun-POSS-Noun LOC ADV
we still have come to reality’s water-surface top toward the speaker
Computational span test.
The visually-delivered computational span test was developed by Sanz, Anfruns,
Lado, Lin, and Medina (2004, 2005a, 2005b). Participants were required to write down
the solution to a problem while remembering the second addend after the presentation of
a problem. Participants recalled the addends corresponding to each solution after a set of
problems presented. The number of addition problems presented per set varied from two
to eight digits. Each equation was shown on the screen for one second. The participants
were given from 5 to 14 seconds to write down all the addends in each set depending on
the number of the problems in each set. They were also given four practice problems to
minimize their unfamiliarity with the test.
Figure 6 presents a trial consisting of two equations. First, when a participant saw
“4+3”, the participant wrote down the solution “7”. Next, the second equation “ 2+7”
appeared. The participant wrote down its solution “9”. When “recall” appeared on the
screen, the participant wrote down the addends that were 3 and 7 in the correct order.
Appendix D presents the test both in English and in Chinese.
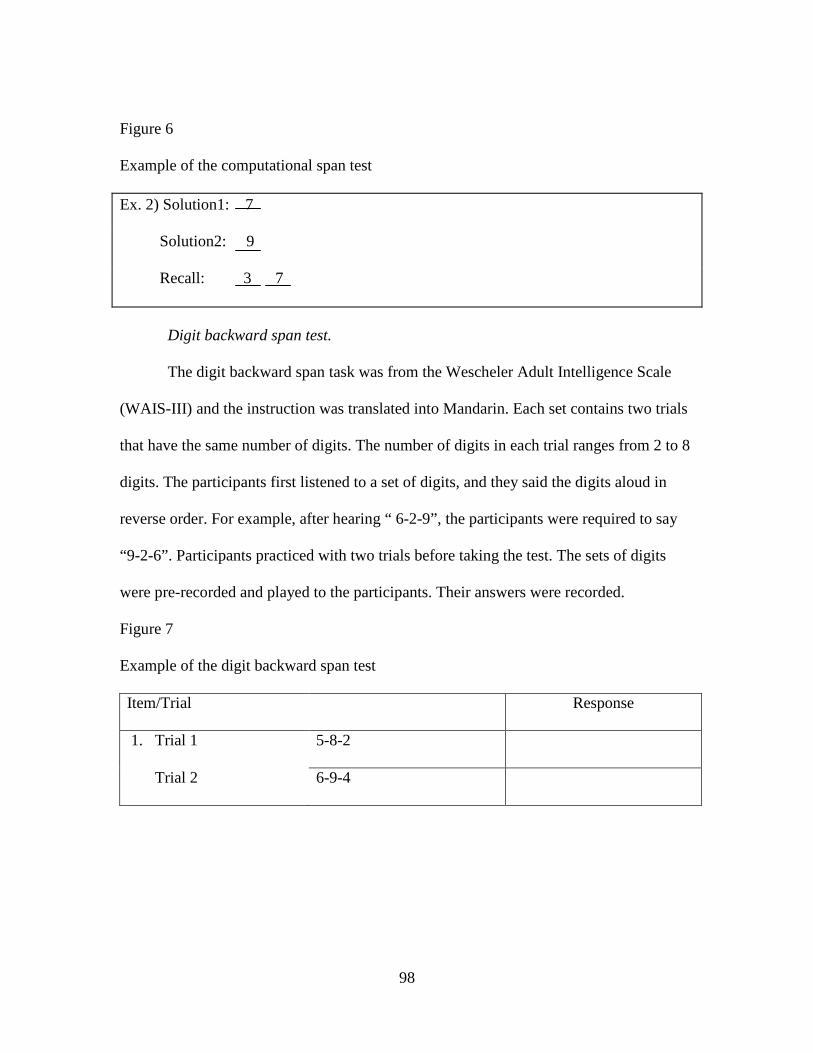
98
Figure 6
Example of the computational span test
Ex. 2) Solution1: 7
Solution2: 9
Recall: 3 7
Digit backward span test.
The digit backward span task was from the Wescheler Adult Intelligence Scale
(WAIS-III) and the instruction was translated into Mandarin. Each set contains two trials
that have the same number of digits. The number of digits in each trial ranges from 2 to 8
digits. The participants first listened to a set of digits, and they said the digits aloud in
reverse order. For example, after hearing “ 6-2-9”, the participants were required to say
“9-2-6”. Participants practiced with two trials before taking the test. The sets of digits
were pre-recorded and played to the participants. Their answers were recorded.
Figure 7
Example of the digit backward span test
Item/Trial Response
1. Trial 1 5-8-2
Trial 2 6-9-4
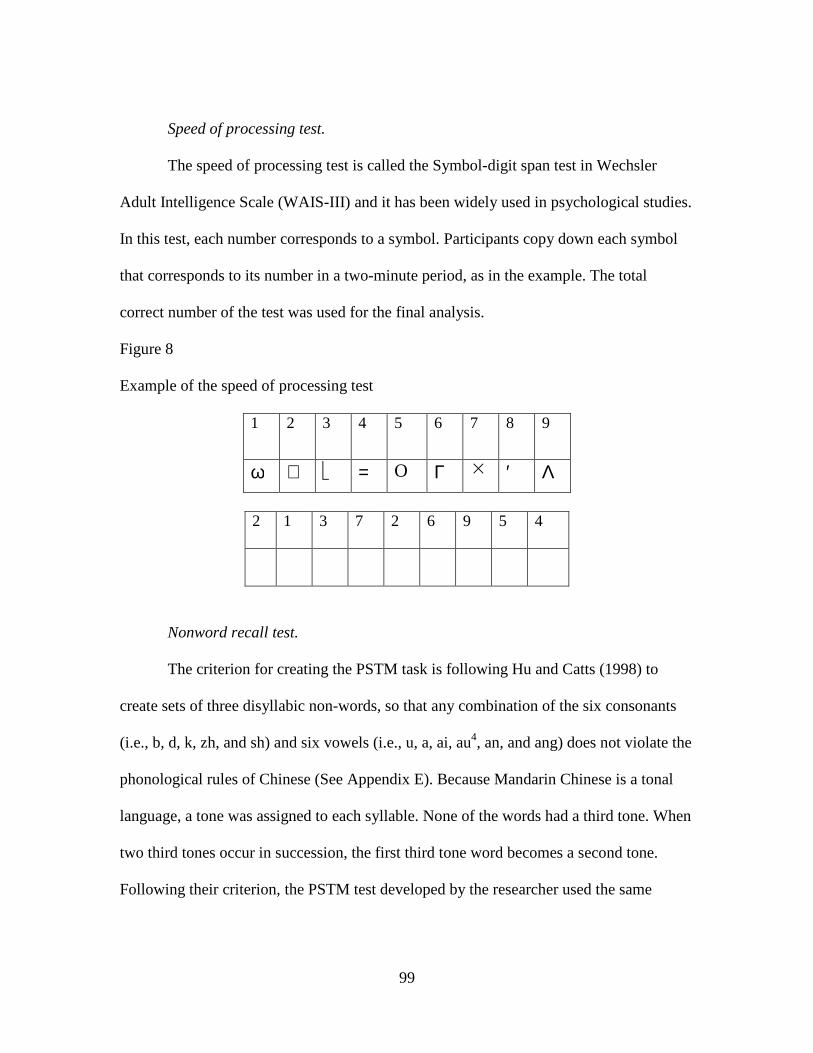
99
Speed of processing test.
The speed of processing test is called the Symbol-digit span test in Wechsler
Adult Intelligence Scale (WAIS-III) and it has been widely used in psychological studies.
In this test, each number corresponds to a symbol. Participants copy down each symbol
that corresponds to its number in a two-minute period, as in the example. The total
correct number of the test was used for the final analysis.
Figure 8
Example of the speed of processing test
1 2 3 4 5 6 7 8 9
ϖ ⊃ = O Γ � ′ Λ
2 1 3 7 2 6 9 5 4
Nonword recall test.
The criterion for creating the PSTM task is following Hu and Catts (1998) to
create sets of three disyllabic non-words, so that any combination of the six consonants
(i.e., b, d, k, zh, and sh) and six vowels (i.e., u, a, ai, au4, an, and ang) does not violate the
phonological rules of Chinese (See Appendix E). Because Mandarin Chinese is a tonal
language, a tone was assigned to each syllable. None of the words had a third tone. When
two third tones occur in succession, the first third tone word becomes a second tone.
Following their criterion, the PSTM test developed by the researcher used the same
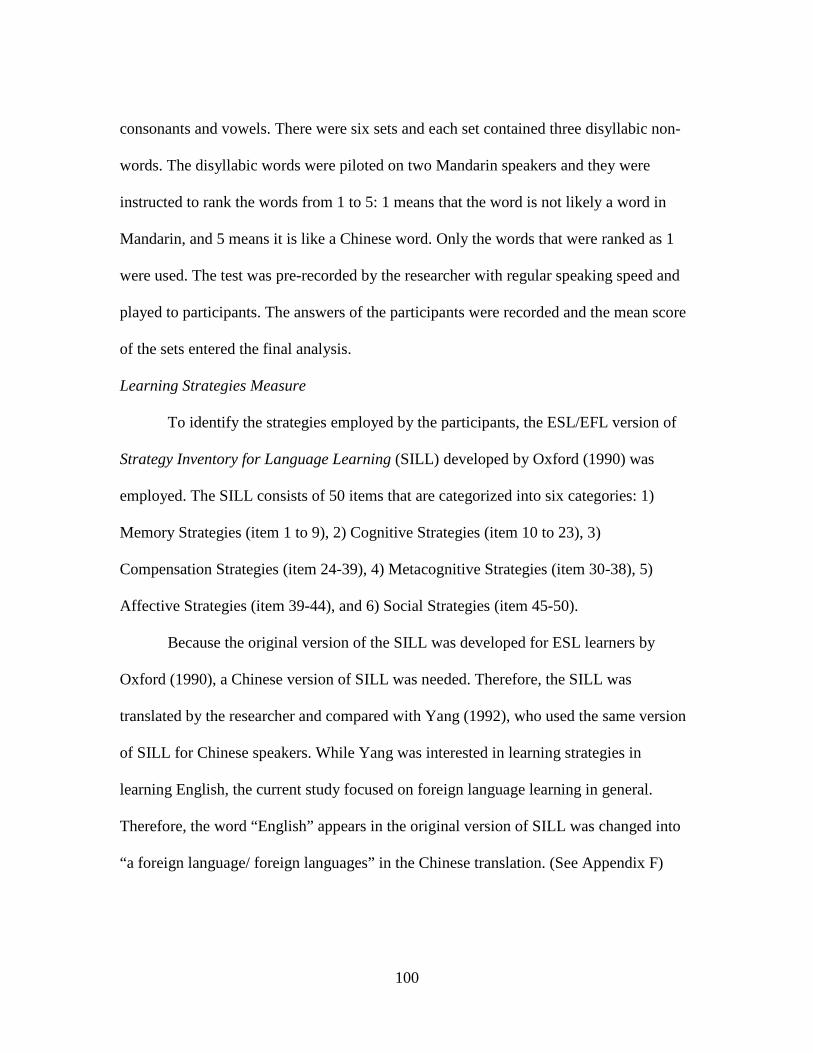
100
consonants and vowels. There were six sets and each set contained three disyllabic non-
words. The disyllabic words were piloted on two Mandarin speakers and they were
instructed to rank the words from 1 to 5: 1 means that the word is not likely a word in
Mandarin, and 5 means it is like a Chinese word. Only the words that were ranked as 1
were used. The test was pre-recorded by the researcher with regular speaking speed and
played to participants. The answers of the participants were recorded and the mean score
of the sets entered the final analysis.
Learning Strategies Measure
To identify the strategies employed by the participants, the ESL/EFL version of
Strategy Inventory for Language Learning (SILL) developed by Oxford (1990) was
employed. The SILL consists of 50 items that are categorized into six categories: 1)
Memory Strategies (item 1 to 9), 2) Cognitive Strategies (item 10 to 23), 3)
Compensation Strategies (item 24-39), 4) Metacognitive Strategies (item 30-38), 5)
Affective Strategies (item 39-44), and 6) Social Strategies (item 45-50).
Because the original version of the SILL was developed for ESL learners by
Oxford (1990), a Chinese version of SILL was needed. Therefore, the SILL was
translated by the researcher and compared with Yang (1992), who used the same version
of SILL for Chinese speakers. While Yang was interested in learning strategies in
learning English, the current study focused on foreign language learning in general.
Therefore, the word “English” appears in the original version of SILL was changed into
“a foreign language/ foreign languages” in the Chinese translation. (See Appendix F)
101
Debriefing Questionnaire
A debriefing questionnaire was given to the participants in the last session and
used to observe any signs of the development of explicit rules. Appendix G provides the
questions. (See Appendix G)
Experimental Design and Procedures
Time series design was used in the experiment (pretest-posttest-delayed posttest)
and four sessions were held. The first session lasted for approximately 1 hour. First,
participants answered a questionnaire to fill out their personal information and prior
language learning experience. After filling out the questionnaire, they were asked to
complete 3 WM tasks: the computational span test, the digit-symbol test, and the
sentence span test to measure their WM capacity. At the end of the first session, the
participants took an English test containing grammar and reading sections to determine
their English level, L2. After this session, the participants were divided into three L2
levels based on their total score on the English test.
In the second session, the participants took vocabulary lessons, vocabulary
quizzes, and language tests. They first received Latin vocabulary lessons and received a
test to determine their knowledge of the vocabulary. Participants had to score 60% or
higher in order to take the language tests. If they failed to do so, they had to repeat the
vocabulary lesson until they passed it. As mentioned earlier, most of the participants
repeated the vocabulary lessons twice and only three of them repeated three times. After
passing the vocabulary quiz, the participants took the four language tests. Notably, a
vocabulary quiz was given before each language test and only the vocabulary used in the

102
language test was tested. At this time, participants had to correctly answer each
vocabulary item in order to take the language test.
The next session took place approximately one week later and lasted around 2
hours. Before beginning this session, participants of each L2 level were randomly
assigned to a more explicit feedback or a less explicit feedback group. A control group,
which had similar L2 proficiency as the low L2 group, was also included in the design
and they received no feedback. During the treatment, the participants practiced with the
target language and feedback was provided after each response, except to the control
group. The more explicit feedback group received “right” or “wrong” as feedback along
with a brief grammatical explanation to indicate the source of an error. The less explicit
feedback group received only feedback, “right” or “wrong”. Upon the completion of the
treatment, participants completed an immediate posttest. They had to score 100% on the
vocabulary tests before taking each language test. The number of vocabulary tests that
participants took ranged from 1 to 8. SILL was given at the end of the session.
The final session was held two weeks later. A delayed posttest was given to test
the participants’ knowledge of the target language. Before the language tests, vocabulary
tests were given to ensure that the errors in the language tests were not due to their
unfamiliarity with the vocabulary. After completing the four language tests, a debriefing
questionnaire was given. Table 4 illustrates the experimental design. Lastly, two WM
tests were given (nonword recall test and digit backward span test).

103
Table 4
Experimental Procedures
1st session
(1) Background questionnaire
(2) WM tasks: computational span test, symbol digit span test, and sentence span test
(3) L2 proficiency test
2nd session
(1) Vocabulary lessons and quizzes
(2) Pre-tests (each language test was preceded by a vocabulary review lesson and a
vocabulary quiz)
3rd session (treatment and immediate post-test, approximately one week later)
(1) Practice phase
• Participants practice with the target language.
• Feedback: “right” or “wrong” with or without grammar rules
(2) Immediate post-test (each language test was preceded by a vocabulary review lesson and
a vocabulary quiz)
(3) Strategy Inventory for Language Learning
4th session (Delayed post-test, two weeks later)
(1) Language tests (each language test was preceded by a vocabulary review lesson and a
vocabulary quiz)
(2) A debriefing questionnaire
(3) WM tasks: Nonword recall test and backward digit span test

104
Scoring and Analysis
L2 Proficiency Test
3 points were given for each correct answer and no points were given for an
incorrect answer on the English test. The total score on the test was used to classify
subjects into three different proficiency groups.
Working Memory Span Tests
A weighted scoring scheme was used to score the sentence and computational
span tests. “ … using weighted scoring because [weighted scoring] follows established
and sound procedure from psychometrics” according to Conway, Kane, Bunting,
Hambrick, Wilhelm, and Engle (2005,p. 776) Weighted scoring scheme only counts the
sum of correctly recalled items from all of the items regardless whether the items are
recalled in the correct order or whether they are perfectly recalled. Although the
participants were required to decide the grammaticality and sense of a sentence in the
sentence span, or to solve the solution of each equation, only their recall items were
scored regardless of their accuracy on the judgments and solution. Making the judgments
or solving the solution was only a way to impose a heavier cognitive load.
For the digit backward span test, each set contained two trials and each trial had
two to eight digits. Following the scoring scheme suggested by WAIS-III, one point was
assigned for each correctly recalled trial and no points were assigned for incorrectly
recalled trial. The maximum score was 14 points. When a participant missed two trials in
a set, the test ended.
105
To score the digit symbol test, one point was given to the symbol matching the
digit given on the answer sheet. The total score of each participant was given based on
how many symbols had been correctly copied.
The nonword recall test contained 6 sets of 3 disyllabic words. Participants were
required to repeat the items heard. One point was given to a correctly recalled syllable
with the right tone and no points were assigned for an incorrectly recalled item. The
average of each set entered the final analysis.
L3 Language Tests
Accuracy scores were from four language tests: a written interpretation test, an
aural interpretation test, a grammaticality judgment test, and a written sentence
production test. Each of the first three tests (the written interpretation test, the aural
interpretation test, and the grammaticality judgment test) consisted of 20 test items,
including 8 distractors. One point was awarded for each correct answer. The maximum
possible score was 12. Among the 12 test items, 6 points were from trained items, which
participants had seen during the treatment. The other half was untrained items, which
they had not seen during the treatment. The items (trained and untrained) entered the
analyses in order to distinguish between chunked knowledge, in which memory could
play a role, and generalized knowledge resulting from rule formations.
Different from the three tests, the written production test had fifteen test items,
including 5 questions as distractors. One point was given for each correct morpheme
attached to the nouns or verbs in a sentence, and the maximum score of a sentence was 3
points. The maximum score of the production test was 30, including 15 points from the
106
trained items and 15 points from the untrained items. Because Latin has a freer word
order, the preference for word order in each sentence used was also recorded. When a
sentence was correctly answered, 1 point was assigned to a SVO sentence, and 2 points
were assigned to a non-SVO sentence. Accuracy and preference scores of the written
production test entered separately into the analyses.
107
CHAPTER 4: RESULTS
Introduction
This section reports results from statistical tests administered with the Statistical
Package for the Social Sciences (SPSS) and the alpha value is set at .05. Descriptive
statistics are presented summarizing scores from four language tests, working memory
capacity (WM) tests, and the mean scores of each category of the Strategy Inventory for
Language Learning (SILL). Descriptive statistics are followed by the reports of the
reliability of the language tests. The main body of this chapter is devoted to the results of
analyses conducted to respond to the five research questions.
Descriptive Statistics
Overall language tests.
L3 development is operationalized as the ability to assign semantic functions to
noun phrases at the sentence level as measured by four tests: a written interpretation test,
an aural interpretation test, a grammaticality judgment test, and a written sentence
production test. The maximum total score for the former three tests was 12: six points
each for trained and untrained items. Table 5 presents the descriptive statistics of the
actual scores on the three tests (a written interpretation test, an aural interpretation test,
and a grammaticality judgment test).
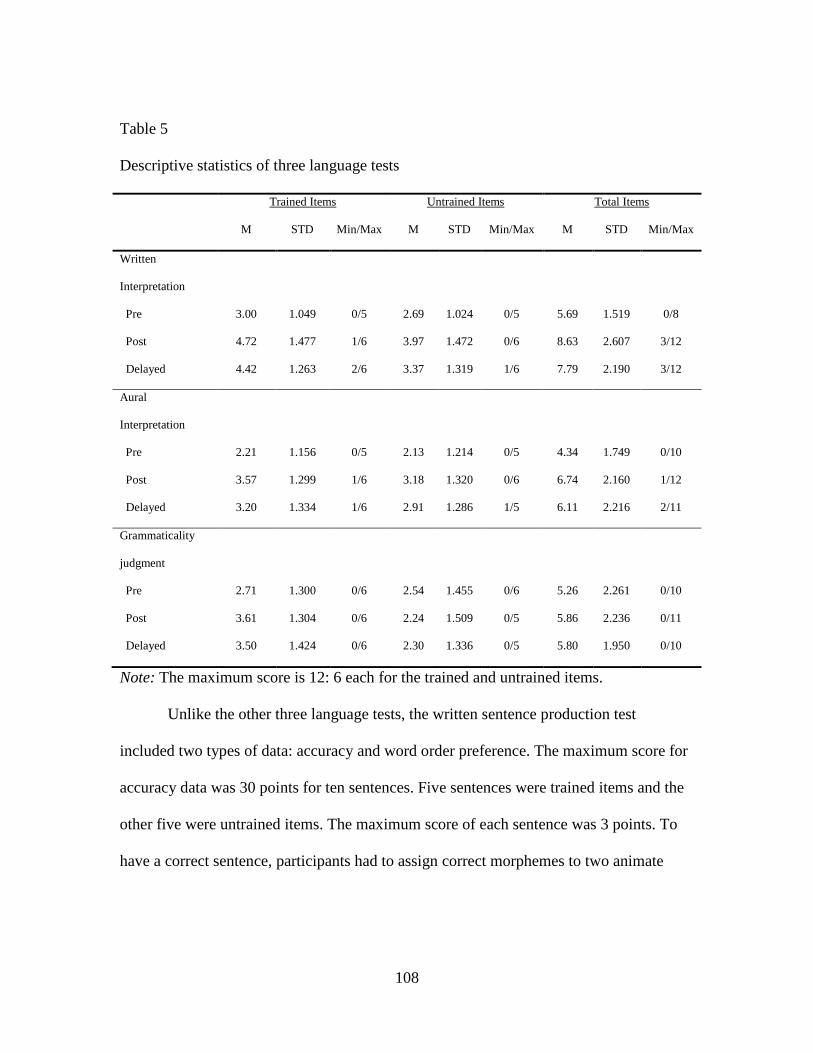
108
Table 5
Descriptive statistics of three language tests
Trained Items Untrained Items Total Items
M STD Min/Max M STD Min/Max M STD Min/Max
Written
Interpretation
Pre
Post
Delayed
3.00
4.72
4.42
1.049
1.477
1.263
0/5
1/6
2/6
2.69
3.97
3.37
1.024
1.472
1.319
0/5
0/6
1/6
5.69
8.63
7.79
1.519
2.607
2.190
0/8
3/12
3/12
Aural
Interpretation
Pre
Post
Delayed
2.21
3.57
3.20
1.156
1.299
1.334
0/5
1/6
1/6
2.13
3.18
2.91
1.214
1.320
1.286
0/5
0/6
1/5
4.34
6.74
6.11
1.749
2.160
2.216
0/10
1/12
2/11
Grammaticality
judgment
Pre
Post
Delayed
2.71
3.61
3.50
1.300
1.304
1.424
0/6
0/6
0/6
2.54
2.24
2.30
1.455
1.509
1.336
0/6
0/5
0/5
5.26
5.86
5.80
2.261
2.236
1.950
0/10
0/11
0/10
Note: The maximum score is 12: 6 each for the trained and untrained items.
Unlike the other three language tests, the written sentence production test
included two types of data: accuracy and word order preference. The maximum score for
accuracy data was 30 points for ten sentences. Five sentences were trained items and the
other five were untrained items. The maximum score of each sentence was 3 points. To
have a correct sentence, participants had to assign correct morphemes to two animate
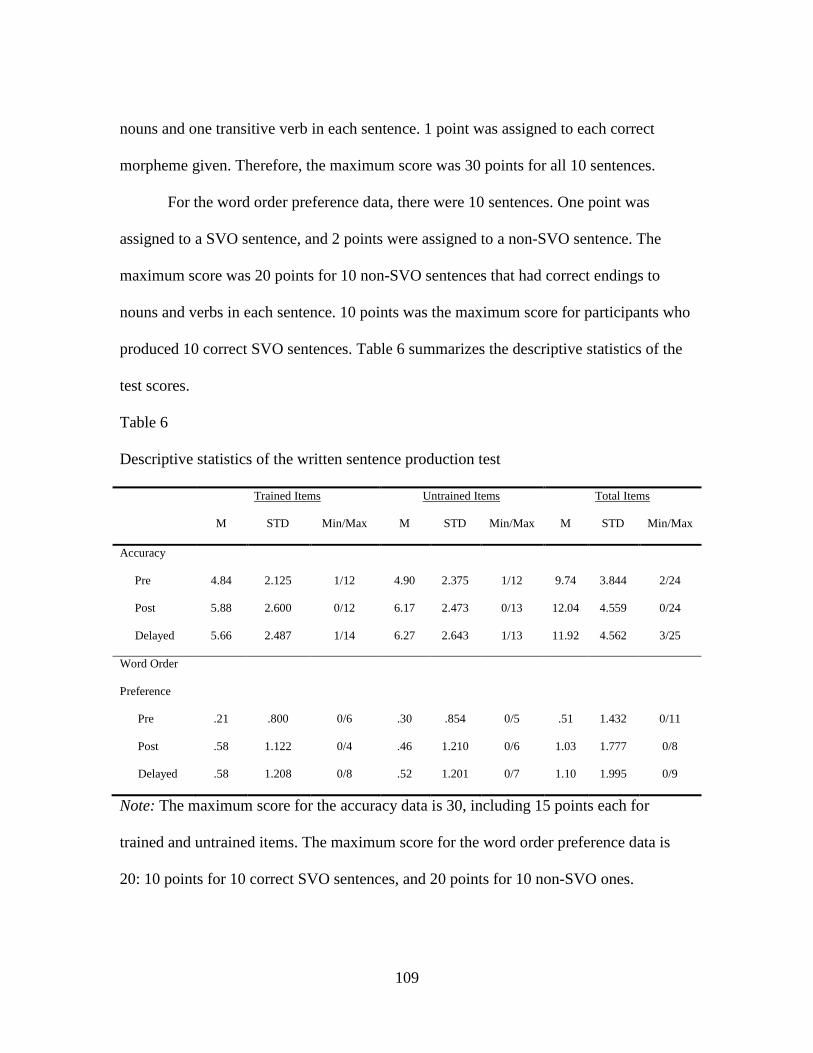
109
nouns and one transitive verb in each sentence. 1 point was assigned to each correct
morpheme given. Therefore, the maximum score was 30 points for all 10 sentences.
For the word order preference data, there were 10 sentences. One point was
assigned to a SVO sentence, and 2 points were assigned to a non-SVO sentence. The
maximum score was 20 points for 10 non-SVO sentences that had correct endings to
nouns and verbs in each sentence. 10 points was the maximum score for participants who
produced 10 correct SVO sentences. Table 6 summarizes the descriptive statistics of the
test scores.
Table 6
Descriptive statistics of the written sentence production test
Trained Items Untrained Items Total Items
M STD Min/Max M STD Min/Max M STD Min/Max
Accuracy
Pre
Post
Delayed
4.84
5.88
5.66
2.125
2.600
2.487
1/12
0/12
1/14
4.90
6.17
6.27
2.375
2.473
2.643
1/12
0/13
1/13
9.74
12.04
11.92
3.844
4.559
4.562
2/24
0/24
3/25
Word Order
Preference
Pre
Post
Delayed
.21
.58
.58
.800
1.122
1.208
0/6
0/4
0/8
.30
.46
.52
.854
1.210
1.201
0/5
0/6
0/7
.51
1.03
1.10
1.432
1.777
1.995
0/11
0/8
0/9
Note: The maximum score for the accuracy data is 30, including 15 points each for
trained and untrained items. The maximum score for the word order preference data is
20: 10 points for 10 correct SVO sentences, and 20 points for 10 non-SVO ones.
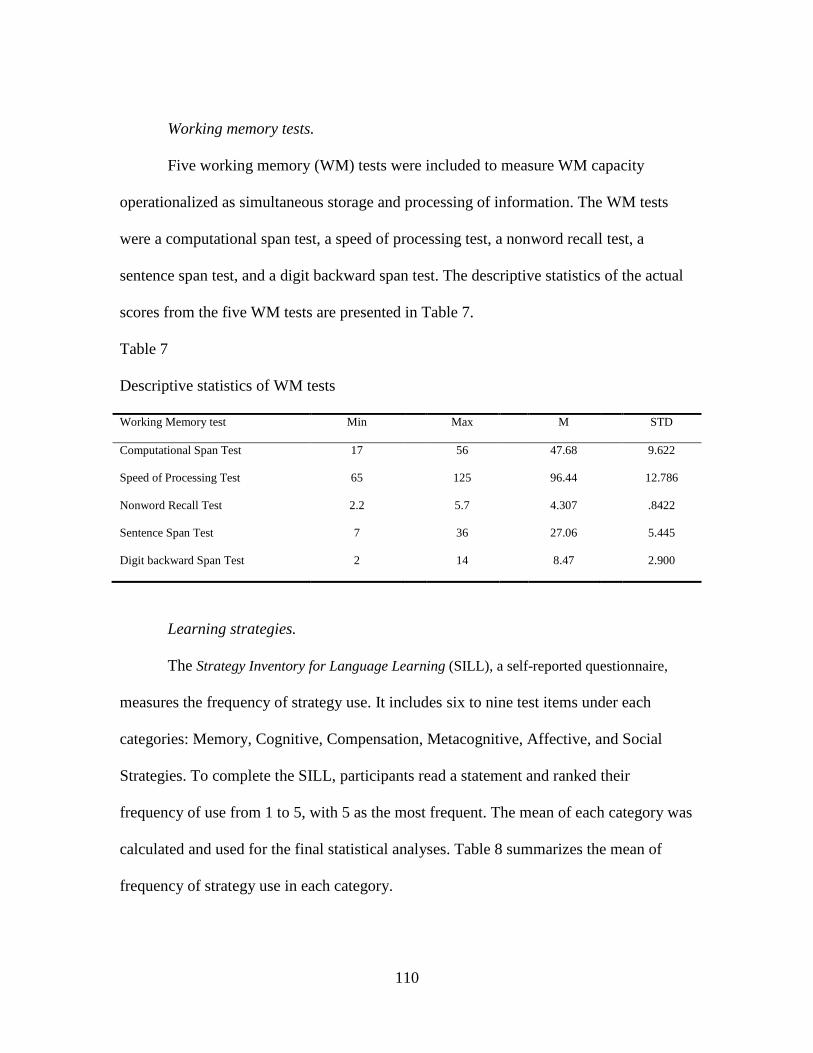
110
Working memory tests.
Five working memory (WM) tests were included to measure WM capacity
operationalized as simultaneous storage and processing of information. The WM tests
were a computational span test, a speed of processing test, a nonword recall test, a
sentence span test, and a digit backward span test. The descriptive statistics of the actual
scores from the five WM tests are presented in Table 7.
Table 7
Descriptive statistics of WM tests
Working Memory test Min Max M STD
Computational Span Test 17 56 47.68 9.622
Speed of Processing Test 65 125 96.44 12.786
Nonword Recall Test 2.2 5.7 4.307 .8422
Sentence Span Test 7 36 27.06 5.445
Digit backward Span Test 2 14 8.47 2.900
Learning strategies.
The Strategy Inventory for Language Learning (SILL), a self-reported questionnaire,
measures the frequency of strategy use. It includes six to nine test items under each
categories: Memory, Cognitive, Compensation, Metacognitive, Affective, and Social
Strategies. To complete the SILL, participants read a statement and ranked their
frequency of use from 1 to 5, with 5 as the most frequent. The mean of each category was
calculated and used for the final statistical analyses. Table 8 summarizes the mean of
frequency of strategy use in each category.

111
Table 8
Descriptive statistics of the mean of the frequency of strategy use under each category
Category of Strategies Min Max Mean STD
Memory Strategies 1.78 4.11 3.0284 .49286
Cognitive Strategies 1.43 4.21 2.8763 .58709
Compensation Strategies 1.67 4.83 3.2889 .63097
Metacognitive Strategies 1.56 4.67 2.8123 .63548
Affective Strategies 1.17 4.17 2.5944 .61405
Social Strategies 1.17 4.33 2.8241 .69345
Note: The mean of test items in each category was based on a 5-Likert scale with 5 as the
most frequently used strategy and 1 as the least used.
Reliability tests.
Prior to addressing the research questions, reliability analyses were run on the
pretest, immediate posttest, and delayed test of each language test using Cronbach’s
alpha. Table 9 provides a summary of the results.
Table 9
Reliability coefficients for L3 development
Pretest Posttest Delayed test
Written interpretation .658 .602 .646
Aural interpretation .512 .538 .560
Grammaticality judgment .511 .399 .510
Written Production (Accuracy) .728 .723 .716
Written Production (Word order preference) .574 .646 .456

112
RQ1: Level of Bilingualism And L3 Language Development
3 x 3 repeated measures ANOVAs with Level as the between-subject factor and
Time as the between-subject factor were run to identify the potential effects that the level
of bilingualism had on participants’ L3 development operationalized as the ability to
assign semantic functions to noun phrases during online sentential processing in an L3
measured by a written interpretation test, an aural interpretation test, a grammaticality
judgment test, and a written sentence production test.
The presentation of the results is as follows: Four sections, one each for every
language test, provide descriptive statistics of the actual scores for each L2 level on the
language tests followed by the results of one-way ANOVAs on pretest scores. Each
section ends with results from the 3 x 3 repeated measures ANOVA with a focus on
trained items first, followed by untrained items and total items. Additionally, when the
repeated measures ANOVAs identify statistical significance, post hoc analyses are run to
identify where the differences lie. When the result is statistically significant, the result of
eta-squared analysis (η²) is also presented to determine how much of the variability in the
group can be accounted for by Level. When the analyses yield no-significant factors or
interactions, power analyses are run to avoid falsely rejecting the null hypothesis.
Written Interpretation Test
Table 10 summarizes descriptive statistics for each level. One-way ANOVAs on
pretest scores did not identify differences between levels: trained items, F(2,87)=.208,
p=.813, untrained items, F(2,87)=.135, p=.874, and total items, F(2,87)=.146, p=.864.

113
Therefore, any differences identified at Time 2 will be the result of participants’
interaction with the treatment.
Table 10
Descriptive Statistics of the written interpretation test by Level
Low L2 Group Mid L2 Group High L2 Group
Mean STD Mean STD Mean STD
Trained items
Pre
Post
Delayed
2.93
4.50
4.20
1.015
1.503
1.215
3.10
4.77
4.17
1.185
1.331
1.341
2.97
4.97
4.77
.964
1.564
1.223
Untrained items
Pre
Post
Delayed
2.63
3.77
3.00
1.098
1.357
1.050
2.67
3.93
3.17
1.213
1.596
1.416
2.77
4.23
3.87
.728
1.455
1.408
Total items
Pre
Post
Delayed
5.57
8.27
7.20
1.455
2.586
1.955
5.77
8.53
7.33
1.695
2.662
2.249
5.73
9.20
8.63
1.437
2.524
2.297
Note: The possible maximum score is 12, including 6 points each from the trained and
untrained items.
The 3 x 3 repeated measures ANOVAs on trained items yielded statistically a
significant effect for Time, F(2,174)=59.066, p<.01, η²=.404, power=1.000, but they did
not show any statistically significant effects for Level, F(2,87)=1.267, p=.287,
power=.269 or a significant Time x Level interaction , F(4,174)=.925, p=.451,
power=.290. Similarly, the 3 x 3 ANOVAs on scores from the untrained items identified
114
a statistically significant main effect for Time, F(2,174)=27.419, p<.01, η²=.240,
power=1.000, but no significant effects were identified for Level, F(2,87)=2.640, p=.077,
power=.512. Time x Level interaction, F(4,174)=.858, p=.490, power=.084, did not reach
significance, either. Not surprisingly, results from the 3 x 3 repeated measures ANOVA
conducted on total scores identified Time as a main factor, F(2,174)=61.594, p<.01,
η²=.415, power=1.000. Neither Level, F(2,87)=2.498, p=.088, power=.489, nor Time x
Level interaction reached significance, F(4, 174)=1.265, p=.285, power=.391.
From these results, we may say that, level of bilingualism does not differentially
affect the rate at which participants learn to assign semantic functions to noun phrases
during online sentential processing in an L3 as measured by a written interpretation test.
Importantly, low power analyses show that lack of significance may be due to the small
sample size.
Aural Interpretation Test
Table 11 presents the descriptive statistics of the actual scores of the aural
interpretation test of each L2 level. One-way ANOVAs showed the levels were not
statistically different on the pretest: trained items, F(2,87)=.130, p=.878, untrained items,
F(2,87)=.549, p=.580, and total items, F(2,87)=.499, p=.609. Therefore, any significant
differences yielded by subsequent analyses may be attributed to the treatment.

115
Table 11
Descriptive Statistics of the aural interpretation test by Level
Low L2 Group Mid L2 Group High L2 Group
Mean STD Mean STD Mean STD
Trained items
Pre
Post
Delayed
2.17
3.33
2.93
1.262
1.184
1.230
2.17
3.60
3.07
1.206
1.329
1.230
2.30
3.80
3.50
1.022
1.349
1.570
Untrained items
Pre
Post
Delayed
2.10
2.97
2.87
1.242
1.159
1.279
2.00
3.17
2.83
.830
1.315
1.367
2.30
3.37
3.07
1.264
1.497
1.202
Total items
Pre
Post
Delayed
4.27
6.30
5.80
1.999
1.822
2.091
4.17
6.77
5.90
1.416
2.254
2.354
4.60
7.17
6.57
1.812
2.350
2.315
Note: The possible maximum score is 12, including 6 points from the untrained items and
6 from the untrained items.
3 x 3 repeated measures ANOVAs conducted on scores from the trained items
yielded a statistically significant main effect for Time, F(2,174)=30.843, p<.01, η²=.262,
power=1.000, but Level F(2,87)=1.768, p=.177, power=.361 and Time x Level
interaction did not reach significance, F(4,174)=.328, p=.859, power=.123. The same
results were identified for the untrained items: Time, F(2,174)=21.340, p<.01, η²=.197,
power=1.000, was a significant factor. Neither Level nor the Level x Time interaction
reached significance: Level, F(2,87)=.881, p=.418, power=.197, and Time x Level

116
interaction, F(4,174)=.166, p=.956, power=.084. Not surprisingly, 3 x 3 repeated
measures ANOVAs on all items combined identified Time as a significant factor,
F(2,174)=43.974, p<.01, η²=.336, power=1.000. Neither Level, F(2,87)=1.618, p=.204,
power=.334, nor the Time x Level interaction, F(4,174)=.292, p=.883, power=.114,
reached significance.
Once again, the results lead us to conclude that L2 proficiency levels do not
differentially affect L3 language development as measured by an aural interpretation test.
However, power analyses, yet again, indicate that the lack of significant effects may be
due to the small sample size.
Grammaticality Judgment Test
Table 12 summarizes the descriptive statistics for performance on the
grammaticality judgment test by each level. One-way ANOVAs on the pretest showed
that all three levels were statistically comparable before the treatment: F(2,87)=.474,
p=.624 for the trained items, F(2,87)=2.722, p=.071 for the untrained items, and
F(2,87)=1.807, p=.170 for the total items.
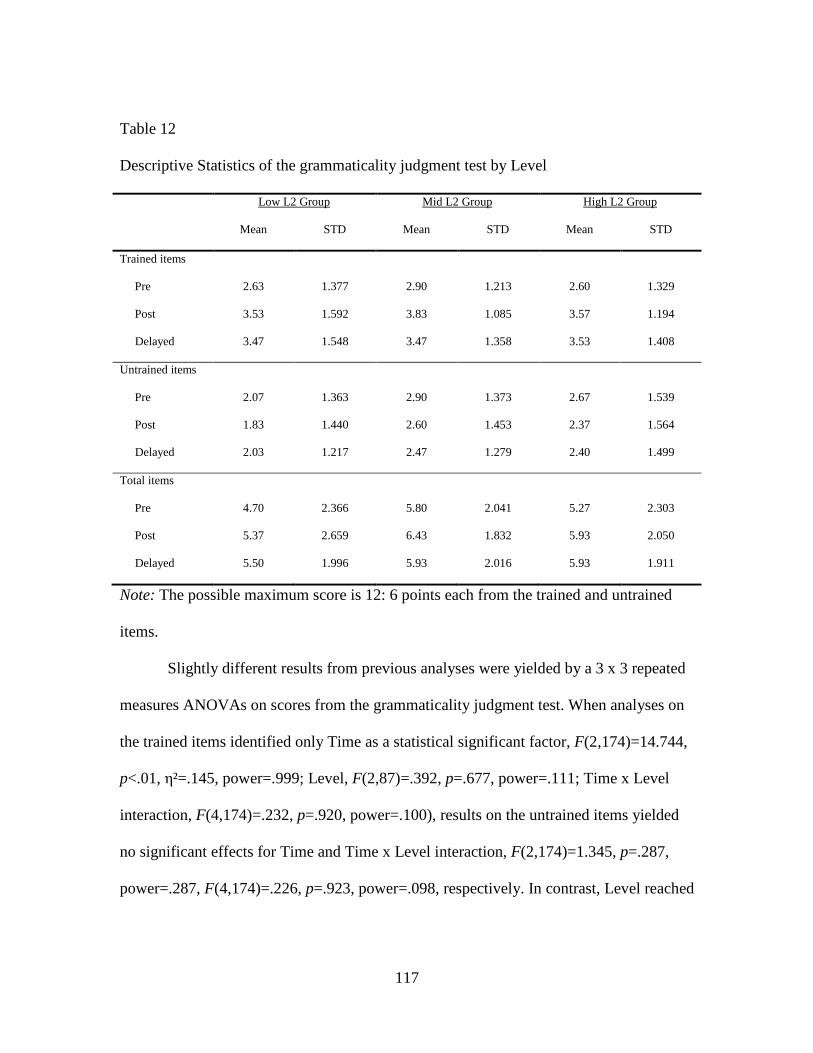
117
Table 12
Descriptive Statistics of the grammaticality judgment test by Level
Low L2 Group Mid L2 Group High L2 Group
Mean STD Mean STD Mean STD
Trained items
Pre
Post
Delayed
2.63
3.53
3.47
1.377
1.592
1.548
2.90
3.83
3.47
1.213
1.085
1.358
2.60
3.57
3.53
1.329
1.194
1.408
Untrained items
Pre
Post
Delayed
2.07
1.83
2.03
1.363
1.440
1.217
2.90
2.60
2.47
1.373
1.453
1.279
2.67
2.37
2.40
1.539
1.564
1.499
Total items
Pre
Post
Delayed
4.70
5.37
5.50
2.366
2.659
1.996
5.80
6.43
5.93
2.041
1.832
2.016
5.27
5.93
5.93
2.303
2.050
1.911
Note: The possible maximum score is 12: 6 points each from the trained and untrained
items.
Slightly different results from previous analyses were yielded by a 3 x 3 repeated
measures ANOVAs on scores from the grammaticality judgment test. When analyses on
the trained items identified only Time as a statistical significant factor, F(2,174)=14.744,
p<.01, η²=.145, power=.999; Level, F(2,87)=.392, p=.677, power=.111; Time x Level
interaction, F(4,174)=.232, p=.920, power=.100), results on the untrained items yielded
no significant effects for Time and Time x Level interaction, F(2,174)=1.345, p=.287,
power=.287, F(4,174)=.226, p=.923, power=.098, respectively. In contrast, Level reached

118
significance, F(2,87)=3.757, p<.05, η²=.079, power=.672. A post hoc analysis showed a
significant contrast between the mid L2 group and the low L2 group. (See Figure 1)
Figure 1
Mean score of the three L2 levels on the untrained items of Grammaticality judgment test
A closer examination revealed that the statistically significant result was
influenced by the poorer performance of the mid L2 group compared to that of the low
L2 group from the pretest to the immediate posttest, F(2,87)=4.036, p<.05 (See Table 13)
DelayedPost Pre
3
2.8
2.6
2.4
2.2
2
1.8
High L2 Group Mid L2 Group
Time
Low L2 Group
Tes
t sco
res

119
Table 13
Post hoc Scheffé results by Level
Level Level Mean Difference Std. Error Sig.
Low L2 Mid L2 -.80* .287 .024
High L2 -.53 .287 .183
Mid L2 Low L2 .80* .287 .024
High L2 .27 .287 .650
High L2 Low L2 .53 .287 .183
Mid L2 -.27 .287 .650
When the trained and untrained items were combined, the ANOVA showed
significant effects for Time, F(2,174)=3.386, p<.05, η²=.037, power=.632, but not for
Level, F(2,87)=2.336, p=.103, power=.462. Time x Level interaction did not reach
significance, F(4,174)=.366, p=.833, power=.114.
Overall, the results suggest that L2 proficiency levels make a difference for the
participants in judging the grammaticality of sentences, shown on the untrained items.
The eta-squared (η²=.079) analysis indicates that roughly 8 % of the variability in the
group is accounted for by Level: mid L2 group was statistically different from the low L2
group.
Written Production Test: Accuracy
Table 14 summarizes descriptive statistics of the actual scores for all three L2
levels on the accuracy data. Different from one-way ANOVAs on trained items,
F(2,87)=.249, p=.780 and the total items, F(2,87)=1.739, p=.182, which yielded no
statistically significant differences, the analyses conducted on the scores from the
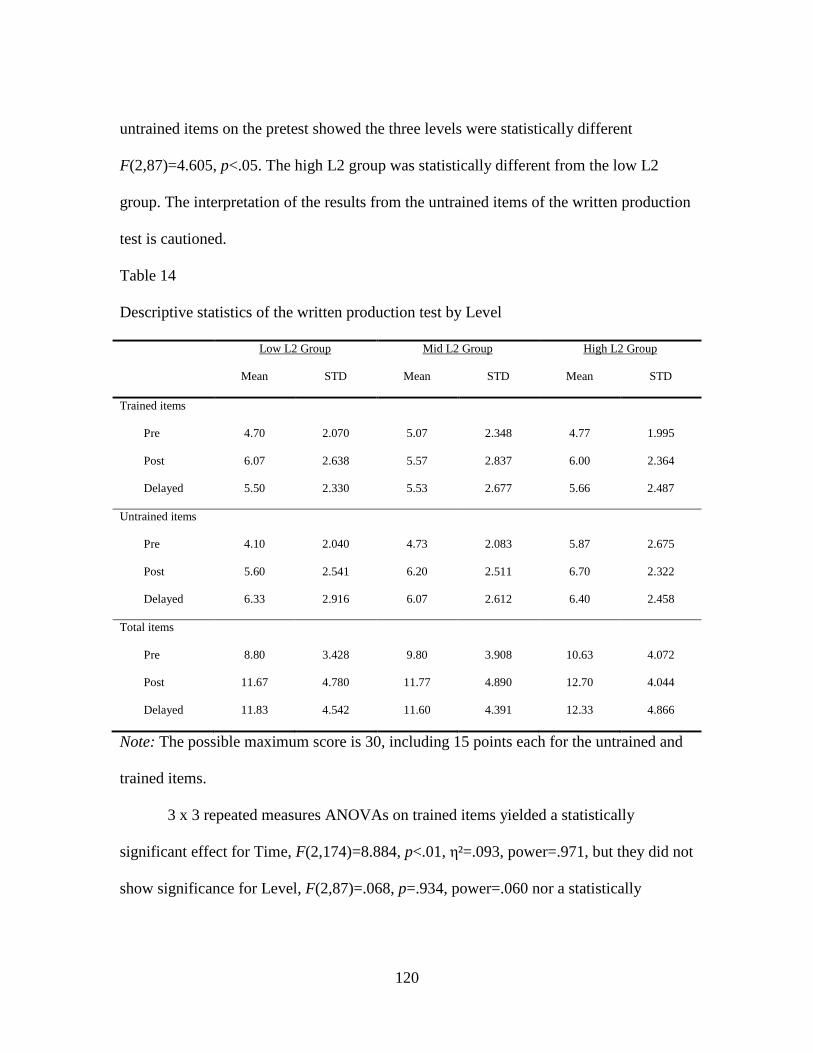
120
untrained items on the pretest showed the three levels were statistically different
F(2,87)=4.605, p<.05. The high L2 group was statistically different from the low L2
group. The interpretation of the results from the untrained items of the written production
test is cautioned.
Table 14
Descriptive statistics of the written production test by Level
Low L2 Group Mid L2 Group High L2 Group
Mean STD Mean STD Mean STD
Trained items
Pre
Post
Delayed
4.70
6.07
5.50
2.070
2.638
2.330
5.07
5.57
5.53
2.348
2.837
2.677
4.77
6.00
5.66
1.995
2.364
2.487
Untrained items
Pre
Post
Delayed
4.10
5.60
6.33
2.040
2.541
2.916
4.73
6.20
6.07
2.083
2.511
2.612
5.87
6.70
6.40
2.675
2.322
2.458
Total items
Pre
Post
Delayed
8.80
11.67
11.83
3.428
4.780
4.542
9.80
11.77
11.60
3.908
4.890
4.391
10.63
12.70
12.33
4.072
4.044
4.866
Note: The possible maximum score is 30, including 15 points each for the untrained and
trained items.
3 x 3 repeated measures ANOVAs on trained items yielded a statistically
significant effect for Time, F(2,174)=8.884, p<.01, η²=.093, power=.971, but they did not
show significance for Level, F(2,87)=.068, p=.934, power=.060 nor a statistically
121
significant Time x Level interaction F(4,174)=.717, p=.582, power=.229. The same
results apply to the untrained items: Only Time was identified as a significant factor,
F(2,174)=14.229, p<.01, η²=.141, power=.999. No statistical significance was reached
for Level and Time x Level interaction, F(2,87)=2.022, p=.139, power=.407 and
F(4,174)=1.597, p=.177, power=.486, respectively. Not surprisingly, 3 x 3 repeated
measures ANOVAs on the total items identified a significant effect only for Time,
F(2,174)=17.492, p<.01, η²=.167, power=1.000. Neither Level, F(2,87)=.773, p=.465,
power=.178 nor Time x Level interaction, F(4,174)=.503, p=.733, power=.169, reached
statistical significance.
Based on the results, we may conclude that level of bilingualism does not
differentially affect L3 development as measured by the accuracy data from the written
sentence production test. Notably, the lack of significance may be due to the smaller
sample size, as indicated by power analyses. Moreover, the one-way ANOVA
administered on the untrained items on the pretest reached significance, so the
interpretation of results is cautioned.
Written Production Test: Word Order Preference
Table 15 summarizes the descriptive statistics of the word order preference data
from the written sentence production test. A one-way ANOVA showed that the three
levels were statistically similar on the pre-tests: trained items, F(2,87)=.847, p=.432,
untrained items, F(2,87)=1.431, p=.245, and total items, F(2,87)=.651, p=.524.

122
Table 15
Descriptive statistics of the written sentence production test (word order preference) by
Level
Low L2 Group Mid L2 Group High L2 Group
Mean STD Mean STD Mean STD
Trained items
Pre
Post
Delayed
.13
.77
.67
.507
1.223
1.124
.37
.37
.60
1.189
.765
1.567
.13
.60
.47
.507
1.303
.860
Untrained items
Pre
Post
Delayed
.13
.30
.73
.507
.750
1.172
.27
.50
.37
.980
1.548
1.033
.50
.57
.47
.974
1.223
1.383
Total items
Pre
Post
Delayed
.27
1.07
1.40
.691
1.701
1.868
.63
.87
.97
2.059
1.852
2.141
.63
1.17
.93
1.217
1.821
1.999
Note: 1 point is for a SVO sentence. 2 points is for 1 non-SVO sentence. The maximum
score is 20 points for 10 correct non-SVO sentences.
The 3 x 3 repeated measures ANOVAs on the trained items yielded a statistically
significant main effect only for Time, F(2,174)=5.462, p<.01, η²=.059, power=.844, but
not for Level, F(2,87)=.180, p=.835, power=.077. No significance was reached for the
Time x Level interaction, F(4,174)= 1.166, p=.327, power=.361. Differently, no
statistical significance was identified on the untrained items: Time, F(2,174)=1.149,
p=.319, power=.250; Level, F(2,87)=.304, p=.739, power=.09; Level x Time interaction,
F(4,174)=1.078, p=.369, power=.335. Combining the items, the results showed only a
123
main effect for Time, F(2,174)=5.171, p<.01, η²=.056, power=.988. The results showed
no statistically significance for Level, F(2,87)=.042, p=.959, power=.138 or the Time x
Level interaction, F(4,174)=1.061, p=.377, power=.330.
The results lead us to conclude that level of bilingualism does not influence L3
development in terms of participants’ preference for SVO or non-SVO sentences, but the
power analysis indicates the smaller sample size may cause the lack of significance.
Summarizing all the results to examine the effect of Level on L3 development, we
can conclude that, with the exception of untrained items of the grammaticality judgment
test, the treatments successfully led participants to develop their ability to assign semantic
functions to noun phrases at the sentence level. They were able to use this newly acquired
knowledge to interpret written and aural input, to judge the grammaticality of sentences,
and to produce written sentences. However, power analyses suggest the lack of
significance identified for most of the item and test types (i.e., written and aural
interpretation tests, and the written production test) may be due to the small sample size.
Next, L2 proficiency levels only differentially affect L3 development when
participants applied what they learned from the treatment to judge the grammaticality of
sentences that they had not been exposed to during the treatment. Table 16 summarizes
significant results yielded by the repeated measures ANOVAs presented in this section.
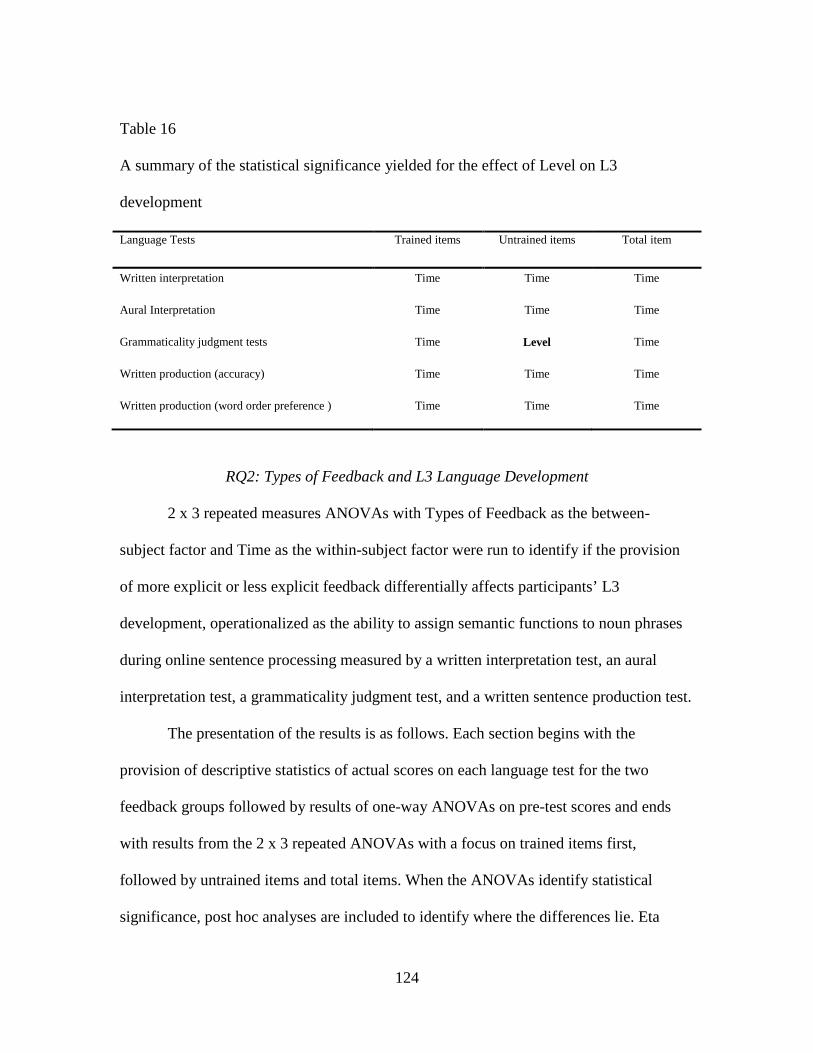
124
Table 16
A summary of the statistical significance yielded for the effect of Level on L3
development
RQ2: Types of Feedback and L3 Language Development
2 x 3 repeated measures ANOVAs with Types of Feedback as the between-
subject factor and Time as the within-subject factor were run to identify if the provision
of more explicit or less explicit feedback differentially affects participants’ L3
development, operationalized as the ability to assign semantic functions to noun phrases
during online sentence processing measured by a written interpretation test, an aural
interpretation test, a grammaticality judgment test, and a written sentence production test.
The presentation of the results is as follows. Each section begins with the
provision of descriptive statistics of actual scores on each language test for the two
feedback groups followed by results of one-way ANOVAs on pre-test scores and ends
with results from the 2 x 3 repeated ANOVAs with a focus on trained items first,
followed by untrained items and total items. When the ANOVAs identify statistical
significance, post hoc analyses are included to identify where the differences lie. Eta
Language Tests Trained items Untrained items Total item
Written interpretation Time Time Time
Aural Interpretation Time Time Time
Grammaticality judgment tests Time Level Time
Written production (accuracy) Time Time Time
Written production (word order preference ) Time Time Time

125
squared (η²) analyses are also run to determine the strength of association between the
independent variable and dependent variables: types of feedback and language tests,
respectively. When the analyses yield no significant factors or interactions, power
analyses are run to avoid falsely rejecting the null hypothesis.
Written Interpretation Test
Table 17 presents a summary of the descriptive statistics of the actual scores of
each feedback group. One-way ANOVAs on the pre-tests showed the two feedback
groups were comparable before the treatment: Trained items, F(1,88)=.000, p=1.000,
untrained items, F(1,88)=.379, p=.540, and total items, F(1,88)=.172, p=.680. Therefore,
any differences identified will be attributed to the treatment.

126
Table 17
Descriptive Statistics of the written interpretation test by Feedback
Less Explicit Feedback Group More Explicit Feedback Group
Mean STD Mean STD
Trained items
Pre
Post
Delayed
3.00
4.02
3.96
.953
1.485
1.261
3.00
5.47
4.80
1.148
1.036
1.160
Untrained items
Pre
Post
Delayed
2.76
3.22
3.18
.957
1.363
1.173
2.62
4.73
3.51
1.093
1.156
1.487
Total items
Pre
Post
Delayed
5.76
7.24
7.13
1.351
2.385
1.961
5.62
10.09
8.31
1.683
1.940
2.372
Note: The possible maximum score is 12, including 6 points from the trained items and 6
from the untrained items.
2 x 3 repeated ANOVAs on the trained items identified two main effects and a
significant interaction: Feedback, F(1,88)=20.839, p<.01, η²=.191, power=.995, Time,
F(2,176)=62.251, p<.01, η²=.426, power=1.000, and Time x Feedback interaction,
F(2,176)=10.154, p<.01, η²=.103, power.985. Figure 2 illustrates the Time x Feedback
interaction. Different types of feedback provide can account for roughly 19% of the
variability between the groups and 10% of the variation within them.
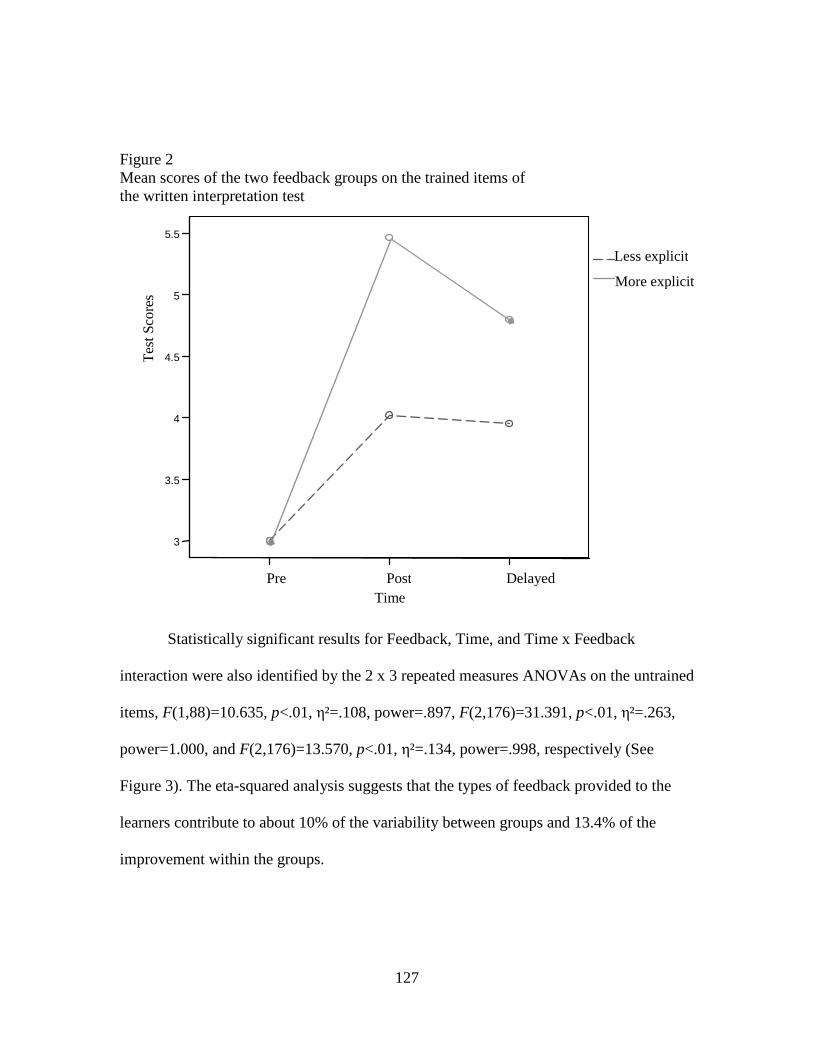
127
Statistically significant results for Feedback, Time, and Time x Feedback
interaction were also identified by the 2 x 3 repeated measures ANOVAs on the untrained
items, F(1,88)=10.635, p<.01, η²=.108, power=.897, F(2,176)=31.391, p<.01, η²=.263,
power=1.000, and F(2,176)=13.570, p<.01, η²=.134, power=.998, respectively (See
Figure 3). The eta-squared analysis suggests that the types of feedback provided to the
learners contribute to about 10% of the variability between groups and 13.4% of the
improvement within the groups.
DelayedPostPreTime
5.5
5
4.5
4
3.5
3
Tes
t S
core
s
More explicit
Less explicit
Figure 2 Mean scores of the two feedback groups on the trained items of the written interpretation test

128
Not surprisingly, the 2 x 3 repeated measures ANOVA results on the trained and
untrained item combined, once again, yielded a main effect for Feedback,
F(1,88)=18.760, p<.01, η²=.176, power=.990, and Time, F(2,176)=72.541, p<01,
η²=.452, power=1.000. The analyses also identified a statistically significant Time x
Feedback interaction, F(2,176)=17.444, p<.01, η²=.165, power=1.000 (See Figure 4). The
eta-squared analysis indicates that 17.6% of the variability between groups and 16.5% of
the difference within groups can be accounted for by the different types of feedback
provided.
Delayed Post Pre Time
5
4.5
4
3.5
3
2.5
Tes
t S
core
s
More explicit
Less explicit
Figure 3 Mean score of the 2 feedback groups on the untrained items of the written interpretation test

129
In a nutshell, practicing the target language with more explicit or less explicit
feedback makes a difference in the accuracy, which participants assign semantic
functions to noun phrases in a non-primary language, as measured by the written
interpretation test. Specifically, the results suggest that providing participants with more
explicit feedback benefits them in language learning more than providing them with less
explicit feedback. The significant Time x Feedback interaction showed that the former
group also improved more than the later group.
Delayed Post Pre Time
10
7.5
5
More explicit
Less explicit
Figure 4 Mean scores of the two feedback groups on the total items of the written interpretation test
Tes
t sco
res
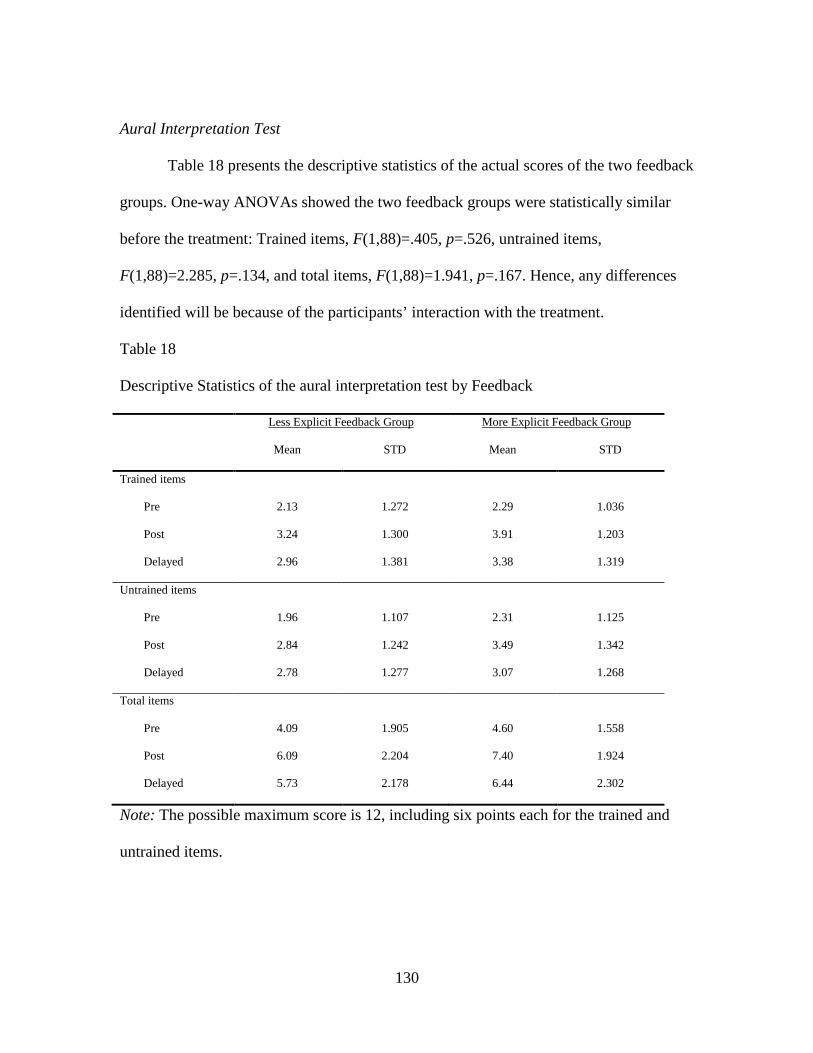
130
Aural Interpretation Test
Table 18 presents the descriptive statistics of the actual scores of the two feedback
groups. One-way ANOVAs showed the two feedback groups were statistically similar
before the treatment: Trained items, F(1,88)=.405, p=.526, untrained items,
F(1,88)=2.285, p=.134, and total items, F(1,88)=1.941, p=.167. Hence, any differences
identified will be because of the participants’ interaction with the treatment.
Table 18
Descriptive Statistics of the aural interpretation test by Feedback
Less Explicit Feedback Group More Explicit Feedback Group
Mean STD Mean STD
Trained items
Pre
Post
Delayed
2.13
3.24
2.96
1.272
1.300
1.381
2.29
3.91
3.38
1.036
1.203
1.319
Untrained items
Pre
Post
Delayed
1.96
2.84
2.78
1.107
1.242
1.277
2.31
3.49
3.07
1.125
1.342
1.268
Total items
Pre
Post
Delayed
4.09
6.09
5.73
1.905
2.204
2.178
4.60
7.40
6.44
1.558
1.924
2.302
Note: The possible maximum score is 12, including six points each for the trained and
untrained items.

131
2 x 3 repeated measures ANOVAs on the trained items yielded significant main
effects for both Feedback, F(1,88)=6.072, p<.05, η²=.065, power=.683, and Time,
F(2,176)=31.331, p<.01, η²=.263, power=1.000. The eta-squared analysis showed
different feedback provided to each group accounted for 6% of the group variation. (See
Figure 5 for an illustration of the results) Different from the results identified on the
written interpretation test, Time x Feedback interaction, F(2,176)=1.041, p=.355,
power=.230, did not reach significance with power analysis suggesting that it may be due
to the small sample size.
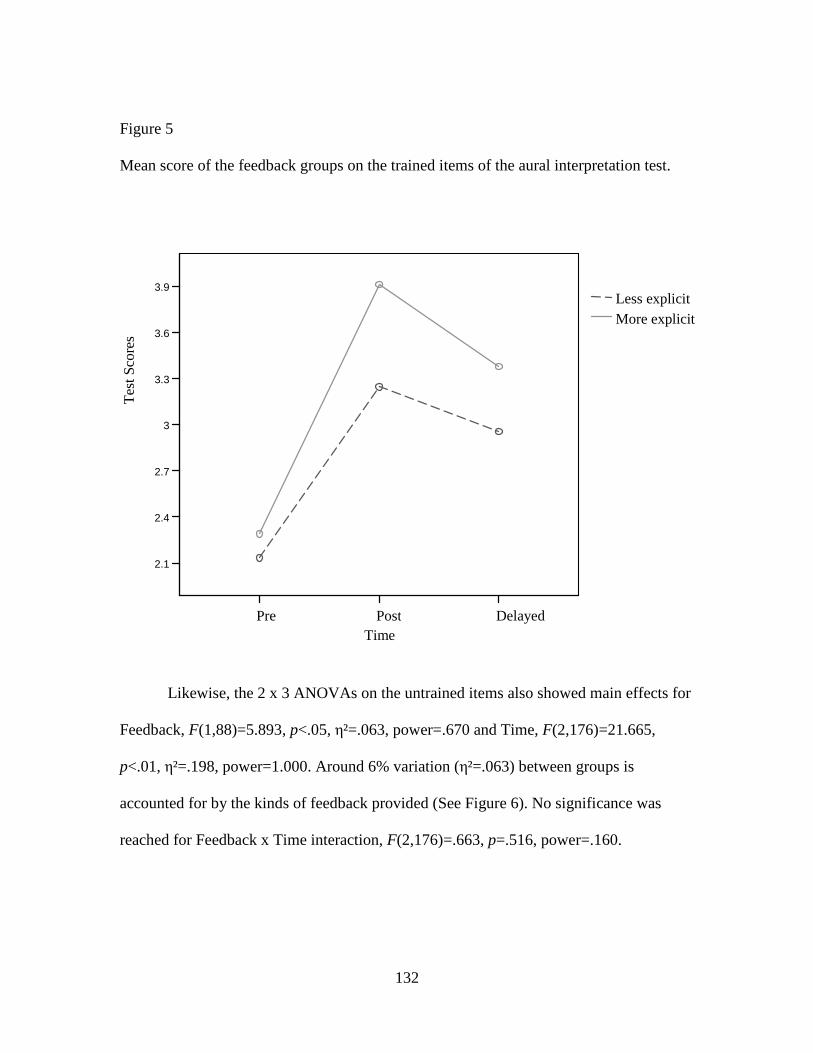
132
Figure 5
Mean score of the feedback groups on the trained items of the aural interpretation test.
Likewise, the 2 x 3 ANOVAs on the untrained items also showed main effects for
Feedback, F(1,88)=5.893, p<.05, η²=.063, power=.670 and Time, F(2,176)=21.665,
p<.01, η²=.198, power=1.000. Around 6% variation (η²=.063) between groups is
accounted for by the kinds of feedback provided (See Figure 6). No significance was
reached for Feedback x Time interaction, F(2,176)=.663, p=.516, power=.160.
DelayedPostPreTime
3.9
3.6
3.3
3
2.7
2.4
2.1
Tes
t S
core
s
More explicit Less explicit

133
Not surprisingly, the analysis on all items combined yielded the same results:
Feedback, F(1,88)=7.831, p<.01, η²=.082, power= .790, and Time, F(2,176)=44.816,
p<.01, η²=.337, power=1.000, were identified as significant factors, but the Time x
Feedback interaction, F(2,176)=1.262, p=.286, power=.272, did not reach statistical
significance. About 8% of the variation between groups (η²=.082) could be explained by
different types of feedback provided. Figure 7 is an illustrated demonstration. Low power
on Time x Feedback interaction shows that the small sample size may cause the lack of
significance found.
Delayed Post Pre Time
3.3
3
2.7
2.4
2.1
1.8
Tes
t S
core
More explicit
Less explicit
Figure 6 Mean score of the untrained items on the aural interpretation test for the two feedback groups

134
The overall results showed that being exposed to more explicit feedback helped
participants outperform those being exposed to less explicit feedback to assign semantic
functions to noun phrases during online sentential processing in an L3, as measured by an
aural interpretation test. Importantly, power analyses show that lack of significance in the
Feedback x Time interactions may be due to the small sample size.
Grammaticality Judgment Test
Table 19 summarizes the descriptive statistics of actual scores of the more and the
less explicit feedback groups on the grammaticality judgment test. One-way ANOVAs on
DelayedPostPre Time
8
6
4
Tes
t sco
res
More explicit Less explicit
Figure 7 The mean score of the two feedback groups on the total items of the aural interpretation test
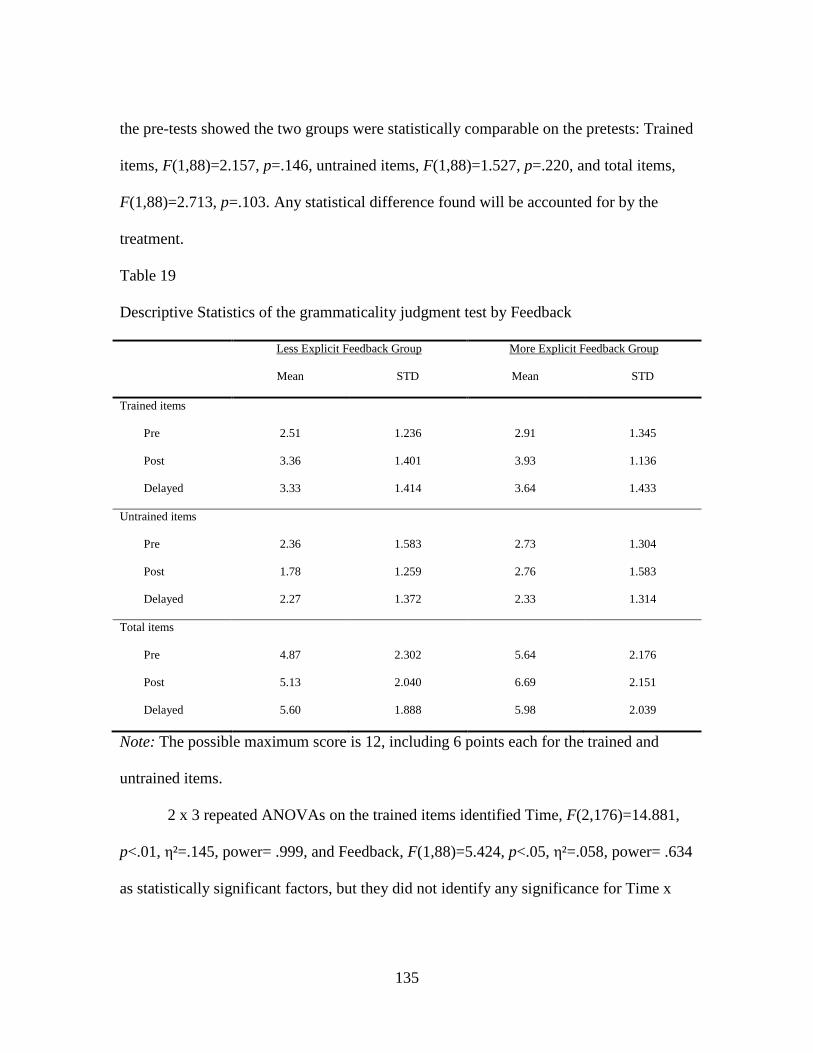
135
the pre-tests showed the two groups were statistically comparable on the pretests: Trained
items, F(1,88)=2.157, p=.146, untrained items, F(1,88)=1.527, p=.220, and total items,
F(1,88)=2.713, p=.103. Any statistical difference found will be accounted for by the
treatment.
Table 19
Descriptive Statistics of the grammaticality judgment test by Feedback
Less Explicit Feedback Group More Explicit Feedback Group
Mean STD Mean STD
Trained items
Pre
Post
Delayed
2.51
3.36
3.33
1.236
1.401
1.414
2.91
3.93
3.64
1.345
1.136
1.433
Untrained items
Pre
Post
Delayed
2.36
1.78
2.27
1.583
1.259
1.372
2.73
2.76
2.33
1.304
1.583
1.314
Total items
Pre
Post
Delayed
4.87
5.13
5.60
2.302
2.040
1.888
5.64
6.69
5.98
2.176
2.151
2.039
Note: The possible maximum score is 12, including 6 points each for the trained and
untrained items.
2 x 3 repeated ANOVAs on the trained items identified Time, F(2,176)=14.881,
p<.01, η²=.145, power= .999, and Feedback, F(1,88)=5.424, p<.05, η²=.058, power= .634
as statistically significant factors, but they did not identify any significance for Time x
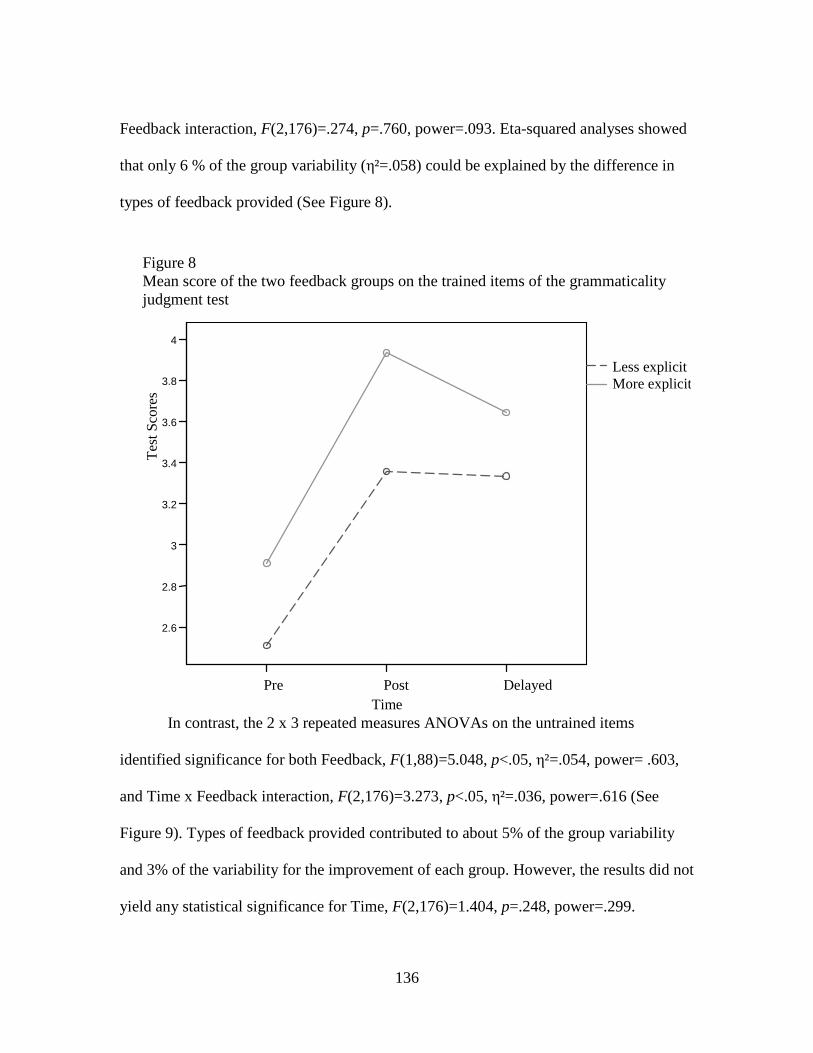
136
Feedback interaction, F(2,176)=.274, p=.760, power=.093. Eta-squared analyses showed
that only 6 % of the group variability (η²=.058) could be explained by the difference in
types of feedback provided (See Figure 8).
In contrast, the 2 x 3 repeated measures ANOVAs on the untrained items
identified significance for both Feedback, F(1,88)=5.048, p<.05, η²=.054, power= .603,
and Time x Feedback interaction, F(2,176)=3.273, p<.05, η²=.036, power=.616 (See
Figure 9). Types of feedback provided contributed to about 5% of the group variability
and 3% of the variability for the improvement of each group. However, the results did not
yield any statistical significance for Time, F(2,176)=1.404, p=.248, power=.299.
DelayedPost Pre Time
4
3.8
3.6
3.4
3.2
3
2.8
2.6
Tes
t S
core
s More explicit Less explicit
Figure 8 Mean score of the two feedback groups on the trained items of the grammaticality judgment test
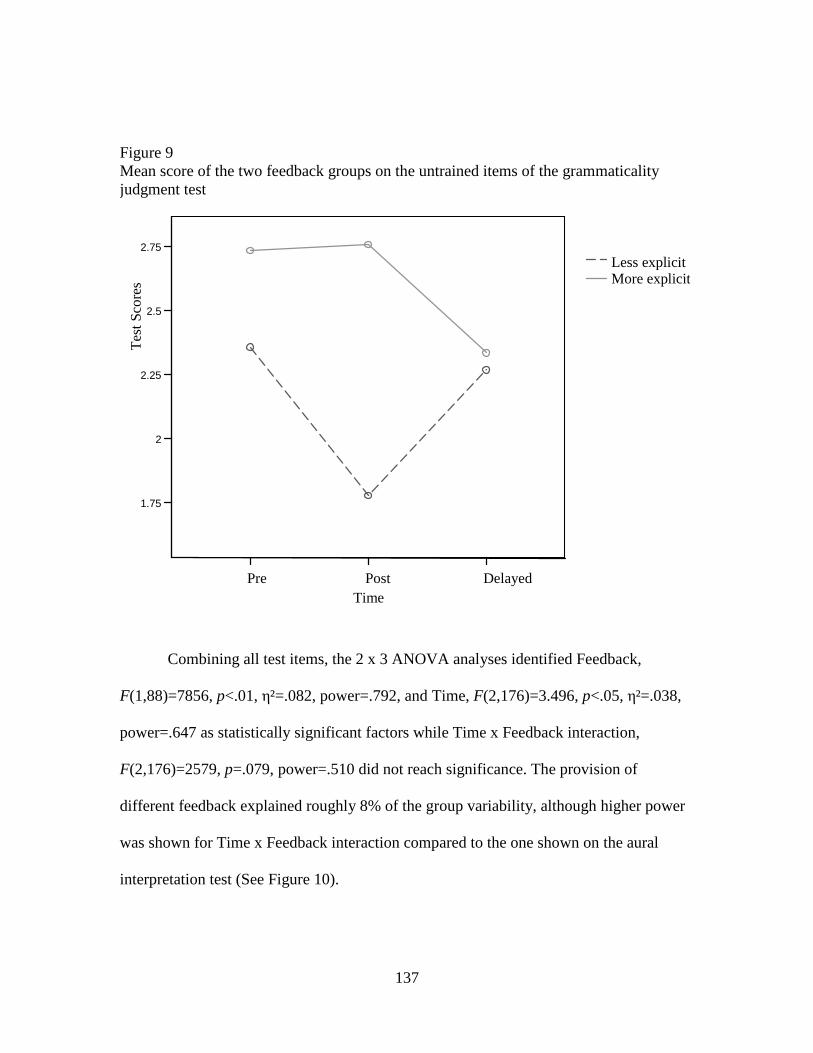
137
Combining all test items, the 2 x 3 ANOVA analyses identified Feedback,
F(1,88)=7856, p<.01, η²=.082, power=.792, and Time, F(2,176)=3.496, p<.05, η²=.038,
power=.647 as statistically significant factors while Time x Feedback interaction,
F(2,176)=2579, p=.079, power=.510 did not reach significance. The provision of
different feedback explained roughly 8% of the group variability, although higher power
was shown for Time x Feedback interaction compared to the one shown on the aural
interpretation test (See Figure 10).
DelayedPost Pre Time
2.75
2.5
2.25
2
1.75
Tes
t S
core
s More explicit Less explicit
Figure 9 Mean score of the two feedback groups on the untrained items of the grammaticality judgment test

138
To conclude, the group received more explicit feedback outperformed those who
received less explicit feedback on different test items. The more explicit feedback group
improved more than the less explicit feedback group over time for the untrained items
(η²=.036). However, not much of the variability (3% - 8%) could be accounted for by
feedback.
Delayed Post
Pre Time
6.5
6
5.5
5
Tes
t sco
re
More explicit
Less explicit
Figure 10 Mean score of the two feedback groups on the total items of the grammaticality judgment test
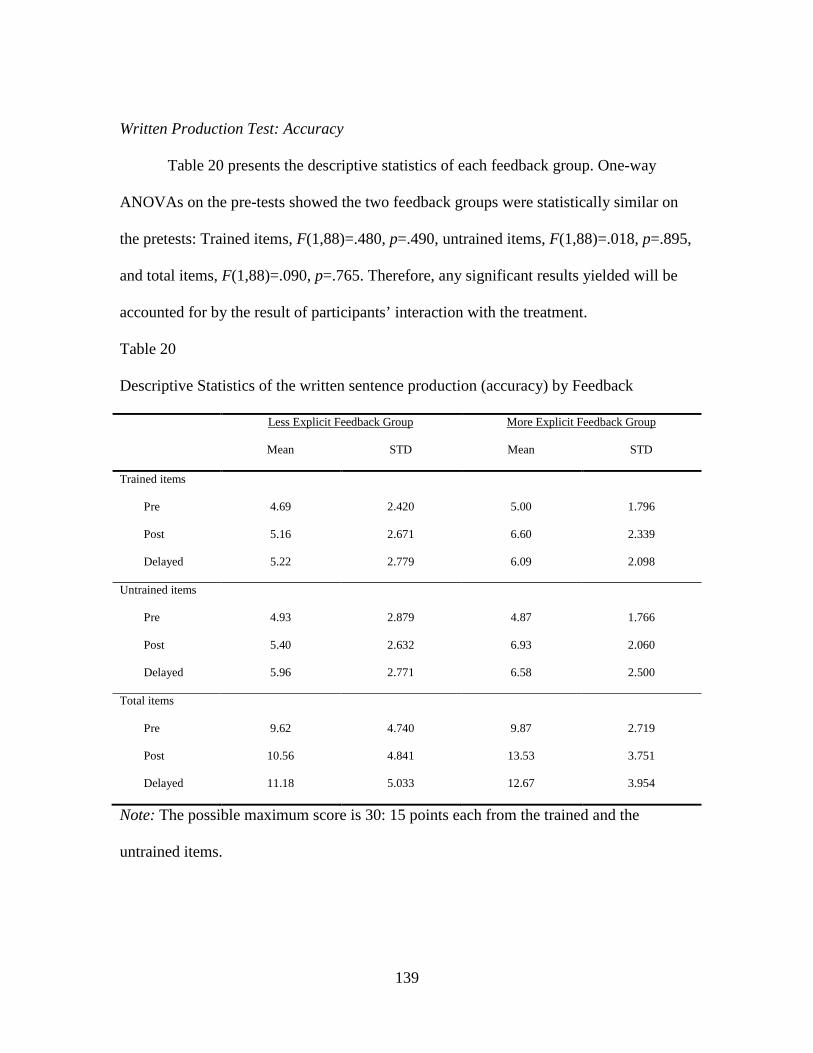
139
Written Production Test: Accuracy
Table 20 presents the descriptive statistics of each feedback group. One-way
ANOVAs on the pre-tests showed the two feedback groups were statistically similar on
the pretests: Trained items, F(1,88)=.480, p=.490, untrained items, F(1,88)=.018, p=.895,
and total items, F(1,88)=.090, p=.765. Therefore, any significant results yielded will be
accounted for by the result of participants’ interaction with the treatment.
Table 20
Descriptive Statistics of the written sentence production (accuracy) by Feedback
Less Explicit Feedback Group More Explicit Feedback Group
Mean STD Mean STD
Trained items
Pre
Post
Delayed
4.69
5.16
5.22
2.420
2.671
2.779
5.00
6.60
6.09
1.796
2.339
2.098
Untrained items
Pre
Post
Delayed
4.93
5.40
5.96
2.879
2.632
2.771
4.87
6.93
6.58
1.766
2.060
2.500
Total items
Pre
Post
Delayed
9.62
10.56
11.18
4.740
4.841
5.033
9.87
13.53
12.67
2.719
3.751
3.954
Note: The possible maximum score is 30: 15 points each from the trained and the
untrained items.
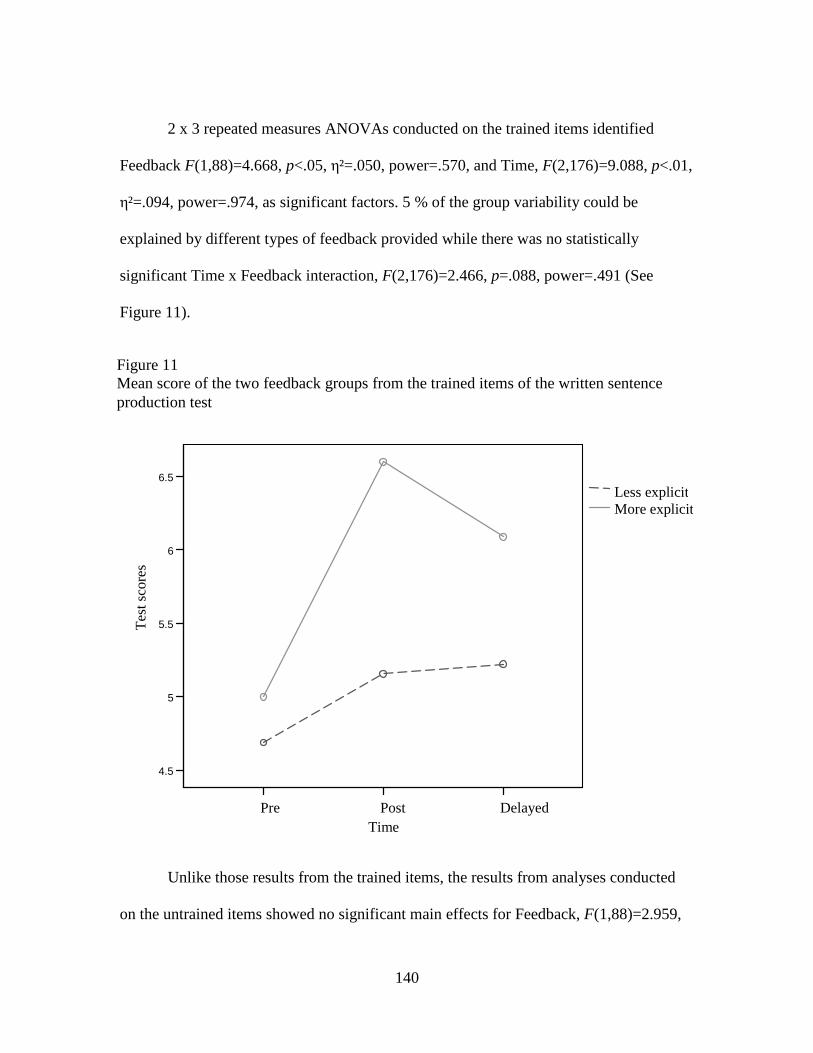
140
2 x 3 repeated measures ANOVAs conducted on the trained items identified
Feedback F(1,88)=4.668, p<.05, η²=.050, power=.570, and Time, F(2,176)=9.088, p<.01,
η²=.094, power=.974, as significant factors. 5 % of the group variability could be
explained by different types of feedback provided while there was no statistically
significant Time x Feedback interaction, F(2,176)=2.466, p=.088, power=.491 (See
Figure 11).
Unlike those results from the trained items, the results from analyses conducted
on the untrained items showed no significant main effects for Feedback, F(1,88)=2.959,
Delayed Post Pre Time
6.5
6
5.5
5
4.5
Tes
t sco
res
More explicit Less explicit
Figure 11 Mean score of the two feedback groups from the trained items of the written sentence production test
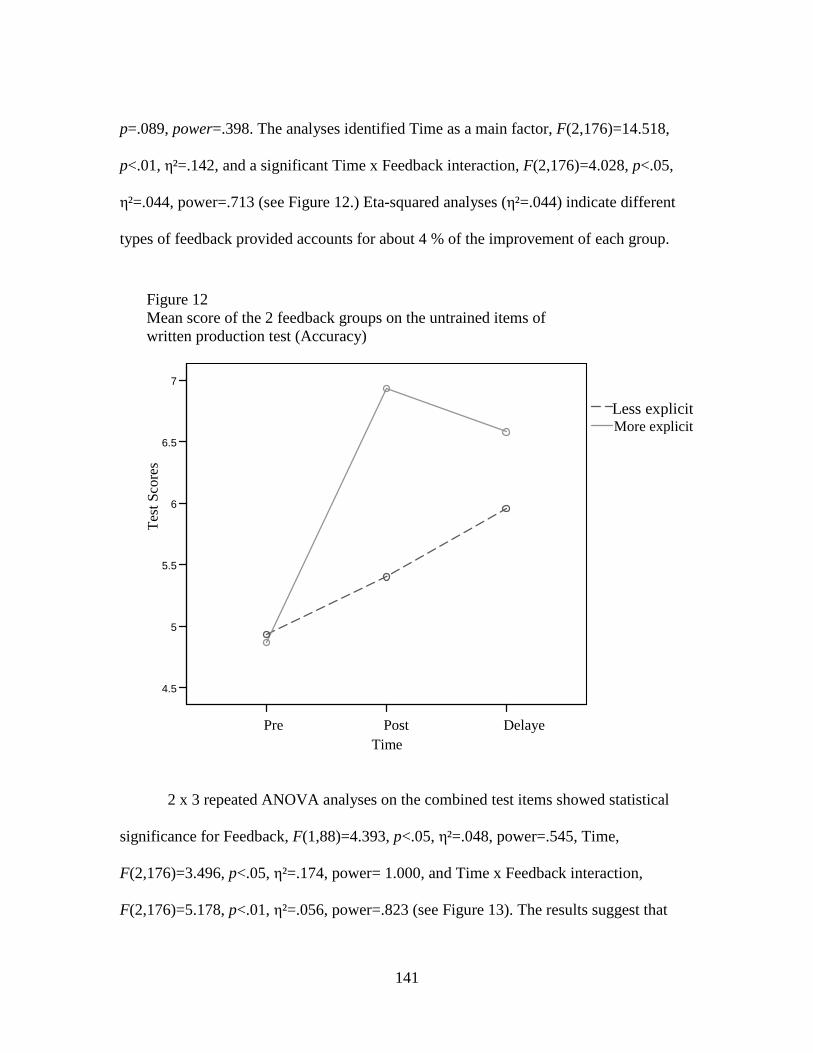
141
p=.089, power=.398. The analyses identified Time as a main factor, F(2,176)=14.518,
p<.01, η²=.142, and a significant Time x Feedback interaction, F(2,176)=4.028, p<.05,
η²=.044, power=.713 (see Figure 12.) Eta-squared analyses (η²=.044) indicate different
types of feedback provided accounts for about 4 % of the improvement of each group.
2 x 3 repeated ANOVA analyses on the combined test items showed statistical
significance for Feedback, F(1,88)=4.393, p<.05, η²=.048, power=.545, Time,
F(2,176)=3.496, p<.05, η²=.174, power= 1.000, and Time x Feedback interaction,
F(2,176)=5.178, p<.01, η²=.056, power=.823 (see Figure 13). The results suggest that
DelayePostPreTime
7
6.5
6
5.5
5
4.5
Tes
t S
core
s
More explicit Less explicit
Figure 12 Mean score of the 2 feedback groups on the untrained items of written production test (Accuracy)
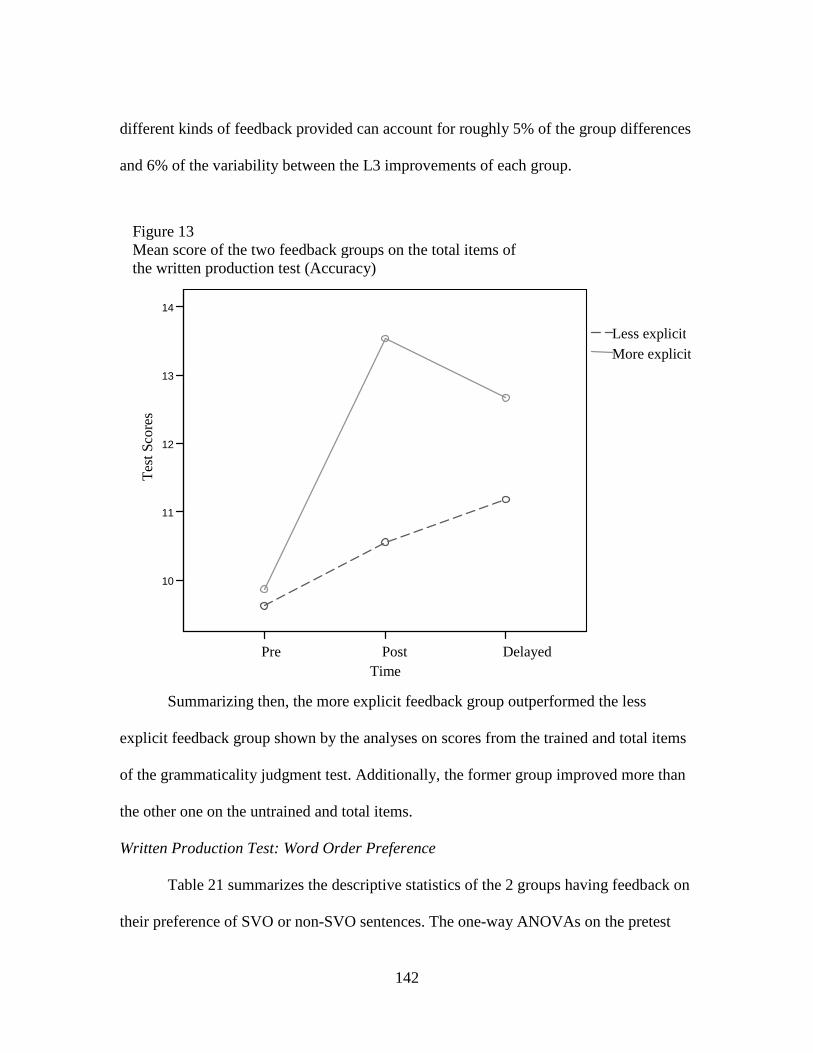
142
different kinds of feedback provided can account for roughly 5% of the group differences
and 6% of the variability between the L3 improvements of each group.
Summarizing then, the more explicit feedback group outperformed the less
explicit feedback group shown by the analyses on scores from the trained and total items
of the grammaticality judgment test. Additionally, the former group improved more than
the other one on the untrained and total items.
Written Production Test: Word Order Preference
Table 21 summarizes the descriptive statistics of the 2 groups having feedback on
their preference of SVO or non-SVO sentences. The one-way ANOVAs on the pretest
DelayedPost Pre Time
14
13
12
11
10
Tes
t S
core
s
More explicit Less explicit
Figure 13 Mean score of the two feedback groups on the total items of the written production test (Accuracy)
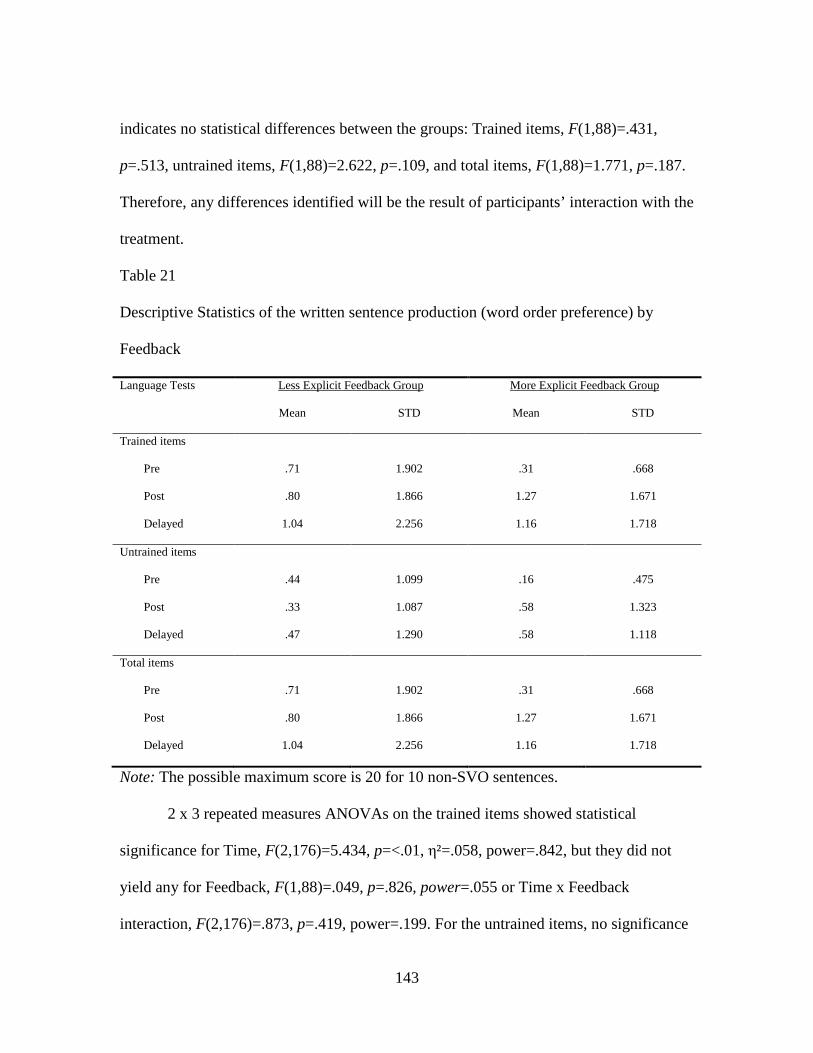
143
indicates no statistical differences between the groups: Trained items, F(1,88)=.431,
p=.513, untrained items, F(1,88)=2.622, p=.109, and total items, F(1,88)=1.771, p=.187.
Therefore, any differences identified will be the result of participants’ interaction with the
treatment.
Table 21
Descriptive Statistics of the written sentence production (word order preference) by
Feedback
Language Tests Less Explicit Feedback Group More Explicit Feedback Group
Mean STD Mean STD
Trained items
Pre
Post
Delayed
.71
.80
1.04
1.902
1.866
2.256
.31
1.27
1.16
.668
1.671
1.718
Untrained items
Pre
Post
Delayed
.44
.33
.47
1.099
1.087
1.290
.16
.58
.58
.475
1.323
1.118
Total items
Pre
Post
Delayed
.71
.80
1.04
1.902
1.866
2.256
.31
1.27
1.16
.668
1.671
1.718
Note: The possible maximum score is 20 for 10 non-SVO sentences.
2 x 3 repeated measures ANOVAs on the trained items showed statistical
significance for Time, F(2,176)=5.434, p=<.01, η²=.058, power=.842, but they did not
yield any for Feedback, F(1,88)=.049, p=.826, power=.055 or Time x Feedback
interaction, F(2,176)=.873, p=.419, power=.199. For the untrained items, no significance
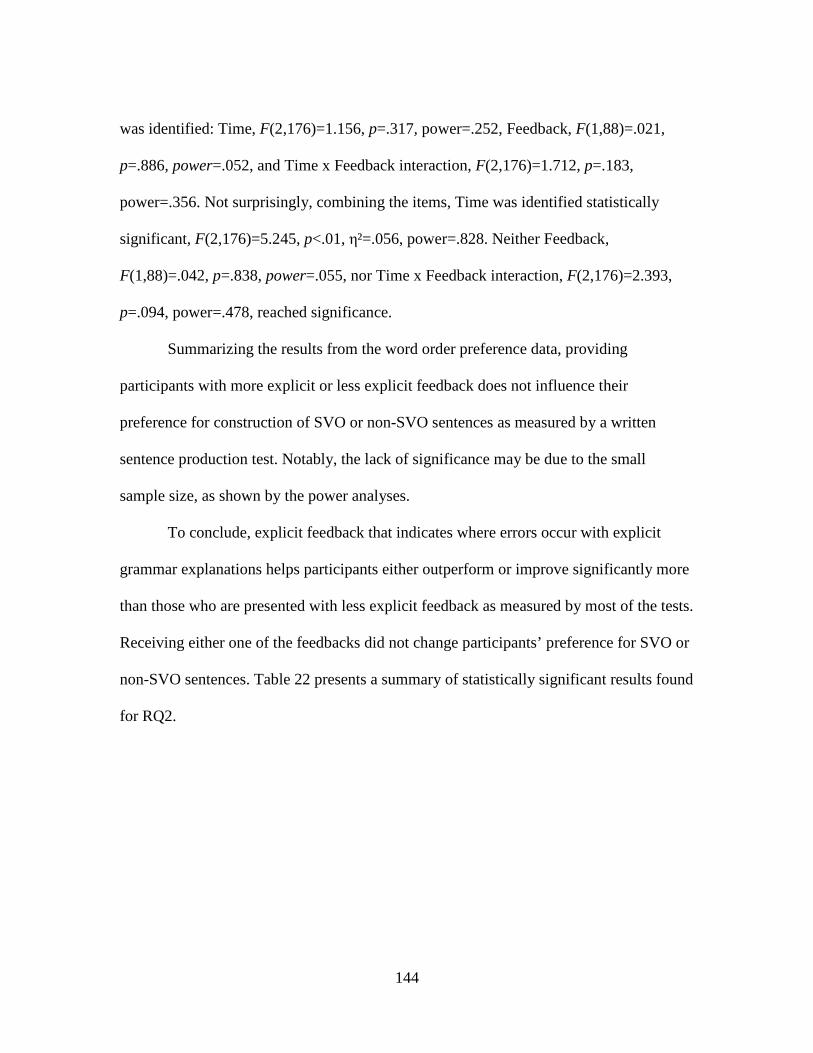
144
was identified: Time, F(2,176)=1.156, p=.317, power=.252, Feedback, F(1,88)=.021,
p=.886, power=.052, and Time x Feedback interaction, F(2,176)=1.712, p=.183,
power=.356. Not surprisingly, combining the items, Time was identified statistically
significant, F(2,176)=5.245, p<.01, η²=.056, power=.828. Neither Feedback,
F(1,88)=.042, p=.838, power=.055, nor Time x Feedback interaction, F(2,176)=2.393,
p=.094, power=.478, reached significance.
Summarizing the results from the word order preference data, providing
participants with more explicit or less explicit feedback does not influence their
preference for construction of SVO or non-SVO sentences as measured by a written
sentence production test. Notably, the lack of significance may be due to the small
sample size, as shown by the power analyses.
To conclude, explicit feedback that indicates where errors occur with explicit
grammar explanations helps participants either outperform or improve significantly more
than those who are presented with less explicit feedback as measured by most of the tests.
Receiving either one of the feedbacks did not change participants’ preference for SVO or
non-SVO sentences. Table 22 presents a summary of statistically significant results found
for RQ2.
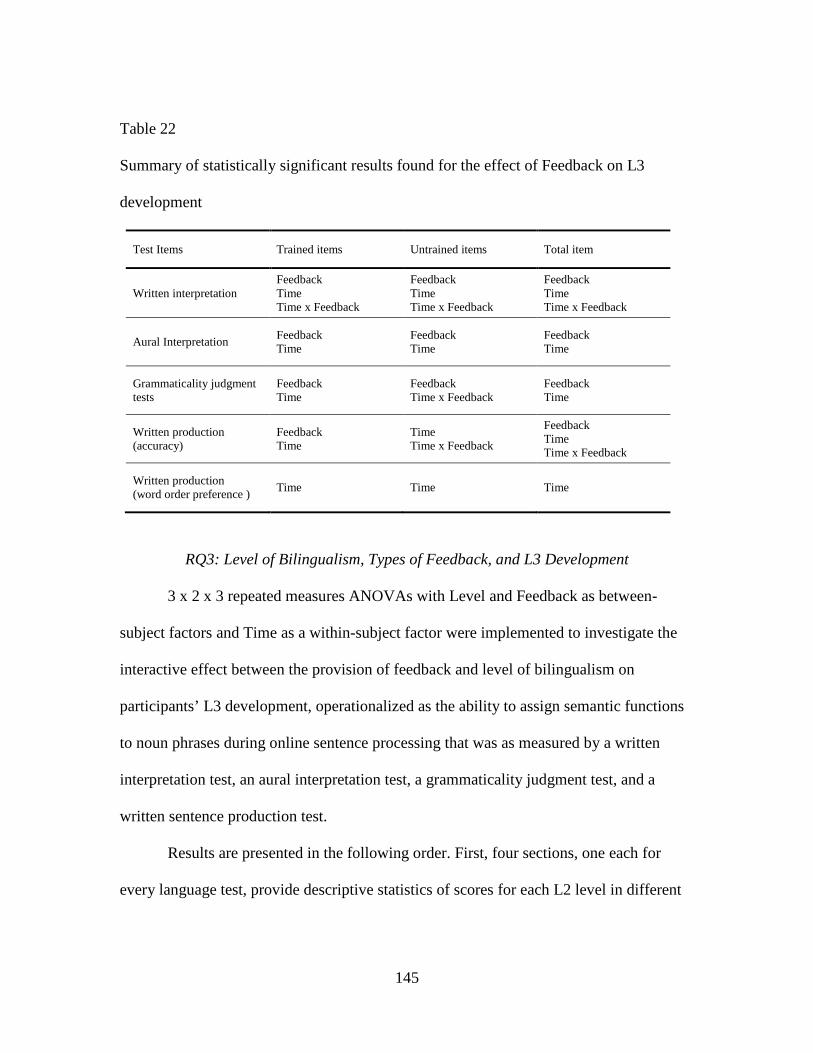
145
Table 22
Summary of statistically significant results found for the effect of Feedback on L3
development
Test Items Trained items Untrained items Total item
Written interpretation Feedback Time Time x Feedback
Feedback Time Time x Feedback
Feedback Time Time x Feedback
Aural Interpretation Feedback Time
Feedback Time
Feedback Time
Grammaticality judgment tests
Feedback Time
Feedback Time x Feedback
Feedback Time
Written production (accuracy)
Feedback Time
Time Time x Feedback
Feedback Time Time x Feedback
Written production (word order preference )
Time Time Time
RQ3: Level of Bilingualism, Types of Feedback, and L3 Development
3 x 2 x 3 repeated measures ANOVAs with Level and Feedback as between-
subject factors and Time as a within-subject factor were implemented to investigate the
interactive effect between the provision of feedback and level of bilingualism on
participants’ L3 development, operationalized as the ability to assign semantic functions
to noun phrases during online sentence processing that was as measured by a written
interpretation test, an aural interpretation test, a grammaticality judgment test, and a
written sentence production test.
Results are presented in the following order. First, four sections, one each for
every language test, provide descriptive statistics of scores for each L2 level in different

146
pedagogical conditions (feedback) on the language tests with a focus on trained items
first, followed by untrained items and total items. Additionally, when the repeated
measures ANOVAs identify statistical significance, post hoc analyses are run to identify
where the differences lie. Eta-squared (η²) analyses are used to determine the strength of
association between the independent and dependent variables. When the analysis yields
no-significant factors or interactions, power analyses are run to avoid falsely rejecting the
null hypothesis.
Written Interpretation Test
Table 23 summarizes the descriptive statistics of the 6 groups of participants at
three different levels (high, mid, and low L2 levels) receiving two different types of
feedback (more explicit and less explicit feedback).
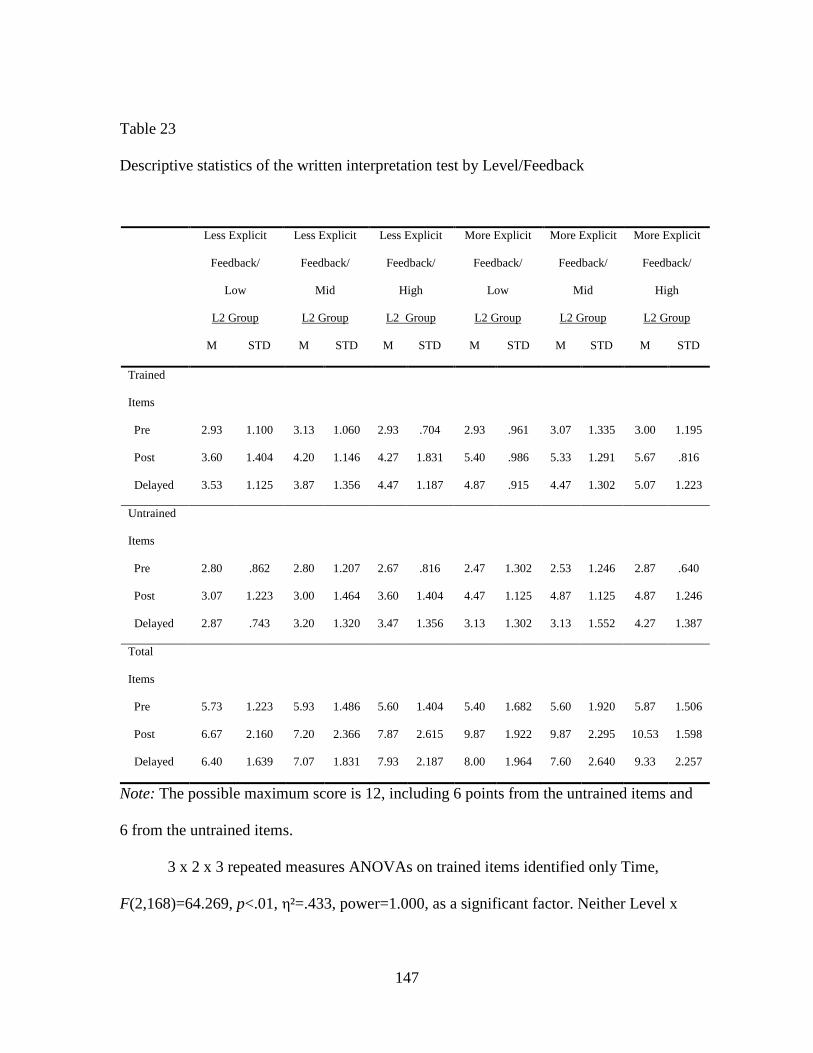
147
Table 23
Descriptive statistics of the written interpretation test by Level/Feedback
Note: The possible maximum score is 12, including 6 points from the untrained items and
6 from the untrained items.
3 x 2 x 3 repeated measures ANOVAs on trained items identified only Time,
F(2,168)=64.269, p<.01, η²=.433, power=1.000, as a significant factor. Neither Level x
Less Explicit
Feedback/
Low
L2 Group
Less Explicit
Feedback/
Mid
L2 Group
Less Explicit
Feedback/
High
L2 Group
More Explicit
Feedback/
Low
L2 Group
More Explicit
Feedback/
Mid
L2 Group
More Explicit
Feedback/
High
L2 Group
M STD M STD M STD M STD M STD M STD
Trained
Items
Pre
Post
Delayed
2.93
3.60
3.53
1.100
1.404
1.125
3.13
4.20
3.87
1.060
1.146
1.356
2.93
4.27
4.47
.704
1.831
1.187
2.93
5.40
4.87
.961
.986
.915
3.07
5.33
4.47
1.335
1.291
1.302
3.00
5.67
5.07
1.195
.816
1.223
Untrained
Items
Pre
Post
Delayed
2.80
3.07
2.87
.862
1.223
.743
2.80
3.00
3.20
1.207
1.464
1.320
2.67
3.60
3.47
.816
1.404
1.356
2.47
4.47
3.13
1.302
1.125
1.302
2.53
4.87
3.13
1.246
1.125
1.552
2.87
4.87
4.27
.640
1.246
1.387
Total
Items
Pre
Post
Delayed
5.73
6.67
6.40
1.223
2.160
1.639
5.93
7.20
7.07
1.486
2.366
1.831
5.60
7.87
7.93
1.404
2.615
2.187
5.40
9.87
8.00
1.682
1.922
1.964
5.60
9.87
7.60
1.920
2.295
2.640
5.87
10.53
9.33
1.506
1.598
2.257

148
Feedback, F(2,84)=.768, p=.467, power=.177, nor Level x Feedback x Time,
F(4,168)=.331, p=.857, power=.124, reached statistical significance. The same results
apply to the untrained items: Time, F(2,168)=83, p<.01, η²=.272, power=1.000, as a
significant factor. Both Level x Feedback, F(2,84)=.300, p=.741, power=.096, and Time
x Level x Feedback interaction, F(4,168)=.168, p=.451, power=.289 did not reach
significance. Not surprisingly, the analyses on the items combined present the same
results. 3 x 2 x 3 repeated measures ANOVAs yielded a statistically significant effect for
Time, F(2,168)=72.279, p<.01, η²=.462, power=1.000, but they did not identify
significance for Level x Feedback, F(2,84)=.336 , p=.716, power=.102 or Time x Level x
Feedback interaction, F(4,168)=.1269 , p=.284, power=.130. Table 24 provides detailed
ANOVA results.
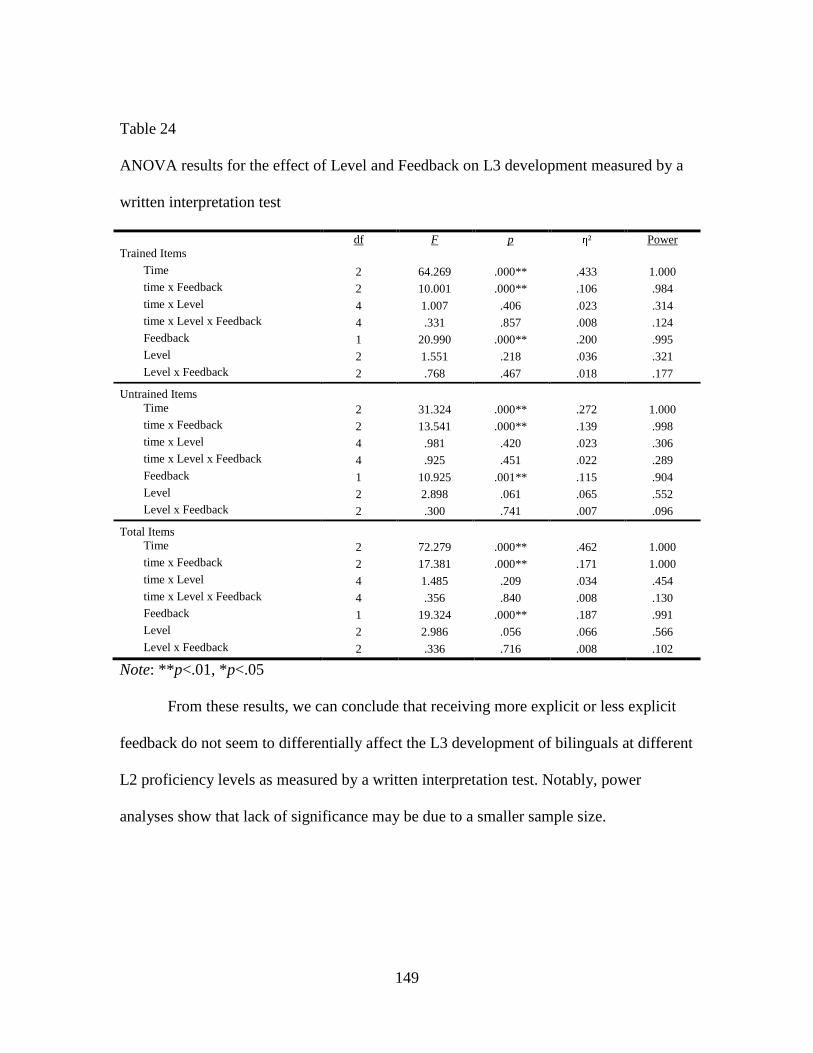
149
Table 24
ANOVA results for the effect of Level and Feedback on L3 development measured by a
written interpretation test
df F p η² Power Trained Items
Time 2 64.269 .000** .433 1.000 time x Feedback 2 10.001 .000** .106 .984 time x Level 4 1.007 .406 .023 .314 time x Level x Feedback 4 .331 .857 .008 .124 Feedback 1 20.990 .000** .200 .995 Level 2 1.551 .218 .036 .321 Level x Feedback 2 .768 .467 .018 .177
Untrained Items Time 2 31.324 .000** .272 1.000 time x Feedback 2 13.541 .000** .139 .998 time x Level 4 .981 .420 .023 .306 time x Level x Feedback 4 .925 .451 .022 .289 Feedback 1 10.925 .001** .115 .904 Level 2 2.898 .061 .065 .552 Level x Feedback 2 .300 .741 .007 .096
Total Items Time 2 72.279 .000** .462 1.000 time x Feedback 2 17.381 .000** .171 1.000 time x Level 4 1.485 .209 .034 .454 time x Level x Feedback 4 .356 .840 .008 .130 Feedback 1 19.324 .000** .187 .991 Level 2 2.986 .056 .066 .566 Level x Feedback 2 .336 .716 .008 .102
Note: ** p<.01, *p<.05
From these results, we can conclude that receiving more explicit or less explicit
feedback do not seem to differentially affect the L3 development of bilinguals at different
L2 proficiency levels as measured by a written interpretation test. Notably, power
analyses show that lack of significance may be due to a smaller sample size.

150
Aural Interpretation Test
Table 25 summarizes the descriptive statistics for participants at three different
English levels (high, mid, and low L2 levels) being exposed to two types of feedback
(more explicit or less explicit feedback).
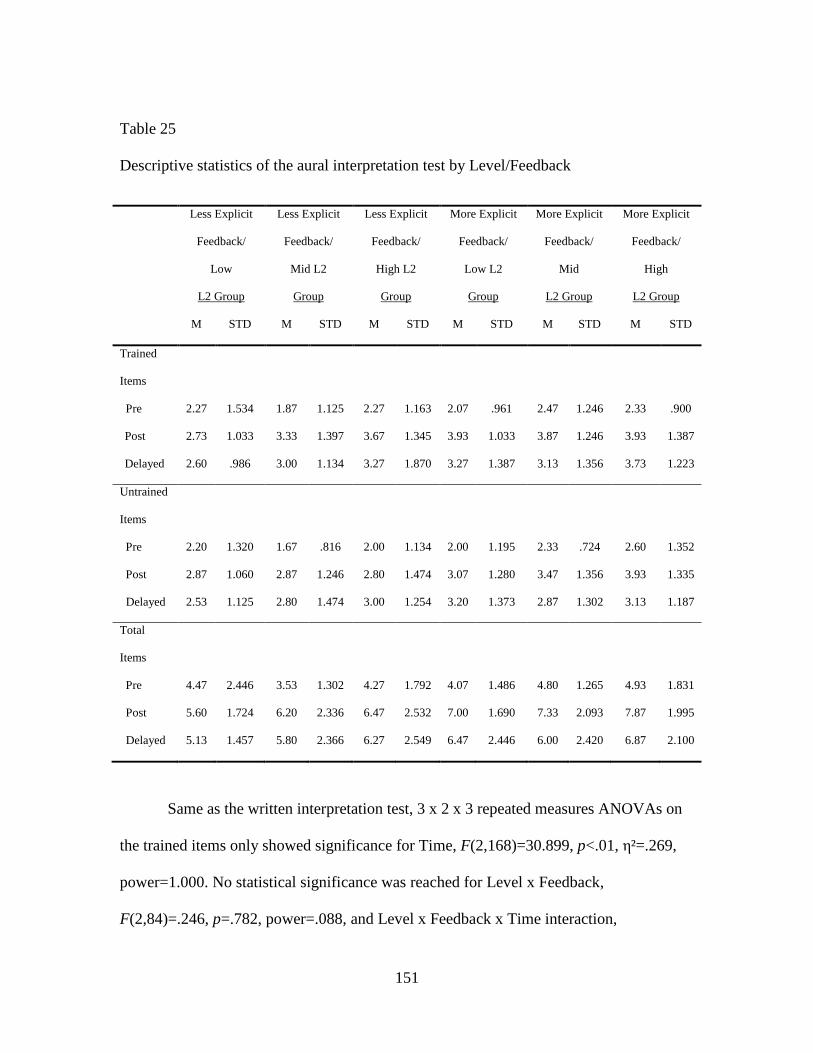
151
Table 25
Descriptive statistics of the aural interpretation test by Level/Feedback
Same as the written interpretation test, 3 x 2 x 3 repeated measures ANOVAs on
the trained items only showed significance for Time, F(2,168)=30.899, p<.01, η²=.269,
power=1.000. No statistical significance was reached for Level x Feedback,
F(2,84)=.246, p=.782, power=.088, and Level x Feedback x Time interaction,
Less Explicit
Feedback/
Low
L2 Group
Less Explicit
Feedback/
Mid L2
Group
Less Explicit
Feedback/
High L2
Group
More Explicit
Feedback/
Low L2
Group
More Explicit
Feedback/
Mid
L2 Group
More Explicit
Feedback/
High
L2 Group
M STD M STD M STD M STD M STD M STD
Trained
Items
Pre
Post
Delayed
2.27
2.73
2.60
1.534
1.033
.986
1.87
3.33
3.00
1.125
1.397
1.134
2.27
3.67
3.27
1.163
1.345
1.870
2.07
3.93
3.27
.961
1.033
1.387
2.47
3.87
3.13
1.246
1.246
1.356
2.33
3.93
3.73
.900
1.387
1.223
Untrained
Items
Pre
Post
Delayed
2.20
2.87
2.53
1.320
1.060
1.125
1.67
2.87
2.80
.816
1.246
1.474
2.00
2.80
3.00
1.134
1.474
1.254
2.00
3.07
3.20
1.195
1.280
1.373
2.33
3.47
2.87
.724
1.356
1.302
2.60
3.93
3.13
1.352
1.335
1.187
Total
Items
Pre
Post
Delayed
4.47
5.60
5.13
2.446
1.724
1.457
3.53
6.20
5.80
1.302
2.336
2.366
4.27
6.47
6.27
1.792
2.532
2.549
4.07
7.00
6.47
1.486
1.690
2.446
4.80
7.33
6.00
1.265
2.093
2.420
4.93
7.87
6.87
1.831
1.995
2.100
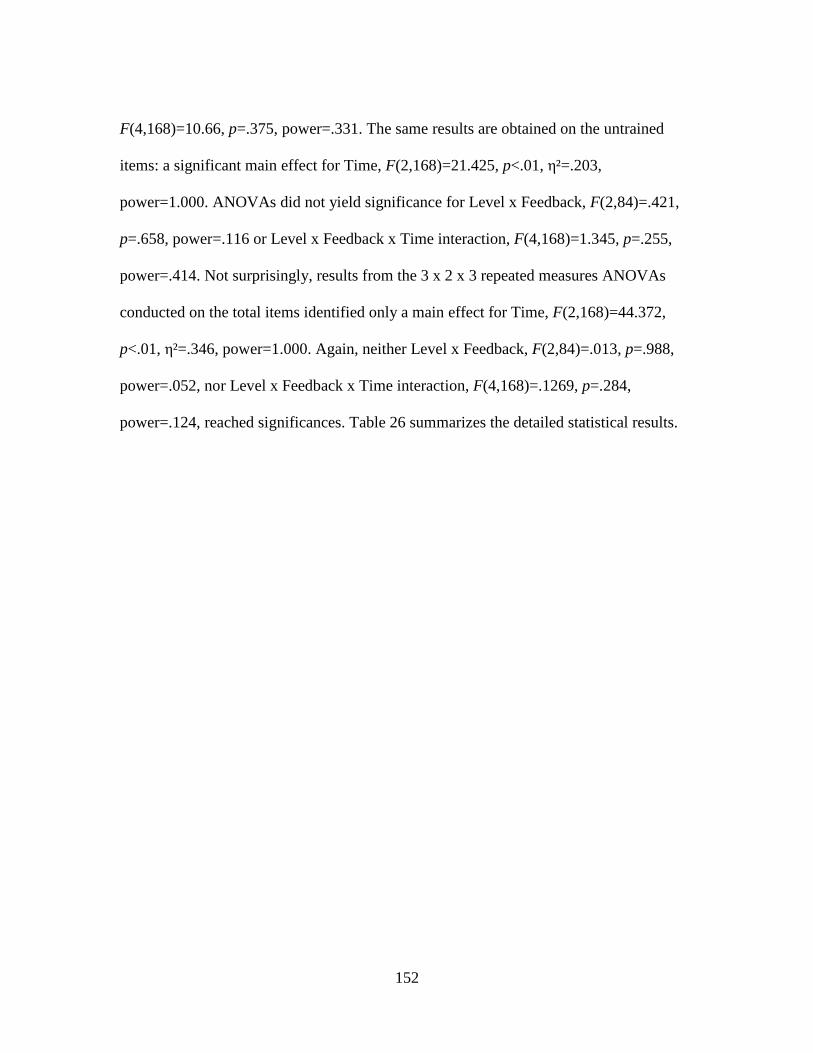
152
F(4,168)=10.66, p=.375, power=.331. The same results are obtained on the untrained
items: a significant main effect for Time, F(2,168)=21.425, p<.01, η²=.203,
power=1.000. ANOVAs did not yield significance for Level x Feedback, F(2,84)=.421,
p=.658, power=.116 or Level x Feedback x Time interaction, F(4,168)=1.345, p=.255,
power=.414. Not surprisingly, results from the 3 x 2 x 3 repeated measures ANOVAs
conducted on the total items identified only a main effect for Time, F(2,168)=44.372,
p<.01, η²=.346, power=1.000. Again, neither Level x Feedback, F(2,84)=.013, p=.988,
power=.052, nor Level x Feedback x Time interaction, F(4,168)=.1269, p=.284,
power=.124, reached significances. Table 26 summarizes the detailed statistical results.
153
Table 26
Summary of detailed statistics for the interaction of Level and Feedback on L3
development measured by an aural interpretation test
Aural Interpretation Test df F p η² Power Trained Items
time 2 30.899 .000** .269 1.000 time x Feedback 2 1.027 .360 .012 .227 time x Level 4 .328 .859 .008 .123 time x Level x Feedback 4 1.066 .375 .025 .331 Feedback 1 6.084 .016* .068 .684 Level 2 1.841 .165 .042 .374 Level x Feedback 2 .246 .782 .006 .088
Untrained Items time 2 21.425 .000** .203 1.000 time x Feedback 2 .656 .520 .008 .159 time x Level 4 .166 .955 .004 .084 time x Level x Feedback 4 1.345 .255 .031 .414 Feedback 1 5.804 .018* .065 .663 Level 2 .918 .403 .021 .204 Level x Feedback 2 .421 .658 .010 .116
Total Items time 2 44.372 .000** .346 1.000 time x Feedback 2 1.250 .289 .015 .269 time x Level 4 .295 .881 .007 .115 time x Level x Feedback 4 1.269 .284 .029 .391 Feedback 1 7.781 .007** .085 .787 Level 2 1.707 .188 .039 .350 Level x Feedback 2 .013 .988 .000 .052
Note: ** p<.01, *p<.05
To conclude, different types of feedback do not differentially affect the rate at
which bilinguals at different L2 levels learn to assign semantic functions to noun phrases
during online sentential processing in an L3, as measured by an aural interpretation test.
Importantly, power analyses show that lack of significance may be due to the small
sample size.
154
Grammaticality Judgment Test
Table 27 presents the descriptive statistics of the actual scores from participants at
different L2 levels (high, mid, and low L2 levels) receiving different types of feedback
(more explicit and less explicit feedback).

155
Table 27
Descriptive statistics of the grammaticality judgment test by Level/Feedback
Note: The possible maximum score is 12: 6 points each from the trained and untrained
items.
Different from the ANOVAs on the written and aural interpretation tests, 3 x 2 x 3
repeated measures ANOVAs administered on the trained items yielded statistical
significance: Level x Feedback, F(2,84)=4.559, p<.05, η²=.098, power=.761, Time,
Less Explicit
Feedback /
Low
L2 Group
Less Explicit
Feedback/
Mid
L2 Group
Less Explicit
Feedback/
High
L2 Group
More Explicit
Feedback/
Low
L2 Group
More Explicit
Feedback/
Mid
L2 Group
More Explicit
Feedback/
High
L2 Group
Mean STD Mean STD Mean STD Mean STD Mean STD Mean STD
Trained
Items
Pre
Post
Delayed
2.40
2.67
3.13
1.352
1.543
1.552
2.80
3.93
3.93
1.265
1.100
1.223
2.33
3.47
2.93
1.113
1.302
1.335
2.87
4.40
3.80
1.407
1.121
1.521
3.00
3.73
3.00
1.195
1.100
1.363
2.87
3.67
4.13
1.506
1.113
1.246
Untrained
Items
Pre
Post
Delayed
1.60
1.20
2.00
1.352
.862
1.363
2.67
2.13
2.67
1.234
1.125
1.175
2.80
2.13
2.13
1.897
1.125
1.552
2.53
2.47
2.07
1.246
1.642
1.100
3.13
3.07
2.27
1.506
1.624
1.387
2.53
2.73
2.67
1.125
1.534
1.447
Total
Items
Pre
Post
Delayed
4.00
3.87
5.13
2.360
2.066
2.232
5.47
6.07
6.60
1.885
1.280
1.502
5.13
5.47
5.07
2.503
2.100
1.534
5.40
6.87
5.87
2.230
2.356
1.727
6.13
6.80
5.27
2.200
2.242
2.282
5.40
6.40
6.80
2.165
1.957
1.897
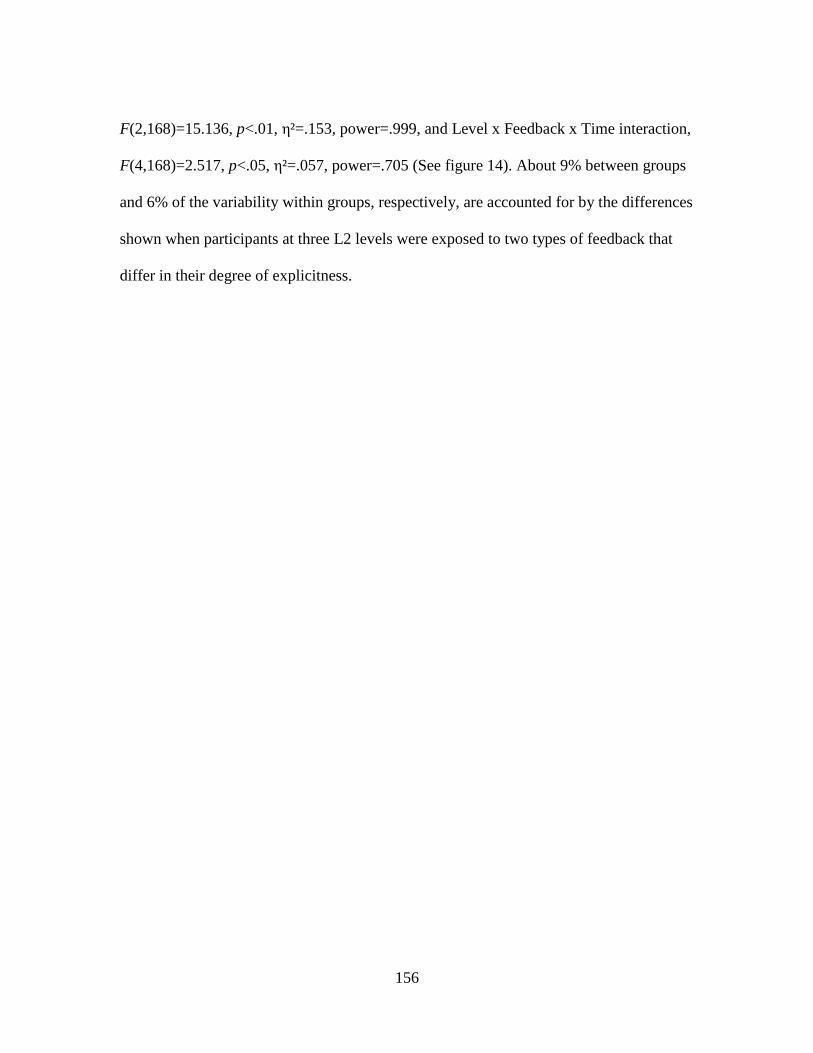
156
F(2,168)=15.136, p<.01, η²=.153, power=.999, and Level x Feedback x Time interaction,
F(4,168)=2.517, p<.05, η²=.057, power=.705 (See figure 14). About 9% between groups
and 6% of the variability within groups, respectively, are accounted for by the differences
shown when participants at three L2 levels were exposed to two types of feedback that
differ in their degree of explicitness.
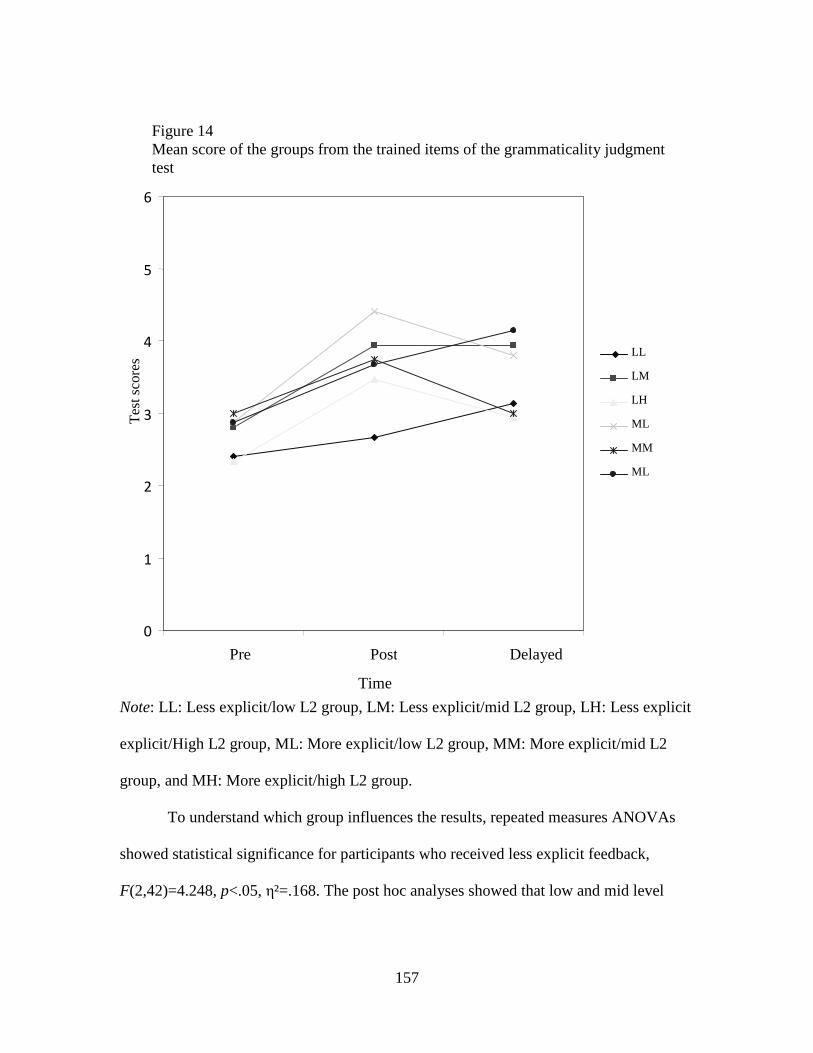
157
Note: LL: Less explicit/low L2 group, LM: Less explicit/mid L2 group, LH: Less explicit
explicit/High L2 group, ML: More explicit/low L2 group, MM: More explicit/mid L2
group, and MH: More explicit/high L2 group.
To understand which group influences the results, repeated measures ANOVAs
showed statistical significance for participants who received less explicit feedback,
F(2,42)=4.248, p<.05, η²=.168. The post hoc analyses showed that low and mid level
Figure 14 Mean score of the groups from the trained items of the grammaticality judgment test
0
1
2
3
4
5
6
Pre Post Delayed
Time
Tes
t sco
res LL
LM
LH
ML
MM
ML

158
were significantly different (See Table 28). On the other hand, ANOVA analyses on
scores from the trained items of 3 L2 levels that received more explicit feedback
identified no statistical significance, F (2,42)=.882, p=.421, power=.192 among the three
L2 levels.
Table 28
Post-hoc Scheffé from scores of the trained items of the grammaticality judgment test by
Levels (participants in the less explicit group)
Level Level Mean Difference (I-J) Std. Error Sig.
Low L2 Mid L2 -.82* .292 .026
High L2 -.22 .292 .750
Mid L2 Low L2 .82* .292 .026
High L2 .60 .292 .134
High L2 Low L2 .22 .292 .750
Mid L2 -.60 .292 .134
Note: p*<.05
Different from the results on the trained items, no significance was identified for
the untrained items: Time, F(2,168)=1.386, p=.253, power=.556, Level x Feedback
interaction, F(2,84)=.469, p=.627, power=.124, and Level x Feedback x Time interaction,
F(4,168)=1.200, p=313, power=.371.
Combining the test items, Level x Feedback, F(2,84)=2.460, p=.092, power=.482
did not reach statistical significance. The analyses identified a main effect for Time,
F(2,168)=3.582, p<.05, η²=.041, power=.658 and a significant Level x Feedback x Time
interaction, F(4,168)=2.701, p<.05, η²=.060, power=.740. See Figure 15 for an
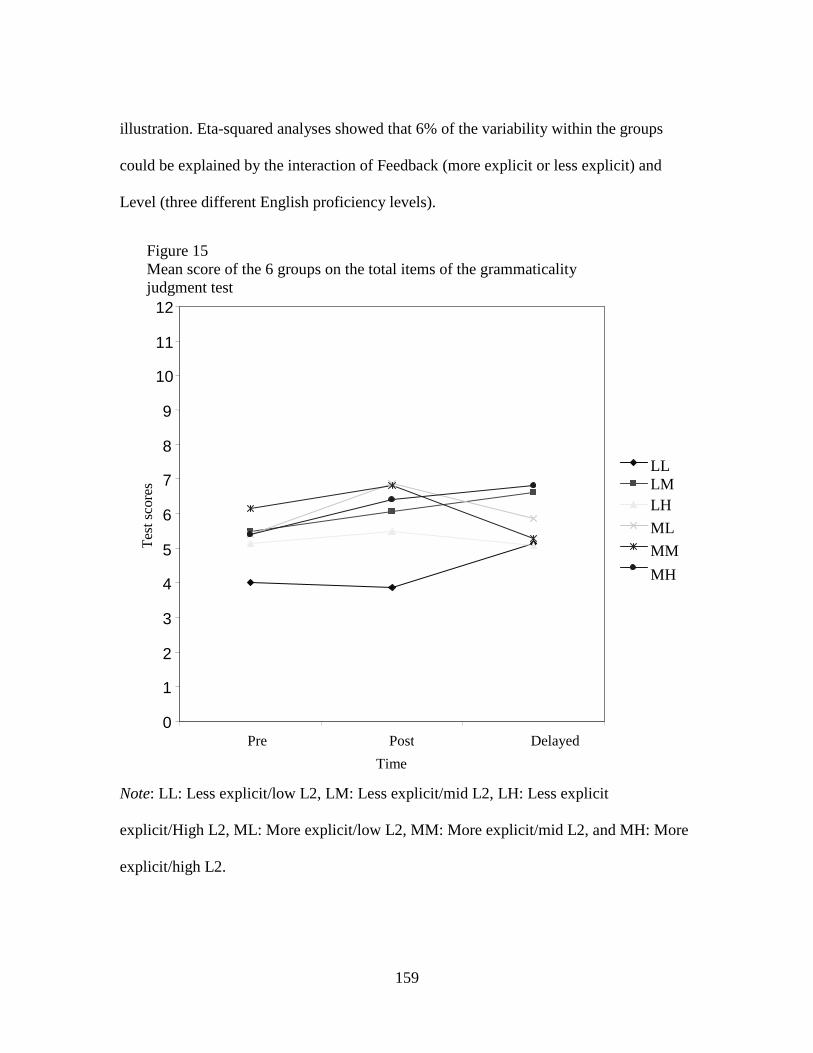
159
illustration. Eta-squared analyses showed that 6% of the variability within the groups
could be explained by the interaction of Feedback (more explicit or less explicit) and
Level (three different English proficiency levels).
Note: LL: Less explicit/low L2, LM: Less explicit/mid L2, LH: Less explicit
explicit/High L2, ML: More explicit/low L2, MM: More explicit/mid L2, and MH: More
explicit/high L2.
Figure 15 Mean score of the 6 groups on the total items of the grammaticality judgment test
0
1
2
3
4
5
6
7
8
9
10
11
12
Pre Post Delayed
Time
Tes
t sco
res
LLLM LH
ML
MM
MH

160
To investigate what influenced the results, ANOVA analyses on the total items
showed no significance for the 3 L2 levels that received more explicit feedback,
F(2,42)=.003, p=.997, power=.050. When comparing the 3 levels that received less
explicit feedback, statistically significant result was found, F(2,42)=5.983, p<.01,
η²=.222. (See Table 29) The post hoc analysis showed that the mid L2 group learned
more than the low L2 group.
Table 29
Post-hoc Scheffé from total scores of the grammaticality judgment test by Level
(participants in the less explicit feedback groups)
Level Level Mean Difference Std. Error Sig.
Low L2 Mid L2 -1.71* .495 .005
High L2 -.91 .495 .196
Mid L2 Low L2 1.71* .495 .005
High L2 .80 .495 .282
High L2 Low L2 .91 .495 .196
Mid L2 -.80 .495 .282
Table 30 provides the summary of statistical significance found for the effect of
Level and Feedback on L3 development as measured by a grammaticality judgment test.

161
Table 30
A summary of ANOVA results for the effect of Level and Feedback on L3 development
measured by a grammaticality judgment test
Grammaticality Judgment Test df F p η² Power Trained Items
time 2 15.136 .000** .153 .999 time x Feedback 2 .279 .757 .003 .094 time x Level 4 .238 .917 .006 .101 time x Level x Feedback 4 2.517 .043* .057 .705 Feedback 1 5.794 .018* .065 .663 Level 2 .446 .642 .011 .120 Level x Feedback 2 4.559 .013* .098 .761
Untrained Items time 2 1.386 .253 .016 .295 time x Feedback 2 3.230 .042* .037 .610 time x Level 4 .233 .919 .006 .100 time x Level x Feedback 4 1.200 .313 .028 .371 Feedback 1 5.319 .024* .060 .626 Level 2 3.897 .024* .085 .689 Level x Feedback 2 .469 .627 .011 .124
Total Items time 2 3.582 .030* .041 .658 time x Feedback 2 2.643 .074 .031 .520 time x Level 4 .387 .818 .009 .138 time x Level x Feedback 4 2.701 .032* .060 .740 Feedback 1 8.405 .005** .091 .817 Level 2 2.613 .079 .059 .507 Level x Feedback 2 2.460 .092 .055 .482
Note: ** p<.01, *p<.05
Concluding the results, practicing with the target language helps participants
judge the grammaticality of sentences as shown on the trained and total items, but this
effect is not shown on the untrained items, which participants had not seen during the
treatment. The results indicate that being exposed to different types of feedback
differentially affect participants at different L2 levels. When examining the performance
of the three L2 levels that received more explicit feedback, no one L2 group was

162
statistically better than the others were. On the other hand, when comparing the three L2
levels that only received “right/wrong” as feedback, the mid L2 group learned better than
the low L2 group on the trained items. The same result is obtained for the total items.
These results suggest that the provision of more explicit feedback to participants at
different L2 levels eliminates the differences that may exist among them. However,
having higher L2 proficiency levels helps participants learn more than others in a more
demanding condition, which participants only receive “right/wrong” as feedback.
Written Production: Accuracy
Table 31 presents the descriptive statistics of the actual scores of participants at 3
different levels (high, mid, and low L2 level) exposed to different kinds of feedback
(more explicit and less explicit).

163
Table 31
Descriptive statistics of written sentence production (accuracy) by Level/Feedback
Note: The possible maximum score is 12: 6 points each for the trained and untrained
items.
The 3 x 2 x 3 repeated measures ANOVA on the trained items showed a main
effect for Time, F(2,168)=8.909, p<.01, η²=.096, power=.971. Yet, they did not identify
significance for Level x Feedback, F(2,84)=2.648, p=.077, power=.513, or Level x
Less Explicit
Feedback/
Low L2
Group
Less Explicit
Feedback/
Mid L2
Group
Less Explicit
Feedback/
High L2
Group
More explicit
Feedback/
Low L2
Group
More explicit
Feedback/
Mid L2
Group
More explicit
Feedback/
High L2
Group
Mean STD Mean STD Mean STD Mean STD Mean STD Mean STD
Trained
Items
Pre
Post
Delayed
4.20
4.80
4.53
2.007
2.336
1.846
4.73
4.53
5.13
2.738
2.722
3.091
5.13
6.13
6.00
2.532
2.825
3.185
5.20
7.33
6.47
2.077
2.350
2.416
5.40
6.60
5.93
1.920
2.640
1.751
4.40
5.87
5.87
1.242
1.885
2.167
Untrained
Items
Pre
Post
Delayed
3.93
4.53
4.87
2.404
2.669
2.748
4.60
5.07
6.13
2.558
2.712
2.326
6.27
6.60
6.87
3.262
2.197
2.997
4.27
6.67
7.80
1.668
1.952
2.336
4.87
7.33
6.00
1.552
1.718
2.952
5.47
6.80
5.93
1.959
2.513
1.751
Total
Items
Pre
Post
Delayed
8.13
9.33
9.40
3.642
4.577
3.851
9.33
9.60
11.27
4.981
4.837
4.743
11.40
12.73
12.87
5.166
4.652
5.986
9.47
14.00
14.27
3.182
3.836
3.900
10.27
13.93
11.93
2.520
4.008
4.148
9.87
12.67
11.80
2.532
3.498
3.550

164
Feedback x Time interaction, F(4,168)=.414, p=.798, power=.145. The same results
apply to the untrained items: there was a main effect for Time, F(2,168)= 15.088, p<.01,
η²=.152, power=.999. Neither Level x Feedback F(2,84)=2.925, p=.059, power=.556, nor
Level x Feedback x Time interaction, F(4,168)=2.034, p=.092, power=.599, reached
statistical significance. Unpredictably, the statistical results on the items combined
yielded statistical significance for Level x Feedback, F(2,84)=3.423, p<.05, η²=.075,
power=.603, while yielding a main effect for Time, F(2,168)=18.495, p<.01, η²=.180(see
Figure 16) . The eta-squared analysis showed about 7% of the variability in the groups
could be explained by the differences among groups. Level x Feedback x Time
interaction did not reach significance, F(4,168)=1.409, p=.233, power=.432.
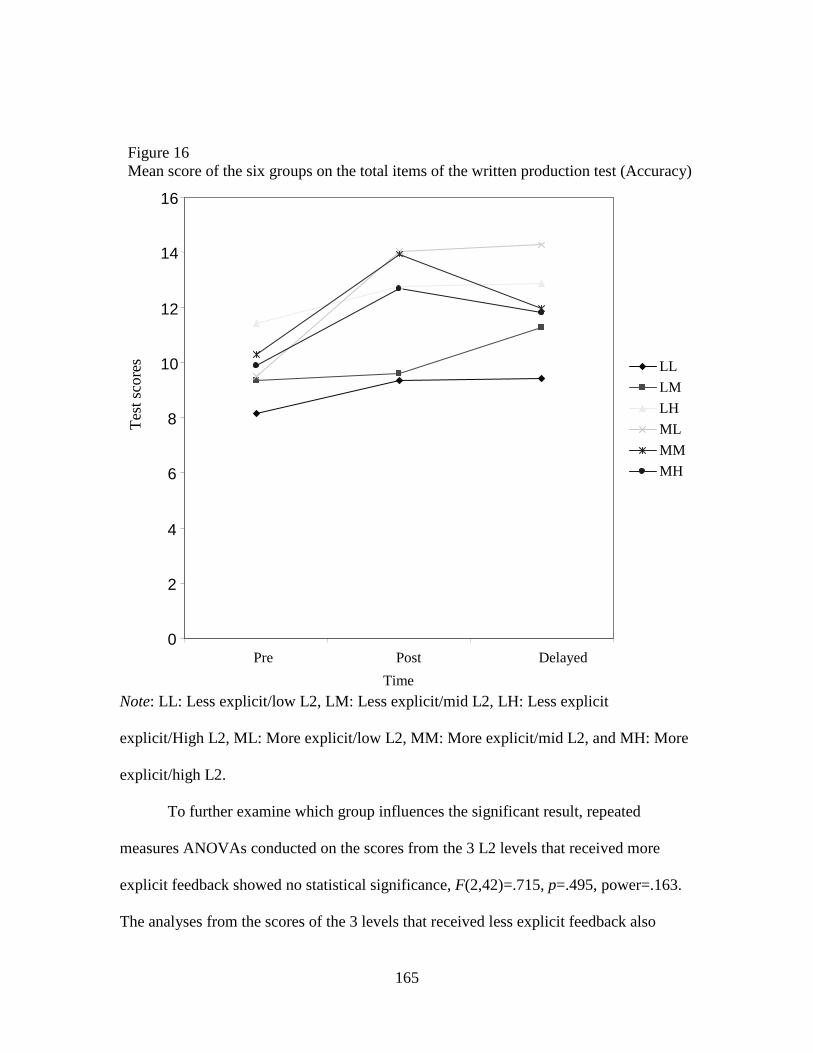
165
Note: LL: Less explicit/low L2, LM: Less explicit/mid L2, LH: Less explicit
explicit/High L2, ML: More explicit/low L2, MM: More explicit/mid L2, and MH: More
explicit/high L2.
To further examine which group influences the significant result, repeated
measures ANOVAs conducted on the scores from the 3 L2 levels that received more
explicit feedback showed no statistical significance, F(2,42)=.715, p=.495, power=.163.
The analyses from the scores of the 3 levels that received less explicit feedback also
Figure 16 Mean score of the six groups on the total items of the written production test (Accuracy)
0
2
4
6
8
10
12
14
16
Pre Post Delayed
Time
Tes
t sco
res
LL
LM
LH
ML
MM
MH

166
revealed no statistical differences, F(2,42)=2.558, p=.089, power=.483. Therefore, we
cannot conclude that some L2 group benefits more under certain conditions (feedback)
like what we found from the analyses on the scores from the trained and total items of the
grammaticality judgment test. It is suspected that the statistically significant Level x
Feedback may be the results of the more explicit group learning more than the less
explicit group across levels as reported in research question 2.
Table 32 presents a summary of the detailed ANOVAs results for the effect of
Level and Feedback on L3 development as measured by the accuracy data from the
written sentence production test.

167
Table 32
Summary of ANOVA results for the interactive effect of Level and Feedback on L3
development measured by a written sentence production test (accuracy)
df F p η² Power Trained Items
time 2 8.909 .000** .096 .971 time x Feedback 2 2.418 .092 .028 .482 time x Level 4 .719 .580 .017 .229 time x Level x Feedback 4 .414 .798 .010 .145 Feedback 1 4.745 .032* .053 .577 Level 2 .074 .929 .002 .061 Level x Feedback 2 2.648 .077 .059 .513
Untrained Items time 2 15.088 .000** .152 .999 time x Feedback 2 4.186 .017* .047 .730 time x Level 4 1.693 .154 .039 .512 time x Level x Feedback 4 2.034 .092 .046 .599 Feedback 1 3.167 .079 .036 .421 Level 2 2.162 .121 .049 .431 Level x Feedback 2 2.925 .059 .065 .556
Total Items time 2 18.495 .000** .180 1.000 time x Feedback 2 5.171 .007** .058 .822 time x Level 4 .532 .712 .013 .176 time x Level x Feedback 4 1.409 .233 .032 .432 Feedback 1 4.601 .035* .052 .564 Level 2 .845 .433 .020 .191 Level x Feedback 2 3.242 .044* .072 .603
Note: ** p<.01, *p<.05
To sum up, these results lead us to conclude that no L2 levels seem to benefit
more than other groups under certain feedback condition as measured by accuracy data
from the written sentence production test although the more explicit group outperformed
the less explicit feedback group. Once again, power analyses indicate that the lack of
significant effects may be due to the small sample size.
168
Written Production: Word Order Preference
Table 33 provides the summary of the descriptive statistics of participants at three
different levels (high, mid, and low L2 level) exposed to two types of feedback (more
explicit and less explicit)
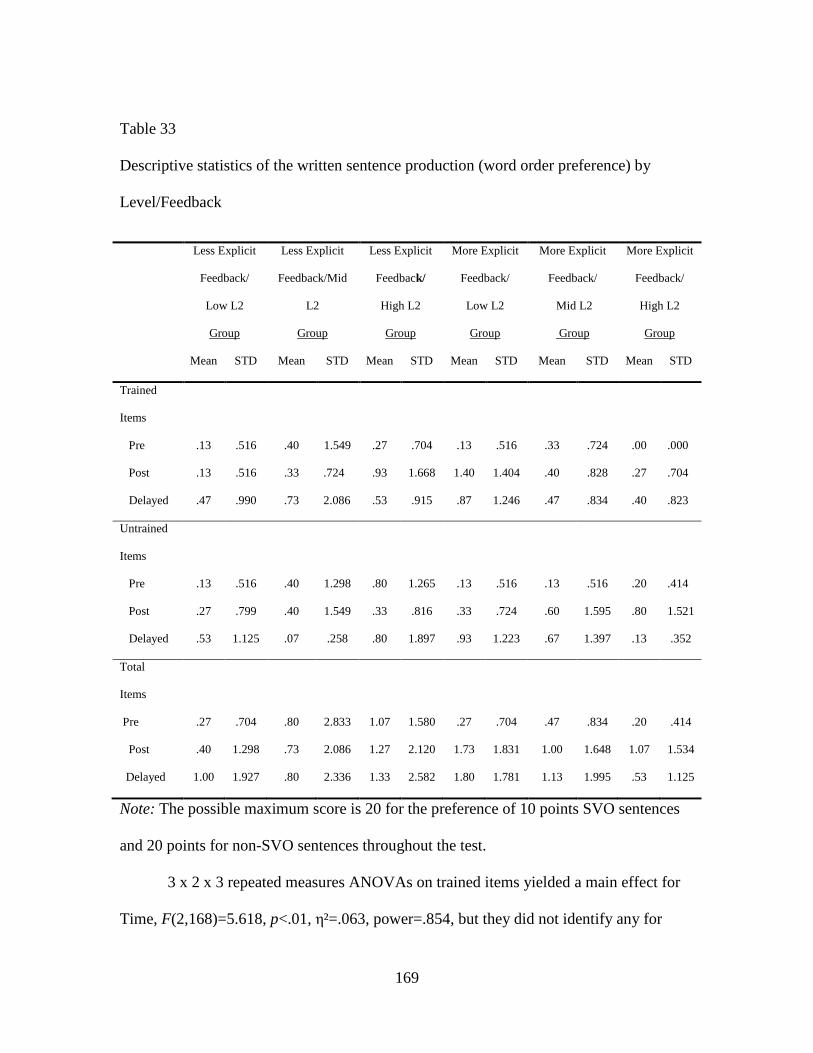
169
Table 33
Descriptive statistics of the written sentence production (word order preference) by
Level/Feedback
Note: The possible maximum score is 20 for the preference of 10 points SVO sentences
and 20 points for non-SVO sentences throughout the test.
3 x 2 x 3 repeated measures ANOVAs on trained items yielded a main effect for
Time, F(2,168)=5.618, p<.01, η²=.063, power=.854, but they did not identify any for
Less Explicit
Feedback/
Low L2
Group
Less Explicit
Feedback/Mid
L2
Group
Less Explicit
Feedback/
High L2
Group
More Explicit
Feedback/
Low L2
Group
More Explicit
Feedback/
Mid L2
Group
More Explicit
Feedback/
High L2
Group
Mean STD Mean STD Mean STD Mean STD Mean STD Mean STD
Trained
Items
Pre
Post
Delayed
.13
.13
.47
.516
.516
.990
.40
.33
.73
1.549
.724
2.086
.27
.93
.53
.704
1.668
.915
.13
1.40
.87
.516
1.404
1.246
.33
.40
.47
.724
.828
.834
.00
.27
.40
.000
.704
.823
Untrained
Items
Pre
Post
Delayed
.13
.27
.53
.516
.799
1.125
.40
.40
.07
1.298
1.549
.258
.80
.33
.80
1.265
.816
1.897
.13
.33
.93
.516
.724
1.223
.13
.60
.67
.516
1.595
1.397
.20
.80
.13
.414
1.521
.352
Total
Items
Pre
Post
Delayed
.27
.40
1.00
.704
1.298
1.927
.80
.73
.80
2.833
2.086
2.336
1.07
1.27
1.33
1.580
2.120
2.582
.27
1.73
1.80
.704
1.831
1.781
.47
1.00
1.13
.834
1.648
1.995
.20
1.07
.53
.414
1.534
1.125

170
Level x Feedback, F(2,84)=2.653, p=.076, power=.514. Level x Feedback x Time
interaction, F(4,168)=2.288, p=.062, power=.658, did not reach significance, either.
For the untrained items, no significance was reached: Time, F(2,168)=1.173
p=.312, power=.255, Level x Feedback, F(2,84)=.858, p=.428, power=.193 and Level x
Feedback x Time interaction, F(4,168)=1.531, p=.196, power=.467.
The analyses on the total items yielded a main effect for Time F(2,168)=5.170,
p<.01, η²=.058, power=.822. No statistical significance was reached for Level x
Feedback, F(2,84)=1.774, p=.776, power=.362 and Level x Feedback x Time interaction,
F(4,168)=.312, p=.870, power=.119. (See Table 34 for a summary of the detailed
ANOVA results.)
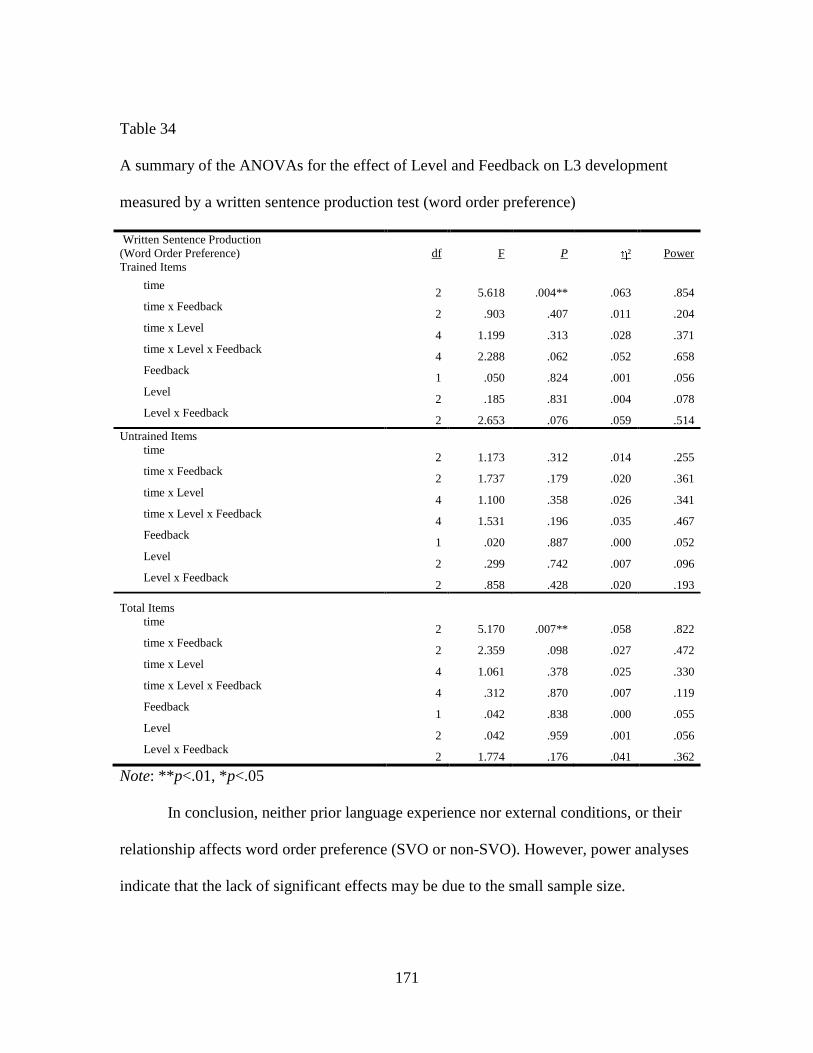
171
Table 34
A summary of the ANOVAs for the effect of Level and Feedback on L3 development
measured by a written sentence production test (word order preference)
Written Sentence Production (Word Order Preference) df F P η² Power Trained Items
time 2 5.618 .004** .063 .854
time x Feedback 2 .903 .407 .011 .204
time x Level 4 1.199 .313 .028 .371
time x Level x Feedback 4 2.288 .062 .052 .658
Feedback 1 .050 .824 .001 .056
Level 2 .185 .831 .004 .078
Level x Feedback 2 2.653 .076 .059 .514
Untrained Items time
2 1.173 .312 .014 .255 time x Feedback
2 1.737 .179 .020 .361 time x Level
4 1.100 .358 .026 .341 time x Level x Feedback
4 1.531 .196 .035 .467 Feedback
1 .020 .887 .000 .052 Level
2 .299 .742 .007 .096 Level x Feedback
2 .858 .428 .020 .193
Total Items time
2 5.170 .007** .058 .822 time x Feedback
2 2.359 .098 .027 .472 time x Level
4 1.061 .378 .025 .330 time x Level x Feedback
4 .312 .870 .007 .119 Feedback
1 .042 .838 .000 .055 Level
2 .042 .959 .001 .056 Level x Feedback
2 1.774 .176 .041 .362
Note: ** p<.01, *p<.05
In conclusion, neither prior language experience nor external conditions, or their
relationship affects word order preference (SVO or non-SVO). However, power analyses
indicate that the lack of significant effects may be due to the small sample size.

172
In a nutshell, results from the analyses conducted to answer RQ 3 show that
participants of different L2 levels seem not to differentially benefit from being exposed to
more explicit or less explicit feedback when learning to assign semantic functions to
noun phrases in an L3 as measured by most of the tests, except for the trained and total
items of the grammaticality judgment test and the total items of the written sentence
production test.
Next, the results showed that being exposed to different feedback to participants
at different L2 level differentially their L3 development as showed on the analyses on the
trained and total items of the grammaticality judgment test. While receiving more explicit
feedback may eliminate the differences that may exist among the three L2 levels,
bilingual advantages appear in a more demanding condition (mid L2 group outperformed
the low L2 group in the less explicit feedback group when judging the grammaticality of
stimuli previously seen). The analyses on the scores from the total items of the written
sentence production tests showed that participants receiving more explicit feedback
outperformed those receiving less explicit feedback across L2 levels, which has been
reported in RQ2. Table 35 presents the significant results identified for RQ 3.

173
Table 35
Summary of the significance for the interaction of Level and Feedback on L3
development
Test Items Trained items Untrained items Total item
Written interpretation Time Time x Feedback Feedback
Time Time x Feedback Feedback
Time Time x Feedback Feedback
Aural Interpretation Time Feedback
Time Feedback
Time Feedback
Grammaticality judgment tests
Time Feedback Level x Feedback Time x Level x Feedback
Time x Feedback Feedback Level
Time Time x Level x Feedback Feedback
Written production (accuracy)
Time Feedback
Time Time x Feedback
Time Time x Feedback Feedback Level x Feedback
Written production (word order preference)
Time x Time
RQ4: WM Capacity and L3 Development
The fourth research question investigates whether WM capacity can explain the
significant results obtained in the previous three research questions by incorporating WM
capacity as a covariate in the analyses of covariance (ANCOVA). Because WM capacity
is not a unitary construct and the disagreements in the literature on how to measure WM
capacity, several WM tests (a computational span test, a speed of processing test, a
nonword recall test, a sentence span test, and a digit backward span test) were employed.
Scores from each measure of WM capacity separately entered the ANCOVA analyses as
covariates. Language test scores, which were dependent variables, entered the analyses to
measure L3 development as measured by four language tests, including three types of test

174
items (trained, untrained, and total items) from 4 language tests (a written interpretation
test, an aural interpretation test, a grammaticality judgment test, and accuracy, and word
order preference data of a written sentence production test.)
Results are presented in the following order. First, results from ANCOVA
analyses entering scores from each WM test as a covariate are separately presented.
When ANCOVAs yield different results from those identified by the repeated measures
ANOVAs, the interpretation is that WM capacity as measured by a specific WM test is
involved. In that case, one-way ANOVAs or correlation analyses are carried out to
investigate the role of WM. For example, when a 2 x 3 repeated measure ANOVA with
Feedback as a between-subject factor and Time as a within-subject factor identifies a
main effect for Feedback or Time x Feedback interaction and ANCOVA with scores
from a digit backward WM test as a covariate does not maintain the same results, the
interpretation is that WM capacity measured by the digit-backward WM test is involved.
In order to unveil the nature of that involvement, a one-way ANOVA with Feedback as
an independent variable and scores from the digit-backward test as a dependent variable
is used. If no significance is reached, the disappearance of Feedback or Time x Feedback
interaction cannot be accounted for by the differences in WM capacity between the
feedback groups. The next step is to run separate correlation analyses to investigate
whether the relationship between WM capacity of each feedback group can be explained
by correlating the WM test scores of each feedback group and their L3 scores. To provide
another example, if ANCOVAs reveal that WM capacity influences the effect for Time,
which is different from the result obtained by the repeated measures ANOVAs,
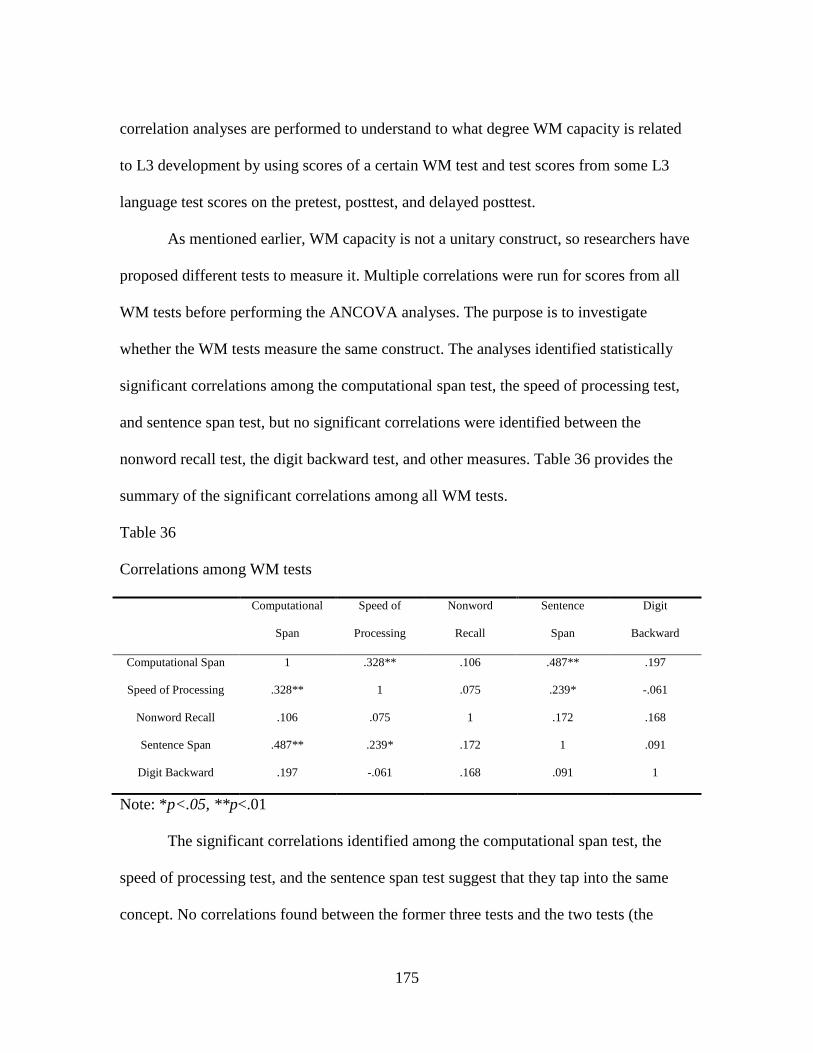
175
correlation analyses are performed to understand to what degree WM capacity is related
to L3 development by using scores of a certain WM test and test scores from some L3
language test scores on the pretest, posttest, and delayed posttest.
As mentioned earlier, WM capacity is not a unitary construct, so researchers have
proposed different tests to measure it. Multiple correlations were run for scores from all
WM tests before performing the ANCOVA analyses. The purpose is to investigate
whether the WM tests measure the same construct. The analyses identified statistically
significant correlations among the computational span test, the speed of processing test,
and sentence span test, but no significant correlations were identified between the
nonword recall test, the digit backward test, and other measures. Table 36 provides the
summary of the significant correlations among all WM tests.
Table 36
Correlations among WM tests
Computational
Span
Speed of
Processing
Nonword
Recall
Sentence
Span
Digit
Backward
Computational Span 1 .328** .106 .487** .197
Speed of Processing .328** 1 .075 .239* -.061
Nonword Recall .106 .075 1 .172 .168
Sentence Span .487** .239* .172 1 .091
Digit Backward .197 -.061 .168 .091 1
Note: *p<.05, **p<.01
The significant correlations identified among the computational span test, the
speed of processing test, and the sentence span test suggest that they tap into the same
concept. No correlations found between the former three tests and the two tests (the
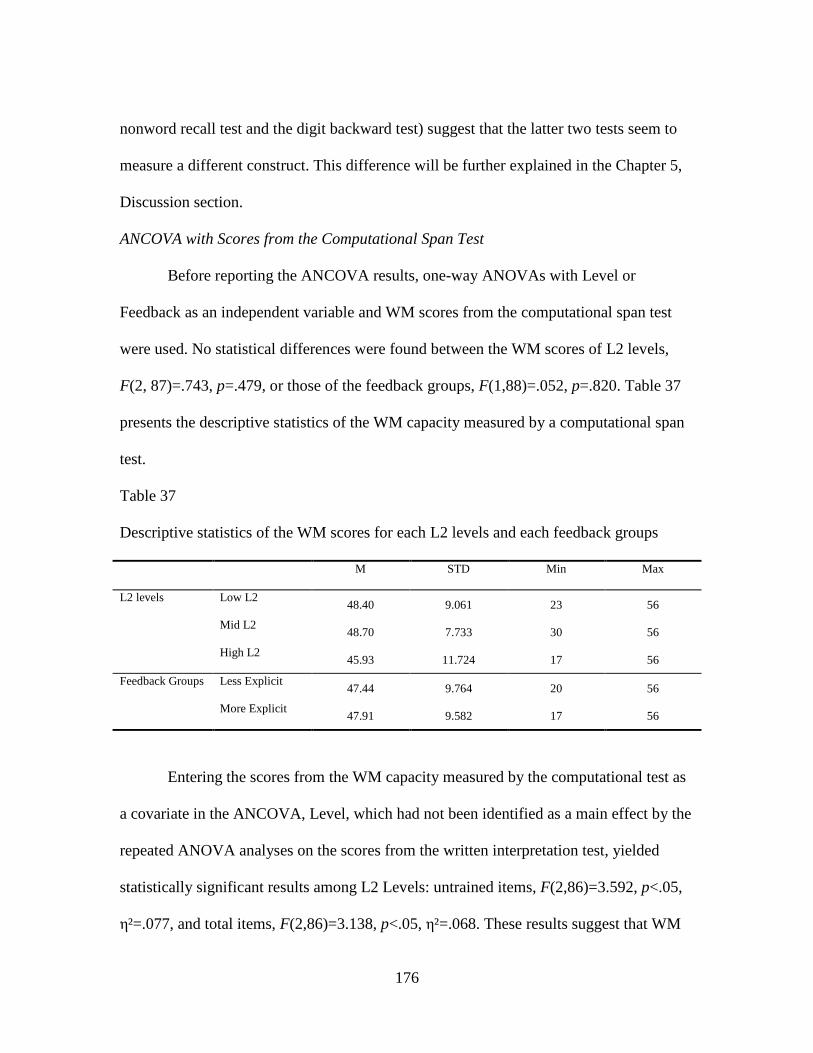
176
nonword recall test and the digit backward test) suggest that the latter two tests seem to
measure a different construct. This difference will be further explained in the Chapter 5,
Discussion section.
ANCOVA with Scores from the Computational Span Test
Before reporting the ANCOVA results, one-way ANOVAs with Level or
Feedback as an independent variable and WM scores from the computational span test
were used. No statistical differences were found between the WM scores of L2 levels,
F(2, 87)=.743, p=.479, or those of the feedback groups, F(1,88)=.052, p=.820. Table 37
presents the descriptive statistics of the WM capacity measured by a computational span
test.
Table 37
Descriptive statistics of the WM scores for each L2 levels and each feedback groups
M STD Min Max
L2 levels Low L2 48.40 9.061 23 56
Mid L2 48.70 7.733 30 56
High L2 45.93 11.724 17 56
Feedback Groups Less Explicit 47.44 9.764 20 56
More Explicit 47.91 9.582 17 56
Entering the scores from the WM capacity measured by the computational test as
a covariate in the ANCOVA, Level, which had not been identified as a main effect by the
repeated ANOVA analyses on the scores from the written interpretation test, yielded
statistically significant results among L2 Levels: untrained items, F(2,86)=3.592, p<.05,
η²=.077, and total items, F(2,86)=3.138, p<.05, η²=.068. These results suggest that WM
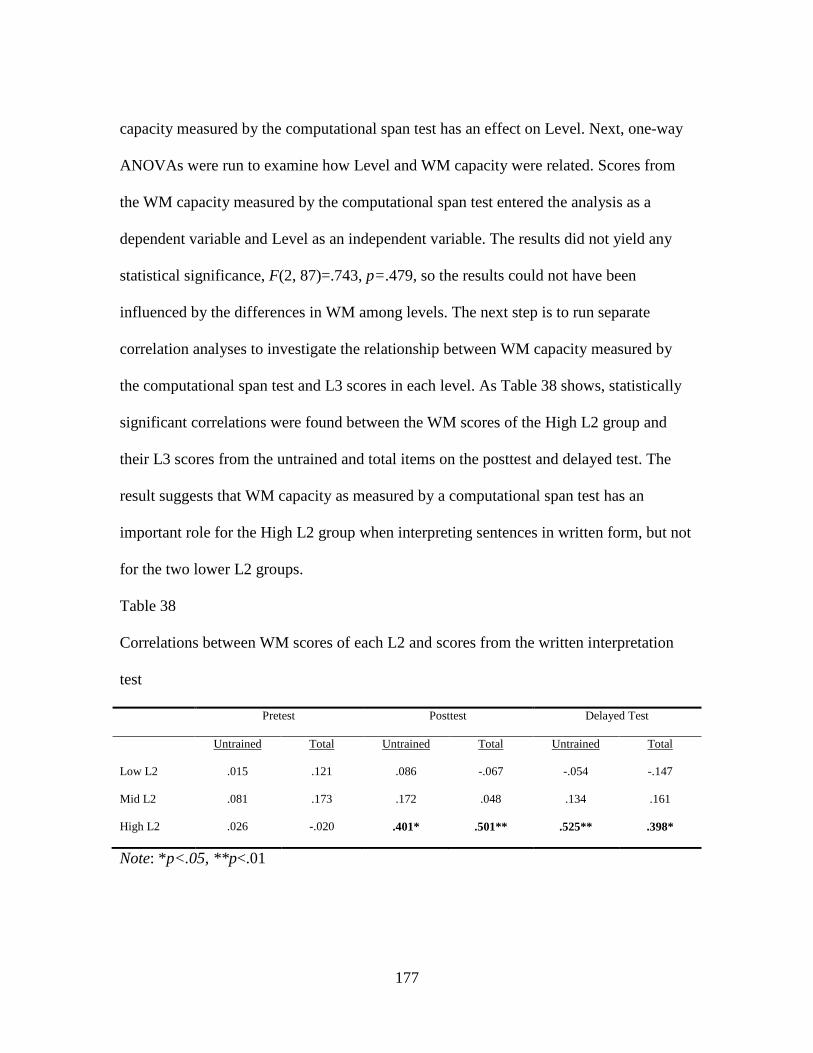
177
capacity measured by the computational span test has an effect on Level. Next, one-way
ANOVAs were run to examine how Level and WM capacity were related. Scores from
the WM capacity measured by the computational span test entered the analysis as a
dependent variable and Level as an independent variable. The results did not yield any
statistical significance, F(2, 87)=.743, p=.479, so the results could not have been
influenced by the differences in WM among levels. The next step is to run separate
correlation analyses to investigate the relationship between WM capacity measured by
the computational span test and L3 scores in each level. As Table 38 shows, statistically
significant correlations were found between the WM scores of the High L2 group and
their L3 scores from the untrained and total items on the posttest and delayed test. The
result suggests that WM capacity as measured by a computational span test has an
important role for the High L2 group when interpreting sentences in written form, but not
for the two lower L2 groups.
Table 38
Correlations between WM scores of each L2 and scores from the written interpretation
test
Pretest Posttest Delayed Test
Untrained Total Untrained Total Untrained Total
Low L2 .015 .121 .086 -.067 -.054 -.147
Mid L2 .081 .173 .172 .048 .134 .161
High L2 .026 -.020 .401* .501** .525** .398*
Note: *p<.05, **p<.01
178
For the role of WM capacity measured by a computational span test in the effect
of Feedback on L3 development, significant main effects for Feedback and Time x
Feedback interaction, which were identified by the repeated measures ANOVAs,
remained the same by the ANCOVAs.
To investigate the role of WM capacity in the interactive effect of Level and
Feedback on L3 development, ANCOVA analyses entering WM capacity measured by a
computational span test as a covariate reached statistical significance for Level x
Feedback, which is different from the results yielded by repeated measures ANOVAs on
the scores of the untrained items of the written sentence production test, F(2,83)=3.801,
p<.05, η²=.084. A factorial ANOVA analysis using Level and Feedback as independent
variables and scores from the computational span test as a dependent variable was run to
examine the relationship. No statistically significant results were identified: Level,
F(2,84)=.748, p=.476, Feedback, F(1,84)=.053, p=.818, and Level x Feedback
interaction, F(2,84)=1.819, p=.169. The lack of significance for main effects and the
interaction revealed not only that WM scores were similar in both feedback groups but
also that for each level there was no difference in WM scores between feedback groups.
Next, Time as a significant factor in the repeated measures ANOVAs was
eliminated in the ANCOVAs to investigate the role of WM capacity in the effect of Level
on L3 development. The results were shown by the ANCOVAs conducted on the scores
from the written interpretation test (trained, untrained and total items), the aural
interpretation test (trained, untrained, and total items), the grammaticality judgment test
(trained and total items), the accuracy data of the written sentence production test
179
(untrained and total items), and the word order preference data of the written sentence
production test (trained, untrained, and the total items). Appendix H provides a summary
of ANCOVA results when entering the WM scores from a computational span test as a
covariate to examine the role of WM capacity in the effect of Level on L3 development.
A lack of significance for Time was also identified by the ANCOVAs when
investigating the role of WM capacity in the effect of Feedback on L3 development
elicited by several tests: 1) the trained, untrained, and total items of the written
interpretation test, 2) the trained, untrained, and total items of the aural interpretation test,
3) the trained and total items of the grammaticality judgment test, 4) untrained, and total
items of the accuracy, and 5) trained, untrained, and total items of the word order
preference data of the written sentence production test (See Appendix I).
Lastly, the same results for Time were replicated for the comparison between the
repeated measures ANOVAs and the ANCOVAs when examining the role of WM in the
interaction between Level of Bilingualism and Types of Feedback on L3 development as
shown on several tests: 1) written interpretation test (trained, untrained, and total items),
2) aural interpretation test (trained, untrained, and total items), 3) grammaticality
judgment test (trained and total items), 4) accuracy data of the written sentence
production (untrained, and total items), and 5) word order preference data of the written
sentence production (trained, untrained, and total items). Appendix J summarizes the
ANCOVA results.
Because of the disappearance of Time as a main effect in the ANCOVAs, the next
step was to investigate to what degree WM capacity as measured by the computational

180
span test was related to L3 development. Correlations were performed on pre, post, and
delayed scores of the WM and language tests. As Table 39 shows, there seems to be no
correlations between L3 development and WM scores from the computational span test,
but a correlation was found between the scores from the posttest from the untrained items
of the written interpretation test and WM scores. The results suggest that WM capacity
plays a role for participants to apply information received from the treatment when
interpreting sentences in written form immediately after the treatment.
Table 39
Correlations between WM capacity measured by a computational span test and language
tests
Pretest Posttest Delayed Test
Trained Untrained Total Trained Untrained Total Trained Untrained Total
Written Interpretation
.081 .031 .077 .111 .218* .174 -.016 .193 .107
Aural Interpretation
.037 .012 .033 .132 .118 .151 .008 -.035 -.016
Grammaticality judgment
-.014 -.059 -.046 -.037 .048 .011 -.153 .167 .003
Written Production (accuracy)
.194 .053 .140 -.033 .116 .044 .093 .123 .122
Written Production (word order preference)
.048 .073 .071 .005 -.003 .001 -.021 .111 .054
Note: *p<.05, **p<.01
To sum up, WM capacity as measured by a computational span test seems to play
a role in explaining the superior performance by the higher L2 group in relation to the
other group as shown by their performance on untrained and total items in the written
interpretation test. Their L2 advantage seems to appear after interacting with the
treatment as shown on the posttests and they are able to apply newly learned input to new
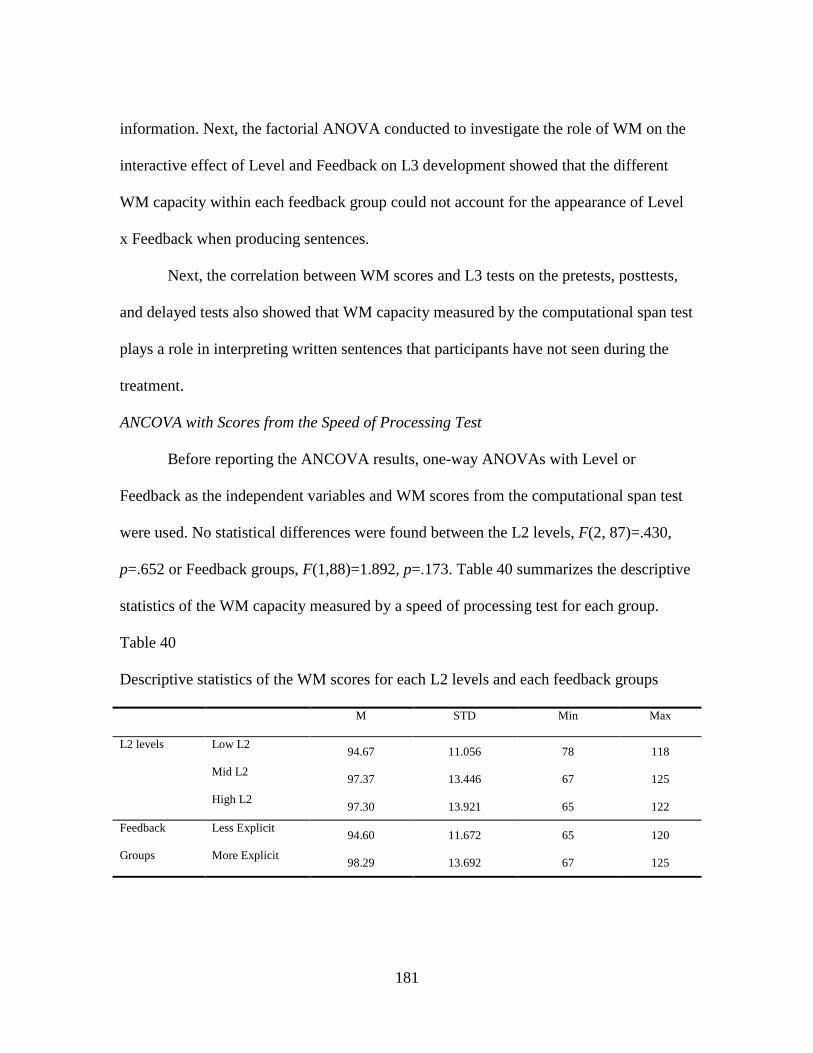
181
information. Next, the factorial ANOVA conducted to investigate the role of WM on the
interactive effect of Level and Feedback on L3 development showed that the different
WM capacity within each feedback group could not account for the appearance of Level
x Feedback when producing sentences.
Next, the correlation between WM scores and L3 tests on the pretests, posttests,
and delayed tests also showed that WM capacity measured by the computational span test
plays a role in interpreting written sentences that participants have not seen during the
treatment.
ANCOVA with Scores from the Speed of Processing Test
Before reporting the ANCOVA results, one-way ANOVAs with Level or
Feedback as the independent variables and WM scores from the computational span test
were used. No statistical differences were found between the L2 levels, F(2, 87)=.430,
p=.652 or Feedback groups, F(1,88)=1.892, p=.173. Table 40 summarizes the descriptive
statistics of the WM capacity measured by a speed of processing test for each group.
Table 40
Descriptive statistics of the WM scores for each L2 levels and each feedback groups
M STD Min Max
L2 levels Low L2 94.67 11.056 78 118
Mid L2 97.37 13.446 67 125
High L2 97.30 13.921 65 122
Feedback
Groups
Less Explicit 94.60 11.672 65 120
More Explicit 98.29 13.692 67 125
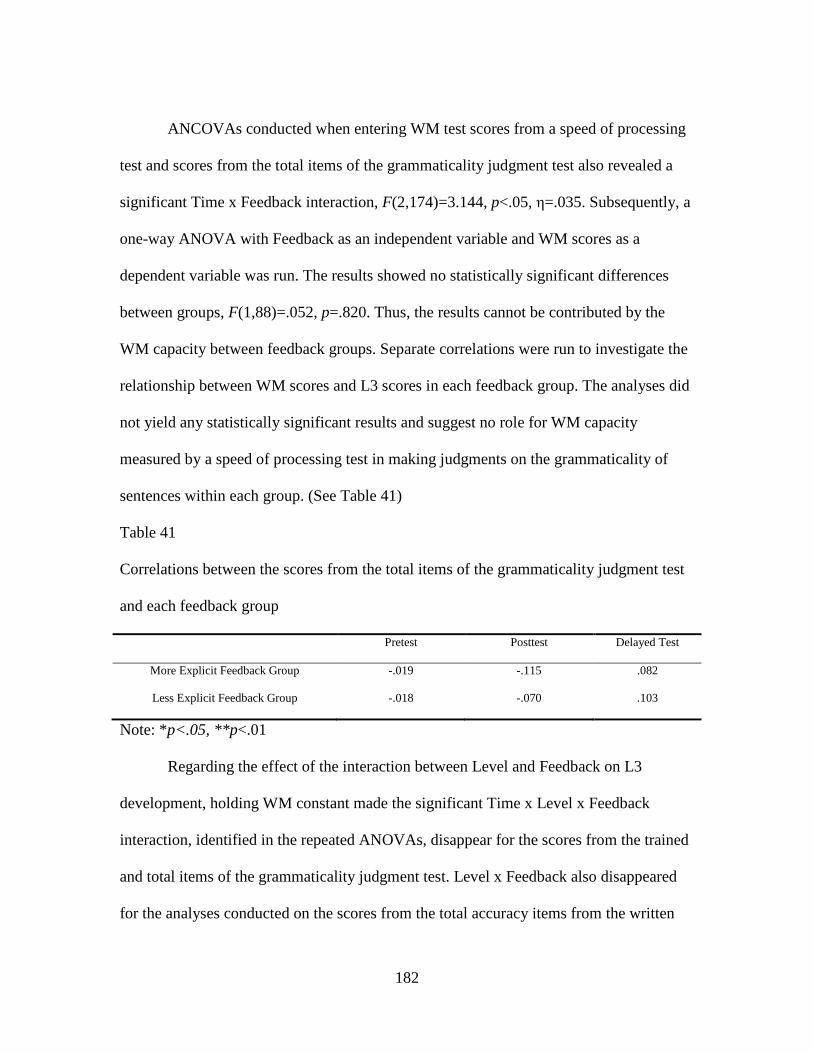
182
ANCOVAs conducted when entering WM test scores from a speed of processing
test and scores from the total items of the grammaticality judgment test also revealed a
significant Time x Feedback interaction, F(2,174)=3.144, p<.05, η=.035. Subsequently, a
one-way ANOVA with Feedback as an independent variable and WM scores as a
dependent variable was run. The results showed no statistically significant differences
between groups, F(1,88)=.052, p=.820. Thus, the results cannot be contributed by the
WM capacity between feedback groups. Separate correlations were run to investigate the
relationship between WM scores and L3 scores in each feedback group. The analyses did
not yield any statistically significant results and suggest no role for WM capacity
measured by a speed of processing test in making judgments on the grammaticality of
sentences within each group. (See Table 41)
Table 41
Correlations between the scores from the total items of the grammaticality judgment test
and each feedback group
Pretest Posttest Delayed Test
More Explicit Feedback Group -.019 -.115 .082
Less Explicit Feedback Group -.018 -.070 .103
Note: *p<.05, **p<.01
Regarding the effect of the interaction between Level and Feedback on L3
development, holding WM constant made the significant Time x Level x Feedback
interaction, identified in the repeated ANOVAs, disappear for the scores from the trained
and total items of the grammaticality judgment test. Level x Feedback also disappeared
for the analyses conducted on the scores from the total accuracy items from the written
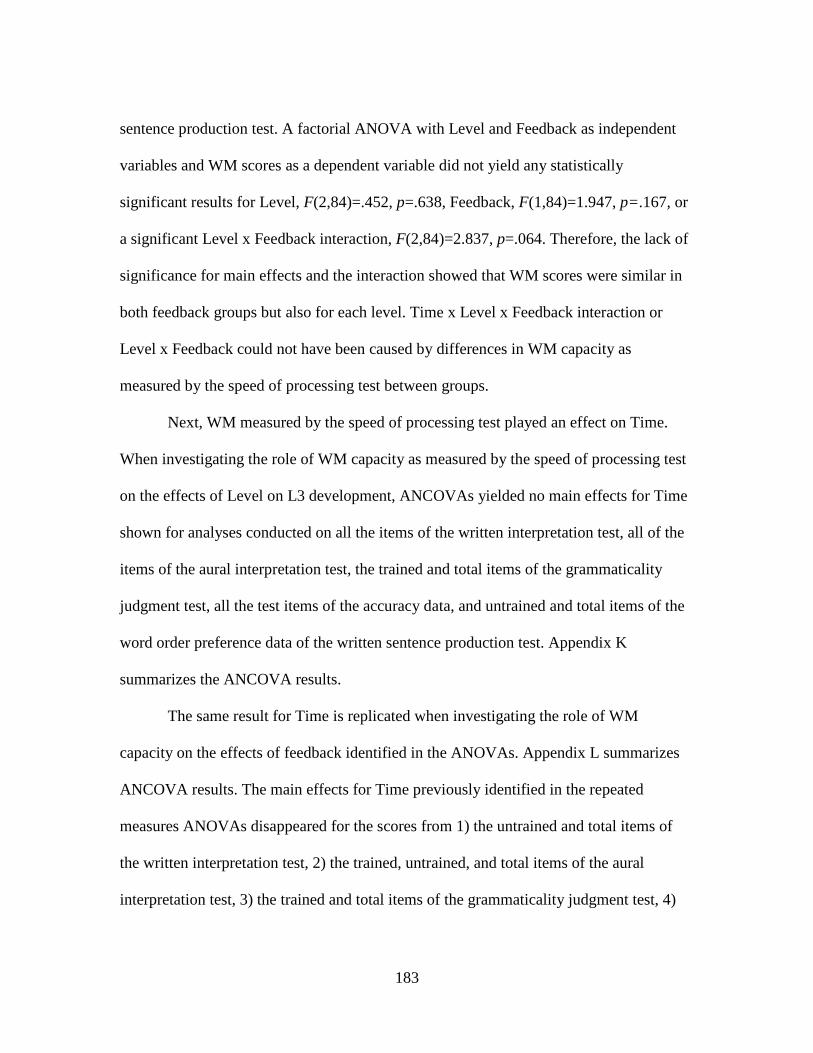
183
sentence production test. A factorial ANOVA with Level and Feedback as independent
variables and WM scores as a dependent variable did not yield any statistically
significant results for Level, F(2,84)=.452, p=.638, Feedback, F(1,84)=1.947, p=.167, or
a significant Level x Feedback interaction, F(2,84)=2.837, p=.064. Therefore, the lack of
significance for main effects and the interaction showed that WM scores were similar in
both feedback groups but also for each level. Time x Level x Feedback interaction or
Level x Feedback could not have been caused by differences in WM capacity as
measured by the speed of processing test between groups.
Next, WM measured by the speed of processing test played an effect on Time.
When investigating the role of WM capacity as measured by the speed of processing test
on the effects of Level on L3 development, ANCOVAs yielded no main effects for Time
shown for analyses conducted on all the items of the written interpretation test, all of the
items of the aural interpretation test, the trained and total items of the grammaticality
judgment test, all the test items of the accuracy data, and untrained and total items of the
word order preference data of the written sentence production test. Appendix K
summarizes the ANCOVA results.
The same result for Time is replicated when investigating the role of WM
capacity on the effects of feedback identified in the ANOVAs. Appendix L summarizes
ANCOVA results. The main effects for Time previously identified in the repeated
measures ANOVAs disappeared for the scores from 1) the untrained and total items of
the written interpretation test, 2) the trained, untrained, and total items of the aural
interpretation test, 3) the trained and total items of the grammaticality judgment test, 4)

184
the trained, untrained and total accuracy items of the written sentence production, and 5)
word order preference: the untrained and total items of the written sentence production
test.
Appendix M summarizes the results when investigating the role of WM in the
effect of the interaction between Level and Feedback on L3 development as shown in the
tests. Again, ANCOVAs did not yield significant main effects for Time shown on the
tests: 1) written interpretation test: the untrained and total items of the written
interpretation test, 2) the aural interpretation test: the trained, untrained, and total items,
3) the grammaticality judgment test: the trained and total items, and 4) written sentence
production test: the trained, untrained and total items of the accuracy data and the word
order preference.
Because Time is not a significant factor in the repeated measures ANCOVAs,
which is different from the results from the repeated measures ANOVAs, correlation
analyses were employed to investigate how WM capacity was related to L3 development.
The results revealed no correlations between WM capacity measured by the speed of
processing test and L3 development, except for those between WM capacity and the
untrained items of the aural interpretation test on the posttest. Results suggest that
participants immediately transfer what they learned during the treatment to untrained
items, but the knowledge transferred does not stay over time. Table 42 presents the
correlation results.
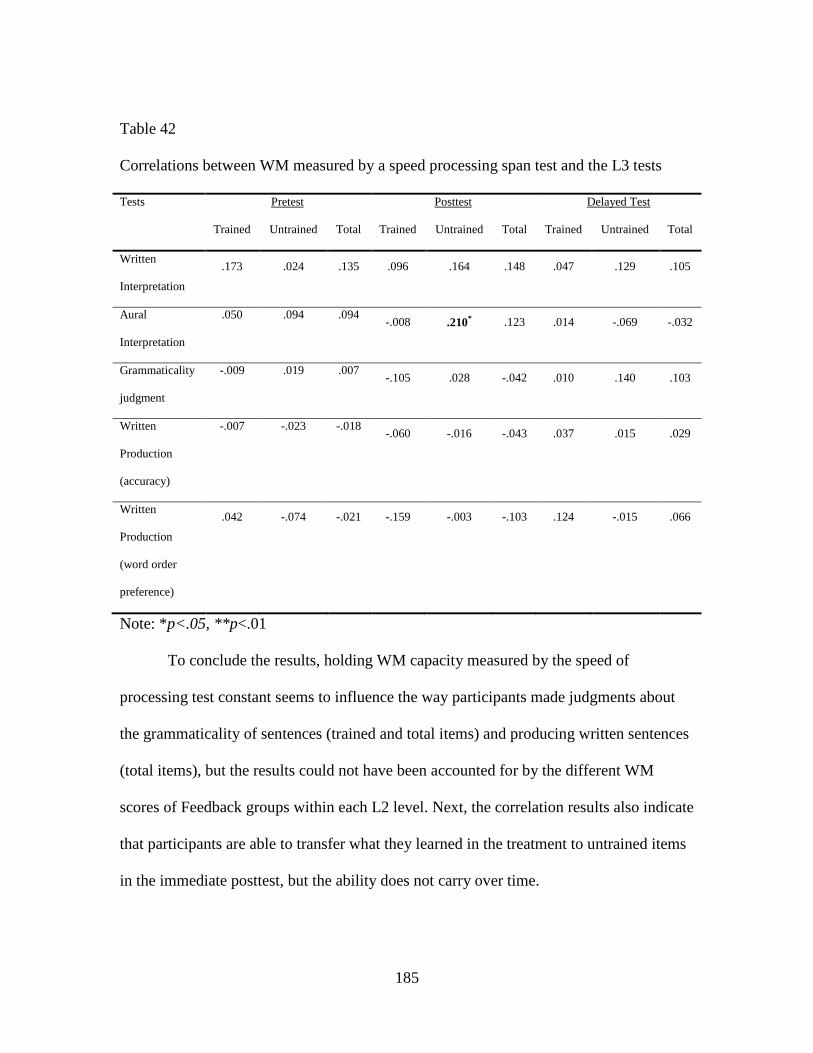
185
Table 42
Correlations between WM measured by a speed processing span test and the L3 tests
Tests Pretest Posttest Delayed Test
Trained Untrained Total Trained Untrained Total Trained Untrained Total
Written
Interpretation
.173 .024 .135 .096 .164 .148 .047 .129 .105
Aural
Interpretation
.050 .094 .094 -.008 .210* .123 .014 -.069 -.032
Grammaticality
judgment
-.009 .019 .007 -.105 .028 -.042 .010 .140 .103
Written
Production
(accuracy)
-.007 -.023 -.018 -.060 -.016 -.043 .037 .015 .029
Written
Production
(word order
preference)
.042 -.074 -.021 -.159 -.003 -.103 .124 -.015 .066
Note: *p<.05, **p<.01
To conclude the results, holding WM capacity measured by the speed of
processing test constant seems to influence the way participants made judgments about
the grammaticality of sentences (trained and total items) and producing written sentences
(total items), but the results could not have been accounted for by the different WM
scores of Feedback groups within each L2 level. Next, the correlation results also indicate
that participants are able to transfer what they learned in the treatment to untrained items
in the immediate posttest, but the ability does not carry over time.
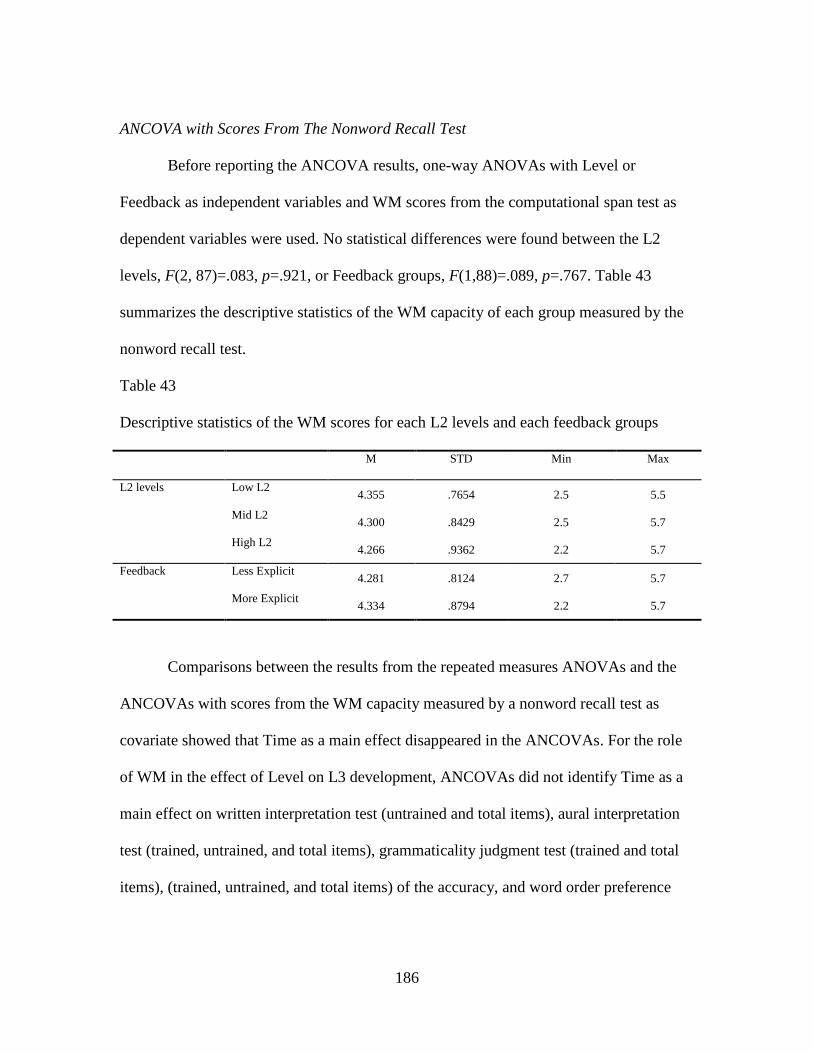
186
ANCOVA with Scores From The Nonword Recall Test
Before reporting the ANCOVA results, one-way ANOVAs with Level or
Feedback as independent variables and WM scores from the computational span test as
dependent variables were used. No statistical differences were found between the L2
levels, F(2, 87)=.083, p=.921, or Feedback groups, F(1,88)=.089, p=.767. Table 43
summarizes the descriptive statistics of the WM capacity of each group measured by the
nonword recall test.
Table 43
Descriptive statistics of the WM scores for each L2 levels and each feedback groups
M STD Min Max
L2 levels Low L2 4.355 .7654 2.5 5.5
Mid L2 4.300 .8429 2.5 5.7
High L2 4.266 .9362 2.2 5.7
Feedback Less Explicit 4.281 .8124 2.7 5.7
More Explicit 4.334 .8794 2.2 5.7
Comparisons between the results from the repeated measures ANOVAs and the
ANCOVAs with scores from the WM capacity measured by a nonword recall test as
covariate showed that Time as a main effect disappeared in the ANCOVAs. For the role
of WM in the effect of Level on L3 development, ANCOVAs did not identify Time as a
main effect on written interpretation test (untrained and total items), aural interpretation
test (trained, untrained, and total items), grammaticality judgment test (trained and total
items), (trained, untrained, and total items) of the accuracy, and word order preference

187
data of the written sentence production test. ANCOVA results are presented in Appendix
N.
To investigate the role of WM capacity in the effect of feedback on L3
development, Time is not identified as a statistically significant main effect in the
ANCOVAs from the analyses on the scores from the following tests: 1) written
interpretation test: untrained and total items, 2) aural interpretation test: trained, untrained
and total items, 3) grammaticality judgment test: trained and total items, and 4) the
accuracy data and word order preference of the written sentence production test: trained,
untrained and total items. Appendix O presents a summary of ANCOVA results.
Finally, ANCOVA analyses run on the scores from the language tests and the
scores from the nonword recall test used to measure WM capacity as a covariate did not
reach statistical significance for Time when examining the role of WM in the interactive
effect of Level and Feedback on L3 development as shown on the following tests: 1) the
untrained and total items of the written interpretation test, 2) the trained, untrained and
total items of the aural interpretation test, 3) the trained and total items of the
grammaticality judgment test, and 4) the trained, untrained, total items of the accuracy
and word order preference data of the written sentence production test. Appendix P
presents the ANCOVA results.
Because of the disappearance of Time as a main effect in the ANCOVAs, shown
in Table 44, correlation analyses between scores from the pretest, posttest, and delayed
test scores and scores from the nonword recall test were used to investigate their
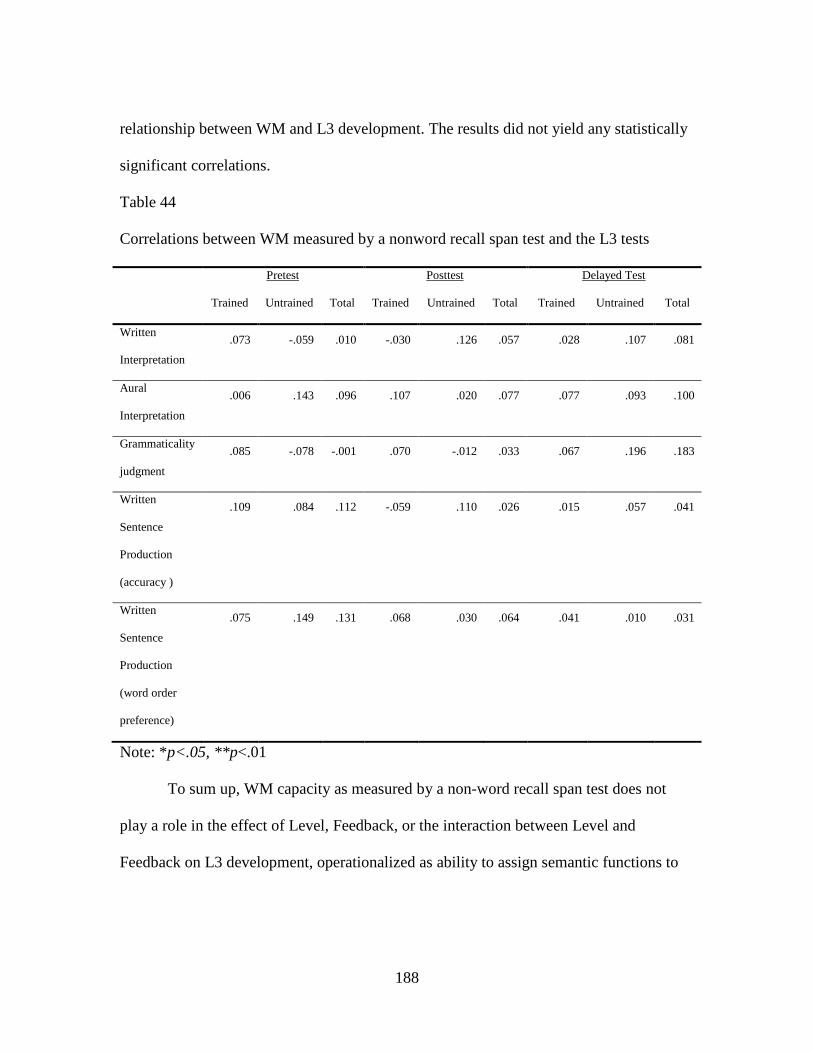
188
relationship between WM and L3 development. The results did not yield any statistically
significant correlations.
Table 44
Correlations between WM measured by a nonword recall span test and the L3 tests
Pretest Posttest Delayed Test
Trained Untrained Total Trained Untrained Total Trained Untrained Total
Written
Interpretation
.073 -.059 .010 -.030 .126 .057 .028 .107 .081
Aural
Interpretation
.006 .143 .096 .107 .020 .077 .077 .093 .100
Grammaticality
judgment
.085 -.078 -.001 .070 -.012 .033 .067 .196 .183
Written
Sentence
Production
(accuracy )
.109 .084 .112 -.059 .110 .026 .015 .057 .041
Written
Sentence
Production
(word order
preference)
.075 .149 .131 .068 .030 .064 .041 .010 .031
Note: *p<.05, **p<.01
To sum up, WM capacity as measured by a non-word recall span test does not
play a role in the effect of Level, Feedback, or the interaction between Level and
Feedback on L3 development, operationalized as ability to assign semantic functions to

189
noun phrases in an L3 measured by a written interpretation test, an aural interpretation
test, a grammaticality judgment test, and a written sentence production test.
ANCOVA with Scores from the Sentence Span Test
Before reporting the ANCOVA results, one-way ANOVAs with Level or
Feedback as the independent variables and WM scores from the computational span test
were used. No statistical differences were identified for the WM capacity of the three L2
levels, F(2, 87)=1.881, p=.159 or those of the two Feedback groups, F(1,88)=.107,
p=.744. Table 45 presents the descriptive statistics of the WM capacity of each group
measured by a sentence span test.
Table 45
Descriptive statistics of the WM scores for each L2 levels and each feedback groups
M STD Min Max
L2 levels Low L2 25.57 6.393 7 36
Mid L2 28.20 3.854 18 35
High L2 27.40 5.612 15 36
Feedback
Groups
Less Explicit 26.87 5.509 15 36
More Explicit 27.24 5.436 7 35
Time was not identified by ANCOVA analyses as a main effect in the following
results. To examine the role of WM in the effect of Level on L3 development when
entering WM measured by the sentence span test as a covariate, the ANCOVA analysis
did not yield significance for Time shown on the scores from the untrained and total
items of the written interpretation test, the trained and total items of the grammaticality
judgment test, the untrained items of the accuracy data from the written sentence
190
production test, and the trained, and untrained and total items of the word order
preference data from the written sentence production test. The results are presented in
Appendix Q.
Similar results for Time were obtained when entering WM capacity measured by
a sentence span test as a covariate to investigate the role of WM in the effect of feedback
on L3, shown on the untrained and total items of the written interpretation, the trained
and total items of the grammaticality judgment test, the untrained items of the accuracy
data from the written sentence production test as well as the untrained and total items of
the preference data from the written sentence production test (see Appendix R).
Lastly, the investigation of the role of WM capacity measured by a sentence span
test in the interaction between Level and Feedback did not identify statistical significance
for Time: the untrained and total items of the written interpretation test, the untrained
items of the accuracy data of the written sentence production test, and the trained and
total items of the grammaticality judgment test and three types of test items of the word
order preference data of the written production test. Differently, a main effect for Level x
Feedback was identified on the accuracy scores from the untrained items of the written
sentence production test. Next, a factorial ANOVA was run by using Level and Feedback
as independent variables and WM scores from the computational span test as the
dependent variable. No statistically significant results were identified: 1) Level,
F(2,84)=1.850, p=.164, 2) Feedback, F(1,84)=.109, p=.743, and 3) Level x Feedback,
F(2,84)=.738, p=.481. The lack of main effect for Level, Feedback, and the interaction
revealed not only that WM scores were similar in both feedback groups but also that

191
there was no differences in WM scores between feedback groups for each level.
Appendix S provides a summary of the ANCOVA results.
Because of the disappearance of Time as a main effect in the ANCOVAs,
multiple correlation analyses were conducted to examine to what degree WM capacity
measured by a sentence span test is related to L3 development. The analyses did not
identify any relationship between WM scores from the sentence span test and the
language pretest, posttest, or the delayed posttests, except for the accuracy data on the
trained items in the written sentence production test (See Table 46). The results only
indicate a correlation between WM capacity measured by a sentence span test and the
trained items of the accuracy data of the written sentence production test. Therefore, WM
capacity seems to play a role before the treatment, but the correlation disappears after the
treatment.

192
Table 46
Correlations between WM measured by a sentence span test and the L3 tests
Pretest Posttest Delayed Test
Trained Untrained Total Trained Untrained Total Trained Untrained Total
Written
Interpretation
.147 .011 .109 .024 .150 .079 .082 .066 .087
Aural
Interpretation
.130 .114 .160 -.057 -.100 -.095 -.029 .007 -.014
Grammaticality
judgment
.013 .044 .036 .027 -.009 .010 .018 .033 .036
Written
Production
(accuracy )
.232* .087 .182 -.113 .076 -.023 -.055 .162 .063
Written
Production
(word order
preference)
.041 .006 .027 -.167 -.104 -.177 -.138 .109 -.018
Note: *p<.05, **p<.01
Summarizing the results, holding WM capacity measured by a sentence span
influenced the Level x Feedback interaction identified on the accuracy scores from the
untrained items of the written sentence production test, but further analysis showed that
the differences could not be caused by the different WM scores for the feedback groups
within each level. Despite that, the correlation analyses showed a correlation between
WM capacity and the accuracy data of the trained items of the written sentence
production, but the relationship disappeared on the posttest and delayed tests.

193
ANCOVA with Scores from the Digit Backward Test
Before reporting the ANCOVA results, one-way ANOVAs with Level or
Feedback as the independent variables and WM scores from the computational span test
were used. No statistical differences were found between the L2 levels, F(2, 87)=.202,
p=.817 or Feedback groups, F(1,88)=.047, p=..829. Table 47 summarizes the descriptive
statistics of the WM capacity measured by a digit backward test.
Table 47
Descriptive statistics of the WM scores for each group
M STD Min Max
L2 levels Low L2 8.67 3.021 4 13
Mid L2 8.20 2.722 2 14
High L2 8.53 3.026 3 14
Feedback Groups Less Explicit 8.40 2.597 4 14
More Explicit 8.53 3.202 2 14
Appendix T provides a summary of the ANCOVA results. ANCOVAs did not
identify statistically significant main effects for Time when examining the role of WM in
the effect of Level and the results were shown on the scores from the written
interpretation test (untrained and total items), the grammaticality judgment test (trained
and total items), the accuracy data of the written sentence production test (trained and
untrained items), and the word order preference data of the written sentence production
test (trained, untrained, and the total items).
Appendix U presents the summary of detailed ANCOVA results when
investigating the role of WM capacity in the effect of Feedback on L3 development.
194
Again, no significance was found as shown on the analyses conducted on the scores from
the trained, untrained and total items of the aural interpretation, the trained and total items
of the grammaticality judgment test, the trained and untrained items of the accuracy data
from the written sentence production test, and lastly the trained, untrained, and total items
of the word order preference data from the written sentence production test.
Appendix V summarizes the ANCOVA results when investigating the role of
WM capacity in the interaction between Level and Feedback on L3 development. The
main effect for Time identified in the repeated measures ANOVAs is altered in the
ANCOVAs as shown by the scores from the trained, untrained and total items of the aural
interpretation test and written sentence production test (accuracy and word order
preference) as well as the trained and total items of the grammaticality judgment test.
Because of the disappearance of Time as a main effect, correlations between WM scores
and L3 tests on the pre, post, and delayed tests were run to investigate the role of WM
capacity. No significance was reached as shown in Table 48.
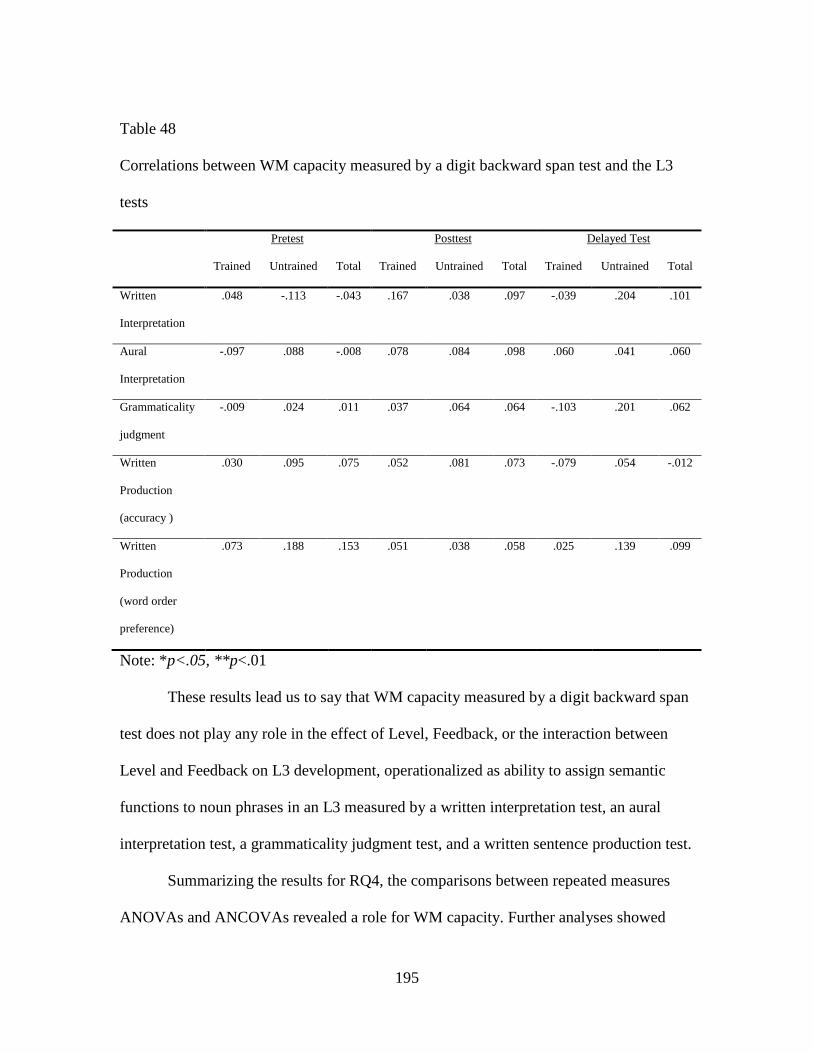
195
Table 48
Correlations between WM capacity measured by a digit backward span test and the L3
tests
Pretest Posttest Delayed Test
Trained Untrained Total Trained Untrained Total Trained Untrained Total
Written
Interpretation
.048 -.113 -.043 .167 .038 .097 -.039 .204 .101
Aural
Interpretation
-.097 .088 -.008 .078 .084 .098 .060 .041 .060
Grammaticality
judgment
-.009 .024 .011 .037 .064 .064 -.103 .201 .062
Written
Production
(accuracy )
.030 .095 .075 .052 .081 .073 -.079 .054 -.012
Written
Production
(word order
preference)
.073 .188 .153 .051 .038 .058 .025 .139 .099
Note: *p<.05, **p<.01
These results lead us to say that WM capacity measured by a digit backward span
test does not play any role in the effect of Level, Feedback, or the interaction between
Level and Feedback on L3 development, operationalized as ability to assign semantic
functions to noun phrases in an L3 measured by a written interpretation test, an aural
interpretation test, a grammaticality judgment test, and a written sentence production test.
Summarizing the results for RQ4, the comparisons between repeated measures
ANOVAs and ANCOVAs revealed a role for WM capacity. Further analyses showed
196
correlations between WM capacity measured by a certain WM span test and L3
development: 1) WM scores from the computational span test and the untrained items of
the written interpretation on the immediate posttest, 2) WM scores from the speed of
processing and the untrained items of the aural interpretation test on the immediate
posttest, and 3) WM scores from the sentence span test and the trained items of the
written sentence production test on the pretest. The results indicate that WM capacity
may play a role in L3 development depending on the types of language tests as well as
the types of items performed.
Next, different results were identified between the repeated measures ANOVAs
and ANCOVAs: 1) Level as a significant main effect for the untrained and total items of
the written interpretation test with scores from the computational span test as a covariate,
2) significant Level x Feedback shown on the untrained items of the written sentence
production test for ANCOVAs with scores from the computational span test as a
covariate, 3) significant Time x Level feedback shown on the total items of the
grammaticality judgment test for ANCOVAs with scores from the speed of processing
test as a covariate, 4) Time x Level x Feedback shown on the trained and total items of
the grammaticality judgment test for ANCOVAs with scores from the speed of
processing test as a covariate, 5) Time x Level interaction shown on the total items of the
grammaticality judgment test for ANCOVAs with scores from the speed of processing
test as a covariate, and 6) Level x Feedback shown on the untrained items of the written
sentence production test with for ANCOVAs with scores from the sentence span test as a
covariate. Further factorial ANOVAs indicate that these results cannot be accounted for
197
by different WM capacity in each feedback group and for each level, there is no
differences in WM capacity.
Next, the analyses showed correlations only among the computational span test,
the speed of processing test, and the sentence span test. The correlation results suggest
that the former three tests and the other two tests (nonword recall and digit backward
span test) may tap into different concept of WM, which will be discussed in Chapter 5.
The correlation results between different WM and language tests at different times
suggest that types of tests used to measure WM capacity may also reveal or hide the role
that WM capacity may has on L3 development.
RQ5: Learning Strategies and L3 Development
Results from research question 1-3 to investigate the role of Level, Types of
Feedback and their interactive effect on L3 development lead us to conclude that higher
L2 proficiency levels, the provision of more explicit feedback, and the interaction of the
two differentially influence L3 development operationalized as ability to assign semantic
functions to noun phrases during online sentential processing in an L3 measured by a
written interpretation test, an aural interpretation test, a grammaticality judgment test, and
a written sentence production test.
This section is devoted to research question 5, which investigates whether
learning strategies can explain those statistically significant results by introducing
frequency of strategy use as covariate in the ANCOVA. With this purpose, ANCOVA
analyses were run on scores from the language tests and the mean score of each strategy
category. Notably, rather than the overall score for all strategies, it is the mean score of
198
each category separately that is used. The results from the ANCOVAs are then compared
with those from the repeated measures ANOVAs conducted previously to test the effects
of controlling for learning strategy use on the relationship between the independent
variables (Level, Feedback, and Time), and the dependent variable (L3 development as
measured by L3 test scores). When results from the ANCOVA analyses are different
from those from the ANOVAs, it is suspected that some strategies influence the results.
Subsequent correlation or one-way ANOVA analyses are conducted. For instance, if
Level effect identified in the repeated measures ANOVA is eliminated in the ANCOVAs,
one-way ANOVAs are run between Level and some category of Strategy Inventory for
Language Learning (SILL) as independent and dependent variables, respectively. The
one-way ANOVA may reveal the statistically different frequency of strategy used in each
L2 level. Multiple correlation analyses are run between L3 test scores on the pre, post,
and delayed tests and SILL if Time effects are eliminated. One would expect correlations
between some category of SILL and L3 test scores to be statistically significant to
conclude that strategies play a role to explain why some group performs better than the
others do. This procedure is applied six times, one for each learning strategy category.
To measure learning strategies, Strategy Inventory for Language Learning (SILL), a
50-item self-reported questionnaire was employed. The 50 items are divided into 6
categories: 1) Memory Strategies: question 1 to 9, 2) Cognitive Strategies: question 10-
23, 3) Compensation Strategies: question 24-29, 4) Metacognitive Strategies: question
30-38, 5) Affective Strategies: question 39-44, and 6) Social Strategies: question 45-50.
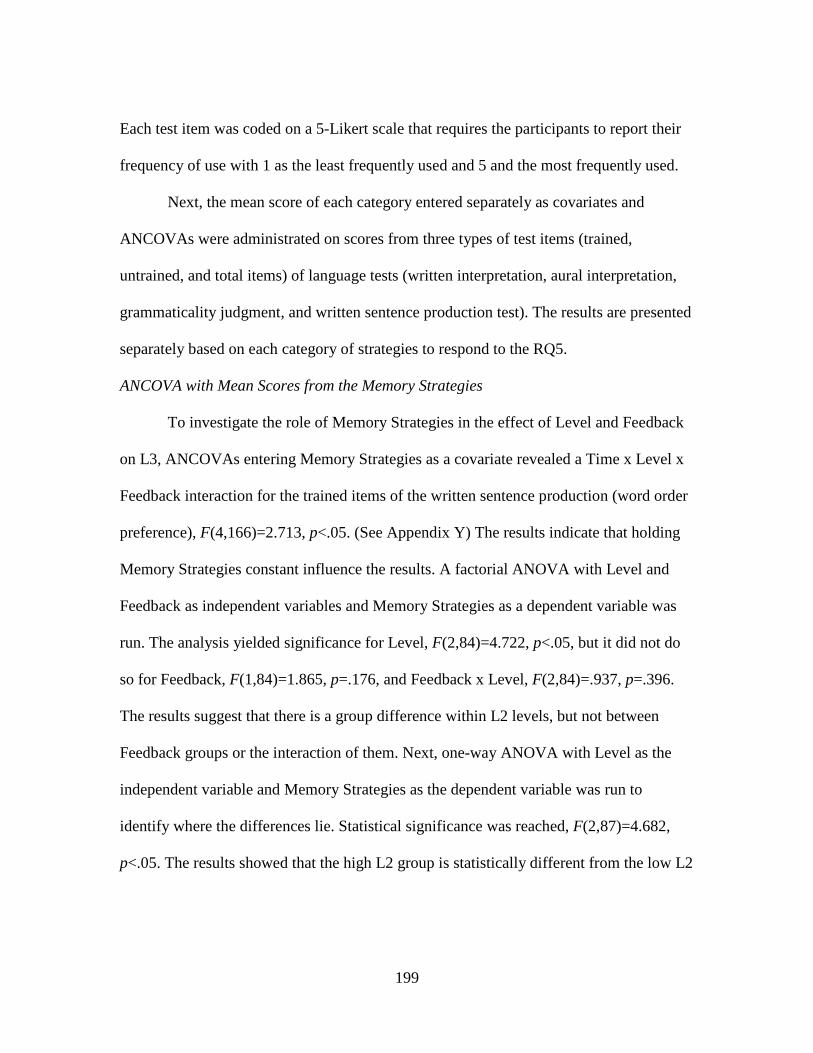
199
Each test item was coded on a 5-Likert scale that requires the participants to report their
frequency of use with 1 as the least frequently used and 5 and the most frequently used.
Next, the mean score of each category entered separately as covariates and
ANCOVAs were administrated on scores from three types of test items (trained,
untrained, and total items) of language tests (written interpretation, aural interpretation,
grammaticality judgment, and written sentence production test). The results are presented
separately based on each category of strategies to respond to the RQ5.
ANCOVA with Mean Scores from the Memory Strategies
To investigate the role of Memory Strategies in the effect of Level and Feedback
on L3, ANCOVAs entering Memory Strategies as a covariate revealed a Time x Level x
Feedback interaction for the trained items of the written sentence production (word order
preference), F(4,166)=2.713, p<.05. (See Appendix Y) The results indicate that holding
Memory Strategies constant influence the results. A factorial ANOVA with Level and
Feedback as independent variables and Memory Strategies as a dependent variable was
run. The analysis yielded significance for Level, F(2,84)=4.722, p<.05, but it did not do
so for Feedback, F(1,84)=1.865, p=.176, and Feedback x Level, F(2,84)=.937, p=.396.
The results suggest that there is a group difference within L2 levels, but not between
Feedback groups or the interaction of them. Next, one-way ANOVA with Level as the
independent variable and Memory Strategies as the dependent variable was run to
identify where the differences lie. Statistical significance was reached, F(2,87)=4.682,
p<.05. The results showed that the high L2 group is statistically different from the low L2
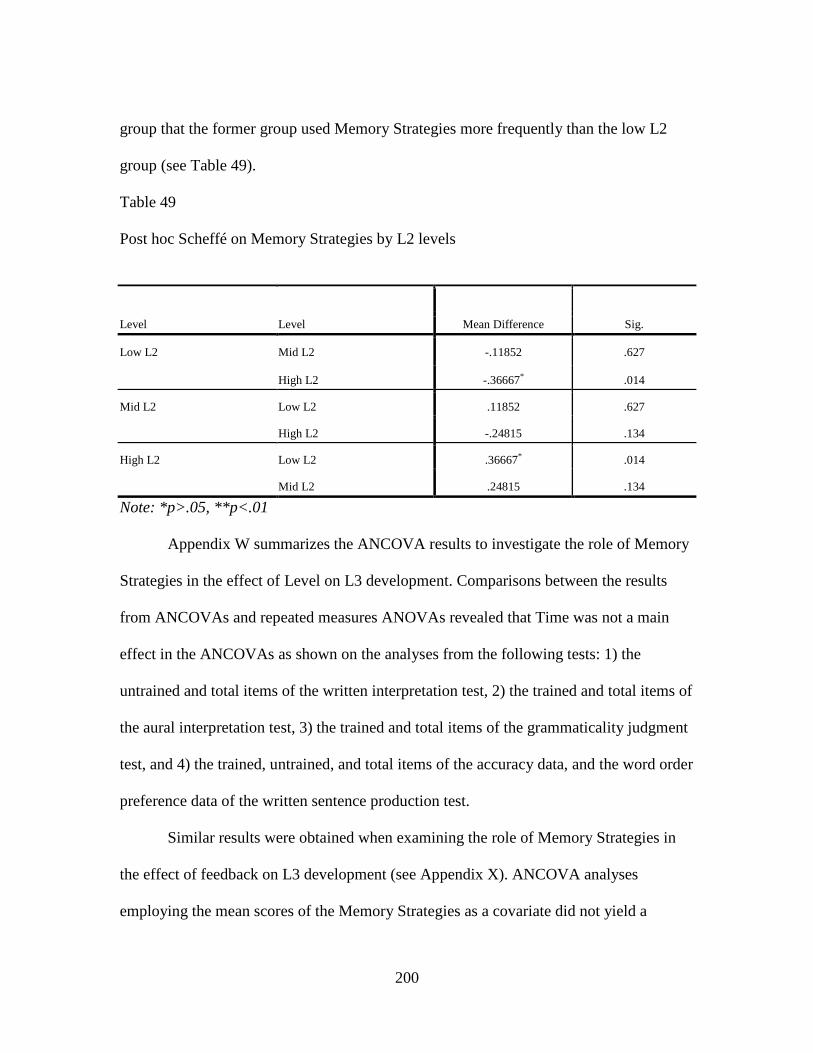
200
group that the former group used Memory Strategies more frequently than the low L2
group (see Table 49).
Table 49
Post hoc Scheffé on Memory Strategies by L2 levels
Level Level Mean Difference Sig.
Low L2 Mid L2 -.11852 .627
High L2 -.36667* .014
Mid L2 Low L2 .11852 .627
High L2 -.24815 .134
High L2 Low L2 .36667* .014
Mid L2 .24815 .134
Note: *p>.05, **p<.01
Appendix W summarizes the ANCOVA results to investigate the role of Memory
Strategies in the effect of Level on L3 development. Comparisons between the results
from ANCOVAs and repeated measures ANOVAs revealed that Time was not a main
effect in the ANCOVAs as shown on the analyses from the following tests: 1) the
untrained and total items of the written interpretation test, 2) the trained and total items of
the aural interpretation test, 3) the trained and total items of the grammaticality judgment
test, and 4) the trained, untrained, and total items of the accuracy data, and the word order
preference data of the written sentence production test.
Similar results were obtained when examining the role of Memory Strategies in
the effect of feedback on L3 development (see Appendix X). ANCOVA analyses
employing the mean scores of the Memory Strategies as a covariate did not yield a
201
statistically significant main effects for Time shown on the analyses conducted on the
following tests: 1) the scores from the untrained and total items of the written
interpretation test, 2) the trained and total items of the aural interpretation test, 3) the
trained and total items of the grammaticality judgment test, and 4) all the test items of the
accuracy and word order preference data of the written sentence production test.
Next, when holding Memory Strategies constant, Time that had previously been
identified by the ANOVAs as a main effect in the interaction between Level and
Feedback on L3 development was eliminated from analyses on the scores of both
accuracy (trained, untrained, and total items) and word order preference data (untrained
and total items) in the written sentence production test. No significant results for Time
were identified for the untrained items of the written interpretation test, the trained items
of the aural interpretation and the trained and total items of the grammaticality judgment
test.
Because the ANCOVAs revealed the elimination of Time as a main factor,
multiple correlation analyses between the L3 test scores on the pre, post, and delayed
post, and the language tests were run to investigate the role of Memory Strategies on L3
development. No statistically significant results were identified (See Table 50). In other
words, there is no relation between Memory Strategies and L3 development.
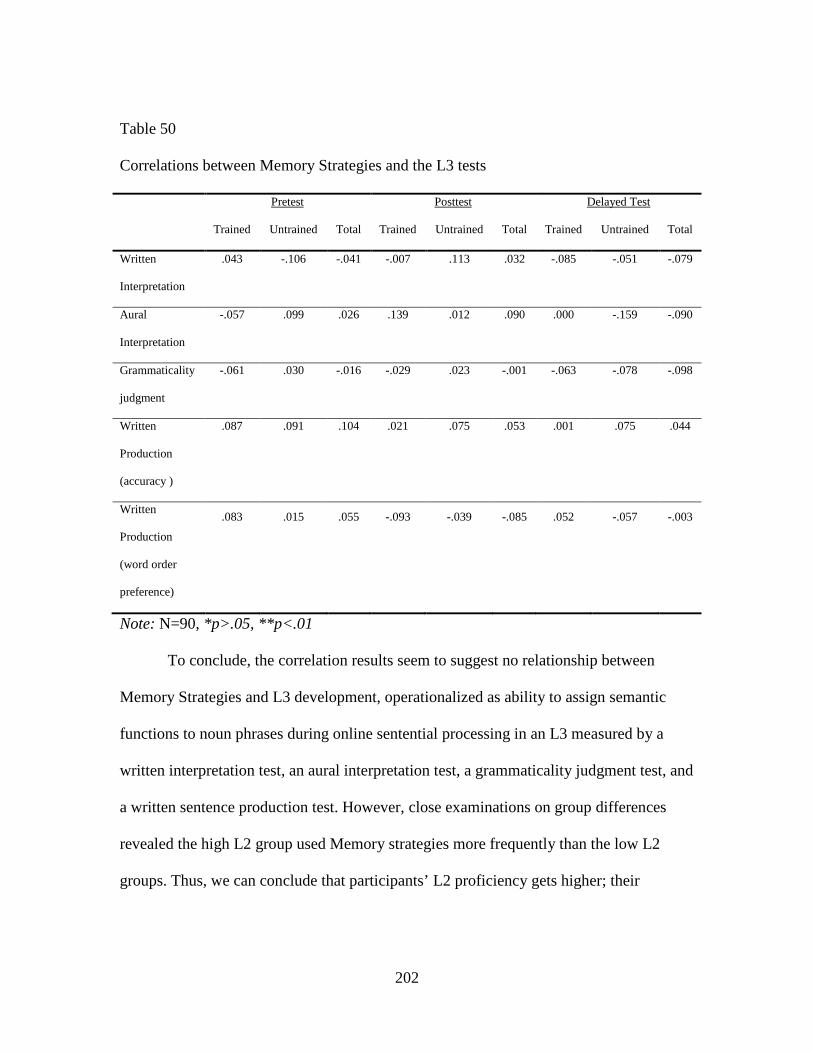
202
Table 50
Correlations between Memory Strategies and the L3 tests
Pretest Posttest Delayed Test
Trained Untrained Total Trained Untrained Total Trained Untrained Total
Written
Interpretation
.043 -.106 -.041 -.007 .113 .032 -.085 -.051 -.079
Aural
Interpretation
-.057 .099 .026 .139 .012 .090 .000 -.159 -.090
Grammaticality
judgment
-.061 .030 -.016 -.029 .023 -.001 -.063 -.078 -.098
Written
Production
(accuracy )
.087 .091 .104 .021 .075 .053 .001 .075 .044
Written
Production
(word order
preference)
.083 .015 .055 -.093 -.039 -.085 .052 -.057 -.003
Note: N=90, *p>.05, **p<.01
To conclude, the correlation results seem to suggest no relationship between
Memory Strategies and L3 development, operationalized as ability to assign semantic
functions to noun phrases during online sentential processing in an L3 measured by a
written interpretation test, an aural interpretation test, a grammaticality judgment test, and
a written sentence production test. However, close examinations on group differences
revealed the high L2 group used Memory strategies more frequently than the low L2
groups. Thus, we can conclude that participants’ L2 proficiency gets higher; their

203
frequency of employing Memory Strategies also increases, but the direction may be
reverse, too.
ANCOVA with Mean Scores from the Cognitive Strategies
The ANCOVA analysis conducted on the scores from the untrained items of the
grammaticality judgment test revealed that Time x Feedback interaction was changed
when holding Cognitive Strategies constant. Appendix AA provides a summary of
ANCOVA results. A one-way ANOVA was used to investigate whether the scores from
the Cognitive Strategies of the participants were different between groups. Feedback was
entered as an independent factor while the mean score from Compensation Strategies
scores was used as a dependent variable. The analysis yielded significant results,
F(1,88)=5.743, p<.05. The explicit feedback groups had higher frequency use of
Cognitive Strategies (M=3.0208, STD=.54758) than the less explicit feedback group
(M=2.7317, STD=.59551).
Cognitive Strategies plays a role in the interactive effect of Level and Feedback
on L3 development. ANCOVAs entering Cognitive Strategies as a covariate conducted
from the scores on the trained items of the written sentence production test (word order
preference) showed that Time x Level x Feedback interaction reached significance, which
was not identified in the repeated measures ANOVAs. Then, a factorial ANOVA entering
Level and Feedback as independent variables and Cognitive Strategies as a dependent
variable was run. The results yielded significance for Feedback, F(1,84)=7.676, p<.01,
Level, F(2,84)=14.588, p<.01 but not for Level x Feedback, F(2,84)=2.224, p=.115. The
statistically significant results indicate that the three L2 levels and the two feedback

204
groups are statistically different, but Level and Feedback did not depend on each other.
Then, a one-way ANOVA with L2 level as an independent variable and Cognitive
Strategies as a dependent variable was run to identify where the differences lie. The
results showed that the three L2 groups were statistically different from each other. (See
Table 51)
Table 51
Post Hoc Scheffé on Cognitive Strategies by Level
Level Level Mean Difference Sig.
Low L2 Mid L2 -.44945* .005
High L2 -.67821* .000
Mid L2 Low L2 .44945* .005
High L2 -.22875 .240
High L2 Low L2 .67821* .000
Mid L2 .22875 .240
Note: *p>.05, **p<.01
A one-way ANOVA with feedback as an independent variable and Cognitive
Strategies as a dependent variable also reached significance, F(1,88)=5.743, p<.05,
showing that the more explicit group (M=3.0208, STD=.54758) used the strategies more
frequently than the less explicit feedback group (M=2.7317, STD=.59551), which was
reported previously.
Next, Cognitive Strategies have an influence on Time. When entering Cognitive
Strategies as a covariate in the ANCOVAs to examine its role in the effect of Level on L3
development, Time, previously identified as a statistically significant main effect by

205
repeated measures ANOVAs, was eliminated as shown by analyses on scores from the
written and aural interpretation test (trained, untrained and total items), the
grammaticality judgment test (trained and total items), and the accuracy (trained,
untrained and total items) and word order preference data of the written sentence
production test (trained, untrained). ANCOVA results are presented in Appendix Z.
Similar results for Time apply when examining the role of Cognitive Strategies in
the effect of Feedback on L3 development. The disappearance of Time as a main effect in
the ANCOVA analyses also showed that Cognitive Strategies had an impact across all of
the test items of the written interpretation, aural interpretation, and the written sentence
production as well as the trained and total items of the grammaticality judgment test.
Comparing the results from ANCOVA analyses which employed Cognitive
Strategies as a covariate and those from the repeated measures ANOVAs conducted to
investigate its role in the interactive effect of Level and Feedback on L3 development, the
comparisons showed that Time was no longer a main effect in the following tests: 1) the
trained items of the written interpretation test , 2) the trained, untrained and total items of
the aural interpretation test, 3) the trained and total items of the grammaticality judgment,
4) the trained, untrained, and total items of the accuracy data of the written sentence
production test, and 5) the untrained items of the word order preference data of the
written sentence production test. Appendix AB provides a summary of the ANCOVA
results.
Because of the elimination of Time as a main effect in the ANCOVA results,
correlation analyses were run between the mean scores of the Cognitive Strategies and

206
the L3 scores. No significant results were identified, which means that there is no relation
between Cognitive Strategies and L3 development (See Table 52).
Table 52
Correlations between Cognitive Strategies and the L3 tests
Pretest Posttest Delayed Test
Trained Untrained Total Trained Untrained Total Trained Untrained Total
Written
Interpretation
-.004 -.039 -.029 .082 .176 .107 .114 .038 .088
Aural
Interpretation
-.012 .092 .051 .137 .056 .116 .104 .009 .068
Grammaticality
judgment
.091 .140 .142 .037 .133 .111 -.031 -.057 -.062
Written
Production
(accuracy)
-.019 .158 .087 -.007 .139 .072 .078 .162 .136
Written
Production
(word order
preference)
-.039 .003 -.020 -.080 -.007 -.055 .122 .116 .144
Note: *p>.05, **p<.01
To conclude, while ANCOVAs suggest a role between Cognitive Strategies and
L3 development, the correlation results cannot identify the relationship. One-way
ANOVAs showed that the three L2 groups were statistically different from each other.
We can conclude that having higher L2 proficiency also helps learners increase their
frequency use of Cognitive Strategies. In addition to the existing differences among the
three L2 groups, the more explicit group also uses Cognitive Strategies more frequently

207
than the less explicit group. This result seems to the treatment influences how one group
makes greater use of Cognitive Strategies than the others do.
ANCOVA with Mean Scores from the Compensation Strategies
The ANCOVAs analyses suggest that Compensation Strategies seem to play a
role in the effect of Feedback on L3 development because the elimination of Feedback as
a main effect in the ANCOVAs, as shown on the total items of the accuracy data of the
written sentence production test, F(1,88)=3.458, p=.066, power=.452. A one-way
ANOVA, using Feedback as an independent variable and Compensation Strategies as a
dependent variable, was employed. No significant result was identified, F(1,88)=3.693,
p=.058. Thus, the results cannot be accounted for by the differences between groups.
Then, separate correlation analyses between the Compensation Strategies from each
feedback group and L3 development on the pretest, posttest, and delayed test scores from
total items of the accuracy data of the written sentence production test was used (See
Table 53). The correlation analyses only identified significance for the less explicit
feedback on the pretest. The results show that Compensation Strategies had a more
important role for the less explicit feedback group than for the more explicit feedback
group before the treatment and that advantage does not appear after interacting with the
treatment and two weeks after the treatment.
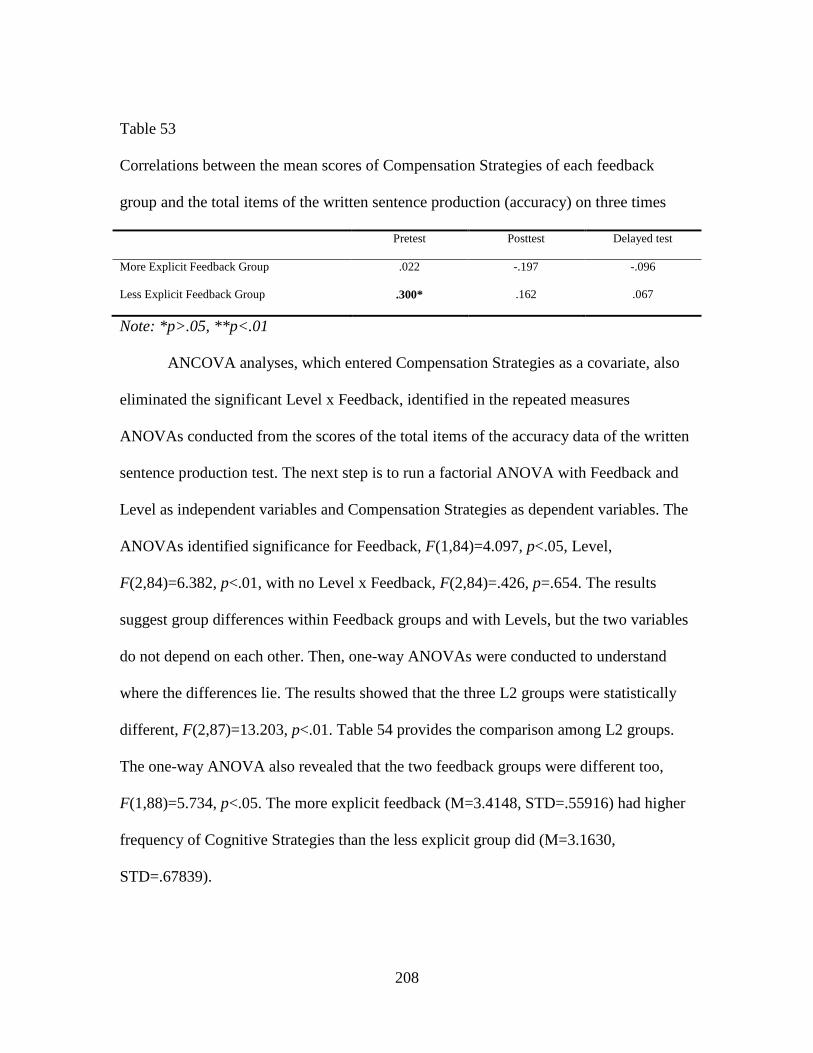
208
Table 53
Correlations between the mean scores of Compensation Strategies of each feedback
group and the total items of the written sentence production (accuracy) on three times
Pretest Posttest Delayed test
More Explicit Feedback Group .022 -.197 -.096
Less Explicit Feedback Group .300* .162 .067
Note: *p>.05, **p<.01
ANCOVA analyses, which entered Compensation Strategies as a covariate, also
eliminated the significant Level x Feedback, identified in the repeated measures
ANOVAs conducted from the scores of the total items of the accuracy data of the written
sentence production test. The next step is to run a factorial ANOVA with Feedback and
Level as independent variables and Compensation Strategies as dependent variables. The
ANOVAs identified significance for Feedback, F(1,84)=4.097, p<.05, Level,
F(2,84)=6.382, p<.01, with no Level x Feedback, F(2,84)=.426, p=.654. The results
suggest group differences within Feedback groups and with Levels, but the two variables
do not depend on each other. Then, one-way ANOVAs were conducted to understand
where the differences lie. The results showed that the three L2 groups were statistically
different, F(2,87)=13.203, p<.01. Table 54 provides the comparison among L2 groups.
The one-way ANOVA also revealed that the two feedback groups were different too,
F(1,88)=5.734, p<.05. The more explicit feedback (M=3.4148, STD=.55916) had higher
frequency of Cognitive Strategies than the less explicit group did (M=3.1630,
STD=.67839).

209
Table 54
Post hoc Scheffé on from mean of Compensation Strategies by Level
Level Level Mean Difference Sig.
Low L2 Mid L2 -.39444* .042
High L2 -.52222* .005
Mid L2 Low L2 .39444* .042
High L2 -.12778 .710
High L2 Low L2 .52222* .005
Mid L2 .12778 .710
Note: *p>.05, **p<.01
The results indicate participants of higher L2 proficiency levels reported higher
frequency use of Compensation Strategies. The more explicit feedback also reported
higher frequency of Compensation Strategies use.
The comparison between ANOVAs and ANCOVAs from the scores of the total
items in the written sentence production test (accuracy data) to examine the role of
Compensation Strategies also showed that it plays a role in the effect of Feedback on L3
development. As reported in the previous paragraph, the more explicit feedback group
used this strategy more frequently than the other group.
Next, statistically significant results identified for Time by the repeated measures
ANOVAs did not sustain. To investigate the role of Compensation Strategies in the effect
of Level on L3 development, the ANCOVA revealed that Compensation Strategies had
an effect on Time in L3 development shown on the elimination of Time as a main effect
in the trained, untrained and total items of the written and aural interpretation test, the
210
trained and total items of the grammaticality judgment test, and the trained, untrained,
and total items of the written sentence production test (accuracy and word order
preference). The ANCOVA results for the role of Compensation Strategies in the effect
of Level on L3 development are presented in Appendix AC.
The results were replicated when entering Compensation Strategies as a covariate
in the ANCOVA analyses to examine the role of Compensation Strategies in the effect of
Feedback on L3 development. As Appendix AD presents, ANCOVA analyses showed
that the main effect for Time, previously identified in the repeated measures ANOVAs,
disappeared for the analyses conducted on scores from the untrained items and total items
of the written interpretation test, all the test items of the aural interpretation test and the
written sentence production test (word order preference) as well as the trained items of
the written interpretation (accuracy data) and the trained and total items of the
grammaticality judgment test.
Lastly, the ANCOVA results did not yield any significant main effect for Time
for its role in the effect of the interaction between Level and Feedback on L3
development, which is different from the results found from the repeated measures
ANOVA analyses. As Appendix AE shows, the results apply to 1) the untrained items of
the written interpretation test, 2) all the test items of the aural interpretation, 3) the trained
items of the grammaticality judgment test, 4) the trained items of the written sentence
production test (accuracy), and 5) all the test items of the written sentence production
test.

211
Because of the elimination of Time as a significant main effect in the ANCOVA
analyses compared to the results yielded by the ANOVA, correlation analyses were run
and showed relationships between the mean scores of Compensation Strategies and
several tests (the trained and total items of the grammaticality judgment on the pretest,
and the total and untrained items of the accuracy data of the written sentence production
test on the pretest). Table 55 summarizes the correlation results. The results suggest a
relationship between Compensation Strategies and L3 development, measured by the
trained and total items of the grammaticality judgment test and the untrained and total
items of the written sentence production test (accuracy).

212
Table 55
Correlations between compensation Strategies and the L3 tests
Pretest Posttest Delayed Test
Trained Untrained Total Trained Untrained Total Trained Untrained Total
Written
Interpretation
-.040 -.045 -.058 -.004 .183 .065 .109 .025 .077
Aural
Interpretation
.069 .101 .111 .108 .123 .140 .072 .128 .116
Grammaticality
judgment
.226* .192 .253* .104 .080 .114 .087 -.057 .024
Written
Production
(accuracy )
.086 .263* 210* .074 .109 .102 -.003 .105 .059
Written
Production
(word order
preference)
.011 -.048 -.022 .010 .007 .011 .095 .108 .123
Note: *p>.05, **p<.01
The correlation results suggest the existing role of Compensation Strategies
before the treatment (shown on the trained and total items of the grammaticality
judgment test and the untrained and total item of the written sentence production test.
Although the differences exist before the treatment, they do not benefit participants’
ability to judgment the grammaticality of a sentence or produce a written sentence.
Summarizing the results, there is a correlation between Compensation Strategies
and L3 development on the pretest, when asking the participants to make judgment on the
grammaticality of sentences and producing written sentences. However, the relationship

213
does not sustain after the treatment or two weeks after the treatment. Next, the results
indicate that having higher L2 proficiency level increases their frequency use of
Compensation Strategies. Moreover, participants in the more explicit feedback group also
use Compensation Strategies more frequently.
ANCOVA With Mean Scores from the Metacognitive Strategies
When entering the Metacognitive Strategies as a covariate in the ANCOVA
analyses and comparing these results with those on the repeated measures ANOVAs
conducted, the results varied. For the untrained and total items of the written
interpretation test, holding WM constant makes the main effect for Level appear. A one-
way ANOVA analysis reached statistical significance, F(2,87)=8.796, p<.01, to
investigate the relationship between Level and Metacognitive Strategies. The results
showed that participants of the low group were significantly different from the other two
groups. The statistically significant findings showed that high (M=3.1037, STD=.60713)
and mid L2 level (M=2.8593, STD=.62031) reported using Metacognitive Strategies
more frequently than the low L2 group (M=2.4741, STD=.52679). In other words, having
higher L2 proficiency may influence participants to use strategies more frequently than
having lower one (See Table 56).

214
Table 56
Post-hoc Scheffé on Metacognitive Strategies by Level
Level Level Mean Difference Sig.
Low L2 Mid L2 -.38519* .044
High L2 -.62963* .000
Mid L2 Low L2 .38519* .044
High L2 -.24444 .277
High L2 Low L2 .62963* .000
Mid L2 .24444 .277
Note: *p>.05, **p<.01
Next, the ANCOVAs eliminated Level x Feedback on the trained items of the
written sentence production test (accuracy data), but it also made a significant Time x
Level x Feedback interaction appear. A factorial analysis was run to identify where the
differences lie. The factorial ANOVA with Level and Feedback as independent variables
and Metacognitive Strategies as the dependent variable identify significant main effect
for Feedback, F(1,84)=7.521, p<.01 and Level, F(2,84)=9.512, p<.01, but it did not
identify Feedback x Level interaction, F(2,84)=1.279, p=.284. The results suggest
existing differences between Feedback groups and within L2 levels, but there was no
relationship between Level and Feedback. The next step is to identify where the
differences lie. A one-way ANOVA with Level as the independent variable and
Metacognitive Strategies as the dependent variable reached significance, F(2,87)=8.796,
p<.01. The post hoc tests showed that the Low L2 group is statistically different from the
mid L2 and the high L2 group, as shown previously in Table 56. A one-way ANOVA
215
also showed that the two feedback groups were different, F(1,88)= 6.269, p<.05. The
more explicit feedback group (M=2.9753, STD=.61632) reported using Metacognitive
Strategies more than the less explicit feedback group (M=2.6494, STD=.61862).
To investigate the role of Metacognitive Strategies in the effect of Level on L3
development, the ANCOVAs conducted on the scores from the untrained and total items
of the written interpretation, trained items of the aural interpretation test, the trained items
and total items of the grammaticality judgment test eliminated the main effect for Time
identified by repeated measures ANOVAs. For all of the test items from the accuracy and
the trained items of word order preference of the written sentence production test, WM
capacity seems to play a role in the effect of the main effect for Time identified in the
ANOVAs. Appendix AF provides a summary of the ANCOVA results.
Appendix AG presents a summary of ANCOVA results. Again, the ANCOVA
analyses showed that the main effect for Time disappeared while holding the
Metacognitive Strategies constant to examine the role of this strategy in the effect of
feedback on L3 development. The same result was replicated by the analyses conducted
on the untrained items of the written interpretation test, the trained items of the aural
interpretation test and the grammaticality judgment test, and the trained, untrained and
total items of the written sentence production test (accuracy) and the untrained items of
the word order preference data.
As Appendix AH shows, ANCOVA analyses that used Metacognitive Strategies
as a covariate revealed that Time was no longer a main effect for the role of
Metacognitive Strategies in the interaction between Level and Feedback on L3

216
development. The result applies to the untrained items of the written interpretation and
the trained items of the aural interpretation. As for the grammaticality judgment test, the
results were shown on the analyses conducted on the scores from the trained and total
items. In addition, Time was not a main effect identified by the ANCOVAs for all of the
test items of the written sentence production test (accuracy) and the untrained items of the
word order preference data.
Because the disappearance of Time as a main effect in the ANCOVAs suggests
Metacognitive Strategies’ role for the effect of Level, Feedback and their interaction,
correlation analyses were run. Significance was reached between the untrained items of
the grammaticality judgment on the pretest and Metacognitive Strategies, which suggest
an existing relationship between them (See Table 57). Correlations between
Metacognitive Strategies and L3 scores from the untrained items of the grammaticality
judgment test on the pretest indicate that the ability to correctly judgment a sentence may
not carry over time. The treatment seems to eliminate the differences among groups.
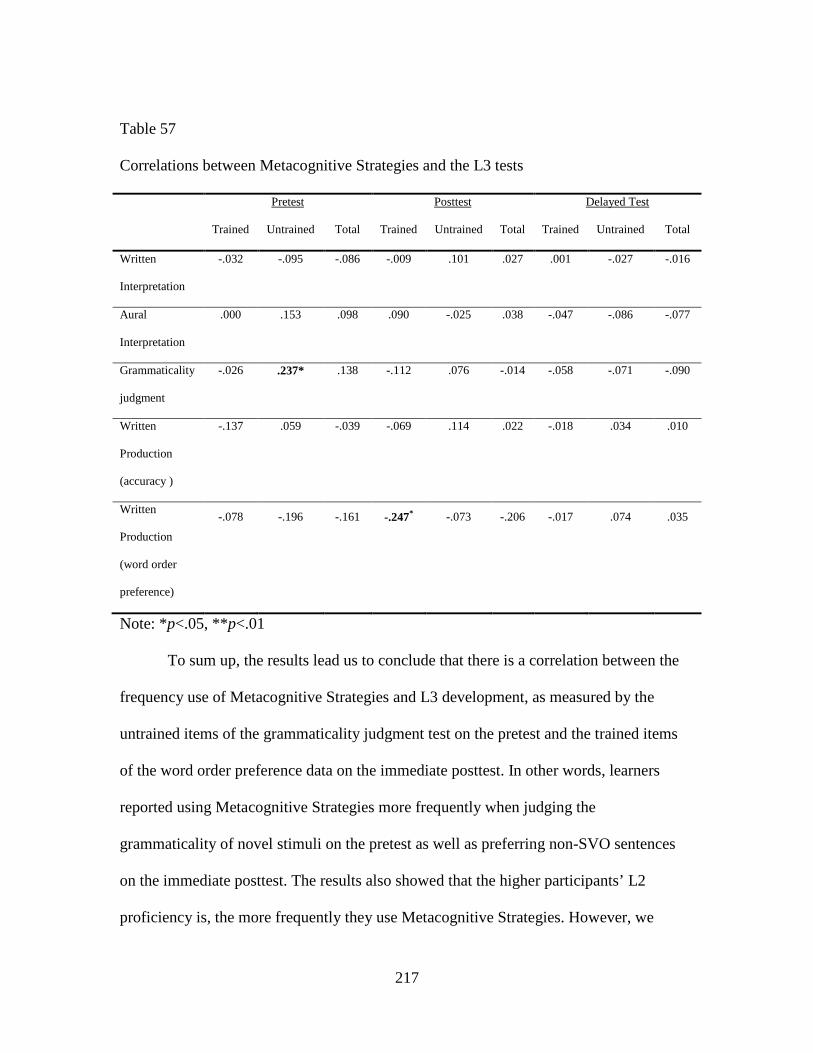
217
Table 57
Correlations between Metacognitive Strategies and the L3 tests
Pretest Posttest Delayed Test
Trained Untrained Total Trained Untrained Total Trained Untrained Total
Written
Interpretation
-.032 -.095 -.086 -.009 .101 .027 .001 -.027 -.016
Aural
Interpretation
.000 .153 .098 .090 -.025 .038 -.047 -.086 -.077
Grammaticality
judgment
-.026 .237* .138 -.112 .076 -.014 -.058 -.071 -.090
Written
Production
(accuracy )
-.137 .059 -.039 -.069 .114 .022 -.018 .034 .010
Written
Production
(word order
preference)
-.078 -.196 -.161 -.247* -.073 -.206 -.017 .074 .035
Note: *p<.05, **p<.01
To sum up, the results lead us to conclude that there is a correlation between the
frequency use of Metacognitive Strategies and L3 development, as measured by the
untrained items of the grammaticality judgment test on the pretest and the trained items
of the word order preference data on the immediate posttest. In other words, learners
reported using Metacognitive Strategies more frequently when judging the
grammaticality of novel stimuli on the pretest as well as preferring non-SVO sentences
on the immediate posttest. The results also showed that the higher participants’ L2
proficiency is, the more frequently they use Metacognitive Strategies. However, we

218
cannot eliminate the possibility of having a reverse direction. In addition, the participants
in the more explicit feedback group use Metacognitive Strategies more frequently than
their counterpart does.
ANCOVA with Mean Scores from the Affective Strategies
To investigate the role of Affective Strategies in the effect of feedback on L3
development, Affective Strategies played a role in the significant Time x Feedback
interaction from the scores of the trained items of written sentence production test
(accuracy). A one-way ANOVA was run to investigate whether participants’ Affective
Strategies scores were different between feedback groups. The results reached
significance, F(1,89)=4.535, p<.05. The results showed that the more explicit feedback
group (M=2.7296, STD=.54621) reported using Affective Strategies statistically higher
than the less explicit feedback (M=2.4593, STD=.65342). See Appendix AJ for the
summary of ANCOVA results.
Next, a significant Time x Level x Feedback interaction was identified by the
ANCOVAs when examining the role of Affective Strategies in the interactive effect of
Level and Feedback on L3 development. (See Appendix AK) A factorial ANOVA was
run to identify where the differences lie. The ANOVA identified significance for
Feedback, F(1,84)=4.605, p<.05, but not Level, F(2,84)=1.037, p=.359, or Feedback x
Level, F(2,84)=1.642, p=.200. The results indicate a difference between Feedback
groups. A one-way ANOVA with Feedback as an independent variable and Affective
Strategies as a dependent variable was run, and the results showed that more explicit

219
group had higher frequency of Affective Strategies than their counterpart, as presented
previously.
Time, which was identified as a main effect in the ANOVAs in the effect of Level
on L3 development, disappeared in ANCOVA analyses conducted on the scores of the
untrained items of the written interpretation test, the trained items of the aural
interpretation test, the trained and the total items of the grammaticality judgment, and all
the test items of both the accuracy, and word order preference data from the written
sentence production test.
Time as a main effect, identified in the repeated measures ANOVAs, also
disappears in the ANCOVAs for the examination of its role in the effect of feedback on
L3 development. This result applies to the following tests: 1) the untrained of the written
interpretation test, 2) the trained items of the aural interpretation test, 3) the trained and
total items of the grammaticality judgment test, 4) the trained and untrained items of the
accuracy data from the written sentence production test, and 5) the trained, untrained and
total items of the word order preference data from the written sentence production test.
Finally, comparing the analyses conducted by the ANCOVA and repeated
measures ANOVAs for the role of Affective Strategies in the interaction between Level
and Feedback on L3 development, Appendix AI shows that the main effect for Time
identified earlier in the ANOVAs was eliminated on the following tests: scores from the
trained and total items of the grammaticality judgment test, the trained and untrained
items of the accuracy data from the written sentence production test, and the untrained
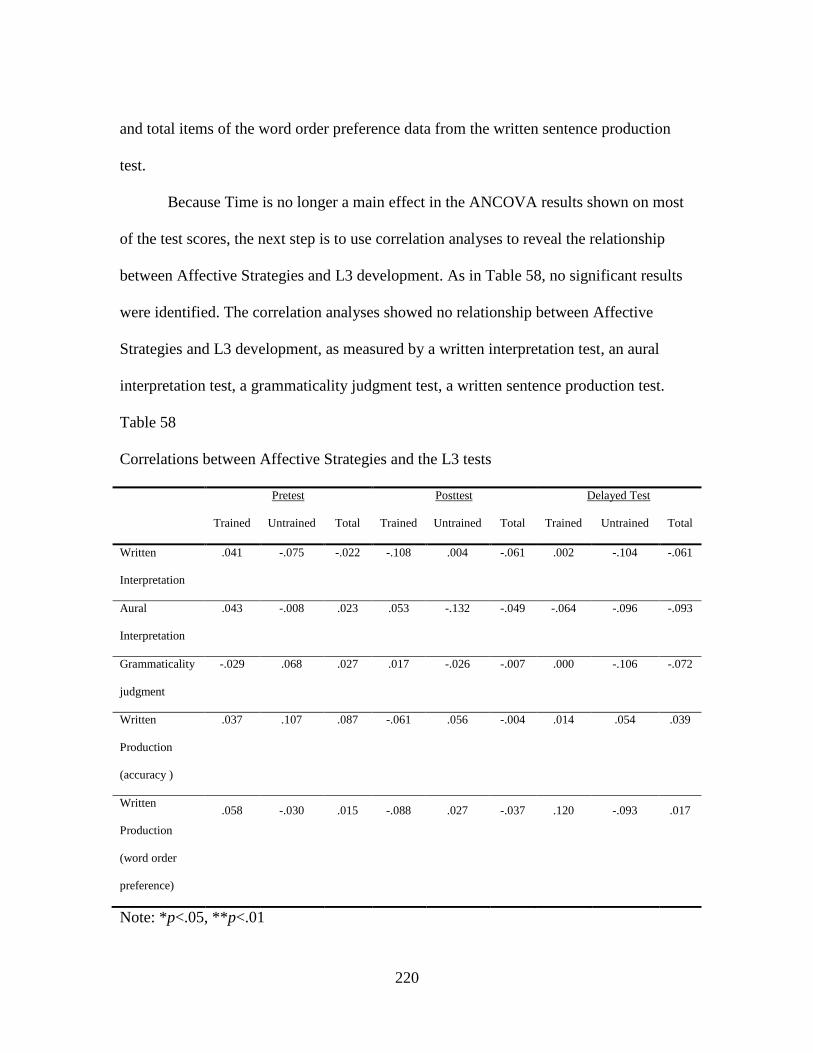
220
and total items of the word order preference data from the written sentence production
test.
Because Time is no longer a main effect in the ANCOVA results shown on most
of the test scores, the next step is to use correlation analyses to reveal the relationship
between Affective Strategies and L3 development. As in Table 58, no significant results
were identified. The correlation analyses showed no relationship between Affective
Strategies and L3 development, as measured by a written interpretation test, an aural
interpretation test, a grammaticality judgment test, a written sentence production test.
Table 58
Correlations between Affective Strategies and the L3 tests
Pretest Posttest Delayed Test
Trained Untrained Total Trained Untrained Total Trained Untrained Total
Written
Interpretation
.041 -.075 -.022 -.108 .004 -.061 .002 -.104 -.061
Aural
Interpretation
.043 -.008 .023 .053 -.132 -.049 -.064 -.096 -.093
Grammaticality
judgment
-.029 .068 .027 .017 -.026 -.007 .000 -.106 -.072
Written
Production
(accuracy )
.037 .107 .087 -.061 .056 -.004 .014 .054 .039
Written
Production
(word order
preference)
.058 -.030 .015 -.088 .027 -.037 .120 -.093 .017
Note: *p<.05, **p<.01

221
To summarize the results for the role of Affective Strategies in the results
observed in the first three research questions, the correlation results suggest no role of
Affective Strategies in the L3 development. However, closely examining the differences
among groups, one-way ANOVAs suggest that participants exposed to more explicit
feedback employ Affective Strategies more frequently than their counterparts.
ANCOVA with Mean Scores from Social Strategies
Comparing the results of the ANCOVAs and those of the repeated measures
ANOVAs to examine the role of Social Strategies in the interaction between Level and
Feedback on L3 development, Social Strategies seem to play a role in Level x Feedback
shown on the scores of the trained items of the written sentence production test
(accuracy) as well as Time x Level x Feedback interaction shown on the total items of the
grammaticality judgment test and the trained items of the written sentence production test
(word order preference). Appendix AN summarizes the ANCOVA results when
examining the role of Social Strategies in the effect of Level and Feedback on L3
development, as measured by four language tests. A factorial ANOVA was conducted to
investigate whether Level and Feedback were related to the Social Strategies. Social
Strategies were entered as the dependent variable and Feedback and Level were entered
as the independent variable. The factorial ANOVA revealed a main effect for Level,
F(2,84)=3.936, p<.05, no main effect for Feedback, F(1,84)=1.049, p=.309, and no Level
x Feedback interaction, F(2,84)=1.359, p=.262. The results indicate differences among
L2 levels, but not for others. One-way ANOVA was run to identify where the differences

222
lie. The results reached significance, F(2,87)= 3.902, p<.05, and showed that the low L2
and the high L2 groups were statistically different (See Table 59)
Table 59
Post hoc Scheffé on Social Strategies by Level
Level Level Mean Difference Std. Error Sig.
Low L2 Mid L2 -.27222 .17348 .297
High L2 -.48333* .17348 .024
Mid L2 Low L2 .27222 .17348 .297
High L2 -.21111 .17348 .480
High L2 Low L2 .48333* .17348 .024
Mid L2 .21111 .17348 .480
Note: p<.05, p<.01
ANCOVA analyses, which entered Social strategies as a covariate to investigate
its role in the effect of Level on L3 development, did not yield any significant main
effects for Time from the scores of the trained and untrained items of the written
interpretation, and all the test items of the aural interpretation, and the written sentence
production test (accuracy and word order preference). On the other hand, the analyses
conducted on the scores from the grammaticality judgment test by the repeated ANOVAs
remained unchanged. The summary of ANCOVA results is presented in Appendix AL.
As Appendix AM shows, Time as a main effect identified in the previous repeated
measures ANOVAs disappeared when investigating its role in the effect of feedback on
L3 development for the untrained and total items of the written interpretation, and all the
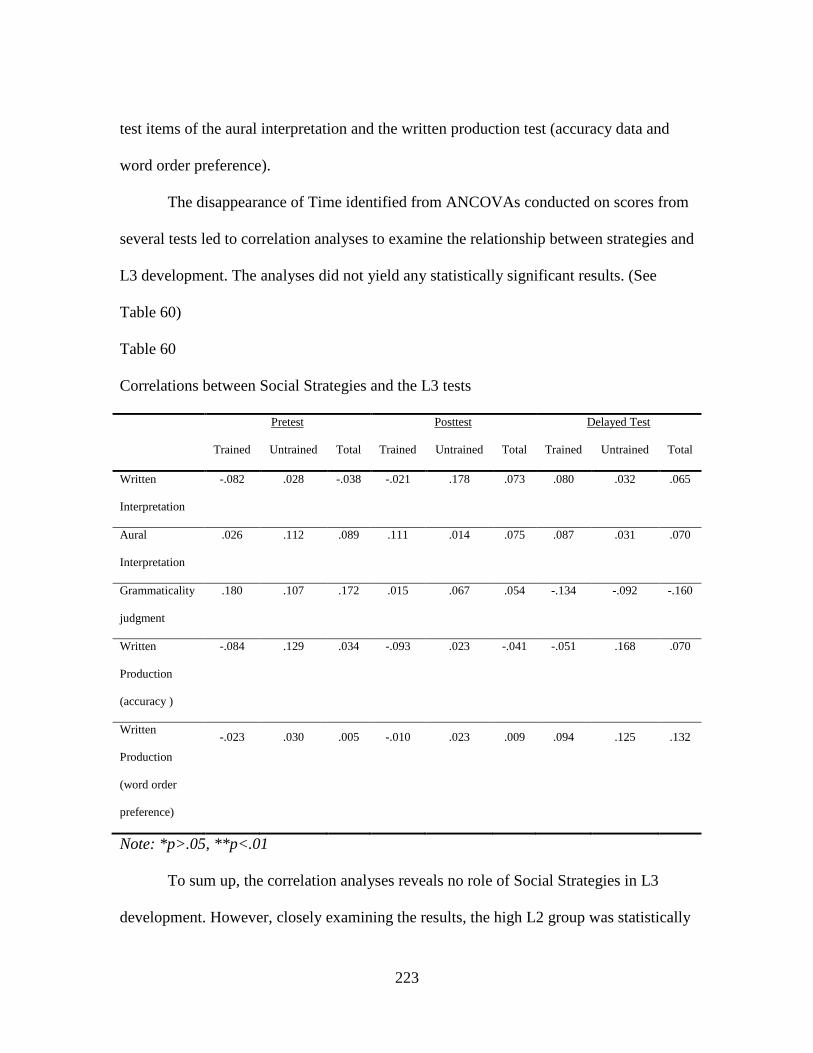
223
test items of the aural interpretation and the written production test (accuracy data and
word order preference).
The disappearance of Time identified from ANCOVAs conducted on scores from
several tests led to correlation analyses to examine the relationship between strategies and
L3 development. The analyses did not yield any statistically significant results. (See
Table 60)
Table 60
Correlations between Social Strategies and the L3 tests
Pretest Posttest Delayed Test
Trained Untrained Total Trained Untrained Total Trained Untrained Total
Written
Interpretation
-.082 .028 -.038 -.021 .178 .073 .080 .032 .065
Aural
Interpretation
.026 .112 .089 .111 .014 .075 .087 .031 .070
Grammaticality
judgment
.180 .107 .172 .015 .067 .054 -.134 -.092 -.160
Written
Production
(accuracy )
-.084 .129 .034 -.093 .023 -.041 -.051 .168 .070
Written
Production
(word order
preference)
-.023 .030 .005 -.010 .023 .009 .094 .125 .132
Note: *p>.05, **p<.01
To sum up, the correlation analyses reveals no role of Social Strategies in L3
development. However, closely examining the results, the high L2 group was statistically
224
different from the low L2 group, as shown on the total items of the grammaticality
judgment test and the trained items of the written sentence production test (word order
preference). The results indicate that having higher L2 level increases the frequency of
using Social Strategies in learning a foreign language, but we cannot eliminate the
possibility that the direction may be reverse.
Table 61 presents the significance changes identified by comparing repeated
measures ANOVAs and ANCOVAs.

225
Table 61
Changes of results between ANOVAs and ANCOVAs in addition to Time for RQ5
Strategies Memory Cognitive Compensation Metacognitive Affective Social
Written
Trained Items
Untrained Items
Total Items
L
Aural
Trained Items
Untrained Items
Total Items
Grammaticality
Trained Items
Untrained Items
Total Items
Accuracy
Trained Items
Untrained Items
Total Items
F
F, L x F
T x F
Word order preference
Trained Items
Untrained Items
Total Items
TxLxF
T xLxF
TxLx F
T x F
TxLxF
LxF,
TxLxF
Note: T is Time, L is Levels, and F is Feedback
To conclude the results, the correlation analyses suggest a role for Metacognitive
Strategies and Compensation Strategies on L3 development. Comparing the results of
ANOVAs and ANCOVAs reveals the role of strategies in different ways. The

226
combination of factorial ANOVAs, one-way ANOVAs or correlations between each
group and L3 development results suggest that strategies play a role in L3 development:
1) the high L2 group uses Memory Strategies and Social Strategies more frequently than
the low groups, 2) the higher L2 proficiency participants have, the more frequently they
use Cognitive Strategies, Compensation Strategies, and Metacognitive Strategies, 3) the
more explicit feedback groups use more Cognitive Strategies, Metacognitive Strategies,
and Affective Strategies than the less explicit feedback group. Lastly, Memory Strategies
play a more important role for High L2, not for the other two groups.
227
CHAPTER 5: DISCUSSION
Introduction
The discussion section is presented in five sections each addressing the five
research questions under investigation followed by a section of Conclusions and
implication as well as a section of limitations and further research. The first section
presents a discussion on the effect of the Level of Bilingualism on L3 development and it
is followed by a section on question 2 that addresses the differential effects of more
explicit and less explicit feedback on L3 development. Section three presents a discussion
on the interactions between Level of Bilingualism and Types of Feedback and its effect
on L3 development. The last two sections are devoted to a discussion of the role of WM
capacity and Learning Strategies, respectively, in explaining the effects identified by
previous analyses.
RQ1: Level of Bilingualism and L3 Language Development
The null hypothesis that the Level of Bilingualism has no effects on L3
development when learners are learning to assign semantic functions to noun phrases at
the sentence level is partially rejected and is supported by the ANOVA analyses
conducted on the trained items of the grammaticality judgment test, which will be
reported in RQ3. This finding has identified evidence for Cummins’ Threshold
Hypothesis (1976, 1978, 1979a, 1979b) that bilingual advantages appear when the
proficiency levels in two languages reach a certain level. In the current study, the
threshold lies between intermediate and beginning L2 learners. Readers should be aware
228
that the evidence to support Cummins’ Hypothesis is based on the results reported in
RQ3.
The current finding supports the studies conducted in bilingual contexts (Cenoz &
Valencia, 1994; Klein, 1995; Sanz, 2000; Thomas, 1998) and laboratory environments
(Nation & McLaughlin, 1986; McLaughlin & Nayak, 1989; Nayak, Hansen, Krueger, &
McLaughlin, 1990; Lado, 2008; Sanz, Anfruns, Lado, Lin, Medina, 2004, 2005) and
extends their findings to EFL learners learning an L3 in a laboratory context.
The result also confirms the findings of other studies in the Latin Project (Lado,
2008; Sanz, Anfruns, Lado, Lin, & Medina, 2004, 2005; Stafford, 2005) with a better
control of prior language experience. According to the Competition Model, language
learning is defined by cue strength and cue validity in languages. Becoming aware of the
cue strengths in languages and hence, adjusting processing strategies is the result of
learning. Although Lado (2008), and Sanz et al. (2004, 2005) successfully identify
thresholds, they are often criticized for the positive transfer from Spanish to Latin, which
both use morphological markings to determine the agent in the sentence. Learners in the
current study are native speakers of Mandarin, which uses semantic cues, at different
English levels, which heavily rely on word order to lead to the correct interpretation of
sentences. Latin is different from Mandarin and English in that it has a free word order
and uses case markings to indicate the agent in a sentence. With a better control of
possible transfer from one language to another, the significant result in the current study
provides valid evidence for the effect of Level of Bilingualism on L3 development for

229
three unrelated languages, which weight cues differently to lead to correct interpretation
of sentences.
In addition, a significant result was only identified by the grammaticality
judgment test and task demand of the language tests may be the answer to why bilingual
advantages do not appear across all language tests (Bialystok, 1986, 1988, 1997, 1999,
2001, 2005, 2008). Bialystok (2001) posits that two cognitive processes: analysis of
representational structures and control of attention contribute to the superior performance
by bilinguals over monolinguals. “… analysis of representational structures is children’s
ability to construct mental representations with more detail and structure than was part of
their initially implicit knowledge… control of attention is responsible for directing
attention to specific aspects of either a stimulus field or a mental representation as
problems are solved in real time. ” (p.177) Her review (e.g., Bialystok, 2008) on the
previous studies suggests that not all the elicitation tests are the same and that the
bilingual advantages are reliably revealed by tests that require high demand on the
processes. In her categorization, the metalinguistic test used in the current study is one of
the reliable tests. Although her taxonomy (2001) is based on the metalinguistic tests she
reviewed, they may be applicable to categorize the other three tests in the current study.
The written and aural interpretation tests, which involve language use, are low in control
and analysis. The written sentence production requires detailed knowledge in order to
produce sentences with correct morphemes attached to the nouns and verb in a sentence
and that makes it high in demand for analysis of representation. Therefore, the task
demand of the four language tests explains the diverse results on the tests.
230
That the inclusion of different tests may elicit different types of knowledge is also
supported by other SLA researchers (e.g., Norris & Ortega, 2000; Robinson, 1995; Sanz,
1997). For example, Sanz has shown that SLA performance varies in the cognitive
demand imposed by elicitation tests. She included the mode of tests (oral and written)
and test types (a sentence completion test, a structured interview test, and a story-telling
test) as variables to compare the effect of instruction on the performance of 44 second-
year learners of Spanish. The results showed that participants performed better in the
written mode rather than in the oral one. The analysis of the written data also showed that
participants performed better in the written mode on the tests. On the other hand, the
experimental group did better only on the sentence completion test in the oral mode, not
the storytelling test. Thus, Sanz shows that not all the elicitation tests are the same
according to the task demand imposed. From these results, we can conclude that tests are
not all equal and the appearance of bilingual advantages depends on the types of
elicitation tests employed.
A closer look at the performance of beginning, intermediate, and advanced
learners on the untrained items of the grammaticality judgment test reveals a surprising
result. The significant result identified in the grammaticality judgment test is due to the
poorer performance of intermediates over beginning L2 learners from the pretest to the
immediate posttest and the result seems to contradict previous studies. We can reasonably
think that the learners’ initial attempt is to apply their processing strategies to novel
stimuli and that interacting with the treatment provides them opportunities to test their
hypotheses. It is easy to see how positive transfer may lead to major gains in L3, but the

231
different weights of cues in the three languages make the transfer difficult. The poor
performance on the immediate posttest suggests that learners seem to forge new
processing strategies, but the hypotheses are discarded two weeks after the treatment.
Besides, intermediate learners seem to be more sensitive to the treatment than other
learners are. Future studies in L3 may replicate the current study with a similar
population of different L2 proficiency levels or include more elicitation tasks to better
understand how the processing strategies are formed and what they are based on, such as
the transfer of L1 and L2 to L3, merger of L1 and L2, or partial attainment of separate L1
and L2 systems, as suggested in MacWhinney (1987).
Importantly, the difference in ability to assign semantic function to noun phrases
at the sentence level, as observed in the untrained items of the grammaticality judgment
test, provides a piece of evidence for system learning. Having higher L2 proficiency
affects the ability to transfer learned knowledge to novel stimuli. In other words, Level of
Bilingualism has an effect on chunking the L3 knowledge and applying it to untrained
items that learners had not been exposed to, which is revealed by the grammaticality
judgment test.
To sum up, the current study identifies a threshold between the beginning and
intermediate L2 learners and supports the previous L3 studies as well as the studies in the
Latin project with a better control of language backgrounds. It also suggests how task
demand may influence the appearance of bilingual advantages. Moreover, it reveals
evidence of system learning rather than item learning, as shown on the untrained items of
the grammaticality judgment test.

232
RQ2: Types of Feedback and L3 Language Development
Several interesting results emerge in relation to the second research question
addressing the differential effects of feedback on L3 development. The results showed
that learners receiving feedback containing metalinguistic information outperform their
counterparts provided with “right/wrong” as the feedback across tasks, except for the
word order preference data of the written sentence production test. These results are in
line with previous studies, which conclude that more explicit types of instruction are
more effective than less explicit ones (e.g., Alanen, 1995; Carroll & Swain, 1993; de
Graaff, 1997; DeKeyser, 1995; Ellis, 1993; Lado, 2008; Nagata, 1993; Nagata &
Swisher, 1995; Robinson, 1996, 1997). Moreover, the current study contributes to the
field by investigating the isolated effects of feedback with task-essentialness practice as
well as including more measures of development.
However, the results of the current study contradict Sanz (2004) and Sanz and
Morgan-Short (2004). Sanz (2004) assigned 142 native English speakers learning
Spanish as an L2 to an implicit or an explicit feedback groups. Similar to the current
study, the explicit feedback group received metalinguistic information as feedback: they
were told the existence of an error, the exact source of the error, and given metalinguistic
information about the error as feedback. The implicit feedback group was told only “OK”
for correct responses or “Sorry, try again” for incorrect responses. The ANOVA analyses
showed no group differences on the interpretation test, the sentence completion test, and
scores from video telling. Sanz concludes that explicit feedback provided during online
sentence processing does not enhance the acquisition of morphosyntax. Similarly, Sanz
233
and Morgan-Short (2004) included 4 groups in a combination of explanation and
feedback. Explanation is operationalized as “explicit rule presentation.” Feedback types
are the same as Sanz (2004). The results showed all groups improved on the written
interpretation and production tests, but provision of explicit information did not add to
the positive effects of input-based practice in L2 development.
Although the results of the current study and theirs stand in contradiction to each
other, a closer examination of the experimental treatments reveals methodological
differences that may account for the results. While Sanz (2004), Sanz and Morgan-Short
(2004) and the current study all include task-essentialness in the treatment, the
background of the participants is different. They included native speakers of English at
the intermediate Spanish level, but the current study recruited naïve L3 learners with
different L2 proficiency levels. In terms of practice, their study included 56 practice
items, but the current study presented the participants with 56 practice items twice. The
exposure to more practice items and time may have increased their opportunity to notice
or understand the target form, as suggested by Ellis (1993). Finally, the task demand
imposed by different tests might be responsible for the contradictory results as already
explained in the earlier section.
Taking the results from different test items into consideration, they suggest that
provision of more explicit feedback helps learners not only in the trained items that they
had seen during the treatment but also in the untrained items that are novel to them. This,
again, indicates the evidence of system learning rather than item-based learning. This
234
feedback facilitates students in learning abstract rules more than just chunking the
knowledge.
To conclude, the analyses conducted to investigate the effect of Feedback on L3
development suggest that provision of more explicit feedback facilitates learning more
than less explicit feedback.
RQ3: Level of Bilingualism, Types of Feedback, and L3 Development
The investigation of whether the interaction between the provision of feedback
and Level of Bilingualism differentially affects L3 development may show no substantial
group differences, but the analyses conducted on the scores from the trained items of the
grammaticality judgment test and on the learners’ overall accuracy in written sentence
production indicate exceptions.
A closer examination of the results from the trained items of the grammaticality
judgment test showed that the intermediate L2 learners outperform the beginning one
when only receiving “right/wrong” as feedback. In contrast, receiving metalinguistic
information as feedback does not distinguish one L2 group from another. For the overall
accuracy of the written sentence production test, none of the L2 learners outperforms
their counterparts in the same feedback groups. The superior performance of the more
explicit feedback group may have contributed to the significant result. Therefore, the null
hypothesis that the interaction between provision of feedback and Level of Bilingualism
does not differentially affect L3 development is partially rejected based on the results
identified on the grammaticality judgment test.
235
First, these results support previous studies that the appearance of bilingual
advantages depends on the explicitness of the input and the types of tasks performed.
(Sanz, Anfruns, Lado, Lin, & Medina, 2004, 2005) In two data-collection periods, Sanz
et al only found out receiving a grammar lesson before the practice with explicit feedback
helps near-native participants outperform the intermediate ones. Practicing the target
language without a grammar lesson is sufficient for near-native learners to learn better
than the intermediate ones, as shown on the untrained items of the aural interpretation test
and the written interpretation. The intermediate and advanced learners, or intermediate
and near-native learners were statistically different on trained items in the written
sentence production test. Their results indicate that explicitness in the input and types of
tests performed influence the appearance of bilingual advantages. While the current study
supports their findings, one key difference needs to be pointed out. Their study
operationalized explicitness in the input as the presentation or the absence of a grammar
lesson. All of their participants received explicit feedback containing metalinguistic
information. Participants in the current study did not receive grammar lessons prior to the
treatment. Their exposure to explicit input was feedback, so there is a difference of
timing of presentation for the explicit input: prior to or during practice and different types
of input: grammar lessons or feedback. To sum up, results from this study and the
previous study in the Latin Project suggest bilingual advantages appear under more
demanding conditions. Providing learners with explicit metalinguistic information seems
to minimize or level out the effect that individual differences may have with respect to
the learning outcome.

236
One study that closely resembles the current study is Lado (2008). She
demonstrated that bilingual advantages appear depending on the external conditions
(types of feedback provided). Specifically, in the aural interpretation test, Lado found that
near-native learners outperform other groups when only receiving “right/wrong” as
feedback, which is the less explicit condition. In the more explicit condition, the basic L2
learners performed statistically worse than the other groups. Lado concludes that
Cummins’ Threshold Hypothesis sustains depending on the explicitness in the input. The
current study supports her results and extends her findings to learners with different
language backgrounds. The current study also found that results vary depending on the
types of tests. In the grammaticality judgment test, there are no differences in the explicit
feedback condition. On the other hand, in the more demanding condition, in which
learners only received “right/wrong” as feedback, having higher L2 proficiency helps L3
development and the threshold appears between the intermediate and the beginning L2
groups. In other words, providing only “right/wrong” feedback is sufficient for learners at
higher L2 levels compared with those at the lower levels to learn a third language. The
results lead us to conclude that the provision of more explicit feedback levels out some
effect that individual differences may have had in L3 development. This lack of
significance among the L2 levels using the more explicit condition may also provide an
explanation for lack of differences found among different bilinguals (simultaneous, pre-
adolescent sequential, post-sequential, and developing sequential bilinguals) in Stafford
(2005).
237
In addition to Sanz et al (2004, 2005) and Lado (2008) working within the Latin
Project conducted with L3 learners, the current study supports previous laboratory studies
that examined the interaction between internal factors and external conditions (Nation &
McLaughlin, 1986; Nayak, Hansen, Krueger, & McLaughlin, 1990) and shows that the
interaction may influence the appearance of bilingual advantages. Moreover, the current
study not only supports their results but also extends their findings to a natural language
learned by Mandarin speakers of English in a laboratory context with different external
conditions; that is, types of feedback in the current study, and memory and rule-discovery
conditions in theirs.
When separating the test items, the result (intermediate L2 learners outperformed
the beginning L2 group) was found only on the trained items of the grammaticality
judgment test, but it was not identified on the untrained items, which participants had not
seen during the treatment. The results suggest that receiving less explicit feedback may
be sufficient for learners at higher L2 levels to learn L3, but this is not enough for them to
apply their chunked knowledge to novel stimuli, system learning.
Despite the results on the grammaticality judgment test, no one L2 group is better
than the others in any one of the conditions, shown on the analyses conducted on overall
accuracy scores from the written production test. It is suspected that the significant Level
x Feedback revealed by the ANOVAs is because of the superior performance by the more
explicit feedback group across L2 levels, which has been discussed in RQ2. Although the
results may, again, confirm the fact that the provision of more explicit feedback may
level out the differences among individuals in the more explicit feedback group, no group
238
differences are found for the L2 levels in the less explicit feedback group. The task
demand imposed by the tests performed may possibly cause the non-significances among
the L2 levels in the less explicit feedback group, as explained earlier.
Clearly, the overall results support the positive effect of bilingualism on L3
development and provide empirical evidence for Cummins’ Hypothesis that bilingual
advantages only emerge when a certain level of bilingual proficiency is attained, as
shown in the grammaticality judgment test. However, these results also suggest that task
demand plays a role in the appearance of bilingual advantages, explained by Bialystok’s
model. Reviewing studies that examine the bilingual advantages, Bialystok (2005)
concludes that bilingual advantages appear on tasks that require high control, which is the
grammaticality judgment test in the current study.
Lastly, comparing the results reported for research question 1 to 3, the
investigation on the interaction between Level and Feedback gives us a more complete
picture of advantages than those reported in RQ1 (the effect of bilingualism on L3
development) or RQ2 (the effect of Feedback on L3development) alone. Because
bilingual advantages appear for untrained items on the grammaticality judgment test
across feedback groups (RQ1) and participants in the more explicit feedback group
outperformed their counterparts (RQ2), it is natural to think that we would find the same
results on the same tests. Significant results found for the untrained items of the
grammaticality judgment test in the RQ1 and the lack of significance for the untrained
items of the grammaticality judgment test in the RQ3 may be due to the small effect size.
(η²=.079). In other words, only 8% difference is accounted for by the L2 levels in the

239
RQ1. The effect may be minimized when separating the participants at each L2 level into
different feedback group in a smaller sample size (n=15).
To conclude, the answers to RQ3 lead us to understand the interaction between
external conditions (types of feedback) and an internal factor (Level of bilingualism) as
well as how task demands of assessments may affect the appearance of bilingual
advantages. These results show us that providing participants with more explicit feedback
may eliminate the effect of individual differences on L3 development. In addition, the
provision of more explicit feedback helps participants more than providing them with
minimal feedback, “right/wrong”. Moreover, with minimal information, participants with
higher L2 proficiency can still take this advantage to achieve superior performance in L3
development when assigning semantic functions to noun phrases at the sentence level.
Importantly, this bilingual advantage can appear even for unrelated languages (L1-
Mandarin, L2-English, L3-Latin) that weight cues differently. In short, examining only
internal factors or external conditions may give us a glimpse to language processing, but
the inclusion of both helps us understand language learning even better!
RQ4: WM Capacity and L3 Development
The fourth research question investigates whether the inclusion of WM capacity
can explain the observed effect found in RQ1-3. The results suggest that WM capacity
plays a role in L3 development as shown by the different results identified between the
repeated measures ANOVAs and the ANCOVAs. The null hypothesis is partially
rejected, as the results are only found between WM capacity measured by three of five
WM tests, and some test items of certain language tests.

240
First, the correlations between the WM test scores and the pretest, posttest, and
delayed tests support previous studies that there is a relationship between WM capacity
and SLA (e.g., Abu-Rabia, 2003; Ando, Fukunaga, Kurahachi, Suto, Nakano, & Kage,
1992; Berquist, 1997; Harrington & Sawyer, 1992; Erlam, 2005; Juffs, 2003; Mackey,
Philp, Egi, Fujii, & Tastumi, 2002; Miyake & Friedman, 1998; Lin, 2004, 2007; Sagarra,
2000; Sanz, Anfruns, Lado, Lin, Medina, 2005; Stafford, 2005; Winke, 2005,). The
results also support the more, the better hypothesis; that is, higher WM capacity is
associated with better performance (Erlam, 2005; Juffs, 2003; Lin, 2004, 2007; Mackey,
Philp, Egi, Fujii, & Tastumi, 2002; Sanz, Anfruns, Lado, Lin, Medina, 2005; Stafford,
2005)
The results also reveal that the WM tests employed to assess WM capacity may
not tap into the same concept. Only the computational span test, speed of processing test,
and the sentence span test correlate with each other in the current study. Non-word recall
and digit backward span tests are often used to measure the storage component of WM
capacity, which is the phonological loop for vocabulary acquisition (e.g., Baddeley, Alan,
Gathercole, Susan, Papagno, Costanza, 1998; Baddeley, 2003). Because the current study
focuses on L3 processing, not vocabulary acquisition, it is reasonable to ascertain for the
lack of significant results between non-word recall and digit backward test and others.
Some researchers (e.g., Hedden, Lautenschlager, & Park, 2005; Maehara & Saito, 2007)
also argue what declines across the adult life span is processing ability that is assessed by
the speed of processing test and WM span tests (i.e., the sentence span tests and the
computational span tests).
241
Both analyses on the scores from the sentence span test and the computation span
test yielded significant correlations, thus supporting Turner and Engle (1989) that
verbally-based and numerically-based WM span tasks both correlate with measures of
verbal ability. In other words, the results support a domain-generality model and refute a
domain-specific view, which make performing a linguistic task different from other tasks
regarding the type of secondary task performed. The result is also supported by Lin
(2005, 2007).
Next, the role of WM capacity varies depending on the tasks performed as
reported earlier: 1) the computational span test correlates with the posttest scores from
the untrained items of the written interpretation test, 2) the Speed of processing test
correlates with the posttest scores from the untrained items of the aural interpretation
tests, and 3) the sentence span test correlates with the pretest scores from the trained
items of the written production test. Different patterns found between WM capacity and
language tests confirm the initial assumption that the task demands imposed by the tests
vary. For instance, the two interpretation tests use different delivery modes, visual and
aural, and require participants to make judgments on matching the pictures after reading
or listening to sentences in the L3. The aural interpretation test appears to demand more
effort because participants have to listen to a sentence and hold it in their memory in
order to make a judgment while the written interpretation test is easier than the aural
interpretation test, as there is less time pressure. Similar results are confirmed by Sanz
(1997). The written sentence production test requires participants to produce a sentence
by attaching correct morphemes to each noun and verb, which may require higher

242
analysis of the language. While the written interpretation, the aural interpretation, and the
sentence production test require language use, the grammaticality judgment test is
traditionally used to elicit participants’ intuition of the acceptability of a sentence.
Correlations between WM capacity measured by the computational span test and
by the speed of processing test and L3 development suggest that learners with greater
WM capacities more successfully maintain information on the immediate posttests;
however, they are not able to carry the knowledge in their minds forward to the delayed
tests. In contrast, WM capacity measured by the sentence span test predicts better
performance for the learners with greater WM capacity, but it does not help them for the
treatments. Only one study may be relevant to the discussion. (Mackey, Philp, Egi, Fujii,
& Tatsumi, 2002) Mackey, Philp, Egi, Fujii, and Tatsumi (2002) found participants of
different WM capacities performed dissimilarly when examining the relationship among
WM capacity, noticing of interactional feedback, and L2 development in English
question formation. They found that participants with lower WM span scores reported
more noticing in the immediate post-test and the ones with higher WM span scores
showed more development in the delayed posttest. Although Mackey et al. seem to
support the current finding, the current study differs from theirs in some aspects. First,
they used composite WM scores of a non-word recall task, a Japanese span task, and an
English sentence span task, but the current study separately analyzed WM capacity
measured by five different WM tests. Next, they employed the ANOVAs to examine the
role of WM capacity, while the current study implemented correlations. Using the
ANOVA analyses the researcher may hide some valuable information between the WM

243
capacity and language learning, as reported in Lin (2005, 2007). Researchers should
further examine if the relationship of language development and WM capacity only
appears or disappears after a certain period of time.
Analyses on scores from the test items (trained and untrained items) in the
language tests also showed differential results for WM capacity. While a relationship is
present between the trained items of the sentence production test and the scores from the
sentence span test, correlations also exist between the untrained items of the aural
interpretation test and the scores from the speed of processing test, and the untrained
items of the written interpretation test and the scores from the computational span test.
The plan to separate the scores is to distinguish chunked knowledge, when learning is
memory driven, and the knowledge resulting from rule formation is being applied to
items not seen in the treatment. The significant result on the written sentence production
test shows that the participants made decisions based on previously encountered items but
they are unable to generalize them to untrained items. This finding provides evidence for
item learning. On the other hand, learners are able to apply what they know to novel
stimuli as the results on the other tests. Task demand imposed by the tests may contribute
to the diverse results, as explained in earlier sections.
The current study also suggests that the relationship between WM capacity and
language development may perhaps be affected by explicitness in the input by comparing
the different results found in the current study with those in Sanz et al., (2004, 2005), Lin
(2005, 2007) and Stafford (2005). Learners in the current study practiced with the target
language with the provision of different feedback. The operationalization of explicitness

244
in the input in Sanz et al., (2004, 2005) and Lin (2005, 2007) is to include a grammar
lesson before practice or not to include a grammar lesson before practice. Stafford (2005)
found that WM capacity measured by a sentence span task was a predictor of L3
development in the same explicit treatment, but with a different sample compared to the
current study (L1 Spanish and L2 English). Future research may consider the significant
role of condition in the investigation of a relationship between WM capacity and
language development.
Holding WM capacity constant also changes the results observed in the effect of
Level on L3 development. Entering WM capacity measured by a computational span test
shows strong correlations between the untrained items of the written interpretation test on
the posttest in the advanced L2 level, but not other L2 levels. WM capacity of the three
L2 levels is statistically similar on the pretest as identified by ANOVA analyses. The
results may be interpreted from an information processing perspective suggested by
Nation and McLaughlin (1986). They said that, “the superior performance of the
multilingual subjects … may have resulted from a tendency to habitually exert more
processing effort in making sense of verbal stimuli… controlled processing may have
occurred. Some controlled processes transpire with great speed….” (p.52). As processing
verbal stimuli requires flexibility between automatic and controlled processing, the
participants at the higher L2 level may be more flexible because they are able to switch
between the two. That flexibility happens in WM and it is captured by the computational
span test. Bialystok (2008) also said, “ … studies comparing monolinguals and

245
bilinguals on aspects of executive processing consistently report advantages for
bilinguals. Their differences have been found at all ages across the lifespan.” (p.5)
The results also suggest there is no relation between the WM capacity of feedback
groups and L3 development, as there is no difference in WM capacity of the feedback
groups and, for each level, their WM capacity is similar for analyses conducted on the
scores of the grammaticality judgment test and written sentence production. The results
suggest that WM capacity has no significant roles in this interaction and that the WM
capacity of either feedback groups or L2 Levels cannot account for the significant results.
Lastly, while studies in comparing monolinguals and bilinguals have
demonstrated the bilingual advantages on nonverbal tasks (e.g., Bialystok & Majumder,
1998), the current study extends their findings to the linguistic tasks; that is L3 language
test. Notably, the results are not applicable to all language tests, but it is applicable to the
grammaticality judgment test in the current study. As Bialystok (2001, 2004, 2008)
points out, bilingual advantages appear only on the tasks that place high demand on
cognitive processes; that is selective attention and high control in this case.
To sum up, the answers to RQ4 suggest that WM capacity plays a role in L3
development and that the higher WM capacity learners have the better performance they
may have. In addition, WM capacity is not language dependent. Moreover, the current
study suggests that whether or not researchers can unveil the role depends on the types of
WM tests employed to measure WM capacity, the task demand imposed by the language
tests, the types of test items (trained or untrained), the explicitness in the input (feedback
provided), and the level of bilingualism.
246
RQ 5: Learning Strategies and L3 Development
The last research question is devoted to understanding the role of Learning
Strategies on L3 development, the null hypothesis that Learning Strategies plays no role
in L3 development is rejected by the different results reported by repeated measures
ANOVAs and by closer examinations using ANCOVA together with further correlation
and ANOVA analyses. The results that learners with higher L2 proficiency use the
strategies (Cognitive Strategies, Compensation Strategies, and Metacognitive Strategies)
more frequently than their counterparts and that advanced L2 learners use strategies
(Memory Strategies and Social Strategies) more frequently than the beginning L2
learners have been supported by previous research in strategies: learners at higher
proficiency levels use strategies more frequently than their counterparts (see a review by
Wharton, 2000). However, the direction may be reverse that using strategies more
frequently helps learners to achieve higher L2 proficiency levels.
The current study, compared to studies that use verbalization data to determine
the use of strategies by learners (Nation & McLaughlin, 1986; Nayak, Hansen, Krueger,
& McLaughlin, 1990; Sanz, Lin, Lado, Bowden, & Stafford, 2009), provides more valid
evidence to L3 studies to explain why learners with more prior language experiences
outperform those with fewer ones as not all strategies used are easily articulated by
learners. As Oxford & Burry-Stock (1995) explained, employing a self-reported
questionnaire has a number of advantages in assessing strategies rather than employing
other methods. Moreover, the findings support Kemp (2007), which uses a different

247
measure of strategies (grammar learning strategies) to compare bilinguals and
multilinguals.
The findings also confirm those of Wharton (2000), which is the only study
investigating the relationship between Learning Strategies and bilinguals on L3
development. He says that there is a positive relationship between frequency of use of
Learning Strategies and L3 development. While Wharton examines the relationship
between Learning Strategies and bilinguals learning another language (French or
Japanese), the current study extends his findings to EFL learners learning Latin in a
laboratory environment. Notably, Wharton (2000) includes bilinguals having different L3
levels while the current study recruited bilinguals at different L2 levels at the initial
development of an L3.
The ANOVA analyses in Wharton revealed relationships between L3 levels and
two of the six categories (Affective and Compensation), but the correlation analyses in
the current study finds positive relationship between Compensation Strategies and L3
development and Metacognitive Strategies and L3 development. When comparing the
mean score of each strategy, the ranking of strategy categories also vary. The ranking
choice of strategies in the current study is Compensation strategy, Memory Strategies,
Cognitive Strategies, Social Strategies, Metacognitive Strategies, and Affective
Strategies, respectively. While Affective Strategies is the lowest in Wharton and the
current study, the more frequently used strategies are Social Strategies and Compensation
Strategies in Wharton. The different results between Wharton and the current study may
be due to the methodological differences between the two studies: learning stage of a

248
language (different L3 proficiency level in Wharton vs. initial L3 development), context
(bilingual vs. EFL), language studied (the Japanese or the French language vs. Latin),
motivation to learn another language (a foreign language vs. a language only learned in
the lab), and settings (a classroom setting vs. a laboratory environment). Previous studies
in strategies have demonstrated how these factors may influence the different results
found in each study (See Oxford & Burry-Stock, 1995 and Wharton, 2000 for a short
review).
Some interesting results, which may not be easily accounted for by the latest
research, appear. First, the current study shows that learners in the more explicit feedback
group use Cognitive Strategies, Metacognitive Strategies, and Affective Strategies more
than their counterparts do. Only one study has examined the situation (Nayak et al., 1990)
Nayak et al. found that multilinguals used strategies more in the rule-search condition
than in the memory condition, but the current study did not find this type of interaction.
The current study revealed that the frequency of use by each level and those of different
feedback groups were independent from each other. In other words, no L2 groups seemed
to use certain strategies more in one condition than the others do. Notably, Nayak et al.
explored the strategies used by the participants performing on a specific task while the
current study examined frequency of use of strategies in general. Because no
verbalization data was included to examine learners’ use of strategies and the SILL is
only based on the strategies reported by the learners, future research is needed to replicate
the current study in order to further examine these results or to include verbalization data
to give a more complete picture of the strategies employed by learners when performing a
249
task. In addition, learners in the more explicit feedback reported use strategies more
frequently may be due to the time that SILL was used, which is after the treatment. It is
suspected that the timing of the data collected may influence their report of strategy use.
The second finding is that Compensation Strategies is a predictor of trained items
of the grammaticality judgment test and the untrained items of the written sentence
production test (accuracy) on the pretest. Metacognitive Strategies predicts L3
development, measured by the untrained items of the grammaticality judgment test on the
pretest and the trained items of the word order preference data of the written sentence
production test on the immediate posttest. The correlations found on the pretest seem not
to help learners on the posttests, although using Compensation Strategies or
Metacognitive Strategies more frequently do help learners perform better on the written
sentence production test. Learners’ motivation in the learning task may influence their
frequency of use of strategies as suggested in research in strategies (e.g., a review by
Wharton, 2000). To my knowledge, no studies have investigated the role of Learning
Strategies at different times (e.g., pretest, posttest, delayed test) and how participants
employ these strategies to novel stimuli and other factors. Future research may examine
whether the frequency of use of strategies change over time is independent from other
factors.
The correlation between Compensation Strategies and Metacognitive Strategies
and L3 development (not other categories of Learning Strategies) also showed interesting
results. The results suggest that using Compensation Strategies (e.g., using linguistic and
other clues) to compensate for the missing knowledge and Metacognitive Strategies (e.g.,

250
overviewing and linking with already known material, paying attention) are especially
useful in this type of task when learners are only provided with feedback. Future research
may explore whether the results of the current study are sustained in similar learning
tasks.
Lastly, a correlation is found between the overall accuracy of the written sentence
production test on the pretest and the mean scores of the Compensation Strategies of the
less explicit feedback group, but not with the more explicit feedback group. According to
Oxford and Burry-Stock (1995), Compensation Strategies is used to compensate for
missing knowledge, such as guessing meanings from the context in reading and listening.
For the less explicit feedback group, using Compensation Strategies may help them more
because of the minimal information they receive, but learners seem not to take the
advantage of this strategy for L3 learning, as shown on the posttests.
To summarize, investigating the role of Learning Strategies in L3 by including
SILL has provided some exciting results other than using verbalization data in the
previous L3 studies. The current study confirms the results of the aforementioned studies
that prior language experience is an influential factors regarding frequency of use of
strategies for the initial L3 development. The current study also confirms and extends the
results of Wharton (2000) to learners of different language backgrounds in a different
context as well as uncovers some remarkable relationship between strategies, L3
development, and external conditions. Moreover, the current study validates the results of
Wharton by including learners at different L2 levels in the same culture learning an L3.

251
Conclusions and Implications
The current study aims to examine both internal factors (level of bilingualism,
cognitive capacity, and Learning Strategies) and external conditions (types of feedback)
and their interaction to contribute to the field of research and language teaching. The
results have provided a piece of evidence to account for the effect of Level of
Bilingualism on L3 acquisition that bilinguals are not all the same as well as a threshold
for the bilingual advantages to appear. The current study has also shown that providing
feedback containing metalinguistic information aids learners in language learning.
Moreover, it has demonstrated that not only providing more explicit feedback may level
out the effect that individual differences have on L3 learning but also that giving minimal
information is sufficient for learners at higher L2 proficiency levels to develop a third
language. The findings in this study suggest a number of implications and extensions for
further research and pedagogy.
For research in bilingualism, these results have provided evidence for Cummins’
Threshold Hypothesis and shown how the appearance of bilingual advantages may
depend on the task demand imposed by the tests performed by using Bialystok’s model.
With a better control of language backgrounds to minimize the positive transfer among
languages, the current study provides support for the appearance of bilingual advantages,
even for three languages that weight cue differently. To educational policy makers, the
results of the current study may have suggested a better time to introduce another
language to EFL learners in Taiwan and demonstrated that introducing another language
252
while learners have not reached a certain level in two languages does not necessarily
promote a positive learning outcome.
The inclusion of pedagogical conditions (types of feedback) has provided SLA
researchers who are interested with information on the effects of feedback and language
teachers that giving feedback containing metalinguistic information benefits learners
across L2 levels. While giving more explicit feedback enhances learning, learners with
higher L2 proficiency levels are able to take the advantage of minimal information in the
input to help them in learning. It is important for language teachers to keep in mind that
although feedback aids language learning, not every learner benefits from input
containing minimal information, which is the less explicit feedback in the current study.
Moreover, not all feedback helps to the same extent; in this case, having less explicit
feedback does not always help learners more than having no practice and feedback.
The current study has also identified the mediating effects that working memory
capacity and Learning Strategies have on L3 development. The results have shown that
having a higher WM capacity enhances learning and learners with higher L2 proficiency
levels tend to use strategies more frequently. Moreover, using Learning Strategies more
frequently helps learners in L3 development. Therefore, it is important for language
teachers to recognize that learners are not the same and that some pedagogical techniques
may benefit some more than others may. To take a step further, identifying and teaching
strategies used by learners may assist language teachers in choosing appropriate
pedagogical methods in order to help students learn a language better or even faster.
253
Limitations and Future Research
In order to deepen their understanding of L3 development, this study opens a
number of avenues for further research, but it also has its limitations. As the analyses
suggests, low power and smaller sample size may contribute to the few significant results
found. Future research may include more participants in each group in order to validate
the results found.
Second, the current study has suggested that bilingual advantages do not appear
across the language tests because task demands imposed by them may influence the
results. Hence, future research may include a variety of elicitation tests in order to
provide a more detailed picture of bilingual advantages.
This study provides evidence for the beneficial effect of giving metalinguistic
information as feedback and shows that learners do not always learn when less explicit
feedback is provided. Because the current study only includes two types of feedback,
future research may consider more types of feedback in the design. In addition, a control
group is only included for the low L2 group. Future research may examine the effect of
different feedback to learners at different proficiency levels. Moreover, because all
groups practiced with the target language and feedback is included as part of the
treatment, researchers may examine whether being exposed to the tasks is sufficient for
language learning.
Next, the findings reveal that WM capacity measured by different WM span tests
may assess different skills. While researchers are interested in the role of WM capacity in
language learning, including more measures of WM capacity may unveil the role that

254
WM capacity plays in language learning. In order to understand the relationship between
WM capacity and L3 development, future research may use a compound score for WM
with those scores that show correlations in order to avoid Type 2 errors.
The current study identifies that learners with higher L2 proficiency levels use
strategies more frequently, but few elicitation techniques are included in the study, such
as verbalization data or interviews. The inclusion of more online or offline elicitation
tools may give us a more complete picture of strategies employed by learners because
SILL only provides the frequency of use of strategies reported by learners and not all
strategies are easily articulated or reported.
The current study is a laboratory study, not conducted in a natural environment. It
is uncertain whether the results are applicable to other settings. Future research may
examine if the same results are obtained in other settings, as research in strategies have
suggested that settings influence strategy use (see a review by Wharton, 2000.)
Future research may also use an omnibus ANOVA that includes level, conditions,
items (trained and untrained) to investigate their interactive effects on L3 development.
Lastly, the duration of the whole study was less than 2 months. The delayed test
was held 2 weeks after the treatment. It would be of interest to examine whether or not
the same results are obtained after a longer period of time.

255
REFERENCE
Abu-Rabia, S. (2003). The influence of working memory on reading and creative writing processes in second language. Educational Psychology, 23, 210-222.
Abu-Rabia, S. & Siegel, S.L. (2002). Reading, syntactic, orthographic and working
memory skills of bilingual Arabic-English speaking Canadian children. Journal of Psycholinguistic Research, 31(6), 661-678.
Alanen, R. (1995). Input enhancement and rule presentation in second language
acquisition. In R. Schmidt (Ed.), Attention and awareness in foreign language learning (pp. 259-302). Honolulu: University of Hawaii Press.
Ando, J., Fukunaga, N., Kurahachi, J., Suto, T., Nakano, T., & Kage, M. (1992). A
comparative study on the two EFL teaching methods: The communicative and the gramatical approach. Japanese of Educational Psychology, 40, 247-256.
Baddeley, A. (1986). Working memory. Oxford: Clarendon Press. (1990). Human memory: Theory and practice. Mahwah, NJ: Erlbaum.
(2000). The episodic buffer: A new component of working memory? Trends in Cognitive Sciences, 4(11):417-423.
(2003). Working memory and language: An overview. Journal of Communication
Disorders, 36(3), 189-208. Baddeley, A., & Hitch, G. (1974). Working memory. In G. H. Bower (ed.), The
psychology of learning and motivation: Vol. 8. Advances in research and theory (pp. 47–90). San Diego, CA: Academic Press.
Baddeley, A., & Logie, R. (1999). Working memory. The multiple-component model. In
P. Shah & A. Miyake (Eds.), Models of working memory (pp. 28–61). New York: Cambridge University Press.
Baddeley, A., Papagno, C., & Vallar, G. (1988). When long-term learning depends on
short-term storage. Journal of Memory and Language, 27, 586–595. Baker, C. (2001). Foundations of bilingual education and bilingualism. Clevedon:
Multilingual Matters.

256
Bates, E. & MacWhinney, B. (1981). Second-language acquisition from a functionalist perspective: Pragmatic, semantic, and perceptual strategies. Annals of the New York Academy of Sciences, 379, 190-214.
(1982). Functionalist approaches to grammar. In E. Wanner & L. Gleitman (Eds.), Language acquisition: The state of the art (pp. 173-218). New York: Cambridge University Press.
(1989). Functionalism and the Competition Model. In B. MacWhinney & E. Bates (Eds.), The crosslinguistic study of sentence processing (pp. 3–73). New York: Cambridge University Press.
Ben-Zeev, S. (1977). The influence of bilingualism on cognitive strategy and cognitive
development. Child Development, 48(3), 1009-1018 Bialystok, E. (1980) A theoretical model of second language learning. In K. Croft (Ed.),
Readings on English as a second language, 2nd Edition. Cambridge, MA: W (1981). Some evidence for the integrity and interaction of two knowledge sources. In R. Anderson (Ed.), New dimensions in research on the acquisition and use of a second language. Rowley, MA: Newbury House.
(1986). Factors in the growth of linguistic awareness. Child Development, 57, 498-510.
(1988). Levels of bilingualism and levels of linguistic awareness. Developmental
Psychology, 24, 560-567. (1997). Anatomy of a revolution. In D. Johnson & K. Erneling (Eds.), The future
of the cognitive revolution (pp. 109-113). New York: Oxford University Press. (1999). Cognitive complexity and attentional control in the bilingual mind. Child Development, 70, 636-644 .
(2001). Bilingualism in development: Language, literacy, and cognition. New York: Cambridge University Press.
(2008) Cognitive effects of Bilingualism across the lifespan. In H. Chan, H. Jacob, & E. Kapia (Eds.), BUCLD 32 Proceedings (pp.1-15). Somerville, MA: Cascadilla Press.
Bialystok, E., Craik, F., Klein, R., & Viswanathan, M. (2004). Bilingualism, aging, and
cognitive control: Evidence from the Simon task. Psychology and Aging, 19(2), 290-303.

257
Bialystok, E., Majumder, S., & Martin, M. M. (2003). Developing phonological awareness: Is there a bilingual advantage? Applied Psycholinguistics, 24(1), 27-44.
Bialystok, E. & Majumder, S. (1998). The relationship between bilingualism and the
development of cognitive processes in problem-solving. Applied Psycholinguistics, 19, 69-85.
Bowles, M. A. (2005). Effects of verbalization condition and type of feedback on L2
development in a CALL task. Unpublished doctoral dissertation. Georgetown University,
Washington, D.C.
Caplan, D. & Waters, G. (1999). Verbal working memory and sentence comprehension. The Behavioral and Brain Sciences, 22(1), 77-94.
Carroll, S. & Swain, M. (1993). Explicit and implicit negative feedback: An empirical
study of the learning of linguistic generalization. Studies in Second Language Acquisition, 15, 357-386.
Cenoz, J. (2000). Research on multilingual acquisition. In J. Cenoz & U. Jessner (Eds.).
English in Europe. The acquisition of a third language (pp. 39-53). Clevedon: Multilingual Matters.
(2001). The effect of linguistic distance, L2 status and age on cross-linguistic
influence in third language acquisition. In J. Cenoz (ed.). Cross-linguistic influence in third language acquisition. Clevedon: Multilingual Matters.
(2003). The additive effect of bilingualism on their language acquisition: A
review. The International Journal of Bilingualism, 7(1), 71-87. Cenoz, J. & Valencia, J.F. (1994). Additive trilingualism: Evidence from the Basque
Country. Applied Psycholinguistics, 15, 195-207. Chamot, A. U. (2005). Language learning strategy instruction: Current issues and
research. Annual Review of Applied Linguistics, 25, 112-130. Cromdal, J. (1999). Childhood bilingualism and metalinguistic skills: Analysis and
control in young Swedish-English bilinguals. Applied Psycholinguistics, 20, 1-20. Cummins, J. (1976). The influence of bilingualism on cognitive growth: A synthesis of
research findings and explanatory hypotheses. Working Papers on Bilingualism, 9, 1-43

258
(1977). Cognitive factors associated with the attainment of intermediate levels of bilingual skills. The Modern Language Journal, 61, (1/2), 3-12
(1978a). Educational implications of mother Tongue maintenance in minority-language groups, Canadian Modern Language Review, 34(3), 395-416
(1978b). The cognitive development of children in immersion programs,
Canadian Modern Language Review, 34(5), 855-883. (1979). Linguistic interdependence and the educational development of bilingual children. Review of Educational Research, 49, 222-51. (1989). A theoretical framework for bilingual special education. Exceptional Children, 56(2), 111-120.
Cummins, J. & Mulcahy, R. (1978). Orientation to language in Ukranian-English
bilingual children. Child development, 49 (4), 1239-1242. Da Fontoura, H. & Siegel, L.S. (1995). Reading, syntactic and working memory skills
ofbilingual Portuguese-English Canadian children. Reading and Writing, 7(1), 139-153.
Daneman, M. & Carpenter, P. A. (1980). Individual differences in working memory and
reading. Journal of Verbal Learning and Verbal Behavior, 19(4), 450-466. De Graff, R. (1997). The eXperanto experiment: Effects of explicit instruction on second
language acquisition. Studies in Second Language Acquisition, 19, 249-276. Hannon, B. & Daneman, M. (2001). A new tool for mearning and understanding
individual differences in the component processes of reading comprehension. Journal of Educational Psychology, 93(1), 103-128.
DeKeyser, R. (1993). The effect of error correction on L2 grammar knowledge and oral
proficiency. The Modern Language Journal, 77(4), 501-514.
(1995). Learning second language grammar rules: An experiment with a miniature linguistic system. Studies in Second Language Acquisition, 17, 379-410.
(2003). Implicit and explicit learning. In C. Doughty, & M. H. Long (eds.), The
handbook of second language acquisition (pp. 313-347). Malden, MA: Blackwell. Elman, J. L. (1993). Learning and development in neural networks: The importance of
starting small. Cognition, 48, 71-99.

259
Ellis, N. (1993). Rule and instances in foreign language learning: Interactions of explicit and implicit knowledge. European Journal of Cognitive Psychology, 5, 289-318.
(1996). Sequencing in SLA: Phonological memory, chunking, and points of order.
Studies in Second Language Acquisition, 18, 91–126
(2001). Memory for language. In P. Robinson (ed.). Cognition and second language instruction (pp. 33-68). Cambridge: Cambridge University Press.
(2002). Frequency effects in language processing: A review with implications for
theories of implicit and explicit language acquisition. Studies in Second Language Acquisition, 24, 143–188.
(2005). At the interface: Dynamic interactions of explicit and implicit language
knowledge. Studies in Second Language Acquisition, 27, 305-352. Ellis, N. & Sinclair, S. G. (1996). Working memory in the acquisition of vocabulary and
syntax: Putting language in good order. The Quarterly Journal of Experimental Psychology, Section A: Human Experimental Psychology, 49A(1), 234-250.
Ellis, R. (1984). Classroom second language development: A study of classroom
interaction and language acquisition. NY: Pergamon Press.
(1994). A theory of instructed second language acquisition. In N. Ellis (ed.), Implicit and explicit learning of languages (pp. 79–114). San Diego, CA: Academic Press.
Engle, R.W., Carullo, J. J., & Collins, K. W. (1991). Individual differences in working
memory for comprehension and following directions. Journal of Educational Research, 84(5), 253-262.
Engle, R. W., Kane, M. J., & Tuholski, S. W. (1999). Individual differences in working
memory capacity and what they tell us about controlled attention, general fluid intelligence, and functions of the prefrontal cortex. In P. Shah, & A. Miyake (Eds). Models of working memory: Mechanisms of active maintenance and executive control. (pp. 102-134). New York: Cambridge University Press.
Engle, R. W., Cantor, J., & Carullo, J. J. (1992). Individual differences in working
memory and comprehension: A test of four hypotheses. Journal of Experimental Psychology: Learning, Memory, and Cognition, 18 (5), 972-992.
Erlam, R. (2005). Language aptitude and its relationship to instructional effectiveness in
second language acquisition. Language Teaching Research, 9(2), 147-171.

260
Errasti, M. P. S. (2003). Acquiring writing skills in a third language: The positive effects of bilingualism. The International Journal of Bilingualism, 7(1), 27-42.
Estes, W (1989). Learning theory. In A. Lesgold & R. Glaser (Eds.), Foundations for a
psychology of education (pp.1-49) NJ: Erlbaum. Eysenck, M. & Keane, M. (2000) Cognitive Psychology: A student's handbook. PA:
Psychology Press Ltd. (2nd ed.) Ferris, D., & Roberts, B. (2001). Error feedback in L2 writing classes: How explicit does
it need to be. Journal of Second Language Writing, 10(3), 161-184.
Fox, W. (2003). Social Statistics. Ontario, Canada: Wadsworth Group. Gathercole, S.E., Willis, C., Emslie, H., & Baddeley, A. (1992). Phonological memory
and vocabulary development during the early school years: A longitudinal study. Development Psychology, 28, 887-898.
Gardner, R. C., & Maclntyre, P. D. (1993). A student’s contributions to second-language.
Part II: Affective variables. Language Teaching, 26, 1-11. Gathercole, V.C.M. (1997). The linguistic mass/count distinction as an indicator of
referent categorization in monolingual and bilingual children. Child Development, 68, 832-42.
Gathercole, S. & Baddeley, A. (1993). Working memory and language. Hove: Sussex.
Erlbaum. Gass, S. (1987). The resolutation of conflicts among competing systems: A bidirectional
perspective. Applied Psycholinguistics, 8, 329-350. Gass, S. M. & Selinker, L. (1992). (Eds.) Language transfer in language learning. PA:
John Benjamins Publishing Co. Genesee, F., Tucker, G.R., & Lambert, W. (1975). Communication skills of bilingual
children. Children Development, 46, 1010-1014. Green, J. M. & Oxford, R. (1995). A closer look at learning strategies, L2 proficienty,
and gender. TESOL Quarterly, 29 (2), 261-297 Harrington, M. (1987). Processing transfer: Language-specific strategies as a source of
interlanguage variation. Applied Psycholinguistics, 8,351-378. Harrington, M. & Sawyer, M. (1992). L2 working memory capacity and L2 reading skill.
Studies in Second Language Acquisition, 14(1), 25-38.

261
Hitch, G. J. (1978). The role of short-term working memory in mental arithmetic. Cognitive Psychology, 10, 302-323. Klein, E. C. (1995). Second versus third language acquisition: Is there a difference? Language Learning, 45, 419-465.
Hitch, G.J., Towse, J. N., & Hutton, U. (2001). What limits children’s working memory
span. Theoretical accounts and applications for scholastic development. Journal of Experimental Psychology: General, 130, 184-198.
Hsiao, Tsung-Yuan & Oxford, Rebecca L. (2002). Comparing theories of language
learning strategies: A confirmatory factor analysis. Modern Language Journal, 86 (3), 368-383.
Jarrold, C. & Towse, J. N. (2006). Individual differences in working memory. Neuroscience, 139,
39-50. Jimenez, R., Garcia, G.E., & Pearson, P. D. (1995). Three children, two languages, and
strategic reading: Case studies in bilingual/Monolingual Reading. American Educational Research Journal, 32(1), 67-97.
Johnson, J., & Newport, E. (1989). Critical period effects in second language learning: The influence of maturational state on the acquisition of English as a second language. Cognitive Psychology, 21, 60-99.
Juffs, A. (2003). Working memory: Understanding current issues in mainstream
Psychology. Paper presented in second langauge research forum, Tucson, A.Z.
(2005). The influence of first language on the processing of wh-movement in Enlgish as a second language. Second Language Research, 21(2), 121-151.
Jung, U.O.H. (1981). Englisch als Fremdsprache für Kinder mit Deutsch als
Zweitsprache. Grazer Linguistische Studien, 14, 83-97. Just, M. A. & Carpenter, P. A. (1992). A capacity theory of comprehension: Individual
differences in working memory, 99(1), 122-149. Kareev, Y., Lieberman, I., & Lev, M. (1997). Through a narrow window: Sample size
and the perception of correlation. Journal of Experimental Psychology: General, 126, 278-287.
Kemp, C. (2007). Strategic processing in grammar learning: Do multilinguals use more
strategies. International Journal of Multilingualism, 4(4), 241-261.
262
Kiewra, K.A., & Benton, S.L. (1988). The relationship between information-processing ability and note-taking. Contemporary Educational Psychology, 13, 33-44.
Klein, E. C. (1995). Second versus third language acquisition: Is there a difference?
Language Learning, 45, 3, pp. 419-465. Kyllonen, P. C., & Christal, R. E. (1990). Reasoning ability is (little more than) working
memory capacity? Intelligence, 14(4), 389-433. Lado, B. (2008). The Role of Bilingualism, Type of Feedback and Cognitive Capacity in
the Acquisition of Non-primary Languages: A Computer-based Study. Unpublished doctoral dissertation. Georgetown University, Washington, D.C.
Lambert, W.E. (1981). Bilingualism and language acquisition. In J. Winitz (Ed.), Native
language and foreign language acquisition (pp. 9-22). New York: The New York Academy of Sciences
Lasagabaster, D. (1998). Learning English as an L3. Review of Applied Linguistics, 121-
122, 51-84. (2000). Three languages and three linguistic models in the Basque educational system. In J. Cenoz & U. Jessner (eds.). English in Europe. The acquisition of a third language (pp. 179-197). Clevedon: Multilingual Matters.
Li, P., Bates, E., Liu, H., & MacWhinney, B. (1993). Processing a language without inflections: A reaction time study of sentence interpretation in Chinese. Journal of Memory and Language, 32, 169–192.
Lightbown, P. M., & Spada, N. (1990). Focus-on-form and corrective feedback
in communicative language teaching: Effects on second language learning. Studies in Second Language Acquisition, 12, 429–448.
Lin, H-J. (2004). Working memory capacity, verbal reports, and third language
acquisition: Do working memory capacity and thinking alound enhance or interfere with L3 acuqisition. Unpublished master thesis. Georgetown University, Washington, D.C.
Lin, H-J. (2007). Working memory and adult L3 development: A computer-delivered study.
Qualifying paper. Georgetown University, Washington, D.C. Logie, R. H. & Baddeley, A.D. (1987). Cognitive processes in counting. Journal of
Experimental Psychology: Learning Memory and Cognition, 13(2), 310-326. Logie, R.H., Gilhooly, K. J., & Wynn, V. (1994). Counting on working memory in
arithmetic problem solving. Memory and Cognition, 22(4), 395-410.
263
Loschky, L. & Bley-Vronman, R. (1993). Grammar and task-based methodology. In Crookes, G. and Gass, S.M. (Eds.) Tasks and language learning (pp.123-167). London, Multilingual Matters.
MacWhinney, B. (1987). Applying the competition model to bilingualism. Applied
Psycholinguistics, 8(4), 315-327. (2005). Extending the competition model. International Journal of Bilingualism, 9(1), 69-84.
MacWhinney, B., & Bates, E. (1987). Competition, variation, and language learning. In
B. MacWhinney (Ed.), Mechanisms of language acquisition (pp. 157–193). Hillsdale, NJ: Erlbaum.
Mackey, A., Philp, J., Fujii, A., Egi, T., & Tatsumi, T. (2002). Individual differences in
working memory, noticing of interactional feedback, and L2 development. In P. Robinson & P. Skehan (eds.), Individual differences in L2 learning (pp. 181–208). Amsterdam: Benjamins.
MacDonald, J. L. (1987). Sentence interpretation in bilingual speakers of English and
Dutch. Applied Psycholinguistics, 8, 379-414. Magiste, E. (1984). Learning a third language. Journal of Multilingual and Multicultural
Development, 5(5), 415-421. McDonald, J. L. (1987). Sentence interpretation in bilingual speakers of English and
Dutch. Applied Psycholinguistics, 8, 379 – 414. McDonough, K. (2005). Identifying the Impact of Negative Feedback and Learners'
Responses on ESL Question Development. Studies in Second Language Acquisition, 27(1), 79-103
McLauglin, B. (1987). Theories of second-language learning. London: Edward
Arntrained. McLaughlin, B., & Nayak, N. (1989). Processing a new language: Does knowing other
languages make a difference? In H. W. Dechert & M. Raupach (eds.), Interlingual processes (pp. 5–16). Tübingen: Gunter Narr.
Miyake, A. & Friedman, N. F. (1998). Individual differences in second language
proficiency: Working memory as language aptitude. In A. F. Healy & L. E. Bounrne (eds.). Foreign Language Learning: Psycholinguistic Studies on Training and Retention (pp. 339-364). Mahwah, NJ: Erlbaum.
264
Miyake, A. & Shah, P. (eds.). (1999). Models of Working Memory: Mechanisms of Active Maintenance and Executive Control. New York: Cambridge University Press.
Muñoz, C. (2000). Bilingualism and trilingualism in school students in Catalonia. In J. Cenoz & U. Jessner (eds.). English in Europe. The acquisition of a third language (pp. 157-178). Clevedon: Multilingual Matters.
Nagata, N. (1993). Intelligent computer feedback for second language instruction. The
Modern Language Journal, 77(3), 330-339. Nagata, N., & Swisher, M. V. (1995). A study of consciousness-raising by computer: The
effect of metalinguistic feedback on second language learning. Foreign Language Annals, 28(3), 337-347.
Nation, R., & McLaughlin, B. (1986). Novices and experts: An information processing
approach to the good language learner problem. Applied Psycholinguistics, 7, 41–56.
Nayak, H., Hansen, N., Krueger, N., & McLaughlin, B. (1990). Language-learning
strategies in monolingual and multilingual adults. Language Learning, 40, 221–244.
Newport, E. (1988). Constraints on learning and heir role in language acquisition: Studies
of the acquisition of American sign language. Language Science, 10, 147-172.
(1990). Maturational constraints on language learning. Cognitive Science, 14, 11- 28.
Newport, E. & Supalla, T. (1990). A critical period effect in the acquisition of a primary
language. Unpublished manuscript, Univeristy of Rochester, NY, Rochester. Newport, E., Supalla, T., Singleton, J., Supalla, S., & Coulter, G. (1990). Critical period
effects in the acquisition of a primary language: Competence in ASL morphology and syntax as a function of age of acquisition. Unpublished manuscript, University of Rochester, Rochester, NY.
Nyikos, M. & Oxford, R. (1993). A factor analytic study of language strategy use:
Interpretations from information-processing theory and social psychology. The Modern Language Jounral,77, 11-22.
Osaka, M. & Osaka, N. (1992). Language-independent working memory as measured by
Japanese and English reading span tests. The Bulletin of the Psychonomic Society, 30(4), 287-289.

265
Oxford, R. L. (1990). Language learning strategies: What every teacher should know. NY: Newbury house publishers.
Oxford, R. & Nyikos, M. (1989). Vriables affecting choice of language learning
strategies by university students. The Modern Language Journal, 73(3), 291-300. Papagno, C., Valentine, T., & Baddeley, A. D. (1991). Phonological short-term memory
and foreign-language vocabulary learning. Journal of Memory and Language, 30(3), 331 -347.
Peal, E. & Lambert, W. E. (1962). The relation of bilingualism to intelligence.
Psychological Monographs. 76(27). Philp, J. (2003). Constraints on “Noticing the Gap”: Nonnative speakers’ noticing of
recasts in NS-NNS interaction. Studies in Second Language Acquisition, 25(1), 99-126.
Ransdell, S. E., Arecco, M. R., & Levy, C. (2001). Bilingual long-term working memory:
The effects of working memory loads on writing quality and fluency. Applied Psychology, 22(1), 113-128.
Ransdell, S., Barbier, M.-L., Niit, T. (2006). Metacognitions about Language Skill and
Working Memory among Monolingual and Bilingual College Students: When Does Multilingualism Matter? International Journal of Bilingual Education and Bilingualism, 9(6), 728-741.
Raz, N., Gunning-Dixon, F. M., Head, D., Dupuis, J. H., & Acker, J. D. (1998).
Neuroanatomical correlates of cognitive aging: evidence from structural magnetic resonance imaging. Neuropsychology, 12(1), 95-114.
Ricciardelli, L.A. (1989). Childhood bilingualism: Metalinguistic awareness and
creativity. Unpublished dissertation submitted to the University of Adelaide, Australia. (1992) Bilingualism and cognitive development in relation to threshtrained theory. Journal of Psycholinguistics Research, 21(4), 301-316
Richardson, J. T. E., Engle, R. W., Hasher, L., Logie, R. H. (1996). Working memory and
human cognition. NY: Oxford University Press. Robinson, P. (1995a). Attention, memory, and the “noticing” hypothesis. Language
Learning, 45, 283–331.

266
(1995b). Task complexity and second language narrative discourse, Language Learning, 45(1), 99-140.
(1996a). Consciousness, rules, and instructed second language acquisition: Vol.
7. Theoretical studies in second language acquisition. New York: Peter Lang. (ed.). (1996b). Task complexity and second language syllabus design: Data-based
studies and speculations. Brisbane, Australia: University of Queensland. (1997). Individual differences and the fundamental similarity of implicit and
explicit adult second language learning. Language Learning, 47, 45–99. (2001). Individual differences, cognitive abilities, aptitude complexes, and
learning conditions in second language acquisition. Second Language Research, 17, 368–392.
(2002). Effects of individual differences in intelligence, aptitude and working
memory on incidental SLA. In P. Robinson (ed.). Individual differences and instructed language learning (pp. 211-251). Philadelphia: John Benjamins.
Romeo, K. B. (2006). Working memory and the acquisition of English relative clauses in
Japanese, Chinese, and Korean learners of English as a second language. Unpublished doctoral dissertation. CA: Stanford University.
Rosa, E., & O’Neill, M. D. (1999). Explicitness, intake, and the issue of awareness.
Another piece to the puzzle. Studies in Second Language Acquisition, 21, 511–556.
Rosa, E. M., & Leow, R. P. (2004). Computerized task-based exposure, explicitness, type
of feedback, and Spanish L2 development. The Modern Language Journal, 88(2), 192-216. (2004) Awareness, different learning conditions, and second language development. Applied Psycholinguistics, 25(2), 269-292.
Rubin, J. (1975). What the “good language learner” can teach us. TESOL Quarterly, 9, 41-51.
Rubin, J. (1981). Study of cognitive processes in second language learning. Applied
Linguistics, 2, 117-131. Sagarra, N. (2000). The longitudinal role of working memory on adult acquisition of
L2 grammar. Unpublished Ph.D dissertation.

267
Sagasta, M. (2003).Acquiring writing skills in a third language: Positive effects of bilingualism. The International Journal of Bilingualism, 7(1).
Sagasta, E. & Pilar, M. (2003). Acquiring writing skills in a third language: The positive
effects of Bilingualism. International Journal of Bilingualism, 7(1), 27-42. Sanz, C. (1997) Experimental tasks in SLA research: Amount of production, modality,
memory, and production processes. In W.R. Glass & A.T. Pérez-Leroux (Eds.) Contmemporary perspectives on the acuqieistion of Spanish (Vol.2, pp.41-56) Somerville, MA: Cascadilla Press. (2000). Bilingual education enhances third language acquisition: Evidence from Catalonia. Applied Psycholinguistics, 21, 23-44. (2007). The role of bilingual literacy in the acquisition of a third language. In C. Pérez Vidal, A. Bel & M. Juan Garau (Eds.), A portrait of the young in the new multilingual Spain: Multilingual Matters.
Sanz, C., Anfruns, M., Lado, B., Lin, H.-J., & Medina, A. (2005a). Bilingualism and degree of explicitness: Do they relate to L3 acquisition? Paper presented at the Second Language Research Forum, Columbia University Teachers' college, New York.
Sanz, C., Anfruns, M., Lado, B., Lin, H.-J., & Medina, A. (2005b). Working memory
capacity and explicitness in the input: Do they affect L3 acquisition? Paper presented at the Second Language Research Forum, Columbia University Teachers' College, New York.
Sanz, Anfruns, M., Lado, B., Lin, H., Medina, A., Bowden, H., Stafford, C. (2004).
Measuring working memory capacity and its relation to bilingualism and L3 acquisition. Paper presented in Second Language Research Forum. Penn State University, PA.
Sanz, C., & Stafford, C. (2004). Acquisition of an L3: Age, WM and Level of
Bilingualism. Paper presented at the Second Language Research Forum. State College, Pennsylvania.
Sanz, C., Bowden, H., & Stafford, C. (2003). Working memory and L2 proficiency as
predictors of enhanced acquisition of an L3. Conference presented in the Second Language Research Forum (SLRF 2003). Tucson, AZ: University of Arizona.
268
Sanz, C., Lin, H.-J., Lado, B., Bowden, H. W., & Stafford, C. A. (2009). Concurrent Verbalizations, Pedagogical Conditions, and Reactivity: Two CALL Studies Language Learning, 59(1), 33-71.
Sanz, C. & Morgan-Short, K. (2004). Positive evidence versus explicit rule presentation
and explicit negative feedback: A computer-assisted study. Language learning, 54(1), 35-78.
(2005). Explicitness in pedagogical interventions: Input, practice, and feedback. In C. Sanz (Ed.), Mind and context in adult second language acquisition: Methods, theory, and practice. Washington, DC: Georgetown University Press.
Sawyer, M. (1992). Language aptitude and language experience: Are they related? In T.
Hayes & K. Yoshioka (Eds.), The language programs of the International University of Japan, Working Papers, 3, 27-45.
Schmidt, R. (1990). The role of consciousness in second language learning. Applied
Linguistics, 11, 129–158. (1993). Awareness and second language acquisition. Annual Review of Applied
Linguistics, 13, 206–226. (1994). Deconstructing consciousness in search of useful definitions for applied
linguistics. AILA Review, 11, 11–26. (1995). Consciousness and foreign language learning: A tutorial on the role of
attention and awareness in learning. In R. Schmidt (Ed.), Attention and awareness in foreign language learning. Honolulu: University of Hawai‘i, Second Language Teaching an Curriculum Center.
(2001). Attention. In P. Robinson (Ed.), Cognition and second language
instruction (pp. 3–32). New York: Cambridge University Press. Scott, M. L. (1994). Auditory memory and perception in younger and traineder adult
second language learners. Studies in Second Language Acquisition, 16, 263-281. Service, E., & Craik, F.I.M. (1993). Differences between young and older adults in
learning a foreign vocabulary. Journal of Memory and Language, 32, 608-623. Shute, V. J. (1991). Who is likely to acquire programming skills? Journal of Educational
Computing Research, 7(1), 1-24. Skehan, P. (1989). Individual differences in second language learning. Studies in Second
Language Acquisition, 13, 275-298.

269
(2002). Theorising and updating aptitude. In P. Robinson (eds.) Individual differences and instructed language learning. Amsterdam/Philadelphia: John Benjamins, 69-95.
Skutnabb-Kangas, T. and Toukomaa, P. (1976) Teaching migrant children's mother tongue and learning the language of the host country in the context of the sociocultural situation of the migrant family. Helsinki: The Finnish National Commission for UNESCO.
Stafford, C. A. (2005). Bilingualism, cognitive capacity and age: A computer-based study
in L3 processing. Unpublished Dissertation, Georgetown University, Washington, DC.
Su, I. (2001a). Transfer of sentence processing strategies: A comparison of L2 learners of
Chinese and English. Applied Psycholinguistics, 22, 83-112. Su, I. (2001b). Context effects on sentence processing: A study based on the Compeition
Model. Applied Psycholinguistics, 22, 167-189. Su, I. (2004). The effects of discourse processing with regard to syntactic and semantic
cues: A competition model study. Applied Psycholinguistics, 25, 587-601. Swain, M., Lapkin, S., Rowen, N., & Hart, D. (1990). The role of mother tongue literacy
in third language learning. Language, Culture and Curriculum, 3(1), 65-81. Thomas, J. (1988). The role played by metalinguistic awareness in second and third
language learning. Journal of Multilingual and Multicultural Development, 9, 235-246.
(1992). Metalinguistic Awareness in Second- and Third-language Learning in R.J. Harris (ed.), Cognitive Processing in Bilinguals. Amsterdam, North-Holland, 531-545.
Thomas, M. (1990). Acquisition of the Japanese reflexive zibun by unilingual and
multilingual learners. In H. Burmeister & P. Rounds (Eds.) Variability in second language acquisition: Proceedings of the Tenth Meeting of the Second Language Research Forum (pp. 701-718). Eugene: University of Oregon.
Thorn, A. & Gathercole, S. (1999). Language-specific knowledge and short-term
memory in bilingual and non-bilingual children. Quarterly Journal of Experimental Psychology, Section A: Human Experimental Psychology, 52A(2), 303-324.

270
Tomlin, R.S., & Villa, V. (1994). Attention in cognitive science and second language acquisition. Studies in Second Language Acquisition, 16, 183-203.
Turner, M. L. & Engle, R. W. (1989). Is working memory capacity task dependent? Journal of Memory and Language, 28, 127-154.
Tuholski, S., Engle, R.W., & Baylis, G. (2001). Individual differences in working memory cpaaicty and enumeration. Memory and Cognition, 29(3), 484-492.
Van Gelderen, A., Schoonen, R., De Glopper, K., Hulstijn, J., Snellings, P., Simis, A., & Stevenson, M. (2003). Roles of linguistic knowledge, metacognitive knowledge and processing speed in L3, L2, and L1 reading comprehension: A structural equation modeling approach. International Journal of Bilingualism, 7(1), 7-25.
VanPatten, B. (2004). (Eds.). Processing instruction: Theory, research, and commentary.
NJ: Lawrence Erlbaum Associates VanPatten, B & Oikkenon, S. (1996). Explanation versus structured input in processing
instruction. Studies in Second Language Acquisition, 18, 495-510. Wagner, D.A., Spratt, J.E., & Ezzaki, A. (1989). Does learning to read in a second
language always put the child at a disadvantage? Some counterevidence from Morocco. Applied Psycholinguistics, 10, 31-48.
Wharton, G. (2000). Language learning strategy use of bilingual foreign language
learners in Signapore. Langauge learning, 50(2), 203-243. Waters, G. S. & Caplan, D. (1996). The capacity theory of sentence comprehension:
Critique of Just and Carpenter. Psychological Review, 103(4), 761-772. (1996). The measurement of verbal working memory capacity and its relation to
reading comprehension. Quarterly Journal of Experimental Psychology, Section A: Human Experimental Psychology, 49A(1), 51-79.
Weinstein, C. E., & Mayer, R. E. (1986). The teaching of learning strategies. In M.
Wittrock (Ed.). Handbook of research on teaching (pp. 315-327). New York: Macmillan.
White, L. (1990). Second language acquisition and universal grammar. Studies in Second
Language Acquisition, 12(2), 121-133. Williams, J. N. & Lovatt, P. (2003). Phonological memory and rule learning. Language
Learning, 53(1), 67-121.

271
Yang, N-D (1992). Second language learners' beliefs about language learning and their use of learning strategies: A study of college students of English in Taiwan. Unpublished Dissertation. The University of Texas at Austin.
(1996). Effective awareness-raising in language learning strategy instruction. In Language Learning Strategies around the World: Cross-cultural perspectives, Rebecca L. Oxford (ed.), 205–210. Manoa: University of Hawaii Press. (1999). The relationship between EFL learners’ beliefs and learning strategy use. System 27: 515–535. (2003). Integrating portfolios into learning strategy-based instruction for EFL college students. IRAL, 41, 293–317
Yelland, G.W., Pollard, J., & Mercuri, A. (1993). The metalinguistic benefits of limits contact with a second language. Applied Psycholinguistics, 14(4), 423-444.
Zobl, H. (1992). Grammaticality intuitions of unilingual and multilingual nonprimary
language learners. In S.W. Gass & L. Selinker (Eds.), Language transfer in language learning (pp.176-196). Philadelphia: John Benjamins.
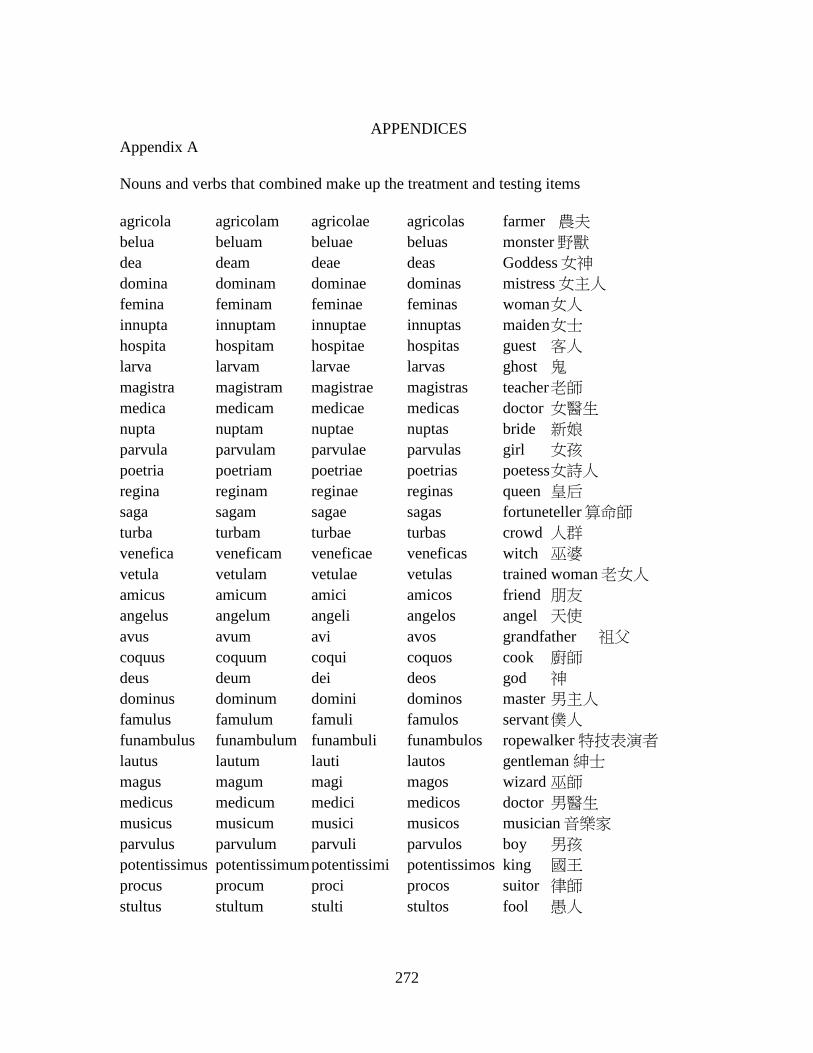
272
APPENDICES Appendix A
Nouns and verbs that combined make up the treatment and testing items
agricola agricolam agricolae agricolas farmer 農夫 belua beluam beluae beluas monster野獸 dea deam deae deas Goddess女神 domina dominam dominae dominas mistress女主人 femina feminam feminae feminas woman 女人 innupta innuptam innuptae innuptas maiden 女士 hospita hospitam hospitae hospitas guest 客人 larva larvam larvae larvas ghost 鬼 magistra magistram magistrae magistras teacher 老師 medica medicam medicae medicas doctor 女醫生 nupta nuptam nuptae nuptas bride 新娘 parvula parvulam parvulae parvulas girl 女孩 poetria poetriam poetriae poetrias poetess 女詩人 regina reginam reginae reginas queen 皇后 saga sagam sagae sagas fortuneteller算命師 turba turbam turbae turbas crowd 人群 venefica veneficam veneficae veneficas witch 巫婆 vetula vetulam vetulae vetulas trained woman老女人 amicus amicum amici amicos friend 朋友 angelus angelum angeli angelos angel 天使 avus avum avi avos grandfather 祖父 coquus coquum coqui coquos cook 廚師 deus deum dei deos god 神 dominus dominum domini dominos master 男主人 famulus famulum famuli famulos servant 僕人 funambulus funambulum funambuli funambulos ropewalker 特技表演者 lautus lautum lauti lautos gentleman 紳士 magus magum magi magos wizard 巫師 medicus medicum medici medicos doctor 男醫生 musicus musicum musici musicos musician音樂家 parvulus parvulum parvuli parvulos boy 男孩 potentissimus potentissimum potentissimi potentissimos king 國王 procus procum proci procos suitor 律師 stultus stultum stulti stultos fool 愚人
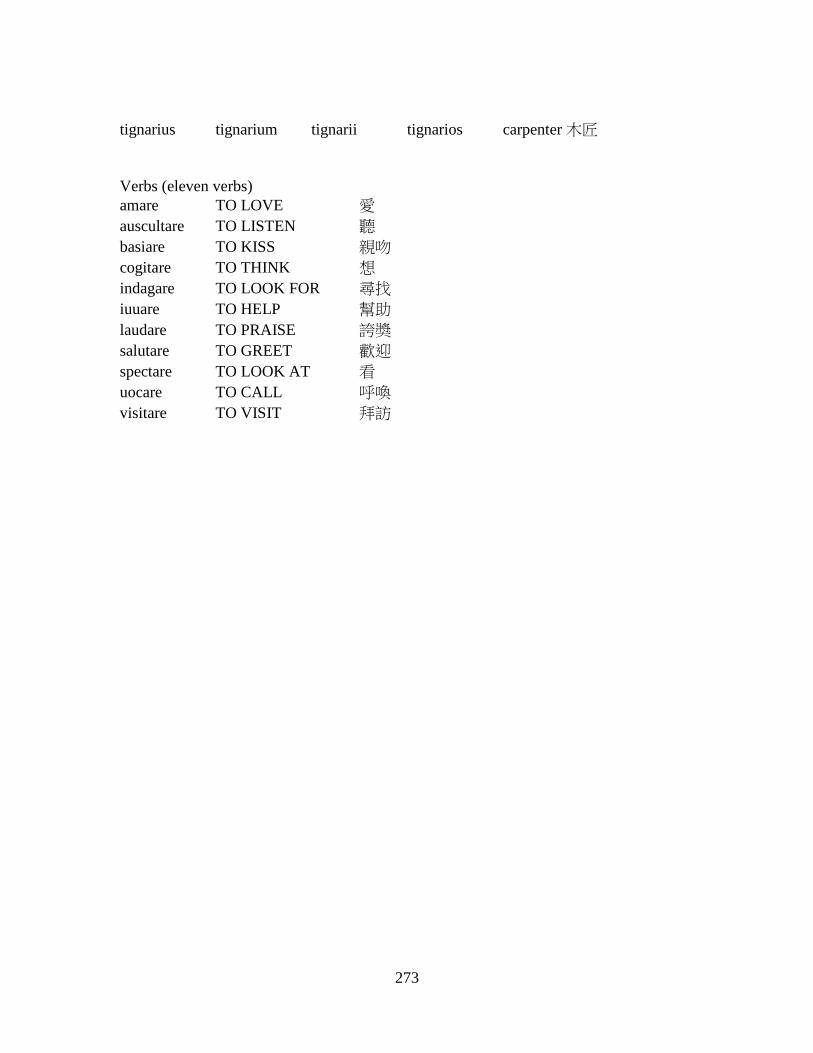
273
tignarius tignarium tignarii tignarios carpenter 木匠
Verbs (eleven verbs) amare TO LOVE 愛 auscultare TO LISTEN 聽 basiare TO KISS 親吻 cogitare TO THINK 想 indagare TO LOOK FOR 尋找 iuuare TO HELP 幫助 laudare TO PRAISE 誇獎 salutare TO GREET 歡迎 spectare TO LOOK AT 看 uocare TO CALL 呼喚 visitare TO VISIT 拜訪
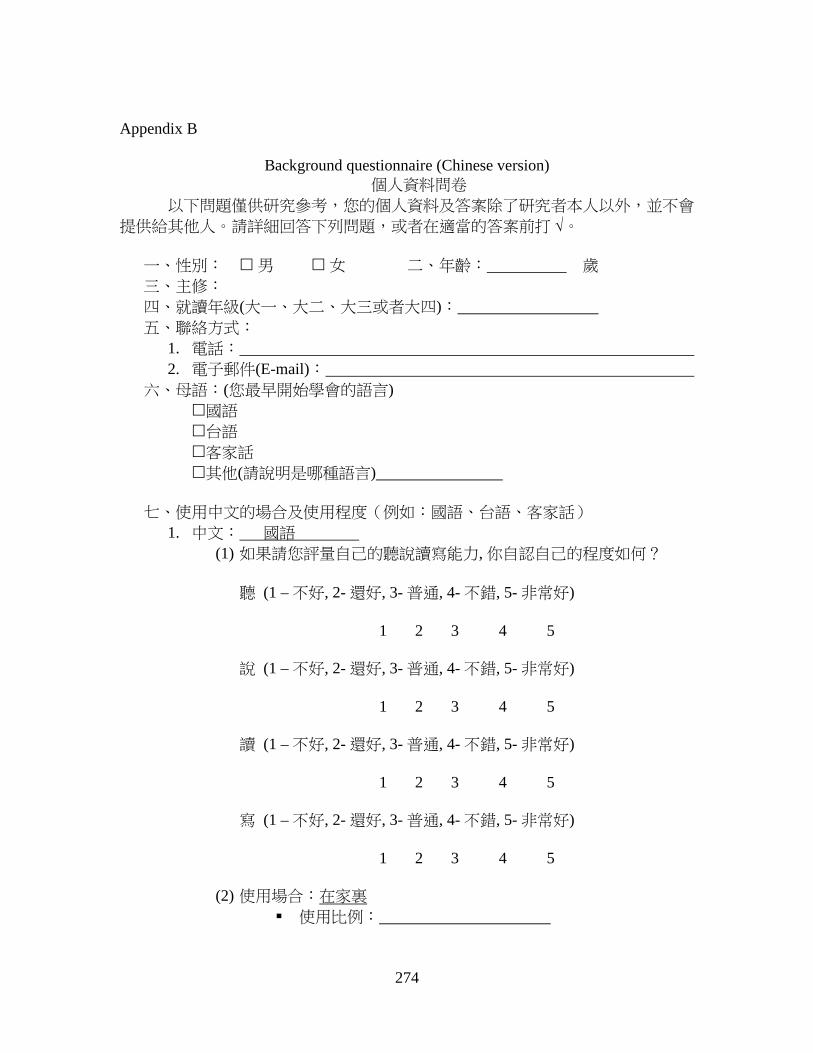
274
Appendix B
Background questionnaire (Chinese version) 個人資料問卷
以下問題僅供研究參考,您的個人資料及答案除了研究者本人以外,並不會
提供給其他人。請詳細回答下列問題,或者在適當的答案前打 √。 一、性別: � 男 � 女 二、年齡: 歲 三、主修: 四、就讀年級(大一、大二、大三或者大四): 五、聯絡方式:
1. 電話: 2. 電子郵件(E-mail):
六、母語:(您最早開始學會的語言) �國語 �台語 �客家話 �其他(請說明是哪種語言)
七、使用中文的場合及使用程度(例如:國語、台語、客家話)
1. 中文: 國語 (1) 如果請您評量自己的聽說讀寫能力, 你自認自己的程度如何?
聽 (1 – 不好, 2- 還好, 3- 普通, 4- 不錯, 5- 非常好)
1 2 3 4 5 說 (1 – 不好, 2- 還好, 3- 普通, 4- 不錯, 5- 非常好)
1 2 3 4 5
讀 (1 – 不好, 2- 還好, 3- 普通, 4- 不錯, 5- 非常好)
1 2 3 4 5
寫 (1 – 不好, 2- 還好, 3- 普通, 4- 不錯, 5- 非常好)
1 2 3 4 5
(2) 使用場合:在家裏 � 使用比例:

275
(3) 使用場合:在學校 � 使用比例:
(4) 使用場合:跟朋友交談時 � 使用比例:
(5) 使用場合: � 使用比例:
(6) 使用場合: � 使用比例:
2. 中文: 台語 (1) 如果請您評量自己的聽說讀寫能力, 你自認自己的程度如何?
聽 (1 – 不好, 2- 還好, 3- 普通, 4- 不錯, 5- 非常好)
1 2 3 4 5 說 (1 – 不好, 2- 還好, 3- 普通, 4- 不錯, 5- 非常好)
1 2 3 4 5
(2) 使用場合:在家裏 � 使用比例:
(3) 使用場合:在學校 � 使用比例:
(4) 使用場合:跟朋友交談時 � 使用比例:
(5) 使用場合: � 使用比例:
(6) 使用場合: � 使用比例:
3. 中文: 客家話 (1) 如果請您評量自己的聽說讀寫能力, 你自認自己的程度如何?
聽 (1 – 不好, 2- 還好, 3- 普通, 4- 不錯, 5- 非常好)
1 2 3 4 5 說 (1 – 不好, 2- 還好, 3- 普通, 4- 不錯, 5- 非常好)
1 2 3 4 5
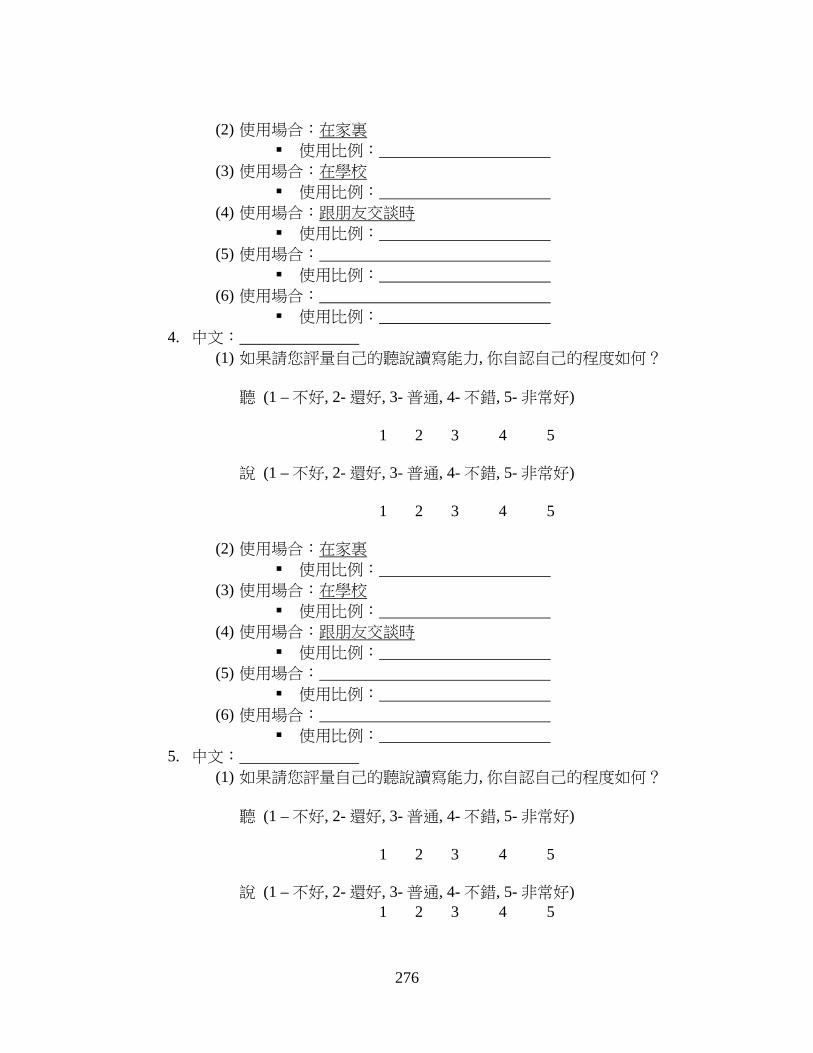
276
(2) 使用場合:在家裏 � 使用比例:
(3) 使用場合:在學校 � 使用比例:
(4) 使用場合:跟朋友交談時 � 使用比例:
(5) 使用場合: � 使用比例:
(6) 使用場合: � 使用比例:
4. 中文: (1) 如果請您評量自己的聽說讀寫能力, 你自認自己的程度如何?
聽 (1 – 不好, 2- 還好, 3- 普通, 4- 不錯, 5- 非常好)
1 2 3 4 5 說 (1 – 不好, 2- 還好, 3- 普通, 4- 不錯, 5- 非常好)
1 2 3 4 5
(2) 使用場合:在家裏 � 使用比例:
(3) 使用場合:在學校 � 使用比例:
(4) 使用場合:跟朋友交談時 � 使用比例:
(5) 使用場合: � 使用比例:
(6) 使用場合: � 使用比例:
5. 中文: (1) 如果請您評量自己的聽說讀寫能力, 你自認自己的程度如何?
聽 (1 – 不好, 2- 還好, 3- 普通, 4- 不錯, 5- 非常好)
1 2 3 4 5
說 (1 – 不好, 2- 還好, 3- 普通, 4- 不錯, 5- 非常好) 1 2 3 4 5

277
(2) 使用場合:在家裏
� 使用比例: (3) 使用場合:在學校
� 使用比例: (4) 使用場合:跟朋友交談時
� 使用比例: (5) 使用場合:
� 使用比例: (6) 使用場合:
� 使用比例: 八、您是什麼時候開始學英文的?學英文學了多久了?(包含自修及課外補習)
� 如果請您評量自己的聽說讀寫能力, 你自認自己的程度如何? 聽 (1 – 不好, 2- 還好, 3- 普通, 4- 不錯, 5- 非常好)
1 2 3 4 5 說 (1 – 不好, 2- 還好, 3- 普通, 4- 不錯, 5- 非常好)
1 2 3 4 5
讀 (1 – 不好, 2- 還好, 3- 普通, 4- 不錯, 5- 非常好)
1 2 3 4 5
寫 (1 – 不好, 2- 還好, 3- 普通, 4- 不錯, 5- 非常好)
1 2 3 4 5
九、您有沒有到過其他英語系國家旅遊或者居住的經驗?如果有,多久?目的 是什麼?
278
十、你還會其他的外語嗎?如果會,是哪種?你學了多久? 2. 外語
� 什麼時候開始學的? � 學了多久? 年 個月 � 如果請您評量自己的聽說讀寫能力, 你自認自己的程度如何?
聽 (1 – 不好, 2- 還好, 3- 普通, 4- 不錯, 5- 非常好)
1 2 3 4 5 說 (1 – 不好, 2- 還好, 3- 普通, 4- 不錯, 5- 非常好)
1 2 3 4 5
讀 (1 – 不好, 2- 還好, 3- 普通, 4- 不錯, 5- 非常好)
1 2 3 4 5
寫 (1 – 不好, 2- 還好, 3- 普通, 4- 不錯, 5- 非常好)
1 2 3 4 5 3. 外語
� 什麼時候開始學的? � 學了多久? 年 個月 � 如果請您評量自己的聽說讀寫能力, 你自認自己的程度如何?
聽 (1 – 不好, 2- 還好, 3- 普通, 4- 不錯, 5- 非常好)
1 2 3 4 5 說 (1 – 不好, 2- 還好, 3- 普通, 4- 不錯, 5- 非常好)
1 2 3 4 5
讀 (1 – 不好, 2- 還好, 3- 普通, 4- 不錯, 5- 非常好)
1 2 3 4 5
寫 (1 – 不好, 2- 還好, 3- 普通, 4- 不錯, 5- 非常好)
1 2 3 4 5

279
4. 外語 � 什麼時候開始學的? � 學了多久? 年 個月 � 如果請您評量自己的聽說讀寫能力, 你自認自己的程度如何?
聽 (1 – 不好, 2- 還好, 3- 普通, 4- 不錯, 5- 非常好)
1 2 3 4 5 說 (1 – 不好, 2- 還好, 3- 普通, 4- 不錯, 5- 非常好)
1 2 3 4 5
讀 (1 – 不好, 2- 還好, 3- 普通, 4- 不錯, 5- 非常好)
1 2 3 4 5
寫 (1 – 不好, 2- 還好, 3- 普通, 4- 不錯, 5- 非常好)
1 2 3 4 5 十一、其他:有沒有其他您想要補充的?

280
Background questionnaire (English version) Personal Information Survey
Questions below are only used as reference. Your personal information and answers will not be provided to anyone else, except for the researcher. Please answer the questions in detail or put a √ in front of the right answer.
一、Gender: � male � female 二、Age: years trained 三、Major: 四、Year (freshman, sophomore, junior, or senior): 五、contact information
3. telephone number:
4. E-mail address: 六、mother language:(the language that you first started to learn)
� Mandarin � Taiwanese � Haga � Others (please explain which language)
七、Occasions that you use Chinese and to what extent you use it (for example: Mandarin, Taiwanese, Haga)
1. Chinese : Mandarin (1) If you are asked to evaluate your listening, speaking, reading and
writing in the language, what do you think of your language abilities, Please circle the one that fits you.
Listening (1 – not very good, 2- not good, 3- fair, 4- good, 5- very good)
1 2 3 4 5
Speaking (1 – not very good, 2- not good, 3- fair, 4- good, 5- very good)
1 2 3 4 5
Reading (1 – not very good, 2- not good, 3- fair, 4- good, 5- very good)
1 2 3 4 5
Writing (1 – not very good, 2- not good, 3- fair, 4- good, 5- very good)
1 2 3 4 5

281
(2) Occasion:at school � percentage:
(3) Occasion:at school � percentage:
(4) Occasion:talk with friends � percentage:
(5) Occasion: � Percentage:
(6) Occasion: � Percentage:
2. Chinese : Taiwanese (1) If you are asked to evaluate your listening, speaking, reading and
writing in the language, what do you think of your language abilities, Please circle the one that fits you.
Listening (1 – not very good, 2- not good, 3- fair, 4- good, 5- very good)
1 2 3 4 5
Speaking (1 – not very good, 2- not good, 3- fair, 4- good, 5- very good)
1 2 3 4 5
(2) Occasion:at school � percentage:
(3) Occasion:talk with friends � percentage:
(4) Occasion: � Percentage:
(5) Occasion: � Percentage:
3. Chinese: Haga (1) If you are asked to evaluate your listening, speaking, reading and
writing in the language, what do you think of your language abilities, Please circle the one that fits you.
Listening (1 – not very good, 2- not good, 3- fair, 4- good, 5- very good)
1 2 3 4 5
282
Speaking (1 – not very good, 2- not good, 3- fair, 4- good, 5- very good) 1 2 3 4 5
(2) Occasion:at school
� percentage: (3) Occasion:talk with friends
� percentage: (4) Occasion:
� Percentage: (5) Occasion:
� Percentage: 4. Chinese:
(1) If you are asked to evaluate your listening, speaking, reading and writing in the language, what do you think of your language abilities, Please circle the one that fits you.
Listening (1 – not very good, 2- not good, 3- fair, 4- good, 5- very good)
1 2 3 4 5
Speaking (1 – not very good, 2- not good, 3- fair, 4- good, 5- very good)
1 2 3 4 5
(2) Occasion:at school � percentage:
(3) Occasion:talk with friends � percentage:
(4) Occasion: � Percentage:
(5) Occasion: � Percentage:
5. Chinese: (1) If you are asked to evaluate your listening, speaking, reading and
writing in the language, what do you think of your language abilities, Please circle the one that fits you.
Listening (1 – not very good, 2- not good, 3- fair, 4- good, 5- very good)
1 2 3 4 5
283
Speaking (1 – not very good, 2- not good, 3- fair, 4- good, 5- very good)
1 2 3 4 5
(2) Occasion:at school � percentage:
(3) Occasion:talk with friends � percentage:
(4) Occasion: � Percentage:
(5) Occasion: � Percentage:
八、Since when, did you start learning English? How long have you been learning English? (including self-study and attending private language institute)
� If you are asked to evaluate your listening, speaking, reading and writing in the language, what do you think of your language abilities, Please circle the one that fits you.
Listening (1 – not very good, 2- not good, 3- fair, 4- good, 5- very good)
1 2 3 4 5
Speaking (1 – not very good, 2- not good, 3- fair, 4- good, 5- very good)
1 2 3 4 5
Reading (1 – not very good, 2- not good, 3- fair, 4- good, 5- very good)
1 2 3 4 5
Writing (1 – not very good, 2- not good, 3- fair, 4- good, 5- very good)
1 2 3 4 5
284
九、Have you ever been to other English-speaking countries? If yes, for how long and for what purpose?
十、Do you know other foreign languages? If yes, what is it? In addition, for how long have you been learning it?
1. foreign language
� since when ? � for how long? years months � If you are asked to evaluate your listening, speaking, reading and
writing in the language, what do you think of your language abilities, Please circle the one that fits you.
Listening (1 – not very good, 2- not good, 3- fair, 4- good, 5- very good)
1 2 3 4 5
Speaking (1 – not very good, 2- not good, 3- fair, 4- good, 5- very good)
1 2 3 4 5
Reading (1 – not very good, 2- not good, 3- fair, 4- good, 5- very good)
1 2 3 4 5
Writing (1 – not very good, 2- not good, 3- fair, 4- good, 5- very good)
1 2 3 4 5
2. foreign language
� since when ? � for how long? years months � If you are asked to evaluate your listening, speaking, reading and
writing in the language, what do you think of your language abilities, Please circle the one that fits you.

285
Listening (1 – not very good, 2- not good, 3- fair, 4- good, 5- very good)
1 2 3 4 5
Speaking (1 – not very good, 2- not good, 3- fair, 4- good, 5- very good)
1 2 3 4 5
Reading (1 – not very good, 2- not good, 3- fair, 4- good, 5- very good)
1 2 3 4 5
Writing (1 – not very good, 2- not good, 3- fair, 4- good, 5- very good)
1 2 3 4 5
3. foreign language � since when ? � for how long? years months � If you are asked to evaluate your listening, speaking, reading and
writing in the language, what do you think of your language abilities, Please circle the one that fits you.
Listening (1 – not very good, 2- not good, 3- fair, 4- good, 5- very good)
1 2 3 4 5
Speaking (1 – not very good, 2- not good, 3- fair, 4- good, 5- very good)
1 2 3 4 5
Reading (1 – not very good, 2- not good, 3- fair, 4- good, 5- very good)
1 2 3 4 5
Writing (1 – not very good, 2- not good, 3- fair, 4- good, 5- very good)
1 2 3 4 5
十一、others: Is there anything else that you would like to add?

286
Appendix C
Sentence Span Test
1. 食物的時侯記得當我拿到銀樓去換 Remember when I bring to a jewelry to exchange for food
2. 那邊開出草來不過像牆頭花爬到牆的 but it is like a flow on the wall, grows grass to the other side of the wall
3. 靠得那麼遠我忽然覺得我們雖然 I suddenly feel that although we are close to each other that far
4. 一個人的眼力萬米賽跑不但考驗 ten-thousand-kilometer race not only tests someone’s eye
5. 一頭的樹木不妨搖曳著 how about wagging a head of trees 6. 手鐲無論如何我心中總有一對金 I always have a pair of gtrained
bracelets no matter what 7. 地獄境界可是我們不能永遠盤桓在美好的 But we cannot stay in the wonderful
hell forever 8. 有一個黑點卻赫然發現水左側 suddenly find a black spot on the left
side of the water 9. 另一間桌子去從一間獄室移到 from one jell to another desk (with
wrong classifier) 10. 歡喜讚嘆對於以後的典章文物我們儘管 Although we prize the historical
things in the future Ungrammatical/Sense
1. 人之所以不同於其他動物 The reason why human beings are different from other animals
2. 是看橫截面都像一種有機的組織 is like an organic organization from the side
3. 又那裡有今日的我和你 how does it have today’s you and me 4. 如果他有周知萬物的智慧 If he has the wisdom to know
everything in the world 5. 只有在做為內在自我肯定的價值實現時 Only when the value that shows self-
confidence 6. 能快快樂樂地做個慈愛的母親 is able to be happy to be a lovely
mother 7. 無論過去未來都可看得出 No matter past and future can see 8. 無非是在同一個大牢裏 not in the same big jell 9. 因為我平時見面的機會並不太多 because I normally don’t have many
opportunities to see 10. 只是面對著全然不抵抗也不逃避的敵人 only face the enemies who doesn’t
defend or run

287
11. 沒有我們的祖宗和那無數的古人 without our ancestors and numerous people in the past
Grammatical/ Nonsense
1. 我們還是要回到現實的水面上來 We still have to come to the real water
2. 民主並不是一群會投票的驢 Democracy is actually not a group of donkeys that can vote.
3. 這書上的圖文是人人懂得的 Everyone can understand the pictorial words.
4. 富蘭克林自傳是每個人奉為圭臬的壞書 The autobiography of Franklin is the classical bad book.
5. 我知道那必是昨夜陪伴我的水餃無疑 I know, it must be the dumplings that accompanied me last night.
6. 影響的程度與物體距離的遠近成方比例 Its influential extent is a square to the distance of objects.
7. 多少衰敗的古國都有不少未來的物品 Many declining trained countries have objects from the future.
8. 倡言守新其實只是迷戀骸骨 Promoting to the notion of new things is just an obsession of the past.
9. 這一對單胞胎被擁抱在同一位慈母懷中 This pair of single twin is hug by the same mother.
10. 有一隻不高不低的蒼蠅營營地飛來飛去 A fly which is not tall or low flies around.
Grammatical/ Sense
1. 母鳥撲在鳥巢上以翅膀護小 Mother birds use their wings to protect its children.
2. 青年們的偶像是勤苦自立的創業者 Diligent and hard-working self-made business owners are idols of adolescents.
3. 他可以在每人的身上看出世間一切施為 He can see everything of the world from everyone.
4. 送報而不看報是令人不可思議的事 It is unbelievable that to deliver newspapers but not read newspapers.
5. 這可是那腐爛發臭的路斃所曾夢想到的 Is that what the rotten and stingy corpus have ever dreamed of

288
6. 聽著拖鞋碰觸磨石子樓梯的聲響下樓 Walk down the stair while listening to the sound of slippers
7. 看到與自己完全一樣的身影在對面 See a shadow that is exactly the same as (my)self
8. 想到方才家人圍坐在此談笑飲食的情景 Think about the situation that (my/our) family was just talking and eating
9. 很多人往往都失敗在最後半圈 Many people usually loss on the last half run.
10. 在這一個現在裡面便有無窮時間的影子 There is an endless shadow inside this
11. 我們不可能再像第一次回家鄉時那樣一同玩樂了 It is impossible for us to have fun together like the time when we first went back home.
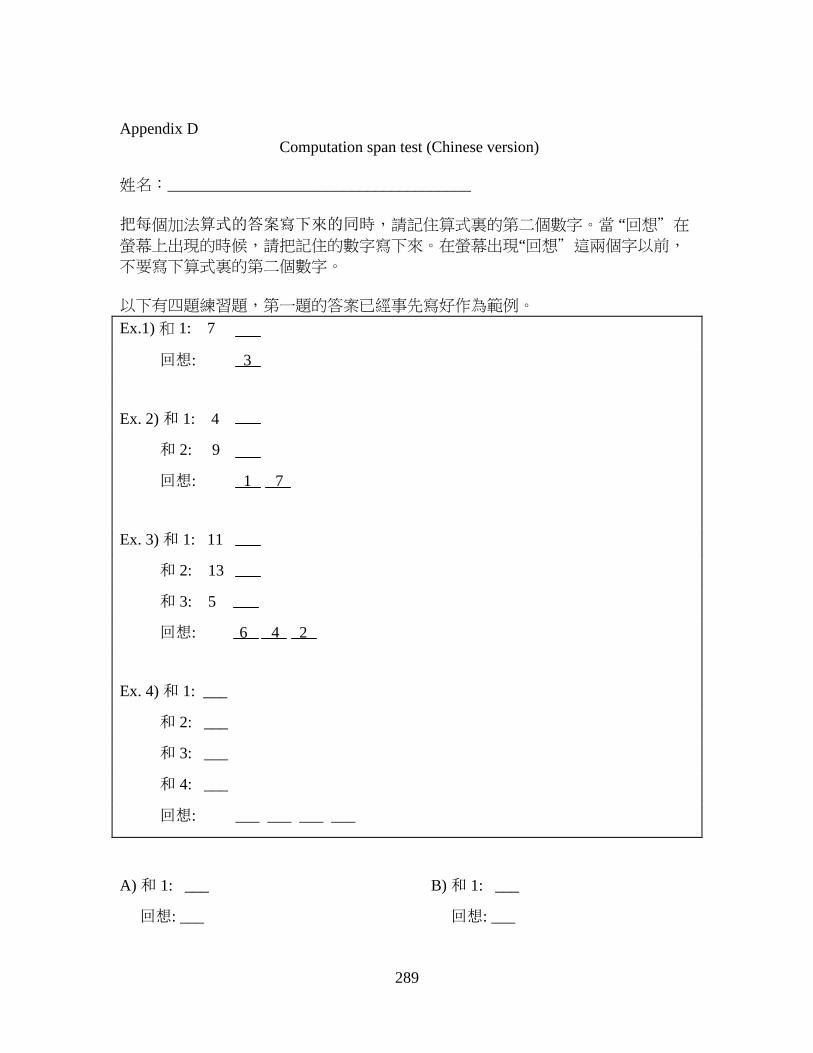
289
Appendix D Computation span test (Chinese version)
姓名:______________________________________ 把每個加法算式的答案寫下來的同時,請記住算式裏的第二個數字。當 “回想"在
螢幕上出現的時候,請把記住的數字寫下來。在螢幕出現“回想"這兩個字以前,
不要寫下算式裏的第二個數字。 以下有四題練習題,第一題的答案已經事先寫好作為範例。
Ex.1) 和 1: 7
回想: 3
Ex. 2) 和 1: 4
和 2: 9
回想: 1 7
Ex. 3) 和 1: 11
和 2: 13
和 3: 5
回想: 6 4 2
Ex. 4) 和 1: ___
和 2: ___
和 3: ___
和 4: ___
回想: ___ ___ ___ ___
A) 和 1: ___
回想: ___
B) 和 1: ___
回想: ___
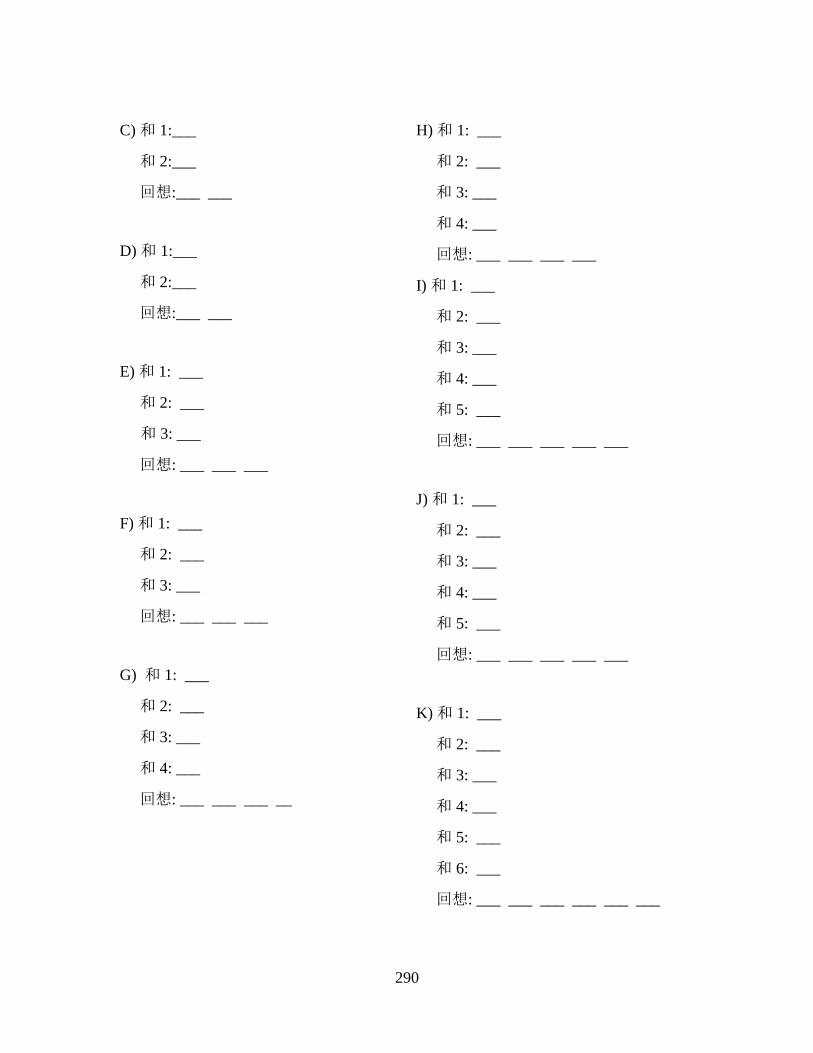
290
C) 和 1:___
和 2:___
回想:___ ___
D) 和 1:___
和 2:___
回想:___ ___
E) 和 1: ___
和 2: ___
和 3: ___
回想: ___ ___ ___
F) 和 1: ___
和 2: ___
和 3: ___
回想: ___ ___ ___
G) 和 1: ___
和 2: ___
和 3: ___
和 4: ___
回想: ___ ___ ___ __
H) 和 1: ___
和 2: ___
和 3: ___
和 4: ___
回想: ___ ___ ___ ___
I) 和 1: ___
和 2: ___
和 3: ___
和 4: ___
和 5: ___
回想: ___ ___ ___ ___ ___
J) 和 1: ___
和 2: ___
和 3: ___
和 4: ___
和 5: ___
回想: ___ ___ ___ ___ ___
K) 和 1: ___
和 2: ___
和 3: ___
和 4: ___
和 5: ___
和 6: ___
回想: ___ ___ ___ ___ ___ ___

291
L) 和 1: ___
和 2: ___
和 3: ___
和 4: ___
和 5: ___
和 6: ___
回想: ___ ___ ___ ___ ___ ___
M) 和 1: ___
和 2: ___
和 3: ___
和 4: ___
和 5: ___
和 6: ___
和 7: ___
回想: ___ ___ ___ ___ ___ ___ ___
N) 和 1: ___
和 2: ___
和 3: ___
和 4: ___
和 5: ___
和 6: ___
和 7: ___
回想: ___ ___ ___ ___ ___ __

292
Computation span test (English version) Name ______________________________________ Instructions: Write down the solution to each equation while remembering the addend (the 2nd digit) each time. When the word “Recall” appears on the computer screen, write down all the addends corresponding to each equation IN ORDER. DO NOT WRITE DOWN THE ADDENDS UNTIL THE WORD “RECALL” APPEARS! There are four examples with which to practice. The first three have been filled in for you. Ex.1) Solution1: 7
Recall: 3
Ex. 2) Solution1: 4
Solution2: 9
Recall: 1 7
Ex. 3) Solution1: 11
Solution2: 13
Solution3: 5
Recall: 6 4 2
Ex. 4) Solution1: ___
Solution2: ___
Solution3: ___
Solution4: ___
Recall: ___ ___ ___ ___
A) Solution1: ___
Recall: ___
B) Solution1: ___
Recall: ___
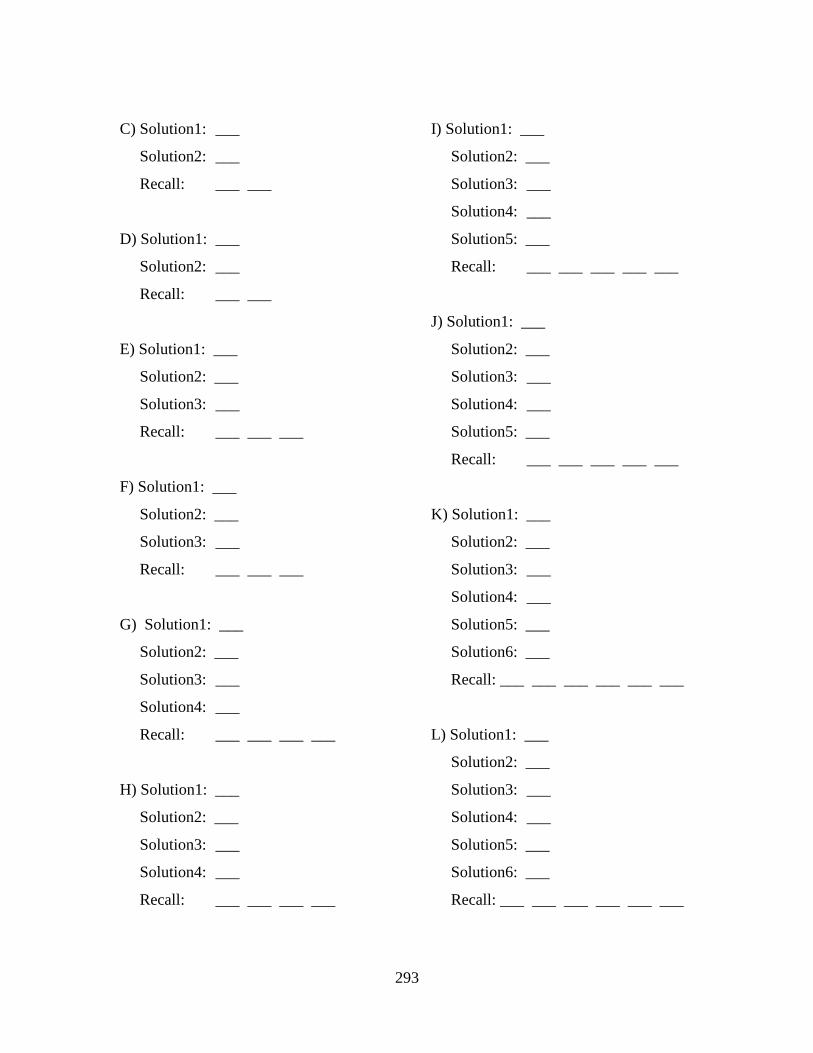
293
C) Solution1: ___
Solution2: ___
Recall: ___ ___
D) Solution1: ___
Solution2: ___
Recall: ___ ___
E) Solution1: ___
Solution2: ___
Solution3: ___
Recall: ___ ___ ___
F) Solution1: ___
Solution2: ___
Solution3: ___
Recall: ___ ___ ___
G) Solution1: ___
Solution2: ___
Solution3: ___
Solution4: ___
Recall: ___ ___ ___ ___
H) Solution1: ___
Solution2: ___
Solution3: ___
Solution4: ___
Recall: ___ ___ ___ ___
I) Solution1: ___
Solution2: ___
Solution3: ___
Solution4: ___
Solution5: ___
Recall: ___ ___ ___ ___ ___
J) Solution1: ___
Solution2: ___
Solution3: ___
Solution4: ___
Solution5: ___
Recall: ___ ___ ___ ___ ___
K) Solution1: ___
Solution2: ___
Solution3: ___
Solution4: ___
Solution5: ___
Solution6: ___
Recall: ___ ___ ___ ___ ___ ___
L) Solution1: ___
Solution2: ___
Solution3: ___
Solution4: ___
Solution5: ___
Solution6: ___
Recall: ___ ___ ___ ___ ___ ___
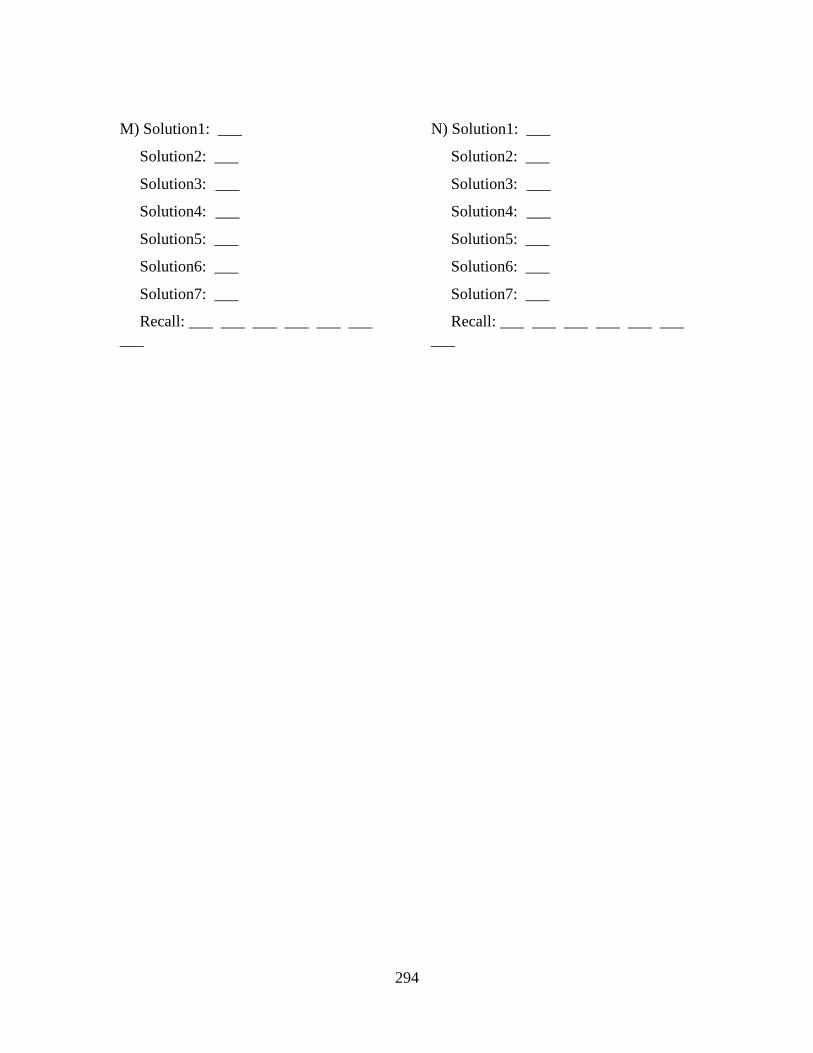
294
M) Solution1: ___
Solution2: ___
Solution3: ___
Solution4: ___
Solution5: ___
Solution6: ___
Solution7: ___
Recall: ___ ___ ___ ___ ___ ___ ___
N) Solution1: ___
Solution2: ___
Solution3: ___
Solution4: ___
Solution5: ___
Solution6: ___
Solution7: ___
Recall: ___ ___ ___ ___ ___ ___ ___
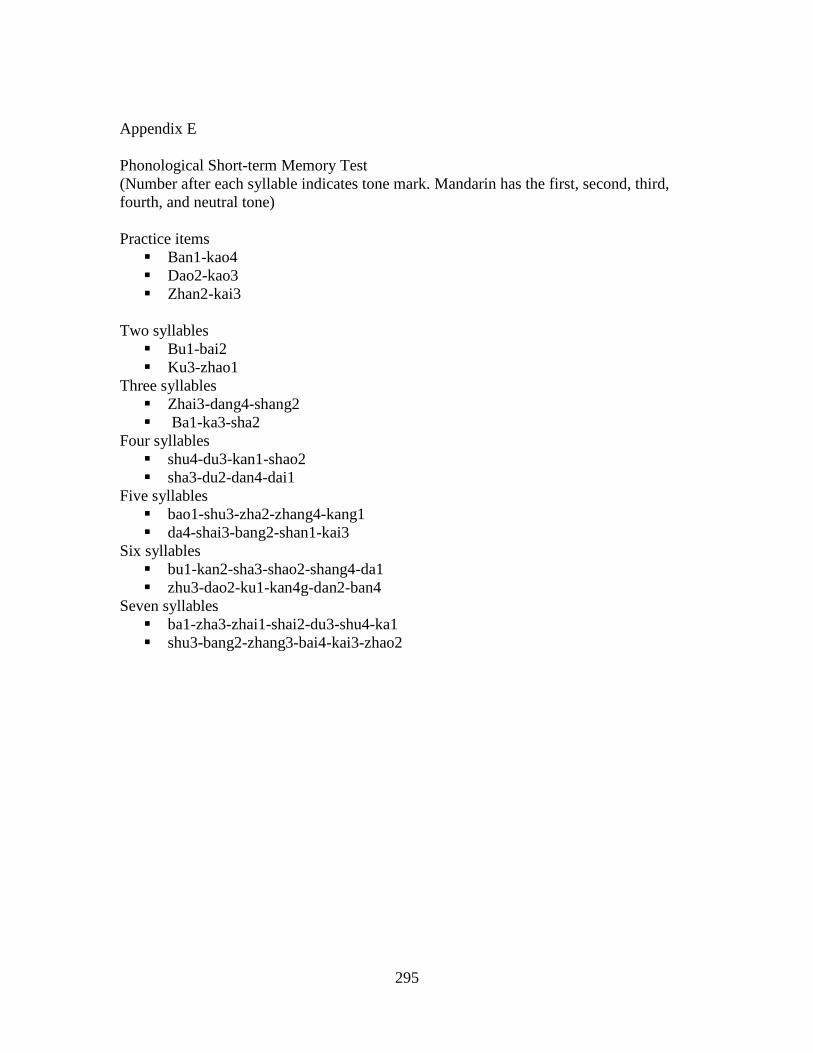
295
Appendix E
Phonological Short-term Memory Test (Number after each syllable indicates tone mark. Mandarin has the first, second, third, fourth, and neutral tone) Practice items
� Ban1-kao4 � Dao2-kao3 � Zhan2-kai3
Two syllables
� Bu1-bai2 � Ku3-zhao1
Three syllables � Zhai3-dang4-shang2 � Ba1-ka3-sha2
Four syllables � shu4-du3-kan1-shao2 � sha3-du2-dan4-dai1
Five syllables � bao1-shu3-zha2-zhang4-kang1 � da4-shai3-bang2-shan1-kai3
Six syllables � bu1-kan2-sha3-shao2-shang4-da1 � zhu3-dao2-ku1-kan4g-dan2-ban4
Seven syllables � ba1-zha3-zhai1-shai2-du3-shu4-ka1 � shu3-bang2-zhang3-bai4-kai3-zhao2
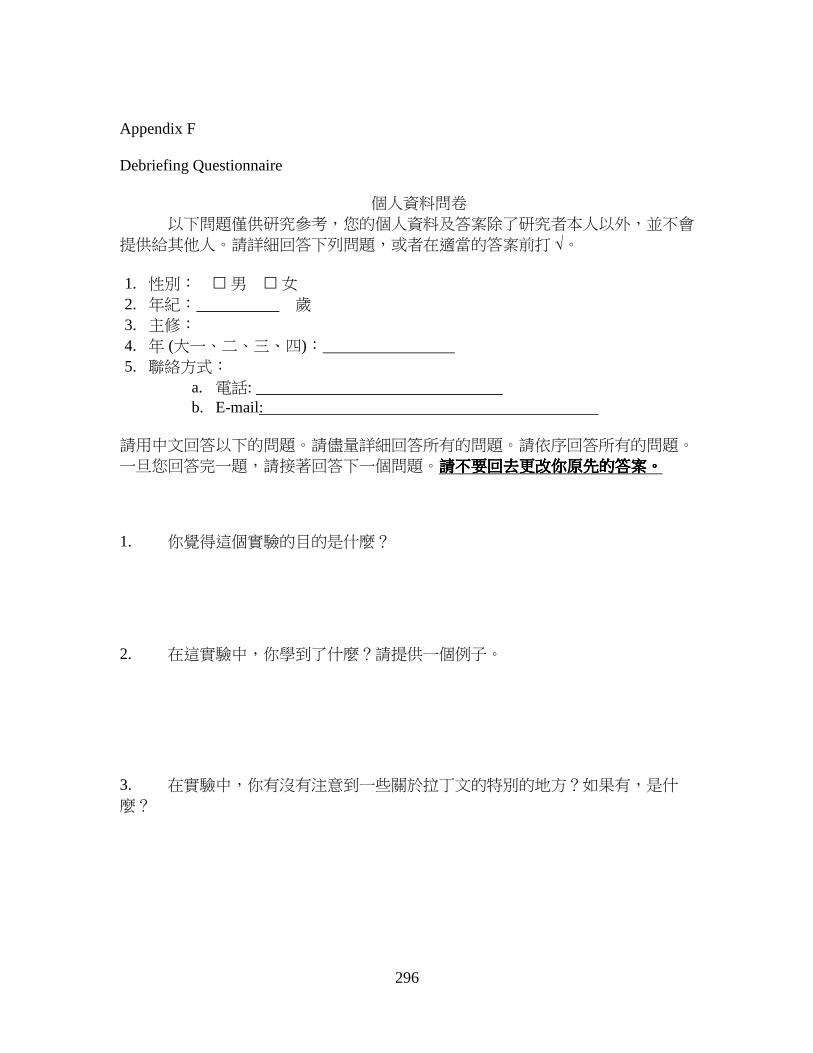
296
Appendix F
Debriefing Questionnaire
個人資料問卷 以下問題僅供研究參考,您的個人資料及答案除了研究者本人以外,並不會
提供給其他人。請詳細回答下列問題,或者在適當的答案前打 √。
1. 性別: � 男 � 女 2. 年紀: 歲 3. 主修: 4. 年 (大一、二、三、四): 5. 聯絡方式:
a. 電話: b. E-mail:
請用中文回答以下的問題。請儘量詳細回答所有的問題。請依序回答所有的問題。
一旦您回答完一題,請接著回答下一個問題。請不要回去更改你原先的答案請不要回去更改你原先的答案請不要回去更改你原先的答案請不要回去更改你原先的答案。。。。 1. 你覺得這個實驗的目的是什麼? 2. 在這實驗中,你學到了什麼?請提供一個例子。 3. 在實驗中,你有沒有注意到一些關於拉丁文的特別的地方?如果有,是什
麼?

297
4. 如果可以,請提供一些拉丁文的文法以便幫助沒學過拉丁文的人了解拉丁文
或者用拉丁文造句。
5. 你覺得拉丁文的課程如何?你覺得有沒有用? 6. 因為每個人被分到的組別不同,在這課程上會有一些不同點。您覺得在您的
文法部分、練習部分、及文法的解釋部份,你喜歡或者不喜歡哪部分?為什麼? 7. 有沒有其他您想補充的意見?

298
Debriefing Questionnaire (English version) Questions below are only used as reference. Your personal information and
answers will not be provided to anyone else other than the researcher. Please answer the questions in detail or put a √ in front of the appropriate answer.
Gender: � male � female 1. Age: years-trained 2. Major: 3. Year (freshman, sophomore, junior, or senior): 4. Contact information :
a. Telephone number: b. E-mail:
Please answer the following questions regarding the language learning study.
Answer them IN ENGLISH with as much detail as possible. You have as much time as you need. You'll need to answer the questions IN the ORDER. Please DO NOT go back to change your original answers. 1. What do you think the purpose of this experiment was? 2. What did you learn as a result of interacting with the tasks? Give an example if possible. 3. Did you notice any particular aspect(s) of the Latin language as you worked through the activities? If yes, what? 4. If you can, please give some sort of rule(s) to explain to someone else how to understand or make a sentence in Latin. 5. What is your overall evaluation of the learning lesson (day 2)? Did you find it enjoyable or useful in any way?
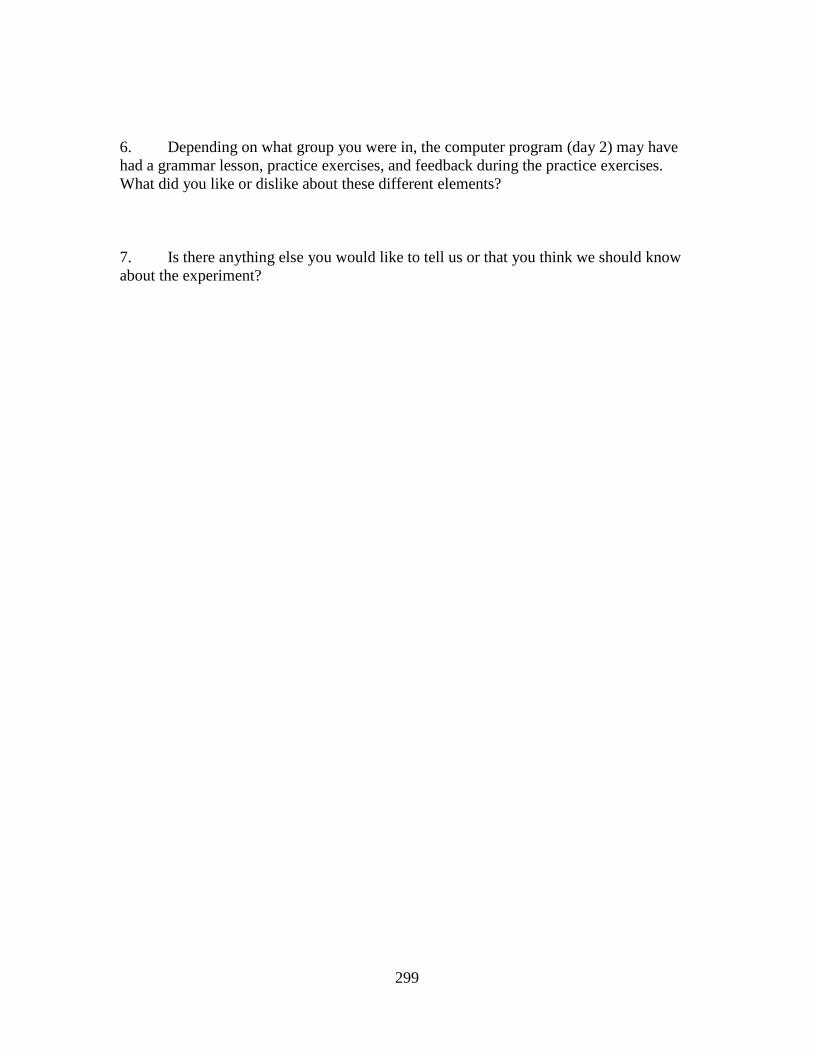
299
6. Depending on what group you were in, the computer program (day 2) may have had a grammar lesson, practice exercises, and feedback during the practice exercises. What did you like or dislike about these different elements? 7. Is there anything else you would like to tell us or that you think we should know about the experiment?

300
Appendix G
SILL worksheet (Chinese version) 在以下的敘述中,您會看到一般人對學習外語的一些看法。請閱讀每一項敘
述,說明選擇最適合您的答案。答案無所謂對錯或錯。我們只對您的看法有興
趣。 1. 我從來不會這樣做 2. 我通常不會這樣做 3. 我有時會,有時不會這樣做 4. 我通常會這樣做 5. 我總是會這樣做
1. 我從來不會這樣做 – 表示該敘述幾乎完全不符合您的情況 2. 我通常不會這樣做 – 表示該敘述多半不符合您的情況 3. 我有時會,有時不會這樣做 – 表示該敘述差不多有一半符合您的情況 4. 我通常會這樣做 – 表示該敘述多半符合您的情況 5. 我總是會這樣做 – 表示該敘述幾乎完全符合您的情況 請依照您真實情況來作答,把最適合您的回答填在答案卷上。切勿依您認為
「您應該如何」或「別人會怎樣」來作答。這些敘述並沒有對或者錯的答
案。
1. 學新單字時,我會把新學的東西聯想到以前學過的東西 2. 我用新學的單字造句,來加深記憶 3. 我把新單字的發音跟相關的形象或者圖形聯想,來幫助記憶 4. 我藉由想像某個可以使用新單字的情況,來記住新單字 5. 我運用類似的發音來記住新單字 6. 我用單字卡來背新單字 7. 我用手勢或者一些肢體動作來記住新單字 8. 我時常複習外文課的內容 9. 我利用單字或者片語出現在書上,電腦上,或者其他地方的位置來記住 10. 我會反覆練習或者寫新單字 11. 我嚐試把外語說得像外國人一樣 12. 我會練習發音 13. 我用不同的方式來練習及使用外文 14. 我嚐試以外文來跟別人交談 15. 我看外文電視或者外語電 16. 我已閱讀外文來作為一項娛樂 17. 我用外文寫筆記、書信、或者報告
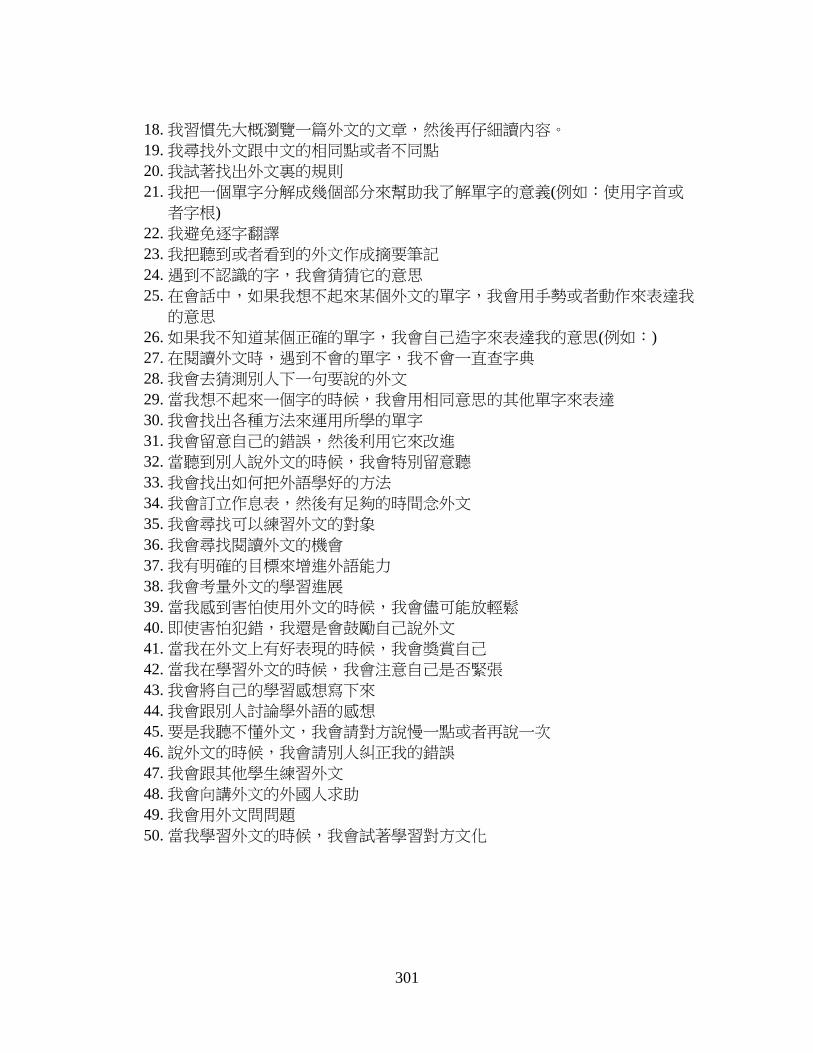
301
18. 我習慣先大概瀏覽一篇外文的文章,然後再仔細讀內容。 19. 我尋找外文跟中文的相同點或者不同點 20. 我試著找出外文裏的規則 21. 我把一個單字分解成幾個部分來幫助我了解單字的意義(例如:使用字首或 者字根) 22. 我避免逐字翻譯 23. 我把聽到或者看到的外文作成摘要筆記 24. 遇到不認識的字,我會猜猜它的意思 25. 在會話中,如果我想不起來某個外文的單字,我會用手勢或者動作來表達我 的意思 26. 如果我不知道某個正確的單字,我會自己造字來表達我的意思(例如:) 27. 在閱讀外文時,遇到不會的單字,我不會一直查字典 28. 我會去猜測別人下一句要說的外文 29. 當我想不起來一個字的時候,我會用相同意思的其他單字來表達 30. 我會找出各種方法來運用所學的單字 31. 我會留意自己的錯誤,然後利用它來改進 32. 當聽到別人說外文的時候,我會特別留意聽 33. 我會找出如何把外語學好的方法 34. 我會訂立作息表,然後有足夠的時間念外文 35. 我會尋找可以練習外文的對象 36. 我會尋找閱讀外文的機會 37. 我有明確的目標來增進外語能力 38. 我會考量外文的學習進展 39. 當我感到害怕使用外文的時候,我會儘可能放輕鬆 40. 即使害怕犯錯,我還是會鼓勵自己說外文 41. 當我在外文上有好表現的時候,我會獎賞自己 42. 當我在學習外文的時候,我會注意自己是否緊張 43. 我會將自己的學習感想寫下來 44. 我會跟別人討論學外語的感想 45. 要是我聽不懂外文,我會請對方說慢一點或者再說一次 46. 說外文的時候,我會請別人糾正我的錯誤 47. 我會跟其他學生練習外文 48. 我會向講外文的外國人求助 49. 我會用外文問問題 50. 當我學習外文的時候,我會試著學習對方文化
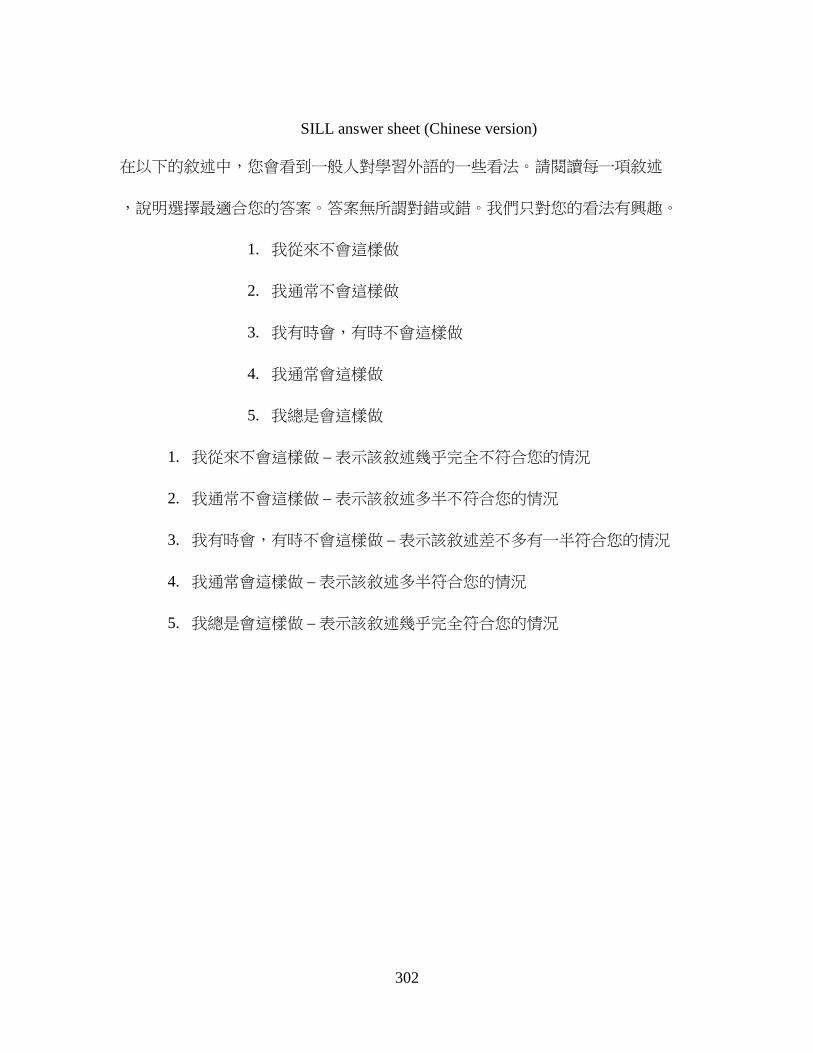
302
SILL answer sheet (Chinese version)
在以下的敘述中,您會看到一般人對學習外語的一些看法。請閱讀每一項敘述
,說明選擇最適合您的答案。答案無所謂對錯或錯。我們只對您的看法有興趣。
1. 我從來不會這樣做
2. 我通常不會這樣做
3. 我有時會,有時不會這樣做
4. 我通常會這樣做
5. 我總是會這樣做
1. 我從來不會這樣做 – 表示該敘述幾乎完全不符合您的情況
2. 我通常不會這樣做 – 表示該敘述多半不符合您的情況
3. 我有時會,有時不會這樣做 – 表示該敘述差不多有一半符合您的情況
4. 我通常會這樣做 – 表示該敘述多半符合您的情況
5. 我總是會這樣做 – 表示該敘述幾乎完全符合您的情況

303
請依照您真實情況來作答,把最適合您的回答填在答案卷上。切勿依您認為
「您應該如何」或「別人會怎樣」來作答。這些敘述並沒有對或者錯的答案。
問
題
問
題
問
題
問
題
問
題
問
題
1. 10. 24. 30. 39. 45.
2. 11. 25. 31. 40. 46.
3. 12. 26. 32. 41. 47.
4. 13. 27. 33. 42. 48.
5. 14. 28. 34. 43. 49.
6. 15. 29. 35. 44. 50.
7. 16. 36.
8. 17. 37.
9. 18. 38.
19.
20.
21.
22.
23.
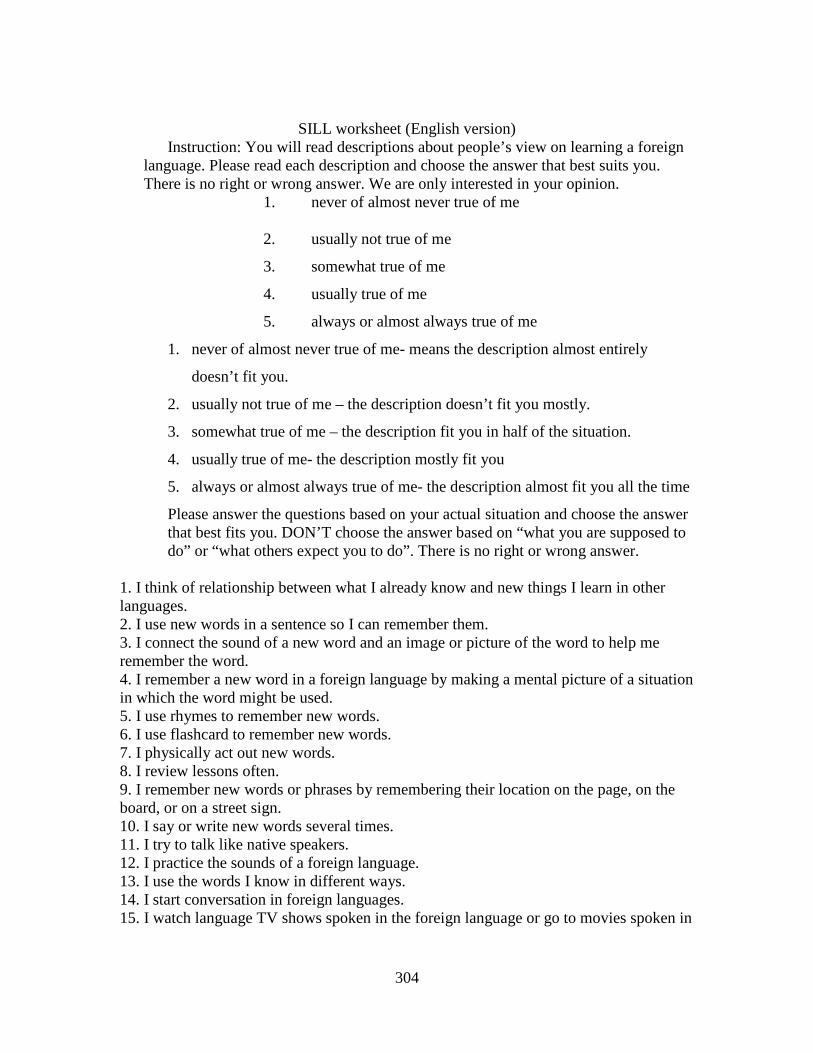
304
SILL worksheet (English version) Instruction: You will read descriptions about people’s view on learning a foreign
language. Please read each description and choose the answer that best suits you. There is no right or wrong answer. We are only interested in your opinion.
1. never of almost never true of me
2. usually not true of me
3. somewhat true of me
4. usually true of me
5. always or almost always true of me
1. never of almost never true of me- means the description almost entirely
doesn’t fit you.
2. usually not true of me – the description doesn’t fit you mostly.
3. somewhat true of me – the description fit you in half of the situation.
4. usually true of me- the description mostly fit you
5. always or almost always true of me- the description almost fit you all the time
Please answer the questions based on your actual situation and choose the answer that best fits you. DON’T choose the answer based on “what you are supposed to do” or “what others expect you to do”. There is no right or wrong answer.
1. I think of relationship between what I already know and new things I learn in other languages. 2. I use new words in a sentence so I can remember them. 3. I connect the sound of a new word and an image or picture of the word to help me remember the word. 4. I remember a new word in a foreign language by making a mental picture of a situation in which the word might be used. 5. I use rhymes to remember new words. 6. I use flashcard to remember new words. 7. I physically act out new words. 8. I review lessons often. 9. I remember new words or phrases by remembering their location on the page, on the board, or on a street sign. 10. I say or write new words several times. 11. I try to talk like native speakers. 12. I practice the sounds of a foreign language. 13. I use the words I know in different ways. 14. I start conversation in foreign languages. 15. I watch language TV shows spoken in the foreign language or go to movies spoken in

305
the foreign language. 16. I read for pleasure in a foreign language. 17. I write notes, messages, letters or reports in a foreign language. 18. I first skim a foreign language passage (read over the passage quickly) then go back and read carefully. 19. I look for words in my own language that are similar to new words in a foreign language. 20. I try to find patterns in a foreign language. 21. I find the meaning of a word in a foreign language by dividing it into parts that I understand. 22. I try not to translate word-for-word. 23. I make summaries of information that I hear or read in a foreign language. 24. To understand unfamiliar words, I make guesses. 25. When I cannot think of a word during a conversation in a foreign language, I use gestures. 26. I make up new words if I do not know the right ones in a foreign language. 27. I read a foreign language without looking up every new word. 28. I try to guess what the other person will say next in a foreign language. 29. If I cannot think of a word in a foreign language, I use a word or phrase that means the same thing. 30. I try to find as many ways I can to use the foreign language. 31. I notice my mistakes in a foreign language and use that information to help me do better. 32. I pay attention when someone is speaking a foreign language. 33. I try to find out how to be a better learner of a foreign language. 34. I plan my schedule so I will have enough time to study a foreign language. 35. I look for people I can talk to in a foreign language. 36. I look for opportunities to read as much as possible in a foreign language. 37. I have clear goals for improving my foreign language skills. 38. I think about my progress in learning a foreign language. 39. I try to relax whenever I feel afraid of using a foreign language. 40. I encourage myself to speak a foreign language when I am afraid of making a mistake. 41. I give myself a reward to treat when I do well in learning a foreign language. 42. I notice if I am tense or nervous when I am studying or using a foreign language. 43. I write down my feelings in a language learning diary. 44. I talk to someone else about how I feel when I am learning a foreign language. 45. If I do not understand something in a foreign language, I ask the other person to slow down or say it again. 46. I ask foreign language speakers to correct me when I talk. 47. I practice foreign languages with other students. 48. I ask for help from native speakers. 49. I ask questions in foreign languages. 50. I try to learn about the culture of native speakers.

306
SILL answer sheet (English version) Instruction: You will read descriptions about people’s view on learning a foreign
language. Please read each description and choose the answer that best suits you. There is no right or wrong answer. We are only interested in your opinion.
1. never of almost never true of me
2. usually not true of me
3. somewhat true of me
4. usually true of me
5. always or almost always true of me
1. never or almost never true of me- means the description almost entirely
doesn’t fit you.
2. usually not true of me – the description doesn’t fit you mostly.
3. somewhat true of me – the description fit you in half of the situation.
4. usually true of me- the description mostly fit you
5. always or almost always true of me- the description almost fit you all the time

307
Please answer the questions based on your actual situation and choose the answer
that best fits you. DON’T choose the answer based on “what you are supposed to do” or
“what others expect you to do”. There is no right or wrong answer.
SILL answer sheet
No.
No.
No.
No.
No.
No.
1. 10. 24. 30. 39. 45.
2. 11. 25. 31. 40. 46.
3. 12. 26. 32. 41. 47.
4. 13. 27. 33. 42. 48.
5. 14. 28. 34. 43. 49.
6. 15. 29. 35. 44. 50.
7. 16. 36.
8. 17. 37.
9. 18. 38.
19.
20.
21.
22.
23.
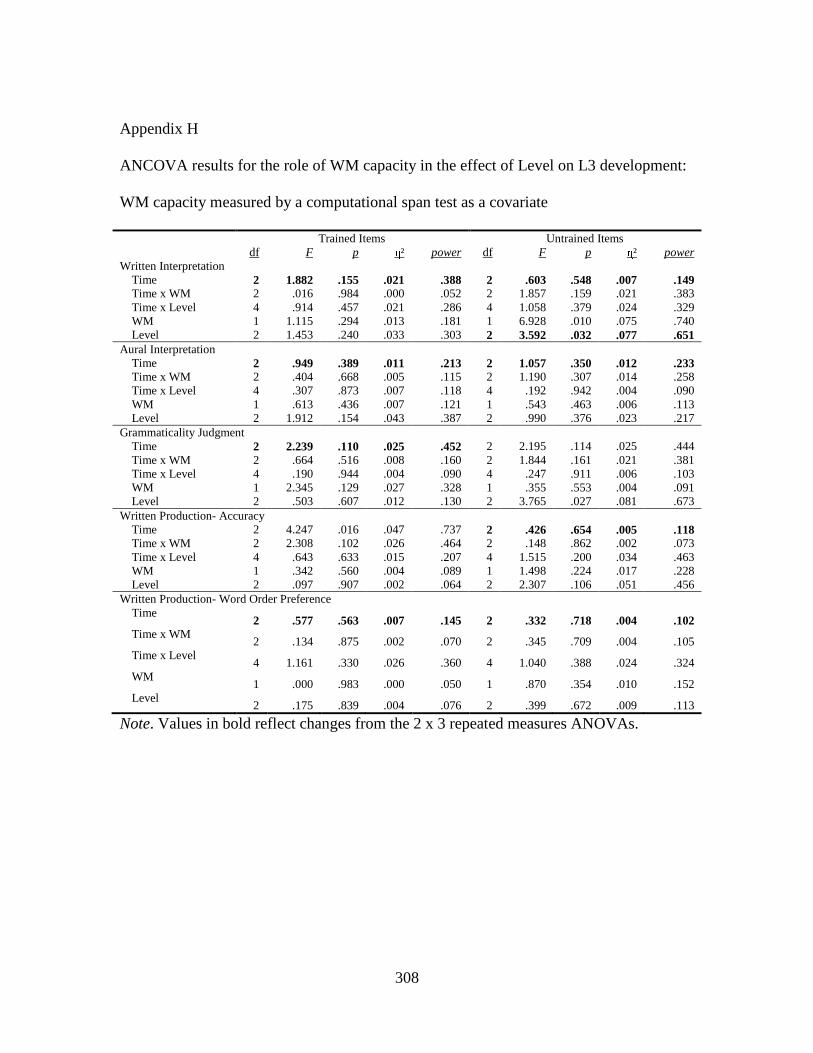
308
Appendix H
ANCOVA results for the role of WM capacity in the effect of Level on L3 development:
WM capacity measured by a computational span test as a covariate
Trained Items Untrained Items df F p η² power df F p η² power Written Interpretation
Time 2 1.882 .155 .021 .388 2 .603 .548 .007 .149 Time x WM 2 .016 .984 .000 .052 2 1.857 .159 .021 .383 Time x Level 4 .914 .457 .021 .286 4 1.058 .379 .024 .329 WM 1 1.115 .294 .013 .181 1 6.928 .010 .075 .740 Level 2 1.453 .240 .033 .303 2 3.592 .032 .077 .651
Aural Interpretation Time 2 .949 .389 .011 .213 2 1.057 .350 .012 .233 Time x WM 2 .404 .668 .005 .115 2 1.190 .307 .014 .258 Time x Level 4 .307 .873 .007 .118 4 .192 .942 .004 .090 WM 1 .613 .436 .007 .121 1 .543 .463 .006 .113 Level 2 1.912 .154 .043 .387 2 .990 .376 .023 .217
Grammaticality Judgment Time 2 2.239 .110 .025 .452 2 2.195 .114 .025 .444 Time x WM 2 .664 .516 .008 .160 2 1.844 .161 .021 .381 Time x Level 4 .190 .944 .004 .090 4 .247 .911 .006 .103 WM 1 2.345 .129 .027 .328 1 .355 .553 .004 .091 Level 2 .503 .607 .012 .130 2 3.765 .027 .081 .673
Written Production- Accuracy Time 2 4.247 .016 .047 .737 2 .426 .654 .005 .118 Time x WM 2 2.308 .102 .026 .464 2 .148 .862 .002 .073 Time x Level 4 .643 .633 .015 .207 4 1.515 .200 .034 .463 WM 1 .342 .560 .004 .089 1 1.498 .224 .017 .228 Level 2 .097 .907 .002 .064 2 2.307 .106 .051 .456
Written Production- Word Order Preference Time
2 .577 .563 .007 .145 2 .332 .718 .004 .102 Time x WM
2 .134 .875 .002 .070 2 .345 .709 .004 .105 Time x Level
4 1.161 .330 .026 .360 4 1.040 .388 .024 .324 WM
1 .000 .983 .000 .050 1 .870 .354 .010 .152 Level
2 .175 .839 .004 .076 2 .399 .672 .009 .113
Note. Values in bold reflect changes from the 2 x 3 repeated measures ANOVAs.
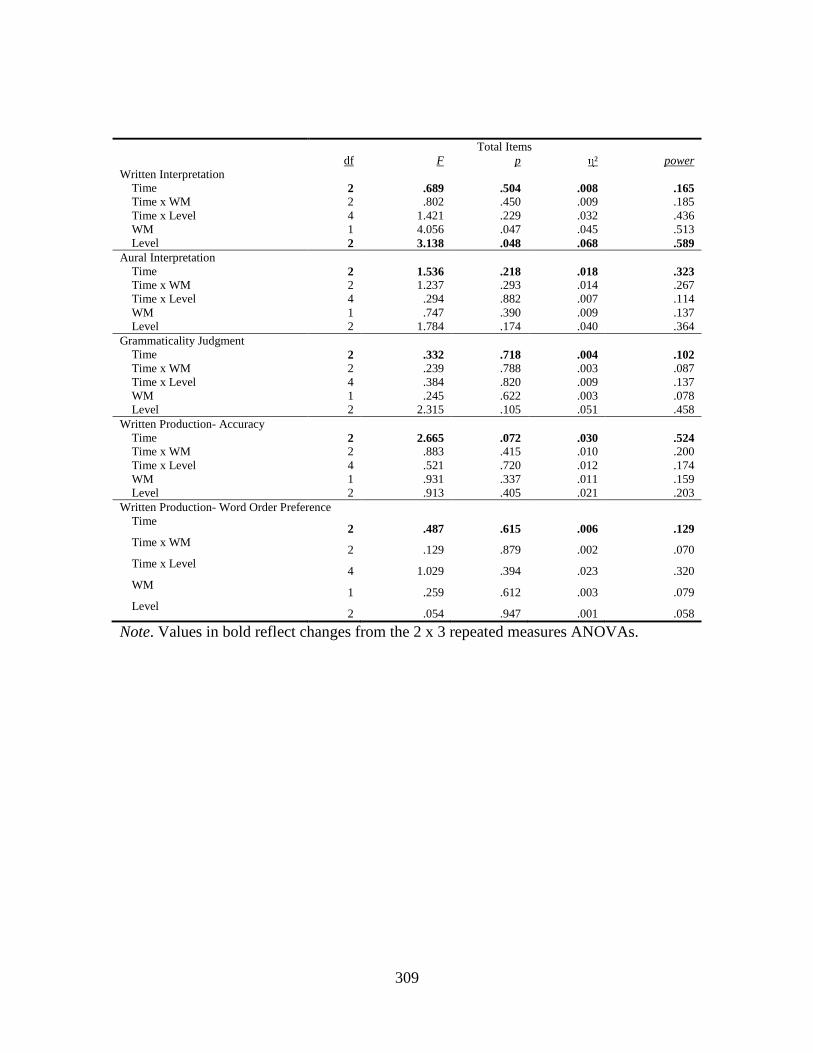
309
Total Items df F p η² power Written Interpretation
Time 2 .689 .504 .008 .165 Time x WM 2 .802 .450 .009 .185 Time x Level 4 1.421 .229 .032 .436 WM 1 4.056 .047 .045 .513 Level 2 3.138 .048 .068 .589
Aural Interpretation Time 2 1.536 .218 .018 .323 Time x WM 2 1.237 .293 .014 .267 Time x Level 4 .294 .882 .007 .114 WM 1 .747 .390 .009 .137 Level 2 1.784 .174 .040 .364
Grammaticality Judgment Time 2 .332 .718 .004 .102 Time x WM 2 .239 .788 .003 .087 Time x Level 4 .384 .820 .009 .137 WM 1 .245 .622 .003 .078 Level 2 2.315 .105 .051 .458
Written Production- Accuracy Time 2 2.665 .072 .030 .524 Time x WM 2 .883 .415 .010 .200 Time x Level 4 .521 .720 .012 .174 WM 1 .931 .337 .011 .159 Level 2 .913 .405 .021 .203
Written Production- Word Order Preference Time
2 .487 .615 .006 .129 Time x WM
2 .129 .879 .002 .070 Time x Level
4 1.029 .394 .023 .320 WM
1 .259 .612 .003 .079 Level
2 .054 .947 .001 .058
Note. Values in bold reflect changes from the 2 x 3 repeated measures ANOVAs.

310
Appendix I
ANCOVA results for the role of WM capacity in the effect of Feedback on L3
development: WM capacity measured by a computational span test as a covariate
Trained Items Untrained Items df F p η² power df F p η² power Written Interpretation Time 2 2.788 .064 .031 .543 2 .479 .620 .005 .128 Time x Computational 2 .023 .978 .000 .053 2 1.528 .220 .017 .322 Time x Feedback 2 10.04 .000 .104 .984 2 13.498 .000 .134 .998 Computational 1 .705 .403 .008 .132 1 5.270 .024 .057 .622 Feedback 1 20.571 .000 .191 .994 1 10.774 .001 .110 .901 Aural Interpretation Time 2 1.183 .309 .013 .257 2 1.016 .364 .012 .225 Time x Computational 2 .433 .649 .005 .120 2 1.112 .331 .013 .243 Time x Feedback 2 1.018 .363 .012 .226 2 .623 .538 .007 .153 Computational 1 .257 .614 .003 .079 1 .268 .606 .003 .081 Feedback 1 5.957 .017 .064 .675 1 5.779 .018 .062 .662 Grammaticality Judgment Time 2 2.401 .094 .027 .480 2 2.323 .101 .026 .466 Time x Computational 2 .750 .474 .009 .176 2 1.962 .144 .022 .402 Time x Feedback 2 .270 .764 .003 .092 2 3.382 .036 .037 .631 Computational 1 2.453 .121 .027 .341 1 .223 .638 .003 .075 Feedback 1 5.691 .019 .061 .655 1 4.949 .029 .054 .595 Written Production- Accuracy Time 2 4.794 .009 .052 .791 2 .391 .677 .004 .112 Time x Computational 2 2.671 .072 .030 .525 2 .287 .751 .003 .095 Time x Feedback 2 2.639 .074 .029 .519 2 3.997 .020 .044 .709 Computational 1 .246 .621 .003 .078 1 .866 .355 .010 .151 Feedback 1 4.574 .035 .050 .562 1 2.875 .094 .032 .389 Written Production- Word Order Preference Time
2 .616 .541 .007 .152 2 .375 .688 .004 .110 Time x Computational
2 .126 .882 .001 .069 2 .417 .659 .005 .117 Time x Feedback
2 .871 .421 .010 .198 2 1.711 .184 .019 .356 Computational
1 .005 .944 .000 .051 1 .675 .413 .008 .128 Feedback
1 .047 .828 .001 .055 1 .015 .902 .000 .052
Note. Values in bold reflect changes from the 2 x 3 repeated measures ANOVAs.

311
Total Items df F p η² power Written Interpretation Time 2 1.227 .296 .014 .265 Time x Computational 2 .457 .634 .005 .124 Time x Feedback 2 17.223 .000 .165 1.000 Computational 1 3.005 .087 .033 .403 Feedback 1 18.808 .000 .178 .990 Aural Interpretation Time 2 1.713 .183 .019 .357 Time x Computational 2 1.209 .301 .014 .262 Time x Feedback 2 1.215 .299 .014 .263 Computational 1 .344 .559 .004 .089 Feedback 1 7.688 .007 .081 .783 Grammaticality Judgment Time 2 .358 .700 .004 .107 Time x Computational 2 .235 .790 .003 .087 Time x Feedback 2 2.591 .078 .029 .512 Computational 1 .332 .566 .004 .088 Feedback 1 7.871 .006 .083 .792 Written Production- Accuracy Time 2 2.896 .058 .032 .560 Time x Computational 2 1.002 .369 .011 .223 Time x Feedback 2 5.284 .006 .057 .831 Computational 1 .594 .443 .007 .119 Feedback 1 4.292 .041 .047 .535 Written Production- Word Order Preference Time
2 .551 .577 .006 .140 Time x Computational
2 .200 .819 .002 .081 Time x Feedback
2 2.397 .094 .027 .479 Computational
1 .231 .632 .003 .076 Feedback
1 .037 .848 .000 .054
Note. Values in bold reflect changes from the 2 x 3 repeated measures ANOVAs.

312
Appendix J
ANCOVA results for the role of WM capacity in the interactive effect of Level and
Feedback on L3 development: WM capacity measured by a computational span test as a
covariate
Trained Items Untrained Items df F p η² power df F p η² power Written Interpretation Time 2 1.837 .163 .022 .379 2 .661 .518 .008 .160 Time x Computational 2 .034 .966 .000 .055 2 2.224 .111 .026 .449 Time x Feedback 2 9.856 .000 .106 .982 2 13.544 .000 .140 .998 Time x Level 4 1.011 .403 .024 .315 4 1.219 .305 .029 .377 Time x Level x Feedback 4 .343 .848 .008 .127 4 1.065 .375 .025 .331 Computational 1 1.598 .210 .019 .239 1 6.617 .012 .074 .720 Feedback 1 20.835 .000 .201 .995 1 11.211 .001 .119 .911 Level 2 1.815 .169 .042 .369 2 3.893 .024 .086 .688 Level x Feedback 2 1.011 .368 .024 .221 2 .056 .946 .001 .058
Aural Interpretation Time 2 .775 .462 .009 .180 2 .549 .578 .007 .140 Time x Computational 2 .629 .535 .008 .154 2 .789 .456 .009 .183 Time x Feedback 2 .993 .373 .012 .221 2 .619 .540 .007 .152 Time x Level 4 .315 .868 .008 .119 4 .185 .946 .004 .089 Time x Level x Feedback 4 1.182 .321 .028 .365 4 1.163 .329 .027 .360 Computational 1 .812 .370 .010 .145 1 .268 .606 .003 .080 Feedback 1 5.956 .017 .067 .674 1 5.688 .019 .064 .654 Level 2 2.023 .139 .046 .406 2 .987 .377 .023 .216 Level x Feedback 2 .378 .686 .009 .109 2 .312 .733 .007 .098
Grammaticality Judgment Time 2 2.226 .111 .026 .449 2 1.632 .199 .019 .341 Time x Computational 2 .859 .426 .010 .196 2 1.347 .263 .016 .287 Time x Feedback 2 .266 .767 .003 .091 2 3.310 .039 .038 .621 Time x Level 4 .183 .947 .004 .088 4 .249 .910 .006 .104 Time x Level x Feedback 4 2.603 .038 .059 .722 4 .896 .468 .021 .281 Computational 1 2.502 .117 .029 .346 1 .543 .463 .007 .113 Feedback 1 6.089 .016 .068 .684 1 5.202 .025 .059 .616 Level 2 .571 .567 .014 .142 2 3.924 .024 .086 .692 Level x Feedback 2 .015 .015 .097 .750 2 .586 .559 .014 .144
Note. Values in bold reflect changes from the 2 x 3 repeated measures ANOVAs.
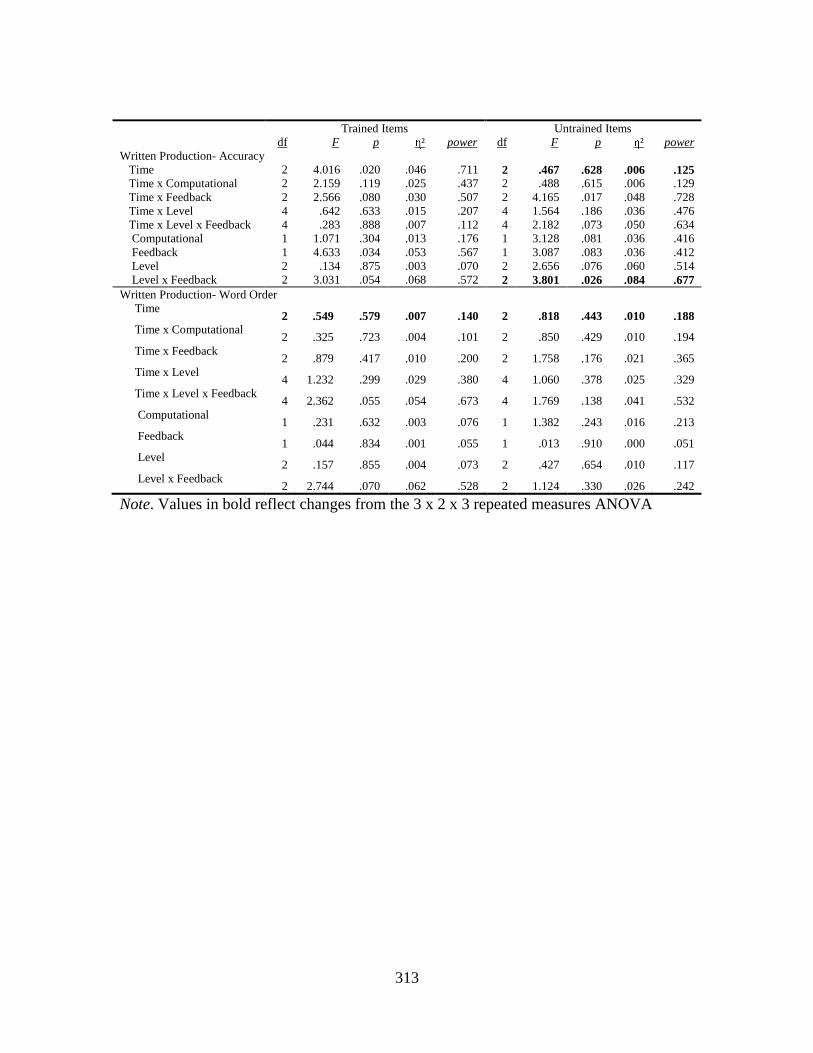
313
Trained Items Untrained Items df F p η² power df F p η² power Written Production- Accuracy Time 2 4.016 .020 .046 .711 2 .467 .628 .006 .125 Time x Computational 2 2.159 .119 .025 .437 2 .488 .615 .006 .129 Time x Feedback 2 2.566 .080 .030 .507 2 4.165 .017 .048 .728 Time x Level 4 .642 .633 .015 .207 4 1.564 .186 .036 .476 Time x Level x Feedback 4 .283 .888 .007 .112 4 2.182 .073 .050 .634 Computational 1 1.071 .304 .013 .176 1 3.128 .081 .036 .416 Feedback 1 4.633 .034 .053 .567 1 3.087 .083 .036 .412 Level 2 .134 .875 .003 .070 2 2.656 .076 .060 .514 Level x Feedback 2 3.031 .054 .068 .572 2 3.801 .026 .084 .677
Written Production- Word Order Time
2 .549 .579 .007 .140 2 .818 .443 .010 .188 Time x Computational
2 .325 .723 .004 .101 2 .850 .429 .010 .194 Time x Feedback
2 .879 .417 .010 .200 2 1.758 .176 .021 .365 Time x Level
4 1.232 .299 .029 .380 4 1.060 .378 .025 .329 Time x Level x Feedback
4 2.362 .055 .054 .673 4 1.769 .138 .041 .532 Computational
1 .231 .632 .003 .076 1 1.382 .243 .016 .213 Feedback
1 .044 .834 .001 .055 1 .013 .910 .000 .051 Level
2 .157 .855 .004 .073 2 .427 .654 .010 .117 Level x Feedback
2 2.744 .070 .062 .528 2 1.124 .330 .026 .242
Note. Values in bold reflect changes from the 3 x 2 x 3 repeated measures ANOVA

314
Total Items df F p η² power Written Interpretation
Time 2 .710 .493 .008 .169 Time x Computational 2 1.083 .341 .013 .238 Time x Feedback 2 17.226 .000 .172 1.000
Time x Level 4 1.693 .154 .039 .511 Time x Level x Feedback 4 4.95 .740 .012 .166 Computational 1 4.662 .034 .053 .569 Feedback 1 19.669 .000 .192 .992 Level 2 3.777 .027 .083 .674 Level x Feedback 2 .474 .624 .011 .125
Aural Interpretation Time 2 1.091 .338 .013 .239 Time x Computational 2 1.196 .305 .014 .259 Time x Feedback 2 1.195 .305 .014 .259 Time x Level 4 .306 .873 .007 .117 Time x Level x Feedback 4 1.272 .283 .030 .392 Computational 1 .649 .423 .008 .125 Feedback 1 7.631 .007 .084 .779 Level 2 1.863 .162 .043 .378 Level x Feedback 2 .001 .999 .000 .050
Grammaticality Judgment Time 2 .159 .853 .002 .074 Time x Computational 2 .036 .965 .000 .055 Time x Feedback 2 2.626 .075 .031 .517 Time x Level 4 .390 .816 .009 .139 Time x Level x Feedback 4 2.543 .042 .058 .710 Computational 1 .167 .684 .002 .069 Feedback 1 8.376 .005 .092 .816 Level 2 2.586 .081 .059 .503 Level x Feedback 2 2.343 .102 .053 .462
Note. Values in bold reflect changes from the 3 x 2 x 3 repeated measures ANOVA

315
Total Items df F p η² power Written Production- Accuracy
Time 2 2.568 .080 .030 .507 Time x Computational 2 .946 .390 .011 .212 Time x Feedback 2 5.269 .006 .060 .829 Time x Level 4 .541 .706 .013 .179 Time x Level x Feedback 4 1.359 .251 .032 .417 Computational 1 2.287 .134 .027 .321 Feedback 1 4.506 .037 .051 .555 Level 2 1.109 .335 .026 .239 Level x Feedback 2 3.970 .023 .087 .697
Written Production- Word Order Time 2 .395 .675 .005 .113 Time x Computational 2 .118 .888 .001 .068 Time x Feedback 2 2.353 .098 .028 .471 Time x Level 4 1.022 .398 .024 .318 Time x Level x Feedback 4 .291 .884 .007 .114 Computational 1 .827 .366 .010 .146 Feedback 1 .033 .856 .000 .054 Level 2 .069 .933 .002 .060 Level x Feedback 2 2.055 .134 .047 .412
Note. Values in bold reflect changes from the 3 x 2 x 3 repeated measures ANOVAs.

316
Appendix K
ANCOVA results for the role of WM capacity in the effect of Level of L3 development:
WM capacity measured by a speed of processing test as a covariate
Trained Items Untrained Items df F p η² power df F p η² power Written Interpretation Time 2 1.835 .163 .021 .379 2 .077 .926 .001 .061 Time x Speed 2 .135 .874 .002 .070 2 .687 .505 .008 .164 Time x Level 4 .932 .446 .021 .292 4 .804 .524 .018 .254 Speed 1 1.864 .176 .021 .271 1 .323 .323 .323 .323 Level 2 1.115 .333 .025 .240 2 .480 .480 .480 .480 Aural Interpretation Time 2 1.152 .318 .013 .251 2 2.722 .069 .031 .533 Time x Speed 2 .168 .845 .002 .076 2 2.740 .067 .031 .536 Time x Level 4 .340 .851 .008 .126 4 .112 .978 .003 .073 Speed 1 .048 .827 .001 .055 1 1.005 .319 .012 .168 Level 2 1.709 .187 .038 .350 2 .812 .447 .019 .185 Grammaticality Judgment Time 2 1.361 .259 .016 .290 2 .717 .489 .008 .170 Time x Speed 2 .732 .483 .008 .173 2 .621 .538 .007 .153 Time x Level 4 .253 .907 .006 .105 4 .272 .896 .006 .109 Speed 1 .380 .539 .004 .094 1 .218 .642 .003 .075 Level 2 .423 .657 .010 .117 2 3.568 .032 .077 .648 Written Production- Accuracy Time 2 .615 .542 .007 .152 2 .243 .785 .003 .088 Time x Speed 2 .256 .774 .003 .090 2 .194 .824 .002 .080 Time x Level 4 .671 .613 .015 .215 4 1.633 .168 .037 .495 Speed 1 .093 .761 .001 .060 1 .118 .732 .001 .063 Level 2 .072 .931 .002 .061 2 2.042 .136 .045 .410 Written Production- Word Order Preference
Time 2 3.420 .035 .038 .637 2 .048 .953 .001 .057
Time x Speed 2 3.250 .041 .036 .613 2 .129 .879 .001 .070
Time x Level 4 1.113 .352 .025 .345 4 1.090 .363 .025 .339
Speed 1 .005 .942 .000 .051 1 .158 .692 .002 .068
Level 2 .181 .835 .004 .077 2 .314 .732 .007 .098
Note. Values in bold reflect changes from the 3 x 3 repeated measures ANOVAs.

317
Total Items df F p η² power Written Interpretation Time 2 .493 .612 .006 .130 Time x Speed 2 .100 .905 .001 .065 Time x Level 4 1.233 .299 .028 .381 Speed 1 2.719 .103 .031 3.71 Level 2 2.305 .106 .051 .456 Aural Interpretation Time 2 1.422 .244 .016 .302 Time x Speed 2 .685 .506 .008 .164 Time x Level 4 .282 .889 .007 .112 Speed 1 .499 .482 .006 .108 Level 2 1.520 .224 .034 .315 Grammaticality Judgment Time 2 1.189 .307 .014 .258 Time x Speed 2 1.092 .338 .013 .239 Time x Level 4 .422 .793 .010 .147 Speed 1 .003 .953 .000 .050 Level 2 2.301 .106 .051 .455 Written Production- Accuracy Time 2 .614 .542 1.228 .151 Time x Speed 2 .296 .744 .592 .096 Time x Level 4 .513 .726 2.053 .171 Speed 1 .121 .729 .001 .064 Level 2 .791 .457 .018 .181 Written Production- Word Order Preference Time
2 1.304 .274 .015 .280 Time x Speed
2 1.389 .252 .016 .296 Time x Level
4 1.155 .333 .026 .358 Speed
1 .029 .866 .000 .053 Level
2 .039 .962 .001 .056
Note. Values in bold reflect changes from the 3 x 3 repeated measures ANOVAs.

318
Appendix L
ANCOVA results for the role of WM capacity in the effect of Feedback on L3
development: WM capacity measured by a speed of processing test as a covariate
Trained Items Untrained Items df F p η² power df F p η² power Written Interpretation Time 2 3.317 .039 .037 .622 2 .358 .700 .004 .107 Time x Computational 2 .617 .541 .007 .152 2 .375 .688 .004 .110 Time x Feedback 2 10.614 .000 .109 .988 2 12.948 .000 .130 .997 Computational 1 .946 .333 .011 .161 1 1.566 .214 .018 .236 Feedback 1 19.134 .000 .180 .991 1 9.336 .003 .097 .856 Aural Interpretation Time 2 1.376 .255 .016 .293 2 2.593 .078 .029 .512 Time x Computational 2 .261 .770 .003 .091 2 2.584 .078 .029 .510 Time x Feedback 2 1.153 .318 .013 .251 2 .368 .693 .004 .108 Computational 1 .000 .993 .000 .050 1 .568 .453 .006 .116 Feedback 1 5.871 .017 .063 .669 1 5.229 .025 .057 .618 Grammaticality Judgment Time 2 1.501 .226 .017 .317 2 1.017 .364 .012 .225 Time x Computational 2 .843 .432 .010 .193 2 .955 .387 .011 .214 Time x Feedback 2 .422 .656 .005 .118 2 3.674 .027 .041 .670 Computational 1 .860 .356 .010 .151 1 .161 .689 .002 .068 Feedback 1 5.939 .017 .064 .674 1 4.640 .034 .051 .568 Written Production- Accuracy Time 2 1.192 .306 .014 .258 2 .637 .530 .007 .156 Time x Computational 2 .623 .537 .007 .153 2 .254 .776 .003 .090 Time x Feedback 2 2.735 .068 .030 .535 2 4.154 .017 .046 .727 Computational 1 .385 .537 .004 .094 1 .201 .655 .002 .073 Feedback 1 4.930 .029 .054 .593 1 3.095 .082 .034 .413 Written Production- Word Order Preference
Time 2 4.204 .016 .046 .732 2 .005 .995 .000 .051
Time x Computational 2 3.920 .022 .043 .700 2 .010 .990 .000 .052
Time x Feedback 2 1.398 .250 .016 .297 2 1.619 .201 .018 .339
Computational 1 .000 .989 .000 .050 1 .151 .698 .002 .067
Feedback 1 .048 .827 .001 .055 1 .039 .844 .000 .054
Note. Values in bold reflect changes from the 2 x 3 repeated measures ANOVAs.

319
Total Items df F p η² power Written Interpretation Time 2 1.656 .194 .019 .346 Time x Computational 2 .071 .932 .001 .061 Time x Feedback 2 17.166 .000 .165 1.000 Computational 1 1.689 .197 .019 .251 Feedback 1 16.922 .000 .163 .982 Aural Interpretation Time 2 1.464 .234 .017 .310 Time x Computational 2 .596 .552 .007 .148 Time x Feedback 2 1.137 .323 .013 .248 Computational 1 .199 .657 .002 .073 Feedback 1 7.244 .009 .077 .759 Grammaticality Judgment Time 2 1.710 .184 .019 .356 Time x Computational 2 1.566 .212 .018 .329 Time x Feedback 2 3.144 .046 .035 .598 Computational 1 .071 .791 .001 .058 Feedback 1 7.824 .006 .083 .790 Written Production- Accuracy Time 2 1.399 .250 .016 .298 Time x Computational 2 .649 .524 .007 .158 Time x Feedback 2 5.521 .005 .060 .848 Computational 1 .333 .565 .004 .088 Feedback 1 4.621 .034 .050 .566 Written Production- Word Order Preference Time
2 1.611 .203 .018 .338 Time x Computational
2 1.510 .224 .017 .318 Time x Feedback
2 2.687 .071 .030 .527 Computational
1 .047 .829 .001 .055 Feedback
1 .054 .816 .001 .056
Note. Values in bold reflect changes from the 3 x 3 repeated measures ANOVAs.
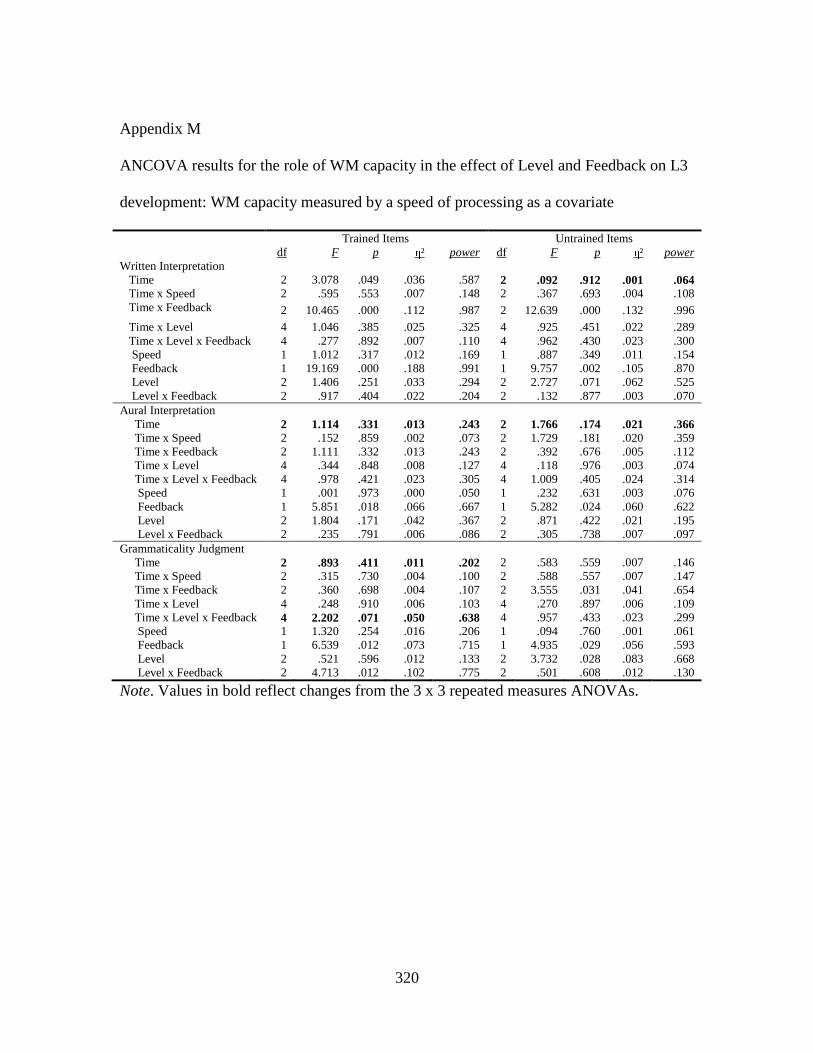
320
Appendix M
ANCOVA results for the role of WM capacity in the effect of Level and Feedback on L3
development: WM capacity measured by a speed of processing as a covariate
Trained Items Untrained Items df F p η² power df F p η² power Written Interpretation Time 2 3.078 .049 .036 .587 2 .092 .912 .001 .064 Time x Speed 2 .595 .553 .007 .148 2 .367 .693 .004 .108 Time x Feedback 2 10.465 .000 .112 .987 2 12.639 .000 .132 .996
Time x Level 4 1.046 .385 .025 .325 4 .925 .451 .022 .289 Time x Level x Feedback 4 .277 .892 .007 .110 4 .962 .430 .023 .300 Speed 1 1.012 .317 .012 .169 1 .887 .349 .011 .154 Feedback 1 19.169 .000 .188 .991 1 9.757 .002 .105 .870 Level 2 1.406 .251 .033 .294 2 2.727 .071 .062 .525 Level x Feedback 2 .917 .404 .022 .204 2 .132 .877 .003 .070
Aural Interpretation Time 2 1.114 .331 .013 .243 2 1.766 .174 .021 .366 Time x Speed 2 .152 .859 .002 .073 2 1.729 .181 .020 .359 Time x Feedback 2 1.111 .332 .013 .243 2 .392 .676 .005 .112 Time x Level 4 .344 .848 .008 .127 4 .118 .976 .003 .074 Time x Level x Feedback 4 .978 .421 .023 .305 4 1.009 .405 .024 .314 Speed 1 .001 .973 .000 .050 1 .232 .631 .003 .076 Feedback 1 5.851 .018 .066 .667 1 5.282 .024 .060 .622 Level 2 1.804 .171 .042 .367 2 .871 .422 .021 .195 Level x Feedback 2 .235 .791 .006 .086 2 .305 .738 .007 .097
Grammaticality Judgment Time 2 .893 .411 .011 .202 2 .583 .559 .007 .146 Time x Speed 2 .315 .730 .004 .100 2 .588 .557 .007 .147 Time x Feedback 2 .360 .698 .004 .107 2 3.555 .031 .041 .654 Time x Level 4 .248 .910 .006 .103 4 .270 .897 .006 .109 Time x Level x Feedback 4 2.202 .071 .050 .638 4 .957 .433 .023 .299 Speed 1 1.320 .254 .016 .206 1 .094 .760 .001 .061 Feedback 1 6.539 .012 .073 .715 1 4.935 .029 .056 .593 Level 2 .521 .596 .012 .133 2 3.732 .028 .083 .668 Level x Feedback 2 4.713 .012 .102 .775 2 .501 .608 .012 .130
Note. Values in bold reflect changes from the 3 x 3 repeated measures ANOVAs.

321
Trained Items Untrained Items df F p η² power df F p η² power Written Production- Accuracy
Time 2 .707 .495 .008 .168 2 .605 .547 .007 .150 Time x Speed 2 .293 .747 .004 .096 2 .570 .567 .007 .143 Time x Feedback 2 2.574 .079 .030 .508 2 4.264 .016 .049 .738 Time x Level 4 .669 .615 .016 .214 4 1.777 .136 .041 .534 Time x Level x Feedback 4 .307 .873 .007 .118 4 2.128 .080 .049 .621 Speed 1 .005 .944 .000 .051 1 .001 .969 .000 .050 Feedback 1 4.628 .034 .053 .566 1 3.078 .083 .036 .411 Level 2 .074 .929 .002 .061 2 2.130 .125 .049 .425 Level x Feedback 2 2.415 .096 .055 .474 2 2.699 .073 .061 .521
Written Production- Word Order Preference Time
2 2.567 .080 .030 .507 2 .235 .790 .003 .086 Time x Speed
2 2.472 .087 .029 .491 2 .300 .741 .004 .097 Time x Feedback
2 1.263 .285 .015 .272 2 1.685 .189 .020 .351 Time x Level
4 1.152 .334 .027 .357 4 1.159 .331 .027 .359 Time x Level x Feedback
4 1.668 .160 .039 .505 4 1.647 .165 .038 .499 Speed
1 .291 .591 .003 .083 1 .010 .919 .000 .051 Feedback
1 .019 .890 .000 .052 1 .024 .877 .000 .053 Level
2 .214 .807 .005 .082 2 .299 .743 .007 .096 Level x Feedback
2 2.775 .068 .063 .533 2 .765 .468 .018 .176
Note. Values in bold reflect changes from the 3 x 2 x 3 repeated measures ANOVAs.

322
Total Items df F p η² power Written Interpretation
Time 2 1.334 .266 .016 .285 Time x Speed 2 .023 .977 .000 .053 Time x Feedback 2 16.944 .000 .170 1.000
Time x Level 4 1.465 .215 .034 .448 Time x Level x Feedback 4 .322 .863 .008 .121 Speed 1 1.296 .258 .015 .203 Feedback 1 17.490 .000 .174 .985 Level 2 2.798 .067 .063 .537 Level x Feedback 2 .314 .732 .007 .098
Aural Interpretation Time 2 1.248 .290 .015 .269 Time x Speed 2 .471 .625 .006 .126 Time x Feedback 2 1.125 .327 .013 .246 Time x Level 4 .289 .885 .007 .113 Time x Level x Feedback 4 1.201 .312 .028 .371 Speed 1 .091 .763 .001 .060 Feedback 1 7.275 .008 .081 .760 Level 2 1.643 .200 .038 .338 Level x Feedback 2 .006 .994 .000 .051
Grammaticality Judgment Time 2 .996 .372 .012 .221 Time x Speed 2 .795 .453 .009 .184 Time x Feedback 2 3.026 .051 .035 .580 Time x Level 4 .427 .789 .010 .148 Time x Level x Feedback 4 2.224 .069 .051 .643 Speed 1 .203 .653 .002 .073 Feedback 1 8.528 .005 .093 .823 Level 2 2.663 .076 .060 .515 Level x Feedback 2 2.420 .095 .055 .475
Written Production- Accuracy Time 2 .982 .377 .012 .219 Time x Speed 2 .579 .561 .007 .145 Time x Feedback 2 5.366 .006 .061 .836 Time x Level 4 .545 .703 .013 .180 Time x Level x Feedback 4 1.372 .246 .032 .421 Speed 1 .003 .953 .000 .050 Feedback 1 4.481 .037 .051 .553 Level 2 .836 .437 .020 .189 Level x Feedback 2 2.973 .057 .067 .564
Written Production- Word Order Preference Time
2 1.850 .160 .022 .382 Time x Speed
2 1.914 .151 .023 .393 Time x Feedback
2 2.608 .077 .030 .514 Time x Level
4 1.173 .324 .027 .363 Time x Level x Feedback
4 .450 .772 .011 .154 Speed
1 .065 .800 .001 .057 Feedback
1 .027 .871 .000 .053 Level
2 .046 .955 .001 .057 Level x Feedback
2 1.766 .177 .041 .360

323
Appendix N
ANCOVA results for the role of WM capacity in the effect of Level of L3 development:
WM capacity measured by a nonword recall test as a covariate
Trained Items Untrained items df F p η² power df F p η² power Written Interpretation Time 2 3.657 .028 .041 .668 2 .156 .856 .002 .074 Time x Nonword 2 .267 .766 .003 .092 2 1.174 .312 .013 .255 Time x Level 4 .904 .463 .021 .283 4 .902 .464 .021 .283 Nonword 1 .067 .797 .001 .058 1 1.086 .300 .012 .178 Level 2 1.268 .287 .029 .269 2 2.735 .071 .060 .527 Aural Interpretation Time 2 .335 .715 .004 .103 2 1.865 .158 .021 .385 Time x Nonword 2 .276 .759 .003 .093 2 .304 .739 .004 .098 Time x Level 4 .337 .853 .008 .125 4 .154 .961 .004 .082 Nonword 1 .731 .395 .008 .135 1 1.469 .229 .017 .224 Level 2 1.827 .167 .041 .372 2 .945 .393 .021 .209 Grammaticality Judgment Time 2 .748 .475 .009 .176 2 2.711 .069 .031 .531 Time x Nonword 2 .020 .980 .000 .053 2 2.351 .098 .027 .471 Time x Level 4 .228 .922 .005 .099 4 .202 .937 .005 .093 Nonword 1 .878 .351 .010 .153 1 .266 .608 .003 .080 Level 2 .401 .671 .009 .113 2 3.770 .027 .081 .674 Written Production- Accuracy Time 2 2.606 .077 .029 .514 2 .669 .514 .008 .161 Time x Nonword 2 1.183 .309 .014 .257 2 .086 .918 .001 .063 Time x Level 4 .733 .570 .017 .233 4 1.593 .178 .036 .484 Nonword 1 .032 .858 .000 .054 1 1.201 .276 .014 .192 Level 2 .070 .933 .002 .060 2 2.116 .127 .047 .423 Written Production- Word Order Preference
Time 2 .226 .798 .003 .085 2 .645 .526 .007 .157
Time x Nonword 2 .021 .979 .000 .053 2 .373 .689 .004 .109
Time x Level 4 1.153 .334 .026 .357 4 1.097 .360 .025 .341
Nonword 1 .496 .483 .006 .107 1 .611 .437 .007 .121
Level 2 .161 .852 .004 .074 2 .322 .725 .007 .100
Note. Values in bold reflect changes from the 3 x 3 repeated measures ANOVAs.
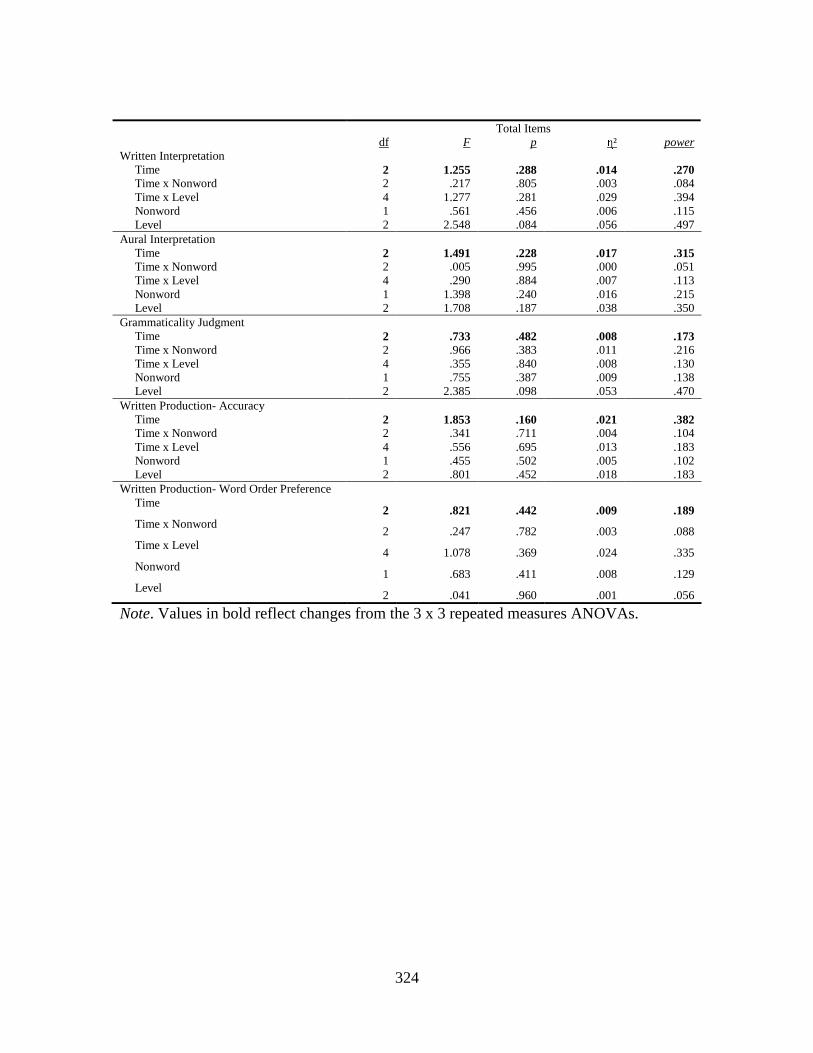
324
Total Items df F p η² power Written Interpretation Time 2 1.255 .288 .014 .270 Time x Nonword 2 .217 .805 .003 .084 Time x Level 4 1.277 .281 .029 .394 Nonword 1 .561 .456 .006 .115 Level 2 2.548 .084 .056 .497 Aural Interpretation Time 2 1.491 .228 .017 .315 Time x Nonword 2 .005 .995 .000 .051 Time x Level 4 .290 .884 .007 .113 Nonword 1 1.398 .240 .016 .215 Level 2 1.708 .187 .038 .350 Grammaticality Judgment Time 2 .733 .482 .008 .173 Time x Nonword 2 .966 .383 .011 .216 Time x Level 4 .355 .840 .008 .130 Nonword 1 .755 .387 .009 .138 Level 2 2.385 .098 .053 .470 Written Production- Accuracy Time 2 1.853 .160 .021 .382 Time x Nonword 2 .341 .711 .004 .104 Time x Level 4 .556 .695 .013 .183 Nonword 1 .455 .502 .005 .102 Level 2 .801 .452 .018 .183 Written Production- Word Order Preference Time
2 .821 .442 .009 .189 Time x Nonword
2 .247 .782 .003 .088 Time x Level
4 1.078 .369 .024 .335 Nonword
1 .683 .411 .008 .129 Level
2 .041 .960 .001 .056
Note. Values in bold reflect changes from the 3 x 3 repeated measures ANOVAs.
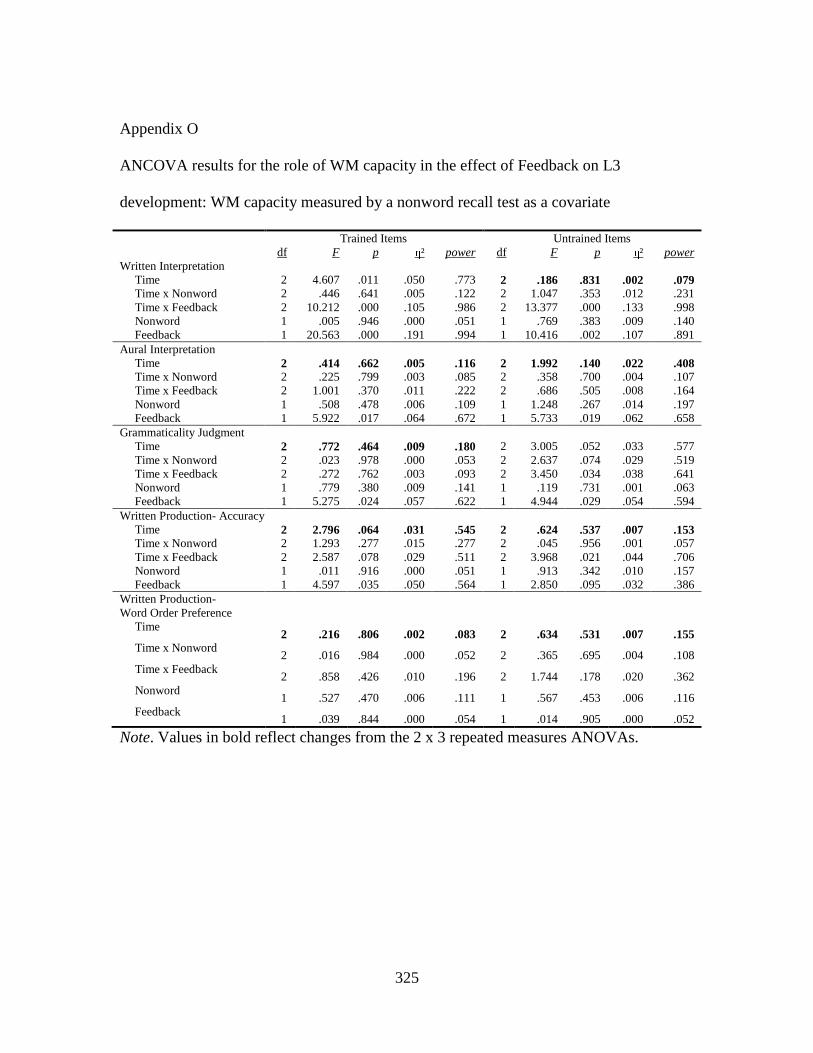
325
Appendix O
ANCOVA results for the role of WM capacity in the effect of Feedback on L3
development: WM capacity measured by a nonword recall test as a covariate
Trained Items Untrained Items df F p η² power df F p η² power Written Interpretation Time 2 4.607 .011 .050 .773 2 .186 .831 .002 .079 Time x Nonword 2 .446 .641 .005 .122 2 1.047 .353 .012 .231 Time x Feedback 2 10.212 .000 .105 .986 2 13.377 .000 .133 .998 Nonword 1 .005 .946 .000 .051 1 .769 .383 .009 .140 Feedback 1 20.563 .000 .191 .994 1 10.416 .002 .107 .891 Aural Interpretation Time 2 .414 .662 .005 .116 2 1.992 .140 .022 .408 Time x Nonword 2 .225 .799 .003 .085 2 .358 .700 .004 .107 Time x Feedback 2 1.001 .370 .011 .222 2 .686 .505 .008 .164 Nonword 1 .508 .478 .006 .109 1 1.248 .267 .014 .197 Feedback 1 5.922 .017 .064 .672 1 5.733 .019 .062 .658 Grammaticality Judgment Time 2 .772 .464 .009 .180 2 3.005 .052 .033 .577 Time x Nonword 2 .023 .978 .000 .053 2 2.637 .074 .029 .519 Time x Feedback 2 .272 .762 .003 .093 2 3.450 .034 .038 .641 Nonword 1 .779 .380 .009 .141 1 .119 .731 .001 .063 Feedback 1 5.275 .024 .057 .622 1 4.944 .029 .054 .594 Written Production- Accuracy Time 2 2.796 .064 .031 .545 2 .624 .537 .007 .153 Time x Nonword 2 1.293 .277 .015 .277 2 .045 .956 .001 .057 Time x Feedback 2 2.587 .078 .029 .511 2 3.968 .021 .044 .706 Nonword 1 .011 .916 .000 .051 1 .913 .342 .010 .157 Feedback 1 4.597 .035 .050 .564 1 2.850 .095 .032 .386 Written Production- Word Order Preference
Time 2 .216 .806 .002 .083 2 .634 .531 .007 .155
Time x Nonword 2 .016 .984 .000 .052 2 .365 .695 .004 .108
Time x Feedback 2 .858 .426 .010 .196 2 1.744 .178 .020 .362
Nonword 1 .527 .470 .006 .111 1 .567 .453 .006 .116
Feedback 1 .039 .844 .000 .054 1 .014 .905 .000 .052
Note. Values in bold reflect changes from the 2 x 3 repeated measures ANOVAs.
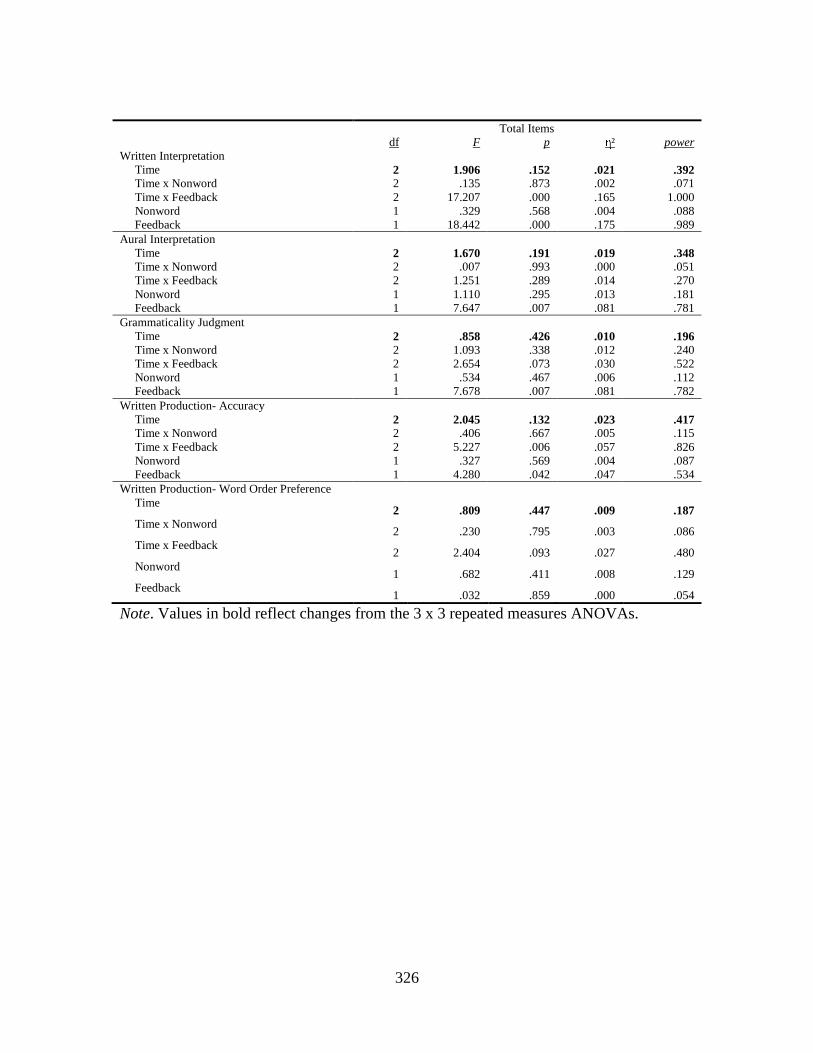
326
Total Items df F p η² power Written Interpretation Time 2 1.906 .152 .021 .392 Time x Nonword 2 .135 .873 .002 .071 Time x Feedback 2 17.207 .000 .165 1.000 Nonword 1 .329 .568 .004 .088 Feedback 1 18.442 .000 .175 .989 Aural Interpretation Time 2 1.670 .191 .019 .348 Time x Nonword 2 .007 .993 .000 .051 Time x Feedback 2 1.251 .289 .014 .270 Nonword 1 1.110 .295 .013 .181 Feedback 1 7.647 .007 .081 .781 Grammaticality Judgment Time 2 .858 .426 .010 .196 Time x Nonword 2 1.093 .338 .012 .240 Time x Feedback 2 2.654 .073 .030 .522 Nonword 1 .534 .467 .006 .112 Feedback 1 7.678 .007 .081 .782 Written Production- Accuracy Time 2 2.045 .132 .023 .417 Time x Nonword 2 .406 .667 .005 .115 Time x Feedback 2 5.227 .006 .057 .826 Nonword 1 .327 .569 .004 .087 Feedback 1 4.280 .042 .047 .534 Written Production- Word Order Preference Time
2 .809 .447 .009 .187 Time x Nonword
2 .230 .795 .003 .086 Time x Feedback
2 2.404 .093 .027 .480 Nonword
1 .682 .411 .008 .129 Feedback
1 .032 .859 .000 .054
Note. Values in bold reflect changes from the 3 x 3 repeated measures ANOVAs.
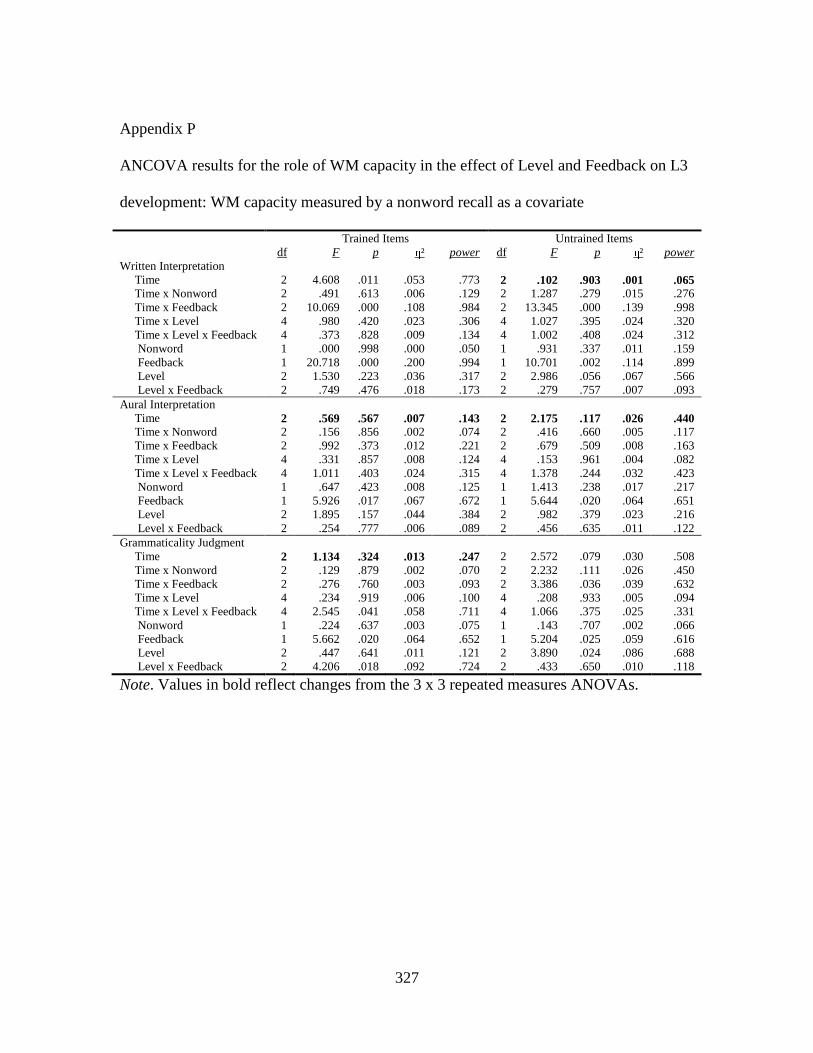
327
Appendix P
ANCOVA results for the role of WM capacity in the effect of Level and Feedback on L3
development: WM capacity measured by a nonword recall as a covariate
Trained Items Untrained Items df F p η² power df F p η² power Written Interpretation
Time 2 4.608 .011 .053 .773 2 .102 .903 .001 .065 Time x Nonword 2 .491 .613 .006 .129 2 1.287 .279 .015 .276 Time x Feedback 2 10.069 .000 .108 .984 2 13.345 .000 .139 .998 Time x Level 4 .980 .420 .023 .306 4 1.027 .395 .024 .320 Time x Level x Feedback 4 .373 .828 .009 .134 4 1.002 .408 .024 .312 Nonword 1 .000 .998 .000 .050 1 .931 .337 .011 .159 Feedback 1 20.718 .000 .200 .994 1 10.701 .002 .114 .899 Level 2 1.530 .223 .036 .317 2 2.986 .056 .067 .566 Level x Feedback 2 .749 .476 .018 .173 2 .279 .757 .007 .093
Aural Interpretation Time 2 .569 .567 .007 .143 2 2.175 .117 .026 .440 Time x Nonword 2 .156 .856 .002 .074 2 .416 .660 .005 .117 Time x Feedback 2 .992 .373 .012 .221 2 .679 .509 .008 .163 Time x Level 4 .331 .857 .008 .124 4 .153 .961 .004 .082 Time x Level x Feedback 4 1.011 .403 .024 .315 4 1.378 .244 .032 .423 Nonword 1 .647 .423 .008 .125 1 1.413 .238 .017 .217 Feedback 1 5.926 .017 .067 .672 1 5.644 .020 .064 .651 Level 2 1.895 .157 .044 .384 2 .982 .379 .023 .216 Level x Feedback 2 .254 .777 .006 .089 2 .456 .635 .011 .122
Grammaticality Judgment Time 2 1.134 .324 .013 .247 2 2.572 .079 .030 .508 Time x Nonword 2 .129 .879 .002 .070 2 2.232 .111 .026 .450 Time x Feedback 2 .276 .760 .003 .093 2 3.386 .036 .039 .632 Time x Level 4 .234 .919 .006 .100 4 .208 .933 .005 .094 Time x Level x Feedback 4 2.545 .041 .058 .711 4 1.066 .375 .025 .331 Nonword 1 .224 .637 .003 .075 1 .143 .707 .002 .066 Feedback 1 5.662 .020 .064 .652 1 5.204 .025 .059 .616 Level 2 .447 .641 .011 .121 2 3.890 .024 .086 .688 Level x Feedback 2 4.206 .018 .092 .724 2 .433 .650 .010 .118
Note. Values in bold reflect changes from the 3 x 3 repeated measures ANOVAs.
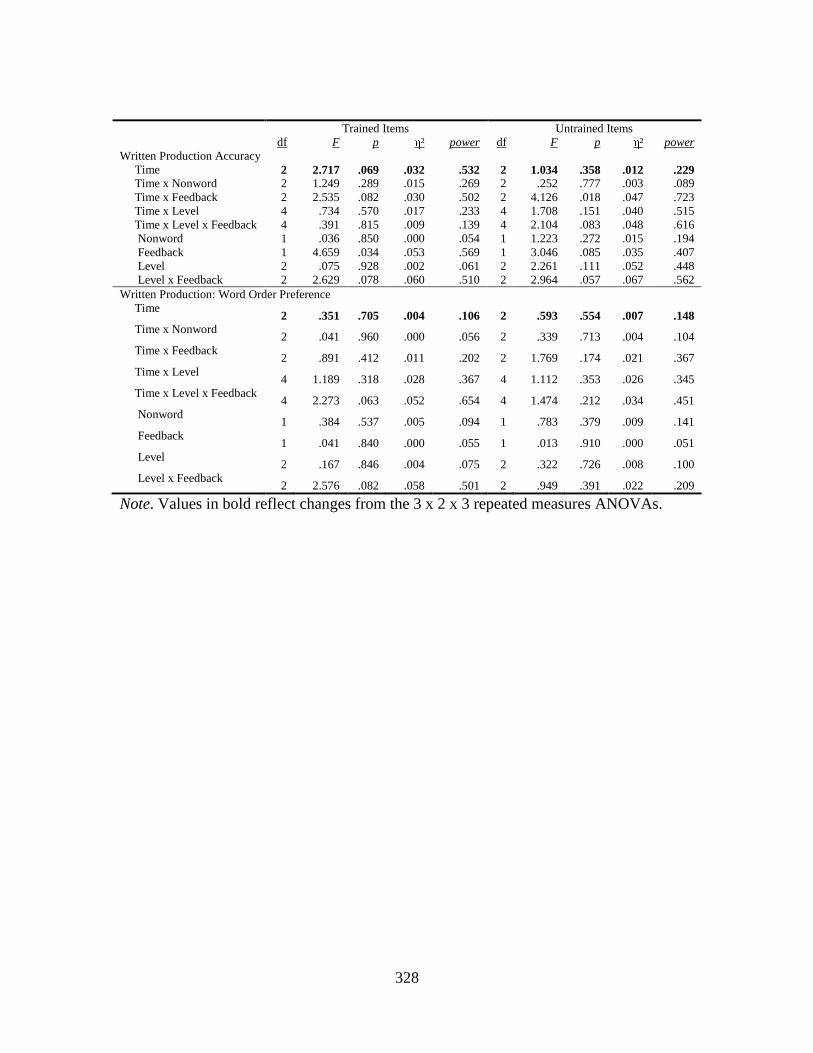
328
Trained Items Untrained Items df F p η² power df F p η² power Written Production Accuracy
Time 2 2.717 .069 .032 .532 2 1.034 .358 .012 .229 Time x Nonword 2 1.249 .289 .015 .269 2 .252 .777 .003 .089 Time x Feedback 2 2.535 .082 .030 .502 2 4.126 .018 .047 .723 Time x Level 4 .734 .570 .017 .233 4 1.708 .151 .040 .515 Time x Level x Feedback 4 .391 .815 .009 .139 4 2.104 .083 .048 .616 Nonword 1 .036 .850 .000 .054 1 1.223 .272 .015 .194 Feedback 1 4.659 .034 .053 .569 1 3.046 .085 .035 .407 Level 2 .075 .928 .002 .061 2 2.261 .111 .052 .448 Level x Feedback 2 2.629 .078 .060 .510 2 2.964 .057 .067 .562
Written Production: Word Order Preference Time
2 .351 .705 .004 .106 2 .593 .554 .007 .148 Time x Nonword
2 .041 .960 .000 .056 2 .339 .713 .004 .104 Time x Feedback
2 .891 .412 .011 .202 2 1.769 .174 .021 .367 Time x Level
4 1.189 .318 .028 .367 4 1.112 .353 .026 .345 Time x Level x Feedback
4 2.273 .063 .052 .654 4 1.474 .212 .034 .451 Nonword
1 .384 .537 .005 .094 1 .783 .379 .009 .141 Feedback
1 .041 .840 .000 .055 1 .013 .910 .000 .051 Level
2 .167 .846 .004 .075 2 .322 .726 .008 .100 Level x Feedback
2 2.576 .082 .058 .501 2 .949 .391 .022 .209
Note. Values in bold reflect changes from the 3 x 2 x 3 repeated measures ANOVAs.
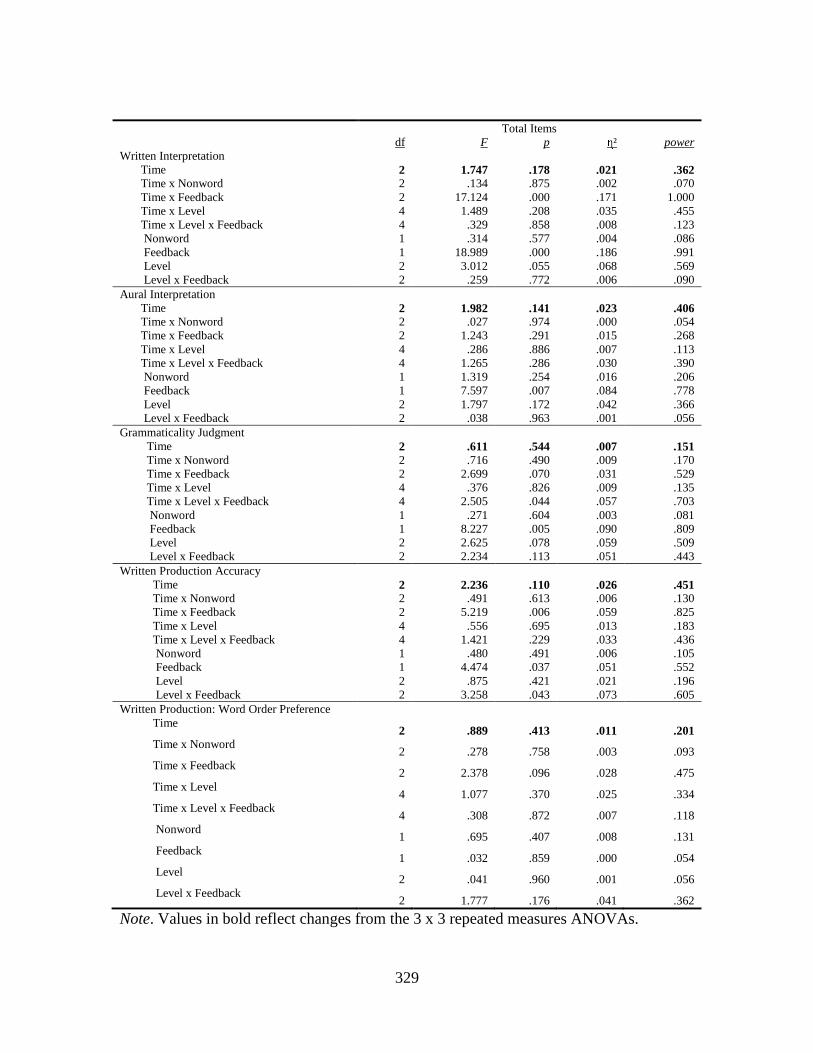
329
Total Items df F p η² power Written Interpretation
Time 2 1.747 .178 .021 .362 Time x Nonword 2 .134 .875 .002 .070 Time x Feedback 2 17.124 .000 .171 1.000 Time x Level 4 1.489 .208 .035 .455 Time x Level x Feedback 4 .329 .858 .008 .123 Nonword 1 .314 .577 .004 .086 Feedback 1 18.989 .000 .186 .991 Level 2 3.012 .055 .068 .569 Level x Feedback 2 .259 .772 .006 .090
Aural Interpretation Time 2 1.982 .141 .023 .406 Time x Nonword 2 .027 .974 .000 .054 Time x Feedback 2 1.243 .291 .015 .268 Time x Level 4 .286 .886 .007 .113 Time x Level x Feedback 4 1.265 .286 .030 .390 Nonword 1 1.319 .254 .016 .206 Feedback 1 7.597 .007 .084 .778 Level 2 1.797 .172 .042 .366 Level x Feedback 2 .038 .963 .001 .056
Grammaticality Judgment Time 2 .611 .544 .007 .151 Time x Nonword 2 .716 .490 .009 .170 Time x Feedback 2 2.699 .070 .031 .529 Time x Level 4 .376 .826 .009 .135 Time x Level x Feedback 4 2.505 .044 .057 .703 Nonword 1 .271 .604 .003 .081 Feedback 1 8.227 .005 .090 .809 Level 2 2.625 .078 .059 .509 Level x Feedback 2 2.234 .113 .051 .443
Written Production Accuracy Time 2 2.236 .110 .026 .451 Time x Nonword 2 .491 .613 .006 .130 Time x Feedback 2 5.219 .006 .059 .825 Time x Level 4 .556 .695 .013 .183 Time x Level x Feedback 4 1.421 .229 .033 .436 Nonword 1 .480 .491 .006 .105 Feedback 1 4.474 .037 .051 .552 Level 2 .875 .421 .021 .196 Level x Feedback 2 3.258 .043 .073 .605
Written Production: Word Order Preference Time
2 .889 .413 .011 .201 Time x Nonword
2 .278 .758 .003 .093 Time x Feedback
2 2.378 .096 .028 .475 Time x Level
4 1.077 .370 .025 .334 Time x Level x Feedback
4 .308 .872 .007 .118 Nonword
1 .695 .407 .008 .131 Feedback
1 .032 .859 .000 .054 Level
2 .041 .960 .001 .056 Level x Feedback
2 1.777 .176 .041 .362
Note. Values in bold reflect changes from the 3 x 3 repeated measures ANOVAs.
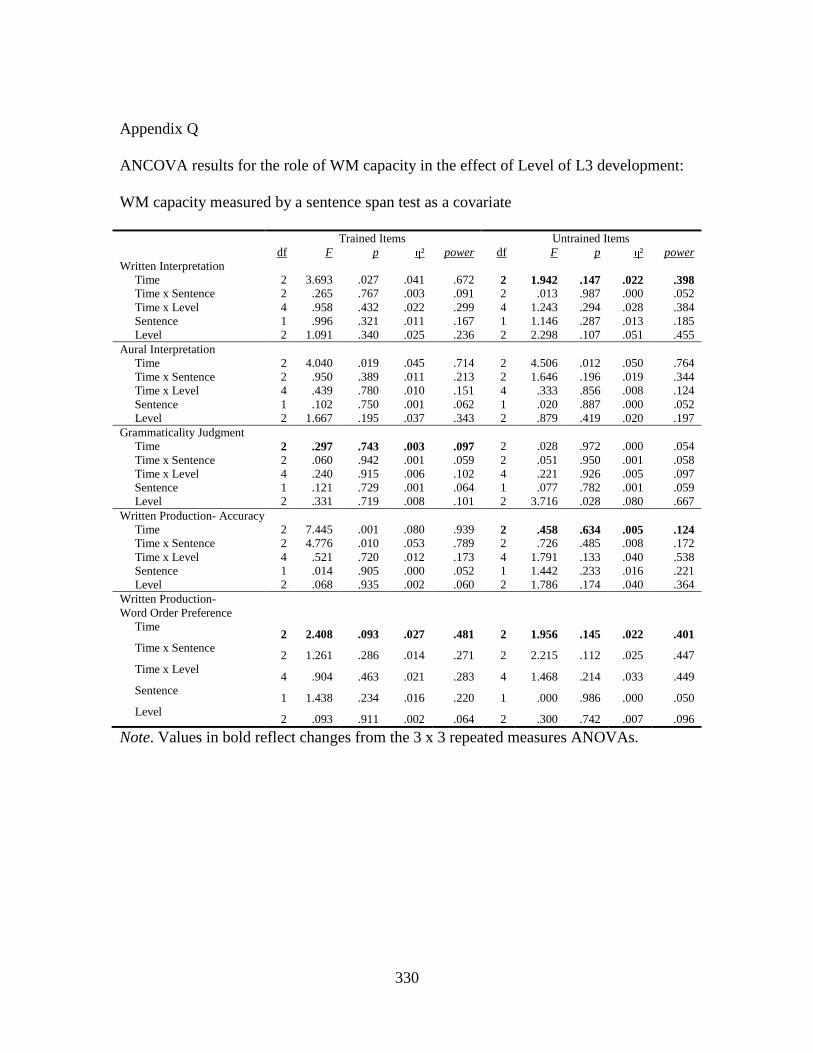
330
Appendix Q
ANCOVA results for the role of WM capacity in the effect of Level of L3 development:
WM capacity measured by a sentence span test as a covariate
Trained Items Untrained Items df F p η² power df F p η² power Written Interpretation Time 2 3.693 .027 .041 .672 2 1.942 .147 .022 .398 Time x Sentence 2 .265 .767 .003 .091 2 .013 .987 .000 .052 Time x Level 4 .958 .432 .022 .299 4 1.243 .294 .028 .384 Sentence 1 .996 .321 .011 .167 1 1.146 .287 .013 .185 Level 2 1.091 .340 .025 .236 2 2.298 .107 .051 .455 Aural Interpretation Time 2 4.040 .019 .045 .714 2 4.506 .012 .050 .764 Time x Sentence 2 .950 .389 .011 .213 2 1.646 .196 .019 .344 Time x Level 4 .439 .780 .010 .151 4 .333 .856 .008 .124 Sentence 1 .102 .750 .001 .062 1 .020 .887 .000 .052 Level 2 1.667 .195 .037 .343 2 .879 .419 .020 .197 Grammaticality Judgment Time 2 .297 .743 .003 .097 2 .028 .972 .000 .054 Time x Sentence 2 .060 .942 .001 .059 2 .051 .950 .001 .058 Time x Level 4 .240 .915 .006 .102 4 .221 .926 .005 .097 Sentence 1 .121 .729 .001 .064 1 .077 .782 .001 .059 Level 2 .331 .719 .008 .101 2 3.716 .028 .080 .667 Written Production- Accuracy Time 2 7.445 .001 .080 .939 2 .458 .634 .005 .124 Time x Sentence 2 4.776 .010 .053 .789 2 .726 .485 .008 .172 Time x Level 4 .521 .720 .012 .173 4 1.791 .133 .040 .538 Sentence 1 .014 .905 .000 .052 1 1.442 .233 .016 .221 Level 2 .068 .935 .002 .060 2 1.786 .174 .040 .364 Written Production- Word Order Preference
Time 2 2.408 .093 .027 .481 2 1.956 .145 .022 .401
Time x Sentence 2 1.261 .286 .014 .271 2 2.215 .112 .025 .447
Time x Level 4 .904 .463 .021 .283 4 1.468 .214 .033 .449
Sentence 1 1.438 .234 .016 .220 1 .000 .986 .000 .050
Level 2 .093 .911 .002 .064 2 .300 .742 .007 .096
Note. Values in bold reflect changes from the 3 x 3 repeated measures ANOVAs.
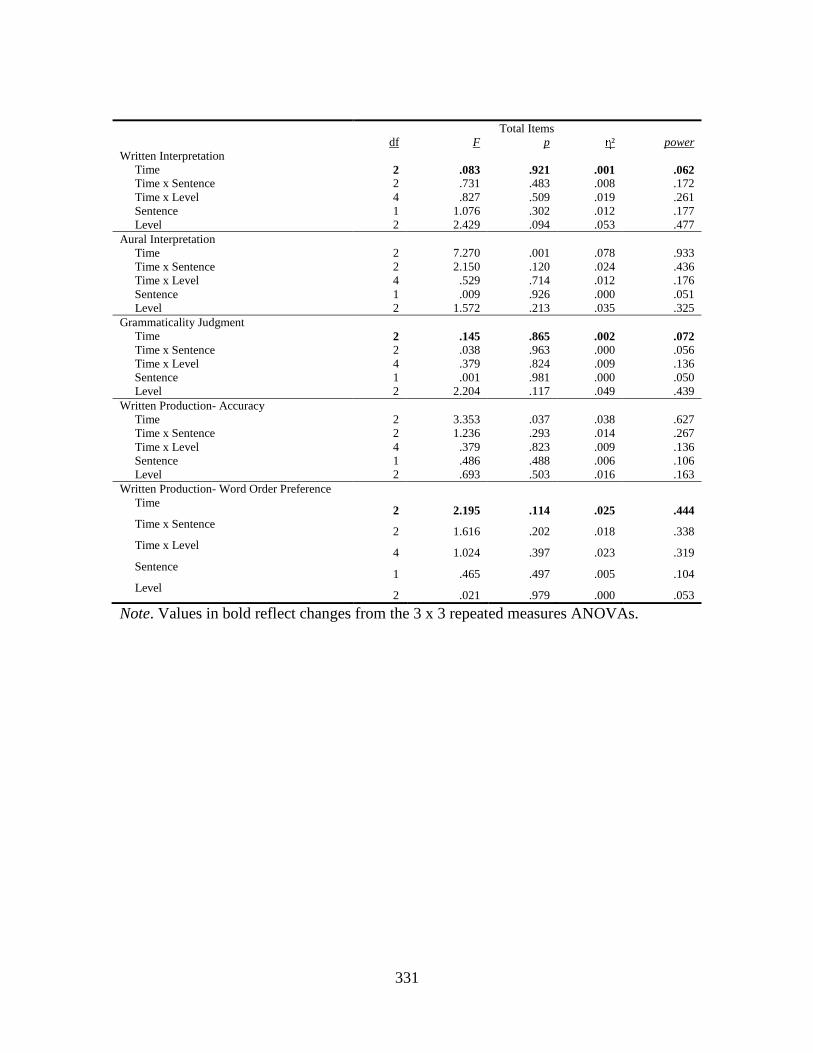
331
Total Items df F p η² power Written Interpretation Time 2 .083 .921 .001 .062 Time x Sentence 2 .731 .483 .008 .172 Time x Level 4 .827 .509 .019 .261 Sentence 1 1.076 .302 .012 .177 Level 2 2.429 .094 .053 .477 Aural Interpretation Time 2 7.270 .001 .078 .933 Time x Sentence 2 2.150 .120 .024 .436 Time x Level 4 .529 .714 .012 .176 Sentence 1 .009 .926 .000 .051 Level 2 1.572 .213 .035 .325 Grammaticality Judgment Time 2 .145 .865 .002 .072 Time x Sentence 2 .038 .963 .000 .056 Time x Level 4 .379 .824 .009 .136 Sentence 1 .001 .981 .000 .050 Level 2 2.204 .117 .049 .439 Written Production- Accuracy Time 2 3.353 .037 .038 .627 Time x Sentence 2 1.236 .293 .014 .267 Time x Level 4 .379 .823 .009 .136 Sentence 1 .486 .488 .006 .106 Level 2 .693 .503 .016 .163 Written Production- Word Order Preference Time
2 2.195 .114 .025 .444 Time x Sentence
2 1.616 .202 .018 .338 Time x Level
4 1.024 .397 .023 .319 Sentence
1 .465 .497 .005 .104 Level
2 .021 .979 .000 .053
Note. Values in bold reflect changes from the 3 x 3 repeated measures ANOVAs.

332
Appendix R
ANCOVA results for the role of WM capacity in the effect of Feedback on L3
development: WM capacity measured by a sentence span test as a covariate
Trained Items Untrained Items df F p η² power df F p η² power Written Interpretation Time 2 4.375 .014 .048 .750 2 .101 .904 .001 .065 Time x Sentence 2 .313 .732 .004 .099 2 .676 .510 .008 .163 Time x Feedback 2 10.184 .000 .105 .985 2 13.295 .000 .133 .997 Sentence 1 1.262 .264 .014 .199 1 1.336 .251 .015 .208 Feedback 1 20.519 .000 .191 .994 1 10.401 .002 .107 .891 Aural Interpretation Time 2 3.829 .024 .042 .689 2 4.176 .017 .046 .729 Time x Sentence 2 .800 .451 .009 .185 2 1.384 .253 .016 .295 Time x Feedback 2 1.102 .335 .013 .241 2 .719 .489 .008 .170 Sentence 1 .196 .659 .002 .072 1 .022 .884 .000 .052 Feedback 1 5.934 .017 .064 .673 1 5.845 .018 .063 .667 Grammaticality Judgment Time 2 .333 .717 .004 .103 2 .011 .989 .000 .052 Time x Sentence 2 .037 .964 .000 .055 2 .077 .926 .001 .062 Time x Feedback 2 .271 .763 .003 .092 2 3.256 .041 .036 .614 Sentence 1 .176 .676 .002 .070 1 .041 .840 .000 .055 Feedback 1 5.299 .024 .057 .624 1 4.955 .029 .054 .595 Written Production-Accuracy Time 2 8.632 .000 .090 .966 2 .445 .642 .005 .122 Time x Sentence 2 5.653 .004 .061 .856 2 .338 .714 .004 .103 Time x Feedback 2 2.851 .060 .032 .553 2 4.004 .020 .044 .710 Sentence 1 .002 .960 .000 .050 1 1.778 .186 .020 .261 Feedback 1 4.602 .035 .050 .564 1 2.823 .097 .031 .383 Written Production- Word Order Preference
Time 2 3.235 .042 .036 .611 2 1.358 .260 .015 .290
Time x Sentence 2 1.870 .157 .021 .385 2 1.495 .227 .017 .316
Time x Feedback 2 .956 .386 .011 .214 2 1.754 .176 .020 .364
Sentence 1 1.652 .202 .019 .246 1 .001 .972 .000 .050
Feedback 1 .071 .790 .001 .058 1 .020 .888 .000 .052
Note. Values in bold reflect changes from the 2 x 3 repeated measures ANOVAs.
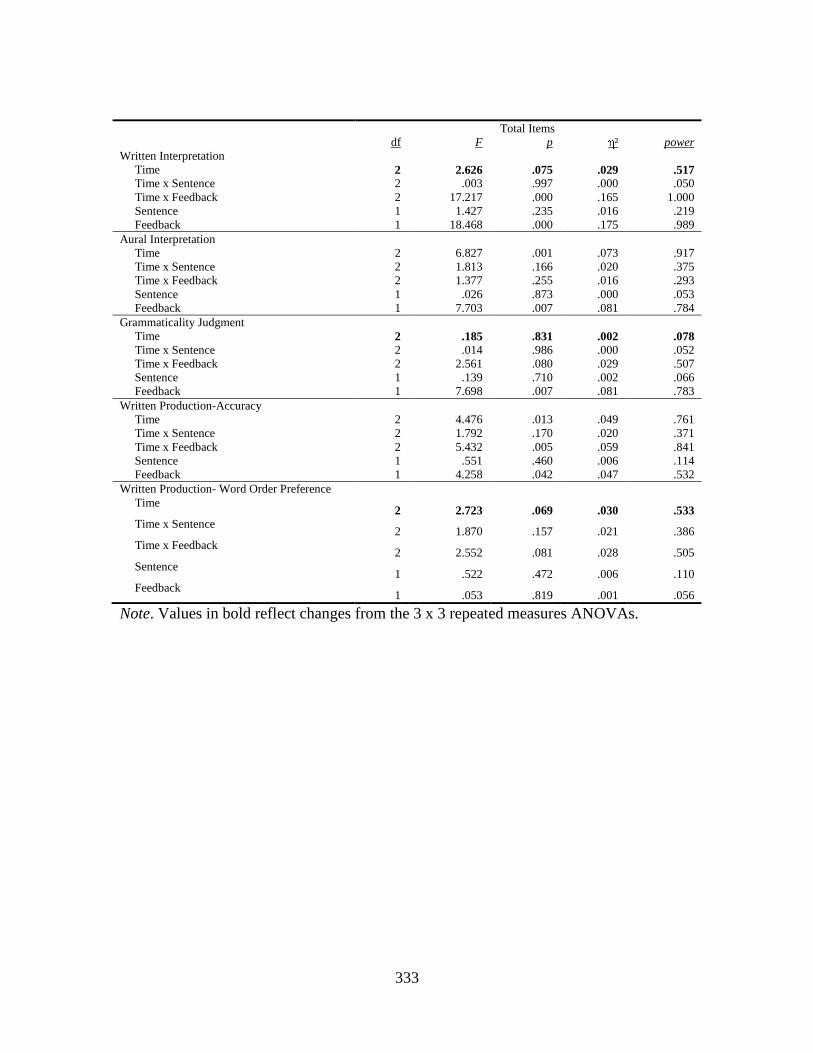
333
Total Items df F p η² power Written Interpretation Time 2 2.626 .075 .029 .517 Time x Sentence 2 .003 .997 .000 .050 Time x Feedback 2 17.217 .000 .165 1.000 Sentence 1 1.427 .235 .016 .219 Feedback 1 18.468 .000 .175 .989 Aural Interpretation Time 2 6.827 .001 .073 .917 Time x Sentence 2 1.813 .166 .020 .375 Time x Feedback 2 1.377 .255 .016 .293 Sentence 1 .026 .873 .000 .053 Feedback 1 7.703 .007 .081 .784 Grammaticality Judgment Time 2 .185 .831 .002 .078 Time x Sentence 2 .014 .986 .000 .052 Time x Feedback 2 2.561 .080 .029 .507 Sentence 1 .139 .710 .002 .066 Feedback 1 7.698 .007 .081 .783 Written Production-Accuracy Time 2 4.476 .013 .049 .761 Time x Sentence 2 1.792 .170 .020 .371 Time x Feedback 2 5.432 .005 .059 .841 Sentence 1 .551 .460 .006 .114 Feedback 1 4.258 .042 .047 .532 Written Production- Word Order Preference Time
2 2.723 .069 .030 .533 Time x Sentence
2 1.870 .157 .021 .386 Time x Feedback
2 2.552 .081 .028 .505 Sentence
1 .522 .472 .006 .110 Feedback
1 .053 .819 .001 .056
Note. Values in bold reflect changes from the 3 x 3 repeated measures ANOVAs.
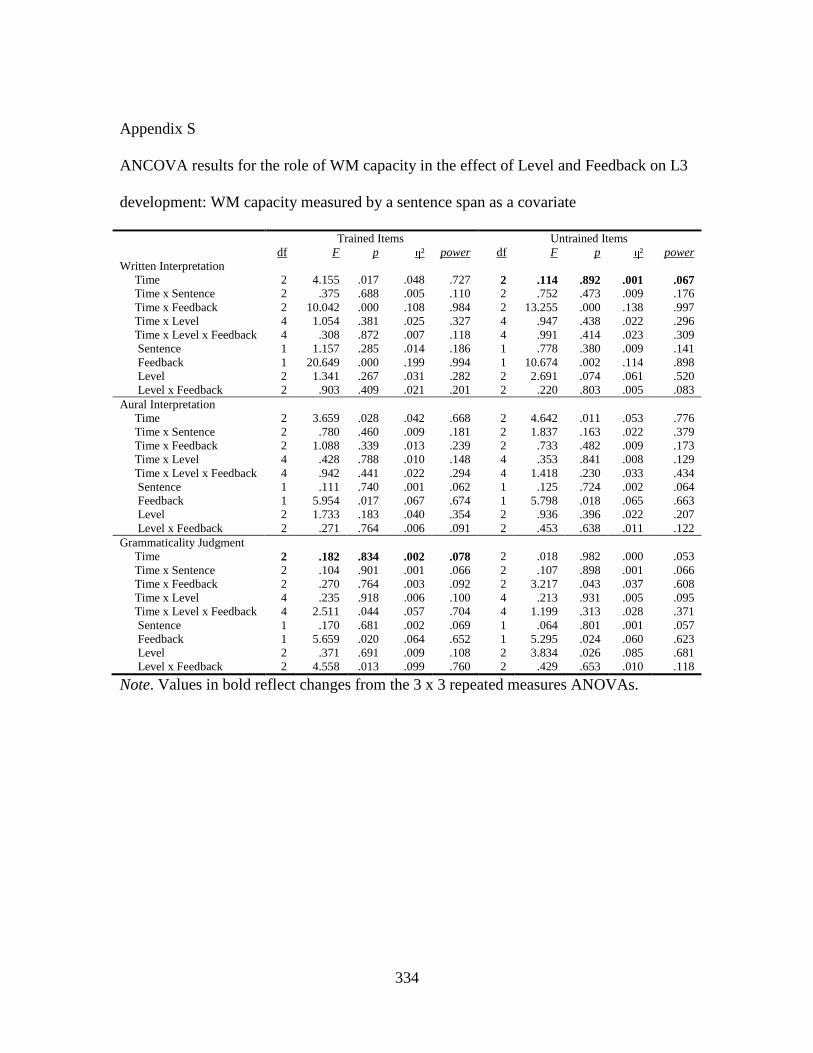
334
Appendix S
ANCOVA results for the role of WM capacity in the effect of Level and Feedback on L3
development: WM capacity measured by a sentence span as a covariate
Trained Items Untrained Items df F p η² power df F p η² power Written Interpretation
Time 2 4.155 .017 .048 .727 2 .114 .892 .001 .067 Time x Sentence 2 .375 .688 .005 .110 2 .752 .473 .009 .176 Time x Feedback 2 10.042 .000 .108 .984 2 13.255 .000 .138 .997 Time x Level 4 1.054 .381 .025 .327 4 .947 .438 .022 .296 Time x Level x Feedback 4 .308 .872 .007 .118 4 .991 .414 .023 .309 Sentence 1 1.157 .285 .014 .186 1 .778 .380 .009 .141 Feedback 1 20.649 .000 .199 .994 1 10.674 .002 .114 .898 Level 2 1.341 .267 .031 .282 2 2.691 .074 .061 .520 Level x Feedback 2 .903 .409 .021 .201 2 .220 .803 .005 .083
Aural Interpretation Time 2 3.659 .028 .042 .668 2 4.642 .011 .053 .776 Time x Sentence 2 .780 .460 .009 .181 2 1.837 .163 .022 .379 Time x Feedback 2 1.088 .339 .013 .239 2 .733 .482 .009 .173 Time x Level 4 .428 .788 .010 .148 4 .353 .841 .008 .129 Time x Level x Feedback 4 .942 .441 .022 .294 4 1.418 .230 .033 .434 Sentence 1 .111 .740 .001 .062 1 .125 .724 .002 .064 Feedback 1 5.954 .017 .067 .674 1 5.798 .018 .065 .663 Level 2 1.733 .183 .040 .354 2 .936 .396 .022 .207 Level x Feedback 2 .271 .764 .006 .091 2 .453 .638 .011 .122
Grammaticality Judgment Time 2 .182 .834 .002 .078 2 .018 .982 .000 .053 Time x Sentence 2 .104 .901 .001 .066 2 .107 .898 .001 .066 Time x Feedback 2 .270 .764 .003 .092 2 3.217 .043 .037 .608 Time x Level 4 .235 .918 .006 .100 4 .213 .931 .005 .095 Time x Level x Feedback 4 2.511 .044 .057 .704 4 1.199 .313 .028 .371 Sentence 1 .170 .681 .002 .069 1 .064 .801 .001 .057 Feedback 1 5.659 .020 .064 .652 1 5.295 .024 .060 .623 Level 2 .371 .691 .009 .108 2 3.834 .026 .085 .681 Level x Feedback 2 4.558 .013 .099 .760 2 .429 .653 .010 .118
Note. Values in bold reflect changes from the 3 x 3 repeated measures ANOVAs.
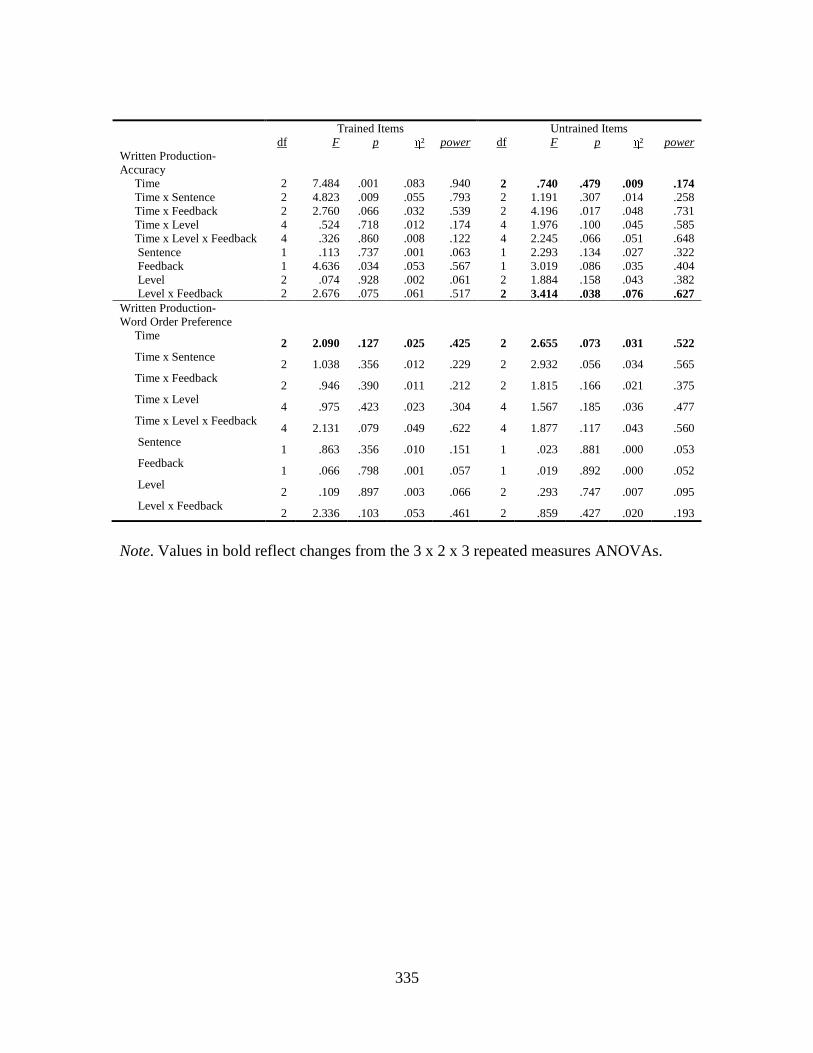
335
Trained Items Untrained Items df F p η² power df F p η² power Written Production- Accuracy
Time 2 7.484 .001 .083 .940 2 .740 .479 .009 .174 Time x Sentence 2 4.823 .009 .055 .793 2 1.191 .307 .014 .258 Time x Feedback 2 2.760 .066 .032 .539 2 4.196 .017 .048 .731 Time x Level 4 .524 .718 .012 .174 4 1.976 .100 .045 .585 Time x Level x Feedback 4 .326 .860 .008 .122 4 2.245 .066 .051 .648 Sentence 1 .113 .737 .001 .063 1 2.293 .134 .027 .322 Feedback 1 4.636 .034 .053 .567 1 3.019 .086 .035 .404 Level 2 .074 .928 .002 .061 2 1.884 .158 .043 .382 Level x Feedback 2 2.676 .075 .061 .517 2 3.414 .038 .076 .627
Written Production- Word Order Preference
Time 2 2.090 .127 .025 .425 2 2.655 .073 .031 .522
Time x Sentence 2 1.038 .356 .012 .229 2 2.932 .056 .034 .565
Time x Feedback 2 .946 .390 .011 .212 2 1.815 .166 .021 .375
Time x Level 4 .975 .423 .023 .304 4 1.567 .185 .036 .477
Time x Level x Feedback 4 2.131 .079 .049 .622 4 1.877 .117 .043 .560
Sentence 1 .863 .356 .010 .151 1 .023 .881 .000 .053
Feedback 1 .066 .798 .001 .057 1 .019 .892 .000 .052
Level 2 .109 .897 .003 .066 2 .293 .747 .007 .095
Level x Feedback 2 2.336 .103 .053 .461 2 .859 .427 .020 .193
Note. Values in bold reflect changes from the 3 x 2 x 3 repeated measures ANOVAs.
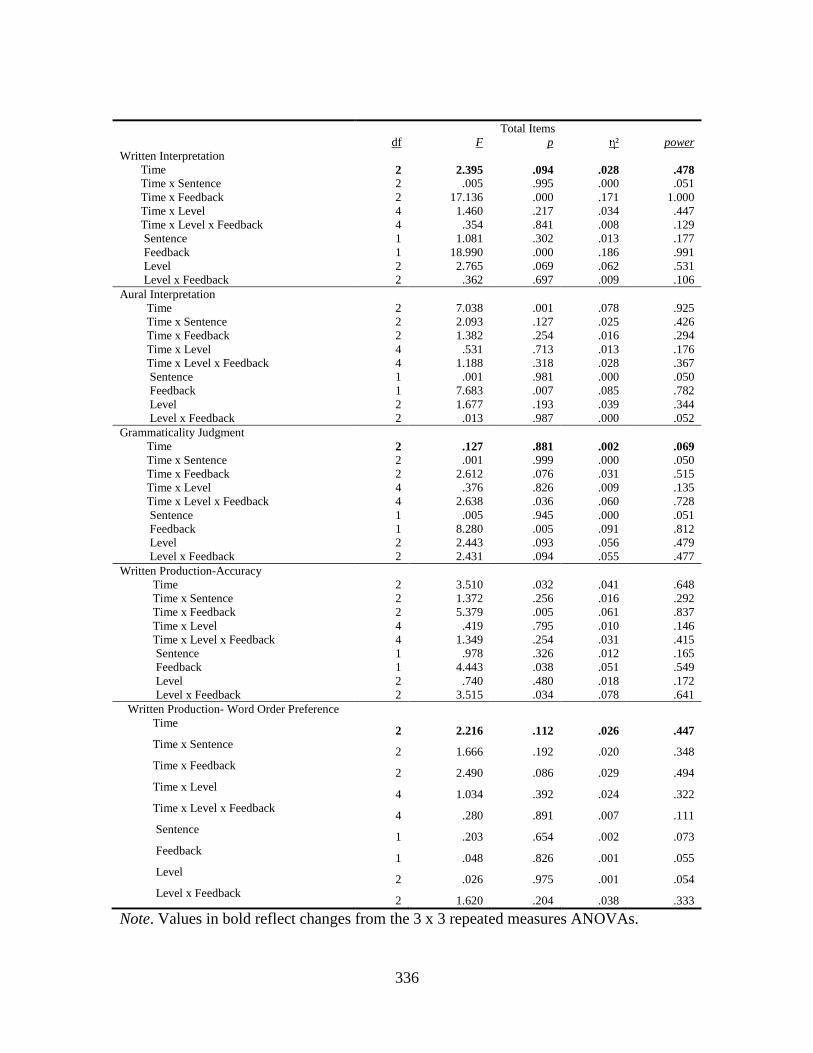
336
Total Items df F p η² power Written Interpretation
Time 2 2.395 .094 .028 .478 Time x Sentence 2 .005 .995 .000 .051 Time x Feedback 2 17.136 .000 .171 1.000 Time x Level 4 1.460 .217 .034 .447 Time x Level x Feedback 4 .354 .841 .008 .129 Sentence 1 1.081 .302 .013 .177 Feedback 1 18.990 .000 .186 .991 Level 2 2.765 .069 .062 .531 Level x Feedback 2 .362 .697 .009 .106
Aural Interpretation Time 2 7.038 .001 .078 .925 Time x Sentence 2 2.093 .127 .025 .426 Time x Feedback 2 1.382 .254 .016 .294 Time x Level 4 .531 .713 .013 .176 Time x Level x Feedback 4 1.188 .318 .028 .367 Sentence 1 .001 .981 .000 .050 Feedback 1 7.683 .007 .085 .782 Level 2 1.677 .193 .039 .344 Level x Feedback 2 .013 .987 .000 .052
Grammaticality Judgment Time 2 .127 .881 .002 .069 Time x Sentence 2 .001 .999 .000 .050 Time x Feedback 2 2.612 .076 .031 .515 Time x Level 4 .376 .826 .009 .135 Time x Level x Feedback 4 2.638 .036 .060 .728 Sentence 1 .005 .945 .000 .051 Feedback 1 8.280 .005 .091 .812 Level 2 2.443 .093 .056 .479 Level x Feedback 2 2.431 .094 .055 .477
Written Production-Accuracy Time 2 3.510 .032 .041 .648 Time x Sentence 2 1.372 .256 .016 .292 Time x Feedback 2 5.379 .005 .061 .837 Time x Level 4 .419 .795 .010 .146 Time x Level x Feedback 4 1.349 .254 .031 .415 Sentence 1 .978 .326 .012 .165 Feedback 1 4.443 .038 .051 .549 Level 2 .740 .480 .018 .172 Level x Feedback 2 3.515 .034 .078 .641
Written Production- Word Order Preference Time
2 2.216 .112 .026 .447 Time x Sentence
2 1.666 .192 .020 .348 Time x Feedback
2 2.490 .086 .029 .494 Time x Level
4 1.034 .392 .024 .322 Time x Level x Feedback
4 .280 .891 .007 .111 Sentence
1 .203 .654 .002 .073 Feedback
1 .048 .826 .001 .055 Level
2 .026 .975 .001 .054 Level x Feedback
2 1.620 .204 .038 .333
Note. Values in bold reflect changes from the 3 x 3 repeated measures ANOVAs.
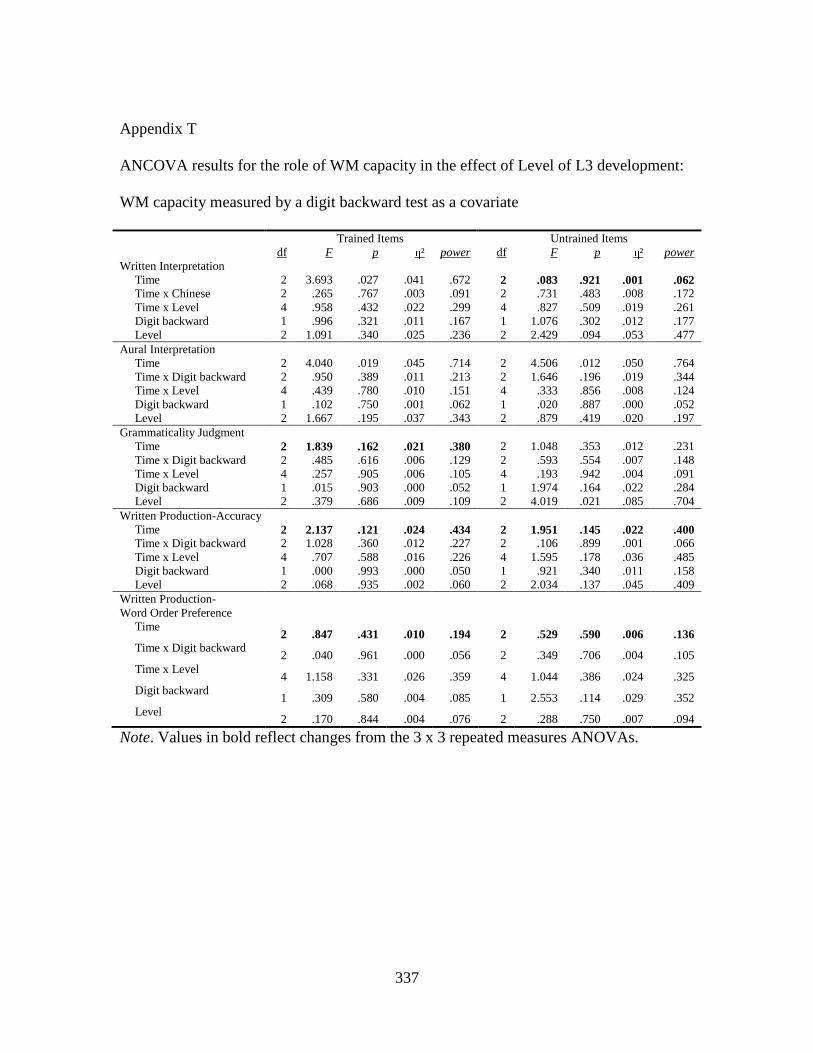
337
Appendix T
ANCOVA results for the role of WM capacity in the effect of Level of L3 development:
WM capacity measured by a digit backward test as a covariate
Trained Items Untrained Items df F p η² power df F p η² power Written Interpretation Time 2 3.693 .027 .041 .672 2 .083 .921 .001 .062 Time x Chinese 2 .265 .767 .003 .091 2 .731 .483 .008 .172 Time x Level 4 .958 .432 .022 .299 4 .827 .509 .019 .261 Digit backward 1 .996 .321 .011 .167 1 1.076 .302 .012 .177 Level 2 1.091 .340 .025 .236 2 2.429 .094 .053 .477 Aural Interpretation Time 2 4.040 .019 .045 .714 2 4.506 .012 .050 .764 Time x Digit backward 2 .950 .389 .011 .213 2 1.646 .196 .019 .344 Time x Level 4 .439 .780 .010 .151 4 .333 .856 .008 .124 Digit backward 1 .102 .750 .001 .062 1 .020 .887 .000 .052 Level 2 1.667 .195 .037 .343 2 .879 .419 .020 .197 Grammaticality Judgment Time 2 1.839 .162 .021 .380 2 1.048 .353 .012 .231 Time x Digit backward 2 .485 .616 .006 .129 2 .593 .554 .007 .148 Time x Level 4 .257 .905 .006 .105 4 .193 .942 .004 .091 Digit backward 1 .015 .903 .000 .052 1 1.974 .164 .022 .284 Level 2 .379 .686 .009 .109 2 4.019 .021 .085 .704 Written Production-Accuracy Time 2 2.137 .121 .024 .434 2 1.951 .145 .022 .400 Time x Digit backward 2 1.028 .360 .012 .227 2 .106 .899 .001 .066 Time x Level 4 .707 .588 .016 .226 4 1.595 .178 .036 .485 Digit backward 1 .000 .993 .000 .050 1 .921 .340 .011 .158 Level 2 .068 .935 .002 .060 2 2.034 .137 .045 .409 Written Production- Word Order Preference
Time 2 .847 .431 .010 .194 2 .529 .590 .006 .136
Time x Digit backward 2 .040 .961 .000 .056 2 .349 .706 .004 .105
Time x Level 4 1.158 .331 .026 .359 4 1.044 .386 .024 .325
Digit backward 1 .309 .580 .004 .085 1 2.553 .114 .029 .352
Level 2 .170 .844 .004 .076 2 .288 .750 .007 .094
Note. Values in bold reflect changes from the 3 x 3 repeated measures ANOVAs.

338
Total Items df F p η² power Written Interpretation Time 2 1.942 .147 .022 .398 Time x Chinese 2 .013 .987 .000 .052 Time x Level 4 1.243 .294 .028 .384 Digit backward 1 1.146 .287 .013 .185 Level 2 2.298 .107 .051 .455 Aural Interpretation Time 2 7.270 .001 .078 .933 Time x Digit backward 2 2.150 .120 .024 .436 Time x Level 4 .529 .714 .012 .176 Digit backward 1 .009 .926 .000 .051 Level 2 1.572 .213 .035 .325 Grammaticality Judgment Time 2 .055 .947 .001 .058 Time x Digit backward 2 .154 .857 .002 .074 Time x Level 4 .356 .839 .008 .130 Digit backward 1 .664 .417 .008 .127 Level 2 2.430 .094 .053 .477 Written Production-Accuracy Time 2 3.103 .047 .035 .591 Time x Digit backward 2 .654 .521 .008 .158 Time x Level 4 .524 .718 .012 .174 Digit backward 1 .250 .618 .003 .078 Level 2 .767 .467 .018 .177 Written Production- Word Order Preference Time
2 1.161 .316 .013 .253 Time x Digit backward
2 .222 .801 .003 .084 Time x Level
4 1.070 .373 .024 .333 Digit backward
1 1.374 .244 .016 .212 Level
2 .023 .978 .001 .053
Note. Values in bold reflect changes from the 3 x 3 repeated measures ANOVAs.

339
Appendix U
ANCOVA results for the role of WM capacity in the effect of Feedback on L3
development: WM capacity measured by a digit backward test as a covariate
Trained Items Untrained Items df F p η² power df F p η² power Written Interpretation Time 2 5.732 .004 .062 .861 2 3.541 .031 .039 .653 Time x Digit backward 2 1.556 .214 .018 .327 2 2.966 .054 .033 .571 Time x Feedback 2 10.104 .000 .104 .985 2 13.817 .000 .137 .998 Digit backward 1 1.030 .313 .012 .171 1 .613 .436 .007 .121 Feedback 1 20.621 .000 .192 .994 1 10.465 .002 .107 .892 Aural Interpretation Time 2 1.062 .348 .012 .234 2 2.538 .082 .028 .503 Time x Digit backward 2 1.407 .248 .016 .299 2 .097 .908 .001 .065 Time x Feedback 2 1.005 .368 .011 .223 2 .648 .524 .007 .158 Digit backward 1 .391 .533 .004 .095 1 .702 .404 .008 .132 Feedback 1 5.956 .017 .064 .675 1 5.776 .018 .062 .662 Grammaticality Judgment Time 2 1.778 .172 .020 .369 2 1.196 .305 .014 .259 Time x Digit backward 2 .421 .657 .005 .117 2 .723 .487 .008 .171 Time x Feedback 2 .257 .773 .003 .090 2 3.299 .039 .037 .620 Digit backward 1 .058 .811 .001 .056 1 1.374 .244 .016 .213 Feedback 1 5.389 .023 .058 .631 1 4.945 .029 .054 .595 Written Production- Accuracy Time 2 2.133 .122 .024 .433 2 2.011 .137 .023 .411 Time x Digit backward 2 1.057 .350 .012 .233 2 .079 .924 .001 .062 Time x Feedback 2 2.452 .089 .027 .488 2 3.986 .020 .044 .708 Digit backward 1 .002 .961 .000 .050 1 .819 .368 .009 .146 Feedback 1 4.618 .034 .050 .566 1 2.880 .093 .032 .389 Written Production- Word Order Preference
Time 2 .743 .477 .008 .175 2 .596 .552 .007 .148
Time x Digit backward 2 .030 .970 .000 .054 2 .430 .651 .005 .119
Time x Feedback 2 .863 .424 .010 .197 2 1.727 .181 .019 .359
Digit backward 1 .324 .571 .004 .087 1 2.599 .111 .029 .358
Feedback 1 .043 .837 .000 .055 1 .012 .914 .000 .051
Note. Values in bold reflect changes from the 3 x 3 repeated measures ANOVAs.
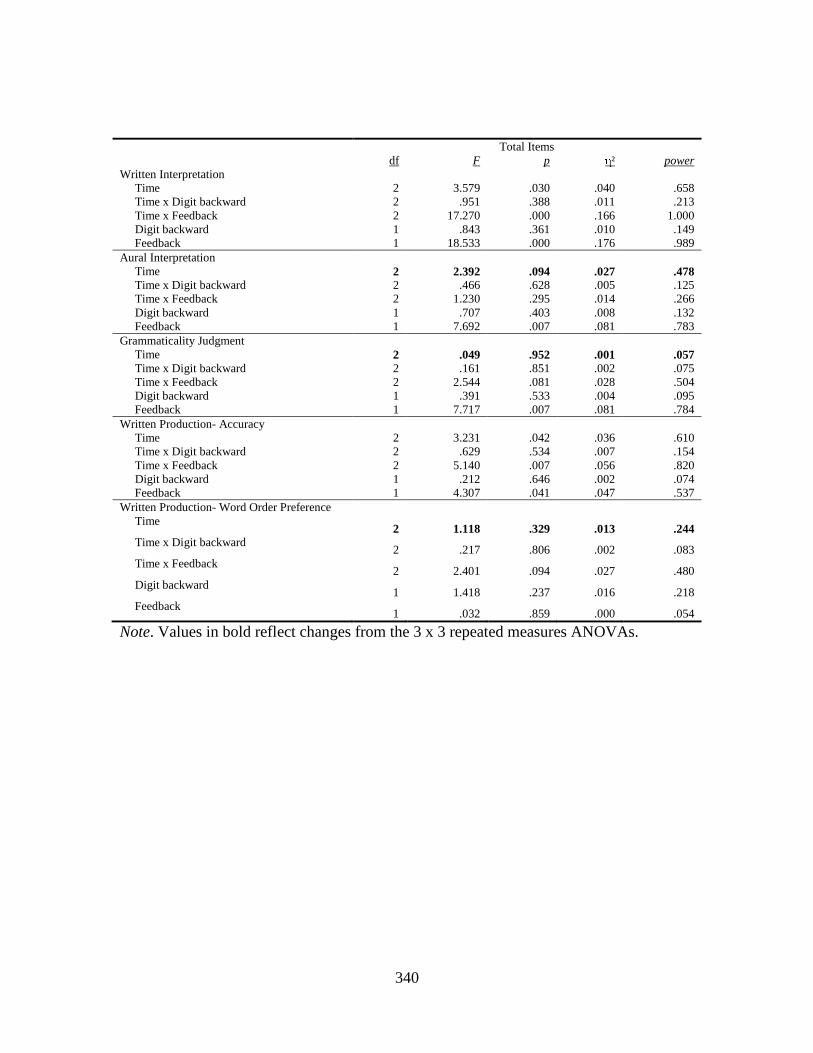
340
Total Items df F p η² power Written Interpretation Time 2 3.579 .030 .040 .658 Time x Digit backward 2 .951 .388 .011 .213 Time x Feedback 2 17.270 .000 .166 1.000 Digit backward 1 .843 .361 .010 .149 Feedback 1 18.533 .000 .176 .989 Aural Interpretation Time 2 2.392 .094 .027 .478 Time x Digit backward 2 .466 .628 .005 .125 Time x Feedback 2 1.230 .295 .014 .266 Digit backward 1 .707 .403 .008 .132 Feedback 1 7.692 .007 .081 .783 Grammaticality Judgment Time 2 .049 .952 .001 .057 Time x Digit backward 2 .161 .851 .002 .075 Time x Feedback 2 2.544 .081 .028 .504 Digit backward 1 .391 .533 .004 .095 Feedback 1 7.717 .007 .081 .784 Written Production- Accuracy Time 2 3.231 .042 .036 .610 Time x Digit backward 2 .629 .534 .007 .154 Time x Feedback 2 5.140 .007 .056 .820 Digit backward 1 .212 .646 .002 .074 Feedback 1 4.307 .041 .047 .537 Written Production- Word Order Preference Time
2 1.118 .329 .013 .244 Time x Digit backward
2 .217 .806 .002 .083 Time x Feedback
2 2.401 .094 .027 .480 Digit backward
1 1.418 .237 .016 .218 Feedback
1 .032 .859 .000 .054
Note. Values in bold reflect changes from the 3 x 3 repeated measures ANOVAs.

341
Appendix V
ANCOVA results for the role of WM capacity in the interactive effect of Level and
Feedback on L3 development: WM capacity measured by a digit backward test as a
covariate
Trained Items Untrained Items df F p η² power df F p η² power Written Interpretation
Time 2 5.184 .007 .059 .823 2 3.466 .034 .040 .642 Time x Digit backward 2 1.657 .194 .020 .346 2 3.110 .047 .036 .592 Time x Feedback 2 9.951 .000 .107 .983 2 13.817 .000 .143 .998 Time x Level 4 1.062 .377 .025 .330 4 .999 .410 .023 .311 Time x Level x Feedback 4 .344 .848 .008 .127 4 1.026 .396 .024 .319 Digit backward 1 1.507 .223 .018 .228 1 .520 .473 .006 .110 Feedback 1 20.842 .000 .201 .995 1 10.745 .002 .115 .900 Level 2 1.584 .211 .037 .327 2 2.883 .062 .065 .550 Level x Feedback 2 .985 .378 .023 .216 2 .243 .785 .006 .087
Aural Interpretation Time 2 .697 .499 .008 .166 2 2.060 .131 .024 .420 Time x Digit backward 2 1.869 .158 .022 .385 2 .013 .987 .000 .052 Time x Feedback 2 .986 .375 .012 .220 2 .644 .527 .008 .157 Time x Level 4 .352 .842 .008 .129 4 .167 .955 .004 .085 Time x Level x Feedback 4 1.298 .273 .030 .400 4 1.284 .278 .030 .396 Digit backward 1 .548 .461 .007 .113 1 .490 .486 .006 .106 Feedback 1 5.963 .017 .067 .675 1 5.687 .019 .064 .654 Level 2 1.842 .165 .043 .374 2 .903 .409 .021 .201 Level x Feedback 2 .313 .732 .007 .098 2 .330 .720 .008 .101
Grammaticality Judgment Time 2 1.700 .186 .020 .354 2 .875 .419 .010 .199 Time x Digit backward 2 .778 .461 .009 .181 2 .472 .625 .006 .126 Time x Feedback 2 .257 .774 .003 .090 2 3.240 .042 .038 .611 Time x Level 4 .269 .897 .006 .108 4 .202 .937 .005 .092 Time x Level x Feedback 4 2.658 .035 .060 .732 4 1.107 .355 .026 .343 Digit backward 1 .010 .920 .000 .051 1 2.378 .127 .028 .332 Feedback 1 5.712 .019 .064 .656 1 5.237 .025 .059 .619 Level 2 .445 .642 .011 .120 2 4.213 .018 .092 .725 Level x Feedback 2 4.493 .014 .098 .754 2 .712 .494 .017 .167
Note. Values in bold reflect changes from the 3 x 3 repeated measures ANOVAs.

342
Trained Items Untrained Items df F p η² power df F p η² power Written Production- Accuracy
Time 2 2.053 .132 .024 .418 2 1.607 .204 .019 .336 Time x Digit backward 2 1.014 .365 .012 .225 2 .004 .996 .000 .051 Time x Feedback 2 2.403 .094 .028 .480 2 4.135 .018 .047 .724 Time x Level 4 .706 .589 .017 .225 4 1.675 .158 .039 .506 Time x Level x Feedback 4 .411 .800 .010 .144 4 1.956 .104 .045 .580 Digit backward 1 .041 .840 .000 .055 1 1.632 .205 .019 .244 Feedback 1 4.668 .034 .053 .570 1 3.083 .083 .036 .411 Level 2 .071 .932 .002 .060 2 2.198 .117 .050 .437 Level x Feedback 2 2.636 .078 .060 .511 2 3.307 .05 .074 .612
Written Production- Word Order Preference
Time 2 .619 .540 .007 .152 2 .788 .456 .009 .183
Time x Digit backward 2 .077 .926 .001 .061 2 .596 .552 .007 .148
Time x Feedback 2 .884 .415 .011 .201 2 1.762 .175 .021 .365
Time x Level 4 1.164 .329 .027 .360 4 1.061 .377 .025 .330
Time x Level x Feedback 4 2.279 .063 .052 .656 4 1.629 .169 .038 .494
Digit backward 1 .812 .370 .010 .145 1 2.915 .092 .034 .393
Feedback 1 .041 .841 .000 .055 1 .011 .917 .000 .051
Level 2 .171 .844 .004 .076 2 .284 .753 .007 .094
Level x Feedback 2 2.897 .061 .065 .552 2 1.075 .346 .025 .233
Note. Values in bold reflect changes from the 3 x 2 x 3 repeated measures ANOVAs.
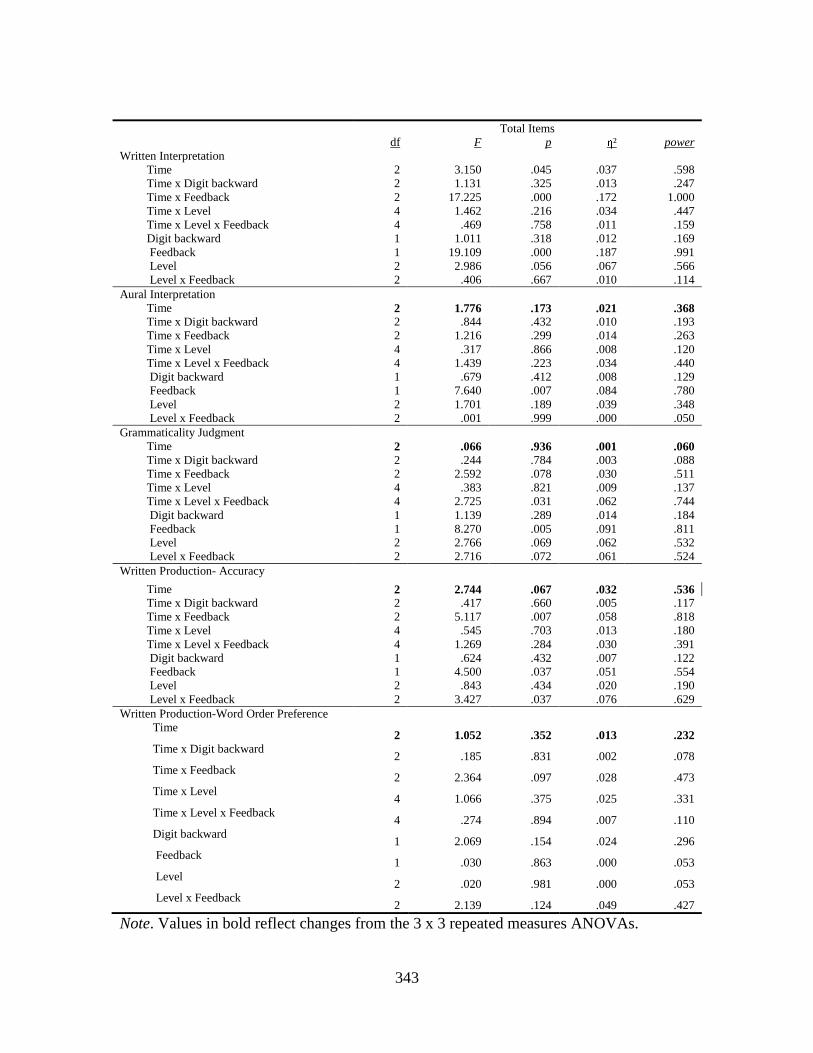
343
Total Items df F p η² power Written Interpretation
Time 2 3.150 .045 .037 .598 Time x Digit backward 2 1.131 .325 .013 .247 Time x Feedback 2 17.225 .000 .172 1.000 Time x Level 4 1.462 .216 .034 .447 Time x Level x Feedback 4 .469 .758 .011 .159 Digit backward 1 1.011 .318 .012 .169 Feedback 1 19.109 .000 .187 .991 Level 2 2.986 .056 .067 .566 Level x Feedback 2 .406 .667 .010 .114
Aural Interpretation Time 2 1.776 .173 .021 .368 Time x Digit backward 2 .844 .432 .010 .193 Time x Feedback 2 1.216 .299 .014 .263 Time x Level 4 .317 .866 .008 .120 Time x Level x Feedback 4 1.439 .223 .034 .440 Digit backward 1 .679 .412 .008 .129 Feedback 1 7.640 .007 .084 .780 Level 2 1.701 .189 .039 .348 Level x Feedback 2 .001 .999 .000 .050
Grammaticality Judgment Time 2 .066 .936 .001 .060 Time x Digit backward 2 .244 .784 .003 .088 Time x Feedback 2 2.592 .078 .030 .511 Time x Level 4 .383 .821 .009 .137 Time x Level x Feedback 4 2.725 .031 .062 .744 Digit backward 1 1.139 .289 .014 .184 Feedback 1 8.270 .005 .091 .811 Level 2 2.766 .069 .062 .532 Level x Feedback 2 2.716 .072 .061 .524
Written Production- Accuracy Time 2 2.744 .067 .032 .536 Time x Digit backward 2 .417 .660 .005 .117 Time x Feedback 2 5.117 .007 .058 .818 Time x Level 4 .545 .703 .013 .180 Time x Level x Feedback 4 1.269 .284 .030 .391 Digit backward 1 .624 .432 .007 .122 Feedback 1 4.500 .037 .051 .554 Level 2 .843 .434 .020 .190 Level x Feedback 2 3.427 .037 .076 .629
Written Production-Word Order Preference Time
2 1.052 .352 .013 .232 Time x Digit backward
2 .185 .831 .002 .078 Time x Feedback
2 2.364 .097 .028 .473 Time x Level
4 1.066 .375 .025 .331 Time x Level x Feedback
4 .274 .894 .007 .110 Digit backward
1 2.069 .154 .024 .296 Feedback
1 .030 .863 .000 .053 Level
2 .020 .981 .000 .053 Level x Feedback
2 2.139 .124 .049 .427
Note. Values in bold reflect changes from the 3 x 3 repeated measures ANOVAs.

344
Appendix W
ANCOVA results for the role of Memory strategies in the effect of Level on L3
development
Trained Items Untrained Items df F p η² power df F p η² power Written Interpretation Time 2 4.140 .018 .046 .725 2 .767 .466 .009 .179 Time x Memory 2 1.051 .352 .012 .232 2 1.717 .183 .020 .357 Time x Level 4 1.242 .295 .028 .384 4 1.001 .408 .023 .312 Memory 1 .634 .428 .007 .123 1 .626 .431 .007 .123 Level 2 1.544 .219 .035 .320 2 2.941 .058 .064 .559 Aural Interpretation Time 2 .400 .671 .005 .114 2 3.707 .027 .041 .674 Time x Memory 2 .928 .397 .011 .209 2 2.026 .135 .023 .414 Time x Level 4 .295 .881 .007 .115 4 .229 .922 .005 .099 Memory 1 .023 .879 .000 .053 1 .508 .478 .006 .109 Level 2 1.664 .195 .037 .342 2 1.092 .340 .025 .236 Grammaticality Judgment Time 2 .352 .704 .004 .106 2 .277 .759 .003 .093 Time x Memory 2 .068 .934 .001 .060 2 .337 .714 .004 .103 Time x Level 4 .242 .914 .006 .102 4 .196 .940 .005 .091 Memory 1 .529 .469 .006 .111 1 .335 .564 .004 .088 Level 2 .398 .673 .009 .112 2 3.893 .024 .083 .689 Written Production- Accuracy Time 2 1.167 .314 .013 .254 2 .126 .882 .001 .069 Time x Memory 2 .484 .617 .006 .128 2 .258 .773 .003 .090 Time x Level 4 .826 .510 .019 .260 4 1.709 .150 .038 .516 Memory 1 .087 .768 .001 .060 1 .137 .712 .002 .066 Level 2 .039 .962 .001 .056 2 1.595 .209 .036 .329 Written Production- Word Order Preference
Time 2 1.809 .167 .021 .374 2 .105 .900 .001 .066
Time x Memory 2 1.360 .259 .016 .290 2 .053 .949 .001 .058
Time x Level 4 1.275 .282 .029 .393 4 1.016 .401 .023 .316
Memory 1 .080 .777 .001 .059 1 .482 .489 .006 .106
Level 2 .214 .808 .005 .082 2 .448 .640 .010 .121
Note. Values in bold reflect changes from the 3 x 3 repeated measures ANOVAs.

345
Total Items df F p η² power Written Interpretation Time 2 2.588 .078 .029 .511 Time x Memory 2 .963 .384 .011 .215 Time x Level 4 1.525 .197 .034 .465 Memory 1 1.144 .288 .013 .185 Level 2 3.022 .054 .066 .572 Aural Interpretation Time 2 2.407 .093 .027 .481 Time x Memory 2 1.340 .265 .015 .286 Time x Level 4 .391 .815 .009 .139 Memory 1 .251 .618 .003 .079 Level 2 1.726 .184 .039 .353 Grammaticality Judgment Time 2 .444 .642 .005 .122 Time x Memory 2 .315 .730 .004 .100 Time x Level 4 .379 .824 .009 .136 Memory 1 .621 .433 .007 .122 Level 2 2.529 .086 .056 .494 Written Production-Accuracy Time 2 .567 .568 .007 .143 Time x Memory 2 .016 .984 .000 .052 Time x Level 4 .448 .773 .010 .154 Memory 1 .128 .722 .001 .064 Level 2 .567 .569 .013 .141 Written Production-Word order preference Time
2 1.165 .314 .013 .253 Time x Memory
2 .831 .437 .010 .191 Time x Level
4 1.141 .339 .026 .354 Memory
1 .042 .838 .000 .055 Level
2 .047 .954 .001 .057
Note. Values in bold reflect changes from the 3 x 3 repeated measures ANOVAs.

346
Appendix X
ANCOVA results for the role of Memory strategies in the effect of Feedback on L3
development
Trained Items Untrained Items df F p η² power df F p η² power Written Interpretation Time 2 4.753 .010 .052 .787 2 .174 .841 .002 .077 Time x Memory 2 .944 .391 .011 .212 2 .617 .541 .007 .152 Time x Feedback 2 10.630 .000 .109 .988 2 12.493 .000 .126 .996 Memory 1 .865 .355 .010 .151 1 .245 .622 .003 .078 Feedback 1 21.589 .000 .199 .996 1 10.787 .001 .110 .901 Aural Interpretation Time 2 .212 .809 .002 .083 2 3.597 .029 .040 .660 Time x Memory 2 .770 .465 .009 .180 2 1.853 .160 .021 .382 Time x Feedback 2 .801 .450 .009 .185 2 .596 .552 .007 .148 Memory 1 .012 .914 .000 .051 1 .392 .533 .004 .095 Feedback 1 5.816 .018 .063 .665 1 6.163 .015 .066 .690 Grammaticality Judgment Time 2 .296 .744 .003 .096 2 .140 .869 .002 .071 Time x Memory 2 .020 .981 .000 .053 2 .246 .782 .003 .088 Time x Feedback 2 .247 .781 .003 .088 2 3.080 .048 .034 .588 Memory 1 1.156 .285 .013 .186 1 .151 .698 .002 .067 Feedback 1 6.039 .016 .065 .681 1 5.145 .026 .056 .612 Written Production- Accuracy Time 2 1.308 .273 .015 .280 2 .825 .440 .009 .190 Time x Memory 2 .471 .625 .005 .126 2 .126 .881 .001 .069 Time x Feedback 2 2.659 .073 .030 .523 2 4.109 .018 .045 .722 Memory 1 .009 .923 .000 .051 1 .559 .457 .006 .115 Feedback 1 4.470 .037 .049 .552 1 2.546 .114 .028 .351 Written Production- Word Order Preference
Time 2 2.038 .133 .023 .416 2 .524 .593 .006 .135
Time x Memory 2 1.457 .236 .016 .309 2 .318 .728 .004 .100
Time x Feedback 2 1.187 .308 .013 .258 2 1.862 .158 .021 .384
Memory 1 .004 .948 .000 .050 1 .213 .646 .002 .074
Feedback 1 .043 .835 .000 .055 1 .042 .838 .000 .055
Note. Values in bold reflect changes from the 3 x 3 repeated measures ANOVAs.
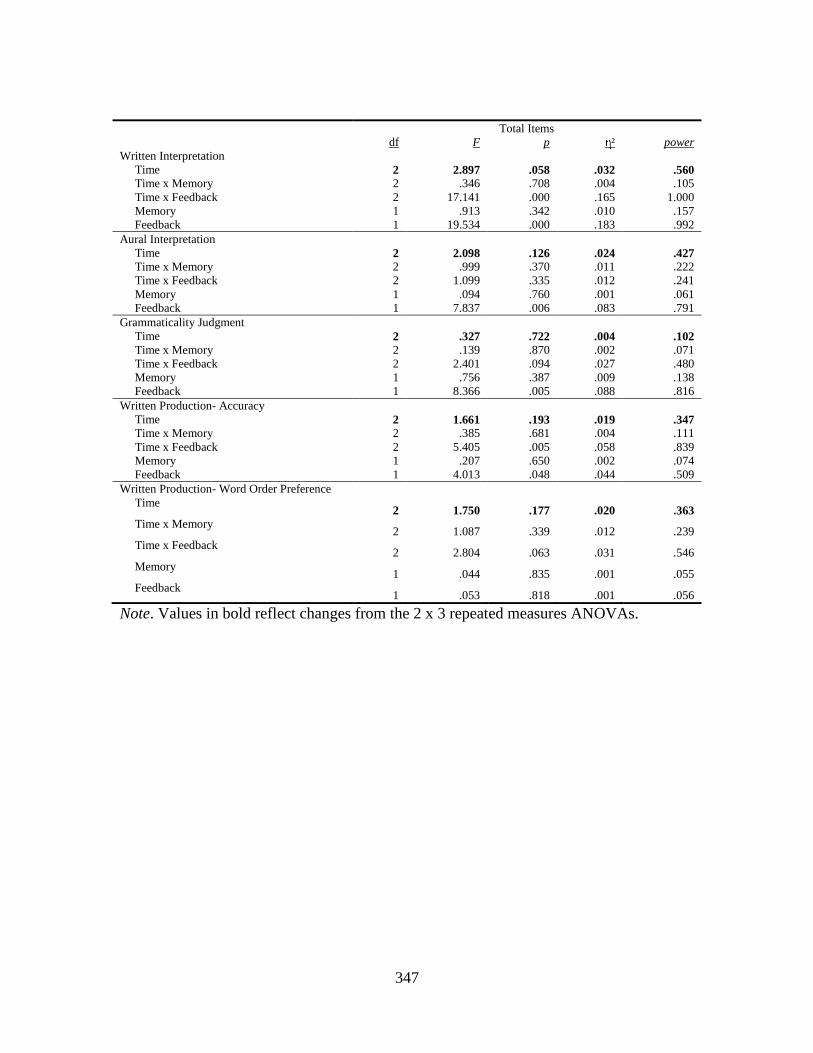
347
Total Items df F p η² power Written Interpretation Time 2 2.897 .058 .032 .560 Time x Memory 2 .346 .708 .004 .105 Time x Feedback 2 17.141 .000 .165 1.000 Memory 1 .913 .342 .010 .157 Feedback 1 19.534 .000 .183 .992 Aural Interpretation Time 2 2.098 .126 .024 .427 Time x Memory 2 .999 .370 .011 .222 Time x Feedback 2 1.099 .335 .012 .241 Memory 1 .094 .760 .001 .061 Feedback 1 7.837 .006 .083 .791 Grammaticality Judgment Time 2 .327 .722 .004 .102 Time x Memory 2 .139 .870 .002 .071 Time x Feedback 2 2.401 .094 .027 .480 Memory 1 .756 .387 .009 .138 Feedback 1 8.366 .005 .088 .816 Written Production- Accuracy Time 2 1.661 .193 .019 .347 Time x Memory 2 .385 .681 .004 .111 Time x Feedback 2 5.405 .005 .058 .839 Memory 1 .207 .650 .002 .074 Feedback 1 4.013 .048 .044 .509 Written Production- Word Order Preference Time
2 1.750 .177 .020 .363 Time x Memory
2 1.087 .339 .012 .239 Time x Feedback
2 2.804 .063 .031 .546 Memory
1 .044 .835 .001 .055 Feedback
1 .053 .818 .001 .056
Note. Values in bold reflect changes from the 2 x 3 repeated measures ANOVAs.
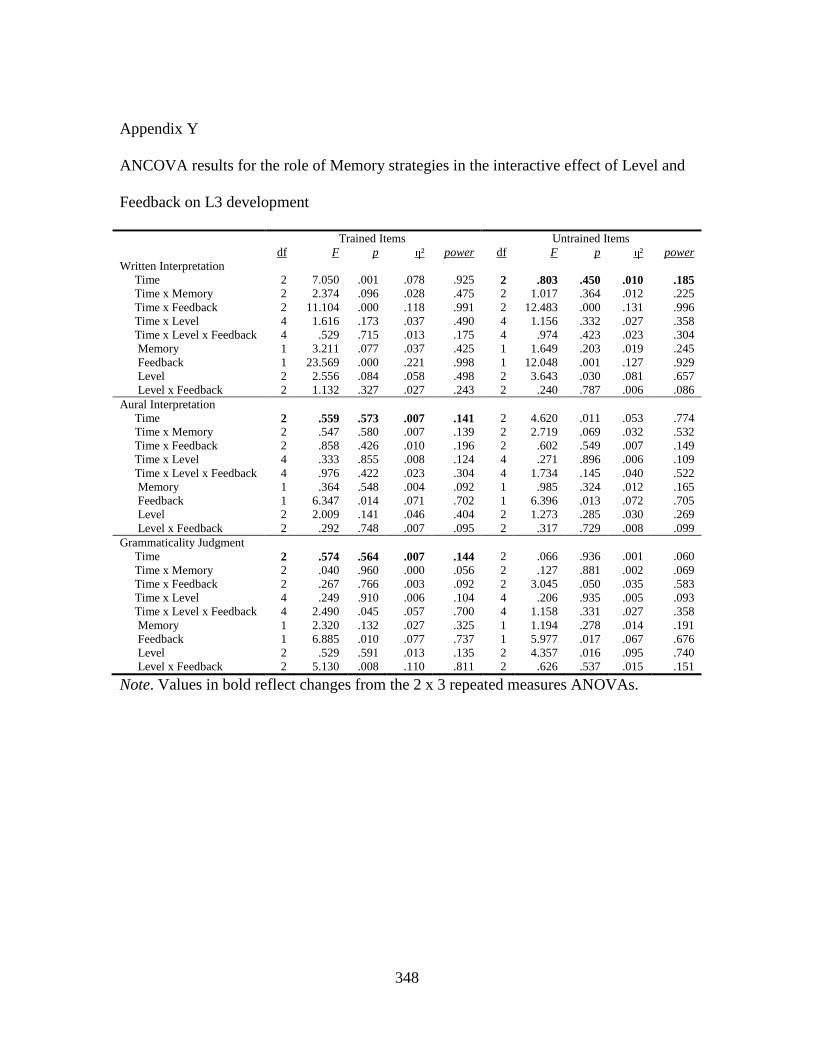
348
Appendix Y
ANCOVA results for the role of Memory strategies in the interactive effect of Level and
Feedback on L3 development
Trained Items Untrained Items df F p η² power df F p η² power Written Interpretation
Time 2 7.050 .001 .078 .925 2 .803 .450 .010 .185 Time x Memory 2 2.374 .096 .028 .475 2 1.017 .364 .012 .225 Time x Feedback 2 11.104 .000 .118 .991 2 12.483 .000 .131 .996 Time x Level 4 1.616 .173 .037 .490 4 1.156 .332 .027 .358 Time x Level x Feedback 4 .529 .715 .013 .175 4 .974 .423 .023 .304 Memory 1 3.211 .077 .037 .425 1 1.649 .203 .019 .245 Feedback 1 23.569 .000 .221 .998 1 12.048 .001 .127 .929 Level 2 2.556 .084 .058 .498 2 3.643 .030 .081 .657 Level x Feedback 2 1.132 .327 .027 .243 2 .240 .787 .006 .086
Aural Interpretation Time 2 .559 .573 .007 .141 2 4.620 .011 .053 .774 Time x Memory 2 .547 .580 .007 .139 2 2.719 .069 .032 .532 Time x Feedback 2 .858 .426 .010 .196 2 .602 .549 .007 .149 Time x Level 4 .333 .855 .008 .124 4 .271 .896 .006 .109 Time x Level x Feedback 4 .976 .422 .023 .304 4 1.734 .145 .040 .522 Memory 1 .364 .548 .004 .092 1 .985 .324 .012 .165 Feedback 1 6.347 .014 .071 .702 1 6.396 .013 .072 .705 Level 2 2.009 .141 .046 .404 2 1.273 .285 .030 .269 Level x Feedback 2 .292 .748 .007 .095 2 .317 .729 .008 .099
Grammaticality Judgment Time 2 .574 .564 .007 .144 2 .066 .936 .001 .060 Time x Memory 2 .040 .960 .000 .056 2 .127 .881 .002 .069 Time x Feedback 2 .267 .766 .003 .092 2 3.045 .050 .035 .583 Time x Level 4 .249 .910 .006 .104 4 .206 .935 .005 .093 Time x Level x Feedback 4 2.490 .045 .057 .700 4 1.158 .331 .027 .358 Memory 1 2.320 .132 .027 .325 1 1.194 .278 .014 .191 Feedback 1 6.885 .010 .077 .737 1 5.977 .017 .067 .676 Level 2 .529 .591 .013 .135 2 4.357 .016 .095 .740 Level x Feedback 2 5.130 .008 .110 .811 2 .626 .537 .015 .151
Note. Values in bold reflect changes from the 2 x 3 repeated measures ANOVAs.
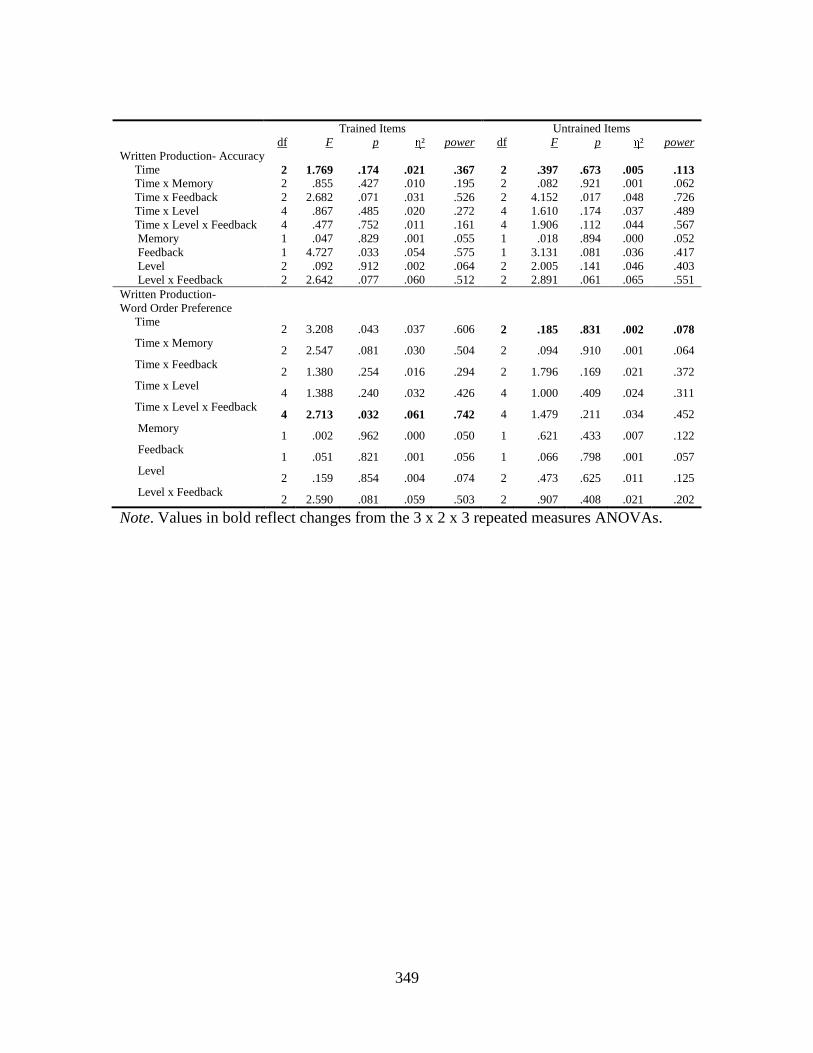
349
Trained Items Untrained Items df F p η² power df F p η² power Written Production- Accuracy
Time 2 1.769 .174 .021 .367 2 .397 .673 .005 .113 Time x Memory 2 .855 .427 .010 .195 2 .082 .921 .001 .062 Time x Feedback 2 2.682 .071 .031 .526 2 4.152 .017 .048 .726 Time x Level 4 .867 .485 .020 .272 4 1.610 .174 .037 .489 Time x Level x Feedback 4 .477 .752 .011 .161 4 1.906 .112 .044 .567 Memory 1 .047 .829 .001 .055 1 .018 .894 .000 .052 Feedback 1 4.727 .033 .054 .575 1 3.131 .081 .036 .417 Level 2 .092 .912 .002 .064 2 2.005 .141 .046 .403 Level x Feedback 2 2.642 .077 .060 .512 2 2.891 .061 .065 .551
Written Production- Word Order Preference
Time 2 3.208 .043 .037 .606 2 .185 .831 .002 .078
Time x Memory 2 2.547 .081 .030 .504 2 .094 .910 .001 .064
Time x Feedback 2 1.380 .254 .016 .294 2 1.796 .169 .021 .372
Time x Level 4 1.388 .240 .032 .426 4 1.000 .409 .024 .311
Time x Level x Feedback 4 2.713 .032 .061 .742 4 1.479 .211 .034 .452
Memory 1 .002 .962 .000 .050 1 .621 .433 .007 .122
Feedback 1 .051 .821 .001 .056 1 .066 .798 .001 .057
Level 2 .159 .854 .004 .074 2 .473 .625 .011 .125
Level x Feedback 2 2.590 .081 .059 .503 2 .907 .408 .021 .202
Note. Values in bold reflect changes from the 3 x 2 x 3 repeated measures ANOVAs.

350
Total Items df F p η² power Written Interpretation
Time 2 5.118 .007 .058 .818 Time x Memory 2 1.557 .214 .018 .327 Time x Feedback 2 17.756 .000 .176 1.000 Time x Level 4 2.042 .091 .047 .601 Time x Level x Feedback 4 .484 .748 .012 .163 Memory 1 3.864 .053 .044 .493 Feedback 1 22.194 .000 .211 .996 Level 2 4.439 .015 .097 .749 Level x Feedback 2 .550 .579 .013 .138
Aural Interpretation Time 2 3.362 .037 .039 .628 Time x Memory 2 1.670 .191 .020 .348 Time x Feedback 2 1.167 .314 .014 .254 Time x Level 4 .473 .755 .011 .160 Time x Level x Feedback 4 1.501 .204 .035 .458 Memory 1 .847 .360 .010 .149 Feedback 1 8.364 .005 .092 .816 Level 2 2.086 .131 .048 .418 Level x Feedback 2 .002 .998 .000 .050
Grammaticality Judgment Time 2 .385 .681 .005 .111 Time x Memory 2 .148 .862 .002 .073 Time x Feedback 2 2.500 .085 .029 .496 Time x Level 4 .392 .815 .009 .139 Time x Level x Feedback 4 2.668 .034 .060 .734 Memory 1 2.559 .113 .030 .353 Feedback 1 9.795 .002 .106 .871 Level 2 3.216 .045 .072 .599 Level x Feedback 2 2.962 .057 .067 .562
Written Production- Accuracy Time 2 1.397 .250 .017 .297 Time x Memory 2 .304 .738 .004 .098 Time x Feedback 2 5.348 .006 .061 .835 Time x Level 4 .398 .810 .010 .141 Time x Level x Feedback 4 1.442 .222 .034 .441 Memory 1 .036 .850 .000 .054 Feedback 1 4.569 .035 .052 .561 Level 2 .827 .441 .020 .187 Level x Feedback 2 3.221 .045 .072 .600
Written Production- Word Order Preference Time
2 1.952 .145 .023 .400 Time x Memory
2 1.452 .237 .017 .307 Time x Feedback
2 2.825 .062 .033 .549 Time x Level
4 1.154 .333 .027 .357 Time x Level x Feedback
4 .421 .794 .010 .146 Memory
1 .204 .652 .002 .073 Feedback
1 .072 .789 .001 .058 Level
2 .060 .942 .001 .059 Level x Feedback
2 1.831 .167 .042 .372
Note. Values in bold reflect changes from the 3 x 3 repeated measures ANOVAs.

351
Appendix Z
ANCOVA results for the role of Cognitive strategies in the effect of Level on L3
development
Trained Items Untrained Items df F p η² power df F p η² power Written Interpretation Time 2 1.164 .315 .013 .253 2 .745 .476 .009 .175 Time x Cognitive 2 .100 .905 .001 .065 2 1.914 .151 .022 .393 Time x Level 4 .746 .562 .017 .237 4 1.054 .381 .024 .328 Cognitive 1 .060 .807 .001 .057 1 .000 .999 .000 .050 Level 2 .844 .434 .019 .191 2 2.124 .126 .047 .425 Aural Interpretation Time 2 .190 .827 .002 .079 2 1.583 .208 .018 .332 Time x Cognitive 2 .299 .742 .003 .097 2 .236 .790 .003 .087 Time x Level 4 .160 .958 .004 .083 4 .203 .936 .005 .093 Cognitive 1 .135 .714 .002 .065 1 .041 .840 .000 .055 Level 2 1.139 .325 .026 .245 2 .653 .523 .015 .156 Grammaticality Judgment Time 2 1.724 .181 .020 .358 2 1.142 .322 .013 .249 Time x Cognitive 2 .542 .582 .006 .139 2 1.307 .273 .015 .280 Time x Level 4 .307 .873 .007 .118 4 .135 .969 .003 .078 Cognitive 1 .117 .733 .001 .063 1 .005 .944 .000 .051 Level 2 .358 .700 .008 .106 2 3.187 .046 .069 .596 Written Production- Accuracy Time 2 .172 .842 .002 .076 2 .628 .535 .007 .154 Time x Cognitive 2 .325 .723 .004 .101 2 1.297 .276 .015 .278 Time x Level 4 .630 .641 .014 .204 4 2.229 .068 .049 .645 Cognitive 1 .014 .907 .000 .052 1 1.258 .265 .014 .198 Level 2 .051 .950 .001 .058 2 .881 .418 .020 .197 Written Production- Word Order Preference
Time 2 2.197 .114 .025 .444 2 2.234 .110 .025 .451
Time x Cognitive 2 2.776 .065 .031 .541 2 2.738 .067 .031 .535
Time x Level 4 1.635 .167 .037 .496 4 2.167 .075 .048 .631
Cognitive 1 .198 .657 .002 .072 1 .122 .727 .001 .064
Level 2 .272 .762 .006 .092 2 .199 .820 .005 .080
Note. Values in bold reflect changes from the 3 x 3 repeated measures ANOVAs.
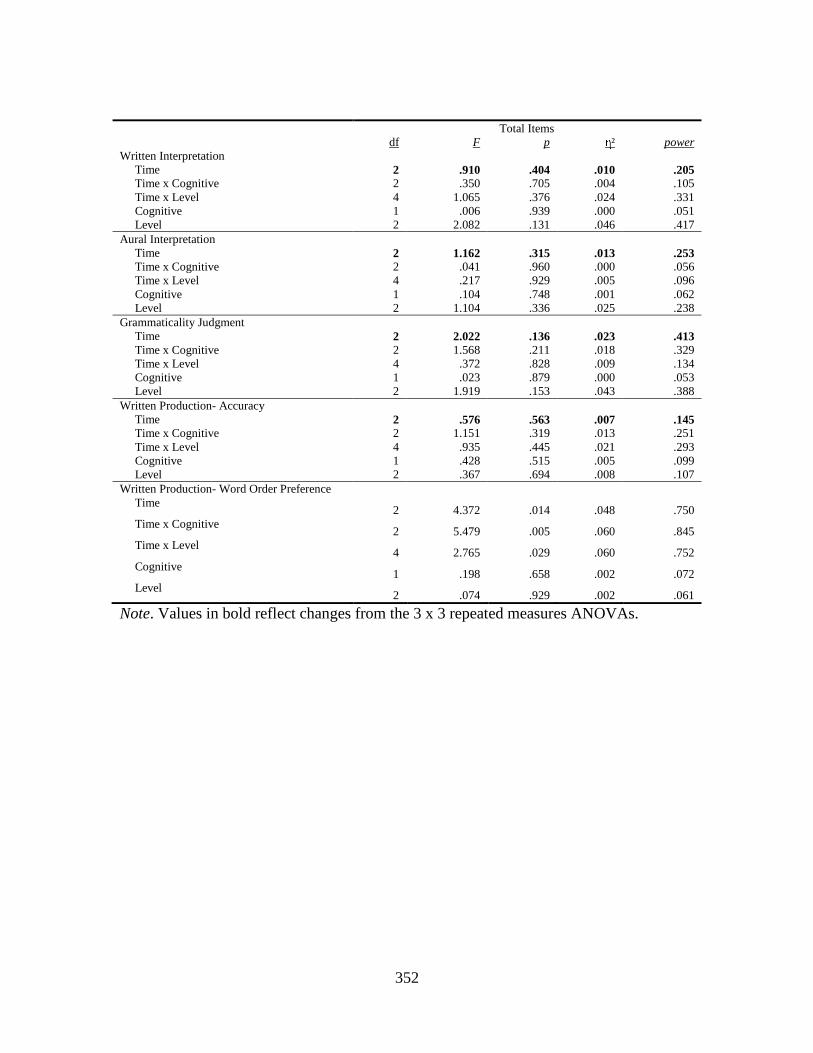
352
Total Items df F p η² power Written Interpretation Time 2 .910 .404 .010 .205 Time x Cognitive 2 .350 .705 .004 .105 Time x Level 4 1.065 .376 .024 .331 Cognitive 1 .006 .939 .000 .051 Level 2 2.082 .131 .046 .417 Aural Interpretation Time 2 1.162 .315 .013 .253 Time x Cognitive 2 .041 .960 .000 .056 Time x Level 4 .217 .929 .005 .096 Cognitive 1 .104 .748 .001 .062 Level 2 1.104 .336 .025 .238 Grammaticality Judgment Time 2 2.022 .136 .023 .413 Time x Cognitive 2 1.568 .211 .018 .329 Time x Level 4 .372 .828 .009 .134 Cognitive 1 .023 .879 .000 .053 Level 2 1.919 .153 .043 .388 Written Production- Accuracy Time 2 .576 .563 .007 .145 Time x Cognitive 2 1.151 .319 .013 .251 Time x Level 4 .935 .445 .021 .293 Cognitive 1 .428 .515 .005 .099 Level 2 .367 .694 .008 .107 Written Production- Word Order Preference Time
2 4.372 .014 .048 .750 Time x Cognitive
2 5.479 .005 .060 .845 Time x Level
4 2.765 .029 .060 .752 Cognitive
1 .198 .658 .002 .072 Level
2 .074 .929 .002 .061
Note. Values in bold reflect changes from the 3 x 3 repeated measures ANOVAs.
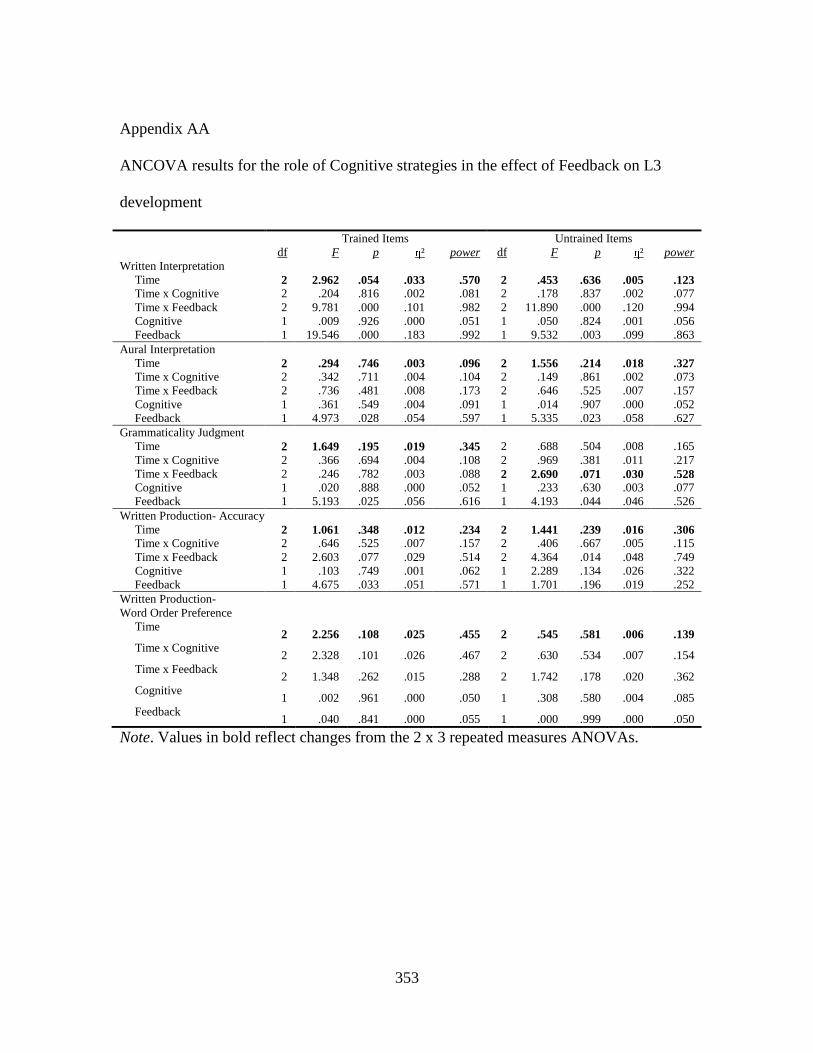
353
Appendix AA
ANCOVA results for the role of Cognitive strategies in the effect of Feedback on L3
development
Trained Items Untrained Items df F p η² power df F p η² power Written Interpretation Time 2 2.962 .054 .033 .570 2 .453 .636 .005 .123 Time x Cognitive 2 .204 .816 .002 .081 2 .178 .837 .002 .077 Time x Feedback 2 9.781 .000 .101 .982 2 11.890 .000 .120 .994 Cognitive 1 .009 .926 .000 .051 1 .050 .824 .001 .056 Feedback 1 19.546 .000 .183 .992 1 9.532 .003 .099 .863 Aural Interpretation Time 2 .294 .746 .003 .096 2 1.556 .214 .018 .327 Time x Cognitive 2 .342 .711 .004 .104 2 .149 .861 .002 .073 Time x Feedback 2 .736 .481 .008 .173 2 .646 .525 .007 .157 Cognitive 1 .361 .549 .004 .091 1 .014 .907 .000 .052 Feedback 1 4.973 .028 .054 .597 1 5.335 .023 .058 .627 Grammaticality Judgment Time 2 1.649 .195 .019 .345 2 .688 .504 .008 .165 Time x Cognitive 2 .366 .694 .004 .108 2 .969 .381 .011 .217 Time x Feedback 2 .246 .782 .003 .088 2 2.690 .071 .030 .528 Cognitive 1 .020 .888 .000 .052 1 .233 .630 .003 .077 Feedback 1 5.193 .025 .056 .616 1 4.193 .044 .046 .526 Written Production- Accuracy Time 2 1.061 .348 .012 .234 2 1.441 .239 .016 .306 Time x Cognitive 2 .646 .525 .007 .157 2 .406 .667 .005 .115 Time x Feedback 2 2.603 .077 .029 .514 2 4.364 .014 .048 .749 Cognitive 1 .103 .749 .001 .062 1 2.289 .134 .026 .322 Feedback 1 4.675 .033 .051 .571 1 1.701 .196 .019 .252 Written Production- Word Order Preference
Time 2 2.256 .108 .025 .455 2 .545 .581 .006 .139
Time x Cognitive 2 2.328 .101 .026 .467 2 .630 .534 .007 .154
Time x Feedback 2 1.348 .262 .015 .288 2 1.742 .178 .020 .362
Cognitive 1 .002 .961 .000 .050 1 .308 .580 .004 .085
Feedback 1 .040 .841 .000 .055 1 .000 .999 .000 .050
Note. Values in bold reflect changes from the 2 x 3 repeated measures ANOVAs.
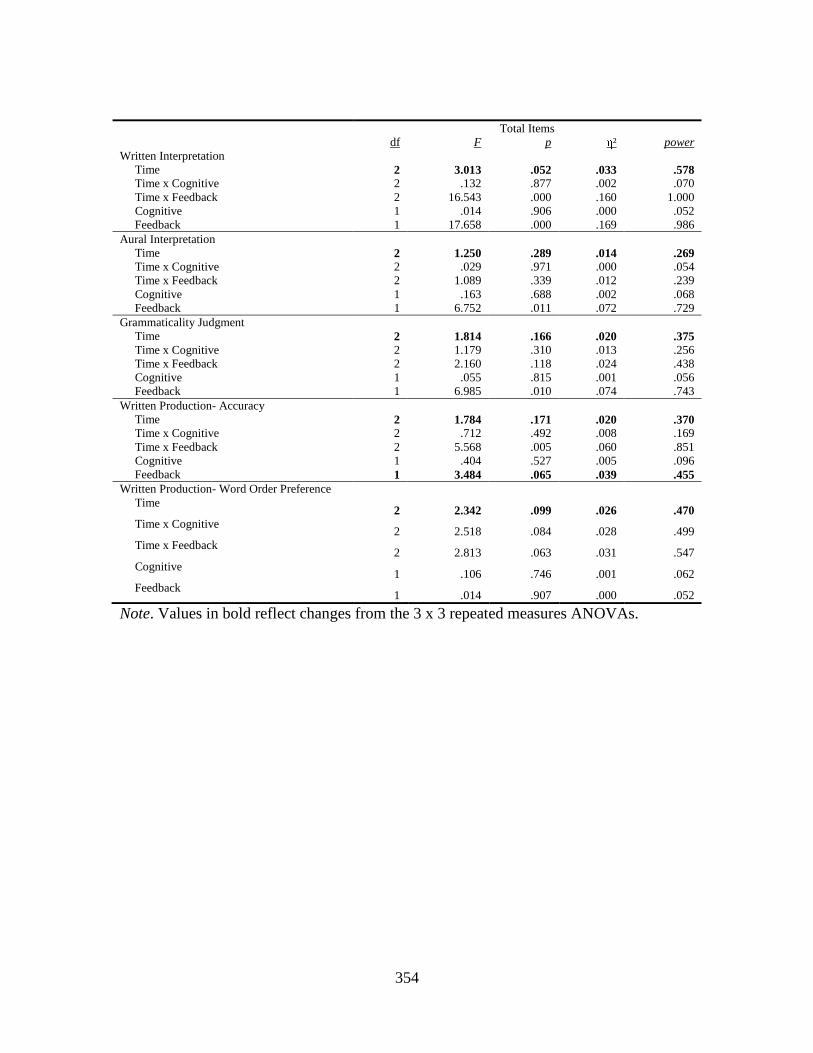
354
Total Items df F p η² power Written Interpretation Time 2 3.013 .052 .033 .578 Time x Cognitive 2 .132 .877 .002 .070 Time x Feedback 2 16.543 .000 .160 1.000 Cognitive 1 .014 .906 .000 .052 Feedback 1 17.658 .000 .169 .986 Aural Interpretation Time 2 1.250 .289 .014 .269 Time x Cognitive 2 .029 .971 .000 .054 Time x Feedback 2 1.089 .339 .012 .239 Cognitive 1 .163 .688 .002 .068 Feedback 1 6.752 .011 .072 .729 Grammaticality Judgment Time 2 1.814 .166 .020 .375 Time x Cognitive 2 1.179 .310 .013 .256 Time x Feedback 2 2.160 .118 .024 .438 Cognitive 1 .055 .815 .001 .056 Feedback 1 6.985 .010 .074 .743 Written Production- Accuracy Time 2 1.784 .171 .020 .370 Time x Cognitive 2 .712 .492 .008 .169 Time x Feedback 2 5.568 .005 .060 .851 Cognitive 1 .404 .527 .005 .096 Feedback 1 3.484 .065 .039 .455 Written Production- Word Order Preference Time
2 2.342 .099 .026 .470 Time x Cognitive
2 2.518 .084 .028 .499 Time x Feedback
2 2.813 .063 .031 .547 Cognitive
1 .106 .746 .001 .062 Feedback
1 .014 .907 .000 .052
Note. Values in bold reflect changes from the 3 x 3 repeated measures ANOVAs.
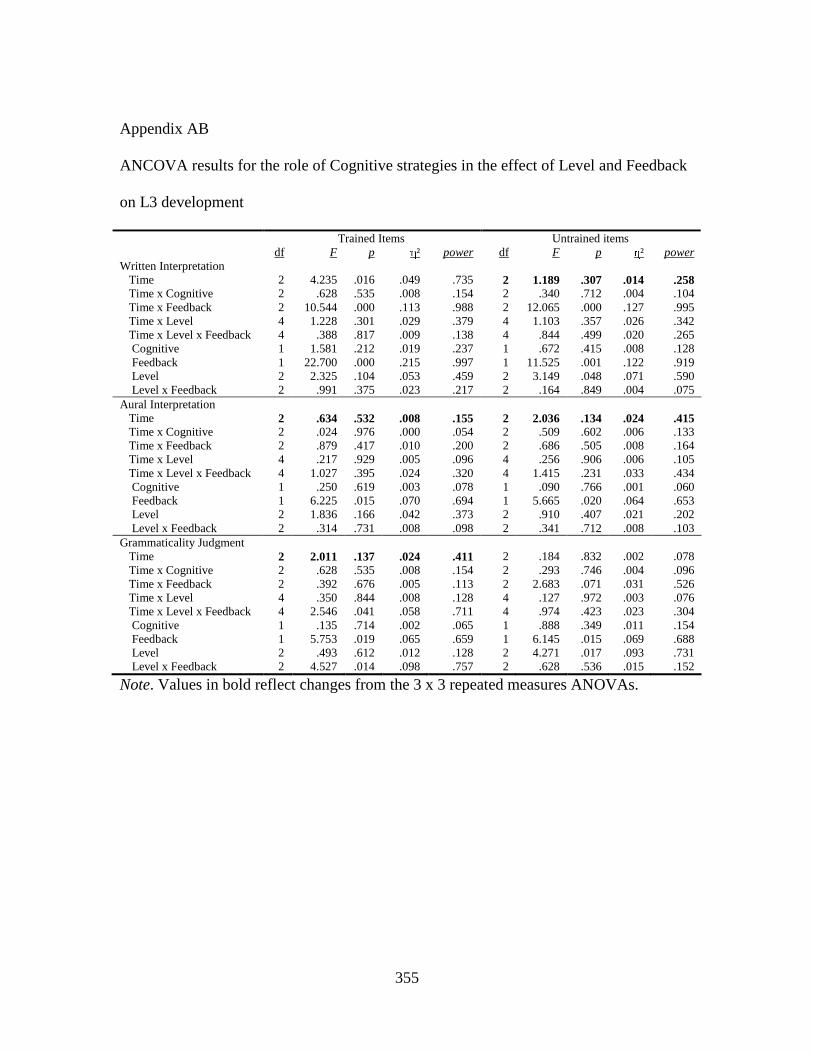
355
Appendix AB
ANCOVA results for the role of Cognitive strategies in the effect of Level and Feedback
on L3 development
Trained Items Untrained items df F p η² power df F p η² power Written Interpretation Time 2 4.235 .016 .049 .735 2 1.189 .307 .014 .258 Time x Cognitive 2 .628 .535 .008 .154 2 .340 .712 .004 .104 Time x Feedback 2 10.544 .000 .113 .988 2 12.065 .000 .127 .995 Time x Level 4 1.228 .301 .029 .379 4 1.103 .357 .026 .342 Time x Level x Feedback 4 .388 .817 .009 .138 4 .844 .499 .020 .265 Cognitive 1 1.581 .212 .019 .237 1 .672 .415 .008 .128 Feedback 1 22.700 .000 .215 .997 1 11.525 .001 .122 .919 Level 2 2.325 .104 .053 .459 2 3.149 .048 .071 .590 Level x Feedback 2 .991 .375 .023 .217 2 .164 .849 .004 .075
Aural Interpretation Time 2 .634 .532 .008 .155 2 2.036 .134 .024 .415 Time x Cognitive 2 .024 .976 .000 .054 2 .509 .602 .006 .133 Time x Feedback 2 .879 .417 .010 .200 2 .686 .505 .008 .164 Time x Level 4 .217 .929 .005 .096 4 .256 .906 .006 .105 Time x Level x Feedback 4 1.027 .395 .024 .320 4 1.415 .231 .033 .434 Cognitive 1 .250 .619 .003 .078 1 .090 .766 .001 .060 Feedback 1 6.225 .015 .070 .694 1 5.665 .020 .064 .653 Level 2 1.836 .166 .042 .373 2 .910 .407 .021 .202 Level x Feedback 2 .314 .731 .008 .098 2 .341 .712 .008 .103
Grammaticality Judgment Time 2 2.011 .137 .024 .411 2 .184 .832 .002 .078 Time x Cognitive 2 .628 .535 .008 .154 2 .293 .746 .004 .096 Time x Feedback 2 .392 .676 .005 .113 2 2.683 .071 .031 .526 Time x Level 4 .350 .844 .008 .128 4 .127 .972 .003 .076 Time x Level x Feedback 4 2.546 .041 .058 .711 4 .974 .423 .023 .304 Cognitive 1 .135 .714 .002 .065 1 .888 .349 .011 .154 Feedback 1 5.753 .019 .065 .659 1 6.145 .015 .069 .688 Level 2 .493 .612 .012 .128 2 4.271 .017 .093 .731 Level x Feedback 2 4.527 .014 .098 .757 2 .628 .536 .015 .152
Note. Values in bold reflect changes from the 3 x 3 repeated measures ANOVAs.
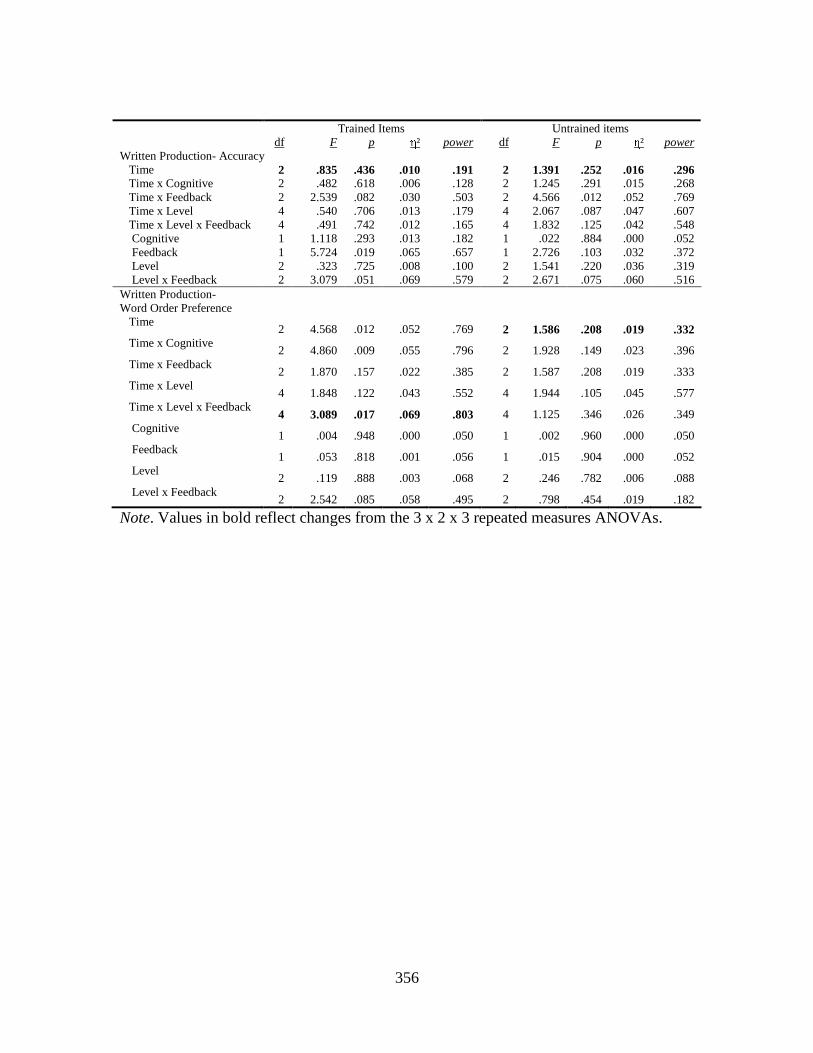
356
Trained Items Untrained items df F p η² power df F p η² power Written Production- Accuracy Time 2 .835 .436 .010 .191 2 1.391 .252 .016 .296 Time x Cognitive 2 .482 .618 .006 .128 2 1.245 .291 .015 .268 Time x Feedback 2 2.539 .082 .030 .503 2 4.566 .012 .052 .769 Time x Level 4 .540 .706 .013 .179 4 2.067 .087 .047 .607 Time x Level x Feedback 4 .491 .742 .012 .165 4 1.832 .125 .042 .548 Cognitive 1 1.118 .293 .013 .182 1 .022 .884 .000 .052 Feedback 1 5.724 .019 .065 .657 1 2.726 .103 .032 .372 Level 2 .323 .725 .008 .100 2 1.541 .220 .036 .319 Level x Feedback 2 3.079 .051 .069 .579 2 2.671 .075 .060 .516
Written Production- Word Order Preference
Time 2 4.568 .012 .052 .769 2 1.586 .208 .019 .332
Time x Cognitive 2 4.860 .009 .055 .796 2 1.928 .149 .023 .396
Time x Feedback 2 1.870 .157 .022 .385 2 1.587 .208 .019 .333
Time x Level 4 1.848 .122 .043 .552 4 1.944 .105 .045 .577
Time x Level x Feedback 4 3.089 .017 .069 .803 4 1.125 .346 .026 .349
Cognitive 1 .004 .948 .000 .050 1 .002 .960 .000 .050
Feedback 1 .053 .818 .001 .056 1 .015 .904 .000 .052
Level 2 .119 .888 .003 .068 2 .246 .782 .006 .088
Level x Feedback 2 2.542 .085 .058 .495 2 .798 .454 .019 .182
Note. Values in bold reflect changes from the 3 x 2 x 3 repeated measures ANOVAs.

357
Total Items df F p η² power Written Interpretation
Time 2 4.731 .010 .054 .785 Time x Cognitive 2 .633 .532 .008 .155 Time x Feedback 2 17.649 .000 .175 1.000 Time x Level 4 1.704 .151 .039 .514 Time x Level x Feedback 4 .470 .758 .011 .159 Cognitive 1 1.978 .163 .023 .285 Feedback 1 21.522 .000 .206 .996 Level 2 4.004 .022 .088 .701 Level x Feedback 2 .360 .698 .009 .106
Aural Interpretation Time 2 1.973 .142 .023 .404 Time x Cognitive 2 .118 .888 .001 .068 Time x Feedback 2 1.267 .284 .015 .272 Time x Level 4 .342 .849 .008 .126 Time x Level x Feedback 4 1.298 .273 .030 .400 Cognitive 1 .206 .651 .002 .073 Feedback 1 7.777 .007 .086 .787 Level 2 1.698 .189 .039 .348 Level x Feedback 2 .004 .996 .000 .051
Grammaticality Judgment Time 2 1.268 .284 .015 .273 Time x Cognitive 2 .709 .494 .008 .168 Time x Feedback 2 2.478 .087 .029 .492 Time x Level 4 .384 .820 .009 .137 Time x Level x Feedback 4 2.446 .048 .056 .691 Cognitive 1 .692 .408 .008 .130 Feedback 1 9.065 .003 .098 .845 Level 2 2.940 .058 .066 .559 Level x Feedback 2 2.564 .083 .058 .499
Written Production- Accuracy Time 2 1.754 .176 .021 .364 Time x Cognitive 2 1.321 .270 .016 .283 Time x Feedback 2 5.573 .005 .063 .851 Time x Level 4 .794 .531 .019 .251 Time x Level x Feedback 4 1.371 .246 .032 .421 Cognitive 1 .248 .620 .003 .078 Feedback 1 4.789 .031 .055 .580 Level 2 .948 .391 .022 .209 Level x Feedback 2 3.333 .041 .074 .616
Written Production- Word Order Preference Time
2 5.213 .006 .059 .825 Time x Cognitive
2 5.928 .003 .067 .873 Time x Feedback
2 3.067 .049 .036 .586 Time x Level
4 2.805 .027 .063 .758 Time x Level x Feedback
4 .308 .873 .007 .118 Cognitive
1 .000 .991 .000 .050 Feedback
1 .039 .843 .000 .054 Level
2 .041 .960 .001 .056 Level x Feedback
2 1.671 .194 .039 .343
Note. Values in bold reflect changes from the 3 x 3 repeated measures ANOVAs.
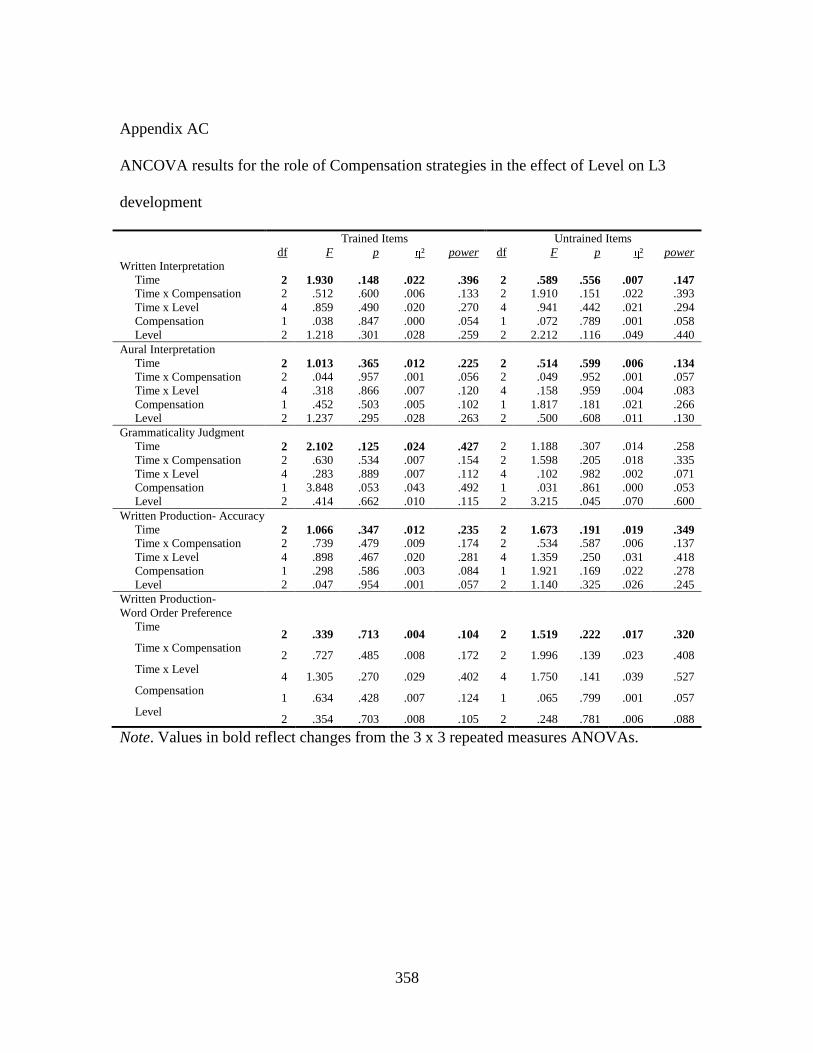
358
Appendix AC
ANCOVA results for the role of Compensation strategies in the effect of Level on L3
development
Trained Items Untrained Items df F p η² power df F p η² power Written Interpretation Time 2 1.930 .148 .022 .396 2 .589 .556 .007 .147 Time x Compensation 2 .512 .600 .006 .133 2 1.910 .151 .022 .393 Time x Level 4 .859 .490 .020 .270 4 .941 .442 .021 .294 Compensation 1 .038 .847 .000 .054 1 .072 .789 .001 .058 Level 2 1.218 .301 .028 .259 2 2.212 .116 .049 .440 Aural Interpretation Time 2 1.013 .365 .012 .225 2 .514 .599 .006 .134 Time x Compensation 2 .044 .957 .001 .056 2 .049 .952 .001 .057 Time x Level 4 .318 .866 .007 .120 4 .158 .959 .004 .083 Compensation 1 .452 .503 .005 .102 1 1.817 .181 .021 .266 Level 2 1.237 .295 .028 .263 2 .500 .608 .011 .130 Grammaticality Judgment Time 2 2.102 .125 .024 .427 2 1.188 .307 .014 .258 Time x Compensation 2 .630 .534 .007 .154 2 1.598 .205 .018 .335 Time x Level 4 .283 .889 .007 .112 4 .102 .982 .002 .071 Compensation 1 3.848 .053 .043 .492 1 .031 .861 .000 .053 Level 2 .414 .662 .010 .115 2 3.215 .045 .070 .600 Written Production- Accuracy Time 2 1.066 .347 .012 .235 2 1.673 .191 .019 .349 Time x Compensation 2 .739 .479 .009 .174 2 .534 .587 .006 .137 Time x Level 4 .898 .467 .020 .281 4 1.359 .250 .031 .418 Compensation 1 .298 .586 .003 .084 1 1.921 .169 .022 .278 Level 2 .047 .954 .001 .057 2 1.140 .325 .026 .245 Written Production- Word Order Preference
Time 2 .339 .713 .004 .104 2 1.519 .222 .017 .320
Time x Compensation 2 .727 .485 .008 .172 2 1.996 .139 .023 .408
Time x Level 4 1.305 .270 .029 .402 4 1.750 .141 .039 .527
Compensation 1 .634 .428 .007 .124 1 .065 .799 .001 .057
Level 2 .354 .703 .008 .105 2 .248 .781 .006 .088
Note. Values in bold reflect changes from the 3 x 3 repeated measures ANOVAs.

359
Total Items df F p η² power Written Interpretation Time 2 .841 .433 .010 .193 Time x Compensation 2 .214 .807 .002 .083 Time x Level 4 1.070 .373 .024 .333 Compensation 1 .021 .884 .000 .052 Level 2 2.345 .102 .052 .463 Aural Interpretation Time 2 1.223 .297 .014 .264 Time x Compensation 2 .003 .997 .000 .050 Time x Level 4 .248 .910 .006 .103 Compensation 1 1.345 .249 .015 .209 Level 2 .987 .377 .022 .217 Grammaticality Judgment Time 2 2.700 .070 .030 .529 Time x Compensation 2 1.888 .155 .021 .389 Time x Level 4 .337 .853 .008 .125 Compensation 1 1.514 .222 .017 .229 Level 2 1.548 .218 .035 .321 Written Production- Accuracy Time 2 1.584 .208 .018 .332 Time x Compensation 2 .315 .730 .004 .100 Time x Level 4 .279 .892 .006 .111 Compensation 1 1.057 .307 .012 .174 Level 2 .411 .664 .009 .115 Written Production- Word Order Preference Time
2 1.682 .189 .019 .351 Time x Compensation
2 2.591 .078 .029 .511 Time x Level
4 1.836 .124 .041 .550 Compensation
1 .357 .552 .004 .091 Level
2 .080 .924 .002 .062
Note. Values in bold reflect changes from the 2 x 3 repeated measures ANOVAs.

360
Appendix AD
ANCOVA results for the role of Compensation strategies in the effect of Feedback on L3
development
Trained Items Untrained Items df F p η² power df F p η² power Written Interpretation Time 2 3.659 .028 .040 .668 2 .196 .822 .002 .080 Time x Compensation 2 .848 .430 .010 .194 2 .472 .625 .005 .126 Time x Feedback 2 10.281 .000 .106 .986 2 11.974 .000 .121 .995 Compensation 1 .315 .576 .004 .086 1 .103 .749 .001 .062 Feedback 1 20.860 .000 .193 .995 1 9.697 .002 .100 .869 Aural Interpretation Time 2 1.020 .363 .012 .226 2 .526 .592 .006 .136 Time x Compensation 2 .004 .996 .000 .051 2 .063 .939 .001 .059 Time x Feedback 2 .977 .378 .011 .218 2 .659 .519 .008 .159 Compensation 1 .592 .444 .007 .118 1 1.413 .238 .016 .217 Feedback 1 5.081 .027 .055 .606 1 4.602 .035 .050 .564 Grammaticality Judgment Time 2 2.126 .122 .024 .432 2 1.213 .300 .014 .262 Time x Compensation 2 .586 .558 .007 .146 2 1.738 .179 .020 .361 Time x Feedback 2 .328 .721 .004 .102 2 3.106 .047 .034 .592 Compensation 1 2.445 .122 .027 .340 1 .327 .569 .004 .087 Feedback 1 3.946 .050 .043 .502 1 4.318 .041 .047 .538 Written Production- Accuracy Time 2 1.274 .282 .014 .274 2 4.263 .016 .047 .739 Time x Compensation 2 .475 .623 .005 .127 2 1.957 .144 .022 .401 Time x Feedback 2 2.546 .081 .028 .504 2 5.000 .008 .054 .808 Compensation 1 .030 .864 .000 .053 1 2.632 .108 .029 .361 Feedback 1 4.286 .041 .047 .535 1 1.891 .173 .021 .275 Written Production- Word Order Preference
Time 2 .530 .590 .006 .136 2 .349 .706 .004 .105
Time x Compensation 2 .538 .585 .006 .138 2 .529 .590 .006 .136
Time x Feedback 2 .967 .382 .011 .216 2 1.562 .213 .018 .328
Compensation 1 .251 .617 .003 .079 1 .154 .695 .002 .067
Feedback 1 .013 .909 .000 .051 1 .004 .951 .000 .050
Note. Values in bold reflect changes from the 2 x 3 repeated measures ANOVAs.

361
Total Items df F p η² power Written Interpretation Time 2 2.737 .068 .030 .535 Time x Compensation 2 .256 .774 .003 .090 Time x Feedback 2 16.868 .000 .162 1.000 Compensation 1 .096 .758 .001 .061 Feedback 1 18.348 .000 .174 .989 Aural Interpretation Time 2 1.271 .283 .014 .273 Time x Compensation 2 .017 .983 .000 .053 Time x Feedback 2 1.179 .310 .013 .256 Compensation 1 1.271 .263 .014 .200 Feedback 1 6.347 .014 .068 .702 Grammaticality Judgment Time 2 2.959 .054 .033 .570 Time x Compensation 2 2.004 .138 .023 .410 Time x Feedback 2 2.594 .078 .029 .512 Compensation 1 1.606 .208 .018 .241 Feedback 1 6.255 .014 .067 .696 Written Production- Accuracy Time 2 4.097 .018 .045 .721 Time x Compensation 2 1.575 .210 .018 .331 Time x Feedback 2 5.974 .003 .064 .876 Compensation 1 .925 .339 .011 .158 Feedback 1 3.458 .066 .038 .452 Written Production- Word Order Preference Time
2 .773 .463 .009 .180 Time x Compensation
2 1.036 .357 .012 .229 Time x Feedback
2 2.353 .098 .026 .472 Compensation
1 .252 .617 .003 .079 Feedback
1 .010 .921 .000 .051
Note. Values in bold reflect changes from the 2 x 3 repeated measures ANOVAs.

362
Appendix AE
ANCOVA results for the role of Compensation strategies in the effect of Level and
Feedback on L3 development
Trained Items Untrained Items df F p η² power df F p η² power Written Interpretation Time 2 4.568 .012 .052 .769 2 .616 .542 .007 .152 Time x Compensation 2 1.115 .330 .013 .244 2 .573 .565 .007 .144 Time x Feedback 2 10.634 .000 .114 .988 2 11.959 .000 .126 .995 Time x Level 4 1.159 .331 .027 .359 4 1.045 .386 .025 .325 Time x Level x Feedback 4 .340 .850 .008 .126 4 .906 .462 .021 .284 Compensation 1 1.827 .180 .022 .267 1 .140 .709 .002 .066 Feedback 1 22.917 .000 .216 .997 1 10.835 .001 .115 .902 Level 2 2.252 .112 .051 .447 2 2.865 .063 .065 .547 Level x Feedback 2 .928 .399 .022 .206 2 .273 .762 .007 .092
Aural Interpretation Time 2 1.691 .188 .020 .352 2 .700 .498 .008 .167 Time x Compensation 2 .148 .863 .002 .072 2 .040 .961 .000 .056 Time x Feedback 2 1.109 .332 .013 .243 2 .681 .507 .008 .163 Time x Level 4 .393 .813 .009 .139 4 .177 .950 .004 .087 Time x Level x Feedback 4 1.087 .365 .026 .337 4 1.291 .276 .030 .398 Compensation 1 .009 .923 .000 .051 1 .933 .337 .011 .159 Feedback 1 5.633 .020 .064 .650 1 4.594 .035 .052 .563 Level 2 1.573 .214 .037 .325 2 .584 .560 .014 .144 Level x Feedback 2 .235 .791 .006 .086 2 .507 .604 .012 .131
Grammaticality Judgment Time 2 2.632 .075 .031 .518 2 .868 .422 .010 .198 Time x Compensation 2 .949 .389 .011 .213 2 1.294 .277 .015 .278 Time x Feedback 2 .404 .669 .005 .114 2 3.125 .047 .036 .594 Time x Level 4 .325 .861 .008 .122 4 .135 .969 .003 .078 Time x Level x Feedback 4 2.625 .037 .059 .726 4 1.099 .359 .026 .341 Compensation 1 2.054 .156 .024 .294 1 .174 .678 .002 .070 Feedback 1 4.228 .043 .048 .529 1 5.434 .022 .061 .635 Level 2 .401 .671 .010 .113 2 3.821 .026 .084 .679 Level x Feedback 2 4.382 .016 .096 .743 2 .500 .608 .012 .130
Note. Values in bold reflect changes from the 3 x 3 repeated measures ANOVAs.

363
Trained Items Untrained Items df F p η² power df F p η² power Written Production- Accuracy Time 2 1.473 .232 .017 .311 2 3.370 .037 .039 .629 Time x Compensation 2 .786 .457 .009 .182 2 1.573 .211 .019 .330 Time x Feedback 2 2.453 .089 .029 .488 2 5.169 .007 .059 .822 Time x Level 4 .856 .492 .020 .269 4 1.340 .257 .031 .412 Time x Level x Feedback 4 .431 .786 .010 .149 4 2.083 .085 .048 .611 Compensation 1 .008 .928 .000 .051 1 .720 .399 .009 .134 Feedback 1 4.553 .036 .052 .559 1 2.408 .125 .028 .335 Level 2 .077 .926 .002 .061 2 1.451 .240 .034 .302 Level x Feedback 2 2.615 .079 .059 .507 2 2.706 .073 .061 .522
Written Production- Word Order Preference
Time 2 .694 .501 .008 .166 2 1.269 .284 .015 .273
Time x Compensation 2 .868 .422 .010 .198 2 1.653 .195 .020 .345
Time x Feedback 2 1.003 .369 .012 .223 2 1.488 .229 .018 .314
Time x Level 4 1.262 .287 .030 .389 4 1.707 .151 .040 .515
Time x Level x Feedback 4 2.336 .058 .053 .668 4 1.462 .216 .034 .447
Compensation 1 .302 .584 .004 .084 1 .022 .883 .000 .052
Feedback 1 .010 .922 .000 .051 1 .011 .915 .000 .051
Level 2 .291 .748 .007 .095 2 .258 .774 .006 .089
Level x Feedback 2 2.481 .090 .056 .485 2 .833 .439 .020 .188
Note. Values in bold reflect changes from the 3 x 2 x 3 repeated measures ANOVAs.
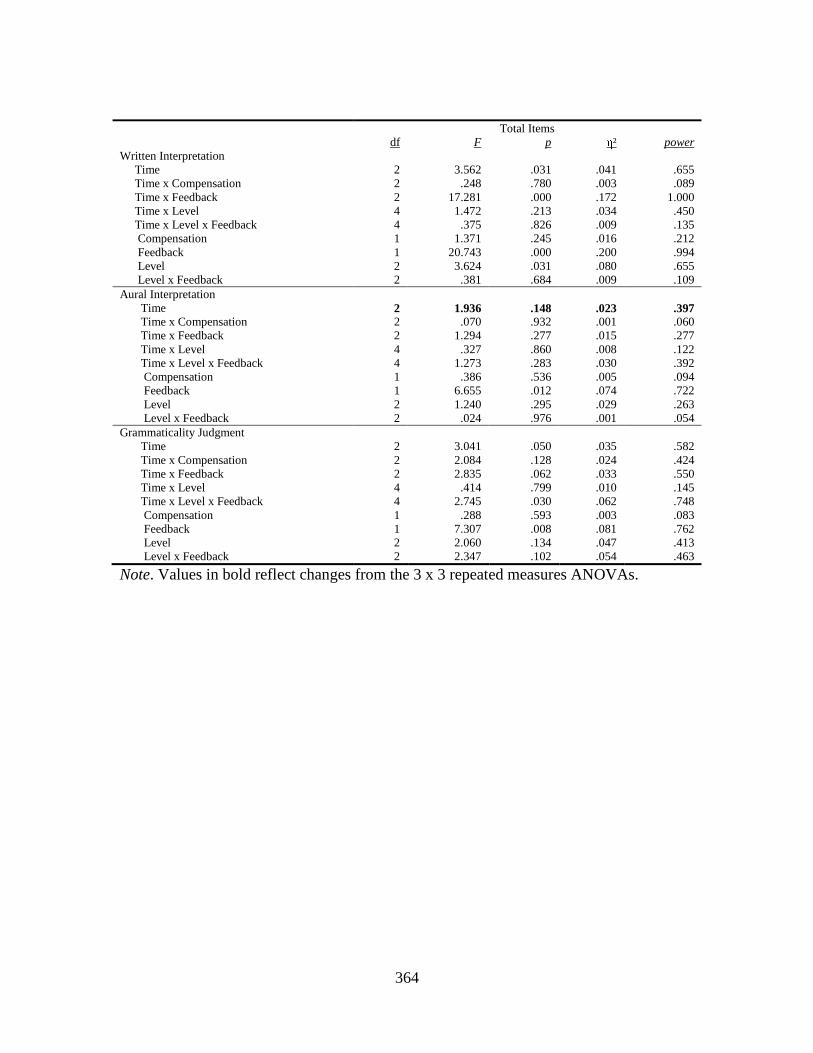
364
Total Items df F p η² power Written Interpretation
Time 2 3.562 .031 .041 .655 Time x Compensation 2 .248 .780 .003 .089 Time x Feedback 2 17.281 .000 .172 1.000 Time x Level 4 1.472 .213 .034 .450 Time x Level x Feedback 4 .375 .826 .009 .135 Compensation 1 1.371 .245 .016 .212 Feedback 1 20.743 .000 .200 .994 Level 2 3.624 .031 .080 .655 Level x Feedback 2 .381 .684 .009 .109
Aural Interpretation Time 2 1.936 .148 .023 .397 Time x Compensation 2 .070 .932 .001 .060 Time x Feedback 2 1.294 .277 .015 .277 Time x Level 4 .327 .860 .008 .122 Time x Level x Feedback 4 1.273 .283 .030 .392 Compensation 1 .386 .536 .005 .094 Feedback 1 6.655 .012 .074 .722 Level 2 1.240 .295 .029 .263 Level x Feedback 2 .024 .976 .001 .054
Grammaticality Judgment Time 2 3.041 .050 .035 .582 Time x Compensation 2 2.084 .128 .024 .424 Time x Feedback 2 2.835 .062 .033 .550 Time x Level 4 .414 .799 .010 .145 Time x Level x Feedback 4 2.745 .030 .062 .748 Compensation 1 .288 .593 .003 .083 Feedback 1 7.307 .008 .081 .762 Level 2 2.060 .134 .047 .413 Level x Feedback 2 2.347 .102 .054 .463
Note. Values in bold reflect changes from the 3 x 3 repeated measures ANOVAs.
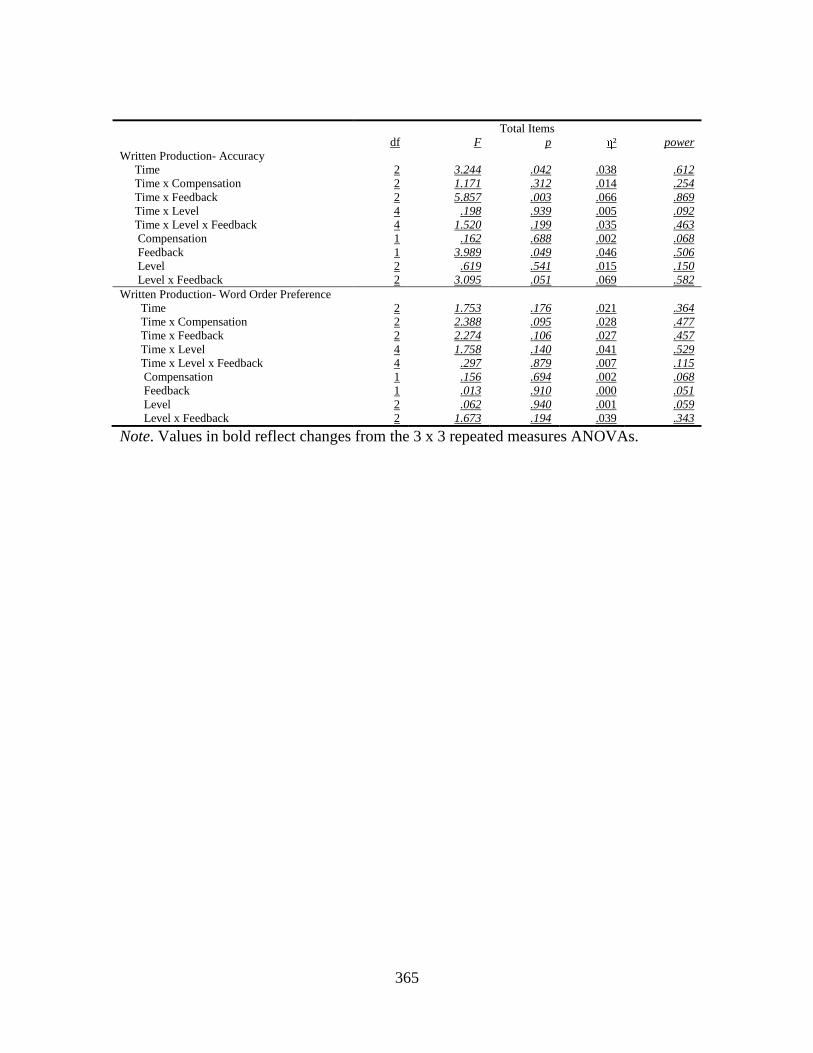
365
Total Items df F p η² power Written Production- Accuracy
Time 2 3.244 .042 .038 .612 Time x Compensation 2 1.171 .312 .014 .254 Time x Feedback 2 5.857 .003 .066 .869 Time x Level 4 .198 .939 .005 .092 Time x Level x Feedback 4 1.520 .199 .035 .463 Compensation 1 .162 .688 .002 .068 Feedback 1 3.989 .049 .046 .506 Level 2 .619 .541 .015 .150 Level x Feedback 2 3.095 .051 .069 .582
Written Production- Word Order Preference Time 2 1.753 .176 .021 .364 Time x Compensation 2 2.388 .095 .028 .477 Time x Feedback 2 2.274 .106 .027 .457 Time x Level 4 1.758 .140 .041 .529 Time x Level x Feedback 4 .297 .879 .007 .115 Compensation 1 .156 .694 .002 .068 Feedback 1 .013 .910 .000 .051 Level 2 .062 .940 .001 .059 Level x Feedback 2 1.673 .194 .039 .343
Note. Values in bold reflect changes from the 3 x 3 repeated measures ANOVAs.
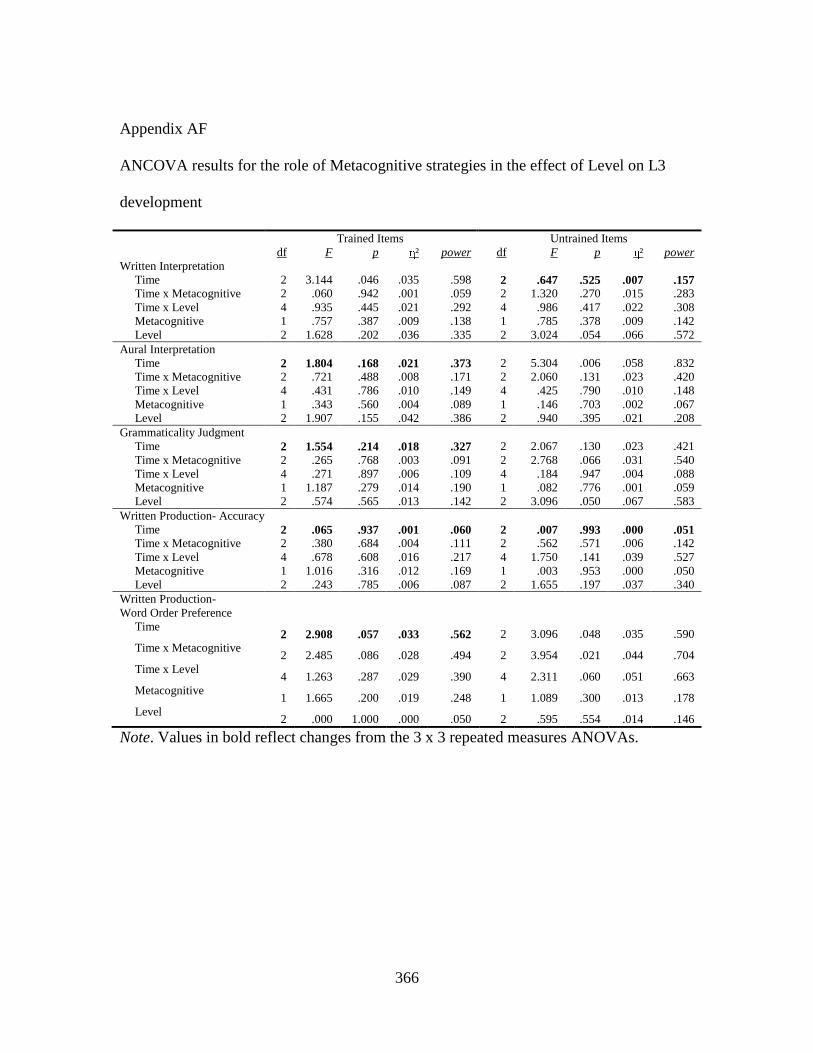
366
Appendix AF
ANCOVA results for the role of Metacognitive strategies in the effect of Level on L3
development
Trained Items Untrained Items df F p η² power df F p η² power Written Interpretation Time 2 3.144 .046 .035 .598 2 .647 .525 .007 .157 Time x Metacognitive 2 .060 .942 .001 .059 2 1.320 .270 .015 .283 Time x Level 4 .935 .445 .021 .292 4 .986 .417 .022 .308 Metacognitive 1 .757 .387 .009 .138 1 .785 .378 .009 .142 Level 2 1.628 .202 .036 .335 2 3.024 .054 .066 .572 Aural Interpretation Time 2 1.804 .168 .021 .373 2 5.304 .006 .058 .832 Time x Metacognitive 2 .721 .488 .008 .171 2 2.060 .131 .023 .420 Time x Level 4 .431 .786 .010 .149 4 .425 .790 .010 .148 Metacognitive 1 .343 .560 .004 .089 1 .146 .703 .002 .067 Level 2 1.907 .155 .042 .386 2 .940 .395 .021 .208 Grammaticality Judgment Time 2 1.554 .214 .018 .327 2 2.067 .130 .023 .421 Time x Metacognitive 2 .265 .768 .003 .091 2 2.768 .066 .031 .540 Time x Level 4 .271 .897 .006 .109 4 .184 .947 .004 .088 Metacognitive 1 1.187 .279 .014 .190 1 .082 .776 .001 .059 Level 2 .574 .565 .013 .142 2 3.096 .050 .067 .583 Written Production- Accuracy Time 2 .065 .937 .001 .060 2 .007 .993 .000 .051 Time x Metacognitive 2 .380 .684 .004 .111 2 .562 .571 .006 .142 Time x Level 4 .678 .608 .016 .217 4 1.750 .141 .039 .527 Metacognitive 1 1.016 .316 .012 .169 1 .003 .953 .000 .050 Level 2 .243 .785 .006 .087 2 1.655 .197 .037 .340 Written Production- Word Order Preference
Time 2 2.908 .057 .033 .562 2 3.096 .048 .035 .590
Time x Metacognitive 2 2.485 .086 .028 .494 2 3.954 .021 .044 .704
Time x Level 4 1.263 .287 .029 .390 4 2.311 .060 .051 .663
Metacognitive 1 1.665 .200 .019 .248 1 1.089 .300 .013 .178
Level 2 .000 1.000 .000 .050 2 .595 .554 .014 .146
Note. Values in bold reflect changes from the 3 x 3 repeated measures ANOVAs.

367
Total Items df F p η² power Written Interpretation Time 2 2.321 .101 .026 .466 Time x Metacognitive 2 .253 .777 .003 .089 Time x Level 4 1.251 .291 .028 .386 Metacognitive 1 1.291 .259 .015 .202 Level 2 3.132 .049 .068 .588 Aural Interpretation Time 2 5.314 .006 .058 .833 Time x Metacognitive 2 1.494 .227 .017 .316 Time x Level 4 .584 .675 .013 .191 Metacognitive 1 .299 .586 .003 .084 Level 2 1.739 .182 .039 .356 Grammaticality Judgment Time 2 2.828 .062 .032 .550 Time x Metacognitive 2 1.857 .159 .021 .383 Time x Level 4 .421 .793 .010 .147 Metacognitive 1 .197 .658 .002 .072 Level 2 2.391 .098 .053 .471 Written Production- Accuracy Time 2 .010 .990 .000 .051 Time x Metacognitive 2 .718 .489 .008 .170 Time x Level 4 .770 .546 .018 .244 Metacognitive 1 .266 .607 .003 .080 Level 2 .900 .411 .020 .201 Written Production- Word Order Preference Time
2 4.066 .019 .045 .717 Time x Metacognitive
2 5.008 .008 .055 .809 Time x Level
4 2.342 .057 .052 .670 Metacognitive
1 1.711 .194 .020 .253 Level
2 .168 .846 .004 .075
Note. Values in bold reflect changes from the 3 x 3 repeated measures ANOVAs.

368
Appendix AG
ANCOVA results for the role of Metacognitive strategies in the effect of Feedback on L3
development
Trained Items Untrained Items df F p η² power df F p η² power Written Interpretation Time 2 5.812 .004 .063 .866 2 1.095 .337 .012 .240 Time x Metacognitive 2 .571 .566 .007 .144 2 .028 .973 .000 .054 Time x Feedback 2 10.653 .000 .109 .989 2 12.239 .000 .123 .995 Metacognitive 1 2.003 .161 .023 .288 1 .655 .420 .007 .126 Feedback 1 23.046 .000 .209 .997 1 11.245 .001 .114 .912 Aural Interpretation Time 2 1.614 .202 .018 .338 2 5.108 .007 .055 .817 Time x Metacognitive 2 .381 .684 .004 .111 2 1.767 .174 .020 .367 Time x Feedback 2 .896 .410 .010 .203 2 .872 .420 .010 .199 Metacognitive 1 .198 .657 .002 .073 1 .284 .595 .003 .082 Feedback 1 6.174 .015 .066 .691 1 6.117 .015 .066 .687 Grammaticality Judgment Time 2 1.672 .191 .019 .349 2 2.034 .134 .023 .415 Time x Metacognitive 2 .306 .737 .004 .098 2 2.899 .058 .032 .561 Time x Feedback 2 .393 .676 .004 .113 2 3.251 .041 .036 .613 Metacognitive 1 2.576 .112 .029 .355 1 .343 .560 .004 .089 Feedback 1 7.204 .009 .076 .756 1 4.047 .047 .044 .512 Written Production- Accuracy Time 2 .676 .510 .008 .162 2 1.261 .286 .014 .271 Time x Metacognitive 2 .410 .664 .005 .116 2 .127 .881 .001 .069 Time x Feedback 2 2.401 .094 .027 .480 2 3.871 .023 .043 .694 Metacognitive 1 2.124 .149 .024 .302 1 .163 .687 .002 .068 Feedback 1 6.134 .015 .066 .688 1 2.402 .125 .027 .335 Written Production- Word Order Preference
Time 2 4.125 .018 .045 .724 2 .872 .420 .010 .198
Time x Metacognitive 2 3.277 .040 .036 .617 2 1.258 .287 .014 .271
Time x Feedback 2 1.832 .163 .021 .379 2 1.451 .237 .016 .307
Metacognitive 1 2.387 .126 .027 .333 1 .602 .440 .007 .120
Feedback 1 .376 .541 .004 .093 1 .115 .736 .001 .063
Note. Values in bold reflect changes from the 2 x 3 repeated measures ANOVAs.
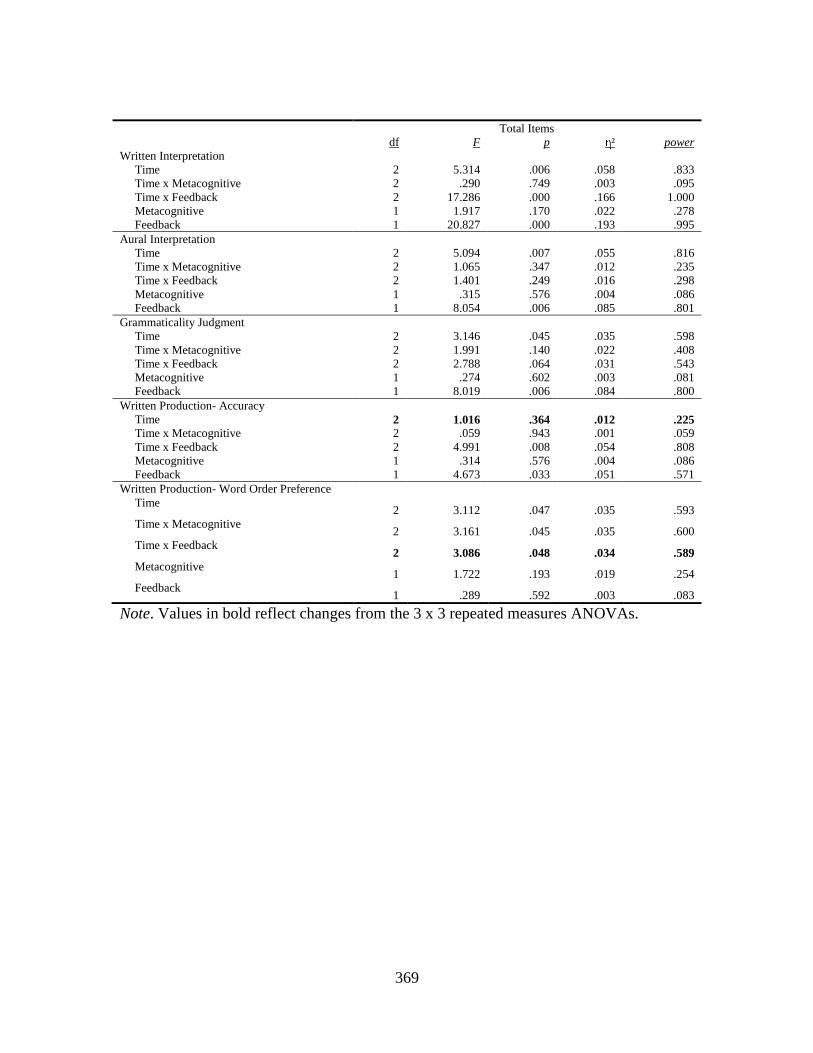
369
Total Items df F p η² power Written Interpretation Time 2 5.314 .006 .058 .833 Time x Metacognitive 2 .290 .749 .003 .095 Time x Feedback 2 17.286 .000 .166 1.000 Metacognitive 1 1.917 .170 .022 .278 Feedback 1 20.827 .000 .193 .995 Aural Interpretation Time 2 5.094 .007 .055 .816 Time x Metacognitive 2 1.065 .347 .012 .235 Time x Feedback 2 1.401 .249 .016 .298 Metacognitive 1 .315 .576 .004 .086 Feedback 1 8.054 .006 .085 .801 Grammaticality Judgment Time 2 3.146 .045 .035 .598 Time x Metacognitive 2 1.991 .140 .022 .408 Time x Feedback 2 2.788 .064 .031 .543 Metacognitive 1 .274 .602 .003 .081 Feedback 1 8.019 .006 .084 .800 Written Production- Accuracy Time 2 1.016 .364 .012 .225 Time x Metacognitive 2 .059 .943 .001 .059 Time x Feedback 2 4.991 .008 .054 .808 Metacognitive 1 .314 .576 .004 .086 Feedback 1 4.673 .033 .051 .571 Written Production- Word Order Preference Time
2 3.112 .047 .035 .593 Time x Metacognitive
2 3.161 .045 .035 .600 Time x Feedback
2 3.086 .048 .034 .589 Metacognitive
1 1.722 .193 .019 .254 Feedback
1 .289 .592 .003 .083
Note. Values in bold reflect changes from the 3 x 3 repeated measures ANOVAs.
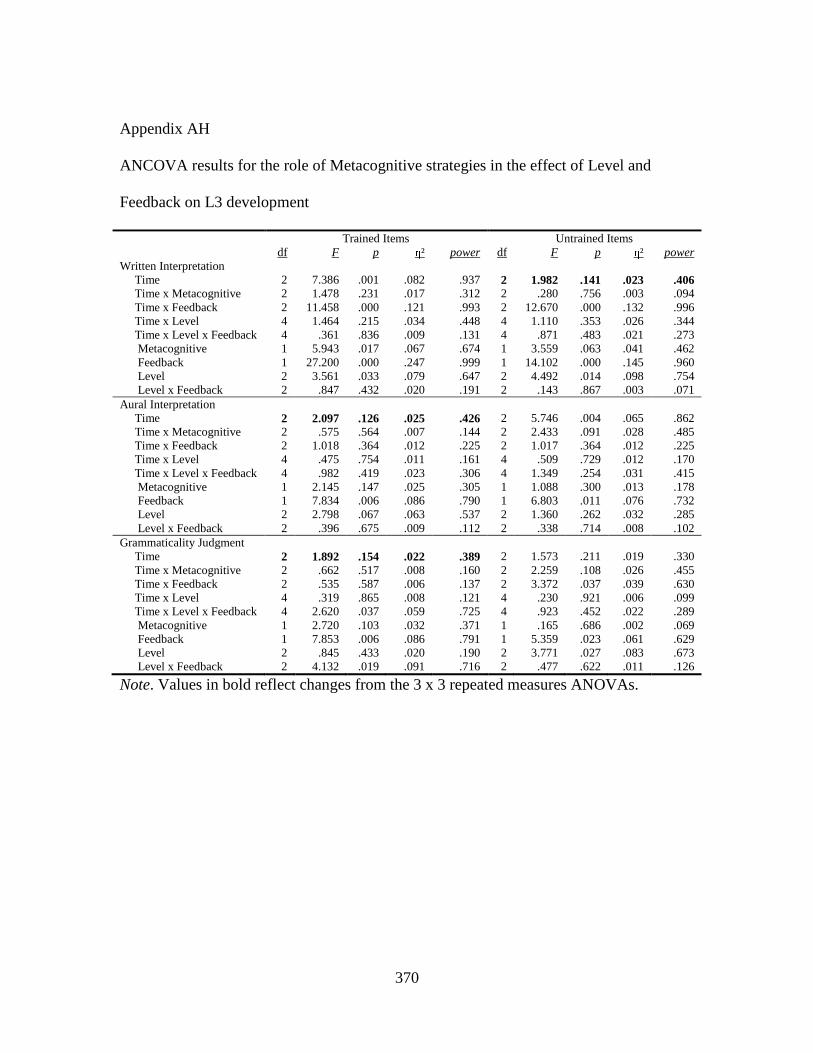
370
Appendix AH
ANCOVA results for the role of Metacognitive strategies in the effect of Level and
Feedback on L3 development
Trained Items Untrained Items df F p η² power df F p η² power Written Interpretation
Time 2 7.386 .001 .082 .937 2 1.982 .141 .023 .406 Time x Metacognitive 2 1.478 .231 .017 .312 2 .280 .756 .003 .094 Time x Feedback 2 11.458 .000 .121 .993 2 12.670 .000 .132 .996 Time x Level 4 1.464 .215 .034 .448 4 1.110 .353 .026 .344 Time x Level x Feedback 4 .361 .836 .009 .131 4 .871 .483 .021 .273 Metacognitive 1 5.943 .017 .067 .674 1 3.559 .063 .041 .462 Feedback 1 27.200 .000 .247 .999 1 14.102 .000 .145 .960 Level 2 3.561 .033 .079 .647 2 4.492 .014 .098 .754 Level x Feedback 2 .847 .432 .020 .191 2 .143 .867 .003 .071
Aural Interpretation Time 2 2.097 .126 .025 .426 2 5.746 .004 .065 .862 Time x Metacognitive 2 .575 .564 .007 .144 2 2.433 .091 .028 .485 Time x Feedback 2 1.018 .364 .012 .225 2 1.017 .364 .012 .225 Time x Level 4 .475 .754 .011 .161 4 .509 .729 .012 .170 Time x Level x Feedback 4 .982 .419 .023 .306 4 1.349 .254 .031 .415 Metacognitive 1 2.145 .147 .025 .305 1 1.088 .300 .013 .178 Feedback 1 7.834 .006 .086 .790 1 6.803 .011 .076 .732 Level 2 2.798 .067 .063 .537 2 1.360 .262 .032 .285 Level x Feedback 2 .396 .675 .009 .112 2 .338 .714 .008 .102
Grammaticality Judgment Time 2 1.892 .154 .022 .389 2 1.573 .211 .019 .330 Time x Metacognitive 2 .662 .517 .008 .160 2 2.259 .108 .026 .455 Time x Feedback 2 .535 .587 .006 .137 2 3.372 .037 .039 .630 Time x Level 4 .319 .865 .008 .121 4 .230 .921 .006 .099 Time x Level x Feedback 4 2.620 .037 .059 .725 4 .923 .452 .022 .289 Metacognitive 1 2.720 .103 .032 .371 1 .165 .686 .002 .069 Feedback 1 7.853 .006 .086 .791 1 5.359 .023 .061 .629 Level 2 .845 .433 .020 .190 2 3.771 .027 .083 .673 Level x Feedback 2 4.132 .019 .091 .716 2 .477 .622 .011 .126
Note. Values in bold reflect changes from the 3 x 3 repeated measures ANOVAs.
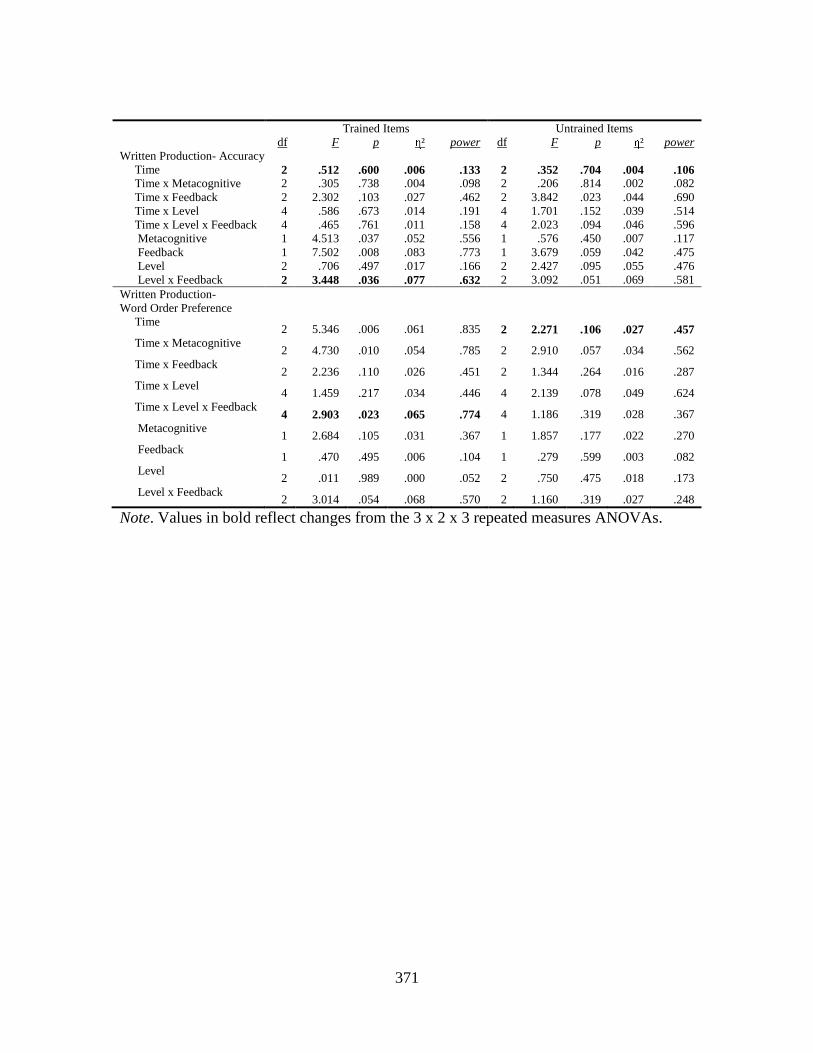
371
Trained Items Untrained Items df F p η² power df F p η² power Written Production- Accuracy
Time 2 .512 .600 .006 .133 2 .352 .704 .004 .106 Time x Metacognitive 2 .305 .738 .004 .098 2 .206 .814 .002 .082 Time x Feedback 2 2.302 .103 .027 .462 2 3.842 .023 .044 .690 Time x Level 4 .586 .673 .014 .191 4 1.701 .152 .039 .514 Time x Level x Feedback 4 .465 .761 .011 .158 4 2.023 .094 .046 .596 Metacognitive 1 4.513 .037 .052 .556 1 .576 .450 .007 .117 Feedback 1 7.502 .008 .083 .773 1 3.679 .059 .042 .475 Level 2 .706 .497 .017 .166 2 2.427 .095 .055 .476 Level x Feedback 2 3.448 .036 .077 .632 2 3.092 .051 .069 .581
Written Production- Word Order Preference
Time 2 5.346 .006 .061 .835 2 2.271 .106 .027 .457
Time x Metacognitive 2 4.730 .010 .054 .785 2 2.910 .057 .034 .562
Time x Feedback 2 2.236 .110 .026 .451 2 1.344 .264 .016 .287
Time x Level 4 1.459 .217 .034 .446 4 2.139 .078 .049 .624
Time x Level x Feedback 4 2.903 .023 .065 .774 4 1.186 .319 .028 .367
Metacognitive 1 2.684 .105 .031 .367 1 1.857 .177 .022 .270
Feedback 1 .470 .495 .006 .104 1 .279 .599 .003 .082
Level 2 .011 .989 .000 .052 2 .750 .475 .018 .173
Level x Feedback 2 3.014 .054 .068 .570 2 1.160 .319 .027 .248
Note. Values in bold reflect changes from the 3 x 2 x 3 repeated measures ANOVAs.

372
Total Items df F p η² power Written Interpretation
Time 2 7.416 .001 .082 .938 Time x Metacognitive 2 1.279 .281 .015 .275 Time x Feedback 2 18.487 .000 .182 1.000 Time x Level 4 1.937 .107 .045 .575 Time x Level x Feedback 4 .430 .787 .010 .149 Metacognitive 1 6.814 .011 .076 .732 Feedback 1 26.041 .000 .239 .999 Level 2 5.665 .005 .120 .850 Level x Feedback 2 .184 .832 .004 .078
Aural Interpretation Time 2 6.064 .003 .068 .881 Time x Metacognitive 2 1.806 .167 .021 .373 Time x Feedback 2 1.628 .199 .019 .340 Time x Level 4 .704 .590 .017 .225 Time x Level x Feedback 4 1.232 .299 .029 .380 Metacognitive 1 2.048 .156 .024 .293 Feedback 1 9.605 .003 .104 .865 Level 2 2.593 .081 .059 .504 Level x Feedback 2 .029 .971 .001 .054
Grammaticality Judgment Time 2 2.961 .055 .034 .570 Time x Metacognitive 2 1.925 .149 .023 .395 Time x Feedback 2 3.214 .043 .037 .607 Time x Level 4 .528 .715 .013 .175 Time x Level x Feedback 4 2.546 .041 .058 .711 Metacognitive 1 1.457 .231 .017 .222 Feedback 1 9.804 .002 .106 .872 Level 2 3.274 .043 .073 .608 Level x Feedback 2 2.291 .107 .052 .453
Written Production- Accuracy Time 2 .638 .530 .008 .156 Time x Metacognitive 2 .394 .675 .005 .113 Time x Feedback 2 4.831 .009 .055 .794 Time x Level 4 .656 .624 .016 .211 Time x Level x Feedback 4 1.445 .221 .034 .442 Metacognitive 1 2.436 .122 .029 .338 Feedback 1 6.350 .014 .071 .702 Level 2 1.680 .193 .039 .345 Level x Feedback 2 3.786 .027 .084 .675
Written Production- Word Order Preference Time
2 4.978 .008 .057 .806 Time x Metacognitive
2 5.539 .005 .063 .848 Time x Feedback
2 3.238 .042 .038 .611 Time x Level
4 2.368 .055 .054 .675 Time x Level x Feedback
4 .209 .933 .005 .094 Metacognitive
1 2.827 .096 .033 .383 Feedback
1 .463 .498 .006 .103 Level
2 .279 .757 .007 .093 Level x Feedback
2 2.192 .118 .050 .436
Note. Values in bold reflect changes from the 3 x 3 repeated measures ANOVAs.

373
Appendix AI
ANCOVA results for the role of Affective strategies in the effect of Level on L3
development
Trained Items Untrained Items df F p η² power df F p η² power Written Interpretation Time 2 6.800 .001 .073 .916 2 1.290 .278 .015 .277 Time x Affective 2 .953 .388 .011 .213 2 .490 .614 .006 .129 Time x Level 4 1.011 .404 .023 .315 4 .925 .451 .021 .290 Affective 1 .419 .519 .005 .098 1 1.228 .271 .014 .195 Level 2 1.385 .256 .031 .290 2 2.966 .057 .065 .563 Aural Interpretation Time 2 2.521 .083 .028 .500 2 3.231 .042 .036 .610 Time x Affective 2 .554 .576 .006 .141 2 .604 .548 .007 .150 Time x Level 4 .381 .822 .009 .136 4 .206 .935 .005 .093 Affective 1 .024 .877 .000 .053 1 1.721 .193 .020 .254 Level 2 1.753 .179 .039 .358 2 1.123 .330 .025 .242 Grammaticality Judgment Time 2 .449 .639 .005 .122 2 .403 .669 .005 .114 Time x Affective 2 .045 .956 .001 .057 2 .756 .471 .009 .177 Time x Level 4 .226 .924 .005 .098 4 .187 .945 .004 .089 Affective 1 .005 .946 .000 .051 1 .304 .583 .004 .085 Level 2 .389 .679 .009 .111 2 3.846 .025 .082 .683 Written Production- Accuracy Time 2 1.570 .211 .018 .330 2 .938 .393 .011 .211 Time x Affective 2 .418 .659 .005 .117 2 .040 .960 .000 .056 Time x Level 4 .687 .602 .016 .220 4 1.548 .191 .035 .472 Affective 1 .012 .911 .000 .051 1 .343 .560 .004 .089 Level 2 .072 .931 .002 .061 2 1.799 .172 .040 .367 Written Production- Word Order Preference
Time 2 2.159 .119 .024 .437 2 .377 .687 .004 .110
Time x Affective 2 1.890 .154 .022 .389 2 .280 .756 .003 .094
Time x Level 4 1.206 .310 .027 .373 4 .980 .420 .022 .306
Affective 1 .207 .650 .002 .074 1 .297 .587 .003 .084
Level 2 .216 .806 .005 .083 2 .352 .705 .008 .105
Note. Values in bold reflect changes from the 3 x 3 repeated measures ANOVAs.
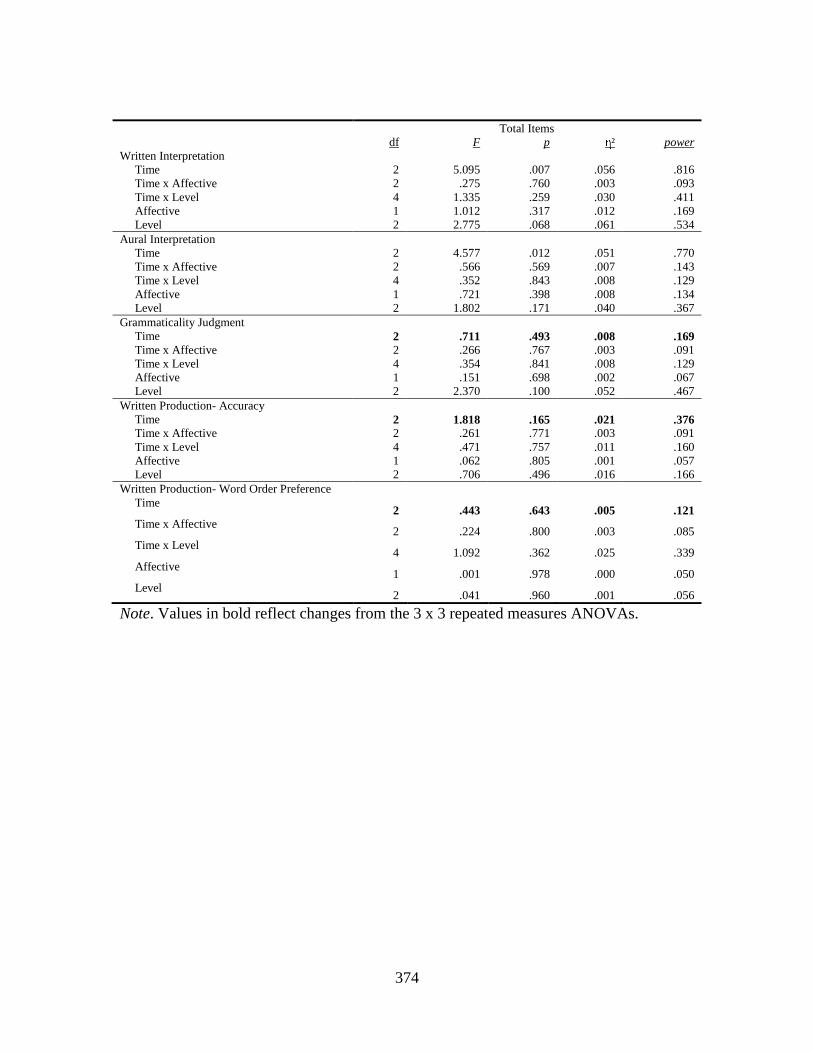
374
Total Items df F p η² power Written Interpretation Time 2 5.095 .007 .056 .816 Time x Affective 2 .275 .760 .003 .093 Time x Level 4 1.335 .259 .030 .411 Affective 1 1.012 .317 .012 .169 Level 2 2.775 .068 .061 .534 Aural Interpretation Time 2 4.577 .012 .051 .770 Time x Affective 2 .566 .569 .007 .143 Time x Level 4 .352 .843 .008 .129 Affective 1 .721 .398 .008 .134 Level 2 1.802 .171 .040 .367 Grammaticality Judgment Time 2 .711 .493 .008 .169 Time x Affective 2 .266 .767 .003 .091 Time x Level 4 .354 .841 .008 .129 Affective 1 .151 .698 .002 .067 Level 2 2.370 .100 .052 .467 Written Production- Accuracy Time 2 1.818 .165 .021 .376 Time x Affective 2 .261 .771 .003 .091 Time x Level 4 .471 .757 .011 .160 Affective 1 .062 .805 .001 .057 Level 2 .706 .496 .016 .166 Written Production- Word Order Preference Time
2 .443 .643 .005 .121 Time x Affective
2 .224 .800 .003 .085 Time x Level
4 1.092 .362 .025 .339 Affective
1 .001 .978 .000 .050 Level
2 .041 .960 .001 .056
Note. Values in bold reflect changes from the 3 x 3 repeated measures ANOVAs.

375
Appendix AJ
ANCOVA results for the role of Affective strategies in the effect of Feedback on L3
development
Trained Items Untrained Items df F p η² power df F p η² power Written Interpretation Time 2 11.178 .000 .114 .992 2 2.926 .056 .033 .565 Time x Affective 2 2.738 .067 .031 .535 2 .302 .740 .003 .097 Time x Feedback 2 12.212 .000 .123 .995 2 13.369 .000 .133 .998 Affective 1 2.277 .135 .026 .320 1 2.452 .121 .027 .341 Feedback 1 23.213 .000 .211 .997 1 12.624 .001 .127 .940 Aural Interpretation Time 2 2.773 .065 .031 .541 2 3.520 .032 .039 .650 Time x Affective 2 .500 .608 .006 .131 2 .764 .468 .009 .178 Time x Feedback 2 1.084 .341 .012 .238 2 .893 .411 .010 .202 Affective 1 .186 .668 .002 .071 1 3.050 .084 .034 .408 Feedback 1 6.187 .015 .066 .691 1 7.736 .007 .082 .785 Grammaticality Judgment Time 2 .458 .633 .005 .124 2 .426 .654 .005 .118 Time x Affective 2 .040 .961 .000 .056 2 .881 .416 .010 .200 Time x Feedback 2 .259 .772 .003 .090 2 3.279 .040 .036 .617 Affective 1 .340 .561 .004 .089 1 .593 .443 .007 .119 Feedback 1 5.721 .019 .062 .657 1 5.553 .021 .060 .644 Written Production- Accuracy Time 2 2.697 .070 .030 .529 2 2.405 .093 .027 .480 Time x Affective 2 1.116 .330 .013 .244 2 .570 .567 .007 .144 Time x Feedback 2 3.102 .047 .034 .591 2 4.473 .013 .049 .760 Affective 1 .315 .576 .004 .086 1 .254 .616 .003 .079 Feedback 1 4.942 .029 .054 .594 1 2.430 .123 .027 .338 Written Production- Word Order Preference
Time 2 2.890 .058 .032 .559 2 .801 .451 .009 .185
Time x Affective 2 2.412 .093 .027 .482 2 .520 .595 .006 .135
Time x Feedback 2 1.464 .234 .017 .310 2 1.761 .175 .020 .365
Affective 1 .104 .747 .001 .062 1 .239 .626 .003 .077
Feedback 1 .020 .887 .000 .052 1 .061 .805 .001 .057
Note. Values in bold reflect changes from the 2 x 3 repeated measures ANOVAs.

376
Total Items df F p η² power Written Interpretation Time 2 10.107 .000 .104 .985 Time x Affective 2 1.713 .183 .019 .356 Time x Feedback 2 19.159 .000 .180 1.000 Affective 1 3.067 .083 .034 .410 Feedback 1 21.724 .000 .200 .996 Aural Interpretation Time 2 5.054 .007 .055 .813 Time x Affective 2 .661 .518 .008 .160 Time x Feedback 2 1.465 .234 .017 .310 Affective 1 1.583 .212 .018 .238 Feedback 1 9.099 .003 .095 .847 Grammaticality Judgment Time 2 .823 .441 .009 .189 Time x Affective 2 .256 .775 .003 .090 Time x Feedback 2 2.521 .083 .028 .500 Affective 1 .704 .404 .008 .132 Feedback 1 8.494 .005 .089 .822 Written Production- Accuracy Time 2 3.915 .022 .043 .700 Time x Affective 2 1.245 .291 .014 .268 Time x Feedback 2 6.096 .003 .065 .883 Affective 1 .001 .975 .000 .050 Feedback 1 4.158 .044 .046 .523 Written Production- Word Order Preference Time
2 1.136 .323 .013 .248 Time x Affective
2 .479 .620 .005 .128 Time x Feedback
2 2.712 .069 .030 .531 Affective
1 .005 .941 .000 .051 Feedback
1 .046 .830 .001 .055
Note. Values in bold reflect changes from the 3 x 3 repeated measures ANOVAs.
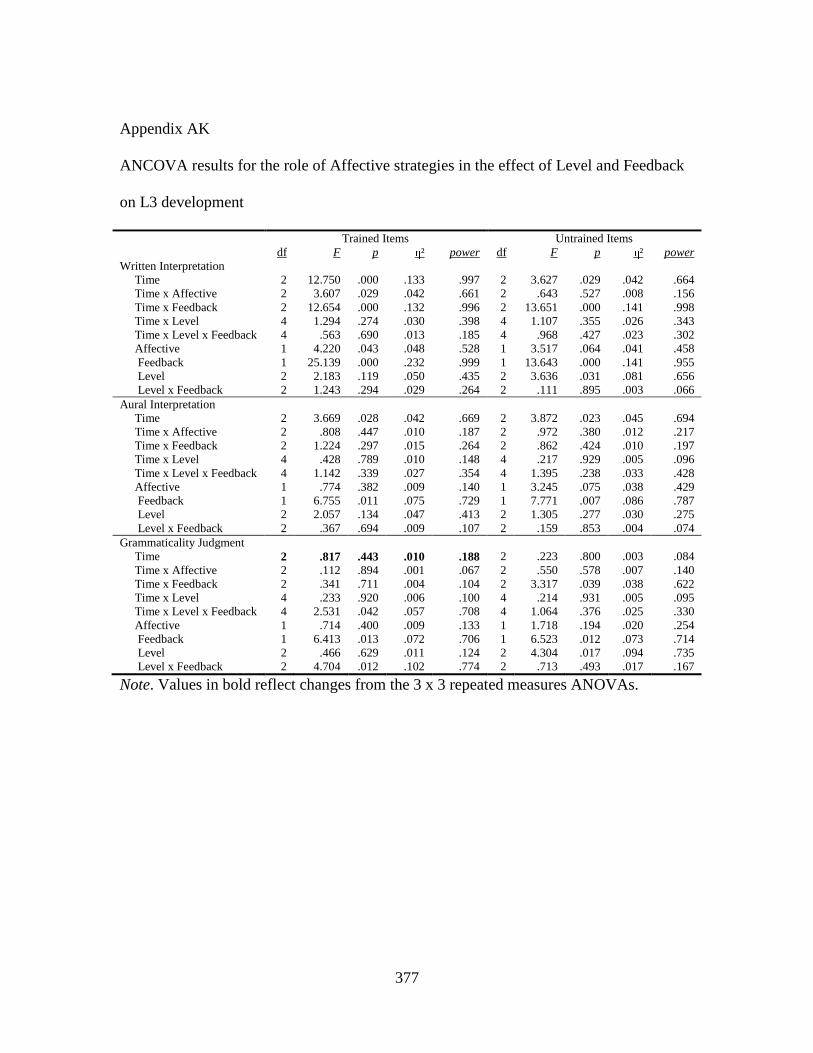
377
Appendix AK
ANCOVA results for the role of Affective strategies in the effect of Level and Feedback
on L3 development
Trained Items Untrained Items df F p η² power df F p η² power Written Interpretation
Time 2 12.750 .000 .133 .997 2 3.627 .029 .042 .664 Time x Affective 2 3.607 .029 .042 .661 2 .643 .527 .008 .156 Time x Feedback 2 12.654 .000 .132 .996 2 13.651 .000 .141 .998 Time x Level 4 1.294 .274 .030 .398 4 1.107 .355 .026 .343 Time x Level x Feedback 4 .563 .690 .013 .185 4 .968 .427 .023 .302 Affective 1 4.220 .043 .048 .528 1 3.517 .064 .041 .458 Feedback 1 25.139 .000 .232 .999 1 13.643 .000 .141 .955 Level 2 2.183 .119 .050 .435 2 3.636 .031 .081 .656 Level x Feedback 2 1.243 .294 .029 .264 2 .111 .895 .003 .066
Aural Interpretation Time 2 3.669 .028 .042 .669 2 3.872 .023 .045 .694 Time x Affective 2 .808 .447 .010 .187 2 .972 .380 .012 .217 Time x Feedback 2 1.224 .297 .015 .264 2 .862 .424 .010 .197 Time x Level 4 .428 .789 .010 .148 4 .217 .929 .005 .096 Time x Level x Feedback 4 1.142 .339 .027 .354 4 1.395 .238 .033 .428 Affective 1 .774 .382 .009 .140 1 3.245 .075 .038 .429 Feedback 1 6.755 .011 .075 .729 1 7.771 .007 .086 .787 Level 2 2.057 .134 .047 .413 2 1.305 .277 .030 .275 Level x Feedback 2 .367 .694 .009 .107 2 .159 .853 .004 .074
Grammaticality Judgment Time 2 .817 .443 .010 .188 2 .223 .800 .003 .084 Time x Affective 2 .112 .894 .001 .067 2 .550 .578 .007 .140 Time x Feedback 2 .341 .711 .004 .104 2 3.317 .039 .038 .622 Time x Level 4 .233 .920 .006 .100 4 .214 .931 .005 .095 Time x Level x Feedback 4 2.531 .042 .057 .708 4 1.064 .376 .025 .330 Affective 1 .714 .400 .009 .133 1 1.718 .194 .020 .254 Feedback 1 6.413 .013 .072 .706 1 6.523 .012 .073 .714 Level 2 .466 .629 .011 .124 2 4.304 .017 .094 .735 Level x Feedback 2 4.704 .012 .102 .774 2 .713 .493 .017 .167
Note. Values in bold reflect changes from the 3 x 3 repeated measures ANOVAs.

378
Trained Items Untrained Items df F p η² power df F p η² power Written Production- Accuracy
Time 2 2.987 .053 .035 .574 2 2.455 .089 .029 .489 Time x Affective 2 1.326 .268 .016 .284 2 .591 .555 .007 .147 Time x Feedback 2 3.158 .045 .037 .599 2 4.643 .011 .053 .776 Time x Level 4 .692 .598 .016 .221 4 1.530 .196 .036 .466 Time x Level x Feedback 4 .559 .693 .013 .184 4 2.093 .084 .048 .613 Affective 1 1.125 .292 .013 .182 1 .062 .804 .001 .057 Feedback 1 5.590 .020 .063 .647 1 3.167 .079 .037 .420 Level 2 .134 .874 .003 .070 2 2.166 .121 .050 .432 Level x Feedback 2 3.022 .054 .068 .571 2 2.900 .061 .065 .552
Written Production- Word Order Preference
Time 2 4.650 .011 .053 .777 2 .793 .454 .009 .184
Time x Affective 2 4.029 .020 .046 .712 2 .585 .558 .007 .146
Time x Feedback 2 1.811 .167 .021 .374 2 1.669 .192 .020 .348
Time x Level 4 1.272 .283 .030 .392 4 .940 .442 .022 .294
Time x Level x Feedback 4 3.086 .018 .069 .802 4 1.672 .159 .039 .506
Affective 1 .000 .984 .000 .050 1 .642 .425 .008 .124
Feedback 1 .049 .826 .001 .055 1 .103 .749 .001 .062
Level 2 .177 .838 .004 .077 2 .379 .685 .009 .109
Level x Feedback 2 2.533 .086 .058 .494 2 1.001 .372 .024 .219
Note. Values in bold reflect changes from the 3 x 2 x 3 repeated measures ANOVAs.

379
Total Items df F p η² power Written Interpretation
Time 2 12.063 .000 .127 .995 Time x Affective 2 2.714 .069 .032 .531 Time x Feedback 2 19.938 .000 .194 1.000 Time x Level 4 1.795 .132 .041 .539 Time x Level x Feedback 4 .617 .651 .015 .200 Affective 1 5.125 .026 .058 .609 Feedback 1 24.010 .000 .224 .998 Level 2 3.956 .023 .087 .696 Level x Feedback 2 .516 .599 .012 .132
Aural Interpretation Time 2 6.320 .002 .071 .894 Time x Affective 2 1.313 .272 .016 .281 Time x Feedback 2 1.587 .208 .019 .333 Time x Level 4 .411 .801 .010 .144 Time x Level x Feedback 4 1.513 .201 .035 .462 Affective 1 2.400 .125 .028 .334 Feedback 1 9.559 .003 .103 .863 Level 2 2.150 .123 .049 .429 Level x Feedback 2 .011 .989 .000 .052
Grammaticality Judgment Time 2 .916 .402 .011 .206 Time x Affective 2 .346 .708 .004 .105 Time x Feedback 2 2.817 .063 .033 .548 Time x Level 4 .390 .816 .009 .138 Time x Level x Feedback 4 2.725 .031 .062 .744 Affective 1 1.828 .180 .022 .267 Feedback 1 9.890 .002 .106 .875 Level 2 2.923 .059 .066 .556 Level x Feedback 2 2.798 .067 .063 .537
Written Production- Accuracy Time 2 4.125 .018 .047 .723 Time x Affective 2 1.391 .252 .016 .296 Time x Feedback 2 6.188 .003 .069 .887 Time x Level 4 .442 .778 .011 .152 Time x Level x Feedback 4 1.550 .190 .036 .472 Affective 1 .508 .478 .006 .108 Feedback 1 5.040 .027 .057 .602 Level 2 .964 .386 .023 .212 Level x Feedback 2 3.451 .036 .077 .632
Written Production- Word Order Preference Time
2 1.218 .298 .014 .263 Time x Affective
2 .628 .535 .008 .154 Time x Feedback
2 2.724 .069 .032 .533 Time x Level
4 1.062 .377 .025 .330 Time x Level x Feedback
4 .369 .831 .009 .133 Affective
1 .196 .659 .002 .072 Feedback
1 .090 .765 .001 .060 Level
2 .044 .957 .001 .056 Level x Feedback
2 1.852 .163 .043 .376
Note. Values in bold reflect changes from the 3 x 3 repeated measures ANOVAs.

380
Appendix AL
ANCOVA results for the role of Social strategies in the effect of Level on L3
development
Trained Items Untrained Items df F p η² power df F p η² power Written Interpretation Time 2 2.655 .073 .030 .522 2 .803 .450 .009 .186 Time x Social 2 .406 .667 .005 .115 2 1.339 .265 .015 .286 Time x Level 4 .800 .527 .018 .253 4 .970 .425 .022 .303 Social 1 .268 .606 .003 .081 1 .390 .534 .005 .095 Level 2 1.389 .255 .031 .291 2 2.079 .131 .046 .417 Aural Interpretation Time 2 .951 .388 .011 .213 2 2.650 .074 .030 .521 Time x Social 2 .089 .915 .001 .063 2 .358 .700 .004 .107 Time x Level 4 .260 .903 .006 .106 4 .226 .923 .005 .098 Social 1 .392 .533 .005 .095 1 .124 .725 .001 .064 Level 2 1.324 .271 .030 .279 2 .712 .493 .016 .167 Grammaticality Judgment Time 2 6.040 .003 .066 .880 2 .812 .446 .009 .187 Time x Social 2 3.048 .050 .034 .583 2 1.100 .335 .013 .241 Time x Level 4 .418 .796 .010 .146 4 .146 .965 .003 .080 Social 1 .032 .858 .000 .054 1 .033 .857 .000 .054 Level 2 .381 .685 .009 .109 2 3.643 .030 .078 .658 Written Production- Accuracy Time 2 .578 .562 .007 .145 2 1.908 .152 .022 .392 Time x Social 2 .026 .975 .000 .054 2 1.809 .167 .021 .374 Time x Level 4 .672 .612 .015 .216 4 2.043 .090 .045 .602 Social 1 .969 .328 .011 .164 1 .635 .428 .007 .124 Level 2 .177 .838 .004 .077 2 1.462 .238 .033 .305 Written Production- Word Order Preference
Time 2 .490 .614 .006 .129 2 .801 .450 .009 .185
Time x Social 2 .905 .407 .010 .204 2 1.206 .302 .014 .261
Time x Level 4 1.287 .277 .029 .397 4 1.461 .216 .033 .447
Social 1 .270 .605 .003 .081 1 .525 .471 .006 .111
Level 2 .260 .771 .006 .090 2 .187 .829 .004 .078
Note. Values in bold reflect changes from the 3 x 3 repeated measures ANOVAs.

381
Total Items df F p η² power Written Interpretation Time 2 3.806 .024 .042 .686 Time x Social 2 .060 .942 .001 .059 Time x Level 4 1.883 .115 .042 .562 Social 1 .225 .636 .003 .076 Level 2 2.468 .091 .054 .484 Aural Interpretation Time 2 2.800 .064 .032 .545 Time x Social 2 .031 .969 .000 .055 Time x Level 4 .304 .875 .007 .117 Social 1 .305 .582 .004 .085 Level 2 1.248 .292 .028 .265 Grammaticality Judgment Time 2 4.714 .010 .052 .783 Time x Social 2 3.644 .028 .041 .666 Time x Level 4 .413 .799 .010 .145 Social 1 .000 .991 .000 .050 Level 2 2.232 .114 .049 .444 Written Production- Accuracy Time 2 1.619 .201 .018 .339 Time x Social 2 .920 .401 .011 .207 Time x Level 4 .629 .642 .014 .203 Social 1 .013 .910 .000 .051 Level 2 .745 .478 .017 .173 Written Production- Word Order Preference Time
2 1.240 .292 .014 .267 Time x Social
2 2.062 .130 .023 .420 Time x Level
4 1.579 .182 .035 .481 Social
1 .474 .493 .005 .105 Level
2 .065 .937 .002 .060
Note. Values in bold reflect changes from the 3 x 3 repeated measures ANOVAs.
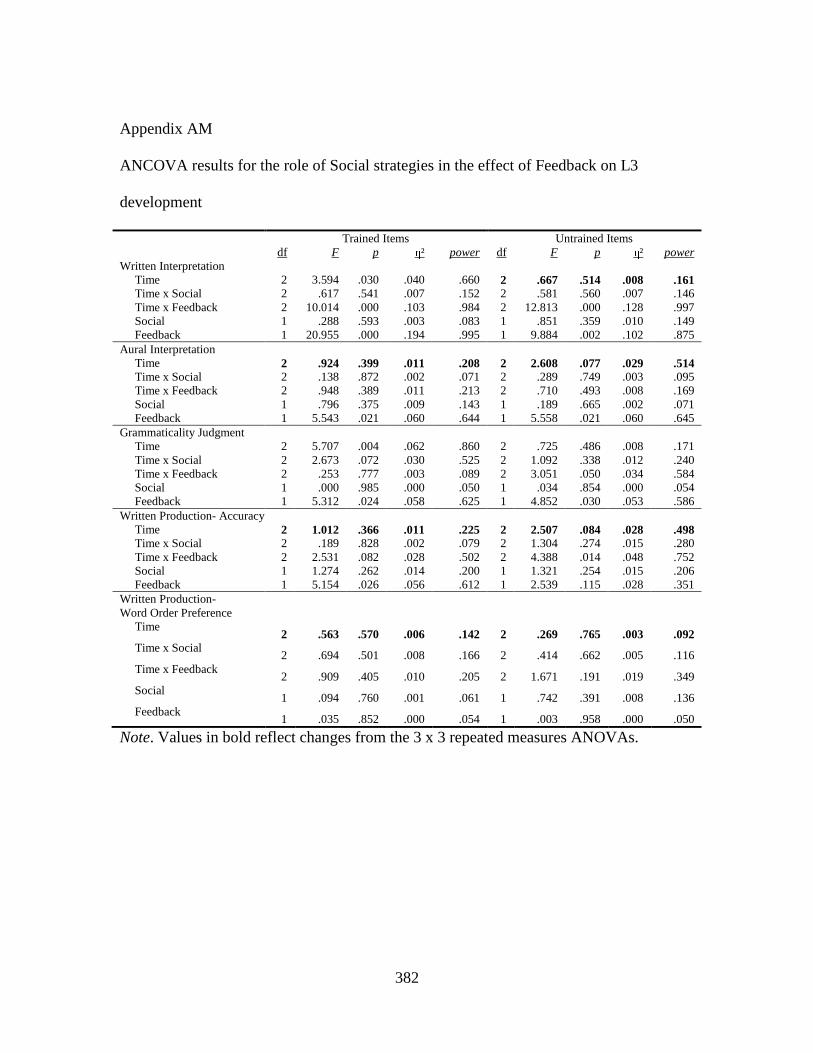
382
Appendix AM
ANCOVA results for the role of Social strategies in the effect of Feedback on L3
development
Trained Items Untrained Items df F p η² power df F p η² power Written Interpretation Time 2 3.594 .030 .040 .660 2 .667 .514 .008 .161 Time x Social 2 .617 .541 .007 .152 2 .581 .560 .007 .146 Time x Feedback 2 10.014 .000 .103 .984 2 12.813 .000 .128 .997 Social 1 .288 .593 .003 .083 1 .851 .359 .010 .149 Feedback 1 20.955 .000 .194 .995 1 9.884 .002 .102 .875 Aural Interpretation Time 2 .924 .399 .011 .208 2 2.608 .077 .029 .514 Time x Social 2 .138 .872 .002 .071 2 .289 .749 .003 .095 Time x Feedback 2 .948 .389 .011 .213 2 .710 .493 .008 .169 Social 1 .796 .375 .009 .143 1 .189 .665 .002 .071 Feedback 1 5.543 .021 .060 .644 1 5.558 .021 .060 .645 Grammaticality Judgment Time 2 5.707 .004 .062 .860 2 .725 .486 .008 .171 Time x Social 2 2.673 .072 .030 .525 2 1.092 .338 .012 .240 Time x Feedback 2 .253 .777 .003 .089 2 3.051 .050 .034 .584 Social 1 .000 .985 .000 .050 1 .034 .854 .000 .054 Feedback 1 5.312 .024 .058 .625 1 4.852 .030 .053 .586 Written Production- Accuracy Time 2 1.012 .366 .011 .225 2 2.507 .084 .028 .498 Time x Social 2 .189 .828 .002 .079 2 1.304 .274 .015 .280 Time x Feedback 2 2.531 .082 .028 .502 2 4.388 .014 .048 .752 Social 1 1.274 .262 .014 .200 1 1.321 .254 .015 .206 Feedback 1 5.154 .026 .056 .612 1 2.539 .115 .028 .351 Written Production- Word Order Preference
Time 2 .563 .570 .006 .142 2 .269 .765 .003 .092
Time x Social 2 .694 .501 .008 .166 2 .414 .662 .005 .116
Time x Feedback 2 .909 .405 .010 .205 2 1.671 .191 .019 .349
Social 1 .094 .760 .001 .061 1 .742 .391 .008 .136
Feedback 1 .035 .852 .000 .054 1 .003 .958 .000 .050
Note. Values in bold reflect changes from the 3 x 3 repeated measures ANOVAs.

383
Total Items df F p η² power Written Interpretation Time 2 2.942 .055 .033 .567 Time x Social 2 .145 .865 .002 .072 Time x Feedback 2 16.884 .000 .163 1.000 Social 1 .025 .874 .000 .053 Feedback 1 18.207 .000 .173 .988 Aural Interpretation Time 2 2.745 .067 .031 .537 Time x Social 2 .011 .989 .000 .052 Time x Feedback 2 1.258 .287 .014 .271 Social 1 .567 .454 .006 .116 Feedback 1 7.275 .008 .077 .760 Grammaticality Judgment Time 2 4.633 .011 .051 .776 Time x Social 2 3.446 .034 .038 .640 Time x Feedback 2 2.419 .092 .027 .483 Social 1 .012 .912 .000 .051 Feedback 1 7.619 .007 .081 .779 Written Production- Accuracy Time 2 2.739 .067 .031 .536 Time x Social 2 1.040 .356 .012 .230 Time x Feedback 2 5.512 .005 .060 .847 Social 1 .000 .991 .000 .050 Feedback 1 4.291 .041 .047 .535 Written Production- Word Order Preference Time
2 .763 .468 .009 .178 Time x Social
2 1.046 .354 .012 .231 Time x Feedback
2 2.387 .095 .027 .477 Social
1 .408 .525 .005 .097 Feedback
1 .019 .892 .000 .052
Note. Values in bold reflect changes from the 3 x 3 repeated measures ANOVAs.
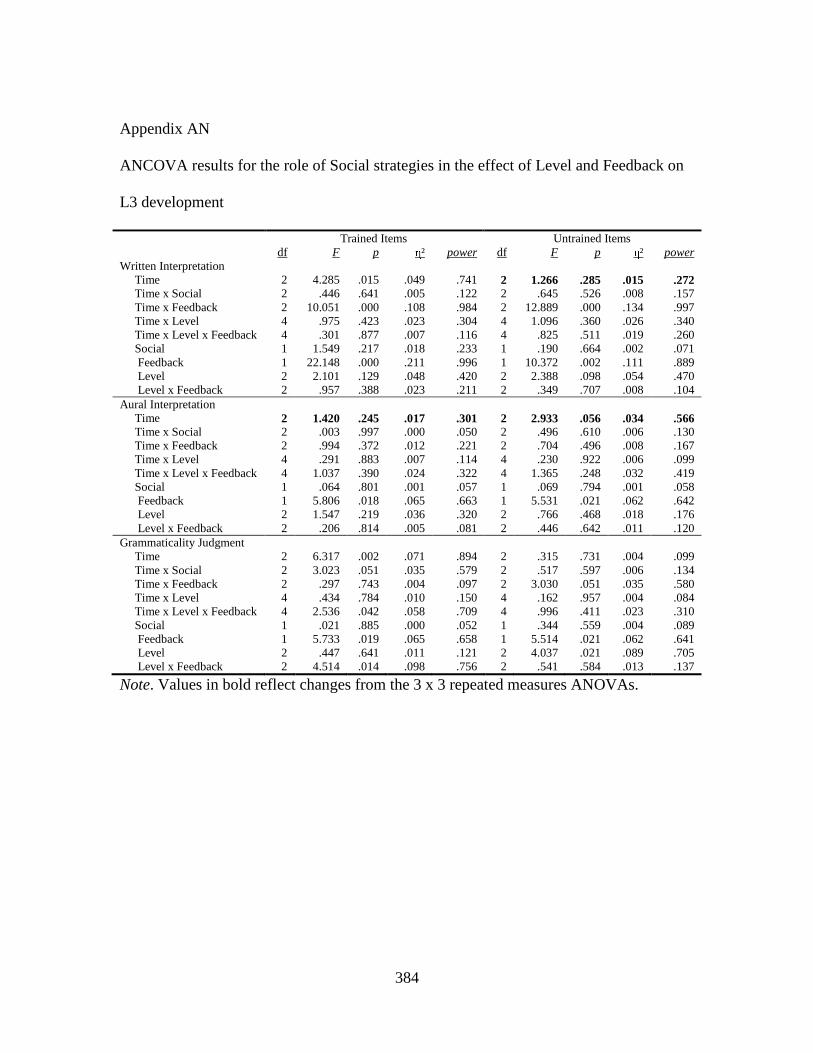
384
Appendix AN
ANCOVA results for the role of Social strategies in the effect of Level and Feedback on
L3 development
Trained Items Untrained Items df F p η² power df F p η² power Written Interpretation
Time 2 4.285 .015 .049 .741 2 1.266 .285 .015 .272 Time x Social 2 .446 .641 .005 .122 2 .645 .526 .008 .157 Time x Feedback 2 10.051 .000 .108 .984 2 12.889 .000 .134 .997 Time x Level 4 .975 .423 .023 .304 4 1.096 .360 .026 .340 Time x Level x Feedback 4 .301 .877 .007 .116 4 .825 .511 .019 .260 Social 1 1.549 .217 .018 .233 1 .190 .664 .002 .071 Feedback 1 22.148 .000 .211 .996 1 10.372 .002 .111 .889 Level 2 2.101 .129 .048 .420 2 2.388 .098 .054 .470 Level x Feedback 2 .957 .388 .023 .211 2 .349 .707 .008 .104
Aural Interpretation Time 2 1.420 .245 .017 .301 2 2.933 .056 .034 .566 Time x Social 2 .003 .997 .000 .050 2 .496 .610 .006 .130 Time x Feedback 2 .994 .372 .012 .221 2 .704 .496 .008 .167 Time x Level 4 .291 .883 .007 .114 4 .230 .922 .006 .099 Time x Level x Feedback 4 1.037 .390 .024 .322 4 1.365 .248 .032 .419 Social 1 .064 .801 .001 .057 1 .069 .794 .001 .058 Feedback 1 5.806 .018 .065 .663 1 5.531 .021 .062 .642 Level 2 1.547 .219 .036 .320 2 .766 .468 .018 .176 Level x Feedback 2 .206 .814 .005 .081 2 .446 .642 .011 .120
Grammaticality Judgment Time 2 6.317 .002 .071 .894 2 .315 .731 .004 .099 Time x Social 2 3.023 .051 .035 .579 2 .517 .597 .006 .134 Time x Feedback 2 .297 .743 .004 .097 2 3.030 .051 .035 .580 Time x Level 4 .434 .784 .010 .150 4 .162 .957 .004 .084 Time x Level x Feedback 4 2.536 .042 .058 .709 4 .996 .411 .023 .310 Social 1 .021 .885 .000 .052 1 .344 .559 .004 .089 Feedback 1 5.733 .019 .065 .658 1 5.514 .021 .062 .641 Level 2 .447 .641 .011 .121 2 4.037 .021 .089 .705 Level x Feedback 2 4.514 .014 .098 .756 2 .541 .584 .013 .137
Note. Values in bold reflect changes from the 3 x 3 repeated measures ANOVAs.

385
Trained Items Untrained Items df F p η² power df F p η² power Written Production- Accuracy
Time 2 1.047 .353 .012 .231 2 2.597 .078 .030 .512 Time x Social 2 .184 .832 .002 .078 2 1.884 .155 .022 .388 Time x Feedback 2 2.505 .085 .029 .497 2 4.598 .011 .052 .772 Time x Level 4 .657 .623 .016 .211 4 2.031 .092 .047 .598 Time x Level x Feedback 4 .454 .769 .011 .155 4 1.871 .118 .043 .558 Social 1 2.958 .089 .034 .398 1 .044 .835 .001 .055 Feedback 1 5.669 .020 .064 .653 1 3.011 .086 .035 .403 Level 2 .333 .718 .008 .102 2 1.852 .163 .043 .376 Level x Feedback 2 3.364 .039 .075 .620 2 2.714 .072 .061 .523
Written Production- Word Order Preference Time
2 1.189 .307 .014 .258 2 .466 .628 .006 .125 Time x Social
2 1.341 .264 .016 .286 2 .780 .460 .009 .181 Time x Feedback
2 1.007 .367 .012 .223 2 1.622 .201 .019 .339 Time x Level
4 1.307 .270 .031 .402 4 1.387 .241 .032 .426 Time x Level x Feedback
4 2.490 .045 .057 .700 4 1.340 .257 .031 .412 Social
1 .015 .902 .000 .052 1 .259 .612 .003 .079 Feedback
1 .043 .837 .001 .055 1 .007 .933 .000 .051 Level
2 .189 .828 .005 .078 2 .206 .814 .005 .081 Level x Feedback
2 2.502 .088 .057 .489 2 .730 .485 .017 .170
Note. Values in bold reflect changes from the 3 x 2 x 3 repeated measures ANOVAs.
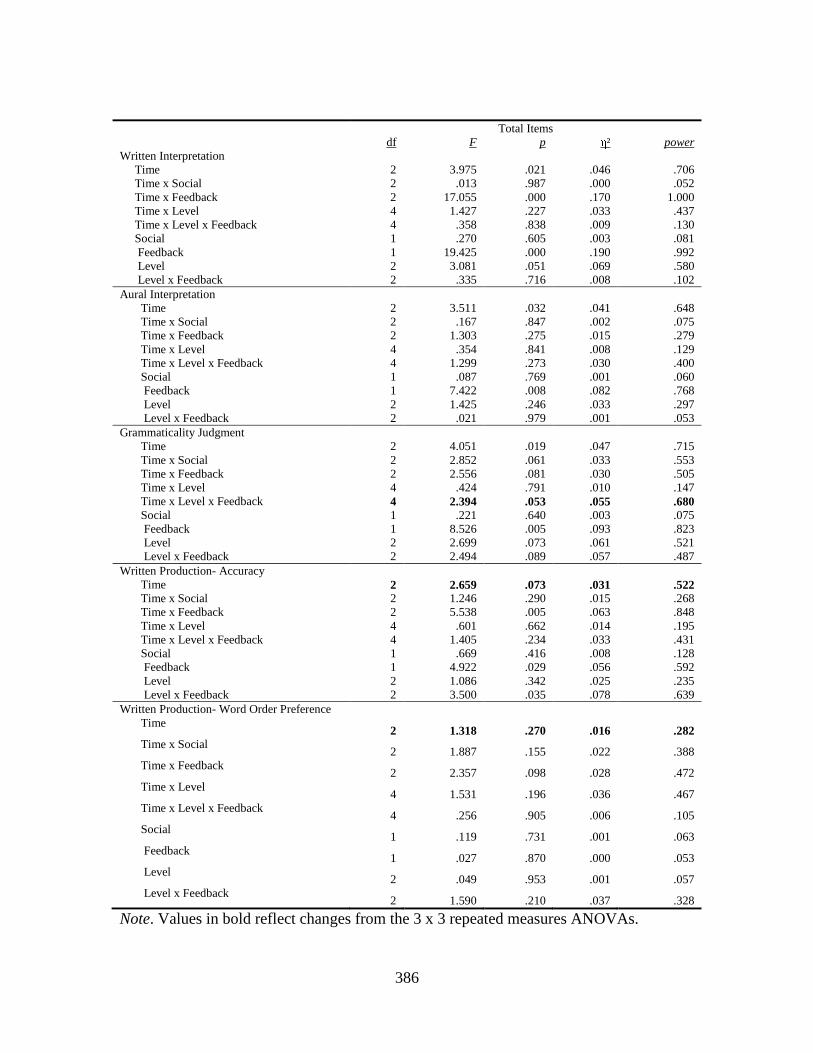
386
Total Items df F p η² power Written Interpretation
Time 2 3.975 .021 .046 .706 Time x Social 2 .013 .987 .000 .052 Time x Feedback 2 17.055 .000 .170 1.000 Time x Level 4 1.427 .227 .033 .437 Time x Level x Feedback 4 .358 .838 .009 .130 Social 1 .270 .605 .003 .081 Feedback 1 19.425 .000 .190 .992 Level 2 3.081 .051 .069 .580 Level x Feedback 2 .335 .716 .008 .102
Aural Interpretation Time 2 3.511 .032 .041 .648 Time x Social 2 .167 .847 .002 .075 Time x Feedback 2 1.303 .275 .015 .279 Time x Level 4 .354 .841 .008 .129 Time x Level x Feedback 4 1.299 .273 .030 .400 Social 1 .087 .769 .001 .060 Feedback 1 7.422 .008 .082 .768 Level 2 1.425 .246 .033 .297 Level x Feedback 2 .021 .979 .001 .053
Grammaticality Judgment Time 2 4.051 .019 .047 .715 Time x Social 2 2.852 .061 .033 .553 Time x Feedback 2 2.556 .081 .030 .505 Time x Level 4 .424 .791 .010 .147 Time x Level x Feedback 4 2.394 .053 .055 .680 Social 1 .221 .640 .003 .075 Feedback 1 8.526 .005 .093 .823 Level 2 2.699 .073 .061 .521 Level x Feedback 2 2.494 .089 .057 .487
Written Production- Accuracy Time 2 2.659 .073 .031 .522 Time x Social 2 1.246 .290 .015 .268 Time x Feedback 2 5.538 .005 .063 .848 Time x Level 4 .601 .662 .014 .195 Time x Level x Feedback 4 1.405 .234 .033 .431 Social 1 .669 .416 .008 .128 Feedback 1 4.922 .029 .056 .592 Level 2 1.086 .342 .025 .235 Level x Feedback 2 3.500 .035 .078 .639
Written Production- Word Order Preference Time
2 1.318 .270 .016 .282 Time x Social
2 1.887 .155 .022 .388 Time x Feedback
2 2.357 .098 .028 .472 Time x Level
4 1.531 .196 .036 .467 Time x Level x Feedback
4 .256 .905 .006 .105 Social
1 .119 .731 .001 .063 Feedback
1 .027 .870 .000 .053 Level
2 .049 .953 .001 .057 Level x Feedback
2 1.590 .210 .037 .328
Note. Values in bold reflect changes from the 3 x 3 repeated measures ANOVAs.

387
Footnotes 1 The current study is part of The Latin Project©, developed to investigate the relationship between bilingualism, cognition, and the acquisition of new linguistic knowledge. All materials, except for the non-word recall test, the sentence span test, and the computational digit span WM test, were originally developed by Cristina Sanz, Harriet Bowden, and Catherine Stafford with support from Georgetown University Graduate School grants to Sanz and assistance from Bill Garr of Georgetown’s UIS/CNDLS. Notably, the materials have been adapted for Mandarin speakers and they are paper-based materials. 2 Although nowadays many researchers seem to view short-term memory as working memory (e.g., Baddeley, 1986; Carpenter & Just, 1989; Daneman & Carpenter, 1980; Just & Carpenter, 1992; Masson & Miller, 1986), the relation between short-term memory and working memory is still debatable (Kail & Hall, 2001). Due to the focus of the study, the distinctions will not be further discussed. 3 Li, Bates, Liu, and MacWhinney (1993) investigated several cues in Chinese: noun animacy, word order, the passive marker bei, the object marker ba, the indefinite marker yi. They found that the passive maker bei is the most reliable cue, followed by animacy, word order, the object marker ba, and the indefinite marker yi, respectively. 4 Although the researcher used “au”, it should be “ao” in Pinyin. It is just a matter of spelling.
Copyright © 2022 FDOKUMEN