Bile acid pool changes and regulation of cholate synthesis in experimental diabetes
12
212 Biochimica et Hiophysica Acfa, 529 (1978) 212.-223 @ Elsevier/North-Holland Biomedical Press BBA 57169 BILE ACID POOL CHANGES AND REGULATION OF CHOLATE SYNTHESIS IN EXPERIMENTAL DIABETES FLAVIO 0. NERVI, CECILIA H. SEVERiN and VICENTE D. VALDIVIESO Departamento de Gastroenterologia, Escuela de Medicina, Uniuersidad Catblica de Chile, Casilla 114-D, Santiago (Chile) (Received September 21st, 1977) Summary The effect of alloxandiabetes and insulin treatment in bile acid pool size and composition, bile acid secretion and cholic acid synthesis was investigated in the rat. The size of the cholate pool was significantly increased 4 days after diabetes induction. It reached a constant size three times that of control ani- mals after 2 weeks of diabetes. Changes in bile acid pool size an secretion were directly dependent of the insulin deficiency state since they were reversed by insulin treatment and were not influenced by the caloric intake of the animal nor the pharmacologic effect of alloxan. Biliary cholate secretion was also 3-fold increased in diabetic rats and it accounted for more than 80% of the total bile acids compared to 60% in the control group. The calculated daily rate of cholate synthesis was increased in diabetic rats and the circadian rhythm of cholate synthesis was abolished in this condition. Therefore, it was shown that the negative feedback mechanism that regulates bile acid synthesis was deleted in diabetes. This mechanism was partially restored after 2 weeks of insulin treatment. These studies demonstrated that bile acid metabolism was pro- foundly changed in alloxan-diabetic rats and suggested that insulin may play an important role in the regulation of bile acid synthesis and intestinal absorption. Introduction The major pathway of cholesterol catabolism is through the intestinal excre- tion of bile acids. Although insulin plays a central role in metabolic regulation and diabetes is frequently associated to hyperlipidemia [ 1,2], arteriosclerotic vascular disease [3,4] and gallstones [ 51, little data exist on the effects of insulin and experimental diabetes on bile acid metabolism. Chronic diabetic rats develop marked modifications of bile acid metabolism [6]. Because the diabetic syndrome induced in the rat by the injection of alloxan or strepto- zotocin usually develops with profound metabolic and anatomic changes
-
Upload
independent -
Category
Documents
-
view
1 -
download
0
Transcript of Bile acid pool changes and regulation of cholate synthesis in experimental diabetes

212
Biochimica et Hiophysica Acfa, 529 (1978) 212.-223 @ Elsevier/North-Holland Biomedical Press
BBA 57169
BILE ACID POOL CHANGES AND REGULATION OF CHOLATE SYNTHESIS IN EXPERIMENTAL DIABETES
FLAVIO 0. NERVI, CECILIA H. SEVERiN and VICENTE D. VALDIVIESO
Departamento de Gastroenterologia, Escuela de Medicina, Uniuersidad Catblica de Chile, Casilla 114-D, Santiago (Chile)
(Received September 21st, 1977)
Summary
The effect of alloxandiabetes and insulin treatment in bile acid pool size and composition, bile acid secretion and cholic acid synthesis was investigated in the rat. The size of the cholate pool was significantly increased 4 days after diabetes induction. It reached a constant size three times that of control ani- mals after 2 weeks of diabetes. Changes in bile acid pool size an secretion were directly dependent of the insulin deficiency state since they were reversed by insulin treatment and were not influenced by the caloric intake of the animal nor the pharmacologic effect of alloxan. Biliary cholate secretion was also 3-fold increased in diabetic rats and it accounted for more than 80% of the total bile acids compared to 60% in the control group. The calculated daily rate of cholate synthesis was increased in diabetic rats and the circadian rhythm of cholate synthesis was abolished in this condition. Therefore, it was shown that the negative feedback mechanism that regulates bile acid synthesis was deleted in diabetes. This mechanism was partially restored after 2 weeks of insulin treatment. These studies demonstrated that bile acid metabolism was pro- foundly changed in alloxan-diabetic rats and suggested that insulin may play an important role in the regulation of bile acid synthesis and intestinal absorption.
Introduction
The major pathway of cholesterol catabolism is through the intestinal excre- tion of bile acids. Although insulin plays a central role in metabolic regulation and diabetes is frequently associated to hyperlipidemia [ 1,2], arteriosclerotic vascular disease [3,4] and gallstones [ 51, little data exist on the effects of insulin and experimental diabetes on bile acid metabolism. Chronic diabetic rats develop marked modifications of bile acid metabolism [6]. Because the diabetic syndrome induced in the rat by the injection of alloxan or strepto- zotocin usually develops with profound metabolic and anatomic changes

213
(anorexia in the acute stage followed by hyperphagia, body weight changes, marked enlargement of the intestine, etc . . .) 17-91, it is difficult to define a specific effect of the insulin deficiency state on bile acid metabolism. This fact is especially relevant if the experimental variables involved in a complex model such as the diabetic rat, are not carefully controlled.
That insulin may participate directly in the regulation of bile acid metab- olism is suggested by the many observations showing several effects of the diabetic state on lipid metabolism. Hepatic triglyceride synthesis [lo], chol- esterol synthesis from acetate [11,12 J and the activity of 3-hydroxy-3-methyl- glutaryl-coenzyme A reductase in the liver [13,14] are inhibited in experi- mental diabetes. In addition, lipoprotein synthesis is grossly impaired in the liver of the diabetic rat [ 151. Conversely, the synthesis of all these substances is stimulated by insulin. The purpose of this work was Z-fold. First, to define the relationship between insulin deficiency and the changes in bile acid metabolism observed in the diabetic animal. Second, to study the effect of exogenous insulin on the altered metabolism of cholic acid in the experimental diabetic state.
Material and Methods
~u~er~a~s. Bile acids used in these experiments were obtained from Calbio- them (Los Angeles, U.S.A.) and Steraloids (Pauling, U.S.A.). [G-3H]Tauro- cholic and [ 14C]cholic acids were purchased from New England Nuclear (Boston, U.S.A.). Hydroxy-steroid dehydrogenase Grade II, cholyl-glycine hydrolase and alloxan were obtained from Sigma Chemical Co. (St. Louis, U.S.A.). All solvents were of the reagent grade and were purchased from E. Merck (Darmstadt, West Germany). Lente insulin was obtained from Novo Ind. A/S (Copenhagen, Denmark) and polyethylene catheters from Clay Adams (Parsippany, U.S.A.).
Animal preparation. Female Sprague-Dawley rats (180-200 g) were housed (four to a cage) in a well ventilated room for a period of 6 weeks prior to the first experiment. The lighting of this room was automatically cycled at 04:OO and 16:OO h, so that animals were available in the mid-dark phase of the cycle at 10:00 h. Rats were fed standard chow and tap water ad libitum. The chow, Alimentos Balanceados (Santiago, Chile), had the following composition per 100 g: 23 g proteins, 6 g lipids, 47 g carbohydrates, 6 g minerals, 5 g fiber and 13 g water. Diabetes was induced with alloxan [6].
To ensure comp~ab~ity, only those animals whose urines gave a positive test for glucose (>500 mg/dl), were used in these experiments. Three groups of diabetic rats received daily subcutaneous injections of insulin for different periods after diabetes induction.
Bile acid pool determination. The animals were killed and the liver and gastrointestin~ tract were removed and cut into small pieces. 40 pmol tauro- cholic acid containing 1.5 ptci [3H]taurocholic acid (spec. act. 3.5 Ciimol) was added and the contents were refluxed in boiling ethanol for a period of 3 h. The extracts were filtered and the filtrates were taken to dryness under nitrogen. The residues were redissolved in a small volume of methanol and applied to thin-layer chromatography plates. After development of the plates,

214
the area corresponding to taurocholic acid was identified by spraying lightly with water and scraped from the plate, eluted with methanol, evaporated, and hydrolysed using cholyl-glycine hydrolase. The liberated bile acids were then methylated and rechromatographed to obtain the final separation of cholic acid. Samples of the [ 3H]taurocholic acid standard were processed in a similar fashion. Finally, the specific activity of cholic acid of each sample was deter- mined and was then compared with the specific activity of the radiolabeled cholic acid standard. This allowed the calculation of the size of the cholate pool, according to the isotopic dilution technique of Eriksson [ 161. The pool size of the other bile acids were derived by determining their relative propor- tion with respect to the size of the cholate pool.
Determination of basal bile acid secretion and apparent rates of cholic acid synthesis. 12 h prior to the experiments, the rats received a dose of 0.7-1.0 ,uCi [‘4C]cholic acid (spec. act. 50 Ci/mmol) intraperitoneally. Under pento- barbital anesthesia a polyethylene catheter PE 10 was secured into the bile duct. A 30 min bile sample was obtained to determine basal bile acid secretion and the specific activity of the cholic acid pool. A polyethylene catheter PE 90 was then secured into the first part of the duodenum; the ileum was sectioned and the caecum devascularized. A continuous infusion of 3 ml/h of Krebs bicarbonate buffer was maintained, from the duodenum to the ileum, for a period of 1 h to eliminate the major portion of the bile acid pool [17]. After this period, three bile samples of 20 min each were collected to measure bile flow, cholic acid concentration and radioactivity. The hourly rate of cholate secreted during this period represented S-15 and 26% of the basal cholate secretion rate in the control and diabetic rats, respectively. Apparent rates of cholate synthesis were calculated in the last bile samples according to the formula:
cholate secretion/h - -- - -. dpm secreted/h
~- = cholate synthesis/h spec. act. of cholate pool
dpm secreted/h where the term -- -- - --
spec. act. of cholate pool
represents the residual fraction of cholate molecules coming from the original pool of cholate at the time the fistula was performed. This fraction represented lo-20% of the cholate secreted after the pool was washed-out in control, dia- betic and insulin-treated rats. Apparent rates of cholate synthesis are expressed as pmol/h. The validity of these rates depends on two assumptions. First, that there is no limitation for the intrahepatocytic transport and canalicular secre- tion for newly synthetized cholic acid. Second, that all newly synthetized cholate molecules are immediately secreted and do no stay in a significant intrahepatocytic pool.
Analytical methods. Biliary bile salts were extracted with 8% NaOH in hot ethanol. The solvent was evaporated under nitrogen and the residue was redissolved in 0.01 M phosphate buffer to which cholyl-glycine hydrolase was added in excess. After incubation at 37°C for 20 min, the reaction was stopped with a drop of 37% HCl. Bile acids were then extracted four times with ethyl

215
ether. The extracts were evaporated and prepared for thin-layer chromatog- raphy. Recovery of deconjugates of known amounts of taurocholate, glyco- cholate, taurochenodeoxycholate, taurodeoxycholate and taurolithocholate subjected to the enzymatic hydrolysis varied between 75 and 85%. Appropriate corrections were applied during analyis of the samples. Separation of the dif- ferent species of free bile acids were performed in silica gel G 0.25 mm chroma- toplates [l&19]. The area corresponding to cholate was scraped from the plates and extracted with methanol. Because the rat has at least two other trihydroxy bile acids besides cholate, LY- and /3-muricholate, and these species have the same motility on the chromatoplates, bile acids were methylated and finally were separated according to the system of Mitropoulos and Myant 1201. Bile acids, serum and urine glucose were quantitated as previously communicated [6]. Results are expressed as the mean 1. 1 S.E. and were tested for significance by using Student’s t-test.
Results
Initial experiments were undertaken to determine the feeding pattern and the evolution of body weight as a function of time in the diabetic rat. This observation is particularly important since the caloric intake is one of the major external factors that can influence cholesterol synthesis in the liver, which is the main source of cholesterol and therefore of bile acids in the rat
Days
Fig. 1. Body weight and daily food ingestion in control and diabetic rats as a function Of time. The animals were fed ground chow ad libitum and were maintained in individual cages. Serum glucose eoncan- tration at the end of the experiment varied between 100 and 150 mg/dl in the controls and 320 and 650 mg/dl in the diabetic rats. Values represent the mean -t 1 S.E. of 12 rats in each group (o-0, Control group; .- - - - - -0, diabetic group).

216
1 I I I I 1 1 1 1 1 1 J
Days
Okr-kYF%- 24
Days
Fig. 2. Liver and small intestinal dry weight
represent the mean + 1 S.E. of four rats in
?ZtWUP).
in control and diabetic rats as a function of time. Values
each group ((I-- ?, control group: l - - - - - -*, diabetic
[21]. Panel A of Fig. 1 illustrates the body weight changes at different periods after alloxan injection. Rats with high and persistent glucosuria loose 10% of their weight during the first week of disease. In panel B it is shown that during this period food ingestion is 50% lower compared to the control group. It is apparent, therefore, that the diabetic rat suffers an important catabolic state during the first week of diabetes, mainly induced by a lower ingestion of food and the permanent glucosuria. After the sixth day, the diabetic group increases the amount of food ingested from 17.5 + 1 g/day in the control group to 23 +
u
TABLE I
BILE ACID POOL COMPOSITION IN CONTROL AND DIABETIC RATS
Values represent the mean i 1 S.E. of five rats in each group. Diabetic rats were killed 12 days after
alloxan-injection. Final rat weight was 218 + 4 g in the control group and 204 * 6 g in the diabetic group.
Bile acid Pool size (funol)
Control Diabetic
Cholic
a-Muricholic
Hyodeoxycholic
Chenodeoxycholic
Deoxycholic
Lithocholic
Total
*P < 0.001.
** P < 0.05.
62 + 4.0 162 i 17’
2.0 + 0.4 4.8~ 0.6**
6.4 ?- 0.6 6.2 2 0.8
26 i 4.0 25 i 2.0
4.0 t 0.8 2.8 + 0.2 **
1.4 i 0.2 1.8 t 0.2
102 _+ 12 203 f 20 *

217
2 g/day, regaining the capacity to increase body weight thereafter at a similar rate than the control animals. The major anatomic compartments of the func- tional bile acid pool are markedly increased in the diabetic rat. As shown in Fig. 2, panel A, liver weight is significantly heavier after the second week of diabetes reaching thereafter a nearly constant weight. The evolution of small intestinal dry weight as a function of time is depicted in panel B. The small intestine begins to be significantly larger in the diabetic rat after the first week of alloxan injection, as previously communicated [ 221. The weight of the organ is almost doubled after the twelfth day, remaining nearly constant until the 30th day of observation. The composition and total size of the bile acid pool is shown in Table I. The most striking finding is the selectivity of the expan- sion of the bile acid pool observed in the diabetic animal. The cholate pool is more than 2.5-fold expanded and a similar increment is also observed in the a-muricholate pool. However, the pools of chenodeoxycholate and lithocholate remain essentially constant and the deoxycholate pool decreased 2-fold in the diabetic group. The expansion of the bile acid pool exclusively depends on the enlargement of the cholate fraction that corresponds to more than 80% of the total pool compared to 60% in the control animals. Fig. 3 shows the evolution of the cholic acid pool size as a function of time. At the 7th day of diabetes the size of the cholate pool was 105 f 10 pmol compared to 60 + 6 pmol in the control animals. After the 12th day, the size of this pool is kept relatively constant in a level 3-fold higher in the diabetic rat. To evaluate the specificity of the insulin deficiency state as the cause of the changes of the cholic acid pool size, the experiments presented in Table II were performed. Four specific factors associated to the experimental diabetic syndrome were evaluated as eventual elicitors of the cholate pool expansion. First, the role of alloxan. Second, the effect of the amount of food ingested. Third, the role of fasting as a factor producing a catabolic state similar to that observed in the acute dia- betic rat. Fourth, the effect of insulin treatment to correct the metabolic dis- turbances of the chronic diabetic rat. Rats injected with alloxan, that devel- oped transient glucosuria, ate the same amount of food as the acute diabetic group, but did not have hyperglicemia, presented with a normal cholate pool.
240 -
; 160-
E a
,,,]_______ -_-- --‘--_________,
” 8 120-
a /c
.z ./’ g ..
60c’ I * I LJz
.v x I P
2 u
OO I I I I I 6 12 16 24 30
Days
Fig. 3. Effect of duration of diabetes on the size of the cholic acid pool. Each value represents the mean +
1 S.E. of 4-6 rats (o-----o, control group; .- - - - - -e, diabetic group).

218
TABLE II
SPECIFICITY OF INSULIN DEFICIENCY IN THE INCREMENT OF CHOLIC ACID POOL SIZE
The animals from groups A, B and C were offered 10 g/day of ground chow and maintained in individual
cages for a period of 96 h after the first experimental manipulation. Group B corresponds to rats injected with alloxan that developed transient and light glucosuria. Fasting was maintained for a period of 72 h prior to the experiments in group D. Groups E and F were injected with alloxan 45 days prior to the experiments. A daily dose of 30 units/kg body weight of insulin was administered subcutaneously from day 30 to day 43 to group F. Groups E and G received a daily subcutaneous injection of saline from day
30 to day 43. Values are the mean ? 1 S.E. of 4-6 animals in each group.
Experimental
group
A. Control 208 * 2 196 ? 2 B. Alloxan 209 fr 3 196 f 3 C. Acute diabetic 199 + 5 173 * 3
D. Fasted 209 * 8 181 i 3 E. Chronic diabetic 203 + 7 238 + 5
F. Insulin 200? 4 245 t 7 G. Control 209 ? 12 275 c 5
Body weight
Initial Final
Food ingestion
(g/day)
10 * 2 8 t 0.7 8 f 0.7 0
ad lib.
ad lib. ad lib.
Liver weight
(g)
7.2 + 0.3 6.3 ? 0.3 5.6 + 0.2
4.8 ? 0.2 11 t 0.4
11 _+ 0.6 8.3 ? 0.3
SlXUm glucose
(mg/W
153 i 15 112 + 7 535 r 62
142 1 11 651 t 43
479 i 54 156r 3
Cholic acid pool
Wmol)
60~ 7 59 + 11 94 + 20 *
61 ? 10 221 + 20
1155 8 ** 65? 4**
* P < 0.05; A vs. C. **P <O.OOl:Evs.FandEvs.G.
However, rats maintained in the same environment that developed glucosuria and hyperglicemia during a period of 4 days, significantly expanded their cholate pool from 60 + 7 to 94 f 20 pmol. Fasting for a period of 72 h pro- duced a similar loss of body weight compared to the acute diabetic group, but
c = m
% I I I 1 1 2 3 4
Time (h)
Fig. 4. Biliary cholic acid specific activity measured in 5-min bile samples collected from anima.ls provided with biliary and duodenal catheters to allow a sequential interruption of the enterohepatic circulation of bile acids. The figure shows the result obtained in one animal from a series of three rats in each group. The taurocholate-fed rats received a daily dose of 150 firno of taurocholate through a gastric cannula for a period of 4 days. Diabetic rats were used 2 weeks after alloxan injections and the insulin-treated animals received a daily subcutaneous dose of 30 units/kg body weight from day 14 to day 21.12-14 h prior to the exPeriments, the animals received an intraperitoneal dose of 0.7 /Ki of [14C]cholic acid. O-0. con- trol; q -, taurocholate fed; l - 0, diabetic; A- A. insulin treated.

TA
BL
E
III
EF
FE
CT
O
F D
IAB
ET
ES
A
ND
IN
SU
LIN
T
RE
AT
ME
NT
O
N B
ILE
A
CID
S
EC
RE
TIO
N
AN
D
CH
OL
AT
E
SY
NT
HE
SIS
All
ra
ts w
ere
fed
a
d I
ibit
um
an
d w
ere
sub
ject
ed
to l
igh
t cy
clin
g
for
6 w
eek
s p
rio
r to
th
e fi
rst
exp
erim
enta
l m
an
ipu
lati
on
. G
rou
p
C r
ecei
ved
an
ora
l d
ail
y d
ose
o
f 15
0
~m
ol
of
tau
roch
ola
te
(Tc)
fo
r a
per
iod
o
f 4
da
ys.
G
rou
ps
B,
D a
nd
E w
ere
stu
die
d
21 d
ay
s a
fter
aI.
Iox
an
inje
ctio
n.
Gro
uts
D
an
d E
had
ma
rked
g
luco
suri
a
pri
or
to
insu
lin
tr
eatm
ent.
A
d
ail
y
do
se
of
30
un
its/
kg
o
f in
suli
n
wa
s in
ject
ed
sub
cuta
neo
usl
y
fro
m
da
y
14
to
da
y
20
in g
rou
p
D
an
d
fro
m
da
y
7 to
da
y
20
in g
roup
E.
Va
lues
rep
rese
nt
the
mea
n
* 1
S.E
. o
f 4-
6 ra
ts i
n e
ach
gro
up
.
Ex
per
imen
tal
gro
up
Lig
ht
ph
ase
wh
en k
ille
d
A.
Co
ntr
ol
B.
Dia
bet
ic
C.
Co
ntr
ol
Tc-
fed
D
. In
suli
n1
E.
Insu
lin
II
Mid
-da
rk
Mid
-lig
ht
Mid
-da
rk
Mid
-lig
ht
Mid
-da
rk
Mid
-da
rk
Mid
-da
rk
Bo
dy
w
eig
ht
Init
ial
Fin
al
198
r 6
229
f 9
189
r 8
222
* 1
201
c 8
197
i 5
206
i: 9
19
4 _f
10
203
+ 5
21
0 c
6 19
0 +
8
206r
9
194
* 4
221
r 6
Liv
er w
eig
ht
(Sl 1.
0 _+
0.4
7.4
f 0.
2
8.8
+ 0
.5
8.2
f 0.
5 6.
8 *
0.3
11.0
*
1.3
10.0
+
1.1
Seru
m
glu
cose
(mg
/dI)
146
t 14
13
6 i:
9
513
?: 3
6
490
+ 2
5 -
96
I 15
19
5 t
36
Bil
e a
cid
sec
reti
on
(/lm
oI/
b)
To
tal
26
i 2.
4 28
?
0.5
64
+ 9
.7
52
1. 5
.0
35
2 4.
0 47
f.
8.0
29
+ 2
.0
Ch
oli
c
14
c 1.
8 2.
0 t
0.3
13
?: 0
.7
1.1
+ 0
.1
*
56
i: 7
.1
1.9
?r 0
.2
44
t 4.
5 1.
6 !z
0.3
26
f:
3.0
0.
5 IO
.03
**
31
t 5.
0 2.
4 r
0.5
21
c 1.
0 1.
1 t
0.1
*
Ch
oli
c a
cid
syn
thes
is
(/L
mo
I/b
)
* P
<
0.
02;
A m
id-l
igh
t v
s. A
mid
-da
rk,
E v
s. A
mid
-da
rk
an
d E
vs.
B m
id-d
ark
.
**
P
<
0.00
1;
C v
s. A
an
d C
vs.
B m
id-d
ark
.
220
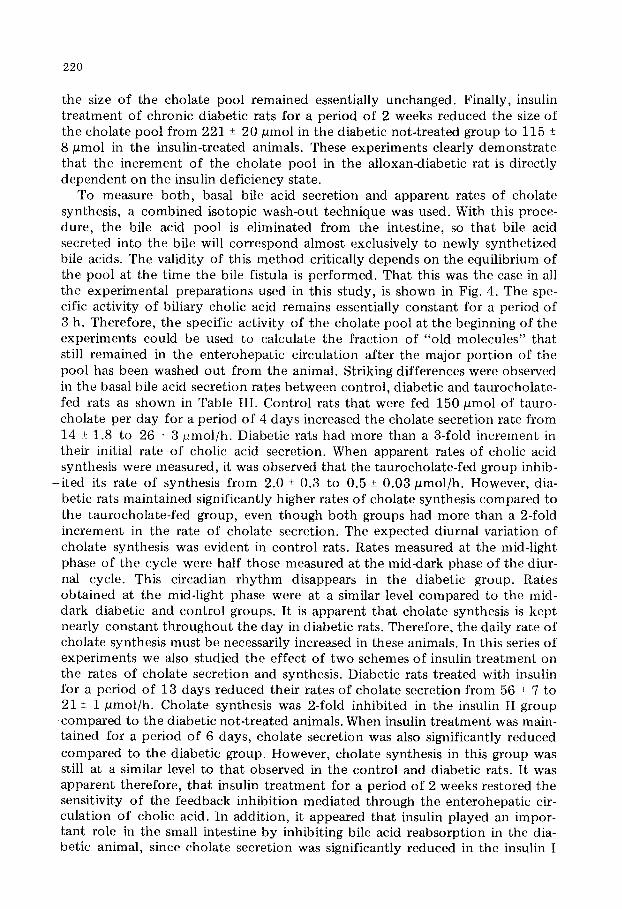
the size of the cholate pool remained essentially unchanged. Finally, insulin treatment of chronic diabetic rats for a period of 2 weeks reduced the size of the cholate pool from 221 + 20 pmol in the diabetic not-treated group to 115 ? 8 pmol in the insulin-treated animals. These experiments clearly demonstrate that the increment of the cholate pool in the alloxandiabetic rat is directly dependent on the insulin deficiency state.
To measure both, basal bile acid secretion and apparent rates of cholate synthesis, a combined isotopic wash-out technique was used. With this proce- dure, the bile acid pool is eliminated from the intestine, so that bile acid secreted into the bile will correspond almost exclusively to newly synthetized bile acids. The validity of this method critically depends on the equilibrium of the pool at the time the bile fistula is performed. That this was the case in all the experimental preparations used in this study, is shown in Fig. 4. The spe- cific activity of biliary cholic acid remains essentially constant for a period of 3 h. Therefore, the specific activity of the cholate pool at the beginning of the experiments could be used to calculate the fraction of “old molecules” that still remained in the enterohepatic circulation after the major portion of the pool has been washed out from the animal. Striking differences were observed in the basal bile acid secretion rates between control, diabetic and taurocholate- fed rats as shown in Table III. Control rats that were fed 150 pmol of tauro- cholate per day for a period of 4 days increased the cholate secretion rate from 14 i 1.8 to 26 ! 3 pmol/h. Diabetic rats had more than a 3-fold increment in their initial rate of cholic acid secretion. When apparent rates of cholic acid synthesis were measured, it was observed that the taurocholate-fed group inhib-
-ited its rate of synthesis from 2.0 t 0.3 to 0.5 ? 0.03 pmol/h. However, dia- betic rats maintained significantly higher rates of cholate synthesis compared to the taurocholate-fed group, even though both groups had more than a 2-fold increment in the rate of cholate secretion. The expected diurnal variation of cholate synthesis was evident in control rats. Rates measured at the mid-light phase of the cycle were half those measured at the mid-dark phase of the diur- nal cycle. This circadian rhythm disappears in the diabetic group. Rates obtained at the mid-light phase were at a similar level compared to the mid- dark diabetic and control groups. It is apparent that cholate synthesis is kept nearly constant throughout the day in diabetic rats. Therefore, the daily rate of cholate synthesis must be necessarily increased in these animals. In this series of experiments we also studied the effect of two schemes of insulin treatment on the rates of cholate secretion and synthesis. Diabetic rats treated with insulin for a period of 13 days reduced their rates of cholate secretion from 56 i 7 to 21 f 1 pmol/h. Cholate synthesis was 2-fold inhibited in the insulin II group compared to the diabetic not-treated animals. When insulin treatment was main- tained for a period of 6 days, cholate secretion was also significantly reduced compared to the diabetic group. However, cholate synthesis in this group was still at a similar level to that observed in the control and diabetic rats. It was apparent therefore, that insulin treatment for a period of 2 weeks restored the sensitivity of the feedback inhibition mediated through the enterohepatic cir- culation of cholic acid. In addition, it appeared that insulin played an impor- tant role in the small intestine by inhibiting bile acid reabsorption in the dia- betic animal, since cholate secretion was significantly reduced in the insulin I

221
group when its rate of synthesis was still in a normal level at the mid-dark phase of the light cycle.
Discussion
The primary purpose of this study was to characterize the alterations of bile acid metabolism in experimental diabetes and to determine the specificity of the insulin deficiency state as the inductor of these alterations. Our experi- ments clearly demonstrate that neither altered food ingestion, or alloxan injec- tion per se are directly responsible for the expansion of the cholate pool. This accrual of the pool exclusively depends on the insulin deficiency state, since it only develops in the hyperglicemic rat and can be partially normalized when exogenous insulin is used to treat the diabetic syndrome. A striking finding in this experimental model is the expansion of the cholate pool, already evident at the 4th day of diabetes, when the animal is still in a marked catabolic state, as judged by the heavy glucosuria, impaired food ingestion and weight loss. The expansion of the bile acid pool necessarily implies a more efficient intestinal absorption of bile acids in the diabetic rat. Recently, Caspary [23] demon- strated that the maximal transport capacity of conjugated cholate per unit of weight tissue is markedly increased in the ileum of the acute diabetic rat. The velocity of transport is normalized thereafter when the comparison is made on a tissue weight basis. However, because of the enlargement of the intestine, the overall capacity to transport bile acids is markedly increased. These findings correlate exactly with the changes of cholate pool size demonstrated in our experiments. In addition, the increased daily rates of cholate synthesis are certainly participating in the specific increment of the pool in the diabetic rat. The selective expansion of the cholate pool must be related to the efficiency for bile acid transport in the intestine that is normally 4-5 times higher for tri- hydroxy than dihydroxy bile acid conjugates [24].
In this investigation the use of an isotope dilution technique associated to the intestinal wash-out system permitted to calculate both, basal rates of biliary bile acid secretion and apparent rates of cholate synthesis in the same animal. That the present method is valid under the conditions specified in this study, is supported by the following observations. First, the isotopic label of the cholate pool was equilibrated at the time of performing the bile fistula in all the experi- mental conditions reported here. The initial specific activity of cholate could thus be used to subtract the portion of “old molecules” secreted after the intestinal pool was washed-out. Second, a cyrcadian rhythm of cholate syn- thesis in the normal rat was found with a maximum rate at the mid-night phase and a minimum, 50% lower, at the mid-light phase of the diurnal cycle. It is note- worthy that a similar oscillation has been previously shown in the chronic bile fistula preparation [25] and in the activity of 7a-hydroxylase, the rate-limiting step of bile acid synthesis [26,27]. Third, when the feedback system was tested in the normal animal by overloading the liver cell with exogenous taurocholate, it was possible to demonstrate a 4-fold inhibition of the calculated rate of cholate synthesis, as was expected to find according to present understanding of the feedback controlling mechanism of bile acid synthesis [ 28,291. We have found that the cyrcadian rhythm of cholate synthesis is lost in the diabetic rat.

222
Rates measured at the mid-light phase were almost twice those of the control groups, maintaining synthetic levels similar to the rates found at the middark phase of the diurnal cycle. If this constant rate of cholate production per h is maintained throughout the 24 h, it can be calculated that the daily rate of cholate synthesis is 43 pmol in the diabetic rat, very similar to the rate previ- ously measured with the isotopic dilution technique of Lindsted [6].
The liver of the diabetic rat is overloaded with bile acids. Since the cholate pool and cholate secretion are 3-fold increased, the liver is receiving three times more bile acids per unit time than the liver of the control rat. In spite of this fact, the feedback mechanism that normally inhibits when the pool is expanded, does not respond in the diabetic rat. Moreover, the calculated daily rate of cholate synthesis is increased in this condition. All the factors that can modify the rate of bile acid synthesis have been shown to operate through modifications of the activity of the enzyme 7a-hydroxylase; therefore it is very likely that the activity of this enzyme must be increased in the liver of the dia- betic rat at the mid-light phase of the diurnal cycle and inhibited in diabetic animals treated with insulin for a period of 2 weeks. It may be possible that insulin has a direct repressor effect on the synthesis of the enzyme 7a-hydroxy- lase that allows an enhancement of its activity in the diabetic state. Alterna- tively, the relative high rates of cholate synthesis develop because the hepatic pool of cholesterol is expanded in the diabetic rat [6]. This mechanism, for example, is operating in the cholesterol-fed rat whose liver is overloaded with cholesterol [ 311.
Hepatic cholesterogenesis, the major source of body cholesterol in the rat [21], is inhibited in diabetes [ 11,121. Therefore, the expansion of the choles- terol pool in this condition must depend on other factors. Since diabetic rats eat more food, secretes more cholesterol into the bile [6], have an enlarged surface for intestinal absorption and the bile acid pool is increased, cholesterol absorp- tion must be necessarily increased. In addition, lipoprotein production in the liver of the insulindeficient animal is grossly impaired [15]. This system is quantitatively the more important pathway for diversion of hepatic cholesterol [30]; therefore, its inhibition facilitates the accumulation of cholesterol in the liver. The low rates of hepatic cholesterogenesis [11,32] and of the activity of the enzyme 3-hydroxy-3-methylglutaryl-CoA reductase [13,14] in the diabetic rat, may be the result of the increment of the bile acid pool size and the higher amounts of cholesterol reaching the liver from the intestine, rather than a direct effect induced by the low concentrations of insulin circulating through the liver. Recently, it has been shown that cholestyramine feeding restores the activity of the hepatic 3-hydroxy-3-methylglutaryl CoA reductase in diabetic rats [33]. This finding supports the concept that the inhibition of hepatic cholesterogenesis in experimental diabetes is secondary to the increment of the bile acid pool size. This mechanism mainly operates through the negative feed- back system mediated by intestinal lipoproteins which, in the normal animal, acts as a major regulator of hepatic cholesterogenesis [ 34,351. The profound and rapid modifications of bile acid metabolism developed in the alloxan-diabetic rat must be taken into account when specific aspects of cholesterol metabolism are studied in diabetes. This statement is important, since it is well known that bile acids play a major role as regulators of hepatic and intestinal cholesterogenesis and of intestinal absorption of cholesterol.

223
Acknowledgements
This work was supported by Research Grant 210/75 from the Direcci6n de Investigacibn de la Universidad Cat6lica de Chile. The authors thank Dr. Carlos Quintana, Chief of the Department of Gastroenterology of the Universidad Catblica de Chile, for his continuous support and encouragement.
References
1 Adlersberg, D. and Eisler, L. (1959) J. Am. Med. Assoc. 170, 1261-1265
2 Hamur, G.J. (1962) Metabolism 11, 850-882
3 Albrink. M.J. Lavietes, O.H. and Man, E.B. (1963) Ann. Intern. Med. 58, 305-323
4 Kenn, H., Rose, G., Pike, D.A., Boyns, D.. Chlouverakis. C. and Mistry, S. (1965) Lancet 2, 505-508
5 Lieber, M.M. (1952) Ann. Surg. 135, 394-405
6 Nervi, F., Gonzaez, A. and Valdivieso, V. (1974) Metabolism 23, 495-503
7 Jervis, E. and Levin, R.J. (1966) Nature 210, 391-393
8 Schedl, H.P. and Wilson, H.D. (1971) J. Exp. Zoo]. 176, 487-496
9 Veleminsky, J., Burr, J.M. and Stauffacher (1970) Eur. J. Clin. Invest. 1, 104-108
10 Nikkila, E.A. (1973) Prog. Biochem. Pharmacol. 8. 271-299
11 Brady, R.O. and Gurin. S. (1950) J. Biol. Chem. 187, 589-596
12 Foster, D.W. and Siperstein, M.D. (1960) Am. J. Physiol. 198, 25-28
13 Lakshmanan. M.R., Nepokroeff. C.M., Ness, G.C., Dugan, R.E. and Porter, J.W. (1973) Biochem.
Biophys. Res. Commun. 50, 704-710
14 Huber, J., Guder, W., Latzin, S. and Hamprecht, B. (1973) Hoppe-Seyler’s Z. Physiol. Chem. 354,
795-798
15 Reaven, E.P. and Reaven. G.M. (1974) J. CIin. Invest. 54, 1167-1178
16 Eriksson, S. (1960) Acta Physiol. &and. 48, 439-442
17 Norman, A. and SjovaII. J. (1958) J. Biol. Chem. 233, 872-885
18 Hofmann. A.F. (1962) J. Lipid. Res. 3, 127-128
19 Pornare. E.W. and Low-Baer, T.S. (1974) Clin. Chin Acta 57, 239-248
20 Mitropoulos, K.A. and Myant, N.B. (1967) Biochem. J. 103. 472-479
21 Dietschy, J.M. and Wilson, J.D. (1970) New Engl. J. Med. 282, 1241-1249
22 Schedl, H.P. and Wilson. H.D. (1971) Am. J. Physiol. 220, 1739-1745
23 Caspary, W.F. (1973) Gut 14. 949-955
24 Schiff, E.R., Small, N.C. and Dietschy, J.M. (1972) J. Clin. Invest. 51, 1351-1362
25 Mitropoulos. K.A., Balasubramanian, S. and Myant, N.B. (1973) Biochim. Biophys. Acta 326.
428-438
26 Gielen. J., Van Cantfort, J., Robaye. B. and Renson. J.C.R. (1969) Acad. Sci. Paris, 269. 731-732
27 Mitropoulos, K.A., Balasubramanian, S., Gibbons, G.F. and ReeVeIS, B.E. (1972) FEBS Lett. 27.
203-206
28 Boyd. G.S. and Percy-Robb, J.W. (1971) Am. J. Med. 51. 580-587
29 Mosbach, E.H. (1972) Arch. Intern. Med. 130, 478-487
30 Sodhi. H.S. (1975) Perspect. Biol. Med. 18. 477-485
31 Beher, W.T., Casazza, K.K., Beher, M.E.. FiIus, A.M. and Bert&us, J. (1970) Proc. SOC. ExP. BioI.
Med. 134. 595-602
32 Wang, R.K. and Van Bruggen, J.T. (1960) J. Biol. Chem. 235, 26-29
33 Lakshmanan, M.R., Dugan, R.E., Nepokroeff, C.M., Ness. G.C. and Porter. J.W. (1975) Arch. Bio-
them. Biophys. 168,89-95
34 Nervi, F.O., Weis, H.J. and Dietschy, J.M. (1975) J. Biol. Chem. 250, 41454151
35 Nervi, F.O. and Dietschy. J.M. (1975) J. Biol. Chem. 250. 8704-8711