Results Briefing for Fiscal Year Ended Jan. 31, 2019 - Pigeon
Upload
khangminh22Category
view
5download
0

The Statement and opinions expressed by authors in this Journal are not necessarily those of the Government.
Contents of the “Bhu-Jal News” are freely reproducible with due acknowledgment.
* The status of members of the editorial Board is as on 08 Sept. 2020
Published by Chairman, Central Ground Water Board, Department of Water Resources, River Development & Ganga Rejuvena on, Bhu-Jal Bhawan, NH-IV, Faridabad - 121 001 (Haryana)
All Editorial correspondence in future may be addressed to the Editors, “Bhu-Jal News”, RGNGWTRI,Naya Raipur-492 016 (C.G.) • E-mail : [email protected]
- Quarterly Journal of Central Ground Water Board
Ministry of Government of India
Jal Shakti
EDITORIAL BOARD
PATRON
Dr. P. NandakumaranChairman, Central Ground Water Board
Shri Sunil KumarMember ( )CGWA
CGWB
Dr. Utpal GogoiMember (East )/RGI
CGWB
Dr. S.K. JainMember ( )South
CGWB
Shri Anoop NagarMember (HQ)
CGWB
Shri G.L. MeenaMember ( )North & West
CGWB
Dr. D. C. SinghalEx. Prof.(IIT-Roorkee)
ADVISORY BOARD
Dr. Anadi GayenScien st-D, RGI
Shri T.B.N. SinghScien st-D, RGI
Shri Sa sh Kumar Regional Director, RGI
EDITORS
Dr. A. Mukherjee, Professor Manav Rachna University Faridabad
Dr. S. Suresh, Supdt. Hg. CGWB Faridabad,
Dr. Ranjan Ray , Sc.-DCGWB Faridabad,
Dr. Rajesh Chandra, Sc.-DCGW , New DelhiA
Dr. M. Senthil Kumar, Sc.-CCGWB, Faridabad
Dr. Indranil R y o , Sc.-CMER, CGWB, Patna
Dr. Keisham Radhapyari , Sc.-BCGWB, GuwahaNER,
ASSOCIATE EDITORS

CONTENTS
Volume - 31 Number 1 - 4 2021
Contents Page No.
Sudhir K Srivastava & G C Pa1. Occurrence of High Uranium in Shallow Ground Water in India 1
2. Anurag Khanna and DebasishBagchi
Rejuvena on and management of springs in U arakhand Himalaya 25
3. Assessment of selected Poten ally Toxic Trace Elements contamina on and 37 groundwater chemistry of the Kolkata Megacity, West Bengal, East India
Keisham Radhapyari
4. Decadal Groundwater Level Analysis of Lucknow District and Effect of Urbaniza on 6 0 on Groundwater
Suparna Da a, Sonam, Anirvan Choudhury, Atalanta N Chowdhury,
Madhukar Singh, Sujatro Ray Chowdhury, Prashant Rai, VikasRanjan, Pramod Kr. Tripathi
V. K. Kulshreshtha and Sourab Gupta
8. Study on round ater quality due to release of waste product from Chadha sugar 1 9 G W 0
Tarun Mishra and Kiran Lale
5. Seawater ingress, aquifer saliniza on and groundwater security in Puri Urban and 72 adjoining areas area in parts of the coastal Odisha
6. Decadal varia on in ground water Quality: A case Study of Jodhpur district, Rajasthan 85 Dr. S. K. Jain, Ms Balinder P. Singh and Dr. Jaipal Garg
7. Assessment of Ground Water Quality in Industrial Zone of Dewas (MP), Central India 95
P and Industrial vt. Ltd., village-kiri afgana, Gurudaspur, Punjab state
Chairman, CGWB
India is confronting an exclusive problem pertaining to the groundwater in terms of both quantity and quality perspectives. Alluvial aquifers of Uttar Pradesh, Bihar, West Bengal and other states within the Indus-Ganga-Meghna-Brahmaputra river belt have massive groundwater potential, but extraction needs to be undertaken very cautiously as shallow aquifers are severely affected by the arsenic contamination. Crystalline and consolidated formations are present in three-fourth parts of India and aquifers within these formations maintain complex pattern with limited yield potential. Hence, the management of hard rock aquifer systems demand judicious extraction of groundwater for various uses.
Publication of Bhujal News has now been shifted to Rajiv Gandhi National Ground Water Training and Research Institute (RGNGWTRI), Naya Raipur, Chhattisgarh. RGNGWTRI has already published one volume in last annual action plan (AAP). This is the second volume being published with eight good quality papers portraying different issues and challenges of groundwater resources of our country. I hope that the scientists of CGWB will contribute scientific papers in future too and maintain uniform flow for the future publications in a systematic manner. I expect active participations of all the offices of CGWB for future issues of the Bhujal News.
Chairman's Page
Dr. P. Nandkumaran
Groundwater is playing a significant role in the economic growth of India. Around 30% of the urban drinking water supplies and 90% of rural drinking water demand are being catered through the groundwater only. Being agrarian country, India is in huge demand of groundwater for irrigation purposes. Domestic and industrial demands are also increasing in accelerated rate. Mostly the western and southern parts of India are witnessing the over-exploitation of aquifers owing to rapid increase in numbers of the shallow and deep tube wells.

Bhujal News started its journey in the year 1985 with an objective to highlight the important news items besides publishing the technical contributions belonging to the scientists of CGWB in a journal format. The assignments in the CGWB are mostly field oriented and the output is measured by submission of technical reports based on the field studies. But, on account of limited circulation of CGWB reports, the results of these field studies, ideas developed and hydrogeological research research outputs could not reach to the scientific community in the national as well as international level. Bhujal News fulfils this gap and serves as a conduit in between CGWB and the outside groundwater research community by highlighting the contributions of CGWB to the general public in the form of publishing the research papers. Therefore, all officers of CGWB irrespective disciplines like scientific or engineering stream should come forward and make it a point that after completion of their field assignments, or laboratory research, the results are transformed into the journal paper format and be submitted to the Bhujal News for onward circulation in wide scale.
EDITORIAL
The Bhujal News volume, 31 contain 8 papers having wide range of topics. It has contents ranging from uranium contamination in shallow aquifers of India to springs in Himalayas. It also contains paper related to sea water ingress and decadal ground water level analysis. Groundwater quality of industrial zones have also been discussed in two papers.
--- Editors
Central Ground Water Board (CGWB) came into effect in the year 1972 after merger of Exploratory Tubewell Organization (ETO) and groundwater wing of Geological Survey of India (GSI). The main aim of CGWB is to provide scientific inputs for management, assessment and regulation of groundwater resources of the country. It is working with a vision of sustainable development and management of groundwater resources in the country. As of today, it has 18 Regions, 17 Divisons and 10 State unit offices functioning throughout the country.

Bhujal News, 31 (1-4) : 01-24
1
OCCURENCE OF HIGH URANIUM IN SHALLOW GROUND WATER IN INDIA
Sudhir K Srivastava*1 and G C Pati2, CGWB, CHQ., Faridabad
*Corresponding [email protected]
ABSTRACT : Uranium is a naturally occurring element with an average abundance of about 3 ppm in the earth crust and present in over 200 minerals. Presence of high Uranium in ground water in different parts of the country has been reported by various central, state & research institutions in the last two decades with availability of better analytical facilities. A total of 13622 groundwater samples were collected from shallow wells water sources across the country and Uranium content has been analysed by ICP-MS. High level of Uranium (more than 30 µg/L as per the WHO guidelines) in groundwater has been detected, predominantly in the states of Haryana (19.6 % of the samples collected), Punjab (24.2 % of the samples collected), Rajasthan (7.2% of the samples collected), Telangana (10.1 % of the samples collected), Uttar Pradesh (4.4% of the samples collected), Andhra Pradesh (4.9 % of the samples collected), Tamilnadu (1.6% of the samples collected), Jharkhand (1.5% of the samples collected) and Chhattisgarh (1.3% of the samples collected). The concentration of Uranium in groundwater has been detected up to 2876 µg/L. Keyword : Ground Water, Uranium, Geogenic, Contamination, WHO

Bhujal News, 31 (1-4) : 01-24
2
1.0 INTRODUCTION India is the world’s largest user of groundwater. More than 60 per cent of
irrigated agriculture and 85 per cent of drinking water needs depend on the ground water resources. Recently, groundwater monitoring has shown elevated levels of uranium in several community water systems and in private tube wells. Uranium is a naturally occurring radioactive metal that occurs in low concentrations in nature. It is present in certain types of soils and rocks, especially granites. Most ingested uranium is due to food intake with lesser amounts accumulated from water or from the air. Uranium mostly is rapidly eliminated from the body, however a small amount is absorbed and carried through the blood stream. Studies show that elevated levels of uranium in drinking water can affect the kidneys. Bathing and showering with water that contains uranium is not considered a health concern. In general, most drinking water sources have radioactive contaminants at levels that are low enough to be considered a public health. However, elevated levels of Uranium in drinking water have been reported in many parts of the world including India. U.S. EPA and the WHO have set drinking water guideline (WHO; 2011) for Uranium in drinking water as 30 μg/L. Atomic Energy Regulatory Board, India has prescribed (AERB ; 2004), the guideline of Uranium in drinking water as 60 μg/L (µg/L ). The occurrence and distribution of uranium in groundwater, is very poorly understood and warrants investigations in detail. Reports of widespread uranium contamination in groundwater across India demand an urgent response (Coyte, et al., 2018, Richards et al. 2020, Prakash et al. 2020). In view of the above, steps are required for monitoring of uranium contamination in shallow ground water through a network Monitoring wells located all across the country.
2.0 HYDROGEOLOGY Behaviour of ground water in the Indian sub-continent is highly complicated due to
the occurrence of diversified geological formations with considerable lithological and chronological variations, complex tectonic framework, climatological dissimilarities and various hydro-chemical conditions. Broadly two groups of rock formations have been identified, depending on characteristically different hydraulics of ground water viz. Porous Formations and Fissured Formations (Saha et al., 2014). 2.1 Porous formations
Porous formations have been further subdivided into Unconsolidated and Semi – consolidated formations. The areas covered by alluvial sediments of river basins, coastal and deltaic tracts constitute the unconsolidated formations. These are by far the most significant ground water reservoirs for large scale and extensive development. The hydrogeological environment and ground water regime in the Indo-Ganga-Brahmaputra basin indicate the existence of potential aquifers having enormous fresh ground water resources. The semi-consolidated formations occur mostly in narrow valleys or structurally faulted basins. The Gondwanas, Lathis, Tipams, Cuddalore sandstones and their equivalents are the most extensive productive aquifers. Under favourable situations, these formations give rise to free flowing wells. In select tracts of northeastern India, these water-bearing formations are quite productive. The Upper Gondwanas, which are generally arenaceous, constitute prolific aquifers.
2.2 Fissured Formations The Fissured or consolidated formations occupy almost two-thirds of the country.
Consolidated formations other than vesicular volcanic rocks have negligible primary porosity. From the hydrogeological point of view, fissured rocks are broadly classified into four type viz. Igneous and metamorphic rocks excluding volcanic and carbonate rocks, volcanic rocks, consolidated sedimentary rocks excluding carbonate rocks and Carbonate rocks.

Bhujal News, 31 (1-4) : 01-24
3
i) Igneous and metamorphic rocks excluding volcanic and carbonate rocks:-The most common rock types are granites, gneisses, charnockites, khondalites, quartzites, schists and associated phyllites, slates, etc. These rocks possess negligible primary porosity but attain porosity and permeability due to fracturing and weathering, which facilitates the yield from their rocks.
ii) Volcanic rocks:-The predominant types of the volcanic rocks are the basaltic lava flows of Deccan Plateau. Water bearing properties of different flow units control ground water occurrence and movement in Deccan Traps. The Deccan Traps have usually poor to moderate permeabilities depending on the presence of primary and secondary pore spaces including vesicles/fractures.
iii) Consolidated sedimentary rocks excluding carbonate rocks:-Consolidated sedimentary rocks occur in Cuddapahs, Vindhyans and their equivalents. These formations consist of conglomerates, sandstones, shales, slates and quartzites. The presence of bedding planes, joints, contact zones and fractures controls the ground water occurrence, movement and yield potential of aquifers.
iv) Carbonate rocks: - Limestones in the Cuddapah, Vindhyan and Bijawar groups of rocks dominates the carbonate rocks other than the marbles and dolomites. In carbonate rocks, the circulation of water creates solution cavities thereby increasing the permeability of the aquifers. Solution activity leads to widely contrasting permeability within short distances in such rocks.
3.0 SOURCES OF URANIUM IN GROUND WATER Uranium is found in very small amounts in nature in the form of minerals. Rocks, soil,
surface and underground water, air, plants and animals all contain varying amounts of it. Natural Uranium is a mixture of three isotopes of Uranium, as 234U, 235U, and 238U. They show different radioactive properties. But all three isotopes behave in the same way chemically, so any combination of the three would have the same chemical effect on a person’s health. Uranium occurs naturally in the +2, +3, +4, +5 and +6 valence states, but most commonly found in the hexavalent form. In nature, hexavalent Uranium is commonly associated with oxygen as the uranyl ion, UO2
2+. In concentrations below 10-6M, UO2 (OH)+ is the dominant species, while above this concentration polymeric forms occur. Carbonate and mixed hydroxo carbonate complexes are formed in geological environment as CO2 in air or closed in ground water play a significant role in their formation. Dissolved uranium can also form stable complexes with naturally occurring inorganic and organic ligands such as phosphate complexes. Uranium is a primordial and heaviest naturally occurring radioactive element that occurs in dispersed state in the earth’s crust with an average concentration of 2–4 mg kg-1. It is commonly present in lignite, monazite and phosphate rocks (typically in the order of 0.005 to 0.02%). In groundwater, Uranium is present as a result of leaching from natural deposits, release from mill tailings, emission from the nuclear industry, contribution from fly ash and phosphate fertilizer application. Naturally occurring Uranium is associated with granitic and metasedimentary rocks, as well as younger sedimentary deposits. Naturally occurring Uranium in groundwater is result of the dissolution of Uranium bearing minerals that have been in contact with groundwater for long periods of time. Elevated concentrations of natural Uranium in well water are more likely to be found in drilled wells that obtain their water from the cracks and fractures of bedrock, rather than dug wells or surface water supplies. Uranium can also be found in the environment as a result of human activities such as mill tailings, emissions from the nuclear industry, and the combustion of coal and other fuels. Naturally occurring Uranium has very low levels of radioactivity. The chemical properties of Uranium in drinking water are of greater health concern than its radioactivity. The factors for Uranium concentration in ground water can be summarized as follows-

Bhujal News, 31 (1-4) : 01-24
4
Many of aquifers are composed of clay, silt and gravel carried down from Himalayan weathering by streams or uranium-rich granitic & pegmatite rocks. There is possibility that over-pumping groundwater from these aquifers result in water levels decline, which leads to the oxidation conditions which, in turn, may enhance Uranium enrichment in the groundwater.
While the primary source of Uranium is geogenic (naturally occurring), anthropogenic (human caused) factors such as excessive decline in groundwater table and Nitrate pollution may trigger uranium mobilisation to groundwater from sediments. Using geochemical and uranium isotope data, it can help in understanding the process of the factors that trigger presence of high uranium concentrations in groundwater. Factors such as uranium content in aquifer sediments / rocks, oxidation state and groundwater chemistry that promotes the formation of soluble uranyl carbonate complexes need to be studied to understand the geochemistry of mobilisation of uranium in groundwater.
Factors such as the amount of uranium contained in sediments in an aquifer; water-rock interactions causing the uranium get dissolved / leached from those sediments / rocks; the oxidation conditions that trigger uranium’s solubility in water; and then the interaction of the leached Uranium with other chemicals such as bicarbonate / sulphate etc. present in groundwater, which can also enhance its solubility.
Anthropogenic activities, especially the over-exploitation of groundwater may also contributing to the problem, which needs to be studies to establish such relation.
Uranium is more soluble in oxidizing, alkaline, and carbonate-rich water than under acidic, reducing conditions.
4.0 HEALTH EFFECTS Water containing low amounts of uranium is usually safe to drink. Because of its
nature, uranium is not likely to accumulate in groundwater, In fish or vegetables uranium that is absorbed and enter in human body is eliminated quickly through urine and faeces. Uranium concentrations are often higher in phosphate-rich soil, but, concentrations often do not exceed normal ranges for uncontaminated soil. Plants absorb uranium through their roots and store it there. Root vegetables such as radishes may contain higher than usual concentrations of uranium as a result (Saha et al., 2014). Preliminary studies on the health effects of drinking uranium-tainted water among animals and humans have revealed that it causes Nephritis (kidney damage). Notably, this is said to be caused by the chemical effect of uranium, rather than a radiological, even though uranium is radioactive. There is also a chance of getting cancer from radioactive uranium. Nonetheless, we need more comprehensive systematic studies to establish the chronic health effects of uranium exposure (Barry Smith, (2004). Uranium contaminated groundwater, if consumed has the potential of causing chronic lung diseases and nephrotoxic damage (Zamora et al. 1998, Kurttio et al. 2002, Guo et al. 2016). Uranium is a radioactive element occurring naturally in groundwater, soil and sediments (Wu et al. 2014). Exposure to Uranium in the natural environment occurs most commonly via oral exposures. Uranium enters the body by eating contaminated food or drinking water that contains it. Dermal exposures occur through skin contact with uranium powders or metals. Usually only those working with products or processes using uranium would be exposed in this way. Another possible route of exposure is from retained depleted uranium metal fragments (shrapnel) that embed in soft tissue. These fragments oxidize in situ and provide a source of ongoing systemic absorption. Inhalation of uranium powder can also occur and is the primary exposure route for workers. As discussed later in this section, inhalation may be an important route of exposure for individuals in “at risk” communities.
Bhujal News, 31 (1-4) : 01-24
5
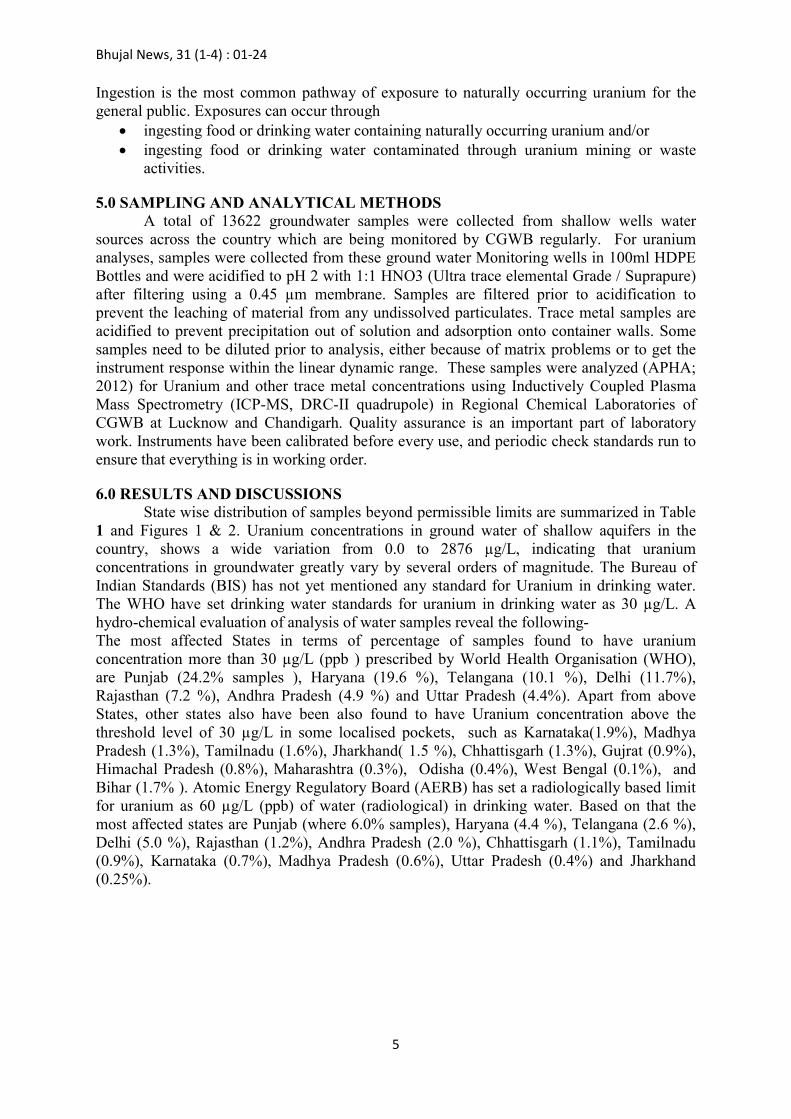
Ingestion is the most common pathway of exposure to naturally occurring uranium for the general public. Exposures can occur through
ingesting food or drinking water containing naturally occurring uranium and/or ingesting food or drinking water contaminated through uranium mining or waste
activities.
5.0 SAMPLING AND ANALYTICAL METHODS A total of 13622 groundwater samples were collected from shallow wells water
sources across the country which are being monitored by CGWB regularly. For uranium analyses, samples were collected from these ground water Monitoring wells in 100ml HDPE Bottles and were acidified to pH 2 with 1:1 HNO3 (Ultra trace elemental Grade / Suprapure) after filtering using a 0.45 µm membrane. Samples are filtered prior to acidification to prevent the leaching of material from any undissolved particulates. Trace metal samples are acidified to prevent precipitation out of solution and adsorption onto container walls. Some samples need to be diluted prior to analysis, either because of matrix problems or to get the instrument response within the linear dynamic range. These samples were analyzed (APHA; 2012) for Uranium and other trace metal concentrations using Inductively Coupled Plasma Mass Spectrometry (ICP-MS, DRC-II quadrupole) in Regional Chemical Laboratories of CGWB at Lucknow and Chandigarh. Quality assurance is an important part of laboratory work. Instruments have been calibrated before every use, and periodic check standards run to ensure that everything is in working order.
6.0 RESULTS AND DISCUSSIONS State wise distribution of samples beyond permissible limits are summarized in Table
1 and Figures 1 & 2. Uranium concentrations in ground water of shallow aquifers in the country, shows a wide variation from 0.0 to 2876 µg/L, indicating that uranium concentrations in groundwater greatly vary by several orders of magnitude. The Bureau of Indian Standards (BIS) has not yet mentioned any standard for Uranium in drinking water. The WHO have set drinking water standards for uranium in drinking water as 30 µg/L. A hydro-chemical evaluation of analysis of water samples reveal the following- The most affected States in terms of percentage of samples found to have uranium concentration more than 30 µg/L (ppb ) prescribed by World Health Organisation (WHO), are Punjab (24.2% samples ), Haryana (19.6 %), Telangana (10.1 %), Delhi (11.7%), Rajasthan (7.2 %), Andhra Pradesh (4.9 %) and Uttar Pradesh (4.4%). Apart from above States, other states also have been also found to have Uranium concentration above the threshold level of 30 µg/L in some localised pockets, such as Karnataka(1.9%), Madhya Pradesh (1.3%), Tamilnadu (1.6%), Jharkhand( 1.5 %), Chhattisgarh (1.3%), Gujrat (0.9%), Himachal Pradesh (0.8%), Maharashtra (0.3%), Odisha (0.4%), West Bengal (0.1%), and Bihar (1.7% ). Atomic Energy Regulatory Board (AERB) has set a radiologically based limit for uranium as 60 µg/L (ppb) of water (radiological) in drinking water. Based on that the most affected states are Punjab (where 6.0% samples), Haryana (4.4 %), Telangana (2.6 %), Delhi (5.0 %), Rajasthan (1.2%), Andhra Pradesh (2.0 %), Chhattisgarh (1.1%), Tamilnadu (0.9%), Karnataka (0.7%), Madhya Pradesh (0.6%), Uttar Pradesh (0.4%) and Jharkhand (0.25%).
Bhujal News, 31 (1-4) : 01-24
6
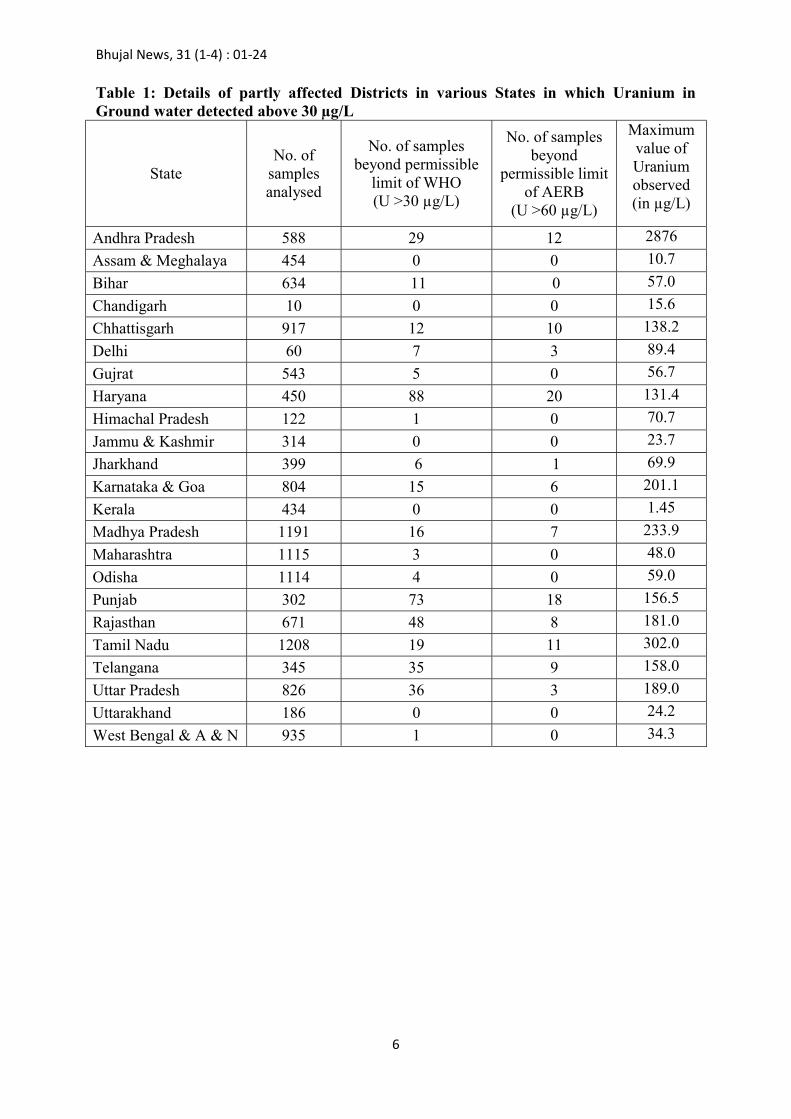
Table 1: Details of partly affected Districts in various States in which Uranium in Ground water detected above 30 µg/L
State No. of
samples analysed
No. of samples beyond permissible
limit of WHO (U >30 µg/L)
No. of samples beyond
permissible limit of AERB
(U >60 µg/L)
Maximum value of Uranium observed (in µg/L)
Andhra Pradesh 588 29 12 2876
Assam & Meghalaya 454 0 0 10.7
Bihar 634 11 0 57.0
Chandigarh 10 0 0 15.6
Chhattisgarh 917 12 10 138.2
Delhi 60 7 3 89.4
Gujrat 543 5 0 56.7
Haryana 450 88 20 131.4
Himachal Pradesh 122 1 0 70.7
Jammu & Kashmir 314 0 0 23.7
Jharkhand 399 6 1 69.9
Karnataka & Goa 804 15 6 201.1
Kerala 434 0 0 1.45
Madhya Pradesh 1191 16 7 233.9
Maharashtra 1115 3 0 48.0
Odisha 1114 4 0 59.0
Punjab 302 73 18 156.5
Rajasthan 671 48 8 181.0
Tamil Nadu 1208 19 11 302.0
Telangana 345 35 9 158.0
Uttar Pradesh 826 36 3 189.0
Uttarakhand 186 0 0 24.2
West Bengal & A & N 935 1 0 34.3

Bhujal News, 31 (1-4) : 01-24
7
Fig. 1 : Status of Uranium in Ground Water of Different States/ UT

Bhujal News, 31 (1-4) : 01-24
8
Fig. 2 : Location of High uranium in Shallow aquifers of India
The details of partly affected districts in various states are given in Table 2. It has been found that 151 districts in 18 States are partly affected by high (>30 µg/L) concentration of Uranium in ground water. Figure 1 shows the distributions of a wide range of uranium concentrations in groundwater, indicating that most samples have very low uranium concentrations. State wise discussions are as follows-

Bhujal News, 31 (1-4) : 01-24
9
Table 2: Districts partly affected with high Uranium in Groundwater in States
Sl No State Districts Partly affected with Uranium> 30 µg/L
1 Andhra Pradesh
Ananthapur, Chittoor, Guntur, Cuddapah, East Godavari, Krishna, Kurnool, Prakasam
2 Bihar
Saran, Bhabhua, Khagaria, Madhepura, Nawada, Sheikhpura, Purnea, Kisanganj, Begusarai
3 Chhattisgarh Bilaspur, Jashpur, Kanker, Korba 4
Delhi North West District, South West District, West District, North District
5 Gujrat Dohad, Ahmedabad, Vadodara, Patan 6
Haryana Ambala, Bhiwani, Faridabad, Fatehabad, Gurugram, Hissar, Jhajjar, Jind, Kaithal, Karnal, Kurukshetra, Mahendergarh, Palwal, Panipat, Rohtak , Sirsa, Sonipat, Yamuna Nagar
7 Himachal Pradesh Mandi 8 Jharkhand Godda, Koderma, Latehar, Palamau 9
Karnataka Bangalore Rural, Bangalore Urban, Bellary, Gulbarga, Kolar, Mandya, Raichur, Tumkur
10 Madhya Pradesh
Balaghat, Betul, Chhatarpur, Datia, Gwalior, Jhabua, Panna, Raisen, Seoni, Shivpuri
11 Maharashtra Bhandara, Gondia, Nagpur 12 Odisha Angul, Dhenkanal, Sundargarh, Sambalpur 13
Punjab Bathinda, Moga, Faridkot, Fatehgarh Sahib, Fazilka, Ferozepur, Hoshiarpur, Jalandhar, Kapurthala, Ropar, Ludhiana, Muktsar, Pathankot, Patiala, Sangrur, SAS Nagar
14
Rajasthan
Ajmer, Alwar, Banswara, Barmer, Bhilwara, Bikaner, Bundi, Chittaugarh, Churu, Dausa, Ganganagar, Jaipur, Jelore, Jodhpur, Karauli, Nagaur, Pratapgarh, Rajsamand, Sawai Madhopur, Tonk, Udaipur
15 Tamil Nadu
Dindigul, Erode, Krishnagiri, Madurai, Mamakkal, Ramnathapuram, Salem, Thiruvannamalai, Tirupur, Tiruvallur
16 Telangana
Adilabad, Hyderabad, Mahabubnagar, Medak, Nalgonda, RangaReddy
17
Uttar Pradesh
Aligarh, Azamgarh, Bijnaur, Badaun, Bulandshaher, Deoria, Farrikhabad, Fatehpur, G.B.Nagar, Ghaziabad, Ghazipur, Hardoi, Hathras, J P Nagar, Kanpur Nagar, Mainpuri, Mathura, Pratapgarh, Raebarelli, Sultanpur, Unnao.
18 West Bengal Malda

Bhujal News, 31 (1-4) : 01-24
10
STATE WISE DISCRIPTION
6.1 Andhra Pradesh A total of 588 ground water samples were collected during Pre-Monsoon season
(May-2019) from Groundwater Monitoring Stations falling in different hydro geological settings of Andhra Pradesh. In 29 samples (4.9%) out of 588 samples analysed, Uranium concentrations have been found to be more than 30µg/L (permissible limit for drinking water prescribed by WHO). Uranium more than 60 µg/L (permissible limits as per Atomic Energy Regulatory Board (DAE)) has been detected in 12 samples. The highest value obtained is 2876 µg/L at Damalcheruvu in Chittoor District in Andhra Pradesh (Figure 3). Districts which are partly affected by high Uranium in ground water are - Ananthapur, Chittoor, Guntur, Cuddapah, East Godavari, Krishna, Kurnool, Prakasam districts. Granites particularly Younger granitic intrusive are the source rocks which may have high concentration of Uranium in Chittoor, Anantapur, Cuddapah and Kurnool districts in Andhra Pradesh. High solubility of Uranium observed from calcium rich associated minerals in host rocks and host rocks with lineaments and subsequent leaching into ground water.
Fig.3 Location of high uranium in Shallow aquifers in Andhra Pradesh
6.2 Assam & Meghalaya
A total of 454 ground water samples were collected during Post-Monsoon season (Nov-2019) from Groundwater Monitoring Stations of the Board falling in different hydro geological settings of the State. Uranium was found to be within the permissible limit of 30 µg/L in all the samples collected. Uranium was in the range of not detectable to 10.66 µg/L. 6.3 Bihar
A total of 634 ground water samples were collected during Post-Monsoon season (Nov-2019) from Groundwater Monitoring Stations falling in different hydro geological settings of the State. Uranium was found to be within the permissible limit of 30 µg/L in all the samples collected from NHS Groundwater monitoring wells except eleven samples (Fig. 4). Uranium was found to be in the range of not detectable to 57 µg/L. The Districts which are partly affected by high Uranium in ground water are - Saran, Bhabhua, Khagaria, Madhepura, Nawada, Sheikhpura, Purnea, Kisanganj, Begusarai.

Bhujal News, 31 (1-4) : 01-24
11
Fig. 4 Location of high uranium in shallow aquifers in Bihar
6.4 Chattisgarh
A total of 917 ground water samples were collected during Pre-Monsoon season (May-2019) from Ground Water Monitoring Stations falling in different hydro geological settings of the State. Uranium was found to be within the permissible limit of 30 µg/L in all the samples collected from NHS Groundwater monitoring wells except twelve samples (Fig. 5). Uranium was found to be in the range of not detectable to 138.2 µg/L. The Districts which are partly affected by high Uranium in ground water are - Bilaspur, Jashpur, Kanker, Korba.
Fig. 5 Location of high uranium in shallow aquifers in Chhattisgarh

Bhujal News, 31 (1-4) : 01-24
12
6.5 Delhi A total number of 60 ground water samples from Groundwater Monitoring wells were
collected for Uranium analysis. Uranium was found to be within the permissible limit of 30 µg/L in all the samples collected except in seven samples. Uranium was found to be in the range of not detectable to 89.4 µg/L (Fig. 6). The Districts which are partly affected by high Uranium in ground water are - North West District, South West District, West District, North District.
Fig.6 Location of high uranium in shallow aquifers in Delhi
6.6 Gujrat and Daman & Diu
A total number of 543 water samples were collected from Groundwater monitoring wells for Uranium analysis. Uranium was found to be within the permissible limit of 30 µg/L in all the samples collected from NHS Groundwater monitoring wells except five samples. Uranium was found to be in the range of not detectable to 56.73µg/L (Fig. 7). The Districts which are partly affected by high Uranium in ground water are - Dohad, Ahmedabad, Vadodara, Patan.
Fig.7 Location of high uranium in shallow aquifers in Delhi

Bhujal News, 31 (1-4) : 01-24
13
6.7 Haryana & Chandigarh A total number of 451 water samples from NHS Groundwater monitoring wells were
collected for Uranium analysis. In 88 samples out of total 451 samples analysed that is in 19.5%, Uranium concentrations have been found to be more than 30µg/L (permissible limit for drinking water prescribed by WHO). Uranium more than 60 µg/L (permissible limits as per Atomic Energy Regulatory Board (DAE) has been detected in 20 samples in Haryana. The highest value obtained is 131.4 µg/L at Sohu in Hissar District. In Chandigarh all samples have been found to be within the permissible limit. The Districts which are partly affected by high Uranium in ground water are - Ambala, Bhiwani, Faridabad, Fatehabad, Gurugram, Hissar, Jhajjar, Jind, Kaithal, Karnal, Kurukshetra, Mahendergarh, Palwal, Panipat, Rohtak , Sirsa, Sonipat, Yamuna Nagar(Fig. 8).
Fig.8 Location of high uranium in shallow aquifers in Haryana
6.8 Himanchal Pradesh
A total of 122 ground water samples were collected from groundwater Monitoring stations falling in different hydro geological settings of the State. Uranium was found to be within the permissible limit of 30 µg/L in all the samples collected from NHS Groundwater monitoring wells except in one sample at Lohara (70.7 µg/L ) in Mandi District.

Bhujal News, 31 (1-4) : 01-24
14
6.9 Jammu & Kashmir A total of 314 ground water samples were collected from ground water monitoring
Stations falling in different hydro geological settings of the State. Uranium was found to be within the permissible limit of 30 µg/L in all the samples collected from NHS Groundwater monitoring wells. The highest value has been obtained in sample at Arnia-II (23.7 µg/L) in Ramgarh block of Jammu District. 6.10 Jharkhand
A total of 399 ground water samples were collected during Pre-Monsoon season (May-2019) from Groundwater Monitoring Stations falling in different hydro geological settings of the State. Uranium was found to be within the permissible limit of 30 µg/L in all the samples collected from NHS Groundwater monitoring wells except six samples (1.5%). Uranium more than 60 µg/L (permissible limits as per Atomic Energy Regulatory Board (DAE)) has been detected in one sample in Jharkhand. The highest values obtained is 69.9 µg/L at Koderma in Koderma District. (Figure 9). Uranium was found to be in the range of not detectable to 69.9 µg/L . The Districts which are partly affected by high Uranium in ground water are - Godda, Koderma, Latehar, Palamau.
Fig.9 Location of high uranium in shallow aquifers in Jharkhand
6.11 Karnataka & Goa
A total number of 737 water samples from Groundwater monitoring Stations were collected. The concentration of uranium ranges from 0.0 to 201.01 µg/L with an average of 4.22µg/L. Out of 737 wells, 14 wells (2%) exceed the WHO permissible limit of 30 µg/L, which are from the districts of Gulburga, Mandya, Raichur, Bangalore Urban, Bangalore Rural, Tumkur, Bellary and Kolar. The details of locations which exceed the permissible limit of 30 µg/L is given in Table 12 & Fig. 10. The highest value of 201.01 µg/L was recorded at location Chintamani, Chintamani Tehsil of Kolar district. Uranium concentration in the shallow ground water of the state varies primarily due to recharge and discharge, which would have dissolved or leached the uranium from the weathered soil to groundwater zone. High uranium concentrations observed in shallow ground water may be due to local geology, anthropogenic activities, urbanization and use of phosphate fertilizers in huge quantity for agriculture purpose. The total uranium resources in phosphate rocks is estimated at 9 X 10⁶metric tons of uranium. Studies have shown that phosphate fertilizer possess uranium concentration ranging from 1 mg/kg to 68.5mg/kg.

Bhujal News, 31 (1-4) : 01-24
15
Hence, the phosphate fertilizers manufactured from phosphate rocks may also contribute uranium to ground water in agriculture region. It is also observed that most of the higher concentrations of uranium were found in the samples collected from intensive agriculture region. To study the impact of mineralization, it is also important to monitor the groundwater quality in deeper aquifer in the area where the higher values of uranium were noticed from shallow aquifer.
Fig.10 Location of high uranium in shallow aquifers in Karnataka
6.12 Kerala
A total of 423 ground water samples were collected during Pre-Monsoon season (May-2019) from Groundwater Monitoring Stations falling in different hydro geological settings of the State. Uranium was found to be within the permissible limit of 30 µg/L in all the samples collected from Ground water monitoring wells. Uranium was found to be in the range of not detectable to 1.45 µg/L.
6.13 Madhya Pradesh A total of 1191 ground water samples were collected during Pre-Monsoon season
(May-2019) from Groundwater Monitoring Stations falling in different hydro geological settings of the State. The concentration of uranium ranges from 0.0 to 233.91 µg/L (Fig. 11). Out of 1191 wells, 16 wells (1.3%) exceeded the WHO permissible limit of 30 µg/L and in 7 wells it has been found to be more than 60 µg/L . The highest value of 233.9 µg/L was recorded at location Ghantigaon, Ghantigaon Tehsil of Gwalior district. The Districts which are partly affected by high Uranium in ground water are - Balaghat, Betul, Chhatarpur, Datia, Gwalior, Jhabua, Panna, Raisen, Seoni, Shivpuri.
Bhujal News, 31 (1-4) : 01-24
16
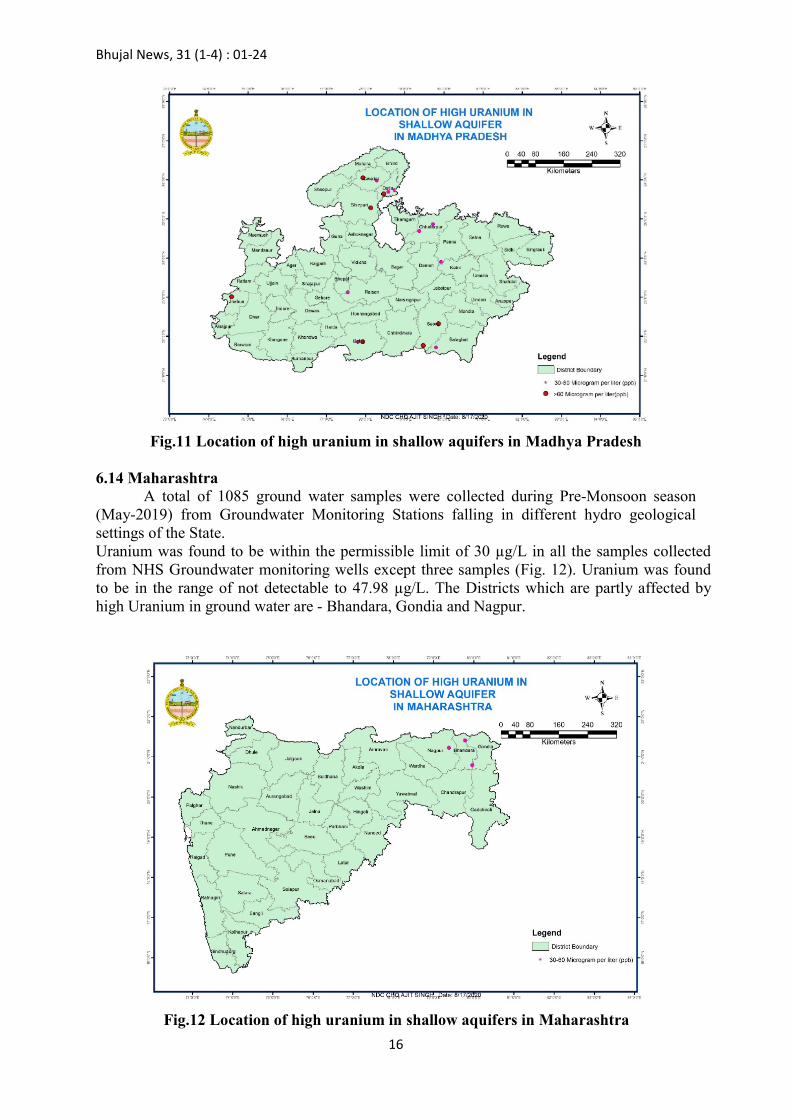
Fig.11 Location of high uranium in shallow aquifers in Madhya Pradesh
6.14 Maharashtra
A total of 1085 ground water samples were collected during Pre-Monsoon season (May-2019) from Groundwater Monitoring Stations falling in different hydro geological settings of the State. Uranium was found to be within the permissible limit of 30 µg/L in all the samples collected from NHS Groundwater monitoring wells except three samples (Fig. 12). Uranium was found to be in the range of not detectable to 47.98 µg/L. The Districts which are partly affected by high Uranium in ground water are - Bhandara, Gondia and Nagpur.
Fig.12 Location of high uranium in shallow aquifers in Maharashtra
Bhujal News, 31 (1-4) : 01-24
17
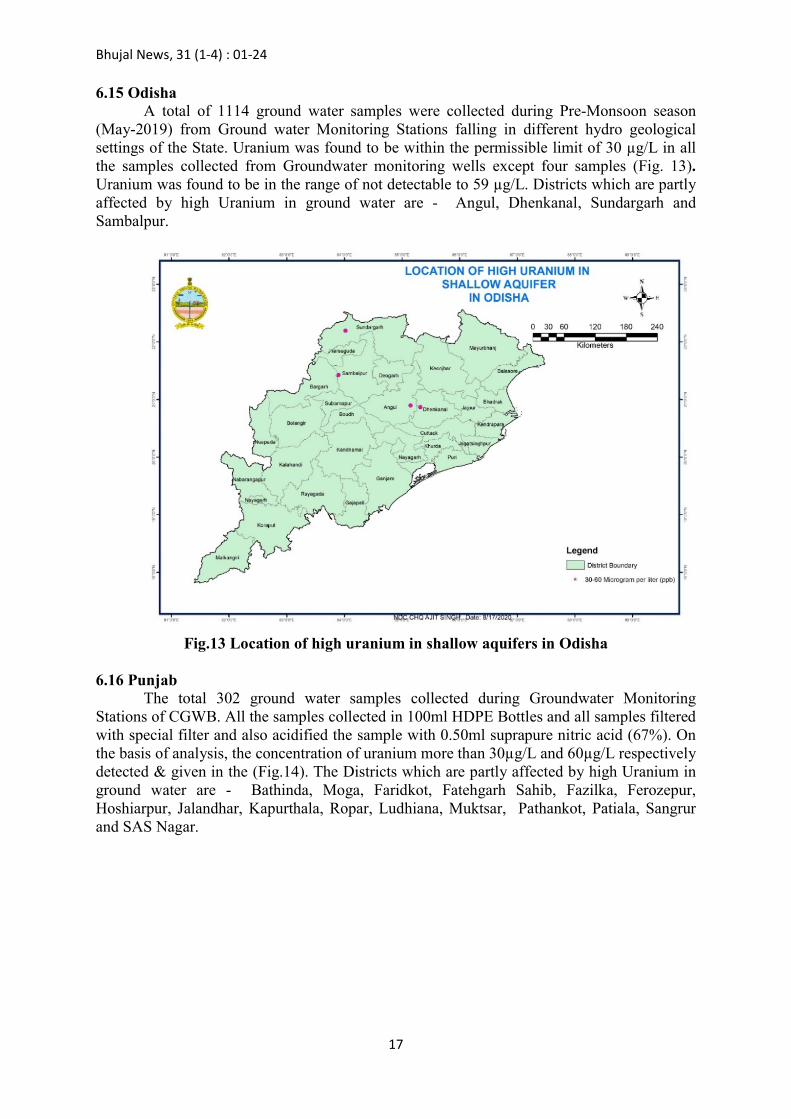
6.15 Odisha A total of 1114 ground water samples were collected during Pre-Monsoon season
(May-2019) from Ground water Monitoring Stations falling in different hydro geological settings of the State. Uranium was found to be within the permissible limit of 30 µg/L in all the samples collected from Groundwater monitoring wells except four samples (Fig. 13). Uranium was found to be in the range of not detectable to 59 µg/L. Districts which are partly affected by high Uranium in ground water are - Angul, Dhenkanal, Sundargarh and Sambalpur.
Fig.13 Location of high uranium in shallow aquifers in Odisha
6.16 Punjab
The total 302 ground water samples collected during Groundwater Monitoring Stations of CGWB. All the samples collected in 100ml HDPE Bottles and all samples filtered with special filter and also acidified the sample with 0.50ml suprapure nitric acid (67%). On the basis of analysis, the concentration of uranium more than 30µg/L and 60µg/L respectively detected & given in the (Fig.14). The Districts which are partly affected by high Uranium in ground water are - Bathinda, Moga, Faridkot, Fatehgarh Sahib, Fazilka, Ferozepur, Hoshiarpur, Jalandhar, Kapurthala, Ropar, Ludhiana, Muktsar, Pathankot, Patiala, Sangrur and SAS Nagar.

Bhujal News, 31 (1-4) : 01-24
18
Fig.14 Location of high uranium in shallow aquifers in Punjab
6.17 Rajasthan
A total of 671 ground water samples were collected during Pre-Monsoon season (May-2019) from Groundwater Monitoring Stations falling in different hydro geological settings of the State. In 48 (7.15%) samples Uranium concentrations have been found to be more than the permissible limit for drinking water prescribed by WHO. Uranium more than 60 µg/L (permissible limits as per Atomic Energy Regulatory Board (DAE)) has been detected in 8 (1.19%) samples in the States. The highest values obtained is 181 µg/L at Bagot in Nagaur District in Rajasthan (Fig. 15). Uranium concentration above 30 μg/L is observed in 21 districts out of 33 districts of Rajasthan state (7.15%). The Districts which are partly affected by high Uranium in ground water are - Ajmer, Alwar, Banswara, Barmer, Bhilwara, Bikaner, Bundi, Chittaugarh, Churu, Dausa, Ganganagar, Jaipur, Jelore, Jodhpur, Karauli, Nagaur, Pratapgarh, Rajsamand, Sawai Madhopur, Tonk and Udaipur.
Bhujal News, 31 (1-4) : 01-24
19
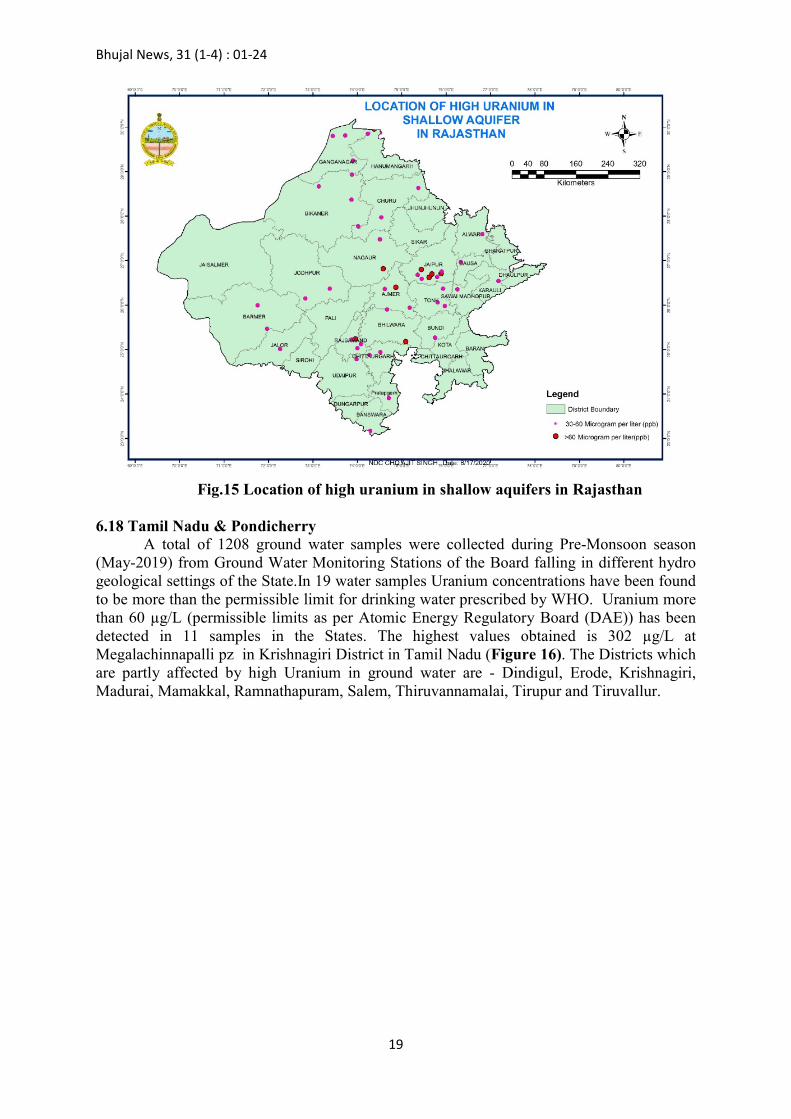
Fig.15 Location of high uranium in shallow aquifers in Rajasthan
6.18 Tamil Nadu & Pondicherry
A total of 1208 ground water samples were collected during Pre-Monsoon season (May-2019) from Ground Water Monitoring Stations of the Board falling in different hydro geological settings of the State.In 19 water samples Uranium concentrations have been found to be more than the permissible limit for drinking water prescribed by WHO. Uranium more than 60 µg/L (permissible limits as per Atomic Energy Regulatory Board (DAE)) has been detected in 11 samples in the States. The highest values obtained is 302 µg/L at Megalachinnapalli pz in Krishnagiri District in Tamil Nadu (Figure 16). The Districts which are partly affected by high Uranium in ground water are - Dindigul, Erode, Krishnagiri, Madurai, Mamakkal, Ramnathapuram, Salem, Thiruvannamalai, Tirupur and Tiruvallur.

Bhujal News, 31 (1-4) : 01-24
20
Fig.16 Location of high uranium in shallow aquifers in Tamilnadu
6.19 Telangana
A total of 345 ground water samples were collected during Pre-Monsoon season (May-2019) from Ground water monitoring Stations of the Board falling in different hydro geological settings of Telangana State. Out of 345 samples analysed, in 36 samples (10.4%)Uranium concentrations have been found to be more than 30µg/L , the permissible limit for drinking water prescribed by WHO. Uranium more than 60 µg/L (permissible limits as per Atomic Energy Regulatory Board (DAE)) has been detected in 10 samples in Telangana States. The highest values obtained is 158 µg/L at Koti in Hyderabad district of Telangana. The following reasons may attribute for high concentration of Uranium in Ground water (Figure 17). Granites particularly younger granitic intrusive can be the source rocks for high concentration of Uranium in Nalgonda and Mahabubnagar districts in Telangana. High solubility of Uranium observed from calcium rich associated minerals of the host rocks and in host rocks having lineaments, the subsequent leaching of uranium into ground water. The Districts which are partly affected by high Uranium in ground water are - Adilabad, Hyderabad, Mahabubnagar, Medak, Nalgonda and Ranga Reddy.

Bhujal News, 31 (1-4) : 01-24
21
Fig.17 Location of high uranium in shallow aquifers in Telangana
6.20 Uttarakhand A total number of 186 water samples from Groundwater monitoring wells of the Board
in 2019 were collected for Uranium analysis. Uranium was found to be within the permissible limit of 30 µg/L in all the samples collected from NHS Groundwater monitoring wells. Uranium was found to be in the range of not detectable to 24.17 µg/L.
6.21 Uttar Pradesh A total number of 826 water samples from Ground water Monitoring Stations were
collected for Uranium analysis. In 22 water samples, Uranium concentrations have been found to be more than the permissible limit for drinking water prescribed by WHO. Uranium more than 60 µg/L (permissible limits as per Atomic Energy Regulatory Board (DAE)) has been detected in 3 samples in the States. The highest values obtained is 189 µg/L at Mohammadpur in Bijnor District in Uttar Pradesh (Figure 18). The Districts which are partly affected by high Uranium in ground water are - Aligarh, Azamgarh, Bijnaur, Badaun, Bulandshaher, Deoria, Farrikhabad, Fatehpur, G.B.Nagar, Ghaziabad, Ghazipur, Hardoi, Hathras, J P Nagar, Kanpur Nagar, Mainpuri, Mathura, Pratapgarh, Raebarelli, Sultanpur and Unnao.

Bhujal News, 31 (1-4) : 01-24
22
Fig.18 Location of high uranium in shallow aquifers in UttarPradesh
6.22 West Bengal & A & N A total of 935 ground water samples were collected during Pre-Monsoon season
(May-2019) from Groundwater Stations falling in different hydro geological settings of the State of West Bengal and A & N. Uranium was found to be within the permissible limit of 30 µg/L in all the samples collected except in one sample at Malda Town (34.26 µg/L) in Malda District.
7.0 REMEDIAL MEASURES Ex situ Treatment (Saha et al., 2014) of radioactive contaminants in ground water fall
into following categories
Adsorption or ion exchange: The water soluble contaminants are captured by sorption onto a solid support that can be natural or synthetic material. Reactive sorption: is based on reaction of contaminant with solid substrate. It is often applied in situ as a barrier wall that the contaminant is forced through and is trapped. Precipitation: This is mostly practiced above ground and involves addition of alkali to raise the pH & precipitate the oxide or hydroxide. Reverse osmosis: Water is transported through a high pressure gradient through a membrane essentially non permeable to the contaminant. Stripping: Only applicable to volatile contaminants like radon. Remedial strategies based on in-situ chemical stabilization are as effective as the geochemistry of the site permits. Such chemical technologies may be generally grouped according to the following paradigm.
Redox Technologies: These technologies attempt to manipulate oxidation-reduction conditions of the subsurface to reduce uranium to uranous (uranium IV) forms. The
Bhujal News, 31 (1-4) : 01-24
23
techniques include in-situ redox manipulation using sodium dithionite, zero-valent iron, microbial induced reduction, and calcium polysulfide technologies. The common deficiency of technologies in this category is that the reduced environment and corresponding uranium precipitate is easily re-oxidized over time. Consequently, over time the “treated” uranium is remobilized. Co-precipitated Iron Oxy-hydroxide: This technology affects only temporary stabilization because the reaction is reversed as the precipitate ages. Phosphate Precipitation Technologies: These technologies apply and modify phosphate with uranyl (uranium VI) forms to remove soluble uranium and prevent further dissolution of uranium by sequestration, immobilization, or precipitation. The resulting reaction seeks to create a stable, long-lasting reaction that removes the source of ongoing uranium contamination to the groundwater. However, this group of technologies requires further development.
Flushing Technologies: This group of remediation technologies uses a variety of leaching solutions to dissolve solid-phase uranium and hydraulic extraction techniques to remove the solubilized uranium. Subsurface stratigraphic heterogeneities make comprehensive treatment difficult to attain. Hydraulic capture and capture of the mobilized uranium can be problematic.
8.0 CONCLUSIONS Uranium levels in ground water may vary depending on geological formations
surrounding the source water, on the presence of factors affecting uranium mobilization & on the proximity of source water to uranium. High level of Uranium in groundwater has been detected, predominantly in the states of Haryana, Punjab, Rajasthan, Telangana, Uttar Pradesh, Andhra Pradesh, Tamilnadu, Jharkhand and Chhattisgarh. The concentration of Uranium in groundwater has been detected at places up to 2876 µg/L. It has been found that 151 districts in 18 States are partly affected by high (>30ppb) concentration of Uranium in ground water. The studies conducted so far with regard to the presence of Uranium in ground water are limited. A thorough and comprehensive investigation is required to be undertaken involving concerned agencies. A comprehensive aquifer wise water sampling should be taken up in the first phase to assess the intensity of contamination. Based on the results, contaminated areas should be precisely demarcated and micro-level studies should be initiated in those pockets. Utmost caution needs to be exercised in these areas for using ground water for drinking purposes. Acknowledgements: The Corresponding authors are thankful to Chairman, Dr.P.Nandkumaran for allowing in contributing this paper for publication. Authors are thankful to all field hydrogeologist and chemists of different regions of CGWB in India for doing sampling and chemical analysis of water samples.
Bhujal News, 31 (1-4) : 01-24
24
References: 1. WHO (2011) Guidelines for drinking-water quality 4th edition, Switzerland Geneva, World
Health Organization, 2011
2. AERB (Atomic Energy Regulatory Board). 2004. Directive for Limit on Uranium in Drinking Water, India. Mumbai: Atomic Energy Regulatory Board.
3. Coyte, R.M., Jain, R.C., Srivastava, S.K., Sharma, K.C., Khalil, A., Ma, L. and Vengosh, A., 2018. Large-scale uranium contamination of groundwater resources in India. Environmental Science & Technology Letters, 5(6), pp.341-347.
4. APHA, AWWA & WEF (2012) Standard Methods for the Examination of Water and Wastewater. Standard Methods 22nd Edition
5. Barry Smith, (2004) Uranium in groundwater, Impacts on health, geochemical exploration and radiate disposal by Earthwise issue 21. British Geological Survey © NERC, pp.18-19
6. Prakash Ram, Bhartariya K.G, Singh Supriya, Singh Karam, Rajak Madhavi, Kaushik Y.B (2020) Uranium and Its Correlation with other Geogenic Contaminants in Ground Water of Ganga Yamuna Doab, Fatehpur District,Uttar Pradesh, India. Journal Geological Society of India Vol.95, pp.359-365.
7. Richards A. Laura, Kumar Arun, Shankar Prabhat, Gaurav Aman, Ghosh Ashok, Polya A. David (2020) Distribution and Geochemical Controls of Arsenic and Uranium in Groundwater-Derived Drinking Water in Bihar, India. International Journal of Environmenta Research and Public Health.
8. Saha D, Singh B P, Srivastava, S K, Diwedi S N and Mukherjee R Concept Note on geogenic contamination of ground water in India, CGWB, MOWR, GOI Faridabad (2014)
9. Zamora ML, Tracy BL, Zielinski JM, Meyerhof DP, Moss MA (1998) Chronic ingestion of
uranium in drinking water: a study of kidney bioeffects in humans. ToxicolSci 43(1):68–77.
10. Kurttio P, Auvinen A, Salonen L, Saha H, Pekkanen J, MäkeläinenI,Vaisanen SB, Penttila IM, Komulainen H (2002) Renal effects ofuranium in drinking water. Environ Health Perspect 110(4):337.
11. Guo H, Jia Y, Wanty RB, Jiang Y, Zhao W, Xiu W, Shen Z, Li Y, Cao Y, Wu Y, Zhang D,
Wei C, Zhang Y, Cao W, Foster A (2016) Contrasting distributions of groundwater arsenic and uranium in the western Hetao basin, Inner Mongolia: implication for origins and fate controls. Sci Total Environ 541:1172–1190
12. Wu Y, Wang Y, Xie X (2014) Occurrence, behavior and distribution of high levels of
uranium in shallow groundwater at Datong basin, northern China. Sci Total Environ 472:809–817.

Bhujal News, 31 (1-4) : 25-36
25
Rejuvenation and management of springs in Uttarakhand Himalaya
Anurag Khanna*1, CGWB, CHQ, Faridabad Debasish Bagch2, CGWB, Eastern Region, Kolkata
*Corresponding [email protected]
Abstract: Springs are the major source of fresh water in the mountainous watersheds of Himalaya within Uttarakhand. In recent times, discharge of the springs in Uttarakhand has diminished due to stress including the effect of Global Climate Change and improper management of the watersheds. It has been reported that in Kumaun Himalaya alone, spring discharge has reduced by 40% over thirty-five years from 1951 to 1986. As per available data, several districts like Almora, Pauri Garhwal, Tehri Garhwal and Chamoli are facing an acute drinking water crisis and a staggering 8800 villages are categorized as water-scarce villages in both the Garhwal and Kumaun Himalaya. There is an urgent need for mitigation and adaptation strategies to address the water security in Uttarakhand. This paper deals with few strategies that should be adopted for spring rejuvenation, which may guide future action research programmes on spring hydrology in Uttarakhand Himalaya. It has been observed that as compared to the spring sanctuary development programme, an integrated springshed management and spring rejuvenation approach has better potential to address the challenges of implementing a long-term, sustainable management of spring-based water supply systems in the Himalaya with the active participation of the local community. A case study on rejuvenation of geothermal spring at Gaurikund with riverbank protection has demonstrated the importance of an integrated study involving geology, hydrogeology, geophysics and engineering survey in the Central Himalaya. Keywords: springshed management, spring rejuvenation, Uttarakhand Himalaya, geothermal spring, electrical Resistivity, tomography

Bhujal News, 31 (1-4) : 25-36
26
1.0 Introduction Uttarakhand State is a part of the north-western Indian Himalayan Region (IHR)
covering a geographical area of 53483 km2. The state is bounded by north latitudes 28º43' to 31º27' and east longitudes 77º34' to 81º02' having ~85% of the total geographical area falling in the mountainous terrain comprising Sub Himalaya, Lesser Himalaya, Central Himalaya and Tethys Himalaya. Springs are of crucial importance in rural Uttarakhand. About 80% of rural households are dependent on springs for drinking water. With changing climatic conditions, springs are drying up because source aquifers are not adequately recharged. The difference in the volume of water flowing down the springs during the dry (summer) and the rainy season is continuously increasing, resulting in too-little and too-much water syndrome. For the sustainable development and management of springs, it is essential to understand the hydrogeology and the surface water regime, both on the local and regional scale. Spring is a location at the land surface where groundwater discharges from an aquifer, creating a visible flow (Kresic and Stevanovic 2010). In other words, spring is a concentrated flow of groundwater issuing from the subsurface into a body of surface water or onto the land surface at a rate sufficient to form a current flow (Schwartz and Zhang 2003). The abrupt termination of aquifers along mountain slopes and exposures in valleys causes the aquifers to discharge groundwater in the form of springs. Appreciable reasons for the problem of drying springs in the Garhwal and Kumaun Himalaya include the abrupt population increase (4.88% of urban population increased between 2001 and 2011 as per the Census, 2011) and decline in spring discharge due to erratic rainfall, which may be an aftermath of Global Climate Change. Other factors which cause springs to dry up are unprecedented construction activity and deforestation in the recharge areas. Deforestation, erosion of topsoil, forest fires and unplanned development reduces the spongy action of land and creates a hydrological imbalance in the springshed (Fetter 2001). The basic concept of spring rejuvenation is how to increase water retention in mountain watersheds for a sustainable discharge and how to manage spring discharge when it is in excess during monsoon or post-monsoon to avoid wastage of potable water resources. Discharge of springs does not remain constant with time and space. Fluctuation in spring discharge is due to variation in the rate of recharge and prevailing hydrological and geological conditions (Todd and Mays 2005). As these conditions do not change very frequently, Spatio-temporal variability of spring discharge can be attributed mainly to the corresponding change in rainfall pattern. Fluctuations in spring discharge are primarily due to variations in the rainfall pattern or more precisely, due to variations in the amount of rainwater that can infiltrate and recharge the aquifer. Marked variation in spring discharge indicates rapid infiltration of rainwater and recharge to the shallow, unconfined aquifers in colluvial springs, and the spring hydrograph shows a strongly periodic, seasonal rhythm. Superimposed on these variations is a periodic (monthly) fluctuation resulting from occasional heavy rainfall, generally in the monsoon period. Groundwater recharge augments the discharge of springs and seepages, thus resulting in higher spring discharge. The high discharge lowers the water table, reduces the hydraulic gradient and the pore water pressure. This transience in recharge and discharge is the cause of the seasonal, local and short-term fluctuations in spring discharge.
Many springs owe their genesis to structural features such as fractures, faults and other structurally weak discontinuity surfaces. These structural elements serve as channels through which groundwater flows and finally emerges from a suitable outlet (also called orifice) in the form of springs. Traditionally, spring water is considered clean due to the natural filtering that occurs during infiltration and its movement through shallow and deep aquifers. Water from springs sufficed the village needs in Uttarakhand in the past. However, over the last two decades or so, both the quantity (discharge) and quality of water from the springs is undergoing depletion and deterioration.

Bhujal News, 31 (1-4) : 25-36
27
2.0 Springs in Uttarakhand Himalaya More than 1200 springs in Uttarakhand have been studied by the Central Ground Water
Board (CGWB), various Non-Government Organizations, academic institutes and universities, central and state government departments working in water sector and various task forces constituted by the Government of India from time to time. In this section, district-wise details of springs studied by the CGWB, Uttaranchal Region (UR) is summarized. A map showing locations of springs in Uttarakhand (CGWB 2018) is given in Fig. 1.
Fig.1 Location of Springs with “Spring Line”, Uttarakhand (CGWB)
Springs can be of various types including gravitational and non-gravitational (Bryan 1919), tectonic and geothermal (hot) springs (Todd and Mays 2005). In Garhwal and Kumaun Himalaya, springs are genetically classified into five types based on field studies by CGWB, UR. The various genetic spring types inventoried in Uttarakhand Himalaya are discussed below:
2.1 Depression springs Such springs are formed when the water table intersects the land surface. Changes in
topography leads to undulation in water table configuration that creates a local discharge area giving rise to formation of a depression spring. Such springs are common in Lesser and Higher Himalaya in Uttarakhand. They are observed in many sections, prominent among which are along Dehradun-Uttarkashi, Rishikesh-Badrinath, Rudraprayag-Kedarnath and Haldwani–Munsiyari road sections. Field photograph of a depression spring in Pithoragarh district is shown in Fig. 2.
Fig. 2. Depression spring (naula) at village Meldungri, Pithoragarh district
Bhujal News, 31 (1-4) : 25-36
28
2.2 Contact springs These springs are formed when permeable rocks overlie low-permeability rocks.
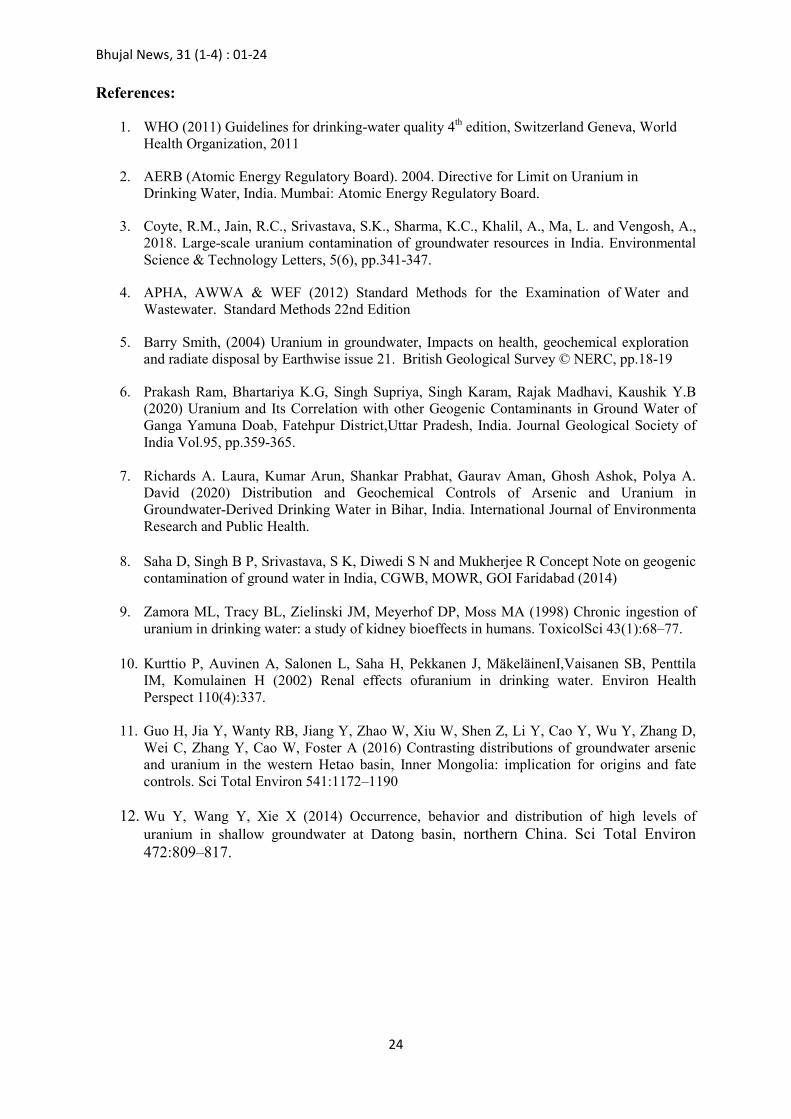
Contact springs are common where phyllites, shales and slates occur in close association with more permeable fractured or jointed rocks. Contact springs occur in areas affected by contact metamorphism that are proximal to basic/metabasic intrusives; prominent among which are the Sonprayag Granite (a part of Kedarnath Granitoids) in Rudraprayag district, Gangotri Granitoids in Uttarkashi district and Bhimtal Metavolcanics in Nainital and Almora districts. Such springs are also observed along the Main Central Thrust and its sympathetic fault-thrust system in Tehri Garhwal, Bageshwar, Chamoli and Pithoragarh districts. Field photograph of a contact spring in the Mussoorie Hills (Garhwal Lesser Himalaya), Dehradun district is shown in Fig. 3.
Fig. 3. Contact spring at Kandighat, Mussoorie Hills, Dehradun district
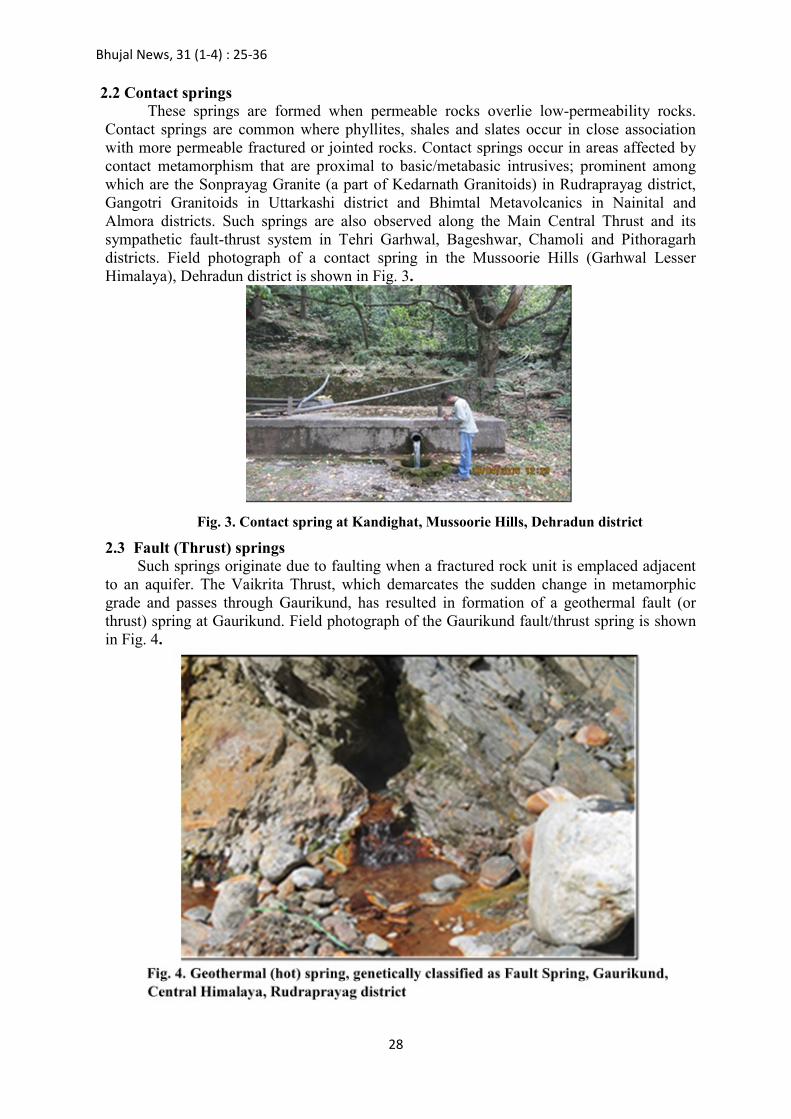
2.3 Fault (Thrust) springs Such springs originate due to faulting when a fractured rock unit is emplaced adjacent to an aquifer. The Vaikrita Thrust, which demarcates the sudden change in metamorphic grade and passes through Gaurikund, has resulted in formation of a geothermal fault (or thrust) spring at Gaurikund. Field photograph of the Gaurikund fault/thrust spring is shown in Fig. 4.
Bhujal News, 31 (1-4) : 25-36
29
2.4. Cavernous springs Such springs are formed where a cavern is connected to a shaft that rises to ground
surface. Subterranean caverns in limestone and dolomitic limestone terrain gives rise to formation of such springs. They are commonly observed in Krol Group of rocks in the Garhwal Himalaya e.g. the famous Kempty Falls (spring) and in Doon Valley at places like Robbers Cave (Gucchu Pani) and Sahastra Dhara (literally meaning a thousand springs), that are also sulphurous. Such springs in limestone terrain also occur in eastern Kumaun Himalaya in Pithoragarh and Champawat districts.
2.5. Joint/Fracture springs : The joint/fracture springs originate in fractured/jointed or low permeability rocks.
Water movement through such rock is principally through fractures and/or joint planes and are formed when these fractures intersect land surface at lower elevations. Such springs are found in almost all the hilly districts of Uttarakhand.
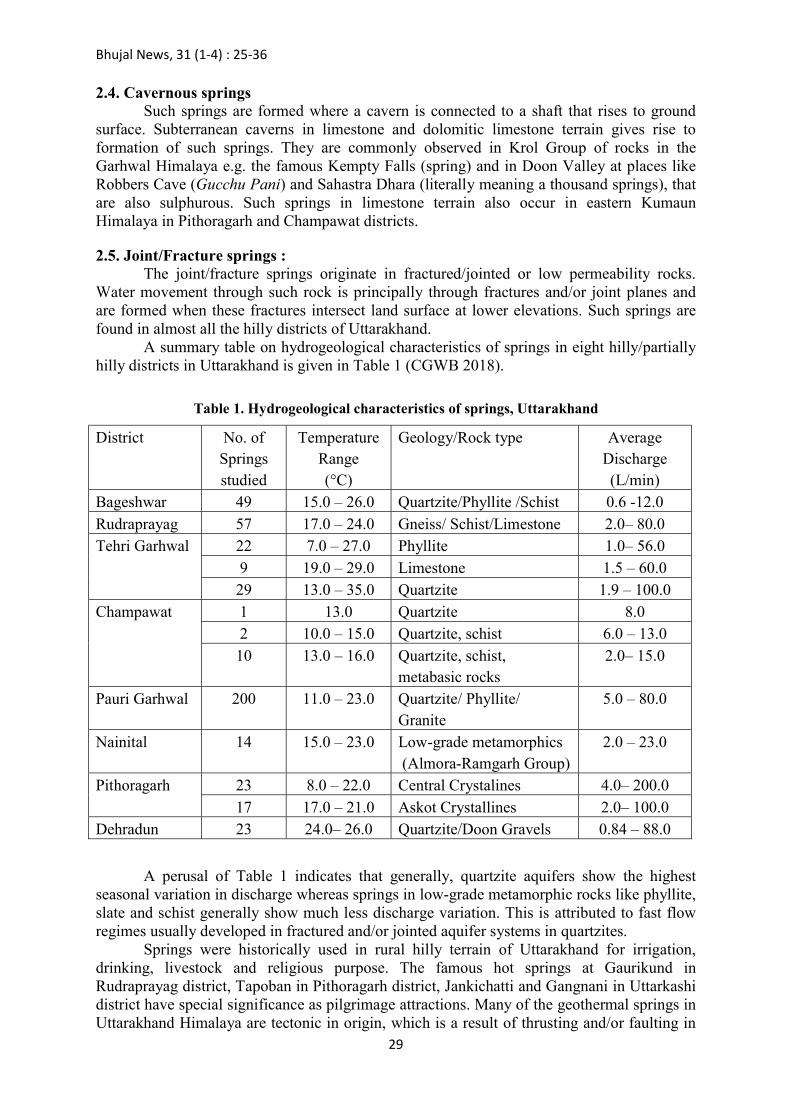
A summary table on hydrogeological characteristics of springs in eight hilly/partially hilly districts in Uttarakhand is given in Table 1 (CGWB 2018).
Table 1. Hydrogeological characteristics of springs, Uttarakhand
District No. of Springs studied
Temperature Range (°C)
Geology/Rock type Average Discharge (L/min)
Bageshwar 49 15.0 – 26.0 Quartzite/Phyllite /Schist 0.6 -12.0 Rudraprayag 57 17.0 – 24.0 Gneiss/ Schist/Limestone 2.0– 80.0 Tehri Garhwal 22 7.0 – 27.0 Phyllite 1.0– 56.0
9 19.0 – 29.0 Limestone 1.5 – 60.0 29 13.0 – 35.0 Quartzite 1.9 – 100.0
Champawat 1 13.0 Quartzite 8.0 2 10.0 – 15.0 Quartzite, schist 6.0 – 13.0 10 13.0 – 16.0 Quartzite, schist,
metabasic rocks 2.0– 15.0
Pauri Garhwal 200 11.0 – 23.0 Quartzite/ Phyllite/ Granite
5.0 – 80.0
Nainital 14 15.0 – 23.0 Low-grade metamorphics (Almora-Ramgarh Group)
2.0 – 23.0
Pithoragarh 23 8.0 – 22.0 Central Crystalines 4.0– 200.0 17 17.0 – 21.0 Askot Crystallines 2.0– 100.0
Dehradun 23 24.0– 26.0 Quartzite/Doon Gravels 0.84 – 88.0
A perusal of Table 1 indicates that generally, quartzite aquifers show the highest seasonal variation in discharge whereas springs in low-grade metamorphic rocks like phyllite, slate and schist generally show much less discharge variation. This is attributed to fast flow regimes usually developed in fractured and/or jointed aquifer systems in quartzites.
Springs were historically used in rural hilly terrain of Uttarakhand for irrigation, drinking, livestock and religious purpose. The famous hot springs at Gaurikund in Rudraprayag district, Tapoban in Pithoragarh district, Jankichatti and Gangnani in Uttarkashi district have special significance as pilgrimage attractions. Many of the geothermal springs in Uttarakhand Himalaya are tectonic in origin, which is a result of thrusting and/or faulting in

Bhujal News, 31 (1-4) : 25-36
30
medium to high-grade meta-igneous and meta-sedimentary rocks. A study has shown that discharge in mountain springs has reduced substantially (50% to >90%) in the Lesser and Sub-Himalaya. A summary table showing reduction in average spring discharge for 496 mountain springs tapped by gravity schemes for drinking water supply, as per the data base compiled from Uttarakhand Jal Sansthan, Dehradun is given in Table 2.
Table 2. Average discharge of springs tapped through gravity-based schemes
(Source: Uttarakhand Jal Sansthan)
District Block No. of springs with percentage reduction in average discharge (L/min) (from 2013
to 2018)
Total number of
springs
50-75% >75-90% >90%
Pauri Garhwal
Ekeshwar 3 18 6 27 Bironkhal 3 11 3 17 Kot 3 33 2 38 Khirsu 3 9 8 20 Pokhra 3 11 1 15 Kaljikhal 3 20 19 42 Pauri 3 7 - 10 Thalisain 3 2 - 5 Pabo 2 9 - 11 Total 26 120 39 185
Dehradun
Raipur 2 1 - 3 Sahaspur 1 - 1 2 Chakrata 2 1 1 4 Doiwala 1 2 - 3 Total 6 4 2 12
Rudraprayag Augustmuni 12 - 3 15 Total 12 - 3 15
Chamoli
Karanprayag 1 - - 1 Pokhari 2 2 - 4 Dasoli 2 3 - 5 Narayan Bagar 2 - - 2 Ghat 3 - - 3 Tharali 3 4 - 7 Gairsain 2 - - 2 Total 15 9 - 24
Tehri Garhwal
Kirtinagar 2 4 1 7 Chamba 2 3 5 10 Jakhnidhar 3 15 4 22 Jaunpur - 1 1 2 Thouldhar 3 2 2 7 Devprayag 3 - - 3
Bhujal News, 31 (1-4) : 25-36
31
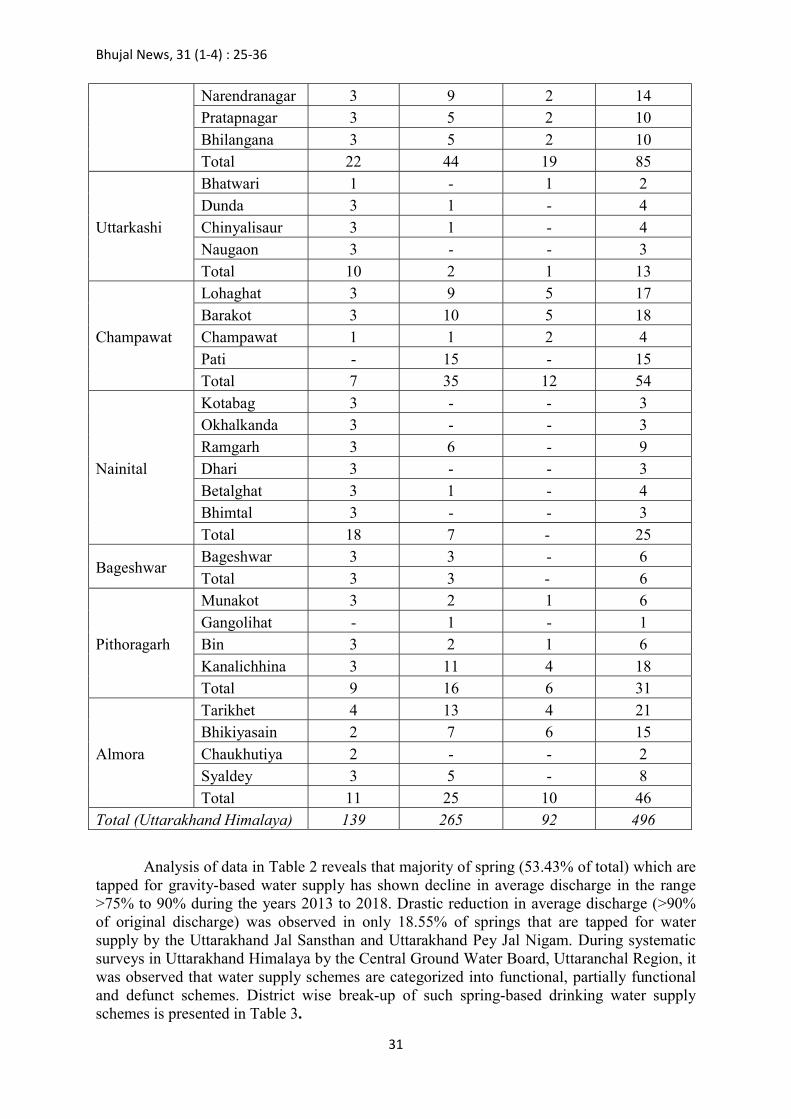
Narendranagar 3 9 2 14 Pratapnagar 3 5 2 10 Bhilangana 3 5 2 10 Total 22 44 19 85
Uttarkashi
Bhatwari 1 - 1 2 Dunda 3 1 - 4 Chinyalisaur 3 1 - 4 Naugaon 3 - - 3 Total 10 2 1 13
Champawat
Lohaghat 3 9 5 17 Barakot 3 10 5 18 Champawat 1 1 2 4 Pati - 15 - 15 Total 7 35 12 54
Nainital
Kotabag 3 - - 3 Okhalkanda 3 - - 3 Ramgarh 3 6 - 9 Dhari 3 - - 3 Betalghat 3 1 - 4 Bhimtal 3 - - 3 Total 18 7 - 25
Bageshwar Bageshwar 3 3 - 6 Total 3 3 - 6
Pithoragarh
Munakot 3 2 1 6 Gangolihat - 1 - 1 Bin 3 2 1 6 Kanalichhina 3 11 4 18 Total 9 16 6 31
Almora
Tarikhet 4 13 4 21 Bhikiyasain 2 7 6 15 Chaukhutiya 2 - - 2 Syaldey 3 5 - 8 Total 11 25 10 46
Total (Uttarakhand Himalaya) 139 265 92 496
Analysis of data in Table 2 reveals that majority of spring (53.43% of total) which are tapped for gravity-based water supply has shown decline in average discharge in the range >75% to 90% during the years 2013 to 2018. Drastic reduction in average discharge (>90% of original discharge) was observed in only 18.55% of springs that are tapped for water supply by the Uttarakhand Jal Sansthan and Uttarakhand Pey Jal Nigam. During systematic surveys in Uttarakhand Himalaya by the Central Ground Water Board, Uttaranchal Region, it was observed that water supply schemes are categorized into functional, partially functional and defunct schemes. District wise break-up of such spring-based drinking water supply schemes is presented in Table 3.

Bhujal News, 31 (1-4) : 25-36
32
Table 3. Categorization of spring-based water supply schemes, Uttarakhand
District Total schemes
Functional schemes
% Partially Functional schemes
% Defunct schemes
%
Udham Singh Nagar and Nainital
325 109 33.54 152 46.77 64 19.69
Almora and Bageshwar
1333 608 45.61 368 27.60 357 26.78
Pithoragarh and Champawat
1097 779 71.01 201 18.32 117 10.67
Dehradun 284 239 84.15 14 4.93 31 10.92
Pauri Garhwal 852 447 52.46 209 24.53 196 23.0
Chamoli and Rudraprayag
742 534 71.97 172 23.18 36 4.85
Tehri Garhwal 736 603 81.93 88 11.96 45 6.11
Uttarkashi 431 392 90.95 28 6.5 11 2.55
Total 5804 3711 -- 1232 -- 861 --
Percentage 100.0 -- 64.0 -- 21.0 -- 15.0
Analysis of data in Table 3 shows that Dehradun, Tehri Garhwal and Uttarkashi are the most developed districts as far as spring-based water supply is concerned, where >80% of total schemes are functional. In contrast, Udham Singh Nagar, Nainital, Almora and Bageshwar districts have fared poorly with <50% functional schemes. This indicates that priority action research programmes on spring rejuvenation are required in these four districts. Among them, Udham Singh Nagar deserves a special mention as springs in this district are not mountainous but originate along the “spring line” in a transitional area between contact of Tarai and Bhabhar zones of the Indo Gangetic alluvial tract (Fig. 1). Rapid and unplanned exploitation of groundwater in Tarai zone in and around urban centres (Rudrapur, Kashipur, SIDCUL areas in Bazpur, Pantnagar, Sitarganj and Khatima) resulted in unprecedented decline in potentiometric surface of confined and leaky confined aquifers. Overexploitation of groundwater through numerous heavy-duty tube wells for about last 15 years has resulted in cessation of artesian and sub-artesian flow conditions along the “spring line”, resulting vanishing springs and substantial reduction in discharge of active springs in the Tarai zone.
From the data presented in Table 3, it is also concluded that 861 defunct water supply schemes (15% of total) need to be made operational through sustainable programme on managed aquifer recharge and water conservation by adopting integrated watershed (or springshed) management practices. Springshed management and spring rejuvenation plans should be implemented on priority in Pauri Garhwal district having 196 defunct water supply schemes. In order to achieve this challenging task, integrated hydrogeological-geophysical-

Bhujal News, 31 (1-4) : 25-36
33
hydrological-remote sensing approach is required with pilot studies followed up by regional-scale implementation.
3.0 Spring rejuvenation and springshed management
A springshed is an area within a groundwater or surface water basin that contributes to the spring flow. The boundaries of a springshed are dynamic as they change due to change in depth to water-table for unconfined aquifers or change in potentiometric surface for confined aquifers (Kresic and Stevanovic 2010).
Spring rejuvenation essentially means a process through which the present discharge of live springs can be augmented so that a dead spring becomes a live spring through treatment of the recharge and the catchment areas. A holistic planning with well-defined objectives is required for a successful spring rejuvenation programme (Negi and Joshi 2009). Major factors responsible for declining discharge of a spring indicating that the spring needs rejuvenation are as follows:
1. Indiscriminate deforestation in the recharge area and catchment area
2. Erratic rainfall in space and time
3. Forest fire in the recharge area, mainly during the summer season
4. Grazing and trampling by cattle in the recharge area
5. Erosion of the top, fertile soil
6. Other anthropogenic factors like construction of roads and buildings in the recharge area and mining in the catchment area.
Studies on spring rejuvenation in Uttarakhand indicates that human interference, unscientific developmental activities, agriculture extension and unplanned road construction are some of the major factors that are creating hydrological imbalances in Garhwal and Kumaun Himalaya (Singh and Pande 1989, Rai et al. 1998). For a sustainable spring rejuvenation programme, some workers have suggested development of a springshed on the lines of a watershed development programme (Negi and Joshi 1996). Field experiments in this direction were done by adopting a “spring sanctuary approach” of developing the catchment area using engineering, biological and social measures (Negi and Joshi 2009). This approach involved implementing artificial recharge measures like construction of trenches, pits, check dams and plantation of native species in the recharge area. This was followed up by protection of the recharge area by barbed wire fencing, minimizing grazing and cutting of fuel wood and grass through social mobilization to create the effect of a “spring sanctuary”. However, pilot studies in IHR has shown that “springshed development approach”, which is actually springshed management through human intervention, has more promise than the traditional spring sanctuary development programme. The former method refines the “spring sanctuary approach” by using geology of the area for identification of recharge area of a spring or group of springs, which often does not follow the catchment or administrative boundary (Tambe et al. 2009). However, the major challenge for implementing a springshed development programme is to study and analyse the geology, hydrology, social and economic conditions on a long-term basis (minimum three to four years) to assess the tangible and intangible benefits of implementing a springshed management programme. Pilot studies on springshed management and spring rejuvenation through community participation needs to be taken up in Uttarakhand, as already discussed. A study on rejuvenation of geothermal (hot) spring at Gaurikund, Rudraprayag district is given below as an example.

Bhujal News, 31 (1-4) : 25-36
34
4.0 Rejuvenation of Gaurikund geothermal spring, Central Himalaya Gaurikund is a famous geothermal spring in Rudraprayag district that originated due
to thrusting/faulting in the Central Himalaya. During the 2013 Kedarnath Disaster, the thermal spring, surrounding temple complex and a part of the town was destroyed. To rejuvenate the thermal spring, integrated geological-hydrogeological-hydrochemical-geophysical-engineering study was done as a part of collaborative assignment involving the regional offices of CGWB at Dehradun, Chandigarh and Lucknow. The study indicated the hot spring is recharged by steep, southerly dipping joints in granite gneiss, heats up due to high geothermal gradient and emerges along the Vaikrita Thrust (CGWB 2016). Hydrogeological analysis shows that to the north of Gaurikund along Mandakini valley, groundwater recharge through deep percolation is the origin of Gaurikund geothermal spring.
During the spring rejuvenation study at Gaurikund (August-September 2016), four outlets of the hot spring were inventoried with discharge varying from 7.46 to 95.54 L/min. Spring water temperature was found to decrease along north-south from 58° to 35°C. This is attributed to mixing of hot water with cooler groundwater. Spring water chemistry indicates high fluoride, sodium and potassium concentrations that are attributed to rock-water interaction. Sources of these constituents in the hot spring water are minerals like apatite, sodic and calcic plagioclase in the Kedarnath (Sonprayag) Granitoids. Electrical Resistivity Tomography (ERT) reveals two distinct low resistivity zones having resistivity ranging from 20 to 50 ohm.m within a depth range of 5 to 15 m. The low resistivity zones are interpreted as main source of the thermal spring, which occur either as fractured zones with channelized groundwater flow or as highly weathered zones. Geological and engineering surveys were carried out along the right bank of Mandakini River at Gaurikund and Sonprayag. The studies indicate the need of land reclamation along Mandakini River and construction of Flood Protection Walls of suitable dimensions to arrest future landslide hazard ~200 m north of the temple complex and continuing ~100 m downstream from the buried hot spring and a defunct cold spring (sheetal kund) source. It was suggested that numerous small flows of hot water streams adjacent to the temple complex should be channelized and diverted into a cement concrete tank, which will act as a replacement tapt kund. A rectangular pit of suitable dimension may be constructed using locally available machinery to initially store the cumulative spring flow, which was measured as 110 L/min (September 2016). Total cost of rejuvenation of Gaurikund hot spring source and the adjacent bathing complex was estimated at Rs. 29.18 Crores. A schematic diagram showing the rejuvenation plan of Gaurikund geothermal spring is shown in Fig 5.
Fig.5 Schematic Rejuvenation plans for Gaurikund geothermal springs (tapt kund), Rudraprayag district, Central Himalayas
Bhujal News, 31 (1-4) : 25-36
35
6.0 Conclusions Hydrogeological characterization of springs reveals that maximum variation in
seasonal discharge is observed in quartzite aquifer system and fractured rock aquifers in high-grade metamorphic rocks of Central Crystalline Group, whereas minimum variation was seen in the phyllite-slate-schist aquifer system. Unplanned development coupled with global climate change in Uttarakhand Himalaya has resulted in drastic reduction in discharge of perennial springs that are tapped for water supply through gravity or lift schemes. Maximum effect of long-term decline (>90% of original discharge) was seen in 92 schemes. Majority of water supply schemes (53.43% of total) recorded average decline of 75-90% during the period from 2013 to 2018. Maximum number of defunct schemes were found in Almora, Bageshwar and Pauri Garhwal district, which constitutes ~50% of total defunct schemes. Action research programmes on spring rejuvenation and springshed management need to be prioritized in these districts. In Uttarakhand Himalayas, springshed management approach has more potential for spring rejuvenation as compared to spring sanctuary development through ecological, geographical and social fencing. Rejuvenation of Gaurikund geothermal spring in Central Himalaya, which is genetically classified as thrust spring, was taken as case study. The study has shown that the buried hot spring source can be rejuvenated by tapping existing outlets into a cement concrete pond, which will serve as a replacement bathing complex. Hydrochemical study at Gaurikund has shown that except high fluoride, quality of spring water is suitable for domestic use. The integrated geological-hydrogeological-engineering study has clearly indicated the need to construct a flood protection wall of suitable dimension along Mandakini River for a sustainable riverbank protection.
Acknowledgements
Authors are thankful to the Chairman, CGWB, Dr. P.Nandkumaran for allowing contribution of the paper for publication. Thanks are due to fellow hydrogeologists for extension of co-operation in bringing out this paper.
Bhujal News, 31 (1-4) : 25-36
36
References
Bryan K. 1919. Classification of springs, The Journal of Geology, 27(7), pp. 522-561. Central Ground Water Board 2018. State Hydrogeological Report of Uttarakhand, Technical
Report (Restricted), Central Ground Water Board, Uttaranchal Region, Dehradun.
Central Ground Water Board 2016. A brief report on Rejuvenation of Gaurikund hot
spring, Gaurikund, Rudraprayag District, Uttarakhand, Unpub. Report of Central
Ground Water Board, Uttaranchal Region, Dehradun.
Fetter C.W. 2001. Applied Hydrogeology, 4th Edition, Pearson Prentice Hall Inc., New
Jersey, pp. 284-289.
Kresic N. and Z. Stevanovic (Ed.) 2010. Groundwater Hydrology of Springs: Engineering,
Theory, Management, and Sustainability, Butterworth-Heinemann (Elsevier).
Negi G.C.S. and Joshi V. 1996. Geohydrology of springs in a mountain watershed: The need
for problem solving research, Current Science, 71(10), pp. 772-776.
Negi G. C. S. and Joshi V. 2009. Geo-Hydrological Studies for Augmentation of Spring
Discharge in the Western Himalaya, Final Technical Report, Ministry of Water
Resources, Govt. of India, New Delhi, 74 p.
Rai S.P., Valdiya K.S. and Rawat J.S. 1998. Management of water resources: Spring
sanctuaries. In K.S. Valdiya (ed.), The Khulgad Project: An Experiment in
Sustainable Development, Gyanodaya Prakashan, Naini Tal, India, pp. 41-60.
Schwartz F.W. and H. Zhang 2003. Fundamentals of Ground Water, John Wiley & Sons Inc.,
New York.
Singh A.K. and Pande R.K. 1989. Changes in the spring activity: Experiences of Kumaun
Himalaya, India. The Environmentalist, 9(1), pp. 75-79.
Tambe S., Arrawatia M.L., Kumar R., Bharti H. and Shreshtha P. 2009. Conceptualizing
strategies to enhance rural water security in Sikkim, Eastern Himalaya, India.
Selected technical papers from the proceedings of the workshop on Integrated Water
Resource Management, Central Ground Water Board, Eastern Region, Kolkata.
Todd D.K and L.W. Mays 2005. Groundwater Hydrology, 3rd Edition, John Wiley & Sons
Inc., New York, pp. 67-75.

Bhujal News, 31 (1-4) : 37-59
37
Assessment of selected Potentially Toxic Trace Elements contamination and groundwater chemistry of the Kolkata Megacity, West Bengal, East India
Suparna Datta*1, Sonam2, Anirvan Choudhury1, Atalanta N Chowdhury1, Keisham Radhapyari3
Suparna Datta1, CGWB, Eastern Region, Kolkata Anirvan Choudhury1, CGWB, Eastern Region, Kolkata Atlanta N. Choudhury1, CGWB, Eastern Region, Kolkata Sonam2, CGWB, Mid-Eastern Region, Patna Keisham Radhapyari3, CGWB, North Eastern Region, Guwahati
*Corresponding author. Tel.: +91-8420562766; e-mail address: [email protected]
Abstract: Megacities in South Asian developing countries are facing serious challenges in providing essential services including water and sanitation due to urbanization, rapid population growth and economic development. With the increasing demand for freshwater and heavy pumping of groundwater, the hydrogeological system may get altered in regions with low natural topographic gradients, such as deltas and floodplains beneath these urban clusters. Poor sanitation and inadequate water supply lead to the input of sewage water into the groundwater and making it unfit for human consumption. The present study focused on an integrated approach to survey the groundwater quality of Kolkata, one of the densest populated megacities of Asia concerning the distribution and co-occurrence of major ions along with potentially toxic trace elements (PTEs) (Cr, Pb, Cu, As, Mn, Fe and Zn) and the radioactive element uranium. Eighteen groundwater samples were collected and analyzed to apprehend the magnitude and the degree of contamination of these constituents in the groundwater regime of the study area. The results reveal that 61% of groundwater samples were found to have electrical conductivity more than 1500 µScm-1 and all the samples were detected with total dissolved solids beyond desirable limit of 500 mg/L (BIS, 2012). The Uranium concentration on the groundwater ranges between 0.0124 and 5.37 μg/L with an average of 0.801 μg/L concentrations and which is well below the safety limits (30 μg/L)of WHO, 2011stipulated value. At a few locations, the concentration of Fe (83%), Mn (72%) and Zn (28%) exceeds the acceptable limit of Indian drinking standards. On the contrary, the concentration of certain trace elements were found to be low and well within the prescribed limits and the average concentrations are found be 1.957 (0.0003 - 8.092) μg/L for chromium; 2.58 (0.7- 13.6) μg/L for copper; 0.632 (0.014 - 2.613) μg/L for arsenic and 0.6 (0.014-2.6) µg/L for lead. The mean concentrations of PTEs in the study area follow the order Fe>Mn>Zn>Pb>Cu>Cr. Analysis of potential contamination, health effects and suitable mitigation measures are also discussed in the paper.
Keywords: Groundwater, Kolkata Megacity, PTEs, Pollution evaluation, Health effect.

Bhujal News, 31 (1-4) : 37-59
38
1.0 Introduction Groundwater is one of the most indispensable sources of fresh water all over the
world. In the absence of available surface water sources, it becomes the main source of freshwater used for residential, industrial, agricultural and commercial activities [1-3]. Due to natural filtration through soils and rocks, groundwater is considered as inherently pure, cleaner and free from pollution and requires little treatment before use [4]. For this reason, people tend to exploit this resource to the maximum, leading to contamination of the underlying aquifers and depletion of the groundwater table [5-6]. With increasing urbanization, industrialization and population growth there is an increasing demand for water, resulting in an adverse effect on both the quantity and quality of groundwater system [7]. The water related issues are more pronounced in Megacities with high population density, non-availability of basic sanitation, production of huge municipal wastes, solid waste dumping and industrial effluents. The megacity Kolkata, with a population load more than 15 million, is scattered with numerous industries such as jute, organic chemicals, pulp and paper, pharmaceuticals, paints and varnish, acid, basic metal alloys, pesticides, leather, and coal-based power. Being in the major urban centers, these industries along with enormous populations require large quantities of water, much of which is supplied by groundwater abstraction. These establishments in and around the city produce effluents with high loads of heavy metals and other contaminants vulnerable to move into the deeper parts of the aquifer making it susceptible for human consumption [8-9]. Along with planned and unplanned industries, the city generates around 3,000 td-1 of municipal solid waste (MSW) at a rate of 450–500 g per capita per day without any source segregation arrangement [10]. Open dumping (without liners and without a leachate management facility), the saturation of an existing landfill site (Dhapa) as well as the threat of groundwater pollution is the most pressing problems for the city today [11] (Fig. 1).
The situation aggravated while paired with the presence of multiple toxic metals, pesticides and a declining trend of groundwater table. Health effects due to co-exposures to a number of toxic metals may be detrimental for both humans and animals and especially to
infants [12-13]. The presence of highly toxic metals in groundwater slightly above the permissible level may make the water more hazardous as compared to a relatively less toxic
one present well above the acceptable limit [14]. These metals come in the food chain and bio-
magnification can pose the greatest danger to organisms near the top of the chain [15-17]. Metals such as Manganese (Mn), Zinc (Zn) and Copper (Cu), in trace concentrations are required for the physiological functions of living cells and regulate many biochemical and neurological processes. The same metals, however, if discharged into natural waters at increased concentrations, in sewage, industrial effluent or from mining operations, can have severe toxicological effects on human, animals and aquatic ecosystems. Cumulative toxins such as arsenic, cadmium, lead and mercury, are particularly hazardous and fatal when co-
existed even within permissible limit [15-19]. In exposure to metals in combination, in one side they bring out their own peculiar health effects and in other side they show synergistic and antagonistic effects due to physiological, chemical and biochemical interactions.
In recent decades, radioactive substances in groundwater have been marked significantly in water quality studies. Uranium is one such naturally occurring radioactive element as well as a chemical toxin. The exposure perspective for uranium should be given prime importance due to its widespread occurrence in the geological formation and increasing groundwater consumption. The distribution of uranium in groundwater and its impact on
groundwater quality has been demonstrated by many researchers [20-23]. The present study focused on an integrated approach to survey the groundwater quality of Kolkata, one of the

Bhujal News, 31 (1-4) : 37-59
39
densest populated megacities of Asia concerning the distribution and co-occurrence of major ions, trace elements (Cr, Pb, Cu, As, Mn, Fe and Zn) and radioactive element U. Checked with the potability of the groundwater in the study area with reference to Bureau of Indian Standard (BIS) drinking water guidelines and World Health Organization (WHO) drinking water guidelines were carried out. Furthermore, the study focuses to investigate the probable sources, adverse health effects and mitigation options attributed to the presence of toxic metals and radioactive uranium in the study area both individually and in combination with each other.
Garbage
Sewage Treated Effluent
Contaminants Leaching
Paddy
Fish
Vegetable
Kolkata City
Dhapa Dumping Ground
Ground Water
Paddy Field Irrigation
Garbage Farming
Fisheries
Sewage Treatment Plants
BAGJO
LA CANAL
HO
OG
LI R
IVER
Fig. 1 Ecological system of the waste recycling in East Kolkata Wetland, a potential source of groundwater contamination. (Modified after Sahu et al., 2013)[9]
2.0 Study area Kolkata (Fig.2) is one of the four metropolitan cities of India and is the capital of the
state of West Bengal. With more than 15 million residents, Kolkata has the third-largest metropolitan area in India and the eighth-largest urban area in the world. According to the Population Division of the United Nations Department of Economic and Social Affairs, the city is projected to have a population of 20.11 Million by 2025.The Central point of the city is located by 20°30' N latitude and 88°30' E longitude, elevations ranging from 1.5 to 9.0 m above mean sea level. Having a geographical area of 187.33 km2, it is approximately 30 km from the Bay of Bengal, and the river tides at Kolkata range over 4m. Kolkata rests on the
floodplains of the Hooghly River along the eastern and western flanks [32]. Lying within the tidal reaches of the Ganges, the city area is mostly flat and sloping from North to South. There are numerous low-lying areas, marshes, wetlands, and shallow lakes in the region. Details of sampling location in Kolkata city with coordinates are illustrated in Table 1.
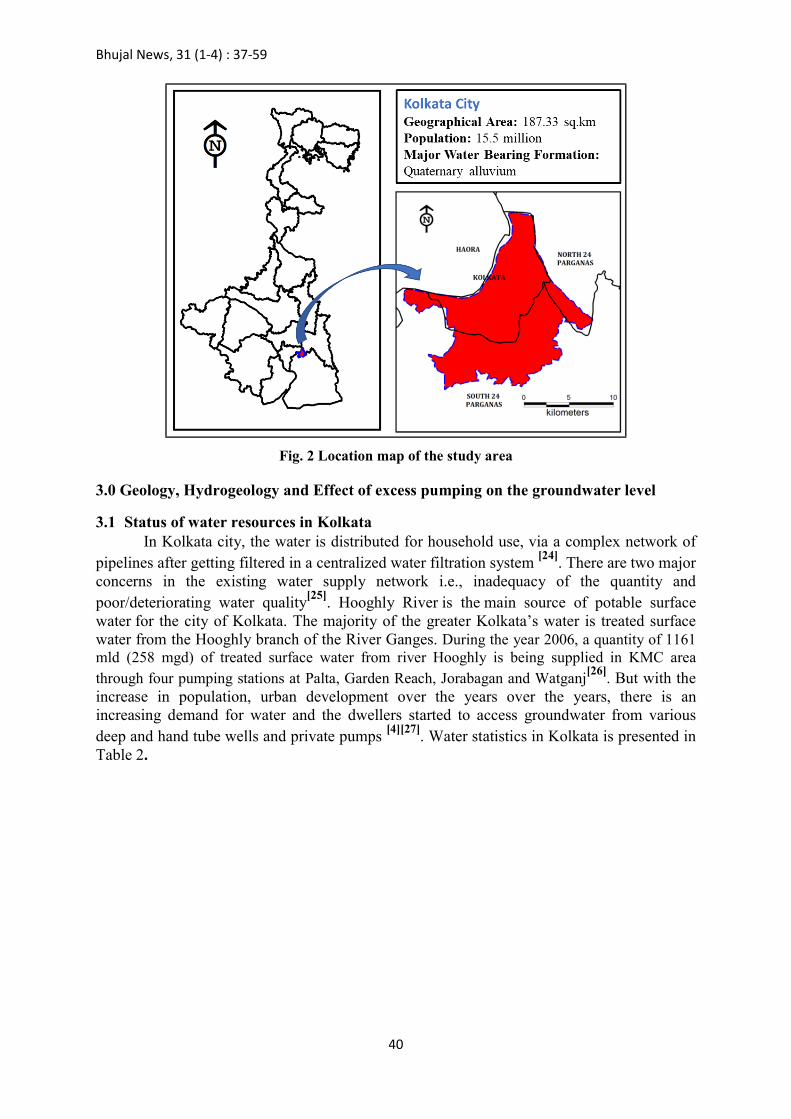
Bhujal News, 31 (1-4) : 37-59
40
Fig. 2 Location map of the study area
3.0 Geology, Hydrogeology and Effect of excess pumping on the groundwater level
3.1 Status of water resources in Kolkata In Kolkata city, the water is distributed for household use, via a complex network of
pipelines after getting filtered in a centralized water filtration system [24]. There are two major concerns in the existing water supply network i.e., inadequacy of the quantity and poor/deteriorating water quality[25]. Hooghly River is the main source of potable surface water for the city of Kolkata. The majority of the greater Kolkata’s water is treated surface water from the Hooghly branch of the River Ganges. During the year 2006, a quantity of 1161 mld (258 mgd) of treated surface water from river Hooghly is being supplied in KMC area through four pumping stations at Palta, Garden Reach, Jorabagan and Watganj
[26]. But with the
increase in population, urban development over the years over the years, there is an increasing demand for water and the dwellers started to access groundwater from various deep and hand tube wells and private pumps [4][27]. Water statistics in Kolkata is presented in Table 2.
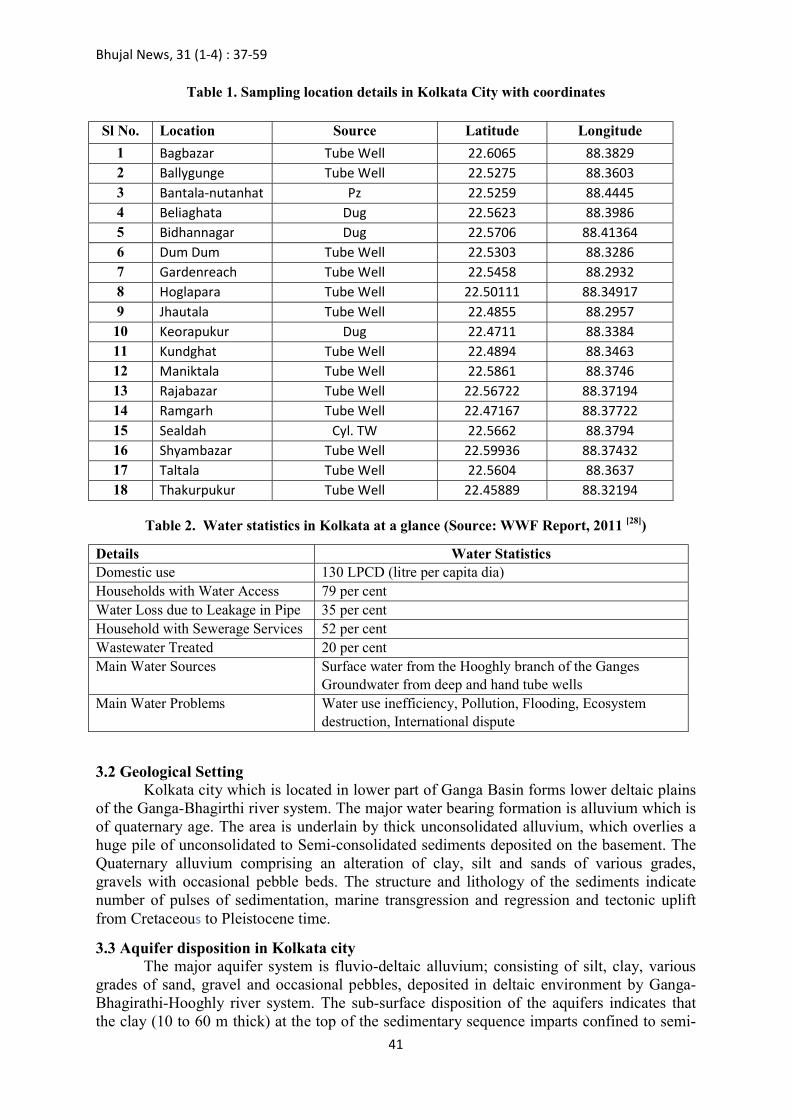
Bhujal News, 31 (1-4) : 37-59
41
Table 1. Sampling location details in Kolkata City with coordinates
Table 2. Water statistics in Kolkata at a glance (Source: WWF Report, 2011 [28])
Details Water Statistics Domestic use 130 LPCD (litre per capita dia) Households with Water Access 79 per cent Water Loss due to Leakage in Pipe 35 per cent Household with Sewerage Services 52 per cent Wastewater Treated 20 per cent Main Water Sources
Surface water from the Hooghly branch of the Ganges Groundwater from deep and hand tube wells
Main Water Problems Water use inefficiency, Pollution, Flooding, Ecosystem destruction, International dispute
3.2 Geological Setting Kolkata city which is located in lower part of Ganga Basin forms lower deltaic plains
of the Ganga-Bhagirthi river system. The major water bearing formation is alluvium which is of quaternary age. The area is underlain by thick unconsolidated alluvium, which overlies a huge pile of unconsolidated to Semi-consolidated sediments deposited on the basement. The Quaternary alluvium comprising an alteration of clay, silt and sands of various grades, gravels with occasional pebble beds. The structure and lithology of the sediments indicate number of pulses of sedimentation, marine transgression and regression and tectonic uplift from Cretaceous to Pleistocene time.
3.3 Aquifer disposition in Kolkata city The major aquifer system is fluvio-deltaic alluvium; consisting of silt, clay, various
grades of sand, gravel and occasional pebbles, deposited in deltaic environment by Ganga- Bhagirathi-Hooghly river system. The sub-surface disposition of the aquifers indicates that the clay (10 to 60 m thick) at the top of the sedimentary sequence imparts confined to semi-
Sl No. Location Source Latitude Longitude
1 Bagbazar Tube Well 22.6065 88.3829 2 Ballygunge Tube Well 22.5275 88.3603 3 Bantala-nutanhat Pz 22.5259 88.4445 4 Beliaghata Dug 22.5623 88.3986 5 Bidhannagar Dug 22.5706 88.41364 6 Dum Dum Tube Well 22.5303 88.3286 7 Gardenreach Tube Well 22.5458 88.2932 8 Hoglapara Tube Well 22.50111 88.34917 9 Jhautala Tube Well 22.4855 88.2957 10 Keorapukur Dug 22.4711 88.3384 11 Kundghat Tube Well 22.4894 88.3463 12 Maniktala Tube Well 22.5861 88.3746 13 Rajabazar Tube Well 22.56722 88.37194 14 Ramgarh Tube Well 22.47167 88.37722 15 Sealdah Cyl. TW 22.5662 88.3794 16 Shyambazar Tube Well 22.59936 88.37432 17 Taltala Tube Well 22.5604 88.3637 18 Thakurpukur Tube Well 22.45889 88.32194

Bhujal News, 31 (1-4) : 37-59
42
confined condition to groundwater occurring in the aquifers below this clay blanket. The aquifers below this clay bed consist of fine to coarse sand, which are occasionally mixed with gravel (Fig. 3A). The characteristic feature of typical deltaic deposition is shown by facies variation at a few places and the top clay bed, shows a transition from aquiclude to aquitard. The thickness of the aquifer varies from place to place with the frequent occurrence of clay lens within them.
AB
C
Fig. 3. Sub-surface disposition of aquifers units in Kolkata (A), Pre-monsoon (2017-18) water level map (B) and Post-monsoon (2017-18) water level map (C)
3.4 Effect of excess pumping on Ground water level in Kolkata city Ground water occurs under confined condition and the piezometric level is
significantly deeper - ranging between 1.59 and 20.67 meters below ground level (m bgl) during pre-monsoon period (Fig. 3B) and between 1.37 and 20.08 m bgl during post-monsoon period (Fig. 3C) in major part of the city. The groundwater level shows a historically declining trend (Fig. 4) and is attributed to huge withdrawal of groundwater for domestic and industrial use. The long term trend of ground water level indicates a falling trend in both pre and post monsoon period.
A fall of 7 to 11 m of ground water level has been recorded in last 45 years from 1958 to 2003, with accentuated trend from 1972 onwards. A study by Kolkata Municipal Corporation (KMC) revealed that at places, having these sharp ground water declining trends, the fresh water in the aquifers shown arsenic infestation, which is of geogenic origin. Pumping groundwater at faster rate than it can be recharged imparts negative effect on the sub-surface aquifer system. The long-term water level declines caused by sustained

Bhujal News, 31 (1-4) : 37-59
43
groundwater pumping can have some severe effects as drying of wells, deterioration of water quality, reduction of water in streams and lakes, increased pumping cost, land subsidence etc.
Because of this Arsenic infestation, around 438 heavy duty tube wells in KMC area, particularly around Central Kolkata (Park Street and Victoria Memorial Hall Area) was sealed and in their place, surface water based water supply have been initiated. It is because of this shift in source, the declining trend of Piezometric surface which continued unabated till 2003 have been somewhat checked and slowly getting restored, with time.
Fig. 4 Selected representative hydrographs in Kolkata Metropolitan area.
4.0 Materials and Methods
4.1 Field investigations and Groundwater sampling Groundwater samples were collected from 18 Ground Water Monitoring Stations
(GWMS) during pre-monsoon season (May, 2019) to encompass all sources of water in the Kolkata Municipal Corporation (KMC) area. The locations of the 18 water-sampling points, collected from tube wells and dug wells are shown in table 1. Samples were collected in high density polyethylene bottles (HDPE) after purging the dug wells (minimum 10 minutes) to
get the fresh groundwater. American Public Health Association (APHA, 2012)[29] guidelines and standard procedures were followed for sampling, storing, transferring and analysis. The samples for analysis of major cations and anions were collected in bottles of 1000 ml capacity without acidification. The other set of samples were collected in 60 mL acid resistant bottles (Tarson) following on-site syringe filtration technique with 0.45 μm membrane filter for the analysis of Uranium (U) and Potential Toxic Elements (PTEs). The samples were acidified by 0.5 mL trace elemental grade HNO3 (Thermo Fisher Scientific) immediately after filtration. After collection, the bottles containing samples were sealed immediately to avoid exposure to air.
4.2 Instrumentation details
4.2.1 Uranium and PTEs Inductively coupled plasma mass spectrometry (ICP-MS) (Thermo iCAP Q) was used
for determination of uranium and heavy metals with a lower detection limit as low as of 0.l ng. In view of the multi-element functionality of the ICP–MS, the analytical conditions were optimized to measure the following elements viz. U, As, Cr, Mn, Zn, Fe, Cu and Pb. Multi-element stock solution containing U, As, Cr, Mn, Zn, Fe, Cu and Pb with concentrations of 10 mg/L As, Fe, Se, Zn with 100 mg/L, has been used for the standard solutions preparations. By combination and appropriate dilution of aliquots of stock solutions the calibration curves were established for the elements analyzed plotting the ratio of the intensity vs. concentration
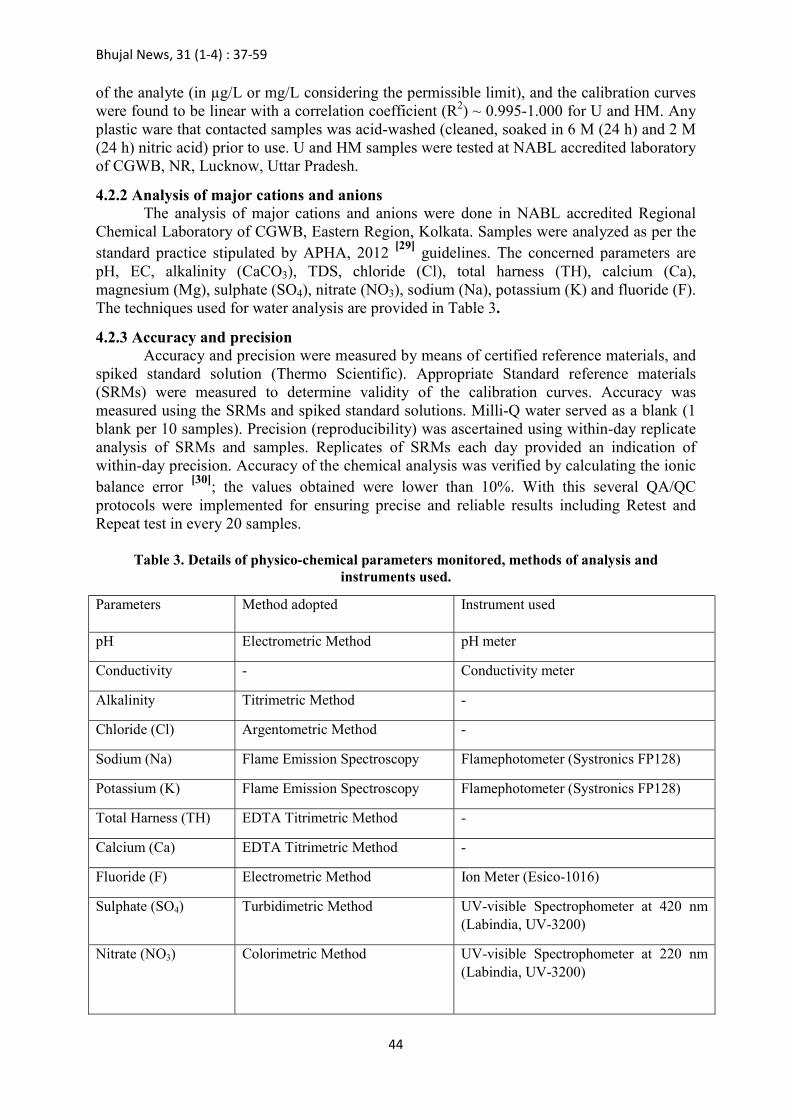
Bhujal News, 31 (1-4) : 37-59
44
of the analyte (in µg/L or mg/L considering the permissible limit), and the calibration curves were found to be linear with a correlation coefficient (R2) ~ 0.995-1.000 for U and HM. Any plastic ware that contacted samples was acid-washed (cleaned, soaked in 6 M (24 h) and 2 M (24 h) nitric acid) prior to use. U and HM samples were tested at NABL accredited laboratory of CGWB, NR, Lucknow, Uttar Pradesh.
4.2.2 Analysis of major cations and anions The analysis of major cations and anions were done in NABL accredited Regional
Chemical Laboratory of CGWB, Eastern Region, Kolkata. Samples were analyzed as per the standard practice stipulated by APHA, 2012 [29] guidelines. The concerned parameters are pH, EC, alkalinity (CaCO3), TDS, chloride (Cl), total harness (TH), calcium (Ca), magnesium (Mg), sulphate (SO4), nitrate (NO3), sodium (Na), potassium (K) and fluoride (F). The techniques used for water analysis are provided in Table 3.
4.2.3 Accuracy and precision Accuracy and precision were measured by means of certified reference materials, and
spiked standard solution (Thermo Scientific). Appropriate Standard reference materials (SRMs) were measured to determine validity of the calibration curves. Accuracy was measured using the SRMs and spiked standard solutions. Milli-Q water served as a blank (1 blank per 10 samples). Precision (reproducibility) was ascertained using within-day replicate analysis of SRMs and samples. Replicates of SRMs each day provided an indication of within-day precision. Accuracy of the chemical analysis was verified by calculating the ionic balance error [30]; the values obtained were lower than 10%. With this several QA/QC protocols were implemented for ensuring precise and reliable results including Retest and Repeat test in every 20 samples.
Table 3. Details of physico-chemical parameters monitored, methods of analysis and
instruments used.
Parameters Method adopted Instrument used
pH Electrometric Method pH meter
Conductivity - Conductivity meter
Alkalinity Titrimetric Method -
Chloride (Cl) Argentometric Method -
Sodium (Na) Flame Emission Spectroscopy Flamephotometer (Systronics FP128)
Potassium (K) Flame Emission Spectroscopy Flamephotometer (Systronics FP128)
Total Harness (TH) EDTA Titrimetric Method -
Calcium (Ca) EDTA Titrimetric Method -
Fluoride (F) Electrometric Method Ion Meter (Esico-1016)
Sulphate (SO4) Turbidimetric Method UV-visible Spectrophometer at 420 nm (Labindia, UV-3200)
Nitrate (NO3) Colorimetric Method UV-visible Spectrophometer at 220 nm (Labindia, UV-3200)

Bhujal News, 31 (1-4) : 37-59
45
5.0 Results and Discussion Results of analyzed hydrogeochemical parameters such as pH, Electrical Conductivity
(EC), Total Dissolved Solid (TDS) and major ions are given in Table 4. The pH of groundwater samples was found slightly acidic to neutral, and it varies from 6.55-7.54 (average 6.96). The EC ranges from 823-2569 μScm-1 (Fig. 5A) with the average 1566 μScm-
1 indicating salinity of water. If drinking water salinity goes beyond 2000 μScm-1, it may cause gastrointestinal irritation to the consumers (WHO 2004). TDS values were found to be exceeding the desirable limit of 500 mg/L (BIS, 2012) in all the locations with range of 526-1644 mg/L(average 1002 mg/L). Similar results have been reported earlier researchers indicating an evidence of major groundwater pollution in Kolkata [31-33].
5.1 Major ion chemistry and suitability for drinking uses Calcium and magnesium were found to be the dominant cations in groundwater
samples of the study area with the values ranged from 6-174 mg/Land 12-132 mg/L, respectively. Weathering of carbonate containing minerals such as calcite, gypsum, cation exchange processes may contribute Ca2+ and Mg2+ ions into groundwater [57]. Na+ and K+ ranges from 69-275 mg/Land 1.3-13.6 mg/L, respectively. The possible sources of Na+ in groundwater are dissolution of rock salts and weathering of sodium bearing minerals and ion exchange may be prevalent process in this scenario as Na/Cl ratio is less than 1 (0.74) in most of groundwater samples [34]. The major trend of cation dominance was Ca2+>Mg2+>Na+>K+ in the samples. In anions, HCO3
− and Cl− are the dominant anions in groundwater followed by SO4
2-, NO3- and F−. 44% of the samples exceeded the desirable limits for Cl− (Fig. 5 B)
values ranging 67-757 mg/L. The HCO3− values varied 158-719 mg/L. The trend of anions dominance for the water samples are HCO3
−>Cl−>SO42−>NO3
−>F−. The concentration of alkalinity was above the desirable limit of BIS in 94% of water samples values ranging (130-590 mg/L). 18 out of 18 samples were found to cross the desirable limit for drinking water in respect of total hardness (200mg/L). The sub-surface aquifer disposition indicates that there is juxtaposition of both fresh and brackish / saline aquifer within the geographical area of KMC. Till date, there is no observed / reported documentation to suggest any adverse phenomenon like sea water ingress / saline water upcoming. The sodium chloride type of water may be attributed to the mixing of fresh water with the already existing brackish / saline water, which might be leaking through the gravel filled annular spaces in some of the older ground water abstraction structures. The top is covered by a significant clay layer, which retards and often refuses local recharge, as well as any immediate leachate related ground water contamination from Municipal Solid Waste dumps / sewerage sources. However, these dumps raise some serious concerns in regard to surface water bodies and wetlands in the immediate environs.
With the excess level of alkalinity, total hardness as well as prevalence of magnesium and calcium in water the risk of cardiovascular diseases, stunted growth, reproductive failure and many fatal diseases may increase [31, 35]. Along with the inorganic contaminant’s pesticides and organic pollutants such as α-HCH and DDT also reported in groundwater of Kolkata [36]. With respect to the major cations and anions, the parameters such as chloride, alkalinity, TDS and total hardness revealed striking concentration exceeding the desirable limit as per BIS (2012) [37], hence not fit for drinking purposes without prior treatment.

Bhujal News, 31 (1-4) : 37-59
46
Fig. 5 (A) Contour map for EC μScm-1and (B) Chloride (mg/L) for Kolkata.
Table 4. Detailed statistical summary of parameters measured in groundwater.
Constituent Min Max Average Std. Dev % Samples beyond BIS (2012)
Desirable Limit pH 6.55 7.54 6.96 0.33 -
Conductance (µS/cm at 25°C) 823.00 2569.00 1566.16 495.79 -
Total dissolved solids (mg/L) 526.72 1644.16 1002.34 317.30 100
Carbonate (CO3) (mg/L) BDL BDL - - -
Bicarbonate (HCO3) (mg/L) 158.60 719.80 474.11 142.52 -
Alkalinity as CaCO3 (mg/L) 130.00 590.00 388.61 116.82 94.4
Chloride (Cl) (mg/L) 67.55 757.15 265.17 170.77 44.4
Sulphate (SO4) (mg/L) 0.00 162.00 22.87 41.26 0
Nitrate (mg/L) 0.00 41.00 8.27 9.73 0
Fluoride (F) (mg/L) 0.00 1.01 0.18 0.27 0
Calcium (Ca) (mg/L) 6.00 174.00 33.67 36.16 5.5
Magnesium (Mg) (mg/L) 12.00 132.28 80.44 35.98 94.4
Hardness as CaCO3 (mg/L) 200.00 620.00 423.33 134.43 100
Sodium (Na) (mg/L) 69.80 275.00 133.42 59.15 -
Potassium (K) (mg/L) 1.30 13.60 4.13 3.23 -
Cr (µg/L) 0.0003 8.093 1.958 2.814 -
Mn (mg/L) 0.031 1.722 0.459 0.497 72
Cu (mg/L) 0.001 0.014 0.003 0.003 0
Zn (mg/L) 0.108 21.088 2.839 5.019 28
As (µg/L) 0.015 2.614 0.633 0.649 0
Pb (mg/L) 0.000 0.003 0.001 0.001 0
U (µg/L) 0.012 5.373 0.801 1.300 0
Fe (mg/L) 0.293 8.573 3.165 2.493 83

Bhujal News, 31 (1-4) : 37-59
47
5.2 Extent of uranium and other heavy metal contamination in groundwater of Kolkata We assessed the extent of uranium and heavy metal contamination in groundwater by
comparing concentration values recorded in the study area with the limits as prescribed by the
World Health Organization (WHO 2012)[38]for U and Bureau of Indian Standards (BIS
2012)[37]for other ions and trace metals (Table 6).The spatial distribution of Uranium and heavy metals in groundwater samples of Kolkata is presented in Fig.7 (A-H).The summary statistics of the concentrations of metal ions in the groundwater samples from different locations is presented in Table-4 as minimum, maximum, mean, standard deviation and percentage of samples crossing the prescribed limit by BIS (2012).
5.2.1 Distribution of uranium Results of uranium concentration in the water samples from 18 locations in Kolkata
city has been tabulated in (Table 6, Fig. 6). Uranium concentration in the ground water samples of the study area have been found to be varying between 0.012479 - 5.3728 μg/L with an average of 0.801046 μg/L. 88.8% of the samples were found to have uranium level <1 μg/L, 5.5% having uranium level 1-5 μg/L and rest 5.5% were found uranium concentration > 5 μg/L (Fig. 8A). By comparing the observed data with the permissible limits of 30 μg/L prescribed by the WHO it has been observed that the Uranium level in ground water of Kolkata is well within the permissible limit.
88.80%
5.50% 5.50%
0.00%
10.00%
20.00%
30.00%
40.00%
50.00%
60.00%
70.00%
80.00%
90.00%
100.00%
<1 μg/L 1-5 μg/L >5 μg/L
% o
f Sam
ples
Uranium Concentration (μg/L)
Fig. 6. Distribution of Uranium in the groundwater of Kolkata.
The lower value of uranium may be attributed as it is correlated with Redox Potential
(Eh). High uranium trends toward lower values of iron in particular, as uranium is associated with more oxidizing conditions. Low redox potential decreases aqueous uranium concentration due to reductive precipitation [40]. As the samples are found to have higher Fe levels, it can be presumed that the lower Eh may lead to the lower dissolution of uranium in the study area. Furthermore, the geochemical conditions favourable to support uranium release and/or mobility are strongly in contrast to those conditions in which Fe and Mn is present [39]. From the correlation matrix (Table 5) it has been found that there is negative correlation between Uranium and Mn, Fe.
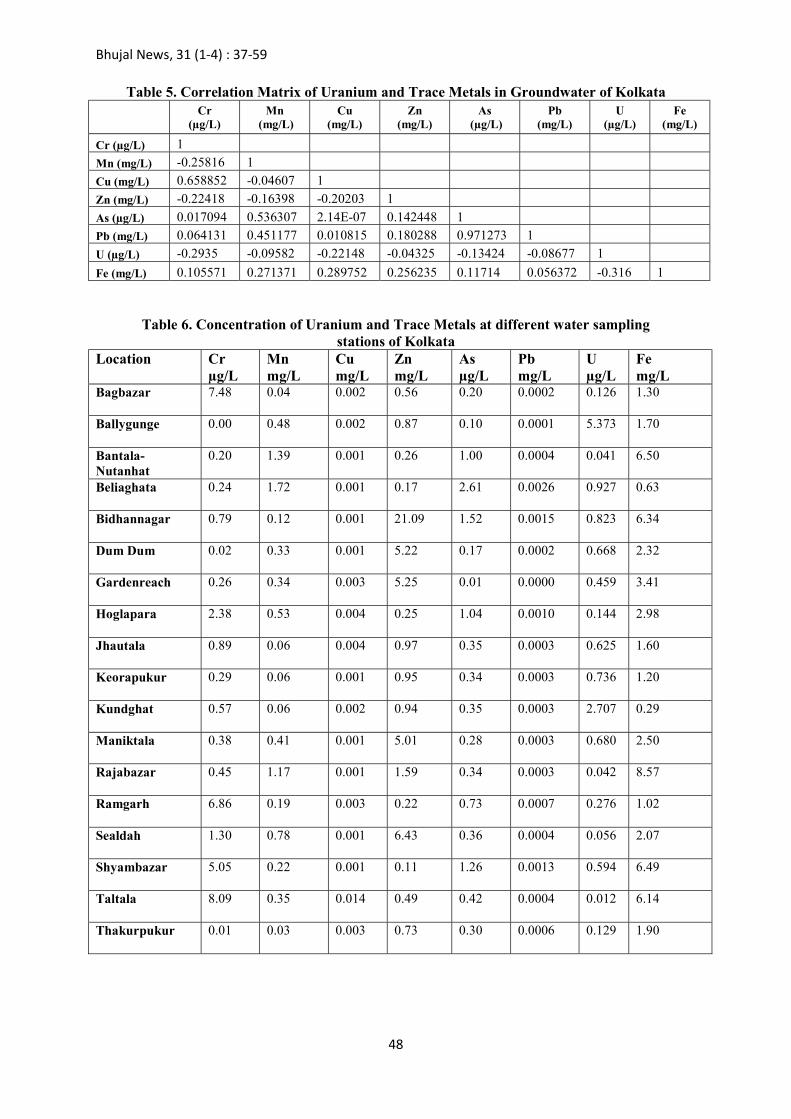
Bhujal News, 31 (1-4) : 37-59
48
Table 5. Correlation Matrix of Uranium and Trace Metals in Groundwater of Kolkata
Cr
(µg/L) Mn
(mg/L) Cu
(mg/L) Zn
(mg/L) As
(µg/L) Pb
(mg/L) U
(µg/L) Fe
(mg/L)
Cr (µg/L) 1
Mn (mg/L) -0.25816 1
Cu (mg/L) 0.658852 -0.04607 1
Zn (mg/L) -0.22418 -0.16398 -0.20203 1
As (µg/L) 0.017094 0.536307 2.14E-07 0.142448 1
Pb (mg/L) 0.064131 0.451177 0.010815 0.180288 0.971273 1
U (µg/L) -0.2935 -0.09582 -0.22148 -0.04325 -0.13424 -0.08677 1
Fe (mg/L) 0.105571 0.271371 0.289752 0.256235 0.11714 0.056372 -0.316 1
Table 6. Concentration of Uranium and Trace Metals at different water sampling stations of Kolkata
Location Cr µg/L
Mn mg/L
Cu mg/L
Zn mg/L
As µg/L
Pb mg/L
U µg/L
Fe mg/L
Bagbazar 7.48 0.04 0.002 0.56 0.20 0.0002 0.126 1.30
Ballygunge 0.00 0.48 0.002 0.87 0.10 0.0001 5.373 1.70
Bantala-Nutanhat
0.20 1.39 0.001 0.26 1.00 0.0004 0.041 6.50
Beliaghata 0.24 1.72 0.001 0.17 2.61 0.0026 0.927 0.63
Bidhannagar 0.79 0.12 0.001 21.09 1.52 0.0015 0.823 6.34
Dum Dum 0.02 0.33 0.001 5.22 0.17 0.0002 0.668 2.32
Gardenreach 0.26 0.34 0.003 5.25 0.01 0.0000 0.459 3.41
Hoglapara 2.38 0.53 0.004 0.25 1.04 0.0010 0.144 2.98
Jhautala 0.89 0.06 0.004 0.97 0.35 0.0003 0.625 1.60
Keorapukur 0.29 0.06 0.001 0.95 0.34 0.0003 0.736 1.20
Kundghat 0.57 0.06 0.002 0.94 0.35 0.0003 2.707 0.29
Maniktala 0.38 0.41 0.001 5.01 0.28 0.0003 0.680 2.50
Rajabazar 0.45 1.17 0.001 1.59 0.34 0.0003 0.042 8.57
Ramgarh 6.86 0.19 0.003 0.22 0.73 0.0007 0.276 1.02
Sealdah 1.30 0.78 0.001 6.43 0.36 0.0004 0.056 2.07
Shyambazar 5.05 0.22 0.001 0.11 1.26 0.0013 0.594 6.49
Taltala 8.09 0.35 0.014 0.49 0.42 0.0004 0.012 6.14
Thakurpukur 0.01 0.03 0.003 0.73 0.30 0.0006 0.129 1.90
Bhujal News, 31 (1-4) : 37-59
49
5.2.2 Distribution of iron, manganese, zinc, arsenic, copper, chromium and lead As per the analyzed data in the study area, the major concern detected is the elevated
concentration of Fe, Mn and Zn in ground water samples. The co-occurrence can ultimately lead to human and animal exposure through food chain or transfer through drinking water. It can be inferred from the tabulated data (Table 6) that the concentration of Fe, Mn and Zn have been observed above their respective safe limits as per BIS in considerable number of samples. 72% of the groundwater samples have been detected with Mn concentration exceeding the permissible limit with the values ranging 0.031 - 1.722 mg/L (Fig 7B, 8C). Maximum concentration of Mn has been found at Beliaghata (1.722 mg/L). Majority of the samples (89%) exceeded the permissible limit for Fe concentration in the study area with values as high as 8.57 mg/L at Rajabazar. From the correlation matrix, a positive correlation has been found between Fe and Mn. This may be due to abundance of Fe and Mn as common metallic element in the earth crust and suitable geochemical condition favouring the
dissolution of the metal [41].Excess Fe in water is mostly accumulated through the weathering
of rocks and industrial effluents discharge [42] and landfill leachate [43] and huge pile of city
garbage [44]. In 28% of the analysed samples, Zn concentration was beyond 5 mg/L (BIS, 2012).
The values of Zn concentration varied from 0.108-21.088 mg/L (average 2.84 mg/L) (Fig. 7E, 8D). Maximum concentration for Zn has been detected in Bidhannagar (21.088 mg/L). It is interesting to note that Zn is an essential trace element and provide protection against
heavy metal toxicity [45-47]. This micronutrient is essential for the development and function
of the nervous system [48], manganese-induced testicular damage and neurotoxicity [49]. But
in excess consumption it may exert toxicity [50]. Concentration of As (Fig. 7C, Table 6) in groundwater samples has been found to be
varying from 2.613 - 0.0146 μg/L with an average of 0.632 μg/L. As per the correlation matrix analyses (Table 5), a positive correlation has been found between As and Mn as well
as As and Fe may be due to the favourable redox potential [51]. Many studies reported that the
shallow aquifers around Kolkata is widely polluted by As [52-54]and the city itself also
reported to be polluted by As [54, 55] but in the recent study groundwater samples from all the locations were well within the permissible limit (As per PHED, Govt. of West Bengal, Kolkata Metro has been declared as As free). This corroborate the pervious study, reported by
McArthur et al. (2018)[56] where they reported As concentrations <10 μg/L by analyzing 280 groundwater samples across Kolkata.
The concentration of Cu, Cr and Pb in the collected samples ranges between 0.0007-0.0136 mg/L, 0.0003 - 8.0926 μg/L and 0.0001- 0.0026 mg/L respectively and have been observed to be below their respective prescribed limits (BIS, 2012). (Fig. 7D, F, G, Table 6).

Bhujal News, 31 (1-4) : 37-59
50
0
0.2
0.4
0.6
0.8
1
1.2
1.4
1.6
1.8
2
1 2 3 4 5 6 7 8 9 10 11 12 13 14 15 16 17 18
mg/
L
B Manganese Concentration in Groundwater
0
0.002
0.004
0.006
0.008
0.01
0.012
0.014
0.016
1 2 3 4 5 6 7 8 9 10 11 12 13 14 15 16 17 18
mg/
L
D Copper Concentration in Groundwater
0
0.5
1
1.5
2
2.5
3
1 2 3 4 5 6 7 8 9 10 11 12 13 14 15 16 17 18
µg/L
C Arsenic Concentration in Groundwater
0
1
2
3
4
5
6
1 2 3 4 5 6 7 8 9 10 11 12 13 14 15 16 17 18
µg/L
A Uranium Concentration in Groundwater
0
5
10
15
20
25
1 2 3 4 5 6 7 8 9 10 11 12 13 14 15 16 17 18
mg/
L
E Zinc Concentration in Groundwater
0.000
0.001
0.001
0.002
0.002
0.003
0.003
1 2 3 4 5 6 7 8 9 10 11 12 13 14 15 16 17 18
mg/
L
F Lead Concentration in Groundwater
0
1
2
3
4
5
6
7
8
9
1 2 3 4 5 6 7 8 9 10 11 12 13 14 15 16 17 18
µg/L
G Chromium Concentration in Groundwater
0
1
2
3
4
5
6
7
8
9
10
1 2 3 4 5 6 7 8 9 10 11 12 13 14 15 16 17 18
mg/
L
H Iron Concentration in Groundwater
Fig. 7 Variation of (A) Uranium and other trace metals viz. (B) Manganese, (C)Arsenic, (D) Copper, (E) Zinc, (F) Lead, (G) Chromium and (H) Iron in Groundwater of Kolkata
(Locatios: 1. Bagbazar, 2. Ballygunge, 3. Bantala-Nutanhat, 4. Beliaghata, 5. Bidhannagar, 6. Dum Dum, 7. Gardenreach, 8. Hoglapara, 9. Jhautala, 10. Keorapukur, 11. Kundghat, 12.
Maniktala, 13. Rajabazar, 14. Ramgarh, 15. Sealdah, 16. Shyambazar, 17. Taltala, 18. Thakurpukur)

Bhujal News, 31 (1-4) : 37-59
51
Fig. 9 Spatial distribution of (A) Uranium mg/L, (B)Fe mg/L, (C) Manganese mg/L and (D) Zinc mg/L in groundwater of Kolkata
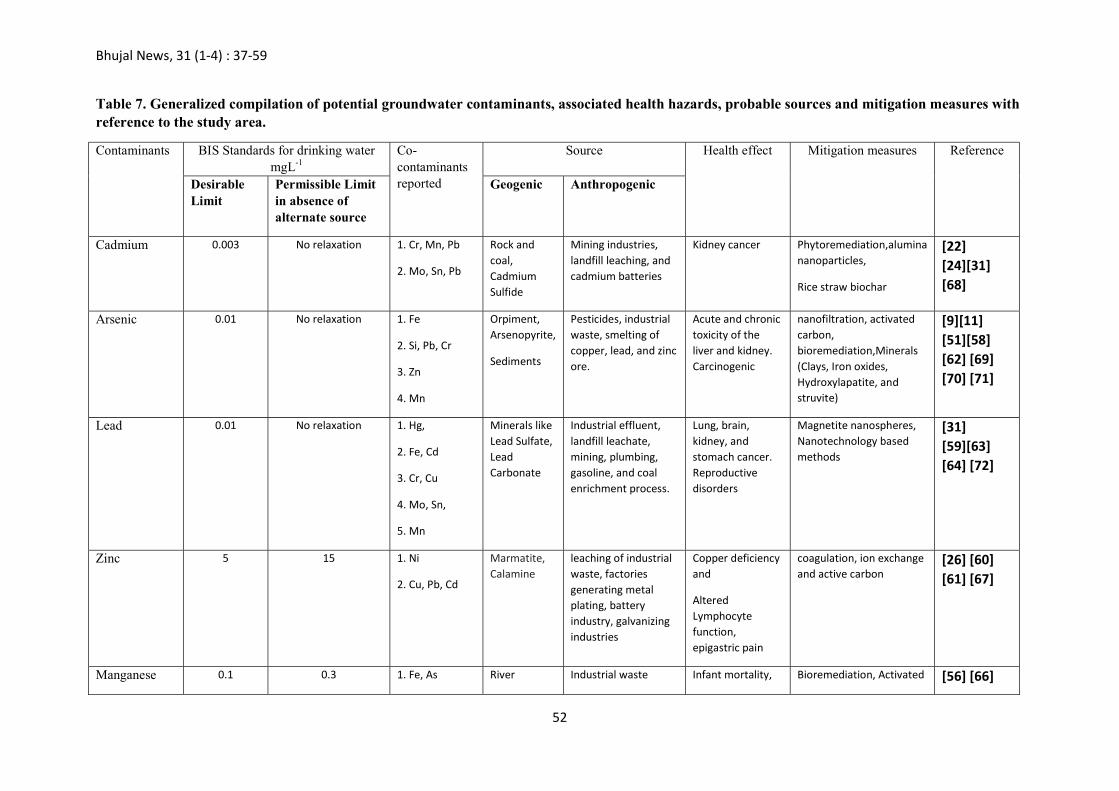
Bhujal News, 31 (1-4) : 37-59
52
Table 7. Generalized compilation of potential groundwater contaminants, associated health hazards, probable sources and mitigation measures with reference to the study area.
Contaminants BIS Standards for drinking water mgL-1
Co-contaminants reported
Source Health effect Mitigation measures Reference
Desirable Limit
Permissible Limit in absence of alternate source
Geogenic Anthropogenic
Cadmium 0.003 No relaxation 1. Cr, Mn, Pb
2. Mo, Sn, Pb
Rock and coal, Cadmium Sulfide
Mining industries, landfill leaching, and cadmium batteries
Kidney cancer Phytoremediation,alumina nanoparticles,
Rice straw biochar
[22] [24][31] [68]
Arsenic 0.01 No relaxation 1. Fe
2. Si, Pb, Cr
3. Zn
4. Mn
Orpiment, Arsenopyrite,
Sediments
Pesticides, industrial waste, smelting of copper, lead, and zinc ore.
Acute and chronic toxicity of the liver and kidney. Carcinogenic
nanofiltration, activated carbon, bioremediation,Minerals (Clays, Iron oxides, Hydroxylapatite, and struvite)
[9][11] [51][58] [62] [69] [70] [71]
Lead 0.01 No relaxation 1. Hg,
2. Fe, Cd
3. Cr, Cu
4. Mo, Sn,
5. Mn
Minerals like Lead Sulfate, Lead Carbonate
Industrial effluent, landfill leachate, mining, plumbing, gasoline, and coal enrichment process.
Lung, brain, kidney, and stomach cancer. Reproductive disorders
Magnetite nanospheres, Nanotechnology based methods
[31] [59][63] [64] [72]
Zinc 5 15 1. Ni
2. Cu, Pb, Cd
Marmatite, Calamine
leaching of industrial waste, factories generating metal plating, battery industry, galvanizing industries
Copper deficiency and
Altered Lymphocyte function, epigastric pain
coagulation, ion exchange and active carbon
[26] [60] [61] [67]
Manganese 0.1 0.3 1. Fe, As River Industrial waste Infant mortality, Bioremediation, Activated [56] [66]

Bhujal News, 31 (1-4) : 37-59
53
sediments, Calcite, Magnetite dissolution
Neurotoxic
Degenerative dementia
carbon sorption [73]
Chromium 0.05 0.05 1. Cd, Cu, Mn, Zn
2. Hg, Pb
Chromite Industrial pollution,
Municipal Solid Waste,
Stomach cancer.
Kidney functionality problem
Magnetite nanospheres [10] [24] [60] [72]
Mercury 0.001 No relaxation 1. Pb Mercury sulfide
Landfill leachate,
Industrial effluents,
Battery industry
Kidney damage Synthetic chelating ligand [24] [59] [74] [75]
Iron 1 No relaxation 1. As
2.Mn, Cd, Cr
Hematite, Magnetite Ores and minerals
Acid mine drainage, Iron pipe corrosion
Alzheimer or Parkinson disease, atherosclerosis
and diabetes
Aeration and filtration, Cation exchange, Activated charcoal
[3][33] [76]
Pesticides Varies for different pesticides 1. DDT, Aldrin,
Dieldrin, Heptachlor
2. DDT, αHCH
- Agricultural runoff, industrial effluent, and disinfectant
Leukaemia, cancer, damage of lever.
Microbial remediation, Absorption, Activated carbon fibre
[36] [65] [77] [78]

Bhujal News, 31 (1-4) : 37-59
54
6.0 Conclusions The present study highlights that the long-term development of Kolkata’s aquifer to serve
clean water to its 15.5 million population is in serious question. Due to huge withdrawal of groundwater for domestic and industrial use, there is an evidence of declining trend in groundwater level with the tune of .0.33m/year. Withdrawal of groundwater at a faster rate than it can be recharged imparts a negative effect on the groundwater quantity as well quality. Significant contamination with multiple heavy metals/PTEs such as Mn, Zn and Fe have been detected in the groundwater of Kolkata. 72% of the groundwater samples have been detected with Mn concentration exceeding the permissible limit as per drinking water standards by BIS (2012). The Maximum concentration of Mn was traced to 1.72 mg/Lin Beliaghata. The Majority of the samples (89%) exceeded the permissible limit for Fe concentration in the study area with values as high as 8.57 mg/Lat Rajabazar area. The concentration of Zn has also been observed above the safe limits in 28% of the groundwater samples. Concerning the prevalent cations and anions, the parameters such as chloride, alkalinity, TDS, and Total hardness revealed striking concentration exceeding the desirable limit for domestic uses.
The phenomenon of radioactive uranium is inconsequential in the groundwater of Kolkata city. The major finding can be marked as the hazard to the residents of Kolkata due to Mn toxicity with the co-occurrence of Zn and Fe in groundwater alongside elevated TDS and TH. The combination of extensive pumping, a low topographic gradient, and multitudinous sources of anthropogenic and natural groundwater contamination gives rise to the water quality threat in Kolkata. These water quality risks must be deliberated with an integrated strategy considering major ions, trace elements and radioactive elements for proper assessment of water quality along with those of water quantity. Nevertheless, the results here will serve as baseline data for the development of a comprehensive strategy for limiting the ingress of toxic elements into the groundwater as well as the treatment of the drinking water for the removal of these contaminants. Enforcement for water sustainability and adopting efficient recharging systems at both the administrative and individual levels is crucial to extricate the groundwater contamination and dwindling of the groundwater resources in the near future.
Acknowledgements The authors thank all the officers of CGWB, ER, Kolkata who have collected the
groundwater samples from various wells for the present study. The authors are also grateful to the Chairman, Member (East), Member (CGWB), Faridabad and Regional Director, CGWB, ER and Regional Director, CGWB, NR, Lucknow for providing help with the PTEs analysis. References
1. El-Hoz, M., Mohsen, A. and Iaaly, A., 2014. Assessing groundwater quality in a coastal area using the GIS technique. Desalination and Water Treatment, 52(10-12), pp.1967-1979.
2. Annapoorna, H. and Janardhana, M.R., 2015. Assessment of groundwater quality for drinking purpose in rural areas surrounding a defunct copper mine. Aquatic Procedia, 4(0), pp.685-692.
3. Banerji, S. and Mitra, D., 2019. Geographical information system-based groundwater quality index assessment of northern part of Kolkata, India for drinking purpose. Geocarto International, 34(9), pp.943-958.
4. Sagane, R., 2000. Water management in mega-cities in India: Mumbai, Delhi, Calcutta and Chennai. Water for Urban Areas: Challenges and Perspectives, pp.85-96.
5. Balakrishnan, P., Saleem, A. and Mallikarjun, N.D., 2011. Groundwater quality mapping using geographic information system (GIS): A case study of Gulbarga City, Karnataka, India. African Journal of Environmental Science and Technology, 5(12), pp.1069-1084.

Bhujal News, 31 (1-4) : 37-59
55
6. Bhattacharya, A.K. and Kumar, D., 2012. Land subsidence in east Calcutta. IOSR J Eng, 2(03), pp.408-413.
7. McDonald, R.I., Weber, K., Padowski, J., Flörke, M., Schneider, C., Green, P.A., Gleeson, T., Eckman, S., Lehner, B., Balk, D. and Boucher, T., 2014. Water on an urban planet: Urbanization and the reach of urban water infrastructure. Global Environmental Change, 27, pp.96-105.
8. Chatterjee, S., Chattopadhyay, B. and Mukhopadhyay, S.K., 2006. Trace metal distribution in tissues of cichlids [Oreochromis niloticus and O. mossambicus] collected from wastewater-fed fishponds in East Calcutta Wetlands, a ramber site. Acta Ichthyologica et Piscatoria, 2(36), pp.119-125.
9. Sahu, P., Sikdar, P.K. and Chakraborty, S., 2016. Geochemical evolution of groundwater in southern Bengal Basin: The example of Rajarhat and adjoining areas, West Bengal, India. Journal of Earth System Science, 125(1), pp.129-145.
10. Chattopadhyay, S., Dutta, A. and Ray, S., 2009. Municipal solid waste management in Kolkata, India–A review. Waste Management, 29(4), pp.1449-1458.
11. Sahu, P., Michael, H.A., Voss, C.I. and Sikdar, P.K., 2013. Impacts on groundwater recharge areas of megacity pumping: analysis of potential contamination of Kolkata, India, water supply. Hydrological sciences journal, 58(6), pp.1340-1360.
12. Mitchell, E., Frisbie, S. and Sarkar, B., 2011. Exposure to multiple metals from groundwater—a global crisis: Geology, climate change, health effects, testing, and mitigation. Metallomics, 3(9), pp.874-908.
13. Barati, A.H., Maleki, A. and Alasvand, M., 2010. Multi-trace elements level in drinking water and the prevalence of multi-chronic arsenical poisoning in residents in the west area of Iran. Science of the total environment, 408(7), pp.1523-1529.
14. Chaturvedi, A., Bhattacharjee, S., Singh, A.K. and Kumar, V., 2018. A new approach for indexing groundwater heavy metal pollution. Ecological Indicators, 87, pp.323-331.
15. Peavy, H.S., Rowe, D.R. and Techobanoglous, G., 1985. Water Quality: Defination, Characteristics, and Perspectives. Environment Engineering, pp.11-43.
16. Kotze, P., Du Preez, H.H. and Van Vuren, J.H.J., 1999. Bioaccumulation of copper and zinc in Oreochromis mossambicus and Clariasgariepinus, from the Olifants River, Mpumalanga, South Africa. WATER SA-PRETORIA-, 25, pp.99-110.
17. Van Oostdam, J., Gilman, A., Dewailly, E., Usher, P., Wheatley, B., Kuhnlein, H., Neve, S., Walker, J., Tracy, B., Feeley, M. and Jerome, V., 1999. Human health implications of environmental contaminants in Arctic Canada: a review. Science of the Total Environment, 230(1-3), pp.1-82.
18. Zadorozhnaja, T.D., Little, R.E., Miller, R.K., Mendel, N.A., Taylor, R.J., Presley, B.J. and Gladen, B.C., 2000. Concentrations of arsenic, cadmium, copper, lead, mercury, and zinc in human placentas from two cities in Ukraine. Journal of Toxicology and Environmental Health Part A, 61(4), pp.255-263.
19. Aremu, D.A., Olawuyi, J.F., Meshitsuka, S., Sridhar, M.K. and Oluwande, P.A., 2002. Heavy metal analysis of groundwater from Warri, Nigeria. International Journal of Environmental Health Research, 12(3), pp.261-267.
20. Nriagu, J., Nam, D.H., Ayanwola, T.A., Dinh, H., Erdenechimeg, E., Ochir, C. and Bolormaa, T.A., 2012. High levels of uranium in groundwater of Ulaanbaatar, Mongolia. Science of the Total Environment, 414, pp.722-726.
21. Singh, K.P., Kishore, N., Tuli, N., Loyal, R.S., Kaur, M. and Taak, J.K., 2018. Uranium Contamination of Groundwater in Southwest Parts of Punjab State, India, with Special

Bhujal News, 31 (1-4) : 37-59
56
Reference to Role of Basement Granite. In Clean and Sustainable Groundwater in India (pp. 95-106). Springer, Singapore.
22. Phillips, D.H., Watson, D.B., Roh, Y., Mehlhorn, T.L., Moon, J.W. and Jardine, P.M., 2006. Distribution of uranium contamination in weathered fractured saprolite/shale and ground water. Journal of environmental quality, 35(5), pp.1715-1730.
23. Alam, M.S. and Cheng, T., 2014. Uranium release from sediment to groundwater: influence of water chemistry and insights into release mechanisms. Journal of contaminant hydrology, 164, pp.72-87.
24. Singh, R.B., Haque, M.S. and Grover, A., 2015. Drinking water, sanitation and health in Kolkata metropolitan city: Contribution towards urban sustainability. Geography, Environment, Sustainability, 8(4), pp.64-81.
25. Roy, J., Chattopadhyay, S., Mukherjee, S., Kanjilal, M., Samajpati, S. and Roy, S., 2004. An economic analysis of demand for water quality: Case of Kolkata. Economic and Political Weekly, pp.186-192.
26. Ground Water Information Booklet, Central Ground Water Board, Ministry of Jal Shakti, Department of Water Resources, RD & GR, Government of India, India.
27. Banerji, S. and Mitra, D., 2019. Geographical information system-based groundwater quality index assessment of northern part of Kolkata, India for drinking purpose. Geocarto International, 34(9), pp.943-958.
28. WWF. 2011. Big Cities Big Water Big Challenges. Water in an Urbanised World. World Wide Fund for Nature. WWF Germany, Berlin.
29. APHA 2012, Standard methods for the examination of water and waste water, 22nd ed. American Public Health Association, American Water Works Association, Water Environment Federation.
30. Hem, J.D., 1970. Study and interpretation of the chemical characteristics of natural water (No. 1473). US Government Printing Office.
31. De, S., Maiti, S.K., Hazra, T. and Dutta, A., 2017. Evaluation of the impact of landfill leachate on groundwater quality in Kolkata, India.
32. Diptendra, D. and Chattopadhyay, B.C., 2009, December. Characterization of soil over Kolkata municipal area. In Proceedings of the Indian Geotechnical Conference, Guntur, India (pp. 17-19).
33. Das, S., Roy, P.K. and Mazumdar, A., 2013. Development of water quality index for groundwater in Kolkata city, West Bengal, India. ARPN Journal of Engineering and Applied Sciences, 8(12), pp.1054-1058.
34. Gautam, S.K., Maharana, C., Sharma, D., Singh, A.K., Tripathi, J.K. and Singh, S.K., 2015. Evaluation of groundwater quality in the Chotanagpur plateau region of the Subarnarekha river basin, Jharkhand State, India. Sustainability of Water Quality and Ecology, 6, pp.57-74.
35. Sengupta, P., 2013. Potential health impacts of hard water. International journal of preventive medicine, 4(8), p.866.
36. Naresh C, G.H.O.S.E. and Dipankar, S.A.H.A., 2009. Synthetic detergents (surfactants) and organochlorine pesticide signatures in surface water and groundwater of greater Kolkata, India. Journal of Water Resource and Protection, 2009.
37. Bureau of Indian Standards, 2012 Drinking water specification IS 10500: 2012.http://cgwb.gov.in/Documents/WQ-standards.pdf (accessed on 25/08/2020).
38. World Health Organization. (2012) Uranium in Drinking-Water—Background Document for Development of WHO Guidelines for Drinking-Water Quality. WHO Press; Geneva, Switzerland

Bhujal News, 31 (1-4) : 37-59
57
39. Richards, L.A., Kumar, A., Shankar, P., Gaurav, A., Ghosh, A. and Polya, D.A., 2020. Distribution and Geochemical Controls of Arsenic and Uranium in Groundwater-Derived Drinking Water in Bihar, India. International Journal of Environmental Research and Public Health, 17(7), p.2500.
40. Alam, M.S. and Cheng, T., 2014. Uranium release from sediment to groundwater: influence of water chemistry and insights into release mechanisms. Journal of contaminant hydrology, 164, pp.72-87.
41. Kumar, S., Bharti, V.K., Singh, K.B. and Singh, T.N., 2010. Quality assessment of potable water in the town of Kolasib, Mizoram (India). Environmental Earth Sciences, 61(1), pp.115-121.
42. Tiwari, A.K., Singh, P.K., Singh, A.K. and De Maio, M., 2016. Estimation of heavy metal contamination in groundwater and development of a heavy metal pollution index by using GIS technique. Bulletin of environmental contamination and toxicology, 96(4), pp.508-515.
43. Faraji, A., Nabibidhendi, G. and Pardakhti, A., 2017. Risk assessment of exposure to released BTEX in district 12 of Tehran municipality for employees or shopkeepers and gas station customers.
44. Nagarajan, R., Thirumalaisamy, S. and Lakshumanan, E., 2012. Impact of leachate on groundwater pollution due to non-engineered municipal solid waste landfill sites of erode city, Tamil Nadu, India. Iranian journal of environmental health science & engineering, 9(1), p.35.
45. Chowdhury, B.A. and Chandra, R.K., 1987. Biological and health implications of toxic heavy metal and essential trace element interactions. Progress in food & nutrition science, 11(1), p.55.
46. Cerklewski, F.L. and Forbes, R.M., 1976. Influence of dietary zinc on lead toxicity in the rat. The Journal of nutrition, 106(5), pp.689-696.
47. Berry, J.P. and Galle, P., 1994. Selenium-arsenic interaction in renal cells: role of lysosomes. Electron microprobe study. Journal of submicroscopic cytology and pathology, 26(2), pp.203-210.
48. Sandstead, H.H., 1994. Understanding zinc: recent observations and interpretations. The Journal of laboratory and clinical medicine, 124(3), pp.322-327.
49. Shukla, G.S. and Chandra, S.V., 1982. Effect of interaction of Mn2+ with Zn2+, Hg2+ and Cd2+ on some neurochemicals in rats. Toxicology Letters, 10(2-3), pp.163-168.
50. Sankhla, M.S., Kumar, R. and Prasad, L., 2019. Zinc Impurity in Drinking Water and Its Toxic Effect on Human Health. Indian Internet Journal of Forensic Medicine & Toxicology, 17(4), pp.84-87.
51. Panda, B.K., 2015. A brief review on the scenario of ground water pollution by arsenic in West Bengal. Int J Ecosyst, 5, pp.75-85.
52. Pal, T., Mukherjee, P.K. and Sengupta, S., 2002. Nature of arsenic pollutants in groundwater of Bengal basin-a case study from Baruipur area, West Bengal, India. Current Science, 82(5), pp.554-561.
53. Hoque, M.A., McArthur, J.M. and Sikdar, P.K., 2012. The palaeosol model of arsenic pollution of groundwater tested along a 32 km traverse across West Bengal, India. Science of the Total Environment, 431, pp.157-165.
54. Chakraborti, D., Das, B., Rahman, M.M., Nayak, B., Pal, A., Sengupta, M.K., Ahamed, S., Hossain, M.A., Chowdhury, U.K., Biswas, B.K. and Saha, K.C., 2017. Arsenic in groundwater of the Kolkata Municipal Corporation (KMC), India: Critical review and modes of mitigation. Chemosphere, 180, pp.437-447.

Bhujal News, 31 (1-4) : 37-59
58
55. Malakar, A., Islam, S., Ali, M.A. and Ray, S., 2016. Rapid decadal evolution in the groundwater arsenic content of Kolkata, India and its correlation with the practices of her dwellers. Environmental monitoring and assessment, 188(10), p.584.
56. McArthur, J.M., Sikdar, P.K., Leng, M.J., Ghosal, U. and Sen, I., 2018. Groundwater quality beneath an Asian megacity on a delta: Kolkata’s (Calcutta’s) disappearing arsenic and present manganese. Environmental science & technology, 52(9), pp.5161-5172.d
57. Zhang, B., Zhao, D., Zhou, P., Qu, S., Liao, F. and Wang, G., 2020. Hydrochemical Characteristics of Groundwater and Dominant Water–Rock Interactions in the Delingha Area, Qaidam Basin, Northwest China. Water, 12(3), p.836.
58. Chatterjee, A., Das, D. and Chakraborti, D., 1993. A study of ground water contamination by arsenic in the residential area of Behala, Calcutta due to industrial pollution. Environmental Pollution, 80(1), pp.57-65.
59. Maiti, S.K., De, S., Hazra, T., Debsarkar, A. and Dutta, A., 2016. Characterization of leachate and its impact on surface and groundwater quality of a closed dumpsite–a case study at Dhapa, Kolkata, India. Procedia Environmental Sciences, 35, pp.391-399.
60. Mohanta, T. and Goel, S., 2014. Assessment of water quality of three different aquatic environments over three seasons. In Singapore 1st International Congress on Environmental, Biotechnology, and Chemistry Engineering. IPCBEE (p. 64).
61. Ali, S.A. and Ahmad, A., 2019. Analysis of Chemical and Heavy Metal Concentrations of Leachates and Impact on Groundwater Quality Near Dhapa Dumping Ground, Kolkata. Asian Profile.
62. Singh, N.K., Raghubanshi, A.S., Upadhyay, A.K. and Rai, U.N., 2016. Arsenic and other heavy metal accumulation in plants and algae growing naturally in contaminated area of West Bengal, India. Ecotoxicology and environmental safety, 130, pp.224-233.
63. Chatterjee, A. and Banerjee, R.N., 1999. Determination of lead and other metals in a residential area of greater Calcutta. Science of the Total Environment, 227(2-3), pp.175-185.
64. Sahu, P. and Sikdar, P.K., 2008. Hydrochemical framework of the aquifer in and around East Kolkata Wetlands, West Bengal, India. Environmental Geology, 55(4), pp.823-835.
65. Malyan, S.K., Singh, R., Rawat, M., Kumar, M., Pugazhendhi, A., Kumar, A., Kumar, V. and Kumar, S.S., 2019. An overview of carcinogenic pollutants in groundwater of India. Biocatalysis and Agricultural Biotechnology, 21, p.101288.
66. Rosin, A., 2009. The long-term consequences of exposure to lead. The Israel Medical Association journal: IMAJ, 11(11), pp.689-694.
67. Plum, L.M., Rink, L. and Haase, H., 2010. The essential toxin: impact of zinc on human health. International journal of environmental research and public health, 7(4), pp.1342-1365.
68. Koju, N.K., Song, X., Wang, Q., Hu, Z. and Colombo, C., 2018. Cadmium removal from simulated groundwater using alumina nanoparticles: behaviors and mechanisms. Environmental Pollution, 240, pp.255-266.
69. Solanki, P., Narayan, M., Rabha, A.K. and Srivastava, R.K., 2018. Assessment of Cadmium Scavenging Potential of Canna indica L. Bulletin of environmental contamination and toxicology, 101(4), pp.446-450.
70. Asere, T.G., Stevens, C.V. and Du Laing, G., 2019. Use of (modified) natural adsorbents for arsenic remediation: A review. Science of the total environment, 676, pp.706-720.
71. Elcik, H., Celik, S.O., Cakmakci, M. and Özkaya, B., 2016. Performance of nanofiltration and reverse osmosis membranes for arsenic removal from drinking water. Desalination and Water Treatment, 57(43), pp.20422-20429.

Bhujal News, 31 (1-4) : 37-59
59
72. Kumari, M., Pittman Jr, C.U. and Mohan, D., 2015. Heavy metals [chromium (VI) and lead (II)] removal from water using mesoporous magnetite (Fe3O4) nanospheres. Journal of colloid and interface science, 442, pp.120-132.
73. Ruiping, L., Lihua, S., Jiuhui, Q. and Guibai, L., 2009. Arsenic removal through adsorption, sand filtration and ultrafiltration: In situ precipitated ferric and manganese binary oxides as adsorbents. Desalination, 249(3), pp.1233-1237.
74. Akpor, O.B. and Muchie, M., 2010. Remediation of heavy metals in drinking water and wastewater treatment systems: Processes and applications. International Journal of Physical Sciences, 5(12), pp.1807-1817.
75. Blue, L.Y., Van Aelstyn, M.A., Matlock, M. and Atwood, D.A., 2008. Low-level mercury removal from groundwater using a synthetic chelating ligand. Water Research, 42(8-9), pp.2025-2028.
76. Khatri, N., Tyagi, S. and Rawtani, D., 2017. Recent strategies for the removal of iron from water: A review. Journal of water process engineering, 19, pp.291-304.
77. Hedegaard, M.J. and Albrechtsen, H.J., 2014. Microbial pesticide removal in rapid sand filters for drinking water treatment–potential and kinetics. Water Research, 48, pp.71-81.
78. Martın-Gullón, I. and Font, R., 2001. Dynamic pesticide removal with activated carbon fibers. Water research, 35(2), pp.516-520.

Bhujal News, 31 (1-4) : 60-71
60
Decadal Groundwater Level Analysis of Lucknow District and Effect of Urbanization on Groundwater
Madhukar Singh1, Sujatro Ray Chowdhury*1, Prashant Rai1, Vikas Ranjan2, Pramod Kr. Tripathi1
Madhukar Singh1, CGWB, Northern Region, Lucknow Sujatro Ray Chowdhury*1, CGWB, Northern Region, Lucknow Prashant Rai2, CGWB, Uttaranchal Region, Dehradun Vikas Ranjan3, CGWA, New Delhi Pramod Kr.Tripathy1, CGWB, Northern Region, Lucknow
*Corresponding author: [email protected]
Abstract : This paper presents an account of water level trends for the Lucknow District and seeks to bring out the effect of urbanization on groundwater decline. Such a record of decline corresponding to urbanization in the Indo-Gangetic Plain is poorly known. The study area occupies 2528 km2 in the state of Uttar Pradesh in the Central Ganga Alluvial Plain. The district had approximately 4.5 million populations in 2011, and its main urban area, which is Lucknow City, the administrative capital of the state houses a population of about 2.9million in 2011. The ten years (2009-18) groundwater level fluctuations from 25 monitoring stations provide reliable data for understanding the temporal variation in water-level concerning urbanization. To understand the decline in water trends, thematic Layers for Pre Monsoon depth to the water level of years 2009 & 2018 were prepared, and corresponding decadal groundwater level fluctuation and groundwater level trends for each of 25 monitoring stations were assessed. The obtained data suggest that the district can be classified in three different regions based on decadal water level fluctuation and Ground Water Level declining trend viz., I) Northern & North-western part, II) Lucknow city, or Central Part & III) Southern & South-eastern Part of the district. The study has revealed a maximum decline rate and fluctuation in the Lucknow city or Central part of the district, which is highly urbanized, thereby effectively exhibiting the effect of urbanization on the decline of groundwater trends.
Keywords: groundwater level fluctuation, urbanization, decadal groundwater level decline, Lucknow

Bhujal News, 31 (1-4) : 60-71
61
1.0 Introduction Migration from rural to urban areas leads to a series of social, economic, political, and natural
impacts (1). Those that are more easily identified are associated with expansion of the urban footprint and increased demand for resources in order to satisfy the needs of populations settled in these areas. India has 2.4% of the world's total area, supporting 17.5% of the world's total population (2-3). The growth of the economy has resulted in increased water consumption (4). Owing to the contamination/pollution, uneven distribution, and other reasons, surface water is, at large, unfit for human consumption (5), which in turn has resulted in massive exploitation of groundwater resources to meet the demand for water (6). It is important to mention that large cities depend mainly on groundwater, for example, Dhaka, Bangladesh (7), Delhi, India (8), Bangalore, India (9), Chennai, India, Hong Kong, China (10), and Seoul, South Korea (11), among others. This has led to intense exploitation of aquifers, bringing about significant changes in flow regime and groundwater quality (12). India's increased dependence on groundwater has caused India to become the top consumer of groundwater in the world (13). As on31st March 2017, the total Annual Extractable Groundwater Resources of India is 392.70 BCM, whereas the total extraction stands at 248.69 BCM (14). About 89% of the total annual extraction is consumed in the agriculture sector (14). It has been observed that due to dense urban settlements, extraction of groundwater resources surpasses the annual replenishable groundwater resources and water level tends to decline (15). This rate of decline is dependent upon the population density, extent of urbanization and other factors (16). Lucknow district, located in Uttar Pradesh state, lies on Central Ganga Alluvial Plain (17). Subsurface material consists of Quaternary unconsolidated sedimentary deposits, forming the country's most potential groundwater resources (17). Lucknow city is the capital of Uttar Pradesh state situated in the central part of the district, which is overgrowing in terms of population and extent (18). The total water supply of Lucknow city was 675 MLD, out of which 395 MLD is met through groundwater in 2015 (19). Pre-monsoon groundwater Level from 2009 to 2018 for the whole Lucknow district was measured and analysed. This long term monitoring has brought out the effect of urbanization on groundwater level fluctuation in the central part of the district.
1.1 Study area Lucknow District (latitude 26°30’N-27°10’N, longitude 80°30’E-81°15’E) having an area of
2528km2 is located in the central part of Uttar Pradesh state, Republic of India (Fig 1.a). Geologically, the area belongs to the Central Ganga Plain (19). The area exhibits a general, Southeastern slope with a general elevation ranging between 103 and 130 m above mean sea level (20). The study area climate is characterized as a "humid subtropical climate "with cold, dry winters from mid-November to February and dry, hot summer from March to mid-May (21). The area receives its maximum precipitation from South-Western Monsoon from June to October (22). The mean maximum and minimum temperature of the warmest and coldest month is recorded at 39.6 °C (May) and 7.9 °C (January), respectively, with mean annual precipitation of about 917.3 mm (22). Soil characteristic of the entire district is mainly deep, well or moderately well drained, and loamy in nature. Some patches of fine sand, silty soil also found. In a narrow belt along N-W fringe of the district, fine calcareous soil is present. Major soil type of capital city is fine silty calcareous, fine loamy and coarse loamy calcareous. (23) (Fig 1. d) Lucknow District has a population of more than 4.5 million, with a decadal growth rate of 25.8% (18). The district comprises of 8 administrative block unit (24). The population of Lucknow City Agglomerate stands at about 2.9 million (in 2011) and represents a decadal growth rate of 29.3% (18). It is presently the 12th most populous urban agglomeration of the country and the most important city of the state (25).

Bhujal News, 31 (1-4) : 60-71
62
Fig. 1: a) Location Map of Study area, b) Land use and land cover of Lucknow district 2009, c)
Land use and land cover of Lucknow district 2018, d) Soil Map of the district.
a)
b)
c)
d)

Bhujal News, 31 (1-4) : 60-71
63
The maximum area is under cropland. A significant amount of land use is under plantation, mostly in North-Western Part of the district, the world-famous Malihabad Mango belt (26). The central part is occupied by the Urban settlement, which has grown significantly in spatial extent from 2009 to 2018 (Fig 1. b & c).
2.0 Hydrogeological settings The District Lucknow forms a part of Central Ganga Alluvium Plain, representing the most
prospective Groundwater Reserve of the country (17). The Gomati River meanders through the district. The river flows approximately NorthWest-SouthEast direction. The Lucknow city is bifurcated by the Gomati, which is a sixth-order (27) groundwater fed Perennial River (28) and left bank tributary of river Ganges.
Geomorphologically, the study area is composed of Quaternary sediments of Holocene age, which in turn is comprised of sand and clay (20). Five aquifer groups have been delineated up to the depth of 680 meter below ground level (mbgl) (20). The first aquifer ranges between the depths of 110-150 mbgl with a transmissivity of about 250-1050 m2/day, specific capacity of 150-325 LPM/m and discharge of 1100-1700 LPM (20). Water Level of the phreatic aquifer ranges between 5-40 mbgl.
3.0 Methodology The data from 25 Groundwater Monitoring Stations was recorded for ten years i.e., 2009 to
2018, to document the temporal changes in water level during the said period. The water level observations were monitored regularly by the scientists of Central Groundwater Board (Northern Region, Lucknow, India) during the Pre-Monsoon (in the last week of May). The collected data was used for the preparation of thematic layers using GIS analyses. Inverse distance weighting method (29) was used to generate depth to water level (DTWL) and water level fluctuation map. All the maps were prepared as a raster image with the help of GIS Software ArcInfo (30). To determine the decadal decline rate of each monitoring station, ten years Pre Monsoon Groundwater level data was plotted against calendar year in Microsoft Excel 2013. The straight-line equation was then used to estimate the variation in water level trends. The extent of urbanization was delineated using the imagery from google earth (31-32) for 2009 and 2018.
4.0 Discussion
4.1 City urban growth Lucknow city is the most important administrative, financial, and educational hub of the state
(33). Most of the economic activities are related to the service sector. Owing to this socio-economic factor, the city has recorded a high rate of in-migration, thereby increasing population and exhibiting rapid expansion in its urban sprawl and changes in the land-use pattern (33). This is clear from the fact that, out of 4.5 million total population, 64.4% reside in Lucknow City (18). In the year 2009, the city area was 258 km2 (Fig. 2) (10.20% of district area) (31), supporting the approximate 2.77 million population (projected from population growth rate between 2001 & 11) (34). In a decade city has grown to cover area 429 km2 (Fig. 2) (16.96% of district area) (32), and the population has reached 3.35 million (projected from population growth rate between 2001 & 11) (34). Generally, the city has grown in all directions, but the maximum growth has been observed in the South-East and South-Western part (Fig. 2). This high population growth and unplanned change in land use have caused rapid degeneration of limited resources such as water and land. Thus, this study aims to bring out the effect of urban growth on groundwater fluctuations.

Bhujal News, 31 (1-4) : 60-71
64
Fig. 2. Urban Sprawl Map (2009 to 2018) of Lucknow City, Uttar Pradesh, India
5.0 Results
5.1) Pre-Monsoon water level scenario during the study period The temporal changes in the depth to groundwater level are attributed to changes in
environmental factors and anthropogenic activities. To better estimate the changes caused by human activities and to reduce the effect of environmental factors, the Pre-Monsoon water level is taken into consideration, which is the time just before the onset of monsoon over India. Pre-Monsoon water level from 2009 to 2018 of the phreatic aquifer was monitored at fixed 25 selected locations in the district. Based on water level trends, the district can be divided into three parts. I) Northern & Northwestern part, II) Lucknow city or Central part and III) South & South-eastern part.
I) Northern & Northwestern part of the district consists of 4 administrative block units, namely Bakshi ka Talab, Kakori, Mal & Malihabad. The shallowest water level recorded in 2009 was 5.1 mbgl. In general, depth to water level in this part ranged between 10-15 mbgl with about 60% of the area exhibiting this water level range (Fig 3.a; Table-1). Around 26% area had water levels ranging between 5-10 mbgl and 19%, beween15-20 mbgl. Figure-3b depicts the scenario in 2018. Depth to water level scenario can be seen to have changed drastically. The shallowest water level is recorded as 7.51 mbgl in the northeastern corner and maximum as 15.96 mbgl (fig. 3.b).Earlier patches having water levels 0-5 mbgl in the extreme northeast and northwest are totally absent. Water level zone of 5-10 mbgl covers about 56% area (Table-1). Zone having water levels in the range 5-10mbgl has reduced to 2%, whereas 15-20 mbgl zone now occupies 32% area. About 56% of the area shows groundwater levels in the range of 10-15 mbgl, indicating that almost entire zone has shifted northwest. Shifting of water level zones of 5-10 and 10-15 mbgl towards northwest has resulted in

Bhujal News, 31 (1-4) : 60-71
65
total absence of the range 0-5 mbgl. Zone having depth to water levels in the range 15-20 mbgl has swelled from 19% to 32%, now occupying some of the part earlier covered by 10-15mbgl.
Fig. 3a. Pre-Monsoon depth to water level map of Lucknow district, Uttar Pradesh, India, urban boundary Year 2009
II) Lucknow city or Central part of the district covers Chinhat and part of Sarojini Nagar block. This part of the district is highly urbanized and more than 64% of the district population (18) resides in this area. In 2009, the deepest water level in the district was recorded in this part. About 48% of the any direction, water levels were relatively shallower (Fig-3.a). In 2018 too, a similar trend can be observed, although with minimum and maximum water levels getting deeper - 21.52 mbgl & 39.35mbgl, respectively, and the gradient becoming steeper. The area having water levels in the range 30-35 mbgl, which was earlier negligible, can be seen to have increased to 17% area showed water levels in the range of 20-25 mbgl (Table-1). The deepest water level, 33.1 mbgl, was recorded in the central portion of the city area (old city) (Fig 3.b; Table-1).
Fig. 3 b. Pre-Monsoon depth to water level map of Lucknow district, Uttar Pradesh, India, urban boundary Year 2018

Bhujal News, 31 (1-4) : 60-71
66
III) Southern & South-eastern Part of the district consists of block units Gosaiganj, Mohanlalganj, and remaining part of Sarojini Nagar. Shallowest depth to groundwater level has been recorded in this part with a minimum of 2.26 mbgl and a maximum of 9.9 mbgl in 2009 (Fig 3.a). About 47% of the area in this zone corresponded to the water level in the range of 5-10 mbgl (Table-1). In 2018, deeper water level ranges encroached upon areas having shallow water level ranges. The area under the shallowest water level range (0-5mbgl) has been reduced to 33% (Table-1). The area under 5-10 mbgl has also been reduced and shifted South-Eastward. Parts with 10-15 and 15-20 mbgl have increased to cover about 37% and 17%. (fig. 3.b.) and (Table-1).
Table 1: Percentage area under corresponding groundwater level ranges in Hydrogeological parts and district
0-5 5-10 10-15 15-20 20-25 25-30 >30 0-5 5-10 10-15 15-20 20-25 25-30 30-35 >35Northern & Northwestern Part 0 26 60 13 1 0 0 0 2 56 32 7 3 0 0Lucknow City or Central Part 0 0 1 46 48 4 1 0 0 0 5 37 40 17 1Southern & Southeastern Part 7 47 22 17 7 0 0 1 33 37 17 9 3 0 0District Total 3 31 39 18 8 1 0 1 12 40 22 13 9 3 0
Hydrogeological Part Range of Water level (mbgl) in 2018Range of Water Level (mbgl) in 2009
% Area
5.2) Decadal Trend of Water Level The decadal trend of water level for all 25 monitoring stations was analysed on the same
pattern explained earlier. Twelve monitoring stations fall under North & North-Western part, seven under Lucknow City or Central part and six under South& South-Eastern Part of the district.
I) In the Northern & Northwestern part, all the 12 Groundwater monitoring stations have shown a decline in water level. From 2009-2014 decline rate was comparatively low, whereas since 2014 decline rate has steeped. Rate of Groundwater decline is minimum in the Bhatoiya monitoring station with 17.7cm /year, and the maximum was observed in Mal monitoring station at 64.77cm/year (Fig 4.a).
II) In the Lucknow City and Central Part, the decline rate is highest, which indicates maximum stress on groundwater is in this part of the district. Each of the seven monitoring stations has shown a very high rate of decline. The minimum decline rate was 72.2cm/year at the Gulistan Colony monitoring station, which itself is more than observed maximum decline rate in the remaining two parts of the district. The maximum rate of Groundwater decline was observed at Vikas Nagar Monitoring station, which is 128.5cm/year. (Fig 4.b).
III) The Southern & Southeastern Part of the district, all the six groundwater monitoring stations have shown the declining trend in groundwater level. The minimum rate of fall was 3.4cm/year at KhawasKhera monitoring station, whereas the maximum rate was observed at the Nagram monitoring station with 27.8cm/year. This part has shown a comparatively least rate of groundwater decline among all the three parts of the district. (Fig 4.c).

Bhujal News, 31 (1-4) : 60-71
67
Fig. 4. Pre-Monsoon decadal trend of groundwater level, a) 12 monitoring stations of Northern & Northwestern part, b) 7 monitoring stations of Lucknow City or Central Part, c) 6 monitoring stations of
Southern & Southeastern Part of Lucknow District, Uttar Pradesh, India
6.0 Discussion As evident from this study, all the groundwater monitoring stations have shown declining
trends during the study period in pre-monsoon depth to groundwater level in the district. The highest fluctuation in ten years of observation period has been recorded in the Lucknow city or Central part of the District (Fig 5.a). Within this part, the heartland of the city has shown a maximum decline. The monitoring station at Vikas Nagar and New Hyderabad in this area has recorded the most considerable decline of 11.81 m and 11.8m, respectively. The smallest decline in this part observed as 6.25 m at the Gulistan Colony monitoring station. One monitoring station (PQS Phase Cant), which was located at the periphery of urban city sprawl in 2008, has come well within urban city sprawl in 2018, It has recorded a steep decline of 11.15m in the study period. The average Groundwater level declining rate in this central part is 103cm/year (Fig 5.b). In Northern & Northwestern part of the district, the range of Groundwater level decline is between 1.52m to 5.76m with an average declining rate of 37cm/year (Fig 5.b). Whereas in the Southern & Southeastern Part of the district, the range of Groundwater level decline is between 1.25m and 2.05m, (except for one monitoring station that has shown a rise) with average declining rate 17cm/year (Fig 5.b).
a) b)
c)

Bhujal News, 31 (1-4) : 60-71
68
Fig. 5. a) Pre-Monsoon groundwater level fluctuation map (2008-18) of Lucknow District, Uttar Pradesh, India, b) Average decadal groundwater level decline rate in three parts of
Lucknow District, Uttar Pradesh, India
a)
b)
Bhujal News, 31 (1-4) : 60-71
69
7.0 Conclusion The continuous decline in the groundwater level trends in the central part of the city manifests
the effect of intense urbanization on the groundwater scenario in the District. The simultaneous decline has also been recorded in the adjoining areas. This suggests that the aquifer is extensive and is laterally connected. Therefore, the adverse effect of urban sprawl is not limited to its area itself; somewhat nearly the whole district is affected in terms of groundwater level decline. The city is projected to grow in the area and population in the coming years at a very high rate. This will further lead to excessive groundwater depletion shortly due to limited surface water availability. Therefore, proper management of the groundwater resource through reduction of groundwater withdrawal and large-scale groundwater recharge through rainwater harvesting is the need for the hour to sustain the city's sustainable growth.
Acknowledgements Authors are thankful to Chairman, CGWB, Dr. P. Nandkumaran and Member, Sh. Sunil
Kumar for allowing the manuscript for publication. The authors are grateful to Shri Y.B.Kaushik (Retd. Regional Director), Dr.Ranjeet Kr. Prasad (Scientist-B), Central Ground Water Board, Northern Region, Lucknow, Uttar Pradesh, India for valuable comments and thoughtful suggestions during work.

Bhujal News, 31 (1-4) : 60-71
70
References 1. Corniello, A., Ducci, D., & Ruggieri, G. (2007). Areal identification of groundwater nitrate contamination sources in periurban areas. Journal of soils and sediments, 7(3), 159-166. 2. United Nations (2019). World Population Prospect 2019. Population Dynamics. Department of Economic and Social Affairs. 3. https://www.worldometers.info/geography/largest-countries-in-the-world/ 4. Shah, T. (2009). India’s ground water irrigation economy: The challenge of balancing livelihoods and environment. Quarterly Journal of Central Ground Water Board, 21-37 5. Govt of India (2009). Central Pollution Control Board, India, Annual Report 2008–2009 .Central Pollution Control Board, Ministry of Environment & Forests, Govt of India. 6. UNESCO (2012) Global water resources under increasing pressure from rapidly growing demands and climate change, according to new UN World Water Development. Media Services UNESCO 7. Morris, B. L., Seddique, A. A., & Ahmed, K. M. (2003). Response of the Dupi Tila aquifer to intensive pumping in Dhaka, Bangladesh. Hydrogeology Journal, 11(4), 496-503. 8. Dash, J. P., Sarangi, A., & Singh, D. K. (2010). Spatial variability of groundwater depth and quality parameters in the national capital territory of Delhi. Environmental Management, 45(3), 640-650. 9. Raju, K. V., Manasi, S., & Latha, N. (2008). Emerging Ground Water Crisis in Urban Areas: A Case Study of Ward No. 39, Bangalore City. Bangalore: Institute for Social and Economic Change. 10. Jiao, J. J., Leung, C. M., & Ding, G. (2008). Changes to the groundwater system, from 1888 to present, in a highly-urbanized coastal area in Hong Kong, China. Hydrogeology journal, 16(8), 1527-1539. 11. Choi, B., Yun, S., Yu, S., Lee, P., Park, S., Chae, G., et al. (2005). Hydrochemistry of urban groundwater in Seoul, South Korea: effects of land use and pollutant recharge. Environmental Geology, 48, 979–990. 12. Naik, P. K., Tambe, J. A., Dehury, B. N., & Tiwari, A. N. (2008). Impact of urbanization on the groundwater regime in a fast growing city in central India. Environmental monitoring and assessment, 146(1-3), 339-373. 13. Giordano, M. (2009). Global groundwater? Issues and solutions. Annual review of Environment and Resources, 34, 153-178. 14. Govt of India (2019). Dynamic Ground Water Resources of India, 2017. Central Ground Water Board, Department of Water Resources, RD & GR, Ministry of Jal Shakti, Govt. of India. 15. Graniel, C. E., Morris, L. B., & Carrillo-Rivera, J. J. (1999). Effects of urbanization on groundwater resources of Merida, Yucatan, Mexico. Environmental geology, 37(4), 303-312. 16. Boken, V. K. (2016). Groundwater Crisis of a Mega City: A Case Study of New Delhi, India. In Balanced Urban Development: Options and Strategies for Liveable Cities (pp. 211-219). Springer, Cham. 17. Jha, B. M., & Sinha, S. K. (2009). Towards better management of ground water resources in India. Quarterly Journal, 24(4), 1-20. 18. Govt of India (2011). District Census Handbook, Village and town dictionary, Lucknow 19. Govt of Uttar Pradesh (2015). Lucknow City – Under Ground Water Stress (An Overview of Urban Aquifers and Ground Water Depletion). Uttar Pradesh Ground Water Department 20. Govt of India (2011). Ground Water Scenario in Major Cities of India. Central Ground Water Board, Ministry of Water Resources. Government of India
Bhujal News, 31 (1-4) : 60-71
71
21. Attri, S. D., & Tyagi, A. (2010). Climate profile of India. Environment Monitoring and Research Center, India Meteorology Department: New Delhi, India. 22. Meteorological Dept. India (Director-General of Observatories). (1953). Climatological tables of observatories in India. Manager of Publications. 23. Soil Map of Uttar Pradesh, ICAR National Bureau of Soil Survey and Land Use Planning (NBSS & LUP) 24. Govt of Uttar Pradesh (2018). Statistical Diary Uttar Pradesh. Economics and Statistics Division, State Planning Institute, Planning Department, Uttar Pradesh 25. Govt of India. Ministry of Housing and Urban Affairs. Number of Cities Towns by City Size Class. Retrieved from http://mohua.gov.in/cms/number-of-cities--towns-by-city-size-class.php 26. Year, U. D. (1987). In Kakori and Malihabad, mango belt of India. In XXI Congress Brasileiro de Fitopatologia Bras (Vol. 13, p. 121). 27. Tangri, A. K., Kumar, D., Singh, D. S., & Dubey, C. A. (2018). The Gomati River: Lifeline of Central Ganga Plain. In The Indian Rivers (pp. 135-150). Springer, Singapore. 28. Dutta, V., Kumar, R., & Sharma, U. (2015). Assessment of human-induced impacts on hydrological regime of Gomti river basin, India. Management of Environmental Quality: An International Journal. 29. Shepard, D. (1968, January). A two-dimensional interpolation function for irregularly-spaced data. In Proceedings of the 1968 23rd ACM national conference (pp. 517-524). 30. ESRI (2005). ArcGIS. Redlands: Environmental Systems Research Institute 31. “Lucknow City”. Google Earth. January 1, 2009. July 15, 2020. 32. “Lucknow City”. Google Earth. December 31, 2018. July 15, 2020 33. Shukla, A., & Jain, K. (2019). Critical analysis of rural-urban transitions and transformations in Lucknow city, India. Remote Sensing Applications: Society and Environment, 13, 445-456. 34. INDIA, P. (2011). Census of India 2011 Provisional Population Totals. New Delhi: Office of the Registrar General and Census Commissioner.

Bhujal News, 31 (1-4) : 72-84
72
Seawater ingress, aquifer salinization and groundwater security in Puri Urban and adjoining areas area in parts of the coastal Odisha
S. Sahu*1, P. K. Mohapatra1, N.C.Nayak2, A.Choudhury3, C Mohanty3, D.N. Mandal1
S.Sahu*1, CGWB, South Eastern Region, Bhubaneswar P.K.Mohapatra1, CGWB, South Eastern Region, Bhubaneswar N.C.Nayak1, CGWB, CHQ. Faridabad A.Choudhury3, CGWB, Eastern Region, Kolkata C.Mohanty3, CGWB, Eastern Region, Kolkata D.N.Mandal1, CGWB, South Eastern Region, Bhubaneswar
*Corresponding author ([email protected])
Abstract : Puri Urban Area (PUA) has remained historically dependent on groundwater for drinking and other domestic uses. In recent years, there has been a rise in the scarcity of fresh drinking water in the city. It has been the biggest challenge for the Municipality to provide fresh potable water to the booming city population and the pilgrims owing to ingress of saline water from sea into the underlying aquifers. This study has been carried out to assess the role of geomorphology and hydrogeology, and their impacts on the groundwater recharge mechanism in and around the PUA, which ultimately affects the availability of fresh groundwater in the locality and regulates the sea-water intrusion. Tube wells with submersible pumps are the main groundwater abstraction structures. Point values of electrical conductance (EC) of groundwater and their spatial distribution suggests that the palaeochannel, sand dunes and beach ridge complexes yield groundwater with relatively low EC. Moderate to high EC values were found to overlie the swampy and clayey areas rich in over-bank deposits of palaeo-rivers and the other thickly populated areas with high groundwater pumping. The depth to water levels in and around the PUA remains largely low between <1.5 m below ground level (bgl) and 4,5 m bgl round the year. The dune areas with relatively more elevations with respect to the sea level reflect comparatively deeper water levels (4.5-8.0 m bgl). The dug wells with shallow water levels show low EC of groundwater.The geomorphic units such as palaeochannel corridors, sand-dunes, beach ridge complexes etc can be preserved for groundwater recharge. Recharge through these features can be augmented by additional supply of water through minor canal networks and other water bodies at the outskirts of the PUA.
Keywords: groundwater, Puri Urban Area, freshwater, salinity, geomorphology, palaeochannels

Bhujal News, 31 (1-4) : 72-84
73
1. Introduction The coastal areas world over are endowed with high rainfall, rich water resources, fertile soil
and extensive arable flat land with intensive agriculture and high population density. The regions remain dynamic socio-economic zones aided by easy sea transportation. The coastal tracts, the transition zone from land to sea and from freshwater to saline water in fact face some unique and severe issues related to land and water resources in comparison to inland areas. In such areas, salinity of water resources, particularly the groundwater restricts the availability of freshwater resources for uses in agriculture and drinking. The groundwater salinity in coastal areas can develop due to various reasons such as sea-water intrusion to the freshwater bearing aquifers mainly due to intense aquifer exploitation, low flushing and accumulation of salts in some isolated aquifers (linked with the palaeochannels), entrapment of old sea-water and sediment in silt and clay predominant aquifer framework, presence of salt beds, less recharge owing to thicker clayey layers at surface, etc (Meinardi, 1975; Custodio, 1981; Vengosh et al., 1999; Aquilina et al., 2002; Allison et al., 2003; Andersen et al., 2005; Werner et al., 2013). Saline water intrusion occurs in coastal freshwater bearing aquifers when the different densities of both the salt-water and freshwater allow sea-water to intrude into the freshwater bearing aquifers. Sea-water intrusion can be caused by natural or anthropogenic means. Rise in sea-level can induce the invasion of saline-water into the landward aquifer (Islam and Tooley, 1999; Woodroffe and Horton, 2005). Coastal flooding of sea-water also affects the shallow aquifers by vertical percolation of salt-water (Delsman et al., 2014). The saline-freshwater interface in the coastal areas remains quite sensitive and any factor reducing the flow of freshwater towards sea would help the interface move landward. Extensive abstraction of groundwater only worsens the condition by allowing the salt-water to move fast towards land in the aquifer (Chachadi and John, 2000; Das and Kumar, 2005; Felisa et al., 2013). Increase in population and demand for groundwater based irrigation in the coastal areas have put tremendous pressure on the sensitive aquifers for meeting the irrigation and drinking needs. Another significant factor that accelerates the landward movement of the saline-freshwater interface includes the low groundwater recharge. It may be caused by hydro-geomorphic conditions such as the presence of thick clayey beds at surface hindering the infiltration and causing water-logging also.
The holy city of Puri on the east coast of Odisha along the Bay of Bengal has remained an important destination for tourists and pilgrims from across the country and world as well for religious significance as the abode of Lord Shree Jagannath and the beauty of the sea-beach. In an urban area of ~16.81 km2, about 2 lakh people reside in independent houses, apartments, maths, monasteries, hotels, lodges, guest houses, etc. Additionally, an average of daily floating population remains at ~1 lakh, which reaches up to ~3 lakhs during various religious occasions, exceeding even 5 lakhs during the annually celebrated Rath Yatra. In the occasion of Nawakalebara during 2015, the figure even approached ~30 lakhs. The urban area of Puri has remained historically dependent on groundwater for drinking and other domestic uses. In recent years, there has been a rise in the scarcity of fresh drinking water in the city and the problem of aquifer salinization shows an increasing trend. It became crystal clear after the reportage of drying up of wells (known as Ganga and Yamuna) in the campus of Jagannath Temple during the year 2005 (CGWB et al., 2005). The names of the wells (used from the very beginning for the supply of water for preparing Mahaprasad) themselves suggest that those have never dried up in the past. It has been the biggest challenge for the Municipality to provide fresh potable water to the booming city population and the pilgrims owing to ingress of saline water from sea into the underlying aquifers, which remained lifeline from the very dawn of the city. In the present work we assess the geomorphological and hydrogeological conditions in and around the Puri Urban Area (PUA) to decipher the possibilities of rain-water harvesting through artificial recharge measures to groundwater. The work puts light on the possible impacts of the rainfall infiltrate and the resultant freshwater front on the intrusion of sea-water into the shallow aquifer in parts of coastal tracts of Odisha State.
2.0 Study area
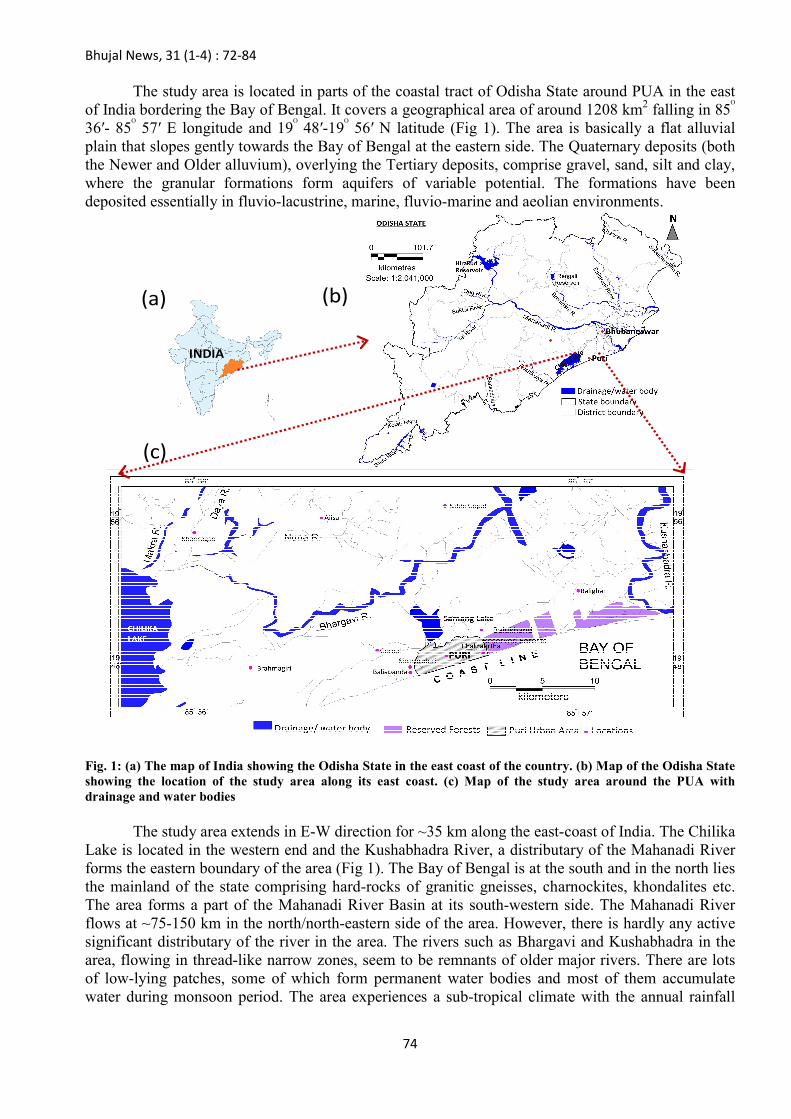
Bhujal News, 31 (1-4) : 72-84
74
The study area is located in parts of the coastal tract of Odisha State around PUA in the east of India bordering the Bay of Bengal. It covers a geographical area of around 1208 km2 falling in 85ᴼ 36′- 85ᴼ 57′ E longitude and 19ᴼ 48′-19ᴼ 56′ N latitude (Fig 1). The area is basically a flat alluvial plain that slopes gently towards the Bay of Bengal at the eastern side. The Quaternary deposits (both the Newer and Older alluvium), overlying the Tertiary deposits, comprise gravel, sand, silt and clay, where the granular formations form aquifers of variable potential. The formations have been deposited essentially in fluvio-lacustrine, marine, fluvio-marine and aeolian environments.
Fig. 1: (a) The map of India showing the Odisha State in the east coast of the country. (b) Map of the Odisha State showing the location of the study area along its east coast. (c) Map of the study area around the PUA with drainage and water bodies
The study area extends in E-W direction for ~35 km along the east-coast of India. The Chilika Lake is located in the western end and the Kushabhadra River, a distributary of the Mahanadi River forms the eastern boundary of the area (Fig 1). The Bay of Bengal is at the south and in the north lies the mainland of the state comprising hard-rocks of granitic gneisses, charnockites, khondalites etc. The area forms a part of the Mahanadi River Basin at its south-western side. The Mahanadi River flows at ~75-150 km in the north/north-eastern side of the area. However, there is hardly any active significant distributary of the river in the area. The rivers such as Bhargavi and Kushabhadra in the area, flowing in thread-like narrow zones, seem to be remnants of older major rivers. There are lots of low-lying patches, some of which form permanent water bodies and most of them accumulate water during monsoon period. The area experiences a sub-tropical climate with the annual rainfall
INDIA
(a) (b)
(c)

Bhujal News, 31 (1-4) : 72-84
75
varying within 1400-1600 mm. More than 85% of the rainfall comes during the monsoon period in the months of June-October.
The basement slopes at an estimated rate of 2.8% (drop of ~28 m per km) seaward in the south/south-east direction, warranting an increase in the alluvial thickness towards sea also. The area can conveniently be divided into two geomorphic parts; (1) the littoral tract of coastal sand dunes, (2) alluvial deltaic plains of the Mahanadi River. The unconsolidated alluvial formations produce complex hydrogeological framework comprising alternations of sand, silt, clay and gravel layers of variable thickness. The complexities arise out of the various depositional environments that the area has faced owing to marine transgressions/ regressions, changing course of rivers and the changes in the associated sub-environments like estuarines, lagoons, floodplains, back-swamps, etc. The people in the area use mostly shallow tube wells (depth range: ~8-55 m below ground) and occasionally dug wells (depth range: 5-10 m below ground) as the groundwater abstraction structures.
3.0 Materials and methods With a focused approach to assess the impacts of the geomorphology and lithology (both at
surface and the sub-surface as well) on the groundwater salinity and saline-water ingress in the shallow aquifer we carried out various hydrogeological traverses in the area in order to gather information about various geomorphic environments existing in the area. We also carried out a door to door sample survey in particularly the PUA and collected the information on the approximate groundwater draft for drinking and measured the in-situ electrical conductance (EC) of the groundwater in various households, apartments, market complexes, hotels and other establishments with the help of portable EC meters. The surveyed groundwater abstractions structures were tube wells and dug wells tapping unconsolidated alluvial aquifers within the maximum depth range of ~5-50 m below ground level (bgl). Besides the EC values obtained from field, we made use of the available EC data, the depth to water level (DTW) data (CGWB, 2016) and the borehole lithologs pertaining to the area for hydrogeological studies. Central Ground Water Board collects DTW data for the phreatic aquifer from some fixed network of observation stations known as National Hydrograph Network Stations (NHNS) in the country. The network stations in the present study area consist of dug wells and some shallow had pumps also. We studied the available lithologs (CGWB, 2017) to get information on the aquifers/aquitards and the geometry of water bearing formations.
The study uses the Shuttle Radar Topography Mission (SRTM) data (source: srtm.csi.cgiar.org) of 90 m resolution to generate Digital Elevation Model (DEM) of the area. In areas of gentle slope, the SRTM-DEM has a vertical accuracy of ±5 m (Rodr´ıguez et al., 2006). SRTM-DEM has been extensively used in geomorphological studies by various authors (e.g., Kale and Shejwalkar, 2008; Andrades Filho and Rossetti, 2012). The False Colour Composite (FCC) satellite images (IRC-IC) and the SRTM-DEM were used to study the geomorphology and palaeochannels in the area with the help of remote sensing and GIS techniques aided by limited field checks.
6.0 Results
6.1 Geomorphology The area is quite low-lying as is evident from the surface elevation map (Fig 2). The elevation
remains less than 27 m above sea level (m asl) with a major part depicting the elevation range of 5-10 m asl. The maximum elevation range of 15-27 m asl is located close to the coastline. These are the beach ridges formed out of the sand dunes. Other linear patches away from the coastline with the elevation range of 10-15 m asl seem to be the palaeo-levees and in some cases the anthropogenic features such as artificial embankments, roads and settlements. The beach ridges remain within the elevation range of 10-15 m asl. The PUA falls in this beach ridge complex zone. The zone comes under the zone of palaeo-shorelines stranded landward owing to recede of the sea. The farthest strandline is located ~4-7 km in the land away from the active shoreline. The PUA is located on such palaeo-surface of sea.
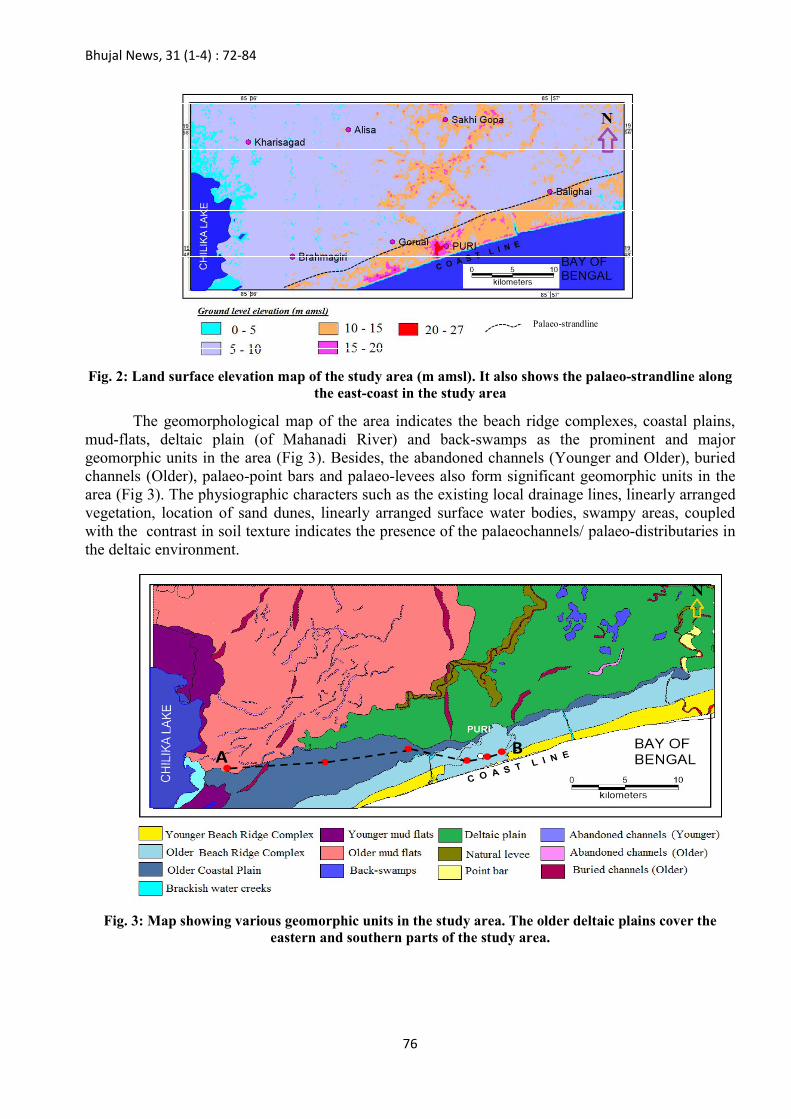
Bhujal News, 31 (1-4) : 72-84
76
Fig. 2: Land surface elevation map of the study area (m amsl). It also shows the palaeo-strandline along
the east-coast in the study area
The geomorphological map of the area indicates the beach ridge complexes, coastal plains, mud-flats, deltaic plain (of Mahanadi River) and back-swamps as the prominent and major geomorphic units in the area (Fig 3). Besides, the abandoned channels (Younger and Older), buried channels (Older), palaeo-point bars and palaeo-levees also form significant geomorphic units in the area (Fig 3). The physiographic characters such as the existing local drainage lines, linearly arranged vegetation, location of sand dunes, linearly arranged surface water bodies, swampy areas, coupled with the contrast in soil texture indicates the presence of the palaeochannels/ palaeo-distributaries in the deltaic environment.
A B
Fig. 3: Map showing various geomorphic units in the study area. The older deltaic plains cover the eastern and southern parts of the study area.
Palaeo-strandline
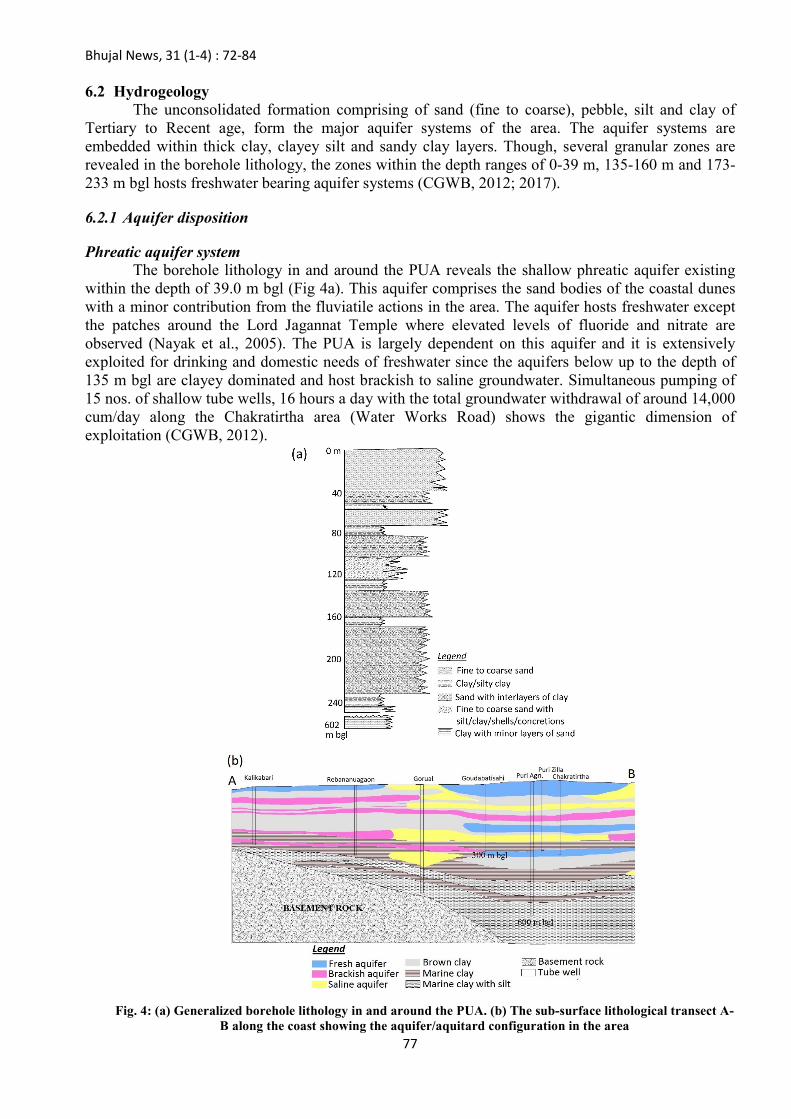
Bhujal News, 31 (1-4) : 72-84
77
6.2 Hydrogeology The unconsolidated formation comprising of sand (fine to coarse), pebble, silt and clay of
Tertiary to Recent age, form the major aquifer systems of the area. The aquifer systems are embedded within thick clay, clayey silt and sandy clay layers. Though, several granular zones are revealed in the borehole lithology, the zones within the depth ranges of 0-39 m, 135-160 m and 173-233 m bgl hosts freshwater bearing aquifer systems (CGWB, 2012; 2017).
6.2.1 Aquifer disposition
Phreatic aquifer system The borehole lithology in and around the PUA reveals the shallow phreatic aquifer existing
within the depth of 39.0 m bgl (Fig 4a). This aquifer comprises the sand bodies of the coastal dunes with a minor contribution from the fluviatile actions in the area. The aquifer hosts freshwater except the patches around the Lord Jagannat Temple where elevated levels of fluoride and nitrate are observed (Nayak et al., 2005). The PUA is largely dependent on this aquifer and it is extensively exploited for drinking and domestic needs of freshwater since the aquifers below up to the depth of 135 m bgl are clayey dominated and host brackish to saline groundwater. Simultaneous pumping of 15 nos. of shallow tube wells, 16 hours a day with the total groundwater withdrawal of around 14,000 cum/day along the Chakratirtha area (Water Works Road) shows the gigantic dimension of exploitation (CGWB, 2012).
Fig. 4: (a) Generalized borehole lithology in and around the PUA. (b) The sub-surface lithological transect A-
B along the coast showing the aquifer/aquitard configuration in the area

Bhujal News, 31 (1-4) : 72-84
78
Deeper aquifer systems Clay, clayey silt and sandy clay layers of variable thicknesses (5-25 m) separate the deeper
aquifers from the overlying phreatic aquifer system (Fig 4b). Except the aquifer systems in the depth ranges of 135-160 m and 173-233 m bgl, all others host brackish to saline groundwater. Though, the granular zones are encountered in the depth ranges of 41-52 m, 57-73 m, 82-125 m and 246-602 m bgl, the frequency of clay, clayey silt and sandy clay layers are more. Within 246-602 m bgl, alternate bands of clay and sand are observed where the clayey layers out-number the sand layers. The clay is greenish grey in color with shell fragments and other fossils. The deeper aquifers hold groundwater in confined conditions. The sub-surface lithology and disposition of aquifers/aquitards in the area also shows thicker clay zones lying at the top of the moderately deep aquifers which might be acting as confining layers to the underlying aquifers (Fig 4b). The yield in the tube wells tapping fresh deeper aquifers varies from 10 lps to 20 lps with transmissivity value ranging between 180-400 m2/day. Though this aquifer is fresh and productive, long duration pumping test (24 hours) conducted by CGWB in the Agricultural Farm at Puri during late seventies leads to the deterioration of the groundwater quality manifested by the increase in Chloride content of the pumped water (CGWB).
6.2.2 Depth to water levels The DTW for the shallow phreatic aquifer pre-monsoon period (May 2016) varied between 1.31-10.0 m below ground level (bgl). A perusal of the DTW contour map indicates that most of the area possessing shallow water levels in the range of 1.31-4.5 m bgl (Fig 5a). The parts closer to the coastline depict DTWs in the range of 1.31-3.0 m bgl. The deeper water levels in the range of 4.5-10.0 m bgl are measured in the north-western parts of the area. In and around PUA, the DTWs varied between 1.31-8.0 m bgl.
The post-monsoon DTWs indicate monsoon based groundwater recharge in the area. The post-monsoon DTWs of the area showed a similar trend with variation between 0.8-6.0 m bgl (Fig 5b). Major part of the area fall in the DTW range of 0.8-3.0 m bgl registering rise in water levels in the range of ~0.5-1.5 m. Areas close to the coastline registered the DTWs in between 0.8-1.5 m bgl. Again, during the post-monsoon measurement also the DTWs are comparatively deeper (range: 0.8-6.0 m bgl) in and around PUA. From the pre- and post-monsoon depth to water levels it is evident that shallow water levels are observed in most parts of the PUA except the raised dune areas especially in and around Lord Jagannath Temple and Tota Gopinath area.
Fig. 5: (a) and (b) the pre- and post-monsoon depth to water level maps respectively for the study area.
(a)
(b)
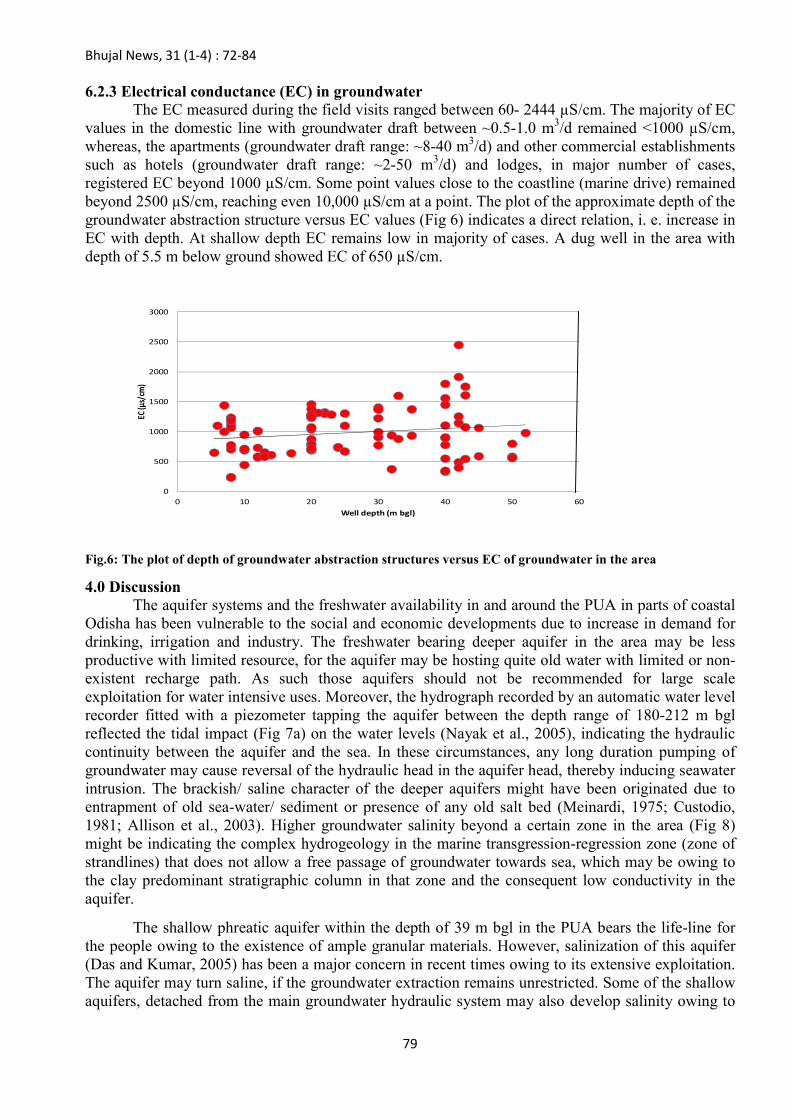
Bhujal News, 31 (1-4) : 72-84
79
6.2.3 Electrical conductance (EC) in groundwater The EC measured during the field visits ranged between 60- 2444 µS/cm. The majority of EC
values in the domestic line with groundwater draft between ~0.5-1.0 m3/d remained <1000 µS/cm, whereas, the apartments (groundwater draft range: ~8-40 m3/d) and other commercial establishments such as hotels (groundwater draft range: ~2-50 m3/d) and lodges, in major number of cases, registered EC beyond 1000 µS/cm. Some point values close to the coastline (marine drive) remained beyond 2500 µS/cm, reaching even 10,000 µS/cm at a point. The plot of the approximate depth of the groundwater abstraction structure versus EC values (Fig 6) indicates a direct relation, i. e. increase in EC with depth. At shallow depth EC remains low in majority of cases. A dug well in the area with depth of 5.5 m below ground showed EC of 650 µS/cm.
Fig.6: The plot of depth of groundwater abstraction structures versus EC of groundwater in the area
4.0 Discussion The aquifer systems and the freshwater availability in and around the PUA in parts of coastal
Odisha has been vulnerable to the social and economic developments due to increase in demand for drinking, irrigation and industry. The freshwater bearing deeper aquifer in the area may be less productive with limited resource, for the aquifer may be hosting quite old water with limited or non-existent recharge path. As such those aquifers should not be recommended for large scale exploitation for water intensive uses. Moreover, the hydrograph recorded by an automatic water level recorder fitted with a piezometer tapping the aquifer between the depth range of 180-212 m bgl reflected the tidal impact (Fig 7a) on the water levels (Nayak et al., 2005), indicating the hydraulic continuity between the aquifer and the sea. In these circumstances, any long duration pumping of groundwater may cause reversal of the hydraulic head in the aquifer head, thereby inducing seawater intrusion. The brackish/ saline character of the deeper aquifers might have been originated due to entrapment of old sea-water/ sediment or presence of any old salt bed (Meinardi, 1975; Custodio, 1981; Allison et al., 2003). Higher groundwater salinity beyond a certain zone in the area (Fig 8) might be indicating the complex hydrogeology in the marine transgression-regression zone (zone of strandlines) that does not allow a free passage of groundwater towards sea, which may be owing to the clay predominant stratigraphic column in that zone and the consequent low conductivity in the aquifer.
The shallow phreatic aquifer within the depth of 39 m bgl in the PUA bears the life-line for the people owing to the existence of ample granular materials. However, salinization of this aquifer (Das and Kumar, 2005) has been a major concern in recent times owing to its extensive exploitation. The aquifer may turn saline, if the groundwater extraction remains unrestricted. Some of the shallow aquifers, detached from the main groundwater hydraulic system may also develop salinity owing to
0
500
1000
1500
2000
2500
3000
0 10 20 30 40 50 60
EC (µ
s/cm
)
Well depth (m bgl)

Bhujal News, 31 (1-4) : 72-84
80
mineralization and accumulation of salts in the groundwater (Vengosh et al., 1999; Aquilina et al., 2002).
Fig. 7: (a) – (b) Composite hydrographs in piezometers tapping the deeper aquifer and the shallow phreatic
aquifer respectively in PUA (for details refer the text) (Modified after Nayak et al., 2005)
Water level data (Fig 7b) in an automatic water level recorder (AWLR) installed close to the beach indicated water table of 2 to 4 meters above mean sea level during rainy season with a gentle slope towards sea. With passage of time it was at just 0.5 m above the msl (Nayak et al., 2005). This shows that the aquifer has already reached the equilibrium and any further exploitation without increasing recharge may induce seawater ingress. Though, the aquifer bears a tremendous potential for groundwater recharge in the sand-dune areas, several clayey (clay in the top slice of the lithology) patches exist in and around the PUA which hinders the natural groundwater recharge mechanism. The natural recharge to the shallow aquifer system has also been reduced owing to rapid urbanization in PUA. Close to the coastline, high-rates of withdrawal of freshwater from the aquifer have already caused intrusion of saline-water into the phreatic aquifer. High groundwater withdrawal is evident from the deeper DTWs observed in and around the PUA, and more particularly along the marine drive close to the coastline (Fig 5). It indicates the hydraulic connection of the phreatic aquifer with the sea. In that case groundwater withdrawal beyond a certain limit from the aquifer may induce rush of saline-water into the aquifer. Earlier (Nayak et al., 2005), based on 20 monitoring station data and automatic water level recorder data, the replenishable groundwater resource was calculated as 9.08 MCM for the PUA only. The groundwater draft was to the tune of 9.64 MCM and thus the stage of groundwater development was estimated at around 106%. Thus, there is very little scope for further groundwater development unless corrective measures for groundwater recharge and water conservation are adopted for sustainable management of the resource in the city.
(b)
(a)
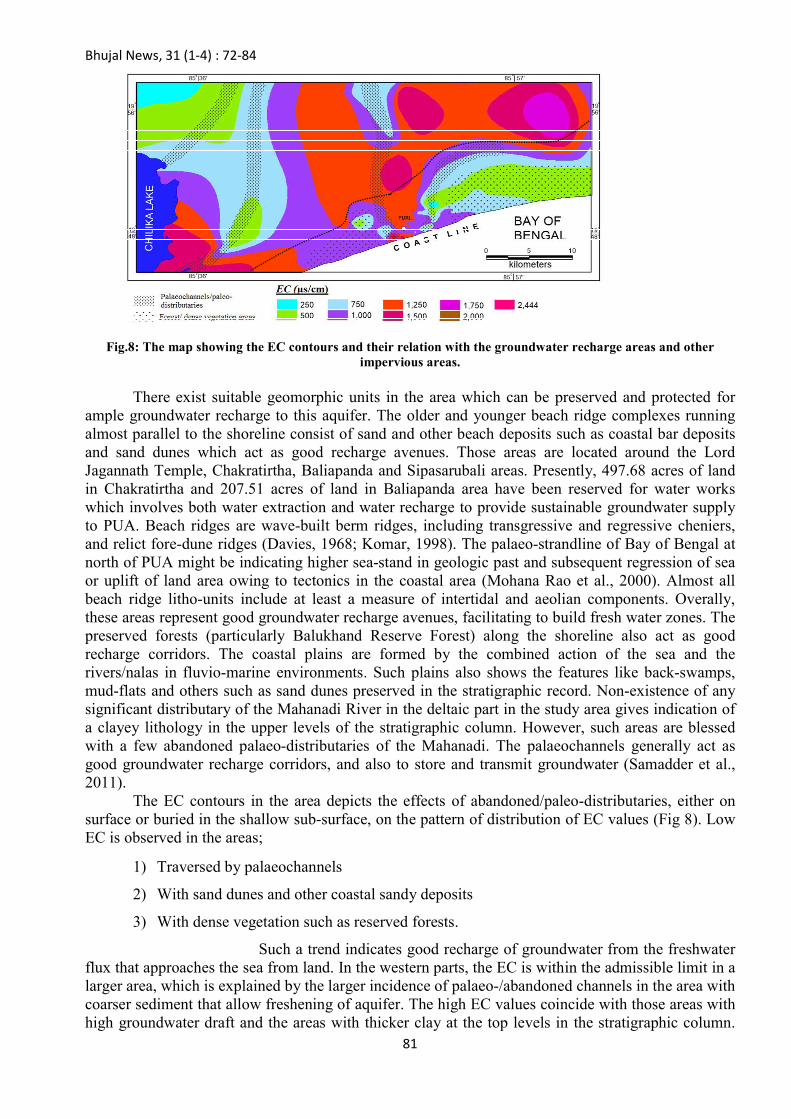
Bhujal News, 31 (1-4) : 72-84
81
Fig.8: The map showing the EC contours and their relation with the groundwater recharge areas and other impervious areas.
There exist suitable geomorphic units in the area which can be preserved and protected for
ample groundwater recharge to this aquifer. The older and younger beach ridge complexes running almost parallel to the shoreline consist of sand and other beach deposits such as coastal bar deposits and sand dunes which act as good recharge avenues. Those areas are located around the Lord Jagannath Temple, Chakratirtha, Baliapanda and Sipasarubali areas. Presently, 497.68 acres of land in Chakratirtha and 207.51 acres of land in Baliapanda area have been reserved for water works which involves both water extraction and water recharge to provide sustainable groundwater supply to PUA. Beach ridges are wave-built berm ridges, including transgressive and regressive cheniers, and relict fore-dune ridges (Davies, 1968; Komar, 1998). The palaeo-strandline of Bay of Bengal at north of PUA might be indicating higher sea-stand in geologic past and subsequent regression of sea or uplift of land area owing to tectonics in the coastal area (Mohana Rao et al., 2000). Almost all beach ridge litho-units include at least a measure of intertidal and aeolian components. Overally, these areas represent good groundwater recharge avenues, facilitating to build fresh water zones. The preserved forests (particularly Balukhand Reserve Forest) along the shoreline also act as good recharge corridors. The coastal plains are formed by the combined action of the sea and the rivers/nalas in fluvio-marine environments. Such plains also shows the features like back-swamps, mud-flats and others such as sand dunes preserved in the stratigraphic record. Non-existence of any significant distributary of the Mahanadi River in the deltaic part in the study area gives indication of a clayey lithology in the upper levels of the stratigraphic column. However, such areas are blessed with a few abandoned palaeo-distributaries of the Mahanadi. The palaeochannels generally act as good groundwater recharge corridors, and also to store and transmit groundwater (Samadder et al., 2011).
The EC contours in the area depicts the effects of abandoned/paleo-distributaries, either on surface or buried in the shallow sub-surface, on the pattern of distribution of EC values (Fig 8). Low EC is observed in the areas;
1) Traversed by palaeochannels
2) With sand dunes and other coastal sandy deposits
3) With dense vegetation such as reserved forests.
Such a trend indicates good recharge of groundwater from the freshwater flux that approaches the sea from land. In the western parts, the EC is within the admissible limit in a larger area, which is explained by the larger incidence of palaeo-/abandoned channels in the area with coarser sediment that allow freshening of aquifer. The high EC values coincide with those areas with high groundwater draft and the areas with thicker clay at the top levels in the stratigraphic column.

Bhujal News, 31 (1-4) : 72-84
82
The areas like back-swamps, palaeo-floodplains and other depressions with underlying thick clayey beds can impede natural groundwater recharge process, thus causing a decrease in the freshwater flux and the associated hydraulic pressure towards sea.
7.0 Conclusions The groundwater salinity in some pockets in and around the PUA are related to certain
mechanism as cited below:
1. Availability of features like open pervious fields, sand dunes and palaeochannels/ palaeo-distributaries act as avenues for groundwater recharge (lateral recharge and recharge from rainfall). Such features as observed in Chakratirtha, Baliapanda, Sipasarubali and Baliguali areas help in freshening of particularly the shallow phreatic aquifers and enhancing the availability of freshwater in the aquifer. The phreatic aquifer bears hydraulic connection with the sea and a recharge with higher flux in the aquifer system is essential. The coastal forests like that of Balukhand Reserved Forest also help in recharging the shallow phreatic aquifer and thus restricting the sea-water ingress towards land.
2. Uncontrolled exploitation of groundwater from the shallow aquifer in the Puri Urban Area for drinking and that for irrigation in peri-urban areas causes ingress of saline water from sea, thus causing a rise in the EC level of groundwater.
3. Presence of impervious layers (over-bank, flood plain mud, back-swamp and mud flat deposits) at the top levels in the stratigraphic column also restricts the natural groundwater recharge processes, which results in decrease of freshwater flux towards sea and ingress of saline water landward in the aquifer.
8.0 Recommendations Availability of freshwater in the shallow aquifers in Puri Arban Area and peri-urban areas can be enhanced by facilitating more groundwater recharge through natural and artificial means. The natural recharge corridors as depicted in the present work (sand-dunes, beach ridge complexes, palaeochannel stretches etc) can be preserved and protected from encroachment. Rehabilitation and rejuvenation of existing ponds and nalas/rivers in the area can produce a positive impact. Some additional ponds, reservoirs and canal lines can be constructed parallel to the coastline so that the groundwater recharge to the shallow aquifer system is enhanced.
Acknowledgements The authors extend their thanks to Sri G C Pati, Chairman, CGWB, Sri S Marwha, Member
(HQ), CGWB and Sri Utpal Gogoi, Member (East), CGWB for giving scope and opportunity to carry out the study. The authors are also thankful to Sri D P Pati, Former Regional Director, CGWB, SER, Bhubaneswar and Sri B K Sahoo, Sc ‘D’, CGWB, SER, Bhubaneswar for their suggestins and advice at different times in doing this work.

Bhujal News, 31 (1-4) : 72-84
83
References
Allison, M.A., Khan, S.R., Goodbred, S.L., Kuehl, S.A., 2003. Stratigraphic evolution of the
Andersen, M. S., Nyvang, V., Jakobsen, R., Postma, D. 2005. Geochemical processes and solute transport at the seawater/freshwater interface of a sandy aquifer. Geochimica et Cosmochimica Acta. 69: 3979-3994.
Andrades, Filho. C. O. and Rossetti, D. F. 2012. Effectiveness of SRTM and ALOS-PALSAR data for identifying morphostructural lineaments in northeastern Brazil; Int. J. Remote Sens. 33 1058–1077.
Aquilina, L., Ladouche, B., Doerfliger, N., Seidel, J. L., Bakalowicz, M., Dupuy, C., et al. 2002. Origin, evolution and residence time of saline thermal fluids (Balaruc springs, southern France): implications for fluid transfer across the continental shelf. Chemical Geology. 192: 1-21.
CGWB, 2012. Feasibility of Artificial Recharge in Puri Town, Odisha, Unpublished report. Central Ground Water Board, South-eastern Region, Bhubaneswar, Ministry of Water Resources, Government of India. CGWB, 2016. Ground Water Year Book, Odisha. Unp. Rep. Central Ground Water Board, South Eastern Region, Bhubaneswar, Odisha. Ministry of Water Resources, RD & GR, Government of India.
CGWB, 2017. National Aquifer Mapping in the district of Puri, Odisha. Interim Unp. Rep. Central Ground Water Board, South Eastern Region, Bhubaneswar, Odisha. Ministry of Water Resources, RD & GR, Government of India.
CGWB, PHED and GWSI, 2005. Joint Inspection Report on Drying up of Ganga & Yamuna Sacred Wells of Lord Jagannath Temple, Puri, Odisha. Central Ground Water Board, South-eastern Region, Bhubaneswar, Government of India; Public Health Division, Bhubaneswar, Government of Odisha; Ground Water Survey and Investigation Department, Bhubaneswar, Government of Odisha. Chachadi, A.G. and C. Joaquim S. John. 2000. “Geoelectrical Studies in Ascertaining Fresh-Water Zones in Coastal Goa”, Coastal Zone Management, S.D.M.C.E.T, Dharwad & IGCP-367, Special Publication, Volume No. 2, pp. 169-172.
Custodio, E. (1981). Sea water encroachnaent in the JJobreaat and Res & areas, near Barcelona (Catalonia, Sriain). Intruded and Relict Groundwater of Marine Origin. VI1 S a l t Water Intrusion Meeting. WIN-81. Uppsala. Sveriges Geologiska Undersbhing, repprter cch reddelanden. 27, pp. 120-152.
Custodio, E., 2002. Aquifer overexploitation: what does it mean? Hydrogeology Journal 10, 254–277.
Das, S., Kumar, K. J. 2005. Management of groundwater in coastal Orissa, India. Intern. Jour. Ecol. Eviron. Sci. 31 (1). 285-297.
Davies, J. L. 1968. Beach Ridges. In: R. Fairbridge (Ed.) Encyclopaedia of Geomorphology.
Delsman, J.R., Hu-a-ng, K.R.M., Vos, P.C., de Louw, P.G.B., Oude Essink, G.H.P., Stuyfzand, P.J., Bierkens, M.F.P., 2014. Paleo-modeling of coastal saltwater intrusion during the Holocene: an application to the Netherlands. Hydrology and Earth System Sciences 18, 3891–3905
Felisa, G., Ciriello, V., Federico, V. D. 2013. Saltwater Intrusion in Coastal Aquifers: A Primary Case Study along the Adriatic Coast Investigated within a Probabilistic Framework. Water 2013, 5, 1830-1847; doi:10.3390/w5041830.
Bhujal News, 31 (1-4) : 72-84
84
Islam, M.S., Tooley, M.J., 1999. Coastal and sea-level changes during the Holocene in Bangladesh. Quaternary International 55, 61–75.
Kale, V. and Shejwalkar, N. 2008. Uplift along the western margin of the Deccan Basalt Province: Is there any geomorphometric evidence; J. Earth Syst. Sci. 117(6) 959–971.
Komar. P. D. 1998. Beach Processes and Sedimentation (2nd edition), Prentice- Hall, 544pp.
late Holocene Ganges – Brahmaputra lower delta plain. Sedimentary Geology 155, 317–342.
Meinardi, C.R. (1975) . Brackish groundwater bodies as a result of geoloqical history and hydrological conditions. R.I.D. Mededeling 75-1, Rijksinstituut voor Drinkwatervoorziening. The Hague. Also in, Symp. on Brackish Water as a factor in Developrent. Beer-Sheva, Israel.
Mohana Rao, K., Reddy, N. P. C., Prem Kumar, M. K., Raju, Y. S. N., Venkateswarulu, K., Murthy, K. S. R. 2000. Signature of Late Quaternary Sea-level Changes and Neo-tectonics Activity Over Visakhapatnam- Gopalpur Shelf, East Coast of India. Proc. Int. Quat. Seminar of INQUA Shoreline, Indian Ocean Commission, pp. 116-124.
Nayak, N. C., Srivastava, S. K., Choudhury, A., 2005. Ground Water Management Studies in Puri Town. Unpublished report. Central Ground Water Board, South-eastern Region, Bhubaneswar, Ministry of Water Resources, Government of India. Rodr´ıguez, E.., Morris, C. S., and Belz, J. E. 2006. A global assessment of the SRTM performance; Photogramm. Eng. Remote Sens. 72, 249–260.
Samadder, R. K., Gupta, R. P., Kumar, S., 2011. Palaeochannels and their potential for artificial groundwater recharge in the western Ganga plains. J Hydrol 400(1):154–164. Vengosh, A., Spivack, A. J., Artzi, Y., Ayalon, A. 1999. Geochemical and boron, strontium, and oxygen isotopic constraints on the origin of the salinity in groundwater from the Mediterranean coast of Israel. Water Resources Research. 35: 1877-1894.
Werner, A. D., Bakker, M., Post, V. E. A., Vandenbohede, A., Lu, C., Ataie-Ashtiani, B., et al. 2013. Seawater intrusion processes, investigation and management: Recent advances and future challenges. Advances in Water Resources. 51: 3-26.
Woodroffe, S.A., Horton, B.P., 2005. Holocene sea-level changes in the Indo-Pacific. Journal of Asian Earth Sciences 25, 29–43.

Bhujal News, 31 (1-4) : 85-94
85
Decadal variation in ground water Quality : A case Study of Jodhpur district, Rajasthan
Dr S. K. Jain1, CGWB, WR, Jaipur Ms Balinder P. Singh1, CGWB, WR, Jaipur Dr Jaipal Garg*1, CGWB, WR, Jaipur
Corresponding Author: *[email protected]
Abstract : Jodhpur district is amongst the largest districts in the state of Rajasthan. In Jodhpur district, where the climate is dry over most of its territories, water resources are both scarce and unequally distributed through time and space, with a potential decrease, due to overexploitation, exploitation of non-renewable deep aquifer, salinization, and pollution. The present study aims to assess the decadal variations of the hydrochemical characteristics of Jodhpur groundwater, a crucial resource. This study develops an approach based on analysis for investigating the spatial and temporal variation of water quality governing processes. The resulting plots of the major chemical components increase the knowledge about how precipitation and human interference impact groundwater quality in Jodhpur district. Variability of groundwater quality in the study area is caused by water rock interactions and the annual changes in the amount and distribution of precipitation. This approach allows to analyze the variation of groundwater quality controlling processes efficiently and simultaneously. Temporal changes of recharged water composition, hydrologic and human factors, may cause periodic changes in groundwater quality. An understanding of the spatial variation and processes affecting water quality is essential in sustaining usable water supplies under changing climate and local environmental pressures. Keywords: groundwater, aquifer, water quality, electrical conductance, temporal variations.

Bhujal News, 31 (1-4) : 85-94
86
1.0 Introduction Jodhpur district (Fig 1) comprises three distinct physiographic units, the alluvial plains, sand
dunes and escarpments. The western and north-western parts of Jodhpur district are characterized by sand dunes. With exception of some parts of Bilara and Osian tehsil, land surface of the district is nearly flat and sandy. The general slope of the terrain is towards west. There is no perennial river in the district and Luni is the only important river in the district.
Attempt has been made to correlate average annual rainfall data (WRD, Rajasthan) of nearest rainguage station of the area with quality data (CGWB) of a particular village. Data gap exists for locations where average rainfall or chemical data of the village is unavailable
Fig 1: District: Jodhpur Administrative Map
2.0 General Groundwater Quality There is a large variation in chemical quality of ground water in the district depending on the characteristics of water bearing formation, movement of ground water, depth to water levels etc. It is seen that in shallow ground water zone, the electrical conductance varies generally from 350 ms/cm to 13800 S/cm at 250C. Highly mineralized ground water occurs in Rann area. The ground water in southern, southeastern, and southwestern parts of the district is saline. In Bap block, northern and western parts have brackish ground water. The electrical conductance is less than 3000 S/cm at 250 C in major part of the district. In the central part of the district where sandstone forms the aquifer, electrical conductance generally varied from less than 1000 to 2000 S/cm at 250 C (Fig 2).
Salinity when expressed in terms of total dissolved solids ranges between 230 mg/l to 8970 mg/l during 2018. Fluoride content in excess maximum permissible limit of 1.5 mg/l has been reported from major parts of the district covering western halves of Bap, Balesar and Phalodi blocks, major part of Shergarh block, eastern and south-central parts of Osian block, southwestern part of Mandore block, northwestern, southwestern and southeastern part of Luni block, northern part of Bhopalgarh and eastern and western part of Bilara block. Nitrate in excess of maximum permissible limit of 45 mg/l has been reported from parts of Osian, Bhopalgarh, Mandore and Luni blocks.Fluoride is high in 28% while 40% samples are contaminated with high nitrate. Sodium is predominant cation in almost 90% samples, while, chloride followed by bicarbonate are main contributing anions. The groundwater is highly sodic and saline.

Bhujal News, 31 (1-4) : 85-94
87
Fig 2: Jodhpur District Electrical Conductivity in Groundwater
3.0 Decadal Variation in Groundwater Quality The long-term repeated groundwater quality data of observation wells (CGWB) has been
analysed and an assessment has been made on the temporal variations of the hydrochemical characteristics of Jodhpur aquifer, a crucial water resource, between 2009 and 2018. The resulting plots of the major chemical components reveal the spatial and temporal variability of groundwater quality. Results of this work increase the knowledge about how precipitation and human contamination impact groundwater quality in Jodhpur district. Spatial variability of groundwater quality in the study area is caused by water rock interactions and the average annual changes in the amount and distribution of precipitation. This approach allows to analyze the variation of groundwater quality controlling processes efficiently and simultaneously.
3.1 Village Bap1 The depth of dug well in village Bap1 is 27.4 m depth and land data from 2009 to 2017 has
been plotted (Fig 3). No fixed pattern in water quality has been observed for these years but a sharp deterioration in general water quality is observed in 2010 with observed TDS values above 6500 mg/l. TDS have fluctuated between 500 to 1500 mg/l in subsequent years. In general, Sodium (Na) is dominant cation while chloride (Cl) followed by sulphate (SO4) is dominant anion. The nitrate (NO3) and fluoride (F) concentrations plotted on log scale depicts anthropogenic contamination with respect to nitrate. Fluoride concentration is steadily decreasing with time while nitrate is increasing with the years indicating contamination due to anthropogenic activity in the area. The effect of rainfall on water quality is observed in subsequent year or two years later. This may be due to time taken for recharge water to percolate to the tapped aquifer.

Bhujal News, 31 (1-4) : 85-94
88
Fig 3: Temporal Variations of the Hydro-chemical Characteristics- Village Bap 1
3.2 Village Devatra
The depth of dug well in Devatra is 35 m and is generally of high salinity. Wide variation in chemical constituents is observed in the decadal data (Fig 4). There has been a considerable increase in total dissolved solids in 2010 and 2012 which may be associated with less precipitation in these years. A spike in nitrate concentration is observed in 2010 followed by sudden decrease in 2016 and 2018. Fluoride concentration is within BIS drinking water limits during the decade. Considerable improvement in water quality is observed in major and minor constituents, post 2017, though rainfall has also been less in the period.

Bhujal News, 31 (1-4) : 85-94
89
Fig 4: Temporal Variations of the Hydro-chemical Characteristics- Village Devatra
3.3 Village Dhawa
The well water of Dhawa village is highly saline with high concentration of total dissolved
solids and Na and Cl followed by Ca and SO4 being the main constituents (Fig 5). Fluctuation in
salinity with respect to all major constituents is observed during the decadal effect of high rainfall in
a particular year on the chemical constituents observed in the consequent year, i.e, higher rainfall in
2010 with decrease in total dissolved solids in 2011.Similarly higher rainfall in 2013 and 2016 with
decrease in all chemical constituents in 2014 and 2017 respectively.
Fig 5: Temporal Variations of the Hydro-chemical Characteristics- Village Dhawa
3.3 Village Mandore1 The dug well at Mandore1 has depth of 35.14 m and groundwater is of medium salinity. A
variable trend with respect to major quality parameters is observed during the decade (2009-2018). A sharp increase in total dissolved solids is observed in 2011 and 2017 with respective increase in all major constituents. Nitrate contamination is prevalent in the ground water and Fluoride concentration has increased sharply to 1.6 mg/l in 2018 as compared to 0.1 mg/l in 2016. Generally, the water quality has improved in the years with higher rainfall. Ca-Mg-Cl type of water is found up to 2017 while mixed type of water is observed in 2018 (Fig 6).

Bhujal News, 31 (1-4) : 85-94
90
Fig 6: Temporal Variations of the Hydro-chemical Characteristics- Village Mandore1
3.4 Village Jodhpur Reported depth of dug well at Jodhpur is 42.99 m. The groundwater quality deteriorated
sharply from 2009 to 2012 with increase in salinity in terms of total dissolved solids (Fig 7). The
groundwater quality with respect to major parameters has improved considerably 2016 onwards and
is of Ca-Mg-Cl type up to 2017, thereafter, it is of mixed type with no major constituent
predominating. High contamination with nitrate is observed especially in the years of low rainfall.
Fluoride, though below 1.5 mg/l during the decade, varies each year with no specific trend.

Bhujal News, 31 (1-4) : 85-94
91
Fig 7: Temporal Variations of the Hydro-chemical Characteristics- Village Jodhpur
3.5 Village Chopasni Nath The groundwater quality has improved slightly during the decade with exception during 2013
and 2017 when there has been in increase major constituents and total hardness specifically (Fig 8). Nitrate contamination is observed all through the decade and depth of well is 16.6 m indicative of anthropogenic activity affecting the groundwater quality. There is wide variation in fluoride concentration, although remaining below 1.5 mg/l in the decade. Ca-Mg-Cl-SO4 type water is predominant upto 2017 but Na and SO4 are predominant ions in 2018 indicating base exchange reaction.
Fig 8: Temporal Variations of the Hydro-chemical Characteristics- Village Chopasni Nath
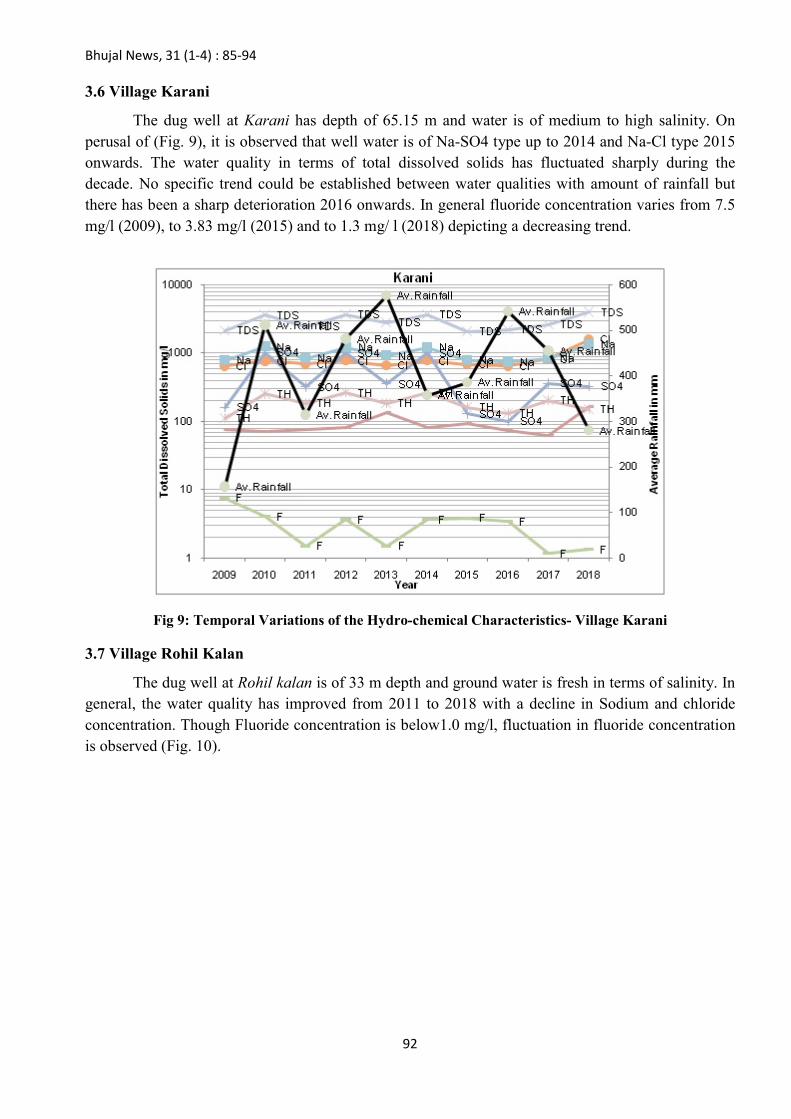
Bhujal News, 31 (1-4) : 85-94
92
3.6 Village Karani
The dug well at Karani has depth of 65.15 m and water is of medium to high salinity. On perusal of (Fig. 9), it is observed that well water is of Na-SO4 type up to 2014 and Na-Cl type 2015 onwards. The water quality in terms of total dissolved solids has fluctuated sharply during the decade. No specific trend could be established between water qualities with amount of rainfall but there has been a sharp deterioration 2016 onwards. In general fluoride concentration varies from 7.5 mg/l (2009), to 3.83 mg/l (2015) and to 1.3 mg/ l (2018) depicting a decreasing trend.
Fig 9: Temporal Variations of the Hydro-chemical Characteristics- Village Karani
3.7 Village Rohil Kalan
The dug well at Rohil kalan is of 33 m depth and ground water is fresh in terms of salinity. In general, the water quality has improved from 2011 to 2018 with a decline in Sodium and chloride concentration. Though Fluoride concentration is below1.0 mg/l, fluctuation in fluoride concentration is observed (Fig. 10).
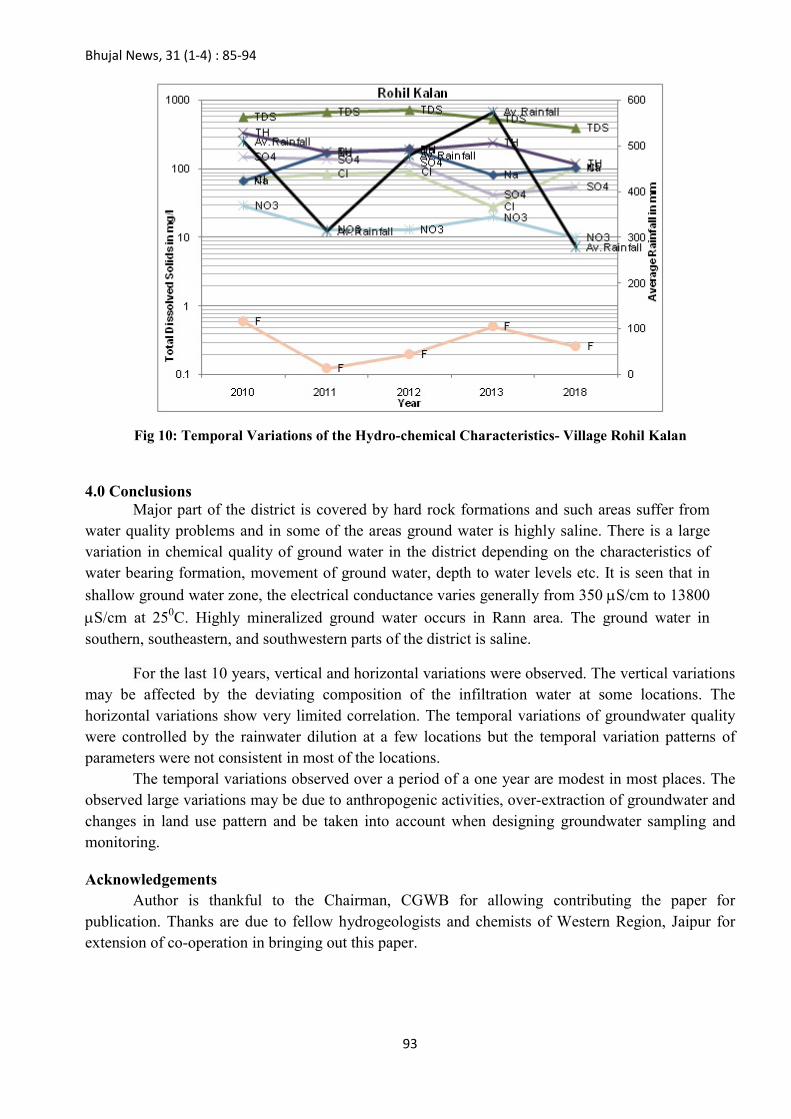
Bhujal News, 31 (1-4) : 85-94
93
Fig 10: Temporal Variations of the Hydro-chemical Characteristics- Village Rohil Kalan
4.0 Conclusions Major part of the district is covered by hard rock formations and such areas suffer from
water quality problems and in some of the areas ground water is highly saline. There is a large variation in chemical quality of ground water in the district depending on the characteristics of water bearing formation, movement of ground water, depth to water levels etc. It is seen that in
shallow ground water zone, the electrical conductance varies generally from 350 S/cm to 13800
S/cm at 250C. Highly mineralized ground water occurs in Rann area. The ground water in southern, southeastern, and southwestern parts of the district is saline.
For the last 10 years, vertical and horizontal variations were observed. The vertical variations may be affected by the deviating composition of the infiltration water at some locations. The horizontal variations show very limited correlation. The temporal variations of groundwater quality were controlled by the rainwater dilution at a few locations but the temporal variation patterns of parameters were not consistent in most of the locations.
The temporal variations observed over a period of a one year are modest in most places. The observed large variations may be due to anthropogenic activities, over-extraction of groundwater and changes in land use pattern and be taken into account when designing groundwater sampling and monitoring.
Acknowledgements Author is thankful to the Chairman, CGWB for allowing contributing the paper for
publication. Thanks are due to fellow hydrogeologists and chemists of Western Region, Jaipur for extension of co-operation in bringing out this paper.

Bhujal News, 31 (1-4) : 85-94
94
References:
1. Hem, J.D., (1985): “Study and interpretation of the chemical characteristics of natural
water” U.S. Geol. Surv. Water Supply Paper, 2254, pp 1263.
2. BIS (2012): Drinking water specifications (Second revision), Bureau of Indian Standards,
Manak Bhawan, 9, Bahadur Shah Zafar Marg, New Delhi, IS 10500.
3. Sharma, M.K.,( 2014) :“Ground Water Pollution Studies in Industrial Cluster of Jodhpur,
District Jodhpur, Rajasthan” CGWB, Western Region Jaipur.
4. Central Ground Water Board (2017) : “Report on Aquifer Mapping and Ground Water
Management Jodhpur District, Rajasthan” Central Ground Water Board (CGWB) Western
Region, Jaipur :
5. RODC, GEMS (2020): “GWMS, Water Quality, 2008-2018” CGWB, WR, Jaipur.
6. http://water.rajasthan.gov.in/wrd#,(2009-2018) :“Rainfall, Annual Rainfall, Rajasthan.pdf”
7. http://cgwb.gov.in/District_Profile/Rajasthan/Jodhpur.pdf,2013,‘GroundWater Information
Booklet,

Bhujal News, 31 (1-4) : 95-108
95
Assessment of Ground Water Quality in Industrial Zone of Dewas (MP), Central India
V. K. Kulshreshtha*1, CGWB, WCR, Ahmedabad Sourab Gupta2, CGWB, CHQ, Faridabad
*Corresponding [email protected]
Abstract: The country’s pollution apex body, the Central Pollution Control Board (CPCB) has found Dewas (MP) as a severely polluted industrial cluster in the country on the basis of the Comprehensive Environmental Pollution Index (CEPI). The CPCB analysis had designated Dewas as a severely polluted industrial cluster since it racked up 68.77 points on the scale. In this context, Central Ground Water Board, North Central Region, Bhopal decided to take up an investigation in April 2013 to assess the ground water quality of the industrial area of Dewas (MP). The present work was undertaken to ascertain the ground water pollution caused by industries situated in Dewas city and to determine groundwater suitability for drinking, irrigation and other ancillary uses by local inhabitants. The methods of study are broadly confined to field survey, which includes the collection of ground water samples covering the industrial area and surrounding villages and laboratory investigation for major ion chemistry and potentially toxic trace elements (PTEs). The study clearly brought out the fact that the quality of ground waters surrounding the industrial area of Dewas has been deteriorated significantly as the percentage of samples with respect to the EC, Cl, HCO3, NO3, SO4,Total hardness, Ca, Mn and Pb exceeds the acceptable limit of Indian drinking standards (BIS, 2012). Suitability of water samples for irrigation purpose was established using standard tools like Wilcox and USSL diagrams, revealed that “C3-S1” (High Salinity & Low Sodium) to “C4-S2” (Very High Salinity & Moderate Sodium)” category for majority of the samples.
Keywords: groundwater, pollution index, PTE, suitability, irrigation

Bhujal News, 31 (1-4) : 95-108
96
1.0 Introduction Dewas has become an important node in the industrial development scenario of Madhya
Pradesh since approximately 450 large, medium and small scale industries are concentrated in the city providing employment to thousands of industrial workers. But another slant of industrialization is the serious damage to the surrounding environment due to the wastes and pollutants generated from the industries. The environmental cost borne by communities located in and around the industrial area in Dewas is dubious. Realizing this trend of pollution in various environmental media like air and water, soil etc. due to industrial waste/effluent, the Ministry of Jal Shakti, River Development & Ganga Rejuvenation, Government of India has adopted a policy for ground water quality assessment of industrial clusters.
2.0 Methodology Detailed survey has been made in study area and have collected 33 water samples in
duplicate (33 for basic parameters + 33 acidified for heavy metal) during the course of a survey scanning through several of open dug wells and bore wells within the periphery of Dewas Industrial Area in the month of April 2013. The samples were collected as per guidelines of American Public Health Association (APHA 2012) in one-litre pre-rinsed airtight polythene bottles after filtration at the site to remove the turbidity and sealed with wax. Total 66 water samples were collected and brought to the Regional Chemical Laboratory, Central Ground Water Board, North Central Region, Bhopal. The collected samples, observing handling requirements, were analyzed in the Regional Chemical Laboratory for basic parameters and selective PTEs which includes Fe, Zn, Mn, Cd, Ni, Cr, Pb and Cu. The pH and EC values were determined in situ with the help of a portable pH-meter and EC-meter whereas other constituents were determined in the laboratory by using different volumetric methods, Flame-photometer (Systonics-128), Spectrophotometer (Shimadzu, UV-1201). The PTEs analysis was carried out by using Atomic Absorption Spectrophotometer (GBC-Avanta). The observed ion-balance-error computed for each set of a complete analysis of the water samples were within the range of acceptability (± 5%) shown in Annexure–I. The list of sampling points and geographical locations of sampling points are shown in fig.1.

Bhujal News, 31 (1-4) : 95-108
97
Fig. 1: Map of Dewas Industrial Area along with locations of sampling Points.
3.0 Suitability for drinking and Domestic use One of the main objectives of the ground water quality monitoring is to assess the
suitability for drinking purposes. Bureau of Indian Standards (BIS) formally known as the Indian Standard Institute (ISI) vide its official document IS: 10500:2012, Second edition (ICS 13.060.20) has recommended the quality standards for drinking purposes and these have been used for finding the suitability of groundwater. Based on BIS prescribed limits for different parameters, the ground water quality around Dewas Industrial Area has been described. Table 1 contains water quality data for supporting the foregoing statements: The Earth’s temperature and that of groundwater too depends on depth. The temperature of groundwater is generally equal to the mean
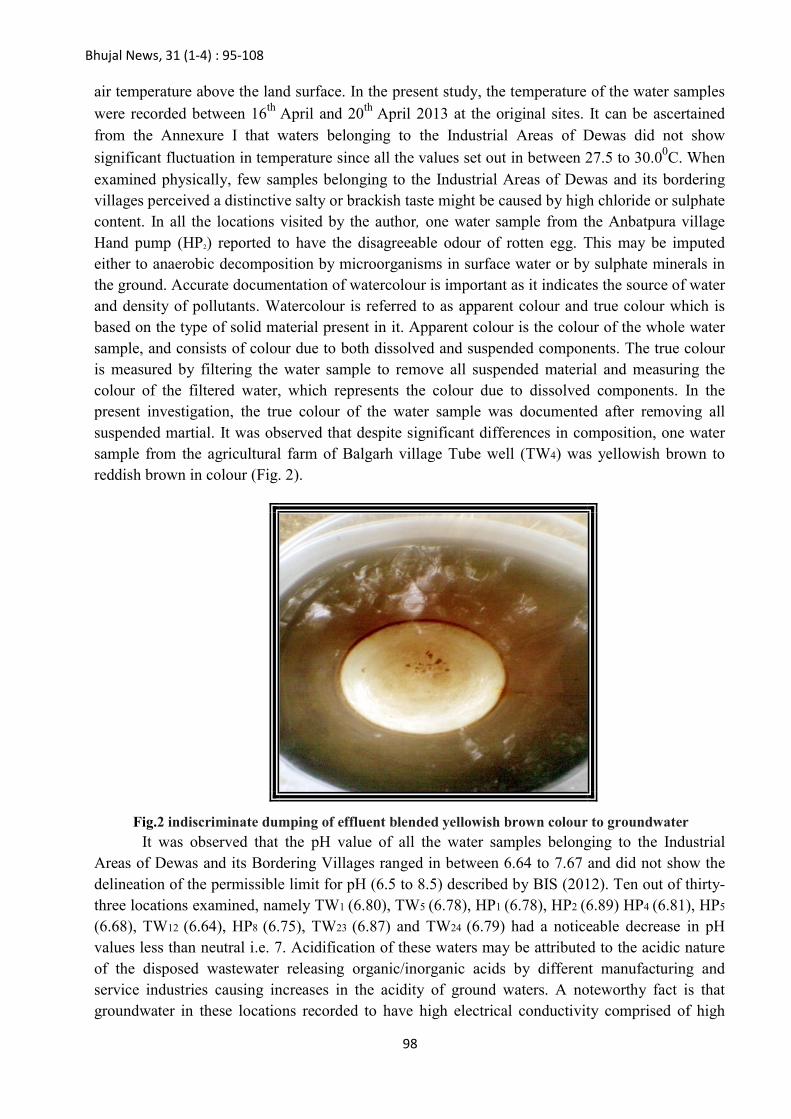
Bhujal News, 31 (1-4) : 95-108
98
air temperature above the land surface. In the present study, the temperature of the water samples
were recorded between 16th April and 20th April 2013 at the original sites. It can be ascertained from the Annexure I that waters belonging to the Industrial Areas of Dewas did not show
significant fluctuation in temperature since all the values set out in between 27.5 to 30.00C. When examined physically, few samples belonging to the Industrial Areas of Dewas and its bordering villages perceived a distinctive salty or brackish taste might be caused by high chloride or sulphate content. In all the locations visited by the author, one water sample from the Anbatpura village Hand pump (HP2) reported to have the disagreeable odour of rotten egg. This may be imputed either to anaerobic decomposition by microorganisms in surface water or by sulphate minerals in the ground. Accurate documentation of watercolour is important as it indicates the source of water and density of pollutants. Watercolour is referred to as apparent colour and true colour which is based on the type of solid material present in it. Apparent colour is the colour of the whole water sample, and consists of colour due to both dissolved and suspended components. The true colour is measured by filtering the water sample to remove all suspended material and measuring the colour of the filtered water, which represents the colour due to dissolved components. In the present investigation, the true colour of the water sample was documented after removing all suspended martial. It was observed that despite significant differences in composition, one water sample from the agricultural farm of Balgarh village Tube well (TW4) was yellowish brown to reddish brown in colour (Fig. 2).
Fig.2 indiscriminate dumping of effluent blended yellowish brown colour to groundwater It was observed that the pH value of all the water samples belonging to the Industrial
Areas of Dewas and its Bordering Villages ranged in between 6.64 to 7.67 and did not show the delineation of the permissible limit for pH (6.5 to 8.5) described by BIS (2012). Ten out of thirty- three locations examined, namely TW1 (6.80), TW5 (6.78), HP1 (6.78), HP2 (6.89) HP4 (6.81), HP5
(6.68), TW12 (6.64), HP8 (6.75), TW23 (6.87) and TW24 (6.79) had a noticeable decrease in pH values less than neutral i.e. 7. Acidification of these waters may be attributed to the acidic nature of the disposed wastewater releasing organic/inorganic acids by different manufacturing and service industries causing increases in the acidity of ground waters. A noteworthy fact is that groundwater in these locations recorded to have high electrical conductivity comprised of high

Bhujal News, 31 (1-4) : 95-108
99
chlorides, sulphates and nitrate contents, which may be responsible for changing the pH level of the groundwater into acidic. Further, emissions of SOx and NOx from industrial sources might have led to an order of magnitude decrease in mean rainfall pH. Based on the distribution of Electrical Conductivity (EC) in table 1, it was observed that the industrial areas of Dewas and its bordering villages had a predominance of EC ranging from 1500 to 2500 (Avg. 2327) µS/cm at
250C indicating the quality of ground water has been gravely contaminated and belongs to poor quality. All the locations examined across the study area had EC values greater than BIS
acceptable limit i.e. 750 µS/cm at 250C, whereas TW18 (4985, highest), HP5 (4420), HP2 (4015), HP5 (3915), TW10 (3915), and TW11 (3700) locations registered EC values greater than BIS
allowable limit i.e.3000 µS/cm at 250C. The vulnerability to decline in groundwater quality as a result of very high EC in the above mentioned wells may be attributed due to the accumulation of salts from wastes/ untreated effluent containing trace metals and other pollutants drained by different industries in the adjacent land thereby polluting the groundwater system.
Generally, for the most water systems, carbonates (CO32-) are the least predominant ions,
whereas bicarbonates (HCO3-) are the dominant anions. The groundwater in and around the
industrial areas of Dewas were found to be absolutely free from carbonate ions. A comparison of the findings with the BIS recommended level of bicarbonate (200 mg/L) for protection of human health indicated that the study area has been predominantly influenced by the presence of
bicarbonate as 87.87% locations had HCO3- ions >200 mg/L. The possible reasons for high
bicarbonate value at 29 out of 33 locations may be attributed either to the dissolution of carbonate minerals from parent material (Carbonatites Deccan Traps) in the watershed soil ultimately reaching to the aquifer may be signalled by high HCO3 values or accumulation of salts from untreated effluent directly injected into the ground.
Chloride (Cl-) is a common anion of natural groundwater apart from the contribution from rain water and through natural activities of human beings. The results pertaining to the chloride study suggested that Industrial Zone of Dewas have a great threat of chloride pollution since 25 out of 33 examined points (75.75%) had chloride concentration greater than the BIS permissible limit
(250 mg/L). The undesirable very high amount of Cl-1 ions with respective increased EC is an indication of greater leaching of salts from the effluent, which move down in the soil profile along with percolating water. The leaching of salts down in the soil profile might have reached the groundwater and contaminated the groundwater. It is noteworthy that chloride is readily transported through the soil.
Quantifying sulphate (SO42-) inputs into groundwater and a release from soils is necessary
for a sulphur balance. Water belonging to the Industrial Zone of Dewas gave apprehension for sulphate pollution since 15 out of 33 locations (54.54%) viz. TW3, TW7, HP3, TW8, TW13, TW14,
TW15, TW16, HP6, HP7, TW17, TW21, TW22, HP9 and TW24 reported to have SO42- concentration
more than BIS acceptable limit (200 mg/l) therewith minimum as 60 mg/l in Jaisingh Nagar (HP9) and maximum as 755 mg/l in Shri Forth Metal (TW12).
It is apparent from the Table 1 that locations representing TW1, TW3, TW4, TW5, HP1,
TW8, TW9, HP5, TW12, TW14, HP6, TW17, HP8, TW20 and HP9) had high NO3- concentration
greater than the BIS desirable limit (45 mg/L), human anthropogenic activities are the main causative agents in the increase of nutrients like nitrate, phosphates, chlorides and calcium and ultimately lead to eutrophication. Nitrates are harmful because they compete with oxygen - carrying-sites in blood haemoglobin. The reduced oxygen content can result in the “blue-baby
Bhujal News, 31 (1-4) : 95-108
100
syndrome” which is why babies and pregnant women are at higher risk of the adverse effects of high nitrates. The study suggested (Table 1) that Industrial Areas of Dewas and its adjoining Villages has no fear of fluoride pollution since all the groundwater resources reported to have fluoride concentration less than the maximum permissible BIS limit (1.5 mg/l) with a minimum as 0.2 in Sanjay Nagar (HP4) and maximum as 1.19 in Hind Filters Ltd.(TW16).
The major cations include Ca2+, Mg2+, Na+, and K+. The cationic chemistry is dominated by the presence of calcium and magnesium in groundwater system. Measurements of water samples collected from 33 locations across the Industrial Area of Dewas showed that 33.33% water (TW1, TW4, TW5, HP1, HP2, HP4, TW11, HP5, HP6, TW18 and TW19,) had calcium content greater than specified guideline of BIS (75 mg/l) with a minimum 28 mg/l found in premises of Ranbaxy (TW7) and maximum as 292 mg/l in the premises of Maa Kripa Packers (TW18). An overview of data pertaining to magnesium concentration (Table 1) revealed that groundwater samples from Industrial Areas of Dewas and its Bordering Villages namely TW1, TW2, TW3, TW5, HP1, HP2,TW6, TW7, HP3 ,TW8 ,HP4 ,TW9, TW10, TW11, HP5, TW12, TW13, TW14, HP7, TW17,
TW18, HP8, TW19, TW20, TW21, TW23, HP9 and TW24 could not meet the BIS prescribed criteria (30 mg/l) for magnesium. The least concentration as 13 mg/L was recorded in TW4 (Agriculture land of Mukesh Patel, Balgarh, Sector-3) whereas greatest concentration was found in TW12 (Shri Forth Metals). The groundwater put to the test as for its quality in and around Dewas Industrial Area might be categorized as hard to very hard for drinking purposes as in thirty out of thirty-three locations symbolically representing TW1, TW2, TW3 ,TW4,TW5, HP1, HP2 ,TW6, TW7, HP3 ,TW8
,HP4 ,TW9, TW10, TW11, HP5, TW12, TW13, TW14, HP6 ,HP7, TW17, TW18, HP8, TW19, TW20, TW21
, TW23, HP9 ,TW24 water sources, the values of total hardness (TH) were found higher than 200 mg/l, which is within the permissible limit (600 mg/l) set by BIS (2012).
The mean concentration of sodium was calculated as 204.09 with the highest as 405 mg/l in HP5 (Biogenesis Industries) and minimum as 74 mg/l in TW21 (Sarita Industries) respectively. It is readily comprehended from the data that all the locations (100%) put under test had sodium concentrations perceptibly higher, indicating unusual leaching of salts from wastes/ untreated effluent containing trace metals and other pollutants drained by different industries into lower horizons of soil resulting deterioration of groundwater deposits. No numerical Indian drinking water quality guideline exists for potassium. Significant variations in potassium concentration in water samples analyzed for Industrial Zone of Dewas were noticed since HP8 recorded as high as
2.9 mg/L K+ whereas TW8 had a minimum as 0.40 mg/L K+ concentration (Table 1).

Bhujal News, 31 (1-4) : 95-108
101
TABLE - 1: Chemical analysis results showing Major and Trace ions concentrations in the study area (All values in mg/l & Ec in µS/cm at 250C)

Bhujal News, 31 (1-4) : 95-108
102
4.0 Chemistry of Selected PTEs The distribution profile of heavy metals in ground water samples collected from the Industrial
Zone of Dewas has been depicted in Table -1. The study suggested that Dewas Industrial Area has no account for copper, zinc and nickel pollution since all waters reported to have their concentrations below the BIS safe limit. Iron more than the BIS allowable limit (0.3 mg/l) was recorded only in two locations namely HP1 (1.07 mg/l, highest), and TW16 (0.54). Two locations namely, TW7 (0.257 mg/l, highest), and TW5 (0.108) recorded manganese excess than the BIS desirable limit (0.1 mg/L); otherwise the area is free from manganese pollution. An overview of the results obtained in relation to cadmium concentration showed that the study area is free from cadmium pollution since all the waters examined were reported to have cadmium concentration less than BIS acceptable limit (0.003mg/l) except one well HP5 which exhibited a concentration negligibly higher (0.004 mg/l) than the BIS acceptable limit. Study revealed that only one location found to be polluted with chromium pollution as it recorded its concentration 0.227 mg/l which is 4.5 times greater than BIS maximum permissible limit (0.05 mg/l as Cr). It is obvious from the Table -1 that the Industrial Areas of Dewas has good enough records for a lead vulnerability since 24.24% locations, namely HP7, TW17, TW18 (highest, 0.105mg/l), HP8, TW22, TW23, HP9 and TW24 reported to have lead concentration higher than the BIS acceptable Limit (0.01); other remaining locations exhibited lead concentrations as zero.
5.0 Suitability of Water for Irrigation Purposes The chemical data of all the water samples pertaining to the Industrial Zone of Dewas were
plotted on the U.S. Salinity Laboratory diagram (Fig. 3). U.S. Salinity Laboratory diagram classifies waters for irrigation purposes based on electrical conductivity (µS/cm at 250C) and sodium adsorption ratio (SAR) Wilcox (1948). It is evident from the diagram that the class C3-S1
(High Salinity & Low Sodium) acquired maximum numbers of wells (45.45%) namely TW3(3), TW7(9), HP3(10), TW8(11), HP4(12), TW9(13), TW14(19), HP6(22), HP7(23), TW17(24), HP8(26), TW20(28), TW21(29), HP9(32) and TW24(33) indicating these waters should be used on soils with good drainage. Waters in the range of 750 to 2,250 µ mhos/cm are widely used, and satisfactory crop growth is obtained under good management and favorable drainage conditions, but saline conditions will develop if leaching and drainage are inadequate (USDA Handbook 60, 1968). Class C4-S2 (Very High Salinity & Moderate Sodium) acquired 27.27% of wells namely TW1
(1), TW4 (4), TW5(5), HP1(6), TW10(14), TW11(15), HP5(16), TW18(25) and TW23 (31) which means these waters may produce an appreciable amount of sodium hazard in fine textured soils having high CEC (Cation Exchange Capacity) and low leaching conditions, therefore, not suitable for irrigation at all, but may be used occasionally under very special conditions by mixing this water with low EC water. Very high salinity tolerant crops should be grown. The five locations representing TW2 (2), TW15 (20), TW16 (21), TW19 (27) and TW22 (30) were grouped under C3-S2
(High Salinity & Moderate Sodium) class, which means that these waters can be used on soils with good drainage. Special management practices are required for salinity control. Salt tolerance crops may be grown. Whereas class C4-S1 (Very High Salinity & Low Sodium) possessed 12.12 % wells i.e. HP2(7), TW6(8), TW12(17) and TW13(18) which implies that these waters are also not suitable for irrigations purpose, but have little/no danger of the development of sodium hazard.

Bhujal News, 31 (1-4) : 95-108
103
Fig. 3 : USSL Diagram of study area Showing Water Quality for Irrigation Purpose.
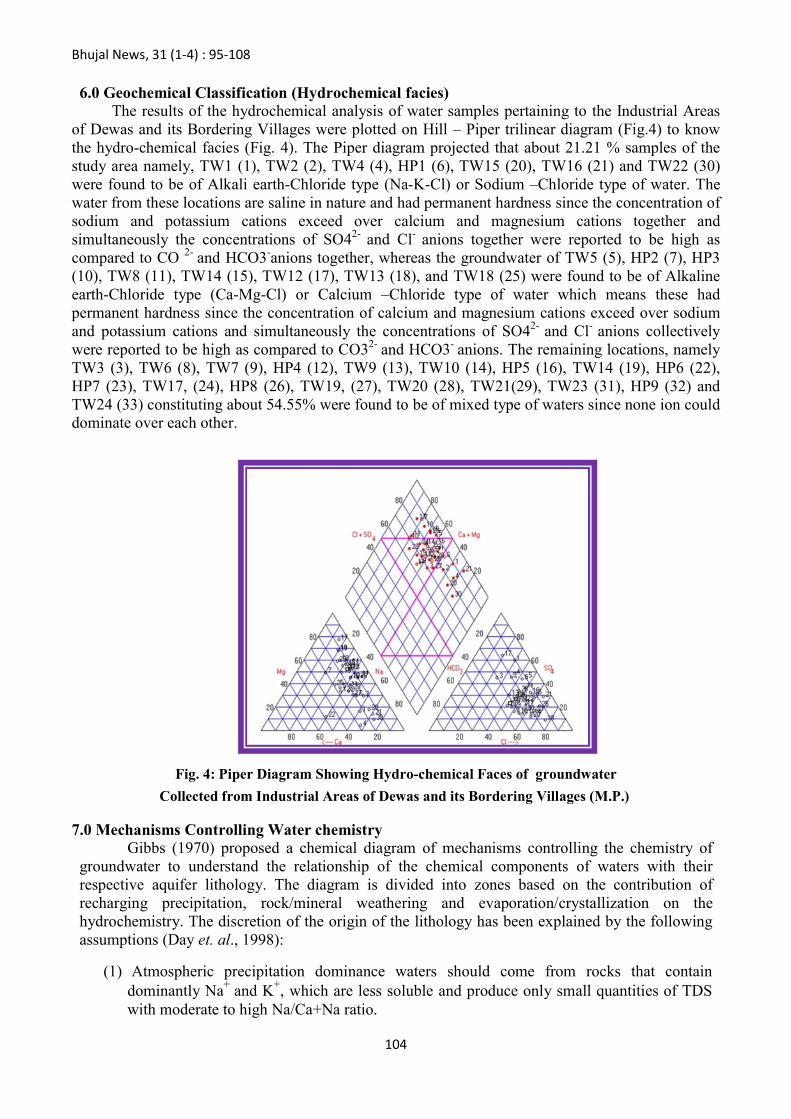
Bhujal News, 31 (1-4) : 95-108
104
6.0 Geochemical Classification (Hydrochemical facies) The results of the hydrochemical analysis of water samples pertaining to the Industrial Areas
of Dewas and its Bordering Villages were plotted on Hill – Piper trilinear diagram (Fig.4) to know the hydro-chemical facies (Fig. 4). The Piper diagram projected that about 21.21 % samples of the study area namely, TW1 (1), TW2 (2), TW4 (4), HP1 (6), TW15 (20), TW16 (21) and TW22 (30) were found to be of Alkali earth-Chloride type (Na-K-Cl) or Sodium –Chloride type of water. The water from these locations are saline in nature and had permanent hardness since the concentration of sodium and potassium cations exceed over calcium and magnesium cations together and simultaneously the concentrations of SO42- and Cl- anions together were reported to be high as compared to CO 2- and HCO3-anions together, whereas the groundwater of TW5 (5), HP2 (7), HP3 (10), TW8 (11), TW14 (15), TW12 (17), TW13 (18), and TW18 (25) were found to be of Alkaline earth-Chloride type (Ca-Mg-Cl) or Calcium –Chloride type of water which means these had permanent hardness since the concentration of calcium and magnesium cations exceed over sodium and potassium cations and simultaneously the concentrations of SO42- and Cl- anions collectively were reported to be high as compared to CO32- and HCO3- anions. The remaining locations, namely TW3 (3), TW6 (8), TW7 (9), HP4 (12), TW9 (13), TW10 (14), HP5 (16), TW14 (19), HP6 (22), HP7 (23), TW17, (24), HP8 (26), TW19, (27), TW20 (28), TW21(29), TW23 (31), HP9 (32) and TW24 (33) constituting about 54.55% were found to be of mixed type of waters since none ion could dominate over each other.
Fig. 4: Piper Diagram Showing Hydro-chemical Faces of groundwater
Collected from Industrial Areas of Dewas and its Bordering Villages (M.P.)
7.0 Mechanisms Controlling Water chemistry Gibbs (1970) proposed a chemical diagram of mechanisms controlling the chemistry of
groundwater to understand the relationship of the chemical components of waters with their respective aquifer lithology. The diagram is divided into zones based on the contribution of recharging precipitation, rock/mineral weathering and evaporation/crystallization on the hydrochemistry. The discretion of the origin of the lithology has been explained by the following assumptions (Day et. al., 1998):
(1) Atmospheric precipitation dominance waters should come from rocks that contain dominantly Na+ and K+, which are less soluble and produce only small quantities of TDS with moderate to high Na/Ca+Na ratio.

Bhujal News, 31 (1-4) : 95-108
105
(2) Rocks dominance waters (mineral weathering processes) show a high concentration of Ca2+ and Mg2+ and HCO3 resulting in moderate TDS and moderate Na/Ca+Na ratio.
(3) Evaporation dominance waters show a high concentration of Na+ and Cl- ions and low concentration Ca2+ and Mg2+ ions due to calcite precipitation resulting in high TDS and high Na/Ca+Na ratio. Gibbs used two ratios in his diagrams, representing the Ratio-I for cations
[(Na+K)/(Na+K+Ca)] and Ratio-II for anions [Cl/(Cl+ HCO3)] as a function of TDS which are widely employed to assess the functional sources of dissolved chemical constituents in waters either through precipitation-dominance, rock-dominance and evaporation dominance.
One of the major shortcomings with the Gibb’s (1970) diagram is that there is no place for waters which have been affected by domestic/industrial contamination or other sources of hydrochemical enrichment outside of the three sources outlined above since a lot of studies have shown the origin of the lithology away from the three major factors, namely, precipitation dominance, rock-water interaction and evaporation-crystallization. It is probably on account of this reason that the diagram is often used together with other hydrochemical assessment diagrams such as Piper, Wilcox etc. integrated with multivariate statistical analyses.
Lastly, to know the mechanisms controlling groundwater chemistry and the relationship of the chemical components of water from their respective aquifers, the chemical data pertaining to the Industrial Areas of Dewas and its Bordering Villages, was plotted on Gibb’s diagram (Fig. 5 & 6). Gibb’s ratio-1 (Cation) ranged from 0.435 to 0.888 with an average of 0.720 whereas Gibb’s ratio-2 (Anions) varied from 0.322 to 0.863 with an average of 0.580, respectively. It is interesting to note that the results show a different phenomenon is responsible for the chemical budget of the waters belonging to Industrial Areas of Dewas and its Bordering Villages, since the majority of the values concentrated away from the three major factors, namely, precipitation dominance, rock-water interaction and evaporation-crystallization. This clearly demonstrates that apart from the natural source, artificial factors, namely, anthropogenic activity have decided the dominance of the ions resulting in drastic changes in the chemical composition of groundwater. There are several factors other than atmospheric precipitation, weathering and evaporation that affect water chemistry. Distance from the ocean, industrial/agricultural/domestic pollution, regional climate, biota and land use patterns all influence the type and concentration of ions in natural waters (Hutchinson, 1957; Gorham, 1961).
Fig. 5: Gibb's Diagram Illustrating the Mechanism Controlling Fig. 6: Gibb's Diagram Illustrating the Mechanism
Controlling Ground Water Chemistry (Ratio-I, Cations) for Sites. Ground Water Chemistry (Ratio-II, Anions) for Sites.

Bhujal News, 31 (1-4) : 95-108
106
8.0 Conclusions It may be finally stated that people residing in and around Dewas Industrial Zone are
paying a heavy price for living near the industrial town in Madhya Pradesh. Published literature and present study have shown that wastes from industries is bringing havoc with groundwater quality in Balgarh, Anbatpura, Sanjay Nagar, Amonagaon, Razeev Nagar, Rasoolpura, ShaKtinagar, Jaisingh Nagar villages, and many other localities across the Industrial Zone of Dewas. The continuous industrialization for the last 50 years has posed a great threat to the surrounding environment of the district.
Acknowledgements The authors are grateful to Chairman CGWB and the Regional Director for according
necessary permission to publish the paper in the Journal. The authors are also thankful to the supporting laboratory staff for extension of co-operation in bringing out this paper.
References
APHA, (1995): Standards Methods for the examination of water and wastewater. BIS (2012): Drinking water specifications, Bureau of Indian Standards, Manak Bhawan, 9,
Bahadur Shah Zafar Marg, New Delhi, IS 10500. Day, J. A., Dallas H. F. and Wackernagel A. (1998): Delineation of management region for South
African rivers based on water chemistry. Aquatic Ecosystem Health and Management, 1,183-197.
Gibbs, R. J. (1970): Mechanism controlling world water chemistry. Science, 170, 1088-1090. Goel, D. K.(1998): Impact of Industrial Pollution on the Quality of Ground Water in parts of Ratlam District, MP. A report published by Central Ground Water Board, NCR, Bhopal,July, 1998.
Gorham, E. (1961): Factors influencing supply of major ions to inland waters with special reverence to the atmosphere. The Geological Society of America, 10.1130/0016- 7606(1961)72[795: FISOMI] 2.0.CO; 2 v. 72 no. 6 p. 795-840
Huchinson G.E. (1957): A treatise on limnology: Geography, Physics and Chemistry. Vol-1, Wiley pages 1016.
Piper, A. M. (1944): A graphical procedure in the geochemical interpretation of water analysis.Am. Geophys. Union Trans., v25, pp 914-928.
Schroeder, H. A. (1960): Relationship between hardness of water and death rate from certain chronic and degenerative diseases in the United Sates, J. Chron. Disease, 12:586-591.
USDA Handbook 60(1968): Diagnosis and Improvement of Saline and Alkali Soils. Indian Edition. Oxford & IBH Publishing Co. Pvt. Ltd., New Delhi.Wilcox, L. V. (1948): The quality of Water for irrigation use. , US Department of Agriculture Bull., 1962, 40.Wiley and Sons. New York: 1015 Pp.
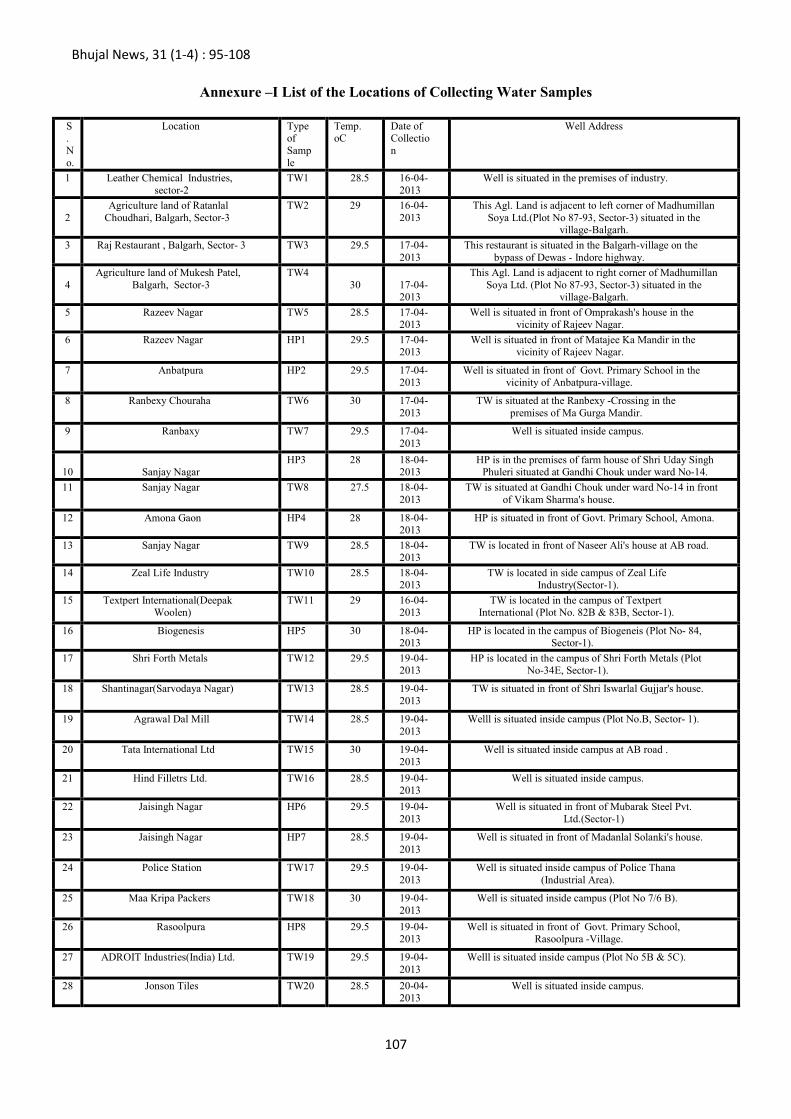
Bhujal News, 31 (1-4) : 95-108
107
Annexure –I List of the Locations of Collecting Water Samples
S.No.
Location Type of Sample
Temp. oC
Date of Collection
Well Address
1 Leather Chemical Industries, sector-2
TW1 28.5 16-04-2013
Well is situated in the premises of industry.
2
Agriculture land of Ratanlal Choudhari, Balgarh, Sector-3
TW2 29 16-04-2013
This Agl. Land is adjacent to left corner of Madhumillan Soya Ltd.(Plot No 87-93, Sector-3) situated in the
village-Balgarh.
3 Raj Restaurant , Balgarh, Sector- 3 TW3 29.5 17-04-2013
This restaurant is situated in the Balgarh-village on the bypass of Dewas - Indore highway.
4
Agriculture land of Mukesh Patel, Balgarh, Sector-3
TW4 30
17-04-2013
This Agl. Land is adjacent to right corner of Madhumillan Soya Ltd. (Plot No 87-93, Sector-3) situated in the
village-Balgarh.
5 Razeev Nagar TW5 28.5 17-04-2013
Well is situated in front of Omprakash's house in the vicinity of Rajeev Nagar.
6 Razeev Nagar HP1 29.5 17-04-2013
Well is situated in front of Matajee Ka Mandir in the vicinity of Rajeev Nagar.
7 Anbatpura HP2 29.5 17-04-2013
Well is situated in front of Govt. Primary School in the vicinity of Anbatpura-village.
8 Ranbexy Chouraha TW6 30 17-04-2013
TW is situated at the Ranbexy -Crossing in the premises of Ma Gurga Mandir.
9 Ranbaxy TW7 29.5 17-04-2013
Well is situated inside campus.
10
Sanjay Nagar
HP3 28 18-04-2013
HP is in the premises of farm house of Shri Uday Singh Phuleri situated at Gandhi Chouk under ward No-14.
11 Sanjay Nagar TW8 27.5 18-04-2013
TW is situated at Gandhi Chouk under ward No-14 in front of Vikam Sharma's house.
12 Amona Gaon HP4 28 18-04-2013
HP is situated in front of Govt. Primary School, Amona.
13 Sanjay Nagar TW9 28.5 18-04-2013
TW is located in front of Naseer Ali's house at AB road.
14 Zeal Life Industry TW10 28.5 18-04-2013
TW is located in side campus of Zeal Life Industry(Sector-1).
15 Textpert International(Deepak Woolen)
TW11 29 16-04-2013
TW is located in the campus of Textpert International (Plot No. 82B & 83B, Sector-1).
16 Biogenesis HP5 30 18-04-2013
HP is located in the campus of Biogeneis (Plot No- 84, Sector-1).
17 Shri Forth Metals TW12 29.5 19-04-2013
HP is located in the campus of Shri Forth Metals (Plot No-34E, Sector-1).
18 Shantinagar(Sarvodaya Nagar) TW13 28.5 19-04-2013
TW is situated in front of Shri Iswarlal Gujjar's house.
19 Agrawal Dal Mill TW14 28.5 19-04-2013
Welll is situated inside campus (Plot No.B, Sector- 1).
20 Tata International Ltd TW15 30 19-04-2013
Well is situated inside campus at AB road .
21 Hind Filletrs Ltd. TW16 28.5 19-04-2013
Well is situated inside campus.
22 Jaisingh Nagar HP6 29.5 19-04-2013
Well is situated in front of Mubarak Steel Pvt. Ltd.(Sector-1)
23 Jaisingh Nagar HP7 28.5 19-04-2013
Well is situated in front of Madanlal Solanki's house.
24 Police Station TW17 29.5 19-04-2013
Well is situated inside campus of Police Thana (Industrial Area).
25 Maa Kripa Packers TW18 30 19-04-2013
Well is situated inside campus (Plot No 7/6 B).
26 Rasoolpura HP8 29.5 19-04-2013
Well is situated in front of Govt. Primary School, Rasoolpura -Village.
27 ADROIT Industries(India) Ltd. TW19 29.5 19-04-2013
Welll is situated inside campus (Plot No 5B & 5C).
28 Jonson Tiles TW20 28.5 20-04-2013
Well is situated inside campus.

Bhujal News, 31 (1-4) : 95-108
108
29 Sarita Indistry TW21 28.5 20-04-2013
Well is situated inside campus.
30 VETRO Engineering Processing TW22 29.5 20-04-2013
Well is situated inside campus.
31 Indira Industries LTD TW23 29.5 20-04-2013
Well is situated inside campus.
32 Jaisingh Nagar HP9 30 20-04-2013
Well is situated behind Jyoti Weighing System.
33 VIPPY Industries Ltd. TW24 30 20-04-2013
Well is situated inside campus.
TW=Tube Well, DW= Dug Well, HP= Hand Pump

BHUJAL NEWS, 31 (1-4) : 109-120
109
Study on ground water quality due to release of waste product from Chada Sugar and Industrial Pvt. Ltd., Village – Kiri Afgana, District- Gurudaspur, Punjab State Tarun Mishra*1, CGWB, South Eastern Region, Bhubaneswar Kiran Lale2, CGWB, North Western Region, Chandigarh
*Corresponding Author: [email protected], [email protected]
Abstract: Contamination by effluents from large industries to shallow aquifers is a major concern for ground water pollution in India.The matter is seriously been taken by present National Green Tribunal constituted by Government of India. In pursuant to molasses leakage from Chadha Sugar Mill, Village Kiri Afgana on dated 16.5.2018 a detailed water quality sampling have been conducted from shallow as well as deep aquifer near the western bank of Beas River just adjacent to the factory to know the extent of ground water contamination by this leakage. After analysis of major, minor and trace elements in ground water samples, it has found that all elements are within permissable limit for drinking and irrigation standards except for high amount of nitrate and iron concentration at few places. Nitrate concentrations can be explained due to to some anthropogenic sources, like decomposed organic matter, leaching of nitrogenous fertilizers etc. The ground water quality of all the samples collected falls in the category of Magnesium bicarbonate type which confirms a recharge area.
Keywords: contamination, sugar mill, aquifer, sample analysis, groundwater

BHUJAL NEWS, 31 (1-4) : 109-120
110
1.0 Introduction
Once considered immune to the pollution, the ground water pollution now a days posing threat to the safe and sustainable source of drinking water. Deteriotion of groundwater quality occurs when its quality parameters are changed beyond their natural variations by the human activities or some natural processes which adds or removes some substances from it. Pollution of ground water with different chemicals released from anthropogenic activities like industries, agriculture are posing the challenges to fullfill drinking water nees of the people. The main objective of the present study was to ascertain the effect of leakage of molasses from the Chadha Sugar Mill,Village Kiri Afgana District Gurdaspur (Punjab) in neighbouring river and thereby on adjoining ground water quality. Study area was selected keeping in view the location of the Mill. The Chada Sugar Mill is located in Village Kiri Afgana,Tehsil Batala, District-Gurdaspur, Punjab on the western bank of River Beas just adjacent to the tributary (where mollases spillage happened) that connects to river Beas towards southeast. The samples were collected in and around the Mill up to 2-3 km of radius. The study was carried out on special reference of Member (HQ), Central Ground Water Board (CGWB). A team of scientific officials from CGWB, NWR, Chandigarh visited the affected site and collected 11 ground water samples (Table-1) from Hand Pump and Tube wells located in and around of Chada Sugar Mills (Fig.1). Groundwater consists of following major chemical elements-Ca+2, Mg+2, Cl-1, HCO3
-1 Na+1, K+1, and SO4
-2(Ojo et.al. 2012). The analysis of ground water for the quantification of physicochemical parameters like Electrical Conductivity (EC), pH, Fluoride, major elements mentioned above and the trace elements provides the details about the suitability of the ground water for various purposes like drinking, agriculture and industrial purposes (C. Sadashivaiah et.al. 2008). It is possible to understand the change in quality due to rock water interaction or any type of anthropogenic influence (Kelley, W. P., 1940 and Wilcox, L.V. 1948 & 1962). Trace metals plays important role in the living system both for human as well as plant life. Some of them are required in a minute/trace amount for the normal functioning of the body and for normal growth of plants. Drinking water containing heavy metals above the maximum permissible limits cause potential risk to human health. Institutionalized water supply like local government bodies and packaged drinking water in urban areas is supplied to the households after thorough quality checks but when it comes to the individuals or private wells which are being used for fulfilling drinking water needs of households or rural hamlets, are possibly the source of water with some of chemical parameters not conforming to the prevailing drinking water standards as water supplied from these wells is not checked for its conformance to the quality standards. Copper plays important role in blood circulation while Iron is essential for oxygen transfer and hemoglobin structure. Similarly other metals too have specific role in the biological system. Some of them are very poisonous for the human being and to other organisms. Presence of these metals more than the permissible limits may cause harm to the living organisms.
Heavy/trace metals usually occur in small amounts in groundwater around industrial areas that use variety of chemicals in the manufacture of batteries, paints, pharmaceutical products, leather processing, agrochemicals, etc. (Momudu, M.A. et.al., 2010). These industries dispose the treated/partially treated wastewater that do/do not meet the standards in the surface water bodies such as rivers, lakes, ponds and into the sea in coastal areas (Isa et al. 2014 , Ashraf et al. 2015 and Vetrimurugan E. et.al. 2017) . Considering these possibilities, we have selected the physicochemical and trace elements as part of our study.

BHUJAL NEWS, 31 (1-4) : 109-120
111
2.0 Hydrogeology
The area forms a part of Indo-Gangetic Alluvial Plains and is mainly oocupied by Quaternary Alluvial deposits laid down by river Beas. As per NAQUIM Report of Gurudaspur District (CGWB, NWR, 2015), the first Aquifer is water table and extends all over the area is composed mainly of less coarse sediments as compared to other groups. This Aquifer is overlain by a thin clay layer of about 0.5 to 2.5 m thick and is also underlain by clayey group which is about 3-6 m thick. In the northeastern part of the district covering the study area, there are 5-6 Aquifers within 300 m depth and ranges in thickness from 20-65 m. These granular zones are laterally extensive in nature. The Aquifer material is mainly composed of medium to coarse sand with beds of gravel at places. The first unconfined aquifer situated in the depth ranges of 11-96 mbg, second unconfined to confined aquifer situated at a depth ranges of 107-220 mbgl and third unconfined to confined aquifer situated at a depth ranges of 230-300 m bgl.
Generally tube wells are constructed upto a depth of 60 to 70 meters and Hand Pumps are constructed upto a depth of 6 to 30 meters in the study area. As per litholog obtained from Chada Sugar Mill from its deep tube well, upto 256 meter depth major aquifer formations(medium to coarse grained sand) having thickness of 4.6 meter to 50.30 meter intercalated with 3 to 6 meter clay. Outcrops of grey fine sand has been observed towards northern and eastern part of sugar mill. Topographic variation has been observed around the factory premises. Northern,northeastern and southeastern part of the mills are generally 10-12 meter lower than western part of the mills. Majority of tubewells located in low lying areas of Beas river are fitted with Diesel Operated pumps with water level ranges from 3-5 mbgl, whereas water level noticed in hand pump in this area ranges from 2.5- 3 mbgl near river Beas. Generally depth of aquifers tapped by tube well and hand pumps ranges from 6 to 25 meter. These shallow aquifers may be directly recharged by the River Beas, therefore majority of the samples are collected from Hand Pumps(Fig.2) to know any direct contamination from river after incidence of Sugar Mill and majority of the samples collected in a linear pattern towards the downstream direction of River Beas which flow towards south. Very few samples are also collected towards upstream direction near Sugar Mill. Deeper water level (10-15 mbgl) are also observed from tube wells of 60 to 70 meter depth. Aquifers tapped by hand pumps and tubewells fitted by diesel operated pumps are generally unconfined and deeper aquifers are of semiconfined type. Main crops in this area is sugar cane.

BHUJAL NEWS, 31 (1-4) : 109-120
112
Fig.-1: Sample location point in and around Chada Sugar mill, Kiri Afgana, Gurudaspur, Punjab

BHUJAL NEWS, 31 (1-4) : 109-120
113
Table 1: Details of sample locations in and around Chada Sugar Mill,Kiri Afgana
Sample No.
Unique ID Location(Village name with lat and long)
Type of Structure Depth of Structure (mbgl)
Type of Analysis
S1 70/18 Bet Pattan (Near factory): Owner-Harpal Singh 31045’33”, 75031’52”
Tube Well 45.73 mbgl Basic, Trace metals (Cd,Cu, Zn, Mn,Pb), Arsenic & Iron
S2 71/18 Bet Pattan (Near factory): Behind shop of M/S Bajaj Export Transport 31045’39”, 75031’27”
Hand Pump 15.24 mbgl --do--
S3 72/18 Bet Pattan (Near river bank): Owner-Resham Singh 31045’39”, 75032’2”
Tube Well 54.88 mbgl --do--
S4 73/18 Bet Pattan (Near river bank): Owner-Ranjit Singh 31045’8”, 75031’30”
Hand Pump 12.19 mbgl --do--
S5 74/18 Rajoya (Near river bank): Owner-Baba Rodha 31044’48”, 75031’16”
Hand Pump 30.49 mbgl --do--
S6 75/18 Mahesh Dogar-In Santosh Nagar Mohalla. Owner-Santokh Singh 31044’4”, 75030’53”
Hand Pump 9.15 mbgl
--do--
S7 76/18 Kullah (Near river bank): Owner-Ratan Singh 31043’50”, 75031’49”
Hand Pump 6.1 mbgl --do--
S8 77/18 Kiri Afgana (300 meter NW of factory) on road. 31046’12”, 75031’14”
Hand Pump 24.39 mbgl --do--
S9 78/18 Kiri Afgana (Northern side of factory,in open agricultural land,in low land ,situated near nalla connected to Beas) on road. 31046’35”, 75031’41”
Hand Pump 9.15 mbgl
--do--
S10 79/18 Phulra (North east of factory in open agricultural low land). 31046’49”, 75032’01”
Hand Pump 6.1 mbgl --do--
S11 80/18 Kiri Afgana (Inside the campus of ADIE Broswon Corporation factory premises) 31045’51”, 75031’49”
Tube Well 230 meter
--do--

BHUJAL NEWS, 31 (1-4) : 109-120
114
Fig.2-Water Samples (S5, S6) are collected from Hand Pump near
Chada Sugar Mill, Kiri Afgana
3.0 Materials and Methods
The samples collected from the locations (Table-I) were analysed in the NABL Accredited laboratory of Central Ground Water Board, North Western Region, Chandigarh for confirming the presence of the various contaminants/parameters as per the Standard methods (American Public Health Agency (APHA), 2017) of ground water quality analysis. Three types of samples were collected from each location viz.
1. Basic analysis: pH, Electrical Conductivity (EC), Carbonate (CO3), Bicarbonates (HCO3), Choride (Cl), Sulphate (SO4), Phosphate (PO4), Nitrate (NO3), Fluoride (F), Calcium (Ca), Magnesium (Mg), Total Hardness (TH), Sodium (Na), Potassium (K), Silicate (SiO2).
2. Trace metals: Cadmium (Cd), Copper (Cu), Manganese (Mn), Zinc (Zn), Lead (Pb), samples acidified with Nitric Acid (HNO3).
3. Arsenic (As) & Iron (Fe): Samples acidified with Hydrochloric acid (HCl). The samples were collected in the air tight polypropylene bottles having capacity of 1L. The
acids i.e. nitric acid and hydrochloric acids used were of AR grade. The samples collected for trace metal analysis were concentrated/digested using hot plate and analyzed using Atomic Absorption Spectroscopy (AAS). Iron was detected using UV-Visible method. Arsenic analysis was carried out using AAS with hydride vapour generation unit. Standard APHA and BIS methods were used to analyze the samples for basic parameters (American Public Health Agency (APHA). 2017).

BHUJAL NEWS, 31 (1-4) : 109-120
115
Table 2: Results of Chemical Analysis: Basic Analysis
Sl.
No.
ID
pH
EC in µS/cm at 250 C
TDS
CO3 HCO
3 Cl SO4 NO3 F PO4 Ca Mg Na K
SiO2
TH as
CaCO3
mg/l
1 70/18 7.47 900 576 Nil 371 56 39 63 0.27 <0.1 111 33 30 5.1 27 412 2 71/18 7.47 698 447 Nil 419 21 0 21 0.49 <0.1 103 25 14 4.2 25 361 3 72/18 7.41 1065 682 Nil 610 63 0 11 0.43 <0.1 144 22 65 11 28 453
4 73/18 7.67 606 388 Nil 359 21 0 20 0.17 <0.1 87 15 27 4.8 18 278
5 74/18 7.50 624 399 Nil 287 35 0 54 0.45 <0.1 87 18 21 5.2 23 289
6 75/18 7.61 782 500 Nil 289 51 0 129 0.33 <0.1 116 9.98
29 5.1 24 330
7 76/18 7.37 775 496 Nil 455 28 36 9.68 0.23 <0.1 107 22 37 8.7 14 361
8 77/18 7.15 789 505 Nil 455 28 0 18 0.33 <0.1 124 21 17 5 24 392
9 78/18 7.49 710 454 Nil 431 14 29 6.5 0.55 <0.1 95 24 31 7.8 14 330
10 79/18 7.38 722 462 Nil 478 21 0 0.66 0.30 <0.1 95 20 46 7.8 25 320
11 80/18 7.73 486 311 Nil 299 14 0 <0.2 <.05 <0.1 58 10 35 9.2 23 186 Acceptable/ Permissible range as per Drinking water standard IS 10500:2012
6.5 to 8.5
500-2000 (Theoretical TDS=EC×0.64)
200-600 (Total Alkalinity as CaCO3)
250 to 1000
NA 45 1 to 1.5
NA 75 to 200
30- to 100
NA NA NA
200 to 600
4.0 Discussion
The study was carried out to assess the impact of release of waste product on surrounding aquifer system. Except for the one sampling point (230 m) all samples were collected from tube wells/hand pumps at a depth ranging from 6 m to 54 m i.e. from shallow aquifers for analysis. The constituents mentioned above (Table 2) are quiet essential for the human body as well as for the irrigation purpose in the agriculture but in desired quantities only. As they act as double headed sword because their excess as well as their deficiency in the drinking water causes undesired and in some cases irreversible impact on the living body consuming it. It is observed from the results that 27% (3 Nos.) of samples are not suitable for the drinking purpose as per drinking water standard IS 10500:2012.
The nitrate contamination (Fig.4) can be attributed to some anthropogenic sources, like organic matter deposition in the soil and leaching of nitrogenous fertilizers from farm activities (Korsaeth, A. 2000 and Sieling, K., et.al. 2006). The average, range and other statistical parameters are listed in the table-III, it is evident from the table below that, some of the parameters considered critical for the drinking purpose are well within the permissible limits of IS 10500:2012 standard which makes this sources of ground water safe for human consumption.
Also it can be inferred from the Table 3 that no immediate effect of release of waste can be seen on the surrounding ground water sources.

BHUJAL NEWS, 31 (1-4) : 109-120
116
Table 3: Normal Statistics of Water Quality Parameters
Parameters EC TDS pH Chloride Fluoride Nitrate Total Hardness
SAR RSC
Range 486-1065 311-682 7.15-7.73 14-63 <0.05-0.55 <0.2-129 186-453 0.25-0.99 (-2.17)-1.45
Average 742 475 7.48 32 0.33 33 337 0.58 --
SD 146.3199 93.7350 0.1514 16.3763 0.1404 36.7686 68.9062 0.2261 1.1459
CV 0.1973 0.1975 0.0202 0.5118 0.4290 1.2148 0.2042 0.3919 -9.3241
Median 722 462 7.47 28 0.33 18 330 0.53 0.31
Fig.3. Piper Trilinear plot
To create a graph with the major water constituents, Piper (1994) suggested drawing two triangles corresponding with the cations and anions, respectively, and one diamond that summarize both triangles. The left triangle represents the cations and the right one the anions. The base of the cation triangle is the axis for calcium, the left side for magnesium and the right one for sodium plus potassium. For the anion one, the base is the axis for chloride, the left side for carbonate plus bicarbonate and the right one for sulfate. According to the location of the sample, the hydrochemical facies can be identified. Said facies are the diagnostic chemical aspect of water solutions occurring in hydrologic systems. The sample does not present a dominant cation type, it definitely corresponds with the bicarbonate type and can be a magnesium bicarbonate type (Fig.3). And we can determine from the graph that alkaline earths exceed alkalies and weak acid is more than strong acid in all the samples.

BHUJAL NEWS, 31 (1-4) : 109-120
117
Fig.4. Distribution of TDS, Chloride, iron and nitrate in ground water samples 4.1 Trace metals analysis including arsenic and iron
The samples collected from the above mentioned sites conform to the drinking water standards except for iron and lead. The entries at 2, 4 and 8 in Table 4 for the Copper which are more than required/acceptable limit (0.05 mg/L as IS 10500:2012) but are well within permissible limit of 1.5 mg/L. The entries at 2,4,7, 8 and 10 for the Iron are exceeding the required/acceptable limit. The presence of iron (Fig.4) in ground water is a direct result of its natural existence in underground rock formations i.e. mainly attributed to the geogenic sources

BHUJAL NEWS, 31 (1-4) : 109-120
118
and precipitation water that infiltrates through these formations. As the water moves through the rocks some of the iron dissolves and accumulates in aquifers which serve as a source for ground water. Since the earth's underground rock formations contain about 5% iron it is common to find iron in many geographical areas around the globe (Raju, N. 2006 and Ityel, D. 2011). Only one sample from deep tube well (sample No.11) showing Lead (Pb) having more than permissible limit. The other results of trace metals analysis are summarized in Table 4.
Table 4: Trace Metals analysis including arsenic and iron
S. No. Unique ID Cu Cd Mn Pb Zn Fe As
mg/L mg/L mg/L mg/L mg/L mg/L mg/L
1 70/18 BDL BDL BDL 0.006 0.003 0.005 BDL
2 71/18 0.246 BDL 0.007 0.006 5.320 1.010 BDL
3 72/18 0.041 BDL 0.122 BDL 0.012 0.028 BDL
4 73/18 0.193 BDL 0.078 BDL 0.770 0.897 BDL
5 74/18 0.002 BDL 0.001 BDL 0.006 BDL BDL
6 75/18 0.003 0.002 0.000 BDL 0.005 BDL BDL
7 76/18 0.007 0.002 0.518 BDL 0.303 0.535 BDL
8 77/18 0.113 0.001 0.012 BDL 0.119 1.842 BDL
9 78/18 0.003 BDL 0.223 BDL 0.005 BDL BDL
10 79/18 0.004 0.002 1.452 BDL 0.009 2.045 BDL
11 80/18 0.002 0.001 0.022 0.036 0.007 0.059 BDL
Acceptable/ Permissible range as per
Drinking water
standard IS 10500:2012
0.05 to 1.5
0.003 NA 0.01 5 to 15 0.3 0.01
The ground water quality data obtained was analyzed / interpreted and correlation coefficient for
parameters was calculated using Pearson correlation. Correlation coefficient measures the strength and direction of correlation between parameters. It ranges from ‘-1’ through ‘0’ to ‘+1’. ‘-1’ indicates negative correlation, ‘+1’ indicates positive correlation while ‘0’ indicates absence of correlation. It is also called the linear correlation coefficient because r measures linear correlation between two variables.

BHUJAL NEWS, 31 (1-4) : 109-120
119
Table 5: Correlation matrix of water quality parameters:
pH EC HCO3 SO4 Cl NO3 F Ca Mg Na K TH
pH 1
EC -0.5263 1
HCO3 -0.6193 0.6990 1
SO4 -0.1455 0.2578 0.0782 1
Cl -0.1350 0.8072 0.2131 0.0961 1
NO3 0.2282 0.1643 -0.5370 -0.0244 0.5704 1
F -0.3845 0.3775 0.3216 0.0300 0.1514 0.0930 1
Ca -0.6328 0.9337 0.6616 0.0765 0.7215 0.2294 0.4518 1
Mg -0.5289 0.5391 0.4564 0.6348 0.2379 -0.1904 0.4320 0.4092 1
Na 0.0031 0.5233 0.6217 0.0313 0.4039 -0.2623 -0.0935 0.3193 -0.0125 1
K 0.0024 0.2609 0.5478 0.1070 0.0779 -0.5045 -0.1321 0.0776 -0.0954 0.8627 1
TH -0.6893 0.9402 0.6993 0.2994 0.6621 0.1015 0.5026 0.9386 0.6970 0.2624 0.0395 1
From the Table 4 it is observed that Ca++ is positively correlated with EC, Cl- and HCO3-,
whereas Mg++ is positively correlated with EC and SO4-.Both Na+ and K+ are having a good correlation with HCO3-. But NO3- having only good correlation with Cl-. 6.0 Conclusions
The results of ground water samples in the study area depict a Magnesium bicarbonate type of ground water (Fig-3). All parameters including trace elements concentration in ground water are within permissible limit as per the drinking water standards IS 10500:2012 and thus suitable for drinking and irrigation purposes. But few samples shows nitrate, iron (Fig-4) concentration above permissible limit. The nitrate contamination can be due to some anthropogenic sources, like decomposed organic matter, leaching of nitrogenous fertilizers etc. and origin of elevated iron concentration may be geogenic. Thus it can be concluded that molasses leakage from Chada Sugar Mill Factory does not have some immediate impact on deterioration of groundwater quality in shallow and deeper aquifer in nearby villages of Kiri Afgana as the study has been carried out within a month of the incident. Also it will be interesting to assess the ground water quality after six months or one year period. Acknowledgements
The authors are highly thankful to Shri G C Pati, Chairman, CGWB, Shri P. Nandakumar, the then Member (HQ), CGWB, CHQ, Faridabad and Shri Anoop Nagar, Regional Director, CGWB, NWR for motivating in completion of the paper and also for assigning the task and helping for analysis at Chemical Lab, CGWB, Chandigarh. References
1. American Public Health Agency (APHA). 2017. Standard Methods for the Examination of Water and Wastewater, 23rd Edition.
BHUJAL NEWS, 31 (1-4) : 109-120
120
2. Ashraf, S., Abbas, F., Ibrahim, M., Rashid, U., Khalid, S., Ahmad, H.R., Hakeem, K.R., Majeed, T. (2015). Application of GIS for the identification and demarcation of selective heavy metal concentrations in the urban groundwater. J. Geog. Sci. 25(2):225–235.
3. Central Ground Water Board, NWR, Chandigarh. (2015)Aquifer Mapping and Management Plan, Gurudaspur District, Punjab.
4. Isa, N.M., Aris, A.Z., Lim, W.Y., Sulaiman, W.N.A.W., Praveena, S.M. (2014). Evaluation of heavy metal contamination in groundwater samples from Kapas Island, Terengganu, Malaysia. Arab. J. Geoscience. 7(3):1087–1100.
5. Ityel, D. (2011). Ground water: Dealing with iron contamination. Filtration & Separation - FILTR SEP. 48. 26-28. 10.1016/S0015-1882(11)70043-X.
6. Kelley, W. P.(1940). Permissible composition and concentration of irrigation waters, Proc. ASCE, 66: 607.
7. Korsaeth, A. 2000. Nitrogen mass balances in conventional, integrated and ecological cropping systems and the relationship between balance calculations and nitrogen runoff in an 8-year field experiment in Norway. Agriculture Ecosystems & Environment 79(2-3):199-214.
8. Li, W., Wang, M.Y., Liu, L.Y., Wang, H.F., Yu, S. (2015). Groundwater heavy metal levels and associated human health risk in the North China Plain. Arab. J. Geosci. 8:10389–10398.
9. Momodu, M.A., Anyakora, Chimezie. (2010). Heavy Metal Contamination of Ground Water: The Surulere Case Study. Res. J. Environ. Earth Sci. 2:39-43.
10. Ojo, Olumuyiwa., Otieno, Fred., Ochieng, George. (2012). Groundwater: Characteristics, qualities, pollutions and treatments: An overview. International Journal of Water Resources and Environmental Engineering. 4(10):58-97.
11. Raju, N. (2006). Iron contamination in groundwater: A case from Tirumala-Tirupati environs, India. Research Communication. 01(01):32-35.
12. Sadashivaiah,C., Ramakrishnaiah, C. R., Ranganna, G. (2008). Hydrochemical analysis and evaluation of groundwater quality in Tumkur Taluk, Karnataka state, India. Int. J. Environ. Res. Public Health 5(3): 158-164.
13. Sieling, K., Kage, H. (2006). N balance as an indicator of N leaching in an oilseed rape – winter wheat – winter barley rotation. Agriculture Ecosystems & Environment 115(1):261-269.
14. Vetrimurugan, E., Brindha, K., Elango, L. et al. (2017). Human exposure risk to heavy metals through groundwater used for drinking in an intensively irrigated river delta. Applied Water Science 7: 3267–3280.
15. Wilcox. L. V. (1948, 1962), The quality water for irrigation use. US Dept. Agriculture Bulletin., 40.
Copyright © 2022 FDOKUMEN