1320 JTECH Jan-2010
19
In Situ Calibration of Hot-Film Probes Using a Collocated Sonic Anemometer: Implementation of a Neural Network E. KIT School of Mechanical Engineering, Tel-Aviv University, Ramat Aviv, Tel Aviv, Israel A. CHERKASSKY Department of Management and Control, Shenkar College, Ramat Gan, Israel T. SANT AND H. J. S. FERNANDO Center for Environmental Fluid Dynamics, and Department of Mechanical and Aerospace Engineering, Arizona State University, Tempe, Arizona (Manuscript received 20 April 2009, in final form 3 August 2009) ABSTRACT Although the integral quantities of atmospheric turbulence are conveniently measured using sonic ane- mometers, obtaining relevant finescale variables such as the kinetic energy dissipation using conventional hot-film/wire techniques remains a challenge because of two main difficulties. The first difficulty is the mean wind variability, which causes violation of the requirement that mean winds have a specific alignment with the hot-film/wire probe. To circumvent this problem, a combination of collocated sonic and hot-film anemometers, with the former measuring mean winds and aligning the latter in the appropriate wind direction via an auto- mated platform, is successfully designed and implemented. The second difficulty is the necessity of frequent and onerous calibrations akin to hot-film anemometry that lead to logistical difficulties during outdoor (field) measurements. This is addressed by employing sonic measurements to calibrate the hot films in the same combination, with the output (velocity) to input (voltage) transfer function for the hot film derived using a neural network (NN) model. The NN is trained using low-pass-filtered hot-film and sonic data taken in situ. This new hot-film calibration procedure is compared with the standard calibration method based on an external calibrator. It is inferred that the sonic-based NN method offers great potential as an alternative to laborious standard calibration techniques, particularly in the laboratory and in stable atmospheric boundary layer settings. The NN approximation technique is found to be superior to the conventionally used polynomial fitting methods when used in conjunction with unevenly spaced calibration velocity data generated by sonic anemometers. 1. Introduction Although the integral scale quantities in the atmo- sphere are often measured, finescale variables (;5 cm and less) are often inferred indirectly because of mea- surement difficulties. Of particular importance is the rate of turbulent kinetic energy (TKE) dissipation «, also known in atmospheric applications as the eddy dissi- pation rate (EDR), that underpins our understanding and nowcasting of atmospheric turbulence (Frehlich and Cornman 2002). It represents a major energy sink in the atmospheric boundary layer (ABL) and hence a mechanism of controlling energy levels at various scales (Monin and Yaglom 1971). In addition, the spatial struc- ture of « is used for analytical studies of atmospheric thermal convection and in computational modeling of ABL dynamics (Hunt 1984). More recently, the EDR- based techniques have been used to inform clear air turbulence for commercial aircraft as well as for opti- mum siting of wind turbines; hence, increasing atten- tion is being given to understanding of the fundamental dynamics of TKE dissipation (Cornman et al. 2004; Fang et al. 2008). Traditionally, « in the atmosphere is indirectly inferred using techniques such as fitting Kolmogorov spectral form to the measured spectra of Corresponding author address: E. Kit, School of Mechanical Engineering, Tel-Aviv University, Ramat Aviv, Tel Aviv 69978, Israel. E-mail: [email protected] JANUARY 2010 KIT ET AL. 23 DOI: 10.1175/2009JTECHA1320.1 Ó 2010 American Meteorological Society
-
Upload
independent -
Category
Documents
-
view
4 -
download
0
Transcript of 1320 JTECH Jan-2010

In Situ Calibration of Hot-Film Probes Using a Collocated SonicAnemometer: Implementation of a Neural Network
E. KIT
School of Mechanical Engineering, Tel-Aviv University, Ramat Aviv, Tel Aviv, Israel
A. CHERKASSKY
Department of Management and Control, Shenkar College, Ramat Gan, Israel
T. SANT AND H. J. S. FERNANDO
Center for Environmental Fluid Dynamics, and Department of Mechanical and Aerospace Engineering,
Arizona State University, Tempe, Arizona
(Manuscript received 20 April 2009, in final form 3 August 2009)
ABSTRACT
Although the integral quantities of atmospheric turbulence are conveniently measured using sonic ane-
mometers, obtaining relevant finescale variables such as the kinetic energy dissipation using conventional
hot-film/wire techniques remains a challenge because of two main difficulties. The first difficulty is the mean
wind variability, which causes violation of the requirement that mean winds have a specific alignment with the
hot-film/wire probe. To circumvent this problem, a combination of collocated sonic and hot-film anemometers,
with the former measuring mean winds and aligning the latter in the appropriate wind direction via an auto-
mated platform, is successfully designed and implemented. The second difficulty is the necessity of frequent
and onerous calibrations akin to hot-film anemometry that lead to logistical difficulties during outdoor (field)
measurements. This is addressed by employing sonic measurements to calibrate the hot films in the same
combination, with the output (velocity) to input (voltage) transfer function for the hot film derived using
a neural network (NN) model. The NN is trained using low-pass-filtered hot-film and sonic data taken in situ.
This new hot-film calibration procedure is compared with the standard calibration method based on an external
calibrator. It is inferred that the sonic-based NN method offers great potential as an alternative to laborious
standard calibration techniques, particularly in the laboratory and in stable atmospheric boundary layer settings.
The NN approximation technique is found to be superior to the conventionally used polynomial fitting methods
when used in conjunction with unevenly spaced calibration velocity data generated by sonic anemometers.
1. Introduction
Although the integral scale quantities in the atmo-
sphere are often measured, finescale variables (;5 cm
and less) are often inferred indirectly because of mea-
surement difficulties. Of particular importance is the rate
of turbulent kinetic energy (TKE) dissipation «, also
known in atmospheric applications as the eddy dissi-
pation rate (EDR), that underpins our understanding
and nowcasting of atmospheric turbulence (Frehlich
and Cornman 2002). It represents a major energy sink
in the atmospheric boundary layer (ABL) and hence
a mechanism of controlling energy levels at various scales
(Monin and Yaglom 1971). In addition, the spatial struc-
ture of « is used for analytical studies of atmospheric
thermal convection and in computational modeling of
ABL dynamics (Hunt 1984). More recently, the EDR-
based techniques have been used to inform clear air
turbulence for commercial aircraft as well as for opti-
mum siting of wind turbines; hence, increasing atten-
tion is being given to understanding of the fundamental
dynamics of TKE dissipation (Cornman et al. 2004;
Fang et al. 2008). Traditionally, « in the atmosphere
is indirectly inferred using techniques such as fitting
Kolmogorov spectral form to the measured spectra of
Corresponding author address: E. Kit, School of Mechanical
Engineering, Tel-Aviv University, Ramat Aviv, Tel Aviv 69978,
Israel.
E-mail: [email protected]
JANUARY 2010 K I T E T A L . 23
DOI: 10.1175/2009JTECHA1320.1
� 2010 American Meteorological Society

sonic anemometers (Kaimal and Finnigan 1994), which
is also known as the inertial dissipation technique, or by
employing special retrieval techniques to low-resolution
lidar or radar measurements based on assumed theo-
retical spectral shapes (Frehlich and Cornman 2002).
Such techniques also assume that turbulence is statistical
stationary, which is not always satisfied in the atmo-
sphere. The direct measurement of « in the atmosphere
using high-resolution instruments, such as hot film/wire,
that can resolve dissipation scales has been rare (Skelly
et al. 2002; Poulos et al. 2006), given the intricacy and
logistical restrictions of the instruments involved. Stan-
dard hot-film/wire techniques work on the premise that
the change of resistance (or an equivalent voltage change)
produced in a heated wire resulting from cooling of a
passing flow is a function of velocity. Thus, a reliable
calibration procedure is necessary to convert the voltage
to velocity. This procedure becomes more complicated
for two-dimensional (2D) or 3D probes, wherein the
wires are inclined to the flow direction.
The approximation of input–output relationships, or
transfer function, for hot-wire/film calibration is usually
realized by measuring the voltage outputs for a range of
flow velocities in low-turbulence environments. The
flow velocity (and if required the flow direction) is sys-
tematically changed over a parameter range of interest,
thus obtaining input points separated at regular in-
tervals. Obtaining such calibration curves in the atmo-
sphere has been a bane, given the difficulty of working in
unfriendly outdoor environments and the necessity of
frequent calibrations in view of slowly changing probe
performance resulting from contamination.
Hot films/wires have been recently used in field ex-
periments together with sonic anemometers, and at-
tempts have been made to use suitably processed data
from the latter to build a calibration set for the former.
During the Cooperative Atmospheric Surface Exchange
Study (CASES-99) in October 1999, Skelly et al. (2002)
deployed two levels of triple-hot-film and sonic ane-
mometers on a 5.5-m tower. Each hot film was collocated
5 cm from the sonic sensing path on a common boom.
According to the authors, seven constant-temperature
triple-hot-film anemometers were calibrated prior to the
deployment using the procedure of Miller et al. (1989),
where a laboratory free-jet wind nozzle was used as the
controlled velocity source (calibrator). Each hot-film
sensor was mounted perpendicular to the flow in the
potential core of the jet, adjoining a Pitot tube, to ob-
tain an effective cooling velocity Vei. In the outdoors,
the data were taken only when the winds were from a
particular direction, thus avoiding complexities of direc-
tional dependence. The change of calibration over the
experiment was said to be minor; thus, the calibration
obtained prior to the experiment was used. Our expe-
rience, however, suggests that calibrations of multiple
hot-film/wire probes are short lived and calibrations for
different wires diverges significantly with time. Figure 2
of Skelly et al. (2002) indeed indicates a probe drift
over the experimental period, suggesting the necessity
of frequent calibration.
A similar setup to that of Skelly et al. (2002) has been
deployed in the Terrain-Induced Rotors Experiment
(T-REX) in Owens Valley, California, during March–
April 2006. The system was dubbed the Outdoor Three-
Dimensional In-Situ Calibrated Hot-film Anemometry
System (OTIHS). An in situ calibration method was
suggested for OTIHS based on the first-use data obtained
from simultaneous measurement of collocated sonic and
hot-film anemometers, with the former providing velocity
data for calibration of the latter (Poulos et al. 2006). The
hot film was aligned with the prevailing wind direction
measured by the sonic anemometer using an automated
platform. The data processing for T-REX work is still in
progress, and the calibration approach the OTIHS de-
velopers anticipate to use will be built upon those of van
Dijk and Nieuwstadt (2004a,b), in particular the lookup
table approach of van Dijk and Nieuwstadt (2004b). In
the latter method, a set of calibration samples Ecal,I is first
collected; for a number of absolute velocities (with arbi-
trary intervals), a set of orientations with regular angular
intervals is acquired. In other words, the lookup table
method requires calibration over regular angular in-
tervals, which is unachievable with an in situ calibration
method based on a random dataset from sonic ane-
mometers. These data are unevenly spaced in the data
domain, for which the applicability of standard inter-
polation techniques such as the polynomial least squares
fitting (PF) for producing calibration approximations is
in doubt.
Considering the versatility of the OTIHS concept, in
that it opens up the possibility of using hot films/wires in
the field without cumbersome calibration devises, the
present authors decided to investigate possible approxi-
mation techniques for accurate interpolation of velocity–
voltage data, even in the presence of unevenly distributed
calibration data. During this research, the neural net-
work (NN) approach (e.g., Haykin 1998) emerged as a
strikingly successful method, and its application for hot-
film calibration is the main topic of this paper. An NN is
a computational device that produces appropriate out-
puts from inputs, based on a selected architecture and
subsequent training to perform intended tasks. If the
general relationships are mapped as functions, say from
Rn to Rm, then an NN with smooth activation functions
can approximate continuous functions with compact sup-
port (i.e., all continuous functions whose domains are
24 J O U R N A L O F A T M O S P H E R I C A N D O C E A N I C T E C H N O L O G Y VOLUME 27

closed and bounded in Rn). This property is a result of
the Stone–Weierstrass theorem: all continuous func-
tions with compact support can be approximated to any
degree of accuracy by a neural network of one hidden
layer with a sigmoid or hyperbolic tangent activation
function (Nguyen et al. 2003; Haykin 1998). It is this
property that we wish to exploit for calibrating hot films/
wires with uneven distributions of datasets. In this paper,
the following methodology was adopted:
1) A laboratory jet device (calibration unit or calibra-
tor) was used to obtain an evenly distributed cali-
bration dataset [called the calibrator-based set (CBS)]
by placing the hot film in the potential core of the jet,
with a miniature Pitot tube alongside for velocity
measurement. The voltage–velocity calibration was
realized using (i) the PF and (ii) training of an NN.
This jet device was used both in the laboratory and
field experiments for obtaining CBS.
2) The hot film was then placed within the probe vol-
ume of a sonic anemometer, and the combination
was used for the measurements at different far field
sections of the laboratory jet where the flow is tur-
bulent as well as in the field to measure atmospheric
turbulence. The utility of these datasets are twofold:
to generate a calibration dataset [called the sonic-
based calibration dataset (SBS)] and to use the same
dataset to compute high-resolution turbulent veloc-
ity fields for hot films. The SBS was used to deter-
mine the coefficients of a PF and to train the NN, as
in CBS.
Table 1 lists the datasets and calibration procedures
used for all four cases. For the CBS, the interpolations
based on NN and PF were found to be essentially
identical, implying that both NN and PF work equally
well. For SBS, however, the NN performed equally well
as the CBS case, but the calibration with PF was found
to be unacceptable. Note that the CBS-based PF cali-
bration (CBS-PF) can be construed as the baseline
(reference) for comparison, because it is the standard
calibration procedure. Although not as good as for the
laboratory case, the NN calibration (SBS-NN) was
found to be in agreement with the standard CBS-PF at
least under certain atmospheric conditions. SBS-PF was
found to be unacceptable for outdoor (field) calibration.
2. Experimental methodology
In this section, the jet facility used for the multiple
purposes of calibration (at the nozzle) and as a canonical
turbulent flow (downstream) in the laboratory and as
a calibrator in the field is discussed first. The mean jet
direction and velocity are known and temperature var-
iations are minimal in the laboratory, whereas in the
field the wind velocity and direction are variable, with
convection (strong vertical velocity and temperature
fluctuations) being the rule rather than the exception
during the day. Our objective is to evaluate the feasi-
bility of a NN to calibrate hot-film probes using in situ
velocity vectors from a sonic probe in the field (under
different ABL conditions) or laboratory.
a. Calibration facility
The custom-made calibration unit consisted of a com-
puter controlled blower, connected to a settling chamber
followed by a contraction with a cross-sectional ratio
of approximately 11 (Fig. 1a) and exit nozzle diameter
De 5 38.1 mm. The same facility was used to measure
all three components of turbulent velocity at various
downstream cross sections.
The design of the probe assembly enabled rotation of
the probe in yaw direction (Fig. 1b) with the yaw-angle
adjustment automated using a National Instruments
model PCI-7330 motion control board and a US Digital
model MD2S microstepping motor (5 microsteps per
step) driver. The yaw angle in this design could be varied
over a wide range (6908) while the probe tips fixed in
space. A National Electrical Manufacturers Association
(NEMA) size 17, 200-step (1.88) stepping motor and 15:1
ratio planetary gearbox (Lin Engineering type 4218S-
02-PG15) was used to rotate the assembly, resulting in
a very high angular resolution of 0.0248 per step. Stepper
motor and control board were interfaced using a National
Instruments UMA-7764 Universal Motion Interface.
b. Instrumentation
Two orthogonal end-flow X probes (TSI model 1241–
20W; see Fig. 1d), which are commonly used in water
applications, were selected considering their robustness
compared to hot wires; probe ruggedness is imperative
in field applications where vibrations and airborne par-
ticulates are common. Fine-wire probes provide a faster
time response, but this was not required to capture
flow dynamics in the present case. The 1241–20Ws are
platinum film probes with a sensing diameter of 50.8 mm
and a sensing length of 1.02 mm (which defines its
TABLE 1. A list of datasets and calibration procedures used
and nomenclature.
Calibration datasets/
approximations PF NN
CBS CBS-PF (1) CBS-NN (2)
SBS SBS-PF (3) SBS-NN (4)
JANUARY 2010 K I T E T A L . 25

spacial resolution). The sensor orientation is 458 relative
to the connector end of probe. Two dual-sensor probe
supports were modified from their original 360 length to
80 and were mounted vertically stacked (in the same
vertical plane), with an overall spatial resolution better
than 6 mm (limited because of the size of the probe
support). A collar was fabricated for the probe sup-
ports, permitting rotation of each probe. Both X probes
were oriented in the horizontal plane during calibra-
tion, and thereafter the upper probe holder was rotated
to obtain two orthogonal X probes, thus providing a
convenient way to measure all three velocity compo-
nents with 2D probes. In this case, the out-of-plane
velocity components need to be small, thus imposing
a constraint on the type of velocity field the probe com-
bination can measure.
FIG. 1. Calibration setup: (a) calibration facility, (b) schematic of calibration unit, (c) cali-
bration unit deployed in the field, and (d) a close-up of miniature Pitot tube and two X hot-film
probes.
26 J O U R N A L O F A T M O S P H E R I C A N D O C E A N I C T E C H N O L O G Y VOLUME 27

The anemometer system employed was the Dantec
type 56C01 with constant-temperature anemometer
(CTA) 56C17 bridges. Signal conditioning was provided
in part by using standard Dantec-made auxiliary boards
and in part by using type 3202 Krohn-Hite low-pass fil-
ters. The ultrasonic anemometers used were of the type
R. M. Young, model 81000 (see R. M. Young Company
2001). The velocity measurement range was set from 0 to
10 m s21 with a sampling frequency of 32 Hz (maximum
allowed). These anemometers provide all three velocity
components with a relatively low spatial (;10 cm) and
temporal (;16 Hz) resolution, and they are a common
workhorse in the field.
c. Laboratory experimental procedure
All experiments were conducted with a nozzle exit
velocity ;8 m s21, measurements were taken at L 5
2000, 3000, and 4000 mm, and the temperature variation
during the experiments was insignificant (less than a few
tenths of a degree). Both CBS and SBS were used in data
analysis. First, a CBS was obtained at the nozzle exit,
followed by turbulent velocity measurements at L 5
3000 mm. The second calibration dataset, SBS, was
obtained by low-pass filtering (via data averaging) the
simultaneously measured voltage signal of hot film and
the velocities of sonic. With sampling frequency of
1000 Hz and the experimental duration of 300 s, 300 000
data points were obtained, which is adequate for any
statistical analysis. The internal maximum sampling
frequency of Sonics is 32 Hz, but 1000 Hz was used for
sonic data acquisition (DAQ) to simplify the procedure
and subsequent analysis.
To obtain the SBS, the data points were averaged over
0.3 s, yielding a dataset of 1000 points. To apply NN, this
calibration dataset served as a training dataset, and 1000
points is an appropriate number for a training dataset,
even when the data points are unevenly distributed.
With orderly distributed data, as in CBS, a fewer num-
ber of points are acceptable. In few laboratory experi-
ments, both the polynomial coefficients for PF and the
model parameters for NN were obtained for CBS, which
contains only 77 points. Nevertheless, as will be shown
later, this limited number of points was sufficient for
successful NN training.
Note that although the probe combination enables
measure all three components of velocity, its calibration
was performed by varying the yaw angle of both X hot
films (oriented in the horizontal plane) relative to the
flow. This 2D calibration differs from the 3D calibration
of a four-wire 3D probe described in Tsinober et al.
(1992) and van Dijk and Nieuwstadt (2004b). Note that
CBS-PF represents the standard method of calibration
(Tsinober et al. 1992; Gulitski et al. 2007a,b,c; van Dijk
and Nieuwstadt 2004a,b; Dobbeling et al. 1990, 1992),
although somewhat different techniques based on ef-
fective velocity approach are also being used (Balint
et al. 1987, 1988, 1991; Jorgensen 1971; Kit et al. 1987,
1988; van Dijk and Nieuwstadt 2004b).
For calibration purposes, a lookup table method can be
applied. For example, van Dijk and Nieuwstadt (2004b)
suggested the following procedure: (i) collect a set of
calibration samples Ecal,I; (ii) for a number of absolute
velocities (with arbitrary intervals), scan a set of ori-
entations with regular angular intervals. The number of
calibration samples required to get the desired accu-
racy in their case was 16 250 for the classic probe (an-
gular increments of 38 and uniform velocity increment
of 0.28 m s21), which may take an entire day. This is
inconvenient in practice and untenable in field situa-
tions. In addition, in atmospheric flows, hot-film mea-
surements face many additional problems over a day,
such as aging, contamination, and calibration drift. Other
issues of concern include path averaging of signal over
the wire, nonuniform temperature distribution over the
wire, loosely mounted wires, thermal cross talking, elec-
trical cross talk between the wire signals, and decorrela-
tion of signals resulting from short wire separation.
d. Field experimental procedure
In the field, obtaining CBS followed the same pro-
cedure as in the laboratory. Thereafter, the hot-film
probe was collocated with the sonic anemometer and the
combination was installed on a tower, with provisions for
changing its height from 1 to 3 m above ground level. The
generation of the calibration dataset (SBS) followed the
same steps as that in the laboratory, except that the data
taken in atmospheric turbulence were used.
e. Data acquisition and calibration details
DAQ was accomplished using a National Instruments
data acquisition board, model PCI-6024E. The software-
selectable board gain was set to 65 V. The board reso-
lution is 12 bit with a maximum sampling rate of 200 000
samples per second. A 16-channel (8 differential) analog
input and 2-channel analog output were used for labo-
ratory data acquisition. During the calibration, signals
from two X probes (4 channels), a pressure transducer,
and the temperature from the sonic anemometer were
acquired. In field measurements, 13 channels were used:
4 channels for each sonic anemometer, 4 for the X probes,
and 1 for the pressure transducer signal (during cali-
bration). Sampling was performed at 1000 Hz in the
laboratory and at 2000 Hz in most field experiments.
During the calibration, both X probes were oriented
in the horizontal plane and placed at the nozzle exit in
the potential core of the jet (low turbulence intensity)
JANUARY 2010 K I T E T A L . 27

alongside a miniature Pitot-static probe. The Pitot tube
provided simultaneous velocity measurements via a
high-resolution Baratron-type pressure transducer. The
velocity field at the nozzle exit was of high spatial ho-
mogeneity, allowing simultaneous calibration of both
X probes. The calibration procedure was fully automated,
and the data acquisition, stepper motor (to change the
probe yaw angle), and blower were controlled by the
same computer. A full calibration dataset (CBS) con-
sisted of 11 yaw positions (from 6308) at 7 variable
velocities.
As mentioned, two types of turbulent flows were
investigated: laboratory turbulent jet and lower atmo-
spheric boundary layer flow. In the former, axially de-
veloping turbulent jet emanating from the calibrator,
sufficiently away from the nozzle, was used. Measure-
ments were made using collocated sonic and hot films;
thus, the homogeneity of the velocity field over the
probe combination was imperative. The Pitot tube and
hot-film measurements showed that such is achieved at
distances of L . 2000 mm (94.5De), where the stream-
wise component was homogeneous over the sonic probe
volume (the effective sonic diameter Ds 5 100 mm) within
10%. Most laboratory measurements were conducted at
the L 5 3000 mm cross section, but a few were also per-
formed at L 5 2000 mm to elucidate the effects of higher
turbulence intensities and L 5 4000 mm for low turbu-
lence intensities.
Unlike in the laboratory, the direction of atmospheric
flows is variable, but the current facility offered the ad-
vantage of following the mean flow direction in the field
by employing the same stepper motor and rotating
frame that was used for calibration. Therein, a feedback
signal was derived based on the three velocity compo-
nents measured by the sonic, which were interrogated at
every 60-s interval. In doing so, the signals were aver-
aged over the last 5 s of each 60-s record to allow suffi-
cient time to filter out smaller-scale fluctuations caused
by the variability of wind direction. If the directional
variability between the beginning and the end of a 60-s
record is more than 108 different, the record was dis-
carded in data processing.
As described previously, the probe calibration was
made in the plane of the probe only, requiring the out-of-
plane velocity component to be relatively small. These
requirements are automatically fulfilled for a horizontally
oriented X hot film, because the mean vertical velocity in
the lower ABL is usually small and only the fluctuating
normal velocity is dominant. When the X-film probes are
vertically oriented, however, the wind velocity should
coincide with the probe plane, which represents a con-
straint in data processing. The effective velocity approach
widely used for calibration indicates that the errors be-
come noticeable when the out-of-plane velocity exceeds
10% of the mean velocity value, and this constraint was
imposed during data processing.
In generating the SBS, the following should be borne
in mind:
1) Although the resolutions of two instruments are
significantly different, at low frequencies the velocity
fields sensed by both probes are the same, and hence
both ought to yield the same velocity field upon low-
pass filtering. The calibration dataset SBS can be
built using low-pass-filtered signals of sonic ane-
mometer (velocity) and hot-film bridges (voltage).
2) A drawback of the last approach is the nonlinearity of
heat transfer (the latter underpins the principle of hot-
film operation). Owing to this nonlinearity, a part of
the high-frequency signal of the anemometer bridge
output is contributed by the low-frequency velocity
field. The low-pass filtering will filter out this high-
frequency contribution, although it is produced by the
low-frequency part of velocity spectrum. It is difficult
to estimate this loss, although the loss should increase
with the turbulent intensity. This paper intends to
investigate (i) the efficacy of using SBS in calibrating
hot films compared to the standard calibration pro-
cedure (CBS), (ii) conditions under which SBS is
sound, and (iii) whether special techniques can be
used to make SBS and CBS closely compatible. Be-
cause the difficulty of in situ calibration is the bane of
field deployment of hot films, a reliable SBS will offer
a breakthrough in atmospheric sensing.
As discussed, CBS and SBS methods were used in con-
junction with PF and NN models to determine the out-
put (variable velocity components felt by the hot-films
probes) and input (voltages generated by the CTA
across the wires) relations for each of the hot films. In
the PF case, commonly used polynomial expressions
were employed. The successful use of PF approach for
X wires was recently reported in Kit et al. (2005, 2007),
where a least squares fit by fourth-order polynomials
was used to compute 15 polynomial coefficients for each
velocity component.
The polynomial approximation has the following form
[van Dijk and Nieuwstadt (2004a,b)]:
Ui5 f
i(E
1, E
2) and
fi(E
1, E
2) 5 �
klc
iklP
k(E
1)P
l(E
2);
Pk(E) 5 Ek, 0 # k, l # 4, k 1 l # 4;
the coefficients of this expression are calculated by
solving a system of linear equations.
28 J O U R N A L O F A T M O S P H E R I C A N D O C E A N I C T E C H N O L O G Y VOLUME 27

The same set of calibration data is used to approxi-
mate the input–output relations by applying an NN ap-
proach, a detailed description of which is given in the
appendix. The neural network approach has been pre-
viously applied on a limited basis (Al-Salaymeh and
Ashhab 2006, 2007) for hot-wire/film calibration, but
such work has been confined to single hot-wire sensors
under different air densities.
3. Laboratory experimental results
The time series of three velocity components were
computed for the entire dataset measured in Lab_Expt 1
using both approaches, PF and NN trained, with CBS,
and a typical comparison is shown in Fig. 2. The data
represent fluctuations after subtraction of mean velocities
and normalized by respective 3 times RMS values. Green
corresponds to velocity components computed using
reference (CBS-PF) calibration, and red represents those
based on CBS-NN model. The agreement is excellent,
with the correlation coefficient higher than 0.99, for all
three velocity components. The fact that the two very
different calibration procedures yield practically the
same result indicates that both models are appropriate
for carrying out calibration of this probe system.
A comparison of two time series of normalized
streamwise, spanwise, and vertical velocities measured
at the jet axis by the hot films, computed using CBS-PF
and SBS-NN for the same laboratory experiment, is
shown in Fig. 3. Green corresponds to velocity compo-
nents computed using reference (CBS-PF) calibration,
and red represents those based on SBS-NN model. The
results summarized in Table 2 clearly show that, even at
relatively high turbulent intensities (.25%), the NN
approach for calibration yields results close to those
obtained using the reference method (CBS-PF).
In Fig. 4, the results are presented for L 5 2000 mm,
wherein the turbulence intensity is higher (by about
30%) than in the previous example. Although the flow
in the sonic probe volume is somewhat inhomoge-
neous because of shorter distance from the jet exit, the
NN model yields results in par with those obtained using
the reference method.
The same PF method can be used with SBS, but this
calibration set differs from CBS in that the latter is con-
structed using data obtained at regular intervals covering
the entire range of hot-film measurements. Conversely,
the SBS data are unevenly distributed over an un-
controlled range of velocities for each velocity compo-
nent. A comparison of velocity fields obtained using
FIG. 2. Plots of (top) streamwise, (middle) transverse, and (bottom) vertical normalized
velocity component for Lab_Expt 1, where L 5 3 m. Red plot shows CBS-PF, and green plot
shows CBS-NN. For superscripts, see Table 1.
JANUARY 2010 K I T E T A L . 29

SBS-PF with that of the reference (CBS-PF) method is
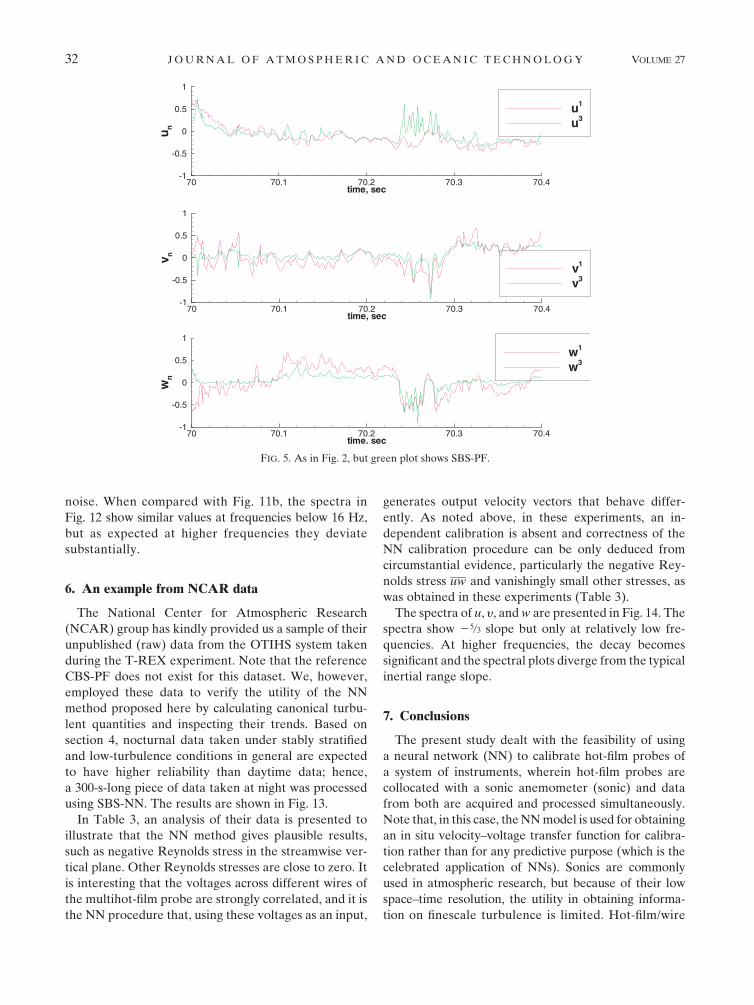
presented in Fig. 5.
The agreement is poor, and this is true for other
similar comparisons (not shown here). Therefore, the
use of PF with SBS is not recommended. The success of
NN when used with SBS can be attributed to its intrinsic
feature, discussed in section 1, with regard to functions
with compact support.
It can therefore be concluded that, under controlled
laboratory conditions, the NN approach is a highly
suitable method for calibrating hot films. High turbulent
intensities have only weak deteriorating effects on the
quality of results obtained using CBS-NN or SBS-NN
when compared to the reference method (CBC-PF), as
explained previously, based on Fig. 4.
4. Field experimental results
In contrast to controlled laboratory conditions, the
wind direction and speed under field conditions have
TABLE 2. Normalized mean and RMS (s) velocities based on different techniques.
Velocities
Expt
Dataset/calibration
method u0 (m s21) y0/u0 w0/u0 su/u0 sy/u0 sw/u0
Laboratory jet experiments
Lab_Expt 1, L 5 3 m CBS-PF 2.20 0.0236 20.0050 0.257 0.207 0.200
CBS-NN 2.20 0.0477 20.0077 0.252 0.210 0.207
SBS-NN 2.20 0.0245 20.0036 0.264 0.209 0.200
SBS-PF 2.18 20.0812 20.0839 0.411 0.369 0.532
Lab_Expt 2, L 5 2 m CBS-PF 3.1 0.0161 20.0387 0.293 0.203 0.210
SBS-NN 2.66 0.0684 20.0248 0.286 0.187 0.178
Field experiments
Field_Expt 1, 1400–1500 30 Mar 2008 CBS-PF 3.347 0.239 0.0024 0.401 0.286 0.195
SBS-NN 2.271 0.539 0.0097 0.498 0.581 0.271
Field_Expt 2, 0530–0630 6 Apr 2008 CBS-PF 1.47 0.0680 20.0551 0.211 0.191 0.184
SBS-NN 1.247 0.0537 0.0305 0.248 0.204 0.192
FIG. 3. As in Fig. 2, but green plot shows SBS-NN.
30 J O U R N A L O F A T M O S P H E R I C A N D O C E A N I C T E C H N O L O G Y VOLUME 27

significant variability, including diurnal thermal forcing
that produces convective boundary layer (CBL) during
the day and stable boundary layer (SBL) at night. The
former consists of turbulent convection that produces
rising and falling thermals over the entire boundary
layer and shear-produced (mechanical) turbulence near
the ground, whereas the latter inhibits turbulence and
confines it to intermittent patchy regions or maintains
weak turbulence over the entire boundary layer (Monti
et al. 2002; Pardyjak et al. 2002). Considering all, it can
be expected that the NN will provide better results for
the SBL. As mentioned, the measurement issues akin to
wind variability were addressed using an automated
wind direction tracking system, and experiments were
conducted covering the entire diurnal cycle. The pa-
rameters corresponding to the field experiments are
given in Table 2.
Figures 6 and 7 show the measurements carried out on
30 March and 5 April 2008, respectively. It can be seen
from Fig. 6 (Field_Expt 1) that, even under strong
convection, there are periods where the results obtained
by the reference (CBS-PF) and SBS-NN are in reason-
able agreement. As shown in Fig. 6b, however, signifi-
cant differences in the results were noted when there are
strong bursts. Further analysis is necessary to determine
criteria to delineate conditions for acceptable data from
those unreliable, which appear to occur during convec-
tion events (this, in part, can be attributed to the strong
vertical velocities present during convection, which makes
the present calibration procedure unsuitable). The results
of an experiments conducted during nocturnal period
(Field_Expt 2) are presented in Fig. 7, which show a good
agreement between results obtained using SBS-NN and
CBS-PF calibrations. The quality of agreement is almost
as good as that obtained under controlled experiments in
the laboratory.
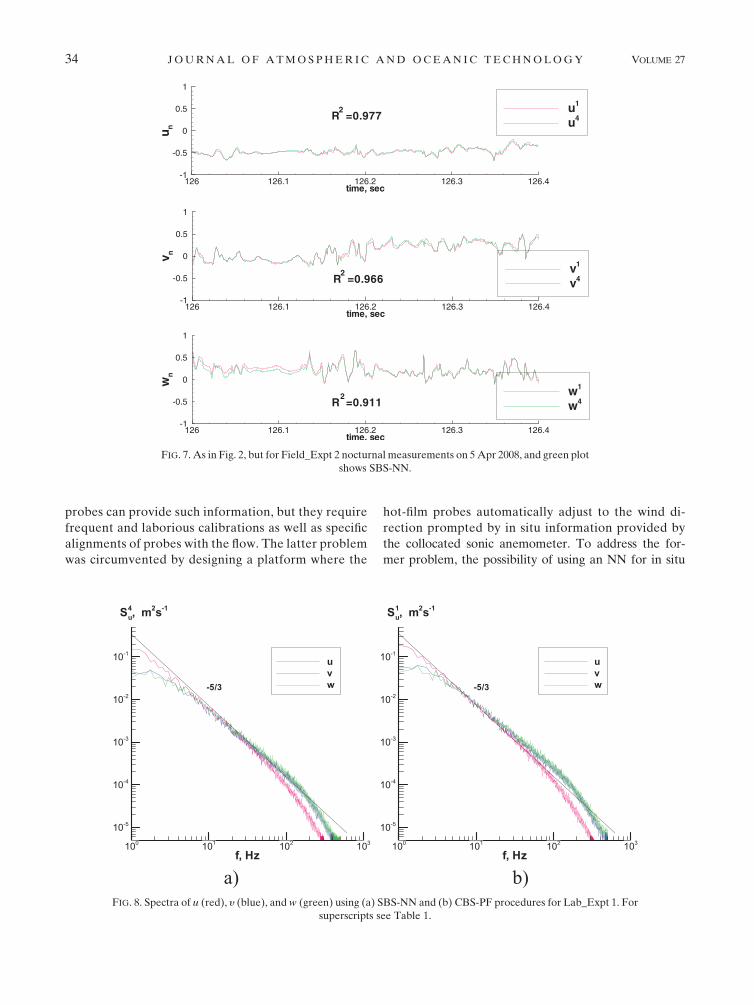
5. Spectral measurements
The spectra computed using data processed using
CBS-PF and SBS-NN procedures are presented in
Figs. 8–11. They show the well known 25/3 slope at lower
frequencies and a faster decay at larger frequencies.
Although their behaviors are very clear and consistent in
the laboratory jet experiment (Figs. 8, 9), the field ex-
periment performed throughout the night shows an
interesting bump in the slope, including even a change
of sign sometimes, at frequencies ;50–100 Hz (see
Fig. 11). This phenomenon remains unexplained and is
in need of further study.
The spectra obtained using data from sonic are pre-
sented in Fig. 12. Note that the sampling rates used for
sonic and hot films were the same. Consequently, the
spectra beyond 16 Hz are unphysical and represent
FIG. 4. As in Fig. 2, but for Lab_Expt 2, L 5 2 m, and green plot shows SBS-NN.
JANUARY 2010 K I T E T A L . 31
noise. When compared with Fig. 11b, the spectra in
Fig. 12 show similar values at frequencies below 16 Hz,
but as expected at higher frequencies they deviate
substantially.
6. An example from NCAR data
The National Center for Atmospheric Research
(NCAR) group has kindly provided us a sample of their
unpublished (raw) data from the OTIHS system taken
during the T-REX experiment. Note that the reference
CBS-PF does not exist for this dataset. We, however,
employed these data to verify the utility of the NN
method proposed here by calculating canonical turbu-
lent quantities and inspecting their trends. Based on
section 4, nocturnal data taken under stably stratified
and low-turbulence conditions in general are expected
to have higher reliability than daytime data; hence,
a 300-s-long piece of data taken at night was processed
using SBS-NN. The results are shown in Fig. 13.
In Table 3, an analysis of their data is presented to
illustrate that the NN method gives plausible results,
such as negative Reynolds stress in the streamwise ver-
tical plane. Other Reynolds stresses are close to zero. It
is interesting that the voltages across different wires of
the multihot-film probe are strongly correlated, and it is
the NN procedure that, using these voltages as an input,
generates output velocity vectors that behave differ-
ently. As noted above, in these experiments, an in-
dependent calibration is absent and correctness of the
NN calibration procedure can be only deduced from
circumstantial evidence, particularly the negative Rey-
nolds stress uw and vanishingly small other stresses, as
was obtained in these experiments (Table 3).
The spectra of u, y, and w are presented in Fig. 14. The
spectra show 25/3 slope but only at relatively low fre-
quencies. At higher frequencies, the decay becomes
significant and the spectral plots diverge from the typical
inertial range slope.
7. Conclusions
The present study dealt with the feasibility of using
a neural network (NN) to calibrate hot-film probes of
a system of instruments, wherein hot-film probes are
collocated with a sonic anemometer (sonic) and data
from both are acquired and processed simultaneously.
Note that, in this case, the NN model is used for obtaining
an in situ velocity–voltage transfer function for calibra-
tion rather than for any predictive purpose (which is the
celebrated application of NNs). Sonics are commonly
used in atmospheric research, but because of their low
space–time resolution, the utility in obtaining informa-
tion on finescale turbulence is limited. Hot-film/wire
FIG. 5. As in Fig. 2, but green plot shows SBS-PF.
32 J O U R N A L O F A T M O S P H E R I C A N D O C E A N I C T E C H N O L O G Y VOLUME 27

FIG. 6. Two time-trace records for Field_Expt 1, midafternoon on 30 Mar 2008, with (a)
reasonable agreement and (b) strong bursts: (top) streamwise, (middle) transverse, and
(bottom) vertical normalized velocity component. Red plot shows CBS-PF, and green plot
shows SBS-NN. For superscripts see Table 1. The start time in Fig. 6a is 1415 LT.
JANUARY 2010 K I T E T A L . 33
probes can provide such information, but they require
frequent and laborious calibrations as well as specific
alignments of probes with the flow. The latter problem
was circumvented by designing a platform where the
hot-film probes automatically adjust to the wind di-
rection prompted by in situ information provided by
the collocated sonic anemometer. To address the for-
mer problem, the possibility of using an NN for in situ
FIG. 7. As in Fig. 2, but for Field_Expt 2 nocturnal measurements on 5 Apr 2008, and green plot
shows SBS-NN.
FIG. 8. Spectra of u (red), y (blue), and w (green) using (a) SBS-NN and (b) CBS-PF procedures for Lab_Expt 1. For
superscripts see Table 1.
34 J O U R N A L O F A T M O S P H E R I C A N D O C E A N I C T E C H N O L O G Y VOLUME 27

calibration of hot films was studied. To this end, the
hot-film velocity outputs based on the standard cali-
bration method and the corresponding outputs from
a calibration based on an NN were compared for both
laboratory and atmospheric turbulent flows. The stan-
dard calibration was conducted using a known flow
obtained in a low-turbulence jet facility or a calibrator,
and polynomial fitting was used to obtain input–output
relations. In the sonic-anemometer-based calibration,
a collocated sonic was used to obtain the calibration
velocity, and an NN was used to obtain the input–
output relation.
The present work involved addressing some technical
and logistical challenges. The velocity at the calibrator
(the jet nozzle where turbulence level is negligible) and
the yaw angle of the hot film were systematically
changed to acquire data for 2D probe calibration. This
method was acceptable, given that the total probe was
an assemblage of two X hot films. During the calibra-
tion stage, they were oriented in the horizontal plane,
FIG. 9. As in Fig. 8, but for Lab_Expt 2.
FIG. 10. As in Fig. 8, but for Field_Expt 1.
JANUARY 2010 K I T E T A L . 35

and one of the probes was then rotated so that the
probe planes were mutually orthogonal, thus allowing
the measurement of all three components. This is a
commonly used procedure for a single X-hot-film probe
(referred to as CBS), and for evenly distributed cali-
bration datasets so obtained the direct polynomial least
squares fit (PF) is an established method to approximate
input–output relations (CBS-PF; also referred to as the
standard calibration method). The same relationship
was also obtained using NN (CBS-NN) and was found to
be indistinguishable from CBS-PF for evenly distributed
datasets.
The calibrated hot film was then collocated with the
sonic to conduct measurements in the same jet but at
a downstream distance where the flow is fully turbulent;
with incremental changes of the jet mean velocity sim-
ilar to those used in CBS (i.e., evenly spaced; however,
the instantaneous velocities are random fluctuations
superimposed on the mean). The new calibration data-
set (SBS) comprises low-pass-filtered velocities and
voltages measured by sonic and hot films, respectively,
which was used to establish velocity/voltage calibration
relation either by training an NN (SBS-NN) or using
a PF (SBS-PF). Both were then employed to evaluate jet
turbulence downstream of the nozzle, which could be
compared with the velocity, obtained using the standard
CBS-PF.
The instrument combination was then placed in the
lower atmospheric boundary layer, and the standard jet-
based CBS was obtained on location, followed by mea-
surements under convective and stably stratified conditions.
In situ sonic and hot-film measurements were used to
obtain calibration relations SBS-NN and SBS-PF.
The main results of the experimental program are as
follows:
(i) For the laboratory turbulent jet, instantaneous ve-
locities obtained using SBS-NN and standard cal-
ibration method (CBS-PF) were almost similar,
FIG. 11. As in Fig. 8, but for Field_Expt 2.
FIG. 12. Spectra of u (red), y (blue), and w (green) velocity data
from sonic anemometer for Field_Expt 2.
36 J O U R N A L O F A T M O S P H E R I C A N D O C E A N I C T E C H N O L O G Y VOLUME 27

indicating striking success of both methods in the
laboratory and the possibility of replacing the (la-
borious) CBS-PF method using an SBS-NN. The
SBS-PF method did not perform well against CBS-PF
and is not recommended.
(ii) Under atmospheric field conditions as well, the
agreement between data processed using SBS-NN
and standard CBS-PF was acceptable when the flow
is stably stratified (nocturnal boundary layer),
whereas the agreement was unacceptable during
convective conditions, particularly when thermal-
burst-like motions are present. A possible reason
is higher vertical velocities prevailing under burst
conditions, which makes our standard calibration
procedures inapplicable. More work is necessary
with 3D probes and calibrations to resolve the issue.
The SBS-PF was found to be highly unsatisfactory
for hot-film calibration in the field.
In all, the NN technique offers great potential to be
used in field calibrations of hot-film/sonic anemometer
combinations, thus avoiding laborious repeated cali-
brations using an external calibrator such as a controlled
jet used in our studies. At present, the use of SBS-NN
technique can be confidently recommended for the in
situ calibration of hot films for the case of atmospheric
stable boundary layer.
Acknowledgments. This work is supported by the Bi-
National Science Foundation (Grant 2004087) and in
part by the Israel Science Foundation (Grant 964/05)
and the U.S. National Science Foundation (ATM). The
authors are grateful to Dr. Greg Poulos and his col-
leagues at NCAR for providing raw data, Professor
I. Wygnanski for help in building the jet facility, and the
Maricopa County Air Quality Division for allowing us
to use one of their test sites.
FIG. 13. Variation of normalized velocity components with time. Measurements by the NCAR
group during night (T-REX experiment). For superscripts see Table 1.
TABLE 3. Mean, RMS, and correlation of voltages (E1, E2, E3) across the wires of hot-film probe and velocity components (u, y, w).
E1 (V) E2 (V) E3 (V) u (m s21) y (m s21) w (m s21)
Mean 2.048 2.086 2.041 1.039 20.0738 20.0420
RMS 0.0323 0.0304 0.0335 0.0977 0.1294 0.0681
Correlation coefs E1E2 E1E3 E3E2 uy uw wy
0.6590 0.7406 0.8617 0.0305 20.2331 0.0449
JANUARY 2010 K I T E T A L . 37

APPENDIX
Short Description of Neural Network Procedure
In the current work, the neural network proce-
dure was based on the multilayer perceptron (MLP)
approach. The model of the k neuron can be de-
scribed as
uk
5 �m
j51w
kjx
jand y
k5 u(u
k1 b
k) 5 u(y
k),
where xj is the jth input signal at the kth neuron, j 5
1, 2, . . . , m; yk is the output of the kth neuron; wkj is the
synaptic weights vector for the kth neuron; uk is the
linear combination of inputs; bk is the activation
FIG. 14. Spectra of NCAR data from Fig. 13: (a) spectra of three voltages measured by triple-sensor hot-film and
(b) spectra of velocities. For superscripts, see Table 1.
FIG. A1. The structure of the generated neural network.
38 J O U R N A L O F A T M O S P H E R I C A N D O C E A N I C T E C H N O L O G Y VOLUME 27

threshold of the kth neuron; yk is the activation potential
of the kth neuron; and u is the activation function. The
activation potential yk is the inner product of the input
vector X on the vector of the synaptic weights W, which
is biased relative to uk by activation threshold bk.
MLP contains one input layer, one or two hidden
layers, and one output layer. The number of nodes of the
input layer and the number of input signals are the same.
We have used a fully connected network. In this case,
each node of the input layer duplicates and sends its
input signal to every neuron of the first hidden layer.
The hidden layer consists of a number h of neurons.
Each kth neuron transforms m input signals to its output
yk by applying this model, which is determined by the
specific vector of synaptic weights wkj, activation
threshold bk, and activation function u. Then, this out-
put is sent to every neuron of the second hidden layer or
to the output layer. The number of neurons at the output
layer is equal to the dimension of the neural networks
output signal.
In our case, the calibration model represents a three-
layer perceptron (MLP3) with input (zero) layer, one
hidden (first) layer, and output (second) layer. The
number of inputs of neural network is m 5 4, the number
of the hidden neurons is h 5 10, and the number of the
neurons at the output layer is q 5 3. The structure of the
generated fully connected neural network is shown in
Fig. A1. The output Y2 of the MLP3 network can be
represented as
Y2
5 u2(Y
1W
211 B
2) and
Y1
5 u1(XW
101 B
1),
where X is the input of the network: dimX 5 (1 3 4), Y1
is the output of the hidden layer: dimY1 5 (1 3 10), Y2
is the output of the network: dimY2 5 (1 3 3), W10 is
the matrix of synaptic weights for the hidden layer:
dimW10 5 (4 3 10), W21 is the matrix of synaptic weights
for the output layer: dimW21 5 (10 3 3), B1 and B2 are
FIG. A2. The u scatterplot. FIG. A3. The y scatterplot.
FIG. A4. The w scatterplot.
JANUARY 2010 K I T E T A L . 39

the vectors of activation threshold for the hidden and
output layers, respectively, and u1 and u2 are the acti-
vation functions for the hidden and output layers, re-
spectively. We have used hyperbolic tangent activation
function u1(y) 5 tanh(y) for the hidden layer and lo-
gistic function u2(y) 5 [1 1 exp(2y)]21 for the output
layer.
For the training of MLP, the back propagation and con-
jugate gradient descent methods were sequentially used.
In all cases, the number of epochs that was necessary for
the generation of the neural network did not exceed 100.
The matrix of activation functions and vectors of ac-
tivation threshold for the hidden and output layers are
shown here:
W10
5
�1.112 �0.100 0.053 �0.198 0.093 0.999 �0.620 �1.511 �0.288 �0.2680.871 �0.332 0.742 0.365 �0.639 �0.199 1.411 1.150 �0.239 0.7840.460 �0.848 0.112 �0.431 1.159 �1.652 �0.642 �0.700 �1.453 0.615�1.385 0.137 �0.949 0.645 �0.282 0.817 0.391 1.194 1.220 �0.020
2664
3775,
W21
5
�1.521 1.441 �0.502�1.154 �0.400 0.808
0.516 0.407 �0.580�0.140 0.798 0.287
0.085 �0.029 �1.554�0.165 �1.169 1.968
0.006 1.461 1.2390.762 1.594 1.160�0.663 �0.006 1.443
0.423 0.450 �0.276
2666666666666664
3777777777777775
,
B1
5 [�0.841 �0.861 �0.511 0.953 0.319 �0.187 0.785 �0.187 �0.563 0.797] , and
B2
5 [�0.199 �0.389 0.296] .
A typical example (Lab_Expt 1) yields the following
correlation coefficients between the observed and the
predicted values of outputs ru 5 0.966, ry 5 0.926, and
rw 5 0.943. Scatterplots for the observed and pre-
dicted values of outputs in the training set are shown
in Figs. A2–A4.
REFERENCES
Al-Salaymeh, A., and M. S. Ashhab, 2006: Modelling of a novel
hot-wire thermal flow sensor with neural nets under different
operating conditions. Sens. Actuators, 126A, 7–14.
——, and ——, 2007: Modeling of the response of a hot-wire an-
emometer with neural nets under various air densities. Sens.
Transducers J., 84, 1590–1606.
Ashhab, M. S., and A. Al-Salaymeh, 2006: Optimization of hot-
wire thermal flow sensor based on a neural net model. Appl.
Therm. Eng., 26, 948–955.
Balint, J.-L., P. Vukoslavcevic, and J. M. Wallace, 1987: A study of
the vortical structure of the turbulent boundary layer. Ad-
vances in Turbulence, G. Compte-Bellot and J. Mathieu, Eds.,
Springer, 450–464.
——, ——, and ——, 1988: The transport of enstrophy in a
turbulent boundary layer. Near Wall Turbulence: 1988 Zoran
Zaric Memorial Conference, Dubrovnik, Croatia, 932–950.
——, J. M. Wallace, and P. Vukoslavcevic, 1991: The velocity and
vorticity vector fields of a turbulent boundary layer. Part 2.
Statistical properties. J. Fluid Mech., 228, 53–86.
Cornman, L. B., G. Meymaris, and M. Limber, 2004: An update
on the FAA Aviation Weather Research Program’s in situ
turbulence measurement and reporting system. Preprints,
11th Conf. on Aviation, Range, and Aerospace Meteorology,
Hyannis, MA, Amer. Meteor. Soc., 4.3. [Available online at
http://ams.confex.com/ams/pdfpapers/81622.pdf.]
Dobbeling, K., B. Lenze, and W. Leuckel, 1990: Basic consider-
ations concerning the construction and usage of multiple hot-
wire probes for highly turbulent three-dimensional flows.
Meas. Sci. Technol., 1, 924–933.
——, ——, and ——, 1992: Four-sensor hot-wire probe mea-
surements of the isothermal flow in a model combustion
chamber at different levels of swirl. Exp. Therm. Fluid Sci., 5,
381–389.
Fang, M., J. Zhang, K. Williams, and J. A. Craig, 2008: Three-
dimensional mosaic of the eddy dissipation rate fields from
WSR-88Ds. Preprints, 13th Conf. on Aviation, Range and
Aerospace Meteorology, New Orleans, LA, Amer. Meteor.
Soc., P4.5. [Available online at http://ams.confex.com/ams/
pdfpapers/130591.pdf.]
Frehlich, R., and L. Cornman, 2002: Estimating spatial velocity
statistics with coherent Doppler lidar. J. Atmos. Oceanic
Technol., 19, 355–366.
Gulitski, G., M. Kholmyansky, W. Kinzelbach, B. Luthi,
A. Tsinober, and S. Yorish, 2007a: Velocity and temperature
derivatives in high-Reynolds-number turbulent flows in the
atmospheric surface layer. Part 1. Facilities, methods and
some general results. J. Fluid Mech., 589, 57–81.
40 J O U R N A L O F A T M O S P H E R I C A N D O C E A N I C T E C H N O L O G Y VOLUME 27

——, ——, ——, ——, ——, and ——, 2007b: Velocity and tem-
perature derivatives in high-Reynolds-number turbulent flows
in the atmospheric surface layer. Part 2. Accelerations and
related matters. J. Fluid Mech., 589, 83–102.
——, ——, ——, ——, ——, and ——, 2007c: Velocity and tem-
perature derivatives in high-Reynolds-number turbulent flows
in the atmospheric surface layer. Part 3. Temperature and
joint statistics of temperature and velocity derivatives. J. Fluid
Mech., 589, 103–123.
Haykin, S., 1998: Neural Networks: A Comprehensive Foundation.
Prentice-Hall, 842 pp.
Hunt, J. C. R., 1984: Turbulence structure in thermal convection
and shear-free boundary layers. J. Fluid Mech., 138, 161–184.
Jorgensen, F., 1971: Directional sensitivity of wire and fiber-film
probes. DISA Info, 11, 31–37.
Kaimal, J. C., and J. J. Finnigan, 1994: Atmospheric Boundary
Layer Flows: Their Structure and Measurement. Oxford Uni-
versity Press, 289 pp.
Kit, E., A. Tsinober, J. L. Balint, J. M. Wallace, and E. Levich,
1987: An experimental study of helicity related properties of
a turbulent flow past a grid. Phys. Fluids, 30, 3323–3325.
——, ——, M. Teitel, J. L. Balint, J. M. Wallace, and E. Levich,
1988: Vorticity measurements in turbulent grid flows. Fluid
Dyn. Res., 3, 289–294.
——, O. Krivonosova, D. Zhilenko, and D. Friedman, 2005: Re-
construction of large coherent structures from SPIV mea-
surements in a forced turbulent mixing layer. Exp. Fluids, 39,
761–770.
——, I. Wygnanski, O. Krivonosova, D. Zhilenko, and D. Friedman,
2007: On the periodically excited, plane turbulent mixing layer,
emanating from a jagged partition. J. Fluid Mech., 589, 479–507.
Miller, D. R., J. Lin, Y. S. Wang, and H. W. Thistle, 1989: A triple-
hot-film and wind octant combination probe for turbulent air
flow measurements in and near plant canopies. Agric. For.
Meteor., 44, 353–368.
Monin, A., and A. Yaglom, 1971: Statistical Fluid Mechanics: Me-
chanics of Turbulence. Vol. 2, Dover, 782 pp.
Monti, P., H. J. S. Fernando, W. C. Chan, M. Princevac,
T. A. Kowalewski, and E. Pardyjak, 2002: Observations of
flow and turbulence in the nocturnal boundary layer over
a slope. J. Atmos. Sci., 59, 2513–2534.
Nguyen, H. T., R. P. Nadipuram, C. L. Walker, and E. A. Walker,
2003: A First Course in Fuzzy and Neural Control. Chapman &
Hall/CRC Press, 301 pp.
Pardyjak, E. R., P. Monti, and H. J. S. Fernando, 2002: Flux
Richardson number measurements in stable atmospheric
shear flows. J. Fluid Mech., 449, 307–316.
Poulos, G. S., S. Semmer, J. Militzer, and G. Maclean, 2006: A
novel method for the study of near-surface turbulence using
3-d hot-film anemometry: OTIHS. Preprints, 17th Symp. on
Boundary Layers and Turbulence, San Diego, CA, Amer.
Meteor. Soc., P2.3.
R. M. Young Company, 2001: Model 81000 ultrasonic anemome-
ter. R. M. Young Manual PN 81000-90 REV 5-03A, 6 pp.
Skelly, B. T., D. R. Miller, and T. H. Meyer, 2002: Triple-hot-film
anemometer performance in CASES-99 and a comparison to
sonic anemometer measurements. Bound.-Layer Meteor., 105,
275–304.
Tsinober, A., E. Kit, and T. Dracos, 1992: Experimental in-
vestigation of the field of velocity gradients in turbulent flows.
J. Fluid Mech., 242, 169–192.
van Dijk, A., and F. T. M. Nieuwstadt, 2004a: The calibration of
(multi-) hot-wire probes. 1. Temperature calibration. Exp.
Fluids, 36, 540–549.
——, and ——, 2004b: The calibration of (multi-) hot-wire probes.
2. Velocity calibration. Exp. Fluids, 36, 550–564.
JANUARY 2010 K I T E T A L . 41