Better News from International Comparisons. What is telling us PISA changes?
28
Better News from International Comparisons. What is telling us PISA changes? 1 Seminar about Income, Inequality and Educational Success in the United States Better News from International Comparisons. What is telling us PISA changes? Juan Pablo Valenzuela (CIAE and Economics Department-University of Chile) and Alejandro Sevilla (CIAE- University of Chile) Draft, May - 2012 I. Background and Motivation Evidence from recent research for the United States demonstrates a rapid increase in academic achievement gap between students with high and low socioeconomic status during the last decades (Murnane and Duncan, 2011). Particularly, Reardon’s (2011) work reports an accelerated increase in Reading and Mathematics outcome gaps for students with higher incomes (90th percentile) against lower income students (10th percentile), for children in the cohorts born in early 80s in regard to cohorts born in the mid-90s, then show an apparent stability among the new cohorts. The gathered evidence from a diversity of national educational outcomes concludes that most of the achievement gap has been widening between children from high and low income, since the 1950s. On the other hand, the trend in achievement gap in Reading and Mathematics standardized test scores between 90/10 income percentiles was 1.0 for the cohorts born from the 50s to early 80s, this trend gap raised up to 1.25 during the mid-1990s (Reardon, 2011). In turn, this trajectory shows an inverse relationship in the gap of academic achievement in students of the same cohorts, given their race. Particularly, in white groups regarding African Americans, as it shows a continuous reduction from cohorts born in the 1940s, where the standardized gap reached 1.50 to those born in the early 2000s with a gap of only 0.50. Evidence from International Comparisons: PISA student assessment programme is such an advantageous opportunity to evaluate educational inequality changes in the United States The growing educational inequality in American students, showed in national educational results, only provide us a partial view of the nature of educational inequalities. We are not able to identify whether they are a reflection of an international trend or even though to be acknowledged by compared experiences in other countries’ achieving to reduce educational inequality. Moreover, the increasing development of international assessment applied sequential every few years as PISA (since 20009) or TIMSS (since 1995)offer an advantageous opportunity to validate U.S. students’ achievement in national tests. In this context, we propose to analyze PISA-Reading results for four main reasons. Firstly, the PISA test has comparability and international representation, these features make this test designed to follow the progress of learning in students from the OECD countries -which belong mostly to developed countries, including the United States- allowing us to compare U.S. educational results at international level. Secondly, PISA provides a unique opportunity for comparison, since the cohort evaluated are those born between 1985-1994, considering that this test been applied to students between 15-16 years. In the United States, these birth cohorts matches with those in the increasing gap of academic achievement by SES, concentrated in the cohorts from 1985-1995. Thirdly, every selected sample has a national representativeness for each country, as well, it is representative of schools’ and students’
-
Upload
manchester -
Category
Documents
-
view
1 -
download
0
Transcript of Better News from International Comparisons. What is telling us PISA changes?
Better News from International Comparisons. What is telling us PISA changes?
1
Seminar about Income, Inequality and Educational Success in the United States
Better News from International Comparisons. What is telling us PISA changes?
Juan Pablo Valenzuela (CIAE and Economics Department-University of Chile) and
Alejandro Sevilla (CIAE- University of Chile)
Draft, May - 2012
I. Background and Motivation
Evidence from recent research for the United States demonstrates a rapid increase in
academic achievement gap between students with high and low socioeconomic status during
the last decades (Murnane and Duncan, 2011). Particularly, Reardon’s (2011) work reports an
accelerated increase in Reading and Mathematics outcome gaps for students with higher
incomes (90th percentile) against lower income students (10th percentile), for children in the
cohorts born in early 80s in regard to cohorts born in the mid-90s, then show an apparent
stability among the new cohorts.
The gathered evidence from a diversity of national educational outcomes concludes that most
of the achievement gap has been widening between children from high and low income, since
the 1950s. On the other hand, the trend in achievement gap in Reading and Mathematics
standardized test scores between 90/10 income percentiles was 1.0 for the cohorts born from
the 50s to early 80s, this trend gap raised up to 1.25 during the mid-1990s (Reardon, 2011).
In turn, this trajectory shows an inverse relationship in the gap of academic achievement in
students of the same cohorts, given their race. Particularly, in white groups regarding African
Americans, as it shows a continuous reduction from cohorts born in the 1940s, where the
standardized gap reached 1.50 to those born in the early 2000s with a gap of only 0.50.
Evidence from International Comparisons: PISA student assessment programme is such an
advantageous opportunity to evaluate educational inequality changes in the United States
The growing educational inequality in American students, showed in national educational
results, only provide us a partial view of the nature of educational inequalities. We are not
able to identify whether they are a reflection of an international trend or even though to be
acknowledged by compared experiences in other countries’ achieving to reduce educational
inequality. Moreover, the increasing development of international assessment applied
sequential every few years as PISA (since 20009) or TIMSS (since 1995)offer an advantageous
opportunity to validate U.S. students’ achievement in national tests.
In this context, we propose to analyze PISA-Reading results for four main reasons. Firstly, the
PISA test has comparability and international representation, these features make this test
designed to follow the progress of learning in students from the OECD countries -which
belong mostly to developed countries, including the United States- allowing us to compare U.S.
educational results at international level. Secondly, PISA provides a unique opportunity for
comparison, since the cohort evaluated are those born between 1985-1994, considering that
this test been applied to students between 15-16 years. In the United States, these birth
cohorts matches with those in the increasing gap of academic achievement by SES,
concentrated in the cohorts from 1985-1995. Thirdly, every selected sample has a national
representativeness for each country, as well, it is representative of schools’ and students’
Better News from International Comparisons. What is telling us PISA changes?
2
population, which ensures an adequate and periodically comparison between countries.
Finally, PISA calculates an index of socio-economic and cultural status of the students and
their families1 from a diverse set of variables; with the purpose of moderate the effects of
temporal changes in families’ socioeconomic conditions, as well as in economy business
cycles. Although this index is not comparable to a traditional socioeconomic index based in
monetary incomes, its advantages remain in its international comparability with every PISA2
participating country. In addition, this index has a closer relationship with permanent income
and social conditions, which simplify the relevance of transitory shocks closely related to the
development of students` educational outcomes.
The first objective is to analyze the development in school performance gaps between cohorts
from 1985-1994 according to their different socioeconomic and cultural conditions, these
findings will allow us to contrast to the consistent widening educational gap in United States
national tests. The second objective is to compare the achievement trajectory in terms of
equity in school performance with other OECD countries3, in order to rank the United States
relative position at international level, and determine the heterogeneity of trajectories
influencing equity in school performance. Finally, we aim to identify the variables and factors
that could explain the distribution path of academic performance of the United States 15 year
old students, for PISA cycle 2000-2009. Moreover, a parallel analysis for some other countries
such as Canada and Germany provide us some insights from their educational equality context
that could guide policies and better practices to improve educational equality in America
educational system.
II. Methodological Strategy
The proposed methodology pursues the spirit of decomposition methods, more frequently
used in labor economics for explaining wages gaps by different demographic groups (i.e.
gender, race) or periods. The first decomposition strategy is Oaxaca-Blinder (1973)
decomposing PISA scores in three components: endowments, coefficients and their
interaction. This strategy allowed us to understand the differences in mean PISA scores for
the three group of comparisons: i) PISA 2000-2009 for the United States, ii) PISA 2009 United
States - Germany and iii) PISA 2009 United States - Canada.
The linear framework model for PISA reading scores is
(1) ���� � �� �∑ ����� ���� ∑ �����
��� � ��� � ���
where Yisg are PISA scores for the student i at the school s for the group of comparison g=USA
(2009-2000), USA-CAN, USA-GER; I are all the student characteristics and S all the school
characteristics; due to the nature of the data in a complex survey design uig and esg are the
residuals at student level and school level.
The mean differences by group of comparison follow
(2) ∆����� � ���� � ����,∆���� � ����� � ����� ,∆���� � ����� � �����
1The ESCS index of socioeconomic and cultural status of the family, which is a continuous variable calculated by PISA, derived
from three different sub-indexes: HISCEI: international index of the highest job status achieved by the father or the mother;
PARED: index of the highest educational level of parents, expressed in years of schooling; and HOMEPOS: index of items at home,
including wealth items, cultpos (cultural items) and hedres (educational resources). 2PISA is an evaluation of three areas: Reading, Mathematics and Science; we will only focus in Reading due to this has the wider
period of evaluation (2000-2009) and test has a larger number of questions each year. 3 The selected OECD countries for the analysis are Canada and Germany.
Better News from International Comparisons. What is telling us PISA changes?
3
where∆��� for� � �� , UC, UG is the mean difference in the three components is for the case
of the United States, PISA 2000-2009.
(3) ∆����� � "#$��% � #$��%&'��� � #$��%
'$��� � ���% � "#$��% � #$��%&′$��� � ���%
where the first term accounts for the endowments effect, the second for the returns effect and
the third component for the interaction effect. In a similar way the differences for the other
two group of comparison can be obtained by using Canada and Germany as the reference
group.
For the purpose of our analysis Oaxaca-Blinder decomposition only offers a first step in
disentangling the effects on the distribution of educational factors at student and school level
and their influence in PISA scores differences. In addition, is limited in measuring the effect of
unobserved components.
In order to understand the effect on equality in educational outcomes, by student’s
socioeconomic conditions, the second methodological strategy follows the decomposition
proposed by Junh, Murphy and Pierce in their influential work in 1993. They developed a
decomposition method based on residual imputation, by ranking preservation in the residuals
percentiles for both groups of comparison. As a result, they suggest that changes in wages
come from differences in quantity effect, return effect and residual effect (T=Q+R+U).
For the residuals imputation we calculate the inverse of the accumulative function of the
residuals conditional to observable variables.
(4) )� � *�+ $,�|�%
Where εg is the total residual of our framework model (1) from uig and esg,ϴg is the percentile
in the residual distribution and Xg the total covariates at student and school level.
To estimate the three JMP effects we estimate the difference between the framework model in
equations (6)-(5) as the total change in PISA scores (T); (8)-(9) as the changes in the quantity
effect (Q); (9)-(7)as the changes in the return effect (R); and [(6)-(5)]-[(8)-(7)] as the changes
in the residual effect (U).
Better News from International Comparisons. What is telling us PISA changes?
4
(5) ��� � ������ � ���
(7) ����1 � ������ � ���� ����|��� (9) ����2 � ������ � ���� ����|��� (10) ����3 � ������ � ���� ����|���
(6) ��� � ������ � ���
(8) ����1 � ������ � ���� ����|���
As one of our main objectives is to determine the distribution of scores achievement by
socioeconomic level, every effect of JMP decomposition is estimated by decil of the index
of socioeconomic cultural status, for the three groups of comparison.
These estimations will be complemented with similar analysis for differences between the
United States with Canada and Germany; both countries should be relevant for American
educational system. Canada because is part of one of the more equality educational
systems, mostly within the group of the Scandinavian countries; whereas Germany in early
2000s was the country with one of the most unequal achievement distribution among
OECD countries, but this has improved at the end of the decade.
Imputation Strategy
PISA datasets always have the inconvenient of missing data; particularly U. S. datasets and
Germany datasets have a sample size around 5,000 observations, not accounting for
imputation strategies will lead us to reduce statistical power influencing the estimations.
This is not the case of Canada with around 24,000 observations. In fact, U.S. datasets from
PISA 2000 have sample size even is around 3,900 cases with not imputation strategies
applied the total sample reduces around 23%. The selected imputation strategy was the
estimation of Euclidean Distance matching procedure, implemented by Kantor (2006) in
his stata command mahapickwhich turns into a variable with a distribution not
statistically different from the original variable.
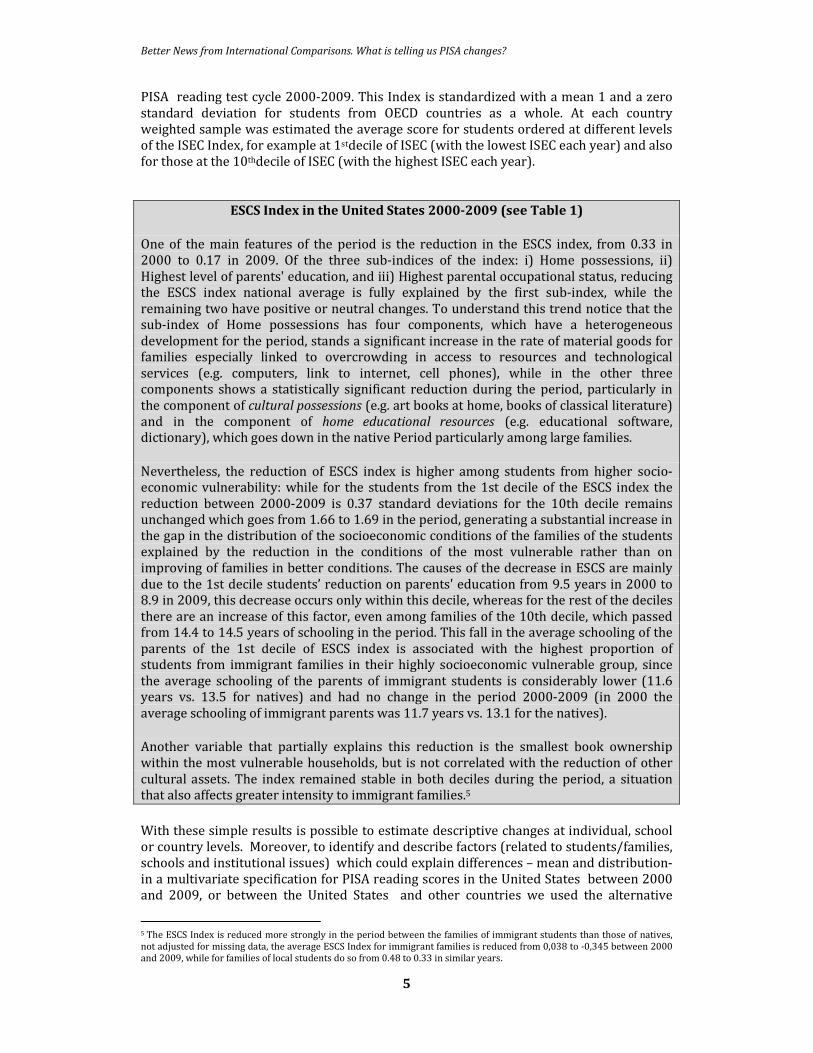
The Euclidean distance matching procedure follows the equation
���, � � ��� � �� � ��� � � � �� � ���� � ����
where i is similar to j than k, if remains D(i,j)<D(i,k)
Then, we can adapt the Euclidean distance to more covariates,
so�� � , ���, … , �!�and�� �, ���, … , �!�, turns into
���, � � ��� � � � �� � ���� � ���� �⋯� ��!� � �!��
All the analyses using PISA results from the reading test were done using individual test
scores estimated by the average of five plausible values for each student and year (2000
and 2009) under the design of a complex survey, representative at school and student
level. Plausible values are random numbers obtained from the distribution of scores
assigned to each student in the sample, in terms of PISA, five of these values are assigned
per observation, for each test in the survey for every PISA cycle (Reading literacy, 2000-
2009)4.
The relevant variable used in the analysis is the index of economics, social and cultural
status(ESCS) calculated by PISA allowing comparisons between and within countries for
4 See PISA 2009Technical Report, OECD 2012 for further references.
Better News from International Comparisons. What is telling us PISA changes?
5
PISA reading test cycle 2000-2009. This Index is standardized with a mean 1 and a zero
standard deviation for students from OECD countries as a whole. At each country
weighted sample was estimated the average score for students ordered at different levels
of the ISEC Index, for example at 1stdecile of ISEC (with the lowest ISEC each year) and also
for those at the 10thdecile of ISEC (with the highest ISEC each year).
ESCS Index in the United States 2000-2009 (see Table 1)
One of the main features of the period is the reduction in the ESCS index, from 0.33 in
2000 to 0.17 in 2009. Of the three sub-indices of the index: i) Home possessions, ii)
Highest level of parents' education, and iii) Highest parental occupational status, reducing
the ESCS index national average is fully explained by the first sub-index, while the
remaining two have positive or neutral changes. To understand this trend notice that the
sub-index of Home possessions has four components, which have a heterogeneous
development for the period, stands a significant increase in the rate of material goods for
families especially linked to overcrowding in access to resources and technological
services (e.g. computers, link to internet, cell phones), while in the other three
components shows a statistically significant reduction during the period, particularly in
the component of cultural possessions (e.g. art books at home, books of classical literature)
and in the component of home educational resources (e.g. educational software,
dictionary), which goes down in the native Period particularly among large families.
Nevertheless, the reduction of ESCS index is higher among students from higher socio-
economic vulnerability: while for the students from the 1st decile of the ESCS index the
reduction between 2000-2009 is 0.37 standard deviations for the 10th decile remains
unchanged which goes from 1.66 to 1.69 in the period, generating a substantial increase in
the gap in the distribution of the socioeconomic conditions of the families of the students
explained by the reduction in the conditions of the most vulnerable rather than on
improving of families in better conditions. The causes of the decrease in ESCS are mainly
due to the 1st decile students’ reduction on parents' education from 9.5 years in 2000 to
8.9 in 2009, this decrease occurs only within this decile, whereas for the rest of the deciles
there are an increase of this factor, even among families of the 10th decile, which passed
from 14.4 to 14.5 years of schooling in the period. This fall in the average schooling of the
parents of the 1st decile of ESCS index is associated with the highest proportion of
students from immigrant families in their highly socioeconomic vulnerable group, since
the average schooling of the parents of immigrant students is considerably lower (11.6
years vs. 13.5 for natives) and had no change in the period 2000-2009 (in 2000 the
average schooling of immigrant parents was 11.7 years vs. 13.1 for the natives).
Another variable that partially explains this reduction is the smallest book ownership
within the most vulnerable households, but is not correlated with the reduction of other
cultural assets. The index remained stable in both deciles during the period, a situation
that also affects greater intensity to immigrant families.5
With these simple results is possible to estimate descriptive changes at individual, school
or country levels. Moreover, to identify and describe factors (related to students/families,
schools and institutional issues) which could explain differences – mean and distribution-
in a multivariate specification for PISA reading scores in the United States between 2000
and 2009, or between the United States and other countries we used the alternative
5 The ESCS Index is reduced more strongly in the period between the families of immigrant students than those of natives,
not adjusted for missing data, the average ESCS Index for immigrant families is reduced from 0,038 to -0,345 between 2000
and 2009, while for families of local students do so from 0.48 to 0.33 in similar years.
Better News from International Comparisons. What is telling us PISA changes?
6
decomposition strategies previously explained, starting with the traditional Oaxaca-
Blinder (1973) decomposition; and then, Juhn, Murphy and Pierce (1993) methodology,
both regularly have been applied to explain changes in the income distribution between
different periods of time in a particular economy or comparing differences across
countries; however during last years they have been implemented at the educational
context by several researchers (Woessmann and Hanushek, 2010; Valenzuela et al, 2009
and 2011).
III. Early findings from international comparison: better news for the United
States
Against recent findings about increasing socioeconomic educational achievement gaps in
the United States during last decades, which are based on national tests, the analyses
based on Reading PISA Test Scores –an international evaluation of 15 year old students
among more than 40 countries in years 2000 and 2009, or to 1985 and 1994 national
cohorts (exactly the period of widening socioeconomic educational achievement gap in the
United States)- realize some alternative conclusions than those indicated from national
sources, which are much more positive about recent advances on equity achievement in
the national educational system but are not conclusive respect to generate a similar trend
in the future. Main preliminary results from PISA analyses are:
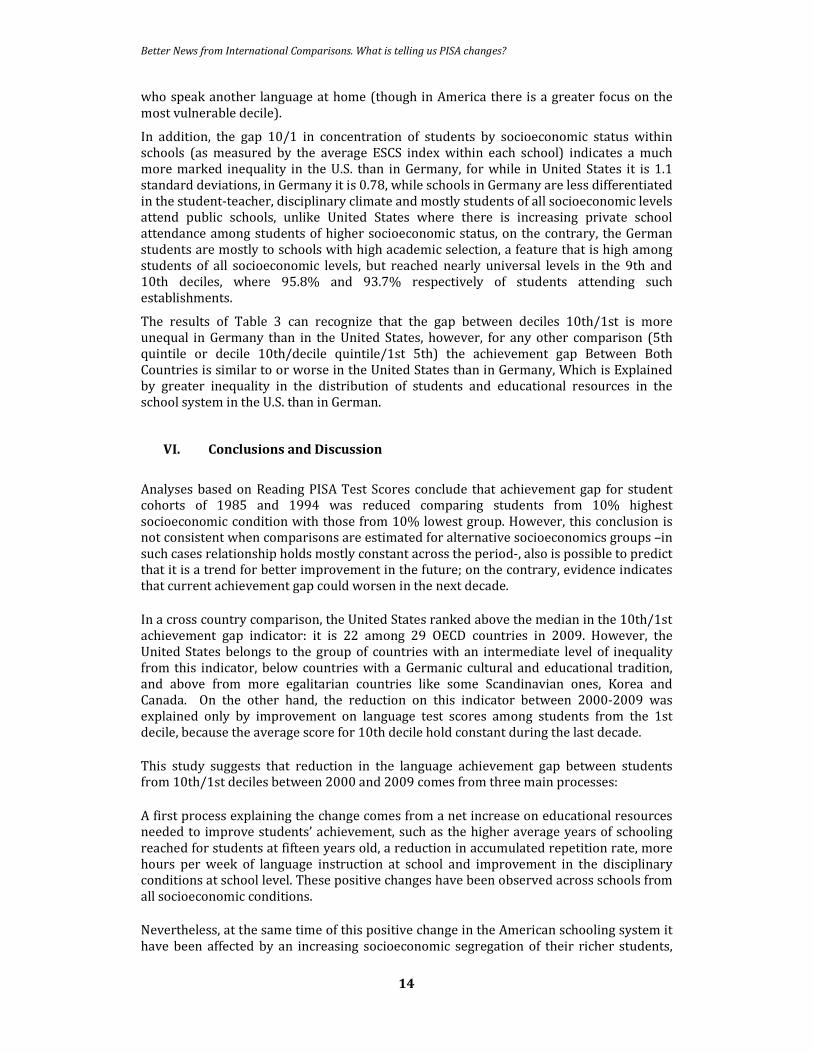
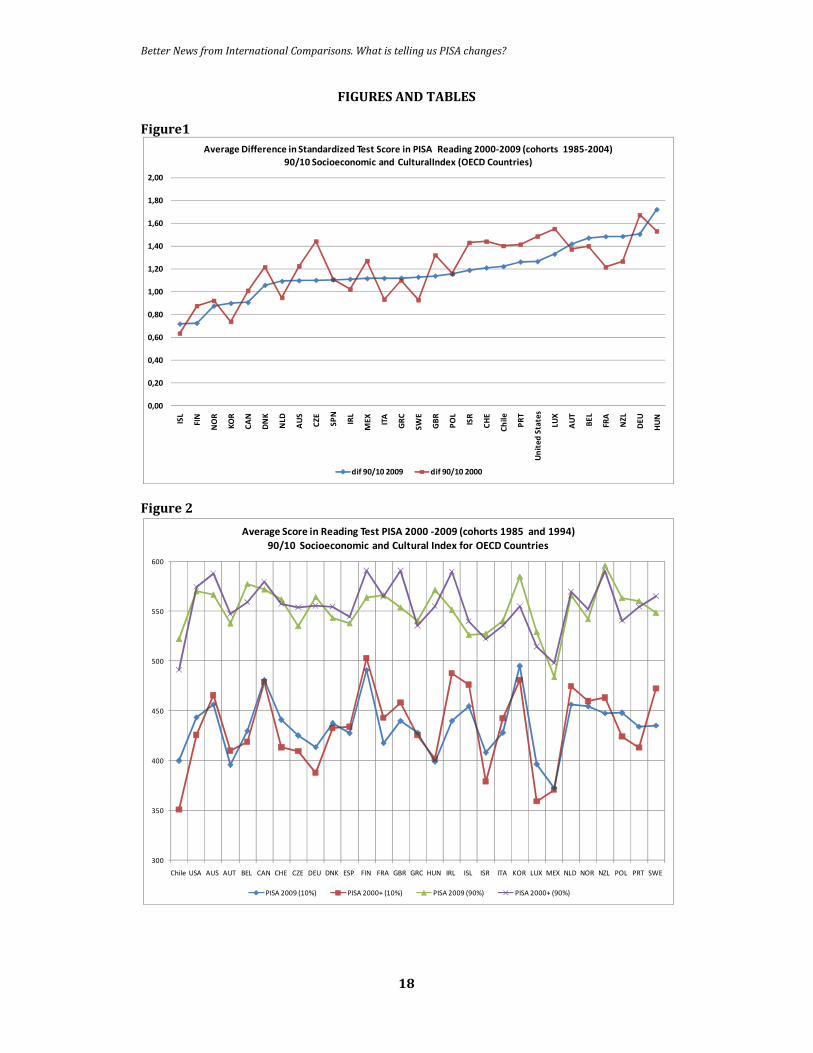
i) For the 1994 cohort, the 90/10 gap in academic performance in Reading PISA
test score is similar to the trend based on national tests (Reardon, 2011), for
PISA dataset it reaches to 1.27 standard deviations (see Figure 1), which is
explained only by a an increment in results for the poorest decile (see Figure
2);
ii) In contrast, this result with the remaining 28 OECD countries, the United States
has a wider gap above the average of OECD countries; being ranked in the
place 22 among 29 countries, below most of the countries of Germanic
composition. Usually with most unequal educational outcomes due to their
early academic segregation strategies (Ammermüller, 2004; Dupriez and
Dumay 2006; Dupriez, Dumay and Vause, 2008). However, the only countries
with a gap less than 1.0 are some of the Scandinavian countries (Finland,
Island and Norway), as well as Korea and Canada (see Figure 1).In this way,
America is in a large group of countries that by 2009 this gap is in a narrow
range between 1.10 and 1.30 standard deviations.
iii) Despite this, comparing the evolution of PISA-Reading results for the period
2000-2009, in which there are the cohorts that have a sustained increase in the
performance gap. American students have a significant and substantial
reduction of this academic results gap; due to the 90/10 gap for 2000 reached
a value of 1.49 (26 in a ranking of 29 countries) dropping to 1.27 in 2009. This
shows that there is not only a reduction in inequality in academic learning,
contrary to the trend in national tests, but this change also allows the U.S. to
improve its relative position among OECD countries, from a place 26 to 22.
However, this trend of reducing disparities in academic performance as
students' socioeconomic status is represented among the OECD member
countries, as 14 of them reduce this gap -among which also highlights the case
of Germany and United Kingdom - while another 7 countries increase this
indicator; standing out France, which goes from 1.22 in 2000 to 1.48 in 2009.
iv) Additionally, narrowing achievement gaps among students from different
socioeconomic status are only concentrated among most vulnerable students
(from the 1st ISEC decile). Comparing trend in achievement gaps for those
students from families of lowest 20% of ISEC (1st and 2nd deciles), respect to
those from families of the highest 20% of ISEC, is almost constant during the
Better News from International Comparisons. What is telling us PISA changes?
7
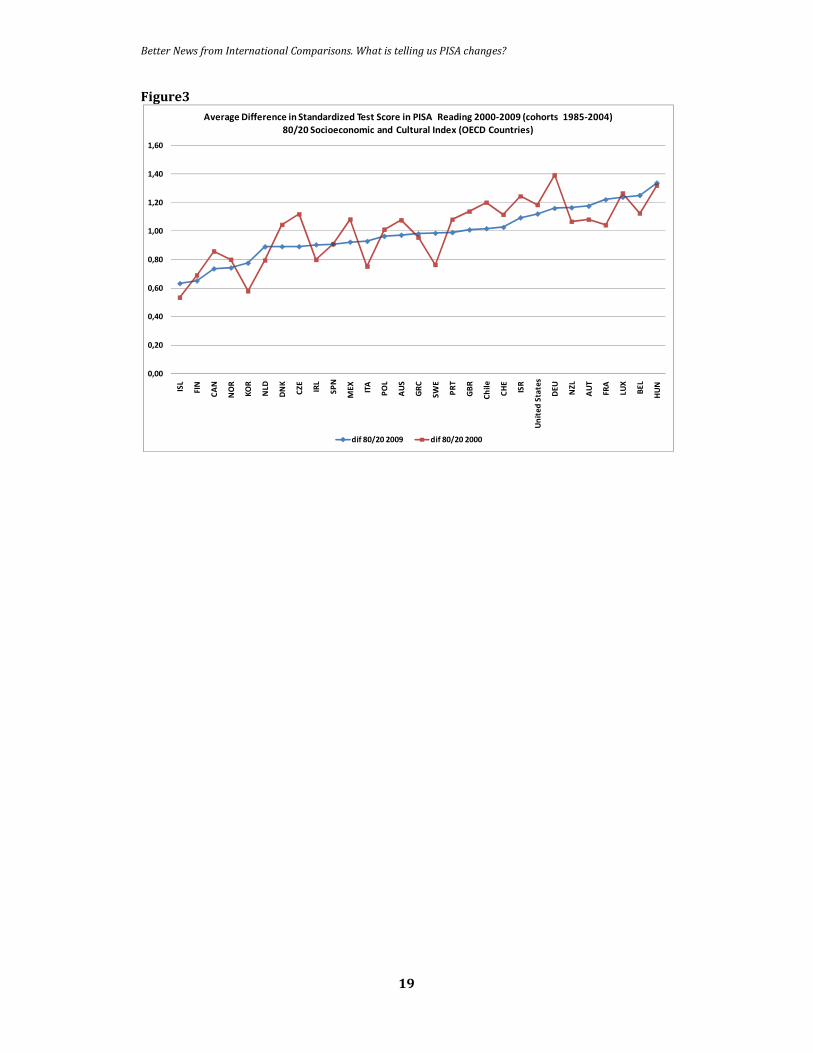
period (see Figure 3). It remarks that continuing to reduce achievement gaps
among a larger share of students is essential to act on schools serving children
from low-medium groups, replicating the success of the improvement from
extremely disadvantaged ones.
IV. The factors associated with achievement gap evolution in the United States
between 2000-2009
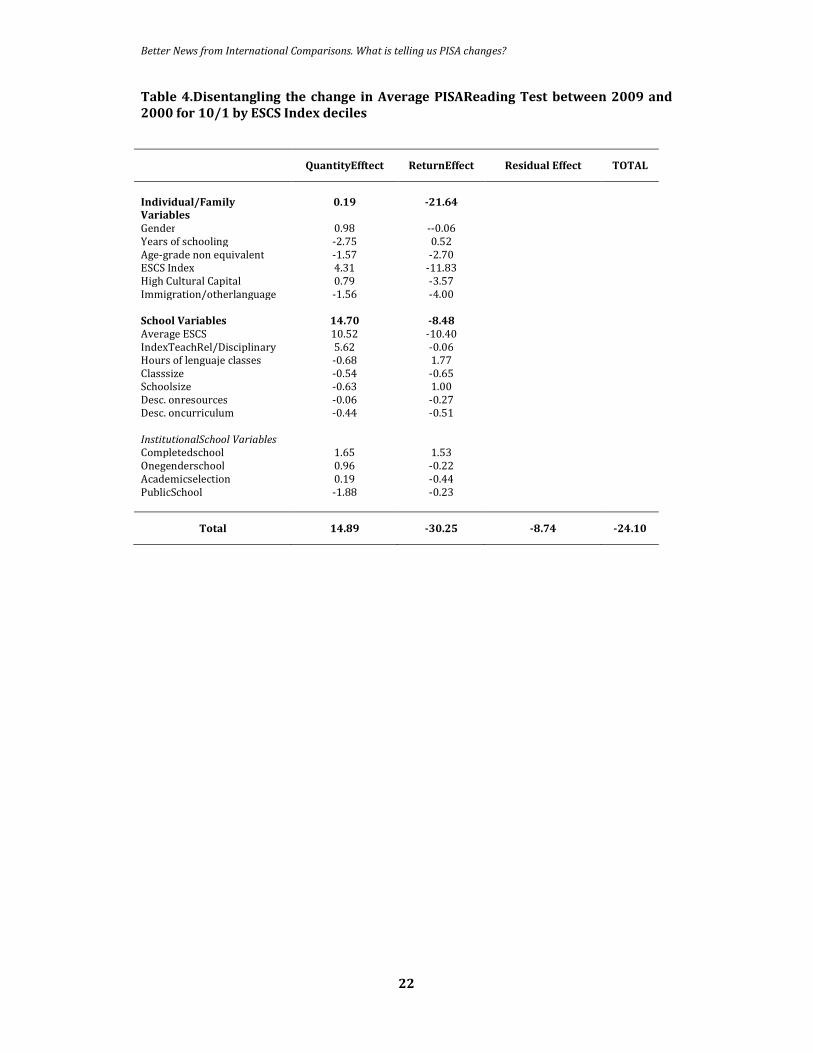
As described above JMP decomposition differentiating factors associated with change in
the distribution of scores on the PISA Reading 2000-2009 among those associated with the
change in the allocation of these factors (changes in the magnitude of the X's endowments
or in the educational production function), changes in the efficiency or effectiveness of
educational resources (changes in coefficients β's), and changes in the waste associated
with these estimates. These results associated with each decile of the distribution of PISA
Reading results can be grouped according to various deciles of socioeconomic and cultural
status (ESCS index) presented by the students' families.
Nationally, the average of U.S. students in PISA reading test shows a non statistically
significant reduction of 4.5 points (or 4.5% of a standard deviation according to the results
of all OECD countries) during the period 2000-2009 (see Table 2). This overall result is
associated with a reduction in the efficiency of the U.S. educational system (27.8 points),
despite the increase in the provision of family and school resources-which have increased
the result slated to average 23.3 points in the country (or 0.23 standard deviations) -
As shown in Table 2, the behavior between the 10th and 1st deciles is highly differentiated
than the national average. On the one hand, the evolution of academic performance of
students in the 10th decile of ESCS Index (which represents 10% of students age 15 from
families of better socioeconomic conditions and cultural affairs) realizes that his results in
PISA Reading remained stable in the period –like to the national average-, this is because
the best conditions on the characteristics of these families and their educational resources,
which slated to be increased standardized test result of 42.5 points (nearly expected to
double the national average) - were offset by a sharp deterioration in the efficiency of the
education system that would transform these larger endowments in much better
educational outcomes.
In contrast, the evolution of the results of the students of 1st decile (those belonging to the
10% most vulnerable in socio-economic and cultural) reports a sharp increase in their
average performance during the period, increasing by 25.2 points-the which are explained
almost entirely by the increase in the amount of resources available at the students, their
families and educational institutions, which would explain an increase to 27.6 additional
points in PISA Reading test scores in 2009 compare to 2000, while deterioration in the
efficiency of educational endowments for the most vulnerable group was significantly
lower in this decile than in better socioeconomic conditions, while a third of the difference
is related to changes in unobservable.
Thus, the reduction in the gap of performance in PISA Reading Between 10/1 deciles is
fully explained by the relative distribution of the substantial reduction in the efficiency of
the U.S. educational system during the period, which is growing on the level improved
socioeconomic and cultural conditions of individual families. As described previously, in
the 10th decile this deterioration leads to a reduction of 41.3 points, while in the 9th decile
does in 36.0 points and on the 8th decile in 34.2 points. The sustained reduction in the
magnitude of this decline on the lower deciles of the ESCS index allowed greater equity in
academic performance on the reading test during the last decade. Thus, the results of PISA
Better News from International Comparisons. What is telling us PISA changes?
8
reading indicated two complementary processes that affected the entire school system
and carries a potential increase in inequality in educational opportunities for future
students: i) on the one hand, have increased educational resources in all deciles, but with
greater concentration among the richest deciles, increased segregation of the best
educational resources between schools attended by students from higher social level, and
ii) at the same time it has reduced the overall system efficiency school, a situation that
affects all socioeconomic groups of students' families, but with greater intensity among the
children of the families of better socioeconomic conditions.
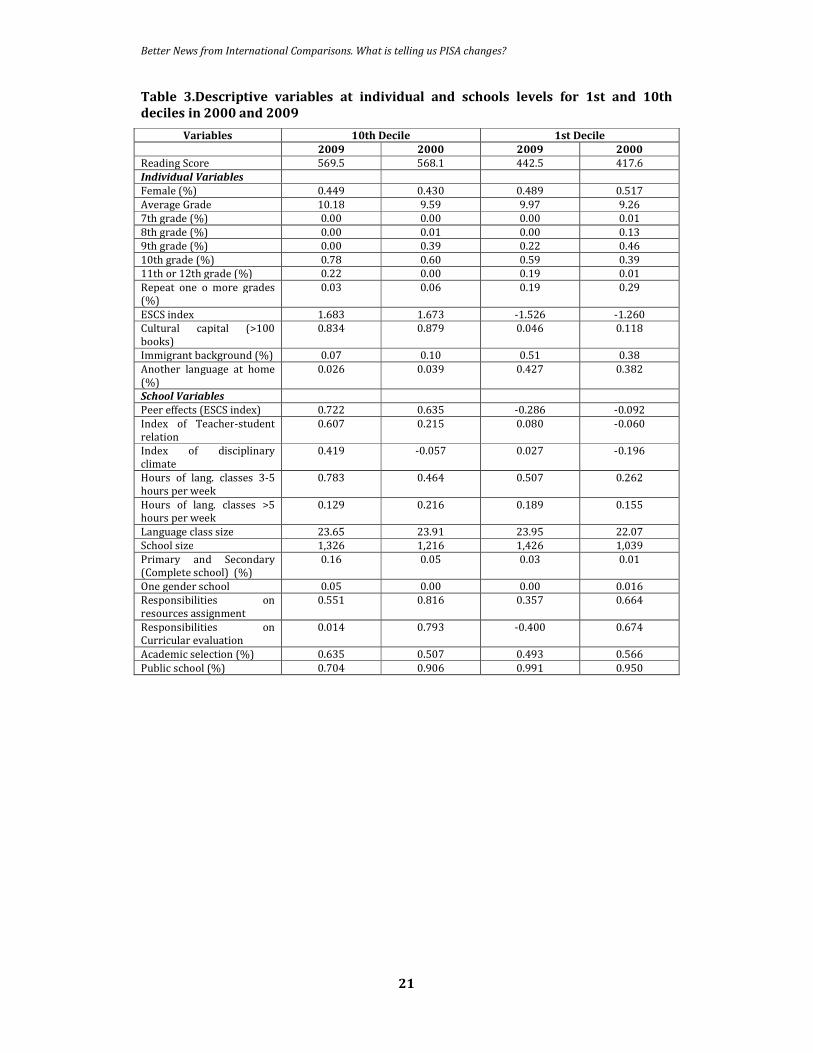
Analysis of the evolution of endowments in the 10/1 deciles between 2000-2009
The evolution of individual, family and schools characteristics that affect educational
performance evolved in different ways for students 10% more vulnerable about 10% of
better socioeconomic conditions (see Table 3). In analyzing the individual variables, one
can see that the average schooling for 15 year old students in 2009 increased by 0.72
years for 1st decile, while doing it by 0.59 years for the 10th decile, reducing the small gap
existing in the average schooling of young Americans, which is quite similar throughout
the entire distribution (10.18 years vs. 9.98 years for students of 10th and 1st deciles),
unlike the average schooling of parents for these two groups of students (14.5 years vs.
8.94 for the parents of 10th and 1st deciles respectively). This process involves the
reduction by almost 3 points in the gap of the results of PISA Reading between 10/1
deciles (Table 4).
A second individual factor, which also allowed greater equity in educational outcomes
between the 10/1 deciles in the period, was the significant reduction in repetition rate,
variable highly associated with school performance (Dupriez, Dumay, and Vause, 2010),
this change could have an effect up to 1.6 point reduction in the gap interdeciles (Table 4).
The percentage of students most vulnerable 10% had failed one or more years of
education was reduced from 29% in 2000 to 19% in 2009, a situation that also occurs
among students in the 10th decile, but at much lower rates due to the limited presence of
this condition among students in better socioeconomic conditions, in 2000 only 6% of
them had failed a grade while in 2009 it had 3%.
Moreover, in the U.S. school system there is a growing inequality in the distribution of
students according to their socioeconomic characteristics, measured by the ESCS index-
and the distribution of students from immigrant6 families, both variables closely linked to
reading educational performance (OECD, 2010). The average gap between ESCS Index
10/1 deciles was 2.93 standard deviations in 2000, a situation which increases to 3.21
standard deviations in 2009, both by a significant decline in this index among students
10% more vulnerable7, as by a slight increase among those from 10% of better
socioeconomic conditions and cultural affairs.
This increase in students' socioeconomic gap is also followed by a larger concentration of
students from immigrant families among most vulnerable deciles, among students from 1st
decile of ESCS index 50% of them had this condition in the year 2009 -in 2000 was only
38% -, while among students in the 10th decile, this percentage has been reduced from
10% in 2000 to 7% in 2009. A similar situation occurs with the unequal concentration of
students who spoken another language than English at home, which is closely associated
6 Importantly, the negative effect on school performance is associated with whether the student's home speak a language
other than English and not directly if parents are immigrants. United States is the only OECD country where the performance
of immigrants is lower than the natives before checking by Socioeconomic background, but after doing the initial situation is
reversed (OECD, 2010, Volume II, page 71). 7 This decline is even more intensive between deciles 2 and 3, but mainly affects the first 7 deciles of the distribution of ESCS
Index (see Table 2 in the appendix).
Better News from International Comparisons. What is telling us PISA changes?
9
with condition to lower academic performance in the U.S., and as well as countries like
Germany and Canada that have high rates of immigrants.
Joining the combined effect of the individual variables, the gap 10/1 should stay
unchanged for the period, explained why the increase in the differential ESCS Index deciles
between canceling the effect of equity linked to the improvement of other variables -
completely leaving the explanation of endowments change the variables associated with
schools.
At the schools characteristics level and their recent developments (see Table 3), we
detected three main features:
The first one is a growing socio-economic segregation of schools, which is seen by the
increase in the average ESCS gap between schools attended by students of 10th and 1st
deciles. For students in 10th decile, with better socioeconomic conditions, the average ESCS
school level is increased from 0.64 in 2000 to 0.72 in 2009, that is, although the ESCS
Index at the individual level is maintained in this decile relatively constant for the same
period, there is a growing concentration of this group of students in a specific group of
schools, potentially resulting processes associated with greater geographical segregation
of income groups, but also, - as we shall see in a moment- to significant changes in the
types of secondary schools to which this group of students attending. Whereas, students in
the 1st decile of the ESCS reduced the average by almost 0.2 standard deviations as a
result of higher concentrations in some schools for students of immigrant families and
most vulnerable, reflecting a process of socioeconomic polarization of American schools,
which account for about 10.5 points increase in the gap between 10/1 deciles linked to
relative changes in the distribution of educational endowments.
A second type of changes at the school level, is improving a set of pedagogical and
educational management conditions at schools. First, during the period shows a steady
improvement in students' relationships with teachers and school climate and discipline of
the establishment, although this improvement is more intensive among the
establishments where students attend the 10th decile than those in the 1st decile (these
factors are related with an increase of up to 5.5 points in the gap 10/1 deciles during the
period). Moreover, during the period shows a relevant increase in hours of reading
instruction within schools, while a reduction of this variable gap between the schools
which were attended by the most vulnerable young people and those of better
socioeconomic status: while in 2000 41.7% of students in the 1st decile and 68% of 10th
decile received 3 or more hours a week reading, these percentages increase to 69.9% and
91.3% respectively.
A third structural change is the growing concentration of top students from socioeconomic
and cultural conditions in private schools, increasing from almost 10% to almost 30% - in
just 9 years student enrollment of the 10th decile of establishments in this group, also
more likely that this group of students academically selective schools attend and offer a
comprehensive educational coverage, both in primary and secondary education, reducing
the potential for integration with students from other socio-economic or attendance at
public education, the least primary education.
Of these three changes to the school level, students' socio-economic segregation is the
most relevant to explain the widening gap in performance between 10th/1st deciles (see
Table 4). This entails a close relationship with increasing gap ESCS Index individually and
with the increase in the gap better discipline and school climate in schools, additional
factors that explain the entire increase in the 10 / 1 deciles of the period.
Better News from International Comparisons. What is telling us PISA changes?
10
Analysis of the evolution of changes in the efficiency of the function of educational
performance in the 10/1 deciles between 2000-2009
Analyzing the trend of PISA results in reading test during the decade, and its relationship
to the levels of efficiency in the transformation of endowments into a better student
achievement, is possible to see four critical factors that will realize the considerable
reduction in the gap 10/1 deciles over the decade.
A first feature is that the observed difference in the gap 10/1 deciles in the efficiency
factors is explained by the strong reduction in efficiency in some factors specific to
individual students, and in particular for its strong deterioration between those in better
socioeconomic conditions with respect to those of the 1st decile. The deterioration in the
efficiency of individual-level variables explained up to seventy percent of total additional
gap between 10/1 deciles associated with changes in efficiency issues.
The first relevant factor at an individual or student level is the reduction by 20% in the
estimated coefficient for the ESCS Index on scores for Reading PISA test in 2009 compared
to 2000, which carries a greater loss in the effectiveness of student learning to better
socioeconomic conditions on those most vulnerable.
This situation is deepened by looking further deterioration of 27% by linking one
additional standard deviation of the average ESCS Index at the school level and better
performance on the results of the reading test at the individual level, which can be a proxy
of the effect on learning even educational. This implies that the observed process of
greater socioeconomic segregation of students between educational institutions has been
accompanied by a critical reduction of the relative efficiency of the overall educational
school system, although more intense in those schools that are focusing on best students
social conditions8, this deterioration has led in turn that is more egalitarian student
achievement, but only temporarily, because the increasing levels of socioeconomic
segregation entail greater difficulties for vulnerable students can improve their
performance in a systematic way (Dupriez, 2011 ; OECD, 2010, Hanushek and
Woessmann, 2010).
Unlike these two factors that negatively affect the performance of students of higher
socioeconomic status, during the same period also shows a reduction in the negative effect
on the language performance of students from immigrant families who speak another
language at home, whose negative effect is reduced 43% in the period, which could reflect
the effectiveness of support programs in the schools where these students attend, very
encouraging results over a period of rapid increase in student population from this group
of families.9 This factor could explain up to 4 points in reducing the gap in outcomes
between the 10/1 deciles.
Finally, the increasing effectiveness of a greater number of hours of English instruction
within schools has led to better performance in average reading scores, and this has
benefited students from all socioeconomic levels, in turn, is identified that the increase in
the number of hours of teaching to some maximum range-brings an opportunity to
improve school performance, a situation that could be exploited between schools serving
the most vulnerable students, since even in 2009 still 30.1 % of students in the 1st decile
received less than 3 hours per week of English classes in their schools.
By jointly analyzing the changes in educational resources and the efficiency of them, about
their impact on reducing the gap between performance in PISA Reading 10/1 deciles,
show that in the school system are a combination of factors occurring positive, especially
8From JMP decomposition the estimated effect for 2000-2009 period on gap achievement reduction between 10/1 deciles
was 13 points from changes in ESCS Index at individual level and 14 additional points from ESCS Index peer effects. 9While in 2003 a 13.6% of students had an immigrant status (who or at least one of her parents was born abroad) in 2009
was 19.5% -an increment of 5.9% during the decade, the second largest increment after Spain among OECD countries.
Better News from International Comparisons. What is telling us PISA changes?
11
in the increase in educational endowments, which are occurring in all socioeconomic
groups, although some of them with a bias that would tend to increase levels of inequality
in the path of educational performance-at least in language for higher schools students.
However, the sharp reduction in the efficiency of the U.S. school system10 has prevented
transform this opportunity into a better educational performance, and this has been more
critical among the highest deciles of ESCS Index (particularly in the 9th and 10th deciles).
Thus, the increasing segregation and polarization of the school system, especially the elite
of his students, seems to involve not only an increase in inequality of educational
opportunities, but could be imposing a high cost in efficiency of the school system affects
all students, but less so for the most vulnerable, which allowed increasing the educational
characteristics of this group (as higher average education, language teaching hours or less
repetition) were not offset by the loss efficiency in the school system. However, this
process is valid only for the comparison between students on the 1st decile 10th decile,
this does not apply to students across the 2nd or the 3rd deciles, which is explained
because during the period 2000-2009 these deciles increased to a lesser extent their
educational endowments and tended to be more similar to students and schools attended
by students from the 1st decile.
V. Comparison of achievement gap in the United States with some OECD
countries
The application of the PISA test in 2009 for all OECD countries allows the comparability of
the U.S. education system with some countries with similar levels of development in order
to identify factors associated with differences in the overall results and the distribution of
these by socioeconomic status11. With this objective, Canada and Germany have selected.
Comparison with Canada
Canada is a country of great interest to compare the learning performance of the United
States, not only because it is its geographical neighbor, but also because it is one of the
most equitable developed country, together with the Nordic countries, in their academic
performance, which is systematically reflected in a smaller gap in scores between students
in PISA Reading 10/1 deciles, quintil5/quintil1 or other statistics. It is also interesting
because the percentage of students, whose families are immigrants, or speaking another
language at home, is as high as in America.
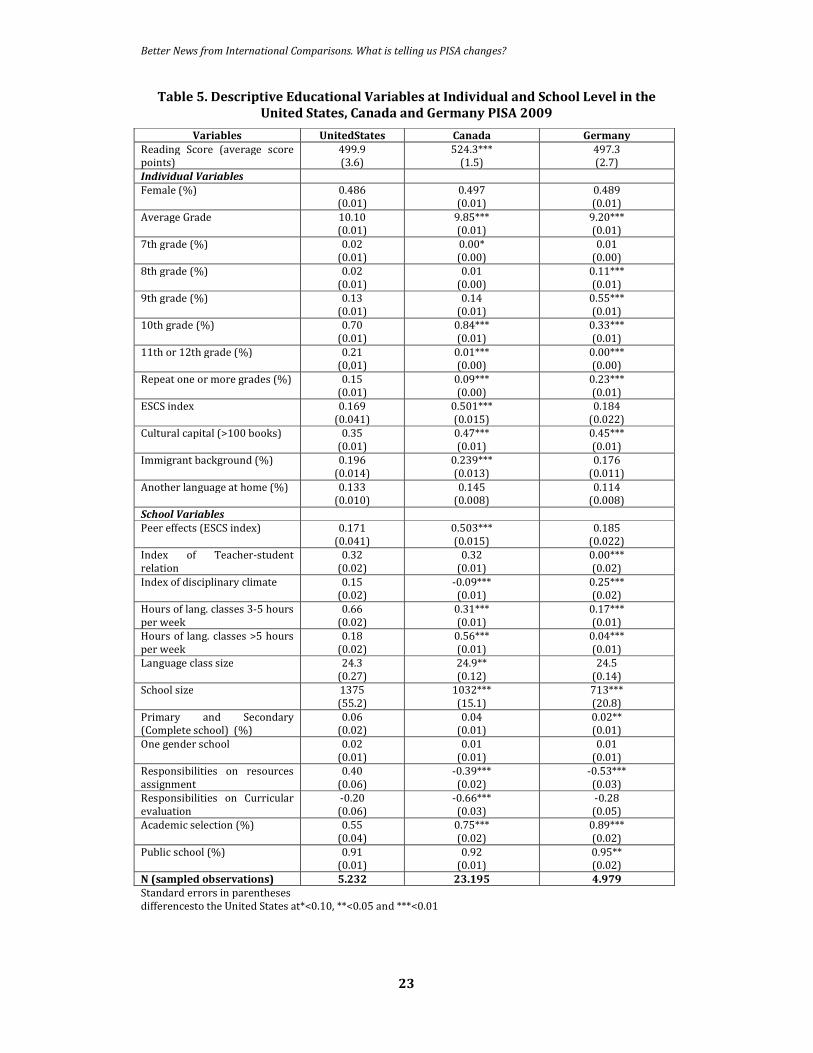
Considering all students (see Table 5), Canadian ones get additional 24.4 points than
American students on Reading PISA test in 2009. In turn, Canadian students have a lower
repetition rate (9% compared with 15% in the U.S.), although their average schooling is
slightly lower than U.S. students (9.85 vs 10.1 years respectively) In addition, Canadian
students have a higher level in the ESCS index, and therefore on the average of this
indicator within the schools attended, with an average of 0.50 standard deviations vs. 0.17
for the United States. At school, 15 years students attend schools with many similarities to
both countries, such as class size, the distribution of enrollment between public and
private schools, and the frequency with which their schools apply mechanisms of
selectivity background; however, U.S. schools tend to be larger, have greater autonomy in
curricular and distribution of resources within the establishment, as well as maintain
better discipline, as declared by the directors of the establishments.
Oaxaca-Blinder decomposition for both countries, which only describes the distribution of
factors associated with differences in educational performance of both countries,
concluded that the additional 24.4 points from Canada over the U.S. in the PISA 2009, two
10 Although in 2009 the results are in line with the socioeconomic and cultural level of students expected for the OECD
countries (OECD, 2010). 11 Also, for the three countries PISA sample is quite representative of all students 15 years of age (see Table 1 in the
Appendix).
Better News from International Comparisons. What is telling us PISA changes?
12
thirds of the difference can be explained because the Canadian system has better
educational endowments and one-third because it is more efficient than the U.S. school
system. The difference in educational endowments is primarily associated with a higher
average socioeconomic and cultural status (ESCS Index average), and, secondly, to the
lowest cumulative grade repetition among Canadian students. Moreover, the causes of
differential efficiency of education systems in Canada are numerous and appear to be
linked to a generalized better performance.
Comparing the distribution of results in PISA Reading with students from the U.S. and
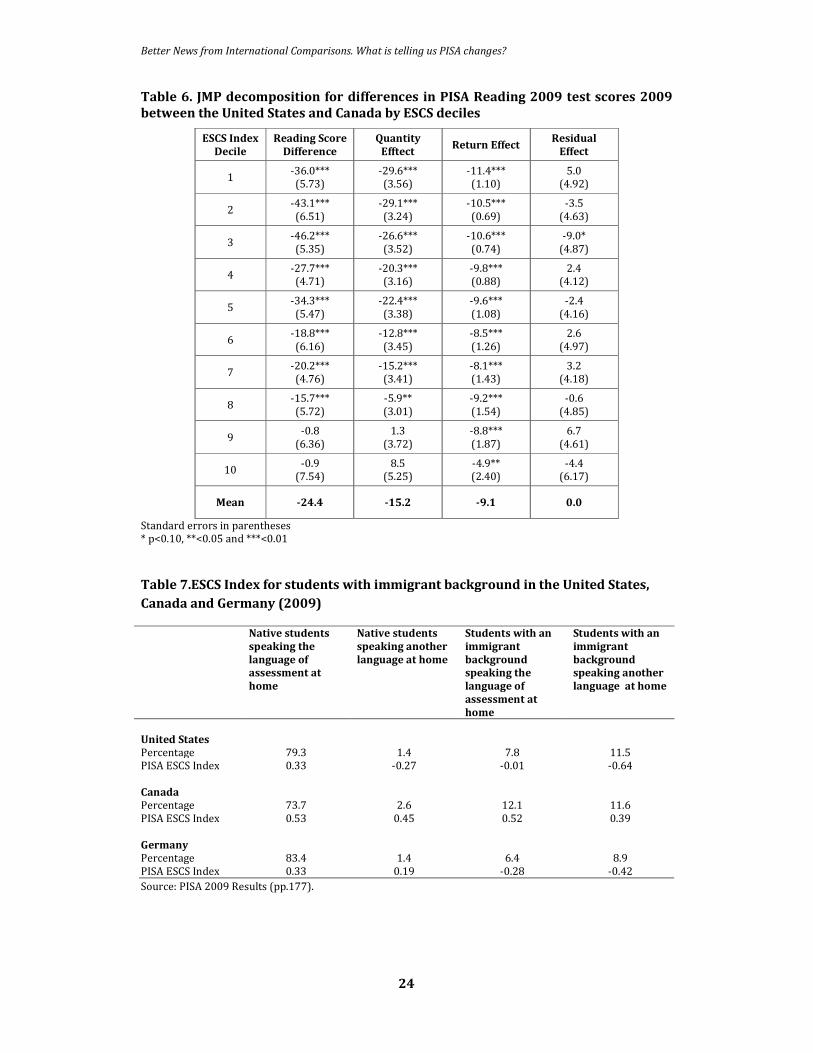
Canada by ESCS deciles (Table 6), by a JMP decomposition, we see that the gap for
students in Canada is growing among lower the socioeconomic decile of students: while in
the first three deciles this difference is about 40 points, among higher deciles for ESCS (9th
and 10th deciles) there is non-significant differences between the two countries. This
heterogeneity in educational differences across socioeconomic deciles is explained by
much greater inequality in the United States in the distribution of educational resources
then in Canada, which is seen in the heterogeneity of the effect associated with the
difference in endowments by ESCS deciles in Table 2 -, conversely, the greater efficiency
educational Canada has a relatively similar effect in all deciles -between 8 and 11 points-
in the PISA Reading test, except for the 10th decile which is only 4.9.
By comparing the characteristics of deciles 10/1 by country stands high ESCS Index gap
between individual-level students 10/1 deciles, which reaches to 3.21 standard deviations
in the USA, while in Canada it is 2.84, although the average of ISEC is higher in Canada.
Also the immigration status of student families are highly concentrated among vulnerable
deciles in the United States, while in the 1st decile to 50.3% of the students present this
condition in the 10th makes only 6.8%, unlike in Canada the distribution of this condition
is less associated with socioeconomic decile, since 30.9% of students in the 1st decile has
this attribute and 25.5% of those in the 10th decile; a similar situation applies to the
situation where families of the students speak another language at home, in USA, 42.5% of
students in the 1st decile vs. 2.6 presents this condition % in the 10th decile, while in
Canada these averages are 22.2% and 12.6% respectively. These differences are explained
fully because most of the immigrants in America hace a low socioeconomic status,
especially those who speak a language at home other than English, while in Canada
immigrants are much more similar in their socioeconomic and cultural conditions the
immigrant population (Table 7).
Whereas the attributes of the schools are highly differentiated in the United States
according to decile of students, in Canada they are much more equally distributed across
schools. Among the factors with greater gaps between the lowest deciles outstanding
difference in the average socioeconomic and cultural conditions of the families of students
attending the same school: while in USA the difference in the average ESCS level school is
1.06 standard deviations between the 10th and 1st deciles, in Canada the difference is half,
then reaches to 0.51 standard deviations. Also this greater equity between deciles 10/1 in
the school system in Canada is found in many other characteristics of schools attended by
young people aged 15 years and the proportion of complete schools, the percentage of
students attending public schools, the Index of better relations between students and
alumni, as well as better disciplinary climate, the same situation happens with the amount
weekly teaching hours of language, where the situation is very homogeneous in Canadian
schools, while in America they are greater the higher the student ESCS.
To conclude, the results for Canada PISA 2009 Reading on the United States show that a
more equitable distribution of resources goes hand in hand in the same situation in school
performance between deciles, but could also explain a general efficiency in the system
school-close to 0.1 standard deviations in PISA scores. However, this difference could be
explained by other factors such as quality of teachers and management teams, as
Better News from International Comparisons. What is telling us PISA changes?
13
compared level literature is inconclusive regarding the effect of higher levels of school
segregation on the expected educational outcomes at national level, although about its
harmful effects on inequality in the distribution of educational outcomes on the (OECD,
2011, Hanushek and Woessmann, 2010).
Comparison with Germany
It is interesting to compare the educational outcomes of Germany with the U.S. because
both share a similar socioeconomic development level, a high level of immigrants, and a
school system - although different from those of the United States for its high level of early
academic tracking (Ammermüller, 2004) - which has high levels of socioeconomic
segregation of students, like the United States (OECD, 2010).
The average of German students reading results are very similar to the average of PISA
reading results from U.S. students, both countries share a similar socioeconomic status -
measured by the PISA ESCS index- and similar conditions of immigrants and linguistic
diversity among 15 years-old students’ families (see Table 5). In contrast, the German
school system uses the percentage of students that have repeated a grade as a curricular
control- performance mechanism, this is reflected in the 23% of students who have failed
one or more years at school; whereas in the U.S. this percentage is 15% - taking into
account that German students start compulsory education a year after U.S students that is
why German students have a lower average of years of schooling among 15 years-old
students. At school level German schools have better disciplinary climate, but lower
quality interaction between students and teachers, that their U.S. counterparts. Also,
although language courses are of similar size in both countries, schools are much smaller
in Germany and at the same time the German school system is characterized by increased
relevance of public educational coverage (95% vs. 91% in United States in 2009), but with
greater intensity of academic selectivity mechanisms of high school students (in Germany
is 89% compared with 55% among American schools).
The Oaxaca-Blinder decomposition shows that U.S. has greater level of endowments
explaining 44.0 points of the score difference mainly associated with a higher average
level of schooling among their students, as well as greater number of hours of reading
instruction in their schools and a lower percentage of students that have repeated a grade.
Nevertheless, these better endowments are neutralized by a lower difference in
coefficients that may suggesting a lower efficiency in the U.S. school system, foremost
reflected in the differences in peer effects which for U.S. PISA reading cycle 2000-2009 has
a significant decline.
On the other hand, the JMP decomposition ordered by deciles of ESCS index shows that
behind a similar average in both countries of PISA reading results there is a strong
differentiation on academic results according to the socioeconomic and cultural level of
students’ families (see Table 8). While the U.S. students have better results in the 1st decile
and between the 10th - 8th decile, in the lower-middle group (between 3rd to 5th deciles)
makes it worse, which is largely due to a difference in educational endowments that favors
U.S. students, and mostly due to the apparent inefficiency of American school system
compared with German school system, these differences increases as the students being
compared with students of better socioeconomic and cultural conditions.
Analyzing the differences between deciles 10/1 within each country shows that Germany
has a higher average schooling gap between students in these deciles, because in Germany
reaches to 0.57 degrees in 2009, while among U.S. students is only 0.21. Moreover,
although the repetition rate in Germany is higher, the gap 10/1 is similar in both
countries, as well as the comparison in the ESCS index at the individual, as well as
indicators of cultural capital, percentage of Students whose families are immigrants and
Better News from International Comparisons. What is telling us PISA changes?
14
who speak another language at home (though in America there is a greater focus on the
most vulnerable decile).
In addition, the gap 10/1 in concentration of students by socioeconomic status within
schools (as measured by the average ESCS index within each school) indicates a much
more marked inequality in the U.S. than in Germany, for while in United States it is 1.1
standard deviations, in Germany it is 0.78, while schools in Germany are less differentiated
in the student-teacher, disciplinary climate and mostly students of all socioeconomic levels
attend public schools, unlike United States where there is increasing private school
attendance among students of higher socioeconomic status, on the contrary, the German
students are mostly to schools with high academic selection, a feature that is high among
students of all socioeconomic levels, but reached nearly universal levels in the 9th and
10th deciles, where 95.8% and 93.7% respectively of students attending such
establishments.
The results of Table 3 can recognize that the gap between deciles 10th/1st is more
unequal in Germany than in the United States, however, for any other comparison (5th
quintile or decile 10th/decile quintile/1st 5th) the achievement gap Between Both
Countries is similar to or worse in the United States than in Germany, Which is Explained
by greater inequality in the distribution of students and educational resources in the
school system in the U.S. than in German.
VI. Conclusions and Discussion
Analyses based on Reading PISA Test Scores conclude that achievement gap for student
cohorts of 1985 and 1994 was reduced comparing students from 10% highest
socioeconomic condition with those from 10% lowest group. However, this conclusion is
not consistent when comparisons are estimated for alternative socioeconomics groups –in
such cases relationship holds mostly constant across the period-, also is possible to predict
that it is a trend for better improvement in the future; on the contrary, evidence indicates
that current achievement gap could worsen in the next decade.
In a cross country comparison, the United States ranked above the median in the 10th/1st
achievement gap indicator: it is 22 among 29 OECD countries in 2009. However, the
United States belongs to the group of countries with an intermediate level of inequality
from this indicator, below countries with a Germanic cultural and educational tradition,
and above from more egalitarian countries like some Scandinavian ones, Korea and
Canada. On the other hand, the reduction on this indicator between 2000-2009 was
explained only by improvement on language test scores among students from the 1st
decile, because the average score for 10th decile hold constant during the last decade.
This study suggests that reduction in the language achievement gap between students
from 10th/1st deciles between 2000 and 2009 comes from three main processes:
A first process explaining the change comes from a net increase on educational resources
needed to improve students’ achievement, such as the higher average years of schooling
reached for students at fifteen years old, a reduction in accumulated repetition rate, more
hours per week of language instruction at school and improvement in the disciplinary
conditions at school level. These positive changes have been observed across schools from
all socioeconomic conditions.
Nevertheless, at the same time of this positive change in the American schooling system it
have been affected by an increasing socioeconomic segregation of their richer students,

Better News from International Comparisons. What is telling us PISA changes?
15
who are not only concentrating in more social homogenous schools, but also a larger share
of them are going to private schools -probably charter schools-, and many of these schools
include both primary and secondary education, reducing social interaction with different
students during schooling time. On the other hand, school segregation of students from the
1st decile of socioeconomic conditions does not seem to have increased in the period,
although increase of the percentage of students with an immigrant background –most of
them from families with lower socioeconomic status than native students-, generated that
schools which enrolled them have a more vulnerable social condition than at the
beginning of the decade, even generating a growing homogeneity among schools enrolling
the most vulnerable 30% of the students.
These trends of reallocation of richer students and increase of immigrant students had a
larger impact than previous positive changes, which explains that achievement gap
between the 10/1 deciles grown up in almost 15 additional points during the period.
A third process has been a reduction of ESCS level at individual and school level on
language scores. Because of the large socioeconomic differences among students and a
highly school segregation of them, this process allowed to reduce inequality on
educational outcomes and to reverse negative effects on the achievement gap between the
10/1 deciles from reallocation of students previously discussed. However, this process
also means that a larger segregation of students from the richest families was
accompanied by a reduction on efficiency in schools that they are enrolled, reverting
expected improvement on language achievement from increasing educational
endowments.
Finally, during the period was also observed a reduction on achievement gap among
immigrant status of students –particularly among those speaking another language at
home-, that evolves in a context where the percentage of immigrant students goes up,
which could be related with a positive effect from schooling programs to support
immigrant students.
From consistent international evidence, rather than is possible to identify a sample of
policies which could impact positively in a reduction on the achievement gap between
10/1 deciles – such as increasing language hours at schools which are teaching to the 30%
of most vulnerable students with less than 3 hours per week; implementing and improving
social support programs for immigrants families and schools where their children are
enrolled-, trends of growing schooling segregation among families with better
socioeconomic condition (from 9th and 10th deciles), larger shares of enrollment into
private schools –particularly for students of higher ESCS- and a more polarized schooling
system, anticipate an increasing socioeconomic educational achievement gaps in the
United States during next decade.
Moreover, comparative experience with Canada and Germany, shows that the distribution
of educational resources in America is much more unequal than in those two countries. As
regards Canada, this is sufficient to explain the widening gap in outcomes between the two
countries 10th/1st deciles, but could sr of the causes that lead to reduced efficiency in the
generation of educational outcomes in the United States on of Canada for up to 0.10
standard deviations in 2009. As regards Germany, it is concluded that the U.S. school
system is more difficult to transform their best educational resources on higher-
performing school, a situation that is even more complex in the high socioeconomic
deciles.
Better News from International Comparisons. What is telling us PISA changes?
16
Another comparative difference among these countries is differences in institutional
framework in the schooling system. It is possible most decentralized educational system in
the United States than in Canada or Germany - countries where a large share of
Educational functions to design and Implement Strategies schooling improvement are
located at state or province level governments (OECD, 2006) - implies more difficulties
and challenges to reduce inequalities across the whole country. It is possible that this
institutional characteristic could be one of reasons to understand why that narrowing
achievement gaps among students in the United States are only concentrated between
10/1 deciles, while in Canada and Germany are more systematic in the whole distribution.
In the same way, could be interesting to compare trends in different achievement gaps
across states from the country, because it allows to identify best practices and to evaluate-
oriented results from strategies to reach more egalitarian outcomes in a sustainable
educational track. A good example of this suggestion is participation of states
(Massachusetts and Minnesota) in the TIMSS in 2007, where 4th grade students from the
State of Massachusetts ranked at the top level in mathematics, surpassed only by students
from Hong Kong and Singapore, this conclusion is similar whether comparison is
estimated for those students with an immigrant background who speaking a different
language of assessment at home12.
12
www.nces.ed.gov/surveys/international/reports/2007_timss_ma.asp
Better News from International Comparisons. What is telling us PISA changes?
17
References
Ammermueller, A. (2004). “PISA: What makes the difference? Explaining the gap in PISA
test scores between Finland and Germany?” Discussion paper 04-04, Centre for European
Economic Research, Manheim, Germany.
Dupriez, V. and X. Dumay (2006). Inequalities in school systems: effect of school structure
or of society structure?. Comparative Education, Vol. 42, No 2, pp. 243-260.
Dupriez, V., X. Dumayand A. Vause (2008).How do school systems manage pupils
heterogeneity ?A reanalysis of PISA 2003.Comparative Education Review, 52 (2), 245-273.
Hanushek, E. and L. Woessmann (2010). The economics of international differences in
educational achievement, NBER, working paper 15.949
Juhn, C.; K. Murphy and B. Pierce (1993). Wage inequality and the rise in return to skill,
Journal of Political Economy 101, June 1993.
Murnane, R. and G. Duncan (Eds.) (2011).Whiter Opportunity? Rising Inequality, Schools, and
Children`s Life Chances. New York: Russell Sage Foundation.
OECD (2011).Pisa Technical Report 2009. Paris, France.
OECD (2010). PISA 2009 Results: Overcoming Social Background. Equity in Learning
Opportunities and Outcomes, Volume II.
OECD (2010). PISA 2009 Results: Learning Trends. Changes in student performance since
2000, Volume V.
OECD (2006).Teachers Matters. Paris, France-
OECD/UNESCO-UIS (2003).PISA 2000 Report, OECD and UNESCO, Paris, France.
Reardon, S. (2011).The widening academic achievement gap between the rich and the
poor: new evidence and possible explanations. In Whiter Opportunity? Rising Inequality,
Schools, and Children`s Life Chances, in R. Murnane& G. Duncan (Eds.), Russell Sage
Foundation, 2011.
Valenzuela, J.P.; C. Bellei; A. Sevilla and A. Osses (2009). What explains the difference in the
PISA Math results between Chile and some OECD and Latin American countries?, in “What
does PISA tell us about the education of high school students in Chile?”, pp. 106-140,
Ministerio de Educación, Santiago, Chile.
Valenzuela, J.P.; C. Bellei; A. Osses and A. Sevilla (2011) ¿Por qué los jóvenes chilenos
mejoraron su competencia lectora en la prueba PISA?, en “Evidencias para políticas
públicas en educación: selección de investigaciones tercer concurso FONIDE”, pp. 265-311,
Ministerio de Educación, Santiago, Chile.
IAP www.nces.ed.gov/surveys/international/reports/2007_timss_ma.asp
Better News from International Comparisons. What is telling us PISA changes?
18
FIGURES AND TABLES
Figure1
Figure 2
0,00
0,20
0,40
0,60
0,80
1,00
1,20
1,40
1,60
1,80
2,00IS
L
FIN
NO
R
KO
R
CA
N
DN
K
NLD
AU
S
CZ
E
SP
N
IRL
ME
X
ITA
GR
C
SW
E
GB
R
PO
L
ISR
CH
E
Ch
ile
PR
T
Un
ite
d S
tate
s
LUX
AU
T
BE
L
FRA
NZ
L
DE
U
HU
N
Average Difference in Standardized Test Score in PISA Reading 2000-2009 (cohorts 1985-2004)
90/10 Socioeconomic and CulturalIndex (OECD Countries)
dif 90/10 2009 dif 90/10 2000
300
350
400
450
500
550
600
Chile USA AUS AUT BEL CAN CHE CZE DEU DNK ESP FIN FRA GBR GRC HUN IRL ISL ISR ITA KOR LUX MEX NLD NOR NZL POL PRT SWE
Average Score in Reading Test PISA 2000 -2009 (cohorts 1985 and 1994)
90/10 Socioeconomic and Cultural Index for OECD Countries
PISA 2009 (10%) PISA 2000+ (10%) PISA 2009 (90%) PISA 2000+ (90%)
Better News from International Comparisons. What is telling us PISA changes?
19
Figure3
0,00
0,20
0,40
0,60
0,80
1,00
1,20
1,40
1,60
ISL
FIN
CA
N
NO
R
KO
R
NLD
DN
K
CZ
E
IRL
SP
N
ME
X
ITA
PO
L
AU
S
GR
C
SW
E
PR
T
GB
R
Ch
ile
CH
E
ISR
Un
ite
d S
tate
s
DE
U
NZ
L
AU
T
FRA
LUX
BE
L
HU
N
Average Difference in Standardized Test Score in PISA Reading 2000-2009 (cohorts 1985-2004)
80/20 Socioeconomic and Cultural Index (OECD Countries)
dif 80/20 2009 dif 80/20 2000

Better News from International Comparisons. What is telling us PISA changes?
20
Table 1. Changes in the main components of ESCS index for decile 1 and decile 10
PISA 2009 PISA 2000
10th Decile 1st Decile 10th Decile 1st Decile
General ESCS (standardized
index at year 2000) 1.69 -1.53 1.66 -1.16
1. Home Possessions
i)Wealth ratio index 2.01 1.36 1.83 0.97
ii) Cultural possesion ratio index 0.89 0.24 0.90 0.24
iii) Books at home (<11 books) 0.1% 55.4% 0.0% 37.8%
iv) Home educational resources
ratio index
0.96 0.58 0.98 0.61
2. Highest educational level of
parents
Years of schooling 14.49 8.94 14.39 9.52
3. Highest parental occupational
status
Index 73.46 30.11 73.11 29.82
Table 2. JMP decomposition for change in PISA score for 2009-2000 between 10th
and 1st deciles by ESCS index
ESCSindex -Decile Reading Score
Difference QuantityEfftect ReturnEffect Residual Effect
10th decile 1.1
(12.50)
42.5***
(7.57)
-41.3***
(2.89)
0.1
(8.55)
1st decile 25.2**
(10.41)
27.6***
(9.18)
-11.0***
(2.52)
8.6
(6.55)
Total -4.5 23.3 -27.8 0.0
Standard errors in parentheses
*<0.10, **<0.05 and ***<0.01
Better News from International Comparisons. What is telling us PISA changes?
21
Table 3.Descriptive variables at individual and schools levels for 1st and 10th
deciles in 2000 and 2009
Variables 10th Decile 1st Decile
2009 2000 2009 2000
Reading Score 569.5 568.1 442.5 417.6
Individual Variables
Female (%) 0.449 0.430 0.489 0.517
Average Grade 10.18 9.59 9.97 9.26
7th grade (%) 0.00 0.00 0.00 0.01
8th grade (%) 0.00 0.01 0.00 0.13
9th grade (%) 0.00 0.39 0.22 0.46
10th grade (%) 0.78 0.60 0.59 0.39
11th or 12th grade (%) 0.22 0.00 0.19 0.01
Repeat one o more grades
(%)
0.03 0.06 0.19 0.29
ESCS index 1.683 1.673 -1.526 -1.260
Cultural capital (>100
books)
0.834 0.879 0.046 0.118
Immigrant background (%) 0.07 0.10 0.51 0.38
Another language at home
(%)
0.026 0.039 0.427 0.382
School Variables
Peer effects (ESCS index) 0.722 0.635 -0.286 -0.092
Index of Teacher-student
relation
0.607 0.215 0.080 -0.060
Index of disciplinary
climate
0.419 -0.057 0.027 -0.196
Hours of lang. classes 3-5
hours per week
0.783 0.464 0.507 0.262
Hours of lang. classes >5
hours per week
0.129 0.216 0.189 0.155
Language class size 23.65 23.91 23.95 22.07
School size 1,326 1,216 1,426 1,039
Primary and Secondary
(Complete school) (%)
0.16 0.05 0.03 0.01
One gender school 0.05 0.00 0.00 0.016
Responsibilities on
resources assignment
0.551 0.816 0.357 0.664
Responsibilities on
Curricular evaluation
0.014 0.793 -0.400 0.674
Academic selection (%) 0.635 0.507 0.493 0.566
Public school (%) 0.704 0.906 0.991 0.950
Better News from International Comparisons. What is telling us PISA changes?
22
Table 4.Disentangling the change in Average PISAReading Test between 2009 and
2000 for 10/1 by ESCS Index deciles
QuantityEfftect ReturnEffect Residual Effect TOTAL
Individual/Family
Variables
0.19
-21.64
Gender 0.98 --0.06
Years of schooling -2.75 0.52
Age-grade non equivalent -1.57 -2.70
ESCS Index 4.31 -11.83
High Cultural Capital 0.79 -3.57
Immigration/otherlanguage -1.56 -4.00
School Variables 14.70 -8.48
Average ESCS 10.52 -10.40
IndexTeachRel/Disciplinary 5.62 -0.06
Hours of lenguaje classes -0.68 1.77
Classsize -0.54 -0.65
Schoolsize -0.63 1.00
Desc. onresources -0.06 -0.27
Desc. oncurriculum -0.44 -0.51
InstitutionalSchool Variables
Completedschool 1.65 1.53
Onegenderschool 0.96 -0.22
Academicselection 0.19 -0.44
PublicSchool -1.88 -0.23
Total 14.89 -30.25 -8.74 -24.10
Better News from International Comparisons. What is telling us PISA changes?
23
Table 5. Descriptive Educational Variables at Individual and School Level in the
United States, Canada and Germany PISA 2009
Variables UnitedStates Canada Germany
Reading Score (average score
points)
499.9
(3.6)
524.3***
(1.5)
497.3
(2.7)
Individual Variables
Female (%) 0.486
(0.01)
0.497
(0.01)
0.489
(0.01)
Average Grade 10.10
(0.01)
9.85***
(0.01)
9.20***
(0.01)
7th grade (%) 0.02
(0.01)
0.00*
(0.00)
0.01
(0.00)
8th grade (%) 0.02
(0.01)
0.01
(0.00)
0.11***
(0.01)
9th grade (%) 0.13
(0.01)
0.14
(0.01)
0.55***
(0.01)
10th grade (%) 0.70
(0.01)
0.84***
(0.01)
0.33***
(0.01)
11th or 12th grade (%) 0.21
(0,01)
0.01***
(0.00)
0.00***
(0.00)
Repeat one or more grades (%) 0.15
(0.01)
0.09***
(0.00)
0.23***
(0.01)
ESCS index 0.169
(0.041)
0.501***
(0.015)
0.184
(0.022)
Cultural capital (>100 books) 0.35
(0.01)
0.47***
(0.01)
0.45***
(0.01)
Immigrant background (%) 0.196
(0.014)
0.239***
(0.013)
0.176
(0.011)
Another language at home (%) 0.133
(0.010)
0.145
(0.008)
0.114
(0.008)
School Variables
Peer effects (ESCS index) 0.171
(0.041)
0.503***
(0.015)
0.185
(0.022)
Index of Teacher-student
relation
0.32
(0.02)
0.32
(0.01)
0.00***
(0.02)
Index of disciplinary climate 0.15
(0.02)
-0.09***
(0.01)
0.25***
(0.02)
Hours of lang. classes 3-5 hours
per week
0.66
(0.02)
0.31***
(0.01)
0.17***
(0.01)
Hours of lang. classes >5 hours
per week
0.18
(0.02)
0.56***
(0.01)
0.04***
(0.01)
Language class size 24.3
(0.27)
24.9**
(0.12)
24.5
(0.14)
School size 1375
(55.2)
1032***
(15.1)
713***
(20.8)
Primary and Secondary
(Complete school) (%)
0.06
(0.02)
0.04
(0.01)
0.02**
(0.01)
One gender school 0.02
(0.01)
0.01
(0.01)
0.01
(0.01)
Responsibilities on resources
assignment
0.40
(0.06)
-0.39***
(0.02)
-0.53***
(0.03)
Responsibilities on Curricular
evaluation
-0.20
(0.06)
-0.66***
(0.03)
-0.28
(0.05)
Academic selection (%) 0.55
(0.04)
0.75***
(0.02)
0.89***
(0.02)
Public school (%) 0.91
(0.01)
0.92
(0.01)
0.95**
(0.02)
N (sampled observations) 5.232 23.195 4.979
Standard errors in parentheses
differencesto the United States at*<0.10, **<0.05 and ***<0.01
Better News from International Comparisons. What is telling us PISA changes?
24
Table 6. JMP decomposition for differences in PISA Reading 2009 test scores 2009
between the United States and Canada by ESCS deciles
ESCS Index
Decile
Reading Score
Difference
Quantity
Efftect Return Effect
Residual
Effect
1 -36.0***
(5.73)
-29.6***
(3.56)
-11.4***
(1.10)
5.0
(4.92)
2 -43.1***
(6.51)
-29.1***
(3.24)
-10.5***
(0.69)
-3.5
(4.63)
3 -46.2***
(5.35)
-26.6***
(3.52)
-10.6***
(0.74)
-9.0*
(4.87)
4 -27.7***
(4.71)
-20.3***
(3.16)
-9.8***
(0.88)
2.4
(4.12)
5 -34.3***
(5.47)
-22.4***
(3.38)
-9.6***
(1.08)
-2.4
(4.16)
6 -18.8***
(6.16)
-12.8***
(3.45)
-8.5***
(1.26)
2.6
(4.97)
7 -20.2***
(4.76)
-15.2***
(3.41)
-8.1***
(1.43)
3.2
(4.18)
8 -15.7***
(5.72)
-5.9**
(3.01)
-9.2***
(1.54)
-0.6
(4.85)
9 -0.8
(6.36)
1.3
(3.72)
-8.8***
(1.87)
6.7
(4.61)
10 -0.9
(7.54)
8.5
(5.25)
-4.9**
(2.40)
-4.4
(6.17)
Mean -24.4 -15.2 -9.1 0.0
Standard errors in parentheses
* p<0.10, **<0.05 and ***<0.01
Table 7.ESCS Index for students with immigrant background in the United States,
Canada and Germany (2009)
Native students
speaking the
language of
assessment at
home
Native students
speaking another
language at home
Students with an
immigrant
background
speaking the
language of
assessment at
home
Students with an
immigrant
background
speaking another
language at home
United States
Percentage 79.3 1.4 7.8 11.5
PISA ESCS Index 0.33 -0.27 -0.01 -0.64
Canada
Percentage 73.7 2.6 12.1 11.6
PISA ESCS Index 0.53 0.45 0.52 0.39
Germany
Percentage 83.4 1.4 6.4 8.9
PISA ESCS Index 0.33 0.19 -0.28 -0.42
Source: PISA 2009 Results (pp.177).
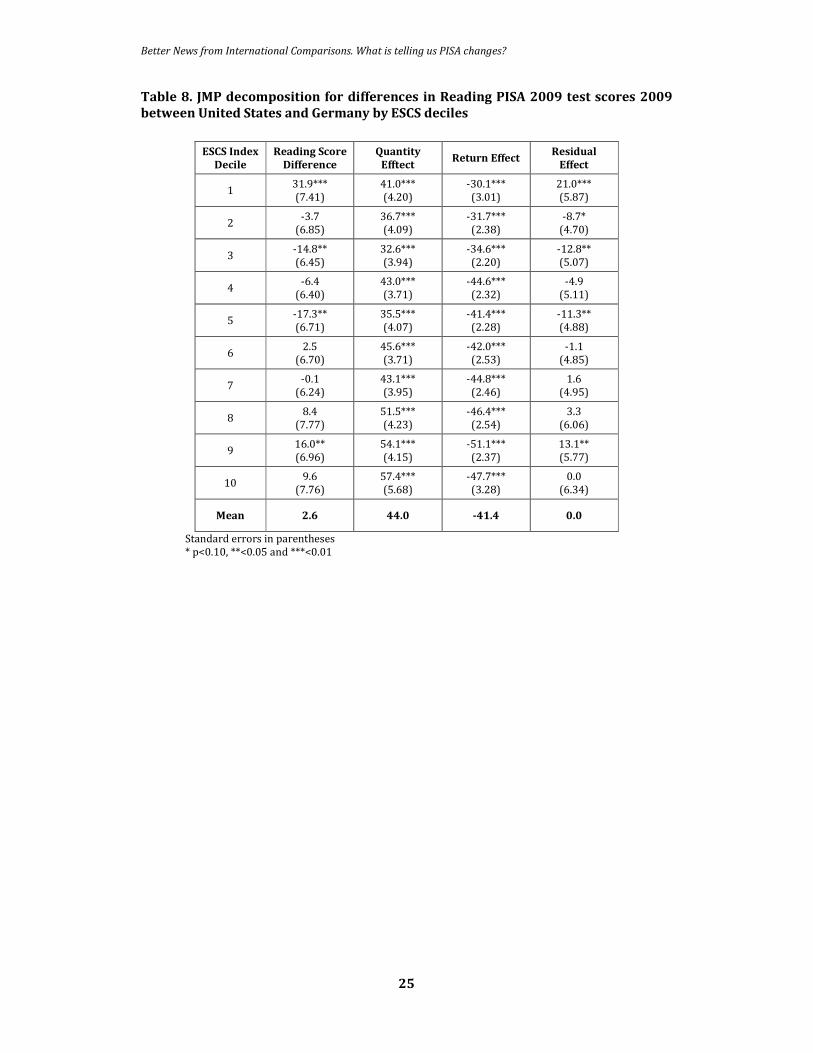
Better News from International Comparisons. What is telling us PISA changes?
25
Table 8. JMP decomposition for differences in Reading PISA 2009 test scores 2009
between United States and Germany by ESCS deciles
ESCS Index
Decile
Reading Score
Difference
Quantity
Efftect Return Effect
Residual
Effect
1 31.9***
(7.41)
41.0***
(4.20)
-30.1***
(3.01)
21.0***
(5.87)
2 -3.7
(6.85)
36.7***
(4.09)
-31.7***
(2.38)
-8.7*
(4.70)
3 -14.8**
(6.45)
32.6***
(3.94)
-34.6***
(2.20)
-12.8**
(5.07)
4 -6.4
(6.40)
43.0***
(3.71)
-44.6***
(2.32)
-4.9
(5.11)
5 -17.3**
(6.71)
35.5***
(4.07)
-41.4***
(2.28)
-11.3**
(4.88)
6 2.5
(6.70)
45.6***
(3.71)
-42.0***
(2.53)
-1.1
(4.85)
7 -0.1
(6.24)
43.1***
(3.95)
-44.8***
(2.46)
1.6
(4.95)
8 8.4
(7.77)
51.5***
(4.23)
-46.4***
(2.54)
3.3
(6.06)
9 16.0**
(6.96)
54.1***
(4.15)
-51.1***
(2.37)
13.1**
(5.77)
10 9.6
(7.76)
57.4***
(5.68)
-47.7***
(3.28)
0.0
(6.34)
Mean 2.6 44.0 -41.4 0.0
Standard errors in parentheses
* p<0.10, **<0.05 and ***<0.01
Better News from International Comparisons. What is telling us PISA changes?
26
APPENDIX
Table 1.Variables Description
Outcome Description
PISA-Reading scores Reading scores, considered the 5 plausible values measured in PISA 2000
and PISA 2009.
Pupil-level variables
Female Takes the value 1 for female students (omitted category: male).
Years of schooling (grade) Grade a student been enrolled at the time it evaluated by PISA scale range
7º through 11th grade (12th grade for PISA 2009 sample).
Relative Grade
(grade compared to modal grade in
country)
Variable indicating whether the student belongs in the grade for his/her
corresponding age. Only for comparisons of U.S. 2000-2009, as a proxy of
students repeatedgrades (omitted category: grade/age equivalent).
Repeat one or more grades
Variable indicating whether the student repeated one or more grades. For
comparisons of U.S.- Canada and U. S. - Germany, (omitted category: not
repeated grades).
Index of economic. social and cultural
status
PISA Index estimated based on: i) index of occupational status achieved
higher by parents, ii) higher education achieved by parents, and iii) index
of household possessions. The index was rescaled in PISA 2000to the year
2009 by PISA consortium. This allows for comparison between the two
assessment cycles.
Cultural possessions
(more than 100 books)
Variable indicating whether the student has more than 100 books at home
(omitted category: fewer than 100 books at home).
Immigrant Background
As PISA concept used to define immigrant students, first-generation and
second-generation students were jointly considered as students with an
immigrant background (omitted category: native students).
Another language at home
When the language at home is a different language than the language of
assessment, (omitted category: language at home is the same as the
language of assessment).
School-level variables
Peers effect of ESCS index Continuous variable that measures the average schooling of the parents of
a student's peers as (measured at pupil-level).
Index of teacher-student relations
The index was recalculated using factor analysis, referring to 2001, taking
into account comparable questions for both cycles, as the original index. i) I
get along with most of my teachers, ii) most of my teachers are interested
in my welfare, iii) most of my teachers really listen to what I have to say, iv)
if I need extra help, will I receive from my teachers, and v) most of my
teachers treat me fairly. Higher values of the index indicate positive
relationships between teachers and students.
Index of disciplinary climate – Language
lessons
The index was recalculated using factor analysis, referring to 2001, taking
into account comparable questions for both cycles, as the original index. i)
Better News from International Comparisons. What is telling us PISA changes?
27
students do not listen to what the teacher is saying, ii) there is noise and
disorder, iii) the teacher has to wait a long time for students to be quiet, iv )
students cannot work well, and v) students do not start work until a long
time after starting the class. Higher values of the index indicate a better
climate for discipline in language classes.
Learning time a week –Language of the
country
Class hours that the student has in the area of language a week, considered
in three separate dummy variables: Up to 3 hrs,. more than 3 hrs. to 5 hrs.,
and over 5 hrs.
Class size of Language lessons Derived from the question: how many students on average are in your
language class?
Schoolsize Calculated by PISA, number of students enrolled at the school.
12th grade Schools Variable indicating whether the school has primary and secondary
education, 12th grades (omitted variable: school with less than 12° grades).
School of only Boys or only Girls Variable indicating whether the school has only students of one sex
(omitted category: mixed school).
School’s Institutional dependance
variables
Index of school responsibility of resources
allocation
Based on the responses of the principals this index was recalculated using
factor analysis, referring to 2001. Considering the same questions for both
cycles, based on the index calculated in 2009: i) selection of teachers to
hire, ii) dismissing teachers, iii) establishing teachers' starting salaries, iv)
to determine salary increases for teachers , v) developing the school
budget, and vi) decide on the allocation of resources within the
establishment. Higher values of the index indicate greater responsibility on
the establishment.
Index of school responsibility for
curriculum and assessment
Based on the responses of the principals this index was recalculated using
factor analysis, referring to 2001. Considering the same questions for both
years, based on the index calculated in 2009: i) establish policies for
student assessment, ii) choosing which textbooks are used, iii) determine
the contents of the classes, and iv) decide what courses will be taught.
Higher values of the index indicate greater responsibility on the
establishment.
Academic selectivity
Indicating whether the school applies academic selection criteria
(student’s record of academic performance and recommendation of feeder
schools.), at least sometimes one of the two requirements. (Omitted
category: no academic selection applied).
SchoolFunding Variables indicating whether school funding is public, (Omitted category:
private (state-subsidized) or private).
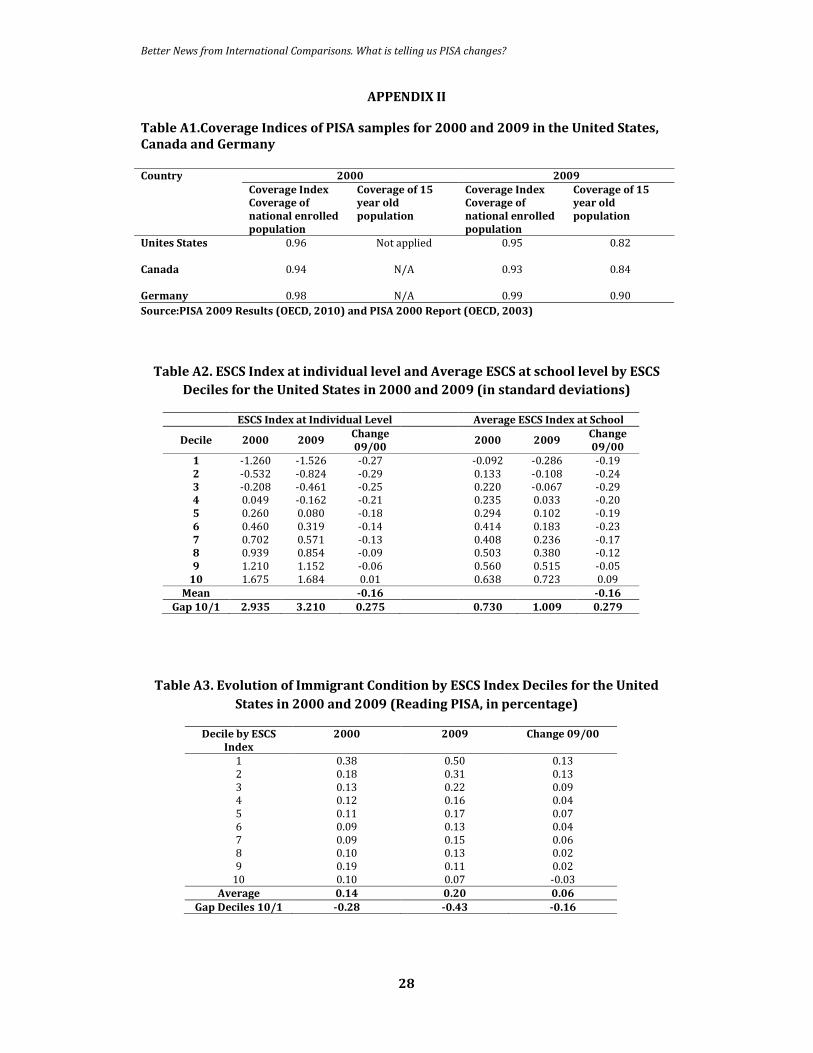
Better News from International Comparisons. What is telling us PISA changes?
28
APPENDIX II
Table A1.Coverage Indices of PISA samples for 2000 and 2009 in the United States,
Canada and Germany Country 2000 2009
Coverage Index
Coverage of
national enrolled
population
Coverage of 15
year old
population
Coverage Index
Coverage of
national enrolled
population
Coverage of 15
year old
population
Unites States 0.96 Not applied 0.95 0.82
Canada
0.94
N/A
0.93
0.84
Germany
0.98
N/A
0.99
0.90
Source:PISA 2009 Results (OECD, 2010) and PISA 2000 Report (OECD, 2003)
Table A2. ESCS Index at individual level and Average ESCS at school level by ESCS
Deciles for the United States in 2000 and 2009 (in standard deviations)
ESCS Index at Individual Level Average ESCS Index at School
Decile 2000 2009 Change
09/00 2000 2009
Change
09/00
1 -1.260 -1.526 -0.27 -0.092 -0.286 -0.19
2 -0.532 -0.824 -0.29 0.133 -0.108 -0.24
3 -0.208 -0.461 -0.25 0.220 -0.067 -0.29
4 0.049 -0.162 -0.21 0.235 0.033 -0.20
5 0.260 0.080 -0.18 0.294 0.102 -0.19
6 0.460 0.319 -0.14 0.414 0.183 -0.23
7 0.702 0.571 -0.13 0.408 0.236 -0.17
8 0.939 0.854 -0.09 0.503 0.380 -0.12
9 1.210 1.152 -0.06 0.560 0.515 -0.05
10 1.675 1.684 0.01 0.638 0.723 0.09
Mean -0.16 -0.16
Gap 10/1 2.935 3.210 0.275 0.730 1.009 0.279
Table A3. Evolution of Immigrant Condition by ESCS Index Deciles for the United
States in 2000 and 2009 (Reading PISA, in percentage)
Decile by ESCS
Index
2000 2009 Change 09/00
1 0.38 0.50 0.13
2 0.18 0.31 0.13
3 0.13 0.22 0.09
4 0.12 0.16 0.04
5 0.11 0.17 0.07
6 0.09 0.13 0.04
7 0.09 0.15 0.06
8 0.10 0.13 0.02
9 0.19 0.11 0.02
10 0.10 0.07 -0.03
Average 0.14 0.20 0.06
Gap Deciles 10/1 -0.28 -0.43 -0.16