BESECURE report D3.1
62
Page 1 SEVENTH FRAMEWORK PROGRAMME SECURITY, Collaborative Project Grant Agreement no. 285222 Best Practice Enhancers for Security in Urban Regions D3.1: Overview of relevant process models, indicators and methods for urban security en- hancement – How to BE SECURE? Deliverable details Deliverable number D3.1. Overview of relevant process models, indicators and methods for urban security enhancement Author(s) Andreas Armborst Due date 24 Delivered date Dissemination level PU Contact person EC Jana Paskajova Contributing Partners 1. EMI 2. TNO 3.
Transcript of BESECURE report D3.1

Page 1
SEVENTH FRAMEWORK PROGRAMME
SECURITY, Collaborative Project
Grant Agreement no. 285222
Best Practice Enhancers for Security in Urban Regions
D3.1: Overview of relevant process models, indicators and methods for urban security en-
hancement – How to BE SECURE?
Deliverable details
Deliverable number D3.1. Overview of relevant process models, indicators and methods for urban security enhancement
Author(s) Andreas Armborst
Due date 24
Delivered date
Dissemination level PU
Contact person EC Jana Paskajova
Contributing Partners
1. EMI
2. TNO
3.

Page 2
Title: GA no.: 285222
EXECUTIVE SUMMARY
Objectives
The objective of this report is to review relevant indicators, manage-rial practices, aids, workflows and other methods for urban security enhancement, and to identify those which are most valuable for the BESECURE urban data platform, the inspirational platform, and the poli-cy support platform. This includes the identification of indicators that can be used to set up a metric for urban security.
Description of the work
What are the most essential ele-
ments in a comprehensive approach
to the enhancement of urban secu-
rity? With this question in mind this
report reviews several instruments,
processes and models of crime pre-
vention such as the European
Standard to Crime Prevention (EN
14383), Crime mapping services,
tools for predictive crime analysis
and the concept of collective effica-
cy. The report concludes with rec-
ommendations about which of
these practical tools can be used
within the BESECURE framework
and how to proceed with them.
Results and conclusions
From the overwhelming supply of instruments and tools
in the domain of urban security and crime prevention,
some are particular useful for BESECUR’s objectives:
The evidence-based policing matrix is an online tool that
links research to practice. It provides a useful structure
for the policy support platform and the inspirational
platform. It is comprehensible, easy to develop, and
presumably helpful for the user.
Some of the instrument presented in the chapters on
crime mapping services and predictive policing, can be
used to develop the urban data platform.
Security metrics such as the Amsterdam and Rotterdam
Safety Index are reasonable approaches to measure
urban security through a mix of relevant indicators, in-
cluding police recorded crime, urban data, and survey
data about social cohesion and fear of crime.
Project information Acronym: BESECURE
Grant Agreement N°:
285222 Total Cost:
€ 4,321,420 EU Contribution:
€ 3,468,092 Starting Date:
01/04/2012 Duration:
36 months Website:
www.besecure-project.eu Coordinator:
Nederlandse Organisatie voor Toegepast Natuurwetenschappelijk Onderzoek – TNO Kampweg 5 P.O. Box 23 3769 ZG Soesterberg, The Netherlands
Partners: TNO, The Netherlands University of Ulster, Ireland Fraunhofer, Germany Albert Ludwigs University,
Germany Itti, Poland The Stephan Lawrence Char-itable Trust, UK
Downey Hynes Ltd, Ireland JVM, UK Crabbe Consulinting, UK ConsiglioNazionale Delle Ricerche, Italy UniversitadegleStudiMedi-terrane, Italy Experian, The Netherlands Stichting dr. H. Verwey Jonker, The Netherlands Erasmus University, The
Netherlands Coordinator contact:
Dr. Heather J. Griffioen-Young T: +31-88-356-378 M: +31-6-2246-1065 F: +31-346-353-977 E: [email protected]

Page 3
Title: GA no.: 285222
Table of Contents
Executive summary ............................................................................................................... 4
1. Introduction ................................................................................................................... 4
2. Urban security and crime prevention ............................................................................. 5
2.1. Nine sectors of crime prevention ............................................................................. 5
3. Approaches to crime prevention .................................................................................. 10
3.1. The European Standards on “Prevention of crime - Urban planning and building design: EN 14383 series ....................................................................................... 10
3.1.1. Appraisal of EN 14838 and supplemental security assessment tools ............. 15
3.2. Predictive Policing and crime mapping technologies ............................................. 17 3.2.1. Appraisal of predictive policing technologies .................................................. 24
3.3. The matrix of evidence-based policing .................................................................. 25 3.3.1. Appraisal of the evidence based policing matrix ............................................. 27
3.4. Conclusions ........................................................................................................... 29
4. Metrics for urban security ............................................................................................ 30
4.1. Crime Data ............................................................................................................ 31 4.2. Urban data ............................................................................................................ 32 4.3. Survey data ........................................................................................................... 35
5. Conclusions ................................................................................................................. 37
6. References .................................................................................................................. 38
7. Annex .......................................................................................................................... 42
8. Amendment: Methodology for an urban security metric………………………….……….52
8.1 How to set up the metric with your own communal data in 4 steps..………..……….58

Page 4
Title: GA no.: 285222
Executive summary
What are the most essential elements in a comprehensive approach to the enhancement of urban
security? With this question in mind this report reviews several instruments, processes and models
of crime prevention such as the European Standard to Crime Prevention (EN 14383), Crime mapping
services, tools for predictive crime analysis and the concept of collective efficacy. The report con-
cludes with recommendations about which of these practical tools are useful within the BESECURE
framework and how to proceed with them.
1. Introduction
How to BE SECURE? Managing urban security is a complex task ranging from short tactical decision
making to long term strategic visions. On each decisional level there are various tasks involved in
order to find a sound basis for actions to be taken. This report presents corresponding tools and aids
involved in this process.
BESECURE covers different, but not all areas within the domain of urban crime prevention. Chapter
2.1 of this report illustrates nine sectors of crime prevention and gives the reader a quick impression
for which of these sectors BESECURE can be relevant. A manager of a correctional facility may be less
interested in the BESECURE urban policy platform than a member of the city crime prevention coun-
cil. A neighbourhood manager may find the policy support platform more useful than a forensic psy-
chiatrist. Urban planners, municipalities, public transport manager, police departments, and crime
prevention councils can use BESECURE as an inspirational tool and a managerial aid. Some European
cities have developed systems to assess, improve and maintain urban security such as the Rotterdam
Safety Index or the risk assessment system in the city of Lucerne, to name just two examples. Espe-
cially those cities who want to develop their own innovative approach to urban security can benefit
from the tools, instruments, and concepts discussed in this report. Its recommendations and ap-
praisals are meant to inspire and encourage the reader to design new approaches, or to rethink old
ones. This report does not articulate directives or prescriptions, but provides background infor-
mation for users in order to articulate them on their own.
This promotes the use of indicators and process models in the management of urban security. Part
two of this report reviews different existing technological regimes1 for the enhancement of urban
security and explains, against this backdrop, the use of indicators for managerial purposes. Part
three suggests that there are three essential ingredients to the approaches presented in chapter
two: Crime data, socio-spatial indicators, and survey data. Part three also discusses the concept of
collective efficacy, its relevance to crime reduction, and how to measure it.
1 Technological regimes organize and restrict development in a particular domain, such as urban security: “In
so far as engineers and firms share similar routines, these form a technological regime. Technological regimes result in technological trajectories, because the community of engineers searches in the same direction” (Geels 2002: 1259). “A technological regime is the rule-set or grammar embedded in a complex of engineering prac-tices, production process technologies, product characteristics, skills and procedures, ways of handling rele-vant artefacts and persons, ways of defining problems; all of them embedded in institutions and infrastruc-tures” (Rip and Kemp 1998: 340).

Page 5
Title: GA no.: 285222
Crime prevention in Europe has a long lasting tradition and although there are remarkable national
differences in the cultures of crime prevention and urban security (e.g. whether or not communal
crime prevention is statutory) there is also some common ground. Policies and ideas have evolved
steadily over the last decades. Considering the thriving landscape of professional crime prevention
initiatives, think tanks, networks, online tools and IT products, the relevant question is: “What inno-
vation can BESECURE add to this?” To make it clear from the beginning, this report does not present
any novel approaches to crime prevention. It rather assists practitioners and policy makers to select
the most relevant ingredients from the seemingly oversupplied market of security tools, and thereby
to enable them to develop their own innovative approaches for securing cities against crime.
2. Urban security and crime prevention
To understand how security in urban areas is efficiently maintained one has to look at the wide
range of professional practices carried out to this end. These practices come under different labels
which essentially mean the same thing (Edwards et al. 2013): ‘urban security’, ‘urban safety’, ‘com-
munity safety’, ‘crime prevention’, ‘integral security’ control deviant, criminal and anti-social behav-
iour by ways and means considered appropriate by the stakeholders who implement them. This
report refers to the notion “urban security” and “crime prevention” interchangeably, designating
efforts to control crime.2
The maintenance of urban security is an inherently political endeavour meant not only to appease
some constituency but also to maintain the social order and the state’s monopoly of force at its
most visible front: the public space. As all political action, crime prevention is not always driven by
evidence and ‘scientific rationality’ but also by political programmes, ideology, political necessities,
budget restrictions, state law, the public opinion, or directives from above.3 Nevertheless
knowledge-based crime prevention is important to effectively manage urban security.
So what is actually being done to achieve this goal? Actions range from single measures such as in-
stalling alley gates, to implementing full-blown governmental crime reduction programmes. Alt-
hough it is not feasible to make an inventory of all the actions taken to reduce and prevent crime,
there are patterns all preventive measures have in common and which leave us with nine conceptual
categories of possible crime interventions.
2.1. Nine sectors of crime prevention
Crime interventions differ in their level of proactivity. They can address the long term social root
causes of crime; they can address more immediate crime risks; or they can reactively mitigate the
consequences of crime. Criminological literature describes these different stages of crime preven-
tion as primary, secondary and tertiary crime prevention (Kube 1987). This distinction (originally
made in preventive healthcare) was introduced by an early pioneer of crime prevention in Germany,
Edwin Kube the former head of the research and development division of the German Federal Crim-
2 See BESECURE deliverable D1.1 (page 10) for disambiguation of the terms safety and security.
3 For an extensive discursive analysis tradition on urban security practices in the Foucauldian see Svenonius
(2011).

Page 6
Title: GA no.: 285222
inal Police Office (BKA KI) and is nowadays an established expression in the terminology of crime
prevention practitioners and researchers. All three types of crime prevention can address the of-
fender, the situation, or the victim. Accordingly there are nine categories (or sectors) of crime pre-
vention (see Table 1).
For the purpose of this report it is important to briefly review these nine principle ways and means
to approach crime related urban insecurities because for each of the nine sectors there are specific
requirements of data, methods and indicators. A risk assessment of an urban area requires data
other than a risk assessment of individual behaviour (for a similar taxonomy see RAND 2013: xiv).
Some crime prevention measures cut across two or more sectors. However for every single sector
there is a corresponding set of indicators that give a basic impression of what ingredients to look for
when designing new approaches or rethinking old ones.
Primary prevention is a description for long-term population-based measures against crime and
delinquency. It is addressed to the population as a whole and from all different preventive ap-
proaches it is the one that is most remote to the crime incident as such. Primary crime prevention
has a dispersed and long-term effect and it is therefore hard to evaluate whether or not the desired
effects have been attained. The delayed and dispersed impact of primary crime prevention might
make it less attractive to those policy makers who look for quick wins and symbolic action, but sus-
tainably low crime rates in large social aggregates can only be achieved through primary crime pre-
vention addressed at potential offenders, victims, and the public space.
The general deterrent effect of criminal punishment affects all members of a society equally no mat-
ter if they ever commit a crime or not. Whether harsher sentences have a preventive effect or not is
a contested question, more often than not won by those who negate this claim. All the same, crimi-
nal punishment also has a non-deterrent and rather symbolic preventive effect: it conveys the mes-
sage that a moral wrong has been committed and that society is not indifferent about it. In the very
first place law-making and law enforcement has the objective to maintain the volatile equilibrium of
justice in a society. If primary prevention fails, all subsequent preventive measures are futile because
then they treat the social symptoms of crime rather than its causes.

Page 7
Title: GA no.: 285222
Primary prevention also operates proactively on the victim-level, that is, before someone actually
has become a victim to crime. The example at hand is the idea of actuarial justice (Feeley and Simon
1992). “[A]ctuarial techniques are used to produce insurance percentage rates needed to establish
premiums to cover expected losses and expenses” (Robert 2007) caused by crime. Actuarial justice
departs from the fair assumption that crime can never be prevented entirely and therefore its inevi-
table, harmful consequences should be mitigated as best as possible. Actuarial justice is not preven-
tion in the strict meaning of the word, but all the same it is proactive as it provides security against
crime before it has happened.
Whereas these two types of primary crime prevention (actuarial techniques and general deterrence)
have only limited applicability on the city level, policy makers and urban planners can apply primary
crime prevention in the public space and in the architectural landscape of the city. The long-lasting
idea of “designing out crime” means to avoid the architectural preconditions of crime through delib-
erate planning. “A great number of experiments have shown that particular types of crime can be
reduced by modifying the opportunity for crime in the built environment. Moving the night-time
tavern crowd away from vacant storefronts after closing time will inevitably reduce the number of
burglaries and vandalism incidents to the stores.” (ENV 14383-2:2003: 5). The European Standard on
“prevention of crime – urban planning and building design” stipulates this particular approach to
urban security, and it is presented in greater detail in the next section of this report.
Secondary prevention is more promptly related to the perpetrator, location or the victim of crime in
that it only targets objects that are at risk. Many, if not most forms of secondary crime prevention
are not implemented by the authorities, but by individuals or private companies who secure their
property, or take measures for personal defence. Target hardening, or personal protection through a
bodyguard are examples of how secondary crime prevention is applied by private actors. Because
security is costly, risk assessment can help to use resources most efficiently in the private and public
sector.
A prerequisite of secondary crime prevention therefore is knowledge about whom or what is at risk,
and to what degree. Policy makers and practitioners can draw from criminological, forensic, psycho-
logical, and sociological research to this end. Studies in these domains have identified hundreds of
“correlates of crimes” (Ellis 2009), and revealed intriguing findings about criminal biographies and
careers (Farrington et. al. 2006, Moffit 1993, Sampson and Laub 2003) as well as criminal decision
making (Katz 1988). However, the sheer volume of available information sometimes appears to be
an obstacle rather than an advantage for urban policy making. It is not surprising that crime preven-
tion practitioners often rely on their immense professional experience and tacit knowledge rather
than on academic research: streetworkers, school councillors, and social workers know their clients
well and use a wide repertoire of preventive measures and programmes to reduce the risk of indi-
vidual offending. The purpose of the BESECURE approach is to synthesize as much relevant research
and as many best practices as possible into a comprehensive knowledge base.
Tertiary prevention describes reactive measures to prevent reoffending, repeated victimisation and
measures to reduce crime rates in established hot spots. Again, for each type of prevention there
are corresponding instruments for risk assessment: Forensic-psychological scales such as FORTES
(forensic operationalised therapy-risk-evaluation system) or LSI-R (Level of Service Intervention –
Revised) use a large repertoire of underlying indicators and scales to assess the risk of individual
criminal behaviour, reoffending and recidivism. Selective Incapacitation is a highly controversial

Page 8
Title: GA no.: 285222
criminal policy that seeks to incapacitate crime prone individuals, e.g. by three strike legislation and
mandatory minimums in sentencing. In regard to the place of crime, crime mapping applications
visualise the spatial distribution and clustering of past crime incidents in order to make predictions
about their trend. Section 3.2 discusses which elements of crime mapping and predictive policing
can be utilised within the BESECURE process.
From this brief overview it becomes clear that a holistic crime prevention strategy is a complex task
spanning different governmental domains and their corresponding professional fields (such as edu-
cation, criminal justice, social work, probationary service, policing, and city planning). The nine sec-
tors of crime prevention illustrated in Table 1 are not mutually exclusive. Some preventive measures
cut across two or more of the nine categories, for instance measures that address at-risk offenders
together with the local setting they live in. Neither are the nine areas of crime prevention equally
relevant on the municipal decision-making level. A city is not a closed social and political system and
is therefore susceptible to all kinds of influences from the wider political, economic, and cultural
environment that affect its security. Conversely, a city has limited impact on its larger environment,
for example to influence national legislation in regard to criminal law (but of course it can enforce
this law more or less strictly). This is not to deny that cities can establish a distinctive security cul-
ture. The most shapeable fields of urban crime prevention are primary prevention in the public
space, secondary prevention of at-risk-offenders, situations and victims, as well as tertiary preven-
tion in crime hot spots (see Table 1).
The nine categories of urban security and crime prevention provide a minimalist overview of the
multitude of disparate measures which often have little else in common than their engagement with
“urban security”. The “evidence-based policing matrix” (Lum, Koper, Telep 2010) takes this typology
a step further. It is an important tool that works as an interface between research and practice. It is
discussed further in Section 3.3 of this report.
Whereas the nine sectors provide a rather analytical picture, more policy driven distinctions set
apart different approaches according to their ideological provenance: e.g. restorative justice vs.
criminal justice, social policy vs. risk management (see Edwards et al. 2013: 271). In a recent study by
the EU URBIS project, urban security policy makers (panel 1) and criminologists (panel 2) where
asked through a Delphi panel about the meaning of “managing urban security”, “the problems of
urban security” and “different approaches to managing these problems”.
One of the key findings of the study is that “Crime prevention rather than urban security remains in
fact the more commonly used term in policy discourse in Europe” (URBIS flyer of ESC conference
Eurocrim 2013). Overall the two Delphi panels reported 25 problems and 15 different approaches to
address them as the most relevant practices of urban security management (see Table 2). There was
considerable disagreement in the panels (both between the two panels and within each of them)
about the prioritisation of problems and approaches. However the vast majority in both panels (con-
sensus among three quarters or more of all respondents) reported that “reducing segregation and
promoting social cohesion” is of primary importance to urban security (Edwards, Hughes, Lords
2013: 270).
This of course is a rather vague statement which few people are inclined to deny, but it points to an
emerging field of urban policy making discussed under the label collective efficacy (initially Sampson
et al. 1997, in regard to city planning e.g. Rukus, Warner 2013). Due to its direct applicability and

Page 9
Title: GA no.: 285222
relevance in urban security making, this report describes a tool to measure the degree of social dis-
integration/cohesion in different areas of a city (see Section 4.3.).
The study of Edwards et al. also shows that policy makers in the European Crime Prevention Net-
work (EUCPN) evaluate risk management approaches as an important managerial tool for the pre-
vention of some crimes (in particular violence and property crimes) but less so for other types of
crime (e.g. alcohol misuse and ASB) (see Figure 1 in the annex). Bearing in mind this result, this re-
port considers risk management as a process to enhance urban security. Risk management is a highly
adaptive process and therefore applicable within the different fields of crime prevention. Within an
established context it proceeds in four straightforward steps: identification, analysis, evaluation, and
treatment. These steps can be taken to manage the risks of different crime related events. At the
analytical stage it can assess the risk that an individual becomes deviant, or that he or she becomes a
victim of crime. It also applies to the situation and location of crime incidents: what is the risk of
Table 2: Problems and approaches of urban security identified in a Delphi panel composed of crimi-nologists and crime prevention practitioners (Edwards, Hughes, Lords 2013: 268).
Problems Approaches
1. Incivility and anti-social behaviour 2. Drug trafficking 3. Property crime (burglary, theft, robbery) 4. Criminal damage (vandalism, graffiti) 5. Fraud 6. Violence against the person (including domestic
violence) 7. Alcohol and drug misuse 8. Firearms-related crime 9. Environmental degradation
(e.g. illegal waste disposal, pollution)
10. Knife-related crime 11. Criminal gangs and organized crime 12. Human trafficking 13. Prostitution, illicit sexual services 14. Corporate crime, including corruption 15. Health and safety in the workplace 16. Corruption of public administration 17. State police violence 18. Terrorism 19. Tax evasion 20. Climate change and natural disasters (flooding,
extreme weather) 21. Protection of critical infrastructure (water and food
security, transport and communications systems, energy grids)
22. Immigration and social cohesion 23. Mass demonstrations and civil unrest associated
with austerity 24. Social exclusion and youth unemployment
Degradation of governing capacity through public ex-penditure
1. Enforcing the criminal law 2. Reducing social segregation and promoting
social cohesion 3. Repressing incivility 4. Increased use of imprisonment and correctional
facilities 5. Use of CCTV surveillance 6. Reassuring citizens about their security and about
their fear of crime 7. Reducing the opportunities for criminal victimization 8. Reducing social inequalities in household income,
access to education, employment, healthcare and housing
9. Preventing the onset of offending behaviour and incivility
10. Punitive sentencing policies 11. Requiring citizens to take responsibility for their own
security and equipping them with the capacity and re-sources to meet this responsibility
12. Restorative justice interventions with perpetrators and victims of criminal offences
13. Celebrating social diversity and promoting the rights of minority groups
14. Enhancing the democratic scrutiny and oversight of security strategies
15. Promoting greater health and safety in the the workplace

Page 10
Title: GA no.: 285222
crime occurring in a certain location? How vulnerable/resilient is a certain urban location to particu-
lar crime types, and so on.
Notwithstanding which security approach, or which combination of approaches one takes, it all
starts with a thorough analysis of the status quo. The next chapter reviews three established crime
prevention regimes that all promote the use of indicators, namely the European Standard on urban
crime prevention EN 14383, Predictive Policing technologies, and the matrix of evidence based polic-
ing. The last chapter proposes three essential ingredients for thorough crime analysis and urban
security risk assessment: survey data on social cohesion, collective efficacy and fear of crime; police
registered crime; and socio-spatial indicators.
3. Approaches to crime prevention
3.1. The European Standards on “Prevention of crime - Urban planning and building de-sign: EN 14383 series
The European Standard “Prevention of Crime – Urban planning and building” (hereafter EN 14383 or
“the standard”) is a blueprint for stakeholders to enhance security of urban regions. It a comprehen-
sive aid for planning, managing and orchestrating crime prevention through urban design. The
standard sets out a detailed technological regime for the enhancement of urban security (actual and
perceived) following the guide of prescribed and harmonised steps of action, including a risk man-
agement process (see Figure 2 in the annex for the flow chart). This process leads the user in seven
steps from identification of a crime problem to the selection of adequate approaches taking into
account relevant context information. What appears to be a black box at first glance is a complex
decision making tool, currently containing one European Standard (CEN/EN 14383-1), four technical
reports (CEN/TR 14383-2/5/7/8) and two technical specifications (CEN/TS 14383-3/4) (see Table 3). 4
The standard originates from the work of Technical Committee (TC) 325, initially assembled in 1996
to formulate a European Standard for the reduction of crime and the fear of crime by urban planning
and building design. The initiating countries were Netherland, Belgium, Denmark, France, Norway,
the United Kingdom, Sweden and Austria (Weicht 2003: 9). One of the early initiators was Paul van
Soomeren who today is the regional director of the International Crime Prevention Through Envi-
ronmental Design (CPTED) Association.
4 The European standard follows a rather mechanic process of crime analysis and prevention whereas
BESECURE tools are less prescriptive and more flexibly used.

Page 11
Title: GA no.: 285222
Table 3: CEN/TC 325 - Published standards
Standard reference Title
CEN/TR 14383-2:2007 Prevention of crime - Urban planning and building design - Part 2: Urban planning
CEN/TR 14383-5:2010 Prevention of crime - Urban planning and building design - Part 5: Petrol stations
CEN/TR 14383-7:2009 Prevention of crime - Urban planning and building design - Part 7: Design and management of public transport facilities
CEN/TR 14383-8:2009 Prevention of crime - Urban planning and building design - Part 8: Protection of buildings and sites against criminal attacks with vehicles
CEN/TS 14383-3:2005 Prevention of crime - Urban planning and building design - Part 3: Dwellings
CEN/TS 14383-4:2006 Prevention of crime - Urban planning and design - Part 4: Shops and offices
EN 14383-1:2006 Prevention of crime - Urban planning and building design - Part 1: Definition of specific terms
prCEN/TR 14383-6 Prevention of crime - Urban planning and building design - Part 6: Schools
CEN= European Committee for standardisation TR = technical report
TS = technical specifications TC = Technical Committee
It is worth reflecting on the mechanism of the standard with a bit of detail here, because it provides
some of the ingredients policy makers may like to consider when designing a comprehensive strate-
gy for urban security. The standard includes contents and processes. Contents are “strategies and
measures [...] to prevent and reduce crime problems in a given environment” whereas “process re-
fers to the question: how to follow an effective and efficient procedure in which stakeholders shall
choose the strategies and measures most effective and feasible to prevent and reduce crime prob-
lems as defined by the stakeholders” (prCEN/TR 14383-2: 491). The user of standard 14383 takes the
following steps:
(1) Identification of the type of urban zone and delimitation of the boundaries of the area (e.g.
postal code areas, statistical areas). This sets the general direction of the process because for
different types of urban environments (residential areas, city centres, office areas, shopping
and retail areas, schools, parking facilities, public transport) there are corresponding process
guidelines, assessment tools, indicators and measures (see Table 1 in the annex). The norm dis-
tinguishes 16 levels of intervention ranging from small scale to large scale. Function and size of
the area determine the level of intervention. Table 1 in the annex gives an overview of these
levels, the respective standards that apply to each of them, as well as of some possible ap-
proaches and types of stakeholders to be involved.
(2) Identification of the crime problem. The standard provides two tools for analysing scope and
extent of crime: a prospective crime assessment tool and a retrospective crime review tool. The
crime assessment is to be applied in the planning of new urban environments. Based on crimi-

Page 12
Title: GA no.: 285222
nological theory and experiences it points planners to potential problems that may emerge as a
consequence of planning mistakes. Essentially, the crime assessment tool is a checklist with 77
risk- and protective factors for environmentally induced crimes. These factors relate to offend-
ers, guardians, and victims and are limited to seven crime issues: burglary, vandalism, street vio-
lence, car crime, theft, arson, and fear of crime. (Annex A shows the complete list).
Unlike crime assessment, crime review is an account of already existing urban insecurities. It
suggests a mix of methods to collect a portfolio of information about the physical environment
of the area, its socio-economic and demographic features and its crime history. The standard
recommends collecting both objective (statistical information) and subjective data (opinions,
fears, and experiences) about crime and provides an extensive practical guide for auditing crime
and safety in an urban area.
(3) Identification of the relevant stakeholders. The standard identifies three types of stakeholders,
who can be involved in the management process: owners (such as the municipalities, public
transport, contractors), specialists (such as police, social workers, research consultants), and the
residents or users of the setting (ENV 14383-2: 501).
Based on the results of crime assessment (or review) the body develops and implements a feasible
and effective strategy or policy together with all relevant stakeholders. The standard describes a set
of possible approaches as well as ways and means to evaluate them (but it does not contain a tool
for evaluation).
The technical specifications (CEN/TS) and technical reports (CEN/TR) of the 14383 series apply to
specific urban environments such as public transport, petrol stations, shops and offices, and schools.
There is no room in this report to cover all of them but one additional tool should be mentioned
here because it offers an extensive list of indicators for actual and perceived urban insecurities pro-
cessed through a risk management approach.
CEN/TS 14838-3 describes a risk assessment tool for “reducing the risks of crimes against people and
property in dwellings and their immediate surroundings through planning and design” (CEN/TS
14838-3: 5). Planning and design, as recommended in the standard, strictly follows the steps speci-
fied in ISO risk management: identification, analysis, evaluation, and treatment. In summary, the
standard is an extensive practical guide to target hardening (i.e. physical protection) including more
than 50 parameters to determine the threat level of a given object and the appropriate measures to
be taken in order to enhance the security of the setting (structured into five action classes). The
manual casually names its criminological underpinnings, namely Rational Choice, Routine Activity,
and Defensible Space.
It encourages the user to look at the territory, design, layout and spatial features of the location
through the eyes of a burglar searching for opportunities and weak spots in the urban landscape.
Environmental features that influence the risk of crime include vehicular access, lighting, light pollu-
tion, footpaths and passageways, letterboxes, emergency exists, layout and location of garages,
fences and walls and many others. Modus operandi, experience and resources of the burglar are
additional determinants of the overall risk score of an object and the required measures to protect
it. Table 4 provides an overview of the general parameter classes and their weighted indicators used
in the assessment.

Page 13
Title: GA no.: 285222
Some parameters are ordinal (e.g. type of offender = (a) opportunist, (b) experienced (c) profession-
al) others are quantitative (e.g. market value of goods in the premises). A weighted score is assigned
to each response category in order to make them measurable by some standard metric. The weight
depends on the assumed (not further specified) impact of each single indicator on the overall net
risk. Instead of statistical validity of the weights the authors of the standard assume face validity. For
instance a high level of noise at the setting increases the overall score by nine points whereas low
density of area increases it by twelve points. A window not visible from the public area that is acces-
sible by climbing, contributes more to the overall risk score than a window that is also accessible by
climbing but is visible from the public area. This weighting system makes sure that target hardening
must increase to the degree the object is hidden from public areas in order to keep the threat level
constant.
Text box 1: description of CEN/TR 14383-2:2007
“This Technical Report gives guidelines on methods for assessing the risk of crime and/ or fear of crime and measures, procedures and processes aimed at reducing these risks. Design guidelines are given for specific types of environments to prevent or counteract different crime problems consistently with the urban planning documents (see 4.3). Furthermore, guidelines for a step by step process are presented to involve all stakeholders (see 4.4) engaged in urban planning and environmental crime reduction as well as all other stakeholders mainly local and regional authori-ties and residents in the multi-agency action needed to minimise the risks of crime and fear of crime. This Technical Report is applicable to the planning process of new, as well as existing, ur-ban areas. An area can be the neighbourhood or environment ranging from just a few houses or streets to the whole city with a focus on public spaces.”

Page 14
Title: GA no.: 285222
Table 4: risk indicators (CEN/TS 14838-3:2005: 26-35)
Parameter class Weighted indicators:
Par
ame
ters
fo
r p
ote
nti
al
sign
ific
ance
of
bu
rgla
ry
Objective importance of the asset
Market value of goods in the premises Type of documents in the premises Irreplaceable goods in the premises
Subjective importance of the asset
Assessed value of items present in the premise Seriousness of an intrusion without theft Most feared kind of aggression
Type of aggressor Opportunist-, experienced-, professional burglar, mone-
tary/politically motivated kidnapper
Par
ame
ters
fo
r p
ote
nti
al r
isk
of
bu
rgla
ry:
ind
ivid
ual
dw
elli
ngs
Site and physical environment
Density of the area Access and road network Types of access Immediate vicinity of the dwelling Presence of landscaping giving visual obstruction Level of noise in the vicinity Site adjoins railway line or river or wooded area
Human and social factors of the environment
Type of development Type of neighbourhood Crime history of the area Neighbourhood relations
Use of the building Access and parking close to the dwelling (vehicles) Access and presence close to the dwelling (pedestrian) Periods of occupancy
Physical characteristics of the build-ing
Cellar, basement or attached garage Accessibility of the roof roof resistance size of roof openings
Windows and French windows
French windows Accessibility of visible windows and French windows Windows at rear or not visible from public areas Shutters/security glazing on easily accessible openings
External doors
Number of external doors External doors in concealed areas Break-in resistance of the weakest external door of the
house
Perimetric and occupant factors
Lighting of accesses Appearance (4 indicators) Protection of valuables (3 indicators) Boundary between public and private space Access control of visitors
The extensive technical guide is followed by an annex with the required assessment instruments
(checklists, parameter scoring sheets, evaluation tables and a cost-benefit checklist of methods to
enhance security in residential blocks). The eventual result the user of the standard will get from the
assessment, is a table summarising the recommended resistance class (conforming ENV 1627) of

Page 15
Title: GA no.: 285222
security features of locks, doors, windows, glazing etc. (see annex Table 2). The resistance class of a
security device informs the user how long it will resist attempts to break it, taking into account the
experience level of the burglar as well as the equipment he uses. From a reverse engineering point
of view the information given in the table can be exploited by a malevolent user to determine which
hardware and techniques are required to breach the security measures of the object under assess-
ment (‘dual use’). Possibly entry methods are explained for all six resistance levels, for example, for
level six: “experienced burglar uses in addition [to the tools named in level 1-5] more powerful elec-
tric tools e.g. drills, jig saw, sabre saw and angle grinder with 230 mm maximum diameter disc”
(CEN/TS 14838-3:2005: 22).
3.1.1. Appraisal of EN 14838 and supplemental security assessment tools
The European Standard5 “gives guidelines for assessing the risk of crime and/or fear of crime and
measures, procedures and processes aimed at reducing these risks” (prCEN/TR 14383-2: 493). Some
may foster the hope that standards can enhance urban security in the same fashion that other
standards have revolutionised processes in their domains. Security and crime prevention however
have an inherently political nature that may resist the imposition of standards, or may bring about
“unintended consequences of different sorts of standards operating in distinct social domains”
(Timmermans, Epstein 2010: 69).
As with every standard the 14838 series does not leave much room for creativity and innovation
because it rests on a rather mechanical understanding of the causes of crime and its prevention. To
be sure, crime prevention can be that simple: fortify your house and burglars will look for an easier
target elsewhere. And if there is no easy target available they might not break into any house at all.
Avoid prominent planning mistakes in the design of car parking facilities and you inhibit the number
of thefts from cars in this particular area or even in the whole city. At the very least, the standard
can raise awareness of the numerous environmental factors that influence crime. It is a strict practi-
cal application of defensible space and routine activity theory and has its place in any comprehen-
sive crime prevention strategy.
However every standardisation bears the risk of standardising mistakes, which are then difficult to
change once the standard becomes a routine. The rather crude scoring system that underlies the risk
assessment of the standard has the advantage that it is easy to apply and the disadvantage that it
may not be as meaningful as the numbers suggest. It appears that social trust and cohesion is the
main driver of some of the assumed risk factors (e.g. incivilities). An urban security policy that rests
on the assessment of flawed indicators is likely to cure symptoms rather than causes. Moreover,
standardised risk assessments are prone to overlook idiosyncrasies in the social configuration of an
urban area. It should therefore be applied in combination with other approaches.
The EN(V) 14838 series is a valuable aid for practitioners who would rather choose from a set of
standardised measures against crime than try to invent new ones. Surprisingly the standard is hardly
known among practitioners. According to a (not representative) survey of the German Institute on
5 The most cost effective way to buy the standard is the online shop of the Estonian Centre for Standardisa-
tion: http://www.evs.ee/groups/13745/protection-against-crime

Page 16
Title: GA no.: 285222
Urbanism Affairs (Difu 2012: 23) less than one out of ten polled city planning offices knew about this
standard.
It should be noted that the European Standard on Prevention of Crime is not the only standardised
tool for enhancing urban security. In fact there are more compendiums, reports, manuals, guides
and handbooks available than this report can cover. Table 5 lists some of the available resources that
are similar to the EN 14383 series. Unparalleled in detail and complexity is the risk assessment guide
to the mitigation of terrorist attacks against buildings of the US Federal Emergency Management
Agency (FEMA 425). The guide is a useful supplement to EN 14383, where measures against political
violence are only considered in regard to attacks against buildings with vehicles but not in regard to
other aggressor tactics such as the use of biological threat agents, IEDs, or small arms (RPGs, guns).
The guide includes a standalone software application called the Risk Assessment Database “that is
both a collection tool and a management tool. Assessors can use the tool to assist in the systematic
collection, storage, and reporting of assessment data. It has functions, folders, and displays to im-
port and display threat matrices, digital photos, cost data, emergency plans, and certain Geographic
Information System (GIS) products as part of the record of assessment. Managers can use the appli-
cation to store, search, and analyse data collected from multiple assessments.” (FEMA 2005: B1-3).
Table 5: Selection of resources for guides and tools on crime prevention through urban design (refer-ring partly to German Institute of Urban Affairs 2012: 23)
Institutions Title
Hessian Ministry of Interior Recommendation of quality seal “Secure Housing”.
Saxony Ministry of Social, Women's and Family Affairs and of Health
Instructions “Secure living quarters - good neighborhood”
North Rhine-Westphalian Crime pre-vention council
Handbook “Crime prevention through urban design”
State of Rhineland Palatinate Guide to urban design and crime prevention
State of Saxony Standards for the “security badge secure Housing”
City of Detmold Checklist for developing areas in rural regions
Dutch Centre for Crime Prevention and Safety
Politiekeurmerk veilig wonen (police quality seal secure hous-ing)
Australian Capital Territory Govern-ment
Crime Prevention and urban design resource manual
New Zealand Police Guidelines for CPTED for licensed and off-licensed premises
US Department of Housing and Ur-ban Development
Creating defensible space
Federal Emergency Management Agency (FEMA)
FEMA 452. Risk Assessment. A how-to guide to mitigate po-tential terrorist attacks against buildings.

Page 17
Title: GA no.: 285222
Many of the resources listed in the table are redundant and offer similar tools and practical recom-
mendations. A noteworthy exception to this canon are the “Guidelines for CPTED for licensed and
off-licensed premises” (ALAC 2012). This resource can be a meaningful add-on to the European
Standard, which deals with different types of urban settings (e.g. schools, petrol stations, shops and
offices) but not with the ubiquitously notorious hot spots of bars and night-time entertainment are-
as. The EN 14383 provides checklists with indicators, as well as prominent planning mistakes in the
layout, interior and exterior design of bars, clubs, ‘watering holes’, and alcohol-selling convenience
stores.
Finally, the ISAN Prevention Model offers a good trade-off between theoretical and empirical valida-
tion on the one hand and practical applicability on the other. Its strength lies in the combination of
indicators from four crucial fields of urban security policy: social Infrastructures (e.g. good schools,
day care, youth centres); Social management (e.g. concierge service, neighbourhood management
office); Architecture and urban design, and Neighbourly community (e.g. social trust, cohesion).
3.2. Predictive Policing and crime mapping technologies
This section reviews elements from predictive policing and crime-mapping services, relevant to the
BESECURE framework. Predictive policing is a neologism and umbrella term for a set of integrated
practices and methods which are employed to collect, analyse and respond to data.
This process usually includes geographical information about crime. The geographic representation
and analysis of crime is an innovation made some 185 years ago (Weisburd, McEwen 1997:4). As of
today, smart cities rely on advanced GIS as a means to improve the living conditions of its inhabit-
ants and to enhance security. Mobile and cloud computing open up new fields of crime analysis and
crime mapping that allow users to monitor crime reports in big cities almost in real time. Gunfire
locators (ShotSpotter) sense the use of guns and transmit the location to law enforcement agencies.
Powerful computers and complex algorithms help to shape Big Data. But what are the actual bene-
fits of this sophistication? To better decide which new technologies are most beneficial for a
BESECURE framework this section reviews the functionalities of online crime mapping services and
instruments of predictive policing.
For this purpose, it is reasonable to look to the highly advanced Anglo-American crime mapping
market, even though many of these examples cannot be transferred one-to-one to the European
context for several reasons. Rather than carrying out our own time-consuming research on crime
mapping software products, this report draws on the results from the “survey and evaluation of
online mapping companies” mandated by the US Department of Justice. It provides “a baseline as-
sessment of what companies exist, what features they provide, data uses, data quality and analytical
functions” (Paulsen, LeBeau 2012: 6).
Seven online-mapping crime services are included in the exploration of the online crime mapping
market. Table 6 summarises the results of the survey. The most advanced service in terms of func-
tionalities is “Regional Analysis and Information Data Sharing” (RAIDS) provided by BAIR Analytics.
The company Public Engines Inc. provides free monthly online training sessions for users in which
analytical practices such as intelligence-led policing, and predictive analysis are taught. The accuracy
of the data from all seven products was within a small margin of error. The report also raises critical
questions about privacy issues of the victims of the mapped crime incidents.

Page 18
Title: GA no.: 285222
Table 6: summary of results of “survey and evaluation of Online Crime Mapping Companies” (Paulsen, LeBeau 2012)
Features
Product (Company)
functionalities Data fees
# of agencies served
Crime types
Temporal Analysis
Map display
Non-crime data
User alert
Buffer analysis
Advanced analysis
Mobile App
Other Acquisition
method Receipt
schedule storage
Storage duration
validation
Crime Mapping (The Omega Group)
144 All
major crimes
Yes, variable
Pin No Yes No Trend Report
Yes Detailed reports
Direct con-nections to agency RMS*
Usually every 12
hours
Secure hosting facility
Rolling 90 days
Tested for accuracy
before going life
Fixed monthly based on
agency size
Crime Reports (Public Engines Inc.)
1.700 All
major crimes
Yes, variable
Pin No Yes No No Yes Provide
tips online Direct feeds or uploads
daily Multiple methods
Fixed monthly based on
agency size
EveryBlock (msnbc*)
16 All
major crimes
No Pin Yes No No No Yes -
Scraping from public websites; consuming public feeds
Daily, hourly,
near real time
Secure Indefinitely yes free
Mapnimbus (Geo. Techn. Group)
25 All
major crimes
Yes Pin Yes Yes No Reports No - Agency upload
daily Secure hosting facility
In perpetuity Yes Based on
agency size
My Neighborhood Update (Corona Solution)
26 7 basic crimes
Yes Pin No Yes No Trend charts
No -
Direct con-nection; automated feed
Up to every
minute
Off-site secure facility
1 year Automated data check
Free. Updates are priced based on
agency size
RAIDS* Online (Bair Analytics)
100+ All
major crimes
Yes, variable
Mult. No Yes Yes Density trends
No Multiple
advanced tools
Agency upload
Depends on agen-
cy
Secure hosting facility
Based of agency
preference
Thoroughly tested
Free. Monthly fee for law-
enforcement-only tool
ATACRAIDS*
Spotcrime (Spot Crime)
n.a. 8
major crimes
No Pin No Yes No No Yes Report a
crime
Scraping from public websites; consuming public feeds
n.a. n.a. n.a. n.a. n.a.
* Abbreviations: RAIDS = Regional Analysis and Information Data Sharing msnbc = Microsoft National Broadcasting Company ATAC = Automated Tactical Analysis of Crime RMS = Remote Management Station

Page 19
Title: GA no.: 285222
In addition to online services there are numerous standalone desktop/mobile applications for crime
mapping available. Given the necessary data, crime mapping can be done using conventional GIS
software (such as ArcGIS). Usually these products provide more analytical functions than online ser-
vices and require more skills and training in GIS. This is where crime mapping companies such as
BAIR Analytics and Public Engines come into play: they compile the customer’s data into meaningful
maps with functions law officers can use on the strategic and tactical levels. Moreover, the crime
mapping business also includes the organisation of conventions and conferences, as well as training
courses. This is not the place for an introduction into crime mapping, but the reader who wants to
learn the necessary skills to set up his own crime mapping GIS project will find plenty of useful text-
books (e.g. Chainey and Ratcliffe 2005), whitepapers (IACA 2012) and comprehensive training pro-
grammes such as those offered on a non-profit basis by the National Institute of Justice (NIJ) and the
International Association of Crime Analysts (IACA).
The spatial analysis of crime patterns can include the prediction of crime, which is often referred to
as predictive policing. Probably the most prominent example of a predictive crime mapping tool on
the market is the software ‘predpol’. Time, Al-Jazeera, The New York Times, The Economist, BBC,
and legions of bloggers have reported about this product. For a large part the media wrongly depict-
ed the software as being able to ‘forecast crime’ (for a really good journalistic ‘story’ about predpol
see Bond-Graham, Winston 2013 in SF Weekly). Fact is that a thorough external evaluation of the
instrument is still missing. The company itself claims evidence of a 13 percent decline in crime rates
(compared to control sites) four months after the implementation of the system. A longitudinal
evaluation without a control site indicated a drop of 19% in property crime in an area where the
software was implemented (Heaton 2012). Although the algorithm and the exact methodology of
the ‘predpol’ software is a well-kept secret, it seems safe to say that it combines some of the statis-
tical models mentioned in the next section, such as near repeat modelling, self-exciting point pro-
cess modelling and kernel density estimation. The vital statistical parts of the predpol engine are
described in an article published by predpol developers in the Journal of the American Statistical
Association” (Mohler et al. 2011). If not for its capability to actually predict crime, predpol is a para-
gon for successful marketing that includes PR, political lobbying, and the building of credibility and
trust by summoning well known academics, Silicon Valley celebrities, and police professionals from
the highest echelons as testimonies for the product (Bond-Graham, Winston 2013).
Predictive policing, if one wants to use this term, includes not only spatial analysis but all instru-
ments – new and old – that have the purpose to assess future crime risks. The next section gives a
general overview of these instruments without explaining them in detail. The reader should keep in
mind that these instruments should not be mistaken for interventions: from the public discussion it
appears that some commentators believe that predictive policing is tantamount to the prevention of
crime. Even though crime mapping can govern police action, this represents but one type of crime
prevention among many other approaches: criminal justice. The BESECURE approach promotes ex-
panding certain elements from predictive policing beyond classical police work into a comprehensive
approach to crime reduction.

Page 20
Title: GA no.: 285222
Conventional and advanced analytical tools
Recalling the nine sectors of crime prevention described earlier in Section 2.1 of this report, it is now
time to focus more narrowly on the corresponding methods and data requirements for each of these
sectors. Table 7 represent the tasks, approaches and statistical models that are associated with each
of the three possible targets of crime prevention: the offender, the situation/location, and the vic-
tim. Whether conventional analytics or more advanced (predictive) analytics are employed depends
on the volume and complexity of the data, which in turn is usually determined by the size of the city
/ jurisdiction of the department. Traditional and intuitive police work may be the most effective ap-
proach to enhance security in small and medium sized towns, whereas more complex crime envi-
ronments usually require more systematic approaches.
The overview in Table 7 sets apart different fields in which predictive instruments can be applied. On
the offender level there are tools to assess the risk of recidivism, domestic violence, amok and
school shootings, retaliatory violence of gangs, and market activity of organised crime. On the situa-
tion/location level there are two types of tools, the first used to identify areas at increased risk and
the second to identify risk factors in urban settings. The objectives of instruments working on the
victim level are: to identify vulnerable populations, to identify how different characteristics of the
urban setting influence the risk of individual victimisation, to identify individuals with a high risk of
victimisation (e.g. for domestic violence).
All the instruments summarised in the table produce different kinds of statements as a result. Some
result in probabilistic statements, other in descriptive scenarios. This poses a problem for the deci-
sion maker because results cannot be compared meaningfully, or it takes a lot of interpretative ef-
fort to do so. For example, the statement: “The presence of a licensed premise in an certain area
increases the likelihood that a violent crime will take place in the confines of this area by ten per-
cent” is a very different result than the statement “The presence of a licensed premise in an certain
area accounts for ten percent of all crime incidents in this area”. How is a decision maker supposed
to know which effect is more harmful for his city? Unfortunately the more advanced and more valid
statistical models tend to produce rather confusing results such as non-linear coefficients (logistic
regression weights) or odds ratios.
Text box 2: predictive policing:
“Researchers, educators, government officials, consultants, crime analysts, police commanders, private software companies, civil rights activists, and the media have all made their interests and positions on the topic well known, and it continues to be hotly debated both inside and outside policing circles. There are a number of stakeholders worth noting in the field of predictive polic-ing. Researchers have the background and expertise to design predictive models; civil rights ac-tivists are concerned that these techniques may intrude on the rights of citizens, especially poor and minority populations; analysts and investigators have a professional interest in how these approaches can improve their work and make it more useful; police chiefs are eager to find new techniques to reduce crime without adding to their workforce; and the private sector sees poten-tial funding from research grants, consulting, and software development.” (RAND 2013: 5).

Page 21
Title: GA no.: 285222
Technical sophistication, it seems, is not necessarily an advantage to every analyst and stakeholder.
Table 7 therefore discriminates between conventional (heuristic) means to enhance security and
more technology driven ones. Both have their place in managing urban security. Interviews with
crime analysts conducted in the US and Canada by the RAND Corporation showed that “Instead of
using the more mathematically structured hot spot methods, departments often use less sophisti-
cated techniques to uncover actionable crime hot spots. They found that these methods are effec-
tive because police departments know their cities. Specifically, they know the high crime neighbor-
hoods, the types of crime likely to occur in each neighborhood, and when they are likely to occur.
They know and understand the population and, generally, they can easily discern crime indicators.
We asked, ‘What predictive techniques do you get the most use out of?’ One crime analyst respond-
ed by describing what can only be interpreted as purely heuristic tools” (RAND 2013: 27). The best
example of such a purely heuristic but nevertheless effective and much favored tool is the classical
crime pin map.”
The results from BESECURE stakeholder interviews in Freiburg came to similar conclusions and re-
veal that the acceptance of electronic decision-support tools and advanced analytics can vary a great
deal between different institutions as well as within different organisational branches of the same
institution. Interviews with police officers in the city of Freiburg (230,000 citizens) showed that more
advanced managerial tools and information systems are of little value for the police and the munici-
palities. The interviewed experts see the value of such tools on a higher organizational level, such as
the Ministry of Internal Affairs. For establishing a BESECURE framework it is important to know more
about the critical size of a city in regard to the meaningful implementation of electronic decision
making tools. It is also crucial to know more about breaking points of organisational size, that is, at

Page 22
Title: GA no.: 285222
which point the decision making process of an organisation is so complex that electronic support
would improve this process. A thorough end user analysis also has to address the question which
cities would benefit to what degree by the adoptation of electronic planning tools? What kind of
cities can be efficiently policed by intuition and experience and which cities need electronic man-
agement support in order to enhance urban security efficiently?
Figure 1: conventional and advanced instruments in policing and hot spot analysis
Conventional crime pin map used in a department of Ger-man municipal Police (Photo: Badische Zeitung Oct/10/2012)
Predpol developer Jeff Brantingham demonstrating predic-tive policing at an LAPD command post in 2012 (Photo: AP/Damian Dovarganes)
The BESECURE approach seeks to strike the right balance between technology driven and conven-
tional (heuristic) means of crime prevention by letting the end user decide upon the tools he wishes
to implement. Which method is finally used within the BESECURE framework is the end user’s deci-
sion. Regarding the exaggerated expectations, the critique, and the worries that some people asso-
ciate with predictive policing it seems advisable to rethink the usage of the term within European
crime prevention practice. Moreover some of the misconceptions should be countered before they
spread, such as the “erroneous theme that advanced mathematical and computational power is
both necessary and sufficient to reduce crime” (RAND 2013: 115)
Nevertheless, some of the instruments within the large repertoire of predictive approaches to crime
prevention have clear benefits. The most relevant instruments for a BESECURE approach are those
that target the situation/location of crime incidents. On this level Risk Terrain Modelling (RTM)
(Caplan et al. 2011) seems to be a promising tool for the urban data platform (see Text box 3). The
RTM toolkit for ArcGIS is free. Equally relevant are instruments that combine the spatial and situa-
tional analysis of crime with the risk of victimisation, such as kernel density estimation (KDE). KDE
can create hot spot maps (single kernel density of crime) but it is also capable of calculating crime
risks in relation to additional spatial characteristics.
CrimeStat dual kernel density routine (Oberwittler 2004) can draw quite a different picture of the
risk landscape within the urban environment, by, for example, discerning between the spatial distri-
butions of crime events within the city versus the spatial distribution of crime incidents in relation to
characteristics of the neighbourhood (see Figure 2). For an introduction into the functionalities of

Page 23
Title: GA no.: 285222
Text Box 3: Risk Terrain Modelling
RAND (2013:51):
“Risk terrain modeling (RTM) is a simple approach to assessing how geospatial factors contribute to crime risk that was developed by Joel Caplan and his associates at Rutgers University. In their compendium on RTM, Caplan and Kennedy describe RTM as follows:
Risk Terrain Modeling (RTM) is an approach to risk assessment in which separate map layers represent-ing the spatial influence and intensity of a crime risk factor is created in a geographic information sys-tem (GIS). […] All map layers are combined to produce a composite risk terrain map with values that ac-count for all risk factors at every place throughout the landscape (Rutgers Center on Public Security, 2011). [http://www.rutgerscps.org/rtm/]
RTM is a toolkit that plugs into ArcGIS. The method used is fairly simple. First, the analyst lays a grid over the jurisdiction to be analyzed. The analyst then tests the statistical relationship between the presence of certain geospatial features in grid cells (where the geospatial features are marked in GIS layers) and the presence of crimes of interest within that grid cell. Features with a strong positive association with crime are selected for the model. The method then counts the number of selected features present in each grid cell; grid cells with the greatest number of risk-inducing features are labeled as likely hot spots (and colored red or orange, typically).”
Muller/IBM (2011):
“Risk terrain modeling provides a way to measure multiple risk factors across spatial units. The resulting product produces a “risk terrain” map which displays the intensity of all risk factors for each spatial unit. This map shows where conditions are favorable for crimes to occur […] The website also provides docu-mented known risk factors by crime type to help identify aggravating and mitigating risk factors. You can decide which risk factors to include through testing with statistical analysis the place-based correlation of each risk factor with the outcome event of interest. An ad hoc approach can also be used, but this requires that you justify your decisions based on existing theory, empirical research and professional experience. At each spatial unit, every risk factor can have only one of two possible values (0 or 1 for aggravating factors, -1 or 0 for mitigating factors). Multiple case studies, and documents on applying RTM to specific crime types (e.g., shootings, aggravated assault) can be found online.”
https://www.ibm.com/developerworks/community/blogs/johnmuller/entry/preview_of_predictive_policing_publication11?lang=en
the CrimeStat programme see Levine 2006 and 2008: 187-193. The crimeStat programme (current
version IV, released June 2013) is open source.6
Instruments that assess purely individual risks of offending, recidivism and victimisation (such as
clinical and forensic inventories) are of lesser importance from an urban policy point of view, with
the exception of those instruments that address the perpetrators and victims of domestic violence.
This topic has been mentioned by several stakeholders as a vital concern of their city and consider-
ing the immense dark figure of this crime, it is easy to see why.
6 All programme resources are available at:
http://www.nij.gov/topics/technology/maps/pages/crimestat.aspx

Page 24
Title: GA no.: 285222
Figure 2 (Oberwittler 2004: 208): Risk surfaces of violent crimes using residential population (left) or
population at risk (right) as denominator (Cologne, 1999/2000, dual kernel density estimation in
CrimeStat 2.0).
It is beyond the scope of this report to go into greater technical detail of each instrument for predic-
tive policing, crime mapping and hot spot analysis. For the purpose of this section it suffices to pro-
vide a rough overview of the range of available applications, models and processes.
One area of application of these tools that seems underdeveloped is the evaluation of preventive
measures. Some of the models could be used to evaluate the effectiveness of policy interventions,
that is, to what degree they mitigate crime risk. Especially in cases where a randomised control
group design is not feasible to assess the measure, it can be the second best approach to include the
intervention as a potential protective factor into a risk assessment model.
3.2.1. Appraisal of predictive policing technologies
The use of computerised aids for the prevention of crime in Europe is a far cry from its Anglo Ameri-
can counterpart. This is neither per se a good nor a bad thing. Many of the benefits of new technol-
ogies come together with new risks, such as concerns over privacy issues. There is some indication
that predictive crime analysis can improve police performance and thereby enhance urban security.
But this success has to be weighed against potential fears among the public about the practice itself.
Some people may prefer the worry of street crime over the apprehension that the authorities own a
tool that can predict it.
According to a baseline assessment of predictive policing, a common pitfall in the application of pre-
dictive policing is “overlooking civil and privacy rights” (RAND 2013: 124). Some technologies men-
tioned in this chapter could not be implemented in European countries for constitutional reasons.
Another important observation taken from the Anglo American experiment is that advanced meth-
ods are not necessarily better than the intuition of experienced professionals. Or as one of the
Page 25
Title: GA no.: 285222
BESECURE stakeholders in Freiburg put it during an interview: that the implementation of a decision
support tool “would be more trouble than it’s worth”.
A recent report on predictive policing from the RAND Corporation advises vendors and developers of
software tools to “move beyond predictions to offer explicit decision support for resource alloca-
tions and other decision.” (2013: xxii) This is what the BESECURE approach is essentially about. In
order to advance the already sophisticated field of urban security enhancement it is essential to
provide easy-to-use, affordable (if not free), accessible, intuitive but yet beneficial instruments.
Moreover we recommend utilising some of the instruments discussed in this section in other areas
of crime control and prevention. Therefore the next section moves from this more technical discus-
sion to the area of policy decision-making and the question: what can these tools and instruments
do about the problems that have been identified?
3.3. The matrix of evidence-based policing
In this chapter we move from the computer-assisted analysis of crime issues to the analysis of poli-
cies and interventions. The nine types of crime prevention presented earlier in this report provide a
minimalist overview of different intervention paradigms at the offender-, location-, and victim level.
The evidence based policing matrix makes this conceptual idea practicable, leading to a better iden-
tification of the best-suited specific course of action. It is an interactive online tool and works as an
interface between research and practice. At its back end stands a continuously updated repository
currently containing the results of 125 evaluation studies in the field of policing. At the front end all
studies are visually arranged in a cuboid that supports helpful GUI functions such as mouse-over
hover boxes that show short information about the otherwise only pictorial represented studies.
Moreover it is possible to look into specific segments of approaches (e.g. only approaches at the
micro place level) and review the respective information in table form.
The objective of the instrument is to process the results of evaluation studies in such a way that they
become meaningful information to practitioners, and not just a simple list of (best) practices. How is
this done? Studies that qualify as scientific evaluations7 of crime interventions are alphanumerically
tagged (coded) in regard to three attributes of the intervention. At the front end these attributes are
represented by three axes in a cuboid. Each study is located within this cuboid according to the con-
figuration of its attributes.8 The three attributes are:
(X) Type or scope of target (parameters: individuals, groups, micro places, neighbourhoods, juris-
diction, nation state).
(Y) Specificity (parameters: general, focused)
(Z) Proactivity (parameters: reactive, proactive, highly proactive).
The effectiveness of each intervention in reducing crime (non-significant-, mixed-, significant effect)
is represented by the shades of the dot that represents the study within the cuboid. Interventions
7 The research design of the evaluation must be experimental or quasi-experimental.
8 The Z and Y axis can be thought of as continuums (with continuous numerical values) but they are treated as
ordinal categories with discrete values. The X axis carries both ordinal and categorical information (a group is smaller than nation state but a micro place is neither more or less in value than a group, but a different entity).

Page 26
Title: GA no.: 285222
that were assessed as having a harmful effect are represented by a triangle. A fifth attribute (meth-
odological rigor) becomes visible only when the user clicks a study or reviews a single slice of the
cuboid (Figure 4).
Figure 4: The evidence-based policing matrix (Lum, Koper, Telep 2011).
The tool is available online9 together with a key10 to the symbols, videos of workshops and general
background information.
The matrix closely resembles the distinction into primary, secondary and tertiary prevention ad-
dressed to offender, location, or the victim as discussed in Section 2.1 (Table 1). ‘Highly proactive’ is
synonymous with primary long-term prevention; reactive is synonymous with tertiary prevention.
The matrix adds specificity as a reasonable third characteristic thereby discriminating between crime
prevention that is focused on single crime issues (e.g. burglary), and crime prevention that is focused
more broadly on for example violent crimes. Specificity can also describe the approach, for example
by telling apart the measure “no alcohol in public transport” from the measure “no alcohol in pub-
lic”.
9 http://cebcp.org/evidence-based-policing/the-matrix/
10 http://cebcp.org/wp-content/evidence-based-policing/the-matrix/MatrixKey.pdf

Page 27
Title: GA no.: 285222
3.3.1. Appraisal of the evidence based policing matrix
The evidence based policing matrix is a literal show case for criminal justice policies. It can contrib-
ute a great deal to the management of urban security if it would show not only criminal justice ap-
proaches but also civic crime prevention policies. The virtue of the tool is that it can relatively easily
be extended and adjusted for this purpose. To use the matrix within the BESECURE project the fol-
lowing changes of the underlying database and coding-scheme are recommended.
For the BESECURE framework the matrix could be extended in order to include not only policing
interventions but also civic crime prevention. To this end additional databases and journals
must be considered when searching for evaluation studies to be included in the matrix reposito-
ry. It is important that the underlying database represents a wide range of approaches and is
kept up to date.
The repository should also include methodologically less rigorous results because some crime
interventions defy experimental or quasi experimental evaluation design. It would be a deficit
to exclude them entirely from policy decision making for this reason alone. The BESECURE poli-
cy platform gives the user leeway to design an urban security approach within organisational,
administrative, budget, and political constrains. Scientific evidence may simply not be the most
decisive criteria when making decisions that are inherently political in nature. “U.S. police agen-
cies and their international counterparts are well known for not using evidence-based practices
[…]. Many of the causes for this are organizational, related to the stubborn and slow-changing
nature of police culture, tradition and practice […].” (Lum, Koper, Telep 2011: 8). This can be
considered unfortunate, but unless one believes that this tendency can be changed in the near
future, it would be short-sighted to withhold scientifically less rigorous evaluations from policy
makers. For this reason studies from all five levels on the Maryland Scientific Method Scale
(SMS) (Sherman et al. 1998: 5, Farrington et. al. 2002) should be included. Sound qualitative
evaluations should be considered, too. Each evaluation result should be displayed to the user
together with the information about the research design, using the five levels of the Maryland
Scientific Method Scale plus the extra category ‘qualitative design’. It is then up to the judge-
ment of the user to decide whether a certain intervention appears to be appropriate within the
given context.
The third recommended modification is to make “crime type” an additional attribute in the
coding structure. Again this does not affect the structure of the matrix, but its underlying repos-
itory and coding-scheme. With a new category “crime types” it is possible to generate crime-
specific matrices that display all the information about the approaches (scope, specificity, pro-
activity, effectiveness) in regard to a specific issue. The original purpose of the matrix is to re-
veal clusters of effectiveness in policing practices in general (i.e. to show which particular con-
figurations of scope, specificity, and proactivity are most effective in reducing crime). It could
also be useful to identify such clusters for specific crime issues.
Through these three simple modifications the matrix could be used to organise, process and visual-
ise the information of the BESECURE database for the policy support platform and the inspirational
platform. Table 3 and 4 in the annex suggests examples how the coding structure can be modified.
What is this tool good for? The matrix is an interface between research and practice. It preselects
knowledge that is relevant for urban policy making from a wide range of sources and databases that

Page 28
Title: GA no.: 285222
are otherwise time consuming to research. Given that a sufficient number of relevant studies from a
wide range of journals are included, practitioners of different positions and functions can use the
matrix to investigate questions such as:
I am the director of the cities’ crime prevention council and I want to allocate grants for crime
prevention initiatives. Are there certain configurations of approaches that are more successful
than others? For example: are proactive and focused interventions at the neighbourhood level
more successful in preventing crime, than highly proactive and general interventions at the in-
dividual level?
I am a neighbourhood manager and I want to review approaches on the neighbourhood level
only. Which approaches have been implemented and how successful were they?
The leaders of my organisation want to shift from reactive to more proactive approaches in our
jurisdiction. Given the same crime issue, which proactive interventions may replace reactive
approaches? Are there crime issues for which reactive approaches cannot be replaced?
There is a constant increase in burglary in one specific area of the city. What are the most effec-
tive reactive interventions? Are reactive measures on the neighbourhood level more effective,
equally effective, or less effective to prevent burglary than highly proactive measures on the
neighbourhood level?
The city council wants to see scientific evidence that the interventions of our department are
effective. Which are the methodologically most rigorous studies for the evaluation of interven-
tions on the group level? (see Figure 5 and Table 10).
The tool can certainly not give plain answers to loaded policy questions, but it helps the user finding
a nuanced and substantiated answer quickly. Depending on how much detail is wanted, the tool
directs the user to the most relevant evaluations and research articles, which then can be reviewed
in all due depth.
Figure5: Comparisons of studies in the Matrix of moderate and strong methods. a Quasi-experiments of moderate
quality. b Studies using stronger quasi and also randomized experimentation (Lum, Koper, Telep 2011: 19)11
11 The figure is taken from the website (as of Feb. 2014) and includes more studies than used in the original
paper (from 2011). Therefore the data in table 10 and figure 5 do not match.

Page 29
Title: GA no.: 285222
Table 8: cross tabulation of SMS [Maryland Scientific Methods Scale] method score versus study results (Lum,
Koper, Telep 2011: 18)
SMS method score
3 4 5
Sig. success 43 (69.4%) 4 (33.3%) 8 (34.8%)
Any other result 19 (30.6%) 8 (66.7%) 15 (65.2%)
Column total 62 (100%) 12 (100%) 23 (100%)
χ2 =11.213, p=.004
3.4. Conclusions
The review of research and development in the domain crime prevention in this chapter included:
(a) instruments to analyse and monitor crime issues (crime-mapping tools)
(b) instruments to analyse crime interventions (the evidence-based policing matrix)
(c) instruments that combine both tasks (the European Standard for Urban Crime Prevention).
None of these instruments alone suffices as a comprehensive approach to urban security, but all of
them offer helpful elements in order to develop one. Each instrument has potentials, pitfalls and
limitations. There is no precise rule of how these instruments can be implemented into the operative
process of an organisation. This depends largely on the objectives the organisation pursues, its cul-
ture, management, and openness for new developments. There are however general frameworks in
which these tools can be imbedded: One such framework is the ISO standard on risk management
(ISO 31000). Risk management proceeds in five steps: establishing the context, risk identification,
risk analysis, risk evaluation, and risk treatment. At this level it is not so different form the SARA
model12 – the recommended process model of the Center for Problem-Oriented Policing (POP) that
proposes the tasks: Scanning (Identification of the problem), Analysis (learning the problem’s causes,
scope and effects), Response (acting to alleviate the problem) and Assessment (determining wheth-
er the response worked).13 These tasks are broken up into 60 steps; each step being a one page poli-
cy with a planning directive not exceeding 1,000 words.14 These steps direct the user to identify the
crime problem in all necessary details (e.g. using the environment/behaviour classification scheme
of step 15); give structured guidelines how to research and process knowledge about best practises
to this particular crime problem from different sources (step 19); to decide on the most sustainable
solution in cooperation with local community partners (step 38), how to evaluate the impact of the
intervention (step 46); and how to effectively communicate the whole process including its suc-
cess/failure to the public, the city council, and other stakeholders (step 54). Taken together the 60
12 http://www.popcenter.org/about/?p=sara
13 http://www.adam-europe.eu/prj/8246/prd/19/4/URBIS_Newsletter_December%202013_EN.pdf
14 http://www.popcenter.org/learning/60steps/

Page 30
Title: GA no.: 285222
steps provide a comprehensive framework to crime prevention. All instruments that have been dis-
cussed in this chapter can also be found in one of the steps of this approach.
Although POP includes and promotes non-criminal justice responses to crime, it remains a “policing”
approach. In regard to urban security many cities in Europe approach crime issues not primarily
through the police but through civic agencies plus the police. After all the police has a mandate that
is not necessarily helpful to solve certain social problems. A civic approach to crime prevention can
slightly shift the way problems are identified, analysed and reacted to. In recent years many cities
have developed their own security reports and safety indices in order to have a monitoring tool that
different agencies can draw upon and relate to. The remaining chapter briefly presents on of these
security metrics and provides some principle guidelines how develop a simple metric for urban secu-
rity.
4. Metrics for urban security
This chapter provides a guide to develop a metric for urban security. To this end it briefly describes
the Rotterdam and the Amsterdam Safety Index that are examples for such a metric. The purpose of
the guide is, to demonstrate how available data and indicators can be used to build a crime and se-
curity index. It recommends three basic components derived from crime data (4.1) urban data (4.2)
and resident surveys (4.3). As a showcase this report sets up a security index for the city of Freiburg.
The Rotterdam safety index (Veiligheidsindex) is a valuable approach to measure urban security
through a mix of relevant indicators, including police recorded crime, and survey data about victimi-
zation, social cohesion, residential satisfaction and fear of crime. For policy makers, the police and
Rotterdam’s residents, it became a reasonable source of information for urban safety. The develop-
ers claim that “the Safety Index has contributed to the fact that safety has become measurable, both
objectively and subjectively, and that we can take action on the basis of this” (Gemeente Rotterdam
2014:43). Other authors have contested these claims (van Swaningen 2007; Noordegraaf 2008) and
point to the risk that the index may be corrupted by those policy makers whose performance is
measured through the instrument. Notwithstanding these debates, security metrics are popular and
various cities in Europe have developed such instruments.
Since 2003, the municipality of Rotterdam publishes the safety index annually. It was planned and
developed by the Social Democratic Party in the electoral term 1998-2002. Pim Fortuyn continued
this approach because it was well suited for his Law and Order policy. Essentially, the safety index is
a score that represents the level of urban security in each of Rotterdam’s 75 boroughs. How is this
score calculated? Several indicators underlie the index score. These indicators are aggregated and
weighted in different stages. The final score is calculated from 12 weighted safety elements. There
are four contextual safety elements (social cohesion, edifice, economic prosperity, resident’s satis-
faction) and eight direct safety elements such as vandalism and violence. All safety elements are
weighted by factors between 1.0 and 2.0 according to their assumed impact on security (e.g. vandal-
ism has a weight of 1,0; violence is weighted with 2.0 because its impact on security is more severe).
Each safety element, in turn, is calculated from three scores: one objective and two subjective
scores. The objective score is based on official statistics of Rotterdam. The objective component of
the safety element ‘theft’ for example is composed of several different crime types that are sub-
sumed as theft in the police statistic. The subjective component of the safety element ‘theft’ is de-

Page 31
Title: GA no.: 285222
termined through a public survey of about 10,000 respondents in Rotterdam. Respondents are asked
whether they have been a victim of theft (victimisation) and whether they perceive theft as problem
or threat within their borough (fear of crime). Eventually the information about all three scores is
pooled into one single score that represents the level of safety of in each borough of Rotterdam.15
Because the Rotterdam safety index is surveyed every year it monitors developments over time. The
municipality of Rotterdam also uses the index as a performance indicator to evaluate the effective-
ness of its urban safety policy.
The city of Amsterdam maintains a similar index (Amsterdamse Veiligheidsindex). It provides an in-
teractive online tool where users can browse customised crime maps for different crime types (such
as violence, theft, burglary) and crime problems as perceived in the population of city district and
quarters. Like the Rotterdam Index it includes longitudinal data from 2003 until 2010.16 Both indices
include elements that are also useful for the BESECURE security metric. The remainder of this chap-
ter will briefly review the three main data components of the Amsterdam and Rotterdam Safety
index: police registered crime data, urban data, and survey data. The showcase to this chapter in the
amendment of this report will demonstrate in more detail and with actual data how a crime and
security metric can be set up.
4.1. Crime Data
The most important single crime figure is arguably the crimes per capita ratio (usually reported as
crime incidents per 100,000 inhabitants). A simple criminological rule of thumb is: the bigger the
city, the more crime per capita it will produce (Nolan 2004, Glaeser 1999, Chamlin/Cochran 2004).
Victimology teaches that the individual probability of falling victim to crime differs between cities
according to population size, and within cities according to neighbourhood characteristics. Statistics
of police-registered crime show a clear pattern: the crime rate increases disproportionally with the
size of the city. In Germany the crime rate of robbery (measured as offences per 100,000 inhabit-
ants) is 7.6 times higher in large cities (population of more than 500,000) than in small cities (popula-
tion of less than 20,000). The rate for assaults and minor bodily harm in large cities is 2.5 times high-
er than in small cities. For insults and damage to property the factor is roughly 2, for theft under
aggravating circumstances 3.6, for theft without aggravating circumstances 3.9.17 Although only 16.2
percent of the German population lives in cities with a population of more than 500,000 this share of
the population produces 28 percent of all police registered crimes, whereas the share of the popula-
tion living in small cities with less than 20,000 inhabitants (41.4 percent) accounts for only 23.8 per-
cent of all crimes (Frevel 2013: 357).
However, from the relation between city size and crime rate one cannot assume that urban growth
over time is necessarily accompanied by a disproportionate growth of crime. In fact it is barely pos-
sible to make general statements about the longitudinal development of a city’s crime rate as a con-
15 for more details about the methodology see:
http://www.rotterdam.nl/Clusters/BSD/Directie%20Veiligheid/Document%202014/methodologische%20verantwoording%20VI%202014.pdf 16
http://osamsterdam.com/index.mpl 17
Numbers have been calculated from the police crime statistics for Germany in 2011 (BKA 2012:60, see also Frevel 2013: 357).

Page 32
Title: GA no.: 285222
sequence of population growth (or shrinkage). Too many factors on too many different levels influ-
ence the overall crime rate of a city.18
On the city level police-registered crime is usually public data. That does not necessarily mean that it
is easy to interpret and ready to use. Depending on the national statistical reporting systems, crime
data is prone to misconception and flawed interpretation. Often it is hardly possible to draw a crime
graph without making several footnotes explaining restrictions, limitations and qualifiers of the
numbers. Crime data can be accounted as prevalence (the percentage of convicted and/or suspected
offenders in the population)19 or incidents (the frequency of reported crime incidents (e.g. per capita
or per 100.000 citizens). Note that police recorded crime refers to reported and suspected incidents
of criminal behaviour, that is before a case is cleared and processed through the criminal justice
system. There are additional statistical systems for each stage of the criminal justice system (cases
investigated, offenses cleared, abatement of action, criminal charges, and convicted offenders).
These numbers diverge greatly from each other. To give an example: In 2004 there 5.5 million inci-
dents of police recorded crimes in Germany whereas in the same year there were only 0.6 million
convicted offenders (BMI 2006: 10).
Although a good deal of interpretation and expert knowledge may be necessary to make proper use
of police recorded crime data, it is an indispensable component to a security metric. An urban secu-
rity metric should show which type of crime is prevalent in which area of the city. More detailed
crime data however is usually less accessible. Some cities publish this information others do not. To
develop an urban security metric it is important to know on which geographical unit crime data can
be projected. All other indicators (urban data and survey data) of the metric must be available for
the same administrative unit (e.g. borough, ward, or district). Otherwise the information cannot be
put together in meaningful way.
4.2. Urban data
Socio-spatial indicators provide contextual information about the area. There is no general rule
which indicators are relevant, because this depends on the type of crime under investigation. Crime
covaries with many different factors (see handbook of crime correlates Ellis et al. 2009). These fac-
tors can include risk factors, protective factors, and symptoms of crime.
18 Chamlin and Cochran (2004: 119) conclude in their multivariate analysis of the population size-crime rela-
tionship: “while population size has no appreciable effect on violent and property crime rates, it is by far and away the single best predictor of violent and property crime counts”. 19
In the German statistical reporting system of the police this figure is called Tatverdächtigenbelastungszahl (TVBZ). TVBZ can be calculated for specific groups (e.g. age cohorts) to compare the proportion of suspects between different groups of the population. For a very comprehensible explanation of the of the idiosyncrasies of the German criminal law statistics, see the Second Periodical Report on Crime and Criminal Control in Ger-many (BMI 2006).

Page 33
Title: GA no.: 285222
Van Steden et al. (2013) found a pragmatic way to reduce the overwhelming number of criminogenic
factors to a list of 19 socio-spatial indicators (See figure 6).
Figure 6: Risk factor selection procedure (van Steden et. al. 2013:50)
These indicators (risk factors) are defined “by their ability to signal the possible occurrence of crime
and criminals in certain urban areas, such as neighborhoods and boroughs” (Van Steden 2013: 49).
From a list of 127 risk factors identified in criminological literature, they selected those that are most
relevant to determine the Amsterdam municipalities Safety Index Score (Amsterdam Veiligheidsin-
dex) (see table 9). Although data for these indicators may not be available in every city, this selection
gives a good idea for how and where to start when developing a security metric.
The selection of indicators further depends on the purpose of the analysis. For instance a policy
maker who wants to address the question “What are the spatial commonalities of crime hot spots?”
needs other indicators than someone who addresses the question: “How does the unemployment
rate affect the crime rate of a certain neighbourhood”, or “which borough has the highest overall
crime risk?”

Page 34
Title: GA no.: 285222
Table 9: Selected risk factors and indicators (van Steden et. al. 2013:52)
1. Male (per 1,000 inhabitants) 2. Poor competencies (adolescents aged 17 to 22 who left school without a diploma per 1,000 inhabit-
ants in the same age category) 3. Non-western foreigners (per 1,000 inhabitants) 4. Possession of fire-arms (registered suspects in police databases per 1,000 inhabitants) 5. Possession of knifes and other close-combat weapons (registered suspects in police databases per
1,000 inhabitants) 6. Drug addicts (number of opiate addicts per 1,000 inhabitants as estimated by the Municipal
Health Service) 7. Adolescents and young adults (adolescents aged 12 to 24 per 1,000 inhabitants) 8. Underage offenders (registered offenders aged 12 to 18 in police databases per postal code) 9. Lack of commitment to school (registered truants aged 5 to 17 per 1,000 inhabitants in the same
age category) 10. School drop-outs (children aged 5 to 18 who are not enrolled in any school per 1,000 inhabitants in
the same age category) 11. Single parenthood (children in single parent families per 1,000 inhabitants) 12. Divorces (children involved a parental divorce per 1,000 inhabitants) 13. Poorly educated parents (number of poorly educated families per 1,000 inhabitants) 14. Unemployment (job seekers registered at the Centre for Work and Income per 1,000 inhabitants) 15. Poverty (persons living in minimum-income households per 1,000 inhabitants) 16. Crowded housing (housing that provides less than one room per occupant per 1,000 inhabitants) 17. Physical degradation of public space (municipal survey data of respondents’ complaints about litter
in their neighbourhood) 18. Availability of soft drugs (presence or absence of a coffee shop in a neighbourhood) 19. Inadequate social cohesion (residential turnover as a percentage of registered inhabitants in a
neighbourhood)
The kind of analysis that can be performed also depends on the level of the data. With data on the
individual level more statistical models can be performed than with aggregated data. In this regard it
is also important to point at ecological fallacy which can appear when dealing with data on the ag-
gregate level. To give an example: We observe a positive correlation on the aggregate level such as:
“Neighbourhoods with a high percentage of immigrants have higher crime rate than neighbour-
hoods with lower percentage of immigrants”. An ecological fallacy can occur when we infer from this
observation that foreigners commit more crimes. This may or may not be the case. With data on the
aggregate level this question cannot be answered. It would therefore be premature to launch an
integration programme or a group specific crime prevention programme for immigrants based on
this kind of analysis.
Next to crime data and urban data, survey data can bring in valuable information to a metric for
urban security.

Page 35
Title: GA no.: 285222
4.3. Survey data
Self-reported crime and victimisation surveys are able to register crime incidents that have not been
reported to the police. Moreover, survey data is necessary when concepts such as fear of crime or
collective efficacy are part of the index and the subsequent policy intervention.
Collective efficacy describes the potential of a neighbourhood community to achieve collective goals
and to perform informal social control. As such collective efficacy cannot be measured in the same
way that one can measure the unemployment rate or the average age in a neighbourhood. There
are however validated survey instruments that measure social cohesion and social trust within a
community, both are elements of collective efficacy. Social cohesion and social trust within a neigh-
bourhood are important dimensions of urban security and therefore are reasonable components of
a crime and security index.
The potential of collective efficacy to reduce violent crime in urban neighbourhoods was first tested
and articulated in an article by Sampson et al. published in Science (Sampson et al. 1997). The con-
cept describes and measures the degree of social cohesion, and the readiness of a community to
perform informal social control in the neighbourhood. Collective efficacy (as the ‘collective’ sug-
gests) exists within spatially bounded social communities.
In their seminal study Sampson and Raudenbush, scrutinised the already well-established correlation
between high rates of violence and neighbourhood characteristics, such as poverty, asking: “what is
it, for example, about the concentration of poverty that accounts for its association with rates of
violence?” (1997: 918). In short, the study found empirical evidence that “collective efficacy of resi-
dents is a critical means by which urban neighbourhoods inhibit the occurrence of personal violence,
without regard to the demographic composition of the population” (919).
This result illustrates the pitfalls of using indicators on the level of social aggregates, which can lead
to wrong interpretation and thus to flawed policy interventions. From the observation that poor
neighbourhoods produce high crime rates (aggregate level) cannot be concluded that poverty reduc-
tion is the only means to reduce crime. If poor and disadvantaged neighbourhoods exercise social
control and maintain social cohesion, they will produce less crime than poor neighbourhoods with
lower collective efficacy. Increasing collective efficacy is usually a more attainable goal than reducing
poverty and therefore might be considered a viable strategic option. “Recognising that collective
efficacy matters does not imply that inequalities at the neighborhood level can be neglected”
(Sampson et al. 1997: 923). So what ingredients are needed to include the concept of collective effi-
cacy into the BESECURE metric?
As said, the degree of collective efficacy in a neighbourhood can be measured through survey in-
struments. It is crucial that the survey is representative not only for the overall city, but also for eve-
ry single administrative geographical unit. This may require large sample size and sophisticated sam-
pling techniques. The public survey (telephone interviews) for the Rotterdam safety index has a net
sample size of 10.250 respondents (about 150 residents from each borough). The city of Freiburg
surveys about 3,000 respondents (postal questionnaire) to obtain a representative sample for each
of its 40 boroughs. This survey can include additional scales to measure the level of fear of crime (for
survey instruments see Gray, Jackson, Farrall 2012), victimisation and other relevant information.

Page 36
Title: GA no.: 285222
To measure collective efficacy Sampson and Raudenbush propose a two-component scale with 10
survey items. Social cohesion and informal social control are treated as latent scales of the meas-
urement construct. The individual scores of the items can be summarised in a single variable (e.g.
sum score or scaled) which is then aggregated to a geographical unit.
Figure 7: Survey scale to measure collective efficacy as proposed by Sampson et al. (1997)
If collective efficacy inhibits crime by countering otherwise criminogenic factors such as poverty, the
straightforward question is: what can be done to increase collective efficacy? Surprisingly there are
not many known policy interventions with explicit reference to this concept. A recent article in the
journal, Cities, observed: “While showing a strong negative link between collective efficacy and
crime, Sampson and Raudenbush (1999, 2001) never articulated strategies to bring it about” (Rukus
and Warner 2013: 37). To fill this void the authors propose “how cities can build collective efficacy,
by engaging in facilitative planning to address the needs of families and children” (37). Cancino
(2005) discusses “the utility of social capital and collective efficacy: social control policy in nonmet-
ropolitan areas”.
Collective efficacy has been proposed as an “agent of resilience” against chronic violence. The Cen-
ter for International Studies of the Massachusetts Institute of Technology has developed “a toolkit
for urban resilience in situations of chronic violence” (MIT 2012: 11, full report Davis 2012). This

Page 37
Title: GA no.: 285222
toolkit20 applies to fragile or even failed cities that suffer from episodes of severe political violence or
violence linked to organised crime.
In addition to deliberate planning many neighbourhood organisations create social cohesion and
promote informal social control without explicitly linking their practice to these concepts. If located
in the evidence based policing matrix discussed above, measures to increase collective efficacy are
proactive interventions on the neighbourhood level that focus on violent crime. As can be seen in
the evidence based policing matrix (Figure 4) many interventions within this cluster have been eval-
uated with a positive result.
Fear of crime of victimisation studies are also valuable components of a crime and security index.
Research into fear of crime came up with many different propositions how to measure the various
dimensions of anxieties (Lotz 1979), fear (Gray, Jackson, Farrall 2012), worries (Jackson 2005: 303),
anger (Farall 2004; Ditton et al. 1999), or otherwise aversive emotions towards crime (Armborst
2014).
5. Conclusions
This report has demonstrated that many tools used within the police sector can be extended to civic
crime prevention. Some of them may be valuable components of the BESECURE tools. Some of the
instrument presented in the chapters on crime-mapping services and predictive policing can be used
to develop the urban data platform. Users could be given different analytical functions such as risk
terrain modelling.
The evidence-based policing matrix is an online tool that links research to practice. It provides a pos-
sible structure for the policy support platform and the inspirational platform. It is comprehensible,
easy to develop, and presumably helpful for the user.
Urban security metrics such as the Rotterdam safety index are valuable analytical tools. Chapter 4
demonstrates that crime data, urban data, and survey data are crucial components of a security
index. The next section (amendment to this report) demonstrates with actual data and in more de-
tail how a security metric can be set up.
20 http://web.mit.edu/cis/urban_resilience_toolkit.pdf
http://web.mit.edu/cis/urbanresiliencereport2012.pdf

Page 38
Title: GA no.: 285222
6. References
ALAC (2012): Guidelines for crime prevention through environmental design (CPTED) for licensed
premises. Wellington [N.Z.]: Alcohol Advisory Council of New Zealand (ALAC).
Albanese, Jay S. (2008): Risk Assessment in Organized Crime: Developing a Market and Product-
Based Model to Determine Threat Levels. In: Journal of Contemporary Criminal Justice 24 (3), pp.
263–273. DOI: 10.1177/1043986208318225.
Armborst, Andreas (2014 forthcomming): Kriminalitätsfurcht und punitive Einstellungen: Indikato-
ren, Messkonstrukte und Interaktionen. In: Soziale Probleme 25(1).
Beken, Tom Vander (2004): Risky business: A risk-based methodology to measure organized crime.
In: Crime, Law and Social Change 41 (5), pp. 471-516.
BMI (2006): Second Periodical Report on Crime and Crime Control in Germany. Abridged version.
Federal Ministry of the Interior und Federal Ministry of Justice. Berlin (ed.).
http://www.bmi.bund.de/SharedDocs/Downloads/EN/Broschueren/Second_Periodical_Report_o
n_Crime_and_en.pdf?__blob=publicationFile.
Bond-Graham, Darwin; Winston, Ali (2013): All Tomorrow's Crimes: The Future of Policing Looks a
Lot Like Good Branding. In: SF Weekly, 2013 (Wednesday, Oct 30 2013).
http://www.sfweekly.com/2013-10-30/news/predpol-sfpd-predictive-policing-compstat-lapd/.
Bosworth, Mary (Hg.) (2005): Encyclopedia of prisons & correctional facilities. Thousand Oaks, Calif:
Sage Publications.
Cancino, J. M. (2005): The Utility of Social Capital and Collective Efficacy: Social Control Policy in
Nonmetropolitan Settings. In: Criminal Justice Policy Review 16 (3), pp. 287–318. DOI:
10.1177/0887403404271247.
Caplan, Joel M.; Kennedy, Leslie W.; Miller, Joel (2011): Risk Terrain Modeling: Brokering Criminolog-
ical Theory and GIS Methods for Crime Forecasting. In: Justice Quarterly 28 (2), pp. 360–381.
Chainey, Spencer; Ratcliffe, Jerry (2005): GIS and crime mapping. Chichester, West Sussex, England,
Hoboken, NJ: Wiley (Mastering GIS).
Chamlin, Mitchell B.; Cochran, John K. (2004): An Excursus on the Population Size-Crime Relation-
ship.
Davis, Diane E. (2012): Urban Resilience in Situations of Chronic Violence. MIT Center for Interna-
tional Studies (Ed.). http://web.mit.edu/cis/urbanresiliencereport2012.pdf
Ditton, Jason; Bannister, Jon; Gilchrist, Elizabeth; Farrall, Stephen (1999): Afraid or Angry? Recali-
brating the 'fear' of Crime. In: International Review of Victimology 6 (2), pp. 83–99.
Edwards, A.; Hughes, G.; Lord, N. (2013): Urban security in Europe: Translating a concept in public
criminology. In: European Journal of Criminology 10 (3), pp. 260–283.
Ellis, Lee; Beaver, Kevin M.; Wright, John Paul (2009): Handbook of crime correlates. 1st ed. Amster-
dam, Boston: Elsevier/Academic Press.
Farrall, Stephen (2004): Revisiting crime surveys: emotional responses without emotions? OR Look
back at anger. In: International Journal of Social Research Methodology 7 (2), pp. 157–171.

Page 39
Title: GA no.: 285222
Farrington, David P (2006): Criminal careers up to age 50 and life success up to age 48. new findings
from the Cambridge Study in Delinquent Development. Ed.: Home Office.
FEMA (2005): Risk Assessment. A How-To Guide to Mitigate Potential Terrorist Attacks Against Build-
ings. The Federal Emergency Management Agency (FEMA) (Ed.) (Risk Management Series).
http://www.fema.gov/media-library-data/20130726-1524-20490-7395/fema452_01_05.pdf
Floeting, Holger; Seidel-Schulze, Antje (2012): Sicherheit in der Stadt - eine Gemeinschaftsaufgabe.
Ergebnisse aus zwei Kommunalbefragungen. Ed.: Deutsches Institut für Urbanistik. Deutsches
Institut für Urbanistik.
Frevel, Bernhard (Hg.) (2012): Handlungsfelder lokaler Sicherheitspolitik. Netzwerke, Politikgestal-
tung und Perspektiven. Frankfurt, M: Verlag für Polizeiwissenschaft (Kooperative Sicherheitspoli-
tik in der Stadt).
Frevel, Bernhard (2013): Managing urban safety and security in Germany: Institutional responsibility
and individual competence. In: European Journal of Criminology 10 (3), pp. 354–367.
Gadd, David; Karstedt, Susanne; Messner, Steven F. (Hg.) (2012): The Sage handbook of criminologi-
cal research methods. Los Angeles: Sage Publications.
Geels, Frank W. (2002): Technological transitions as evolutionary reconfiguration processes: a multi-
level perspective and a case-study. In: Research Policy 31 (8–9), p. 1257–1274.
Glaeser, Edward L.; Sacerdote, Bruce (1999): Why Is There More Crime in Cities? In: Journal of Politi-
cal Economy 107 (S6), pp. S225.
Gray, Emily; Jackson, Jonathan; Farrall, Stephen (2012): In Search of the Fear of Crime: Using Inter-
disciplinary Insights to Improve the Conceptualisation and Measurement of Everyday Insecurities.
In: David Gadd, Susanne Karstedt und Steven F. Messner (Hg.): The Sage handbook of criminolog-
ical research methods. Los Angeles: Sage Publications, pp. 268–281.
Heaton, Brian (2012): Predictive Policing a Success in Santa Cruz, Calif. In: Government Technology.
Heinz, Wolfgang (2004): Kommunale Kriminalprävention aus wissenschaftlicher Sicht. Dokument aus
der Internetdokumentation Deutscher Präventionstag. Ed.: Hans-Jürgen Kerner und Erich Erich
Marks. Deutscher Präventionstag.
International Association of Crime Analysts (2012): GIS Software Requirements for Crime Analysis.
Standards, Methods, & Technology (SMT) Committee White Paper. IACA. Overland Park, KS.
http://www.iaca.net/Publications/Whitepapers/iacawp_2012_07_gis_requirements_for_crime_a
nalysis.pdf
Jackson, Jonathan (2005): Validating New Measures of the Fear of Crime. In: International Journal of
Social Research Methodology 8 (4), pp. 297–315.
Katz, Jack (1988): Seductions of crime. Moral and sensual attractions in doing evil. New York: Basic
Books.
Kube, Edwin (1987): Systematische Kriminalprävention. Ein strategisches Konzept mit praktischen
Beispielen. Wiesbaden (Sonderbände der BKA-Forschungsreihe, 25).

Page 40
Title: GA no.: 285222
Levine, Ned (2006): Crime Mapping and the Crimestat Program. In: Geographical Analysis 38 (1), pp.
41–56.
Levine, Ned (2008): CrimeStat: A Spatial Statistical Program for the Analysis of Crime Incidents. In:
Shash Shekhar und Hui Xiong (Hg.): Encyclopedia of GIS: Springer US, pp. 187-193.
Lotz, Roy (1979): Public Anxiety about Crime. In: The Pacific Sociological Review 22 (2), pp. 241–254.
Lum, Cynthia; Koper, ChristopherS.; Telep, Cody W. (2011): The Evidence-Based Policing Matrix. In:
Journal of Experimental Criminology 7 (1), pp. 3-26. DOI: 10.1007/s11292-010-9108-2.
Messing, Jill Theresa; Thaller, Jonel (2012): The Average Predictive Validity of Intimate Partner Vio-
lence Risk Assessment Instruments. In: Journal of Interpersonal Violence.
Moffitt, Terrie E. (1993): Adolescence-limited and life-course-persistent antisocial behavior: a devel-
opmental taxonomy. In: Psychological Review 100, pp. 674–701.
Mohler, G. O.; Short, M. B.; Brantingham, P. J.; Schoenberg, F. P.; Tita, G. E. (2011): Self-Exciting
Point Process Modeling of Crime. In: Journal of the American Statistical Association 106 (493), pp.
100–108. DOI: 10.1198/jasa.2011.ap09546.
Nolan III, James J. (2004): Establishing the statistical relationship between population size and UCR
crime rate: Its impact and implications. In: Journal of Criminal Justice 32 (6), pp. 547–555.
Noordegraaf, Mirko (2008): Meanings of measurement. The real story behind the Rotterdam Safety
Index. In: Public Management Review 10 (2), S. 221–239.
O'Toole, Mary Ellen (1999): The School Shooter: A Threat Assessment Perspective. Ed.: Federal Bu-
reu of Investigation. Federal Bureu of Investigation. Quantico, VA.
Paoli, Letizia; Greenfield, Victoria A.; Reuter, Peter (2009): The world heroin market. Can supply be
cut? Oxford, New York: Oxford University Press (Studies in crime and public policy).
Paulsen, Derek; LeBeau, James (2012): Survey and Evaluation of Online Crime Mapping Companies.
Ed.: U.S. Department of Justice. National Institute of Justice. Rockville, MD. Online verfügbar un-
ter https://www.ncjrs.gov/App/Publications/abstract.aspx?ID=261981.
Peak, Ken; Barthe, Emmanuel P. (2009): Community Policing and CompStat: Merged, or Mutually
Exclusive? In: The Police Chief 76 (12).
Pearson-Goff, Mitchell; Herrington, Victoria (2013): Police leadership: A systematic review of the
literature. In: Policing (online first).
Perry, Walt L., et al. (2013): Predictive policing. The role of crime forecasting in law enforcement
operations. Santa Monica: RAND Corporation.
Power, Michael (2007): Organized uncertainty. Designing a world of risk management. Oxford, New
York: Oxford University Press.
Power, Michael (2009): The risk management of nothing. In: Accounting, Organizations and Society
34 (6–7), pp. 849–855. DOI: 10.1016/j.aos.2009.06.001.
Reuter, Peter (1983): Disorganized crime. The economics of the visible hand. Cambridge, Mass: MIT
Press (MIT Press series on organization studies).

Page 41
Title: GA no.: 285222
Rip, Arie; Kemp, René (1998): Technological change. In: S. Rayner und E.L Malone (Hg.): Human
choice and climate change. Vol. II, Resources and technology. Columbus, OH: Battelle Press, pp.
327–399.
Rukus, Joseph; Warner, Mildred E. (2013): Crime rates and collective efficacy: The role of family
friendly planning. In: Cities 31 (0), pp. 37–46. DOI: 10.1016/j.cities.2012.09.006.
Sampson, Robert J.; Raudenbush, Stephen W. (1997): Neighborhoods and violent crime: A multilevel
study of collective efficacy. In: Science 277 (5328), pp. 918–924.
http://www.redibw.de/db/ebsco.php/search.ebscohost.com/login.aspx%3fdirect%3dtrue%26db
%3daph%26AN%3d9708282546%26site%3dehost-live
Shekhar, Shash; Xiong, Hui (Hg.) (2008): Encyclopedia of GIS: Springer US.
Sherman, Lawrence W.; Farrington, David P.; Welsh, Brandon C.; MacKenzie, Doris Layton (Hg.)
(2002): Evidence-Based Crime Prevention. London: Routledge.
Sherman, Lawrence W.; Gottfredson, Denise C.; MacKenzie, Doris Layton; Eck, John; Reuter, Peter;
Bushway, Shawn D. (1998): Preventing Crime: What Works, What Doesn’t, What’s Promising. Ed.:
Jeremy Travis. National Institute of Justice.
Steden, Ronald; Boutellier, Hans; Scholte, Ruben D.; Heijnen, Merijn (2013): Beyond Crime Statistics:
The Construction and Application of a Criminogenity Monitor in Amsterdam. In: European Journal
on Criminal Policy and Research 19 (1), pp. 47–62.
Svenonius, Ola (2011): Sensitising urban transport security. Surveillance and policing in Berlin, Stock-
holm and Warsaw. Stockholm: Stockholm University (Södertorn political studies, 10).
Timmermans, Stefan; Epstein, Steven (2010): A World of Standards but not a Standard World: To-
ward a Sociology of Standards and Standardization *. In: Annu. Rev. Sociol. 36 (1), pp. 69–89.
Tusikov, Natasha (2012): Measuring organised crime-related harms: exploring five policing methods.
In: Crime Law Soc Change 57 (1), pp. 99-115. DOI: 10.1007/s10611-011-9345-y.
Van Steden, Ronald; Boutellier, Hans; Scholte, Ruben D.; Heijnen, Merijn (2013): Beyond Crime Sta-
tistics: The Construction and Application of a Criminogenity Monitor in Amsterdam. In: European
Journal on Criminal Policy and Research 19 (1), pp. 47–62.
van Swaaningen, René (2007): A tale of two cities. The governance of crime and insecurity in Rotter-
dam and Amsterdam. In: Klaus Sessar, et. al. (Eds.): Anxious cities. Anxious cities: studies in feel-
ings of insecurity and safety policies in European Communities. Wien: Lit Verlag (Schriften zur
Rechts- und Kriminalsoziologie, Bd. 1), pp. 237–256.
Weicht, Christian (2003): Kriminalprävention durch Umweltgestaltung. Dokument aus der Internet-
dokumentation Deutscher Präventionstag. Ed.: Hans-Jürgen Kerner und Erich Erich Marks.
Weisburd, David; McEwen, Tom (1998): Crime mapping and crime prevention. Monsey, N.Y: Criminal
Justice Press (Crime prevention studies, v. 8).

Page 42
Title: GA no.: 285222
7. Annex
Annex figure 1: risk management as principle approach for different problems (Edwards, Hughes, Lord 2013: 278)

Page 43
Title: GA no.: 285222
Annex figure 2: The process of the European Standard on Crime prevention EN 14383 (prCEN/TR
14383-2 2006: 510)

Page 44
Title: GA no.: 285222
Annex Table 1: Levels at which action can be taken to improve security in the built environment
(prCEN/TR 14383-2 2006: 495-497)

Page 45
Title: GA no.: 285222
Annex A: safety audit framework of an urban security project (prCEN/TR 14383-2 2006: 520-525)
Safety audit framework of an urban project
D.1 The basic principles
D.1.1 Strengthening the user’s identification with the place and the user’s sense of belonging to the place enhances perception of safety and prevention of crime because people develop a sense of respect and protection for the places they belong to.
D.1.2 Vitality of streets and public areas is a major factor for crime prevention, because the
use of public spaces produces spontaneous surveillance. Mixed uses (commercial, residential, recreation etc.) and diversified activities imply different users at different times, thus providing constant spontaneous surveillance.
D.1.3 Every measure concerning safety should take into account the most vulnerable population.
D.1.4 Urban developments based on creating safer areas opposed to the outer world (perceived as a source of insecurity) are to be avoided because they will lead to exclusion and residential enclosure or inward oriented spaces.
D.1.5 Places mainly used by temporary users (stations, interchange points, etc.) are general-
ly more vulnerable to crime than other areas, due to the scarce sense of belonging to the place of the users. These places should be carefully considered.
D.1.6 To improve crime prevention, planning and design should avoid creating deserted spaces
(without vitality), as well as undefined or hidden places, because vandalism and other criminal acts tend to concentrate in these places. If un-avoidable, these places should be managed in term of safety.
D.1.7 A continuous urban grid and a clear layout of public places improve users’ self-orientation and their feeling safe. Visibility of pedestrian spaces and routes from surround-
ing buildings and streets improves crime prevention and the perception of safety.
D.1.8 A clear delimitation between public and private space facilitate the management of the spac-es.
D.1.9 Planning and design of circulation routes to services and housing should carefully consider safety and accessibility for all kinds of population. If a circulation route cannot provide the suffi-cient safety or feeling of safety an alternative route should be offered.
D.1.10Decayed or abandoned buildings and areas, as well as dreary places communicate fear of
crime and attract antisocial behaviours and crimes. Maintenance and other actions should be undertaken to prevent decay; once decay has started, these areas should be carefully monitored and treated.
D.1.11In some cases, to improve crime prevention it is necessary to support spontaneous surveillance (mixed uses, vitality etc.) also with organized surveillance, implementable in many different ways The organisation of spaces should be conceived in order to facilitate this type of surveillance and emergency intervention.
D.1.12Electronic surveillance (CCTV etc.) is not an answer to bad planning or urban design. It is useful only when it is a part of a general security plan.
D.1.13Temporary arrangements and situations (construction yards, detours, temporary barriers and fences) produce not only discomfort but also create potentially dangerous places. Therefore, during construction works next to used spaces, temporary situations and fencing must be carefully studied and designed also in terms of crime prevention.
D.2 Urban planning strategies
D.2.1 Taking into account the existing social and physical structures
a) Does the project function as an integrated part of the whole urban structure ?
b) Does the project take into account the needs and demands of the local population ?
c) Does the project take into account the existing social networks ?
d) Does it encourage local sociability ?
e) Does the new built form integrate well with its surroundings ?

Page 46
Title: GA no.: 285222
f) Does the project fit in with the organization of the existing neighbourhoods ?
g) Will the project affect the social balance ?
h) What measures are taken to manage the impact of changes ?
i) Is the new area connected to the existing city structure or does it break the existing pattern ?
j) Do the edges of the project take into account the character of the existing urban fabric or do they create
k) a gap in the vitality of the urban system ?
l) Does the project take into account the existing crime problems of the area and its sur-
roundings ?
D.2.2 Guaranteeing accessibility and avoiding enclaves
a) Does the street network of the project provide continuity with the existing street pattern ?
b) Does the project encourage outward-facing layouts and necessary through routes to ensure populated public spaces ?
c) Does the building or street pattern avoid creating enclaves ?
d) Does the project provide good accessibility to the public transport system and safe routes to
the stops ?
e) Does the project allow for some traffic flow on local streets so as to avoid creating deserted places or restricted street access ?.
D.2.3 Creating vitality (blending functions and attractive layout)
a) Do the project functions encourage vitality in the area particularly in public spaces ?
b) Does the project foresee mixed uses that generate vitality and natural surveillance ?
c) Are pedestrian, bike or mixed traffic routes conceived as to increase vitality and prevent separate movements (that decrease it) ?
d) Does the foreseen mix of uses induce compatible activities or will it generate risk of conflicts
(i.e. housing and night activities) ?
e) Does liveliness go through all-day-long or is it limited to particular times ?
f) Do specific areas need all-day-long activities to reduce crime opportunities ?.
D.2.4 Providing mixed status (blending socio-economic groups, avoiding isolation and segre-
gation)
a) Does the project encourage a careful mix of social economic groups to reduce isolated and seg-regated enclaves which increase crime ?
b) Does the development participate to balancing social economic groups on the scale of the sur-rounding neighbourhood or the city ?
c) Does the project avoid creating conditions which may induce segregated low income areas ?.
D.2.5 Creating adequate urban density to allow vitality and natural surveillance
a) Does planning provide opportunities for enhancing the sense of neighbourhood and of belonging to the place ?
b) Is land use intensive enough to create opportunities for human presence and liveliness ?
c) Do the high-density areas provide for adequate public space ?.
D.2.6 Avoiding physical barriers (due to infrastructures etc.) and waste land
a) Do the infrastructures of the project avoid creating physical barriers, enclaves or waste land ?
b) Does the project overcome physical barriers due to existing infrastructures ?
c) What does the project suggest to manage the existing waste lands ?.
D.3 Urban design strategies
D.3.1 Layout (continuity of urban fabric and pedestrian and bicycle routes)
a) Does the design create continuity with the existing streets and pedestrian/bicycle routes ?
b) Does the layout provide for clear orientation of pedestrians ?
c) Does the layout allow easy and safe walking through the site ?
d) Does design allow new users to know where they are and to find their way around, to enhance the feeling of security ?
e) Is the building arrangement compatible with the surrounding urban fabric ?.
D.3.2 Specific location of activities
a) Are there sufficient activities or residents and users to provide spontaneous surveil-

Page 47
Title: GA no.: 285222
lance on every street and public space ?
b) Are the services linked to housing (bicycle rooms, laundries, meeting rooms etc.) located
in a way that they can contribute to spontaneous surveillance ?
c) Does the location of commercial activities create vitality and natural surveillance ?
d) Are pedestrian and bike routes designed in a way as to enhance vitality ?.
D.3.3 Time schedules coordination to guarantee continuous natural surveillance
a) Are the opening hours of the activities in the buildings facing public spaces able to provide continuous natural surveillance ?
b) Are there any specific actions planned to provide safety during time gaps in the vitality ?
c) Are there specific activities which can be introduced/ relocated to improve the time span of
natural surveillance ?
d) Do specific spaces need activity and lighting during night time ?.
D.3.4 Visibility (overview, sight lines between e.g. dwellings and public space, lighting, etc.)
a) Does design provide good visibility of building entrances ?
b) Do landscaping and vegetation allow sufficient visibility and natural surveillance ?
c) Are bus stops and entrance to underground stations and parking facilities located as to allow maximum visibility ?
d) Are the activities on the ground floor provided with good visibility, to allow natural surveil-
lance and calling for help ?
e) Do façades provide visibility on public spaces from various floors ?
f) Are long blind walls without openings along pedestrians routes or sidewalks avoided ?
g) Are spaces well lit to reduce fear of crime ?
h) Is a good visibility provided on isolated areas in order to reduce the risk and fear of crime ?.
D.3.5 Accessibility (orientation, space to move, alternatives routes, limiting access for nonauthorized people)
a) Are bus stops, entrances to underground stations and parking facilities located close to lively
areas to reduce crime opportunities ? Are there safe routes to reach them ?
b) Are the accesses to public facilities located in lively areas so that their surveillance is enhanced and the flows they generate contribute to natural surveillance ?
c) Does the project provide access control or restriction to problematic spaces and zones at risk
(crime targets) ?
d) Are there safe routes spaces accessible for disabled people ?
e) Is good accessibility guaranteed for security and safety services (police. firemen, medical) ?
f) Does the design provide clear accesses and routes, or is signage needed ?
g) Are routes and paths designed taking into account risks and fear of crime for pedestri-ans ?
h) Are parking lots located keeping safety criteria in mind ?
i) Was flow considered in deciding whether it is necessary to separate public access from profes-sional access (for facilities, commercial, leisure centres) ?
j) Are the connections between the different buildings (paths, alleyways) conceived in term of safety ?
k) To improve safety, is there a need of creating compartments in large building complexes or under-
ground parking ?.
D.3.6 Territoriality (human scale, clear public/private zoning, compartmentalization)
a) Is the difference between public, semi-public, semi-private and private spaces clear to users, in order to bring them into legitimate uses ?
b) Is the separation between public and private spaces materialized, physically or symbolically ?
c) Does the design of a space make clear the purpose of the space ?
d) Have the spaces been thought for different target groups according to their needs ?
e) Does this territoriality create feeling of ownership and responsibility among the users ?
f) Is the scale of the new designed space in accordance with its purpose and uses ?.
D.3.7 Attractiveness (colour, material, lighting, noise, smell, street furniture) a) Is the character of public spaces friendly for users, in accordance with common sense, to en-
hance appropriation by the users ?

Page 48
Title: GA no.: 285222
b) Does the project create attractive and useful places for people, to enhance sense of belonging
and responsibility ?
c) Does the project avoid creating nuisances that make the attractiveness of the area decline ?
d) Does the design stimulate and allow for spontaneous activities ?.
D.3.8 Robustness (materials e.g. street furniture, fences)
a) Does the concept and design allow for durable construction which minimize deterio-ration and maintenance ?
b) Would the materials (benches, dustbins, signage) be robust enough to resist to vandalism ?
c) Is the use of robust materials compatible with their attractiveness ?
d) Have the choice of materials been thought with crime prevention in mind (robust materi-
als, replacing flammable materials for the risks of arson) ?
e) Are they adapted to the needs of the users ?.
D.4 Management strategies
D.4.1 Target hardening/removal
a) Does the project provide for human and material security measures for spaces which have been identified as high-risk space or targets of crime ?
b) Should the project plan specific accessibility, protection and compartmentalization of technical places, electricity, gas, water and telephone systems ?.
D.4.2 Maintenance
a) Are maintenance and management strategies and measures planned ?. Do the design and lay-
out facilitate these ?
b) Are maintenance measures planned so that spaces will be attractive and lively and generate a sense of responsibility and security ?
c) Does the management strategy provide for stakeholders, steps to be taken and regular monitor-ing and assessment measures ?
d) Does the maintenance strategy ensure quick, responsive and prompt responses to reduce
the risk of vandalism, repetition of offences as well as to reduce feeling of derelict or un-used spaces ?
e) Are the different spaces within the area equally maintained to prevent the risks of crime to focus on some ?
f) Does the management strategy provide for a partnership between the stakeholders to ensure
homogeneous measures and implementation (regular meetings, specific document) ?
g) Does the maintenance strategy ensure specific measures for lighting, electricity and tele-phone systems (regarding protection and quick repairs if needed) ?.
D.4.3 Surveillance (patrolling, camera monitoring)
a) Is there a security professional in the management staff ?
b) Have the different measures of surveillance been studied and assessed (police, security services, concierges/janitors, block guards, on foot, by car, natural surveillance, Closed Circuit Television (CCTV) ?
c) Have specific surveillance for public facilities access routes and entrances/exits been provided, during the day and during the night ?
d) Who are the different stakeholders for safety and security ? What is their own area of action and responsibility ?
e) Does the project provide for a balanced set of surveillance measures, including the definition
of public and private responsibilities ?
f) Do specific places of the area require a surveillance to be supported by Closed Circuit Television
(CCTV system) ? In these cases, does the CCTV system provide for regular monitoring and assessment measures ? Is the connection between the surveillance professionals and the management stakeholders organized, to reinforce the effectiveness of both parts ?.
D.4.4 Rules (for conduct of the public in public spaces)
a) Does the project define and communicate clear rules for the use in public spaces ?
b) Do users perceive easily and plainly those rules defined by managers ?
c) Does those rules increase the sense of responsibility towards the space ?
d) Is the application of the rules checked and overhauled by managers and surveillants ?
e) Is it necessary to foresee actions of communication between managers, surveillants and
residents or users of the space ?

Page 49
Title: GA no.: 285222
f) Is it necessary to distribute a document which would clarify the rules in terms of mainte-nance and prevention of crime ?.
D.4.5 Providing infrastructures for particular groups
a) Does the project take into account the whole population on site or likely to come on site (homeless, drug addicts) ?
b) Does the project provide specific measures for these specific target groups (to see vulnera-
ble persons for their route, creation of a reception and information center, organization of focus groups) ?
c) Does the project take into account the perception of the most vulnerable groups such as wom-
en, children or seniors ?
d) Is it foreseen to create an appropriate partnership between social workers and managers ?.
D.4.6 Communication (of preventive messages and rules of conduct for the public)
a) Does the project include the provision of information to explain the rules to the residents
or users of public facilities ?
b) Will users be in a position to easily get information and to ask managers for help or assis-tance ?
c) In order to improve the feeling of security for residents and to reduce risks of crime, is it neces-
sary to communicate the prevention measures ?
d) Which actions to increase public awareness will be implemented for potential users and specific
populations (like juvenile groups) in order to increase the sense of responsibility toward the new area ?
e) How will the current users or residents of the existing neighbourhood be involved in the project so they are encouraged to use the site and not vandalize or attack it ?

Page 50
Title: GA no.: 285222
Annex table 2 Table: recommended resistance class of products CEN/TS 14838-3:2005: 8)

Page 51
Title: GA no.: 285222
Annex Table 3: Coding structure of the evidence-based policing matrix (Center for Evidence-based crime policy
Attribute
Coding
intervention
Result Rigor (based on SMS)
X-axis: Type or scope of target:
Y-axis: specifity of intervention
Z-axis: Level of proactivity
SS=sign. Success NS=non-sign. M =mixed SB=sign. harmful
M =moderat. rigorous R =rigorous VR=Very Rigorous
I=individuals G=groups MP=micro places N=neighborhoods J=jurisdictions Na=nation
G=general F =focused
R=reactive P= proactive HP= highly proactive
Crack house raids reduced crime for about 12 days; crime reductions decayed quickly (Sherman/Rogan 1995)
m VR MP F P
[…] 124 studies … … … … …
Annex table 4: recommended modification for the BESECURE policy support platform and inspirational platform.
Attribute
Coding
Intervention
Result Rigor 5-Level SMS
x-axis: Type or scope of target:
Y-axis: specifity of intervention
Z-axis: Level of proactivity
Crime type
SS= sign. success NS = non-sign. M= mixed SB = sign. harmful
1=weak 2 3 4 5=strong 6=qualitative
I=individuals G=groups MP=micro places N=neighborhoods J=jurisdictions Na=nation
G=general F=focused
R=reactive P= proac-tive HP= highly proactive
N= narcotic B = burglary D = disorder V= vehicle T= theft […]
model project for heroin assisted treatment of opioid dependent pa-tients: effect: sustainable decline in individual delin-quent behavior of treated persons (Verthein et al. 2008)
ss 5; 6 G F P N, D, T
[…] BESECURE database
… … … … … …

Page 52
Title: GA no.: 285222
8. Amendment: Methodology for an urban security metric

Page 53
Title: GA no.: 285222
Figure 8: Showcase of the security metric with data for Freiburg’s borough Old City Mid.
security
componentsub-categories indicators value base
year (2006)
base 2007 2008 2009 2010 2011Baseyear 2007 2008 2009 2010 2011
*residential nearness 34,90 0 -0,6 0,3 -0,9 -1,4 -0,9
residential anonymity 9,60 0 2,1 5,2 6,3 6,3 6,3
*average living area in m² 37,40 0 1,9 2,7 2,9 1,9 5,3
high rise buildings 0,32 0 -0,8 0,0 0,0 -50,0 -0,8
males 45,90% 0 1,3 3,1 3,7 1,5 4,1
adolescents and young adults 18,89% 0 -2,1 -8,6 -9,0 -3,9 -1,7
single parenthood 1,10% 0 14,5 15,7 14,6 36,5 45,1
divorces 0,45% 0 -4,0 -51,5 -45,9 -53,0 9,0
unemployment 3,81% 0 7,9 -0,1 -2,3 -5,2 -18,5
long-term unemployment 1,33% 0 -20,7 -31,4 -23,8 -45,2 -100,0 0,0 -1,3 -6,0 -5,2 -10,3 -10,3
unemployment among young adults 1,13% 0 -21,8 -15,4 -43,9 -48,0 -87,6
underage offenders 30,47% 0 1,6 -4,8 6,3 -12,0 -22,6
foreigners 13,03% 0 7,3 3,3 8,2 7,9 10,3
Germans wmb 9,80% 0 -1,0 0,0 12,2 12,2 12,2
crowded housing 37,40 0 -1,9 -2,7 -2,9 -1,9 -5,3
bicycle theft 226 0 -17,7 -24,3 -12,8 -29,2 -6,2
shop lifting 1539 0 -30,7 -39,1 -24,2 -44,1 -49,5
pickpocketing 452 0 -51,5 -30,5 -60,6 -74,3 -67,3
burglary 1 0 500,0 300,0 700,0 600,0 600,0
battery 344 0 -10,8 26,5 41,0 -2,9 33,1
aggravated battery 133 0 -18,8 24,8 28,6 6,0 8,3
sexual offences 7 0 0,0 71,4 0,0 -28,6 42,9
robbery 19 0 0,0 -5,3 0,0 -26,3 31,6
0,0 -28,6 8,4 -10,7 -22,2 -12,9
possession 62 0 -53,2 14,5 -30,6 -50,0 -46,8
trade 8 0 -75,0 37,5 -37,5 50,0 -62,5
1999 2001 2010 2012
people here help each other 2,74 0 10,6 25,5 14,2
people here know each other 2,62 0 0,0 13,4 5,3
trusted neighbourhood 3,19 0 6,0 7,5 6,0
often conflicts 2,03 0 -3,0 5,4 5,9
parents don't care 2,40 0 -11,3 -12,5 -19,6
no shared values 2,68 0 -22,0 -13,1 -17,5 0,0 8,0
no respect for law and order 2,04 0 -9,3 -0,5 0,5
residents' feeling insecure 2,62 0,00 -17,9 0,0 -19,1
pe
rce
pti
on
s (s
urv
ey
scal
es) so
cial
co
hes
ion
Development single indicator
2006-2011
fear
of
crim
e
po
lice
reco
rded
cri
me
development narco
annual change rates
development violent crime
soci
al
dis
inte
grat
ion
8,9 9,6
social cohesion(negative growth rates indicate higher risks)
social disintegration(positive growth rates indicate higher risk)
development property crime
crime index
(high values indicate more crime incidents)
collective efficacy index(high va lues indicate more col lective efficacy = more cohes ion and less dis integration)
nar
coti
csvi
ole
nt
crim
ep
rop
erty
crim
e
Security metric for Freiburg Old City Mid (area code 111)
urban data index(high values indicate presence of risk factors and absence of protective factors)
Security Index II(average development within security component)
urb
an r
isk
fact
ors
(Am
ster
dam
Cri
min
oge
nit
y M
on
ito
r)
bu
ilt e
nvi
ron
men
t
(ho
usi
ng)
development urban risk factors
(Amsterdam criminogenity monitor)
Security Index I(average development within sub-category)
development built environment
urb
an d
ata

Page 54
Title: GA no.: 285222
The purpose of the metric is to give an overview on the development of key indicators from three
different data components: police registered crime data, urban risk factors, and resident’s survey
data. Each of these components is subdivided into categories (e.g. property crime, violent crime,
social cohesion, built environment, urban risk factors), which in turn are comprised by a set of nu-
meric indicators (e.g. frequency of police recorded aggravated assaults). The metric depicts the an-
nual growth rate of each single indicator, as well as the overall growth rate (or net development) of
the subcategories and the three security components. Graphs and colours show whether the devel-
opment of an indicator indicates more or less crime related insecurities in a certain area of the city.
The metric has three panels I-III where different kind of information is given (Figure 8). Panel I names
the 33 single indicators, and the scheme in which they are grouped together into eight categories
and three components. The first component ‘urban data’ is divided into the category ‘built environ-
ment’ (with 4 indicators) and ‘urban risk factors’ (with 11 indicators). The second component ‘police
recorded crime’ has three categories (property crime, violent crime and narcotics) with a total of 10
indicators. For example: ‘battery’ is an indicator of the category ‘violent crime’ that belongs to the
data component ‘police recorded crime’). The third component ‘perceptions’ also has three catego-
ries called ‘social cohesion’, ‘social disintegration’ (each with three indicators) and ‘fear of crime’
(single indicator).
Figure 8: three panels of the metric.
Panel II contains the statistical information about these indicators, including value and annual trend
rates. The first column ‘indicator value’ displays what value the indicator had in the base year 2006.
The indicators have different units of measurement such as ratios (e.g. of high rise/low rise build-
ings) absolute numbers (of crime incidents), square measures (of living area) and mean values (of
survey scales). The column ‘indicator value’ informs, for instance, about how many incidents of ‘bike
theft’ occurred in 2006 in this particular area of the city, or how many percent of all offenders where
‘underage offenders’. The next columns show the annual change rates of these values in the time
period from 2006 until 2011 (survey data points are 1999, 2001, 2010, 2012). For the base year 2006
the value of each indicator is set to 0. Like with a price index the annual change rates indicate the
relative growth and shrinkage of a product or a group of products in relation to the base year, but it

Page 55
Title: GA no.: 285222
does not tell how much this product cost in 2011, or how much incidents of bicycle theft there were
in 2011. To give an example of the annual change rates of bicycle theft: In the base year 2006 there
were 226 police registered bicycle thefts in Freiburg’s city area 111 (old city central) as the reader
can see in the column ‘indicator value’. In 2007 there were 17,7% less bike thefts (186) than 2006,
and in 2008 there were 24,3% less bike thefts (171) than in 2006, and in 2009 there were 12,8% less
(197) bike thefts then in 2006.
Some indicators displayed in panel I and II are risk factors whereas others are protective factors.
Growth rates of risk factors are coded red, negative growth rates are coded green. With protective
factors it is the other way around: Positive values are coded green, negative values are coded red.
For police recorded crime of course all indicators indicate more crime. Therefore the colour of the
annual change rate is green if it is negative and red if it is positive. Within the data component ‘ur-
ban data’ and ‘perception’ there are risk- as well as protective factors. Social cohesion is a protective
factor, that is, growing values indicate more security, whereas social disintegration is a risk factor
and therefore growing values indicate less security. ‘Residential nearness’ and ‘average living area’
are protective factors as well. Next to the column with the annual change rate are two spark-lines,
illustrating the trend of each indicator (line chart) together with its growth/shrink rate (bar chart). To
give an example of how to read the spark lines: In 2007/08 the chart line falls. In 2009 it goes up as
the number of bike theft increased compared to the previous year but is still lower than in the base
year 2006, where the line begins. The bar chart shows the rates of growth/shrinkage for each year
compared with the base year (which is always 0). They are also colour coded considering whether
they depict a protective or risk factor.
Although it is intuitive to compare the development of different security related indicators, the met-
ric should be interpreted with great caution. A ten percent increase of two different risk factors does
not imply that each risk factor has the same impact on the security situation in this area. In fact the
metric does not make any claims about the strength of correlation between an indicator and e.g. the
crime rate. It is also important to consider the absolute value in the column ‘indicator value’. This
adds meaning to the annual change rate. In the data of our showcase there has been a 500 percent
increase of burglary in 2007 but this corresponds to an increase from 1 incident in 2006 to 6 inci-
dents in 2007, which is a less alarming increase.
The trend lines in panel III display the average development of the eight subcategories (security indi-
ces I) and the three components (security indices II). If the index includes both protective- and risk
factors the respective indicators are recoded so that they have a uniform direction indicating either
more or less security. Security Indices I and II of ‘urban data’ and ‘police recorded crime’ indicate
risks: increasing lines indicate more crime or the risk thereof. Social cohesion and social disintegra-
tion go in opposite directions as their names suggest. Both are merged into the collective efficacy
index which is coded as a protective factor. Higher values indicate more collective efficacy = more
cohesion and less disintegration.
Disproportionally large growth or shrinkage rates of a single indicator (outliers) can distort the aver-
age development of an index. For this reason the indicator ‘burglary’ is not included in the index for
property crime and the overall crime index. To demonstrate the effect of outliers, the indicator ‘high
rise buildings’ is included in the built environment index. In the base year 2006, two of all 632 resi-
dential houses in the old city of Freiburg had eight levels or more. In the following year there were
five more houses in the same area so the ratio was 2 to 637. This corresponds to an annual change

Page 56
Title: GA no.: 285222
rate of -0,78 (rounded to -0,8 in the metric). In 2010 however one of the two high rise houses was
demolished, which corresponds to a 50 percent drop in the annual change rate. Compared to the
annual change rate of all other indicators within the built environment category (between -1,43 and
6,25 percent) this is a disproportional large value that distorts the mean development of all four
indicators as the dip in the development line of the built environment index shows. Whether to in-
clude or exclude outliers from the index I and II is a matter of statistical and criminological consider-
ation. Even a single tower block can have a criminogenic effect in an area so it depends on local ex-
pertise whether it is reasonable to include or exclude the outliers of this this indicator. In our show-
case it is included for demonstrative purposes only. A second option is to weight indicators with
outlying values.
8.1. How to set up the metric with your own communal data
This manual describes how municipalities, neighbourhood managers, crime prevention councils, or
other practitioners in the field of urban security can set up their own local security metric. Compared
with some of the other approaches and tools described in this report the setup of the security metric
is a relatively easy process, but of course it also has limited analytical capabilities. The assignment of
resources necessary to create the metric depends on the availability of data, the number of included
indicators, the update intervals, reporting periods, the number of areas the metric is projected to,
and many other things. From our experience with the showcase we estimate that a similar metric
(with 33 indicators for one borough) can be put together by a single employee within one week giv-
en that all the necessary data for each indicator is readily accessible. Once the data structure is set
up, it will cost considerably less efforts to project the metric to additional boroughs. There is also a
lot of potential to automate this process especially if many areas are monitored or if the reporting
intervals are more frequent (e.g. monthly). Again this depends on the availability of data and the
purpose of the metric. The metric can be set up in four steps:
Step 1: determine the purpose of the metric
The metric is not an end in itself. It should have a well-defined purpose. The purpose and the availa-
bility of data determines which indicators are to be included, how they are measured and defined, to
which urban areas the metric is projected to (city wide, districts, boroughs), how long the reporting
intervals are, what the base year of comparison is, and many other questions. Our showcase is based
on rather random decision about all these questions as the purpose is to demonstrate its setup.
Nevertheless it contains actual data and is fully operative in this regard.
An appropriate use of the metric is to present disperse statistical information to the public, policy
makers or communal departments. As such it could be one element within the periodical safety and
security report of a city. Another field of application can be evaluation and performance measure-
ment. In any case the integrity of the data is crucial and the metric should be maintained by non-
partisan organization, otherwise it is susceptible to political influence.

Page 57
Title: GA no.: 285222
Step 2: Select and group indicators
Our showcase monitors 33 indicators grouped in eight different categories (such as violent crime and
social cohesion). These categories are meaningful but abstract, that is, they cannot be observed and
measured directly. What can be observed and measured directly however, are their underlying indi-
cators. By definition an indicator is a quantifiable (or otherwise assessable) and measurable charac-
teristic that marks the presence or absence of an otherwise non-observable phenomenon. The pro-
cess of making non-observable phenomenon measureable through the use of indicators is called
operationalization. Each category in the security metric has to be operationalised. There are only
few general rules for this process as it depends on the nature of the category. Violent crime, for in-
stance, apparently comprises criminal offences in which the offender resorts to some physical vio-
lence as a means to reach his ends. Within this category one could further distinguish between coer-
cive violence and retaliative violence, or between sexual violence and non-sexual violence, as all of
these types of violence have very different causes and consequences.
The decision which indicators are grouped together is determined by the purpose of the metric and
by theoretical assumptions. In our showcase the category violent crime is composed of four offenses
that are presumably of interest to the general public. It can be used for example to inform the public
about the gap between incidents of battery and robbery in the city centre. From the point of view of
crime prevention or prosecution this selection would make less sense as the crimes types are crimi-
nologically and forensically too diverse. For these purposes indicators would be grouped in a differ-
ent way. Neither is the category in the showcase an exhaustive list of offenses that qualify as violent
crime. The German police statistic includes about 50 different types of violent crime, some of which
are relevant for urban security others are not.
The category ‘built environment’ represents the propensity of an urban area to produce crime re-
gardless of other social factors. This category is based on theoretical assumptions and empirical re-
search on place based and situational explanations of crime described previously in chapter 2 of this
report. It states that certain urban architectural features can have a criminogenic or preventive ef-
fect. For example ‘residential nearness’ (measured by the indicator ‘percentage of buildings with one
or two apartments’) is a protective factor against crime whereas the percentage of ‘high rise build-
ings’ is a risk factor. There are numerous other indicators that could be used to conceptualise the
built environment category, such as signs of physical deterioration (broken windows). To conceptual-
ise this category for the showcase, we used the best indicators that were available in the official
statistics. For a more thorough assessment we recommend to conduct a structured documentation
of criminogenic/preventive physical features with one of the broken windows assessment tools of-
ten used in criminological research.
The category ‘urban risk factors’ is derived from empirical research into the numerous correlates of
crime. For the sake of simplicity we select our indicators from the Amsterdam criminogenity Moni-
tor’s ‘short list of risk factors’, as discussed in chapter 4.2 of this report (van Steden et. al. 2013:50).
It includes very general risk factors identified in criminological meta studies. There is not enough
room here to review the research of every indicator. Neither does the showcase metric give any
information about why or how strong these factors correlate with crime, not to speak of causing
crime. The only thing that can be concluded from these indictors is that they indicate potential social
problems like crime. The indicator ‘percentage of males’ for example is included because males
commit more crimes than females. Freiburg is no exception to this global trend: for every female

Page 58
Title: GA no.: 285222
offender there are three male offenders in Freiburg (in 2011 there were 2402 investigated female
offenders and 7286 male offenders). The percentage of male residents in an area therefore is a risk
factor in the metric but it does not explain why males commit more crimes. Many of the indicators
classified as risk factors in the metric correlate with each other on a multivariate level. That can lead
to flawed interpretations about the predictive validity of an indicator. In Freiburg foreigners do not
commit more crime than Germans as the indicator ‘foreigners’ could imply. But foreigners more
often bear other risk factors (such as unemployment or a lack of social capital), which increases the
likelihood that they become criminal. If controlled for other risk factors, the nationality, or migration
status of a person is usually a non-significant, or a very weak predictor of crime.
The short list of the Amsterdam criminogenity monitor is a convenient starting point for developing
a security metric. Yet, we recommend a more deliberate selection process when cities develop their
own metric taking into account local idiosyncrasies and a more thorough understanding of urban
correlates of crime.
The categories social cohesion, social disintegration and fear of crime are based on survey indicators.
The city of Freiburg conducts representative surveys in which these concepts are included. As can be
seen in the showcase, the monitoring period for ‘perceptions’ (survey data) is different than the
monitoring period of police recorded crime and urban data. This is due to the circumstance that no
other survey data is available in Freiburg. The wording of the survey questions is slightly different
than the wording described in figure 7 of chapter 4.3, and the scale used in Freiburg is short of one
item. The values displayed in the metric are the means of the 5-point Likert Scale survey questions.
Collective efficacy is a powerful explanation for varying crime rates in different neighbourhoods of a
city. The category fear of crime is measured by just one survey indicator asking respondents “how
safe they feel when they walk in their neighbourhood at night?” More elaborate crime surveys ask
respondents for crime specific insecurities and distinguish between different emotional responses to
the threat of crime (worry, anxiety, fear, anger).
Categories can be added to or deleted from the showcase metric depending on purpose and data
availability. It is important however that the formation of categories is a deliberate and transparent
process that reflects the purpose of the metric.
Step 3: acquire data, consider geographical boundaries, and compile dataset
In order to fill the metric with information, data for each indicator must be collected for the entire
reporting period (2006 until 2011 in the showcase) and for all areas. Simultaneously with the selec-
tion of indicators, the developer of the metric has to consider to which geographical unit every indi-
cator can be projected to. The showcase metric shows the development of indicators within one of
41 boroughs of Freiburg (so called three digit areas). This is the area in the old city of Freiburg (code
111), which is notorious for its high rate of violent crime (mostly battery). Other geographical classi-
fication systems can be postcode areas, electoral districts, census areas or others. One of the ad-
vantages of the security metric is that different areas of a city are monitored thereby considering
socio-geographical and criminogenic contexts within the urban environment. Statistical boundaries
however are not always a good delimiter for social contexts. Grown neighbourhoods or crime hot
spots can cut cross administrative units. Eventually it is a compromise between availability of data,
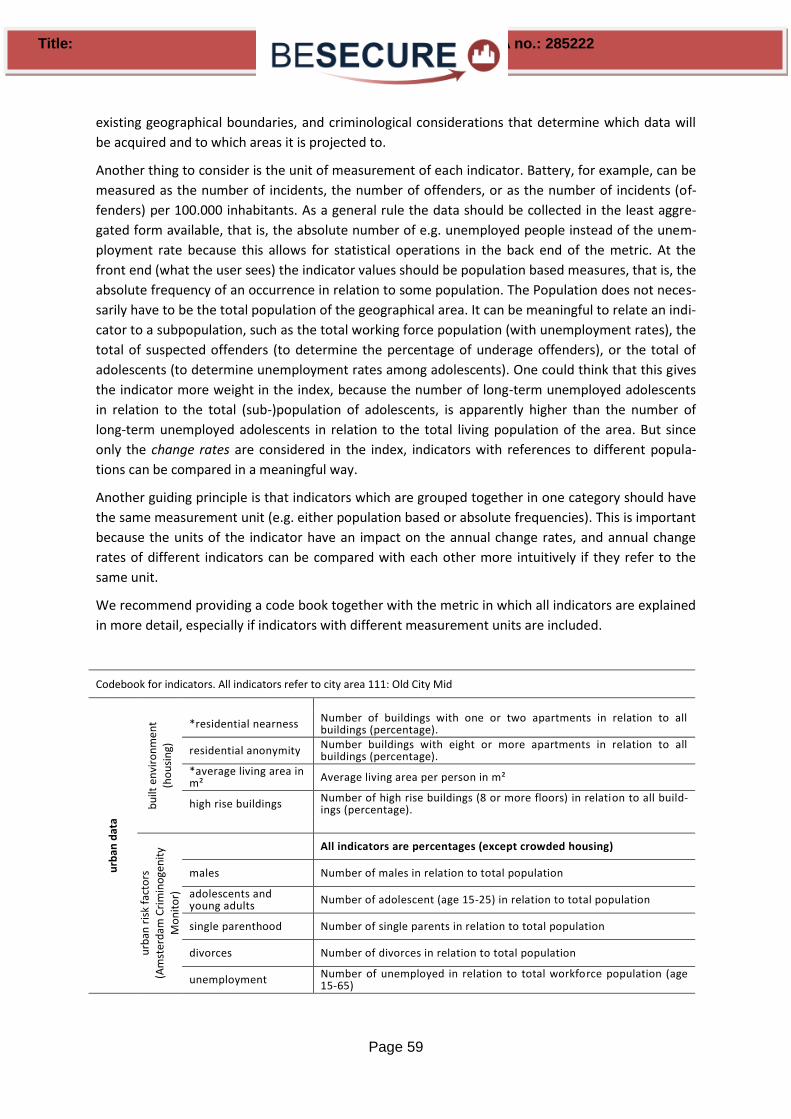
Page 59
Title: GA no.: 285222
existing geographical boundaries, and criminological considerations that determine which data will
be acquired and to which areas it is projected to.
Another thing to consider is the unit of measurement of each indicator. Battery, for example, can be
measured as the number of incidents, the number of offenders, or as the number of incidents (of-
fenders) per 100.000 inhabitants. As a general rule the data should be collected in the least aggre-
gated form available, that is, the absolute number of e.g. unemployed people instead of the unem-
ployment rate because this allows for statistical operations in the back end of the metric. At the
front end (what the user sees) the indicator values should be population based measures, that is, the
absolute frequency of an occurrence in relation to some population. The Population does not neces-
sarily have to be the total population of the geographical area. It can be meaningful to relate an indi-
cator to a subpopulation, such as the total working force population (with unemployment rates), the
total of suspected offenders (to determine the percentage of underage offenders), or the total of
adolescents (to determine unemployment rates among adolescents). One could think that this gives
the indicator more weight in the index, because the number of long-term unemployed adolescents
in relation to the total (sub-)population of adolescents, is apparently higher than the number of
long-term unemployed adolescents in relation to the total living population of the area. But since
only the change rates are considered in the index, indicators with references to different popula-
tions can be compared in a meaningful way.
Another guiding principle is that indicators which are grouped together in one category should have
the same measurement unit (e.g. either population based or absolute frequencies). This is important
because the units of the indicator have an impact on the annual change rates, and annual change
rates of different indicators can be compared with each other more intuitively if they refer to the
same unit.
We recommend providing a code book together with the metric in which all indicators are explained
in more detail, especially if indicators with different measurement units are included.
Codebook for indicators. All indicators refer to city area 111: Old City Mid
urb
an d
ata
bu
ilt e
nvi
ron
me
nt
(ho
usi
ng)
*residential nearness Number of buildings with one or two apartments in relation to all buildings (percentage).
residential anonymity Number buildings with eight or more apartments in relation to all buildings (percentage).
*average living area in m² Average living area per person in m²
high rise buildings Number of high rise buildings (8 or more floors) in relation to all build-ings (percentage).
urb
an r
isk
fact
ors
(A
mst
erd
am C
rim
ino
gen
ity
Mo
nit
or)
All indicators are percentages (except crowded housing)
males Number of males in relation to total population
adolescents and young adults
Number of adolescent (age 15-25) in relation to total population
single parenthood Number of single parents in relation to total population
divorces Number of divorces in relation to total population
unemployment Number of unemployed in relation to total workforce population (age 15-65)

Page 60
Title: GA no.: 285222
long-term unemploy-ment
Number of long-term unemployed (>1 year) in relation to total work-force population (age 15-65)
unemployment among young adults
Number of unemployed adolescents and young adults (age 15-25) in relation to total population of adolescents and young adults
underage offenders Number of underage offenders (< age 21) in relation to all investigated suspects of crime incidents in the area (also considers non-residents).
foreigners Number of foreigners in relation to total population
Germans wmb Germans with migration background in relation to total population
crowded housing Average living area per person in m²
po
lice
re
cord
ed
cri
me
pro
per
ty
crim
e
All indicators of police reported crime are absolute frequencies of police reported crime incidents
bicycle theft Aggravated theft of bicycle. Statistical reference key *4**3*
shop lifting Shop lifting (aggravated and non-aggravated): *26***
pickpocketing Pickpocketing *90***
burglary Theft by burglary of a dwelling 435***
vio
len
t cr
ime
battery Culpable actual bodily harm 2240***
aggravated battery Culpable grievous bodily harm 2220**
sexual offences All offences against bodily autonomy 1000**
robbery Blackmail and use of force or threats against life or limb, robbery caus-ing death, Theft and use of force to retain stolen goods, Attacking a driver for the purpose of committing a robbery 2100**
nar
coti
cs
possession General violations against § 29 BtMG including purchase of all listed drugs 7310**
trade Illegal trade and trafficking of narcotics according to §29 BtMG, includ-ing all there listed drugs. 7320**
pe
rce
pti
on
s
(su
rve
y sc
ale
s)
soci
al c
oh
esio
n
people here help each other
Mean of survey variable with response categories: 1=completely disa-gree; 2= disagree; 3 = even; 4= agree; 5 = completely agree
people here know each other
See above
trusted neighbour-hood See above
soci
al d
isin
tegr
atio
n
often conflicts See above
parents don't care See above
no shared values See above
no respect for law and order
See above
fear
of
crim
e
residents' feeling insecure
Mean of survey variable asking respondents: “how safe do you feel when you walk in your neighbourhood at night?” response categories: 1= very safe; 2=safe; 3=even ; 4= somewhat unsafe 5=very unsafe

Page 61
Title: GA no.: 285222
Step 4: create the metric: annual trend rates, spark lines, indices I and II.
When the arrangement of indicators and categories is finished and all necessary data is accessible,
the data set can be compiled with spreadsheet software. The spreadsheet structure in the back-end
of the metric basically is the same as in the front end: rows represent the indicators columns the
years. This is done on separate spreadsheet for each area to which the metric is projected to. Only a
few calculations in the back-end of the metric are necessary in order to visualise the information
given in panel II-III. The indicator value in the base year (𝐼0) is the point of reference for the annual
change rates. Within each category they should have the same measurement unit (here: rates, abso-
lute frequencies, and means). The urban risk factors are population based rates. To give an example:
the indicator ‘adolescents and young adults’ (18,89%) is calculated by dividing the number of all ado-
lescent between the age of 15-25 (which are 706 individuals) by the number of the total population
in area 111 in the base year 2006 (which are 3737). This result is displayed in the front end in the
column ‘indicator at base year’. This rate has to be calculated for all years of the reporting period
(here 2007 until 2011) by dividing the frequency of the indicator for the reporting year through the
population of the area in the same year:
𝐼𝑖 = 𝐹𝑖
𝑃𝑖
With: 𝐼𝑖= Index value in reporting year i; 𝐹𝑖 = absolute frequency of the indicator in reporting year i;
𝑃𝑖 = Population in reporting year i.
Some indicators of the category ‘urban risk factors’ or not divided by population total but by a sub-
population at a given time 𝑃𝑖𝑠 (See codebook). When subpopulations are considered their quantity in
the monitored areas must be known of course.
The results of 𝐼𝑖(here 𝐼2007 to 𝐼2011), remain in the backend of the metric, except for 𝐼0, which is
reported in the column ‘value base year’. The front end shows the annual change rates 𝑇𝑖 of 𝐼𝑖calcu-
lated by:
𝑇𝑖 = [(100
𝐼0) 𝐼𝑖] − 100
𝑇𝑖 is the growth rate of the indicator in the reporting year 𝑖 compared to the value of the indicator in
the base year (𝐼0) expressed in percent. To give an example how to read the trend rates appearing
on the front end (under the component ‘perceptions’): the mean score of the survey question ‘there
is no respect for law and order in our neighbourhood’ (1= completely agree; 5 = completely disagree)
is 𝐼0 = 2,04 in the base year (1999). In 2001 it is 3,3 percent lower (𝑇2001) and 2010 it is 0,5 percent
higher than in 1999.
In the showcase metric the change rate for the base year is always 0 percent (as this is the reference
point) and the annual change rates are accounted in positive and negative percentages. Another
option for reporting the annual change rates is to set the value to 100 in the base year (instead of 0).
The difference between these two ways of representing growth rates is that falling rates are ex-
pressed in positive values < 100 and growing rates in values > 100. This is similar to price indices and
therefore might be a more familiar way of depicting annual variations.

Page 62
Title: GA no.: 285222
As noted before some indicators are risk factors and others are protective factors. Positive annual
change rates of risk factors indicate that the risk of crime is growing in an area; positive change rates
of protective factors indicate falling crime risks. Because this obstructs intuitive interpretation,
change rates are colour coded in the front end of the metric. Positive values of risk factors are coded
red, negative values are coded green. With protective factors it is the other way around: Positive
values are coded green, negative values are coded red. In Excel this can be done with the function
‘conditional formatting’ that assigns colour formatting to cells with positive or negative values. The
trend lines (line and bar charts) in the next columns of the metric represent the annual change rates
of single indicators. In Excel (2010 or newer) the spark lines function creates these trend charts di-
rectly on the front-end sheet. For single indicators the source data can be selected directly from
range of cells at the front end.
Security Index I and II in panel III are spark lines, too. All indicators of these average trend lines have
to point into the same direction of either more or less risk for crime related urban insecurities. That
means that protective factors (those who turn green when they increase) have to be inverted in the
back-end of the metric where the raw data of the metric is stored, so that higher values indicate
more risks regardless of what information the indicator represents (the only exception is social co-
hesion and social efficacy, where positive growth rates indicate less crime risks). To maintain intui-
tive interpretation of the single indicators this should be done in the back end of the metric. For
example, higher values and growing chart lines of the indicator ‘average living area’ as displayed in
the metric, should actually mean more living area, not less. In the data for the two spark lines ‘de-
velopment built environment’ and ‘urban data index’ in the back-end, these values are recoded so
that higher values actually mean more risk, i.e. less average living area.
To calculate the mean for a category 𝑘 in the reporting year 𝑖 use:
�̅�𝑖 =1
𝑛∑ 𝑥𝑖𝑘
𝑛
𝑘=1
Whereas �̅�𝑖 is the mean of the category in the reporting year, 𝑘 is the number of indicators within
the category and 𝑥𝑖𝑘 is value of the kth indicator in the reporting year 𝑖. All indicator values of pro-
tective factors have to be inverted: −(𝑥𝑖𝑘). In Excel this can be done by putting a minus sign in front
of the value within the formula for calculating the mean, e.g. MEAN([value1]; [value2]; [-value3]).
Whit the mean values of a category for the entire reporting period the spark lines for the indices I
and II can be drawn on the front end sheet of the metric. To calculate Indices II just repeat the pro-
cedure with all the indicator values you want to group together within the index (do not calculate
the means for Index II by calculating the means of means of Index I). In addition to the chart line the
showcase also specifies the numeric values of means for all indices II for the reporting years. The
user can see that the eleven urban risk factors decreased by an average of 10,3 percent in 2011
(compared to 2006).


![[D3.1] Report on identified supply, demand and financing opportunities](https://static.fdokumen.com/doc/165x107/6315d087b1e0e0053b0f3724/d31-report-on-identified-supply-demand-and-financing-opportunities.jpg)