Italia, Sicilia, Sardinia epigraphicae - Repertorio bibliografico, 6, in Suppl.It., 27, 2013
Upload
independentCategory
view
0download
0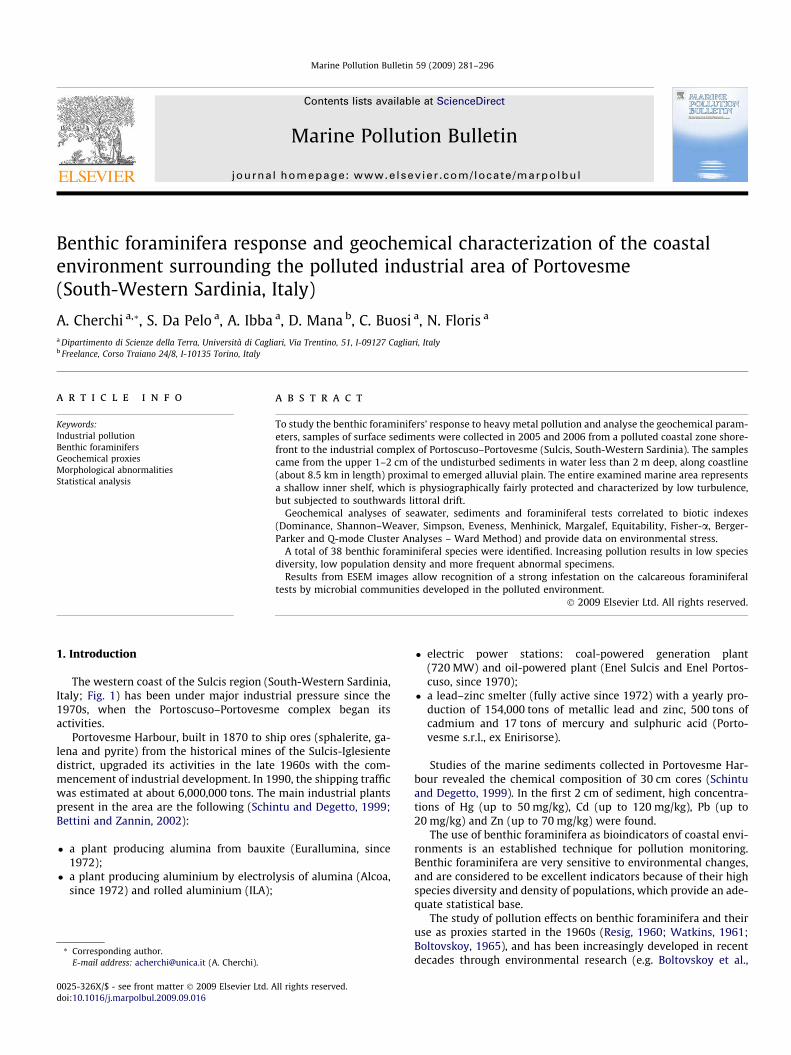
Marine Pollution Bulletin 59 (2009) 281–296
Contents lists available at ScienceDirect
Marine Pollution Bulletin
journal homepage: www.elsevier .com/locate /marpolbul
Benthic foraminifera response and geochemical characterization of the coastalenvironment surrounding the polluted industrial area of Portovesme(South-Western Sardinia, Italy)
A. Cherchi a,*, S. Da Pelo a, A. Ibba a, D. Mana b, C. Buosi a, N. Floris a
a Dipartimento di Scienze della Terra, Università di Cagliari, Via Trentino, 51, I-09127 Cagliari, Italyb Freelance, Corso Traiano 24/8, I-10135 Torino, Italy
a r t i c l e i n f o
Keywords:Industrial pollutionBenthic foraminifersGeochemical proxiesMorphological abnormalitiesStatistical analysis
0025-326X/$ - see front matter � 2009 Elsevier Ltd. Adoi:10.1016/j.marpolbul.2009.09.016
* Corresponding author.E-mail address: [email protected] (A. Cherchi).
a b s t r a c t
To study the benthic foraminifers’ response to heavy metal pollution and analyse the geochemical param-eters, samples of surface sediments were collected in 2005 and 2006 from a polluted coastal zone shore-front to the industrial complex of Portoscuso–Portovesme (Sulcis, South-Western Sardinia). The samplescame from the upper 1–2 cm of the undisturbed sediments in water less than 2 m deep, along coastline(about 8.5 km in length) proximal to emerged alluvial plain. The entire examined marine area representsa shallow inner shelf, which is physiographically fairly protected and characterized by low turbulence,but subjected to southwards littoral drift.
Geochemical analyses of seawater, sediments and foraminiferal tests correlated to biotic indexes(Dominance, Shannon–Weaver, Simpson, Eveness, Menhinick, Margalef, Equitability, Fisher-a, Berger-Parker and Q-mode Cluster Analyses – Ward Method) and provide data on environmental stress.
A total of 38 benthic foraminiferal species were identified. Increasing pollution results in low speciesdiversity, low population density and more frequent abnormal specimens.
Results from ESEM images allow recognition of a strong infestation on the calcareous foraminiferaltests by microbial communities developed in the polluted environment.
� 2009 Elsevier Ltd. All rights reserved.
1. Introduction
The western coast of the Sulcis region (South-Western Sardinia,Italy; Fig. 1) has been under major industrial pressure since the1970s, when the Portoscuso–Portovesme complex began itsactivities.
Portovesme Harbour, built in 1870 to ship ores (sphalerite, ga-lena and pyrite) from the historical mines of the Sulcis-Iglesientedistrict, upgraded its activities in the late 1960s with the com-mencement of industrial development. In 1990, the shipping trafficwas estimated at about 6,000,000 tons. The main industrial plantspresent in the area are the following (Schintu and Degetto, 1999;Bettini and Zannin, 2002):
� a plant producing alumina from bauxite (Eurallumina, since1972);
� a plant producing aluminium by electrolysis of alumina (Alcoa,since 1972) and rolled aluminium (ILA);
ll rights reserved.
� electric power stations: coal-powered generation plant(720 MW) and oil-powered plant (Enel Sulcis and Enel Portos-cuso, since 1970);
� a lead–zinc smelter (fully active since 1972) with a yearly pro-duction of 154,000 tons of metallic lead and zinc, 500 tons ofcadmium and 17 tons of mercury and sulphuric acid (Porto-vesme s.r.l., ex Enirisorse).
Studies of the marine sediments collected in Portovesme Har-bour revealed the chemical composition of 30 cm cores (Schintuand Degetto, 1999). In the first 2 cm of sediment, high concentra-tions of Hg (up to 50 mg/kg), Cd (up to 120 mg/kg), Pb (up to20 mg/kg) and Zn (up to 70 mg/kg) were found.
The use of benthic foraminifera as bioindicators of coastal envi-ronments is an established technique for pollution monitoring.Benthic foraminifera are very sensitive to environmental changes,and are considered to be excellent indicators because of their highspecies diversity and density of populations, which provide an ade-quate statistical base.
The study of pollution effects on benthic foraminifera and theiruse as proxies started in the 1960s (Resig, 1960; Watkins, 1961;Boltovskoy, 1965), and has been increasingly developed in recentdecades through environmental research (e.g. Boltovskoy et al.,
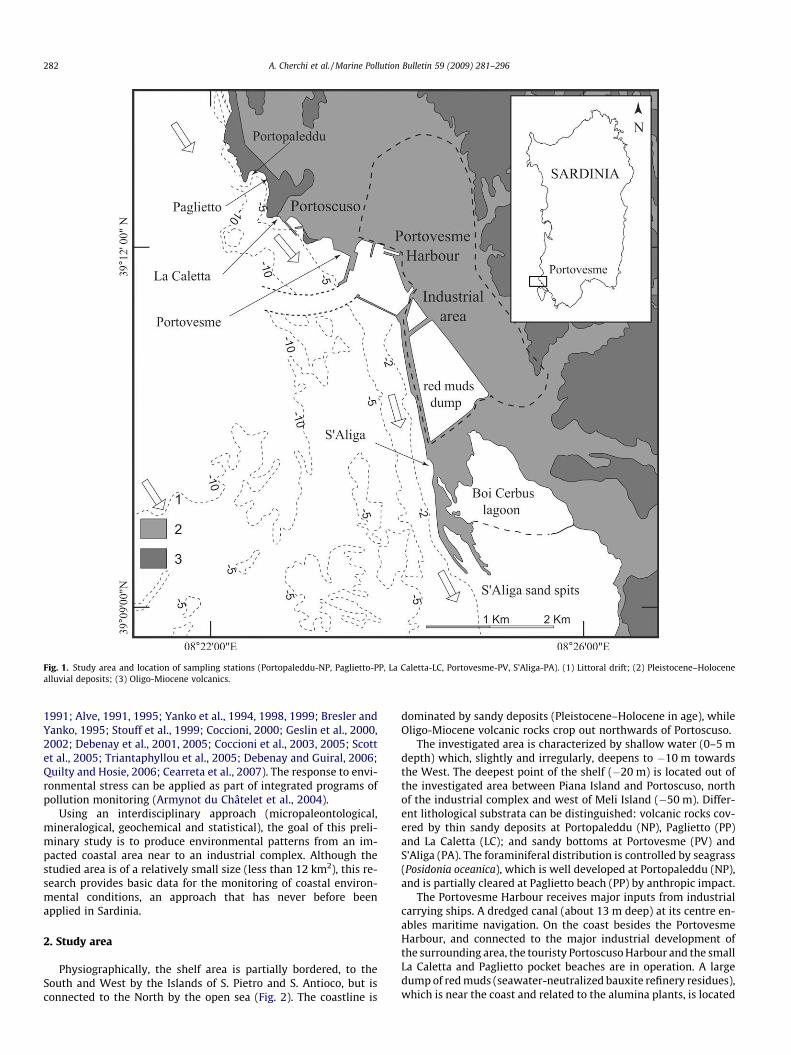
Fig. 1. Study area and location of sampling stations (Portopaleddu-NP, Paglietto-PP, La Caletta-LC, Portovesme-PV, S’Aliga-PA). (1) Littoral drift; (2) Pleistocene–Holocenealluvial deposits; (3) Oligo-Miocene volcanics.
282 A. Cherchi et al. / Marine Pollution Bulletin 59 (2009) 281–296
1991; Alve, 1991, 1995; Yanko et al., 1994, 1998, 1999; Bresler andYanko, 1995; Stouff et al., 1999; Coccioni, 2000; Geslin et al., 2000,2002; Debenay et al., 2001, 2005; Coccioni et al., 2003, 2005; Scottet al., 2005; Triantaphyllou et al., 2005; Debenay and Guiral, 2006;Quilty and Hosie, 2006; Cearreta et al., 2007). The response to envi-ronmental stress can be applied as part of integrated programs ofpollution monitoring (Armynot du Châtelet et al., 2004).
Using an interdisciplinary approach (micropaleontological,mineralogical, geochemical and statistical), the goal of this preli-minary study is to produce environmental patterns from an im-pacted coastal area near to an industrial complex. Although thestudied area is of a relatively small size (less than 12 km2), this re-search provides basic data for the monitoring of coastal environ-mental conditions, an approach that has never before beenapplied in Sardinia.
2. Study area
Physiographically, the shelf area is partially bordered, to theSouth and West by the Islands of S. Pietro and S. Antioco, but isconnected to the North by the open sea (Fig. 2). The coastline is
dominated by sandy deposits (Pleistocene–Holocene in age), whileOligo-Miocene volcanic rocks crop out northwards of Portoscuso.
The investigated area is characterized by shallow water (0–5 mdepth) which, slightly and irregularly, deepens to �10 m towardsthe West. The deepest point of the shelf (�20 m) is located out ofthe investigated area between Piana Island and Portoscuso, northof the industrial complex and west of Meli Island (�50 m). Differ-ent lithological substrata can be distinguished: volcanic rocks cov-ered by thin sandy deposits at Portopaleddu (NP), Paglietto (PP)and La Caletta (LC); and sandy bottoms at Portovesme (PV) andS’Aliga (PA). The foraminiferal distribution is controlled by seagrass(Posidonia oceanica), which is well developed at Portopaleddu (NP),and is partially cleared at Paglietto beach (PP) by anthropic impact.
The Portovesme Harbour receives major inputs from industrialcarrying ships. A dredged canal (about 13 m deep) at its centre en-ables maritime navigation. On the coast besides the PortovesmeHarbour, and connected to the major industrial development ofthe surrounding area, the touristy Portoscuso Harbour and the smallLa Caletta and Paglietto pocket beaches are in operation. A largedump of red muds (seawater-neutralized bauxite refinery residues),which is near the coast and related to the alumina plants, is located
Fig. 2. Generalized map showing study area (detail in Fig. 1) and bathymetry. (1) Emerged lands; (2) 0–10 m; (3) 10–20 m; (4) >20 m; (5) study area (from Carta nauticadall’Isola di S.Pietro a Capo S. Marco, 1:100.000, Istituto Idrografico della Marina Italiana, 1988; topographic survey, 1967; modified).
A. Cherchi et al. / Marine Pollution Bulletin 59 (2009) 281–296 283
between Portovesme and S’Aliga (Fig. 1). The greatest environmen-tal stress has been recorded from Portovesme Harbour to S’Aliga.
The coastline between Portoscuso and S’Aliga Cape is relativelywell protected from the strong action of the waves. The wind-fieldis dominated by the Mistral (north-western direction). This coast-line is affected by a southwards littoral drift which is responsiblefor a sediment-transfer to the continuously growing sand spits ofthe S’Aliga peninsula (Atzeni and Ginesu, 1993; Di Gregorio et al.,1996). Spano and Pinna (1956) have demonstrated its southwardsprogradation of about 750 m in 108 years (1845–1953). Whencomparing the I.G.M. (Istituto Geografico Militare) topographicmaps of 1965 and 1987, it can be seen that a second spit grewup at S’Aliga, about 250 m seawards. During this time, the Porto-vesme Harbour was enlarged, the dredged canal was deepenedand the red mud dump was realized (cf. Figs. 1 and 2). The increasein size of the sandy S’Aliga peninsula has favoured the formation ofthe Boi Cerbus lagoon, which is more protected thanks to thedevelopment of the S’Aliga spits.
The industrial area, which is located on an alluvial plain,spreads out about 710 ha, 480 of which are occupied by a numberof activities (chemical, metallurgical, thermo-electrical; see Sec-
tion 1). The large industrial development has a considerable envi-ronmental impact (SO2, NOx, CO2, HF, F, Pb, Zn, Cd, Cr, red muds,high concentrations of total suspended particulates–TSP), suchthat the industrial district of Portoscuso–Portovesme has been de-clared an environmental hazard (D.P.C.M. – Prime Ministerial de-cree, 23.04.1993) because of the several ‘‘danger centres” that arerecognized (ARPAS: Sardinian Environmental Protection Agency,2007).
Emissions into the atmosphere and all of the surrounding envi-ronments have been estimated annually at 65,000 tons of SOx,4,000 tons of dust, 10 tons of Pb and 100 tons of Fe (Gazzetta Uffic-iale, 1993; Schintu and Degetto, 1999). The large electric powerstations and the numerous chimneys (about 140) produce signifi-cant amounts of CO2.
3. Materials and methods
In July 2006, seawater samples and superficial sediments werecollected in water less than 2 m deep at four stations: Paglietto(PP), La Caletta (LC), Portovesme (PV) and S’Aliga (PA) (Fig. 1).For a preliminary analysis of the foraminiferal assemblages, a pre-
284 A. Cherchi et al. / Marine Pollution Bulletin 59 (2009) 281–296
vious field sampling was carried out in July 2005 at the same sites.To enable the most recent deposition to be considered, the sampleswere taken from the upper 1–2 cm of the virtually undisturbedsediments (Quilty and Hosie, 2006).
Sampling stations (PP, LC, PV and PA) were selected along thecoast (about 10–15 m from the coastline), two to the north (PP,LC) and one (PA) to the south, respectively, of the industrial com-plex of Portoscuso–Portovesme (Fig. 1). To emphasize the struc-tural diversity and abundance of the foraminiferal assemblagesfrom polluted and unpolluted environments, a supplementary sta-tion was sampled (Portopauleddu-NP; Fig. 1) for microfauna char-acterization. This station, which is fairly sheltered from theindustrial pollution, reveals a phytal habitat (seagrasses) charac-terized by more diversified epiphytic foraminiferal assemblages.A preliminary analysis of the coastal sediments at this site hasshown a better environmental pattern supported by a more shel-tered physiographic position when compared to the nearby PPstation.
Because a spot horizontal distribution often characterizes thebenthic foraminiferal assemblages (Murray, 1991; Hoheneggeret al., 1993), more than one sample from each station should be ta-ken to avoid the risk of a none representative sample (Debenayet al., 1996; Murray, 2006). Thus, from each station and at severalsites (NP1–4, PP1–4, LC1–4, PV1–4 and PA1–4) covering a surface ofabout 1 m2 (Debenay and Guiral, 2006), a cluster of four subsam-ples of constant volume (50 cm3) were hand collected using a plas-tic ring. A total of 20 samples of sediment, coming from an area ofless than about 12 km2, were examined. In the laboratory, the wetsamples were stained with Rose Bengal (Walton, 1952) to differen-tiate living from dead individuals. The samples were then washedthrough a set of nested sieves (63, 125, 180, 250 lm) and oven-dried at 60 �C. Flotation (ZnBr2) was used to separate foraminifersfrom the sediment. All sieved fractions were examined with a stan-dard binocular microscope.
For the PP, LC, PV and PA sampling stations, to prevent samplebias, a composite sample was obtained by mixing the 4 subsamplescollected, both for medium-grained (a > 125 lm) and fine-grained(b < 125 lm) fractions (e.g. PP1a + PP2a + PP3a + PP4a;PP1b + PP2b + PP3b + PP4b). After homogenization, foraminiferalspecimens from 5 cc of the > 125 lm size fraction (a – mediumgrained) and 5 cc of the < 125 lm size fraction (b – fine-grained)were picked, counted and identified following the generic classifi-cation of Loeblich and Tappan (1987), Cimerman and Langer(1991) and Hottinger et al. (1993).
The foraminifers were observed through an environmentalscanning electron microscope with EDS microanalysis (FEI ESEMQuanta 200).
Living and dead individuals and abnormal and pyritized testswere counted separately.
For the geochemical characterization of the examined stations,seawater, sediments and selected abnormal individuals were col-lected at each sampling site. Pore-waters of sediments were char-acterized for selected physical-chemical parameters.
Seawater samples, collected at the water–sediment interface,were filtered in situ through a 0.4 lm pore-size polycarbonate fil-ter with an all-plastic filtration assembly, and acidified upon fil-tration for metal analyses. At each sampling site, temperature,pH, and Eh were measured for both the seawater and pore waterof the sediments. The Eh was measured by platinum electrodeand the value corrected against Zobell’s solution (Nordstrom,1977). Alkalinity and conductivity were also measured for seawa-ters. Anions were determined by ion chromatography (IC DionexDX-120), and cations by ICP-AES (ARL-3520B) and ICP-MS (PerkinElmer DRC-e). Because of the complex matrix of seawater, thestandard addition method was employed for the determinationof some trace elements (Cd, Pb and Zn) (Danzer and Currie,
1998; Cidu, 1999). The validation of the method was performedby applying the same conditions to the CASS-3 coastal seawaterreference material. The samples and CASS-3 were diluted fivetimes with a 1% ultrapure HNO3 solution before sample spiking.Accuracy and precision were estimated at 10% or better usingthe standard reference solution and random duplicate samples.The limit of quantification (10r value of blank solution responseover time) was respectively 0.01 lg/l for Cd, 0.6 lg/l for Pb and0.1 for Zn. The ionic balance was always in the order of ±8%. Spe-ciation and equilibrium calculations were carried out using thePHREEQC computer program with the Wateq4f database. ThePHREEQC uses ion-association and Debye Hückel expressions toaccount for the non-ideality of aqueous solutions. This type ofaqueous model is adequate at low ionic strength but may breakdown at higher ionic strengths (in the range of seawater andabove). The use of an ionic-strength term in the Debye Hückelexpressions has been fit for the major ions using chloride mean-salt activity-coefficient data (Truesdell and Jones, 1974). Thus, insodium chloride dominated systems, the model may be reliableat higher ionic strengths (Parkhurst and Appelo, 1999). The satu-ration index (SI) is calculated as log IAP/K, where IAP is the prod-uct of the relevant ionic species and K is the solubility product forthe specific mineral.
Mineralogical and geochemical analyses were carried out on thesediment samples and on the abnormal porcelanaceous foraminif-eral tests (miliolids), which were mechanically grounded in anagate mortar. Abnormal miliolid tests came from the sampling sta-tions at LC, PV, and PA. A blank sample of regular miliolid tests wasalso collected for comparison purposes at the same bathimetry of anon industrially-polluted area in the Eastern part of the Gulf ofCagliari (Capitana).
For mineralogical analyses by the X-ray powder diffraction(XRD) of sediments, data were collected in the 3–70� 2h angularrange on an automated Panalytical X’pert Pro diffractometer withNi-filter monochromatized Cu-Ka1 radiation (k = 1.54060 Å), oper-ating at 40 kV and 40 mA, using the X’Celerator detector in scan-ning mode with PSD length of 2.022�. X-ray pattern treatmentswas carried out by Panalytical High Score software and consistedof smoothing, Ka2 stripping and peak search. This final step findspeak positions by detecting the minima from the second derivativeof the diffractogram.
Leaching experiments were performed on sediments in order toevaluate the metal content of water soluble fraction and metallinked mostly to the carbonate fraction. Two aliquots of 2 g of eachsample were put into a 250 ml wide mouth HD-PE bottle with50 ml of Milli-Q� ultrapure water (pH 5.6) and 50 ml of a 1 Nsuprapur HCl solution (pH � 0), respectively. The bottles weresealed and shaken automatically at 185 rpm for 24 h at room tem-perature. The leachates were centrifuged at 3000 rpm for five min-utes and then filtered through a 0.4 lm pore-size polycarbonatefilter with an all-plastic filtration assembly. An aliquot of eachsample was acidified for analyses of Ca, Mg, Na, K, S, Cd, Cr, Fe,Mn, Pb and Zn by ICP-AES.
For porcelanaceous foraminiferal tests samples digestion, twoportions of each sample were washed with ultrapure water (Mil-liQ�) by mechanical agitation in order to remove detrital grains.The samples were dried, accurately weighted and digested by slowheating in a temperature bath at 30 �C in a Teflon becker with 3 mlof ultrapure HNO3 (67%). Solutions were diluted to 10 ml withultrapure water in volumetric flasks, and transferred to new HD-polyethylene bottles for storage (Jarvis, 1992). Metals were deter-mined by ICP-AES and ICP-MS.
All geochemical, mineralogical and micropaleontological analy-ses for this study were performed at the Earth Sciences Depart-ment and at the CGS (Centro Grandi Strumenti) of the Universityof Cagliari.
A. Cherchi et al. / Marine Pollution Bulletin 59 (2009) 281–296 285
Taxa counts and geochemical parameters were provided for sta-tistical analysis.
Based on total foraminiferal assemblages, biodiversity in-dexes were extracted using the PAST statistical software. Theywere then used as a tool to determine the general communitystructure of the studied area; Dominance, Shannon-Wiever,Simpson, Eveness, Menhick, Margalef, Equitability, Fisher-a andBerger-Parker indexes were calculated (Hayek and Buzas,1997; Sterne and Smith, 2001; Spellerberg, 2005; Hammerand Harper, 2005).
Subsequently, a Q-Mode cluster analysis (based on absoluteabundances of taxa) was used to verify the differences and similar-ities between sampled localities. Cluster analysis (also known assegmentation analysis or taxonomy analysis) is a numerical meth-od which seeks to identify homogeneous subgroups in a popula-tion by minimizing within-group variations and maximizingbetween-group variations. Finally, to detect and define the rela-tionships between pollutants and biodiversity, a correlation analy-sis was carried out in medium fraction (>125). A classic statisticaltool, correlation analysis defines the degree of correlation betweentwo variables, expressed as a value ‘‘r” ranging between �1 (strongnegative correlation – as Y increases, X decreases) and +1 (strongpositive correlation – as Y increases, so does X).
4. Results
4.1. Geochemical settings
Seawater composition at the sampling stations at PP, LC, PV andPA is reported in Table 1.
The pH values range between 7.9 and 8.2, and Eh values be-tween 0.34 and 0.37 V. Compared to the average composition ofseawater (Pilson, 1998; Morley et al., 1997; Cotruvo, 2005), thechemical composition in the Portovesme area shows an enrich-ment of SO4 with respect to conservative elements (Cl, Na and Li)and a higher value of heavy metals, in particular Pb and Zn. Speci-ation and equilibrium calculations indicate that Zn2+ is the mostabundant Zn species in the solution, while the uncharged ionPbCO3 is the most abundant Pb species; only 1–2% of Pb in solutionoccurs as a free ion. Cadmium is present, mainly as complexes withCl (Table 2). The saturation indexes indicate that all collected
Table 1Seawater composition at the four sampling stations compared with the mean composition
SurfacePilson (1998)
Estern MediterraneanCotruvo (2005)
Western MMorley et
pH – – –Eh V – – –T �C – – –Ca g/L 0.43 0.42 –Mg g/L 1.3 1.40 –K g/L 0.4 0.46 –Na g/L 11.04 11.80 –S04 g/L 2.8 2.95 –CI g/L 19.82 21.2 –HCO3 g/L 0.13 – –Br g/L 0.07 0.0155 –B lg/L 4600 – –Ba lg/L 14.3 – –Cd lg/L 0.1 – 0.1–0.03Li lg/L 123 – –Mo lg/L 10.2 – –Pb lg/L 0.002 – 0.07–0.01Sr lg/L 8131 – –Zn lg/L 0.4 – –TDS g/L 35.17 38.6 –
a These data refer to the maximum and minimum of the means of the values determ
waters were at equilibrium condition, or slightly oversaturated,with respect to calcite, aragonite and amorphous iron hydroxides,suggesting that a precipitation of these minerals is possible. Inthese conditions, coprecipitation and/or adsorption of heavy met-als could also occur.
Pore waters analyses show that the pH decreases and the redoxconditions become more reducing immediately below the water/sediments interface, especially at the PV sampling station (Table 3).
Mineralogical analyses of sediments show that quartz and feld-spars are the predominant phases in the whole area, while clayminerals are abundant at the PV sampling site. Calcite and arago-nite were also detected, and they are mostly attributable to frag-ments of shells.
Table 4 shows the analytical results of leaching experimentsperformed on sediments collected at the sampling stations at PP,LC, PV and PA. After leaching in water, the ionic concentrationsin the leachate aqueous solutions are mainly attributable to themarine component in which the sediments were immersed. Na/Mg and SO4/Mg ratios correspond approximately to those of sea-water (about 8 and 1.4, respectively). The leaching in water didnot extract detectable concentrations of heavy metals.
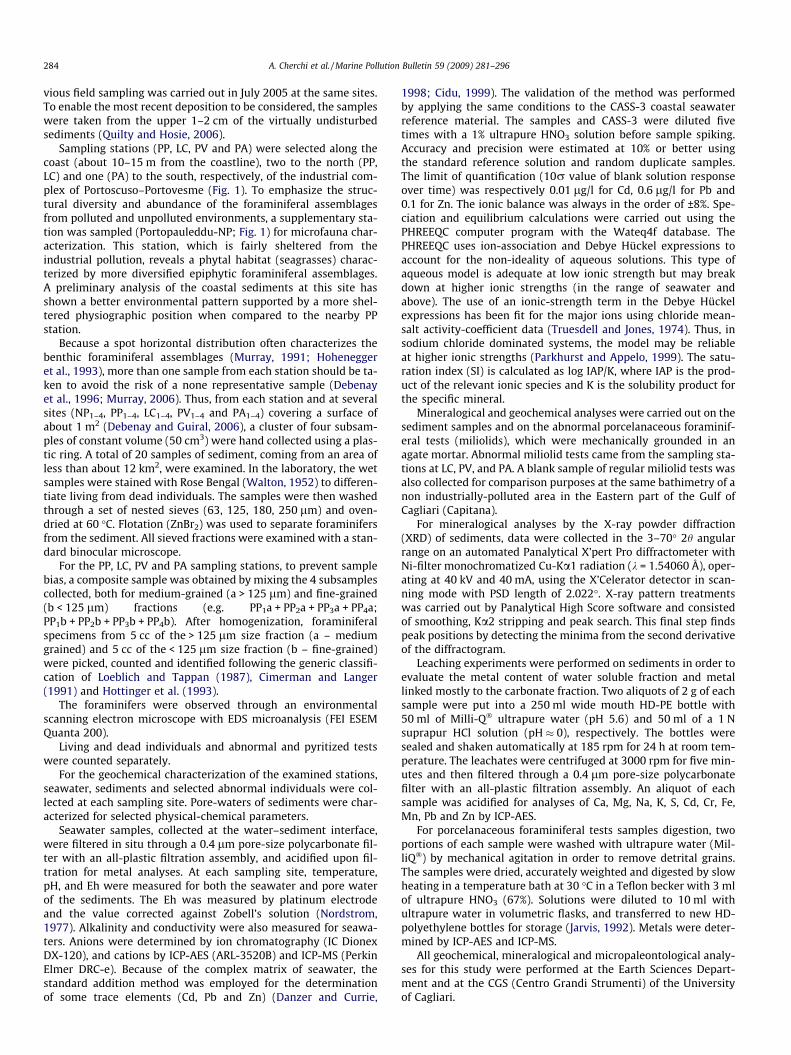
Leaching in HCl mainly dissolves the carbonatic fraction; addi-tional contributions can come from desorption of ions from clayminerals and iron hydroxides. The Cd and Pb in these leachates ex-ceed the limits (0.3 and 30 mg/kg, respectively) of Italian regula-tions for the ‘‘environmental quality standard of coastal marinesediments” (D.M. 56/2009). The greater concentrations of Cd, Pband Zn were measured in the leachate from the PV and PA samples(Fig. 3).
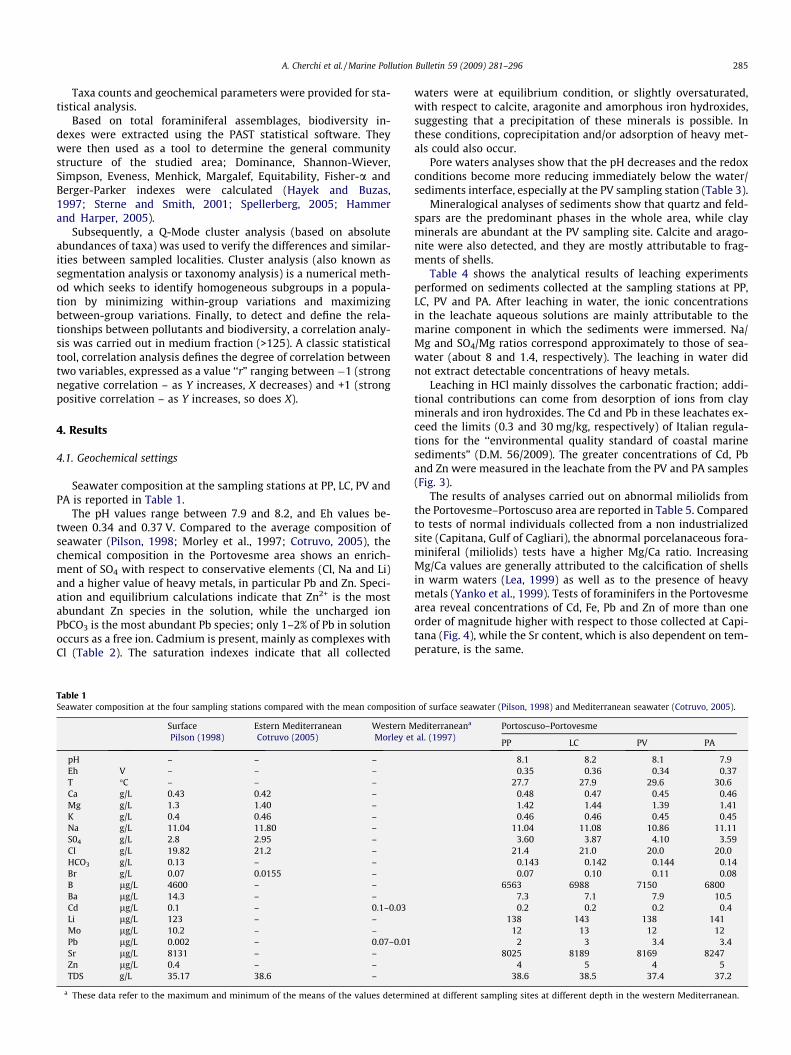
The results of analyses carried out on abnormal miliolids fromthe Portovesme–Portoscuso area are reported in Table 5. Comparedto tests of normal individuals collected from a non industrializedsite (Capitana, Gulf of Cagliari), the abnormal porcelanaceous fora-miniferal (miliolids) tests have a higher Mg/Ca ratio. IncreasingMg/Ca values are generally attributed to the calcification of shellsin warm waters (Lea, 1999) as well as to the presence of heavymetals (Yanko et al., 1999). Tests of foraminifers in the Portovesmearea reveal concentrations of Cd, Fe, Pb and Zn of more than oneorder of magnitude higher with respect to those collected at Capi-tana (Fig. 4), while the Sr content, which is also dependent on tem-perature, is the same.
of surface seawater (Pilson, 1998) and Mediterranean seawater (Cotruvo, 2005).
editerraneana
al. (1997)Portoscuso–Portovesme
PP LC PV PA
8.1 8.2 8.1 7.90.35 0.36 0.34 0.37
27.7 27.9 29.6 30.60.48 0.47 0.45 0.461.42 1.44 1.39 1.410.46 0.46 0.45 0.45
11.04 11.08 10.86 11.113.60 3.87 4.10 3.59
21.4 21.0 20.0 20.00.143 0.142 0.144 0.140.07 0.10 0.11 0.08
6563 6988 7150 68007.3 7.1 7.9 10.50.2 0.2 0.2 0.4
138 143 138 14112 13 12 12
2 3 3.4 3.48025 8189 8169 8247
4 5 4 538.6 38.5 37.4 37.2
ined at different sampling sites at different depth in the western Mediterranean.
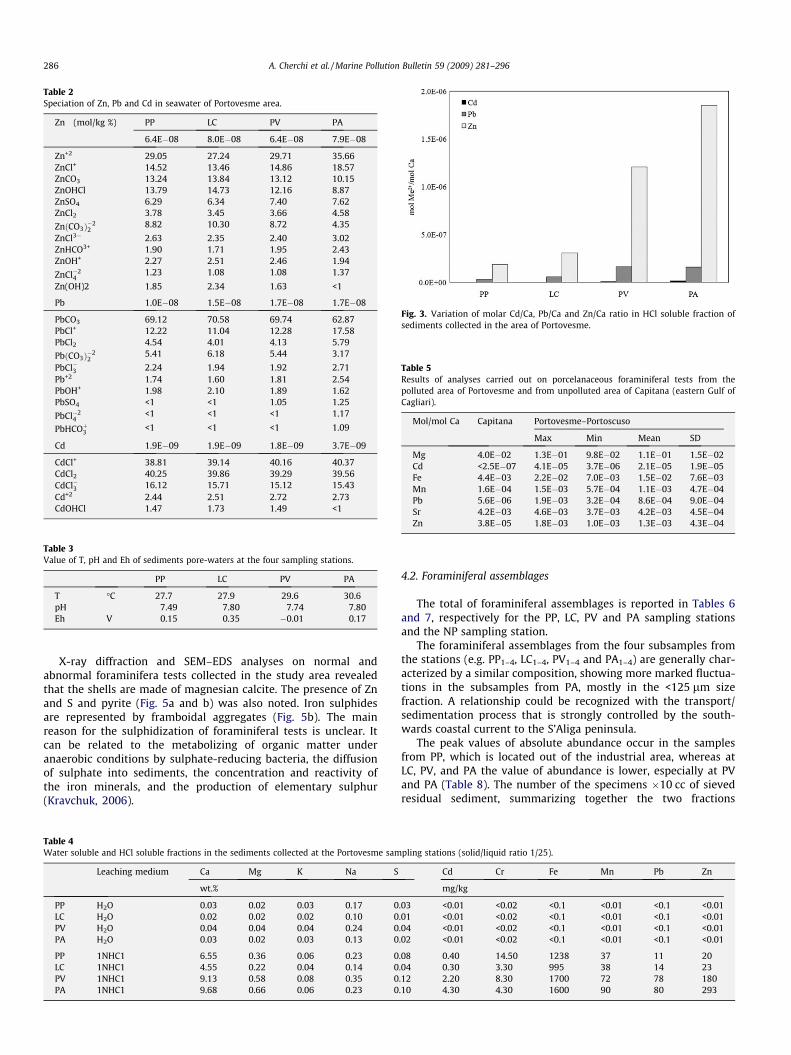
Table 2Speciation of Zn, Pb and Cd in seawater of Portovesme area.
Zn (mol/kg %) PP LC PV PA
6.4E�08 8.0E�08 6.4E�08 7.9E�08
Zn+2 29.05 27.24 29.71 35.66ZnCl+ 14.52 13.46 14.86 18.57ZnCO3 13.24 13.84 13.12 10.15ZnOHCl 13.79 14.73 12.16 8.87ZnSO4 6.29 6.34 7.40 7.62ZnCl2 3.78 3.45 3.66 4.58
ZnðCO3Þ�22
8.82 10.30 8.72 4.35
ZnCl3� 2.63 2.35 2.40 3.02ZnHCO3+ 1.90 1.71 1.95 2.43ZnOH+ 2.27 2.51 2.46 1.94
ZnCl�24
1.23 1.08 1.08 1.37
Zn(OH)2 1.85 2.34 1.63 <1
Pb 1.0E�08 1.5E�08 1.7E�08 1.7E�08
PbCO3 69.12 70.58 69.74 62.87PbCl+ 12.22 11.04 12.28 17.58PbCl2 4.54 4.01 4.13 5.79
PbðCO3Þ�22
5.41 6.18 5.44 3.17
PbCl�3 2.24 1.94 1.92 2.71Pb+2 1.74 1.60 1.81 2.54PbOH+ 1.98 2.10 1.89 1.62PbSO4 <1 <1 1.05 1.25
PbCl�24
<1 <1 <1 1.17
PbHCOþ3 <1 <1 <1 1.09
Cd 1.9E�09 1.9E�09 1.8E�09 3.7E�09
CdCl+ 38.81 39.14 40.16 40.37CdCl2 40.25 39.86 39.29 39.56CdCl�3 16.12 15.71 15.12 15.43Cd+2 2.44 2.51 2.72 2.73CdOHCl 1.47 1.73 1.49 <1
Table 3Value of T, pH and Eh of sediments pore-waters at the four sampling stations.
PP LC PV PA
T �C 27.7 27.9 29.6 30.6pH 7.49 7.80 7.74 7.80Eh V 0.15 0.35 �0.01 0.17
Fig. 3. Variation of molar Cd/Ca, Pb/Ca and Zn/Ca ratio in HCl soluble fraction ofsediments collected in the area of Portovesme.
Table 5Results of analyses carried out on porcelanaceous foraminiferal tests from thepolluted area of Portovesme and from unpolluted area of Capitana (eastern Gulf ofCagliari).
Mol/mol Ca Capitana Portovesme–Portoscuso
Max Min Mean SD
Mg 4.0E�02 1.3E�01 9.8E�02 1.1E�01 1.5E�02Cd <2.5E�07 4.1E�05 3.7E�06 2.1E�05 1.9E�05Fe 4.4E�03 2.2E�02 7.0E�03 1.5E�02 7.6E�03Mn 1.6E�04 1.5E�03 5.7E�04 1.1E�03 4.7E�04Pb 5.6E�06 1.9E�03 3.2E�04 8.6E�04 9.0E�04Sr 4.2E�03 4.6E�03 3.7E�03 4.2E�03 4.5E�04Zn 3.8E�05 1.8E�03 1.0E�03 1.3E�03 4.3E�04
286 A. Cherchi et al. / Marine Pollution Bulletin 59 (2009) 281–296
X-ray diffraction and SEM–EDS analyses on normal andabnormal foraminifera tests collected in the study area revealedthat the shells are made of magnesian calcite. The presence of Znand S and pyrite (Fig. 5a and b) was also noted. Iron sulphidesare represented by framboidal aggregates (Fig. 5b). The mainreason for the sulphidization of foraminiferal tests is unclear. Itcan be related to the metabolizing of organic matter underanaerobic conditions by sulphate-reducing bacteria, the diffusionof sulphate into sediments, the concentration and reactivity ofthe iron minerals, and the production of elementary sulphur(Kravchuk, 2006).
Table 4Water soluble and HCl soluble fractions in the sediments collected at the Portovesme sam
Leaching medium Ca Mg K Na S
wt.%
PP H2O 0.03 0.02 0.03 0.17 0LC H2O 0.02 0.02 0.02 0.10 0PV H2O 0.04 0.04 0.04 0.24 0PA H2O 0.03 0.02 0.03 0.13 0
PP 1NHC1 6.55 0.36 0.06 0.23 0LC 1NHC1 4.55 0.22 0.04 0.14 0PV 1NHC1 9.13 0.58 0.08 0.35 0PA 1NHC1 9.68 0.66 0.06 0.23 0
4.2. Foraminiferal assemblages
The total of foraminiferal assemblages is reported in Tables 6and 7, respectively for the PP, LC, PV and PA sampling stationsand the NP sampling station.
The foraminiferal assemblages from the four subsamples fromthe stations (e.g. PP1–4, LC1–4, PV1–4 and PA1–4) are generally char-acterized by a similar composition, showing more marked fluctua-tions in the subsamples from PA, mostly in the <125 lm sizefraction. A relationship could be recognized with the transport/sedimentation process that is strongly controlled by the south-wards coastal current to the S’Aliga peninsula.
The peak values of absolute abundance occur in the samplesfrom PP, which is located out of the industrial area, whereas atLC, PV, and PA the value of abundance is lower, especially at PVand PA (Table 8). The number of the specimens �10 cc of sievedresidual sediment, summarizing together the two fractions
pling stations (solid/liquid ratio 1/25).
Cd Cr Fe Mn Pb Zn
mg/kg
.03 <0.01 <0.02 <0.1 <0.01 <0.1 <0.01
.01 <0.01 <0.02 <0.1 <0.01 <0.1 <0.01
.04 <0.01 <0.02 <0.1 <0.01 <0.1 <0.01
.02 <0.01 <0.02 <0.1 <0.01 <0.1 <0.01
.08 0.40 14.50 1238 37 11 20
.04 0.30 3.30 995 38 14 23
.12 2.20 8.30 1700 72 78 180
.10 4.30 4.30 1600 90 80 293
Fig. 4. Mean molar ratio of selected metals in abnormal (Portovesme area) andnormal (Capitana, Cagliari) miliolid tests.
A. Cherchi et al. / Marine Pollution Bulletin 59 (2009) 281–296 287
(a > 125 lm, b < 125 lm) of each sample-cluster, ranges from 352(PA) to 5712 (PP). An abrupt decrease in the total number of indi-viduals occurs southwards of PP, from LC (763 specimens) to PA(352 specimens), and is doubtless related to the chemical impactof the industrial area (Fig. 6).
Few species are more abundant than 5% (Table 6 – Appen-dix A). They range from 9% to 11% for all sampling stations,but several taxa show a peak value higher than 10% (e.g. Cibi-cides pseudolobatulus, Elphidium crispum, Rosalina bradyi, Rosali-na floridensis at Paglietto; Asterigerinata mamilla, E. crispum, C.pseudolobatulus, Lobatula lobatula at La Caletta; C. pseudolobatu-lus, L. lobatula, E. crispum at Portovesme; Quinqueloculina unge-riana, Pseudotriloculina laevigata, L. lobatula, E. crispum atS’Aliga).
When comparing the hyaline specimens with the porcelana-ceous ones in each sampling site, the opposite behaviour in bothsize fractions (a > 125 and b < 125 lm) can be observed: withincreasing pollution, the hyaline specimens decrease, whereasthe porcelanaceous increase (Fig. 7). This observation could be ex-
Fig. 5. EDS analyses on ab
plained by the presence of pores in hyaline tests, making themmore sensitive to chemical stress. Among the hyaline forms, Elphi-dium, Rosalina and Ammonia decrease (although by different per-centages), whereas Haynesina increase in proportion to theincrease in pollution (Fig. 6). The tolerance to stressed environ-ments of Haynesina germanica is well documented (e.g. Cearreta,1988; Stubbles et al., 1993; Coccioni, 2000; Debenay et al., 2000;Armynot du Châtelet et al., 2004).
Abnormal specimens are present at the PP, LC, PV and PA sta-tions, but at the PP one, which is the most distant from the pollutedarea, these are low (3%). Peak values (>5%) are recorded at the PVand PA stations (Table 6 – Appendix A). The first (with 8% ina > 125 lm and 5% in b < 125 lm) corresponds to the greatestindustrial input, whereas the second reveals higher values (10%in a > 125 lm; 11% in b < 125 lm), according to southwards littoraldrift.
Abnormal specimens were examined with a SEM microscopein order to analyse the types of deformations. Morphologicalabnormalities in the studied samples are characterized by irregu-lar outlines, distorted chamber arrangements, irregular chambers(mainly last chambers), swellings, dwarfism, and twinned tests(Plates 1 and 2). Abnormal specimens were recognized as belong-ing mainly to L. lobatula, Peneroplis spp., C. pseudolobatulus andmiliolids. Deformed tests (elphidiids) were observed. The peakof pyritized tests is also in accordance with an increase ofpollution.
A good environmental quality is seen (contrary to the stationssampled in the industrial area) in the Portopauleddu-NP station(Fig. 1). The total foraminiferal assemblages (Table 7 – AppendixB) recognized at the unpolluted Portopaleddu site are composedof 38 species belonging to 24 genera. The microfauna appear tobe richer than those at other sampling sites, and include several at-tached epiphytic foraminifera (Plates 2 and 3).
4.3. Biotic indexes
Biodiversity is generally accepted as a measure of the state ofhealth of an ecological system; a Biodiversity Index expresses, as a
normal miliolid tests.
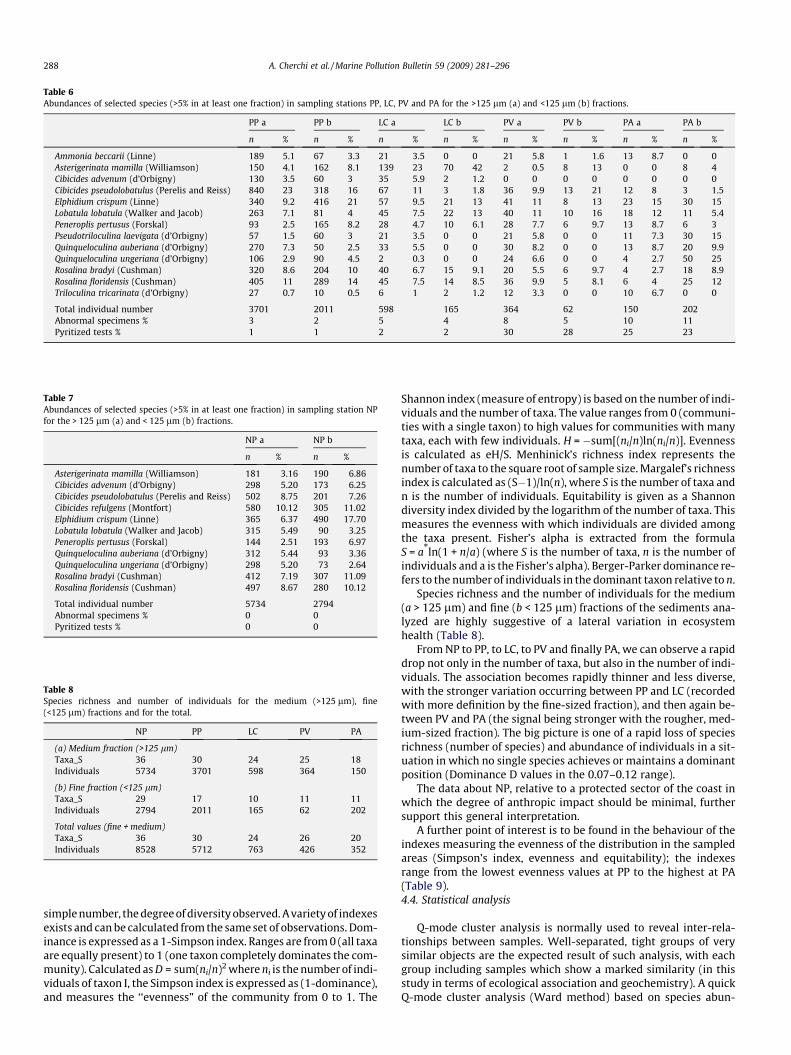
Table 6Abundances of selected species (>5% in at least one fraction) in sampling stations PP, LC, PV and PA for the >125 lm (a) and <125 lm (b) fractions.
PP a PP b LC a LC b PV a PV b PA a PA b
n % n % n % n % n % n % n % n %
Ammonia beccarii (Linne) 189 5.1 67 3.3 21 3.5 0 0 21 5.8 1 1.6 13 8.7 0 0Asterigerinata mamilla (Williamson) 150 4.1 162 8.1 139 23 70 42 2 0.5 8 13 0 0 8 4Cibicides advenum (d’Orbigny) 130 3.5 60 3 35 5.9 2 1.2 0 0 0 0 0 0 0 0Cibicides pseudolobatulus (Perelis and Reiss) 840 23 318 16 67 11 3 1.8 36 9.9 13 21 12 8 3 1.5Elphidium crispum (Linne) 340 9.2 416 21 57 9.5 21 13 41 11 8 13 23 15 30 15Lobatula lobatula (Walker and Jacob) 263 7.1 81 4 45 7.5 22 13 40 11 10 16 18 12 11 5.4Peneroplis pertusus (Forskal) 93 2.5 165 8.2 28 4.7 10 6.1 28 7.7 6 9.7 13 8.7 6 3Pseudotriloculina laevigata (d’Orbigny) 57 1.5 60 3 21 3.5 0 0 21 5.8 0 0 11 7.3 30 15Quinqueloculina auberiana (d’Orbigny) 270 7.3 50 2.5 33 5.5 0 0 30 8.2 0 0 13 8.7 20 9.9Quinqueloculina ungeriana (d’Orbigny) 106 2.9 90 4.5 2 0.3 0 0 24 6.6 0 0 4 2.7 50 25Rosalina bradyi (Cushman) 320 8.6 204 10 40 6.7 15 9.1 20 5.5 6 9.7 4 2.7 18 8.9Rosalina floridensis (Cushman) 405 11 289 14 45 7.5 14 8.5 36 9.9 5 8.1 6 4 25 12Triloculina tricarinata (d’Orbigny) 27 0.7 10 0.5 6 1 2 1.2 12 3.3 0 0 10 6.7 0 0
Total individual number 3701 2011 598 165 364 62 150 202Abnormal specimens % 3 2 5 4 8 5 10 11Pyritized tests % 1 1 2 2 30 28 25 23
Table 7Abundances of selected species (>5% in at least one fraction) in sampling station NPfor the > 125 lm (a) and < 125 lm (b) fractions.
NP a NP b
n % n %
Asterigerinata mamilla (Williamson) 181 3.16 190 6.86Cibicides advenum (d’Orbigny) 298 5.20 173 6.25Cibicides pseudolobatulus (Perelis and Reiss) 502 8.75 201 7.26Cibicides refulgens (Montfort) 580 10.12 305 11.02Elphidium crispum (Linne) 365 6.37 490 17.70Lobatula lobatula (Walker and Jacob) 315 5.49 90 3.25Peneroplis pertusus (Forskal) 144 2.51 193 6.97Quinqueloculina auberiana (d’Orbigny) 312 5.44 93 3.36Quinqueloculina ungeriana (d’Orbigny) 298 5.20 73 2.64Rosalina bradyi (Cushman) 412 7.19 307 11.09Rosalina floridensis (Cushman) 497 8.67 280 10.12
Total individual number 5734 2794Abnormal specimens % 0 0Pyritized tests % 0 0
Table 8Species richness and number of individuals for the medium (>125 lm), fine(<125 lm) fractions and for the total.
NP PP LC PV PA
(a) Medium fraction (>125 lm)Taxa_S 36 30 24 25 18Individuals 5734 3701 598 364 150
(b) Fine fraction (<125 lm)Taxa_S 29 17 10 11 11Individuals 2794 2011 165 62 202
Total values (fine + medium)Taxa_S 36 30 24 26 20Individuals 8528 5712 763 426 352
288 A. Cherchi et al. / Marine Pollution Bulletin 59 (2009) 281–296
simple number, the degree of diversity observed. A variety of indexesexists and can be calculated from the same set of observations. Dom-inance is expressed as a 1-Simpson index. Ranges are from 0 (all taxaare equally present) to 1 (one taxon completely dominates the com-munity). Calculated as D = sum(ni/n)2 where ni is the number of indi-viduals of taxon I, the Simpson index is expressed as (1-dominance),and measures the ‘‘evenness” of the community from 0 to 1. The
Shannon index (measure of entropy) is based on the number of indi-viduals and the number of taxa. The value ranges from 0 (communi-ties with a single taxon) to high values for communities with manytaxa, each with few individuals. H = �sum[(ni/n)ln(ni/n)]. Evennessis calculated as eH/S. Menhinick’s richness index represents thenumber of taxa to the square root of sample size. Margalef’s richnessindex is calculated as (S�1)/ln(n), where S is the number of taxa andn is the number of individuals. Equitability is given as a Shannondiversity index divided by the logarithm of the number of taxa. Thismeasures the evenness with which individuals are divided amongthe taxa present. Fisher’s alpha is extracted from the formulaS = a*ln(1 + n/a) (where S is the number of taxa, n is the number ofindividuals and a is the Fisher’s alpha). Berger-Parker dominance re-fers to the number of individuals in the dominant taxon relative to n.
Species richness and the number of individuals for the medium(a > 125 lm) and fine (b < 125 lm) fractions of the sediments ana-lyzed are highly suggestive of a lateral variation in ecosystemhealth (Table 8).
From NP to PP, to LC, to PV and finally PA, we can observe a rapiddrop not only in the number of taxa, but also in the number of indi-viduals. The association becomes rapidly thinner and less diverse,with the stronger variation occurring between PP and LC (recordedwith more definition by the fine-sized fraction), and then again be-tween PV and PA (the signal being stronger with the rougher, med-ium-sized fraction). The big picture is one of a rapid loss of speciesrichness (number of species) and abundance of individuals in a sit-uation in which no single species achieves or maintains a dominantposition (Dominance D values in the 0.07–0.12 range).
The data about NP, relative to a protected sector of the coast inwhich the degree of anthropic impact should be minimal, furthersupport this general interpretation.
A further point of interest is to be found in the behaviour of theindexes measuring the evenness of the distribution in the sampledareas (Simpson’s index, evenness and equitability); the indexesrange from the lowest evenness values at PP to the highest at PA(Table 9).4.4. Statistical analysis
Q-mode cluster analysis is normally used to reveal inter-rela-tionships between samples. Well-separated, tight groups of verysimilar objects are the expected result of such analysis, with eachgroup including samples which show a marked similarity (in thisstudy in terms of ecological association and geochemistry). A quickQ-mode cluster analysis (Ward method) based on species abun-
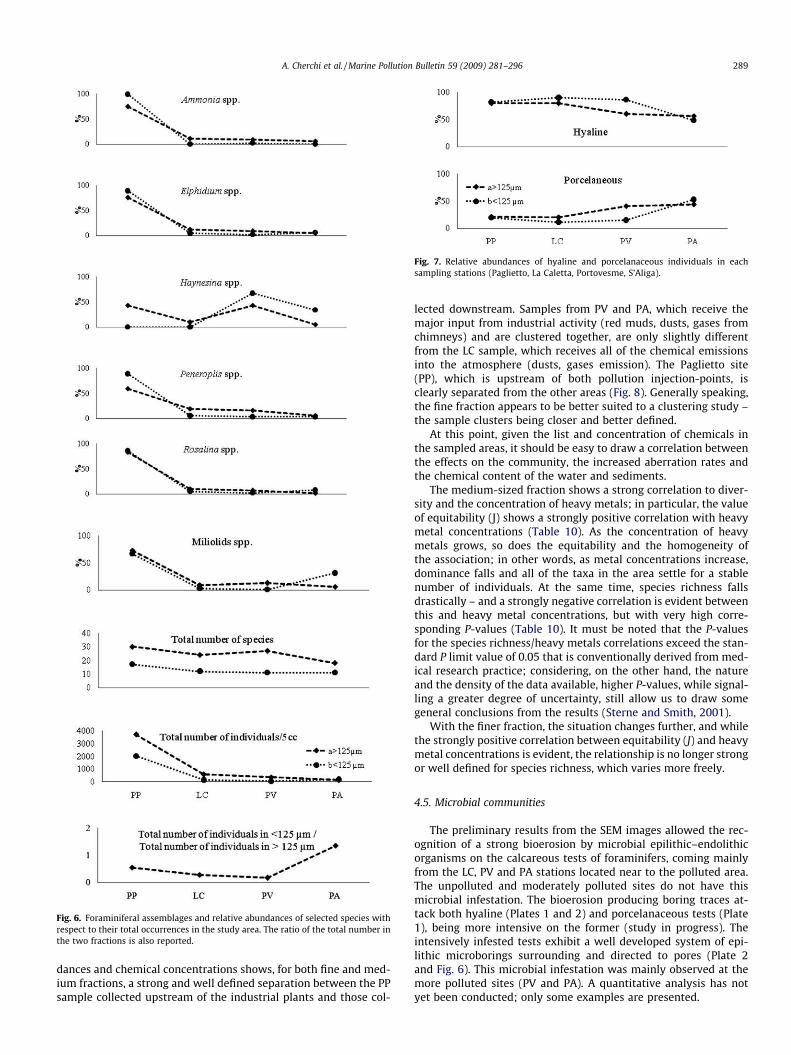
Fig. 6. Foraminiferal assemblages and relative abundances of selected species withrespect to their total occurrences in the study area. The ratio of the total number inthe two fractions is also reported.
Fig. 7. Relative abundances of hyaline and porcelanaceous individuals in eachsampling stations (Paglietto, La Caletta, Portovesme, S’Aliga).
A. Cherchi et al. / Marine Pollution Bulletin 59 (2009) 281–296 289
dances and chemical concentrations shows, for both fine and med-ium fractions, a strong and well defined separation between the PPsample collected upstream of the industrial plants and those col-
lected downstream. Samples from PV and PA, which receive themajor input from industrial activity (red muds, dusts, gases fromchimneys) and are clustered together, are only slightly differentfrom the LC sample, which receives all of the chemical emissionsinto the atmosphere (dusts, gases emission). The Paglietto site(PP), which is upstream of both pollution injection-points, isclearly separated from the other areas (Fig. 8). Generally speaking,the fine fraction appears to be better suited to a clustering study –the sample clusters being closer and better defined.
At this point, given the list and concentration of chemicals inthe sampled areas, it should be easy to draw a correlation betweenthe effects on the community, the increased aberration rates andthe chemical content of the water and sediments.
The medium-sized fraction shows a strong correlation to diver-sity and the concentration of heavy metals; in particular, the valueof equitability (J) shows a strongly positive correlation with heavymetal concentrations (Table 10). As the concentration of heavymetals grows, so does the equitability and the homogeneity ofthe association; in other words, as metal concentrations increase,dominance falls and all of the taxa in the area settle for a stablenumber of individuals. At the same time, species richness fallsdrastically – and a strongly negative correlation is evident betweenthis and heavy metal concentrations, but with very high corre-sponding P-values (Table 10). It must be noted that the P-valuesfor the species richness/heavy metals correlations exceed the stan-dard P limit value of 0.05 that is conventionally derived from med-ical research practice; considering, on the other hand, the natureand the density of the data available, higher P-values, while signal-ling a greater degree of uncertainty, still allow us to draw somegeneral conclusions from the results (Sterne and Smith, 2001).
With the finer fraction, the situation changes further, and whilethe strongly positive correlation between equitability (J) and heavymetal concentrations is evident, the relationship is no longer strongor well defined for species richness, which varies more freely.
4.5. Microbial communities
The preliminary results from the SEM images allowed the rec-ognition of a strong bioerosion by microbial epilithic–endolithicorganisms on the calcareous tests of foraminifers, coming mainlyfrom the LC, PV and PA stations located near to the polluted area.The unpolluted and moderately polluted sites do not have thismicrobial infestation. The bioerosion producing boring traces at-tack both hyaline (Plates 1 and 2) and porcelanaceous tests (Plate1), being more intensive on the former (study in progress). Theintensively infested tests exhibit a well developed system of epi-lithic microborings surrounding and directed to pores (Plate 2and Fig. 6). This microbial infestation was mainly observed at themore polluted sites (PV and PA). A quantitative analysis has notyet been conducted; only some examples are presented.
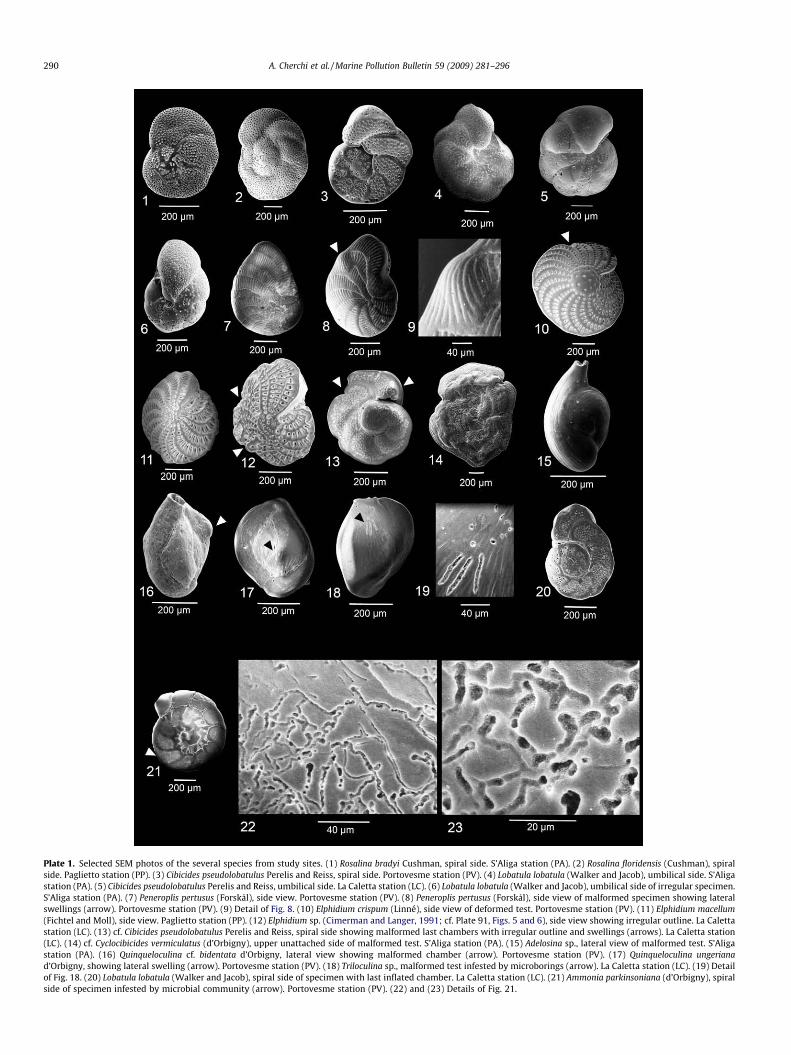
Plate 1. Selected SEM photos of the several species from study sites. (1) Rosalina bradyi Cushman, spiral side. S’Aliga station (PA). (2) Rosalina floridensis (Cushman), spiralside. Paglietto station (PP). (3) Cibicides pseudolobatulus Perelis and Reiss, spiral side. Portovesme station (PV). (4) Lobatula lobatula (Walker and Jacob), umbilical side. S’Aligastation (PA). (5) Cibicides pseudolobatulus Perelis and Reiss, umbilical side. La Caletta station (LC). (6) Lobatula lobatula (Walker and Jacob), umbilical side of irregular specimen.S’Aliga station (PA). (7) Peneroplis pertusus (Forskål), side view. Portovesme station (PV). (8) Peneroplis pertusus (Forskål), side view of malformed specimen showing lateralswellings (arrow). Portovesme station (PV). (9) Detail of Fig. 8. (10) Elphidium crispum (Linné), side view of deformed test. Portovesme station (PV). (11) Elphidium macellum(Fichtel and Moll), side view. Paglietto station (PP). (12) Elphidium sp. (Cimerman and Langer, 1991; cf. Plate 91, Figs. 5 and 6), side view showing irregular outline. La Calettastation (LC). (13) cf. Cibicides pseudolobatulus Perelis and Reiss, spiral side showing malformed last chambers with irregular outline and swellings (arrows). La Caletta station(LC). (14) cf. Cyclocibicides vermiculatus (d’Orbigny), upper unattached side of malformed test. S’Aliga station (PA). (15) Adelosina sp., lateral view of malformed test. S’Aligastation (PA). (16) Quinqueloculina cf. bidentata d’Orbigny, lateral view showing malformed chamber (arrow). Portovesme station (PV). (17) Quinqueloculina ungerianad’Orbigny, showing lateral swelling (arrow). Portovesme station (PV). (18) Triloculina sp., malformed test infested by microborings (arrow). La Caletta station (LC). (19) Detailof Fig. 18. (20) Lobatula lobatula (Walker and Jacob), spiral side of specimen with last inflated chamber. La Caletta station (LC). (21) Ammonia parkinsoniana (d’Orbigny), spiralside of specimen infested by microbial community (arrow). Portovesme station (PV). (22) and (23) Details of Fig. 21.
290 A. Cherchi et al. / Marine Pollution Bulletin 59 (2009) 281–296
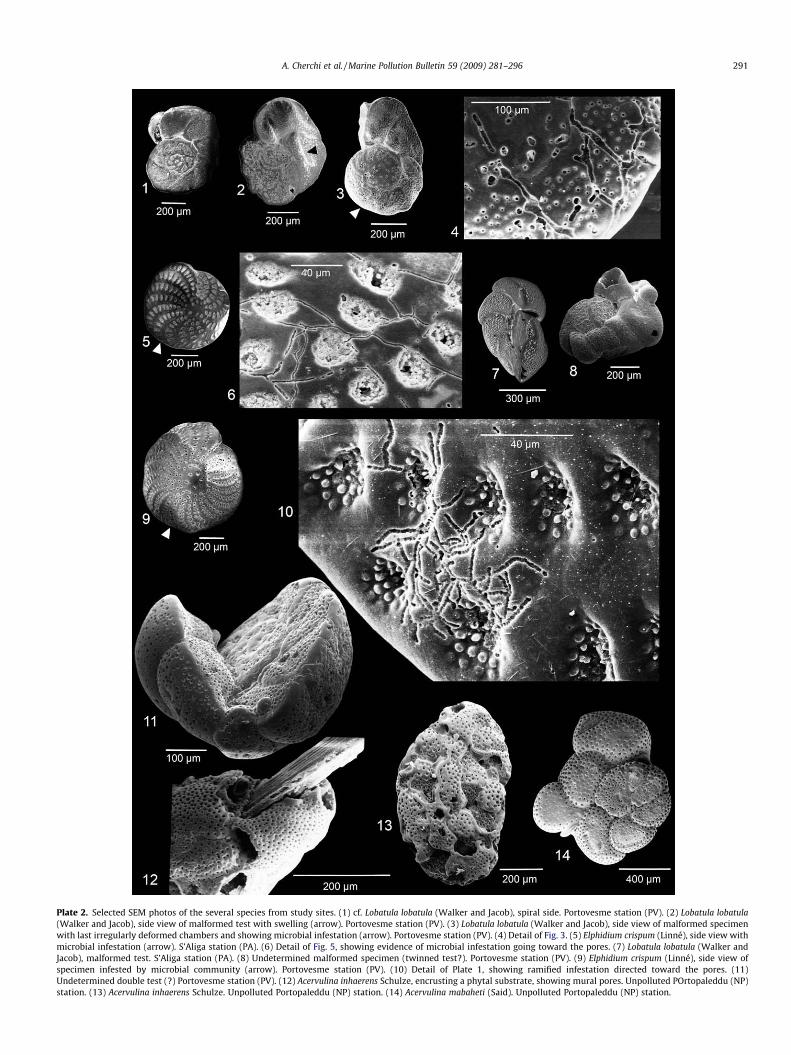
Plate 2. Selected SEM photos of the several species from study sites. (1) cf. Lobatula lobatula (Walker and Jacob), spiral side. Portovesme station (PV). (2) Lobatula lobatula(Walker and Jacob), side view of malformed test with swelling (arrow). Portovesme station (PV). (3) Lobatula lobatula (Walker and Jacob), side view of malformed specimenwith last irregularly deformed chambers and showing microbial infestation (arrow). Portovesme station (PV). (4) Detail of Fig. 3. (5) Elphidium crispum (Linné), side view withmicrobial infestation (arrow). S’Aliga station (PA). (6) Detail of Fig. 5, showing evidence of microbial infestation going toward the pores. (7) Lobatula lobatula (Walker andJacob), malformed test. S’Aliga station (PA). (8) Undetermined malformed specimen (twinned test?). Portovesme station (PV). (9) Elphidium crispum (Linné), side view ofspecimen infested by microbial community (arrow). Portovesme station (PV). (10) Detail of Plate 1, showing ramified infestation directed toward the pores. (11)Undetermined double test (?) Portovesme station (PV). (12) Acervulina inhaerens Schulze, encrusting a phytal substrate, showing mural pores. Unpolluted POrtopaleddu (NP)station. (13) Acervulina inhaerens Schulze. Unpolluted Portopaleddu (NP) station. (14) Acervulina mabaheti (Said). Unpolluted Portopaleddu (NP) station.
A. Cherchi et al. / Marine Pollution Bulletin 59 (2009) 281–296 291
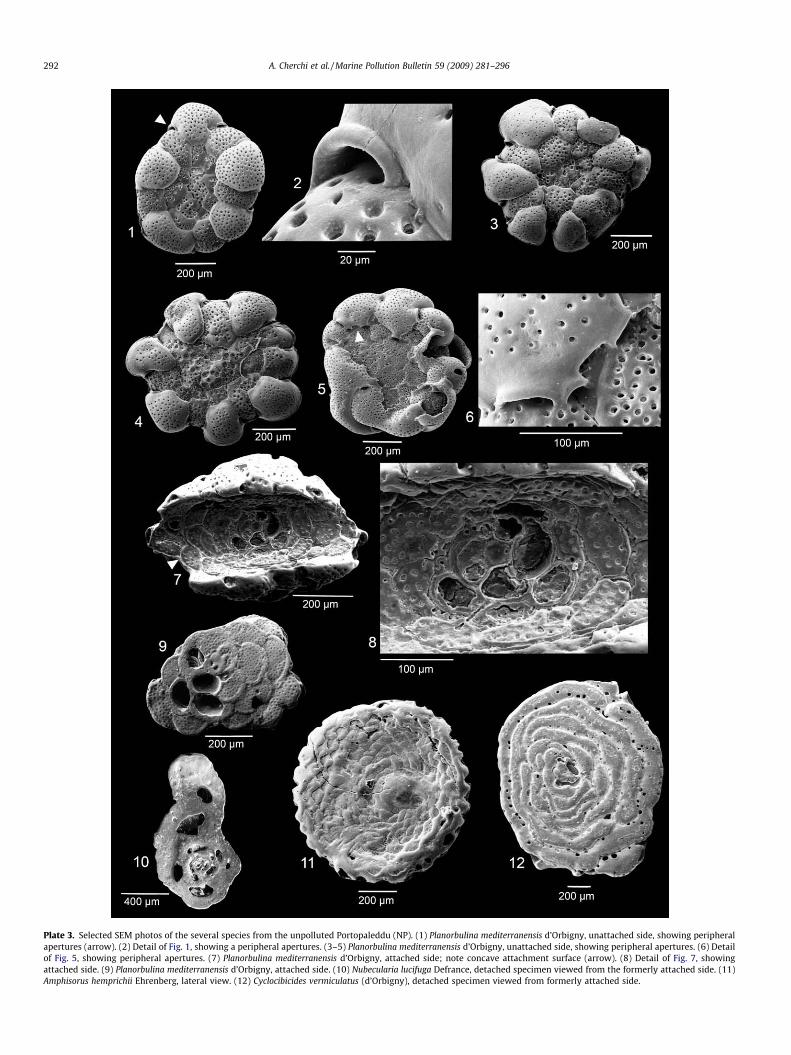
Plate 3. Selected SEM photos of the several species from the unpolluted Portopaleddu (NP). (1) Planorbulina mediterranensis d’Orbigny, unattached side, showing peripheralapertures (arrow). (2) Detail of Fig. 1, showing a peripheral apertures. (3–5) Planorbulina mediterranensis d’Orbigny, unattached side, showing peripheral apertures. (6) Detailof Fig. 5, showing peripheral apertures. (7) Planorbulina mediterranensis d’Orbigny, attached side; note concave attachment surface (arrow). (8) Detail of Fig. 7, showingattached side. (9) Planorbulina mediterranensis d’Orbigny, attached side. (10) Nubecularia lucifuga Defrance, detached specimen viewed from the formerly attached side. (11)Amphisorus hemprichii Ehrenberg, lateral view. (12) Cyclocibicides vermiculatus (d’Orbigny), detached specimen viewed from formerly attached side.
292 A. Cherchi et al. / Marine Pollution Bulletin 59 (2009) 281–296
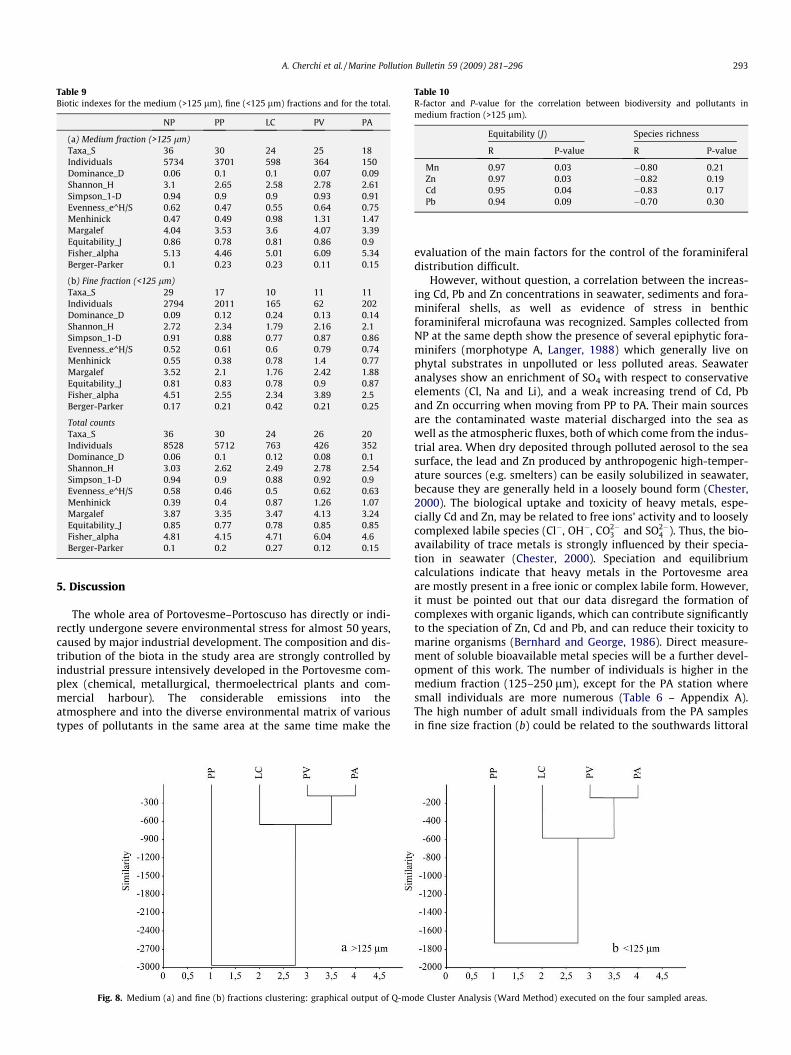
Table 10R-factor and P-value for the correlation between biodiversity and pollutants inmedium fraction (>125 lm).
Equitability (J) Species richness
R P-value R P-value
Mn 0.97 0.03 �0.80 0.21Zn 0.97 0.03 �0.82 0.19Cd 0.95 0.04 �0.83 0.17Pb 0.94 0.09 �0.70 0.30
Table 9Biotic indexes for the medium (>125 lm), fine (<125 lm) fractions and for the total.
NP PP LC PV PA
(a) Medium fraction (>125 lm)Taxa_S 36 30 24 25 18Individuals 5734 3701 598 364 150Dominance_D 0.06 0.1 0.1 0.07 0.09Shannon_H 3.1 2.65 2.58 2.78 2.61Simpson_1-D 0.94 0.9 0.9 0.93 0.91Evenness_e^H/S 0.62 0.47 0.55 0.64 0.75Menhinick 0.47 0.49 0.98 1.31 1.47Margalef 4.04 3.53 3.6 4.07 3.39Equitability_J 0.86 0.78 0.81 0.86 0.9Fisher_alpha 5.13 4.46 5.01 6.09 5.34Berger-Parker 0.1 0.23 0.23 0.11 0.15
(b) Fine fraction (<125 lm)Taxa_S 29 17 10 11 11Individuals 2794 2011 165 62 202Dominance_D 0.09 0.12 0.24 0.13 0.14Shannon_H 2.72 2.34 1.79 2.16 2.1Simpson_1-D 0.91 0.88 0.77 0.87 0.86Evenness_e^H/S 0.52 0.61 0.6 0.79 0.74Menhinick 0.55 0.38 0.78 1.4 0.77Margalef 3.52 2.1 1.76 2.42 1.88Equitability_J 0.81 0.83 0.78 0.9 0.87Fisher_alpha 4.51 2.55 2.34 3.89 2.5Berger-Parker 0.17 0.21 0.42 0.21 0.25
Total countsTaxa_S 36 30 24 26 20Individuals 8528 5712 763 426 352Dominance_D 0.06 0.1 0.12 0.08 0.1Shannon_H 3.03 2.62 2.49 2.78 2.54Simpson_1-D 0.94 0.9 0.88 0.92 0.9Evenness_e^H/S 0.58 0.46 0.5 0.62 0.63Menhinick 0.39 0.4 0.87 1.26 1.07Margalef 3.87 3.35 3.47 4.13 3.24Equitability_J 0.85 0.77 0.78 0.85 0.85Fisher_alpha 4.81 4.15 4.71 6.04 4.6Berger-Parker 0.1 0.2 0.27 0.12 0.15
A. Cherchi et al. / Marine Pollution Bulletin 59 (2009) 281–296 293
5. Discussion
The whole area of Portovesme–Portoscuso has directly or indi-rectly undergone severe environmental stress for almost 50 years,caused by major industrial development. The composition and dis-tribution of the biota in the study area are strongly controlled byindustrial pressure intensively developed in the Portovesme com-plex (chemical, metallurgical, thermoelectrical plants and com-mercial harbour). The considerable emissions into theatmosphere and into the diverse environmental matrix of varioustypes of pollutants in the same area at the same time make the
Fig. 8. Medium (a) and fine (b) fractions clustering: graphical output of Q-mo
evaluation of the main factors for the control of the foraminiferaldistribution difficult.
However, without question, a correlation between the increas-ing Cd, Pb and Zn concentrations in seawater, sediments and fora-miniferal shells, as well as evidence of stress in benthicforaminiferal microfauna was recognized. Samples collected fromNP at the same depth show the presence of several epiphytic fora-minifers (morphotype A, Langer, 1988) which generally live onphytal substrates in unpolluted or less polluted areas. Seawateranalyses show an enrichment of SO4 with respect to conservativeelements (Cl, Na and Li), and a weak increasing trend of Cd, Pband Zn occurring when moving from PP to PA. Their main sourcesare the contaminated waste material discharged into the sea aswell as the atmospheric fluxes, both of which come from the indus-trial area. When dry deposited through polluted aerosol to the seasurface, the lead and Zn produced by anthropogenic high-temper-ature sources (e.g. smelters) can be easily solubilized in seawater,because they are generally held in a loosely bound form (Chester,2000). The biological uptake and toxicity of heavy metals, espe-cially Cd and Zn, may be related to free ions’ activity and to looselycomplexed labile species (Cl�, OH�, CO2�
3 and SO2�4 ). Thus, the bio-
availability of trace metals is strongly influenced by their specia-tion in seawater (Chester, 2000). Speciation and equilibriumcalculations indicate that heavy metals in the Portovesme areaare mostly present in a free ionic or complex labile form. However,it must be pointed out that our data disregard the formation ofcomplexes with organic ligands, which can contribute significantlyto the speciation of Zn, Cd and Pb, and can reduce their toxicity tomarine organisms (Bernhard and George, 1986). Direct measure-ment of soluble bioavailable metal species will be a further devel-opment of this work. The number of individuals is higher in themedium fraction (125–250 lm), except for the PA station wheresmall individuals are more numerous (Table 6 – Appendix A).The high number of adult small individuals from the PA samplesin fine size fraction (b) could be related to the southwards littoral
de Cluster Analysis (Ward Method) executed on the four sampled areas.
294 A. Cherchi et al. / Marine Pollution Bulletin 59 (2009) 281–296
drift, as well to the increase of pollutant flux from the Portovesmeplants, as documented by geochemical analyses on the sediments.In fact, although the small size tests can be easily transported bythe coastal current, a correlation between small size specimensand pollution by heavy metals can be recognized. According toYanko et al. (1994), the pollution by heavy metals gives rise todwarfism of the specimens as well as often pyritized and abnormaltests. In the PV samples, pyritized (up to 30%) and abnormal (up to11%) tests are common (Table 6 – Appendix A). Yanko et al. (1998)observed a correlation between pollution and abnormal test for-mation. Culture experiments have been carried out by Sharifiet al. (1991), demonstrating that the value of heavy metals mea-sured in the foraminiferal abnormal tests was higher than in nor-mal ones, leading to the conclusion that abnormalities may beinduced by heavy metals. The proportions of foraminiferal abnor-malities have been recorded in polluted areas by several authors:10–20% in an estuary in England (Sharifi et al., 1991), 3–5% to 7%in a Norwegian fjord (Alve, 1991), 2–3% at the coast of Israel (Yan-ko et al., 1998), more than 10% in the Goro Lagoon, Italy (Coccioniet al., 1997) and up to 11% in the Manzalah Lagoon, Egypt (Samir,2000). A relationship between pollution and abnormalities isproved in the polluted Portovesme area by chemical analyses onthe miliolids’ abnormal tests, showing that the values of heavymetals measured in the abnormal tests are higher than in normalones.
Considering the very low number (1–4%) of living individuals inthe polluted environments (mainly at the PV and PA stations), totalbenthic foraminifers’ assemblages (dead and living) were used forstatistical purposes, providing a larger database (Scott and Medioli,1980; Samir and El-Din, 2001; Fatela and Taborda, 2002; Armynotdu Châtelet et al., 2004; Debenay and Guiral, 2006; Frezza and Car-boni, 2007). Total assemblages are almost statistically identical andonly diverge when the living/total becomes large (Murray, 1976,1991) and biotic indexes do not show significant differences be-tween living and dead populations (Yanko et al., 1994).
Diversity indexes (Hayek and Buzas, 1997; Spellerberg, 2005)can provide some further information on the structure of the stud-ied communities (Table 9). It is also important to note that we arenot dealing here with a stratigraphic sequence, in which each sam-ple belongs to a different time and we can see the changing indexesas an evolution through time in the same environment; we areactually dealing with contiguous areas, which have been subjectedto some diversity-effecting factor(s), with the end result dependingon space (distance from the source of pollutants, currents and dif-fusion of substances) as well as on time.
The increase of evenness and equitability in the sampled areas –from the lowest values in Paglietto to the highest in Punta S’Aliga –also deserves further discussion. Both evenness and equitabilityare measures of the uniformity in the distribution of the differenttaxa (Hammer and Harper, 2005), their value being higher whenall the taxa are equally abundant in the given sample. The generaltrend of increasing equitability as species richness and abundancesdecrease suggests that whatever factor is acting on the community,it achieves two separate effects: it eliminates a number of taxaaltogether, while acting on the surviving taxa by leveling out theirnumbers. This is the domain of ecotoxicology, and only an ecotox-icological study on the samples might shed light on the observedvariation in the indexes.
The groups identified by the clustering process support thehypothesis that both dominant sea-currents and the geographicalplacement of industrial plants are strictly connected with the dis-tribution and concentration patterns of heavy metals, and cantherefore be considered to be factors controlling the distributionsof the biodiversity in the sampled areas: PP being upstream ofindustrial compounds, LC being directly in front of the urban area,but also impacted by the industrial activity (dusts, gas emissions in
the atmosphere) from the industrial area; PV is downstream ofboth main pollution sources, whereas PA receives the industrialpollutant flux transferred by the southwards littoral current.
The percentage of aberrant individuals and pyritized tests canbe used to further explore these hypotheses (Table 6).
The increasing number of abnormal individuals as biodiversitydecreases (see Section 5) seems to point to a factor (or complexof factors) having a strongly chronic effect on the community,and clearly connected geographically to the anthropic activitiesin the wider area.
The results of the correlation analysis are strongly influenced bythe grain-size of the sample. In the medium-sized fraction, metalconcentrations increase and species richness and dominance falls,and equitability increases, with all of the surviving taxa in the areasettling for a stable number of individuals. The situation is lesswell-defined for the fine-grained samples, where the correlationbetween heavy metals and species richness is much more erratic.
This might confirm the chronic nature of the effect of the heavymetals in the environment – the pollutants act on single individu-als more than on the bulk of the species, and influence biodiversitynot by eliminating whole species from the picture, but chiefly byleveling out the number of individuals in the populations, killingoff individuals selectively (e.g. the smaller and weaker in theassemblage) and inducing the birth of aberrant individuals.
A very large development of microbial epiliths and endoliths inthe foraminiferal tests from the investigated area were recognized.The nature of the microbial diversified communities was not iden-tified, but it is possible to recognize a morphological diversity inthe traces, probably belonging to different types of microendolithicorganisms (cyanobacteria, rhodophyceae, clorophyceae, fungi;Radtke et al., 1997). The increase in pollution is marked by strongmicrobial infestation (cyanobacteria?) on the calcareous tests offoraminifers (Plates 2 and 3), reaching a peak at the polluted sites(PV and PA). Environmental considerations suggest that the heavymetals pollution has favoured the microbial endolithic mode of life.Similar features are shown in the SEM pictures published by Camp-bell (1983) and Hallock (2000).
A relationship between the occurrence of microendolithis(‘‘cyanophites”) and industrial pollution has already been provenby Campbell (1983) in the intertidal and supratidal zones of ahighly polluted area next to refineries and the petrochemical com-plex of Augusta – Priolo (Sicily, Italy). Casts of endolith boreholeswere prepared according to the technique employed by Golubicet al. (1970) to determine the nature of the endolithic taxa attrib-uted to cyanophites (Campbell, 1983; Figs. 2–7, 8–10). Populationsof Amphistegina and Heterostegina, extensively infested by cyano-bacteria, were also described from the West Australian shelf (Hal-lock et al., 1996; Plate 1, fig. f) and related to CO2 increase.
The extensive infestation from the Portovesme area developedparticularly on the hyaline tests in connection with the pores of for-aminifers, indicating a possible CO2 bioavailability from photosyn-thetic organisms (also confirmed by the lower pH of the pore watersof sediments over the seawater ones). Further studies using the castmethod will be necessary to clear the systematic position of themicrobial assemblages from the Portovesme area (Plates 1 and 2).
6. Conclusions
The overall results show the response of benthic foraminifersand endolithic microbial infestation to the impact of major indus-trial activity (plants and commercial harbour).
The geochemical characterization of seawater, sediments andforaminiferal (porcelanaceous) tests clearly evidences a correlationbetween pollutants, environments and biota. An important factordetermining foraminiferal distribution is a marine southward cur-rent favouring the transportation of smaller tests.
A. Cherchi et al. / Marine Pollution Bulletin 59 (2009) 281–296 295
Comparative analyses between geochemical data obtained fromthe examined coastal environments and other unpolluted Mediter-ranean sites exhibit high heavy metal values for the Portovesmearea.
The correlation between biodiversity (several indexes) and pol-lutants was recognized. A strongly positive correlation with heavymetal concentration is shown by the equitability (J) value. A Q-Mode cluster analysis, based on foraminiferal assemblages andgeochemistry, exhibits a definite separation of the highly pollutedand less polluted sampling sites.
This study, although preliminary, together with geochemical re-sults and statistical analyses, emphasizes that the response of biotato the industrial pollution of Portovesme could give rise to moredetailed sampling and investigation in the area.
Acknowledgements
The authors are very grateful to Mimma Caredda, Rafaele Caboi,Myriam Del Rio, Pierfranco Lattanzi, Francesca Podda, Elodia Musu,Sandro Mameli and Giorgio Contis (Faculty and Technicians at theDepartment of Earth Sciences of the University of Cagliari) for theirconstructive collaboration and analytical support. The authors arealso grateful to CINSA (Interdipartimental Center of EnvironmentalSciences – University of Cagliari) for making available its LAMP Re-search Laboratories for this study. We would also like to thank Da-vid Scott, Mario Sprovieri, Elena Romano and Luisa Bergamin fortheir constructive comments.
Appendix A. Supplementary data
Supplementary data associated with this article can be found, inthe online version, at doi:10.1016/j.marpolbul.2009.09.016.
References
Alve, E., 1991. Benthic foraminifera in sediment cores reflecting heavy metalpollution in Sonfjord, W. Norvay. Journal of Foraminiferal Research 21, 1–19.
Alve, E., 1995. Benthic foraminiferal responses to estuarine pollution: a review.Journal of Foraminiferal Research 25, 190–203.
Armynot du Châtelet, E., Debenay, J.P., Saulard, R., 2004. Foraminiferal proxies forpollution monitoring in moderately polluted harbors. Environmental Pollution127, 27–40.
Agenzia Regionale per la Protezione dell’ambiente della Sardegna (ARPAS), 2007.Determinazione dei valori di fondo nelle matrici ambientali dell’area diPortoscuso (CI). Progetto operativo, p. 29 (unpublished report).
Atzeni, A., Ginesu, S., 1993. Evoluzione dei litorali della Sardegna e interventi diequilibrio. In: Aminti, P., Pranzini, E. (Eds.), La difesa dei litorali in Italia. Edizionidelle Autonomie, Roma, pp. 215–231.
Bernhard, M., George, S.G., 1986. Importance of chemical species in uptake, loss andtoxicity of elements for marine organisms. In: Bernhard, M., Brinckman, F.E.,Sadler, P.J. (Eds.), The Importance of Chemical ‘‘Speciation” in EnvironmentalProcessing. Springer-Verlag, Berlin, pp. 385–422.
Bettini, V., Zannin, D., 2002. Portoscuso, la gassificazione della V.I.A.-Il GassificatoreAti-Sulcis, le problematiche ambientali connesse al progetto. CUEN, Napoli.
Boltovskoy, E., 1965. Los foraminiferos recientes. Editorial Universitaria de BuenosAires.
Boltovskoy, E., Scott, D.B., Medioli, F.S., 1991. Morphological variations benthicforaminiferal tests in response to changes in ecological parameters: a review.Journal of Paleontology 65, 175–185.
Bresler, V., Yanko, V., 1995. Acute toxicity of heavy metals for benthic epiphyticforaminifera Pararotalia spinifera (Le Calvez) and influence of seaweed-deriveddoc. Environmental Toxicology and Chemistry 14, 1687–1695.
Campbell, S.E., 1983. Petrochemical pollution: endolith response. VIes jornéesd’études sur les pollutions marines en Méditerranée. In: Workshop on Pollutionof the Mediterranean, Cannes, 2–4 décembre 1982, CIESM, Monaco, pp. 183–189.
Cearreta, A., 1988. Population dynamics of benthic foraminifera in the Santonaestuary, Spain. Revue de Paléobiologie 2, 721–724.
Cearreta, A., Alday, M., da Conceiçao Freitas, M., Andrade, C., 2007. Postglacialforaminifera and paleoenvironments of the Melides Lagoon (SW Portugal):towards a regional model of coastal evolution. Journal of Foraminiferal Research37, 125–135.
Chester, R., 2000. Marine Geochemistry. Blackwell, Oxford.
Cidu, R., 1999. Trace elements Li, Be, B, Al, V, Cr, Co, Ni, Se, Sr, Ag, Sn, Sb, Ba and Tl.In: Nollet, L.M.L. (Ed.), Handbook of Water Analysis. Marcel Dekker, Inc., pp.459–482.
Cimerman, F., Langer, M.R., 1991. Mediterranean Foraminifera. AcademiaScientiarum et Artium Slovenica, Ljubljana. p. 30.
Coccioni, R., Gabbianelli, G., Gentiloni Silverj, D., Fonti, P., Kaminski, M.A.,Monechi, S., Tateo, F., 1997. Benthic foraminiferal response to heavy metalpollution in the Goro Lagoon (Italy). In: The First International Conference onApplication of Micropaleontology in Environmental Sciences. Tel Aviv, Israel,pp. 47–48.
Coccioni, R., 2000. Benthic foraminifera as bioindicators of heavy metal pollution – acase study from the Goro Lagoon (Italy). In: Martin, R.E. (Ed.), EnvironmentalMicropaleontology, pp. 71–103.
Coccioni, R., Marsili, A., Venturati, A., 2003. Foraminiferi e stress ambientale. In:Coccioni, R. (Ed.), Verso la gestione integrata della costa del Monte S. Bartolo:risultati di un progetto pilota. Quaderni del Centro di Geobiologia Universitàdegli Studi di Urbino, vol. 1. pp. 99–118.
Coccioni, R., Marsili, A., Frontalini, F., Troiani, F., 2005. Foraminiferi bentonici emetalli in traccia: implicazioni ambientali. In: Coccioni, R. (Ed.), La dinamicaevolutiva della fascia costiera tra le foci del fiume Foglia e Metauro: verso lagestione integrata di una costa di elevato pregio ambientale. Quaderni delCentro di Geobiologia Università degli Studi di Urbino, vol. 1. pp. 57–92.
Cotruvo, J.A., 2005. Water desalination processes and associated health andenvironmental issues. Water Conditioning & Purification 47 (1), 13–17.
Danzer, K., Currie, L.A., 1998. Guidelines for calibration in analytical chemistry. Pure& Applied Chemistry 70, 993–1014.
Debenay, J.P., Pawlowski, J., Decrouez, D., 1996. Les foraminifères actuels. Masson,Paris.
Debenay, J.P., Guillou, J.J., Redois, F., Geslin, E., 2000. Distribution trends offoraminiferal assemblages in paralic environments: a base for usingforaminifera as early warning indicators of anthropic stress. In: Martin, R. (Ed.),Environmental Micropaleontology. Plenum Publishing Corporation, pp. 39–67.
Debenay, J.P., Tsakiridis, E., Soulard, R., Grossel, H., 2001. Factors determining thedistribution of foraminiferal assemblages in Port Joinville Harbor (Ile d’Yeu,France): the influence of pollution. Marine Micropaleontology 43, 75–118.
Debenay, J.P., Millet, M., Angelidis, M., 2005. Relationships between foraminiferalassemblages and hydrodynamics in the Gulf of Kalloni (Greece). Journal ofForaminiferal Research 35, 327–343.
Debenay, J.P., Guiral, D., 2006. Mangrove swamp foraminifera, indicators of sea levelor paleoclimate? Revue de Paléobiologie 2, 567–574.
Di Gregorio, F., Federici, P.R., Fierro, G., Ginesu, S., 1996. Atlante delle spiagge dellaSardegna, Foglio n 232–233, Isola di S. Pietro-Carbonia. R.A.S, Cagliari.
Fatela, F., Taborda, R., 2002. Confidence limits of species proportion in microfossilassemblage. Marine Micropaleontology 45, 169–174.
Frezza, V., Carboni, G., 2007. Distribution of recent foraminiferal assemblages nearthe Ombrone River mouth (Northern Tyrrhenian Sea, Italy). Revue deMicropaléontologie 52, 43–66.
Gazzetta Ufficiale della Repubblica Italiana, 1993. Piano di disinquinamento per ilrisanamento del territorio del Sulcis-Iglesiente No. 190 (14.08.93).
Geslin, E., Stouff, V., Debenay, J.P., Lesourd, M., 2000. Environmental variation andforaminiferal tests abnormalities. Environmental Micropaleontology, Topics inGeobiology. Kluwer Academic/Plenum Publishers, New York. p. 15.
Geslin, E., Debenay, J.P., Duleba, W., Bonetti, C., 2002. Morphological abnormalitiesof foraminifera tests in Brazilian environments: a comparison between pollutedand non-polluted areas. Marine Micropalentotogy 45, 151–168.
Golubic, S., Brent, G., Lecampion, T., 1970. Scanning electron microscopy ofendolithic algae and fungi using a multipurpose casting-embeddingtechnique. Lethaia 3, 203–209.
Hallock, P., Bone, Y., Collins, L.B., James, N.P., 1996. Larger foraminifera of thewest Australian shelf: modern maladies and pleistocene paleodepths. In:Geological Society of America Annual Meeting, Abstract, Denver, CO, GAAPBC,pp. 28–129.
Hallock, P., 2000. Symbiont-bearing foraminifera: harbingers of global change? In:Lee, J.J., Hallock, P. (Eds.), Advances in the Biology of Foraminifera, 2000.Micropaleontology 46 (Suppl. 1), 95–104.
Hammer, O., Harper, D., 2005. Paleontological Data Analysis. Blackwell Publishing,Oxford.
Hayek, L.A., Buzas, M.A., 1997. Surveying Natural Populations. Columbia UniversityPress, New York.
Hohenegger, J., Piller, W.E., Ball, C., 1993. Horizontal and vertical spatialmicrodistribution of foraminifers in the shallow subtidal gulf of Trieste,northern Adriatic Sea. Journal of Foraminiferal Research 23, 79–101.
Hottinger, L., Halicz, E., Reiss, Z., 1993. Recent Foraminiferida from the Gulf ofAqaba, Red Sea. Academia Scientiarum et Artium Slovenica, Ljubljana. p. 33.
Jarvis, I., 1992. Sample preparation for ICPMS. In: Jarvis, K.E., Gray, A.L., Houk, R.S.(Eds.), Handbook of Inductively Coupled Plasma Mass Spectrometry. BlackieAcademic and Professional, Glasgow, UK, pp. 172–224.
Kravchuk, A., 2006. Benthic foraminifera as indicators of pollution in the north-western shallow part of the Black Sea. Geophysical Research, Abstracts, 8, SRef-ID: 1607-7962/gra/E6U06-A-00518.
Langer, M., 1988. Recent epiphytic foraminifera from Vulcano (Mediterranean Sea).Revue de Paléobiologie, special vol. 2 (Benthos’86), pp. 827–832.
Lea, D.W., 1999. Trace elements in foraminiferal calcite. In: Sen Gupta, B.K. (Ed.),Modern foraminifera. Kluwer Academic Publishers, UK.
Loeblich, A.R., Tappan, H., 1987. Foraminiferal Genera and their Classification. VanNostrand Reinhold Company, New York. pp. 1 and 2.
296 A. Cherchi et al. / Marine Pollution Bulletin 59 (2009) 281–296
Morley, N.H., Burton, J.D., Tankere, S.P.C., Martin, J.M., 1997. Distribution andbehavior of some dissolved trace metals in the western Mediterranean Sea.Deep-Sea Research II 44 (3–4), 675–691.
Murray, J.W., 1976. Comparative studies of living and dead benthic foraminiferaldistributions. In: Hedley, R.H., Adams, C.G. (Eds.), Foraminifera. Academic Press,London, pp. 45–110.
Murray, J.W., 1991. Ecology and Palaeoecology of Benthic Foraminifera. LongmanScientific and Technical, New York.
Murray, J.W., 2006. Ecology and Applications of Benthic Foraminifera. CambridgeUniversity press, Cambridge.
Nordstrom, D.K., 1977. Thermochemical redox equilibria of Zobell’s solution.Geochimica et Cosmochimica Acta 41, 1835–1841.
Parkhurst, D., Appelo, C.A.J., 1999. User’s guide to PHREEQC (version 2) – Acomputer program for speciation, batch-reaction, one-dimensional transport,and inverse geochemical calculations. USGS Water-Resources InvestigationsReport 99-4259.
Pilson, M.E.Q., 1998. An Introduction to the Chemistry of the Sea. Prentice-Hall, Inc,Upper Saddle River, NJ.
Quilty, P.G., Hosie, G., 2006. Modern Foraminifera, Swan River estuary, WesternAustralia: distribution and controlling factors. Journal of Foraminiferal Research36, 291–314.
Radtke, G., Hofmann, K., Golubic, S., 1997. A bibliographic overview of micro- andmacroscopic bioerosion. Courier Forschungsinstitut Seckenberg 201, 307–340.
Resig, J.M., 1960. Foraminiferal ecology around ocean outfalls of southern California.In: Person, E. (Ed.), Disposal in the Marine Environment. Pergamon Press,London, pp. 104–121.
Samir, A.M., 2000. The response of benthic foraminifera and ostracods to variouspollution sources: a study from two lagoons in Egypt. Journal of ForaminiferalResearch 30, 83–98.
Samir, A.M., El-Din, A.B., 2001. Benthic foraminiferal assemblages andmorphological abnormalities as pollution proxies in two Egyptian bays.Marine Micropalentology 41, 193–237.
Schintu, M., Degetto, S., 1999. Sedimentary records of heavy metals in the industrialharbour of Portovesme, Sardinia (Italy). The Science of the Total Environment241, 129–141.
Scott, D.B., Medioli, F.S., 1980. Quantitative studies of marsh foraminiferaldistribution in Nova Scotia and comparison with those in other parts of theworld: implications for sea level studies. Cushman Foundation for ForaminiferalResearch, Special Publication, 17.
Scott, D.B., Tobin, R., Williamson, M., Medioli, F.S., Latimer, J.S., Boothman, W.A.,Asioli, A., Henry, V., 2005. Pollution monitoring in two North American
estuaries: historical reconstructions using benthic foraminifera. Journal ofForaminiferal Research 35, 65–82.
Sharifi, A.R., Croudace, I.W., Austin, R.L., 1991. Benthic foraminiferids as pollutionindicators in Southampton Water, southern England, UK. Journal ofMicropaleontology 10, 109–113.
Spano, B., Pinna, M., 1956. Le spiagge della Sardegna. Ricerche sulle spiagge italiane,vol. VII. CNR, Roma.
Spellerberg, I.F., 2005. Monitoring Ecological Change. Cambridge University Press,Cambridge.
Sterne, J.A.C., Smith, G.D., 2001. Sifting the evidence–what’s wrong with significancetests? British Medical Journal 322, 226–231.
Stouff, V., Geslin, E., Debenay, J.P., Lesourd, M., 1999. Origin of morphologicalabnormalities in Ammonia (Foraminifera): studies in laboratory and naturalenvironments. Journal of Foraminiferal Research 29, 152–170.
Stubbles, S.J., Hart, M., Williams, C.G., Green, J., 1993. Responses of foraminifera topresence of heavy metal contamination and acid mine drainage. In: Mineral,Metals, and the Environment 2nd Conference. Institution of Mining andMetallurgy, Prague, September 3–6, pp. 217–235.
Triantaphyllou, M.V., Tsourou, T., Koukousioura, O., Dermitzakis, M.D., 2005. Écolgiedes foraminifères et des ostracodes dans les environments côtiers du sud-est del’île d’Andros (mer Egée Centrale, Grèce). Revue de Micropaléontologie 48, 279–302.
Truesdell, A.H., Jones, B.F., 1974. WATEQ, a computer program aqueous speciation-solubility calculations: theoretical manual, user’s guide, and documentation, forcalculating chemical equilibria in natural waters. Journal of Research, U.S.Geological survey 2, 233–248.
Walton, W.R., 1952. Techniques for recognition of living foraminifera.Contributions from the Cushman Foundation for Foraminiferal Research 3,56–90.
Watkins, J.G., 1961. Foraminiferal ecology around the Orange County, California,ocean sewer outfalls. Micropaleontology 7 (2), 199–206.
Yanko, V., Kronfeld, J., Flexer, A., 1994. Response of benthic foraminifera to variouspollution sources: implications for pollution monitoring. Journal ofForaminiferal Research 24, 1–17.
Yanko, V., Ahmad, M.G., Kaminski, M., 1998. Morphological deformities ofbenthic foraminiferal tests in response to pollution by heavy metals:implications for pollution monitoring. Journal of Foraminiferal Research 28,177–200.
Yanko, V., Arnold, A.J., Parker, W.C., 1999. Effects of marine pollution on benthicforaminifera. In: Sen Gupta, B.K. (Ed.), Modern Foraminifera. Kluwer AcademicPublishers, Dordrecht.
Copyright © 2022 FDOKUMEN