BENSC EXPERIMENTAL REPORTS 2003
288
Hahn-Meitner-lnstitut Berlin DE04F7266 Berlin Neutron Scattering Center r • / / : 14.5T 1 i'' BENSC EXPERIMENTAL REPORTS 2003
-
Upload
khangminh22 -
Category
Documents
-
view
1 -
download
0
Transcript of BENSC EXPERIMENTAL REPORTS 2003

Hahn-Meitner-lnstitut Berlin DE04F7266
Berlin Neutron Scattering Center
r
• / / :
14.5T
1 i ' '
BENSC EXPERIMENTAL REPORTS 2003


BENSCEXPERIMENTAL REPORTS
2003
edited by
Y. Kirschbaum, M. Tovar, D. Bischoffand R. Michaelsen
Berlin Neutron Scattering Center
Hahn-Meitner-lnstitut Berlin
April 2004
Berichte des Hahn-Meitner-Instituts Berlin
HMI - B 595
ISSN 0936 - 0891

Cover picture:
Field distorted magnetic spiral structure of CsCuCI3
From measurements at the triple axis spectrometer E1 the distortion of the uniform spiral by amagnetic field H could be obtained: The spin reduction present at zero field due to thefrustration on the triangular lattice is lifted for the spins pointing along the field while the size ofthe ordered spins opposite to the applied field is reduced even more. In addition spins along Hmove together and spins opposite to H spread apart.
(For further details please see experimental reports on page 4 and the report ofN.Stüßer, U. Schotte, A. Hoser, M. Meißner, in the Proceedings of the ECNS Montpellier, 2003)
The cover was designed by Digital Recording, Schwedenstrasse 9, D-13359 Berlin, http://www.dire.de
Editorial:
The Berlin Neutron Scattering Center(BENSC) is a department of theHahn-Meitner-lnstitut Berlin GmbH.BENSC develops and runs the NeutronScattering Instruments at the BerlinResearch Reactor BER II and isresponsible for the service to externalusers.The Hahn-Meitner-Institut-Berlin in derHelmholtz-Gemeinschaft (HMI) is anational research institution financed bythe Federal Republic of Germany andthe City State of Berlin.
Address:
Berlin Neutron Scattering CenterBENSCThe Scientific SecretaryDr. Rainer MichaelsenHahn-Meitner-lnstitutGlienicker Strasse 100D - 14109 Berlin (Wannsee)
Phone: +49 - 30 - 8062 3043, -2304
Fax: +49 - 30 - 8062 2523
Email: [email protected]
Net: http://www.hmi.de/bensc

CONTENTS
Introduction
List of BENSC Instruments
How to apply for BENSC Beam Time
Acknowledgement for Support by the European Commission
List of Contributed Reports
IV
VI
VIII
IX
XI
Part 1: EXPERIMENTAL REPORTS 2003
Magnetism
Magnetic Structure and Phase Transitions
Magnetic Thin Films
Structure
Chemical Structure
Structural Excitations
Soft Matter
Biology
Material Science and Industrial Applications
Development of Instruments and Methods
Fundamental Physics and Others
1
89
94
125
1
94
131
158
181
213
234
Part II: LIST OF BENSC PUBLICATIONS
Papers 2003 and supplement 2002 242
Theses 2003 254
AUTHOR INDEX 255
III

Introduction
The present volume contains 237 BENSC Ex-perimental Reports - 170 from external usersand 67 from BENSC staff members - and givesan overview on the experimental work carried outon BENSC during the year 2003.
BENSC User Service
BENSC is open to both, the national and theinternational user community, whereby about 70percent of the beam time is available to externalusers; 20% for long term collaborating groupsfrom German universities and other researchinstitutions and 50 % for peer reviewed shortterm projects.
Detailed descriptions of all essential BENSCneutron scattering instruments are available -and updated - on the BENSC Webpage.
http://www.hmi.de/bensc/instrumentationA colour printed version (brochure HMI-B 577) ison the market since March 2001 and availableon request.
BENSC puts special emphasis on sample envi-ronment under extreme conditions: high fields,high pressure, high, low and ultra low tempera-tures. The sample environment group has pub-lished a detailed technical handbook on BENSCsample environment. The handbook is updatedcontinuously and available in the INTERNETunder
http://www.hmi.de/bensc/sample-env/home.html
Scientific Selection Panel
The short term project beam time allocations forthe scheduled instruments are established on asemi-annual basis in collaboration with a scien-tific selection panel, the "user committee'. The2003 beam time quota for the short term projectsof the external user groups were allocated at twouser committee sessions in November 2002 andMay 2003. Twelve external and two in-housecommittee members have been involved:
External members:Prof. Dr. P. Baglioni
Univ. Firenze, ItalyProf. Dr. G. Decher
Univ. Strasbourg, FranceDr. M. Enderie
ILL Grenoble, FranceDr. Bela Farago
ILL Grenoble, FranceProf. Dr. M. Lerch
Techn. Univ. Berlin, GermanyProf. Dr. M. Loewenhaupt
Techn. Univ. Dresden, GermanyDr. R. May
ILL Grenoble, FranceProf. Dr. G. Renger
Techn. Univ. Berlin, GermanyDr. L. Pintschovius
FZ Karlsruhe, Germany / LLB Saclay, FranceProf. Dr. V. Sechovsky
Charles Univ. Prague, Czech RepublicProf. Dr. J. Texeira
CEA/CNRS/LLB Saclay, FranceProf. Dr. B. Toudic
Univ. Rennes I, FranceInternal members:
Prof. Dr. F. MezeiHMI-Berlin
Dr. H.A. GrafHMI-Berlin
Support for European Access to BENSCfrom the European Commission
The access of European research groups toBENSC has been generously supported by theEuropean Community under the Access to Re-search Infrastructures action of the ImprovingHuman Potential Programme (IHP). The EUsupport under IHP was available for groups fromEuropean Member States as well as for groupsfrom the Associated States; for groups fromSwitzerland slightly modified rules applied. Aslisted on page IX, an important proportion of thecontributions in this volume report on EU sup-ported experiments.
The "European Access to BENSC" action turnedout to be very successful. For the 4 years period2000-2003 our IHP files include
330 IHP supported projects, with700 visits of European users and
2213 neutron instrument days delivered.
The share of these BENSC users in the numberof BENSC publications in high-ranking journals issuperproportionally high.
Therefore we are happy to inform our usercommunity that the EU support for BENSC ac-cess will be continued under the 6th EU Frame-work Programme (FP6).
IV

Strong Representation of BENSC Usersat the ECNS in Montpellier
Not unexpectedly, the users and staff membersof BENSC have been extremely active partici-pants at the 3rd European Conference on Neu-tron Scattering, Montpellier, Sept. 2003:
They presented roughly 15% of all conferencecontributions. For some scientific fields, e.g."Magnetism" (clearly magnetism!), "Disorderedand Frustrated Systems", "Industrial and MedicalApplications", and "Neutrons and Life Science",the BENSC partition increased up to over 20%.More than 2/3 of the BENSC contributions camefrom our external users.
New Neutron Guide Hall
The construction of the new neutron guide hall isnow under way, the foundation ceremony for thebuilding has been held on 8 December 2003,and, due to the relatively mild winter, the prog-ress in schedule. It is foreseen that the Wide-Angle Spin-Echo Instrument V5 will move fromthe old hall to the new hall. V5 will profit from thereplacement of the old neutron guide by a newballistic guide with multispectral neutron beaminjection. The replacement of the guide will startin October 2004.
Other planned - and fully financed - instrumentsin the new hall areUSANSHigh resolution SANS, equipped with a
novel focusing techniqueEXED Extreme Environment Diffractometer,
equipped with tof-momochromatisation.
The experiment site for EXED is in addition fore-seen for the project of a 25T high field magnet.And suited as well for potential projects witheven higher steady magnetic fields.
. L-L-Rainer Michaelsen

List of BE NSC Instruments
Instruments in the Experiment Hall (Thermal Neutrons)
NO.
E1
E 2
E 3
E 4
E 5
E 6
E7
E9
E10
Instrument ext.
Thermal 3-Axis Spectrometerwith Polarization Analysis 3101Flat-Cone- andPowder Diffractometer 3102Residual Stress Analysis andTexture Diffractometer 31032-Axis Diffractometer 3104(E4a: Test Device)4-Circle Diffractometer 3104
Focusing Single CrystalDiffractometer 3105Residual Stress Analysis Diffractometer(under construction) 3107Fine Resolution Powder Diffractometer(FIREPOD)
3He-Diffractometer (HELINE)
Tube
D1N
R1
T2
R2
R3
T4
D1S
T5
D1S
Instalment Staff
Hans A.GrafJens KlenkeUniv. Tübingen:
Jens-Uwe HoffmannRainer SchneiderTobias Poeste co-op. TU BerlinKarel ProkesVadim Sikolenko
Anja Loose
Jorge Hemandez-VelascoNorbert StüßerRainer SchneiderFlorian Henkel
Dimitri ArgyriouDaniel TöbbensMichael TovarKonrad SiemensmeyerSlavomir Mat'as
March 2004
ext.
277831672185
3096323728042847
2793
2768317130963237301627932768
27573135
Room
LS 335LS 334A 239
A 132A 129LR 138LR 141
LR 129
LR 144LR 142A 132A 133LR 137LR 129LR 144LS 132LS 138
Instruments in the Cold Neutron Guide Hall
No.
V1
V 2
V 3
V 4
V 5
V 6
V 7
B8
V12a
V12b
V13V14
Instrument ext.
Membrane Diffractometer3121
3-Axis Spectrometer for Cold Neutrons(FLEX) 3122
Time-of-Flight Spectrometer(NEAT) 3123
Small Angle Scattering Instrument(SANS)
3124
Spin-Echo Spectrometer with Time ofFlight Option (SPAN) 3125Reflectometer
2806
Cold n Tomography (CONRAD)(under construction)
n-Autoradiography 3121
Double-Crystal Diffractometer(bent crystal) 3131Double-Crystal Diffractometer(lamellar crystal) 3131Fundamental Physics
Mirror Test Device
Tube
NL1A
NL1B
NL2°
NL3A
NL4
NL4
NL1BU
NL1A
NL3B
NL3B
NL3B
NL1B0
Instrument Staff
Thomas Hauß co-op.Univ. DüsseldorfSilvia Dante TU Darmstadt
Peter VorderwischKlaus Habicht co-op. TU DarmstadtOleg SobolevMargarita RussinaJörg PieperAlexandra BuchsteinerAlbrecht WiedenmannUwe KeiderlingElvira Garcia-MatresJörg HaugAndre HeinemannCatherine PappasCarlos FehrN.N.Marita GieriingsRoland Steitz co-op. MPI-KGF GolmRumen Krastev co-op.TU Berlin
Nikolay Kardjilov
Birgit Schröder-SmeibidlLee-Ann MertensWolfgang Treimer TFH BerlinMarkus Strobl TFH BerlinTFH Berlin: Wolfgang Treimer
Ekaterina Korobkina
Thomas Krist
ext.
20712071217128073067315930733179228323393240233927692046307231412924214930772298
23372292222124902221
2290
2045
Room
LS 333LS 333A 334A 333A 331A 351A 348A 349LR 211LR 209LR 208LR 209LR 208A 346A 344LS 130A 226A 221A 223A 317
GE145V122A 319A 316A 319
V132
A 233
Sample Environment Michael MeissnerPeter SmeibidlSebastian Genscher
220430803133
LS 131LR 147LS 113
VI

Berlin Neutron Scattering Center
V4(SANS)
? ' ,2, 3
^
(SPAN)

How to Apply for BENSC Beam Time
BENSC is open to both the national and the international user community with up to 70% of thebeam time available to external users. The main portion of this beam time is foreseen for shortterm research proposals. Applications for short term beam time will be examined by a scientificselection committee twice each year,
deadlines for submission of proposals are 15 March and 15 September.
Requests for urgent experiments (Directors's discretionary time) and for industrial use may besubmitted at any time.
Applications for BENSC beam time should be made electronically. The BENSC ONLINEPROPOSAL SUBMISSION (OPS) system is available in the internet via
http ://www.hmi.de/bensc/user-info/user-info_en. html
Further information on BENSC instrumentation can be obtained from the internet via
http ://www.hmi.de/bensc/instrumentation/instrumentation_en. html
The latest four-colour printed version of the instrumentation brochure (HMI-B 577) is on themarket since March 2001 and available on request:
BENSC-HMIOffice of the Scientific SecretaryGlienicker Str. 100D -14109 Berlin (Wannsee)GermanyPhone +49 - 30 - 8062 2304Fax: +49 - 30 - 8062 2523Email: benec9hmi.de
The BENSC Experimental Reports are intended as interim summaries. In view of the short time availablebetween the termination of certain experiments and the deadline for this report, the results presentedhere have to be considered as very preliminary. The inclusion of reports in this volume does notconstitute a publication in the usual sense. Final results will be submitted for publication in regularscientific journals.
VIM

Acknowledgement for Support by the European Commission
FP5. IHP. Access to Research Infrastructures
For most of the groups from European Community Member States and Associated States, the access toBENSC has been supported by the European Community under the
Access to Research Infrastructure Action of the Improving Human Potential Programme (IHP)
Results of IHP supported groups are contained in 66 reports of this volume.
contract number HPRI-CT-1999-00020 (IHP I) contract period 02/2000 - 01/2003 (IHP- no. <399)
contract number HPRI-CT-2001-00138 (IHP II) contract period 11 /2001 - 02/2004 (IHP- no. >400)
IHP
145
220
318
403
413
445
446
448
448
449
452
454
462
472
473
476
482
497
498
499
501
502
503
506
508
1509
512
513
514
515
516
517
518
p.
77
1
192
18
139
197
140
158
175
37
183
134
126
181
20
67
160
207
41
90
3
60
92
193
121
167
136
168
172
79
135
42
46
authors
Deriu et al.
Idzikowski et al.
Arrighi et al.
Jensen et al.
Lo Celso et al.
Saroun et al.
Stepanek et al.
Klösgen et al.
Klösgen et al.
Marcano et al.
Barrallier et al.
Guilleaume et al.
lolin et al.
Schmidt et al.
Harrison et al.
Coldea et al.
Phoenix et al.
Vogl et al.
Hense et al.
Temst et al.
Jensen et al.
Gamari-Seale et al.
Montaigne et al.
Jobic et al.
Bourdarot et al.
Natali et al.
Calandrini et al.
Paciaroni et al.
Berti et al.
Bag lion i et al.
Triolo et al.
Gondek et al.
Tran et al.
affiliation
Univ. Parma, I
IMF PAS Poznari, PL
HWU Edinburgh, UK
Univ. Copenhagen, DK
Univ. Palermo, I
ASCR NPI Rez, CZ
IMC Prague, CZ
Univ. Odense, DK
Univ. Odense, DK
Univ. Cantabira, E
ENSAM, F
CNRS-Uni Bordeaux, F
LAS. Riga, LV
ISIS, RAL, UK
Univ. Edinburgh, UK
Univ. Oxford, UK
Univ. Centr. Lane. UK
Univ. Wien, A
TU Wien, A
KU Leuven, B
Univ. Copenhagen, DK
NCSR Demokritos, GR
LPM Nancy, F
CNRS Lyon, F
CEA Grenoble, F
OGG-INFM, Grenoble F
Univ. Parma, I
Univ. Perugia, I
Univ. Firenze, I
Univ. Firenze, I
IPCF-CNR, Messina, I
JU Krakow, PL
PAS Wroclaw, PL
IHP•n°
519
520
521
522
524
525
544
546
547
548
549
550
554
555
558
560
561
562
563
564
567
568
570
572
574
575
576
577
578
579
580
583
584
P-
44
112
97
70
150
69
127
91
25
24
23
198
108
48
184
87
124
123
174
169
137
132
225
49
113
2
14
43
45
236
190
152
73
authors
Wawrzynska et al.
Szymczak et al.
Borowiec et al.
Coldea et al.
Carelli et al.
Lake et al.
Güdel et al.
Temst et al.
Svoboda et al.
Vejpravova et al.
Kamarad et al.
Saroun et al.
Landa-Cänovas et al.
Campo et al.
Barrallier et al.
Farago et al.
Cahvo-Dahlborg et al.
Dahlborg et al.
Guenet et al.
Paciaroni et al.
Aliotta et al.
Triolo et al.
lolin et al.
Brück et al.
Szymczak et al.
Idzikowski et al.
Regulski et al.
Gondek et al.
Wawrzynska et al.
Tripadus et al.
Smrcok et al.
McLure et al.
Lake et al.
affiliation
JU Krakow, PL
PAS IP Warsaw, PL
PAS IP Warsaw, PL
Univ. Oxford, UK
Univ. Surrey, UK
Univ. Oxford, UK
Univ. Bern, CH
KU Leuven, B
CU Prague, CZ
CU Prague, CZ
ASCR IP Prague, CZASCR NPI Rez, CZ
ICMM-CSIC Madrid, E
Uni Zaragoza, ICMA, E
ENSAM, F
ILL Grenoble, F
CNRS Nancy, F
CNRS Nancy, F
Univ. Strasbourg, F
Univ. Perugia, I
CNR IPCF Messina, I
IPCF-CNR, Messina, I
L.A.S. Riga, LV
Univ. Amsterdam, NL
PAS IP Warsaw, PL
IMF PAS Poznart, PL
Univ. Warsaw, PL
JU Krakow, PL
JU Krakow, PL
IFIN-HH Bucharest, RO
SAS Bratislava, SK
Univ. Sheffield, UK
Univ. Oxford, UK
IX

Notice:
The quality of figures in the electronic versions, CD and WEB (http://www.hmi.de/bensc)
- especially in colour presentation - is remarkably higher than in print version

List of Contributed Experimental Reports
PAGE TITLE TEAM PROPOSAL
Magnetic Structure and Phase Transitions
1 Spin waves In amorphous andnanocrystalllne
(x = 10 or 30)
B. Idzikowski1
T. Krenicky2
J. Klenke3
S. Danilkin3
1INIF PAS Poznan, PL2ÜEF SAV KoSice, SK3HMI Berlin
E1 PHY-02-0308
2 Neutron investigations of NI3AI itinerant B. Idzikowski1
electron system Y.-H. Hyun2
Y.V. Kudryavtsev3
J. Klenke/
1IMF PAS Poznan, PL2Univ. Hanyang, Seoul3NAS IMP Kiev, UA4HMI Berlin
E1 PHY-02-0397
3 Hc2 and magnetism in ErNijBzC A.JensenA.B. Abrahamsen2
K.N. Toft2
N.H. Andersen2
P. Smeibidl3
S. Kausche3
1Univ. Copenhagen, DK2Risoe, DK3HMI Berlin
12 Axis conversion effect in DyCu2 M. Rotter1
S. Raasch2
M. Dörr2
X. Chen1
1Univ.Wien,A2TU Dresden3CU, Prague
P. Svoboda3
18 The magnetic structure of E1HI2B2C inan applied field along the c-axis
A. Jensen1
N.H. Andersen2
A.B. Abrahamsen2
K. Prokes3
S. Danilkin3
1Univ. Copenhagen, DK2Risoe, DK3HMI Berlin
E1 PHY-02-0366
4
5
6
7
8
10
11
Magnetism in RbCuCh and CsCuCh
Inelastic studies of UNiAl (2)
Phase transitions in Cu1.2sAgo.2sSe
Detailed investigation of the magneticstructures of TbCu2 on a single crystal
Magnetic order and diffuse scattering inRNI2B2C
Strong domain effects in the hexagonalferromagnet cobalt
Physical properties of magnetite Fe3O4confined In a porous glass
N. Stüßer1
U. Schotte1
A. Hoser2
K. Prokes
S. DanilkinJ. Klenke
A. Schneidewind1
A. Kreyßig2
U. Witte2
A. Kreyssig1
O. Stocker?J.U. Hoffmann3
U. Köbler1
A. Hoser2
I. Golosovsky1
D. Kurdyukov2
1HMI Berlin2FZ Jülich/RWTH Aachen
HMI Berlin
HMI Berlin
1MPI CPfS Dresden2TU Dresden
1TU Dresden2MPI CPfS Dresden3Univ. Tübingen1RWTH Aachen2IFF, FZ-Jülich1PNPI, Gatchina, RU2PTI, St. Petersburg, RU
E1
E1
E1
E2
E2
E2
E2
PHY-02-385 +EF
EF
EF
PHY-01-1094
PHY-01-1095/01-1249
PHY-01-1251
PHY-01-1257
E2 PHY-01-1330
13
14
15
16
17
Spin-structure in Nd(i.x)PbxMnO3 singlecrystals
Reinvestigatlon ofß-Mn02 magneticstructure
Magnetic ordering ofY0.1 Ca0eGaxMni.xO3 (x = 0.01, 0.05)
Stability of the AF structure In UNIAInear the TN
Magnetic diffuse scattering in Nao.ToC02single crystals
U.K. Rößler1
J.-U. Hoffmann2
M. Regulski1
R. Przenioslo1
W. Slawinski1
J.-U. Hoffmann2
Th. LonkaiA. PfrommerJ.-U. Hoffmann
K. Prokes
D. Argyriou1
N. Aliouane1
J.-U. Hoffmann2
1IFW Dresden2Univ. Tübingen1 Univ. Warsaw, PL2Univ. Tübingen
Univ. Tübingen
HMI Berlin
1HMI Berlin2Univ. Tübingen
E2
E2
E2
E2
E2
PHY-01-1331
PHY-01-1333
PHY-01-1402EF
EF
EF
E4 PHY-01-1125
XI

PAGE
List of Contributed Experimental Reports
TITLE TEAM PROPOSAL
19
20
21
22
23
24
25
26
27
28
29
30
31
32
33
34
35
36
37
38
Domain growth kinetics ingeometrically frustrated Isingantiferromagnet CoNb&eMagnetic structure determination andH,T phase diagram of the S=1/2 squarelattice antiferromagnet (SCAP)2CuCI4Magnetic structure of TbNis
Investigation oftheA-phase ofCeCu2Si2 in an external magnetic field
Pressure induced magnetic structuresin Lu2Fen
Magnetic phases ofNdFezSh singlecrystalMagnetic phase transitions inU(Ni,Pd)2Si2 single crystals under highpressure
Magnetic field effect on ferromagneticorder in Ndi.agCeo.isCu04
Magnetic field dependence of themartensltic transformation in Ni2MnGa
Frustrated magnetic moments inCePdAI in magnetic fieldsMagnetic structures in UlrAI
Metamagnetic transitions in DyNiAl
On the magnetic structure ofUlrGe
Crystal structure ofLa2Cu04 andLai.xSrxCuO4(x = 0.01)
Magnetic structure ofLa2CuO4
Crystal and magnetic structure ofTbVO3
Antiferromagnetic order in NdVO3
Antiferromagnetic order in LaVO3
The low temperature magnetic phasesofCeNii.xCux
Magnetic order in CeCu&h
S. Mitsuda1
Y. Inomoto1
K. Prokes2
A. Harrison1
F. Coomer1
R. Feyerherm2
A.N. Pirogov1
S. Lee2
A. Podlesnyak3
0 . Stocken1
E. Faulhaber2
H.S. Jeevan1
J. Kamarad1
0 . Prokhnenko1
K. Prokes2
J. VejpravovaJ. Prchal
P. Svoboda1
F. Honda1
J. Prchal1
K. Prokes2
M. Matsuura1
P. Dai2
K. Prokes3
D. Argyriou3
S. Shapiro1
P. Vorderwisch2
K. Prokes2
K. Prokes
K. Prokes1
J. Prchal2
K. Prokes1
J. Prchal2
K. Prokes
B. Keimer1
G. Blumberg3
Y. Ando4
M. Reehuis12
B. Keimer1
G. Blumberg3
Y. Ando4
M. Reehuis12
C. Ulrich1
B. Keimer1
M. Reehuis112
C. Ulrich1
B. Keimer1
M. Reehuis1'2
C. Ulrich1
B. Keimer1
M. Reehuis12
N. Marcano1
J.C. Gomez Sal1
J. Hernandez Velasco2
E. Faulhaber1
0 . Stockert2
1Tokyo US, JP2HMI Berlin
1Univ. Edinburgh, UK2HMI Berlin
1RAS Ekatarinburg, RU2SKKU Suwon, KP3ETHZ & PSI, CH1MPI CPfS Dresden2TU Dresden
1ASCR IP Prague, CZ2HMI Berlin
CU Prague, CZ
1CU Prague, CZ2HMI Berlin
1ORNL, USA2Univ. Tennessee, USA3HMI Berlin
1BNL Upton, US2HMI Berlin
HMI Berlin
1HMI Berlin2CU Prague, CZ1HMI Berlin2CU Prague, CZ
HMI Berlin
1MPI-FKF Stuttgart2HMI Berlin3Bell Labs, NJ4CRIEPI, Komae, Tokyo1MPI-FKF Stuttgart2HMI Berlin3Bell Labs, NJ4CRIEPI, Komae, Tokyo1MPI-FKF Stuttgart2HMI Berlin
1MPI-FKF Stuttgart2HMI Berlin
1MPI-FKF Stuttgart2HMI Berlin
1Univ. Cantabria, E2HMI Berlin
1TU Dresden2MPI CPfS Dresden
E4
E4
E4
E4
E4
E4
E4
E4
E4
V4
E4
E4
E4/E6
E5
E5
E5
E5
E5
E6
E6
PHY-01-1128
CHE-01-1206
PHY-01-1276
PHY-01-1352
PHY-01-1353
PHY-01-1354
PHY-01-1355
PHY-01-1357
EF
EF
EF
EF
EF
PHY-01-1378
PHY-01-1378
PHY-01-1380
PHY-01-1380
EF
PHY-01-1211
PHY-01-1278
XII

PAGE
List of Contributed Experimental Reports
TITLE TEAM PROPOSAL
39 New nitrogen compounds G. Auffermann1
R. Kniep1
R. Niewa1
M. Kirchner1
J. Hernandez-Velasco2
N. Stüßer2
1MPI CPfS Dresden2HMI Berlin
E6 CHE-01-1279
40
41
42
43
On the two magnetic order parametersof yttrium iron garnet (YIG)Spin structure in HoAg
Neutron diffraction studies of magneticordering in R3Co8Sn4 (R-rare earth)compoundsNeutron diffraction studies ofnon-stoichiometric RNi(i.x)ln(i*x) compounds(R-rare earth)
U. Köbler1
A. Hoser2
K. Hense1
E. Grate1
A. Hoser2
L. Gondek1
S. Baran1
J. Hernandez-Velasco2
L. Gondek1
S. Baran1
J. Hernandez-Velasco2
1IFF, FZ-Jülich2RWTH Aachen1TU Wien, A2RWTH Aachen
1JU Krakow, PL2HMI Berlin
1JU Krakow, PL2HMI Berlin
E6
E6
E6
E6
PHY-01-1281PHY-01-1283
PHY-01-1284
PHY-01-1368
44 Neutron diffraction study of RsCu^U (R• Tb, Dy, Ho, Er) compounds
E. Wawrzynska1
J. Hernandez-Velasco'N. Stüßer2
B. Penc1
A. Szytula1
Z. Tomkowicz1
1JU Krakow, PL2HMI Berlin
E6 PHY-01-1286
45
46
47
48
49
50
51
52
53
54
Neutron diffraction study ofR3Pd,Ge4(R = Tb and Er) compounds
Neutron diffraction study of poly- andsinglecrystalline UNio.sSb2 samples
The magnetic structure of theferromagnetic compound NagCozOr
Rare-earth spin canting and magneticirreversibility in NdeFe10AI4
Neutron diffraction study of a virgintransition in MnFe(P,Si) compounds
Magnetic order in CeBiPt
Phase diagram of NaxCai.xCo204with xe[0.85, 0.95]
Phase Diagram ofNaxCo02
with xe [0.6,1] at room temperature
Phase separation v's quantum criticalpoint In perovskitic manganites
Complex structure of theNaxCoO2,yD2O, NaxCo02, yH2O zD2O
E. Wawrzynska1
J. Hernandez-Velasco2
B. Penc1
A. Szytula1
V.H. Tran1
J. Hernandez-Velasco2
N. Stüßer2
O. Leynaud1
M. Sofin1
M. Jansen1
J. Hernandez-Velasco2
J. Campo1
J. Luzon1
J.G. Cuello2
J. Hernandez-Velasco3
E. Brück1
L. Zhang1
O. MozerK. Prokes3
O. Stockert1
G. Goll2
D. ArgyriouC. MilneN. AliouaneJ. Hernandez-Velasco
D. ArgyriouC. MilneN. AliouaneJ. Hernandez-Velasco
D.N. ArgyriouC. MilneN. AliouaneJ. Hernandez-Velasco
D. ArgyriouC. MilneN. Aliouane
1JU Krakow, PL2HMI Berlin
1PAS ILTSR Wroclaw, PL2HMI Berlin
1MPI-FKF Stuttgart2HMI Berlin
1MRI of Aragon, E2ILL, Grenoble, F3HMI Berlin
1 Univ. Amsterdam, NL2Univ. Modena, I3HMI Berlin
1MPI CPfS Dresden2Univ. KarlsruheHMI Berlin
HMI Berlin
HMI Berlin
HMI Berlin
E6
E6
E6
E6
E6
E6
E6
E6
E6
E6/E9
PHY-01-1370
PHY-01-1287
CHE-01-1364
PHY-01-1365
MAT-01-1367
PHY-01-1478EF
EF
EF
EF
XIII

PAGE
List of Contributed Experimental Reports
TITLE TEAM PROPOSAL
55
56
57
58
59
In situ neutron diffraction on thedischarging process of an alkalinebattery
Magnetic structures ofR&aMOs at H=0and applied field (R=1MGd, Dy, Ho;M=Co, Ni, Cu)Influence of preparation conditions onthe magnetic structure ofMnCr2O4spinelMagnetic investigations in the spinelsystem CuxNii.xCr2Ö4
The determination of the magnetic andnuclear structure ofNarCozOe
N. KardjilovI. MankeJ. BanhartJ. Hernandez-Velasco
J. Hernandez-Velasco
D.M. Többens
M. Tovar1
R. Torabi12
0. Leynaud1
M. Sofin1
M. Jansen1
J. Hernandez-Velasco2
HMI Berlin
HMI Berlin
HMI Berlin
1HMI Berlin2TH Berlin1MPI-FKF Stuttgart2HMI Berlin
E6
E6E9
E9/E6
E6/E9
E9
EF
EF
EF
EF
CHE-01-126201-1280
60 A neutron diffraction study ofLaCoo.sMno.5f Lao.7Cao.3Coo.sMfJo.sO3 andLaaaSro.2Coo.sMno.sO3
H. Gamari-Seale1
I.O. Troyanchuk2
A. Sazonov2
K.L. Stefanopoulos1
D.M. Többens3
1NCSR Demokritos, GR2NAS Minsk, BY3HMI Berlin
68 Spin dynamics in the unconventionalquantum magnet NH4CuCh
Ch. Rüegg1
P. Vorderwisch2
P. Smeibidl2
S. Kausche2
M. Meissner2
1LNS, ETH Zürich & PSI2HMI Berlin
E9 PHY-01-1264
61
62
63
64
65
66
67
Neutron diffraction study ofLai.xSrxCoO3 magnetic structure atx- 0.15 and 0.3Neutron powder diffraction study ofEu(BaNd)2Cu3O7
Crystal and magnetic structure ofmanganese malonate
Magnetic moments of the transitionmetal ions in MnF2, FeF2 and C0F2
Two magnetically ordered phases inFe[C(CN)3h
Enhancement of the magnetic order inMg doped CuGeOe
Magnetic excitations ofquasi-1D Isingchain at high field
V.V. Sikolenko1
A. Sazonov2
V.A. Sirenko1
V.V. Eremenko1
M. Tovar2
R. FeyerhermD. M. TöbbensS. LandsgesellW. Jauch1
M. Reehuis2'1
R. Feyerherm1
A. Loose1
T. Hauß2'1
S. Landsgesell1
R.J. BirgeneauS. WakimotoC. Stock
R. Coldea1
D.A. Tennant2
K. Habicht43
P. Smeibidl3
1HMI Berlin2NAS Minsk, BY
1ILT Kharkov, UA2HMI Berlin
HMI Berlin
1HMI Berlin2MPI-FKF Stuttgart
1HMI Berlin2Univ. Düsseldorf
Univ. Toronto, CAN
1Univ. Oxford, UK2RAS, UK3HMI Berlin^ U Darmstadt
E9
E9
E9
E9
V1
V2/E1V2
PHY01-1268
MAT-01-1271
EF
EF
EF
PHY-02-0347
PHY-02-0352
V2 PHY-02-0374
69 Three dimensional field-inducedmagnetism in High-Tc La2.xSrxCu04
B. Lake1
K. Lefmann2
N. Christensen2
1Univ. Oxford, UK2Risoe, DK
V2 PHY-02-0379
70 Field-induced magnetization plateau ina 2D frustrated quantum magnet
R. Coldea1
D.A. Tennant2
T. Ono3
K. Habicht4'5
S. Genscher5
1Univ. Oxford, UK2RAS, UK3TIT, Tokyo, JP^ U Darmstadt5HMI Berlin
V2 PHY-02-0380
XIV

PAGE
List of Contributed Experimental Reports
TITLE TEAM PROPOSAL
71
72
73
74
75
7677
78
79
80
81
82
83
84
85
86
87
88
Neutron Resonance spin echo (NRSE)study of the magnon linewidth inBaMnF4
Neutron Resonance spin echo (NRSE)study of the Q- and temperaturedependence of the magnon linewidth inMnF2
Searching for charge order in High-TcLa2.xSrxCu04
Phonon softening preceding thereverse martensltic transformation inNhMnGa
Magnetic field effect on anti-ferromagnetic order Ndi.asCeaieCuO4
Inelastic Studies ofUNiAI(1)
Nanostructured intermetallic alloys withGMR behaviour
Pressure dependence of the magneticphase diagram in MnSi
SANS investigation of magneticnanoparticles using polarized neutrons
SANSPOL studies of hard magneticNdeoFexCo3o.xAlio(x = 20, 7.S and 0)alloysSANSPOL in multicomponent Nd-basedalloys at high temperatures
Magnetic Field induced arrangement ofconcentrated magnetosomes studiedby SANSField variation technique and Langevlnbehaviour of Co-ferrofluldsSANSPOL measurements fora newkind of Co-Ferrofluids
SANSPOL • Investigations of CobaltFerrite Fluids
SANSPOL investigation of magneticpolystrene nanopartlcels
Surface dynamics of magnetism offerrofluid particles
Characterisation of the water depletionlayer at the water/hydrophobicinterface: effect surface hydrophobicity
S.P. Bayrakci1
T. Keller1
B. Keimer1
K. Habicht32
S.P. Bayrakci1
T. Keller1
B. Keimer1
K. Habicht32
B. Lake
P. Vorderwisch1
S. Shapiro2
M. Matsuura1
P. Dai2
0. Sobolev3
D. Argyriou3
K. Prokes
A. Deriu1
F. Spizzo1
A. Hoell2
L. Pintschovius1
D. Reznik2
C. Pfleiderer2
P. Baglioni1
D. Berti1
A. Wiedenmann2
0. PerroudE. Garcia-MatresA. Wiedenmann
E. Garcfa-Matres0. PerroudA. WiedenmannA. HoellA. Wiedenmann
A. HeinemannA. WiedenmannA. HeinemannA. WiedenmannM. Kammel
M. KammelA. WiedenmannA. Heinemann
M. KammelA. WiedenmannA. HeinemannB. Farago1
E. Dubois2
R. Perzynski2
M. Grunze1
M. Himmelhaus1
M. Maccarini1
R. Steitz2'34
1MPI-FKF Stuttgart2HMI Berlin3TU Darmstadt
1MPI-FKF Stuttgart2HMI Berlin3TU Darmstadt
Univ. Oxford, UK
1HMI Berlin2BNL Upton, US
1ORNL, USAzUniv. of Tennessee.USA3HMI Berlin
HMI Berlin1Univ. Parma, I2HMI Berlin
1FZ Karlsruhe2Univ. Karlsruhe
1Univ. Firenze, I2HMI Berlin
HMI Berlin
HMI Berlin
HMI Berlin
HMI Berlin
HMI Berlin
HMI Berlin
HMI Berlin
1ILL Grenoble, F2CNRS, Paris, F
1Univ. Heidelberg2TU Berlin3MPI-KGF Golm4HMI Berlin
V2
V2
V2
V2
V2
V2V4
V4
V4
V4
V4
V4
V4
V4
V4
V4
V5
V6
PHY-02-0400
EF
PHY-02-0402PHY-02-0415
EF
EF
PHY-04-0595
PHY-04-0802
CHE-04-0807
EF
EF
EF
EF
EF
EF
EF
PHY-03-0301
CHE-04-0895
XV

PAGE
List of Contributed Experimental Reports
TITLE TEAM PROPOSAL
Magnetic Thin Films
89
90
91
Spin density waves in Cr/Ni bilayers
Polarized neutron reflectivity onexchange bias nanostructures
Polarized neutron reflectivity onexchange bias nanostructures
H. Zabel1
E. Kravtsov1
K. Prokes2
V. Sikolenko2
K. Temst1
H. Loosvelt1
0 . Popova1
H. Fritzsche2
K. Temst1
H. Loosvelt1
0 . Popova1
M. Gierlings2
1RU Bochum2HMI Berlin
1KU Leuven, B2HMI Berlin
1KU Leuven, B2HMI Berlin
E4 PHY-01-1274
V 6 PHY-04*0832
V 6 PHY-04-0897
92 Antiferromagnetic In Fe I MgO / Fetrilayer
F. Montaigne1
J. Faure-Vincent1
C. Bellouard1
M. Gierlings2
H. Fritzsche2
1LPM Nancy, F2HMI Berlin
V 6 PHY-04-0833
93 Off-specular PNR studies on a Co/CoOexchange bias multilayer
M. Gierlings1
M. Gruyters1
D. Riegel1
M. Prandolini1
H. Fritzsche1 z
1HMI Berlin2NRC Chalk River, CAN
V 6 PHY-04-0914EF
Chemical Structure
94 Search for static charge order peaks inoptimally doped YBCO
L. Pintschovius FZ Karlsruhe E1 PHY-02-0365
95 Diffuse scattering of cation-doped I. Kaiser-Bischoffzirconia-oxynitride J.U. Hoffmann2
1LMU München2Univ. Tübingen
E2 CHE-01-1250
96 Diffuse scattering of cation-dopedzirconia-oxynitride
I. Kaiser-Bischoff1
J.U. Hoffmann2
1LMU München2Univ. Tübingen
E2 CHE-01-1332
97 Structural and magnetic phase M.T. Borowiec1
transition of potasslum-holmium J.U. Hoffmann2
double tungstates I. Glavatski3'4
1PAS IP Warsaw, PL2Univ. Tübingen3HMI Berlin4NAS IMP Kiev, UA
E2 PHY-01-125401-1334
98 Neutron diffraction study oforientational glass state
L. S. Smirnov1
J.U. Hoffmann2
I. Glavatski3-4
1RFSSCITEP Moscow2Univ. Tübingen3HMI Berlin4NAS IMP Kiev, UA
E2 PHY-01-1256
99 Refinement of the hydrogen positionsin (NH4)2SeO4
L.S. Smirnov1
A. Loose2
N. Berntsen3
G. Melnyk3
1RFSSCITEP Moscow2HMI Berlin3JG-Univ. Mainz
E5 PHY-01-1223
100 Hydrogen positions in ND4DSO4 K. KnorrG. Lentz
CAU Kiel E5 MAT-01-1291
101 Single crystal study of the structuralinstability in deuteratedK4BEDT-TTF)2CU [N(CN)JBr
S. Siillow1
J. Kreitlow1
A. Loose2
R. Feyerherm2
1TU Braunschweig2HMI Berlin
E5 PHY-01-1376
102 Neutron diffraction study ofSrFe03s C. Ulrich1
B. Keimer1
M. Reehuis1'2
1MPI-FKF Stuttgart2HMI Berlin
E5 PHY-01-1379
103 Superstructures in Zn2x(Culn)1.xS2 thinfilms
S. Schorr1
F. Fleischer1
N. Stüßer2
1Univ. Leipzig2HMI Berlin
E6 PHY-01-1282
XVI

PAGE
List of Contributed Experimental Reports
TITLE TEAM PROPOSAL
104 Structure and anion ordering in S. Schorr1
A. Franz1
M. Tovar2
1Univ. Leipzig2HMI Berlin
E9 PHY-01-1263
105 Structural anomalies and cation S. Schorr1
ordering in 2ZnSe-CulnSe2 M. Tovar2
1Univ. Leipzig2HMI Berlin
E9 PHY-01-1340
106 Structural anomalies and cation S.Schorr1
ordering in 2ZnSe-CulnSe2 N. Stüßer2
1Univ. Leipzig2HMI Berlin
E6 PHY-01-1361
107 Neutron diffraction study of FeCr2S4 R.Sadykov1
and substituted spinels N. Stüßer2
(Feo.ixlnx)o.sCuodCr2S4(xBO.3;O.4) underpressure up to 20kbar
1RAS Russia2HMI Berlin
E6 PHY-01-1373
108 Cation order and magnetic structure ofruale related SbVO4
A. Landa-Cänovas1
J. Garcfa-Garcfa2
J. Hernändez-Velasco3
1ICMM-CSIC Madrid, E2Univ. Stockholm, S3HMI Berlin
E6 CHE-E9 01-1366
109 Hydration of NaxCoO2 C. MilneD. ArgyriouJ. Hernandez-Velasco
HMI Berlin E6 EF
110 Crystal and Magnetic structure of theMolecular Magnet Mn(NCS)zpyz2
J. Hernandez-Velasco1
N.N. Bordallo1
R. Feyerherm1
J.L. Manson2
1HMI Berlin2ANL, Argonne, USA
E6 EF
111 Phase transition in Sr, Mg dopedLaGaOe superionlc conductors
M.M. Günter1
H. Boysen2
M. Lerch1
D. M. Többens3
1TU Berlin2Univ. München3HMI Berlin
E9 CHE-01-1260
112 Orbital order-disorder transitions in La- H. Szymczak1
deficient perovskite manganites M. Tovar2
1PAS IP Warsaw, PL'HMI Berlin
E9 PHY-01-1265
113 Neutron diffraction studies of crystaland magnetic structures of
H. Szymczak1
M. Tovar2
1PAS IP Warsaw, PL2HMI Berlin
E9 PHY-01-1346
114 Neutron diffraction study offerroelectric NaNO2 nanowires
A. Naberezhnov1
A. Sotnikov1
M. Tovar2
1PTI St. Petersburg, RU'HMI Berlin
E9 PHY-01-1201
115 Order parameter and structure ofnanocomposite NaNO2 embedded intoporous glass
A. Naberezhnov1
Y. Kumzerov2
M. Tovar3
1RAS loffe St. Petersburg2HMI Berlin
E9 PHY-01-1269
116 Structure and phase transition in aconfined KH1PO4
A. NaberezhnovO. Smirnov2
M. Tovar3
1RAS loffe St. Petersburg2RAS PNPI Gatchina, RU3HMI Berlin
E9 PHY-01-1348
117 New Compounds G. AuffermannR. Kniep1
B. Schupp2
C. Sekar2
G. Krabbes2
D. M. Többens3
nMPI CPfS Dresden2IFW Dresden3HMI Berlin
E9 CHE-01-1261
118 New nitrides and Nitridometalates G. Auffermann1
R. Kniep1
R. Niewa1
D. Zherebtsov1
Y. Prots1
1MPI CPfS Dresden2HMI Berlin
E9 CHE-01-1338
119
120
Cubic - cubic phase transition ofalumosilicate iodide sodalite
Crystal structure of Ce*°Nlo.»Cuo.i
D. M. Többens2
Th.M. Gesing1
C.H. Rüscher1
J.-Ch. Buhl1
D. M. Többens2
N. Marcano1
J.C. Gomez Sal1
J. Hernändez-Velasco2
1Univ. Hannover2HMI Berlin
1Univ. Cantabria, E2HMI Berlin
E9 EF
E9 EF
XVII

PAGE
List of Contributed Experimental Reports
TITLE TEAM PROPOSAL
121
122
123
124
Study of the magnetic transition andhidden order in URu&i at 17 TeslaRotational tunneling as a probe ofadsorption sites and potentials inmethyl iodide clathrate
HBcrostructure of the molten GaPbmonotectic alloyNKcrostructure ofPdSi metallic glassesof different thickness produced underfully controlled experimental conditions
Structural Excitations
F. BourdarotB. FakM. Prager1
A. Desmedt2
A. Buchsteiner3
J. Pieper3
U. Dahlborg1
J. Haug2
M. Calvo-Dahlborg1
CM. Bao1
U. Dahlborg1
J. Haug2
CEA Grenoble, F
1FZ Julien2Univ. Bordeaux, F3HMI Berlin
1CNRS Nancy F2HMI Berlin1CNRS Nancy F2HMI Berlin
V2
V3
V4
V4
PHY-02-0375CHE-03-0256
PHY-04-0874MAT-04-0875
125 NRSE Investigation of PhononLifetimes In the conventionalSuperconductor Nb
K. Habicht31
F. Mezei1
T. Keller2
B. Keimer2
S. Bayrakci2
1HMI BENSC2MPI-FKF Stuttgart3TU Darmstadt
V2 PHY-02-0387
126 Neutron scattering by ultrasound in themosaic single crystals
E. lolin1
L. Rusevich1
F. Mezei2
J. Pieper2
A. Buchsteiner2
1L.A.S., Riga, LV2HMI Berlin
V3 PHY-03-0238
127 Ground state energy splittings in atetrahedral Coflll) complex
H.U. Güdel1
R. Bircher1
A. Sieber1
H. Weihe2
A. Buchsteiner3
1Univ. Bern, CH2Univ. Copenhagen, DK3HMI Berlin
V3 PHY-03-0267
128 Investigation of the low energyvibrational density of states inamorphous-FeojYoj ribbons
W. Keune1
B. Sahoo1
V. Kuncser2
J. Pieper3
1Univ. Duisburg-Essen2NIPM Bucharest, RO3HMI Berlin
V3 PHY-03-0287
129 Quasielastic neutron scattering ofmethyl fluoride and methyl chloride
O. Kirstein1
M. Prager2
A. Buchsteiner3
1ANSTO, AU2FZ Jülich3HMI Berlin
V3 PHY-03-0294
130 Spin echo study of the phason R A. Branddynamics in i-AICuFe quasicrystals C, Pappas2
1Univ. Duisburg2HMI Berlin
V5 PHY-03-0250
Soft Matter
131 Hydrogen-bonded structures in F. Aliottamethanol/CCU mixtures D. M. Többens2
1IPCF Messina,2HMI Berlin
E9 PHY-01-1344
132 Local structure in atactic polypropyleneacross the glass transition
A. Triolo1
D. M. Többens2
O. Russina2
1IPCF-CNR, Messina, I2HMI Berlin
E9 PHY-01-1345
133 Intriguing structural behaviour of themodel system L-alanine
N. Bordallo1
D.N. Argyriou1
M. Barthes2
1HMI Berlin2Univ. Montepellier II, F
E9 EF
134 Molecular dynamics in the F. Guillaume1
incommensurate 2-decanone/urea A. Desmedt1
crystal R. Lechner2
1CNRS - Univ. Bordeaux, F2HMI Berlin
V3 CHE-03-0234
135 Segmental dynamics of confined PEO A. Triolo1
O Russina2
J. Pieper2
1CNR IPCF Messina, I2HMI Berlin
V3 PHY-03-0262
XVIII

PAGE
List of Contributed Experimental Reports
TITLE TEAM PROPOSAL
136
137
138
139
140
141
142
143
144
145
146
147
148
149
150
151
152
Dynamic features ofhydration waterinteracting with Hydrophobie molecules
Incoherent quasi elastic neutronscattering in methanol/CCI4 mixtures
Dynamics of the CH3.and NHe-groups inL-alanine
Structural investigation onphosphollpidlc-cyclodextrin derivatives
Nanostructured ternary polymersystems
Dynamics of 4-n-4'-octyl-cyanobiphenilby neutron spin echoTemperature dependence ofpoly(etylene oxide) brushes
Internal order of polyelectrolytemultilayers
The osmotically swollen phase ofpolyelectrolyte brushesIs there an odd/even effect of the watercontent of polyelectrolyte multilayers?
Polyelectrolyte multilayers: hydrationand odd-and-even effects
Thermodynamic stability ofpolyelectrolyte multilayers
Chemical switching of protein-surfaceInteractions with weak polyelectrolytebrushes
Vapour sorption in min self-assembledAu-nanoparticle/dendrimer compositefilms
Polymer interfaces near the criticalpointStudy of the geometry of lipid coupledto polyelectrolyte multilayers
Spontaneous temperature-recycledwetting at solid/liquid interfaces innear-critical liquid/liquid mixturesmediated by wall coating
V. Calandrini1
A. Deriu1
G. Onori2
R. Lechner3
J. Pieper3
F. Aliotta1
C. Vasi1
F. Saija1
A. Buchsteiner2
H.N. Bordallo1
C. Fehr1
S. Rols2
M. Bathed2
F. Lo Celso1
R. Triolo1
U. Keiderling2
P. Stepanek1
P. Cernoch1
D. Clemens2
A. Wiedenmann2
C. FehrC. Pappas
C. HelmA. WesemannH. AhrensC. HelmM. GopinadhanH. Ahrens
CA. HelmH. AhrensR. v. Klitzing1
W. Wong1
S. Schemmel1
R. Steitz1'2'3
M. Schönhoff1
D. Carriere1
R. Krastev1'2'3
C. Delajon1
I. Estrela-Lopis1
E. Donath1
G. Ibarz2
R. Krastev23-4
M. Tanaka1
F. Rehfeldt1
R. Steitz2'3'4
T. Vossmeyer1
R. Krastev2'3'4
N. Krasteva1
C. Carelli1
M. Sferrazza2
C. Delajon1'2
R. Krastev2'3'4
I.A. McLure1
M.C. Vergara-Gutierrez1
R. Stertz"'4
1Univ. Parma, I2Univ. Perugia, I3HMI Berlin
1CNR IPCF Messina, I2HMI Berlin
1HMI Berlin2Univ. Montepellier II, F
1Univ. Palermo, I2HMI Berlin
1IMC Prague, CZ2HMI Berlin
HMI Berlin
Univ. Greifswald
Univ. Greifswald
Univ. Greifswald
1TU Berlin2MPI-KGF Golm3HMI Berlin
1MPI-KGF Golm2TU Berlin3HMI Berlin
1Univ. Leipzig2MPI-KGF Golm^ U Berlin4HMI Berlin1TU München2TU Berlin3MPI-KGF Golm4HMI Berlin1Sony Stuttgart2MPI-KGF Golm3TU Berlin4HMI Berlin1Univ. Surrey, UK2Univ. Brussels, B1Uni+ISIS Strasbourg, F2MPI-KGF Golm3TU Berlin4HMI Berlin1Univ Sheffield, UK2TU Berlin3MPI-KGF Golm4HMI Berlin
V3
V3
V3
V4
V4
V5
V6
V6
V6
V6
V6
V6
V6
V6
V6
V6
V6
PHY-03-0264
PHY-03-0289
EF
CHE-04-0689
CHE-04*0748
EF
MAT-04-0662
PHY-04-0893
PHY-04-0894PHY-04-0822
PHY-04-0826
PHY-04-0829
PHY-04-0830
MAT-04-0831
PHY-04-0836CHE-04-0859LT
CHE-04-0900
XIX

PAGE
List of Contributed Experimental Reports
TITLE TEAM PROPOSAL
153 Lipid bilayer formation on hydrophilic R. Krastev1'2'3
substrate in presence sucrose Th. Gutberlet4
1MPI-KGF Golm2TU Berlin3HMI Berlin4PSI Villigen, CH
V6 CHE-04-0908LT
154 Vapour sorption in thin self-assembled R. Krastev123
AU-nanoparticle/hexadecanedithiol N. Krasteva4
composite films T. Vossmeyer4
1MPI-KGF Golm2TU Berlin2HMI Berlin4Sony Stuttgart
V6 CHE-04-0909LT
155 Depletion of water at the hydrophilicsolid/liquid interface
R. Steitz123
G.H. Findenegg1
S. Schemmel
TU Berlin2MPI-KGF Golm3HMI Berlin
V6 CHE-04-0910LT
156 Depletion of methanol at theHydrophobie solid/liquid interface
R. Steitz123
G.H. Findenegg1
S. Schemmel
TU Berlin2MPI-KGF Golm3HMI Berlin
V6 CHE-04-0911LT
157 Surfactant layers at the Si/liquidinterface as a function of time andtemperature
R. Steitz12'3
G.H. Findenegg1
S. Schemmel
1TU Berlin2MPI-KGF Golm3HMI Berlin
V6 CHE-04-0912LT
Biology
158
160
Stability of lipid bilayers uponinteraction with membrane activemolecules
Neutron diffraction studies on themembrane interactions of m-calpain,domain V
B. Klösgen1
M. Dathe2
T. Hauß4'3
S. Dante5
D.A. Phoenix1
S. Dennison1
F. Harris1
S. Dante2
T. Hauß34
Univ. Odense, DK2FI Mol. Pharm. Berlin3HMI Berlin4Univ. DüsseldorfT U Darmstadt1Univ. Centr. Lane. UK2TU Darmstadt3Univ. Düsseldorf4HMI Berlin
V1
V1
PHY-01-1229
BIO-01-1233
161 Peptide-membrane interaction R. WillumeitM. KumpugdeeS. LinserF. Förster
GKSS Geesthacht V1 BIO-01-129401-1384
163 Interactions of lipids with peptideantibiotics
F. Bringezu1
A. Gabke1
M. Majerowicz1
T. Hauß23
S. Dante4
1Univ. Leipzig2Univ. Düsseldorf3HMI Berlin*TU Darmstadt
V1 BIO-01-1295
164 Localizing the quinone domain ofubiquinone in the oxidized and reducedstate
ThS.T.N.
. Haines1
Dante2
Hauß34
Dencher2
1 City Coll. of CUNY, USA2TU Darmstadt3Univ. Düsseldorf4HMI Berlin
V1 BIO-01-1296
165 Investigation of model stratum corneumlipid via neutron diffraction
M. Kiselev1'2
J. Zbytovska1
S. Wartewig1
R. NeuberfS. Dante3
T. Hauß4'5
1MLU Halle2JINR Dubna, RU^TU Darmstadt4Univ. Düsseldorf5HMI Berlin
V1 BIO01-1387
166 Interaction of β-amyloid peptide (1-42)with lipid unilamellar vesicles
S. Dante1
T. Hauß2'3
N. Dencher
1TU Darmstadt2Univ. Düsseldorf3HMI Berlin
V1 BIO-01-1427
167 Transfection efficiency versusmembrane dynamics in DNA-cationiclipoplex
F. Natali1
C. Castellano2
J. Pieper3
A. Buchsteiner3
1OGG-INFM, Grenoble, F2Univ. Roma, I3HMI Berlin
V3 BIO-03-0258
XX

PAGE
List of Contributed Experimental Reports
TITLE TEAM PROPOSAL
168 Effect of the environment on thelysozyme dynamics. A quaslelasticneutron scattering study (1)
A. Paciaroni1
A. de Francesco1
L.E. Bove2
M. Marconi1
1Univ. Perugia, I2OGG-INFM, Grenoble, F
V3 BIO-03-0265
169 Effect of the environment on thelysozyme dynamics. A quasielasticneutron scattering study (2)
A. PaciaroniA. de Francesco1
L.E. Bove2
J. Pieper3
1Univ. Perugia, I2OGG-INFM, Grenoble, F3HMI Berlin
V3 BIO-03-0291
170 Dynamics of hydration water in modelmembranes systems
A. Buchsteiner1
J. Pieper1
A. Lerf2
1HMI Berlin2Walther-Meissner-lnst.,Garching
V3 BIO-03-306EF
171 Protein flexibility in photosystem II ofgreen plants
J. Pieper1
R. Lechner1
T. Hauß2'1
M.Weß3
G. Renger3
1HMI Berlin2Univ. Düsseldorf3TU Berlin
V3 EF
172 Molecular recognition ofphosphottponucleosides in direct andreverse micelles
D. Berti1
F. Baldelli Bombelli1
M. Bonini1
A. Brand2
1Univ. Firenze, I2HMI Berlin
V4 BIO-04-0808
173 What makes elastase specific? A. Zychlinsky1
M. IngersollH.N. Bordallo2
T. Hauß32
'MPI-IB Berlin2HMI Berlin3Univ. Düsseldorf
V4 BIO-04-0868
174 Large-scale chain conformation in J.-M. Guenet1
stereoregularpolyelectrolyte/protein V. Ball1
complexes U. Keiderling2
1Univ. Strasbourg, F'HMI Berlin
V4 CHE-04-0872
175 The wetting behaviour of hydrophobicpolymer layers
B. Klösgen1
R. Krastev3'24
R. Steitz2'3'4
1Univ. Odense, DK2TU Berlin3MPI-KGF Golm4HMI Berlin
V6 PHY-04-078404-0892
176 Preparation of polymer supportedcharged lipid layers for adsorptionstudy ofAß(25-35)
S. Dante1
Th. Hauß25
R. Steitz3'4'5
1TU Darmstadt2Univ. Düsseldorf3TU Berlin4MPI-KGF Golm
V6 BIO-04-0850
aHMI Berlin177 Adsorption of globular proteins on a
planar polyelectrolyte brushC. Czeslik1
G. Jackler1
R. Steitz2'3'4
Univ. Dortmund2TU Berlin3MPI-KGF Golm4HMI Berlin
V6 CHE-04-0889
178 Biocomposite planar polyelectrolyte S. Gromelski1
multilayers as a tool to understand R. Krastev1'23
different DNA transport systems
1MPI-KGF Golm2TU Berlin3HMI Berlin
V6 BIO-04-0890
179 Adsorption of amyloid beta (1-40) S. Rocha1
peptide on hydrophobic polymer R. Krastevcovered solid surfaces G. Brezesinski1
,1,2,3
1MPI-KGF Golm2TU Berlin3HMI Berlin
V6 CHE-04-0907LT
180 Adsorption of amyloid beta (1-40) S. Rocha1 1MPI-KGFGolm V6 EF-LTpeptide at hydrophilic polymer R. Krastev123 2TU Berlincovered solid surface G. Brezesinski1 3HMI Berlin
Material Science and Industrial Applications
181 In situ study of non-stoichiometrlcSrFeOx under different oxygen partialpressures
M. Schmidt1
S.J. Campbell2
M. Hofmann3
1ISIS, RAL, UK2Univ. NSW, AU3TU München
E2 MAT-01-1181
182 Phase transformation in 7U modulated N. Glavatska1
structure in non-stoichiometric Ni-Mn- I. Glavatski12
Ga martenslte J.U.Hoffmann3
1NAS IMP Kiev, UA2HMI Berlin3Univ. Tübingen
E2 MAT-01-1335
XXI

PAGE
List of Contributed Experimental Reports
TITLE TEAM PROPOSAL
183
184
Neutron determination of residualstress In a nhrided notched part
Neutron evaluation of residual stress inindustrial screws
L. BarrallierA. FabreA. GerbelJ. Jeanjean
L. BarrallierA. FabreJ.-E. Masse
ENSAM, F
ENSAM, F
E3
E3
MAT-01-1243
MAT-01-1393
185 Residual stresses in cylinders, -comparison of neutron and X-raydiffraction measurements -continuation for a 20MnCrB casehardenable steel
T. Hirsch1
S. Rocha1
T. Poeste2'3
1Univ. Bremen, IWT2HMI Berlin^"U Berlin
E3 MAT-01-1299
F. Henkel2
R. Schneider2
186 Investigation of the residual stressprofile along the radius of a highlyloaded turbine wheel
R. HessertT. Poeste23
H. Freydank2
R. Schneider2
1MTU Aero Space2HMI Berlin' Berlin
E3 EF
187 Development of the stress profile closeto the Inner surface of an impellerduring the production process
R. Böschen1
T. Poeste2'3
H. Freydank3
R. Schneider3
1MTU Friedrichshafen2TU Berlin3HMI Berlin
E3 EF
188
189
Analysis of residual stresses inAISi7Mg/-SiC/70p MMCs by neutrondiffraction
Misfit measurements on Ni-basesuperalloys
U. Göbel1
H.P. Degischer2
R. Schneider3
T. Poeste3'4
F. Henkel3
P. Lemke3
R. Gilles1
M. Hölzel1'2
D. Mukherji3
D. del Genovese3
P. Strunz4
1 Siemens AG München2TU Wien3HMI Berlin^ U Berlin
1TU München2TU Darmstadt3IWF TU Braunschweig4PSI Villigen, CH5HMI Berlin
E7 MAT-01-1240
E9 MAT-01-1341
D. M. Többens0
190 Quantitative phase analysis of Portland L Smrcok1
clinkers and the products of their O. Pritula1
chemical decomposition P. M. Többens2
1SAS Bratislava, SK2HMI Berlin
E9 MAT-01-1347
191 Neutron diffraction studies of the V. Efimov1
relaxor PLZT 8/85/35 irradiated by high- S. Tyutyunnikov1
current pulsed electron beam V. Sikolenko2
1JINR Dubna, RU2HMI Berlin
E9 PHY-01-1349
192 Chain-end effects on local dynamics inlong chain alkanes
V. Arrighi1
F. Saggio1
H. Qian1
A. Desmedt2
1HWU Edinburgh, UK'HMI Berlin
V3 CHE-03-0204
193 Diffusion of linear alkanes in NaX H. Jobic1
zeolite A. Buchsteiner2
1CNRS Lyon, F2HMI Berlin
V3 CHE-03-0260
194 Dynamic coupling of cation diffusion D. Wilmer1
and anion reorientation in solid H. Feldmann1
solutions of sodium orthophosphate A. Buchsteiner2
and sodium sulfats
1Univ. Münster2HMI Berlin
V3 MAT-03-0286
195 Changes in fprecipitate morphology in G.Schumacher1 1HMI Berlin V4 MAT-single crystal superalloy SC16 during P. Strunz2 2PSI Villigen, CH 04-0741thermal treatment
196 Sintering process in LaiZriOi and G. Schumacher1
SrZrO3 ceramics thermal barrier P. Strunz2
coatings R. Vassen3
1HMI Berlin2PSI Villigen, CH3FZ Julien
V4 MAT-04-0796
197 Investigation of cavities mlcrostructurein Y-TZP ceramics using SANS
J. SarounV. Ryukhtin1
S. Harjo2
Y. Motohashi2
A. Wiedenmann3
1ASCR NPI Rez, CZ2lbaraki Univ., JP3HMI Berlin
V4 MAT-04-0750
XXII

PAGE
List of Contributed Experimental Reports
TITLE TEAM PROPOSAL
198 Characterisation of precipitatesinduced by irradiation in reactor vesselsteels
J. Saroun1
0. Muransky1
J. Kocik1
E. Garcia-Matres2
A. Heinemann2
1NPI Rez, CZ2HMI Berlin
V4 MAT-04-0869
199 Polarised SANS investigations of blockcopolyslloxane-complexed cobaltnanoparücles
T. St. Pierre1
L. Harris1
E. Gilbert2
A. Hoell3
1Phy. Dept, UWA, AU2Bragg Institute, AU3HMI Berlin
V4 PHY-04-0761
200 Investigation of the microstructure offerrofluids using small angle neutronscattering
S. OdenbachL PopJ. HilljegerdesA. Muslimayne
Univ. Bremen V4 MAT-04-0798
201 SANS investigations on RPVsteel after A. Ulbricht7
reirradlatlon A. Heinemann2
1FZ Rossendorf2HMI Berlin
V4 MAT-04-0799
202 Hard magnetic properties of bulkamorphous NdeoFe2oCoioAlio
H. HermannE. Garcia-Matres2
A. Wiedenmann2
1IFW Dresden2HMI Berlin
V4 MAT-04-0800
G. Kumar
203
204
205
206
207
Insitu characterization of precipitationsequence in a modified 706-type Ni-Fesuperalloy
Microstructural evolution ofnanocrystalline Mania during sinteringSANS investigation of precipitationhardening In AA 8016 alloyImpact of ultrasonic agitation ondispersions ofultraflne silica powders,analyzed with time-resolved SANS
Diffusion studies in Intermetallicphases with NSE. L11 structures
J. Eckert1
D. Mukherji1
P. Strunz2
D. del Genovese3
R. Gilles4
M. Winterer1
U. Keiderling2
J. Haug
H. Hahn1
H. Sieger1
U. Keiderling2
A. Wiedenmann2
G. Vogl1
M. Rennhofer1
C. Pappas2
C. Fehr2
1ETH Zürich, CH2PSI Villigen, CH3TU Braunschweig*TU München1Univ. Duisburg-Essen2HMI BerlinHMI Berlin
1TU Darmstadt2HMI Berlin
1Univ.Wien,A2HMI Berlin
V4
V4
V4
V4
V5
MAT-04-0865
MAT-04-0882EF
EF
PHY-03-0251
208 High flux neutron tomographyinvestigation of a Lil battery
J. Banhart1
I. Manke1
A. Hilger1
N. Kardjilov1
M. Dierik2
B. Masschaele2
1HMI Berlin2Univ. Gent, B
V7 EF
209
210
211
212
Real-time imaging with cold neutrons
SANS investigation of plasticallydeformed stainless steel
Porosity study in Ag-Cu alloyspecimens
Porosity study In Ag-Cu alloyspecimens
N. Kardjilov1
A. Hilger1
M. Dierik2
B. Masschaele2
V.T. Lebedev1
G. Török2
A. ManescuF. SpinozziF. Fiori
A. ManescuF. SpinozziF. Fiori
1HMI Berlin2Univ. Gent, B
1RAS PNPI Gatchina, RU2RU KFKI Budapest, H
Univ. Ancona, I
Univ. Ancona, I
V7
V12a
V12a
V12a
EF
MAT-04-0819
MAT-04-0820
MAT-04-0820cont.
XXIII

PAGE
List of Contributed Experimental Reports
TITLE TEAM PROPOSAL
Development of Instruments and Methods
213
214
215
216
217
218
219
The influence of an organic phase onthe efficiency of a ceramic neutronimage plate
Diamagnetic signal from Bi singlecrystal (polarization option at E4)
Neutron transmission through apackage of Al and 10B slitsTesting the use of sapphire sampleholders in high-temperature powderdiffractionThe new "BerSANS-PC" dataprocessing softwareInstrumental resolution on V4 afterchanging the detector readout systemDetector efficiency map and dead timecorrection on V4 after changing thedetector readout system
J. Zimmermann1
R. Kolb1
J. Klenke2
S. Danilkin2
K. ProkesV. SikolenkoF. Mezei
J. PetersN. StüßerD. M. Többens
U. Keiderling
A. WiedenmannJ. HaugA. WiedenmannJ. Haug
1TU Darmstadt2HMI Berlin
HMI Berlin
HMI Berlin
HMI Berlin
HMI Berlin
HMI Berlin
HMI Berlin
E1
E4
E6
E9
V4
V4
V4
OTH-02-0384EF
EF
EF
EF
EF
EF
EF
220 Mew front-end electronics and dataacquisition system for SANS detector
Th. Wilpert1
W. Altmann1
J. Haug1
R. Schneider1
G. Montermann2
1HMI Berlin2mesytec gbr, Putzbrunn
V4 EF
221 Larmor precession tomography F. MezeiC. PappasR. Schneider
HMI Berlin V5 EF
222 Neutron spin-echo angle coding R. Pynn1
M. Fitzsimmons1
H. Fritzsche2
J. Major3
1LANL, USA2NRC Chalk River, CA3MPI MF Stuttgart
V6 MAT-04-0854/04-0905
223 Small angle scattering from D2O-treatedanodizedAI wire and ribbon
K. Habicht12
T. Keller34
M. Strobl5
1TU Darmstadt2HMI Berlin3MPI-FKF Stuttgart4FRM II Garching5TFH Berlin
V12 EF
224 USANS studies of artificial lattice M.Strobl,W. Treimer
TFH Berlin V12 EF
225 Inelastic neutron scattering byultrasound - research by bonse hartdiffractometer
E. lolin1
L. Rusevich1
M. Strobl2
W. Treimer2
P. Mikula3
1IPE, Riga2TFH Berlin3NPI, Rez, Prague
PHY-V12 04-0884
a
226 First three dimensional refractioncontrast tomography
M. Strobl2'W. Treimer2
A. Hilger1'2
1HMI Berlin2TFH Berlin
EFV12
a227 Refraction contrast tomographies of
different shaped samplesM. StrobrW. Treimer2
A. Hilger.1,2
1HMI Berlin2TFH Berlin
EFV12
a228 Refraction contrast tomographic
imagingW. Treimer2
M. Strobl2
A. Hilger1'2
C. Seifert2
1HMI Berlin2TFH Berlin
EFV12
a
229 Refraction contrast tomographies insimple Bonse-Hart DCD set-up
M. Strobl2
W. Treimer2
A. Hilger1'2
1HMI Berlin2TFH Berlin
EFV12
b
XXIV

PAGE
List of Contributed Experimental Reports
TITLE TEAM PROPOSAL
230 Test of two Si-wafer based collimators M. StrobrW. Treimer2
T. Krist1
M. Seurig2
1HMI Berlin2TFH Berlin
EF
V12b
231 Spatial resolved USANS measurements M. Strobl1
A. ManescuTFH Berlin2HMI Berlin
EF
V12b
232 Investigation of a focusing parabolicguide by a radiography method
P. Böni1
N. Kardjilov2
A. Hilger23
M. Strobl3
W. Treimer3
1TU München2HMI Berlin3TFH Berlin
EFV12
b
233 Development of neutron opticalelements
Fundamental Physics and Others
234
235
236
Translational diffusion of Hz in singlewalled carbon nanotubes
Study of the diffusion of molecularhydrogen In nanoporous materials
Molecular dynamics in tryclyinesulphate (TGS)
T. Krist1
J. Hoffmann2
P. Sokol1
D. Narehood1
J. Pieper2
R. Lechner2
P. Sokol1
Y. Glanville1
J. Pieper2
R. Lechner2
V. Tripadus1
J. Pieper2
A. Buchsteiner2
A. Serban1
1HMI Berlin2Univ. Tübingen
Venn State Univ., USA2HMI Berlin
1Penn State Univ.. USA2HMI Berlin
1IFIN-HH Bucharest, RO2HMI Berlin
V14
V3
V3
V3
EF
PHY-03-0269
PHY-03-0297
PHY-03-0293
237 Search for scission neutrons usingangular correlations in fission of U-23S
G.V. DanilyanV.S. Pavlov1
I. Karpikhin1
V. Krakhotin1
A.V. Fedorov1
B. Golub2
E. Korobkina2
D.Fink1
M.Müller1
M.Behar2
M.F.Soarez2
P. Alegaonkar3
1RF SSC ITEP Moscow2HMI Berlin
1HMI Berlin2UFRGS Porto Alegre,
BrazilUniv. Pune, India
V13 PHY-05-005
B7 EF238 Redistribution of ion-implanted eLi*inpolystyrene
239 Autoradlographs from the painting"Armlda abducts the sleeping Rlnaldo(-1037)" by Nicolas Poussin120x150 cm2
C. Laurenze-Landsberg1
C. Schmidt1
L.A. Mertens2
B. Schröder-Smeibidl2
1 Gemäldegalerie Berlin(GMB)
2HMI Berlin
B8
240 Autoradiographs from the painting"Valley with Diane and her nymphs "by C. SchmidtJan Tilens (1589-1830),89x156 cm2
C. Laurenze-Landsberg1
LA. Mertens'B. Schröder-Smeibidl2
Gemäldegalerie Berlin(GMB)
2HM! Berlin
B8
XXV


PHY-02-0308.doc // brandt // 03.03.04 Seite 1 von 1
EXPERIMENTAL REPORT Proposal N° PHY-02-308
Instrument E1Spin waves in amorphous and nanocrystalline Fe73.5-
xNixSi13.5Cu1Nb3B9 (x=10 or 30) Local Contact J. Klenke
Principal Proposer: B. Idzikowski, IFM PAN Poznań, Poland Date(s) of ExperimentExperimental Team: T. Krenicky, ÚEF SAV Košice, Slovakia
J. Klenke, HMI, Berlin, GermanyS. Danilkin, HMI, Berlin, Germany
29.1.2003–10.2.2003
Date of Report: 30.12.2003
Iron based alloys of FINEMET-type are of particularinterest due to their superior magnetic properties(e.g. extremely low coercivity). This nanocrystallinesoft magnetic material can be produced by stoppingthe onset of crystallization of certain amorphousalloys.
The mean field theory does not explain correctlythe local magnetic excitations in amorphousmagnetic materials, which are characterized by theabsence of long-range topological order. A possibleway to determine the value of the spin wavestiffness constant D which follows from the spinwave theory is a detailed analyses of thetemperature behavior of the magnetization in thesematerials [1] but more complex information could beprovided by inelastic neutron scattering experiment.
The amorphous ribbons Fe73.5-
xNixSi13.5Cu1Nb3B9 (x=10 or 30) were prepared bysingle-roller technique. Typical dimensions of theribbons are 25 mm of thickness and 10 mm ofwidth. The temperature dependence of magneticbehavior of the samples shows Fig. 1.
0 200 400 600 8000.0
0.2
0.4
0.6
0.8
1.0
1.2
1.4
1.6
mag
netiz
atio
n [a
. u.]
temperature [°C]
Fe63.5Ni10Si13.5Cu1Nb3B9 Fe43.5Ni30Si13.5Cu1Nb3B9
Fig. 1. Magnetization-versus-temperature forFe73.5-xNixSi13.5Cu1Nb3B9 (x=10 or 30)
Amorphous precursors was annealed in vacuumat 400C and 500C for 1 hour in order to produceset of amorphous (as-quenched), relaxedamorphous and nanocrystalline (with small amountof crystalline phase) samples, respectively.
The inelastic neutron scattering spectra weretaken on the E1 triple-axis spectrometer at Hahn-Meitner-Institut Berlin (BENSC) with 40-10-10-10collimation. The q-constant method was used for
searching magnon excitations at temperaturesbetween 105 and 500 K (see Fig.2).
-0.8 -0.6 -0.4 -0.2 0.0 0.2 0.4 0.6 0.830
40
50
60
70
80
90
100
q=0.075T = 300 K
Fe43.5Ni30Si13.5Cu1Nb3B9 as-quenched
coun
ts
energy transferFig. 2. Gaussian fits of measured spectrum for
Fe43.5-xNi30Si13.5Cu1Nb3B9 ribbon
For a Heisenberg feromagnet with only nearest-neighbor interactions, the spin-wave dispersion atsmall q is given by ħωq = Dq2. The calculated val-ues of spin wave stiffness constants for the as-quenched Fe63.5Ni10Si13.5Cu1Nb3B9 ribbons atq = 0.075 are listed in upper part of Table 1. Addi-tionally, we observed wide-spreading of the mainpeak with temperature of the sample annealing (lastrow in Table 1).
TABLE 1. The stiffness constants D forFe43.5Ni30Si13.5Cu1Nb3B9 ribbons obtained from the slopeof the dispersion relation curves and mean peak width
D[meV·Å2]Measurement tem-perature [K] as-
quenchedannealed at
400°Cannealed at
500°C200 113 120 -300 102 110 -400 - 89 109
Energy rangeMean peak width 0.88 0.95 1
In conclusion, partially crystallization of samplesprovide an open area for investigation of the spinwave stiffness constant values in these materials.
References:[1] B. Idzikowski, A. Wrzeciono, J. Kovac; IEEE Trans. Magn.
30 (1997) 561[2] G. Shirane, S.M. Shapiro, J.M. Tranquada: Neutron Scatter-
ing with a Triple-Axis Spectrometer, Cambridge UniversityPress, 2002
1

PHY-02-0397.doc // brandt // 03.03.04 Seite 1 von 1
EXPERIMENTAL REPORT Proposal N° PHY-02-397Instrument E1Neutron investigations of Ni3Al itinerant
electron system Local Contact J. Klenke
Principal Proposer: Bogdan Idzikowski, IMF PAS Poznań, Poland Date(s) of ExperimentExperimental Team: Young-Hoon Hyun, Hanyang Univ., Seoul, Korea
Yuri V. Kudryavtsev, Nat. Acad. Sci. Ukraine, KievJens Klenke, HMI, Berlin, Germany
28.10.2003 – 12.11.2003
Date of Report: 30.12.2003
Ni3Al alloy is a typical weakly-itinerant ferromagnetin which spin fluctuations play an important role.Such ferromagnets are characterized by the exis-tence of the ferromagnetically-ordered regions farabove TC. We have investigated by neutron diffrac-tion magnetic behavior of stoichiometric and off-stoichiometric single crystal and polycrystallinealloys below and above transition temperatures.
It is known that for stoichiometric γ’-phase Ni3Alsingle crystal no high-temperature transition wasobserved. But there is a crossover from spin fluc-tuator to ferromagnet at some small deviations ofthe Ni concentrations in this alloy.
In our investigated alloys Ni0.752Al0.248 andNi0.771Al0.229 the spin fluctuation is unlikely the ex-planation of the existence of the high-temperaturetransition Tm, as well as the low-temperature one TC(see Fig. 1). Thus, the high-temperature kink canbe caused by the transition into a true paramag-netic state. The existence of magnetic inhomoge-neity in the alloy confirmed by the AC magneticsusceptibility measurements in which the suscepti-bility curve exhibits two magnetic transitions, one at87.5 K and the other at 252 K play a key role for thephysical properties.
0 50 100 150 200 250 3000.00
0.01
0.02
0.03
0.04
0.05
0.06
0.07
Tm
Tc
Ni0.77Al0.23
m = 0.08930 ggamma = 8 g/cm3
frequency = 133 HzAC field = 1 Oe
AC s
usce
ptib
ility
[arb
. uni
ts]
Temperature [K]
Fig. 1. Temperature dependence of magneticsusceptibility for NiAl sample.
Three different models explain the existence oftwo transitions temperatures for the off-stoichiometric alloy : (i) Stoner-Edwards-Wohlfarth[1] (ii) the selfconsistent renormalization of the spin-fluctuation [2], and (iii) a modified self-consistentrenormalization of the spin-fluctuation modelutilizing the Ginzburg-Landau formalism [3]. Therewere evidences for the well-defined spin-waveexcitations, obtained by small-angle neutron-scattering [4] and inelastic neutron scattering [5]experiments. However, the influence of magnetic
fields on magnetic behavior can be attributed to anenhancement of the effective electronic mass dueto the spin fluctuations.
38.0 38.5 39.0 39.5 40.0 40.5 41.0
300
600
300
600
250
500
250
500
250
500
Tc > Tm = 10 K
2 degrees
Tc = Tm = 50 K
Tc < Tm = 85 K
Cou
nts/
MO
N50
000
Tc < Tm = 10O K
Tc << Tm = 150 K
Fig. 2. Evolution of the (100) neutron diffraction peakintensity for NiAl sample at different temperatures.
Fig. 2 shows some additional diffraction featuresaround the main diffraction peak. For this effectnonlocalized itinerant electrons could beresponsible.
In conclusion, using instrument E1 the isothermsof the neutron diffraction patterns around the [100]or [111] Bragg peaks were collected. The experi-ment was performed at various temperaturesbetween 4.2 and 300 K and also in externalmagnetic fields.
References:1. E. C. Stoner, Proc. Roy. Soc. London, Ser. A 139, 339 (1939);D. M. Edwards and E. P.Wohlfarth, ibid 303, 127 (1968); E. P.Wohlfarth, Rev. Mod. Phys. 25, 211 (1953).2. T. Moriya and A. Kawabata, J. Phys. Soc. Jpn. 34, 639(1973); 35,669 (1973).3. S. N. Kaul and A. Semwal, Phys. Lett. A 254, 101 (1999);S. N. Kaul, J. Phys.: Condens. Matter 11, 7597 (1994).4. N. R. Bernhoeft, I. Cole, G. G. Lonzarich, G. L. Squires, J.App. Phys. 53, 8024 (1982)5. N. R. Bernhoeft, G. G. Lonzarich, P. W. Mitchell, D. M. Paul,Phys. Rev. B 28, 422 (1983).
2

EXPERIMENTAL REPORT
Hc2 and magnetism in ErNi2B2C
Proposal N PHY-02-366
Instrument E1
Local Contact
J. Klenke
Date(s) of Experiment
1. 4. - 9. 4. 2003
Principal Proposer: Anette Jensen, University of Copenhagen
Experimental Team: A.B. Abrahamsen, K.N. Toft and N.H. Andersen,Risø National LaboratoryP. Smeibidl and S. Kausche, Hahn-Meitner Institut
Date of Report19. 12. 2003
Magnetism and superconductivity coexist inseveral of the borocarbides RNi2B2C (R = Dy,Ho, Er, Tm) and the interaction between the twostates is often observed as features in the uppercritical field Bc2 due to ordering of the rare earthmoments. We have examined the magnetic or-dering of the R = Er compound and mapped outa set of transitions between spin density waveswith different commensurate wave vectors whena magnetic field is applied along the crystallo-graphic [010] direction of the tetragonal I4/mmm
unit cell. The transitions are found to be in-dependent of the upper critical field Bc2 of thesuperconducting state.
Experiment and Results
The critical temperature of the superconductingstate in R = Er is Tc = 11 K and the Er mo-ments order into a transverse spin density wavebelow the Neel temperature TN = 6.8 K in zeroapplied field. Two equally populated magneticdomains are observed and the wave vector isQA = (0.55, 0, 0) or QB = (0, 0.55, 0) with thepolarization along the [010] or [100] direction re-spectively.
Transitions in the majority domain with or-dering vector QA are found when the appliedfield is increased along the [010] direction andthe domain is suppressed at B = 2.2 T andT = 1.8 K as shown on figure 1. The zero fieldstructure with QA = 0.55 rlu is first replaced byQA = 0.572 rlu at B = 0.7 T. The wave vec-tor then reaches the maximum QA = 0.59 rlu atB = 1.1 T, decreases back to QA = 0.58 rlu andfinally stabilizes at QA = 0.572 rlu at B = 1.7 T.The minority domain QB with the moments per-pendicular to the applied field shows no changein wave vector and is suppressed at B = 1.3 T.
The transitions are caused by the locking of
the spin density wave to commensurate struc-tures, which has been explained by a mean fieldmodel[1]. Thus the QA = 0.572 rlu structurehas been suggested to consist of 7 ferromag-netic planes, which are coupled antiferromagnet-ically in the configuration (↓↑↑↓↓↑↑). The prin-ciple Fourier component of the structure will beQ = 4
7= 0.571 rlu. Similar but more compli-
cated spin-slip structures have been justified bythe mean field model and are indicated by hor-izontal lines in figure 1. A puzzling observationis the lack of hysteresis in the intensity of theminority domain as the applied field is rampeddown. This might be connected to creation offlux lines at the upper critical field Bc2 ≈ 1.5 T.
0 0.5 1 1.5 2
0.55
0.56
0.57
0.58
0.59
B [T]
Q [r.l.u]
11/2016/29
5/9
4/7
11/1918/3114/24
10/17
16/27
0 0.5 1 1.5 20
0.5
1
1.5
2
2.5
3
3.5
4
4.5Int. intensity [arb. units]
B [T]
B||(010)
T = 1.8 K
Figure 1: Properties of the majority domainQA = (Q, 0, 0) (squares) and minority domain QB =(0, Q, 0) (circles) when the field is applied along the[010] direction. Closed and open symbols representthe field history ramping up and down respectively.Left : Ordering wave vector variation of QA and QB.Right: Integrated intensity variation of QA and QB
domain. The total intensity is shown by the solidline. The non-uniform intensity variation is due toextinction.
[1] J. Jensen, Phys. Rev. B 65, 140514, 2002
3

PHY-02-0385_ EF.doc // brandt // 09.03.04 Seite 1 von 1
EXPERIMENTAL REPORT Proposal N° EF*Instrument E1*Magnetism in RbCuCl3 and CsCuCl3Local Contact *
Principal Proposer: N. Stüßer, U. Schotte, HMI Berlin Date(s) of ExperimentExperimental Team: N.Stüßer, A.Hoser FZ Jülich/RWTH Aachen *26.5.-4.6.03
12.11.-16.11.0328.11.-2.12.03
Date of Report: 6.12.03*
RbCuCl3 is a frustrated antiferromagnet of theABX3 family. The ordering temperature isabout 19 K and the saturation field amounts to66 Tesla at low temperatures. Similar to ourstudies of CsCuCl3 we wanted to investigatethe field dependence of the magnetic structure.
Our experiments were performed with the E1-spectrometer in a diffracting mode and wehave used the magnet VM1b to apply fields upto 14.5 Tesla. Single crystals were provided byH. Tanaka. The linear dimensions of thecrystals used were in the order of 10 mm.At zero field RbCuCl3 has a magneticpropagation vector of about (0.297 0.297 0) i.e.the moments order ferromagnetically along cwhile the moments are arranged in a helixwithin the ab-plane [1]. First we havemeasured the magnetic satellite reflection as afunction of temperature at zero field and at13.5 Tesla. Fitting a power law behaviourwithin a reduced temperature regiont = (TN-T)/TN ≤ 10-1 we obtained a criticalexponent β with a value of 0.237(4) and0.265(8) for H = 0 Tesla and H = 13.5 Tesla.The first value of is slightly larger than thereported 0.200(9) in [1]. From our measurements we find a shift in thepropagation vector by 1.5% with temperature(fig. 1). This behaviour is different to thetemperature independence of the propagationobserved for CsCuCl3.In a next step we looked to the field behaviourof the magnetic structure. The field wasapplied parallel and perpendicular to thec-axis. Scans were along (h h 0). Thesemeasurements were performed attemperatures around 2 K and at temperaturesjust below TN. Up to 14 Tesla no additionalsatellite reflections (higher harmonics) couldbe found which would indicate a significantdistortion of the regular spiral. Also the positionin reciprocal space of the satellite was notinfluenced by the field. Only a slight decreasein the peak intensities could be observed.Since the saturation field at low temperatures
is quite large with about 66 Tesla our appliedfields up to 14 Tesla were not sufficient toaffect the magnetic structure significantly.Therefore our field limitation to 14 Tesla doesnot allow to study the change in the magneticstructure even at temperatures close to TN byneutron diffraction.
Fig.1 : temperature behaviour of magneticsatellite measured at zero field.
Beside RbCuCl3 we have further studiedCsCuCl3 and performed a Fourier analysis ofthe field distorted spiral. A typical result of ouranalysis is shown fig.2 showing that orderedmoments are elongated along field directions.In addition spins rotate towards field and spinsin opposite direction spread apart. fig.2:
magnetic spiral of CsCuCl3 in a field of 11.5 Tesla.
[1] M. Reehuis et.at. J. Phys. And Chem. of Solids62 (2001) 1139-1143
1 1 .5 T
0 2 4 6 8 10 12 14 16 18 20
0,292
0,294
0,296
magnetic satellite reflection RbCuCl3
(h h
0)
temperature [K]
4

EF_01_Prokes.doc // brandt // 03.03.04
EXPERIMENTAL REPORT Proposal N° EFInstrument E1
Inelastic Studies of UNiAl (2) Local Contact J. Klenke
Principal Proposer: K.Prokes, HMI Berlin Date(s) of ExperimentExperimental Team: K.Prokes, HMI Berlin
26.6.2003-6.7.2003
Date of Report: 7.7.2003
UNiAl forms in the hexagonal ZrNiAltype of structure and orders anti-ferromagnetically (AF) below TN = 19.3 K [1].History-dependent phenomena exist in UNiAl.Two antiferromagnetic steructures arecompeting. The microscopic differencebetween the zero-field AF structure with qold =(0.1 0.1 0.5) and the new one with qnew =(0.173 0 0.5) is that the sine-wave modulationof U moments (in both cases the amplitudeamounts to 1.3 µB, moments are directed alongthe c axis and the sample consists from three kdomains) is along the [110] in the former and[100] in the latter case [2]. From V2experiment we have realized that no welldefined magnetic excitations exist in UNiAl.
The crystal (the same as in the case ofV2 study) was placed in the 14.5 T cryomagnetVM1 and investigated on E1 with ratherrelaxed colimation 80'-40'-40' to increaseintensity on account of resolution.
In Fig. 1 we show the contour plots ofthe temperature dependencies of thequasielastic response function measured at thetwo characteristic reflections (old left) atvarious magnetic fields. As can be seen, the oldAF structure remains stable in the wholetemperature range in fields up to ~ 8T. Abovethis field, the new AF structure starts tocompete with the old one and above 11 T itbecomes stable. Note the appearance of the"new" reflection at ~7K upon the field of 11 T(about 4 K lower than the "old" reflectionappears) and gradual disappearance of the"old" reflection at lower temperatures. Thispoints to a slow relaxation phenomena - due tothermal activation. Fact that the old reflectionappears at higher temperature that the new onepoints to existence of second magnetic phasetransition. Interestingly, field of 11 Tcorresponds well with the field above whichthe magnetic phase transition is of the first
orTarenex
R[1MC[231
5
Old 0T
T (K)5 10 15 20 25 30 35
E (m
eV)
-0.4
-0.2
0.0
0.2
0.4
0.6
0.8
1.00 200 400 600 800 1000
New 0T
5 10 15 20 25 30 35-0.4
-0.2
0.0
0.2
0.4
0.6
0.8
1.00 200 400 600 800 1000
T (K)
E (m
eV)
Old 8T
5 10 15 20 25 30 35
E (m
eV)
-0.4
-0.2
0.0
0.2
0.4
0.6
0.8
1.00 200 400 600 800 1000
New 8T
T (K)5 10 15 20 25 30 35
-0.4
-0.2
0.0
0.2
0.4
0.6
0.8
1.00 200 400 600 800 1000
E (m
eV)
T (K)
Old 11T
T (K)5 10 15 20 25 30 35
E (m
eV)
-0.4
-0.2
0.0
0.2
0.4
0.6
0.8
1.00 200 400 600 800 1000
New 11T
T (K)5 10 15 20 25 30 35
E (m
eV)
-0.4
-0.2
0.0
0.2
0.4
0.6
0.8
1.00 200 400 600 800 1000
Fig. 1: Quasielastic signal measured at the old andnew magnetic reflections at various applied fields(top-zf, middle-8T, bottom-11T) upon cooling. Notesignificant signal around TN (which decreases withfield) and appearance of signal at lower temperaturesin fields above 8T at the new reflection (right).
Seite 1 von 1
der type [1]. A significant intensity aroundN suggests that both AF structures competeound TN. This can also explain moderatelyhanced specific heat of UNiAl. See also V2perimental report.
eferences] V. Sechovsky and L. Havela: in Handbook ofagnetic Materials, ed. K.H.J. Buschow, vol. 11,h.1 ]K. Prokeš, et al. Physica B: Condensed Matter,2-313, (2002), 872

EF_02_Danilkin.doc // brandt // 03.03.04 Seite 1 von 1
EXPERIMENTAL REPORT Proposal N° EF
Instrument E1Phase transitions in Cu1.25Ag0.25Se Local Contact
Principal Proposer: S. Danilkin Date(s) of ExperimentExperimental Team: S. Danilkin, HMI, SF2
J. Klenke, HMI, SF2 10.07. – 11.07.200325.08. – 29.08.2003.
Date of Report: 15.01.2003
The temperature of superionic transition inCuxSe depends on composition. It equals to414 K in Cu2Se and lies below room T forcompounds with Cu content x = 1.75 – 1.85.High - T superionic -phase has an f.c.c.structure with disordered distribution of Cucations. The ordered low - T -phase has acomplicated noncubic structure.
1 2 3 4
0
200
400
600
Inte
nsity
, arb
. uni
ts
Q, A-1
Fig. 1. Diffraction patterns of - Cu1.98Se at RT.Upper curve –double crystal scan.Lower curve – triple-axis mode, E 0 scan.
Diffraction study of polycrystalline samplesCu2Se [1] reveal the presence of strong diffusescattering, which was attributed to structuraldisorder and correlation between thermaldisplacements of atoms. The relativecontribution of these two parts in diffusebackground could be measured using triple-axis spectrometer in conventional diffractionmode and with analyser crystal fixed to E 0.
In the present experiment we studied thediffuse scattering in polycrystalline samplesCu1.75Se and Cu1.98Se. The cylindrical samples(8.5 and 4.8 g in weight) were prepared bysolid-state reaction of high purity Cu and Sepowders at 720 K. Measurements have beendone with spectrometer E1 at = 2.419 Å withcollimation 40-40-40-80.
The diffraction patterns of - and - Cu1.98Se are shown in Fig. 1 and 2. Spectrameasured with and without analyser crystal
were normalised to have the same area ofelastic Bragg peaks.
In addition to strong elastic Braggreflections spectra of -Cu1.98Se at RT (Fig. 1)show the presence a number of small coherentpeaks which form the irregular backgroundwith maximum intensity around Q = 3 Å-1.Different behaviour was observed for the samecompound in -phase (Fig. 2). The smallpeaks smooth out and the strong diffuseinelastic scattering is seen only in the spectrameasured in double crystal mode.
1 2 3 4
0
200
400
Inte
nsity
, arb
. uni
ts
Q, A-1
Fig. 2. Diffraction pattern of - Cu1.98Se at 450 K.Upper curve –double crystal scan.Lower curve – triple-axis mode, E 0 scan.
This result contradicts with data from Ref. 1which do not show notable difference betweenspectra measured in double crystal and E 0modes of experiment. Probably this is due to anarrower elastic window in our experiment,which cuts off the low-energy excitations. Ourresult shows that diffuse scattering insuperionic phase arises mainly fromcorrelations among the thermal displacementsof the ions. Note that measured diffractionpattern of - Cu1.75Se is very similar to that ofCu1.98Se at 450 K (Fig. 2).
References:
1. Sakuma T, Aoyama T., Takahashi H. ShimotoY. Morii Y., Physica B, 213-214 (1995) 399.
6

PHY-01-1094.doc // brandt // 03.03.04 Seite 1 von 1
EXPERIMENTAL REPORT Proposal N° PHY-01-1094
Instrument E2Detailed investigation of the magneticstructures of TbCu2 on a single crystal. Local Contact
J.-U. Hoffmann
Principal Proposer: Astrid Schneidewind, MPI-CPfS Dresden Date(s) of ExperimentExperimental Team: Astrid Schneidewind, MPI-CPfS Dresden
Andreas Kreyssig, TU Dresden, IAPDUlrike Witte, TU Dresden, IAPD
30.01.-03.02.2002
Date of Report: 22.12.2002
The magnetic structure of TbCu2 is assumed to becollinear with magnetic moments along the a-directionof the orthorhombic crystal [J. Phys. Soc. Japan 47(1979) 67]. The magnetic unit cell is 3a x b x ccompared to the lattice parameters a, b, c. Thepropagation vector is found to be = (1/3 0 0). At aboutT = 42 K a phase transition commensurate
incommensurate is expected with increasingtemperature (Néel temperature TN = 55 K). The magneticbehaviour of TbCu2 was new investigated in the contextof the studies on Tb0.5Dy0.5Cu2 by different methods.Some results of these investigations do not fully agreewith the known magnetic structure. To ascertain how farthe unexplained results are connected with changes ofthe magnetic structure dependent on temperature theneutron scattering experiment on a single crystal wasperformed at E2/BENSC.
Fig.1: Intensities measured in the reciprocal (h0l)-planeat T = 1.6 K.
The experiment was performed with = 0.239 nm usingadditional filters to suppress higher harmonics of . Thescans were taken by rotating the sample and detecting180° of the reciprocal ac- or ab-plane at T = 1.6, 5, 20,42 and 61 K. Reflections belonging to the expectedmagnetic structure have to be found at positions =G (1/3 0 0) and 3 =G (1 0 0) when G is a reciprocallattice vector. For moments directed parallel to amagnetic intensities are forbidden at the (h 0 0)-positions. Fig. 1 shows as an example that magneticintensities belonging to , 2 and 3 were observed at(h 0 0) positions as well as at (h 0 l0) positions in thereciprocal ac-plane. The same result is found in thereciprocal ab-plane. Contamination of 2 and 3 areexcepted by the experiment. Scans around selectedreflections according to the first, second and thirdharmonics of the fundamental wave vector of themagnetic structure were performed depending on thetemperature, using different steps, especially attemperatures 1.6K T 5K.
The results of the experiment show:
The additional phase transition observed bymagnetization measurements at T = 2.3 K is notconnected with changes in the magnetic orcrystalline structure.
It has to be accepted that there exists a component ofthe magnetic moment perpendicular to thecrystalline a-direction. In addition, the reflectionsbelonging to 2 do not agree with the knownmagnetic structure of TbCu2. Thus the magneticstructure described by Hashimoto et al. [J. Phys.Soc. Japan 47 (1979) 67] has to be extended bysome details.
There is no indication for an incommensuratemagnetic structure in TbCu2. The postions ofreflections belonging to do not change withtemperature within the experimental error. Thephase transition at about T = 42 K is connected withthe vanishing of the reflections according to higherharmonics, i. e. the character of the magneticstructure changes from a squared up structure to asinusoidal structure.
7

PHY-01-1095+1249.doc // Kreyssig // 16.03.04 Seite 1 von 2
EXPERIMENTAL REPORT Proposal N° PHY-01-1095 PHY-01-1249
Instrument E2Magnetic order and diffuse scattering inRNi2B2C Local Contact
Jens-Uwe HoffmannPrincipal Proposer: Andreas Kreyssig Date(s) of ExperimentExperimental Team: Andreas Kreyssig; TU Dresden, IFP
Oliver Stockert; MPI CPfS DresdenJens-Uwe Hoffmann; HMI Berlin
22.01.-29.01.200222.01.-05.02.2003
Date of Report: 06.02.2004
The tetragonal rare earth nickel borocar-bides continue to be of experimental andtheoretical interest due to their intriguinglow-temperature properties caused by theinterplay between superconductivity andmagnetism [1]. In particular TbNi2B2Corders only antiferromagnetically belowTN = 15 K, while HoNi2B2C becomessuperconducting below Tc = 8 K andshows different antiferromagneticallyordered phases below TN = 6.8 Kcoexisting with superconductivity. In theantiferromagnetic (AF) state, the magneto-crystalline anisotropies caused by CEFeffects yield different moment directions,[1 0 0] for TbNi2B2C and [1 1 0] forHoNi2B2C. The AF structure in TbNi2B2C isgiven by a propagation vector =(0.545 0 0). In contrast, HoNi2B2C shows asimple AF stacking with a propagationvector 1 = (0 0 1) at lowest temperature,while in a limited temperature range justbelow TN, i. e. 5.2 K - 6.8 K two additionalAF modulations with 2 = (0.585 0 0) and3 = (0 0 0.915) appear. Surprisinglyneutron diffraction on polycrystallineTbNi2B2C and HoNi2B2C revealed abovethe respective Néel temperatures signifi-cant magnetic intensity at the positions ofthe satellite reflections [2, 3]. The aim ofthe neutron diffraction experiments on E2was to investigate in detail the nature ofthis additional magnetic scattering by usingsingle crystals and recording intensitymaps of reciprocal planes.Rod-like single crystals of 6 mm diameterwere grown by the floating zone methodusing the 11B isotope to avoid strongneutron absorption. Specimen with alength of 6 mm for TbNi2B2C and 14 mmfor HoNi2B2C were cut from the rods. Bothsamples were measured in the (H 0 L)
scattering plane at temperatures between2 K and 150 K with a neutron wavelengthλ = 2.39 Å. Measuring times to record areciprocal plane (with 900 steps in samplerotation Ω and a step size ∆Ω = 0.2 deg.)varied between 9 hours in the vicinity of TNand 23 hours far above TN.
Fig. 1: (H 0 L) scattering plane of TbNi2B2C andHoNi2B2C at temperatures just above the Néeltemperatures TN = 15 K and 6.8 K, respectively.
Intensity maps for both compounds takenjust above TN are displayed in Fig. 1. Themost prominent feature in TbNi2B2C is azig-zag structure along [0 0 1] at roughlyhalf integer values of the H component. Inaddition, intensity is observed aroundpositions (H 0 L) with (H + L) odd. Besidesthese two features, which are diffuse innature and visible up to 50 K, magneticcritical scattering is observed at the AFsatellite positions and decreases rapidly inintensity towards higher temperatures. Thediffuse scattering directly indicates theshort-range correlations between the Tb3+
magnetic moments due to RKKYinteraction which is determined by thewave-vector dependent susceptibility of the
8

PHY-01-1095+1249.doc // Kreyssig // 16.03.04 Seite 2 von 2
conduction electrons. In comparison,HoNi2B2C exhibits similar features asfound in TbNi2B2C with only minor differen-ces due to the moment direction. Thisreflects a nearly unchanged susceptibilityof the conduction electrons and is in linewith expectations from band structurecalculations [4]. However, the magneticcritical scattering in HoNi2B2C appears tobe much stronger than in TbNi2B2C at atemperature approximately 10 % above TN.It is worth noting that the shape of thecritical scattering indicates an anisotropy inthe correlation lengths.As already mentioned, the wave-vectordependent susceptibility of the conductionelectrons is visible through the short rangecorrelations of the rare earth localmagnetic moments. In order to study theinfluence of superconductivity on themagnetism the experiment on HoNi2B2Cwas extended to temperatures in thevicinity of Tc. It should also shed light onthe question if the number of conductionelectrons contributing to RKKY interactionis reduced due to Cooper pairing.
Fig. 2: HoNi2B2C single crystal mounted on a gonio-meter for neutron diffraction together with the coilsystem for insitu AC-susceptibility measurements(top) and AC-susceptibility vs. temperature of theHoNi2B2C single crystal (bottom).
In order to be able to relate the onset ofsuperconductivity and the possible changeof the magnetic diffuse scattering an insituAC-susceptibility measurement wasestablished. The realisation was mainlystimulated by the immediate support of thecryogenics team. The experimental setupconsisting of the HoNi2B2C crystal moun-
ted on a microgoniometer and the suscep-tibility coil system is shown in Fig. 2.
Fig. 3: (H 0 L) scattering plane of HoNi2B2C attemperatures below and above thesuperconducting transition temperature Tc = 8.3 K.
The temperature dependence of the ACsusceptibility as shown in the lower panelof Fig. 2 is in good agreement withmeasurements reported [3]. Superconduct-ivity sets in below 8.3 K given by the sharpdrop of the AC susceptibility. The so-calledre-entrant behavior is indicated by theanomaly around 5.2 K. In addition to themeasurement at 7 K, intensity maps wererecorded close to Tc at 8 K and at 10 K,i. e. well above Tc. The magnetic diffusescattering at these three temperatures, asshown in Figs. 1 and 3, does not exhibit aqualitative difference apart from theexpected overall decrease of the signalwith increasing temperature. In conse-quence, the conduction electrons formingCooper pairs at low temperature do notseem to contribute to the RKKY interactionnot only in the superconducting, but also inthe normal conducting state. This impliesthat the fraction of the conduction electronsresponsible for the RKKY interaction andsubsequently for the magnetism of theHo3+ moments, do not take part in thesuperconductivity.
[1] P. C. Canfield et al. Physics Today 51 (Oct. 1998)40.
[2] A. Kreyssig et al. In: K.-H. Müller (Ed.), Rare EarthTransition Metal Borocarbides. Kluwer AcademicPublishers (2001) 181.
[3] A. Kreyssig et al. Physica B 234-236 (1997) 737.[4] M. Divis et al. Phys. Rev. B 62 (2000) 6774.
2 3 4 5 6 7 8 9 10-1.0
0.0AC Susceptibility
Temperature T [ K ]
Susc
ept.
[ a. u
. ]
9

PHY-01-1251.doc // brandt // 03.03.04
EXPERIMENTAL REPORT Proposal N° PHY-01-1251Instrument E2Strong domain effects in the hexagonal
ferromagnet cobalt Local Contact Jens-Uwe Hoffmann
Principal Proposer: U. Köbler, IFF, FZ-Jülich Date(s) of ExperimentExperimental Team: U. Köbler, IFF, FZ-Jülich
A. Hoser, Institut für Kristallographie, RWTH Aachen
05.05. – 14.05.200312.11. – 17.11.2003
Date of Report: 15.12.2003
We have shown recently that the thermaldecrease of the spontaneous magnetization ofthe itinerant ferromagnets iron cobalt andnickel can be described over a largetemperature range by a simple Tε powerfunction [1]. The observed empirical exponentsε fit an universality scheme which wasoriginally derived for insulating compoundswith a quenched orbital moment and a welldefined spin quantum number [2]. Evidently,also in the itinerant ferromagnets an effectivespin quantum number can be defined. Table 1shows how the exponents ε depend on thedimensionality of the interactions and onwhether the spin is integer or half-integer.
The known data for the spontaneousmagnetization of cobalt follow a perfect T5/2
dependence but the hyperfine field obtainedusing 59Co zero-field NMR shows a T3/2
dependence. Fig.1 compiles the two data setson a T5/2 scale [1].The T5/2 dependence of the magnetizationcorresponds to the axial symmetry prepared byaligning all moments parallel to the easy c-axis. The zero-field T3/2 law must be identifiedwith the universality class of the domain wallswhich dominate the thermodynamics for thestate in which domains and walls coexist.Our neutron scattering results on a Co singlecrystal are much different. The zero-field T3/2
dependence is confirmed but the magnetizationdecreases much stronger than in the two otherexperiments. Moreover, two amplitudecrossovers are observed. This demonstrates
that neutron scattering samples only a smallpart of the mixture of domains and walls.
[1] U. Köbler et al. Physic[2] U. Köbler et al. J. Phys (2001) 3089
3D
2
D
3
Dan
isotro
pic
1
D
2
Dan
isot
ropi
c
exch
ange
inte
ract
ions
25
23
29
T
T
T 3
T 2
T 2T
half - integer spininteger spin
0 2 4 6 8 10 12 14
0.93
0.94
0.95
0.96
0.97
0.98
0.99
1.00
1.01
M /
M 0
T 5 / 2 / 10 6 ( K 5 / 2 )
fcchcp
T 0 = 703 K
hcp cobalt
59 Co NMR
~ T 3 / 2
~ T 5 / 2
magnetization
0 2000 4000 6000 8000 10000 12000 140000,3
0,4
0,5
0,6
0,7
0,8
0,9
1,0
Co
sqrt(
mag
n. in
t.)
T3/2 (K3/2)
10
Fig. 2.
Fig. 1.
Seite 1 von 1
a B 339 (2003) 156.. Soc. Japan 70

PHY-01-1257.doc // brandt // 16.03.04 Seite 1 von 1
EXPERIMENTAL REPORT Proposal N° PHY-01-1257Instrument E2Physical properties of magnetite Fe3O4 confined
in a porous glass.Local Contact: M. Tovarand U. Hoffman
Principal Proposer: I. Golosovsky, Petersburg Nuclear Physics Institute,188350, Gatchina, St. Petersburg, Russia. Date(s) of Experiment
Experimental Team: D. Kurdyukov, A. F. Ioffe Physico-Technical Institute,194021, St. Petersburg, Russia. 2.04.2003-8.04.2003
Date of Report: 18.01.2004
The magnetic properties of magnetite were firstrecorded by Greek writers and magnetitelodestones were used as a compass. During thetwentieth century, derived materials for magneticrecording and for high-frequency applicationswere developed. In 1941 E. Verwey made thefundamental discovery that magnetite undergoesfirst-order transition on cooling ~ 120 K, at whichthe resistivity increases sharply and the structuredistorts from cubic symmetry. Despite muchresearch, no conclusive structural model of thelow temperature phase has emerged and thequestion of the phase transitions remainscontroversial. Therefore the properties ofconfined magnetite, in the condition of “restrictedgeometry“, are of particular interest.
A magnetite had been embedded in a vycorporous glass with the mean pore diameter 70 Åby „bath deposition method". The synthesis ofFe3O4 within nanopores was done for the firsttime, nevertheless the neutron profile analysisshowed that impurities do not exceed somepercents (see Figure 1).
From synchrotron experiments [1] it is knownthat the splitting of reflection 440 due to Verweytransition corresponds to the lattice distortion∆d/d about 0.002. However, we did not observeany changing of FWHM of 440 peak in interval50 K – 280 K with accuracy 0.02 degree, thatcorresponds ∆d/d ~ 0.0004. Also, we did notobserve any changing in the peak position withinan accuracy ~ 0.001 Å-1 (in q-space). The cubiclattice parameter in interval 50 - 280 K practicallydoesn’t change, 8.400(2) - 8.408(2) Å.
These data shows that the structure distortionat the Verwey transition in confinement, if exists,is much smaller comparing with the bulk. Fromthe peak broadening the averaged size of theembedded nanoparticles was found of 85(5) Å.
Because of the lack of observable distortion,the profile analysis was carried out in the frameof the spinel structure. This structure containseight Fe3+ ions in tetrahedral A-sites and eightFe2+ plus eight Fe3+ ions in octahedral B-sites. Inan ideal spinel structure the parameter x defining
the position of O2- ion is equal 0.25. Indeed forFe3O4 in confinement we got x = 0.258(1), that isconsistent with those reported for the bulk [2].Refinement shows that A- and B-sites are notfully occupied by Fe ions, the occupation factorwas of 0.74(1) only. It means that a magnetite inconfinement is not stoichiometric.
Below Tcurie=853 K, a magnetite is magneticallyordered. From the peak intensities the “ordered”moments were calculated of 4.30(14) µB and1.94(7) µB in A- and B-sites respectively, that issmaller than the values of 5.04 µB and 4.02 µBmeasured for A- and B-sites in the bulk [3].
The reduction of magnetic moment had beenobserved in MnO [4] and CoO [5] confined withina porous glass and had been attained to spindisordering at nanoparticle surface. Surprisinglythat moment reduction observed in confinedFe3O4 appears different for octahedral andtetrahedral sites.
Figure 1. Neutron diffraction patterns of Fe3O4,measured at 50 K and λ = 1.215 Å. Diffusebackground is from the matrix of amorphous SiO2.
1. J. Wright et. al., PRB, 66, 214422, (2002).2. H. Okudera et. al., Acta Cryst., B52, 450, (1996)3. C. Shull et. al., PR 84, 912 (1951)4. I. Golosovsky et. al., PRL, 86, 5783, (2001). I.Golosovsky, D. Tobbens, M. Tovar, BENSC Exp.
Report, 2002, HMI, Berlin, 2003. p.68
20 40 60 80
3000
4000
5000
6000
7000
8000
inte
nsity
(arb
. un.
)
2 (degrees)
11

PHY-01-1330.doc // brandt // 09.03.04 Seite 1 von 1
EXPERIMENTAL REPORT Proposal N° PHY-01-1330Instrument E2Axis Conversion Effect in DyCu2Local Contact Jens-Uwe-Hoffmann
Principal Proposer: Martin Rotter, Universität Vienna Date(s) of Experiment:Experimental Team: Sebastian Raasch, TU Dresden
Mathias Doerr, TU DresdenMartin Rotter, University ViennaX. Chen, University ViennaPavel Svoboda, Charles University, Prague
24.06.2003-08.07.2003
Date of Report: 10.October 2003
The conversion process of DyCu2 and Tb0.5Dy0.5Cu2 hasbeen studied with the Flat-Cone Neutron Spectrometer atE2. For the first time the E2 was successfully combinedwith the VM-4 cryostat, inclined by 7.2 degree.The hk0, hk1/2 and hk1 planes have been measured atseveral magnetic fields. At 33K and 4.4T the axis-conversion was observed,which means that the magnetic easy axis becomes thehard axis and vice versa. Before this experiment twopossible crystallographic models for this macroscopiceffect had been suggested. Model 1, that assumes a fieldinduced increase of the crystallographic symmetry fromorthorhombic CeCu2 type into an overall hexagonalAlB2 type, could be ruled out. Reflections in the hk1/2plane should not be visible in this model (see Fig. 1).Model 2 associates the axis conversion with the decay ofthe single crystal into three domains, rotated by 120degree within quasi-hexagonal plane. We foundreflections especially in hk1/2 plane, which are inagreement with this model. An open question is thedomain-population. Further intensity analysis of thealready measured data might give information about thepopulation of the three domains, but the statistic andresolution of the data are not sufficient to give detailedresults.
Fig.1: HK1/2 of Tb0.5Dy0.5Cu2 T=50K B=0 before (right) andafter conversion (left).
A continuation of this experiment with attention on theintensities of the satellite reflections in the AF1 phase isnecessary. A back-conversion has been tried. Neither decreasing themagnetic field to zero nor warming up the crystal toroom temperature led to a virgin state crystal.Thus in this system the 4f electrons of the rare earthform a magnetic field driven nano-machine inducing astructural transformation of the crystal.
References:[1] M. Loewenhaupt, M. Doerr, M. Rotter, T. Reif, A.Schneidewind Magnetic field induced Ising axis conversion inTb0.5Dy0.5Cu2 single crystals Braz. J. of Physics 30 (2000) 754-757[2] M. Rotter, M. Loewenhaupt, S. Kramp, T.Reif, N. M. Pyka,W. Schmidt, R. Kamp Anisotropic magnetic exchange inorthorhombic RCu2 compounds Europ. Phys. J.B 14 (2000) 29-42[3] P. Svoboda, M. Doerr, M. Loewenhaupt, M. Rotter, T. Reif,F. Bourdarot, P. Burlet Structural change in DyCu2 singlecrystal induced by magnetic field Europhys. Lett. 48 (1999)410-414
Fig.2: HK1 of Tb0.5Dy0.5Cu2 T=50K B=0 before (right) andafter conversion (left).
12

PHY-01-1331.doc // brandt // 16.03.04 Seite 1 von 1
EXPERIMENTAL REPORT Proposal N° PHY-01-1331
Instrument *E2Spin-structure in Nd(1-x)PbxMnO3 single crystals Local Contact
*Jens-Uwe Hoffmann
Principal Proposer: Ulrich K. Rößler, IFW Dresden Date(s) of ExperimentExperimental Team: Ulrich K. Rößler, IFW Dresden
Jens-Uwe Hoffmann, HMI Berlin / Uni Tübingen *25.8. – 3.9. 2003
Date of Report: *20.12. 2003
Nd1-xPbxMnO3 belongs to the perovskiticmixed-valent manganites of type R1-xAxMnO3(R is La or a rare earth and A a divalent ion)displaying metallic ferromagnetism andcolossal magnetoresistance (CMR) in thedoping-range 0.2 < x ≤ 0.5. In such manganitesystems, the magnetic moments of R-ions mayact as probe for the magnetism of the Mn-O-subsystem, or they may undergo an orderingtransition at lower temperature. As shown inFig. 1 the system Nd0.85Pb0.15MnO3, whichorders ferromagnetically at Tc = 115 K,displays below 50 K an anomaly which mayindicate the onset of Nd-ordering.
Fig. 1: Magnetization M after field-cooling (FC) andzero-field cooling (ZFC) of Nd0.85Pb0.15MnO3 (leftscale); right scale and inset: specific heat C andC/T vs. temperature T. Anomalies indicated bydownturn in M(T) towards low temperature andpeak around 10 K in C(T).
Two single crystals of the system Nd1-xPbxMnO3 grown at IISc Bangalore [1] havebeen investigated. Both show ferromagnetism,but Nd0.85Pb0.15MnO3 is insulating whileNd0.70Pb0.30MnO3 shows an insulator-metaltransition and CMR related to theferromagnetic ordering. Neutron diffraction wasperformed on the E2-flat-cone instrument. Thex=0.3 crystal has been mounted to map the
(hk0)-plane using neutron wavelengthλ=2.39 Å, (indexed according the assumedorthorhombic structure Pbmn). The crystalshowed twinning due to the slight differencebetween lattice parameter a=5.45 Å, b=5.47 Å.The (hk1)-plane was mapped with 1.21Å andtemperature scans for the (111) and(011)/(101) Bragg-peaks were collectedsupplementing data from first experiment onthis crystal. The x=0.15 crystal (also indexedaccording to Pbmn) was mounted to map (h0l)and (h1l)-planes, with λ=2.39 Å, 1.21 Årespectively. Temperature evolution for seriesof Bragg-peaks (101), (002), (-201), (-200),(102), (211), (-111), (112) was collected.
Fig. 2: Evolution of (101)-Bragg peak intensity forNd0.85Pb0.15MnO3.
For both crystals, there is clear evidence for asluggish Nd-ordering for T<50 K and a spin-reorientation involving both magneticsublattices. Below 15 K (x=0.3) or 10 K(x=0.15) a further reorientation transitionoccurs, resulting in a structure with essentiallyferromagnetically coupled Nd- and Mn-sublattices and a small canting withantiferromagnetic component.
[1] N. Ghosh, et al., J. Magn. Magn. Mater. 256 (2003)286.
0 50 100 150 200 250 300 350
0.01
0.1
1
10
100
0 50 100 150 200 250 300 3500
20
40
60
80
100
1 10 100
0.2
0.4
0.6FC
Nd0.85Pb0.15MnO3
M (e
mu/
g)
T (K)
ZFC
H=3000 Oe
H=100 Oe
Tc = 115 K
C ( J / (m
ole K))
C/T
( J
/ mol
e K2 ))
T [K]
0 25 50 75 100 125 150
T_MEAN
3000
3250
3500
3750
4000
4250
4500
Integrated intensity
13

PHY-01-1333.doc // brandt // 09.03.04 Seite 1 von 1
EXPERIMENTAL REPORT Proposal N° PHY-01-1333
Instrument E2Reinvestigation of β-MnO2 magnetic structureLocal Contact J.-U. Hoffmann
Principal Proposer: M. Regulski, Inst. of Exp. Phys. Univ. Warsaw Date(s) of ExperimentExperimental Team: R. Przeniosło, M. Regulski, and
W. Sławiński, Inst. of Exp. Phys. Univ. WarsawJ.-U. Hoffmann, Univ. Tübingen & HMI
2003-10-152003-10-19
Date of Report: 2003-12-19
The family of MnO2 oxides are technologicallyimportant materials used widely in theproduction of dry-cell batteries. They are alsovery promising as materials for chemicalapplications as adsorbents, catalysts orsensors [1]. -MnO2 is the most stable andabundant member of the MnO2 oxide family.
-MnO2 has a tetragonal rutile-type crystalstructure with a=4.3980 Å, c=2.8738 Å [2] andspace group P42/mnm. Each unit cell containstwo Mn+4 ions, one at (0,0,0) and the second at(1/2,1/2,1/2). According to Yoshimori [3] all thespins in -MnO2 are aligned parallel in the cplane and screw along the c axis with a pitchof (7/2)c. The magnetic unit cell is seven timeslarger along the c axis than the chemical unitcell. This means that the propagation vector kequals (0,0,2/7). The Néel temperature of thisordering is about 92 K. According to recentexperimental results -MnO2 has anincommensurate magnetic ordering withpropagation vector k equal (0,0,2/7+ε), where εis about 0.01 [4]. The discovery of the -MnO2incommensurate magnetic ordering hasimportant consequences on the calculation ofthe values of the exchange integrals in -MnO2by Yoshimori, and Ohama and Hamaguchi[3,5]. These calculations were based on theassumption that the pitch of the screw ofmagnetic structure in -MnO2 is exactly (7/2)c.
Neutron powder diffraction experiments wereperformed by using the Flat-Cone-Diffracto-meter E2 operating at a neutron wavelengthsof 1.2 Å. and 2.37 Å. The measurements wereperformed from 10 K to RT. The preliminaryresults of our n.p.d. experiment are presentedin ref. 6. The detailed studies of the changes ofthe -MnO2 magnetic ordering versustemperature is in progress and will bepublished elsewhere.
W acknowledge the support by the EuropeanCommission under the Access to Research ofthe Human Potential Programme (contractnumber HPRI-CT-2001-00138), and thesupport by the Committee for ScientificResearch (Poland).
References
1) S. Suib, Chemical Innovation 30 (2000) 27.2) D.B. Rogers, R.D. Shannon, A.W. Sleight,
J.L. Gillson, Inorg. Chem. 8 (1969) 841.3) A. Yoshimori, J. Phys. Soc. Japan 14 (1959)
807.4) H. Sato, K. Wakiya, T. Enoki, T. Kiyama, Y.
Wakabayashi, H. Nakao, and Y. Murakami,J. Phys. Soc. Jpn. 70 (2001) 37.
5) N. Ohama and Y. Hamaguchi, J. Phys. Soc.Jpn. 30 (1971) 1311.
6) M. Regulski, R. Przeniosło, I. Sosnowska,J.-U. Hoffmann, Phys. Rev. B 68 (2003)172401.
14

PHY-01-1402_EF.doc // brandt // 09.03.04 Seite 1 von 1
EXPERIMENTAL REPORT Proposal N° PHY-01-1402 EF
Instrument E2Magnetic ordering of Y0.1Ca0.9GaxMn1-xO3(x=0.01, 0.05) Local Contact
J.-U.Hoffmann
Principal Proposer: Th. Lonkai, Uni. Tübingen Date(s) of ExperimentExperimental Team: A. Pfrommer, Uni. Tübingen
Th. Lonkai, Uni.TübingenJ.-U. Hoffmann, BENSC / Uni. Tübingen
9.-13.7.2003
Date of Report: 19.12.2003
Y0.1Ca0.9GaxMn1-xO3, an orthorhombic perov-skite, is a candidate for CMR materials. As apreliminary experiment we performed X-raypowder diffraction experiments at the new im-age-plate of the high-resolving Guinier-diffractometer in Tübingen for 01.0x and
05.0x at 11<T<300 K. Neutron powder data( 21.1 Å and 4.2 Å ) collected on sam-ples with 01.0x and 05.0x reveal themagnetic ordering dependence on Ga doping.
Fig. 1 depicts the magnetic peaks (110) and(011) ( 01.0x ). The ordered magnetic mo-ment of Manganese resulted from simultane-ous Rietveld-refinements of neutron and X-raypowder data [2], [3]. Fig.2 exhibits the magni-tude of the magnetic moment, assuming thesame critical behaviour for each of the threecomponents. The single components are
Bx ]4[49.0 , By ]3[9.0 and
Bz ]8[8.1 (4K, 01.0x ). Néel- tempera-tures TN =105,6K ( 01.0x ) and TN =88K( 05.0x ) resulted from least squares refine-ments (“Fit”, red and blue line) of an empiricalcritical power law [1]:
NTTI 1
The anomaly in thermal dependence of the A-axis (Fig. 3, 05.0x ) at Neel temperatureshows evidence of magnetostriction caused bythe magnetic ordering process in the manga-nese lattice.
[1] K. Hagdorn et al., Euro. Phy. J.B. 11(1999),p. 243[2] J.K. Maichle, J. Ihringer, W. Prandl, J. Appl.Cryst. 21, 22-27 (1988)
[3] http://www.uni-tuebingen.de/uni/pki/simref/simref.html
Fig.1: Magnetic Peak (110) und (011) (x=1%)
Fig 2: Manganese ordering
Fig. 3: Magnetostriction of the lattice constants (x=5%)
30 31 32 33 34 35
500
1000
1500
2000
2500
3000
3500
T=4.2K
T=105K
2 [°]
T [K]
cts
[a.u
.]
0 20 40 60 80 100 120
0,0
0,5
1,0
1,5
2,0
Mn x=1% Fit Mn x=5% Fit
[
B]
T [K]
0 50 100 150 200 250 3005,3036
5,3038
5,3040
5,3042
5,3044
5,3046
5,3048
5,3050
5,3052
5,3054
5,3056
0 50 100 150 200 250 3005,262
5,264
5,266
5,268
5,270
5,272
5,274
latti
ce c
onst
ant C
[Å]
A-axis
T [K]
C-axis
latti
ce c
onst
ant A
[Å]
15

EF_03_Prokes.doc // brandt // 15.03.04 Seite 1 von 1
EXPERIMENTAL REPORT Proposal N° EFInstrument E2Stability of the AF structure in UNiAl near the TN
Local Contact J.-U. Hoffmann
Principal Proposer: K. Prokes, HMI Date(s) of ExperimentExperimental Team: K. Prokes, HMI
30.9.2003-6.10.2003
Date of Report: 10.10.2003
Introduction to magnetic ordering ofUNiAl is given of the BENSC experimentalreports 2003 - namely in the section of theinsrument V2 and E1 [1]. From V2 experimentwe have realized that the competition betweenthe two indicated AF structures takes placeeven in zero field in the vicinity of TN.
The crystal (originating from the samebatch as in the case of E1 and V2 study) wasplaced in the standard orange cryostat andinvestigated on E2 with rather relaxedcolimation to gain intensity. We have collectedseveral scans in the L=0 and L=0.5 planes inthe temperature region 2.2-25 K.
Fig. 1: Contour plots for the L=0.5 plane recorded at 2.2(top), 19.12 and 19.72 K.
In Fig. 1 we show parts of three contour plotsfor the L=0.5 plane recorded at 2.2, 19.12 and19.72 K (TN = 19.3K). The center is situated at(1 1 0.5). Apparent is that the angularcoherence along the dashed cirle “3” decreases.This indicates that the competition between theold and new AF structure becomes moreimportant around TN as it happens also inmagnetic above 8T (see report from E1experiment). In Fig. 2 we show the temperaturedependence of the radial position and width ofreflections determined by fitting as indicated inthe first picture by arrows marked as “1” and“2”, respectively. As can be seen, withincreasing temperature the “length” of thepropagation vector and the width of magneticpeaks increases. The former result is totallyunexpected. The latter result is expected,however, it appeared that the peak width
Fig. 2: Temperature dependence of the h and kcomponent of the propagation vector q = (qh qk 0.5)along the “1” shown in Fig 1 (a) and the angulardependence of the normalized intensity along the circle“3” shown in Fig 1 (b).
perpendicular and along the circle are a, verydifferent and b, both are larger than the widthof nuclear reflections, the former one abouttwice, the latter one about three times even atthe lowest temperatures. This reflects limitedcorrelation length of the old magnetic structure.Reference [1]K. Prokeš, et al. Phys. Rev. B 58 (1998) 2692
0 5 10 15 20 25
0,100
0,105
0,110
q h =
qk
(r.l.u
.)
T (K)
(a)
60 70 80 90 100 110 120-0,2
0,0
0,2
0,4
0,6
0,8
1,0
Nor
mal
ized
Inte
nsity
Positional angle (deg.)
(b)
16

EXPERIMENTAL REPORT Proposal N° EF Instrument:: E2Magnetic diffuse scattering in Na0.70CO2
single crystals Local Contact:Hoffmann, Jens-Uwe
Principal Proposer: Argyriou Dimitri, HMI Berlin Date of ExperimentExperimental Team: Aliouane Nadir, HMI Berlin
Argyriou Dimitri, HMI BerlinHoffmann, Jens-Uwe, HMI Berlin Uni Tübingen
02/12/03 to 9/12/03
Date of Report: 14/01/2003
The layered cobaltite compounds: NaxCoO2 (x ∈[0.70,1]) were studied due to their high thermopowerproperties associated with a low resistivity in the abplane. The electronic and magnetic interactions arisefrom the doping of x charge carrier to form a mixed valentsystem: NaxCo3+
x Co4+1-xO2. where the Co3+ state is S= 0
with t62g configuration and the Co4+ state is S=1/2 with t52gconfiguration. The thermopower in these compoundsseems to be produced by a spin entropy mechanism[1].
From a structural point of view the Na0.70CoO2 canbe describe, in P6/3mmc Space Group (a=2.85Å,c=10.85Å), as layered of edge shared octahedral CoO6along the (ab) plan separated by a layered of Na+. Forx=0.70, the susceptibility measurement present aferromagnetic to a paramagnetic transition at T=22K. Theidea of entropy reduction in field is that the field polarizesparamagnetic hoping Co4+ spin into an ordered structurewhich should produce a diffuse scattering.
To observe this diffuse scattering and the associatedq vector, we use a single crystal of Na0.70CoO2(2.5x2.5x13mm size) obtained by Image furnace floatingzone technique.
We took (ac) reciprocal space cut (Fig.1) of neutrondiffraction on E2. The first observation (at T=1.7K andT=30K without field) indicated that the expectedsymmetry of the P6/3mmc is not corrected since we seeforbidden reflection the (003) and (001). Since
We scan the two main directions [(00l) and (-hh0)] ofour reciprocal space cut at different temperatures andfields (1.7K, 30K at H=0 and 5T). We observe diffusescattering around (003) reflection and near the (000)beam (see Fig 2). We follow too along only the
direction, at 10K and 20K 22K without field (see Fig.3). .
Fig.1: (ac) reciprocal cut at T=30K and H=0T. Thevertical arrows indicate the extra reflection (001) and(003). The horizontal one indicate the (-110) reflection.
Fig.2: (a) reciprocal space cut around the (003) andintegreated intensity versus field. (b) reciprocal space cutaround the (000) and integreated intensity versus field.
Fig.3: evolution of the diffuse scattering around the 003reflection versus temperature without field.
The diffuse scattering around the (003) and (000)according the Fig.2 could be interpreted as a magneticdiffuse scattering to confirm that point we should obtainother data with fild at different temperature.
[1] Y. Wang et al., Nature 423,425(2003)
17

PHY-01-1125.doc // brandt // 16.03.04 Seite 1 von 1
EXPERIMENTAL REPORT Proposal N° PHY-01-1125Instrument E4The magnetic structure of ErNi2B2C in an
applied field along the c-axis Local Contact K. Prokes
Principal Proposer: Anette Jensen, Oersted Laboratory,University of Copenhagen Date(s) of Experiment
Experimental Team: N. H. Andersen, Risoe Nat. Lab.A. B. Abrahamsen, Risoe Nat. Lab.K. Prokes, S. Danilkin, BENSC, HMI
29/1-8/2-2003
Date of Report: *04-12-2003
Magnetic ordering and superconductivity are ingeneral considered as mutual exclusive, but therare-earth nickel borocarbides RNi2B2C (R =Dy, Ho,Er, Tm) belong to a small group ofmaterials where these two phenomena coexist.The coexistence offers a unique possibility tostudy the interplay between superconductivityand magnetism.The Erbium compound R = Er is supercon-ducting at temperatures below Tc=11 K in zeroapplied field and the crystalline unit cell istetragonal I4/mmm. If the material is cooledbelow the Néel temperature TN=6 K, themagnetic moments of the Er3+ ions form atransversely polarized spin-density wave withthe moments parallel to the [010] direction anda modulation wave vector Q=(Qx,Qy,0) withQx≈0.55 rlu and Qy≈0 rlu. At temperatures wellbelow TN, the development of higher orderharmonics shows that the magnetic structure issquaring up. This phenomenon, however, hasnot been examined quantitatively in theexperiment to be reported on here, since theintensities of both magnetic and nuclearreflections are severely affected by extinction.
Experiment and resultsWe have studied the variation of Q as functionof temperature when applying a magnetic fieldup to 12 T along the crystallographic c-axis.Figure 1 summarizes the results. Black dotsmark the (T,H) points where the measurementswere made and the upper critical field isindicated by the line marked Hc2 [3]. Thevalues of Qx are shown as a contour plot. Wewere able to reach a maximum field of 12 Tbefore the sample was detached from thesample stick. At 12 T, the Néel temperature is4.5 K, hence it takes a very large field toquench the antiferromagnetic ordering. This isin agreement with the results of a mean field
model [1,2] and experimental results obtainedby Schmiedeshoff et al [4]. In contrast to the results obtained when thefield is applied in the a-b-plane [1], we observeno distinct changes that indicate a phasetransition. Only a small continuous increase inQx is observed as function of H and T, and Qyremains zero within experimental error.
[1] A. Jensen, K. Nørgaard Toft, A. B.Abrahamsen, M. R. Eskildsen, N.H. Andersen, J.Jensen, P. Hedegård, J. Klenke, S. Danilkin, K.Prokes, V. Sikolenko, P. Smibidl, S. L. Bud’ko, P.C. Canfield, (to be published)[2] J. Jensen, Physical Review B, 65, 140514, 2002[3] S. L. Bud'ko, P. C. Canfield, Physical ReviewB, 61, 22, R14932-R14935, 2000[4] G. M. Schmiedeshoff, S. Touton, W. P.Beyermann, A. H. Lacerda, S. L. Bud’ko, P. C.Canfield, Int. J. Mod. Phys. B 16, 3212 (2002)
Figure 1: Variation of the modulation wave vector Qx asfunction of temperature and applied magnetic field alongthe c-axis of ErNi2B2C. The values of Qx in rlu areshown as a contour plot and the Néel temperatures asderived from the intensity of the magnetic 1st orderreflection are marked by the squares. The line marked TNis obtained by a mean field model [1,2].
18

PHY-01-1128.doc // brandt // 03.03.04 Seite 1 von 1
EXPERIMENTAL REPORT Proposal N° PHY-01-1128Instrument E4Domain growth kinetics in geometrically frus-
trated Ising antiferromagnet CoNb2O6 Local Contact K. Prokes
Principal Proposer: S. Mitsuda, Tokyo Univ. of Science Date(s) of ExperimentExperimental Team: Y. Inomoto, S. Mitsuda, Tokyo Univ. of Science, Japan
K. Prokes, HMI Berlin 26.5.2003 - 2.6.2003
Date of Report: 22.12.2003
Geometrically frustrated isosceles triangular Isingantiferromagnet CoNb2O6 exhibits the domain growthkinetics in the four-fold degenerate antiferromagnetic(AF) phase below TN2~1.95 K[1,2]. We have found thataverage domain size at T=1.5 K grows with timeaccording to power law (t)=0+Ctn with growthexponent n~0.2 that is extremely small compared withn=0.5 of conventional Ising magnets. In presentexperiments, to study how the power law holds overwide temperature range in AF phase, we measured, atvarious temperature, the time evolution of scatteringprofile along a* direction in the transverse scans at (01/2 0) Bragg point after field-quench from H=2000 Oeto zero field, revealing that the growth exponent n~0.2is almost temperature independent and the pre-factor Cis temperature dependent so that C(T) can be fitted toC0exp(-E/kBT) as shown in Fig. 1 (a). This functionalform of C(T) suggests existence of a kind of activationenergy E that must be relevant to the mechanism of thedomain growth kinetics in this system where thedomain walls move stochastically back and forth incontrast with the curvature-driven domain motion in theconventional Ising magnets. The fitted parameterE/kB~10 K is several hundred times larger than thecompeting exchange interactions in the isoscelestriangular lattice. It should be noted that quite recentlyintroduced He3 refrigerator with VM-3 cryomagnet wasinvaluable in present experiments to provide access tothe temperature region of T=1.0 K~2.0 K. By ac-susceptibility measurements in the three-folddegenerate ferrimagnetic (FR) phase, we have observedphenomena originated from the domain growth kinetics.As shown in Fig. 1 (c), an anomalous peak was detectedat specific field Hs=1300 Oe where A’C’-type domainwall is considered to move almost freely from energycalculation[2]. This peak appears only in the field-increasing scan after zero-field-cooling (ZFC) whereasno peak appears in the field-decreasing scan after field-cooling (FC). This is because the domain walls areembedded in passing through the first-order AF-FRtransition field in the former process, whereas FR singledomain state is formed in the latter process. Actually,we have observed, at only around Hs, the time evolutionof ’ obeying power law ’(t)=’eq+At-n with n~0.2.Therefore, in present experiments, we tried toinvestigate the domain growth kinetics at Hs bymeasuring the time evolution of scattering profile alongb* direction in the transverse scans at (3 1/3 0) Braggpoint in the time range up to 2.5 104 sec. Although wecould not directly observe the domain growth kinetics at
Hs within our experimental accuracy, we observedinteresting field dependence of the width Wb along b*direction as shown in Fig. 1 (b); In the field-decreasingscans after FC, the width Wb is almost the instrumentalresolution limit at all fields, whereas the width Wb inthe field-increasing scan after ZFC at T=1.2 Kdecreases rapidly around Hs corresponding to theanomaly in the ac susceptibility measurement. Thismeans that the domain growth at Hs is faster than theother field, i.e. existence of the domain growth kineticsat Hs.
Fig. 1: (a) Semi-log plot of the temperature dependenceof the prefactor C(T) in the AF phase. (b) Magneticfield dependence of half width at half maximum Wb ofscattering profile along b* in the magnetic field scan.The lines are guide for the eyes. (c) Magnetic fielddependence of in-phase susceptibility ’. Both in (b)and (c), open and closed symbols denote fieldincreasing scans after ZFC and field decreasing scansafter FC, respectively.
[1] S. Kobayashi, S. Mitsuda, T. Jogetsu, J. Miyamoto,and H. Katagiri, Phys. Rev. B 60, R9908 (1999).
[2] S. Kobayashi, K. Okano, T. Jogetsu, J. Miyamoto,and S. Mitsuda, (submitted to PRB)
19

CHE-01-1206.doc // brandt // 03.03.04 Seite 1 von 1
EXPERIMENTAL REPORT Proposal N° * CHE-01-1206Instrument * E4Magnetic structure determination and H,T phase
diagram of the S=1/2 square lattice antiferromagnet(5CAP)2CuCl4
Local Contact * Ralf Feyerherm
Principal Proposer: Andrew Harrison, University of Edinburgh, UK Date(s) of ExperimentExperimental Team: Andrew Harrison, University of Edinburgh, UK
Fiona Coomer, University of Edinburgh, UKRalf Feyerherm, HMI, Germany
* 29 April – 7th May2003
Date of Report: * August 5th 2003
2-amino-5-chloropyridinium (5CAP) copper (II)chloride (CAPCC) is one of a family of S=½ squareantiferromagnets of general formula A2CuX4(where A is related to 5CAP through substitution ofother groups such as methyl for chlorine, and X =Cl, Br) 1-4. These materials are of interest inrelation to the magnetic behaviour of high-Tcsuperconducting materials based on layeredcuprates, and related low-dimensional, low-moment antiferromagnets5. In particular, CAPCChas a relatively low value of in-plane magneticexchange J (0.57 K) which means that the magneticproperties may be tuned significantly through theapplication of experimentally accessible appliedmagnetic fields6. The structure and basic magnetic character ofCAPCC have been determined for the protonatedmaterial, revealing TN = 0.75 K. In a previousexperiment at BENSC we performed the firstneutron scattering measurements of spincorrelations in a perdeuterated sample of thematerial7. In that experiment the crystal wasmounted with a* and c* in the horizontal scatteringplane, and a survey made of likely magneticreflections at 30 mK; in addition, the (H,T) phasediagram was explored with H up to 5 T, and thecritical scattering near (the (101) reflectionmeasured carefully near TN to determine the criticalexponent for sublattice magnetisation. Wetherefore proposed a follow-up experiment with b*and c* in the scattering plane so that we couldcollect a complete set of magnetic reflections, andalso explore a new dimension of the (H,T) phasediagram. The aim was to elucidate the spinstructure as a function of H and T and thus probethe properties of class of co-operative magnet.The sample that had been used in the previousexperiment proved to be no longer useable forsingle crystal diffraction, presumably because ofdegradation by the thermal cycling (this material isstable for long periods in air, under ambientconditions). As a consequence, we were compelledto use a new crystal which was smaller and had alower level of deuteration (of the order of 67%).This sample had the same value for TN as the
perdeuterated sample according to SQUIDmagnetometry measurements, but the structurefactors for the nuclear reflections proved to be verydifferent according to a mapping of Bragg peaks,and normalisation of magnetic peaks to the nuclearpeaks therefore requires care when data from thetwo samples are compared (this will be donethrough simulation of two sets of nuclear structurefor the two compositions in conjunction withexperimental structure factors for appropriatereflections). The smaller size of this second samplegreatly increasing the count times required tocollect magnetic data with good signal/noise ratio.A careful survey of scattering intensity inaccessible regions of the (0kl) plane over thetemperature range 51 – 800 mK, and in verticalfields from 0 – 10 T revealed magnetic scattering at(011), (01-1) and (01-3) at base temperature andzero field (for the single crystal orientation weused, we were only able to access regions of the(0kl) scattering plane with positive values of k).Consideration of the relative intensities of thesereflections suggests that the component of themoments in (0kl) plane in the magnetically orderedphase lie close to the (011) direction. A moredetailed survey of the response of the system toapplied field was made through measurement of theintensity of selected peaks, most prominent ofwhich was the (01-1) reflection, but we observed nofurther magnetic transitions than had been observedin previous magnetometry and neutron scatteringmeasurements.References[1] P. Zhou and J. E. Drumheller, J. Appl. Phys. 69, 5804
(1991).[2] P. R. Hammar, D. C. Dender, D. H. Reich, et al, J. Appl.
Phys 81, 4615 (1997).[3] F. M. Woodward, C. P. Landee, J. Giantsidis, et al.,
Inorganica Chimica Acta 324, 324 (2001).[4] F. M. Woodward, A. S. Albrecht, C. M. Wynn, et al., Phys.
Rev. B 65, 144412 (2002).[5] E. Manousakis, Rev. Mod. Phys. 63, 1 (1991).[6] M. E. Zhitomirsky and A. L. Chernyshev, Phys Rev. Lett.
82, 4536 (1999).[7] A.Harrison, R.Feyerhem, D.Visser, K. Grant and V.
Bondah-Jagalu, work in preparation (2003) and BENSCreport for 2002.
20

EXPERIMENTALREPORTTitle
Name(s) Affiliation
Proposal Nº
Instrument
Local Contact
Date(s) of Experiment
Date of Report
Principal Proposer:
Experimental Team:
Magnetic structure of TbNi5E4
.K. Prokeš, V. Sikolenko
PHY-01-1276
A. N. Pirogov, IPM of RAN, Ekaterinburg, Russia
Seongsu Lee, Phys. Dept., SKKU, Suwon, Korea;A. A. Podlesnyak, LNS ETH-Zurich and PSI, Switzerland;
16-25 February 2003
4.1.2004
Recent resistivety and susceptibilitymeasurements [1, 2] indicated the magnetic stateof the hexagonal TbNi5 compound may not be assimple a collinear ferromagnet below Tc=23 K aspreviously thought. Using a powder neutrondiffraction we made the conclusion [3] that theTbNi5 exhibited the incommensurate FAN-likemagnetic structure over whole temperature regionfrom 2 to 23 K. In that previous study weperformed the measurements only by a heating ofthe sample.The aim of the present experiment is to study amagnetic structure of the TbNi5 single crystal byboth a heating and a cooling and to determine aneffect of an external magnetic field on itsmagnetic state. During the meusurements thecrystal has been oriented a- (c-) axis horizontalyand parallely to the magnetic field. We werealways statrting the cooling-measurements from30 K.We determined the temperature dependencies ofthe intensities of the (100), (001) and (101) peaksand satellites in the vicinity of them (see Fig. 1).
10 20 30
0.5
1.0
1.5
0.5
1.0
1.5
Temperature [K]
(001) (001)-
(001)+
Inte
nsity
[a. u
.]
Fig. 1: The temperature dependencies of theintensities of the (001) peak and (001)- and (001)+
satellites by heating (bottom) and cooling (top) ofthe TbNi5 single crystal.It is seen that there are clear anomaly at Tt
c 10 K
li h i b
K and week one at Tth 16 K by the cooling and
heating regimes, respectively. The value of the Tth
coincides with the temperature at which aresistivety peak was be found in [1]. In view ofour present and previous data we can suppose twoversions for the explanation of the anomaly at theTt
c (or Tth). One of them is the incommensurate
FAN-like structure keeps both below and abovethe Tt
c, but the value of the ferromagneticcomponent of the Tb-ion moment noticeablydecreases with temperature. The other is a ratiobetween a simple spiral and a collinearferromagnet phases sharp lowers withtemperature.An application of an external magnetic fieldinduced a transition from the incommensuratestructure to commensurate ferromagnet one. It isclear seen from Fig. 2. This transition undergoesby the critical field Hc=0.3 T after that theferromagnetic state keeps even at the out field.
70 71 72 73 740
2
4
6
Inte
nsity
[10
4 , cou
nts]
O m ega [deg]
0 0 .1 T 0 .2 T 0 .25 T 0.3 T
Fig. 2: The scans of the (101) peak and (101)- and(101)+ satellites by the magnetic field (H isparallel to a-axis) at 12 K.
References[1] V.M.T.S. Barthem et al., J. Phys. Condens.Mat. 9 (1997) 7609.[2] V.M.T.S. Barthem et al., J. Magn. Magn.Mater 208 (2000) 97.S. Lee et al., Europh. Lett. 62 (2003) 350.
21

EXPERIMENTAL REPORT
Investigation of the A-phase of CeCu2Si2 in anexternal magnetic field
Proposal N PHY-01-1352
Instrument E4
Local Contact
Karel Prokes
Date(s) of Experiment
26. 11. - 5. 12. 2003Principal Proposer: O. Stockert, MPI CPfS DresdenExperimental Team: E. Faulhaber, Institut fur Festkorperphysik,
TU DresdenH. S. Jeevan, MPI CPfS Dresden
Date of Report 16. 12. 2003
The low-temperature physical properties ofCeCu2Si2, the first heavy-fermion superconduc-tor, are very sensitive to the preparation of thesample. We investigated a large ’A-type’ sin-gle crystal, showing antiferromagnetic ordering(TN ≈ 0.86 mK; µeff. ≈ 0.1 µB) but no supercon-ductivity. Especially, we were interested in theproperties of the A-phase in an external mag-netic field. We used the magnet VM1, equippedwith the dilution stick DS3 to reach low tem-peratures and to provide a magnetic field ofup to 12 T. We investigated the magnetic fielddependence at two different temperatures, atT1 ≈ 60 mK, where a direct transition from A-to B- phase occurs, and at T2 ≈ 500 mK, wherethe two phases are separated by a ’paramagneticgap’ (see Fig. 1). Fig. 2 shows selected rocking-scans across the investigated (0.215 0.215 1.48)magnetic satellite reflection. Although othermagnetic satellite reflections could be observed,we focused on the (0.215 0.215 1.48) peak dueto the good intensity to background ratio. Afirst evaluation of the intensity vs. magnetic fieldis shown in Fig. 3. No qualitative difference inthe field dependence could be observed for thetwo temperatures (although the phase transitionfield changes with temperature as expected [1]).A small change of the ω position was found forboth temperatures, but is much smaller than thechange with temperature above the lock-in tem-perature TL.
LT NT2T1T
0
B−phase
A−phase
?
T [mK]60 500350 800
B [T
]
~8
Figure 1: Schematic phase diagram of CeCu2Si2.The lock-in transition (TL) and the two mea-sured temperatures T1 and T2 are marked.
Special thank goes to the sample-environmentgroup (P. Smeibidl et al.) for their support.
-53 -52 -51 -50ω [°]
200
300
400
500
600
700
800
900
B = 0TB = 1TB = 2TB = 3TB = 4TB = 5T
-53 -52 -51 -50ω [°]
200
300
400
500
600
700
800
900
neut
ron
coun
ts p
er 1
06 mon
itor (
appr
ox 3
35s)
B = 0TB = 2TB = 4TB = 6TB = 8T
T = 500 mK
T = 60 mK
Figure 2: Selected rocking-scans across the in-vestigated magnetic satellite reflection, shiftedby a constant value for better distinction. (rawdata + Gaussian fits as a guide for the eye).
0 2 4 6 8Magnetic field µ0H [T]
0
50
100
150
200
Inte
gra
ted
In
ten
sity
[a
rb. u
nits
]
T = 60 mKT = 500 mK
Figure 3: Integrated intensity of the magneticsatellite reflection (see text) for the two temper-atures.
[1] T. Tayama et al., Phys. Rev. B67 (2003)214504[2] O. Stockert et al., submitted to PRL22

PHY-01-1353.doc // brandt // 16.03.04 Seite 1 von 1
EXPERIMENTAL REPORT Proposal N° PHY-01-1353Instrument E4Pressure induced magnetic structures in
Lu2Fe17 Local Contact K. Prokeš
Principal Proposer: J. Kamarád, Institute of Physics, Prague Date(s) of ExperimentExperimental Team: O. Prokhnenko, Institute of Physics, Prague
K. Prokeš, Hahn-Meitner-Institute, Berlin 29.10 – 13.11.2003
Date of Report: 20.12.2003
Pressure induced changes of magnetic structures ofintermetallic Lu2Fe17 compound have been studied byneutron diffraction at wide temperature range in fieldup to 6.5 T using E4 diffractometer with VM2magnet. The single crystal of Lu2Fe17 was fixed in aCuBe pressure cell and oriented with its b-axis || H ||axis of rotation of diffractometer, i.e. the beam lay inthe crystal ac-plane. The positions of magnetic andnuclear diffraction lines had been determined from l-scans in reciprocal space whereas intensities of thelines were obtained from -scans. Large changes ofthe lattice parameters induced by temperature,pressure and/or magnetic field have been taken intoaccount in conversion into reciprocal space. Set of 21accessible diffraction nuclear lines and visible (101)±,(002)± and (300)± satellites with propagation vectorq= (0 0 ±z) was collected at ambient pressure andunder pressures 3.5 kbar and 4.3 kbar.
Fig. 1: Temperature dependence of the propagationvector z at different pressures. The star and squaresymbols represent results of the previous studies.
A general tendency - an increase of the propagationvector component z of a helical magnetic structurewith increasing pressure (Fig. 1) - indicates anincrease of negative magnetic interactions withdecreasing Fe-Fe distances. A decrease of z down tozero with decreasing temperature indicates anincrease of a helix length to infinity and a continuoustransition into a collinear ferromagnetic structurebelow TC at ambient pressure. A similar behaviourhas been observed under pressure 3.5 kbar down to
75 K only! Below this temperature the satellitesdissapeared indicating a discontinuous transition intoferromagnetic phase. Under higher pressures, thetemperature dependence of z exhibits minimum intemperature range 75 K - 125 K. Contrary tomacroscopic magnetization measurements underpressure, no temperature and field hystereses of boththe satellite positions and the magnetic contributionsto intensities of the nuclear lines were observed !
Fig. 2: Nuclear (002) reflection at para- (270 K), heli-(with satellites at 150 K) and ferromagnetic (5 K) statesat 3.5 kbar compared to one at 5 K and 4.3 kbar.
The intensities of all the nuclear reflections weredetermined in paramagnetic state. Their observedindependence on pressure manifests the reliability ofthe measured data. The magnetic contributions to theintensities of the lines have been measured inhelimagnetic and ferromagnetic states in fields up to6.5 T. An absence of the satellites and simultaneouslyan enhancement of the nuclear intensities indicateobviously a presence of the ferromagnetic phasebelow 70 K at 3.5 kbar. The collinear ferromagneticphase seems to be suppressed under pressure 4.3 kbareven at 5 K where the satellites exist in addition toenhanced intensity of (002) line (see, Fig. 2).Moreover, a difference in field dependencies of themagnetic contributions to the nuclear reflections havebeen observed at low and mediate temperatures underpressures above 3.5 kbar. This probably points to acreation of a new non-collinear magnetic phase inLu2Fe17 under pressure at temperatures below 70 K.
0 50 100 150 200 250
0,05
0,10
0,15
0,20
0,25
0,30
0 kbar
3.5 kbar
9.1 kbar
4.3 kbar
Lu2Fe17?
z (
r.l.u
.)
Temperature (K)
-76 -75 -74 -73 -72 -710
500
1000
1500
2000
2500
3000
3500
(002) +(002) -
(002)
Inte
nsity
(deg)
4.3 kbar, 5 K, 0 T
3.5 kbar, 270 K, 0 3.5 kbar, 150 K, 0 3.5 kbar, 5 K, 0 T
23

PHY-01-1354.doc // brandt // 09.03.04
EXPERIMENTAL REPORT Proposal N° PHY-01-1354Instrument E4Magnetic phases of NdFe2Si2
single crystal Local Contact K. Prokeš
Principal Proposer: Jana Vejpravová, Charles Univ., Prague Date(s) of ExperimentExperimental Team: Jiří Prchal, Charles Univ., Prague
30.9. -5.10. 2003
Date of Report: *5.12.2003
NdFe2Si2 crystallizes in the tetragonalThCr2Si2-type of structure (space group I4/mmm) andorders antiferromagnetically (AF) below TN~15K [1]with the c-axis as an easy magnetization direction.Earlier powder neutron diffraction reports of NdFe2Si2claim that also iron atoms care a small magnetic momentand the iron sublattice orders ferromagnetically (F) at TCpretty above the room temperature, while RE ions showlong range AF ordering below TN. Contrary to the pilotresults, further studies report the iron atoms to benonmagnetic within the whole REFe2Si2 series.
We have grown a single crystal of NdFe2Si2 andstudied it by standard bulk techniques. Comparing toother authors [1,2,3] slightly lower ordering temperatureTN = 13.9 K was observed for our single-crystal. Inaddition another anomaly at T1 = 13.1 K was found onthe specific heat dependence, reflecting additional order-to-order magnetic phase transition [4]. Magnetizationmeasurements have confirmed the c-axis as the easymagnetization axis in NdFe2Si2 with the Nd3+ saturatedmagnetic moment of 3.1 B at 2K that agrees well withthe value obtained from the neutron diffraction reportedin [2]. Furthermore, NdFe2Si2 exhibits at 2 K ametamagnetic phase transition in B = 1.09 T (B || c-axis)that has not been reported yet – no single crystal havenot been studied until now. To clarify the situation wehave decided to determine the magnetic structures ofNdFe2Si2 single crystal and to establish the magneticphase boundaries in magnetic field.
The to date reported magnetic structure consistsof Nd magnetic moments oriented parallel to the c-axisforming ferromagnetic basal planes (there are two planesin the unit cell), which are than stacked along the c-axisin sequence (+ + - -+ + - - ...).
We supposed that the lower magnetic phasetransition may correspond to a lock-in transition fromincommensurate spin wave to commensurate collinearmagnetic structure. The experiment was performed onthe E4 diffractometer with the neutron wavelength of 2.4Å. The crystal was mounted in h-l scattering plane in theHM1 cryomagnet and the magnetic field was firstapplied along the easy axis (c) and then along the a. Thissetup was chosen to be able to observe with B||c bothpropagations along l simultaneously. However, we wereable to reach only 2 reflections in the scattering plane:(1 0 -3) for B||a and (2 0 2) for B||c. Contrary to thespecific heat data, only one AF phase has been observedbelow TN. The propagation vector was found to be q =(0, 0, 1/2), in agreement with that reported in [2]. On theother hand, no extra magnetic intensity due to ironsublattice order has been observed, which supports the
fact, that iron remains nonmagnetic in this compoundand possible contribution to magnetic intensities reportedin [2] might be caused by a ferromagnetic impuritypresent in the sample. When applying magnetic field ||c,intensity of (2 0 2.5) satellite decreases and it completelyvanishes above 1.1T, where the field inducedferromagnetic state occurs (see Fig. 1) in an agreementwith magnetization data.
A wesydacryprocothenesatupmascedeWB||ha
[1]Pa[2][3](19[4]
F
24
B||c (2 0 2.5)NdFe2Si2
B (T)0.0 0.2 0.4 0.6 0.8 1.0 1.2 1.4 1.6
I rel (
a.u.
)
0
5
10
15
201.8K
5K7.7K9.2K
11.7K
12.9K
13.4K
13.5K
13.7K
ig. 1: Field dependence of (2 0 2.5) reflection intensity.
Seite 1 von 1
possible splitting of (2 0 2.5) in h has been checked asll, the only uncertainty remains to be verified:
mmetrical satelite (2 0 1.5) is missing at the diffractionta. It might be due to the dead angle of theomagnet. Nevertheless, some more complicatedpagations cannot be excluded. Unfortunately,
mplete set of data for B||a has not been recorded due to lack of time. In agreement with bulk and previous
utron data (B||c setup), magnetic intensity of bothellites of (1 0 –3) decrease smoothly in temperature to highest measured field 1.5T and no additionalgnetic phase has been observed. To complete thenario, an additional experiment with B||a is highly
sirable.e may conclude, that the magnetic phase diagram withc is complete and no order-to-order phase transitions been observed by neutron diffraction experiment.
References: Leciejewicz, J. et al., Prace Fizyczne – Zeszyt 26,nstwowe Wydawnictwo Naukowe, Krakow (1987) Pinto, H. et al., Phys. Rev. B7, 3261 (1973) Felner, I. et al., Solid State Commun., 16, 100557) Svoboda, P. et al, Physica B, 328 (2003) 139

PHY-01-1355.doc // brandt // 09.03.04 Seite 1 von 1
EXPERIMENTAL REPORT Proposal N° PHY-01-1355Instrument E4Magnetic phase transitions in U(Ni,Pd)2Si2
single crystals under high pressure Local Contact Karel Prokeš
Principal Proposer: Pavel Svoboda, Charles University, Prague Date(s) of ExperimentExperimental Team: Fuminori Honda, Charles University
Jiří Prchal, Charles UniversityKarel Prokeš, BENSC
From 6.10.2003To 14.10.2003
Date of Report: 4.13.2003
U(Ni0.91Pd0.09)2Si2 compound ordersantiferromagnetically (AF) and exhibits threedifferent AF structures below TN at ambientpressure [1]. All the structures consist offerromagnetic basal planes stacked along thec-axis with different q = (0, 0, qz) propagation.It has been found that the ground state ofU(Ni0.91Pd0.09)2Si2 reveals the coexsitence ofthe simple AF-I phase (+ - + - stacking) like inUPd2Si2 and a small fraction ofuncompensated AF phase (UAF) with + + -stacking like in UNi2Si2. It was also found in theelectrical resisitivity measurement under highpressure that the UAF phase in the groundstate becomes dominant with increasingpressure [2]. In order to confirm the fact, wehave been carried out a neutron diffraction(ND) measurement on substituted singlecrystal of U(Ni0.91Pd0.09)2Si2 under highpressure.
We used the same U(Ni0.91Pd0.09)2Si2single crystal which was used in the previousND measurement on E4. Sample was placedinside the conventional type Cu-Be pistoncylinder high pressure cell in order not to turninside the cell. The single crystalline samplewas carefully oriented by X-ray Laue methodand was fixed on the Al tube and placed intothe pressure cell within the a-c scattering planeand the magnetic field was applied parallel tothe c-axis. The spindle oil was used as apressure transmitting medium. Pressure insidethe cell was determined from the electricalresistance of Manganin wire placed in thepressure chamber. We used 6 T horizontalmagnet so as to investigate magnetic field –temperature (B-T) phase diagram clearly.
At first, pressure was carefully appliedup to 1 GPa at room temperature and thepressure cell was inserted into the cryostat.Due to the thermal contraction, pressure insidethe cell became reduced down to 0.75 GPabelow 150 K. At 4 K, ND profile indicates thecoesxistence of AF-I and UAF phase in 0 T.The volume fraction of UAF phase in thecoexistence region is significantly larger than
that at ambient pressure. It means hydrostaticpressure promotes the UAF phase inU(Ni,Pd)2Si2 system as we expected. But it isalso clear that 0.75 GPa is still not enough tosurpress AF-I phase completely.
Fig 1: Magnetic phase diagram ofU(Ni0.91Pd0.09)2Si2 compound at pressure 0.75 GPa.
Several temperature scans in fixedmagnetic fields and magnetic field scans atfixed temperatures both for magnetic andnuclear diffraction peaks have been done inorder to make clear the development ofmagnetic phases with respect to temperatureand magnetic field at high pressure. Fromthese results, we tentatively construct a B-Tmagnetic phase diagram at 0.75 GPa (Fig.1).
On 13.10, the reactor was shut downfor a few hours, but Dr.Prokeš gave us anadditional beam time on the last day of ourexperiment for compensation. Thanks to thatwe could successfully finish at least themeasurement on U(Ni0.91Pd0.09)2Si2.
References[1] P. Svoboda et al., Physica B, in press[2] F. Honda et al., Phys. Rev. B, 61(2000) 11267
T (K)0 20 40 60 80 100 120 140
B (T
)
0
2
4
6
8U(Ni0.91Pd0.09)2Si2
0.75 GPa, B//c-axis
AF-I
UA
F+A
F-I
IC
UAF
para
.
25

PHY-01-1357.doc // brandt // 16.03.04 Seite 1 von 1
EXPERIMENTAL REPORT PHY-01-1357Instrument E4Magnetic field effect on antiferromagnetic
order in Nd1.85Ce0.15CuO4Karel Prokes
Principal Proposer: Masato Matsuura, Condensed Matter SciencesDivision, Oak Ridge National Laboratory
Jan.23-30,2003July 31-Aug.7,2003
Experimental Team: Pengcheng Dai, Department of Physics andAstronomy, The University of TennesseeKarel Prokes, Hahn-Meitner-InstituteDimitri Argyriou, Hahn-Meitner-Institute
*
Date of Report: Dec.22,2003
One of the most important unresolvedproblems in the high-Tc cuprates is the nature ofcorrelated electron state at low temperature whensuperconductivity is suppressed. On application ofmagnetic field, magnetic flux penetratessuperconductor and forms vortex lattice.Theoretically, it was predicted thatantiferromagnetic (AF) orderings are induced in thevortex state. The understanding of high-Tcsuperconductivity suppressed state gives usefulinformation for all theoretical models. Throughextensive neutron scattering study on optimallydoped Nd1.85Ce0.15CuO4, we have discovered thaton application of a 7 Tesla field, the elastic intensityat(1/2,1/2,0), (1/2,3/2,0), and (1/2,0,0) areinduced at low temperature. While the observationof field induced peak at (1/2,1/2,0) or (1/2,3/2,0)suggests that antiferromagnetism compete withsuperconductivity, the field induce peak at (1/2,0,0)is puzzling because structure factor for two-dimensional AF ordered high-Tc cuprates showmagnetic scattering at (1/2,1/2,0) and (1/2,3/2,0)but not at (1/2,0,0).
Recently, Mang et al. found that theannealing process necessary to makesuperconducting Nd2-xCexCuO4 (NCCO) alsoinduces epitaxial cubic (Nd,Ce)2O3 (NO) as animpurity phase. This impurity phase is latticematched with the a-b plane of NCCO(aNO=11.1Å=2√2aNCCO, aNCCO=3.92Å) but its latticeparameter along c-axis is 10% smaller than that ofNCCO. Nuclear Bragg peaks of the impurity phaseappear at (1/2,1/2,0), (1/2,3/2,0), (1/2,1/2,2.2), etc.Since, application of magnetic field will induce aferromagnetic moment in the impurity phase at(1/2,1/2,0), (1/2,3/2,0), and (1/2,0,0), it is importantto determine how much of scattering at these peaksoriginate from the impurity phase. Here, we reportfield dependence of AF peaks of NCCO andimpurity phase up to B=14.5T.
The neutron scattering experiments wereperformed on the two-axis spectrometer E4. Thehorizontal collimation was 40'-40'-Sample-40' insequence from reactor to analyzer with fixedincident neutron energy Ei=13.6meV. Two pyrolyticgraphite filters were placed in front of the sample toeliminate higher-order contamination. We used asplit-coil superconducting magnet VM-1.
First, we measured field dependence of(1/2,0,0), (1/2,1/2,0), and (1/2,3/2,0) in the (HK0)zone where the vertical field is parallel to the c-axis.To compare the field-induced scattering from theimpurity phase with that at (1/2,0,0), (1/2,1/2,0), and(1/2,3/2,0) for B||c-axis, we realigned the crystal inthe (H,H,L) zone where the applied vertical field isalong the [1,-1,0], the cubic edge direction of(Nd,Ce)2O3. By measuring the field dependence ofthe scattering at (1/4,1/4,1.1), (1,1,2.2) and(0,0,2.2) positions, we are probing the magneticfield effect of the impurity phase on (1/2,0,0),(1/2,3/2,0), and (1/2,1/2,0) for the B||c-axisgeometry, respectively.
Figure 1 Field dependence of the integrated intensity of AF andimpurity peaks measured at 5K. The circles are data taken atNIST, while triangles and rectangles are two separateexperiments at HMI.
Fig. 1 shows the field dependence of theAF and impurity peaks. To estimate the contributionof impurity peak quantitatively, we normalizeintegrated intensity to 1 at zero field except(1/2,0,0) and (1/4,1/4,1.1) where no peaks wasfound at zero field. The (1/2,0,0) and (1/4,1/4,1.1)are normalized to 1 at 6T(~upper critical field 6.2T).We found that the impurity scattering cannotexplain observed field-induced intensity at AFpeaks (1/2,1/2,0) and (1/2,3/2,0). However, the(1/2,0,0) and impurity peak (1/4,1/4,1.1) areindistinguishable within error bars. Therefore, weconclude that while (1/2,0,0) may originate fromimpurity phase, the most of field effect at(1/2,1/2,0) and (1/2,3/2,0) is due to suppression ofsuperconductivity.
26

EF_05_shapiro.doc // brandt // 03.03.04 Seite 1 von 2
EXPERIMENTAL REPORT Proposal N° EF/SF1Instrument E4Magnetic field dependence of the marten-sitic
transformation in Ni2MnGa Local Contact K. Prokes
Principal Proposer: Stephen Shapiro, Brookhaven Nat. Lab. (BNL) Date(s) of ExperimentExperimental Team: Peter Vorderwisch, HMI-SF1
Karel Prokes, HMI-SF2 10. - 17.12.2003
Date of Report: 25.01.2004
The ferromagnetic Heusler alloy Ni2MnGa isknown to undergo a martensitic transformationfrom a face centred cubic (austenitic) phase toa face centred tetragonal (martensitic) phaseupon cooling. Deviations from the stoichiome-tric composition Ni2MnGa only slightly changethe Curie temperature TC, but have a drasticeffect on the transformation temperature TM,on the appearance of a premartensitic phase,and on the lattice structure of the martensiticphase.
Whereas composition dependent phases andtransformation temperatures have been exten-sively studied, the effect of a magnetic field ontransformation temperatures is by no meansunderstood. Experimental findings, based onvarious methods, differ in magnitude and evenin sign for the temperature change TM underequivalent magnetic fields [1,2].
Neutron diffraction is among the most accuratemethods to study structural phase changes.We have used the two-axis-diffractometer E4and the vertical magnet VM3 to performdiffraction experiments on a Ni2MnGa singlecrystal close to the stoichiometric compositionwith TM 220 K. The (vertical) magnetic fieldwas oriented along the [001] axis. We havefollowed, at a pre-set sample temperature inorder to ensure thermal equilibrium, theintensities of: (I) the (220) and (200) reflectionsin the cubic and tetragonal phases, (ii) themodulation peak (1.67 2.33 0) in the pre-martensitic cubic phase, and (iii) themodulation peak (1.6 2.4 0) in the tetragonalmartensitic phase. Applied fields were 0, 1.5and 4 Tesla. The peak intensity at eachsample temperature was determined fromsample rocking scans. Derived peak intensitiesfor all measured reflections at 1.5 Tesla aresummarised in Figs. 1 and 2. The obtainedtransition temperature TM at this field is about1.5 K lower than in zero field, a result verifiedin different temperature scans. A complete
analysis of all experimental data is presentlyperformed.
Fig. 1 Peak intensities for cooling the sampleat 1.5 Tesla through the transformation
Fig. 2 Peak intensities for heating the sampleat 1.5 Tesla through the transformation
[1] K. Ullakko et al., Appl. Phys. Lett. 69(1996) 1966
[2] I. Dikshtein et al., IEEE Transactionson Magnetics 35 (1999) 3811
27

EXPERIMENTALREPORTTitle
Name(s) Affiliation
Proposal Nº
Instrument
Local Contact
Date(s) of Experiment
Date of Report
Principal Proposer:
Experimental Team:
Frustrated magnetic moments in CePdAl in magneticfields
E4
K. Prokeš
EF
K. Prokeš HMI Berlin
K. Prokeš HMI Berlin 12.11.-16.11.200317.12.-21.12.2003
13.1.2003
CePdAl is an antiferromagneticheavy-fermion crystallizing in the hexagonalZrNiAl type of structure. Below 2.7 K itorders magnetically with propagation vector~ (0.5 0 0.35). It is reported that between 1.3and 0.6 K another propagation appears thatcould be not identified [1]. It is also reportedthat around 3.2, 3.4 and 4 T there aremetamagnetic-like transitions (field along thehexagonal axis) [2]. The latter one, to aferromagnetic state leads a magnetization thatdoes not correspond with expected Cemagnetic moment magnitude. The aim of theexperiment was to check the magnitude of Cemoments, identification of the secondpropagation vector in zero field anddetermination of magnetic structures abovethe first metamagnetic transition.
Two neutron diffraction experimentswere performed at E4 instrument with thewavelength of 2.44 Å. Magnetic field hasbeen produced in the first (second)experiment by using HM1 (HM2) horizontalmagnets. In the first experiment we useddilution stick and in the second the new 3Hesystem. Unfortunately, we have experiencedtechnical problems which prevented us tofinalize both experiments. The lowest stabletemperature was 1.0 K, resp. 1.35 K.
In Fig. 1 we show the temperaturedependence of the integrated intensity andposition (ql component of the propagationvector) of magnetic reflection (0.5 0 ql). Ascan be seen, the propagation vector decreaseswith lowering the temperature. No newreflections could be found below 1.3 K.
In Fig. 2 we show field dependence oftwo magnetic reflections. The (0.5 0 ql≈0.35)propagation vector vanish at 1.3K above the
1 2 3 40
1
2
3
Inte
nsity
(a.u
.)
T (K)
Intensity
CePdAl(0.5 0 0.355)
0.352
0.353
0.354
0.355
0.356
Position
Fig. 1:The temperature dependence of integrated intensity
and position of (0.5 0 ql) magnetic reflection.
0 1 2 3 4
0.0
0.5
1.0
1.5
2.0
2.5
Inte
nsity
(a.u
.)
0H (T)
(0.5 0 0.355) (0.5 0 0.645)
CePdAl
Fig 2: Field dependence of two magnetic reflections ofCePdAl with field applied along the c axis.
first metamagnetic transition at 3.2 T. Up to3.2 T it remains constant. This fact is ratherstriking considering the fact that thepropagation vector is temperature dependentand that it is proposed that 1/3 of the Cemoments are due to frustration paramagnetic.No other magnetic reflections could be foundin a given time above this field. Furtherstudies are clearly needed.References[1] Dönni et al., J.Phys: Cond. Matter 8 (1996)
11213[2] S. Hane et al., Physica B 281&282 (2000) 391
28

EXPERIMENTALREPORTTitle
Name(s) Affiliation
Proposal Nº
Instrument
Local Contact
Date(s) of Experiment
Date of Report
Principal Proposer:
Experimental Team:
Magnetic structures in UIrAlE4
K. Prokeš
EF
K. Prokeš HMI
J. Prchal DES, Charles University, PragueK. Prokeš HMI, Berlin
5.-10. August 2003
21.8.2003
UIrAl compound crystallizes in theZrNiAl-type hexagonal structure and isreported to exhibit a ferromagnetic (F) orderwith the Curie temperature of 64 K. Uraniummagnetic moment equals to 0.94 B [1].Newer report indicates, however TC = 62 Kand = 0.96 B [2].
Single crystal of UIrAl has beengrown by a modified Czochralski method.The magnetization was measured along theprincipal axes in the temperature range4.2-70 K in a vibrating magnetometer with asuperconducting coil providing fields up to14 T. Temperature dependence of saturatedmagnetization deduced from magnetizationcurves is shown in Fig. 1. Neutron diffractionwas performed at E4 instrument with thewavelength of 2.439 Å.
Our measurements showed the latticeparameters to be a = 692.9 pm, c = 401.0 pm,what is in a relatively good agreement withthat reported in literature [1,2]. The freeposition parameters of U and Al we found tobe xU = 0.579 and xAl = 0.243.
T (K)0 20 40 60
Ms (
B)
0.0
0.2
0.4
0.6
0.8
1.0 UIrAl
c-axis
Fig. 1: Temperature dependence of saturatedmagnetization in UIrAl [2].
With decreasing temperature below TC,intensity of few nuclear reflections increases.
This is consistent with the ferromagneticordering. Analysis of the (100) reflectionleads to the Curie temperature TC=(65 5) K.The relative-intensity temperaturedependence of the representative reflection(100) is shown in Fig. 2 together with thesquare of the magnetization [2] measuredalong c-axis. The agreement is rather good.
The peak-intensities differencesbetween low-temperature phase (T = 1.8 K)and paramagnetic state (T = 40 K) has beenused for the refinement. The direction of themoments is along c-axis as proposed inRef. [1]. The magnitude of all the momentssitting on U-sites was found to beU = (0.93 0.10) B. This is in a very goodagreement with the previously reported valueof 0.94 B (or 0.96 B, respectively).
UIrAl
T (K)0 20 40 60 80
MS2 (
B2 )
0.0
0.2
0.4
0.6
0.8
1.0
I norm
(a.u
.)
0.0
0.2
0.4
0.6
0.8
1.0
MS2 (c-axis)
Inormalised (-1 0 0 reflection)
Fig. 2: Temperature dependence of the intensity of the(100) reflection in comparison with the square ofmagnetization measured along the c-axis.
Reference[1] V. Sechovsky and L. Havela: in Handbook ofMagnetic Materials, ed. K.H.J. Buschow, vol. 11,Ch.1[2] A.V. Andreev, J. Alloys Comp. 336 (2002)77-80
29

EXPERIMENTALREPORTTitle
Name(s) Affiliation
Proposal Nº
Instrument
Local Contact
Date(s) of Experiment
Date of Report
Principal Proposer:
Experimental Team:
Metamagnetic transitions in DyNiAlE4
K. Prokeš
EF
K. Prokeš HMI Berlin
K. Prokeš HMI BerlinJ. Prchal DES, Charles University, Prague
18.8.-3.9.2003
12.1.2003
DyNiAl belongs to a large group ofRTX compounds crystallizing in theZrNiAl-type hexagonal structure, space groupP-62m (No. 189). Previous magneticsusceptibility, magnetization and neutron-diffraction studies, performed onpolycrystalline samples [1,2], showed thatDyNiAl orders ferromagnetically atTC = 31 K with the magnetic momentoriented along the c-axis and that itundergoes an order-order transition belowT1 = 15 K where an antiferromagneticcomponent described by q´= (0.5 0 0.5)appears within the basal plane. At 2 K and infields up to 14 T there are two metamagneticphase transitions along the hard a axis. Alongthe b axis there is only one, the otherprobably taking place at higher fields. Alongthe c axis only a ferromagnetic signal and nometamagnetic transitions is visible (Fig.1).
B (T)0 2 4 6 8 10 12 14
M (
B)
0
2
4
6
8
10
abc
DyNiAl
T = 2 K
Fig. 1: The magnetization curves of DyNiAl measuredwith magnetic field applied along individual axes.
To trace changes in the magneticstructure with field we have performedmeasurements on E4 applying magnetic fieldalong the b and a axis. Clear indication of the
appearance of an another magnetic structureabove ~1.5 T (see Fig. 2) exists although theAF propagation vector remains unchanged.
B (T)
0 2 4 6 8 10 12 14
Inte
nsity
(a.u
.)
0
20
40
60
80
100
120
140
1601011/2 0 1/23/2 0 3/2
DyNiAlB || b-axis
Inte
nsity
(a.u
.)
0
500
1000
1500
2000
1000013/2 0 1/2
Fig 2: Field dependence of several nuclear andantiferromagnetic reflections of DyNiAl with fieldapplied along the b axis.
The q´= (0.5 0 0.5) propagation vector doesnot vanish up to 14.5 T suggesting that thelow- and the high-field magnetic structuresdiffer in the direction of magnetic moments.When the field was applied along the hard aaxis, sample detached due to a strongmagnetic torque. This part of the experimenthas to be repeated.
These measurements have been donein frame of the Summer Student Programme2003 (J. Prchal).References[1] G. Ehlers, H. Maletta, Z. Phys. B 101 (1996)
317.[2] P. Javorský, P. Burlet, V. Sechovský,
R. R. Arons, E. Ressouche, G. Lapertot,Physica B 234-236 (1997) 665.
30

EXPERIMENTALREPORTTitle
Name(s) Affiliation
Proposal Nº
Instrument
Local Contact
Date(s) of Experiment
Date of Report
Principal Proposer:
Experimental Team:
On the magnetic structure of UIrGeE4, E6
K. Prokeš
EF
K. Prokeš HMI Berlin
K. Prokeš HMI Berlin21.1.-23.1.,20.2.-22.2.,3.3.-7.3.,10.6.-13.6.2003
12.1.2004
UIrGe belongs to orthorhombic UTXcompounds in which hybridization plays a veryimportant role. Despite of the considerable effortover last 15 years or so [1-3] it still represents oneof the most puzzling cases among compounds.Bulk properties of UIrGe point to anantiferromagnetic (AF) order below 16-18 K [1].Several neutron experiments performed bydifferent groups on powders [4] and singlecrystals [5] failed to detect magnetic signal.
Two UIrGe single crystals have beengrown from a stoichiometric melt by a modifiedCzochralski method, oriented by a LAUE X-raytechnique, and investigated at the double-axisdiffractometer E4, installed at BENSC. We usedan additional PG filter in order to reduce the /2contamination. Rather relaxed 40’-40’-40’collimation was chosen to maximize the intensity.
We have collected two identical sets (at25 and 1.8 K) consisting of 46 independentreflections of the (hk0), (h0l) and (0kl) type (eachmeasured for about 40 minutes). Fitted resulting(Gaussian profile) integrated intensities werecorrected for the Lorentz factor. A standard U3+
magnetic form factor has been assumed.Refinements of the experimental data set
taken at 25 K (above TN of 17 K), suggested thatthe crystal structure is of the TiNiSi type (Pnma),in agreement with the literature.A weak signal developing on top of few nuclearpositions below the magnetic phase transition [4]has been observed. In Fig. 1 we show thetemperature dependence of the intensity atthe(010) reflection (magnetic origin only). Searchfor magnetic signal in zero field revealed that amagnetic signal larger than the associatedstatistical error is present only on 12reflections. There are only five reflections forwhich the magnetic signal is larger than 2,and merely (201) and (010) reflections havethe signal to ratio larger than four.Knowing the propagation vector q = (0 0 0)
of all of reflclemocom0.1Ref[1] VMatNor[2]
(1[3] B[4] K[5] V[6] Rep
mr
Fig
31
0 5 10 15 20 25 30300
400
500
600
UIrGesingle crystal
(010) reflection
Inte
nsity
(Cou
nts/
90s)
T (K)
Fig. 1: Temperature dependence of the intensityeasured on top of the (010) reflection with
emoved collimator in the front of the detector.
the mathe posthe whectionsarly thadel shoponen
9 (1) µBerences
. Sechoverials, Voth-HollandR. Troć a988) 389. Cheval. Prokeš H Tran eR.A. Ro
ort, (1993
. 2: Schcry
ematic representation of the magnetic andstallographic structures of UIrGe.
gnetic structure one can constructsible models. The fitting procedureole data set containing the twelve to allowed models showed quitet the best agreement is reached forwn in Fig. 2. The a and the c axists equal at 1.8 K to 0.30 (8) and, respectively.
ský and V. Havela, in Handbook of Magneticl. 11, Ch. 1, ed. K.H.J. Buschow, (Amsterdam:, 1998) p. 1nd V.H. Tran . J. Magn. Magn. Mater. 73,.ier et al., J. Magn. Magn. Mater. 75, (1988) 13.et al., Phys. Rev. B. 60, (1999) 9532.t al., Solid State Commun. 98, (1996) 111.binson et al., MLNSC-LANSCE Progress)

PHY-01-1378_1.doc // brandt // 16.03.04 Seite 1 von 1
EXPERIMENTAL REPORT Proposal N° PHY-01-1378
Instrument E5Crystal structure of La2CuO4 andLa2−xSrxCuO4 (x = 0.01) Local Contact
M. Reehuis
Principal Proposer: B. Keimer, MPI Stuttgart Date(s) of ExperimentG. Blumberg, Bell Labs, Murray Hill, NJY. Ando, CRIEPI, Komae, Tokyo
Experimental Team: M. Reehuis, MPI Stuttgart, HMI Berlin 24.06. – 13.07.03
Date of Report: 03.12. 2003
La2−xSrxCuO4 is the simplest hightemperature superconductor and has servedas a model system for numerous theories ofhigh temperature superconductivity. A detailedmicroscopic picture of the evolution of thestructural and magnetic properties as afunction of doping has been derived fromneutron data [1]. Almost all prior work hasbeen carried out on twinned crystals. Theproperties of our untwinned samples werefound to be substantially different. This lead usto a fundamental reinvestigation of thestructural and magnetic properties.
For the experiment we used untwinnedcrystals of La2CuO4 (2.9 × 2.9 × 5.2 mm3) andLa2−xSrxCuO4 (x = 0.01) (4.2 × 3.6 × 5.5 mm3).Single-crystal diffraction data have beencollected on the instrument E5 at 325 K(La2CuO4) and 295 K (La2−xSrxCuO4 with x =0.01), respectively. The crystal structure ofboth compounds could be refined in theorthorhombic space group Bmab. Here theLa(Sr)-atoms are on the Wyckoff position 4f,the Cu-atoms on 4a, the O1-atoms on 8e andthe O2-atoms on 8f, respectively. The resultsof the refinements are summarized in Tables 1and 2. Here it can be seen that the positionaland anisotropic parameter are very similar inboth compounds.
In order to check a lower symmetry of thecrystal structure we measured reflections thatare forbidden for the orthorhombic spacegroup Bmab (B 2/m 21/a 2/b). For bothsamples we found additional weak intensitieson 0k0 with k = odd and h0l with h, l = odd.These reflection conditions imply the absenceof a 21-axis parallel to y as well as the absenceof the glide planes a and b perpendicular to yand z. On the other hand these reflectionconditions still imply the presence of a B-centred lattice, resulting at least in themonoclinic space group B2/m (B 2/m 1 1). Therefinement of the crystal structure in a lowersymmetry is still in work. Thus actually we cannot exclude a space group with even lowersymmetry as B2 (B 2 1 1) or Bm (B m 1 1).
From the refinement of the lattice parametersusing the orientation matrix we could notobserve significant changes for the angles , and from 90° indicating a monoclinic cell.
Table 1. Positional parameters and occupancies ofLa2CuO4 at 325 K and La2−xSrxCuO4 with x = 0.01(below) at 295 K. The used neutron wavelengthwas 0.8839 Å. a = 5.3568(6) Å, b = 5.4058(5) Å, c = 13.1432(11) ÅBmab x y z pop La 0 0.00670(4) 0.36148(2) 1.0001(10)Cu 0 0 0 0.9991(15)
O1 ¼ ¼ 0.00714(3) 1.0016(14)O2 0 0.03410(10) 0.18364(3) 0.9925(16)
R(F) = 0.020, 1024 (481 unique) reflections
a = 5.3528(8) Å, b = 5.3992(6) Å, c = 13.1449(15) ÅBmab x y z pop La/Sr 0 0.00653(5) 0.36142(2) 0.9979(12)Cu 0 0 0 1.0038(19)
O1 ¼ ¼ 0.00689(3) 1.0040(16)O2 0 0.03249(14) 0.18361(4) 0.9968(20)
R(F) = 0.025, 1359 (472 unique) reflections
Table 2. Anisotropic thermal parameters ofLa2CuO4 at 325 K and La2−xSrxCuO4 with x = 0.01(below) at 295 K.
U11 U22 U33 U12 U23La 0.69(2) 0.63(1) 0.47(1) 0 0.04
Cu 0.35(2) 0.29(1) 0.90(2) 0 0.03(1)O1 0.65(2) 0.57(1) 1.46(2) 0.19(2) 0O2 2.14(3) 1.58(2) 0.66(2) 0 0.10(1)
U11 U22 U33 U12 U23La/Sr 0.68(2) 0.56(1) 0.35(1) 0 0.04
Cu 0.28(2) 0.27(1) 0.79(2) 0 0.01(1)O1 0.65(2) 0.49(1) 1.36(2) 0.20(2) 0O2 2.07(3) 1.59(2) 0.59(2) 0 0.06(1)The thermal parameters Uij (given in 100 Å2) are in the formexp[22(U11 h2a*2 …2U13 hla*c*)]. For symmetry reasonsthe values U13 are equal to zero in this structure.
[1] For a review, see M.A. Kastner, R.J. Birgeneau, G.Shirane, Y. Endoh, Rev. Mod. Phys. 70 (1998) 897.
32

PHY-01-1378_2.doc // brandt // 09.03.04 Seite 1 von 1
EXPERIMENTAL REPORT Proposal N° PHY-01-1378
Instrument E5Magnetic structure of La2CuO4
Local Contact M. Reehuis
Principal Proposer: B. Keimer, MPI Stuttgart Date(s) of ExperimentG. Blumberg, Bell Labs, Murray Hill, NJY. Ando, CRIEPI, Komae, Tokyo
Experimental Team: M. Reehuis, MPI Stuttgart, HMI Berlin 25.08. – 03.09.03
Date of Report: 04.12. 2003
Almost all prior work on the systemLa2−xSrxCuO4 has been carried out on twinnedcrystals. A neutron diffraction study carried outon E5 has shown that the lattice structure ofuntwinned La2CuO4 single crystals isdescribed by a monoclinic space group, ratherthan the Bmab group found in twinnedLa2CuO4 [1]. Therefore we also reinvestigatethe magnetic structure of the Cu-sublattice.Pure La2CuO4 is a Mott insulator that ordersantiferromagnetically at 310 K as determinedfrom susceptibility measurements [2]. Themagnetic properties are strongly dependent onthe heat treatment of the samples. Oxygenvacancies in the crystal can lower the orderingtemperature down to 50 K [3].
For the experiment an untwinned singlecrystal of La2CuO4 (2.9 × 2.9 × 5.2 mm3) hasbeen used. Diffraction data were collected onthe instrument E5 between 10 K and 325. Asobserved in Ref. [3] the strongest magneticintensity could be observed on the position ofthe Bragg reflection 100. In Fig. 1 it can beseen that the magnetic intensity of thismagnetic reflection vanishes at the Néeltemperature TN = 320(4) K. This temperature isin good agreement with the value obtainedfrom susceptibility measurements [2]. Thepresence of the reflection 100 indicates thatthe magnetic moments of the Cu atoms(Wyckoff position 4a) in 0,0,0 (1), 0,½,½ (2),½,0,½ (3) and ½,½,0 (4) order with a spinsequence (in Bmab) and a momentdirection parallel to the b- and/or c-axis. Ourrefinements finally showed that the magneticmoments are aligned parallel to the b-axis. Onthe other hand one could expect an additionalcomponent of the moment along the a- and/orc-axis with spin sequences and/or . These types of ordering can be excluded,since we could not detect any magneticintensity on the positions of the reflections 010,001, 110 and 101. The magnetic moment perCu atom as obtained from the refinements isexp = 0.426(7) B resulting in a residual RF(mag)
= 0.030. Here we used the structure factors ofthe strongest magnetic peaks given in Table 1.
0 50 100 150 200 250 3000
200
400
600
800
1000
1200
1400
1600 La2CuO4
001 and 110 are absent
010101
011
100
Inte
nsity
(cou
nts)
T (K)
Fig. 1. Temperature dependence of the integratedintensity of the Bragg reflections 100, 010, 101 and011.
Table 1. Observed and calculated magneticstructure factors of La2CuO4.
hkl F 2obs F 2cal
100 0.172 0.180011 0.027 0.025102 0.162 0.162103 0.103 0.087
[1] B. Keimer, G. Blumberg, Y. Ando, M.Reehuis, BENSC Experimental Reports2003, present Volume.
[2] A.N. Lavrov, Y. Ando, S. Komiya, I.Tsukada, Phys. Rev. Lett. 87 (2001)017007.
[3] T. Freltoft, J.E. Fischer, G. Shirane, D.E.Moncton, S.K. Sinha, D. Vaknin, J.P.Remeika, A.S. Cooper, D. Harshman, Phys.Rev. B 36 (1987) 826.
33

PHY-01-1380_1.doc // brandt // 16.03.04 Seite 1 von 1
EXPERIMENTAL REPORT Proposal N° PHY-01-1380
Instrument E5Crystal and magnetic structure of TbVO3 Local Contact M. Reehuis
Principal Proposer: C. Ulrich, B. Keimer, MPI Stuttgart Date(s) of ExperimentExperimental Team: M. Reehuis, MPI Stuttgart, HMI Berlin
C. Ulrich, MPI Stuttgart 17.02. – 06.03.03
Date of Report: 04.12. 2003
Vanadates with the formula RVO3 (R = rareearth element) exhibit many exciting propertieswhich can be related to orbital or spinrearrangements. YVO3 for example exhibitstwo different magnetic phase transitions. In aprevious study we were able to explain theunusual properties of one of these phases bynovel orbital fluctuations [1]. In this experimentwe have extended our investigations to TbVO3.
A large single crystal (3 × 3 × 4 mm3) ofTbVO3 was grown by the floating zonetechnique [2]. Data were collected on the four-circle diffractometer E5. The crystal structureat 10 K, 80 K, 160 K and 295 K could berefined in the orthorhombic space group Pbnm.Here the Tb- and O1-atoms are on the Wyckoffposition 4c, the V-atoms on 4b and the O2-atoms on 8d. The results of the refinements ofthe 10 K data are summarized in Table 1.
Table 1. Positional and thermal parameters ofTbVO3 measured at 10 K. The used neutronwavelength was 0.8839 Å. The value Bis of thevanadium was fixed during the refinements. a = 5.3435(9) Å, b = 5.6042(10) Å, c = 7.5584(9) ÅPbnm x y z Bis [Å2]Tb 0.0174(1) 0.0652(1) ¼ 0.14(2)V ½ 0 0 0.2 O1 0.1048(2) 0.4653(2) ¼ 0.29(2)O2 0.3059(2) 0.3020(2) 0.0542(1) 0.37(2)
R(F) = 0.037, 376 (unique) reflections
Below the Néel temperature TN = 117 Kmagnetic intensities could be detected on thepositions of the crystallographyically forbiddenreflections 100 and 010. This satisfies thereflection condition for the mode C( ) forthe V-atoms in the positions ½,0,0; ½,0,½;0,½,0; 0,½,½, respectively. The refinements ofa data set collected at 73 K confirmed analignment of the vanadium moments in the ab-plane: x = 0.83(7) B and y = 0.94(7) B [exp
= 1.25(6) B]. For the isotypic compound YVO3the same type of ordering was observed in theab-plane, but the presence of an additional Gzcomponent in YVO3 showed that the spins are
canted out of the ab-plane by 16.50. This is notthe case for TbVO3.
Below 13 K the spins of the terbium atomsorder spontaneously. The presence of the verystrong reflection 010 and the absence of 100and 001 confirm an antiferromagnetic order ofthe terbium moments along the a-axis with themode Cx. Further, the presence of 200 and 002and the absence of 020 suggests an additionalferromagnetic component (Fy) along the b-axis.For the magnetic moments we obtain x =6.08(11) B and y = 5.03(14) B. The totalterbium moment exp = 7.89(13) B is thereforesomewhat smaller than the theoretical value ofa free Tb3+-ion, exp = 9.0 B.
Fig. 1. Temperature dependence of theintegrated intensities of the magnetic Braggreflections 100 and 010.
[1] C. Ulrich, G. Khaliullin, J. Sirker, M. Reehuis, M. Ohl,S. Miyasaka, Y. Tokura, B. Keimer, Phys. Rev. Lett.,in print.
[2] S. Miyasaka, Y. Okimoto, M. Iwama, and Y. Tokura,Phys. Rev. B 68, 100406(R) (2003).
1
10
100
1000
10000
0 50 100 1500
200
400
600
800
1000
1200
1400
0 50 100 150
100
Inte
nsity
(c
ount
s / 1
0 se
c) 010
TbVO3
100
Inte
nsity
(c
ount
s / 1
0 se
c)
T (K) T (K)
010
34

PHY-01-1380_2.doc // brandt // 09.03.04 Seite 1 von 1
EXPERIMENTAL REPORT Proposal N° PHY-01-1380
Instrument E5Antiferromagnetic order in NdVO3 Local Contact M. Reehuis
Principal Proposer: C. Ulrich, B. Keimer, MPI Stuttgart Date(s) of ExperimentExperimental Team: M. Reehuis, MPI Stuttgart, HMI Berlin
C. Ulrich, MPI Stuttgart 29.09. – 09.10.03
Date of Report: 04.12. 2003
Rare-earth orthovanadates exhibit outstan-ding physical properties like novel one-dimen-sional orbital fluctuations observed in YVO3 [1].In this study we have extended ourinvestigations to determine the magneticstructure of NdVO3, which, in contrast to YVO3,shows only one magnetic phase transition [2].
Large single crystal of NdVO3 were grownby the floating-zone technique [2]. We haveinvestigated a crystal with a volume of 36 mm3
on the four-circle diffractometer E5 using theneutron wavelength = 2.33 Å (PG). Fromdata sets collected at 10 K, 150 K and 295 Kthe crystal structure could be refined in theorthorhombic space group Pbnm. Anti-ferromagnetic order of the V3+-ions sets in atthe Néel temperature TN = 135 K. In Fig. 1 itcan be seen that the magnetic intensity of theBragg peaks 100, 010, 102 and 012 increasespontaneously below this temperature. TheNd-moments order at a much lower tem-perature. At about 65 K the magnetic intensityof the reflections 100, 010 and 012 show anadditional increase, whereas the intensity of102 decreases. This can be ascribed to anantiferromagnetic order of the Nd-sublattice,which is gradually induced by the antiferro-magnetic order of the vanadium sublattice.
The magnetic structure of the V3+-sublatticehas been refined from a data set collected at88 K. Here the magnetic moments of the V-atoms were found to be aligned within the ab-plane: x = 0.48(2) B and y = 0.79(2) B [exp
= 0.92(1) B]. Along both directions in the ab-plane the V-atoms show the spin sequence(C-mode). By extrapolation we expectmoments at 10 K of x = 0.61(2) B and y =0.98(2) B [exp = 1.16(1) B]. This is muchsmaller than the moment of 2 B for a free V3+-ion. The large reduction of the magneticmoment suggests the presence of orbitalfluctuations as observed in YVO3 [1].
From the data set collected at 10 K we wereable to determine the magnetic structure of theNd-sublattice. Here, we also obtain a C-typemagnetic order, but that the coupling between
the Nd- and V-moments are different in signalong the b-axis (see Table 1). From therefinements of the magnetic structure weobtained values of x = 0.21(3) B and y =0.42(3) B for the Nd-ions. The experimentalmoment exp = 0.47(4) B is much smaller thanthe theoretically expected moment of eff =3.62 B of a free Nd3+-ion.
0
500
1000
1500
2000
2500
50 100 1500
200
400
600
800
1000
1200
1400
1600
1800
0 50 100 1500
500
1000
1500
2000
2500
3000
0
1000
2000
3000
4000
5000
6000
7000
010
Inte
nsity
(c
ount
s / 1
0 se
c)
102
T (K)
012
Inte
nsity
(c
nts
/ 10
sec)
T (K)
100
Fig. 1. Temperature dependence of theintegrated intensities of the magnetic Braggreflections 010, 100, 012 and 102.
Table 1. Spin sequences of the V- and Nd-moments along the x- and y-axis.
Nd x y V x yx, y, ¼ ½ , 0, 0
x, y, ¾ ½ , 0, ½
½ x, ½ y, ¼ 0, ½ , 0
½ x, ½ y, ¾ 0, ½ , ½
[1] C. Ulrich, G. Khaliullin, J. Sirker, M.Reehuis, M. Ohl, S. Miyasaka, Y. Tokura,and B. Keimer, Phys. Rev. Lett., in press.
[2] S. Miyasaka, Y. Okimoto, M. Iwama, and Y.Tokura, Phys. Rev. B 68, 100406(R) (2003).
35

EF_10_Ulrich.doc // brandt // 15.03.04 Seite 1 von 1
EXPERIMENTAL REPORT Proposal N° Eigenf.
Instrument E5Antiferromagnetic order in LaVO3 Local Contact M. Reehuis
Principal Proposer: C. Ulrich, B. Keimer, MPI Stuttgart Date(s) of ExperimentExperimental Team: C. Ulrich, MPI Stuttgart
M. Reehuis, MPI Stuttgart, HMI Berlin 09.10. – 19.10.03
Date of Report: 04.12. 2003
Vanadates with the perovskite structure(RVO3; R = rare earth ion) exhibit a multitudeof exciting properties like metal-insulatortransitions or temperature induced magneti-zation reversals. In a previous study we haveinvestigated YVO3, which has two magneticphases, a G-type and a C-type phase. The C-type phase exhibits unusual static anddynamic magnetic properties [1]. We were ableto identify this phase, using a novel theoreticalmodel with one-dimensional orbital fluctu-ations, as an ‘orbital Peierls’ state [1]. In orderto confirm our theoretical model we haveextended or studies to LaVO3, which alsopossesses the C-type magnetic structure.
LaVO3 shows a structural and magneticphase transition at about 140 K. Above thistemperature the compound crystallizes in theorthorhombic space group Pbnm [2] and belowin the monoclinic one P21/a. Due to therelatively large La3+-ion the distortion from theideal cubic structure is quite small. This maybe the reason that some sort of growth stresscauses a crystallisation in other directionsresulting multiple twins. In contrast to thelanthanum vanadate the compounds NdVO3,TbVO3 and YVO3 are available in form ofsingle crystals.
A large crystal of LaVO3 (about 40 mm3)was grown using the travelling-solvent floating-zone technique [3]. Our investigations showedthat the crystal was polydomain. Elasticneutron scattering experiments wereperformed on the four-circle diffractometer E5,using a neutron wavelength of = 2.33 Å (PG).In order to determine structural and magneticphase transitions, we have measured thetemperature dependence of the integratedintensity of the reflections 100 and 202. Thespontaneous increase of the reflection 100 canbe ascribed to the magnetic ordering of thevanadium spins; the increase of the intensity of202 to the structural phase transition from theorthorhombic to the monoclinic phase. Figure 1shows that the structural phase transitionoccurs at 145 K, whereas the magnetic phase
transition occurs at the lower temperature of143 K.
As observed for NdVO3 and TbVO3 [4] theV3+-sublattice in the lanthanum compoundshows a magnetic order of C-type. Due to themultiple twinning of the sample, the direction ofthe moments could not be determined.However, the magnetic structure of LaVO3 maybe expected isotypic to that of the Nd- and Tb-vanadate, where the moments are perfectlyaligned within the ab-plane. In contrast, in theC-type phase of YVO3 the spins are canted outof the ab-plane by about 16.50.
Fig. 1. Temperature dependence of theintegrated intensities of a magnetic (100) and astructural (202) Bragg reflection.
[1] C. Ulrich, G. Khaliullin, J. Sirker, M. Reehuis, M.Ohl, S. Miyasaka, Y. Tokura, and B. Keimer,cond.-mat./0211589; Phys. Rev. Lett. in press.
[2] P. Bordet, C. Chaillout, M. Marezio, Q. Huang,A. Santoro, S.-W. Cheong, H. Takaki, C.S.Oglesby, P. Batlogg, J. Solid State Chem. 106(1993) 253.
[3] S. Miyasaka, Y. Okimoto, M. Iwama, and Y.Tokura, Phys. Rev. B 68, 100406(R) (2003).
[4] M. Reehuis, C. Ulrich, and B. Keimer, BENSCExperimental Reports 2003, present Volume.
130 135 140 145 150 155 1600
40
80
120
160
70000
80000
90000
T [K]
LaVO3
(1 0 0)
Inte
nsity
(c
ount
s / 2
0 se
c)
(2 0 2)
36

PHY-01-1211.doc // brandt // 03.03.aa Seite 1 von 1
EXPERIMENTAL REPORT Proposal N° PHY-01-1211Instrument E6The low temperature magnetic phases of
CeNi1-xCux Local Contact J. Hernández Velasco
Principal Proposer: N. Marcano, CITIMAC,Univ. Cantabria Date(s) of ExperimentExperimental Team: N. Marcano, J. C. Gómez Sal, CITIMAC, U.C.
J. Hernández Velasco, HMI Berlin15-21.1.20031-6.4.2003
Date of Report: 26.9.2003
This paper is a part of a work devoted tocomplete the research in the magneticstructures of the CeNi1-xCux series [1]. In thepresent work we have performed neutrondiffraction experiments in x= 0.4 and 0.5samples which are classified as ferromagnetsat very low temperatures evolving to aninhomogeneous spin glass state at highertemperatures as has been observed by AC-DCmagnetization and SR measurements [2].The aims of the experiment in thediffractometer E6 were determining themagnetic structure and the magnetic momentvalue of the CeNi1-xCux samples x= 0.4 and0.5. Powder samples of 8 grams weremounted using a 3He-4He dilution stick. For x=0.5 we have obtained spectra from 2Theta=5-85 at 15K, 1.5K, 500mK and 50mK. Eachspectrum took 15 hours in order to get goodstatistics except the lowest temperature thattook 30 hours due to the low magnetic signalexpected. Technical problems, however, didnot allow us to obtain reasonable results fromthese measurements using the Variox cryostat,i.e. no difference between dilution and basetemperature diffraction patterns was observed,but the experimental period was split due tomalfunction of one dilution stick.
In the second period, same sampleswere mounted in the cryomagnet VM3 using a3He-4He dilution stick. Diffraction patterns werecollected at 5K and 40mK with no applied fieldfrom 2Theta= 5-85 for x= 0.5 compound. Thebest Rietveld analysis leads to a FeB- typestructure and to a simple collineararrangement for T= 40mK with the magneticmoments of the four Ce ions within the unit cellalong the b axis. Magnetic contribution to theneutron diffraction pattern is displayed inFigure 1. The magnetic moment valueobtained was 0.5B. The strong reductionrespect to the free ion value of Ce3+(2.14B)shows the strong Kondo interaction present inthis compound. The evolution of this structureunder applied field at 40mK is also underanalysis.
For x= 0.4 compound, in the first periodwe obtain also two spectra at 40mK and 5Kfrom 2Theta= 5-85. In this case, however, nonoticeable differences in the diffractionpatterns were found which could be related tothe even stronger reduction of the Ce3+
magnetic moment. In order to look for anyevidence of ferromagnetic order, diffractionpatterns were collected in the second period at40mK under different applied magnetic fields(0, 2.5, 3.5, 4.5 and 5T). In search of anyhysteresis effect, we have measured again at40mK and zero field after removing the appliedfield. Reflections increase in intensity, whichsupports the existence of a ferromagneticcomponent in CeNi0.6Cu0.4 at very lowtemperature.
Figure 1.- Magnetic contribution to the neutrondiffraction pattern for CeNi0.5Cu0.5 obtained bysubtracting 40mK and 5K patterns at H=0. Verticalmarks correspond to position of Bragg reflections fromthe ferromagnetic collinear structure.
References
[1] J.I. Espeso et al, Eur. Phys. J. B, 18 (2000) 625.[2] N. Marcano et al, to appear in Phys. Scripta B,October 2003.
25 30 35 40 45 50 55 60 65
Inte
nsity
(arb
.Uni
ts)
2Theta (degrees)
(010
) (10
1)
(110
)(2
00)
(011
)
(201
)(1
11)
(002
)(2
10)
(102
)(2
11)
(300
) (012
)
CeNi0.5Cu0.540mK-5K
37

EXPERIMENTAL REPORT
Magnetic order in CeCu2Si2
Proposal NPHY-01-1278
Instrument E6
Local Contact
N. Stußer
Date(s) of Experiment
3.-9.2.2003
Principal Proposer: E. Faulhaber, IAPD, TU Dresden
Experimental Team: O. Stockert, Max Planck Institute CPfS Dresden
Date of Report12.3.2003
The heavy-fermion compound CeCu2Si2 isstill of considerable interest due to the inter-play of unconventional superconductivity andthe magnetically ordered A phase. Neutrondiffraction has failed in observing any magneticorder in CeCu2Si2 so far. This is partly becauseof the fact that only powder or very small sin-gle crystals were available. However, due to im-proved sample preparation large single crystalsof high quality with masses up to a few hun-dred mg are now available. A second importantstep towards the observation of magnetic orderin CeCu2Si2 was our previous investigation ofthe doped system CeCu2(Si1−xGex)2 [1]. Wecould follow the antiferromagnetic order startingfrom high Ge concentrations (x = 0.5) down tox = 0.05 where the propagation vector changesonly slightly from τ ≈ (0.277 0.277 0.51) forx = 0.5 to τ ≈ (0.22 0.22 0.55) for x = 0.05.
With this knowledge we started our investi-gation of the magnetic order in CeCu2Si2 on alarge single crystal with a mass m ≈ 340mg onthe diffractometer E6 at temperatures betweenT = 50mK and 1K. Using the (h h l) planeas scattering plane we recorded intensity mapsof reciprocal space, mainly around the positionswhere we expected magnetic intensity from thelowly doped CeCu2(Si1−xGex)2.
Unambigiously, antiferromagnetic peaks wereobserved at Q = (0.22 0.22 1.48) and symme-try equivalent positions at the lowest tempera-ture T = 50mK, but were absent at T = 1K.An analysis yields a propagation vector τ ≈
(0.22 0.22 0.52) close to the values found fordoped CeCu2(Si1−xGex)2. The magnetic orderseems to be determined by nesting since cal-culations of the Fermi surface predict nestingfor q ≈ (0.23 0.23 0.5) [2], in close agreementwith the experimental results for the propaga-
0 0.2 0.4 0.6 0.8T (K)
0
100
200
300
400In
tegr
ated
Inte
nsity
(ar
b. u
nits
)
CeCu2Si2(0.22 0.22 1.48)
38.2
38.4
38.6
38.8
39
39.2
39.4
Pea
k po
sitio
n ω
(o )
Figure 1: Temperature dependence of the in-tegrated intensity (lower panel) and the posi-tion (upper panel) of the (0.22 0.22 1.48) mag-netic satellite peak in CeCu2Si2 as determinedby rocking scans.
tion vector. Fig. 1 shows the temperature de-pendence of the integrated intensity and thepeak position of the (0.22 0.22 1.48) magneticpeak. The magnetic intensity vanishes at around800mK in close agreement with specific heatmeasurements yielding the Neel temperature tobe TN ≈ 860mK. The peak position (in anglespace) moves with temperature below TN mostlikely due to the change of the Fermi surfaceand/or the chemical potential with temperature,but remains constant below T ≈ 350mK indicat-ing a possible lock-in transition.
[1] O. Stockert et al., Proceedings of SCES 2002in Krakow, to be published in Acta PhysicaPolonica B.
[2] G. Zwicknagl, unpublished results.
38

CHE-01-1279.doc // brandt // 16.03.04 Seite 1 von 1
EXPERIMENTAL REPORT Proposal N° CHE-01-1279
Instrument E6New Nitrogen CompoundsLocal Contact N. Stüßer
Principal Proposer: G. Auffermann, R. Kniep, MPI CPfS DresdenR. Niewa, M. Kirchner, MPI CPfS Dresden Date(s) of Experiment
Experimental Team: G. Auffermann, MPI CPfS DresdenJ. Hernandez-Velasco, N. Stüßer, HMI Berlin 26.05.-29.05.2003
Date of Report: 18.12.2003
The compound (Ce3N)In crystallises in the anti-perovskite type structure [1]. The composition(Ce3N0.9)In was deduced from chemical analyses aswell as from X-ray and neutron powder diffractionon microcrystalline samples at ambient temperature(a = 504,72(1) pm, Pm3m) [2]. A neutron diffract-ion experiment carried out on (Ce3N0.9)In at 1.5 K(Fig. 1) showed that additional strong reflectionsappear, which can be explained by a spin structurewith an antiferromagnetic ordering (kmag = ½ ½ ½,I-centred unit cell: a = 1007.58(7) pm) [3]. Thisresult is in agreement with data from magneticsusceptibility measurements indicating an antiferro-magnetic ordering between 6 K and 10 K.
Fig. 1: Neutron diffraction patterns of (Ce3N0.9)In ( = 179.775(9) pm) at 298 K (black) and 1.5 K(blue) without external field.
Additionally, magnetisation measurements show aninteresting metamagnetic behaviour of (Ce3N0.9)In.The magnetisation per formula unit as a function ofthe external field is depicted in Fig. 2 for differenttemperatures. To analyse the behaviour of the spin-structure at different magnetic fields, i. e. the mag-netic phase diagram, neutron powder diffractionexperiments were performed at T = 1.8 K (wellbelow TN) in zero field and after applying anexternal field of H = 5 T (see Fig. 3). Besides thedisappearance of several magnetic reflections in thepattern, some nuclear reflections change in intensityindicating a transition from a simple antiferro-
magnetic spin-structure to one with ferromagneticcontributions. The analysis of the magnetic struc-tures is still in progress.
Fig. 2: Magnetisation per formula unit of(Ce3N0.9)In as a function of the external magneticfield at different temperatures.
Fig. 3: Neutron diffraction patterns of (Ce3N0.9)In( = 245.2(1) pm) at 1.8 K without external field(blue) and in an external field of H = 5 T (green).
References[1] M. Kirchner, W. Schnelle, F. R. Wagner, R. Niewa,
Solid State Sci. 2003, 5, 1247.[2] G. Auffermann, R. Kniep, Y. Prots, R. Niewa,
M. Tovar, BENSC Exp. Rep. 2001, HMI-B584, ISSN0936-0891, 102.
[3] G. Auffermann, R. Kniep, R. Niewa, M. Kirchner, N.Stüßer, J. Hernandez-Velasco, D. Többens,BENSC Exp. Rep. 2002, HMI-B590, ISSN 0936-0891,51.
39

PHY-01-1281.doc // brandt // 09.03.04
EXPERIMENTAL REPORT Proposal N° PHY-01-1281
Instrument E6On the two magnetic order parameters ofyttrium iron garnet (YIG) Local Contact
N. Stüßer
Principal Proposer: U. Köbler, IFF, FZ-Jülich Date(s) of ExperimentExperimental Team: U. Köbler, IFF, FZ-Jülich
A. Hoser, Institut für Kristallographie, RWTH-Aachen
27.01. - 02.02.2003
Date of Report: 15.12.2003
The cubic garnet Y3Fe5O12 belongs to theuniversality class with isotropic interactions and ahalf-integer spin (S=5/2) [1]. In this universalityclass two magnetic ordering structures can occur[2]. These must be identified as different orderparameters if the associated phase transitions aredifferent. The moment orientations of the two orderparameters are orthogonal. YIG fits this systematic. The orthogonality offerromagnetic (F) and antiferromagnetic (AF)component reveals clearly from the crossover of theparamagnetic susceptibility. Fig.1 reproducesearlier susceptibility data. At high temperatures theexpected Curie-Weiss law with Θ0 is observed.On approaching TN crossover to the Curie-Weisslaw of the F component occurs. The steeper slopeof -1 corresponds to ~1/5 of the total moment.Note that near TN the AF component isperpendicular to the field.In a first study of YIG (PHY-01-1219) theorthogonality of the two order parameters wasconfirmed. Fig.2 compares our data of thesublattice magnetization with literature data for thespontaneous magnetization on a T2 scale. It revealsthat the Curie transition of the F component iscontinuous but the Néel transition of the AFcomponent is discontinuous. Note that we haveassumed that the ferromagnetic moment componentof ~1/5 contributes only by 0.04 to the neutronscattering intensities and can be neglect.In the present experiment we have observed a fieldinduced first order orientational transition of thesublattice magnetization in the configuration Bo //Q. Fig.3 shows that in contrast to the sublatticemagnetization the macroscopic magnetizationshows no hysteresis and no phase transition. Thisalso demonstrates the mutual independence of thetwo orthogonal magnetic structures of YIG at leastfor Bo0.
References :[1] U. Köbler et al. Physica B 328 (2003) 276.[2] U. Köbler et al. J. Phys.: Cond. Matter 13 (2001) 6835.
0.0 0.2 0.4 0.6 0.8 1.00.0
0.2
0.4
0.6
0.8
1.0
S = 5 / 2Y 3 Fe 5 O 12
T / T N1.00.80.60.40.2
m ;
h hf ;
( I /
I 0 ) 0
.5
( T / T N ) 2
57Fe NMR magnetization R. Pauthenet ( 1982 ) magnetization P. Hansen et al. ( 1983 ) neutron scattering ( 211 )
40
( I /
I ) 1
/ 2
Fig.1.
0.0 0.1 0.2 0.30.0
0.1
0.2
0.3
0.4
0.5
0.6
0.7
0.8
0.9
1.0
0
B 0 ( Tesla )
YIGT = 2 K
neutron scattering
magnetization
B 0 || q
Fig. 3.
Fig. 2.
Seite 1 von 1

PHY-01-1283.doc // brandt // 09.03.04
EXPERIMENTAL REPORT Proposal N° PHY-1-1283Instrument E6Spin structure in HoAgLocal Contact N.Stüßer
Principal Proposer: K. Hense, Inst. f. Festkörperphysik TU-Wien Date(s) of ExperimentExperimental Team: K. Hense, Inst. f. Festkörperphysik TU-Wien
E. Gratz, Inst. f. Festkörperphysik TU-WienA. Hoser, Inst. f. Kristallographie, RWTH-Aachen
25.02. – 02.-03.2003
Date of Report: 10.12.2003
HoAg is an intermetallic compound whichcrystallizes in the cubic CsCl – type structurewith a Neel temperature of 33K. In theliterature it has been shown that the magneticunit cell is basically tetragonal with cell edgescmag = 2a0 and amag = a0 (a0 = 3.594Å, the cubiccell constant at room temperature). The modelfor the magnetic ordering is a sinusoidallymodulated transverse spin wave propagation inthe tetragonal [100] direction with the momentspolarized in the c – axis direction. Themodulation wave lenght of 48±2Å isincommensurate with the crys-tallographic unitcell and does not vary with temperature [1].From our bulk property studies at the TUVienna (magnetoresistance, magnetisation andmagnetostriction experiments) on a poly-crystalline sample material we constructed thephase boundaries in the magnetic phasediagram up to about 9T. From this it followsthat the zero field magnetic structure obviouslychanges near to 6T in the range 2K<T<20K[2]. In our E6 experiments in fields up to 6.5Tthis boundary in the magnetic phase diagrammhas been confirmed. As can be seen from theneutron diffraction pattern at 2.1K in fields up to 6.5T (see figure 1) the four-fold splitting ofthe magnetic (311)M reflection changes into atwo-fold splitting with a simultaneous increaseof the magnetic intensity on the nuclear peaks.Fgure 2 shows the increase of the nuclearintensity of the (100)-reflection with the field.As far as we have finished the analysis of thesedata it appears that the 6T boundray marks theonset of commensurate magnetic structure inthis higher field region.We performed now neurton experiments infield up to 14T which will shed more light onthe magnetic structure in this region.
2 Theta
T=2.1K
O T
3 T
6.5 T
5.5 T
(200)N
(311)M
0 T3 T5.5 T6.5 T
T=2.1 K(100)
2 Theta
Refer(2) N(2) J.
Fig. 1 The splitting of the (311)M magnetic reflexionwith the field
Fig. 2 The increase of the intensity of the (100) with
41
Seite 1 von 1ences. Nereson, AIP Conf. Proc., No.5 (1972) 669.
Enser, Diplomarbeit TU Wien (2000)
the field

PHY-01-1284.doc // brandt // 17.03.04 Seite 1 von 1
20 40 60 80 100
Nucl.Magn.Imp.
2 [deg.] 2 [deg.]
Er3Co8Sn4
2 [deg.]
20 40 60 80
Ho3Co8Sn4
20 40 60 80 100
Tb3Co8Sn4
EXPERIMENTAL REPORT Proposal N° PHY-01-1284Instrument E 6Neutron diffraction studies of magnetic
ordering in R3Co8Sn4 (R-rare earth)compounds.
Local Contact J. Hernandez-Velasco
Principal Proposer: L. Gondek1 Date(s) of ExperimentExperimental Team: L. Gondek1 S. Baran1
J. Hernandez-Velasco, HMI Berlin1Institute of Physics, Jagiellonian University,Reymonta 4, 30-059 Krakow, Poland
29 Apr – 5 May 2003
Date of Report: 23 Oct 2003
Ternary rare-earth intermetalliccompounds of the R3Co8Sn4 family areextensively studied owing to their potential useas permanent magnets. So far, onlycrystallographic and magnetic data werepublished for several compounds of thatfamily. In this report the neutron diffractionmeasurements results for R3Co8Sn4 (R=Y, Tb,Ho, Er) are reported [1]. The neutron-diffraction data collected in the paramagneticstate at 100 K for R=Y, 120 K for R=Tb, 85 Kfor R=Ho, and 60 K for R=Er, confirmed theP/63mc crystallographic structure. Using thelow-temperature (at 1.5 K) neutron-diffractionspectra, the crystal and the magnetic structureof the investigated compounds weredetermined (see figure for diffraction patternsand table for crystal cell parameters at 1.5 K).The Tb3Co8Sn4 compound was found to be aferromagnet with TC of 90 K. At 1.5 K the Tbmagnetic moments of 6.6(2) µB lie along the a-axis. That structure is stable up to the Curietemperature. For compound with holmium, amore complicated magnetic structure must beintroduced. The Ho magnetic moments of7.5(1) µB form a noncollinear structure withinthe ab-plane at 1.5 K. Atabout 30 K a reorientation ofHo moments in the ab-planeoccurs. The Tb atoms formferromagnetic quasi chains.For these two compounds themagnitude of the rare-earthmagnetic moment is lowerthat the theoretical value. Inthe case of Er3Co8Sn4,ferromagnetic ordering alongthe c-axis is visible. The Ermagnetic moments are equalCompound a [Å] c [Å]Y3Co8Sn4 8.834(3) 7.438(2)Tb3Co8Sn4 8.820(2) 7.424(2)Ho3Co8Sn4 8.793(2) 7.406(2)Er3Co8Sn4 8.757(1) 7.385(2)
to 8.4(2) µB, which is only slightly lower than thevalue for the free R3+ ion. For that compound,the magnetic contribution of the ErCoSnimpurity was detected and indexed. In order toclarify the Co magnetic structure additionalhigh-statistic diffractograms of Y3Co8Sn4 in theordered phase at 1.5 K and in the paramagneticphase at 100 K were collected. Unfortunately, itturns out that the Co magnetic moment is fartoo small to give a magnetic contribution to thecollected spectra. We made a simulation toestimate its value on the basis of the spectra. Itmust be much smaller than 0.3 µB. This isconsistent with performed TB-LMTOcalculations where the Co magnetic moment islower than 0.17 µB.The changes in the rare-earth magneticmoment orientation perpendicular to the c-axisfor R=Tb and Ho, or parallel to it for R=Er,seem to be connected with changes in the signof B0
2 crystalline electric field (CEF) parameter.
[1] L. Gondek, A. Szytula, S. Baran, A. Szajek, J.Hernandez-Velasco, Physica B, accepted for press.
42

PHY-01-1368.doc // brandt // 09.03.04 Seite 1 von 1
EXPERIMENTAL REPORT Proposal N° PHY-01-1368Instrument E 6Neutron diffraction studies of non-
stoichiometric RNi(1-x)In(1+x) compounds (R-rare earth).
Local Contact J. Hernandez-Velasco
Principal Proposer: L. Gondek1 Date(s) of ExperimentExperimental Team: L. Gondek1 S. Baran1
J. Hernandez-Velasco, HMI1Institute of Physics, Jagiellonian University,Reymonta 4, 30-059 Krakow, Poland
02-06 Oct 2003
Date of Report: 23 Oct 2003
Polycrystalline samples of HoNi0.8In1.2,ErNi0.9In1.1 and DyNi0.9In1.1 were investigatedby neutron diffraction experiment [1].Previously published data for stoichiometric 1-1-1 compounds indicate that HoNiIn andErNiIn compounds are ferromagnets (orderingalong the c-axis) with TC of 22 K and 9 Krespectively while DyNiIn was found to be anantiferromagnet with TN of 32 K [2-3]. DC bulkmagnetic measurements show that with rise ofthe x parameter the ordering temperature islowered moreover changes in the magneticordering occur. For DyNi0.9In1.1 (TN=14 K)compound antiferromagnetic character ofmagnetic coupling is conserved, but somechanges in comparison to 1-1-1 stoichiometrywas noticed. Magnetic contributions in neutrondiffraction pattern collected at 1.5 K can beindexed with single magnetic phase (Fig. 1),with propagation vector k=(0.5, 0, 0.5),whereas for 1-1-1 compounds an additionalmagnetic phase establishes. The Dy magneticmoment is equal to 3.9 µB. At 1.5 K HoNi0.8In1.2compound has a non-collinear magneticstructure, where moments lie in the basalplane with the angle of 1200 between nearestneighbours. Magnitude of the Ho magneticmoment is 1.5(1) µB only (See Fig. 2). The lowangles part of the pattern exhibits “shaken”background (in fact it consists of manyoverlaped weak peaks). For ErNi0.9In1.1compound additional sine-modulatedcomponent lying in the basal plane was found.The first phase is the same as for 1-1-1compound, the Er magnetic moments of5.63(7) µB are coupled ferromagnetically alongthe c-axis. But there are additional magneticreflexes, which must be described by sine-modulated component of the magneticmoment lying in the basal plane. The in-planecomponent of 5.9(1) µB is modulated withpropagation vector k=(0.127, 0.324, 0.339). Inall investigated compounds the diffusescattering was evidenced – it is connected with
structural disorder caused by non-stoichiometry. There is a strong evidence of creating of somemagnetically ordered clusters where orderingseems to be different that for whole sample. Inaddition it is quite probable that part of the rareearth’s moments remains unordered below thebulk ordering temperature. These can explainwhy the moments are much lower than for thefree ions.
Fig. 1 Pattern for DyNi0.9In1.1 at 1.5 K.
Fig. 2 Pattern for HoNi0.8In1.2 at 1.5 K.
[1] L. Gondek, A. Szytula, S. Baran, M. Rams, J.Hernandez-Velasco, Yu. Tyvanchuk, submitted toJ. Magn. Magn. Mater. [2] L. Gondek, A. Szytula, B. Penc, J. Hernandez-Velasco, A. Zygmunt, J. Magn. Magn. Mater. 262(2003) L177.[3] L. Gondek, S. Baran, A. Szytula, J. Hernandez-Velasco, J. Magn. Magn. Mater. in press..
43

PHY-01-1286.doc // brandt // 09.03.04 Seite 1 von 1
10 20 30 40 50 60 70 80
NM1NIMMIMM2
NM 1NIM
NNIM
Inte
nsity
[a.u
.]
2 [deg]
60 K
1.5 K
13 K
EXPERIMENTAL REPORT Proposal N° PHY-01-1286
Instrument E6Neutron Diffraction Study of R3Cu4Si4 (R=Tb,Dy, Ho, Er) compounds. Local Contact
Dr N. Stüßer
Principal Proposer:E. Wawrzyńska, M. Smoluchowski Institute of Physics,Jagiellonian University, Reymonta 4, 30-059 Kraków,Poland
Date(s) of Experiment
Experimental Team: J. Hernandez-Velasco, N. Stüßer, BENSC, Hahn-MeitnerInstitut, Glienicker Straße 100, D-14109 Berlin-Wannsee,B. Penc, A. Szytuła, Z. Tomkowicz, M. SmoluchowskiInstitute of Physics, Jagiellonian University, Reymonta 4,30-059 Kraków, Poland
10.04.2003-16.04.2003
Date of Report: 12.12.2003
Neutron diffraction studies of polycrystallineR3Cu4Si4 (R=Tb, Dy, Ho, Er) intermetalliccompounds with the orthorhombic Gd3Cu4Ge4-type crystal structure (space group Immm, no.71) indicate the existence of different magneticstructures. Rare earth atoms occupy twononequivalent 2d and 4e sublattices. The rareearth magnetic moments order at lowtemperatures in all these compounds.For R=Tb [1] below TN equal to 50 K the Tbmoment in the 2d site orders and forms acollinear magnetic structure. At the tempe-rature of Tt1=38 K a transition from the com-mensurate magnetic structure, described bythe propagation vector k2=(0,½,0) to an incom-mensurate one, described by the propagationvector k1=(0,0.515,0) is observed. Below Tt2equal to 7 K the Tb moment in the 4e siteforms a sine-wave modulated structure descri-bed by the propagation vector k3=(0.23,½,½).In Dy3Cu4Si4 the magnetic moments localizedat the rare earth atoms order simultaneouslyand the order is described by the propagationvector k=(0,½,0) accompanied by k=(0,½+δ,½+δ) at low temperatures. In Ho3Cu4Si4 twopropagation vectors are needed to model themagnetic order. These are: k=(½,0.316(2),½)for the 4e sublattice, which disorders as firstwhile increasing temperature, and k=(0,½,0)for the 2d sublattice. Similar situation is obser-ved for Er3Cu4Si4 where the propagation vec-tors are: k=(0,1−δ,0) for the 4e sublattice,which disorders as first while increasingtemperature, and k=(0,½+δ,0) for the 2d sub-lattice.
Fig 1. Neutron diffraction patterns of Tb3Cu4Si4 collectedat 1.5, 13 and 60 K. The circles represent the experi-mental points; the solid lines are calculated profiles forthe model crystal and magnetic structures described inthe text and the differences between the observed andcalculated intensities (at the bottom of each diagram).The vertical bars indicate the Bragg peaks of nuclear (N)and magnetic (M1) for k2=(0,½,0) and (M2) for k3=(0.23,½,½) ordering in Tb3Cu4Si4 and of nuclear (NIM)and magnetic (MIM) origin for the TbCuSi impurity phase.In the top diagram several peaks of unknown origin arepresent.
[1] Wawrzyńska E, Penc B, Stüßer N, Szytuła A, Tomkowicz Z, Solid State Commun. 126 (2003) 527.
44

PHY-01-1370.doc // brandt // 09.03.04 Seite 1 von 1
0 2 4 6 8 10 12 14
b
T [K]
2001 peaka
16 20 24 28 32 36
310 1
101 1
301+
- 2
002
110 1
200 1
Pea
k A
rea
[a.u
]
Inte
nsity
[a.u
]
2 [deg]
1.5 K 5 K 8 K 9 K 10 K 11 K 12 K 13 K 20 K
011- 2
20 30 40 50 60 70 80 90 100
1.5 K
NIM1IM2
Inte
nsity
[a.u
.]
2 [deg]
20 K
NIM1IM2M1M2
EXPERIMENTAL REPORT Proposal N° PHY-01-1370
Instrument E6Neutron Diffraction Study of R3Pd4Ge4 (R=Tband Er) compounds. Local Contact
Dr N. Stüßer
Principal Proposer:E. Wawrzyńska, M. Smoluchowski Institute of Physics,Jagiellonian University, Reymonta 4, 30-059 Kraków,Poland
Date(s) of Experiment
Experimental Team: J. Hernandez-Velasco, BENSC, Hahn-Meitner Institut,Glienicker Straße 100, D-14109 Berlin-Wannsee, GermanyB. Penc, A. Szytuła, M. Smoluchowski Institute of Physics,Jagiellonian University, Reymonta 4, 30-059 Kraków,Poland
18.08.2003-24.08.2003
Date of Report: 18.12.2003
Neutron diffraction studies of polycrystallineR3Pd4Ge4 (R=Tb and Er) intermetalliccompounds with the orthorhombic Gd3Cu4Ge4-type crystal structure (space group Immm, no.71) indicate the existence of different magneticstructures. Rare earth atoms occupy twononequivalent 2d and 4e sublattices and theirmagnetic moments order at low temperaturesin both compounds.For R=Tb both sublattices order simultane-ously at the Néel temperature of about 13 K. At1.5 K there are two propagation vectorsdescribing the magnetic ordering. One of themis k1=(0,0,0), which describes the antifer-romagnetic ordering in the 4e sublattice inwhich the magnetic moments align in the yz-plane whereas the second one:k2=(0,0.212(1),0.788(1)) describes the antifer-romagnetic ordering in both 2d and 4esublattices in which the magnetic momentsalign along the z-axis and lie in the yz-plane,perpendiculary to those described by the k1vector, respectively. The neutron diffractionpatterns of Tb3Pd4Ge4 are shown in Figs. 1and 2a.In case of the Er compound the magneticstructure below the Néel temperature of about4 K is also described by two propagationvectors: k1=(0,0,0), which describes theantiferromagnetic ordering in the 4e sublatticewhereas the second one: k2=(0,0.139(2),0)describing the antiferromagnetic ordering inthe 2d sublattice. In both sublattices themagnetic moments align along the z-direction.
Fig 1. Neutron diffraction patterns of Tb3Pd4Ge4 measu-red at 1.5 and 20 K. The labels N, IM1, IM2, M1 and M2indicate the nuclear, impurity and magnetic phases.
Fig 2. Parts of the neutron diffraction patterns ofTb3Pd4Ge4 measured at different temperatures (a) andthe temperature dependence of the magnetic peak inten-sity. The 1 and 2 label the magnetic phases connectedwith the k1 and k2 propagation vectors, respectively.
45

PHY-01-1287.doc // brandt // 16.03.04 Seite 1 von 1
EXPERIMENTAL REPORT Proposal N° PHY-01-1287 Instrument E6Neutron diffraction study of
poly- and singlecrystalline UNi0.5Sb2 samples. Local Contact Jorge Hernández-Velasco
Principal Proposer: V. H. Tran, Inst. Low Temp. & Struc. Res. Date(s) of ExperimentExperimental Team: V.H. Tran, Inst. Low Temp. & Struc. Res.
J. Hernández-Velasco, HMIN. Stüβer, HMI
5-5-2003 –9-5-2003
Date of Report: 20-01-2004
X-ray data of polycrystalline and singlecrystalline samples of UNi0.5Sb2 have indicated thatthis compound crystallizes in the tetragonal HfCuSi2-type structure with a = 4.319 and c = 9.015 Å at roomtemperature. The measurements of both magnetic andelectronic transport properties point out that thecompound orders antiferromagnetically below TN =160 K and goes into a phase transition of the first-order at approximately TM = 75 K [1]. In order todetermine magnetic structure(s) and as well as toexplore the nature of the phase transition at TM wehave undertaken neutron diffraction experiments onboth crystalline and single crystalline samples ofUNi0.5Sb2.
The neutron diffraction (ND) patterns collectedwith spectrometer E6 ( = 2.45 Å) at temperaturesabove TN are characteristic of the only nuclearscattering in a tetragonal system. But surprisingly, inaddition to the majority Bragg reflections belongingto the HfCuSi2-type unit cell [2], there appear a lot ofsuperlattice lines, which can be well indexed as 10½,103/2 and so on. This means that the superlatticelines could correspond to a unit cell with the sameparameter a but with the doubled parameter c. Theneutron data collected on the single crystallinesample at RT have confirmed the observation l/2.Therefore, on the contrary to the X-ray data, thecrystal structure deduced from the neutron diffractionexperiments is a superstructure of the HfCuSi2-type.Attempts of calculations for a new type of crystalstructure for UNi0.5Sb2 were carried out based onseveral models. Among applied, the P –4 M 2 spacegroup yields the best refinement with a = 4.301 (1)and c = 17.943(2) Å for the data at 200 K. From therefinement we see that the occupation of the nickelatoms in the unit cell is less than the stoichiometry0.5. The atomic positions are as follows: U1 (0, 0.5,0.3790), U2 (0.5, 0.0, 0.1205), Ni1 (0, 0, 0); Ni2 (0, 0,0.5); Sb1 (0, 0, 0.4176); Sb2 (0, 0, 0.2059); Sb3 (0,0.5, 0.072); Sb4 (0.5, 0.5, 0.2558). Nevertheless, weare not satisfied with the refinement owing to largeagreement factors. Unfortunately, the available dataare not sufficient for the determination of the crystalstructure for UNi0.5Sb2. At 150 K e.g. below TN, some nuclearreflections (101, 103 and 105) do show some
ferromagnetic contributions to their intensities.Moreover, there appears also pure magneticreflection (113) in the ND patterns. This findingimplies the onset of an antiferromagnetic ordering,confirming the magnetic data already obtained. Basedon the collected data around TN, we confirm the Néeltemperature to be of 160 K. Since the compoundundergoes into a phase transition at ~ 75 K, we haveperformed a number of scans nearby thistemperature, during cooling and as well as heating upthe sample around TM. We observe that withdecreasing temperature the intensity of magnetic
peak 101 below 76 K suddenly falls down, andsimultaneously a magnetic peak 100 appears (seefigure). In the case of increasing temperature, theintensity of the magnetic peak 100 decreases to zeroabove 85 K. This behaviour is accompanied withincreasing in the intensity of the 101 peak. As a mainresult of experiment we have detected a largehysteresis (T ~ 10 K) behaviour of spins on themagnetic uranium atoms. Our finding wouldindicate that the anomaly at TM is a transition of thefirst order and is magnetic in origin. A reorientationof spins is the plausible mechanism.
[1] Z. Bukowski et al. private information.[2] D. Kaczorowski et al., PRB 58 (1998) 9227.
0 50 100 150 2000
400
800
1200
1600
0 50 100 150 2000
400
800
1200
1600
Inte
nsiti
es (a
rb. u
nits
)
(100)
Inte
nsitie
s (a
rb. u
nits
)
T (K)
(101)
T (K)
46

CHE-01-1364.doc // brandt // 03.03.04 Seite 1 von 1
EXPERIMENTAL REPORT Proposal N° CHE-01-1364Instrument E6The magnetic structure of the ferromagnetic
compound Na9Co2O7 Local Contact J. Hernandez-Velasco
Principal Proposer: Olivier Leynaud, Max Planck Institute fürFestkörperforschung, Stuttgart, Germany Date(s) of Experiment
Experimental Team: Mickael Sofin, ibid.Martin Jansen, ibid.Jorge Hernandez-Velasco, HMI Berlin
8-10 Oct 2003
Date of Report: 16 Jan. 2004
Researches on sodium cobaltates compoundswere lead 30 years ago by several teams [1,2].Recently, some discoveries in this field, andespecially the existence of a thermoelectriceffect in NaCo2O4 [3] and superconductivity inNa0.35CoO2·1.3H2O [4], were leading us to findnew compounds, trying by this way to modifyand understand their physical properties.The compound Na9Co2O7 is one compound ofthis family. There is two main interestingproperties in this material. First, structurally,the structure can be described with isolatedCoO3 triangle and CoO4 tetrahedra, bothsurrounded by sodium atoms. Second, thecompound exhibits a long range ferromagneticorder. This point is noticeable considering thatnone of the compounds synthesised so farwere ferromagnetic.In order to solve the ferromagnetic structure ofthis compound, an efficient and powerful toolshould be used. Because the resolution is notso important and we need a very good flux inorder to determine precisely the momentinvolved in the magnetic structure, theinstrument E6 appeared to be a well designeddiffractometer.Measurements were done in severaltemperatures. Higher and lower temperature(40 and 1.5 K respectively) were used (seefigure 1) to refine the nuclear and magneticstructures, and in consequence weremeasured with longer times. Intermediatetemperatures were obtained with shorter times,in order to follow with numerous differenttemperatures the evolution of the magneticmoment involved into the magnetic structure.This can be done, using magnetic intensities ofthe main peaks (see figure 2 and e.g. peak(110) which is almost purely magnetic).First results are showing a classical behaviourfor the evolution of the magnetic moment withthe temperature. The nuclear structure wasrefined successfully at 40 K and the magneticstructure is still under considerations.
Figure 1: Neutron powder diffraction patterns ofNa9Co2O7 on E6 at higher and lower measuredtemperatures (40 and 1.5 K respectively). Data weremeasured in three angular domains. Experimental dataare shown on the top. Difference pattern (i.e. magneticcontributions (1,5 K – 40 K)) is presented on the bottom.
Figure 2: Neutron powder diffraction patterns ofNa9Co2O7 on E6 at various intermediate temperatures.Evolution of the intensities of several main peaks ((010),(110) and (111)), with the temperature. The displayedpatterns are (from top to bottom): 5, 14, 16, 17, 18, 20 K.
References:[1] M. Jansen & R. Hoppe, Z. Anorg. allg. Chem. 408,104-106 (1974)[2] C. Fouassier, G. Matejka & al., J. Solid State Chem. 6,532-537 (1973)[3] I. Terasaki, Y. Sasago & K. Uchinokura, Phys. Rev. B56(20), R12685-R12687 (1997)[4] K. Takada, H. Sakurai & al., Nature 422, 53-55 (2003)
47

PHY-01-1365.doc // brandt // 16.03.04 Seite 1 von 1
EXPERIMENTAL REPORT Proposal N° PHY-01-1365Instrument E6Rare-earth spin canting and magnetic
irreversibility in Nd6Fe10Al4 Local Contact J. Hernández-Velasco
Principal Proposer: CAMPO, Javier, Materials Research Institute of Aragón Date(s) of Experiment
Experimental Team: CAMPO, Javier; LUZON, Javier; as aboveCUELLO, J. Gabriel; Institut Laue LangevinHERNANDEZ VELASCO, Jorge; HMI
1-12-2003 to 5-12-2003
Date of Report: 19/01/2004
Rare earth compounds of the R6Fe13Xfamily (R=light rare earth, X=Cu, Ag, Au, Si,Sn,…) crystallize in a tetragonal structure withspace group I4/mcm. R sites are 8f and 16l, Fesites are 4d, 16l1, 16l2 and 16k, and X atomsoccupy a 4a site. With X = Al or Ga a stabilityrange exists, forming compounds R6Fe14-yXywith y extending to 4.5 or more. The excess Xatoms are believed to substitute Fepreferentially at 16l1 sites.
Nd6Fe11-xAl3+x compounds orderantiferromagnetically into a spin structure bestdescribed as a stacking of ferromagneticallyordered Nd and Fe blocks with alternating spinorientations, separated from each other by anAl layer. For applied fields larger than a criticalvalue a metamagnetic transition occurs, afterwhich spins rotate into a common alignment,saturating at very high fields.
Detailed investigation at lowtemperatures has shown that Nd moments donot behave in total coherence with the Fe spins.Large transition hysteresis and magnetichistory effects are observed for T below 30 K[1], which are attributed to a canting of Ndspins.
On the other hand, our magnetizationresults strongly suggest that a (metastable)collinear state can be obtained in an appliedmagnetic field, sweeping it through themetamagnetic transition (> 2.5 T) and back tozero [2]. Therefore, it has been extremelyinteresting to collect neutron diffractogramsbefore and after an in situ magnetic fieldcycling process at low temperature, to see if thenoncollinearity of the Nd spins will bedestroyed as predicted.
Preliminary results for the compoundNd6Fe10Al4 are showed in the figure. Thisresults seem indicate that after cycling themagnetic field from 0 to 6.5 and then to 0 T (attemperature 1.8 K) the magnetic structureevolves from a partial canting of Nd momentsto a total basal structure of the Nd momentsafter the sweeping. It is worth noting themarked increase of intensity on the magneticreflection at the lowest angle H > Ht whichpersists after removing the field.
Figure. Neutron diffraction patterns collected at1.8 K for different applied magnetic fields from0 to 6.5 and then to 0 Tesla.
[1] S. Jonen, H.R. Rechenberg and J. Campo, J. Magn.Magn. Mater 242-245 (2002) 803.[2] J. Campo, S. Jonen and H.R. Rechenberg, to bepublished.
0 T3.5 T6.5 T5 T4 T3 T2 T1 T0 T
48

MAT-01-1367.doc // brandt // 03.03.04 Seite 1 von 1
EXPERIMENTAL REPORT Proposal N° MAT-01-1367Instrument E6Neutron Diffraction Study of A Virgin
Transition in MnFe(P,Si) Compounds Local Contact K. Prokeš
Principal Proposer: E. Brück, WZI, University of Amsterdam, NL Date(s) of ExperimentExperimental Team: L. Zhang, WZI, University of Amsterdam, NL
O. Moze, INFM, University of Modena, ITK. Prokeš, HMI, SF-2, DE
15-21/12/2003
Date of Report: 30/01/2004
Recently, the magnetocaloric effect (MCE), especiallynear room-temperature, has attracted growing interest,because of the prospect of realizing magnetic cooling forwide-scale applications such as refrigeration, airconditioning and so on. MnFe(P,As) compounds showgiant MCEs (GMCE) at the Curie temperature (TC) [1].By adjusting the P/As ratio TC can be tuned from 150 Kto 335 K. The GMCE in these compounds is associatedwith a first-order transition from a low-temperatureferromagnetic to a high-temperature paramagnetic phasewithout breaking of the crystallographic symmetry,while the strong magneto-elastic interaction leads to alarge contraction of the basal plane and simultaneouslyexpansion of the c axis. In order to further understandand modify the GMCE in these novel compounds, westudied the effect of Si substitution. Surprisingly besidesall the other changes, a peculiar history dependence ofthe magnetic phase transition was discovered. The as-prepared sample shows a significantly lower transitiontemperature than one that has experienced thermalcycling, namely a virgin TC. Here we report on our firststudy of this virgin transition by neutron diffraction.
Powdered samples were prepared by mechanicalalloying. The x-ray diffraction patterns and EPMAanalysis indicate that the samples contain a small amountof impurity phases (< 8%). Using diffractometer E6 atBENSC HMI in Berlin neutron diffraction patterns werecollected in three steps (each step covered 2θ = 33°simultaneously) ( = 2.4 Å, collimator 10’, 9° < 2θ <108°). The vanadium sample-container filled with about7 gram powder was placed in a VM-5 cryostat, whichcomprises a magnet generating a magnetic field up to 6T. The temperature is regulated between 100 K and 500K by a heater and a liquid-nitrogen flow cold-finger. Thediffraction patterns were recorded at differenttemperatures and in several magnetic fields with about20 minutes counting time for each step. The raw datawere processed using Caress and then analyzed withFullProf.
The neutron diffraction patterns recorded during thefirst cooling on MnFeP0.6Si0.4 sample (Fig.1) show thecoexistence of two sets of reflections and a significantincrease of the low-temperature ferromagnetic phase at150 K when a magnetic field of 5 T was applied, whichmanifest the first-order character and the field-inducedcharacter of this virgin phase-transition. The neutrondiffraction patterns contain a number of significantreflections from the aluminum parts on the sampleholder and also a small reflection from an unidentifiedimpurity phase. The other reflections can be fairlydescribed by using a MnFe(P,As) structure model [2]
with As replaced by Si in the Rietveld-refinements. Thepattern recorded at 300 K after the first cooling shows aminute variation of the intensity distribution over thedifferent reflections compared to the pattern recordedalso at 300 K on the virgin sample. This variation can bewell accommodated by a platy habit orientation usingMarch’s function. In fact the sample experienced amagnetic field of 5 T during cooling as shown in figure1, therefore it is understandable that a preferredorientation was induced in the ferromagnetic state andremained in the powder stack also above the Curietemperature. So far the experiment does not show anyevidence for atomic-position swapping during the firstcooling, which is highly suggested for interpreting thishistory dependence. Besides the interference of Alreflections, a rather weak coupling of the sample withthe temperature control and the sample thermometerresulted in some ambiguity when data for nominallysame temperatures are compared. In conclusion, to beable to discriminate between preferential orientation andposition changes, additional measurements with abroader range in angle would be needed.
40 42 44 46 48 50
110
001
150 K 5 T
150 K 0 T
200 K 5 T
200 K 0 T
300 K 0 T
Inte
nsity
(arb
.)
2(Deg.)
MnFeP0.6Si0.4
001
110
Fig. 1 The variation of the neutron diffraction patterns atdifferent temperatures and in different magnetic fields duringthe first cooling. The underscored numbers index thereflections from low-temperature ferromagnetic phase. Theothers are reflections from the high-temperature paramagneticphase.
[1] O Tegus, E Brück, K H J Buschow, F R de Boer, Nature415 (2002) 151.
[2] M Bacmann, J L Soubeyroux, R Barrett, D Fruchart, RZach, S Niziol, R Fruchart, J. Magn. Magn. Mater. 134(1994) 59.
49

EXPERIMENTAL REPORT
Magnetic order in CeBiPt
Proposal NPHY-01-1478
Instrument E6
Local Contact
N. Stußer
Date(s) of Experiment
12.11. – 16.11.2003
Principal Proposer: O. Stockert, Max Planck Institute CPfS Dresden
Experimental Team: G. Goll, Physikalisches Institut, University Karlsruhe
Date of Report6.1.2004
Investigations of ternary rare earth com-pounds continue to be an active topic of re-search because of their intriguing magnetic prop-erties. The equiatomic ternary RBiPt inter-metallic compounds (R = rare-earth elements)crystallize in the cubic MgAgAs-type structure(space group F43m) and show a variety of lowtemperature properties ranging from semicon-ductor or semimetal-like behavior of NdBiPt tomagnetism and heavy fermion-like behavior inYbBiPt with one of the highest measured spe-cific heat coefficients γ = C/T = 8J/molK2.
In particular CeBiPt, first characterized byCanfield et al. [1] with a lattice constant a= 6.811 A, shows antiferromagnetic order atTN ≈ 1K as evidenced by sharp maxima in spe-cific heat, susceptibility and magnetization mea-surements [2]. Neutron diffraction on the diffrac-tometer D23 at the ILL/Grenoble on a CeBiPtsingle crystal [3] have revealed that the anti-ferromagnetic structure is an AF-type I struc-ture with a propagation vector τ = (1 0 0) andmoments also along [1 0 0]. We determined aNeel temperature TN = 1.15K in good agree-ment with thermodynamic measurements. Sur-prisingly, the whole temperature variation of themagnetic intensity is well described by a Bril-louin function with J = 5/2. However, sincelarge extinction effects were observed, the or-dered moment could not been determined reli-ably. A crude analysis yields an ordered momentof µ ≈ 0.5µB.
To overcome the extinction problems we per-formed a neutron powder diffraction experimenton CeBiPt powder (m ≈ 9 g) using the diffrac-tometer E6 with a neutron wavelength λ =2.444 A. Diffraction pattern were taken at sev-eral temperatures below and above TN = 1.15K.Fig. 1 displays the diffraction pattern of CeBiPt
up to 2Θ = 70 taken at 0.45K and 1.5K to-gether with the difference pattern. The crystalstructure is confirmed to be cubic with a latticeconstant a = 6.793(4) A. The difference patternclearly shows magnetic peaks at the positions ex-pected. However, there exist some yet unidenti-fied nuclear peaks not belonging to the CeBiPtstructure (marked by ”?”). We are still in theprocess of data treatment to identify the foreignphase and to extract the ordered moment.
10 30 50 702Θ (deg.)
-0.2
0
0.2
0.4 (110
)
(210
)(2
11)
(221
)(3
10)
Difference
0
20
40
60
neut
ron
coun
t-ra
te (
1000
cou
nts
/ hou
r)
T = 1.5 K
0
20
40
60
(111
)(2
00)
?
(220
)
?
CeBiPtT = 0.45 K
Figure 1: Neutron count-rate versus scatteringangle 2Θ in CeBiPt for T = 0.45K (top) andT = 1.5K (middle). The bottom panel showsthe difference diffraction pattern.
[1] P. C. Canfield et al., J. Appl. Phys. 70 (1991)5800.
[2] T. Pietrus et al., Physica B 281–282 (2000)745.
[3] O. Stockert et al., unpublished results.
50

EF_11_Argyriou.doc // brandt // 03.03.04 Seite 1 von 1
EXPERIMENTAL REPORT Proposal N° EF Instrument:: E6Phase diagram of NaxCa1-xCo2O4
with x[0.85, 0.95] Local Contact J. Hernández-Velasco
Principal Proposer: Argyriou Dimitri, Milne Chris, Aliouane Nadir Date of ExperimentExperimental Team: Aliouane Nadir, Hernández-Velasco Jorge;
HMI Berlin 31/08/03 to 03/09/03
Date of Report: 15/01/2003
The layered cobaltite compounds:NaxCoO2 (x ∈ [0.50,1]) were initially studieddue to their high thermopower propertiesassociated with a low resistivity in the abplane. By changing x, we form a mixed valentsystem: NaxCo3+
x Co4+1-xO2 where the Co3+
state is S=0 with t62g configuration and the Co4+
state is S=1/2 with t52g configuration. It has been shown, for x=0.75, that
Na0.75CoO2 is a strongly correlated systemfrom both specific heat, magnetic susceptibilityand resistivity measurements[1]. For x=0.5,Na0.50CoO2 presents an unusual electricaltransport along the c-axis[2] suggesting atransition at 170K from a metallic to a polaronicstate. In this way (modifying x), we change thecontent of Co4+, which is a Jahn-teller activeanion, producing a strong correlated system.
There is another way of modifying theelectronic and magnetic structure, by thechemical substitution of single charge cation(Na+) with a bivalent cation (Ca2+). In this way,we tried to obtain the following mixed valentsystem: Na+
xCa2+1-xCo3+
(2-x)Co4+xO4 crystallizing
in hexagonal symmetry as NaxCoO2, butdoubling the c-axis length (see Fig.1). Thus adouble layered cobalt compound.
Taking into account the correlationbetween electronic doping and properties inthe single layered cobalt compounds, we wantto determine if the phase diagram intemperature and composition in this system issimilar to NaxCoO2 one.
To verify this hypothesis, we haveperformed neutron powder diffractionexperiment on E6 at room temperature withdifferent elements of the phase diagram(x=0.85, 0.90, 0.95) and versus temperaturefor x=0.95 compound. See Fig.2.
Previous SQUID measurements haveshown a magnetic transition, but the analysisof the neutron diffraction patterns allows us toassociate this magnetic transition to animpurity phase of Co3O4 (TN=40K) and not tothe main phase.
Fig.1: Representation of the crystal structure ofNaxCa1-xCo2O4 compounds. Notice a doubling ofthe c-axis respect to NaxCoO2 compounds.
Fig.2: Evolution of the neutron diffraction patternsof Na0.95Ca0.5Co2O4 at different temperature (1K,10K, 15K, 20K, 25K, 30K, 40K, 50K and 80K).Bragg peaks marked by an arrow are associated tothe antiferro-paramagnetic transition of an smallimpurity of Co3O4 .
[1] T. Motohashi et al., Physical Rev B 67, 64406 (2003); T.Motohashi et al., App. Phys. Lett. 79, 1480 (2001).[2] I. Terasaki, Proceeding of the 18th International Conferenceon thermoelectrics, 569 (1999).
/Ca
51

EF_12_Argyriou.doc // brandt // 03.03.04 Seite 1 von 1
EXPERIMENTAL REPORT Proposal N° EF Instrument:: E6Phase diagram of NaxCoO2
with x[0.6, 1] at room temperature Local Contact J. Hernández-Velasco
Principal Proposer: Argyriou Dimitri, Milne Chris, Aliouane Nadir Date of ExperimentExperimental Team: Aliouane Nadir, Hernández-Velasco Jorge;
HMI Berlin 13/10/03 to 16/10/03
Date of Report: 14/01/2003
The layered cobaltite compounds:NaxCoO2 (x ∈ [0.50,1]) were initially studieddue to their high thermopower propertiesassociated with a low resistivity in the abplane. The electronic and magneticinteractions arise from the doping of x chargecarrier to form a mixed valent system: NaxCo3+
xCo4+
1-xO2 where the Co3+ state is S=0 with t62gconfiguration and the Co4+ state is S=1/2 witht52g configuration. Their electronic andmagnetic properties evolve with the dopingcontent x.
It has been shown that Na0.75CoO2 is astrongly correlated system from both specificheat, magnetic susceptibility and resistivitymeasurements[1]. Magnetic order has veryrecently been detected. It has also beenreported too that the application of field resultsin a decrease of the spin entropy of the systemand that has been suggested as a possiblemechanism for the enhanced thermopower inthe system[2]. Poorer x compounds such asNa0.5CoO2 have also been recently examineddue to its high thermal-power properties. Theunusual c-axis electrical transport [3] inNa0.5CoO2 suggests a transition at 170K from ametallic to a polaronic state.
On decreasing the doping (x), therecould be an evidence of structural changes inthe CoO2 sheets, as the Co4+ t2g
5, S=1/2 stateis Jahn-Teller active. According to the formerstructural studies the NaxCoO2 (x ∈ [0.50,1])crystallizes in a hexagonal cell P63/mmc withCoO2 layers formed by edge sharing CoO6octahedra (see Fig.1). The Jahn-teller effect inthese CoO6 octahedra could lead to structuraldistortions.
To verify this hypothesis, we haveperformed neutron powder diffractionexperiments on E6 at room temperature atdifferent doping levels of the phase diagram(x=0.6, 0.75, 0.85, 1).
Preliminary results are shown in Fig.2.We observe new Bragg reflections whoseintensities increase with the sodium content.
These reflections can not be indexed in theprototype space group P63/mmc. The formalstudy done with x-ray diffraction does not showsuch a result. This phenomenon could berelated to separation in the phase diagram ofNaxCoO2 and the presence of an impurity isnot excluded. The possibility of index the newreflections in a monoclinic cell is also underanalysis. This work is still in progress.
Fig.1: Representation of the crystal structure of theNaxCoO2 compounds.
Fig.2: Neutron powder diffraction patterns fordifferent doped samples at room temperature. Thegreen arrows indicate the Bragg peaks whichincrease with the amount of sodium content (x).
[1] T. Motohashi et al., Physical Rev B 67, 64406 (2003); T.Motohashi et al., App. Phys. Lett. 79, 1480 (2001).[2] Takada, K. et al., Nature 422, 53 (2003).[3] I. Terasaki, Proceeding of the 18th International Conferenceon thermoelectrics, 569 (1999).
52

EF_13_Argyriou.doc // brandt // 03.03.04 Seite 1 von 1
EXPERIMENTAL REPORT Proposal N° EFInstrument E6Phase Separation v’s Quantum Critical Point
in Perovskitic Manganites. Local Contact J. Hernández-Velasco
Principal Proposer: Dimitri N. Argyriou, HMI Date(s) of ExperimentExperimental Team: Christopher J. Milne, HMI
Nadir Aliouane, HMIJorge Hernández-Velasco, HMI
9-5-03 – 11-5-03 9-6-03 – 13-6-03
Date of Report: 15-01-04
Recent studies of bandwidth controlledperovskites Pr1-x(Ca1-ySry)xMnO3 have thrownup two possible scenarios for behaviour closeto the Charge Ordered insulator/ Ferromagneticmetal transition. One possibility is that there isa “Quantum Critical Point” type feature withthe presence of a signatory charge disorderedparamagnetic phase. Alternatively there is aphase coexistence scenario. The aim of thisstudy is to determine the nature of thetransition in the above system. By changing the size of the A cation radiusat constant doping one can affect the Mn-O-Mnbond angles in AMnO3 with resulting, modest,changes in the one electron bandwidth. Such“tuning” near optimum doping allows theproduction of materials with properties varyingfrom charge and orbital ordered (CO) insulatorto ferromagnetic (FM) metal. A recent study of the Pr0.55(Ca1-ySry)0.45
MnO3 system showed that at y0.2 the criticaltemperatures for the charge-orbital orderingand ferromagnetic transitions collide at 200Kforming a “bicritical point” [1].
Fig. 1. Bicritical nature reported in [1].
Contrarily a study of the Pr0.65(Ca1-ySry)0.35MnO3 system showed that the phase diagram isdominated by mesoscopic-macroscopic phasecoexistence, rather than any “bicritical” feature[2].
Fig. 2. Complex phase separation reported in [2].
In this study we aim to map out the phasediagram of Pr0.55(Ca1-ySry)0.45MnO3 anddetermine whether a Charge DisorderedParamagnetic phase exists, signifying aQuantum Critical Point, or whether phasecoexistence is the basis for the M-I transition. For the experiments subject of this report weanalysed samples with y = 0.22, 0.24, 0.25 and0.28, which lie to the ferromagnetic side of thephase diagram, to check for the correctmagnetic signatures. Scans were taken oncooling from room temperature to 2K in 10degree steps and on heating with the evolutionof ferromagnetic peaks monitored. These experiments now have to besupplemented by examination of samples withy < 0.22 to move through the QCP/Phaseseparated area to the CO state. Collection ofthese data, and additional data monitoring thestructural responses, will allow a full mappingof this phase diagram revealing the effect of thechange of doping level on the width of anyphase separated region.
[1] Y. Tomioka and Y. Tokura, Phys. Rev. B66, 104416(2002).
[2] G.R. Blake et al., Phys. Rev. B66, 144412 (2002).
53

EF_14_Argyriou.doc // brandt // 03.03.04 Seite 1 von 1
EXPERIMENTAL REPORT Proposal N° EF Instrument:: E6/E9Complex Structure of the NaxCoO2,yD2O,
NaxCoO2,yH2O zD2O Local Contact:D. TobbensJ. Hernández-Velasco
Principal Proposer: Argyriou Dimitri, Milne Chris, Aliouane Nadir Date of ExperimentExperimental Team: Aliouane Nadir,
Milne Chris, HMI Berlin 13/12/03 to 14/12/03
Date of Report: 14/01/2003
The recent report of superconductivity ataround 4K in the layered sodium colbaltoxyhydrate, NaxCoO2.yH2O (x≈0.35], y≈1.3) [1]
is interesting for two reasons. The first reason is the fact that it’s the first
superconducting cobalt compound. The second reason is that according to the
initial structural reports, NaxCoO2.yH2O can bedescribed as a triangular network of edgeshared octahedral CoO6 octahedrea separatedby layers of water and sodium. ThusNaxCoO2.yH2O may be suitable material to testthe RVB[2] theory for explaining thesuperconductivity in triangular frustratedsystems.
To obtain these compounds you must firstform the precursor NaxCoO2 (x≈0.7). then inorder to move the desired sodium content, weimmerse the powder precursors in a Br2-acetonitrile solution with a 2, 5, 50 timesexcess (designated 2X, 5X, 50X) as comparedto Na content. After 24 hours in the solutionthe powder is washed with clean acetonitrileand then H2O or D2O. The samples are thenhydrated in a controlled, moisture rich,atmosphere of D2O or mixture of D2O/H2O.
There is a debate regarding the structure ofthese compounds. One the Difficulty arises inobtaining good neutron powder diffractionpatterns for Reitveld analysis due to thepresence of excess water that shows up asice.
First to obtain good neutron powderdiffraction patterns we should eliminate the no-bonded water (ice scattering and diffusescattering of H) without destroying thestructure. To follow this step, we use E6instruments, due to the high flux of neutrons.After that, the dehydrated sample istransferred to E9 instrument cooled at 1.7Kdue to high resolution.
To dehydrated, we place the differentsamples (2X,yD2O and 50X,yD2O and
5X,yH2O zD2O), in a orange standard cryostat,and cooled at 260K. Vacuum is then appliedand the sample is freeze dried.
The dehydratation process was followed bymonitoring the bragg peaks of the ice. It takesroughtly 8 hours to dehydrated a X50 andX5,yD2O.
For an X5,yH2O zD2O compound thedehydration process is shorter (5 hours). Onthe fig 1, we can see the typical pattern of thedehydratation process of the no-bonded water.
Fig 1: Evolution of the non intercalated water(mark by green arrows) in the X50,yD2Opowder (obtained with a 50 times excess ofBr2) at 260K (each patterns were taken every20 minutes).
[1] Takada, K. et al., Nature 422, 53 (2003).[2] Anderson, P. W, Mater. Res. Bull. 8, 153 (1973)
54

EF_15_Kardjilov.doc // J. Hernández-Velasco // 03.03.04 Seite 1 von 1
EXPERIMENTAL REPORT Proposal N° EFInstrument E6In situ neutron diffraction on the discharging
process of an alkaline battery. Local Contact J. Hernández-Velasco
Principal Proposer: N. Kardjilov, I. Manke, J. Banhart (SF3) Date(s) of ExperimentJ. Hernández-Velasco (SF2)
Experimental Team: J. Hernández-Velasco BENSC-HMI Berlin. 29.9.-1.10.2003
Date of Report: 15.1.2004
The unique property of neutron beams comparedwith X-rays regarding their penetration powerinside matter makes them advantageous to follow insitu processes in industrial devices. Within thisframework neutron diffraction techniques could beuseful to monitoring those transformations wherestructural phase transitions are taking place.In this sense, we have investigated the evolution ofcrystalline phases by in situ diffraction using E6while the discharging process of an alkaline battery.A standard commercial battery IEC type-(LR 61)has been used for this purpose, see Fig. 1 below.
Figure 1.- Cross section and components of a non rechargeablealkaline Zn-Mn battery. The dimensions of the one used in theexperiment were: 8 mm and h 40 mm (m 6g). It washeld vertically with the bottom and top parts covered with Cd,the height exposed to the beam was 3 cm.
Four batteries were studied in the set ofmeasurements. The experimental diffractionpatterns of a charged (1.5 V) and a discharged (upto 0.5 V) ones are shown in Fig. 2. Some Braggreflections coming from several of the main phases(that show hexagonal symmetry) are marked.While the overall reaction can be formallydescribed by: Zn + 2MnO2 ZnO + Mn2O3various intermediate steps in the transformation
occur and it was possible to identify differentcrystalline phases (oxides, hydroxides) whichappear during the process of discharge, bymeasuring the intensity scattered from a batteryconnected to a resistance ( = 2 ohm). In a periodof time about 13 h we collected 33 diffractionpatterns in the angular range 41.52 74.5 (seeFig. 2 inset), the main changes take place between1.5 and 4.5 h after the discharging process has beenstarted. The correlation of phase contents (whichcould be determined from the integrated intensitiesof peaks) with time of discharge / voltage decay,give us interesting information about the kinetics,and it may be useful to improve the performance ofthese, otherwise, common devices. The analysiswill be carried out in due course. However, there isan inherent problem to properly quantify due to theexistence of non crystalline materials and hydrogencontent which contributes to the background anddecreases the signal to noise ratio, as well asoverlapping of reflections from different phases.For example both the cathode (mostly MnO2) andanode (mainly Zn powder) contain an electrolyte ofKOH and H2O. The former electrode also presentsC graphite (11%) and the latter some gellingagent. Some degree of amorphization during thecorrosion of the anode is observed, andcomplementary neutron tomography investigationsshow that the solution proceeds from the outer tothe inner part of the cell.
Figure 2.- Neutron diffraction patterns of batteries charged(bottom) and discharged (top). The inset shows the evolution ofsome patterns (502 73) while discharging. Peaks from thesteel can and brass CuZn-36 of the arrester pin are present too.
Cgraphite ZnO (001) (002) (101)(002) MnO2 (100) (002) (101) Zn(100) Zn(101)
55

EF_16_Hernandez..doc // J. Hernández-Velasco // 15.03.04 Seite 1 von 1
EXPERIMENTAL REPORT Proposal N° EFInstrument E6/E9Magnetic structures of R2BaMO5 at H=0 and
applied field (R=160Gd, Dy, Ho; M=Co, Ni, Cu). Local Contact J. Hernández-Velasco
Principal Proposer: Date(s) of ExperimentExperimental Team: J. Hernández-Velasco, BENSC-HMI Berlin. E9:10-13.6. & 25-27.8.03
E6:12-18.5. & 29/30.8.036/7.10. & 26-30.11. 2003
Date of Report: 15.1.2004
The four Immm-R2BaMO5 oxides (R3+=Dy, HoM2+= Co, Ni) and the Pnma-160Gd2BaCuO5compound have been studied by means ofneutron diffraction at zero and appliedmagnetic field up to H= 5T (VM3)/6.5T (VM2).It is worth noting that depending on thesynthesis conditions R2BaCoO5 show bothpolymorphic forms [1], being isostructural withthe Immm-Ni oxides or isomorphous to thePnma-Cu green phases. Both periodicity (seeTable below) and orientation of the magneticmoments depends on electronic and crystalstructure. In this sense, this family is an idealscenario to test the close relation betweenmagnetic properties structure and composition.
Compound Space Gr. TNéel (K) k (H=0)Dy2BaNiO5 Immm 64 [½, 0, ½]
Dy2BaCoO5 Immm 23 [½, 0, ½]
Dy2BaCoO5 Pnma 8 [0, 0, ½]
Ho2BaNiO5 Immm 53 [½, 0, ½]
Ho2BaCoO5 Immm 79 [½, 0, ½]Ho2BaCoO5 Pnma 5.4 [0, ½, ½]Gd2BaCuO5 Pnma 12 [0, 0, ½]
Pnma-R2BaMO5 oxides present lower TN thanthe Immm forms due to less favoured pathwaysfor the superexchange interactions. In theformer the M2+ are located in isolated (MO5)tetragonal pyramids, while in the latter aframework of chains is built up with vertexsharing octahedra (MO6).A comparison of Immm-R2BaMO5 magneticstructures at H=0 shows that mR and mCo arenearly perpendicular, however in the case ofthe Ni oxides mR and mNi are quite parallel(although not completely collinear). This couldbe an indication of weakly coupled R3+ and
Co2+ sublattices compared with R3+-Ni2+. Whena magnetic field is applied (in steps H=0.2T)the differences are even more marked, forexample the patterns at H=0 and 5T for Immm-Ho2BaMO5 are shown below, while for the Cooxide (top) the transitions are reversible oncethe field is removed, for the Ni one (bottom)there is an hysteresis effect, both spinarrangements at H=0 differ markedly andpreferred orientations of the powder can beexcluded on the basis of the observed nuclearreflections when the sample is warmed to reachthe paramagnetic state.
Long counting times were required to getenough statistics for the refinements, due to thehigh absorption cross sections of cobalt andrare earths, remarkably Dy and Gd [2].[1] J. Hernández-Velasco, Ph.D. Thesis. Univ.C. Madrid, 2001.[2] Sample enriched on isotope 160Gd was kindly provided by Dr. I.Golosovsky. See PSI Prog. Report 1992, p.110.
H=0 initialH=0 finalH=5TT=1.7K
H=0 initialH=0 finalH=5TT=6K
56

EF_17_Többens.doc // brandt // 15.03.04 Seite 1 von 1
EXPERIMENTAL REPORT Proposal N° EFInstrument E9, E6Influence of preparation conditions on the
magnetic structure of MnCr2O4 spinel Local Contact
Principal Proposer: D. M. Többens, HMI Date(s) of ExperimentExperimental Team: D. M. Többens, HMI
23.-26.1. / 20.2. / 16.4. /16.-19.10. / 6.-7.12.
Date of Report: 12.12.03
MnCr2O4 spinel is known to undergo twomagnetic phase transitions at lowtemperatures [1]. Below ≈40K the magneticstructure is collinear. Below ≈16K a LKDMmagnetic spiral structure is formed. In neutrondiffraction patterns this results insuperstructure reflections additional to thoseoriginating from the cubic cell of the chemicalstructure. However, the structure featuresdescribed in the literature differ widely [1,2].
The samples studied here have beenprepared with the combustion synthesismethod from a stoichiometric mixture of metalnitrates and urea [3]. This method results in avery fine grained powder of MnCr2O4 spinel. Itwas used directly for experiments and asstarting material for further treatment: sinteringat various temperatures for various times orpower ball milling in alcoholic suspension.
Neutron powder diffraction has been doneusing a OS cryostat on E9 and E6 withwavelength of 1.80 Å and 2.44 Å, respectively.Measurements on the D8 x-ray powderdiffractometer and on the SQUID experimenthave also been used.
Powder diffraction experiments with both x-rays and neutrons reveal particle sizebroadening of the Bragg reflections ofLorentzian-type. The refined average particlesizes of the various samples range from1800(40) Å through 450(10) Å. Temperaturedependent SQUID measurements of themagnetisation have been done on differentlytreated samples and curves of spontaneousand remnant magnetisation have beenderived. Neutron powder diffraction at the E9and E6 diffractometers of BENSC was used tostudy the magnetic structure of the samples.
For the phase transformation at ≈40K thereare only few significant changes: a slightincrease of the transition temperature for thesample with the highest particle size wasobserved. The absolute value of themagnetisation was found to be highest for theuntreated sample (with a particle size of
870(2)Å) and to decrease for both higherparticle size (tempered samples) and lowerparticle size (milled samples).
The transformation at ≈16K, however,shows various changes both in the magneticsuperstructure and the overall magnetisation.The sample with the highest particle sizeshows only one transition at ≈18K, which isassociated with the formation of magneticsuperstructure reflections. For smaller particlesthe spontaneous magnetisation shows twotransition points at ≈18K and at ≈20K; theformation of superstructure reflectionshappens at ≈20K. For very small particle sizesthe intensities of the superstructure reflectionsdecrease and the changes of the macroscopicmagnetisation become very small.
[1] Vratislav S., Zajíček J., Jirák Z., Andresen A.F.,J. Mag. Magn. Mat., 1977, 5, 41-50.
[2] Dwight K.., Menyuk N., Feinleib J., J. Appl.Phys., 1966, 37, 3, 962-963.
[3] Sundar Manoharan S., Patil K.C., J. Am. Ceram.Soc., 1992, 75, 1012-1015.
500 1000 1500 20000
400
800
1200Amplitude of magnetic structure factors at 1.6 K
F(-1,-1,1,0) F(2,2,0,-1) F(0,2,2,0)
|F|
[ arb
itrar
y un
its ]
Particle size [ Å ]
57

EF_18_tovar.doc // brandt // 03.03.04 Seite 1 von 1
EXPERIMENTAL REPORT Proposal: EF
Instrument E6+E9MAGNETIC INVESTIGATIONS IN THE SPINELSYSTEM CUxNI1-xCR2O4 Local Contact
M. Tovar
Principal Proposer: M. Tovar, HMI Berlin Date(s) of ExperimentExperimental Team: M. Tovar, HMI Berlin
R. Torabi, TH Berlin/HMI 08/25-09/01, 2003
Date of Report: 15.12.2003
Experiment:
Some crystalline compounds show aremarkable dependence of their crystalstructure (lattice parameters, volume) of theapplied magnetic field. This effect is wellknown as the so called giant magnetostrictiveeffect or giant magnetostriction and is appliedin different technological fields.
The compound CuCr2O4 is ferrimagnetic belowTc=130K [1]. To find out, if the compoundshows magnetostrictive properties neutronmeasurements at different temperatures anddifferent magnetic fields using VM3 werecarried out.
Magnetic fields were chosen between 0 and 5Tesla, temperatures between 2 and 300 K.The step resolution was 32, wavelength was2.4 Å and 1,7973 Å, respectively.
Results:
As an example of the various measurementsFigure 1 shows the neutron diffraction patternof the compound CuCr2O4 at 2 K and differentapplied vertical magnetic fields measured atE9.
Fig. 1: Neutron diffraction patterns of CuCr2O4 at 2 K and0 T (1) as well as at 2 K and 5 T (2) applied verticalmagnetic field
Lattice parameters were extracted from thesemeasurements using the whole powder patternfitting option of the Fullprof program (seetable 1).
Table 1: Lattice parameters of CuCr2O4 at 2K and 0T and5T applied magnetic field:
Field / lat. par. a c
0 T 8.542078 7.715812
5 T 8.542652 7.716860Absolute
Difference < 0.01% < 0.02%
The differences between the lattice parametersfor 2 K and 0 T and 2 K and 5 T, respectively,are below 0.02%, i.e., they are out of theinstruments measuring precision.
This means that CuCr2O4 exhibits nomeasurable magnetostriction effect since itscrystal structure does not show a remarkabledependeny from magnetic field.
While the peak position in the diffractogramshence are nearly identical, differences in themeasured intensity are obvious. Thesedifferences are caused by the inducedpreferred orientation since the crystals tend toadjust to the magnetic field.
Literature:
[1] Prince, E. (1957), Acta Cryst. 10, 554-556.
(1)
(2)
58

CHE-01-1262+1280.doc // brandt // 03.03.04 Seite 1 von 1
EXPERIMENTAL REPORT Proposal N° CHE-01-1262 CHE-01-1280
Instrument E9/E6The determination of the magnetic andnuclear structure of Na7Co2O6 Local Contact
D. Többens
Principal Proposer: Olivier Leynaud, Max Planck Institute fürFestkörperforschung, Stuttgart, Germany Date(s) of Experiment
Experimental Team: Mikhail Sofin, ibid.Martin Jansen, ibid.Jorge Hernandez-Velasco, HMI Berlin
14-16 Apr. 200316-17 Apr. 2003
Date of Report: 16 Jan. 2004
Researches on sodium cobaltates compoundswere lead 30 years ago by several teams [1,2].Recently, some discoveries in this field andespecially the existence of a thermoelectriceffect in NaCo2O4 [3] and superconductivity inNa0.35CoO2·1.3H2O [4] were leading us to findnew compounds, trying to modify and explainthese observed physical properties.The structure of the compound Na7Co2O6 wassolved on a single crystal. It can be describedeasily by isolated CoO3 triangle surrounded bysodium atoms. An only crystallographicallyindependent Co atom was found in the cellwhich is amazing considering the mixedoxidation state (Co(II),Co(III)). This compoundexhibits also noticeable magnetic properties, along range antiferromagnetic order beingobserved down to 12 K approximately.Solving the mixed oxidation state problemrequires a very high resolution instrument likeE9 [6] to obtain precise values for atomicparameters and conclude on the validity of thestructure Data are shown on figure 1.Transition is easily observed and magneticpeaks can be indexed with the normalcrystallographic cell. The propagation vector isthen k (0,0,0).
Figure 1: Neutron powder diffraction pattern on E9 forNa7Co2O6. Open and full circles represent 100 and 1.5 Krespectively. Top and bottom lines represent a Le Bail fit,and the difference between experimental and calculatedintensities. Bars indicate Bragg’s peaks positions.
The transition temperature can be confirmedby the observation of the evolution of intensityof e.g. the main magnetic peak (figure 2). Onthese data, collected on E6, almost no moremagnetic intensity is observed up to 12 K
Figure 2: Neutron powder diffraction pattern on E6 forNa7Co2O6. Evolution of the intensity of the peak (200)with temperature. It’s clearly shown than transition occursaround 12 K with a rapid transition in a range of 2-3 K.Data are (top to bottom): 2, 8, 10, 11, 11.5, 12, 15 and40 K).After the first refinements, we haveencouraging results allowing to think that thereis a splitting of Co atoms into twocrystallographically different subsets. Thisdifferentiation is reinforced by the propagationvector that implies a lowering of symmetry thatcould be connected to the nuclear one.We still continue to search in these directions,refinements are in progress, and should givesoon clarifications on the nuclear and magneticstructures.References:[1] M. Jansen & R. Hoppe, Z. Anorg. allg. Chem. 408,104-106 (1974)[2] C. Fouassier, G. Matejka & al., J. Solid State Chem. 6,532-537 (1973)[3] I. Terasaki, Y. Sasago & K. Uchinokura, Phys. Rev. B56(20), R12685-R12687 (1997)[4] K. Takada, H. Sakurai & al., Nature 422, 53-55 (2003)[5] M. G. Barker & G. A. Fairhall, J. Chem. Res. (S), 371(1979)[6] D. M. Többens, N. Stüßer & al., Mater. Sci. Forum378-381, 288-293 (2001)
59

PHY-01-1264.doc // brandt // 16.03.04 Seite 1 von 1
EXPERIMENTAL REPORT Proposal N° PHY-01-1264
Instrument E9A Neutron Diffraction Study of LaCo0.5Mn0.5O3,La0.7Ca0.3Co0.5Mn0.5O3
and La0.8Sr0.2Co0.5Mn0.5O3Local Contact D. Többens
Principal Proposer: H. Gamari-Seale, IMS, NCSR, Demokritos, Greece Date(s) of ExperimentExperimental Team: I.O. Troyanchuk, ISSSP NAS, Minsk, Belarus
A.P. Sazonov, as aboveK.L. Stefanopoulos, IPC, NCSR, Demokritos, GreeceD.M. Többens, HMI, Berlin
03.03-07.03.2003
Date of Report:
LaCo0.5Mn0.5O3 has been found to be ferromagnetic(FM) however the origin of ferromagnetism in thiscompound is under question. Magnetisationmeasurements revealed two FM transition temperaturesderiving from two different crystallographic phasescoexisting in the same sample [1]. In the phase with thehigher TC Co is trivalent in a low spin state and Mn andCo are not ordered; in the phase with the lower TC theions are Mn4+ and Co2+ are crystallographically ordered.Thus the compound was interest to study by neutrondiffraction technique.In all perovskites with the general formula ABO3 thereduction of the tolerance factor, produces strain and asconsequence affects their properties and might as wellchange the structure of the compound. For this reasonwe have an interest to study the structural changes inLaCo0.5Mn0.5O3 by decreasing the tolerance factor. Forthis we have performed neutron powder diffraction data(NPD) experiments on La0.7Ca0.3Co0.5Mn0.5O3 andLa0.8Sr0.2Co0.5Mn0.5O3 in which Ca or Sr have reducedthe tolerance factor by the substitution part of La.Phase purity of all samples was checked by X-raypowder diffraction. The NPD were collected in the E9diffractometer in the reactor BerII in Berlin using Gemonocromator, plane (511) with wavelength 1.798 Å.Measurements were performed in the range of 1.5 – 298 K in a zero magnetic field. The neutron patternswere refined by the Rietveld method using the Fullprofprogram.The refinement of the data gave the following results.LaCo0.5Mn0.5O3 crystallises into two phases: anorthorhombic Pbnm structure with a random distributionof Mn and Co and monoclinic P21/n structure where theCo2+ and Mn4+ ions are ordered with a ratio of 73/27respectively (fig. 1). It becomes ferromagnetic and themagnetic moment of 2.5 µB along the y-axis.La0.8Sr0.2Co0.5Mn0.5O3 is rhombohedral, space group 3R(fig. 2). In this compound, the magnetic moment isabout 0.7 µB. The refinement gives a 40% of antisitedefects, i.e. the occupancy at 3b is composed of 60% ofCo and 40% of Mn. The opposite is true for 3a.La0.7Ca0.3Co0.5Mn0.5O3 is refined in the P21/n spacegroup (fig. 3). The refinement gives a 40% of antisitedefects, as for La0.8Sr0.2Co0.5Mn0.5O3. However, the
magnetic contribution below the magnetic transition isvery small and cannot be refined.
Fig. 1. Refinement of the NPD patterns ofLaCo0.5Mn0.5O3 at 1.5 K. The inset shows somemagnetic contributions into peaks.
Fig. 2. Refinement of the NPD pattern ofLa0.8Sr0.2Mn0.5Co0.5O3 at 298 K. The inset showssome magnetic contributions into peaks.
Fig. 3. The refinement of the NPD pattern ofLa0.7Ca0.3Co0.5Mn.0.5O3 at 298 K. Magnetic
contributions were too small.
1. V.L. Joseph et al, Solid State Communication 121(2002) 219
20 40 60 80 100 120 140
0
4000
8000
20 24 28 32 36 40
0
300
600
Inte
nsity
(arb
. uni
ts)
2 (degree)
(002)
(200
)(1
12)
20 40 60 80 100 120 140
0
4000
8000
20 24 28 32 36 40
0
300
600
Inte
nsity
(arb
. uni
ts)
2 (degree)
20 40 60 80 100 120 140
0
3000
6000
9000
12000
20 24 28 32 36 40
0
300
600
Inte
nsity
(arb
. uni
ts)
2 (degree)
60

benscrep_SIkolenko_2003 // brandt // 07.01.04 Seite 1 von 1
EXPERIMENTAL REPORT Proposal N° PHY-01-1268
Instrument E9 Neutron diffraction study of La1-xSrxCoO3 magnetic structure at x = 0.15 and 0.3
Local Contact D. Többens, V.Sikolenko
Principal Proposer: V.V.Sikolenko, HMI Berlin Date(s) of Experiment Experimental Team: A.P.Sazonov, ISSSP Minsk
26.05 – 01.06.2003
Date of Report: *
The discovery of “colossal magnetoresistance effect” (CMR) in the manganites with perovskite structure stimulated the interest to the new perovskite-type compounds other, than LaMnO3. A large magnetoresistance was obtained in La1-xSrxCoO3 with 0.15 < x < 0.2 [1]. However, ferromagnetic ordering in La1-xSrxCoO3 does not lead to a metal-insulator transition like in CMR materials [2, 3]. In addition, these compounds are of industrial interest because of their catalytic properties and possibilities to use them as electrode material in solid-oxide fuel cell and as a membrane in oxygen separation processes [4]. However, magnetic structure dependence on Sr doping level is still not clear (compare, for example [3] and [5]). Undoped LaCoO3 does not contain Co4+ and is paramagnetic. Magnetic moment appears when strontium substituted for lanthanum and converts Co3+ to Co4+. According to Goodenough model ([6]) tetravalent cobalt ions polarize neighbouring Co3+ ion through the intermediate oxygen ion to the high spin state, Co3+ - O2- - Co4+. This interaction induces ferromagnetism of La1-xSrxCoO3. Authors of [7] predicted appearance of spin glass at x < 0.18 due to competition between Co3+ - Co4+ double exchange and long range RKKY mechanisms.
We studied the magnetic structure of La1-
xSrxCoO3 at x = 0.15 and 0.3 at the E9 spectrometer with incident neutron wavelength λ = 1.31 Å.
Fig 2. presents temperature dependence of Co-O distance. This distance decreases with the increasing of x values. However in case of x = 0.3 we didn’t observed any pecularities, like in [3].
Fig.1 shows a neutron Powder diffraction pattern
and Rietveld refinement for x = 0.3 sample. Ferromagnetic ordering has been found only at Sr concentrationa x = 0.3.
0 50 100 150 200 250 300
1,915
1,916
1,917
1,918
1,919
1,924
1,925
1,926
1,927
1,928
1,929
1,930 x = 0.3
Co-O
dis
tan
ce
T (K)
x = 0.15
Co
-O d
ista
nce
Fig.2 The temperature variation of the Co-O-Co band
angle of the x = 0.3 sample seems to saturate above Curie point, whereas this angle in the sample x = 0.15 smoothly increases with the temperature increasing.
References [1] G.Briceno et.al. Science 270 (1995) 273 [2] I.Troyanchuk et.al. J.Phys.:Cond.Mat. 12 (2000) 2485 [3] R.Cacinfo et.al. Phys. Rev. B 59 (1999) 1068 [4] R.Sonntag et.al. Physica B 241-243 (1998) 393 [5] V.Sathe et.al. J.Phys.:Cond.Mat. 8 (1996) 3889 [7] J.B.Goodenough Progress in Solid State Chemistry vol.5 (1971) 145 [7] P.A.Joy et.al. J.Phys.: Condens.Matter 11 (1999) L217
61

MAT-01-1271.doc // brandt // 03.03.04 Seite 1 von 1
EXPERIMENTAL REPORT Proposal MAT-01-1271
Instrument E9Neutron Powder Diffraction Study ofEu(BaNd)2Cu3O7
Local Contact M. Tovar
Principal Proposer: Prof. V.A. Sirenko, ILT, Kharkov Date(s) of ExperimentExperimental Team: Prof. V.V. Eremenko, ILT, Kharkov
Dr. Michael Tovar, BENSC, HMI, Berlin 21.02. – 03.03.2003
Date of Report:
Background
It was shown recently, that high temperaturesuperconductors (HTSC) with perovskite struc-ture are characterized by giant (up to 10-4) mag-netostriction. It means, that they are potentialcandidates for magnetostrictive applications. Thisobservation attracted a number of experimentaland theoretical studies of magnetostriction in therelated materials [1]. On the other hand, the de-veloped approach for analysis of magnetostrictionmeasurements on superconductors, makes thesemeasurements a unique tool for examining thepressure dependences of bulk superconductorproperties and Fermi surface topology, as well aspinning phenomena [2]. This is the consequenceof two components of magnetostriction – a re-versible one and irreversible one, respectively.The reported activity is THE FIRST structuralstudy of magnetostriction in superconductors.
Object of investigation
were high temperature superconductors with rearearth substitutions, corresponding to differentlevels of doping (concentration of carriers) [3].The preliminary X-ray measurements have showna sufficient difference of its unit cell volume innormal and superconducting stage.
Aims of investigation
was to check connection of volume changes atlow temperatures below superconducting transi-tion and magnetostrictive properties. Thereforeneutron diffraction studies above and below Ts,including measurements in magnetic field, wereperformed.
Experimental results
Typical measured diffraction patterns are shownin Fig. 1. The calculated lattice parameters re-vealed a pronounced change of unit cell volume.Its field sensitivity testifies the connection of thisdifference with superconducting transition.
Fig. 1: Neutron diffraction pattern of Eu(BaNd)2Cu3O7 at 50 K and 150 K at magneticfields of 0T and 4T
Discussion
The volume change, associated with supercon-ducting transition indicates high value of thepressure derivatives of bulk superconductingproperties. The sign of volume change in mag-netic field most possibly shows, that volumechange at transition is sufficiently higher, thanthat, connected with thermal contraction contribu-tion. The reversible behavior indicates no pinningeffects involved in the measuring field.
Literature:
[1] Eremenko V., Sirenko V., Szymczak H., NabialekA., Magnetostriction of superconductors. LowTemperature Physics, vol.25, Apr. 1999, pp.232-254.
[2] V.V. Eremenko, V.A. Sirenko, R. Schleser, P.Gammel, Magnetostriction in the mixed state ofsuperconducting 2H-NbSe2 single crystals, LowTemp. Phys., 2001, 27, 7, 305-310
[3] Youwen Xu., Kramer MJ., Dennis KW., Wu H.,O'Connor A., McCallum RW., Malik SK. YelonWB., Substitution for Ba by light rare-earth inEu123 solid solutions. Physica C, vol.341-348,pt.1, Nov. 2000, pp.613-14.
62

EF_19_Feyerherm.doc // brandt // 03.03.04 Seite 1 von 1
EXPERIMENTAL REPORT Proposal N° EFInstrument E9Crystal and magnetic structure of manganese
malonate Local Contact
Principal Proposer: Ralf Feyerherm, HMI Date(s) of ExperimentExperimental Team: Ralf Feyerherm, Daniel Többens, HMI
Sample preparation: S. Landsgesell, HMI 30.09. – 01.10.03 15.11. – 16.11.03
Date of Report: 08.12.2003
Extending our previous studies of molecularmagnetic materials to new ligands, we have studieddeuterated manganese malonate dihydrate,Mn(C3D2O4).2D2O. This compound was recentlyreported not to exhibit magnetic ordering down to2.0K [1]. However, our own magnetizationmeasurements, carried out with a Quantum DesignMPMS Squid Magnetometer, showed clearindications for magnetic ordering below TN = 2.7 Kin both the deuterated and a hydrogenated sample.
Neutron powder diffraction measurements werecarried out on E9 at temperatures 1.5 and 3 K,using an Orange cryostat, and at 298 K. Thewavelength was 1.7969 Å. Figure 1 shows the twolow-temperature spectra together with thecorresponding Rietveld refinements. Our data areconsistent with the crystal structure determinedbefore by x-ray diffraction at room temperature(space group Pca21). The basic structural feature isthe formation of 2D networks in the ab plane (twoper unit cell), see Fig. 2. We obtain a=9.6124(8) Å,b = 7.3619(6) Å, and c = 8.3225(9) Å. Thecorresponding values at 1.5 K are a = 9.6396(4) Å,b = 7.3390(4) Å, c = 8.1986(4) Å. The thermalexpansion between 1.5 and 300 K is highlyanisotropic, a/a = - 2.8·10-3, b/b = + 3.1·10-3, c/c= + 15.1·10-3. Notably, the ab plane area keepsalmost constant while the c axis expandssignificantly on heating – consistent with the 2Dnature of the crystal structure.
The 1.5 K spectrum reveals additional Braggreflections associated with long-range magneticordering. These reflections can be indexed on thebasis of the crystallographic cell pointing to asimple antiferromagnetic ordering of the four Mnmoments within a unit cell. The relative intensitiesof the magnetic reflections are well describedassuming the magnetic space group Pc’a21’ and amoment orientation || c. The refinement of thismodel results in an ordered moment of 3.8(1)B. Asmall canting of the moments from the c axis isallowed by symmetry but can not be determined.The magnetic structure is depicted in Fig. 2.
Additional temperature dependent measurementsbetween 1.5 and 3K were carried out on E6. Thesedata show that the magnetic Bragg intensityreduces continuously with increasing temperatureand vanishes around 2.7 K, consistent with themagnetization data.
Figure 1: Powder neutron diffraction data measured at1.5 and 3 K. The additional Bragg reflections marked byarrows occurring at 1.5 K are associated with long rangemagnetic ordering.
Figure 2: Crystal and magnetic structure of manganesemalonate at 1.5 K determined from E9 powder neutronpowder diffraction data. For clarity, only one 2Dnetwork is shown and D atoms are omitted.
References[1] T. K. Maji et al., Inorg. Chem. 42 (2003) 709.[2] T. Lis, J. Matuszewski, Acta Cryst. B35 (1979) 2212.
5 15 25 35 45 55 652 (°)
0.0
0.5
1.0
1.5
2.0N
eutro
nco
unts
(103
)
1.5K3.0K
(100)(101)
63

EF_20_Jauch.doc // brandt // 03.03.04 Seite 1 von 2
EXPERIMENTAL REPORT Proposal N° Eigenf.
Instrument E9Magnetic moments of the transition metalions in MnF2, FeF2 and CoF2 Local Contact
D. Többens
Principal Proposer: W. Jauch, HMI Berlin Date(s) of ExperimentM. Reehuis, MPI Stuttgart, HMI Berlin
Experimental Team: M. Reehuis, MPI Stuttgart, HMI Berlin 07.07. – 10.07.03
Date of Report: 08.12. 2003
Surprisingly, reliable experimental valuesfor the ordered magnetic moments in transitionmetal difluorides are lacking in the literature.We have therefore recorded neutron powderpatterns of MnF2, FeF2 and CoF2 at T = 1.8 Kon the powder diffractometer E9. The neutronwavelength was = 1.7971 Å, and thescattering angle range covered 5 - 150°. In theRietveld refinements the standard structureparameters were fixed to the values obtainedfrom our high-accuracy single-crystal studies.Scattering lengths and magnetic form factorswere taken from Ref. [1]. The refined totalmagnetic moments tot (proportional to the sum2S + L) are shown in Table 1. These valuesare compared with the pure spin magneticmoments S obtained from high-energymagnetic x-ray diffraction [2] and from densityfunctional theory within the generalizedgradient approximation [3].
From -ray charge density analyses of thedifluorides, the total number of 3d-electronson the metal is found to be virtually identicalwith the formal integer values [4]. For theelectronic spin-only system MnF2, it shouldtherefore hold: tot = S = 5 B. Bothexperimental values are in satisfactoryagreement with expectation. A similar result ismet with in FeF2 where S agrees with the freeatom value. The large uncertainty of theneutron value (due to sample quality) preventsa conclusive inference about a possiblecontribution from unquenched orbital angularmomentum.
For CoF2, the observed spin moment isconsiderably smaller than the moment of 3 Bthat corresponds to the S = 3/2 state. In viewof the integer 3d-population, the spinreduction cannot be related to charge transfereffects as observed in CoO [5]. The spinreduction has been ascribed to single-ionanisotropy with a spin moment of 2.18 B,obtained from spin-wave theory [6], which isremarkably close to the observed one. Fromcombination of the neutron and x-ray results
the orbital moment is obtained as L = 0.4 B,leading to an orbital-to-spin angularmomentum ratio of L/S = 0.4 [as compared toL/S = 2 for the free atom].
From inspection of Table 1, it is obviousthat the calculated values of S are notsupported by experiment. For MnF2 and FeF2the predicted values are too small, whereasfor CoF2 the corresponding value is definitelytoo large. Density functional theory thuspresently fails to reproduce a basic ground-state property such as the spin magneticmoment.
Table 1. Total magnetic moments tot (in B) of thetransition metal ions, as determined from E9neutron powder data. Also given are the spinmagnetic moments S obtained from synchrotron x-ray measurements [2] and from ab initiocalculations [3].
tot (E9) S (x-ray) S (Theory)
MnF2 4.89(5) * 5.16(6) * 4.47
FeF2 4.30(16) 3.93(4) 3.51
CoF2 2.60(4) 2.21(2) 2.62
* Zero-point spin deviation correction of 2.4 % wasapplied [7].
[1] International Tables for CrystallographyVol. C (1995).
[2] J. Strempfer, U. Rütt, S.P. Bayrakci, Th.Brückel, W. Jauch, Phys. Rev. B, in print.
[3] P. Dufek, P. Blaha, V. Sliwko, K. Schwarz,Phys. Rev. B 49 (1994) 10170.
[4] W. Jauch, M. Reehuis, A.J. Schultz, ActaCryst. A, in print.
[5] W. Jauch, M. Reehuis, Phys. Rev. B 65(2002) 125111.
[6] M.E. Lines, Phys. Rev. 137 (1965) A982.[7] H. Yasuoka, Tin Ngwe, V. Jaccarino, Phys.
Rev. 177 (1969) 667.
64

EF_21_Feyerherm.doc // brandt // 03.03.04 Seite 1 von 1
EXPERIMENTAL REPORT Proposal N° EFInstrument V1Two magnetically ordered phases in
Fe[C(CN)3]2 Local Contact
Principal Proposer: Ralf Feyerherm, HMI Date(s) of ExperimentExperimental Team: Ralf Feyerherm, A. Loose, A. Hauss, HMI
Sample preparation: S. Landsgesell, HMI 24.06. – 06.06.2003
Date of Report: November 04th 2003
After recent extensive studies of frustratedmagnetic ordering in manganese tricyano-methanide, Mn[C(CN)3]2 [1], we have extended theinvestigation of the M[C(CN)3]2 series to M = Fe.Our magnetic susceptibility data on Fe[C(CN)3]2showed a broad maximum around 3.8 K, pointingto short-range ordering effects. Below 3.8 K, thesusceptibility behaves monotonously, giving noclear indication for any magnetic phase transition.However, heat capacity measurements performed atHMI [2] indicated the presence of two phasetransitions around 1.9 and 2.4 K and hence of twomagnetic phases in Fe[C(CN)3]2. In order to clarifythis apparent contradiction, neutron powderdiffraction measurements were performed at V1 inzero and under applied horizontal magnetic fieldusing the cryomagnet HM1. In accompanyingmeasurements at E9, the low-temperature crystalstructure of Fe[C(CN)3]2 was determined.
20 40 60 80
2 (°)
0
2
4
Inte
nsity
(arb
.u.)
T = 2.0 K
[100
]-k I
[0
00]+
k I
[101
]-k I
[001
]+k I
20 40 60 80
2 (°)
0
2
4
6
Inte
nsity
(arb
.u.)
T = 1.6 K
[1/2
0 1
/2]
[1/2
0 3
/2]
[3/2
0 1
/2]
[1/2
1 1
/2]
[3/2
0 3
/2]
[1/2
1 3
/2]
[1/2
0 5
/2]
[3/2
1 1
/2]
Figure 1: Difference of diffractograms measured at 2.0and 2.9 K (top) and the difference of the 1.6 and 2.9 Kdiffractograms (bottom). The 1.6 K data indicate that avolume fraction of about 20% is still in phase I.
Figure 1 shows the difference of diffractogramsmeasured at 2.0 and 2.9 K (top) and the differenceof the 1.6 and 2.9 K diffractograms (bottom). At2.0 K, two significant magnetic Bragg reflectionsare observed that can be indexed only assuming anincommensurate magnetic propagation vector kI =(0.530(5) 0 0). At 1.6 K, the magnetic Braggpattern is completely different. Several magneticreflections can be identified and indexed assuminga doubling of the unit cell along a and c, i.e., apropagation vector kII = (½ 0 ½). Obviously, thetwo phase transitions observed in the heat capacitydata are related to two different magnetic phases Iand II. The Rietveld refinement of the data isshown in Fig. 1 as solid line. The resultingmagnetic structures are depicted in Figure 2.
Figure 2: Magnetic structures of the two orderedmagnetic phases of Fe[C(CN)3]2. The moment lie in thebc plane close to the corresponding N-Fe-N bonds.
At 1.7 K, a magnetic field of about 2 T drives thesystem from phase II to I, while magnetic orderingis destroyed a field larger than 4 T.
[1] R. Feyerherm, A. Loose, J. L. Manson, J. Phys.: Condens. Matter 15 (2003) 663-673; 6057.[2] T. Polinski, M. Meißner, private communication.
0
a
c
b
0
a
b
c
c
k = I (0.53, 0, 0) = 3.4(1) B
k = II (½, 0, ½) = 3.2(1) B
= 4.513Å
65

EXPERIMENTAL REPORT N° *PHY-02-347
Instrument *V2, E1 Enhancement of the magnetic order in Mg doped CuGeO3 J. Klenke and
P. Vorderwisch
Principal Proposer: R.J. Birgeneau, University of Toronto, Canada Date(s) of Experiment Experimental Team: S. Wakimoto, University of Toronto, Canada C. Stock, University of Toronto, Canada
*December 2002
Date of Report: *December 22, 2003 Introduction:
CuGeO3 was the first inorganic material discovered to undergo a spin-Peierls transition. In the Peierls state the copper ions form dimer pairs and a gap opens in the magnetic excitation spectrum. The phase diagram of Cu1-
xMgxGeO3, where the Cu2+ ions are replaced by the non-magnetic Mg2+ ions, has been studied in detail with both x-ray and neutron scattering. At low temperatures, a dimerized long-range antiferromagnetic order exists for x<0.35 and a uniform antiferromagnetic phase exists for x>0.35. At high magnetic fields the dimerized phase becomes unstable to the formation of domain walls, or solitons, resulting in an incommensurate (IC) phase. In the pure undoped material this is a first order transition that occurs at 12.5 T. An important question is how the presence of domain walls affects the dimerized antiferromagnetic phase for low Mg concentrations. Experiment:
In this experiment we studied the effect of impurities on the high-magnetic field IC phase using single crystals of Cu1-xMgxGeO3 with x=0.02 (dimerized antiferromagnetic order) and 0.04 (uniform antiferromagnetic order). The samples were grown by the floating zone method and characterized by DC magnetization and heat capacity measurements. The x=0.02 sample has a spin-Peierls transition at 11 K and a Neel transition at 2.5 K. Magnetization as a function of applied magnetic field shows the commensurate (C) to IC transition to occur at 9 T. The x=0.04 sample undergoes only a Neel transition at 4.3 K. Neutron measurements were conducted at the V2 and E1 spectrometers using fixed final
energies of 3.5 meV and 13.9 meV. Magnetic fields up to 14 T were used to study the magnetic structure.
One of the most important findings in this research is summarized in Fig. 1 which displays scans through the antiferromagnetic Bragg position (0,1,0.5) at applied fields of 0 T and 14 T. The magnetic peak is found to show a large enhancement for applied magnetic fields greater than the critical field at which the C-IC transition occurs. Remarkably, the magnetic peak remains commensurate although the structural peak is reported to be incommensurate. This result reveals an unusual and strongly inhomogeneous ground state with the magnetic and Peierls order parameters decoupled.
Figure 1: Transverse scans through the magnetic Bragg peak at applied fields of 0 and 14 T along the [100] direction. The positions of the structural incommensurate peaks are marked by arrows.
report_CuGeO // brandt // 22.12.03 Seite 1 von 1 66

PHY-02-0352.doc // brandt // 03.03.04
EXPERIMENTAL REPORT Proposal N° PHY-02-352Instrument V2Magnetic excitations of quasi-1D Ising chain
at high field Local Contact K Habicht
Principal Proposer: R. Coldea, University of Oxford, UK Date(s) of ExperimentExperimental Team: R. Coldea, University of Oxford, UK
D.A. Tennant, Rutherford Appleton Lab, UKK. Habicht, P. Smeibidl, HMI
23.01-3.02.2003
Date of Report: 24.02.2003We use transverse magnetic fields to drive anIsing magnet through a quantum phasetransition between an ordered ferromagneticphase and a quantum-disordered spin-liquidstate. This transition is expected to occur whenquantum tunnelling processes induced by thetransverse field overcome the tendency tomagnetically order favoured by the Isingexchange. We explore this scenario onCoNb2O6, a quasi-1D Ising ferromagnet with alow exchange J~1.5 meV. We measured the field dependence of theexcitations in a large (6.75 g) single crystal ofCoNb2O6 mounted with the magnetic chains(c-axis) in the horizontal scattering plane.Magnetic fields from the VM-1 magnet wereapplied along the b-axis transverse to the Isingdirection and the sample was cooled to dilutionfridge temperatures to minimise thermaldisorder effects. Maps of the excitations weremade at 0.5, 1, 3, 4, 5 and 8 T using the V2spectrometer in standard focused configurationwith collimators guide-50-open-open and fixedkF=1.1, 1.2 and 1.54Å-1. A cooled Be filter wasplaced before the analyser to cut out higher-order contamination in the scattered beam. Const-Q scans across the 1D Brillouinobserved large changes in the lineshape anddispersion relations with field. Fig 1 shows thefield dependence of the gap at theferromagnetic zone centre along the chaindirection (1.5,0,0). Above 2 T the gapdecreases with increasing field approaching aminimum around Bc=5.3 T above which itincreases again with a smaller slope uponfurther increasing field. Fig 2 shows that theexcitation lineshape also changes qualitativelyfrom a broad continuum below Bc to aresponse dominated by a sharp magnon modeabove Bc.
This behaviour is consistent with a phasetransition accompanied by a change in thenature of the excitations at Bc. At low fieldsexcitations are domain walls of the Ising order
and a neutron spin-flip scattering creates pairsof such excitations giving rise to a scatteringcontinuum). Above Bc excitations aremagnons of the ferromagnetic order along thefield and are observed in the form of sharppeaks in the neutron cross-section. In thepresence of interchain couplings the gap isexpected to close only at the positions of the3D magnetic Bragg peaks in the orderedphase indexed by ± q, q =(0,1/2,0) andhorizontal fields are required to access thebehaviour at those positions. A full analysis ofthe data is currently in progress.
67
n 1B (Tesla) || b0 2 4 6 8
Gap
Ene
rgy
(meV
)
0.0
0.5
1.0
1.5Q = (1.5,0,0)
Bc = 5.3 T
Energy (meV)0.5 1.0 1.5 2.0
0
20
40
Cou
nts/
mon
itor (
~4 m
ins)
0
20
40
60
800
200
400
600
B = 4.0 T
B = 4.5 T
B = 8.0 T
Fig. 1 Excitation gap at the ferromagneticzone centre Q=(1.5,0,0) vs field.
Seite 1 vo
Fig. 2 Lineshapes at the ferromagnetic zonecentre Q=(1.5,0,0) vs field below and abovethe critical field Bc=5.3 T.

PHY-02-0374.doc // brandt // 03.03.04 Seite 1 von 1
EXPERIMENTAL REPORT Proposal N° PHY-02-374Instrument V2Spin Dynamics in the Unconventional
Quantum Magnet NH4CuCl3 Local Contact P. Vorderwisch
Principal Proposer: Ch. Rüegg, LNS, ETH Zurich & PSI Date(s) of ExperimentExperimental Team: Ch. Rüegg, LNS, ETH Zurich & PSI
P. Vorderwisch, P. Smeibidl, S. Kausche,M. Meissner, BENSC, HMI
30.4.-7.5. 2003
Date of Report: 17.1.2004
High field magnetization measurementsdetermined the unconventional m(H) saturationcurve of S=1/2 NH4CuCl3. At T=4 K and below,unexplained quantum plateaus correspondingto m=1/4 and m=3/4 of the saturation areclearly visible for 4T<H<13T and 18T<H<25T,respectively [1]. Specific heat studiespostulated the segregation of the S=1/2moments in fully ordered and fully disordered,following the net distribution 1/4, 1/2 and 1/4 ofthe total sites according to the unconventionalsaturation curve. High field ESRmeasurements revealed that the magneticexcitations might have a spin gap in theplateaus, but no spin gap in between [2].Elastic neutron scattering experiments todetect the m=1/4 ordering at T<TN=1.3 K wererecently performed at SINQ, PSI. In zero-field,long-range magnetic ordering is confirmed bymagnetic Bragg peaks observed belowTN=1.3 K.Matsumoto et al. postulate the segregation ofthe spin dimers in individual magneticsubsystems with volume fractions of 25%, 50%and 25%, which become structurally possibleby a recently observed phase transition at lowtemperatures [3]. The excitations of thesubsystems are expected to be centred around0.3meV, 1.6meV and 3.0meV.Inelastic neutron scattering (INS)investigations on powder samples, as well ason deuterated single crystals proof theexistence of two nearly dispersionlessexcitations around 1.6meV and 3.0meV,T=1.5K>TN. The predicted low-lying branchcould not be resolved. Our INS experiments onsingle crystals in high magnetic fields, FLEX(BENSC, Berlin) and TASP (SINQ,PSI),unambiguously identify these excitations astriplet waves by characteristic Zeemansplitting, see data at H=4T in Fig. 1.Additionally, the opening of a field-inducedspin gap inside the first plateau could beverified, see Fig. 1, and may be interpreted asthe field-induced reopening of a spin gap in afully polarized ferromagnetic subsystem.
These experimental results already indicatethe microscopic mechanism leading to theplateaus. Beside the partial order in zero-field(25% of the spin system) successive quantumphase transitions of nearly decoupledsubsystems with singlet ground-states andindividual spin gaps to excited triplet states(50% and 25%) provide a consistentexplanation for the plateaus and favour themodel proposed by Matsumoto et al..However, the individual values of theexchange interactions remain partiallyunknown.
Figure 1: Observed field dependence of theexcited states in ND4CuCl3 measured at thezone centre Q=(0,0,1) on FLEX (HMI, Berlin).The two almost dispersionless branchesaround 1.6 meV and 3.0 meV are clearlyidentified as triplets by characteristic Zeemansplitting, see data at H=4T (lines representmodel expectations for isolated dimers, solidlines the driving excitations for the formation ofthe gapped plateau phase). The opening of aspin gap inside the first plateau isdemonstrated.
[1]
[2]
[3]
W. Shiramura et al., J. Phys. Soc. Jpn. 67,1548 (1998)B. Kurniawan et al., Phys. Rev. Lett. 82,1281 (1999)M. Matsumoto et al., Phys. Rev. B 68,180403 (2003)
0
1
2
3
4
5
0 2 4 6 8 10 12 14
Ener
gy tr
ansf
er [m
eV]
Magnetic field [T]
68

PHY-02-0379.doc // brandt // 09.03.04 Seite 1 von 1
EXPERIMENTAL REPORT Proposal N° *PHY-02-379Instrument *V2/FlexThree Dimensional Field-Induced Magnetism
in High-Tc La2-xSrxCuO4 Local Contact *Peter Vorderwisch
Principal Proposer: Bella Lake, Oxford University Date(s) of ExperimentExperimental Team: Kim Lefmann, Risø National Laboratory
Niels Christensen, Risø National Laboratory *1-7/3/03 & 18-23/8/03
Date of Report: *25/1/2004
There is strong evidence that magneticinteractions play a crucial role in themechanism driving high-temperaturesuperconductivity in cuprate superconductors.Recently several experiments [1,2] andtheories [3,4] have shown that a magnetic fieldapplied in the superconducting state ofunderdoped La2-xSrxCuO4 (LSCO) inducesantiferromagnetic order. The field-inducedantiferromagnetism is significant (0.23B/Cu2+,H=14.5T, T=2K) and the ordering temperatureoften coincides with Tc. So far all the neutronscattering experiments have been performedwith the superconducting copper oxide planesof LSCO lying in the scattering plane of thespectrometer and the out-of-plane directionhas not been explored in a field.
The magnetism in LSCO is assumed tobe two-dimensional because of the muchweaker out-of-plane exchange interactions.However our previous measurements at HMI(PHY-02-0334) show that while the zero-fieldmagnetism is indeed two-dimensional the field-induced magnetism is somewhat three-dimensional. Doped strongly correlatedelectron systems such as LSCO are known todisplay highly sample-dependent behaviour.The aim of this experiment is therefore toconfirmed the results in another sample anddetermine whether this is intrinsic behaviour.
The horizontal magnet HM1 was usedfor this experiment and measurements tookplace around the magnetic position[1.12,0.12,l] where the out-of-plane wavevectorl was varied. A series of in-plane scans weremade through the magnetic peak for differentvalues of l. These scans were fitted to extractthe amplitude of the signal and this is plotted inthe top part of the figure. The blue circlesrepresent the zero-field amplitudes while thered circles represent the amplitudes in a fieldof H=6T. It is clear that a field induces signal atthe reciprocal lattice point (l=4), whereas awayfrom the reciprocal lattice point theenhancement is much smaller, this isillustrated in the bottom part of the figure
where the field-induced signal (in-fieldamplitude minus zero-field amplitude) isplotted.
This result confirms the finding of ourearlier measurements and suggests that whilethe magnetism is confined to the copper oxideplanes in zero field, the magnetic correlationsbetween the planes become increasingsignificant in an applied field. Since in thisexperiment the field was applied perpendicularto the planes, the vorticies also ran in thisdirection. A possible model is therefore ofvortices connecting magnetic regions alongtheir length and enhancing the magneticcorrelation length in c direction.
[1] B. Lake et al. Nature 415 299 (2002).[2] B. Kaykovich et al. Phys. Rev B 66 014528(2002)[3] E. Demler et al. Phys. Rev.Lett. 87 067202(2001).[4] J.-P. Hu et al. LANL cond-mat/0108273 (2001)
69

PHY-02-0380.doc // brandt // 03.03.04
EXPERIMENTAL REPORT Proposal N° PHY-02-0380Instrument V2Field-induced magnetization plateau in a
2D frustrated quantum magnet Local Contact K Habicht
Principal Proposer: R. Coldea, University of Oxford, UK Date(s) of ExperimentExperimental Team: R. Coldea, University of Oxford, UK
D.A. Tennant, Rutherford Appleton Lab, UKT. Ono, Tokyo Institute of Technology, Japan K. Habicht, S. Gerischer, HMI
26.5-5.6.2003
Date of Report: 28.6.2003Cs2CuBr4 is a spin-1/2 triangular-lattice
antiferromagnet which shows an unusualmagnetization plateau in applied field at 1/3rd
saturation. Plateau phases correspond toparticularly stable and generally gapped groundstates and the aim of the experiment was to explorethe microscopic properties of the plateau phaseobserved in the 2D quantum magnet Cs2CuBr4.
Experiments were made on a large (6.8 g)single crystal of Cs2CuBr4 mounted in the abhorizontal scattering plane. Magnetic fieldsprovided by the VM-1 cryomagnet were appliedalong the c-axis for which the plateau phase occursfor 13 <B<14.2 T. To determine the magneticstructure a complete set of magnetic diffractionpeaks were collected at zero field, on the plateauphase (13.75 T) and above the plateau (14.8 T)using the V2 spectrometer with flat monochromatorand analyser, collimators guide-60-open-open, andfixed kF=1.35 Å-1. A cooled Be filter was placedbefore the sample to cut out higher-ordercontamination in the incident beam. Inelasticmeasurements were made in the focusedconfiguration with kF=1.2, 1.35 and 1.5 Å-1 and Befilter in the scattered beam.
Measuremets of magnetic Bragg peaks areshown in Fig 1 and Fig 2 indicates how themagnetic structure evolves with field. At B=0 spinsform a spiral in the (bc) plane, which transforms inapplied field into an ellipse elongated along thefield axis. The ordering wavevector changes fromQ=0.574(2) b* (B=0) to 0.676(2) at 14.8 T with alocking-in near the commensurate value of 2/3 forthe same field range where the magnetizationshows a plateau. In the plateau phase the structureis nearly collinear along the field axis, with only avery small transverse ordered component, in broadagreement with theories suggesting a locked-inphase with the spins on a triangle in an up-up-downalignment.
Inelastic measurements were also made tocompare the magnetic excitations in zero field andin the plateau phase (13.75 T). Fig. 3 shows asignificant change in the scattering at theantiferromagnetic zone boundary (0,0.75,0). A fullanalysis of the data is currently in progress.
7
Fm
[1, K, 0] -0.70 -0.65 -0.60 -0.55
Cou
nts /
Mon
itor ~
1 m
in
100
200
300
400
B= 14.8 TB = 6 T
0
Fig. 1 Field dependence of the (1,Q,0) magneticBragg peak, which measures the ordered spincomponent along b-axis (perpendicular to field).
Fig. 2 Magnetic structure and orderingwavevector Q as a function of applied field.
B || c (Tesla)0 2 4 6 8 10 12 14 16
Q (r
lu)
0.58
0.60
0.62
0.64
0.66
0.68
(1,Q,0)(0,Q,0)
Plat
eau
Seite 1 von 1
ig. 3 Magnetic excitations at the antiferro-agnetic zone boundary K=(0,0.75,0).
Cou
nts /
Mon
itor ~
5 m
in
0
10
20
30
40
50B = 0 TB = 13.75 T

PHY-02-0400.doc // brandt // 09.03.04 Seite 1 von 1
EXPERIMENTAL REPORT Proposal N° PHY-02-0400Instrument V2-NRSENeutron Resonance Spin Echo (NRSE) Study of the Magnon
Linewidth in BaMnF4Local Contact K.Habicht
Principal Proposer: S.P.Bayrakci, T.Keller, B.Keimer MPI f. FKF,Stuttgart; K.Habicht, HMI, Berlin Date(s) of Experiment
Experimental Team: S.P.Bayrakci, MPI für Festkörperforschung,StuttgartK.Habicht, TU-Darmstadt; HMI, Berlin
5.12 – 17.12.2003
Date of Report: 14.1.2004
An extensive theoretical literaturedeveloped over several decades treats the energyrenormalization and lifetime of spin waves inHeisenberg antiferromagnets.[1] However, outsidenarrow regions of temperature and wavevector,such results have remained untestable by anytechnique. In the case of inelastic neutronscattering (INS) experiments, the restriction resultsfrom limitations of the instrumental resolution.
The neutron resonance spin echo (NRSE)technique is uniquely suited to such investigations,as the method of “phonon focusing” exploits theexcellent resolution of the spin-echo technique overthe entire Brillouin zone, thus permitting accuratemeasurement of the linewidths of narrow dispersiveexcitations.
We recently performed the firstmeasurements of a magnon linewidth using theNRSE-TAS technique, achieving a smallestmeasured linewidth of 10.8 1.8eV [2]. Thecompound we studied was MnF2, which exhibitsreasonably large single-ion anisotropy: the gap atthe zone center is about 17% of the magnon energyat the zone boundary. Large anisotropycomplicates comparison with existing theories forthe origin of the linewidth. We therefore turned toBaMnF4, for which the corresponding figure is only9%.
In the current experiment, we used the coldtriple-axis spectrometer V2 (FLEX) with the NRSEoption to measure the magnon linewidth inBaMnF4. Our crystal has a volume of 4.5cm3 andwas mounted in the (HKK)-plane. ki was fixed at1.70Å-1, which corresponded to a transversebackground TAS resolution of ~0.01Å-1 FWHM. Atunable PG filter was used to reject higher-ordercontamination. We investigated magnons with |q|ranging from 0 - 0.15 r.l.u., at T = 1.8 K (0.07 TN).We focused on magnons propagating along qa,around the antiferromagnetic wavevector (0 –0.5–0.5).
The coil tilt angles for NRSE werecalculated using an analytical expression for thespin-wave dispersion [3] which fits previous
experimental data well, in combination with valuesof the magnon energy measured during theexperiment. Coil tilt angles were as large as (=12.1°, = -37.6°), for qa = 0.1.
In the NRSE-TAS technique, thepolarization of the scattered neutrons is measuredas a function of the spin-echo time . Thispolarization is the Fourier transform of the spectrallineshape. The observed polarizations decay asP()=P0 exp(-), which corresponds to aLorentzian lineshape. From the fit, we obtain thelinewidth .
An unusual feature of this experiment wasthe observation of “dips” in P() for data measuredwith the spectrometer in the W configuration (Fig.1). We are currently investigating this phenomenon.The smallest experimental linewidth, extractedfrom the envelope of P(), was 3 2eV. Acomparison with theoretical predictions will followonce the analysis of the data is completed.
Fig.1: Experimental [100] magnon linewidth in BaMnF4at q = -0.05 r.l.u., T = 1.8 K.
[1] See, e.g., A. Harris et al., PRB 3, 961 (1971).[2] S.P. Bayrakci et al., BENSC Experimental Reports,2002 and 2003.[3] D.E. Cox et al., PRB 19, 5754 (1979).
0 10 20 30 40 50 60 70 80 90 1001101200,01
0,1
1
= 10 ± 3 eV
Pola
rizat
ion
(ps)
71

EF_22_Bayrackci.doc // brandt // 15.03.04 Seite 1 von 1
EXPERIMENTAL REPORT Proposal N° EF-SF1Instrument V2-NRSENeutron Resonance Spin Echo (NRSE) Study of the Q-
andTemperature Dependences of the Magnon Linewidth in MnF2Local Contact K.Habicht
Principal Proposer: S.P.Bayrakci, T.Keller, B.Keimer MPI f. FKF,Stuttgart; K.Habicht, HMI, Berlin Date(s) of Experiment
Experimental Team: S.P.Bayrakci, T.Keller, MPI fürFestkörperforschung, StuttgartK.Habicht, TU-Darmstadt; HMI, Berlin
1.04 – 15.04.2003
Date of Report: 15.12.2003
An extensive theoretical literaturedeveloped over several decades treats the energyrenormalization and lifetime of spin waves inHeisenberg antiferromagnets. However, outsidenarrow regions of temperature and wavevector,such results have remained untestable by anytechnique. In the case of inelastic neutronscattering (INS) experiments, the restriction resultsfrom limitations of the instrumental resolution.
In MnF2, one of the most intensivelystudied antiferromagnets, the magnon linewidth has been investigated only in the critical region:therein is the linewidthsufficiently broad that INSmeasurements are not resolution-limited. An INSstudy of the low-temperature damping in the nearlyisotropic antiferromagnet RbMnF3 found partialagreement with theory [1]. However, thedeconvolved linewidths were significantly smallerthan the instrumental resolution: the smallestdeconvolved was only 2% of the lowestmeasured value of 195eV [2].
In this experiment, we used the cold triple-axis spectrometer V2 (FLEX) with the neutronresonance spin echo (NRSE) option to measure themagnon linewidth in MnF2 over a broad range oftemperatures. The NRSE technique is uniquelysuited to such investigations, as the method of“phonon focusing” exploits the excellent resolutionof the spin-echo technique over the entire Brillouinzone, thus permitting accurate measurement of thelinewidths of narrow dispersive excitations.
We used a half-cylindrical crystal ofvolume 8.5cm3, mounted in the ac-plane. ki wasfixed first at 1.74Å-1 and later at 2.00Å-1,corresponding to a fixed transverse backgroundTAS resolution of ~0.01Å-1 FWHM. A tunable PGfilter was used to reject higher-order contamination.We investigated magnons with |q| ranging from 0 -0.2 r.l.u., at temperatures between 4 and 60K (0.06- 0.9TN). We focused on magnons propagatingalong qc in the antiferromagnetic Brillouin zonecentered at (100).
The coil tilt angles for NRSE werecalculated using an analytical expression for the
spin-wave dispersion [3] which fits previousexperimental data well, in combination with valuesof the magnon energy measured during theexperiment. Coil tilt angles were as large as (=29.3°, = +9.85°), for qc=0.2.
In the NRSE-TAS technique, thepolarization of the scattered neutrons is measuredas a function of the spin-echo time . Thispolarization is the Fourier transform of the spectrallineshape. The observed polarizations decay asP()=P0 exp(-), which corresponds to aLorentzian lineshape. From the fit, we obtain thelinewidth .
The data after initial analysis exhibits theexpected monotonic increase in linewidth withincreasing q and T (Fig. 1). The smallest measuredlinewidth is 10.8 1.8eV; the largest is92.7 9.4eV. A comparison with theoreticalpredictions will follow once the analysis of the datais completed.
Fig.1: Experimental [0l] magnon linewidths in MnF2 atvarious temperatures.
[1] A. Harris et al., PRB 3, 961 (1971).[2] C. Windsor et al., PRL 37, 855 (1976).[3] A. Okazaki et al., Phys. Lett. 8, 9 (1964).
0,00 0,05 0,10 0,15 0,200
102030405060708090
100110120
(
eV)
q (r.l.u.)
T = 4 K 10 K 20 K 30 K 40 K 50 K 60 K
72

PHY-02-0402.doc // brandt // 03.03.04 Seite 1 von 1
EXPERIMENTAL REPORT Proposal N° *PHY-02-402Instrument *V2/FlexSearching for Charge Order in High-Tc La2-
xSrxCuO4 Local Contact *Peter Vorderwisch
Principal Proposer: Bella Lake, Oxford University Date(s) of ExperimentExperimental Team:
*23-28/8/03
Date of Report: *25/1/2004
One of the most interesting theories inthe efforts to understand high-temperaturesuperconductorivity is to consider them aselectronic textures of charge and spin stripes[1]. Stripe phases occur as a compromisebetween the antiferromagnetic interactionsamong magnetic ions and the Coulombinteractions between charges and the zero-point kinetic energy of the doped holes. Bothspin and charge signal is expected as asignature of stripe ordering. Spin ordering hasbeen widely reported in the high-Tc materialLa2-xSrxCuO4 (LSCO) and co-exists withsuperconductivity, however the chargeordering has not been observed although thereare indications of its presence most notably inthe related material La1.6-xNd0.4SrxCuO4 wheresuperconductivity is suppressed [2,3]. The aimof this experiment was to search for chargeordering in LSCO.
The measurements took place on anunderdoped LSCO sample (x=0.1) that isknown to possess substantial spin ordering atlow temperatures (0.15B). The spin orderpeaks occur displaced from theantiferromagnetic lattice points by anincommensurate wavevector =0.12 and thecorresponding charge order is expected atdisplacement 2 from the nuclear Bragg peakpositions. An extensive search for the chargeorder took place around the expectedpositions, however no sign of any charge orderwas found here or elsewhere. It is possible thatthe charge order was beyond the sensitivity ofthe experiment or that charge ordering simplydoes not exist in LSCO, either way the result isin line with previous attempts to measurecharge order in this material using neutron orx-ray scattering which have also produced nullresults.
References[1] See, for example, V.J. Emery and S.A.Kivelson, J. Phys. Chem. Solids 61 (2000)467. [2] M. v. Zimmermann et al, Europhys. Lett. 41(1998) 629. [3] T. Niemoller et al., Eur. Phys. J. 12 (1999)509.
73

PHY-02-0415.doc // brandt // 03.03.04 Seite 1 von 1
EXPERIMENTAL REPORT Proposal N° PHY-02-415Instrument V2Phonon softening preceding the reverse
martensitic transformation in Ni2MnGa Local Contact P. Vorderwisch
Principal Proposer: Peter Vorderwisch, HMI-SF1 Date(s) of ExperimentExperimental Team: Stephen Shapiro, Brookhaven Nat. Lab. (BNL)
Peter Vorderwisch, HMI-SF1 29.07. - 10.08.2003
Date of Report: 25.01.2004
The ferromagnetic Heusler alloy Ni2MnGa isknown to undergo a martensitic transformationfrom a face centred cubic (austenitic) phase toa face centred tetragonal (martensitic) phaseupon cooling. Deviations from the stoichiome-tric composition only slightly change the Curietemperature TC, but have a drastic effect onthe transformation temperature TM, on theappearance of a premartensitic phase, and onthe lattice structure of the martensitic phase.
In the austenitic phase, three different studiesof the phonon dispersion in alloys with (I) TMbelow, (II) TM around, and (III) TM above roomtemperature have been performed. In allcases, a transverse acoustic phonon branchsoftens when the transformation is approached(‘precursor effect’) [1,2,3].
Application of a magnetic field of sufficientstrength can be used to produce a single-domain martensitic phase. This allowsmeasurement of the phonon dispersion in thisphase. Previous V2 / FLEX experiments on asingle crystal with TM = 284 K (group II)showed already that in the [2- 2+ 0] directionan anomaly at 0.4 occurs (whereas in [2-0 2+] direction higher phonon energies withno anomaly was observed).
We have now extended these experiments ona single crystal with TM 220 K (group I). Thisgroup differs from group II in the occurrence ofa premartensitic phase. Furthermore, phononsoftening at 0.33 (see Fig. 1) is morepronounced than in group II - crystals.
Comparing the now determined acoustic pho-non dispersion in the martensitic phase (Fig. 2)with the corresponding branch in the group II –crystal, we find the same shape with softeningat 0.4 with only minor temperaturedependence of the phonon energy.
Fig. 1 Transverse acoustic phonons in the austenitic phase
Fig. 2 Transverse acoustic phonons in themartensitic phase
[1] A. Zheludev et al., Phys. Rev. B 51 (1995) 11310[2] U. Stuhr et al., Phys. Rev. B 56 (1997) 14360[3] U. Stuhr et al., J. Phys.: Condens. Matter 12 (2000) 7541
74

EF_23_matsuura.doc // brandt // 03.03.04 Seite 1 von 1
EXPERIMENTAL REPORT EFInstrument V2Magnetic field effect on antiferromagnetic
order in Nd1.85Ce0.15CuO4Dimitri Argyriou
Principal Proposer: Masato Matsuura, Condensed Matter SciencesDivision, Oak Ridge National Laboratory
Feb.3-10,2003
Experimental Team: Pengcheng Dai, Department of Physics andAstronomy, The University of TennesseeOleg Sobolev, Hahn-Meitner-InstituteDimitri Argyriou, Hahn-Meitner-Institute
Date of Report: Dec.22,2003
One of the most important questions in thephysics of high-temperature (high-Tc)superconductor is magnetic interaction in CuO2plane. The parent compounds of the high-Tcsuperconductors are antiferromagnetic (AF)insulators characterized by a simple doubling of thecrystallographic unit cell in the CuO2 planes. Whenholes are doped into these planes, the long-rangeAF-ordered phase is destroyed and the lamellarcopper-oxide materials become metallic andsuperconducting. This raises the fundamentalquestion concerning the role of magnetism in thesuperconductivity of these materials.
Recently, We have discovered that onapplication of a few Tesla field, the elastic intensityat three types of AF positions (i) (1/2,0,0), (ii)(1/2,1/2,0), and (iii) (1/2,3/2,0) increasedramatically. This observation of field induced peakat (1/2,1/2,0) or (1/2,3/2,0) suggests thatantiferromagnetism compete withsuperconductivity. The widths of field-inducedpeaks are resolution-limited, indicating in-plane spincorrelation length is over 300Å. If the observedfield-induced effect is directly related to the vortexlattice and suppression of superconductivity, shouldthe induced order be two-dimensional or three-dimensional in reciprocal (or real) space? Theanswer to this question will shed new light to theorigin of superconductivity. For the (1/2,3/2,0) typeAF peak, we performed neutron diffractionmeasurement with using horizontal magnet HM-2 in2002, and found that peak width is also resolution-limited along c-direction. However, we could notstudy c-axis correlation of other two AF peaks(1/2,0,0) and (1/2,1/2,0) because of dark angle ofmagnet. One way to perform the experiment is touse smaller Ei to avoid dark angles of HM-2magnet. Here, we show neutron diffractionmeasurement performed on the triple-axisspectrometer V2.
The horizontal collimation was Guide-60'-Sample in sequence from reactor to analyzer. Befilter was placed after the sample to eliminatehigher-order contamination. The superconductingCuO2 planes were aligned perpendicular to thehorizontal plane and in the [H, H, L] zone. Indices inthis paper are represented in the chemical unit cellof tetragonal symmetry of NCCO (space group
I4/mmm). We used a split-coil superconductingmagnet HM-2, and the magnetic field B was appliedup to 4T perpendicular to the CuO2 planes andalong the c-axis.
Figure 1 Magnetic field effect of the antiferromagnetic spincorrelation along c-axis around (a) (3/2,0,0) and (b) (1/2,1/2,0).In order to sneak out dark angle of magnet, Ei=4 and 2.5meVwere used for (3/2,0,0) and (1/2,1/2,0), respectively.
Figure 1 shows the effect of a B//c-axis fieldon the scattering at (a) (3/2,0,L) and (b) (1/2,1/2,L).We observed sharp field-induced peak at both(3/2,0,0) and (1/2,1/2,0). The correlation lengthalong c-axis was calculated to be 69 and 66 Å for(3/2,0,0) and (1/2,1/2,0), respectively. Thisindicates field induced AF order is threedimensional with rather shorter correlation length inc-direction than that in a-b plane.
75

EF_24_Prokes.doc // brandt // 03.03.04
EXPERIMENTAL REPORT Proposal N° EFInstrument V2
Inelastic Studies of UNiAl (1) Local Contact P.Vorderwisch
Principal Proposer: K.Prokes, HMI Berlin Date(s) of ExperimentExperimental Team: K.Prokes, HMI Berlin
5.6.2003-13.6.2003
Date of Report: 7.7.2003
UNiAl forms in the hexagonal ZrNiAltype of structure and orders anti-ferromagnetically (AF) below TN = 19.3 K.Upon application of magnetic field along thehexagonal axis there is below TN ametamagnetic transition (BC = 11.4 T at 2K)towards a ferromagnetic structure [1]. Thepropagation vector of the zero-field AFstructure, qold = (0.1 0.1 0.5), has all threecomponents. Two of the three U moments(coupled ones) in the unit cell are sine-wavemodulated along the [110] direction with theamplitude of 1.3 µB. The third moment is alsomodulated in the same direction, however, withsmaller amplitude of 0.7 µB [2].
When the field is removed, a different,new AF structure is established in UNiAl.Namely, the modulation direction rotates by300 towards the [100] direction. All the threemoments seem to be modulated with the sameamplitude of 1.3 µB. The propagation vectorqnew = (0.173 0 0.5) has the same length andalso the direction of moments along the c axisis preserved. Because the two AF structureshave different values of the γ [1] we hoped toresolve also different inelastic signals. Withthis aim we have investigated UNiAl singlecrystal (3 mm sphere) on the V2 spectrometerwith the 14.5 T cryomagnet VM1B. Due tosmall vertical opening of the magnet we had toturn the crystal by about 200 around the [100]direction in order to reach two characteristicmagnetic reflections - namely (1.1 1.1 0.5) and(1.173 0 0.5). When trying to prepare the newAF state in UNiAl we have crossed the criticalfield to a ferromagnetic state of 12.14 T and thecrystal detached (due to strong anisotropy).However, Fig. 1 shows that the new AF state isat 11.8 T established after ~ 12 hours and that itis not in fact necessary to cross the BC. Whendecreasing the field to zero, intensities relax totheir original values, however, much slower.
In Fig. 2 we show the response functionas a function of the energy transfer measured atthe two characteristic reflections. No clearlydefined excitations could be resolved. This is
76
-1.5 -1.0 -0.5 0.0 0.5 1.0 1.50
2
4
6
8
10
12
14
16
UNiAl1.8 K, 11.8 T(20 deg. off the c-ax)
Inte
nsity
(Cou
nts/
mon
itor)
- (deg.)
new fresh new 12h new 24h
old fresh old 12h old 24h
Fig. 1: Rocking curves through the new (1.173 0 0.5)andold (1.1 1.1 0.5) magnetic reflections just afterreaching 11.8 T (fresh) and after 12 and 24 hours.
0 1 2 30.000
0.005
0.010
0.015
0.020
0.025
0.030
0.035
UNiAl
Inte
nsity
(Cou
nts/
Mon
itor)
E (meV)
new 1.8K zf after 11.8 T old 1.8K zf after 11.8 T new 1.8K zf cooled old 1.8K zf cooled
Fig. 1: Response function vs. E measured at the oldand new magnetic reflections at 1.8 K after exposingUNiAl to 11.8 T and after zero-field cooling.
Seite 1 von 1
obviously due to sine-wave modulation leadingto unequal magnetic moments: each pair of Umagnetic moments yields another value of theexchange energy. The response function inUNiAl consists of many contributions havingsmall intensity and centered at different energytransfers. See also E1 experimental report.References[1] V. Sechovsky and L. Havela: in Handbook ofMagnetic Materials, ed. K.H.J. Buschow, vol. 11,Ch.1 [2]K. Prokeš, et al. Phys. Rev. B 58 (1998) 2692

PHY-04-0595.doc // brandt // 17.03.04 Seite 1 von 1
EXPERIMENTAL REPORT Proposal N° PHY-04-595
Instrument V4Nanostructured intermetallic alloys with GMRbehaviour Local Contact
A. Hoell
Principal Proposer: Deriu, Antonio, Dept. of Physics, University ofParma and INFM (Italy) Date(s) of Experiment
Experimental Team: Spizzo. Federico Dept. of Physics, Universityof Parma and INFM (Italy)Hoell, Armin, HMI Berlin
22.-25. January 02
Date of Report: 07/03/2003
Using polarized small angle neutron scatteringwe have investigated large-scale structural andmagnetic properties of granular Fe-Ag filmsand “core-shell” nanoparticles composed by aniron core surrounded by an oxide layer. Thesesystems are of interest owing to their peculiarmagnetotransport properties (Giant Magneto-Resistance) that are strongly dependent uponparticle size and morphology [1]. Theexperiment was performed on the V4diffractometer applying an external magneticfield H of 1.1 T perpendicular to the neutronbeam at the sample position. When polarisedneutrons are used without polarisation analysisof the scattered neutrons the scattering crosssection I-(Q) for neutron polarisation parallel tothe magnetic field H differs from I+(Q) wherethe neutron spin is antiparallel to H.
Fe-Ag alloysFig.1:
The samples were prepared in form of granularfilms by DC co-sputtering. The two-dimensional scattering patterns I- and I+ wereanisotropic and differ from each other
indicating the presence of a strong magneticcontribution. Fig.1 shows the I-(QH) andI+(QH) scattering curves for Fe20Ag80 andFe10Ag90 compositions.For both samples the I+ and I- figures nearlycoincide around 0.8 Å-1 and evidence twodifferent regions for the magnetic and nuclearcorrelations. These are attributed to singlemagnetic particles (higher Q region) and toparticle aggregates (lower Q region).
Fe-FeO core-shell particlesThese samples were prepared by the InertGas Condensation technique. Fig.2:
The I+ and I+ scattering profiles (Fig.2) showtwo crossing points at 0.07 Å-1 and 0.12 Å-1
respectively. These features are typical ofparticles with a composite structure that can beinterpreted in terms of a magnetic coresurrounded by an oxide layer with a lowermagnetic moment. Fitting results to adistribution of polydisperse spheres indicatethat the thickness of oxide shell (t) iscomparable to the size of the iron core(R) (R =5.20.4 nm and t = 5.00.4 nm).
[1] Allia P. et al., Phys. Rev. B 52, 15398.
0.1 110-2
10-1
100
101
102
103
104
105
Scat
terin
g cr
oss
sect
ion
(cm
-1sr
-1)
Q (nm-1)
I+
I-
77

PHY-04-0802.doc // brandt // 09.03.04 Seite 1 von 1
EXPERIMENTAL REPORT Proposal N° PHY-04-802
Instrument V4Pressure dependence of the magneticphase diagram in MnSi Local Contact
E. Garcia-Matres
Principal Proposer: L.Pintschovius, Forschungszentrum Karlsruhe Date(s) of ExperimentExperimental Team: D. Reznik, Forschungszentrum Karlsruhe
C. Pfleiderer, Universität Karlsruhe 28 June –2 July 2003
Date of Report: 24 August 2003MnSi is an itinerant ferromagnet which orders at Tc= 29.5 K. The ferromagnetic order is rather complexbecause of the presence of a long wavelengthhelical modulation that is due to a lack of inversionsymmetry of the cubic structure. Tc is reduced byapplying pressure and seems to vanish at pressurepc = 14.6 kbar inferred from macroscopicmeasurements [1]. Our aim was to study thesuppression of magnetic order on applyingpressure using a microscopic technique, because ithas been suggested that MnSi enters a genuinenon-Fermi liquid phase above pc [2,3]. Firstmeasurements of this kind were carried out at theLaboratoire Léon Brillouin using a triple-axisspectrometer. To our surprise, we found thatmagnetic order survives at pc and even atsomewhat higher pressures. The observedmagnetic order is, however, very peculiar in that thepropagation vector of the helical modulation doesno longer point along the (111)-direction as atambient pressure but shows a broad angulardistribution around the (110)-direction.
We started our experiments on V4 by repeatingsome measurements at a pressure much below pc ,i.e. p = 9 kbar, to become familiar with theinstrument. Then, we switched to a sample under apressure considerably higher than pc , i.e. p = 18kbar. We were able to obtain a number ofremarkable results which can be summarized asfollows :
A sizeable ordered magnetic moment surviveseven at such a high pressure. On cooling in zerofield, the angular distribution of the propagationvector of the magnetical helix is extremely broad.Therefore, the magnetic order is easily overlooked.By applying a magnetic field of about 0.4 T, thepropagation vector can be aligned along the fielddirection. After switching off the field, the inducedorder remains albeit with an increased mosaicspread of the propagation vector (see Fig. 1). Thelongitudinal correlation length of the magnetic orderis at least 200 nm, i.e. the magnetic order can beconsidered as long range. The magnetic order isstill helical as inferred from measuremnts withpolarized neutrons (Fig. 2) and the length of thehelix is only about 10 % shorter than at ambientpressure.
Fig. 1 Peak intensity of the magnetic Bragg peakcorresponding to helical magnetic order as a function ofthe applied applied. The sample was under a pressure of18 kbar. Note that the intensity vanishes at a field of 0.6T because the helicity is suppressed at such a high field.
Fig. 2 SANS patterns measured with polarized neutronson a MnSi sample under a pressure of 18 kbar and a field
of 0.4 T. The direction of the neutron spins was parallel(left) or antiparallel (right) to the magnetic field. Notethe pronounced difference in intensity of the spot at theleft margin of the patterns. This spot would becompletely absent on the left hand pattern if the flippingratio were infinite (actual value : 22). This intensitydifference is characteristic of helical magnetic order. Thestrong scattering seen at the center of the patterns is dueto the thick walls of the pressure cell.
[1] C. Pfleiderer et al., Phys. Rev. B 55, 8330 (1997).[2] C. Pfleiderer et al., Nature 414, 427 (2001).[3] C. Pfleiderer, Physica B327, 100 (2002).
0.0 0.1 0.2 0.3 0.4 0.5 0.6
5000
10000
15000
20000
25000
zero field cooledin
tens
ity
field (T)
78

CHE-04-0807.doc // brandt // 09.03.04 Seite 1 von 1
EXPERIMENTAL REPORT Proposal N° CHE-04-807Instrument V4SANS Investigation of Magnetic
Nanoparticles Using Polarized Neutrons Local Contact A. Heinemann
Principal Proposer: Piero Baglioni, Univ. Florence Date(s) of ExperimentExperimental Team: M. Bonini, Univ. Florence
Debora Berti, Univ. FlorenceAlbrecht Wiedenmann, HMI Berlin
15/18 May 2003*
Date of Report: 23/01/2003
Ferrofluids constituted by magneticnanoparticles have been synthesized andcharacterized by means of small anglescattering of polarized neutrons. Two different synthesis were performed. In thefirst one, ferrofluids constituted by mixedferrites were obtained by co-precipitation inalkaline medium. Cobalt, Copper and Nickelferrite nanoparticles were prepared and thendispersed in deuterated cyclohexane by usingoleic acid as dispersant. The SANSPOL optionallowed us to separate the surfactant’s and themagnetic core’s contributes to the scatteredintensity, providing useful information aboutthe size distribution of the magnetic particles.The surfactant shell has been characterized aswell.Results show that by changing the cation inthe mixed ferrites (Co, Cu, Ni) different sizedistributions of the nanoparticles wereobtained. In the same way, the aggregationbehaviour of these particles is strongly affectedby the ferrite composition, i.e. the magneticmoment of the nanoparticles plays a major rolein the structure of the ferrofluid under anexternal magnetic field.In the second synthesis, nearly monodisperse-Fe2O3 nanoparticles were prepared bythermal decomposition of an iron carbonylcomplex in presence of a surfactant. Thesenanoparticles were then dispersed indeuterated cyclohexane to form a stableferrofluid, In more details, the synthesis wasperformed by using three differentiron/surfactant molar ratios: 1, 0.5 and 0.33.We expected this ratio to strongly influenceboth the average size and the polydispersity ofthe obtained nanoparticles.Results obtained by SANSPOL confirmed ourexpectations. In particular the polydispersity ofthe magnetic nanoparticles dramaticallyincreases when the surfactant amount isdecreased. Nanoparticles prepared by using airon/surfactant ratio equal to 0.33 are nearlymonodisperse, as shown by the presence of“bumpings” in the SANSPOL results, (see
figure 1). `When the ratio is equal to 0.5, thesebumpings are less pronounced and theyalmost disappear when the ratio is 1.Coming back to the 0.33 ratio sample, themean diameter of the nanoparticles, includingthe surfactant shell, is about 10 nm.We have been able to accurately evaluate thesurfactant shell thickness, This was of greathelp in optimizing the synthetic procedure, inparticular to find out the most appropriatemetal to surfactant molar ratio.
0.1
2
4
68
1
2
4
68
10
2
4
68
Inte
nsity
[cm
-1]
6 80.01
2 4 6 80.1
2
Q [Å -1]Figure 1. Arithmetic mean of the flipper on andflipper off SANSPOL spectra of the -Fe2O3ferrofluid prepared with a 1:3 iron/surfactantmolar ratio.
79

EF_25_Perroud.doc // brandt // 15.03.04 Seite 1 von 1
EXPERIMENTAL REPORT Proposal N° EFInstrument V4SANSPOL studies of hard magnetic
Nd60FexCo30-xAl10 (x=20, 7.5 and 0) alloys. Local Contact A .Wiedenmann
Principal Proposer: O. Perroud HMI Berlin Date(s) of ExperimentExperimental Team: O. Perroud HMI Berlin
E.García-Matres HMI BerlinA. Wiedenmann HMI Berlin
25. Jul – 31. Jul 2003
Date of Report: 9.12.2003Ferromagnetic Nd-Fe-Co-Al alloys can beprepared as bulk amorphous alloys whichexhibit good hard magnetic properties at roomtemperature and can be considered as newtype of metallic amorphous permanent magnet[1]. X-ray diffraction and scanning electronmicroscopy investigations [2] of mould-castNd60FexCo30-xAl10 rods (0 ≤x ≤ 30) revealed aninhomogeneous microstructure consisting ofNd-rich regions and Fe-rich spherulites. In thethermomagnetic curves, two Curietemperatures TC1 = 50 K and TC2 = 495 K wereattributed to the Nd-rich crystallites andmetastable U-phase which have been found inthe Fe-rich spherulites, respectively [3,4]. Forthe Nd60Co30Al10 samples only one Curietemperature at about 50 K has been observed.
The aim of the present small angle neutronscattering investigation with polarised neutrons(SANSPOL) is to analyse the magneticnanostructure and to elucidate the origin of thehard magnetic behaviour between Tc1 and Tc2.
Small-angle neutron scattering were carriedout at instrument V4 at the Hahn-MeitnerInstitut. The experiment was equipped with a 6T horizontal cryomagnetic for the experimentsat low temperature. Samples of different Feconcentration (x=0, 7.5 and 20%) have beenstudied in the temperature range between 2Kand 250K in external magnetic fields up to 6T. In order to complete the temperature evolutionof the SANSPOL intensities around the higherCurie temperature, another experiment havebeen performed with the appropriated sampleenvironment.(See Experimental Report)We report our results for the experiments atlow temperatures.
The 2D SANSPOL intensities I+ and I- wereaveraged over azimuth angle of = 10,where the neutron spin are aligned antiparallel(+) or parallel (-) to the magnetic field vector H.The arithmetic mean [(I-)+(I+)]/2 whichcorresponds to the scattering pattern of non-polarised neutrons shows non anisotropy in
the 2- dimensional pattern for all temperaturesfor applied magnetic fields oH = 1T. Itcorroborates the weak magnetic scatteringcontributions and in addition.
0.1 1
0.1
1
10
100
1000SUM H//Q1 T
Nd60Fe7.5Co22.5Al10
3.)
accuracy--
1.)
2.) change factor
2 K30 K50 K70 K100 K150 K250 K
UNTITLED.opj
Q[nm-1]
Scat
terin
gcr
oss-
sect
ion
[cm
-1]
Fig.1 Neutrons scattering curves in 1 Thorizontal applied field versus the temperature.
We observed that the scattering cross-sectionat lower temperature (ferromagnetic state) isconsiderably higher than largest temperatures(paramagnetic state). The temperatureevolution of the scattering curves for 6 Tmagnetic field was plotted, showing the samebehaviour as for 1 T. It is seen to depend onlyweakly on H, indicating that this field isinsufficient to align the spins. However a weakanisotropic effect was observed at largertemperatures. For better understandingmeasurements at higher magnetic field areplanned.
This work is supported by DFG-Wi-1153/3-1
References
[1] K.H.J. Buschow et al.,J.Magn.Magn.Mater 22 (1981) 220. [2] G.J. Fan et al., J. Mater. Res., Vol. 15 (2000) 1556.[3] R. Sato Turtelli et al., Physical Review B 66 (2002) 54441.[4] G. Kumar et al., J. of Alloys and Compounds 248 (2003) 309.
80

EF_26_Garcia-Matres.doc // brandt // 03.03.04 Seite 1 von 1
EXPERIMENTAL REPORT Proposal N° EFInstrument V4SANSPOL in multicomponent Nd-based
alloys at high temperatures Local Contact E. García-Matres
Principal Proposer: E.García-Matres HMI Berlin Date(s) of ExperimentExperimental Team: E.García-Matres HMI Berlin
O. Perroud HMI BerlinA. Wiedenmann HMI Berlin
26. Aug – 29. Aug2003
Date of Report: 11.12.2003
Binary and multicomponent rare earth-basedalloys present remarkable magnetic propertiesdepending strongly on the cooling conditions[1]. In the as-cast Nd-Fe and Nd-Fe-Al alloys,the large room temperature coercivities havebeen attributed to magnetic exchange couplingbetween magnetically ordered clusters withlarge random anisotropy [2] and smallcrystallites that act as pinning center [3].Clusters like those may grow during cooling atlow cooling rate up to a critical size of fewnanometers. It is assumed that the magneticproperties are correlated to the structuralfluctuations on a nanometre scale.
The aim of the present small angle neutronscattering investigation with polarised neutrons(SANSPOL) is to observe magnetic and non-magnetic clusters and crystallites embedded inamorphous metallic alloys on a scale of 2 to 20nm and to analyse these data by meanssuitable models. Therefore, binary Nd80Fe20and quaternary Nd60Fe7.5Co22.5Al10 sampleshave been investigated. Both samples exhibittwo Curie temperatures at 50K and 550K [4].
Small-angle neutron scattering were carriedout at instrument V4 at the Hahn-MeitnerInstitut. The experiment was performed attemperatures between 300 K and 600 K in 1 Thorizontal electromagnet with furnace. Theseries of measurements with varioustemperatures were repeated at each of threedifferent configurations, covering the q-rangeof about 0.06 nm-1 to 3 nm-1. The datareduction and correction for backgroundscattering and instrument sensitivity functionswas performed using the HMI-standard“BerSANS” software.
The Nd60Fe7.5Co22.5Al10 sample was preparedin rods with 2 mm diameter to reduce the sizeof crystals and then cut in the form of bars of 5 mm length and 2 mm breadth. The thicknessof the sample is 0.4 mm. We stack 4 piecestogether to form plates of 6 mm x 7 mmdimensions.One-dimensional scattering curves wereextracted from the scattering patterns, I+ (theneutron spins are aligned antiparallel to themagnetic field) and I- (parallel) by averageingover azimuth angle of = 10 in sectorsparallel (=0) and perpendicular (=90) tothe magnetic field. These curves and thearithmetic mean [(I-)+(I=)]/2 (corresponding tothe case of non-polarised neutrons) were fittedwith a model of three log-normal distributionsof spherical particles. The volume weightedaverage radii of the three inhomogenities areR1=1.88 nm, R2=5.75nm and R3=18.8 nm,where R1 and R2 were assigned to thepresumed Nd-crystallites and R3 to the Fe-richmatrix. Nd80Fe20 sample (one pellet of 5mm diameterx 0.25 mm) was measure at 300K. The datawas analysed in sectors parallel andperpendicular to the magnetic field. TheseSANSPOL one-dimensional curves were fittedwith a model of only two log-normaldistributions of spheres per curves withvolume-weighted size <R1> =2.3 nm and <R2>= 8.4 nm
This work is supported by DFG-Wi-1153/3-1
References
[1] E. Matsubara, et al Sci.Pep.RITU A 43 (1977)83[2] L. Xing et al J. Appl. Phys. 88 (2000) 3565[3] R. Sato Turtelli et al., Physical Review B 66 (2002)54441.[4] G. Kumar et al., J. of Alloys and Compounds 248(2003) 309.
81

EF_27_Hoell.doc // brandt // 03.03.04 Seite 1 von 1
EXPERIMENTAL REPORT Proposal N° EF; SF3
Instrument V4Magnetic field induced arrangement ofconcentrated magnetosomes studied by SANS Local Contact
Armin Hoell
Principal Proposer: Armin Hoell, HMI – Berlin Date(s) of ExperimentExperimental Team: Armin Hoell, HMI – Berlin
Albrecht Wiedenmann, HMI - Berlin 15.3. – 24.03. 2002
Date of Report: 05. 01. 2004Magnetosomes are intracellular magnetic nano-structuresformed by biological mechanism in magnetotacticbacteria. They consist of nano-sized magnetite crystals,covered by protein and lipid membranes. Magnetosomeformation in bacteria is a potential production road ofuseful biomaterials. Great efforts are currentlyundertaken to cultivate these magnetotactic bacteria toproduce and extract the magnetosomes particles, whichhas proven to be difficult [1]. Here we present a SmallAngle Neutron Scattering (SANS) investigation onconcentrated magnetosomes extracted from cultivatedbacteria (Magnetospirillum gryphiswaldense). The two-dimensional SANS pattern for non-polarisedneutrons of the high concentrated sample is shown inFig. 1. It is obvious that the iso-intensity lines are not ofradial symmetry. There are no well-defined peaks suchas observed recently in Co-FF [2], instead, we observestreaks of higher intensity in vertical direction. Thestreak of the highest intensity goes through the centre atQx=0 intermitted only by the beam-stop (whiterectangle). Two streaks occur to the left and to the rightat Qx1= 0.11 nm-1 and less pronounced at Qx2= 0.22nm-1. Such scattering pattern is in fact characteristic foran one-dimensional periodic arrangement of scatteringobjects leading to equidistant planes perpendicular to theaxis. Apparently the core-shell particles are arranged inchain like structures that are aligned in direction of themagnetic field. The projections of the scattering planesonto the detector then give rise to the observed streaks ofzero, first and second order (dashed lines in Fig.1).In order to evaluate quantitatively the anisotropicscattering, reciprocal lattice scans along the grey lineshave been extracted by using azimuthally averaging insectors of 15° width and plotted in Fig. 2. From thehorizontal scan along the field direction (centred atQy=0) the positions of the first and second orderscattering planes are determined at Qx1=0.11 nm-1 andQx2=0.22 nm-1, respectively. This leads to the “perio-dicity” d = n2/Qxn = 57.1 nm which corresponds to thenearest neighbour distance of particle inside the chain.The other three scattering curves of Fig.2 correspond toreciprocal lattice scans in vertical Q-directionsperpendicular to the applied field and centred at Qx=0(open circles) and Qx1= 0.11 nm-1 (triangles). In thisdirection no peak is observed but only a continuousdecrease of the intensities with increasing Qy. Theintensities of these curves scale to each other reflectingthe finite length of the chains and to their imperfectalignment in the magnetic field, i.e. the absence of anycorrelation between the chains. From the behaviour atlow Q we conclude that particles are spontaneously
arranged in short segments of chains, which in zero fieldare randomly distributed and getting aligned along anapplied magnetic field. Comparing the d-value (57.1 nm)with the total particle size 2R=2(R’+dR)= 50.4 nm,measured at diluted sample, we conclude that the lipidshells of neighbour particles nearly get in touch whenthey are arranged in chains [3].Fig.1: 2D iso-intensity SANS pattern of a concentratedsample in a horizontal magnetic field of 1 T applied per-pendicular to the incoming neutrons. The vertical dashedlines represent the quasi 1D scattering planes of 0th 1st
and 2nd order.Fig.2: Reciprocal lattice scans extracted along the fourgrey lines in Fig. 1 are shown.[1] K. Grünberg, C. Wawer, B. M. Tebo, D. Schüler, Appl.
Environ. Microbiol. 67 (2001) 4573-4582.[2] A. Wiedenmann, A. Hoell, M. Kammel, P. Boesecke, Phys.
Rev. E 68 (2003) 031203.[3] A. Hoell, A. Wiedenmann, U. Heyen, D. Schüler, Nano-
structure and field induced arrangement of magnetosomesstudied by SANSPOL, Physica B, (2004), accepted.
Q [nm ]x-1
Q [n
m]
y-1
-0.11 0.110
-0.11
0.11
0
-0.22 0.22
H
0.11
10
100
: Qy = 0 : Q
x = 0
: Qx = 0.11 nm-1
: Qx =-0.11 nm-1
Momentum transfer [nm-1]
Scat
terin
g cr
oss-
sect
ion
[cm
-1]
82

EF_28_Heinemann.doc // brandt // 03.03.04 Seite 1 von 1
EXPERIMENTAL REPORT Proposal N° EF-SF3Instrument V4Field variation technique and Langevin
behaviour of Co-ferrofluids Local Contact *
Principal Proposer: A. Heinemann, A. Wiedenmann Date(s) of ExperimentExperimental Team: A. Heinemann, HMI Berlin
*22.08.03-25.08.03
Date of Report: *
The real magnetic nanostructure of ferrofluids arestill under discussion. From a SANSPOLexperiment with 3 different samples with differentH/D-ratios of the solvent (toluene) we obtainedstructure information [2].Together with the fieldvariation experiment here we can test the theory ofsuperparamagnetic behaviour of Co-nanoparticles.
Measurements were performed on the instrument,V4, using the polarisation option, SANSPOL [3].The Ion-Ioff intensities are predestinated to observethe influence of the convolution of magneticparticle size distribution with volume dependentLangevin behaviour of a single particle. In Fig. 1and Fig. 2 experimental data and the outcome of asimultaneous nonlinear least square fit procedureare shown. The curves for six different externalmagnetic fields (H=4mT,10mT,19mT,40mT,400mT,998mT) are fitted simultaneously with onemodel. In Fig. 1 and Fig. 2 only the results for twodifferent fields are picked up to prevent confusion.New developed analysis software was used toobtain confidence intervals for the parameters. Fig. 1 shows the influence of a 5% variation of themean particle radius to the scattering curves.We find very good agreement of the results with aLangevin behaviour of superparamagneticnanoparticles. A further data analysis is inprogress.
Work supported by DFG priority programSPP1104.
References:
[1] A. Heinemann, BENSC report 2003 [2] A. Wiedenmann, Mat. Science Forum, 312-314(1999) 315-324.
Figure 1: SANSPOL intensities of the highdeuterated sample. (Ion - Ioff ) intensities for twodifferent external mag. Fields. A simultaneous lest-square fit result (lines) and the influence of a 5%mean radius variation (dashed lines) are shown.
Figure 2: SANSPOL intensities of the highdeuterated sample. (Ion - Ioff ) intensities for twodifferent external mag. Fields. A simultaneous lest-square fit result (lines) and the influence of a 5%shell thickness variation (dashed lines) are shown.
83

EF_29_Heinemann.doc // brandt // 03.03.04 Seite 1 von 1
EXPERIMENTAL REPORT Proposal N° EF-SF3Instrument V4SANSPOL measurements for a new kind of
Co-Ferrofluids Local Contact *
Principal Proposer: A. Heinemann, A. Wiedenmann, M. KammelHMI Berlin Date(s) of Experiment
Experimental Team: A. Heinemann, HMI Berlin *18.08.03-22.08.03
Date of Report: *Dez 2003-12-15
A new preparation method of ferrofluids [1] opensthe access to ferrofluids with a small sizedistribution. This method works with a thermaldecomposition Co-Carbonyl compound in thepresence of Trialkylaluminium. The magnetic coresare stabilized against coagulation witholeoylsarkosine. A ferrofluid with a small sizedistribution is interesting for some biomedicalapplications, e.g. hyperthermia [2]. We performSANSPOL measurements, in order to evaluate theirunknown nanostructure. For this structureinvestigation 3 different samples with differentH/D-ratios of the solvent (toluene) was prepared.
Measurements were performed on the instrument,V4, using the polarisation option, SANSPOL [3].The SANSPOL intensities for two polarisationstates Ion(QH) and Ioff(QH) are presented inFig.1 and Fig.2.
The strong dependence of the scattering curveshapes from the different contrast between thenanoparticles, there shell and the solvent are usedfor constrained nonlinear least square fits [4]. Theresults are in good agreement with the preparatorypredictions. The obtained values for the magneticparticle size and size distribution (4.1nm ± 0.8nm)provide a basis for the test of exactsuperparamagnetic behaviour of the Co-nanoparticles. The data analysis is in progress.
Work supported by DFG priority programSPP1104.
Figure 1: Ion(QH) SANSPOL intensities withdifferent H/D-ratios of the solvent (toluene) andferrofluid concentrations.
Figure 2: Ioff(QH) SANSPOL intensities withdifferent H/D-ratios of the solvent (toluene) andferrofluid concentrations.
References:
[1] H. Bönnemann, W. Brijoux, R. Brinkmann, N. Matussevitch, H. Modrow, N. Palina, N. Waldöfner,Inorganica Chimica Acta 2003, accepted[2] R. Hiergeist, W. Andrä, N. Buske, R. Hergt, I. Hilger, U. Richter, W. Kaiser, JMMM 201 (1999) 420-422[3] A. Wiedenmann, Mat. Science Forum, 312-314 (1999) 315-324.[4] A. Heinemann and A. Wiedenmann, J. Appl. Cryst 36, 845-849 (2003)
84

EF_30_Kammel.doc // brandt // 03.03.04 Seite 1 von 1
EXPERIMENTAL REPORT Proposal N° EFInstrument V4SANSPOL - investigations of
Cobalt Ferrite Fluids Local Contact *
Principal Proposer: M. Kammel, HMI Berlin Date(s) of ExperimentExperimental Team: A. Wiedenmann, HMI Berlin
A. Heinemann, HMI BerlinM. Kammel, HMI Berlin
28.11. - 30.11.03
Date of Report: *
Ferrofluids are dispersions of magneticnanosized particles stabilized by coating theseparticles with surfactant material. Thesemagnetic fluids have multiple interestingproperties, which offer new medical andtechnique applications. There are severalapplications in development using cobalt ferriteparticles, e.g. the magnetocrystalline anisotropyof such particles is practical for magnetic ink-jet printing which allows the production ofmagnetic readable structures [1]. Furthermore,magnetic fluids based on cobalt-ferritenanoparticles surfaces coated with oleic acidhas been used to treat tumours in dogs [2].
A new biocompatible surfactant of citric acidallows the binding of antibodies to the surfaceof such a composite particle, but the structureof such a magnetic liquid is unsettled yet.
In order to evaluate the unknown structure andthe size distribution of the core-shell as well asthe magnetic structure of the cobalt ferritecores we performed Small Angle NeutronScattering studies using polarised neutrons(SANSPOL) [3]. All measurements wereperformed on the Instrument V4 of the BERIIreactor at the Hahn-Meitner-Institute Berlin,using polarised neutrons with a wavelength of=0.6nm.
Additionally to the magnetic contrast variationwith polarized neutrons we used differentsolvents in a so-called chemical contrastvariation. Three samples were produced thesame way with the same magnetic particles andthe solvents water, heavy water and galden.The measured scattering intensities withpolarised neutrons are shown in Figure 1. Theanalysis of these scattering data is still inprogress.
0.01 0.1 10.01
0.1
1
10
100
1000
I- - H2O
I+ - H2O
I- - D2O
I+ - D2O
I- - Galden I+ - Galden
Q [nm-1]
Scat
terin
g cr
oss-
sect
ion
[cm
-1]
Fig. 1: SANSPOL scattering curves of cobaltferrite-ferrofluids in water, heavy water andgalden. The polarisation of the incomingneutrons is denoted by I- ans I+.
Reference:[1] R. Chandrasekhar et al, Journal of ImagingTechnology 13 (1987) 55-59.[2] M. Sincai, D. Ganga, D. Bica, L. Vekas,JMMM 225 (2001) 235-240.[3] A. Wiedenmann, Mat. Science Forum, 312-314 (1999) 315-324.
85

EF_31_Kammel.doc // brandt // 03.03.04 Seite 1 von 1
EXPERIMENTAL REPORT Proposal N° EFInstrument V4SANSPOL investigation of magnetic
polystyrene nanoparticles Local Contact *
Principal Proposer: M.Kammel, HMI Berlin Date(s) of ExperimentExperimental Team: A. Wiedenmann, HMI Berlin
A. Heinemann, HMI BerlinM.Kammel, HMI Berlin
1.9. - 3.9.03
Date of Report: *
The advantages of magnetic polystyrenenanoparticles are the possibility of a physicaladsorption of antibodies or proteins and thepossibility of functionalizing the styrene forenabling covalent binding of antibodies,proteins or cells. The magnetic polystyrenenanoparticles consist of any magnetiteparticles (Fe3O4) stabilized by oleic acid and isembedded in bigger particle of polystyrene.[1]In water dispersed these particles give a socalled ”ferrofluid”.To evaluate the unknown complex structure ofsuch water dispersed particles we perform aSANSPOL [2] measurement with chemicalcontrast variation. All measurements wereperformed on the Instrument V4 of the BERIIreactor at the Hahn Meitner Institute Berlin,using polarised neutrons with a wavelength of=0.6nm.We investigated four different samples:samples dispersed in D2O with deuterated andnon-deuterated styrene and samples in H2Owith deuterated und non-deuterated styrene.This allows the distinction of differentcompounds in the system. There is a highcontrast to the deuterated styrene in thesystem of non-deuterated styrene (=1.41 1010
cm-2) and deuterated water (=6.33 1010 cm-2) ,so that in this case the scattering intensitymust be dominated by the scattering of thepolystyrene particle. On the other hand, in thesystem with deuterated styrene (=5.99 1010
cm-2) and deuterated water the contrast ofmagnetite (=6.98 1010 cm-2) is higher andeffects from the scattering of the magnetiteparticles should be visible.In Figure 1 the scattering intensities fordeuterated water are shown. In fact thescattering intensity of the sample withdeuterated styrene in deuterated waterdepends on the polarisation of the neutrons.For the analysis of these both scatteringcurves we have to assume two sorts ofparticles. The contrast of the bigger particlesdepends on the polarisation of the neutrons
and therefore they can only be the magnetiteparticles with an average radius of 7.1nm. Thesmaller particles have an average radius of2.1nm. Since the existence of oleic acid in thesample, it is possible that the oleic acid formsstructures like micelles in the sample.In the case of non-deuterated styrene anddeuterated water, where the scatteringintensity must be dominated by the styreneparticles, the guinier approximation yields avalue of 23.8 nm for the average radius ofthese particles. The comparison with results ofRamirez [1] for the size of the styrene particles(diameter of 41nm) shows a good agreement.
0.1 10.1
1
10
100
I- - nonedeuterated styrene I+ - nonedeuterated styrene I- - deuterated styrene I+ - deuterated styrene
Q [nm-1]
Scat
terin
g cr
oss-
sect
ion
[cm
-1]
Figure 1: SANSPOL intensities of the sampleswith deuterated water as solvent for bothpolarisation states.
References:[1] L.P. Ramirez, K. Landfester, Macrmol. Chem. Phys.2003, 204, 22-31.[2] A. Wiedenmann, Mat. Science Forum, 312-314(1999) 315-324.
86

benscrep_PHY-03-0301.doc // brandt // 15.11.03 Seite 1 von 1
EXPERIMENTAL REPORT Proposal N° PHY-03-0301
Instrument SPAN (V5)Surface dynamics of magnetism offerrofluid particles Local Contact
Katia Pappas
Principal Proposer: Bela Farago ILL Grenoble Date(s) of Experiment
Experimental Team: Emmanuelle Dubois CNRS/LI2C PARIS VIRegine PERZYNSKI CNRS/LMDH, PARIS VI 03/11/2003
Date of Report: 15/11/3002
The main aim of he expriment was to find the originof an apparently inelastic signal in the SANSmagnetic scattering form ferrofluid particles. NeutronSpin echo showed a increasing inelstic contribution ataround 100K which again disappeared approaching10K. As the SPAN spectrometer at HMI is able tomeasure in time of flight mode with polarizationanalysis. We wanted to see the nature of theinleasticity.
In the first part of the experiment we tried to see theinelastic scattering in Time of Flight mode withpolarization analysis. Even in the best resolutionmode ther was no signe of inelsatic scattering.However we have found that the signel of theELASTIC scattering was not always reproducibleand the polarization analysis gave inconsistentresults. As the instrument is capable to measure at thesame time the transmitted beam as well, we checkedthe beam polarization under different coolingcondition. It turned out that the sample has veryunusual properties. Cooling a a field a low as 3Gauss, apparently causes a freez in of the filed in thesample at around 100-60K and casues partialdepolarization of the beam. This explains why theSpin Echo showed an apparent inelastic signal. Thedetailed analysis of the emasurment is under way andwill be completed by magnetization measurments.
Fig1-2: The polarization analysis 6 counts whencooled down in 3 gauss vertical. Detectors 0 (firstfigure) is the transmitted beam which shows thatwhen the beam polarization id vertical there is nodepolarization, while the other two components areat least partially depolarized. Detector 2 at very lowangle, It shows that just as monitored by the directbeam, strong depolarization persists up to about60K but comes to to normal only around 250K. (P-par -V and P-par-N counts should be closely thesame.
1.6x10⁶
1.4
1.2
1.0
0.8
0.6
0.4De
tect
or 0
20015010050T Sample
BpN down BpQ down BpV down BpN up BpQ up BpN up
280x103
260
240
220
200
180
Dete
ctor
2
20015010050T Sample
BpN down BpQ down BpV down BpN up BpQ up BpN up
The samples will be re-studied with susceptibilymeasurements.Note that prior to NSE measurements they werechecked for eventual depolarization of the beam,but only at room temperature. As we realizedindeed at room temperature there is no problem, butonly at lower temperatures.
87

Rep_CHE-04-0895_RS_.doc // brandt // 19.12.03 Seite 1 von 1
EXPERIMENTAL REPORT Proposal N° CHE 04-0895
Instrument V6 Characterisation of the water deplation layer at the water/hydrophobic interface: effect surface hydrophobicity
Local Contact Roland Steitz
Principal Proposer: M. Grunze, M. Himmelhaus, Univ. Heidelberg Date(s) of Experiment Experimental Team: Marco Maccarini, Universität Heidelberg Roland Steitz, TU Berlin
26.11.03 1.12.03
Date of Report: 17.12.03 Sample preparation. Mixed self assembling monolayers (SAMs) of deuterated dodecanthiol (C12D25) and of dodecanthiol (C12H25) and of C12D25 and mercapto undecanol (C11OH) were adsorbed on polycrystalline thin Au films (~60 nm) evaporated on Si wafers with 1 nm Ti as adhesion promoter. The films with a layer thickness of ~11 Å were prepared by immersion of the substrates into 1 mM solution of EtOH and the relevant mixture of molecules overnight. After removal from the solution, the samples were rinsed with ethanol p.a., sonicated for 5 minutes, and blown dry with argon. The sample were made in our laboratory and precisely characterised by means of Ellipsometry, Infra Red Reflection Absorption Spectroscopy (IRRAS) and Contact Angle measurements. Subsequent the characterisation, the sample were stored in an inert gas atmosphere (Ar). Experimental procedure. The wafers were first mounted into an Al chamber, which could be evacuated down to 10-2 mbar, and the reflectivity profiles were measured in vacuum for each sample in order to estimate the thickness of the layer sequences. The measurement in water index matched to gold were performed by placing the sample in a liquid cell. The water was first degassed and then flowed in with a syringe connected to the cell by Teflon pipes. The use of a cold lamp allowed us a very clear view of the interior of the cell in order to exclude the presence of macroscopic air bubbles during the filling procedure. Measurements The experimental time allocated to us, in view of the duration of the experiments (9 hours for the vacuum and 12 hours for the liquid), allowed us the complete measurements of three samples of different hydrophobicity as measured from the contact angle (θadv=109°, 90°, 60°) Results: Figure 1 shows the reflectivity data for the most hydrophobic sample having a advancing contact angle of 109°. The
assumption that the water in contact with the substrate surface has properties similar to bulk water did not give any reasonable results (see Figure 1, dashed line). In order to fit the reflectivity profile, a different distribution of water density next to the SAM had to be postulated: a three box model of water was introduced that could represent, in a first approximation, the gradient of density occurring near the hydrophobic surface. The result is reported in Figure 1. A preliminary and non-conclusive analysis shows a drastic reduction of water density (~30% of the density of bulk water) for the first box in contact with the surface. This box has a thickness of the order of 20-30 Å. The second box is characterised by a moderately reduced density (~ 80% of the density of bulk water) extending over 60-80 Å. The three-box model can be applied also to model the most hydrophilic sample analysed (θadv= 60°), although the density depletion is less pronounced in the latter case.
0,00 0,04 0,08
1E-5
1E-4
1E-3
0,01
0,1
Ref
lect
ivity
Q[Å-1]
Exp 3-box model 1-box model
Figure 1 Neutron reflectivity data for the most hydrophobic sample (θadv=109°) and fits: bulk water in contact with substrate (dashed line); 3-box model (solid line)
88

03.03.04 Seite 1 von 1
EXPERIMENTAL REPORT Proposal N° PHY-01-1274
Instrument E4 Spin density waves in Cr/Ni bilayersLocal Contact K. Prokes
Principal Proposer:Prof. H. Zabel , Institut fürExperimentalphysik/Ferstkörperphysik, Ruhr-Universität Bochum, 44800 Bochum
Dates of Experiment
Experimental Team: Dr. E. Kravtsov, Institut fürExperimentalphysik/Ferstkörperphysik, Ruhr-Universität Bochum, 44800 BochumDr. K. Prokes and Dr. V. Sikolenko, Hahn-Meitner-Institut, 14901 Berlin
05.-14. May 200302.-11. June 2003
Date of Report: 12. December 2003
Bulk Cr is an itinerant antiferromagnetdisplaying an incommensurate spin densitywave (SDW) below TN=311 K. The SDWbehaviour in bulk Cr is well established nowand considerable progress has been alsomade towards understanding of SDWmagnetism in Cr alloys [1]. In recent years theSDW magnetism in thin Cr films andmultilayers has attracted intensiveinvestigations motivated by new physicsarising in these systems due to proximityeffects from neighbouring layers [2]. Cr/Nibilayer is a system in which the SDW state isexpected to be under strong influence ofproximity effects at the Cr-Ni interfaces. Thepresent experiment was aimed to trace theproximity effect of the neighbouring Ni layer onthe SDW state in the Cr film.
The investigations were done at aCr(2000Å)/Ni(60 Å) thin film system grown withmolecular beam epitaxy on a MgO(001)substrate. The deposition rate and temperaturewere optimized to produce a high qualitysystem composed of bcc (001) Cr and fcc(001) Ni films. The sample structure wascharacterized in situ with RHEED and LEEDtechniques and ex situ with high resolution X-ray diffraction.
The SDW structure was determined byNeutron Scattering studies at the E4instrument installed at BENSC. To determinethe SDW parameters in the bilayers wemeasured the intensity of SDW satellitesarising around positions of (001) and (100) Crmagnetic Bragg peaks. The position andintensity of satellites contains all theinformation on SDW state in Cr (period,polarisation, propagation direction). Themeasurements were taken at low temperatures
in the range from 1.8 K to 10 K for externalmagnetic field values 10 and 100 Oe.
The neutron scattering experiments haverevealed the SDW satellites arising in H-direction around the (010) position and nosatellites around the (100) position. The SDWwas found to be longitudinally polarized andpropagating out of the film plane. Application ofexternal magnetic field in the film plane doesnot change the polarisation and propagationdirection of the SDW.
111.0 111.5 112.0 112.5 113.0 113.5450
500
550
600
650
700
750
800
850
coun
ts
, degrees
Fig. 1: -scan through the position (0.051 1 0)corresponding to a satellite reflection from anincommensurate SDW propagating out of thefilm plane. The measurement was done at 4 K
in magnetic field 100 Oe.
The research was partly supported by the SFB491 “Magnetic Heterostructures: Structure andelectronic Transport”.
References
[1] E. Fawcett Rev. Mod. Phys. 60, 209 (1988).[2] H. Zabel J. Phys. Condens. Matter. 11,9303 (1999).
89

EXPERIMENTAL REPORT Proposal N° PHY-04-832 Instrument: V6 ”Polarized neutron reflectivity on
exchange bias nanostructures” Local Contact: Dr. H. Fritzsche
Principal Proposer: Dr. Temst Kristiaan, VSM, K.U.Leuven, Belgium Date(s) of Experiment: Experimental Team: Loosvelt Hugo, VSM, K.U.Leuven, Belgium Dr. Popova Olena, VSM, K.U.Leuven, Belgium Dr. Fritzsche Helmut, HMI, Germany
26/02/03 – 07/03/03
Date of Report: 07/11/2003 Polarized neutron reflectometry (PNR) is used to investigate the magnetization reversal mechanism in thin exchange biased Co/CoO lines with strong shape anisotropy. Due to the magnetic moment carried by neutrons one is able to probe the in-plane vectorial components of the magnetization. This is ideal to discriminate between different magnetization reversal mechanisms in order to model theoretically the influence of the nanostructuring on the exchange bias effect. Thin Co (14 nm)/CoO (1.6 nm) lines were prepared by sputtering. The investigated sample consisted of 2 µm wide, parallel lines in a period of 15 µm. The PNR experiments were performed at the V6 reflectometer. The measurements were carried out at 10 K after cooling the sample in a field of 0.4 T applied perpendicular or parallel to the lines. First studied configuration was when the lines were perpendicular to the applied field. Figure 1 presents the spin-analyzed specular reflectivities at saturation field Hsat = 0.4 T. The intensity of the four possible combinations of incident and reflected neutron beam cross sections (Ruu, Rdd, Rud, Rdu) was measured. The non spin flip (NSF) intensities, denoted by Ruu and Rdd, are generated by sample magnetization components (anti)parallel to the neutron spin, while the spin flip (SF) intensities, denoted by Rud and Rdu, are generated by magnetization components perpendicular to the neutron spin. Fig. 1: Reflectivity versus reciprocal scattering vector q plot at Hsat = 0.4 T. The lines are perpendicular to the applied field. A magnetic splitting between Ruu and Rdd can be observed. This splitting is relatively small, because the specular signal also contains an important contribution from the non-magnetic bare substrate in between the Co/CoO lines. We estimate that approximately 13 % of the surface is covered by the Co/CoO lines. The SF signal is very weak.
After the measurement at saturation, the magnetic field was decreased to the first coercive field HC1 = - 0.09 T. There the NSF signals show no magnetic splitting (figure not presented). This is consistent with the absence of a net magnetization at the coercive field. The SF signals were as weak as at saturation field, and no spin-flip enhancement was observed. Therefore, the magnetization reversal in this case happens via domain creation and domain wall motion, as in continuous Co/CoO film at the first coercive field. The sample, still with applied field perpendicular to the lines, has been then saturated in negative field –0.4 T; after that the second coercivity field was reached.
0,01 0,02 0,03 0,041E-4
1E-3
0,01
0,1
1
Ref
lect
ivity
q (Å-1)
Rdd Ruu Rud Rdu
Fig. 2: Reflectivity versus reciprocal scattering vector q plot at second coercive field HC2 = 0.012 T. The lines are perpendicular to the applied field.
0,01 0,02 0,03 0,041E-4
1E-3
0,01
0,1
1
Ref
lect
ivity
q (Å-1)
Rdd Ruu Rud Rdu
Figure 2 shows the spin-analyzed specular reflectivity at the second coercive field HC2 = 0.012 T with the field perpendicular to the lines. The spin-flip intensity here is clearly enhanced compared to the situation in saturation. This indicates the presence of a magnetization component perpendicular to the applied field (in this case parallel to the lines). The magnetization reversal mechanism at this coercive field is dominated by rotation of the magnetization in the Co/CoO lines. Obviously, the magnetization reversal mechanism is different in opposite branches of the hysteresis loop in the perpendicular configuration. When the field is applied parallel to the Co/CoO lines, no enhancement of the spin-flip intensity can be observed at any coercive field (not shown). It indicates that, for a field parallel to the lines, the magnetization reversal at both coercive fields occurs by the same mechanism on the contrary to the case of lines perpendicular to the field or a continuous Co/CoO film. This is attributed to the strong shape anisotropy present in the thin parallel lines.
Exp_report_March2003 // brandt // 12.11.03 Seite 1 von 1 90

EXPERIMENTAL REPORT Proposal N° PHY-04-897Instrument V6 “Polarized neutron reflectivity on
exchange bias nanostructures” Local Contact Dr. M. Gierlings
Principal Proposer: Dr. Temst Kristiaan, VSM, K.U.Leuven, Belgium Date(s) of Experiment Experimental Team: Loosvelt Hugo, VSM, K.U.Leuven, Belgium Dr. Popova Olena, VSM, K.U.Leuven, Belgium Dr. Gierlings Marita, HMI, Germany
12/10/03 – 19/10/03
Date of Report: 07/11/03 The present work is the continuation of the proposal N° PHY-04-832 where the magnetization reversal mechanism in exchange biased lines has been studied. The shape anisotropy of the sample in this experiment has been decreased in comparison to the previously used line structure. The investigated sample consisted of Co/CoO rectangles of size 1 µm × 4 µm within 10 µm period. These rectangles covered 4% of the substrate. As the amount of the magnetic material on the sample was so small and arranged in a periodical structure, the off-specular reflection configuration only has been used for the measurements. The external magnetic field has been applied along either the in-plane easy or hard axis of the nanostructures. This allowed us to study how the shape anisotropy imposed on the ferromagnet affects the coupling to the antiferromagnet. First of all, the angle range for the off-specular peak has been found carrying out a Θ - 2Θ scan at magnetic saturation (Fig. 1). Then the detector was adjusted to the off-specular reflection and the field sweep has been performed in the range from –0.4 T to 0.4 T. Spin analysis of the neutrons detected by position-sensitive detector has been carried out. Fig. 1. (Θi, Θf) intensity map for up neutrons scattered from the Co/CoO rectangular dots in magnetic saturation. In the first experiment the complete magnetic hysteresis of the sample has been probed along an easy magnetization axis. The sample was field cooled along the long edge of the rectangles and measured along the same edge. The positive (negative) part of the hysteresis loop has been measured after the positive (negative) field cooling. In this case the magnetisation reversal mechanism has been found to be different in two hysteresis curve branches: domain nucleation and domain wall motion in the descending branch and the magnetization rotation in the ascending branch. On the contrary to the line sample, the same reversal mechanisms have been found in the second experiment,
when the cooling and measurement field was applied along the hard axis (or short edges of the rectangles). The outcome of this experiment is shown in the Fig. 2a-c. There no spin flip signal is observed at first coercive field (descending hysteresis branch). The spin flip signal is present at the second coercive field (ascending branch).
0
100
200
300
400
0 0.1 0.2 0.3 0.4
I uuI ddI udI du
Inte
nsity
, cou
nts
Field, T
HC2
= 88 Oe
0
100
200
300
400
0 -0.1 -0.2 -0.3 - .40a
I uuI dd I ud I du
Inte
nsity
, cou
nts
Field, T
HC1
= 1145 Oe
0
100
200
300
400
0 -0.1 -0.2 -0.3 -0.4
I uu I dd I ud I du
Inte
nsity
, cou
nts
Field, T
0
100
200
300
400
500
0 0.1 0.2 0.3 0.4
I uuI dd I ud I du
Inte
nsity
, cou
nts
Field, T
b
c d
Fig. 2. Magnetic field scans in off-specular configuration. All four measurements have been performed with the applied field parallel to the short edges of the rectangles. For the graphs a, b, c the cooling field has been applied also along short edge of the rectangles. The measurements have been carried out: a) from the first remanence through the first coercivity field till the negative saturation; b) from the negative saturation till the second remanence; c) from the second remanence trough the second coercivity field till the positive saturation. d) The cooling field has been applied along the long edge of rectangles, and then the sample has been turned by 90° and was measured along the short edge in increasing field from 0 T to 0.4 T.
Off-specular reflection
The third experiment consisted of sample field cooling along an easy axis (long rectangle edges) and measuring along the hard axis (short rectangle edges) in increasing field from 0 T to 0.4 T (Fig. 2d). This way the strength of the induced unidirectional anisotropy could have been estimated. Unfortunately, it appeared that the maximum available field was not sufficient to overcome the exchange anisotropy. Another drawback of the present beamtime was the impossibility to finish the complete hysteresis field sweep of the training loop due to the lack of time.
Exp_report_Oct2003 // brandt // 12.11.03 Seite 1 von 1 91

PHY-04-0833.doc // brandt // 09.03.04 Seite 1 von 1
EXPERIMENTAL REPORT Proposal N° PHY-04-0833Instrument V6Antiferromagnetic coupling in Fe/ MgO /Fe
trilayer. Local Contact H. Fritzche
Principal Proposer: F. Montaigne, LPM Nancy Date(s) of ExperimentExperimental Team: J. Faure-Vincent, LPM Nancy
C. Bellouard, LPM NancyM. Gierlings, HMI BerlinH. Fritzsche, HMI Berlin
02.04 -10.04.2003
Date of Report: 19.12.03The interlayer exchange coupling between twoferromagnetic layers separated by a metallicspacer has been studied extensively for 15years. Nevertheless, it is only recently that anantiferromagnetic coupling has been observedthrough an insulating spacer in Fe/MgO/Fe/Cofor MgO thicknesses below 0.8 nm [1]. The epitaxial growth of bccFe on MgO(100)wafers is performed along the (100)Fe plane.As a matter of fact, two perpendicular easyaxis are present in the film plane. With decreasing field after saturation along aneasy axis, the reversal of the thinner magneticlayer occurs in positive field (fig. 1a), asexpected for an antiferromagnetic coupling.Nevertheless, it occurs in two steps. The aimof the neutron experiment was to investigatethe magnetic configuration of this layer duringthis peculiar reversal.
100 200 300 400 500
1E-3
0,01
0,1
Rud Ruu Rdd Rdu
b)
q = 0.31 nm-1
Ref
lect
ivity
Field (G)
0,7
0,8
0,9
1,0
a)
norm
alis
edm
agne
tisat
ion
Fig. 1 : a) Part of a magnetisation loopcorresponding to the reversal of the Fe thin layer ina Fe 340nm / MgO 0.6 nm / Fe 57 nm / V 66 nmmultilayer measured with decreasing field aftersaturation. b) field dependence of non spin flip andraw spin flip neutron reflectivities at q = 0.31 nm-1.
The up-up (uu), down-down (dd) reflectedintensities measured for an applied field of 200Oe are plotted in figure 2. The good agreement
with the simulations performed with anantiferromagnetic alignment of the bilayercorroborates the existence of a couplingthrough the MgO layer. The spin flip intensitiesobtained after corrections from thecontributions of the uu and dd intensities arezero. The non spin flip and raw spin flip intensitiesfor q = 0.31 nm-1 are plotted in figure 1 as afunction of the applied field H. For H > 350 Oeor < 250 Oe, the intensities are constant.These points correspond to the parallel andantiparallel alignment of the Fe layers, with nomagnetic component perpendicular to theapplied field. Figure 1 shows that theintermediate state of magnetisationcorresponds to a maximum of the spin flipcomponent. The spectra measured for thismaximum are well simulated with aperpendicular configuration of the magneticlayers. The neutron experiment then suggestsa coherent rotation of the thin layer during themagnetisation process along an easy axis,with a step corresponding to an alignmentalong the second easy axis.
0,00 0,01 0,02 0,03 0,04 0,05 0,06 0,071E-4
1E-3
0,01
0,1
1 Rdd Ruu simulation
Ref
lect
ivity
q (Å-1)
Fig 2: Experimental and simulated reflectedintensities for a Fe 340nm/ MgO 0.6 nm/ Fe 57 nm/ V66 nm multilayer with H = 200 Oe applied along an Feeasy axis.
[1] J.Faure-Vincent et al. Phys. Rev. Lett.89, 107206 (2002)
92

PHY-04-0914.doc // brandt // 09.03.04 Seite 1 von 1
EXPERIMENTAL REPORT Proposal N° PHY-04-914Instrument V-6Off-specular PNR studies on a Co/CoO
exchange bias multilayer Local Contact Marita Gierlings
Principal Proposer: M.Gierlings, M.Gruyters, D. Riegel, HMI Date(s) of ExperimentExperimental Team: M. Gierlings, M. Prandolini, HMI
M. Gruyters, HU BerlinH. Fritzsche, Chalk River
Aug. 2001Jul./Aug 2003
Date of Report: 15.12.2003
The magnetization reversal processes in a [Co/CoO/Au]Exchange bias (EB) multilayer have been investigatedusing specular and off-specular Polarized Neutron Re-flectometry (PNR). The EB effect [1] occurs in ferro-magnetic materials which are coupled to an antiferro-magnet. EB can be induced by field cooling the FM/AFsystem in an external magnetic field below the Néel
temperature of the AFM. The effect is usually charac-terized by a unidirectional shift of the magnetichysteresis loop and by increasing coercivities withdecreasing temperatures. As has been reported earlier,specular PNR measurements on the present systemrevealed asymmetric magnetization reversal processeson opposite sides of the same hysteresis loop. Thereversal on the decreasing field branch was characterized
by domain wall motion, while the reversal at theincreasing field branch (e.g. at position B) wascharacterized by rotation of the magnetization whichcould be concluded from significantly increased spin flipintensities. Using a position sensitive detector (PSD) off-
specular scattering experiments at characteristic fieldshave further revealed the presence of a broad distributionof domain sizes for the reversal process at the increasingfield branch (top figure on the left: i-f maps recorded
at magnetic saturation and close to the coercive field atthe increasing field branch: diagonal ridge: specularreflected intensity). Furthermore magnetic field scanshave been performed at different incident angles, wherethe specular and off-specular intensities of the reflectedneutrons have been detected and plotted in a 2D intensitymap as a function of the magnetic field and the angle ofreflection f. This is shown in the bottom figure on theleft for an incident angle of i = 0.48 and for increasingmagnetic fields. The intensity map is attached to thecorresponding part of the magnetic hysteresis loop.Largely increased off-specular intensities at smallerreflection angles can be seen in the plot. Since the non-spin-flip and spin-flip intensities are not separated in thepresent intensity maps, additional rocking scans havebeen performed at characteristic incident angles andmagnetic fields using the 3He-detector tubes togetherwith the V6-spin-analyzer. In the figure on the right thenon-spin flip (I-- ) and spin-flip (I-+) intensities are shownfor the rocking curves measured at an applied field B of5.6 mT at the increasing field branch for 2= 1.18 (firstBragg peak). For comparison the corresponding (I--)rocking-curve for the case of magnetic saturation is alsoplotted. It has to be mentioned that the present data is notcorrected for the efficiency of the analyzer. This figureshows that a large part of the off-specular scatteredintensity, recorded for a magnetic field at the increasingfield branch, is caused by spin-flip-scattering. Furtheranalysis of the data is in progress.
[1] W.H. Meiklejohn and C.J. Bean, Phys. Rev. 105, 904 (1957)
0,4 0,5 0,6 0,7 0,8
1E-3
0,01
0,1
1
Ref
lect
ivity
i
I - - saturation I - - 5.6 mT I + - 5.6 mT
0.08
0.480.68
0.28
-200 -100 0 100 200
-0,008
-0,004
0,000
0,004
0,008T=10 K A
C
B
HEB
H =39.3 mTEB
Mag
netic
Mom
ent (
emu)
Magnetic Field (mT)
i=0.48
f
log I5
4
3.5
4.5
0.2
0.4
0.6
0.8
1.0
1.2
1.41.40.2 0.4 0.40.6 0.60.8 0.81.0 1.01.2 1.2
f
1
0.1
0.01
0.001
0.0001
I- at
saturation
i=0.48
C
i
93

PHY-02-0365.doc // brandt // 03.03.04 Seite 1 von 1
EXPERIMENTAL REPORT Proposal N° PHY-02-0365Instrument E1Search for static charge order peaks in
optimally doped YBCO Local Contact J. Klenke
Principal Proposer: L. Pintschovius, FZ Karlsruhe Date(s) of ExperimentExperimental Team: L. Pintschovius
29 Apr – 6 May
Date of Report: 25 August 2003
The experiment was undertaken to search forcharge order peaks in optimally doped YBCO(Tc=93 K). Charge order will manifest itself by theappearance of superlattice peaks related to thelattice distortion induced by the charge order. Suchsuperlattice peaks are generally quite weak, i.e. ofthe order 10-5 of strong fundamental Bragg peaks.Therefore, it is quite difficult to separate chargeorder related peaks from the background or, evenmore importantly, to discriminate them against faintpeaks of other origins. The best strategy appears toperform temperature dependent measurementsbecause charge order is expected to develop onlyat low temperatures. This strategy was indeedadopted in the present experiment.
The area in momentum space where the searchwas done, was guided by previous phononmeasurements which showed evidence for 2Ddynamic charge stripe order at a wavevector q =0.27 b* (two-dimensional means that the c-component of the wavevector is unimportant) [1].The question was whether this charge stripe orderremains dynamic at all temperatures or whether astatic component develops on cooling to very lowtemperatures (the dynamic charge order was foundto develop already at about T = 200 K). Using thesame sample on which the phonon measurementshad been done at Saclay, no charge order relatedelastic signal could be found down to T = 3 K.Although the elastic signal collected with very longcounting times did show a certain temperaturedependence (see Fig. 1), the q-dependence of thistemperature effect strongly speaks against relatingit to charge order. Rather, the weak peaks seen atQ = (2.21,0,0.5) and Q = (2.27,0,0.5), respectively,are very probably contributions from fundamentalBragg peaks and the fourth order of the incomingneutrons. The temperature dependence of the peakintensity can well be explained by the Debye-Wallerfactor. We note that the sample was twinned andtherefore two peaks are expected from the a- andthe b-direction, respectively, at slightly differentwavevectors. The observed peak splitting is in verygood agreement with this hypothesis.
We further searched for a low energy signal at theq-position of the phonon anomaly but found none inthe energy range accessible on E1, i.e. up to about3 meV (see Fig. 2).
Fig. 1 Elastic scattering intensity along the line fromQ = (2.13,0,0.5) to (2.4,0,0.5). A charge orderrelated peak is expected to show up at low T at thecenter of the scan. However, the observedstructures have very probably nothing to do withcharge order but are probably contaminations fromthe fourth order of the incoming beam.
Fig. 2 Constant-energy scan with E = 3 meVperformed at T = 3 K. The scan was made to lookfor a signal at the position of the charge orderrelated phonon anomaly at q = 0.25. Apparantly,any such signal is very much smaller than the oneobserved in a scan through the LA phonon branchat the same temperature.
[1] L. Pintschovius et al., cond-mat/0308357
2.10 2.15 2.20 2.25 2.30 2.35 2.40100
150
200
coun
ts/4
E5m
on
(X,0,0.5)
3 meV 3 K 0.1 x LA
2.15 2.20 2.25 2.30 2.35 2.4015000
16000
17000
18000
19000
20000
coun
ts/1
h
(X,0,0.5)
T=3 K T=200 K
94

CHE-01-1250.doc // brandt // 03.03.04 Seite 1 von 1
EXPERIMENTAL REPORT Proposal N° CHE-01-1250Instrument E 2Diffuse scattering of cation-doped
zirconia-oxynitride Local Contact Jens-Uwe Hoffmann
Principal Proposer: Ines Kaiser-Bischoff, LMU München, Kristallogr.. Date(s) of ExperimentExperimental Team: Ines Kaiser-Bischoff, LMU München
J.-U. Hoffmann, BENSC, HMI Berlin/Uni Tübingen 7.04. – 18.04.2003
Date of Report: 8.12.03
Zirconia, doped with cations and/or anions, shows ahigh ionic conductivity based on anions vacancies.To understand this property it is necessary to knowboth long (LRO) and short (SRO) range orderingeffects of cations, anions and vacancies. The aim ofthe experiments was to study the SRO by analysingthe diffuse scattering of single crystal samples.Different layers of the [1-10] zone of four sampleswere investigated at the instrument E2 with awavelength of = 0.91 Å.
Sample 1: The temperature dependence of thediffuse scattering of Y0.04Zr0.96O1.64N0.223, which wasmeasured first in 1999 at RT (OTH-01-735), wasinvestigated up to 1400°C. At RT, this sampleshows a characteristic distribution of the diffusescattering: diffuse maxima are parts of globaldiffuse phenomena such as bands perpendicular to111. These diffuse phenomena, which are typicalfor cubic stabilized zirconia, do not disappear athigh temperature in contrast to X-ray investigations,but become slightly weaker. This intensitydistribution was successfully fitted with the programTVtueb (written for the instrument E2) using amodel based on random vacancies and radialdisplacements of the surrounding atoms (EF-report2002)(Fig. 1).
Sample 2: Zr0.83Y0.17O1.915 heated under argonatmosphere (causing a color change from colorlessto black) show at RT the same characteristic diffusephenomena. But, additionally to that, diffusemaxima are observed at positions of tetragonalBragg-reflections, which cannot be explained by thecurrent defect model (circles in Fig. 2).
Sample 3: Zr0.82Sc0.18O1.91 crystallises in R-3. Itdoes not show the typical diffuse scattering of cubiczirconia, but the distribution of the intensities of thesuperstructure reflections reflects the same featureso that it can be termed as “rhombohedral SRO”(Fig. 3). There are weak diffuse maxima atpositions of tetragonal Bragg-reflections.
Sample 4: Zr0.82Sc0.18O1.91+1mol%Al2O3 is cubicand shows the same characteristic distribution ofthe diffuse scattering. Unfortunately, it was not asingle crystal but consists of two individuals.
Conclusion: The characteristic distribution of thediffuse scattering are caused by the rhombohedralSRO, well described by the defect model. Sampleswith low amount of anion vacancies show additionaltetragonal SRO, manifested by diffuse maxima atpositions of tetragonal Bragg-reflections.
These experiments are part of a continuing investigationof ZrO2 doped with different amounts of various cationsand anions, within the DFG-SPP “Substitutionseffekte inionischen Festkörpern”.
95

CHE-01-1332.doc // brandt // 03.03.04 Seite 1 von 1
EXPERIMENTAL REPORT Proposal N° CHE-01-1332Instrument E 2Diffuse scattering of cation-doped
zirconia-oxynitride Local Contact Jens-Uwe Hoffmann
Principal Proposer: Ines Kaiser-Bischoff, LMU München, Kristallogr. Date(s) of ExperimentExperimental Team: Ines Kaiser-Bischoff, LMU München
J.-U. Hoffmann, BENSC, HMI Berlin/Uni Tübingen 7.10. – 15.10.2003
Date of Report: 8.12.03
The analysing of the diffuse scattering of cationand/or anion doped zirconia single crystals givesinformation about the short range order (SRO) ofanions, cations and vacancies. Different layers ofthe [1-10] zone of four samples were investigated atthe instrument E2 with a wavelength of = 0.91 Å.
Sample 1: Because of the small amount of Y2O3 thesample Zr0.96Y0.04O1.98 is stabilized in the tetragonalstructure. This sample is the original material of thenitrogen-doped sample Y0.04Zr0.96O1.64N0.223 (cubicwith tetragonal contribution), which was measuredin 1999 at RT (OTH-01-735). It shows acharacteristic distribution of the diffuse scatteringbased on a rhombohedral SRO (CHE-01-1250),which is typical for cubic stabilized zirconia. Diffusemaxima are parts of global diffuse phenomena suchas bands perpendicular to 111. It was expectedthat the tetragonal sample does not show thesephenomena according to conclusions drawn fromearlier powder diffraction measurements. Butrudiments of the diffuse scattering perpendicular[001] at l=4 can be observed (Fig. 1). This meansthat even the small amount of vacancies (1%)induces some rhombohedral SRO.
Fig. 1: 0. layer of [1-10] zone
Sample 2: ZrO2 doped with 15 mol% Y2O3(Zr0.74Y0.26O1.87) has nearly the same amount ofvacancies as the earlier measured quaternarysample Y0.04Zr0.96O1.64N0.223. The important questionwas, whether the characteristic diffuse scattering ofa sample is principally influenced by the type ofdopant (cation and/or anion) or by the amount ofvacancies independently of the way they aregenerated. Sample 2 shows the same diffusephenomena such as bands perpendicular to 111but the distribution of the diffuse maxima as well as
their shape differs significantly from that of thequaternary phase (Fig. 2).
Fig. 2: 0. layer of [1-10] zone
Sample 3: For comparison, sample 2 had beenadditionally doped with nitrogen. Except for a smalldecrease in intensity, there are no large differencesbetween the diffuse scattering of sample 2 and 3.
Sample 4: This sample belongs to a series ofsamples based on ZrO2+9.5mol%Y2O3. Thismaterial heated under Argon atmosphere (CHE-01-1250) and doped with nitrogen (OTH-01-735) hasalready been measured with neutrons. The sampleheated under argon atmosphere was oxidisedagain by heating under air causing a change incolor from black to milky white (sample 4).Comparing these three samples, the diffusescattering resulting from rhombohedral SRO ispresent in all samples. They differ only in details.But the samples heated in argon and again in airshow additional diffuse maxima at positions oftetragonal Bragg peaks caused by tetragonal SRO(Fig. 3).
Fig. 3: 0. layer of [1-10] zone
Conclusion: Doping with nitrogen appears to havetwo different effects on the diffuse scattering. First,by increasing the amount of vacancies it causes thedisappearance of tetragonal SRO (Fig. 3) ortetragonal LRO respectively. Second, nitrogen itselfinfluences the form and shape of the rhombohedraldiffuse scattering, when comparing samples(Fig. 2)with the same amount of vacancies.
96

PHY-01-1254 +1334.doc // brandt // 03.03.04 Seite 1 von 1
EXPERIMENTAL REPORT Proposal N° PHY-01-1254 PHY-01-1334
Instrument E2Structural and magnetic phase transitions of potassium-holmium double tungstates
Local Contact Dr. Jens-Uwe HoffmannIllya Glavatsky
Principal Proposer:Dr. Mieczyslaw Tadeusz BOROWIEC Institute of Physics, Polish Academy of Sciences,Warsaw, Poland
Date(s) of Experiment05.02.2003-09.02.200318.08.2003-26.08.2003
Experimental Team: Dr. Jens-Uwe Hoffmann, HMI Berlin Illya Glavatsky, HMI Berlin/NAS IMP Kiev, UA
Date of Report: 22.01.2004
The alkali-dysprosium double tungstatesbelong to the class of magneto-elastics withinterrelation between magnetic and elastic ordering.The compounds with formula ARE(WO4)2 (AREW),where A is alkali ion, RE is rare earth element(RE=Dy, Er, Ho, Nd), are characterised by low-symmetry and by low-dimensionality.
Scientific interest is mainly connected withstructural phase transition (SPT) of the cooperativeJahn-Teller effect (CJTE) type which occurs in someof them at several kelvins region and with themagnetic ordering at subkelvins region.
For KHoW the spontaneous SPT of the CJTEtype was observed at 5.6K in thermodynamical(specific heat, thermal expansion), magnetic(magnetization, susceptibility, magnetostriction) andspectroscopic (optical absorption and luminescence)experiments. The problem of the magnetic phasetransition (MPT) for KHoW is still open. In specificheat (including specific heat in magnetic field) andsusceptibility experiments without doubt the inducedmagnetic phase transition was found at 0.4K forH=1T and 0.33K for H=0.1T. The spontaneous(H=0T) magnetic phase transition exists for KHoWat temperature below 0.33K if it exists. But ourexperimental possibilities (in thermodynamical andmagnetic experiments) are not enough to solve thisproblem. From theoretical point of view it is not clearthat the spontaneous magnetic phase transition forKHoW is possible or not. If it is possible (because ofcrystal field) the KHoW single crystal would be socalled singlet magnet.
The neutron scattering measurements weremade on powdered sample in the CD3OD (in thedeuterized methanol; because of the problem withtemperature stabilizing and sorptive properties of thepowder of the "pure" potassium holmium doubletungstate) and oriented KHoW single crystal.
First part of experiments on powdered sampleas well as on oriented single crystal (PHY-01-1254)was made for two temperatures: 1.6K and 10K. Anydifferences which could be connected to structuralphase transition at 5.6K were not found probablybecause of high experimental errors.
The neutron scattering experiment, in theframe of the project PHY-01-1334, was directed tosolve the problem of conditions of the MPT existencefor KHoW single crystal and to determine thestructure of the magnetic state for it.
For experiments in magnetic field (PHY-01-1334) on powdered sample as well as on orientedsingle crystal the set of selected temperatures andmagnetic fields was following: T=1.5K, H=0T;T=0.3K, H=0T; T=0.05K, H=0T; T=0.3K, H=0.1T;T=0.05K, H=0.1T; T=0.05K, H=1T. The choice ofabove temperature and magnetic field values isconnected with our experimental results of specificheat and susceptibility experiments.
The neutron scattering spectra in paramagneticstate (1.5K) obtained for powdered sample arecomposed from several lines with the first, mostintensive reflex at about 21.8 degrees (for wavelength2.396A; mono.: graphit). Background of the spectrais enough high. It is a main reason of not smallexperimental errors. Probably the new low angleBragg reflexes were found at about 18.0 degrees forfollowing set of temperatures and magnetic fields:T=0.05K, H=0T; T=0.3K, H=0.1T; T=0.05K,H=0.1T; T=0.05K, H=1T.
The results obtained for oriented KHoW singlecrystal are only clear for magnetic field H=1T (attemperature T=0.05K): in this case we can see somesmall additional characteristic peaks. Probably theyare the peaks of new antiferromagnetic phase. Thepeaks are small and wide but on the correct positions,so it suggests they are the pure magnetic structurepeaks. The experimental results for oriented singlecrystal for magnetic field H=0.1T and H=0T are notenough clear because of not small experimentalerrors. In these cases we need further experimentswith higher statistics.
Sumarizing for potassium-holmium doubletungstate we found the induced magnetic phasetransition for H=1T. The confirmation of theexistence of the induced MPT for H=0.1T and thespontaneous MPT (for H=0T) in this moment is notpossible and needs additional experiments.
97

PHY-01-1256.doc // brandt // 16.03.04 Seite 1 von 1
EXPERIMENTAL REPORT Proposal N° PHY-01-1256Instrument: E2Neutron diffraction study of orientational
glass state Local Contact J.-U.Hoffmann
Principal Proposer: L.S.Smirnov, FSUE SSC RF ITEP, Moscow Date(s) of ExperimentExperimental Team: J.-U.Hoffmann, HMI Berlin
I.Glavatskyy, HMI Berlin/ NAS IMP Kiev, UA 13.05.03-18.05.03
Date of Report: 19.09.2003
The orientation glass (OG) state in the[Rbx(NH4)1-x]3H(SO4)2 (or RAHS) mixedcrystals, found in [1] at low temperature, wasstudied for rubidium concentrations x=0.11(S1) and 0.2 (S2), placed in different regions ofx-T phase diagram. Recent investigations arethe continuation of the proposal PHY-01-1099. Earlier studies of OG state for S1showed the appearance of modulationstructure in the (a*c*) plane at temperature 1.6K. The observed modulation vectors have theprojections on axes *0a and *0c pointing on2-dimensional modulation vectors. Now themeasurements of diffraction maps on E2diffractometer (λo=2.396 Å) at temperatures100 and 1.7 K were carried out from S1 but inother orientation, which could permit toobserve the reflections in (b*c*) plane.Obtained diffraction maps in (ω, 2θ)coordinates are presented for single crystal S1in Fig. 1 at 100 K.
Fig. 1. S1, T=100KThe cooling of sample S1 is accompanied bythe appearance of weak reflection near onebasic reflection at temperature 1.7K. This basicreflection with the coordinates (35.8o, 48.3o)determined at 100 K is presented in Fig. 2aand appeared satellit reflection withcoordinates (51.2o,50.4o) determined at 1.7 Kis presented in Fig. 2b. Thus the observationof satellite reflection in (b*c*) plane gives thethe possibility to suppose 3-dimentionalmodulation structure of OG with rubidium
concentration x=0.11 on x-T phase diagram ofRAHS.
a) b)
Fig. 2. S1: a) T=100K, b) T=1.7K.
The diffraction measurements were carried outwith S2 in (a*c*) and (b*c*) planes at 100 and2.4 K. Samples S1 and S2 have similarmonoclinic crystal structure. Therefore thesearch of the modulation structure for S2 wascarried out in (b*c*) plane for differenttemperatures. The influence of temperatureon the diffraction near basic diffraction peakwith coordinates (35.8o, 48.4o) at 100K and2.4K is presented in Fig. 3. It is shown thatnothing additional satellite reflection appearsnear this basic reflection at 2.4 K.
Fig. 3. S2: a) T=100K, b) T=2.4K.
Thus it is possible to do the conclusion aboutthe existence on x-T phase diagram theboundary between regions with orientationglass states OG1 (x=0.11) and OG2 (x=0.20).The OG1 region has 3-dimentional modulationstructure.1. A.I.Baranov, V.V.Dolbinina, E.D.Yakushkinet al, Ferroelectrics, 217 (1998) 285.
98

PHY-01-1223.doc // brandt // 03.03.04 Seite 1 von 1
EXPERIMENTAL REPORT Proposal N° PHY-01-1223Instrument E5Refinement of the hydrogen positions in
(NH4)2SeO4. Local Contact Dr.A.Loose
Principal Proposer: L.S.Smirnov, FSUE SSC RF ITEP, Moscow Date(s) of Experiment
Experimental Team: A. Loose, HMI, BerlinN.Berntsen, Johannes Gutenberg-Universität MainzG.Melnyk, Johannes Gutenberg-Universität Mainz
*29.04.-18.05.2003
Date of Report: *24.07.2003
Ammonium selenate, (NH4)2SeO4, does not undergo anyphase transitions from room to helium temperature andpresents a model crystal structure for the study of theorientational positions of the ammonium ions inside theunit cell.
The crystal structure of (NH4)2SeO4 as it wasdetermined by an x-ray investigation in [1], has at roomtemperature a monoclinic unit cell with the sp. gr. C2/m,lattice parameters a=12.15(1) Å, b=6.418 Å, c=7.711 Åand =115.5o. The results of this X-ray study showedthat the ammonium groups are deformed and that the N-H bonds differ significantly from the ones in the freeNH4
+ ion (see Table 3). The refinement of all hydrogen positions in
(NH4)2SeO4 has been carried out with the help ofneutron single crystal diffraction on the four circlediffractometer E5 (BENSC HMI, Berlin) with thewavelength =0.9019 Å at room temperature. Thedetermined lattice parameters are a=12.4319(49) Å,b=6.5744(36) Å, c=7.8845(31) Å and =115.513(18)o.The number of measured reflections was 1055, and 874unique reflections were used for LSM calculations withthe SHELXL-97 program. The obtained R1-factor was0.0677.
The determined atomic positions in ammoniumselenate are presented in Table 1.
Table 1. The refined atomic positions of(NH4)2SeO4 (neutron single crystal diffraction at 300 K).
Atom x y z Occup.Se 0.17500(16) 0.0 0.21779(25) 0.5O1 0.32188(28) 0.0 0.36044(47) 0.5O2 0.09644(31) 0.0 0.34392(45) 0.5O3 0.14396(21) 0.20912(43) 0.08565(32) 1.0N1 0.51694(21) 0.0 0.24540(31) 0.5N2 0.84157(17) 0.0 0.26123(25) 0.5H1 0.43686(72) 0.0 0.2617(13) 0.5H2 0.92317(78) 0.0 0.2528(12) 0.5H3 0.58496(72) 0.0 0.3835(12) 0.5H4 0.85644(64) 0.0 0.40247(91) 0.5H5 0.52672(86) 0.1259(12) 0.17567(98) 1.0H6 0.79054(58) 0.1255(10) 0.19458(81) 1.0
The determined isotropic thermal parametersfor the atoms of ammonium selenate are presented inTable 2. The anisotropic thermal parameters for allatoms of ammonium selenate will be presented in aspecial publication as separate paper.
Table 2. The determined isotropic thermalparameters for the atoms of ammonium selenate
Atom UeqSe 0.02016(41)O1 0.03595(82)O2 0.03667(85)O3 0.03227(50)N1 0.03166(46)N2 0.02737(44)H1 0.0574(21)H2 0.0563(20)H3 0.0614(24)H4 0.0463(15)H5 0.0718(19)H6 0.0573(14)
All determined Se-O and N-H bonds with thehelp of the refined H-positions are presented in Table 3.
Table 3. Comparison of the bond lengths for the ionsNH4(I), NH4(II) and SeO4 obtained by the x-ray study in[1] and in the recent neutron scattering study.
Atoms x-ray, [Å],[1]
Neutron,[Å]
Se-O1 1.645 1.6823Se-O2 1.644 1.6672Se-O3 1.643 1.6668
N(I)-H1 0.890 1.057N(I)-H3 0.936 1.052N(I)-H5 0.861 1.029N(II)-H2 0.947 1.045N(II)-H4 0.922 1.047N(II)-H6 1.041 1.035
Thus it is shown that the N-H bonds for theammonium groups NH4(I) and NH4(II) in ammoniumselenate are indeed close to those of the free ammoniumion. The results of our neutron scattering study do notconfirm the model of deformed ammonium ions inammonium selenate, which was proposed on the basis ofthe x-ray study.
Ref.:1.R.L.Carter, C.Koerntgen, T.N.Margulis, ActaCrystall., B33 (1977) 592.
99

MAT-01-1291.doc // brandt // 03.03.04 Seite 1 von 1
EXPERIMENTAL REPORT Proposal N° MAT-01-1291
Instrument E5 Hydrogen Positions in ND4DSO4
Local ContactDr. A. Loose
Principal Proposer: Dr. Karsten Knorr, Universität Kiel Date(s) of ExperimentExperimental Team: Gisela Lentz, Universität Kiel
2.04.-5.05.2003
Date of Report: 19.12.2003
Acid sulfates with the general chemicalcomposition AHSO4 (A being alkali-metal orammonium ions) are potential candidates forfuture applications like fuel cells, since somemembers of this family show high protonconductivity. In particular the NH4, Rb and Cs-members undergo a phase transition to asuper-protonic state in the region of 400 to 470K. For the NH4- and Rb-compounds thistransition occurs only at high pressure(Baranov (1985)). No indication of a super-protonic state in KHSO4 has been found yetSharon and Kalia (1977). On the one hand thedifferent conductivities and the mentionedtransitions to a super-protonic state suggest aninfluence of the size of the cations and,consequently, of the interatomic distances. Onthe other hand the Cs, Rb- and NH4-compounds show the superprotonic behavioureven under high pressure which generallyresults in a decrease of interatomic distances.There is obviously a change of further criticalparameters versus the K-compound leading tothe super-protonic conductivity in the NH4-, Rb-and Cs-compounds. This change of criticalparameters we started to investigate.
As a first step we investigated KHSO4 (Knorr2001). The second step was to gain furtherinformation about one of the high conductingcompounds with similar interatomic bond-lengths. The compound closest to KHSO4 inthis context with a high protonic conductivity isNH4HSO4.
The structure of NH4HSO4 was published ear-lier by Nelmes (1971) in a pseudoorthorhombicsetting with the non-conventional space groupB21/a. No information about the proton positi-ons in NH4HSO4 was found in literature, whichwill be necessary for further comparison ofstructural details, especially that of the hydro-gen bonds. No phase transition was foundbetween RT and the melting point at 420 K(Gesi and Ozawa (1977), (Baranov (1985)).
The crystals were obtained from an aqueoussolution of (ND4)2SO4 and D2SO4 at a ratio of1:2 through slow evaporation. The substanceis very hygroscopic and has to be kept undersilicon oil. We expect an exchange of theammonium hydrogens and the acid hydrogenatoms, since similar behaviour was found for(NH4)3H(SO4)2 (Engelhardt 2001) and adisorder of the ammonium hydrogens alreadyat room temperature.
We obtained one dataset at RT on the E54-circle diffractometer at HMI with a coppermonochromator and a wavelength of 0.9019 Å.The crystal size was 5x4x3mm3, the measuringtime was 3 weeks.
The structural model of Nelmes could beconfirmed. Using the conventional setting inspace group P21/c, the lattice parameters are a = 14.717 (6) Å, b = 4.718 (2) Å, c = 15.162 (6) b = 121.08 (1) Å. The observed scattering power of the crystalunder the given neutron flux turned out to beinsufficient for the determination of thehydrogen positions. Further investigations arenecessary.
This research is supported by the GermanScience Foundation, DFG (grant Kn507/3-1).
References:A.I. Baranov, E.G. Ponyatovskii, V.V. Sinitsyn,R.M. Fedosyuk, L.A. Shuvalov, Sov. Phys.Cryst. 30(6) (1985) 653-654A. Engelhard, M.Fechtelkord, L.Schwalowsky,U.Bismayer, J.-Ch. Buhl, Z .Krist. Suppl. 18(2001) 172K.Gesi, K.Ozawa, J.Phys.Soc.Jap. 43(2)(1977) 563-569K. Knorr, G.Y. Lentz, BENSC Exp. Rep. (2001)101R.J. Nelmes, Acta Cryst. B 27 (1971) 272-281M. Sharon, A.K. Kalia, J. Chem. Phys. 66(1977) 3051-305
100

PHY-01-1376.doc // brandt // 09.03.04 Seite 1 von 1
EXPERIMENTAL REPORT Proposal N° PHY-01-1376
Instrument E5Single crystal study of the structural instability in deuter-ated -(BEDT-TTF)2Cu [N(CN)2]Br
Local ContactA. Loose
Principal Proposer: S. Süllow, TU Braunschweig Date(s) of ExperimentExperimental Team: J. Kreitlow, TU Braunschweig
S. Süllow, TU BraunschweigA. Loose, R. Feyerherm, HMI
19.8.03-25.8.03
Date of Report: 22.12.2003
The present experiment was scheduled asexploratory study, in order to determine thefeasibility of our experimental program. Its goalwas to establish directly the frozen-in structuraldisorder in the organic charge-transfer salt -(BEDT-TTF)2Cu[N(CN)2]Br [1,2]. In this super-conducting material, Br acts as spacer be-tween layers of BEDT-TTF [3]. Recently, astructural instability has been identified andcorrelated with the electronic properties [4]. Inthermal expansion experiments hysteresis andglass-like behavior were observed in the range50 to 80K. These features have been linked toa freezing of structural degrees of freedom,which may account for various so far non-understood experimental observations, likeresistive anomalies and cooling rate depend-ent superconducting parameters [5-7].As yet, there is no direct evidence as to whichof the structural units undergoes this freezingtransition. Tentatively, it has been attributed tothe [CH2)2] end groups connecting the BEDT-TTF layers to Br. These ethylen groups canadopt two possible out-of-plane configurations,which – if frozen-in randomly – might be thecause for the structural disorder [8]. The question of the structural disorder, its typeand level, bears relevance to the understand-ing of the superconducting and normal stateproperties. Therefore, in an exploratory ex-periment we investigated the structural proper-ties for -(BEDT-TTF)2Cu [N(CN)2]Br. For thismaterial, only small crystals are available. Ac-tually, for deuterated material we had the larg-est crystal produced so far, with a volume of2mm3. Still, in our experiment on the E5 spec-trometer this crystal turned out to be too smallas to allow a determination of the structuralparameters with the high resolution required toestablish the structural disorder. We thereforestopped further investigation by means of neu-tron scattering. Presently, very detailed X-raydiffraction experiments are carried out with thegoal to resolve the question of the disorder.
[1] M. Lang, Supercond. Rev. 2, 1 (1996).
[2] R.H. McKenzie, Science 278, 820 (1997).[3] H.H. Wang et al., Synth. Met. 41-43, 1983(1991).[4] J. Müller et al., Phys. Rev. B 65, 144521(2002).[5] M.A. Tanatar et al., Phys. Rev. B 59, 3841(1999).[6] X. Su et al., Phys. Rev. B 57, R14056(1998).[7] A. Kawamota, K. Miyagawa, K. Kanoda,Phys. Rev. B 59, 3841 (1999).[8] A.J. Schultz et al., J. Sol. State. Chem. 94352 (1991).
101

PHY-01-1379.doc // brandt // 16.03.04 Seite 1 von 1
EXPERIMENTAL REPORT Proposal N° PHY-01-1379
Instrument E5Neutron diffraction study of SrFeO3 Local Contact M. Reehuis
Principal Proposer: C. Ulrich, B. Keimer, MPI Stuttgart Date(s) of ExperimentExperimental Team: M. Reehuis, MPI Stuttgart, HMI Berlin
C. Ulrich, MPI Stuttgart 21.07. – 10.08.03
Date of Report: 20.12. 2003
SrFeO3 is a very interesting material as it ismetallic and exhibits a helical spin structure belowTN = 135 K. It is therefore right at the borderlinebetween an itinerant and a strongly localizedelectron system. For different oxygen dopingSrFeO3 undergoes different crystallographicphase transitions forming a Ruddlesden-Popperseries of lattice structures [1]. Our magneto-resistance (MR) measurements have shown thatcubic SrFeO3.00 (space group Pm3m) is metallic inthe entire temperature range and shows a largenegative MR-effect at a second magnetic phasetransition at 55 K [2]. A tetragonal sample SrFeO2.87(or Sr8Fe8O23, I/4mmm) showed semiconductingbehaviour upon cooling at the second magneticphase transition at 75 K. Our Mössbauer studiesrevealed that this phase transition in the tetragonalphase is accompanied by a charge ordering ofFe3.5+ into Fe3+ and Fe4+. An orthorhombic sampleon the other side showed semiconductingbehaviour and a pronounced positive MR-effect at70 K [2].
Large high quality single crystals of SrFeO3were grown by the travelling-solvent floating-zonetechnique [3]. In order to control the oxygencontent, the samples where annealed in oxygenatmosphere. Elastic neutron scattering experimentswere performed at the four-circle diffractometer E5using the neutron wavelength = 2.33 Å (PG). Wehave investigated two crystals with different oxygencontents. Our experiments have shown that bothcrystals contain a phase mixture of the cubic andthe tetragonal phase. The crystal SrFeO2.95 consistspredominantly of the cubic phase whereas thecrystal SrFeO2.84 is almost purely tetragonal.
Figure 1 shows the temperature dependenceof selected structural and magnetic Braggreflections. Both samples show magnetic Braggreflections below TN = 135 K located aroundnuclear Bragg reflections at Q = (h+,k+,ℓ+) with = 0.13. This indicates that both crystals exhibit ahelical spin arrangement with a propagation vectorparallel to the [1,1,1]-direction. From the refinementof the magnetic structure we obtaine a magneticmoment of exp = 2.48(2) B with a residual RF =0.048 for the cubic sample. Taking into account thatthe sample contains about 10 % of the tetragonalphase the moment is expected to be exp = 2.55 B.This is also in a good agreement with the value2.7(4) B given in Ref. [4].
A crystallographic phase transition occurs atabout 75 K. Although our resistivity measurementsshowed a huge negative MR-effect accompaniedwith a charge ordering in the tetragonal phase atthis temperature, we have not observed any effectin the magnetic structure. Due to the fact that thesample is strongly twinned we were not able todetermine the crystal structure of the lowtemperature phase.
Fig. 1. Temperature dependence of the integratedintensities of magnetic and nuclear Braggreflections of SrFeO2.95 and SrFeO2.84.
[1] J.P. Hodges, S. Short, J.D. Jorgensen, X. Xiong, B.Dabrowski, S.M. Mini, C.W. Kimball, Solid StateChem. 151 (2000) 190.
[2] A. Lebon, P. Adler, C. Bernhard, A.V. Boris, A.V.Pimenov, A. Maljuk, C.T. Lin, C. Ulrich, B. Keimer,Phys. Rev. Lett. in print.
[3] A. Maliuk, J. Strempfer, C. Ulrich, A. Lebon, C.T. Lin,J. Cryst. Growth 257 (2003) 427.
[4] T. Takeda, Y. Yamguchi, H. Watanabe, Phys. Soc.Jpn. 33 (1972) 967.
7x10⁴
8x10⁴
9x10⁴
1x10⁵
1x10⁵
1x10⁵
1x10⁵
1x10⁵
0 50 100 150 200 2500
50
100
150
200
250
5x10⁵
5x10⁵
5x10⁵
5x10⁵
5x10⁵
5x10⁵
5x10⁵
5x10⁵
0 50 100 150 200 250 3000
300
600
900
1200
1500
SrFeO2.84 SrFeO2.95
(0, 0, 2)
Inte
nsity
(c
nts
/ 10
sec)
(0.13, 0.13, 1.13)
Inte
nsity
(c
nts
/ 10
sec)
Temperature (K)
(0, 0, 2)
(0.13, 1.13, 0.13)
Temperature (K)
102

PHY-01-1282.doc // brandt // 09.03.04 Seite 1 von 1
EXPERIMENTAL REPORT Proposal N° PHY-01-1282Instrument E6Superstructures in Zn2x(CuIn)1-xS2 thin filmsLocal Contact N. Stüßer
Principal Proposer: S. Schorr Date(s) of ExperimentExperimental Team: F. Fleischer, University Leipzig
S. Schorr, University LeipzigN. Stüßer, HMI Berlin
4.3. – 8.3. 2003
Date of Report: *
The semiconducting system (2ZnS)x(CuInS2)1-x(ZCIS) was found to form a solid solutionseries [1] with a miscibility gap for 0.095 x 0.42. Samples with x<0.095 show tetragonalchalcopyrite type structure, samples withx>0.42 cubic sphalerite type structure. In thetetragonal phase exist besides orientationdomains extending along all <100> directions,which occour in ZCIS single crystals as well asin powders, domaines with CuAuI-ordering,which were in ZCIS firstly observed in thinfilms [2] and also found in single crystals. In this experiment we used a ZCIS film, inwhich CuAuI-type ordering was actually foundby SAD and HRTEM to search by neutrondiffraction for an evidence of this ordering.Thin film was synthesized by Pulsed LaserDeposition (PLD), using target with thecomposition Zn0.298Cu0.346In0.357S. The PLDsystem was equipped with a KrF excimer laser(Lamda Physik LPX 305, =248nm,DL=1.1Jcm-2, p=5.510-6mbar). As substrate(100)GaP was used, the film was deposited at asubstrate temperature of 550°C. Thecomposition of the thin film wasZn0.092Cu0.477In0.431S, determined by EDXanalysis on a TEM. The film thickness was1.1µm, measured also by TEM.Neutron diffraction experiments on this thinfilm were carried out at the focusing singlecrystal diffractometer E6, using a wavelengthof =2.45Å.The first diffraction pattern (fig. 1) shows the220 peak of the GaAs-substrate and the 204and 220 peak of the ZCIS layer. Fig. 2 showsanother part of the diffraction pattern, wherethe 100 and 110 peak of the CuAuI structurecould be identified. Thus the neutron diffraction experiment on aZCIS thin film with tetragonal chalcopyritetype structure shows clearly the existence ofthe CuAuI type superstructure.
Fig. 1: Part of the measured diffraction pattern for thinfilm with a chemical composition ofZn0.092Cu0.477In0.431S. The tip marked peak can be assignthe 204 peak of the CuAuI-ordered phase, but wasn’tclearly identified.
Fig. 2: Part of the measured diffraction pattern for thethin film with a chemical composition ofZn0.092Cu0.477In0.431S. The existens of the 101 and 110CuAuI-ordered phase peak caused by the existend of thedomains extending along all <100> directions.
[1] G. Wagner, F. Fleischer, S. Schorr, will be published[2] G. Wagner et al., thin solid films 376 (2000) 82-88
103

PHY-01-1263.doc // brandt // 03.03.04 Seite 1 von 1
EXPERIMENTAL REPORT Proposal N° PHY-01-1263Instrument E9Structure and anion ordering in BaPbO3-
Local Contact M. Tovar
Principal Proposer: S. Schorr, University Leipzig, IMKM Date(s) of ExperimentExperimental Team: S. Schorr, University Leipzig, IMKM
A. Franz, University Leipzig, IMKMM. Tovar, HMI Berlin
3. 2. – 10. 2. 2003
Date of Report: 14. 3. 2003
Structures in the perovskite family ABX3 have heldthe interest over many years. We study the oxidicsolid solution BaPbO3--BaSnO3 which isconsidered as model system, because fundamentalproperties change in dependence of temperatureand chemical composition. Especially the oxygencontent respectively the oxygen deficiencydetermines the electric properties in a critical way.Thus physical properties can be influenced andcontroled specific by cation substitution and anionsubstructure.BaPbO3- samples were synthesized by modifiedsol-gel technique from barium and lead oxalatesand calcination in air using an optimisedtemperature profile (up to 850°C). The sampleswere annealed at 800°C in different atmospheres(argon, vacuum, air, oxygen) which corresponds todifferent oxygen fugacities. Neutron powder diffraction experiments wereperformed at the high resolution powderdiffractometer E9 (=1.7969Å) at roomtemperature and at higher temperatures (320°C,500°C, 700°C) in order to study the phasetransitions.Oxygen deficiency before annealing was =0.26.Although we expected different oxygen contentaccording to different oxygen fugacities as we havefound in samples synthesized before, the oxygendeficiency and Pb4+/Pb2+ ratio was constant (=0.5,Pb4+/Pb2+
1) in samples annealed in argon,vacuum, air and oxygen atmospheres, even thougthe unit cell volume decreases (fig. 1).
Fig. 1: Unit cell volume in dependence ofatmospheres during annealing.
Fig. 2: Powder diffraction pattern for BaPbO3-annealed in oxygen (upper) and argon (lower).
Thus the at room temperature measured diffrac-tograms are similar apart from the sample annealedin argon atmosphere (fig. 2). Rietveld refinements(FULLPROF) were done on all diffractogramsusing the monoclinic (s.g. I2/m) and the ortho-rhombic (s. g. Imma) structure model resulting incomparable fit qualities (tab. 1). No hints for ananion superstructure was found. The sampleannealed in argon could be refined with themonoclinic structure model only.
atmosph. monoclinic orthorhombicRBragg
2 RBragg 2
argon 4.54 4.61 - -vacuum 4.78 3.05 5.05 3.54air 4.32 3.79 4.38 3.95oxygen 3.63 2.39 3.73 2.43non-annealed 3.91 2.92 4.2 3.1Tab. 1: RBragg and 2 values of Rietveld refinments.
The high temperature measurements were refinedusing a tetragonal (s. g. I4/mcm) and a cubic model(s.g. Pm 3 m) respectively, resulting in comparablefit qualities.A decision about the room (monoclinic/ ortho-rhombic) and high temperature structure(tetragonal/ cubic) was not possible. Therefore thisproblem has to be studied in again in future.
atmosphere20h O2 10h O2 5h Luft unbehandelt10h Vakuum 15h Argon
310,6
310,8
311,0
311,2
312,8
312,9
313,0
313,1
313,2
V EZ [A
ngst
röm
]
104

PHY-01-1340.doc // brandt // 09.03.04 Seite 1 von 1
EXPERIMENTAL REPORT Proposal N° PHY-01-1340
Instrument E9Structural anomalies and cation orderingin 2ZnSe – CuInSe2 Local Contact
M. Tovar
Principal Proposer: S. Schorr, University Leipzig Date(s) of ExperimentExperimental Team: S. Schorr, University Leipzig
M. Tovar, HMI Berlin 6.10. - 8.10.2003
Date of Report: 22. 12. 2003
Ternary VIIIII CBA 2 chalcopyrite compounds forma large group of semiconducting materials withdiverse optical, electrical and structural properties[1]. Of special interest are the structural anomalies:the tetragonal distortion where the ratio between thelattice parameters c/2a differ from the idealvalue (ideal=1) and the anion displacement ¼-u (uis the x coordinate of the anion). Substitutingcertain elements into given ABC2 chalcopyrites(2D2+
A+ + B3+) results in quaternary D2x(AB)1-
xC2 compounds. Hereby formed solid solutionseries allow systematic studies of structuralproperties.In this regard we study the semiconducting systems2ZnX–CuInX2 (X = S, Se, Te), which areinteresting photovoltaic materials. Starting with thesolid solution system Zn2x(CuIn)(1-x)S2 (ZCIS)[2],we were able to observe experimentally the cationdistribution on the two metal sites of thechalcopyrite structure for the first time [3].Now the studies were extended to the solid solutionseries Zn2x(CuIn)(1-x)Se2 (ZCISe). ZCISe powdersamples were synthesized by solid state reaction ofthe elements in sealed evacuated silica tubes atT=850°C and homogenized. This procedure wasrepeated, finally the samples were cooled down toroom temperature with a temperature gradient of 2K/ h. The sample composition was determined byEDX analysis on TEM. Depending on chemicalcomposition the system undergoes a structuralphase transition from the tetragonal chalcopyrite-type structure to the cubic sphalerite-type structure,showing a a miscibility gap for 0.09<x<0.35 (2-phase field) [4]. Single phase tetragonal samples arewithin 0x0.09. Neutron powder diffraction experiments on singlephase tetragonal samples were performed on thehigh resolution powder diffractometer E9 (=1.797Å). Structural parameters (lattice constants, anionparameter, tetragonal deformation) were obtainedby the Rietveld analysis of the data, using theFULLPROF software package and the chalcopyritestructure model as starting point for the refinement. The lattice constants follow Vergard’s rule, but thetetragonal distortion, resulting in the expected
values c/2a>1, shows an unexpected dependence onchemical composition (see fig. 1). Comparingtetragonal distortion and anion displacement of theZCIS and ZCISe systems, it was found that the firstwas smaller in ZCISe although the anions are moredisplaced from their ideal positions (see fig. 2).
Fig. 1: Tetragonal lattice constants and tetragonaldistortion in dependence of chemical composition. Thesolid and dotted line corresponds to linear fits of thedata, the dashed line is guided by the eye.
Fig. 2: Anion displacement parameter in dependence ofchemical composition, comparison of ZCIS [5] andZCISe.
[1] J. L. Shay, J. H. Wernick, Ternary Chalcopyrite Semico-nductors, 1974 [2] S. Schorr, N. Stüßer, BENSC Experimental Report 2002[3] S. Schorr, M. Tovar, N. Stüßer, Bente, Physica B accepted[4] G. Wagner, S. Schorr, S. Lehmann, in preparation[5] S. Schorr, M. Heuer, V. Riede, submitted in Phys. Rev. B
105

PHY-01-1361.doc // brandt // 09.03.04 Seite 1 von 1
EXPERIMENTAL REPORT Proposal N° PHY-01-1361Instrument E6Structural anomalies and cation ordering
in 2ZnSe – CuInSe2 Local Contact N. Stüßer
Principal Proposer: S. Schorr, University Leipzig Date(s) of ExperimentExperimental Team: S. Schorr, University Leipzig
N. Stüßer, HMI Berlin 10.10. – 12.10. 2003
Date of Report: 22. 12. 2003
The solid solution series Zn2x(CuIn)1-xS2 (ZCIS)was studied over many years concerning structureand superstructure [1, 2, 3] and the structural phasetransition between the cubic sphalerite typestructure and the tetragonal chalcopyrite typestructure [4, 5]. The distribution of Zn, Cu and Inon the both different cation sites of thechalcopyrite type structure, especially importantfor the anion displacement, is not discussed inliterature, where some authors only suggest astatistic Zn distribution [4, 5]. The Cu/Zn differentiation problem existing in X-ray diffraction is solved by neutron diffraction,because of the different neutron scattering crosssections for Zn and Cu. We have performed neutronpowder diffraction experiments on ZCIS powdersamples [6] and were able to deduce fromexperimental determined anion parameter and metalsite occupancies determined in the Rietfeldrefinement of the neutron diffraction data the cationdistribution on the two metal sites of thechalcopyrite structure in this system for the firsttime [7].Now the studies were extended to the solid solutionseries Zn2x(CuIn)(1-x)Se2 (ZCISe). Details aboutsample synthesis can be found in PHY-01-1340.Note that two types of samples were investigated,one with a substitution 2Zn2+
Cu+ + In3+, the otherwith 2Zn2+
2Cu+. As in former investigations [6],neutron powder diffraction experiments using twodifferent wavelenths will be combined (E9:=1.797 Å and E6: =2.44 Å). The latter isnescessary to measure smaller reflexes, which carrythe information about the cation ordering, with veryhigh statistics. Cation site occupancies wereobtained from the Rietveld analysis of these datacombined with the data mesured at the highresolution powder diffractometer E9 (PHY-01-1340), using the FULLPROF software package andthe chalcopyrite structure model as starting pointfor the refinement. The neutron scattering length ofthe cation sites was calculated from the refinedcation site occupancies and compared withcalculated values, for the latter a statistic Zndistribution (sample type Zn2x(CuIn)1-xSe2, fig. 1)and In only occupied site (sample type Zn2xCu1-
2xInSe2, fig. 2) respectively, was assumed. Thecomparison gives a clear evidence for a non-statistic Zn distribution and Cu-In anti siteoccupation.
Fig. 1: Sample type Zn2x(CuIn)1-xSe2: Comparison ofexperimental and calculated (lines) neutron scatteringlengths for the both metal sites in the chalcopyrite typestructure.
Fig. 2: Sample type Zn2xCu1-2xInSe2: Comparison ofexperimental and calculated (lines) neutron scatteringlengths for the both metal sites in the chalcopyrite typestructure.
[1] K.Bente, Th. Döring, Chem. Erde 51 (1991) 291[2] G. Wagner et al., Thin Solid Films 82 (2000) 376[3] M. Heuer, K. Bente, Z. Krist. NCS 13 (2002) 217[4] O. V. Parasyuk et al., J. All. Comp. 57 (2003) 348[5] P. Gallardo, Phys. Stat. Sol. (a) 119 (1992) 134[6] S. Schorr, N. Stüßer, BENSC Experimental Report 2002[7] S. Schorr, M. Tovar, N. Stüßer, Bente, Physica B accepted
106

PHY-01-1373.doc // brandt // 09.03.04 Seite 1 von 1
EXPERIMENTAL REPORT Proposal N° *PHY-01-1373
Instrument *E6NeutronDiffraction Study of FeCr2S4 and substituted spinels (Fe0.5-xInx)0.5Cu0.5Cr2S4(x=0.3;0.4) under Pressure up to 20kbar.
Local Contact * N. Stüßer
Principal Proposer: R.Sadykov , Inst. For High Pressure Phys.RAS, Russia Date(s) of Experiment
Experimental Team: N. Stüßer , HMI Berlin *28Jul-04Aug2003
Date of Report: *
In order to study the phase transition inFeCr2S4 we carried out neutron powderdiffraction under high pressure up to 20 kbarand magnetic fields up to 6 Tesla. In Fig.1 wepresent the nonmagnetic high pressure clampcell used in our experiments. A powder ofFeCr2S4 + NaCl was put in the cell togetherwith a mixture of Fluorinert FC75 andFC77 (1:1) as pressure medium. The pressurewas determined from the change in the latticeconstants of NaCl.
1
2
3
4
5
6
7
60.0020.00
19.50
4,7
12.7
Fig.1. High pressure cell.1-cell body-nonmagnetic alloy 40HNU,2- nut-Ti alloy,3.-extrusion ring-CuBe, 4-sample can-lead (Pb), 5- can caps-Pb,6-pistons- nonmagnetic alloy 40HNU, 7-pistons.This cell is nonmagnetic down to 2°K and upto magnetic fields of 6 Tesla, there is nochange in the diffraction pattern from the cell.
In Fig.2 it is shown that Tc is shifted to highertemperatures from 171.3 K at 0 kbar up to182.3 K at 12.5 kbar, i.e. dTc/dP = 0.88 K/kbar.Data analyses of the measurements at highmagnetic fields up to 6Tesla are in progress.
.
0 20 40 60 80 100 120 140 160 180 200
0,2
0,4
0,6
0,8
1,0
1,2
P=12.5kbar
P=0kbar
FeCr2S4,
FitI(1
11),a
.uni
ts
T,K
Fig.2. Pressure dependence of magnetic (111)peak intensity vs. temperature at two differentpressures 0 kbar and 12.5 kbar.
Neutron diffraction was also performed at thesubstituted spinel Cu0.5(Fe0.2In0.3)Cr2S4showing that the ferrimagnetic phase coexistswith short ordering at low temperaturesindicating partially a spin glass state.Measurements at Cu0.5(Fe0.1In0.4)Cr2S4 showvery small magnetic peaks showing that this ismore close to a pure spin glass state.
10 12 14 16 18 20 22 24 26 28 30 32 34 36 38 40 42 44 462,0x10³
4,0x10³
6,0x10³
8,0x10³
1,0x10⁴
1,2x10⁴
1,4x10⁴
1,6x10⁴
1,8x10⁴
111
220
coun
ts
2teta
Fig,.3. Neutron diffraction pattern of Cu0.5(Fe0.2In0.3)Cr2S4 at T=2.3°K.
107

CHE-01-1366.doc // J. Hernández-Velasco // 03.03.04 Seite 1 von 1
EXPERIMENTAL REPORT Proposal N° CHE-01-1366Instrument E6/E9Cation order and magnetic structure of Rutile
related SbVO4 Local Contact J. Hernández-Velasco
Principal Proposer: A. Landa-Cánovas, ICMM-CSIC Madrid Date(s) of ExperimentExperimental Team: A. Landa-Cánovas
J. García-García, Arrhenius Lab. Univ. StokholmJ. Hernández-Velasco, BENSC-HMI Berlin
E9: 8-10.12.2003 E6: 5-7 & 10-12.12.2003
Date of Report: 15.1.2004
SbVO4 series of compounds is used as part of acatalyst in a recently developed method for thedirect production of acrylonitrile by theammoxidation of propane. In the non-stoichiometric series described as Sb0.9V0.9+x0.2-xO4
(0x0.2), cation vacancies () are introduced inthe basic rutile type-structure following themechanism: 4V3+ 3V4+ + , while antimonyremains as Sb5+. The reduced phase (richest in V3+)has been reported to be Sb0.9V1.1O4 [1], whichshows by electron diffraction superlatticereflections characteristic of a two-fold rutilesuperstructure along c. However the X-ray powderdiffraction pattern showed only basic rutilereflections (ar = 4.6085(1), cr = 3.0867(1) Å, S.G.P42/mnm). The careful reciprocal lattice study byelectron diffraction has revealed the following unitcell for the rutile superstructure: a =2ar, b = 2br, c= 2cr. (subindex r refers to the basic rutile unit cell).Its space group, I41md, was determined by meansof CBED. A structural model based on alternatingSb and V cations ordering along c in the chains ofedge-sharing octahedra was proposed. No cationvacancies have been observed for this reducedphase, while for the compounds synthesized inoxidizing conditions the presence of vacancies hasbeen confirmed [2]. In fact, electron diffractionexperiments have shown that vacancies order in thebasic rutile structure giving rise to a modulatedstructure on the other end member of the series,namely Sb0.9V0.9O4 [3]. On the other hand,magnetic susceptibility [4] and Sb Mössbauer [5]studies could indicate magnetic ordering though itwas unclear and the magnetic structure remainedunknown. Thus we performed the study of 3different samples of the series Sb0.9V0.9+x0.2-xO4 byusing neutron diffraction: 1) a reduced phase richon V3+ which shows the nuclear superstructure bySb-V ordering. 2) an oxidized phase rich on V4+
which shows the vacancies ordering. 3) anintermediate phase which shows Sb-V disorder. Inthis way, we try to determine the magnetic structureof reduced SbVO4 coming from the ordering ofvanadium magnetic moments, which certainly takesplace at TN ~50K, and to study how the substitutionof V3+ (S=1) by V4+ (S = ½), while the synthesis
conditions become more oxidizing, affects the spinarrangement in Sb0.9V0.9+x0.2-xO4. This order seemsto be destroyed by the appearance of vacancies andthe chemical disorder in the cations positions. Tofollow the evolution of the order parameter and getgood statistics for the Rietveld analysis we carriedout the experiments using the diffractometer E6ranging at temperatures from room (RT) to 1.5K,Fig. below. Another aim is to confirm the model ofnuclear superstructure that we proposed based onthe electron diffraction and HRTEM data, as far asit is not possible to measure the intensity in anabsolute scale with the mentioned technique, anddue to the higher contrast for the cations involvedwhich is achievable with neutron diffractioncompared with X-rays. The fact that V coherentscattering length for neutrons is rather small give usan obvious advantage to determine the superstruct-ure due to alternating Sb-V occupation of two sitessplit from the substructure. To measure the samplesat RT we used the high resolution powderdiffractometer E9. Due to the unique property ofthe neutrons to interact with ordered magneticmoments, the magnetic scattering coming from theV spins could be constrained to its crystallographicposition, giving more information than at firstglance could be expected by its almost null nuclearscattering. Weak reflections could be associated tothe vacancies modulation in the oxidized sample.
[1] Landa-Cánovas A.R.;Hansen S.;Ståhl K., Acta Crystallogr. B (1997), 53, 221[2] Hansen S.;Ståhl K.;Nilsson R.;Andersson A., J. Solid State Chem. (1993),102, 340 [3] Landa-Cánovas A.R., Nilsson J., Hansen S., Ståhl K., Andersson A.,J. Solid State Chem. (1995) 116, 369 [4] Schüer H., Klemm W., Z. Anorg. Allg.Chem. (1973) 395, 287 [5] Birchall T., Sleight A.W., Inorg. Chem. (1976) 15,868.
108

EF_32_Milne.doc // brandt // 03.03.04 Seite 1 von 1
EXPERIMENTAL REPORT Proposal N° EFInstrument E6Hydration of NaxCoO2.Local Contact J. Hernández-Velasco
Principal Proposer: Chris Milne, Dimitri Argyriou, HMI Date(s) of ExperimentExperimental Team: Chris Milne, HMI
Jorge Hernández Velasco, HMI 29.5.03 – 8.6.03
Date of Report: 26-1-04
The discovery of high temperaturesuperconductivity in layered copper oxides [1]has fuelled the search for similar properties inlayered compounds containing other transitionmetals. These attempts had yielded onlySr2RuO4 [2] until the recent discovery ofsuperconductivity at around 5K in a compoundof stoichiometry NaxCoO2yH2O(x~0.35 andy~1.3) [3].From a structural perspective, the mostfascinating aspect of this new superconductoris the triangular like network ofsuperconducting CoO2 sheets and thestructural changes involved during thehydration step in which H2O is inserted to thestructure. This insertion of water is critical tothe observation of superconductivity.
Figure 1. Two schematic views of the layeredcobaltate indicating areas in which the H2Oreside.
The aim of this experiment was to study, in-situ, the structural evolution of the fullyhydrated superconductor from the anhydrousparent. This involved placing the dehydratedsample Na0.35CoO2 in an open can and thenclosing it inside a larger can containing D2O.Cadmium shielding was used to mask thebottom and top of the sample set-up and toavoid the scattering from the liquid. Patternswere then taken every 20 minutes andmonitored to look for a structural response.
Over the course of time we observed changesin the pattern however they were slight and didnot indicate full transformation. We paused themeasurement to check there was still D2O inour can. In the course of this check it wasapparent, by inspection of the sample, thathydration was taking place however it was nothomogeneous and that only sample right nextto the opening of the inner can was becominghydrated, and not all the bulk. The powder wasthus mixed to allow more of the sample tohydrate. Subsequent analysis of data setsshowed that still very little of the sample in thebeam was becoming hydrated and fullhydration was not achieved by the end of theallotted time.
In order for this experiment to be successful animproved set up is required. This would involvea system where more water can reach a largersurface area of the sample, perhaps soakedcotton wool in the bottom of the sample can orby having holes in the side of the can so thatD2O enters from more directions hydratingmore of the sample.
[1] J.G. Bednorz and K. Mueller, Zeit. Phys. B64, 189 (1986).
[2] Y. Maeno et al., Nature 372, 532 (1994).
[3] K. Takada et al., Nature 421, 53 (2003).
109

EF_33_Hernandez-V.doc // J. Hernández-Velasco // 15.03.04 Seite 1 von 1
EXPERIMENTAL REPORT Proposal N° EFInstrument E6Crystal and Magnetic structure of the Molecular
Magnet Mn(NCS)2pyz2. Local Contact J. Hernández-Velasco
Principal Proposer: J. Hernández-Velasco, H.N. Bordallo, R. Feyerherm Date(s) of Experiment
HMI; J.L. Manson EWUExperimental Team: J. Hernández-Velasco, BENSC-HMI Berlin 3-6.11.2003
Date of Report: 15.1.2004
We have already investigated the magneticstructure of the isostructural coordinationcompound Fe(NCS)2pyz2 containing also thebridging pyridyl-donor ligand pyrazine (pyz or1,4-diazin C4N2H4). Substitution of M = Fe2+
with Mn2+ gives rise to extreme changes in themagnetic properties of the system which areevidenced in the drastic decrease of theordering temperature. The former [1] showsincommensurate magnetic order at TN≈ 6.7K,while the latter was known to not exhibit longrange order down to 1.8 K. However AFinteractions are expected to be operative in thiscoordination polymer. Then an experimentusing a special sample environment wasperformed (3He/4He dilution refrigerator insertheld in a Variox cryostat), a Cu samplecontainer evacuated and sealed with In wasused in order to enhance thermal transfer, andthe lowest temperature reached in the chamberwas about 60 mK. The data were collectedusing the E6 diffractometer. The experimentalpatterns are shown in Fig. 1 indicating theexistence of a magnetic phase transition fromthe paramagnetic state to a well definedperiodical arrangement of the magneticmoments.
Figure 1.- NPD data at T=10.6 K, 60 mK and differencebetween them (pure magnetic scattering).
The IC nature of the Fe(NCS)2pyz2 magneticstructure could be explained and is underanalysis at the light of possible stackingdisorder in the lattice due to the layered shapeof the net. In this sense, anisotropic broadeningof reflections has been observed in highresolution neutron diffraction patterns [1] andstreaking of diffraction maxima has been foundusing electron diffraction and HRTEMtechniques [2]. The monoclinicic unit cell ofboth M(NCS)2pyz2 at RT is shown in Fig. 2.
Figure 2.- Representation of M(NCS)2pyz2 unit cell M=Fe, Mn(S.G. C2/m ; a ~10.2 Å; b ~10.4 Å; c ~7.2 Å; β~118.8°).
Nevertheless, the Mn compound shows acontinuous phase transition of its nuclearstructure while cooling from RT, which isevidenced for the first time. The transformationis reversible and anisotropic expansion-contraction of the lattice is not surprisingtaking into account the 2D sheet-like characterof this polymer. Within this framework, thebehaviour of the system seems to be quitecritical depending on symmetry changes, whichshould be considered to understand the relationbetween structure and properties. Then anotherpoint to solve is the determination of thecrystallographic differences between the lowand high T phases.
[1] L. C. Chapon, H. N. Bordallo, J. L. Manson, J.Hernández-Velasco et al. Submitted to Phys. Rev. B.[2] J. Hernández-Velasco, A. Landa et al. Unpublished.
110

Seite 1 von 1
EXPERIMENTAL REPORT Proposal N° CHE-01-1260Instrument E9
Phase transition in Sr, Mg doped LaGaO3 SuperionicConductors Local Contact
Daniel M. Többens
Principal Proposer: Günter, Marco M., TU Berlin Date(s) of ExperimentExperimental Team: Boysen, Hans, Uni München
Lerch, Martin, TU BerlinTöbbens, Daniel M., HMI Berlin
16 Jan – 23 Jan 2003
Date of Report: 29.07. 2003
Solid superionic conductors are important materialsfor technical applications, e.g. in fuel cells.Recently, a new type of oxygen ionic conductorwas reported, based on perovskite-type LaGaO3,allowing operating temperatures at 800°C. Oxygenvacancies in the anion lattice, necessary to enhancethe ionic conduction, can be introduced by dopingLaGaO3 with aliovalent oxides like SrO and MgO[1]. In order to understand the conductionmechanism in La1-xSrxGa1-yMgyO3-0.5(x+y) samples,we determined the phase relationships as a functionof temperature and composition for a sample seriesof doped LaGaO3 samples. In a continuation of our previous work [2] the phaserelationships of a sample series of doped materialas a function of temperature and composition wereexamined by neutron powder diffraction at E9. Inthis contribution we report on detailed structuralinvestigations of different La0.9Sr0.1Ga1-yMgyO3-
0.5(0.1+y) samples with various Mg-dopantconcentrations (with x = 0, 0.1, and 0.2) leading todifferent concentrations of oxygen vacancies. Thesamples were prepared by a novel solutioncombustion synthesis technique using nitratesolutions and employing urea as a complexingagent [5]. The neutron data were collected at theinstrument E9 (wavelength of 1.797 Å) equippedwith a high-temperature furnace. The 2Θ-rage wasup to 160° with a step width of 0.05°.Measurements were carried out between roomtemperature and 1000 °C in intervals of 100 °C.The observed distortions of the parent perovskitestructure are due to the oxygen octahedral tiltswhich can be described within the Glazernomenclature [3].Continuing our previous work we now concentrateon stuctural details of the samples with the generalformula La0.9Sr0.1Ga1-yMgyO3-0.5(0.1+y). Those samplesall expose a rhombohedral cR3 structure at hightemperatures (T > 400°C). The geometricaldescription of the rhombohedral perovskitestructural parameters has been thoroughly revisedby Megaw et al. [4]. In the rhombohedral spacegroup cR3 the only structural parameters are theoxygen position parameter x and the hexagonallattice parameters a and c. The oxygen position
determines the rotation angle φ of the GaO6octahedron. For a cubic perovskite the rotationangle would be 0. Figure 1 depicts the octahedralrotation angle at high temperatures for the samplesinvestigated. It can be seen that with increasingMg-dopant concentration and temperature therotation angle is decreased. However, even at1000°C the rotation angle is not reduced to zero. At
Fig. 1: Variation of the rotation angle φ of the oxygenoctahedron for various La0.9Sr0.1Ga1-yMgyO3-0.5(0.1+y) samles.Error bars are smaller than the size of the symbol.
1000°C a rotation angle of 4.6 ° is attained for thesample La0.9Sr0.1Ga0.8Mg0.2O2.85. Correspondingly,the structure becomes more cubiclike but still beingrhombohedral. The continous decrease of the of thetilt angle of the perovskite phase as shown in Fig. 1is indicative of a displacive type of phase transitionwhich could possibly related to second-order typephase transition. This investigation clearly showsthat neutron diffraction is the superior method for aprecise determination of the correct type of thedistortion and the oxygen position in the cell.
The financial support of the DFG (No. LE781/7-1) is gratefullyacknowledged.[1] H. Huang, M. Feng, J.B. Goodenough, J. Am.
Ceram. Soc. 79[4], 1010, (1996).[2] M. Lerch, H. Boysen, T. Hansen, J. Phy. Chem.
Solids 62, 445, (2001).[3] A.M Glazer, Acta Crystallogr. B28 (1972) 3384[4] H.D. Megaw, and C.N.W. Darlington, Acta
Crystallogr. A31, 1975, 161.
2.5
5.0
7.5
10.0
0.0
400 600 800 1000 1200 1400 1600 1800
Oct
ahed
ron
rota
tion
[φ]
Temperature [°C]
La0.9Sr0.1GaO2.95
La0.9Sr0.1Ga0.9Mg0.1O2.9
La0.9Sr0.1Ga0.8Mg0.2O2.85
111

PHY-01-1265.doc // brandt // 16.03.04 Seite 1 von 1
EXPERIMENTAL REPORT Proposal N° PHY-01-1265Instrument E9Orbital order-disorder transitions in La-
deficient perovskite manganites Local Contact Michael Tovar
Principal Proposer: Henryk Szymczak,Institute of Physics,PAS Date(s) of ExperimentExperimental Team: Henryk Szymczak, Institute of Physics, Polish Acad.Sci
Michael Tovar, BENSC HMI Berlin 29 Jan-05 Feb 2003
Date of Report: 09.07.2003
The detailed study of room temperature crystalstructure, elastic and magnetic properties of thesamples La0.88MnOx (2.82 ≤ x ≤ 2.96) was carried out.The most reduced La0.88MnO2.82 sample containingonly Mn3+ ions was shown to be antiferromagnet withTN=140 K. The crystal structure of investigatedcompounds was found to undergo a number ofconcentration depended phase transitions: fromorbitally ordered orthorhombic (x≤2.86) to orbitallydisordered orthorhombic (2.87≤x≤2.90), and then tomonoclinic type of unit cell distortion (x≥2.91). It wasshown that magnetic state of the samples of theLa0.88MnOx system strongly correlates with the type oftheir orbital ordering. The compounds withantiferromagnetic component exhibit the features ofcooperative orbital ordering, while pure ferromagneticsamples, with TC up to 255 K for x=2.96, are orbitallydisordered.The study of elastic properties has revealedanomalous jump of Young`s modulus value at hightemperature for both orbitally ordered and orbitallydisordered orthorhombic compounds. The temperatureof anomaly was found to decrease with increase ofoxygen content
TABLE I. Refined structural parameters ofLa0.88MnO2.87 sample at T=300 K-space group Pnma(upper panel) and at T=500 K-space group I2/a (lowerpanel).
The temperature hysteresis of about 20 K hasindicated first order crystal structure phase transition.In order to study the change of the crystal structurewith a temperature and to reveal the origin of theanomalous behavior of the temperature dependence ofYoung`s modulus value we carry out the neutrondiffraction study of La0.88MnO2.87 compound (TC=170K) which exhibited the sharp increase of Young`smodulus value above 440 K.The anomalous increase of Young`s modulus value isfound to be associated with the transition tomonoclinic structure. The refinement of the crystalstructure below 400 K was performed using Pnmaspace group. At 500 K, the space group I2/a was used.The structural parameters obtained in the refinementfor T=300 K and T=500 K are presented in Table I. Itcan be shown that decrease of a temperature down to200 K leads to increase of distortion of MnO6octahedron. Moreover, the inversion of unit cellparameters (b/2<c<a) corresponding to so-called O’-orthorhombic crystal structure is observed at T=200K. These facts indicate the stabilization of orbitallyordered component. The situation changes with thefurther decrease of a temperature. The ferromagneticcontribution appears starting with the pattern acquiredat T=100 K and, simultaneously, distortions of MnO6octahedrons diminish.
Atom Position x y z
LaMnO1O2
4c4b4c8d
0.02090.00000.49450.2216
0.25000.00000.25000.5335
0.99550.50000.06640.2291
CellDiscrepancy factors
a=5.5227 ÅRp=4.5%
b=7.7837 ÅRwp=5.8%
c=5.5353 ÅRB=4.8% χ2=1.99
Atom Position x y z
LaMnO1O2
4e4a4e8f
0.25000.00000.2500-0.0215
0.50240.00000.05980.2161
0.00000.00000.00000.2781
CellDiscrepancy factors
a=7.8221ÅRp=4.8%
b=5.5575ÅRwp=6.1%
c=5.5043ÅRB=5.4%
β=90.78°χ2=2.21
112

PHY-01-1346.doc // brandt // 16.03.04 Seite 1 von 1
EXPERIMENTAL REPORT Proposal N° PHY-01-1346Instrument E9Neutron diffraction studies of crystal and magnetic
structures of La(1-x)Bi(x)MnO(3) Local Contact Michael Tovar
Principal Proposer: Henryk Szymczak,Institute of Physics,PAS Date(s) of ExperimentExperimental Team: Henryk Szymczak, Institute of Physics, Polish Acad.Sci
Michael Tovar, BENSC HMI Berlin19.08.03 - 25.08.03,
Date of Report: 03.12.2003
While the lanthanum-based manganites (Ln=La, Y,rare-earth ion) are antiferromagnetic [1], bismuthmanganite is a ferromagnetic insulator [2]. Moreover,while substitution of the lanthanide by an alkaline-earth metal leads to a transition from theantiferromagnetic to a ferromagnetic metallic state, asimilar substitution for BiMnO3-based manganitesdestroys the ferromagnetic order [2]. The aim of thepresent work was to study phase transitions in asystem of manganites where La3+ ions are replaced byBi3+ ones. Formally upon such a substitution thevalence of the manganese ions should not change. Theneutron diffraction experiments for La0.6Bi0.4MnO3.02and La0.4Bi0.6MnO3 samples were performed with awavelength of neutrons λ=1.7974 Å in thetemperature range 2-300 K. The data have been analyzed with the Rietveld method using FullProfprogram. The magnetization study has revealed thatmagnetic properties strongly depend on oxygencontent. The La0.6Bi0.4MnO3.10 sample prepared in airis characterized by Curie point 90 K whereas reducedLa0.6Bi0.4MnO3.02 exhibits higher Curie point – 120 K.Decrease of oxygen content leads to enhancement ofthe magnetization from 1.8 to 2.9 µB/f.u. in a field of1.5 T. According to ZFC and FC magnetization vs.temperature dependence La0.4Bi0.6MnO3.12 is a spinglass with Tf=40 K whereas reduced La0.4Bi0.6MnO3.02has ferromagnetic component below 70 K.Magnetization strongly depends on external magneticfield reaching value 1.6 µB/f.u. for the reducedsample. All the samples show insulating behaviorbelow room temperature. The structural refinementwas performed using different models; the best fittingwas obtained for the Pnma space group. Both reducedsamples have relatively small O-type distortions of the
Table I. Selected interatomic distances (in Å) andangles (in degrees) for La0.6Bi0.4MnO3.02 andLa0.4Bi0.6MnO3.02 samples at different temperatures
unit cell at all the temperatures. The observed andcalculated diffraction patterns of studied samples arein very good agreement. The refined magneticmoment at 2 K is 2.47 µB/Mn and directed along y-axe. No appreciable ferromagnetic contribution wasdetected for La0.6Bi0.4MnO3.02 compound. The Mn-Odistances which characterize the Jahn-Teller distortionare presented in Table 1. One can see that MnO6octahedron is slightly distorted; however themagnitude of the distortion is incompatible withcooperative orbital ordering observed in compoundssimilar to LaMnO3. Therefore one can conclude thatBi-doped samples do not exhibit cooperative Jahn-Teller orbital ordering. The Mn-O-Mn bonds anglesare close to 1600. This magnitude of the anglecorresponds to ferromagnetic super-exchangeinteractions between both Mn3+-O-Mn3+ and Mn3+-O-Mn4+ in agreement with Goodenough considerations[3]. However, it has not been observed anyappreciable ferromagnetic contribution forLa0.4Bi0.6MnO3.02 compound. For this reason one canconclude that Goodenough criteria for ferromagnetismin manganites are not valid for Bi-containingmanganites. Apparently the tendency of 6s2 lone pairof Bi3+ to hybridize with 2p orbitals of oxygen couldbe responsible for anomalous magnetic properties ofmanganites.
1. S. Quezel-Ambrunaz, Bull. Soc. Fr. Mineral andCrystallogr., 91, 339 (1968).2. I.O. Troyanchuk, N.V. Samsonenko, E.F.
Shapovalova, I.M. Kolesova, and H. Szymczak, J.Phys.: Condens. Matter. 8, 11205 (1996).
3. J. Töpfer and J.B. Goodenough, J. Solid StateChem. 130, 117 (1997).
Compound T (K) Mn-O1 (m) Mn-O2 (s) Mn-O2 (l) Mn-O1-Mn Mn-O2-Mn
x=0.4 2 1.995 1.975 2.000 157.36 160.56200 1.992 1.985 1.990 158.22 160.12
x=0.6 2 1.963 2.003 2.004 155.13 161.07300 1.981 2.001 2.010 156.80 158.60
113

PHY-01-1201.doc // brandt // 03.03.04 Seite 1 von 1
EXPERIMENTAL REPORT Proposal N° PHY-01-1201
Instrument E9Neutron diffraction study of ferroelectricNaNO2 nanowires. Local Contact
M. Tovar
Principal Proposer: A. Naberezhnov Ioffe Phys.- Tech. Institute,S.-Petersburg, Russia Date(s) of Experiment
Experimental Team: A. Sotnikov Ioffe Phys.-Tech. InstituteM. Tovar HMI, Berlin, Germany 03/12/2002 –
13/12/2002
Date of Report: 10/03/2003
Natural chrysotile asbestos (Mg3Si2O5(OH)4)forms a regular set of closely packed parallelultrathin dielectric tubes [1] with externaldiameters of ~ 30 nm and with internal channeldiameters (in our samples) 6(1.5) nm. Themisorientation of these nanochannels is betterthen 2 degrees. Sodium nitrite belongs to so-called order-disorder ferroelectrics, undergoesthe first-order ferroelectric phase transition(PT) at ≈ 438 K and melts at 554 K. Due tohigh wetting ability molten NaNO2 penetratesinto asbestos channels and forms quasi one-dimensional structure. The volume amount oflinear nanostructured materials achieves 7%.Neutron diffraction measurements wereperformed on E9 in the temperature regionRT<T<543K, i.e. below and above the bulk PTtemperature. Preliminary data treatmentallows us to make the following conclusions:• NaNO2 within asbestos is completely textured• The structure of sodium nitrite in asbestosbelow the ferroelectric TC corresponds to thebulk orthorhombic structure, but the volume ofthe unit cell at low temperatures is smaller.• Upon heating the intensities of Bragg peaksat large Q decrease faster than in the bulk andnanocomposite glass samples.• Temperature dependence of order parameterof embedded NaNO2 does not correspond toobserved for the bulk material and differs fromthe earlier obtained for NaNO2 in porous glass[2] (Fig.1). Above 413 K the intensities ofBragg peaks depending on order parameterare very small and correspond to the valueexpected for the paraelectric phase. This factis evidence of further decrease of TC forNaNO2 in asbestos relatively the valuesobserved for the bulk and nanocompositeglass samples. The obtained results permit toestimate this temperature as close to 413 (2.5)K. Temperature dependence of orderparameter follow a power law (1-T/TC)β with β= 0.341(0.035). This value corresponds to thatobserved for NaNO2 within porous glass [2].
• Above 543 K we did not observed anydiffraction picture. On cooling diffractionpatterns began to restore below 508 K.
Fig.1 Temperature dependences of orderparameter for the bulk (circles), embedded inglass (triangles) and in asbestos (rectangles)NaNO2.
REFERENCES1 Yu. A. Kumzerov, “Nanostructured Films
and Coating”, G.M.Chow et al. (eds), Kluver
Academic Publishers, 2000, pp. 63-76.2 B. Dorner, I. Golosovsky Yu. Kumzerov, A.
Naberezhnov, S. Vakhrushev, Structure offerroelectrics in a restricted geometry,Abstracts of 2nd International Workshop onDynamics in Confinement, France,Grenoble, 22-25 January, 2003, P31.Submitted in Eur. Phys. Journal E.
114

PHY-01-1269.doc // brandt // 16.03.04 Seite 1 von 1
EXPERIMENTAL REPORT Proposal N° PHY-01-1269
Instrument E9Order parameter and structure of nanocompositeNaNO2 embedded in porous glass Local Contact
M. Tovar
Principal Proposer: A. Naberezhnov Ioffe Phys.- Tech. Institute,S.-Petersburg, Russia Date(s) of Experiment
Experimental Team: Yu. Kumzerov Ioffe Phys.-Tech. InstituteM. Tovar HMI, Berlin, Germany 29/04/2003 –
08/05/2003
Date of Report: 10/09/2003
In these experiment we have studiedthe temperature evolution of structure ofsodium nitrite embedded into porous glasseswith average pore diameter 3 ±0.5 nm andhave determined the temperature dependenceof order parameter in the ferroelectric phase.The bulk sodium nitrite belongs to so-calledorder-disorder ferroelectrics, undergoes thefirst-order ferroelectric phase transition (PT) at≈ 438 K and melts at 554 K. Due to highwetting ability molten NaNO2 penetrates intoporous glass. The volume amount ofnanostructured materials achieves 18-19%.Neutron diffraction measurements wereperformed on E9 in the temperature regionRT<T<493K, i.e. below and above the bulk PTtemperature. Preliminary data treatmentallows us to make the following conclusions:• This confined ferroelectrics forms a systemof interconnected dendrite clusters withaverage size (~17 nm) which essentiallyexceeds the pore diameter. This average sizeis practically temperature independent. • The structure of sodium nitrite in asbestosbelow the ferroelectric TC corresponds to thebulk orthorhombic structure.• As for sodium nitrite within 7 nm porous glass[1] upon heating throughout TC the intensitiesof Bragg peaks at large Q decrease faster thanin the bulk, but the unit cell volume increasessmaller than for 7 nm glass (Fig.1).• Temperature dependence of order parametercorresponds to the observed for 7 nm glass [1]and differs essentially from observed for thebulk [2] (Fig.2). The obtained results permit toestimate this temperature as close to 429.5(3.9) K. Temperature dependence of orderparameter follow a power law (1-T/TC)β with β= 0.26(0.03). This unexpected value of β donot correspond to that observed for NaNO2within porous glass [1] and could be take placedue to unsufficient accuracy of measurementsin the vicinity of TC. In future we are going tocarry out the additional measurements nearTC.
Fig.1 Temperature dependences of unit cellvolume for the bulk (red circles) andembedded in 7 nm glass (blue triangles) and 3nm glass (black rectangles) NaNO2.
Fig. 2 Temperature dependences of orderparameter for the bulk and for NaNO2 in 7 and3 nm glasses
REFERENCES
1. A. Naberezhnov, Yu. Kumzerov et al . Eur. Phys.J. E, (2003) in press 2 A. da Costa Lamas, S.-L. Chang, and S. Caticha-Ellis, Phys.Stat. Sol. (a) 68, (1981) 173.
3 00 3 50 4 00 4 50 5 00 5 50 6 00106
108
110
112
114
116
118
Volu
me,
A3
T , K
N aN O 2 w i th in 3 n m g las s pu re N aN O 2 N aN O 2 w i th in 7 n m g las s
2 80 3 20 3 60 4 00 4 400 ,0
0 ,2
0 ,4
0 ,6
0 ,8
1 ,0
T , K
7 n m g las s bu lk 3 n m g las s
115

PHY-01-1348.doc // brandt // 09.03.04 Seite 1 von 1
EXPERIMENTAL REPORT Proposal N° PHY-01-1348
Instrument E9Structure and phase transition in a
confined KH2PO4 Local Contact M. Tovar
Principal Proposer: A. Naberezhnov Ioffe Phys.- Tech. Institute,S.-Petersburg, Russia Date(s) of Experiment
Experimental Team: O. Smirnov Petersburg Nuclear Physics Institute, Gatchina, RussiaM. Tovar HMI, Berlin, Germany
04/11/2003 –15/11/2003
Date of Report: 23/01/2004
KH2PO4 (KDP) is classical "order-disorder"ferroelectric and undergoes the first-orderphase transition (PT) at ≈ 123 K. Its bulkstructure and properties are studied in detail.KDP is very suitable for preparation ofnanocomposite structures with differenttopology and (along with NaNO2) could beconsidered as a model compound for study ofsize effect. We have tried to study thetemperature evolution of structure of KDPwithin 7 nm porous glasses. Unfortunately theintensities from KDP were very small and wehave used the beam time for continuation thestudy of nanostructured NaNO2 within porousglasses with average pore diameter 3±0.5 and20±1.5 nm. We have determined thetemperature dependence of order parameter inthe ferroelectric phase for samples with 20 nmpores and improved this dependence forsamples with 3 nm pores in a vicinity of TC(Fig.1). Neutron diffraction measurementswere performed in the temperature regionRT<T<471 K, i.e. below and above thetemperature of ferroelectric PT for the bulkNaNO2. Preliminary results are the same:• Confined NaNO2 form a system ofinterconnected dendrite clusters with averagesize exceeded essentially the average porediameter. These values are practicallytemperature independent for the bothnanocomposite materials (Fig. 2). • Above 423 K the structure of NaNO2 within 3nm glasses corresponds to the paraelectricphase.• In the ferroelectric phase the temperaturedependence of order parameter follows apower law (1-T/TC) β. Using new results wehave improved the values of criticaltemperature (TC= 418.5±3.5 K) and criticalexponent (β = 0.31±0.04) with) for NaNO2within 3 nm porous glasses.• Temperature dependence of order parameterfor NaNO2 within 20 nm glasses does notfollow the power low with reasonable values ofTC and β and in a vicinity of TC visibly differs
from the analogous ones for NaNO2 within 3and 7 nm glasses (Fig. 1). Possibly in thisnanocomposite material we observe thecrossover to the behavior of order parameterobserved in the bulk. Using thephenomenology for the first order phasetransition we have estimated the value of TC(435.7±4.0 K), which coincides with TC for thebulk (437 K).
300 350 400 4500,0
0,2
0,4
0,6
0,8
1,0
T , K
30 A g las ses bu lk 200 A g las ses 70 A g las ses
Fig.1 Temperature dependences of orderparameter for the bulk and for NaNO2 within20, 7 [1] and 3 nm glasses.
320 360 400 440 480100
200
500
600
Size
, A
T ,K
Fig. 2 Average size of coherent cluster forNaNO2 within 20 nm (open squares) and 3 nm(black triangles) glasses.REFERENCES1. A. Naberezhnov, A. Fokin, Yu. Kumzerov, A.Sotnikov, S. Vakhrushev, and B. Dorner, Eur.Phys. J. E 12, (2003), s21-s24.
116

03.03.04 Seite 1 von 1
EXPERIMENTAL REPORT Proposal N°CHE-01-1261Instrument E9
New CompoundsLocal Contact D. Többens
Principal Proposer: G. Auffermann, R. Kniep, MPI CPfS Dresden Date(s) of ExperimentB. Schüpp, C. Sekar, G. Krabbes, IFW Dresden
Experimental Team: G. Auffermann, MPI CPfS DresdenD. Többens, HMI Berlin 07.04.-08.04.2003
Date of Report: 12.12.2003
The five-leg spin ladder compound La8Cu7O19was synthesized by solid state reaction fromthe oxides La2O3 and CuO at 1288 K in air.Neutron diffraction experiments were carriedout at 293 K at the powder diffractometer E9.In combination with X-ray diffraction studiesthe reported experiment led to the determi-nation of the crystal structure (especially pre-cise oxygen positions) of La8Cu7O19 by jointstructure refinements of X-ray and neutronpowder diffraction data (Fig. 1) applying theprogram FULLPROF [1].
Fig. 1: Neutron powder diffraction pattern at293 K (observed, calculated and differenceprofiles, ticks mark the Bragg positions).
La8Cu7O19 is the n = 3 member of ahomologous series with the general formulaA4+4nB8+2nO14+8n. The Cu–O substructure inLa8Cu7O19 contains three-octahedra-wideribbons of Jahn-Teller-elongated octahedra.These structural units can be interpreted asparts of a perovskite layer in La2CuO4 with awidth of n = 3 octahedra in accordance withthe corresponding blocks in La2Cu2O5 (n = 2)reported by Cava et al. [2]. The La2CuO4 typeribbons are terminated by copper-oxygenplanes of a complex geometry [3]. La8Cu7O19 crystallizes in the monoclinic spacegroup C2/c (No. 15) with the lattice para-
meters a = 13.8310(4) Å, b = 3.75827(9) Å,c = 34.5917(8) Å and = 99.332(2)°(dimensions and standard deviations fromRietveld refinement).
Fig. 2: Crystal structure of La8Cu7O19.
References:[1] J. Rodriguez-Carvajal, LLB, Saclay FULLPROF.2K Version 1.9e (2001).[2] R.J. Cava, T. Siegrist, B. Hessen, J.J.
Krajewski, W.F. Peck jr., B. Batlogg, H.Takagi, J.V. Waszcak, L.F. Schneemeyer,H.W. Zandbergen, J. Solid State Chem. 94(1991) 170.
[3] B. Schüpp, C. Sekar, W. Gruner, G.Auffermann, C. Bähtz, G. Krabbes, Z.Anorg. Allg. Chem. submitted.
20 40 60 80 100 120 140 160-20-10
0102030405060708090
100
rel.
inte
nsity
angle 2 / °
b a
c
LaCuO
117

CHE-01-1338.doc // brandt // 03.03.04 Seite 1 von 1
EXPERIMENTAL REPORT Proposal N°CHE-01-1338Instrument E9New Nitrides and NitridometalatesLocal Contact D. Többens
Principal Proposer: G. Auffermann, R. Kniep, MPI CPfS Dresden Date(s) of ExperimentR. Niewa, D. Zherebtsov, MPI CPfS Dresden
Experimental Team: Yu. Prots, MPI CPfS DresdenD. Többens, HMI Berlin
29.10.-03.11.2003
Date of Report: 18.12.2003
Li3[ScN2] was prepared from Li3N with Sc or ScNin nitrogen atmosphere at 1020 K as a light yellowpowder with an optical band gap of about 2.9 eV[1]. To locate all atoms reliably, X-ray and neutronpowder diffraction experiments were carried out.Based on both patterns the crystal structure wasrefined (Ia3, Z = 16, Rietveld: a = 1003.940(8) pm,X-ray diffraction: Rprofile = 0.078, RBragg = 0.070;neutron diffraction: Rprofile = 0.077, RBragg = 0.074;Fig. 1).
Fig. 1: X-ray (top, CuK1 radiation) and neutron(bottom, = 179.65(1) pm) diffraction patterns ofLi3[ScN2] (dots), fitted and difference profiles. Ticksindicate positions of Bragg reflections.Li3[ScN2] is the first nitridoscandate and the firstcompound with Sc in tetrahedral coordination.Li3[ScN2] crystallises in an ordered superstructureof the Li2O structure type, leading to a three-dimensional framework of all-vertex-sharingtetrahedra 3
[ScN 3
2/4 ] (Fig. 2). The distances in therange of d(ScN) = 210.7(1) pm – 212.5(1) pm inLi3[ScN2] are slightly shorter than the correspond-
Fig. 2: Sc-N framework (green hollow tetrahedra) inLi3[ScN2] (red: Li). One cubic unit cell is shown.
ding distances in the binary ScN with Sc inoctahedral coordination (d(ScN) 225 pm). Li isdisplaced from the center of the N-tetrahedratowards one trigonal face (Fig. 3), as indicated bythree shorter distances d(LiN) = 209.7(6) pm,210.6(6) pm, 222.8(6) pm, which are in the rangeexpected for Li in tetrahedral or trigonal planarcoordination by N, and one longer distance d(LiN)= 245.6(6) pm. The distance d(LiN) = 210.6 pmwas determined for the trigonal planar coordinatedLi-site in -Li3N [2].
Fig. 3: Coordination of the Sc and Li sites in Li3[ScN2]:Sc is surrounded by a nearly ideal tetrahedron, Li is dis-placed from the center of a tetrahedron towards one trig-onal face. Distances are given in pm, standard deviationsin parentheses.
References:[1] R. Niewa, D. A. Zherebtsov, S. Leoni, Chem.Eur. J. 2003, 9, 4255.[2] A. Rabenau, H. Schulz, J. Less-Common Met.1976, 50, 155.
118

EF_34_Gesing.doc // brandt // 03.03.04 Seite 1 von 1
EXPERIMENTAL REPORT Proposal N° EF
Instrument E9 *Cubic – cubic phase transition ofalumosilicate iodide sodalite Local Contact
D. Többens
Principal Proposer: Th. M. Gesing, Mineralogie, Uni Hannover Date(s) of ExperimentExperimental Team: C. H. Rüscher, Mineralogie, Uni Hannover
J.-Ch. Buhl, Mineralogie, Uni HannoverD. M. Többens, HMI Berlin
3.-6.7.2003
Date of Report: *12.12.2003
The thermal expansion behaviour ofalumosilicate halogenide sodalites has beeninvestigated by Henderson and Taylor [1]. Adiscontinuity in the temperature dependinglattice parameters was observed for the iodidecompound and an explanation was related tothe untilting of the framework (P-43n -> Pm-3n)together with a T-O bond length shortening.However, structural investigations for thiscompound are not reported so far. We haverecently reported about a similar effecttogether with the temperature dependingcrystal structure data observed foralumosilicate nitrate sodalites [2] and about theclose analogy of both sodalites [3]. A furthersupport for the strange effect of T-O bondlength contraction with increasing temperaturecan now be given here using temperaturedepending neutron diffraction measurementswhich offer the possibility for good positionaldata of the framework oxygen atom which ismainly responsible for the observed effects.These investigations were carried out at theHahn-Meitner-Institut using the BENSC E9high resolution diffractometer with a hightemperature furnace and a wavelength of130.77 pm. During the refinement with Rietan-2000 [4] we have calculated the latticeparameters as well as the variable positionalparameters with isotropic displacementparameters in the space group P-43n. For thehighest temperature an additional refinementwas carried out in space group Pm-3n withanisotropic displacement parameters for theoxygen atoms and sodium on a split position.The refined lattice parameters and theresulting cell volumes (Fig. 1) correspond tothe values given by Henderson and Taylor [1]indicating the disappearance of strain at TC ~1030 K. Na atoms were found on 8e x, x, x inP-43n and on 16i x, x, x with half occupation inPm-3n below and above TC, respectively. Thetetragonal tetrahedra distortion = ’ - ’’ istemperature independent (4.5° and 6.0° for theAlO4 and SiO4 units, respectively). For the
average T-O distances we found a gradualdecrease below and a slight increase above TCwith increasing temperature. The latticeparameter of 918 pm refined here for theuntilted framework (Pm-3n) is explainedassuming bond length shortening andtetragonal tetrahedra distortion. Neglecting thebond length shortening would give 929 pm, anadditional neglecting of the tetragonaltetrahedra distortion would lead to 935 pm.The expected framework oxygen position inPm-3n is x, y, 0. Refining the structure aboveTC in P-43n with isotropic displacementparameters for the oxygen atoms they arefound on z = 0.0123(14), whereasanisotropically z = 0.0048(28) leading to andisplacement ellipsoid perpendicular the Al-O-Si direction as also observed in anisotropicrefinements in Pm-3n.
730
735
740
745
750
755
760
765
770
775
200 300 400 500 600 700 800 900 1000 1100 1200 1300Temperature /K
cellvolume/10
6
pm3
Na8[AlSiO4]6(I)2
C.M.B. Henderson and D. Taylor
neutron diffraction this report
X-ray diffraction unpublished
Fig. 1: Temperature depending increase of thecell volume.
[1] C. M. B. Henderson and D. Taylor: Phys.Chem. Mineral. 2 (1978) 337. [2] C. H. Rüscher, Th. M. Gesing and J.-Ch.Buhl: Z. Kristallogr. 218 (2003) 332. [3] C. H. Rüscher, Th. M. Gesing and J.-Ch.Buhl: Beih. Eur. J. Mineral. 14 (2002) 140. [4] F. Izumi and T. Ikeda: Mater. Sci. Forum,198 (2000) 321.
119

EF_35_Marcano.doc // Noelia Marcano // 03.03.04 Seite 1 von 1
EXPERIMENTAL REPORT Proposal N° EFInstrument E9
Crystal structure of Ce60Ni0.9Cu0.1 Local Contact J. Hernández-Velasco
Principal Proposer: N, Marcano, J. C. Gómez Sal CITIMAC,Univ. Cantabria Date(s) of Experiment
Experimental Team: J. Hernández-Velasco, HMI Berlin 8.4.2003
Date of Report: 10.12.2003
Recently, the Ce- based intermediate-valence (IV)compound CeNi, which has a metallic ground state,has been reported to shows a gap-like magneticexcitation spectra at low T [1] similarly to onestypical for “Kondo-insulator”. However, in manyaspects CeNi behaves as a “classical” IV compound[2]. CeNi1-xCux with x= 0.1 appears to be a suitablemodel system for studies of the role of Ce-Niinteraction in the formation of the unusualproperties of CeNi [3].In the CeNi1-xCux system, the crystal structure of Nirichest phases correspond to the CrB type, while onincreasing Cu content they adopt the FeB type.The aim of the experiment on the diffractometer E9was to determine the crystalline structure of theCe60Ni0.9Cu0.1 compound taking into account thedifferent coherent scattering lengths for Cu and Ni,and also some advantage comes from the nullincoherent scattering of the 60Ni isotope, which inturn is need to perform scheduled inelastic neutronscattering measurements at HET (ISIS).The powder diffraction pattern was collected atroom temperature using a neutron wavelength=1.7972 Å. Collecting time was 22 hours in orderto get good statistics, because 60Ni coherentscattering cross section is much lower than that ofthe natural isotopic mixture.The Rietveld refinement of the data led to theorthorhombic Cmcm type structure in agreementwith X-ray analysis performed previously, butNi/Cu distribution can not be distinguished withthis technique. In this model, the Ce, Ni/Cu atomsare occupying 4c positions (0, y, 1/4). The resultsobtained from the refinement are summarised intable 1.Figure 1 shows the observed and calculatedintensities of CeNi0.9Cu0.1 at 300K consideringrandom distribution of Ni/Cu atoms within thesame crystallographic position. However, certainreflections can not be indexed on the basis of CrBtype structure, it could be related to spurious phasespresent in this sample. Further analysis of thesedata is in progress.
Table 1.- Crystal structure parameters of CeNi0.9Cu0.1 asdetermined from neutron powder diffraction data.
T(K) a (Å) b (Å) c (Å) V(Å 3)300 3.809(1) 10.570(4) 4.387(2) 176.6
4c Wyckoff Ce Ni/Cu
y 0.07606 0.36206
Fig.1.- Rietveld refinement of the neutron diffractionpattern obtained on E9 at 300K for CeNi0.9Cu0.1. Dotscorrespond to the experimental profile, line is thecalculated one.
References[1] V. N. Lazukov et al., Europh. Lett., 33 (1996) 141.[2] D. Gignoux et al., J. Less-Common Met., 94 (1983)165.[3] V. N. Lazukov et al., Applied Physics A, 74 (2002)S559.
20 40 60 80 100 120 140
Inte
nsity
(a.u
)
2Theta (Degrees)
CeNi0.9
Cu0.1
T= 300K
120

hmi_report.doc // brandt // 06.07.03 Seite 1 von 1
EXPERIMENTAL REPORT Proposal N° PHY-02-375
Instrument V2Study of the magnetic transition andhidden order in URu2Si2 at 17 Tesla Local Contact
K. Habicht, K. Prokes
Principal Proposer: F. Bourdarot, CEA Grenoble Date(s) of Experiment
Experimental Team: B. Fåk, CEA Grenoble24.6-7.7.3
Date of Report: 7.7.3
! URu2Si2 presents one of the most enigmaticproblems in heavy-fermion physics: the hugespecific heat anomaly observed at TN=17.5 Kcannot be explained by the tiny ordered moment(m=0.03 mB) that develops at the same temperature.We have recently measured the magnetic fielddependence of the ordered antiferromagnetic(AFM) moment and the magnetic excitations inURu2Si2 for fields up to 17 T applied along thetetragonal c axis, using the FLEX triple-axisspectrometer [1]. The decrease of the tiny momentwith increasing field does not follow a simplepower law, but shows a clear inflection point,indicating that the moment disappears first at themetamagnetic transition at 36 T. This suggests thatthe order parameter m (the ordered moment) iscoupled linearly to a hidden order parameter y.Within Landau-Ginzburg theory, y belongs then tothe same irreducible representation and hencebreaks time-reversal symmetry. Within such ascheme [2], the (field dependence of the) transitiontemperature TN for the ordered moment should bethe same as for the hidden order parameter y. Sincethe macroscopic properties seem related to thehidden order rather than the magnetic moment, onlyneutron scattering can be used to measure the realtransition temperature TN for the AFM order.The first part of the present experiment consisted ofmeasuring the temperature dependence of themagnetic moment at H=17 T. The FLEX spectro-meter was used in W configuration with a flatPG(002) analyzer, a collimation of 35'-60'-60'-60', a15-cm long cooled Be filter in the incident beamand a PG filter oriented at 18 degrees to reflect outsecond order neutrons in the scattered beam. Thesingle-crystalline URu2Si2 sample of diameter 6 mmand height 4 mm used in previous measurements[1] was mounted between two Dy rods, which wereinserted in the vertical cryomagnet VM1b, giving amagnetic field of 17 T along the c axis.The transition temperature was determined from thetemperature dependence of the magnetic Braggpeak intensity. The weakness of the moment andthe strong background due to elastic incoherentnuclear scattering and fission neutrons implies longcounting times: 1 hour per temperature at H=0 T
and 11 hours at H=17 T (see Fig. 1). In the lattercase, the signal-to-background ratio was 1/10.In the second part of the experiment, we measuredthe temperature dependence of the magneticexcitations at 17 T, using FLEX in a long-chairconfiguration with a horizontally focusing analyzer,a 15-cm long cooled Be filter in the scattered beam,and a final energy of 5 meV. The motivation forthis experiment was that the field dependence of thelowest-energy gap in the magnetic dispersion curveat the AFM point at low temperatures measured byneutron scattering [1] is opposite to that deducedfrom from specific-heat and electrical resistivitymeasurements [3]. In the present experiment, aclear softening of the gap energy is observed withincreasing temperature, and the gap appears tovanish at the same temperature as the momentvanishes. These results give further evidence for theexistence of a hidden order parameter y that islinearly coupled to the magnetic moment and hencebreaks time reversal symmetry.
References[1] F. Bourdarot, B. Fåk, K. Habicht, and K.
Prokes, Phys. Rev. Lett. 90 (2003) 067203.[2] N. Shah et al., Phys. Rev. B 61 (2000) 564.[3] M. Jaime et al., Phys. Rev. Lett. 89 (2002)
287201.
940
960
980
1000
1020
1040
0 0.5 1 1.5
URu2Si2 V2 June 2003Q=(100) H=17 T
Coun
ts p
er 2
0 m
in.
T/TN
Fig. 1. Temperature dependence of the AFM Braggpeak intensity in URu2Si2 at a field of 17 T.
121

EXPERIMENTAL REPORT
Rotational tunneling as a probe of adsorption
sites and potentials in methyl iodide clathrate
Proposal N CHE-03-0256
Instrument V3
Local Contact
Buchsteiner, Pieper
Date(s) of Experiment
1. 4. - 9. 4. 2003
Principal Proposer: Michael Prager, Forschungszentrum Julich
Experimental Team: Michael Prager, Forschungszentrum JulichA. Desmedt, University Bordeaux IA. Buchsteiner and J. Pieper, HMI
Date of Report8. 8. 2003
Introduction
Methyl iodide water clathrate CH3I × 17H2O
crystallizes in the cubic II structure. While thewell known methane clathrate is the prototype ofa system with non polar guest molecules CH3I
is a very strong dipole. It interacts with themolecules of host water surface via dipole-dipoleinteraction. Methyl iodide may develop into amodel system of encaged polar material.
Experiment and Results
Tunneling and quasielastic neutron spectra weremeasured in the temperature regime 2 < T [K] <
145. The g. 1 shows the tunneling spectrumof a fully protonated sample. There is a strongasymmetry in lineshape at the energy gain andenergy loss sides. At downscattering a clear dou-blet line at 495 and 295 eV is observed whilethe gap at 380 eV between these two lines islled up by an additional line at upscattering.Only this latter peak is in thermal equilibriumwith the lattice. Due to slow spin conversionthe excited tunnel states of the other two sys-tems are still populated. The rotational barriersof the three adsorption sites extend from 3.6 to8.0 meV. The linewidths indicate a 25% width ofthese mean potentials. The 3 sites are attributedto 3 inequivalent H-bonds od the cage surface.
Some quasielastic spectra are shown in g.2 The QNS intensity is described by twoLorentzians. Due to the linear increase of itswidth and a maximum of the inelastic incoher-ent structure factor (IISF) outside the windowof the spectrometer the broad component is as-signed to methyl rotational diusion. The nar-row component has the maximum of the IISFaround 1.2 A1 (jump distance ∼4A) and repre-sents flips of the whole molecule.
Figure 1: Spectrum of CH3I × 17H2O. Sampletemperature 2.4K. Instrument: NEAT, =7.0A,δEres = 50eV , Q∼1.6A1. Solid line: t.
Figure 2: Quasielastic spectra of CH3I
clathrate. The ve curves cover the temperatureregime 45 ≤ T [K] ≤ 145.
Calculations based on the crystal structureand pair interaction potentials similar to thoseperformed for nonpolar methane clathrates [2]shall quantify the presented results.
[1]M. Prager, A. Desmedt, A. Buchsteiner, J.Pieper, ECNS03, Montpellier (2003)[2]C. Gutt, W. Press, A. Huller, J. Tse, H.Casalta, J. Chem. Phys. 114,4160(2001)
122

PHY-04-0874.doc // brandt // 09.03.04 Seite 1 von 1
EXPERIMENTAL REPORT Proposal N° PHY-04-0874Instrument V4Microstructure of the molten GaPb
monotectic alloy Local Contact Jörg Haug
Principal Proposer: Ulf-Dahlborg, LSG2M, Nancy Date(s) of ExperimentExperimental Team: Ulf Dahlborg, LSG2M, Nancy
Jörg Haug, HMI Berlin 17-19 October 2003
Date of Report: *7 January 2004
The investigation of the microinhomo-geneity of monotectic systems is important froma technological point of view as pseudo-alloyscan be formed after crystallization with a “frozenemulsion” structure, thus having uniqueproperties. The main problem is to inhibit theseparation of the alloy into two layers enrichedwith different atomic components during thecooling process. Popel at al. [1] studied thepossibility of suppressing the separation processin Al-In alloys employing an overheating of theinitial melt above a temperature TH
andsubsequent cooling at the rate of the order of 1K/s. It was found that for all compositions meltsheated to a temperature below TH a boundarybetween phases enriched in different componentsforms upon solidification. As the melttemperature rises and approaches TH, thisboundary is smeared out and at T> TH, acomplete suppression of macro-segregationoccurs. Thus, in monotectic alloys that aresolidified from a melt subjected to a preliminaryhomogenizing heat treatment, the tendency tomacro-segregation declines, which allows one toobtain castings with a more uniform and dispersestructure. In order to get the first direct experimentalconfirmation of the metastable micro-inhomogeneity of liquid monotectic alloys, toestimate the mean size and the volume fraction ofdisperse particles, small angle neutron scatteringon Ga-40at.%Pb were performed. Scatteringcurves were measured during heating at 700 and1100C and again at 700C during cooling. Threesample-detector distances, 2m, 4m, and 12mwere used. The measurements were however notcompletely successful as it turned out that themicrostructure of the silica cans used for thesample and for the empty can measurementswere not identical. The measurements could thusunfortunately not be corrected in anunambiguous way.
Nevertheless, by comparing themeasured SANS patterns at 700C before andafter heating to 1100C some useful informationcould be obtained. Thus the difference between
the two measurements is presented in fig. 1. Onlythe measurements on 2m and 4m are included inthe figure as the statistical accuracy in thedifference from the 12m one makes itmeaningless to show. It can be concluded that anoverheating of the melt to a temperatureconsiderable above the liquidus definitely affectsthe microstructure of the monotectic melt. Thesize range where changes are seen in thisexperiment is in full agreement with theconclusions by Popel et al [1]. They are also inaccordance with earlier measurements on aeutectic SnPb melt [2].
In order to obtain some quantitativeinformation on segregation in phenomena inmolten monotectic alloys a continuation of themeasurements are anticipated and a new proposalwill be submitted shortly.
Fig. 1. Difference between measured SANSpatterns at 700C before and after the melt washeated to 1100C.
References
[1] P.S.Popel, O.A.Chikova, I.G.Brodova andI.V.Polents, Phys. Metals and Metallography.74(3) (1992) 274 [2] U.Dahlborg, M.Calvo-Dahlborg, P.S.Popeland V.E.Sidorov, Eur. Phys. J. B14 (2000) 639
123

PHY-04-0875.doc // brandt // 09.03.04 Seite 1 von 1
EXPERIMENTAL REPORT Proposal N° MAT-04-0875
Instrument V4Microstructure of PdSi metallic glasses of differentthickness produced under fully controlled conditions
Local Contact Jörg Haug
Principal Proposer: Monique Calvo-Dahlborg, LSG2M, Nancy Date(s) of ExperimentExperimental Team: CuiMin Bao, Ulf Dahlborg, Nancy
Jörg Haug, HMI Berlin 7.11.2003-10.11.2003
Date of Report: 2 January 2004
From our earlier studies of the structure and thecorrelation between the structure and themicrostructure of metallic glasses with their physicalproperties we have shown that metallic glasses areseldom structurally homogeneous. This is true notonly for metallic glass ribbons but also for so-called“bulk” amorphous materials. Metallic glasses containusually regions that are crystalline, partly crystallineor amorphous with another composition than theamorphous matrix. The existence of these regions isnot detected by conventional investigation methodssuch as DSC and X-ray diffraction. However, theseregions strongly influence the mechanical, magneticand corrosion properties [1,2,3]. The project brieflydiscussed below comprises the thesis work of one ofthe applicants (CMB).
The aim of this work is thus to obtain a firm basis fora proper characterization of a metallic glass, both inthe shape of ribbon and in bulk. For this purposemetallic glasses of exactly the same composition(Pd82Si18) but with different thickness have beenproduced under fully controlled productionconditions.
Some measured SANS patterns, obtained bycombining measurements on 1 and 4m sample-detector distances are shown in figs. 1 and 2. Thethickness of sample 1 was 88 µm and of sample 6 237µm. Both samples were quenched from the sametemperature after the same heat treatment of the melt.The larger thickness of sample 2 was obtained using alower speed of the wheel during the quenchingprocess. It can be seen that the level of the diffusescattering is considerably higher for sample 1. It isknown that palladium-containing materials have avery large ability to absorb hydrogen. As the surfacearea is much larger for sample 1 the higher level ofthe diffuse scattering for sample 1 might indicate thathydrogen has been absorbed and that it stays close tothe ribbon surface.
Some general conclusions can be drawn from figs 1and 2. The SANS signal is small which might showthat the ribbons are very homogeneous. However,there exist several crystalline modifications in thePdSi system with compositions very similar to theamorphous one and also with similar densities. Thusthe contrast between amorphous and crystallineregions might not be large enough to yield a
significant signal. This possibility is presently underinvestigation. Guinier radii RG for the 6 investigated samples havebeen calculated. They all fall in the range 3 to 6 nm. Ageneral conclusion is that the larger ribbon thickness,the larger is RG.
Fig. 1
Fig. 2
References
[1] U. Dahlborg and M. Calvo-Dahlborg, Mat. Sci.Eng. A 283 (2000) p.153-163.[2] M. Calvo-Dahlborg, J.M. Ruppert, E.D.Tabachnikova, V.Z. Bengus, U. Dahlborg, F.Haeussler, V.E. Sidorov and P.S. Popel, Journal dePhysique IV France 11 (2001) p. 4-41 – 4-49.[3] M. Calvo-Dahlborg, Mat. Sci. Eng. A 226 (1997)p.833-845.
124

PHY-02-0387.doc // brandt // 03.03.04 Seite 1 von 2
EXPERIMENTAL REPORT Proposal N° PHY-02-387Instrument V2-NRSENRSE Investigation of Phonon Lifetimes in
the conventional Superconductor Nb Local Contact K.Habicht
Principal Proposer: K. Habicht, F. Mezei, HMI, BerlinT. Keller, MPI f.FKF, Stuttgart, FRM-II,GarchingB. Keimer; MPI f. FKF, Stuttgart
Date(s) of Experiment
Experimental Team: S. Bayrakci; MPI f. FKF, StuttgartK. Habicht; HMI,Berlin; TU-Darmstadt
14.04.– 17.04.2003;17.12.– 21.12.2003
Date of Report: 06.01.2003
Within the standard BCS theory ofsuperconductivity, electron-phononinteractions play a fundamental role. Thephonons participating in the formation ofCooper pairs are expected to show an abruptchange in lifetime as the temperature passesthrough the transition temperature TC, as hasbeen confirmed by standard inelastic neutronscattering experiments in a few favorablecases [1, 2].
Due to the small size of the effect and theresolution limits of the standard techniques,experimental verification is in general difficult.The neutron resonance spin-echo technique(NRSE) is a possible solution to the problem,since it can resolve energy transfers within theresolution ellipsoid of a background three-axisspectrometer. Phonons relevant for theelectron-phonon interaction are usuallydispersive, so the spin-echo focusingtechnique with tiltable fields must be used.Since the electron-phonon interaction had notyet been investigated with the NRSE method,we chose single-crystal niobium as thematerial with which to begin such studies.Niobium has the advantage of having beenwell studied with respect to its phonondispersion. Also, the change of linewidth at TC= 9.2 K has been measured for selected TAphonons [2].
In our experiments, the TAS was operated in aconfiguration with scattering senses (SM=-1,SS=-1, SA=+1) in order to minimize the effectsof the curvature of the dispersion surface. Thetransverse Q-resolution was about 0.015 -1
FWHM at fixed incident ki = 2.0 -1. Second-order contamination is substantiallysuppressed by the curved neutron guide. Noadditional collimators were used.
The required tilt angles of the RF coils werecalculated from Born-von-Kàrmàn fits to data
taken in the course of our experiments. For the[0.025 0.025 0] T1 phonon investigated, tiltangles = -31.3° and = 27.4° were used. A cylindrical crystal (10 mm diameter, 30 mmlong) was mounted with the [100] axisperpendicular to the scattering plane. Sincecrystal mosaicity can play an important role inthe data correction of NRSE studies oftransverse excitations [3], we measured themosaic spread of the crystal both on agamma diffractometer and in NRSEexperiments. Averaged over the total crystalvolume, was 8' .
The raw data was normalized to thepolarization measured in the direct beam andcorrected for mosaicity. Our experimentsclearly show a significant change in thephonon lifetime. At T = 23.4 K, well aboveabove TC, we obtain = 73(12) eV HWHM,whereas at T = 5 K, in the superconductingstate, we get = 40(12) eV (see Fig.1).
5 10 15 20 25
0.1
1
Pola
rizat
ion
[ps]
T = 5 K T = 23.4 K
Fig. 1: Lifetime of the [0.025 0.025 0] T1 phononbelow and above TC.
[1] J.D.Axe, G.Shirane, Phys. Rev. Lett. 30, 6, 214(1973)[2] S.M.Shapiro et al., Phys. Rev. B 12, 11, 4899 (1975)
[3] K.Habicht, R.Golub, T.Keller, J.Appl.Cryst. 36, 1307 (2003)
125

PHY-03-0238.doc // brandt // 03.03.04 Seite 1 von 1
EXPERIMENTAL REPORT Proposal N° PHY-03-238
Instrument V3Neutron Scattering by Ultrasound in theMosaic Single Crystals. Local Contact Jörg
PieperPrincipal Proposer: Eugene Iolin, Inst Physical Energetic, Riga, Latvia Date(s) of ExperimentExperimental Team: Leonid Rusevich,Inst Physical Energetic, Riga, Latvia
Ferenc Mezei, HMI, Berlin, GermanyJorg.Pieper, HMI, Berlin, GermanyAlexandra Buchsteiner, HMI, Berlin, Germany
22.01.03 –27.01.03
Date of Report: 19.12.2003
Neutron scattering by the h. f. ultrasonic waves(USAW) in single crystals (s.c.) is studied for along time. USAW strongly increases intensityof scattering in the perfect s.c. Position isanother for the case of the mosaic s.c. Thenumber of experiments is small. Theory is onlyat the beginning. In order to observe themeasurable effects it is necessary to use largeUSAW amplitude (generator voltage, V). Thiscircumstance leads to the heating of sampleand additional scattering by the thermalphonons. We applied V3 (NEAT) ToF instrument for themeasurements of the intensity of quasi elasicscattering Ihqe(V). Beautiful energy resolutionV3 instrument allows to cut off contribution ofthe thermal phonons from the intensity of thediffracted beam. It is relatively easy to changeneutron wave length at V3. However, V3instrument is used mainly for non single crystalsamples and without ultrasonic excitation. Wespend some time in order to install singlecrystal holder and sample inside 152 cmvacuum insert to cryostat with h.f. cables andultrasonic transducers and so on. The qualityof achieved technical results can be seen fromtesting measurements of ultrasonic effect atthe Si (111) s.c. plate.(Fig.1). For the case ofthe mosaic KBr s.c. that ultrasound reallyincreases an intensity of quasi elasticscattering (Fig.2). The achieved energyresolution completely cut off contribution ofphonons with frequency more than 20 GHz.This resolution could be seriously improved.Our observation is in qualitative agreementwith results of previous Neutron Spin Echoresearch [1]. Probably, our result can beexplained in the frame of the following modelof secondary extinction [2]. We suppose thatthe mosaic structure angular distributionfunction G contains many deep narrow holesWithout ultrasound neutrons corresponded tothese holes aren’t scattered. Ultrasoundcouples neutrons inside of holes with statesoutside of holes. Therefore “holes inscattering” are filled and intensity is increasing.
0
0.2
0.4
0.6
0 1 2 3
Voltage, VIh
qe(V
)/Ihq
e(V
=0)-
1
TheoryExp. Data
Fig. 1 Quasielastic neutron scattering in Si,(111) reflection. TAW, frequency 70.2 MHz.The maximum value of TAW amplitude isabout 0.1 nm.
0.96
0.98
1
1.02
1.04
1.06
1.08
1.1
0 1 2 3 4 5
Voltage, V
Ihqe
(V)/I
hqe(
V=0
)
Fig.2 Quasielastic neutron scattering in KBr,(200) reflection. TAW, frequency 78 MHz.Energy resolution 85 eV.
We made also some previous measurementwith ultrasonically excited mica s.c.
[1] E.Iolin, B.Farago, F.Mezei, E.Raitman, andL.Rusevich, SPIE Vol. 3239, p. 406 , (1997).[2] E.Iolin, L.Rusevich, J.Pieper, A.Buchsteiner, F.Mezei, ECNS, Sept. 3-6, 2003,Montpellier, France. Abstr. Book, D94, p.198.
126

EXPERIMENTAL REPORT Proposal N° PHY-03-0267Instrument NEAT Ground State energy splittings in a
tetrahedral Co(III) complex Local Contact Dr. A. Buchsteiner
Principal Proposer: Hans-Ueli Güdel, Universität Bern Date(s) of Experiment Experimental Team: Roland Bircher, Universität Bern Andreas Sieber, Universität Bern
Hogni Weihe, University of Copenhagen Alexandra Buchsteiner, HMI Berlin
03. – 08. March 2003
Date of Report: 19.12.03 The title compound K5[CoW12O40]·20 D2O crystallizes in the space group P3(1). The tetrahedral coordination of Co(III) in this Keggin-structure polyoxotungstate has been established [1] and excited electronic states have been located by optical spectroscopy [2]. The splitting of the 5E ground state, however, has not been determined and is highly relevant to evaluate the potential of tetrahedral Co(III) ions as constituents for possible single molecule magnets. The experiment was carried out on the time-of-flight spectrometer NEAT at 2K and 25K. with an incident neutron wavelength of 5.1 Å and 8 Å, giving an experimental resolution of 92 and 39 µeV, respectively. Figure 1 shows the INS spectrum at 2K and 25K with an incident wavelength of 5.1 Å. The energy transfer ranges from –2.2 to 2.2 meV, and the spectra correspond to the sum of the whole Q-range from 23 to 122 Å-1. The sample exhibits one broad feature at -0.35 meV. No
further excitations were observed in the higher energy part of the spectrum. The observed feature is assymetrically broadened at the flank towards higher energy transfer. The FWHM of about 220 µeV is about 2.5 times larger than the experimental resolution. The intensity of the peak is temperature dependent. The spectra in Figure 1 illustrate the decreasing intensity with increasing temperature on the neutron energy loss side. With increasing temperature intensity shows up on the neutron energy gain side. The Q-dependence of the peak shows a maximum at low Q. From the T and Q dependence the feature can be undoubtly attributed to magnetic transitions in the split Co(III) ground state. Further work is underway to explain the experimental data.
0.14
0.12
0.10
0.08
0.06
0.04
0.02
0.00
Inte
nsity
[a.u
]
-1.5 -1.0 -0.5 0.0 0.5 1.0 1.5Energy [meV]
25 K
2 K
Figure 1: INS spectra of the title compound at two different temperatures with an incident neutron wavelength of5.1 Å obtained on NEAT and summed over all Q values. The spectrum at 25 K is drawn with an offset.References [1] G. Muncaster, G. Sankar, C.R.A. Catlow, J.M. Thomas, S.J. Coles and M. Hursthouse, Chem. Mater. 12, 16
(2000) [2] K. Kojima and J. Matsuda. Bull. Chem. Soc. Jpn. 58, 821-825, (1985); K. Kojima, J. Matsuda, N. Kojima, T.
Ban and I. Tsujikawa. Bull. Chem. Soc. Jap. 60, 3213-3217 (1987)
exp_report_phy-03-0267_final.doc // 06.01.04 Seite 1 von 1 127

PHY-03-0287.doc // brandt // 03.03.04
EXPERIMENTAL REPORT Proposal N° PHY-03-0287Instrument V3Investigation of the low energy vibrational density of
states in a-Fe0.3Y0.7 ribbons Local Contact Dr. J. Pieper
Principal Proposer: Prof. Dr. Werner Keune,Universität Duisburg-Essen, Duisburg Date(s) of Experiment
Experimental Team: Prof. Dr. Werner Keune, Uni-Duisburg, GermanyMr. Balaram Sahoo, Uni-Duisburg, GermanyDr. V. Kuncser, NIPM, Bucharest, Romania Dr. J. Pieper, BENSC, HMI, Berlin, Germany
27.08. – 03.09.2003
Date of Report: 15.09.03
The most attracting part of the vibrationaldensity of states (VDOS) in amorphousmaterials is the low energy region where theVDOS gives rise to the so called boson peak,which is absent in crystalline substances.Boson peak is the excess of vibrational modes,anomalous and still unexplained, with respectto that of the Debye model [g(E) E2] at lowenergies. Although this low energy excitationshave been studied more widely in complexbiological systems [1] they were observedearlier by coherent inelastic neutron scatteringon simple binary metallic glasses such as a-Mg0.7Zn0.3 alloy[2].
In this reported experiment simple binaryamorphous Fe0.3Y0.7 alloy ribbons were studiedat temperatures of 4.2, 77 and 300 K byinelastic neutron scattering (INS). According to[3], two different incident neutron wavelengthsof 2.0 (incident energy ~20 meV) and 5.1 Å(~3.2 meV) were chosen in order to measureINS spectra for energy gain and energy loss ofthe neutron at room temperature. Thecorresponding elastic energy resolutions were921 and 93 µeV, respectively. However, atother temperatures only 2.0 Å was chosen. Q-range for NEAT:2.0 Å: 0.77-5.8 A-1
5.1 Å: 0.3-2.3 A-1
The sample was placed inside the cryo-furnace at V3 by putting the sample inside theslab-shaped aluminum sample holder in argonatmosphere that was made airtight by usingindium shielding. The spectra were measuredand analysed by the standard program at V3.Figure 1(a) shows INS spectra of a-Fe0.3Y0.7alloy ribbons obtained with an incident neutronwavelength of 2 Å at a temperature of 300 K.
The Debye-Waller factor has been calculatedfrom the elastic peak intensity. The density ofvibrational states [Figure 1(a) insert] has been
calculated and the so called boson peak[Figure 1 (b)] has been discovered in theseribbons. The peak position is found to be atabout 4 meV. However, the low temperaturedata could not be analysed because of lack ofsample holder measurement in order toremove the background contribution.
(a) (b)
12
Figure 1(a) INS spectrum and thstates (insert) of amoribbons obtained with wavelength of 2 Å at 30a-Fe0.3Y0.7 alloy ribbonsspectrum after evaluatdensity of states.
References:1. see for example, Ore
Bizzarri A. R. and CChem. B 2001, 105,references there in.
2. Suck H. B., and RudMetals II, Beck H. (editors) Topics in A(Springer, Berlin) p. 2
3. Pieper, J.; Irrgang,Lechner, R.E., Appl74, 1264-1266
8
Seite 1 von 1e vibrational density ofrphous Fe0.3Y0.7 alloy
an incident neutron0 K, (b) Boson peak in obtained from the INSion of the vibrational
cchini A., Paciaroni A.,annistraro S., J. Phys. 12150-12156 and the
in H., 1983 in: Glassyand Güntherodt H. J.pplied Physics Vol. 5317
K.-D.; Renger, G.;ied Physics A (2002),

phy-03-0294 // brandt // 09.01.04 Seite 1 von 1
EXPERIMENTAL REPORT Proposal N° PHY-03-0294
Instrument NEATQuasielastic neutron scattering of methylfluoride and methyl chloride Local Contact
Dr A. Buchsteiner
Principal Proposer: Oliver Kirstein, ANSTO, Australia Date(s) of ExperimentExperimental Team: Oliver Kirstein, ANSTO, Australia
Michael Prager, FZJ, GermanyAlexandra Buchsteiner, HMI, Germany
25.11. - 5.12. 2003
Date of Report: 09.01.2004
The fundamental quantities, which determine thespatial arrangement of the atoms of a molecule andthe dynamics, are the intermolecular interactionpotentials. A precise knowledge of these potentialswould allow calculating the crystal structure as wellas the dynamics of any molecular system.Recently, the structure of the methyl fluoride wassolved [1] and this offered the possibility to studyin a systematic way the group of the methyl halideswhich belong to the most simple organic moleculescontaining halides. A lattice dynamical calculationbased on the crystal structure of the methyl fluorideand chloride predicts values for the activationenergy Ea of the rotating CH3 group of therespective molecule [2]. An experimental value forthe activation energy can be obtained by studyingthe temperature dependence of the quasielastic linebroadening. At higher temperatures classical jumpsof the protons of the methyl group over thepotential barrier occur causing the mentioned linebroadening.
The study of the methyl halides has been startedwith the using quasielastic neutron scattering of thefluoride and chloride using the multi-chopperinstrument NEAT. The incident wavelength waschosen to be 8 Å with an energy resolution of 30µeV. Temperature dependent neutron spectra havebeen collected for both compounds in thetemperature range of 38.6-113.2 K (CH3F) and82.2-169.0 K (CH3Cl). An Arrhenius plot of theobtained values for the line broadening vs. thetemperature allowed extracting activation energiesfor both compounds. A preliminary analysis incase of the methyl fluoride yields a value of
Arrhenius plot of the qe-linewidths, CH3F
Arrhenius plot of the qe-linewidths, CH3ClEa=13.4 meV. The value obtained for the methylchloride is Ea=48.1 meV. Both values are close tocalculated values of 16.4 meV (CH3F) and 45.7meV (CH3Cl), the difference in Ea for the CH3Cl isonly about 5%. On the other hand, the difference of18% in case of the CH3F is not unexpected and mayindicate that the parameters used in [2] may needsome refinements or that the calculations need tomodel more detailed the H-F bonding.
A further and refined analysis will provideinformation about the threefold and sixfoldcontribution of the angle dependent potential bycombining the values for activation energies Ea,quantum mechanical tunnel splittings
ωt and
librational transitions E01.
References[1] R. M. Ibberson, M. Prager, Acta Cryst. B52,892-895 (1996)[2] O. Kirstein, M. Prager, J. Chem. Phys., to bepublished
AcknowledgementsWe would like to thank not only the local contactbut also the BENSC for their professional supportduring the experiment.
129

x.doc // brandt // 17.03.04 Seite 1 von 1
EXPERIMENTAL REPORT Proposal N° PHY-03-250
Instrument SPANSpin Echo Study of the Phason Dynamics ini-AlCuFe Quasicrystals Local Contact
Catherine Pappas
Principal Proposer: R. A. Brand, Universität Duisburg-Essen Date(s) of ExperimentExperimental Team: Catherine Pappas, HMI Berlin
02/2003
Date of Report: 29/01/2004
We have performed an initial neutron spin-echo(NSE) experiment on V5 to study the hightemperature phason dynamics in the icosahedralquasicrystal i-AlCuFe. Our purpose was toobserve phason dynamics and separate thedifferent atomic components (especially Cu andFe) using changes in the scattering cross section.Three different samples with natural isotopes,57Fe and 60Cu respectively were available, but inthis initial experiment there was only time tostudy the natural iron sample.
This experiment was performed at 0.25 nm (0.25and 0.9 nm would be possible and necessary inorder to cover the supposed phason jump rates ofthe copper and iron isotopes). The initialexperiment was on a sample with naturalisotopes.
The idea of this experiment was to start at about600 K. At this temperature there is practically nophason dynamics, so we will basically see thephonons. Then going to 1100 K we will see bothphonons and, increasingly, phasons. (In a further,the different isotopes change the contrast
between the different elements: 60Cu has a muchhigher scattering cross section than natural Cu,and 57Fe has a much lower one than natural iron).
Our initial experiments on the natural-isotopesample showed some problems at the very lowand high Q ranges. Thus here we only presentresults at one Q-value, and in terms of the Debye- Waller factor f(T). We compare the NSE resultswith those from Mössbauer spectroscopy in thefigure. The Mössbauer results show the decreasein log(f(T)) from low T to about 600K mainlydue to thermal vibrations. These thermalvibrations are adequately modelled with theDebye-model, shown as a solid line in the figure.The decrease above 600 K cannot be due tothermal vibrations, but must originate from localatomic dynamics called phason flips. The NSEresult for this Q-value surprisingly follows theDebye result. This can only mean that by chance(since we intended to cover a larger Q-range) wehave studied a range for which an iron phasonjump is not involved! It is then clear that a studyof the originally-planned Q-range should yieldthe characteristic jump (1/Q) of iron phason flips
0 100 200 300 400 500 600 700 800 900 1000 1100 12000.1
0.2
0.3
0.4
0.5
0.60.70.80.9
1
i-Al62Cu25.5Fe12.5
f(T)
T (K)
SE Neutron Mössbauer Debye-model f(T)
130

PHY-01-1344.doc // brandt // 09.03.04 Seite 1 von 1
EXPERIMENTAL REPORT Proposal N° PHY-01-1344
Instrument E9Hydrogen-bonded structures inmethanol/CCl4 mixtures Local Contact
D. M. Többens
Principal Proposer: Aliotta, F., CNR IPCF Messina, Italy Date(s) of ExperimentExperimental Team: Többens, D. M., HMI
24.-27.6.2003
Date of Report: 12.12.03
The experiment has been performed with theaim of improving previous result, recentlyobtained at the E9 instrument, onCCl4/CD3OD mixtures. The investigation hasbeen undertaken in order to test the validity ofthe working hypothesis of the existence ofpolymeric clusters with a relatively largeaggregation number at enough high methanolconcentrations.
The results from the previous experiment(see figure), taken with a wavelength of 1.798Å, are of enough good quality to allow thecomparison with the indication from aMolecular Dynamics simulation, performedusing a site-site interaction model containing aCoulomb plus a Lennard-Jones term. Themain obstacle in reaching a conclusive resultcame from the occurrence that ourexperimental data allow just the comparisonwith the total pair correlation functions whilesome indication about the partial paircorrelation functions are required, in order todistinguish among the contribution fromhydrogen in different position within themethanol molecules.
For this reason we tried to gain thenecessary information from somemeasurements performed on partiallydeuterated samples, i.e. on samples prepared
with H/D isotope substitution of the hydroxylgroup and/or of the CH3 group. Samples hasbeen prepared at three different methanolvolume fraction, namely Φ =0.1, 0.2 and 1.
For each explored concentration threesamples have been prepared using CD3OD,CD3OH and an equimolar mixture ofCD3OD/CD3OH.
Unfortunately, the instrumental con-figuration was set to a wavelength of 2.8 Å byaccident, which was not discovered until afterthe experiment. Due to this the exploredQ-range turned out to be more limited thanthat previously explored. In addition, also thestatistics was not as good and proved to be notgood enough to obtain the necessary details.
1 2 3 4 5 6 70
500
methanol(50%)
methanol(70%)
methanol(100%)
CCl4
Inte
nsity
Å-1
131

PHY-01-1345.doc // brandt // 16.03.04 Seite 1 von 1
EXPERIMENTAL REPORT Proposal N° PHY–01–1345
Instrument E9Local structure in atactic polypropyleneacross the glass transition. Local Contact
D. M. Toebbens
Principal Proposer: A. Triolo, IPCF-CNR, Messina, Italy Date(s) of ExperimentExperimental Team: A. Triolo, IPCF-CNR, Messina, Italy
D. M. Toebbens, HMI BerlinO. Russina, HMI Berlin
16–21/12/2003
Date of Report: 22/12/2003
In the past few years we have been active incharacterizing the collective dynamics in atacticpolypropylene, by means of state of the art NeutronSpin Echo measurements that have been collectedat the SPAN spectrometer (HMI).
In order to fully capture the features of thecollective dynamics, a proper knowledge must bepossessed of the static structure factor of thismaterial as a function of the temperature.Accordingly we decided to collect diffraction dataat the E9 diffractometer on the same sample thathad been used for the dynamics studies.
Using a wavelength of 1.79 Ǻ , we accessed a Qrange between 0.3 and 6.5 Ǻ-1. The sample wascontained into a cylindrical cell (diameter=3 mm),this allowed a uniform exploration of the wholeaccessible Q range. The temperature that werestudied are 2, 80, 140, 170, 200, 230, 260, 280, 300,320, 340, 360 K. Such a temperature range and gridreflects the analogous data sets that were collectedat the NSE spectrometer.After collection the data have been corrected for thedetector sensitivity.In Figure 1, a plot containing selected data isshown. In particular we report the data at 2, 200and 300 K
Figure 1. Diffraction data set collected at E9 on fullydeuterated atactic polypropylene at three selectedtemperatures: 2, 200 and 300 K.
Apart from the strong Bragg peaks, due to thealuminium sample container, the patterns arecharacterized by the occurrence of three majorpeaks.
These peaks fall approximately in the followingpositions: I) 1.1 Ǻ-1; II) 3.0 Ǻ-1 and III) 5.3 Ǻ-1.While peaks II and III correspond to intramolecularcorrelations, peak I is associated to intermolecularcorrelations. This is supported by the temperaturedependences of the peaks positions. It can benoticed that only the position of peak I is stronglydependent on temperature, as can be expected if theintermolecular distance depends on density.In Figure 2 we plot an enlarged view of thetemperature dependence of peaks I and II for alarger set of temperatures.
Figure 2. Temperature dependence of the diffractionpeak I, associated to the intermolecular correlation inatactic polypropylene amorphous phase.
We are now in the progress of rationalising thecollected data and compare the static structurefactor temperature dependence with the collectivedynamics results.
132

EXPERIMENTAL REPORT Proposal N° EF
Instrument E9 Intriguing structural behavior of the model system L-alanine
Local Contact D. Többens
Principal Proposer: H.N. Bordallo, HMI Date(s) of Experiment Experimental Team: D.N. Argyriou, HMI M. Barthès, Université Montpellier II
28/07-03/08/2003
Date of Report: 10/12/2003 L-Alanine (C2H4(NH2)COOH) is the smallest chiral naturally occurring amino acid. The system crystallizes in the P212121 space group, with 4 (+H3N-C2H4-COO-) zwitterionic molecules in the unit cell, linked by three networks of hydrogen bonds of unequal strength [1,2,3]. Earlier observations of non-linear behavior of two Raman modes at 42 and 49cm-1, assigned to dynamic localization of vibrational energy [4], have attracted a supplementary interest to this widely investigated compound, building block for proteins and model system for a large range of important processes in biochemistry. Besides the anomalous intensity of the two low frequency Raman modes, some other unusual properties have been revealed in the past years, such as: negative thermal expansion along the c-axis [2-3], unusual temperature dependence of the energy of the infrared band related to the torsion of the NH3
+ group [5-6], large sound wave velocity in the same c direction of the strongest chain of H-bonds, about twice the calculated value [7], thermal conductivity not obeying the usual temperature hyperbolic dependence [8]. Moreover recent birefringence and light depolarization measurements indicate either some subtle symmetry breaking around 220 K [9], which is inconsistent with previous structural data [2,3], or a deformation of the molecule. New results on the fully hydrated L-alanine, obtained using the ID10A beam line at ESRF together with X-rays structure determination at intermediate temperatures, ruled out the hypothesis of a conventional structural phase transition in L-alanine [10]. While no change in the space group symmetry was observed, an anomalous decrease, by discrete steps, of the c lattice parameter was revealed on heating the crystal from 10 K to room temperature. This observation may be connected to a progressive conformational change of the NH3
+ group of the zwitterionic molecule. Indeed the analysis of the whole set of physical properties of crystalline L-Alanine is tentatively explained by the existence of an analogous to a dynamic Jahn-Teller
effect due to the NH3+ charge - lattice coupling, which could explain both the splitting of some vibrations and the properties related to a microscopic lattice instability as well as the onset of transmitted light depolarization below 220 K. Here we used E9 to study in detail the crystal structure of the fully deuterated L-alanine (C2D4(ND2)COOD), as a function of temperature. From the figure below we can argue that indeed L-alanine molecule undergoes a deformation, clearly revealed by changes in specific bond lengths. A more detailed study is underway. Fig. Structure of L-alanine of at 300 and 100K [1] H. J. Simpson Jr and R. E. Marsh, Acta Cryst. 20, 550 (1966). [2] R. Destroet al J. Phys. Chem. 92, 966, (1988). [3] M. S. Lehmanet al J. A. Chem. Soc. 94, 2657 (1972). [4] A. Miglioriet al Phys. Rev. B 38, 13464 (1988). [5] J. Bandekaret al, Spectrochimica Acta 39A, 357 (1983). [6] C. H. Wang and R. D. Storms, J. Chem. Phys. 55, 3291 (1971) ; K. Machidaet al, Spectrochim Acta 34A, 909 (1978). [7] A.Micu, et al, J. Phys. Chem. 99, 5645 (1995). [8] R. S. Kwok et al, Sol. St. Comm. 74, 1193 (1990). [9] M. Barthes et al, J. Phys. Chem. A 106, 5230-5241, (2002). [10] M. Barthes et al submitted to European Phys. J. B
HMI.rep_E9_ala.doc // brandt // 11.12.03 Seite 1 von 1 133

CHE-03-0234.doc // brandt // 03.03.04 Seite 1 von 1
EXPERIMENTAL REPORT Proposal N° CHE-03-234Instrument V3Molecular dynamics in the incommensurate
2-decanone/urea crystal. Local ContactR.E. Lechner
Principal Proposer: F. Guillaume, CNRS - Université Bordeaux I Date(s) of ExperimentExperimental Team: F. Guillaume
A. Desmedt, CNRS - Université Bordeaux IR.E. Lechner, HMI
December 2002
Date of Report: *January 2004
AimsThe aim of this proposal was to investigatethe host/guest interactions in a prototypeexample of a self – organized molecularcompound constructed from twointerpenetrating sublattices. The meanstructure at room temperature of the hostsubsystem is hexagonal P6122. The diffusescattering observed for 2-decanone/urea atroom temperature reflects the strong disorderof the guest subsystem. On cooling the samplethe urea host substructure is unchanged butthe 3-D ordering of the guest substructure isclearly evidenced through the apparition ofnew Bragg reflections and the disappearanceof the diffuse scattering lines. The aim ofthese experiments was to investigate thetemperature dependence of the translationaland rotational motions of the 2-decanoneguest molecules in the channels of the ureainclusion compound.ExperimentsSelectively deuterated single crystals (needle-like) of CH3-CO-(CH2)7-CH3 / CO(ND2)2 wereplaced in slab containers so that the ureachannel axes were parallel to each other. Usingthis mosaic of single crystals, two scatteringgeometries were considered (Q and Q//)allowing the translational and rotationalmotions of the guest molecules to be probedindependently. In a previous experiment (CHE-03-0184), spectra at medium resolution (60µeV, 0 = 6.3 Å) were recorded on the time-of-flight spectrometer NEAT at temperaturesbetween 320 K and 200K. The results obtainedwere very satisfactory but the observedquasielastic broadenings were close to theinstrumental resolution. Thus, in this proposal,new experiments have been performed between250K and 180K with a resolution of the orderof 30 µeV to complete this study.
Short description of the resultsThe analysis performed by fitting oneLorentzian function plus an elastic peak to theexperimental spectra at 2 resoluaions providesthe EISFs, shown in figure 1 and a roughestimation of the widths of the quasielasticlines.
Fig. 1: EISFs for 2-decanone/urea in the Q
(full lines) and Q// geometries (dashed lines) at30 µeV resolution (open symbols) and 60 µeVresolution (filled symbols).The comparison between the EISFs obtained atdifferent resolutions is particularly satisfactory.However, such comparison does not hold whenconsidering the widths of the quasielastic lines.For example, the widths for the Q spectra with60 µeV resolution are significantly larger thanthose obtained with a resolution of 30 µeV.Obviously the shapes of the profiles arecomplex and involve several Lorentzianfunctions with different widths.These results demonstrate that the dynamicdisorder (rotational and translational) iseffective even at 200K were a 3D ordering ofthe guest substructure has been evidenced bymeans of X-ray diffraction. The detailedanalysis of these data, and in particular themodelling of the translational diffusion of theguest molecules within the channels, iscurrently under progress.
0
0.2
0.4
0.6
0.8
1
0 0.5 1 1.5 2
EISF
Q / Å-1
250 K
200 K
134

EXPERIMENTAL REPORT Proposal N° PHY-03-0262Instrument NEATSegmental Dynamics of confined PEOLocal Contact R. E. Lechner
Principal Proposer: Alessandro Triolo, IPCF-CNR, Messina, Italy Date(s) of ExperimentExperimental Team: Alessandro Triolo, IPCF-CNR, Messina, Italy
Olga Russina, HMI, Berlin, GermanyJoerg Pieper, HMI, Berlin, Germany 9-14/6/2003
Date of Report: 29/12/2003
Polymer dynamics is a complex issue, whosepeculiarities are being actively investigated bothfrom an experimental and a theoretical point ofview, at present.
We have been active in the last years in exploringthe properties of both self and collective dynamicsin simple, synthetic polymers, such aspolypropylene, polyisobutylene, polypropyleneoxide and polyethylene oxide (PEO). The two latterpolymers are attracting a great deal of attention fortheir successful applications as PolymerElectrolytes. This class of materials is generallycomposed by a PEO-like polymer added with inertsalt, such as LiClO4. The ether units of PEOsolvate the Li cation and lead to a mechanicallystable films with interesting conduction propertiesthat are related to the hopping of the Li cation,which is triggered by the segmental dynamics ofthe polymer.PEO, while being an ideal solvating polymer for Libased salts, still presents the major drawback ofbeing crystalline below ca 330 K. In theseconditions, the conductivity of the correspondingPEs is strongly limited, as ionic conduction mainlyoccurs in the amorphous phase.A number of smart approaches have beendeveloped in order to get an appreciableconductivity also at room conditions: among thesethe most promising seems to be the confinement inporous rigid matrixes, which hinders polymercrystallization, thus allowing enhancing theamorphous, ion-conducting, fraction of thematerial.In collaboration with a group at the IndianaUniversity (USA), we developed a partially organicinert matrix, which behaves as a rigid cage for thePEO molecules. In Figure 1, we show thetemperature dependence of the ToF pattern fromthis matrix. It can be appreciated that, across atemperature change from 260 to 340 K (i.e. acrossroom conditions) negligible changes in thedynamics occur.
Thco28apbesloposupohihireWdy
135
e corresponding patterns from the polymernfined inside the rigid matrix and the neat one at 0 K are compared in Figure 2. It can bepreciated that despite the low temperature (muchlow the melting point of PEO), evidences of aw dynamics can be found for the confinedlymer. This result indicates the existence of abstantial amount of amorphous PEO when thelymer is confined into the rigid matrix, which isndered from crystallization and thus possesses agh degree of mobility that ultimately issponsible for the conductivity process.ork is in progress in order to fully compare thenamics of the neat and confined polymer.
Figure 1. Comparisonbetween the ToF
QENS patterns for therigid matrix at 260 (__)
and 340 (- -) K.Only negligiblechanges in the
dynamics occur.
FigCom
betweeQENS ppure PEthe samwhen c
the rigidat 2
The slowin the
sampleactive, ethe PE
p
ure 2.parisonn the ToFatterns forO (__) ande polymeronfined in matrix (- -)80 K. dynamics
confined is alreadyven below
O meltingoint.

PHY-03-0264.doc // brandt // 03.03.04 Seite 1 von 1
EXPERIMENTAL REPORT Proposal N° PHY-03-0264Instrument V3Dynamic Features of Hydration Water
interacting with Hydrophobic Molecules Local Contact Jörg Pieper
Principal Proposer: V. Calandrini, Phys. Dept., Univ. of Parma-I Date(s) of ExperimentExperimental Team: A. Deriu, Phys. Dept., Univ. of Parma-I
G. Onori, Phys. Dept., Univ. of Perugia-IR.E. Lechner, BENSC,HMI, Berlin–D
05/05/03 – 13/05/03
J. Pieper, BENSC,HMI, Berlin–DDate of Report: 19/01/2003
Tert-butyl alcohol (TBA) and trimethyl-amino-N-oxide (TMAO), have the same large hydrophobicmoiety, but different polar groups and they can beused as model system to study the microdiffusivityproperties of water involved in hydrophobichydration shells. Previous experiments performedat BENSC on these model systems revealed that: i)in the temperature range 273T320 K theintroduction of hydrophobic molecules leads to adecrease of the diffusion coefficient of water withrespect to that of pure water in both TBA andTMAO solutions (report PHY-03-0186), ii) in aTBA/water mixture at 2mol% TBA concentration thehydrophobic effect seems to decrease withincreasing temperature above ~ 320 K, until themicro-diffusivity parameters reach those of purewater at about 360K. Conversely, in TMAO/water atthe same solute concentration, the hydrophobicshells appear still very stable at 360 K (report PHY-03-0237). Due to experimental problems (oxidation ofthe Al cells at the highest temperatures explored), thespectra above 340 K, in the previous experimentperformed, were too noisy to allow unambiguousconclusions. In the experiment reported here (PHY-03-0264) we completed the previous one (PHY-03-0237), investigating in detail the T-dependence of thedynamics of hydration water in the range 320-370 K,for TBA and TMAO aqueous solutions at fixed soluteconcentration (0.02 molar fraction). Perdeuteratedsolutes were used to minimise the incoherentscattering from TBA and TMAO. Cells with an innergolden-coating we were used to avoid Al oxidisation.The measurements were performed using the tofspectrometer NEAT at = 5.1Å (energy resolutionE=70 eV (FWHM)). The measurements confirmthe expected behaviour: the spectra relevant to theTBA/water mixture become very similar to those ofpure water at ~ 360 K, while those from the TMAOaqueous solution show a smaller broadening, thusindicating a slower dynamics (see Fig 1). In fig.2 thediffusion coefficients obtained using a memoryfunction approach [1] are displayed vs. T. Filledsymbols refer to previous experiments and opensymbols refer to the present experiment. The datashow that when temperature is increased fromregion (a), where the hydrophobic effect ismaximum, to region (b) the diffusion coefficientsmeasured for the TBA/water solution progressivelyapproach those of pure water. This is in agreementwith the hypothesis that the hydrophobic effect
progressively decreases with increasingtemperature owing to a loss of stability of thehydration structures. On the contrary, in the sameT-region, the diffusion coefficients for theTMAO/water mixture are systematically smallerthan those of pure water. This behaviour can beascribed to the presence of a different polar groupwith a dipole moment three times bigger in TMAOthan in TBA. This result is in qualitative agreementwith MD simulations suggesting that hydrophobichydration shells are more stable in TMAO than inTBA/water solutions [2].
0.0
0.5
1.0
1.5
2.0
0 .0 0.5 1 .0 1.50.0 0 .5 1.0 1 .50.0
0.2
0.4
0.6
0.8
T B A /H2O
T=320 K
H 2O
TM A O /H2O
fit to the m odel T=360 K
Iinte
nsity
(a.u
)
h (m eV )
Fig 1.:QENS spectra from water /TBA, water /TMAO andpure water at 320 and 360K for Q=1.34 Å-1.
260 280 300 320 340 3600123456789
a b
T (K)
D x
109 (m
2 s-1)
& H2O& TBA/H
2O
& TMAO/H2O
Fig 2.: Translational diffusion coefficient, D, vs. T for TBAand TMAO aqueous solutions and for pure water. Filledsymbols: previous experiments; open symbols: presentexperiment. Continuous lines are guides to the eyes.
Acknowledgments: This experiment was supported bythe EC under the IHP II (contract HPRI-CT-2001-00138). References[1] U. Balucani and M. Zoppi, in Dynamics of the LiquidState (Clarendon Press, Oxford, 1994); M. Di Bari, et al.,Physica B 266, 92 (1999); V. Calandrini et al. J. Chem.Phys. (2004) in press.[2] S.Fornili et al. J.C.S.Faraday Trans., 91, 3803 (1995).
136

PHY-03-0289.doc // brandt // 03.03.04 Seite 1 von 1
EXPERIMENTAL REPORT Proposal N° PHY-03-0289Instrument V3 (NEAT)Incoherent Quasi Elastic Neutron Scattering
in methanol/CCl4 mixtures. Local Contact Alexandra Buchsteiner
Principal Proposer: Francesco Aliotta, IPCF-CNR Messina Date(s) of ExperimentExperimental Team: Cirino Vasi, IPCF-CNR Messina
Franz Saija, IPCF-CNR MessinaAlexandra Buchsteiner, HMI-BENSC Berlin
13-19 October 2003
Date of Report: 21 October 2003
The aim of this experiment was to investigatethe concentration dependence of thediffusional dynamics in methanol/CCl4mixtures, in order to gain useful information todescribe the microscopic mechanisms drivingthe structural relaxation processes that havebeen recently observed by dielectricmeasurements and Brillouin scatteringexperiments.
The Quasi Elastic Neutron Scatteringexperiment has been performed both onmixture CH3OH/CCl4 and CH3OD/CCl4, inorder to test if some reorientational process isinvolved in the observed structural relaxation.A wavelength of 7 Å has been selected for theincident neutrons, with an energy resolution of140 eV. The scattered intensity profiles hasbeen collected on the Q range.3 Å-1Q 1.6 Å-1 (18 131).
-0.4 -0.2 0.0 0.2 0.40
1
2
3
4
5
6
7
meV
Inte
nsity
(a.u
.)
CCl4 =0.3 =0.5 =0.6 =0.9
Fig.1
In Fig 1 we report, as an example, some of theexperimental data at different values of themethanol volume fraction and at fixed =69°.Both a translational and a rotationalcontribution are observed. Probably a secondslower diffusive process takes place, but weneed further accurate analysis in order toconfirm this point.
The line-width of the translational IQENS lineexhibits a broadening as the methanol contentincreases (until the =0.5 value is reached). Athigher concentrations a narrowing of theline-width is observed. The grey and light greyshadows in Fig. 1 mark CCl4 and =0.3mixture, respectively, while the dark greyshadowed line represents the instrumentalresolution (vanadium).No difference has been observed betweenCH3OH/CCl4 and CH3OD/CCl4 mixtures, sowe can conclude that rotations of the CH3groups are not involved in the structuralrelaxation. The observed behaviour of the translationalline-widths agree with the experimental resultsfor the excess (respect to ideality) adiabaticcompressibility (Fig. 2)
0.0 0.2 0.4 0.6 0.8 1.0
7
8
9
10
11
0.0 0.5 1.00.0
0.5
s (c
m ×
s2 /g)x
1011
Methanol volume fraction
S
xM
Fig.2
and static dielectric constant (Fig. 3)
0.0 0.2 0.4 0.6 0.8 1.00
5
10
15
20
25
30
35
m
Fig. 3137

EXPERIMENTAL REPORT Proposal N° EF
Instrument V3 Dynamics of the CH3 and NH3-groups in L-alanine
Local Contact J.Pieper, A.Buchsteiner
Principal Proposer: H.N. Bordallo, HMI Date(s) of Experiment Experimental Team: C. Fehr, HMI S. Rols and M. Barthès, Univ. Montpellier II
29/04-04/05/2003
Date of Report: 15/12/2003 An approach to better understand the interactions in proteins is to investigate the structure and dynamics of simplified systems. Crystalline zwitterionic molecules such as L-alanine provide an excellent example. L-Alanine is one of the 20 protein amino acids serving as building blocks for proteins. It has a tetrahedral structure with a central alpha carbon atom, the Cα, with a α-amino group, a α-carboxylic acid group and a hydrogen atom attached to it. A methyl group, as the R-group, makes alanine hydrophobic.
By selective deuteration a study of the dynamics of the motion of each hydrogen group in polycrystalline L-alanine (C2H4(NH2)COOH) was undertaken using quasi-elastic neutron scattering. The QENS data were obtained using NEAT (∆E=90µeV, λ i=5.1Å) on (C2D4(NH2)COOH), between 100K and ambient, and due to time constraints on (C2H4(ND2)COOD) at 100, 180 and 235K. The isotope samples have been synthesized by Dr. Ehrenstorfer GmbH (Augsburg, Germany) with purity greater than 99%.
theThi
Considering that the scattering function, S(Q,ω) can be written as a purely elastic component, superimposed to a quasi-elastic broadening, which provides information about the characteristic time of the motion, we get:
)Qu(00
1iii0
22exp)Q(s)Q(S
where
)(L)Q(A)()Q(S),Q(S
><−
∑=
=
ω+ωδ=ω
)TQ(0
2expSS −=
N
The exponent is the Debye-Waller factor and <u2> is the thermally averaged mean square motion of the atoms. For a classical Harmonic oscillator, <u2> α T and the intensity becomes
, so one would expect linear temperature dependence of the DWFs for T<<Q2.
The integration of the QENS signal over the whole angular range, giving S0(Q) for (C2D4(NH2)COOH) is given in fig. 1. Interestingly, it shows a break on the line between 180 and 160 K. It is important to remember that the temperature dependence of S0(Q) does not solely come from the dynamic displacements, but also the changes in the static atomic positions within the unit cell. New results on L-alanine, obtained using the ID10A beam line at ESRF together with X-rays and neutron structure determination at intermediate temperatures, ruled out the hypothesis of a conventional structural phase transition in L-alanine [1,2]. While no change in the space group symmetry was observed, an anomalous decrease, by discrete steps, of the c lattice parameter was revealed on heating
crystal from 10 K to room temperature. s observation may be connected to a
progressive conformational change of the NH3+
group of the zwitterionic molecule [1].
S 0(Q
) Temperature (K) Fig1. Evolution of the elastic component for (C2D4(NH2)COOH). Note the deviation between 160- 180K. The analysis of the Q-dependence is underway. [1] M. Barthès et al submitted to European Phys. J. B [2] For more details on l-alanine look at the report untitled Intriguing structural behavior of the model system L-alanine, by H.N. Bordallo et al
HMI.rep_V3_ala.doc // brandt // 05.01.04 Seite 1 von 1 138

CHE-04-689.rtf // brandt // 09.03.04 Seite 1 von 1
EXPERIMENTAL REPORT Proposal N° CHE-04-689Instrument V4
Structural Investigation on Phospholipidic-CyclodextrinDerivatives Local Contact
U. Keiderling
Principal Proposer: Fabrizio Lo Celso, University of Palermo Date(s) of ExperimentExperimental Team: Roberto Triolo, University of Palermo
U. Keiderling, HMI Berlin 5-7 July 2002
Date of Report: 23-1-2004
cyclodextrin-water
1.00E-02
1.00E-01
1.00E+00
1.00E+01
1.00E-01 1.00E+00 1.00E+01
q
I(q)
Cyclodextrin (CD) are cyclic oligosaccharides which
have the characteristic shape of a truncated cone.
Commonly, they are constituted by 6, 7 or 8 glucose
units linked to each other by a 1- → 4 – glucosidic
bond and they are named , and cyclodextrin,
respectively. The spatial disposition of the atoms in the
molecule generate an inner hydrophobic cavity that
allows the formation of inclusion compounds with
organic molecules of suitable size and polarity.
The continuous challenge of using CD for
solubilization and drug targeting has led to the
preparation of a wide variety of chemically modified
derivatives (CDs) in order to improve the properties of
the host molecules. Recently we got interested in
investigating new amphiphilic CDs, which are obtained
by grafting seven phospholipidic groups on the cyclic
oligosaccharide core. These compounds should be able
to give micellar aggregates in aqueous solution. These
may open new ways for the targeting of biologically
active molecules and especially for drug delivery. It is
our intention to study the dependence of aggregation
phenomena changing the host charge, by varying the pH
of solution, as well as the length of the alchylic chain of
the phospholipidic groups. SANS is the primary
technique we intend to use to resolve the average
structure of the aggregates, by making extensive use of
external isotopic substitution (use of H2O-D2O mixtures
as solvent).
Unfortunately due to a series of problems
concerning mainly the correct purification of the
products, it is not easy to give a reliable interpretation of
the SANS experimental results. In the figure shown
aside, the blue curve gives a strong indication of the
consequences of problems during purification. Indeed it
possible that the resulting solution shows a phase
separation.
139

CHE-04-0748.doc // brandt // 09.03.04 Seite 1 von 1
EXPERIMENTAL REPORT Proposal N° CHE-04-748
Instrument V4Nanostructured ternary polymer systems Local Contact
Albrecht Wiedenmann
Principal Proposer: Petr Stepanek, IMC, Prague Date(s) of ExperimentExperimental Team: Peter Cernoch, IMC, Prague
Daniel Clemens, BENSCAlbrecht Wiedenmann, BENSC
6-10.12.2002
Date of Report: 28.1.2004
We have performed small angle neutronscattering experiments using the instrumentV4, on several samples of ternary mixtures ofd-polystyrene (PS), polymethylmethacrylate(PMMA) and the parent diblock copolymer,polystyrene-b-polymethylmethacrylate, withvariable amounts of d-toluene as solvent. Thepurpose is to determine whether amicroemulsion is created upon dilution and whatare its properties (transition temperatures,characteristic size).
The characteristic size of the polymerstructures investigated is rather large so that thepeak of the structure factor was located veryclose to the edge of the beam stop, even atsample to detector distance of 16 m. Fig.1 showsa typical scattering curve obtained.
The intensity of the peak increasessubstantially with decreasing temperatureindicating a sharper composition profile at lowtemperatures. Increasing the solvent content (d-toluene) from 20 to 30% decreases the peakintensity by a factor of about 8 meaning thateither the interfacial profile is weaker or that thetransition between the disordered andmicroemulsion phase is substantially shifted intemperature. This will be established in thedetailed data analysis that will follow aftercomplementary light scattering experiments willhave been performed.
The equipment was working perfectly and thelocal contact scientist was very helpful andsupportive.
Fig.1 Normalized scattered intensity as afunction of q for a ternary mixture of PS,PMMA, PS-PMMA and 20% d-toluene, at atemperature of 18oC.
140

EF_38_Fehr.doc // brandt // 15.03.04 Seite 1 von 2
EXPERIMENTAL REPORT Proposal N°
Instrument V5Dynamics of 4-n-4’-octyl-cyanobiphenilby Neutron Spin Echo Local Contact
Carlos Fehr
Principal Proposer: Carlos Fehr, HMI Date(s) of ExperimentExperimental Team: Catherine Pappas, HMI
Carlos Fehr, HMI 09/10-19/10/2003
Date of Report: 19/11/03
The study of metastable solid states inmesogenic compounds, like liquid crystals, hasattracted considerable attention in recent years,motivated mainly by the wide range of technicalapplications of this kind of compounds. Intensivework has been carried out in studying the effect ofconfinement and quenched disorder on the phasetransition, the dynamics and the structure ofmesomorph phases, lesser effort has been made instudies focused on the crystalline phases. HoweverLC-forming compounds are known to present solid-crystalline polymorphism (SCP). And this SCP waseven proposed to be a necessary condition for acompound to present some mesomorphousphases. Moreover, the structure and molecularorganization of mesophases should be stronglyrelated to those of the metastable solid phases.Therefore a better understanding of thepolymorphism of solid phases is required to betterdescribe the properties of these liquid crystals.
Thermotropic liquid crystals and inparticular cyanobiphenils, have been used asmodel materials since they offer a wide choice ofstructures and phase transitions in a relativelynarrow temperature range. [1,2]
No previous work on NSE in cyanobiphenils hasbeen found in the literature. And in the presentexperiment we performed a preliminarymeasurement on the liquid crystal system in thenon confined state. The goal was to compare withprevious time-of-flight (TOF) experiments made atMIBEMOL (LLB-Saclay) and at IN6 (ILL-Grenoble)on both, non-confined and confined samples indifferent sol-gel matrices.[3].
We performed the measurement in the vicinity ofthe diffraction peaks at 1.25 Å-1 and 0.5 Å -1 [4], ata wavelength of 6.5 Å.
The figure shows the deduced intermediatescattering function s(Q,t) for several temperaturesfrom 100 K up to 275 K.
Q =1.2 2
0
0. 1
0 . 2
0 . 3
0 . 4
0 . 5
0 . 6
0 . 7
0 . 8
0 . 9
1
0 . 0 1 0 . 1 1 1 0
Fourier Time (ns )
S(Q
,t)
10 0 K
15 0 K
2 0 0 K
2 5 0 K
2 7 5 K
The data show no significant temperaturedependence and no significant relaxation, in therange of Fourier time covered by the experiment (0.02 ns to 2.2 ns ).
The analysis in relation with the previous TOF datais under way.
REEFERENCES[1] Fehr et al. “Raman investigation of stable andmetastable states of 4-0ctyl-4’-cyanobiphenyl confined inporous silica matrices”. Phys. Rev. E 67, 061706 (2003).
[2] Fehr et al. “Orientational order and dynamics ofnematics liquid crystals in porous media“. Submitted toPhysical Review E.
[3] Unpublished data.
[4] Fehr et al. “Solid state polymorphism of liquid crystalsin confined geometries”. Eur. Phys. J. E 12, s01 (2003)00
141

MAT-04-0662.doc // brandt // 09.03.04 Seite 1 von 1
EXPERIMENTAL REPORT Proposal MAT-04-662Instrument V6Temperature Dependence of Poly(etylene
oxide) Brushes Local Contact Roland Steitz
Principal Proposer: Christiane A. Helm, Physik, Uni Greifswald Date(s) of ExperimentExperimental Team: Alexander Wesemann, Physik, Uni Greifswald
Heiko Ahrens, Physik, Uni Greifswald August 2001#
Date of Report: *18.12.03
Surface coatings with ethylene oxide (EO)polymers have encountered tremendous interestbecause of many potential medical applications,such as the preparation of biocompatible surfacesand drug carriers. Originally, it was assumed thatPEO lays flat on the surface, then it desorbs. Toinvestigate PEO brushes, block copolymersconsisting of a hydrophobic and a hydrophilicgroup are studied at the air/water interface.1 As thehydrophobic anchoring group served fluid poly(etylethylene) (PEE), which guarantees that thehydrophilic block is in equilibrium. The PEE-thickness was determined with X-ray reflectometry.We focussed on PEE797PEO893.
a
b
c
d
abcd
0.02 0.04 0.06 0.08
0.2
0.6
1.0
1.4
1.8
2.2
2.6
3.0
3.4
3.8
A
R /
RF
Qz[Å-1]
1000 10000 100000
01020304050
A1
Area per Molecule [Å2]
(m
N/m
)
Isotherm
-200 0 200 400 600 800-5,0x10⁻⁷
0,0
5,0x10⁻⁶
5,5x10⁻⁶
6,0x10⁻⁶
6,5x10⁻⁶
PEO-Brushair PEE Subphase: D2O
a b c A d
SLD
[Å-2]
z [Å]
Fig. 1: Left: Neutron reflectivity curves (points) normalized on theFresnel reflectivity together with fits (lines) of PEE797PEO893 on theD2O surface at molecular areas indicated in the isotherm in the inset (1
is the desorption transition of PEO). The high frequency oscillationsare due to the PEO-brushes. The oscillations with low frequency atlarge Qz are due to the PEE-anchoring group. Note that curve A wasmeasured after compressing the monolayer very quickly, which lead tofour instead of two-three PEO interference minima. Right: Scatteringlength density profiles corresponding to the fitted reflectivity curvesshown left. Note that the quickly compressed curve A exhibits a muchsharper PEO/water interface then the slowly decaying equilibriumdensity profiles.
PEE797PEO893 block copolymers were investigatedat the air/water surface at different graftingdensities, a typical example for the neutronreflectivity curves are depicted in Fig. 1. We wouldlike to emphasize that the main features, the PEE-melt and the PEO-brushes were also observed witha 54%/46% and a 30%/70% D2O/H2O mixture.1Slow compression (three to four 8-10 hour breaks)is necessary to obtain the brush profiles correspondroughly to those of anchored adsorbing polymers(cf. Fig. 1 left). On fast compression (0.9 Å2/s), a
much sharper polymer/water interface is observed,(the magenta curves in Figs 1. left and right). If wecompress directly to high pressures, and wait therefor about 20 hours, no relaxation occurs (trianglesin Fig.2). Even if we expand and recompress, norelaxation in the profile can be observed.Fig. 2 gives an overview of the PEO brush lengthHPEO as function of the temperature duringmonolayer compression. HPEO is defined as the firstmoment of the PEO density distribution along thesurface normal.1 The kinetically induced changes inthe brush profile have minor influence on HPEO.Lowering the temperature makes water anincreasingly good solvent for PEO5, causinggrowing of the radius of gyration in solution and anincrease in the brush thickness (cf. Fig. 2).Increasing the temperature has the inverse effect.The exponent of the power law is the same as foundbefore.1,2,4
0,0005 0,0010 0,0015 0,0020150
200
250
300
350
400
450
500
550
c(6°C) = 4750 c(20°C) = 4510 c(35°C) = 4200
HPEO = c(T)A-0.35 6°C 20°C
30% D2O, 20°C 35°CPE
O T
hick
ness
H P
EO
[Å]
Grafting Density [1/Å2]
Fig. 2 The PEO layer thickness of PEE797PEO893. Each symbolrepresents a different monolayer, temperatures of the experiments areindicated in the figure. The squares symbolyze the reflectivity curvesshown right. The triangles represent a monolayer, which wascompressed very quickly, and then relaxed, leading to large error barsin the molecular area).
1A. Wesemann, R. Steitz, H. Ahrens, S. Förster, C.A. Helm, Langmuir, 19,709 (2003).
2B.H. Bijsterbosch; V.O. d. Haan; A.W. d. Graaf, M. Mellema, F.A.M.Leermakers, M.A. Cohen-Stuart, A.A. v. Well, Langmuir 1995,11, 4467-4473.
3M.S. Kent, L.T. Lee, B.J. Facotr, F. Rondelez, G.S. Smith, J. Chem.Phys. 1995, 103, 2320-2342.
4E.P.K. Currie, F.A.M. Leermakers, M.A. Cohen-Stuart, G.J. Fleer,.Macromolecules 1999, 32, 487-498.81, 4172-4175.
5J.N. Israelachvili, Intermolecular Forces, Academic Press, 1991.
# The experiments were revisited after analysis of MAT-94-781, andGPC analysis of the polymer.
142

PHY-04-0893.doc // brandt // 16.03.04 Seite 1 von 1
EXPERIMENTAL REPORT Proposal PHY-04-0893Instrument V6Internal Order of Polyelectrolyte MultilayersLocal Contact Roland Steitz
Principal Proposer: Christiane A. Helm, Physik, Uni Greifswald Date(s) of ExperimentExperimental Team: Manesh Gopinadhan, Physik, Uni Greifswald
Heiko Ahrens, Physik, Uni Greifswald 11.12.-18.12.03*
Date of Report: *18.12.03
Self-assembly processes of polyelectrolytes involvingelectrostatic interactions can be used to build-upmultilayered materials with unique properties. The basicprinciple is the sequential adsorption of positively andnegatively charged polyelectrolytes[1,2]. Therefore,polyelectrolyte multilayers form two-dimensionallystratified layers which are growing step-by-step into thethird dimension. This leads to a behavior beingdominated by internal interfaces and local interactions,and differing largely from the corresponding volumematerial properties.Polyelectrolyte adsorption onto an oppositely chargedinterface is determined by electrostatic and secondaryinteractions[3,4]. On increase of the salt concentration inthe deposition solution, both the polyelectrolytecoverage and the thickness of the adsorbed layerincrease, features which are attributed to the screening ofthe electrostatic force[2]. However, little is known aboutthe nature, the origin and the influence of the secondaryforces[4,6]. The solvent quality declines on temperaturerise, therefore it can be varied systematically. We foundthat the thickness per layer pair increases by about80%[5,6], if the solution temperature is varied between 5and 45oC, a finding confirmed by neutron reflectivity (cf.Fig. 1).Since the segmental distribution of one polyelectrolytelayer is broader than its thickness[1], the interdigitationis large enough to result in a monomer density, which isconstant along the surface normal for both polycationand polyanion. The interpenetration of consecutivelayers has been explained by the formation of ion contactpairs, which causes the pronounced stability ofmultilayers. The films shown in Fig. 1 were organized in asuperlattice of 3 perprotonated layers and 1perdeuterated layer in 4 repeat units, contrast is providedby selectively deuterated PSS layers. On heating thepreparation solution, the thickness of both thesuperstructure and the film increases. Simultaneously,the Bragg peaks decrease in intensity, indicative of morepronounced interdigitation, a feature obviously promotedby the secondary forces. However, if the preparationtemperature is risen up to 45oC, the film/air interfaceroughens considerably. Also, the Bragg peak almostdisappears. These structural data indicate thatpolyelectrolyte molecules adsorb in a collapsed stateonto the oppositely charged film surface, stratification isno longer prominent. Multilayer preparation at highertemperature turned out to be impossible.
Fig. 1. Polylectrolyte multilayers prepared from polystyrene(sulfonate)(PSS) and poly(allylamine hydrochloride) (PAH) at differenttemperatures with selectively deuterated PSS-layers, i.e.PEI/PSS(PAH/PSS-D/PAH/PSS)4. Top: Neutron reflectivity curves offilms prepared from 1 M KCl solution at T=5, 15, 15, 25, 35, 40 and45°C (top to bottom). For clarity, the reflectivity curves are shiftedrelative to each other, , the lines connecting the minima of equal orderare guides to the eye. Bottom: The same data, yet normalized relativeto the Fresnel-Reflectivity.[1] G. Decher, Science 277 (1997) 1232.[2] M. Schönhoff, Curr. Opin. Colloid Interf. Sci. 8 (2003) 86.[3] R. R. Netz, J.-F. Joanny, Macromolecules 32 (1999) 9013.[4] S. S. Shiratori, M. F. Rubner, Macromolecules 33 (2000) 4213.[5] H. Ahrens, K. Büscher, D. Eck, C. Luap, G. Papastavrou, J.
Schmitt, R. Steitz, C. A. Helm, Makromolekulare Chemie -Macromolecular Symposia (2003) acc
[6] K. Büscher, H. Ahrens, K. Graf, C. A. Helm, Langmuir 18(2002) 3885.
0,0 0,5 1,0 1,5 2,0 2,510-6
10-5
10-4
10-3
10-2
10-1
100
101
102
103
104
105
106
107
108 5°C
15°C
25°C
35°C
40°C
45°C
Ref
lect
ivity
theta [deg]
0,0 0,5 1,0 1,5 2,0 2,50
1
6
12
18
24
30
36
42
480,00 0,02 0,04 0,06 0,08 0,10
5°C
15°C
25°C
35°C
40°C
45°C
R/R
F
Incident Angle [ °]
Qz [Å-1]
143

PHY-04-0894.doc // brandt // 09.03.04 Seite 1 von 1
EXPERIMENTAL REPORT Proposal PHY-04-894Instrument V6The Osmotically Swollen Phase of
Polyelectrolyte Brushes Local Contact Roland Steitz
Principal Proposer: Christiane A. Helm, Physik, Uni Greifswald Date(s) of ExperimentExperimental Team: Heiko Ahrens, Physik, Uni Greifswald
28.8.-3.9.03
Date of Report: 19.12.03
Polyelectrolytes are difficult to understand becauseof the entwined correlations of chain configurationand charge, coupled with the long-rangedinteractions inherent to these structures. Thesimplest imaginable system are polyelectrolytebrushes, where the charged chains are anchored byone end at a flat surface.1 We studied the poly(styrene sulfonate) (PSS)segment density profile with X-ray reflectivity,with PSS brushes anchored by a hydrophobic blockof poly(ethylene) (PEE) at the air/water interface2.Since the anchor is fluid at room temperature, thePEE-PSS joints can attain a new equilibriumdistribution after a monolayer compression orexpansion. The electron density profiles of themonolayers were determined with X-ray reflectivityas function of the grafting density and saltconditions. Two polyelectrolyte brush phases canbe distinguished:3 at low salt the osmoticallyswollen brush characterized by ion incorporationand constant thickness; when the ion concentrationin the brush is comparable to the one in subphase(> 0.1 M) the salted brush is found. The lattershrinks when the molecular area or the subphasesalt concentration is increased, according to powerlaws.2,3,4
However, one disadvantage of the X-ray reflectivityis the poor contrast. The method relies heavily onelectron-rich counterions, like Cs+ or K+. Onehopes, that the counterions trace the polymer chainclosely, and thus a reliable image of the segmentdensity profile is obtained. We found this to be truefor the salted brush phase at high electrolyteconcentrations (ie 1 Mol/L KCl)4, and wanted toinvestigate the osmotic brush phase. Also, we weremotivated by a recent discussion on the nature ofthe osmotic brush phase. Originally, the polymerwas assumed to be a slightly deformed Gaussiancoil2. However, we2,4 and othersreferences in 5,6 find thatthe polyelectrolyte brush thickness is 30-70% of thecontour length. This is serious stretching. Recenttheories5,6 predict that the thickness of an osmotic-cally swollen brush is not constant, but increaseslinearly with the grafting density. This prediction agrees with the brush thickness asdetermined from the first moment of the brush
profile, as well as from the neutron reflectivitymeasurements of the osmotic brush shown in Fig.1.
Unfortunately, the values obtained by these twomethods do not coincide. Possibly, an explanationis that the isotherms obtained on D2O differ fromthose on H2O. Therefore additional isotherms andX-ray reflectivity measurements will be performed.
32.4 0
26.2 0
33.3 1
23.0 1
38.7 10
30.4 10[mN/m] [mM]
Cs
0.01 0.02 0.03 0.04 0.05 0.06 0.07 0.08
1.0
1.6
2.2
R /
RF
Qz[Å-1]
Fig. 1: Top: Normalized neutron reflectivity curves on three differentsubphases: pure D2O (black and gray), 0.001M CsCl solution (hues ofred) and 0.01M CsCl solution (hues of green). The lateral pressures areindicated. For clarity, the curves are displaced relative to each other.Bottom: The polymer volume fraction obtained from fits to thereflectivity curves. In the inset the thickness of the polyelectrolytebrush as obtained from both neutron and X-ray reflectivity is shown.
1 S. Alexander, J, Phys. (Paris) 38, 983 (1997). P.-G. d. Gennes,Macromolecules, 13, 1069 (1980)
2 H. Ahrens, S. Förster, C.A. Helm, Phys. Rev. Let. 81, 4712 (1998)3 O.V. Borisov, E. B. Zhulina, T. M. Birstein, Macromolecules, 28,
1419 (1994)4 H. Ahrens, R. Steitz, K. Büscher, S. Förster, D. Eck, C.A. Helm,
Macrom. Symp., subm. (2003)5 C. Seidel, Macromolecules 36, 2536 (2003)6 A. Naji, R.R. Netz, C. Seidel Eur. Phys. J. E 12, 223 (2003)
0.000 0.001 0.002
140
160
180
D2O
1mM CsCl
10mM CsCl1mMCsCl X-ray
0 50 100 150 200 250 3000.0
0.2
0.4
0.6
0.8
Grafting Density [Å-2]
z [Å]
H [Å
]
144

RepPHY-04-0822.doc // R. Steitz // 17.03.03 Seite 1 von 1
EXPERIMENTAL REPORT Proposal N° PHY-04-822Instrument V6Is there an odd/even effect of the water
content of polyelectrolyte multilayers? Local ContactRoland Steitz
Principal Proposer: Regine v. Klitzing, TU Berlin Date(s) of ExperimentExperimental Team: John E. Wong, TU Berlin
Sebastian Schemmel, TU BerlinRoland Steitz, TU Berlin and HMI
27.1.-2.2. 2003
Date of Report: 14.03.03
Polyelectrolyte multilayers built on silicon wafers byalternating adsorption of polyanions (poly(styrenesulfonate), PSS) and polycations (poly(allylaminehydrochloride), PAH) from aqueous (H2O) solutionswere investigated by neutron reflectometry in ahumidity chamber. Three multilayers, (PAH/PSS)8,(PAH/PSS)8.5 and (PAH/PSS)9 were measuredagainst vacuum (p < 5 mbar), against saturatedD2O or H2O vapor (i.e. 100% r.h. at p=1 bar) andagain, against vacuum in that order to check on anodd/even effect of the water content in those filmsthat was predicted by an NMR study [1].All films showed a pronounced response whentransferred from vacuum to saturated D2O (or H2O)vapor. The neutron reflectivity from the filmsincreased due to substantial absorption of heavywater in the multilayers. Also the number of Kiessigoscillations in the reflectivity curves (see Fig. 1)increased due to the associated swelling of thefilms. The comparison of spectra that were taken asa function of time after changing the environment(vacuum or saturated water vapor) revealed a twostep process of hydration of the multilayers that hadnot been observed beforehand. In a fast first step(< 1h) film thickness increased to 97% of theequilibrium value. Also the scattering lengthdensity, SLD, raised to 90% of its equilibrium value,which was established after 9h. The same timedependence was observed on dehydration. Thereflectivity curves against vacuum before and afterrehydration in D2O vapor did not overlap (see alsoFig. 1a and d). This finding suggests that a certainamount of heavy water be strongly bound to thepolyelectrolyte multilayer. This water was notremoved upon dehydration in vacuum. Exposure ofthe film at this stage to ambient lab.-atmosphere(44% r.h. H2O) showed moderate enhancement ofreflected intensity over 2½ h. Subsequentdehydration in vacuum re-established theconditions found prior to exposure to ambient lab.-atmosphere. This proofs that the bound heavywater could not be replaced by light water presentin the ambient lab.-atmosphere and in the partiallyswollen film. It was only subsequent rehydration insaturated H2O vapor (100% r.h.) for 6h that yieldedfull replacement of the bound heavy water. Thereflectivity curve taken from the multilayer againstvacuum after this final rehydration matched the veryfirst reflectivity curve taken against vacuum (Fig. 1,curve a) at all points (not shown).
0.00 0.02 0.04 0.06 0.08 0.10 0.12
10-5
10-4
10-3
10-2
10-1
100
a b c d
Ref
lect
ivity
Q [Å-1]
Fig. 1: Neutron reflectivity from the Si/(PAH/PSS)9film against vacuum after preparation (a), againstsaturated D2O vapor (b) and (c), with (c) taken 8hafter (b), and against vacuum (d) after (c).
From the complete set of measurements in drystate (vacuum, p < 5mbar) -- D2O vapor (100% r.h.)-- dry state in that order the total amount of water inthe fully hydrated film was deduced to 53% with afraction of bound water of 6%. The latter remains inthe dehydrated films and cannot be removed byreduced pressure. It is exactly for this reason that acomplete set of reflectivity measurements isnecessary to deduce the SLD of the pure polymerpair (PAH/PSS) to 1.56·10-6 Å-2 in our case.Due to the unexpected slow kinetics of hydrationand dehydration we did not succeed in finishing offthe proposed series on a minimum of 5 films withsubsequent numbers of polyelectrolyte layers. Thecheck on the predicted odd/even effect of the watercontent in those films remains still open. From theconducted measurements on three samples with16, 17 and 18 layers the film swelling on hydrationwas 1.43 ± 0.20, 1.54 ± 0.12 and 1.44 ± 0.05,respectively. Although these results seem tosupport the odd/even effect the error bars are toolarge to draw a definite conclusion. As the errorsdecreased with increasing film thickness furthermeasurements with thicker films are required.
References[1] B. Schwarz, M. Schönhoff, Langmuir 18, 2964(2002).
145

PHY-04-0826.doc // brandt // 09.03.04 Seite 1 von 1
EXPERIMENTAL REPORT Proposal N° PHY-04-826Instrument V6Polyelectrolyte multilayers:
hydration and odd-and-even effects Local Contact R.Krastev
Principal Proposer: M. Schönhoff, MPI, Golm, Germany Date(s) of ExperimentExperimental Team: D. Carriere, MPI, Golm, Germany
R. Krastev, HMI Berlin/TU Berlin, Germany/M. Schöenhoff, MPI, Golm, GermanyC. Delajon, MPI Germany
21.02 - 25.02.2003
Date of Report: 12.12.2003
Silica particles (550 nm diameter) werecoated with PSS and PAH polyelectrolytes. Inthis system, water is shared between water inthe polymer layers and “free” water. These twofractions could be characterized bymeasurements of the transverse relaxationrate of water (so-called R2) using classicalNMR techniques. Bernd Schwarz and MonikaSchönhoff have thus demonstrated theexistence of an “odd-and-even” effect [1]: whenthe particles are coated with an odd number oflayers (PAH terminated), the system shows ahigh relaxation rate. On contrary, when theparticles are coated with an even number oflayers (PSS terminated), the relaxation rate issignificantly lower. They suggested that theseoscillations in R2 might be due to oscillations inthe water content of the layers; alternativelyoscillations of the water mobility might be thedriving mechanism.
We have thus investigated thewater content of polyelectrolyte multilayers byneutron reflectivity. An increasing number oflayers was deposited on a flat silicium surface,in conditions similar to the preparation of thecolloidal particles. After each deposition, thereflectivity curve was recorded and theconcentration of water in the layers wascomputed. It allows to detect an “odd-and-even” variation of the amount of water pervolume of sample. The samples terminated bya PSS layer are slightly more hydrated thanthe samples terminated by a PAH layer. This isconsistent with results reported by R. vonKlitzing (ellipsometry, [2]) or by M. Mc Cormick(MAS NMR, [3]), but requires an adaptation ofthe NMR model.
[1] B. Schwarz, M. Schönhoff, Colloids and Surfaces A:Physicochemical and Engineering Aspects 198-200(2002) 293-304[2] R. von Klitzing, oral communication, German-FrenchNetwork meeting, May 2003.[3] M. McCormick et al., Macromolecules 36 (2003)3615-3625.
13 14 15 160
50
100
150
200
250
Solv
ent s
urfa
ce d
ensi
ty (A
)
Number of layers
Fig. 1: The density of D2O in the polyelectrolytemultilayer film as a function of the number of depositedlayers.
146

PHY-04-0829.doc // brandt // 09.03.04
EXPERIMENTAL REPORT Proposal N°PHY-04-0829Instrument V6Thermodynamic stability of polyelectrolyte
multilayers Local Contact R. Krastev
Principal Proposer: I. Estrela-Lopis, Leipzig University, Germany Date(s) of ExperimentExperimental Team: E. Donath, Leipzig University, Germany
G. Ibarz, MPI, Golm, GermanyR. Krastev, HMI, Berlin, Germany
29.04-03.05.2003
Date of Report: 20.12.2003
The layer-by-layer adsorption technology hasbeen applied to colloidal templates. After layerformation, hollow capsules can be fabricatedby core dissolution. The capsule wall uponaging or annealing undergoes structuralrearrangements, which influence on the wallpermeability. The understanding of thetransport mechanism across the layer and tocontrol it are crucial for many applications.Thus, neutron reflectivity measurements wereconducted on flat surfaces with the aim tostudy the thermally induced changes of theinterior of polyelectrolyte layers. This methodhas a better resolution in comparison withSANS experiments on colloids because ofsedimentation problems.The reflectivity was studied for a system of 41polyelectrolyte layers (PSS/PAH). The controlwas not deuterated while the other sample haddeuterated PSS (dPSS) on every sixthposition. To obtain information about thechange of the internal structure on averageafter annealing the samples were measured atroom temperature before (Fig. 1) and afterannealing at 80°C. The arrow shows the Braggpeak, which provides the thickness per layer ofabout 23 Å. This correlates well with the singlelayer thickness calculated from the total depthof the sandwich. The PE layers are stronglyintercalated (=40Å). Two more samples consisting of 27 PE layerscontained two deuterated blocks:[dPSS/PAH/dPSS]PAH/ and PSS/PAH/[dPSS/PAH/dPSS] which were inserted intothe film either closely to the Si surface or farfrom it (Fig.2). The fitting provided informationabout thickness and interpenetration level ofthe selected layers located far from thesurface. Unfortunately, reflectivity measurements afterannealing failed because of technical reasonson the instrument V6. How the position, theshape of Bragg peak and other parameters ofthe selected blocks behaved after temperaturetreatment remained unanswered. (Fig. 3.
shows the preliminary study conducted in July002)
Si/PE41 (every 6th layer is dPSS)
147
2
Fig.1. Neutron reflectivity of the undeuteratedand partially deuterated samples.
0.02 0.04 0.06 0.08
1E-5
1E-4
1E-3
0.01
0.1
1
Q, Å-1
Ref
lect
ivity
Si/PE41 (undeuterated layers)
Fig. 2. Reflectivity curve of the sample:SI/PEI/(PSS/PAH)7/[(dPSS/PAH)2/PSS/PAH]2
0.02 0.04 0.061E-5
1E-4
1E-3
0.01
0.1
1
Ref
lect
ivity
Q, Å -1
deuterated b locks far f rom the Si su rface f it
1 deuterated blocks closed to the Si surface
Seite 1 von 1
Fig. 3. Preliminary investigation of the sample:SI/PAH/[PSS/PAH/(dPSS/PAH)2]2/(PSS/PAH)7
0.03 0.06 0.09
1E-4
1E-3
0.01
0.1
Ref
lect
ivity
Q, A-1
the same sample after heating

PHY-04-0830.doc // brandt // 09.03.04 Seite 1 von 1
EXPERIMENTAL REPORT Proposal N° PHY-04-830Instrument V6Chemical Switching of Protein-Surface Interactions
with Weak Polyelectrolyte Brushes Local Contact R. Steitz
Principal Proposer: Motomu Tanaka, TU München Date(s) of ExperimentExperimental Team: Motomu Tanaka, TU München
Florian Rehfeldt, TU MünchenRoland Steitz, HMI Berlin
13.05.03 – 18.05.03
*This project aims at chemical “switching” ofinteraction between water-soluble proteins andultrathin polymer monolayers by pH titration underphysiological conditions. To achieve a highpolymer chain density, we transferred insolublemonolayers of the amphiphilic diblock copolymersonto hydrophobized silicon. The copolymer, (poly-(DMAEMA-b-MMA)) with 50 % of “switchable”DMAEMA block (DB 50) was synthesized by S.P.Armes (Univ. Sussex). The behavior of a “control”system, polyethylethylene-block-polyethyleneoxide(PEE-PEO), synthesized by S. Förster (Univ.Hamburg), towards protein adsorption was alsoinvestigated.
Our second beamtime (May 2003) was dedicated totest the nonspecific physisorption of relativelysmall, water soluble proteins (bovine serumalbumin, BSA) to “switchable” DB50 and “control”PEE-PEO films.As the first series of experiments, specularreflectivities of DB50 films with high chain density(200 Å2/chain) were measured before and afterincubation with a BSA solution. Figure 1 presentsthe R/Rf plots for the DB50 films at pH = 8.5before and after BSA treatment. As seen in thefigure, there is no change, and thus no adsorption,after protein incubation within the experimentalaccuracy. On the contrary, DB50 films with lowerchain density (400 Å2/chain) exhibited a clearchange due to BSA treatment at pH = 8.5 (Figure2). In contrast to the curves in Fig.1, the deviationbetween the curves in Fig. 2 is outside theexperimental error.
Interestingly, previous fluorescence microscopyexperiments at pH = 8.5 indicated a slight butdistinct protein adsorption at high chain density.To gain quantitative insights on the adsorbedamount of BSA the optimization of proteinconcentration and incubation time will be carriedout by ex-situ x-ray reflectivity experiments in drystate.
For final conclusions, further neutron reflectivityexperiments on films with high chain density underoptimized conditions are necessary.
As control experiments, we transferred a monolayerof PEE-PEO diblock at high chain density (200Å2/chain), since PEO chains in contact with D2Oare known to avoid physisorption of proteins. Afterconfirming the stability of the film in D2O, it wasincubated with the BSA solution. The PEE-PEOfilm showed no changes upon protein incubation.To conclude this work consistently with that onDB50 films, final experiments have to beconducted also on a PEE-PEO film with a lowchain density (400 Å2/chain) to crosscheck on thesteric effect on protein adsorption.
Figure 1: R/Rf plot of DB50 with high chain density(200Å2/chain) before and after BSA incubation
Figure 2: R/Rf plot of DB50 with low chain density(400Å2/chain) before and after BSA incubation
148
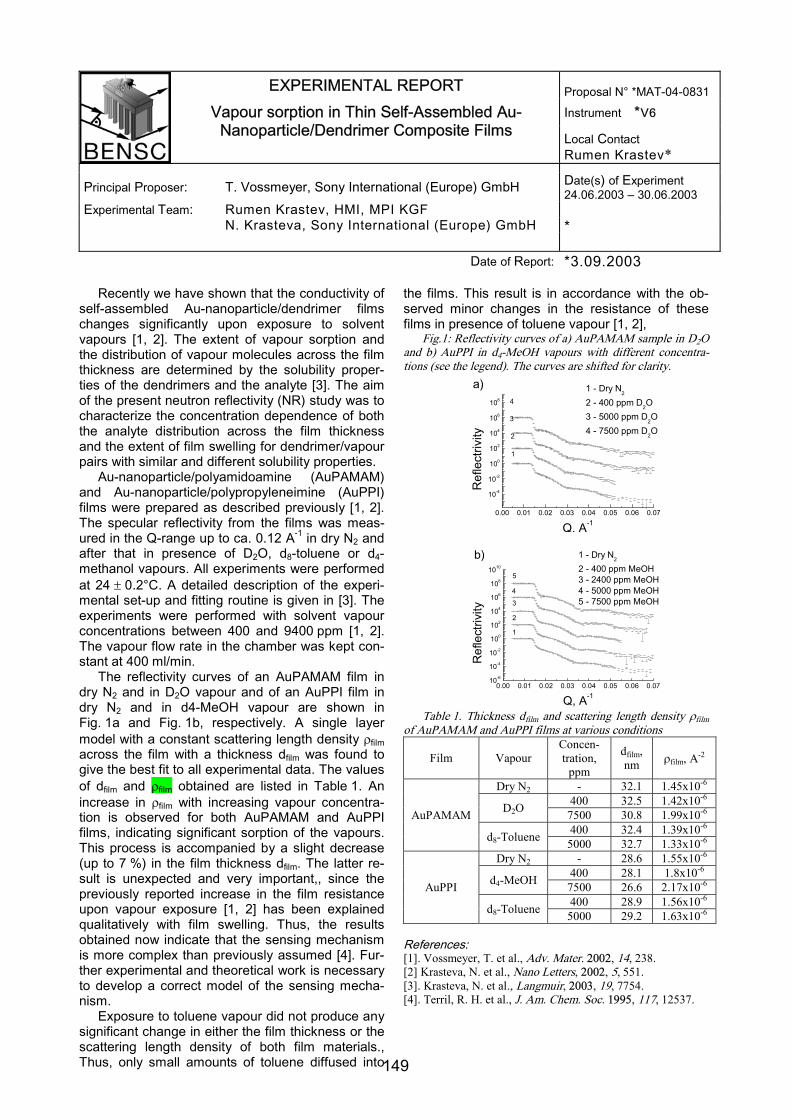
EXPERIMENTAL REPORT Proposal N° *MAT-04-0831
Instrument *V6Vapour sorption in Thin Self-Assembled Au-Nanoparticle/Dendrimer Composite Films Local Contact
Rumen Krastev*
Principal Proposer: T. Vossmeyer, Sony International (Europe) GmbH Date(s) of Experiment24.06.2003 – 30.06.2003
Experimental Team: Rumen Krastev, HMI, MPI KGFN. Krasteva, Sony International (Europe) GmbH *
Date of Report: *3.09.2003
Recently we have shown that the conductivity ofself-assembled Au-nanoparticle/dendrimer filmschanges significantly upon exposure to solventvapours [1, 2]. The extent of vapour sorption andthe distribution of vapour molecules across the filmthickness are determined by the solubility proper-ties of the dendrimers and the analyte [3]. The aimof the present neutron reflectivity (NR) study was tocharacterize the concentration dependence of boththe analyte distribution across the film thicknessand the extent of film swelling for dendrimer/vapourpairs with similar and different solubility properties.
Au-nanoparticle/polyamidoamine (AuPAMAM)and Au-nanoparticle/polypropyleneimine (AuPPI)films were prepared as described previously [1, 2].The specular reflectivity from the films was meas-ured in the Q-range up to ca. 0.12 A-1 in dry N2 andafter that in presence of D2O, d8-toluene or d4-methanol vapours. All experiments were performedat 24 0.2°C. A detailed description of the experi-mental set-up and fitting routine is given in [3]. Theexperiments were performed with solvent vapourconcentrations between 400 and 9400 ppm [1, 2].The vapour flow rate in the chamber was kept con-stant at 400 ml/min.
The reflectivity curves of an AuPAMAM film indry N2 and in D2O vapour and of an AuPPI film indry N2 and in d4-MeOH vapour are shown inFig. 1a and Fig. 1b, respectively. A single layermodel with a constant scattering length density filmacross the film with a thickness dfilm was found togive the best fit to all experimental data. The valuesof dfilm and film obtained are listed in Table 1. Anincrease in film with increasing vapour concentra-tion is observed for both AuPAMAM and AuPPIfilms, indicating significant sorption of the vapours.This process is accompanied by a slight decrease(up to 7 %) in the film thickness dfilm. The latter re-sult is unexpected and very important,, since thepreviously reported increase in the film resistanceupon vapour exposure [1, 2] has been explainedqualitatively with film swelling. Thus, the resultsobtained now indicate that the sensing mechanismis more complex than previously assumed [4]. Fur-ther experimental and theoretical work is necessaryto develop a correct model of the sensing mecha-nism.
Exposure to toluene vapour did not produce anysignificant change in either the film thickness or thescattering length density of both film materials.,Thus, only small amounts of toluene diffused into
the films. This result is in accordance with the ob-served minor changes in the resistance of thesefilms in presence of toluene vapour [1, 2],
Fig.1: Reflectivity curves of a) AuPAMAM sample in D2Oand b) AuPPI in d4-MeOH vapours with different concentra-tions (see the legend). The curves are shifted for clarity.
0.00 0.01 0.02 0.03 0.04 0.05 0.06 0.07
10-4
10-2
100
102
104
106
108
a)4
3
2
1
1 - Dry N2
2 - 400 ppm D2O3 - 5000 ppm D2O4 - 7500 ppm D2O
Ref
lect
rivity
Q, A-1
0.00 0.01 0.02 0.03 0.04 0.05 0.06 0.0710-6
10-4
10-2
100
102
104
106
108
1010
5
4
3
2
1
1 - Dry N2
2 - 400 ppm MeOH3 - 2400 ppm MeOH4 - 5000 ppm MeOH5 - 7500 ppm MeOH
Ref
lect
rivity
Q, A-1
b)
Table 1. Thickness dfilm and scattering length density filmof AuPAMAM and AuPPI films at various conditions
Film VapourConcen-tration,
ppm
dfilm,nm film, A-2
Dry N2 - 32.1 1.45x10⁻⁶
400 32.5 1.42x10⁻⁶D2O 7500 30.8 1.99x10⁻⁶
400 32.4 1.39x10⁻⁶AuPAMAM
d8-Toluene 5000 32.7 1.33x10⁻⁶
Dry N2 - 28.6 1.55x10⁻⁶
400 28.1 1.8x10⁻⁶d4-MeOH 7500 26.6 2.17x10⁻⁶
400 28.9 1.56x10⁻⁶AuPPI
d8-Toluene 5000 29.2 1.63x10⁻⁶
References:[1]. Vossmeyer, T. et al., Adv. Mater. 2002, 14, 238.[2] Krasteva, N. et al., Nano Letters, 2002, 5, 551.[3]. Krasteva, N. et al., Langmuir, 2003, 19, 7754.[4]. Terril, R. H. et al., J. Am. Chem. Soc. 1995, 117, 12537.
149

PHY-04-836_Carelli.doc // brandt // 13.01.04 Seite 1 von 1
EXPERIMENTAL REPORT Proposal N° PHY-04-836
Instrument V6 Polymer interfaces near the critical point Local Contact Rumen Krastev
Principal Proposer: Clara Carelli, University of Surrey Date(s) of Experiment
Experimental Team: Dr Michele Sferrazza, Université Libre de Bruxelles, Bruxelles, Belgique
Clara Carelli, University of Surrey, Guildford, Surrey, UK
26/05/-01/06/2003
Date of Report: 17/12/2003 The interfacial width in polymer/polymer systems is broader than mean-field predictions due to thermally excited capillary waves [1]. For ultra-thin films, the spectrum of capillary waves is modified by the confinement with a substantial effect on the interfacial width. However, when criticality is approached, the relative importance of short and long range forces in influencing the capillary waves spectrum is not very well understood. The presence of short-range interactions, i.e. truncation forces due to the cut of the interfacial profile by a wall, involves a square-root dependence of the interfacial width on film thickness [2]. Long-range dispersion forces instead introduce a cut-off on the capillary waves spectrum and lead to a logarithmic dependence [1]. To elucidate this issue, neutron reflectivity experiments have been performed on bilayers of random copolymers of ethylene and ethyl-ethylene, with the goal to study confinement effects for different conditions of miscibility. By changing the structure of the parent polybutadiene, we have been able to control the copolymer ratio between ethylene and ethyl-ethylene, and therefore to obtain pairs of polymers with different Flory-Huggins interaction parameter [3]. Two different pairs of polymers with degree of immiscibility χΝ=4.8 and χΝ=7.7 and molecular weight Mw~150K have been investigated. For each pair, we prepared a series of samples fixing the thickness of the top layer at about 4000 Ǻ and varying the thickness of the bottom layer in the range 700 -7500 Ǻ. The first layer was made by spin coating the deuterated polymer directly onto the silicon substrate, while the hydrogenous polymer was before spun onto a glass slide and then floated in water to deposit it on the top. The thickness of all the layers has also been characterised by ellipsometry. All the samples
have then been annealed for 5 days at 80oC, above the glass transition temperature, and specular reflectivity has been measured with the reflectometer V6. Our results showed the dependence of the interfacial width on bottom film thickness: the interface roughness increases with the thickness up to a limit thickness, after which it is constant. By comparing the two systems, as shown in Figure 1, it can also observed that the interface roughness increases faster when the degree of immiscibility χΝ is smaller, and the value of the limit thickness at which the interfacial width reaches equilibrium is in this case higher. This difference suggests that for χΝ=4.8 short range forces become more important in determining the interfacial width, therefore the thickness dependence is stronger,while long range forces are dominant for χΝ=7.7 and the dependence on the thickness is in this case logarithmic. [1] M. Sferrazza et al. Phys. Rev. Lett. 78, 4744 (1997). [2] T. Kerle et al.,Phys Rev. Lett. 77, 1318 (1996) [3] G. Reichart et al., Macromolecules 31,7886 (1998)
0 1500 3000 4500 6000 750020
30
40
50
60
70
80
90
chiN=4.8 chiN=7.7
Inte
rface
roug
hnes
s (A
)
Thickness (A)Fig1.Interface roughness as a function of the thickness of the bottom layer for pairs of polyolefins with different degree of miscibility: χΝ =4.8 and χΝ =7.7
150

CHE-04-859LT.doc // brandt // 09.03.04 Seite 1 von 1
EXPERIMENTAL REPORT Proposal N° CHE-04-859 LTInstrument V6Study of the geometry of lipid coupled to polyelectrolyte multilayers
Local Contact KRASTEV, Rumen
Principal Proposer: DELAJON, Christophe, Uni. Strasbourg Date(s) of ExperimentExperimental Team: DELAJON, Christophe, Uni. Strasbourg
KRASTEV, Rumen, HMI Berlin June 9th-June 13th 2003
Date of Report: September 19th 2003
The aim of this study was:1. to test the possibility to deposit a stable lipid
layer on the top of a polyelectrolyte block, and ifyes, the possibility of obtainingpolymer/lipid/polymer sandwiches;
2. to study the hydration of these lipid layers.
The used substrates were four Si wafers covered withpolymer blocks P1 and P2 composed ofpoly(ethyleneimine) PEI, poly(allylamine hydrochloride)PAH and perdeuterated poly(sodium 4-styrenesulfonate)dPSS obtained by layer-by-layer technique and lipidblocks L obtained by immersion in an aqueous vesiclesolution:
P1 is PEI/(dPSS/PAH) 6; P2 is (PAH /dPSS/PAH); L is a mixture of DMPA and DMPC.
The experiments were carried out in the gas tight cell atV6 at two different D2O vapour compositions:
saturated atmosphere, relative humidity near to100% (cf. Figure 1);
dry atmosphere (cf. Figure 2).
Figure 1 Reflectivity curves in D2O saturated atmosphere
Figure 2 Reflectivity curves in dry atmosphere
The first sample (P1) showed an unexpectedly highthickness (cf. Figure 3), probably because it wasoverexposed to D2O vapour in comparison with the othersamples. This prevented us to obtain a reliable SLDprofile of the P1 block, and also to determine for instancethe amount of D2O at the P1/L interface in the followingsamples. It seems that the time of exposure to D2Ovapour plays a very important role in the swelling effectand the reference sample was overexposed to thisenvironment in comparison with the other samples.
Figure 3 Total sample thickness (red curve: in D2Osaturated atmosphere, black curve: in dry atmosphere,blue curve: results from Xray reflectivity in ambient air).
Nevertheless, the total thickness measurements obtainedfrom the neutron reflectivity curves as well as the onesobtained by Xray reflectivity and ellipsometry (not shownhere) proved the successful deposition of the lipid on thepolymeric basis, and the feasibility ofpolymer/lipid/polymer and polymer/lipid/polymer/lipidsandwiches.
Exact SLD profiles could not be obtained because of theproblem encountered with the reference sample P1, butthe deswelling of all the samples during the dryingprocess as well as the partial reswelling in air (XRmeasurements) are observed.
1 2 3 4
240
260
280
300
320
340
360
380
400
Thic
knes
s (Å
)
Sample index
0,00 0,01 0,02 0,03 0,04 0,05 0,06 0,07 0,08 0,09 0,101E-6
1E-5
1E-4
1E-3
0,01
0,1
1
10
100
1000 1: P1 2: P1/L 3: P1/L/P2 4: P1/L/P2/L
NR (0% D2O relative humidity)
Ref
lect
ivity
Q (Å-1)
0,00 0,01 0,02 0,03 0,04 0,05 0,06 0,07 0,08 0,09 0,101E-6
1E-5
1E-4
1E-3
0,01
0,1
1
10
100
1000 1: P1 2: P1/L 3: P1/L/P2 4: P1/L/P2/L
NR (100 % D2O relative humidity)
Ref
lect
ivity
Q (Å-1)
151

CHE-04-0900.doc // Steitz // 09.03.04 Seite 1 von 1
EXPERIMENTAL REPORT Proposal N° CHE-04-900
Instrument V6Spontaneous temperature-recycled wetting atsolid/liquid interfaces in near-critical liquid/liquidmixtures mediated by wall coating Local Contact
Roland Steitz
Principal Proposer: I.A. McLure, Univ. Sheffield, UK Date(s) of ExperimentExperimental Team: Marcos Vergara-Guttierrez, Univ. Sheffield
R. Steitz, TU BerlinI.A. McLure, Univ. Sheffield, UK
18.-27.8. 2003
Date of Report: 29.01.2004
The objectives of the current proposal werebased on findings made by McLure and Shaw in2002 (CHE-04-724) on a member of the methanol +cyclohexane family of mixtures, (CD3OD + c-C6H12),mixture, and by Howse, Salou, and McLure on theperdeutero-inverted mixture (CH3OH + c-C6D12)(CHE-04-520) in 2000. It was directed at confirmingthe facile creation of a wetting layer on passing intothe two-phase region at a critical point followed byits disappearance at a wetting transition tempera-ture Tw¸ followed by ready remixing at the criticaltemperature to recover the one phase. The wettinglayer could not be re-established without re-entering the single phase. These phenomenaneeded verification for the original and somerelated but fundamentally different systems.
Fig. 1 Adsorption and wetting at the Si/liquid interface ofcritical C4E1 + D2O near its lower critical endpoint
The experiments were performed on threemixtures of critical composition which wereinvestigated with respect to near-critical wetting at ahydrophilic silicon oxide wall: C4E1 + D2O (B), i-C4E1 + D2O (C), and CD3OD + c-C6H12 (A'). MixtureB differs from mixture A in that it has both a lowerand an upper critical point. We are interested in theLCST at TLCS = 44 ºC. The mixture region ofimmiscibility is known as a closed loop with andupper critical point at an unknown highertemperature. Cycling the temperature through andwell above the LCST showed the occurrence of awetting layer but at no point did a transition to lowerreflectivity occur that might be taken as dewettingevent (Fig. 2). This might be because it is higherthan the highest temperature reached, 80 ºC, or it
0.1 0.2 0.3 0.4 0.50.0
0.2
0.4
0.6
0.8
1.0 n-C4E1; 40 °C n-C4E1; 45 °C n-C4E1; 35 °C n-C4E1; 45 °C rep n-C4E1; 70 °C
Ref
lect
ivity
scattering angle, theta [deg]
Fig. 2 Temperature dependent reflectivity of the Si/liquidinterface of C4E1 + D2O (critical composition: x = xc).
closed loop makes dewetting impossible to achievein that eventually as T rises the composition of theD2O-rich wetting layer return closer to the criticalcomposition.
Mixture C has a lower LCST = 42 ºC and soincreases the available temperature range aboveTLCS in which to observe dewetting. Once morehowever, despite heating to 80 ºC again, nodewetting transition was observed.
We then re-visited CD3OD + c-C6H12 (mixtureA') with TUCS = 54.1 ºC. Its temperature was cycledand on lowering from the one-phase region wefound the formation of a CD3OD-rich wetting layerthat did not disappear even at the lowestexperimental temperature T = 5.53 ºC. There wasno hint of the expected dewetting transition. Apossible explanation of its absence is that the over-aggressive RCA cleaning created a thick andporous SiO2 layer that absorbed in the first two setsof runs an amount of D2O that was not removed byrepeated rinses with first CH3OH followed by similarrinsings with CD3OD. This residual water could thenrender the SiO2 layer unusually hydrophilic and somore readily wetted by the alkanol-rich wettingphases encountered here. In consequence, in orderfor dewetting to occur, a much lower Tw than for aless assertive hydrophilic surface must beaccessed. Since this is hard to accomplish in thelight of experimental conditions, probably a betterpath leads to Tw via a less aggressive cleaningprocedure.
152

Krastev_06_03_rev_2.doc // brandt // 19.01.04 Seite 1 von 1
EXPERIMENTAL REPORT Proposal N°CHE-04-908LT
Instrument V6 Lipid Bilayer Formation on Hydrophilic Substrate in presence of Sucrose Local Contact R. Krastev
Principal Proposer: Rumen Krastev1,2 Date(s) of Experiment Experimental Team: Rumen Krastev1,2, Thomas Gutberlet3 1HMI, Glienicker Strasse 100, 14109 Berlin – Germany
2MPIKG, Am Mühlenberg 1, 14476 Golm – Germany 3Paul Scherrer Institut, 5232 Villigen, Switzerland
15.04. – 17.04.2003
Date of Report: 05.05.2003
In recent experiments we have investigated the formation of phospholipid layers on solid substrates in the presence of aqueous sugar solutions. Results from earlier studies [1-3] have shown that the addition of sugar leads to an increase in the interlayer distance. At comparatively small concentrations this effect is explained by moderate hydration repulsion between the layers. On further increase of the sugar concentration an enormous increase in the lamellar spacing is obtained which is attributed to double layer electrostatic or swelling effects. In accordance with these results a slight increase in interlamellar spacing of phospholipid multilamellar stacks was found when the phospholipid DMPC was adsorbed towards a bare crystalline Si-interface (BENSC Exp. Rep. 2002). To tune possible electrostatic interactions between the Si-interface and the phospholipid layer the Si-surface was coated with a medium thick polyelectrolyte (PE) cushion in the present experiments. The cushion was prepared by layer-by-layer deposition of six (PSS/PAH) polyelectrolyte bilayers. The deposition was performed from solutions in presence of 1 M NaCl.
The measurements were performed using the solid/liquid experimental cell for neutron reflectivity [4] at the instrument V6. Reference measurements on the thickness of the bare PE layer against D2O were performed first. The influence of sucrose on the thickness of the layer was checked as well performing another measurement against 0.5 M sucrose solution in D2O. No influence of the sugar on the PE layer thickness was observed.
The PE layer was exposed to freshly sonicated protonated DMPC vesicles (1 mg/ml) in 0.5 M sugar solution in D2O at 26 °C. In Fig. 1 the reflectivity curves obtained from the experiments at various times after introduction of the DMPC suspension are presented. The reflectivity pattern changes with time. After about 6 h a Bragg peak at qz=0.09 Å-1 shows the presence of multi-lamellar stacks of phospholipid bilayers close to the polymer cushion interface. The interlamellar repeat distance is d = 70 Å. The reflectivity curve can be fitted with a model assuming patches of stacks of bilayers merged with the reflectivity curve of the polyelectrolyte layer (Fig. 2). The thickness of the polyelectrolyte cushion is 320 Å, the FWHM of the
Bragg peak corresponds to about 13 DMPC bilayers.
0,00 0,02 0,04 0,06 0,08 0,10 0,12 0,141E-8
1E-7
1E-6
1E-5
1E-4
1E-3
0,01
0,1
1
10
multilamellarBragg peak
refle
ctiv
ity
qz (Ang.-1)
hCushion/D2O hCushion/D2O+0.5M Sucrose+DMPC (6h) hCushion/D2O+0.5M Sucrose+DMPC (12h)
Fig.1: Reflectivity curves from interfaces of Si/h-cushion/D2O (∆), Si/h-cushion/DMPC suspension/ D2O after 6 h ( ) and after 12 h ( ).
0.00 0.02 0.04 0.06 0.08 0.10 0.12 0.141E-8
1E-7
1E-6
1E-5
1E-4
1E-3
0.01
0.1
1
background
Ref
lect
ivity
qz (Ang.-1)
hCushion/D2O+0.5M Sucrose+DMPC multilayer stack hCushion merge
Fig. 2: Modelling of reflectivity curve from interfaces of Si/h-cushion/DMPC suspension/ D2O after 6 h. As the concentration of DMPC in the sugar solution was high (1 mg/ml) the occurrence of multilamellar stacks as patches adsorbed to the polyelectrolyte cushion instead of single adsorbed bilayers covering the surface is a concentration effect and not related to the presence of sugar molecules. References: [1] Gordeliy et al. Biophys. J 75 (1998) 2343 [2] Krasteva et al. J.Phys.Chem.B 105 (2001) 1185 [3] Krasteva, PhD Thesis, Univ. Potsdam (2001) [4] Howse et al J.Chem.Phys. 116 (2002) 7177
153

EXPERIMENTAL REPORT Proposal N° CHE-04-909LT
Instrument *V6 Vapour sorption in Thin Self-Assembled Au-Nanoparticle/Hexadecanedithiol Composite Films Local Contact
Rumen Krastev*
Principal Proposer: Rumen Krastev, HMI, MPI KGF Date(s) of Experiment 04.10.2003 – 05.10.2003
Experimental Team: Rumen Krastev, HMI, MPI KGF N. Krasteva, Sony International (Europe) GmbH T. Vossmeyer, Sony International (Europe) GmbH
*
Date of Report: *12.12.2003
In recent neutron reflectivity studies [1, 2] we have shown that the extent of vapour sorption and the distribution profile of vapour molecules across the film in Au-nanoparticle/dendrimer composite films depends on the matching between the solubil-ity properties of the organic component of the film and the analyte. The present study represents an extension of the previously conducted measure-ments to an additional composite material, compris-ing hexadecanedithiol (HDT) as organic film com-ponent. The aim of the work is to characterize in-situ both the analyte distribution across the film thickness and the extent of film swelling caused by the sorption of vapour molecules in this material.
Au-nanoparticle/HDT film (AuHDT) was pre-pared as described previously [3]. The specular reflectivity from the films was measured in the Q-range up to ca. 0.12 A-1 in dry N2 and after that in presence of saturated vapours of d8-toluene. All experiments were performed at 24 ± 0.2°C. A de-tailed description of the experimental set-up is given elsewhere [1].
The reflectivity curve of AuHDT film in dry N2 is shown in Fig. 1 (curve 1). A single layer model with a constant scattering length density (ρfilm) a a thic-ness dfilm was found to give the best fit to the ex-perimental curve of the dry AuHDT film. The values of dfilm and ρfilm obtained are listed in Table 1. The value of ρfilm corresponds to a gold volume fraction of about 31% in the film.
The reflectivity curve of the film measured in the presence of d8-toluene vapours is also shown in Fig. 1 (curve 2). The reflectivity of the sample changed as a result of vapour/film interactions. In contrast to the reflectivity curve of the dry film, the curve of the vapour-dosed AuHDT could only be fitted with a more sophisticated two-layer model. This result suggests a complex distribution of va-pour molecules within the film, as illustrated by the scattering length density profile of the film dosed with d8-toluene (Fig. 2). Dosing the film with tolu-ene vapours results in an increase in ρfilm, indicating that certain amount of toluene is adsorbed in the film. The film thickness changes only slightly, indi-cating a swelling of few percent only. Additionally, a thin layer with greater scattering length density is formed on the top of the film, which is probably due to condensation of vapour at the gas/film interface. We note, however, that this preliminary interpreta-tion requires further verification by more detailed investigations.
0.00 0.02 0.04 0.06 0.08 0.101E-7
1E-6
1E-5
1E-4
1E-3
0.01
0.1
1
10
100
1000 1 - dry N2
2 - d8-toluene
Fit two-layer model
Fit one-layer model
2
1
Ref
lect
ivity
Q [A-1]
Fig.1: Reflectivity curves (symbols) of AuHDT film in dry N2 (1) and in saturated d8-toluene (2) vapours. The curves are shifted for clarity. The lines represent the best fits to the ex-perimental curve of the vapour-dosed film assuming one-layer (dash) or two-layer (solid) models for the film structure.
-10 0 10 20 30 40 50
0
1x10⁻⁶
2x10⁻⁶
3x10⁻⁶
4x10⁻⁶
toluene condensation layer
d8-toluene
dry N2
ρ [A
-2]
Distance [nm]
Fig.2: Scattering length density profiles of the AuHDT film in dry N2 and a saturated d8-Toluene atmosphere.
Table 1. Thickness (dfilm) and scattering length density (ρfilm) of AuHDT film at various conditions
Vapour Model dfilm, nm ρfilm, A-2 dry N2 one layer 29.5 1.31x10⁻⁶
one layer 41.1 3.49x10⁻⁶ 31.1 1.91x10⁻⁶ d8-toluene two layers 5.57 4.68x10⁻⁶
References: [1]. Krasteva, N. et al., Langmuir, 2003, 19, 7754. [2]. Joseph, Y. et al., Faraday Discuss., 2004, 125, 77. [3]. Joseph, Y. et al., J. Phys. Chem. B, 2003, 107, 7406.
154

CHE-04-0910_LT.doc // Steitz // 16.03.04 Seite 1 von 1
EXPERIMENTAL REPORT Proposal N° CHE-04-910 LT
Instrument V6Depletion of water at the hydrophilicsolid/liquid interface Local Contact
Roland Steitz
Principal Proposer: R. Steitz, G.H. Findenegg, TU Berlin Date(s) of ExperimentExperimental Team: S. Schemmel, TU Berlin
R. Steitz, TU Berlin1.-7.7.200328.-31.10.20035.-11.12.2003
Date of Report: 16.01.2004
Lately, neutron reflectivity experimentsprovided evidence for the depletion of water atthe interface against extended hydrophobicsubstrates. 2-5 nm thick layers of reducedwater density (90% bulk water density) werefound [1, 2]. The depletion of water at thesesubstrates is seen as a (weak) dewetting ofthese single hydrophobic walls in contact withwater as theoretically predicted [3].
Here, we report on neutron reflectivityexperiments on the interface of morehydrophilic substrates in contact with water.The substrates consisted of polyelectrolytemultilayers, PEI/(d-PSS/PAH)6 and PEI/(d-PSS/PAH)6/d-PSS, prepared on silicon singlecrystals, which served as the top of a flow cellmade up by a Teflon trough. The multilayersabsorb substantial amounts of water.Therefore, they are suspected invisible to theimpinging neutrons upon appropriatescattering length density (sld) of the liquidphase. The neutrons ( = 0.466 nm) assessedthe polyelectrolyte/liquid interface through thesilicon backing. A set of typical reflectivitycurves from the same polyelectrolyte coatingupon different contrasts (by changing theD2O/H2O ratio) of the water fronting is shownin Figure 1. The reflectivity of the solid/liquidinterface is strongly dependent on the sld ofthe bulk water phase. The conditionalscattering length density of the 28-30 nm thickpolyelectrolyte films was extracted from fits tothe spectra (solid lines in Fig. 1) and plottedversus the sld of the water fronting (Fig. 2).The matchpoint of film and water sld wascalculated from a linear fit to the data to5.03·10-6 Å-2. For this condition the Kiessigfringes stemming from the interference ofneutrons that are reflected at the silicon/filmand at the film/water interface, respectively,are completely suppressed (Fig. 1, middle).This finding proves that the polyelectrolytecoatings are contrast matched and subse-quently, that there is no depletion of water atthe hydrophilic polyelectrolyte/liquid interfaceat first glance. At least it is save to say that it is
Fig. 1: Reflectivity from the interface of a PAHterminated film against water of different sld. Thesolid line “Index match” is the calculated reflectivityof the interface for the invisible film at this condition.
Fig. 2: Plot of the conditional sld of the PAH termi-nated films, Nb Film, versus the sld of the waterfronting, Nb Subphase, and linear fit to the data(solid line).
much less pronounced than that observed atthe hydrophobic solid/liquid interface.
[1] R. Steitz et al., Langmuir 19 (2003) 2409[2] D. Schwendel et al., Langmuir 19 (2003) 2284
0,0 0,6 1,2 1,810-6
10-5
10-4
10-3
10-2
10-1
100
101
* 10
* 1
* 0.1
Ref
lect
ivity
theta [deg]
D2O IMW 5.03 Index match H2O
-2 0 2 4 6
3
4
5
6
matchpoint = 5.03E-6 Å-2
106 x
Nb
Film
/ Å-2
106 x Nb Subphase / Å-2
Jul03 Oct03
155

CHE-04-0911_LT.doc // Steitz // 16.03.04 Seite 1 von 1
EXPERIMENTAL REPORT Proposal N° CHE-04-911LT
Instrument V6Depletion of methanol at the hydrophobicsolid/liquid interface Local Contact
Roland Steitz
Principal Proposer: R. Steitz, G.H. Findenegg, TU Berlin Date(s) of ExperimentExperimental Team: S. Schemmel, TU Berlin
R. Steitz, TU Berlin 2.-8. 6. 2003
Date of Report: 20.01.2004
Neutron reflectivity experiments conductedon the interface of deuterated polystyrene, d-PS, thin films and heavy water, D2O, revealeda depletion of water at the d-PS/D2O interface.2-5 nm thick layers of reduced water density(90% bulk water density) were found as afunction of air saturation of the water sampleand on the time elapsed after contacting it withthe hydrophobic surface [1].
In 2003 we continued above line ofexperiments on the interface d-PS films spin-coated on silicon substrates, in contact withless hydrophilic liquid phases, namelydeuterated methanol, CD3OD, hydrogenatedmethanol, CH3OH and deuterated isopropanol,C3D7OD. Reference measurements were alsoconducted on the d-PS samples against airand D2O. The d-PS coated silicon single crys-tals served as the top of a flow cell made up bya Teflon trough. The neutrons ( = 4.66 Å)assessed the d-PS/liquid interface through thesilicon backing. Each reflectivity run took 10h.
Figure 1 shows the reflectivity curves ofthe interface of d-PS coating 1 against deuter-ated and hydrogenated methanol, respectively.Against CD3OD the Kiessig interferencefringes of the interface are very much suppres-sed due to the small scattering length density(sld) difference (0.60·10-6 Å-2) between the d-PS film (Nbd-PS = 6.41·10-6 Å-2) and the liquidsubphase (NbCD3OD = 5.81·10-6 Å-2). The situa-tion is reversed after displacement of CD3ODby CH3OH. The interference fringes are fullyretrieved. The sld difference in that case is6.56·10-6 Å-2 (NbCH3OH = -0.37·10-6 Å-2). The de-tailed analysis of the spectra revealed that thesld and the apparent thickness of the d-PScoating are dependent on the fronting. The firstfinding is easily explained a minor imperfectionof d-PS film 1. It contains cavities with avolume fraction of 0.034 to 0.067 (as extractedfrom the individual measurements against airand CH3OH). They are filled by the particularfronting. The second finding is more peculiaras it is only observed in case of the CD3ODfronting. While in all other cases, with subse-
Fig. 1: Reflectivity from the interface of d-PS coa-ting 1 against deuterated and hydrogenated metha-nol. Solid lines are fits to the data corresponding tothe real space profiles shown in the Inset.
quent measurements against air(1), D2O,air(2), CD3OD, CH3OH, air(3), C3D7OD, air(4),in that order, the thickness of the d-PS coatingis 237 – 240 Å, it is only for the CD3OD frontingthat the thickness is 257 Å (see Fig.1 Inset).As this change in thickness of ~20 Å is onlytemporary, and vanished after displacement ofCD3OD by CH3OH, it is not a deuterated con-tamination the d-PS film, stemming from theCD3OD subphase. If it was a hydrogenatedcontamination, it would show up again whenmeasured against C3D7OD, which was not thecase.
The origin of the apparent increase inthickness is presently unclear. However, onemay speculate whether it is the reverse of thedepletion that is induced in the D2O subphase.For this d-PS coating a depletion of 16% bulkwater density is found in a 21 Å thick liquidlayer against bulk D2O. The apparent increasein thickness of ~20 Å when measured againstCD3OD would indicate a surface enrichment of~8% bulk methanol density in the liquid phase.Further experiments are necessary to confirmabove observation.
[1] R. Steitz et al., Langmuir 19 (2003) 2409
0,0 0,5 1,0 1,5 2,0 2,5 3,0
10-5
10-4
10-3
10-2
10-1
100
-100 0 100 200 300
0
2x10⁻⁶
4x10⁻⁶
6x10⁻⁶
Ref
lect
ivity
scattering angle, theta [deg]
CD3OD CH3OH
CH3OH
CD3ODd-PS
distance from interface, z [Å]
Nb
[Å-2]
CD3OD CH3OH
Si
156

CHE-04-0912_LT.doc // Steitz // 16.03.04 Seite 1 von 1
EXPERIMENTAL REPORT Proposal N° CHE-04-912 LT
Instrument V6Surfactant layers at the Si/liquid interface asa function of time and temperature Local Contact
Roland Steitz
Principal Proposer: R. Steitz, G.H. Findenegg, TU Berlin Date(s) of ExperimentExperimental Team: S. Schemmel, TU Berlin
R. Steitz, TU Berlin 8.-12. 5. 2003
Date of Report: 28.01.2004
Recently, grazing incidence small angleneutron scattering experiments (GISANS) onthe interface of a hydrophilic silicon substrateand a diluted solution of a nonionic surfactant,C8E4, in D2O, lead to a revised picture of thestructure of the surfactant adsorbed layer.Contrary to expectation of isolated surfactantaggregates of equilibrium shape and sepa-ration, transient surfactant clusters with nopreferred lateral structure were found at halfcoverage of the interface [1].Here, we report on neutron reflectivity experi-ments conducted on the same system, hydro-genated C8E4 in D2O, against a hydrophilicsilicon wall, under experimental conditions thatwere identical to the ones of the GISANSexperiments. The neutrons ( = 4.66 Å) asses-sed the solid/liquid interface through the siliconbacking of the flow cell. A set of typicalreflectivity curves from the pure silicon/D2Ointerface (reference) and from the interfaceagainst solutions of C8E4 in D2O is shown inFig. 1. Each reflectivity curve was measuredfor 1½ times (~10-12 h) to crosscheck on timedependence. As is obvious from Fig. 1, thereflectivity of the solid/liquid interface did notchange upon displacement of D2O by the C8E4solutions in D2O, nor was it dependent on C8E4concentration or sample temperature. Asecond set of experiments with an independ-ently prepared solution C8E4 in D2O (C8E4 II.)confirmed the results obtained from the first setof experiments. In addition, we did not observeany time dependence of the reflectivity in anycase. This result is very different from theresults of the GISANS experiment where astrong off-specular signal was observed as afunction of sample temperature, indicative of afragmented C8E4 adsorption layer at thesilicon/liquid interface.Presuming an adsorbed amount of 5.7 molC8E4/m2 according to results obtained by Kiralyet al. by calorimetric measurements oncontrolled pore glasses [2] and a layer thick-ness of 50 Å (diameter of a C8E4 micelle), the
Fig.1: Neutron reflectivity from the Si/C8E4 solutioninterface
scattering length density (sld) of the adsorptionlayer would be 4.19·10-6 Å-2 with a surfactantvolume fraction = 0.35. This layer wouldshow up in the reflectivity pattern of theinterface as the black solid line in Fig. 1 (adlayer 1). Clearly, experimentally this is not thecase. Reducing the ad layer thickness to 25 Åwhile keeping the adsorbed amount constantincreases to 0.70 and thus decreases the sldof the ad layer to 2.02·10-6 Å-2 (ad layer 2, redline in Fig. 1). In the latter case the sld of thead layer is perfectly matching the sld of thesilicon backing and therefore, the C8E4adsorption layer is invisible to the neutrons.The same is true for a C8E4 ad-layer of 53 Åthickness and = 0.70 as was found at thePMMA surface [3]. Therefore, the C8E4 ad-layer cannot be resolved with the givencontrast. Reversed contrast (deuterated C8E4in H2O) has to be applied to resolve the adlayer in future experiments.
[1] Steitz, R.; Findenegg, G.H.; Müller-Busch-baum, P.; Schemmel, S.; Cubitt, R.; ILLExperimental Reports 2003, 9-10-638
[2] Kiraly, Z.; Börner, R.H.K.; Findenegg, G.H.Langmuir 1997, 13, 3308
[3] Steitz, R.; Uredat, S.; Findenegg, G.H.;BENSC Experimental Reports 1999, 235
0,0 0,5 1,0 1,5 2,0 2,5 3,0 3,5
10-5
10-4
10-3
10-2
10-1
100 D2O C8E4 (0.8 cmc), 24 °C C8E4 (0.8 cmc), 35 °C C8E4 (2.0 cmc), 24 °C C8E4, II. (0.8 cmc ) 24 °C ad layer 1 ad layer 2
Ref
lect
ivity
Scattering angle, theta [deg]
157

EXPERIMENTAL REPORT Proposal N° PHY-01-1229Instrument V1Stability of Lipid Bilayers upon Interaction with
Membrane Active Molecules Local Contact Th. Hauss, S. Dante
Principal Proposer: Beate Klösgen, Phys. Dept., Univ. ofSouthern Denmark, Odense, DenmarkBeate Klösgen, Univ. of Southern DenmarkMargitta Dathe, Inst. of MolecularPharmacology, Berlin-Buch, GermanyThomas Hauss, HMI Berlin, Germany
Experimental Team:
Sylvia Dante, HMI Berlin, Germany
Date(s) of Experiment
29.4.-3.5.2003*
Date of Report: 26/01/2004
Small organic molecules are surprisinglyabundant natural tools that are found as neuro-transmitters, as second messengers and asswitching regulators in complex reactions. Inaddition to their direct chemical activity theymay as well affect membrane functionality asmodulators of the bilayer fluidity and / orstiffness. Many of them are amphiphilic andreadily partition into fluid (lipid) bilayers, butthe related interaction mechanisms as well asthe structural changes induced upon that inter-action are not known. Such membrane-activeand reactive molecules are promising candi-dates for the design of drugs as e.g. modernanesthetics and novel antibiotics [1, 2].Here we report about an investigation of theantimicrobial peptide KLA1. The peptides of
Fig.1 : Small angle scattering patterns collected from stacks ofPOPC membranes. Repeat distances: down most: almost drysample (52.3Å); middle: in 50µM KLA1 solution in D2O(62.3Å); uppermost: in pure D2O (62.2Å (1st order); 62.1Å(2nd order)). No further changes were observed within hours.
the KLA class are artificial and mimic thenatural frog toxin magainin[3]. Already atvery low concentrations (10-50nM) they are
aggressive antibacterial molecules that induceimmediate leakiness with subsequent cell death.KLA1 comprises 18 amino residues; it is solublein water and acquires a helical amphiphilic struc-ture with approaching polar surfaces as mem-
Fig. 2: Cryo-TEM image ofvesicles of SOPC, exposed toa KLA1 solution (50nM) for 2min before being rapidlyfrozen.
branes. Two competing models, the barrel and thecarpet [4] formation, are discussed as structuralbasis of the observed lysis. Both require theassociation of several peptide molecules. Anotheroption is a continuous softening of the membranethat might initiate a transition into a non-lamellarphase, at least locally. Such a feature is accessibleby small angle scattering experiments on stacks ofmembranes. As a model system pure lipid bi-layers of palmitoyl-oleoyl-phosphatidylcholine(POPC) were chosen and exposed to an excessaqueous bulk solution of KLA1, up to 50µMconcentration.The results are shown in fig.1 and prove that thelamellar state of the membranes persists. Theformation of stable passage structures is thus ruledout. Moreover, the bilayers are not significantlysoftened as the repeat distances are independent ofthe presence of KLA1.
158

This view is also supported by findings fromelectron micrsocopy (see fig.2) that show anincreased affinity of adjacent bilayer to adhereand even fuse, as compared to control sampleswithout KLA1. The bilayer feature itself ishowever not destroyed. This is also substanti-ated by conductivity measurements on blacklipid membranes (BLM, not shown here) thatindicate the presence of fluctuating poresrather than supporting the idea of stablebarrel-like structures or carpet-supportedleakage files.The integrity of essentially intact lipid bilayersthat was found even after long times of expo-sure was rather surprising in view of theleakage rates reported from fluorescencemeasurements. The membranes are extremelyweak when exposed to mechanical stress: evenat lowest KLA1 concentrations a globalporosity makes it impossible to apply forcesand to measure elastic parameters by use ofmicroaspiration techniques (Kim & Klösgen,in preparation). All in all, it was impossible tosubstantiate one of the models discussed sofar; instead, a dynamically fluctuating porestructure might explain, as a third model, thelytic effects and the mechanical weakness andalso the apparent structural stability. Still, theinsertion and the localization of the peptide inthe membrane shall be further explored. Wetherefore aim to continue with a combinedstudy using calorimetry, fluorescence, andsmall angle neutron scattering. The latter shallthe give information about the average posi-tion of the peptide as it can be extracted fromthe scattering profile determined from experi-ments on a system of lipid bilayers anddeuterated peptides.
References
[1] S. Schreier, S.V.P. Malheiros and E. de Paula,Biochimica Et Biophysica Acta-Biomembranes1508 (2000) 210-234.
[2] W. van 't Hof, E.C.I. Veerman, E.J. Helmerhorstand A.V.N. Amerongen, Biological Chemistry382 (2001) 597-619.
[3] M. Dathe, J. Meyer, M. Beyermann, B. Maul, C.Hoischen and M. Bienert, Biochimica EtBiophysica Acta-Biomembranes 1558 (2002)171-186.
[4] J.A. Whiles, R. Brasseur, K.J. Glover, G.Melacini, E.A. Komives and R.R. Vold,Biophys. J. 80 (2001) 280-68.
159

Experimental report B10-01-1233 Dennison // brandt // 17.11.03 Seite 1 von 1
EXPERIMENTAL REPORT Proposal N° BIO-01-1233
Instrument V1
Neutron diffraction studies on the membrane
interactions of m-calpain, domain V. Local Contact Thomas Hauß
Principal Proposer: David. A. Phoenix, University of Central Lancashire Date(s) of Experiment Experimental Team: Sarah. R. Dennison, University of Central Lancashire
Frederick Harris, University of Central Lancashire
Silvia Dante, HMI Berlin
06/10/02 – 09/10/02 15/01/03 – 30/01/03
Thomas Hauß, HMI Berlin
Date of Report:
17/11/03
Introduction m-Calpain is a medically important, calcium dependent heterodimeric protease whose activity appears to be modulated by lipid / membrane interactions [1]. Theoretical analyses of mammalian m-calpains identified a common sequence, GTAMRILGGVI (VP1) with the potential to form a lipid interactive a-helix [2]. This was confirmed by experimental analysis, which showed that VP1 adopts high levels of a-helical structure in the presence of various lipids [3]. Further theoretical analysis predicted that the a-helix possessed structural amphilicity and a gradient of hydrophobicity similar to those of known oblique orientated a-helices [3].
A series of measurements were undertaken by the V1 membrane diffractometer, in order to determine the location of domain V in a model membrane, representative of a biomembrane. The V1 instrument is ideally suited to these experiments which utilize stacked lamellar bilayers with the peptide lying within the bilayer.
Experiment and Results Protonated VP1 and deuterated VP1* (GTAMRIL(d10)GGVI) were synthesized by solid state methods and purified by HPLC to a purity greater than 98%. Chloroform solutions of palmitoyloleyl phosphatidycholinec (POPC) and palmitoyloleyl phosphatidyserine (POPS) were prepared (10:1 molar ratio) and used to separately solubilise VP1 and VP1* (lipid: peptide molar ratio 97:3). The samples were then evenly sprayed onto a quartz microscope slide using an artist’s airbrush. Under these conditions, lipid samples self assemble to form multi-lamellar structures, which may be considered as stacked membrane bilayers. These treated slides were placed in a vacuum desiccator for 12 h to remove all traces of chloroform. Samples were then individually placed in an aluminium thematically controlled sample can and rehydrated for 24 h at 25oC with relative humidity maintained at 98% using Teflon water baths containing saturated potassium sulphate solution. Three isotopic compositions: 50%, 20% and 8% 2H2O were used to assist with phase assignment. After each completed neutron diffraction measurement the sample slide was rehydrated with the water at the next isotopic composition with at
least 24 h allowed for equilibration. The scattering intensities were recorded up to the 5th order. Data analysis was performed according to Hauß
[4] and the resulting scattering length density profiles are shown in Figure 1.
10x10-3
5
0
-5
-10
sca
tte
rin
g d
en
sity
(a
.u.)
50403020100
z(Å)
Figure 1. Shows the neutron scattering density profile generated by a POPC/POPS membrane (continuous grey) in the presence of VP1 (continuous black) and VP1* (dotted black).
Discussion In the presence of POPC:POPS lipid membranes, VP1 showed a neutron scattering density profile (figure1) consistent with penetration of the acyl chain region of these membranes. These results support the prediction that m-calpain VP1 segment penetrates the membrane.
In contrast, the presence of VP1* showed no significant effect on the neutron scattering density profiles suggesting that there were no significant levels of VP1* penetration with POPC/POPS membranes. Recent monolayer studies have shown there is no significant interaction with DMPC:DMPS at a similar lipid ratio. In combination with these results it would suggest that the deuteration of the GTAMRILGGVI leucine residue has affected the ability of the segment to interact with membranes. Further investigations are on-going.
References [1] Biswas, S., Harris, F., & Pheonix, D. A. (2001) Biologist. 48. 273-277 [2] Damen, A., Harris, F., Biswas, S., Wallace, J., & Phoenix, D. (2001) Mol Cell Biochem. 223. 159-63 [3] Brandenburg, K., Harris, F., Dennison, S., Seydel, U & Phoenix, D. (2002) Eur J Biochem. 269, 5414-22 [4] Hauß, T., Dante, S., Dencher, N. A., & Haines, T.H., (2002) Biochim Biophys Acta. 1556. 149-54
160

BIO-01-1294+1384.doc // brandt // 03.03.04 Seite 1 von 2
EXPERIMENTAL REPORT Proposal N° BIO-01-1294 BIO-01-1384
Instrument V1Peptide Membrane Interaction
Local Contact Dr. Th. Hauß
Principal Proposer: Dr. Regine Willumeit, GKSS, Geesthacht Date(s) of ExperimentExperimental Team: Dr. Mont Kumpugdee, Sebastian Linser,
Frank Förster, GKSS, Geesthacht 01.06.-13.06.0328.07.-10.08.03
Date of Report: 04.11.03
IntroductionAntibacterial peptides which are a componentof the innate immune system of most speciesare possible antibiotic candidates to overcomethe development of resistance by bacteria. Theattractiveness of these molecules is based ontheir small size (in most cases less than 30amino acid residues) and their interaction withthe membrane of the target cell. The mode ofaction is so far not understood but there isevidence that a direct physical attack of themembrane lipids rather than a proteinmediated mechanism leads to membranedisruption and cell death. In this work the synthetic peptide NK-2 is in thefocus of interest. It is derived from NK-lysin, anantibacterial and cytotoxic protein, which isisolated from porcine NK-cells. In contact withthe cell membrane the peptide (res. 39-65 ofNK-lysin, with minor modifications), resemblesan amphipathic -helix. NK-2 shows highactivity against various bacterial strains andCandida albicans, but does not exhibitcytotoxicity against human cells [1,2]. In order to understand the selectionmechanism with respect to the target cell andthe following membrane destruction theinteraction of the peptide with modelmembranes mimicking bacterial or red bloodcell membranes was investigated by SAXS,DSC, FTIR and neutron diffraction. While thefirst methods tell us how the lipids will reactupon contact with the peptide only neutrondiffraction can give us the information whereand how the peptide is positioned in themembrane. This should lead to anunderstanding of the reaction mechanism on amolecular level.In the above mentioned periods of beam timewe investigated model membranes composedof the phospholipids POPE and POPG.
Especially the latter is only abundant inbacterial cell membranes and furthermore as anegatively charged lipid it should be theelectrostatic counterpart for the cationicpeptide. POPE on the other hand is a criticalmembrane component because it exhibits anon-planar bi-layer structure which is assumedto support membrane fusion or membranedestruction in the case of peptide antibiotics. In previous measurements we tried to mimic abacterial membrane by mixing both lipids.Unfortunately it turned out that we did notachieve a homogeneous mixed bi-layer systembut that the two lipids separate. Consequentlywe started to investigate the position of NK-2in model membranes consisting of only onelipid well knowing that for a completeunderstanding of the system the interaction ofdifferent lipids might play an essential role.
MethodsIn different measurements native NK-2 andpartially deuterated peptides (amino acid inposition 2 (Isoleucine) and 23 (Leucine),Figure 1) were mixed with POPE or POPGvesicles and multi-lamellar films prepared.They were measured under 98% humidity(water) at three different contrast conditions(100%, 50%, 0% D2O) at 20° C.
Figure 1: Structure of NK-2 with highlighteddeuterated amino acids as derived from the NMR-structure of NK-lysin [3]
161

BIO-01-1294+1384.doc // brandt // 03.03.04 Seite 2 von 2
ResultsThe measurements resulted in well defineddiffraction peaks usually up to the 5th order(Figure 2). Only in the case of POPE in 100%D2O four orders were detectable. From the peak position it was calculated thatthe repeat distance of POPE (63 Å) wasslightly larger than for POPG which was 60 Å.
Figure 2: Comparison of the diffraction data ofPOPE and POPG in 100% D2O. It can be seen,that the repeat distance of the lipids varies slightly.
The addition of peptide did not lead to asystematic or significant change in the repeatdistance. Averaged over all contrast conditionsand samples the repeat distance of POPE wasdetermined to be 62 +/- 2 Å while it was 59 +/-2 Å for POPG. The calculation of thescattering length density profiles showed aquite different structural image (examples infigures 3 and 4).
Figure 3: Scattering length density profile of POPE+ NK-2[H].
While in the case of POPE the water layerbetween the lipid bi-layers is relatively smallthis changes in the case of POPG. Without a
peptide this is understandable since POPG isa negatively charged lipid. Still upon addition ofthe positively charged peptide the water layercould become smaller since the electrostaticrepulsion is smaller. We observe the contrary.An explanation could be the low concentrationof the peptide, here a mol ratio of 100 lipidsper one peptide was chosen. This would notseverely decrease the electrostatic repulsion.
Figure 4: Scattering length density profile of POPG+ NK-2[H].The preliminary data analysis revealed that thepositions of the peptide were quite different forPOPE and POPG. While a strong scatteringcontribution of the deuterated amino acid(s)was found outside the POPE membrane, forthe POPG membrane the label scattering waslocalized inside the membrane. It is alsoremarkably that for each model membrane thescattering contribution for the three differentlylabelled peptides is always found almost at thesame position. In terms of model building wetherefore expect the peptide as a whole is notinserting perpendicular into the membrane. So far no lipids resembling higher organismmembranes like erythrocytes walls have beenused as peptide counterpart in neutrondiffraction experiments. This should be a taskin the future where an investigation of theinteraction between NK-2 and POPC isplanned.
References[1] Andrä, J., Berninghausen, O., Wülfken, J.
and Leippe, M. (1996) FEBS Lett. 385, 96-100.
[2] Andrä, J. and Leippe, M. (1999) Med.Microbiol. Immunol. 188, 117-124.
[3] Andersson, M. et al. (1995) EMBO J. 14,1615-1625.
162

EXPERIMENTAL REPORT Proposal N° BIO-01-1295
Instrument V1 Interaction of lipids with peptide antibiotics Local Contact
Thomas Hauß
Principal Proposer: F. Bringezu, University of Leipzig Date(s) of Experiment Experimental Team: A. Gabke, University of Leipzig M. Majerowicz, University of Leipzig T. Hauß, S. Dante, HMI Berlin
05.05.-19.05.2003
Date of Report: 18.12.2003 Antimicrobial peptides are increasingly recognized as part of the innate defense system of animals and plants. The host defense peptides usually exhibit a high specificity towards their target cells, i.e. some show toxicity towards human erythrocytes while others are only active against microorganisms. The latter peptides are of major interest for the development of novel antibiotics. Such developments, however, require the understanding of the mode of action and the selectivity of active peptides on a molecular level. Our study is focused on Cynthaurin, a novel antimicrobial peptide from hemocytes of a tunicate, halocynthia aurantium. The native peptide has a mass of about 6.2 kDa and is composed of two 30-residue monomers. The latter were synthesized using deuterated amino acids to give the d-ALA5 and d-ALA21 monomers, which were used for the neutron diffraction studies. To get an insight in the structural details of the interaction of Cynthaurin with bacterial membrane lipids, measurements were performed on lipid bilayers composed of a POPC/POPG (3/1 mol/mol) mixture (S1) and subsequent mixtures with d-ALA5 (S2) and d-ALA21 (S3) in molar ratios of 3 mol% peptide respectively. Oriented samples were obtained by slightly dropping the dispersion on quartz slides (65 x 15 x 3 mm), removing the solvent using a vacuum dessicator (12 h) and final rehydration / incubation for 24 h at room temperature at 98 % humidity maintained by K2SO4 solution. Contrast variation was achieved by adjusting the atmosphere in the sample chamber at three different H2O/D2O compositions (50 %, 20 % and 8 % D2O). The diffraction intensities were measured up the 5’th order of the lamellar spacing at 20 °C. The sample quality was proofed by measuring the mosaicity using rocking scans. S1 shows a mosaicity of 0.3 ° indicating the excellent sample quality. Fig. 1 compares the diffraction patterns obtained for S1, S2 and S3, respectively. The data analysis was performed based on isomorphous replacement yielded the phased structure factors as plotted in Fig. 2.
Peptide adsorption leads to increased mosaicity thus the quality of the bilayer orientation is strongly decreased. From the calculation of the scattering length density profiles (Fig. 2) one could conclude that the peptide strongly adsorbs to the negatively charged head groups. For the d2-ALA5 in S2 the increased intensity in the hydrophobic core could be an indication for an membrane insertion of the helix with the C-terminal end of the chain. This was not found for S3 (d2-ALA21), but the increased SLD suggests predominant binding of the N-terminus of the helix at the negatively charged PG – head groups.
0.1 0.2 0.3 0.4 0.5 0.60.1
1
S1
Q / [Å-1]
S2
Inte
nsity
/ [a
.u.]
S3
Fig. 1. Diffraction patterns observed for pure lipid multilayers S1 and lipid Cynthaurin mixtures containing 3 mol % peptid S2 (d-ALA5) and S3 (D-ALA21).
-30 -20 -10 0 10 20 30
-0.01
0.00
0.01
0.02
S1 S2 S3
Scat
terin
g le
ngth
den
sity
z / [Å] Fig. 2. Scattering length density profiles as calculated from the diffraction data of S1, S2 and S3.
163

EXPERIMENTAL REPORT
Localizing the quinone domain of ubiquinone in theoxidized and reduced state
Proposal N BIO-01-1296
Instrument V1
Local Contact
T.Hauß
Date(s) of Experiment
29. 03. - 5. 04. 2003
Principal Proposer: Thomas Haines,City University of New York
Experimental Team: Silvia Dante, HMI and TU-DarmstadtT. Hauß , HMI and Heinrich-Heine-Uni DusseldorfNorbert Dencher, TU Darmstadt
Date of Report18. 12. 2003
Introduction
Ubiquinone (CoQ) is a major intermediate in an-imals and humans for ATP synthesys. It shut-tles electrons/protons across the mitochondrialmembrane. The molecule has 2 domains, thequinone domain with its redox capability anda large hydrocarbon domain composed of up to10 isoprene units. For its important function asredox shuttle, the quinone moves electrons andprotons in the membrane. In our recent investi-gations we were able to locate by neutron diffrac-tion a perdeuterated polyisoprene, i.e. squalane,in the bilayer center; protonated CoQ was alsolocalized in the core of a perdeuterated mem-brane (BIO-01-1234, unpublished results). Us-ing CoQ specifically deuterated in the quinonedomain, its location in the lipid bilayer shouldbe determined by neutron diffraction both forthe oxidized and the reduced state.
Experiment and Results
1,2-dimyristoyl-phosphatidylcholine (DMPC)and 1,2-dimyristoyl-phosphatidylserine (DMPS)were products of Avanti Polar Lipids; proto-nated coenzymeQ was obtained from Sigma,deuterated CoQ10 was synthezised in the labof Prof. Robert Bittmann in the Dept. ofChemistry and Biochemistry, Queens Collegeof CUNY. CoQ10 was reduced following awell-known chemical protocol. To keep it inthe reduced form, the following procedure wascarried on under Argon atmosphere. Chloro-form solutions containing DMPC/DMPS 90:10w/w with protonated and deuterated 10%molar CoQ10 were sprayed on quartz glass,resulting in oriented stacked lipid layers. Thetotal lipid weigth was 20 mg. Traces of thesolvents were removed by overnight dessication
at p < 1 mbar. The samples were than placedin thermostated aluminum cans in which thehumidity was controlled by aqueous saturatedsolutions of K2SO4 kept in Teflon resevoirs.The measuring temperature was T=25C.The diffraction measurements were performed0,08:0,92, D2O/H2O. Diffraction patterns wereobtained by rocking the samples around theexpected Bragg positions. Due to restrictedmeasuring time diffractograms up to the 6thorder for each sample were recorded, the totaltime for each scan being 24 h. Unfortunatelythis experiment gave no useful result. We hadthe feeling, during the sample preparation, thatthe synthesis of the deuterated CoQ10 had notbeen successful. In fact, the compound showeda different chemical behaviour, compared toCoQ10 in oxidized form. Moreover, it neverrecovered its yellow colour after oxidation. Theunsuccessful synthesis was confirmed later byMALDI-TOF. We plan to repeat the experimentafter new synthesis of deuterated CoQ.
[1] T. Hauß, S.Dante, N.A.Dencher and T.H.Haines,Biochimica Biophysica Acta, 1556 (2002) 149-154.
164

BIO-01-1387.doc // brandt // 16.03.04 Seite 1 von 1
EXPERIMENTAL REPORT Proposal N° BIO-01-1387 Instrument V1Investigation of model stratum corneum lipids
via neutron diffraction Local Contact Th. Hauss
Principal Proposer: M. Kiselev - MLU, Halle(Saale), Germany; JINR,Dubna, Russia. Date(s) of Experiment
Experimental Team: J. Zbytovska, S. Wartewig, R. Neubert - MLU, Halle.S. Dante, Th. Hauss - HMI, Berlin. 3.11-17.11.2003
Date of Report: 16.11.2003
Two mixed systems composed ofceramide 6/ cholesterol/ palmitic acid/cholesterol sulfate and DMPC/ ceramide 6were characterized via neutron diffraction.Samples were prepared as orientedmultilamellar stack of lipids on quartzsubstrate. Diffraction pattern was collected asrocking curves measured at appropriatescattering angles 2. The systems werestudied at two contents of humidity (60% and99%) at temperatures of 32 oC and 81 oC.
The low mosaicity of the ceramide 6/cholesterol/ palmitic acid/ cholesterol sulfatesample (0.12 degree) allowed to collect fiveorders of diffraction at T=32 oC as presentedin Fig. 1. The neutron scattering density acrossthe bilayer (x) was calculated from theintensities of diffraction peaks measured atthree different contents of D2O (8, 20, and50%). The internal membrane structure wasdetermined by fitting the (x) function with fourGaussian functions corresponding to theposition and width of polar head groups,cholesterol molecules, hydrocarbon chains,and CH3 groups (Fig 2). The parameters of thesystem presented at Fig. 1 and 2 are: lamellarrepeat distance 45.60.5 Å, membranethickness 45.6 Å, width of polar region 4.8 Å,position of cholesterol molecules 13.2 Å, widthof CH3 region 7.2 Å. The equal values of therepeat distance and membrane thicknessreflect the low hydration of the multilamellarstructure. This finding was proved viameasurements of the system in excess ofwater, which showed an increase of the repeatdistance from 45.6 Å at 60% humidity to 47.2 Åat full hydration. The full hydration of themembrane takes about 19 hours and creates1.6 Å water layer between the membranes.Water molecules penetrate into the lipid bilayeron a thickness of 8.8 Å.
Increasing the temperature to 81oC at97% humidity, the present quaternary systemexhibits two phases with repeat distances of40.5 Å and 45.8 Å.
Fig. 1. Rocking curves measured at 6 differentdetector angles 2=7, 11.2, 16.8, 22.4, 28,33.6 degree from the system ceramide 6/cholesterol/ palmitic acid/ cholesterol sulfatewith components ratio 55/25/15/5 (w/w). 60%humidity, T=32 oC , 8% D2O.
-20 -10 0 10 20-15 -5 5 15 25-25
x, Å
-40
0
40
80
120
x
), a.
u.
Fig. 2. The neutron scattering length densityprofile (red points) and fitting curve (solid redline) for the system presented at Fig. 1.Dashed lines corresponds to the position andwidth of the polar head group (light blue),cholesterol (blue), CH2 chains (pink), and CH3groups (black).
0,0 0,1 0,2 0,3 0,4 0,5 0,6 0,7 0,8 0,91000
10000
100000
d=45.6±0.5Å
Inte
nsity
, a.u
.
Q,Å-1
165

EXPERIMENTAL REPORT
Interaction of β-amyloid peptide (1-42) with lipidunilamellar vesicles
Proposal N BIO-01-1427
Instrument V1
Local Contact
Date(s) of Experiment
29. 09. - 19. 10. 2003
Principal Proposer: Silvia Dante, HMI and TU-Darmstadt
Experimental Team: T. Hauß , HMI and Heinrich-Heine-Uni DusseldorfNorbert Dencher, TU Darmstadt
Date of Report17. 12. 2003
Introduction
In previous neutron diffraction investigations, wewere able to locate a selectively deuterated frag-ment of β-amyloid peptide in membranes of dif-ferent lipid composition [1], and with differentpreparation methods [2]. In the present studywe have extended our investigation to the inter-action of the full length β-amyloid peptide Aβ(1-42) with lipid unilamellar vesicles.
Experiment and Results
Dimiristoyl-phosphatidylcholine (DMPC), fulldeuterated dimiristoyl-phosphatidylcholine(d67-DMPC), dimiristoyl-phosphatidylserine(DMPS), and deuterated dimiristoyl-phosphatidylserine (d54-DMPS) were productsof Avanti Polar Lipids; Aβ(1-42) was purchasedby Bachem. Unilamellar vesicles of protonatedDMPC/DMPS and deuterated d67-DMPC/d54-DMPS were prepared by sonication. The totallipid amount per sample was 10 mg, and themolar ratio DMPC/DMPS was 10:1. The samevesicle dispersion was used to prepare twosamples, with and without Aβ(1-42). The incu-bation of the peptide (3% molar) was carried onadding aliquots of the peptide solutions to thevesicles while a short sonication burst of twoseconds was applied by a bath type sonicator,to mix the sample and increase the diffusionof the peptide. The time interval betweenthe additions of two successive drops was atleast 15 minutes. The vesicle dispersions werethan placed on quartz slides and let to dry ina dust free environment. The samples werethen placed in thermostated aluminum cans inwhich the humidity was controlled by aqueoussaturated solutions of K2SO4 kept in Teflonresevoirs. This procedure adjustes the relative
humidity to 98%. The measuring temperaturewas T=40C. The diffraction measurements wereperformed at different isotopic ratios of the at-mosphere, namely 0,5:0,5, 0,2:0,8, 0,08:0,92, 0:1D2O/H2O. Diffraction patterns were obtainedby rocking the samples around the expectedBragg positions. The total time for each scanwas 24 h. Neutron diffraction spectra showedup to the 5 diffraction orders. The presence ofAβ(1-42) affected greatly the mosaicity and thespacings of the samples. The scattering densityprofile of the protonated membrane in presenceand absence of and Aβ(1-42) are shown in Fig.1. Further data evaluation and modeling arecurrently in progress.
[1] S.Dante, N.A.Dencher and T.Hauß, BiophysicalJournal, (2002) 2610-2616, 83[2] S.Dante, N.A.Dencher and T.Hauß, Biochemistry,(2003) 13667-13672, 42
10
5
0
-5
scattering length density
-20 -10 0 10 20
z (Å)
protonated membrane protonated membrane
+ Ab(1-42)
Figure 1: Diffraction patterns of a protonated lipidmembrane with and without Aβ(25-35), in atmosphereof 98% H2O
166

x.doc // brandt // 17.03.04 Seite 1 von 1
EXPERIMENTAL REPORT Proposal N° BIO-03-258Instrument V3Transfection efficiency versus membrane dynamics
in DNA-cationic lipoplexLocal Contact Jörg Pieper
Principal Proposer: Francesca Natali, OGG-INFM, Grenoble, Fr Date(s) of ExperimentExperimental Team: Carlo Castellano, Università di Roma, Italy
Jörg Pieper, BENSC, Berlin, DEAlexandra Buchsteiner, BENSC, Berlin, DE
24/02/2003-03/03/2003
Date of Report: 26/01/2003
The use of cationic liposomes (CL) to deliver DNA into cells hasreceived great attention in gene therapy.Recent studies have clearly shown that CL-DNA complexes arecomprised of liquid crystalline structures where a periodic onedimensional (1D) lattice of parallel DNA strands is confinedbetween two dimensional (2D) lipid bilayers. Duringcomplexation the cationic lipids neutralize the negative charge ofDNA and allow the complex to approach the anionic surface of acell. Cationic liposomes contain both cationic and neutral lipid(or the so-called helper lipid) and different morphologies areexpected to arise for the choice of the non-ionic lipid. Inparticular this last seems to influence and often to improve thetransfection efficiency acting on the structure of the complex butalso on its dynamics (the rigidity of cationic lipid membranes ismodified by this “fluidising factor”). The resulting complexstructure varies from a lamellar to a hexagonal phase as afunction of the lipid composition and of the neutral lipid/chargedlipid ratio. In the case of the neutral DOPC the liposomescomplexes consist of the above mentioned multilayer structurewith strands of DNA confined in aqueous solution regions. Therelationship between system composition and the concentrationof DNA in the complexes is of special interest because thetransfection efficiency can be related to the amount of DNAentering the cell. In this context to understand the protondynamics (mainly arising from the H atoms) governed by theneutral-cationic lipid mixture we already performed at IN13(ILL) elastic incoherent neutron scattering experiments in a widetemperature range. These measurements have shown a not negligible influence ofDNA concentration on the anisotropy of membrane dynamics. Inparticular, the out of plane motion of the lipids seems to bestrongly affected by the presence of high DNA concentration, inparticular at the isoelectric point. This result could be assigned toan increased dynamics of the space restricted vertical translationof the lipid molecules. To confirm the suggested hypothesis, aquasi-elastic investigation was needed. The aim of the presentproject was exactly to get a deeper knowledge on the DNA-liposomes interaction, investigating the dynamics that characterisesthese systems by a quasi-elastic investigation, thus extending ourfirst IN13 elastic neutron scattering study. We have measuredQENS spectra on V3 time of flight multichopper spectrometer(NEAT) in a large energy range (between –1.8 mev and 8.0 eV),in the Q range between 0.38 and 2.18 Å-1 with an incidentwavelenght = 5.1 Å and an energy resolution E = 93eV, onoriented lipoplex membrane in order to establish if a significantquasi-elastic contribution difference could be pointed out. Wehave performed our measurements in the low temperature regime(around 250 K), where the system is supposed to be frozen in agiven conformation, and at room temperature. Lamellar DNA-cationic lipoplex have been prepared by mixing small unilamellarliposomes obtained sonicating the mixtures of cationic lipid suchas dioleoyl trimethylammonium propane (DOTAP) and a neutrallipid such as dioleoyl phosphatidylcholin (DOPC) with linearDNA.Three different DNA-cationic concentration ratios havebeen investigated at the two temperature points: in particular thepure DOTAP/DOPC lipid mixture with a neutral lipid percentage= 0.50, the complex CL-DNA with excess of cationic lipid ( =4) and at the isoelectric point ( = 2.2). We have also acquired
spectra of the empty cell (sample-holder plus SiO2 wafers onwhich the complexes are deposited) and of standard vanadium. Inparticular, by building up oriented structures, the investigation hasbeen independently selective to the in-plane and out-of-planemembrane motion, depending by the direction of the beam respectto the normal to the sample (135º and 45º respectively). A first dataanalysis performed using the program PROFIT shows apronounced dynamics in both in and out-of-plane motions of thelipid molecules in the ~10 ps time scale, time-window accessibleby the used instrument V3. In particular we denote the presenceof the same kind of anisotropy in the H dynamics at theisolelectric point, that we already evidenced by our former elasticexperiments in a slower time scale (~100 ps). We have analysedour data using one Lorentzian contribution and the vanadiumscan for the experimental resolution function, calculating theEISF of the system as a function of Q at high and lowtemperature (see figure below for the T = 300 K case at theisoelectric point). Using the AGATHE program we haveevidenced that the model of rotation over a circle for the in-planemotions (chain defect motions and rotational diffusion) and themodel of the diffusion inside a restricted volume like a sphere ofradius around 1.6 Å (model of Volino and Dianoux) for the out-of-plane ones well reproduce the EISF behaviour and the HWHMof the quasi elastic component. Further data analysis is howeverin progress.
References: C.R. Safinya, Curr. Opinion Str. Biol. 11, 440(2001); S. König, W. Pfeiffer, T. Bayerl, D. Richter, and E.Sackmann, J. Phys. II France 2, 1589 (1992); C. Castellano, F.Natali, D. Pozzi, G. Caracciolo and A. Congiu, Physica B, inpress; M. Bée, Quasielastic Neutron Scattering: principles andapplications in solid state chemistry, biology and materialscience, Adam Hilger, Bristol, 1988.
0 .4
0 .5
0 .6
0 .7
0 .8
0 .9
1
0 0 .5 1 1 .5 2 2 .5
= 2 .2
in p la n eo u t o f p la n e
EIS
F
Q ( Å -1 )
T = 3 0 0 K
167

BIO-03-0265.doc // brandt // 03.03.04
EXPERIMENTAL REPORT Proposal N° *BIO-03-0265
Instrument *V3Effect of the environment on lysozyme dynamics. Aquasielastic neutron scattering study. Local Contact
*Joerg PieperPrincipal Proposer: Dr. A. Paciaroni, Università di Perugia Date(s) of ExperimentExperimental Team: Dr. A De Francesco, Università di Perugia
Dr. L.E. Bove, INFM, GrenobleDr. Joerg Pieper, BenscM. Marconi, Università di Perugia
*03-09/02/2003
Date of Report: *14/03/2003
We performed an inelastic and quasielasticneutron scattering investigation on lysozymesolvated with both deuterated glycerol andheavy water. The experiment was performedat the V3 spectrometer with an incidentneutron wavelength of 8 Å and an energyresolution of 30µeV. We measured thefollowing lysozyme + deuterated glycerol +heavy water mixtures (numbers refer to therelative weight of lysozyme-glycerol-water):1:1:0 and 1:1:0.4. All the samples have beenmeasured both at 200K and at 300K. The low-temperature measurements were performed toestimate the vibrational contribution for eachsample. This has to be subtracted to the roomtemperature intensity after Bose rescaling inorder to properly evaluate the only quasielasticsignal. Fig. 1 shows the dynamical structure factorS(2,E) of the samples 1:1:0 and 1:1:0.4 at anaverage 2 value of 75o at 200K. In both thecases is well visible an inelastic bump, whosecentre seems to shift to higher energies ashydration increases. At room temperature a quasielastic signal hasbeen revealed. Its intensity increases as afunction of the hydration degree. In fact, Fig. 2shows that the quasielastic signal of thesample 1:1:0.4 is enhanced with respect to1:1:0 sample. On the same figure, we showthat, after the Bose rescaling, the 200Kspectrum of the sample 1:1:0 superimposes tothe 300K intensity at the same hydration levelfor energies above ~5meV. Even if the dataanalysis is still in progress we have found thatthere is quasielastic signal also in the energyrange immediately above 0.015 meV, thus
justifying the need to use the high energyresolution configuration.
Fig.1
E (meV)0 2 4 6 8 10 12 140.000
0.005 0 h T=200K 0.4 h T=200K
S(2
) (
a.u.
)
E (meV)
168
0 21E-3
0.01
0.1
1
10
S(2
) (
a.u.
)
Fig.2
V3 in
Seite 1 von 1
4 6 8 10
0 h T=200K 0 h T=300K 0.4 h T=300K
E (meV)

BIO-03-0291.doc // brandt // 03.03.04
EXPERIMENTAL REPORT Proposal N° *BIO-03-0291
Instrument *V3Effect of the environment on lysozyme dynamics. Aquasielastic neutron scattering study.
Local Contact *Joerg Pieper
Principal Proposer: Dr. A. Paciaroni, Università di Perugia Date(s) of ExperimentExperimental Team: Dr. A De Francesco, Università di Perugia
Dr. L.E. Bove, INFM, GrenobleDr. Joerg Pieper, Bensc *18-27/08/2003
Date of Report: *5/01/2004
We performed an inelastic and quasielasticneutron scattering investigation on lysozymesolvated with both deuterated glycerol andheavy water. The experiment was performedat the V3 spectrometer with an incidentneutron wavelength of 8 Å and an energyresolution of 30µeV. This experiment wasconceived to complete the data set of theexperiment BIO-03-0265 (see the relative exp.Report). We measured the following lysozyme+ deuterated glycerol + heavy water mixtures(numbers refer to the relative weight oflysozyme-glycerol-water): 1:1:0.1, 1:1:0.2,1:1:0.3, 1:1:0.6 at 200K and at 300K. The low-temperature measurements were performed toestimate the vibrational contribution for eachsample. This has to be subtracted to the roomtemperature intensity, after Bose rescaling, inorder to properly evaluate the only quasielasticsignal. Fig. 1 shows the dynamical structure factorS(2,E) binned in the whole angular range atan average 2 value of 75o at 200K. Theinelastic bump centred at about 4meV seemsto shift to higher energies as hydrationincreases. At room temperature the quasielastic intensityincreases as a function of the hydrationdegree. This is shown in Fig. 2 where themeasured dynamical structure factor isreported. The double logarithmic scale allowsus to reveal the features of the quasielasticsignal over a wide energy range (The dashedline is the experimental resolution function). Athigh hydration values this contribution beginsimmediately above 0.015 meV, thus justifyingthe need to use V3 in the high energyresolution configuration, and extends up to~5meV.
1
1E-3 0.01
1E-4
1E-3
0.01
0.1
1
S(2
,E) (
a..u
.)
0 2 40.0000
0.0002
S(2
,E) (
a..u
.)
169
Fig.
2
6 8 10 12 14
1:1:0 1:1:0.2 1:1:0.4
E (meV)
Fig.
Seite 1 von 1
0.1 1 10
1:1:0.4 1:1:0.3 1:1:0.2 1:1:0.1 1:1:0
E (meV)

EXPERIMENTAL REPORT
Dynamics of hydration water in model
membrane systems
Proposal N: Bio-03-306 EF
Instrument: V3
Local contact: A. Buchsteiner
Principal proposer:
Experimental team:
A. Buchsteiner, HMI
A. Buchsteiner, HMIJ. Pieper, HMIA. Lerf, Walther-Meissner-Institut, Garching
Date(s) of Experiment:
29.09. – 12.10.2003
Date of report: 14.12.2003
The topology and elasticity of membranes, biological andcrystalline inorganic ones, are very sensitive to the swel-ling behavior. Crystalline membranes can serve as modelsystems [1]. The swelling state of such membranes andits relation to the hydration behavior is not well charac-terized from a physical point of view.Therefore we investigated the dynamics of water moti-on within the interlayer space of graphite oxide which issuitable as model membrane [2].
With quasielastic neutron scattering we measured the gra-phite oxide at 3 different humidity levels (H2O) with a re-solution of 93eV. To cover a broad range of humiditieswe chose an almost dry level (10% water content), an in-termediate level (20%) and an almost wet sample (60%).The equlibration times ranged between 3 and 48 h.
In order to determine the actual layer distance of thesamples we calculated them from the Bragg peaks foundin the neutron scattering spectra and compared these va-lues with those measured with X-ray scattering in prepa-ration of the neutron scattering experiments. We founda good agreement between both types of values.However, for the intermediate hydration value we had tonotice a strong influence of the equilibration conditions(equilibration time, amount of material, etc.) onto theresulting layer distance. Up to now there seems to existno stable intermediate humidity level, but that has to beexamined further.Special attention was paid to get very well defined samp-les and to measure them with a very good statistics. Fi-gure 1 shows the scattering function for one Q-value.
The data were fitted with a model covering translationaldiffusion and isotropic rotational diffusion for up to threewater types: bound water (no translational diffusion), hy-dration water (exact definition has to follow in future)and bulk water (free translation and rotation) (developedfrom a model described in [3]). The model takes alsointo account a damped harmonic oscillator term for thedescription of the inelastic part of the spectrum.This model describes the data relatively good and wecould clearly distinguish three types of water which con-tribute with different fractions to the scattering functiondepending on the humidity level of the graphite oxide.
Further data analysis should give exact fractions of watertypes and prove the used model. Future measurementswill investigate a different time scale (higher resolution)in order to get additional information about the slow mo-vements of bulk water and also information about the
(10%)
(20%)
(60%)
Figure 1: Scattering function S(Q,ω) for the differenthumidities of graphite oxide for Q=2.24A−1
graphite oxide itself.
[1] M.J. Bowick et al., Physics Reports 344 (2001) 255[2] J.H. DeBoer et al., Proc. Koninkl. Nederl. Akad. Weten-schappen, Series B61 (1958) 242[3] J. Pieper et al., Chemical Physics 292 (2003) 465
170

EF_39_Pieper.doc // brandt // 15.03.04 Seite 1 von 1
EXPERIMENTAL REPORT Proposal N° EF
Instrument V3Protein Flexibility in Photosystem II of GreenPlants Local Contact: J. Pieper
Principal Proposer: J. Pieper, HMI Date(s) of ExperimentExperimental Team: J. Pieper, R. E. Lechner, Th. Hauß, HMI
M. Weß, G. Renger, Max-Volmer-Institut,TU Berlin
27.01. – 02.02.200302.06. – 08.06.2003
Date of Report: 29.12.03
Photosynthesis is a fundamental physiologicalprocess in nature representing thetransformation of solar radiation into storablechemical energy. This photochemical processof all oxygen evolving photoautotrophicorganisms (cyanobacteria, algae and greenplants) comprises the light-induced cleavage ofwater and fixation of carbon by formation of acarbohydrate (CH2O)n under release of oxygen(for a review see ref. 1). The key steps inphotosynthetic water cleavage take place in amultimeric membrane-bound protein complexreferred to as Photosystem II (PS II). Thereaction pattern of PS II is characterized by ahigh degree of specific coupling betweenstructural dynamics and function. Recentfindings revealed that dehydration (2) as wellas lowering of temperature leads to blockageof individual redox reactions of PS II (3).The aim of the present study was toinvestigate the protein flexibility in PSII as afunction of temperature. PS II membranefragments were hydrated using D2O vapor of awell-defined relative humidity (r.h.) of 90 %.Quasielastic neutron scattering (QENS)experiments were carried out using an incidentneutron wavelength of 5.1 Å and an elasticresolution of 93 µeV on NEAT. The experimentwas repeated for a vacuum dried sample.In a preliminary analysis the data were fit usinga Lorentzian model. The resulting EISF (Q) areshown in Fig. 1. A significant quasielasticcontribution is present for T > 230 K, only.As shown in Fig. 2, the mean squaredisplacement for PS II clearly increases withincreasing temperature. The linear increase forT < 230 K is characteristic for vibrationalmotions while the stronger increase forT > 230 K is due to large amplitude motions.The temperature dependence of chargetransfer efficiency shows a similar behaviourwith an onset at about 230 K (3). The lattercharacteristic transition is not observed for thedry sample (not shown). It can be concludedthat there is a clear correlation between proteinflexibility and function of PSII (4).
Figure 1EISF (Q) for PSII at temperatures of 100, 240and 300 K obtained by a Lorentzian fit.
Figure 2Mean square displacement of PSII as afunction of temperature (diamonds). Thecharge transfer efficiency is depicted in red (2).
References:1. G. Renger, Biochim. Biophys. Acta 1503 (2001) 210-
2282. O. Kaminskaya, G. Renger, V. A. Shuvalov,
Biochemistry 42 (2003) 8119-81323. Garbers, F. Reifarth, J. Kurreck, G. Renger, F.
Parak, Biochemistry 37 (1998) 11399-114044. Pieper, J.; Weß, M.; Hauß, Th.; Lechner, R.E.;
Renger, G., to be published
171

benscrep_2003.doc // brandt // 12.11.03 Seite 1 von 1
EXPERIMENTAL REPORT Proposal N°BIO-04-0808
Instrument V4 Molecular recognition of phospholiponucleosides in direct and reverse micelles
Local Contact
A. Brandt
Principal Proposer: Debora Berti, University of Florence Date(s) of Experiment
Experimental Team: F. Baldelli-Bombelli, University of FlorenceMassimo Bonini, University of FlorenceAstrid Brandt, HMI
From 03/10/03 to06/10/03 (backlog)
Date of Report: November 2003Aim of this experiment was the investigation ofstructural features of ternary systems formedby phospholiponucleosides, water and oil.The chosen surfactants were the dilauroyl-phosphatidyl derivatives of adenosine anduridine and their 1:1 mixture in the L1 corner ofthe phase diagram. These double-chainedsurfactants have been the subject of a detailedinvestigation in our laboratory for some years[1] and have shown -in aqueous phase-extremely interesting features both foraggregational and for molecuar recognitionproperties, that is base-base selectiveinteraction along the micellar surface.Dilauroyl-phosphatidyl derivatives show atmoderate ionic strengths an extended micellargrowth along the axial direction; combinedSANS, SLS, QELS and Cryo-TEM haveprovided evidence of flexibility of theaggregates, that have been ful lycharachterized from a structural point of view.On the other hand we have spectroscopic(NMR and Circular Dichroism) confirmationthat an extended pattern of base-baseinteractions are present on the micellar surfaceand that the extent of interaction is modulatedby interfacial curvature, being maximum for aplanar packing of surfactant molecules (e.g.lamellar phases and liposomes).Therefore it would be extremely interesting toinvestigate the pattern of base-baserecognition in reverse curvatures. As the firststep of this experimental development weproposed the modulation of interfacialcurvature by means of oil addition to a directmicellar phase. We selected polymerlikeflexible micelles as the starting aggregates.In order to fully exploit the q-range available,three different configurations have beenperformed (front, 4m and back); Experimentshave concerned a fixed surfactant volumefraction and different oil (cyclohexane) content,ranging from 0.3 to 0.9% v/v). Bothhydrogenated and deuterated cyclohexanehave been used.The results presented in this report are meantto be really preliminary, in view of the fact that
experiements have been performed only onemonth ago. However some main conclusionscan already been drawn.
-8000
-6000
-4000
-2000
0
2000
4000
200 220 240 260 280 300 320[q
] l[deg
cm
2 /dm
ol]
l[nm]
Figure 1
Cyclohexane inducesdramatic changes onbase base interactionpattern: an intuit iveevidence can be inferredfrom CD spectra on DLP-Adenosine
microemulsions as a function of the oil content(increasing in the direction indicated by thearrow) presented in Figure 1. At high oilcontent the spectrum resembles that exhibitedby diC8P-Adenosine arranged on globularmicelles: a structural characterization couldascribe this effect to a rod to globule transition.
0.1
1
10
100
0.1 1
0.3%0.5%0.8%
q [nm-1
]
0.1
1
10
0.1 1
dlpadlpudlpa:dlpu
q [nm-1
]
Figure 2a Figure2bFigure 2a illustrates this strucutral evolution forDLP-Adenosine; while the lowest oil contentshows the persistence of a polymerlikestructure with the characteristic scalingbehavior, the other data have been modeledwith a polydisperse spherical core (apolarchains+cyclohexane)/shell (polar head region)strucutre; the results are consistent with a coreradius increasing with oil content (from 30 Å to40 Å) and a fixed polar shell (7Å); however theresults obtained for the deuterate oil samples(Figure 2b for the highest oil contentand thethree different surfactants) evidentiate a cleardependence on polar head nature,demonstrating a penetration of cyclohexane inthe corona shell that is modulated by thenucleic base. Further analysis is in progress.[1] P.Baglioni, D. Berti, Curr. Opinion Coll. Int.Sci, 2003,8,55-61 and ref therein
172

EXPERIMENTAL REPORT Proposal N° BIO-04-0868
Instrument V4 What makes elastase specific? Local Contact A. Heinemann
Principal Proposer: A. Zychlinsky, MPI for Infection Biology Date(s) of Experiment Experimental Team: M. Ingersoll, MPI for Infection Biology H.N. Bordallo and T. Hauß, HMI
29-31/08/2003
Date of Report: 11/12/2003 Shigella are the causative agents of bacillary dysentery. The infection is ultimately controlled by the arrival of neutrophils, which trap the Shigella in phagosomes where its virulence factors are degraded and the bacteria are killed. The protein responsible for the degradation of Shigella virulence factors, neutrophil elastase (NE), is found in granules also containing cathepsin G (CG) [1]. Interestingly, although X-ray crystallography reveals that the structures of the inhibited proteins are nearly identical they have different biology; only NE specifically destroys Shigella virulence factors [2]. Given that biological molecules are flexible and soft, small changes within the molecular structure may play a significant role in protein function. To test the hypothesis that the conformations of these two proteins, while active and in solution, are in reality different, we have performed an experiment comparing NE and CG, dissolved in D2O, using V4 at the HMI. The use of SANS in such a study is possible because, although we need to measure non-physiological concentration, i.e. 10 mg/ml, enzymatic assay results show that both proteins are still active in D2O, at this concentration, and after 72 hours in the beam [3]. Furthermore, the unusual stability combined with the ability to obtain large amounts of protein and having the crystal structures of both proteins makes us uniquely able to perform experiments to test the nature of the enzymes in solution. Our preliminary results are quite encouraging, as the SANS data indicate that, in solution, the NE is different from the CG in shape or size, see Fig. 1. These results support our original hypothesis that the substrate specificities vary due to diverse folding conformations. It is important to note that the original crystal structures very nearly overlap each other, but the structures were crystallized with their inhibitors. The specific inhibitors for NE and CG are mimics of their peptide substrates and block enzymatic activity.
Fig.1 Comparison of the scattering data of NE (green circles) to CG (red squares).
Fig 2. Comparison the data obtained before and after the addition of CG inhibitor to CG (red squares) and to NE(green circles). We hypothesize that the enzymes possess varying substrate specificities because their native conformations in solution are different. The SANS data supports this idea. Furthermore, we argue that the enzymes may adopt a similar structure upon encounter with their substrates. The crystallography data would suggest that this is possible. From enzymatic assay results, we know that addition of a CG inhibitor to CG and NE inhibits the activity of CG while the NE remains unaffected. In Fig. 2, the data obtained after the addition of CG inhibitor to CG and to NE are shown, indicating that the addition of CG inhibitor to CG was able to significantly change the shape of the enzyme. [1] Yv. Weinrauch et al, Nature 417, 91 - 94 (02 May 2002) [2] C. Mattos et al. Nat Struct Biol 1 55 (1994); P. Hof et al. EMBO J 15 5481 (1996)
[3] M. Ingersoll, private comm. Report_2003.doc // brandt // 11.12.03 Seite 1 von 1 173

CHE-04-0872.doc // brandt // 09.03.04 Seite 1 von 1
EXPERIMENTAL REPORT Proposal N° CHE-04-872Instrument V4Large-scale chain conformation in stereo-
regular polyelectrolyte/protein complexes Local Contact H. Keiderling
Principal Proposer: GUENET J.M. ICS, UPR22 STRASBOURGFrance Date(s) of Experiment
Experimental Team: BALL V. ICS, UPR22 STRASBOURG FranceKEIDERLING, U., HMI Berlin 06.10.03 to 09.10.03
Date of Report: 18.12.03
The formation of polyelectrolyte/proteincomplexes in solution has been and is stillstudied owing to both practical and theoreticalinterests. Recently, we have investigated theinteraction mechanism between alkalinephosphatase and poly(styrene sulphonate). Wehave observed that the denaturationtemperature and the protein activity dependupon the polymer tacticity. For instance,denaturation occurs some 15°C higher withiPSS (isotactic sulphonated polystyrene) thanwith aPSS (atactic sulphonated polystyrene).Similarly, the activity is not altered with iPSSwhereas it is strongly reduced with aPSS. In the present investigation by neutronscattering, we have attempted to determine theconformation of the polymer by matching thecoherent signal of the protein with anappropriate mixture of D2O/H2O.
Figure 1: Kratky-plot (q2I(q) in arbitrary unitsfor aPSSD in water () and for aPSSD/protein inwater ().
The first results show that no conformationalchange occurs with atactic polystyrene (figure1) unlike what is seen with isotactic andsyndiotactic polystyrene (figure 2).
Figure 2: Kratky-plot (q2I(q) in arbitrary unitsfor iPSSD in water () and for iPSSD/protein inwater ().
The results are currently under interpretation.
0.00 1.00 2.00 3.000.00
0.20
0.40q2I(q) (a.u.)
q (nm -1)
0.00 1.00 2.00 3.000.00
0.20
0.40q2I(q) (a.u.)
q (nm -1)
174

EXPERIMENTAL REPORT Proposal N° PHY-04-0784PHY-04-0892
Instrument V6The Wetting Behaviour of HydrophobicPolymer Layers Local Contact
R. Steitz, R. Krastev
Principal Proposer: Beate Klösgen, Phys. Dept., Univ. ofSouthern Denmark, Odense, DenmarkBeate Klösgen, Univ. of Southern DenmarkRumen Krastev, HMI Berlin, GermanyRoland Steitz, HMI Berlin, Germany
Experimental Team:
Date(s) of Experiment
2.2.-7-2-200330.11.-4.12.2003*
Date of Report: 27/01/04The initial goal of the experiments reported herewas part of the attempt to develop a protocol for thepreparation of soft supported membranes to be usedfor biophysical studies. Some techniques as atomicforce microscopy (AFM) and fluctuationcorrelation spectroscopy (FCS) require theavailability of extended flat surfaces; this is alsotrue for a future application in biosensors orbioassays for analytical purposes. However, theformation of soft and stable and even functionalbio-membranes along supporting interfaces is anissue in itself because the physics of the depositionprocess and the details of the interaction with theinterface are not settled.Our initial choice consisted of thick (>300Å)hydrophobic polymers layers of polystyrene (PS)that were spin-coated onto crystalline Si/SiO2 sub-supports. Lipid layers were successfully depositedonto these surfaces by spontaneous adsorption fromsuspensions of unilamellar vesicles (r~50nm). Thebuilt-up of the sandwiched layer was monitoredstep by step using neutron reflectivity and contrastmatching [1]. Due to the hydrophobicity of thepolymer a trilayer of an inner monolayer and anouter bilayer of lipid were reproducibly found.However, comparing the observations made inmany experiments by many users of differentprojects, all brought together by Roland Steitz, andall using that kind of polymer layers in aqueoussurroundings, we had to concede that we all wereusually incapable to match the contrast of thepolymer layer and the adjacent bulk water. Instead,we observed more or less pronounced fringessuperimposed to the expected intensity decay. Aftermany discussions and by comparison withadditional experimental results it was finallyconcluded that the observations were due toincomplete wetting at the polymer–water interface.The results so far can be explained by the presenceof an extended depletion layer [2] of reducedmechanical density. As a consequence of alteringthe water structure along the interface, thescattering length density is different from the one inbulk water. This depletion layer unavoidably forms
due to the interfacial hydrophobic mismatch; minordisturbances of it induce the creation of big nano-bubbles [2, 3]. As a result we intend to accomplish the observations sofar by investigating more systems with polymer sheetsof comparable thickness and varying hydrophilicity.The first choice here is the polyelectrolyte layer(PEI/( PSS/PAH)XPSS). This system is ratherhydrophilic, and the terminating PSS–layer even yieldsa charged polyelectrolyte surface. Without the finalPSS-layer, the surface is electrically neutral.Unexpected difficulties arose from the high watercontent included in the polar polymer layer: during thespring beamtime we could not find a sufficiently well-defined matching point by fitting the observed curves.Therefore, the autumn beamtime was essentiallydedicated to the determination of the proper matching(16% H2O, 84% D2O; mol/mol) by determining it fromexperiments of PEI/( PSS/ PAH)6 PSS exposed to aseries of D2O/H2O mixtures. Control experimentsreveal a good matching with that aqueous subphase butthere are still fringe traces visible. These have to befurther explored in view of the depletion layer model.Lipid membranes could be deposited onto the PEI/(PSS/ PAH)6 PSS polymer surface but the depositionefficiency and surface quality were not as good asfound with the PS interface. This must also be furtherinvestigated. As yet, there is not a lot of knowledgeabout the deposition process itself. Apart from theinterfacial tension also the shape and especially the sizeof the lipid vesicles applied may be crucial.
References
[1] T. Gutberlet, R. Steitz, J. Howse, I. Estrela-Lopisand B. Klösgen, Applied Physics A - MaterialsScience & Processing 74 (2002) S1262-S1263.
[2] R. Steitz, T. Gutberlet, T. Hauss, B. Klosgen, R.Krastev, S. Schemmel, A.C. Simonsen and G.H.Findenegg, Langmuir 19 (2003) 2409-2418.
[3] A.C. Simonsen, P.L. Hansen and B. Klösgen, J.Coll. Interface Sci. (2004).
175

EXPERIMENTAL REPORT Proposal N° BIO-04-850
Instrument V6 Preparation of polymer supported charged lipid layers for adsorption study of Aβ(25-35) Local Contact
R. Steitz
Rep_BIO-04-850EF.doc // brandt // 30.01.04 Seite 1 von 1
Principal Proposer: Silvia Dante, TU Darmstadt and HMI Date(s) of Experiment Experimental Team: Silvia Dante, TU Darmstadt and HMI Thomas Hauß, HHU Düsseldorf and HMI Roland Steitz, TU Berlin and HMI
29.9.-3.10.2003
Date of Report: 30.01.2004 To gain information about the adsorption of small peptides, like the beta-amyloid Aβ(25-35) peptide, in/on lipid membranes, we have developed a method to prepare model membranes (stacked lipid layers) via fusion of small unilamellar vesicles onto a polymer coated substrate. In particular, the interaction of the peptide with the lipid membrane may be driven by electrostatic forces, since Aβ carries a positive charge, and the natural neuronal membrane is negatively charged. We choose therefore to utilize charged polyelectrolytes to coat the substrate, and we investigated the adsorption process of negatively charged vesicles. The substrate was prepared by coating a silicon wafer with a layer of poly(ethyleneimine) followed by six bilayers of poly(styrene-sulfonate)/poly(allylamine-hydrochloride) by self-assembly technique. As model lipids a mixture of DMPC and DMPS, 90:10 mol/mol, was chosen. DMPC was fully deuterated, while the negatively charged DMPS had fully deuterated alkyl chains. The vesicles were prepared by extrusion with a 100 nm filter at a concentration of 1 mg/ml. The contrast scenario of the neutron reflectivity experiment monitoring the membrane fusion was chosen such as to highlight the lipid layers. Fig. 1 shows the reflectivity from the stratified poly-electrolyte cushion sandwiched between the silicon backing and the liquid fronting, D2O and H2O, respectively. As expected, the reflectivity changed as a function of the liquid environment with a reduced scattering length density of the water-swollen polymer film in the latter case. After displacement of the H2O liquid phase by the suspension of d-DMPC/d-DMPS vesicles in H2O the reflectivity of the interface at low Q started to increase again, a clear signature of the onset of the adsorption of the lipids to the polymer cushion. Figure 2 shows the kinetics of lipid adsorption, monitored by the increase in the reflected intensity at fixed Q as a function of time. Assuming a first order rate law, I(t) ~ 1-exp(-kt), the rate constant k as extracted from the fit to the data is 0.087 h-1. The half-time of the process would thus be t1/2 = 8h. We stopped the adsorption process after 18h by displacing the reservoir, namely the lipid vesicles in H2O, by pure H2O. This did not induce a decay in reflected intensity. Hence, there is no or at least negligible lipid desorption from the interface. This conclusion was further corroborated by subsequent
0.00 0.02 0.04 0.06 0.08 0.1010-5
10-4
10-3
10-2
10-1
100
Ref
lect
ivity
Q [Å-1]
D2O, 2 H2O, 2 Lipids/H2O, 2
Fig.1: Reflectivity curves from the polymer cushion (d = 257 Å) against different liquid frontings. Note the pronounced change in reflectivity of the interface after adsorption of the lipids to the polymer cushion. Solid lines are fits to the data, the dash-dotted line corresponds to a single adsorbed lipid bilayer (40 Å thickness).
0 3 6 9 12 15 18 21 240
2000
4000
6000
8000
10000
12000
14000
H2O
y = A*(1-exp(x-xc) + B A 10128.66779 ±142.0993xc 0 ±0k 0.08692 ±0.00297B 3790.26532 ±54.3843
coun
ts D
1 @
0.0
122Å
-1
time [h]
Lipids in H2O
Fig. 2: Kinetics of adsorption as monitored by the reflected intensity from the interface (counts D1) at fixed Q as a function of time after insertion of vesicles in H2O. and repeated reflectivity runs on the lipid-coated interface (Fig.1, curve 3, Lipids/H2O, 2). The adsorbed lipid membrane however, is not a single bilayer as is obvious from the mismatch of the experimental data and the corresponding model calculation (red line in Fig. 1). The best match (solid line corresponds to a lipid layer thickness of 160 Å and a roughness of ~ 70 Å towards H2O.
176

CHE-04-0889.doc // brandt // 09.03.04 Seite 1 von 1
EXPERIMENTAL REPORT Proposal N° CHE-04-0889Instrument V6Adsorption of globular proteins on a planar
polyelectrolyte brush Local Contact Roland Steitz
Principal Proposer: C. Czeslik, Universität Dortmund Date(s) of ExperimentExperimental Team: C. Czeslik, Universität Dortmund
G. Jackler, Universität DortmundR. Steitz, Hahn-Meitner-Institut Berlin
6 – 12 Oct. 2003
Date of Report: 18 Dec. 2003
At almost all interfaces, proteins adsorbspontaneously. Recently, it has been foundthat colloidal particles that are covered with apolyelectrolyte brush are capable of bindinghuge amounts of proteins at low ionic strength.However, raising the ionic strength to about200 mM leads to a remarkable proteinresistance of the particles [1]. This effect isindependent of the net protein charge, i. e.negatively charged bovine serum albumin(BSA) is adsorbed at a negatively chargedpoly(acrylic acid) (PAA) brush at low ionicstrength, but it is repelled from the surface athigh ionic strength where the electrostaticrepulsion is minimized. It has been concludedthat the driving force for the protein adsorptionat the PAA brush is the release of counterionsfrom the brush which increases the entropy ofthe system [1].
In view of the unique properties of apolyelectrolyte brush in terms of proteinadsorption, we have studied for the first timethe adsorption of the protein BSA on a planarPAA brush at different ionic strength usingneutron reflectometry. The preparation of thePAA brush was performed according to theliterature with slight modifications [2].
In Fig. 1, neutron reflectivities of asilicon/water interface that has been modifiedwith a PAA brush are shown. Theseexperiments were performed with D2O as thesolvent. In addition, the contrast was varied byusing a D2O/H2O mixture to excludeambiguities in the data analysis. The pH-valueof the solutions was adjusted to 6.5 with a 10mM MES buffer. As can be seen from Fig. 1,the exchange of the D2O-buffer by a BSAsolution does not change the reflectivity of theinterface, if NaCl (500 mM) is added, i. e. thereis no BSA adsorption at high ionic strength. Incontrast, rinsing with a BSA solution withoutadded NaCl leads to BSA adsorption at thePAA brush. Thus, the variable protein affinityof a planar polyelectrolyte brush as a functionof ionic strength has been demonstratedsuccessfully.
Additional experiments have also beenperformed where a BSA solution without NaClwas used first. Then, increasing the ionicstrength to 200 mM does not change theobserved neutron reflectivity, i. e. nodesorption takes place. This finding can beattributed to an ionic strength that is too low fordesorption and/or to slow desorption kinetics.
In a preliminary analysis of the data,the concentration profile of the adsorbed BSAacross the interfacial region was determined.From this, it is quite clear that the BSA isdistributed over the whole PAA brush whichhas a thickness of about 200 Å in solution. Atthe inner interface of the brush, BSA isenriched suggesting an additional interactionwith the PS sublayer. However, a moredetailed analysis of the data is required todraw further conclusions.
Fig. 1 Neutron reflectivities of a silicon/water interfacemodified with a poly(acrylic acid) (PAA) brush. The dataare normalized to the reflectivity of a clean silicon/waterinterface. The data clearly indicate that BSA is adsorbingat the PAA brush only, if the ionic strength is low.
[1] C. Czeslik, R. Jansen, M. Ballauff, A. Wittemann, C.A. Royer, E. Gratton, T. Hazlett, Physical Review E(2004), in press. [2] E. P. K. Currie, A. B. Sieval, M. Avena, H. Zuilhof, E.J. R. Sudhölter, M. A. Cohen Stuart, Langmuir 15 (1999)7116-7118.
177

BIO-04-0890.doc // brandt // 09.03.04 Seite 1 von 1
EXPERIMENTAL REPORT Proposal N° *BIO-04-0890Instrument *V6Biocomposite planar polyelectrolyte
multilayers as a tool to understand differentDNA transport systems Local Contact Krastev,R.
Principal Proposer: Gromelski, S.; MPI-KGF, Golm, Germany Date(s) of ExperimentExperimental Team: Gromelski, S.; MPI-KGF, Golm, Germany
Krastev R., HMI Berlin; MPI-KGF, Golm, Germany *26.07 - 31.07.2003
Date of Report: 18.09.2003
Due to the pathogenicity of the parental virusesit is supposed to assemble an „artificial virus“. In order to find a biocomposit which has theadvantages of viral vectors regarding genetransfer, but does not have the infectiouspotency of a virus we develop artificial viruses.The preparation of artificial viruses starts withthe fabrication of a hollow capsule byadsorbing layer-wise polyelectrolytes on asoluble template. This capsule will then becovered by a lipid layer with an integratedvirus membrane components. Therefore themolecular basis of the polyelectrolyte - lipidinteraction have to be studied. The experiments were carried out in asolid/liquid experimental cell in theta/2 thetageometry at the V6 reflectometer. Thereflectivity from the sample was scanned overthe whole range of incident angles of theincoming beam. The measurements wereperformed on a silicium block covered by a(PSS/PAH)6 cushion (PSS Poly StyreneSulfonate and PAH Poly AllylamineHydrochloride). The block was prepared, driedand stored in lab atmosphere for several daysbefore measurements.We studied the coupling of bilayers of DMPAand DMPC on PAH and DMPC on PSS aboveand below the phase transition. The adsorptionof DMPA on PAH terminated cushion at atemperature of 26°C which is below the phasetransition of the lipid causes formation layerwith very high roughness We attribute this tothe formation of non-continuous multilayerwith incorporated vesicles in it. The adsorptionat a temperature above the phase transition(55°C) leads to the formation of smooth layerwith a thickness of 70 Å. We recognise this asa formation of a lipid bilayer. A decrease of thetemperature to 23°C decreases the bilayerthickness to 56 Å (Fig. 1). That points to acondensation of chains at lower temperatures
because of the stronger interaction of thehydrocarbon chains. DMPC was adsorbed on PAH and PSS at26°C. The adsorption on PAH leads to aformation of non-continuous layer with highroughness on the polyelectrolyte cushion. Theadsorption on a PSS determined cushion leadsto a bilayer with a thickness of 55Å.
0,00 0,02 0,04 0,06 0,081E-6
1E-5
1E-4
1E-3
0,01
0,1
1
10
100 PAH terminated cushion at 55°C PAH terminated/D2O + 0.5mg/ml DMPA at 55°C PAH terminated/D2O + 0.5mg/ml DMPA at 23°C
Ref
lect
ivity
Q, A-1
Figure 1. Neutron reflectivity curves of a PAHterminated polyelectrolyte cushion with an adsorbedDMPA bilayer at different temperatures
0,00 0,03 0,061E-6
1E-5
1E-4
1E-3
0,01
0,1
1
10
100
1000
Ref
lect
ivity
Q, A-1
PAH terminated cushion PAH terminated + 0,5mg/ml DMPC PSS terminated cushion PSS terminated+ 0,5mg/ml DMPC
Figure 2. Neutron reflectivity curves of DMPC, adsorbedon a PAH- and a PSS terminated polyelectrolyte cushionat 26°C
178

brandt // 22.01.04 Seite 1 von 1
EXPERIMENTAL REPORT Proposal N°CHE-04-907EF
Instrument V6 Adsorption of amyloid beta (1-40) peptide on hydrophobic polymer covered solid surfaces Local Contact
R.Krastev
Principal Proposer: S. Rocha, MPI, Golm, Germany Date(s) of Experiment Experimental Team: S. Rocha, MPI, Golm, Germany R.Krastev, HMI Berlin/TU Berlin, Germany/ G.Brezesinski, MPI, Golm, Germany
4.05. – 7.05.2003
Date of Report: 12.12.2003
Alzheimer’s disease is a progressive neurodegenerative disorder of the human brain, characterized by fibrillar amyloid plaques. Plaques are composed predominantly of insoluble fibrils of amyloid beta-peptide (Aβ). The peptide, of 39 to 43 amino acids residues, is a product of cleavage a transmembranar protein. Although the mechanism of Alzheimer’s disease is not fully understood, the conformational transitions of Aβ peptide seem to play an important role. In physiological environments many processes occur at interfaces and strong surface interactions may be responsible for damage the native structure of the peptide. It is described that fibril formation of Aβ might depend on the nature of the surface [1].
In a preceding experimental report it was shown that Aβ does not adsorb on different (uncharged or negatively charged) hydrophilic surfaces. In the present report the adsorption of Aβ on hydrophobic surfaces was studied.
Neutron reflectometry was used to provide information about the thickness of adsorbed peptide layer and possible changes in the Aβ layer after the adsorption on the solid support. The experiments were performed in θ/2θ geometry on the reflectometer V6. The solid/liquid experimental set-up was employed. Si-blocks (50x80x15 mm3) were used as substrates. Two samples were prepared. i) Si substrate covered with polysiloxane-dodecanoic acid complex [2]; ii) Si-block covered with the polystirene (PS). Both samples were prepared by spin coating.
First, the samples were exposed to D2O and the reflectivity curves were obtained (Figures 1 and 2 for the samples i) and ii) respectively). Pure D2O used as a subphase was then exchanged with an Aβ solution in D2O with a concentration of 4.6 µM. The reflectivity curves were collected after 12 h. The time delay is necessary to allow for equilibrium adsorption of the peptide onto the polymer film. The results are shown with red points in figures 1 and 2. The curves are shifted for clearance. There is a pronounced shift in the position of the Kiessig fringes in the reflectivity spectra in the both cases. This shows that a layer of Aβ on top of the polymer is formed. The experiments were repeated after 56 h. No further change in the reflectivity curves was observed which proves that the equilibrium was established within the first 12 h. The results were fitted using
the Parratt program. The best fits to the experimental data are shown with lines on the figures. The data for the thickness (h), scattering length density (SLD) and the roughness (σ) of the Aβ layer are presented in the Table.
Since the surfaces are not charged, hydrophobic interactions are the driving forces for the occurrence of adsorption of the peptide on the hydrophobic layers. Aβ has two hydrophobic clusters: residues 17 to 21 and residues 29 to 40. The hydrophobic surface induces exposure of the hydrophobic clusters, leading to adsorption.
0.00 0.02 0.04 0.06 0.08 0.10 0.121E-7
1E-5
1E-3
0.1
10
Ref
lect
ivity
Q, Å-1
2
1
Fig. 1: NR curves of polysiloxane-surfactant complex covered Si substrate in D2O (1) and in solution of Aβ in D2O (2).
0.00 0.02 0.04 0.06 0.08 0.101E-6
1E-4
0.01
1
100
Ref
lect
ivity
Q, Å-1
2
1
Fig. 2: NR curves of PS covered Si substrate in D2O (1) and in solution of Aβ in D2O (2).
Surface: h, Å SLD, Å-2 σ, Å Complex 6.3 1.1x10⁻⁶ 3
PS 13.1 1.2x10⁻⁶ 2 1. T. Kowalewski, D. M. Holtzman, Proc. Natl. Acad. Sci 96 (1999) 3688. 2. Thünemann et al J. Mater. Che. 11 (2001) 381.
179

ExpRep_Rocha1_EF_LTGolmb.doc // brandt // 15.12.03 Seite 1 von 1
EXPERIMENTAL REPORT Proposal N° EF-LT
Instrument V6 Adsorption of amyloid beta (1-40) peptide at hydrophilic polymer covered solid surfaces Local Contact
R.Krastev
Principal Proposer: S. Rocha, MPI, Golm, Germany Date(s) of Experiment Experimental Team: S. Rocha, MPI, Golm, Germany R.Krastev, HMI Berlin/TU Berlin, Germany G.Brezesinski, MPI, Golm, Germany
7.02. - 9.02.2003
Date of Report: 12.12.2003
The presence of amyloid plaques consisting of insoluble fibrils of amyloid β−peptide (Aβ) is characteristic of Alzheimer’s disease. The peptide, which comprises 39 to 43 amino acids residues, derives from a transmembranar protein, the amyloid precursor protein (APP). Normally Aβ peptide exists in monomer or dimer form in body fluids, whereas the amyloid fibrils are rich in β-sheet structure. There is some evidence that interaction with surfaces may be crucial for fibril formation of Aβ peptide [1]. The size and the shape of Aβ peptide aggregates, as well as the kinetics of their formation, exhibited pronounced dependence on the physicochemical nature of the surface [1]. Here different hydrophilic films were used in order to determine the degree of adsorption of Aβ peptide on these type of surfaces.
Neutron reflectometry was used to provide more information about the thickness of adsorbed peptide layer and possible changes in the Aβ layer after the adsorption on the solid support. The experiments were performed in θ/2θ geometry on the reflectometer V6. The solid/liquid experimental set-up was employed. Si-blocks (50x80x15 mm3) were used as substrates. Two samples were prepared. i) Si substrate covered with polyelectrolyte multilayer film PEI/(PSS/PAH)6/PSS. The film was prepared by layer-by-layer deposition [2]. Using the PSS as the last layer a negatively charged film is obtained; ii) Si-block covered with the non-ionic polymer Formvar. The polymer film was prepared by dipping the Si substrate in the solution of the polymer.
First, the bare cushions were exposed to D2O and the reflectivity curves were obtained (curves 1 on Figures 1 and 2). The pure D2O used as a subphase was then exchanged with Aβ solution in D2O with a concentration of 4.6 µM. The reflectivity curves were measured after 12 hours, in order to ensure the adsorption equilibrium of the peptide onto the polymer layers. The results are shown with red points in figures 1 and 2. The curves are shifted for clearance. The results were fitted using the Parratt program. The best fits to the experimental data are shown with lines on the figures. No shift in the position of the Kiessig fringes in the reflectivity spectra was observed. The polymer film thickness before and after the exposure to the peptide did not changed. This shows that the peptide did not adsorb on the
hydrophilic films. The experiments were repeated after 56 h of exposure to the Aβ solution. Likewise, no changes in the reflectivity curves were obtained (results are not shown).
The electrostatic interactions, which are the main driving forces for adsorption of proteins on hydrophilic surfaces, were eliminate in the case of non-ionic Formvar. Electrostatic repulsion must occur in the case of negatively charged polymer, since the peptide has also negative charges. The adsorption is therefore entropically unfavourable.
0.00 0.02 0.04 0.06 0.081E-7
1E-5
1E-3
0.1
10
Ref
lect
ivity
Q, Å-1
(PSS/PAH)6/PSS (PSS/PAH)6/PSS+Amyloid(12h)
2
1
Fig. 1: NR curves of PE covered Si substrate in D2O (1) and in
solution of Aβ in D2O (2).
0.00 0.02 0.04 0.06 0.08 0.101E-7
1E-5
1E-3
0.1
10
Ref
lect
ivity
Q, Å-1
Formvar+D2O Formvar/Amyloid+D2O
2
1
Fig. 2: NR curves of Formvar covered Si substrate in D2O (1)
and in solution of Aβ in D2O (2). 1. T. Kowalewski, D. M. Holtzman, Proc. Natl. Acad. Sci 96 (1999) 3688. 2. G. Decher, Science 277 (1997) 1232
180

FILENAMEAUTHORDATEdd.MM.yyPAGENUMPAGES
EXPERIMENTAL REPORT Proposal N°MAT-01-1181Instrument E2In situ study of non-stoichiometric SrFeOx
under different oxygen partial pressures Local Contact Dietmar Hohlwein
Principal Proposer: M. Schmidt, ISIS Facility, Rutherford AppletonLaboratory, United Kingdom Date(s) of Experiment
Experimental Team: M. Schmidt, ISIS, RAL, UKM. Hofmann, Technische Universität MünchenS.J. Campbell, ADFA, UNSW, Australia
10-16 December 2002
Date of Report: 21 June 2003
The non-stoichiometric strontium iron oxideSrFeOx (2.5 x 3.0) is a mixed oxygenconductor at elevated temperatures. Study ofthis material can help in understanding oxygenelectrolytes as well as contributing todevelopment of new materials for clean energysources and the chemical industry.
The composition x and crystal structureof SrFeOx depend on temperature and oxygenpartial pressure in the atmosphere. Thecrystal structure of SrFeOx was studied usingneutron powder diffraction in the temperaturerange of 300-900C under oxygen partialpressures from a range of pO2=0.003-1 bar.Diffraction patterns were collected over the 2= 5-85 angular range, with a step size of 0.1using a neutron wavelength =1.215 Å. For the experiment the E2 diffractometer wasequipped with a standard vacuum furnacefitted with a silica insert to protect it againstoxidizing atmosphere. The oxygen partialpressure over the sample was controlled usingoxygen-nitrogen mixtures with the followingoxygen partial pressures: 0.003, 0.005, 0.01,0.21, 0.33 and 1.0 bar. The experiment wascarried out under atmospheric pressure. Acontinuous flow of gas over the sample (fewcm3/min.) was maintained to ensure constantoxygen partial pressure. The sample wasequilibrated at given temperature for 1 h priorto data collection. However, due to problemswith neutron optics we had to discard theresults of the pO2=1.0 bar run.
The temperature and oxygen pressureranges employed in the experiment coversubstantial part of a SrFeOx phase diagram.We have observed phase transitions from thelow-symmetry room temperature SrFeOxstructures into cubic perovskite type crystalstructure as functions of T and pO2. Anexample of a refined cubic pattern is presentedin Fig. 1. The relatively intense and “bumpy”background comes from the silica glass insert.The collected data will enable us to describethe evolution of SrFeOx structural parameters
as functions of T, pO2 and composition x. Asan example, Fig. 2 shows the cubic latticeparameter of high-temperature SrFeOx phaseas a function of composition x. Data pointscorresponding to different pO2 and T lie on asingle line. Additionally, for x>2.6 SrFeOxseems to obey Vegard’s law.
15 30 45 60 75
0
500
1000
1500
2000
In
tens
ity [c
ount
s]
2 [deg]
Fig 1. Refined neutron powder diffraction pattern ofSrFeOx at 900C under pO2=0.21 bar. The ticksmark SrFeOx Bragg reflections. The small peak at2=30 originates from a thermocouple.
2.50 2.55 2.60 2.65 2.70 2.75 2.80 2.857.70
7.75
7.80
7.85
7.90
Latti
ce c
onst
ant [
Å]
x in SrFeOx
0.33 0.21 0.01 0.005 0.003
Fig 2. Cubic lattice parameter of SrFeOx as afunction of oxygen content x for the oxygen partialpressures marked in the legend. The line is a guidefor the eye.
181

Nadejda // 16.03.04Seite 1 von 1
EXPERIMENTAL REPORT Proposal N°MAT –01-1335Instrument *E2Phase transformation in 7M modulated structure in non-
stoichiometric Ni-Mn-Ga martensite Local Contact J.-U.Hoffmann.
PrincipalProposer:
N.Glavatska, Institute for Metal Physics, Kiev, UA Date(s) ofExperiment
Experimental I.Glavatskiy, Inst. for Metal Physics, Kiev UA/ HMI BerlinTeam: J.-U.Hoffmann, HMI Berlin, BENSC 5.08-10.08.2003
07.11.2003
Present investigation concerns neutron diffractionstudy of structure and phase transformations duringheating and cooling from 380K to room temperaturein off-stoichiometric Ni-Mn-Ga Heusler alloyNi2.053Mn1.105Ga0.842.
The unit cell in martensite in the studied singlecrystal is determined as orthorhombic 7-layered withа=0.5847 nm, b=0.5855 nm, c=0.6173 nm at 296K.Studied specimen has temperatures of martensite-austenite transformation As= 350K, Af= 370K, Ms=340K and Curie point Tc= 376K. Experiment: During the experiment performed onE2 diffractometer (λ=0.239 nm) the singlecrystalline specimen was aligned to have (001) planecoinciding with scattering plane defined by the wavevectors of incident and scattering neutrons. Crystalstructure was studied in the temperature intervalfrom T=295K up to 385K during heating andcooling cycles.Results. In the studied temperature interval, martensite wasfound to have 7-layered modulated structure. Latticemodulation (7R) is observed in directions [202] and[022].
Fig.1 Austenite reciprocal space, T=380K. a = 0.5854 nm.
Fig.2. Martensite reciprocal space, T=300K.Observed 7R modulated lattice with parameters:a=0.585 nm, b= 0.586 nm, c= 0.617 nm.
Temperature dependence of martensite latticeparameters a, b and c is opposite. I.e. a and b axesshortens with cooling from point of martensitetransformation, at the same time c axis rises withcooling. This behaviour strongly affects latticedistortion ratio of martensite.
300 320 340 360 380
5,846
5,848
5,850
5,852
5,854
5,856
5,858
5,860
5,862
-p
aram
ter,
angs
trem
Temperature, K
#68T=300K:a=5,852 Ac=6,170 A
change of parameter in temperature interval from T=342K till T=295K: / = 0,239%
As
182

MAT-01-1243.doc // brandt // 03.03.04 Seite 1 von 1
EXPERIMENTAL REPORT Proposal N° MAT-01-1243Instrument E3Neutron Determination of Residual Stress in a
Nitrided Notched Part Local Contact Rainer Schneider
Principal Proposer: L. Barrallier, ENSAM Date(s) of ExperimentExperimental Team: A. Fabre, ENSAM
A. Gerbel, ENSAMJ. Jeanjean, ENSAM
17 Feb – 27 Feb 2003
Date of Report: *27. 11. 2003
IntroductionNitriding is thermochemical treatment generallyused to improve fatigue life of treated made steelparts. During the diffusion of nitrogen, precipitationphenomena creates nitrides increasing thesuperficial hardness of parts and generatingsuperficial residual stresses. Many type ofmechanical parts are nitrided like gears, shafts,etc… Residual stress profiles generated arefunction of the nitriding conditions (time,temperature, nitrogen activity,…), the compositionof steel but also depend on geometry of part. Insome case for example for gears, superficial curveradius are very small as the same order thannitriding depth. In this case it is very difficult todetermine in-depth stress gradient using classicalX-ray diffractometry. Neutron diffraction techniqueis well-adapted method to determine such stressgradient. No removal of matter is necessary and itis possible to determine in-depth map stress tensornear notches. Due to the experimental aberrationlike absorption, wavelength and intensity dispersionin probe volume, some corrections are necessarynear the surface to determine true stress profile.Using complete neutron spectrometer modelling itis possible to corrected stress gradient byexperimental aberration.
Experiment and resultsPrevious experimentations shown that it waspossible to determine nitriding residual stress in thecase of plane geometry with a good accuracycomparing with X-ray diffraction. Residual stressprofiles in a case of notched specimen weredetermined using neutron diffraction at HMIfacilities. The sample was a part of pinion nitridedand ground. The grade of the steel was32CrMoV13 before nitriding. We mademeasurement first on the fillet between the twoteeth, and second on tooth flank, in order todetermine the geometrical effect on stressdistribution.These measurements have been carried out in mode with several independent incidence angles(30,15,0,-30,-60,-90), for diffracting angle variationbetween 61° to 81 °, with a step of 0.02 °. An analysis of the experimental results intensityversus depth allowed us to determine the realposition of the surface in the entire measurementconfigurations. After corrections of these shifts, the
experimental 2- positions have been comparedwith simulated 2- positions, the figure 1 presents2- versus depth obtained by experimental resultsand by model results.
In-depth stress tensor has been deduced from theshift between experimental and model results of 2- positions and determined using the smallestvolume gauge using sin2
method. The figure 2presents first results of in-depth stress for the fillet.
In the core of the part, stress value shows asignificant difference from zero, it is not realist. Itseems to be a shift in stress level. These stressesobtained by treatment of experimental are notsatisfactory. It is now necessary to improve thesimulation treatment and decrease the volumegauge of experimental results in order to conferaccuracy to this analysis method.
183

MAT-01-1393.doc // brandt // 03.03.04 Seite 1 von 1
EXPERIMENTAL REPORT Proposal N° MAT-01-1393Instrument *E3Neutron Evaluation of Residual Stress in industrial screws
Local Contact Rainer Schneider
Principal Proposer: L. Barrallier, ENSAM Date(s) of ExperimentExperimental Team: A. Fabre, ENSAM
J.E. Masse, ENSAM 21 to 31. 07. 2003
Date of Report: *27. 11. 2003
Introduction
Non-destructive ultrasonic evaluation of residualstresses in industrial screws (for nuclear applicationby example) is more and more used to controlfiability of “assemblage”. Many studies have beenperformed but many questions are in suspension toimprove the data treatment and the optimization ofexperimental procedure in order to increase theprecision of measurement.Ultrasonic techniques need to have a standardgauge to validate residual stresses experimentalprocedure. Many parameters can have an influenceon stresses evaluation like the materialmicrostructure, the screw geometry and the stressgradients. In these conditions, the use of specialassembly with squeeze screws seems to beinteresting. Neutron diffraction associated with X-ray diffraction and finite element calculus will beused to characterize mechanical state of theultrasonic standard gauge to evaluate stresses.
Experiment and results
The material of screw was quenched and tempered35CrMo4 steel. Stiffness of the assembly has beenchose higher than screw one. To avoid deformationof screw due to the thermal effect, the material ofassembly have been chose the same.Neutron diffraction have been well adapted as non-destructive technique to determine stress state inscrew. We made measurement first on the head ofthe screw, twice on the body of the screw, and thirdon the screw thread near the nut.These measurements have been carried out in mode with several independent incidence angles(12,30,60,78) on the head and (18,13,28,90) on thescrew thread, for diffracting angle variation between70° to 75 °, with a step of 0.02 °. Residual stress inthe screw have been determined, using sin2
method, in the longitudinal direction in the head andbody of screw but also near the nut in the screwthread. Figure 1 presents the experimental results of axialstress using neutron facilities and modelling stressobtained by finite element calculus along the screw.
In this finite element modelling, the load is appliedon six threads with a decreasing effect, in thecontact zone between nut and screw.Stresses on the head of the screw are illustrated onthe left of the graph. Stresses on the nut in thescrew thread are shown on the right of the graph.
Modelling stress evolution and experimental stressevolution seem to be the same. First, the value ofaxial stresses increase from the surface to thebackside of the head. Along the body screw thevalue of the stresses is constant. On the screwthread near the nut, the value of the stressesdecreases. We can see it seems to be a shift betweenexperimental and calculus values. ……….
With this experiment it will be possible to finiteelement calculus in order to have standard gaugeto perform ultrasonic test in tensile screw.
184

MAT-01-1299.doc // brandt // 03.03.04 Seite 1 von 1
EXPERIMENTAL REPORT Proposal N° MAT-01-1299Instrument E3“Residual stresses in cylinders, -comparison of Neutron and X-
ray diffraction measurements - continuation for a 20MnCr5 casehardenable steel” Local Contact
Tobias Poeste
Principal Proposer: Thomas Hirsch, IWT Date(s) of ExperimentExperimental Team: A. da S. Rocha and T. Hirsch, IWT
T. Poeste, F. Henkel and R. Schneider, HMI 24th of June to 06th ofJuly 2003
Date of Report: 10th of October 03
1 IntroductionA Combination of X-ray- and neutron diffraction wasused to identify residual stress distributions overwhole cylinders’ cross sections. Investigatedresidual stress distributions were generated bydifferent manufacturing steps in the manufacturingroute of a shaft (SFB 570 - ”DistortionEngineering”). Results are presented in this reportfor machining and quenching steps.
2 Experimental DescriptionCylinders were manufactured from the steel20MnCr5 with following chemical composition inmass-%: 0.2 C; 0.17 Si; 1.34 Mn; 0.011 P; 0.02 Sand 1.09 Cr. Cylinders of 200mm x 20mm havebeen machined from a delivered rod of 30mm indiameter. Afterwards some of the cylinders havebeen austenitized and symmetrically quenched by agas nozzle field with a gas velocity per nozzle of150m/s. A ferritic perlitic microstructure wasobserved in the machined cylinders. Afterquenching of this low carbon steel, mixtures ofbainite and pearlite occur over the whole crosssection. Residual stresses were measured at themiddle part of the cylinders. In the neutrondiffraction experiments, volume elements ofapproximately 2x2x2mm were defined by the slits’choice. X-ray RS measurements were executed inthe IWT-Bremen using Cr-k radiation and thestandard sin2
method. X-ray RS depth’s profileswere performed by measurements after successiveelectro-chemical layer removals. Different samplesfrom the cylinders were produced for the d0establishment: powder, thin plates and cubes. Thepowder was prepared by filing and afterwardsannealing of the filed powder. Thin plates (0.5mmthickness) transversal to cylinder axis and cubes(3x3x3mm) from whole cross section wereprepared by EDM and electropolishing of theirsurfaces. As a second way to establish d0, residualstresses measured over the whole cross sectioncombining X-ray and neutron diffraction werechecked for the balance of stresses.
3 ResultsFigure 1 presents results for the machined cylinder.As measured by X-rays, a high gradient of stressesexist at near surface region. The RS are about350MPa at surface and change from tensile tocompressive at about 0.06mm from the surface.
The RS become less compressive for higherdistances from surface and from neutron RSmeasurements they are around zero at a distancearound 2mm from surface. For higher distancesfrom surface (3mm to 9mm) slightly tensile RS weremeasured. The results of X-rays and neutronmeasurements are checked by the RS balanceover the cross-section.
-400-300-200-100
0100200300400500600
0 2 4 6 8 10
Distance from center [mm]
Res
idua
l Stre
sses
[MPa
] axial_neutronsradia_neutronshoop_neutronsaxial_X-rayshoop_X-rays
Center
Fig.1: Residual stresses measurements by neutron andX-rays for a cylinder after machining.
In the quenched cylinder, compressive stressesaround –100MPa were measured by X-rays at nearsurface areas changing to nearly zero at a distanceof 0.3mm from surface. For distances higher than1mm, neutrons gave tensile stresses around 100MPa. The RS measured by neutrons presented forthe quenched cylinder a high scatter (approx. +/-60MPa). The scatter is probrably related to theheterogeneous microstructure of this low carbonsteel after quenching (mixture of pearlite andbainite) giving an aleatory change of d0 for differentsampled volumes.
4 Consequences A detailed work concerning specially the d0determination will be published in the near future incooperation with HMI [“Some experiments for d0determination in neutron diffraction”, Rocha, A daS.; Hirsch, T.; Schneider, R.]. The next experiments will be extended to othersteps of the shaft manufacturing route includingcarburizing of the cylinders for which a d0 gradientmust be taken into account.
185

EF_41_Schneider.doc // brandt // 15.03.04 Seite 1 von 1
EXPERIMENTAL REPORT Proposal N° EFInstrument E3Investigation of the residual stress profile along the
radius of a highly loaded turbine wheel Local Contact Rainer Schneider
Principal Proposer: Roland Hessert, MTU Aero Space Date(s) of ExperimentExperimental Team: Tobias Poeste, TU Berlin
Henrik Freydank, HMIRainer Schneider, HMI
approx. 5 weeks, finishedin june 2003
Date of Report: December 12th 2003
Figure 1: MTU turbine wheel
A wavelength of 1.37Å was used to determinethe local strains within a gauge-volume of3x3x3 mm3 and 5x5x5mm3. For geometryreasons the position of the 311 Ni-reflectionwas evaluated.
Figure 2: Ni 311 reflection on the twodimensional detector of E3
Tensile stresses in tangential direction within acritical region of a test specimen could beidentified. The results of the investigation ofseveral components lead to an optimization ofthe production process.
For the determination of the stress-free latticeparameter d0 we compared the results fordifferent methods:
1) powder of defined grain size2) annealed powder3) small cubes4) random walk method
The resulting stresses could be benchmarkedby the comparison to the outcomes ofdestructive x-ray measurements, hole-drillingexperiments and the conformance to boundaryconditions.
We found that cubes, smaller than the gaugevolume and steadily rotated on the sampletable, deliver values for d0 which fit to all theother results and conditions very well. Theheat treated powder as well as the randomwalk method gave us a fair approximation ford0 in contrast to the not annealed powdersample.
186

EF_42_Schneider.doc // brandt // 03.03.04 Seite 1 von 1
EXPERIMENTAL REPORT Proposal N° EFInstrument E3Development of the stress profile close to the inner
surface of an impeller during the production process Local Contact Rainer Schneider
Principal Proposer: Reiner Böschen, MTU Friedrichshafen Date(s) of ExperimentExperimental Team: Tobias Poeste, TU Berlin
Henrik Freydank, HMIRainer Schneider, HMI
approx. 3 weeks, finishedin june 2003
Date of Report: December 12th 2003
Figure 1: MTU impeller
Markierung „ 0 °“
radial
tangential
Figure 2: measurement positions along theradius of the impeller raw part
The residual stress profiles along the radius ofan impeller (and its raw part) have beeninvestigated according to figure 2. Awavelength of 1.37Å was used to determinethe local strains within a gauge-volume of2x2x2 mm3. For geometry reasons the positionof the 311 Al-reflection was evaluated. The investigated component showed no effectof large grains as usually found in Al-alloys.The experimentally found stress data fits verywell to the destructivly found values at the end
of the project by x-rays and hole-drilling.Additionally the stress profile along the radiusis qualitatively in very good agreement with thepredictions calculated by the finite-elementmethod. d0 was determined by using smallcubes of a component of the same charge.
187

MAT-01-1240.doc // brandt // 03.03.04 Seite 1 von 1
EXPERIMENTAL REPORT Proposal N° MAT-01-1240Instrument E7Analysis of Residual Stresses in AlSi7Mg/-
SiC/70p MMCs by Neutron Diffraction Local Contact:R. Schneider, M. Hofmann,T. Poeste
Principal Proposer: U. Göbel, Siemens AG, H.P. Degischer, TUVienna Date(s) of Experiment
Experimental Team: U. Göbel, Siemens AGR. Schneider, T. Poeste, F. Henkel,P. Lemke, HMI Berlin
25.Feb. – 8. March 200304.Jul. – 13.Jul. 2003
Date of Report: 15.12.2003
Particle reinforced Metal Matrix Composites with up to70 vol.% silicon carbide in a cast AlSi7Mg metal matrixshow interesting characteristics especially fortechnological applications in high power electronics.Here Al-SiC is used as baseplate material for electronichigh power modules, so called IGBTs (Insulated GateBipolar Transistor) to reduce thermally inducedmismatch stresses between baseplate and ceramicsubstrate and to provide a high heat conductivity forefficient heat dissipation of Ohmic losses in theelectronic component (heat sink) [1].
Due to the permanently changing thermal load of themodules during operation in connection with residualstresses and other material inhomogeneities (micropores,SiC-particle distribution, etc.) baseplate deformationsrespectively distortions are caused. This can lead toreduced heat dissipation or solder fatigue (delamination)and has big influence on lifetime and reliability of themodules. Important for the understanding of the materialfailure is the understanding of residual stresses in thecomposite and their change under operating conditionsrespectively under dynamic thermal load.
For the characterisation of residual stresses in thevolume neutron diffraction experiments on instrumentE7 were carried out allowing selective measurements ofresidual stresses in each phase. Measurements wereperformed on differently fabricated materials withspecific thermal histories for defined and comparableresidual stress states in-situ under cyclic thermal load upto 500°C in steps of 100°C to study stress relaxationprocesses.
The instrument is equipped with a two-dimensionalposition sensitive multi wire proportional 3He counter(128 x 128 pixel). It was possible to view an angle rangeof 8° (2) for simultaneous measurements of SiC(202) =88° (2) and Al(311) = 96° (2). Additional equipmentfor in-situ high temperature measurements was anellipsoidally focusing mirror oven device with thesample stored between two copper blocks in oder toreach better temperature stability. Measurement timewas 1 hour per temperature step. The wavelength was1.86 Å. The sample geometry of 4.5 mm x 20 mmcylinder and a primary slit (aperture 1.5 x 15 mm2
parallel cylinder axis) defined the gauge volume.
Due to the good spectral resolution of instrument E7 X-ray diffraction results could be completely confirmed.Type II residual stresses decrease with increasingtemperature approaching 0 MPa at 200°C. One canobserve the influence of thermal history on type IIresidual stresses. Thus, for example, matrix plastificationdue to quenching in lN2 and reheating to RT leading to astressfree state of the sample can be observed.Relaxation processes take place in the whole volume [2].The results reached will be published later.
I would like to thank HMI for the approval of thisbeamtime, furthermore R. Schneider, F. Henkel and P.Lemke for their encouragement during themeasurements.
[1] G. Lefranc, Low thermal expansion and highconductivity MMCs, Proceedings MATERIALICA,Munich (2000)
[2] U. Göbel, G. Lefranc, A. Pyzalla, H.P. Degischer,Zerstörungsfreie Untersuchung von Eigenspannungen inAlSi7Mg/SiC/70p Metall-Matrix-Verbundwerkstoffenmit Hilfe von Röntgen- und Neutronenbeugung, 14thSymposium Verbundwerkstoffe und Werkstoffverbunde,Wiley-VCH (2003) pp. 230 – 235
188

EXPERIMENTAL REPORT Proposal N° MAT-01-1341
Instrument E9Misfit measurements on Ni-base superalloysLocal Contact Dr. Daniel Toebbens
Principal Proposer: Dr. Ralph Gilles, TU München Date(s) of ExperimentExperimental Team: Dr. R. Gilles, M. Hölzel, TU München/
TU Darmstadt, Dr. D. Mukherji, ETH Zürich,D. del Genovese, IWF TU Braunschweig,Dr. P. Strunz, PSI, Dr. D. Toebbens, HMI
09.10.03 – 14.10.03
Date of Report: 11.11.03
Neutron diffraction studies were performedat E9 on Ni3Al based ’ precipitates (S.G.:Pm3m) which had been extracted from W-rich superalloys by electrochemicaldissolution. In addition, diffraction patternshave been taken from corresponding bulksamples, containing ’ precipitatesembedded in a Matrix (S.G.: Fm3m). Thealloy was heat treated to produce 450 nmsize cuboidal precipitates. The lattice misfitbetween and ’ results in coherencystresses, which play an important role inthe strengthening mechanism ofsuperalloys. In addition to measurementsof lattice parameters in bulk samples, westudy extracted particles in their relaxedcondition to get complementaryinformation on coherency stresses nearthe /’ interfaces. Furthermore, thepatterns of extracted precipitates areeasier analysed, since no overlappingreflections from the matrix occur. The data from the extracted precipitateswere collected at 300 K as well as 5 Kusing neutrons of = 1.7969 Ă. Rietveldanalysis revealed a lattice parameter of3.58502(6) Ă at 300 K and 3.57758(7) Ă at5 K. The measurements at 5 K did not giveindications for postulated magneticscattering contributions. In the singlecrystalline bulk samples the ’precipitations were found to be wellaligned. Thus, huge (n00) reflections of ’phase have been recorded at appropriatesample orientations.
20 30 40 50 60 70 80 90 100 110 120 130 140
0
1000
2000
3000
4000
5000
6000
7000
' (321) ' (320) ' (310) ' (221) ' (211) ' (210)
Al (200)
' (110) ' (100)
' (222)
' (311)
' (220)
' (200)
' (111)
neut
ron
coun
ts
2 [°]
Fig.1: Measured and calculated diffractionpattern of extracted Ni3Al based ’ precipitates.
0 20 40 60 80 100 120 140
0
500000
1000000
1500000
2000000
2500000
' (300) ' (100)
' (200)
neut
ron
coun
ts
2 [°]
Fig.2: Diffraction pattern of Ni3Al based ’precipitates embedded in Matrix.
0 10 20 30 40 50 60 70 80 90 100 110 120 130 140300
400
500
600
700
800
900
1000 ' (100)
(331)
' (300)
(220)
' (200)
(111)
neut
ron
coun
ts
2 [°]
Fig.3: Zoom in Fig.2 showing reflections of the matrix next to ’ reflections.
189

MAT-01-1347.doc // brandt // 03.03.04 Seite 1 von 1
EXPERIMENTAL REPORT Proposal N° MAT-01-1347Instrument E9Quantitative phase analysis of Portland clinkers and
the products of their chemical decomposition Local Contact D.Tőbbens
Principal Proposer: L.Smrcok, IICh, Slovak Acad Sci, Bratislava Date(s) of ExperimentExperimental Team: L.Smrcok, IICh, Slovak Acad Sci, Bratislava
O.Pritula, IICh, Slovak Acad Sci, BratislavaD.Tőbbens, HMI, Berlin
22-24.07.2003
Date of Report: 19.12.2003
Quality of clinkers/cements strongly depends ontheir phase composition, mostly on the amounts ofalite (C3S), belite (C2S), ferrite (C4AF) andaluminate (C3A). Diffraction patterns of clinkers arevery complex, due to heavy overlap of thediffractions of the dominant phases, C3S and C2S[1]. Complexity of the patterns can be howeverreduced by chemical treatment of clinkers leadingto two residues, here referred to as KOSH andSAM[2]. After a treatment KOSH residue containscalcium silicates, while in a SAM residue calciumaluminates/ferrites are concentrated. Some minorphases like MgO may however appear in bothresidues. Diffraction data were collected at roomtemperature in high-intensity mode using thewavelength of 2.816Å. Samples were put tovanadium containers with Ø 14 mm. Using a presetmonitor count/step strategy diffraction patterns oftwo industrial clinkers (marked as A and B) and theKOSH residues obtained from them were collected.Usage of a larger wavelength resulted in betterdiffraction resolution than in previousexperiments[3]. KOSH residues – calculated weight fractions ratiosw(C3S)/w(C2S) were closer to the expected valueswhen compared to the results obtained by X-raydiffraction refinements (Table1).
Clinker A w(C3S)/w(C2S)M T MT
Neutron 3.30 - 4.44X-ray 1.65 15.67 9.00Expected value 5.92 5.92 5.92
Clinker B Neutron 2.70 32.33 5.67X-ray 24.00 32.33 23.75Expected value 9.25 9.25 9.25 Table 1: Calculated and expected weight fractionsw(C3S)/w(C2S) ratio values for KOSH residues ofthe clinkers A and B. M – calculations with onlymonoclinic, T - only triclinic and MT – both C3Smodifications (polymorphs) were used.
Clinkers – phase weight fraction values calculatedusing of 1.797 Å [3] and 2.816Å wavelength datawere comparable, and the w – values absoluteerrors were not higher than 10%. The C3S phasewas determined with the highest accuracy,accuracy of the other w’s decreased with
decreasing expected abundance of each phase inthe clinkers. The refinements based on neutrondata were numerically more stable in comparison toX-ray refinements. This fact led for example tosmaller relative errors of C2S cell parametersvalues in comparison to X-ray refinements (Fig1).
Fig.1: Cell parameters relative errors for X-ray(X)and neutron(N, both wavelengths) refinements. [1] Taylor, J.C., Hinczak I., Matulis C.E.; Powder Diff.15, (2000) 7-18. [2] Gutteridge W.A.; Cem. Concr. Res.9, (1979) 319-324. [3] BENSC Experimental ReportMAT-01-1199 (2002).
190

benscrep_Efimoff_2003 // brandt // 08.01.04 Seite 1 von 1
EXPERIMENTAL REPORT Proposal N° PHY-01-1349
Instrument E9 Neutron diffraction study of relaxor PLZT 8/65/35 irradiated by high-current pulsed electron beam
Local Contact D.Többens, V.Sikolenko
Principal Proposer: Vadim Efimov, JINR, 141980 Dubna, Russia Date(s) of Experiment Experimental Team: S.Tyutyunnikov, JINR, 141980 Dubna, Russia V.Sikolenko, HMI, 14109 Berlin
09.07 – 14.07.2003
Date of Report: *
The transparent ferroelectric ceramic of lanthanum modified lead zirconate PLZT x/65/35 is widely investigates because of unusual optical, dielectric and piezoelectric properties, in particular, wide frequency-dependent maximum of complex permittivity and complicated phase diagram caused by morphotropical phase boundary between high- and low-temperature rhombohedral phases.
External pulsed irradiation by charged particle beam could lead to changing of metastable condition and, as a result, to changing of structural, electrical and ferroelectrical properties.
We have performed combined X-ray and neutron powder diffraction studies of the PLZT 8/65/35 [(Pb0.92La0.08)(Zr0.65Ti0.35)O3 ceramic samples, irradiated by high-current pulsed electron beam with energy 800 keV, current 200 A, and pulse duration 200 ns with 1 pulse, 10 pulses and 100 pulses. We used E9 diffractometer with wavelength 1.97 Å. All measurement was performed at room temperature. Fig.1 shows part of the neutron diffraction pattern of non-irradiated sample
Fig.1 neutron diffraction pattern or the PLZT 8/65/35 The irradiation by one pulse lead to splitting of some reflection due to appearance of perovskite structure distortions.
But irradiation by 10 and 100 pulses doesn’t change the structure drastically. Only weak
changes in intensities were observed. We connect them with a weak reorientation of oxygen atoms. The possible explanations would be the next: one pulse of high-current electron beam lead to fast adiabatic heating and, as a result, to the shock wave generation. It produces volume effect of changes of crystal lattice. Another effect is changing of charge carriers concentration due to electron irradiation. Pulse frequency in our experiments was 0.5 Hz. A great number of pulses lead to gradually heating of sample and to annealing of irradiation effects.
191

CHE-03-0204.doc // brandt // 09.03.04 Seite 1 von 1
EXPERIMENTAL REPORT Proposal N° CHE-03-204Instrument V3Chain-end effects on local dynamics in long
chain alkanes Local Contact A.Desmedt
Principal Proposer: Valeria Arrighi, Heriot-Watt University Date(s) of ExperimentExperimental Team: Federico Saggio, Heriot-Watt University
Hong Qian, Heriot-Watt UniversityArnaud Desmedt, HMI
March 2002*
Date of Report: December 2003*
This experiment was a continuation of previousmeasurements carried out on NEAT toinvestigate the dynamics of polyethylene (PE)melts and shorter chain alkanes.
In a previous experiment, we carried outQENS measurements on three PE samples: n-tetratetracontane (n-C44H90), and PE withMw=2150 and 108000 g mol-1. The molecularweight dependence of the local dynamicsmeasured by QENS provided an experimentalbasis for direct comparison with MolecularDynamics (MD) simulations carried out byProf. J.P. Ryckaert‘s group (Universite’ Librede Bruxelles, Belgium). A first summary of thiswork has been published (1).
In this experiment we carried out a series ofmeasurements on n-triacontane and n-hexacontane in the range 350 to 480 K. Thelow melting temperature of the n-triacontanesample made it possible to collect QENS dataat 350 K where MD simulations indicate thattwo separate dynamic processes exist (2).
The time-of-flight data were converted toenergy transfer and from the incoherentdynamic structure factor at constant angle theequivalent quantity at constant Q wasdetermined. The S(Q, ω) data and thecorresponding intermediate scattering functionwere analysed using a KWW function, with a Qindependent β parameter. The results indicatethat the distribution of relaxation times varieswith temperature and depends on the samplebeing investigated. Additionally, as shown inFigure 1 for n-triacontane at 350 K, thereappear to be evidence for deviations from theKWW model.
The validity of the approach used here toanalyse the QENS data from NEAT is beingexplored.
The results to date have made it possible tocompare samples and establish trends
between activation energy and molecularweight. As shown in Figure 2, values ofactivation energy determined from thetemperature dependence of the characteristictimes display a trend with molar mass that is aresult of chain end effects. The trend is similarto that reported for values extracted fromviscosity measurements.
Figure 1- Intermediate scattering function of C30H62 at 350K: thelines indicate fits to a KWW function using a Q independent βparameter.
Figure 2 – Molecular weight dependence of the activation energyas determined from fitting of the I(Q,t) data.
References:
(1) G Arialdi, K. Karatasos, J.-P. Ryckaert, V.Arrighi, F. Saggio, A. Triolo, A. Desmedt, J.Pieper and R.E. Lechner, Macromolecules,36, 8864 (2003)
(2) G Arialdi, J.-P. Ryckaert, D.N. Theodorou,Chem Phys, 292, 371 (2003)
0.01
0.1
1
0 0.002 0.004 0.006 0.008 0.01 0.012 0.014 0.016 0.018 0.02time(ns)
I(Q
,t)
Q = 0.50Q = 0.75Q = 1.00Q = 1.25Q = 1.50Q = 1.75Q = 2.00
0,0
5,0
10,0
15,0
20,0
100 1000 10000 100000 1000000Mw(g/mol)
E a(k
J/m
ol)
192

rep_jobic.doc // brandt // 04.12.03 Seite 1 von 1
EXPERIMENTAL REPORT Proposal N° CHE-03-260
Instrument V3 Diffusion of linear alkanes in NaX zeolite Local Contact A. Buchsteiner
Principal Proposer: JOBIC Herve, CNRS Lyon, F Date(s) of Experiment Experimental Team: JOBIC Herve, CNRS Lyon, F BUCHSTEINER Alexandra
26/05-2/06/2003
Date of Report: 4/12/2003 In the industrial applications of zeolites, such as catalytic and separation processes, diffusional effects generally become important for large and complex molecules. However, there is no consensus in the literature on the order of magnitude of diffusivities in zeolites, even for simple molecules like methane. Large discrepancies are still reported when comparing the diffusion coefficients obtained from various experimental methods. The two techniques which probe diffusion in the interior of the zeolite crystals: quasi-elastic neutron scattering (QENS) and pulsed-field gradient NMR (PFG NMR), usually yield comparable diffusivities. However, the activation energies derived from QENS are often lower than those obtained by PFG NMR. This may indicate the presence of defects on a length scale larger than the mean diffusion path covered during the QENS experiments, typically up to 6 nm (it can be noted that the size of precursor particles observed during crystallisation is ca. 10 nm). On the other hand, the molecular displacements in PFG NMR are much larger (a few µm) so that intracrystalline transport barriers, due to twinning or intergrowth, can be experienced. The dynamics of C8 and C12 adsorbed in NaX have been measured on NEAT, between 400 and 540 K. The spectra were fitted with a model corresponding to a diffusion within a sphere convoluted by a jump diffusion model. As shown in Figure 1, there is a good agreement between experimental and calculated spectra. The diffusion coefficients and the activation energy for diffusion could thus be determined. Comparisons are being made with results obtained in Leipzig by PFG NMR.
Figure 1. Comparison between experimental and calculated QENS spectra obtained for C12 in NaX zeolite, at 540 K, at different Q values.
-0.2 0.0 0.2 0.4In
tens
ity0
10
20
30
-0.2 0.0 0.2 0.4
Inte
nsity
0
5
10
15
20
E(meV)
-0.2 0.0 0.2 0.4
Inte
nsity
0
2
4
6
8
Q = 0.176 Å-1
Q = 0.383 Å-1
Q = 0.673 Å-1
193

EXPERIMENTAL REPORT
Dynamic Coupling of Cation Diffusion and AnionReorientation in Solid Solutions of Sodium Orthophosphate
and Sodium Sulfate
Proposal N MAT-03-0286
Instrument V3
Local Contact
R.E. Lechner
Date(s) of Experiment
Jul 20 – Jul. 29, 2003Principal Proposer: D. Wilmer, University of MunsterExperimental Team: H. Feldmann, University of Munster
D. Wilmer, University of MunsterA. Buchsteiner, BENSC
Date of Report January 12, 2004
Like pure Na3PO4, solid solutions ofNa3PO4and Na2SO4 belong to a group of materials whichexhibit both dynamic anion rotational disorder andgood cation conduction in a cubic phase. Advan-tages of adding sulfate are the stabilisation of theion-conducting cubic phase down to room temper-ature and an increased ion conductivity due to thecreation of vacancies.
Earlier quasielastic neutron scattering experi-ments on NEAT were performed to examine the re-orientational anion motion in the picosecond range.The quasielastic contributions of the spectra weresuccessfully interpreted as being essentially due tothe coherent oxygen scattering of the reorienting an-ions [1, 2]. TheQ-dependent quasielastic weightswere compared to models for the coherent oxygenscattering caused by the anion rotational motion. Itturned out that models which considered the reori-entation of the phosphate anions alone could not ex-plain the quasielastic intensity in the low-Q regime,i.e., below about 1.5A−1. More recent model cal-culations [2] considered the cooperative reorienta-tion of a unit consisting of a tetrahedral anion witha cation attached to one of the tetrahedral surfaces.The best fits were obtained by a model describes acircular rotational diffusion of such aXO4Na unitwith one of the X-O axis fixed, at least on the timescale of the experiment. Therefore, our experimen-tal results might be considered as a direct indicationof a dynamic correlation of cations and anions inxNa2SO4 · (1− x)Na3PO4, possibly in the sense ofthe famous paddle-wheel model of Lunden.
This interpretation, however, is only acceptableas long as multiple scattering contributions to thequasielastic scattering can be ruled out as a possi-ble cause of the quasielastic intensity at lowQ. In aneffort to determine the true quasielastic scattering,additional experiments were performed at differentwavelengths and with improved counting statistics.Spectra from0.1Na2SO4 · 0.9Na3PO4 were takenat two temperatures using incident wavelengths of5.0A, 8.0A, and 10.0A, the elastic energy reso-lution being about 100µeV in all cases. Whilethe measurement at 5A monitors three Bragg peaksfrom sample and container, the measurements at
larger wavelengths do not, thereby drastically reduc-ing the chance of quasielastic-elastic combinations.
Data analysis of our earlier measurements used asum of aδ function and a single Lorentzian (rep-resenting the quasielastic scattering), both broad-ened by the Gaussian instrumental resolution func-tion. Our newly obtained data sets, howewer, arebetter fitted by a combination of a rather narrow anda broad Lorentzian line. The width of the broad lineshowed only minorQ dependence, suggesting thatit originates in the localised reorientational anionmotion. This width was determined simultaneouslyfrom all spectra taken at the same wavelength. Thecorresponding intensities of the broad component areshown in Fig. 1. As seen in our earlier measure-ments, the quasielastic intensity of the broad compo-nent increases monotonically. In addition, there is nodrastic decrease in the quasielastic intentity at lowQupon increasing the wavelength of the incident neu-trons, suggesting that, at least at first sight, there isno strong influence of multiple scattering contribu-tions. This statement, however, has to be confirmedby our ongoing data analysis.
0 0.5 1 1.5 2 2.5Q/Å
-1
0
0.05
0.1
0.15
quas
iela
stic
inte
nsity
/a.u
. 5 Å, free fit
5 Å8 Å10 Å
0.1 Na2SO
4· 0.9 Na
3PO
4
600 K
Fig. 1.: Quasielastic intensities (broader line).
[1] D. Wilmer, K. Funke, M. Witschas, R. D. Ban-hatti, M. Jansen, G. Korus, J. Fitter, R. E. Lech-ner,Physica B266(1999) 60.
[2] D. Wilmer, H. Feldmann, R.E. Lechner,Phys.Chem. Chem. Phys.4 (2002) 3260.
194

M
EXPERIMENTAL REPORT Proposal N° MAT-04-741Instrument V4Changes in ’ precipitate morphology in single crystal
superalloy SC16 during thermal treatment Local Contact A. Wiedenmann
Principal Proposer: G. Schumacher, HMI Berlin Date(s) of ExperimentExperimental Team: P. Strunz, PSI Villigen - CH
16. - 17.10.2003
Date of Report: 08.01.2004
The single-crystal superalloy SC16 serves as amodel alloy for many investigations. Applying anuniaxial creep stress in (001)-direction at hightemperatures results in the formation of ’-rafts. Arecent study on the early stages of the formation of’-rafts on creep-deformed SC16 showed roundingof the edges of the initially cuboidal ’ precipitatesprior to the formation of rafts [1]. On the other handit was shown that purely thermal treatment of SC16also results in a rounding [2]. It suggests that theobserved rounding of the precipitate during initialcreep period is due to purely thermal effects whilethe subsequent raft formation is caused by theanisotropic elastic field induced by uniaxialmechanical loading.In order to separate thermal and mechanicaleffects, an in-situ SANS measurement of standard-heat-treated SC16 was performed. The experimentwas carried out using a high-temperature furnaceemployed for holding the sample at 950°C. Theselected scattering curves together with theoptimum fits (using the NOC program [3]) andcorresponding models are displayed in the figure.It was found that the precipitate shape changessignificantly on heating/cooling whereasmorphological changes during the holding at 950°Cwere relatively small. Therefore, it can be expectedthat the final change in precipitate shape wouldhappen also after shorter holding at elevatedtemperature followed by cooling.
An interesting feature is that the shape becomesmore cubic-like at heating to 950°C. The edges aremore rounded at room temperature; however,precipitates are significantly more rounded after thethermal cycle (β=0.71; β beeing a shapeparameter: β=0 for cube, β=1 for sphere) thanbefore it (β=0.57). This corresponds to the view thatrounding of precipitate is purely thermal effect.The obtained decrease of the geometric volumefraction (see the models) at 950°C with respect toroom temperature indicates partial dissolution ofprecipitates at this temperature. It seems that thisdissolution is related to the change of theprecipitate shape mentioned above. At the sametime, a decrease of the scattered intensity occures,most probably due to the change of the scatteringcontrast (matrix is enriched by the elements fromthe dissolved precipitates/precipitate parts).The behavior on cooling differs from that one onheating, causing thus the difference in the originaland final morphology of the precipitates. Thisindicates an importance of the heating/coolingperiod of the thermal cycle. However, the influenceof the heating/cooling rate cannot be assessed fromthis single experiment.[1] P. Strunz, G. Schumacher, W. Chen, D. Mukherji, R.
Gilles and A. Wiedenmann, Applied Physics A 74(2002), 1083-1085
[2] D. Bettge, Thesis, TU Berlin, (1996).[3] P. Strunz, R. Gilles, D. Mukherji and A. Wiedenmann,
J.Appl.Cryst. 36 (2003) 854-859
RT before heating 10 min at T=950°C 14 h at T=950°C RT after heating
AT-04-0741.doc // brandt // 09.03.04 Seite 1 von 1
-0.006 -0.003 0.000 0.003 0.006
-0.003
0.000
0.003
0.006
-0.006 -0.003 0.000 0.003 0.006
-0.003
0.000
0.003
0.006
Qy (
Å-1)
Qx (Å-1)
-0.006 -0.003 0.000 0.003 0.006
-0.006 -0.003 0.000 0.003 0.006Qx (Å
-1)-0.006 -0.003 0.000 0.003 0.006
Qx (Å-1)
-0.006 -0.003 0.000 0.003 0.006
482-1.21E3 192-482 76.1-192 30.2-76.1 12.0-30.2
4.9E4-1.2E5 1.9E4-4.9E4 7.7E3-1.9E4 3.1E3-7.7E3 1.2E3-3.1E3
-0.006 -0.003 0.000 0.003 0.006Qx (Å
-1)
0 1 2 3 4 5 6 7 8012345678
y (
m)
x (m)0 1 2 3 4 5 6 7 8
x (m)0 1 2 3 4 5 6 7 8
x (m)0 1 2 3 4 5 6 7 8
x (m)
195

MAT-04-0796.doc // brandt // 09.03.04 Seite 1 von 1
EXPERIMENTAL REPORT Proposal N° MAT-04-796Instrument V4Sintering process in La2Zr2O7 and SrZrO3
ceramic thermal barrier coatings Local Contact A. Wiedenmann
Principal Proposer: G. Schumacher, HMI Berlin Date(s) of ExperimentExperimental Team: P. Strunz, PSI Villigen - CH
R. Vassen, FZ Jülich 13. - 15.10.2003
Date of Report: 19.12.2003
Due to phase transformations and sintering ofpores, operation of the standard material forthermal barrier coatings (YSZ) is limited to thetemperatures ≤1200°C. La2Zr2O7, SrZrO3 andother perowskites and aluminates arepromising candidates for application evenabove 1300°C. The sintering process isexpected to be slower in these materials.The in-situ SANS measurement of annealedsamples of air-plasma sprayed La2Zr2O7,SrZrO3 is presented. The experiment wasperformed at V4 as a continuation of previousinvestigation of YSZ coatings [1] using ILLhigh-temperature furnace at increasingtemperature up to 1300°C. The selectedscattering curves of the present experimenttogether with their fits (using the SASFITprogram [2]) for SrZrO3 are displayed in Fig. 1.Unlike in the case of YSZ [1], no separatepopulations of medium-size pores andnanopores were visible in the as-sprayed orex-situ (measurement recently carried out atSINQ, PSI) treated samples. The observeddata could be well described by a continuous,very broad distribution of pores which were inmajority larger than the size-detection limit ofthe facility (giving thus Porod-like scattering).The scattering from medium-size pores issuperimposed on that scattering. Only the wingof the size distribution towards the small sizescan be evaluated in detail. The changes in the
overall size distribution at this wing were thusmodelled by a medium-size pore (100 -1000 Å)distribution. However, the in-situ measurementof SrZrO3 coating revealed - similarly as in thecase of YSZ [1] - a creation of nanopores.Therefore, an additional size distribution(nanopores) was used for the description ofdata obtained at elevated temperatures.Fig. 2. displays the resulting parameters(volume fraction and mean size) for both useddistributions. Creation of nanopores is clearlyvisible starting at 900°C (contrary to 800°C forYSZ). The nanopores still increase theirvolume at 1000°C, but they start to disapear at1100°C because of their growth (see theincrease of the medium-size-pores volumefraction). Within 1h holding at 1200°C, thenanopores completely disapear (they cannotbe thus visible in ex-situ treated samples) andthe volume fraction of medium-size poresdecreases. This behaviour differs from thebehaviour of the YSZ layers where thenanopores were still visible even after 10h ofexposition at 1200°C.On further heating to 1300°C and holding atthat temperature, medium-size pores decreasetheir volume so that they becomeundistinguishable from very large cracks.[1] G. Schumacher, P. Strunz, R. Vassen (2003):BENSC Experimental reports 2002, p.218[2] J. Kohlbrecher, PSI, private communication
0.01 0.10.001
0.01
0.1
1
10
100
1000
10000
SrZrO3: Cross sectionselected scattering curves
491°C 1101°C begin 1101°C end (1h) 1200°C end (1h) 1300°C end (4.5h)
d/d
(cm
-1sr
-1)
Q (Å-1)Fig. 1. Selected scattering curves (SrZrO3) withsubtracted diffuse (temperature dependent) scattering.
00:00 04:00 08:00 12:00 16:00 20:00 24:00 28:00
0
200
400
600
800
1000
1200
1400
Tem
pera
ture
(°C
)
Temperature
time (hours)
SrZrO3
00:00 04:00 08:00 12:00 16:00 20:00 24:00 28:000.000
0.002
0.004
0.006
Volume fraction: medium-size pores nanopores
volu
me
fract
ion
(dim
ensi
onle
ss)
time (hours)00:00 04:00 08:00 12:00 16:00 20:00 24:00 28:00
10
100
1000
mea
n ra
dius
(Å)
Mean radius: medium-size pores nanopores
time (hours)
Fig. 2. The fit results (volume fraction, size) for SrZrO3sample. The temperature profile is displayed as well.
196

MAT-04-0750.doc // brandt // 16.03.rr Seite 1 von 1
EXPERIMENTAL REPORT Proposal N° MAT-04-0750
Instrument V4Investigation of cavities microstructure in Y-TZP ceramics using SANS Local Contact
A. Wiedennman
Principal Proposer: Jan Šaroun, Nuclear Physics Institute, Řež Date(s) of ExperimentExperimental Team: Vasyl Ryukhtin, NPI Řež
S. Harjo, Y. Motohashi , Ibaraki UniversityA. Wiedenmann, HMI Berlin
02.12.2002 - 05.12.2002
Date of Report: 10.04.2003
The formation of cavities during superplasticdeformation of ceramics limits applicable strain-ratesand amplitudes of the deformation and determinessubstantially the mechanical properties of finalproduct. Evolution of the cavities depends also on thecomposition of the material and temperature andreflects the physical mechanisms, which govern thesuperplastic deformation. Measurements of themicrostructural characteristics of the cavities aretherefore essential for understanding thesemechanisms as well as for finding optimumconditions for plastic working of ceramic components.
Pure 3mol% yttrium-stabilised tetragonal ZrO2polycrystals (3Y-TZP) and 80wt% 3Y-TZP + 20wt%Al2O3 composite (20A-TZP) materials were studied inthis experiment. The 3Y-TZP specimens were pre-deformed to more than 100% at the both "proper"superplastic conditions (strain rate of ‘=3.3x10⁻⁴ s-1 atT=1623 K) and "high-strain rate" conditions(‘=66.7x10⁻⁴ s-1 at T=1723 K). The 20A-TZPspecimens were pre deformed from e=0% to 100% atthe strain rate of ‘=3.3x10⁻⁴ s-1 and T=1723K. Thischoice permits comparison with our previous resultson slowly deformed 3Y-TZP samples at T=1723 K[1]. The average "as-received" grain sizes of matrixare 0.39m and 0.77 m for 3Y-TZP and Al2O3,respectively.
SANS measurements were carried out at =0.6 nmand detector distances of 16 m, 4 m and 1 m. Even atthe highest resolution, the |Q|-dependence of thescattering function followed Porod law, with only aminor deviation near the beam centre due to theinstrument resolution and multiple scattering effects.Nevertheless, the 2-dimensional patterns of scatteredintensity permitted us to study the changes inanisotropy of the cavities, which was the primary aimof this measurement.
For the 20A-TZP samples, we observed similarbehaviour as with the earlier measurement of 3Y-TZPmaterial at low strain-rate and high temperature [1].The cavities are isotropic at small deformations(=10...20 %), but start to elongate vertically (parallelto the tension) with increasing strain, up to the aspectratio of about 1.2 (see Fig. 1). Qualitatively differentbehaviour was observed in the 3Y-TZP materialdeformed at higher speed or lower temperature. The
horizontally elongated pattern shown in Fig.1a wassuperposed with a newly observed verticallyelongated one (Fig.2). This change in deformationbehaviour can probably be related to the change in the'~n dependence (n~3 to n~2 transition) reported in[2], which indicates that different mechanisms controlthe deformation below and above certain thresholdvalues of strain-rate and temperature. Our SANSresults clearly show that the "high strain-rate & lowtemperature" mechanism is accompanied by thecreation of flat cavities or cracks perpendicular to thetension, which may eventually lead to the fracture ofthe material.
The SANS measurements carried out at the V4instrument will be treated simultaneously with theresults of USANS measurements performed on thesame samples at the NPI Rez. We should thus obtainconsistent characteristics of the surface and anisotropyas well as the mean size (or size distributions) andvolume fractions of the cavities.
Fig. 1. SANS patterns of "as-fabricated" (a) and deformed(b) 20A-TZP sample deformed under proper superplasticconditions.
Fig. 2. Scattering from the 3Y-TZP specimens deformed at(a) '= 3.3x10⁻⁴ s-1, T=1623 K and (b) '= 6.6x10⁻³ s-1,T=1723 K.
References[1] S. Harjo et al., Materials Transactions 43 (2002)2480-2486.[2] D. M. Owen, A. H. Chokshi (1998), Acta Mater.46, 667-679.
-0.02 -0.01 0.00 0.01 0.02-0.02
-0.01
0.00
0.01
0.02 = 0 % a)
Qy,
Å-1
Qx, Å-1
-0.02 -0.01 0.00 0.01 0.02-0.02
-0.01
0.00
0.01
0.02 = 100 % b)
Qx, Å-1
-0.02 -0.01 0.00 0.01 0.02-0.02
-0.01
0.00
0.01
0.02 = 50 %
a)
Qy,Å-1
Qx, Å-1-0.02 -0.01 0.00 0.01 0.02
-0.02
-0.01
0.00
0.01
0.02 = 50 %b)
Qx, Å-1
197

bensc_MAT-04-0869.doc // brandt // 18.12.03 Seite 1 von 1
EXPERIMENTAL REPORT Proposal N° MAT-04-0869Instrument V4Characterisation of precipitates induced
by irradiation in reactor vessel steels Local ContactA. Heinemann
Principal Proposer: J. Šaroun, NPI Řež, Czech Republic Date(s) of ExperimentExperimental Team: O. Muraňský, NPI Řež, Czech Republic
J. Kočík, NRI Řež, Czech RepublicE. Garcia-Matres & A. Heinemann, HMI Berlin
3.11.2003 – 6.11.2003
Date of Report: 18.12.2003
The experiment was a continuation of ourearlier research of low Cu and Ni steels withthe aim to study the influence of steelcomposition on the precipitate-type irradiationdamage and to link the evolution of theprecipitates with other parameterscharacterising embrittlement (transitiontemperature, yield strength).
The measurement was carried out at twosample-detector distances of 1.1 m and 4 m,respectively, using neutron wavelength λ=0.6nm. The samples with dimensions10x10x2mm3 where measured in saturatinghorizontal magnetic field 1.1 T. Though thisfield is not strong enough to really saturatesteel magnetisation, we have checkedexperimentally that it is sufficient to saturatethe scattering in the range of large Q, wherethe irradiation damage effects are observed.Details of material compositions, treatment andirradiation levels can be found in [1].
The main achievements are:1) Completion of the SANSmeasurements on two sequences of Cr-Mo-Vsteel samples (15Kh2MFA and 10KhFMT)characterising the radiation damage independence on irradiation level. Results forfluences missing in the earlier experiment(MAT-04-508), as well as for the irradiatedRPV steels of other compositions wereobtained so that SANS data can be nowcompared with TEM studies performed on thesame materials [1]. Azimuthally averagedscattering curves for the Cu-rich steel (A533)and low Cu steel with increased Cr, Ni, Mo,and V contents (VVER –1000 type) arecompared in Fig.1. Though further analysis isnecessary for qualified conclusions, the shapeof the scattering function indicates theprecipitates are better developed in the case ofA533 steel, while the slower decay in the othercase might be explained by rather diffusenature of irradiation induced precipitates.
0.1 11E-4
1E-3
0.01
0.1
1
A533 (Cu rich) 15Ch2NMFAA (Cr, Ni, V)
dΣ/dΩ
(Q) ,
cm
-1
Q , nm-1
material:
Fig.1. Scattering from A533 steel (Cu rich) iscompared with the VVER-1000 type steel (Cr, Ni,V rich). The data are azimuthally averaged, signalsfrom non-irradiated samples were subtracted.
2) In addition, we have newly investigatedsamples of 10ChMFT steel after cyclicalirradiation and annealing (Fig.2). Preliminaryresults reveal the presence of coarsenedprecipitates after two subsequentirradiation/annealing cycles. More detailedcharacterisation of their size distribution andassessment of compositions should bepossible after further data analysis.
0.1 11E-4
1E-3
0.01
0.1
1
10
dΣ/dΩ
(Q) ,
cm
-1
Q , nm-1
IAIA IAIAI
irradiation/annealing history:
steel 10ChMFT
Fig.2. Scattering from steel samples after multipleirradiation (I) and annealing (A) cycles. Thescattering cross-sections are azimuthally averagedand the signal from non-irradiated sample wassubtracted.
[1] J. Kočík, E. Keilová, J. Čížek, I. Procházka,J. Nucl. Mater. 303 (2002) pp. 52-64.
198

PHY-04-0761.doc // brandt // 09.03.04 Seite 1 von 1
EXPERIMENTAL REPORT Proposal N° PHY-04-761
Instrument V4Polarised SANS Investigations of BlockCopolysiloxane-Complexed Cobalt Nanoparticles
Local Contact: A. Hoell
Principal Proposer: Dr. Tim St. Pierre, PHYSICS DEPT., UWA, AUSTRALIA Date(s) of ExperimentExperimental Team: Dr. Linda Harris, PHYSICS DEPT., UWA, AUSTRALIA
Dr. Elliot Gilbert, BRAGG INSTITUTE, AUSTRALIADr. Armin Hoell, BENSC, HMI
22-25 July 2003
Date of Report: 6TH JANUARY 2004Thermolysis of dicobalt octacarbonyl is aneffective approach to form magnetic cobaltnanoparticles. Riffle et al. have demonstratedthat amphiphilic block copolymer micelles,such as PDMS-PCPMS-PDMS, may act aseffective steric dispersion stabilisers [1]. Riffleet al. have recently prepared a series of cobaltnanoparticle dispersions with narrow sizedistribution using these micelles as nanoreactortemplates [2]. The motivation for studying thissystem is to prepare well-defined cobalt metaldispersions in PDMS fluids to serve asmagnetic non-toxic biomedical materials,particularly for treating retinal detachmentswhere biocompatible magnetic fluids arerequired. In order to be of widespread use, itneeds to be demonstrated that the particles donot irreversibly cluster in the presence ofapplied magnetic fields.
We have made preliminary SANSmeasurements in zero field and ca. 0.1 T on theAUSANS instrument at ANSTO, Australia.Magnetic measurements indicate that the fluidsreach magnetic saturation at just above 1 Tapplied field. At 0.1 T applied field, SANSdata indicated no significant anisotropy ofscattering of neutrons from the cobaltnanoparticle fluid. This is a promising resultwith regard to the potential for biomedicalapplications of the fluids. However, thebehaviour of the fluids in higher fields, closerto the magnetic saturation, needed to beinvestigated.
In these experiments, performed on the V4instrument, we have studied one of the series ofcobalt ferrofluids at a field of 1 T and have alsoemployed polarised neutrons with the aim ofmore effectively separating the nuclear andmagnetic scattering. We measured thescattering in both the zero-field-cooled (ZFC)and field-cooled (FC) states - Temperature =
100K and 300K and Field = 0 and 1 Tesla -using the 6 T horizontal field cryomagnet.
Figure 1 shows the SANS from the ferrofluidin a 1 T field at 100K with the correspondingnuclear and magnetic scattering functionsseparated. Figure 2 is a corresponding 2D plotfor the intermediate q setting that has beengenerated from the subtraction of I+ (flipperoff) from I- (flipper on) scattering. This processhighlights the nuclear-magnetic cross-term.Detailed data analysis is underway.
0.01
0.1
1
10
Inte
nsity
/ cm
-1
3 4 5 6 7 8 90.01
2 3 4 5 6 7 8 90.1
2 3
q / A -1
'NUCLEAR' 'MAGNETIC'
I-
I+
Figure 1 - SANS from ferrofluid in 1T field at 100K.
Figure 2 - SANS pattern generated from I- (flipper on) -I+ (flipper off) from ferrofluid at 100K in 1 T field in FCseries showing nuclear-magnetic cross-term. Fielddirection is horizontal.References:[1] Riffle et al., Polym. Prep. 41 (2000) 1368.[2] Rutnakornpituk et al., Polymer 43 (2002) 2337.
199

MAT-04-0798.doc // brandt // 09.03.04 Seite 1 von 1
EXPERIMENTAL REPORT Proposal N° MAT-04-798
Instrument V4Investigation of the microstructure of ferrofluids usingSmall Angle Neutron Scattering
Local Contact A. Wiedenmann
Principal Proposer: Stefan Odenbach, ZARM University of Bremen Date(s) of ExperimentExperimental Team: Loredana Pop, ZARM University of Bremen
Jens Hilljegerdes, ZARM University of BremenAlie Muslimayne, ZARM University of Bremen
02.07. - 07.07.200303.12. - 08.12.2003
Date of Report: 17.12.2003The experimentally observed field induced changesof the viscosity of ferrofluids under shear flow can betheoretically explained using a model based onchain-like structure formation in the fluids. To corre-late the rheological behaviour of ferrofluids to theirmicrostructure, small angle neutron scattering ex-periments were carried out. The scattering experi-ments were performed for three different cobaltbased ferrofluids, (supplied by Bönnemann/M. P. I.Mühlheim), with a high magnetoviscous effect. Dueto the strong magnetic moments of the Co particles,strong dependency of the scattering patterns on themagnetic field strength and shear rate were ob-served. The SANS experiments were carried out in amagnetic field range from 0 to160 kA/m, directedparallel to the neutron beam and shear rates variedwithin the range from 0 to 200 s-1. The scatteringpattern corresponding to the static case, for eachmagnetic field strength was considered as a refer-ence. Subtracting the reference from the resultsobtained for different shear rates, the non-relevantcontribution to the scattering due to the carrier liquid,surfactant and small particles that do not formstructures, was eliminated. Applying a magneticfield, chains will be formed within the fluid. In thestatic case, the chains are aligned parallel to thebeam, the neutrons will detect only the cross sectionof the first particle from the chains. A shear flowapplied to the fluid sample causes a deviation of thechains from their initial direction. The neutrons willdetect the projection of the chains on the detector,so the nuclear component of the scattering patternwill change. Due to the deviation of the total mag-netic moment of a chain from the initial direction,also a modification of the magnetic component ofthe scattering appears. The magnetic component ofthe scattering depends on the azimuth angle be-tween the direction of the magnetic moment and thescattering vector and therefore the difference scat-tering patterns show also an anisotropy. For lowmagnetic field strength the chains formed are shortand hence their projection on the detector is alsosmall. The anisotropy of the difference scatteringpictures appears only for high shear rates, thismeans for high deviations of the chains. For stronger magnetic fields, the chains becomelonger; their projection, which can be detected byneutrons, increases with an increasing shear rate.The scattered intensity as well as the anisotropygrows relative to the reference. This behaviourcould be observed for the all three fluids.
Fig. 1: Scattering patterns for Co85 (0.30% Co in L9)
Further investigations were carried out by rotatingthe rheometer with 10 degree relative to the neu-tron beam. Thus, even in the static case, in thepresence of a magnetic field an anisotropy of thescattering patterns can be observed. This is astrong indication for chain formation, aligned paral-lel to the magnetic field direction. Furthermore,applying a shear rate, the anisotropy is deviatedfrom the initial direction, due to a deviation of thechains from the direction of the magnetic field.
Fig. 2: a-d: Difference scattering patterns for Co87_02 (0.86%Co in kerosene) for H=160kA/m e-h: Difference scattering patterns for Co87_03 (0.35%Co in kerosene)for H=160kA/m
A qualitative and quantitative analysis of the datacomparing it with numerical investigations of thefluids microstructure is in progress.
γ = 1 s-1. γ = 5 s-1. γ = 100 s-1.γ = 10 s-1.
MAX= 2900MIN= -500
MAX= 6700MIN= -500
MAX= 3500MIN= -500
MAX= 1500MIN= -200
MAX= 450MIN= -100
MAX= 1600MIN= -400
MAX= 1100MIN= -150
MAX= 800MIN= -130
MAX= 140MIN= -70
MAX= 70MIN= -60
MAX= 40MIN= -80
MAX= 200MIN= -130
-100 -80 -60 -40 -20 0 20 40 60 80 100 ↓ ↓ MIN MAX
Reference:
160 kA/m
80 kA/m
50 kA/m
γ = 10 s-1. γ = 200 s-1.
a) MAX= 6500 b) MAX=28000
γ = 10 s-1. γ = 200 s-1.
c) MAX= 900 d) MAX=1400
e) MAX= 2500 f) MAX=20000 g) MAX= 350 h) MAX=850
γ = 0 s-1.Reference:
α=0° α=10°
500→MAX
450
400
350
300
250
200
150
100
50
0
γ = 0 s-1.
200

BENSC-Exp-Report-MAT-04-0799.doc // Andreas Ulbricht // 15.01.04 Seite 1 von 1
EXPERIMENTAL REPORT Proposal N° MAT-04-0799
Instrument V4SANS investigations on RPV steel afterreirradiation Local Contact
A. Heinemann
Principal Proposer: A. Ulbricht, FZ Rossendorf e.V. Date(s) of ExperimentExperimental Team:
A. Ulbricht, FZ Rossendorf e.V.A. Heinemann, HMI Berlin GmbH
07.-10.08.2003
Date of Report: 12.01.2004
The aim of the experiment was to examine andevaluate the susceptibility to neutron embrittlementon reactor pressure vessel (RPV) steel afterirradiation, annealing and re-irradiation consideredfrom the microstructure point of view.
The material investigated was VVER 440-typeweld material in the following conditions: I.) unir-radiated, II.) irradiated (about 0.035 dpa), III.) post-irradiation annealed at 750 K / 100 h, IV.) re-irradiated (about 0.038 dpa) and V.) annealed at750 K / 100 h after re-irradiation.
The measurements were carried out withsamples of 0.8 mm thickness under a saturatingmagnetic field perpendicular to the neutron beam (= 0.6 nm) direction to separate magnetic andnuclear scattering.
The SANS data have been evaluated under theassumptions of a two-phases approach and a poly-disperse system of spherical non-ferromagneticparticles by Fourier analysis using the indirecttransformation method according to [1] aftersubtraction of the incoherent scatteringcontribution. The incoherent term was determinedfrom the measured intensity of the unirradiatedmaterial by means of the Porod law.
The determined volume fraction-related sizedistribution functions calculated from the coherentscattering are depicted in Fig. 1 and show thetypical appearance for the RPV steels: a broaddistribution without a clear maximum in the sizerange of 5 nm to 10 nm in the unirradiatedcondition and an additional sharp, high maximumnear a radius of 1 nm in the irradiated condition.Annealing reduces this first maximum almost up tothe initial level. Only in the size distributiondetected by the magnetic SANS contribution isvisible an effect which hints to a small growth ofthe radiation defects.
The difference between the results of the re-irradiated sample and the first irradiation is evident.The effect of the radiation is considerably lower.There is no clear increase of microstructuralfeatures in the size range near 1 nm. Annealingafter re-irradiation produces again a small growthof the microstructural defects.
Eventually the A-ratio (ratio between totalSANS cross section and nuclear cross section) ischanged by re-irradiation as well. It is 1.6 after thefirst irradiation and about 2.2 after the secondirradiation. This supports the hypothesis that re-irradiation does not completely reproduce the stateof the original irradiation.
[1] O. Glatter, J. Appl. Cryst. 13 (1980) 7-11.
0.0
0.2
0.4
0.6
0.8
1.0
0.0
0.2
0.4
0.6
0 5 10 150.00
0.04
0.08
0.12
1st irradiation (0.035 dpa) 2nd irradiation (0.038 dpa) 2nd annealing 1st annealing as-received state
DV (R
,
/2) /
arb
it.u.
(a)
1st irradiation (0.035 dpa) 2nd irradiation (0.038 dpa) 2nd annealing 1st annealing as-received state
(b)
D V (R
, 0) /
arb
it.u.
1st irradiation (0.035 dpa) 2nd irradiation (0.038 dpa) 2nd annealing 1st annealing as-received state
(c)
R / nm
c R /
vol.-
% n
m-1
Fig. 1: Volume distribution functions Dv ofdefects in a VVER 440-type weld metala) weighted with the total scattering contrast,Dv=cR2 b) weighted with the nuclear scatteringcontrast, Dv=cRnuc
2 c) weighted with the mag-netic scattering contrast, Dv=cRmag
2 (absolutevalues calculated for non-ferromagnetic defects).
201

MAT-04-0800.doc // brandt // 09.03.04 Seite 1 von 1
EXPERIMENTAL REPORT Proposal N° MAT-04-0800Instrument V4Hard magnetic properties of bulk
amorphous Nd60Fe20Co10Al10 Local Contact A. Wiedenmann
Principal Proposer: H. Hermann, IFW Dresden Date(s) of ExperimentExperimental Team: E. García-Matres, A. Wiedenmann, HMI Berlin
G. Kumar, J. Eckert, IFW Dresden 29 April-4 May, 2003
Date of Report: 20.12.2003
Multicomponent Nd-based alloys preparedfrom the melt show a high variability of theirmagnetic properties and depend strongly on thecooling conditions. The properties range fromhard to soft magnetism and include severalmagnetic phase transitions. It is expected thatthe properties are controlled by the micro-structure of the solidified material on ananometre scale. This was the reason for in-vestigating the material by means of small an-gle scattering using polarised neutrons (SAN-SPOL). The first part of the experiments was totest the new 128 x128 detector where problemswith two channels appeared which gave rise tocomplications in the data analysis. The bulk amorphous Nd60FexCo30-xAl10 alloyswere prepared by melting pure 99.9% Nd, Fe,Co and Al in an arc-melting furnace in an ar-gon atmosphere. The ingots were remelted byan induction coil in an argon atmosphere andthe cylindrical rods of 5 mm diameter were castby ejecting the melt into a copper mould.Samples of 1 mm thickness were used for theneutron experiments.The field used for the measurements was µ0H =2 T for temperatures between 6 K and 100 Kand µ0H = 1 T between 300 K and 480 K(Fig.1). From the fit of the nuclear scatteringcurves we found the presence of two Nd-richnanocrystallite contributions. The magneticscattering curves Ion and Ioff at different tem-peratures show a change in the intensity signwhich is related to the magnetic transitions Tc1and Tc2 observed in the previous studies. AtTc1= 50 K the Nd-nanoparticles became par-amagnetic. As holes in the metastable ferro-magnetic phase they act as „pinning centers“ .At temperatures larger than Tc2=500K the fer-romagnetic matrix became paramagnetic.SANSPOL measurements confirm the hardmagnetic properties of the as-cast samples
considering a domain wall pinning model(Fig.2 and ref. [1]).
[1] E.García-Matres, A. Wiedenmann, G.Kumar,J.Eckert, H. Hermann, L. Schultz: Hard magnetic prop-erties of bulk amorphous Nd60Fe20Co10Al10 investigatedby SANSPOL, ECNS, Montpellier Sept., 2003.
Fig.1 Temperature behaviour of the SANSPOL intensi-ties Ion(o) and Ioff() of Nd60Fe20Co10Al10 .
Fig. 2 Scattering length density profiles ofNd60Fe20Co10Al10 for T<Tc1, Tc1<T<Tc2, and T > Tc2.The lines correspond to the nuclear scattering length andthe open circles to the magnetic scattering length (right).
202

MAT-04-0865.doc // Dominique Del Genovese // 16.03.04 Seite 1 von 1
EXPERIMENTAL REPORT Proposal N° MAT-04-0865
Instrument V4In-Situ Characterisation of precip. sequence in amodified 706-type Ni-Fe-superalloy Local Contact
A. Wiedenmann
Principal Proposer: Dr. Debashis Mukherji, ETH Zürich, CH Date(s) of ExperimentExperimental Team: Dr. Pavel Strunz, PSI Villigen, CH
Dominique Del Genovese, TU BraunschweigRalph Gilles, TU München
9. - 11.10.03
Date of Report: 17.12.03
DT706 is a newly developed Ni-Fe based alloy [1],with its chemical composition derived from the wellknown Inconel 706 alloy (IN706). The new materialaims to improve the creep resistance as well as thelong term microstructural stability in order to meetthe application requirement as a new class ofsteam turbine material, with aim to increase theservice temperatures above 700°C. Above 650°C,the precipitation hardened IN706 alloy shows apronounced tendency for transformation of thehardening phases (i.e. the fcc, Ni3(Al,Ti) ' phaseand the bct, Ni3Nb '' phase) into a hcp, Ni3Ti phase, with detrimental effects on the mechanicalstrength. On the other hand, the precipitation ofintergranular plates is essential to promote theformation of serrated grain boundaries which areresponsible for improving the creep crack growthresistance in IN706 alloy. The new DT706 alloy hasbeen specifically designed to improve the stabilityof the microstructure through a suitable modificationof the (Al+Ti)/(Nb) ratio in the IN706 composition.However, this compositional change requiresoptimisation of the heat treatment parameters of thenew alloy DT706. Phase transformations in DT706,at high temperatures, were therefore studied by in-situ SANS following the experience gained onIN706 [3,4].Three different in-situ SANS experiments wereperformed on DT706 in the allocated beam time.Samples were measured in-situ at high temperaturefollowing a heat treatment cycle which produces amicrostructure similar to that in IN706 thatoptimises the creep crack growth resistance inIN706 [1]. The heat treatment cycle consists of asolution treatment at 1080°C for 2 h, cooled at therate of ~5 K/min to the precipitation temperature(which was varied in different in-situ cycles) andhold at this temperature for 10 h. Three different stabilisation temperatures, namely 835°C, 920°Cand 940°C were selected for these experiments.Although scattering measurements were performedduring the whole cycle time, only the mostsignificant part of the results is presented here forbrevity. The scattering cross sections ddmeasured at the beginning and at the end of thestabilisation temperature for each sample areplotted as a function of Q and shown in Fig. 1.
Fig 1: scattering intensities obtained during the in-situ cycles
A first qualitative interpretation of the results, basedon the knowledge formerly gained on IN706, ispresented. The increase at low Q-values in thecurves of samples 2 and 3 after cooling fromsolution temperature indicates that the precipitationof phase begins already upon cooling from thesolutioning temperature. Interestingly, in both casesthe scattering is not changing during the hold time,showing that at these temperatures there ispractically no growth of the precipitates. Further,no significant differences between samples 2 and 3can be detected. After cooling to a lowertemperature (835°C, sample 1), the scatteringincreases also at higher Q values due to theprecipitation of ' particles. The size of ' (estimatedas ~ 50-100 nm), as well as the size of phase,however, do not change with time during theholding. These results, when compared to theprevious results of IN706, suggest an enhancedprecipitation kinetics of and ' phases in DT706.Electron microscopy is now being performed on thein-situ SANS samples to confirm the presence ofonly and ’ phase in the microstructure as ispresently assumed.
[1]: J. Rösler , M. Götting, D. Del Genovese et al.: AEM,Vol. 5, No. 7, p. 469, (2003).[2]: D. Mukherji, P. Strunz, D. Del Genovese, R. Gilles,BENSC Experimental reports 2001, HMI.[3]: D. Mukherji, P. Strunz, D. Del Genovese, R. Gilles,BENSC Experimental reports 2002, HMI.[4]: D. Mukherji, P. Strunz, D. Del Genovese et al.: Metall.Trans. A, in print.
1E-3 0,01 0,10,01
0,1
1
10
100
1000
10000
100000 Sample 1, 832°C begin Sample 1, 832°C end Sample 2, 940°C begin Sample 2, 940°C end Sample 3, 920°C begin Sample 3, 920°C end
Qx (Å-1)
d/d
(c
m-1sr
-1)
203

MAT-04-0882.doc // Uwe Keiderling // 09.03.04 Seite 1 von 1
EXPERIMENTAL REPORT Proposal MAT-04-0882Instrument V4Microstructural Evolution of Nanocrystalline Titania During Sintering
Local Contact U.Keiderling
Principal Proposer: M.Winterer (Universität Duisburg-Essen) Date(s) of Experiment
Experimental Team: U.Keiderling (HMI) 15.12.-18.12.2003
Date of Report: 6.1.2004
Nanosized powders can be synthesized by a largevariety of techniques. However, the consolidationinto fully dense, ultrafine ceramics withoutsignificant grain growth still remains a challenge.The characteristics of the starting powder have aprofound influence on the processability andmicrostructure of the final product. The biggestlimiting factor for sintering of ultrafine titaniapowder to full density is the presence ofagglomeration. During compaction theseagglomerates behave as large entities introducing awide variation in pore size. Due to different rates ofpore closure during densification, larger pores willdevelop into a porous microstructure. The pores canonly be removed at high sintering temperatures andlong sintering time, resulting in exaggerated graingrowth. Even for high quality, weakly or non-agglomerated powders special efforts have to beundertaken to suppress grain growth whilecompletely densifying the ceramic material.The aim of the present experiment was to studysintering in-situ by SANS as a function of time-temperature profiles (firing cycles or sinteringschedules). These experiments provide informationon the microstructural evolution during sinteringand lead to optimum processing routes for theproduction of dense, nanocrystalline titaniaceramics.The experiments were performed in the HTF-1furnace. A new sample holder for in-situ sinteringexperiments has been designed, consisting of singlecrystal alumina windows and a niobium frame.With this equipment it was possible to measureSANS in-situ during high temperature vacuumsintering with optimum counting statistics, becausethe neutron beam did not have to be limited bysmall slits to avoid scattering from the sampleholder. The time resolution achieved for theinvestigation of the time-dependent sintering was 2min. Three different temperature-time schedules(firing cycles) have been measured for each of threesample-detector distances (1.1 m, 4 m, 15.865 m):isothermal sintering at 650°C for 3 h, isothermalsintering at 850°C for 3 h, and short overheating ofthe sample to 950°C (< 30 seconds), followed byconsecutive isothermal sintering at 650°C for 3 h.
In all cases, the initial heating from ambienttemperature to 650°C, 850°C or 950°C wasperfomed with by fast firing with a heating rate >250 K/min.The experiments have been performed immediatelybefore the copy deadline of this report volume. Theresults of the experiments will be published in thefuture.
204

EXPERIMENTAL REPORT Proposal N° EF SANS investigation of precipitation hardening in AA6016 alloy
Instrument V4
Local Contact: J. Haug
Principal Proposer: J. Haug, HMI Date(s) of Experiment Experimental Team:
09.07.-13.07.2003 29.09.-01.10.2003
Date of Report: 15.12.03
Aluminum alloys of the AA6XXX series whichcontains Mg and Si as major elementaladditions are of special interest for theautomotive industry. Alloys like AA6016generally contain an excess of Si above thatrequired to form stoichiometric Mg2Si in orderto improve the hardening response. Theprecipitation of these alloys is quite complexand not fully understood. The decomposition isbelieved to proceed in the following sequenze[1,2]:(Mg+Si)clusters/GP(I)→β''/GP(II)needles→β'rods
→β(Mg2Si)plates
With SANS it is possible to observe the smallclusters (1-5nm), which can not be seen usingTEM, and the β'' needles (10x2nm2) [3]. The samples were first annealed at 540°C for1h and then quenched in water. Afterquenching two different ageing treatmentswere considered: ageing at 185°C (V29-V33)and at 235°C (V70-V74) for different times(see Figs.). Fig. 1 reports the SANS curves for thesamples V29-V33. At high Q-values (~1nm-1)we observe scattering from smallinhomogeneities and their diameter grow withincreasing annealing time. For the samplesV70-V74 (Fig. 2) the curves can be dividedinto two ranges: one in the high Q region(~1nm-1) and one in the lower Q region(~0.2nm-1). The inhomogeneities from the highQ region corresponds to sizes between 0.5and 3nm which is in the range expected for theclusters. The size distributions for the clustersin V30-V33 are given in Fig. 3. The biggerinhomogeneities in the samples V70-V74corresponds to β'' needles with sizedistributions from 10-50nm (calculated forspheres).
References:[1] I. Dutta, S.M. Allen, J. Matter Sci. Lett. 10 (1991) 323.[2] A.K. Gupta, D.J Lloyd, S.A. Court, Mat. Sci. Eng.A320 (2001) 140.[3] G. Albertini, G. Caglioti, F. Fiori, R. Pastorelli, Phys.B. 272-278 (2000) 921.
Fig. 1: SANS curves from samples V29-V33annealed at 185°C.
Fig. 2: SANS curves from samples V70-V74annealed at 235°C.
Fig. 3: Size distributions for samples V30-V33.
benscrep_072003.sxw // brandt // 17.12.03 Seite 1 von 1205

EF_44_Hahn.doc // Uwe Keiderling // 15.03.04 Seite 1 von 1
EXPERIMENTAL REPORT Proposal N° EF-NanomatInstrument V4Impact of ultrasonic agitation on dispersions of ultrafine silica
powders, analyzed with time-resolved SANSLocal Contact U.Keiderling
Principal Proposer: H.Hahn, H.Sieger (TU Darmstadt), Date(s) of ExperimentU.Keiderling, A.Wiedenmann (HMI)
Experimental Team: U.Keiderling (HMI), H.Sieger (TU Darmstadt) 14.5.-16.4.2003
Date of Report: 17.12.2003
In advanced ceramic processing, ultrafine powdersare employed to reduce sintering temperature andtime to obtain a fine-grained structure. The mainobstacle for achieving full density is the presence ofagglomeration. The aim of the experiments was toinvestigate, which sizes of agglomerates can befound in suspensions of ultrafine powders of silica,and in which way these agglomerate sizes areinfluenced by impact of high-power ultrasound atdifferent pH-values of the dispersion. Theagglomerate sizes of ultrafine silica dispersions,and the way to minimize them, play an importantrole both in industrial and in the academic field,since many properties of the dispersions are relatedto the size, e.g. polishing performance orrheological behavior.For the present study, ultrafine silica powders wereproduced by Chemical Vapor Synthesis (CVS). Thepowders were dispersed at different pH values inpure distilled water (pH=4) and in NaOH aqueoussolutions (pH=9.5,11,13) with a solid concentrationof 3wt%.For the SANS measurements, a Starna flow cellwith a thickness of 1 mm was placed in the neutronbeam. This flow cell was connected to a closed tubecircuit in which the dispersion circulated, driven bya flexible-tube pump. Outside the sample positionof the SANS instrument, the dispersion passed acooled double wall glass cell, in which anultrasonic sonode with a diameter of 14 mm and apower of 200 W acted on the dispersion. Afterswitching on the pump, first the scattering withoutultrasonic agitation was measured as a reference,followed by a series of SANS spectra with a verygood time resolution of only 4 min over a period ofapproximately 80 min, yielding 20 snapshots of thestructure evolution. One final measurement wasperformed a few minutes after switching off theultrasonic sonode, in order to determine whetherthere was any relaxation towards the agglomeratesizes before ultrasonic agitation.The measurements covered a wide range of thescattering vector Q between 0.035 nm-1 and 3.2 nm-
1. This was achieved by repeating the experimentthree times for each sample at sample-detector
distances of 1.0 m, 4.0 m and 15.8 m, respectively,each time using a fresh amount of sample liquid.The data reduction was performed using the HMI-standard "BerSANS" software package. The two-dimensional data revealed a perfect circularsymmetry, and were radially averaged to producethe scattering curves d/d. The related sizedistributions were calculated from these scatteringcurves by direct model fitting of lognormaldistributions of spheres.Fig. 1 shows volume-weighted size distributions forsilica at two different pH values. At pH=9 (right),with increasing time an amount of additional largeagglomerates is formed. This could be due tosintering of the primary particles caused by the highpower ultrasonic impact. On the other hand, at ahigher pH=11 (left) the agitation has no visibleeffect on the primary particles themselves. This iscaused by the fact that at this pH the silica on thesurface of the primary particles already begins todissolve in the liquid, thus preventing theconcatenation of particles.Complementary measurements with photoncorrelation spectroscopy (PCS) revealed that on alarger length scale of R ≈ 100 nm, in both caseslarge agglomerates were destroyed. This leads tothe final conclusion, that ultrasonic agitationsimultaneously causes opposite effects onagglomeration on different length scales. Theproper working point for ultrasonic agitation is apH value where the particle material just starts dodissolve, thus preventing the production ofunwanted new agglomerates.
Fig. 1: Size distributions from SANS data.
0 10 20 30 40 500,0000
0,0005
0,0010
0,0015pH 11
before 02.25 min 06.50 min 11.00 min 15.25 min 19.75 min 24.00 min 28.50 min
NV(
R)*
[cm
-1*n
m-4]
R [nm]0 10 20 30 40 50
0,0000
0,0005
0,0010
0,0015
0,0020
pH 9.5 before 02.00 min 06.25 min 10.25 min 14.50 min 18.50 min 22.75 min 26.75 min
NV(
R)*
[cm
-1*n
m-4]
R [nm]
206

PHY-03-0251.doc // brandt // 03.03.04 Seite 1 von 1
EXPERIMENTAL REPORT Proposal N° PHY-03-0251Instrument V5-SPANDiffusion studies in intermetallic phases with NSE.
L12 structures Local Contact C. Pappas
Principal Proposer: G. Vogl, Universität Wien Date(s) of ExperimentExperimental Team: M. Rennhofer, Universität Wien
C. Pappas, HMI BerlinC. Fehr, HMI Berlin
26.05.03-13.06.03
Date of Report: 22.12.03
To solve the problem of the unknown cause ofdepolarisation in use of furnace HTF2 at the beamtime PHY-03-0245 in December 2002 samples withB2 structure were measured. We investigated a Nirich NiGa sample with B2 structure which had beensuccessfully measured before in the HTF1 furnace[1]. Therefore, the results and NSE spectra are knownfor this sample.
The orientation of the crystals was tested with a Lauecamera and set to be ideal to get a huge momentumtransfer of about 1.4-1 to 1.8-1. The NiGa samplewas cut out of the same crystal as for the formersuccessful experiments and was prepared in anidentical way. The crystals were embedded in Al2O3paper and placed in a sample holder made ofniobium sheets with a thickness of about 0.5mm. Theholder was mounted in the centre of the furnace,correctly oriented to the incoming neutron beam.
For the measurement of the NiGa sample the HTF2furnace as well as the new nonmagnetic HZ01B hightemperature furnace were used. With the HZ01Bfurnace the depolarisation by the furnace can beexcluded completely. Technical problems in the useof HZ01B in the high temperature region led to lossof much beam time. Spectra for the sametemperatures and angles as in experiment PHY-03-0245 were therefore taken with the HTF2 furnace.But this time for the sample which was wellcharacterised in the former successful experiment.
So far the data evaluation shows a linear increase indepolarisation with increasing temperature for theNiGa sample and for a quartz reference sample –with a higher depolarisation for the quartz samplewhich is an unexpected result.The data evaluation is in progress.
[1] M. Kaisermayr, M. Rennhofer, G. Vogl, C.Pappas, and S. Longeville, Phys. Rev. B 66,024302 (2002).
207

EF_45_Banhart.doc // brandt // 03.03.04 Seite 1 von 1
EXPERIMENTAL REPORT Proposal N° EFInstrument V7High flux neutron tomography investigation of
a LiI battery Local Contact N. Kardjilov
Principal Proposer: J. Banhart, I. Manke - HMI Date(s) of ExperimentExperimental Team: A. Hilger, N. Kardjilov, I. Manke - HMI
M. Dierik, B. Masschaele - Gent University, Belgium Nov 20 - Dec 20, 2003
Date of Report: December 10, 2003
The high cold neutron flux available at the newradiography position V7 at HMI was used fornon-trivial applications as real-time imagingand tomography investigations of strongabsorbing samples. As it is known Li possessone of the highest attenuation coefficients forcold neutrons among all the elements of ca.105 cm-1. So the task to investigate a LiIbattery with dimensions 2.6x2.8x0.3 cm3 by aneutron tomography method was a challengefor the recently established tomography facilityat HMI. To perform a good tomographyreconstruction a set of equidistance sampleprojections around a 180o angular interval areneeded. This means that for some of theprojections the neutron transmission shouldsucceed for a LiI thickness of app. 2.6 cm.In spite of the high flux of 3x10⁹ n/cm2s theexpected transmission of the beam in thesecases was estimated of 7x10⁻⁴ % which isconsiderably lower in comparison to thetransmission of the transversal direction of thebattery of 0.3 cm giving a transmission of 25%.Such a strong difference in the transmission atdifferent projection angles usually leads toundesired artefacts in the tomographyreconstruction.To improve the signal-to-noise ratio for theprojections with a bad neutron transmissionseveral images were collected for every angleposition. After adding up of all of them a finalprojection image for the corresponding anglewas obtained. The set of final projectionimages was tomographically reconstructedusing a standard back-projection algorithm.The used detector system was based on a 12-bit peltier cooled CCD camera with 1280x1024pixel. The image from the LiZnS scintillatorwas projected via a mirror and a lens systemonto the CCD chip giving a detector resolutionof 26 m/pixel. Unfortunately the real spatialresolution was limited by the energy-dependant beam divergence produced by theNi coated neutron guide at this beam line andit was estimated in the order of 250m. The
number of the collected projections in the 180o
angular interval was 200 which corresponds toan angular rotation step of 0.9o. For eachangular position 50 images with an exposuretime of 0.3s were recorded and summed out toform a final image for the sample projectionunder this angle. After the summation theobtained final projections possessed an imagedynamics of 32-bit grey levels much betterthan the recorded 12-bit single images. Twoprojection images at angles of 0o and 90o areshown below.
Fig.1 Radiography images at 0o and 90o
The reconstruction algorithm was implementedin a self written IDL® routine where theprojections were normalized and prepared fortomography algorithm. After applying of thetomography reconstruction the obtained 3Dmatrix was visualized by the 3D viewersoftware VGstudio® (Fig. 2).
Fig. 2 3D tomography representation
28 mm
26 mm3 mm
208

EF_46_Kardjilov.doc // brandt // 03.03.04
EXPERIMENTAL REPORT Proposal N° EFInstrument V7Real-time imaging with cold neutronsLocal Contact N. Kardjilov
Principal Proposer: N. Kardjilov, HMI Date(s) of ExperimentExperimental Team: A. Hilger, HMI
M. Dierik, Gent University, BelgiumB. Masschaele, Gent University, Belgium
Nov 20 - Dec 20, 2003
Date of Report: December 10, 2003
The new neutron radiography beam line atHMI V7 is placed at the end of the curvedneutron guide NL1b facing the cold source ofthe BER 2 reactor. The existence of a neutronguide helps to achieve an enormous high coldneutron flux in the order of ca. 3x10⁹ n/cm2s atthe sample position with a negligiblebackground of gammas and fast neutrons.These conditions are very suitable for a real-time imaging where the quality of the imagesdepends directly on the intensity of the neutronbeam. The image quality depends also on thebeam collimation which is limited in our caseby the energy-dependant divergence producedfrom the guide. A measure for the level of thebeam collimation is the so-called L/D ratio,described in more details elsewhere [1], wherethe larger the ratio the better is the beamcollimation. For a Ni coated guide the L/Dvalue in case of a cold neutron beam ismeasured in the order of 70 [1] which is muchlower than the typical value for a standardneutron radiography facility of 200. The badbeam collimation requires a shorter distancebetween the sample and the detector plane inorder to achieve a good spatial resolution. Thisdetermined the used contact radiographymethod in the performed experiments wherethe sample was placed as close as possible tothe detector.The used detector system was based on the12-bit triggered CCD camera Sensicam1280x1024 pixels with a fast electronic shutterallowing exposure times down to 1 ms. Theimage obtained by the LiZnS scintillator wasprojected via a mirror and a lens system ontothe CCD chip giving a projection ratio of 26m/pixel. As a test sample a model air-craft combustionengine was investigated. The dimensions ofthe motor (WxHxT) 70.9x69.7x31.4 mm3 werefitted to the beam size of 30x50 mm2. For thefirst tests the engine was driven by a coupledelectromotor. On the crankshaft of the enginean aluminium disk with a slit and a photo
sensor were placed in order to produce anexact trigger signal for the camera system. The collection of the data was based on theso-called stroboscopic method at repetitionprocesses where a set of images wererecorded exactly at the same position of thepiston in the cylinder. After adding up of all theimages for the corresponding piston position,an average momentum image with a betterstatistics was obtained. Using the time delayoption of the camera software the wholecombustion cycle was visualized by such“frozen” momentum images. The experiment was performed by a rotationspeed of the engine of 1110 rpm. Theexposure time was set to 1 ms. For a definedpiston position 200 images were recorded.The time delay between two piston positionswas set to 1 ms. The image processing wasperformed by a self written IDL routine whereafter correction and normalization of thecollected images the average momentumimages were calculated.Four images at different time moments areshown below. As a zero moment the bottomposition of the piston was chosen.
[1] B.Schillinger
s s
209
0 m
, Nondestr.Test.Eval.,
s
5 m
s
15 m 10 mSeite 1 von 1
v.16,141

MAT-04-0819.doc // brandt // 09.03.04 Seite 1 von 1
EXPERIMENTAL REPORT Proposal N° MAT-04-0819Instrument V12ASANS investigation of plastically deformed stainless
steelLocal Contact M.Strobl, W.Treimer
Principal Proposer:V.T.Lebedev, Petersburg Nuclear PhysicsInstitute, 188300 Gatchina, St.Petersburgdistr.Russia
Date(s) of Experiment
Experimental Team:Gy.Torok, Research Institute for Solid StatePhysics and Optics, H1525, POB49, Budapest,Hungary 18-30.09.2003
Date of Report: 3.12.2003
Metals fracture concepts are mainly based on electronmicroscopy data for surfaces and thin metal slices. Thefracture criteria development needs interior defectsinvestigation. A plastic deformation induces a hugescattering much stronger than from original materials,especially in fracture zone [1]. It testifies the scatteringsources (microcracks, voids) which evolution by thedeformation should be studied. We have measured the SANS (neutron wavelength=0.476 nm, monochromatic beam) to recognize thepeculiarities of the fracture of austenite stainless steelsX18H10T commonly used in the WWR-type nuclearpower plants. The steel cylinders (diameter 3mm)plastically deformed at 20oC up to fracture (strain S=0-60%), have shown some structural changes (Fig.1). Theintensity detected at momentum transfers (parallel orperpendicular to deformation axis) demonstrates a fractaltype behavior I(q)=Io/[(1+qRc
2)]D/2 where Io is forwardintensity, parameter D is the fractal dimension and Rc isthe correlation radius of defects. In original samples (nondeformed) the exponent 2<D<3 indicates the low-dimensional defects, i.e. dislocations' network withcorrelation scale RC~103nm comparable with crystallineblocks (Fig.2). The deformation leads to the decrease ofradius and to the increase of the fractal dimension. It canbe interpreted as a result of dislocations generation byplastic deformation making a dense dislocations'network. At the strain S*~45% we observe the crossoverfrom mass fractals to surface fractals (D>3) and at highS~50-60% the D4 approaches to Porod limit forsmooth surfaces. At high deformations up to the fracturethe scattering shows the development of internal surfacerelated to small-size defects (voids, size RC~40-50nm)with smooth borders. These defects are only slightlyelongated in the direction of deformation.
1. V.T.Lebedev, Gy.Torok et.al., J.Appl.Cryst. 36 (2003)629-631.
1 E - 3 0 ,0 1 0 , 11 E - 5
1 E - 4
1 E - 3
0 ,0 1
0 ,1
1
B )
I(q) ,
arb
.un.
q , n m -1
q p e r p e n d i c u la r S S = 0 % 2 9 - 3 0 % 5 9 -6 0 % ,f r a c t u re
1 E - 3 0 ,0 1 0 , 11 E - 7
1 E - 5
1 E - 3
0 ,1A )
I(q) ,
arb
.un.
q p a ra l l e l S 0 % 2 9 -3 0 % 5 9 -6 0 % , f ra c t u r e
Fig.1. SANS from the samples at q S (A) and q S (B) for different strain degrees S.
0 10 20 3 0 40 50 6 0
2
4C )
S , %
D
q pa ra lle l S q pe rpe nd . S
0 10 20 3 0 40 50 6 010
1 00
10 00
B )
Rc, n
m
q pa ra lle l S q pe rpen d . S
0 10 20 3 0 40 50 6 00,01
0 ,1
1 A )
I o, arb
. un.
q pa ra lle l S q pe rpend icu la r S
Fig.2. Parameters of scattering function vs. elongation.
210

MAT-04-0820(1).doc // brandt // 16.03.04 Seite 1 von 1
EXPERIMENTAL REPORT Proposal N° MAT-04-820
Instrument V12aPorosity study in Ag-Cu alloy specimensLocal Contact Markus Strobl
Principal Proposer: Adrian Manescu, University of Ancona Date(s) of ExperimentExperimental Team: Francesco Spinozzi, University of Ancona
Fabrizio Fiori, University of Ancona 20.01-30.01.2003
Date of Report: 19.06.2003
The investigated samples are Ag-Cu alloy ringspecimens. Experiments were performed at theV12 double-crystal diffractometer of the HMI-BENSC, Berlin. The incident neutronwavelength was = 4.76 Å and the Q-rangewas 1.6105
4.6103 Å1.Figure1 below shows the measured SANS
cross sections )(Qdd
for the investigated four
samples. The best fit curves, as obtainedaccording to the procedures described in theprevious section, are also presented (for sake ofclarity, the curves are scaled by a factor 10).
Figure 1. Measured SANS curves for the investigatedspecimens and corresponding best fit curves
The size distributions of the pores N(R) andD(R) = R3 N(R) are presented in Figures 2 and3, respectively. It can be noticed that the sizedistributions corresponding to the investigatedspecimens are not very large. The detectedpores are distributed in a broad range of size,running from few Å to about 5 µm. Inparticular, the D(R) curves put into a majorevidence the contribution of bigger pores(around 1 µm size).
Figure 2. Size distribution functions N(R) obtained
from the best fit of SANS curves in Figure 1
Figure 3. D(R) functions obtained from the best fit ofSANS curves in Figure 2
The volume fractions f of the pores (porosity),obtained from the fits, are reported in the Table1 below. The volume fractions were calculatedby integrating the curves in Figure 3:
dRRDf )(342
Table 1 – Volume fraction (porosity) of the pores.Sample Porosity (%)
g027 0.865g029 0.228g035 0.314
g029-2 0.220
211

MAT-04-0820(2).doc // brandt // 16.03.04 Seite 1 von 1
EXPERIMENTAL REPORT Prop. N° MAT-04-820 - cont.
Instrument V12aPorosity study in Ag-Cu alloy specimensLocal Contact Markus Strobl
Principal Proposer: Adrian Manescu, University of Ancona Date(s) of ExperimentExperimental Team: Francesco Spinozzi, University of Ancona
Fabrizio Fiori, University of Ancona 23.06-29.06.2003
Date of Report: 29.12.2003
The investigated samples are Ag-Cu alloy ringspecimens. Experiments were performed at the V12double-crystal diffractometer of the HMI-BENSC,Berlin. The incident neutron wavelength was = 4.76 Åand the Q-range was 1.6105
4.6103 Å1.The porosity in three Ag-Cu alloy rings was evaluated indifferent points as presented in the figure below:
In order to determine the porosity, we have firstcalculated the scattering length density of the alloys,reported in the table below:
Sample Alloy Ag %wt.
Cu %wt.
Zn %wt. (106
Å2)g027 925 Legor
A92.8 5.3 1.9 3.67
g029 935 IrZn20
93.5 4.5 2 3.64
g035 925 92.5 7.5 0 3.74
From the cross sections, )(/ Qdd , the sizedistributions of pores N(R) is determined byexperimental data on the basis of the “two phase model”,which gives:
dRQRFRVRNQdd 222 )()()()()(
From the size distributions of the pores N(R) and porevolume distribution D(R)=R3N(R), it can be noticed that
the detected pores are distributed in a broad range of
size, running from few Å to about 5 µm. In particular,the D(R) curves put into a major evidence thecontribution of bigger pores (around 1 µm size). Actually, the Small Angle Neutron Scattering techniqueallows also the detection of particles with size smallerthan few micrometers. Therefore, in our case, also smallpores are revealed. Their number turns out to be muchhigher than the one of the bigger pores. Generally, theirpresence should be taken into account for what concernsthe mechanical properties of the material as theircoarsening as a consequence of thermal and/ormechanical treatments can be a relevant source of crackopening and failure.The volume fractions f of the pores (namely theporosity), is calculated by
dRRDf )(34
Sample Meas.No.
f% <f>%
St.dev f%
g027 p1 0.0041 0.005 0.001g027 p2 0.0060g027 p3 0.0054g027 p4 0.0045g029 p1 0.0250 0.019 0.006g029 p2 0.0191g029 p3 0.0084g029 p4 0.0210g029 p5 0.0182g029 p6 0.0203g035 p1 0.0644 0.047 0.017g035 p2 0.0403g035 p3 0.0652g035 p4 0.0361g035 p5 0.0410
As one can see from the table above, all the sampleshave small porosity, of the order of 102%. However,relatively large differences exist between the averagevalues for the different samples: the pore volumefraction of the sample g035 (0.047%) is higher by abouta factor ten as compared to the sample g027 (0.005%)and by about a factor two as compared to the sampleg029 (0.019%). Moreover, within each samples differentregions show different porosity.Those variations can beof technical interest for the aim of the study, i.e. forclassifying the defects of the silver casting process.
2
4 3
1 16
2
3
45
42
1
35
Measurementpoints
g027 g029 g035
212

OTH-02-0384_EF.doc // brandt // 03.03.04 Seite 1 von 1
EXPERIMENTAL REPORT Proposal N° *OTH-02-384-EF
Instrument E1The influence of an organic phase on theefficiency of a ceramic neutron image plate Local Contact
J.Klenke
Principal Proposer: J. Zimmermann, R.Kolb, TU-Darmstadt Date(s) of ExperimentExperimental Team: R.Kolb, J. Zimmermann, TU-Darmstadt
J. Klenke, S. Danilkin, HMI Februrary 2003
Date of Report: *
Introduction:
The storage mechanism in neutron image plates is
based on the conversion of neutrons by a neutron
converter (usually a Gd-compound) into electrons and
the initiation of the storage mechanism of a storage
phosphor (usually BaFBr:Eu2+) by the generated
electrons. The electrons thereby penetrate the storage
phosphor and generate defects which are able to store
the neutron information as a latent image. The readout
of this information is performed by optical stimulation
of defects resulting in the so called photostimulated
luminescence (PSL). The intensity of the PSL signal
reflects the efficiency of the NIP.
Motivation:
Commercial NIPs are based on a powder mixture
embedded in an organic binder which act as
mechanical stabilizer. It was assumed that the organic
binder has only a mechanical meaning and hence
ceramic NIPs without organic binder should improve
the efficiency. It was shown in previous experiments
that it is possible to synthesize ceramic NIPs avoiding
the organic binder. The expected improvement were
observed concerning the spatial resolution of the NIP,
which could be increased from 10 Lp/mm of a
commercial NIP up to 23 Lp/mm for a ceramic NIP.
Contrary to the expectations the PSL-intensity of the
ceramic NIP was half as much as for a commercial
NIP. Additionally experiments analyzing the behavior
of the storage phosphor due to x-ray irradiation show
that for this kind of radiation an increasing PSL-signal
for ceramic NIPs could be observed. This leads to the
assumption that the organic binder acts not only as
mechanical stabilizer but has an influence on the
creation mechanism of defects in the storage phosphor
while irradiating with neutrons.
Experimental:
To prove this assumption a ceramic Nip was divided
into two pieces the one half was covered with an
organic glue.
The sample prepared as shown in the sketch above
was irradiated for 5 minutes at the E1 and
subsequently read out with a self made scanner system
to detect the spatial PSL-intensity.
Results and Discussion:
In the diagram stated below the observed spatial
distribution of the PSL-intensity is shown.
It is easily seen that the PSL-Intensity of the glue-
covered part (right side) of the NIP shows a higher
PSL output. This behavior proves the assumption that
the organic influences the storage mechanism and
even in ceramic NIPs an improvement could be
achieved.
213

EXPERIMENTALREPORTTitle
Name(s) Affiliation
Proposal Nº
Instrument
Local Contact
Date(s) of Experiment
Date of Report
Principal Proposer:
Experimental Team:
Diamagnetic signal from Bi single crystal(polarization option at E4)
E4
K. Prokeš
EF
K. Prokeš HMI BerlinK. Prokeš HMI BerlinV. Sikolenko HMI BerlinF. Mezei HMI Berlin
2.-13.July 2003
18.7.2003
This experiment was performed in theframework of our attemp to reestablish thepolarization option on E4. Last year (see therelevant repor from 2002) we have identifiedthat the depolarization of neutron beamproduced by bender inserted in the 42.5 0
chanel occur between the end of the benderand the exist of the channel. In this, about 0.5m long channel are situated following items:secondary shutter, monitor and concreteblock that defines the size of the beam. It wasrecognized that if the polarizing bender isplaced after the shielding block and guidingfield are provided, the polarization degreereaches about 90 %. If a VM-2 magnet isplaced on the instrument table thepolarization decreases by 2-3% However,when the bender is placed inside the neutronchannel, i.e. before the shielding box thatdoes not contain any guiding magnetic field,the polarizatin degree drops to about 70 %.To improve the polarization, we have inserteda small device that provides a guiding insidethe concrete block and a small magneticdevice around the monitor. The only regionwithout guiding field remains then thesecondary shutter.
A better solution is to place flipperinside the soft iron joke that shields theflipper from the stray field and put it insidethe shielding box. In such a way, polarizationdegree of 74% can be achieved.
However, the biggest source ofdepolarization seems to be inhomogeneousfield in the active volume of the flipper coils.This can be reduced by suitable constructionof the flipper coils. It has been shown that ifone use flipper coils constructed fordiffractometer E1 inserted to the same soft
iron joke, one can achieve polarization degreeof 86 %, i.e. to e degree that is close to valueachieved with polarizing bender outsideshielding. New flipper coils are underpreparation and are supposed to be ready byMarch 2004.
With the best set-up (bender insidechannel, E1 flipper coils inside iron joke) wehave tried to identify the diamagnetic signalin a large single crystal of Bi. VM-2 magnetwas used to produce field of 6T that wasapplied perpendicular to the trigonal axis ofBi crystal. We have collected intensities forboth spin up and down orientations of fourreflections as a function of temperature (seeFig. 1).
0 20 40 60 80 1000.996
0.997
0.998
0.999
1.000
1.001
1.002
1.003
1.004
1.005
1.006
Bi single crystalVM2 6T
R (=
I+ /I- )
T (K)
(113), (110) (003), (006)
Fig. 1: Temperature dependence of the flipping ratiosof four nuclear reflections of a large single crystal ofBi in magnetic field of 6T applied along the [100]direction.
As was expected, the signal is very small andonly (006) reflection shows signal that is largerthan 3σ. The detailed analysis has to be stillperformed. However, it is clear that polarizedneutrons are sensitive enough to probediamagnetism in condensed matter.
214

EF_48_Peters.doc // bra
EXPERIMENTAL REPORT Proposal N° *Instrument E6Neutron transmission through a package of
Al and 10B slits Local Contact N. Stüßer
Principal Proposer: J. Peters, HMI Berlin Date(s) of ExperimentExperimental Team: J. Peters, HMI Berlin
N. Stüßer, HMI Berlin 28.10.2003
Date of Report: 3.12.2003
A high speed Fermi chopper is planned to be part of thenew time-of-flight powder diffractometer EXED inorder to achieve a very high resolution in time and inthe d-spacing (d/d = 2.4 10-4 at 2 Å). The Fermichopper is constituted by a rotor and a slit packageinside (see fig. 1), which is composed by alternatinglayers of a material which is highly permeable forneutrons and a material which is a good neutronabsorber.
As the slit package requithe homogeneity of the lpackage has been producAstrium to benchmark itformed by layers of AlMby 0.1 mm thick layers cfibre reinforced plastic) Eof 50:50 percent by voludimensions 65 x 10 x 8 m
To check the homogeneitransmission measuremediffractometer. For this ebeen turned into the diremm diameter has been pThe measurements were wavelength = 0.24 nm positions by rotating the (-scan). Every positionseconds. The scans are sh
The shape of the curves i[1] and all three curves lo
Furthermore, a translatiobeen studied at three diffdiaphragm has a diameteone permeable layer is 0possible: the neutron beaand one absorbing layer
0
5000
10000
15000
20000
25000
30000
35000
40000
trans
mitt
ed in
tens
ity
Fig. 1:Schematicalrepresentation ofthe Fermi chopperrotor and the slitpackage inside.
ndt // 03.03.04
rements are high with respect toayers, a sample of a small slited by the company EADSs quality. The sample isgSi1 of 0.5 mm thickness andomposed of CFRP (carbonpoxy and 10B in a relationship
me. The sample has them³.
ty of the slit thicknesses, ant has been done at the E6xperiment, the detector hasct beam and a diaphragm of 1laced in front of the sample.performed using theat three different verticalsample around the vertical axis has been probed about 38own in fig. 2.
s almost triangular as it shouldok very similar.
n in horizontal direction haserent vertical positions. As ther of 1 mm and the slit width of.5 mm, different scenarios arem scans two permeable layersin between or it covers one
Fig. 2: -scans of a slit package at three differentvertical positions.
permeable layer and two absorbing layers plus little partsof the neighboring permeable layers. The results areshown in fig. 3.
-6 -5 -4 -3 -2 -1 0 1 2 3 4 5 6-5000
(°)
2
Seite 1 von 1Fig. 3: Horizontal scans of a slit package at threedifferent vertical positions.
The increase at the sides corresponds to the border of thesample. In between the curves are almost constant. Thesmall deviations are due to the above mentioneddifferent beam coverings of the slits.
[1] M. Marseguerra & G. Pauli, Nucl. Instr. Meth. 4(1959) 140 – 150.
0 1 2 3 4 5 6 7 8 9 10 11 12 13 14 15 16 17 18
35000
40000
45000
50000
55000
trans
mitt
ed in
tens
ity
x-pos (arb. units)
15

EF_49_Többens.doc // brandt // 03.03.04 Seite 1 von 1
EXPERIMENTAL REPORT Proposal N° EFInstrument E9Testing the use of sapphire sample holders in
high-temperature powder diffraction Local Contact
Principal Proposer: D. M. Többens, HMI Date(s) of ExperimentExperimental Team: D. M. Többens, HMI
1.-2.7.03
Date of Report: 12.12.03
Single crystalline sapphire has become afrequently used material in synthesis andoptics. This material has various advantagescompared to other commonly used materials,such as vanadium, tantalum, niobium,aluminum or glass, which should make it avery good choice for the production of sampleholders for neutron powder diffraction at veryhigh temperatures:
No Bragg reflections from the sampleholder: The use of a crystalline material avoidsthe problem of an increased background.However, with polycrystalline materials thisresults in a full Bragg diffraction pattern fromthe sample holder increasing the problem ofpeak overlap. The use of a single crystallinecontainer avoids this drawback. In theparticular case of corundum the longhexagonal c axis can be aligned parallel to theaxis of the container. It is then normal to thediffraction plane of instruments with Debye-Scherrer or similar geometry. In this case onlythe hki0 plane of the reciprocal lattice will beinside the diffraction plane. Since the latticeparameter a is small, the number of possibleBragg reflections from the container is alsosmall. Due to the strong general reflectioncondition of -h+k+l=3n it is further decreased.Even on instruments with high divergencies itis no problem to find an orientation of thecontainer without any Bragg reflections.
Low absorption: Al2O3 has a low absorptioncoefficient for neutrons. This allows the use ofthick-walled containers (6 mm in our case)resulting in a high mechanical stability. For x-rays the absorption coefficient is about thesame as the one of the glass capillariesnormally used, making it an alternative there,too.
Mechanical, thermal and chemical stability:Due to its high chemical stability and very highmelting point (2318 K) corundum is the idealmaterial for high temperature sample holders.Vanadium, often used in neutron diffraction,also has a high melting point. But its reactivity
with oxygen and reduced metals it very high,too, which sometimes results in the destructionof the sample holder.
Low background: One of the most importantqualities in a powder diffraction sample holderis the absence of Bragg reflections. This isnormally achieved by using a non-crystallinematerial such as glass. For neutron radiation,due to the negative scattering lengths of someisotopes, it also possible to use materials witha coherent scattering length of nearly zero, i.e.vanadium or Ti/Zr alloy. However, both caseslead to increased incoherent scattering andaccordingly to high background intensities.
At room temperature the test tubesproduced gave diffraction patterns whichlooked very promising. There were some smallresidual reflection as well as some diffusescattering. However, these contributions wereless then the background and reflectionsobserved from the thick-walled vanadiumcontainers normally used at BENSC for high-temperature powder diffraction.
Unfortunatelly at high temperatures theintensity of the diffuse scattering increases,especially at high diffraction angles. Becauseof this sappire should not be choosen as thestandard material for high-temperatureexperiments. However, it is usefull for reactivesamples and at instruments with a limitedrange of diffraction angles.
216

EF_50_Keiderling.doc // Uwe Keiderling // 03.03.04 Seite 1 von 1
EXPERIMENTAL REPORT Proposal N°
Instrument V4The new "BerSANS-PC" data processing software
Local Contact U.Keiderling
Principal Proposer: U.Keiderling, HMI Berlin Date(s) of Experiment
Experimental Team:
Date of Report: 29.12.2003
The new "BerSANS-PC" data processing softwarehas been developed for the SANS instrument "V4".Comprising all essential functions of the"BerSANS" program available on workstationsunder UNIX and OpenVMS in the past, thissoftware is a completely new development fornetwork-independent use on local PCs andnotebooks with a full-feature graphical interface. Itis a comfortable, easy-to-use and error-proof tool toperform the standard data processing procedures ina fast and efficient way. The program was writtenin "Borland Delphi", and has been extensivelytested under Windows 98/2000/XP. "BerSANS-PC" is freely available for all interested users.The program provides all tools necessary for thedata treatment, starting from two-dimensional rawdata files as obtained from the measurement, andending with corrected anisotropic or isotropic datafiles which can then be used for physicalinterpretation by other programs. The graphicalinterface has been designed on a "what you see iswhat you can do" basis, without any hidden contextmenus or key combinations. At each point duringoperation, exactly those options are displayedwhich are currently possible and useful. Thisfeature is supported by the implementation of avery extensive internal error check mechanism anda continuous analysis of the internal program status,which together form more than half of the originalsource code. The data reduction procedures utilizecommand files, thus allowing a high degree ofautomation. The program supports a multi-lingualinterface, with the possibility to freely switchbetween languages at any time. Languagescurrently available include English and German.Different detector sizes can be defined.A special new feature of the program is the data filemanager. This is a unique tool for the compilationof data file sets for all kinds of data treatment anddata display. Options offered for data file selectionare: individual picking from a list, selection of acontinuous range of run and/or extension numbers,selection of a regular pattern of run numbers(alternatively pick N files and skip M files), searchfor special values or value ranges of file headerentries, or any combination. The data file manager
also supports the transfer of an entire selected datafile set from one window of the program to another.All windows offer various display, printing andoutput options.
217

EXPERIMENTAL REPORT Proposal N° EF
Instrumental resolution on V4 afterchanging the detector readout system
Instrument V4
Local Contact J. Haug
Principal Proposer: A. Wiedenmann, HMI Date(s) of ExperimentExperimental Team: J. Haug, HMI
July, 2003
Date of Report: 08.01.04
The readout system of the position sensitivedetector at V4 was changed in January, 2003.The new readout electronic uses interpolationof interstrip positions to give a 128x128position output. To check the behaviour andquality of the “new” detector some testmeasurements were carried out and comparedwith the old 64x64 measurements. Because ofproblems with the new software the testsstarted in July 2003.For instrumental resolution silver behenate(AgBE) powder can be used as a standard[1,2]. AgBE featuring three Bragg reflections inthe angular range used by SANS. Fig.1exhibits the two-dimensional SANS pattern ofAgBE for =6.05Å, sample detector distance(SD) of 0.975m and collimation 2m.Corrections of background, transmission,detector efficiency and calibration for absoluteintensity were done using the new BerSANSdata reduction software [3]. The intensity wasradially averaged and plotted versus 2 in Fig.2 (black circles). By fitting Gaussian functions(red lines) the position and FWHM(2) of theBragg peaks were calculated and comparedwith previous measurements [2] in Tab. 1.The FWHM(2) of the new system issomewhat smaler than for the old system. Toget more familiar with the dependence of theFWHM from detector cells, the radiallyaveraging in BerSANS was done over twocells (blue squares in Fig. 2). This is leading tothe same number of data points as for the64x64 detector. This reduction in data pointsresults in a decrease of the maximum and anincrease of the FWHM to 1.151 in theGaussian fit (blue line) of (001).
References:[1] U. Keiderling, R. Gilles, A. Wiedenmann J. Appl.Cryst. 32 (1999) 456.[2] R. Gilles, U. Keiderling, P. Strunz, A. Wiedenmann,H. Fuess Mat. Sci. Forum 321-324 (2000) 264.[3] U. Keiderling The new "BerSANS-PC" dataprocessing software BENSC Rep. 2003
Fig. 1: Two-dimensional neutron scatteringintensity pattern of AgBE with three Braggreflections (=6.05Å, SD=0.975m, Coll. 2m)
Fig. 2: Radially averaged scattering intensityplotted versus 2.
(001) (002) (003)
new(128x128)
2 5.879 11.776 17.752
FWHM(2) 1.086 1.429 1.925
old(64x64)
2 5.814 11.672 17.555
FWHM(2) 1.222 1.636 2.137
Tab. 1: Comparison of the FWHM(2) of thenew and old readout system.
benscrep_resolution.sxw // brandt // 12.01.04 Seite 1 von 1218

EXPERIMENTAL REPORT Proposal N° EFDetector efficiency map and dead timecorrection on V4 after changing thedetector readout system
Instrument V4
Local Contact J. Haug
Principal Proposer: A. Wiedenmann, HMI Date(s) of Experiment
Experimental Team: J. Haug, HMIJuly, 2003
Date of Report: 15.01.04The readout system of the position sensitivedetector at V4 was changed in January, 2003[1]. On V4 water is used as calibration standard.For an incoherent scatterer such as water thewhole scattering is uniform in the solid angle4 and the measured and corrected scatteringfrom the standard sample shows upfluctuations in efficiency of individual detectorelements. Thus, measurement of water can beused to calculate the 2D detector efficiencymap which represents the fluctuation of eachcell about the mean value of 1. The calibrationscalar, which represents the average of thecounts/cell, was calculated using GRASANSP[1]. The detector efficiency map can now becalculated by dividing the 2D image by thecalibration scalar (Fig. 1).Fig. 2 shows the fluctuation of the cells aroundone for different dates since change ofelectronic/software until now. It can be clearlyseen that before July the fluctuations are highand no gaussian distribution is available. Afterfurther corrections in July the efficiency gives asharp gaussian distribution (blue curves in Fig.2).In Fig. 3 the efficiency was compared with awater measurement of the old 64x64 detector.Therefore, the data points of the 128x128measurement were reduced to 64x64 (greenpoints). The gaussian distribution shows thesame FWHM than for the 64x64 detector.
For the detector dead time correctionplexiglass (1mm thickness) was used becauseof its homogenious scattering and highintensity over the entire detector. Various slitsand distances were used to get 16 intensitieswith and without attenuator. The dead time was determined by fitting the nonparalysablemodel Iatt=I/(A*(1-*I) with:I: Intensity without attenuatorIatt: Intensity with attenuatorA: Attenuation factorNew detector dead time: =4.23e-06s
References:[1] J. Haug, A. Wiedenmann, BENSC Rep. 2003[2] http://www.ill.fr/lss/grasp/grasp_main.html
Fig. 1: Two-dimensional detector efficiencymap of water.
Fig. 2: Fluctuation of the detector cells aboutthe mean value 1.
Fig. 3: Fluctuation of the detector cells for128x128 and 64x64 detector.
benscrep_det_eff_v4_2.sxw // Jörg Haug // 01.03.04 Seite 1 von 1219

EF_53_Wilpert.doc // Th. Wilpert // 03.03.04 Seite 1 von 1
EXPERIMENTAL REPORT Proposal N° DevelopmentInstrument V4New Front-end Electronics and Data Acquisition System for SANS
DetectorLocal Contact Th. Wilpert
Principal Proposer: Th. Wilpert, W. Altmann (HMI) Date(s) of Experiment
Experimental Team: Th. Wilpert, W. Altmann, J. Haug (HMI)R. Schneider, G. Montermann (mesytec gbr)
April – July 2003
Date of Report: 22.1.2004
After several failures during the recent years of the morethan 15-year old front-end electronics of the SANSdetector (Leti-type XYP 64 x 64) [1] it was necessary toreplace the complete readout electronics and theacquisition system. In addition, it was indispensable tocheck the actual pressure in both chambers of thedetector, since the absolute pressure sensors indicatedconstantly decreasing and diverting values.The modular system of mesytec [2] consists of 16 8-foldpreamplifier and shaper PCB-cards on 4 front-endboards, mounted directly at the backside of the detector.Four border strips are read out separately and are used asveto if a neutron has triggered. The amplifier signals aretransmitted to four MCU-34 modules (1/12 wide NIM).Here the signals are sorted (even/odd), re-grouped andanalysed for their hit pattern and a digital position iscalculated. The output of these modules is transmittedvia a short parallel bus to the MIU interface module(1/12 wide NIM), which determines the absolute x- andy-position. All units described above are mounted in theelectronics compartment under normal pressure at thebackside of the detector. The NIM-bin is supplied onlyby a +6 V power cable via the MIU-module and the totalpower consumption of these modules is only 5 W.Hence, no special cooling is required while the detectoris operated in a vacuum vessel.The front-end MIU-module communicates via a serialevent bus (up to 30 m BNC cable) with the centralprocessing module MCPD (2/12 wide NIM) situated inthe measuring cabin. The MCPD buffers the data andtransfers them via Ethernet to a PC. The system iscompletely remote controlled by the data acquisitionsoftware mesydaq running under LINUX. A CORBAinterfacing system for external process control, e.g. byCARESS is implemented. Furthermore, the MCPDmodule accepts an trigger input, allowing the acquisitionof time-of-flight experiments by using a chopper systemor other time correlation measurements with 1, 2, or 4 µsresolution and a range of up to 520 ms.The system has three main operation modes: XYposition readout (standard mode), position-amplitudemode or a diagnostic mode. In the XY position mode thecoordinates are readout with a resolution of 128x128channels, in which the intermediate position (64channels per coordinate intrinsic resolution) aredetermined by weighted interpolation. The spectra showsome (stable) differential non-linearity, which can becorrected offline. The main new feature is the position-amplitude mode, which gives the sum amplitude (percoordinate) and its distribution vs. X or Y (cf. Fig. 1).The feature allows background suppression by setting
two thresholds. The diagnostic mode delivers extensiveinformation on errors or conditions for discarding eventsand allows thus an optimization of parameter setting.Moreover, the whole system can be checkedindependently from the detector by using a remotecontrolled pulser. The total processing time per event isabout 3 µs (i.e. 10% dead time at 35 kHz counting rate).The acquisition software mesydaq controls the front-endelectronics and handles the data storage. Three modesare available here: XY-histogramming, 128 XY timeframes and list-mode data (event-by-event recording).
Fig. 1. The accumulated pulse height spectrum of theY-coordinate allows background discrimination
First measurements in the position-amplitude modeshowed amplitude distribution, strongly varying with theposition. The interpretation lead to the conviction thatthe detector had lost already a good fraction of its gasand the internal membrane, which separates the detectionvolume (3He+CF4) from the compensation volume (4He),must be heavily deformed. It turned out, after balancingthe pressure by depressurizing the 4He volume that thedetector had lost during the last seven years after repairby CERCA more than 270 mbar 3He+CF4 (of1750 mbar). The differential pressure between the twochambers before this operation was 120 mbar, a factor often more than specified for save operation. The missinggas reduces at the time being the efficiency from 78% to73% at 0.6 nm. The SANS experiment went into regularexperimental operation middle of July 2003 afterextensive bug fixing of the new software.
[1] Centre d’Étude Nucléaire de Grenoble, Divisiond’Électronique de Technologie et d’Instrumentation,Avenue des Martyrs 85, F-38041 Grenoble CEDEX
[2] mesytec gbr, www.mesytec.com
220

EF_54_Mezei.doc // brandt // 03.03.04 Seite 1 von 1
EXPERIMENTAL REPORT Proposal N° *Instrument V5Larmor precession tomography Local Contact *C. Pappas
Principal Proposer: F. Mezei HMI Date(s) of ExperimentExperimental Team: C. Pappas HMI
R. Schneider HMI *3-8.12.2002
Date of Report: *22.12.2003
The unique capability of Larmor precession to labeleach neutron individually can be used to decoupleresolution from characteristics of the incomingneutron beam such as divergence andmonochromatisation. This remarkable property issuccessfully applied in Neutron Spin Echo (NSE)spectroscopy, where the labelling of the velocity ofneutrons directly measures the energy transfer atthe sample. The resolution can therefore beimproved substantially, reaching the 105 range,while keeping the high intensity advantage of aroughly monochromatic and poorly collimatedbeam. In a similar way, the labelling of neutrontrajectories can be used in high resolutiondiffraction, small angle scattering or neutronreflectometry.
In Neutron tomography, an established non-destructive analysis technique with numerousmedical and industrial applications, high spatialresolution implies high beam collimation and verylong instruments. In this case, Larmor precessiondecouple resolution from the geometry of thespectrometer. A first feasibility test of the methodtook place at SPAN. The goal was do deduce asimple spatial structure form the Larmor precessionof neutrons diffracted by a Bragg peak inbackscattering geometry.
For intensity reasons we chose the (002) Braggreflection of pyrolytic graphite. The sample wasmade out of two plates 1x1 cm2 separated by adistance of 1cm. The plates had a thickness of~0.5 mm and 1 mm respectively. The reducedthickness of the first plate lead to a reducedreflecting power so that some neutrons could reachthe second plate and be reflected.
At the incoming wavelength of 0.626 nm the Braggreflection occurs at a scattering angle of 1370.SPAN is the only Neutron Spin Echo spectrometerto reach such high scattering angles and offeredthe unique possibility to record the pattern resultingfrom the precessions of the neutrons reflected bythe two graphite plates. We note that for thismeasurement we did not use any π-flipper at thesample and the precessions after the sample addedto the precessions before the sample.
The spectrometer was set to a given magnetic fieldconfiguration and we recorded the precessions bysweeping the magnetic field locally at the sample,from ~0.2 mT up to ~ 2 mT. The neutrons reflectedby the second plate experience a higher magneticfield integral that the neutrons reflected by the firstplate and this difference is proportional to the fieldat the sample. The precession of the neutronsreflected by the first plate is given by:A1+B1cos(/v), where is the magnetic fieldintegral, the neutron gyromagnetic ratio and v theneutron velocity. The precession of neutronsreflected by the second plate is given by:A2+B2cos() and the superposition of the twocontributions leads to the pattern shown in thefigure. In this figure the neutron intensity wasrecorded as a function of the current in the coilsaround the sample, which is proportional to themagnetic field at the sample. The blue points arethe experimental data and the red line is the best fitto the superposition of two cosine functions,reflecting the geometry of the set-up.
Figure: precession pattern recorded as a functionof the current in the coils, which create themagnetic field in the sample area of SPAN. Theneutrons were Bragg reflected by two pyrolyticgraphite plates separated by 1 cm.
221

MAT-04-0847+0905.doc // brandt // 09.03.04 Seite 1 von 1
EXPERIMENTAL REPORT Proposal N° MAT-04-847/905
Instrument V-6Neutron Spin Echo Angle CodingLocal Contact Marita Gierlings
Principal Proposer: Roger Pynn, Los Alamos National Lab Date(s) of ExperimentExperimental Team: Michael R. Fitzsimmons, LANL
Helmut Fritzsche, Chalk RiverJanos Major, MPI Stuttgart
10-04-03 to 15-04-03 &01-11-03 to 08-11-03
Date of Report: 5-12-03
During our April run we implemented thin (10)permalloy (Py) spin turn foils for the first time. Ourcalculations of the demagnetization fields causedby these films had led us to optimal choices for thedimensions of these films. As the plot of beampolarization versus film orientation plotted belowshows, these foils now work exactly as predicted bysimple theory (solid line).
220 240 260 280 300 320 340 360-1.0
-0.8
-0.6
-0.4
-0.2
0.0
0.2
0.4
0.6
0.8
1.0
Data: Data54_polModel: pi_on_2_fitWeighting: y No weighting Chi^2/DoF = 0.00092R^2 = 0.9965 K 2.01933 ±0.00239x0 271.17802 ±0
Pola
rizat
ion
Rotation Stage Angle (degrees)
pol10 micron foil tuning curve
Once the tuning curve has been established, thefilms can be removed and reinserted in the beamwith reproducible effect.
Although we achieved highly polarized (P > 0.9)spin echoes before inserting our 30 Py precessionfilms, the echo polarization decreased to ~0.65 withprecession films even when the latter were atrelatively large angles (~10º) to the neutron beam.We eventually traced this effect to the demagnet-ization fields produced by the precession foils.
Our attempts to make measurements on a realsample were thwarted by the fact that out signalsappeared to randomly jump in value. After severaldays, we traced this effect to changes in themagnetic field produced by the neighbouringspectrometer. The small field produced by SPANchanges the field between the two Py foils of our flipper. Although this results in only a small changein flipper efficiency, the effect is amplified by thefinal /2 turn (essentially converting the cosine of asmall angle into its sine).
Our November run was much more successful. Weconclusively showed that we could see echo depol-arization for reflection from a sample comprising a30 nm-thick block copolymer film on a Si substrateand that this depolarization was absent for bare Si.Further analysis of this data is on-going and wehope to determine the sensitivity limits of thetechnique by comparing with data already takenwithout polarized neutrons. Secondly, we examineda very rough Zr sample (this material cannot bepolished) and found results that are consistent withzero specular reflection even below the assumedcritical angle. This information could not have beenobtained from a traditional experiment.
Finally, we reconfigured V6 with a horizontalreflection plane, a wide-angle polarization analyzer(borrowed from FLEX), and a PSD and attemptedto measure structure within the plane of a blockcopolymer film. This film, composed of d-PS andPMMA has 35-nm-diameter, 30-nm-long PMMAcylinders perpendicular to the film plane. Thecylinder axes show considerable short-rangepositional order, according to SEM images, and areseparated by roughly 45 nm. The echo polarizationswe measured for the unscattered and diffuselyscattered beams are shown below
0 200 400 600 800 1000 12000,0
0,1
0,2
0,3
0,4
0,5
0,6
0,7
0,8
0,9
1,0
Peak
Ech
o Po
lariz
atio
n
Spin Echo Length
Poldiffus Polunscat.
PMMA rods in d-PS 45 nm apart (nominal)SEL = 360/period of precession fringes in degrees
Unfortunately time did not permit us to completethis experiment. We really need to measure atsmaller values of the spin echo length to try toestablish the presence of a peak in the echopolarization around the 45 nm column separationdistance.
222

EF_55_Habicht.doc // brandt // 03.03.04 Seite 1 von 1
EXPERIMENTAL REPORT Proposal N° EF-SF1
Instrument V12Small angle scattering from D2O-treatedanodized Al wire and ribbon Local Contact
M. Strobl
Principal Proposer: K. Habicht, TU Darmstadt; HMI, BerlinT. Keller, MPI f.FKF, Stuttgart, FRM-II,Garching Date(s) of Experiment
Experimental Team: M. Strobl, HMI, BerlinK. Habicht, TU Darmstadt; HMI, Berlin 02.04.– 08.04.2003
Date of Report: 15.12.2003
The neutron resonance spin-echo (NRSE)technique is ideally suited for the application ofspin-echo focusing, a method which permitsthe determination of very small lifetimes ofelementary excitations with finite dispersion.An example of such an instrument is the NRSEoption in use at the cold three-axisspectrometer V2. Experimentally, the NRSEtechnique relies on up to 8 RF-flipper coilseach situated within an additional coil whichprovides a static magnetic field.
In the current NRSE configuration, theneutrons have to pass through a considerableamount of material that conducts the currentswhich in turn provide the magnetic fields. It isof particular importance for inelastic work on acold TAS to keep any losses in neutron flux toa minimum. Due to its good transmissionproperties, a natural choice for the material isaluminium. Since conventional insulatingmaterial (epoxy) contains hydrogen, anodizedAl wire is usually used instead. The farbricationprocedure includes treatment of the anodizedmaterial in H2O to remove metallic salts. As aconsequence, microscopic pores filled with H20form in the anodized layer, potentially givingrise to small angle neutron scattering (SANS)due to the scattering length contrast betweenthe pores and the surrounding Al material.
In the course of an upgrade of the NRSEoption at V2, we performed a SANS study ofvarious Al material on the double-crystaldiffractometer V12. Al wire (diameter 1 mm,single layer) and Al ribbon (thickness 1 mm,width 10 mm, 20 layers thick) was tested eitheruntreated or after a heat treatment at T~150°Cfor several hours in 10 bar of D2O atmosphereto enable H2O / D2O exchange. The incidentwavelength was 4.76 . Fig. 1 shows acomparison between wires from two differentfabrication batches. In all of the experimentsusing wires, the wires were orientedhorizontally, i.e. along the axis of the
collimating slit. D2O treatment does not alterthe SANS spectra, though a significantdifference between different fabricationbatches could be detected. SANS scattering ofthe Al ribbon (20 layers) is comparable to thescattering from a single layer of wire material,as shown in Fig. 2. If the wires are oriented vertically, a largefraction of the incident intensity is scattered offthe direct beam due to diffraction off the edgesof the wire. A vertical orientation is also usedfor the RF coils in the NRSE apparatus.We conclude that the use of band material issuperior to the use of wire material and thatthe D2O treatment has no effect on the SANSproperties of anodized Al.
-0.10 -0.05 0.00 0.05 0.101E-5
1E-4
1E-3
0.01
norm
aliz
ed in
tens
ity
q [Å-1]
new wire , untreated new wire , D2O old wire , untreated old wire , D2O
Fig.1: SANS spectra for horizontally-oriented Alwire.
-0.10 -0.05 0.00 0.05 0.101E-5
1E-4
1E-3
0.01
norm
aliz
ed in
tens
ity
q [Å-1]
new ribbon, untreated new ribbon, D2O old wire , D2O old wire, D2O, vertical
Fig.2: SANS spectra for horizontally- and vertically-oriented Al wire and ribbon.
223

EF_56_Strobl.doc // brandt // 03.03.04 Seite 1 von 1
EXPERIMENTAL REPORT Proposal N° *Instrument V12USANS studies of artificial latticeLocal Contact M. Strobl, W. Treimer
Principal Proposer: M. Strobl, W. Treimer Date(s) of ExperimentExperimental Team: M. Strobl
Jun. and Sep. 03
Date of Report: Dec. 03
Introduction
The diffraction patterns of a two dimensionalartificial lattice were measured with the doublecrystal diffractometers (DCD) V12a and V12bThe periodical lattice of the Si sample wasmanufactured in high quality as shown inFig.1. With such measurements one cancharacterise the performance of theinstruments and allow a direct comparison ofthe sample in real space and its diffractionpattern in reciprocal space. Additionally theseexperiments allow a study of the neutroncoherence properties in reciprocal and in realspace [1,2]
Experiments
Fig. 1 Layout of the two-dimensional Si lattice
The sample was a Si wafer with an edgedregular lattice of quadratic pores (Fig. 1). Thecentres of the pores formed equilateral triangleswith a side length of 2.3 µm resulting in ahexagonal symmetry. The depth of the poreswas about 90 µm and it turned out that due toedge and prism effects an accurate alignment ofthe samples perpendicular to the neutron beamwas important.
The lattice constants in theperpendicular directions (a) and (b) can begiven with da = 2.3 µm and db = 4 µm. Thepositions of the interference maxima in suchalignment can simply be given by Qy = 2n/d
where y denotes the direction in which theDCD resolves the momentum transfer (Qya =1.5 x 10⁻³ nm-1, Qyb = 2.7 x 10⁻³nm-1) (Fig.2)
-8 -6 -4 -2 0 2 4 6 8
100
1000
10000
coun
ts /
hour
Qy [10-3 nm-1]
0° (a) 90° (b)
Fig. 2 Diffraction pattern at orientations a,b (V12a)
By rotating the sample around an axis parallelto the incident beam a three-dimensionalmapping of the scattering pattern can bedescribed by )cosnsinn(G)(Q 21yy
where ß is the rotation angle and n are theordering numbers [2].
0
1,57
-1,57
3,14
-3,14
4,7
-4,7
Q [10 nm]
y
-3
0° 90° 180°rotational angle ß [degrees]
Fig.3 Diffraction intensity map due to rotation of sample
References
[1] Treimer, W., Strobl, M., Hilger, A. Phys.Lett. A 289, 151-154 (2001)[2] Jericha, E. et al., J. Appl. Cryst. 36, 778, (2003)
224

PHY-04-0884.doc // brandt // 16.03.04 Seite 1 von 1
EXPERIMENTAL REPORT Proposal No. PHY-04-884Instrument V12aInelastic Neutron Scattering by Ultrasound.
Research by Bonse-Hart Diffractometer Local Contact W.Treimer, M.Strobl*
Principal Proposer: E. Iolin, Institute of Physical Energetics, Riga Date(s) of ExperimentExperimental Team: E.Iolin, Institute of Physical Energetics, Riga
L.Rusevich, Institute of Physical Energetics, RigaM.Strobl, Hahn-Meitner Institute, BerlinW.Treimer, Hahn-Meitner Institute, BerlinP.Mikula, Nuclear Physics Institute, Rež, Prague
28/11/03 – 19/12/03*
Date of Report: 19/12/03
It is well known that neutron Double Crystal(DCD) and Bonse-Hart (BHD) diffractometersare widely applied for the research of UltraSmall Angle Scattering in the condensedmatter. However, BH and DC technique is fluxlimited even at high-flux reactors. It is alsoknown that h.f. ultrasound leads to theincreasing of the intensity of the diffractedbeam. Unfortunately this increasing isaccompanied by a loss of the impulseresolution. Some time ago it was argued [1,2]that it should be possible to improvesimultaneously resolution and intensity for thecase of DCD. It could be achieved by theexcitation of the h.f ultrasound with the samefrequency f in DC monochromator andanalyser. Such perspective is especiallyinteresting for the case of BHD [3]. Here wereport the first results of correspondingexperiments. We studied ultrasonic effects inSi(111) single crystal plates by means of DCDand triple-bounces BHD. Neutron wavelength=0.523 nm.We excited longitudinal acoustic wave (LAW)with frequency f=70.27 MHz and 210 MHz inSi(111) plate and analysed scattered beam bymeans of similar Si plate without ultrasonicexcitation (DCD regime) or by triple-bouncesBH analyser. It can be seen from Fig.1, thatBH analyser leads to the strong improvementof contrast with moderate, ~20%, loss ofintensity of the main peak. It happened due tothe strong suppression of reflectivity outside ofthe Darwin plateau in the BH analyser. BHanalyser ”allows” to observe higher orderultrasonic phonon satellites.We found some results concerning DCD withsimultaneously ultrasonically excitedmonochromator (LAW) AND analyser (TAW).We used two different generators with almostthe same generated signal frequency.Therefore corresponding ultrasonic excitationsweren’t coherent with each other. It can beseen from Fig.2 that peak intensity is seriously
increasing and simultaneously the contrast isstrongly improved in this “double-sound” case.
Fig.1. Rocking curves for the case of DCD andBH analyser. Monochromator:LAW, 70.27MHz.
Fig.2. DCD Rocking curves. Monochromator:a) ultrasound switch off; b) LAW, 70.27MHz.Analyser – TAW, 70.27MHz.
At our level of knowledge both above descibedresults were observed for the first time.
[1] E.Iolin, Zh.Tekhn.Fiz.,Pis’ma 15, 52,1989.[2] E.M.Iolin et al., Phys. stat.sol. (b), 21, 1996.[3] E.Iolin, ECNS 2003, Abstract Book and Conf.
Program, D22, p.160.
0
10000
20000
30000
40000
50000
-50 -40 -30 -20 -10 0 10 20 30 40 50
Ang. sec.
BH analys.DC
0
10000
20000
30000
40000
50000
60000
70000
80000
-50 -40 -30 -20 -10 0 10 20 30 40 50
Ang. sec.
sound in analys.two sounds
225

EF_57_Strobl.doc // brandt // 03.03.04 Seite 1 von 1
EXPERIMENTAL REPORT Proposal N° *Instrument V12aFirst three dimensional refraction contrast
tomography Local Contact M. Strobl, W. Treimer
Principal Proposer: M. Strobl Date(s) of ExperimentExperimental Team: M. Strobl
W. TreimerA. Hilger
Feb. 03
Date of Report: Dec. 03
Introduction
It has been shown in earlier works thatsmallest beam deviations (µrad) caused byrefraction can be used to reconstruct themacroscopic inner structure of samples by themeans of tomography [1,2]. Such tomographicscans have mainly been performed in the bentcrystal type double crystal diffractometer(DCD) V12a using a one-dimensional positionsensitive detector (PSD). This set-up provideda q-resolution in the PSD, while the spatialresolution was achieved by scanning thesample through a slit collimated beam.Therefore up to now just 2-dim. sample slicescould have been imaged representing the wholesamples, which necessarily had congruent crosssections on their full penetrated height [2].Replacing the 1-dim. PSD by a state of the artscintillator-CCD camera detection system withtwo-dimensional resolution enables the three-dimensional tomographic reconstruction ofsamples with varying cross sections. However,the scanning of the sample by a slit is stillnecessary to enable horizontal spatialresolution. First promising results achievedwith the new detector system and usingrefraction contrast as imaging signal shall bepresented.
Experimental
The asymmetric perfect Si analysercrystal was bent to a maximum curvature witha radius of RA = 13 m. Together with the pixelresolution of the 2-dim. PSD of 0.1 x 0.1 mm2
this curvature creates a q resolution – as couldbe measured - of 5 x 10⁻⁵ nm-1 per detectorimage matrix column. The 2-dim. PSD was astate of the art detector used in conventionalattenuation contrast neutron radiography (NR)and neutron tomography (NT) [3]. The active
detector area was 100 x 100 mm2 resolved by1024 x 1024 pixel. The sample was an Alcylinder with a vertical 2 mm hole and a oblige(app. 20°) 1 mm hole. It was scanned using a0.8 * 30 mm2 slit at 60 projection angles on360°. The refraction parameters werecalculated from the data [2] and 22corresponding image slices (0.6 mm thick) ofthe sample were calculated.
Results
This results – by combining thereconstructed slices - in a 3D reconstruction ofthe sample on the height of 13.2 mm. It can beseen from the figures (Fig. 1) that the samplestructure could have been imaged satifactorily.
Fig.1 Three slices at different heights, cut 3D image(d)
References[1] Treimer,W. et al., Appl. Phys. Lett. 83, 2, 2003[2] Strobl,M., Diss., TU-Wien, 2003[3] Schillinger,B., Diss., TU-München, 1999
3 m m a b
c 3 m m d
226

EF_58_Strobl.doc // brandt // 03.03.04 Seite 1 von 1
EXPERIMENTAL REPORT Proposal N° *Instrument V12aRefraction contrast tomographies of
different shaped samples Local Contact M. Strobl, W. Treimer
Principal Proposer: M. Strobl Date(s) of ExperimentExperimental Team: M. Strobl
W. TreimerA. Hilger
Mar.-.... 03
Date of Report: Dec. 03
Introduction
In order to test the new method of re-fraction contrast tomography and to gain expe-rience with special shaped surfaces in or of asample a series of different samples has beenmeasured within this year.
Experiments
To minimise the measurement timemost of the samples consisted of Al, a low ab-sorption material for thermal and cold neutrons.Furthermore we wanted to investigate imagecontrast that stems only from refraction con-trast. Just one sample was made of brass inorder to compare all of the three contrast pa-rameters that could simultaneously be recorded(refraction, attenuation and USANS). Specialattention was paid on different geometries. Thestructure sizes were of 1 until 20 mm. Allmeasurements were performed straight forwardas described in [1,2,3].
Results
The brass cylinder could be imaged byall of the three contrast methods as was ex-pected. However, the refraction contrast (a)image provides the best quality (Fig. 1).
Fig. 1; a refraction, b attenuation, c USANS contrast
The following reconstructions were from therefraction contrast from Al samples only. Allmeasurements and reconstructions were suc-cessful so far. Nevertheless obvious artefacts
could be identified in the case of long straightedges (Fig.2).
Fig. 2 different refraction reconstructions of Al samples
These artefacts could be explained due to thereconstruction theory [2] as a sampling prob-lem mainly. It must be mentioned that the sam-ple (d) could not be imaged by one of the bestconventional instruments NEUTRA [4] of thePSI (Swiss). The lastexample shall demon-strate the successfulreconstruction of amore complicatedstructure.
Fig. 3, refraction contrast image of al matrix with severalholes
References
[1] Treimer,W. et al., Appl. Phys. Lett. 83, 2, 2003[2] Strobl,M., Diss., TU-Wien, 2003[3] Treimer,W. et al., BENSC Rep. 2001, p227[4] Lehmann,E.H., Proc. 15th WC on NDT, Rome 2000
a b c4 m m
6 m m2 m m
3 m m1 m m
a b
c d
6 m m
227

EF_59_Treimer.doc // brandt // 16.03.04 Seite 1 von 1
EXPERIMENTAL REPORT Proposal N° *Instrument V12aREFRACTION CONTRAST TOMOGRAPHIC
IMAGING Local Contact W. Treimer, M. Strobl
Principal Proposer: W. Treimer, TFH Date(s) of ExperimentExperimental Team: M. Strobl, TFH
A. Hilger, HMIC. Seifert, TFH
Feb. – Aug. 2002
Date of Report: Jan. 2003
Introduction
Last year works on tomographicimaging using refraction contrast have alreadybeen reported in this place [1]. The imagingquality was rather poor and not yet satisfyingthen. Efforts have been made to improve thereconstruction techniques and the treatment ofthe measured data. Last years results werecalled promising and however latest resultsconfirm this “promise”.
Experimental
Referring to last years report and theone in 2000 [2] the data acquisition within theV12a double crystal diffractometer (DCD)shall not be described again. Nothing has beenchanged in the experimental set-up and themeasuring procedure anyway. Also the primarycalculation of the refraction parameter could bekept unchanged. But now this data is notreconstructed directly by means of FBP. Withrespect to the character of the data and aftermathematical considerations it turned out to beuseful to integrate the single projections. Thisis done in a discrete manner point for point as itis not reasonable to fit any mathematicalfunction. It has to be mentioned as well thatthis method is not an exact mathematicalprocedure but however the results areconvincing as will be shown.
Results
Different samples have been tested. Inthe beginning the already known [1,2]cylindrical samples were imaged (Fig. 1). Theirmeasures are: Fig. 1a: Al, diameter 15 mm, holes d = 2 mm;Fig. 1b: brass, diameter 10 mm, holes 1–4 mm;
Fig. 1a, b refraction contrast images of cross-sections
In order to study the usability for all kinds ofgeometry also more complicated cross-sectionswere imaged. Figure 2 gives two examples: 2ashows a hexagonal shaped sample (side lengthss = 3.5 mm) of Al with two holes of 1 mmdiameter. 2b shows an Al matrix of moreirregular shape with s = 26 mm and differentholes of d = 4 and 6 mm.
Fig. 2a, b refraction contrast images of Al samples
References
[1] W.Treimer, M.Strobl, A.Hilger, H.J.Peschke,BENSC Exp. Rep. 2001, ISSN 0936-0891, S. 227[2] W.Treimer, M.Strobl, BENSC Exp. Rep. 2000ISSN 0936-0891, S. 254
228

EF_59_Treimer.doc // brandt // 03.03.04 Seite 1 von 1
EXPERIMENTAL REPORT Proposal N° *Instrument V12bRefraction contrast tomographies in simple
Bonse-Hart DCD set-up Local Contact M. Strobl, W. Treimer
Principal Proposer: M. Strobl Date(s) of ExperimentExperimental Team: M. Strobl
W. TreimerA. Hilger
jan.-.... 03
Date of Report: Dec. 03
Introduction
Although first experiments concerningrefraction contrast tomography with a sampleusing a Bonse Hart double crystaldiffractometer (DCD) set-up failed in 1999these experiments were repeated this year. Thereason of failure was supposed to be knownand should be corrected. Additionally the set-up was improved for this new measurementseries of refraction contrast tomography [1,3].
Experiments
The V12b DCD set-up was ready to actfor tomographic measurements with twoasymmetric (b = 0.25) single-bounce perfect Sisingle crystals ([111]), one as themonochromator the other as analyser. Theasymmetric reflection provided a higher fluxdensity (narrower beam) on one hand and anincreased full width at half maximum (FWHM= 14 arcsec) of the instrumental curve on theother hand [2]. The higher flux reduced thenecessary exposure time and the increasedFWHM increased the resolvable angular range[3]. Tomographic scans were performed with aslit (width 0.8 mm) in front of the sampleposition, keeping the analyser crystal fixed atthe angle of app. the half maximum. Therefraction angle could be calculated from theintensity recorded in every point of the scans[4] in order to reconstruct the sample crosssection [3]. Two cylindrical samples have beenscanned, one made of brass the other of Al. Inboth cases reconstructions were tried using thefiltered back projection (FBP) algorithm [5]applied to the attenuation and the refractionparameters calculated from the measured data.In former experiments just the brass samplewas used and only attenuation contrast imagescould successfully be reconstructed.
Results
The data of the measurement with theAl sample provided good contrast andsufficient quality for the refraction parameterreconstruction (Fig. 1a). An attenuationcontrast reconstruction as expectedly failed bythe lack of contrast (Fig. 1b).
Fig.1 Al sample a) refraction and b) attenuation contrast
Fig.2 Brass sample, a)refraction, b)attenuation contrast
Contrarily in the case of the brass sample justthe attenuation contrast image could bereconstructed successfully. This is due to thestrong USANS of brass, distorting the intensitydistribution and hence falsifies the refractionparameter calculation.
References
[1] Treimer,W. et al., Appl. Phys. Lett. 83, 2, 2003[2] Treimer,W., Nucl. Inst. Meth. A 368, 1996[3] Strobl,M., Diss., TU-Wien, 2003[4] Kiss,M.Z. et al., Phys. Med. Biol. 48, 2003[5] Kak,A.C. et al., IEEE Press, NY, 1988
ba 4 m m
ba
229

EF_60_Strobl.doc // brandt // 03.03.04 Seite 1 von 1
EXPERIMENTAL REPORT Proposal N° *Instrument V12bTest of two Si-wafer based collimatorsLocal Contact M. Strobl, W. Treimer
Principal Proposer: M. Strobl, W. Treimer Date(s) of ExperimentExperimental Team: M. Strobl
T. KristM. Seurig
Jul. 03
Date of Report: Dec. 03
Introduction
For tomography as well as for positionresolving experiments with the double crystaldiffractometer (DCD,V12a and V12b) acompact beam collimation is necessary.Therefore two such collimators, manufacturedby Neutron Optics Berlin (NOB), have beenordered and tested. Collimators consist of abulk of 40 x 60 x 0.12 mm3 Si wafers with 0.5µm Gd layers. the active area is 25 x 40 mm2.
Experiments
The measurements were performed atthe V12b DCD. In the first measurements eachcollimator was placed on the sample tablebetween the monochromator and the analysercrystal. The incident beam was defined by aslit. Rocking curves were recorded regarding tothe divergence of the collimator (rotation) andlinear shift. The registered intensity distributionin the case of rotation had a full width at halfmaximum of approximately 0.5° and wasdisplaying the divergence of the beam(convoluted with the much smaller angularacceptance of the collimator). The transmissionwas found not to be perfectly homogeneousalong the width of the device (Fig.1). Aminimum relative transmission of 83 %compared to the maximum could be found insome areas while the mean value was 92 %.
0 5 10 15 20 25 300.0
0.2
0.4
0.6
0.8
1.0
norm
. int
ensi
ty
mm
transmission along collimator width
Fig. 1 relative transmission
-30 -20 -10 0 10 20
0.2
0.4
0.6
0.8
1.0 instrumental rocking curves
norm
. int
ensi
tyarcsec
without collimator with collimator
Fig. 2 Rocking curves with and without collimator
A rocking curve of the analyser crystal withand without collimator demonstrated its smallinfluence onto the resolution function of theinstrument. Aligning both collimators in thebeam, setting one on his maximumtransmission position, and rotating the other,yields an intensity distribution, which is due tothe convolution of the angular transmissionprofiles of both collimators. Suggesting thecollimators to be equal, the FWHM of thedistribution of 10´ fitted – due to convolution -well to their required angular acceptance widthof 7´. (Fig. 3). Additionally the absolutetransmission could be calculated from this datato be about 54 %.
-0.4 -0.2 0.0 0.2 0.40.0
0.2
0.4
0.6
0.8
1.0
norm
. int
ensi
ty
degrees
angular acceptance width: 10´
Fig. 3, both collimators in the beam
230

EF_61_Strobl.doc // brandt // 03.03.04 Seite 1 von 1
EXPERIMENTAL REPORT Proposal N° *EFInstrument V12bSpatial resolved USANS measurementLocal Contact M. Strobl, W. Treimer
Principal Proposer: M. Strobl, A. Manescu Date(s) of ExperimentExperimental Team: M. Strobl
Aug. 03
Date of Report: Dec. 03
A two dimensional position sensitivedetector (PSD) and a Bonse-Hart double crystaldiffractometer (DCD) enables position resolvedsmall angle scattering measurements. Thismeans that the different scattering behaviour ofdifferent parts of a sample can be visualised bymapping this information. This method can beuseful if for example the homogeneity, thedistribution of scattering pores or other innerstructures is of interest.
The V12b DCD was equipped with twoasymmetric reflecting Si [-111] single perfectcrystals in the monochromator and analyserposition. Due to the asymmetric reflection atthe monochromator crystal the beam in theinstrument is broadened in horizontal direction(i.e. decreased flux density) but the width ofthe instrumental curve is decreased (highermomentum resolution) [1]. The analyser on theother hand decreases the beam width again andhence concentrates the intensity onto a smallerdetector area. Of course the image of thesample is distorted by that but can easily becorrected by accumulating intensity in verticaldirection afterwards as well. Anyway thespatial resolution of the PSD (50 x 50 µm2)was higher than the actual resolution due to thebeam divergence. Hence the result wascalculated by accumulating a bigger number ofpixels. The sample was a silver ring (toroidal,thickness app. 4 mm) with an outer radius of 25mm including a bigger sphere (diameter app. 8mm). It was mounted in a sample positionclose to the analyser crystal. The PSD itselfwas a handmonitor combined with a CCDcamera (like used in other measurementsbefore [2]) and was positioned immediatelyafter the analyser crystal. First an image of thebeam (reflected by the analyser) was recordedwithout sample in order to perform a flat fieldcorrection with the data collected with the
sample. When the sample was installed ascattering curve by rocking the analyser crystalwas recorded and can be analysed for everypoint of the recorded images. As the flux is lowand hence the exposure times are very long therocking curves were measured with sevenpoints only. Two images were derived from themeasurements showing similar results. Thefirst one (Fig.1) is a map of the peakintensities, while the second is mapping the fullwidth at half maximum (FWHM) of thescattering curve in every point (Fig. 2).
Fig.1 Mapping of Peak intensities
Fig. 2 Mapping of FWHM valuesClearly the materials inhomogeneities arevisible comparing corresponding areas as thedata were not yet corrected for differentthicknesses. Very low peak intensities due tostrong scattering - beside other effects – limitedalso the sharpness of the pictures..
References[1] Treimer,W., Nucl. Inst. Meth. A 368, 1996[2] Treimer,W. et al., BENSC Rep. 2000, 255
231

EXPERIMENTAL REPORT Proposal N° EFInstrument V12bInvestigation of a focusing parabolic guide by
a radiography method Local Contact M. Strobl
Principal Proposer: P. Böni, TU MünchenN. Kardjilov, HMI Date(s) of Experiment
Experimental Team: A. Hilger, HMIM. Strobl, HMIW. Treimer, HMI
Jul 21- Aug 10, 2003
Date of Report: December 10, 2003
The aim of the experiment was to investigatethe focusing properties of a new type focusingneutron guide (trumpet) with parabolic shapedwalls. The device was placed at our set upV12b with the kind contribution of the companySwissNeutronics. The guide had a length of445 cm with an entrance area of 16 x 16 mm2
and an output area of 4 x 4 mm2. The interiorsurfaces were coated with a supermirror m=3and due to their parabolic shape it was thoughtthat an incident parallel beam could befocused onto a single spot in the focus point. To prove this statement the neutron intensitydistribution at different distances behind theguide was recorded by a standard radiographydetector described in [1]. The experimentswere performed at the V12b instrument with apreliminary monochromatization of the incidentcold neutron beam by a Si (111) perfect crystal=5.2 Å. The beam divergence of ca. 0.5o wasintroduced by the existence of a Ni coatedneutron guide at this beam line. The position ofthe guide in the beam was adjusted with anaccuracy of 0.05o by a combination of a tilt anda rotation table. The distance between theradiography detector and the end of the guidewas set with the help of a translation table. Asketch of the experimental arrangement isshown in Fig. 1.
at a large distance from the exit) are shown inFig. 2.
exit of the guide focus point large distance Fig.2 Inverted radiography images of theintensity distribution at different distancesbehind the focusing guide
The area of the beam spot in the focus point(the picture in the middle) was estimated in theorder of ca. 1 mm2.The intensity gain was calculated as the fluxratio of the images with and without theutilization of the focusing guide. The result as afunction of the distance behind the guide fortwo monochromators with a different energyacceptance: Si(111) with /~10-3 andC(200) with /~10-2 are shown in Fig. 3.
10
20
30
Si (110) perfect crystal Graphite (200) mosaic crystal
Focus point at 18 mm
d = 18 mm d = 50 mm
Neutron beam
EF_62_Böni.doc // brandt // 03.03.04 Seite 1 von 1
Fig.1 Layout of the experiment
The recorded images at three differentdistances d behind the focusing guide (directat the exit of the guide, in the focus point and
0 10 20 30 40 50
3
4
Gai
n
Distance, mm
Fig. 3 The measured intensity gain for twomonochromators
1. http://www.ndandm.com/products.htm#readout
Diaphragm
FocusingguideSingle
crystalDetector
232

EF_63_Krist.doc // brandt // 03.03.04 Seite 1 von 1
EXPERIMENTAL REPORT Proposal N° EF
Instrument V 14
Development of neutron optical elements Local Contact Th. Krist
Principal Proposer: Th. Krist, HMI Date(s) of ExperimentExperimental Team: Th. Krist, HMI, Jan Hoffmann, HMI
2003
Date of Report: 19 December 2003
By improving the control of the triode sputter machine itwas possible to produce polarising FeCo-Si supermirrorswith up to 600 layers, thus reaching a critical angle ofmore than m=3. In Fig. 1 the neutron reflectivity isshown. The mean flipping ratio in the interval from0.4°–1.6°was 53, giving a polarisation of 96.3%. Thereflectivity at m=3 amounts to 80%.
Fig 1 Reflection of neutrons with a wavelength of 4.72 Å from aFeCo-Si supermirror with 600 layers for both neutron spin statestogether with the polarisation and the flipping ratio.
Solid state lensA first test was made at V 14 at BENSC to collimate aneutron beam with a wavelength of 4.72 Å divergingfrom a 0.4 mm wide slit by a stack of 10 silicon waferseach with a thickness of 0.5 mm and a length of about 40 mm coated with FeCo-Si supermirrors. Our set up
Fig. 2 Neutron intensity in the direct beam and in the beam reflected bya solid state lens
consisted of wafers with equal thickness and was set atan angle of 0.7° to the centre of the beam. The lens wasat distances of 1300 mm symmetrically set between theslit and the detector which was covered by a further slitof 0.4 mm width. 200 mm before the lens a slit was setto define the beam width impinging onto the lens. Firstthe direct beam was measured by a detector scan, givenin Fig. 2 as black line. Then the lens was inserted and thereflected beam was measured by a detector scan, givenin Fig. 2 as triangles. It was found that 65% of theneutrons in the direct beam were reflected in a beamwith a FWHM corresponding to 29% of the FWHM ofthe direct beam. The intensity was 1.89 times the one ofthe direct beam.
Solid state collimatorA solid state collimator with a collimation of 0.5°FWHM was built from Si wafers with a thickness of0.2mm. The cross section was 40mm x 80mm. Thelength was only 29mm.In Fig. 2 the transmission is given linearly to show thetriangular shape and in logarithmically to show the fastdecrease at the ends of the transmission interval.
Fig. 3. Transmission of neutrons with a wavelength of 4.72 Å througha solid state collimator.
0.0 0.2 0.4 0.6 0.8 1.0 1.2 1.4 1.6 1.80.0
0.2
0.4
0.6
0.8
1.0Flip ratio / 100
Polarisation
Ref
lect
ed in
tens
ity
Theta [deg]
spin up spin down simulation
0.0
0.2
0.4
0.6
0.8
1.0
polarisation flip ratio
-0.3 -0.2 -0.1 0.0 0.1 0.2 0.30.0
0.5
1.0
1.5
2.0Solid state lens
Focussed beam relative to direct beam:Area 0.65Height 1.89FWHM 0.29 (1.47mm)
Direct beam
Focussed beam
First slit width0.4 mm
Slit before detector hassame width as first slit:0.4 mm = 0.0176°
Neu
tron
inte
nsity
Relative angle [deg]
-1.0 -0.5 0.0 0.5 1.0 1.5
1E-5
1E-4
1E-3
0.01
0.1
1
Solid state Collimator 30'
Inte
nsity
Theta [deg]
..-0.5 0.0 0.5 1.0
0.0
0.2
0.4
0.6
0.8
1.0ChannelsWidth 0.22 mmLength 27.0 mm
233

PHY-03-0269.doc // brandt // 03.03.04 Seite 1 von 1
EXPERIMENTAL REPORT Proposal N° PHY-03-0269
Instrument * V3Translational Diffusion of H2 on Single WalledCarbon Nanotubes Local Contact
* Jörg Pieper
Principal Proposer: Paul Sokol, Penn State University Date(s) of ExperimentExperimental Team: David Narehood, Penn State University
Jörg Pieper, HMI BerlinRuep Lechner, HMI Berlin
* January 15-21st,2002
Date of Report: *29 December 2003
Translational diffusion of molecular hydrogenadsorbed on single walled carbon nanotubes(SWNTs) has been studied with quasielasticneutron scattering (QENS) measurementsperformed on the NEAT spectrometer. Thesemeasurements are a continuation of previousQENS studies [1] of molecular hydrogenadsorbed on SWNTS and provide furtherinformation on the system. While the previousmeasurements were taken over a temperaturerange of 30K – 45K with the molecularhydrogen introduced into the sample under apressure of 1 atmosphere, these measruements(Figure 1) were taken over a temperature rangeof 40K – 80K with the hydrogen introducedinto the sample under a pressure of 10atmospheres. In addition, in thesemeasurements the instrument was configuredto allow the dynamics of the sytsem to bestudied at lower momentum transfers. Thequasielastic component to the scattering, as inthe previous measurements, is well describedby a liquid-like jump diffusion (Figure1).Both, diffusion coefficients and jump-lengths,have been extracted from the data with thismodel. The diffusion observed in thesemeasurements follows an Arrhenius behaviorand is consistent with that observed in theprevious measurements [1]. The jump-lengthsextracted (Figure 2) give a mean length of2.65±0.15 Å which is consistent with the 2.49Å between the centers of neighbooringhexagons forming the external surface of thetubes. This indicates that the most probablejump made by the molecules in a diffusive stepis between the center of hexagons on theexternal surface of the tubes.
[1] Narehood et al., PRB 67 205409 (2003)
0
0.2
0.4
0.6
0.8
1
0 0.5 1 1.5
FWH
M(m
eV)
Q(Å-1)
0
0.02
0.04
0.06
0.08
0.1
-1 -0.5 0 0.5 1
S(Q
,E)
E(meV)
Figure 1: The Lorentzian FWHM component of thescattering for each detector group is shown as a functionof Q. The solid line represents the fit to the liquid-likediffusion model. In the inset, scattering data taken at60K is shown as well as the fit (solid-line) and thecomponents to the fit (dashed-lines).
1
1.5
2
2.5
3
3.5
4
30 40 50 60 70 80 90
l o(Å)
Temp(K)Figure 2: Jump-lengths extracted from the QENSmeasurements performed on H2 adsorbed on SWNTs.The dashed line indicates the distance between thecenters of hexagons which form the external surface ofthe tubes and the solid line is the mean value of theextracted lengths.
234

PHY-03-0297.doc // brandt // 03.03.04 Seite 1 von 1
EXPERIMENTAL REPORT Proposal N° PHY-03-297Instrument V3Study of the Diffusion of Molecular Hydrogen
in Nanoporous Materials Local Contact Jörg Pieper
Principal Proposer: Paul Sokol, Penn State University Date(s) of ExperimentExperimental Team: Yvonne J. Glanville, Penn State University
Jörg Pieper, HMI BerlinRuep Lechner, HMI Berlin
31.10. – 09.11.03
Date of Report: 29 December 2003
The effects of confinement are of interest infundamental and applied physics, and have beenextensively studied[1-5]. Disordered porous media,such as porous glasses, have both disordered porewalls and disordered pore geometry. Adsorbates inthese materials exhibit a suppressed freezingtemperature, and hysteresis upon warming. Thesephenomena have generally been interpreted withthe Gibbs-Thompson equation, although thisappears to break down for small pores[6]. Fullyordered porous media, such as zeolites, have bothan ordered pore structure and ordered (crystalline)pore walls. Adsorbates confined in these systemsexhibit enhanced freezing due to their strong andregular interactions[7].
The recent development of templatedsynthesis has now allowed the study of confinementeffects in mesoporous materials with highly orderedpore connectivity. Two examples of the newpartially ordered materials are the porous glassesMCM-48 and MCM-41. MCM-48 has independentinterwoven 3-dimensional channels with disorderedpore walls[8]. The channels have a well definedcubic space group[9], Iad3. MCM-41 producedthrough a very similar process as MCM-48, usingthe same materials has a much simpler poreconnectivity. The pore walls of MCM-41 are alsodisordered, but the pores themselves are rodsarranged in a hexagonal array.
A study of the diffusion of hydrogenadsorbed in the pores of MCM-48 and MCM-41 asa function of temperature was undertaken onNEAT. The data though not fully analyzed hasyielded some interesting information about thefreezing of hydrogen within the pores of MCM-48.The freezing point is observed as a loss of quasi-elastic scattering. The pore diameter of this systemis 20Å, which is quite small compared to thedisordered porous media studied. Suppression ofthe freezing temperature is observed by at least 2K.Diffusion constants have not been extracted at thistime though. Due to a very rapid ortho-para conversionof the hydrogen species within the pores of theMCM-41 gleaning information about the freezingof hydrogen was difficult. This enhanced
conversion in MCM-41, which was not seen inMCM-48, indicates that though these materials areproduced through nearly identical processes andmaterials the symmetry and adsorption sites arevery different and play a large role in theconversion in the hydrogen.
1. J. L. Tell and H. J. Maris, Phys Rev B28, 5122(1983).
2. Chem Phys Lett 328, 2000.
3. D. F. Brewer, J. C. N. Rajendra, and A. L.Thomson, J Low Temp Phys 101, 317 (1995).
4. P. E. Sokol et al., Physica B 929 (1998).
5. T. E. Huber and H. L. Tsou, Phys Rev B 57,4991 (1998).
6. Journal of Physics: Condensed Matter 13, 2001).
7. J. P. Bouchard, E. C. DELARA, and R. KAHN,Europhys Lett 17, 583 (1992).
8. K.Schumacher et al., Langmuir 16, 4648 (2000).
9. M. Thommes, R. Koehn, and M. Froeba, J PhysChem B 104, 7932 (2000)
235

PHY-03-0293.doc // Vasile Tripadus // 03.03.04 Seite 1 von 1
EXPERIMENTAL REPORT Proposal N° PHY-03-293
Instrument V3Molecular Dynamics in Tryclycine Sulphate(TGS) Local Contact
Jörg Pieper
Principal Proposer: Vasile Tripadus IFIN-HH, Bucharest Date(s) of ExperimentExperimental Team: Jörg Pieper HMI, Berlin
Alexandra Buchsteiner HMI, BerlinAlin Serban IFIN-HH, Bucharest
28.07.03-04.08.03
Date of Report: 01.10.2003
Using the V3 instrument from the BENSC –HMI wehave measured the TOF neutron scattering spectra on aTGS powder sample. The measurements were carriedout at 93 and 42 µeV resolution power respectively.Using the “FITMO4” BENSC program we calculated theincoherent scattering law S(Q,ω) for seven temperaturesbetween room temperature and 343o K. TGS is aferroelectric at room temperature. In this phase below49.5oC the symmetry is monoclinic with space group P21whereas above this critical point the structure gainsadditional symmetry planes in the space group P21/m.The elementary cell of TGS contains three distinctglycine molecules denoted with GI, GII and GIII. Theyare connected between them and SO4 groups by differenthydrogen bonds/1/.The crucial motions that are involvedin phase transition are the NH3-GI reorientational motionaround an axis contained in the mirror planes b=1/4 or ¾and the tunnelling of proton in the hydrogen bond GII-H-GIII.The main results obtained in this experiment could besummarised in the following statements.- the inelastic part of the spectrum remains
unchanged on going through Tc- the molecular motions involved in the phase
transition are comprised in the quasielatic peak- we fitted the quasielastic peak with an elastic line
EISF (Fig.1) and two other lorentzians - the width of the first lorentzian that fits the
quasielastic part could be correlated with therotational levels of amino group in GI glycinemolecule /2/.The width of this lorentzian has acritical behaviour, (Fig.2). The residence timesassociated with motions are in the range 4.1÷3.210-11sec.
- the second lorentzian corresponds to a fastermolecular motion of the order 10-12 sec. His widthhas also a critical behaviour. We are not able in thismoment to assign this lorentzian to a certainmotion.
- the hydrogen tunnelling motion in the GII-H-GIIIhydrogen bond was measured by dielectricspectroscopy. His energy of oscillations might havea value of 0.025meV/3/. In order to observe thismotion a better resolution is necessary.
- if we presume that the dependence of EISF of Q isgiven by the oscillations of the NH3 group betweentwo equivalent sites, -double-well potential- themean distance between the two positions, obtainedby fitting is less than 1 Å in the ordered phase.
Fig.1. EISF as a function of Q for theenergy window ∆E = 100 µeV, twolorentzians fix broadenings.
Fig.2 The line width of the firstlorentzian as a function of temperature
References1. Genowefa Slorasek , A. Heurer, H.Zimmerman and
U.Haeberlen, j.Phys.:Condens.Matter1 (1989)5931-5954
2. Rajul Ranjan Choudhury, R.Chitra andM.Ramanadham, J.Phys:Condens.Matter 15 (2003)4641-4650
3. Petzelt et.al. Ferroelectrics (1987) 73,101-23
0 .2 0 .4 0 .6 0 . 8 1 .0 1 .2 1 .4 1 .6 1 .8 2 .0 2 .20 . 6 0
0 . 6 5
0 . 7 0
0 . 7 5
0 . 8 0
0 . 8 5
0 . 9 0
0 . 9 5
1 . 0 0
EIS
F
Q (A - 1)
T =29 4 K T =31 3 K T =31 8 K T =32 8 K T =33 8 K T =34 3 K
290 300 310 320 330 340 350
0.5
1.0
1.5
2.0
2.5
Tc
The
wid
th o
f the
firs
t Lo
rent
zian
(meV
)
Temperature (K)
236

PHY-05-005.doc // brandt // 03.03.04 Seite 1 von 1
EXPERIMENTAL REPORT Proposal N° PHY-05-005
Instrument V-13Search for scission neutrons using angularcorrelation in fission of U-235 Local Contact
Katerina Korobkina
Principal Proposer: Danilyan, ITEP, Moscow Date(s) of ExperimentExperimental Team: Pavlov, ITEP, Moscow
Karpikhin, ITEP, MoscowKrakhotin, ITEP, MoscowFedorov, ITEP, MoscowGolub, BENSC, HMIKorobkina, BENSC, HMI
Sept. - Dec. 2003
Date of Report: 13.12.2003
During the second half of 2003 themultichannel angular correlation setup havebeen tested on the polarized cold neutronbeam (instrument V-13). This setup includesfission chamber with of 48 mg 235U target andtwo fission fragment multiwire proportionalcounters situated at both sides of target in theorthogonal geometry respect to the neutronbeam transversal polarization direction.Outside the fission chamber there are 4 fastneutron detectors composed of the plasticscintillator and photomultiplier. The neutrondetectors situated at the angles 500 and 900 inorthogonal geometry respect to neutron beamand average fission axis directions.Scintillators detect not only prompt fissionneutrons but prompt fission gamma's too. Todistinguish between them the time-of-flighttechnique is used. The 4 time-to-amplitudeconverters used together with multichannelADC. Delayed coincidence spectra betweenthe signals from neutron detectors and fissionfragment detectors are collected during themeasurements at both opposite directions ofneutron beam polarization. Last is reversedevery second. Thus the count rates under theneutron peak for each directions of polarizationcan show the correlation between themomentum of prompt fission neutron and thedirection of fissile nuclei polarization.
At the end of 2003 we've started themeasurements of the P-odd angularcorrelation between the captured neutron spinS and the momentum of the prompt fissionneutron P , i.e. the correlation of type: W()=Const.(1 + a S P) = Const.(1 + a cos()), (1)where a is the correlation coefficient, - anglebetween S and P. The result of measurement by 11 December is
a = (6.6 3.3)105.The expected magnitude of the correlationcoefficient a is an order of 105 in the
assumption that the ratio of scission tofragment neutron is 0.1. Thus we must achievethe accuracy in asymmetry measurementsabout 5106. At the end of this year we'llachieve accuracy not better then 105.Therefore we should continue measurementduring 2004.
237

EF_64_Fink.doc // brandt // 03.03.04 Seite 1 von 1
EXPERIMENTAL REPORT Proposal N° *Instrument B7Redistribution of ion-implanted 6Li+
in polystyrene Local Contact D.Fink
Principal Proposer: D.Fink, M.Müller, HMI Berlin Date(s) of ExperimentExperimental Team: M.Behar, M.F.Soarez, UFRGS Porto Alegre,
P.Alegaonkar, Univ. Pune, India 1.1.2002-31.12.2002
Date of Report: 30.3.2003
6Li+ ions of 100 keV energy were implantedinto polystyrene foils at fluences of 1x10¹³ to1x1014 cm-2,and subsequently thermally annealedat 100, 150, 200, and 250° C for 1 hour each.The lithium depth distributions were measuredwith Neutron Depth Profiling („NDP“) at the Berlinresearch reactor BER II (position B7).
Fig.1: As-implanted lithium depth distributions inpolystyrene, comparison with prediction (TRIM) anddiffusion simulation.
The total Li content detected by NDP in themeasured depth interval amounts to ~90 % of theimplanted fluences, which indicates that a minorpart of the implanted Li has been lost alreadyduring the implantation by diffusion into the bulk.It turned out that in no case, the theoreticallyexpected depth distributions were found. Instead,the profiles indicated considerable redistributionof all implanted lithium ions already during theimplantation at room temperature. All profilesappear to be a superposition of two components,a peaked one around 120 nm depth, and a flatone that extends deep into the bulk polymer. Under the assumptions that the as-implanted Liions distribute according to the ballistic codeTRIM immediately after their slowing-down, thatthey undergo subsequently a diffusionalredistribution, and that they are finallyimmobilized by traps, we are capable to performsatisfying simulations of the as-measuredimplantation distributions, Fig.1. The diffusioncoefficients derived from these simulations are D= 9.0x10⁻¹¹, 3.0x10⁻¹¹, 3.3x10⁻¹⁰, and 4.0x10⁻¹⁰
cm2s-1 for polystyrene irradiated at fluences of 0,1x10¹³, 5x10¹³, and 1x1014 cm-2, respectively.
These values tell us that at low fluences Litrapping dominates the migration process,whereas at higher fluences the excess freevolume formation overtakes the leading role. The simulations further show that the densitydistributions of the traps are proportional to thetotal amount of energy loss according to theTRIM prediction, with equal trapping probabilitiesof both the nuclear and electronic traps. Thissignifies that the nuclear damage centers aremore efficient in impurity trapping than theelectronic traps by about one order of magnitude,as the total number of particles trapped in bothnuclear and electronic traps is roughly the same,though around 10 times more energy is spent inelectronic excitation than in nuclear collisions. As subsequent ageing of the samples for up tohalf a year left the lithium depth profilespractically unaffected, and as the deriveddiffusion coefficients are strongly fluencedependent, this redistribution during implantationwas ascribed to radiation enhanced diffusion(RED). In fact, the extrapolation of thermaldiffusion coefficients measured at 100 to 250 °C(in the order of 10-11 to 10-10 cm2s-1) to ambienttemperature yields values that are smaller by oneto two orders of magnitude than those onesdetermined here. The RED of impurities inpolymers is promoted by the existence of voidsthat provide pathways for them, and also wholeimpurity-void complexes can diffuse as an entitywith enhanced speed. This explains the long tailwhich we found in the Li depth distributions, andit also makes clear why there is found RED evenin the neighboring pristine matter. Upon thermal annealing, the trapped impuritiesare partly released and resume their diffusivemotion. The detrapping is high for low-fluenceimplanted samples and low for high-fluenceimplanted polystyrene. The Arrhenius plotderived from the thermal diffusion coefficientsgives an activation energy of Ea = 100 ± 30 meVwhich is lower than for many comparablesystems. That difference therefore indicates thatat least the mobility of light impurities is not justgoverned by the self-diffusion of the polymericmatrix, but that the implant itself is mobile.
238
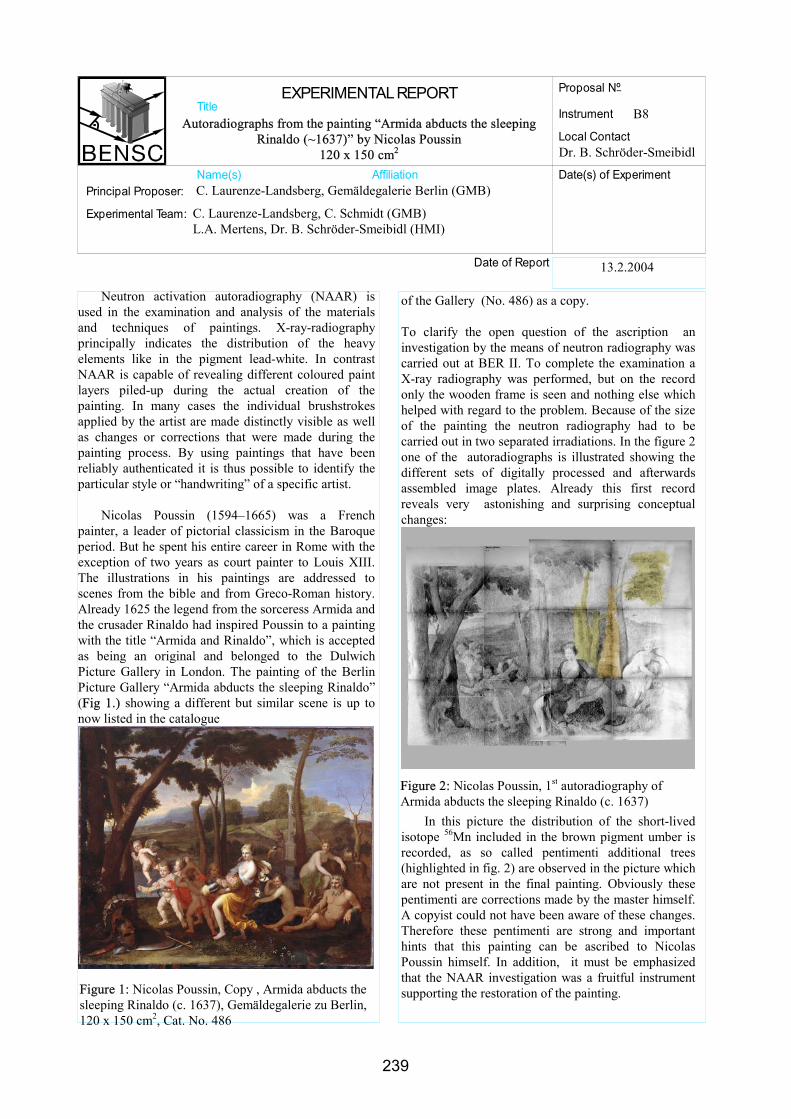
EXPERIMENTALREPORTTitle
Name(s) Affiliation
Proposal Nº
Instrument
Local Contact
Date(s) of Experiment
Date of Report
Principal Proposer:
Experimental Team:
Autoradiographs from the painting “Armida abducts the sleepingRinaldo (~1637)” by Nicolas Poussin
120 x 150 cm2
B8
Dr. B. Schröder-Smeibidl
C. Laurenze-Landsberg, Gemäldegalerie Berlin (GMB)
C. Laurenze-Landsberg, C. Schmidt (GMB)L.A. Mertens, Dr. B. Schröder-Smeibidl (HMI)
13.2.2004
Neutron activation autoradiography (NAAR) isused in the examination and analysis of the materialsand techniques of paintings. X-ray-radiographyprincipally indicates the distribution of the heavyelements like in the pigment lead-white. In contrastNAAR is capable of revealing different coloured paintlayers piled-up during the actual creation of thepainting. In many cases the individual brushstrokesapplied by the artist are made distinctly visible as wellas changes or corrections that were made during thepainting process. By using paintings that have beenreliably authenticated it is thus possible to identify theparticular style or “handwriting” of a specific artist.
Nicolas Poussin (1594–1665) was a Frenchpainter, a leader of pictorial classicism in the Baroqueperiod. But he spent his entire career in Rome with theexception of two years as court painter to Louis XIII.The illustrations in his paintings are addressed toscenes from the bible and from Greco-Roman history.Already 1625 the legend from the sorceress Armida andthe crusader Rinaldo had inspired Poussin to a paintingwith the title “Armida and Rinaldo”, which is acceptedas being an original and belonged to the DulwichPicture Gallery in London. The painting of the BerlinPicture Gallery “Armida abducts the sleeping Rinaldo”(Fig 1.) showing a different but similar scene is up tonow listed in the catalogue
of the Gallery (No. 486) as a copy.
To clarify the open question of the ascription aninvestigation by the means of neutron radiography wascarried out at BER II. To complete the examination aX-ray radiography was performed, but on the recordonly the wooden frame is seen and nothing else whichhelped with regard to the problem. Because of the sizeof the painting the neutron radiography had to becarried out in two separated irradiations. In the figure 2one of the autoradiographs is illustrated showing thedifferent sets of digitally processed and afterwardsassembled image plates. Already this first recordreveals very astonishing and surprising conceptualchanges:
In this picture the distribution of the short-livedisotope 56Mn included in the brown pigment umber isrecorded, as so called pentimenti additional trees(highlighted in fig. 2) are observed in the picture whichare not present in the final painting. Obviously thesepentimenti are corrections made by the master himself.A copyist could not have been aware of these changes.Therefore these pentimenti are strong and importanthints that this painting can be ascribed to NicolasPoussin himself. In addition, it must be emphasizedthat the NAAR investigation was a fruitful instrumentsupporting the restoration of the painting.
Figure 2: Nicolas Poussin, 1st autoradiography ofArmida abducts the sleeping Rinaldo (c. 1637)
Figure 1: Nicolas Poussin, Copy , Armida abducts thesleeping Rinaldo (c. 1637), Gemäldegalerie zu Berlin,120 x 150 cm2, Cat. No. 486
239

EXPERIMENTALREPORTTitle
Name(s) Affiliation
Proposal Nº
Instrument
Local Contact
Date(s) of Experiment
Date of Report
Principal Proposer:
Experimental Team:
Autoradiographs from the painting“Valley with Diane and her nymphs ”
by Jan Tilens (1589-1630), 89 x 156 cm2
B8
Dr. B. Schröder-Smeibidl
C. Laurenze-Landsberg, Gemäldegalerie Berlin (GMB)
C. Laurenze-Landsberg, C. Schmidt (GMB)L.A. Mertens, Dr. B. Schröder-Smeibidl (HMI)
20.2.2004
Neutron activation autoradiography (NAAR) hasturned out to be a suitable non-destructive method toinvestigate paintings. The main advantages of neutronsin comparison to X-rays are the high penetration depthand the fact that the activation cross section (n,)depends on the isotope. Therefore different pigmentsdue to different nuclides with different half-life timescan be figured on separated films like in contrastvariation. In the present experiment this method is usedto analyse the techniques of painting in order to learnmore about the genesis of the picture and the specialindividual technique of the artist.
Jan Tilens (1589 – 1630) was a Flemish artist ofthe beginning 17th century spending his life in Antwerp.The painting of the Berlin Picture Gallery “Valley withDiane and her nymphs” (Fig. 1) presents a landscapedominated by a castle and a river valley. By X-rays itwas observed that a cut divided the picture diagonally:The picture is originally composed of two woodenparts. The lower left part covering once a cembalo ispainted on both sides, front and back, the upper rightpart was added in a second step presumably later and is only painted at the front.
The open question was the genesis of this picture. HasTilens himself added the second part and created thepicture in one step or has he painted the cembalo coverat first and added later the second part? A thirdpresumption was also discussed that another artistcould have completed the picture. To clarify thisquestion a investigation by neutron autoradiographywas performed.
Figure 2: Jan Tilens, 2nd neutron autoradiography of“Valley with Diane and her nymphs”
Figure 1: Jan Tilens, “Valley with Diane and hernymphs”, Gemäldegalerie zu Berlin, 89 x 156 cm2,Cat. No. 732
In contrast to the X-ray record the front paintingcan only be observed in the neutron autoradiograph.The radioactive nuclides 64Cu, half-life time 12.8 d, and76As with a half-life time of 1.1d have blackened thesensitive films or image plates (Fig. 2). With broadlong brush strokes Tilens has defined the architectureand the surrounding landscape. The details above allshrubs and trees were carried out by a fine brush. Thefigures were painted onto the already existinglandscape.
The added upper part contains also Cu and As aspigments and in addition Sb. The bushes and treesreveal the same painting technique as found in thelower first part. But the big trees connecting both partsof the picture are painted by another brush stroke afterconnecting both tables and contain other pigments. Theleaves of these big trees contain e.g. the pigment Smalt(As). In contrast the trees painted at the Cembalo coverare carried out by a pigment containing Cu. By meansof these big trees the artist had tried to connect bothparts and create an harmonic composition. The originalriver valley nearly disappeared. It is only seen at thelower right end and is supplemented by a second river,coming white foaming from the background.
To summarise: Probably Tilens himself has addedthe upper table and created in two steps the observedlandscape. The big trees are painted later to create anharmonic impression of landscape. The figures werepainted onto the existing picture. This report confirmsthe theory that Tilens had only painted the landscapeand the figures were added by F. Francken Junior.
240

Part II
LIST OF PUBLICATIONS
Papers 242 - 253
Theses 254
241

BENSC Experimental Reports 2003 Part II, List of Publications
Publications 2003BENSC Experiments and BENSC Authors
2001 (supplement)
Hoell, A.; Bley, F.; Wiedenmannn A.; Simon, J.P.; Mazuelas A.; Boesecke, P.:Composition fluctuations in the demixed supercooled liquid state of Zr4iTii4Cui2.sNiioBe22.s:A combined ASAXS and SANS StudyScripte Materialia 44 (2001), 2335-2339
Kämmet, M.; Hoell, A.; Wiedenmannn, A.:Structure of magnetite ferrofluids investigated by SANS with polarized neutronsScripte Materialia 44 (2001), 2341-2345
2002 (supplement)
Harjo, S.; Kojima, N.; Motohashi, A.; Saroun, J.; Ryukthin, V.; Strunz, P.; Loidl, R.; Baron, N.:Characterization of cavities in superpiasticaily deformed tetragonal zirconia poiycrystais bymeans of small angle neutron scatteringMaterials Transactions 43 (2002), 2480-2486
Lukas P.; Sittner P.; Neov D.; Novak, V.; Lugovyy D.; Tovar, M.:R-Phase phenomena in neutron diffraction investigations of thermomechanicaiiy loaded NiTiPoiycrystaisMaterials Science Forum 404-7 (2002), 835-840
Müller, R.; Hiergeist, R.; Gawalek, W.; Hoell, A.:Glas crystallised nanocrystalline Ba-ferrite particles for ferrofluidsProceedings of the Sixth International Conference on Nanostructured Materials (2002), 1-6
Prager,M.; Combet, J.; Parker, S.F.; Desmedt, A.; Lechner, R.E.:The methyl rotational potentials of Ga(CH3>3 derived by neutron spectroscopyJournal of Physics: Condensed Matter 14 (2002), 10145-10157
Wiedenmannn, A.; Hoell, A.; Kammel, M.:Small-angle scattering investigations of cobalt-ferrofluids using polarised neutronsJournal of Magnetism and Magnetic Materials 252 (2002), 83-85
2003
Abrahams, S.C.; Ravez, J.; Ritter, H.; Ihringer, J.:Structure-property correlation over five phases and four transitions in PbsAhFigActa Crystallographica Section B: Structural Science 59 (2003), 557-574
Agosti, E.; Moze, O.; Cadogan, J.M.; Suzuki, K.; Heinemann, A.; Hoell, A.:A small angle polarized neutron scattering investigation of magnetic correlations innanocrystalline Fes9Zr7B3CuiMaterial Research Society Symposium Proceedings 746 (2003), 219-224
Aliotta, F.; Triolo, A.:Polymer electrolytes dynamics as probed by qensNotizario Neutroni E. Luce di Sincrotrone 8 (2003), 14-19
Andreev, A.M.; Honda, F.; Sechovsky, V.; Prokes, K.:Magnetization study of a URhSi single crystalActa Physica Polonica B 34 (2003), 1437-1440
Andreev, A.V.; Sechovsky, V.; Prokes, K.; Homma, Y.; Syshchenko, O.; Sebek, J.; Bartashevich,M.I.; Goto, T.; Shiokawa, Y.; Jurek, K.:Magnetism in UNJ2/3Rhi/3AI single crystalPhil. Mag. 83 (2003), 1613-1633
V4
V4
V4
EU-IHP: 187
E9
EU-IHP: 186
V4
V3
V4
E2
V4
EU-IHP: 210
V3
EU-IHP: 28
E4
E4
242

BENSC Experimental Reports 2003 Part II, List of Publications
Publications 2003BENSC Experiments and BENSC Authors
Arialdi, G; Karatasos, K.; Ryckaert, J.-P.; Arrighi, V.; Saggio, F.; Triolo, A.; Desmedt, A.; Pieper, J.;Lechner, R.E.:Local dynamics of polyethylene and its oligomers : a molecular dynamics interpretation of theincoherent dynamic structure factorMacromolecules 36 (2003), 8864-8875
Bazela, W.; Dyakonov, V.; Pashchenko, V.; Penc, B.; Szymczak, H.; Hernandez-Velasco, J.;Szytula, A.:Neutron diffraction study of crystal and magnetic structure of (Lao.7Cao.3)i-xMni+x03 (x=0,0.1)systemsPhysical Status Solidi B 236 (2003), 458-461
Bazela, W.; Wawrzynska, £.; Penc, B.; Stüßer, N.; Szytula, A.; Zygmunt, A.:Magnetic structures of RjRhSis (R=Ho, Er) compoundsJournal of Alloys and Compounds 360 (2003), 76-80
Bergenti, /.; Deriu, A.; Savini, L; Bonetti, F.; Hoell, A.:Polarised neutron small angle scattering investigation of Fe-0 composite nanoparticlesJournal of Applied Crystallography 36 (2003), 450-453
Berti, D., Baldelli Bombelli, F., Almgren, M., Baglioni, P.:Micellar aggregates formed by dilauroylphosphatidylnucleosidesin: Self Assembly, B. Robinson Ed., IOS Press, Amsterdam (2003), 348-357
Bordello H.N.; Kolesnikov A.I.; Kolomiets A.V.; Kalceff W.; Nakotte H.; Eckert J.:Inelastic neutron scattering studies ofTbNiAIH14 and UNiAIH2.o hydridesJournal of Physics: Condensed Matter 15 (2003), 2551-2559
Bourdarot, F.; Fak B.; Habicht K.; Prokes K.:Inflection point in the magnetic field dependence of the ordered moment of URu2Si2 observedby neutron scattering in fields up to 17 TPhysical Review Letters 90 (2003), 067203-1-067203-4
Cho, S. J.; Krist, Th.; Mezei, F.:Determination of interface growth with atomic resolution in FeCo-Si multilayersThin Solid Films 434 (2003), 136-144
Cho, S. J.; Krist, Th.; Mezei, F.:Dependence of interface layer thickness in FeCo-Si multilayers on sputtering parametersThin Solid Films 444 (2003), 158-164
Dante, S; Hauß, T; Dencher, N.A.:Insertion of externally administered amyloid beta peptide 25-35 and perturbation of lipidbilayersBiochemistry 42 (2003), 13667-13672
Davies, S.M.A.; Harroun, T.A.; Hauß, T; Kelly, SM; Bradshaw, J.P.:The membrane bound N-terminal domain of human adenosine diphosphate ribosylationfactor-1 (ARF1)FEBS Letters 548 (2003), 119-124
De Stefanis, A.; Tomlinson, A.A.G.; Steriotis, Th.; Stefanopoulos, K; Keiderling U.:Nanostructures of the montmorillonite-derived restructured clays K10®, HMO and theMg2+ exchanged analogue Mg-HMO. A SANS, N2 sorption and XRPD studyJournal of Materials Chemistry 13 (2003), 1145-1148
Doster, W.; Diehl, M.; Gebhardt, R.; Lechner, R.E.; Pieper, J.:TOF-elastic resolution spectroscopy: time domain analysis of weakly scattering (biological)samplesChemical Physics 292 (2003), 487-494
Ehlers, G.; Casalta, H.; Lechner, R.E.; Maletta, H.:Dynamics of frustrated magnetic moments in antiferromagnetically ordered TbNiAl probed byspin echo and time-of-flight spectroscopyIn: Mezei F. [u.a.] [Eds.]: Neutron spin echo spectroscopy: basics, trends and applications. Berlin:Springer, 2003 (Lecture notes in physics ; 601) - ISBN 3-540-44293-6 (2003), 222-231
V3
EU-IHP: 162318
E6
EU-IHP: 217
E6
EU-IHP: 153
V4
EU-IHP: 145
V4EU-IHP: 144EU-IHP: 415
Los Alamos
V2
EU-IHP: 62
V14
V14
V1
V1
EU-IHP: 223
V4
EU-IHP: 55
V3
243

BENSC Experimental Reports 2003 Part II, List of Publications
Publications 2003BENSC Experiments and BENSC Authors
Ersez, T.; Kennedy, S. J.; Hicks, T. J.; Krist, Th.; Miles, P. A.:New features of the long-wavelength polarization analysis spectrometerPhysica B 335 (2003), 183-187
Feldmann, H; Lechner, R.E.; Wilmer, D.:Unusual fast cation conduction in the high-temperature phase of lithium sodium sulfateMaterial Research Society Symposium Proceedings 756 (2003), EE2.4.1-EE2.4.6
Feyerherm, R.:[Cu(pyrimidine)(NO3)2]n : a coordination polymer with quasi one-dimensionalJournal of Magnetism and Magnetic Materials 256 (2003), 328-333
Feyerherm, R.; Loose, A.; Manson, J. L.:Unusual magnetic-field dependence of partially frustrated triangular ordering in manganeseJournal of Physics: Condensed Matter 15 (2003), 663-673
Feyerherm, R.; Loose, A.; Rabu, P.; Drillon, M.:Neutron diffraction studies of canted antiferromagnetic ordering in Co(ll) hydroxideterephtalateSolid State Sciences 5 (2003), 321-326
Fritzsche H.; Lieutenant K.:Performance of reflectometers on different moderators and target stations of the ESS projectJournal of Neutron Research 11 (2003), 61-68
Fritzsche, H.; Bonn, S.; Hauschild, J.; Prokes, K; Klenke, J.:Suppression of incommensurate spin-density waves in thin epitaxial Cr(110) layers of a V/CrmultilayerEuropean Physical Journal B 36 (2003), 175-181
Fritzsche, H.; Temst, K.; van Bael, M.:Off-specular polarized neutron reflectometry from periodic arrays of lithographicallystructured Co dotsLangmuir 19 (2003), 7789-7793
Fritzsche, H.; Temst, K.; van Bael, M.:Off-specular polarized neutron reflectometry on lithographically structured thin filmsRec. Res. Devel. Applied Phys. 6 (2003), 105-121
Fuertes Marron, D.; Meeder; A.; Bioeck; U.; Schubert-Bischoff; P.; Pfänder, N.; Würz, R.; Babu, SM.;Th. Schedel-Niedrig, Th.; Lux-Steiner, M.Ch.:Microstructural properties of CVD-grown CuGaSe2 based thin solid filmsThin Solid Films 431 (2003), 237-241
Garcia-Matres, E.; Stüßer, N; Hofmann, M.; Reehuis, M.:Magnetic phases in Mni.xFexW04 studied by neutron powder diffractionEuropean Physical Journal B 32 (2003), 35-42
Genzel, Ch.; Reimers, W.:Depth-resolved X-ray residual stress analysis in PVD (Ti,Cr)N hard coatingsZeitschrift für Metallkunde 94 (2003), 655-661
Gil, A.; Penc, B.; Baran, S.; Wawrzyska, E.; Szytula, A.; Hemandez-Velasco, J.; Zygmunt, A.:Magnetic properties of RTxSn2 (R=Gd,-Er; T=Co, Ni)Neutron Scattering and Complementary Methods in Investigations of Condensed Phase, publishedby University of Podlasie Publishing House, Poland (2003), 103-109
Gil, A.; Penc, B.; Baran, S • Hemandez-Velasco, J.; Szytula, A.; Zygmunt, A.:Magnetic structures of R""xSn2 (R=Tb, Ho) compoundsJournal of Alloys and Compounds 361 (2003), 32-35
Glavatska, N.:Redistribution of twin martensitic domains in magnetic shape memory Ni2MnGa alloys causedby external magnetic fieldFerroelectrics 290-292 (2003), 93-102
V3
E9
E6
E9
CO
O
>LU
LU
E1
E4
V6
V6
TEM
E6
E9
E6
EU-IHP: 216
E6
EU-IHP: 216
E2
E1
244

BENSC Experimental Reports 2003 Part II, List of Publications
Publications 2003BENSC Experiments and BENSC Authors
Glavatska, N., Mogilniy, G.; Danilkin, S.; Hohlwein, D.:Temperature dependence of lattice parameters in martensite and effect of the externalmagnetic field on martensite structure in NbMnGa studied in situ with neutron diffractionMaterials Science Forum 443-446 (2003), 397-400
Glavatska, N.; Mogylny, G.; Glavatskiy, /.; Danilkin, S.; Hohlwein, D.; Beskrovnij, A.; Södenterg, O.;Lindroos, V.:Temperature dependence of martensite structure and its effect on magnetic-field-inducedstrain in Ni2MnGa magnetic shape memory alloysJournal de Physique IV IY (2003), 963-967
Göbel, U.; Lefranc, G.; Degischer, HP.:Zerstörungsfreie Untersuchung von Eigenspannungen in AISi7Mg/SiC/70p Metall-Matrix-Verbundwerkstoffen mit Hilfe von Röntgen- und NeutronenbeugungProceedings 14. Symposium Verbundwerkstoffe und Werkstoffverbunde Wien (Hrsg. H.P.Degischer), Wiley-VCH, Weinheim (2003), 230-235
Göbel, U.; Lefranc, G.; Degischer, H.-P.:Non-destructive investigation of AISi7Mg/SiC70p MMCs by means of Acoustic Scanningmicroscopy, X-ray and neutron diffractionMaterialwissenschaft und Werkstofftechnik 34 (2003), 375-380
Gondek, L; Duraj, R.; Penc, B.; Stüßer, N.; Tomkowicz, Z ; Szytula, A.:Magnetic properties of NdMn2-xFexGe2(x = 0.3,0.4 and 1.0) compoundsPhysical Status Solidi A 196 (2003), 348-351
Gondek, L; Penc, B.; Stüßer, N.; Szytula, A.; Zygmunt, A.:Magnetic structures and phase transitions in TbRhSi, DyRhSi and HoRhSiPhysical Status Solidi A 196 (2003), 305-308
Gondek, L; Szytula, A.; Baran, S.; Zygmunt, A.; Hernandez-Velasco, J.:Physical properties of RTIn compounds (R=rare earth, T=Ni or Au)Neutron Scattering and Complementary Methods in Investigations of Condensed Phase, publishedby University of Podlasie Publishing House, Poland (2003), 95-102
Gondek, L; Szytula, A.; Penc, B.; Hemandez-Velasco, J.; Zygmunt, A.:Magnetic structures of RTIn (R = Ce, Er; T = Au, Ni) compoundsJournal of Magnetism and Magnetic Materials 262 (2003), L177-L180
Graf, H:Single-crystal neutron diffractometry - recent developments and trendsZeitschrift für Kristallographie 218 (2003), 75-83
Habicht, K.; Golub, R; Gähler R.; Keller T.:Space-time view of neutron spin echo, correlation functions and phonon focusingIn: Mezei F. [u.a.] [Eds.]: Neutron spin echo spectroscopy: basics, trends and applicatbns. Berlin:Springer, 2003 (Lecture notes in physics; 601). - ISBN 3-540-44293-6 (2003), 116-132
Habicht, K; Golub, R.; Keller, T.:The resolution function in neutron spin-echo spectroscopy with three-axis spectrometersJournal of Applied Crystallography 36 (2003), 1307-1318
Häußler, F.; Dehn, F.:SANS-Untersuchungen als Beitrag zur Aufklärung von Struktureigenschaftenzementgebundener WerkstoffeBautechnik 80 (2003), 713-718
Heinemann, A.; Wiedenmann, A.; Kammel, M.:The full potential of small-angle scattering with polarised neutrons for structure parameterevaluation in magnetic liquidsPhysica B (2003), 327
Heinemann, A.; Wiedenmann, A.; Kammel, M.; Hoell, A.:Polarized small-angle neutron scattering (SANSPOL) for discrimination of nanosizedcomponents in ferrofluidsMagnetohydrodynamics 39 (2003), 105-110
E2
E1
E2
E1
E3
E3
E6EU-IHP: 153EU-IHP: 315
E6EU-IHP: 154
E6EU-IHP: 465
E6EU-IHP: 465
V2
V2-NRSE
V4V12
V4
V4
245

BENSC Experimental Reports 2003 Part II, List of Publications
Publications 2003BENSC Experiments and BENSC Authors
Heinemann, A.; Wiedenmann, A.:Benefits of polarized small-angle neutron scattering on magnetic nanometer scale structuremodelingJournal of Applied Crystallography 36 (2003), 845-849
Heinemann, A.; Wiedenmann, A.; Kammel, M.; Boennemann, H.:Magnetic liquid structure obtained with polarised small-angle neutron scatteringJournal of Magnetism and Magnetic Materials (2003), 35
Hermann, H.; Mattem, N.; Kühn, U.; Heinemann, A.; Lazarev, N.P.:Evolution of spatial heterogeneity in a Zr-based metallic glassJournal of Non-Crystalline Solids 317 (2003), 91-96
Hoell, A.; Kammei, M.; Heinemann, A.; Wiedenmann, A.:Solvent dependent arrangement of shell molecules in ferrofluids studied by small-anglescattering with polarized neutronsJournal of Applied Crystallography 36 (2003), 558-561
Hoell, A.; Müller, R.; Heinemann, A.; Wiedenmann, A.:Structure investigations of barium-hexaferrite ferrofluids and its precursors by SANS withpolarized neutronsMagnetohydrodynamics 39 (2003), 111-118
Hohlwein, D.; Hoffmann, J.-U.; Schneider, R.:Magnetic interaction parameters from paramagnetic diffuse neutron scattering in MnOPhysical Review B: Condensed Matter 68 (2003), 140408-1-140408-4
Hoinkis, E.; Ziehl, M.:A small-angle neutron scattering study of activated carbon fibresCarbon 41 (2003), 2047-2056
Honda F.; AndreevA.V.; Sechovsky V.; Prokes K.:Magnetic properties of a URhSi single crystalPhysica B 329-333 (2003), 486-488
Huster, D.; Vögel, A.; Katzka, C; Scheidt, H.A.; Binder, H.; Dante, S.; Gutberiet, T.; Zschömig, O.;Waldmann, H.; Arnold, K.:Membrane insertion of a lipidated ras peptide studied by FTIR, Solid-state NMR, and neutrondiffraction spectroscopyJournal of the American Chemical Society 125 (2003), 4070-4079
Hutanu, V.; Gorzel, A.; Klenke, J.; Rupp, A.:Progress of the 3He neutron spin filter project at HMIPhysica B 335 (2003), 205-210
Janousova, B.; Sechovsky, V.; Prokes, K.; Komatsubara, T.:Microscopic origin of irreversible GMR effect in CePtSn around 3 TPhysica B 328 (2003), 145-147
Jauch, W.; Reehuis, M.:Electron density distribution in paramagnetic and antiferromagnetic MnO:A gamma-ray diffraction studyPhysical Review B: Condensed Matter 67 (2003), 184420-1-184420-8
Joseph Y.; Krasteva; N.; Besnard; I.; Guse; B.; Rosenberger; M.; Wild; U.; Knop-Gericke; A.; Schlögl;R.; Krustev, R.; Yasuda, A.; Vossmeyer, T.:Gold-nanoparticle/organic linker films: self-assembly, electronic and structuralcharacterisation, composition and vapour sensitivityFaraday Discussions 125 (2003), 77-97
Kaiser-Bischoff, /.:Neutronenstreuuntersuchungen an den gemittelten und fehlgeordneten Strukturen inStickstoff-dotiertem ZirkoniaShaker-Verlag (2003) ISBN: 3-8322-1208-6
V4
V4
V4
V4
V4
E2
V4
V1
E1
E4EU-IHP: 303
V6
E2
246

BENSC Experimental Reports 2003 Part II, List of Publications
Publications 2003BENSC Experiments and BENSC Authors
Kang, H. J.; Pengcheng, Dai; Lynn, J. W.; Matsuura, M.; Thompson, J. R.; Shou-Cheng, Zhang;Argyriou, D. N.; Onose, Y.; Tokura, Y.:Reply to comment on "Antiferromagnetic order as the competing ground state in electron-doped Ndi.esCeo.i5Cu04"Nature 426 (2003), 140
Kang, H.J.; Dal, P.; Lynn, J.W.; Matsuura, M.; Thompson, J.R.; Zhang, S.C.; Argyriou, D.N.; Onose,Y.; Tokura, Y:Antiferromagnetic order as the competing grond state in electron-doped Ndi «sCeoisCuO.»Nature 423 (2003), 522-525
Keller T.; Keimer B.; Habicht K.; Golub R.; Mezei F.:Neutron resonance spin echo - triple axis spectrometry (NRSE-TAS)in: Mezei F. [u.a.] [Eds.]: Neutron spin echo spectroscopy: basics, trends and applications. Berlin:Springer, 2003 (Lecture notes in physics ; 601). - ISBN 3-540-44293-6 (2003), 74-86
Khaykovich, B.; Birgeneau, R.J.; Chou, F.C.; Erwin, R.W; Kastner, M.A.;.Lee, S.-H.; Lee, Y.S.;Smeibidl, P.; Vorderwisch, P.; Wakimoto, S.:Effect of a magnetic field on long-range magnetic order in stage-4 and stage-6superconducting La2CuC>4+yPhysical Review B: Condensed Matter 67 (2003), 054501-054506
Köbler, U.; Hoser, A.; Hupfeld, D.:A complete description of the order parameter of Heisenberg-type magnets for 0 < T< TcPhysica B 328 (2003), 276-282
Krasteva, N.; Krustev, R.; Yasuda; A.; Vossmeyer, T.:Vapour sorption in self-assembled gold nanoparticle/dendrimer films studied by specullarneutron reflectometryLangmuir 19 (2003), 7754-7760
Krist, Th.; Mezei, F.:Solid state elements for neutron opticsIn G. Mank and H. Conrad, Eds. Proc. ICANS-XVI May 12-15, 2003, Düsseldorf-Neuss, Germany(2003), 387-394
Lang, P.; Willner, L; Pyckhout-Hintzen, W.; Krastev, R:Isotropie to nematic transition in solutions of cylindrical PB-PEO block copolymer micellesclose to a wallLangmuir 19 (2003), 7597-7603
Lebedev V.T.; Gordeev G.P.; Torok Gy:Modified NSE with spectrum modulation at PNPI: specific features and applicationsLecture Notes in Physics V.601, Neutron Spin Echo Spectroscpy, Ed. F.Mezei, Springer- Verlag,Berlin-Heidelberg-New York (2003), 65-73
Lebedev, V.T.; Torok, G.; Oriova, D.W.; Melenevskaya, E.Yu; Vinogradova, L.V.:Ternary fullerene-porphyrine-polymer compounds: structural peculiarities in aqueoussolutions studied by SANSXII Intern.Conf. on selected problems of modern physics, June 8-11, 2003, Dubna, Russia,Abstracts (2003), 110
Lebedev, V.T.; Török, Gy.; Czer, L; Oriova, D.N.; Zgonnik, V.N.; Melenevskaya, Yu, £.;Vinogradova, L.V.; Treimer, W.:Fullerene - polymer complexes: fractal crossover in solutionsJournal of Applied Crystallography 36 (2003), 646-648
Lebedev, V.T.; Török, Gy.; Czer, L; Treimer, W.; Oriova, DM; Sibilev, A.I.:Polymer hydration and microphase decomposition in poly(N-vinylcaprolactam)-water complexJournal of Applied Crystallography 36 (2003), 967-969
Lebedev, V.T.; Torok, Gy; Cser, S.; Len, A.; Oriova, D.W.; Melenevskaya, Yu, E.; Vinogradova, L.V.;Ratnikova, O.V.; Zgonnik, V.N.; Treimer, W.:Triple porphyrine-fullerene-polymer compounds: hydration and structuring in aqueoussolutionsThe 6th Biennial Int. Workshop "Fullerenes and Atomic Clusters", June 30 - July 4, 2003 (2003), 208
E4
E4
V2
V2
E1
V6
V6
V12a
V12a
V12EU-IHP: 137
V12a
247

BENSC Experimental Reports 2003 Part II, List of Publications
Publications 2003BENSC Experiments and BENSC Authors
LechnerR. E.(Guest Editor); Domcke W.; Hochstrasser R. M.; Trommsdorff, H. P. (Eds.):Quasielastic neutron scattering of structural dynamicsin Condensed Matter. Special Issue, Chemical Physics 292, (2003), Nos. 2-3
Lechner R. £.;PrefaceSpecial Issue, Chemical Physics 292 (2003), 119-120
Lechner R. £.:QENS 2002 Held in PotsdamNeutron News 14, No. 2 (2003), p. 4-4
Lee, S.; Podlesnyak, A.; Prokes, K.; Sikolenko, V.; Park, J-G.; Gerasimov, E.; Pirogov, A:Magnetic phase transitions in single crystalline TbNi53rd Europ. Conference on Neutron Scattering, Abstract book and Conference program, Sep. 3-6,2003, Montpellier, France (2003), 52-
Lieutenant, K.; Krist, Th.; Monkenbusch, M.; Manoshin, S.; Ohl, M.; Zsigmond, G.; Mezei, F.:MC simulations of a beamline for a NSE instrument at SNSProc. ICANS-XVI May 12-15, 2003, Dussektorf-Neuss, Germany, (2003), 505-512
Ling, C. D.; Granado, £.; Neumeier, J. J.; Lynn, J. W.; Argyriou, D. N.:Inhomogeneous magnetism in La-doped CaMnOj.1. Mesoscopic phase separation due to lattice-coupled ferromagnetic interactionsPhysical Review B: Condensed Matter 68 (2003), 134439 -1
Lonkai, Th.; Tomuta, D.G.; Hoffmann, J.-U.; Schneider, R.; Hohlwein, D.; Ihringer, J.:Magnetic two-dimensional short-range order in hexagonal manganKesJournal of Applied Physics 93 (2003), 8191-8193
Major, J.; Dosch, H.; Felcher, G. P.; Habicht, K.; Keller, T; te Velthuis, S. G. £.; Vorobiev A.;Wahl, M.:Combining of neutron spin echo and reflectivity: a new technique for probing surface andinterface orderPhysicaB 336 (2003), 8-15
Maksimov, I.; Litterst, F.J.; Rechenberg, H.; de Meto, M. A. C; Feyerherm, R.; Hendrikx, R. W. A.;Gortenmulder, T. J.; Mydosh, J. A.; Süllow, S.:The effect of disorder on the magnetic and transport properties of UPd2xSnPhysical Review B: Condensed Matter 67 (2003), 104405/1-104405/10
Maksimov, /.; Litterst, F.J.; Süllow, S.; Feyerherm, R.; Mydosh, J. A.:Structural and magnetic ordering in UPdi 8sSnActa Physica Polonica B 34 (2003), 967-970
Mang, P.K.; Larochelle, S.; Greven, M.:Spurious magnetism in a high-temperature superconductorNature 426 (2003), 139-140
Manson, J.L; Chapon, L. C; Bordallo, H. A/.; Feyerherm, R.; Argyriou, D. N.; Loose, A.:Spin ordering in the mixed-ligand antiferromagnet Mn[N(CN)2]2(pvrazine)Journal of Magnetism and Magnetic Materials 260 (2003), 465-469
Matsuura, M.; Dai, P.; Kang, H. J.; Lynn, J. W.; Argyriou, D. N.; Prokes, K.; Onose, Y.; Tokura, Y.:Effect of a magnetic field on the long-range magnetic order in insulating Nd2Cu04 andnonsuperconducting and superconducting NdusCeo.isCuCMPhysical Review B: Condensed Matter 68 (2003), 144503-144515
McKinsey, D.N.; Brome, C.R.; Dzhosyuk, S.N.; Golub, R.; Habicht, K.; Huffman, P.R.; Korobkina, £.;Lamoreaux, S.K.; Mattoni, C.E.H.; Thompson, A.K.; Yang, L; Doyle, J.M.:Time-dependence of liquid-helium fluorescencePhysical Review A: Atomic, Molecular, and Optical Physics 76 (2003), 062716-1-062716 -10
Mukhen'i, D.; Strunz, P.; Del Genovese, D.; Gilles, R.; Rosier, J.; Wiedenmann, A.:Investigation of microstructurai changes in Inconei 706 at high temperatures by In-Situ SANSMetallurgical and Materials Transactions A: Physical Metallurgy and Materials Science 34A (2003),2781-2792
E4
E2
V2
E6
E6
E4
E6V2
E4
V13
V4
248

BENSC Experimental Reports 2003 Part II, List of Publications
Publications 2003BENSC Experiments and BENSC Authors
Müller, R.; Hiergeist, R.; Gawalek, W.; Hoell, A.:Ba-ferrite particles for magnetic liquids with enhanced Neel relaxation time and lossinvestigationsMagnetohydrodynamics 39 (2003), 49-52
Nakotte, H.; Chang, S.; Alsmadi, AM; Jung, M.H.; Lacerda, A.H.; Prokes, K.; Brück, £.; Mihalik, M.:Hard-axis magnetoresistance and metamagnetic transition in UPdSnActa Physica Polonica B 34 (2003), 987-990
Narehood, D. G.; Pearce, J. V.; Eklund, P. C; Sokol, P. E.; Lechner, R. E.; Pieper, J.;Copley, J. R. D.; Cook, J.:Diffusion of H2 adsorbed on single walled carbon nanotubesPhysical Review B: Condensed Matter 67 (2003), 205409
Ohl, M.; Monkenbusch, M.; Richter, D.; Mezei, F.; Pappas, C; Lieutenant, K.; Krist, Th.;Zsigmond, G.:A high resolution neutron spin echo spectrometer for the SNS with T £ 1MSProc. ICANS-XVI May 12-15, 2003, Düsseldorf-Neuss, Germany, (2003), 207-214
Ollivier J.; Rufflä B.; Longeville S.; Bourges P.; Lechner R. E.; ToudicB.:Central peak near the incommensurate displacive phase transition of BCPSSpecial Issue, Chemical Physics 292 (2003), p. 171
Paciaroni, A ; Orecchini, A.; Cinelli, S.; Onori, G.; Lechner, R.E.; Pieper, J.:Protein dynamics on the picosecond (imescale as affected by the environment.A quasielastic neutron scattering studyChemical Physics 292 (2003), 397
Pappas, C; Triolo, A.; Mezei, F.; Kischnik, R.; Kali, G.:Wide angle neutron spin echo and time-of-flight spectrometerIn: Mezei F. [u.a.] [Eds.]: Neutron spin echo spectroscopy: basics, trends and applications. Berlin:Springer, 2003 (Lecture notes in physics ; 601). - ISBN 3-540-44293-6 (2003), 35-47
Penc, B.; Szytula, A.; Hemandez-Velasco, J.; Zygmunt, A.:Antiferromagnetic properties of ternary galides RRhGa (R=Tb, Ho and Er)Journal of Magnetism and Magnetic Materials 256 (2003), 373-380
Peters, J.:The "seed-skewness" integration method generalized for three-dimensional Bragg peaksJournal of Applied Crystallography 36 (2003), 1475-1479
Peters, J.; Treimer, W.:Bloch walls in a nickel single crystalRecent Res.Devel.Physics 4 (2003), 309-331
Pieper, J.; Charalambopoulou, G.; Steriotis, Th.; Vasenkov, S.; Desmedt, A.; Lechner, R.:Water diffusion in fully hydrated porcine stratum corneumChemical Physics 292 (2003), 465-476
Prager, M.; Grimm, H.; Desmedt, A.; Lechner, R.E.:Methyl rotational potentials of trimethyl metal compounds studied by inelastic andquasielastic neutron scatteringChemical Physics 292 (2003), 161-169
Prager, M.; Grimm, H.; Parker, S.F.; Lechner, R.; Desmedt, A.; McGrady, S.; Koglin, £.;Methyl group rotation in trimethylaluminiumJournal of Physics: Condensed Matter 14 (2003), 1833-1845
Prokes, K;Andreev, A.V.; Honda, F.; Sechovsky, V.:Magnetic structure of URhSi single crystalJournal of Magnetism and Magnetic Materials 261 (2003), 131-138
Prokes, K.; Nakotte, H.; Bartashevich, M. /.; Doerr, M.; Sechovsky, V.:Neutron diffraction and magnetization studies of U2Pd2ln single crystals in high magneticfieldsPhysical Review B: Condensed Matter 68 (2003), 014405 -1-014405 - 6
V4
E4
V3
183
V3
EU-IHP:412
V5
E6EU-IHP.215EU-IHP: 216EU-IHP:217
E5.V1
E8
V3EU-IHP: 54
V3
V3
E4
E4
249

BENSC Experimental Reports 2003 Part II, List of Publications
Publications 2003BENSC Experiments and BENSC Authors
Prokes, K; Gukasov, A.; Takabatake, T.; Fujita, T.; Sechovsky, V.:Magnetic form factor of URhGeActa Phys. Pol. B 34 (2003) 1473-1476
Prokes, K.; Muhoz-Sandoval, £.; Chinchure, Aravind D.; Mydosh, J.A.:Magnetic structure and transitions of Dy2Ni2PbPhysical Review B: Condensed Matter 68 (2003), 0134427
Prokes, K.; Nakotte, H.; Sechovsky, V.; Brück, E:.Neutron scattering studies on uranium compounds in high magnetic fieldsJournal of Physics: Condensed Matter 15 (2003), S1985-S1989
Pynn, R.; Fitzsimmons, M.R.; Fritzsche, H.; Major, J.; Rekveldt, T.:Does beam divergence matter for neutron reflectometry?Physica B 336 (2003), 1-7
Rainforth, W.M.; Black, M.P.; Higginson, R.L.; Palmiere, E.J.; Sellers, CM; Papst, i; Warbichler, P.;Hofer, F.; van Dijk, N.H.; Offerman, S.E.; Strunz, P.:A critical comparison of the methods of quantifying precipitate size distribution in a modelFe-30Ni-Nb microalloyed steelProceedings of the International Conference on Thermomechanical Processing: Mechanics,Microstructure & Control, Sheffield, UK, 23-26 June 2002, Editors E.J. Palmiere, M. Mahfouf, and C.Pinna (2003), 204-211
Reehuis, M.; Krimmel, A.; Büttgen, N.; Loldl, A.; Prokofiev, A.:Crystallographic and magnetic structure of ZnV2O4European Physical Journal B 35 (2003), 311-316
Reehuis, M.; Wolff, M.W.; Krimmel, A; Scheldt, E.-W.; Stüßer, N.; Loidl, A.; Jeitschko, W.:Magnetic phase transitions in TbFe2Alio, HoFezAho and ErFe2AlioJournal of Physics: Condensed Matter 15 (2003), 1773-1782
Regulski, M.; Przenioslo, R.; Sosnowska, /.:Incommensurate magnetic structure of ß-MnO2Physical Review B: Condensed Matter 68 (2003), 172401-1-172401-4
Rekveldt, M.Th.; Bouwman, W.G.; Kraan, W.H.; Uca, O.; Grigoriev, S.V.; Habicht, K.; Keller, T.:Elastic neutron scattering measurements using larmor precession of polarized neutronsIn: Mezei F. [u.a.] [Eds.]: Neutron spin echo spectroscopy: basics, trends and applications. Berlin:Springer, 2003 (Lecture notes in physics ; 601). - ISBN 3-540-44293-6 (2003), 87-99
Removic-Langer, K.; Hunter Dunn, J.; Langer, J.; Arvanitis, D.; Maletta, H.; Holub-Krappe, E.:Spin and orbital moments in Au/Co/Au(111)W(110) across the spin-reorientierung transition-temperatureNuclear Instruments and Methods in Physics Research Section B 200 (2003), 210-214
Rohling, S.; Häußler, F.:Beobachtung der Strukturentwicklung und Strukturveränderung des Zementsteins mit Hilfeder Neutronenkleinwinkelstreuung (Vortrag)Tagungsbericht - Band 1,15. Internationale Baustofftagung IBAUSIL, Bauhaus-Universität Weimar,24. - 27.09.2003 15 (2003), 1-0479-1-0488
Rousseau, D.; Marty, J.-D.; Mauzac, M.; Martinoty, P.; Brandt, A.; Guenet, J.-M.:Conformation in solution of side-chain liquid crystal polymers as a function of the mesogen-graft amountPolymer 44 (2003), 2049-2055
Rüegg, Ch.; Cavadini, N.; Furrer, A.; Güdel, H.-U.; Krämer, K; Mutka, H; Wildes, A.; Habicht, K.;Vorderwisch, P.:Bose-Einstein condensation of the triplet states in the magnetic insulator TICuCbNature 423 (2003), 62-65
Russina, O.; Mezei, F.; Russina, M.; Lechner, R.; Ollivier, J.:Experimental emulation of repetition rate multiplication, a novel technique for neutron time-of-flight spectroscopy on pulsed sourcesIn: Mank G. [u.a.] [Eds.]: Proceedings of the 16th Meeting of the International Collaboration onAdvanced Neutron Sources ICANS - XV11 (2003), 315-320
E6EU-IHP: 418
E4
V6
V4EU-IHP: 80EU-IHP: 211
E6
E9
E6
E2EU-IHP: 576
V2-NRSE
V6
V4
V4EU-IHP: 58
V2EU-IHP: 543
250

BENSC Experimental Reports 2003 Part II, List of Publications
Publications 2003BENSC Experiments and BENSC Authors
Schallehn, M.; Winterer, M.; Weirich, T.E.; Keideriing, U.; Hahn, H.:In-situ preparation of polymer-coated aluminia nanopowders by chemical vapor synthesisChemical Vapor Deposition 9 (2003), 40-44
Schindler, A.; König, R.; Herrmannsdörfer, T.; Braun, H.F.; Eska, G.; Günther, D.; Meißner, M.;Mertig, M.; Wahl, R.; Pompe, W.:Superconductivity at 20 pK in compacted submicrometer platinum powdersPhysica B 329-333 (2003) 1427-1428
Schmidt, M.; Hofmann, M.; Campbell, S.J.:Magnetic structure of strontium ferrite S^Fe-iOnJournal of Physics: Condensed Matter 115 (2003), 8691-8701
SchötO, S.; Meißner, M.; Günther, D.:Specific heat of normal conducting UPt3 revisitedPhysica B 329-333 (2003), 616-617
Schwendet, D.; Hayashi, T.; Dahint, R.; Pertsin, A.; Grunze, M.; Steitz, R.; Schreiber, F.;Interaction of water with self-assembled monolayers: neutron reflectivity measurements of thewater density in the interface regionLangmuir 19 (2003), 2284-2293
Sechovsky, V.; Honda, F.; Janousova, B.; Prokes, K.; Svoboda, P.; Syshchenko, O.; Andreev, A.V.:Magnetic correlations reflected by anomalies in transport and elastic properties of uraniumintermetallicsPhysica B 328 (2003), 95-99
Sechovsky, V.; Honda, F.; Prokes, K.; Svoboda, P.; Syshchenko, O.; Andreev, A.V.; Kamaräd, J.:Pressure-induced phenomena in U intermetallicsActa Physica Polonica B 34 (2003), 1377-1386
Sechovsky, V.; Honda, F.; Svoboda, P.; Prokes, K.; Chemyavsky, O.; Doerr, M.; Rotter, M.;Loewenhaupt, M.:Antiferromagnetism and magnetoelasticity of UNiAlPhysica B 329-333 (2003), 480-481
Sitepu, H; KhalilAllafi, J.; Schmahl, W.W.; Eggeier, G.; Többens, D.M.:A neutron diffraction study of the martensitic transformations in aged Ni-rich NiTi alloysJournal de Physique IV 112 (2003), 643-646
Sittner, P.; Novak, V.; Lukas, P.; Neov, D.; Toebbens, D.M.:In-situ neutron diffraction studies of martensitic transformations In NiTiJournal de Physique IV 112 (2003), 709-712
Smeibidl, P.; Mezei, F.; Meißner, M.; Prokes, K.; Schröder-Smeibidl, B.; Steiner, M.:Neutron scattering facility for continuous high magnetic fields up to 40 T at Hahn-Meitner-Institut BerlinPhysica B 329-333 (2003), 1666-1667
Spizzo, F.;Angeli, E.; Bisero, D.; Da Re, A.; Ronconi, F.; Vavassori, P.; Bergenti, A; Deriu, A.;Hoell, A.:SANS measurements with polarised neutrons on FeAg magnetic granular systemsJournal of Applied Crystallography 36 (2003), 826-828
Steitz, R.; Gutberlet, T.; Hauss, T.; Klösgen, B.; Krastev, R.; Schemmel, S.; Simonsen, A. C;Findenegg, G. H.:Nanobubbles and their precursor layer at the interface of water against a hydrophobicsubstrateLangmuir 19 (2003), 2409-2418
Stocken, O.; Deppe, M.; Geibel, C; Steglich, F.; Hohlwein, D.; Schneider, R.:Neutron diffraction study of the magnetism in single-crystalline CeCu2(Sii-xGex)2Acta Physica Polonica B 34 (2003), 963-966
Strunz, P.; Mukherji, D.; Gilles, R.; Rosier, J.; Wiedenmann, A.:Small-angle neutron scattering: a tool for microstructural investigation of high-temperaturematerialsMaterials Science Forum 426-432 (2003), 821-826
V4
E6
V6
E6EU-IHP: 38
E9
E9EU-IHP: 186EU-IHP: 444
V4EU-IHP: 145
V6
E2
V4
251

BENSC Experimental Reports 2003 Part II, List of Publications
Publications 2003BENSC Experiments and BENSC Authors
Strunz,P.; Gilles, R.; Mukherji, D.; Wiedenmann, A.:Evaluation of anisotropic small-angle neutron scattering data; a faster approachJournal of Applied Crystallography 36 (2003), 854-859
Stubenrauch, C; v. Klitzing, R:Disjoining pressure isotherms of thin liquid films - new concepts and perspectivesJournal of Physics: Condensed Matter 15 (2003), 1197-1232
Svoboda, P.; Honda, F.;Andreev, A.V.; Vejpravova, J.; Prokes, K.; Sechovsky, V.:Evolution of magnetic structures in U(Nii.xPdx)2Si2 systemPhysica B 329-333 (2003), 502-503
Szytula, A.:Neutron diffraction and magnetic measurements in investigation of magnetic properties ofrare earth intermetallic compoundsNeutron Scattering and Complementary Methods in Investigations of Condensed Phase, publishedby University of Podlasie Publishing House, Poland (2003), 73-82
Szytula, A.; Penc, B.; Gondek, L; Stüßer, N.:Magnetic structure of NdMni.S5Feo.45Ge2 as a function of temperature and pressureJournal of Alloys and Compounds 358 (2003), L1-L5
Szytula, A.; Penc, B.; Stüßer, N.:Incommensurate magnetic ordering in NdNiSnJournal of Magnetism and Magnetic Materials 265 (2003), 94-97
Szytula, A.; Penc, B.; Stüßer, N.:Neutron diffraction studies of magnetic structure of TbAg2Si2Journal of Magnetism and Magnetic Materials 263 (2003), 21-25
Szytula, A.; Wawrzynska, E.; Penc, B.; Stüßer, N.; Zygmunt, A.:Magnetic properties of R3CU4X4 (R = Gd-Er; X = Ge, Sn) compoundsPhysical Review B: Condensed Matter 327 (2003), 167-170
Toudic B.; Le Lann H.; Guillaume F.; LechnerR. E.; Ollivier J.; Bourges P.:Coherent neutron scattering analysis of alkane dynamical disorder inside nanoporous ureaintergrowth crystalsSpecial Issue, Chemical Physics 292 (2003), 191-199
Torok, Gy.;Lebedev, V.T.; Gordeev, G.P.:Compact NSE concept and realizationLecture Notes in Physics V.601, Neutron Spin Echo Spectroscpy, Ed. F.Mezei.Springer- Verlag,Beriin-Heidelberg-New York (2003), 56-64
Treimer, W.; Strobl, M.; Hilger, A.; Seifert, C; Feye-Treimer, U.:Refraction as imaging signal for computerized (neutron) tomographyApplied Physics Letters 83 (2003), 398-400
Treimer, W.; Strobl, M.; Hilger, A.; Feye Treimer, U.:Scattering effects as imaging signals for neutron tomographyProceedings of the 3rd World Congress on Industrial Process Tomography PCTCanada (Banff) (Sept. 2003), 744-749
Tritthart, J.; Häußler, F.:Pore solution analysis of cement pastes and nanostructural investigations of hydrated C3SCement and Concrete Research 33 (2003), 1063-1070
Troyanchuk, I.O.; Trukhanov, S.V.; Shapovalova, E.F.; Khomchenko, V.A.; Tovar, M.; Szymczak, H.:The influence of oxygen vacancies on magnetic state of La0.50D0.50-MnO3-gamma(D = Ca, Sr) ManganitesJournal of Experimental and Theoretical Physics Letters 96 (2003), 1055-1064
Troyanov, S.I.; Kosterina, E.V.; Loose, A.; Reehuis, M.; Kemnitz, E.:Single-crystal neutron diffraction study of the phase transition in (NH4)H5(PO4)2Zeitschrift für Kristallographie 218 (2003), 470-474
V4
V4
E4EU-IHP: 302
E6EU-IHP: 154
E6EU-IHP: 315
E6
E6
E6
EU-IHP: 466
V5
V12a
V12a
V4
E9EU-IHP: 574
E5
252

BENSC Experimental Reports 2003 Part II, List of Publications
Publications 2003BENSC Experiments and BENSC Authors
Ulrich, C; Khaliullin, G.; Sirker, J.; Reehuis, M.; Ohl, M.; Miyasaka, S.; Tokura, Y.; Keimer, B.:Magnetic neutron scattering study of YVO3: Evidence for an orbital Peieris statePhysical Review Letters 91 (2003), 257202-1-257202-4
Vertessy, B. G.; Magazü, S.; Mangione, A.; Migliardo, F.; Brandt, A.:Structure of Escherichia coli dUTPase in solution: A small angle neutron scattering studyMacromolecular Bioscience 3 (2003), 477-481
Wawrzynska, £.; Baran, S.; Ledejewicz, J.; Sikora, W.; Stüßer, N.; Szytula, A.:Magnetic structures of R3Mn4Sn4 (R = La, Pr and Nd)Journal of Physics: Condensed Matter 15 (2003), 803-814
Wawrzynska, £.; Hemandez-Velasco, J,; Penc, B.; Sikora, W.; Szytula, A.; Zygmunt, A.:Magnetic ordering of R3Cii4Sn4 (R = Tb, Dy, Ho and Er)Journal of Physics: Condensed Matter 15 (2003), 5279-5296
Wawrzynska, £.; Hemandez-Velasco, J,; Penc, B.; Szytula, A.; Zygmunt, A.:Magnetic structures of R3Cu4Ge4 (R = Tb, Dy, Ho, Er)Journal of Magnetism and Magnetic Materials 264 (2003), 192-201
Wawrzynska, E.; Penc, B.; Hemandez-Velasco, J.; Szytula, A.; Zygmunt, A.:Neutron diffraction studies of the magnetic structure of Ho3Pd4Ge4Journal of Alloys and Compounds 350 (2003), 68-71
Wawrzynska, E.; Penc, B.; Stüßer, N.; Szytula, A.; Tomkowicz, Z.:Magnetic structure of Tb3Cu4Si4Solid State Communications 126 (2003), 527-530
Wesemann, A.; Ahrens, H.; Steitz, R.; Forster, S.; Helm, C. A.:Internal interface of a compressed PEE-PEO diblock copoiymer monolayerLangmuir 19 (2003), 709-716
Wiedenmann, A.; Hoell, A.; Kammel, M.; Boesecke, P.:Field-induced pseudeo-crystalline ordering in concentrated ferrofluidsPhysical Review E 68 (2003), 31203-31212
Wolter, A.U.B.; Klauss, H.-H.; Litterst, F. J.; Burghardt, T.; Eichler, A.; Feyerherm, R.; Süllow, S.:A pressure study of the antiferromagnetic phase of FePM2Cl2 (PM = pyrimidine)Polyhedron 22 (2003), 2139-2140
Zsigmond, G.; Krist, Th.; Mezei, F.:Monte-Carlo simulation of polarizing cavitiesPhysica B 335 (2003), 266-269
E5
V4EU-IHP: 143
E6EU-IHP: 466
E6EU-IHP: 466
E6EU-IHP: 466
E6EU-IHP: 578
E6EU-IHP: 519
V6
V4
E6
253

BENSC Experimental Reports 2003 Part II, List of Publications
ThesesExamina
PhD-theses and diploma
2002 (supplement)
Beirne, E.:Magnetic properties of the intermetallic compounds PrNiSn and NdNiSnUniversity College of London, 2002 (PhD)
Kaiser-Bischoff, 1.:Neutronenstreuuntersuchungen an den gemitteiten und fehlgeordneten Strukturen inStickstoff-dotiertem ZirkoniaLMU München, 2002 (PhD)
V2EU-IHP: 161
E2
2003
Allen, Jonathan Paul:Magnetism in uranium and praseodymium intermetallic compounds studied by inelasticneutron scatteringUniversity College of London, 2003 (PhD)
Calandrini, V.:Water dynamics in dilute aqueous solutionsUniv. degi Studi di Parma, 2003 (PhD)
Strobl, M.:New alternative contrast methods in neutron computer tomographyTU -Wien, 2003.(PhD)
Tomuta, D.:Investigations of hexagonal manganites with magnetic and non magnetic rare earthsUniv. Leiden/ NL, 2003 (PhD)
Vejpravova, J.:Preparation, identification and study of selected RECu2 single-crystalsCharles University, Prague, 2003 (diploma)
Habilitationen
2003
Häußler, F.:Der Zusammenhang zwischen gemessenen Neutronenstreukurven und der Porosität imHinblick auf die Zementsteineigenschaften Permeabilität und DauerhaftigkeitUniversität Leipzig, 2003
v. Klitzing, Re-structuring of polyelectrolytes in thin films and at single interfacesTU Berlin, 2003
V2EU-IHP: 423
V3EU-IHP: 141EU-IHP: 209EU-IHP: 457
V12a
E9EU-IHP: 149
E2EU-IHP: 85EU-IHP: 123EU-IHP: 188
V4V12
V6
254

AUTHOR INDEX
255


AUTHOR INDEX
author page author page author page
AAbraham sen A.B.Ahrens H.Alegaonkar P.Aliotta F.Aliouane N.
Altmann W.Andersen N.H.Ando Y.Argyriou D.
Arrighi V.Auffermann G.
BBaglioni P.Baldelli Bombelli F.Rail \ /Dalf V.
Ranhart 1UCIIII ICH t vl.
Ran C M^JCt^J ^^m IV I •
Raran SBarrallier L.Barthes M.Bayrakci S.RpharM^J ^1 1 Gl 1 IVI»
Bellouard CL^^^ll^/udl Vt ^ >
Berntsen N.Berti D.Bircher R.Birgeneau R.J.Blum berg G.Böni P.Bonini M.Bordallo N.
Borowiec M.T.Böschen R.Bourdarot F.Bove L.E.Boysen H.Brandt A.Brand R.A.Brezesinski G.Bringezu F.Brück E.Buchsteiner A.
BuhlJ.-Ch.
C
Calandrini V.Calvo-Dahlborg M.Campbell S.J.Campo J.Carelli C.
3,18142, 143,144
17,
17,
238131,137
51, 52, 53,54
2203,18
32,3326,51,52,53, 54, 75,
109, 133192
39. 117. 118
-t
110
122129170,
7917217/
«5*5 20R
1241 £.*T
42, 43183, 184133, 138
M, 72, 1252^8
9299
79, 17212766
32,33232172
, 133, 138,17397
187121
168, 169111172130
179, 18016349
126, 127,137, 167,193, 194,
236119
13612418148
150
Carriere D.Castellano C.Pamnph Poernuoii r.onen A.Christensen N.Clemens D.Coldea R.Coomer F.oueiio J O .uzesiiK \J.
D
Dahlborg U.Dai P.Danilkin S.Danilyan G.V.Dante S. 158,
Dathe M.de Francesco A.Degischer H.P.del Genovese D.Delajon C.Dencher N.Dennison S.Deriu A.Desmedt A.Dierik M.Donath E.Dörr M.Dubois E.
c
Eckert J.Efimov V.Eremenko V.V.Estrela-Lopis I.
FFabre A.FakB.Farago B.Faulhaber E.Faure-Vincent J.Fedorov A.V.Fehr C.Feldmann H.Feyerherm R.
Findenegg G.H.Fink D.Fiori F.Fitzsimmons M.Fleischer F.Förster F.Franz A.Freydank H.Fritzsche H.
14616714ft1 Hw
1969
14067,70
20*ro
i77I I I
123,12426,75
1,6,18,213237
160, 163, 164,165,166, 176
158168, 169
188189,203146, 151164, 166
16077,136
122, 134,192208, 209
1471287
20219162
147
183, 18412187
22,3892
237138,141,207
19420, 63, 65,
101, 110155, 156, 157
238211,212
222103161104
186, 18790, 92, 93,
222
GGabke A.Gamari-Seale H.Garcfa-Garcfa J.Garcia-Matres E.
Gerbel A.Gerischer S.Gesing Th.M.Gierlings M.Gilbert E.Gilles R.Glanville Y.Glavatska N.Glavatski I.Göbel U.Goll G.Golosovsky I.Golub B.Gomez Sal J.C.Gondek L.Gopinadhan M.Gratz E.Gromelski S.Grunze M.Gruyters M.Güdel H.U.Guenet J.-M.Guillaume F.Günter M.M.Gutberlet Th.
M
H
Habicht K.
Hahn H.Haines Th.Harjo S.Harris F.Harris L.Harrison A.Haug J.
Hauß T. 65,164,
Heinemann A.
Helm C.Henkel F.Hense K.Hermann H.Hernandez Velasco J
16360
10880,81,198,
20218370
11991,92,93
199189, 203
235182
97,98,1821885011
23737, 12042,43
14341
1788893
127174134111153
67,70,71,72,125, 223
20616419716019920
123,124,205,218,219,220158, 160, 163,165,166,171,
173,17683, 84, 85, 86,
198,201142, 143, 144
185, 18841
20237, 39, 42,43, 44, 45,46, 47, 48,51,52,53,55, 56, 59,
108, 109,110,120
257

AUTHOR INDEX
author page author page author page
Hessert R.Hilger A.
Hilljegerdes J.Himmelhaus MHirsch T.Hoell A.Hoffmann J.U.
Hofmann M.Hölzel M.Honda F.Hoser A.Hyun Y.-H.
|
Ibarz G.Idzikowski B.Ingersoll M.Inomoto Y.lolin E.
JJackler G.Jansen M.Jauch W.Jeanjean J.Jeevan H.S.Jensen A.JobicH.
£
Kaiser-BischoffKamarad J.Kammel M.Kardjilov N.Karpikhin 1.Kausche S.Keiderling U.
Keimer B.
Keller T.Keune W.Kirchner M.Kirstein 0.Kiselev M.Klenke J.Klösgen B.Kniep R.Knorr K.Köbler U.Kocik J.Kolb R.Korobkina E.Krabbes G.Krakhotin V.
186208, 209, 226, 227,
228,229, 232200
88185
77,82, 1998,13, 14, 15,
17, 95, 96, 97,98,182,233
18118925
4,10,40,412
1471,217319
126, 225
17747,59
6418322
3, 18193
I. 95,9623
84, 85, 8655,208, 209, 232
2373,68
139, 174,204,206,217
32, 33, 34, 35, 36,71,72,102,12571,72, 125,223
12839
129165
1,2,6,213158, 175
39, 117, 118100
10,40198213237117237
KrastevR. 146,153,
Krasteva N.Kravtsov E.Kreitlow J.Krenicky T.Kreyßig A.Krist T.Kudryavtsev Y.V.Kumar G.Kumpugdee M.Kumzerov Y.Kuncser V.Kurdyukov D.Lake B.
LLanda-Gänovas A.Landsgesell S.Laurenze-Landsberg C.Lebedev V.T.Lechner R.
LeeS.Lefmann K.Lemke P.Lentz G.Lerch M.Lerf A.Leynaud O.Linser S.Lo Celso F.Lonkai Th^ ^ / l l > \ d l 1 1 1 *
Loose A.Loosvelt H.Luzon J
M
Maccarini M.Majerowicz M.Major J.Manescu A.Manke 1.Manson J.L.
Marcano N.Marconi M.Masschaele B.Masse J.-E.Matsuura M.McLure I.A.Meissner M.Melnyk G.Mertens L.A.Mezei F. 125Mikula P.Milne C. 51,Mitsuda S.
147, 149,151,154, 175,178,
179, 180149,154
89101
17,8
230, 2332
20216111512811
69,73
10863,65
239, 240
210134, 136,171,
234, 2352169
188100111170
47,59161139
1565, 99, 101
90, 9148
88163222
211,212,23155, 208
110
37,120168
208,209184
26,751526899
239, 240126,214,221
22552,53,54,109
19
Montaigne F.Montermann GMotohashi Y.Moze O.Mukherji D.Müller M.Muransky O.Muslimayne A.
NNaberezhnov ANarehood D.Natali F.Neubert R.Niewa R.
uOdenbach S.Ono T.Onori G.
P
Paciaroni A.Pappas C.Pavlov V.S.Penc B.Perroud O.Perzynski R.Peters J.Pfleiderer C.Pfrommer A.Phoenix D.A.Pieper J.
Pintschovius L.Pirogov A.N.Podlesnyak A.Poeste T.PopL.Popova O.Prager M.Prandolini M.Prchal, J.Pritula O.Prokes K. 5
Prokhnenko O.Prots Y.Przenioslo R.Pynn R.
QQian H.
9222019749
189,203238198200
114,115,116234167165
39,118
20C7C
136
168, 16S130,141,207,221
23744,4580,81
8721E
7E1£
16C122,126, 128135, 136,167169,170, 171234,235, 236
78,942121
185, 186, 187, 18820C
90,91122, 129
9324, 25, 29, 30
19016,18,19,23,25,26, 27, 28, 29, 30,31,49,76,89,214
2311814
222
192
258

AUTHOR INDEX
author page author page author page
RRaasch S.Reehuis M.
Regulski M.Rehfeldt F.Renger G.Rennhofer M.Reznik D.Riegel D.Rocha S.Rols S.Rößler U.K.Rotter M.Rüegg Ch.Rüscher C.H.Rusevich L.Russina 0.Ryukhtin V.
SSadykov R.Saqqio F.Sahoo B.Saija F.Saroun J.Sazonov A.Schemmel S.
Schmidt C.Schmidt M.Schneider R.
Schneidewind A.Schönhoff M.Schorr S.
Schotte U.Schroder-Smeibidl B.Schumacher G.Schupp B.Seifert C.Sekar C.Serban A.Seurig M.Sferrazza M.Shapiro S.Sieber A.Sieger H.Sikolenko V.
Sirenko V.A.Slawinski W.Smeibidl P.Smirnov L.S.Smirnov 0.Smrcok L.Soarez M.F.
1232, 33, 34, 35,
36, 64, 10214
179
145,
185,188
103,
61
148171207
7893
,180, 185138131268
119126,225132,135
197
107192128137
197, 19860,61
155, 156,157
239, 240181
186, 187,220, 221
7146
104, 105,106
4239,240
195, 196117228117236230150
27,74127206
,89,191,214
6214
3, 67, 6898,99
116190238
Sobolev O.Sofin M.Sokol P.Sotnikov A.Spinozzi F.Spizzo F.Qt Piprrp T
StefanopoulosSteitz R.
Stepanek P.Stock C.Stocked O.Strobl M.
Strobl M.Strunz P.
Stüßer N.
Süllow S.Svoboda P.Szymczak H.Szytula A.
TTanaka M.Temst K.Tennant D.A.Többens D.M.
ToftK.N.Tomkowicz Z.Torabi R.Török G.Tovar M.
Tran V.H.Treimer W.
Triolo A.Triolo R.Tripadus V.Troyanchuk 1.0Tyutyunnikov S
UUlbricht A.Ulrich C.
7547,59
234,235114
211,212771 t
199K.L. 6088,145,148, 152,
155, 156,157, 175,176, 177
14066
8, 22, 38, 50223, 225, 226,227, 228, 229,230 231 232
224189, 195, 196,
2034,39,44,46,103,
106,107,215101
12,25112,113
44,45
14890,9167,70
57, 60, 63,111, 117, 118,119,131,132,189,190,216
34458
21058,62, 104,
105, 112, 113,114,115,116
46224, 225, 226,227, 228, 229,
230, 232132,135
139236
60191
20134,35,36,102
Vv. Klitzing R.Vasi C.Vassen R.Vejpravova J.Vergara-GutierrezVogl G.Vorderwisch P.Vossmeyer T.
W
Wakimoto S.Wartewig S.Wawrzynska E.Weihe H.Wesemann A.WeßM.Wiedenmann A.
Willumeit R.Wilmer D.Wilpert Th.Winterer M.Witte U.Wong W.
ZZabel H.Zbytovska J.Zhang L.Zherebtsov D.Zimmermann J.Zychlinsky A.
14513719624
M.C. 152207
27, 68, 74149, 154
66165
44,45127142171
79,80,81,82,83, 84, 85, 86,140, 197, 202,206,218,219
161194220204
7145
8916549
118213173
259

JJS
J • J +
a)
b)


![Finale 2003 - [Untitled3]](https://static.fdokumen.com/doc/165x107/63186635cf65c6358f01f7b4/finale-2003-untitled3.jpg)