Benefits of green energy and proportionality in high speed wide area networks connecting data...
6
Benefits of Green Energy and Proportionality in High Speed Wide Area Networks Connecting Data Centers Baris Aksanli and Tajana Simunic Rosing Computer Science and Engineering Department University of California, San Diego La Jolla, USA {baksanli, tajana}@ucsd.edu Inder Monga Energy Sciences Network Lawrence Berkeley National Laboratory Berkeley, USA [email protected] Abstract — Many companies deploy multiple data centers across the globe to satisfy the dramatically increased computational demand. Wide area connectivity between such geographically distributed data centers has an important role to ensure both the quality of service, and, as bandwidths increase to 100Gbps and beyond, as an efficient way to dynamically distribute the computation. The energy cost of data transmission is dominated by the router power consumption, which is unfortunately not energy proportional. In this paper we not only quantify the performance benefits of leveraging the network to run more jobs, but also analyze its energy impact. We compare the benefits of redesigning routers to be more energy efficient to those obtained by leveraging locally available green energy as a complement to the brown energy supply. Furthermore, we design novel green energy aware routing policies for wide area traffic and compare to state-of-the-art shortest path routing algorithm. Our results indicate that using energy proportional routers powered in part by green energy along with our new routing algorithm results in 10x improvement in per router energy efficiency with 36% average increase in the number of jobs completed. Keywords-green energy, network, energy proportional, routing. I. INTRODUCTION The number of online services—such as search, social networks, online gaming and video streaming— has exploded. Due to data locality issues and the demand for fast response times, such services are usually distributed across geographically diverse set of data centers. This is clearly already the case for larger companies, such as Google and Facebook, but is also increasingly true of smaller companies who can leverage cloud offerings from companies such as Amazon [26]. This trend is also fueled by a dramatic increase in the usage of virtualization technology. For example, Amazon’s EC2 allows load balancing between virtual machine instances [26]. Internet services usually have frontline service jobs and a background set of batch jobs that prepare data for the online services. For example, in order for eBay to be able to guarantee very low response times to their customer’s requests, they need to have an updated and well indexed database of items, usually obtained by running batch jobs. Often, there are two classes of performance metrics used – services response times, usually measured in 10s to 100s of milliseconds, and batch job throughput. Normally the service providers’ goal is to ensure that service times are within specified bounds, while batch jobs are expected to progress at a reasonable rate. In addition to performance, a key challenge in such distributed data centers is the energy cost which includes the cost of computing and data transmission. A recent study [8] shows that as of 2007 at least 2% of the total carbon emission of the world comes from IT. World-wide power consumption due to IT has been growing, with more than 80% due to the way equipment is used [29][30]. The telecommunication infrastructure takes up to 40% of the total IT energy cost, and is expected to continue growing as demand for distributed data processing continues to rise [30]. One of the key tradeoffs in the design of distributed services is how data center operators and network providers deliver the needed performance at minimum energy cost. While quite a bit of work has focused on energy optimization of data center computing, relatively little has been done for geographically distributed networks connecting the data centers. The overall electricity cost (“brown energy”) of networking can be very high. For example, Telecom Italia is the second largest consumer of electricity in Italy [31]. One way to reduce these costs is to leverage green energy sources such as solar and wind. Intermittent green energy has been explored as a way to perform additional work in data centers [9] and to cap the peak power of a data center [7], but has not been leveraged to offset the cost of backbone networking. An alternate way is to redesign network elements so that they consume less power. For simplicity purposes we model the total energy cost of backbone networking as a function of power consumption of routers and links. Typically the power cost of the links is a function of distance due to the need for signal amplification, while router power cost is largely fixed at the peak level as the primary objective of router design has been maximizing performance at all cost. As a result, routers dominate the backbone network’s energy consumption [14]. Recently there have been a few publications studying how routers could be redesigned to be more energy proportional [13] [15]. As the utilization levels of backbone networks tend to be low, around 30% [15], redesigning routers to be energy proportional and then enabling network to leverage this is important. Furthermore, routers are the primary network elements that ensure high speed connectivity between distributed data centers. Currently routes are typically determined statically by using shortest-path algorithm. However, as routers become more energy proportional, and as their supply is complemented by using highly variable green energy, there will be a need for dynamic route adjustment depending on the current state of the load on particular 978-3-9810801-8-6/DATE12/©2012 EDAA
Transcript of Benefits of green energy and proportionality in high speed wide area networks connecting data...

Benefits of Green Energy and Proportionality in High
Speed Wide Area Networks Connecting Data Centers
Baris Aksanli and Tajana Simunic Rosing
Computer Science and Engineering Department
University of California, San Diego
La Jolla, USA
{baksanli, tajana}@ucsd.edu
Inder Monga
Energy Sciences Network
Lawrence Berkeley National Laboratory
Berkeley, USA
Abstract — Many companies deploy multiple data centers across
the globe to satisfy the dramatically increased computational
demand. Wide area connectivity between such geographically
distributed data centers has an important role to ensure both the
quality of service, and, as bandwidths increase to 100Gbps and
beyond, as an efficient way to dynamically distribute the
computation. The energy cost of data transmission is dominated
by the router power consumption, which is unfortunately not
energy proportional. In this paper we not only quantify the
performance benefits of leveraging the network to run more jobs,
but also analyze its energy impact. We compare the benefits of
redesigning routers to be more energy efficient to those obtained
by leveraging locally available green energy as a complement to
the brown energy supply. Furthermore, we design novel green
energy aware routing policies for wide area traffic and compare
to state-of-the-art shortest path routing algorithm. Our results
indicate that using energy proportional routers powered in part
by green energy along with our new routing algorithm results in
10x improvement in per router energy efficiency with 36%
average increase in the number of jobs completed.
Keywords-green energy, network, energy proportional, routing.
I. INTRODUCTION
The number of online services—such as search, social networks, online gaming and video streaming— has exploded. Due to data locality issues and the demand for fast response times, such services are usually distributed across geographically diverse set of data centers. This is clearly already the case for larger companies, such as Google and Facebook, but is also increasingly true of smaller companies who can leverage cloud offerings from companies such as Amazon [26]. This trend is also fueled by a dramatic increase in the usage of virtualization technology. For example, Amazon’s EC2 allows load balancing between virtual machine instances [26].
Internet services usually have frontline service jobs and a background set of batch jobs that prepare data for the online services. For example, in order for eBay to be able to guarantee very low response times to their customer’s requests, they need to have an updated and well indexed database of items, usually obtained by running batch jobs. Often, there are two classes of performance metrics used – services response times, usually measured in 10s to 100s of milliseconds, and batch job throughput. Normally the service providers’ goal is to ensure that service times are within specified bounds, while batch jobs are expected to progress at a reasonable rate.
In addition to performance, a key challenge in such distributed data centers is the energy cost which includes the cost of computing and data transmission. A recent study [8] shows that as of 2007 at least 2% of the total carbon emission of the world comes from IT. World-wide power consumption due to IT has been growing, with more than 80% due to the way equipment is used [29][30]. The telecommunication infrastructure takes up to 40% of the total IT energy cost, and is expected to continue growing as demand for distributed data processing continues to rise [30].
One of the key tradeoffs in the design of distributed services is how data center operators and network providers deliver the needed performance at minimum energy cost. While quite a bit of work has focused on energy optimization of data center computing, relatively little has been done for geographically distributed networks connecting the data centers. The overall electricity cost (“brown energy”) of networking can be very high. For example, Telecom Italia is the second largest consumer of electricity in Italy [31]. One way to reduce these costs is to leverage green energy sources such as solar and wind. Intermittent green energy has been explored as a way to perform additional work in data centers [9] and to cap the peak power of a data center [7], but has not been leveraged to offset the cost of backbone networking.
An alternate way is to redesign network elements so that they consume less power. For simplicity purposes we model the total energy cost of backbone networking as a function of power consumption of routers and links. Typically the power cost of the links is a function of distance due to the need for signal amplification, while router power cost is largely fixed at the peak level as the primary objective of router design has been maximizing performance at all cost. As a result, routers dominate the backbone network’s energy consumption [14]. Recently there have been a few publications studying how routers could be redesigned to be more energy proportional [13] [15]. As the utilization levels of backbone networks tend to be low, around 30% [15], redesigning routers to be energy proportional and then enabling network to leverage this is important. Furthermore, routers are the primary network elements that ensure high speed connectivity between distributed data centers. Currently routes are typically determined statically by using shortest-path algorithm. However, as routers become more energy proportional, and as their supply is complemented by using highly variable green energy, there will be a need for dynamic route adjustment depending on the current state of the load on particular
978-3-9810801-8-6/DATE12/©2012 EDAA

connections, the performance needs of applications running in the data centers, and green energy availability.
In this paper, we analyze the use of wide area network in a multiple data center system. The main goal is to improve the energy efficiency of the networking infrastructure, while ensuring service times and batch job throughput constraints are met for large scale distributed data center deployments. The main contributions of our work can be summarized as follows:
� We quantify the energy cost of a data transfer over the
backbone network.
� We show that energy proportionality and green energy can
make a dramatic difference to network energy efficiency.
� We design a novel green energy aware routing algorithm
capable of ensuring quality of service needs are met while
improving energy efficiency by 10x.
II. RELATED WORK
A number of projects have explored the idea of wide area job balancing for distributed data centers. A number of strategies have been developed to determine the best strategy for transferring data center jobs to locations where the electricity is cheaper [1, 4, 5]. This has been aided by the fast live VM migration that is possible with very short downtimes, on the order of a few seconds [28]. Green energy usage in data center systems is a very recent topic [2,3,7-10]. Work presented just this year explored how to effectively leverage green energy availability to complement brown energy supply for data centers [2, 3, 9]. Green energy has been used to cap the peak power in the system [7]. Green energy prediction has been shown to dramatically increase the effective renewables utilization for data center operations in [25]. However, none of the projects that have looked at job balancing in distributed data centers consider the energy cost of the backbone networks while transport energy consumption can be significant for distributed cloud-based data center applications [38].
On aggregate, network service providers consume a lot of electricity, with Telecom Italia and British Telecom taking around 1% of nation’s electricity [12]. This comes at a steep cost, with electricity costs reaching up to 50% of operating expenses for some providers. There has been quite a bit of research on energy efficient backbone networks. The first category includes shutting down idle network elements [15] and provisioning the network to identify the elements that can be shut down without affecting the connectivity [17], [14], [20]. Another way to increase network energy efficiency is to leverage the fact that line cards consume a large portion of the router power and by adjusting the number of active line cards the power consumption can be decreased significantly [24]. Additionally, dynamic software solutions such as energy aware routing [18], [32] to select the energy efficient path and bandwidth adjusting to reduce the router power consumption [27] are used to improve network energy efficiency. Recent
projects, like the GreenStar network, propose to experiment with using green energy to power zero-carbon data centers and migrating workloads over the network based on presence of renewable energy [37]. Another work uses brown and green energy together in a problem formulation to minimize carbon emissions [16]. However, energy aware policy they deploy and the green energy supply do not change and adapt over time.
In contrast to the previous work, our work focuses on increasing the energy efficiency of the backbone network without shutting down any connected data centers, network devices or links connecting them. We showcase the effects of theoretical and practical proportionality in network elements on energy efficiency. We use dynamic prediction of green energy availability to improve the reliability and decrease the carbon footprint of the network. In addition, we show that the design of dynamic routing policies leveraging green metrics effectively utilizes energy-efficiency of the routers and decreases the brown energy use significantly.
III. DATA CENTER AND NETWORK MODELING
An effective strategy for managing backbone network energy costs, while at the same time ensuring that data center jobs meet their performance constraints, requires careful modeling of not only the network links, but also of the data centers and the servers within them. In this section, we present the models we use to represent data centers and the network elements. For the data center validation we used a fully operational data center container, while for validating backbone network energy costs we leverage models of energy consumption of state-of-the-art backbone routers [14].
TABLE I: Inter-arrival and service time parameters Lognormal Distribution Parameters α µ
Rubis 1600 Clients Inter-arrival time (ms) 1.23 0.59
Rubis 3200 Clients Inter-arrival time (ms) 1.12 0.43
MapReduce Job Service time (sec) 1.44 5.24
A. Data Center Model
Each data center container is modeled after the one we have on campus. It has 200 Intel’s Nehalem servers running Xen VM. We run Rubis on our machines to model service-sensitive eBay-like workload [6] with 90
th%ile of response times at
150ms. Multiple MapReduce instances are run as batch jobs. A single MapReduce job consists of a number of tasks that are dispatched in parallel. The job is complete when all tasks finish. Although we have two types of jobs in a data center, we transfer only batch jobs between geographically distributed data centers, as service request sensitive tasks have very tight timing constraints, and often relay on fast local connections to ensure those constraints are met. We assume that data is replicated among the data centers automatically in order to ensure better reliability [36]. Thus, when a batch job is moved, relatively little data has to be moved with it.
Each data center scheduler uses two separate job arrival
TABLE II: Parameters and values used in the simulation
Parameter Value Parameter Value Parameters Value
Mean Web Request Inter-arrival time 5ms Average # tasks per MapReduce job 70 Idle Server Power 212.5W
Mean Web Request Service time 20ms Average required throughput level per MR job 0.35 Peak Server Power 312.5W
Service Request SLA 150ms Number of servers in a data center 200 Idle Router Power 1381W
Mean MapReduce Job Inter-arrival time 2 min Number of data centers 5 Peak Router Power 1781W
Mean MapReduce Task Service time 4 min Number of routers 12 # line cards 10

queues: web services (Rubis) and batch jobs (MapReduce). Service and batch job interarrival times are modeled using log normal distribution based on our measurements of Rubis and MapReduce running on Nehalem servers and results of analysis presented in [34] and [35] respectively (see Table I for parameters). For simplicity, we assume that each server has at minimum one web services request queue, and one or more batch jobs slots to execute. Web services start execution whenever there are available computing resources (CPU and memory) to ensure their response time requirements are met whenever possible. Load balancing strategy described in [25] is used to distribute requests within data centers. Although data centers have the same number and type of servers, the request arrival rates are different for each of them representing varying demands based on location and the time of day. We leverage these differences for geographically distributed load balancing.
For simplicity we have a single controller that monitors and manages load of the data centers and the network. Each data center sends the available resource (CPU, memory etc.) profile to the controller every 30 min as MapReduce jobs typically take less than 30min to complete. Based on this information, the controller computes the average resource usage of the overall set of data centers. Then, starting from the center with least amount of extra resources, it balances the resources across the system. This process continues until the amount of available resources in each data center is more balanced under the constraint of available network bandwidth or a data center cannot find a task to transfer. The actual transfer of batch jobs is initiated by the controller once the rebalancing analysis completes. Data centers provide lists of candidate jobs, while the network computes the path and the available bandwidth of the path, depending on the routing policies used. Then the controller computes the traffic matrix between data centers in terms of size of data (a function of the number of VMs) and initiates the transfers accordingly.
We compare the simulation results with a real experimental setup running a mix of Rubis and MapReduce workloads on a set of Intel Nehalem servers from our data center container. Tables I & II list the values of the parameters we use in our simulation. We observed only 3% average error in modeling power consumption, 8% on MapReduce job completion times and 6% on service job’s response times, which is more than accurate enough for our purposes.
B. Backbone Network
Our model is based on typical telecom network characteristics [19] consisting of routers, hubs, storage and computation elements, complemented with infrastructure PDUs, UPS, and air conditioners to keep them operational. Given that the large fraction of the overall network energy cost is due to routers, we specifically focus on this aspect. In addition, routers maybe designed to be more energy proportional going forward, while optical links have a fixed energy cost that is a function of the distance between amplifiers [15]. Thus, in our analysis we neglect the link cost, as it is just a fixed offset to the overall energy consumed. The power consumption of the router can be estimated using a linear model [11] with bandwidth utilization ratio 0<u<1, idle power, Pidle and peak power, Ppeak as follows:
P = Pidle + u * (Ppeak - Pidle) (1)
Figure 1: Power curves for different network power schemes
In current routers, Pidle is high, thus the energy consumption is not at all proportional to network load limiting the potential savings. However, there have already been a number of proposals on how routers can be made more energy proportional [13,15], ranging from turning off line cards that are not being used, to more complex circuits and system solutions. Figure 1 shows the power models of routers we use in our simulations. The non-proportional model represents measurements of an actual state-of-the-art router [14] that is capable of supporting four 100Gbps links concurrently. Its peak and idle power value are listed in Table II. The step function proportional is the power curve we measured by removing line cards from the same router – similar to on/off approach presented in [11]. Smooth proportionality model assumes techniques have been developed to “smooth out” the step proportional curve, while the ideal proportionality represents the best case linear proportionality.
Figure 2: Network Topology; squares = data centers, circles = routers
In our simulations we model a subset of LBNL ESnet’s network topology as shown in Figure 2 [33]. We use 5 endpoints where data center containers reside (represented by squares) with 12 intermediate routers connected with all relevant connections (circles on Figure 2). Upon request for a larger backbone data transfer, the network identifies a path to carry the data between two endpoints of a transfer. State-of-the-art systems determine and configure that path statically by using shortest path algorithm.
ESnet dramatically improved on the state-of-the-art routing and bandwidth allocation algorithms by developing On-Demand Secure and Advance Reservation System (OSCARS) [23]. OSCARS enables users to reserve dynamic virtual circuits (VC) by computing path online to construct VCs with required bandwidth. This solution works well in situations where the only goal is performance. However, the energy consumption is becoming another key constraint. As a result, an energy-aware dynamic routing algorithm is needed to identify and adjust the path during the transfer so both performance and energy constraints can be met in the most effective way.
0
300
600
900
1200
1500
1800
0 100 200 300 400
Po
wer
(W
)
Bandwidth (Gbit/s)
non-proportional
smooth proportional
step function proportional
ideally proportional
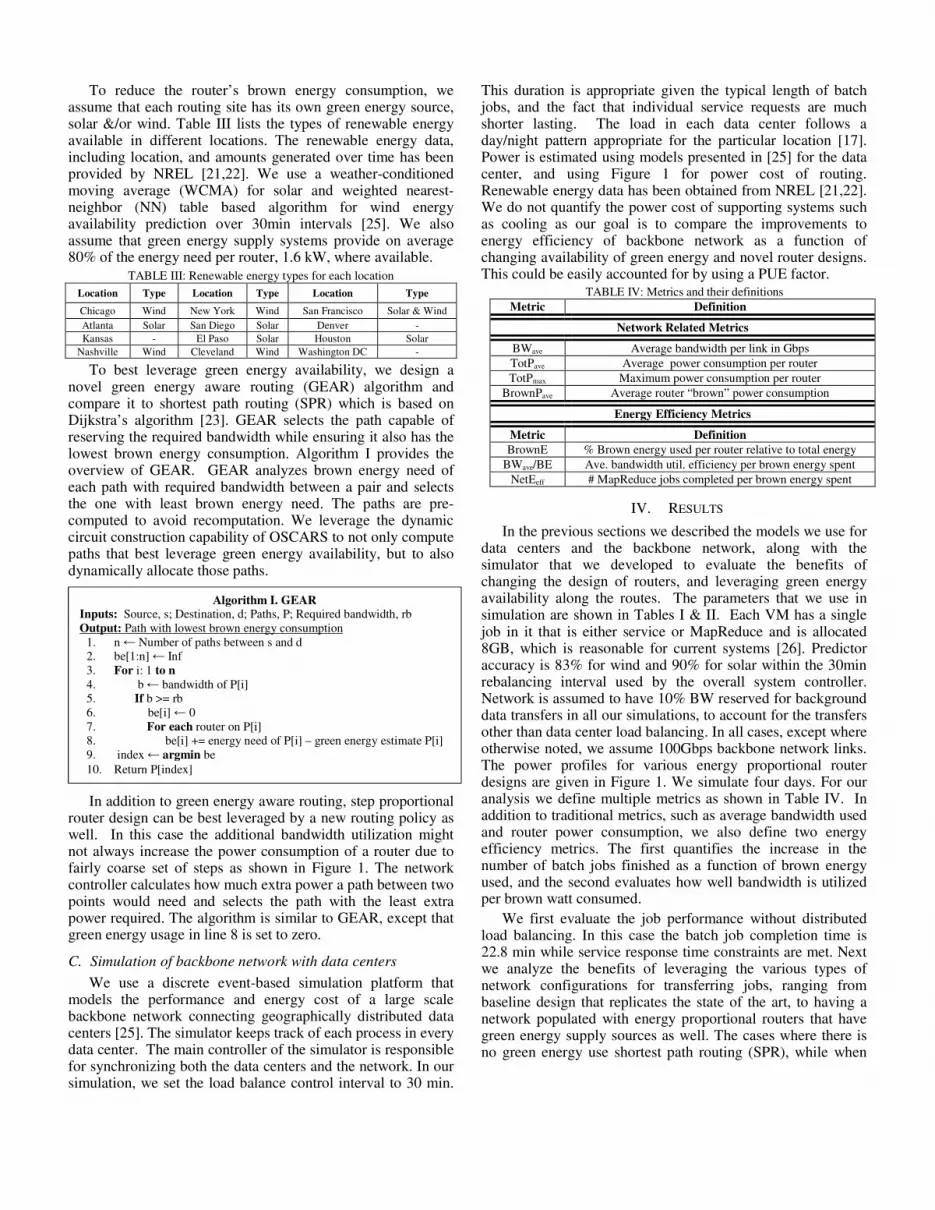
To reduce the router’s brown energy consumption, we assume that each routing site has its own green energy source, solar &/or wind. Table III lists the types of renewable energy available in different locations. The renewable energy data, including location, and amounts generated over time has been provided by NREL [21,22]. We use a weather-conditioned moving average (WCMA) for solar and weighted nearest-neighbor (NN) table based algorithm for wind energy availability prediction over 30min intervals [25]. We also assume that green energy supply systems provide on average 80% of the energy need per router, 1.6 kW, where available.
TABLE III: Renewable energy types for each location
Location Type Location Type Location Type
Chicago Wind New York Wind San Francisco Solar & Wind
Atlanta Solar San Diego Solar Denver -
Kansas - El Paso Solar Houston Solar
Nashville Wind Cleveland Wind Washington DC -
To best leverage green energy availability, we design a novel green energy aware routing (GEAR) algorithm and compare it to shortest path routing (SPR) which is based on Dijkstra’s algorithm [23]. GEAR selects the path capable of reserving the required bandwidth while ensuring it also has the lowest brown energy consumption. Algorithm I provides the overview of GEAR. GEAR analyzes brown energy need of each path with required bandwidth between a pair and selects the one with least brown energy need. The paths are pre-computed to avoid recomputation. We leverage the dynamic circuit construction capability of OSCARS to not only compute paths that best leverage green energy availability, but to also dynamically allocate those paths.
In addition to green energy aware routing, step proportional router design can be best leveraged by a new routing policy as well. In this case the additional bandwidth utilization might not always increase the power consumption of a router due to fairly coarse set of steps as shown in Figure 1. The network controller calculates how much extra power a path between two points would need and selects the path with the least extra power required. The algorithm is similar to GEAR, except that green energy usage in line 8 is set to zero.
C. Simulation of backbone network with data centers
We use a discrete event-based simulation platform that models the performance and energy cost of a large scale backbone network connecting geographically distributed data centers [25]. The simulator keeps track of each process in every data center. The main controller of the simulator is responsible for synchronizing both the data centers and the network. In our simulation, we set the load balance control interval to 30 min.
This duration is appropriate given the typical length of batch jobs, and the fact that individual service requests are much shorter lasting. The load in each data center follows a day/night pattern appropriate for the particular location [17]. Power is estimated using models presented in [25] for the data center, and using Figure 1 for power cost of routing. Renewable energy data has been obtained from NREL [21,22]. We do not quantify the power cost of supporting systems such as cooling as our goal is to compare the improvements to energy efficiency of backbone network as a function of changing availability of green energy and novel router designs. This could be easily accounted for by using a PUE factor.
TABLE IV: Metrics and their definitions Metric Definition
Network Related Metrics
BWave Average bandwidth per link in Gbps
TotPave Average power consumption per router
TotPmax Maximum power consumption per router
BrownPave Average router “brown” power consumption
Energy Efficiency Metrics
Metric Definition
BrownE % Brown energy used per router relative to total energy
BWave/BE Ave. bandwidth util. efficiency per brown energy spent
NetEeff # MapReduce jobs completed per brown energy spent
IV. RESULTS
In the previous sections we described the models we use for data centers and the backbone network, along with the simulator that we developed to evaluate the benefits of changing the design of routers, and leveraging green energy availability along the routes. The parameters that we use in simulation are shown in Tables I & II. Each VM has a single job in it that is either service or MapReduce and is allocated 8GB, which is reasonable for current systems [26]. Predictor accuracy is 83% for wind and 90% for solar within the 30min rebalancing interval used by the overall system controller. Network is assumed to have 10% BW reserved for background data transfers in all our simulations, to account for the transfers other than data center load balancing. In all cases, except where otherwise noted, we assume 100Gbps backbone network links. The power profiles for various energy proportional router designs are given in Figure 1. We simulate four days. For our analysis we define multiple metrics as shown in Table IV. In addition to traditional metrics, such as average bandwidth used and router power consumption, we also define two energy efficiency metrics. The first quantifies the increase in the number of batch jobs finished as a function of brown energy used, and the second evaluates how well bandwidth is utilized per brown watt consumed.
We first evaluate the job performance without distributed load balancing. In this case the batch job completion time is 22.8 min while service response time constraints are met. Next we analyze the benefits of leveraging the various types of network configurations for transferring jobs, ranging from baseline design that replicates the state of the art, to having a network populated with energy proportional routers that have green energy supply sources as well. The cases where there is no green energy use shortest path routing (SPR), while when
Algorithm I. GEAR Inputs: Source, s; Destination, d; Paths, P; Required bandwidth, rb
Output: Path with lowest brown energy consumption
1. n ← Number of paths between s and d
2. be[1:n] ← Inf
3. For i: 1 to n
4. b ← bandwidth of P[i]
5. If b >= rb
6. be[i] ← 0
7. For each router on P[i]
8. be[i] += energy need of P[i] – green energy estimate P[i]
9. index ← argmin be
10. Return P[index]

green energy is available we compare SPR with our GEAR algorithm. We next provide the analysis of all these results.
Non-Proportional Routers: Data centers transfer batch job VMs to a remote center in order to reduce the computational burden and obtain higher performance for the waiting jobs. When transferring data, we use two different bandwidth allocation policies. The first one, all-bandwidth policy, allocates all the available bandwidth of the links whenever a path is constructed. The second one, necessary-bandwidth policy, allocates just enough bandwidth to the path, so that the transfer time for data takes at most 100 sec through a 100Gbps path. The first policy yields faster data transfer, however it also saturates links. The second results in more network availability. Table V summarizes results for both policies. Using network to adaptively distribute batch jobs improves the job completion times by 30% while not changing the service’s response times. Both AB and NB policies have comparable performance and power consumption as the dynamic power range of baseline network is very small. Bandwidth utilization is 1.5x lower for NB, which may enable additional data to be transferred as needed. As a result, our simulations show that with NB policy 34% of the tasks are executed in a remote center with 5% more tasks transferred than with AB.
TABLE V: Baseline results: all bandwidth (AB), necessary bandwidth (NB)
Metric AB NB Metric AB NB
Ave. MR job completion (min) 17.5 16.8 TotPave 85% 83%
Ave. MR task completion (min) 4.22 4.25 BWave 66 48
In Figure 3 we explore the performance of the batch jobs and the average power consumption of a router with different bandwidth values available per link when utilizing the necessary bandwidth policy. Performance and power consumption do not change significantly between 50-100Gbps of the available network bandwidth. MapReduce job completion times approach the case where no load balancing is used as network bandwidth drops down to 10Gbps. This explains why today load balancing is not done very often as most links are at 10Gbps. By increasing the number of servers by 2x and keeping the server load constant, we get better job performance. However, further increases of number of servers do not result in better performance as there is no need for extra resources with the fixed load rate. Increasing the server load 2x while keeping the server number fixed decreases performance by 7%. Further server load increase creates significant performance drop, 15%, with 10-20 Gbps bandwidth.
Energy Proportional Routers: We use three different proportionality schemes as shown in Figure 1: ideal, smooth and step proportionality. Job completion time service times do not change significantly as compared to the non-proportional network case. Table VI summarizes all results for the next subsections. All power numbers are reported as a percent of router peak power listed in Table II. Bandwidth, BWave, is in
Gbps. Looking at the columns corresponding to situations where no green energy is used, it is clear that NB allocation yields better power consumption for all proportionality schemes. Average power savings are around 70% if there is ideal, 50% for smooth and 35% for step function proportionality compared to non-proportional case. Network energy efficiency, NetEeff, improves dramatically - by 3x, while bandwidth energy efficiency, BWave/BE, increases by at most 4x.
We also use the energy aware routing algorithm for step proportionality (described in Section III.B) with NB policy in our simulation and obtain 48% of peak power per router on average. The dynamic policy results in 6% better power consumption compared to the state-of-the-art shortest path policy, but leads to 3% more transfer delay.
Green Energy & Non-Proportional Routers: For the next two scenarios we supplement the traditional grid (brown) power with green energy and evaluate the benefits of green energy along with green-energy aware routing, and new router designs. Our goal is to reduce the brown energy consumption as much as possible by effectively leveraging renewable energy availability. Here we use our green energy aware routing (GEAR) algorithm. When there is a data transfer initiated between two data centers, GEAR chooses the path with the least brown energy needed, which may not be the shortest one. Thus, in Table VI we compare GEAR to the shortest path routing (SPR) for all tests with green energy. The difference between SPR and GEAR routing algorithms when using green energy with non-proportional routers is minimal as non-energy proportional routers have very high idle power.
Green Supply & Energy Proportional Routers: We next combine GEAR with energy proportional router design. We do not implement any changes to GEAR specific to energy proportionality assumption as it chooses the path with smallest brown energy need regardless of the power curve used. The total (green + brown) power consumed by all networking elements with GEAR increases between 0.5- 5% compared to SPR depending on router design. However, GEAR
TABLE VI: Summary of key results w/o Green Energy w/ Green Energy
Non-Prop. Ideal Prop. Smooth Prop. Step Prop. Non-Prop Ideal Prop. Smooth Prop. Step Prop.
Policies AB NB AB NB AB NB AB NB SPR GEAR SPR GEAR SPR GEAR SPR GEAR
TotPave% 85% 83% 33% 24% 51% 44% 61% 54%
83% 86% 24% 28% 45% 48% 53% 57%
BrownPave% 62% 59% 8% 3% 15% 9% 20% 12%
BrownE% 100% 75% 68% 33% 10% 33% 18% 38% 21%
NetEeff 58 59 153 210 97 112 83 95 84 85 628 1675 358 559 251 419
BWave/BE 0.77 0.57 2 2 1.29 1.11 1.08 1.12 0.77 0.93 6 18 3.2 6.1 2.4 4.58
BWave 66 48 66 48 66 48 66 48 48 55 48 55 48 55 48 55
75
77
79
81
83
85
15
17
19
21
23
25
0 20 40 60 80 100
Aver
age
Pow
er C
on
sum
pti
on
(%
pea
k)
MR
Job
Com
p.
Tim
e (m
in)
Bandwidth of links (Gbps)
Job Comp. Time (min)2x load2x servers4x load4x serversPower/router (% peak)
Figure 3: MapReduce job completion time & power vs. bandwidth

compensates this increase by using more green energy, which results in lower brown energy usage. As a result, GEAR uses 7% less brown energy for non-energy proportional routers and 15% less for smooth proportional routers. The percentage of brown energy consumed when using GEAR, BrownE%, drops dramatically with energy proportional HW, dropping down to as low as 3% when ideal proportionality is assumed and as high as 12% with step proportionality.
Furthermore, GEAR has 2x better network energy efficiency, NetEeff, and 2.3x better BWave/BE compared to SPR. Compared to non-proportional router design with no green energy usage, the improvement is 7x for NetEeff and 8x for BWave/BE with step proportionality, 10x for NetEeff and 11x for BWave/BE with smooth and 27x for NetEeff and 31x for BWave/BE with ideal proportionality. These dramatic improvements indicate that even relatively simple redesign of routers along with green energy availability and novel green-energy aware routing algorithm design can results in dramatic reductions in the operating expenses for backbone network operators.
V. CONCLUSIONS
High bandwidth and energy efficient backbone network design is critical for supporting large scale distributed data centers. In this paper, we propose novel energy aware routing policies along with different energy proportionality schemes for network hardware. We use a simulation platform to compare our energy aware policies to state-of-the art routing policy with different power curves. Our results show that the network brown energy efficiency improves 10x with smooth proportionality and can be as high as 27x with ideal energy proportionality using energy aware policies.
ACKNOWLEGMENT
This work was sponsored in part by the Multiscale Systems Center (MuSyC), National Science Foundation (NSF) Project GreenLight, Energy Sciences Network (ESnet), NSF ERC CIAN, NSF Variability Expedition, NSF Flash Gordon, CNS, NSF IRNC TransLight/StarLight, Oracle, Microsoft and Google. We also want to thank Chin Guok for his guidance on path computation algorithms.
REFERENCES
[1] L. Rao, X. Liu, L. Xie, W. Liu. Minimizing Electricity Cost:
Optimization of Distributed Internet Data Centers in a Multi-Electricity-
Market Environment. INFOCOM, 2010.
[2] Z. Liu, M. Lin, A. Wierman, S.H. Low, L. Andrew. Geographical Load
Balancing with Renewables. Sigmetrics, 2011.
[3] Z. Liu, M. Lin, A. Wierman, S. H. Low, and L.L.H. Andrew. 2011.
Greening geographical load balancing. Sigmetrics, 2011.
[4] A. Qureshi, R. Weber, H. Balakrishnan, J. Guttag, and B. Maggs.
Cutting the electric bill for internet-scale systems. SIGCOMM, 2009.
[5] B. Bergler, C. Preschern, A. Reiter, S. Kraxberger. Cost-Effective
Routing for a Greener Internet. CPSCom , 2010.
[6] Rubis. http://rubis.ow2.org/
[7] D. Gmach, J. Rolia, C. Bash, Y. Chen, T. Christian, A. Shah, R. Sharma
and Z. Wang. Capacity Planning and Power Management to Exploit
Sustainable Energy. CNSM, 2010.
[8] D. Gmach, Y. Chen, A. Shah, J. Rolia, C. Bash, T. Christian, R. Sharma.
Profiling sustainability of data centers. ISSST, 2010.
[9] A. Krioukov, C. Goebel, S. Alspaugh, Y. Chen, D. Culler, R. Katz
Integrating Renewable Energy Using Data Analytics Systems:
Challenges and Opportunities. IEEE Data Engineering Bulletin. 2011.
[10] K. Le, R. Bianchini, T.D. Nguyen, O. Bilgir, M. Martonosi. Capping the
brown energy consumption of Internet services at low cost. GCC, 2010.
[11] P. Mahadevan, P. Sharma, S. Banerjee, and P. Ranganathan. A Power
Benchmarking Framework for Network Devices. Networking , 2009.
[12] R. Bolla, R. Bruschi, F. Davoli, F. Cucchietti. Energy Efficiency in the
Future Internet: A Survey of Existing Approaches and Trends in Energy-
Aware Fixed Network Infrastructures. Communications Surveys &
Tutorials, IEEE, Vol. 13, No. 2. (2011), pp. 223-244.
[13] A. P. Bianzino, L. Chiaraviglio, M. Mellia, GRiDA: a Green Distributed
Algorithm for Backbone Networks. IEEE Online Green
Communications Conference, 2011.
[14] R. Tucker, J. Baliga, R. Ayre, K. Hinton, W. Sorin. Energy
Consumption in IP Networks. ECOC Symposium on Green ICT 2008.
[15] W. Fisher, M. Suchara, J. Rexford. Greening backbone networks:
reducing energy consumption by shutting off cables in bundled links.
SIGCOMM, 2010.
[16] S.Ricciardi, D.Careglio, F.Palmieri, U.Fiore, G.Santos-Boada, J.Sole-Pareta. Energy-Aware RWA for WDM Networks with Dual Power Sources. ICC 2011.
[17] L. Chiaraviglio, M. Mellia, F. Neri. Energy-aware Backbone Networks:
a Case Study. GreenComm, 2009.
[18] Petander, H., Energy-aware network selection using traffic estimation.
ACM MICNET, 2009.
[19] Y.Zhang, P.Chowdhury, M.Tornatore, B.Mukherjee. Energy Efficiency
in Telecom Optical Networks. Communications Surveys & Tutorials,
IEEE , vol.12, no.4, pp.441-458, Fourth Quarter 2010
[20] M. Xia, M. Tornatore, Y. Zhang, P. Chowdhury, C. Martel, B.
Mukherjee. Greening the Optical Backbone Network: a Traffic
Engineering Approach. ICC, 2010.
[21] National Renewable Energy Laboratory: Solar Resources.
http://www.nrel.gov/gis/solar.html
[22] National Renewable Energy Laboratory: Wind Resources.
http://www.nrel.gov/rredc/wind_resource.html
[23] C.P. Guok, D.W. Robertson, E. Chaniotakis, M.R. Thompson, W.
Johnston, B. Tierney. A User Driven Dynamic Circuit Network
Implementation. 2008 IEEE GLOBECOM Workshops.
[24] J. Chabarek, J. Sommers, P. Barford, C. Estan, D. Tsiang, and S.Wright, Power awareness in network design and routing. INFOCOM, 2008.
[25] B. Aksanli, J. Venkatesh, L. Zhang, T. Rosing. Utilizing Green Energy
Prediction to Schedule Mixed Batch and Service Jobs in Data Centers.
HotPower, 2011.
[26] Amazon EC2. http://aws.amazon.com/ec2/
[27] K. Kant. Power control of high speed network interconnects in data
centers. INFOCOM, 2009.
[28] F. Travostino, P. Daspit, L. Gommans, C. Jog, C. de Laat, J. Mambretti,
I. Monga, Bas van Oudenaarde, S. Raghunath, P. Y. Wang, Seamless
live migration of virtual machines over the MAN/WAN, Future
Generation Computer Systems, Volume 22, Issue 8, Pages 901-907
[29] Global Action Plan Report, An inefficient truth,
http://www.globalactionplan.org.uk/, 2007.
[30] SMART 2020 Report, Enabling the low carbon economy in the
information age. http://www.theclimategroup.org, 2008.
[31] S.Pileri. Energy and Communication: Engine of the human progress.
INTELEC 2007 keynote, Rome, Sep. 2007.
[32] Andrews, M., Anta, A. F., Zhang, L., and Zhao, W. Routing and
scheduling for energy and delay minimization in the powerdown model.
INFOCOM, 2010.
[33] ESnet Network Topology. http://www.es.net/network/network-maps/
[34] S. Kavulya, J. Tan, R. Gandhi and P. Narasimhan. An Analysis of
Traces from a Production MapReduce Cluster. Carnegie Mellon
University, Techinal Report. DOI: CMU-PDL-09-107.
[35] D. Ersoz, M. S. Yousif, and C. R. Das. Characterizing Network Traffic
in a Cluster-based, Multi-tier Data Center. ICDCS, 2007.
[36] S. Ghemawat, H. Gobioff, S. Leung. The Google file system. SIGOPS
Oper. Syst. Rev. 37, 5.
[37] K.K.Nguyen, M.Cheriet, M.Lemay, B.St.Arnaud, V.Reijs, A.Mackarel, P.Minoves, A.Pastrama,W.Heddeghem. Renewable energy provisioning for ICT services in a future internet. In The future internet, 2011.
[38] J.Baliga, R.W.A.Ayre, K.Hinton, R.Tucker.Green Cloud Computing: Balancing Energy in Processing, Storage, and Transport. Proceedings of the IEEE , vol.99, no.1, pp.149-167, Jan. 2011