
Benefit Cost Analysis of Emission Standards for Coal-based ...
92
-
Upload
khangminh22 -
Category
Documents
-
view
1 -
download
0
Transcript of Benefit Cost Analysis of Emission Standards for Coal-based ...


Benefit Cost Analysis of Emission
Standards for Coal-based Thermal
Power Plants in India
July, 2018

Center for Study of Science, Technology and Policy (CSTEP) is a private, not-for-profit (Section 25)
Research Corporation registered in 2005.
UrbanEmissions.info was founded with the vision to be a repository of information, research, and
analysis related to air pollution.
Shakti Sustainable Energy Foundation works to strengthen the energy security of India by aiding the
design and implementation of policies that support renewable energy, energy efficiency and sustainable
transport solutions.
Designing and Editing by CSTEP
Disclaimer
While every effort has been made for the correctness of data/information used in this report, neither
the authors nor CSTEP accept any legal liability for the accuracy or inferences for the material contained
in this report and for any consequences arising from the use of this material.
The views and analysis expressed in this document do not necessarily reflect those of Shakti Sustainable
Energy Foundation. The Foundation also does not guarantee the accuracy of any data included in this
publication nor does it accept any responsibility for the consequences of its use.
© 2018 Center for Study of Science, Technology and Policy (CSTEP)
For private circulation only. Any reproduction in full or part of this publication must mention the title
and/or citation, which is mentioned below. Due credit must be mentioned regarding the copyright
owners of this product.
This report should be cited as: Srinivasan S., Roshna N., Guttikunda S., Kanudia A., Saif S., Asundi
J.(2018). Benefit Cost Analysis of Emission Standards for Coal-based Thermal Power Plants in India,
(CSTEP-Report-2018-06).
July, 2018
Center for Study of Science, Technology and Policy
# 18, 10th Cross, Mayura Street,
Papanna Layout, Nagashettyhalli, RMV II Stage,
Bangalore-560094 Karnataka, INDIA
Tel.: +91 (80) 6690-2500
Fax: +91 (80) 2351-4269
Email: [email protected]
Website: www.cstep.in

Executive Summary
In December 2015, the Ministry of Environment, Forest and Climate Change (MoEFCC) notified
emission standards for limiting Sulphur Oxides (SOx), Nitrogen Oxides (NOx), Particulate
Matter (PM) and Mercury (Hg) emissions in coal-based Thermal Power Plants (TPPs). As of
December 2017 (the deadline for meeting these standards), compliance was poor. Further,
other government departments under the Ministry of Power (MoP) are mulling over a delay
in implementation of these standards (Chaudhary, 2017; Mohan, 2017). In this context, this
study evaluated the benefits and costs associated with the implementation of these emission
standards.
Some of the key results of the analysis are presented below:
Without compliance, the study estimates that the SOx and NOx emissions will double, as
compared to 2015 baseline emissions, while PM10 emissions will increase by 30% over the
next 15 years. Implementing control technologies to meet norms could reduce the projected
emissions of SOx by 95%, NOx by 87% and PM by 83%, in 2030.
To comply with the emission standards, power producers will have to make significant
investments in installing Pollution Control Technologies (PCT), i.e., INR 0.5–1 crore (INR 5–10
million)/MW for nearly 80% of the plants in 2030. This study estimates an industry
opportunity of around INR 2,50,000 crore (2500 billion) for the pollution control equipment
industry, over the next 15 years.
Plants in five states will account for over 50% of the total costs needed for PCT installation, till
2030. Privately owned plants will face the highest costs for implementing these standards
(over 45%), followed by state-owned (32%), and centrally-owned plants (24%). However, the
lack of domestic manufacturing capacity, availability of technology providers in India, and the
time taken for procurement and installation of PCTs may deter a time bound implementation
plan.
Over 3.2 lakh premature loss of lives, 5.2 crore (52 million) Respiratory Hospital Admissions
(RHA) and 126 million Work Loss Days (WLD) can be avoided till 2030, if the standards are
met by 2025. Of the monetised health benefits (estimated to be INR 9,62,222 crore), 92% are
from deaths avoided and 8% is from morbidity reduction i.e. avoided RHA and WLD.
The study highlights that the monetised benefits outweigh the costs within the initial years of
PCT installation. The five states where plants need to invest more than 50% will also accrue
the highest health benefits.
The electricity tariff is likely to increase between INR 0.25–0.75/kWh; this can have a
substantial impact on the end consumers. The revision in electricity tariffs in order to meet
the emission standards will be challenging to implement in many states, where power tariffs
are regulated.
This study recommends a one year grant window to expedite the implementation of the norms
to enable fund-raising for the high upfront costs. The government could set-up a grant of up to
INR 93,500 crore (INR 935 billion), which power producers (of recent vintage) can avail over
a one-year window. The remaining units can petition tariff revisions with electricity
regulators, in keeping with the Electricity Act, 2003 and associated tariff guidelines.

Acknowledgements
The authors are thankful to the Shakti Sustainable Energy Foundation for providing us the
support to conduct this study.
The authors acknowledge the following individuals for their timely contribution and reviews:
CSTEP colleagues for data collection and analytical inputs: Murali Ramakrishnan
Ananthakumar, Venkatesh Vunnam, Arijit Chanda, Nikhilesh Dharmala, Pareexit Chauhan and
Anuradha Venkatesh.
CSTEP Reviewers: S.S. Krishnan, Thirumalai N.C., Suresh N.S., Bellarmine K.C., Riya Rachel,
Harshid Sridhar and Pratima Singh.
CSTEP Editorial support: Merlin Francis and Arushi Sen
Cover page design: Aswathy Shivaji
External Reviewers: V.T. Sathyanathan (Retd GM, BHEL), Anand Rao (IIT Bombay), Srinivas
Murthy (former Chairman, KERC), Priyavrat Bhati (CSE), and Ashok Sreenivas (Prayas Energy
Group).
Further, this project greatly benefitted from the emission standards related inputs from Dr.
S.K. Paliwal, Scientist, Central Pollution Control Board (CPCB) and inputs on pollution control
technology applicability from Piyush Banafer, Arun Unni, and Antony Mariasundaram
(General Electric-Alstom).

Glossary
Emission standards Emission standards are legal or regulatory requirements that
quantify permissible limits of air pollutants that can be
released by a specific source into the atmosphere.
Ambient concentration It is an indicator of the state of the environment in terms of air quality, and is an indirect measure of population exposure to air pollution of health concern in urban areas.
Removal efficiency of a pollution
control technology
Removal efficiency is the amount of pollutant captured/removed by the pollution control equipment. It is represented in terms of percentage of quantity of inlet pollutant.
Plant load factor Plant load factor is the measure of capacity utilisation of plant. It is measured in terms of output of a power plant with respect to the maximum output it could produce.
Gross calorific value Heat produced by combustion of unit quantity of a solid or liquid fuel when burned is termed as calorific value of a fuel.
Coal blending Coal blending is a process of mixing coals of various calorific value and composition to improve the calorific value of coal per unit quantity.
Flue gas stack The flue gas stack is a type of chimney through which combustion gas from power plants were given out to atmosphere. The height of flue-stack ranges between 150 m and 275 m for Indian coal thermal power plants. The height and volume of flue gases affect the flue gas dispersion.
Eulerian photochemical
atmospheric dispersion model
Eulerian model is a numerical technique used to simulate air pollutant dispersion. In Eulerian models, the region of interest is divided into horizontal and vertical cells and equations of continuity are solved in each cell (Zannetti, 1993).
Horizontal resolution of grid The smallest cell dimension for dispersion modelling at 0.25 degrees.
Emission trajectories The progression of emissions from TPP units over a period of time. In this analysis annual emission loads were estimated for a 15 year time period of 2015-2030.These estimations are dependent on what controls are applied and when to meet the standard.
Baseline emission Baseline emissions are underlying characteristic (in concentration or emission factor terms) of different gases in the flue of TPPs with existing levels of controls as on 2015.
Partial equilibrium It is the condition of economic equilibrium which takes into consideration only a part of the market, ceteris paribus, to attain equilibrium. This makes analysis simpler than in a general equilibrium model which includes an entire economy. Under a dynamic condition in energy models, illustratively, prices adjust until supply equals demand.


Table of Contents
1. Introduction ........................................................................................................................................................ 1
1.1 Trends in Coal-based Power Generation and Emissions ........................................................ 1
1.2 Adequacy of Environmental Protection Amendment Rules, 2015 ..................................... 2
2. Study Objective .................................................................................................................................................. 4
3. Methodology and Approach ......................................................................................................................... 5
3.1 Interpreting Emission Standards ..................................................................................................... 5
3.2 Estimating System Wide Emission Loads from Coal TPPs..................................................... 8
3.3 System Level Costs and Benefits for PCT Installation ........................................................... 16
4. Results and Discussion ................................................................................................................................ 20
4.1 Interpretation of Emission Standards ......................................................................................... 20
4.2 Emission Trajectories for Scenarios Considered .................................................................... 22
4.4 Summary and Policy Recommendations .................................................................................... 33
Annexure-A ................................................................................................................................................................ 35
CSTEP Power Plant Database and Ancillary Model Input Data ....................................................... 35
Annexure–B ............................................................................................................................................................... 37
Estimating Baseline Emission Factors for Coal TPPs .......................................................................... 37
Annexure - C .............................................................................................................................................................. 46
Pollution Control Technology Compendium ........................................................................................... 46
Annexure-D ................................................................................................................................................................ 55
Monetising Mortality & Estimation of Impact of PCT Costs on Tariff ........................................... 55
Bibliography .............................................................................................................................................................. 68

List of Figures
Figure 1: Post-Independence Growth of Power Sector in terms of Installed Capacity (MW) .... 1
Figure 2: Pictorial Representation of the Approach .................................................................................... 5
Figure 3: Ash and Sulphur Content (%) in Various Coal Types ............................................................... 7
Figure 4: Schematic for Estimating System Level Emissions for a given Unit .................................. 8
Figure 5: Coal Linkages of TPPs in 2015 and 2030 ...................................................................................... 9
Figure 6: District-wise Installed Capacity as on 2015 and 2030 ......................................................... 10
Figure 7: Schematic Diagram of Coal TPPs with PCTs ............................................................................. 12
Figure 8: Logic Flow for PCT Choice ................................................................................................................ 14
Figure 9: Supra-linear and Linear Form of ER Function ......................................................................... 17
Figure 10: Current Emission Factors (EF) ................................................................................................... 21
Figure 11: Electricity Generation, Coal Consumption and Emission Trajectories in the
Reference Case .......................................................................................................................................................... 22
Figure 12: Specific Emissions Trajectories in the Reference Case ...................................................... 23
Figure 13: Emission Trajectories for Policy Scenarios ............................................................................ 24
Figure 14: Specific Emissions with and without Pollution Controls in 2030 ................................. 24
Figure 15: Share of PCT Investment required for SOx, NOx and PM10 Reduction .......................... 25
Figure 16: PM2.5 Concentration due to TPP Emissions with and without PCT (PS 2) ................. 26
Figure 17: PM2.5 Concentration due to TPP Emissions with and without PCT (PS2 & Reference)
(continuation) ........................................................................................................................................................... 27
Figure 18: Mortality Reduction in Two Policy Compliance Scenarios............................................... 28
Figure 19: State-wise share of PCT Investment required (PS 2) ......................................................... 29
Figure 20: State-wise Mortality Reduction with Emission Standard Compliance (PS 2) .......... 29
Figure 21: Avoided Cumulative Mortality (a) and RHA (b) till 2030 with Implementation of
Emission Standards (PS 2)................................................................................................................................... 30
Figure 22: Benefit vs. Cost Analysis of New Emission Standards in TPPs (PS 2) .......................... 31
Figure 23: Percentage Share of Ownership of Plants in 2003–16 Vintage ...................................... 32
Figure 24: Schematic Representation of Mass Balance Analysis ......................................................... 38
Figure 25: Current Concentration of SOx in Flue Gas (mg/Nm3) ......................................................... 43
Figure 26: Current Concentration of NOx in Flue Gas (mg/Nm3) ........................................................ 44
Figure 27: Current Concentration of PM10 in Flue Gas (mg/Nm3) ...................................................... 44
Figure 28: Comparison of Pollutant Emission with Other Inventories ............................................. 45
Figure 29: Post-combustion SOx Control Technology Applicability ................................................... 49
Figure 30: Applicability of Catalytic Reduction Technology ................................................................. 50
Figure 31: Diagrammatic Representation of Approach for Financial Analysis of PCT Impact on
Tariff ............................................................................................................................................................................. 56

List of Tables
Table 1: New Emission Standards ....................................................................................................................... 2
Table 2: Old Emission Standards ......................................................................................................................... 2
Table 3: Summary of Power Plant Database and Installed Capacity (GW) in 2030 .................... 11
Table 4: Cost vs Removal Efficiency of Pollution Control Technologies........................................... 13
Table 5: Qualitative Representation of TPP Installed Capacity and PCT Investment ................. 14
Table 6: ESP Removal Efficiency Specification based on Previous Standards ............................... 15
Table 7: Phased Implementation of Standards in Policy Scenarios ................................................... 15
Table 8: Cases for Financial Assessment of PCT Costs ............................................................................. 20
Table 9: Emission Standards in terms of mg/MJcoal .................................................................................. 21
Table 10: Cost Implications of PCT Implementation in Coal Power Plants ..................................... 31
Table 11: Non-coal Power Generation Installed Capacity used in IMRT ......................................... 35
Table 12: Renewable Energy Potential (GW) .............................................................................................. 36
Table 13: Coal Composition and Gross Calorific Value for Indian Coal Types ............................... 37
Table 14: Coal Composition and Gross Calorific Value for Imported Coal Types ......................... 37
Table 15: Molar Flow Rate of Flue Gas Components ................................................................................ 42
Table 16: Water Source for Plants Operational in 2015–30 Period ................................................... 48
Table 17: Technical Parameters of Pollution Control Technologies .................................................. 51
Table 18: Cost of PCT ............................................................................................................................................. 51
Table 19: Normalised Pollutant Abatement Costs ..................................................................................... 54
Table 20: Value of Statistical Life in Literature ........................................................................................... 55
Table 21: Number of Units Commissioned in Different Vintage Capacity ....................................... 56
Table 22: Cases for Financial Analysis ............................................................................................................ 57
Table 23: Implications on Emissions with the Implementation of PCTs .......................................... 58
Table 24: Base Rate for Return on Equity as per CERC guidelines ..................................................... 59
Table 25: Total Capital Investment for Representative Cases .............................................................. 60
Table 26: Components of Working Capital ................................................................................................... 60
Table 27: Operational and Maintenance Expenses ................................................................................... 60
Table 28: Depreciation Rate as per CERC guidelines ............................................................................... 61
Table 29: Operational Norms for Coal Power Plant .................................................................................. 61
Table 30: Coal Composition ................................................................................................................................ 62
Table 31: Discount Rate ........................................................................................................................................ 63
Table 32: Capital Investment for PCTs Implemented in each Representative Plant ................... 64
Table 33: Cost of Reagents and By-product ................................................................................................. 65
Table 34: O&M Expenses for PCTs ................................................................................................................... 65
Table 35: Miscellaneous Expenses ................................................................................................................... 66


Benefit Cost Analysis of Emission Standards for Coal-based Thermal Power Plants in India
© CSTEP www.cstep.in 1
1. Introduction
1.1 Trends in Coal-based Power Generation and Emissions
Coal has dominated the power supply mix since the mid-1980s (Figure 1). As of 2017, coal-
based Thermal Power Plants (TPPs) accounted for 77% of the total electricity generation.
Around 58% of India’s total installed capacity, of 334 GW, was coal-based TPPs (CEA, 2017 b).
Given coal’s dominance in power generation, the electricity sector has been a major source of
pollutant emission.
Figure 1: Post-Independence Growth of Power Sector in terms of Installed Capacity (MW)
Source: (CEA, 2017 b)
In 2015, the power sector contributed 50% of the 10,500 kT of annual Sulphur Oxide (SOx)
emissions, 30% of the 7,332 kT Nitrogen Oxide (NOx) emissions, and 8% of the 6,331 kT of
Particulate Matter of size ≤2.5µm (PM2.5) emissions (IEA and IIASA, 2015). The coal TPPs were
estimated to be the highest contributor of SOx and NOx emissions. These local pollutants lead
to acute and chronic respiratory diseases, leading to premature deaths (HEI, 2010).
Despite the government’s plans for increasing renewable energy generation, thermal power is
likely to dominate generation in the foreseeable future. Coal is likely to contribute up to 80%
of the electrical generation required in 2022, and over 60% of electrical generation in 2030
(Byravan, et al., 2017) (CEA, 2016 b). As per the Central Electricity Authority’s (CEA) plans,
around 50 GW of new coal power generation units are under construction (CEA, 2016 b).
Further, CEA has estimated that an additional coal-based capacity of 44 GW will be required
during 2022–27, to meet demand.
This implies increased pollution loads of SOx, NOx and PM from the power sector. Earlier, the
Ministry of Environment and Forests had published norms for flue gas stack height to facilitate
wider dispersion of pollutants1. Over time, emission standards were also prescribed for
particulate matter. With substantial increase in coal-based generation in the last decade, and
1 Dispersing pollutants can minimise the hazardous effects of pollutants by aiding it to spread over a large area, thus minimising its concentration in nearby areas. Stack height requirements: Unit capacity <210 MW = 14 (Q) 0.3. Where, Q is emission rate of SO2 (kg/hr). Between 210 and 500 MW = 220 metres; >=500 MW =275 metres.
0
50
100
150
200
250
300
350
1947 1950 1956 1961 1966 1974 1979 1985 1990 1997 2002 2007 2012 2015 2017
Inst
alle
d C
apac
ity
(G
W)
Coal Gas Diesel Nuclear Hydro Other Renewables

Benefit Cost Analysis of Emission Standards for Coal-based Thermal Power Plants in India
www.cstep.in © CSTEP 2
the increase in SOx and NOx emissions, MoEFCC announced new pollutant emission standards,
in December 2015, to limit emissions from coal and lignite TPPs (MoEFCC, 2015).
1.2 Adequacy of Environmental Protection Amendment Rules, 2015
The standards notified in December 2015, mandated a limit on SOx, NOx, and Hg (mercury)
concentration in the flue gas leaving the stack, and tightened the old norms (1989) for PM
emission concentrations. The norms were differentiated by plant unit, capacity and vintage
(Table 1 and Table 2).
Table 1: New Emission Standards
Installation Period
Unit Capacity (MW)
Pollutants concentration (mg/Nm3)
SOx NOx PM Hg Before 2003 <500 600 600 100 0.03
≥500 200
2003–2016 <500 600 300 50 0.03 ≥500 200
From 2017 All Units 100 100 30 0.03
Table 2: Old Emission Standards
Source: (MoEFCC, 2017); (Implementation of Pollution Control– II, CPCB, 2008)
The new standards are comparable to the stringent norms set in the United States of America
(USA), European Union (EU) and China (WRI, 2012) . Yet, there is concern over the lack of
specification of a minimum time period for measurement2. The US and EU specify a 30-day
rolling average, which enables compliance checks (Sahu, 2015). Also, measurement of
pollutants, in terms of concentration, depends on the excess air fed into the boiler; standards
can be met by diluting the flue gas, i.e., feeding-in more excess air into the boiler. An
amendment to the Environment Protection Amendment Rules (EPAR) in 2017, addressed
some ambiguity on excess air contribution to pollutant concentration by specifying the
composition of oxygen (6% on dry basis) in flue gas (MoEFCC, 2017).
Moreover, in the absence of a comprehensive industry document to guide the TPP industry or
regulators, there are three uncertainties that merit attention while thinking about this air
pollution regulation and its efficacy: (1) baseline emission profile; (2) pollution control
options; and (3) benefits to society.
Baseline Emissions in Indian TPPs
In Indian TPPs, there is large uncertainty on the actual baseline emission concentrations.
Although the Continuous Emission Monitoring Systems (CEMS) are mandated by MoEFCC in
2 Excess air of 10-30% is usually fed into the boiler to ensure complete combustion of coal.
Unit Capacity (MW) Pollutants concentration (mg/Nm3)
SOx NOX PM Hg <210 None None 350 None ≥210 None None 150 None

Benefit Cost Analysis of Emission Standards for Coal-based Thermal Power Plants in India
© CSTEP www.cstep.in 3
TPPs, data has not been made public yet (CPCB, 2017). Further, to derive these values, coal
composition and unit level performance characteristics are required. While the CEA reports
some of the performance related metrics, such as Plant Load Factors (PLF) and historic
generation, only few plants record or report the chemical coal composition or Gross Calorific
Value (GCV) of the coal used.
Data collected during the course of this study indicated that Indian TPPs use a combination of
sub-bituminous coal and lignite—the coal sourced can be mapped to nine geographically
distinct coal fields in India and abroad (South African, Indonesian and Australian coal) (Details
in Annexure-A) The calorific value of coal from domestic collieries is low, while imported coal
has higher calorific value. Blended domestic and imported coal has been used in the past to
address non-availability of domestic coal. Several new plants have listed imported coal as their
primary fuel source, in environmental impact assessment documents. Imported coal is
relatively higher in sulphur content (>0.5%), implying increased SOx emissions. Meanwhile, a
plant relying on domestic coal results in higher PM emissions due to its higher ash content
(30–40%).
MoEFCC reported current average emission factors of pollutants as 7.3 g/kWh for SOx, 4.8
g/kWh for NOx, and 0.98 g/kWh for PM10 (PIB, 2015). Several other studies also reported
emission factors estimated based on different assumptions on a representative coal
composition, or power plant operating characteristics (Garg, Kapshe, Shukla, & Ghosh, 2002;
Chakraborty, et al., 2008; Mittal, Sharma, & Singh, 2014). Moreover, at the system scale,
research has indicated that pollution impacts were not isolated to the individual plant’s site,
and emissions dispersed over 200 km away from the plant site (Guttikunda & Jawahar, 2014).
However, disaggregated and system level impacts have not been evaluated.
Pollution Control Options
Emission of NOx, SOx and PM can be reduced by installing Pollution Control Technologies
(PCTs) at different stages of a power plant’s operations; pre-combustion, in-combustion, and
post-combustion. We compiled a list of technologies applicable in the Indian context, along
with their costs from literature (Bhati & Ramanathan, 2016; GE Power, 2016). However,
technology providers in India are limited, and data on cost typically represent the global
market. The detailed review of these technologies showed that the cost of implementation,
especially upfront costs, are the highest for post-combustion options, while pre-combustion
technologies are the least costly (Refer Annexure C).
The pre-combustion control technologies that can be adopted in coal TPPs are coal washing
and blending. Installation of Low NOx Burner (LNB) and Over-Fire Air (OFA) inside the boiler
are the in-combustion controls available for NOx. Limestone injection into the furnace is an
effective in-combustion control applicable for SOx reduction. The available post-combustion
control technologies are Flue Gas Desulphuriser (FGD) for SOx, Selective Catalytic or Non-
Catalytic Reduction (SCR/SNCR) for NOx, and Electrostatic Precipitators (ESPs) or fabric filters
for PM. The percentage of emission reduction for PCTs varies between 25% for SOx with coal
washing, and 99.6% for PM reduction with high efficiency ESP. Most of the existing TPPs have
an ESP installed to meet the earlier emission standards. Lastly, although standards are also
specified for Hg, the current emission level of Hg from coal TPPs is lower than the standard’s

Benefit Cost Analysis of Emission Standards for Coal-based Thermal Power Plants in India
www.cstep.in © CSTEP 4
specification (estimated at average of 0.012 mg/Nm3 in Annexure-B). Hence, additional PCT
installations will not be required for Hg control.
This study has consolidated recent data and evaluated costs in the context of industry-wide
adherence to the new standards. This is useful since speculation on costs have deterred power
producers. They have sought delays in the deadline to meet new standards, and require clarity
on tariff revisions that will relieve financial stress. MoP, in consonance with the industry,
announced a phasing plan, moving the original MoEFCC deadline from 2019 to 2023 for
different plants (CEA, 2017 a). The MoEFCC also indicated its support to MoP in the Supreme
Court, to extend the compliance deadline to 2022, recently (Mohan, 2017).
Benefits of Meeting New Standards
Compliance with the new standards will reduce local pollution, and yield health and ecosystem
benefits3. Only a select few studies have evaluated the health benefits from installing pollution
controls in individual plants—the industry-wide implication has not been evaluated, yet. In
the plant level analyses, costs of controls have been compared with the health benefit; for
example, avoiding one premature death is estimated to cost INR 0.15 crore (INR 1.5 million)
to INR 3 crore (INR 3 million), depending on the exposed population and plant capacity (Malik,
2013). Other studies have demonstrated that (depending on a range of monetary values
assigned to health benefits) interventions to install pollution controls in Indian TPPs pass the
benefit vs. cost test (HEI, 2010; Pope, Cropper, Coggins, & Cohen, 2015; Gunatilake, Herath;
Ganesan, Karthik; Bacani, Eleanor, 2014).
In this context, we felt that it is relevant and timely to assess the social benefits and costs of
implementing the emission standards, across the industry. We felt that this could aid in
convincing stakeholders on the usefulness of the new emission standards, thus facilitating
installation of PCTs in a time-bound manner.
2. Study Objective
This study aims to evaluate the implications of new emission standards by carrying out a
system-wide benefit-cost analysis for the period 2015 to 2030. We chose this time frame for
evaluating costs and benefits since power sector plans were available till 2030 in the public
domain (including the National Electricity Plan scenarios to incorporate the 40% fossil-free
power generation capacity target as per India’s Nationally Determined Contributions). The
following components have been included in the study:
1) Evaluation of implications of adherence to new emission standards, by:
a. Assessing the applicability of control measures and associated technology costs
b. Estimating the impact on cost of power generation and total system costs
c. Assessing and monetising the social and health benefits
2) Recommendations to facilitate implementation, by:
a. Identifying challenges in compliance
3 Studies have shown that reduced SOx can reduce soil and rain acidification thereby reducing threat to biodiversity and ecosystem services. However, assessment of these social benefits was not included in this study.

Benefit Cost Analysis of Emission Standards for Coal-based Thermal Power Plants in India
© CSTEP www.cstep.in 5
b. Presenting the ‘true cost of coal’, accounting for environmental externalities and
assessing regulatory requirements
3. Methodology and Approach
In order to evaluate the benefits and costs of implementation of the emission standards, this
study pursued three tracks of analysis: (1) Interpreting the emission standards in terms of
normalised mass flow rates; (2) Estimating emission loads from TPPs (under different levels
of compliance, at a system level); and (3) Quantifying social costs and benefits (including
technology investment, running costs, health costs or benefits, and associated tariff
implications). The pictorial representation of the approach is shown in Figure 2.
Figure 2: Pictorial Representation of the Approach
3.1 Interpreting Emission Standards
The standards for various pollutants have been specified in concentration terms. However, in
order to understand the impact of the standards on different capacity and vintage, or in other
words, different pollution loads, the standards needed to be converted to mass flow rate terms.
As mentioned in the Introduction section, data on the baseline emissions (concentrations) for
various TPPs are not available in the public domain. The diversity in coal linkages, i.e., the GCV
of domestic, imported and blended coal, and their respective elemental composition, needs to
be factored into any estimation of current emission mass flow rates. Hence, a stoichiometric
mass balance analysis was carried out using data available in peer-reviewed literature,
government reports, and technical reports to estimate current emission flow rates and factors.
These were normalised with respect to input energy, and compared to the requirements under
the emission standards.
This section provides the methodology used to estimate current pollutant emission factors
from TPPs. It also provides the steps followed to convert concentration based emission
standards into normalised mass metrics.
•Mass balance approach for estimating current pollutant emissions
•Converting concentration based standards to normalised mass flow rates
Interpreting Emission Standards
•Establish baseline
•System perspective•Modelling scenarios •Dispersion modelling
Estimating emissions from TPPs
• System level costs
•Health benefits•Financial implications
of PCTs
Quantifying social costs or benefits

Benefit Cost Analysis of Emission Standards for Coal-based Thermal Power Plants in India
www.cstep.in © CSTEP 6
Estimation of Current Pollution Emissions
Equation 1 shows the mass balance approach for normalised mass flow for emissions in TPPs.
Equation 1
𝑚𝑔𝑖
𝑀𝐽𝐶𝑗= 𝑓[{𝑘𝑔𝐶𝑗}{% 𝑜𝑓 𝑘𝐶𝑗}{𝑎𝑘}]
Where, 𝑚𝑔𝑖
𝑀𝐽𝐶𝑗 is the normalised emission factor for pollutant i for coal typ𝑒;
𝑘𝑔𝐶𝑗 is the quantity of coal Cj equivalent to 1 MJ of input energy;
% 𝑜𝑓 𝑘𝐶𝑗 denotes percentage composition of chemical constituent k in the coal type
Cj;
𝑎𝑘 is the combustion conversion factor of k at given boiler condition.
The input data for this equation was obtained from an in-depth literature review and feedback
from experts. The approach used for data collection is presented below:
Step 1: Identify the types and classifications of coal used in Indian TPPs (MoC, 2016).
Step 2: Gather data on coal composition and calorific value (Chandra & Chandra, 2004; CERC,
2014; Falcon & Ham, 1988; Belkin & Tewalt, 2007).
Step 3: Identify conversion rates of chemical components during combustion based on
experimental studies (Cai, Guell, Dugwell, & Kandiyoti, 1993; Brimblecombe, 1996; Mittal,
Sharma, & Singh, 2014; Pershing & Wendt, 1977; Bartonova, Juchelkova, Kilka, & Cech, 2011;
USEPA, 1998).
Step 4: Identify technical operating parameters for the boiler, existing pollution control
equipment and stack exit physical characteristics (Chandra & Chandra, 2004; Mittal, Sharma,
& Singh, 2014; Chakraborty, et al., 2008; Khan & Khan, 2014).
Based on the review of literature, we identified nine domestic collieries supplying coal to TPPs:
Eastern Coalfields Limited (ECL), Northern Coalfield Limited (NCL), Central Coalfields Limited
(CCL), South Eastern Coalfields Limited (SECL), Mahanadi Coalfields Limited (MCL), Singareni
Collieries Coal Limited (SCCL), Bharat Coking Coal Limited (BCCL) and Lignite4 (same
composition was considered for all lignite collieries as data in literature was available only for
Neyveli Lignite). Three imported coal types, mainly used in Indian TPPs, are Indonesian, South
African and Australian. The calorific value of domestic coal categories varies between 3800
and 4500 kcal/kg, while the value for imported coal is between 6300 and 7800 kcal/kg. The
ash and sulphur content, from literature for the 12 coal classifications used in this study, is
given in Figure 3.
4 Includes Kutch lignite and Neyveli lignite

Benefit Cost Analysis of Emission Standards for Coal-based Thermal Power Plants in India
© CSTEP www.cstep.in 7
Figure 3: Ash and Sulphur Content (%) in Various Coal Types
Domestic coal types are seen to have a low share of sulphur (≤0.5%) and higher ash content
(30–40%) as compared to imported coal. This implies higher PM emission factors and lower
SOx emission factors for TPPs that consume domestic coal. Meanwhile, imported coal from
Indonesia and South Africa have higher sulphur (>2%) content than domestic coal, thus has
higher SOx emission factors. The details of coal composition and GCV of these coal types are
presented in Annexure–B.
The flow rate of NOx, SOx and PM105 were estimated using stoichiometric equations, assuming
an overall plant efficiency6 of 33% for a typical Indian TPP (CEA, 2013). The key operational
parameters and conversion factors for various chemical constituents are given below.
Baseline emission concentration varies based on the coal linkage. SOx concentration in flue gas
is the least for NCL (1053 mg/Nm3) and as high as 3152 mg/Nm3 for SCCL, within the Indian
sub-bituminous categories; it is the highest for Lignite (7362 mg/Nm3). In comparison, the SOx
concentration for Indonesian coal is higher at 4819 mg/Nm3. The NOx concentrations for
Indian and imported coal are in a similar range as the percentage shares of nitrogen in the fuel
are similar. The average NOx concentration for different coal types was estimated as 952
mg/Nm3. The average PM10 concentration in flue gas, accounting for ESP of removal efficiency
97% (to cater to older norms), is 183 mg/Nm3 for domestic coal, and 24 mg/Nm3 for imported
5 It is assumed that SOx formed during combustion is in SO2 form. Similarly, for NOx, only NO is considered. 6Overall plant efficiency depends on boiler efficiency and steam cycle efficiency (Reddy, 2014).
0.0%
0.5%
1.0%
1.5%
2.0%
2.5%
0%
10%
20%
30%
40%
50%
% o
f Su
lph
ur
Co
mp
osi
tio
n
% o
f A
sh
Co
mp
osi
tio
n
Ash Sulphur
Key Assumptions
Combustion temperature in boiler is 1500 K (Cai, Guell, Dugwell, & Kandiyoti,
1993)
Excess air supplied to boiler is 20% (Mittal, Sharma, & Singh, 2014)
92.5% of sulphur in coal is combusted and only SO2 is formed (Mittal, Sharma, &
Singh, 2014)
20% fuel nitrogen is converted to NO constituting 72.5% of the total NOX formed
(Pershing & Wendt, 1977)
PM10 emission was calculated as follows: 2.3 times the % of ash in 1 lb of coal
(USEPA, 1998)
Temperature and pressure at flue gas stack is taken as 422 K , 1atm (Chakraborty,
et al., 2008)

Benefit Cost Analysis of Emission Standards for Coal-based Thermal Power Plants in India
www.cstep.in © CSTEP 8
coal. Details of this calculation, emission factors in terms of mg/MJcoal and sensitivity with plant
operational parameters are provided in Annexure-B.
Conversion of Emission Standards: Concentration to Mass Flow Terms
Mass flow rate estimation is a more robust approach, eliminates dependencies on excess air,
and allows for a diverse representation of coal linkages. The emission standards in
concentration terms were converted into mg/MJcoal using average F-factor (Flue Gas Volume/
Thermal Energy Input) derived for different coal types (Equation 2). Details are provided in
Annexure-B.
Equation 2
𝑀𝑜𝐸𝐹𝐶𝐶 (𝑚𝑔
𝑁𝑚3) ∗ 𝐹𝑓𝑎𝑐𝑡𝑜𝑟 (
𝑁𝑚3
𝑀𝐽) = 𝐸𝑚𝑖𝑠𝑠𝑖𝑜𝑛 𝑠𝑡𝑎𝑛𝑑𝑎𝑟𝑑 (
𝑚𝑔
𝑀𝐽𝑐𝑜𝑎𝑙)
3.2 Estimating System Wide Emission Loads from Coal TPPs
The pictorial representation of the methodology for estimating system wide emission loads is
shown in Figure 4.
Figure 4: Schematic for Estimating System Level Emissions for a given Unit
The emission trajectories for all TPP units operating between 2015 and 2030 were estimated
using derived emission factors from the mass balance analysis. Additional input data required
for emission load calculation are plant level coal linkages, existing PCT, and power plant
characteristics such as historic plant efficiency and PLF. This data for each TPP unit was
collected from two databases and validated with environmental clearances (CoalSwarm, 2016;
CEA, 2015). The percentage share of installed capacity linked to various coal types is shown in
Figure 57. Wherever data on coal was not available (~20 GW), the nearest coal field or port
was considered. In 2015, as per our estimation, the highest consumption was for SECL and
MCL coal (among domestic categories) and Indonesian coal consumption was the highest in
7 Several plants in India consume two or more coal types. For the current study, single coal type is considered to reduce complexity. Among plants that consume two or more domestic coals, the cheaper option was considered for the analysis. Amongst those which use imported with domestic coal, 100% imported coal was considered.
𝑓𝑜𝑟 𝑎𝑙𝑙 𝑢𝑛𝑖𝑡𝑠
Database on Plant Characteristics Annual Coal
Consumption Trajectories
(tonnes) Unit-wise Electricity Generation Trajectories
(MWh)
Coal Linkages
Data base on Coal Characteristics
Future Electricity Demand
Unit-wise Emission
Trajectories (tonnes)
Removal Efficiency of
Best PCT Option

Benefit Cost Analysis of Emission Standards for Coal-based Thermal Power Plants in India
© CSTEP www.cstep.in 9
the imported coal category. The share of Indonesian coal will increase to 11% by 2030, driving
up the overall SOx emission loads.
Figure 5: Coal Linkages of TPPs in 2015 and 2030
Figure 6 shows the district-wise installed capacity of coal TPPs in 2015 and 2030. As shown,
more coal TPPs will be operational in coastal regions, and states such as Chhattisgarh, West
Bengal and Jharkhand, in 2030.
SECL21%
MCL18%
WCL11%
CCL11%
ECL10%
NCL10%
Indonesian4%
South African…
Lignite3%
SCCL3% BCCL
2%
2015: 173 GW
SECL19%
MCL18%
WCL9%CCL
12%
ECL12%
NCL7%
Indonesian11%
South African
5%
Lignite2% SCCL
4%
BCCL1%
Australian0.22%
2030: 263 GW

Benefit Cost Analysis of Emission Standards for Coal-based Thermal Power Plants in India
10 www.cstep.in © CSTEP
Figure 6: District-wise Installed Capacity as on 2015 and 20308
8 The size of bubble denotes the installed capacity. The smallest circle and largest circle represents ≤500 MW and 4620 MW respectively.
2015 2030

Benefit Cost Analysis of Emission Standards for Coal-based Thermal Power Plants in India
© CSTEP www.cstep.in 11
Estimating Unit-wise Power Generation Trajectories
CSTEP’s India Multi Region TIMES model (IMRT) was used to arrive at power generation
profiles for TPPs in India during 2015–30. TIMES (The Integrated MARKAL EFOM System) is
a dynamic partial equilibrium optimisation model, which is widely used for energy and
environment systems analysis to explore least cost and low emission pathways. It supports
technology level representation of primary energy (coal, gas, oil, etc.), transformation
(electricity generation, refineries) and end-use (industry, buildings, transport) sectors. The
power sector has been modelled at the unit level, with states as regions. An electricity-only
version of the model was used for this study, which is driven by exogenous electricity demand,
specified at the state level. Per capita electricity consumption was projected9 at the national
level to derive national level electricity demand, based on projected population (United
Nations, 2017) . This demand was then allocated to states based on projected shares of states.
CSTEP’s consolidated power plant database included existing units (as on 2015) and planned
units (expansion and new proposed). In new subcritical, supercritical and ultra-super critical
plants, efficiencies of 36%, 38% and 41% were assumed respectively. A summary of the
database used is provided in Table 3. Plants operating during 2015–30 were seen to operate
at a weighted average PLF of 74% in 203010. Additional plants beyond the CEA’s plan were not
required to meet the exogenous electricity demand. Costs of solar PV technologies reflect the
current reverse bidding tariffs of INR 4/kWh. All other model inputs on technology costs are
consistent with previous national modelling exercises conducted by CSTEP [Refer
supplementary material of (Byravan, et al., 2017)].
Table 3: Summary of Power Plant Database and Installed Capacity (GW) in 2030
Commissioning
year Category
No of
Units
Total
Capac
ity
GW
%
Ownership
Centre State Pvt
No of
Units
Capac
ity
GW
No of
Units
Capa
city
GW
No of
Units
Capa
city
GW
Before 2003 Plant
Capacity
<500 MW
346 46 18
%
81 12 234 31 31 3
Plant
Capacity
≥500 MW
24 12 5% 18 9 5 3 1 1
Between 2003
and 2016
Plant
Capacity
<500 MW
163 37 14
%
16 4 50 12 97 21
Plant
Capacity
≥500 MW
136 93 35
%
45 25 28 21 63 47
On or after 2016 Plant
Capacity
<500 MW
37 7 3% 3 1 6 2 28 5
Plant
Capacity
≥500 MW
115 68 26
%
20 10 28 19 67 39
Total 821 263
183 61 351 86 287 116
9 Per capita electricity consumption will reach around 2400 kWh/capita by 2030. 10 PLF Range: 66% in older plants and around 90% in newly installed plants that require lesser shutdown periods for maintenance works.

Benefit Cost Analysis of Emission Standards for Coal-based Thermal Power Plants in India
www.cstep.in © CSTEP 12
Further details on model inputs are provided in Annexure A. Based on these, the IMRT model
was used to generate a reference trajectory of state-wise generation profiles. This was mapped
to individual power plants to derive coal consumption and emissions at flue-stack.
PCT Module and Scenario Phasing
The PCT module laid out the levels of controls based on the choice of control technology under
difference scenarios. Pollution control measures can be enforced in different stages of power
plant process, targeting one or more pollutants. A typical power plant can be disaggregated
into three stages depending on the layout — pre-combustion, in-combustion and post-
combustion [Refer Figure 7].
Figure 7: Schematic Diagram of Coal TPPs with PCTs
Data on PCTs (technical and cost parameters) was gathered after extensive literature survey
and discussions with technology manufacturers and providers. Detailed data are provided in
Annexure C. Table 4 illustrates, qualitatively, the trade-offs between removal efficiency and
cost for various PCTs (Bhati & Ramanathan, Clearing the Air, 2016) (Cropper, Gamkhar, Malik,
Limonov, & Partridge, 2012).
Pre-combustion
In-combustion
Post-combustion

Benefit Cost Analysis of Emission Standards for Coal-based Thermal Power Plants in India
© CSTEP www.cstep.in 13
Table 4: Cost vs Removal Efficiency of Pollution Control Technologies
The usage of washed coal instead of raw coal can reduce SOx emissions in flue gas by 25% and
PM emissions by 30% (Cropper, Gamkhar, Malik, Limonov, & Partridge, 2012). Washed coal
can also improve the plant’s performance by enhancing overall plant efficiency by 1.2%, and
increasing plant load factor (PLF) by 4% (Zamuda & Sharpe, 2007).). It can also improve the
ESP efficiency to design efficiency, ruling out the need for upgrading older ESPs to meet new
standards (Zamuda & Sharpe, 2007). NOx reduction technologies such as OFA and LNB can be
considered for units facing less stringent norms. Further, limestone injection with 55–60% SOx
removal efficiency can be considered as an alternative to the land intensive FGD installations
(~1.5 acres for 210 MW) in existing plants that are facing land availability constraints. In new
units, facing more stringent standards, post-combustion control technologies such as FGD for
SOx, SCR or SNCR for NOx, and high performance ESPs/Bag filters for PM reduction will likely
be required. However these can increase the land footprint required. The reduction of PM10
with controls also leads to a reduction in PM2.5 loads from the flue stack (van Harmelen,
Visschedijk, & Kok, 2002). Moreover, most post combustion technologies require the TPP to
be shut down during installation of the PCTs. This ranges from two to four weeks for a wet
FGD to six months for a dry FGD (which requires modification in the existing PM filters). For
PM10 control upgrades and in-combustion NOx technologies, installation time required is less
than six months. However procurement and installation of post combustion technologies can
take up to two years (Bhati & Ramanathan, 2016).
We developed a PCT applicability matrix for each plant. This was determined by emission
reduction required, derived from base emissions (determined by coal linkage and plant
operating characteristics), and the emission standard (based on vintage and unit capacity), as
well as natural resource linkage (fresh water/land availability). The final choice of technology
was determined by costs. This included upfront and running costs (including costs from
Pre-Combustion In-Combustion Post-Combustion
Removal η
Cost

Benefit Cost Analysis of Emission Standards for Coal-based Thermal Power Plants in India
www.cstep.in © CSTEP 14
increase in auxiliary consumption, and reduction in power plant efficiency). Refer Figure 8 for
logic flow.
Figure 8: Logic Flow for PCT Choice
In certain cases, a combination of pre-combustion and in-combustion technologies can also be
used to meet the desired emission standards and lower costs. However, very few plants can
use this to meet their emission standards, and others will have to invest in high capital cost
options.
Table 5 highlights that plants of vintage 2003–16 need to invest in high cost PCTs to meet
emission standards for NOx and SOx, yet upgradation of existing ESPs will not be costly for
them. However, several new plants (up to 20 GW which use high ash content coal) may need
to use washed coal along with planned ESP installations to achieve the prescribed emission
norm.
Table 5: Qualitative Representation of TPP Installed Capacity and PCT Investment
Pollutant SOx NOx PM10
Commissioning
Year
High cost
PCTs (GW)
Medium
cost PCTs
(GW)
High cost
PCTs (GW)
Low cost
PCTs (GW)
High cost PCTs
(GW)
Medium
Cost PCTs
(GW)
Before 2003 47 11 8 50 0 58
Between 2003-16 121 9 127 3 0 130
After 2016 75 75 0 16 59
Scenarios for Phasing of Emission Standards
This study explored three scenarios; a reference scenario and two policy scenarios to analyse
the impact of phased PCT installation on system level costs and benefits.
Reference Scenario: For the reference case, ESPs of removal efficiency ranging 95–98.5%
was considered, since older TPPs are assumed to adhere to previous emission standards for
PM (Table 6).
Is PCT water source same as
plant source
Choice of PCT Is it the cheapest option (INR/t of
pollutant removed)
Does PCT meet removal efficiency
target
Yes
No
Yes
No
Yes
No

Benefit Cost Analysis of Emission Standards for Coal-based Thermal Power Plants in India
© CSTEP www.cstep.in 15
Table 6: ESP Removal Efficiency Specification based on Previous Standards
Condition ESP removal efficiency
Equivalent emissions at stack exit (mg/Nm3)
TPP units commissioned before 2009 , Capacity <210 MW
95% 350
TPP units commissioned before 2009 , Capacity <210 MW
97% 150
TPP capacity units commissioned on or after 2009
98.5% 100
For policy scenarios, additional PCTs were required to meet the new PM, NOx and SOx emission
standards—chosen based on applicability and cost constraints described earlier.
Policy Scenario 1 (PS 1): The CEA proposed a phasing plan for FGD installation in March 2017
for 62% of the existing installed capacity, for the time period 2019 to 2023 (CEA, 2017 a). This
phasing plan is likely to have factored in grid feasibility and land constraints in TPPs. Although
68 GW of current installed capacity is not included in CEA’s FGD plan, PS 1 has also included
compliance for all existing plants. By 2025, all plants that are operational as per the power
sector model analysis are modelled to install and run appropriate PCTs to comply with
respective MoEFCC targets.
Policy Scenario 2 (PS 2): The second policy scenario is targeted to reduce adverse health
effects. Recent studies indicate that more health benefits can be accrued in air-sheds with
lower PM2.5 concentrations (Pope, Cropper, Coggins, & Cohen, 2015). Based on the district-
wise ambient PM2.5 concentration derived from satellite data for 2015, and TPP’s contribution
to PM2.5 concentration in that air shed, a phasing plan was modelled targeting plants in those
districts first. TPPs in districts where ambient PM2.5 concentration was below 30 µg/m3 were
targeted first (between 2019 and 2021). Hence, a higher installed capacity was targeted first
(Table 7). To account for grid feasibility, we assumed that any district with more than 3 GW
capacity could not incorporate controls in a short period of time. Plants in districts with
greater than 3 GW capacity would install controls in 2020. One more year was given for
compliance for plants in districts where there was a high contribution by TPPs to ambient
PM2.5 concentration (by 2021)11. All remaining plants were modelled as complying with the
last deadline in the CEA phasing plan, i.e., 2025.
A comparison of the year-wise targeted installed capacity is given in the table below:
Table 7: Phased Implementation of Standards in Policy Scenarios
Year PS 1 targets (GW) PS 2 targets( GW)
2019 5 15
2020 11 26
2021 45 50
2022 30
2023 15
2025 All remaining (68 GW) Remaining (83GW)
11 Contribution from TPPs in each district was evaluated using the CAMx model in the base year.

Benefit Cost Analysis of Emission Standards for Coal-based Thermal Power Plants in India
www.cstep.in © CSTEP 16
3.3 System Level Costs and Benefits for PCT Installation
To estimate the system level cost and benefits of implementing the emission standards, the
study accounted for investment, operating and maintenance costs of PCTs for every active unit
between 2015 and 2030. Further, the economic penalty of impact on TPP performance such
as reduction in boiler efficiency and increased auxiliary consumption were also captured12.
The location specific and disaggregated emission load trajectories (2015–30) under different
policy scenarios were used to estimate the change in PM2.5 concentrations due to reduction in
TPP pollution. This was translated to avoided mortality and morbidity. The health impact was
estimated using the Global Burden of Disease estimation approach (HEI, 2010; Pope, Cropper,
Coggins, & Cohen, 2015; Gunatilake, Herath; Ganesan, Karthik; Bacani, Eleanor, 2014). The
value of statistical life was informed by detailed literature review, and used to monetise the
health estimates. The following section provide further details.
Costs of Implementing Emission Standards
Literature review and stakeholder engagements informed capital and O&M costs for PCTs
used in this analysis. We modelled 14 discrete PCTs including three measures which were a
combination of two control options. We considered PCT costs in INR/kg of pollutant removed,
derived from total costs [Refer Annexure C for illustrative representation]. For existing plants,
the capital investment component was normalised to the remaining plant life during 2015–30,
while the running cost components were annualised. In new plants, capital costs were
normalised to the years of operation in the time period of interest (till 2030), and then
annualised. Based on the results of the emission trajectories at the unit level, we estimated
costs as a product of the quantity of emissions removed in each unit and the cost per kg of
pollutant removed.
Health Benefits
Long-term exposure to ambient fine particulates (PM2.5 concentrations) has been associated
with increase in risk to all-cause diseases and cardio-vascular mortality. Further studies of
health costs by the US-Environment Protection Agency (USEPA), indicate that nearly 90% of
health costs are associated with increased risk of mortality and morbidity (Pope, Cropper,
Coggins, & Cohen, 2015). For this study, hence, the focus of analysis was to estimate the
avoided mortality and morbidity due to PM2.5 reduction.
For this analysis, Urban Emissions used its Comprehensive Air Quality Model with Extensions
(CAMx) for dispersion modelling13. This Eulerian photochemical dispersion model is suitable
for integrated assessments of gaseous and particulate air pollution due to its modularity in
evaluating physical and chemical processes, and for apportioning the contributions for single
or multiple sources to the receptor regions. In this analysis, ambient PM2.5 was modelled for
all emissions from coal-fired TPPs. The model captured the primary PM contributions and the
secondary contributions from SOx and NOx emissions to the ambient PM2.5 concentrations.
12 The average coal cost is around INR 0.18/MJ and real costs for average power from the model was estimated to be around INR 1.8 to INR 2 /kWh during 2015-2030. 13 CAMx is an open-source atmospheric dispersion model. The model and its working manual is available @ http://www.camx.com. The dispersion model is driven with meteorology processed using WRF meteorological model (available @ http://www.wrf-model.org) with inputs from the NCEP reanalysis fields (available @ http://www.cdc.noaa.gov/cdc/data.ncep.reanalysis.html).

Benefit Cost Analysis of Emission Standards for Coal-based Thermal Power Plants in India
© CSTEP www.cstep.in 17
In order to analyse the health benefits on implementing new emission standards, the gridded
decrease in concentration of PM2.5 due to PCT installations in TPPs was estimated.
Equation 3
The impact on health was then estimated based on the stylised equation from Pope, et al.,
2015, which establishes the relationship of mortality avoided and change in PM2.5
concentrations (Equation 3). The Excess Risk (ER) function can follow either linear or supra-
linear forms (Pope, Cropper, Coggins, & Cohen, 2015). The linear relation with PM2.5 implies
that ER per 1 µg/m3 of PM2.5 increase is same for any ambient concentrations. However, in a
recent study, which consolidated learnings from epidemiological assessments on ambient
PM2.5 exposure and risk across different regions, it was observed that the ER or concentration
response is likely to be supra-linear (concave) at higher levels of exposure (Burnett, et al.,
2014) (Pope, Cropper, Coggins, & Cohen, 2015). This implies that a given incremental
reduction in ambient PM2.5 concentrations (ΔPM2.5) will yield greater benefits in cleaner areas
than more polluted areas. This is counterintuitive from how pollution regulation in countries
like India target polluted areas to protect the population at risk. In India, where ambient PM2.5
concentrations are already higher than the US or European countries, the slope of the ER
function, albeit flatter due to a supra-linear form (Figure 9), does not necessarily indicate that
marginal benefits of pollution control are lesser due to high population density.
Figure 9: Supra-linear and Linear Form of ER Function
To estimate district-wise ER, satellite data of ambient PM2.5 concentrations at the ground level
in 2015 (mean average) were used. As per this data, annual average PM2.5 ambient
concentrations ranged between 5.8 µg/m3 and 108 µg/m3 across districts.
0
0.2
0.4
0.6
0.8
1
1.2
0 40 80 120 160 200
ER
fu
nct
ion
ER- supra linear ER- linear
Mortality 𝐴𝑣𝑜𝑖𝑑𝑒𝑑 = ∆ 𝑃𝑀2.5 × 𝐸𝑥𝑝𝑜𝑠𝑒𝑑 𝑃𝑜𝑝𝑢𝑙𝑎𝑡𝑖𝑜𝑛 × ∆𝐸𝑅 × 𝐵𝑎𝑠𝑒𝑙𝑖𝑛𝑒 𝑑𝑒𝑎𝑡ℎ 𝑟𝑎𝑡𝑒
𝐸𝑅 (𝑒𝑥𝑐𝑒𝑠𝑠 𝑟𝑖𝑠𝑘) = 0.4 × {1 − exp −0.03(𝑃𝑀2.5)0.09 }
Supra-linear Concentration Response Function (CRF) considered on the basis of GBD Assessments
25 km X 25 km grid
Annually
Ambient concentrations from satellite data by district
National mortality rate

Benefit Cost Analysis of Emission Standards for Coal-based Thermal Power Plants in India
www.cstep.in © CSTEP 18
The spatial distribution of the base year population and its projections till 2030 were also
required for mortality estimation. The district-wise population data obtained from Census
2011 were spatially mapped for 0.25° grid, using Global Rural Urban Mapping Project
(GRUMP), a geo-referenced framework of urban and rural areas (Guttikunda & Jawahar,
2014). The overall population was projected to grow at 1.06% per annum, including
differential growth in urban and rural areas.
The annual baseline death rate for India in 2015 was 6.66 per thousand (Gunatilake, Herath;
Ganesan, Karthik; Bacani, Eleanor, 2014). During 2015 to 2030, the mortality rate was
assumed to decline at a rate of 2.03% annually (derived from historic mortality rate data from
World Bank 1960-2015)14.
Equation 4
Morbidity health endpoints such as RHA and WLD were estimated using Equation 4.
Monetising Benefits
This study monetised avoided premature deaths and morbidity using Value of Statistical Life
(VSL) and Cost of Illness (CoI) arrived from in-depth literature studies. Studies in the last
decade and a half estimated a wide range of VSLs. Across studies, VSL varies owing to various
dimensions like individual risk taking behaviour and individual characteristics such as age,
income, gender, race, immigrant status, etc. Thus, there is no uniform VSL and the VSL
estimates have to be adjusted for these dimensions (Viscusi W. K., 2011). However, the
estimation of VSL across geographic spread, accounting for risk taking behaviour and
individual characteristics was beyond the scope of this study. Instead, we considered a value
of INR 2.8 crore per life from a recent study (Madheswaran, 2007); this study accounted for
risk preferences of over 1000 workers in Chennai and Mumbai based on a hedonic price model.
This value is also within range of values reported in empirical research from India in recent
14 Same death rate is assumed across all districts
Morbidityi Avoided Annually = ∆ 𝑃𝑀10 𝑥 𝐸𝑥𝑝𝑜𝑠𝑒𝑑 𝑃𝑜𝑝𝑢𝑙𝑎𝑡𝑖𝑜𝑛 𝑥 𝐷𝑅𝐹𝑖
25 km X 25 km grid
Where i – Number of Respiratory Hospital Admission Cases (RHA) or Work Loss Days (WLD)
Inputs: PM
2.5 concentration from Urban Emission’s CAMx runs
25 km x 25 km grid PM2.5
/PM10
scaling factor obtained from CSTEP runs based on
emission inventory model- Multi-resolution Emission Inventory for China (MEIC,
2018)
DRFRHA
– 1.3 per 10 µg/m3
change in PM10
concentration (Gunatilake, Herath;
Ganesan, Karthik; Bacani, Eleanor, 2014) (HEI, 2010)
DRFWLD
– 31.5 days/1000 adults per 10 µg/m3
change in PM10
concentration (HEI,
2010)

Benefit Cost Analysis of Emission Standards for Coal-based Thermal Power Plants in India
© CSTEP www.cstep.in 19
decades [Refer Annexure-D]. The reported study value was adjusted to reflect the 2015 base
year, since the base year of comparison for costs and benefits is 2015.
For monetising morbidity benefits, the following values were taken as direct benefits
transferred based on CoI estimation (Gunatilake, Herath; Ganesan, Karthik; Bacani, Eleanor,
2014):
Monetary value of each RHA case – INR 13,750
Monetary value of each WLD (average daily wage in India) – INR 224
Estimating Impact on Tariff
Under the Electricity Act, any costs borne by the power producer owing to change of law can
be passed on to the consumer (The Electricity Act, 2003; CERC, 2014). Therefore, the
regulatory agencies will now have the task of evaluating petitions for revisions in tariffs owing
to PCT installation in TPPs. Given the differentiated impact on TPPs of the emission norms, the
costs incurred will also vary. In this regard, this study evaluated the additional impact on tariff
for various cases, following the provisions in the Electricity Act, 2003 and Tariff policy, 2006
notified by the Government of India (MoLJ, 2003). According to the Electricity Act 2003,
centrally-owned stations with inter-state electricity transmission have to follow the terms and
conditions specified by the Central Electricity Regulatory Commission (CERC) (CERC, 2014).
In case of generating stations within a state, tariff is determined by the respective state
electricity regulatory commissions.
The revised emission standards are specified for vintage and unit capacity. Based on the TPP
database, it was seen that increasingly larger capacity units were installed since 2003. Plants
installed before 1992 (~37 GW or 135 units) are of old vintage. In these plants, PCTs are
economically infeasible due to very high retrofit costs and additional land requirement. Hence
this category was not considered for financial evaluation. For plants commissioned between
1992 and 2003, majority of the installations (62 units) were 210 MW. Between 2003 and 2016,
120 units of 210 MW or 500 MW capacities (about 60 each) were commissioned. Among the
proposed plants (to be commissioned after 2016), nearly 80% of all units in the pipeline are
600 or 660 MW capacity (CEA, 2016 a; CEA, 2013; CoalSwarm, 2016). Based on the PCT
module and TPP database explained above, we assessed four cases for tariff impact (Table 8).
The cases developed represent 84% of the likely total installed capacity in 2030 (263 GW).

Benefit Cost Analysis of Emission Standards for Coal-based Thermal Power Plants in India
www.cstep.in © CSTEP 20
Table 8: Cases for Financial Assessment of PCT Costs
Case Description Representative
of (in 2030) PCT implemented &
association removal efficiency Useful life left (as on 2017)15
Case 1 210 MW subcritical unit commissioned
in 2002
20 GW LNB and OFA (52.5% for NOx), washed coal (30% for PM and 25% for SOx), LI (55% for SOx)
10
Case 2a 210 MW subcritical unit commissioned
in 2011
135 GW
Upgradation of ESP (99.4% for PM), LI (55% for SOx), SCR (90%
for NOx)
19
Case 2b 500MW supercritical unit commissioned in
2011
Upgradation of ESP(99.4% for PM), WFGD (95% for SOx), SCR
(90% for NOx)
19
Case 3 660 MW Supercritical unit commissioned in
2017
68 GW ESP (99.6% for PM), WFGD (95% for SOx), SCR (90% for NOx)
25
The Levelised Tariff (Cost) of Electricity (LToE) was estimated for each case. Results from this
analysis can serve as a benchmark for evaluating tariff increment petitions due to PCTs in
future petitions. Annexure D provides details on methodology and calculations for financial
analysis.
4. Results and Discussion
This section is divided into three parts: (1) Interpretation of emission standards; (2) Emission
trajectories for scenarios considered; and (3) Costs and benefits of complying with new
emission standards.
4.1 Interpretation of Emission Standards
The current emission factors for various coal types used in Indian TPPs were estimated
following a stoichiometric mass balance approach. Emission factors given in Section 3.1 were
normalised to mass flow rates with respect to input energy (mg/MJcoal) for ease of
interpretation (Figure 10). The current emission factor of SOx varies between 316 and 2969
mg/MJcoal based on the type of coal used in TPPs. SOx emissions from TPPs that use Indonesian
coal or lignite emits more than five times of SOx as compared to domestic coal. The NOx
emission factor for both Indian and imported coals are similar. The current PM10 emissions
with ESPs vary between 43 and 89 mg/MJcoal for domestic coal, while that with imported coal,
it is around 2–11mg/MJcoal, owing to its low ash content.
15 Useful life of 25 years was considered

Benefit Cost Analysis of Emission Standards for Coal-based Thermal Power Plants in India
© CSTEP www.cstep.in 21
Figure 10: Current Emission Factors (EF) 16
The new emission standards in concentration metrics were converted into mg/MJcoal using
Equation 2 (Table 9).
Table 9: Emission Standards in terms of mg/MJcoal
Installation Period
Unit Capacity(MW) Pollutants concentration (mg/MJcoal)
SOx NOX PM10 Hg
before 2003 <500 190.68
190.68 31.78 0.01 ≥500 63.56
2003 -2016 <500 190.68
95.34 15.89 0.01 ≥500 63.56
from 2017 All 31.78 31.78 9.53 0.01
Based on the new emission standards and current emission factors, new plants (commissioned
after 2016) need to reduce SOx and NOx emissions by 95–98% and PM10 by 20% (imported
coal) to 85% (indigenous coal). The plants commissioned during 2003 and 2016 need to curb
SOx emission by 88–95% and NOx emission by ~80% to meet the emission standards. Also,
these plants need to reduce PM10 emission by 20–85% depending on the coal type used. TPPs
commissioned before 2003 have to comply with a more relaxed standard as compared to the
16 The domestic coal type denotes the average coal composition of indigenous sub-bituminous coal type used in Indian TPPs
0
500
1,000
1,500
2,000
2,500
3,000
SOx
EF
(m
g/M
J coal
)
010203040506070
PM
10
EF
(m
g/M
J coal
)
0
50
100
150
200
250
300
350
400
NO
x E
F (
mg/
MJc
oal
)

Benefit Cost Analysis of Emission Standards for Coal-based Thermal Power Plants in India
www.cstep.in © CSTEP 22
plants of 2003–16 vintage, and these plants can meet the new standards by reducing their
current emission by 30% (PM) and 66% (SOx).
4.2 Emission Trajectories for Scenarios Considered
Based on the future electricity demand projections, electricity generation from TPPs till 2030
were estimated using the IMRT model. Around 90 GW of additional capacity, including
expansion plans and new coal TPPs, were modelled for the 2015–30 time period, to meet the
demand (accounting for retirement of 40 years). This is similar to the coal capacity addition
plans from CEA’s own scenario planning, which accounts for 50 GW of under-construction
plants and an additional capacity of 44 GW during 2022–27 (CEA, 2016 b). The IMRT model
suggests that in 2030 for a total electricity generation of around 2900 TWh, around 62% will
be from coal TPPs. Using state level electricity generation profiles from the model, annual coal
consumption for each unit in 2015–30 was estimated. The annual coal consumption in the
power sector will double from 515 million tonnes in 2015, to 1023 million tonnes in 2030. The
reference emission trajectories till 2030, based on the coal linkage at plant level and derived
emission factors, are given in Figure 11.
Figure 11: Electricity Generation, Coal Consumption and Emission Trajectories in the Reference Case
As shown in Figure 11, in the reference scenario, SOx and NOx emissions will double by 2030
(non-compliance of standards). PM10 emissions are expected to increase by ~30%. The smaller
815
1078
15241637
0
500
1,000
1,500
2,000
2015 2020 2025 2030
TW
h
0
500
1000
2015 2020 2025 2030
CO
AL
(M
T)
Domestic LigniteIndonesian South AfricanAustralian
6449
13494
2966
6050
605790
0
4,000
8,000
12,000
16,000
2015 2020 2025 2030
Em
issi
on
s (k
T)
SOx NOx PM10

Benefit Cost Analysis of Emission Standards for Coal-based Thermal Power Plants in India
© CSTEP www.cstep.in 23
rate of increase in PM10 emissions can be attributed to ESPs installed in existing TPPs to meet
earlier standards17.
Figure 12: Specific Emissions Trajectories in the Reference Case
Even though the absolute emissions will increase year-on-year, the overall specific emissions
of generation remain around the same during 2015 to 2030 (Figure 12). In the reference case,
specific pollutant emissions for SOx, NOx and PM10 in 2015 were 7.92 g/kWh, 3.64 g/kWh and
0.74 g/kWh, and 7.68 g/kWh, 3.44 g/kWh and 0.45 g/kWh in 2030, respectively. A marginal
decrease in SOx and NOx specific emissions is foreseen in 2030 mainly due to the addition of
new plants with higher overall plant efficiency. The specific emission for PM10 will reduce by
nearly half due to the installation of high performing ESPs in new plants.
Emission Trajectories for Policy Scenarios
The emission trajectories for the reference and two policy scenarios (with additional PCTs to
meet the standards) are shown in Figure 13.
During 2019 and 2025, a gradual reduction in emission is seen, reflecting the implementation
of PCT phasing plan in existing TPP units. By 2030, with the implementation of PCTs, the SOx
and NOx emission can be reduced by 95% and 87%, respectively, and PM10 increase can be
limited by 83%. Complying with the new emission standards will also drastically reduce the
SOx, NOx and PM10 specific emissions in 2030 to 0.36 g/kWh, 0.43g/kWh and 0.08 g/kWh,
17 A sensitivity analysis on reference emission trajectories was carried out with blended domestic and imported coal in the ratio, 70:30 (typical blending ratio in India). With the blended coal emission factor, the total emissions in the reference trajectory reduced by 6% of the total SOx emission from TPPs. In other pollutants deviation was marginal.
7.927.68
0.00
1.50
3.00
4.50
6.00
7.50
9.00
2015 2020 2025 2030
Spec
ific
SO
xem
issi
on
(g
/kW
h)
3.64 3.44
0.00
1.50
3.00
4.50
6.00
7.50
9.00
2015 2020 2025 2030
Spec
ific
NO
xem
issi
on
(g
/kW
h)
0.74
0.45
0.00
0.20
0.40
0.60
0.80
1.00
2015 2020 2025 2030
Spec
ific
PM
10
emis
sio
n
(g/k
Wh
)

Benefit Cost Analysis of Emission Standards for Coal-based Thermal Power Plants in India
www.cstep.in © CSTEP 24
respectively (Figure 14). For SOx and NOx, the intensity drops by 20 times and 8 times
(respectively) as the plants didn’t have to meet any emission standards earlier.
Figure 13: Emission Trajectories for Policy Scenarios
Figure 14: Specific Emissions with and without Pollution Controls in 2030
Costs for Complying with Standards
We estimated the total investment required till 2030 based on the unit-level PCT choices from
the applicability matrix and compliance timeframe, specified under each scenario. This
included additional expenses such as operational and maintenance costs (O&M)18 of PCTs,
reagent costs and additional costs (plant efficiency reduction and increased auxiliary
consumption). The total investment under PS 1 was INR 3,96,200 crore (INR 3,962 billion).
Under PS 2, the total investment required was INR 3,91,100 crore (INR 3,911 billion) 19. Capital
investment of INR 2,57,700 crore accounts for 64% to 70% in PS 1 and PS 2, respectively.
18 O&M costs include annual maintenance expenses, labour costs, auxiliary power consumption and penalty for reduction in overall plant efficiency in terms of additional coal requirement. 19 There is a marginal difference in total costs between PS 1 and PS 2 since delayed implementation on certain plants leads to lower running costs. Moreover, greater benefits are be seen in PS 2, explained in the following section.
7.68
3.44
0.450.34 0.43 0.08
0
2
4
6
8
SOx NOx PM10
Spec
ific
em
issi
on
s
(g/k
Wh
)
Reference Policy Compliance
6449
0
3000
6000
9000
12000
15000
2015 2020 2025 2030
SOx
(kT
)
591
13494
95%
6050
2966
7620
2000
4000
6000
8000
2015 2020 2025 2030
NO
X(k
T)
87%
790
605
1350
500
1000
2015 2020 2025 2030
PM
10
(kT
)
Reference scenario PS 2 PS 1
83%

Benefit Cost Analysis of Emission Standards for Coal-based Thermal Power Plants in India
© CSTEP www.cstep.in 25
Figure 15: Share of PCT Investment required for SOx, NOx and PM10 Reduction
The investment required for SOx PCTs was highest, owing to the high capital cost, as compared
to other pollutant controls (accounts for 63% of the total investment) (Figure 15). Privately-
owned plants will face the highest costs for meeting standards (over 45%), followed by state-
owned (32%), and centrally-owned plants (24%).
Comparison with Other Studies
Recent estimates are available from other research groups and the power producers
association. The Centre for Science and Environment (CSE) reported that the total capital
investment required for installing PCTs in 169 GW of existing plants (excluded 17 GW of old
vintage) is around INR 71,700 crore (Bhati & Ramanathan, 2017). Albeit CSE accounted for the
varied costs of PCTs required by different vintage and capacity plants in detail, this assessment
did not consider O&M costs, which we estimate will account for at least 30% of the total costs.
In their assessment, CSE also reported that TPP units commissioned between 2003 and 2016
can meet NOx emission standards with cheaper control technologies such as LNB and OFA.
Whereas, in our analysis, baseline NOx concentrations were modelled for each plant. This
indicated that only lignite TPP units commissioned between 2003 and 2016 can achieve the
NOx target using LNB (2.5 GW). Since we have compared our weighted average NOx specific
emissions in g/kWh with the values reported by MoEFCC (PIB, 2015), we feel our
representation of costs is reasonable and possibly better disaggregated.
Another study by the Association of Power Producers (APP) estimated capital costs required
for PCT installation in recent TPPs (commissioned after 2003), and accounted for 186 GW of
installed capacity (including 54 GW of proposed TPPs on the anvil). Their capital cost is
estimated at INR 2,80,000 crore (Krishnan, 2016). While its order of magnitude is consistent
with this study’s aforementioned capital cost estimate, APP estimates covered fewer plants
and may have over-estimated the market opportunity (we estimated investments required for
263 GW of installed capacity by 2030).
SOx63%
Nox32%
PM105%
SOx Nox PM10

Benefit Cost Analysis of Emission Standards for Coal-based Thermal Power Plants in India
26 www.cstep.in © CSTEP
Figure 16: PM2.5 Concentration due to TPP Emissions with and without PCT (PS 2)
Base year 2015
Reference 2019 (Without PCT)
Reference 2023 (Without PCT)
Policy Scenario 2019 (With PCT)
Policy Scenario 2023 (With PCT)

Benefit Cost Analysis of Emission Standards for Coal-based Thermal Power Plants in India
© CSTEP www.cstep.in 27
Figure 17: PM2.5 Concentration due to TPP Emissions with and without PCT (PS2 & Reference) (continuation)
Reference 2025 (Without PCT)
Reference 2030 (Without PCT)
Policy Scenario 2025 (With PCT)
Policy Scenario 2030 (With PCT)

Benefit Cost Analysis of Emission Standards for Coal-based Thermal Power Plants in India
www.cstep.in © CSTEP 28
Benefits on Complying New Emission Standards
PM2.5 in ambient air is responsible for major diseases and associated premature mortality
(Cropper, Gamkhar, Malik, Limonov, & Partridge, 2012). The CAMx dispersion modelling was
used to estimate the change in ambient PM2.5 concentration owing to TPP emissions. The
population weighted average concentration (attributed to TPP emissions) in 2015 was around
1.21µg/Nm3 and will increase to 2.19 µg/Nm3 in 2030 if standards are not implemented by 2025
(Figure 16 and Figure 17). The PM2.5 concentration (from TPPs) was high in states like West
Bengal, Chhattisgarh, Tamil Nadu and Maharashtra owing to the larger number of TPPs in these
states. Once emission controls are installed, the population weighted average concentration of
PM2.5 in 2030 will drop to 0.15 µg/m3 (93% lesser than the reference case).
Based on the difference in gridded PM2.5 concentrations (annual average) between the reference
and policy scenarios, we estimate that around 3.0 to 3.2 lakh premature deaths can be avoided
during 2019 and 2030.
Moreover, the health benefits will continue beyond 2030 and were not estimated in this study.
From Figure 18, it can be inferred that targeting TPPs in lesser polluted air sheds based on PS 2
phasing plans can save 15,000 additional lives between 2019 and 2025.
Figure 18: Mortality Reduction in Two Policy Compliance Scenarios
The costs per life saved was estimated to be in the range INR 1.36 crore (PS 2) to INR 1.44 crore
(PS 1).
Further, we estimated the avoided diseases or morbidity in terms of RHA and WLD avoided.
Implementing PCTs, can avoid about 5.1 crore hospital admission cases due to respiratory
disorders (43 lakhs cases per annum) for the period 2019–30. This implies a reduction in 126
million WLD due to poor health from TPP emissions.
Regional Comparison of Costs and Benefits
Most of the existing and planned coal plants are located in the states of Chhattisgarh, Tamil Nadu,
Maharashtra and Uttar Pradesh. Hence, these plants will have to incur the largest investments
and most states will also see commensurate health benefits. Figure 19 and Figure 20 illustrate
the cost and benefit shares in five major states. Over 50% of the total investment will be in five
states, namely Maharashtra, Uttar Pradesh, Chhattisgarh, West Bengal and Andhra Pradesh.
0
5,000
10,000
15,000
20,000
25,000
30,000
35,000
40,000
45,000
20
15
20
16
20
17
20
18
20
19
20
20
20
21
20
22
20
23
20
24
20
25
20
26
20
27
20
28
20
29
20
30
Nu
mb
er o
f L
ives
Sav
ed
PS 1 PS 2

Benefit Cost Analysis of Emission Standards for Coal-based Thermal Power Plants in India
© CSTEP www.cstep.in 29
Figure 19: State-wise share of PCT Investment required (PS 2)
Figure 20: State-wise Mortality Reduction with Emission Standard Compliance (PS 2)
The states with maximum health benefits are Tamil Nadu, West Bengal, Maharashtra, Andhra
Pradesh and Uttar Pradesh. Mortality avoided due to TPP emissions are seen to be lesser in Uttar
Pradesh as compared with Tamil Nadu despite the former’s higher population density. This is due
to the excess risk estimation linked to a supra-linear function, wherein the slope is adjusted for
districts based on base year ambient PM2.5 concentration in 2015. The average ambient PM2.5
concentration from satellite data in Uttar Pradesh’s districts was around 88 µg/m3 where risk
was lower, while in Tamil Nadu was ~ 27 µg/m3 where risk is greater.
Though Chhattisgarh ranks third in PCT investment, the benefit in this state is relatively lesser
than benefits seen in West Bengal. This is mainly attributed to its lower population density.
Whereas in West Bengal, with less than 7% of the total investment, it is ranked second in the
number of lives saved. This can be attributed to its higher exposed population, and emission
controls in Chhattisgarh’s TPPs lowering ambient concentrations and exposure. States such as
West Bengal, Tamil Nadu, Jharkhand and Chhattisgarh have the highest morbidity benefits. The
cumulative regional impact on mortality and morbidity is depicted in a grid-wise plot (Figure 21).
14%
12%
10%
10%
9%
45%
Maharashtra Uttar Pradesh Chhattisgarh
Andhra Pradesh West Bengal Other States
10%
8%
16%
8%
13%
45%
Maharashtra Uttar Pradesh Tamil Nadu
Andhra Pradesh West Bengal Other States

Benefit Cost Analysis of Emission Standards for Coal-based Thermal Power Plants in India
www.cstep.in © CSTEP 30
Figure 21: Avoided Cumulative Mortality (a) and RHA (b) till 2030 with Implementation of Emission Standards (PS 2)
Benefit Cost Analysis
This study evaluated the costs of and benefits from implementing the emission standards. The
monetised benefit of avoided premature deaths is estimated to be INR 8,88,038 crore during
2015 to 2030. Further costs avoided due to reduction in RHA and WLD was estimated to be INR
74,184 crore [INR 71,367 crore (RHA) and INR 2,817 crore (WLD)]. The total health benefit was
monetised to be INR 9,62,222 crore by 2030. However, when the monetised benefit annually was
plotted against the annual investment for phased implementation of emission controls, benefits
outweighed investment in 2019. This indicates that India can accrue significant economic gains
by implementing emission standards for TPPs in a time bound manner.
(a) (b)

Benefit Cost Analysis of Emission Standards for Coal-based Thermal Power Plants in India
© CSTEP www.cstep.in 31
Figure 22: Benefit vs. Cost Analysis of New Emission Standards in TPPs (PS 2)
The analysis indicates that in order for estimated health benefits (lives saved, RHA & WLD) and
estimated costs to ‘break-even’ by 2030, premature mortality can be valued at up to INR 99 lakh
per life saved. This translates to around 100 times average per capita income in India in 2015.
This ratio is lower when compared to USA valuation –150 times the average per capita income20
(United States Environment Protection Agency).
Estimating Impact on Tariff
This section estimates the incremental increase in electricity tariff because of PCTs. We estimated
the generation cost (with and without PCTs) for four representative cases, as described in the
methodology section. In older plants, which use low cost control options, the tariff increases by
around 9%. In newer and larger units, higher investment is needed to install high performance
control equipment, leading to tariff hikes of 20% to 25%. Evidently, there is a considerable
increase in the electricity tariff [Refer Section 2.3 and Annexure-D for further details].
Table 10: Cost Implications of PCT Implementation in Coal Power Plants
Cases Generation cost without PCT (INR/kWh)
Generation cost with PCT
(INR/kWh)
Increase in generation cost
(INR/kWh)
Percentage increase
(%) Case 1 2.74 2.99 0.25 9 Case 2a Case 2b
3.23 2.92
3.92 3.65
0.69 0.73
21 25
Case 3 3.27 3.89 0.63 19
From the analysis, we inferred that case 2 plants (or units installed during 2003–16) will face the
highest impact on tariffs. This is because of the high upfront costs of the PCTs required to meet
the stringent standards, and lesser time to recover the investment from tariff increase. Also, as
shown in the Methodology Section, case 2 plants account for the highest share of installed
capacity (over 50% of total installed capacity). Therefore, tariff revision petitions from these
category units are likely to be the highest.
20 USEPA’s default VSL for monetising benefits at $7.4 million (INR 4.8 crore) per life in 2006
2,57,729
3,91,095
9,62,222
0
2,00,000
4,00,000
6,00,000
8,00,000
10,00,000
12,00,000
2015 2017 2019 2021 2023 2025 2027 2029
INR
Cro
re a
t 2
01
5 P
rice
s
Cumulative capital cost Cumulative total cost Cumulative mortality + morbidity benefit

Benefit Cost Analysis of Emission Standards for Coal-based Thermal Power Plants in India
www.cstep.in © CSTEP 32
Figure 23: Percentage Share of Ownership of Plants in 2003–16 Vintage
Of these plants, around 52% is privately owned (Figure 23). The state and centrally owned plants
may find it easier to meet the upfront costs of PCTs via planned budgetary allowances. However,
individual power producers in the private sector will find it challenging to front the large amount
of PCT investment required.
The higher capital investments for SOx and NOx controls, as well as additional regent costs, drive
up the overall costs for implementing the standards. Further, since lesser time is available to this
vintage of plants to recover investments, tariff is higher (increase of 20% to 25%) in this category
as compared to Case 3 plants. In Case 1 plants, we anticipate an increase of around 9% (0.28
INR/kWh). The tariff increase in this case is significant despite the less costly PCTs due to a lower
recovery time. Also, it is important to note that in plants that need to install WFGDs (Case 2b and
Case 3), a considerable reduction in the additional cost incurred is possible with the development
of synthetic gypsum—a by-product from WFGD. The FGD gypsum can be used in cement
production, road construction, and agriculture to improve soil properties. The tariff in this case
can be limited to INR 3.82/kWh (~17%).
Comparison of Estimated Tariff with Other Studies
CSE estimated that the average tariff increase without accounting for O&M investments would be
around INR 0.20–0.35/kWh (Bhati & Ramanathan, 2017). Meanwhile, APP which likely
accounted for high capital intensive options, estimated tariff increase in the range of INR
0.50/kWh to INR 1.25/kWh (Krishnan, 2016)21. This study’s financial cases for tariff assessment
are comparable with our estimates and cover a wider range of cases in a consistent manner.
Impact of PLF on Tariff
The impact of PCT installation on generation tariffs for plants operating at lower PLFs is
significant. We estimated that the base tariff (without PCTs) for plants operating at lower PLF
(50%) is possibly already much higher—by INR 0.7/kWh (Case 1) to INR 0.97/kWh (Case 2b).
This implies that these power producers are already facing a 27–33% increase in generation
costs. The major reason for lower PLFs in TPPs is the lack of continuous coal supply, increased
maintenance time in older TPPs, and issues of surplus power in the grid (Mukherjee & Tripathy,
2017) (Equitymaster, 2018). According to a Reuters analysis, over 50 TPPs based on coal or gas
are operating at lower PLFs (30–50%) (Mukherjee & Tripathy, 2017).
With the introduction of PCTs in these plants, the difference in tariff will be compounded, and will
be as high as INR 1/kWh (Case 1) to INR 2/kWh (Case 2b). Therefore, installation of PCTs in
21 Further, a news report informed by the Minister for Power reported that the tariff can increase by INR 0.62-0.93/kWh in the first year of plant’s operation with PCTs (PTI, 2018).
Center24%
State24%
Private52%

Benefit Cost Analysis of Emission Standards for Coal-based Thermal Power Plants in India
© CSTEP www.cstep.in 33
plants operating at lower PLFs will put them under more financial stress. Hence, in plants of
relatively newer vintage, PCT installations will be financially viable only if measures to improve
PLF are undertaken. For older plants operating at the bare minimum technical PLF, policy
guidelines that mandate shutdown plans, especially in winter months when emissions may not
disperse, would be economically more feasible than installing PCTs. Seasonal shut down plans
have also been deployed in China (Lelyveld, 2017). Similar allowances have also been considered
in the European Union (Wynn & Coghe, 2017). These guidelines can serve as a template for the
Indian context.
4.4 Summary and Policy Recommendations
This study has shown that the MoEFCC’s new standards would imply that SOx emissions from
individual TPPs will reduce by 67–95%, NOx by 41–95% and PM10 by 50–85% across plants of
different unit capacity and vintage. We estimated that the total investment for installing and
operating PCTs till 2030 will be around INR 3,96,200 crore. However, the benefits accrued include
avoiding over 3 lakh premature deaths and morbidity reduction. When monetised, the benefits
outweigh cumulative investments. Hence, the standards if implemented in a time bound manner
can offer considerable social benefits.
Possible policy interventions to address implementation bottlenecks, like firming up tariff
revisions guidelines, and financing options for managing high upfront costs, are provided below:
1. Pass tariff onto consumers
The Electricity Act mentions recourse to power producers in cases where tariff revisions
are necessitated by a change in law, such as the new emission standards. Based on the
financial case analysed (including capital and variable costs), we propose the following
options to pass tariff onto consumers:
a. State Electricity Regulatory Commissions (SERC) and CERC include an allowance in
the new tariff guidelines (2019–24) for plants commissioned between 2003 and 2016
to avail a tariff hike of up to INR 1/kWh for 5 years, or up to INR 0.7/kWh for 10 years.
b. SERCs and CERCs include an allowance provision of up to INR 8.5 lakhs/MW per
annum, for 5 years, for older units (Case 1) to recover their PCT investment. This
would be similar to the annual allowance provision in older guidelines given to old
plants for cost recovery of life extension activities (INR 7.5 lakhs/MW per annum)
(CERC, 2014).
2. Provide one year grant window or subsidy scheme
Since upfront costs will likely be a serious barrier in implementing the standards in a time
bound manner, the government can consider an enabling grant corpus or a subsidy
scheme. Providing a one-year window for availing a grant of INR 93,500 crore can support
the PCT capital investment needed in plants commissioned between 2003 and 2016 (or
37% of the total capital investment). Plants that seek this may not be entitled to the tariff
revisions owing to increased capital investments. However, they can seek tariff revisions
based on allowance of up to INR 18 lakhs/MW per annum toward variable or operating
cost of PCT (limiting the end tariff increase to 14%).
3. Enable additional revenue for new plants
Newer plants will have to compete in the electricity market with higher tariffs. A loan
interest waiver or lower loan interest rate for PCTs, to incentivise quicker uptake, can
have only a marginal effect on limiting tariff increase; tariffs will still increase by around
17%. Meanwhile the development of a synthetic gypsum (a by-product from FGD) market

Benefit Cost Analysis of Emission Standards for Coal-based Thermal Power Plants in India
www.cstep.in © CSTEP 34
in India can provide additional revenue for new plants. Synthetic gypsum can be used as
a raw material in cement and glass manufacturing industries, or as a construction
material. This could limit the increase in tariff to 15% (approx. INR 0.5/kWh increase in
tariff).
Lastly, the government needs to address other concerns such as lack of domestic PCT
manufacturing capacity, limited technology providers in India, and the delays in procurement and
installation of PCTs (up to 2 years). One possible solution could be the removal of tax levies for
imported PCT equipment during a five-year window. Further, since this is an industry-wise
mandate, shutdown time for installation of PCTs in several plants and PCT procurement plans,
need to be evaluated and scheduled from a grid-stability perspective. Furthermore, select plants
with stranded capacity or financial stress could be allowed explore options to operate during
monsoon seasons and face closures in winter months.
Limitations of this Study
Uncertainty on power plant operating conditions
The combustion conversion factors for carbon, hydrogen, sulphur and nitrogen in coal were
assumed to be constant in the mass balance analysis. These conversion factors are a function of
boiler characteristics such as temperature and pressure, and excess air fed to the boiler. These
can also be modelled dynamically or measured at the flue stack (via CEMS). This would reduce
the uncertainty on baseline emission factors, and by extension, the choice of PCTs and costs.
Data gaps in power plant data
The data on coal linkages for 20 GW installed capacity was not available. In this case, the nearest
coal fields were considered as the coal source. Better data on coal usage and composition can
enable more robust estimation of emission trajectories and choice of PCTs.
Unavailability of all sources emission inventory and regional baseline health effects
The study used a static baseline death rate based on nationally reported numbers. District-wise
death rate for the base year may affect the estimated values. Similarly, there is no emission
inventory and projection available for all point sources till 2030. Hence tracer runs on CAMx were
used that isolated the effects of TPPs on ambient PM2.5 concentrations. With improvements in
data availability and modelling approaches, the estimation of the regional variation can be
strengthened.

Benefit Cost Analysis of Emission Standards for Coal-based Thermal Power Plants in India
© CSTEP www.cstep.in 35
Annexure-A
CSTEP Power Plant Database and Ancillary Model Input Data
Coal Plants
Coal power plants in India were classified based on vintage and unit capacity, specified in
emission standards for carrying out the current study, conducted at CSTEP.
As shown in Table 3, a majority of the TPP units before 2003 were less than 500 MW capacity. It
is also seen that increasingly larger capacity units have been installed since 2003. Around 72% of
the total existing installed capacities are between 2003 and 2016. In the proposed plant category
(to be commissioned after 2016), nearly 80% of all units in the pipeline are 600 or 660 MW unit
capacity (CEA, 2016 a; CEA, 2013; CoalSwarm, 2016). Majority of the high capacity (≥500 MW)
plants are privately owned.
Non-coal Power Plants
The CEA database was used to baseline generation, installed capacity and efficiency for nuclear,
gas and diesel power plants (Table 11). The installed capacity of renewables was benchmarked
against data provided by CEA (2016) for which the model identified representative plants.
Table 11: Non-coal Power Generation Installed Capacity used in IMRT
Ownership Gas Diesel Nuclear Hydro Renewable Total (GW)
Central 7 0 7 12 0 26
State 7 0 0 30 2 39
Private 11 0 0 3 55 70
All India 25 1 7 45 57 135
Based on progress against India’s three-stage civil nuclear plans, we accounted for around 22 GW
of nuclear installed capacity being operational by 2030. Meanwhile, the CEA has plans for an
additional 15.9 GW of large hydro power plants. Further, based on the lower investment cost
specified for solar plants, the 175 GW target of the NDCs is also achieved by 2030.
Coal Linkages
Data on type of coal linked to TPP units were collected from various literature sources (CEA,
2015; CoalSwarm, 2016). Few assumptions were made wherever data were not available, such
as choosing nearest coal fields or ports. The major domestic coal suppliers are SECL and MCL, and
that among imported coal is Indonesian coal. In practice, to limit PM emissions, the MoEFCC had
stipulated that ash content in coal used at TPPs can’t exceed 34% - hence several plants blend
domestic coal with imported or lower ash coal.
Inputs on Plant-level Efficiency
Efficiency is the ratio of the energy generated to the total heat units of fuel consumed. Station heat
rate (kCal/kWh) is the energy expended to obtain a unit of useful work (Nowling, 2015). The
efficiency is the inverse of heat rate. Efficiency of a thermal power plant can be calculated by using
Equation 5.

Benefit Cost Analysis of Emission Standards for Coal-based Thermal Power Plants in India
www.cstep.in © CSTEP 36
Equation 5
Efficiency = (Fuel emission factor/ specific emission factor of plant)*conversion factor22
Using the above equation, we back calculated the plant level efficiencies of coal TPPs in the CSTEP
database. We triangulated the plant level data against emissions and generation data provided in
the CO2 database for historic years (2010–15). Based on the equation given above, the calculated
efficiencies assumed for power sector modelling averaged around 30.2% across existing TPPs.
This is marginally lower than the 32% average efficiencies calculated from the average station
heat rate reported for coal plants in recent years. Around 5% of the installed capacity or 56 units
had efficiency lesser than 30%. Around 81% of these inefficient plants were state-owned and the
remaining were owned by the centre or private power producers.
Resource Availability Inputs
The IMRT model was provided state-level renewable energy resource potential as per estimates
of the Ministry of the New and Renewable Energy.
Table 12 summarises the all India estimate by resource category.
Table 12: Renewable Energy Potential (GW)
Solar Wind Small Hydro Biomass
749 102.8 19.7 25.1
Source: (Ministry of New and Renewable Energy, 2017)
Further, our analysis also accounted of coal resource availability driven by production and costs,
and defined in INR/PJ terms annually for different domestic and imported coal types. We used
overall production targets from CIL for domestic coal till 2020 (estimated at around 700 MT for
non-coking domestic coal) and assumed these will be realised by 2030 (CCO, 2015; Saha, 2017).
Similarly, using historic trends coal import availability was projected to grow by around 3.5 times
to around 381 MT (Indian Bureau of Mines, 2015). Based on available data, coal cost at pithead
was assumed to range from INR 720/tonne (GCV range 3400-3700 kcal/kg) to INR 2900/tonne
(SCCL coal of GCV 5110 kcal/kg) (CIL, 2016; The Singareni Colleries Company, 2017). Further,
transport costs based on travel distance from pithead to TPP were also factored in as the location
of the TPP units were known. This ranged from INR 205/tonne of coal (distance of 1–125 km) to
INR 1607/tonne of coal (distance of 1100–1200 km) (Railway Board, Ministry of Railways, 2015).
22 CEA reported a fuel emission factor of 90.6 g CO2/MJ in its emission database updated in 2016. Station level specific emission averaged at 1.04 t CO2/MWh for coal plants. Conversion factor (1 MWh=3600J)

Benefit Cost Analysis of Emission Standards for Coal-based Thermal Power Plants in India
© CSTEP www.cstep.in 37
Annexure–B
Estimating Baseline Emission Factors for Coal TPPs
Coal types majorly used consist of 9 domestic and 3 imported. The nine major coal fields in India
are Western Coal Field Limited (WCL), Eastern Coal Field Limited (ECL), Central Coal Field
Limited (CCL), Mahanadi Coal Field Limited (MCL), Northern Coal Field Limited (NCL), South-
Eastern Coal Field Limited (SECL), Singareni Collieries Company Limited (SCCL), Bharat Coking
Coal Limited (BCCL), Neyveli Lignite Corporation and Kutch Lignite. The imported coal majorly
used in India are Indonesian, South African and Australian. The composition and calorific value
of 9 domestic coal types and 3 imported coal types are given in Table 13 and Table 14,
respectively.
Table 13: Coal Composition and Gross Calorific Value for Indian Coal Types
Component ECL NCL CCL SECL WCL MCL SCCL BCCL Lignite
Carbon (%) 46.9% 40.3% 42.3% 50.2% 42.1% 35.6% 46.2% 43.0% 26.0%
Hydrogen
(%) 3.0% 2.6% 2.7% 3.1% 2.9% 2.5% 2.9% 2.6% 2.3%
Sulphur (%) 0.5% 0.3% 0.5% 0.5% 0.7% 0.5% 1.0% 0.4% 1.5%
Nitrogen (%) 1.2% 0.8% 0.9% 1.1% 0.9% 0.9% 0.9% 1.0% 0.2%
Oxygen (%) 10.5% 5.5% 9.5% 8.2% 4.3% 7.3% 9.3% 6.5% 16.3%
Moisture (%) 5.3% 9.4% 7.8% 6.1% 7.5% 8.2% 5.2% 1.0% 47.0%
Ash (%) 29.6% 37.4% 33.0% 28.0% 37.8% 40.9% 31.4% 41.4% 7.0%
Hg (%) 8 x 10^-6
%
6 x 10^-6
%
22 x 10^-6
%
10 x 10^-6
%
12 x 10^-6
%
20 x 10^-6
%
12 x 10^-6
%
8 x 10^-6
%
8 x 10^-6
%
GCV
(kcal/kg) 4450 3835 4111 5008 4562 3570 5110 4875 2234
Table 14: Coal Composition and Gross Calorific Value for Imported Coal Types
Component Indonesian South African Australian
Carbon (%) 62.37 74.99 70
Hydrogen (%) 5.02 5.16 4.80
Sulphur (%) 2.21 1.31 .50
Nitrogen (%) 0.96 1.88 1.70
Oxygen (%) 9.71 7.04 6.30
Moisture (%) 9.68 1.09 2.30
Ash (%) 10.05 8.53 14.40
Hg (%) 12 x 10^-6 % 8 x 10^-6 % 8 x 10^-6 % GCV (kcal/kg) 6290 7540 6990

Benefit Cost Analysis of Emission Standards for Coal-based Thermal Power Plants in India
www.cstep.in © CSTEP 38
Figure 24: Schematic Representation of Mass Balance Analysis
To estimate the variations in emissions pertaining to coal compositions, a typical TPP unit of 210
MW capacity and plant operational parameters such as Plant Load Factor (PLF) of 70% and
overall plant efficiency of 33% (Indian average as per CEA data base) was considered for pollutant
estimation. The schematic representation of mass balance calculations is shown in Figure 24.
The current concentration of pollutants emitted from coal TPPs was estimated from volumetric
flow rate of the flue gas and the mass flow rate of the pollutants at stack exit, as given in Equation
6.
Equation 6
Concentration (mg
Nm3) = 𝑀𝑖̇
�̇�
Where,
�̇�𝑖 − Mass flow rate of pollutant i in the flue gas, (mg
year)
�̇� − Flue gas volumetric flow rate (FGFR) at STP (Standard Temperature and Pressure), (Nm3
year)
The mass flow rate of the each pollutant was obtained from stoichiometric mass balances and the
flue gas volumetric flow rate at ideal condition was calculated assuming that flue gas behaves as
ideal gas (Chandra & Chandra, 2004).
The volumetric flow rate of pollutant i in the flue gas,
Equation 7
𝑉𝑖̇ (m3
year) =
𝑛𝑖̇ 𝑅𝑇1
𝑃1
Where,
�̇�𝑖 – Molar flow rate of Pollutant i, (mol
year)
T1 – Temperature at stack exit
P1 – Pressure at stack exit
Calorific Value of coal
Coal Composition
Conversion Factors
Combustion Equations
Plant Characteristics Coal Consumption
(kg/hr)
Ideal Gas Equation
Concentration
(mg/Nm3)
Emission Factor (mg/MJ
input)
Pollutant flow rate (kg/hr) (kmol/hr)

Benefit Cost Analysis of Emission Standards for Coal-based Thermal Power Plants in India
© CSTEP www.cstep.in 39
R – Universal gas constant, 8.314 J
K mol
The sum of volumetric flow rate of all the components in flue gas was used to calculate the FGFR
using ideal gas Equation of State (EoS).
Equation 8
𝑃1�̇�1
𝑇1=
𝑃2�̇�2
𝑇2
Equation 9
�̇�2 =𝑃1�̇�1𝑇2
𝑇1𝑃2
Where,
�̇�1 – Sum of volumetric flow rate (m3
year) at stack exit conditions
P2 – 101325 Pa
T2 – 273.15 K
The mass flow rate of flue gas components estimated from stoichiometric calculations and FGFR
calculated from Equation 9 were then inputted to Equation 6 to evaluate the concentration of
each pollutant in flue gas at STP. The concentration of the flue gas components like CO2, H2O, SOx,
NOx and PM10 were evaluated.
Stoichiometric Calculations
The combustion reactions for solid fuels like coal, coke are as follows.
C + O2 → CO2
H2 + 1/2O2 → H2O
S + O2 → SO2
1/2N2 + O2 → NO2
N2 + O2 → 2NO
Mass flow rate of ith component in the coal is given by,
Equation 10
�̇�𝑖 = 𝐶𝐹𝑅 x 𝑤/𝑤𝑖
Where,
w/wi – weight fraction of ith component in the coal
CFR – Coal flow rate (kg/year)
The coal flow rate (kg/year) was calculated using Equation 11.

Benefit Cost Analysis of Emission Standards for Coal-based Thermal Power Plants in India
www.cstep.in © CSTEP 40
Equation 11
𝐶𝐹𝑅 = 𝑆𝑝𝑐 x 𝐺𝐸𝑁.
Where,
𝑆𝑝𝑐 – Specific coal consumption (kg/kWh)
GEN – Annual power generation (kWh)
Equation 12
𝑆𝑝𝑐 = 860
𝜂 𝑥 𝐺𝐶𝑉.
Where η – percentage of overall efficiency of plant
GCV - gross calorific value of coal (kcal/kg)
Equation 13
𝐺𝐸𝑁 = PLF % x unit capacity(MW) x PAF % x 24 x 365
Where PLF % - Plant Load Factor (%) = Energy generated during the period (kWh)
Total Capacity (MW)x Total hours in the period under review
PAF% - Plant Availability Factor, which depends on coal availability
The molar flow rate of component i (�̇�i) can be calculated from �̇�𝑖 of ith component using
molecular mass (MWi).
Equation 14
�̇�𝑖 =�̇�𝑖
𝑀𝑊𝑖.
The theoretical amount of oxygen required for complete combustion of coal in combustion
chamber was estimated from the molar flow rate for each component.
Equation 15
Theoretical oxygen required for combustion (kmol/year) O𝑇 = C + H
2+ S + N − O.
Where C, H, S, N, O be the molar flow rate of carbon, hydrogen, sulphur, nitrogen and oxygen in
inlet coal, respectively.
Equation 16
Theoretical oxygen required for combustion (kg/year) o𝑇 = O𝑇 x 32.
Equation 17
Excess oxygen supplied (kg/year) o𝐸 = (1 + 𝜀) x o𝑇 .
Where, ε is the percentage of excess air.
Weight percentage of oxygen in air is taken as 23.3%.

Benefit Cost Analysis of Emission Standards for Coal-based Thermal Power Plants in India
© CSTEP www.cstep.in 41
Air supplied (kg/year) 𝐴𝑠 =𝑂𝐸
0.233.
Equation 18
Weight percentage of nitrogen in air is 76.7%.
Nitrogen in supplied air (kg/year) N𝑠 = 0.767 x 𝐴𝑠.
Estimation of SOx, NOx, PM10 and Hg Mass Flow Rates
CO2 emissions were calculated based on the mass balance approach mentioned earlier using the
combustion equations. The percentage conversion of carbon in the boiler was accounted in the
calculation. It has been reported in previous experimental studies that about 88–95% of the
carbon in coal gets converted at the combustor (Mittal, Sharma, & Singh, 2014). The fraction of
carbon that remains un-burnt depends on coal properties, residence time and furnace
temperature (Sathyanathan & Mohammed, 2004). From previous experimental results, it was
estimated that 0.5–10% of un-burnt carbon mixes with the fly ash and 2–30% is retained in the
bottom ash depending on the combustion condition. In the calculation, the conversion of carbon
to CO2 was taken as 95% (Mittal, Sharma, & Singh, 2014). About 4% of carbon in coal was assumed
to have been retained in bottom ash and remaining un-burnt carbon was emitted with fly ash.
NOx formation in the boiler is a complex heterogeneous equilibrium reaction that leads to the
formation of NO and other oxides of nitrogen (Cai, Guell, Dugwell, & Kandiyoti, 1993) (Song, Pohl,
Beer, & Sarofim, 1982). Instead of using the complex equilibrium equation for mass balance
analysis, a simple correlation for nitrogen combustion was developed from previous
experimental results. It was observed that the amount of NO formed from these reactions
constitutes about 50–95% of the total nitrogen oxides formed. Approximately 5–10% of the
nitrogen is being converted to NO2 (Cai, Guell, Dugwell, & Kandiyoti, 1993). For the simplicity of
calculations, it was assumed that only NO was formed in the boiler. From laboratory experiments,
it was found that only 15–30% of the nitrogen present in coal is typically converted (Pershing &
Wendt, 1977). The unreacted nitrogen mixes with flue gas and is emitted as molecular nitrogen.
In the presence of excess air and at high temperature (>1500K), the nitrogen in the inlet air gets
oxidised (Bartonova, Juchelkova, Kilka, & Cech, 2011). The nitrogen oxide thus formed is called
thermal-NOx. From experimental analysis, it was found that around 10–25% of the total nitrogen
oxides were from atmospheric nitrogen.
Mercury emissions from TPPs were calculated based on the combustion conversion factors
mentioned in the peer-reviewed publications. Typically around 58% of the mercury present in
the coal was emitted to the air along with other flue gas components. The remaining Hg is in fly
ash and can be assumed to be captured by ESPs (CIMFR, 2014).
The percentage of sulphur in coal that gets converted in the combustor was taken as 92.5%
(Mittal, Sharma, & Singh, 2014). From laboratory experiments, it was observed that sulphur was
retained in ash as calcium sulphate. The compound thus formed was unstable at high temperature
and dissociated at boiler temperature, and does not facilitate the retention of sulphur in ash
(Mittal, Sharma, & Singh, 2014). On the other hand, a chemical composition analysis of ash
collected from various power plants shows significant sulphur content. This can be due to its
association with un-burnt carbon. It was also assumed that only SO2 was emitted from stack since
only small fraction of other sulphur oxides were formed in the combustion chamber (Cai, Guell,
Dugwell, & Kandiyoti, 1993). The hydrogen in coal gets converted to H2O completely.

Benefit Cost Analysis of Emission Standards for Coal-based Thermal Power Plants in India
www.cstep.in © CSTEP 42
The ash contained in coal splits into bottom ash and fly ash after combustion. Around 25% of total
ash in the input coal becomes bottom ash (Jayaranjan, D, van, Ajit, & Annachhatre, 2014). The
bottom ash gets collected at coal furnace bottom as it is too large to be carried up along with the
flue gas, and remaining fine particles (fly ash) get entrained with other gases. Among all the fly
ash fractions, PM10 can cause severe respiratory problems, compared to other size fractions.
Uncontrolled emission for PM10 was estimated by using emission factors established by USEPA
for sub-bituminous coal with pulverised coal as firing configuration. Since most of the Indian
plants have an ESP, and considering its particulate removal efficiency, the PM10 emitted from the
stack is taken as 3% of the total PM10 released from the combustion chamber. The emission factor
for unabated cumulative PM10 emission per tonne of coal was calculated using the equation given
below (USEPA, 1998).
Equation 19
PM10(kg tonne of coal⁄ ) = 2.3 x (percentage of ash in coal) x 0.454.
Assumptions made for the mass flow rate calculations:
Steady state process
Combustion temperature in boiler is 1800 K with 20% excess air (Khan & Khan, 2014)
(Mittal, Sharma, & Singh, 2014)
92.5% of Sulphur in coal is converted and only SO2 is formed
Only 20% fuel Nitrogen is converted to NO. 72.5% of the total NOX is due to the oxidation
of the bound nitrogen in the fuel
Temperature and Pressure at stack is taken as 422 K , 1atm (Chakraborty, et al., 2008)
Fuel- lean combustion is considered
Electro Static Precipitator (ESP) removal efficiency is considered as 97%.
Fuel-lean combustion is normally practiced in TPPs, since fuel-rich combustion leads to CO
formation and incomplete combustion of coal. The excess air is given in such a way that the
amount of air will not lead to uncontrolled formation of NOx. It was observed that excess air of
10–30% was given to the combustion in various Indian plants. The molar flow rate of each of the
flue gas components were calculated using stochiometric combustion equations, and conversion
factors are shown in Table 15.
Table 15: Molar Flow Rate of Flue Gas Components
Flue gas components Molar flow rate of flue gas components (�̇�) (kmol/year)
CO2 C x 0.95
H2O H
SO2 S x 0.925
NOfuel-N
NOtotal
(2 x N x 0.20) (2x N x 0.20)
0.725
O2 OE – OT + OR- ON
N2 NR
Hg Hgcoal x 0.58
Where, NOfuel-N is the nitric oxide from conversion of fuel nitrogen (kmol/year) and NOtotal is the
total nitric oxide formed (kmol/year).

Benefit Cost Analysis of Emission Standards for Coal-based Thermal Power Plants in India
© CSTEP www.cstep.in 43
The oxygen required for thermal-NOx formation is calculated from the total NOx formed. Around
27.5% of the NOtotal was from thermal-NOx. Using the stoichiometric equation for the formation
of NOx, the oxygen required was calculated using the Equation 20.
Equation 20
ON(kmol year⁄ ) = 0.275
2x NOtotal.
Oxygen remaining in the boiler due to incomplete combustion is given as,
Equation 21 O𝑅(kmol year⁄ ) = (C x 0.05) + (N x 0.8) + (S x 0.075).
Equation 22
Nitrogen remaining in the boiler is given as,
N𝑅(kmol year⁄ ) =Ns
28− (
0.275
2 x NOtotal ) + (0.8 x N).
Equation 23
Hg associated with ash is given as,
𝐻𝑔(kmol year⁄ ) = 𝐻𝑔𝑐𝑜𝑎𝑙 x (1 − 0.58)
The molar flow rate of flue gas components were converted to mass flow rate using molecular
mass. The mass flow rate of each flue gas components and volumetric flow rate of flue gas were
switched in to calculate the concentration of each component. The estimated current
concentration of SOx, NOx and PM10 are shown in Figure 25, Figure 26 and Figure 27.
The Hg concentration in flue gas is least for NCL (0.0064 mg/Nm3) and is highest for MCL (0.0238
mg/Nm3). The average concentration of Hg in flue gas is around 0.012 mg/Nm3 – lower than
stipulated in the emission standards.
Figure 25: Current Concentration of SOx in Flue Gas (mg/Nm3)
0
2000
4000
6000
8000
SOx
and
NO
X(m
g/N
m3)
Coal type

Benefit Cost Analysis of Emission Standards for Coal-based Thermal Power Plants in India
www.cstep.in © CSTEP 44
Figure 26: Current Concentration of NOx in Flue Gas (mg/Nm3)
Figure 27: Current Concentration of PM10 in Flue Gas (mg/Nm3)
The mass flow rates of pollutants were also normalised using output or input energy, as described
in the main report.
Comparison with Other Data
The present study on current emission factor of pollutant from TPPs was compared with earlier
studies. Most of the studies reported emissions in terms of normalised mass flow rates with
respect to output electricity (Figure 28). The results from this analysis are in-line with other
inventories.
0
400
800
1200
1600
NO
x(m
g/N
m3)
Coal type
0
50
100
150
200
250
300
PM
10
(mg/
Nm
3)
Coal type

Benefit Cost Analysis of Emission Standards for Coal-based Thermal Power Plants in India
© CSTEP www.cstep.in 45
Figure 28: Comparison of Pollutant Emission with Other Inventories
Source: (Garg, Kapshe, Shukla, & Ghosh, 2002; Mittal, Sharma, & Singh, 2014; Chakraborty, et al., 2008; Chandra & Chandra, 2004)
0
2
4
6
8
10
12
CSTEP Garg et al., 2002 Mittal et al., 2014 Chakraborty et al.,2008
Chandra etal.,2004
SO
2an
d N
Ox
(g/k
Wh
)
Various Inventories
SO2 NOx

Benefit Cost Analysis of Emission Standards for Coal-based Thermal Power Plants in India
www.cstep.in © CSTEP 46
Annexure - C
Pollution Control Technology Compendium
Emissions of SOx, NOx and PM can be reduced by implementing PCTs at different stages of a power
plant, where it is divided into three stages based on the installation of PCTs.
1. Pre-combustion control technologies
2. In-combustion control technologies
3. Post-combustion control technologies
Working Principle and Applicability of PCTs
1.1. Pre-combustion Control Technologies
Control measures that can be implemented before the boiler are coal beneficiation and blending
(Mishra, Das, Biswal, & Reddy, 2015; Cropper, Gamkhar, Malik, Limonov, & Partridge, 2012).
1.1.1. Coal Beneficiation
Coal beneficiation is the process in which coal is washed before pulverisation. This process aims
at reducing the ash content of coal. According to a recent study by Cropper et al (2012), washed
coal can reduce emissions of PM10 by 30% and SOx by 25%.
1.1.2. Coal Blending
Coal blending involves mixing of low-quality coal with high ash content and low calorific value
with other types of coal. This method is employed to increase the thermal energy generation per
unit of coal combusted, by increasing the gross calorific value of blended coal. In India, typically
blending is done with imported coal with higher calorific value; up to 30% as stipulated by CEA
(CEA, 2012 a). Therefore the overall consumption of coal will decrease. As a consequence, ash in
per unit coal reduces and is synergetic with the goal to reduce PM per unit electricity generated.
However, in some imported types of coal, where sulphur content is higher, this implies a trade-
off in terms of higher SOx emissions per unit electricity generated. For example, a domestic coal
(ash content >30% and sulphur content >0.5%) blended with Indonesian coal (ash content <
15%, sulphur content >2%) could result in higher SOx and lower PM emissions.
1.2. In-combustion Control Technologies
LNB and OFA for NOx control, and Limestone Injection (LI) for SOx control, are measures that are
installed in a boiler to reduce pollutant emission (Bell & Buckingham, 2010). In-combustion
technologies like LNB and OFA are ready retrofits with low installation time requirements
(around two months). However fabrication is required for installing a LI set-up.
1.2.1. Low NOx Burners
LNB is used to reduce NOx formation in the boiler by reducing combustion temperature and
creating oxygen-lean zones. Multiple burners are installed in the combustion chamber which
controls the temperature and inlet air. The burners lower the inlet air flow rate thereby reducing
the combustion in that boiler zone creating fuel rich zones. Under lower combustion
temperatures, due to higher energy requirement for NOx formation, emissions are limited. LNBs
can reduce NOx emission by 50% and a marginal effect in boiler efficiency occurs (Beér, 2003;
Bell & Buckingham, 2010; BHEL, 2016). Major boiler manufacturers in India already include LNBs
as part of their new boiler designs (BHEL, 2006).

Benefit Cost Analysis of Emission Standards for Coal-based Thermal Power Plants in India
© CSTEP www.cstep.in 47
1.2.2. Over Fire Air
OFAs work on the same principle of reducing combustion temperatures in the boiler to restrict
NOx formation. However, unlike LNBs, in OFAs, the principle of staged air injection above the
burner is used. The unique designs of air supply ports in OFAs create fuel rich pyrolysis zones in
the lower part of the furnace, supplying only 70–80% of the required air (by stoichiometry),
creating a fuel-rich zone. The remaining air that is required is injected into the upper furnace in
the form of high velocity air jets. OFAs alone can yield up to 30% NOx reduction, however in
conjunction with LNB, NOx emissions can be limited by 40–70% (Beér, 2003; General Electric,
2005; ESMAP, 2001).
1.2.3. Limestone Injection
LI into the boiler is one of the cheaper methods to control SOx emissions. The limestone is either
injected above the flame in the boiler, or into the ductwork after the boiler. SOx present in flue
gases bonds with the dry sorbent and forms sulphites, which can be captured in the existing
particulate controls. This is an option for plants where land is not available for installing post-
combustion control technologies. Requirement of sophisticated design and fabrication are
required without which the boiler efficiency could be affected (Bhati & Ramanathan, 2016).
1.3. Post-combustion Control Technologies
FGD for SOx, SCR/SNCR for NOx, and ESPs and bag filters for PM are the available post-combustion
control technologies.
SOx control technologies: There are three types of FGD, categorised based on the reagents used
or process type (dry, wet and seawater based).
1.3.1. Dry Flue Gas Desulphuriser
Dry FGD covers a range of technologies in which SOx reacts with limestone particles in a humid
environment to form sulphite (Sargent & Lundy, 2007).
Spray Dry Absorber (SDA): The process uses a roof gas disperser, central gas disperser for
dispersing flue gas and an atomizer to spray reagent slurry (Babcock & Wilcox Power Generation
Group, 2016). Inside a SDA, lime slurry is atomized and sprayed over the flue gas to absorb SOx.
The dry product thus formed is collected in the ESP.
Novel Integrated Desulphurisation (NID): This GE-Alstom patented control technology consists
of an integrated hydrator/mixer system, a duct reactor, and a fabric filter system; each module
can service 75 MW. Hydrated lime [Ca(OH2)] is used as a reagent to react with SOx in humid
conditions (GE Alstom, 2016).
Circulating Dry Scrubbers (CDS): In CDS, a fluidised bed of hydrated lime is used for SOx control.
Flue gas is recirculated in this system to facilitate maximum utilisation of unreacted lime
(Babcock & Wilcox Power Generation Group, 2016). The products formed are a mixture of
calcium sulphite (CaSO3), calcium sulphate (CaSO4) and unreacted lime (CaO). The removal
efficiency of CDS can be improved by increasing the amount water sprayed on the fluidised bed
(Shahzad & Yousaf, 2017).
Equation 24: Reactions in a CDS:
𝐿𝑖𝑚𝑒𝑠𝑡𝑜𝑛𝑒: 𝐶𝑎𝐶𝑂3 (𝑠) + 𝑆𝑂2 (𝑔) → 𝐶𝑎𝑆𝑂3 (𝑠) + 𝐶𝑂2 (𝑔)
𝐿𝑖𝑚𝑒: 𝐶𝑎(𝑂𝐻)2 (𝑠) + 𝑆𝑂2 (𝑔) → 𝐶𝑎𝑆𝑂3 (𝑠) + 𝐻2𝑂(𝑙)

Benefit Cost Analysis of Emission Standards for Coal-based Thermal Power Plants in India
www.cstep.in © CSTEP 48
Dry FGDs are more economically feasible for smaller power producing units, since in units of
capacity >400 MW, wet FGD installation works out to be less expensive.
1.3.2. Wet FGD
Wet freshwater FGD: The wet freshwater FGD uses lime slurry to remove SOx. The flue gas drawn
from the boiler is directed into the absorption tower by a booster fan. Inside the absorber tower,
the flue gas comes into contact with the limestone slurry, sprayed through nozzles installed at the
top of the tower. The chemical reaction occurs between the SOx in the gas and lime slurry, forming
calcium sulphite (CaSO3). Calcium sulphite, thus formed, is then oxidised at the bottom of the
tower using compressed air, forming calcium sulphate (CaSO4) or gypsum (Babcock & Wilcox
Power Generation Group, 2016). Gypsum is a saleable by-product and can be used as a raw
material in the cement manufacturing industry. Good quality limestone is required to produce
saleable gypsum, and is available in various parts of India (OTM, 2009). The quantity of limestone
required per kg of SOx removed ranges between 1.5 kg and 2 kg, depending on the CaCO3 content
in the limestone (Power Engineering, 2006).
Equation 25: Reactions in a Wet FGD:
𝐿𝑖𝑚𝑒𝑠𝑡𝑜𝑛𝑒: 𝐶𝑎𝐶𝑂3 (𝑠) + 𝑆𝑂2 (𝑔) → 𝐶𝑎𝑆𝑂3 (𝑠) + 𝐶𝑂2 (𝑔)
𝐿𝑖𝑚𝑒: 𝐶𝑎(𝑂𝐻)2 (𝑠) + 𝑆𝑂2 (𝑔) → 𝐶𝑎𝑆𝑂3 (𝑠) + 𝐻2𝑂(𝑙)
𝐶𝑎𝑆𝑂3 (𝑠) + ½𝑂2 (𝑔) + 2𝐻2𝑂(𝑙) → 𝐶𝑎𝑆𝑂4 · 2𝐻2𝑂(𝑠)
Seawater FGD: This process uses seawater as a reagent and no other chemicals are required for
the reaction. Instead of limestone, the natural alkalinity of seawater is used to absorb acidic gases
like SOX (Babcock & Wilcox Power Generation Group, 2016). The effluent seawater, after reaction,
flows into the seawater treatment system (SWTS) to complete the oxidation of the absorbed SOx
into sulphate. The sulphate ion thus formed is harmless and can be sent back to sea.
The resource linkage data on water source linked to each coal-based power plant were collected.
These included 48% authenticated sources data points (data obtained from the Global Energy
Observatory, 2015), 36% non-authenticated sources (newspaper articles, industry visit reports
and research reports online) and 16% data points based on assumption of 3 km proximity to
seawater. Around 82% of the total installed capacity operating during 2015–30 period use fresh
water resources.
Table 16: Water Source for Plants Operational in 2015–30 Period
Water Source Installed Capacity( GW)
Freshwater 217
Seawater 41
Freshwater and Seawater 3
Sewage water 2
Total 263
The water source was used to determine if a power plant can install seawater FGD. This condition
was applied across all the power plants, to identify all the coastal power plants that can utilise
seawater in their FGDs.

Benefit Cost Analysis of Emission Standards for Coal-based Thermal Power Plants in India
© CSTEP www.cstep.in 49
Figure 29: Post-combustion SOx Control Technology Applicability
1.3.3. SCR
Post-combustion controls reduce NOX emissions by converting it into nitrogen (N2) gas. In SCR,
the flue gas reacts with ammonia or urea over a catalyst to reduce NOX into nitrogen and water.
Vanadium, titanium and tungsten oxides are used as catalyst (Hatton, 2008). SCRs can reduce NOx
emission by 75–90%.
In SCR, the flue gas along with the reagent is passed over a catalyst bed. Complex reactions occur
between NOx in the flue gas and the reagent. The reaction can be simplified, as given in the
equation below.
Equation 26: Ammonia based catalytic reduction system:
4NO + 4NH3 + O2 → 4N2 + 6H2O
6NO + 8NH3 → 7N2 + 12H2O
Equation 27: Urea based catalytic reduction system:
𝑁𝐻2𝐶𝑂𝑁𝐻2 + 2 𝑁𝑂 + ½ 𝑂2 → 2 𝑁2 + 𝐶𝑂2 + 2 𝐻2𝑂23
1.3.4. SNCR
SNCR is a non-catalytic system that reacts with an aqueous solution of ammonia water or urea to
reduce the NOx into nitrogen and water vapour (Mussatti, Srivastava, Hemmer, & Strait, 2000).
Flue gas temperature should be around 870–12000C. The ammonia or urea is carried by an air
stream or steam, and injected into the flue gas at the appropriate temperature zone. A
representation of the applicability is given in Figure 30.
23 The molar ratio of ammonia fed to NOx removed is 1 (PCC- Oxidation Technologies, 2017).
Yes
Yes
Yes
No
No
No

Benefit Cost Analysis of Emission Standards for Coal-based Thermal Power Plants in India
www.cstep.in © CSTEP 50
Figure 30: Applicability of Catalytic Reduction Technology
PM Control Technologies
1.3.5. Electrostatic Precipitators (ESP)
An ESP uses electrical forces to capture the charged particles from an incoming gas. In this
process, the flue gas is ionised when it is passed between conductors of opposite polarity due to
the applied voltage (Environmental Protection Agency, 2016). A high intensity electric field is
created, driving the positively charged dust particles towards a ground plate where dust is
collected. The dust collected is then transferred to hoppers, referred to as fly ash. For existing
plants with ESPs, retrofitting it by replacing the collecting and emitting electrodes, and module
additions can improve the dust collection efficiency. A removal efficiency of 97–99.4% can be
achieved by ESPs. However, high performance ESPs needed in newer plants would also imply a
higher land area requirement due to greater array sizing of filters (CEA, 2007).
Combination of Control Technologies
If a plant does not comply with the target or meet the required removal, despite installing a PCT,
then a secondary measures (pre-combustion technology) can be applied. This approach is used
for in-combustion techniques for boiler designs in China and USA. With design modifications, to
include a combination of measures, there will be a marginal increase in the removal efficiency,
which can help a plant attain the emission target. Few combination technologies can be
implemented in existing Indian TPPs of recent vintage to meet the targets. These include LNB and
OFA; LI and washed coal; and ESP and washed coal (Beér, 2003). The combination of LNB and
OFA can reduce 35–60% of NOx. LI and washed coal can reduce SOx emission by around 70%. For
some of the new plants where emission standards are stringent, installing older ESPs may not be
enough to meet the norms. In such cases, usage of washed coal along with the ESP can achieve
removal efficiency >99.6%. Detailed descriptions on the PCTs are tabulated in Table 17 (Babcock
& Wilcox Power Generation Group, 2016; Bell & Buckingham, 2010; GE Alstom, 2016; Mishra,
Das, Biswal, & Reddy, 2015; Bhati & Ramanathan, 2016).
Based on the reviewed literature, we collated the relevant technical parameters and costs of
installing and running PCTs. These are summarised in Table 17 and Table 18.

Benefit Cost Analysis of Emission Standards for Coal-based Thermal Power Plants in India
© CSTEP www.cstep.in 51
Table 17: Technical Parameters of Pollution Control Technologies
PCT Removal efficiency (%)
Auxiliary Power Consumption (%)
Fresh water Consumption (m3/MWh)
Remarks
WFGD 95 0.7% 0.25 Limestone is used as reagent and gypsum is the by-product. SWFGD 92 1.1% 0 Seawater is used and reagent is not required.
Dry FGD (SDA and CDS) 92-98 0.65- 1% 0.15 Cost effective for unit of capacity <=400 MW. Can reduce SO3, HCl, HF, heavy metals and PM2.5 emission.
LI 57 0.7% 0 Limestone is used as a reagent. LI+ washed coal 69 0.7% 0 Washed coal is used in the boiler along with LI.
SCR 90 0.6% 0.05 Urea or ammonia are used as reagents with catalyst. SNCR 57.5 0.6% 0.05 Urea or ammonia are used as reagents. LNB 50 0%
LNB+OFA 53 0% Combining in-process PCT improves removal, efficiency. ESP 99.6 0.1% Cost parameters given for high performance ESP retrofits.
ESP + washed coal 99.8 0.1% Washed coal reduces ash.
Table 18: Cost of PCT
PCT Capital cost (Million INR/MW) O&M cost (INR/MW/annum) Reagent cost (INR/kWh)
WFGD 5 0.6 0.02- 0.15 SWFGD 3 0.6 0
Dry FGD (SDA and CDS) 3.5 0.6 0.02-0.16 LI 1.5 0.6 0.02-0.15
LI+ washed coal 1.5 0.6 0.02-0.16 SCR 3 0.05 0.01-0.07
SNCR 2 0.01 0.01-0.04 LNB 0.5 0 0
LNB+OFA 0.8 0 0 ESP 0.5 0.05 0
ESP + washed coal 1 0.1 0.08

Benefit Cost Analysis of Emission Standards for Coal-based Thermal Power Plants in India
www.cstep.in © CSTEP 52
Normalising PCT Costs
The capital cost, O&M cost and reagent costs for each PCT modelled were normalised to per unit
of pollutant removed for ease of calculation. The representation of costs of PCT in INR/kg of
pollutant removed reflects costs incurred and pollution abated during 2015–30 for each unit.
[Refer Table 19].
A representative calculation of normalised costs for a given TPP unit to INR/kg of pollutant
removed is given below.
Cost Estimation for WFGD for SOx Reduction
Capital Cost= INR 5 million/MW
O&M Cost = INR 0.6/MW/annum
Reagent costs = 6 INR/kg of SOx removed
Type of coal used in TPP – Central Coal fields Limited (CCL)
Assumed PLF = 70% (from CEA database)
Operating years (15 years or remaining plant life during 2015-30, whichever is lesser) = 15 years
Emission factor of SOx for CCL coal without PCT = 6.1 g/kWh (based on mass balance analysis)
Emission factor of SOx for CCL coal with FGD = 0.3 g/kWh
SOx removed = (Emission factor without FGD – emission factor with FGD) = 5.8 g/kWh
Capital costs in INR/kWh= Capital cost (
INR million
MW)
103 x PLF x 8760 x life of PCT=
5 x 10⁶
103 x 0.7 x 8760 x 15 = 0.05 INR/kWh
Capital costs in INR/kg of SOx removed = Capital costs (
INR
kWh)
quantity of SOx removed (kg
kWh)=
0.05
5.8∗10^−3 = 8.6
INR
kgof SOx removed
O&M costs in INR/kWh = O&M cost (
INR million
MW annum)
103 x PLF x 8760=
5.8 x 10^5
103 x PLF x 8760= 0.09 INR/kWh
O&M costs in INR/kg of SOx removed = O&M cost (
INR
kWh)
Quantity of SOx removed(kg
kWh)=
0.09
5.8 x 10^−3= 15
INR
kgof SOx removed
Auxiliary consumption = 0.7% of total generation
Base electricity cost = INR 2/kWh
Energy penalty due to auxiliary consumption = 𝐵𝑎𝑠𝑒 𝑒𝑙𝑒𝑐𝑡𝑟𝑖𝑐𝑖𝑡𝑦 𝑐𝑜𝑠𝑡 (
𝐼𝑁𝑅
𝑘𝑊ℎ)∗% 𝑜𝑓 𝑎𝑢𝑥𝑖𝑙𝑖𝑎𝑟𝑦 𝑐𝑜𝑛𝑠𝑢𝑚𝑝𝑡𝑖𝑜𝑛
𝑄𝑢𝑎𝑛𝑡𝑖𝑡𝑦 𝑜𝑓 𝑆𝑂𝑥 𝑟𝑒𝑚𝑜𝑣𝑒𝑑(𝑘𝑔
𝑘𝑊ℎ)
= 2∗0.7∗10−2
5.8 𝑥 10−3
= 2.4 INR/kg of SOx removed
Total INR/kg of SOx removed during 2015-2030
= 𝐶𝑎𝑝𝑖𝑡𝑎𝑙 𝑐𝑜𝑠𝑡 (𝐼𝑁𝑅
𝑘𝑔) + 𝑂&𝑀 𝑐𝑜𝑠𝑡 (
𝐼𝑁𝑅
𝑘𝑔) + 𝐸𝑛𝑒𝑟𝑔𝑦 𝑝𝑒𝑛𝑎𝑙𝑡𝑦 (
𝐼𝑁𝑅
𝑘𝑔) + 𝑅𝑒𝑎𝑔𝑒𝑛𝑡 𝑐𝑜𝑠𝑡 (
𝐼𝑁𝑅
𝑘𝑔)
= 32 INR/kg of SOx removed

Benefit Cost Analysis of Emission Standards for Coal-based Thermal Power Plants in India
© CSTEP www.cstep.in 53
In some PCTs which are installed in the boiler, like LI, a reduction in the overall efficiency is likely.
This penalty on boiler efficiency was estimated as an additional expense in terms of increase in
coal consumption.
Additional expense due to reduction is boiler efficiency in INR/kWh is computed as follows:
𝑐𝑜𝑎𝑙 𝑐𝑜𝑠𝑡 (𝐼𝑁𝑅
𝑀𝐽) 𝑥 𝑟𝑒𝑑𝑢𝑐𝑡𝑖𝑜𝑛 𝑖𝑛 𝑒𝑓𝑓𝑖𝑐𝑖𝑒𝑛𝑐𝑦 𝑜𝑓 𝑏𝑜𝑖𝑙𝑒𝑟(%) 𝑥 𝑜𝑣𝑒𝑟𝑎𝑙𝑙 𝑝𝑙𝑎𝑛𝑡 𝑒𝑓𝑓𝑖𝑐𝑖𝑒𝑛𝑐𝑦 𝑓𝑜𝑟 𝑎 𝑡𝑦𝑝𝑖𝑐𝑎𝑙 𝑝𝑙𝑎𝑛𝑡 𝑥
860 (𝑘𝑐𝑎𝑙
𝑘𝑤ℎ) 𝑥 4186 𝑥 10−6
= 0.19 𝑥 0.8% 𝑥 33% 𝑥 860 𝑥 4186 𝑥 10−6 = 0.002 INR/kWh
Penalty on efficiency in INR/kg of SOx removed = 𝑃𝑒𝑛𝑎𝑙𝑡𝑦 𝑜𝑛 𝑒𝑓𝑓𝑖𝑐𝑖𝑒𝑛𝑐𝑦 (
𝐼𝑁𝑅
𝑘𝑊ℎ)
𝑞𝑢𝑎𝑛𝑖𝑡𝑦 𝑜𝑓 𝑆𝑂𝑥 𝑟𝑒𝑚𝑜𝑣𝑒𝑑 (𝑘𝑔
𝑘𝑊ℎ)=
0.002
5.8 𝑥 10−3
= 0.34 INR/kg of SOx removed
The INR/kg of pollutant removed was multiplied by the cumulative pollutant emission abated in
each scenario (2015–30). This cost was aggregated under each policy scenario to arrive at the
total system cost of installing and operating the PCT for meeting the emission standard.

Benefit-Cost Analysis of Emission Standards in Coal-based Thermal Power Plants in India
www.cstep.in © CSTEP
Table 19: Normalised Pollutant Abatement Costs
PCT Domestic Lignite Indonesian South African Australian
Capital cost
Reagent cost
O&M cost
Total Capital
cost Reagent
cost O&M cost
Total Capital
cost Reagent
cost O&M cost
Total Capital
cost Reagent
cost O&M cost
Total Capital
cost Reagent
cost O&M cost
Total
Small WFGD
53 7 15 75 9 3 15 28 18 9 15 42 36 11 15 62 86 10 15 112
WFGD 13 7 15 35 2 3 15 20 3 9 15 28 7 11 15 33 17 10 15 42
CDS 7 7 15 29 1 3 15 20 2 9 15 27 5 11 15 31 11 10 15 37
SDA 7 7 16 30 1 3 16 21 2 9 16 28 5 11 16 32 12 10 16 38
SWFGD 6 0 16 22 1 0 16 17 2 0 16 18 4 0 16 20 10 0 16 26
LI 5 6 14 26 1 3 14 18 2 9 14 25 3 11 14 28 8 10 14 32
LI and washed
coal 4 26 20 51 1 6 20 27 1 14 20 36 3 23 20 46 7 42 20 69
SCR 11 12 2 25 22 6 2 30 15 17 2 34 9 20 2 32 10 19 2 31
SNCR 11 13 1 24 23 6 1 29 16 17 1 34 10 20 1 31 10 19 1 29
LNB 3 0 1 4 6 0 1 7 4 0 1 5 3 0 1 3 3 0 1 3
OFA 4 0 1 5 8 0 1 9 6 0 1 7 3 0 1 5 4 0 1 5
LNB+ OFA
5 0 1 7 11 0 1 12 8 0 1 9 5 0 1 6 5 0 1 6
ESP 1 0 0 1 1 0 0 2 2 0 0 3 4 0 0 4 12 0 0 12
ESP + washed
coal 1 4 0 5 1 9 0 11 2 18 0 21 3 26 0 30 12 85 0 97

Benefit Cost Analysis of Emission Standards for Coal-based Thermal Power Plants in India
© CSTEP www.cstep.in 55
Annexure-D
Monetising Mortality & Estimation of Impact of PCT Costs on Tariff
Table 20: Value of Statistical Life in Literature
Study Low High In 2015 (INR Crore*)
Brandon & Hommann, 1994 0.07 0.60
IGIDR, 1994 0.19 4.33
Shah & Nagpal, 1997 0.10 1.7
Simon et al, 1999 2.19 5.14
Shanmugam 2000 4.38 7.83
Shanmugam 2001 16.15 16.45
Madheshwaran, 2007
2.78
*Adjusted from reported values with 8% discount rate based on (Zhuang, Liang, Lin, & Guzman, 2007)
Source: (Shah & Nagpal, 1997; Simon, Cropper, Alberini, & Arora, 1999; Shanmugam K. R., 2000; Shanmugam K. R., 2001; Brandon & Hommann, 1994; IGIDR, 1994; Madheswaran, 2007)
Research based on empirical data globally suggest that VSL is elastic with income—with
increasing average incomes, the average VSL would likely grow in India (Viscusi & Aldy, 2003);
this was not accounted for in this analysis.
Tariff Impact
Coal power plants need to implement pollution control measures to achieve the emission
target notified by MoEFCC on December 15, 2015. Depending on a unit’s installed capacity,
vintage and applicability of PCTs, the capital investment for SOx, NOx and PM controls, together
can range between INR 4–10 million/MW. This indicates that PCTs costs approx. 7–20% of the
initial capital investment required for a new plant. Therefore, assessments of impact on tariff
with PCT installation in TPPs are required for recovering investment in a justifiable manner.
In the following section, a detailed methodology to evaluate the financial implications of PCT
installation, in terms of cost of power generation, is provided. Further, details of policy cases
examined to scope out the applicability of possible regulatory provisions are also given.
Figure 31 provides the diagrammatic representation of the approach used for estimating the
impact of PCT costs on tariff.

Benefit Cost Analysis of Emission Standards for Coal-based Thermal Power Plants in India
www.cstep.in © CSTEP 56
Figure 31: Diagrammatic Representation of Approach for Financial Analysis of PCT Impact on Tariff
1. Case Development for Financial Analysis
The revised emission standards put forth by MoEFCC classified plants based on vintage and
unit. The existing and proposed power plant units were classified into the three categories,
namely plants commissioned: (1) before 2003; (2) between 2003 and 2016; and (3) after
2016. Further, it is sub-classified based on unit capacity or boiler capacity (lesser than 500
MW and greater than or equal to 500 MW).
As seen in Error! Reference source not found., a majority of the TPP units commissioned
efore 2003 were less than 500 MW; larger capacity units have been installed since 2003.
Around 72% of the existing installed capacities are of the 2003–16 vintage. In the category for
proposed plants (to be commissioned after 2016), nearly 80% of all units in the pipeline are
of 600 or 660 MW (Table 3) unit capacity (CEA, 2013) (CEA, 2016 a) (CoalSwarm, 2016). While
TPPs installed before 1992 account for around 37 GW (or 135 units), they were omitted from
the current financial analysis as they are nearing the end of their life.
Table 21: Number of Units Commissioned in Different Vintage Capacity
Number of units <1992 1992-2002 2003-2016 >2016
60 MW 19 1 7 2
110 MW 26 1 3 0
210/250 MW 78 62 60 2
550 MW 12 8 59 8
600 MW 0 0 42 14
660 MW 0 0 42 84
Based on the overall efficiency of plant, the boiler type is classified into subcritical (25–34%),
supercritical (35–38%) and ultra super critical (39–42%). The plants that were commissioned
between 1992 and 2003 comprise of only subcritical ones. Among the plants commissioned
between 2003 and 2016, the percentage share of subcritical and supercritical plants are 58%
and 42%, respectively. In the proposed plant classification, 86 GW (~ 81% of installed
capacity) are supercritical plants, and nearly 5% of them are ultra super critical (CoalSwarm,
2016). The boiler type was also considered as a critical parameter while developing the cases
Power plant database
Emission standard
Develop cases for financial analysis
Estimate cost of electricity generation for
base plant
Analyse impact of PCT on cost of
electricity generation
Financial parameters
Plant operational parameters PCT applicability
PCT cost module

Benefit Cost Analysis of Emission Standards for Coal-based Thermal Power Plants in India
© CSTEP www.cstep.in 57
for the financial analysis to estimate PCT installation impact. A representative plant was
considered as a case in each vintage category to evaluate the same.
Key assumptions for case development:
The commissioning year for the case considered for the financial analysis is the year in
which maximum units were installed.
For plants commissioned before 2003, an annual reduction in PLF of 1 % is considered.
Based on the targeted compliance, we evaluated the control measures needed to be
implemented in each case. For Case 1, PCTs with lesser removal efficiencies and comparatively
lower capital cost are suitable to meet the relatively lenient emission standards notified for
this category of plants by MoEFCC. Therefore, a combination of pre-combustion and in-
combustion control technologies [refer Annexure-C] were considered for this category. The
usage of washed coal, instead of raw coal, can reduce SOx emissions in flue gas by 25% and
particulate matter emissions by 30%. The washed coal can also improve the plant’s
performance by enhancing overall plant efficiency by 1.2% and increasing PLF by 4%. It can
also improve the existing ESP efficiency, thus ruling out the need for upgradation of older ESPs
to meet new standards. In-combustion technologies such as OFA and LNB for NOx, and LI for
SOx were considered to meet the prescribed standards.
The Case 2a category with lower capacity units have to comply with slightly stringent
standards of NOx and PM reduction. High performance PCTs such as SCR for NOx and ESPs/
Bag filters for PM reduction are also needed for this category to meet the standards. Since most
of the TPP units in this category do not have the land required for FGD installation, these plants
can opt for a LI system for SOx control, given its lax standards.
For Case 2b plant units, PCTs with higher performance and removal efficiencies are needed as
the emission standards are more stringent. Post-combustion control technologies such as FGD
for SOX reduction can be deployed in these plants as they have enough land area, in accordance
with the MoEFCC guidelines on environmental clearance for larger capacity units (CEA, 2010).
For plants commissioned after 2016, emission standards are even more stringent, and they
will be required to install efficient post-combustion control technologies to adhere to the
standards. The control measures chosen for each case are given in Table 22.
Table 22: Cases for Financial Analysis
Case Pollution control technologies implemented
Case 1 LNB and OFA, Use washed coal, LI Case 2a Up gradation of ESP, LI, SCR Case 2b Up gradation of ESP, FGD, SCR
Case 3 ESP, FGD, SCR
2. Implications on Emissions with the Implementation of PCTs
Based on the case-wise controls identified in the previous section, it is imperative to check
whether emission standards are met. In order to evaluate this, the cumulative reduction from
the pollution control measures was estimated using a basic mass balance approach [Refer
Annexure-B] for a representative coal power plant using a 50:50 blended coal from South
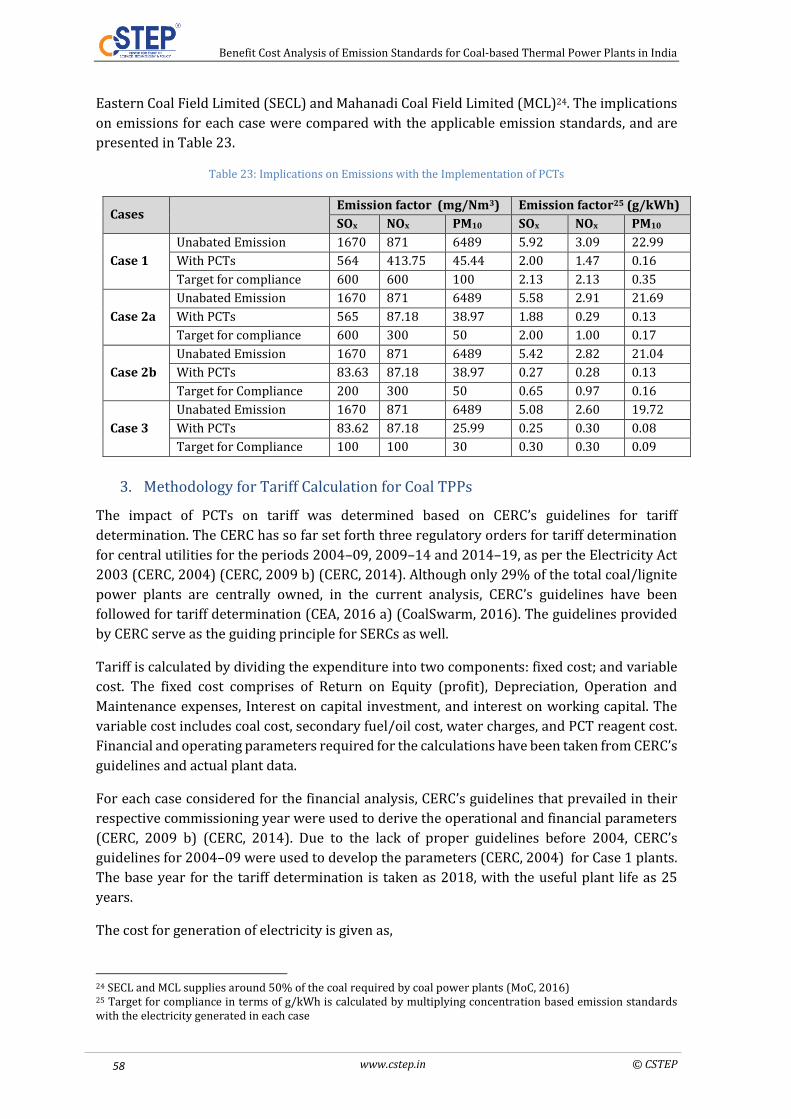
Benefit Cost Analysis of Emission Standards for Coal-based Thermal Power Plants in India
www.cstep.in © CSTEP 58
Eastern Coal Field Limited (SECL) and Mahanadi Coal Field Limited (MCL)24. The implications
on emissions for each case were compared with the applicable emission standards, and are
presented in Table 23.
Table 23: Implications on Emissions with the Implementation of PCTs
Cases
Emission factor (mg/Nm3) Emission factor25 (g/kWh)
SOx NOx PM10 SOx NOx PM10
Case 1
Unabated Emission 1670 871 6489 5.92 3.09 22.99
With PCTs 564 413.75 45.44 2.00 1.47 0.16
Target for compliance 600 600 100 2.13 2.13 0.35
Case 2a
Unabated Emission 1670 871 6489 5.58 2.91 21.69
With PCTs 565 87.18 38.97 1.88 0.29 0.13
Target for compliance 600 300 50 2.00 1.00 0.17
Case 2b
Unabated Emission 1670 871 6489 5.42 2.82 21.04
With PCTs 83.63 87.18 38.97 0.27 0.28 0.13
Target for Compliance 200 300 50 0.65 0.97 0.16
Case 3
Unabated Emission 1670 871 6489 5.08 2.60 19.72
With PCTs 83.62 87.18 25.99 0.25 0.30 0.08
Target for Compliance 100 100 30 0.30 0.30 0.09
3. Methodology for Tariff Calculation for Coal TPPs
The impact of PCTs on tariff was determined based on CERC’s guidelines for tariff
determination. The CERC has so far set forth three regulatory orders for tariff determination
for central utilities for the periods 2004–09, 2009–14 and 2014–19, as per the Electricity Act
2003 (CERC, 2004) (CERC, 2009 b) (CERC, 2014). Although only 29% of the total coal/lignite
power plants are centrally owned, in the current analysis, CERC’s guidelines have been
followed for tariff determination (CEA, 2016 a) (CoalSwarm, 2016). The guidelines provided
by CERC serve as the guiding principle for SERCs as well.
Tariff is calculated by dividing the expenditure into two components: fixed cost; and variable
cost. The fixed cost comprises of Return on Equity (profit), Depreciation, Operation and
Maintenance expenses, Interest on capital investment, and interest on working capital. The
variable cost includes coal cost, secondary fuel/oil cost, water charges, and PCT reagent cost.
Financial and operating parameters required for the calculations have been taken from CERC’s
guidelines and actual plant data.
For each case considered for the financial analysis, CERC’s guidelines that prevailed in their
respective commissioning year were used to derive the operational and financial parameters
(CERC, 2009 b) (CERC, 2014). Due to the lack of proper guidelines before 2004, CERC’s
guidelines for 2004–09 were used to develop the parameters (CERC, 2004) for Case 1 plants.
The base year for the tariff determination is taken as 2018, with the useful plant life as 25
years.
The cost for generation of electricity is given as,
24 SECL and MCL supplies around 50% of the coal required by coal power plants (MoC, 2016) 25 Target for compliance in terms of g/kWh is calculated by multiplying concentration based emission standards with the electricity generated in each case

Benefit Cost Analysis of Emission Standards for Coal-based Thermal Power Plants in India
© CSTEP www.cstep.in 59
𝐶𝑜𝑠𝑡 𝑓𝑜𝑟 𝑔𝑒𝑛𝑒𝑟𝑎𝑡𝑖𝑜𝑛 𝑜𝑓 𝑒𝑙𝑒𝑐𝑡𝑟𝑖𝑐𝑖𝑡𝑦 (𝐼𝑁𝑅
𝑘𝑊ℎ) =
𝑇𝑜𝑡𝑎𝑙 𝑒𝑥𝑝𝑒𝑛𝑑𝑖𝑡𝑢𝑟𝑒 (𝑅𝑠
𝑦𝑒𝑎𝑟)
𝑁𝑒𝑡 𝑔𝑒𝑛𝑒𝑟𝑎𝑡𝑖𝑜𝑛 (𝑘𝑊ℎ𝑦𝑒𝑎𝑟
)
The total expenditure incurred by the plant is divided into two parts, fixed cost and variable
cost. The fixed part includes:
1. Interest on capital loan
2. Return on equity capital
3. Interest on working capital
4. Depreciation
5. Operation and maintenance (O&M) cost
The variable part of tariff depends on the landed26 cost of:
1. Coal
2. Secondary fuel oil
3. Water
3.1 Components of fixed cost
Return on Equity
Return on Equity (RoE) is a measure of profitability that determines the profit a company
generates with the money invested by the shareholders. The base rate of RoE for each case is
taken as the base rate prescribed by CERC guidelines.
Table 24: Base Rate for Return on Equity as per CERC guidelines
Financial parameters 2004-09 guidelines 2009-14 guidelines 2014-19 guidelines
Return on Equity % 14% 15.50% 15.50%
Interest Rate for Capital Loan
The capital investment for a coal power plant includes benchmark capital cost (equipment
cost), land cost, construction expenditure, Interest during construction (IDC), and Incidental
expenditure during construction (IEDC).
The capital investment for each representative case were derived from CERC reports and
Detailed Project Reports (DPRs) of the coal power plants (CERC, 2012) (Maharastra Electricity
Regulatory Commission , 2010). IDC is calculated by assuming 12.5% as the interest rate,
considering the base plant construction time defined by CERC (~31–36 months), and
validating the same using the DPRs of new plants27 (CERC, 2014) (STEAG Energy Services India
Pvt. Ltd, 2014). IEDC is considered as 2% of the bench mark cost.
Land required for a base plant is around 0.99 acres/MW and for WFGD it is 0.007 acres/MW
(Samantaray, Singh, & Mukherjee, 2004). The land cost is taken as INR 7 lakhs/acre; in other
words INR 0.69 million/MW (EAI, 2013).
26 Landed cost includes transportation cost and taxes 27 IDC for new coal power plants is around 8–19% of total capital investment.

Benefit Cost Analysis of Emission Standards for Coal-based Thermal Power Plants in India
www.cstep.in © CSTEP 60
The debt equity ratio of capital investment is taken as 70:30, as per CERC guidelines. Based on
CERC’s guidelines, the actual plant data were considered for loan interest rate (12.5%) (CLP
India Private Limited, 2015) (CERC, 2013). The moratorium period is not considered in our
analysis, therefore power plants have to pay interest on the term loan from the commercial
date of operation (CERC, 2004).
The total capital cost for base plant cases are calculated as,
Equation 28
𝑇𝑜𝑡𝑎𝑙 𝐶𝑎𝑝𝑖𝑡𝑎𝑙 𝐼𝑛𝑣𝑒𝑠𝑡𝑚𝑒𝑛𝑡 = 𝐵𝑒𝑛𝑐ℎ 𝑚𝑎𝑟𝑘 𝑐𝑎𝑝𝑖𝑡𝑎𝑙 𝑐𝑜𝑠𝑡 + 𝐼𝐷𝐶 + 𝐼𝐸𝐷𝐶
Table 25: Total Capital Investment for Representative Cases
Cases Unit capacity
Bench mark capital cost (INR million/MW)
IDC (INR million/MW)
IEDC (INR million/MW)
Total capital investment (INR million/MW)
Case 1 210 MW 35 5.7 0.7 42.1 Case 2a Case 2b
210 MW 500 MW
40 40
6.5 6.5
0.8 0.8
47.9 47.9
Case 3 660 MW 50 8.0 1 59.7
Interest on Working Capital
The interest rate for working capital loan is taken as 13.2% for all the cases based on the DPRs
of the TPPs and CERC’s tariff orders (CLP India Private Limited, 2015) (CERC, 2013) (STEAG
Energy Services India Pvt. Ltd, 2014). The working capital for TPPs includes the following
components:
Table 26: Components of Working Capital
Working capital components
2004–09 guidelines 2009–14 guidelines 2014–19 guidelines
Coal stock 1 ½ moths for pit-head 2 months for non-pit head
1 ½ months for pit-head 2 months for non-pit head
1 ½ months for pit-head 2 months for non-pit head
Secondary fuel oil stock 2 months 2 months 2 months Maintenance spares 1% of historical capital
cost escalated @ 6% per annum
20% of O&M 20% of O&M
Sales Receivables 2 months 2 months 2 months O&M expenses 1 month 1 month 1 month
Operation and Maintenance (O&M) Cost
The O&M cost for a TPP includes expenditure on repairs and maintenance, wages, insurance,
etc., but excludes fuel cost and water charges. The base plant O&M cost for various plant
capacities were given in CERC’s guidelines.
Table 27: Operational and Maintenance Expenses
O&M expenses
Unit capacity Unit 2004–09 guidelines
2009–14 guidelines
2014–19 guidelines
210/250 MW lakhs/MW 10.4 18.2 28.7 500 MW lakhs/MW 9.36 13 23.9 600 MW and above lakhs/MW 9.36 11.7 17.3
Escalation rate of O&M expenses % 4% 5.72% 6.30%

Benefit Cost Analysis of Emission Standards for Coal-based Thermal Power Plants in India
© CSTEP www.cstep.in 61
Depreciation
Depreciation was calculated on 90% of the total capital investment, using the Straight Line
Method for the first 12 years, with the depreciation rate prescribed by CERC. The remaining
depreciable amount is distributed across the remaining plant life. For simplicity in calculation,
the depreciation rate for equipment is considered as overall depreciation rate, as it contributes
to around 80% of the total investment. The depreciation rate for tariff calculation is as per
CERC guidelines.
Salvage Value
The salvage value for coal power plants after 25 years is considered as 10% of the benchmark
capital cost (excluding construction and erection expense).
Table 28: Depreciation Rate as per CERC guidelines
Depreciation (for 12 years)
Unit 2004–09 guidelines 2009–14 guidelines 2014–19 guidelines
% 5.28% 5.83% 5.28%
Term Loan Period
The term loan period is calculated by equating the principle repayment in each year to the
depreciation amount, as per the CERC guidelines.
Net Electricity Generation
The net electricity generation is determined based on the operational norms specified by
CERC. The operational norms for coal power plants, as per CERC guidelines, are given in Table
29.
Table 29: Operational Norms for Coal Power Plant
Operational parameters Unit 2004–09 guidelines
2009–14 guidelines
2014–19 guidelines
Plant Availability Factor (PAF) % 80% 85% 85%
Plant Load Factor (PLF) % 80% 85% 85%
Gross Station
Heat Rate
210/250 MW kCal/
kWh
2650 2500 2450
500 MW 2550 2425 2375
New Plants N/A N/A 1.045 x Design Heat Rate28
Auxiliary
Power
Consumption
(APC %)
210/250 MW
%
9%/8.5%29 9%/8.5% 9%/8.5%
500 MW (steam driven)
7.5%/7% 6.5%/6% 5.75%/5.25%
500 MW (power
driven) 9%/8.5% 9%/8.5% 7.75%/8.25%
The gross electricity generated by a coal power plant is given as,
Equation 29
𝐺𝑟𝑜𝑠𝑠 𝐺𝑒𝑛𝑒𝑟𝑎𝑡𝑖𝑜𝑛 (𝑘𝑊ℎ
𝑦𝑒𝑎𝑟) = 𝑃𝐴𝐹(%)𝑥 𝑃𝐿𝐹(%)𝑥 𝑢𝑛𝑖𝑡 𝑐𝑎𝑝𝑎𝑐𝑖𝑡𝑦 (𝑀𝑊)𝑥 24 𝑥 365 𝑥 1000
Where, PAF – Plant Availability Factor
28 Maximum Design Heat rate is 2273 kcal/kWh for plants with sub-bituminous Indian coal as fuel (CERC, 2014) 29 The higher value of auxiliary consumption in each category denotes the plants with cooling tower

Benefit Cost Analysis of Emission Standards for Coal-based Thermal Power Plants in India
www.cstep.in © CSTEP 62
PLF- Plant Load Factor
Equation 30
𝑁𝑒𝑡 𝐸𝑙𝑒𝑐𝑡𝑟𝑖𝑐𝑖𝑡𝑦 𝑔𝑒𝑛𝑒𝑟𝑎𝑡𝑖𝑜𝑛 (𝑘𝑊ℎ
𝑦𝑒𝑎𝑟) = (1 − 𝐴𝑃𝐶) 𝑥 𝐺𝑟𝑜𝑠𝑠 𝑔𝑒𝑛𝑒𝑟𝑎𝑡𝑖𝑜𝑛
Therefore Fixed Cost for Electricity Generation is,
Equation 31
Fixed cost per unit (Rs
kWh)
=
𝑅𝑒𝑡𝑢𝑟𝑛 𝑜𝑛 𝐸𝑞𝑢𝑖𝑡𝑦 + 𝐼𝑛𝑡𝑒𝑟𝑒𝑠𝑡 𝑜𝑛 𝑡𝑒𝑟𝑚 𝑙𝑜𝑎𝑛 + 𝐼𝑛𝑡𝑒𝑟𝑒𝑠𝑡 𝑜𝑛 𝑤𝑜𝑟𝑘𝑖𝑛𝑔 𝑐𝑎𝑝𝑖𝑡𝑎𝑙 + 𝑂𝑀 𝑒𝑥𝑝𝑒𝑛𝑠𝑒𝑠 +𝐷𝑒𝑝𝑟𝑒𝑐𝑖𝑎𝑡𝑖𝑜𝑛 − 𝑆𝑎𝑙𝑣𝑎𝑔𝑒 𝑣𝑎𝑙𝑢𝑒
𝑁𝑒𝑡 𝐸𝑙𝑒𝑐𝑡𝑟𝑖𝑐𝑖𝑡𝑦 𝐺𝑒𝑛𝑒𝑟𝑎𝑡𝑖𝑜𝑛
3.2 Components of Variable cost
The variable cost component to estimate the LCOE is calculated 2017 onwards, unlike the fixed
cost component, which was calculated from the commercial operation year of the plant.
Coal
The sub-bituminous Indian coal is considered as the coal type for all the representative cases.
A fuel mix of SECL and MCL in the ratio 50:50 is considered as the coal type [Refer Annexure-
B] (MoC, 2016) (CIMFR, 2014). The landed coal cost is calculated by adding a coal cess amount
of INR 400/tonne of coal and INR 768/tonne (transportation cost for 500 km) as the
transportation cost, as per the railway freight charges (Ministry of Railways, 2015)
(Chandrasekaran, 2016) (CIL, 2016). The coat cost, as on May 2016 for SECL, MCL 50:50
blended coal, is INR 2238/tonne. The composition of coal is given in Table 30.
Table 30: Coal Composition
Component Weight/Weight Ratio
Carbon 0.429
Hydrogen 0.028
Sulphur 0.005
Nitrogen 0.01
Oxygen 0.078
Moisture 0.072
Ash 0.345
Hg 1.50E-07
The GCV of coal is 4289 kcal/kg. The escalation rate for coal is not considered in the present
analysis as per the CERC notification on coal procurement rate for power sector (CERC, 2016).
Secondary Fuel Oil
The cost of secondary fuel oil is taken from literature, and is around INR 10,000/kl. Its GCV is
considered as 10,000 kcal/litre (CERC, 2009 a). 0% escalation rate is assumed for secondary
fuel oil.

Benefit Cost Analysis of Emission Standards for Coal-based Thermal Power Plants in India
© CSTEP www.cstep.in 63
Water Charges
The representative plants considered as base cases are inland plants. They mostly depend on
fresh water sources. The cost of water for coal power plants is taken as INR 7 per m3 and the
specific consumption 7 m3/MWh (CEA, 2012 b) (Muthuraman, 2016).
Specific oil consumption = 1 ml/kWh (CERC, 2009 a)
Equation 32
𝑆𝑝𝑒𝑐𝑖𝑓𝑖𝑐 𝑜𝑖𝑙 𝑐𝑜𝑠𝑡 (𝐼𝑁𝑅/𝑘𝑊ℎ) = 𝑆𝑝𝑒𝑐𝑖𝑓𝑖𝑐 𝑜𝑖𝑙 𝑐𝑜𝑛𝑠𝑢𝑚𝑝𝑡𝑖𝑜𝑛 (𝑚𝑙
𝑘𝑤ℎ) 𝑥 𝐶𝑜𝑠𝑡 𝑜𝑓 𝑜𝑖𝑙 (
𝐼𝑁𝑅
𝑘𝑙) 𝑥 1000
Equation 33
𝑆𝑝𝑒𝑐𝑖𝑓𝑖𝑐 𝑐𝑜𝑎𝑙 𝑐𝑜𝑠𝑡 (𝐼𝑁𝑅/𝑘𝑊ℎ)
= 𝑆𝑝𝑒𝑐𝑖𝑓𝑖𝑐 𝑐𝑜𝑎𝑙 𝑐𝑜𝑛𝑠𝑢𝑚𝑝𝑡𝑖𝑜𝑛 (𝑘𝑔
𝑘𝑤ℎ) 𝑥 𝐶𝑜𝑠𝑡 𝑜𝑓 𝑐𝑜𝑎𝑙 (
𝐼𝑁𝑅
𝑡𝑜𝑛𝑛𝑒) 𝑥 1000
Equation 34
𝑆𝑝𝑒𝑐𝑖𝑓𝑖𝑐 𝑤𝑎𝑡𝑒𝑟 𝑐ℎ𝑎𝑟𝑔𝑒 (𝐼𝑁𝑅/𝑘𝑊ℎ) = 𝑆𝑝𝑒𝑐𝑖𝑓𝑖𝑐 𝑤𝑎𝑡𝑒𝑟 𝑐𝑜𝑛𝑠𝑢𝑚𝑝𝑡𝑖𝑜𝑛 (𝑚3
𝑀𝑤ℎ) 𝑥 𝑊𝑎𝑡𝑒𝑟 (
𝐼𝑁𝑅
𝑚3) 𝑥 1000
Equation 35
𝑇𝑜𝑡𝑎𝑙 𝑣𝑎𝑟𝑖𝑎𝑏𝑙𝑒 𝑐𝑜𝑠𝑡 𝑝𝑒𝑟 𝑢𝑛𝑖𝑡 𝑜𝑓 𝑒𝑙𝑒𝑐𝑡𝑟𝑖𝑐𝑖𝑡𝑦 𝑔𝑒𝑛𝑒𝑟𝑎𝑡𝑒𝑑
= 𝑆𝑝𝑒𝑐𝑖𝑓𝑖𝑐 𝑜𝑖𝑙 𝑐𝑜𝑠𝑡 + 𝑆𝑝𝑒𝑐𝑖𝑓𝑖𝑐 𝑐𝑜𝑎𝑙 𝑐𝑜𝑠𝑡 + 𝑆𝑝𝑒𝑐𝑖𝑓𝑖𝑐 𝑤𝑎𝑡𝑒𝑟 𝑐ℎ𝑎𝑟𝑔𝑒
Equation 36
𝑉𝑎𝑟𝑖𝑎𝑏𝑙𝑒 𝑐𝑜𝑠𝑡 𝑐𝑜𝑚𝑝𝑜𝑛𝑒𝑛𝑡 𝑝𝑒𝑟 𝑢𝑛𝑖𝑡 (𝐼𝑁𝑅/𝐾𝑊ℎ)
=𝑇𝑜𝑡𝑎𝑙 𝑣𝑎𝑟𝑖𝑎𝑏𝑙𝑒 𝑐𝑜𝑠𝑡 𝑝𝑒𝑟 𝑢𝑛𝑖𝑡 𝑜𝑓 𝑒𝑙𝑒𝑐𝑡𝑟𝑖𝑐𝑖𝑡𝑦 𝑔𝑒𝑛𝑒𝑟𝑎𝑡𝑒𝑑
𝑁𝑒𝑡 𝐸𝑙𝑒𝑐𝑡𝑟𝑖𝑐𝑖𝑡𝑦 𝐺𝑒𝑛𝑒𝑟𝑎𝑡𝑖𝑜𝑛
3.3 Levelised Tariff of Electricity (LToE)
The discounted rate is required to calculate LToE. The Weighted Average Cost of Capital
(WACC) is considered as the discount rate for tariff calculation. WACC is calculated as follows:
Equation 37
𝑊𝐴𝐶𝐶 =(𝐸𝑞𝑢𝑖𝑡𝑦% 𝑥 𝑅𝑜𝐸 ) + (𝐷𝑒𝑏𝑡% 𝑥 𝐼𝑛𝑡𝑒𝑟𝑒𝑠𝑡 𝑟𝑎𝑡𝑒 𝑓𝑜𝑟 𝑐𝑎𝑝𝑖𝑡𝑎𝑙 𝑖𝑛𝑣𝑒𝑠𝑡𝑚𝑒𝑛𝑡)
𝐸𝑞𝑢𝑖𝑡𝑦% + 𝐷𝑒𝑏𝑡%
The discounted rate for each representative case was calculated considering the CERC’s
guidelines prevalent in each time period.
Table 31: Discount Rate
Financial parameters Unit 2004-09 guidelines 2009-14 guidelines 2014-19 guidelines
Discount rate (WACC) % 12.95% 13.40% 13.40%
The LToE has been calculated for the remaining plant life using the following equation:

Benefit Cost Analysis of Emission Standards for Coal-based Thermal Power Plants in India
www.cstep.in © CSTEP 64
Equation 38
𝐿𝑒𝑣𝑒𝑙𝑖𝑠𝑒𝑑 𝑇𝑎𝑟𝑖𝑓𝑓 𝑜𝑓 𝐸𝑙𝑒𝑐𝑡𝑟𝑖𝑐𝑖𝑡𝑦 (𝐿𝑇𝑜𝐸)
= ∑ (𝐹𝑖𝑥𝑒𝑑 𝑐𝑜𝑠𝑡 + 𝑉𝑎𝑟𝑖𝑎𝑏𝑙𝑒 𝑐𝑜𝑠𝑡)25
𝑖= 2017−𝐶𝑜𝐷 𝑜𝑓 𝑃𝑙𝑎𝑛𝑡 ∗ 𝐷𝑖𝑠𝑐𝑜𝑢𝑛𝑡 𝑟𝑎𝑡𝑒𝑖
∑ 𝐷𝑖𝑠𝑐𝑜𝑢𝑛𝑡 𝑟𝑎𝑡𝑒𝑖25𝑖= 2017−𝐶𝑜𝐷 𝑜𝑓 𝑃𝑙𝑎𝑛𝑡
4. Tariff Determination for Coal Power Plants with PCTs
The tariff determination with PCTs was conducted following the same methodology as the one
described above.
The additional costs that the plant has to incur for the installation of PCT are mentioned below.
Fixed cost: Capital cost for PCT installation
Variable cost:
1. Reagent costs for PCTs
a. Limestone for FGD
b. Urea/ammonia for SCR/SNCR
2. Catalyst cost for SCR
3. Additional Water charges for PCTs
4. Costs for waste disposal of gypsum slurry
4.1 Fixed Cost for PCTs
Capital Investment for PCTs
The capital investment for PCTs varies depending on the PCTs chosen. The PCTs considered
for each case, with the capital investment needed, are shown in Table 32.
Table 32: Capital Investment for PCTs Implemented in each Representative Plant
Cases Capital investment (INR million/MW)
Case 1 3.9
Case 2a 6
Case 2b 8
Case 3 8.5
The cost of washed coal is approximately INR 490/tonne (Cropper, Gamkhar, Malik, Limonov,
& Partridge, 2012).
The capital investment of PCTs for Case 1, 2a, 2b is considered as an additional fixed cost, as
per the CERC guidelines. For new plants, the capital investments for PCTs are included in the
base plant capital investment with a debt equity ratio of 70:30.
Interest on Working Capital for PCTs
The use of reagents in post-combustion technologies demands an additional working capital.
The added components to the working capital are:
Limestone cost for 2 months of generation
Urea cost for 2 months of generation

Benefit Cost Analysis of Emission Standards for Coal-based Thermal Power Plants in India
© CSTEP www.cstep.in 65
O&M expenses of FGD, SCR, ESP
Table 33: Cost of Reagents and By-product
Reagent Cost (INR/tonne) Low quality limestone (70% pure) 2900
Urea 12000 High quality limestone30 3500
Gypsum (by-product from FGD) 1200
O&M Expenses for PCTs Table 34: O&M Expenses for PCTs
O&M cost
PCTs INR million/MW WFGD 0.6
SCR 0.5 ESP 0.5
SNCR 0.1 LNB & OFA 0
Limestone Injection 0
Depreciation Rate for PCTs
Depreciation is calculated using the Straight Line Method (SLM), assuming the depreciation
rate as that of the base plant.
Salvage Value for PCTs
The salvage value of 5%31 is assumed after the end of base plant life.
Net Generation of Electricity
Equation 39
𝑁𝑒𝑡 𝑒𝑙𝑒𝑐𝑡𝑟𝑖𝑐𝑖𝑡𝑦 𝑔𝑒𝑛𝑒𝑟𝑎𝑡𝑖𝑜𝑛 (𝑘𝑊ℎ
𝑦𝑒𝑎𝑟) = (1 − 𝐴𝑃𝐶 − 𝐴𝑃𝐶 𝑜𝑓 𝑃𝐶𝑇𝑠) 𝑥 𝐺𝑟𝑜𝑠𝑠 𝑒𝑙𝑒𝑐𝑡𝑟𝑖𝑐𝑖𝑡𝑦 𝑔𝑒𝑛𝑒𝑟𝑎𝑡𝑖𝑜𝑛
Fixed Cost for PCTs for Case1, 2 Plants
Equation 40
Fixed cost per unit for PCTs (INR
kWh)
=
𝑃𝐶𝑇 𝑎𝑙𝑙𝑜𝑤𝑎𝑛𝑐𝑒 + 𝐼𝑛𝑡𝑒𝑟𝑒𝑠𝑡 𝑜𝑛 𝑤𝑜𝑟𝑘𝑖𝑛𝑔 𝑐𝑎𝑝𝑖𝑡𝑎𝑙 𝑓𝑜𝑟 𝑃𝐶𝑇𝑠 + 𝑂𝑀 𝑒𝑥𝑝𝑒𝑛𝑠𝑒𝑠 +
𝐷𝑒𝑝𝑟𝑒𝑐𝑖𝑎𝑡𝑖𝑜𝑛 − 𝑆𝑎𝑙𝑣𝑎𝑔𝑒 𝑣𝑎𝑙𝑢𝑒)
𝑁𝑒𝑡 𝑒𝑙𝑒𝑐𝑡𝑟𝑖𝑐𝑖𝑡𝑦 𝑔𝑒𝑛𝑒𝑟𝑎𝑡𝑖𝑜𝑛
Fixed Cost for PCTs for Case 3 Plants
30 Limestone of high quality is required to generate saleable by-product. 31 5% salvage value is assumed, as PCTs consist of lesser amount of metal parts, as compared to base plant

Benefit Cost Analysis of Emission Standards for Coal-based Thermal Power Plants in India
www.cstep.in © CSTEP 66
Equation 41
Fixed cost per unit for PCTs (INR
kWh)
=
𝑖𝑛𝑡𝑒𝑟𝑒𝑠𝑡 𝑜𝑛 𝑃𝐶𝑇 𝑖𝑛𝑣𝑒𝑠𝑡𝑚𝑒𝑛𝑡 + 𝐼𝑛𝑡𝑒𝑟𝑒𝑠𝑡 𝑜𝑛 𝑤𝑜𝑟𝑘𝑖𝑛𝑔 𝑐𝑎𝑝𝑖𝑡𝑎𝑙 𝑓𝑜𝑟 𝑃𝐶𝑇𝑠 + 𝑂𝑀 𝑒𝑥𝑝𝑒𝑛𝑠𝑒𝑠 +
𝐷𝑒𝑝𝑟𝑒𝑐𝑖𝑎𝑡𝑖𝑜𝑛 − 𝑆𝑎𝑙𝑣𝑎𝑔𝑒 𝑣𝑎𝑙𝑢𝑒)
𝑁𝑒𝑡 𝑒𝑙𝑒𝑐𝑡𝑟𝑖𝑐𝑖𝑡𝑦 𝑔𝑒𝑛𝑒𝑟𝑎𝑡𝑖𝑜𝑛
Total Fixed Cost for Coal Power Plants with PCTs
Equation 42
Fixed cost for coal power plants with PCTs (INR
kWh)
= 𝐹𝑖𝑥𝑒𝑑 𝑐𝑜𝑠𝑡 𝑓𝑜𝑟 𝑏𝑎𝑠𝑒 𝑝𝑙𝑎𝑛𝑡 + 𝐹𝑖𝑥𝑒𝑑 𝑐𝑜𝑠𝑡 𝑓𝑜𝑟 𝑃𝐶𝑇𝑠
4.2 Variable Cost for PCTs
The reagents, such as limestone and urea, requirement for the representative cases were
calculated based on a mass balance analysis.
Approximately 1.5 tonne of limestone is required to remove one tonne of SOx (Buecker, 2010;
Bhati & Ramanathan, 2016). The limestone required per year is calculated from the annual SOx
generation [Refer Annexure-B].
Equation 43
𝑉𝑎𝑟𝑖𝑎𝑏𝑙𝑒 𝑐𝑜𝑠𝑡 𝑓𝑜𝑟 𝑙𝑖𝑚𝑒𝑠𝑡𝑜𝑛𝑒 (𝐼𝑁𝑅/𝑘𝑊ℎ) =𝐿𝑖𝑚𝑒𝑠𝑡𝑜𝑛𝑒 𝑟𝑒𝑞𝑢𝑖𝑟𝑒𝑑 𝑖𝑛 𝑎𝑛 𝑦𝑒𝑎𝑟 ∗ 𝐶𝑜𝑠𝑡 𝑜𝑓 𝑙𝑖𝑚𝑒𝑠𝑡𝑜𝑛𝑒
𝑁𝑒𝑡 𝑒𝑙𝑒𝑐𝑡𝑟𝑖𝑐𝑖𝑡𝑦 𝑔𝑒𝑛𝑒𝑟𝑎𝑡𝑖𝑜𝑛
In SCR/SNCR, urea requirement per tonne of NOx removal is around 0.625 tonne (Process
Combustion Corporation, 2016; Bhati & Ramanathan, Clearing the Air, 2016). The annual urea
requirement is calculated from NOx emission, and the variable cost for urea is calculated.
Equation 44
𝑉𝑎𝑟𝑖𝑎𝑏𝑙𝑒 𝑐𝑜𝑠𝑡 𝑓𝑜𝑟 𝑢𝑟𝑒𝑎 (𝐼𝑁𝑅/𝑘𝑊ℎ) =𝑈𝑟𝑒𝑎 𝑟𝑒𝑞𝑢𝑖𝑟𝑒𝑑 𝑖𝑛 𝑎𝑛 𝑦𝑒𝑎𝑟 ∗ 𝐶𝑜𝑠𝑡 𝑜𝑓 𝑢𝑟𝑒𝑎
𝑁𝑒𝑡 𝑒𝑙𝑒𝑐𝑡𝑟𝑖𝑐𝑖𝑡𝑦 𝑔𝑒𝑛𝑒𝑟𝑎𝑡𝑖𝑜𝑛
Equation 45
𝑉𝑎𝑟𝑖𝑎𝑏𝑙𝑒 𝑐𝑜𝑠𝑡 𝑓𝑜𝑟 𝑤𝑎𝑡𝑒𝑟 (𝐼𝑁𝑅
𝑘𝑊ℎ)
=(𝑊𝑎𝑡𝑒𝑟 𝑟𝑒𝑞𝑢𝑖𝑟𝑒𝑑 𝑓𝑜𝑟 𝐹𝐺𝐷 + 𝑆𝐶𝑅) (
𝑚3
𝑀𝑊ℎ) ∗ 𝐶𝑜𝑠𝑡 𝑜𝑓 𝑤𝑎𝑡𝑒𝑟 (
𝐼𝑁𝑅𝑚3 ) ∗ 10−3
𝑁𝑒𝑡 𝑒𝑙𝑒𝑐𝑡𝑟𝑖𝑐𝑖𝑡𝑦 𝑔𝑒𝑛𝑒𝑟𝑎𝑡𝑖𝑜𝑛 (𝑘𝑊ℎ𝑦𝑒𝑎𝑟
)
Miscellaneous Expenses
The other variable costs with PCT implementation are given in Table 35 .
Table 35: Miscellaneous Expenses
INR/kWh
Waste disposal for FGD (for low quality limestone) 0.092
Catalysts cost for SCR 0.024

Benefit Cost Analysis of Emission Standards for Coal-based Thermal Power Plants in India
© CSTEP www.cstep.in 67
Equation 46
Variable cost of PCTs (INR
kWh)
= 𝑉𝑎𝑟𝑖𝑎𝑏𝑙𝑒 𝑐𝑜𝑠𝑡 𝑓𝑜𝑟 𝑙𝑖𝑚𝑒𝑠𝑡𝑜𝑛𝑒 (INR
𝑘𝑊ℎ) + 𝑉𝑎𝑟𝑖𝑎𝑏𝑙𝑒 𝑐𝑜𝑠𝑡 𝑓𝑜𝑟 𝑈𝑟𝑒𝑎 (
INR
𝑘𝑊ℎ)
+ 𝑉𝑎𝑟𝑖𝑎𝑏𝑙𝑒 𝑐𝑜𝑠𝑡 𝑓𝑜𝑟 𝑤𝑎𝑡𝑒𝑟 (INR
𝑘𝑊ℎ) + 𝑀𝑖𝑠𝑐𝑒𝑙𝑙𝑎𝑛𝑒𝑜𝑢𝑠 𝑒𝑥𝑝𝑒𝑛𝑠𝑒𝑠 (
INR
𝑘𝑊ℎ)
4.3 Levelised Tariff of Electricity (LToE)
Equation 47
𝐿𝑒𝑣𝑒𝑙𝑖𝑠𝑒𝑑 𝑇𝑎𝑟𝑖𝑓𝑓 𝑜𝑓 𝐸𝑙𝑒𝑐𝑡𝑟𝑖𝑐𝑖𝑡𝑦 (𝐿𝑇𝑜𝐸) =
∑ (𝐹𝑖𝑥𝑒𝑑 𝑐𝑜𝑠𝑡+𝑉𝑎𝑟𝑖𝑎𝑏𝑙𝑒 𝑐𝑜𝑠𝑡+𝑓𝑖𝑥𝑒𝑑 𝑐𝑜𝑠𝑡 𝑜𝑓 𝑃𝐶𝑇𝑠+𝑣𝑎𝑟𝑖𝑎𝑏𝑙𝑒 𝑐𝑜𝑠𝑡 𝑜𝑓 𝑃𝐶𝑇𝑠)25𝑖= 2017−𝐶𝑜𝐷 𝑜𝑓 𝑃𝑙𝑎𝑛𝑡 ∗
𝐷𝑖𝑠𝑐𝑜𝑢𝑛𝑡 𝑟𝑎𝑡𝑒𝑖
∑ 𝐷𝑖𝑠𝑐𝑜𝑢𝑛𝑡 𝑟𝑎𝑡𝑒𝑖25𝑖= 2017−𝐶𝑜𝐷 𝑜𝑓 𝑃𝑙𝑎𝑛𝑡

Benefit Cost Analysis of Emission Standards for Coal-based Thermal Power Plants in India
www.cstep.in © CSTEP 68
Bibliography
Babcock & Wilcox Power Generation Group. (2016). Spray Dry Flue Gas Desulfurization
Systems. Retrieved from Babcock & Wilcox Power Generation Group:
http://www.babcock.com/library/Documents/e1013178.pdf
Babcock & Wilcox Power Generation Group. (2016). Technologies for SO2 and Acid Gas
Control. Retrieved Dec 12, 2016, from Babcock & Wilcox Power Generation Group:
http://www.babcock.com/library/Documents/E1013221.pdf
Bartonova, L., Juchelkova, D., Kilka, Z., & Cech, B. (2011). On Unburned Carbon in Coal Ash
from Various Combustion Units. International Journal of Chemical, Molecular, Nuclear,
Materials and Metallurgical Engineering, 5(4), 280-283. Retrieved from
http://waset.org/publications/4929/on-unburned-carbon-in-coal-ash-from-various-
combustion-units
Beér, J. M. (2003). Clean and Efficient Coal based Electric Power Generation. Fuel Chemistry
Division. Cambridge: Massachusetts Institute of Technology. Retrieved from
https://web.anl.gov/PCS/acsfuel/preprint%20archive/Files/48_1_New%20Orleans_
_03-03_0447.pdf
Belkin, H. E., & Tewalt, S. J. (2007). Geochemistry of Selected Coal Samples from Sumatra ,
Kalimantan , Sulawesi , and Papua , Indonesia. Virginia: U.S. Geological Survey.
Retrieved from http://pubs.usgs.gov/of/2007/1202/
Bell, R. D., & Buckingham, F. P. (2010). An Overview of Technologies for Reduction of Oxides of
Nitrogen from Combustion Furnaces. Alexandria: MPR Associates, Inc. Retrieved
December 08, 2016, from http://www.mpr.com/uploads/news/nox-reduction-coal-
fired.pdf
Bhati, P., & Ramanathan, S. (2016). Clearing the Air. New Delhi: Centre for Science and
Environment.
Bhati, P., & Ramanathan, S. (2017). Using the National Clean Energy Fund to Clean Coal Power
Plants. New Delhi: Centre for Science and Environment. Retrieved November 17,
2017, from Centre for Science and Environment:
http://cdn.cseindia.org/attachments/0.54264300_1506509315_NCEF.pdf
BHEL. (2006). Energy R&D BHEL Role & Contribution. Conference Presentation. Bharat Heavy
Electricals Limited. Retrieved from
http://www.irade.org/day3/session1/k%20ravikumar1.ppt
BHEL. (2016). New Environmental Norms on NOx for Thermal Power Generation- A Challenge.
Bharat Heavy Electricals Limited. Retrieved from
https://www.eecpowerindia.com/codelibrary/ckeditor/ckfinder/userfiles/files/1_B
HEL%20New%20Environmental%20Norms%20on%20NOx%20PART%201.pdf
Brandon, C., & Hommann, K. (1994). The Cost of Inaction:Valuing Economy-Wide Cost of
Environmental Degradation in India. Modelling Global Sustainability . Tokyo: United
Nations University. Retrieved from
https://www.scienceopen.com/document/vid/4b5a0a1e-7f38-42ec-b03c-
eda58a1c6dd4

Benefit Cost Analysis of Emission Standards for Coal-based Thermal Power Plants in India
© CSTEP www.cstep.in 69
Brimblecombe, P. (1996). Air Composition and Chemistry (2 ed.). Cambridge: Cambridge
university Press.
Buecker, B. (2010, January 06). Wet-Limestone FGD Byproduct Generation and Limestone
Consumption Calculations. Retrieved from Power Engineering: http://www.power-
eng.com/articles/print/volume-114/issue-6/Features/wet-limestone-fgd-
byproduct-generation-and-limestone-consumption-calculations.html
Burnett, R. T., Pope III, C. A., Ezzati, C., Olives, S. S., Lim, S. M., Shin, H. H., . . . Cohen, A. (2014).
An Integrated Risk Function for Estimating the Global Burden of Disease Attributable
to Ambient Fine Particulate Matter Exposure. Environmental Health Perspectives.
doi:10.1289/ehp.1307049
Byravan, S., Sahil, A. M., Ananthakumar, M. R., Goyal, N., Kanudia, A., Ramamurthi Vijay, P., . . .
Paladugula, l. A. (2017). Quality of life for all: A sustainable development framework
for India's climate policy reduces greenhouse gas emissions. Energy for Sustainable
Development, 48-58.
Cai, H. Y., Guell, A. J., Dugwell, D. R., & Kandiyoti, R. (1993, March). Heteroatom Distribution in
Pyrolysis Products as a Function of Heating Rate and Pressure. Fuel, 72(3), 321-327.
doi:10.1016/0016-2361(93)90049-8
CCO. (2015). Provisional Coal Statistics 2014-15. Ministry of Coal, Coal Controller's
Organisation. Kolkata: Government of India. Retrieved from
http://coal.nic.in/sites/upload_files/coal/files/coalupload/Provisional1415.pdf
CEA. (2007). Report on the Land Requirement of Thermal Power Stations. Central Electricity
Authority. New Delhi: Ministry of Power, Government of India. Retrieved from
http://www.cea.nic.in/reports/others/thermal/tpm1/land_requirement.pdf
CEA. (2010). Review of Land Requirement for Thermal Power Stations. Central Electricity
Authority. New Delhi: Ministry of Power, Government of India. Retrieved from
http://www.cea.nic.in/reports/others/thermal/tetd/land_review_report.pdf
CEA. (2012 a). Report of the Group for Studying Range of Blending of Imported with Domestic
Coal. Central Electricity Authority. New Delhi: Government of India.
CEA. (2012 b). Report on Minimisation of Water Requirementin Coal Based Thermal Power
Stations. New Delhi: Ministry of Power, Government of India. Retrieved from
http://www.cea.nic.in/reports/others/thermal/tetd/min_of%20water_coal_power.p
df
CEA. (2013). Review of Performance of Thermal Power Stations for 2012-13. Central Electricity
Authority. New Delhi: Ministry of Power, Government of India.
CEA. (2015). Review of Performance of Thermal Power Stations 2014-15. Central Electricity
Authority. New Delhi: Ministry of Power, Government of India.
CEA. (2016 a). All India Installed Capacity of Utility Power Stations. Central Electricity
Authority. New Delhi: Ministry of Power, Government of India. Retrieved from
http://www.cea.nic.in/reports/monthly/installedcapacity/2016/installed_capacity-
12.pdf

Benefit Cost Analysis of Emission Standards for Coal-based Thermal Power Plants in India
www.cstep.in © CSTEP 70
CEA. (2016 b). Draft National Electricity Plan. Central Electricity Authority. New Delhi:
Ministry of Power, Government of India. Retrieved September 20, 2017, from
http://www.cea.nic.in/reports/others/ps/pspa2/draft_nep_trans_2016.pdf
CEA. (2017 a). FGD Installation Plan. (Ministry of Power, Government of India) Retrieved
August 10, 2017, from Central Electricity Authority:
http://cea.nic.in/fgd_installation.html
CEA. (2017 b). Growth of Electricity Sector in India from 1947-2017. Central Electricity
Authority. New Delhi: Ministry of Power, Government of India. Retrieved January 16,
2018, from http://www.cea.nic.in/reports/others/planning/pdm/growth_2017.pdf
CERC. (2004). Terms and Conditions of Tariff- Regulations. Central Electrcity Regulatory
Commisson. New Delhi: Government of India. Retrieved from
http://www.cercind.gov.in/08022007/Final-Order-Terms.pdf
CERC. (2009 a). Tariff Deteremination Methodology for Thermal Power Plant. Central
Electricity Regulatory Authority. New Delhi: Ministry of Power, Government of India.
Retrieved from
http://www.npti.in/Download/Distribution/Tariff%20Determination%20-
%20Write%20up.pdf
CERC. (2009 b). Terms and Conditions of Tariff- Regulations. Central Electricity Regulatory
Commission. New Delhi: Goverment of India. Retrieved November 2016, from
http://cercind.gov.in/Regulations/Terms-and-Conditions-of-Tariff-
Regulations_2009-2014.pdf
CERC. (2012). Benchmark Capital Cost (Hard cost) for Thermal Power Stations with Coal as
Fuel. Central Electricity Regulatory Commission. New Delhi: Ministry of Power.
Retrieved from
http://cercind.gov.in/2012/regulation/Benchmark_Capital_Cost_for_TPS.pdf
CERC. (2013). Approval of Traiff Order for Vallur Thermal Power Project. Central Electricity
Regulatory Commission. New Delhi: Government of India. Retrieved from
http://www.cercind.gov.in/2013/orders/SO198.pdf
CERC. (2014). Terms and Conditions of tariff -Regulations,2014. Central Electrcity Regulatory
Commission. New Delhi: Government of India. Retrieved October 2016, from
http://cercind.gov.in/2014/regulation/reg21.pdf
CERC. (2016). Notification on Guidelines for Determination of Tariff by Bidding Process for
Procurement of Power by Distribution Licensees. Central Electricity Regulatory
Commisision. New Delhi: Ministry of Power, Government of India. Retrieved from
http://cercind.gov.in/2016/escalation/noti1.pdf
Chakraborty, N., Mukherjee, I., Santra, A., Chowdhury, S., Chakraborty, S., Bhattacharya, S., . . .
Sharma, C. (2008). Measurement of CO2, CO, SO2, and NO Emissions from Coal-based
Thermal Power Plants in India. Atmospheric Environment, 42(5), 1073-1082.
doi:10.1016/j.atmosenv.2007.10.074
Chandra, A., & Chandra, H. (2004). Impact of Indian and Imported Coal on Indian Thermal
Power Plants. Journal of Scientific and Industrial Research, 63(2), 156-162. Retrieved

Benefit Cost Analysis of Emission Standards for Coal-based Thermal Power Plants in India
© CSTEP www.cstep.in 71
from http://nopr.niscair.res.in/bitstream/123456789/17587/1/JSIR 63(2) 156-
162.pdf
Chandrasekaran, K. (2016). Cess on Coal from Rs 200 to Rs 400 Per Tonne Welcomed by Solar
Power Developers. Retrieved from The Economic Times:
http://economictimes.indiatimes.com/industry/energy/power/cess-on-coal-from-
rs-200-to-rs-400-per-tonne-welcomed-by-solar-power-
developers/articleshow/51197969.cms
Chaudhary, J. (2017). India’s Coal Sector Seeks to Avoid Emissions Norms. Retrieved February
16, 2018, from India Climate Dialogue:
http://indiaclimatedialogue.net/2017/11/17/india-coal-sector-avoid-emissions-
norms/
CIL. (2016). Price Notification. Coal India Limited, Government of India. Retrieved from
http://www.ccai.co.in/circular-policies/cil/cil-price-notification-dt-29.05.16-
revising-price-of-non-coking-coal-wef-30-05-2016.pdf
CIMFR. (2014). Assessment of the Mercury Content in Coal Fed to Power Plants and Study of
Mercury Emissions from Sector in India. Central Institute of Mining & Fuel Research .
Council of Scientific & Industrial Research, Government of India.
CLP India Private Limited. (2015). Detailed Project Report for 2x1000 MW Imported Coal
Based Thermal Power Project at Paguthan, Bharuch District, Gujarat. Gurgaon:
Lahmeyer International (India) Pvt.Ltd. Retrieved from
http://www.environmentclearance.nic.in/writereaddata/Online/TOR/0_0_25_Jun_2
015_1525529771Pre-feasibilityReport.pdf
CoalSwarm. (2016). India and coal. Retrieved March 20, 2017, from SourceWatch, Center for
Media and Democracy: https://www.sourcewatch.org/index.php/India_and_coal
Conservation Action Trust and UrbanEmissions.info. (2014). Coal Kills: Health Impacts of Air
Pollution from India's Coal Power Expansion. Mumbai: Greenpeace India. Retrieved
from http://www.greenpeace.org/india/en/publications/Coal-Kills/
CPCB. (2017). Online Monitoring Industrial Emission Effluent. Retrieved from
http://cpcb.nic.in/Online-Monitoring-Industrial-Emission-Effluent/
Cropper, M., Gamkhar, S., Malik, K., Limonov, A., & Partridge, I. (2012). The Health Effects of
Coal Electricity Generation in India. Resources for the Future.
EAI. (2013). Cost of 1 MW Solar Plant in India Estimate, Cost of 1 MW Solar Power Plant by
CERC, Cost of Solar PV Plant using Cheaper Panels. Retrieved October 22, 2016, from
EAI Catalyzing Cleantech & Sustainability:
http://www.eai.in/club/users/aathmika/blogs/24192
Environmental Protection Agency. (2016). Electrostatic Precipitators. Ohio: Environmental
Protection Agency. Retrieved from
http://www.epa.state.oh.us/portals/27/engineer/eguides/electro.pdf
EPA. (n.d.). United States Environment Protection Agency. Retrieved 2018, from
https://www.epa.gov/environmental-economics/mortality-risk-valuation

Benefit Cost Analysis of Emission Standards for Coal-based Thermal Power Plants in India
www.cstep.in © CSTEP 72
Equitymaster. (2018). Retrieved May 02, 2018, from Power Sector Analysis Report:
https://www.equitymaster.com/research-it/sector-info/power/Power-Sector-
Analysis-Report.asp
ESMAP. (2001). Technology Assesment of Clean Coal Technology for China: Electric Power
Production Volume I. Washington: Energy Sector Management Asssistance
Programme. Retrieved from
http://documents.worldbank.org/curated/en/256911468769135709/pdf/2348801
0vol-01.pdf
Falcon, R., & Ham, A. (1988). The characteristics of Southern African coals. Journal of the
South African Institute of Mining and Metallurgy, 88(5), 145-161. Retrieved July 8,
2016, from https://www.saimm.co.za/Journal/v088n05p145.pdf
Garg, A., Kapshe, M., Shukla, P. R., & Ghosh, D. (2002). Large point source (LPS) emissions
from India: regional and sectoral analysis. Atmospheric Environment, 36, 213-224.
GE Alstom. (2016). NID Flue Gas Desulphurisation System for the Power Industry. Retrieved
Dec 12, 2016, from Alstom:
http://energiaadebate.com/alstom/Sistemas%20de%20Control%20de%20Aire/Nid
%20Flue%20Gas%20Desulphurization.pdf
GE Power. (2016). NOx Control Through Selective Catalytic Reduction. Retrieved November
17, 2016, from Air Quality Control Systems:
https://www.gepower.com/steam/aqcs/nox-control
General Electric. (2005). Application of Layered Control Technologies to significantly Reduce
NOx Emissions from Coal-Fired Boilers. Dalian, China. Retrieved from
https://www.netl.doe.gov/publications/proceedings/05/NOx_SO2/NOx%20Present
ations/NOx-%20GE-%20Tobin.pdf
Gunatilake, Herath; Ganesan, Karthik; Bacani, Eleanor. (2014). Valuation of Health Impacts of
Air Pollution from Power Plants in Asia: A Practical Guide. Metro Manila: Asian
Development Bank. Retrieved June 07, 2017, from
https://www.adb.org/sites/default/files/publication/149583/south-asia-wp-30.pdf
Guttikunda, S. K., & Jawahar, P. (2014). Atmospheric emissions and pollution from the coal-
fired thermal power plants in India. Atmospheric Environment, 92, 449-460. Retrieved
from http://dx.doi.org/10.1016/j.atmosenv.2014.04.057
Hatton, J. (2008). A Case Study of the Selective Catalytic Reduction (SCR) System at the
Algonquin Power Energy-From waste facility. NAWTEC16-1903, p. 6. Retrieved from
http://www.seas.columbia.edu/earth/wtert/sofos/nawtec/nawtec16/nawtec16-
1903.pdf
HEI. (2010). Outdoor Air Pollution and Health in Development Countries of Asia: A
comprehensive Review. Massachusets: Health Effects Institute. Retrieved December
23, 2017, from
https://www.healtheffects.org/system/files/SR18AsianLiteratureReview.pdf
IEA and IIASA. (2015). Implications of Energy Trajectories from the World Energy Outlook
2015 for India's Air Pollution. International Institute for Applied Systems Analysis.
Paris: International Energy Agency. Retrieved January 16, 2018, from

Benefit Cost Analysis of Emission Standards for Coal-based Thermal Power Plants in India
© CSTEP www.cstep.in 73
https://www.iea.org/media/weowebsite/2015/Air_pollution_emissions_impacts_In
dia_WEO2015_IIASA.pdf
IGIDR. (1994). Economic Valuation of Air Quality Degradation. Bombay.
Implementation of Pollution Control– II, CPCB. (2008). Thermal Power Plants. New Delhi.
Retrieved from http://cpcb.nic.in/uploads/Thermal_Power_Plant_overview.pdf
Indian Bureau of Mines. (2015). Indian Minerals Yearbook 2013. Ministry of Mines (MoM).
Nagpur: Government of India. Retrieved from
http://ibm.nic.in/writereaddata/files/09232015122613Port%20Facilities.pdf
Jayaranjan, M. L., D, E., van, H., Ajit, P., & Annachhatre. (2014). Reuse Options for Coal Fired
Power Plant Bottom Ash and Fly Ash. Reviews in Environmental Science and
Biotechnology, 13(4), 467-486. doi:10.1007/s11157-014-9336-4
Khan, S., & Khan, S. (2014). Boiler and Its Tangential Fuel Firing System. International Journal
of Automation and Control Engineering, 3(3), 71-84. doi:10.14355/ijace.2014.0303.02
Krishnan, R. (2016). What the new green norms for thermal power plants imply. Retrieved
August 14, 2017, from Livemint:
http://www.livemint.com/Money/1Ql0E3I2PVqmRQRROIJRYK/What-the-new-
green-norms-for-thermal-power-plants-imply.html
Lelyveld, M. (2017). China Plans Winter Smog Shutdowns. Retrieved April 2018, from Radio
Free Asia: https://www.rfa.org/english/commentaries/energy_watch/china-plans-
winter-smog-shutdowns-04172017103455.html
Madheswaran, S. (2007). Measuring the Value of Statistical Life: Estimating Compensating
Wage Differentials Among Workers in India. Social Indicators Research, 84(1), 83-96.
Retrieved from http://www.jstor.org/stable/20734507
Maharastra Electricity Regulatory Commission. (2010). MERC order for Approval of Capital
Cost & Tariff for TPC Trombay Unit No. 8. Mumbai. Retrieved from
http://www.mercindia.org.in/pdf/Order%2058%2042/TPC-
8_tariff%20order_19th%20Jan%202010.pdf
Malik, K. (2013). Essays on Energy and Environment in India. University of Maryland.
Maryland: College Park.
MEIC. (2018). Multi-resolution Emission Inventory for China . Retrieved from MEIC webpage:
http://www.meicmodel.org/index.html
Ministry of New and Renewable Energy. (2017). Statewise Potential of various renewable
energy technologies. New Delhi. Retrieved from https://data.gov.in/catalog/state-
wise-potential-various-renewable-energy-technologies
Ministry of Railways. (2015). Adjustments in Base Freight Rates Effective from 01.04.2015.
New Delhi: Railway Board, Government of India. Retrieved from
http://www.ccai.co.in/circular-policies/railways/railway-rates-circular-no.8.pdf
Mishra, B. K., Das, B., Biswal, S. K., & Reddy, P. S. (2015). Overview of Beneficiation, Utilization
and Environmental Issues in Relation to Coal Processing. Proceedings of the Indian
National Science Academy, 725-737. Retrieved from

Benefit Cost Analysis of Emission Standards for Coal-based Thermal Power Plants in India
www.cstep.in © CSTEP 74
http://www.insa.nic.in/writereaddata/UpLoadedFiles/PINSA/Vol81_2015_4_Art05.
Mittal, M. L., Sharma, C., & Singh, R. (2014). Decadal Emission Estimates of Carbon dioxide,
Sulfur dioxide, and Nitric oxide Emissions from Coal Burning in Electric Power
Generation Plants in India. Environmental Monitoring and Assessment, 186(10), 6857-
6866. doi:10.1007/s10661-014-3894-3
MoC. (2016). Provisional Coal Statistics 2015-16. Ministry of Coal, Coal Controller's
Organisation. Kolkata: Government of India. Retrieved November 2016, from
http://www.coalcontroller.gov.in/writereaddata/files/Provisional%20Coal%20Stati
stics%202015-16.pdf
MoEFCC. (2015). Notification on Emission Standards in Coal Power Plants. New Delhi:
Ministry of Environment, Forest and Climate Change. Retrieved December 15, 2017,
from
http://www.moef.gov.in/sites/default/files/Thermal%20plant%20gazette%20scan.
MoEFCC. (2017). Environment (Protection) Amendment Rules. New Delhi: Ministry of
Environment, Forest and Climate Change.
Mohan, V. (2017). Environment Ministry aligns itself with power ministry seeks relaxed
deadline on emission norms for polluting power plants. Times of India. Retrieved
from
https://timesofindia.indiatimes.com/home/environment/pollution/Environment-
ministry-aligns-itself-with-power-ministry-seeks-relaxed-deadline-on-emission-
norms-for-polluting-power-plants/articleshow/62088026.cms
MoLJ. (2003). The Electricity Act, 2003. Legislative Department, Ministry of Law and Justice.
New Delhi: Government of India. Retrieved January 2017, from
http://www.cercind.gov.in/Act-with-amendment.pdf
Mukherjee, P., & Tripathy, D. (2017). The debt threat lurking behind India's zombie power
plants. Retrieved April 30, 2018, from Reuters: https://in.reuters.com/article/us-
india-power-debt/the-debt-threat-lurking-behind-indias-zombie-power-plants-
idINKBN1A6039
Mussatti, D. C., Srivastava, R., Hemmer, P. M., & Strait, R. (2000). Selective Noncatalytic
Reduction. United States: Environmental Protection Agency. Retrieved from
https://www3.epa.gov/ttn/ecas/docs/cs4-2ch1.pdf
Muthuraman, M. (2016). Reduction in Power Plant Specific Water Consumption.
International Power Plant O&M conference (p. 8). Noida: Indian Power Stations - IPS
2016. Retrieved from
https://www.researchgate.net/publication/295073310_REDUCTION_IN_POWER_PL
ANT_SPECIFIC_WATER_CONSUMPTION
Nowling, U. (2015). Understanding Coal Power Plant Heat Rate and Efficiency. POWER:
Business & Technology for the Global Generation Industry Since 1882. Retrieved 12 07,
2016, from http://www.powermag.com/understanding-coal-power-plant-heat-rate-
and-efficiency/

Benefit Cost Analysis of Emission Standards for Coal-based Thermal Power Plants in India
© CSTEP www.cstep.in 75
OTM. (2009). Gypsum Market Research Study. South Africa: Over the moon. Retrieved from
http://www.zitholele.co.za/wp-content/uploads/2015/11/Appendix-J-PED-
Marketability-Study-Report.pdf
PCC- Oxidation Technologies. (2017). SNCR-SCR. Retrieved Januray 14, 2017, from PCC-
Oxidation Technologies Product Website: http://www.pcc-
sterling.com/products/thermal-oxidizers/scr-sncr/
Pershing, D. W., & Wendt, J. O. (1977). Pulverised Coal Combustion: The Influence of Flame
Temperature and Coal Composition on Thermal and Fuel NOx. Symposium
(International) on Combustion, 16(1), 389-399. doi:10.1016/S0082-0784(77)80339-
1
PIB. (2015). Environment Ministry Notifies Stricter Standards for Coal Based Thermal Power
Plants to Minimise Pollution. Retrieved from
http://pib.nic.in/newsite/PrintRelease.aspx?relid=133726
Pope, C. A., Cropper, M., Coggins, J., & Cohen, A. (2015). Health Benefits of Air Polllution
abatement policy: Role of the shape of the concentration response function. Journal of
the Air and Waste Pollution Association, 65(5), 516-522. doi:
10.1080/10962247.2014.993004
Power Engineering. (2006). Wet-Limestone Scrubbing Fundamentals. Retrieved December
2017, from Power Engineering: https://www.power-
eng.com/articles/print/volume-110/issue-8/features/wet-limestone-scrubbing-
fundamentals.html
Process Combustion Corporation. (2016). Post-Combustion NOx Reduction… SNCR or SCR?
Retrieved from PCC: http://www.pcc-sterling.com/products/thermal-oxidizers/scr-
sncr/
PTI. (2018). Power Ministry not in Favour of Retrofitting Old Plants to Meet Emission Norms.
Retrieved Januray 30, 2018, from ET Energy World:
https://energy.economictimes.indiatimes.com/news/power/power-ministry-not-in-
favour-of-retrofitting-old-plants-to-meet-emission-norms/62345966
Railway Board, Ministry of Railways. (2015). Rates Circular No. 8: Adjustment in base freight
rates effective 01.04.2015. Retrieved from http://www.ccai.co.in/circular-
policies/railways/railway-rates-circular-no.8.pdf
Reddy, J. P. (2014). Clean Coal Technologies for Power Generation. CRC Press.
Saha, D. (2017). Money Needed For India’s 2020 Coal Target = 4 Times Defence Budget.
IndiaSpend. Retrieved from http://www.indiaspend.com/cover-story/money-
needed-for-indias-2020-coal-target-4-times-defence-budget-18548
Sahu, R. (2015). Comments on Draft Notification on Air Emission Standards for Coal-Based
Thermal Power Plants by the Government of India, Ministry of Environment, Forests,
and Climate Change.
Samantaray, A. K., Singh, N. P., & Mukherjee, T. K. (2004). Evaluation of Potential Pit-Head
Sites for Coal-based Thermal Power Stations Based on Site-Suitability Index(SSI)
Using Geospatial Information. Map Asia Conference 2004, (p. 8). Beijing. Retrieved

Benefit Cost Analysis of Emission Standards for Coal-based Thermal Power Plants in India
www.cstep.in © CSTEP 76
from https://www.geospatialworld.net/wp-
content/uploads/images/pdf/ma04103.pdf
Sargent & Lundy. (2007). Flue Gas Desulfurization Technology Evaluation. National Lime
Association, Chicago. Retrieved from
https://www.lime.org/documents/publications/free_downloads/fgdte_dry-wet-
limestone2007.pdf
Sathyanathan, V. T., & Mohammed, K. P. (2004). Prediction of Unburnt Carbon in Tangentially
Fired Boiler Using Indian Coals. Fuel, 2217-2227.
Shah, J. J., & Nagpal, T. (1997). Urban Air Quality Management Strategy in Asia: Greater
Mumbai Report. Washington D.C.: The World Bank. Retrieved from
http://documents.worldbank.org/curated/en/587831468772744677/Urban-air-
quality-management-strategy-in-Asia-Greater-Mumbai-report
Shahzad, B. K., & Yousaf, M. (2017). Coal Fired Power Plants: Emission Problems and
Controlling Techniques. Journal of Earth Science and Climate Change, 8(7).
doi:10.4172/2157-7617.1000404
Shanmugam, K. R. (2000). Valuations of Life and injury Risks:Empirical Evidence.
Environmental and Resource Economics, 16(4), 379-389. Retrieved from
https://doi.org/10.1023/A:1008364502517
Shanmugam, K. R. (2001). Self Selection Bias in the Estimates of Compensating Differentials
for Job Risks in India. Journal of Risk and Uncertainty, 22(3), 263-275.
doi:https://doi.org/10.1023/A:1011135118675
Simon, N. B., Cropper, M., Alberini, A., & Arora, S. (1999). Valuing Mortality Reductions in
India: A Study of Compensating Wage Differentials. Washington, D.C.: The World Bank.
Retrieved from
http://documents.worldbank.org/curated/en/582261468751139383/Valuing-
mortality-reductions-in-India-a-study-of-compensating-wage-differentials
Song, Y. H., Pohl, J. H., Beer, J. M., & Sarofim, A. F. (1982). Nitric Oxide Formation During
Pulverized Coal Combustion. Combustion Science and Technology, 31-40.
STEAG Energy Services India Pvt. Ltd. (2014). Detailed Feasibility Report for 800 MW Coal
Based Power Plant at Panipat Thermal Power Station. Panipat: Haryana Power
Generation Corporation Ltd. Retrieved from
http://environmentclearance.nic.in/writereaddata/online/tor/0_0_09_feb_2015_14
50378431annexure-dfr.pdf
The Singareni Colleries Company. (2017). Price Notification. Retrieved from
https://scclmines.com/uploads/coalPrice/6.PDF
The World Bank. (2014). Electric power consumption (kWh per capita). Retrieved October 3,
2017, from The World Bank:
https://data.worldbank.org/indicator/EG.USE.ELEC.KH.PC?locations=IN
United Nations. (2017). World Population prospects - Key Findings & Advance Tables .
Population Division, Department of Economic and Social Affairs. United Nations.
Retrieved from
https://esa.un.org/unpd/wpp/Publications/Files/WPP2017_KeyFindings.pdf

Benefit Cost Analysis of Emission Standards for Coal-based Thermal Power Plants in India
© CSTEP www.cstep.in 77
USEPA. (1998). Bituminous and Subbituminous Coal Combustion Emission Factors, in AP-42,
Compilation of Air Pollutant Emission Factors (Vol. 1). United States Environmental
Protection Agency.
van Harmelen, A., Visschedijk, A., & Kok, H. (2002). Potentials and costs to reduce PM10 and
PM 2.5 emissions from industrial sources in Netherlands. Apeldoorn: TNO Environment
Energy and Process Innovation.
Viscusi, W. K. (2011). Policy Challenges of the Heterogeneity of the Value of Statistical Life.
Published Articles & Papers., 95. Retrieved from
http://research.create.usc.edu/published_papers/95.
Viscusi, W. K., & Aldy, J. E. (2003). The Value of a Statistical Life: A Critical Review of Market
Estimates Throughout the World. Journal of Risk and Uncertainty, 27(1), 5-76.
WRI. (2012). China Adopts World-Class Pollutant Emissions Standards for Coal Power Plants.
Retrieved March 26, 2018, from
http://www.chinafaqs.org/files/chinainfo/China%20FAQs%20Emission%20Standar
ds%20v1.4_0.pdf
Wynn, G., & Coghe, P. (2017). Europe’s Coal-Fired Power Plants: Rough Times Ahead. Institute
of Energy Economics and Financial Analysis. Retrieved from http://ieefa.org/wp-
content/uploads/2017/05/Europe-Coal-Fired-Plants_Rough-Times-Ahead_May-
2017.pdf
Zamuda, C. D., & Sharpe, M. A. (2007). A Case for Enhanced Use of Clean Coal in India. 36.
Ranchi, India: Coal Beneficiation and Utilization of Rejects.
Zhuang, J., Liang, Z., Lin, T., & Guzman, F. D. (2007). Theory and Practice in the Choice of
Social Discount Rate for Cost Benefit Analysis: A survey. ERD Working Paper(95).


CENTER FOR STUDY OF SCIENCE, TECHNOLOGY AND POLICY
#18 & 19, 10th Cross, Mayura Street,
Papanna Layout, Nagashettyhalli, RMV II Stage,
Bengaluru- 560094
Karnataka, INDIA
Tel: +91 (80) 6690-2500
Fax: +91 (80) 2351-4269
Email: [email protected]