Beneath the Veneer of Fragmentation: Television Audience Polarization in a Multichannel World
17
366 Beneath the Veneer of Fragmentation: Television Audience Polarization in a Multichannel World By James G. Webster This study reviews the history of television audience fragmentation in the United States and uses a secondary analysis of Nielsen peoplemeter data to assess the cur- rent state of both fragmentation and audience polarization across 62 of the most prominent television networks. Audience fragmentation is more advanced than is generally recognized. Polarization, the tendency of channel audiences to be com- posed of devotees and nonviewers, is also evident, though modest. Contrary to the “law of double jeopardy,” there are now many examples of both small-but-loyal and small-but-disloyal audiences. Loyalty and audience fragmentation affect net- work profitability and have social consequences. As recently as 1977, three broadcast networks accounted for over 90% of all the prime-time television watched by Americans (Veronis, 1994). Everyone consumed a similar, broadly appealing, diet of news and entertainment. Since then, an ava- lanche of programming, much of it targeted to specific segments of the popula- tion, has fragmented the audience almost beyond recognition. These changes affect network profitability, but they can have social consequences as well. Theo- rists have raised two related concerns. One is the fear that nations will be denied a powerful medium of social integration in which all citizens can attend to the nation’s business (Katz, 1996). Another even more worrisome prospect is that technology and advertiser-driven programming will reconfigure the mass audi- ence into many small, relatively exclusive communities of interest that never en- counter dissident voices or different points of view (e.g., Sunstein, 2001; Turow, 1997). These concerns map onto two features of audience behavior: fragmenta- James G. Webster (PhD, 1980, Indiana University) is a professor in the Department of Communication Studies at Northwestern University. He thanks Nielsen Media Research for making the necessary data available and Turner Broadcasting for executing the NPower analyses. The author also thanks Eszter Hargittai, Peter Miller, Amaya Ochoa, Robert Verbanac, Jack Wakshlag, and Steve Wildman for their valuable comments and contributions. Correspondence may be directed to Webster at Department of Communication Studies, 2240 Campus Drive, Northwestern University, Evanston, IL 60208. Copyright © 2005 International Communication Association
-
Upload
northwestern -
Category
Documents
-
view
2 -
download
0
Transcript of Beneath the Veneer of Fragmentation: Television Audience Polarization in a Multichannel World
Journal of Communication, June 2005
366
Beneath the Veneer of Fragmentation:Television Audience Polarizationin a Multichannel World
By James G. Webster
This study reviews the history of television audience fragmentation in the UnitedStates and uses a secondary analysis of Nielsen peoplemeter data to assess the cur-rent state of both fragmentation and audience polarization across 62 of the mostprominent television networks. Audience fragmentation is more advanced than isgenerally recognized. Polarization, the tendency of channel audiences to be com-posed of devotees and nonviewers, is also evident, though modest. Contrary to the“law of double jeopardy,” there are now many examples of both small-but-loyaland small-but-disloyal audiences. Loyalty and audience fragmentation affect net-work profitability and have social consequences.
As recently as 1977, three broadcast networks accounted for over 90% of all theprime-time television watched by Americans (Veronis, 1994). Everyone consumeda similar, broadly appealing, diet of news and entertainment. Since then, an ava-lanche of programming, much of it targeted to specific segments of the popula-tion, has fragmented the audience almost beyond recognition. These changesaffect network profitability, but they can have social consequences as well. Theo-rists have raised two related concerns. One is the fear that nations will be denieda powerful medium of social integration in which all citizens can attend to thenation’s business (Katz, 1996). Another even more worrisome prospect is thattechnology and advertiser-driven programming will reconfigure the mass audi-ence into many small, relatively exclusive communities of interest that never en-counter dissident voices or different points of view (e.g., Sunstein, 2001; Turow,1997). These concerns map onto two features of audience behavior: fragmenta-
James G. Webster (PhD, 1980, Indiana University) is a professor in the Department of CommunicationStudies at Northwestern University. He thanks Nielsen Media Research for making the necessary dataavailable and Turner Broadcasting for executing the NPower analyses. The author also thanks EszterHargittai, Peter Miller, Amaya Ochoa, Robert Verbanac, Jack Wakshlag, and Steve Wildman for theirvaluable comments and contributions. Correspondence may be directed to Webster at Department ofCommunication Studies, 2240 Campus Drive, Northwestern University, Evanston, IL 60208.
Copyright © 2005 International Communication Association
Television Audience Polarization
367
tion and polarization. Although the first is familiar to students of television, thesecond is largely undocumented. This study reviews both the history and currentstate of fragmentation, and presents a comprehensive assessment of audiencepolarization across 62 of the most prominent television networks in the U.S. I findthat audience fragmentation is more advanced than is generally recognized. Con-trary to much research and theory on audience behavior, many “small but loyal”audiences have begun to emerge, though none is so faithful to its favorite networkas to confirm the worst fears of social polarization.
Audience FragmentationBetween cable television, direct broadcast satellites, and other “alternative deliv-ery systems,” over 80% of U.S. homes now have access to more than just theirlocal broadcasters. The result, according to Nielsen Media Research, is that theaverage television household (which includes virtually all American homes) canreceive over 100 channels of programming (Nielsen, 2003). This is a dramatic andrelatively recent change in the television-viewing environment. By way of com-parison, in 1990 the average household could receive only 33 channels. Whenone considers the burgeoning numbers of VCRs, DVDs, PVRs, and newer broad-band delivery systems, the typical American TV viewer functions in an ever moreabundant, at least numerically, multichannel environment.
Media companies have been quick to exploit the expanding delivery system. Atlast count, there were 339 “national cable networks” (NCTA, 2004). Many offersome combination of new programming and reruns. Most are designed to attracta certain kind of viewer, but they all compete for the attention of the audience.Webster (1986) described this new media environment by highlighting three waysin which it differed from the old. First, in the new environment, programming is,in the aggregate, more diverse. Although diversity is subject to many definitions(Napoli, 1999), one would be hard pressed to argue that TV programming today ismore homogeneous than, say, in the 1950s. Second, in the new environment,content is correlated with channel. Rather than offering a little something foreveryone, channels tend to specialize in a particular type of content. Althoughsome newer entrants have opted for the familiar “broadcast” model, most net-works “narrowcast” whatever type of content they believe will attract a desireddemographic. Third, channels in the new environment are differentially available.Almost since their inception, the “big three” networks—that is, NBC, CBS, andABC—were available to all television households. Every home had a uniform, iflimited, universe of programming from which to choose. Today, different deliverysystems offer different bundles, or tiers of service, at different prices. The reach ofeach network is, thereby, circumscribed while the menu of choices can vary sig-nificantly from one household to the next.
Webster (1986) went on to suggest that these changes would produce twofeatures in macrolevel audience behavior: fragmentation and polarization. Frag-mentation describes a process by which the mass audience, which was onceconcentrated on three or four viewing options, becomes more widely distributed.As a result, the average channel audience becomes smaller. This is a reasonablywell-documented feature of the U.S. television industry. Although the older, main-
Journal of Communication, June 2005
368
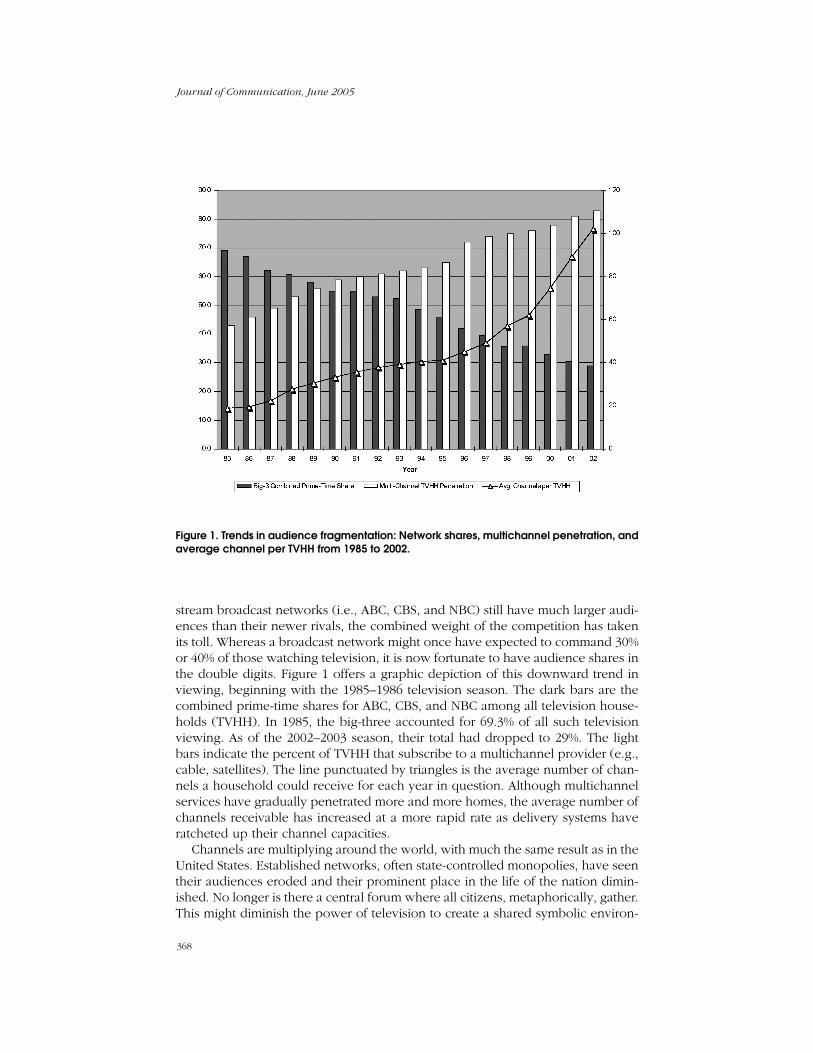
stream broadcast networks (i.e., ABC, CBS, and NBC) still have much larger audi-ences than their newer rivals, the combined weight of the competition has takenits toll. Whereas a broadcast network might once have expected to command 30%or 40% of those watching television, it is now fortunate to have audience shares inthe double digits. Figure 1 offers a graphic depiction of this downward trend inviewing, beginning with the 1985–1986 television season. The dark bars are thecombined prime-time shares for ABC, CBS, and NBC among all television house-holds (TVHH). In 1985, the big-three accounted for 69.3% of all such televisionviewing. As of the 2002–2003 season, their total had dropped to 29%. The lightbars indicate the percent of TVHH that subscribe to a multichannel provider (e.g.,cable, satellites). The line punctuated by triangles is the average number of chan-nels a household could receive for each year in question. Although multichannelservices have gradually penetrated more and more homes, the average number ofchannels receivable has increased at a more rapid rate as delivery systems haveratcheted up their channel capacities.
Channels are multiplying around the world, with much the same result as in theUnited States. Established networks, often state-controlled monopolies, have seentheir audiences eroded and their prominent place in the life of the nation dimin-ished. No longer is there a central forum where all citizens, metaphorically, gather.This might diminish the power of television to create a shared symbolic environ-
Figure 1. Trends in audience fragmentation: Network shares, multichannel penetration, andaverage channel per TVHH from 1985 to 2002.
Television Audience Polarization
369
ment (Beniger, 1983). Commenting on the public broadcasters of Europe andIsrael, Katz (1996) argued that the increasing segmentation of audiences deniesnation-states a means with which to promote social integration and a sense ofcommon purpose.
Although the audience for older networks is unquestionably shrinking, frag-mentation is not without potential social benefits. Promoting diversity is a corner-stone of communications policy in most liberal democracies (McQuail, 1992; Napoli,2001). Fragmentation could mean that instead of everyone watching programsdevoted to the “lowest common denominator,” the mass audience is now distrib-uted across a more diverse universe of content. This would be a testament to whatNapoli refers to as “horizontal” diversity of exposure. Whether it is ultimatelygood for society, though, depends on what happens under the veneer of fragmen-tation. Are viewers using the choices they have to sample a little of each network—achieving what Napoli (1999) called “vertical” diversity of exposure—or simplybingeing on their favorites?
What is not clear from the gross measures of audience size reported in Figure1, then, is the intensity with which people use any given channel. If a network has10% of the audience, is that because each person spends about 10% of his or hertime watching, or does it mean that some people watch for extended periods oftime while others ignore it altogether? Is the audience for each network normallydistributed or polarized into groups of very heavy and very light users? Eitherpattern of behavior could account for the audience fragmentation we see.
Audience PolarizationAssessing the tendency of audiences to polarize around classes of content canhelp us understand the social implications of the new media environment. Forinstance, common notions of selective exposure (e.g., Zillmann & Bryant, 1985)raise the troubling prospect that people will use the abundance of choice to avoidmaterial they find distasteful and seek out material that conforms to their predis-positions. A steady diet of such programming might, in turn, cultivate perceptionsof reality at variance with larger social norms (e.g., Gerbner, Gross, Morgan,Signorielli, & Shanahan, 2002). Sunstein (2001) explicitly warned that filtering outdissident voices in favor of “like-minded” speech can lead to “group polarization.”Certainly, media companies that are interested in creating loyal, demographicallyhomogeneous audiences are only too happy to cater to those preferences. If eachchannel’s audience represents a small group of viewers who watch their favoritenetwork and little else (i.e., a polarized audience), it would comport with fearsthat the mass audience is being reorganized into segments prone to social polar-ization (e.g., Gitlin, 1998; Sunstein, 2001; Turow, 1997).
Like fragmentation, audience polarization is a macrolevel construct that de-scribes the behavior of a large group of people (i.e., an audience) rather than anyone person (Webster & Phalen, 1997). In the old media environment in which afew widely available networks offered a broad menu of programming, the poten-tial for audience polarization was limited. In the case of newer television net-works, however, there are two reasons to expect polarization: (a) the correlationof content with channels, and (b) the differential availability of those channels.
Journal of Communication, June 2005
370
Economic models of program choice (e.g., Owen & Wildman, 1992),gratificationist theory (e.g., Rosengren, Wenner, & Palmgreen, 1985), and severaldecades of industry practice (e.g., Webster, Phalen, & Lichty, 2000) all suggest thatdifferent kinds of people prefer different types of programming and that they acton those preferences to gratify a variety of appetites. Modern television networksare designed with that in mind. NCTA’s list of cable networks includes channelsspecializing in news, sports, music, movies, history, arts, science, science fiction,religion, comedy, cartoons, cooking, weather—you name it. Other networks offera more varied menu of program types, yet explicitly cater to men, women, chil-dren, Blacks, or Latinos. This is partly an effort to establish a distinctive brand(e.g., if you want news, turn to CNN). It is, even more importantly, an attempt toproduce a particular audience demographic that can be sold to advertisers. Eventhe new broadcast networks such as UPN, WB, and PAX intentionally skew eitheryoung or old. They are expected to appeal to some but not to others. As Turownoted, cable networks “aiming to lure desirable types to specialized formats havefelt the need to create ‘signature’ materials that both drew the ‘right’ people andsignaled the ‘wrong’ people that they ought to go away” (1997, p. 5). They are, inother words, designed to polarize the audience.
This consequence of modern programming practice is compounded by thedifferential availability of channels. With over 300 national networks and manymore regional or local services trying to enter the 100-channel household, thereare going to be losers. At present, no cable network reaches as many viewers asthe original broadcast networks. Many cable networks are simply unavailable inthe majority of television households. As a practical matter, the structure of themedia environment forces some of a channel’s potential audience to the pole ofnonuse, even if their preferences would dictate otherwise. Webster (1986) calledthis de facto polarization. Furthermore, when channel capacities are unconstrained,viewers themselves winnow the choices in their environment by subscribing tosome services and not others, and/or establishing relatively stable “channel reper-toires” that effectively exclude most channels from consideration (e.g., Ferguson& Perse, 1993; Heeter, 1988; Neuendorf, Atkin, & Jeffres, 2001). For example,Nielsen reports that the average U.S. household uses fewer than 15 channels, andthat in homes receiving 200 channels, only 19 are actually watched (Nielsen,2003). Of course the composition of the repertoire varies from household to house-hold, thereby creating differential patterns of channel use.
Unfortunately, neither media theory nor the available evidence establishes thebreadth or depth of audience polarization in the new media environment. Using1982 Arbitron television diary data collected in a southwestern market, Webster(1986) demonstrated that the lone Spanish-language station had an unusuallyloyal audience. Specifically, whereas the station captured a 6.3 market share acrossall viewers, the few who actually tuned in spent 37.6% of their time with thestation. This was consistent with an earlier study by Barwise and Ehrenberg (1984),also using local market data, that found minority-language and religious stationsenjoyed abnormally high time-spent-viewing (TSV) levels despite their otherwiselimited reach. Barwise and Ehrenberg, however, argued that these were excep-tional cases, and that their main finding was one of “double jeopardy.”
Television Audience Polarization
371
First described by McPhee (1963), what is sometimes called the law of doublejeopardy (Goodhardt, Ehrenberg, & Collins, 1987) stipulates that unpopular cul-tural products have the dual problem of both small and disloyal audiences. This isdirectly at odds with the intuitively appealing notion that small audiences tend tobe composed of die-hard fans, the so-called small-but-loyal audience. Indeed,several more general studies of audience behavior that have operationalized audi-ence loyalty as either TSV (Barnes, 1990; Barwise & Ehrenberg, 1984) or repeat-viewing (Ehrenberg & Wakshlag, 1987; Webster & Wang, 1992) have indicated thatdouble jeopardy is the rule, not the exception. If this phenomenon holds up in themultichannel environment, it suggests a limited potential for audience polariza-tion. In fact, in a more recent and far-reaching evaluation of audience behaviorand television economics, Barwise and Ehrenberg (1988) concluded, “Thirty yearsfrom now, we believe, television will still be a mass medium with largelyunsegmented audiences watching varied programs for many hours and mostly ata low level of involvement” (p. 121).
The extent of audience polarization is, then, very much an open question. Theanswer has pragmatic implications for how media companies make, predict, andsell audiences (Napoli, 2003), but it also has implications for the role this mostpopular of all media might play in binding the nation together. If the multichannelenvironment succeeds in fragmenting the audience into small groups that usesome sources intensively while they ignore most of the others, then we mayindeed be experiencing what Turow (1997) described as “a major shift in balancebetween society-making media and segment-making media” (p. 3). It is time tosee what lies beneath the veneer of fragmentation. Specifically, I will address fiveresearch questions:
RQ1: How is the total audience distributed across the available networks?
RQ2: What percentage of viewers use (or fail to use) each network in thecourse of a week?
RQ3: How much time do people spend with the networks they elect to view?
RQ4: What is the relationship between network audience size and averageTSV?
RQ5: Among those who use a network, what percentage of their overall TVviewing time is devoted to that versus other networks?
Method
The study is based on an analysis of data collected by Nielsen Media Researchusing its national peoplemeter sample, sometimes called the Nielsen TelevisionIndex (NTI). These are the data on which virtually all national TV media buys, andmany programming decisions, are based. Peoplemeters are electronic devices thatmonitor the behavior of all TV sets in sample households and are designed so thatindividual members of the household can signal their presence to the meter. Nielsen
Journal of Communication, June 2005
372
places meters in homes using a multistage cluster sampling procedure. During thetime of data collection, Nielsen had a national sample of just over 5,000 house-holds that included almost 13,000 individuals. Over any measurement period, theactual number of homes providing useful information is somewhat less than thetotal installed base. For a more complete description of Nielsen’s methods, seeWebster et al. (2000).
The data for this study were collected during the first week of February 2003.Rather than singling out any one “daypart” (e.g., prime time), I included all view-ing. I chose this time frame because (a) it was a “sweeps” month during which themajor national networks were broadcasting new programs, rather than reruns; (b)it was when TV viewing is at seasonal highs, yet unaffected by major holidays;and (c) it was of sufficient scope and duration to provide fairly stable metrics ofchannel use. It was also far enough in advance of the U.S. invasion of Iraq—which happened in late March—that the results are not likely to have been skewedby world events. With limited exception, the analysis is based on the behavior ofall adults age 18 and over, again to provide a broad, stable overview of channeluse. There were 8,575 such people in the sample, representing a population of207,210,000 persons nationwide. Unfortunately, data for Spanish-language net-works, which come from a separate Hispanic sample (NHTI), were unavailable.
The centerpiece of the analysis is a rather large table that describes each of 62national networks on five dimensions. These networks are the most widely viewedin the U.S. and serve as the study’s units of analysis. The first column of informa-tion is the universe of households in which each network can be received, ex-pressed as a percentage of total TV households (TVHH). This is a structural vari-able that may be of importance in explaining de facto polarization. The secondcolumn presents each network’s overall share of audience: That is, of all theviewing done by adults during the week, what percentage of the total number of“man hours” is attributable to a particular network? This is a conventional measureof audience size and is the most common metric for representing audience frag-mentation. It is the kind of audience behavior that’s reported in Figure 1.
The third column of data is the network’s cumulative audience (sometimescalled the cume rating or cume). It is expressed as the percentage of all persons18+ who have viewed for at least 1 minute during the week. Though it is aconventional measure of audience size, it offers a glimpse at polarization. Theobverse of the cume is the percentage of viewers who never, for reasons ofstructure or preference, watch that network. It captures the number of peoplewho sit at the pole of nonuse. The last two columns offer a more direct assess-ment of polarization. These data are less familiar than “ratings” and “shares” andso deserve a few words of explanation.
Nielsen Media Research sells a service to clients called NPower. It allows thoseclients to access the Nielsen database so they can produce customized analyses.One reason that polarization is not well documented in the academic literature isbecause it is a form of cumulative audience behavior (see Webster et al., 2000)that is not routinely described by Nielsen in published reports. NPower, however,is capable of tracking individuals over time and producing a number of suchmeasures. I produced two, each with certain virtues and limitations.
Television Audience Polarization
373
The first is time-spent-viewing. This is a simple metric, directly analogous tothe measures of time-spent-listening common in radio research. It is the averagenumber of minutes per week spent viewing the network in question, among thosewho tuned in for at least a minute (i.e., those in the cume). So, in the case of abroadcast network with a large cume, TSV is based on a large number of people.In the case of a cable network with a smaller cume, it is based on a smaller samplesize. It is the average amount of time that people who used the networkactually spent watching that network, whether in only one or in multipleviewing sessions. In addition to being straightforward, it is a common measure ofloyalty in studies assessing the double jeopardy effect (e.g., Barnes, 1990; Barwise& Ehrenberg, 1984).
The second measure is share-within-cume. This is an unconventional measure.Simple TSV can be hard to interpret without reference to the total amount of timea channel’s users spend watching television. This measure adjusts for that byrepresenting TSV as the percentage of total TV viewing time. In other words,among those who watched the network (the cume), what share of their time didthey spend watching? As with TSV, it is based on samples that vary with the size ofthe cume. It is the measure Webster (1986) used to assess intensity of channel use.A high share-within-cume, relative to the network’s overall share, would signalaudience polarization.
Results
Table 1 presents the results of the NPower analysis. Sixty-two networks are listeddown the left-hand side. To make the table easier to evaluate, I organized these aseither broadcast or cable networks and, within each network grouping, sortedthem by the average time spent viewing. To the right are the five columns of datadescribed above. I discuss each, moving from left to right. To aid in understandingthe relationships among these variables, Table 2 offers a correlation matrix of allfive variables across 62 cases.
TVHH Universe describes the percentage of all television households, an esti-mated 106.7 million at the time of this survey, capable of receiving the networksignal in question. This is a powerful structural constraint that shapes networkusage. As expected, the older broadcast networks have near universal penetrationof the market, with coverage ranging from 99 to 95% of all TVHH. The mostsuccessful, advertiser-supported cable networks generally cover 80 to 70% of themarket, while newer or more regional services have considerably less coverage.Premium cable services (i.e., HBO, Showtime, Cinemax, and The Movie Channel)that charge an additional fee to subscribers have smaller coverage still. Becausethere are 339 national cable networks, there are over 270 services not included inTable 1. These would undoubtedly be at the lower end of the coverage spectrum.
Share of total audience viewing expresses how large a “piece of the pie” eachnetwork gets. If all sources of programming were listed, the numbers would addup to 100%. In the case of Table 1, the column total is 65. In other words, 35% ofall the television viewing done during this week in February is attributable to

Journal of Communication, June 2005
374
Table 1. Television Audience Fragmentation and Polarization
Network TVHH Share of total Weekly Weekly Share universe audience cume TSV within (%) viewing (%) cume
BROADCAST
CBS 95 6.3 65 189 7.9NBC 95 5.9 67 173 7.4ABC 97 5.1 66 152 6.4PBS 99 2.0 45 89 3.7FOX 93 1.9 47 78 3.3WB 90 0.8 25 59 2.4PAX 85 0.4 15 55 2.0UPN 86 0.4 18 46 1.7
CABLE
HBO 33 2.0 20 196 8.0FOX News Channel 77 2.7 27 193 7.5Lifetime Movie 34 0.6 7 167 5.5Cinemax 20 0.7 9 159 6.3SHOWTIME 21 0.6 9 146 5.5Turner Network Television (TNT) 81 2.3 34 134 5.0Lifetime 81 1.9 28 130 4.8Game Show Network 47 0.4 6 128 4.4TV Land 73 1.1 16 127 4.2CNN 81 2.1 35 118 4.7Nickelodeon 81 1.5 25 117 4.6TBS Superstation 82 2.3 39 116 4.5SOAP Network 27 0.1 2 115 4.0Hallmark Channel 47 0.5 9 110 3.7Court TV 71 0.8 16 103 3.6Home & Garden TV 75 1.0 20 97 3.8USA Network 81 1.6 34 95 3.6Cartoon Network 77 0.7 15 95 3.7SCI-FI Channel 75 0.8 17 87 3.0The Movie 19 0.2 5 86 3.0ESPN 81 1.1 25 85 3.4History Channel 77 1.0 23 85 3.4A&E 81 1.1 26 85 3.1MSNBC 73 0.9 23 76 2.9Food Network 73 0.7 17 75 2.9Black Entertainment TV (BET) 70 0.5 14 75 2.7Toon Disney 35 0.1 3 72 2.6The Learning Channel 79 1.1 30 71 2.8American Movie Classics 79 0.9 25 71 2.5Disney Channel 76 0.6 18 70 2.7FX 75 0.9 26 66 2.6WGN Superstation 53 0.6 17 64 2.3Animal Planet 76 0.7 21 63 2.3Discovery 81 0.9 29 59 2.3MTV 80 0.7 26 55 2.3Comedy Central 77 0.6 22 53 2.2CNN Headline News 78 0.7 25 51 2.0Spike TV (TNN) 81 0.7 26 51 1.9

Television Audience Polarization
375
CNBC 79 0.4 14 51 2.0Weather Channel 80 0.6 24 50 1.9Speed Channel 52 0.1 6 48 1.8Discovery Health 39 0.1 5 45 1.7Country Music Television (CMT) 62 0.3 12 43 1.6ESPN2 79 0.4 21 41 1.6ABC Family 80 0.5 23 40 1.6Woman’s Entertainment (WE) 47 0.2 8 38 1.3Bravo 65 0.3 14 36 1.3Entertainment TV (E!) 75 0.5 25 36 1.5Travel Channel 66 0.3 16 36 1.3VH1 78 0.4 23 34 1.4TV Guide Channel 53 0.3 19 32 1.2National Geographic 39 0.1 5 31 1.1Outdoor Life 47 0.1 5 28 1.0FUSE 28 0.0 2 16 0.6
TOTAL 65.0
Network TVHH Share of total Weekly Weekly Share universe audience cume TSV within (%) viewing (%) cume
Table 1, Continued
sources not shown on the table. This would include individual stations broadcast-ing syndicated or locally produced programming (e.g., the local news), as well asthose 270 missing national networks. I should also note that this method of calcu-lating share of total audience assumes that each network is feeding programming24 hours a day. For all broadcast networks and some cable-only services, that isnot the case. Hence their shares of total viewing may seem rather low. By way ofcontrast, if shares are calculated only during those times when each broadcastnetwork was actually on the air, their numbers are significantly higher (e.g., ABCis 9.1; CBS, 10.8; FOX, 8.4; NBC, 11.3; UPN, 2.4; and WB, 3.1). These are closer tothe audience shares typically reported in the popular and trade press.
That said, these shares of total audience viewing numbers capture rather wellthe phenomenon of audience fragmentation and provide a detailed answer toRQ1. The big-three networks have roughly twice the audience of their nearestcompetitors. In absolute terms, though, they now occupy just a sliver of the timepeople spend watching TV. Beyond them, viewing is, in the aggregate, widelydistributed. The overall pattern of results fits what is sometimes called “Pareto’sLaw” (Neuman, 1991; Webster & Lin, 2002), wherein a small number of offeringsaccount for a disproportionate share of the market. For instance, if we assumethere are 300 national networks, then the top 5% of networks account for 40% ofthe viewing. Even so, this is a rather egalitarian distribution compared to othermore abundant media such as books and magazines (Hindman & Cukier, 2003;
Journal of Communication, June 2005
376
Yim, 2002). Across the Internet, by way of comparison, the top 5% of websitesaccount for 75% of the user traffic (Adamic & Huberman, 1999). There is, then,considerable “horizontal” diversity of exposure to television.
Weekly cume reveals the percentage of the adult population that watched (or,conversely, failed to watch) each network. These data answer RQ2 and offer ourfirst indication of polarization. Once again, the big-three networks (i.e., ABC, CBS,and NBC) top the list. Each one is viewed by approximately two thirds of theaudience during the week. Of course, that means that one third of the adultpopulation doesn’t watch ABC or CBS or NBC during a time of particularly heavytelevision viewing. Beyond the major broadcast networks, audience cumes dropoff rather quickly. In fact, each of the remaining 59 networks was unviewed by amajority of the audience. The correlation between TVHH universe and cume (r =.753) suggests this is largely a matter of de facto polarization. Whatever the cause,for newer networks, a large part of the audience sits at the pole of nonuse. Evenamong networks that have a large potential universe, cumes can be low. Forexample, UPN can be received in 86% of all TVHHs, yet it has a weekly reach ofjust 18% of adults.
The remaining columns offer additional measures of audience polarization.Here, a more complicated picture of audience behavior begins to emerge. Aver-age time-spent-viewing (TSV) answers RQ3 and gives us a sense of the intensity ofchannel use among those who do view a network. Each of the big-three networkscontinues to do well, being viewed for 2 1/2 to 3 hours a week, but the networksracking up the largest TSV are HBO and FOX News Channel: Each was watchedfor over 3 hours a week. Premium cable channels and networks specializing inmovies are watched for relatively long periods of time. Beyond that, an odd col-lection of networks with otherwise small audience shares are high on the list.
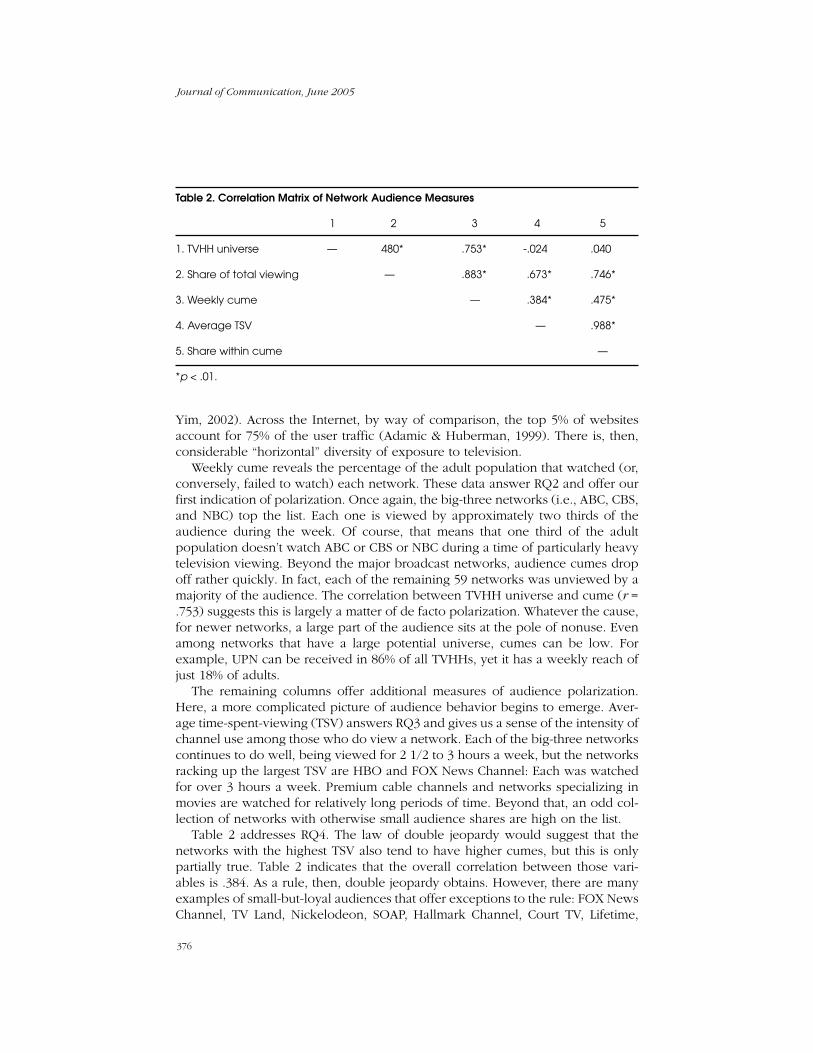
Table 2 addresses RQ4. The law of double jeopardy would suggest that thenetworks with the highest TSV also tend to have higher cumes, but this is onlypartially true. Table 2 indicates that the overall correlation between those vari-ables is .384. As a rule, then, double jeopardy obtains. However, there are manyexamples of small-but-loyal audiences that offer exceptions to the rule: FOX NewsChannel, TV Land, Nickelodeon, SOAP, Hallmark Channel, Court TV, Lifetime,
Table 2. Correlation Matrix of Network Audience Measures
1 2 3 4 5
1. TVHH universe — 480* .753* -.024 .040
2. Share of total viewing — .883* .673* .746*
3. Weekly cume — .384* .475*
4. Average TSV — .988*
5. Share within cume —
*p < .01.
Television Audience Polarization
377
Table 3. Comparing the Distribution of Viewing Time Across Four Groups of Viewers
Share of viewing devoted to selected sources
BET FOX HBO MTV viewers viewers viewers viewers
BROADCASTa
CBS affiliates 7.71 8.79 7.65 7.64NBC affiliates 6.80 9.42 9.32 8.05ABC affiliates 6.91 8.11 8.11 7.37PBS affiliates 1.04 1.41 .94 1.21FOX affiliates 6.10 4.77 4.93 5.86WB affiliates 2.98 2.07 2.58 3.16PAX affiliates .45 .46 .31 .34UPN affiliates 2.17 1.18 1.53 1.75
CABLE
HBO 2.36 1.80 8.05b 2.67FOX News Channel 2.10 7.47b 2.16 2.31Turner Network Television (TNT) 3.37 2.61 2.35 3.22TBS Superstation 2.86 2.52 1.94 3.05Lifetime 2.71 1.98 1.69 2.29CNN 1.47 2.88 1.97 1.87USA Network 2.36 1.81 1.44 2.20Nickelodeon 2.19 1.49 1.45 1.96MTV 1.71 .85 1.03 2.32b
ESPN 1.72 1.08 1.26 1.56A&E 1.39 1.45 1.05 1.33History Channel .98 1.62 1.27 1.28BET 2.69b .44 .70 1.10MSNBC 1.06 1.63 .93 1.07Cinemax .77 .55 2.45 .71Toon Disney 1.52 .70 .92 1.25Spike TV (TNN) 1.04 .80 .65 1.18Comedy Central .80 .70 .79 1.18Disney Channel 1.14 .58 .79 .93SCI-FI Channel .84 .70 .80 .87VH1 .91 .48 .49 .96CNBC .19 .65 .36 .37
All other sources 29.66 29.00 30.09 28.94
Total of all-time viewing 100.00 100.00 100.00 100.00
Note: Numbers are the percentages of time each group devoted to each programmingsource.
a Unlike in Table 1, broadcast sources include all viewing attributable to affiliates, not justprogramming fed by the network.
bThis number is the share-within-cume for the network in question.
Journal of Communication, June 2005
378
Lifetime Movie, and the Game Show Network, to name a few. No one genreappears to dominate. Furthermore, if we eliminate the big-three networks fromthe picture, the overall correlation between cume and TSV is .112, a statisticallyinsignificant relationship. Interestingly, TSV was unrelated to the channel’s uni-verse. So, the most available channels were not necessarily the ones that drew themost intense use.
Share-within-cume expresses TSV as a percentage and answers RQ5. So, forexample, although FOX News is viewed by just 27% of the adult population (i.e.,the cume), those people spend 7.5% of their time watching the network. Thebalance of their viewing was widely distributed across the remaining networks,roughly in proportion to total audience shares. The same general pattern exists forall networks. Those who watched a given network spent a small portion of theirtime there and distributed the remainder of their viewing across channels, withthe big-three networks typically receiving the largest shares.
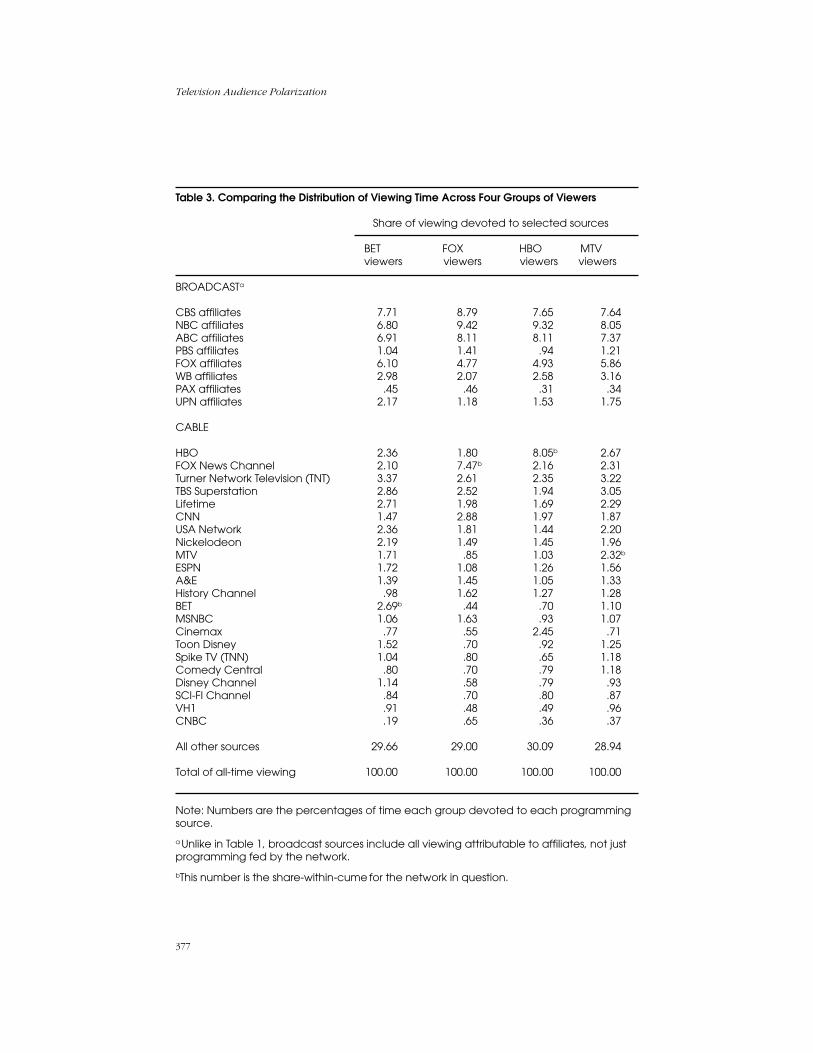
Table 3 illustrates how four groups of viewers distributed their time acrossselected programming sources. These were among the most disparate distribu-tions I found. The correlation between the share distribution of BET viewers andFOX News viewers was .885 (N = 62, p < .001). By way of comparison, 1,891correlations were computed for all possible network pairings. The correlationsranged from .992 to .740, but the vast majority (86%) exceeded .90. Almost all ofthe correlations below that level were associated with pay cable networks (e.g.,HBO, Showtime, etc.). The people who pay for such services watch them almostas much as a major broadcast network (e.g., ABC, CBS, etc.), causing their sharedistributions to deviate somewhat from the norm. What is remarkable is howsimilar the viewers of any given channel are when it comes to how they distributetheir TV viewing time across the universe of available content.
Conclusion
The phenomenon of audience fragmentation is well underway—more so than isgenerally appreciated. ABC, CBS, and NBC, the bastions of American broadcast-ing, accounted for a total of 17.3% of all the time people spent watching televi-sion. This is considerably lower than the prime-time audience shares we oftenhear reported, and it reflects the fact that broadcast networks are “dark” throughmuch of the day. Of course, the parent corporations of these networks have otherways to reach the public but, in an absolute sense, the big-three are nowhere nearthe dominant presence they once were.
Still, the older networks occupy a unique position in the media landscape.They are available in virtually all U.S. homes. Their audience shares and weeklycumes far exceed those of the nearest competitors. They offer something foralmost everyone and a majority of people are clearly in the habit of watchingthem. In the parlance of advertising, no other networks can deliver the reach ofthese broadcasters. Though they are not the expansive public forums envisionedby Katz (1996), they do provide a modicum of common ground for Americanviewers.
Television Audience Polarization
379
In addition to their large cumulative audiences, the big-three networks enjoyhigh levels of TSV. This is the classic double-jeopardy phenomenon. However,contrary to earlier research, this study suggests that the old networks are now theexception rather than the rule. Once they are removed from the equation, there islittle, if any, relationship between the size of a network’s audience and the amountof time its viewers spend watching. There are now many examples of both small-but-loyal and small-but-disloyal audiences. This is essentially the kind of audiencebehavior that characterizes highly competitive radio markets (Barnes, 1990; Dick& McDowell, 2004).
Whether the big-three will continue to occupy a privileged position in thefuture is a question that deserves further study. In any event, it is clear that thedays when one television network could routinely command the attention of thenation are over, and there is no media institution on the horizon to inherit thatfunction. Must this, as Katz (1996) feared, deal a critical blow to our shared senseof national identity? A part of the answer lies in understanding the dynamics ofaudience polarization.
Variable and generally modest levels of polarization lie beneath the surface ofthe fragmented audience. Much of this is driven by the structure of the mediaenvironment itself. Many networks are simply unavailable to substantial subsets ofthe population, creating a de facto polarization of the audience. Further, with theexception of premium services, or specialized channels on costly tiers of service,this source of polarization seems largely unrelated to content or viewer prefer-ences. These structural factors, however, explain only half the variance in cumu-lative audiences. Even if all channels were universally available, polarization wouldstill be evident.
It is well established that in multichannel environments, people maintain reper-toires far smaller than the number of channels at hand (Ferguson & Perse, 1993;Neuendorf et al., 2001; Nielsen, 2003). So even when channels are technicallyavailable, they go unwatched. The data contain many examples of networks thathave TVHH universes far in excess of their weekly cumes, including A&E, ESPN,Spike TV, MTV, CNBC, the Cartoon Network, the Food Network, even PAX andUPN. The audience for each of these networks is “loyal” in so far as they are morelikely than the general population to watch them. This is obviously the result ofsystematic preferences for types of content. Even so, it is far from the kind of lock-step loyalty one might expect from the application of a traditional notion of selec-tive exposure to information. Nor does this picture comport with the direst predic-tions of social polarization.
Dystopian portrayals of the new media environment often envision the massaudience disaggregating into more or less self-contained communities of interest:The common public sphere is broken into many “sphericules” or “enclaves” (seeGandy, 2001; Gitlin, 1998; Sunstein, 2001). This is more than mere fragmentation;it is polarization with a vengeance. Turow (1997) offered the most extensivelydeveloped of these portraits. He saw advertisers and new media technologiesbreaking America into the equivalent of “gated” communities.
Measures of polarization offer a way to assess how much time people spendbehind those gates. Consider three networks that cater to specific segments of the
Journal of Communication, June 2005
380
audience: Black Entertainment Television (BET), MTV, and FOX News. BET pro-vides “entertainment, music, news and public affairs programming for the African-American audience” (NCTA, 2004, p. 53). MTV offers “youth-oriented program-ming,” including music videos and many regularly scheduled series. FOX Newsclaims to offer “fair and balanced coverage of the day’s events,” but is widelyregarded as appealing to a politically conservative viewership. Each reaches amodestly sized audience, with weekly cumes of 14%, 26%, and 27%, respectively.Those who tune into BET or MTV spend less than 3% of their time with thosechannels. Even the audience for FOX News, with its high TSV, spends 92.5% of itstime watching something else on television. The rest of their time is widely distrib-uted across the channels they have available. Of course, it may be that even a littleexposure to certain materials has big social effects, but if these viewers live incloistered communities, they evidently spend a good deal of time out and about.
These findings are consistent with early studies of Internet usage (e.g., Webster& Lin, 2002). According to Neuman, “research thus far on Web behavior revealsdiverse personal interests but a surprising balance among specialized and ‘main-stream’ sites among new and experienced users” (2001, p. 311). Perhaps, insteadof bingeing on one type of content, American media users are more “omnivorous”(Holt, 1998; Peterson & Kern, 1996). Before we can truly understand the diet ofmedia consumers, though, we need to look beyond the usage statistics of any onemedium and study people’s exposure to specific types of content across all media.
It remains to be seen whether a varied diet characterizes media consumptionworldwide. Fragmentation is occurring everywhere. Television viewers in Beijingnow have access to over 70 channels of television (CSM, 2002). New, satellite-delivered networks are spanning national borders. Much of this is being driven bythe same economic and technological factors that are shaping the American audi-ence. Imagine something similar to Table 1 with data across all the world’s majornetworks. What would the audience for Aljazeera or Al-Arabiya look like? Thecombined weight of religion, language, and culture may well polarize global au-diences with a force that is unimaginable in the American marketplace.
References
Adamic, L. A., & Huberman, B. A. (1999). The nature of markets in the World Wide Web. Palo Alto, CA:Xerox Palo Alto Research Center.
Barnes, B. E. (1990). Electronic media audience behavior in the multichannel environment: Patternsof demographic homogeneity and time spent viewing. Unpublished doctoral dissertation, Northwest-ern University, Evanston, IL.
Barwise, T. P., & Ehrenberg, A. S. C. (1984). The reach of TV channels. International Journal ofResearch in Marketing, 1, 37–49.
Barwise, T. P., & Ehrenberg, A. S. C. (1988). Television and its audience. London: Sage.
Beniger, J. R. (1983). Does television enhance the shared symbolic environment? Trends in labeling ofeditorial cartoons, 1948–1980. American Sociological Review, 48, 103–111.
CSM (2002). Television in China: 2001 overview. Beijing, PRC: CVSC-Sofres Media.
Dick, S. J., & McDowell, W. (2004). Estimating relative audience loyalty among radio stations usingstandard Arbitron ratings. Journal of Radio Studies, 11, 26–39.
Television Audience Polarization
381
Ehrenberg, A. S. C., & Wakshlag, J. (1987). Repeat-viewing with people meters. Journal of AdvertisingResearch, 27, 9–13.
Ferguson, D. A., & Perse, E. M. (1993). Media and audience influences on channel repertoire. Journalof Broadcasting & Electronic Media, 37, 31–47.
Gandy, O. H. (2001). Dividing practices: Segmentation and targeting in the emerging public sphere. InW. L. Bennett & R. M. Entman (Eds.), Mediated politics: Communication in the future of democracy(pp. 141–159). Cambridge, UK: Cambridge University Press.
Gerbner, G., Gross, L., Morgan, M., Signorielli, N., & Shanahan, J. (2002). Growing up with television:Cultivation processes. In J. Bryant & D. Zillmann (Eds.), Media effects: Advances in theory andresearch (pp. 43–67). Mahwah, NJ: Erlbaum.
Gitlin, T. (1998). Public sphere or public sphericules? In T. Liebes & J. Curran (Eds.), Media, ritual andidentity (pp. 168–174). London: Routledge.
Goodhardt, G. J., Ehrenberg, A. S. C., & Collins, M. A. (1987). The television audience: Patterns ofviewing (2nd ed.). Westmead, UK: Gower.
Heeter, C. (1988). The choice process model. In C. Heeter & B. Greenberg (Eds.), Cable-viewing (pp.11–32). Norwood, NJ: Ablex.
Hindman, M., & Cukier, K. N. (2003, December). Measuring media concentration online and offline.Paper presented at the conference on Media Diversity and Localism: Meaning, Metrics, and thePublic Interest, New York, NY.
Holt, D. B. (1998). Does cultural capital structure American consumption? Journal of Consumer Re-search, 25(1), 1–25.
Katz, E. (1996). And deliver us from segmentation. Annals of the American Academy of Political andSocial Science, 546, 22–33.
McQuail, D. (1992). Media performance: Mass communication and the public interest. Newbury Park,CA: Sage.
McPhee, W. N. (1963). Formal theories of mass behavior. New York: Free Press.
Napoli, P. M. (1999). Deconstructing the diversity principle. Journal of Communication, 49(4), 7–34.
Napoli, P. M. (2001). Foundations of communications policy: Principles and process in the regulationof electronic media. Cresskill, NJ: Hampton Press.
Napoli, P. M. (2003). Audience economics: Media institutions and the audience marketplace. NewYork: Columbia University Press.
National Cable & Telecommunications Association. (2004). Cable developments 2004. Washington, DC:Author.
Neuendorf, K. A., Atkin, D. J., & Jeffres, L. W. (2001). Reconceptualizing channel repertoire in theurban cable environment. Journal of Broadcasting & Electronic Media, 45, 464–482.
Neuman, W. R. (1991). The future of the mass audience. New York: Cambridge University Press.
Neuman, W. R. (2001). The impact of the new media. In W. L. Bennett & R. M. Entman (Eds.), Mediatedpolitics: Communication in the future of democracy (pp. 299–320). Cambridge, UK: Cambridge Uni-versity Press.
Nielsen Media Research. (1985–2003). Television audience report. New York: Author.
Owen, B. M., & Wildman, S. S. (1992). Video economics. Cambridge, MA: Harvard University Press.
Peterson, R. A., & Kern, R. M. (1996). Changing highbrow taste: From snob to omnivore. AmericanSociological Review, 61, 900–907.
Journal of Communication, June 2005
382
Rosengren, K. E., Wenner, L. A., & Palmgreen, P. (Eds.). (1985). Media gratifications research: Currentperspectives. Beverly Hills, CA: Sage.
Sunstein, C. (2001). Republic.com. Princeton, NJ: Princeton University Press.
Turow, J. (1997). Breaking up America: Advertisers and the new media world. Chicago: University ofChicago Press.
Veronis, Shuler, & Associates. (1994). Communications industry forecast. New York: Author.
Webster, J. G. (1986). Audience behavior in the new media environment. Journal of Communication,36(3), 77–91.
Webster, J. G., & Phalen, P. F. (1997). The mass audience: Rediscovering the dominant model. Mahwah,NJ: Erlbaum.
Webster, J. G., Phalen, P. F., & Lichty, L. W. (2000). Ratings analysis: The theory and practice of audi-ence research. Mahwah, NJ: Erlbaum.
Webster, J. G., & Lin, S. F. (2002). The Internet audience: Web use as mass behavior. Journal ofBroadcasting & Electronic Media, 46, 1–12.
Webster, J. G., & Wang, T. (1992). Structural determinants of exposure to television: The case of repeatviewing. Journal of Broadcasting & Electronic Media, 36, 125–136.
Yim, J. (2002). Audience concentration in the media. Unpublished doctoral dissertation, NorthwesternUniversity, Evanston, IL.
Zillmann, D., & Bryant, J. (Eds.). (1985). Selective exposure to communication. Hillsdale, NJ: Erlbaum.