Behavioral Correlates to Nutritional Status of Preschool Children
10
Med. J. Cairo Univ., Vol. 62, No. 1, March: 49 -58, 1994 Behavioral Correlates to Nutritional Status of Preschool Children ZEINAB BISHRY, M.D.; SOHAIR 1. SALEM, Ph.D.; FEISAL A. YUNIS, Ph.D.; HAGER A. ORABY, Ph.D.; HANAA A. WAFAY, Ph.D.; ABLA G. KHALIFA, Ph.D. and ZEINAB M. MONEER, Ph.D. The Childhood Studies, Ain Shams University and the Child Health Department, National Research Center, Faculty of Arts, Cairo University. Abstract In this study, nutritional status of 185 preschool children aged between 3 and 6 years was assessed by investigating dietary intake, anthropometric measurements and protein status. Results of nutritional status parameters were correlated with a battery of psychological tests that covered intelligence, memory, learning, thinking, problem solving and attention. Dietary intake data showed that 49% of the children had caloric intake and 12% had protein intake that were lower than the recommended dietary al- lowance. A significant positive correlation was shown between caloric intake and in- telligence. Plant protein as well showed significant correlation with thinking and problem solving. Height for age showed deficit in 19% of the children when com- pared to NCHS standards. Percentage weight for age and height for age were signifl- cantly correlated to thinking, problem solving and to intelligence, None of the protein status parameters showed significant correlation with the results of any of the psycho- logical tests. Introduction DEVELOPMENT is a function of nutri- tion and learning. Physical maturation in- cluding maturation of the central nervous system, consists of increase of size and greater complexity of structure that leads to greater functional capacity. Child devel- opment during the preschool and middle school years is variable with respect to dif- ferent domains of development Ill. Children living in disadvantaged envi- ronment display deficits in cognitive devel- opment [2,3]. Those children are mostly characterized by chronic protein-energy malnutrition (PEM), as well as by iron de- ficiency anemia [41. Accordingly, investi- gators have considered cognitive deficits as correlates of nutritional status as well as of iron-deficiency anemia 561. Malnutrition, per se, clearly alters the central nervous system by acutely or chronically limiting its metabolic, structu- ral and functional capabilities and perfor- 49
-
Upload
khangminh22 -
Category
Documents
-
view
3 -
download
0
Transcript of Behavioral Correlates to Nutritional Status of Preschool Children

Med. J. Cairo Univ., Vol. 62, No. 1, March: 49 -58, 1994
Behavioral Correlates to Nutritional Status of Preschool Children
ZEINAB BISHRY, M.D.; SOHAIR 1. SALEM, Ph.D.; FEISAL A. YUNIS, Ph.D.; HAGER A. ORABY, Ph.D.;
HANAA A. WAFAY, Ph.D.; ABLA G. KHALIFA, Ph.D. and ZEINAB M. MONEER, Ph.D.
The Childhood Studies, Ain Shams University and the Child Health Department, National Research Center,
Faculty of Arts, Cairo University.
Abstract
In this study, nutritional status of 185 preschool children aged between 3 and 6 years was assessed by investigating dietary intake, anthropometric measurements and protein status. Results of nutritional status parameters were correlated with a battery of psychological tests that covered intelligence, memory, learning, thinking, problem solving and attention. Dietary intake data showed that 49% of the children had caloric intake and 12% had protein intake that were lower than the recommended dietary al- lowance. A significant positive correlation was shown between caloric intake and in- telligence. Plant protein as well showed significant correlation with thinking and problem solving. Height for age showed deficit in 19% of the children when com- pared to NCHS standards. Percentage weight for age and height for age were signifl- cantly correlated to thinking, problem solving and to intelligence, None of the protein status parameters showed significant correlation with the results of any of the psycho- logical tests.
Introduction
DEVELOPMENT is a function of nutri- tion and learning. Physical maturation in- cluding maturation of the central nervous system, consists of increase of size and greater complexity of structure that leads to greater functional capacity. Child devel- opment during the preschool and middle school years is variable with respect to dif- ferent domains of development Ill.
Children living in disadvantaged envi-
ronment display deficits in cognitive devel- opment [2,3]. Those children are mostly characterized by chronic protein-energy malnutrition (PEM), as well as by iron de- ficiency anemia [41. Accordingly, investi- gators have considered cognitive deficits as correlates of nutritional status as well as of iron-deficiency anemia 561.
Malnutrition, per se, clearly alters the central nervous system by acutely or chronically limiting its metabolic, structu- ral and functional capabilities and perfor-
49

50 Zeinab Bishty, et al.
mance. In other circumstances, malnutri- tion, reflected in chronic limitation of amounts of food consumed, may result in
general stunting of growth accompanied by reduced brain size, decreased brain cell number and immature or incomplete bio- chemical organization of the brain 171.
The availability of several criteria to as- sess the nutritional status raises the possi- bility to demonstrate the existence of a re- lationship between nutritional status per se and behavior.
The aim of this study was to explore the relationship between nutritional status and behavior in a group of preschool chil- dren.
Material and Methods
Recruitment of the subjects:
One hundred eighty five children aged 3-6 years, of both sex were randomly cho- sen from two-day care centers that are lo- cated into two zones in a semi-urban com- munity “Boulak El-Dakrour”, In Giza governorate, Children having congenital anomalies of any degree of mental retarda- tion, or any chronic disease that may inter- fere with behavioral assessment were ex- cluded from the study. The aim of the study design was primarily explained to the mothers of the children. Accordingly, mothers signed a written consent that al- lowed their children to be included in the study.
Study design:
At the first visit every child was sub- jected to a thorough clinical examination that included chest, heart, abdominal and neurological systems. Nutritional status was assessed by correlating dietary intake, anthropometric measurements and bio- chemical tests of protein status.
Dietary intake was assessed by using 24 hours recall procedure. It was carried out by asking the mothers about the type and approximate amount of each food con- sumed by each child per day and for two successive days @I.
Anthropometric measurements includ- ed weight, height, triceps, biceps and sub- scapular skinfold thickness and mid upper arm circumference I91.
Psychological assessment of the chil- dren was accomplished by a battery of be- havioral tests that covered intelligence, memory, learning, thinking, problem solv- ing and attention.
For blood analysis 5 mls blood sample was collected from each child between 9- 11 am, serum was separated and kept at -20°C until analysis for albumin, prealbu- min and transferrin.
Biochemical methods:
Serum albumin was determined by us- ing bioanalytic Kit No. 27001.2, after the method of Doumes et al., IlOl.
Serum prealbumin was determined by using the M-partigen Immuno Diffusion plates that were purchased from Bchring Corp. code no. O.T. 3 W.O. Ill].
Serum transferrin was determined by using Nor partigen Radial Immuno Diffu- sion plates that were purchased from Beh- ring Corp. Code no. DUCKO, Ill].
Psychological tests:
The children were individually tested by professional psychologist. Raven’s col- ored progressive matrix (CPM), I121 Digit span forward and digit span backward, sub-subjects from the Wechsler Intelli- gence Scale for children (WISC) 1131. A free recall test I141 that assesses the child’s
Behavioral Correlates to Nutritional Status Sl
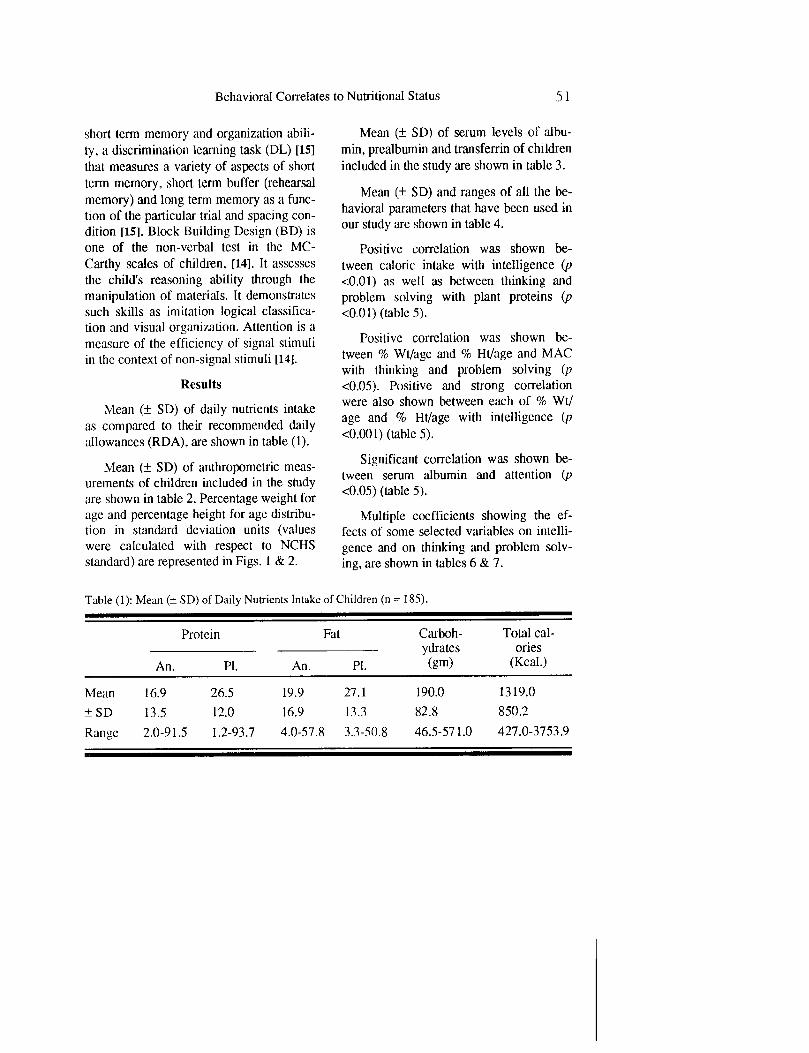
short term memory and organization abili- ty, a discrimination learning task (DL) [151 that measures a variety of aspects of short term memory, short term buffer (rehearsal memory) and long term memory as a func- tion of the particular trial and spacing con- dition WI. Block Building Design (BD) is one of the non-verbal test in the MC- Carthy scales of children, ~41. It assesses the child’s reasoning ability through the manipulation of materials. It demonstrates such skills as imitation logical classifica- tion and visual organization. Attention is a measure of the efliciency of signal stimuli in the context of non-signal stimuli [14].
Results
Mean (k SD) of daily nutrients intake as compared to their recommended daily allowances (RDA), are shown in table (1).
Mean (-+ SD) of anthropometric meas- urements of children included in the study are shown in table 2. Percentage weight for age and percentage height for age distribu- tion in standard deviation units (values were calculated with respect to NCHS standard) are represented in Figs. I & 2.
Mean (k SD) of serum levels of albu- min, prealbumin and transferrin of children included in the study are shown in table 3.
Mean (+ SD) and ranges of all the be- havioral parameters that have been used in our study are shown in table 4.
Positive correlation was shown be- tween caloric intake with intelligence (p ~0.01) as well as between thinking and problem solving with plant proteins (p ~0.0 1) (table 5).
Positive correlation was shown be- tween % Wt/age and % Ht/age and MAC with thinking and problem solving (p ~0.05). Positive and strong correlation were also shown between each of % Wt/ age and % Ht/age with intelligence (p <O.OOl) (table 5).
Significant correlation was shown be- tween serum albumin and attention (p ~0.05) (table 5).
Multiple coefficients showing the ef- fects of some selected variables on intelli- gence and on thinking and problem solv- ing, are shown in tables 6 & 7.
Table (1): Mean (+ SD) of Daily Nutrients Intake of Children (n = 185).
Mean
+SD
Range
Protein
An. PI.
16.9 26.5
13.5 12.0
2.0-9 1.5 1.2-93.7
Fat Carboh- Total cal- ydrates ories
An. Pl. (gm) (Gal.)
19.9 27.1 190.0 1319.0
16.9 13.3 82.8 850.2
4.0-57.8 3.3-50.8 46.5-57 1 .O 427.0-3753.9

52 Zeinab Bishry, et al.
Table (2): Mean (* SD) of Anthropometric Measurements of Children (n = 185.
Measurement Mean (SD) Range
Wt (kg) 17.1 ;:*;; lo- 29 Ht (cm) 104.9
(1:4) 80- 121
MAC* (cm) 15.9 lo- 21 Biceps SF** (mm) 7.1
ii.;; -
Z - 19
Triceps (mm) 10.2 22 Subscapular SF (mm) 6.5 (2:l) 4 - 17 Fat index (mm) 16.7 (4.6) 7 - 39
* MAC = Mid arm cirumference. ** SF = Skin fold thickness.
Table (3): Mean (+- SD) of Serum Levels of Albumin, Prealbumin and Transferrin of Children Includ- ed in the Study.
Parameter N
Albumin (gm /dl) 163 Prealbumin (ng /dl) 134 Transferrin (mg /dl) 174
Mcatl (SD)
4.3 (0.3) 16.4 (4.9) 312.0 (56.8)
Range
2.7 - 5.1 3.5 - 43.7 122.0 - 474.0
Table (4): Mean Scores (i S.D.) of behavioral Tests (n = 168).
Tests Mean scores
(-+ SD) Range
Memory and learning (ML) Free recall (FROR) Organization (ORG) Digit span (DS) Discrimination learning (DL) Thinking and problem solving (BD) Intelligance Attention (VIG)
90.4 (4.4) 11-38 4.9 ii*:,’ 3 -12 2.0 O-8 6.0 (2:l) 0 - 26
(4.3) 0 - 26 Z (1.8) o- 12 li.6 (4.9) 2- 31 26.7 (4.9) 3 - 32

Behavioral Correlates to Nutritional Status 53
Table (5): Pearson Correlation Cofficient between Behavioral Scores and Indicators of Nutritional Status.
Memory and Thinkmg and Intelligence Attention learning prohlcm solving
Dietary intake: Calories Animal proteins Plant proteins
Anthropometric measurement: Weight /age Height /age Mid arm circumference
Serum proteins: Albumin Prealbumin Transferrin
* p < 0.05 ** p < 0.001
-0.02 0.13 0.18 -0.01 0.10 0.09 0.02 -0.03 -0.12 0.19 0.11 0.03
-0.08 0.21 0.22 0.12 -0.13 0.19 0.26 0.06 -0.08 0.20 0.14 0.08
-0.08 -0.03 -0.10 -0.15 -0.04 -0.01 -0.14 -0.00 1 0.01 -0.10 -0.02 0.04
Table (6): Multiple Regression Coefficients Showing the Effect of Some Selected Variables on Intel- ligence.
Variables Regession Standard coefficient error p -value
Age 0.798 Height 0.074
-0.186 Prealbumin Calories 0.00 1 R-square 0.196
* Variables that entered the regression equation
0.657 0.228 0.080 0.036
0.059 0.098 0.001 0.354
Table (7): Multiple Regression Coefficients Showing the Effect of Some Selected Variables or, Thinking and Problem Solving.
Regession Variables coefficient
Age 0.739 0.050 Height
Calories 0.001 Plant protein 0.019 R-square 0.316
* Variables that entered the regression equation
Standard error
0.190 0.022 0.001 0.011
p -value
0.001 0.027 0.894 0.101

-- .:,
--. -
Zeinab Bishry, et al,
3&O -80 -110 -140 -170 180+
Intake /Allowance x 100
500r -80 -110 -140 -170 -200 210+
less Intake /Allowance x lQ0
Fig. (1): Distribution of percentage caloric in- Fig. (2): Distribution of percentage protein in- take as related to caloric allowance of chil- take as related to protein allowance of chil- dren in age range of 3-6 years. dren in age range of 3-6 years.
-3SD -2SD-1SD 0 +ISD +?SD+3SD OVER lSD+
Weight
Fig. (3): Weight for age distribution in standard deviation units (values were calculated with respect to NCHS standard).
Discussion
In this study, nutritional status of 185 preschool children age between 3 and 6 years was assessed by correlating dietary, anthropometric and biochemical parame- ters. Behavior was assessed by a battery of tests that covered intelligence, thinking and problem solving, memory and attention.
The daily caloric intake of children in the different age groups ranged from 427 to 3753.9 Kcal/day with a mean of 1319.0 f 530.2 Kcal (table 1). Fifteen percent of cases were taking between 30-50% of their
-3SD -2SD-1SD 0 +lSD +2SD+3SD OVER 3SD+
Height
Fig. (4): Height for age distribution in standard deviation units (values were calculated with respect to NCHS standards.
daily recommended caloric allowance and 34% of them were taking 80% of their rec- ommended caloric allowance (Fig. 1). This amounts to a total of 49% of the children were taking lower caloric intake than their recommended allowance.
The daily intake of animal protein ranged from 2 to 91.5 gm with a mean of 16.9 + 13.5 gm and that of plant prote ranged from 1.2 to 93.7 gm with a me: I level of 26.5 f 12 gm (table 1). On com- paring total protein intake of those children with recommended daily allowance for this age range (Fig. 2), it was shown that 12%

Behavioral Correlates to Nutritional Status 55
of the children were taking 65% of the rec- ommended daily protein allowance. The rest of the children were having adequate protein intake. This denotes that dietary protein intake of the children was more ad- equate as compared to their caloric intake. However, the higher intake of dietary plant proteins that amounted to 78.6% of the to- tal protein intake is not favorable.
Frequency distribution histograms for weight per age and height per age of the children as related to NCHS standards 1161 showed normal distributions. Height deli- tit was more pronounced since 19% of the children were less than -2 SD of Ht/age (Fig. 4). This may reflect the reduced ca- loric intake of the children as mentioned above. This was demonstrated by the sig- nificant correlation (p < 0.05) that was shown between height and caloric intake of the children.
Triceps, biceps and subscapular skin- fold thickness and upper are circumference were assessed. The use of skinfold thick- ness in the assessment of nutritional status of children was based on the assumption that increased subcutaneous fat resulting from either high caloric intake or low ener- gy expenditure reflected caloric reserve 1171. In our study, it was found that there was relative thinness in both sexes. This was demonstrated in that 37% of the chil- dren were below 3 SD of their biceps skin- fold thickness, 32% of them were below 3 SD of their triceps skinfold thickness and that 14% of them were below 3 SD of their subscapular skinfold thickness. Similar thinness in triceps skinfold was previously reported in black children as compared to the white ones [181. The authors attributed the small triceps skinfold thickness in their cases either due to differences in socioeco- nomic levels or due to genetic differences
between black and white. Mat-tore11 et al. [19] attributed the same phenomenon in their children to limitation in their caloric intake as opposed to protein ingestion, Ap- parently the major problem of our children was the reduced caloric intake as reflected in height deficit and skinfold deficits.
In this study protein status was assessed by measuring serum albumin, serum preal- bumin and transferrin. Serum albumen ranged between 2.7 and 5.1 gm/dl, with a mean value of 4.2 + 0.22 gm/dl (table 3). These results are in accordance with those previously reported for children in this age range [20,211. Serum albumin level could be maintained despite the reduced protein supply since the biological half life of al- bumin is 20 days [22,23]. Serum albumin level is considered a poor index of short term status of protein and energy intakes. Cases in this study with serum albumin less than 3.0 gm/dl are considered at risk.
Serum prealbumin ranged between 3.5 mg/dl and 43.7 mg/dl with a mean value of 16.4 f 4.9 mgldl (table 3). Normal distribu- tion of serum prealbumin was shown, with 26.4% of the children had serum prealbu- min less than 15 mg/dl. Serum prealbumin is more responsive to dietary changes than either albumin or transferrin since it has a biological half life of two days 1221. Shetty et al. I201 found that restriction of both ca- loric and protein intake led to rapid fall in prealbumin concentration. This finding was to some extent demonstrated in our study since cases with reduced serum pre- albumin had less caloric and less protein intakes. Our study as well showed that both albumin and prealbumin levels were significantly correlated (p < 0.001). This means that in some cases serum albumin was slightly reduced whenever serum pre- albumin was markedly reduced. The lack

56 Zeinab Bishry, et al.
of international cut-off level of prealbumin is a limitation to assess protein deficiency by using this parameter. Serum transferrin ranged from 122 to 474 mg/dl with a mean level of 312 + 56.8 mg/dl (table 3). Only two children showed reduced serum trans- ferrin level (122.0 and 180 mg/dl). It is
/
worthy to mention that albumin levels of those children were 2.8 and 2.9 gm/dl re- spectively and prealbumin level were 10.9 & 12.1 mg/dl. i.e protein status of those two children was considerably affected. Apart from that no significant correlation was shown between transferrin levels and each of albumin and prealbumin levels.
Means, standard deviations and ranges of the scores of all behavioral parameters that have been used in our study are shown in table (4). Memory and learning score (ML) were calculated by adding, free re- call test (FReR), organization test (ORG), Digit span test (DS) and discrimination learning test (Dl). This procedure was jus- tified on the grounds of the highly signifi- cantly intercorrelations among these indi- vidual tests (p ~0.00).
Pearson’s correlation coefficients be- tween behavioml scores and indicators of nutritional status used in this study are shown in table (5). Apparently, thinking problem solving and intelligence were mostly affected as shown by the significant correlation with each of the dietary intake and anthropometric measurements. Though the correlations were significant, yet they were not strong as shown from the low p values. Albumin is the only indicator of protein status that showed weak negative correlation with attention. Similarly Gupta et al. [241 and Guzman et al. [251 showed that intelligence was significantly correlat- ed with nutritional status, in particular ca- loric intake. Freeman et al. [26] found that children who received high protein-caloric
supplement and whose mothers were as well supplemented during pregnancy were more likely to score high in cognitive tests. Body weight and height were shown in previous studies to be correlated with some cognitive parameters. This was shown in the study of Lasky [27], wheti he, found that body weight and height’ of infants were the best predictors of infant mental and motor scores. Similar observation on preschoolers in USA showed that the mean IQ differed significantly from the lowest to the highest quartiles of stature [28,21.
Multiple regression analysis of the dif- ferent variables on intelligence is shown in table 6, where age, height, prealbumin and caloric intake entered the regression equa- tion. However, as indicated from the value of R-square only 19.6% of the variation in intelligence could be explained by the sig- nificant variability in height and prealbu- min levels. The impact of the variables of this study on thinking and problem solving is shown in table (7).
Age and height contributed by 31.6% of the variation in thinking and problem solving. For attention none of the variables apart from age showed significant relation to attention with 17.4% of the variation in attention could be explained by age varia- tion. Memory and learning were the only behavioral parameters that were not affect- ed by any of the variables studied.
In this regard, multiple regression anal- ysis demonstrated the extent of contribu- tion of the various nutritional parameters on behavior. This finding, though prelimi- nary, yet it confirms the previous view that nutritional status significantly contributes to cognitive development. Extensive work in this regard need to be planned for differ- ent age groups and with a variety of age standardized tests.

Behavioral Correlates to Nutritional status 57
l-
2-
3-
4
5
6-
7-
s-
9-
References
HOROWITZ, F.D.: Child development for
the pediatrician, ,symposium on behavioral
pediatrics. Pediatric Clinics of North Ameri-
ca, Vol. 29, No. 2, April, 1982.
JOHNSTON, F.E.; LOW, SM.; BAESSA,
Y. and MAC VEAN, R.: Interaction of nu-
tritional and socioeconomic status as deter-
minant of cognitive development in disad-
vantaged Urban Guatemalan children. Am.
J. Physic. Anthropol., 73: 501-506, 1987.
POLLITT, E.; HATHIRAT, P.; KOTCHAB-
HAKD, N.J.; MISSELL, L. and VALYA-
SEVI, A.: Iron deficiency and educational
achievement in Thailand. Am. J. clin. Nutr.,
50 (3): 687-96, 1989.
CALVO, B.B. & GNAZZO, N.: Prevalence
of iron deficiency in children aged 9-24 mo.
from large urban area of Argentina. Am. J.
Clin. Nutr., 52 (3): 534-40, 1990.
LOZOFF, B.: Iron and learning potential in
childhood. Bull. N.Y. Acad. Med., 65(10):
1050-66, 1989.
FAIRCHILD, W.; MAAS, J.D.; HABICHT,
J.P.: Iron deficiency and behaviour: Criteria
for testing causality. Am. J. Clin. Nutr., 50
(3): 568-74, 1989.
Food and Nutrition Board of NAS-NRC:
Nutrition review, Vo1.31, No. 8; Aug. 242-
246, 1973.
National Academy of Sciences: Food and
Nutrition Board, Recommended dietary al-
lowances, National Research Council (ed).
Washington DC., 1980.
TANNER, J.M. and WHITEHOUSE, R.H.:
Revised standard of triceps and subscapular
skinfolds in British children, Arch. Dis.
Child., 50:142, 1975.
lo- DOUMAS, B. T. ; WATSON, W. A. and
BIGGS, H.G.: Albumin standard and the
measurements of serum albumin with bro-
mocresol green. Acta, 31:87, 1975.
1 l- MACINI, G.; GARBONARA, A. 0. and
HEREMANS, J.F.: Immunochemical quan-
titation of antigens by single radial immuno-
diffusion. Immunochem, 2:235, 1985.
12- RAVEN, J.C.; COURT, J.H. and RAVEN,
J.: Manual for Raven’s progressive matrices
and vocabulary scales. The coloured pro-
gressive matrices ed. J.C. RAVEN LTD
publisher H.K. Lewis and Co LTD London,
1971.
13- WECHSLER, D.: Manual for the Wechsler
Intelligence scale for children revised. Da-
vid Wechsler; Psychological Corporation,
New York, 1974.
14- MC CARTHY, D. : Manual for the MC
Carthy scales of children’s abilities ed. Da-
rothea McCarthy, publisher the psychologi-
cal corporation, New York, 1972.
15- POLLITT, E. : Behavioral tests battery
methods for the evaluation of the impact of
food and nutrition programs, edited by Sa-
hen D.E.; Lockwood R. and Scrimshow
N.S. The United States University, pp 198,
1984.
16. National Center ForHealth Statistics: NCHS
growth curves for children birth - 18 years.
United States. Washington D.C. and Wel-
fare. (Vital and Health Statistics Series 11)
DHEW publication.
17- FRISANCHO, A.R. : Triceps skinfold and
upper arm muscle size norms for assess-
ment of nutritional status. Am. J. Clin.
Nutr., 27: 1052-1057, 1974.
1% JOHNSTON, F.E. & BELLER, A.: Anthro-
pometric evaluation of the body composi-
tion of black and white Puerto&an new-

58 Zeinab Bishry, et al.
born. Am. J. Clin. Nutr., 29: 61-65, 1976. ic rates in obesity. Lancet, I: 1122-25.
19- MARTORELL, R.; YARBROUGH, C.;
LECHTIG, A.; DELGADO, H. and KLEIN,
R.E.: Upper arm anthropometiic indicators
of nutritional status. Am. J. Clin. Nutr., 29:
46-53.
24- GUPTA, S .; DHINGRA, D.C.; SINGH, M.
V. and ANAND, K.: Impact of nutrition on
intelligence. Indian Pediatr., 12: 1079-82.
20- SHETTY, P. S.; WATRASIEWDZ, K. E.;
JUNG, R.I. and JAMES, W.P.T.: Rapid-
turnover transport proteins: An index for
subclinical protein energy malnutrition.
Lancet, 2: 230-232, 1979.
25 GUZMAN, V.; GUTHRIE, H.A. & GUTH-
RIE, G.M.: Physical and intellectual devel-
opment in Philippine children fed five dif-
ferent dietary staples. Am. J. Clin. Nutr.,
29: Nov. 1242-1251, 1976.
21- KA’I’HXYN, G. D.: Nutrition survey in Ta-
basco, Mexico: Nutritional status of pre-
school children. Am. J. of Clin. Nut., 37:
1010-1019, 1983.
26-FREEMAN, H.E.; KLEIN,R.E.; TOWNSED,
J.W. and LECHTIG, A.: Nutrition and cog-
nitive development among rural Guatema-
lan children. Am. J. Publ. Health, 70: 1277-
1285, 1980.
22- BARBARA, A.; UNDERWOOD & ABRA-
HAM. STIKEL: Measuring impact using la-
boratories methodologies, in methods for
the evaluation of the impact of food and nu-
trition programs. (David, E., Richard Lock-
wood and Nevin Scrimshaw, eds) United
National University.
27- LASKY, R. E.; KLEIN, R. F.; YAR-
BROUGH, C.; ENGLE, P.L. and LECH-
TIG, A.: The relationship between physical
growth and infant behavioral development
in rural Guatemala. Child Development, 52:
219-226.
23- JAMES, W.P.T.; DAVIES, H.L.; BAILES,
J. and DAUNCEY, M.J.: Elevated metabol-
28- POLLITT, E. and MUELLER, W.: The re-
lation of growth to cognition in a well nour-
ished preschool population. Child Dev., 53:
1157-1163, 1982.