Behavior Signatures of Birds: An Automated Way to Extract Wing Beat Frequency and Flap Glide Patters...
13
Behavior Signatures of Birds An Automated Way to Extract Wing Beat Frequency and Flap- Glide Patterns from Thermal Imagery Val Cullinan, Ph.D. Corey Duberstein, M.Sc. Shari Matzner, Ph.D. 1
-
Upload
independent -
Category
Documents
-
view
0 -
download
0
Transcript of Behavior Signatures of Birds: An Automated Way to Extract Wing Beat Frequency and Flap Glide Patters...
Behavior Signatures of Birds
An Automated Way to Extract Wing Beat Frequency and Flap-Glide Patterns from Thermal Imagery
Val Cullinan, Ph.D.
Corey Duberstein, M.Sc.
Shari Matzner, Ph.D.
1

Acknowledgements
Signature Discovery Initiative: PNNL National Security Directorate
Wind and Water Power Program: DOE Office of Energy Efficiency & Renewable Energy
2
Presentation Overview
Problem Statement
Wing Beat as a Signature
Data Extraction
Wing Beat Position
Conclusions
3
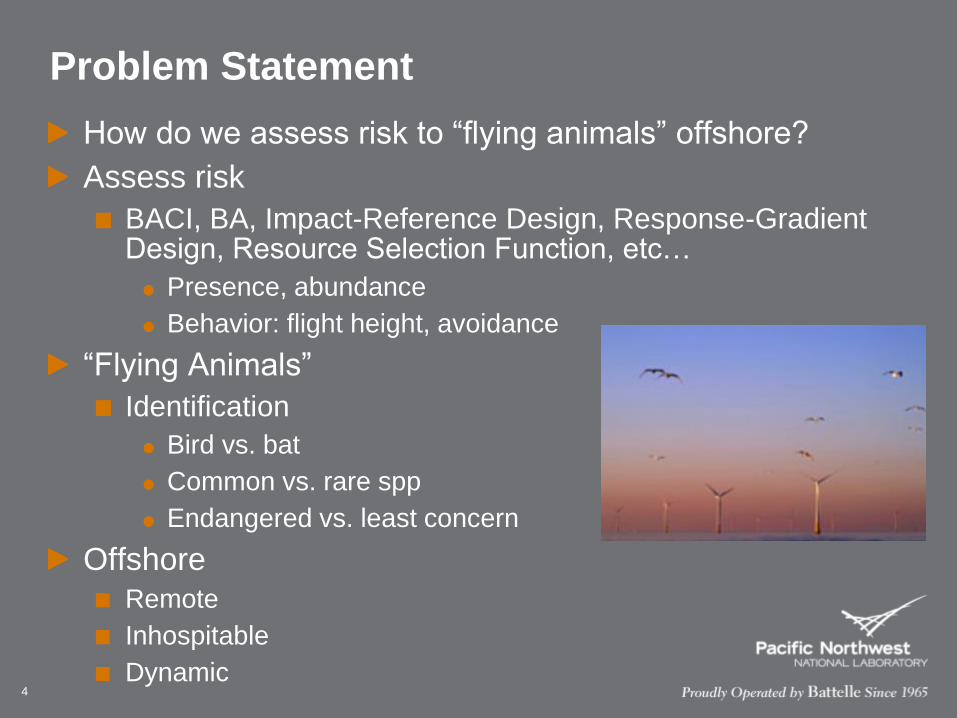
Problem Statement
How do we assess risk to “flying animals” offshore?
Assess risk
BACI, BA, Impact-Reference Design, Response-Gradient Design, Resource Selection Function, etc…
Presence, abundance
Behavior: flight height, avoidance
“Flying Animals”
Identification
Bird vs. bat
Common vs. rare spp
Endangered vs. least concern
Offshore
Remote
Inhospitable
Dynamic4
Wing Beat as a Signature
Pennycuick 1996, 2001 allometric model
F = mass3/8acceleration1/2wingspan-23/24 wing area-1/3 air density-3/8
Bruderer et al. 2010
Measured 155 species, compiled 45 species (Europe)
4 flight types:
Continuous flapping: wading birds, waterfowl, auks, gulls, terns
Soaring: storks, pelicans, lg raptors
Dynamic soaring: albatrosses, shearwaters
Flap-glide: passerines, gulls, terns
Conclusion: Pennycuick pretty reliable for continuous flapping flight
5
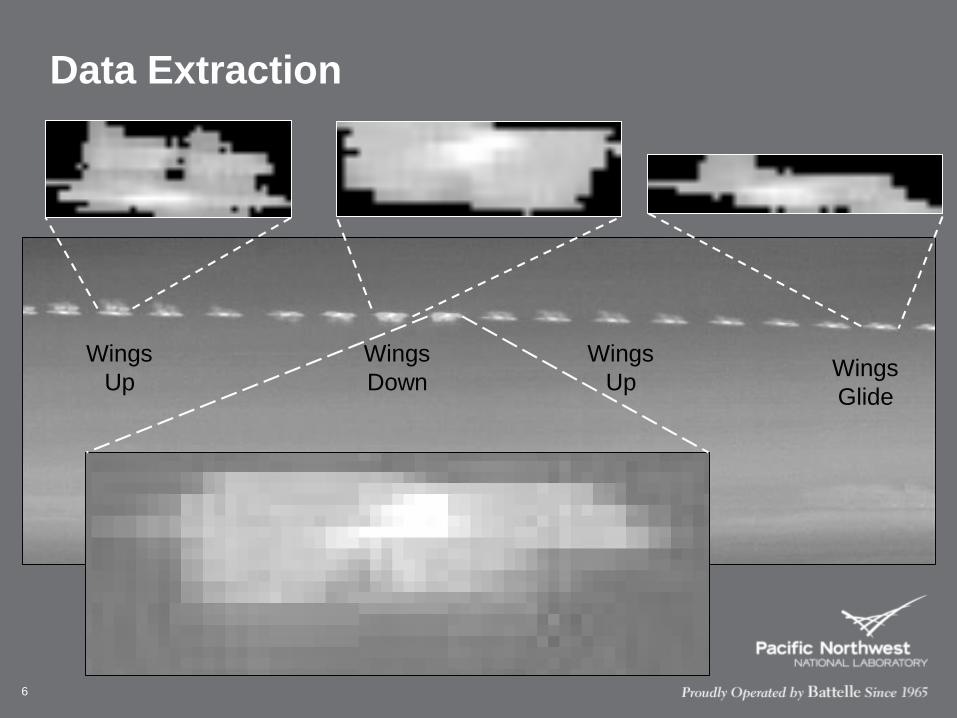
Data Extraction
6
Wings
DownWings
Glide
Wings
Up
Wings
Up
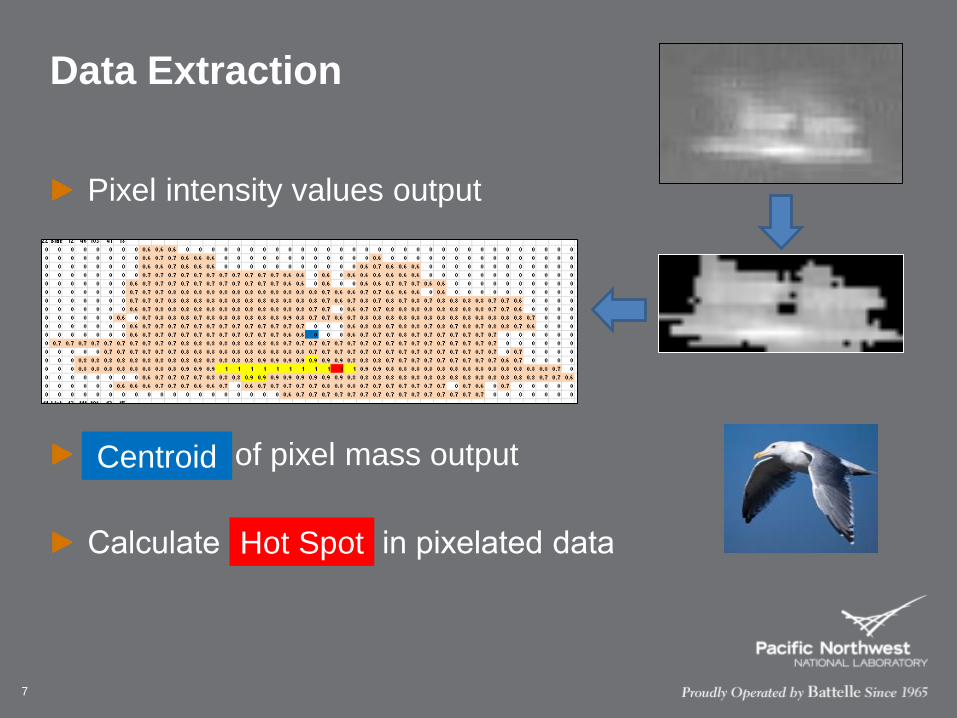
Data Extraction
Pixel intensity values output
Centroid of pixel mass output
Calculate “hot spot” in pixelated data
7
Hot Spot
Centroid
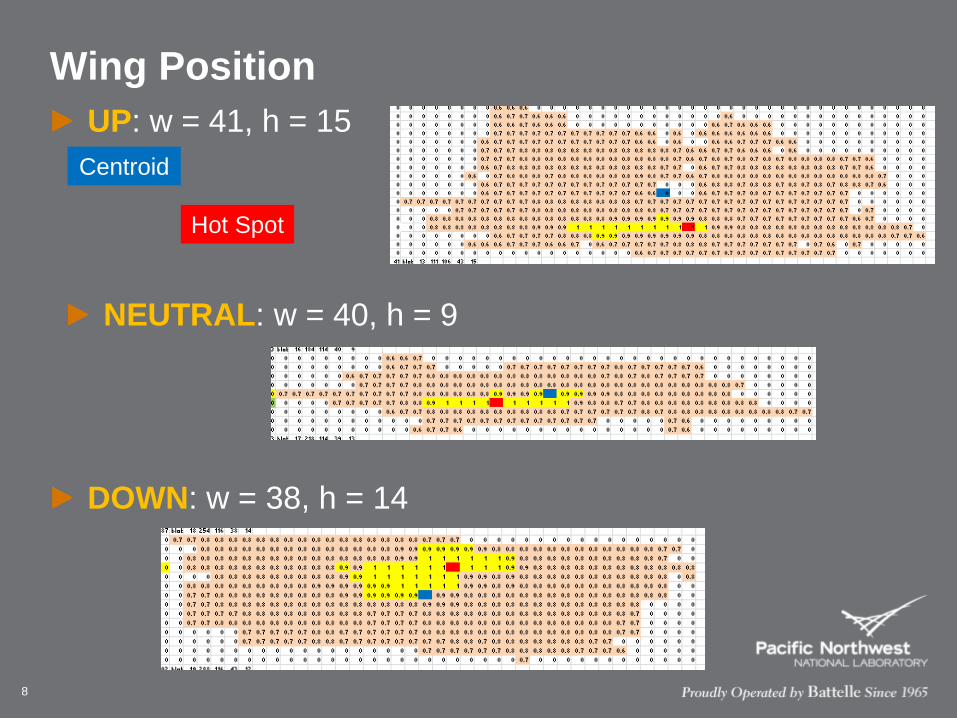
Wing Position
8
UP: w = 41, h = 15
Hot Spot
Centroid
NEUTRAL: w = 40, h = 9
DOWN: w = 38, h = 14
Wing Position
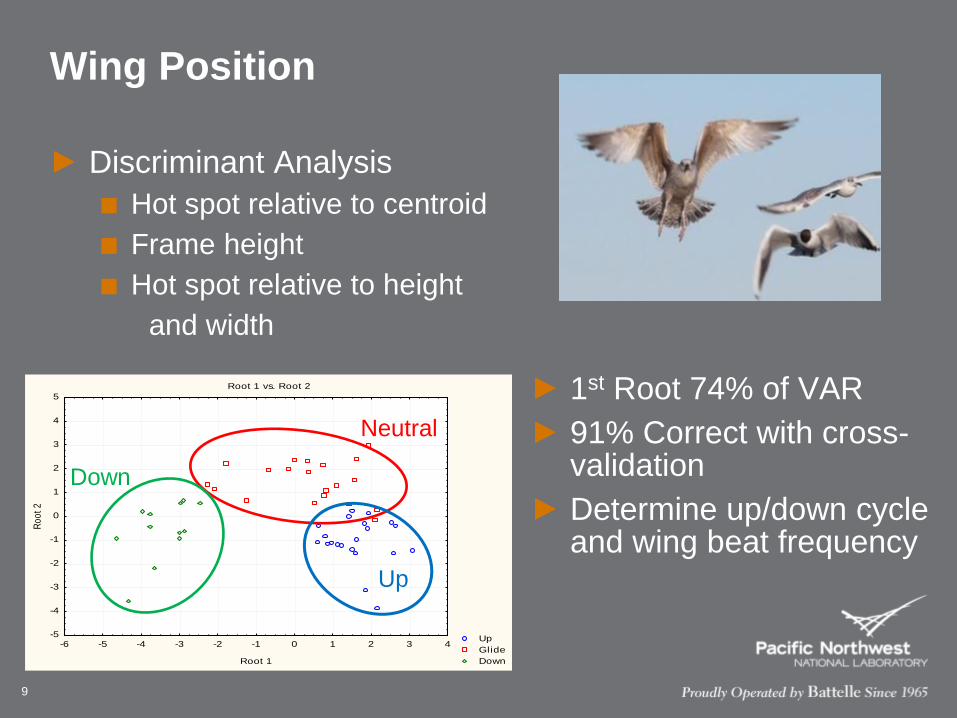
Discriminant Analysis
Hot spot relative to centroid
Frame height
Hot spot relative to height
and width
9
Root 1 vs. Root 2
Up
Glide
Down
-6 -5 -4 -3 -2 -1 0 1 2 3 4
Root 1
-5
-4
-3
-2
-1
0
1
2
3
4
5
Ro
ot
2
1st Root 74% of VAR
91% Correct with cross-validation
Determine up/down cycle and wing beat frequency
Neutral
Up
Down
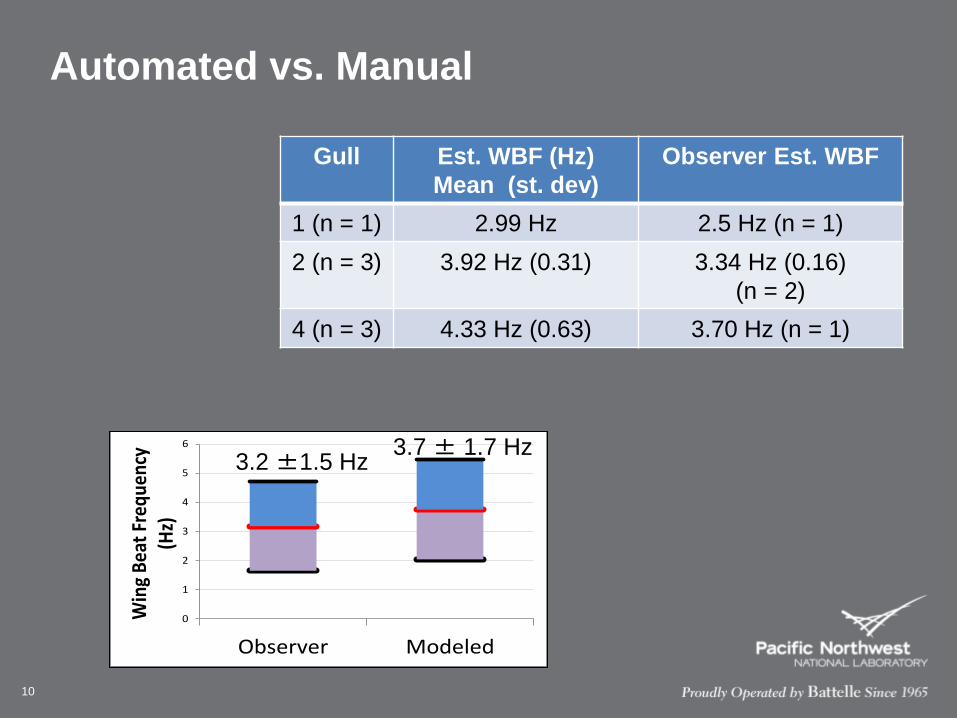
Automated vs. Manual
10
Gull Est. WBF (Hz)
Mean (st. dev)
Observer Est. WBF
1 (n = 1) 2.99 Hz 2.5 Hz (n = 1)
2 (n = 3) 3.92 Hz (0.31) 3.34 Hz (0.16)
(n = 2)
4 (n = 3) 4.33 Hz (0.63) 3.70 Hz (n = 1)
0
1
2
3
4
5
6
Observer Modeled
Win
g B
eat
Freq
uenc
y (H
z)
3.7 ± 1.7 Hz3.2 ±1.5 Hz
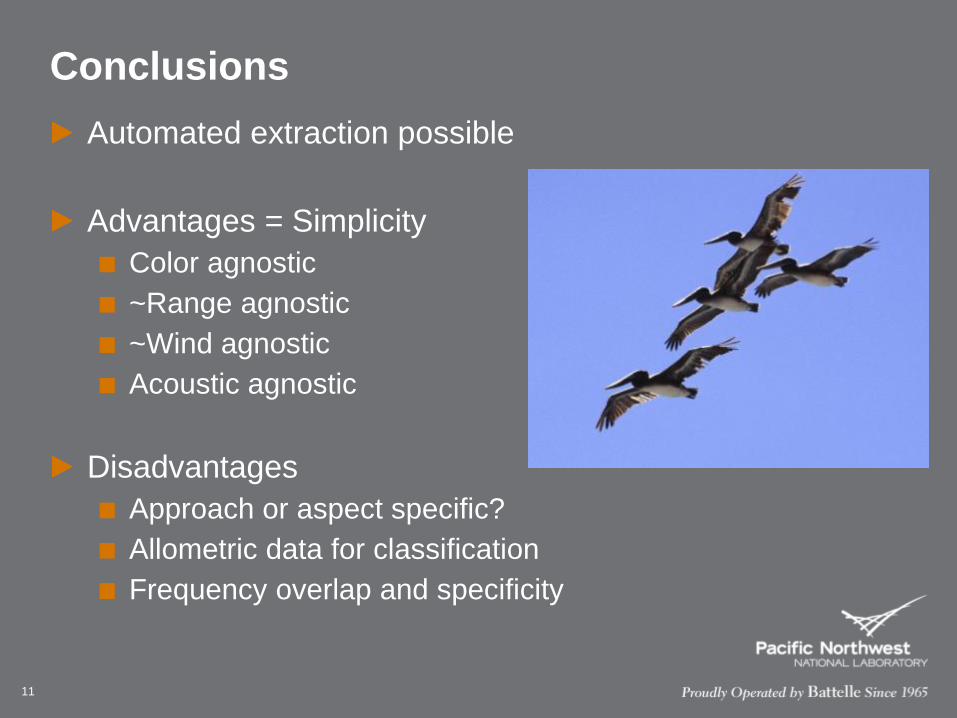
Conclusions
11
Automated extraction possible
Advantages = Simplicity
Color agnostic
~Range agnostic
~Wind agnostic
Acoustic agnostic
Disadvantages
Approach or aspect specific?
Allometric data for classification
Frequency overlap and specificity
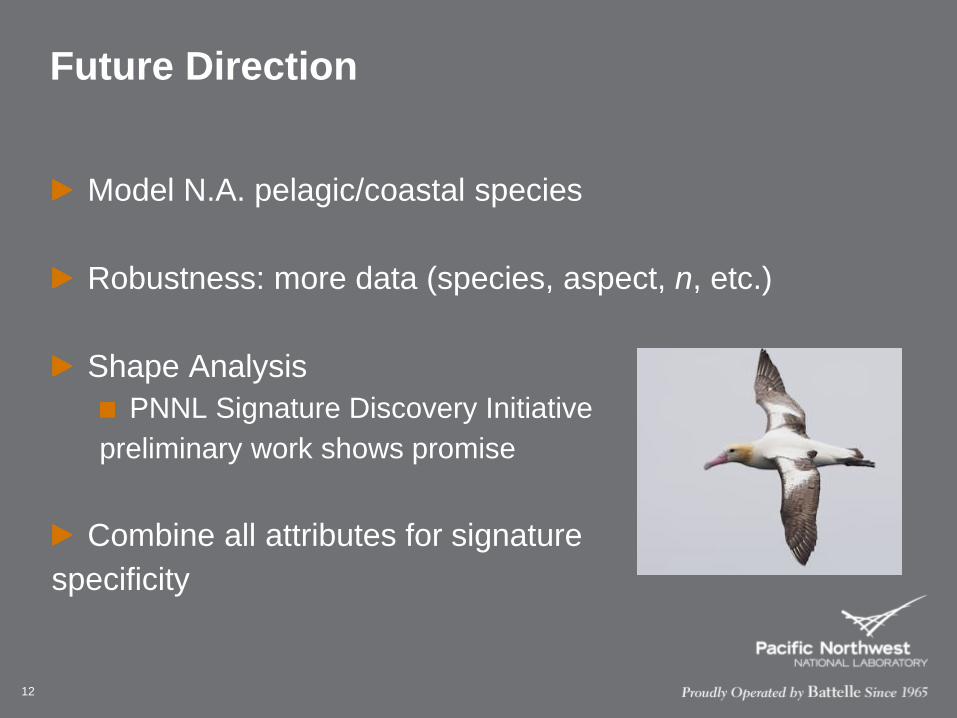
Future Direction
Model N.A. pelagic/coastal species
Robustness: more data (species, aspect, n, etc.)
Shape Analysis
PNNL Signature Discovery Initiative
preliminary work shows promise
Combine all attributes for signature
specificity
12
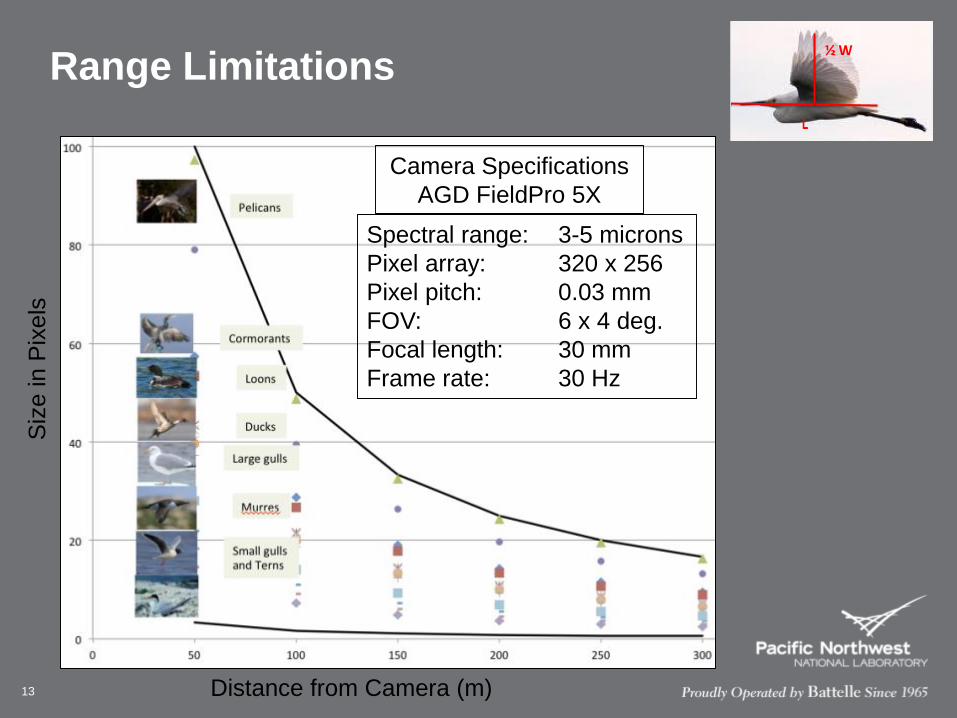
13 Distance from Camera (m)
Siz
e in P
ixels
Spectral range: 3-5 microns
Pixel array: 320 x 256
Pixel pitch: 0.03 mm
FOV: 6 x 4 deg.
Focal length: 30 mm
Frame rate: 30 Hz
Camera Specifications
AGD FieldPro 5X
Range Limitations½ W
W