Blade-Mounted Flap Control for BVI Noise Reduction Proof-of ...
196
NASA Contractor Report 195078 f Blade-Mounted Flap Control for BVI Noise Reduction Proof-of-Concept Test Seth Dawson, Ahmed Hassan, Friedrich Stmub and Hormoz Tadghigh! McDonnell Douglas Aerospace McDonnell Douglas Helicopter Systems Mesa, Arizona 85215 Contract NAS1-19060 July 1995 National Aeronautics and Space Administration Langley Research Center Hampton, Virginia 23681-0001
-
Upload
khangminh22 -
Category
Documents
-
view
0 -
download
0
Transcript of Blade-Mounted Flap Control for BVI Noise Reduction Proof-of ...

NASA Contractor Report 195078f
Blade-Mounted Flap Control for BVI Noise ReductionProof-of-Concept Test
Seth Dawson, Ahmed Hassan, Friedrich Stmub and Hormoz Tadghigh!
McDonnell Douglas AerospaceMcDonnell Douglas Helicopter SystemsMesa, Arizona 85215
Contract NAS1-19060
July 1995
National Aeronautics and
Space AdministrationLangley Research CenterHampton, Virginia 23681-0001


Table Of Contents
Section Page
Summary .
1.0 Introduction
2.0 Test Description
3.0 Mechanical System Description . .3.1 Test Stand . . .3.2 Rotor . . .3.3 Blades ....3.5 Flap Actuation Mechanism3.6 Design Process, Mechanical Design of Hardware
3.6.1 Aeroacoustic Analyses Summary3.6.2 Dynamic Analyses Summary3.6.3 Mechanical Design Summary
3.7 Cam Profiles
4.0 Data Acquisition . . .4.1 Hardware Description For Data Acquisition4.2 Software Description . .4.3 Typical Test Day Description4.4 Acoustic Data Acquisition/Reduction .
4.4.1 Real-Time Data Acquisition
4.5
4.4.1.1 Microphone and Kulite Pressure Transducer Data4.4.1.1.1 Transducer Calibrations .4.4.1.1.2 Background and Reflected Noise Checks4.4.1.1.3 Test Point Data .
4.4.1.2 Microphone Traverse4.4.1.3 Wind Tunnel and Rotor Data .
4.4.2 Acoustic and Pressure Data Reduction
4.4.2.1 Analytical Processing4.4.2.1.1 Engineering Units Conversion4.4.2.1.2 Ensemble Averages . .4.4.2.1.3 BVl Filtering .4.4.2.1.4 Background and Reflected Signals .
4.4.2.2 Data Display •4.4.2.3 Permanent Data Storage and Backup.
Dynamic Data Acquisition
5.0 Test Procedures and Conduct5.1 Installation and Checkout . .
5.2 Background Noise . .5.3 Weight Tares5.4 Aerodynamic Tares5.5 Track and Balance . .
Number
2
4
55666778910
111112131616161718181919191919202020212121
212223242425

Table Of Contents (cont'd)
Section Page
5.6 Baseline Test Matrix . .
5.7 -12.5 Degree Acoustic Cam.5.8 -17.5 Degree Acoustic Cam.5.9 -20.0 Degree Acoustic Cam.5.10 2P3A Performance Cam .5.11 2P6A Performance Cam .
5.12 Dynamics With Null Cam .5.13 3P2A Dynamics Cam5.14 5P4A Dynamics Cam5.15 No Horn Baseline Case5.16 Removal of Model .
6.0 Test Results6.16.2
Stand Shake Test
Dynamics data6.2.1 Rotor Dynamics
6.2.1.1 Rotor Speed Sweeps.
6.2.1.2 Frequency Sweeps .6.2.1.3 Transient Testing6.2.1.4 Standpipe Response.
6.2.2 Vibration Reduction. .
6.2.3 Performance Improvement.6.3 Sample Aerodynamic and Pressure Data.
6.3.1 Advancing Side BVI.6.3.1.1 Effect of Trailing Edge Flap Deployment6.3.1.2 Effect of the Peak Flap Deflection Amplitude
6.3.1.3 Effect of the Phase Shift in Azimuthal Flap Schedule6.3.2 Retreating Side BVI.
6.4 Sample Acoustic Data . . .6.4.1 Advancing Side BVI . . .
6.4.1.1 Effect of Trailing Edge Flap Deployment6.4.1.2 Effect of Peak Deflection Amplitude.
6.4.1.3 Effect of the Phase Shift in Azimuthal Flap Schedule6.4.2 Retreating Side BVI . . .
6.5 Effect Of Acoustic Cams On Power Required
7.0 Conclusions .8.0 References .
Appendix A: Tunnel Test Tare Results and Correction Equation .
Appendix B: Test Log, Run Log, Instrumentation List, and Data Point Log .
Number
252728303233343636
3637
37384040404141424243444545
4547
48494949515253
54
5657
156159
ii

List Of Table Headings
Table
12
3
4
5
6
7
8
910
11
12
1314
15
16
1718
19202122
2324252627282930
Baseline Performance Test MatrixBaseline Acoustic Test Matrix .
Test Matrix For -12.5 ° Cam With 0 ° Azimuth
Test Matrix For -12.5 ° Cam With -10 ° Azimuth .
Test Matrix For -12.5 ° Cam With +10 ° Azimuth.
Test Matrix For -12.5 ° Cam With +20 ° Azimuth.
Test Matrix For -17.50 Cam With -20 ° Azimuth .Test Matrix For -17.5 ° Cam With 0 ° Azimuth .
Test Matrix For -17.5 ° Cam With -5° Azimuth
Test Matrix For -17.5 ° Cam With -140 ° Azimuth
Test Matrix For-20 ° Cam With -10 o Azimuth
Test Matrix For -20 o Cam With 0° Azimuth
Test Matrix For-20 ° Cam With -10 ° Azimuth . .
Test Matrix For -20 ° Cam With -15 ° Azimuth
Test Matrix For 2P3A Performance Cam With 11.7 ° Azimuth.Test Matrix For 2P3A Performance Cam With 56.7 ° Azimuth.
Test Matrix For 2P3A Performance Cam With 101.7 ° Azimuth
Test Matrix For 2P3A Performance Cam With 146.7 ° Azimuth
Test Matrix For 2P6A Performance Cam With 11.7 ° Azimuth.Test Matrix For Baseline Rotor Dynamic ExcitationTest Conditions For Flow VisualizationConditions For Propulsive Force Comparison
Test Conditions For 5P4A Dynamics Cam With -9 ° Azimuth .Test Conditions For No Hom Baseline Rotor .Shake Test Instrumentation (height relative to hub plane) .Shake Test Frequency SweepsTest Stand Modes And ResponseGround Resonance Modal Data ....
Frequencies Used In Transient Testing . ° .Shaft Angles Used . .
Page
2627
27
27
28
28
28
28
2930
30
31
3131
32
32
33
3334353535
3637393940404242
iii
Figure
List Of Figure Captions
Page
Figure (1)
Figure (2)
Figure (3)
Figure (4)
Figure (5)
Figure (6)
Figure (7)
Figure (8)
Figure (9)
Figure (10a)
Figure (10b)
Figure (1 la)
Active Flap Rotor and Test Stand At NASALangley 14- by 22-Foot Subsonic Tunnel
Schematic of Active Flap Model Rotor Hub andRotor Mast.
Cross Section of Active Flap Model Rotor Blade.
Strain Gauges and Pressure TransducerLocations.
Flap Actuation Mechanism.
Typical BVl Noise Reduction Active FlapDeflection Profile Versus Azimuth Position.
CAMRAD/JA Results. Bound Circulation versus
Azimuth Position. I_ = 0.15, Ct = 0.007, r/R = 0.93
Solid Line is Baseline Rotor, Broken Line is
Schedule 50 (20 ° Cam) Active Flap Deflection.
Typical RFS2.BVl Results. Temporal DifferentialPressure Gradients Near Blade Leading Edge versus
Azimuth. !_ = 0.15, Ct = 0.007, dR = 0.93.
Solid Line is Baseline Rotor, Broken Line is Schedule
50 (20 ° Cam) Active Flap Deflection.
Typical WOPWOP Results. BVI Sound Pressure Level
in dB Two Rotor Radius Under Rotor. !1 = 0.15, Ct =0.007, dR = 0.93. Baseline Rotor Data; Schedule 50
(20 ° Cam) Active Flap Deflection Rotor Data; andDifference Between Baseline and Schedule 50 IsShown.
Desired and Measured Flap Deflection VersusAzimuth Position For Acoustic Cam Profiles
Desired and Measured Flap Deflection VersusAzimuth Position For Harmonic Cam Profiles
Schedule 50 Cam Example of Trailing Edge FlapDeflection Over Four Revolutions
59
60
61
62
63
64
65
66
67
68
69
7O
iv
Figure
Figure (1 lb)
Figure (1 lc)
Figure(12)
Figure (13)
Figure (14)
Figure (15)
Figure (16)
Figure (17)
Figure (18)
Figure (19)
Figure (20a)
Figure (20b)
Figure (21)
Figure (22)
Figure (23)
Figure (24)
Schedule 2P6A Cam Example of Trailing Edge FlapDeflection Over Four Revolutions
Schedule 5P4A Cam Example of Trailing Edge FlapDeflection Over Four Revolutions
Acoustic Data Acquisition - Hardware Configuration.
Acoustic Data Acquisition - Data Flow.
Acoustic Data Acquisition - Overall Process Control.
Position of Microphones Relative to Rotor in WindTunnel, Top View.
Test Set Up For Shake Test.
Frequency Response Function, R6 HubAccelerometer, Lateral and R7, Balance RollingMoment.
Stand Frequency Response Function, R8 MastAccelerometer, Lateral and R13 Mast AccelerometerLongitudinal.
Stand Frequency Response, R14 HubAccelerometer, Longitudinal and R12 Balance Pitch.
Blade Chord Bending at Station 23 Versus RotorSpeed.
Standpipe Torque Versus Rotor Speed.
Power Spectra For Blade Flap, Chord and TorsionResponse at Station 23, and For Main Rotor ShaftTorque at Nominal Rotor Speed (18.12 Hz).
Longitudinal Cyclic Input and Chord BendingResponse at Station 23.
Rotor Balance Pitch Moment Frequency ResponseBaseline and 5P4A Cams.
Rotor Balance Pitch Moment Time Histories,Baseline and 5P4A Cams.
Page
71
72
73
74
75
76
77
78
79
80
81
81
82
83
84
85
V

Figure
Figure (25)
Figure (26)
Figure (27)
Figure (28)
Figure (29)
Figure (30)
Figure (31)
Figure (32)
Figure (33)
Figure(34)
Propulsive Force Versus Advance Ratio ForBaseline and 2P3A Cams.
L/D Versus Advance Ratio For Baseline And2P3A Cams.
Measured blade surface pressures (Ct/a=0.0764,
t1=0.149, e¢Tpp=5 °. aft, x/C=0.03) Baseline rotor
configuration: Test # 0733, Point # 0891
Measured blade surface pressures (Ct/a=0.0764,
!_=0.149, ecr-pp=5 °. aft, x/C=0.03) Flapped rotor
configuration: Test # 2916, Point # 2082
Nominal flap schedule with a peak deflection of
-12.5 ° and the schedule with a -20 ° of phase shift.
Calculated differential pressures (Ct/(_=0.0764,
p.=0.149, (zTpp=5 °. aft, x/C=0.03) Baseline rotor
configuration: Test # 0733, Point # 0891
Calculated differential pressures (Ct/c=0.0764,
!1=0.149, (zTpp=5 °. aft, x/C=0.03) Flapped rotor
configuration: Test # 2916, Point # 2082
Calculated differential pressures (Ct/(_=0.0760,
i_=0.149, (zTPP=3 °. aft, x/C=0.03) Baseline rotor
configuration: Test # 0731, Point # 0852
Calculated differential pressures (Ct/_=0.0764,
i_=0.149, o_Tpp=3 °. aft, peak deflection- 12.5oo,
phase shift in azimuth=-10 °, x/C=0.03) Flapped rotorconfiguration: Test # 2900, Point # 1774
Calculated differential pressures (Ct/a=0.0764,
t_=0.149, o¢Tpp=3 °. aft, peak deflection =-17.5 °,
phase shift in azimuth=-10 °, x/C=0.03) Flapped rotorconfiguration: Test # 3915, Point # 3105
Page
86
87
88
89
90
91
92
93
94
95
vi

Figure Page
Figure (35)
Figure (36)
Figure (37)
Figure (38)
Figure (39)
Figure (40)
Figure (41)
Figure (42)
Calculated differential pressures (Ct/c=0.0764,
!_=0.149, (zTpp=3 °. aft, peak deflection=- 17.5 °,
phase shift in azimuth=-20 °, x/C=0.03) Flappedrotor configuration: Test # 4034, Point # 4044
Measured blade surface pressures (Ct/c=0.076,
p.=0.199, (xTpp=4 °. aft, x/C=0.03) Baseline rotor
configuration: Test # 0738, Point # 1014
Measured blade surface pressures (Ct/G=0.076,
!1=0.199, (xTpp=4 °. aft, peak deflection = -12.5 °,
phase shift in azimuth=-10 °, x/C=0.03) Flappedrotor configuration: Test # 2904, Point # 1899
Measured blade surface pressures (Ct/c=0.076,
_=0.199, (zTpp=4 °. aft, peak deflection = -17.5 °,
phase shift in azimuth=-10 °, x/C=0.03) Flappedrotor configuration: Test # 3922, Point # 3177
Measured blade surface pressures (Ct/G=0.076,
I1=0.199, (xTpp=4 °. aft, peak deflection = -20 °,
phase shift in azimuth=-10 °, x/C=0.03) Flappedrotor configuration: Test # 4047, Point # 3746
Calculated differential pressures (Ct/c=0.0865,
!_=0.199, _Tpp=2.5°. aft, x/C=0.03) Baseline rotor
configuration: Test # 0741, Point # 1158
Calculated differential pressures (Ct/G=0.0865,
_=0.199, o_Tpp=2.5 °. aft, peak deflection=-17.5 °,
phase shift in azimuth=0 °, x/C=0.03) Flapped rotorconfiguration: Test # 3910, Point # 2845
Calculated differential pressures (Ct/c=0.0865,
p.=0.199, e_Tpp=2.5 °. aft, peak deflection=-17.5 °,
phase shift in azimuth=-5 °, x/C=0.03) Flapped rotorconfiguration: Test # 3941, Point # 3084
96
97
98
99
100
101
102
103
vii
Figure Page
Figure (43)
Figure (44)
Figure (45)
Figure (46)
Figure (47)
Figure (48)
Figure (49a)
Figure (49b)
Calculated differential pressures (Ct/o=0.0865,
I1=0.199, (xTpp=2.5 °. aft, peak deflection=-17.5 °,
phase shift in azimuth=-10 °, x/C=0.03) Flappedrotor configuration: Test # 3925, Point # 3234
Calculated differential pressures (Ct/o=0.0865,
p.=0.199, (xTpp=2.5 °. aft, peak deflection=- 17.5 °,
phase shift in azimuth=-20 °, x/C=0.03) Flappedrotor configuration: Test # 3741, Point # 2628
Measured blade surface pressures (Ct/o=0.0764,
_=0.149, aTpp=3 °. aft, x/C=0.03) Baseline rotor
configuration: Test # 0731, Point # 0852
Measured blade surface pressures (Ct/o=0.0764,
p.=0.149, (xTpp=3 °. aft, peak deflection=- 17.5 °,
phase shift=+140 °, x/C=0.03) Flapped rotorconfiguration: Test # 5030, Point # 4373
Measured blade surface pressures (Ct/o=0.087,
_=0.199, e_Tpp=2.5 °. aft, x/C=0.03) Baseline rotor
configuration: Test # 0741, Point # 1158
Measured blade surface pressures (Ct/o=0.0764,
p.=0.199, e_Tpp=2.5 ° aft, peak deflection=-17.5 °,
phase shift=+140 °, x/C=0.03) Flapped rotorconfiguration: Test # 5050, Point # 4412
BVISPL Contour Plot Based on Spectra of
Averaged Time Histories (Ct/o = 0.0765, o_Tpp=5
degrees aft, 11=0.1488) Baseline RotorConfiguration - Test # 0733
BVlSPL Contour Plot Based on Spectra of
Averaged Time Histories (Ct/o = 0.0777, (xTp P = 5
degrees aft, !_=0.1487, Peak Flap Deflection=-12.5 degrees, Azimuthal Phase Shift = -20degrees ) Flapped Rotor Configuration - Test #2916
104
105
106
107
108
109
110
111
o.°
Vlll

Figure
Figures (50a & 50b)
Figures (51a & 51b)
Figures (52a & 52b)
Figures (53a & 53b)
Figure (54a)
Figure (54b)
Figure (55a)
Figure (55b)
Figure (56a)
Average Acoustic Time Histories at MicrophoneTraverse Station 9 on the Advancing Side - Test#s 0733 & 2916
Ensemble-averaged Narrowband Spectra atMicrophone Traverse Station 9 on the AdvancingSide - Test #s 0733 & 2916
Average Acoustic Time Histories at MicrophoneTraverse Station 9 on the Retreating Side - Test#s 0733 & 2916
Ensemble-averaged Narrowband Spectra atMicrophone Traverse Station 9 on the RetreatingSide - Test #s 0733 & 2916
BVISPL Contour Plot Based on Ensemble-
averaged Spectra (Ct/c = 0.0868, (_TPP = 2.5
degrees aft, !1=0.1987) Baseline RotorConfiguration - Test #0741
BVISPL Contour Plot Based on Spectra of
Averaged Time Histories (Ct/(_ = 0.087, o_TpP = 2.5
degrees aft, !1=0.1987) Baseline RotorConfiguration - Test #0741
BVISPL Contour Plot Based on Ensemble-
averaged Spectra (Ct/c =0.0875, o_Tpp= 2.5
degrees aft, I_=0.1986, Peak Flap Deflection =12.5 degrees, Azimuthal Phase Shift = 0 degrees)Flapped Rotor Configuration - Test # 2741
BVISPL Contour Plot Based on Spectra of
Averaged Time Histories (Ct/c = 0.0875, o_Tpp=2.5
degrees aft, _=0.1986, Peak Flap Deflection=-12.5 degrees, Azimuthal Phase Shift = 0degrees ) Flapped Rotor Configuration - Test #2741
BVISPL Contour Plot Based on Spectra of
Averaged Time Histories (Ct/(_ = 0.0773, O_TpP = 3
degrees aft, !1=0.1492) Baseline RotorConfiguration Test # 0731
Page
112
113
114
115
116
117
118
119
120
ix
Figure
Figure (56b)
Figure (56c)
Figures (57a & 57b)
Figure (57c)
Figures (58a & 58b)
Figure (58c)
Figure (59a)
Figure (59b)
BVISPL Contour Plot Based on Spectra of
Averaged Time Histories (Ct/_ = 0.0776, (zTpp= 3
degrees aft, i_=0.1486, Peak Flap Deflection=
-12.5 degrees, Azimuthal Phase Shift =-10degrees ) Flapped Rotor Configuration - Test #2900
BVISPL Contour Plot Based on Spectra of
Averaged Time Histories (Ct/a = 0.0778, (zTpp= 3
degrees aft, i_=0.1488, Peak Flap Deflection=- 17.5
degrees, Azimuthal Phase Shift = -5 degrees )Flapped Rotor Configuration - Test # 3915
Average Acoustic Time Histories at MicrophoneTraverse Station 9 on the Advancing Side - Test#s 0731 & 2900
Average Acoustic Time Histories at MicrophoneTraverse Station 9 on the Advancing Side;Flapped Rotor - Test # 3915
Ensemble-averaged Narrowband Noise Spectra atMicrophone Traverse Station 9 on the AdvancingSide - Test #s 0731 & 2900
Ensemble-averaged Narrowband Noise Spectra atMicrophone Traverse Station 9 on the AdvancingSide ; Flapped Rotor - Test # 3915
BVISPL Contour Plot Based on Spectra of
Averaged Time Histories (Ct/c = 0.078, (zTp P = 4
degrees aft, [u=0.1991) Baseline Rotor
Configuration Test # 0738
BVlSPL Contour Plot Based on Spectra of
Averaged Time Histories (Ct/c = 0.0768, (xTpp= 4
degrees aft, p=0.1982, Peak Flap Deflection=-12.5
degrees, Azimuthal Phase Shift = -10 degrees )Flapped Rotor Configuration - Test # 2904
Page
121
122
123
124
125
126
127
128
X
Figure
Figure (59c)
Figure (59d)
Figures (60a & 60b)
Figures (60c & 60d)
Figures (61a & 61b)
Figures (61c & 61d)
BVlSPL Contour Plot Based on Spectra of
Averaged Time Histories (Ct/_ = 0.0775, (zTp P = 4
degrees aft, _=0.1988, Peak Flap Deflection=
-17.5 degrees, Azimuthal Phase Shift = -10degrees ) Flapped Rotor Configuration Test #3922
BVISPL Contour Plot Based on Spectra of
Averaged Time Histories (Ct/(_ = 0.0764, e_Tp P = 4
degrees aft, I_=0.198, Peak Flap Deflection=-20
degrees, Azimuthal Phase Shift = -10 degrees )Flapped Rotor Configuration - Test # 4047
Average Acoustic Time Histories at Microphone
Traverse Station 9 on the Advancing Side - Test#s 0734 & 2904
Average Acoustic Time Histories at MicrophoneTraverse Station 9 on the Advancing Side - Test#s 3922 & 4047
Ensemble-averaged Narrowband Noise Spectra at
Microphone Traverse Station 9 on the AdvancingSide - Test #s 0738 & 2904
Ensemble-averaged Narrowband Noise Spectra at
Microphone Traverse Station 9 on the AdvancingSide - Test #s 3922 & 4047
Page
129
130
131
132
133
134
Figure (62a)
Figure (62b)
BVISPL Contour Plot Based on Spectra of
Averaged Time Histories (Ct/c = 0.0868, eTPP =
2.5 degrees aft, p.=0.1987) Baseline Rotor
Configuration Test # 0741
BVISPL Contour Plot Based on Spectra of
Averaged Time Histories (Ct/c = 0.0896. (zTp P =
2.5 degrees aft, _=0.1990, Peak Flap Deflection=
-17.5 degrees, Azimuthal Phase Shift = 0 degrees)Flapped Rotor Configuration Test # 3910
135
136
xi
Figure
Figure (62c)
Figure (62d)
Figure (62e)
Figures (63a & 63b)
Figures (64a & 64b)
Figure (64c)
Figure (65a)
Figure (65b)
BVISPL Contour Plot Based on Spectra of
Averaged Time Histories (Ct/o = 0.0889, ¢xTpP =
2.5 degrees aft, 1[=0.1985, Peak Flap Deflection=-17.5 degrees, Azimuthal Phase Shift = -5degrees) Flapped Rotor Configuration Test # 3941
BVISPL Contour Plot Based on Spectra of
Averaged Time Histories (Ct/o = 0.0887, o_Tpp =
2.5 degrees aft, 1[=0.1983, Peak Flap Deflection=-17.5 degrees, Azimuthal Phase Shift = -10degrees ) Flapped Rotor Configuration Test #3925
BVISPL Contour Plot Based on Spectra of
Averaged Time Histories (Ct/o = 0.0879, o_TpP =
2.5 degrees aft, 1[=0.1990, Peak FlapDeflection=-17.5 degrees, Azimuthal Phase Shift= -20 degrees) Flapped Rotor Configuration Test# 3741
Average Acoustic Time Histories at MicrophoneTraverse Station 9 on the Advancing Side - Test#s 0741 & 3925
Ensemble-averaged Narrowband Noise Spectraat Microphone Traverse Station 9 on theAdvancing Side - Test #s 0741 & 3910
Ensemble-averaged Narrowband Noise Spectraat Microphone Traverse Station 9 on theAdvancing Side ; Flapped Rotor - Test # 3925
BVISPL Contour Plot Based on Spectra of
Averaged Time Histories (Ct/o = 0.0773, o_TpP =3
degrees aft, 1[=0.1492) Baseline RotorConfiguration Test # 0731
BVISPL Contour Plot Based on Spectra of
Averaged Time Histories (Ct/o = 0.0764, (zTp P = 3
degrees aft, 1[=0.1496, Peak Flap Deflection=-17.5degrees, Azimuthal Phase Shift = +140 degrees )Flapped Rotor Configuration - Test #5030
Page
137
138
139
140
141
142
143
144
xii
Figure
Figures (66a & 66b)
Figures (67a & 67b)
Figures (68a & 68b)
Figures (69a & 69b)
Average Acoustic Time Histories at MicrophoneTraverse Station 9 on the Retreating Side - Test#s 0731 & 5030
Average Acoustic Time Histories at MicrophoneTraverse Station 9 on the Advancing Side - Test#s 0731 & 5030
Ensemble-averaged Narrowband Noise Spectraat Microphone Traverse Station 9 on theRetreating Side - Test #s 0731 & 5030
Ensemble-averaged Narrowband Noise Spectraat Microphone Traverse Station 9 on theAdvancing Side - Test #s 0731 & 5030
Page
145
146
147
148
Figure (70a)
Figure (70b)
Figures (71a & 71b)
Figures (72a & 72b)
Figures (73a & 73b)
Figures (74a & 74b)
BVISPL Contour Plot Based on Spectra of
Averaged Time Histories (Ct/c = 0.0868, e_TpP =
2.5 degrees aft, p=0.1987) Baseline RotorConfiguration - Test # 0741
BVISPL Contour Plot Based on Spectra of
Averaged Time Histories (Ct/c = 0.0890, eWp P =
2.5 degrees aft, _=0.1987, Peak Flap Deflection=-17.5 degrees, Azimuthal Phase Shift = +140degrees ) Flapped Rotor Configuration - Test#5050
Average Acoustic Time Histories at MicrophoneTraverse Station 9 on the Retreating Side - Test#s 0741 & 5050
Average Acoustic Time Histories at MicrophoneTraverse Station 9 on the Advancing Side - Test#s 0741 & 5050
Ensemble-averaged Narrowband Noise Spectraat Microphone Traverse Station 9 on theRetreating Side - Test #s 0741 & 5050
Ensemble-averaged Narrowband Noise Spectraat Microphone Traverse Station 9 on theAdvancing Side - Test #s 0741 & 5050
149
150
151
152
153
154
xiii

Figure Page
Figure (75) Power Required for Descent Flight Condition
(1_= 0.20 and Ct = 0.008 ) for Baseline and ActiveFlap Rotor Configurations and Cruise Flight
Condition for Baseline Rotor (_=0.3, Ct=0.008) 155
xiv
NOTATION
CtMhNRX, Xbar
Of,,C_Tpp
(_
ASAPHP
spsSPL
thrust coefficienthover Mach numbernominal rotor speedPropulsive force coefficient
tip path plane angle of attack
advance ratio
rotor soliditydatabase programHewlett Packardsamples per secondsound pressure level
XV

Summary
This report describes a wind tunnel test of the McDonnell Douglas HelicopterSystems (MDHS) Active Flap Model Rotor at the NASA Langley 14- by 22-FootSubsonic Tunnel. The primary purpose of the test was to examine the reduction ofBVl noise. This report is intended as a detailed record of the program, its conduct,and results. No analysis of the results is performed. This report briefly describesthe aeroacoustic research leading to the initiation of this test program. The designof the model rotor and flap actuation profiles is described. The conduct of the testprogram is detailed. Examples of performance, aerodynamic and acoustic data arepresented and discussed.
The test demonstrated that BVI noise reduction and vibration reduction were
possible with the use of an active flap. Aerodynamic results supported the acousticdata trends, showing a reduction in the strength of the tip vortex with the deflectionof the flap. Acoustic results showed that the flap deployment, depending on thepeak deflection angle and azimuthal shift in its deployment schedule, can produceBVI noise reductions as much as 6 dB on the advancing and retreating sides. Thenoise reduction was accompanied by an increase in low frequency harmonic noiseand high frequency broadband noise. A brief assessment of the effect of the flapon vibration showed that significant reductions were possible. The greatestvibration reductions were found in the four per rev pitching moment at the hub. Upto 76% reduction was measured at t_ = 0.30, and Ct = 0.006. Performanceimprovement cam results were inconclusive, as the improvements were predictedto be smaller than the resolution of the rotor balance.
1.0 Introduction
To investigate the use of a blade-mounted active flap for Blade Vortex InteractionNoise (BVI) reduction, rotor performance improvement, and vibration reduction,McDonnell Douglas Helicopter Systems (MDHS) and researchers from the NASALangley Research Center performed a test of an active flap equipped model rotorin the Langley 14- by 22-Foot Subsonic Tunnel. The model and test stand wereassembled and tested in hover in Mesa at MDHS's Remote Test Facility fromSeptember 1993 through January 1994. The six week tunnel entry at Langley's14- by 22-Foot Subsonic Tunnel took place between 1 February 1994 and 15March 1994.
The primary objective of this wind tunnel test was to perform an aeroacousticinvestigation of the reduction of Blade Vortex Interaction (BVI) noise with theMcDonnell Douglas Active Flap Rotor (MDAFR) system. The secondary objectivewas to study the performance characteristics of an active flap rotor with two per revflap deflection. The tertiary goal was to investigate vibration reduction with N/revflap deflection.
Low speed BVI occurring during descent in terminal area operations has been anobjectionable noise source for many years. Unfortunately it continues to be adominant source in present day helicopters and even plagues the promising newtiltrotor transport concept [1]. A great deal of effort has been expended inexamining means to alleviate BVI noise [2-8]. Much of this work has been focusedon methods of altering the characteristics of the rolled-up tip vortices which are theprincipal contributors to the high frequency impulsive noise. Investigators haveexamined both passive and active means of reducing the vortex strengths.Included among the passive techniques are tip shape variations that reduce tiploading to lower the tip vortex strength, and the use of subwings, extending beyondthe rotor tip causing the formation of an additional tip vortex which interacts withand diffuses the primary vortex. Tip anhedral has also been used as a means of
increasing the blade-vortex separation distance, although this was principallyintended to improve hover performance. Active means of controlling tip vortexstrength require additional weight, control system complexity and impactsreliability. Nevertheless, the severity of the problem dictates that these approachesbe considered.
Recognizing the need to explore new technologies for BVI noise reduction, aNational program was launched by NASA. The first phase, referred to as the"National Rotorcraft Noise Reduction Program" emphasized research infundamental BVI noise prediction methodologies as they applied to conventionalrotorcraft. At the end of the first phase of the program, NASA issued a ResearchAnnouncement for Innovative Noise Reduction Concept studies. Participants fromacademia, industry, and research establishments were asked to demonstrate,through numerical studies or wind tunnel testing, the potential benefits from usingtheir respective active and/or passive BVI noise control concepts. Among thevarious concepts examined were doubly swept forward blade tips, passive trailingedge spoilers or drag generators, and the MDHS blade-mounted trailing edge flapconcept. The MDHS study concluded that average noise reductions on the order
2
of 5 dB can be achieved with the unsteady deployment of the trailing edge flap.The active control concept rested on the validated premise that the rapid variationsin blade airloads, which are to a large extent responsible for the generation ofimpulsive noise during BVl, can be reduced by the unsteady motion of the trailingedge flap. This is accomplished by direct changes in the vortex-wake trajectoriesand strengths.
It has been shown [9,10] that blade-mounted flaps are feasible for use in thehelicopter operating environment as a primary rotor control device. Blade mountedflaps are used effectively to control the Kaman SH-2F Sea Sprite. Analyticalstudies [11] demonstrated that the flap appeared to offer a viable mechanism forreducing the impulsive aerodynamic response due to blade-vortex interaction. Inboth analytical and experimental studies, it has been shown [12] that strongleading edge pressure fluctuations occur during BVl conditions. Experience alsoshows that trailing edge flaps create aft pressure loading which might be utilized toalleviate the impulsive nature of BVl. Thus, in the concept tested in this experiment,the flap is applied in the regions where BVl occurs to alter the local bladeresponse. As an active device, the flap motions can be tailored to achievemaximum benefit throughout a range of descent flight conditions. The flap can alsobe used to reduce the strength of portions of certain tip vortices which are mostresponsible for strong BVI. This is achieved by altering the spanwise liftdistributions near the tip in those areas of the disk where the critical vortexelements are being generated.
With these goals in mind, a NASA Langley sponsored study was performed byMDHS to develop the active flap concept. The aerodynamic and acoustic toolspreviously used in the prediction of BVl [13] were modified to simulate a rotorhaving trailing edge flaps. The method was applied to analytically evaluate theperformance, aerodynamics and acoustics of the one-seventh scale BELL AH-1Gmodel rotor system (see reference [14]) employing a 25-percent chord, 18-percentspan trailing edge flap. More specifically, flap deployment amplitudes, rates,duration and azimuthal location of the peak deflection were investigated in variousflap schedules seeking maximum BVI noise reduction with minimum performanceloss. For this study, a partial power descent flight condition at 65 knots, with 300fpm descent rate was chosen as it represents a case where significant blade-vortexinteractions were found in both blade surface pressures (aerodynamic) andmicrophone (acoustic) measurements obtained in the DNW wind tunnel tests [14]of the (unflapped) model rotor. Results of the analytical study [15] showed averagereductions in the BVl noise levels on the order of 5 dB with moderate powerpenalties, on the order of 18% to 58% for a number of flap schedules.
Based on the results of this study, MDHS proposed to NASA Langley in 1991 ademonstration of this technique on a model rotor in the 14- by 22-foot SubsonicTunnel. NASA Langley and MDHS agreed to a joint Proof-of-Concept wind tunneltest. NASA Langley funded portions of the aeroacoustic analysis to design theactive flap deflection profiles, the preliminary design of the model rotor, benchtesting of the flap actuation hardware, the wind tunnel test, and the final report.MDHS funded portions of the aeroacoustic analysis to design the active flapdeflection profiles, the detailed design of the active flap model rotor, the fabrication
3
of the rotor, modifications to MDHS' Large Scale Test Rig, and an integration test ofthe hardware in Mesa, AZ. The wind tunnel test was a team effort with participantsfrom NASA Langley's Aeroacoustics Branch and the Applied Acoustics Branch ofthe Acoustics Division, 14- by 22-Foot Subsonic Tunnel operations crew from theTunnel Operations Branch, Technical Support Section D, US ArmyAeroflightdynamics Directorate, and MDHS engineers and technicians. MDHSdirected daily test operations, operated the rotor test stand and acquiredperformance data from the model, and evaluated the quality of aerodynamic andacoustic data. NASA Langley 14- by 22-Foot Subsonic Tunnel personnel operatedthe wind tunnel, motor generator set and supported model maintenance. NASASubsonic Aerodynamics Branch, Applied Aerodynamics Division personnelsupported the test program with mechanical and test engineering support. NASALangley Acoustics Division personnel acquired pressure and acoustic data,processed, and evaluated that data.
2.0 Test Description
The major milestones that were accomplished during installation and testing of therotor system included:
1. Installation of test stand on sting support in tunnel.2. Completion of shake test to identify stand modes.3. Installation and checkout of rotor, control console and data
acquisition system.4. Hub balance and rotor track and balance.
5. Aerodynamic tare runs and acoustic background noise runs withhub turning, no blades.
6. Exploration of test envelope with rotor using flow visualization toensure no ingestion of open jet shear layer for three acoustic testconditions and for performance test conditions.
7. Completion of baseline test matrix, with null cam, three acoustictest conditions and performance baseline points.
8. Completion of acoustic test matrix (3 test conditions) for -12.5 °active flap deflection cam (Schedule 63).
9. Completion of acoustic test matrix (3 test conditions) for -17.5 °active flap deflection cam (Schedule (65).
10. Completion of acoustic test matrix (3 test conditions) for -20.0 °active flap deflection cam, (Schedule 50).
11. Completion of performance test matrix for 3.0 °, two per revsinusoidal flap deflection.
12. Completion of performance test matrix for 6.0 °, two per rev,sinusoidal flap deflection.
13. Completion of dynamics test matrix for 2.0 °, three per revsinusoidal flap deflection.
14. Completion of vibration test matrix for 4.0 °, four per rev, sinusoidalflap deflection.
15. Completion of no horn baseline case.16. Removal of model from wind tunnel test section.
4
3.0 Mechanical System Description
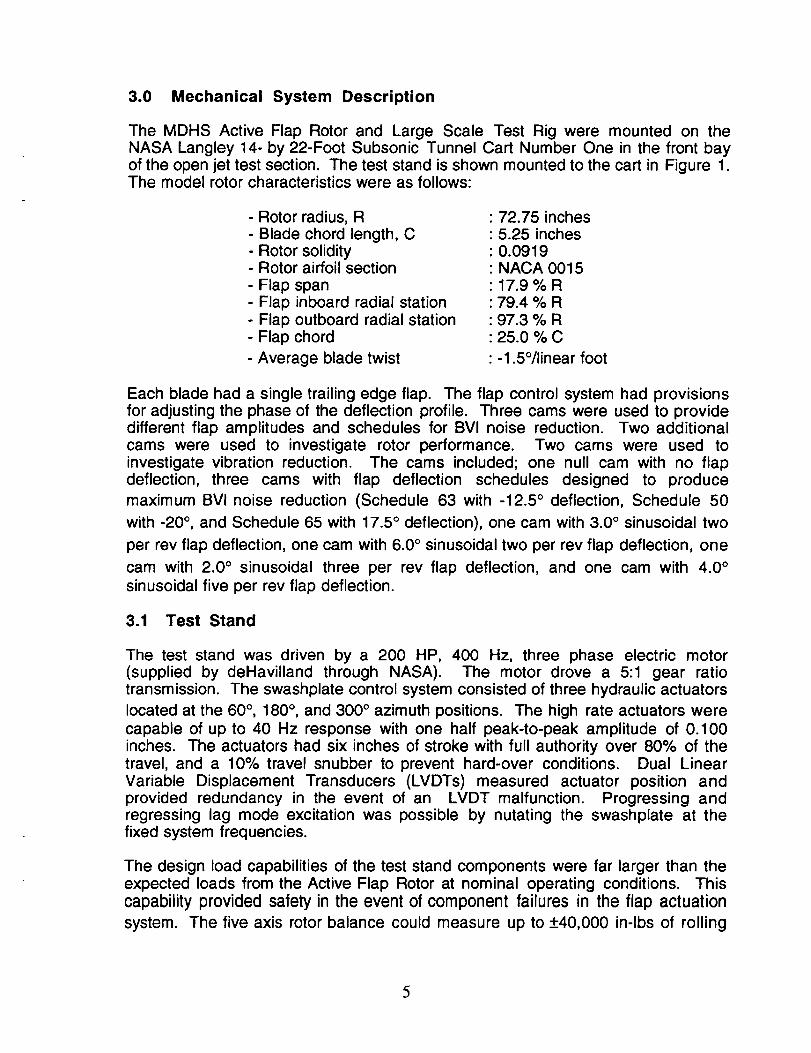
The MDHS Active Flap Rotor and Large Scale Test Rig were mounted on theNASA Langley 14-by 22-Foot Subsonic Tunnel Cart Number One in the front bayof the open jet test section. The test stand is shown mounted to the cart in Figure 1.The model rotor characteristics were as follows:
- Rotor radius, R : 72.75 inches- Blade chord length, C : 5.25 inches- Rotor solidity : 0.0919- Rotor airfoil section : NACA 0015
- Flap span : 17.9 % R- Flap inboard radial station : 79.4 % R- Flap outboard radial station : 97.3 % R- Flap chord : 25.0 % C
- Average blade twist : -1.5°/linear foot
Each blade had a single trailing edge flap. The flap control system had provisionsfor adjusting the phase of the deflection profile. Three cams were used to providedifferent flap amplitudes and schedules for BVl noise reduction. Two additionalcams were used to investigate rotor performance. Two cams were used toinvestigate vibration reduction. The cams included; one null cam with no flapdeflection, three cams with flap deflection schedules designed to produce
maximum BVl noise reduction (Schedule 63 with -12.5 ° deflection, Schedule 50
with -20 °, and Schedule 65 with 17.5 ° deflection), one cam with 3.0 ° sinusoidal two
per rev flap deflection, one cam with 6.0 ° sinusoidal two per rev flap deflection, one
cam with 2.0 ° sinusoidal three per rev flap deflection, and one cam with 4.0 °sinusoidal five per rev flap deflection.
3.1 Test Stand
The test stand was driven by a 200 HP, 400 Hz, three phase electric motor(supplied by deHavilland through NASA). The motor drove a 5:1 gear ratiotransmission. The swashplate control system consisted of three hydraulic actuators
located at the 60 °, 180 ° , and 300 ° azimuth positions. The high rate actuators werecapable of up to 40 Hz response with one half peak-to-peak amplitude of 0.100inches. The actuators had six inches of stroke with full authority over 80% of thetravel, and a 10% travel snubber to prevent hard-over conditions. Dual LinearVariable Displacement Transducers (LVDTs) measured actuator position andprovided redundancy in the event of an LVDT malfunction. Progressing andregressing lag mode excitation was possible by nutating the swashplate at thefixed system frequencies.
The design load capabilities of the test stand components were far larger than theexpected loads from the Active Flap Rotor at nominal operating conditions. Thiscapability provided safety in the event of component failures in the flap actuation
system. The five axis rotor balance could measure up to +40,000 in-lbs of rolling
5
and pitching moments and up to +1950 Ibs of side force and axial force. The teststand and rotor mounted in the 14- by 22-Foot Subsonic Tunnel are shown inFigure 1.
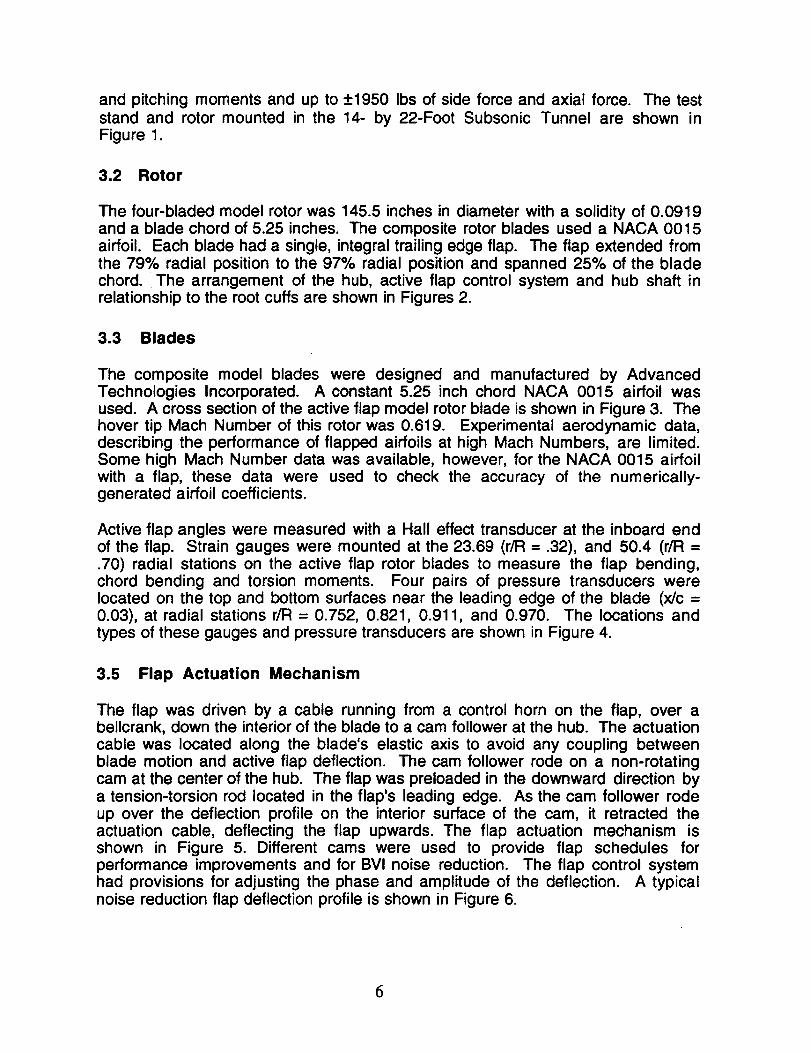
3.2 Rotor
The four-bladed model rotor was 145.5 inches in diameter with a solidity of 0.0919and a blade chord of 5.25 inches. The composite rotor blades used a NACA 0015airfoil. Each blade had a single, integral trailing edge flap. The flap extended fromthe 79% radial position to the 97% radial position and spanned 25% of the bladechord. The arrangement of the hub, active flap control system and hub shaft inrelationship to the root cuffs are shown in Figures 2.
3.3 Blades
The composite model blades were designed and manufactured by AdvancedTechnologies Incorporated. A constant 5.25 inch chord NACA 0015 airfoil wasused. A cross section of the active flap model rotor blade is shown in Figure 3. Thehover tip Mach Number of this rotor was 0.619. Experimental aerodynamic data,describing the performance of flapped airfoils at high Mach Numbers, are limited.Some high Mach Number data was available, however, for the NACA 0015 airfoilwith a flap, these data were used to check the accuracy of the numerically-generated airfoil coefficients.
Active flap angles were measured with a Hall effect transducer at the inboard endof the flap. Strain gauges were mounted at the 23.69 (r/R = .32), and 50.4 (r/R =.70) radial stations on the active flap rotor blades to measure the flap bending,chord bending and torsion moments. Four pairs of pressure transducers werelocated on the top and bottom surfaces near the leading edge of the blade (x/c =0.03), at radial stations r/R = 0.752, 0.821, 0.911, and 0.970. The locations andtypes of these gauges and pressure transducers are shown in Figure 4.
3.5 Flap Actuation Mechanism
The flap was driven by a cable running from a control horn on the flap, over abellcrank, down the interior of the blade to a cam follower at the hub. The actuationcable was located along the blade's elastic axis to avoid any coupling betweenblade motion and active flap deflection. The cam follower rode on a non-rotatingcam at the center of the hub. The flap was preloaded in the downward direction bya tension-torsion rod located in the flap's leading edge. As the cam follower rodeup over the deflection profile on the interior surface of the cam, it retracted theactuation cable, deflecting the flap upwards. The flap actuation mechanism isshown in Figure 5. Different cams were used to provide flap schedules forperformance improvements and for BVl noise reduction. The flap control systemhad provisions for adjusting the phase and amplitude of the deflection. A typicalnoise reduction flap deflection profile is shown in Figure 6.
6
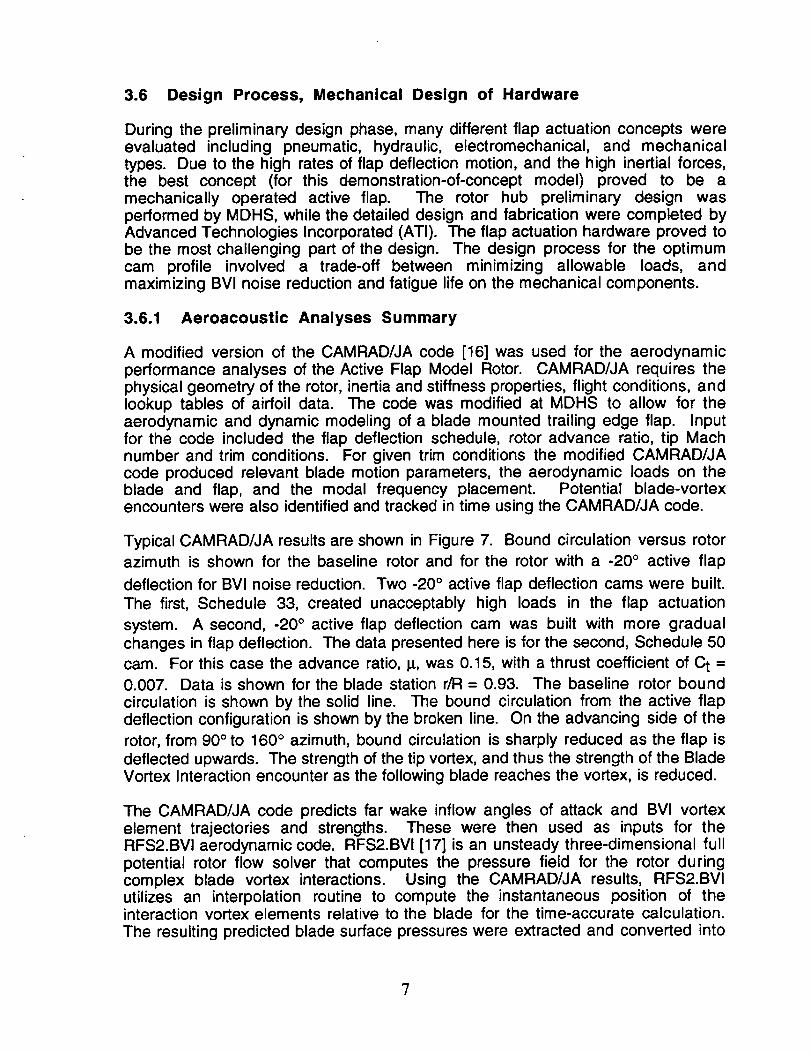
3.6 Design Process, Mechanical Design of Hardware
During the preliminary design phase, many different flap actuation concepts wereevaluated including pneumatic, hydraulic, electromechanical, and mechanicaltypes. Due to the high rates of flap deflection motion, and the high inertial forces,the best concept (for this demonstration-of-concept model) proved to be amechanically operated active flap. The rotor hub preliminary design wasperformed by MDHS, while the detailed design and fabrication were completed byAdvanced Technologies Incorporated (ATI). The flap actuation hardware proved tobe the most challenging part of the design. The design process for the optimumcam profile involved a trade-off between minimizing allowable loads, andmaximizing BVl noise reduction and fatigue life on the mechanical components.
3.6.1 Aeroacoustic Analyses Summary
A modified version of the CAMRAD/JA code [16] was used for the aerodynamicperformance analyses of the Active Flap Model Rotor. CAMRAD/JA requires thephysical geometry of the rotor, inertia and stiffness properties, flight conditions, andlookup tables of airfoil data. The code was modified at MDHS to allow for theaerodynamic and dynamic modeling of a blade mounted trailing edge flap. Inputfor the code included the flap deflection schedule, rotor advance ratio, tip Machnumber and trim conditions. For given trim conditions the modified CAMRAD/JAcode produced relevant blade motion parameters, the aerodynamic loads on theblade and flap, and the modal frequency placement. Potential blade-vortexencounters were also identified and tracked in time using the CAMRAD/JA code.
Typical CAMRAD/JA results are shown in Figure 7. Bound circulation versus rotor
azimuth is shown for the baseline rotor and for the rotor with a -20 ° active flap
deflection for BVI noise reduction. Two -20 ° active flap deflection cams were built.
The first, Schedule 33, created unacceptably high loads in the flap actuation
system. A second, -20 ° active flap deflection cam was built with more gradualchanges in flap deflection. The data presented here is for the second, Schedule 50
cam. For this case the advance ratio, !_, was 0.15, with a thrust coefficient of C t =
0.007. Data is shown for the blade station r/R = 0.93. The baseline rotor boundcirculation is shown by the solid line. The bound circulation from the active flapdeflection configuration is shown by the broken line. On the advancing side of the
rotor, from 90 ° to 160 ° azimuth, bound circulation is sharply reduced as the flap is
deflected upwards. The strength of the tip vortex, and thus the strength of the BladeVortex Interaction encounter as the following blade reaches the vortex, is reduced.
The CAMRAD/JA code predicts far wake inflow angles of attack and BVI vortexelement trajectories and strengths. These were then used as inputs for theRFS2.BVI aerodynamic code. RFS2.BVl [17] is an unsteady three-dimensional fullpotential rotor flow solver that computes the pressure field for the rotor duringcomplex blade vortex interactions. Using the CAMRAD/JA results, RFS2.BVIutilizes an interpolation routine to compute the instantaneous position of theinteraction vortex elements relative to the blade for the time-accurate calculation.
The resulting predicted blade surface pressures were extracted and converted into
?
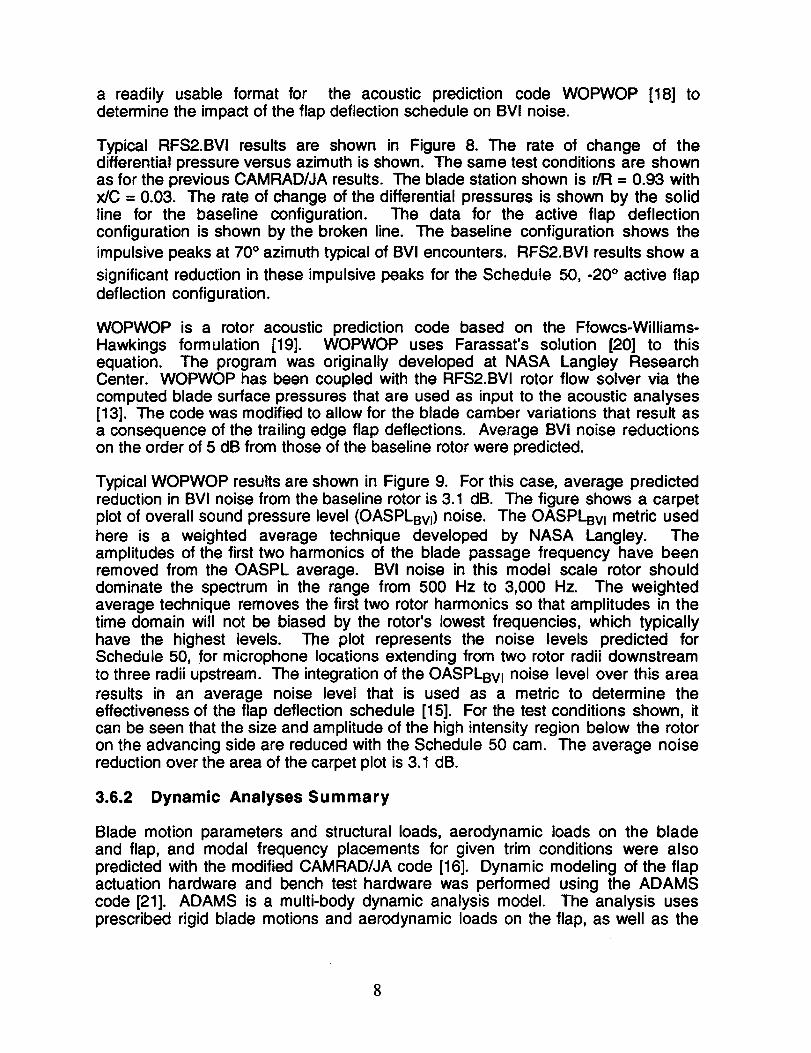
a readily usable format for the acoustic prediction code WOPWOP [18] todetermine the impact of the flap deflection schedule on BVI noise.
Typical RFS2.BVI results are shown in Figure 8. The rate of change of thedifferential pressure versus azimuth is shown. The same test conditions are shownas for the previous CAMRAD/JA results. The blade station shown is r/R = 0.93 withx/C = 0.03. The rate of change of the differential pressures is shown by the solidline for the baseline configuration. The data for the active flap deflectionconfiguration is shown by the broken line. The baseline configuration shows the
impulsive peaks at 70 ° azimuth typical of BVI encounters. RFS2.BVI results show a
significant reduction in these impulsive peaks for the Schedule 50, -20 ° active flapdeflection configuration.
WOPWOP is a rotor acoustic prediction code based on the Ffowcs-Williams-Hawkings formulation [19]. WOPWOP uses Farassat's solution [20] to thisequation. The program was originally developed at NASA Langley ResearchCenter_ WOPWOP has been coupled with the RFS2.BVI rotor flow solver via thecomputed blade surface pressures that are used as input to the acoustic analyses[13]. The code was modified to allow for the blade camber variations that result asa consequence of the trailing edge flap deflections. Average BVI noise reductionson the order of 5 dB from those of the baseline rotor were predicted.
Typical WOPWOP results are shown in Figure 9. For this case, average predictedreduction in BVI noise from the baseline rotor is 3.1 riB. The figure shows a carpetplot of overall sound pressure level (OASPLBv I) noise. The OASPLBv =metric usedhere is a weighted average technique developed by NASA Langley. Theamplitudes of the first two harmonics of the blade passage frequency have beenremoved from the OASPL average. BVI noise in this model scale rotor shoulddominate the spectrum in the range from 500 Hz to 3,000 Hz. The weightedaverage technique removes the first two rotor harmonics so that amplitudes in thetime domain will not be biased by the rotor's lowest frequencies, which typicallyhave the highest levels. The plot represents the noise levels predicted forSchedule 50, for microphone locations extending from two rotor radii downstreamto three radii upstream. The integration of the OASPLBvI noise level over this area
results in an average noise level that is used as a metric to determine theeffectiveness of the flap deflection schedule [15]. For the test conditions shown, itcan be seen that the size and amplitude of the high intensity region below the rotoron the advancing side are reduced with the Schedule 50 cam. The average noisereduction over the area of the carpet plot is 3.1 dB.
3.6.2 Dynamic Analyses Summary
Blade motion parameters and structural loads, aerodynamic loads on the bladeand flap, and modal frequency placements for given trim conditions were alsopredicted with the modified CAMRAD/JA code [16]. Dynamic modeling of the flapactuation hardware and bench test hardware was performed using the ADAMScode [21]. ADAMS is a multi-body dynamic analysis model. The analysis usesprescribed rigid blade motions and aerodynamic loads on the flap, as well as the
8

mass, damping, elasticity and geometric properties of the flap actuationmechanism. Given prescribed cam follower motions, the analysis produces timehistories of the dynamic loads on components, displacements of the linkagemechanism driving the flap, and flap motions.
3.6.3 Mechanical Design Summary
The design process for the optimum cam profile involved a trade-off betweenminimizing allowable loads, maximizing BVI noise reduction, and maximizingfatigue life of the mechanical components. A number of flap schedule parametershad a direct impact on the level of the predicted BVl noise, and on the noisereductions. These included the duration, or dwell, of the maximum flap deflection,the azimuth location for initiating the dwell, the maximum amplitude of the flapdeflection, and the initiation and completion points of the deflection on the rotorazimuth. Flap schedule parameters that directly affected the mechanical loads onthe actuation hardware include the magnitude of the flap deflection, and thecurvature of the ramp-up and ramp-down deflection profile, which directly impactedthe cam follower acceleration. The design process consisted of an iterativeprocedure where all these factors were varied parametrically. The resultingaerodynamics, acoustics, dynamics and loads were then analyzed, and a newiteration was initiated based on these results.
During this iterative process it became clear that the ideal flap deflection profile, foran aerodynamics or acoustics engineer, moved instantaneously to its deflected
position of -20 °, and back to the neutral position just as quickly. The dynamicsengineer's ideal flap deflection profile was one with a smooth sinusoidal 2/rev
deflection of-20 ° . The design engineer's ideal flap deflection profile had nodeflection at all to reduce loads. Although sophisticated analysis tools were usedto examine the effects of the flap deflection profile, the iterative design procedurewas performed manually using a concurrent engineering approach. The final flapdeflection profiles produced the required BVl noise reduction with loads resulting inan adequate fatigue life for key components.
As described in Section 3.0, three acoustic cams, two performance cams, and twovibration cams were tested. An iterative procedure was used to create the camprofile from the desired flap deflection profile.
3.7 Cam Profiles
Time histories of trailing edge flap deflection with the objectives of reducing BVInoise, improving rotor performance, and reducing vibratory hub loads were definedby analysts in the respective disciplines. The azimuthal variations were thentranslated into a cam profile using the ADAMS computer code model of the flapactuation mechanism.
The schedule 50 cam (nominal -20 °) used on the whirl tower was machined based
on predictions from an early ADAMS model, which had 0.026 in/deg followermotion per flap deflection. Examination of whirl tower test data showed that the
9

actual flap deflection was higher. Four test points (90 - 93) at nominal rotor speed
and collective of 2, 0, 2, and 4 ° were used to define an average flap amplitude.Using the ASAP database tools to average flap angles in the constant sections ofthe profile, the following values for flap amplitude were obtained for blades onethrough four: 22.24, 20.90, 22.57, 20.23. The average flap amplitude for this cam
was thus determined to be 21.49 °, resulting in 0.0242 in/deg follower motion perflap deflection.
The 2/rev performance cams were based on a later ADAMS model, updated frombench test data. This model had 0.01866 in/deg follower motion per flap deflection.Two cams were built as follows:
2P3A cam: _ =3.25 ° cos 2(¥+15 °)
2P6A cam: _ =6.5°cos 2(_+15 d)
Both cams had a 15° azimuth lead, included to account for dynamics and to stillplace the maximum flap amplitude at zero azimuth. The amplitudes were increased
from the nominal 3 ° and 6 °, to obtain the desired amplitude around the azimuth in
an average sense. Examining whirl tower test data, it was seen that the 2P6A camproduced a flap amplitude of 5.3 ° at an azimuth lead of 11.7 °. This indicates 0.0228in/deg follower motion per flap deflection.
Subsequent cams were built using 0.0242 in/deg follower motion per flapdeflection. These included schedule 63 (12.5 cam), schedule 65 (17.5 cam) and
schedule 50 (-20 ° cam) for noise reduction. Note that the previous schedule 50cam was used during initial checkout in the wind tunnel, labeled as 22 cam. Twoharmonic cams were built for vibration reduction as follows:
3P2A cam: & =-2°cos 3¥
5P4A cam: &=-4°cos 5_
However, data could only be obtained with the 5/rev cam, because of a standpiperesonance near 3/rev. The azimuthal variation of flap deflection for all tested camprofiles is shown in Figures 10(a) and 10(b). Recall that the flap deflection isdefined as positive with the trailing edge deflected down. Also, it should be notedthat several conventions of cam phasing are used. Of these, the test data phasecorresponds directly to the value read from the azimuth plate on top of the standpipe.
Typical examples of trailing edge flap deflections over four rotor revoluhons are
shown in Figures 11a, b, c. For the -20 ° cam, data from all four flaps are shown toillustrate the variation in amplitudes from blade to blade. For the 2P6A and 5P4Acams, the data clearly shows that the azimuthally varying aerodynamic loading (at
]0
an advance ratio of 0.3) causes a 1/rev modulation of the periodic flap anglemotion amplitude.
4.0 Data Acquisition
The McDonnell Douglas Active Flap Rotor Test data acquisition and reductionsystem was used to perform the loads monitoring functions, to monitor test standhealth, to acquire data from the test stand, to acquire data from the wind tunnel, tocommunicate with NASA acoustic data computer, and to store data. NASALangley digitized and processed pressure and acoustic data. The McDonnellDouglas portion of the data acquisition system consisted of three HP-BASICworkstations. For each test condition, the rotor balance forces, blade parametersand rotor control positions were recorded for 40 revolutions at a rate of 64 pointsper revolution. During the 18 point acoustic traverses, the test stand data wasacquired at all 18 points based on a predetermined option sent by the acousticdata computer. For each test condition, the tunnel speed, temperatures andpressures were read from the tunnel data computer.
4.1 Hardware Description For Data Acquisition
The McDonnell Douglas portion of the data acquisition system consisted of threeHP workstations namely, the "Slave Computer", the "Master Computer", and the"Health Monitoring Computer". The operating system for each was HP-BASICversion 6.2.
The slave computer was a Motorola 68040 based HP 9000/382. This computerwas used to perform all the data storage. It was configured with a 165 MByte LIFformat internal SCSI hard disk, three external 110 MByte LIF format disk drives andone HP 9144 1/4 inch tape drive. The slave computer was equipped with an RS-232 port andtwo HP-IB cards. The RS-232 port was used at 19200 baud to send
the derived Ct/c and X parameters to the health monitor computer. The primary
HP-IB port was used in non-active controller mode to communicate with the mastercomputer to get the raw data parameters for loads monitoring and test pointprocessing. The secondary HP-IB port was used to control the disk drives and theprinter and to communicate with the NASA acoustic data acquisition computer.Since, HP BASIC does not support printer buffering, an Eventide buffer box wasused to streamline the printing process. This buffer box allowed any printouts orgraphics to quickly be dumped to the printer without holding up the computer. Theslave computer information was displayed on a 17 inch color monitor.
The health monitoring computer was a Motorola 68030 based HP 9000/350equipped with RS-232 and HP-IB interfaces. The health monitor was connected toan HP 3497A 20-channel scanner through the HP-IB card to acquire the test standtemperatures as well as the hydraulic pressure and oil pressure. The health
monitor information was displayed on a 9 inch color touch screen monitor. The Ct/c
and X derived parameters were acquired from the slave computer through the RS-232 port. These parameters were displayed on the monitor, and used by the pilot
]1
to fly the rotor. The disk drive and printer were also controlled through the HP-IBcard.
The master computer was a Motorola 68040 based HP 9000/382. This computerwas used primarily as a loads monitor. The loads monitored included the rotorbalance parameters, blade parameters, and control actuator positions. The mastercomputer was equipped with 3 GPIO cards, an RS-232 card, and an HP-IB card.The 3 GPIO cards were used to communicate with the HP 3852A Data Acquisitionunit with 2 extends. The RS-232 port was used to communicate at 19200 baudwith the wind tunnel data computer. The HP-IB card was used to send commandsto the data acquisition unit and communicate with the slave computer. The mastercomputer information was displayed on a 17 inch color monitor.
4.2 Software Description
The health monitor program was designed to provide the pilot and test team with aquick look of the test stand (not rotor) parameters. These parameters included 13temperature sensing devices located on the hub, stand pipe, motor, and coolingwater system. The health monitoring screen also displayed the hydraulic systemlow and high side pressures, the lubricating system pressure and the flow sensor.The health monitor was equipped with a touch screen which allowed for a quick,one touch screen dump of the display at any given time. The printout andcontinuous display included the test time and date. The health monitor screen wasalso used to display additional information for the pilot. While an additional monitorand faster bus (not RS-232) would have been preferable for this purpose, this
solution was the best for the given resources. For this test the Ct/(_ and X
parameters were displayed on the health monitor screen.
The master computer program (BVlWHIRL14) primarily performed all of the dataacquisition for the test stand, rotor and wind tunnel data computer. It wasconfigured with icon menus and softkey menus. The icons which appeared onprogram status represent the assignments, rates, amplifier control, calibration, andloads monitor screens, respectively. The assignments screen was used to definethe channels (72 in this case) with an instrument ID number, name and units. Theload limits for each channel and warning limit were also included here. Thisscreen was also used to change the active state of a channel as instrumentationwas added or deleted from the configuration or if a channel were to malfunction.The rates screen was used to examine or change the rate (or E-U/volts) for eachchannel. The amplifier control screen was used to digitally control theprogrammable amplifier, but this feature was not used for this test. The calibrationscreen could be used to perform an RCAL for any of the channels or to simplyexamine the volts on each channel as opposed to its engineering units value. Thescreen could be used effectively as a voltmeter for every channel. The loadsmonitor screen was used to examine the steady and oscillatory values for eachchannel. In addition to the 72 raw channels, several derived quantities were
displayed on this screen. For this test the quantities included, C,t/a, V/(.Q*R)
(advance ratio), Mh, Vkts. The rotor speed was read by the optical encoder anddisplayed in both RPM and percent Nr. This screen had softkeys for recording
]2
(setting) the non-rotating zero voltages. These zeros were used as the interceptwhen calculating the engineering unit values. Another softkey allowed a timehistory plot of the last revolution to be displayed for a selected channel. This plotwas updated about every second. There were also softkeys for performance andstability. The performance softkey was used to acquire 40 revolutions of data andstore it in memory. This feature was not used during actual testing. Instead, theslave computer sent a command to the master computer to send the resultsimmediately to the slave computer. For stability data, a switch was used to changethe data trigger from the one per revolution pipper (used for performance data) to avoltage trigger keyed on the stop button in the dynamic control portion of the rotorcontrol console. In this case, the stability data was stored in memory until the slavecomputer sent a request for it.
The slave computer program (BVISLAVE14) was used to control thecommunication between all of the computers as well as to archive, process, andprint data. During testing, the slave computer was used primarily in the datamonitor mode to review loads and to command data acquisition. The loads monitor
mode was the only mode in which the Ct/c and X values were transferred to the
health monitor computer. There, values were only transferred when the slavecomputer wasn't busy performing other functions. When the rotor was not spinning,the slave computer was used to copy data to tape and to review the stored files withthe time history plotting functions, the spectrum plotting functions and the movingblock analysis function.
4.3 Typical Test Day Description
The operation of the data acquisition and monitoring computer is described herefor a typical test day. The beginning for each test day would start with a checkout ofthe health monitor to see if it was running properly. Usually the health monitor wasrunning continuously. The next step was to ensure that both the master and slavecomputers were in the loads monitoring mode. The internal hard disk on the slavewould be checked to see that it was clear of data files. The slave's internal harddisk could hold approximately 450 files or points. At this point, the data system wasready for testing and the test director was brought up to date on the status of thedata system.
While the test director was going through the pre-test checklist, he would ask for thenon-rotating zero to be taken. This was performed on the master computer wherethe zeros were set to the current voltage levels with blade #1 over the boom withzero shaft tilt. At the same time the "print volts" option on the slave would be usedto print the current voltage levels. This was used to track any shifts in any of theparameters, particularly the balance channels. The test director would then call forrotor speed to be brought up. The data acquisition on the master computer wouldthen be switched from static to dynamic mode. In static mode, screen updatesoccurred about every three seconds. This was due to a two second time-out whilethe program looked for the one per rev signal which was not present without rotorrotation. Once in dynamic mode, screen updates occurred about every second.
]3
Once the rotor reached 100% RPM (1087 rpm), a dynamic zero (flat pitch 100%RPM) data point was taken. The test condition number for this point varied with theinstalled cam. The data point was acquired by selecting the GET&SENDPERFORM option on the slave computer. The data operator would then enter thetest condition number. He would then confirm the point number. (The pointnumber was unique for every data point. It began at 1 and ended at 4886 for thistest.) He would then type in the test point description which would always include
the cam configuration name and often included the RPM, Ct/_, advance ratio andshaft angle. Once the data operator entered these five pieces of information, theslave would instantly command the master to acquire the wind tunnel condition,take 40 revolutions of rotor data, and to return control to the slave. When the resultsreturned, the operator would have the choice of whether or not to save the data.After saving the raw data, the derived parameters would be calculated and printedon the line printer. At this point the slave computer would return to monitoring theloads.
For acoustic data points the procedure was similar. Once the rotor and wind tunnelwere at the specified test condition, the test director would instruct the MDHS dataengineer to begin the traverse process. The data engineer would first select theSETUP AUTOMATE option, then enter the test condition number, first point numberand test point description. At this point the softkeys would turn from white to blue,indicating that IEEE-488 communication with address 825 (the acoustic VAX)would be allowed. The data engineer would then use the headset to tell the NASAdata engineer that the data system was ready to take data and provide him with thedata storage option. There were two data storage options for acoustic data. Withoption 1, the NASA computer commanded the MDHS computer to store the rawdata disk and to print out a summary for each of the 18 points along the traversepath. With option 2, the NASA computer would instruct the MDHS computer to takeall 18 points but only to save the data and printout the results for the first and 18thpoints. After receiving permission from the MDHS data engineer, the NASA data
engineer would then begin the traverse process. The acoustic data comPuterwould first ask the slave computer for the position for the hub in the tunnel. Thiswas used to calculate the initial traverse position. Next, the acoustic data computerwould command a data point to be taken. While the MDHS computer was gettingthe performance data, the acoustic data computer was acquiring data from themicrophones and pressure transducers. Once the MDHS master computerreceived the data from the voltmeters, it would send a =1" back to the slaveindicating that it had finished acquiring the data. The slave would then send thepoint number to the acoustic data computer. This action informed the acoustic datacomputer that it could now move the traverse and allowed it to open a file with thepoint number in the file name, The master would then send the data to the slaveand the slave would calculate the derived parameters and return to the loadmonitoring mode. Once the acoustic data computer had finished storing its data todisk, it would send a command to the slave to send the results. The slave wouldthen send a specified list of derived parameters to the acoustic data computer andreturn to the loads monitoring mode. This process would be repeated until thetraverse was completed, at which time the acoustic data computer would tell theslave that the traverse was done. The slave would then disable communications
with the acoustic data computer and the softkeys would return from blue to white.
]4

The data acquisition process during the traverse was automated. Once the traversewas initiated, no further actions were required by the data engineer. Each traverserequired seven to eight minutes. If at any time during the traverse, a loads ormechanical problem developed, the MDHS data engineer could select the QUITAUTOMATE softkey which would return the softkeys to white, block outcommunications with the acoustic data computer, and allow both the master andslave computers to function in the loads monitoring mode without interruption. This
allowed the test director and pilot to monitor parameters such as thrust, Ct/o realtime, while reacting to any emergency that might arise.
At the end of each test run, another data point would be taken at 100% RPM andflat pitch. The rotor speed would then be brought to zero. At this time a non-rotating data point would be taken, stored and printed. The current voltages wouldalso be printed. The rotating data point and zeros were compared with previouspoint to check for zero drift or any other possible problems.
After the data acquisition run was completed, the slave computer would be put intoarchive mode. The first screen in the archive mode lists the number of files storedon the internal hard disk. The data engineer would place a 1/4-inch tape into theslave's tape drive. If it was a new tape, he would initialize it. With this drive, 175data points would fit on each of the 65 Mb tapes. Once the tape was ready, hewould select DISK TO TAPE action which would copy every data file on the harddisk to the 1/4-inch tape. If there were more than 175 files, he would be promptedto eject the tape, install a new one, and the copy would continue. This tape drivewas one of the weakest links in the data system due to its slow data storage speed.It required four minutes to copy one file to tape, so to fill a tape required 11.5 hours.This extended duration was due to the tape winding and rewinding in order to writeto the header at the beginning of the tape then append the data to the end of thetape. With 12 hours of scheduled testing each day, little time was available for dataarchiving. In practice, this was not a problem. When the copy to tape wascomplete, the tape was ejected and write locked. Then all of the files on theinternal hard disk were copied to one of the three external hard disks. Thisoperation required 10 seconds per file. This was particularly important if timeconstraints precluded a full archiving of all files on disk. The files which were notarchived could be retrieved from the external hard disks and saved during the nextarchive operation. The external hard driver allowed the files to be recalled once thedata was purged from the internal disk. After this operation, the files were thencopied to the transfer disk (a 330 Mb HFS disk which is easily removable from thecomputer). This copy required 20 seconds per file. The transfer disk was thendisconnected from the slave computer, mounted on an HP UNIX workstation (HP9000/360 running HP-UX 9.0). The raw data files were then transferred over theethernet network to an HP workstation in Mesa (HPR07, an HP 9000/735) via ftp(file transfer protocol). The network speed varied with type of data, but typically itrequired from 30-60 seconds per file to transfer them to Mesa. Once the raw datawas on disk in Mesa, it was copied to 4mm tape in tar format. Then the data wasloaded into the ASAP database denoted at BVINASA. The BVlNASA database
included the recorded channels as well as the derived parameters (recalculated onthe HP in Mesa with the latest code corrections).
]5

Once it was confirmed that the files transferred to Mesa were copied without error,the data on the slave's internal hard disk was purged, leaving only the data copiedto the external disks. The data system was now ready for testing again.
During the many hours required to complete the two backups of the test data, themaster computer and the health monitor computer were available to debuginstrumentation problems, calibrate channels, and/or make changes to thesoftware.
4.4 Acoustic Data Acquisition/Reduction
The acoustic data acquisition and reduction hardware was provided by NASALangley, and coupled to the McDonnell Douglas Active Flap Rotor Test dataacquisition and reduction system. Three figures are included to facilitateunderstanding of the involved processes and equipment. Figure 12 illustrates themajor processes controlled by the host and remote computers. Figure 13 showsthe major instrumentation and bus connections to facilitate the defined processes.Figure 14 is an overall data and process flow schematic.
As depicted in Figure 12, the control processes can be partitioned into two majorcategories, one to control the data acquisition processes and one to control digitalsignal processing. The major acquisition processes include real-time dataacquisition and temporary data storage. The major signal processing areasinclude analytical processing, permanent data storage and backup, and datadisplay. Separate computers controlled the acquisition and signal processingoperations. The computers and hard disks were clustered for quick data fileaccess, computations, and display. This also facilitated sharing of peripherals,such as digital tape drives and printers.
4.4.1 Real-Time Data Acquisition
Again referring to Figure 12, the real-time data acquisition control software wascomprised of five modules that controlled the microphone and rotor blade pressuretransducer (from the eight Kulite channels) data digitization, the microphonetraverse, and the tunnel environment and rotor performance data transter from theMDHS computer. These modules were all coupled together in an outer loop thatallowed menu selection of various data acquisition types. The so,ware thencoupled the appropriate modules together to perform the desired tunctaon.
4.4.1.1 Microphone and Kulite Pressure Transducer Data
Sixteen analog microphones (B&K 4134 1/2 inch condenser type corrected forpressure response, with nose cone) were mounted on a traverse andsystematically translated to pre-determined data acquisition stat0ons. Themicrophones moved from upstream of the rotor to downstream of the rotoracquiring data at 17 positions as can be seen in Figure 15. Each microphonechannel, consisting of a microphone cartridge, preamplifier, and power supply, was
]6
directly wired to an amplifier/filter unit for signal conditioning, which was thenconnected to a 16-bit digitizer system. During rotor data acquisition, data weredigitized using an external clock provided by a 1024/rev signal originating from therotor head. Data acquired when the rotor hub was not rotating, such asmicrophone calibrations, were digitized using an internal clock. Continuousanalog data were simultaneously digitized from all channels into discrete datawhich were entered into 8-Mbyte memory resident on each channel. Each channelcould thus contain up to 4 million data samples. Memory contents were directlytransferred to control computer memory via a high-speed parallel interface. Inaddition to the microphone data, the rotor l/rev signal was also digitized by theacoustic data acquisition system. All of the digitized data were then written tomagnetic disk as a single file of 17 channels (16 microphones plus the l/rev) ofdynamic data, along with rotor and tunnel information for each traverse location.
As described previously, one of the rotor blades was outfitted with eight Kulitepressure transducers. At the beginning of each microphone traverse sweep, datafrom these eight transducers were substituted for the eight retreating sidemicrophone channels by an eight-channel software controllable data switch. Bladepressure data was sampled at the same frequency as acoustic data and processedin the same manner. Filter settings for the transducers were the same as acousticchannels. Binary count data were written into the same file with the advancing sideacoustic data. A flag in the file header record indicates that channels 9-16 areKulite channels.
The different data categories include microphone and Kulite blade surfacepressure calibrations, tunnel background and reflected noise checks, and test pointdata taken with the traverse in operation. These categories were selectable from amain menu inside the data acquisition software. For each menu item, the dataacquisition software would couple the appropriate control modules together toperform the selected operation.
4.4.1.1.1 Transducer Calibrations
Microphone calibrations were performed each day both before and after testingusing a standard B&K 4220 pistonphone producing a pure tone at a frequency of250 Hz and an amplitude of 124 dB. Calibration signals were digitized for 5seconds at a rate of 20000 Hz to measure system amplitude response. Theinternal 6 MHz clock of the data acquisition computer was stepped down togenerate the data acquisition clock signal. The signal conditioning filters wereconfigured as for test point data acquisition, with settings of AC-coupled low-passfilters set at 10 kHz during the microphone calibrations. Spectral plots of channelamplitude were displayed on the data processing computer after each calibrationto insure proper operation of all microphone data channels. In addition, calibrationdata files containing filter setting information and channel mean and standarddeviation statistics were written to a file for use by the data acquisition system toconvert raw digital counts into engineering units. This eliminated the intermediatestep of converting raw digial counts to voltages, and then converting the voltages toengineering units.
]7

Kulite channel calibration was performed by applying a series of known staticpressures to each port, and acquiring data in the same way as for the microphonecalibrations, with the exception that the filters were DC-coupled. A slope-interceptlinear relation between pressure and digital counts was used to convert the Kulitesignals into engineering units.
4.4.1.1.2 Background and Reflected Noise Checks
Tunnel background noise was measured at each of the speeds of interest with therotor operating without blades. Since the hub was rotating, all filter settings andsample rates were the same as for normal rotor data acquisition. For reflectiontesting, blasting caps were mounted to a bar extending from the rotor hub in thenominal position of expected BVI. Data were acquired at 100 kHz sample rate for 5seconds to insure that the blast and all of its reflections were captured.
4.4.1.1.3 Test Point Data
Sixteen channels of microphone data and one channel of l/rev data were
acquired for the various rotor operating conditions and flap configurations. Foreach condition, a complete microphone traverse sweep defined the noise field in aplane below the rotor system. Seventeen acoustic data sampling stations (shownin figure 15) defined where the traverse system was stopped, enabling datarecording for aproximately 32 rotor revolutions (about 1.8 seconds). Theprocedural order of events was as follows:
1. Advance traverse to full forward position, if not already there.2. Acquire data at full forward position from all eight of the Kulite
transducers and the eight microphones on the advancing side ofthe rotor and write data to file. Begin processing of that data ondata processing computer.
3. Take data at full forward position using all 16 microphones. Assoon as data are successfully acquired, move traverse to nextposition. Write data to file. Begin processing of that data.
4. Receive traverse position feedback from indexer. Verify correctposition by comparison with station position table.
5. Repeat acquisition, move, data write, data processing, and verifyprocess to last station.
6. Move traverse full forward to repeat the acquisition process for thenext test point, while the rotor was trimmed for the next testcondition.
Filter gain settings were adjusted to prevent signal clipping. A 4096/rev counterfrom the rotor, divided down to 1024/rev, served as an external clock for thedigitizer. At a nominal rotor speed of 1087 RPM, this provided a sample rate of18551 Hz.
]8
4.4.1.2 Microphone Traverse
The microphone traverse system shown in Figure 13, which is comprised oftraverse rails, 4 Compumotor single-axis indexer/drives (2 floor rails and 2 siderails), microphone wings, and interfaces, were software controlled by the dataacquisition control computer. The standard RS-232C serial interface was usedbetween the control computer and Compumotor indexer. Three basic commandswill define two speeds (rack return and acquisition rates), desired position, andactual position. The step drives were commanded to stop at each acquisition pointto allow the control computer to write digitized acoustic data to disk. A programmedsequence of instructions automated the positioning of the microphone wings at theknown locations along the sweep shown in Figure 15.
4.4.1.3 Wind Tunnel and Rotor Data
Rotor and wind tunnel state data were all acquired via IEEE-488 interface fromMDHS for each test point. Tunnel data were first acquired by MDHS from theMODCOMP, and then packaged with the rotor performance data for that test pointfor transfer to the acoustic data acquisition computer. These data were then writtenwith that transducer data into one combined file for the test point.
4.4.2 Acoustic and Pressure Data Reduction
4.4.2.1 Analytical Processing
As indicated in Figures 13 and 14, all analytical processing was accomplished onthe acoustic data processing computer, which was clustered with the acoustic dataacquisition computer. The data acquisition computer notified the data processingcomputer when data files were available for analytical processing.
4.4.2.1.1 Engineering Units Conversion
The 18-channel unformatted data files were read to input test point information(from the header record) and binary acoustic and/or rotor blade surface pressuredata. The conversion process used digital counts data from the acoustic data filesand channel calibration means and standard deviations from the calibration files.Converted pressure outputs were in units of Pascals for both microphone andKulite data. The 1/rev signal channel did not require conversion, since it did notactually have any engineering value other than volts, and was only used toexamine the stability of the rotor speed in any case.
]9
4.4.2.1.2 Ensemble Averages
Time history averaging occurred over 30 rotor revolutions on an azimuthallydependent basis. This produced an average time history of 1024 pointsrepresenting one complete rotor cycle. Spectral averaging also used the same 30rotor revolutions that were Fast Fourier transformed and averaged across likefrequency bins to produce a single spectral estimate of assumed Chi-squaredistribution with N=30, 60 degrees of freedom, and +/- 1.2 dB confidence interval at80% confidence level. The Chi-square distribution applies to non-tonal(broadband) data; data associated with tones are non-Chi-square distributed andthus do not ascribe to these confidence levels.
4.4.2.1.3 BVI Filtering
Integration of the narrowband spectra of all frequency bins from the 5th to 40thharmonics of the blade passage frequency were used to obtain a metric referred tohereafter as BVISPL. The BVISPL were used to compare the effectiveness of
different flap motions in reducing BVI noise. The BVISPL were used to generatecontour plots that displayed trends of both BVI amplitude and directivity for eachrotor operating condition.
In order to focus on changes to the harmonic noise only, a second version of theBVISPL metric was also computed. Here, a narrowband spectrum was computedfrom each average time history, and that spectrum was then integrated over thesame range as before. This permitted an examination of changes to the BVI noise,without including broadband noise increases due to the flap deflection. These arethe values that are primarily used in this report.
4.4.2.1.4 Background and Reflected Signals
Data input and engineering units conversion were the same as for test point data.Individual microphone narrow band spectral analyses for each free stream velocitywere computed and reviewed. Data from reflection testing were converted toengineering units and displayed as instantaneous time histories, to allowexamination of the acoustic character of the test chamber. Relative time delaysbetween direct and reflected signals were used to estimate the location of reflectivesurfaces. These data caused application of additional acoustic foam on the modelwhen a model surface was indicated to be a substantial source of reflections.Examination of the background noise data, when compared with measured rotordata, showed that there was a significant signal-noise ratio except at the lowestrotor frequencies, when the rotor background noise began to approach the level ofthe rotor signal.
2O
4.4.2.2 Data Display
Calibration data for microphones were displayed on the data processing computerterminal as soon as acquired. During test point data acquisition, min-max, averagetime history, and narrowband spectra data plots were generated on the dataprocessing computer for display at the terminal. These plot files were also storedon hard disk for later display or printing. At the end of each traverse, a single colorcontour plot of BVlSPL as a function of spatial position was generated and printedto a color printer. The combination of stored time history and spectrum line plots, inconjunction with the printed color contours, allowed quick on-line examination of allchannels.
4.4.2.3 Permanent Data Storage and Backup
Data file storage on optical disks and 8-mm cassette tapes was completed dailyduring either lulls in the testing, or during first shift by a delayed batch process.Each 8-mm tape could hold approximately 2.1 Gbytes and each optical disk 594Mbytes. All raw and processed data were stored in this manner, so all data areredundantly preserved.
4.5 Dynamic Data Acquisition
In order to examine rotor dynamic stability, the hydraulically driven swashplate wasused to excite rotor modes. Collective excitation was accomplished by a verticalsinusoidal excitation of the swashplate. Inplane mode excitation was accomplishedby nutating the swashplate at the progressing or regressing mode frequencies. Thebasic performance data acquisition program was used with the exception of thetrigger. Once the excitation level had been set to excite the blade mode withsufficient amplitude, the computer trigger was armed. When the excitation was cutoff, the computer triggered the data acquisition program and recorded thetransients over 40 rotor revolutions. The shake test and dynamic data aredescribed in detail in Section 6.1 and 6.2.
5.0 Test Procedures and Conduct
The wind tunnel test was conducted at the NASA Langley 14- by 22-Foot SubsonicTunnel. The test stand was attached to Cart Number One in the front bay of thewind tunnel test section. The wind tunnel was operated _n the open jetconfiguration with no side walls or top to the test section. The floor of the testsection was lowered by two feet and acoustic treatment installed Acoustictreatment was applied to the tunnel area around the test section. A traversing rakewith microphones was installed to map the acoustic field below, and both upstreamand downstream, of the rotor. The array of acoustic microphone data acquisitionlocations is shown in Figure 15. The smoke generator and traverse system locatedin the tunnel settling chamber were used for flow visualization to ensure that therotor did not ingest the shear layer at lower tunnel speeds. Following shake tests ofthe rotor test stand (Section 6.1) and checkout of the motor control, rotor control
2]
panel, dynamic control panel and test health monitoring system, the blades withactive flaps were installed for the wind tunnel test. A complete instrumentation anddata system verification and checkout were conducted. Oscillographs,oscilloscopes and digital monitors were used to monitor rotor parameters and toassure safe operation of the test.
The wind tunnel test lasted six weeks. The first two weeks were used to perform abrief shake test, and reinstall the acoustic treatment and acoustic traverse in thewind tunnel. Set up of test stand and instrumentation proceeded on a double shiftoperation during installation of the acoustic treatment. Four weeks of double shiftoperation were used for rotor checkout and testing. Before conducting the windtunnel test, a checkout of the motor, controls, test stand, instrumentation, rotorsystem, and data acquisition system, was needed. The checkout proceeded insteps to verify the operation of the system.
5.1 Installation and Checkout
The test stand was installed in wind tunnel. Power, lubrication, instrumentation andcooling lines were routed and secured. A crane was used to lift the model, insections, into the tunnel. The model was assembled on the bayonet mount in thetunnel section. The hub was reassembled by MDHS personnel following thenondestructive testing inspection of the spiders by NASA Langley personnel.
A shake test of the test stand and hub was performed. A detailed description of theshake test can be found in section 6.1. Stand natural frequencies and dampingwere measured so that known stand resonances could be avoided. Dynamicsengineers studied stand natural frequencies and rotor modes, identifiedresonances and ensured aeromechanical stability. Ground resonance stabilitycharacteristics were determined based on CAMRAD/JA results from isolated blade
properties, and shake test results.
The shake test attachment fittings were removed. The blades and cable controlturnbuckles were not installed. The null cam was installed and cam followers were
left in place. The rotating system instrumentation was installed and its operationverified. The control system rigging was checked. Control system clearances werechecked as well. The rotor control console operation, instrumentation and dynamiccontrol console operation were verified.
Checks of the calibrations on the control system, motion indicators, drive systemand rotor balance measurements were performed. The check calibration of thebalance revealed that the balance normal force was not responding according toprevious calibrations. Check loads were reapplied for three balance forces andtwo balance moments. The data was reduced, and a new balance calibrationmatrix derived. The corrected balance calibration matrix and a description of thebalance calibration procedures can be found in Appendix A.
The shaft angle was swept from -15 ° to 15 ° and clearances for model hardwareand instrumentation checked. The precise position of the center of the hub wasmeasured during the shaft angle sweep with surveying instruments. A table of
22

height (Z) corrections for shaft angle was developed to maintain the hub onposition at the centedine of the tunnel. NASA Langley sting operators appliedthese corrections to the shaft for every shaft angle required during the test. Themeasurements of hub position were performed again with the shaft height (Z)corrections applied. The fore and aft position (x) versus shaft angle were recorded.This data was used to correct the acoustic traverse positions to maintain the samerelationship between the microphone array and the rotor hub for every shaft angle.
The motor and test stand were operated to 110% nominal RPM to ensure correctoperation. The hub imbalance was determined, and the rotor balanced to 15 in-grams. The HP3562 spectrum analyzer was used to develop a balance chart forthe rotor. With the RPM stabilized, the balance phase and magnitude data weretaken from the HP3562 analyzer. The magnitude was derived from the balancepitch moment reading at 1/rev rotational frequency. A known weight ofapproximately 40 grams was added to the damper bracket for blade number 1.The measurement was repeated. From the baseline delta weight balance andphase data, a correction delta weight and azimuth angle were calculated. This, ingeneral, required that weight be added to two adjacent blades. If the imbalancewas greater than 2000 in-grams, additional delta weights were generated to bringthe blades into balance.
Occasionally, an alternative approach was used to simplify this procedure. It wasassumed that the magnitude change was the same for all blades and that thephase shift was 90 ° difference between the adjacent blades for a given deltaweight. This approach only required the addition of a delta weight once to any oneof blades instead of to all blades.
On 14 February with a bare hub, the motor drive control was exercised up to 110 %RPM (1195 RPM) and the control system operated through 100% of its collectiveand cyclic pitch range. Collective pitch was exercised through the range 0 ° to 8.0 °and lateral and longitudinal cyclic from 0 ° to 2.0 °.
The data acquisition system operation was verified. Performance data on teststand and rotor were acquired with check loads. The digital data bus between theLangley wind tunnel computers and the MDHS data acquisition system wasexercised and correct operation verified. Data with the acoustic microphone arraywas acquired. The digital data bus from the acoustic and pressure data acquisitionsystem was exercised and correct operation verified.
Acoustically treated test stand fairings were then installed. NASA LangleyAcoustics Division personnel performed a bang test to quantify the acousticproperties of the test section and model. Any "hard spots" identified whichproduced distinct echoes were treated with acoustic foam. A final bang test wasperformed to document and quantify all acoustic reflections.
5.2 Background Noise
Background noise runs were performed on 16 February 1994. Background noisedata was taken at tunnel speeds of m = 0, 0.10, 0.15, and 0.20. For each tunnel
23

speed, an acoustic traverse was performed at shaft angles of o_s = 0, 5.0, 10.0, -5.0,-10.0 degrees.
5.3 Weight Tares
The blades were installed and weight tares were acquired on 18 February 1994.The shaft angle was run throughout the range +13.0° to -13.0 ° in 2.0 ° increments.The rotor was not turning for these tare runs. Balance data was acquired at eachpoint and at 0 ° shaft tilt. The blades were removed and weight tare data acquiredfor the bare hub only with the same shaft angles.
5.4 Aerodynamic Tares
Rotor balance data were corrected for aero tares. These are subtracted from therotor balance measurements to calculate the force due exclusively to the rotorblades. Aero tare runs were performed with the rotor at 100% RPM on 18 Februarywithout the blades. Performance data for the rotor test stand were acquired for a
range of tunnel speed (i_) and shaft angles (as) The collective pitch was set to 0.0 °
(ec=0.0°). Lateral and longitudinal cyclic were set to zero (A 1=0, B 1=0). A sweep
of shaft angles was also performed with the tunnel off and the rotor at 100% RPM.
Shaft angle was swept from -13 to +13 ° in 2° increments (as= 13, -11, -9, -7, -5, -3,
-1, 0, 1, 3, 5, 7, 9, 11, 13 degrees). It should be noted that the shaft angles usedhere are corrected values. The shaft angles were corrected for open jet effectsusing the method of Heyson [22]. Typical corrections were on the order of 0.5degrees for the cases tested. The same shaft angle sweep was performed for
tunnel speeds ranging from 69 ft/sec to 241 ft/sec, in 35 ft/sec increments (1_= .10,.15, .20, .25, .30, .35). The performance data were curve fit and used as tare valuesfor measured rotor performance.
The cable control turnbuckles and blades were installed. The active flaps were setto the neutral position. The blade strain and pressure instrumentation wereconnected and operation of this instrumentation verified. The control systemcalibration with blade pitch measurements at 75% radius was rechecked. Staticcheck loads were placed on the blades and the strain gauge calibrations verified.
Rotating aerodynamic tares were repeated on 22 February for the highest two
tunnel velocities, I_ - .30, and .35. At zero tunnel speed, the rotor was run up to100% RPM incrementally. Performance data was acquired at 544, 652, 870, 978,
1033, and 1087 RPM (50%, 60%, 80%, 90%, 95%, and 100%). At I_ = .05, .10, .15,
.20, and .25, tare data was acquired at a shaft angle of zero. At i_ - .30 and .35, the
shaft angle was swept from -13 to +13 ° in 2° increments (o_s =-13, -11, -9, -7, -5, -3,
-1, 0, 1, 3, 5, 7, 9, 11, 13 degrees). As mentioned earlier, the shaft angles usedhere are the corrected values. The performance data were curve fit and used astare values for measured rotor performance.
24
5.5 Track and Balance
On 22 February the rotor was run up to 100% RPM incrementally with blades on.The null cam, with no flap deflection, was installed. The rotor imbalance wasmeasured and a rotor balance performed as described in Section 5.0.Performance data was acquired at 544, 652, 870, 978, 1033, 1087, and 1120 RPM(50%, 60%, 80%, 90%, 95%,100%, and 103%). Stability data was not taken as thedynamics engineer had determined that stability was high based on the results ofthe shake test. Rotor track and balance runs were integrated with the performancetesting.
The rotor was tracked during the run up. The blade tips were monitored on thevideo camera using a four per rev strobe. Both the track and balance needed to bewithin acceptable limits before increasing operational rotor speed. The final trackand balance were done at 100% RPM (1087) with the track procedure completedfirst followed by the balance procedure. Below 100% RPM corrections to track andbalance were made only if a blade was out of track by more than .7 inches or theblade imbalance was greater than 2000 in-grams. These units were used as thebalance mass scale was calibrated in grams, and the mechanic's ruler wascalibrated in inches.
At 100% rotor speed with the collective at flat pitch and with neutral cyclic, the rotorwas tracked to within 0.1 inches and balanced to within 15 in-grams. Track andbalance were checked at other collective pitch positions and tunnel speeds as thetest envelope was expanded.
Once the rotor was tracked and balanced at 100% RPM, and a collective and cyclicsweep was performed, blade motion indicators were check calibrated. Flap motionindicators were calibrated over a range of -8 ° to +8 °. Lag motion indicators werecalibrated over a range of -5° to 5 °. The lag dampers were disconnected for thiscalibration. Check loads were applied to the rotor to verify the strain gaugecalibrations.
Rotor speed sweeps, collective sweeps and cyclic sweeps were repeated on 24February.
5.6 Baseline Test Matrix
The rotor was tested in forward flight for the first time on 25 February. Data wasacquired for the baseline test matrix with the null cam. For each test point, the rotor
was established on the test condition defined by the parameters Ct/a, Mh, 1_,and insome cases, shaft angle. Baseline data was taken for the performance testconditions, dynamics test conditions, and acoustic test conditions. These baselinedata were acquired on 25 and 26 February. A sweep of rotor speed, collectivepitch and cyclic pitch was performed for repeatability checks with prior runs.
The 12.125 foot diameter Active Flap Rotor was a large rotor for the 14- by 22-FootSubsonic Tunnel open jet test section. At low tunnel speeds and advance ratios(m) there was a significant possibility that the tunnel shear layer could be ingestedby the rotor. Researchers at the US Army AFDD performed calculations that
25

suggested that this would not occur at the lowest advance ratio test point (Ct/_ =
0.0762, i_ = 0.15). In order to verify that shear layer was not significantly influencedby the rotor inflow, a flow visualization study was performed. The smokegeneration system, located in the settling chamber upstream of the test section,was used to study this phenomena. Smoke streamlines were generated along theedge of the test section near the shear layer. Video cameras were used to monitorthe smoke streamlines in the test section. Their behavior throughout the testenvelope was used to judge whether the rotor was ingesting the shear layer. Theflow visualization studies showed no shear layer ingestion throughout the testenvelope.
Performance data was taken in forward flight at fixed shaft angles predicted byanalysis. Since the normal forces required to produce the target propulsive force,X, were smaller than could be read by the balance, the shaft angle required foreach test point was determined from theory. When the rotor was flown at velocities
of over I_ - .20, the normal force measurements were large enough to producereliable X measurements. The performance baseline data test matrix is shown inTable 1.
Table 1. Baseine Performance Test Matrix
iz X oL Ctla
0.15 0.12 -1.89 0.0653 0.0060-1.71 0.0762 0.0070-1.61 0.0871 0.0080
0.20 0.12 -3.24 0.0653 0.0060-2.72 0.0871 0.0080
0.25 0.12 -5.03 0.0653 0.0060-4.19 0.0871 0.0080
0.30 0.12 -7.38-6.12
0.06530.0871
Ct
0.00600.0080
The performance runs raised concerns over the calibration of the balance. A checkcalibration of the balance axial force was performed up to 200 Ibs in 50 Ibsincrements. The data fit with previous calibrations.
For acoustic data, the microphone rake traverse was located in its most forward,
upstream position. The shaft was then swept slowly back from o_= 0.0 ° to c¢= 10.0 °
incrementally to aid in locating the shaft angle corresponding to maximum BVInoise. Sweeps of the acoustic traverse were performed for each discrete shaftangle. The shaft angles for maximum BVI noise could then be identified for each ofthe three acoustic test conditions. During the acoustic traverse, the model pilot
maintained constant Ct/a, while minimizing blade flapping. No adjustments in rotorspeed to maintain M h were required while the sweeps were completed.
Once the shaft angle for maximum BVI noise was determined, four data pointsbracketing this shaft angle were acquired. Data points were taken at shaft anglesof the maximum BVI angle + 1 degree and + 2 degrees. At each test condition, therotor was flown in trimmed condition by the pilot with first harmonic flapping, bI and
26
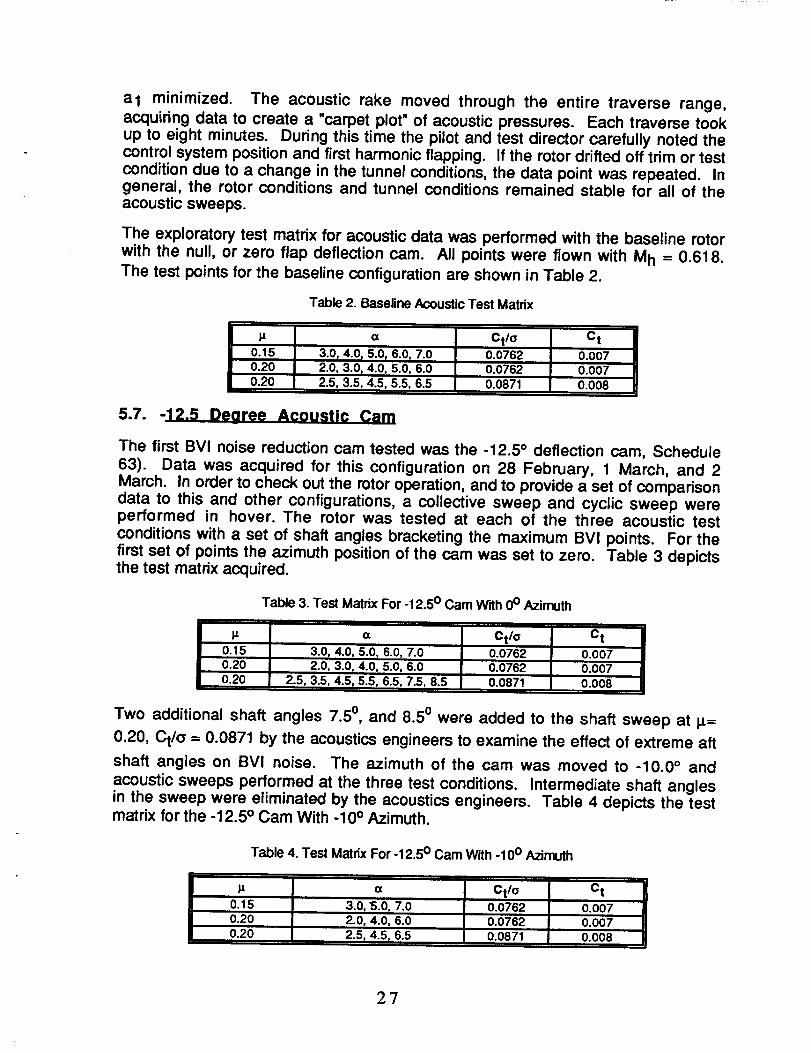
al minimized. The acoustic rake moved through the entire traverse range,acquiring data to create a "carpet plot* of acoustic pressures. Each traverse tookup to eight minutes. During this time the pilot and test director carefully noted thecontrol system position and first harmonic flapping. If the rotor drifted off trim or testcondition due to a change in the tunnel conditions, the data point was repeated. Ingeneral, the rotor conditions and tunnel conditions remained stable for all of theacoustic sweeps.
The exploratory test matrix for acoustic data was performed with the baseline rotor
with the null, or zero flap deflection cam. All points were flown with M h = 0.618.The test points for the baseline configuration are shown in Table 2.
Table 2. Baseline Acoustic Test Matrix
I_ a Ct/a C t
0.15 3.0 r 4.0 r 5.0 r 6.0 r 7.0 0.0762 0.0070.20 2.0, 3.0, 4.0, 5.0, 6.0 0.0762 0.0070.20 2.5, 3.5, 4.5, 5.5, 6.5 0.0871 0.008
5.7. -12.5 De oree Acoustic Cam
The first BVI noise reduction cam tested was the -12.5 ° deflection cam, Schedule63). Data was acquired for this configuration on 28 February, 1 March, and 2March. In order to check out the rotor operation, and to provide a set of comparisondata to this and other configurations, a collective sweep and cyclic sweep wereperformed in hover. The rotor was tested at each of the three acoustic testconditions with a set of shaft angles bracketing the maximum BVI points. For thefirst set of points the azimuth position of the cam was set to zero. Table 3 depictsthe test matrix acquired.
Table 3. Test Matrix For -12.5 ° Cam W'dh 0 ° Azimuth
iz c¢ Ctl o C t
0.15 3.0, 4.0, 5.0, 6.0, 7.0 0.0762 0.0070.20 2.0, 3.0, 4.0, 5.0, 6.0 0.0762 0.007
i 0.20 2.5, 3.5, 4.5, 5.5, 6.5, 7.5, 8.5 0.0871 0.008
Two additional shaft angles 7.5 °, and 8.50 were added to the shaft sweep at I_=
0.20, Ct/a = 0.0871 by the acoustics engineers to examine the effect of extreme aft
shaft angles on BVI noise. The azimuth of the cam was moved to -10.0 ° and
acoustic sweeps performed at the three test conditions. Intermediate shaft anglesin the sweep were eliminated by the acoustics engineers. Table 4 depicts the testmatrix for the -12.5 ° Cam With -10 ° Azimuth.
Table 4. Test Matrix For -12.5 ° Cam W'dh -10 ° Azimuth
i_ cz
0.15 3.0, 5.0, 7.00.20 2.0, 4.0, 6.0
0.20 2.5 r 4.5 r 6.5
Ct/o Ct
0.0762 O.OO70.0762 0.0070.0871 O.OO8
27
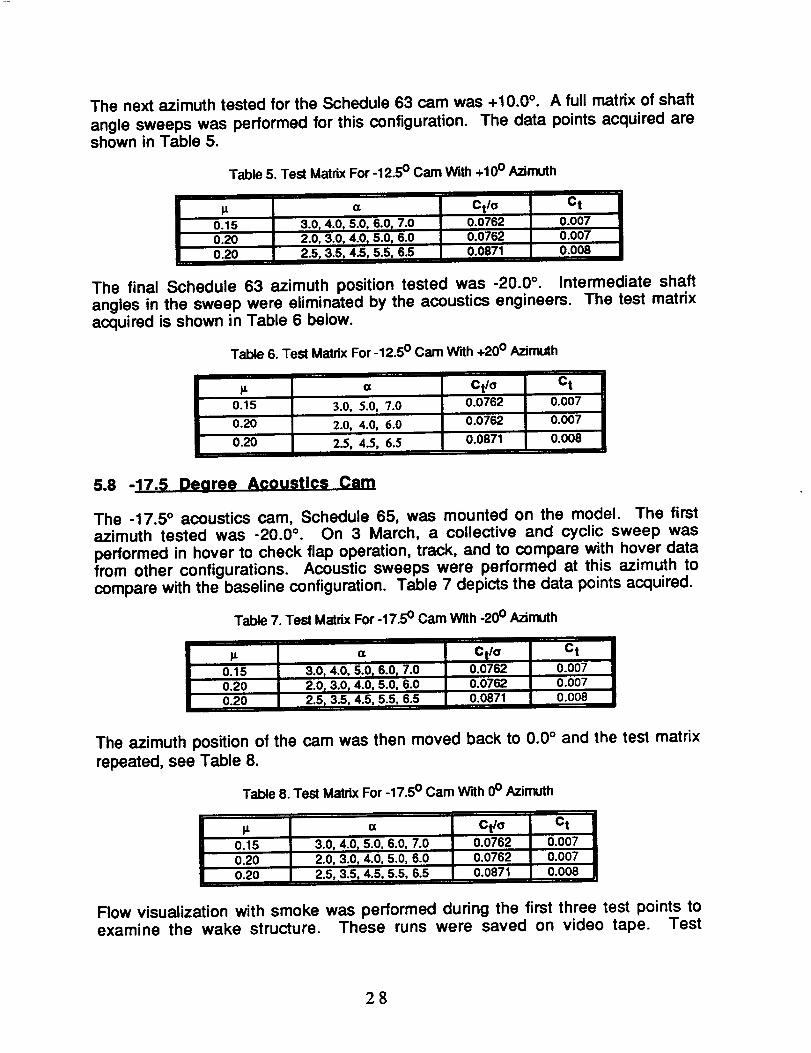
The next azimuth tested for the Schedule 63 cam was +10.0 °. A full matrix of shaft
angle sweeps was performed for this configuration. The data points acquired areshown in Table 5.
li0.150.200.20
The final Schedule 63 azimuth position tested was -20.0 °.angles in the sweep were eliminated by the acoustics engineem.acquired is shown in Table 6 below.
Table 6. Test Matrix For-12.5 ° Cam W'dh +20 ° Azimuth
Table 5. Test Matrix For -12.5 ° Cam With +100 Azimuth
a Ctlo Ct
3.0, 4.0_ 5.0, 6.0 r 7.0 0.0762 0.0072.0, 3.0, 4.0, 5.0_ 6.0 0.0762 0.0072.5, 3.5, 4.5, 5.5, 6.5 0.0871 0.008
Intermediate shaftThe test matrix
li a Ctla Ct
0.15 3.0, 5.0, "/.0 0.0762 0.007
0.20 2.0, 4.0, 6.0 0.0762 0.007
0.20 2.5, 4.5, 6.5 0.0871 0.008
5.8 -17.5 De aree Acoustics Cam
The -17.5 ° acoustics cam, Schedule 65, was mounted on the model. The firstazimuth tested was -20.0 °. On 3 March, a collective and cyclic sweep was
performed in hover to check flap operation, track, and to compare with hover datafrom other configurations. Acoustic sweeps were performed at this azimuth tocompare with the baseline configuration. Table 7 depicts the data points acquired.
Table 7. Test Matrix For -17.5 ° Cam With -20 ° Azimuth
li a Cf_lo Ct
0.15 3.0, 4.0, 5.0, 6.0, 7.0 0.0762 0.0070.20 2.0, 3.0, 4.0, 5.0, 6.0 0.0762 0.0070.20 2.5, 3.5, 4.5, 5.5, 6.5 0.0871 0.008
The azimuth position of the cam was then moved back to 0.0 ° and the test matrix
repeated, see Table 8.
Table 8. Test Matrix For -17.5 ° Cam With 0° Azimuth
I"
li u Ctla Ct
0.15 3.0_ 4.0, 5.0, 6.0, 7.0 0.0762 0.0070.20 2.0, 3.0, 4.0, 5.0, 6.0 0.0762 0.0070.20 2.5, 3.5, 4.5, 5.5, 6.5 0.0871 0.008
Flow visualization with smoke was performed during the first three test points toexamine the wake structure. These runs were saved on video tape. Test
28
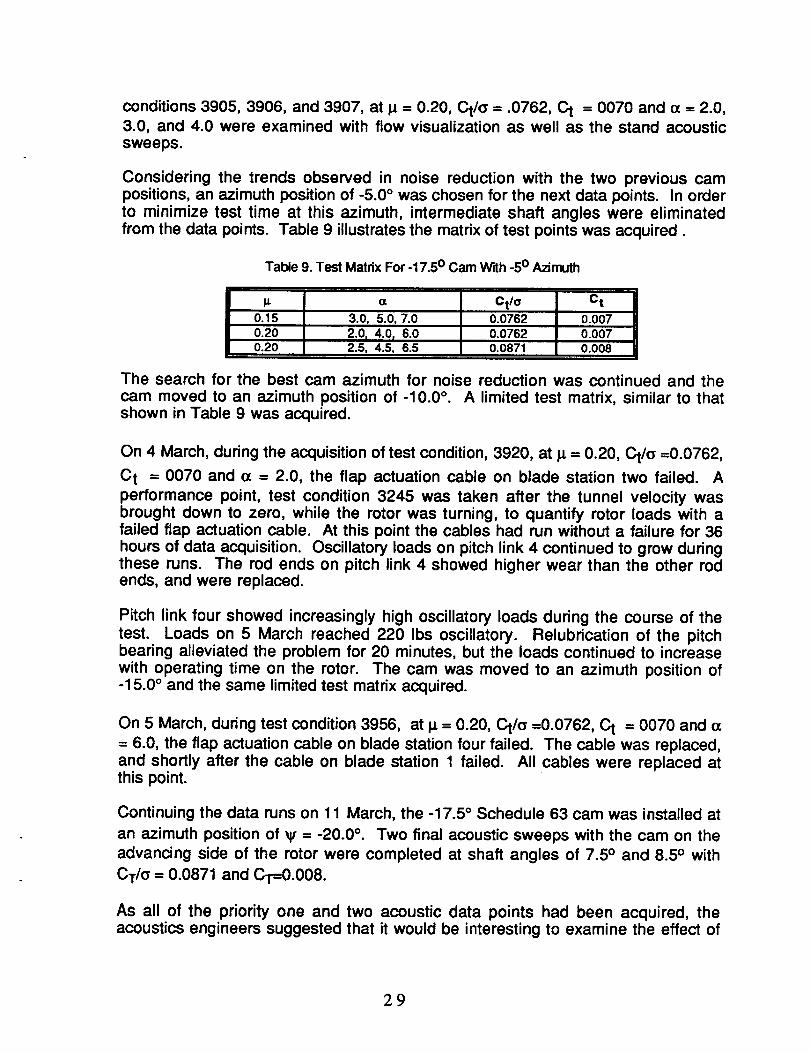
conditions 3905, 3906, and 3907, at _ = 0.20, Ct/a = .0762, Ct = 0070 and o_= 2.0,3.0, and 4.0 were examined with flow visualization as well as the stand acousticsweeps.
Considering the trends observed in noise reduction with the two previous campositions, an azimuth position of -5.0 ° was chosen for the next data points. In orderto minimize test time at this azimuth, intermediate shaft angles were eliminatedfrom the data points. Table 9 illustrates the matrix of test points was acquired.
Table 9. Test Matrix For -17.5 ° Cam W'dh -5 ° Azimuth
0.15 3.0, 5.0, 7.00.200.20
2.0 r 4.0 r 6.02.5, 4.5, 6.5
Ct/o Ct0.0762 O.OO70.0762 0.0070.0871 0.008
The search for the best cam azimuth for noise reduction was continued and thecam moved to an azimuth position of -10.0 °. A limited test matrix, similar to thatshown in Table 9 was acquired.
On 4 March, during the acquisition of test condition, 3920, at i_ = 0.20, C.,t/G=0.0762,
C t = 0070 and o_ = 2.0, the flap actuation cable on blade station two failed. A
performance point, test condition 3245 was taken after the tunnel velocity wasbrought down to zero, while the rotor was turning, to quantify rotor loads with afailed flap actuation cable. At this point the cables had run without a failure for 36hours of data acquisition. Oscillatory loads on pitch link 4 continued to grow duringthese runs. The rod ends on pitch link 4 showed higher wear than the other rodends, and were replaced.
Pitch link four showed increasingly high oscillatory loads during the course of thetest. Loads on 5 March reached 220 Ibs oscillatory. Relubrication of the pitchbearing alleviated the problem for 20 minutes, but the loads continued to increasewith operating time on the rotor. The cam was moved to an azimuth position of-15.0 ° and the same limited test matrix acquired.
On 5 March, during test condition 3956, at _ = 0.20, Ct/a =0.0762, C t = 0070 and (_= 6.0, the flap actuation cable on blade station four failed. The cable was replaced,and shortly after the cable on blade station 1 failed. All cables were replaced atthis point.
Continuing the data runs on 11 March, the -17.5 ° Schedule 63 cam was installed at
an azimuth position of _ = -20.0 °. Two final acoustic sweeps with the cam on the
advancing side of the rotor were completed at shaft angles of 7.5 ° and 8.5 ° with
CT/O = 0.0871 and CT=0.008.
As all of the priority one and two acoustic data points had been acquired, theacoustics engineers suggested that it would be interesting to examine the effect of
29
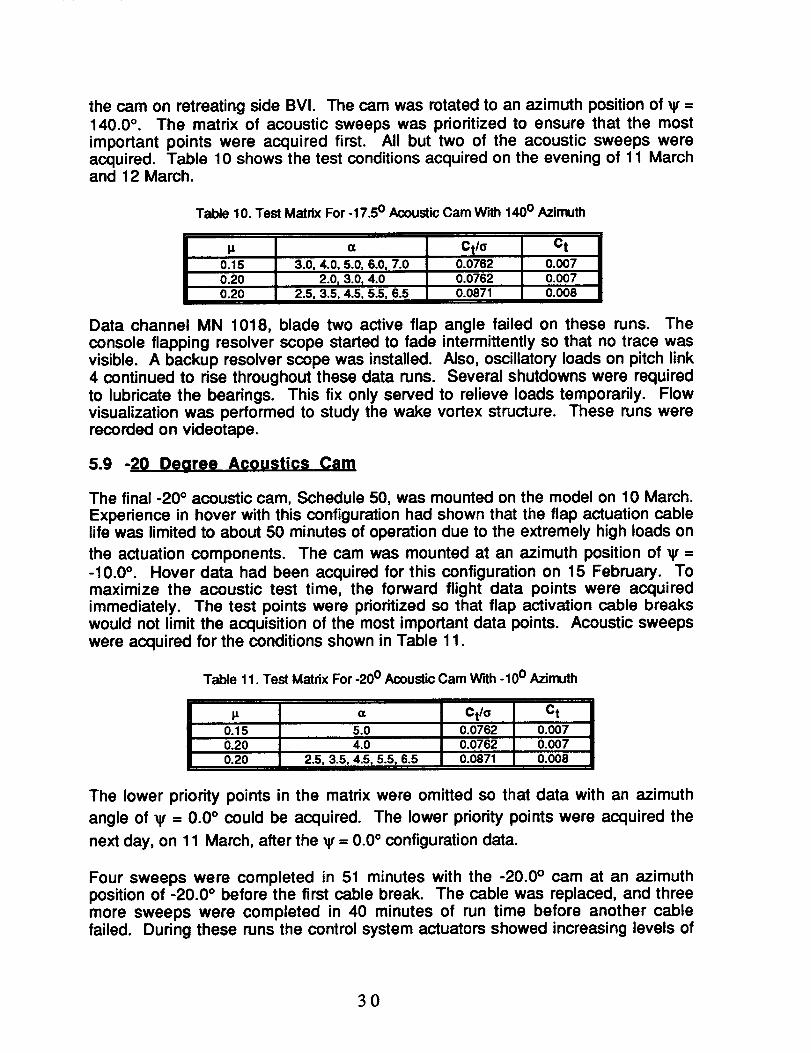
the cam on retreating side BVI. The cam was rotated to an azimuth position of _ =140.0 °. The matrix of acoustic sweeps was prioritized to ensure that the mostimportant points were acquired first. All but two of the acoustic sweeps wereacquired. Table 10 shows the test conditions acquired on the evening of 11 Marchand 12 March.
Table 10. Test Matrix For-17.5 ° Acoustic Cam W'dh 140 ° Azimuth
I_ a Ct/o Ct
0.15 3.0, 4.0, 5.0, 6.0, 7.0 0.0762 0.0070.20 0.0762 0.0070.20
2.0, 3.0, 4.02.5, 3.5, 4.5, 5.5, 6.5 0.0871 0.008
Data channel MN 1018, blade two active flap angle failed on these runs. Theconsole flapping resolver scope started to fade intermittently so that no trace wasvisible. A backup resolver scope was installed. Also, oscillatory loads on pitch link4 continued to rise throughout these data runs. Several shutdowns were requiredto lubricate the bearings. This fix only served to relieve loads temporarily. Flowvisualization was performed to study the wake vortex structure. These runs wererecorded on videotape.
5.9 -20 Deoree Acoustics Cam
The final -20 ° acoustic cam, Schedule 50, was mounted on the model on 10 March.Experience in hover with this configuration had shown that the flap actuation cablelife was limited to about 50 minutes of operation due to the extremely high loads on
the actuation components. The cam was mounted at an azimuth position of W =-10.0 °. Hover data had been acquired for this configuration on 15 February. Tomaximize the acoustic test time, the forward flight data points were acquiredimmediately. The test points were prioritized so that flap activation cable breakswould not limit the acquisition of the most important data points. Acoustic sweepswere acquired for the conditions shown in Table 11.
Table 11. Test Matrix For -20 ° Acoustic Cam With -10 ° Azimuth
p. a Ct/o Ct
0.15 5.0 0.0762 0.0070.20 4.0 0.0762 0.007
2.5,3.5,4.5,5.5,6.5 0.0871 0.0080.20
The lower priority points in the matrix were omitted so that data with an azimuth
angle of _ - 0.0 ° could be acquired. The lower priority points were acquired the
next day, on 11 March, after the _ - 0.0 ° configuration data.
Four sweeps were completed in 51 minutes with the -20.0 ° cam at an azimuthposition of -20.0 ° before the first cable break. The cable was replaced, and threemore sweeps were completed in 40 minutes of run time before another cablefailed. During these runs the control system actuators showed increasing levels of
3O

error signals. These were attributable to the poor quality of the hydraulic fluid in thehydraulic cart. Several =patch tests" were completed, and filtering of the fluidperformed. The fluid was brought up to a Class 6 or Class 7 level. The hydraulicfluid quality was a recurring problem throughout the test.
The Schedule 50 cam was installed at an azimuth position of ¥ = 0.0 ° on 10 Marchand acoustic data was acquired. Again, the order of acquisition of test points wasprioritized to make the best use of available time on the rotor. Table 12 illustratesthe conditions for the acquired test points.
Table 12. Test Matrix For -20 ° Acoustic Cam With 0° Azimuth
I_ _ Ctlo C t0.15 5.0, 7.0, 3.0, 5.0 0.0762 0.0070.20 2.0, 4.0, 6.0 0.0762 0.0070.20 2.5, 4.5, 5.5, 6.5 0.0871 0.008
The cam azimuth position was then returned to ¥ = -10.0 ° and several more of theremaining acoustic sweeps for this matrix completed, see Table 13.
Table 13. Test Matrix For -20 ° Acoustic Cam With -10 o Azimuth
P- Q
0.15 7.0
0.20 2.01 6.00.20 7.5 r 8.5
Ctlo Ct
0.0762 0.0070.0762 0.0070.0871 0.008
In the written test log, 4031 was also identified in a written comment as 4032 with
test conditions for the Schedule 50 cam at an azimuth of _ - -10.0 ° and I_ = 0.15,
Ct/a = .0762, Ct = .0070 and o_= 5. The computer performance data log retains the4031 nomenclature and identifies the point with the test conditions with an azimuth
of_-- 0.0 ° and i_ = 0.15, Ct/(; =0.0762, Ct =0.0070 and (x -- 5 °.
On 10 and 11 March the cable on hub position three failed after four acousticsweeps. All four cables were replaced. The remaining five sweeps for the 0.0 °cam azimuth position were completed. One sweep was completed at a camazimuth position of -10.0 ° before the hub position three cable failed again. Thecable was replaced and five additional sweeps were performed.
The cam was repositioned at an azimuth position of _ = -15.0, and a limited set ofacoustic sweeps acquired, see Table 14.
Table 14. Test Matrix For -20 o Acoustic Cam W'dh -15 ° Azimuth
p. (x Ct/o C t0.15 5.0 0.0762 0.0070.20 5.0 0.0762 0.007
i 0.20 4.5 0.0871 0.008
31

A number of data channels failed during the data runs on 11 March. Theseincluded MN1025 pitch link 1, MN1030 blade two flap bending, MN 1031 bladetwo chord bending, and MN 1034 blade two torsion bending at the 23.7 radialstation.
5.10 2P3A Performance
The 2P3A performance cam was tested next, on 2 and 3 March. The first azimuthposition tested was 11.7°. In order to check out the rotor operation, and to providea set of comparison data to this and other configurations, a rotor speed sweep,collective sweep and cyclic sweep were performed in hover.
Performance data points were acquired at the same shaft angle as for the baselinerotor, see Table 15.
Table 15. Test Matrix For 2P3A Performance Cam W'dh 11.7° Azimuth
0.10
0.15
0.20
X0.12
0.12
0.12
0.12
0.12
0.25
0.30
G
-0.92-0.81-1.89-1.61-3.24-2.72-5.31-4.19-7.38-6.12
¢tlo0.06530.0871
Ct
0.00600.0080
0.0653 0.00600.0871 0.00800.06530.08710.06530.08710.06530.0871
0.00600.00800.00600.00800.00600.0080
High blade chord bending loads were encountered at p = 0.10 and 0.15 for Ct/o =
0.0871. The performance engineer requested an additional test point at p - 0.25
for Ct/o = 0.0979. High cyclic blade chord loads at station 23.67 precluded the
acquisition of this data point.
The azimuth position of the cam was changed to 56.7 ° , and the test matrix
acquired, see Table 16. No data was acquired at p - 0.10.
Table 16. Test Matrix For 2P3A Performance Cam W'rth 56.7 ° Azimuth
P
0.15
0.20
0.25
0.30
X0.12
0.12
0.12
0.12
(x
-1.89-1.61-3.24-2.72-5.31-4.19-7.38-6.12
Ctlo0.06530.08710.06530.08710.06530.08710.06530.0871
Ct
0.00600.00800.00600.00800.00600.00800.00600.0080
32
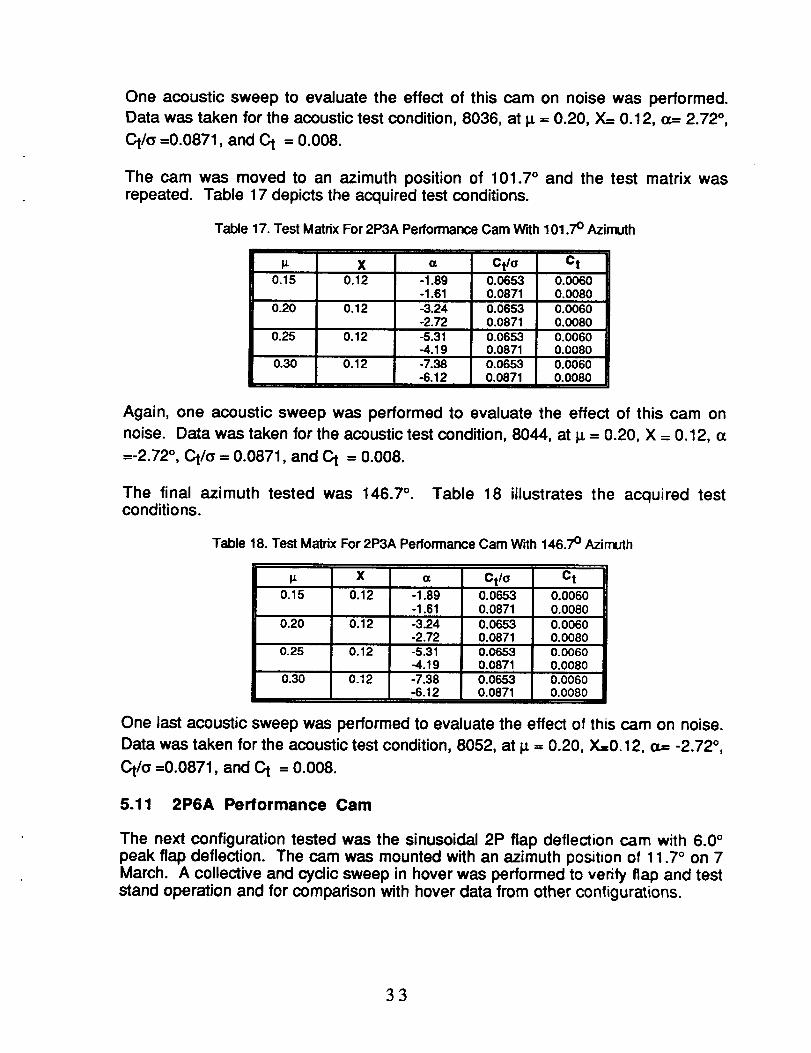
One acoustic sweep to evaluate the effect of this cam on noise was performed.Data was taken for the acoustic test condition, 8036, at I_ = 0.20, X= 0.12, (z= 2.72 °,
Ct/(_ =0.0871, and Ct = 0.008.
The cam was moved to an azimuth position of 101.7 ° and the test matrix wasrepeated. Table 17 depicts the acquired test conditions.
Table 17. Test Matrix For 2P3A Performance Cam With 101.7° Azimuth
Xp- (z Ct/a Ct0.15 0.12 -1.89 0.0653 0.0060
-1.61 0.0871 0.00800.20 0.12 -3.24 0,0653 0.0060
-2.72 0,0871 0.00800.25 0.12 -5.31 0.0653 0.0060
-4.19 0.0871 0.00800.30 0.12 -7.38
-6.120.06530.0871
0.00600.0080
Again, one acoustic sweep was performed to evaluate the effect of this cam on
noise. Data was taken for the acoustic test condition, 8044, at I_ = 0.20, X = 0.12, (z
=-2.72 °, Ct/_ = 0.0871, and Ct = 0.008.
The final azimuth tested was 146.7 °. Table 18 illustrates the acquired testconditions.
Table 18. Test Matrix For 2P3A Performance Cam Wdh 146.7 ° Azimuth
I_ X ¢¢ Ctlo C t
0.15 0.12 -1.89 0.0653 0.0060-1.61 0.0871 0.0080
0.20 0.12 -3.24 0.0653 0.0060-2.72 0.0871 0.0080
0.25 0.12 -5.31 0.0653 0.0060-4.19 0.0871 0.0080
0.30 0.12 -7.38-6.12
0.06530.0871
0.00600.0080
One last acoustic sweep was performed to evaluate the effect of this cam on noise.
Data was taken for the acoustic test condition, 8052, at i_ = 0.20, X=0.12, o.= -2.72 °,
Ct/a =0.0871, and C t = 0.008.
5.11 2P6A Performance Cam
The next configuration tested was the sinusoidal 2P flap deflection cam with 6.0 °peak flap deflection. The cam was mounted with an azimuth position of 11.7 ° on 7March. A collective and cyclic sweep in hover was performed to verify flap and teststand operation and for comparison with hover data from other conligurations.
33
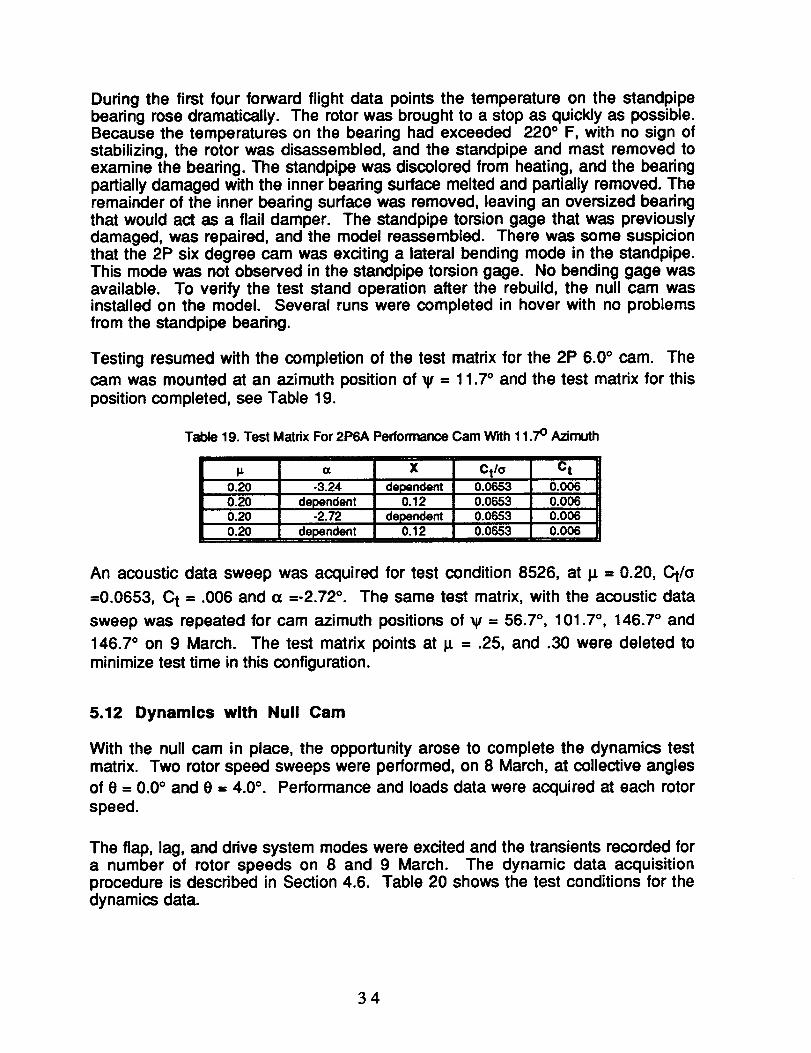
During the first four forward flight data points the temperature on the standpipebearing rose dramatically. The rotor was brought to a stop as quickly as possible.Because the temperatures on the bearing had exceeded 220 ° F, with no sign ofstabilizing, the rotor was disassembled, and the standpipe and mast removed toexamine the bearing. The standpipe was discolored from heating, and the bearingpartially damaged with the inner bearing surface melted and partially removed. Theremainder of the inner bearing surface was removed, leaving an oversized bearingthat would act as a flail damper. The standpipe torsion gage that was previouslydamaged, was repaired, and the model reassembled. There was some suspicionthat the 2P six degree cam was exciting a lateral bending mode in the standpipe.This mode was not observed in the standpipe torsion gage. No bending gage wasavailable. To verify the test stand operation after the rebuild, the null cam wasinstalled on the model. Several runs were completed in hover with no problemsfrom the standpipe bearing.
Testing resumed with the completion of the test matrix for the 2P 6.0 ° cam. The
cam was mounted at an azimuth position of ¥ = 11.7 ° and the test matrix for thisposition completed, see Table 19.
Table 19. Test Matdx For 2P6A Performance Cam With 11.7 ° Azimuth
I lz
0.200.200.20
(x
-3.24
dependent-2.72
dependent
X I Ctl° Ct
dependent ! 0.0653 0.006
0.12 0.0653 0.006
dependent 0.0653 0.0060.12 0.0653 0.006
An acoustic data sweep was acquired for test condition 8526, at I_ = 0.20, Ct/o
=0.0653, C t = .006 and a =-2.72 °. The same test matrix, with the acoustic data
sweep was repeated for cam azimuth positions of _ = 56.7 °, 101.7 °, 146.7 ° and
146.7 ° on 9 March. The test matrix points at 1_ = .25, and .30 were deleted to
minimize test time in this configuration.
5.12 Dynamics with Null Cam
With the null cam in place, the opportunity arose to complete the dynamics testmatrix. Two rotor speed sweeps were performed, on 8 March, at collective angles
of @= 0.0 ° and @= 4.0 °. Performance and loads data were acquired at each rotor
speed.
The flap, lag, and drive system modes were excited and the transients recorded fora number of rotor speeds on 8 and 9 March. The dynamic data acquisitionprocedure is described in Section 4.6. Table 20 shows the test conditions for thedynamics data.
34

Table 20. Test Matrix For Baseline Rotor Dynamic Excitation
RPM Collective Lateral
Cyclic435 0.0°, 4.0° 0.0
652 0.0°, 4.0 ° 0.0 0.0
870 0.0 °, 4.0 ° 0.0 0.0
1087 0.0°, 4.0 ° 0.0 0.0
LongitudinalCyclic
0.0
Excitation
TypeFlapLag
Drive systemFlapLag
Drive SystemFlapLagFlapLag
Flow visualization runs (see Table 21) were performed in forward flight toreexamine the rotor wake structure. These were performed at a shaft angle of (_ =4.0 ° and a hover tip Mach number of _ = 0.618.
Table 21. Test Conditions For Flow Visualization
Iz ¢z Ct/o Ct0.10 4.0 0.0762 0.0070.15 4.0 0.0762 0.007
0.20 4.0 0,0762 0.007
For previous performance data, predicted shaft angles had been used, instead offlying to X. This procedure had been used, as the balance measurement of normalforce at low advance ratios was imprecise. At higher advance ratios however, themeasured propulsive force appeared to be more accurate. The shaft anglespredicted by simple theory were not producing the correct propulsive force, X. Inorder to compare the predicted shaft angle data points to points with a fixedpropulsive force, data was taken with each technique at a series of flight conditions,see Table 22.
Table 22. Conditions For Propulsive Force Comparison
I_ _ X. Ct/a C t
0.20 -3.24 dependent 0.0653 0.0060.20 dependent 0.12 0.0653 0.0060.20 -2.72 dependent 0.0653 0.0060.20 dependent 0.12 0.0653 0.006
0.25 -5.3 dependent 0.0653 0.0060.25 dependent 0.12 0.0653 0.0060.25 -4.19 dependent 0.0653 0.0060.25 dependent 0.12 0.0653 0.0060.30 -7.38 dependent 0.0653 0.0060.30 dependent 0.12 0.0653 0.0060.30 -6.12 dependent 0.0653 0,0060.30 dependent 0.12 0.0653 0.006
In order to fill out the baseline configuration acoustic test matrix, two acousticsweeps were performed for test conditions 550 and 551. These were completed attest conditions of I_ = 0.20, Ct/a =0.0871, Ct = 0.0080 and (x = 7.5 °, and 8.5 °. No
35
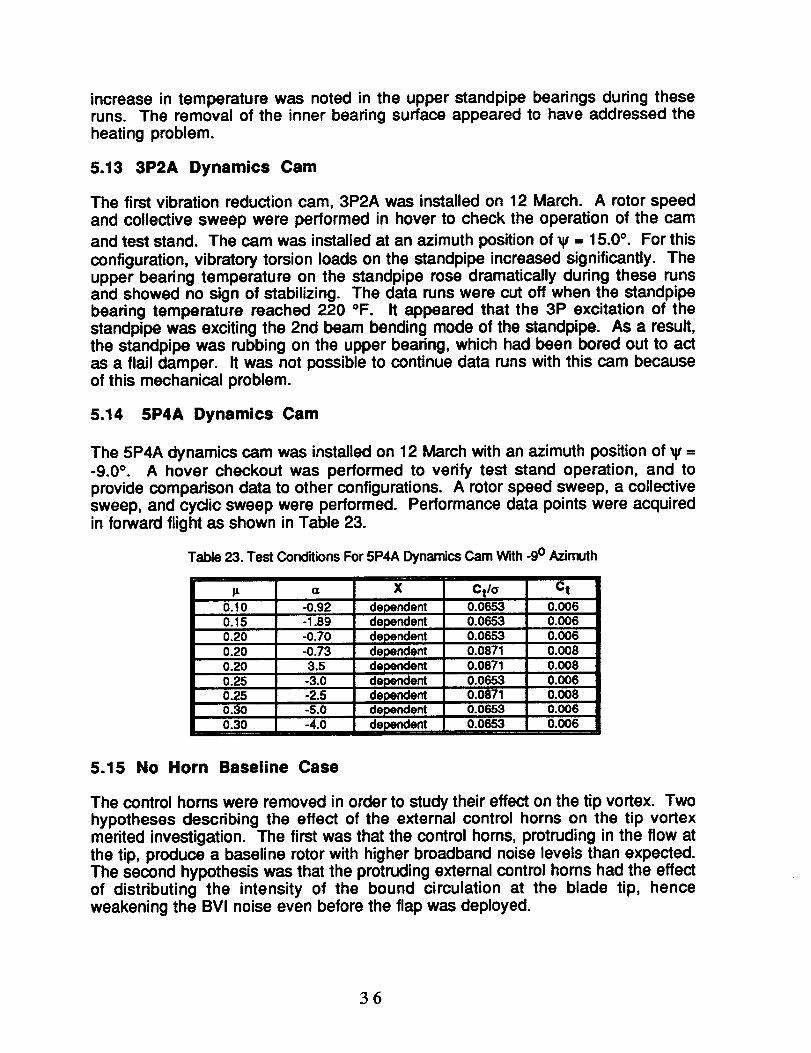
increase in temperature was noted in the upper standpipe bearings during theseruns. The removal of the inner bearing surface appeared to have addressed theheating problem.
5.13 3P2A Dynamics Cam
The first vibration reduction cam, 3P2A was installed on 12 March. A rotor speedand collective sweep were performed in hover to check the operation of the cam
and test stand. The cam was installed at an azimuth position of _ = 15.0 °. For thisconfiguration, vibratory torsion loads on the standpipe increased significantly. Theupper bearing temperature on the standpipe rose dramatically during these runsand showed no sign of stabilizing. The data runs were cut off when the standpipebearing temperature reached 220 °F. It appeared that the 3P excitation of thestandpipe was exciting the 2nd beam bending mode of the standpipe. As a result,the standpipe was rubbing on the upper bearing, which had been bored out to actas a flail damper. It was not possible to continue data runs with this cam becauseof this mechanical problem.
5.14 5P4A Dynamics Cam
The 5P4A dynamics cam was installed on 12 March with an azimuth position of _ =-9.0 °. A hover checkout was performed to verify test stand operation, and toprovide comparison data to other configurations. A rotor speed sweep, a collectivesweep, and cyclic sweep were performed. Performance data points were acquiredin forward flight as shown in Table 23.
Table 23. Test Conddions For 5P4A Dynamics Cam With -9 ° Azimuth
0.10
G
-0.920.15 -1.890.20 -0.700.20
0.20
-0.733.5
0.25 -3.00.250.300.30
-2.5-5.0-4.0
X
dependentdependentdependentdependentdependentdependent
dependentdependentdependent
Ct/a0.0653
Ct
0.0060.0653 0.0060.0653 0.006
0.0871 0.0080.0871 0.0080.0653 0.0060.08710.0653
0.0653
0.0080.0060.006
5.15 No Horn Baseline Case
The control horns were removed in order to study their effect on the tip vortex. Twohypotheses describing the effect of the external control horns on the tip vortexmerited investigation. The first was that the control horns, protruding in the flow atthe tip, produce a baseline rotor with higher broadband noise levels than expected.The second hypothesis was that the protruding external control horns had the effectof distributing the intensity of the bound circulation at the blade tip, henceweakening the BVI noise even before the flap was deployed.
36

In order to examine these hypotheses, the control horns and flap actuation cableswere removed. The tips were modified with set screws to adjust the active flaps toan angle of 0.0 °. The holes in the blade tips for the control cables were sealed withtape. The rotor in this configuration was tested on 14 March. A collective sweep inhover was performed and a limited acoustic matrix was acquired as shown in Table24.
Table 24. Test Conditions For No Horn Baseline Rotor
I_ ¢¢ Ctlo C t
0.15 3.0_ 5.0 r 7.0 0.0762 0.0070.20 2.0, 4.0, 6.0 0.0762 0.0070.20 2.5, 4.5, 6.5 0.0871 0.008
The results showed that the rotor was, on an average, approximately 2 dB louderthan the baseline rotor with the control horns, in the BVI cases acquired here. Thisresult tends to support the second theory, that the vortex structure was morediffused with the control horn. Flow visualization was performed during these runsand recorded on video tape. The results were inconclusive in supporting eithertheory. Further studies however, of blade pressures and acoustic time histories willbe required to draw any definitive conclusions.
5.16 Removal of Model
The no control horn rotor configuration was the last configuration tested. Theblades were removed from the hub, and a final check calibration performed onbalance normal force. The results matched those taken previously during the testprogram. The model was removed from the test section in several majorcomponents. The instrumentation was removed from the control room by acombined crew of NASA and MDHS personnel.
6.0 Test Results
Data was acquired over a period of five weeks from 5 February to 15 March. Asummary of all data points, i.e. with data acquired by the HP data system andstored in the ASAP database, and runs, i.e. rotor turning, is shown in Appendix B.This includes the respective test dates, test configuration and objective or camphase (in degrees) as applicable. Initial checkout, taros, etc. were conducted up torun 70. The number of data points per segment of runs for each cam, and the totalnumber of data points and run time per cam are also shown. In total 4886 datapoints and 81:02 hours of run time were accumulated in the tunnel. Note that 50runs with a total run time of 17:07 hours were conducted during integration testingat the whirl tower in Mesa.
A summary of all runs conducted in the tunnel is shown in the run log, Appendix B.This includes the date, run number, start and end time of the run, the time per run(rotor turning), and the total cumulative run time in the tunnel. Additionalinformation is listed for the data runs (71 through 156, total of 66:34 hours).Maintenance actions and comments, and the cumulative run time for the cam
37

follower bearings (CFB) are listed. This is followed by the cable log which showswhen and on which hub arm a flap actuation cable failed. Last, the cam log showsthe cumulative time per cam and phase value for each run.
Complete listings of measured and derived data, and of all data points, inchronological order, including condition number, test point number, description oftest condition, as well as recorded values for the rotor speed (rpm), advance ratio
(vor), corrected shaft angle of attack (alfsc - deg), thrust coefficient/solidity (ct/_),and tip mach number (tipm) are also included in Appendix B.
6.1 Stand Shake Test Data
A ground vibration survey (GVS) of the MDHS Large Scale Test Rig mounted in theNASA Langley 14x22 Foot Subsonic Wind Tunnel was conducted to determine thedynamic characteristics of the rotor support. Specifically the objectives were:
1. Determine test stand modal frequencies, damping, and mass as well asmode shapes for use in an aeromechanical stability (ground and airresonance) analysis of the coupled rotor/support system.
2. Determine test stand modes within the range of 1 to 100 Hz to identifypossible loads and vibration problems at rotor speed multiples.
The test article consisted of the MDHS Large Scale Test Rig which was bolted tothe NASA Langley 14- by 22-Foot Subsonic Tunnel Cart 1, mounted in the forwardbay. The complete active flap rotor hub, control system, mast and standpipe wereinstalled, except for the blades, pitch links, and slip ring assembly. In place of theblades, four weights of approximately 3.44 pounds each were bolted to the hubarms. The test stand consisted of the rotor balance system, gearbox, motor, and teststand sled. No fairings were installed on the model. The drive system was installedwith all flexures and couplings but without a motor lockout device. The test standwas mounted on the clamshell support normally used for the wind tunnel sting.
The shake test was conducted using a single input and recording multiple outputs.Lateral or longitudinal force inputs were provided by a hydraulic actuator over afrequency range of 1 to 100 Hz (including 5/rev) at a force level of 100 poundspeak-to peak. Using a 4 foot long rod and load cell, the shaker was connected tothe test stand at the upper end of the auxiliary hub (4.5 inch below the hub plane).On the other end, the shaker was attached to a large mass of 2500 pounds, whichwas suspended by a 10 to 12 feet long chain. This large mass assured that theactuator output was effectively transmitted to the test stand. The length of the cable,together with the value of mass, provided enough frequency separation betweenthe pendulum mode and the lowest test stand frequency of interest. Figure 16shows the test setup.
An HP signal generator was used to provide a stepped sine sweep input to theactuator. Frequency steps were chosen at 0.01 Hz in the 1 to 30 Hz range, and at0.1Hz in the 30 to 100 Hz range. Instrumentation used during the shake test (seeTable 25) consisted of the load cell, an accelerometer located on the hub (3 inchabove hub plane) and oriented in the direction of the applied load, the balance roll
38
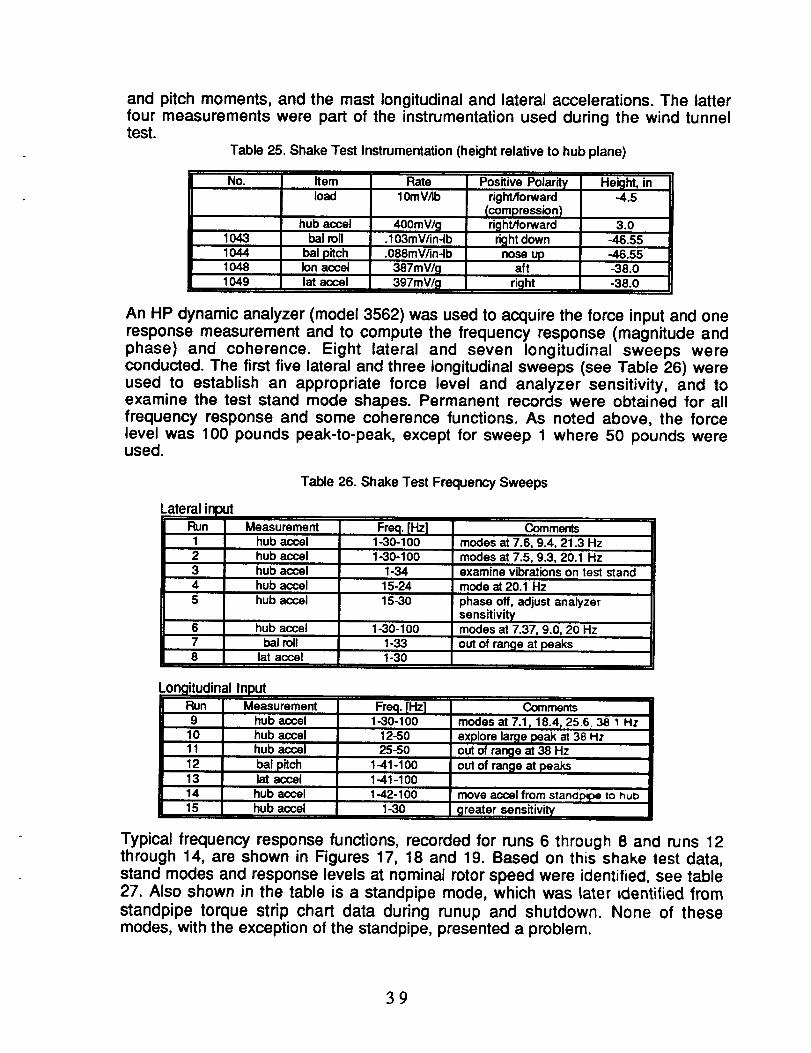
and pitch moments, and the mast longitudinal and lateral accelerations. The latterfour measurements were part of the instrumentation used during the wind tunneltest.
Table 25. Shake Test Instrumentation (height relative to hub plane)
No. Item Rate Positive Polarity Height, inload 10mV/lb right/forward -4.5
(compression}hub accel 400mV/g . right/forward 3.0
1043 bal roll .103mV/in-lb right down -46.551044 bal pitch .088mV/in-lb nose up -46.551048 Ion accel 387mV/g aft -38.01049 lat accel 397mV/g . right -38.0
An HP dynamic analyzer (model 3562) was used to acquire the force input and oneresponse measurement and to compute the frequency response (magnitude andphase) and coherence. Eight lateral and seven longitudinal sweeps wereconducted. The first five lateral and three longitudinal sweeps (see Table 26) wereused to establish an appropriate force level and analyzer sensitivity, and toexamine the test stand mode shapes. Permanent records were obtained for allfrequency response and some coherence functions. As noted above, the forcelevel was 100 pounds peak-to-peak, except for sweep 1 where 50 pounds wereused.
Table 26. Shake Test Frequency Sweeps
Lateral inputRun Measurement Freq. [Hz]
1-30-100Comments
1 hub accel modes at 7.6, 9.4, 21.3 Hz2 hub accel 1-30-100 modes at 7.5, 9.3, 20.1 Hz3 hub accel 1-34 examine vibrations on test stand4 hub accel 15-24 mode at 20.1 Hz5 hub accel 15-30
hub accelbal roll
lat accel
LoncjitudinalInputMeasurement
hub accelRun
1-30-1001-331-30
9Freq. [Hz]
1-30-10010 hub accel 12-5011 hub accel 25-5012 1-41-100131415
halp_chlat accelhub accel
phase off, adjust analyzersensitivitymodes at 7.37, 9.0, 20 Hz
out of range at peaks
hub accel
1-41-1001-42-10o
1-30
Comments
modes at 7.1, 18.4, 256.38 1 Hz
explore large peak at 38 Hzout of rar_e at 38 Hzout of rankle at Peaks
move accel from standpipe to hubgreater sensitivity
Typical frequency response functions, recorded for runs 6 through 8 and runs 12through 14, are shown in Figures 17, 18 and 19. Based on this shake test data,stand modes and response levels at nominal rotor speed were identified, see table27. Also shown in the table is a standpipe mode, which was later identified fromstandpipe torque strip chart data during runup and shutdown. None of thesemodes, with the exception of the standpipe, presented a problem.
39
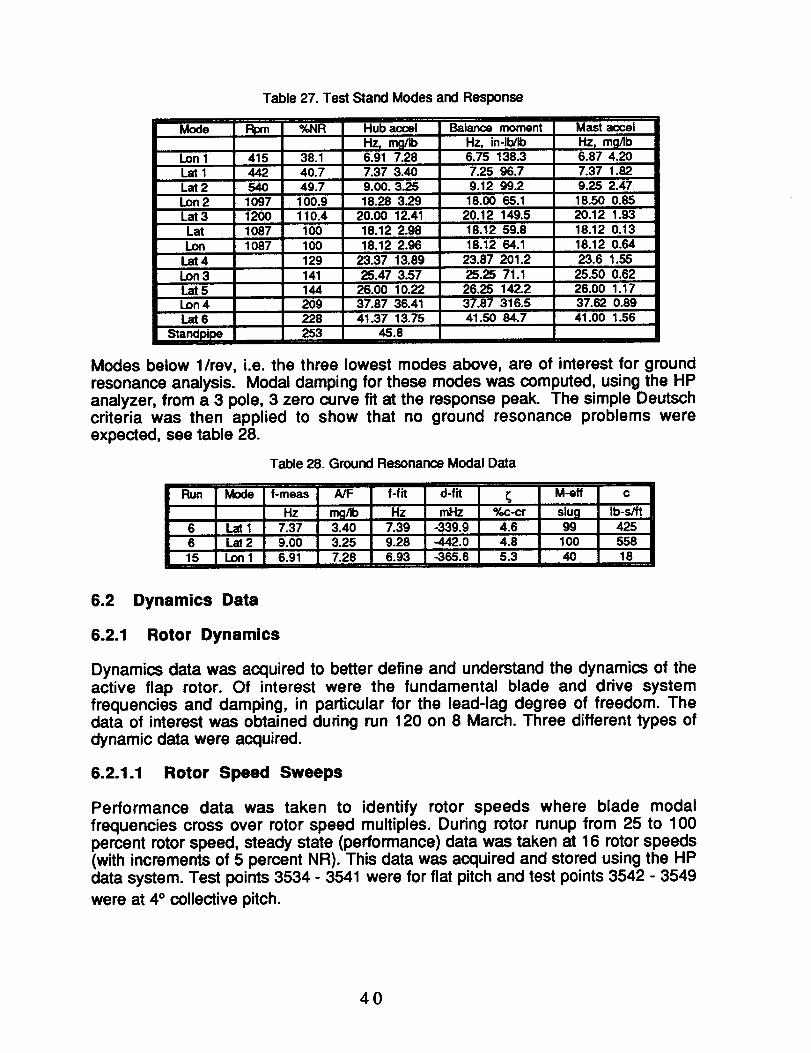
Table 27. Test Stand Modes and Response
Mode
Lon 1LatlLat 2
Lon 2Lat3Lat
LonLat 4Lon 3Lat 5Lon 4Lat 6
Standpipe
Rp_
4154425401097120010871087
_/_IR
38.140.749.7
100.9110.4
100100129
141
Hub accel Balance moment
18.28 3.2920.00 12.41
Hz, in-lb/Ib
Mast accel
Hz_ mg/Ib6.87 4.206.75 138.3
7.37 3.40 7.25 96.7 7.37 1.829.00. 3.25 9.12 99.2 9.25 2.47
18.00 65.1 18.50 0.85
18.12 2.9818.12 2.96
20.12 149.518.12 59.818.12 64.1
23.87 201.225.25 71.1
23.37 13.8925.47 3.57
20.12 1.9318.12 0.1318.12 0.64
23.6 1.5525.50 0.62
144 26.00 10.22 26.25 142.2 26.00 1.17209 37.87 36.41 37.87 316.5 37.62 0.89228 41.37 13.75 41.50 64.7 41.00 1.56253 45.8
Modes below l/rev, i.e. the three lowest modes above, are of interest for groundresonance analysis. Modal damping for these modes was computed, using the HPanalyzer, from a 3 pole, 3 zero curve fit at the response peak. The simple Deutschcriteria was then applied to show that no ground resonance problems wereexpected, see table 28.
Table 28. Ground Resonance Modal Data
6.2 Dynamics Data
6.2.1 Rotor Dynamics
Dynamics data was acquired to better define and understand the dynamics of theactive flap rotor. Of interest were the fundamental blade and drive systemfrequencies and damping, in particular for the lead-lag degree of freedom. Thedata of interest was obtained during run 120 on 8 March. Three different types ofdynamic data were acquired.
6.2.1.1 Rotor Speed Sweeps
Performance data was taken to identify rotor speeds where blade modalfrequencies cross over rotor speed multiples. During rotor runup from 25 to 100percent rotor speed, steady state (performance) data was taken at 16 rotor speeds(with increments of 5 percent NR). This data was acquired and stored using the HPdata system. Test points 3534 - 3541 were for flat pitch and test points 3542 - 3549
were at 4 ° collective pitch.
4O
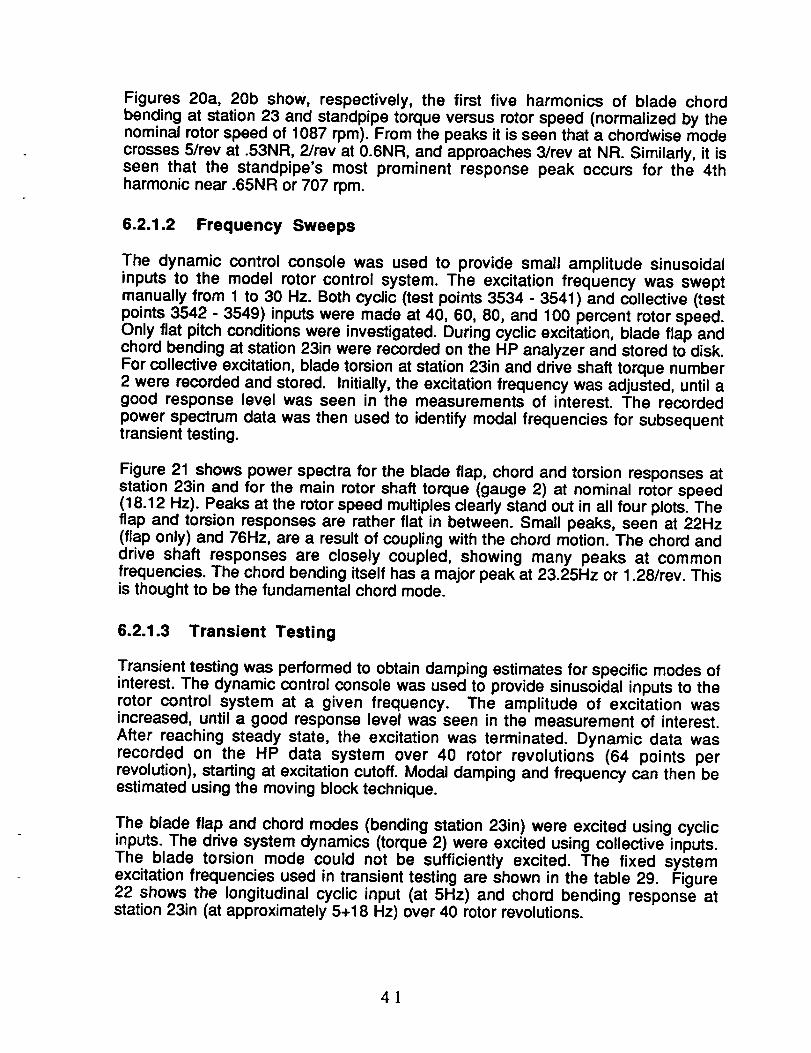
Figures 20a, 20b show, respectively, the first five harmonics of blade chordbending at station 23 and standpipe torque versus rotor speed (normalized by thenominal rotor speed of 1087 rpm). From the peaks it is seen that a chordwise modecrosses 5/rev at .53NR, 2/rev at 0.6NR, and approaches 3/rev at NR. Similarly, it isseen that the standpipe's most prominent response peak occurs for the 4thharmonic near .65NR or 707 rpm.
6.2.1.2 Frequency Sweeps
The dynamic control console was used to provide small amplitude sinusoidalinputs to the model rotor control system. The excitation frequency was sweptmanually from 1 to 30 Hz. Both cyclic (test points 3534 - 3541) and collective (testpoints 3542 - 3549) inputs were made at 40, 60, 80, and 100 percent rotor speed.Only fiat pitch conditions were investigated. During cyclic excitation, blade flap andchord bending at station 23in were recorded on the HP analyzer and stored to disk.For collective excitation, blade torsion at station 23in and drive shaft torque number2 were recorded and stored. Initially, the excitation frequency was adjusted, until agood response level was seen in the measurements of interest. The recorded
power spectrum data was then used to identify modal frequencies for subsequenttransient testing.
Figure 21 shows power spectra for the blade flap, chord and torsion responses atstation 23in and for the main rotor shaft torque (gauge 2) at nominal rotor speed(18.12 Hz). Peaks at the rotor speed multiples clearly stand out in all four plots. Theflap and torsion responses are rather flat in between. Small peaks, seen at 22Hz(flap only) and 76Hz, are a result of coupling with the chord motion. The chord anddrive shaft responses are closely coupled, showing many peaks at commonfrequencies. The chord bending itself has a major peak at 23.25Hz or 1.28/rev. Thisis thought to be the fundamental chord mode.
6.2.1.3 Transient Testing
Transient testing was performed to obtain damping estimates for specific modes ofinterest. The dynamic control console was used to provide sinusoidal inputs to therotor control system at a given frequency. The amplitude of excitation wasincreased, until a good response level was seen in the measurement of interest.After reaching steady state, the excitation was terminated. Dynamic data wasrecorded on the HP data system over 40 rotor revolutions (64 points perrevolution), starting at excitation cutoff. Modal damping and frequency can then beestimated using the moving block technique.
The blade flap and chord modes (bending station 23in) were excited using cyclicinputs. The drive system dynamics (torque 2) were excited using collective inputs.The blade torsion mode could not be sufficiently excited. The fixed systemexcitation frequencies used in transient testing are shown in the table 29. Figure22 shows the longitudinal cyclic input (at 5Hz) and chord bending response atstation 23in (at approximately 5+18 Hz) over 40 rotor revolutions.
41

Table29.Frequenciesusedin transienttesting
%NR Rap Chord D/S40 4.25 14.560 3.70 5.4,10.9 16.480 3.75 3.1,8.1 17.9100 3.80 6.7,5.0
6.2.1.4 Standpipe Response
During rotor runup and shutdown, several peaks in the standpipe torque wereobserved on the strip chart. A fourier analysis of this measurement at nominal rotorspeed indicated a mode at 47.5 Hz or 2.6/rev. Consistent with this, the highestresponse peak always occurred around 680 rpm rotor speed. This corresponds tothe crossover of the standpipe torsion mode with 4/rev. From the strip charts, amodal frequency of 45.8 Hz or 2.5/rev was determined. Smaller responses wereobserved around 340 rpm (crossover with 8/rev) and near 910 rpm (crossover with3/rev). This mode did not present a problem, as long as the 680 rpm range wascrossed rapidly, except for testing with the 3/rev vibration reduction cam.
6.2.2 Vibration Reduction
Simulations have shown that a trailing edge flap can also be effective in reducingvibratory loads. Vibration reduction was therefore added to the test program as athird objective. Two vibration reduction cams were built, drawing on previous
simulation results. Both cams had a cosine profile, one with 2 ° amplitude and 3/rev
frequency, the other with 4° amplitude and 5/rev frequency.
In order to facilitate the data reduction for this objective, additional derivedparameters were defined and added to the database. The 4/rev and 8/rev vibratorycomponents of three hub forces and pitch and roll moments are added vectoriallyto form the vibration indices J4PRT and J8PRT, respectively. The 4/rev and 8/revindices are then combined, using a relative weighting from ADS-27, to form theoverall vibratory hub load index JRT. The mast longitudinal and lateralaccelerations are similarly combined to from J4MST, J8MST, and JMST.
J4PRT =
J8PRT =
(DRAGRT2,,, + SIDERTi4p + LIFTRT24p + (ROLLRT2_ +PITCHRT2,p)/144 )1/2
(DRAGR'I'28p + SIDER'FZsp. LIFTR_ep + (ROLLRT2ep +PITCHRT2sp)/144 )""
JRT
J4MST
J8MST
= (J4PRT 2 + 0.486 J8PR_) 1/2
= (MST ACCL LNG24p + MST ACCL LAT24p)1/2
= (MST ACCL LNG28p + MST ACCL LAT2sp)1/2
JMST = (J4MST 2 + 0.486 J8MST2) 1/2
42

As noted above, the standpipe had a torsion mode near 2.5/rev, well separatedfrom 3/rev. However, the 3/rev vibration reduction cam caused sufficient torsion andcoupled bending motions of the standpipe, such that the standpipe would makecontact with its centering bearing. As a result, bearing temperature rose veryrapidly and exceeded limits when running at nominal rotor speed. Running with thenull cam confirmed that the bearing temperature rise was caused by the 3/rev cam.Any further running with this cam had to be abandoned and only limited hovercheckout test data was obtained.
Figure 23 shows the rotor balance pitch moment frequency response for the
baseline case and with the flap moving at 4 ° and 5/rev (5P4A cam). Significantreductions in the response at 4, 5, and 8/rev are evident. Similarly, Figure 24shows the balance pitch moment time histories for the baseline and active control
case over four rotor revolutions. Again, substantial reductions in amplitudes areseen.
6.2.3 Performance Improvement
The application of active control to improve rotor performance is an attractiveconcept. In particular, 2/rev inputs have been investigated, to improve aerodynamicperformance and alleviate stall. However, this type of input cannot be generatedthrough a swashplate on rotors with four or more blades. In contrast, the active flaprotor provides control inputs to the trailing edge flap in the rotating system and canthus be used to apply inputs at any arbitrary harmonic.
Simulations with the CAMRAD/JA code showed that 2/rev inputs to the flap could
improve rotor performance. This would occur at high thrust (Ct=.009, _=.25) and at
high speed (Ct=.008, 1_=.40). Two cams were built to investigate possibleperformance improvements in the tunnel. Both cams have a 2/rev profile withamplitudes of 3 and 6°; they are denoted 2P3A and 2P6A cams.
In setting rotor trim conditions and measuring rotor performance accurately, twoderived parameters are of importance. The nondimensional propulsive force X is
X= Cx _: _: f2 4A b
a 2p.
Cx DRAGNH
where _ pA (o_)2a
with f is the equivalent flat plate drag area and ,_ is the blade area. The equivalentlift to drag ratio is
L
D1.688 * VKTS * LIFTNH
HPNH * 550 + 1.688 * VKTS * DRAGNH
43
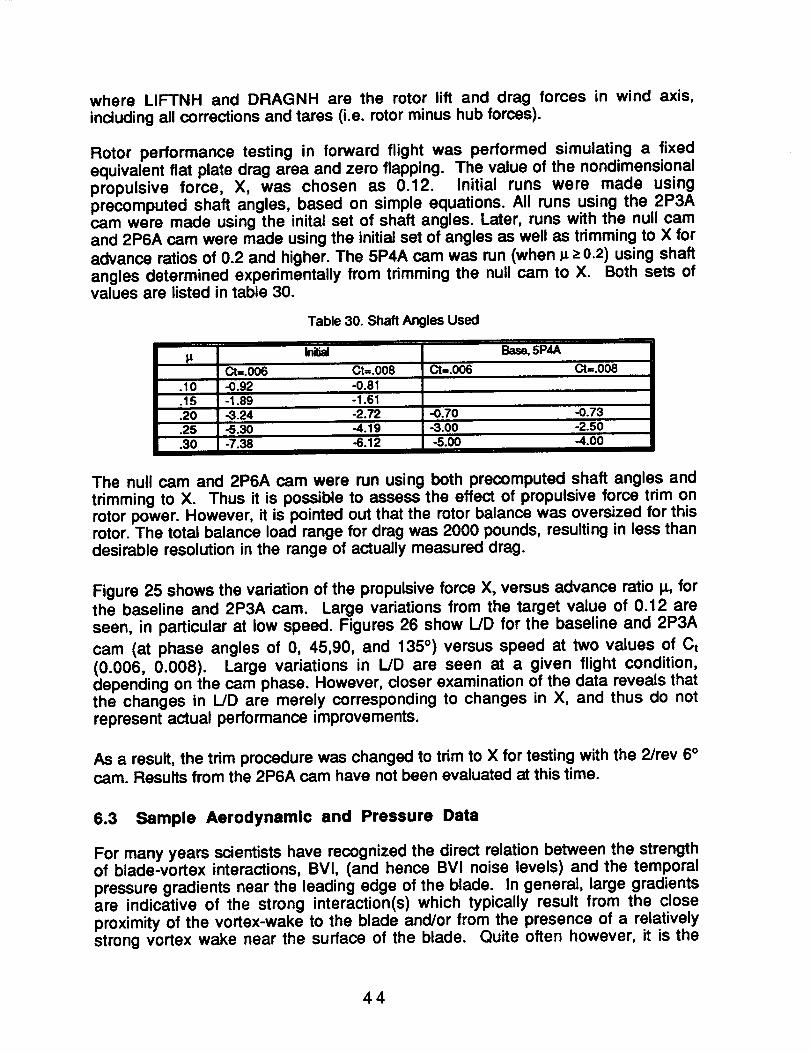
where LIFTNH and DRAGNH are the rotor lift and drag forces in wind axis,including all corrections and tares (i.e. rotor minus hub forces).
Rotor performance testing in forward flight was performed simulating a fixedequivalent fiat plate drag area and zero flapping. The value of the nondimensionalpropulsive force, X, was chosen as 0.12. Initial runs were made usingprecomputed shaft angles, based on simple equations. All runs using the 2P3Acam were made using the inital set of shaft angles. Later, runs with the null camand 2P6A cam were made using the initial set of angles as well as trimming to X for
advance ratios of 0.2 and higher. The 5P4A cam was run (when _ > 0.2) using shaftangles determined experimentally from trimming the null cam to X. Both sets ofvalues are listed in table 30.
Table 30. Shaft Angles Used
k_ Base, 5P4A14
Ct=.006 Ct=.008 Ct=.006 Ct=.O08
.10 -0.92 -0.81-1.61
.25
.30
.15 -1.89
.20 -3.24 -2.72 -0.70 -0.73-5.30 -4.19 -3.00 -2.50
-5.00 -4.00-7.38 -6.12
The null cam and 2P6A cam were run using both precomputed shaft angles andtrimming to X. Thus it is possible to assess the effect of propulsive force trim onrotor power. However, it is pointed out that the rotor balance was oversized for thisrotor. The total balance load range for drag was 2000 pounds, resulting in less thandesirable resolution in the range of actually measured drag.
Figure 25 shows the variation of the propulsive force X, versus advance ratio I_, forthe baseline and 2P3A cam. Large variations from the target value of 0.12 areseen, in particular at low speed. Figures 26 show L/D for the baseline and 2P3A
cam (at phase angles of 0, 45,90, and 135 °) versus speed at two values of Ct(0.006, 0.008). Large variations in L/D are seen at a given flight condition,depending on the cam phase. However, closer examination of the data reveals thatthe changes in L/D are merely corresponding to changes in X, and thus do notrepresent actual performance improvements.
As a result, the trim procedure was changed to trim to X for testing with the 2/rev 6 °cam. Results from the 2P6A cam have not been evaluated at this time.
6.3 Sample Aerodynamic and Pressure Data
For many years scientists have recognized the direct relation between the strengthof blade-vortex interactions, BVI, (and hence BVI noise levels) and the temporal
pressure gradients near the leading edge of the blade. In general, large gradientsare indicative of the strong interaction(s) which typically result from the closeproximity of the vortex-wake to the blade and/or from the presence of a relativelystrong vortex wake near the surface of the blade. Quite often however, it is the
44

differential pressures or the temporal gradients of the differential pressures, ratherthan the pressures themselves, near the leading edge of the blade that are used toassess the intensity of BVI. These quantities also represent the blade lift or the timevariation of the blade lift during the blade-vortex encounters. In this section,discussion of the acquired surface pressure data near the leading edge of theblade (x/C=0.03) at four radial stations for the flapped model rotor as a function ofthe trailing edge flap schedule (peak deflection angle, phase shift in azimuth), tippath plane angle, advance ratio and blade thrust will be presented. Recall that thefour radial stations with pressure instrumentation are located atRbar--PJFItip=0.7522, 0.8214, 0.9105, 0.9836. The first radial station is located justinboard of the inner unflapped/flapped blade juncture (i.e., on a blade section withno flap). The second, third and fourth radial stations are located on the flappedsection of the rotor at the following positions; just outboard of the inner flapjuncture, mid span and just inboard of the outer flap juncture. For contrast, whereapplicable, results for the baseline model rotor (i.e., with the flap in the neutralundeflected position) will also be presented.
6.3.1 Advancing Side BVI
6.2.1.1 Effects Of Trailing Edge Flap Deployment
Figure 27 depicts the azimuthal variations of the measured upper (kulite # 1, 3, 5,7) and lower (kulite # 2, 4, 6, 8) surface pressures (in Pascal) near the leadingedge of the blade (x/C=0.03) at the four blade radial stations Rbar= 0.7522, 0.8214,0.9105, 0.9836 respectively. For this case, the wind tunnel test conditions are:
advance ratio 1_=0.149, tip path plane angle 0_=5° aft and Ct/_ = 0.0764. As seen,
the presence of the advancing blade BVI characterized by the rapid, and
sometimes impulsive, fluctuation in the surface pressures is evident in the 40 °-80°azimuth range. On the retreating side, similar interactions can be seen in the
260-300 azimuth range with the strongest interaction occurring in the vicinity of the
280 ° azimuth. In Figure 28, we illustrate the measured blade surface pressures forthe flapped rotor utilizing the trailing edge flap schedule with a peak amplitude of-12.5 (the minus sign indicates a flap up position) degrees and a -20 ° azimuthalshift from the nominal position, see Figure 29. Clearly, with the exception of someweak interactions remaining between the 60 and the 800 azimuthal positions, allthe previously observed advancing blade interactions seen in Figure 27 have beenreduced in strength or completely eliminated. On the retreating side, a singleinteraction, rather than the multiple interactions seen in Figure 27, is seen near the300 o azimuth position. An alternative representation of the measured surfacepressures shown in Figures 27 and 28 is given in Figures 30 and 31 which depict,respectively, the differential pressures (in KPa) at x/C=0.03 for the baseline and theflapped model rotors as a function of blade azimuth.
6.3.1.2 Effects Of The Peak Flap Deflection Amplitude
Figures 32-35 depict the calculated differential pressures, (Pu -Pl), using themeasured individual upper and lower surface pressures) for the baseline rotor andfor the flapped rotor with peak flap deflections of -12.50 , -17.50 and -20.00
45
respectively. For the flapped model rotors, a -10° phase shift in azimuth from thenominal flap schedules was used. For these cases, the advance ratio is 0.148, the
tip path plane angle o¢is 3 ° aft and Ct/a=0.076. As seen, with the increase in the
peak deflection amplitude, the character of the advancing BVI is also changed. Forexample, for the baseline configuration, the impulsiveness which is observed in theinteraction which occurs between the 600 and 800 azimuthal positions at all fourradial stations is reduced with the -12.50 peak flap deflection to a more gradualvariation at Rbar= 0.8214, 0.9105, 0.9836. At Rbar = 0.7522 and 0.8214, one canalso see some indication of BVI which may have resulted from a shift in the positionof the vortex wake and/or a change in the strength of the wake due to thedeployment of the flap. Unfortunately, with the absence of any detailed flowfieldmeasurements of the strength of the vortex wake and its position relative to theblade, one can only infer that a combination of both must have resulted in theseinteractions. With the -17.5 °, -20.0 o peak flap deflections, very little evidenceremains of the original BVI observed for the baseline rotor. However, in Figure 34at Rbar=0.8214, significant changes in the blade surface pressure levels areobserved. These changes are attributed to a possible erroneous reading of thelower surface pressures by kulite # 4 (see the pressure signal for kulite # 4 inFigure 35 at Rbar=0.8214). On the retreating side, increasing the amplitude of thedeflection seem to have no direct effect on the strength of the most dominant BVIwhich occurs near the 280 o azimuthal position. (Note the change in scale betweenthe figures)
For an advance ratio of 1_=0.2, Ct/o = 0.087 and tip path plane angles of 2.5 °, 4.5 °aft, similar blade pressure trends were observed for the unflapped and flapped
model rotor with -12.5 °, -17.5 ° and -20.0 ° peak deflections.
Figures 36-39 depict respectively the measured surface pressures for the baselinerotor and for the flapped rotor with peak flap deflections of - 12.5 °, -17.5 ° and -20.00respectively for a higher forward speed flight condition. For the flapped rotor
configurations, a -10 ° phase shift from the nominal flap schedules were applied.For these cases, the advance ratio I_ is 0.199, the tip path plane angle is 4 o aft and
Ct/a = 0.076. For the baseline rotor, the advancing blade BVI are evident between
the 20 and the 80 ° azimuthal positions at all four radial stations. For the flapped
rotor with -12.5 ° peak deflection, it is clear that re-enforcement (due to the increasein the slopes of the pressure time histories) of the advancing BVI have taken placeat Rbar = 0.7522, 0.8214 with the most dominant interaction taking place between
the 60 and the 80 ° azimuthal positions. At Rbar = 0.9105, 0.9836, a single
interaction is seen in the vicinity of the 50 ° azimuth position. Similarly, for the
flapped model rotor with a -17.5 ° peak deflection, the number of advancing BVIshas been reduced with an obvious increase in their intensity (note the change of
scale). This behavior is also seen for the flapped rotor with a -20.0 ° peakdeflection. Overall, the peak-to-peak amplitude of the measured pressure signalsseem to increase with the increase in the amplitude of the peak deflection.Therefore, for this flight condition, one would therefore expect the BVI noise levels
46
to increase relative to those of the baseline rotor (i.e., the BVI noise levels using the-20.0 ° peak deflection are higher than those using the -17.5, -12.5 ° peakdeflections and, of course, are even higher than those for the baseline rotor). Onthe retreating side, no evidence in the change of the number and/or intensity of theBVI can be seen as a function of the peak flap deflection angle.
6.3.1.3 Effects Of the Phase Shift In Azimuthal Flap Schedule
Figures 40-44 depict the calculated differential pressures (using the measuredindividual upper and lower surface pressures) for the baseline rotor and for the
flapped rotor with a peak flap deflection of -17.5 ° and 0, -5, -10, -20.0 ° azimuthalphase shift respectively relative to the predicted nominal flap schedule. For these
cases, the advance ratio is I_ - 0.199, the tip path plane angle o_ is 2.5 ° aft and
Ct/c=0.0865. For the baseline rotor, four BVI can be identified between the 0 and
80 ° azimuthal positions at Rbar=0.7522, 0.8214. For Rbar=0.9105, 0.9836, a more
dominant (due to its impulsiveness) BVI can be seen near the 600 azimuth position.
The retreating blade BVI can also be identified in the vicinity of the 300 ° azimuthposition. With the -17.50 flap deflection and zero phase shift, it is clear that thenumber of dominant BVIs on the advancing side at Rbar=0.7522, 0.8214 havebeen reduced to two. At Rbar=0.9105, 0.9836, the original impulsive BVI near the
60 ° azimuth can no longer be seen. For the -5 ° phase shift, with the exception of
the BVI seen at Rbar=0.7522 between the 60 and 80 ° azimuthal positions, noevidence of BVI can be seen at the other three radial blade stations. AtRbar=0.8214, the pressure levels are also significantly different from those of the
baseline rotor because of a possible malfunction of kulite # 4. For the -10 ° phaseshift, the character of the differential pressures at Rbar=0.7522, 0.8214 is quitesimilar with some indication of BVI presence. The peak-to-peak amplitudes near
the 60 ° azimuth at Rbar=0.9105, 0.9836 are also slightly larger than those for the
-5 ° phase shift. Figures 41-44 also indicate that the strength of the retreating bladeBVI is insensitive to the phase shift in azimuth. This, of course, is expected sincethe implemented flap deployment schedules were meant to only influence theadvancing blade BVI by altering the strength of the vortex wake at its point ofgeneration and its trajectory as it convects by the blade.
For an advance ratio of 0.15, Ct/c = 0.076, reductions in the number of advancing
side BVIs were also seen for tip path plane angles of 3% 5 ° aft and peak flap
deflections of -12.5 ° , -17.5 ° and -20.0 ° . Similar reductions were also seen at an
advance ratio of 0.2 and a tip path plane angle of 3 ° aft. However, for a tip path
plane angle of 4 ° aft, though the number of advancing BVIs has also been reduced,their intensity was increased. This increase in intensity will undoubtedly beassociated with higher BVI noise levels.
47

6.3.2 Retreating Side BVI
Thus far, we have shown how to reduce the strength, or completely eliminate, theadvancing blade BVI. We have succeeded in achieving this goal by implementingflap schedules which affect the strength of the vortex wake at its generation azimuthand/or its trajectory and hence the blade-vortex separation distances at theinteraction azimuth. In this section, we present results where our goal was toinfluence, by reducing the strength or by completely eliminating, the retreatingblade BVI. To achieve this goal, one must also attempt to influence the strength ofthe vortex wake at its generation azimuth. Figures 45, 46 depict respectively themeasured upper and lower blade surface pressures for the baseline rotor and for
the flapped rotor (peak flap deflection=-17.5 °, azimuthal phase shift=+140°). In
these tests, the advance ratio is 0.149, the tip path plane angle o¢is equal to 3 ° aft
and Ct/o=0.0764. In Figure 45 one can clearly identify the retreating side BVI
which take place between the 260 ° and the 300 ° azimuthal positions with the
strongest interaction occurring near the 280 ° azimuth position, see the pressuresignals for kulites 5-8 at Rbar-0.9105 and 0.9836. With the deployment of thetrailing edge flap, Figure 46 indicates that there has been a considerable reductionin the strength of the retreating blade BVI by virtue of the significantly lowertemporal gradients as compared with those for the baseline rotor. The constantreading provided by kulite # 4 on the lower surface of the blade at Rbar=0.8214 isan indication of a malfunction in the circuitry of the pressure transducer. On theadvancing side, note that there has been a slight increase in the intensity of the BVIwith the deployment of the flap (note the different pressure scales in Figures 45, 46.
Figures 47, 48 illustrate respectively the measured upper and lower surfacepressures for the baseline rotor and for the flapped rotor (peak flap deflection=-
17.5 °, azimuthal phase shift=+140°). For these tests, the advance ratio is 14=
0.199, the tip path plane angle o¢is equal to 2.5 ° aft and Ct/o=0.0764. As seen,
with the deployment of this flap schedule, the retreating side BVI at Rbar-0.7522,0.8214 and 0.9105 has been completely eliminated. However, a much weaker
retreating side BVI can be seen at Rbar=0.9836 near the 320 ° azimuth. This is in
contrast to the four much stronger interactions seen in the vicinity of the 300 °azimuth for the baseline rotor. On the advancing side, milder variations in thesurface pressures can be seen with the deployment of the trailing edge flap. Again,in Figure 48, the constant reading provided by kulite # 4 on the lower surface of theblade at Rbar-0.8214 is an indication of a malfunction in the circuitry of thepressure transducer.
For an advance ratio of 14= 0.2, Ct/o = 0.077, and tip path plane angles of 3 and 4°aft, significant reductions in the number, as well as intensity, of the retreating side
BVIs were observed for the flapped model rotor with +140 ° phase shift. In general,the observed reductions in the number of retreating side BVIs were accompaniedby minimal changes to the advancing side BVI.
48
6.4 Sample Acoustic Data
As discussed earlier, acoustic data were obtained using a traversing microphonearray (see section 4.4.1.1). The reduced acoustic data presented in this report isbased on the on-line data reduction techniques employed by NASA during thewind tunnel test. The microphone signals were digitized at a rate of 1024 16-bitsamples per rotor revolution, which corresponds to an approximate sample rate of18,200 samples per second. The acoustic time histories were acquired for a totalof 30 rotor revolutions for each of the 16 microphones of the traversing array. On-line data processing included ensemble-averaged time histories ensemble
averaged over 30 revolutions. Narrowband spectra for ensemble-averaged timehistory as well as single rotor revolution time history were generated. In addition,single rotor revolution spectra were averaged over 30 revolutions to obtainensemble-averaged spectra. It should be noted that while the ensemble-averagedspectra contain the rotor broadband noise component, it is filtered out in thespectra based on averaged time history.
In order to assess the overall BVI noise reduction achieved using the trailing edgeflap, the acoustic results are presented here in three formats. These are;
- noise contour plots (over the microphone traverse plane) usingthe BVI noise metric BVISPL, which is based on the sum ofthe energy contained in the narrowband spectra between the5th and the 40th harmonics (frequency range dominatedusually by BVI noise),
ensemble-averaged time histories and,
ensemble-averaged narrowband noise spectral data.
The BVISPL contour plots are based on the spectra of averaged time histories andtherefore do not include the rotor broadband noise component. These contourplots, however, show the effect of flaps on the harmonic BVI noise and its directivity.The averaged time histories and the ensemble-averaged narrowband spectra arepresented only for some of the microphones which are located at microphonetraverse station 9, as shown schematically in Figure 15. Since the locations ofthese microphones generally correspond to the max BVI lobe position, the acousticinformation furnished through these microphones is considered to be fairlyaccurate in assessing the effectiveness of the trailing edge flap in reducing therotor BVI noise. Because the reduced acoustic data presented here are from theon-line data, it was not possible to correct the variations in the Y-axis scale limitsbetween the different time history plots presented here.
6.4.1 Advancing Side BVI
6.4.1.1 Effect of Trailing Edge Flap Deployment
Figures 49a and 49b, show the contour plots respectively for the rotor baseline
and the flapped rotor with -12.5 ° peak flap deflection and -20 ° phase azimuthalshift from the predicted nominal schedule. The rotor operating conditions for this
49
case are; advance ratio, 1_=0.1488, tip path plane angle, o_=5 ° aft, and
Ct/c=0.0765. As shown, the flap deployment on the rotor advancing side reduced
the max BVl noise lobe by more than 5 dB. The corresponding BVlSPL values forthe rotor retreating side were reduced by a very small amount.
Figures 50a and 50b, illustrate the acoustic time histories for mics 9 to 12 (seeFigure 15) which are located on the rotor advancing side for the baseline and theflapped rotor respectively. Clearly, the time histories for the baseline rotor show astronger 4-per-rev impulsive BVl signal compared with the flapped rotor results.Also, despite of lack of significant reduction in amplitude of the signal between thebaseline and the flapped rotor, the BVl characteristics of the time histories for thebaseline are much more acoustically impulsive in nature.
Figures 51a and 51b, show the ensemble-averaged narrowband noise spectra atthe same microphone locations selected for the time history plots for the baselineand for the flapped rotor respectively. It is shown that the harmonic content of thenoise spectra for the baseline rotor is higher compared with the correspondingspectral data for the flapped rotor. For the baseline spectra data, the mid-rangefrequencies, where the BVl noise is normally dominated, is higher by as much as10 dB (maximum). Also, as shown in the spectra for the flapped rotor (Figure 51b),the sound pressure levels associated with the first few harmonics have beenincreased significantly (by 8-10 dB) for the flapped rotor relative to the baseline.The narrowband spectra also reveal that the flap deployment has increased the
high frequency (>3 kHz) broadband noise levels by about 2 to 4 dB. The increasein the noise levels in the first few harmonics for the flapped rotor could be due toan increase in low frequency unsteady airloads given the rotor trim conditionsremained unchanged relative to the baseline rotor. The broadband noise increasecould be due to the vortices shed from the separated flow behind the deflected flap.
Figures 52a, 52b and 53a, 53b show pressure time histories and spectral datarespectively for the baseline and flapped rotors at the retreating side microphonelocations (mics 1 4, see Figure 15). Clearly, the flap deployment on theadvancing side had very little influence on acoustic data at these microphonelocations.
Sample contour plots are also presented where the BVISPL was computed fromthe ensemble-averaged narrowband spectra and therefore contain the additionalrotor broadband noise component in the frequency range between the 5th and
40th harmonics. Figures 54a and 54b show the contour plots based on BVISPL
computed from ensemble-averaged narrowband spectra and spectra based onaveraged time history for the baseline rotor. Figures 55a and 55b show similarcontour plots for the flapped rotor with -12.5 ° peak flap deflection and nominalphase setting. The test conditions for these plots are; advance ratio, 1_=0.1987, tippath plane angle, o_=2.5° aft, and Ct/c=0.0868. As seen, on the advancing side, theinclusion of the broadband noise component has increased the max BVlSPL lobe
5O
by approximately 2 dB for the baseline and flapped rotors. However, no noticeablechange in the max BVI lobe on the retreating side is observed. Since, both thebaseline and the flapped rotor results increased by similar amounts, theassessment of the BVI noise reductions provided in this report is thus accurate inestablishing the effectiveness of the trailing edge flap in reducing the rotor BVInoise. In fact, a comparison of Figures 54a and 55a show noise reduction on theorder of 3 to 4 dB in the maximum BVl lobe even when the broadband noisecomponent is included in the BVISPL estimation. It should also be noted that thereare some test conditions where the flap deployment has increased BVl and thehigh frequency broadband noise levels, as will be discussed later.
6.4.1.2 Effect of Peak Deflection Amplitude
Figures 56a-c, show the BVISPL contour plots for the baseline and the flapped
rotor configurations (with peak flap deflections of -12.5 ° and -17.5 °) respectively.
For the flapped rotor with a peak deflection angle of -12.5 °, a-10 ° azimuthal phaseshift from the nominal flap schedule was used while for the -17.5 ° peak deflection,
an azimuthal phase shift of -5 ° from the nominal schedule was used. For these
cases, the advance ratio is 1_=0.1492, tip path plane angle is _=3 °, and
Ct/(_=0.0773. As shown, there is a reduction of 3-4 dB in the maximum BVISPL for
the -12.5 ° schedule and about 1-2 dB for the -17.5 °. As for the retreating side,
there is virtually no significant changes in the BVlSPL values from those of thebaseline rotor for all the schedules presented here.
Figures 57a-c, illustrate the acoustic time histories for the microphone locations inthe vicinity of the maximum BVlSPL lobe (i.e., mics# 9 - 12; see Figure 15) for the
baseline and flapped (with -12.5 °, -17.5 ° peak flap deflections) rotors respectively.Clearly, the depicted time histories for the baseline are more impulsive in nature interms of pulse width and amplitude as compared to the flapped rotor data. Also, asshown in Figures 57b and 57c, there are some changes in pulse shape from semi-impulsive for the baseline rotor to a broader signal due to the flap deployment. Asa result, a reduction in the BVI noise in the mid-range frequency as observed in thenoise spectra as depicted in the Figures 58a-c. From these noise spectra, it is alsoobserved that the rotor broadband noise levels were increased by as much as 4-5dB for the flapped rotor as compared to the baseline rotor. It shou_ be mentionedhere that it is not possible to provide any tangible technical d_scusslon pertaining tothe details of the broadband noise source(s) without performing further analyses.
For the test condition considered, the increase in the peak flap deflection angle didnot significantly affect the noise data, although from the contour plots, one can
deduce that the -12.5 ° flap deflection produced slightly larger BVl norse reductions
than the -17.5 ° flap deflection. This observation, however, is not lotally supportedby the limited spectral data shown.
5]
For completeness, in order to truly assess the effectiveness of all flap schedulesemployed in the wind tunnel test to reduce the rotor BVI noise, we now present aset of acoustic data for a test condition where flap deployment, in combination with
some azimuthal shift (e.g., -10 °) increased the BVI noise. Figures 59a-d illustrate
the contour plots for the baseline rotor and for the flapped rotor for peak flap
deflections equal to -12.5 °, -17.5 °, and -20 ° respectively. For these cases, the
advance ratio is 1[=0.199, the rotor shaft angle o¢= 4° aft and Ct/o--0.0764. As seen,the maximum BVI lobe on the rotor advancing side has increased by 3 to 10 dBdue to the deployment of the flap for all the flap. On the retreating side, with the
exception of the -17.5 ° schedule where the BVISPL actually increased by 4 dB,there was no significant changes in the BVI noise intensity for the flapped rotor.
Figures 60a-d depict the measured time histories for the baseline and the flapped
rotor (mics 9 - 12) with peak flap deflection of -12.5 °, -17.5 °, and -20 ° (azimuthal
phase shift of -10 °) respectively. Noting that the plot scales are different, all the
depicted time histories are impulsive in nature illustrating clearly 4-per-rev BVI typepulses. The peak- to- peak pressure values for all the flap schedules consideredhere are significantly higher. This confirms the adverse effects of the trailing edgeflap on the BVI noise attenuation (an average increase of 100%) for this particularrotor flight condition. Figures 61a-d illustrate the sound pressure level spectra forthe baseline and flapped rotors. As observed in these spectra, consistent with thetime histories and the contour plots, the harmonic content in the baseline data isdetectable up to 1200 Hz as compared to the 2000 Hz for the flapped rotor. Alsothe harmonic noise and broadband noise are significantly higher for the flappedrotor test cases. Overall, it is obvious that the flap deployment for this rotor flightcondition has adversely affected the BVI noise. Additional detailed analysis isneeded to determine the reasons behind the increase in BVI with flap deploymentfor this test condition.
6.4.1.3 Effect of the Phase Shift in Azimuthal Flap Schedule
Figures 62a-e, illustrate the contour plots respectively for the baseline and flapped
rotors with peak flap deflection of -17.5 ° and azimuthal phasing of 0 (nominal), -5 °,
-10 ° and -20 °. The test conditions for this data are; advance ratio, 1[=0.199, tip path
plane, o_=2.5 ° aft, and CUo=0.0896. It is shown that the flap deployment on theadvancing side reduced the max BVI noise lobe by 2 dB without any significant
effects on the retreating side BVI noise intensity. Shifting the cam from 0 ° to -20 °from the nominal, further reduced the max BVISPL noise lobes by 4 dB as well asreducing the max BVI lobe domain, see Figures 62b-e. Note that similar phasevariations in the use of higher harmonic control [7] have resulted in optimizing themaximum BVI noise reduction.
Figures 63a and 63b, depict the measured acoustic time histories for the baseline
and flapped rotor with -10 ° phase shift. The time histories are shown only for mics.
52
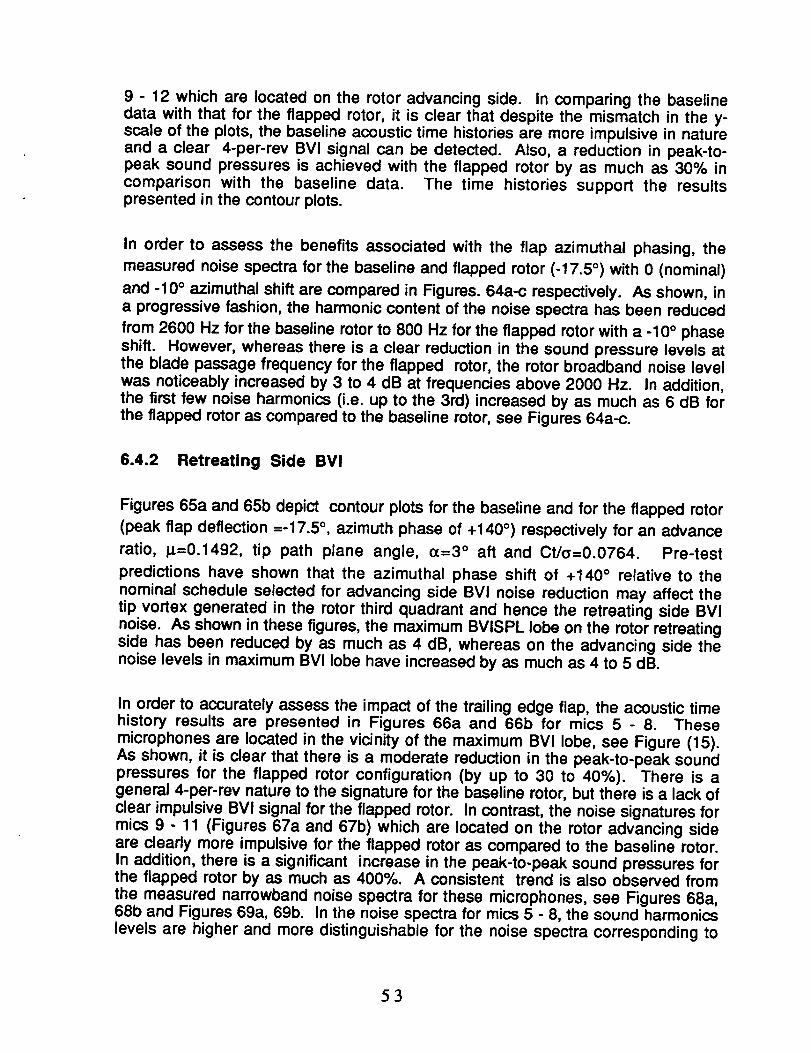
9 - 12 which are located on the rotor advancing side. In comparing the baselinedata with that for the flapped rotor, it is clear that despite the mismatch in the y-scale of the plots, the baseline acoustic time histories are more impulsive in natureand a clear 4-per-rev BVI signal can be detected. Also, a reduction in peak-to-peak sound pressures is achieved with the flapped rotor by as much as 30% incomparison with the baseline data. The time histories support the resultspresented in the contour plots.
In order to assess the benefits associated with the flap azimuthal phasing, the
measured noise spectra for the baseline and flapped rotor (-17.5 °) with 0 (nominal)
and -10 ° azimuthal shift are compared in Figures. 64a-c respectively. As shown, ina progressive fashion, the harmonic content of the noise spectra has been reduced
from 2600 Hz for the baseline rotor to 800 Hz for the flapped rotor with a -10 ° phaseshift. However, whereas there is a clear reduction in the sound pressure levels atthe blade passage frequency for the flapped rotor, the rotor broadband noise levelwas noticeably increased by 3 to 4 dB at frequencies above 2000 Hz. In addition,the first few noise harmonics (i.e. up to the 3rd) increased by as much as 6 dB forthe flapped rotor as compared to the baseline rotor, see Figures 64a-c.
6.4.2 Retreating Side BVI
Figures 65a and 65b depict contour plots for the baseline and for the flapped rotor
(peak flap deflection =-17.5 ° , azimuth phase of +140 °) respectively for an advance
ratio, 1u.=0.1492, tip path plane angle, ¢z=3 ° aft and Ct/c=0.0764. Pre-test
predictions have shown that the azimuthal phase shift of +140 ° relative to thenominal schedule selected for advancing side BVI noise reduction may affect thetip vortex generated in the rotor third quadrant and hence the retreating side BVInoise. As shown in these figures, the maximum BVISPL lobe on the rotor retreatingside has been reduced by as much as 4 dB, whereas on the advancing side thenoise levels in maximum BVI lobe have increased by as much as 4 to 5 dB.
In order to accurately assess the impact of the trailing edge flap, the acoustic timehistory results are presented in Figures 66a and 66b for mics 5 - 8. These
microphones are located in the vicinity of the maximum BVI lobe, see Figure (15).As shown, it is clear that there is a moderate reduction in the peak-to-peak soundpressures for the flapped rotor configuration (by up to 30 to 40%). There is ageneral 4-per-rev nature to the signature for the baseline rotor, but there is a lack ofclear impulsive BVI signal for the flapped rotor. In contrast, the noise signatures formics 9 - 11 (Figures 67a and 67b) which are located on the rotor advancing sideare clearly more impulsive for the flapped rotor as compared to the baseline rotor.In addition, there is a significant increase in the peak-to-peak sound pressures forthe flapped rotor by as much as 400%. A consistent trend is also observed fromthe measured narrowband noise spectra for these microphones, see Figures 68a,68b and Figures 69a, 69b. In the noise spectra for mics 5 - 8, the sound harmonicslevels are higher and more distinguishable for the noise spectra corresponding to
53

the baseline rotor versus the flapped rotor. It appears that the noise spectralocated on the rotor advancing side are also contaminated with somewhat strongerhigh frequency broadband noise. As a result, a typical broadband noise hump isclearly visible in the spectra for mics 9 - 12, Figures 69a and 69b.
Figures 70a and 70b, depict the contour plots for baseline and flapped rotors with
-17.5 ° flap schedule and +140 ° azimuth phase shift at an advance ratio 1_=0.1987,
tip path plane o¢=2.5° aft, and Ct/a=0.086. The overall trend observed for this rotor
test condition is very similar to the one observed for the lower Ct/a and the 0.1492advance ratio discussed above, where the max BVI noise level has been reducedon the rotor retreating side by about 6 dB and increased on the advancing side byabout 2 dB, see Figures. 70a and 70b. Figures 71a and 71b show the reductionsin the peak-to-peak sound pressures from those of the baseline rotor atmicrophones 5 - 8. Figures. 72a and 72b depict a clear 4-per-rev BVI noisesignature with an increase (by as much as 100%) in the peak-to-peak soundpressures for the flapped rotor on the advancing side. The correspondingnarrowband noise spectra (mics 5 - 12) for the baseline versus the flapped rotor issomewhat mixed with no noticeable reduction for mics 9 - 12 on the advancingside, but a more clear reduction for the mics 5 - 8 on the retreating side, seeFigures. 73a, 73b and Figures 74a, 74b.
In summary, the preceding discussion showed, through sample plots of measuredacoustic data, that the flap deployment, and in particular the peak deflection angleand azimuthal shift can produce BVI noise reductions of the order of 6 dB on theadvancing and retreating sides. However, it is often accompanied by increases inlow frequency harmonic noise and high frequency broadband noise. We have also
shown that for certain test conditions, most notably for 1_=0.2 and Ct/a=0.076, that
the BVI noise levels increased with the deployment of the flap. It should be notedthat most of the conclusions reached here are based on limited acoustic data. A
more comprehensive analysis of the data should be conducted to establish morecleady the effects of the trailing edge flap on BVI noise.
6.5. Effects Of Acoustic Cams On Power Required
The deflection of the flap for acoustic noise reduction, vibration reduction orperformance improvements added additional power requirements to the rotor.These requirements came from two sources, the mechanical power required tooperate the flap actuation mechanism, and the power required to overcome theaerodynamic drag of the deflected flap.
The torque required by the rotor and active flap actuation system was measuredwith strain gauges on the drive shaft. The cam for the flap actuation system washeld stationary by a nonrotating standpipe, which ran up the center of the driveshaft. The standpipe torque was measured with strain gauges and represented thetorque required to actuate the active flaps. The difference between the drive shafttorque and the standpipe torque was the torque delivered to the rotor itself.
54
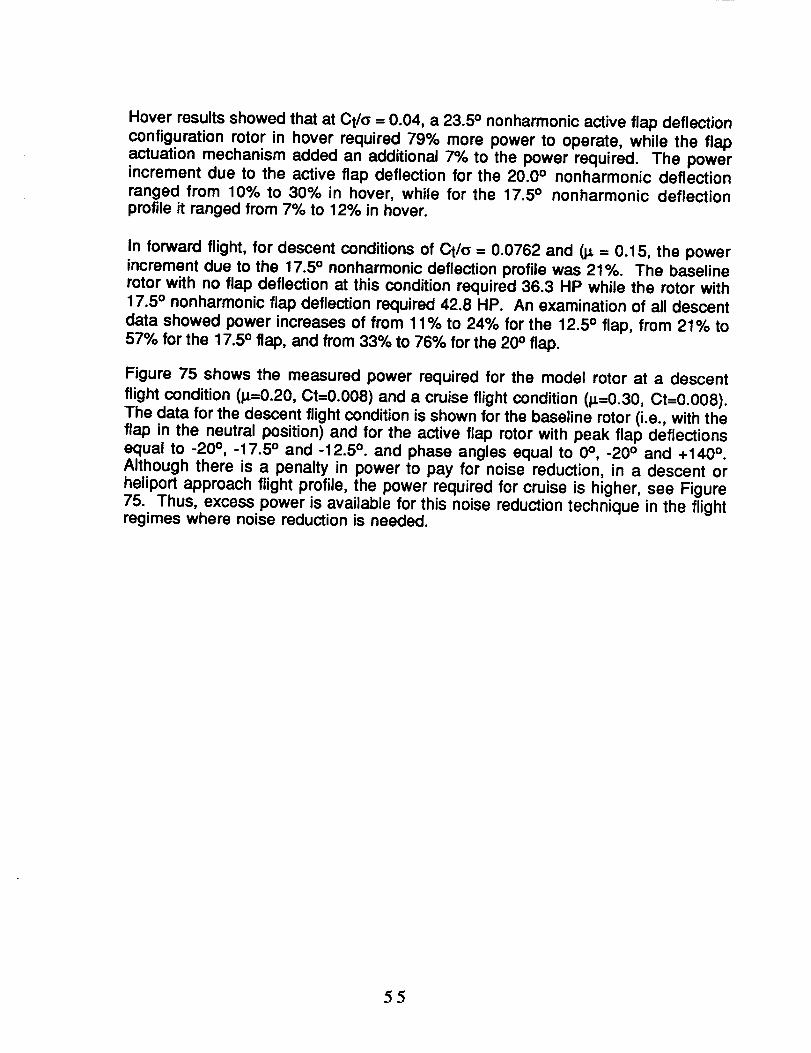
Hover results showed that at Ct/a = 0.04, a 23.5 ° nonharmonic active flap deflectionconfiguration rotor in hover required 79% more power to operate, while the flapactuation mechanism added an additional 7% to the power required. The powerincrement due to the active flap deflection for the 20.0 ° nonharmonic deflectionranged from 10% to 30% in hover, while for the 17.5 ° nonharmonic deflectionprofile it ranged from 7% to 12% in hover.
In forward flight, for descent conditions of Ct/o = 0.0762 and (1_= 0.15, the powerincrement due to the 17.5 ° nonharmonic deflection profile was 21%. The baselinerotor with no flap deflection at this condition required 36.3 HP while the rotor with17.5 ° nonharmonic flap deflection required 42.8 HP. An examination of all descent
data showed power increases of from 11% to 24% for the 12.5 ° flap, from 21% to57% for the 17.5 ° flap, and from 33% to 76% for the 20 ° flap.
Figure 75 shows the measured power required for the model rotor at a descent
flight condition (_=0.20, Ct=0.008) and a cruise flight condition (t_=0.30, Ct=0.008).The data for the descent flight condition is shown for the baseline rotor (i.e., with theflap in the neutral position) and for the active flap rotor with peak flap deflectionsequal to -20 °, -17.5 ° and -12.5 °. and phase angles equal to 0°, -20 ° and +140 °.Although there is a penalty in power to pay for noise reduction, in a descent orheliport approach flight profile, the power required for cruise is higher, see Figure75. Thus, excess power is available for this noise reduction technique in the flightregimes where noise reduction is needed.
55
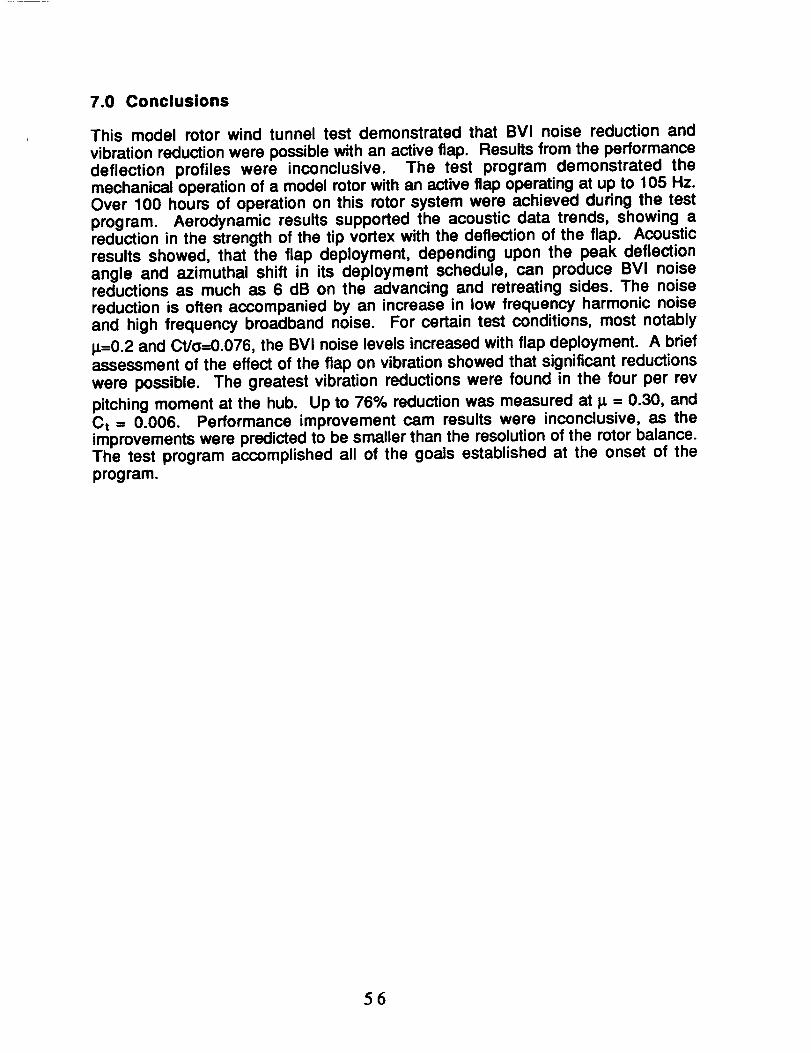
7.0 Conclusions
This model rotor wind tunnel test demonstrated that BVI noise reduction andvibration reduction were possible with an active flap. Results from the performancedeflection profiles were inconclusive. The test program demonstrated themechanical operation of a model rotor with an active flap operating at up to 105 Hz.Over 100 hours of operation on this rotor system were achieved during the testprogram. Aerodynamic results supported the acoustic data trends, showing areduction in the strength of the tip vortex with the deflection of the flap. Acousticresults showed, that the flap deployment, depending upon the peak deflection
angle and azimuthal shift in its deployment schedule, can produce BVI noisereductions as much as 6 dB on the advancing and retreating sides. The noisereduction is often accompanied by an increase in low frequency harmonic noiseand high frequency broadband noise. For certain test conditions, most notably
1_=0.2 and Ct/a=0.076, the BVI noise levels increased with flap deployment. A briefassessment of the effect of the flap on vibration showed that significant reductions
were possible. The greatest vibration reductions were found in the four per rev
pitching moment at the hub. Up to 76% reduction was measured at i_ - 0.30, andCt - 0.006. Performance improvement cam results were inconclusive, as theimprovements were predicted to be smaller than the resolution of the rotor balance.The test program accomplished all of the goals established at the onset of theprogram.
56
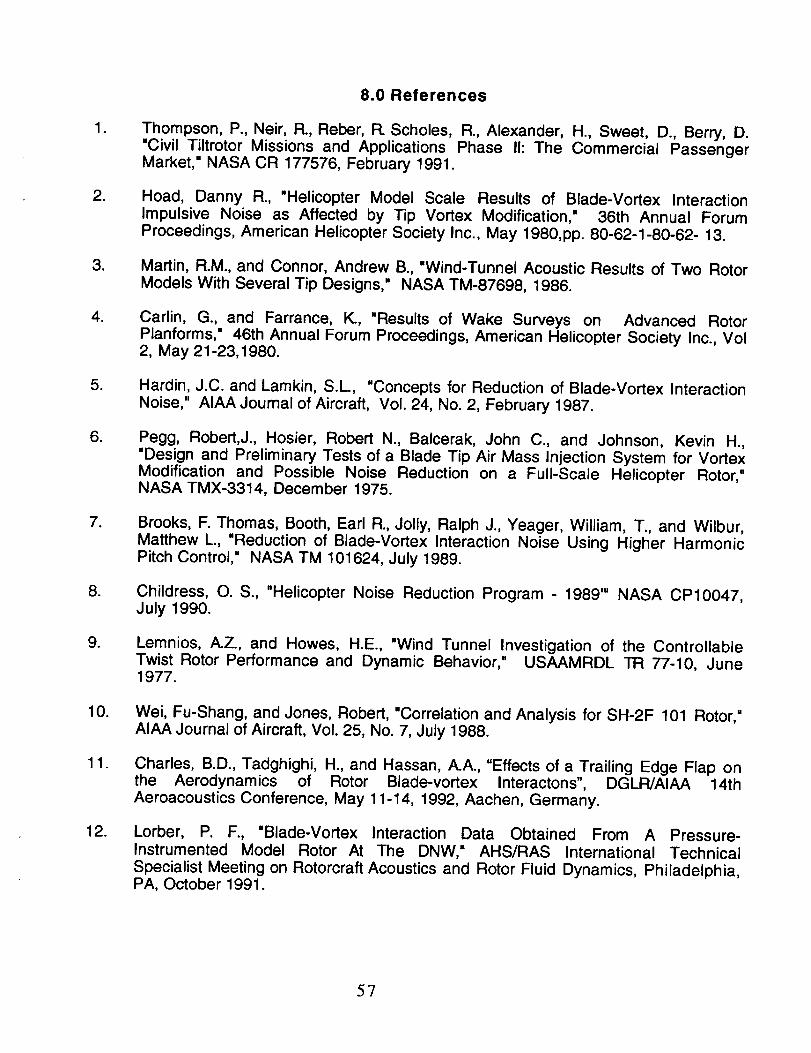
°
.
.
,
°
°
°
°
°
10.
11.
12.
8.0 References
Thompson, P., Neir, R., Reber, R. Scholes,"Civil Tiltrotor Missions and ApplicationsMarket," NASA CR 177576, February 1991.
R., Alexander, H., Sweet, D., Berry, D.Phase I1: The Commercial Passenger
Hoad, Danny R., "Helicopter Model Scale Results of Blade-Vortex InteractionImpulsive Noise as Affected by Tip Vortex Modification," 36th Annual ForumProceedings, American Helicopter Society Inc., May 1980,pp. 80-62-1-80-62- 13.
Martin, R.M., and Connor, Andrew B., "Wind-Tunnel Acoustic Results of Two RotorModels With Several Tip Designs," NASA TM-87698, 1986.
Carlin, G., and Farrance, K., "Results of Wake Surveys on Advanced RotorPlanforms," 46th Annual Forum Proceedings, American Helicopter Society Inc., Vol2, May 21-23,1980.
Hardin, J.C. and Lamkin, S.L., "Concepts for Reduction of Blade-Vortex InteractionNoise," AIAA Joumal of Aircraft, Vol. 24, No. 2, February 1987.
Pegg, Robert,J., Hosier, Robert N., Balcerak, John C., and Johnson, Kevin H.,"Design and Preliminary Tests of a Blade Tip Air Mass Injection System for VortexModification and Possible Noise Reduction on a Full-Scale Helicopter Rotor,"NASA TMX-3314, December 1975.
Brooks, F. Thomas, Booth, Earl R., Jolly, Ralph J., Yeager, William, T., and Wilbur,Matthew L., "Reduction of Blade-Vortex Interaction Noise Using Higher HarmonicPitch Control," NASA TM 101624, July 1989.
Childress, O. S., "Helicopter Noise Reduction Program - 1989'" NASA CP10047,July 1990.
Lemnios, A.Z., and Howes, H.E., "Wind Tunnel Investigation of the ControllableTwist Rotor Performance and Dynamic Behavior," USAAMRDL TR 77-10, June1977.
Wei, Fu-Shang, and Jones, Robert, "Correlation and Analysis for SH-2F 101 Rotor,"AIAA Journal of Aircraft, Vol. 25, No. 7, July 1988.
Charles, B.D., Tadghighi, H., and Hassan, A.A., "Effects of a Trailing Edge Flap onthe Aerodynamics of Rotor Blade-vortex Interactons", DGLR/AIAA 14thAeroacoustics Conference, May 11-14, 1992, Aachen, Germany.
Lorber, P. F., "Blade-Vortex Interaction Data Obtained From A Pressure-Instrumented Model Rotor At The DNW," AHS/RAS International TechnicalSpecialist Meeting on Rotorcraft Acoustics and Rotor Fluid Dynamics, Philadelphia,PA, October 1991.
5'7
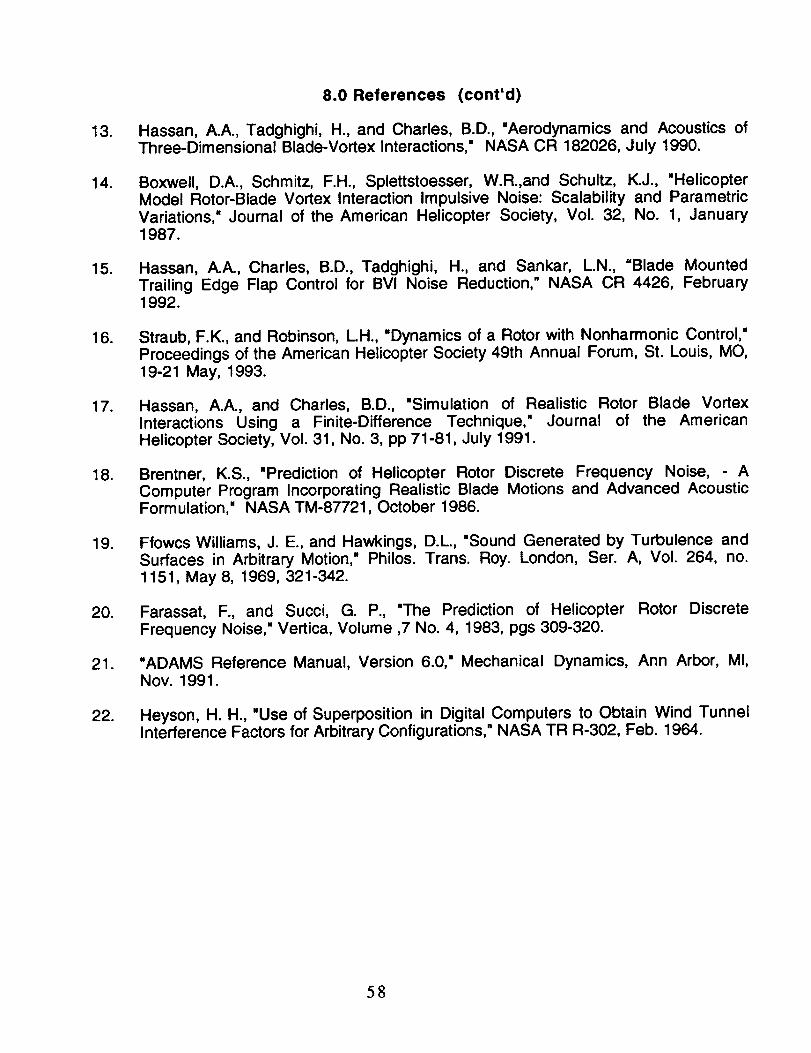
13.
14.
15.
16.
17.
18.
19.
20.
21.
22.
8.0 References (cont'd)
Hassan, A.A., Tadghighi, H., and Charles, B.D., "Aerodynamics and Acoustics ofThree-Dimensional Blade-Vortex Interactions," NASA CR 182026, July 1990.
Boxwell, D.A., Schmitz, F.H., Splettstoesser, W.R.,and Schultz, K.J., "HelicopterModel Rotor-Blade Vortex Interaction Impulsive Noise: Scalability and ParametricVariations," Journal of the American Helicopter Society, Vol. 32, No. 1, January1987.
Hassan, A.A., Charles, B.D., Tadghighi, H., and Sankar, L.N., "Blade MountedTrailing Edge Flap Control for BVl Noise Reduction," NASA CR 4426, February1992.
Straub, F.K., and Robinson, LH., "Dynamics of a Rotor with Nonharmonic Control,"Proceedings of the American Helicopter Society 49th Annual Forum, St. Louis, MO,19-21 May, 1993.
Hassan, A.A., and Charles, B.D., "Simulation of Realistic Rotor Blade VortexInteractions Using a Finite-Difference Technique," Journal of the AmericanHelicopter Society, Vol. 31, No. 3, pp 71-81, July 1991.
Brentner, K.S., "Prediction of Helicopter Rotor Discrete Frequency Noise, AComputer Program Incorporating Realistic Blade Motions and Advanced AcousticFormulation,' NASA TM-87721, October 1986.
Ffowcs Williams, J. E., and Hawkings, D.L., "Sound Generated by Turbulence andSurfaces in Arbitrary Motion," Philos. Trans. Roy. London, Ser. A, Vol. 264, no.1151, May 8, 1969, 321-342.
Farassat, F., and Succi, G. P., "The Prediction of Helicopter Rotor DiscreteFrequency Noise," Vertica, Volume ,7 No. 4, 1983, pgs 309-320.
"ADAMS Reference Manual, Version 6.0," Mechanical Dynamics, Ann Arbor, MI,Nov. 1991.
Heyson, H. H., "Use of Superposition in Digital Computers to Obtain Wind TunnelInterference Factors for Arbitrary Configurations," NASA TR R-302, Feb. 1964.
58
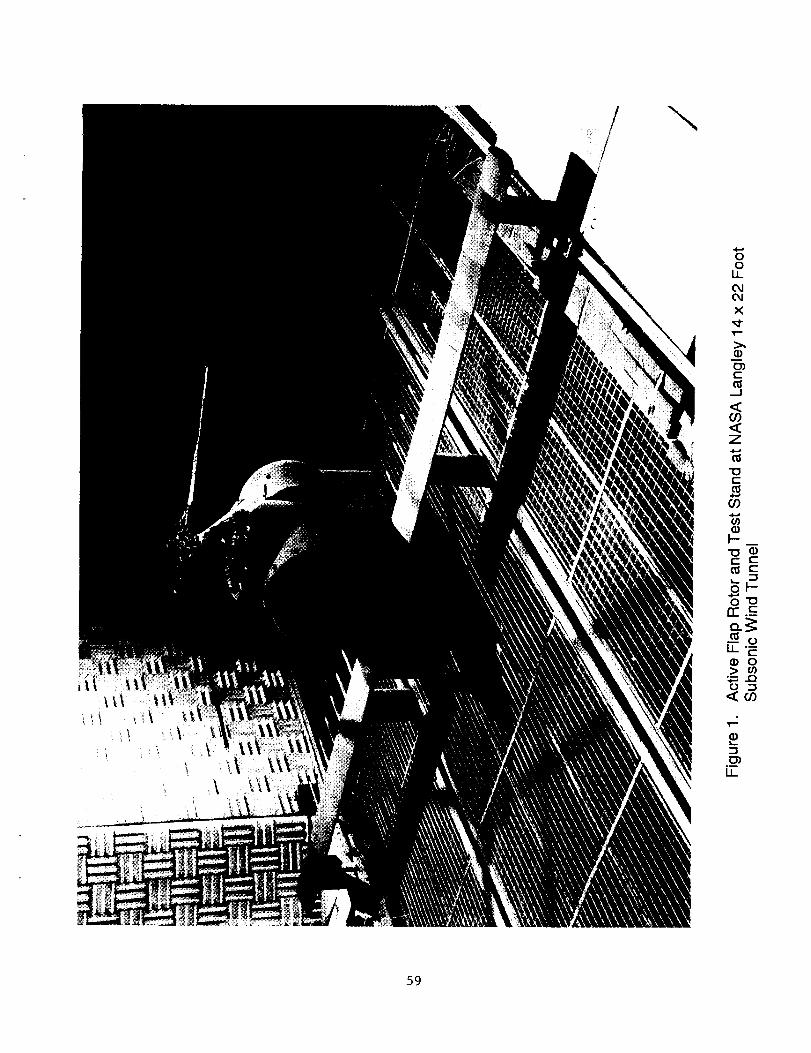
\
0o
LL
X
0")
<O_<Z
70c
k-70 •
CC
1.1_"_
U_
59

W0
_Jrn
orr10I:
'1-
ort"
O
LI.,.
0
"6._o
E
0Or)
-',1
LL
6O
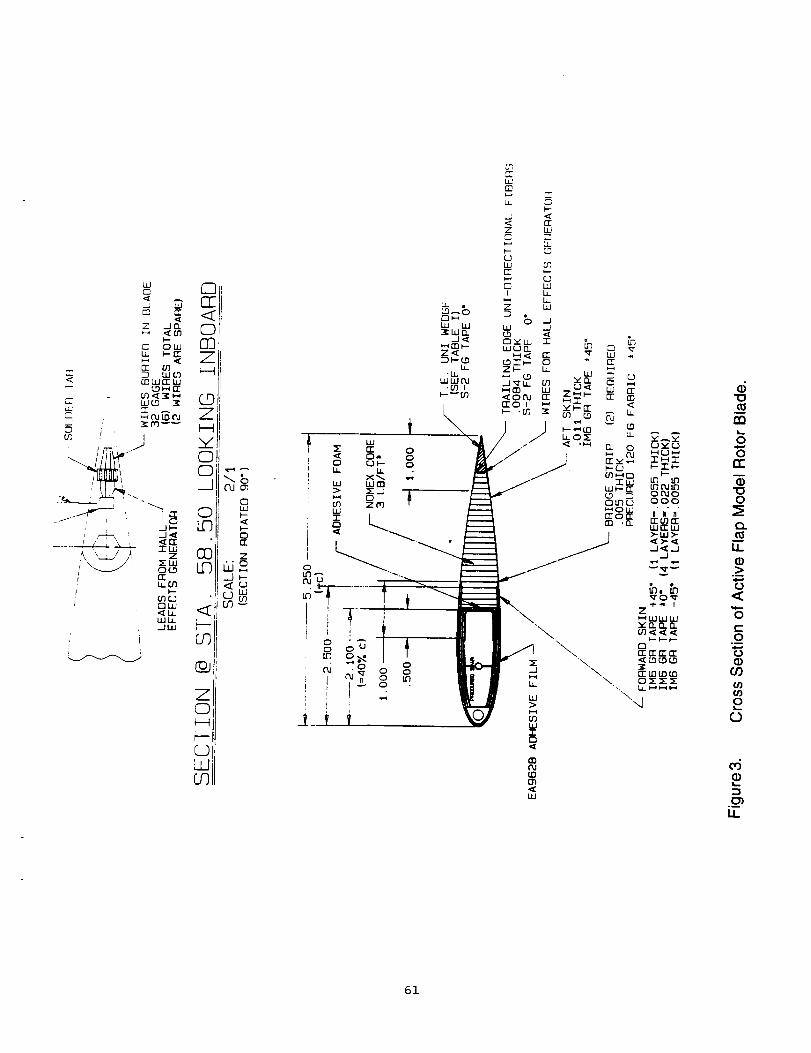
Z(D
"(3
t_n
00_r
-oo
o.
LL
._>0
oC0
0
O3
@@
£0
_5
U_
61

_ Blade InstrumentationItem Radial Station [in]
flap, lag, torsion strain gauges
flap, lag strain gauges
pressure transducers
pressure transducers
pressure transducers
pressure transducers
23.69
50.40
54.72
59.76
66.24
70.56
Rotor Data and Geometry
no. of blades N 4
rotor radius [in] R 72.75
rotor speed [rpm] 12 1087
chord [in] c 5.25
Lock number "/ 2.2
solidity cr 0.092
linear twist [deg] 8tw -g
flap chord cf/c 0.25
flap.lag hinge re/R , r.T/R .0825
feather bearing re/R .1409
blade pins r_p/R .2016
root cutout ra/R .2500
flap inboard rl/R .7937
flap outboard r2/R .9729
pitch horn arm [in] xph 4.6648
damper arm [in] xd 4.4665
rB. r_ .__re --
rbp _
ra _ i
rl ----
r2__.R ----
I
]
I
I
II
Figure4. Strain Gauges and Pressure Transducer Locations.
62

C
III!
IItt
III/
o
LLI
_8
0"I0
0rr
>=(3
63
:E0
Jill
o
e-
f,3
CD
E0
I
t-O
(3
f3_
O'Cn-r_
i�
Z
qJ
c_0
q_
(3C3
qJ
_3C_
u)
t-oq)
c0
°B
(3
Q.
=3C3)
IJ..
C_
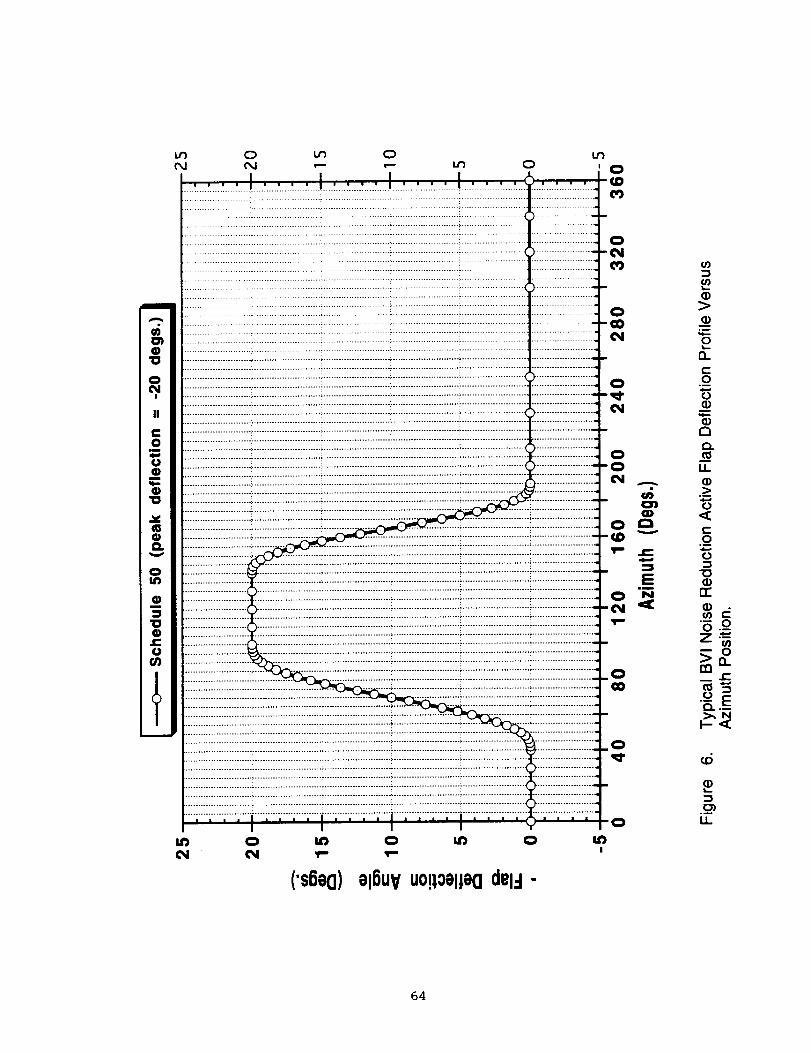
('s6ao) al6UVu0!10allaOdel=l-
r_
r3)(1)>_.mo
rl
o
oQ)
m
Q)a
0_1.1_Q).>o<
o°_
o2_
_d
z__g.II1e-
_. __
cd
I,,-
U.
64
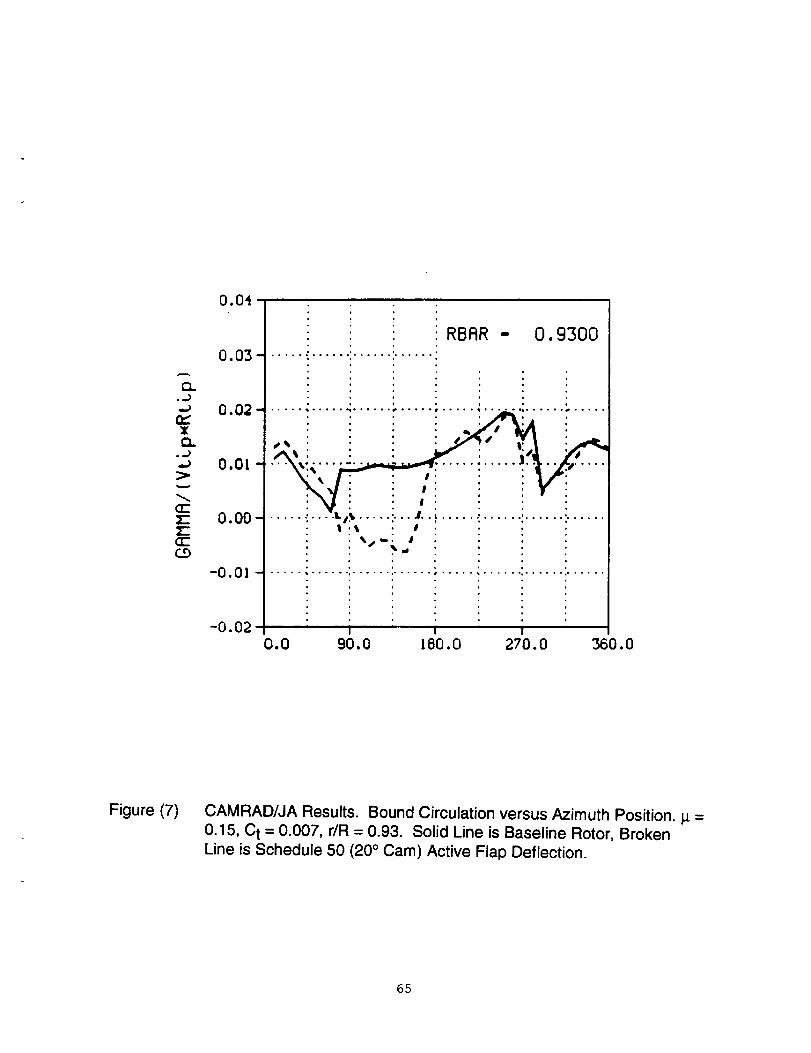
Q...,)
t_
c_
w
(IE
(IEC_9
0.04
0.03 -
0.02 -
0.01 -
0.00 -
-o.01 -
-0.02
RBAR - 0.9300
..... ; ...... :...... : ..... . .- • _" : ...... ; ...... , .....
i- ! ivl_S"''• IP
........... , ...... _ ........... • ...... ° ...... . ......
0.0 90.0 180.0 270.0 360.0
Figure (7) CAMRAD/JA Results. Bound Circulation versus Azimuth Position. _ =0.15, Ct = 0.007, r/R = 0.93. Solid Line is Baseline Rotor, BrokenLine is Schedule 50 (20 o Cam) Active Flap Deflection.
65
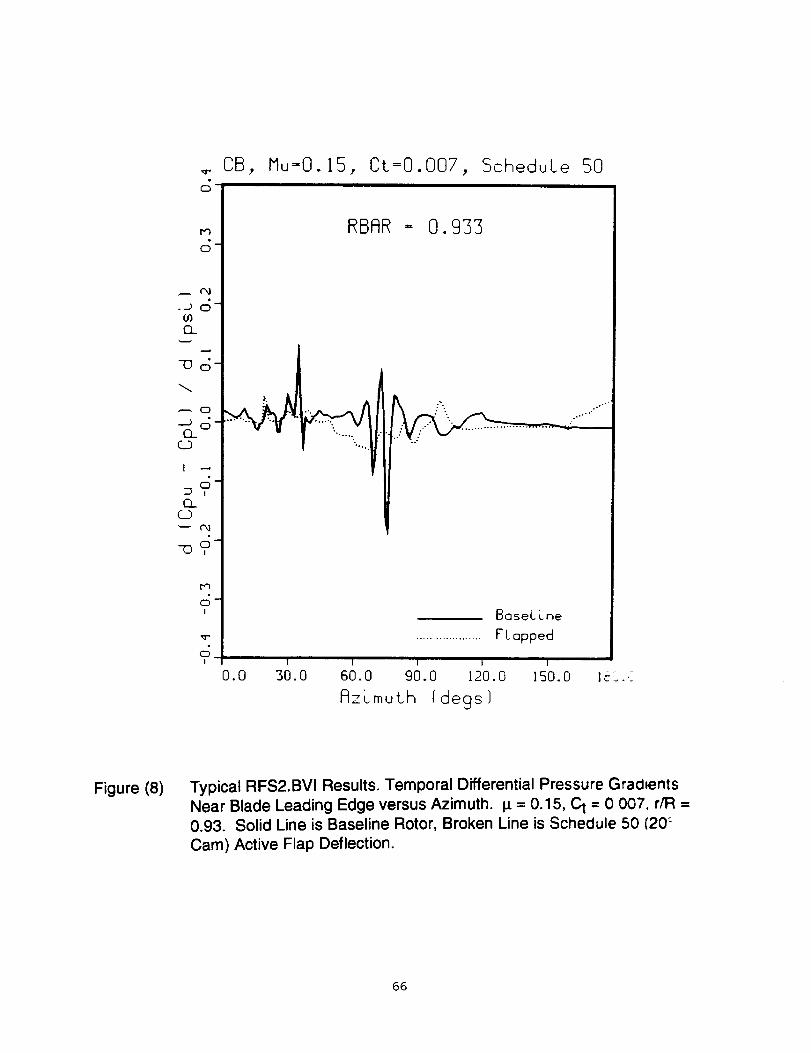
g
r,'3
c;
(/)O._
-oc5
O
I --
ELC_3
C'_
-o,o
c;I
c;!
CB, Mu-O.15, Ct=O.O07, ScheduLe 50
RBRR = 0.933
.,,.°.°
BaseLLne
.................... F Lapped
I I I I I
0.0 SO.O 60.0 90.0 120.0 150.0 ]_,i,.u
AzLmuth I degs)
Figure (8) Typical RFS2.BVI Results. Temporal Differential Pressure Grad0entsNear Blade Leading Edge versus Azimuth. I_= 0.15, C_,t = 0 007. r/R =0.93. Solid Line is Baseline Rotor, Broken Line is Schedule 50 (20 _Cam) Active Flap Deflection.
66
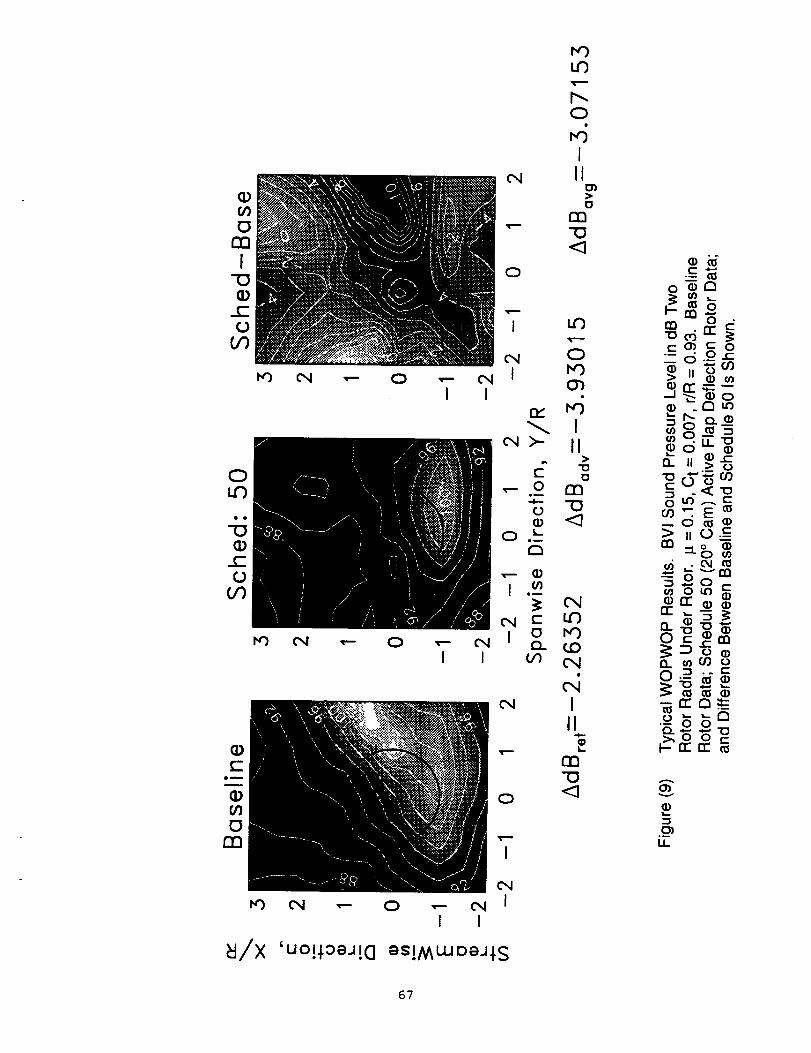
0
I
I
0LC)
I
E
C/1E_
m
0
I
_I/X 'uo!¢oeJ!(] es!MwoeJ¢S
67
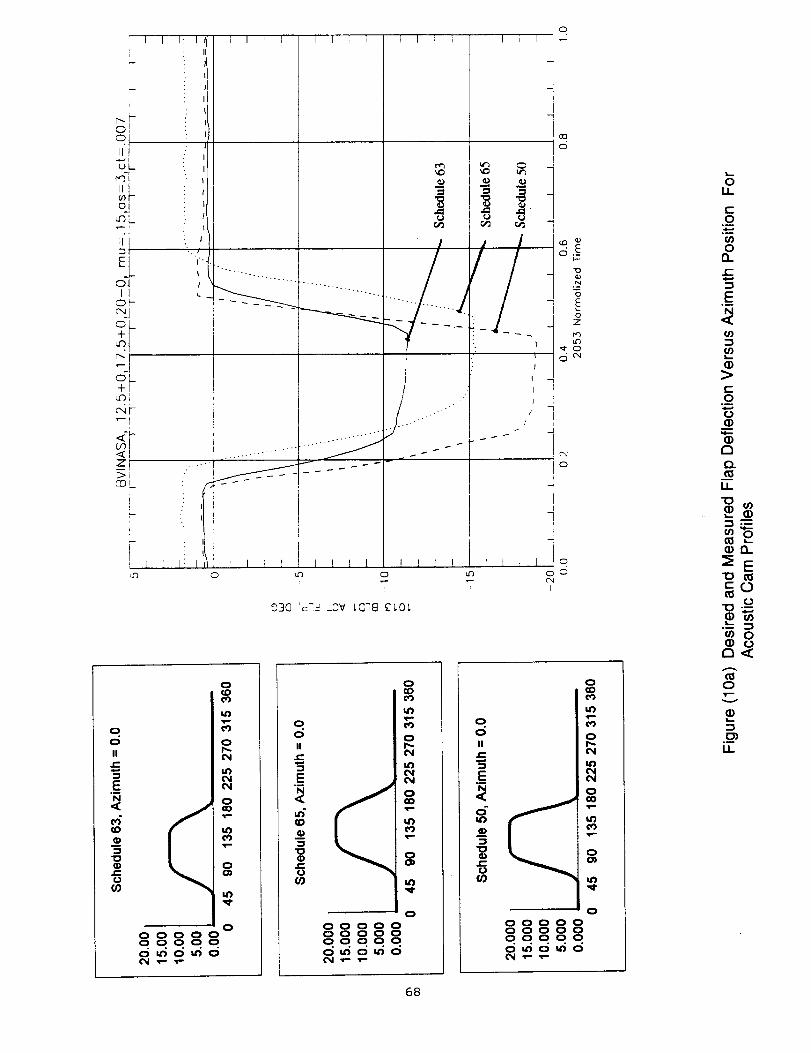
I1"
II(_--
0
tl"
E
o'-I
O-
d+
o'_+
Z
>1_L
I I: I_ i I I t I ] [ I
I
; I
I
I
I
: I!
- I
I
J. I
i
! F: II I ] ', ! r I I !
1
.. /. ..-'''"
0
c5
c5
, ciI
J
/
//
1 0
!!I
4
! I I l o
ff_ <23 0
I
03(3 'c'-' .L3V I.C'38 £1.OL
i:
"O
N
BE
OZ
ft..)
O
oo
IIr-
E0_
.I=U
o
o
O0ooO0
0_0_0
t_3
o
o
00OOO00000OOOOO0_0_0
o. ,_
c_
o
OOOOOOO000o. o. o. o. o.o_o _f) Ot%l _" T"
LL
EO
O13.
(-
E°_
cO
>E.9O
a)
O.c_
LL
"O(D u)I... (1)
a) O.
_E
co
•_- :3_O 0
0
0T'-
.__U..
68

! I h I
0-
II
E,-
i
O_-cC)
I<C-
r_
.-....
, ..o-"
.s-
t f
\ ...--" .....
_".-_...-.-._.-_
/ /
/
7.;.-..-..-.-.-.:-':-:'+
I l
°-...°..--.,
. --..-
"+,,,
°"°
I I I
o..c'_l_
_z_
p--
¢,0
\I_ "'".
/i
s
/
_ -_ 2_ ........ "-,_. ......
. - f/
:2:211;2 " -.........,..'''
I :r I -"_i I i tI I 7 ,.,i I i p i i"_" C4 O
I
030 'd73 10V £078 gl0L
"'--+...+...
_m
°
...--'" ('%1..-
I
I t r ocOO
I I
O
00
c5
I (,O _
o_EI"--
N
O
OZ
P_3
U_
d_
O
O
II
¢-
EN
-s
e-U
o
i +Oo
/+o
00000
00000
+
o
LL
C.o
0
E°--
0
O.
LL
0
_E
c(].) O
_, _
P:,
&
69

O0-
C.D
00_-
0k'_l"
I----
4-_/')-<Z-
>-rn_
m
m
1
I I l--+I,-'-"t'-1"-l'--I I I I I I i I i i ! I i i i I TJ I
.........--.....!_._:i.......... "
i __ ::--=-= =_-_- ........ =----------------:..- .-f
I _, .-"i .°. ; ................ "
ji . ; -
.... ii,_................... -_==----i..... i iC
i ilJ"_T -[ -I-I- - I- I_-L=L=,=_+--I--g--':F-'_- 4-I- I I I I
(:_ ul') C) LO 0I ,-- ,-- IN ¢nl
I I I I
6ap 'dol.l _oo .r-apolq 9'cj'_,'EL01.
Q;E
°_
i.--lO
N
-__--
oEo
Z
oo4
o
0LL
0c-0
o
at'_
LL
C_"0LU
r.-°_
°_
0
_.eO.
E
XW
E
0
LO f-_.o
o q>oOrr
U_
?0
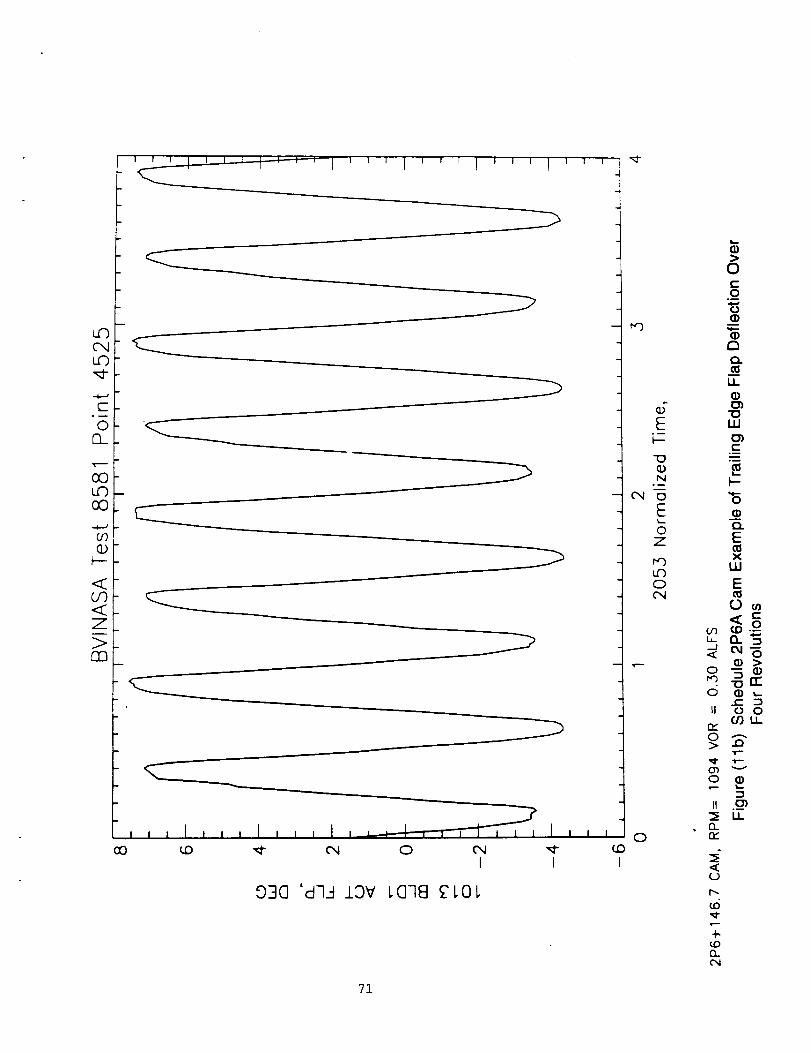
Co_
00_
oO
cO
U)
H-
<
<Z
>CC)
03I I
03(] 'dq-I J.3V t (]-18 £"L0 I,
_D
I
E°_
No_
¢xl 0
E0
Z
0
o
0C0
O
¢'1¢11
Ii
Ill
e-
l--
"60_
E
XIll
E
0 _
II o 0r.fJ 1.1_
rY
61 .__
r_
(..)
t_
_d
+
rl
71
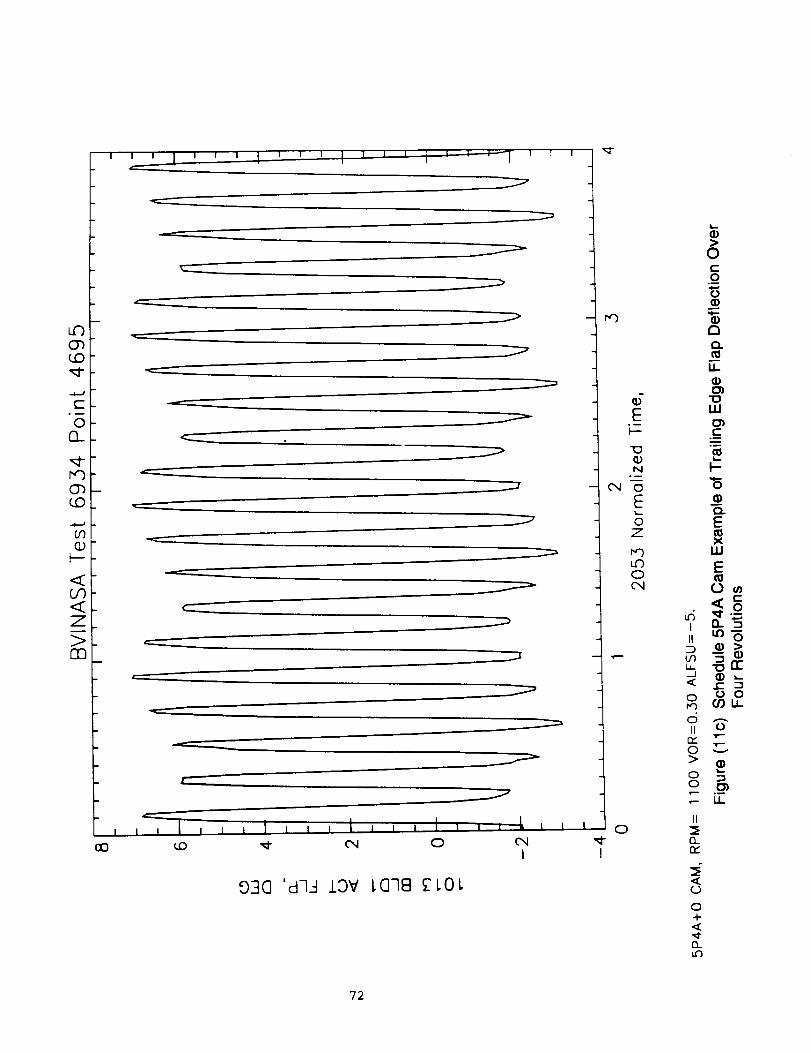
L._Ob(..0"::t"
E
o0._
r,QObLO
0303
h-"
<U")<Z
>m
"L------
--..L'"
0o
03(] 'd-I_-I .LDV L(]q8 (ZLOL
F')
¢;E
I---
(DU
o_
(N O
EO
Z
r_Lr)O
O
I
Ot-O
O_e(1)ElQ.
LL(1)C_
iii
I-"6_eQ.E
XIii
E
<,--
u_ -o rrJ G)
0 0 0(/) I.L
d ,,.--II 0
o:_ t--'T--"0 ----
> _
•- U.
II
rl
:/
0+
13_if3
72

O'c._
<,.'_
-i
o
/
i
,q
,t
ml
li| ,
a
m ,
_=__
_._e>
m
n
I--
c-ool
I-O
CU
CU"I-
i
l--._o
-i_r"
-IO
_c
c_
LI_
73
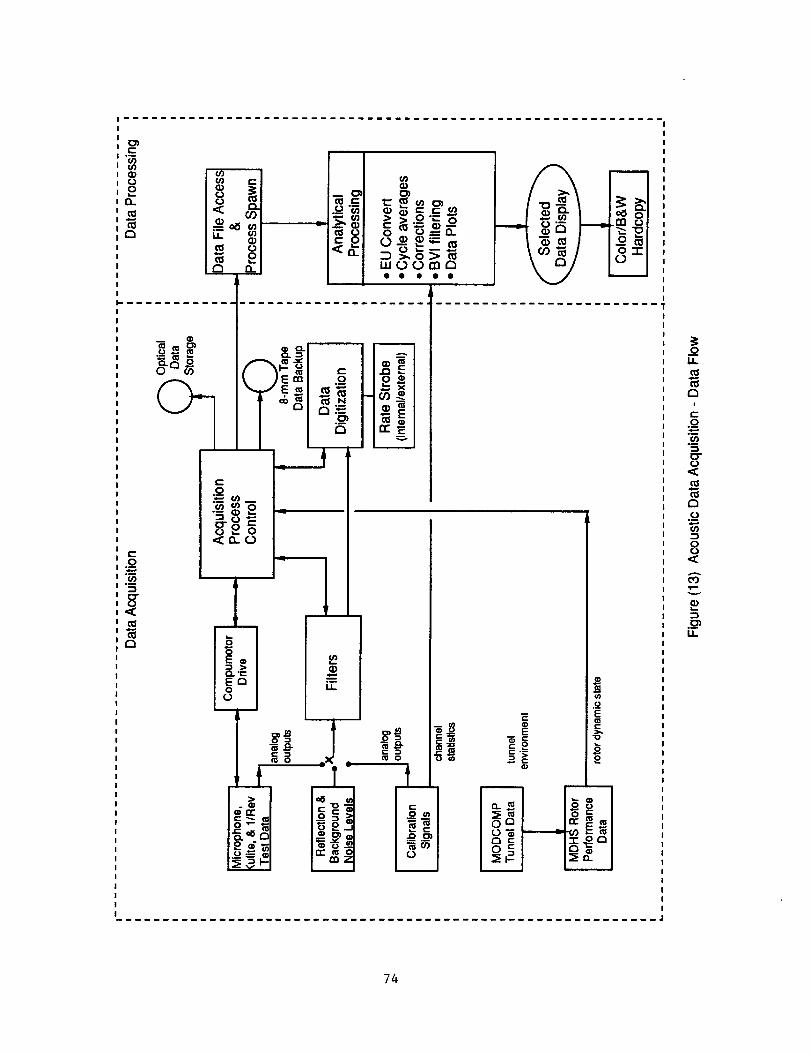
o_(I)
q3(3
I,-g
o(2.
t-.9
E
r-_
I
(/) I
_E
q) -
(_ OI
a
ri
._ >,_-r- 0
__ooo _ _-ma
_-I eo
v
c
-s__<=.8
---T'-'
!
o'-_1_'_1
1I
_-_t21 0
E
__:
E
"13
o
r_I_L_L_I _ _ I I_ °_
oii
C3i
{-.o.=0
0_C3o
03
0o
cO
v
LL
i_.l
74
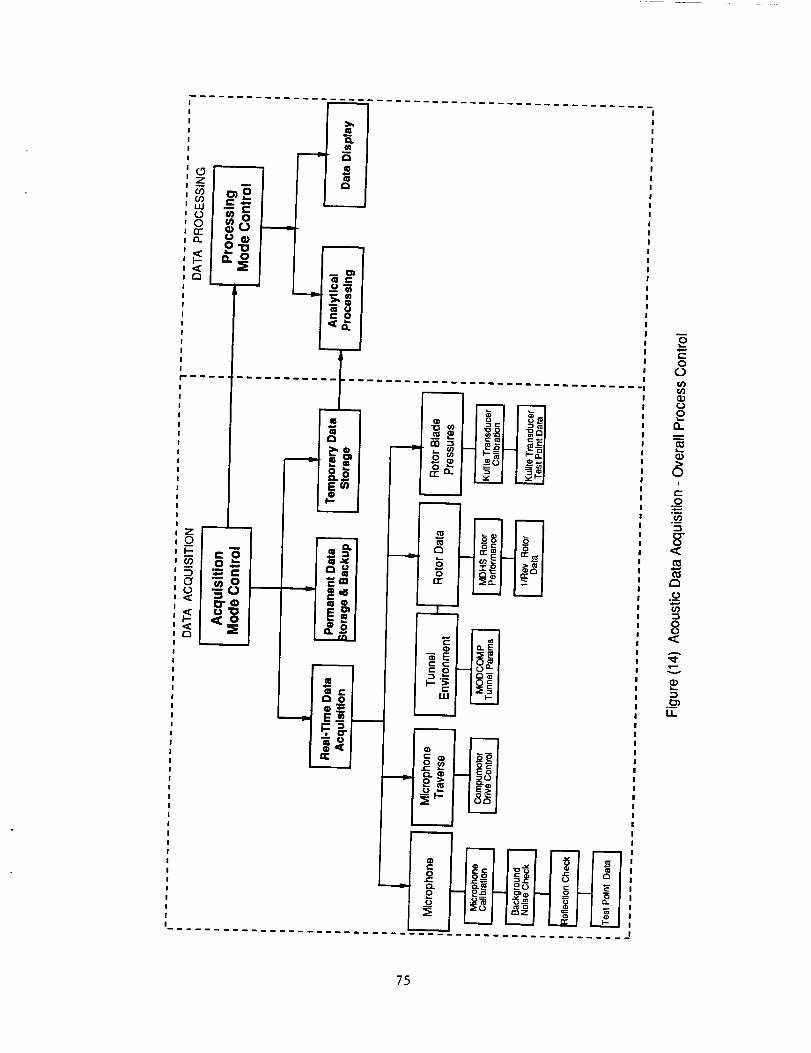
o "_0
I_ U GI
-1-u
0
0i#)
0
pI:l,.
.o
"-!
,,.,.
o
A
Li.
75
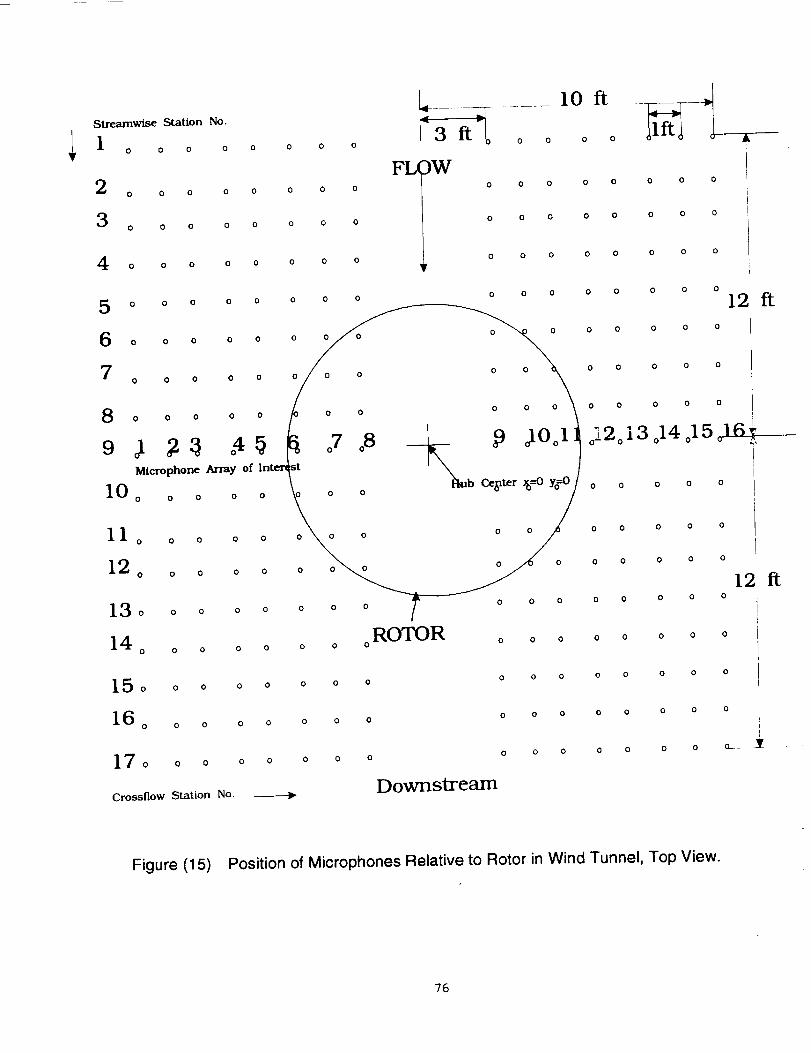
Streamwise Station No.
I I o o o o 0 0 0 0
o o o
o o o
o o
o o
o 0 0
0 0 0 0 0
5
6
7
0 0 0 0 0
0 0 0 0 0
0 0 0 0 0
0 0 0 0 0
9 ol _:_ o4_Microphone Array of Inter
I0o o o o o
1 0 O 0
120 0 0
0 0
0 0
3 o o o o o
4 o o o o o
5 0 0 0 0 0
6 o o o o o
7 o o o o o
Crossflow Station No.
0 0 0
0 0 0
1
FL_W o o o0 0 0
0 0 0
lOft
0 0
0 0
0 0
0 0 0 I
0 0 0
0 0 0 0 0 0
i ° o
/
1o\ o o _b c_t_ _---oy?
o ooo ooy0 O_ 0
0 0 0 7" 0 0 0
ROTOR o o oO 0 0
0 0 0 0 0
0 0 0 0 0
12
0 0 0 0 0
0 0 0 0 0
0 0 0 0 0
o12o 13 o14 o15 o-L6-_,,
0 0 0 0 0
0 0 00 0 0
0 0 00 0 0
0 0 0 0 0
0 0 0 0 0
120 0 0 0 0
0 0 00 0 0
0 0 0 0 0
Downstream
0 0 0 0 0
ft
0 0 0 0
ft
0 0 0 0
0
Figure (15) Position of Microphones Relative to Rotor in Wind Tunnel, Top View.
76

Figure (16) Test Set Up For Shake Test.
77
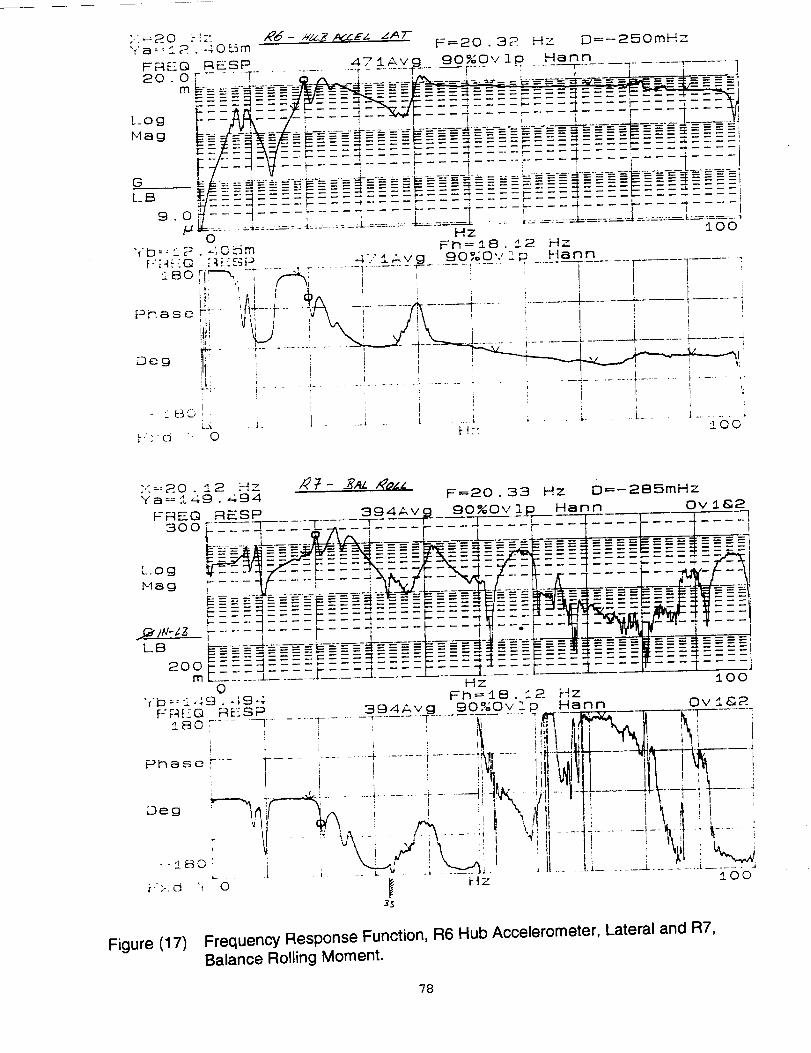
.{a:=£2..¢05 m ' F=20.32 Hz D=--250mHz
FREQ RESP 471Avg 90_Ovip Harm !20.0[-- r .... ......... r ...... r......... ' r _........ _......m
L.ogNag
-- : _ .. _........ 4-_--_-----_-----_---__-Z_=----------=
--=i---- --- -''--'_-----_-----._-zzzl'-zzz -ZZZ B.....I- - - _T - _Z= b:_--=--_-4_-------_---_=--==--_-_-_-_-_--_-_-----t
_-.__:4 __- -_--_--_----=--:-" -=__---_=_-=--_---=_------I_-==._===--,
F__-, -=--: :r-- :: :-:: : :::: : :: 4 : : :-i .... i: .... I_- 'I_ -- -- "1 -- _I_"--r--- ! ] 1 " / 1 .......... L .........
.... --::---q_-=:== ---=_-L_------== ==- ..-===_- ==--- .... ------ --____I
L_B ............. .q ____-----. -- _- .... --- , ___:T:--.=,--:-_---::--+----_ .... _ ...... 4 .... r---if--- i• _-.i.... _....... -i.........S=-.......=.._-..... ............... _oo
H Hz0 FI_==_,8. _2 Hz
"Jb--:" 2.--',05m ..... • ,,_p Ha_n::.aO [l'-"b .... "': '- ....... -'1::-&-'::Y9 ....... -........ 7 ..........
r._T. -' f"_:, i i I' _ ' _ I i . I i ]
" ".............. ! i ip_a_ o i!i4---_.... _-f-k-- -i....... -_ ..... T - i T
Degj ....
rd- i .... P " - _...... i ....... , ';• ! _ i I ii I 1 " ' !
-.2eBOl ; ; i.......L.,; i. I ..; i t-i:: _ " ' " " -260
_-"d "; 0
Ov1&2
!00
Figure (17) Frequency Response Function, R6 Hub Accelerometer, Lateral and R7,Balance Rolling Moment.
?8
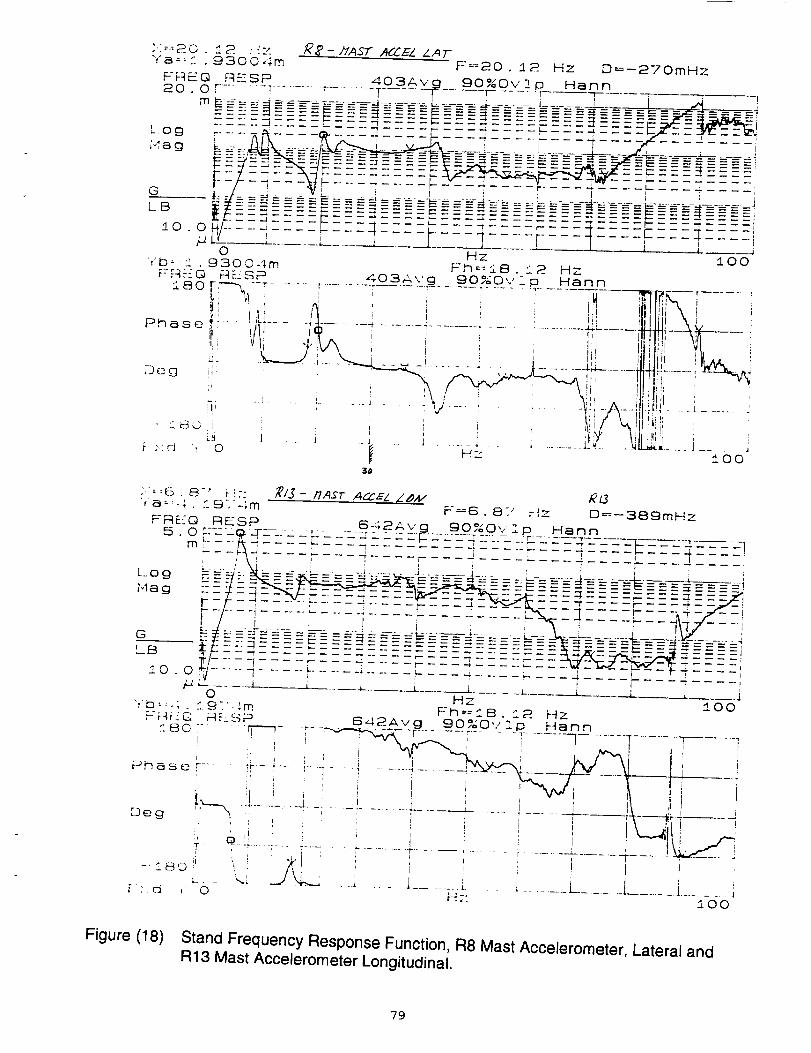
::=-_20. ! _ i _z R_- ?lAST alZEZ ZAT
"Y'a=-::'.. 9300,Im F.=:20. 52 l.-4z D=--270mHzF--[-:1EQ RESP
403Avg 90%Ovn p Harm20 . 0 F....... ] ........... T....... T...... "-7"=.... r- .... .r r--_-,-
m ..... L i , , , -- I
_--:-_- :::_::-_::::_=---=---- z:::_,----_-_---_
------------ - ----;;-: # - - = = --- = ---"E _== - ___---- -=iE-- =-_--_i -:_- = = _ -------_-=-=-=--_- =-=-__-_-_--=LB IijEE-_-E-EE::=E EE--E =E = =-= = = =_ = = = =_== =..,.= = =- [
_o o_/:-::--_: -b--: :l :_ ::::::::::::::::::::::::_L .... .i- 7+.... r.... 1.... i ]
0 Hz :tO0'(b=:1 . 9300--J,m Fh--_I8. ::2 Hz
F,:q _- Q RVSP 403ivg 90%0,., - p Hann-:.eo r.,-"-_.,--T...... r .............r ...._.......... T................ '-,-...... ,-
+_ i"4............i_..... - .........7....... ; _ +i_ iilillli \+P'_ t__ _I1! i_ 7 I i..... ! ............._,,_---i_fki.r--k_
?.uk ., + #Ii!1ii'71,.J: ._ i . .._._ J ._ i ! i 111',1!I 71,_
.... ................... + ............,: _ . i : ,, ----+-r+-..- ....... r,b ..... 4
-. .._ . _.... , _ '_: _i - llbllil : ',' _ , ' :. t/ .... , - - -t, I--A----!!I.'_I_I- --_ ........ ": , ! ' ii, / \ I!!ioii] ,
............................. i__ __ ..... j .... ]/- "-:d ', 0 I HZ !00
_l.ll
;7==6 ._-' _ !:: ,_IJ- //Asr AK-_I /_A/ RI.J
r_=_.; . :'.9._',rn _-_6. 8-:" P_,z E:)_--38_ml--I_--F-Ri_{Q RESP 6+42Avg 90,o0., Z0.-" _ ,5. 0 :-: , o. _:i...... , ...... , ......... , .............. P Harm
m + - -- _ -_ ..... ___ _ __ ..... F - - - -_ ..... - - - - :_ =------:-z_--_ _-z---=!- _ _ _ ---_----F_-_ ..... ;-- _ , "- 7--- - .... . .... _----4---E!
, "_ ..... r-------------- .--__ , t i! / \_ I ! , , --r .... r"----/ ....
L_O@ _-==.4:._=--;-_.,..=-_---___-. .... ,= J ...... j_.. ', i l I r_---,-+_ :: .--------==-- + ------=_:_:__+_--._-_ ............ ---- J-...... ---- E ........ - - - _- --__-_ ..........
+ "Z..... : ..... r- .... -_ ....... E---r---- :-- -+r-l---_ .... __c_._-:E's- -+---.,----,--+:;,'='-:i, d_+ . z ..... ,_. _..!_ i ! --7-_7 -_, .... F---ll_./ .... :+: .I: _ -- _ .... _, -------- _. __+---- ----- t------= _ ........ [email protected]___;.l.___z__+ ..... -_
' _ ---';E I .... t-- -- -- -- ;;zI .... _-------4._._- ..... _ .-_-- ----" ---- -- -- -- --i. z..--z--- _+- _.- ._+,B t-_E:_::-_-=__--=-__==-.===_========. - ......... ,____-I,_ - .... "-r .... +---- "+ ,--- _ .... I,, ,-, ,-,1:t: :, __-2 _ : -.... _ - - - --+........ _ +_. - - - -,
,.17 + i ; + --- , ..... _- -_ _ --'----_-.
,'-"- ..... ---_--_ .... _.... ___i _-...... z_ ' ! __ jO H Z _____.t ......"_'b:,.; . 1_-'.;m Fin =_, B 12 HZ !00
- o_ ........ _ 642Avg 90%0', _ n +4=,-,,-,
j " i , f ' , ' . '
: ; : : : I ! I _% ^.f i I t j: I i I t _ '
Deo _ ' '. -_ " -7 ...... ,+"-------4-, ............ _+._.______J£_ .'., I i: ' _ _ ' ,+ ; ,+ _A---]ft_. m.:L + : ' ' : It, x-": , _ -:.... I-: " '_ .......... _ .... +.............. _L .... i I ',._ -__ .
.. _ +i :_ 'i "J.'[ ' : I I -r .... . .... +--._,o: : ! ' AI i + I _ I !
-. . .._- _ _.i -_ _ ....i ..... i__ _ i 1o , 0 tH.+ +-- l__ 100
Figure (18) Stand Frequency Response Function, R8 Mast Accelerometer, Lateral andR13 Mast Accelerometer Longitudinal.
79
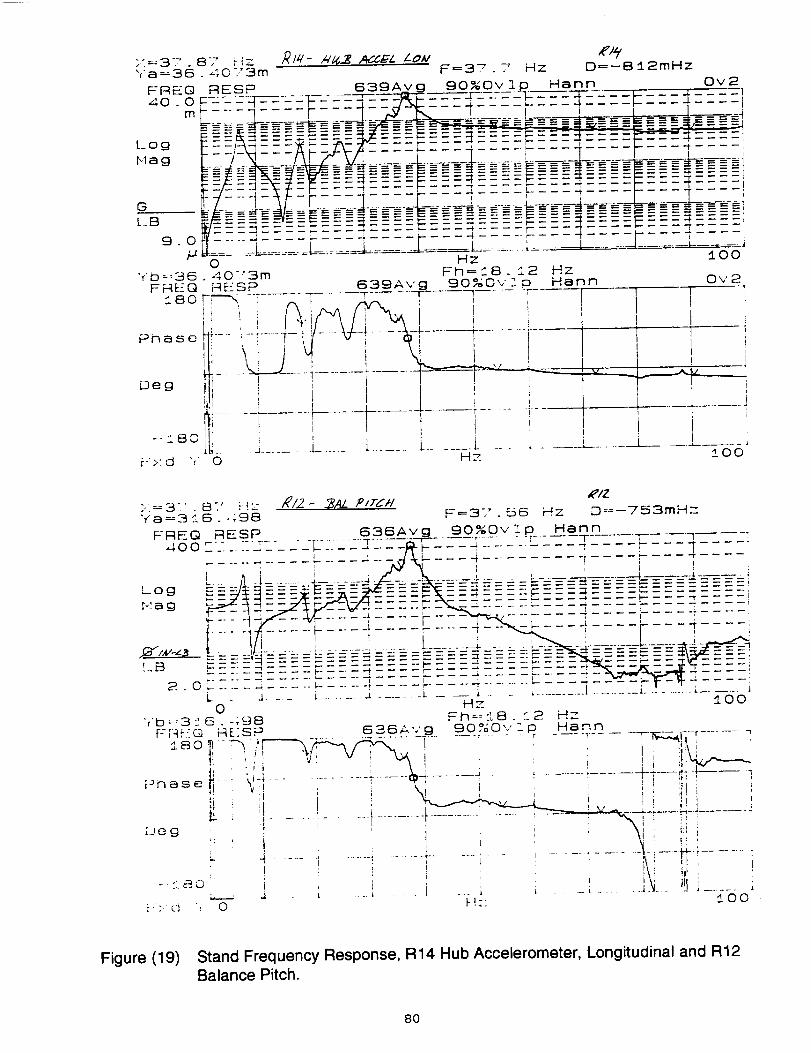
Ya=36 .--I0:73m F--37. 7 Hz D=--B_2mHzFIESP 39Av g ..... P ________.____--__ --]FREQ 6 90%071 Hann Ov2
40.0_ ---7 .... . -_____G__----_ ........ _ .... P---_ .... im r .... 7 .... F - ._ -,47 ]x___l ....... L _ _ _ '_L_=____--__ =-4
-_ = =-_I-_-:---_:_-_ -_-_--____=-__ E _ = -= -=-_ _- _ _-_ _ - =4
_Tzz:.i-_F-..... l----z_zzzz_zzzz:izzzzpzzz-7._ ..... . ...... if=-_i#_.-__-'- _-" _ ===----'---- _----------_E_--------_------_---- _-_-_ ----_------- "- .... _---b :-_]_---_- ;:_._ = _=__-._ ___..... ==== ======---_r- ..... , ---_. ..... _ --_ ......... _,.... , ---_ .... ,
-ZZ_ZZZZEZZZ ,ZZZZ Z___ ...... _---_ ....... ff ...._. o __--_-_-:._-L.--..... L_.... _._____.-.ZZ---_ .......F__--A- ......--Z--.-_
H Hz _000'FD:-,_G. 40-'3m
FRELQ I_ESP_BO
P_so
Deg
Fim=__8. :2 Hz
6_3_9.A_:_p_ 9__0%Ov'p. Hann"-"i-I _, ! _ ,
•- --h4- .... 4- ......... ! t
.... i -i .......t- t "/-- tT--_ ' i t
........ , ......i
Or2
!
I
I
, .......1..... t..... L. ,., ij_ i....... J-........ L ...... __L_ .... _ ,
......................... Hz __O0
>:=37' . 8:" P_:" A_/2- _AZ P/_dH•fa=3:.6.-:;98 F=37". 56 Hz D .... 753mH:
F"REQ RESP 636A=v___.g 90%0v _Zp Ha_ln __...... _2L- L--_ p L 4 ...... -- - - - -, . -400 r ...... Z - " - .__- .... -.... , ...... T...... F -- -- -[l
- ...... _ _ ,, ,_,4dl_ ---4 ..... _ .... f .... '----'_ ....
,.. ........ _=_._-=. =============================Log F_= =_!/_E-3E_=-_ _ = ;- _r_ =----.=_ = = _ _--: : :: _ : : : = = = = :,_ = : : = = = :-- I
_-_ ___-]4- ...... ------ ..... _--------_ .... r-----t .... +h1_g .... r- - --_ ....... ,--- -'_ ..... m---- .... ,............r.........,V ..... 1-f _; t _ __ ____.___---- _ .... -----_ .... ,l" ...... 4-#:i_1 -- ..... ! .... r'- ...... _ _ ! / , iI ' 1 it ill i __ '__z_ . , i--":_- -2..... =-__-==-_--_==-:____ ==- - - _=W----- -_--:'._B...... •-4',........... 7 F- _ ! ' __---- ' '
2 0;-- ..... -i _- -t ..... _ "_ ......................... _....... 1........... _......... ,-....... iL _...... _........." ..........L -- ---H_ ..... _,oo
O"FD =,3 _' 6 . -',98 Fim=: "L8..t 2 Hz
F:F4F.-Q RE-SP 636Avg 90,%0v" p Hann_,80
[30 g
..................... :........_-- - _ ..... _ r T-_i;-[ ...... 7
11 ' / ! "1,1; V ! • ,,x _ : I :1',\ i
!, ' , I _%t ] t ' il ! l '
'I : _ , r ,, , ; i i _, 'k t
[ _ ] .__: .... _ _ _ - ..... 4 ........ t- i .... I_t ....... 7
'_ : . , ........... ____. _oo
Figure (19) Stand Frequency Response, R14 Hub Accelerometer, Longitudinal and R12
Balance Pitch.
8o
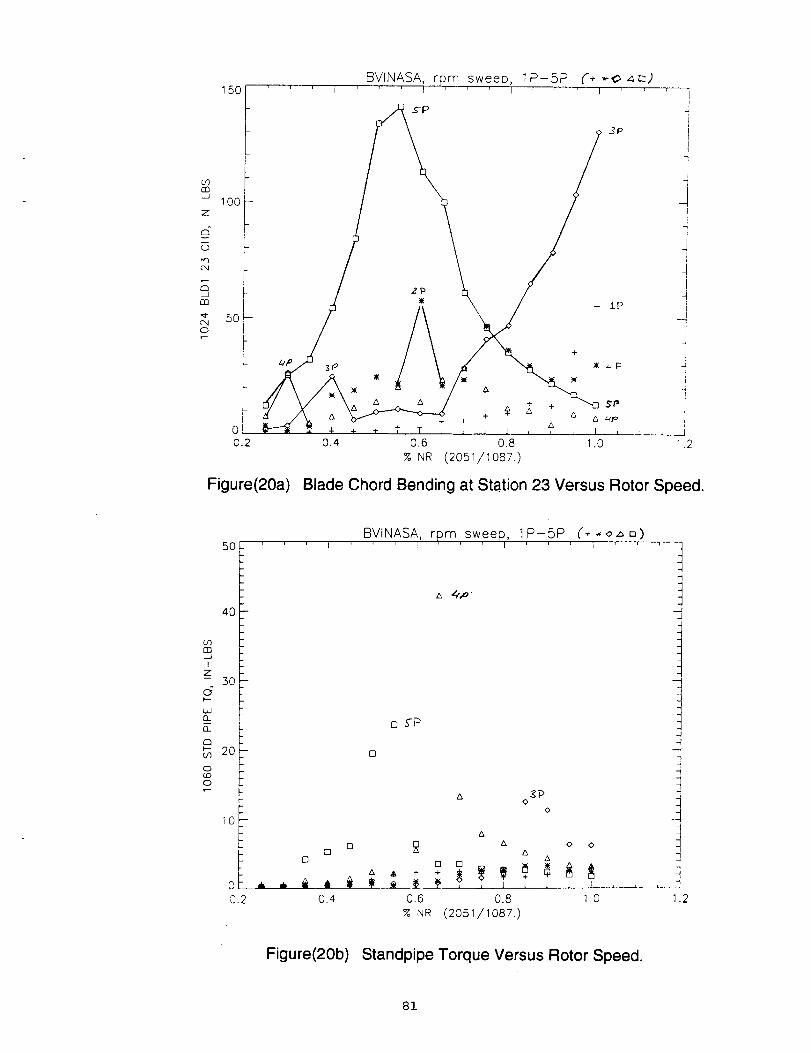
150
3P
Figure(20a) Blade Chord Bending at Station 23 Versus Rotor Speed.
5O
4O
(.,3r_J
IZ-- 30d
b.Jr_
G-
rin_-- 20CO
O
O
BVINASA,I rpm, ,sweep' 1P-SP,, , ('..oz_u)b
z_ 4,p ¸
r-
E
1°In
I [][]
O.2 O.4
SPO
o
[] S-P
0
A
,x
& O OA
A0 []
0.6 0.8 1.0
% NR (2051/1087.)
]
1.2
Figure(20b) Standpipe Torque Versus Rotor Speed.
81

X=23.25 HzYa=9.63323
POWER SPEC_30 .0
dB
Peak
EUI
dBEUlpk
k
90Av
k
Fh=18. 1 Hz = /cl_vR
80_Ov 1 Harm T/_AP23 )vl
--50 . 0
Fxcl Y 0Yb=31. 0327
POWER SPEC240 . 0 ,,
dBIN--LBpk
dB
PeakIN--LB
--4O. 0
90Avc
Fxd Y 0
:I00
Hz 100
X=25.62 HzYa=--17.089 dBEUlpk
P W SPEC13_. ERO
8_Av,
Fh=18. 1 Hz =I_H_
7g_Ov 1 p Ha n n To/_4m/v z3
clB ,, j.
EUI
--50 . 0
Fxd Y 0
Yb=6.46193 dBIN--LBpkPOWER SPEC2 8lAY,
30 . 0 _ ,/
dB
Peak
IN--LB
--50 . 0
__..L
HzFh=18.179%Ovid
IO0mz
Hann /'f_' ._'#A_F 7_Z
L
. _ _ _
Fxd Y 0 Hz !GO
Figure (21) Power Spectra For Blade Flap, Chord and Torsion Response at Station 23,
and For Main Rotor Shaft Torque at Nominal Rotor Speed (18.12 Hz).
82
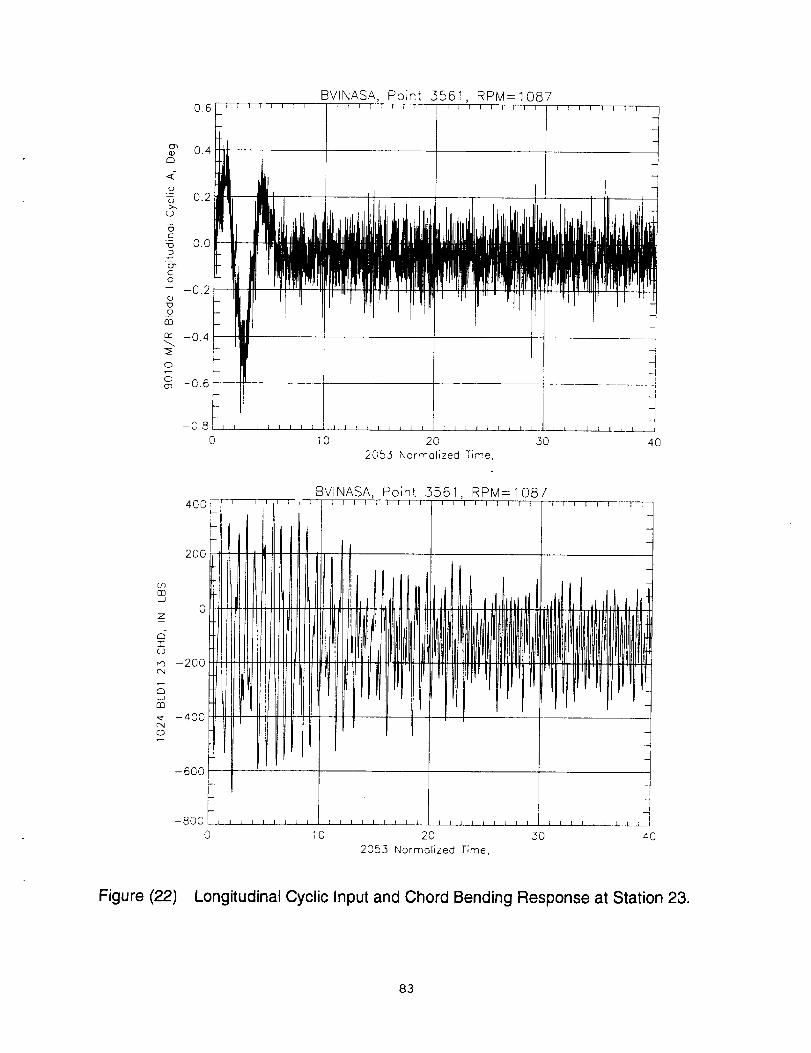
BVINASA,Point .3561,RPM--1087
CT,
¢m
<-
.o_
X(..)
6r
=6
c_CO
_J
O
rF
O
SC_
10 20 30
2053 Normolized Time,
400 : ,
2OO
BVINASA, Point 3561, RPM=1087
Or)
nn
0Z
"1"
O
_n -20004
--Am
,_ -400C'-4
0
-6OO
1
-800
0 10 20 30
2053 Normalized Time,
4O
Figure (22) Longitudinal Cyclic Input and Chord Bending Response at Station 23.
83
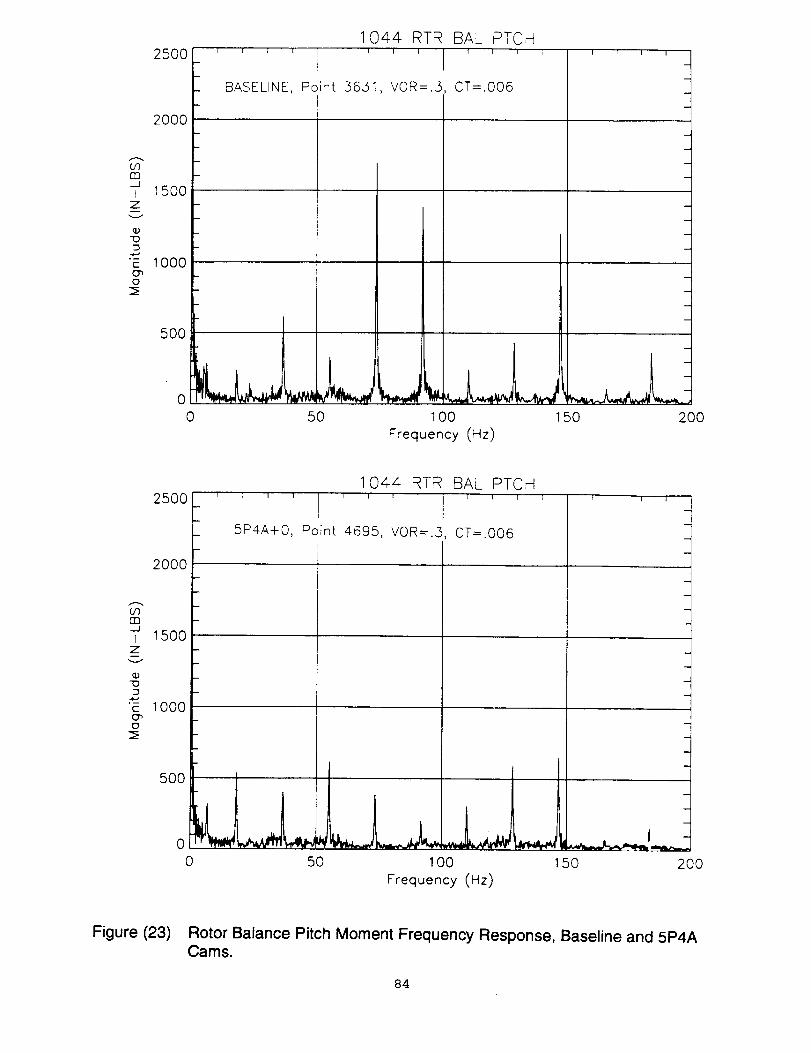
2500
2000
dj 1500
Z
E 1000
o
500
00
I I 1 I I
1044- RTR BAL PTCH[ I I I I I
BASELINE, Point 3631, VOR=.3 CT=.O06
5O
P I I
1O0
Frequency (Hz)5O 2OO
2500
2000
JI 1500
Z
c 1000
o
500
00
1044 RTR BAL PTCHt_-T----r--_--r-----r------l---_r_
5P4A+O, Point 4695, VOR=.3 CT=.O06
5O IO0
Frequency (Hz)
.J
J
50 200
Figure (23) Rotor Balance Pitch Moment Frequency Response, Baseline and 5P4ACams.
84

UhQ3
I
Z
Si--n
CD
O:"
F_,q-
0
5P4A+O, Point 4695, VOR=.5, CT=.O061.5x104L,-- r , , T _ , T r _ , _ , f + + , r
i-II--
,L_
1.0xlC4i
/I
I I I I I I I I i i I i I [ I I [
/
f
I
I [ 1 I I I I _ I I i I I I 1 I I i i I I I I L i I i
2 ,3
2053 Normolized Time,
.j
Figure (24) Rotor Balance Pitch Moment Time Histories, Baseline and 5P4A Cams.
85

_q
LD
I
o
C_
c"
O3E)c-
°--
>n
I I I I 1
+
+
+
I I I I I
d d
' I l ,
++
._J
•"4 +
+++
I I I I t
0
d
I I I I I I I I
"I"
.K_g
_g
-H-
1 I I I I I
C4 _-
d oI I
Joqx #8L6 e^o
I I I I
+ -_-
II I I I I
{.o
6I
LDr_
d
OF3
O
o
d-
O
0 -
C) "O
-4,-
0LD0O_
_ ° _
0 o
0
"-2.0
0
_d0
I
E
0<
7OE
(1)C
o--
Q)(/)
rn
o°_
m(1)
e-
13<
o0
U.
._>
Q.
v
LL
86
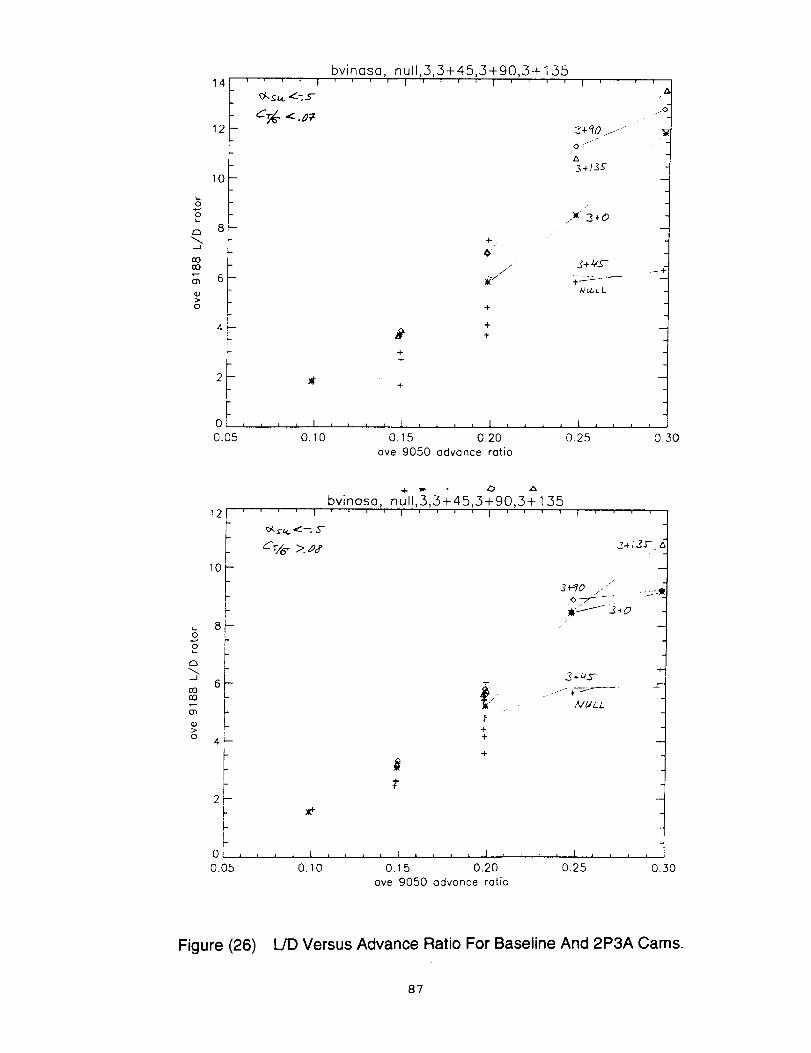
14
12
10
0
8
O0
O0
>0
i _ i _ }
d'.s_ _-=.S"
bvinoso, nu11,3,3+45,3+90,3+135' ' ' I ' ' ' ' I .... I '
Z*qO j-
%3._13E
i
i
j6
iI ++
+
/
.._ 3+0
+/
,/" L* _L-_-." +:_=--
.q_LL
+
+
+
FO| I I I I I I I I I I I I I I 1 I I I I 1 I I I I
0.05 O. 10 O. 15 0.20 0.25
ave 9050 advance ratio
0.30
bvinaso, nu11,3,3+45,3+90,3+15512| ' ' ' ' I .... I .... I .... I ....
Cr/6- >.od' 24 12-r',
10-
8
oE3
oO
oO
o>
o 4P--
L
L
+
+
+
+
t
3+qO /" .- __._o--r -/Illd-f-- -__0
.-JJ _i._ _- -='-
�rOLL
Oi I I I I I ' ' _ ' I i I I I I I I l I I _ , _ I
0.05 0.10 0.15 0.20 0.25
ave 9050 advance ratio0.30
Figure (26) L/D Versus Advance Ratio For Baseline And 2P3A Cams.
87
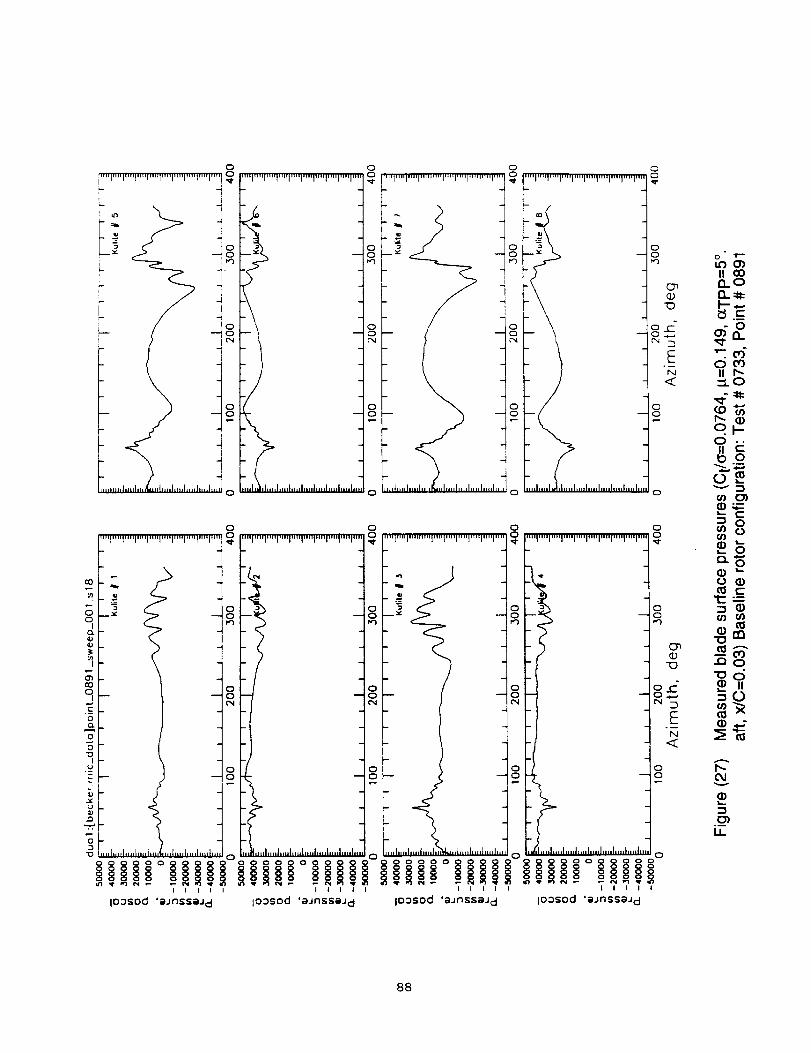
ao
o.
_p
0o
9
0
o
o
Iu
E
E_ ; -
_t,,',,,,',,,,',,,,_,,,',,,,',,,,',,,,',,,o o
IIIII IIIII
IDOSO_ "gJnssaJ d ioosod '_JnssgJ d
88
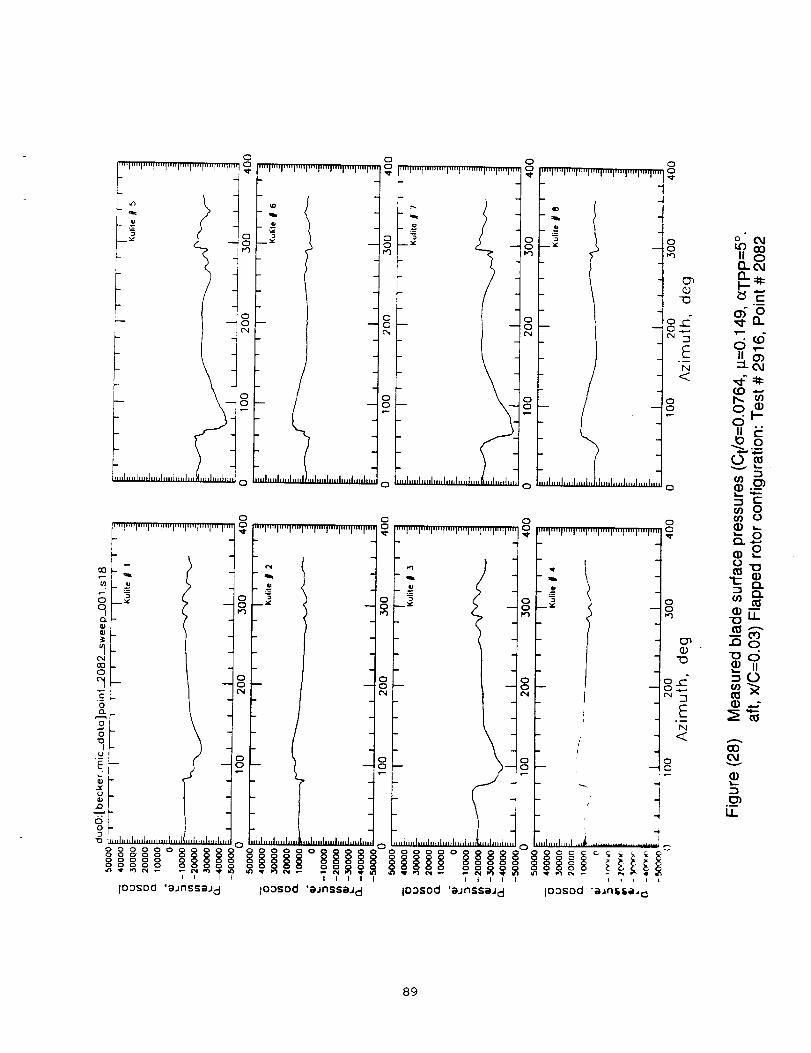
o
3 ,o-z _ 0
00
oo
o
o
I'"'l'"'l'"'l ""l""l'"'l',,,i,..,r,,,i.,,, _
Tm
oo{'N
,,h,,,l,,,,l ,,h,,,l,.,,h,,,h,,,h,_
0
-i
0 _ 0 IIItlllIllll[lllllllllllllJllllll
o: o
_0 .... 0 ,,h,.,h,.,I ...... h..h,.h,,,h,.
o
E
<
g
o
:,,,,i.,,i,,.,i,,+,r,,,,i,,,.I,,,.l.,,.i.,,,i ....
nn
0 __
BnIlu¢1
"1
o
'5
0
"0I-
E
"_ h.,h,,,h,.,h.,,d,,,,I ....
I
\i
/-
,,I,.,I,,,,h.l
I I I I l
loDsocl 'aJnssaj d
o o
,_,,i,,i,,,,I,,,,i,.,.i,,,.I.,,,i,,.,i,,,,i,,1 o
,,,,l,,,,l,,,,l,,,,f,,.l,,,,i.,,,],,,,l,,,_l,.,,
fill
i3
))I---!
,.,,l.,,h.,,h
oo
I I I I I
Io:)$od 'aJnssa.J d
oo '"'l""l'"'l'"l'"'l'"'l'"'l'"'l""l"'
+
IJ
/
/
o
o
ool,,q
-0
o+-oo
:. ,,l,..,l,.,.,,,,r' '_ ...............
I I I I I i + I I
IOOSO0 'aJnssaJ d IO0Sod "a+ng_aac_
GOII 0no_nm:h--
t--o_O
d¢o
O_
¢.0 -.-+
0
_oOm%._ i-- .
o) 0(f) oO) ,.-
_o0
13) ,-0
'1= O)n
o),-r"0
--0 +)-_0
"odII
_0
_00_1v
11...
ii
89
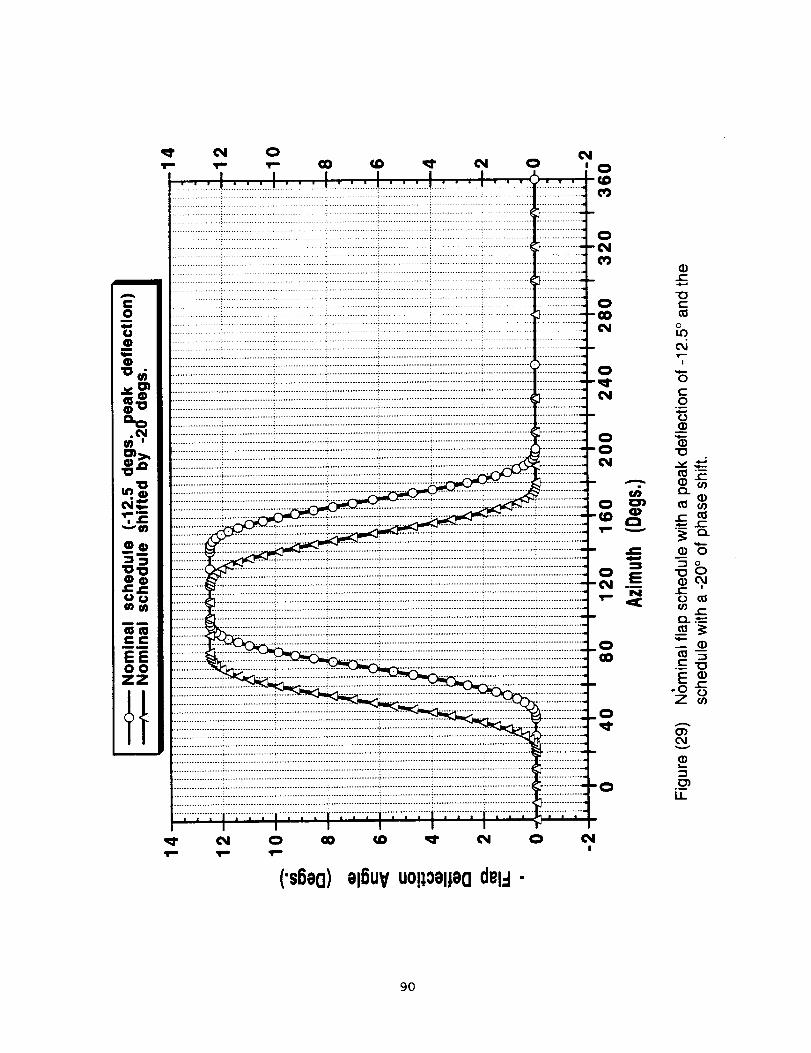
i-
O
O
O
l-
"ot-
oI.D
o,i1-,.!
ot-o
Q..
(I)oo
_o
E_oO
Z
o')odv
(D
.m
LL
('s6ea)el6UVuo!:lOel_eOdel=l-
9O
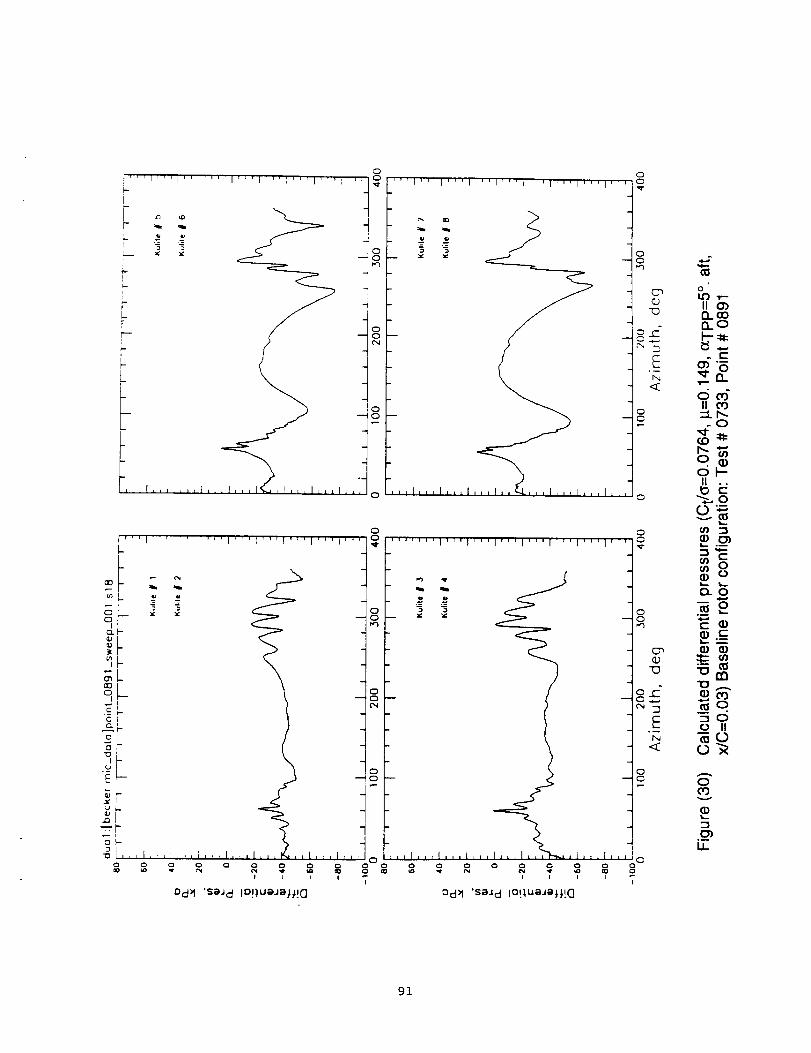
l , _ I
,I ,II,LI,,,I,,, I,,,
I I I
Od_ 'SaJd lO!lueJell!O
0 0
'''I'''I'''I'''I'''I'''IT''I'''I 'l'
0
tO,,,-.II G>13_00nO
. c-
0')'_"¢ O,.
dco"II o3:::L r-..
.o,,¢1'-(.o :#::
p=..-,(f)
ol--II ..0 c'-
00..=,
(/) ::5
m._
CLO
.__ o
m.__c_
::¢:
"10.._.Q) oO_0-mOo II
0
v
2
LL
91
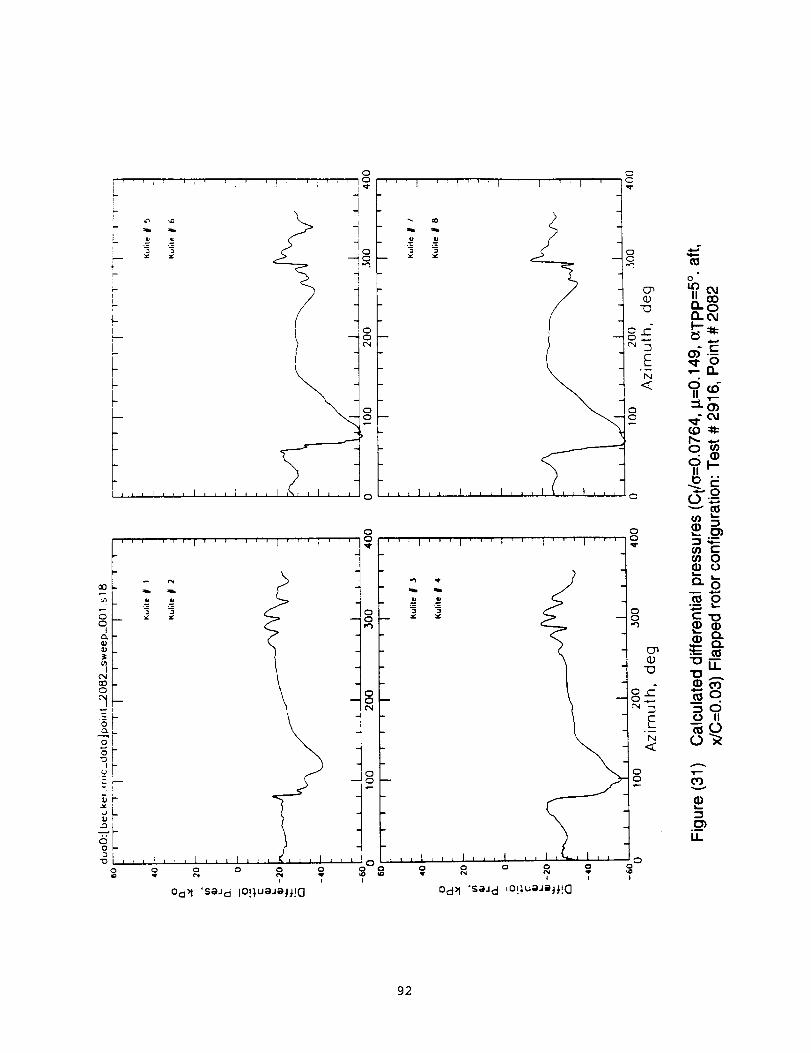
0
L _f
f
L1 0i
O I0
] iI ] i i k , j i 1 i , , I , , ; 1 , I , , , 0
, , ' i , , i _ , , i i ; i , i ¸ ,
X
- 2.
0C
-0
EN
<
0C
O
0, O
__ o
i r
g o gI
oI
0d_ 'sgJ d lO!luaJeJ}!O
X
g gI
0
0
I I I
Od)l 'sgJ d 10!luiJitt!O
0
_0nonc_
o_._-_- o,-n
_E_0
0
_-0u
o
r-- o_) _)
-on-
0 II
v
._mLL
92
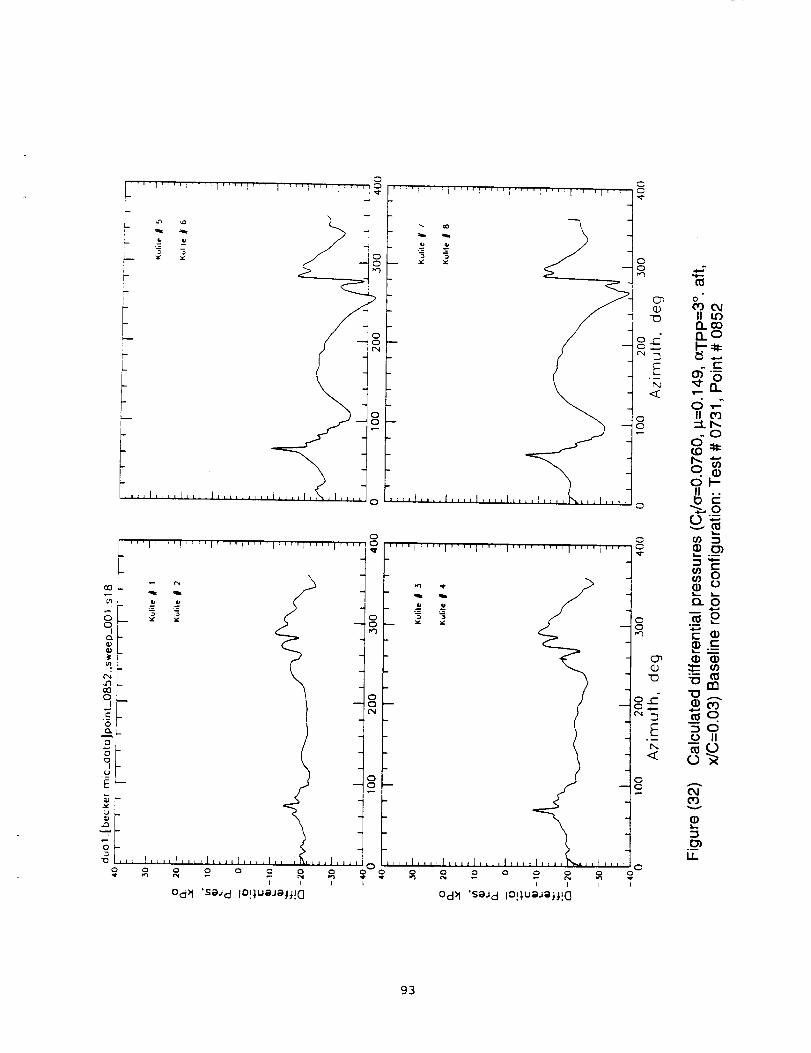
r , ,i ,
r I .... i .... i .... I , i I r ' r [ .... J .....
L
,,,l,_,,t_,,+l .... I,+,,l .... I, _,I++,o
C+
.... I ii.... I_l [ I I i_; ..j,,_,..... ....
3
.... i .... I,,_,1 .... I_, 'C
.... I .... I .... I .... I .... I''''1 .... I''
0oI
oeoc_j-o II LO
no0
II cO:::LI',..
-00(D :lq:
• I1)ol---II
_-0
"0
_0o II
v
2
U_
g3

0
_ 4J\
f-
F
L
LI
E
F, , , i , , , I , , , I , , ,
0
0
$ oI
94
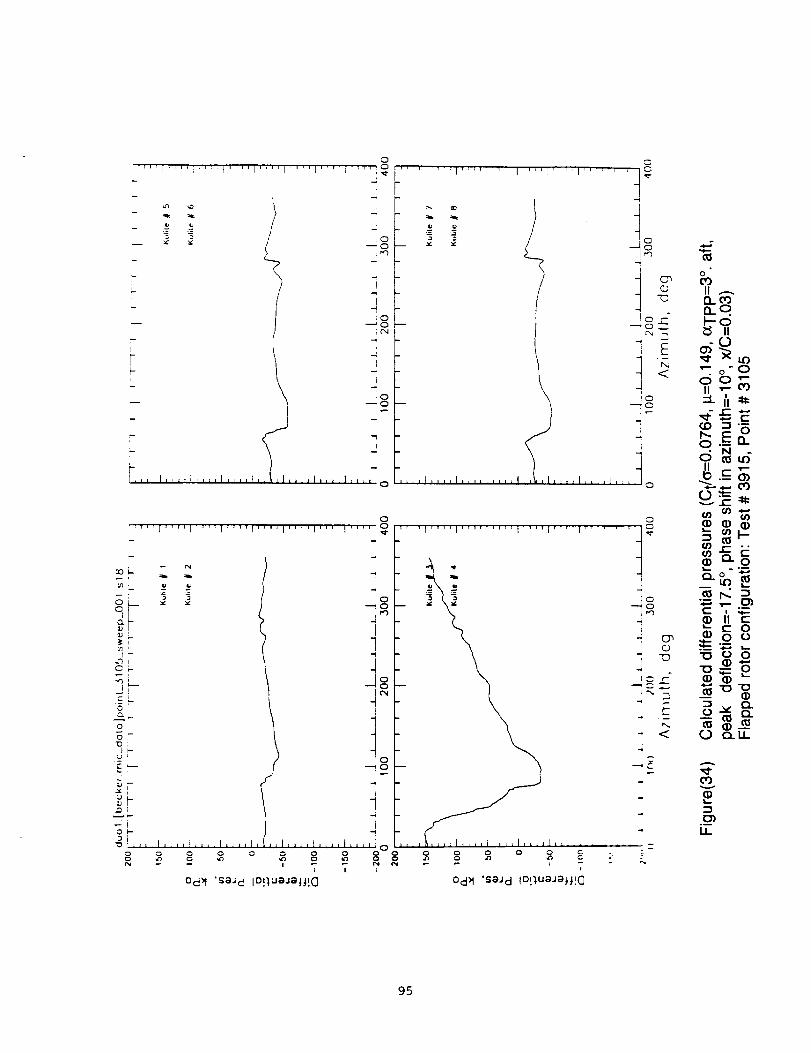
oI"l .... i .... I .... II"ll .... I' ':1 .... [o
q _
- ._ .-= [0 oo
1.... I .... I,,, I .... I, ,,,,I .... I .... 1 o
.... I .... F .... I .... r .... I''''1''''1 .... 0
!
00i- -
S__ _
O I
O,
_FE--
r
oo o oo o o
OdN 'sa_ d lO!lUaJajj!G
...... l':"i ' 'I.... ]....I....' +
"+I/
1.... I .... I .... i .... I_,l,l,r,_l,,,,[,_
C
C3
0
c_ 00
"_ 0. o3
._ _ II
E _._ ,_- _b. "_- "O
<_ . oO O "-II "- C¢)
C
c_ =.8
ci Nmu4
0
i ''_'I .... I .... J .... 1 .... i .... I ...... "_"
-
_ 0 0._--_
-o__oo _"_ ,_
g
p i i I [ I _ +v
I
0ci)I 'SgJ d ID[lugJa_,l!C]
,I .... ! .... I,,,,, 0
I I I
95

0
.....I.....I.....I.....I_
q
- _ 01-il,'lI
i°0
(N
f
i
I
0
0
'''"I ....'I'""I ....'
lJo
p#
3
=
iiiiiiii
00
0
0
00
0-- 0
(N
0- 0
, I,,,,,I,,,, o
0
oo
oo(N
00
..... I ..... I ..... I'"
3_Y
.... 1,,,,,I, ,I,,,
0ii 0
00
00c_
0
0o 0o oo 0
I
'""I'''"I'''"I'"0
il 0
p,)
lp
"B
i,,,I .....ii, l....I_
o° ° 8
I
loosod 'aJnssaJct
"'''I'''''I"'"I'"''
3
0
o
96
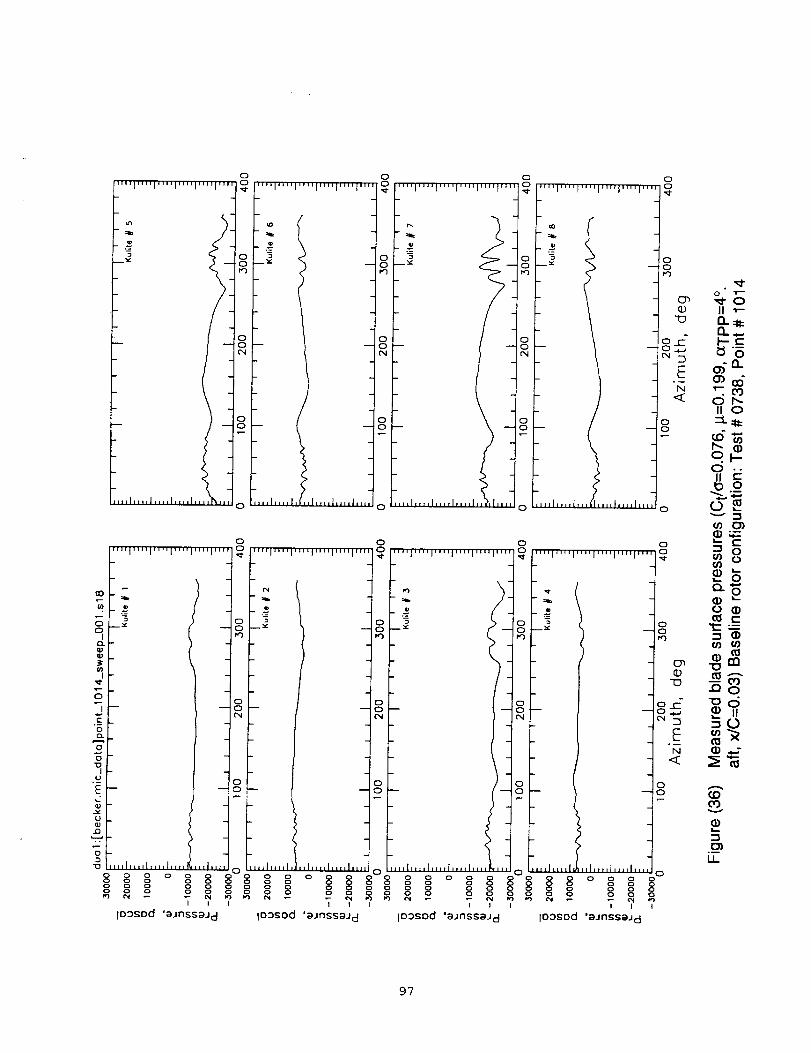
'"'I .... I'"'I .... I .... I'"'
// .
i .
,,,I .... I .... I .... I,,,,_,,_
o
o I""I .... I .... I .... I .... I'"'
oOL
Ii--
o
O,li
ooFJ .... I .... I, ,I .... I.... l,,ll,
o
'll .... I .... I .... I .... I .... _ ..... I .... I .... l .... I .... I'
i-
b
¢'1
_ m
oL5o
EI
e-
lu
E-
UILl
.g•"_ ,,,I,,,,I_,,,I,,,,
0
00 ,
nn
I:o
iD !,,,,l,,,,l,,,i,,,l,
0
_oo
E
oo
o
.... I .... I .... I .... I.... I'"¢
o
En _1"0¢J II
-_ n_:n..
,-oo
or,-.II o
:=___
q_0 0.
II E
_.__
o,!_ _ _-0
(/) O(/)
0
r') o
o ,I::: ---o
oo _.
o_
LL
o
"It
-.=
2) --_:")i
) --
)
,,I,,, ) ,,,,I,,,,I ,,l,,,,l,,,,l,_i ) ,_,I,,,,I ,,l,,,,l,,,,l,ll
°° ° °° ° ° ° ° o° o° °o ° ° ° § ° o° ° ° ° § o° o° ° ° ° ° ° °o oo oo oo o °o oo o oo oO oo°° o° o° o° o° o ° ° ° o o o o _ o o ,_,_ _ oo o o o oo o o o o
Io0Sod 'aJnssaJcl 1o 3sod 'aJnsSaJc] IO3sod 'aJnssaJcI io3sod 'aJnssaJ d
97
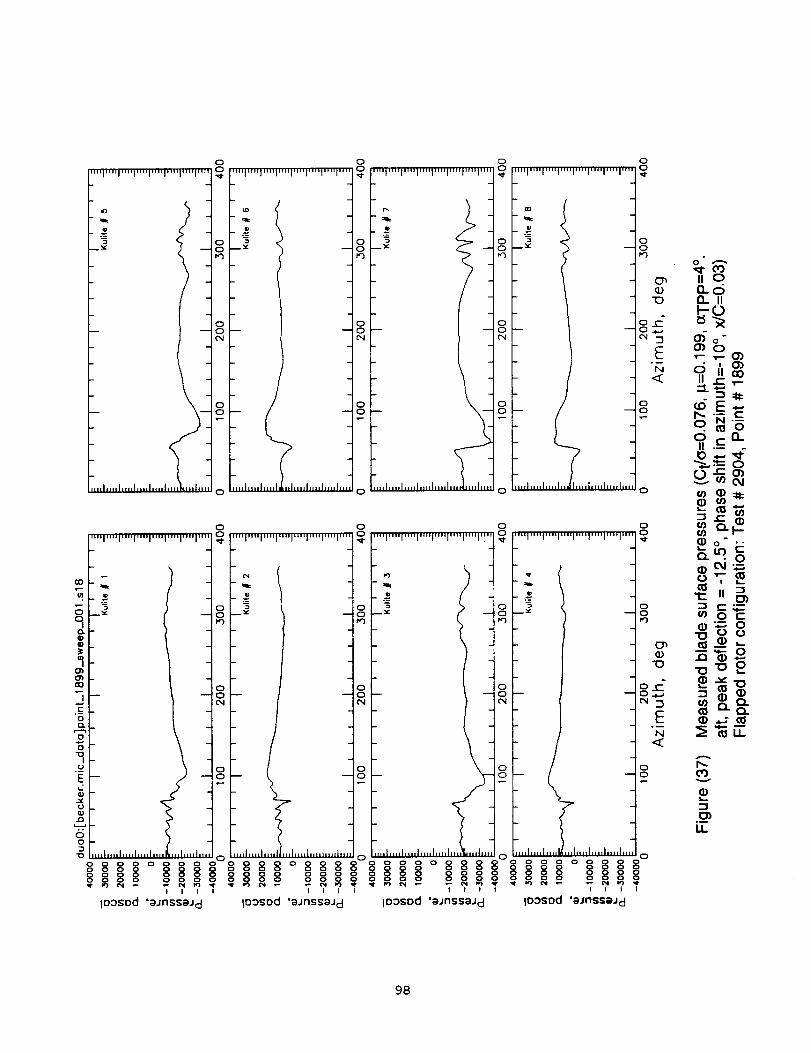
oo
oo
....I""I"'T'"I'"'I'"'I""I....o0 '"'I'"'I""I'"I'"T"'I'"'I ....
oo
o
00
I)
o
o
98
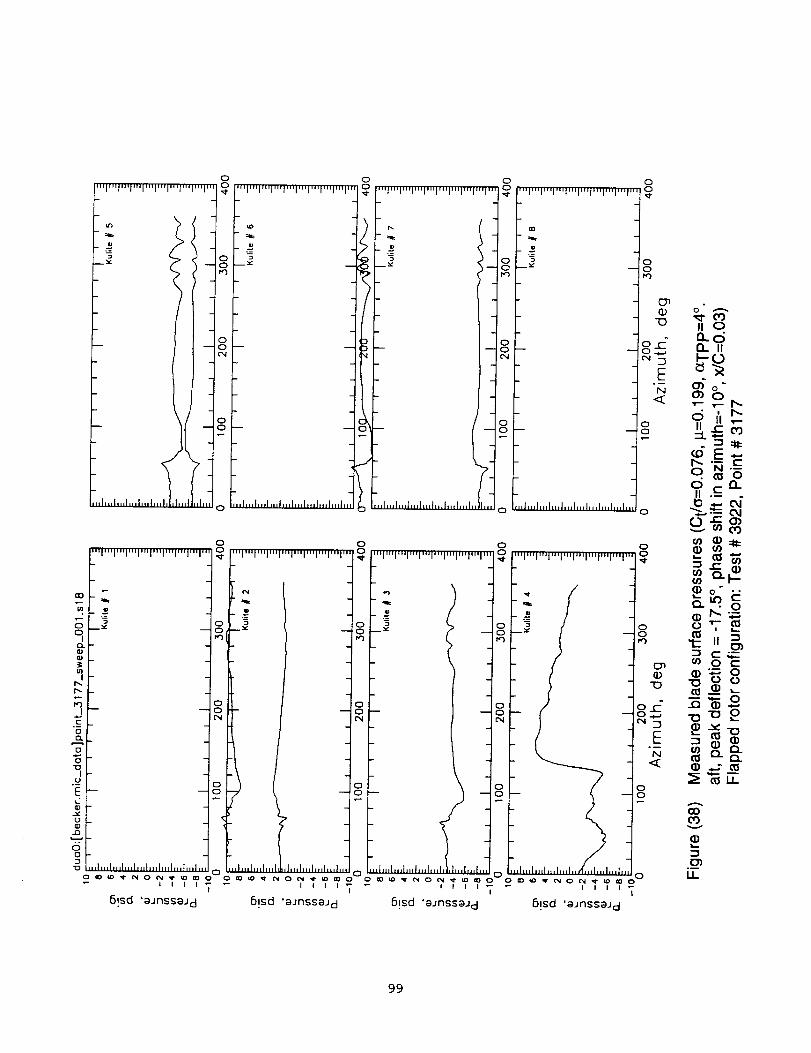
99
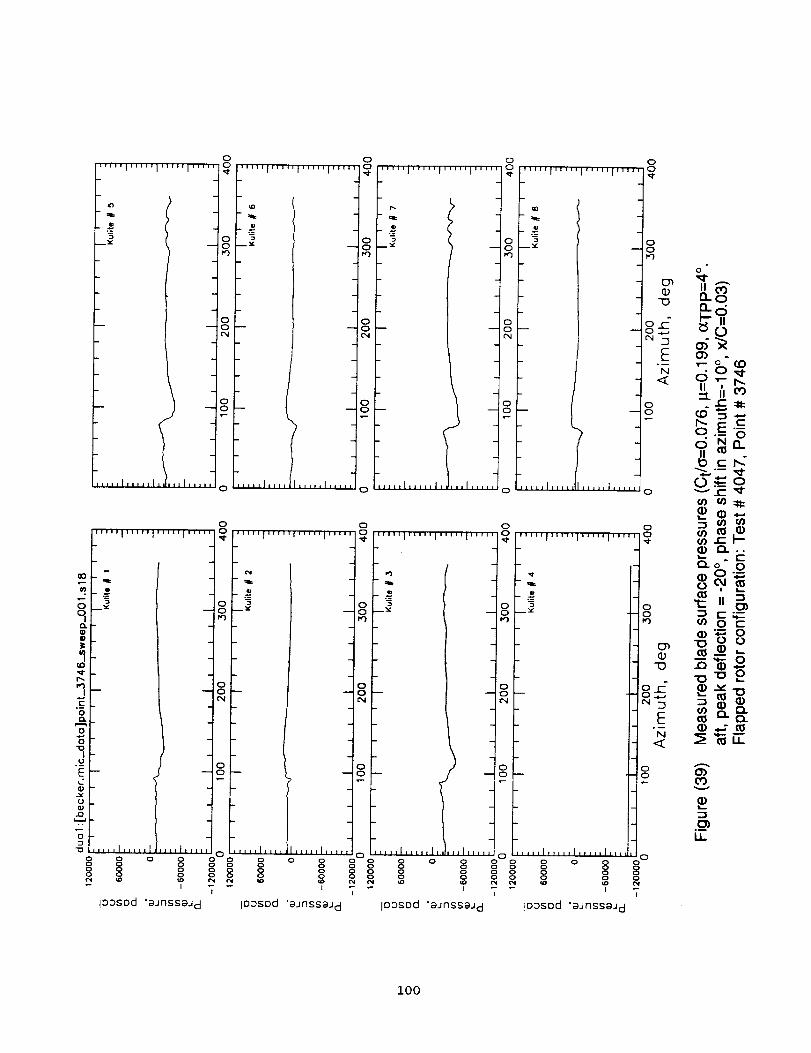
..... I ..... I ..... I'"
_::£
I
- I
,,,,I ..... I,l,,,Ij,a_
' .... I .... '1 ..... I ....
00
.
O _t_c
o
2
._uE
U
r_
3-1
0 0 O 0o o oo o
10asDd "aJnssaJ d
oIf (:3
"4"
oo_3
o
o- o
o
o
e
- 0
.
g
oo
o o
'_1 ..... _..... q..... f .....
E
_ 2) 1-
ilt1_1111
o:)o o
8 8 8
I
""'1'''"1 ..... I'"
r_
q_
e
.... I ..... I,l,,,l_z_,
o*, C
_t
oo
O
O_4
oo
i E3
..... I' .... I"_"1 '''''
-5
.3
,,,,,I,,,,i 3 ,,,I,,,,,I,
o 8 8 o° o o ooo 8
I
1O3sDd 'aJnssaJcl 1oasod 'aJnssaJcl
_3
q¢:
...=3
o
.... i ..... fl ..... _.... i o
o o,_,,, , 0
_1" I ''"1''''_1''"' _1"
'11"
'3
:) [,,,,,1_,,,,I,,,,,I,,,
8 8 o° ° 8o o o
o o o oI
tO3SOd "ajrlSSaJ d
= &En •
o=-
•_ i_,, --'_= i,N
_ 0 _'_o_
C_. o-.£
°oU) 0 C
-C) _ 0
-- 11) ._ _I
< _NEoo
e3
LL
oo
8o
ioo
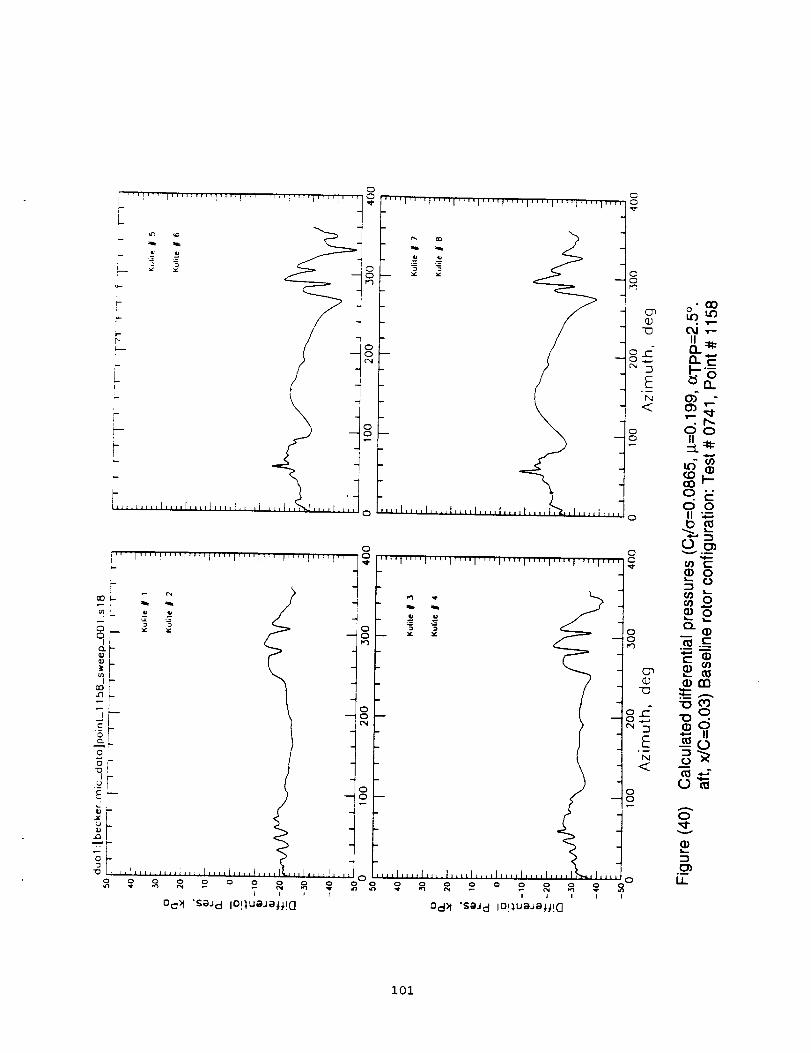
I
O0 qll ,ll
"Fo!
.Jr-
0
;l_llJlilIl"_llI"llI'lII'llI';ltl
'"'1 .... I .... I .... 1 .... I""1 .... I .... I_'"1 ''
! °
,,,!,,,,I,,,,1,,,_],,,,i,,,,I,,, , ,I,,,,1,,,
0
g£
EN
t :_ .... I,,,,1 .... 1.... I,,,,I,,,,I,,,,I,, ,I,,,
t I I I I I I I I I
Od_ 'SGJ d IO!}uaJ;ait!C } od)l 's{tJ d io!:_uaJett!C ]
I.D
CXl ,r"IIn_
2.a_,_-
O0II
:_L _
q_0 0
(1) 0
_11:1
q
_.,.2o"_
0
v
o_
Ii
i01
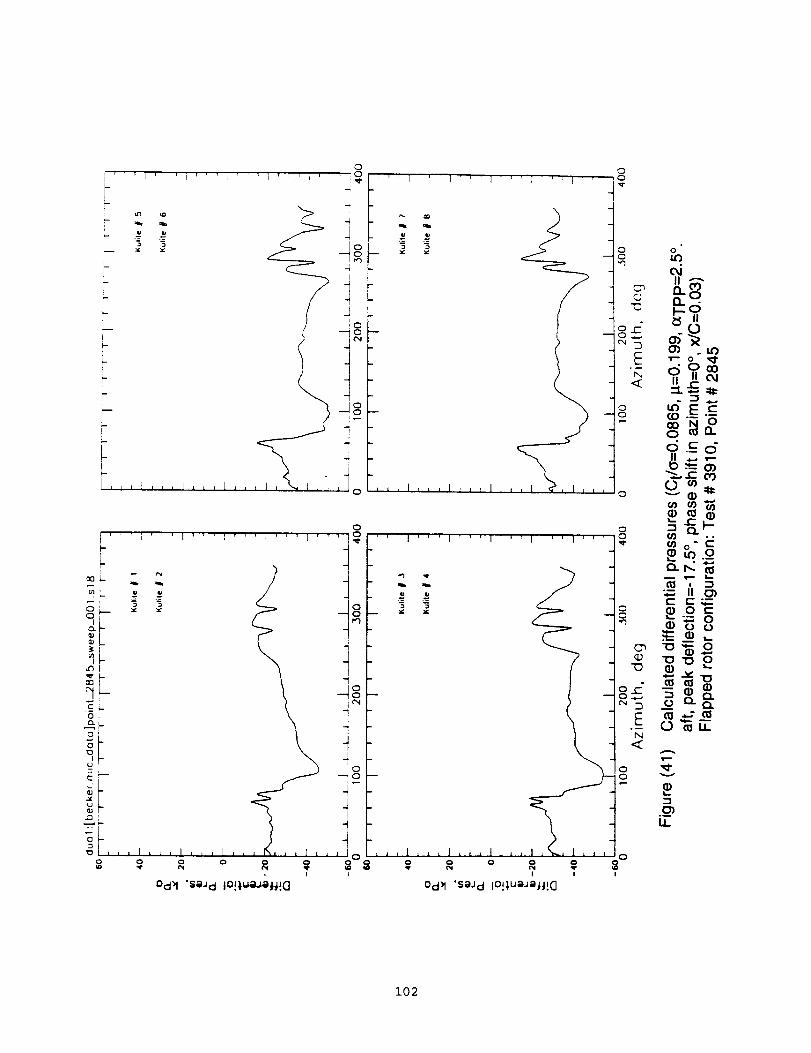
O
.... i+_!
.-z ._
, -+ .+ i_
! -m
..j
I°O+ , ! , _ , + , , , I , + j I , ' 0
' ' ' i ' ' ' I ' ' ' : ' ' ' t ' ' ' ] ' ' '
0
o
0
O, ,C
4+
O o
G I_. -
+..:+_,
.-o _ E Eo _ . .-
- _ _ 0
d ._ o"II .,-, .,--I_ ."=--O)
O m :l:l:O _ 11)
U') O') "_U')
13) m _m I---
• ,
E t- _._.
m _o 8
...,.: m._- 8"+mN
<
- 11)I,...
.__ii
, , , i , . , I , , , i , , r i , , . i
iiii Ilk
4U 41,1
I !
Od>I 'seJ d 10!_,ua._ej,j!0
0, 0
0
I
102
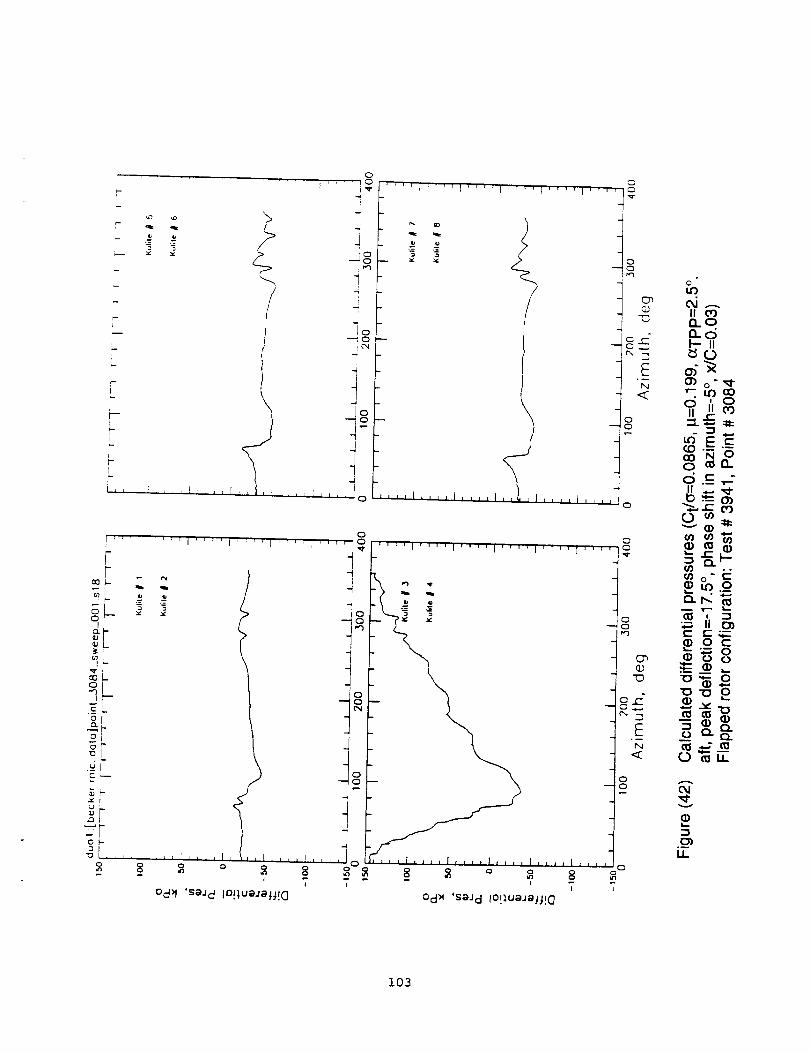
E._
N
o o
I
0d_l 'saJ d io!luaJalj!C ]
0
tOt'XI _-..
nOa_dI-- II
O_
?,-,,,o
_-_'--CO 00 ft.d .__,--II _t"
_ .1: k"O
¢1) ¢/) in
_._
c- _-_._) 0 c"
'-'_ 0
n
o o.
OJ
IDL=,
O)oi
1.1_
103

o
o')v
LL
104
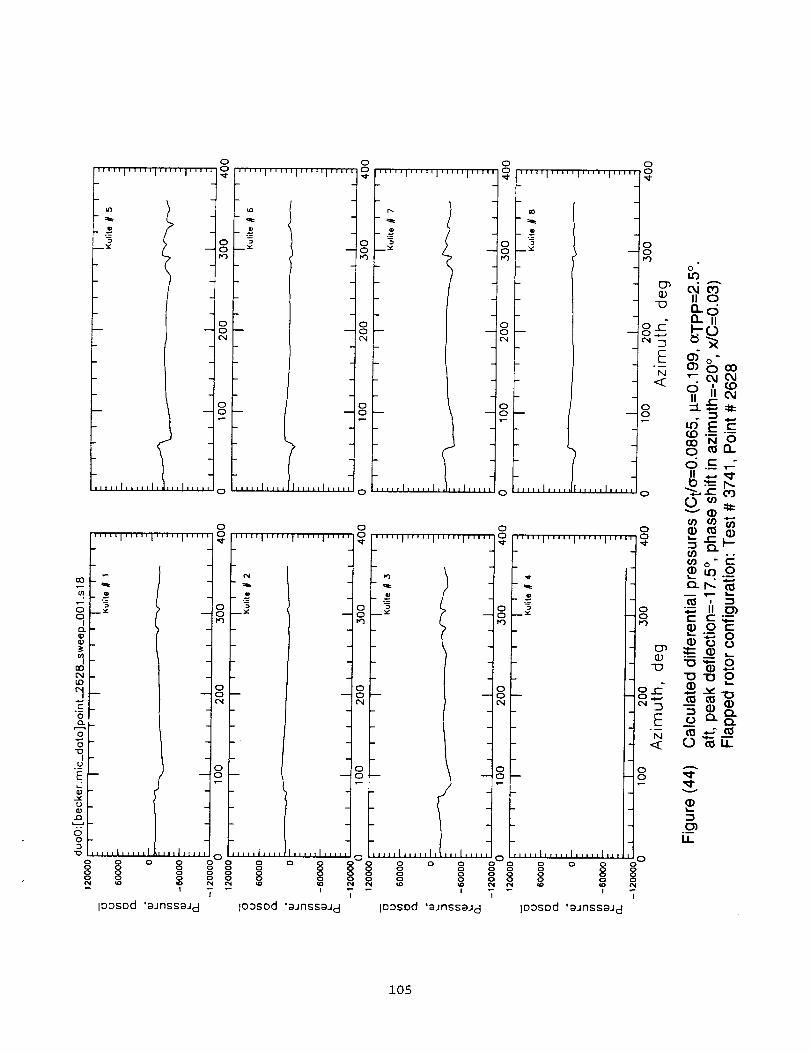
a3
S0
CQ
3u
t-O
0
t#
Ec
UW
43
_50-1
o
ooo
J
I
.... I ..... I 1,,,I ....
0 0
oI 't0 ,,,I,,, ,,,,,I,
00
,iii 0
....I.....II
_''lllllli
o o o 8 8o g 8 o
I
10asod 'aJnssaJ d
0
'''"l""'l'""l'''"
J ....I....
0
o
0
oo o o8 oo 88 g o
I
IDDsDd 'aJnsssJ d
105
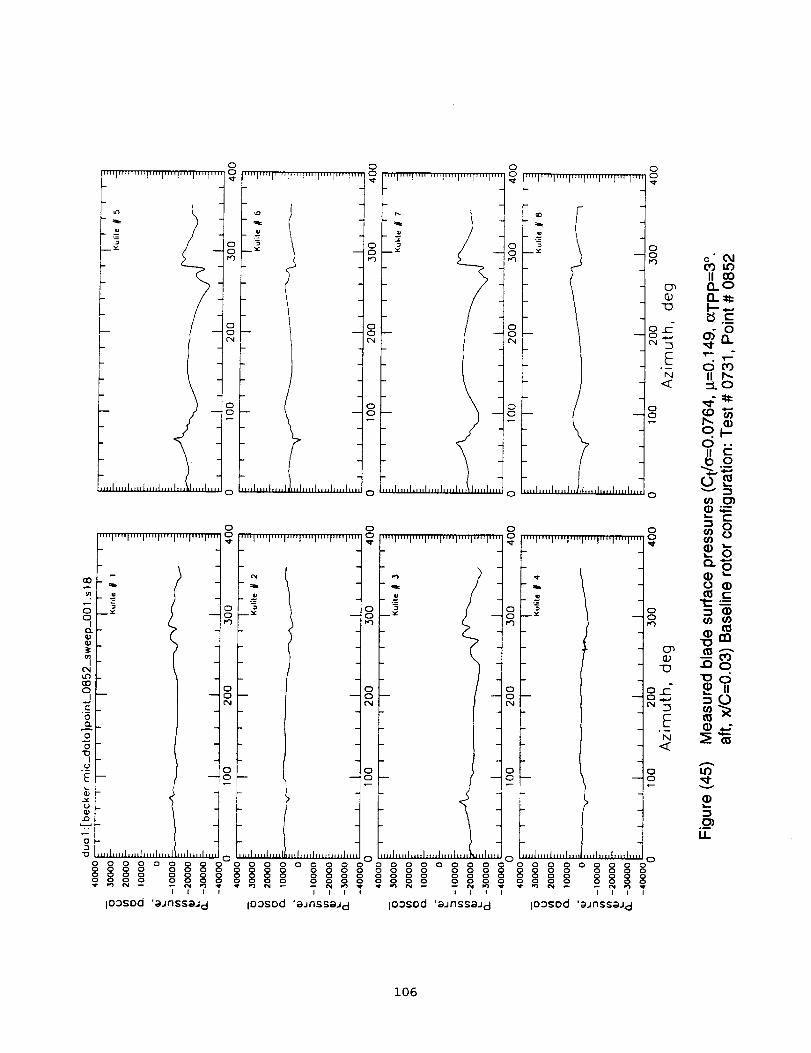
O0
I/I
0I
0
0
0
0
IIj
E
D"0
00
00
00
00
00
0 00 0
0
0
,,,,1,,,,,,,,,,,,,,,,o,,,,,,,,,,,,,,......8888°8_88 8888°__ 8888°_888 8 °°°°°°°°000 0000
IIII IIII IIII IIII
IO3Sod 'aJnsssJ d ioDsod 'aJnssaJ d ioosod 'aJnSSaJ d ioosod 'sJnssaJ d
106
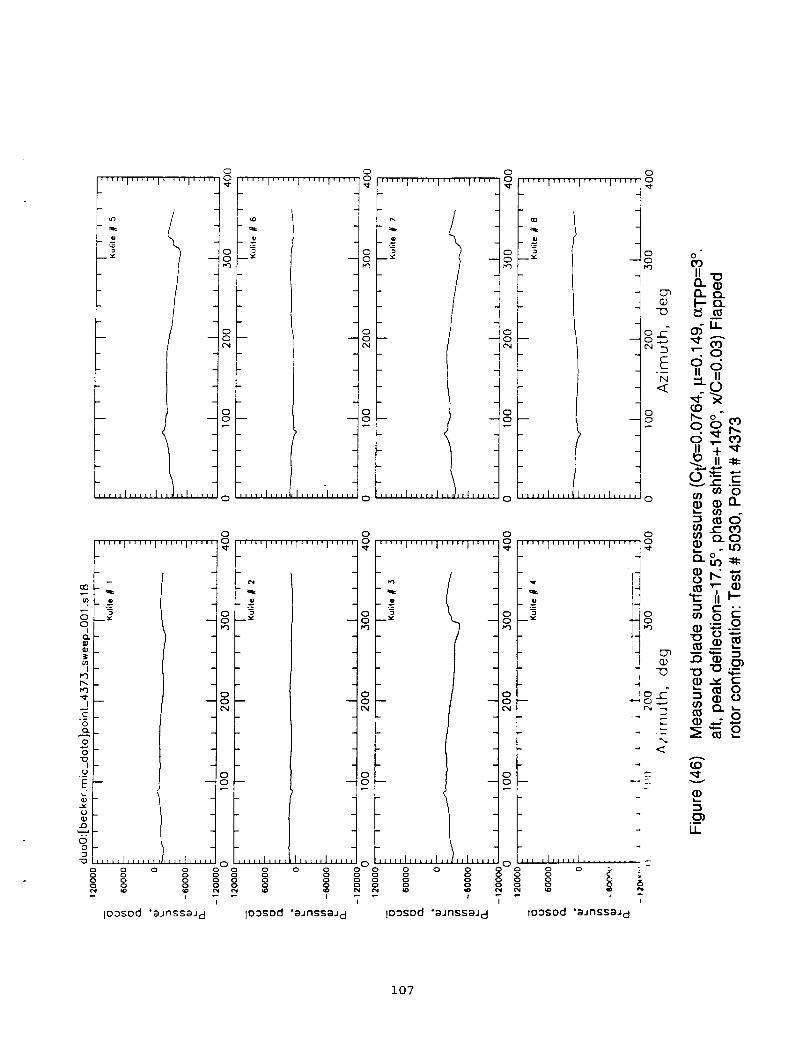
gO
,-g
012)
I'.'R
E
0
0"0
Iu
E
.0
00
"I3
go
o
0 00
'''*'1 ..... I .... 'I''''' 0"_'1
_J
I)
_ L _
g¢N
g
0 ..... I .... tl ..... I .....
..... I ..... I ..... I ..... !
J
!.... I ..... I .... I ....
o o _oo o
g gI
lo3sod 'gJnss@Jcl
0
-- 0
0--01"
I
0
0 iiJll ii i_,- 1 '''I' '''1''''
00 --
0 ..... I .... 1,,,,,I ....
o oo g o go g o gI
10390(:1 "_jl'lSS_J d
0
, 0
_g
J
°1o
oo
0
8 oo o°g oI
'""I'""I'""I'"
]
.... I ..... I,,I,,I ....
g o §g 8
I
io3sod '_JnssgJ d
_ _. .
o° o_bm
0 r'l) ¢_ 0ii) el) rl
_mC_0
',:1" I'''''1 ....
o
t: I--_ (-- ..
o_o
.4
,,,,I,,,,,I ............0
o g g o _ -:
loosod "_Jnss_ d
107
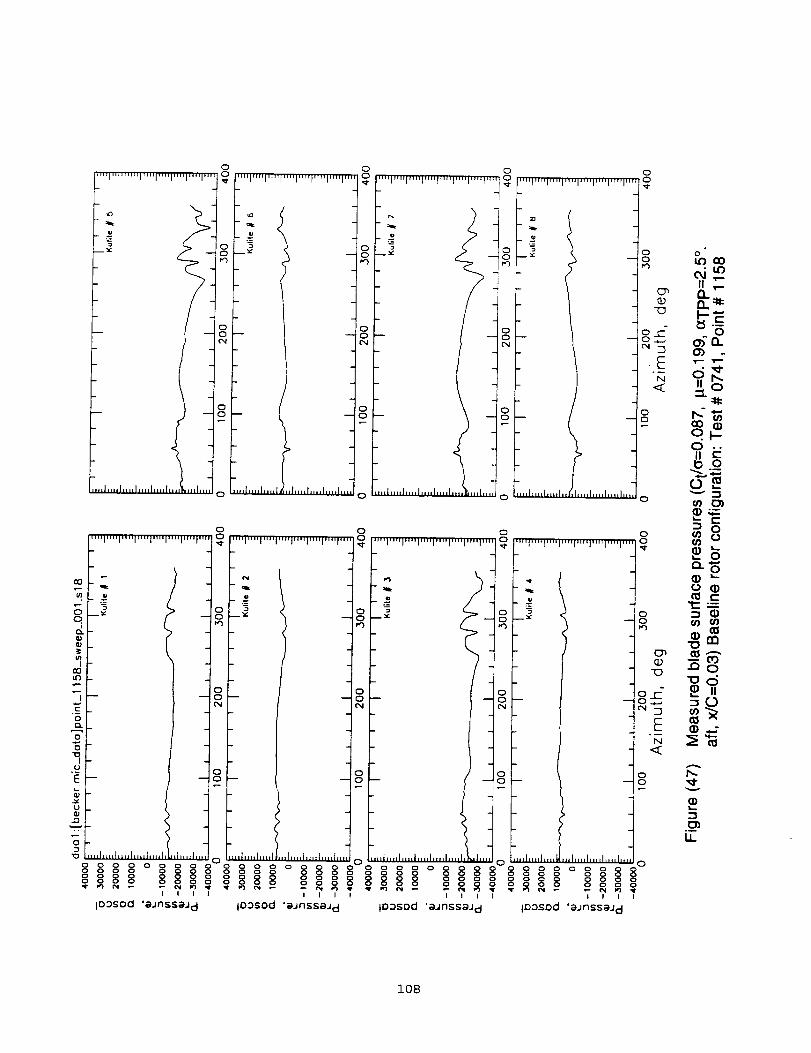
0
0 0
0
0 ,,,h,,,h,,,I,,( ,,,,h,,,I,,,,h,,,
108
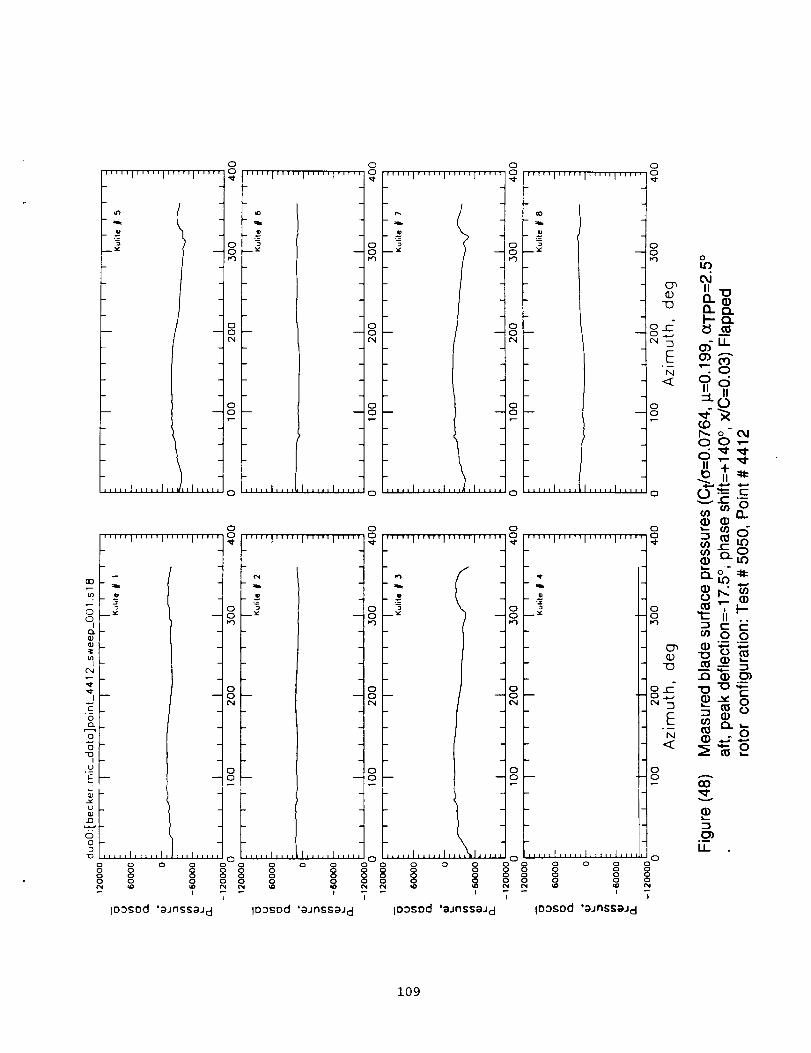
0
..... I ..... I ..... I .... ' I _c'__
j-
//
0--t0
0"_lO
0_0
t
I -,,,,i,,,,,I,, ,,I,,,,,, 0
00
00
8 8 °o 0
8
I
,,-,4
o 00
lo:)_od 'aJinSsaJ d
F,,,,,I,,,,,I,,,,,I,,,
F-
iiillllll
o o
" °I' .... i..... i..... J..... -_o
8e_
8IN
OO
IllllllltllO
I ..... I ..... I ..... I ....
..... I ..... I'''"1"'
]
o o oo oo 0
!
IO3sod 'aJns_aJ d
_. // ©
-- 0
\
..... t ..... I,,J,I ..... oi
0 0
,, 0 '""1'""1"'"1 ..... o
oo
8IN
oo
Oo oo 0
8 8
t
0
Oo
109
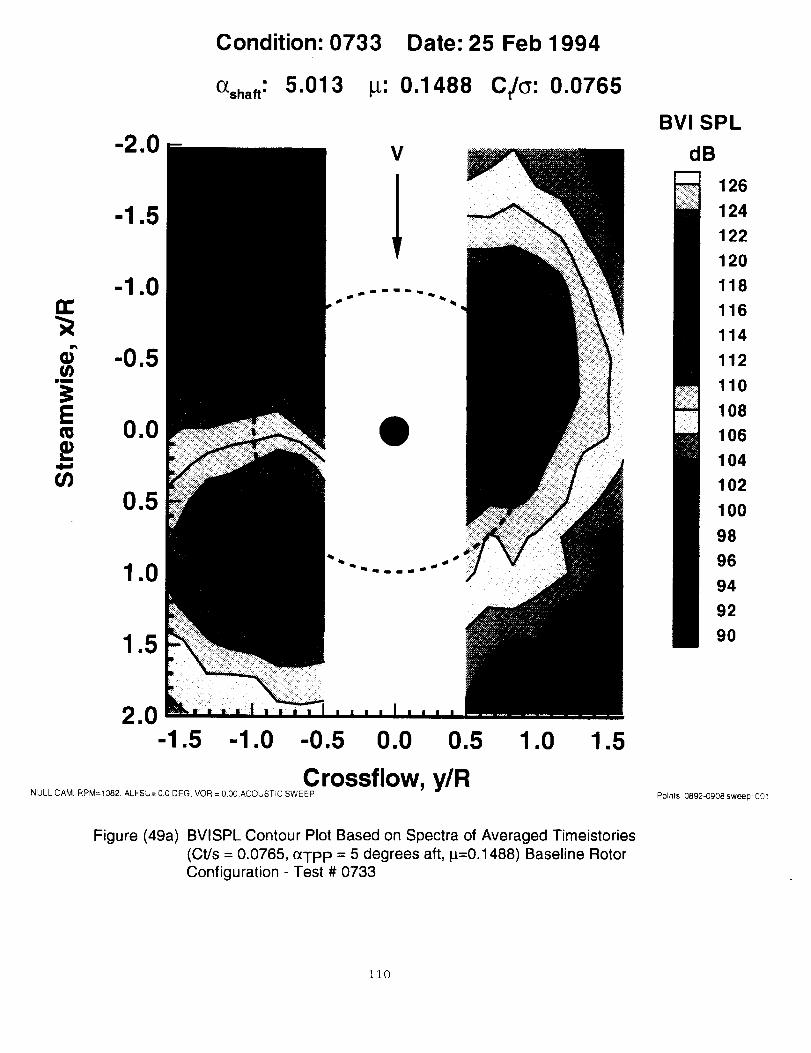
Condition: 0733 Date: 25 Feb 1994
O_shaft: 5.013 _: 0.1488 C/G: 0.0765
-2.0
-1.0n-
-0.5._¢
0.0
030.5
1.0
1.5
i
2.0-1.5 -1.0 -0.5 0.0 0.5 1.0 1.5
Crossflow, y/RNULL CAM, RPM=1082, ALFSU= 0.0 DEG, VOR = O.O0,ACOUSTIC SWEEP
BVI SPL
dB
126
124
122
120
118
116
114
112
110
108
106
104
102
100
98
96
94
92
9O
Points 0892-0908 sweep: 001
Figure (49a) BVISPL Contour Plot Based on Spectra of Averaged Timeistories(Ct/s = 0.0765, o_TpP = 5 degrees aft, _=0.1488) Baseline RotorConfiguration - Test # 0733
Ii0
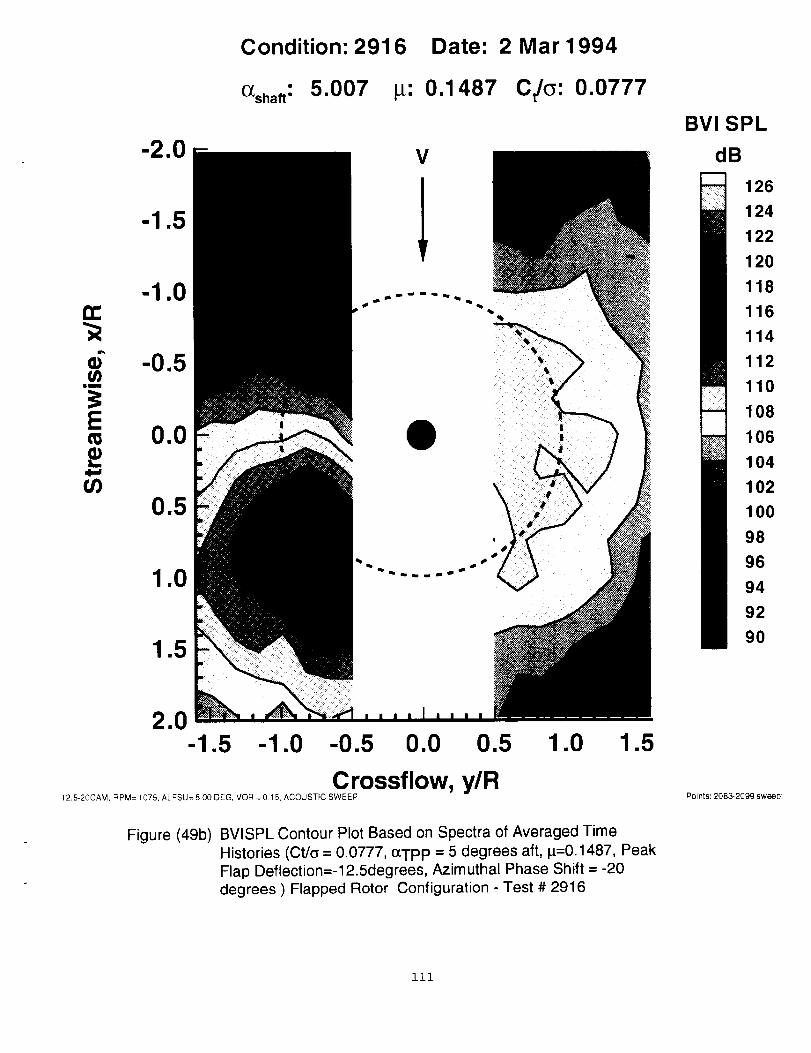
Condition: 2916 Date: 2 Mar 1994
_sha_t: 5.007 p: 0.1487 Ct/(_: 0.0777
-1.0n-
¢; -0.5
0.0.=
U)0.5
1.0
1.5
V
2.0-1.5 -1.0 -0.5 0.0 0.5 1.0 1.5
Crossflow, y/R12.5-20CAM. R PM: 1075. ALFSU= 5.00 DEG, VOR = 0 15, ACOUSTIC SWEEP
Figure (49b) BVISPL Contour Plot Based on Spectra of Averaged TimeHistories (Ct/_ = 0.0777, o_TpP = 5 degrees aft, p=0.1487, PeakFlap Deflection=-12.5degrees, Azimuthal Phase Shift = -20degrees ) Flapped Rotor Configuration - Test # 2916
BVI SPL
dB
126
124
122
120
118
116
114
112
110
108
106
104
102
100
98
96
94
92
90
Points: 2083-209g sweep:
iii
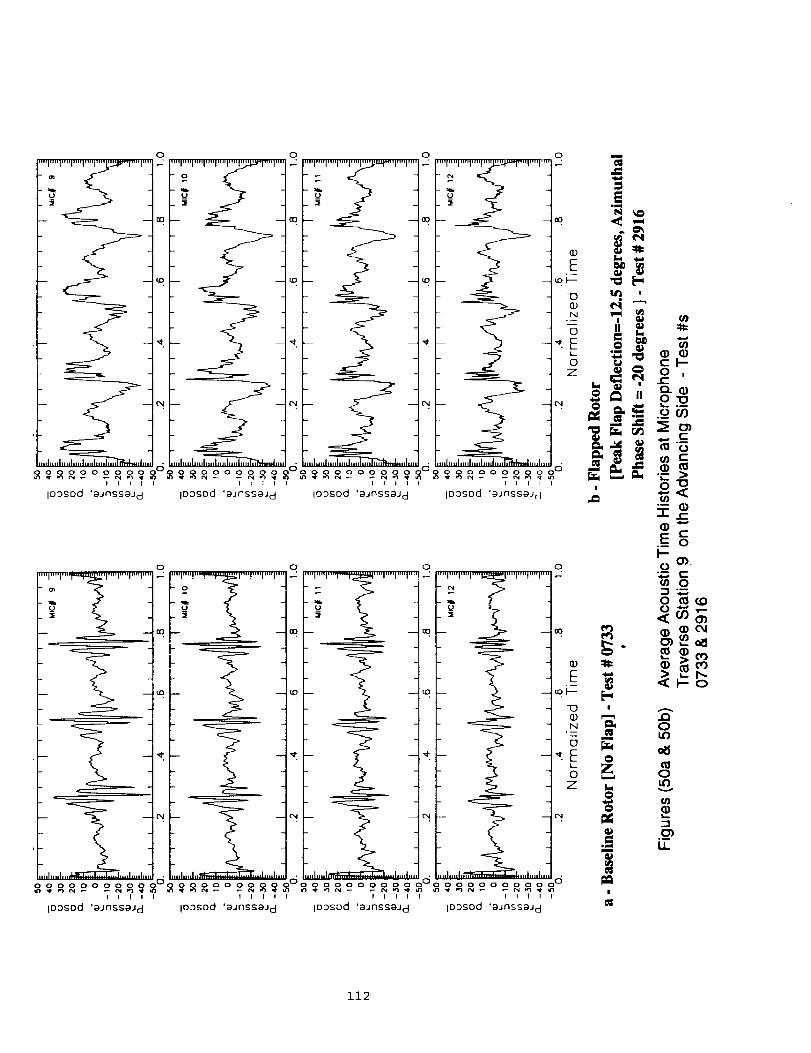
0 0 0 0
.... I'"T"_T"T"T"T'" ,-: .... I""l""f--"f'_l_ll'"T'"l"'T ''' ,.': "T"T'_""I"'T"T'"! ,J -T,-I-,.I,,-I_-.T,,T-T ,_, ,4
u u _ u
_ __.._ -_ - _ _. - __
, -- '_. "- -- _. -- - "_ -- -- "¢..E
ooooooooooo°ooooooooooo ooooooooooo ooooooooooo
ioosod 'aJnssaJ d io3sod '_Jnssa_ d io3sod 'aJnssaJ_ io3sod 'aJnssaJcl
•-- q)
q) ----
.e_(_.o
0_._0 _(D
<
I
0
|
112

113

114
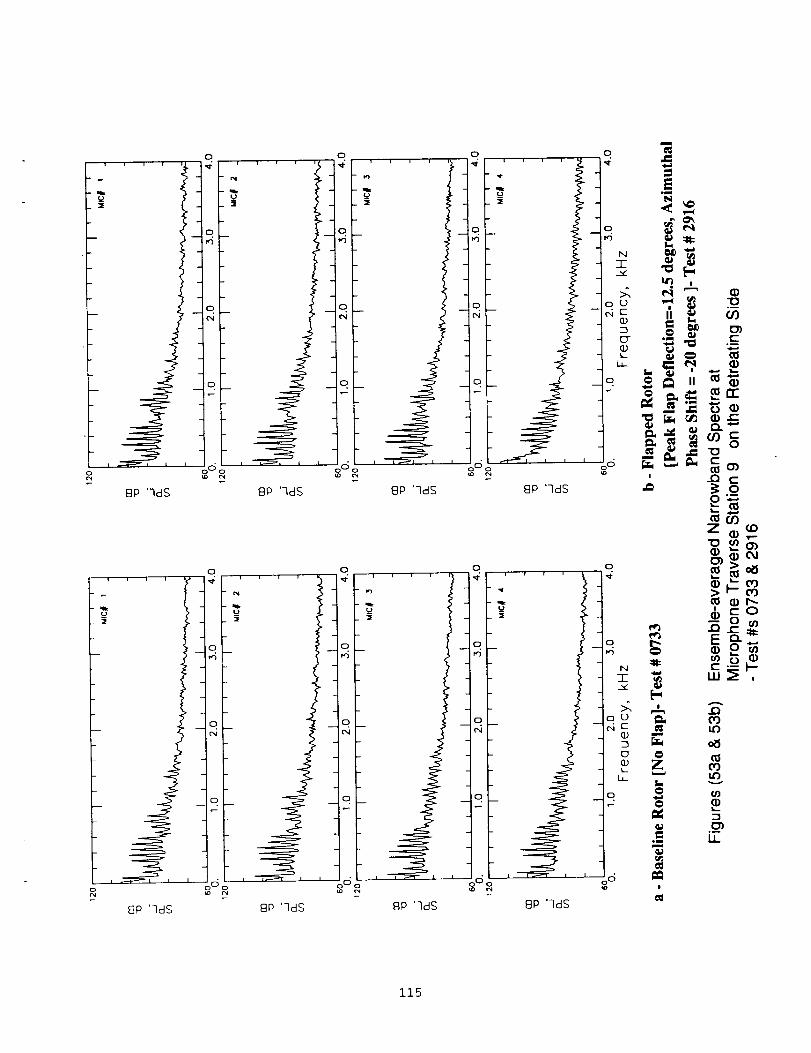
115
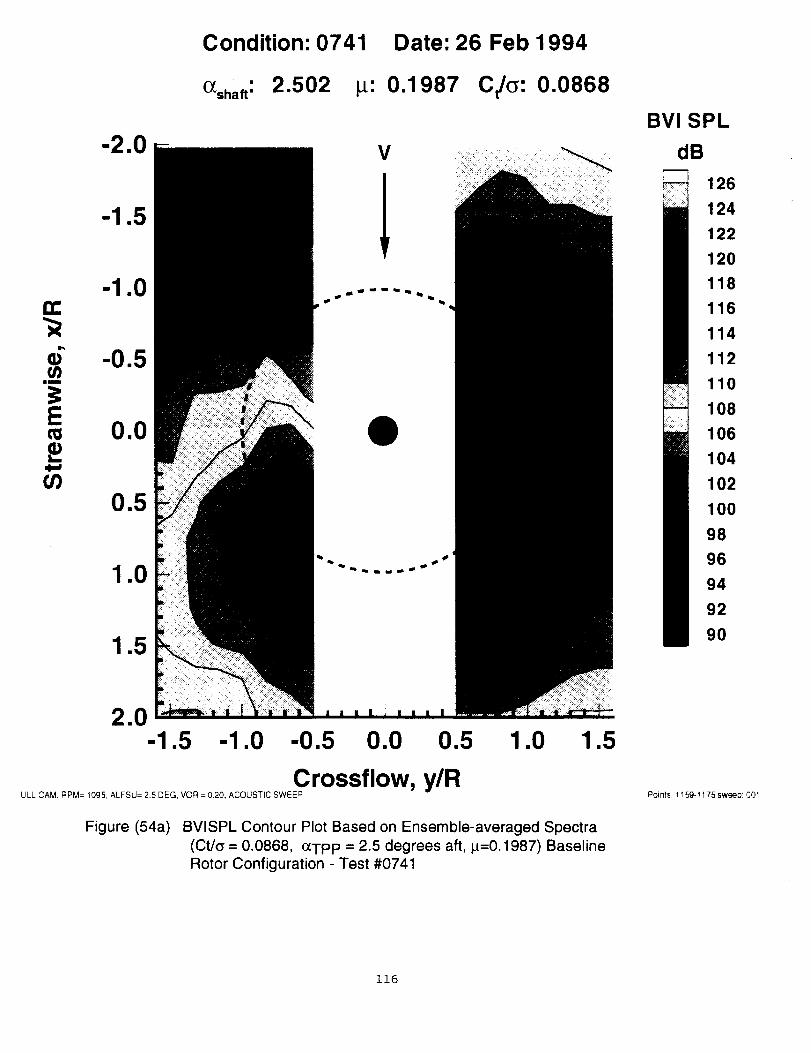
Condition: 0741 Date: 26 Feb 1994
O%h..: 2.502 !_: 0.1987 C/G: 0.0868
n-
6(/}
-2.0
-1.0
Em 0.0
,4.=1
U30.5
1.0
1.5
V
2.0-1.5 -1.0 -0.5 0.0 0.5 1.0 1.5
Crossflow, y/RULL CAM, RPM= 1095, ALFSU= 2.5 DEG, VOR = 0.20, ACOUSTIC SWEEP
Figure (54a) BVISPL Contour Plot Based on Ensemble-averaged Spectra
(Ct/c = 0.0868, o_TpP = 2.5 degrees aft, _=0.1987) BaselineRotor Configuration - Test #0741
BVI SPL
dB
126
124
122
120
118
116
114
112
110
108
106
104
102
100
98
96
94
92
9O
Points: 1159-1175 sweep: 001
116
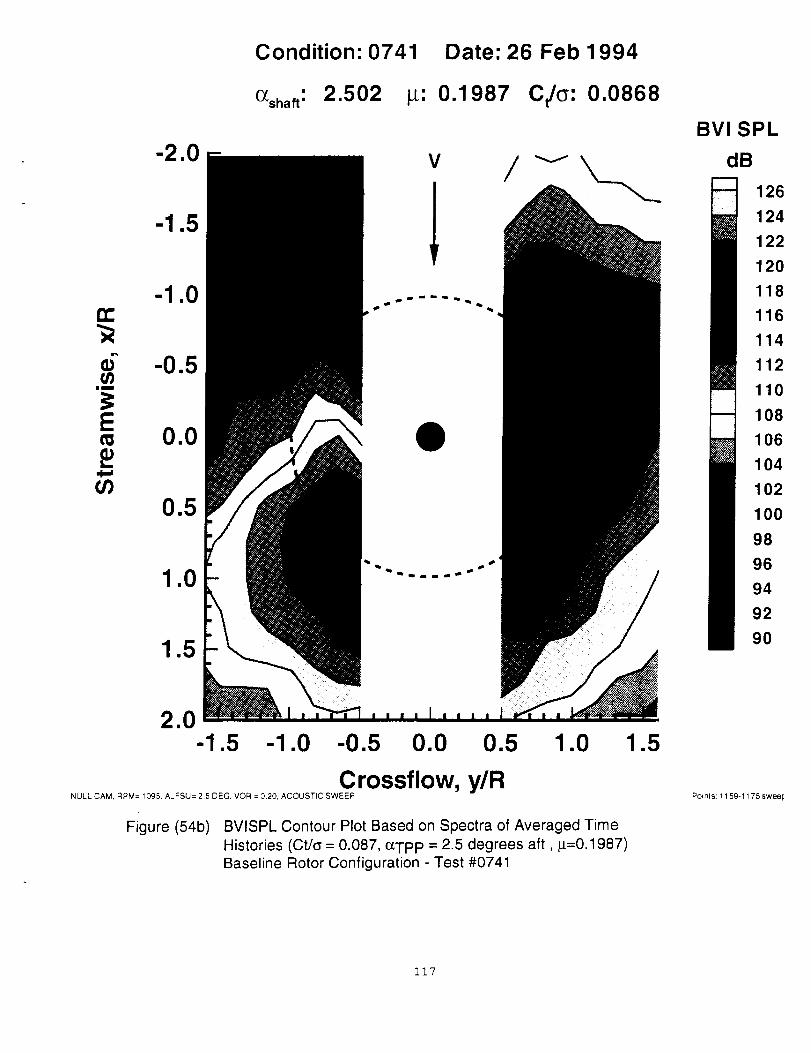
Condition: 0741 Date: 26 Feb 1994
O_shaft: 2.502 _: 0.1987 Ct/_: 0.0868
-2.0
-1.0n-
6 -0.5
0.0,e
O)0.5
1.0
1.5
2.0-1.5 -1.0 -0.5 0.0 0.5 1.0 1.5
Crossflow, y/RNULL CAM, RPM= 1095, AL_SU= 2.5 DEG, VOR = 0.20, ACOUSTIC SWEEP
Figure (54b) BVISPL Contour Plot Based on Spectra of Averaged Time
Histories (Ct/_ = 0.087, c_TpP = 2.5 degrees aft, _t=0.1987)Baseline Rotor Configuration - Test #0741
BVI SPL
dB
126
124
122
120
118
116
114
112
110
108
106
104
102
100
98
96
94
92
90
Points: 1159-1175 swee_
117

Condition: 2741 Date: 1 Mar 1994
(_shaft: 2.502 p: 0.1986 Ct/_: 0.0875
-2.0
-1.0n-
6 -0.5.__
0.0
,4,,,I
0.5
1.0
1.5
2.0-1.5 -1.0 -0.5 0.0 0.5 1.0 1.5
Crossflow, y/R12.5+1¢CAM. RPM= 1082, ALFSU= 2,50 DEG, VOR = 0,20,ACOUSTIC SWEEP
Figure (55a) BVISPL Contour Plot Based on Ensemble-averaged Spectra
(Ct/_ =0.0875, _Tpp = 2.5 degrees aft, #=0.1986, Peak FlapDeflection = 12.5 degrees, Azimuthal Phase Shift = 0 degrees )
Flapped Rotor Configuration - Test # 2741
BVI SPL
dB
126
124
122
120
118
116
114
112
110
108
106
104
102
100
98
96
94
92
90
Poinls: 1718-1734 sweep: 001
118
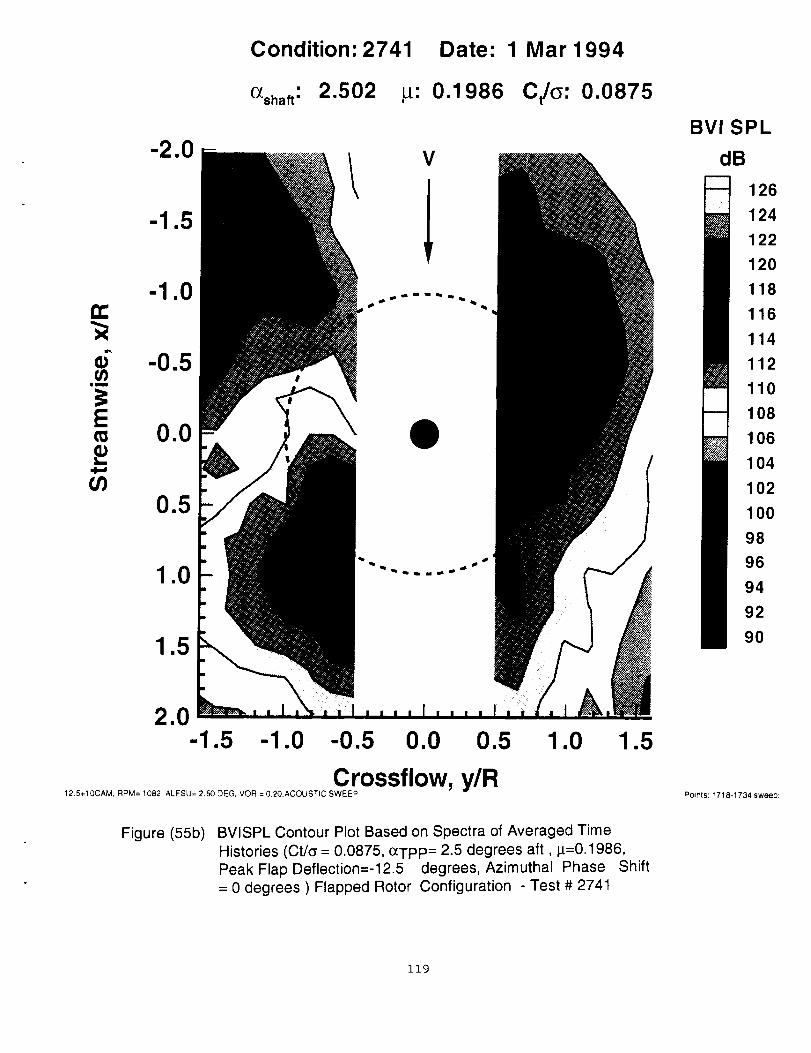
Condition: 2741 Date: 1 Mar 1994
O_shaft: 2.502 _: 0.1986 C_: 0.0875
-1.0n-
-0.5.__
0.0.=
O30.5
1.0
1.5
V
2.0-1.5 -1.0 -0.5 0.0 0.5 1.0 1.5
Crossflow, y/R12.5+10CAM, RPM= 1082. ALFSU= 2.50 DEG, VOR = 0,20.ACOUSTIC SWEEP
Figure (55b) BVISPL Contour Plot Based on Spectra of Averaged Time
Histories (Ct/_ = 0.0875, c_Tpp= 2.5 degrees aft, p.=0.1986,Peak Flap Deflection=-12.5 degrees, Azimuthal Phase Shift= 0 degrees ) Flapped Rotor Configuration - Test # 2741
BVI SPL
dB
126
124
122
120
118
116
114
112
110
108
106
104
102
100
98
96
94
92
90
Poinls: 1718-1734 sweep:
119

Condition: 0731 Date: 25 Feb 1994
(_'shaft: 3.016 _: 0.1492 Ct/_: 0.0773
-2.0
-1.0n-
6 -0.5._¢
0.0,4_
U30.5
1.0
1.5
V
2.0-1.5 -1.0 -0.5 0.0 0.5 1.0 1.5
Crossflow, y/RNULL CAM, FIPM=1087, ALFSU= 3.0 DEG. VOR = 0,15.ACOUSTIC SWEEP
Figure (56a) BVISPL Contour Plot Based on Spectra of Averaged Time
Histories (Ct/c = 0.0773, o_TpP = 3 degrees aft, p=0.1492)Baseline Rotor Configuration Test # 0731
BVI SPL
dB
126
124
122
120
118
116
114
112
110
108
106
104
102
100
98
96
94
92
9O
_oinls: 0853-0869 sweep: 001
120
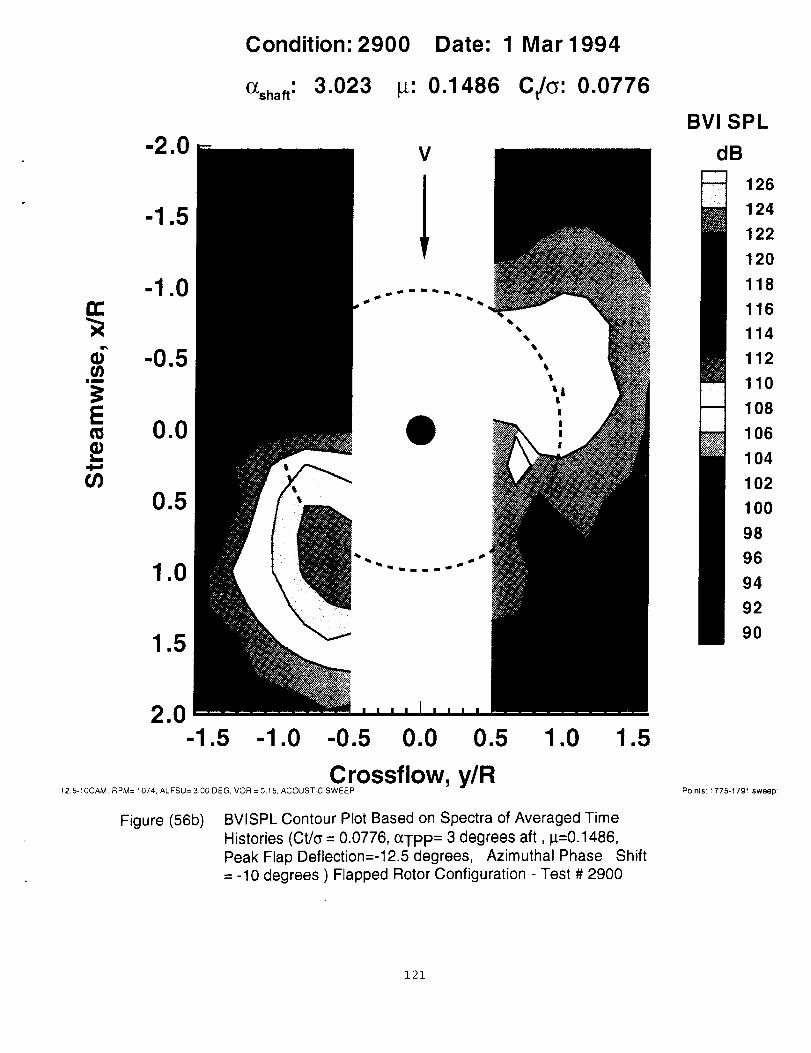
Condition: 2900
O_shaft: 3.023 _:
Date: 1 Mar 1994
0.1486 C/o: 0.0776
-2.0
-1.0n-
6 -0.5.co
0.0,=U_
0.5
1.0
1.5
V
2.0-1.5 -1.0 -0.5 0.0 0.5 1.0 1.5
Crossflow, y/R125-10CAM, RPM= 1074. ALFSU= 300 DEG, VOR =0.15, ACOUSTIC SWEEP
Figure (56b) BVISPL Contour Plot Based on Spectra of Averaged Time
Histories (Ct/_ = 0.0776, o_Tpp= 3 degrees aft, 1_=0.1486,Peak Flap Deflection=-12.5 degrees, Azimuthal Phase Shift= -10 degrees ) Flapped Rotor Configuration - Test # 2900
BVI SPL
dB
126
124
122
120
118
116
114
112
110
108
106
104
102
100
98
96
94
92
9O
Poinls: 1775-1701 sweep:
121

Condition: 3915 Date: 4 Mar 1994
(_shaft: 3.018 _: 0.1488 Ct/_: 0.0778
-2.0
-1.0n-
6 -0.5._¢
0.0,4.,l
0.5
1.0
1.5
V
I
|I
I
2.0-1.5 -1.0 -0.5 0.0 0.5 1.0 1.5
Crossflow, y/R17.5_5 CAM, RPM= 1077. ALFSU = 3.0 DEG, VOR =015, CT/SIGMA = 076
Figure (56c) BVISPL Contour Plot Based on Spectra of Averaged TimeHistories (CtJG = 0.0778, o_Tpp= 3 degrees aft, p=0.1488, PeakFlap Deflection=-17.5 degrees, Azimuthal Phase Shift = -5degrees ) Flapped Rotor Configuration - Test # 3915
BVI SPL
dB
126
124
122
120
118
116
114
112
110
108
106
104
102
100
98
96
94
92
90
Points: 3106-3122 sweep: 001
122
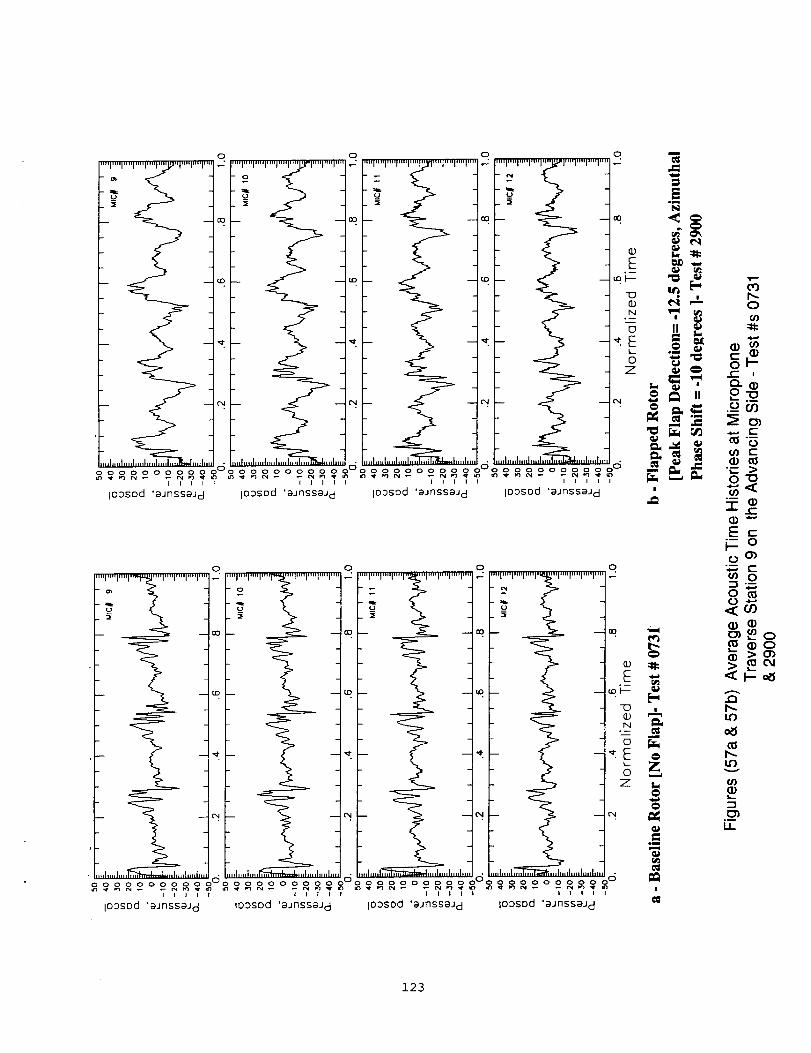
ioDsDd "gJnssaJ d IODSDd 'aJnssaJ d
o o
II
ooo_ooo_ooo ooooooooooo _..._"_. g-o>_
ioDsod 'aJnssaJcj tODsod 'aJnssaJc} joDsod 'aJnssaJcl IODSOd 'aJnssaJ d
ioosod 'aJnssaJ d IOosod 'aJnssaJcI
i
=,
..-.<
(-
E=_=oo o)
c00 0
0o -,-'
(D (D
>(OO4
b-
b-
LL
123
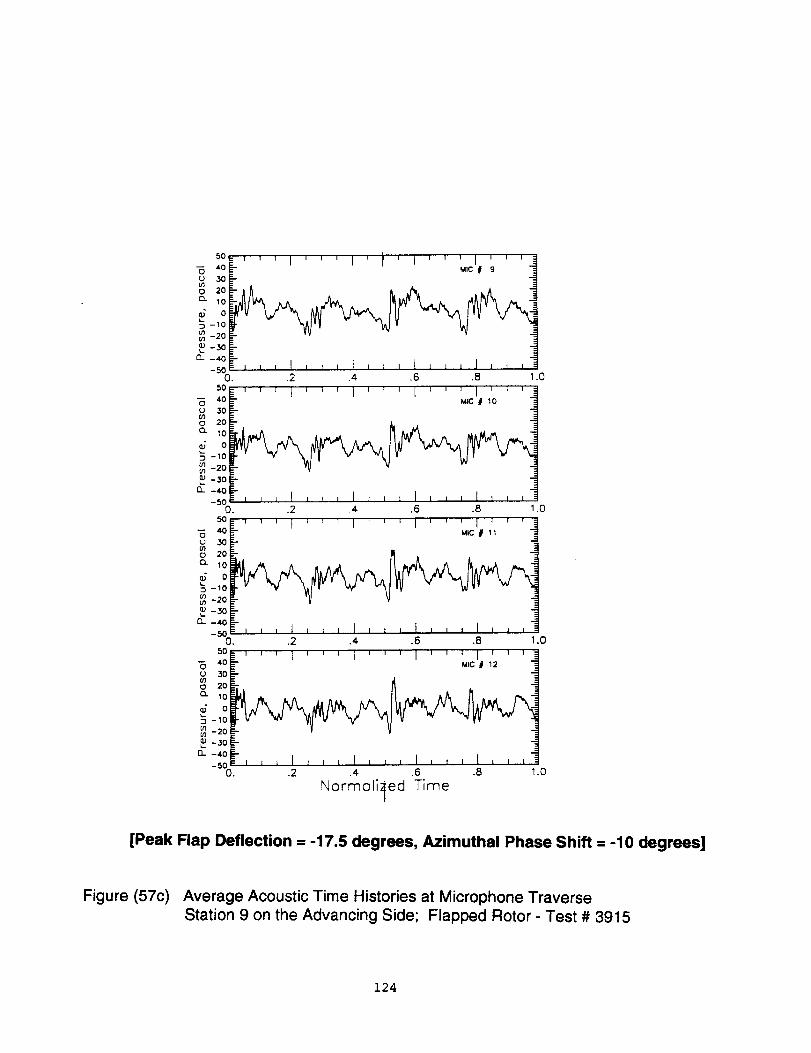
5O
-- 40o
300 20
o. 10
o*_ -10
-20
-30
CL -40
-50
" ' ' ' I ' ' ' I ' i ' I ' ' ' I ....=- MIC _ 9
E, , , I L , i I , , , I , , , I , I i_O.
5O
40
_oo 20
cL 10
Q; o-10
-20
-30i
0- -4oj-50
2 4 6 8 0
I'1[_1#1 °
_tlI,Lll,l,L_0.
5O
4030
o 20
EL 10
_; o-10
-20
-30
0--40
-50
2 4 6 8 10
1 ' l ' I I ' _i
0.
5O
40
0 30030 20Q" 10
oD -10
-20
-300--40
-500.
2 4 6 8 1.0
1 ' ' i I ' I ' 'MIC # 12
2 4 .6 .8 1.0
Normoli_ed Time
[Peak Flap Deflection = -17.5 degrees, Azimuthal Phase Shift = -10 degrees]
Figure (57c) Average Acoustic Time Histories at Microphone Traverse
Station 9 on the Advancing Side; Flapped Rotor Test # 3915
124
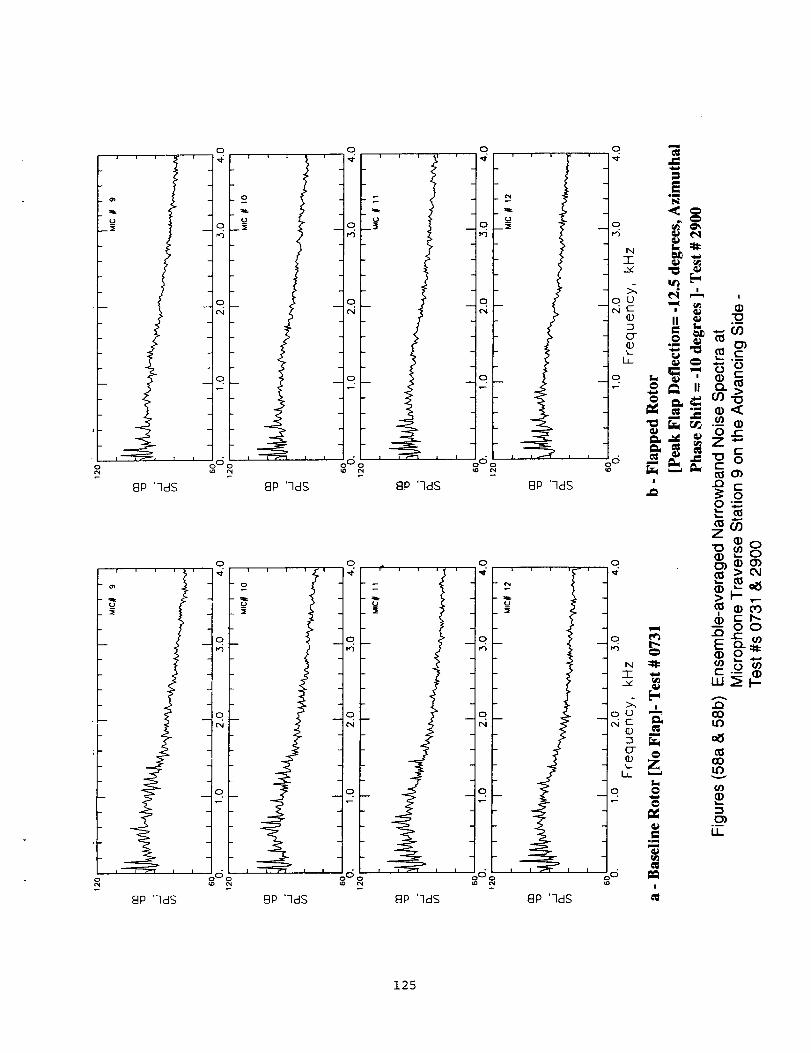
o
J i i b¸ i
_u
I '_l l i
8P '7dS
! i i
_P 'TdS
0
o
o
8P '7dS
o 0 o
8P '7dS
0
o,I
o 0 o
o
8P 'qdS
o o o
o o
I IIoOo oOo
8P '7dS
8P '7dS
, i i - ,
i i
8P 'qdS
_oo'__ m
Z
>O4
>1--
l-" r,_
v
ffl
°_
LL
|
o./
o
oo_o |
125
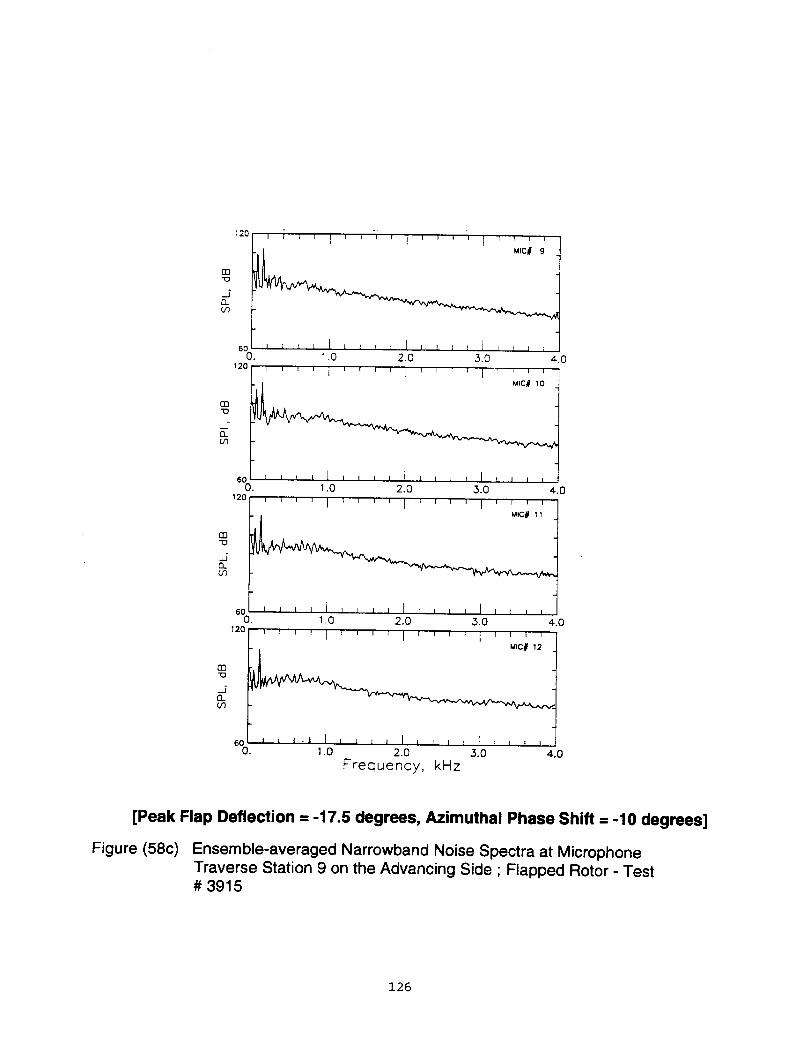
O3
.5ELb3
(33-O
_j"EL(.,3
rn
.5£1.CO
03"O
EL(/3
uo ' ; ' ' I ' ' "' ' I .... I ' ' ' '
6o , I z , I , I T I J i z L i j , i , i0. 1.0 2.0 3.0 4.0
12o ' ' ' ' I ' ' ' ' i ' ' ' ' I ' ' ' '
0. 1.0 2.0 3.0 4.0
12o ' ' ' ' I ' ' ' ' I ' ' ' ' I ' ' ' '
6o , , K, J, , , J r,,,, I I, ,0. 1.0 2.0 3.0 4.0
MtC# 12
6O0.
' ' ' _ f , L , J I , L , , f , , , ,1.0 2.0 3.0
Frequency, kHz4.0
[Peak Flap Deflection = -17.5 degrees, Azimuthal Phase Shift = -10 degrees]
Figure (58c) Ensemble-averaged Narrowband Noise Spectra at Microphone
Traverse Station 9 on the Advancing Side ; Flapped Rotor - Test# 3915
126
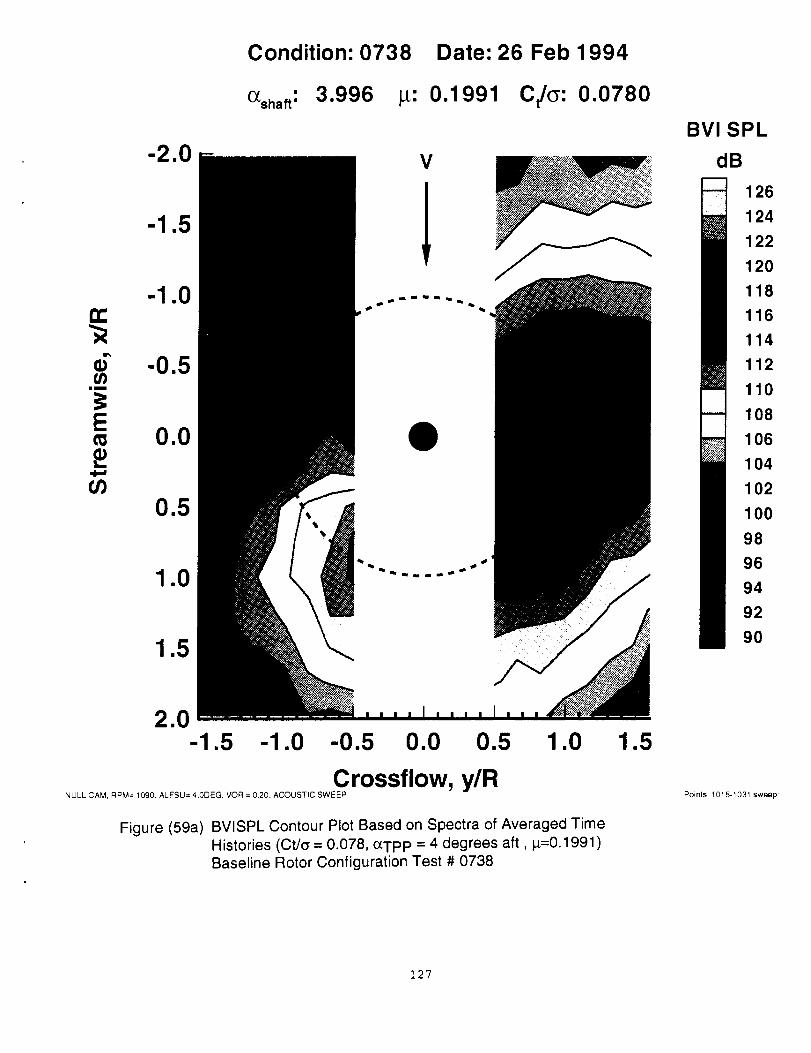
Condition: 0738 Date: 26 Feb 1994
Of,shaft: 3.996 _: 0.1991 C/o: 0.0780
-1.0n-
6 -0.5
_ 0.0
0.5
1.0
1.5
V
2.0-1.5 -1.0 -0.5 0.0 0.5 1.0 1.5
Crossflow, y/RNULL CAM. RPM= 1090, ALFSU= 4.0DEG, VOR = 0.20. ACOUSTIC SWEEP
Figure (59a) BVISPL Contour Plot Based on Spectra of Averaged Time
Histories (Ct/_ = 0.078, o_Tp P = 4 degrees aft, p=0.1991 )Baseline Rotor Configuration Test # 0738
BVI SPL
dB
126
124
122
120
118
116
114
112
110
108
106
104
102
100
98
96
94
92
90
Points: 1015-1031 sweep:
127

Condition: 2904 Date: 1 Mar 1994
(_shaft: 4.001 _: 0.1982 Ct/o: 0.0768
-2.0
0.0
V
2.0-1.5 -1.0 -0.5 0.0 0.5 1.0 1.5
Crossflow, y/R12.5-10CAM. RPM= 1081, ALFSU= 4.00 DEG, VOR = 0.20, ACOUSTIC SWEEP
Figure (59b) BVISPL Contour Plot Based on Spectra of Averaged TimeHistories (Ct/G = 0.0768, o_Tpp= 4 degrees aft, _=0.1982, PeakFlap Deflection=-12.5 degrees, Azimuthal Phase Shift =-10degrees ) Flapped Rotor Configuration - Test # 2904
BVI SPL
dB
126
124
122
120
118
116
114
112
110
108
106
104
102
100
98
96
94
92
9O
Points: 1900-1916 sweep: 001
128
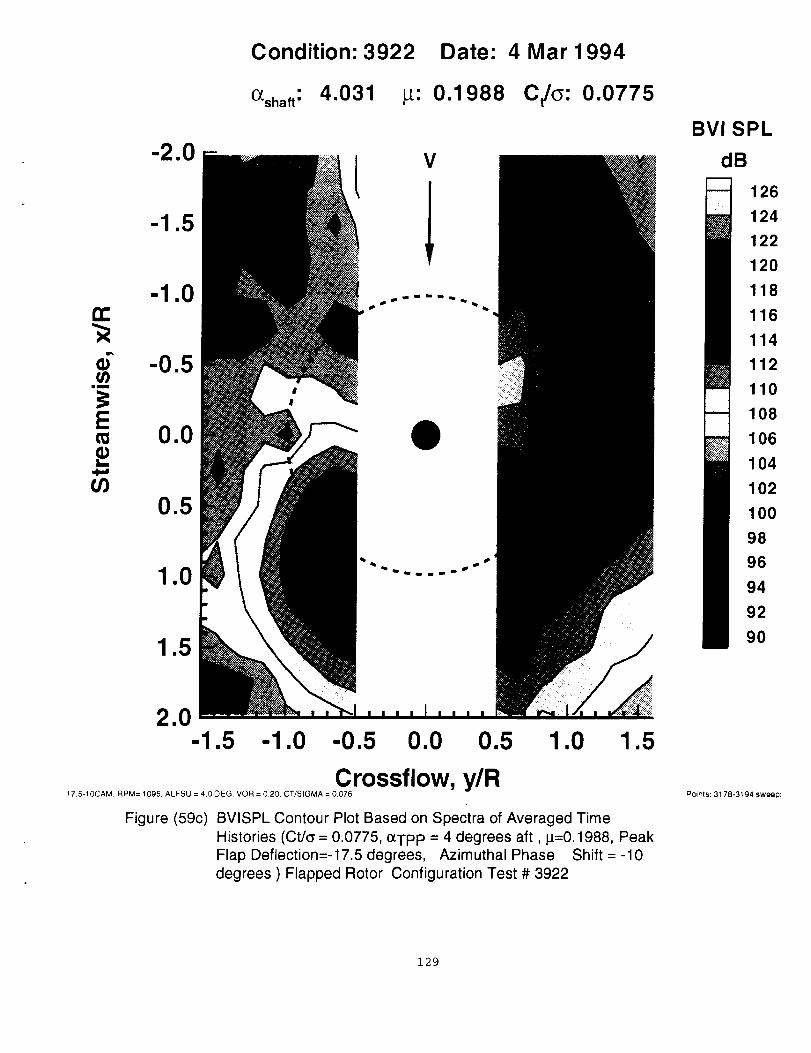
Condition: 3922
O_shaft-" 4.031 _:
Date: 4 Mar 1994
0.1988 C/o: 0.0775
-1.0n-
6 -0.5
_ 0.0
ffl0.5
1.0
1.5
V
2.0-1.5 -1.0 -0.5 0.0 0.5 1.0 1.5
Crossflow, y/R17.5-10CAM RPM= 1095, ALFSU = 4.00EG. VOR = 0.20, CT/SIGMA = 0.076
Figure (59c) BVISPL Contour Plot Based on Spectra of Averaged TimeHistories (Ct/o = 0.0775, c_TpP = 4 degrees aft, _=0.1988, PeakFlap Deflection=-17.5 degrees, Azimuthal Phase Shift =-10degrees ) Flapped Rotor Configuration Test # 3922
BVI SPL
dB
126
124
122
120
118
116
114
112
110
108
106
104
102
100
98
96
94
92
90
Poinls: 3178-3194 sweeD:
129
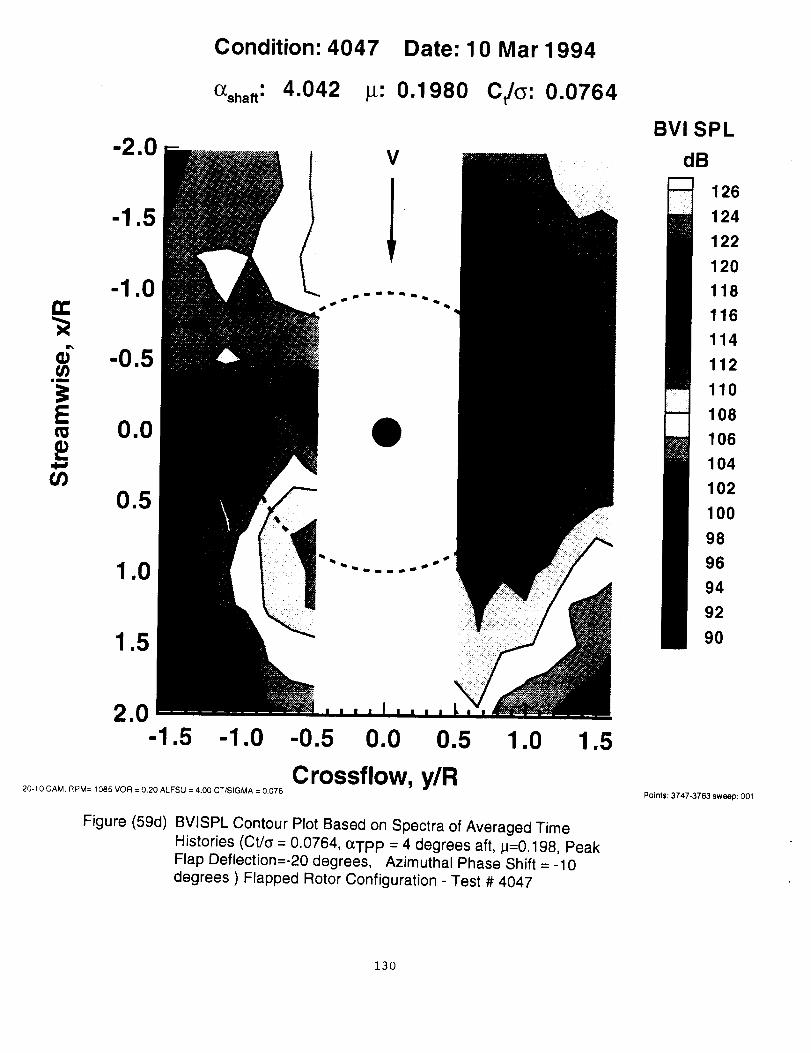
Condition: 4047 Date: 10 Mar 1994
(_shaft: 4.042 _: 0.1980 Ct/_: 0.0764
-2.0
0.0
2.0-1.5 -1.0 -0.5 0.0 0.5 1.0 1.5
Crossflow, y/R20-10 CAM, RPM= 1085 VOR = 0.20 ALFSU = 4.00 CT/SIGMA = 0.076
Figure (59d) BVISPL Contour Plot Based on Spectra of Averaged TimeHistories (Ct/_ = 0.0764, (zTp P = 4 degrees aft, _t=0.198, PeakFlap Deflection=-20 degrees, Azimuthal Phase Shift = -10degrees ) Flapped Rotor Configuration - Test # 4047
BVI SPL
dB
126
124
122
120
118
116
114
112
110
108
106
104
102
100
98
96
94
92
90
Poinls: 3747-3763 sweep: 001
130
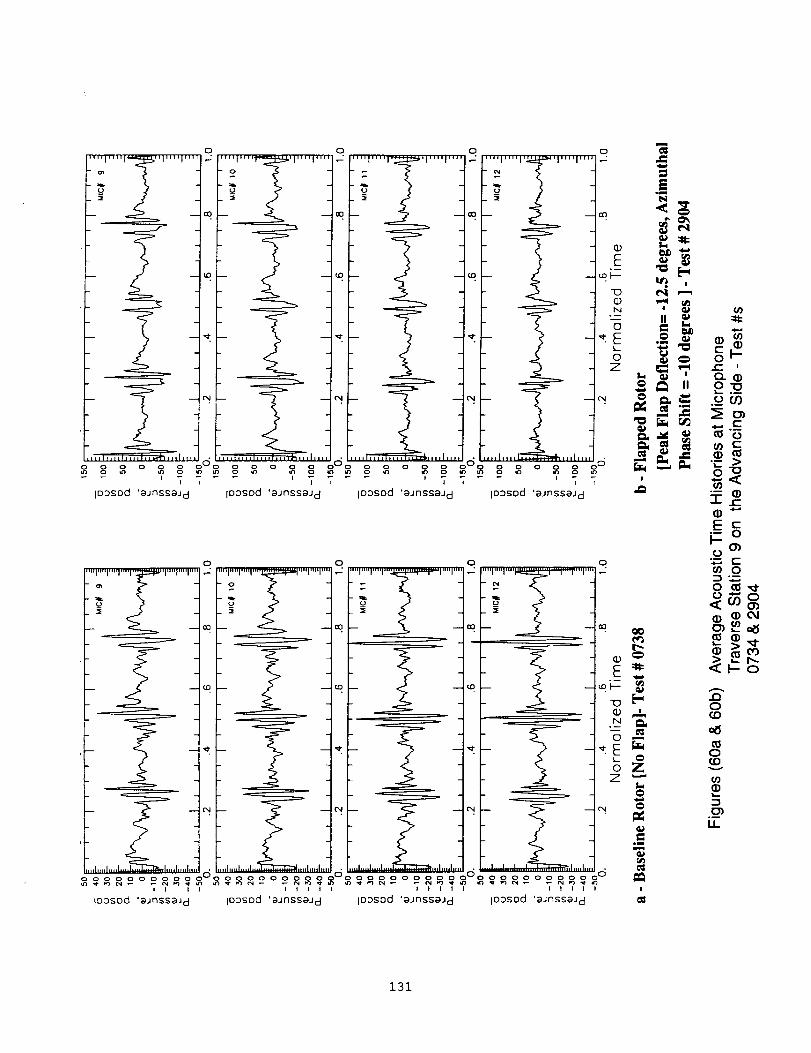
0 0 0 0 "_
....' ...."_" ....'""1_l'''''''''_ 'l....'""1_1''''' ...._k _'_....'""1_1''''_...."_" ...."'"1_ _-
- _- _- _. _. _ er_
!
- _. _. _ _E o __ o_-
_ _. _ _. .£ _
_ _ _'_o "E >
ooooooo°oo_oooo°OoOOO_oO_.°_oOOO_,, _-_ 07IOgSod 'aJnssaJ d 1o3sod 'aJnssaJcl 1oosod 'aJnssaJ d iD3sod 'aJnssaJEi
,,,T.T,,,I,..F..I_,T,.I.,,, I....
S
,,h,,,h..I ........ .......... I.. .... .,,I,,
000 0 O 0
ooooooooooo°oooooooooo? ooo oooI I I I I _ _" I I I I I I I
IOosDd 'aJnssaJ d ioosod 'aJnssaJ d 1oDsod 'aJnssaJcI
"-- (D-1- c_(1) _-"Eci:o
(_oo "_ E:
(_ 0
o_o< o_
_ _-o
I t I I I
IO0SOd 'aJnssaJ d
oz
@
=.m
_a
!
.(D0E)
0(Dv
(/)
_)i...
E_I1
131
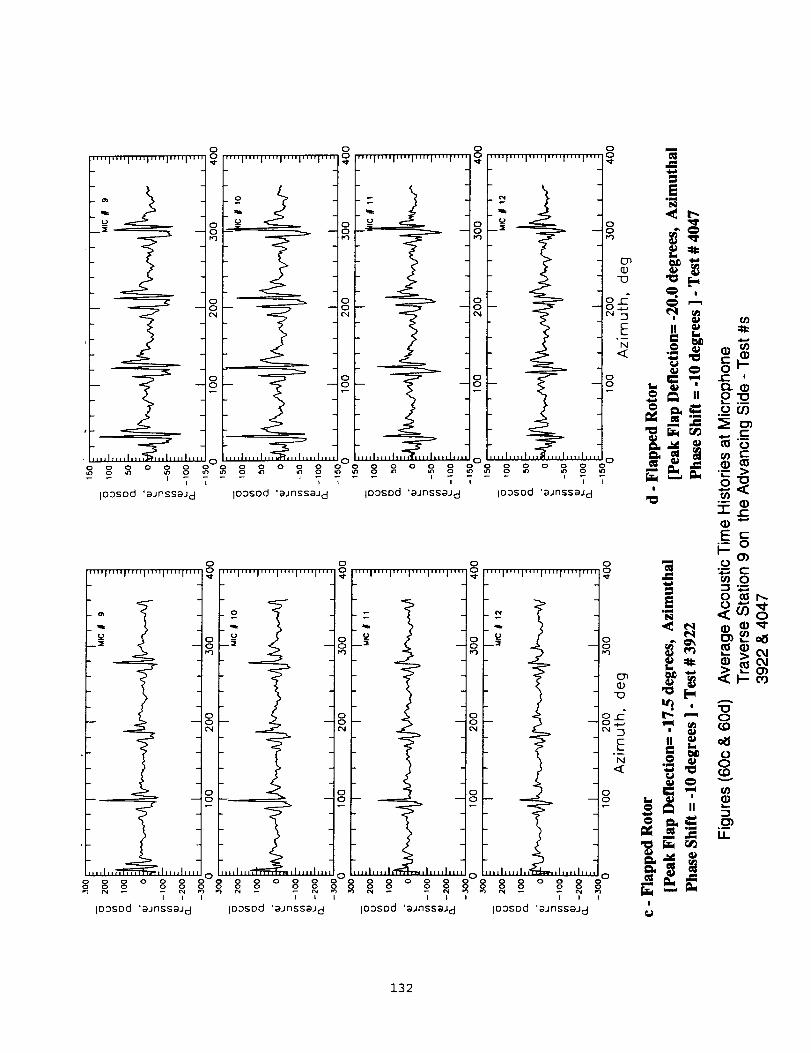
132

9P '7dS
i i
i I
AP 'qds
0
11o
133
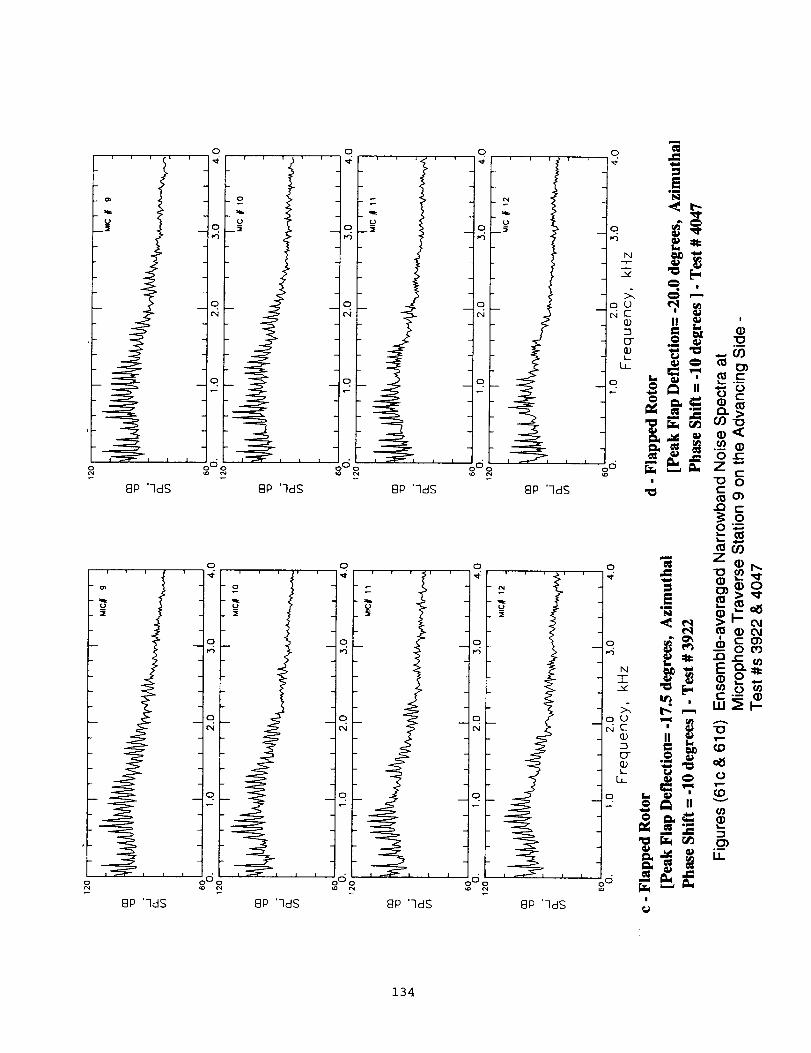
134

Condition: 0741 Date: 26 Feb 1994
(_shaft: 2.502 _: 0.1987 Ct/o: 0.0868
-2.0
-1.0n-
6 -0.5.__
o= 0.0.=
030.5
1.0
1.5
V
2.0-1.5 -1.0 -0.5 0.0 0.5 1.0 1.5
Crossflow, y/RNULL CAM, FIPM= 1095, ALFSU= 2.5 DEG, VOR = 0,20, ACOUSTIC SWEEP
Figure (62a) BVISPL Contour Plot Based on Spectra of Averaged Time
Histories (Ct/_ = 0.0868, o_TpP = 2.5 degrees aft, p=0.1987)Baseline Rotor Configuration Test # 0741
BVI SPL
dB
126
124
122
120
118
116
114
112
110
108
106
104
102
100
98
96
94
92
90
Points: 1159-1175 sweep
135

Condition: 3910 Date: 3 Mar 1994
(_'shaft: 2.515 It: 0.1990 C/o: 0.0896
-2.0
0.0
v
#
2.0-1.5 -1.0 -0.5 0.0 0.5 1.0 1.5
Crossflow, y/R17.5+0CAM. APM= 1081. ALFSU = 2.5 DEG, VOR = 0.20, CTISIGMA = 0.087
BVI SPL
dB
126
124
122
120
118
116
114
112
110
108
106
104
102
100
98
96
94
92
9O
Points: 2846-2862 sweep: 001
Figure (62b) BVISPL Contour Plot Based on Spectra of Averaged TimeHistories (Ct/o = 0.0896, (_TPP = 2.5 degrees aft, p=0.1990,Peak Flap Deflection=-17.5 degrees, Azimuthal Phase Shift = 0degrees ) Flapped Rotor Configuration Test # 3910
136

Condition: 3941 Date: 4 Mar 1994
(_shaft" 2.496 _: 0.1985 Ct/_: 0.0889
n-
6._¢
-1.0
.=d--,I
U)0.5
1.0
1.5
V
2.0-1.5 -1.0 -0.5 0.0 0.5 1.0 1.5
Crossflow, y/R17.5-5 CAM. RPM= 1086, ALFSU = 2.5 DEG, VOR = 0.20. CT/SIGMA = 087
Figure (62c) BVISPL Contour Plot Based on Spectra of Averaged TimeHistories (Ct/c = 0.0889, o_TpP = 2.5 degrees aft, p=0.1985,Peak Flap Deflection= -17.5 degrees, Azimuthal Phase Shift = -5degrees ) Flapped Rotor Configuration Test # 3941
BVl SPL
dB
126
124
122
120
118
116
114
112
110
108
106
104
102
100
98
96
94
92
90
Points: 3085-3101 sweep: 0
137
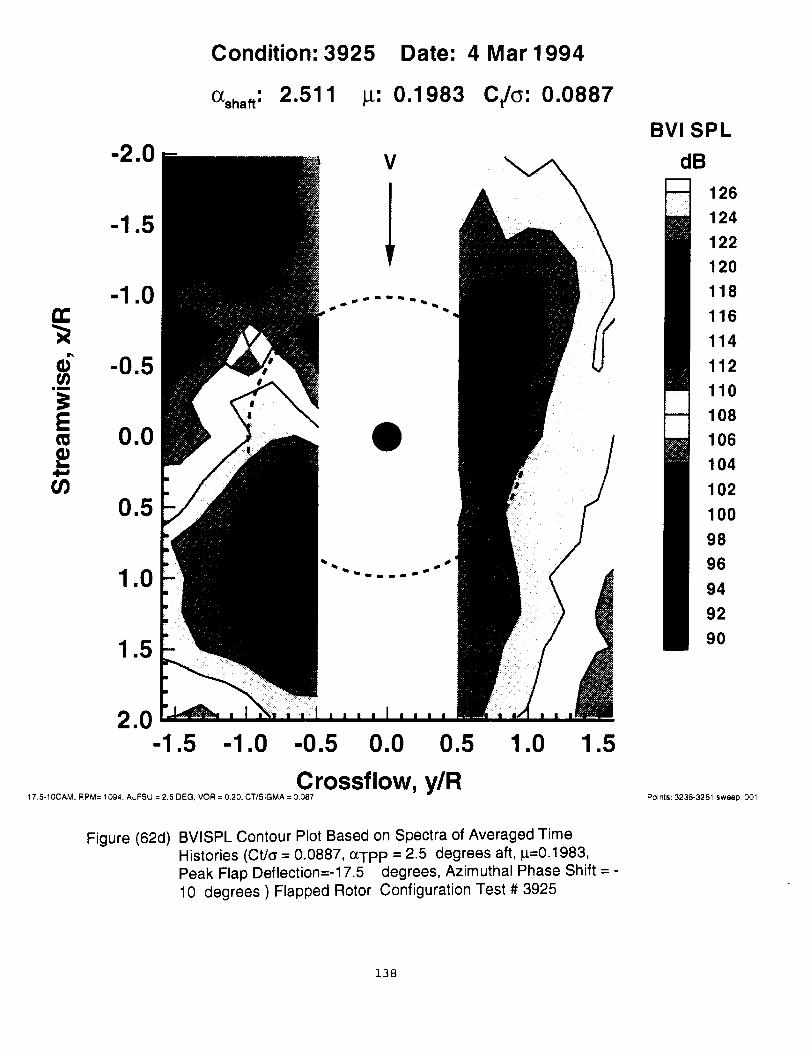
Condition: 3925 Date: 4 Mar 1994
(_shaft: 2.511 _: 0.1983 C/G: 0.0887
-2.0
0.0
V
2.0-1.5 -1.0 -0.5 0.0 0.5 1.0 1.5
Crossflow, y/R17.5-10CAM, RPM= 1094, ALFSU = 2.5 DEG, VOR = 0,20, CT/SIGMA = 0,087
BVI SPL
dB
126
124
122
120
118
116
114
112
110
108
106
104
102
100
98
96
94
92
90
Points: 3235-3251 sweep: 001
Figure (62d) BVISPL Contour Plot Based on Spectra of Averaged TimeHistories (Ct/<_= 0.0887, o_TpP = 2.5 degrees aft, t1=0.1983,Peak Flap Deflection=-17.5 degrees, Azimuthal Phase Shift = -
10 degrees ) Flapped Rotor Configuration Test # 3925
138
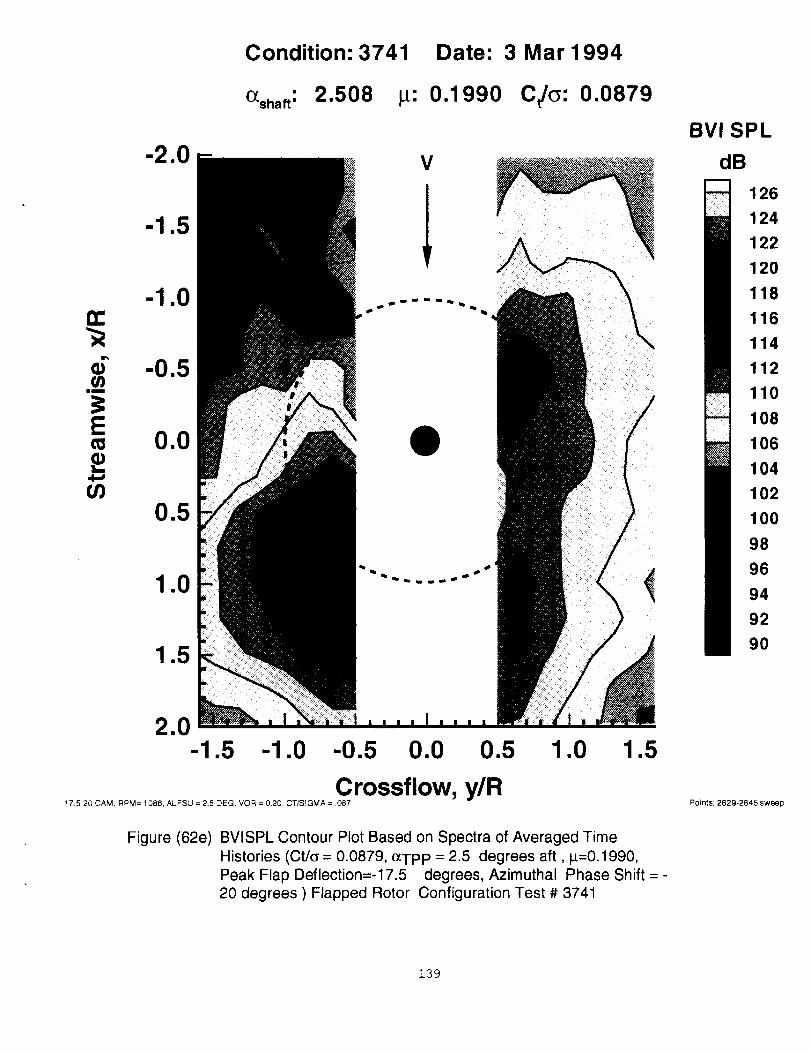
Condition: 3741 Date: 3 Mar 1994
(_shaft: 2.508 _: 0.1990 C/o: 0.0879
n-
6U)
-1.0
0.0
0.5
1.0
1.5
\
2.0-1.5 -1.0 -0.5 0.0 0.5 1.0 1.5
Crossflow, y/R_7 5-20 CAM. RPM= 1086. ALFSU = 2.5 DEG, VO_ = 0.20, CT/SIGMA = ,087
Figure (62e) BVISPL Contour Plot Based on Spectra of Averaged TimeHistories (Ct/G = 0.0879, _TPP = 2.5 degrees aft, 1_=0.1990,Peak Flap Deflection=-17.5 degrees, Azimuthal Phase Shift =-20 degrees ) Flapped Rotor Configuration Test # 3741
BVI SPL
dB
126
124
122
120
118
116
114
112
110
108
106
104
102
100
98
96
94
92
90
Points: 2629-2645 sweep
139
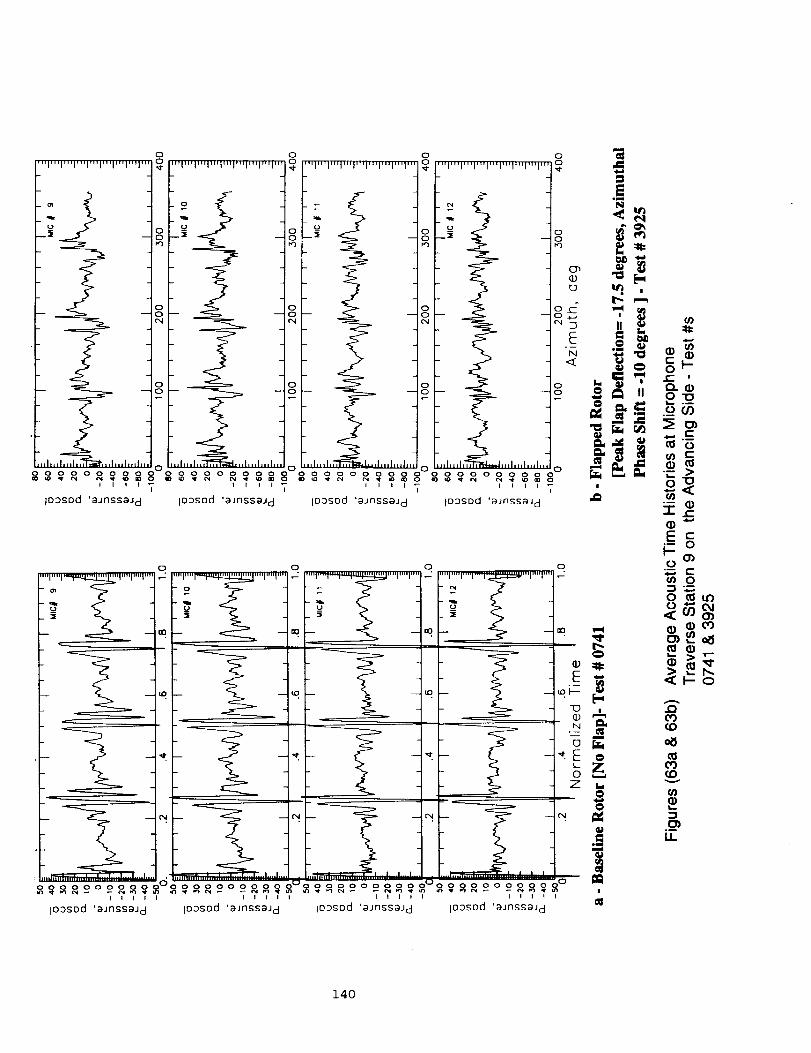
i
ioDsod 'aJnssaJ d ioosod 'aJnssaJ d
o o
_o oo oo_ "_-- _.I I I I I I 1 I I I I I I I
to3sod 'aJnssaJ d IO3Sod 'aJnssaJ d io3sod 'aJnssaJ d
o
I I | I I
IO3Sod 'aJnSSaJcI
140
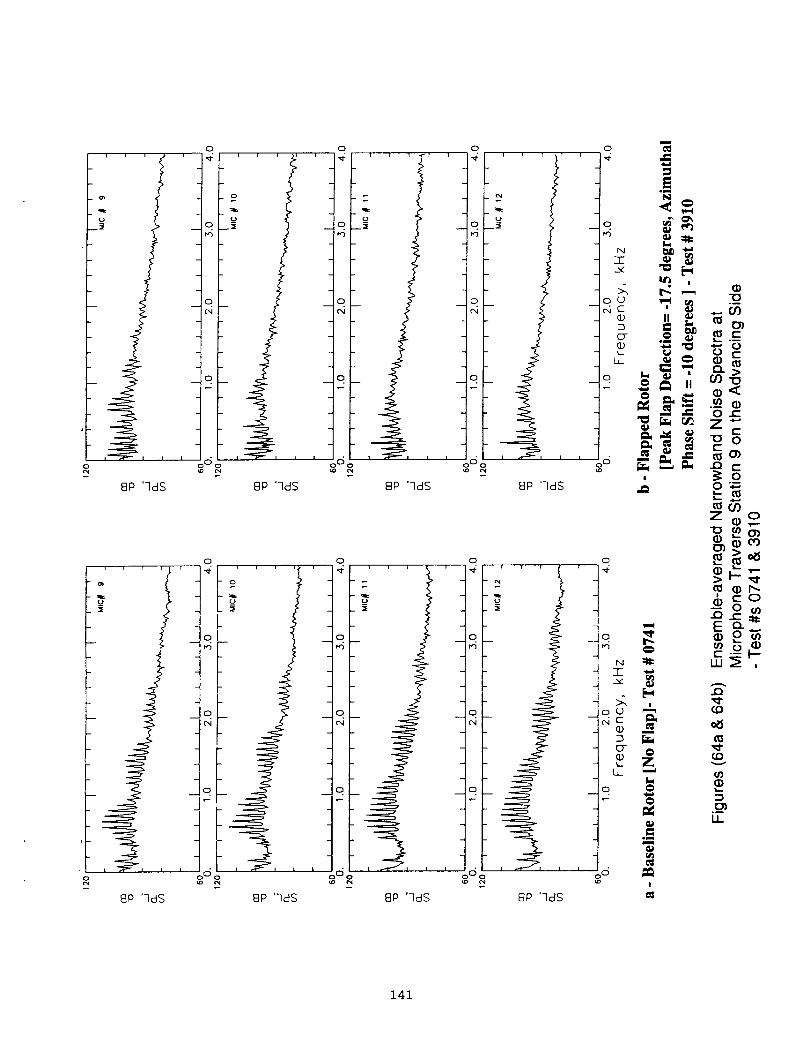
8P']dS
8P']dS
0 0
4_ o ..... 4
8P 'qdS
8P ']dS
8P '3dS
i4i
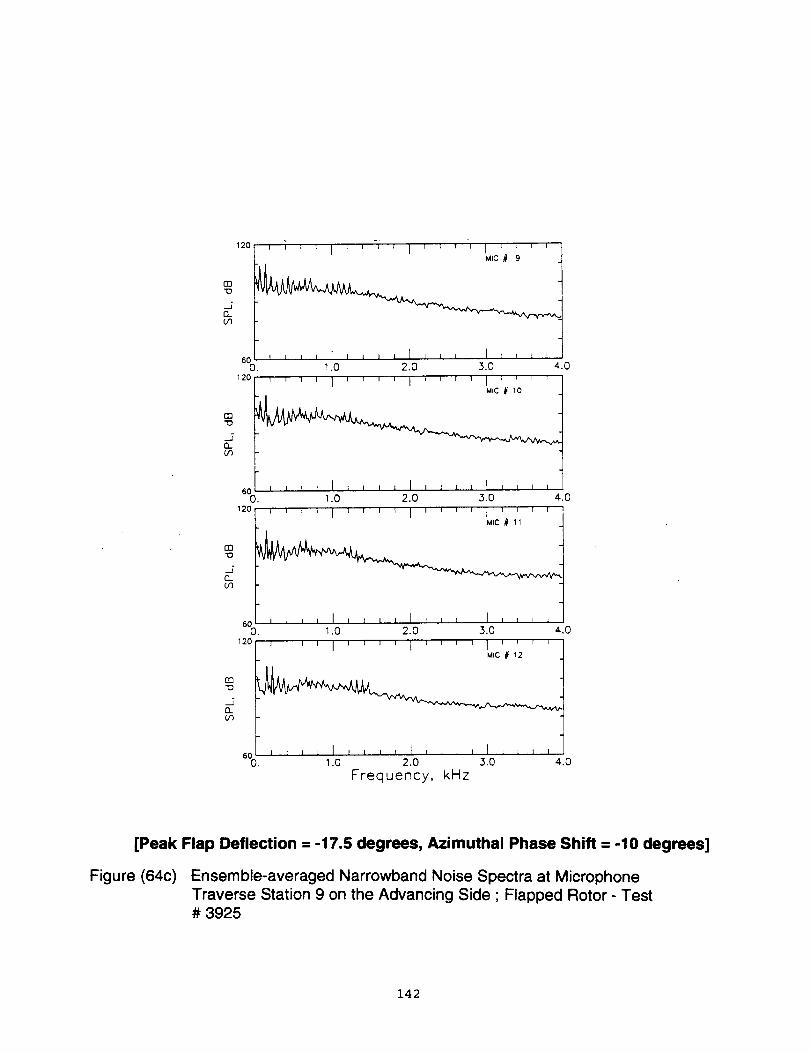
Mzc # 9
J
6c i L i _ I i i i I I L I I I I I ! i IO. 1.0 2.0 3.0 4.0
12°1, .... I .... I ' ' ' ' I ....
60 , i 1K ! i i i i [ I I I I I I I I IO. 1.0 2.0 3.0 4.0
12o _ , , , i , , _ _ i , , , , i , , _ ;M_C# _1
J
60 i_l,lirlll_]lllllk_0. 1.0 2.0 3.0 4.0
12o ' ' ' ' I ; ' ' ' I ; ' ' ' I ' ' ' 'M_C# 12
m
__J{3..o3
6o z _ i i I J _ i i I I i ; 1 t _ _ I Io. 1.0 2.0 3.0 4.0
Frequency, kHz
[Peak Flap Deflection = -17.5 degrees, Azimuthal Phase Shift = -10 degrees]
Figure (64c) Ensemble-averaged Narrowband Noise Spectra at Microphone
Traverse Station 9 on the Advancing Side ; Flapped Rotor - Test# 3925
142
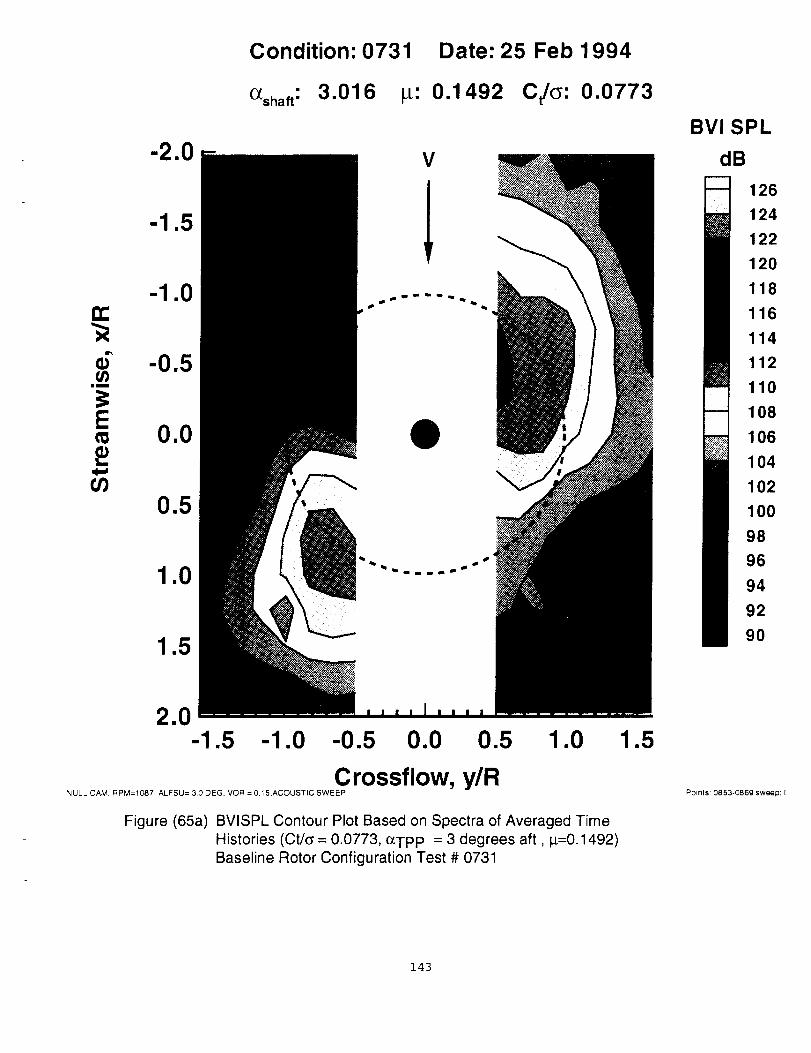
Condition: 0731 Date: 25 Feb 1994
(_shaft: 3.016 !_: 0.1492 C/G: 0.0773
-2.0
-1.0n-
6 -0.5
0.0
0.5
1.0
1.5
2.0-1.5 -1.0 -0.5 0.0 0.5 1.0 1.5
Crossflow, y/RNULL CAM, RPM=1087, ALFSU= 3.0 DEG, VOR = 0.15.ACOUSTrC SWEEP
Figure (65a) BVISPL Contour Plot Based on Spectra of Averaged TimeHistories (Ct/o = 0.0773, (_TPP = 3 degrees aft, _=0.1492)Baseline Rotor Configuration Test # 0731
BVI SPL
dB
126
124
122
120
118
116
114
112
110
108
106
104
102
100
98
96
94
92
90
Points: 0853-0869 sweep: (
143
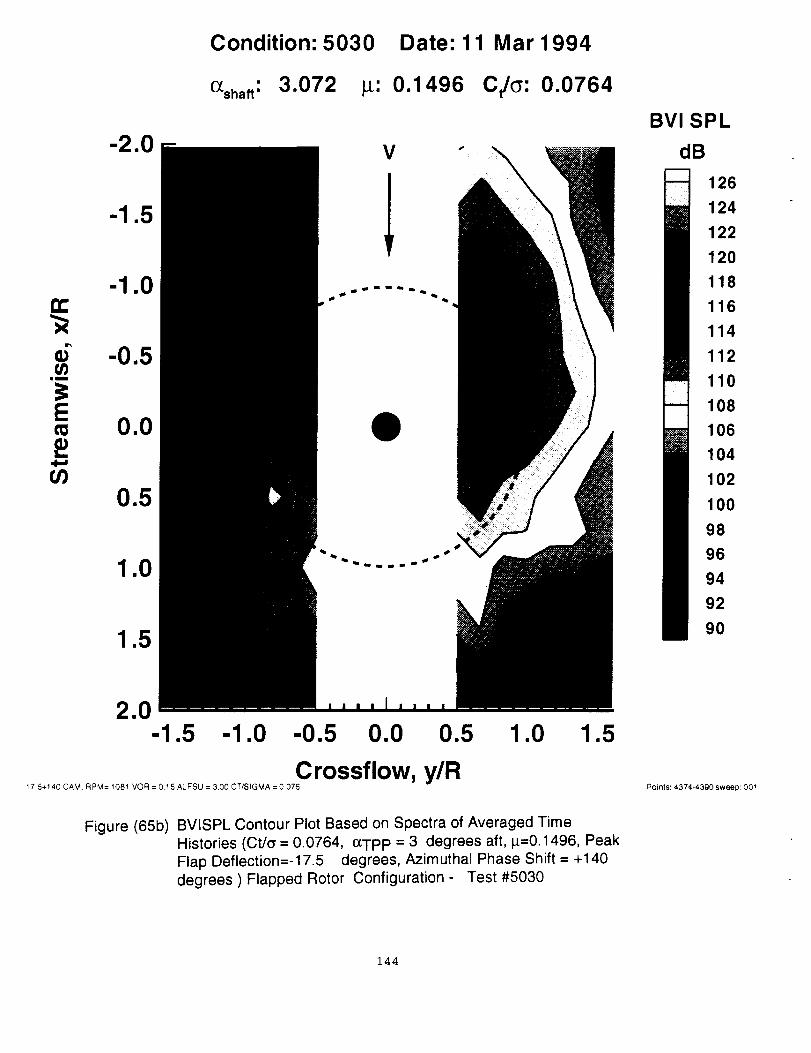
Condition: 5030 Date: 11 Mar 1994
(_shaft: 3.072 _L: 0.1496 Ct/o: 0.0764
-1.0n-
6 -0.5.on
== 0.0.=O3
0.5
1.0
1.5
2.0-1.5 -1.0 -0.5 0.0 0.5 1.0 1.5
Crossflow, y/R17.5+140 CAM, RPM= 1081 VOR = 0.15 ALFSU = 3,00 CT/SIGMA = 0.076
Figure (65b) BVISPL Contour Plot Based on Spectra of Averaged TimeHistories (Ct/_ = 0.0764, (zTp P = 3 degrees aft, p.=0.1496, PeakFlap Deflection=-17.5 degrees, Azimuthal Phase Shift = +140degrees ) Flapped Rotor Configuration - Test #5030
BVI SPL
dB
126
124
122
120
118
116
114
112
110
108
106
104
102
100
98
96
94
92
90
Points: 4374-4390 sweep: 001
144

ioosod 'aJnssaJ d IODSod 'aJnssaJ d tDDSDd 'aJnssaJ d IODsDd 'ajnssaJ d
0 o 0 0
o I-t-- ,
£z2_
._ t'-
0 __rr
°--
Eci.7-o
O)o
0
0 _0
_D
°_
145

- o o o o_- _._-- 0 0 0 0 ..__.,
_ ._.9._
:,fl,i,hi_,,,h.h,,I,l._ 0 L,,,I_,II,,,I,,,I,,J 0 L,l,,,l,,,k_.,iii,h,,,,,,'l 0 L, ih,,h,.,,,,I ,_,h,,hl,,,,,,,,,lilt_ 0 _ _ (_i "0
io3sod 'a,Ls'S;Jd ' io3sod 'aJ'nsL;Jd ' IO3Sod °aJ'ns_;_d ' Ioosod °g,Ls;;Jc# ' P_, _ -c-" m>
,,,,,,,,,,,,,,,,,,,,,,o ,,,,,,,,,,,......... ......o ..................................oF................._................._:oO
1 1I _o,_v., 0
_ e
_ B
5".
.,h,,,h.,,_.,h.,h.,I ...... .h,,,I.,._,,I.,,,I..,h.,, • ..,I.,,l_,,,,h.,h,.,I ........... I,,,,h,,Q.,h,,,h,.h,,,i_. -
o_o ooo ooo ooo 0_0oOo ooo _- =I I I I I I I I I t -- "_ I I I I I i i
ioosod 'g_nsseJ d io3sod 'gJnssgJ d IOosod 'sJnssgJ d IO3Sod 'gJnssgJd
146

147
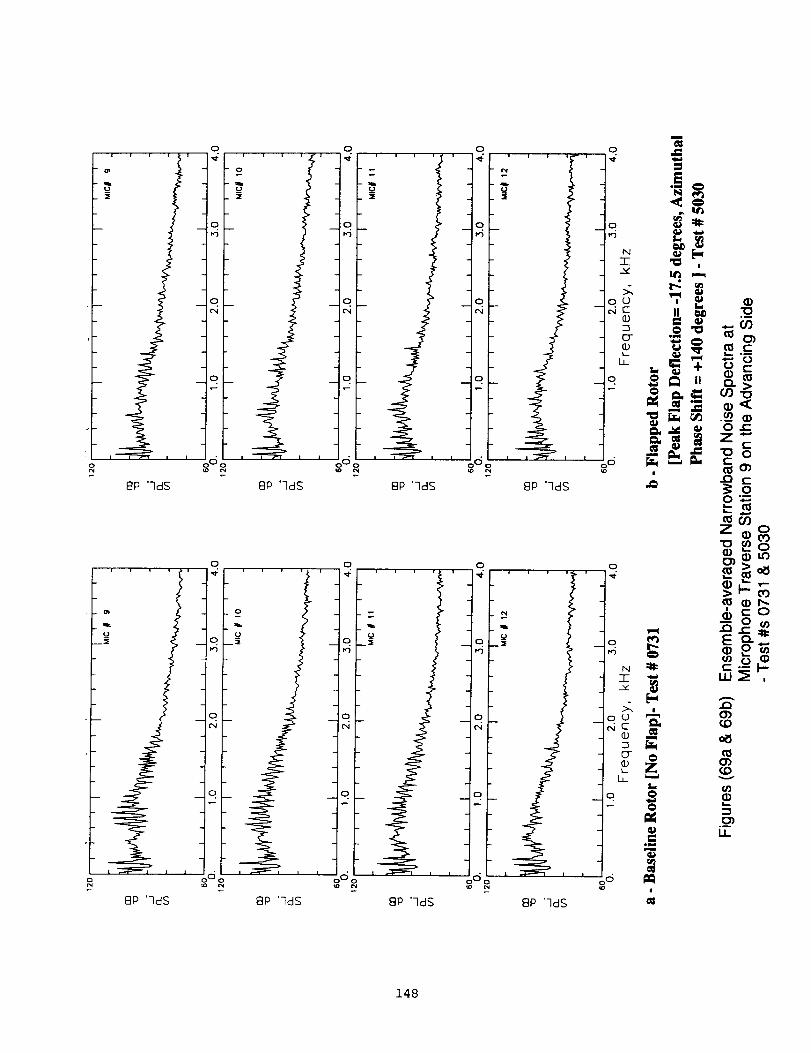
8P '7dS 8P '7dS 8P '7dS 8P 'qdS
0 0 0
0 0
0 0
8P '7dS 8P 'qdS 8P 'qdS
148
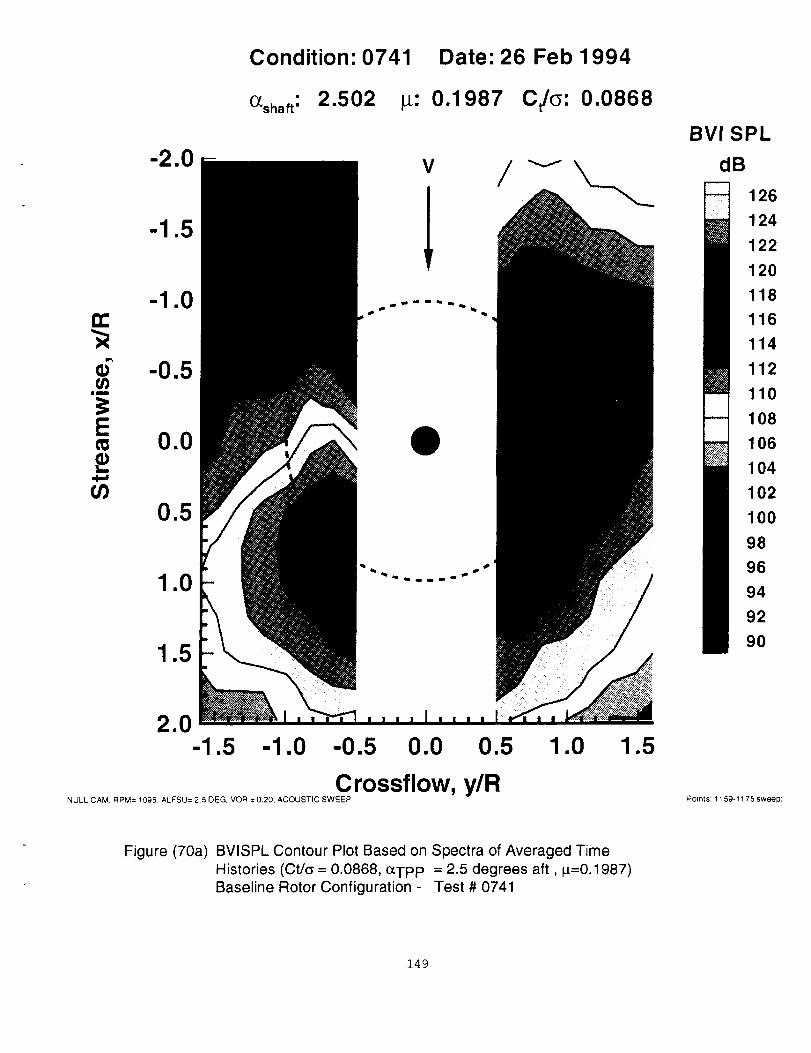
Condition: 0741 Date: 26 Feb 1994
_shaft: 2.502 B: 0.1987 Ct/o: 0.0868
-2.0
-1.0n-
6 -0.5.__
0.0.=00
0.5
1.0
1.5
2.0-1.5 -1.0 -0.5 0.0 0.5 1.0 1.5
Crossflow, y/RNULL CAM, R PM= 1095, AL_'SU= 2.5 OEG. VOR = 0.20. ACOUSTIC SWEEP
BVI SPL
dB
126
124
122
120
118
116
114
112
110
108
106
104
102
100
98
96
94
92
90
Points: 1159-1175 sweep:
Figure (70a) BVISPL Contour Plot Based on Spectra of Averaged TimeHistories (Ct/o = 0.0868, ocTpP = 2.5 degrees aft, I.t=O.1987)Baseline Rotor Configuration - Test # 0741
149
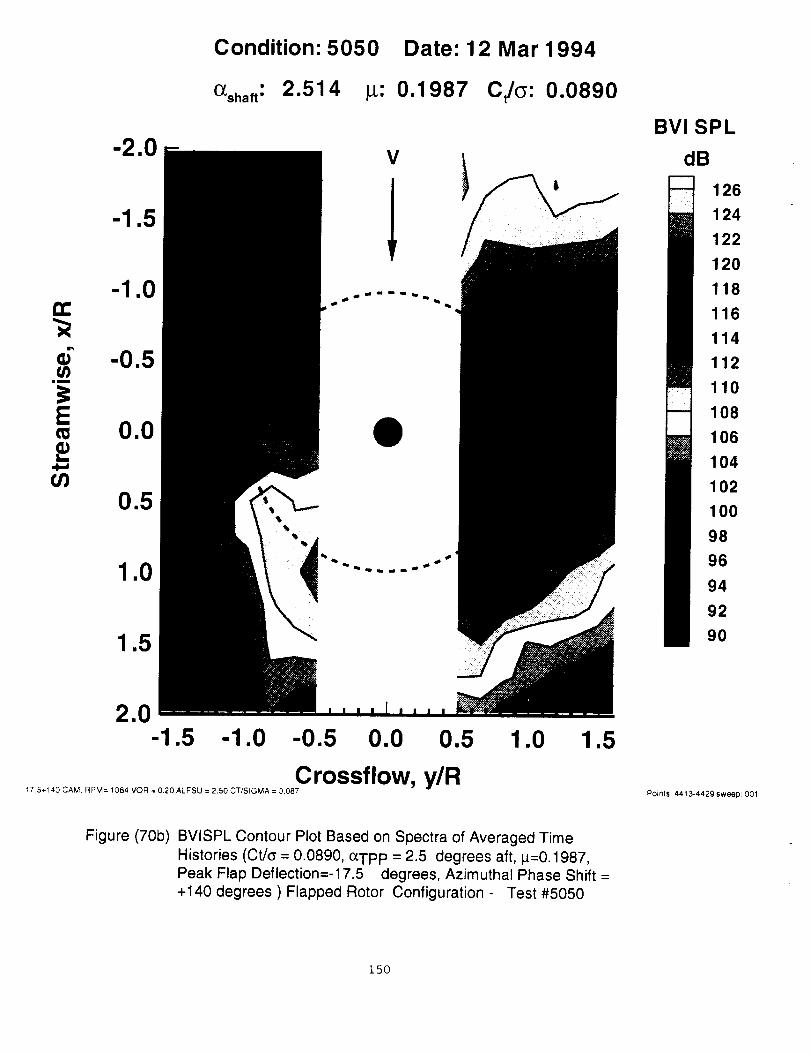
Condition: 5050 Date: 12 Mar 1994
(_shaft: 2.514 _: 0.1987 C/o: 0.0890
-2.0
-1.0iv-
-0.5
0.0
0.5
1.0
1.5
V
2.0-1.5 -1.0 -0.5 0.0 0.5 1.0 1.5
Crossflow, y/R175+140 CAM. RPM= 1084 VOR = 0.20 ALFSU = 2.50 CT/SIGMA = 0.087
BVI SPL
dB
126
124
122
120
118
116
114
112
110
108
106
104
102
100
98
96
94
92
9O
Points: 4413-4429 sweep: 001
Figure (70b) BVISPL Contour Plot Based on Spectra of Averaged TimeHistories (Ct/_ = 0.0890, o_TpP = 2.5 degrees aft, 1_=0.1987,Peak Flap Deflection=-17.5 degrees, Azimuthal Phase Shift =+140 degrees ) Flapped Rotor Configuration - Test #5050
150

0
0
0
151
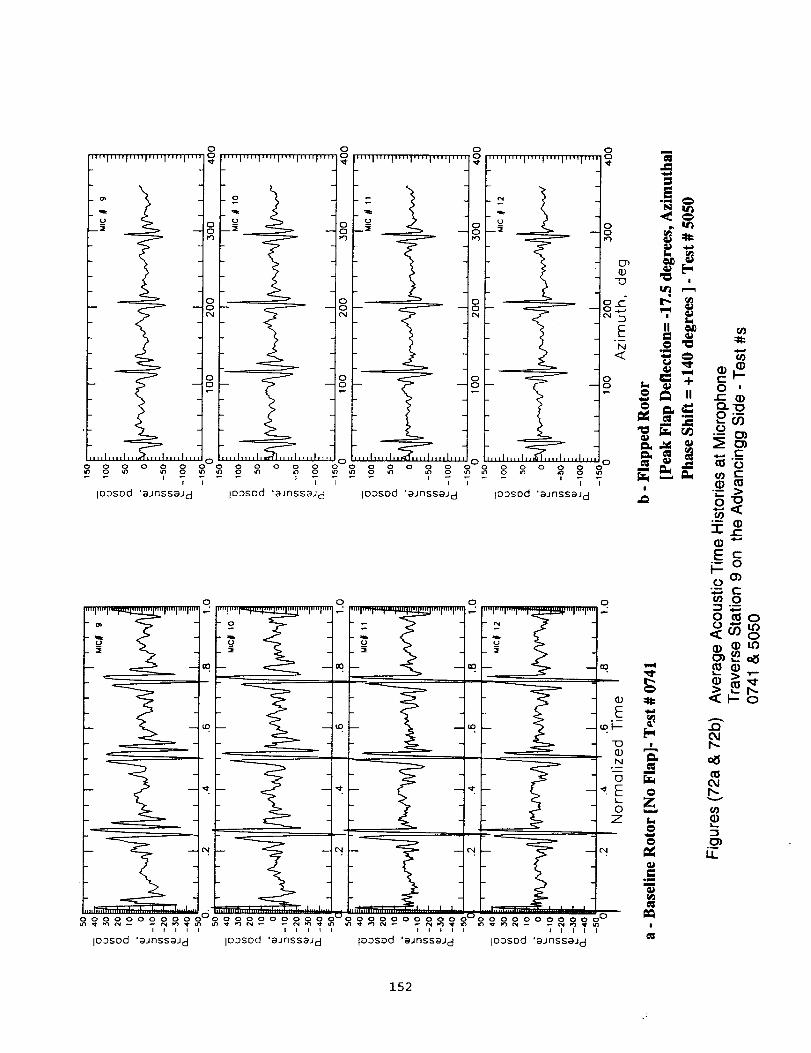
0 0 o 0
[""I .... I .... , .... l .... ,'"'J _° ['"'l .... I .... I.... I .... ,""j_°j'"'l .... I .... I .... J.... l'"'j°j ''''. .... , .... , .... I .... ,,,,,,o
[ ][ ]f 71- ]
E:2 IF: ii:2 ii:2 1
CN r'4 ¢N _1 _ a _
i i i r- ID
,.-. C_---_ 1:_
I I I I I I I I |
IO3sod '_.Jnss_.Jc:l l°3Sod '_Jnss_Jc_ l°_s°d '_'Jnss_Jcl l°3S°d '_JnsS_Jcl ,,0
o o o o
0-, o•,,-, <l:
°_
"r_-_) .,..-,E_
i.:oO)
o
0
0 _0
b-
t_
ffl
.__LL.
152

8P'7dS
8P'7dS
0
0
0
N
0
o C) o
0
0
0
8P '7cls
8P '7dS
O
0
oo o
0
0
/8P '7dS
8P 'qdS
0
0
0 ° o
0
Oi
0
C)
o 0 o
8P 'qdS
!
.EN
153

8P 'qdS - 8P "ldS 8P '-IdS
0 0
..... /,_/ .... ,_
i i8P 'qdS 8P '-ldS 8P '-lids
0
8P 'qds
154
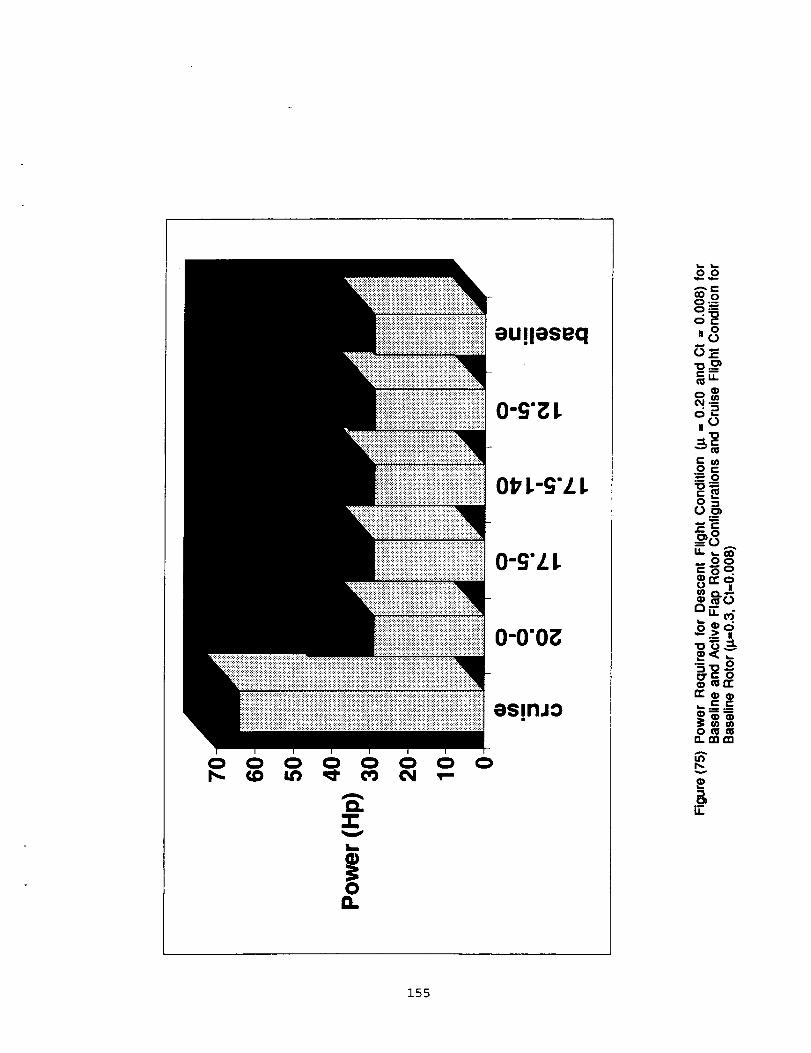
0 0 0 0 0 0 0 0
O.
V
L_
0O.
eU!leseq
0-_;'_1.
0'!7L-g'/_ I.
O-S'/..t
0-0"0_
es!nJo
oo..__-d_,,8
II0
Oc
c_8_
._
A
.o.a: ci_,o.- m___o
._cc
omm
_=_
3.55
Appendix A
BVI Tunnel test Tare Results and Correction Equations
The tare runs were completed in the Langley 14- by 22-foot Subsonic Tunnelon Friday, February 18, Saturday February 19, and Tuesday, February 22 1994.The values from the runs on the 18th and 19th are stored in the file
BVI_TARE.XLS for all five balance forces and torque. The weight Tares werecalculated from data in this file. Three additional files were created to calculatetares for lift, drag, pitch and torque. The lift file was not used, but it is calledLIFTTARE.XLS. The file AXLTARE.XLS contains the data and correctionequations for both DRAG and PITCH. The file TORQTARE.XLS contains thedata and correction equation for the torque gauges. The corrections below usethe variable naming convention used in the test plan and are the correctionused in all post processing programs and the online system beginning onMonday the 28 of February 1994.
Lift: The balance appeared to drift in all five axes and the data from the aeroand rotation taro runs indicate mostly drift and it is my conclusion the change inlift during the rotation and wind on runs are due only to drift and notaerodynamics or dynamics at least to the extent to which the instrumentation isaccurate. Thus, the only lift tare is for weight. The weight taros were acquiredwith both blades on and blades off. The blades off points were used togenerate the aero tares. The blades on weight taros are shown below. The Lifttares are:
TWN FR B=27.32075" SIN (ALFS U) +1008.355* (1.-COS (ALFS U) )TRNFRB=0.TMNFRB=0.
LIFT, RT=NFRHC-TWNFRB-TRNFRB
where NFRHC is the corrected normal force at the hub
LIFT, HT=LIFT, RT-TMN FRB
for reference the blades off weight taro is:
twnfrb (no blades)=26.19128*SIN(ALFSU)+1016.023"(1 .-COS(ALFSU))
Dr__.ag:The balance appeared to drift a considerable amount during the runs onFebruary 18th and 19th, but the run on the 22nd was performed with a quick qsweep the results seem consistent, so this run was used to generate the aerotares for both DRAG and PITCH. The results suggest some effect of RPMchanges on drag, but these were attributed to drift and not the physics of therotor system. Thus, only the effects of weight and q are shown in the tares. Thedrag tares are:
TWAFRB=992.4972*SI N (ALFSU)-I 4.858(1 .-COS(ALFSU))TRAFRB=O.
156
TMAFRB=0.012195*qpsfA2+1.580381 *qpsf
DRAG,RT=AFRHC-TWAFRB-TRAFRB
where AFRHC is the corrected axial force at the hub)DRAG,HT=D RAG,RT-TMAFRB
for reference the blades off weight tare is:
twsfrb(no blades)=971.329*SlN(ALFSU)+43.47764*(1 .-COS(ALFSU))
Side: All of the change appears to be drift in the measurement and no physicalmeaning can be applied to the data. Also, no trend seems to exist, so noaerodynamic or rotation tares were applied to the side force. The side tares are:
TWSFRB=-I 3.7467*SIN(ALFSU)+27.94548*(1 .-COS(ALFSU))TRSFRB--0.TMSFRB=0.
SlDE, RT=SFRHC-TWSFRB-TRSFRB
where SFRHC is the corrected side force at the hub
SlDE,HT=SlDE,RT-TMSFRB
for reference the blades of weight tare is:
twsfrb(no blades)=-11.1573*SIN(ALFSU)+-5.36711 *(1 .-COS(ALFSU))
Roll: None of the roll tare values seem to be significant except for the weighttare. Thus only the weight tare was applied to the roll force. The roll tares are:
TWRMRB=979.6701 *SIN(ALFSU)-1568.76*(1.-COS(ALFSU))TRRMRB--0.TMRMRB--0.
ROLL, RT=RMRHC-TWRMRB-TRRMRB
RMRHC is the corrected roll moment at the hub
ROLL, HT-ROLL, RT-TMRMRB
for reference the blades of weight tare is:
twrmrb(no blades)=898.9695*SlN(ALFSU)-189.23*(1.-COS(ALFSU))
Pitch: The pitch aero tares at the hub seem to match the 46.55 inch offset fromthe balance times the axial force. However, a better correlation was foundusing a polynomial based on qpsf since using the axial force directly created asystem with two linearly dependent variables. Also, it was determined the pitchdid not vary significantly with RPM. The pitch tares are:
TWPMRB=-25301.9"SI N(ALFSU)+1493.207(1 .-COS(ALFSU))
15?
TRPMRB--0.
TMPMRB=-0.00641 *qpsfA3-0.09434*qpsf^2+5.121993*qpsf
PITCH,RT=PMRHC-TWPMRB-TRPMRBPMRHC is the corrected pitch moment at the hub
PITCH,HT-PITCH,RT-TMPMRB
for reference the blades of weight tare is:twnfrb(no blades)=26.19128*SIN(ALFSU)+1016.023"(1 .-COS(ALFSU))
_llr.gJI¢_: The primary torque bridge was out during the tare runs, but thebackup gauge was very repeatable during the runs. Of course there is noweight tare for torque and shaft angle seemed to have no effect on torque. It isa very strong function of RPM and a mild function of q. A linear estimatingprocess was used to determine a function of both RPM and q. The average ofthe torque values acquired at a specific q and 100% RPM over a range of shaftangles was used to determine the dependency on q and the results of a coupleof RPM sweeps was used for the dependency on RPM. The torque tares aregiven by:
TTORQ1 =0.0000726*qpsP3-0.03063*qpsfA2+5.101959*qpsf+0.257654* R PM"l-i'ORQ2=0.0000726*qpsfA3-0.03063*qpsf^2+5.101959*qpsf+0.257654*RPM
TORQ, HT =TORQ-3-1"ORQ1TORQ2, HT-TORQ2-TTORQ2
158

Appendix B
Test Log, Run Log, Instrumentation List, and Data Point Log
159

TEST95O¢950¢
95O¢9501950195029502950395039504
9504950695O6950795O89506
951095119512951395149515951a9517951895199520
95219522
95249525
9527
9528953095309530
963O
9530
9530953O953O953O953595309530
953O95301153ON30
95ao953O
1153O9530
1163O
ml2145
454749Sl5253474747
474747474745
32343536
ActiveFlapRotor,Run
RCAL AXL 950
RCAL AXL 950RCAL AXL-_0RCAL SIDE 956.4RCAL SIDE-956.4RCAL NORM 2180.RCAL NORM-2180.RCAL ROlL 44651
RCAL ROLL.44551RCAL PITCH 44357
RCAL PITCH44_7APPLIED LOAD PITCH 2300APPLIED LOAD PITCH 4600APPUED L.ON) IqTCH (BOOAPPLIED LOAD PITCH 9200
) PfTCH 13800
) LOAD PITCH 225"92
) LOAD I:ql"CH200"92) PITCH 175"92
Ills) AXiN. "/S I.BS
) LOAD AXIAL 100 UlS
_AXIAL 150 I.BS
LOAD A,XIN. 300 LBS
LOAD AXI/¢ 250 LBSLOAD A,XIAL225 LBSLOAD AXlN. 250 LBSLOAD AXIN. 175 LBSLOAD AXIAL 150 LBSLOAD AXIAL 150 LBSLOAD AXIN. 125 LBS
LOAD AXl/¢ 100 LBSLOAD AXlN. 7S I.BSLOAD AXIAL S0 LBS_ AXIAL 2S I.BSLON) AXIN. 0 LBS
LOAD SIDE -3(XX.BS WITH _L SWITCH (LOAD WAS REALL• CAM ZERO PITCH 978RI=M
NUU. CAM ZERO PfTCH 1087RPM
NUU. CAM ZERO PITCH 10a7RI=MNULL CAM ZERO PITCH 1087RPM 2DEG COL
NLJLLCAM ZERO PITCH 1087RPM 6DEG COLNUI.L CAM ZERO PITCH 1087RPM 7DEG CCX..
NULL C/IM ZERO PITCH I(_TRPM 2DEG COL 1,SDEG RIGHT ROU.
NULL C,aMZERO PITCH 1067RPM 2D_G COL 1.SDEG LEFT ROLLNULL CAM ZERO PITCH 1087RPM 2:DEG COL 1.00EG NOSE UPNULL CaM ZERO PITCH 10871RPM2DEG COL 1.5OEG NO6E UPNULL CNd ZERO PITCH 10671RPM2DEG COL 1.00EG NOSE 0OWNNUI.L CJWI ZERO PITCH 1087RPM 2DEG COL 1.SDEG NOSE DOWN
NULL CAM ZERO PITCH 1957RPM 0OEG COL 0.0DEG NOSE DOWNNULL CAM ZERO PITCH 1033RPM 0OEG COL 0.00EG NOSE DOWNNULL C4_ ZERO PITCH 1033RPM 2 DEG COL 0.0OEG NOSE OOWNNULL CAM ZERO PITCH 1033RPM 4 DEG COL 0.0OEG NOSE DOWNNULL CAM ZERO PITCH 1033RPM 6 DEG COL 0.0OEG NOSE DOWN
160
0.00 -12.47 o.ol
o.oo -lZ ' 0-°10.00 6.02' o.ol0.00 S.67' o.ol
0.00 -11.38' 0.0 I0.00 [email protected]_ 0.0 I0.(30 -2174.40' O.Ol0.00 -0.76' 0.010.00 .-4.81' o.OI
0.00 -40.40' r,.OJ0.00 35.30' o.nl0.00 -0.58 J o.0]0.00 0.05' o.ol0.0(3 -0.19' o.ol
0.00 -0.28 ....0.00 -0.02' o.ol
0.00 0.12' o.oiI
0.00 2.21 o.oi
0.00 1.95' O.OI0.90 0,62' o.OI0.00 0,49' o.ol0.00 0.82' o.O[
I0.00 0.07, 0.00.00 -0.70 o.ol0.00 0.20' o.ol
0.00 4.95 1 o.o I
0.00 -0.60, o.o i0.00 -0.10 o.oi
0.9o -o.451 o.olo.oo -0- 1 o.olo._ "°-°21 °.°1o.oo O.Ol I o.oI0.00 -0,35 o.a,
o.oo -o.s,' o_oIo.oo -1.531 0.oI0.00 -0.25 o.o,0.00 -026' O.Ol
0.00 0.01 ' O.OII I
o.oo o.oo 0.oio.oo o_s' 0-°10.00 -0.18' 0.01
o.oo o.o : O-,I0.00 -0.38 o.oi0.00 -0.94' o.ol
I0.00 -1.78 o.ol
o.® o..' o-010.00 -0.951 o.oI0.00 -0.59 o.ol
o.oo .1.95' 0010.00 -1.47' 0.01
to.00 -1.35 o.ol
I0.00 -1.68 o.oi
o.oo -1.=I o.olo.oo 0-010.00 -0.71 o.o!
I Io.oo 1.90 o.ol
I I0.00 1.37 o.o I
o.oo I._ I o.ol0.00 0.75, 0.01o.oo o.,1 o.ol0.00 0.951 o.oi0.00 0.42 oJol
o.oo s.s21 o.ol0.00 -30.33 19.51
0.00' -28._ I 25.9 I0.00 -27.89 26.4 I
0.00 114.91, 30.1 l0.01 315.67 42.110.52 530.53 61.'zi
0.02 645.16 73.2 I
0.03 757.51 872Io.01! 121.16 3o.7!0.01; 123.47 31,61
o 1:11,.3113o.910.00 114,2,7 31.11
o.o,i 1,,.,11 3o.sl0,.001 110.56 31.11
o 1! lO3.1, 31.oIO.OlI Io_ 3o.sIo.oo_ _l.Oe 25.11
oJ]ol ..42.27' 22.8I0.011 74.54' 25.8
o.o 1 Io.ol I 437.52, s_._]

TEST3721222324251812
8778738756769118138538128.54
814821g02863864
812813812
856858999:813860862812
8880881865886:811657868
370871
872865011012010
9139149150168739gg
1900190119021903
lg041908190819051906190719121911191019131914170117021703
1704170517061707170_1709
17101711171217131714171517161717
POINT DATE
8,5 15-Feb-9486 15-Feb-g487 15-Feb-9488115-Feb-948911S-Feb-94go 15-Feb-9491 15-Feb-9492 15-.Feb-.9493 15-Feb-9494! 15-Feb-g495; 15-Feb-g49G 15-Feb-9497 15-Feb-9498 15-Feb,-94
99 15..Feb,-94100 15-Feb-94101115-.Feb-94102 115-Feb.g4
103 15-Feb-g4104 15-Feb-94105 15..Feb-94
106 15-Fot_94,107 15-Feb-941108lS-Feb-g4l109 16-Feb-94110 16-Feb-94111 16-Feb-94112 16-Feb-94115 16-Feb-g4119 16.Feb-94120 16-Feb-94121 16-I:eb-94122 16-Feb,.94
123 16-Feb-g4125 16-Feb-g4126 16-Feb-64127 16-Feb-g4128 16-Feb-g4129 16-Fob-g4
130 16-Feb-94131 16-Feb..g4132 16-Feb-g4133 16.Feb-94134 16-Feb-94135 16-Feb-94136 16-Feb-94137 16-Fob-94
138 16-Feb,.94138 16-.Feb-94140 16-Feb-g4141 16-Feb.84142 16-F_>g4
143 l&4Fe_-g4
144 1G.-F_-g4
162 16-Feb-g4180 16-Fcd>-g4198 16-Feb-94216 16-Feb-g4234 16..Fcd_-94252 16..Feb-64270 16-Feb,4)4288 16-Feb-043O6 16-Feb-_327 16,.Feb,.94345 16-F¢_:-94363 16.Fob-g4381 16-Feb-g4401 17-Feb-g4
419 18..Feb.g4420 19-.Feb-94
421 19..Feb._4422 1g-Feb-04423 19-Feb-94424 19-Fe_94425 19.-Feb-94426 19-Feb-94427 Ig-F_-04
428 1g-Feb-g4429 1g-Feb-g4430 1g-Feb.8,4431 19-Feb-94432 19-Fob-94433 19-Feb,-94434 19-Feb-94435; 19-Feb-94
4.'06:454.'09:514:11:154:12:16
4:13.'574:15.'084:17:44
4:19:4120:39:0820:40:50
20:43:5220:44:4220:47:23
20:65.'0720.'56:1720:57:1920.'58-.3120:59:2321.'00:19
21:01:0921.'02:4721.'03:5221:08:22
0:48:220:52'.230:_:18O.'56'.291:00:595:18:455:27:32
5"3.8:355:29:445:3O:565:32.'O85".37:115'.38:125:29.'005".39:515:40:465:41:345:42:4315:43:375:44:225:46:245:47:51
5:48:375:49:175:49:56S:50:435.'51:22S:51:58
5:52:485:54:57
21:18.'0321:27:2121:36:4521:45:4821:56:3322:17:3022:26:4532".35:5432:45.'02
32:56:1923:17:15
23:28:5223:38:1533:49:.15
0:.14:16
33:55:5O0.'07:13O:O8:260:.10.'030:11.'090:12.'04
0:13:210:14:210:.15:220:.16'.300:17:380:.18:570:19:45
0:20:470"21:420:3_:18
0:40:28
NULL CAM ZERO PITCH 1033RPM 8 DEG COL 0.0DEG NOSE DOWNNULL CAM ZERO PITCH g78RFIM 0 DEG COL 0.0OEG NOSE DOWNNULL CAM ZERO PITCH 978RPM 2 DEG COLl.NULL CAM ZERO PITCH 978RPM 4 DEG COLl.NULL CAM ZERO PITCH 978RPM 6 DEG COLl.NULL CAM ZERO PITCH 978RPM 8 DEG COLLNULL CAM ZERO PITCH 870RPM 2 DEG COILNULL CAM ZERO WrCH 652RPM 2 DEG COLl.
!20+0 CAM 652 RPM PERF.PT20+0 CAM 652 RPM 2 DEG COLL. PERF20+0 CAM 870 RPM 0 DEG COLL. PERF20+0 CAM 870 RPM 2 DEG COLL. PERF20+0 CAM 978 RPM 0 DEG COLL. PERF20+O CAM 1087 RPMO D£G COLL. PERF20+0 CAM 1087 RPM 1 DEG COLL. PERF20+0 CAM 1087 RPM 2 DEG COLL. PERF20+0 CAM 1087 RPM 3 DEG COLL. PERF
20+0 CAM 1087 RPM 4 DEG COLL. PERF20+0 CAM 1087 RPM 5 DEG COLL. PERF20+0 CAM 1087 RPM 6 DEG COLL. PERF20'_ CAM 1087 RF_ 70EG COLL. PERF20"¢-0CAM 1087 RPM 8 DEG COLL. PERF
20+0 CAM 1087 RPM 2 DEG COLL. ACOUSTIC20+0 CAM 1087 RPM20+0 CAM 1087 RPM 2 DEG COLL
20+0 CAM 1087 RPM 2 DEG COIL 1 DEG RIGHT20+0 CAM 1087 RPM 2 D£G COLl. 2 DEG RIGHT
20+0 CAM 00 RPM 0 DEG COLL 0 DEG RIGHT20+0 1087 RIM
20+0 1087 RPM 2 DEG COLL 1 DEG NOSE UP20+0 1087 RPM 2 DEG COiL 2 DEG NOSE UP20+0 1087 RPM 2 DEG COLL20+O 1087 RPM 2 DEG COLL 1 DEG NC_E DOWN20+O 1087 RPM 2 DEG COLL 2 DEG NO_;E DOWN20+0 1033 RPM20+0 1033 RPM 1DEG COLL20+0 1003 RPM 2 DEG COLL20'¢.0 1033 RIM 3 DEG COLL20+0 1033 RPM 4 DEG COLL20+0 1033 RIM 50EG COLL20+0 1033 RIM 6 DEG COLL20+0 1033 RPM 7 DEG COLL
20+0 1023 RPM 8 DEG COLL20+0 1033 RPM 0 DEG COLL
20+0 978 RIM 0 DEG COLL20+0 978 RIM 1DEG COLL_+0 978 RPM 2 DEG COLL
20+0 978 RPM 3 DEG COLL
20+0 978 RPM 4 DEG COLL20+0 978 RPM 5 DEG COLL20+0 978 RPM 6 D£G COLL20+0 978 RPM 7 D£G COLL
TEST POINT
HUB.N.FSt_0.,RPM- 1087,VOR_0.HUBJU..FSU,,5.,RPM_ 1087,VOR-0.HUB.ALFSU- 10.,RPM- 1087,VOR=O.HUS,ALFS U_5.,RRMm 1087,VOR-0.HUB,ALFSUL10.,RPtM- 1087,VOR-0.HUB,AUFSU--10.,RPM= 1087.VOR,-0.15HUB,ALFSU-..5.,RPM- 1087,VOR-0.15
HUB,ALFSU,- 0pRPM,, 1087,VOR=0.15HUB,ALFSU=5.,RPM- 1087,VOR,,O.1S
HUB,N.FSU,,10.,RPM, 11087,VOR,,0.1SHUB,ALFSUmt0.,RPM_1087.V_.20
HUB,ALFSI,._ 5.,RPM=1087,_.20HUB,ALFSU- 0.,RPM" 1087,_.20HUB,ALF_.,RFM= 1087,VOR_0.20HUB ,AUFSUe-IO. ,RIPMi 1087,_:20BLADES ON TARE,ALFSU_13.0DEGBLADES ON TARE,ALFSU=11.0OEG
BLADES ON T.ARE,ALF_.0OEGBLADES ON TARE,ALFSU-07.0DEGBLADES ON TARE,ALFSU',05.0DEGBLADES ON TARE.ALFSU,=03.0DEGBLADES ON TARE JU,.FSU_01.0OEGBLADES ON TARE,ALFSU_00.0 DEG
BLADES ON TARE,ALFSU,,-01.0 DEGBLADES ON TARE,ALFSU,,-03.0 DEG
IBLADES ON TARE,ALFSU'r.-0G.0 DEG!BLADES ON TARE,N,.FSU"-07.0 DEG:BLADES ON TAREALFSU,k08.0 DEGBLADES ON TARE_MJ=SU_11.0 DEGBLADES ON TARE,ALFSU=-13.0 DEGBLADES OFF TARE,ALFSU,,-13.0 DEG
BLADES OFF TARE,ALFSU_11.0 D£G
161
CT
0.0050.0010.0010.0020.0030.0050.001
0.0010.0010.0020.0010.001o.001o.oolo.ooi
0.0020.0020.0030.003
0.0040.0050.0060.002o.oolo.ool0.002o.ool
o.ooi0.002o.ooi0.002
0.002o.oo2_0.ooi!o.oolo.o020.002
0.0030.0030.0040.0050.0060.001o.001
o.001o.ool
0.0020.0830.0030.0040.005
o.001o.ool0.0Ol0.0010.0010.0010.0010.0010.001
0.001O.0010.001
o.0ol0.OOlo.oo1!
mmmm
mm
mmmmmmmmmm
Mu
0.020.000.00o.o2!0.02:0.030.00
0.000.000.00
0.000.000.00
0.000.000.010.010.01
0.020.020.020.030.010.00O.010.010.010.000.000.000.010.01
0.000.010.00,0.000.010.010.020.020.010.030.020.000.00
0.000.000.010.020.020.320.02
0.080.000.000.000.000.080.140.150.15
0.150.150.2O
O.2O0.20:0.20i
O.2O9.030.000.010.000.0(
0.000.000.000.000.000.000.000.000.000.000.000.00
Lm_lb-)662.55-50.4g45.96
193.21
363.08566.26
19.69*11.90
-8.11:42.76
-22.1366.26
-16.28-8.7257.41
125.94236.38
329.52423.35524.77630.62753.21120.41-80.6572.9178.2696.01
-15.44-31.92152.70
152.12140.89147.76150.63
3.7159.82
135.61230.56311.753.98.81492.57595.13;702.41:
10.124.02
48,62117.47197.15268.72356.51455.77538.73
22.529.23
41:2652.8435.1624.375.251.06
-3.63-6.96
-11.04-4.72
10.512t .4328.2429.45-1.33-I .08-1.0g-1.03
-1.27-0.95-0.85-1.04-0.99-1.22-0.86-1.011-0.74-0.6a-0.72
26.6326.24
HP
74._19.21 .;30.,
42.162.
15ri
7:10(9.;
22.'21.:30._40.S40.;40.445.,d
51.'38._67.477....94.(41.C40._41/;42....45.(0.£
40.;41.£
40.c40.E43.145.135.C34.435.439.444.65o.g56.g69.381.835.330.4
29.631.033.437.343.951.159.2
0.04.4
15.625.424.625.56.86.65.95.9
6.06.7
6.66.r:7.78.(
0.¢O.C0.C0.00.0
0.n0.n0.Q0.(]0.00.00.00.00.00.00.0
0.0
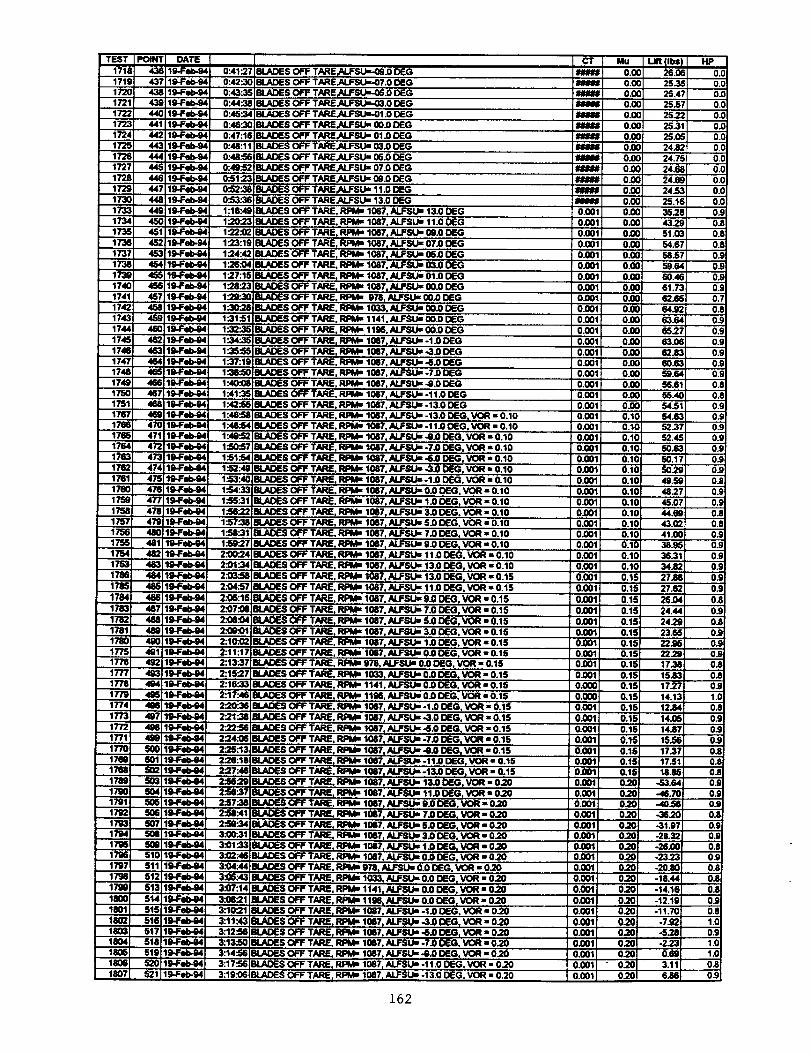
i i,-_l171,171!17217217"_17Z172.17_.
172t17217"_17"_17317_173,173
17317317317317_174'174:174:174,
17411741174_174_174t175(175'176_,1761
17_178,
17_17E176'176(1754175(1761175(175(175a176_178_
17M1784
17_17_1781178C1775177_1777177117"/317741773
177217711770
176517651760179117g_1793179417gG17961767170517gg
18001801180218031804180618061807
BLADES OFF TARE N.FSUI-(_.O OEGBLADES OFF TARE N.FSU,,.O7,0 DEGBLADES OFF TARE N.FSU,,-O5,0 DEG8LADES OFF TARE N.FSU,,-03.0 DEGBLADES OFF TARE N.FS_I.0 DEGBLADES OFF TAPE N..FSUm 00.0 DEGBLADES OFF TARE N.FSU1 01.0 DEGBLADES OFF TARE,N.FSU n 03.0 DEGBLADES OFF TARE.N.FSU1 05.0 DEG
DEG
BLADES OFF TARE.ALFSU 1 13.0 DEG
1067, ALFSU,, 13.0 DEGBLADES OFF TARE. RUMs 1087, ALFSU,, 11.0 DEG
BLADES OFF TARE,, RPM- 1067, ALFSUm 00.0 DEGBLADES OFF TARE, RIMs 1087, ALFSU= 07.0 DEG
BLADES OFF TARE_ RPM,, 1087, ALFSU1 05.00EGBLADES OFF TARE, RPIdu 1087. ALFSU,n 03.0 DEGBLADES OFF TARE. RPMR 1087. ALFSU 1 01.0 DEGBLADES OFF TARE. RPMm 1087, AL,=SU,=00,0 DEGBLADES OFF TARE, RPM1 976, ALFSU1 00.0 DEGBLADES OFF TARE. RPM- 1033, ALFSU1 08..00EGBLADES OFF TARE. RPM,, 1141, ALFSU,, 00,0 DEG
BLADES OFF TARE. RPM1 1196, N.FSU1 00,0 DEGBLADES OFF TARE, _ 1087. N.FSU1-1.0 DEGBLADES OFF TARE, RPM1 1087. ALFSU,_ ..3.0 DEGBLADES OFF TARE, RPMm 1057. ALFSUs 5.0 DEGBLADES OFF TARE, RPM" 1057, N.JFSU" -7.0 DEGBLADES OFF TARE, RJ:M" 1087, ALIFSU,, .6.0 DEGBLADES OFF TARE, RPM" 1047 ALFSU" -I 1.00EGBLADES OFF TARE RPM_ 1067, AUFSU" -13.0 DEGBLADES OFF TARE, _ 1067, ALFSU,' -13.0 DEG VOR • 0.10BLADES OFF TARE, RPM_ 1067, ALFSUm-11.0 DEG VOR "O.10BLADES OFF TARE, RPM- 1087. N.FSU1.6.0 DEG. VOR 1 0.10EIt.AIDESOFF TARE, RPM,,, 1087, ALFSU,1-7.0 DEG, VOR • 0.10BLADES OFIF TARE, RPMm'1087 ALFSt,_ .6.0 DEG, VOR ,m0.10BLADES OFF TARE. RPMB 1087. ALFSU,, -3.0 DEG, VOR - 0.10BLADES OFF TARE, _ 1087, ALFSU,, -1.0 DEG, VOR 1 0.10
BLADF.SOFF TARE. RPM- 1057. _ 0,0 DEG, VOR : O.10BLADES OFF TARE, RpMm 1087, ALFSU s 1.0 DEG. VOR "0.10
BLADES OFF TARE, RPM,m 10671rALFSU1 3.0 DEG. VOR 1 0.10BLADES OFF TARE, RPM" 1087, N.FSU_ 5,00EG. VOR" 0.10BLADES OFF TARE. RPM" 1087. ALFSU1 7.0 DEG. VOR - 0.10
BLADES OFF TARE. _ 1057_ALFSU,, g,0 DEG, VOR " 0.10BLADES OFF TARE, RPMm 1087, ALFSU" 11.0 DEG, VOR • 0.10BLADES OFF TARE. RPMR 1057, ALFSU,' 13.0 DEG, VOR I" 0.10
BLADES OFF TARE, RPM" 1087. ALFSU= 13.0 DEG_ VOR • 0.15, RIM" 1087, ALFSU1 11.0 DEG, VOR - 0.15
1087. N.FSU,' 9.0 DEG, VOR" 0.15,RPMu 1087. _ 7.0 DEG, VOR ,, 0.15
BLADES OFF TARE, RP'M_ 1057, ALFSU 1 S.0 DEG, VOR - 0.15
BLADES OFF TARE, RpM1 1087, ALFSUs 3.0 DEG, VOR • 0.15BLADES OFF TARE. RPM,, 1057, ALFSU1 1.0 DEG, VOR • 0.15BLADES OFF TARE, RPM1 1087, N.FSL_ 0,0 DEG, VOR - O.15BLADES OFF TARE. RPM,m 978, ALFSU s 0.0 DEG, VOR - 0.15
BLADES OFF TARE, RPId,, 1033, ALFSU,, 0.0 DEG. VOR ,, 0.15BLADES OFF TARE. RI:NI,, 1141, ALFSU_ 0.0 DEG, VOR • 0.15BLADES OFF TARE, RPM_ 1108, ALFSU" 0.0 DEG, VOR ,, O.15BLADES OFF TARE. RPM,• 1087, ALFSU1-1.0 DEG, VOR ,, 0.15BLADES OFF TARE, RPM,, 1087, N..FSU1-3.0 DEG, VOR - 0.15BLADES OFF TARE. RPM_ 1087, N.FSt_ .6.0 DEG, VOR - 0.15BLADES OFF TARE, RPM• 1087, N.FSU,,' -7.0 DEG, VOR • 0.15
BLADES OFF TARE, RPM_ 1087, _ -8.0 DEG_ VOR • 0.15
BLADES OFF TARE. RPM- 1087, N.FSU,, 11.0 DEG_ VOR "0.20BLADES OFF T.NRE_RPM_ 1057, ALJFSU'_9,0 DEG VOR1,0.20BLADES OFF TARE, RPM," 1087, ALFSU" 7.0 DEG. VOR" 0.20
BLADES OFF TARE RPM_ 1087.ALFSU_ S.0DEG, VOR,, 0.20BLADES OFF TARE. RPM• 1057, N..FSt_ 3.0 DEG, VOR - 0.20BI..ADESOFF TARE RPMm 1087 _ 1.0DEG VORs0.20
BLADES OFF TARE. RPM• 1087, ALFSU,, 0.0 I:M:_. VOR - 0.20BLADES OFF TARE. _ 978, ALFSUm0.0 DEG, VOR - 0.20
BLADES OFF TARE, RR_ 1083. N.FSU_ 0.0 DEGr VOR - 0.20BLADES OFF TARE, RPM,' 1141, ALFSU,, 0.0 DEG, VOR - 0.20
BLADES OFF TARE. RPM, m1165, N.FSU_ 0.0 DEGt VOR • 020
BLADES OFF TARE RPM,,,,1087. ALFSU,, -Q.0 DEG. VOR = 0.20BLADES OFF TARE, RPM- 1087, ALFSU,, -11.00EG, VOR • 0.20
BLADES OFF TARE vRI:'M_ 1057t ALFSU,, -13.0 DEG_VOR • 0.20
162
Mu
0.C0.C0.C0.(:
0.C0.©0.00.O0.00.0
0.00.0
0.0O.00.00.0O.0O.0O,00.00.0
0.00.00.00.00.0O.00.00.00.00.00.00.1_0.1_0.1_0.1_0.1q0.1_
0.1q0.110.1q0.110.1i0.110.110.110.1(0.1_,
0.1,'0.1!
0.1,'0.1'0.1.'0.1!0.1!0.1,'0.1,'0.1;0.1!0.1'0.1:
0.1'0.1.'0.1...o.1..'0.1_o.2c0.2C0.2C0.2C0.2C0.2_
O2O02O0.2O02O02O0.2O02O
02O0.2O
0.2O02O
" 02002O
Lift _Ibl25.C25_25.,I25_25._25_25.c24.124._24.1_
24.1_24_25.135.243.251.054.558.550.580.461.7
62.664.963.665.265.O62.88o.650.656.655.454.5$4.652.352.450.6
50.150.24g.S48.245.O44._43.041.038.935.334._27_
27._26.0
24.4,24_25._22_22.2117._15.1_17.2:14.1:12.8,14.0_
14.$_15.5¢17.3_17.5_18.8,'
-53.6'-46.7(-¢0.5(-36.2(-31.0_-28.3_-26,0C-23.2_-20.8_-18.44-14.1(i-12.1g-11.70
-782.6.28-2.230.6_3.11
6.86
HP
CCCCCCCCCC
COO0000000
0000000000000000
00
000000000
000
00O,O,O,O.O.O.1.O,O.
0.O.0O.O,O_0"O;
0.;0._O_0.1
0._OJ
0.1O.l0._OJ1.(0.|1.(1.(0,!O..C
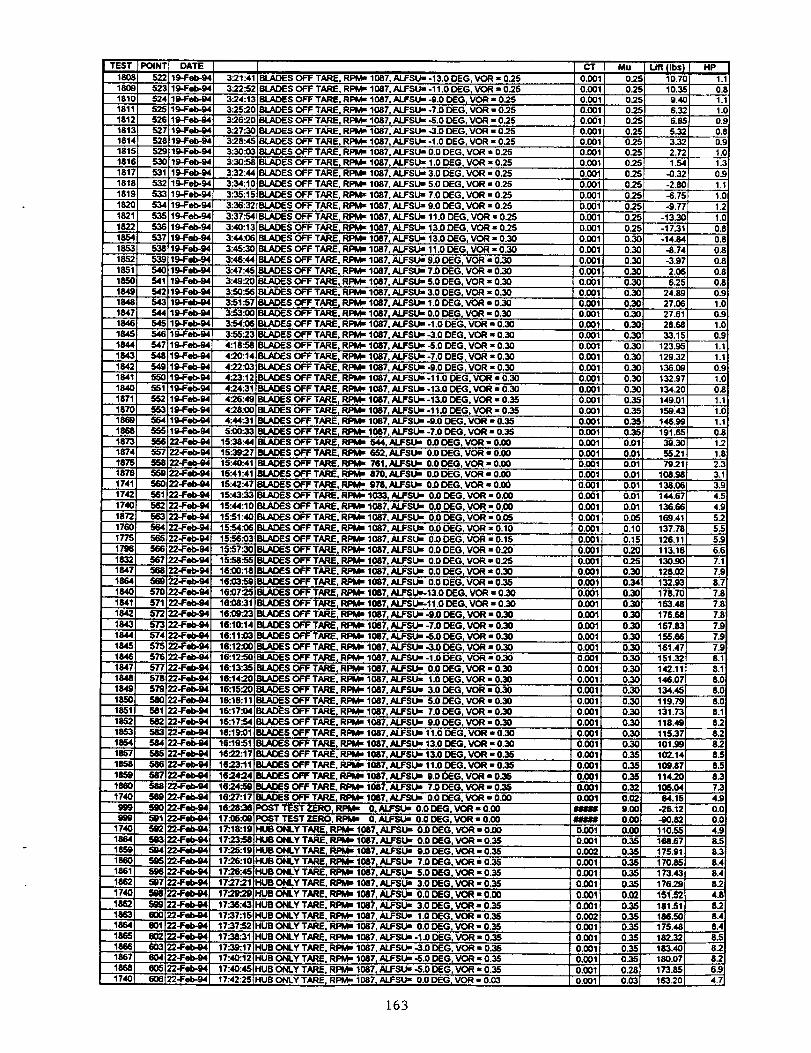
' TEST180_181(181'181;181:181,18t_1811181_1811181!182'182;185_185_185;1851185(18_184_184;184(184_184_184,!184;1841184C1871187(lm155_187_187d18n187(1741174;174C1872176C1775179_18321847188418401841184218431844184518461847184818491850185118521853185418571858185018601740
_g9g9
1740186418501860186116821740
186215531864
186518661867
18681740
BLADES OFF TARE, RPMR 1087, ALFSU = -13.0 DEG VOR = 0"25BLADES OFF TARE, RPM" 1087,ALFSU,' -11.0 DEG VOR - 0,25BLADES OFF TARE, RPM- 1087. ALFSU_ .9.0 DEG VOR = 0"25BLADES OFF TARE. RPM- 1087. ALFSU,, -7.0 DEG VOR - 0"25BLADES OFF TARE, RPM- 1087, ALFSU,, -5.0 DEG VOR = 0"25BLADES OFF TARE, RPIVk, 1087. ALFSUm -3.0 DEG VOR - 0,25W.ADES OFF TARE. RPM- 1087, ALFSU" -1.0 DEG VOR - 0"25
1087. ALFSU- 0.9 DEG VOR = 0"251087, ALFSU- 1.9 DEG VOR = 9.25
BLADES OFF TARE, RPt_ 1087. ALFSU" 3.0 DEG VOR - 0,_5, RPM- 1087, ALFSU= 5.0 DEG VOR - 9.25
BLADES OFF TARE. RPM= 1087. ALFSU= 7.0 DEC; VOR = 0.25BLADES OFF TARE, RPM" 1087, ALFSU" 9.0 DEG VOR = 0.25
BLADES OFF TARE. RPM" 1087, ALFSU" 11.0 DEG VOR = 0"25BLADES OFF TARE, RPM- 1087. ALFSUs 13.0 DEG VOR = 0.25BLADES OFF TARE, RPM= 1087. ALFSU= 13.0 DEG VOR - 0.30BLADES OFF TARE, RPM= 1087, ALFSU= 11.0 DEG VOR = 0.30BLADES OFF TARE, RPM" 1087. ALFSU= 9.00EG VOR" 0.30BLADES OFF TARE, RIM" 1087.ALFSU" 7.0 DEG VOR - 0_0
ALFSU" 5.0 DEG VOR - 0.30ALFSU,, 3.0 DEG VOR • 0.30ALFSIJ_ 1.0 DEG VOR - 0.30
BLADES OFF TARE, RPIV_ 1087, ALFSU- 9.0 DEG VOR = 0_0BLADES OFF TARE, RPM= 1087, ALFSU" -1.0 DEG VOR - 0.30BLADES OFF TARE, RPM" 1087. ALFSU- -3.0 DEG VOR = 0.30BLADES OFF TARE, RPM= 1087, ALFSU_ -5.0 DEG VOR = 0.30BLADES OFF TARE, RPM" 1087, ALFSU" -7.00EG VOR = 0.30
BLADES OFF TARE. RPM= 1087, ALFSU" -I).0 DEG VOR = 0.30BLADES OFF TARE. RPM" 1087, ALFSU"-11.0DEG VOR - 0.30BLADES OFF TARE, RPM,, 1087, ALFSU,, -13.0 DEG VOR ,, 0.30BLADES OFF TARE, RPt_ 1087, ALFSU_ -13.0 D£G VOR - 0.35• .ADES OFFTARE, RPM= 1087, ALFSU'-ll.0DEG VOR = 0_5BLADES OFF TARE, RPt_ 1087, ALFSU,, -9.9 DEG VOR = 0.35BLADES OFF TARE. RPM- 1087, ALFSU= -7.0 DEG VOR = 0.35BLADES OFF TARE, RPM- 544, ALFSU_ 9.gDEG VOR=0.00BLADES OFF TARE, RPM" 652, ALFSUm O.0 DEG VOR = 0.00BLAD_S OFF TARE. RPM" 761,ALFSUm 0.0DEG VOR-0.00BLAD£S OFF TARE, RPM_ 870, ALFSU_ 0.0 DEG VOR = 0.00BLADES OFF TARE, RPM" g78, ALFSU_ 0.0 DEG VOR - 0.00BLADES OFF TARE, RPM= 1033, ALFSU_ 0n DEG VOR - 0.08BLADES OFF TARE. RPM" 1087 ALFSU" 0.0 DEG VOR - 0.00BLADES OFF TARE. RIM= 1087, ALFSU_ 0.0 DEG VOR - 0.08
BLADES OFFTARE, RPM- 1087, ALFSU= 0.0DEG. VOR • 0.10BLADES OFF TARE. RPM= 1087, ALFSU- 0.0 DEG VOR - 0.15BLADES OFF TARE, RPI_ 1087, ALFSU= 0.0 DEG VOR - 0_9BLAD£S OFF TARE. RPM- 1087, ALFSU,, 0.9DEG VOR=9.25BLAD£S OFF TARE. RPI_ 1087. ALFSU_ 0.0DEG VOR=0_I0BLADES OFF TARE, _ 1087, ALFSU" 0.0 DE(; VOR - 0_5BLADES OFF TARE, RPM" 1087, ALFSU'-13.0 DEG VOR = 0.30BLADES OFF TARE, RPM_ 1087, ALFSU"-11.0 DEG VOR - 0_0BLADES OFF TARE, RPM= 1087, ALFSU', -_.0 DEG VOR • 0_0
BLADES OFF TARE, RPM= 1087, ALFSU= -7.0 DEG VOR - 030BLADES OFF TARE, RPM- 1087, ALFSU" -5.0 DEG VOR - 0.30_LAD£S OFF TARE, RPM- 1087, ALFSU- -3.0 DEG VOR = 0.30BLADES OFF TARE. RPM- 1087. ALFSU- -1.0 DEG VOR - 0.30• J_ES OFF TARE, RPM= 1087,ALFSU- 0.00EG VOR-0.30
1087, ALFSU,, 1.0 DEG VOR • 0.301087,ALFSU,, 3.0D£G VOR,,0.30
BLADES OFF TARE, RPM-1087,ALFSU,, 5.0DEG VOR • 0.308LADES OFFTARE, RF'M= 1087,AUFSU,, 7.0DEG VOR•0.30
BLADES OFF TARE. RPM,, 1087, ALFSU,, 9.0 DEG VOR ,, 0.30BLADEs OFF TARE, RPM- 1087, ALFSU_ 11.0 D£G VOR ,, 0.30
BLADES OFF TARE, RPM= 1087, ALFSU• 13.0 DEG VOR - 0.30BLADES OFF TARE, RPM- 1087, ALFSU,, 13.0 DEG VOR ,, 0.35BLADES OFF TARE, RPM= 1087,ALFSU= 11.0D_G VOR-0_35
ALFSU- 9.0 DEG, VOR - 0_15BLADES OFF TARE, RPM" 1087, ALFSt_ 7_ DEG, VOR = 0_35BLADES OFF TARE, RPM= 1087, ALFSU= 0_ D£G, VOR - 0.00POST TEST ZERO, RIM= (3,ALFSU_ 0.0 DEG, VOR - 0.00POST TEST ZERO, RIM= 9, ALFSU" 0.0 DEG, VOR - 9.00
18:116:118:1
16:116:118:1
17:1 HUB ONLY TARE, RPM" 1087, ALFSU,, 0_0 D£G, VOR - 0_0
HUB ONLY TARE. RPM_ 1087. ALFSU_ 0.0 DEG, VOR - 0.35HUB ONLY TARE, RPM_ 1087, ALFSU_ 9_ DEG, VOR - 9.35HUB ONLY TARE, RPM_ 1087, ALFSU,, 7.0 DEG, VOR = 0.35
HUB ONLY TARE, RPM_ 1087, ALFSU- 5.0 DEG. VOR ', 0.35HUB ONLY TARE, RPM= 1087, ALFSU_ 3.0 DEG. VOR • 0.35
HUB ONLY TARE, _ 1087, ALFSU= 0.0 DEG. VOR - 0.00HUB ONLY TARE. _ 1087 ALFSU= 3.0 DEG, VOR • 035HUB ONLY TARE. RPM= 1087. ALFSU= 1.0 DEG. VOR - 0.35HUB ONLY TARE, RPM= 1087, ALFSU= 0.0 DEG, VOR - 0.35HUB ONLY TARE. RPM- 1087. ALFSU_ -1.0 DEG, VOR - 035HUB ONLY TARE. _ 1087. ALFSU_ -3.0 DEG. VOR - 035HUB ONLY TARE, RPM" 1087, ALFSU" -5.9 DEG, VOR ,, 0.35
HUB ONLY TARE, RPM= 1087, N.FSU• -5.0 DEG, VOR " 0.35
HUB ONLY TARE I RPM" 10_7_ALFSU=, 0.9 DEG_ VOR ,, 9.03
163
Mu
9"29.29"29"20"29.2:0.2_9"2_9.2_0.2_9.2=0.2_0.2_
0.2_0.2_0.30.30.30.30.39.310.319.310.310.310.310.31
0.310.310.30.3,'0.39.310.310.0 _0..0'0.0"0.0'0.0'0.0'0.0'0.0_
0.1(0.1,=0.2t9.2_0.3(0.3_0.3_0.3_0.3_
0.3(9.3_0.3C9.3C0._C0.3(0.3C0.3(0.3C
0.3_0.3C
0.3C0.3E0.3_,0.3E0._0.0_g.OC9.0C0.0_0.359.35
0.350.3_0,350.02
0.3_0.350.350.350.359.35
0.289.63
19.7119.3:9.4_6.3:6.8.'5.3:3.3;2.7;,1.5_
-0.3:-2.8(-6.7.=-9.71
-13.3(-17.31-14.8_
,.8.7,1-3.9;2.0(6"2:
24.8S27.0(27.6128.6_33.1.=
123.9_129.32
136.0_132.g?134_(149.01159.4_146.9S191.6_3_.31:55.2179"21
108.9_138.0_144.67135.6_169.41
137.78126.11113.1§130-90128.0_132.93178.7O163.4_176.68
167.83155.66161.47151.32142.11146.07134.45119.79131.73
118.49115_7
101.99102.1410g.87114.20108.0484.15
-28.12.90.82
110.55168.67175.91170.85
173.43176 "291S1.52
181_1186.50175.48182.32183.40180.97173.85163.20
HP10,1.19.9.9.1.1.0.1.1.1.
I.0.0.,
0.,0.,
0.i
0.19.11.10.!1.10.!1.1.
0.!1.10.i1.1.1
1.0.11.'1.42.:3.3.!4J4._5_
5.!5.!6.17.'7._8._7.17.!7.1
7_7_7J8."8._8.(8.(8.(8._8",8.;
8,"8.'8.,=8._
4._0.(0.(4.c8.!8.,_8.,I
8A8.;4.18.;8._8A8J8.28.26.g4.7

i TEST9_9_,
1744186;18_18_187(187"9_7O(7O'7_7_21
7_
7_
7O(4;
70;
7O(51
7_Sin.9SS
4_41
7O(70170_7_
217m
4_7OE
4_41414147
47474747474745
9W
454545454545
4545454545454545
4545454646474747474747474747
474747474747
POST TEST ZERO, RPM_ 1087, ALFSU- 0.0 DEG, VOR - 0.00POST TEST ZERO, P.PM=06O0, ALFSU_ 0.0 DEG, VOR - 0.00HUB ONLY TARE, RPM" 1067, ALFSU', 0.0 DEG. VOR - 0.00HUB ONLY TARE, RPM- 1087, ALFSU- -5.0 DEGo VOR" 0.35HUB ONLY TARE, RPM', 1087, ALFSU_ -7.0 DEG, VOR • 0.35HUB ONLY TARE, RIM= 1067, ALFSU_ -9.0 DEG, VOR = 0_5
HUB ONLY TARE, RPMR 1087, ALFSU_-11.0 DEG, VOR = 0.35HUB ONLY TARE. RPM,, 1087, ALFSU_-13.0 DEG, VOR = 0.35POST TEST ZERO. RPM- 1067. ALFSU=-13.0 DEG. VOR = 0.35
RPM= 544 ALFSU- 0.0 DEG, VOR - 0.00RIM= 652, ALFSU• 0.0 DEG, VOR • 0.00RPM" 761. ALFSU• 0.00EG. VOR - 0.00
RPM" 87O, N.FSU" 0.0DEG, VOR=0.00RIM" 978 ALFSU" 0.0 DEG, VOR - 0.08
ALFSUs 0.0 DEG, VOR • 0.00
ALFSUs 0.0 DEG, VOR - 0.00NULL CAM, RPMJ 1120, ALFSUs 0.0 DEG, VOR = 0_0NULL CAM, RPM= 1087, ALFSU" 0.0 DEG, VOR" 0.00
1087, ALFSU _ 0.0 DEG, VOR ,, 0.001087, AJ.FSU_ 0.0 DEG, VOR = 0.00
NULL CAM, RPM_ 1087, ALFSU- 0,0 DEG, VOR - 0.00
NULLCAM. RPM= 1087, ALFSU,', 0.0 DEG, VOR • 0.001087. ALFSU" 0.0 DEG, VOR" 0.001087. ALFSU" 0.0 DEG, VOR ", 0.081087, ALFSUm 0.0 DEG, VOR • 0.001087, ALIFSU• 0.0 DEG. VOR - 0.00
!:N_T TEST ZERO, RPM," 1087. ALFSU,' 0.0 DEG, VOR " 0.6OPOST TEST ZERO. RPM" 1087, ALFSU" 0.0 DEG, VOR ,' 0.00
1087, ALFSU_ 0.0 DEG, VOR • 0.001087, ALFSU" 0.0 DEG, VOR - 0.00
544, ALFSU" 0.0 DEG, VOR - 0.00NULLCAM, RPM- 652. ALFSU- O.ODEG, VOR•O.00
761, ALFSU" 0.00EG, VOR • 0.00:NULL _ RPM_ 87O, ALFSU- 0.0 DEG, VOR =' 0.00
978, ALFSU" 0.0 DEG, VOR - 0.00
NULL CAM, RPM_ 1033,ALFSU- 0.0DEG, VOR • 0.00NULL CAM, RPM- 1087,ALFSU" 0.0 DEG, VOR - 0.00NULL CAM, RPMm 1120,ALFSU,, 0.0 DEG, VOR • 0.00
NULL CAM, RPMu 1087, ALFSU" 0.0 DEG, VOR • 0.00NULL CAM. RPM" 1087, ALFSU" 0.0 DEG, COLL" 2.0 D£GNULL CAM, RPMm 1087, ALFSU= 0.0 DEG, COLl. • 2.0 DEG, LAT" .5 DEGHULL CAM, RPMm 1087, ALFSU = 0.0DEG, COLL" 2.0 DEG, LAT = 1.0 D£GNULL CAM, RPM_ 1087.ALFSU,, 0.0DEG. COLL• 2.0 D£G LAT" 1.5 DEG
ALFSU• 0.0DEG. COLL"2.0DEG LAT"2.0DEGN.FSU,, 0.0DEG, COLL•2.0DEG LAT-0.0DEG
ALFSU,, 0.0DEG. COLL•2.0DEG LONGA•0.S DENULL CAM. RPM,, 1087 N.FSU-, O.OD£G. COLL•2.0DEG LONGA,, 1.0 DE
NULLC,NM, RPM-, 1087 N..FSU,, O.ODEG. COLL=2.0DEG LONGA- I.SDENULL CAM, RPM= 1087 ALFSU• 0.0 D£G, COLL" 2.0 DEG LONGA ,, 2.0 DE
N.FSU,, 0.0 DEG.NULL CAM, RPM- O,ALFSU,, 0.0 DEG, 0,0,0NULL CAM, RPM,, 1087 ALFSU• 0.0 DEG, 0,0,0
ALFSU,, 0.0 DEG, 0.0.0ALFSU,, 0.0 DEG, O.0.0
AUFSU_ 0.0 DEG. 0.0,0ALFSU- 0.0 DEG, 0,0,0N.FSU- 0.0 DEG, 0,0,0
NULL CAM, RPM- 1067 ALFSU_ 0.0 DEG. 0,0,0NULL CAM. RPMs 1087 ALFSUa 0.0 DEG. 0,0,0NULL CAM, RPM- 1087 ALFSU,, 0.0 DEG, 0,0,0
N.FSU-NULL CAM, RPMm 1087NULL CAM. RPMs 1087
0.00EG, 0,0_0ALFSUi 0.0 DEG, 0,0.0
NULL CAM. RPM_ 1087 ALFSU_ 0.0 DEG, 0,0,0ALFSUs 0.0 DEG, 0,0,0
NULL CAM, RPM_ 1087, ALFSU_ 0.0 DEG, 0,0,0N.FSU- 0.0 DEG, 0,0,0
NULL CAM, RPM_ 1087 ALFSU- 0.0 DEG, 0,0,0
ALFSt,bo.oDEO.0,0,0NULL C.4M. RPM,, 1067. ALFSt.k, 0.0 DEG. 0,0.0
1087, ALFSU_ 0.0 DEG, COLL • 2.0 DEG1087, ALFSUm 0.0 DEG, COLl. • 2.0 DEG1087 ALFSUm 0.0 DEG, COLl. =' 2.0 DC'G1087. ALFSU" 0.0 DEG, C(XJ. - 2.0 DEG1087, ALFSUm 0.00EG, COIL - 2.0 DEG
1087, ALFSU- 0.0 DEG, COLL • 2.0 DEGNULL CAM, RPM_ 1087. ALFSU*, 0.0 DEG. COLL • 2.0 DEG
1087, ALFSU,, 0.0 DEG, COLL ,, 2.0 DEG
1087_ALFSU,, 0.0 DEG. COLL ,, 2.0 DEG_ULL CAM. RPM_ 1087. ALFSU_ 0.0 DEG, COLl. ,, 2.0 DEG_ULL CAM, RPM,, 1087. ALFSU," 0.0 DEG. COLl. • 2.0 DEG
1087, ALFSU,, 0.0 DEG, COLl." 2.0_DEGNULL CAM. RPM= 1087, ALFSU" 0.0 DEG. COLl. ,, 2.0 DEGNULL CAM. RI=M_ 1087, ALFSU- 0.0 DEG. COLL - 2.0 DEG
ALFSU" 0.0 DEG, COiL = 2.0 DEG
164
Mu
9.00.00.0O.3O.303030.30.00.00.00.O0.O0.00.O0._,
0.0_0.0_0.G0.0_0.0:
0.0;0.0:0.0:0.0;0._9.0(9.0(0.0:0.0;0.0'0.0'0.0'0.0'0.0"0.0_0.0_0.0(0.0_
0._0.0'0.0"
0.¢0.0"0.0'0.0_0.0_0.0_
0.0_O.O(9.O(0.0_o.olo.010.01o.01
o.010.010.01O.Ol0.01
o.olo.ol0.01o.oio.oi0.010.010.010.01
0.010.010.010.010.020.020.010.020.020.010.020.020.020.020.01
45.1!5.0(
108.6'138.0_13_.0(140.2_139.3_135.0_23.8;
112-9;
142.5_180.4C225,3(
263.2(287_
290.O(338.41307.11381,?.3427.97
518.1_56O.3_729.4(:821.45963.N
1049.4(:-11.7S
-8.30192.47400.44
1.0_6.70
15.0223.5740.7549.7959.4368.2766.18
195.4116o.la203.82
211.51214.65194.13
194.3,5202.14
206.02206.3463-59
-40.2114.6323.1423.8525.83
26.6923.8226.5727.083O.0627.81
28.3327.4326.9O29._26.3029.5733.4926.4027.g3
15225154.11152.16152.75155.98154.63
I S?:_S152.75152.57153.521S_.24
HP
O.O.5.8.8.8.8.8.0.'
4.6.:
9.1
14.
19.:22._
26J30.,26.q29.'
33.126.,'
45.'
51.:6O.:75.:89J
0.(0.1
27.::30.l
4.;5._
9,a
13.!18.(21._26.;3123O.(33.=
33.,"32.!
34.(37.;32. _
33.;32"3o.;
31.;25.,
0.(27._26..i26.(26_26..=
26.(26325._26.!26..i
26.(25,'25..!26_25.125.1126.;26.(262
2_,_29._26.129.126._29.729.529.428.926.929.429.129.629.129.7

TEST44444:
9970707O70
270
4
997O
27O
24
7O2424
7O4
704
7O4:
7055
7O7171
4:44
44444'4:
4:7t,71_71_
7171;71;71_7Z7ZT_72,72
72_7Z72i4:
7272'
72_72_72'72'72'72'72;72_
72'72
72'72'72;72;72;
POINT
6926936646956966976986997O07017027O3
704705
7087O770870g710711712713714715716717
71871972O721722723724725726727728729
730731732733734735736737738739740741
742743744745746747748749750
751752753754
755756757758
75076O761762763764765766767788
76877O771
772773774775776
4:42"=E4:42:4_4:43_74:43"_|4:45:454:48:17
21:42:3721:43"_S21:442(21:45".'_21:48:4_21:49_21:50"3221:52.t)2
22:48:1_22:47"_23"_1"_423:22_723"_4:1.:23:53:0_23:54:2123.'55'_
0:31:4_0:32:410:33:5_
0:34:3_0:35".310:37.@?0:37:3__.38:1_0_8:450:39:140:39.-520:40:3S0:43:2_0:45".330:.47:14
0:48:130.51:440_3._0.53:450_4_0.56._30_6"35
0.57:351:00.'0,11:01:231.133:541:13.-52121:14
128:111"33._1:38._¢1:43:4¢1:47.<_1.51:18
1_2_1_3:452.'62:4_2.'08:252:10:512:12:4_220_2_2:153:57:023.'58:29
4:12:534:14"_04:40:904:47.'064:49:.114_2:144_4204_5_4:5725
4_._05_0:345._2_55._4_05._7.O45.'08:575:17:005:18.535:20:11
NULL CAM, RPM,, 1087, ALFSU= 0.0 DEG, COLL - 2.0 DEGNULL CAM, RPM,, 1087, ALFSU- 0.0 DEG, COLL ,, 2.0 DEGNULL CAM, RPM= 1087, ALFSU= 0.0 DEG, COLL= 2.0 DEGNULL CAM, RPM" 1087 ALFSU" 0.0 DEG, COLL = 2.0 DEGNULL CAM, RPM- 1087, ALFSU'= 0.0 DEG,NULL CAM, RPM_ O,ALFSU _ 0.0 DEG,NULL CAM, RPM_ 544, ALFSU,, 0.0 D_G,NULL CAM, RPM_ 652 ALFSU" 0.0 DEG,NULL CAM. RPM" 761, ALFSU = 0.0 D_GNULL CAM, RPM_ 870, ALFSU: 0.0 DEGNULL CAM, RPM" 978, ALFSU" 0.0 DEGNULL CAM. RPM" 1033, ALFSU,' 0.0 DEGNULL CAM, RPM" 1087, ALFSU= 0.0 DEGPOST ZERO, RPM" 0800, ALFSU- 0.0 DEGNULL CAM, RPM" 544, ALFSU," 0.0 DEGNULL CAM, RPM= 978. ALFSU" 0.0 DEG
NULL CAM, RIM= 544, ALFSU" 0.0 DEGNULL CAM, RPM= 978. ALFSU= 0.0 DEGNULL CAM, RPM- 1087, ALFSU,, 0.0 DEGNULL CAM. RPM_ 544, ALFSU• 0.0 DEGNULL CAM, RPM_ 078, ALFSU_ 0.00EGNULL CAM, RPM_ 1087 ALFSU" 0.0 DEGNULL CAM, RIM" 978 ALFSU_ 0.0 DEG
NULL CAM, RPM- 1087 ALFSU _ 0.0 DEGNULL CAM, RPM_ 1120 ALFSU= 0.0DEGNULL CAM, RPM_ 1087 ALFSU_ 0.0 DEGNULL CAM, RPM- 1087, ALFSU= 0.0 DEG, COiL = 1.0 DEGNULL CAM, RiM= 1087. ALFSU = 0.0 DEG, COIL - 2.0 DEGNULL CAM, RPM" 1087. ALFSU- 0.00EG, COLL = 3.0 DEGNULL CAM, RPM= 1087 ALFSU- 0.00EG. COIL = 4.0 DEGNULL CAM, RPM= 1087. ALFSU= 0.0 DEG, COLl. = 5.0 DEG
NULL CAM, RPM_ 1087, ALFSU= 0.0 DEG, COiL = 6.0 DEGNULL CAM, RPM_ 1087. ALFSU_ 0.0 DEG, COLL - 7.0 DEGNULL CAM, RPM- 1087, ALFSU _ 0.0 DEG, COLL = 8.0 DEG
NULL CAM, RIM= 1087, ALFSU= 0.0 DEG, COLL - 9.0 DEGNULL CAM, RPM_ 1087, ALFSU,, 0J_ D£G, COLl. = 10.0 DEGNULL CAM, RPM_ 1087, ALFSU" 0_ DEG, COIL = 0.0 DEG
NULL _ RRM- 1087, ALFSU,, 0.0 DEG, COLl. - 2.0 DEGNULL CAM, RPM,, 1087, N.FSU,, 0.0 DEG, OOLL ,,, 2.0 DEG, I.AT ,, 0.5 DEGNULL CAM, RPM= 1087, ALFSU,, 0.0 DEG. CCILL ,, 2.0 DEG, LONGA,, 1.0 DENULL CAM, RPM,, 1087, ALFSU,, 0.0 DEG, COLL ,, 2.0 DEG, LONGA - 1.5 DE
NULL CAM, RIM= 1087. ALFSU,, 0.0 DEG, COLL ,, 2.0 DEG, LONGA,, 2.0 DENULL CAM, RPM- 1087, ALFSU,, 0.0 DEG, CCX.L ,, 2.0 DEG, LAT ,, 0.5 DEG
NULL CAM, RPM= 1087,ALFSU,, 0.0OEG, COLL - 2.0 DEG, LAT,, 1.0 DEGNULL CAM, RPM_ 1087, ALFSU_ 0.0 DEG, COLl. - 2.0 DEG. LAT = 1.5 DEGNULL CAM, RPM- 1087. ALFSU= 0.0 DEG. COLL = 2.0 DEG, LAT - 2.0 DEGNULL CAM, RPM = 1087, ALFSIJ= 0.0 DEG, COIL - 2.0 DEG. I.AT - -2.0 DEGNULL CAM. RPM= 1087 ALFSU= 0.00EG. COIL = 0.0 DEG. I.AT = 0.0 DEGNULL CAM. RPM" 1087, ALFSlJ= 0.0 DEG, COLL - 0.0 DEG, I.AT = 0.O DEG C
NULL CAM, RPM_ 1087, ALFSU _ 0.0 DEG, COLL = 0.0 DEG, VOR = 0.08NULLCAM, RPM" 1087,ALFSU_ 0_ OEG. COLL -0.0 DEG, VOR = 0.05NULL CAM, RPI_ 1087.ALFSU" 0_ OEG, VOR = 0.075NULL CAM, RPM_ 1087. N.FSU_ 0.0 DEG. VOR = 0.100
NULL CAM, RPM" 1087, ALFSU_ -.85 OEG, VOR - 0.100NULL CAM, RPM" 1087. ALFSU_ -.85 DEG. VOR = 0.125NULL CAM, RIM= 1087, ALFSU_ -.85 DEG, VOR" 0.15NULL CAM, RPM_ 1087, ALFSU_ -1.71 DEG. VOR - 0.15NULL CAM. RPI_ 1087 ALFSU_ -1.71 DEG, VOR - 0.15NULL CAM. RPM- 1087 ALFSU- -1.71 DEG. VOR - 0.15NULL CAM, RFM" 1081, ALFSU" -2_0 DEG, VOR = 0.175NULL CAM, _ 1082, ALFSIJ- -2.q0 DEG, VOR" 0200NULL CAM, RPI_ 1082, ALFSU_ -2_0 DEG, VOR - 0200NULL CAM, RPM_ 1064, ALFSU= -2_0 DEG, VOR = 0_00NULL CAM, RPI_ 1087, ALFSU" 0.0 DEG, VOR = 0.000
NULL CAM, RPM" 0, ALFSU" 0.0 DEG, VOR - 0.000NULL _ RPM • 1077, NJ=SU_ 0.0 DEG, VOR =0.150
NULL CAM, RPM_ 1077, ALFSU_ 0.0 DEG, VOR - 0.150 KULITE POINT
NULL CAM, RPM_ 1087_ALFSU= 0NULL C4s,M, RPM" 0, ALFSt.k" 0NULL CAM, RPM" 1087,ALFSU" 0NULL CAM, RPM_ 1087, ALFSU_ 0, VOR = .150NULL CAM, RPM_ 1077, ALFSU- SWEEP FOR ACOUSTIC, VOR - .150NULL CAM, RPM_ 1077, ALFSU_ SWEEP FOR ACOUSTIC, VOR - .150
NULL CAM, RPM- 1077, N.FSU- SWEEP FOR ACOUSTIC, VOR - .150NULL CAM, RPM,, 1077, ALFSU,, SWEEP FOR ACOUSTIC. VOR - .150NULL CAM, RPMB 1077, ALFSU _ SWEEP FOR ACOUSTIC, VOR - .150NULL CAM, RPMB 1077, ALFSU_ SWEEP FOR ACOUSTIC, VOR • .150NULL CAM, RPM" 1077, ALFSU _ SWEEP FOR ACOUSTIC, VOR • .150NULL CAM, RPM_ 1077. ALFSU_ SWEEP FOR ACOUSTIC. VOR - .150NULL CAM, RPM- 1077, ALFSU_ SWEEP FOR ACOUSTIC. VOR - .150
NULL CAM, RPM_ 1077. ALFSU- SWEEP FOR ACOUSTIC, VOR = .150NULL CAM, RI=M_ 1077. ALFSU- SWEEP FOR ACOUSTIC. VOR - .150NULL CAM, RPM_ 1078, ALI=SUmSWEEP FOR ACOUSTIC, VOR - _00NULL CAM. RPMW 1078. ALFSU- SWEEP FOR ACOUSTIC. VOR - _00
NULL CAM_ RIM= 10781ALFSUm SWEEP FOR ACOUSTIC_ VOR =
o0o
o00
00
0
0
o
00oo
o
0.020.020.010.010.019.0¢0.030.020.020.020.010.010.019.000.02
0.010.020.010.010.02
o.01O.Ol0.01o.010.010.010.020.020.02
0.020.020.030.030.040.040.040.010.020.020.020.O3
0.010.020.020.010.020.020.010.04
0.050.050.07
0.100.100.120.150.150.150.150.170.2O0.2O0.2O0.01
9.000.150.150.019.00
0.010.150.150.150.150.150.150.150.150.150.150.150.150.2002O0.20
152.5153.6154.8
151.831.3
-28.4-18.2_-12.5,-4.4:
7.7:.19.8:38.41 ! ;53.131 :-7.45
-16.75
9.779.03
44.4_68.281 :
-11.4519.9738.621 :20.44
41.45 I51.45 1 :50,941 :
104.831192.881 :286.431 :
384.12[488.211 :602.861 ,722.17647.511970.181 11
1101.801 1:75.171 :
205.621 :205,241 :204.471 :208.611 ;
213.881 :201.051 :
204..931 :207.631 :217.711 :205.O31 :
60.411 '.913.401 1_
366.451 :942.091929.981
405.191 :_31.181926.20 I271.371 '.801.65 I930.091
1051.901 J913.311 l785.161911.011 i
1042.501-8.731 :
-52.40916.931914.79198.911 :28.67
22.071 :914.201924.6@I916_31 I918.081 !912.041 ,620.321 ,915.441 ,908.831 :908.801 :913_7 ] :908.4_906.331905.711 ,916.021 '919.9f
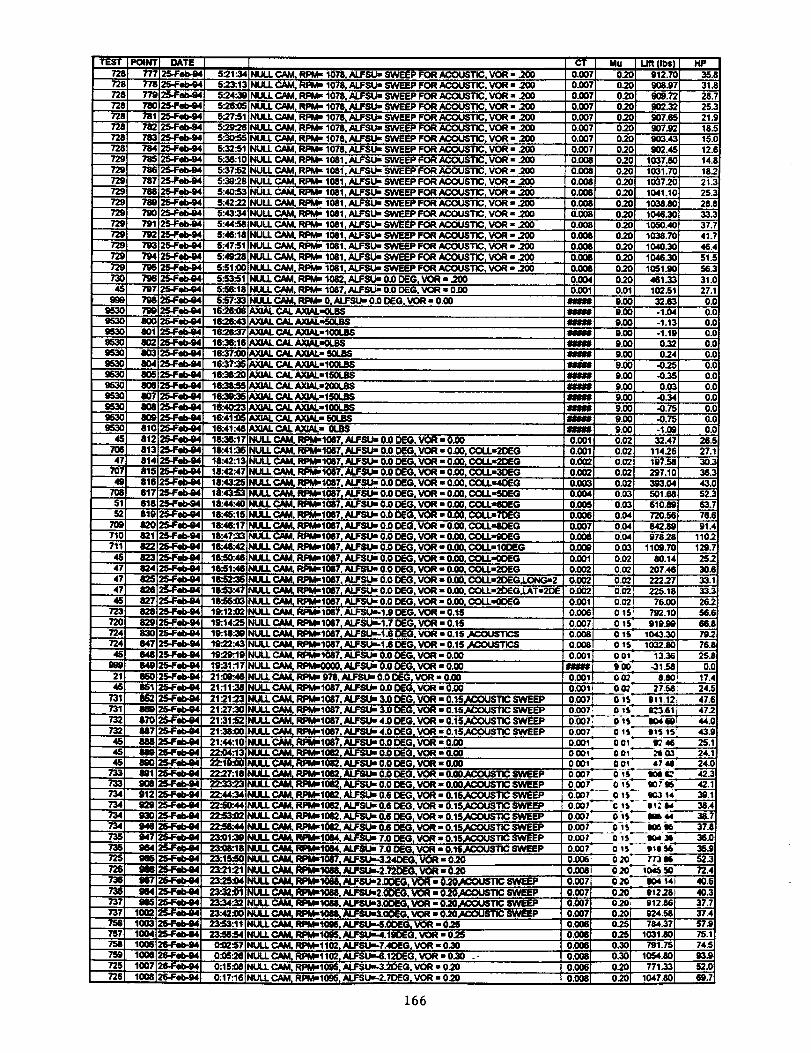
TEST_6_8_8_8
_a728
72872872972972g729729729729729729
72972973O
9_9530g530953O95309530
953Og530
9530953O953095309530
70647
7O7
7O851
7og710711
i
i
ml
e
e
POIN'I
771771775
78C781
7_78_78478_78_78778O7M79¢791792793
79479_790797
79871m8OO8018028O38O48058068O78O9a0Q810812813814815
810817
81881982O821822823824
825826827828829830847848849
O5O881852
87O
887888MSN0NI908912
930
944947
964946966967964905
1002100310041005_10061007
1008
1078, ALFSU- SWEEP FOR ACOUSTIC VOR 8.200RPMs 1078, ALFSU 8 SWEEP FOR ACOUSTIC, VOR - .200
ALFSU" SWEEP FOR ACOUSTIC VOR - .200
ALFSU,' SWEEP FOR ACOUSTIC VOR - .200ALFSU,, SWEEP FOR ACOUSTICALFSU= SWEEP FOR ACOUSTIC
VOR- 200VOR - _00
NULL C.4M, RPMn 1078, .4J.FSU,, SWEEP FOR ACOUSTIC VOR - 200NULL CAM, RPM= 1078. ALFSU,, SWEEP FOR ACOUSTIC VOR - 200NULL CAM, RPM,, 1081, ALFSU" SWEEP FOR ACOUSTIC VOR - _00NULL CAM, RPM,, 1061, ALFSU- SWEEP FOR ACOUSTIC VOR ', 200NULL CAM, RPM,, 1081, ALFSU" SWEEP FOR ACOUSTIC VOR" .200NULLCAM. RPMs 1561 ALFSLk' SWEEP FOR ACOUSTIC VOR-.200NULLCAM, RRM" 1081 ALFSU" SWEEP FOR ACOUSTIC VOR - .200NULL CAM, RPM" 1081 ALFSI.k' SWEEP FOR ACOUSTIC VOR" .200NULL CAM, RPM" 1081 ALFSU" SWEEP FOR ACOUSTIC VOR 8.200
NULL CAM, RPM" 1081,ALFSU" SWEEP FOR ACOUSTIC VOR- 200RPIMu 1081, ALFSU" SWEEP FOR ACOUSTIC VOR - 200
1081 ALFSLk, SWEEP FOR ACOUSTIC VOR- 200
1081,ALFSU,, SWEEP FOR ACOUSTIC VOR- .200
RPM_ 1082, ALFSU-0.0 DEG. VOR- 200RPg_ 1087, ALFSU= 0.0 DEG, VOR - 0.00
020 912.7C020 908.93020 909.7;
020 9023;020 907.6_
020 907.9;0.20 903.47.020 902.4_0.20 1037.8;:0.20 1031.7C0.20 1O3720020 1041.1(:020 1038_C020 1046.3(:02O 1050.40
02O 1038.70020 1040.30020 1046300.20 1051.90
020 461_30.01 102.51
RPM- 0, ALFSU- 0.0 DEG. VOR ,, 0.00 g.00AXLa4.CAL A)0AL-0LBS g.00AXIAL CAL AXIAL,,56LBS 9.00AXIAL CAL AXJIAL-100LBSAXIAL CAL AXIAL'01.B$AXJALCAL AXIAL" 50Li_
S0LSS0LBS
VOR" 0.00ALFSI_' 0_ DEG COLL'2DEG
N.FSU" 0_ DEG, VOR - 0_0, COLL-2DEGALFSU" 0J0 DEG COLL-3DC"G
ALFSU= 0_ DEG, VOR" 0_0, COLL'4OEGNULL CAM, RPMu1087, ALFSI.k, 0.0 DEG, VOR - 0.00, COLL_SDEG
ALFSU,, 0.0 DEG. VOR - 0_0. COLL,,6OEGALFSU- 0.0 DEG COLL-7OEG
NULL CAM. RI:M_1067, ALFSU8 0.00EG, VOR n 0.00, COLL_JDEGN.FSU• 0o0DEG. VOR - 0.00, GOLL,4;OEGN.FSU= 0_ DEG, VOR "0_0, COLL-10OEG
NULL CAM. RPM-1057, ALFSU,, 0.0 DEG+VOR 8 0.00, COLL_X)EGALFSU,, 0.0 DEG. VOR - 0_0, COLL-2DEG
32_3-1.04-1.13
9.00 -1.1g
9.00 0_29.00 O249.00 -025g.00 -035g.00 0.03
9.00 -0.349.00 -0.759.00 .0.759.00 -I .090.02 32.47
0.02 114280.02 197.58
0.02 297.100.02 393.040.03 501.680.03 610_0.04 720.56O.04 842_90.04 978280.03 1109.700.02 80.140.02 207.46
ALFSU= 0.0 DEG, VOR ,, 0.00, COLL-2DEG 0.02 22227NULL CAM, RPM81567o ALFSU_ 0.0 DEG, VOR - 0J00, COLL-2DEGJ_T-2DE
ALFSU- 0.0 DEG. VOR - 0_0CAM. RPM_1067, ALFSU_IJI DEG, VOR - 0.15
N.FSU--I.7 DEG, VOR ,, 0.16NULL CAM. RPMel0_7. ALFSU--1.6 DEG. VOR - 0.15 _COUSTICS
ALFSUn-I.5 DEG, VOR - 0.15 JI_USTICSALFSU" 0.00EG. VOR - 0.00
. RPM'0000, NJ:$U" 0.0 DEG. VOR - 0.00N.FSU- 0.00EG, VOR - O.00_LFSU- 0.0 DEG, VOR - 0.03ALFSU- 3.0 DEG. VOR - 0.15_v(_OUSTIC SWEEP
NULL CAM. RPIv_1087, N.FSU- 3.0 DEG. VOR - 0.15_X::OUSTIC SWEEP
ALFSU- 4.0 DEG, VOR - 0.15,_COUSTIC SWEEPNULL CAM. RPM_I087, ALFSU_ 4.0 DEG, VOR - 0.15,ACOUSTIC SWEEP
ALFSU,, 0.0 DEG. VOR - 0.00
RPM_1062. ALFSU_ 0.0 DEG, VOR ,, 0.00RPM_1082. VOR" 0_0
RPM_1042. ALF$1.k, 0J_ DEG, VOR - 0.00.ACOUSTIC SWEEP
VOR - 0.15._JSTIC SWEEPNULL CJ_. RRMm1082NULLC_NULL CAM, RPM=1082 N.FSU,, 0.6 DEG, VOR • 0.15_COUSTIC SWEEPNULL CAM, RPM_1084. ALFSU8 7.0 DEG, VOR - 0.15_VCOUSTIC SWEEP
RlPt_1064, _ 7.0 DC-G_VOR - 0.IS,ACOUSTIC SWEEPNULL CAM, RPI_10_' _24DEG VOR - 0.20NULL CAM. RPMul0U N.FSUL2 72DEG VOR I, 020
RPMnl0_I, N.FSU"2.00_G, VOR 8 0.20_
ALFSLk,3.0DEGVOR - 02O_COUSTIC SWEEP
RPM-1056.
NULL CAM. RPM=I0_, N.FSIJ,,-4.19OEG. VOR - 025NULL CAM. RPM_1102 _7.4DEG, VOR - 0.30
L CAM, RPM_1102, ALFSIJ_-6.120EG, VOR • 0,t0 . -ALFSU'_32DEG, VOR • 020
VOR • 02O
o 15p
o ls 1032.8000_ 13.36
100 -.11.56o 02 8.80o 02 27.580 IS 911 1:0 tS 9=361o15 904 60,
0007 0 sS, 9sSooi !1_4600s 215030ol 4744
lip3531
282521
1815121418.21.25.28.33.37.
41.46.51.56.
31.27.0.O.0.O.0.0.0.0.0.O.O.O.0.
25.
27.30.36.
43_52.63.76._91.
110lZO.25_30.1
33.33.:
25_56._56._79.'76._2S._0.1
17.,
24.147J47.:'44.i
25.124.1
SlO slbo+$o I$ _ 14 35.1© Is I1:1,4
0,007 0 15 I1_ M0tb IQ_lb0_S !:>4.14o 15 11+11s6
0.oo6 r (: 29" 773 116
O2O 9O402O02oq0201 024.¢(((0.201 771.
(
36.0
166
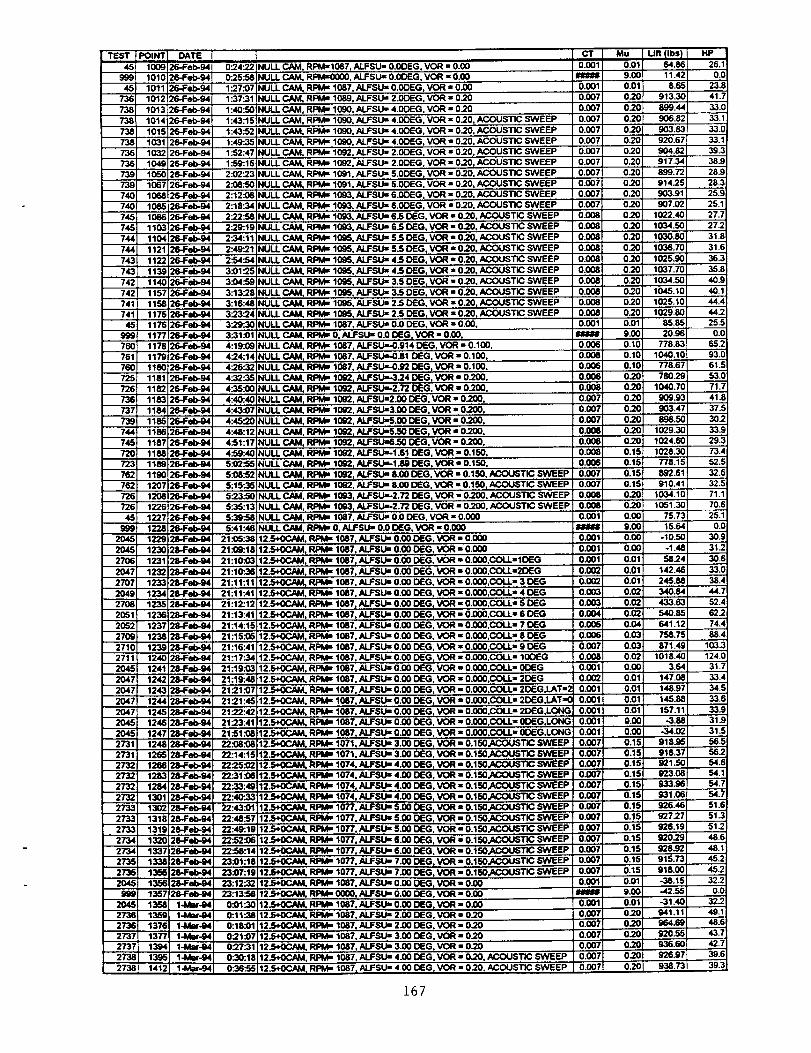
TEST45
99945
736
738738 _
738738736736739739740740745745744
744743743742
742741
74145
99975076176O725726
736737739744745720723762762726726
45999
2O45
204527082O4727O72O4927082051
20522709271027112045204720472O47
2047204520452731273127322732
2732273227332733273327342734273527352045
9_20452736273627372737273_2738
_1_1009101010111012
1013101410151_1103210491050108710681085108611_11_
112111_11391140115711_
11_11_117711_11_1150118111_
11_11_11_11501167115011_11_1_7120812261_71228
122912301_112321233
12341235
1236123712_12391240124112_12_1244
12_12_124712_12_12661283
12841_113021318131S132_
133_135_135(
135_135513_13_1394139_141;
NULL CAM, RPM"1087, AgFSU= O.ODEG, VOR = 0.08NULL CAM, RI:Mffi(XX)O,IALFSUffiO.ODEG, VOR "0.50
NULL CAM, RPM" 1087, ALFSU" 0.0DEG, VOR • 0.00NULL CAM, RPM= 1089, ALFSU= 2.0DEG, VOR = 0.20NULL CAM, RPM- 1090, ALFSU= 4.0DEG. VOR - 0.20NULL CAM, RPM= 10gO,ALFSU= 4.0DEG, VOR - 020, ACOUSTIC SWEEPNULL CAM, RIM= 1090, ALFSU=,4.0DEG, VOR = 0.20, ACOUSTIC SWEEPNULL CAM, RPIVI=1090, ALFSU=,4.0DEG, VOR = 020, ACOUSTIC SWEEPNULL CAM, RI=_I= 1092, ALFSU= 2.0DEG, VOR - 020, ACOUSTIC SWEEPNULL CAM. RPM= 1092, ALFSU= 2.0DEG. VOR - 0.20, ACOUSTIC SWEEPNULL CAM, RPM= 1091, ALFSU=,5.0DEG. VOR - 0_0. ACOUSTIC SWEEPNULL CAM, RPMm 1081o ALFSU=,5.0DEG, VOR - 020, ACOUSTIC SWEEPNULL CAM, RPM= 1083. ALFSU= 6.0OEG. VOR - 020, ACOUSTIC SWl:l:PNULL CAM, RPM= 1093. ALFSU- 6.0DEG, VOR = 020. ACOUSTIC SWEEPNULL CAM, RPM- 10G3. ALFSU= 6.5 DEG. VOR = 0_0, ACOUSTIC SWEEPNULL CAM, RPM" 1083, ALFSU= 6.5 DEG, VOR - 020. ACOUSTIC SWEEPNUII CAM, RPM= 1095, ALFSU" 5.5 DEG, VOR ='0_0, ACOUSTIC SWEEP
NUll CAM, RPM= 1095, ALFSU= 5.5 DEG. VOR • 020, ACOUSTIC SWEEPNULL CAM. RPM" 1085. ALFSU= 4.5 DEG, VOR = 020, ACOUSTIC SWEEPNUll CAM, RPM= 1095, ALFSU= 45 DEG, VOR • 020, ACOUSTIC SWEEPNUll CAM. RPM= 1095, ALFSU= 3.50EG. VOR - 020, ACOUSTIC SWEEPNUll CAM, RPM= 1095, ALFSU= 3_ DEG. VOR • 0_0. ACOUSTIC SWEEPNUll CAM, RPM= 1095. ALFSU= 2.5 DEG. VOR = 020. ACOUSTIC SWEEPNUll CAM, RPM= 10_5. ALFSU= 2_ DEG, VOR = 0_0. ACOUSTIC SWEEP
RPM= 1087. ALFSU=' 0.0 DEG, VOR =,0.00.ALFSU= 0.0 DEG, VOR - 0.00,
RPM= 1087, ALFSU=-0.914 DEG. VOR - 0.100,ALFSU=-0.81 DEG, VOR = 0.100,
RPM= 1087, ALFSU=-0.92 DEG, VOR = 0.100,
NUll CAM, RPM= 1092, ALFSUm324 DEG, VOR - 0_0,RPM- 1092, ALFSU=-2.72 OEG, VOR - 0200,
ALFSU-2.00 DEG, VOR • 0_0,ALFSU-3.00 DEG, VOR • 0_O0,
RPM= 1092, ALFSU=5.500EG, VOR - 0200,ALFSU_.50 DEG, VOR = 0_00,
RIM= 1092, ALFSLI=6_0 DEG, VOR - 0.200,RPM= 1092. ALFSU,=-1.61 DEG, VOR = 0.150,RPI_ 1092, ALFSLk,-1.89 DEG, VOR = O.150,RPM= 1002, ALFSU= 6.00 DEG, VOR - 0.150, ACOUSTIC SWEEPRRMI= 1092. ALFSU,, 6.00 DEG, VOR = 0.150, ACOUSTIC SWEEP
NULL CAM, RPM= 1003, ALFSUm2.72 DEG, VOR - 0_00, ACOUSTIC SWEEPNUll CAM, RPM= 1093, ALFSU=-2.72 DEG. VOR - 0.200, ACOUSTIC SWEEPNUll CAM, RPM- 1087, ALFSU,, 0.0 DEG. VOR - 0.080
NULL CAM, RPM= 0, ALFSU= 0.0 DEG, VOR = O.50012_<)CAM, RPM= 1087, ALFSU= 0.00 DEG, VOR - 0.000
12_5+0CAM, RPM" 1087, ALFSU= 0.00 DEG. VOR = 0.50012_.J_M, RPM= 1087, ALFSU,, 0.00 DEG, VOR = 0.000,COLL-1DEG12_S+0CAM,RPM= 1087, ALFSU= 0.00 DEG. VOR • 0.050,CCILL-2DEG12.5_0CAM, _ 1087, ALFSU= 0.00 DEG, VOR "O.050,COLL- 3 DEG12_OCAM, RPM= 1087. ALFSU=' 0.00 DEG, VOR ==O.000,CO.L= 4 DEG12.5+0CAM, RPM" 1087, ALFSU,, 0.00 DEG, VOR - 0.000,COLL- 5 DEG
ALFSU" 0.500EG. VOR = 0.000,COIL= 6 DEG
12.5+OCAM, RPM= 1087. ALFSU= 0.00 DEG, VOR - 0.000,COLL= 7 DEG12.5+0CAM, RPM= 1087, ALFSU=' 0.00 DEG, VOR - 0,000,COil" 8 DEG12.5+OCAM, RPM" 1087, ALFSU= 0.00 OEG, VOR • O.050.COLL• 90EG12.5+OCAM, RRVl- 1087. ALFSU- 0.08 DEG, VOR = 0.500.COLL= 1ODEG12.5+0CAM, RPM= 1087, ALFSU=' 0.08 DEG. VOR" 0.000,COils 0OEG12.5+OCAM, RPM= 1087. ALFSU= 0.50 DEG, VOR - 0.000.COLL" 2DEG12_5+OCAM, RPM" 1087, ALFSU" 0.00 OEG, VOR - 0.000.COil= 2DEGJ.AT'212.5+0CAM, RPM= 1087. ALFSU= 0.50 DEG, VOR "0.000.COLL• 2DEG,LAT'(]
RPM= 1087. ALFSU= 0.00 DEG, VOR - 0.000.COil= 2DEG_.ONGRPM= 1087, ALFSU= 0.00 OEG. VOR • 0.(X30.COll= 0DEG.LONGRPM = 1087, ALFSU= 0.00 DEG. VOR = 0.000.COil= 0DEG.LONG
12.S+0CAM, RPM= 1071. ALFSU= 3.500EG. VOR = 0.150_COUSTIC SWEEP12.5+0CAM, RPM= 1071. ALFSU= 3.00 DEG, VOR • 0.150_OOUSTIC SWEEP12.5+0CAM, RPM" 1074, ALFSU= 4.00 DEG. VOR = 0.150_OUSTIC SWEEP
RPM= 1074, ALFSU= 4.00 DEG, VOR - 0.150_COUSTIC SWEEPRPM= 1074, ALFSU = 4.00 DEG, VOR = 0.150J_COUSTIC SWEEP
ALFSIJ= 4.00 DEG, VOR • 0.150_CXJSTIC SWEEP
. RPM" 1077, ALFSU= 5.00 DEG, VOR = 0.150_3USTIC SW_I=P12£_OCAM, RPM" 1077. ALFSU= 5.50 DEG, VOR - 0.150_X:OUSTIC SWEEP12,_0CAM. RPM" 1077, ALFSU- 5.00 DEG, VOR - 0.150_COUSTIC SWEEP
. _ 1077, N.FSU" 6.00 DEG, VOR" 0.150,=_COUSTIC SWEEP12._,.J_M, RPM= 1077, ALFSU= 6.00 DEG. VOR - 0.150_COUSTIC SWEEP12.5+0CAM, RPM= 1077, ALFSU- 7.00 OEG, VOR = 0.150j_OUSTIC SWEEPt2£_0CAM, _ 1077, ALFSU=, 7_0 DEG, VOR = 0.150_COUSTIC SWEEP
12_,,AM, RPM= 1087, ALFSU= 0.00 DEG, VOR - 0.00ALFSU= O.00 DEG, VOR - 0.00
12,_vAM, _ 1067. ALFSU= 0J00 DEG, VOR = 0.0012_H)CAM, _ 1087. ALFSU=,2_O DEG. VOR = 0_O12_d_.,AM, RPM= 1087, ALFSU= 2J00DEG. VOR - 0_O12_S+OCAM.RPt,t- 1087, ALFSU= 3.50 DEG. VOR - 02012,5_OC_1Vl,RPM" 1087, ALFSU= 3.08 DEG, VOR - 0_012.5+0C_M, RPM= 1087, ALFSU" 4.00 DEG, VOR - 020, ACOUSTIC SWEEP
ACOUSTIC SWEEP
167
Mu
0.019.500.010.2010.20 I0.20 I020 I
0.201020 I020 I
0_010_0_
0_010_010_010_010_010_01
0_010_010_010201020 I0_010.019.000.1010.1010.1010_0t0.20102010.201
02010.20102010.15t0.1510.1510.15102010.2010.0(:9.000.000.O¢0_1
0.01 I0.oi to.o210.0210.0210.041
0.0310.03t0.02i0.500.01 I0.01 I0.01 I0.01 I0.0¢0.O¢0.1510.1510.15t0.1510.1610.1510.1510.15l0.1510.1510.1510.1510.151
0.01 I9_01
0.01 I0.2010.201020102010.201
0201
LJn8E4;6_
S2S 34
72S 25S
|1( 40
1( 501(1( 701(1( 70
1( 5O1( 10t( 101( SO
¢5g_
; ¢31( 1¢
1( 7(
I 5¢1( 3(1(
1(; 1E
I 61! 41
1( 1C1( 3(
4_
I 1;
4_1( 4(
6_' O_
' 11
|
|
|
|
, 15
,| 11
|! 73
26.1O.C
23._41.7
33.C33.133.(:33.139.9.338.926.928.325.925.127.7272
31.831.636.335.840.9
40.144.4
44225.50.0
65.293.(:61.5
53,r71.?41._37.53O.233.S29.373.452.532.E
32.571.170.6
25.10.(:
30.S
31230.633.r38.444.7
52.462.274.488.4
1032124,(:
31.733.434.533._33.g31.g
31._56.556_54.654.154.7
51.651.351.2486
48.145.245.232.20.0
32249.1
48.643.742.739.6
39.3
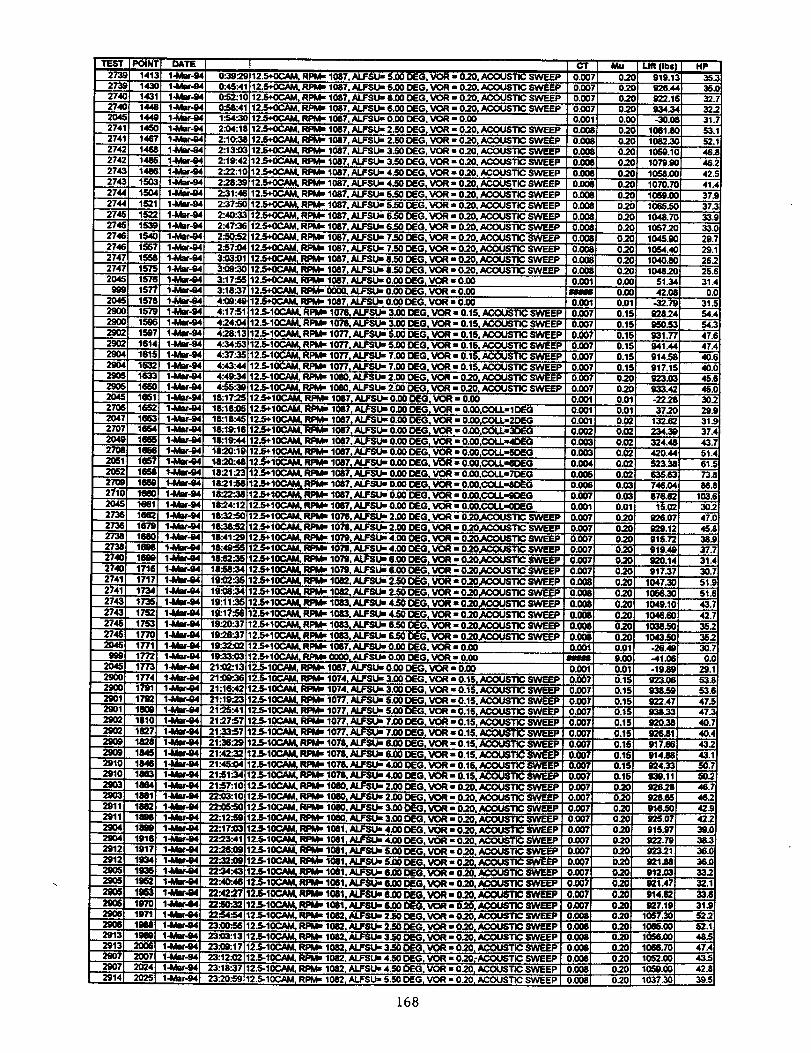
II_I)I
273274274294274274274:274:
274_27,_274,274,274_274_
274_274_274_274_20_
20_
290,29O,
290_204_27_
204_270;
2701205_
27m271(204_If,Jr
273(273_2731274¢274¢
2741274127432743
274527452O45m
2O45
_'vu1
29oi
29102910
29112911290429o4
29122912
291329134"YJl
2914
12.5+0CAM. RPM" 1087. ALFSU" 5.00 DEG, VOR • 0.20, ACOUSTIC SWEEPALFSUm 5.00 DEG. VOR u 0.20. ACOUSTIC SWEEP
12.5+0CAM, RPM= 1087, ALFSU" 6.00 DEG VOR "0.20. ACOUSTIC SWEEP12.5+0CAM. RPM= 1067. ALFSU" 6.00 DEG. VOR" 020. ACOUSTIC SWEEP12.5_0CAM. RPM_ 1087, ALFSU" 0.00 DEG, VOR " 0.0012.5+0CAM, RPMm 1087. ALFSU" 2.50 DEG. VOR " 0.29, ACOUSTIC SWEEP
ALFSU• 2.50 DEG, VOR" 020, ACOUSTIC SWEEPALFSU- 3.50 DEG, VOR _, 0.20 ACOUSTIC SWEEP
12.5+0CAM. RPM" 1087. ALFSUu 3.50 D£G. VOR "0.20. ACOUSTIC SWEEP12.$',OCAM. RPM,_1087. ALFSUi 4.50 D£G. VOR ,, 0.20, ACOUSTIC SWEEP12.5+0CAM. RPM- 1087. ALFSU,, 4.50 DEG. VOlt" 020. ACOUSTIC SWEEP
12.5+0CAM, RPMs 1087. ALFSU" 5.50 DEG. VOR - 020. ACOUSTIC SWEEP12.S,"0CAM. _ 1087. ALFSU,, 5.50 DEG. VOR ,' 020. ACOUSTIC12.5+0CAM. RIM" 1087. ALFSU,' 6.50 DEG. VOR • 0"20, ACOUSTIC SWEEP12.5,'OCAM, RIM,, 1087. ALFSU,, 6.50 DEG, VOR • 0"20, ACOUSTIC SWEEP12.5,*'0CAt_ RPM" 1087. ALFSU_ 7.50 DEG. VOR "020. ACOUSTIC SWEEP12.5+0CAM, RPMw 1087. ALFSU_ 7.50 DEG. VOR ,J 0.20. ACOUSTIC SWEEP
RPM" 1087 ALFSU" 8.50 DEG. VOR • 020. ACOUSTIC SWEEP12.5+0CAM. RPMs 1087, ALFSUi 8.50 DEG, VOR • 0.20. ACOUSTIC SWEEP
12.5"*-0CJlM.RPMm 1087, ALFSU_ 0.00 DEG_VOR • OJ0012.5+0CAM. RPM• 0000, ALFSU,, 0.00 DEG. VOR • 0.0012.5+0CAM. RPMu 1087, ALFSUm 0.00 DEG, VOR" 0.00
12.5-10CAM. RPMm 1076. ALFSU_ 3.00 DEG, VOR • 0.1S.12.5-10CAM. RPM,' 1076, ALFSU• 3.00 DEG, VOR" 0.15. ACO4JTTIC SWEEP125-10CAM. RPM" 1077, ALFSU" 5.00 DEG, VOR" 0.15. ACOUSTIC SWEEP
10CAM, RPM_ 1077. ALFSU" 5.00 DEG, VOR • 0.15. ACOUSTIC SWEEP1077. ALFSU• 7.00 DEG. VOR • 0.15, ACOUSTIC SWEEP
12.5-10CAM, RIM" 1077. ALFSU" 7.00 DEG, VOR • 0.15. ACOUSTIC SWEEP12.$-10CAM. _ 1080, ALFSU" 2.00 DEG, VOR" 0"20. ACOUSTIC SWEEP
1080. ALFSU" 2.00 DEG_ VOR" 0.20_ ACOUSTIC SWEEP12.5+10CAM. RPMR 1087. ALFSU" 0.00 DEG. VOR • 0.00
1087, ALF$1.Ji 0.00 DEG, VOR • 0.00.COLL'IDEG1087. ALFSUs 0.00 DEG. VOR" 0.00,COLL-2DEG
1087, ALFSU,, 0.00 DEG_ VOR • 0.00,COLL•3DEG12.5+10CAM. RPM" 1087. ALFSU,, 0.00 DEG, VOR • 0.00.COLLmlDEG
ALFSU" 0.00 DEG. VOR • O.00.COLL"7OEG
ALFSU,, 0.00 DEG. VOR - 0.00,COLL,,a__G12..r_10CAM, RPM" 1076. AJ.FSU,, 2.00 DEG. VOR" 0.20,ACOUSTIC SWEEP
_,RPM" 1076. ALFSU- 2.00 DEG, VOR ,, 0.20,ACOUSTIC SWEEP12.$+1_ RPM," 1079, ALFSUm 4.00 DEG, VOR "0.20.ACOUSTIC SWEEP12.5+10CAM, RPMw 1076
12.5+10CAM, RPM_ 1079 ALFSU," G.00 DEG, VOR • 0.20,ACOUSTIC SWEEPRPM_ 1079. ALFSU_ 6.00 DEG, VOR _, 0"20,ACOUSTIC SWEEP
RPM_ 1082. ALFSU,, 2.50 DEG, VOR • 0.20,ACo(Js'rlc SWEEPRPM_ 1082. ALFSU,, 2.50 DEG, VOR ,, 0.20,ACOUSTIC SWEEP
ALFSU,, 4.50 DEG, VOR • 0.20,ACOUSTIC SWEEP
ALFSU- 4.50 DEG. VOR • 0.20_COUSTIC SWEEP12.S+IOCAM. RPM_ 1083, _ 6.50 DEG, VOR ,, 0.20,ACOUSTIC SWEEP
ALFSU• 6.50 DEG. VOR • O.29.ACOUSTIC SWEEP1087. ALFSU_ 0.00 DEG. VOR - 0.00
RPM_ 1074, ALFSUi 3.00 DEG. VOR • 0.15_ ACOUSTIC SWEEP12.5-10CAM. _ 1074 ALFSU,, 3.00 DEG. VOR • 0.15, ACOUSTIC SWEEP
12.S-10CAM, RPMm
1077, ALFSUm 5.00 DEG. VOR ,, 0.15, ACOUSTIC SWEEP
1077. ALFSU," 7.08 DC'G.VOR - 0.15 vACOUSTIC SWEEP1077_ALFSU• 7.00 DEG, VOR ,, 0.15, ACOUSTIC SWEEP
ALFSU" 8.00 DEG. VOR ,, 0.15, ACOUSTIC SWEEP1078. N.FSLh' 6.00 OEG, VOR i 0.15.1078. &LFSU_ 4.00 DEG. VOR - 0.15, ACOUSTIC SWEEP
12.5-10CAM, _ 1078, _ 4.00 DEG. VOR - 0.15, ACOUSTIC SWEEP12.5-10CAM. RPM" 1080. ALFSU,, 2.00 DEG. VOR - _____,ACOUSTIC SWEEP12.5-10CAM. RPM,,12.5-10CAM. RPM_
1000, N..FSU_ 2.00 DEG_ VOR - 0.20. ACOUSTIC SWEEP10e0, N.JFSU• 3.00 DEG. VOR I" 0.20, ACOUTT_ SWEEP
12.5-10C_4, RPIM_ 1080, ALFSU,, 3.00 DEG, VOR ,, 0.20 ACOUSTIC SWEEP12.5-10C/_M. RPM_ 1081, N.FSU• 4.00 DEG. VOR • 020 ACOUSTIC SWEEP
1081, ALFSU,, 4.00 DEG. VOR s 0.20, ACOUSTIC SWEEP
12.S-10CAM, RPMm 1082 AI.FSU,, 3.50 DEG. VOR ,, 0.20, ACOUSTIC SWEEP
ALFSU,, 3.50 DEG, VOR - 0.20. ACOUSTIC SWEEPALFSU" 4.50 DEG. VOR - 0.20;'ACOUSTIC SWEEP
ALFSU_ 4.50 DEG. VOR • 0.20 vACOUSTIC SWEEPACOUSTIC SWEEP
168
MuO.2O.2O.2O.20.00.2O.2O.2
0.2O.2O202O.2O20._.
0.,_0.,_0._.0._0.00.00.00.110.1_0.1!0.1_0.1!o.1_
0._0.,_0.Oo.oo.0_0.(_o.0_0._0._o.0_o_0.0_0.o"O2(
o2(0.2(0.2(
o2(O.2(0.2(O.2(0.2(
n__.02¢0.2(0.019.o¢0.01
o.150.150.150.15
0.150.150.150.I'_0.150.150.2O0.200.200.200"20O.2O0"20O.2OO.2OO2O
02O
0=o02OO2OO2O0200.200.2O0.20
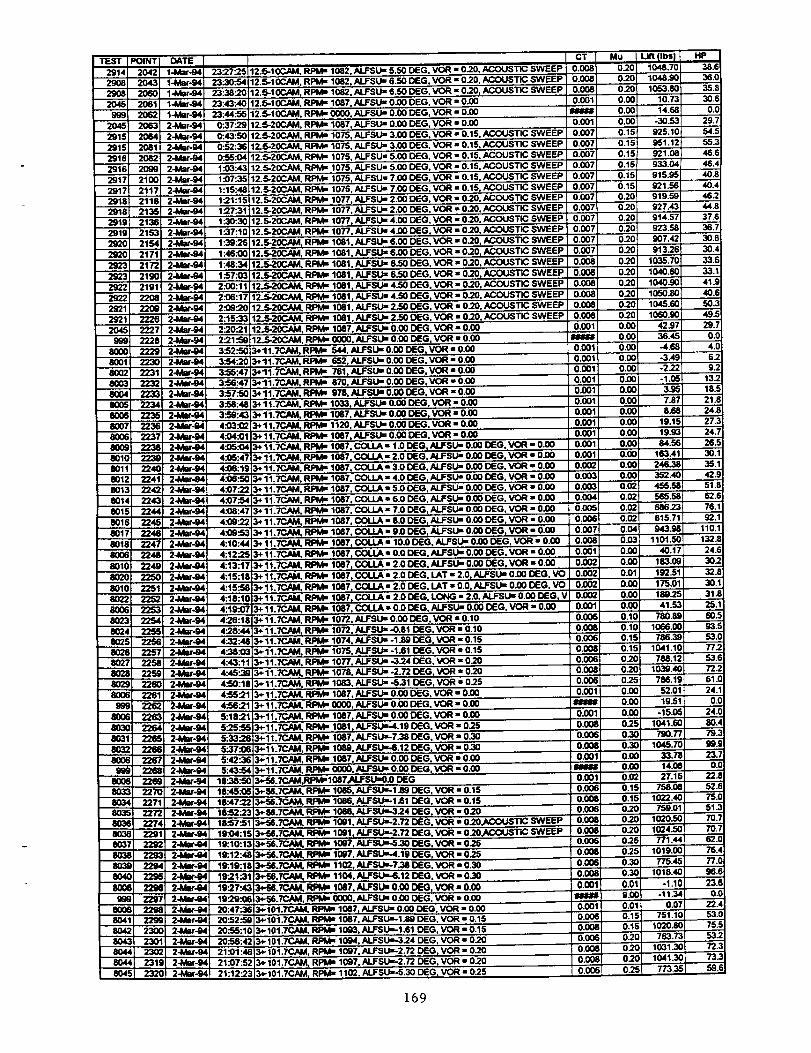
12.5-t0CAM. RPM _ 1082, ALFSU = 5.50 DEG, VOR = 0_0, ACOUSTIC SWEEP
12.5-10C_A, RPM" 1052, ALFSU" 6.50 _r__G, VOR = 020, ACOUSTIC SW_t"RPMs 1082. ALFSU _ 6.50 DEG, VOR = 020, ACOUSTIC SWEEP
12.5-IOCJ_, RPM- 1087. ALFSU,, 0.00 DEG, VOR • 0.00
RPM,, ___X___,ALFSU,, 0.50 DEG, VOR - 0.00
12.5-2_, RPM_ 1087, ALFSU,, 0.50 DEG, VOR • 0.50
12.5-20CAM, RpMm 1075, ALFSU- 3.08 D£G. VOR = 0.15, ACOUSTIC SWEEP
12.5-20CAM, RPM- 1075, ALFSU_ 3.00 D£G. VOR - 0.15, ACOUSTIC SWEEP
12.5-20C_Vl, RPM _ 1075, ALFSUs 5.00 DEG, VOR - 0.15, ACOUSTIC SWEEP
12.5-20CAM, RPM- 1075. ALFSUs 5.00 DEG. VOR = 0.15, ACOUSTIC SWEEP
12.5-20CAM, RPM- 1075, ALFSUs 7.00 DEG. VOR = 0.15, ACOUSTIC SWEEP
12.5-20CAM. RPM- 1075, ALFSU_ 7.00 DEG, VOR - 0.15, ACOUSTIC SWEEP
12.5-20CAM. RPI_ 1077, ALFSU _ 2.00 DEG, VOR - 0_0, ACOUSTIC SWEEP
RIM= 1077, ALFSU.. 2.00 DEG, VOR - 0_0, ACOUSTIC SWEEP
12.5-ZOCAM, RPIVI_ 1077, ALFSU = 4.00 DEG, VOR - 0_0. ACOUSTIC SWEEP
RPM" 1077, ALFSUm 4.00 DEG VOR "0.20, ACOUSTIC SWEEP
12.5-20C,¢M, RIM= 1081. ALFSU" 6.00 DEG VOR • 0.20, ACOU:_TIC SWEEP
12.5.20CAM, RI:M _ 1081. ALFSU" 6.50 DEG VOR" 020, ACOUSTIC SWEEP
RPM s 1081, ALFSU = 6.50 DEG VOR • 0.20, ACOUSTIC SWP.._.V
12.5.20CAM, RPM= 1081, ALFSU= 6.50 DEG VOR • 0.20, ACC_TiC SWP..EP
RPM" 1081, ALFSU" 4.50 DEG VOR" 0.20, ACOUSTIC SWr::t:V
RPM" 1081, ALFSU" 4.50 DEG, VOR • 0-20, ACOUSTIC SWF.."P"
12.5-20CAM, RPM s 1081, ALFSU_ 2.50 DEG VOR" 0.20, ACOUSTIC SWPEP
12.5-20CAM, RPM" 1081, ALFSU" 2.50 DEG VOR" 0.20, ACOUSTIC SWEEP
12.5-20CAM, RPM" 1087, ALFSU" 0.08 DEG VOR" 0.00
12.5-20CAM, RPMs 0000,ALFSU • 0.00 DEG VOR = 0.00RPM- 544. ALFSU-0.00DEG VOR=0.00
3+11.7CAM. _ 652, ALFSU" 0.00 DEG VOR - 0.00
3+11.7C_Vl. RPM R 761. ALFSU_ 0.00 DEG VOR - 0.00
3+11.7C4_1. RPM" 570, ALFSU _ 0.00 DEG VOR - 0.00
3+11.7CAM. RPMm 978, ALFSUs 0.00 DEG VOR" 0.08
3+11.7CN_. _ _n___. ALFSU _ 0.00 DEG VOR = 0.50
3+ 11.7C .__. RPMm 1087, ALFSUm 0.08 DEG. VOR • 0.08
3+ 11.7C.MA. RPM m 1120. ALI=SU m 0.00 DEG. VOR" 0.00
3+ 11.TCRM. RPM" 1087. ALFSUm 0.00 DEG. VOR - 0.08
RPII_ 1087, _ ' & = 1.0 DEG ALFSU a 0.00 DEG. VOR - 0.00
3+ 11.7C_M, RPM _ 1087, C-__-n A = 2.0 DEG, ALFSU- 0.50 DEG. VOR - 0.00
3+ 11.TCAM. RPM- 1087. -_-.J-n A = 3.0 DEG, ALFSU a 0.08 DEG. VOR - 0.00
3+ 11.7CAM. RPI_- 1087. COLLA - 4.0 DEG, ALFSU m 0.00 DEG. VOR - 0.00
3+ 11.TC.NM. RPM_ 1087. COLLA - 5.0 DEG, ALFSU a 0.00 DEG, VOR • 0.00
3+ 11.TCAM, RPM" 1087, _ n_. 6.0 DEG, ALFSUm 0.00 DEG, VOR - 0.08
RPMm 1087, COLLA = 7.0 DEG, ALFSUJ 0.00 DEG, VOR • 0.00
RPM" 1087, COLLA" 8.0 DEG, ALFSU" 0.00 DEG VOR = 0.00
COLLJ_- 9.0 DEG, ALFSU- 0.080EG VOR - 0.08
RPM- 1087. COLLA - 10.0 DEG.ALFSUm 0J)0 DEG, VOR" 0.00
3+ 11.TCAM. _ 1087, COLLA = 0.0 DEG. ALFSUm 0.08 DEG, VOR = 0.00
3+ 1 t.TCAM. _ 1087, ____n _ • 2.0 DEG, ALFSUm 0.08 DEG, VOR • 0.08
3+ 11.TCAM. RPM _ 1087, _ ! • = 2.0 DEG, LAT = 2.0. ALFSUm 0.00 DEG, VO
3+ 11.7CAM. _ 1087. C_-C_! A • 2.0 DEG. LAT = 0.0. ALFSUm 0.08 DEG, VO3+ 11.TC.SM. RPI_ 1081, C__ ! A • 2.0 DEG, LONG • 2.0. AU=SUm 0.00 DEG, V
3+ 11.7CN_ RPM" 1087, _ ! _, • 0.0 DEG, ALFSU" 0.08 DEG, VOR • 0.00
3+ 11 .TC/_M, RPM- 1072, ALFSU" 0.50 DEG, VOR = 0.10
3+ 11.7C/_, R.,m_'-. 1072, ALFSU,, -0.81 D£G, VOR = 0.10
3+ 11.TCAM, R..m_._ 1074, ALFSU" -1.89 DEG, VOR • 0.15
3+11.?CAM, R..m#'.. 1075. ALFSU" -1.81 DEG. VOR • 0.15
RPM= 1077. ALFSU_ -30.4 DEG. VOR = 020
RPM_ 1072, ALFSUm -2.72 D£G. VOR • 0_0
}_11.TCAM, RPM- 1083, ALFSUm -5.31 DEG. VOR • 0_5
_F_11.7CAM, RPt_ 1087. ALFSUm 0.00 DEG. VOR - 0.08
3+11.TCAM, RPI_ _n___, ALFSUm 0.00 DEG. VOR = 0.08ALFSU,, 0.08 DEG, VOR - 0.08
ALFSU=-4.1g DEG. VOR = 0.25
RPM," 1087, ALFSU•-7.38 DEG, VOR "0.30
RPM- 1089. ALFSU_6.12 DEG. VOR = 0.30
ALFSUm 0.30 DEG. VOR = 0.08ALFSU- 0.50 VOR = 0.00
VOR - 0.15
RPM_ 1086, ALFSU_l.81 DEG. VOR = 0.15
3_-56.7CAM. _ 1086, ALFSU_3.24 DEG. VOR = 020RPM_ 1081. ALFSU_-2.72 DEG. VOR = 020_;::OU_]-I_ SWEEP
3_56.7CAM, RPM,, 1081_ ALFSU--2.72 DEG, VOR = 020.ACOUSTIC SWEEP3_-5_.7CAM, RPM,, I0_7, N.FSU_5.30 DEG, VOR = 0.25
ALFSU--4.19 DEG, VOR = 025
1102. ALFSU_-738 DEG, VOR = 0.30
ALFSU--5.30 DEG_ VOR • 0.25
169
1101 .,_
40.'
1041.
788.
1041._
1045.
33.
27.
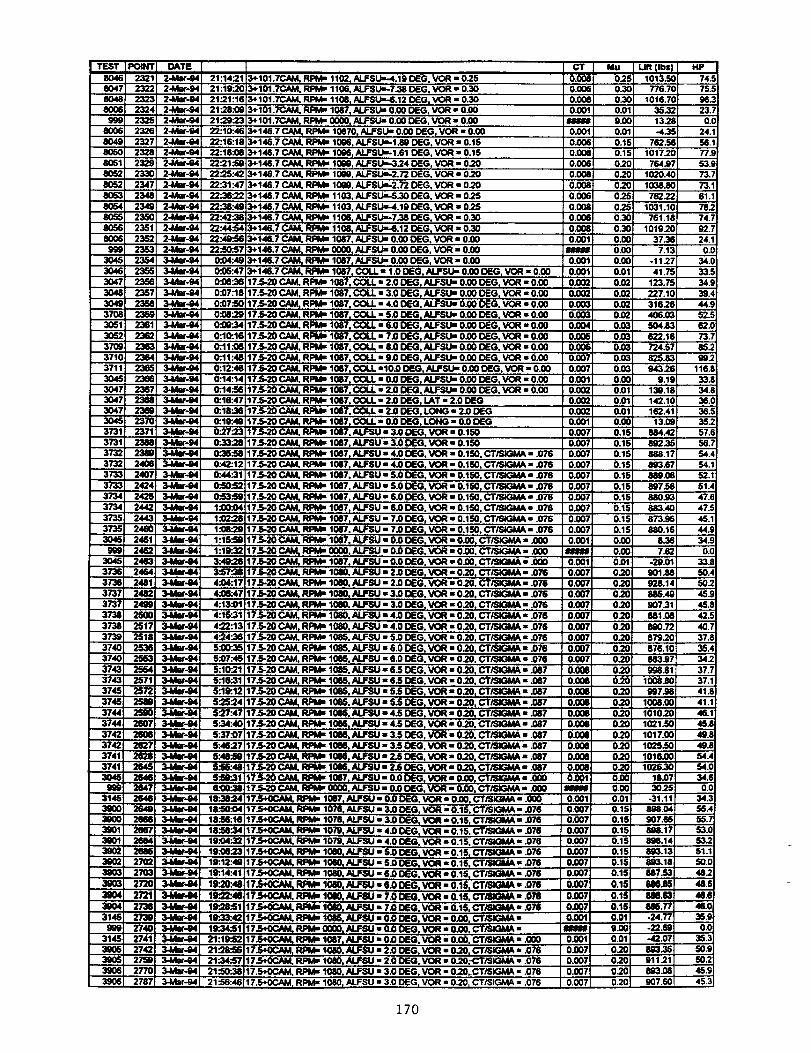
J Mu
RPMn 1102. ALFSU--4.19 DEG, VOR - 0.25
3+101.7CAM, RPM_ 1106 ALFSUm-7.38 DEG, VOR - 0_0
9
9
31
31
3+101.7CAM, RPM_ 1108, ALFSU--6.12 DEG, VOR s 0.30
3+101.7CAM, RPM- 1087_ ALFSLk, 0.O0 DEG, VOR - 0.003+101.7CAM. RPMu 0850, AU=SUn 0.00 DEG, VOR • 0.00
3+146.7 CAM, RPMm 10870, ALFSU_ 0.00 DEG, VOR - 0.003+146.7 C_M, RPMs 1086, ALFSULI.88 DEG. VOR - 0.16
3+146.7 CAM, _ 10e6, ALFSU_l.61 DEG, VOR - 0.15
3+148.7 CNd, RPM- 108g, ALFSU--3.24 DEG, VOR - 0203+146.7 CAM, RPMu l(_e, ALFSU_2.72 DEG, VOR o 0_0
3+148.7 CAM, RPMn 10_, ALFSU_2.72 DEG, VOR • 020
3+148.7 _ RPMu 1103, ALFSUu-5,_0 DEG, VOR • 0_5
3+146.7 CAM, RPMu 1103. ALFSUa_t.19 DEG, VOR - 0_5
3+146.7 C_M, RPMu 1108, ALFSUu-7_B DEG, VOR - 0.30
3+148.7 CAM, RPMu 1108, ALF_.12 DEG, VOR - 0_0
3+146.7 CAM, RPM- 1027_ ALFSUm 0.00 DEG, VOR • 0.003+148.7 CAM, RPMs 0000, ALFSUs 0.QO OEG, VOR • 0.00
3+148.7 CAM, Rl:q_ 1067, ALFSU- 0.00 OEG, VOR - 0.00
ALFSU- 0.00 OEG. VOR - 0.50
17_-20 CN_L RPM- 1087, COLL • 2.0 DEG. ALFSU- 0_O DEG. VOR - 0.00
17.5-20 CAM, RPI_ 1087, COLL • 3_ DEG, ALFSUo 0.00 DEG, VOR - 0.50
17.5..20 CAM, RPMR 1087, VOR - 0.00
17.5-20 CAM. RPMs 1087, COLL - S.0 DEG, N.FSUu 0.00 DEG, VOR • 0.5017_-20 _ RPM_ 1087, DEG, VOR - 0.00
COLL • 7.00EG, ALFSU- 0_00EG. VOR -0.00
17_-20 CAM, RPIV_ 1087, VOR • 0.00
17_-20 CAM. RPMu 1087, COLL • 9.0 DEG, ALFSU u 0.00 DEG, VOR • 0.00
17.5-20 CAM, RPM u 1087, COLL •10_ DEG, ALFSU m 0.00 DEG, VOR - 0.00
17.5-20 CAM. RPMu 1087, COLL • 0.0 DEG, ALFSU m 0.00 DEG, VOR • 0.00
173-20 CAM, RPMu 1067, COLL o 2.0 DEG, ALFSUn 0.00 DEG VOR m 0.00
17_-20 CAkL RPM_ 1087, COLL - 2_ DEG, LAT - 2.0 DEG
17_-20 CAN_ RPMm 1087, COiL • 2.0 DEG, LONG • 2.0 DEG
17.5-20 CAM, _ 1087, COLL - 0.0 DEG, LONG- 0.0 DEG
17_-20 CJ_L RPMm 1087, ALFSU - 3.0 DEG, VOR • 0.150
17_-20 CNd6 RPMm 1087, _ • 3.0 DEG, VOR • 0.150
17"5"-20 _ RPM" 1087, ALFSU • 4.0 DEG, VOR o 0.150 CT/SIGMA - .076
17.5..20 _ RPMs 1087, ALFSU u 4.0 DEG, VOR - 0.150 CT/81GMA - .076
17.5..20 _ RPMs 1087, ALFSU" S.0 DEG, VOR - 0.150 CT/SlGMA • .076
17.5"20 CNVL RPM" 1087, ALFSU - S_ DEG, VOR - 0.150 CT/SK3MA - .076
17.5-20 _ RiM" 1087. ALFSU • 6.0 DEG. VOR o 0.150 CT/SIGMA - .076
17.5-20 CN_ RPMu 1087, ALFSU o 6.0 DEG, VOR • 0.150 CT/SIGMA - .076
17.5-20 CAM, RPM_ 1067, ALFSU - 7.O OEG, VOR - 0.150 CT/SIGMA s .076
17.5-20 CAM, RPMu 1087, ALFSU - 7.0 DEG, VOR- 0.150 CT/Sk3k_- .076
17.5.20 CAM, RPM• 1087_ N.FSU ,, 0.0 DE(;, VOR - 0.00 CT/$K3MA • .(XX)173-20 CN_ RPMn 0050, ALFSU m0.0 DEG, VOR - 0_0. CT/SIGMA - .500
17.5-20 CAM, RPMm 1087, _ "0.0 DEG, VOR - 0_0, CT/SIGMA • .000
RPM_ 1080. ALFSU - 2.0 DEG, VOR - 0_0, CT/SIGMA • .076
17.5-20 CAM. _ 1080, ALFSU - 2.0 DEG, VOR - 0.20. CT/_K3MA - .076
ICAI_ RPMu 1080,ALFSU- 3.0 DEG, VOR • 020, CT/SIGMA- .07617.5-20 CAM, RPM,- ALFSU - VOR- 020, CT/SIGMA- .076
17.5..20 CAM, _ 1050_ ALFSU • 4.0 DEG0 VOR • 0.20, CT/SIGMA • .076
173-20 CAM, RPM_ 1080, ALFSU • 4.0 DEG, VOR - 0.20, CT/SIGI_A_ • .076
17.5..20 CNVL RPM" 1085, ALFSU - 5.0 DEG. VOR - 0.20. CT/SIGMA • .076
17.5-20 CAM, RPM- 10_5, ALFSU • 6.0 DEG, VOR - 0.20, CT/$1GMA • .076
, RPM- 1056, ALFSU - 6.0 D_G, VOR - 0.20, CT/SIGMA " .076
17.,5-20 CAM. RPMu 1085, AI,=SU 8 6.50EG0 VOR - 0_0, CT/SK3MA • .067
ALFSU _ , VOR : 0.20, CT/SIGMA • .087
17 _;-20 CAM. RPM_ 1085. ALFSU • 5.5 DEG, VOR • 0.20. CT/SIGtdA • .087
RPM" 1016, ALFSU - 5.5 DEG, VOR - 0.20, CT/$1GMA • _87
17.5..20 CA_L RPMu 1086,_ _ 4.5 DEG, VOR • 0.20. CT/$1GMA • .087
17.5`-20 CAM, RPM" 1066, ALFSU • 4.S OEG, VOR • 0.20, CT_IGMA • .087
,ALFSU - 3.5 DEG, VOR u 0.20, CT/SiGMA • .087
ALFSU ,, 3.50EG, VOR - 0.20. CT/SlGMA - .08717.5..20 CAM, RPM_ 1086, ALFSU • 2.5 DEG, VOR • 0.20, CT/SIGMA • .087
17.5-.20 CAM, _ 1086_ ALJFSU • 2.5 DEG, VOR • 0.20, CT/$1GMA" .087
17.5..20 C_L RPM_ 1087. ALFSU o 0.0 DEG, VOR - 0_50, CT/SIGMA - .00017.5..20 CAM, RPM_ 0_0, _- 0.00EG, VOR • 0.00, CT/SIGMA- .000
17_r_0cAI_ RPM n 1087, ALFSU • O.0 DEG, VOR • 0..50. CT/SK3MA- .0(X)
ALFSU • 3.0 DEG, VOR - 0.15, CT/SIGMA - .076
ALFSU - 3.00EG_ VOR • 0.15, CT/SIOMA • .076
17,r_.J_L RPMo 1079_ ALFSU • 4.0 DEG, _" 0.15. CT/SIGMA • .07617_0CAM, P.PM_ 1079, ALFSU - 4.00EG, VOR - 0.15, CT/SIGMA" .076
17,_0CAM, RPMu 1080, ALFSU • S.0 DEG VOR • 0.15, CT/SJGMA • .076
17_ RFq_ 1080, ALFSU - 5.0 DEG, VOR • 0.15, CT/SIGMA • .076
17,r_qkll, RPM_ 1080, ALFSU - 6.0 DEG, VOR" 0.15, CT/SIGMA" .076
VOR - 0.tS, CT/SIGI_" .076
17.5_CA_ RPMu 1010, ALF3U • 7.0 DEG, VOR • 0.15, CT/SIGMA" .076
6 RPM_ 10_0, ALFSU • 7.00EG, VOR - 0.16, CT/8_GMA • .076
ALFSU" 0.00EG, VO_ - 0_0, CT/SlGI_-
NJ=SU • 0J) OEG_ VOR • 0.00, CT/SIGMA"ALFSU o 0.00EG, VOR • 0_0, CT/S#GMA • _00
RPM" 1080, ALFSU • 2.00EG, VOR • 0.20, CT/StGMA - .076
17._OCAi_ RPM_ 1080, ALFSU o 2.00EG. VOR - O.20,_3T/SIGMA - .O76
17.5+0CA_ RPM_ 1050. ALFSU • 3.0 DEG. VOR - 0.20_CT/SIGMA - .076
ALFSU - 3.0 OEG_ VOR = 0_01CT/SIGMA = .O76
_I,_,_It013.5( 74....
776.7( 75_
1016.7( 96_
35.3; 23._
13.21 0.C
-4_ 24.1
1_ 762.5( 56.1
1_ 1017.2( 77.1;
764.9; 53.£
1020.4( 73.7
1038.8( 73.1
762._ 61.1
1031.1C 78.2
761.1| 74.7
101g.2c g2.7
37_ 24.1
7.1_ 0.O
-11.27 34.0
41 .Tl 33.5
123.7'; 34.9
227.1¢: 39.4
316.2e I 44.9406.0:3 52.5
504.8,1 62.0
622.1e 73.7
724J? 85.2
825.8_ 99.2
94321 116.8
9.1S 33.813_.1| 34.8
142.1C I 36.0162.41 36.5
13.0_ I 35.2
I! 884.4_ 57.6
I! 892.3_ l 56.7II 888.17 54.4
I! Im3.67 $4.1
II 889.0t 52.1
I| im7.5_ 51.4
I! 860.93 47.6
I! iS83.4_ 47.5
II 873._ 48.1
I! 880.11_ 44.9
8.3_ 34.9
7.$2 0.0
-29.011 33.8
501.M. $0.4928.14 50.2
085.4_ 46.9
507.311 45.8
881.08. 42.5850.72 40.7
879.2(] 37.8
876.10 35.4
88387 34.2
_11 37.71008.80 37.1
997,981 41.81008.00 41.1
101020 46.1
1021.50 45.8
1017.00 4g.8
1025_0 49.8
1016_0 54.4
1026.30 $4.0
13.071 _.6i30.2S
-31.11' _._11
I! 856.04' _AI
r_ 507.56' _.71
:e 8_8.17' 53.01
8 896.141 53.2 I5 8_3.13 _ II
5 893.18' 50.01
!i 087.50' 4a.21
IN.13' 48.61
s m._l 48.01-24.771 35_1
-"501 ool-42.07 353I893.35 50.91
911.211 502 I
893.08, 4.._.91907.60, 4_ a!
170
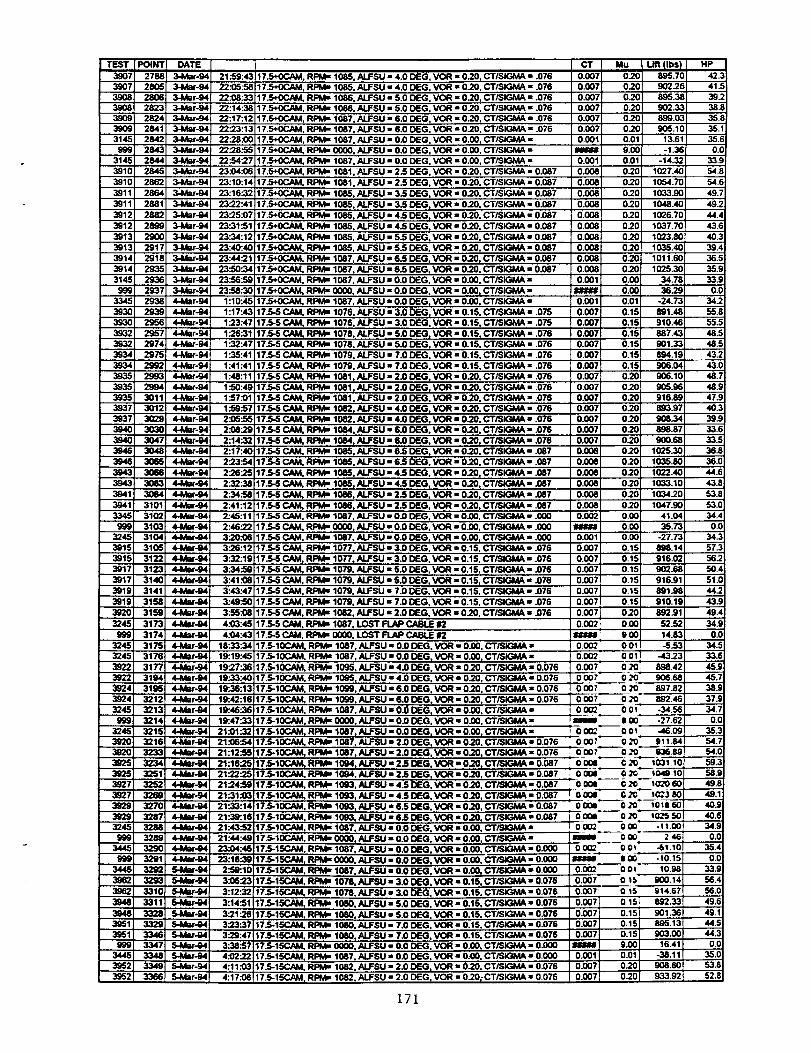
TES"
31_
391
391
391
391
39'
39'
39'
39131 291'
39141 2911
39'
31,
39351 301'
39371 301;
301
391
301
391
391
391
39241 321;
32451 321,
9_)1 3214
39201 321(
39481 3311
3_
3_.
21_9:4322._5._
22.t)8:3322:14:38
22:17:12
22")3:13
22")8.100
22")8:55
22_>4.27
23._4._6
23:10:14
23:16:32
23_2:41
23")5.1)7
23'_1:51
23:34:12
23:40:40
23:44"21
23:50:34
23:56:59
23:56:301:10:45
1:17:43
1"_3:47
1.26:31
1:32:47
1:35:41
1:41:41
1:48:11
1_0:49
1:57.01
1:56:57
2.'05:56
2.08:29
2:14:32
2:17:40
2::23:54
2:26:25
2.:32:38
2:34:58
2:41:12
2:45:11
2:46".22
3"20.'06
3".26:12
3:32:19
3:34_dJ
3:41._6
3:43:47
3:49:50
3:56.'08
4.'03:45
4.'04:4318:33:34
19:19:45
19")7"36
19"_3:40
19_6:13
19:42:16
19:45"_6
19:47:33
21._1"32
21._6:54
21:12_5
21:16"25
21_2")5
21.24£)9
21:31._3
21_13:14
21"_39:16
21:43_.
21:44:49
23_4:45
23:18"_0
2£d_:10
3_6"23
3:12"_2
3:14:51
3:21 263:23'37
3".29:47
3.'_:57
4.O2:22
4:11._3
4:17._8
17-5+0CAM. RPM= 1085, ALFSU = 4.0 DIEG, VOR = 020, CT/SlGMA = .076
17:5+0CAM, RPM" 1085, ALFSU • 4.0 DEG, VOR = 020. CT/SlGMA = .076
17-5+0CAM, RPM= 1086. ALFSU - 5.0 DEG. VOR = 0_0, CT/SIGMA = .076
17.5+0CAM, RPM- 1086. ALFSU - 5.0 DEG, VOR - 020. CT/SlGMA = .076
17.5"-0CAM, RRM= 1087. ALFSU - 6.0 DIEG VOR - 020, CT/SlGMA = .076
17.5+OCAM, RPM= 1087. ALFSU = 6.0 DEG. VOR = 0_0. CTISlGMA = .076
17-5+0CAM, RPM- 1087, ALFSU = 0.0 DEG. VOR = 0.00. CT/SlGMA =17.5+0CAM, RPM= 0000. ALFSU = 0.0 DEG VOR = 0.00. CT/SlGMA =
17-5+0CAM. RPM- 1087, ALFSU - 0.0 DEG, VOR - 0.00. CT/SIGMA -
17.5+OCAM. RPM= 1081,'ALFSU = 2.5 DEG, VOR = 0:_0. CT/SlGMA = 0.087
17-5+0CAM, RPM= 1081. AJ.FSU = 2.5 DEG, VOR • 0_.0, CT/SlGMA - 0.087
17.5+00AM, RPM= 1085, ALFSU = 3.5 DEG, VOR = 020, CT/Sk3MA = 0.087
17.5+0CAM. RPM= 1085. ALFSU = 3.5 DEG, VOR = 020, CT/SICJAA = 0.087
17.5+0CAM. RPM- 1085. ALFSU - 4.5 DEG, VOR - 0_0, CT/SlC.ddA = 0.087
17-5+0CAM, RPM= 1085, ALFSU = 4.5 DEG, VOR - 0_0, CT/SlGMA = 0.087
17-5+0CAM, RPM= 1085. ALFSU • 5-5 DEG VOR = 0_0, CT/SlGMA = 0.087
17.5+OCAM. RPM- 1085, ALFSU - 5.5 DEG, VOR - 0_0. CT/SIGMA - 0.087
i17.5+0CAM, RPM= 1087. ALFSU • 6-5 DEG VOR • 0_0, CT/SlGMA • 0.087
17.5+0CAM. RPM= 1087. ALFSU • 6.5 DEG. VOR • 0_0, CT/SlGMA • 0.087
17.5+0CAM. RPM- 1087, ALFSU • 0.0 DEG, VOR • 0.08. CT/SIGMA •
17.5+0CAM, RPt_ 0800. ALFSU • 0.0 DEG VOR • 0.08, CT/SlGMA •
17.5+0CAM. RPM= 1087, ALFSU - 0.0 DEG, VOR • 0.00. CT/SlGMA •
17.5-5 CAM. RPM= 1076, ALFSU • 3.0 DEG, VOR • 0.15. CT/SlGMA • .075
17.5-5 CAM. RPM= 1076, ALFSU • 3.0 DEG, VOR • 0.15, CT/SlGMA • .075
17.5-5 CAM. RIM= 1076, ALFSU • 5.0 DEG, VOR • 0.15. CT/SlGMA • .076
17.5-5 CAM. RPM- 1078, ALFSU • 5.0 DEG. VOR • 0.15. CT/Sk3MA - .076
17.5-5 CAM. RPM= 1079, ALFSU • 7.0 DEG, VOR • 0.15, CT/SlGMA • .07617.5-5 CAM, RPM= 1079. ALFSU • 7.0 DEG. VOR • 0.15. CT/SIGMA • .076
17.5-5 CAM. RPM" 1081, ALFSU • 2.0 DEG. VOR • 0_0, CT/SIGMA • .076
17-5-5 CAM. RIM= 1081, ALFSU • 2.0 DEG, VOR • 0_0, CT/SIGMA = .076
17-5-5 CAM. RPM= 1081, ALFSU • 2.0 DEG. VOR • 0_0, CT/SlGMA = .076
17_ CAM, RPM= 1082, ALFSU" 4.00EG, VOR • 0_0, CT/SlGMA = .076
17£P5 CAM. RPt4_ 1082, ALFSU = 4.0 DEG, VOR • 0_0, CT/SlGMA • .076
17-5-5 CAM, RPM= 1084, ALFSU = 6.0 DEG, VOR = 0_0. CT/SlGMA - .076
17-5-6 CAM, RPM= 1084, ALFSU = 6.0 DEG, VOR • 0_0, CT/SlGMA • .076
17.5-5 CAM, RPM" 1085, ALFSU • 6-5 DEG, VOR • 0_0, CT/SlGMA • .087
17-5-5 CAM, RPM = 1085, ALFSU = 6-5 DEG, VOR • 020, CT/SIGMA • .087
17.5-5 CAM, RPM" 1085, ALFSU • 4-5 DEG, VOR • 0_0, CT/SlGMA • .087
17.5-5 CAM. RPM= 1085, ALFSU • 4-5 DEG, VOR • 0_0, CT/SlGMA • .087
17.5-5 CAM, RPM= 1086, ALFSU • 2-5 DEG, VOR • 0_0, CT/SlGMA • .087
17.5-5 CAM, RI=M= 1086, ALFSU • 2-5 DEG, VOR • 0_0, CT/SlGMA • .087
17.5-5 CAM, RPM= 1087, ALFSU • 0.0 DEG, VOR ,, 0.00. CT/SIGMA • .000
17.5-S CAM, Rl:_lk, 0000, ALFSU • 0.0 DEG, VOR • 0.00, CT/SlGMA • .000
17.5-5 CAM. RPM= 1087, ALFSU • 0.0 DEG, VOR • 0.00, CT/SlGMA • .00017.5-5 CAM. RPM= 1077, ALFSU" 3.0 DEG. VOR • 0.15. CT/SlGMA • .076
17.5-5 CAM. RPM= 1077. ALFSU - 3.0 DEG. VOR • 0.15. CT/SlGMA • .076
17.5-5 CAM, RPt_ 1079. ALFSU • 5.0 DEG VOR • 0.15. CT/SlGMA • .07617.5-5 CAM, RPM= 1079, ALFSU • 5.0 DEG, VOR = 0.15, CT/SlGMA • .076 0.151
17.5.5 CAM. RPM= 1079, ALFSU • 7.0 DEG, VOR • 0.15. CT/SlGMA • .076
17.5-5 CAM, RPM= 1079. ALFSU • 7.0 DEG, VOR • 0.15. CT/SlGMA - .076
17.5-5 CAM, RIM= 1082o ALFSU • 2.0 DEG, VOR • 0_0, CT/SlGMA • .076
17.5-5 CAM, RPM= 1087, LOST FLAP CABLE 112
17-5-5 CAM, RPM= 0800, LOST FLAP CABLE 112
17_5-10CAM. RPM= 1087. ALFSU" 0.0 DEG. VOR • 0.00. CT/SlGMA •
17_-10CAM. RPM= 1087, ALFSU • 0.0 DEG. VOR • 0.00. CT/SlGMA •
17.5-10CAM. RPM= 1095, ALFSU • 4.0 DEG. VOR • 0"20. CT/SlGMA = 0.076
17.5-10CAM. RPM= 1095. ALFSU • 4.0 DIEG, VOR • 020, CT/SlGMA - 0.076
0,2O 895.71
0"20 90221! 02O 895_
0.20 902.3:0"20 899.0:
0"20 905.11
0.01 13.6'
9.00 -1.3(
0.01 -14.3_
0"20 1027.4(
0"20 1054.7(
0"20 1033.9(
020 1048.4(
020 1026.7C
0"20 1037.7(
0"20 1023.8(
0"20 1035.4(
0"20 1011.60
0"20 1025.30
0.00 34.7_
0.08 1 36.2_0.01 -24.7_
0.15 891.4_0.151 910.4(
0.15 887.4_
0.15 901.3_o.15 894.1. =
0.15 906.0,1
0.20 908.1C
0"20 905.9(
0"20 916.85020 8_3.97
0"20! 908.34o.20] aeB.67o2ol g08-seo201 1o'_.x0.201 1035.8(:
0201 ,0_4(0201 t033.1c0.201,=4")c0.201 1047.9(;
o,081 4,.04oooi _.0.001 -27._0.15 ! 898.14
0.15! 916.0_
015i 902.6_
17.5-10CAM, RPId_ 1099, ALFSU • 6.0 DEG, VOR • 0_0. CT/SlGMA • 0.076
17:5-10CAM. RPM= 1009, ALFSU • 6.0 [;)lEG, VOR" 0.20. CT/SlGMA - 0.076
17.5-10CAM, RPM= 1087, ALFSU • 0.0 DEG, VOR • 0.00, CT/SlGMA •
17.5-10CAM. RPM= 0000, ALFSU" 0.0 DEG, VOR - 0.08. CT/SlGMA =
17.5.10CAM, RPM= 1087, ALFSU • 0.0 DEG, VOR • 0.00. CT/SiGMA •
17.5.10CAM, RJ=M= 1087, ALFSU • 2.0 DEG, VOR • 0.20. CT/SlGMA • 0.076
17-5-10CAM, RI=M= 1087, ALFSU • 2.0 DEG, VOR • 0.20, CT/SlGMA • 0.076
17:5-10CAM, RPM" 10_4 ALFSU • 2.5 DEG, VOR • 020, CT/SlGMA • 0.087
17-5-10CAM, RPM= 1004. ALFSU • 2-5 DEG, VOR • 0.20. CT/SiGMA • 0:087
916.91
0151 591.9_0.15 910.1S
0.0071 0201 892.91 ,
0.OO2; 0.001 52.5,1I
; 9oo 14._OOO2 0 01 -5.53
O002 001! -43230 007' 0 20; 898.42
0OO7 02O 9O6.68 4
O(X_7 020' 897.82
17_-1_ RPM= 1003, ALFSU • 4-5 DEG, VOR • 0"20. CT/SlGMA • 0.087
17.5-100AM. RPM= 1003, ALFSU - 4.5 DEG, VOR • 0"20, CT/SlGMA • 0.087
17.5-t0CAM, RPM= 1093, ALFSU • 6.5 DEG, VOR - 0"20, CT/SlGMA - 0.087
17.5-10CAM. RPM= 101_3. ALFSU • 6-5 DEG. VOR • 0"20. CT/SlGMA - 0.087
17.5.100AM. RPM• 1087, ALFSU • 0.0 DEG, VOR • 0.00, CT/SlGMA •
t7.5-t0CAM, RIM= O(X)O, ALFSU =' 0.0 DEG, VOR • 0.08. CT/Sk3MA ='
17-5-15CAM, RPM• 1087, ALFSU " 0.0 DEG, VOR • 0.00, CT/SIGMA • 0.008
17_'15CAM, RPM" 0080, ALFSU - 0.0 DEG, VOR • 0.00, CT/S_MA" 0.000
17-5-15C/_, RPM= 1087 ALFSU • 0.0 DEG, VOR • 0.00, CT/S_.J_ " 0.000
17-5-150AM, RPI_ 1078,/M.FSU • 3.0 DEG, VOR • 0.15, CT/SlGMA • 0.076
17:5-15C/tM, RPM= 1078, ALFSU • 3.0 DEG, VOR • 0.15. CT/StGMA • 0.076
17_-15CAM, RPM= 1080, ALFSU - S.0 DEG, VOR" 0.15, CT/SlGMA • 0.076
17_-15CAM. RPM= 1080, ALFSU • 5.0 DEG, VOR • 0.15, CT/SIGMA = 0.076
t7_-15CAM, RPM= 1080, ALFSU = 7J3 DEG, VOR - 0.15, CT/SIGMA = 0.076
17:5-15CAM. RPM= 1080. ALFSU • 7.0 DEG, VOR • 0.15, CT/SlGMA • 0.076
17.5-1_. RPM= 0000. ALFSU = 0:0 DEG, VOR - 0.00. CT/Sk3MA - 0.000
17.5-15CAM. RPM- 1087. ALFSU • 0.0 DEG. VOR • 0._0. CT/SlGMA • 0.0(X)17-5-15CAM. RPM= 1082, ALFSU = 2.0 DEG. VOR • 0"20, CT/SIGMA • 0.076
17.5-15CAM_ RPM" 10821ALFSU - 2.0 DEG_ VOR = 0.20_-CT/SIGMA • 0.076
0.002 00t 10.98
E
5
4
4
4
4
3
3
3
50.007 0 IS 900.14
0.0071 0 t$ 914.67
0.007] 015_ 8,92.33
0.0071 0.15 901.3_
o.oo71 0.15 895.1."
0.007 0.15 _03.0(] 9.00 16.41
0.081J 0.01 -38.1_
0.087 0"20 908.8(
0.087 0.20 933.9:,
171
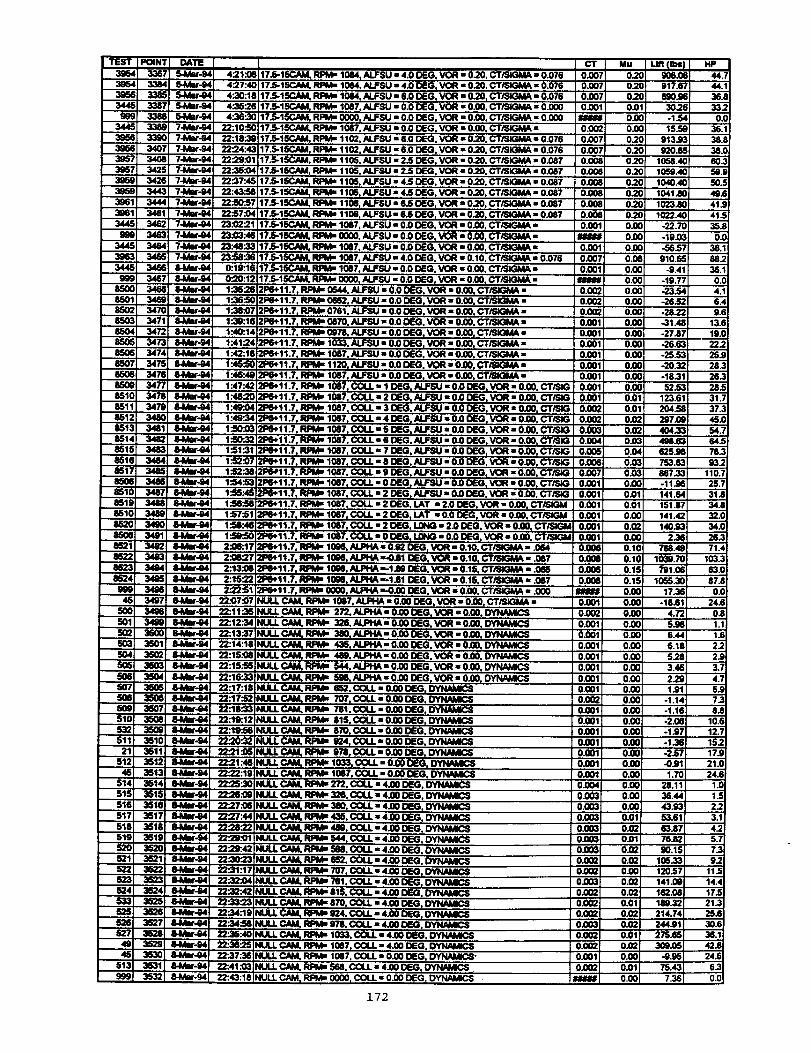
365395365344
344
395395
3S6308344
344
344
85O85O
85O85O85O85O
85085O
850851q8518SI:8S1;85%851_851q851'
85118511851!852_
650(853'
1152:852,
5O(501S_SO_SO_SO_
5O(
Sm50_51(53251121
512
$14SIE
517
51_SlS
52C52152252_52453352_52_52?
4S45
5139913
17.5-15CAM. P.PM_ 1084_ALFSU s 4.0 DEG, VOR - 0-20, CT_k3MA • 0.07617.5-15C_A1, _ 1064. ALFSU • 4.0 DEG, VOIR ,, 0.20, CT/SIGM_ • 0.076
17.5-15CAM. RPI)_ 1084 ALFSU - 6.0 DEG, VOR o 0.20_ CT/SIGMA - 0.07617.5-15CAM, RPM,, 1087. ALFSU - 0.0 DEG, VOR • 0.00. CT/SIGMA = 0.000
1105, ALFSU - 4.5 DEG _0.20, CT/SIGMA - 0.0871106, ALFSU • 6.50EG, VOR • 0.20, CT/SIGMA • 0.087
1067. ALFSU • 0.0 lEG, VOR • 0.00, CT/SIGMA •DEG CT/SIGMA -
RPM" 0844. ALFSU - 0.00EG, VOR • 0.00, CT/SlGMA -
RPMs 0852, ALFSU - 0.00EG, VOR ,, 0.00_ CT/SIGMA -N.FSU - 0.00EG, VOR - 0.00. CT/SiGMA -
_11.7, RPMw 0879. ALFSU - 0.0 lEG. VOR • 0.00. CT/SJGMA •RPM_ 0078. ALFb'U" 0.0 DEG. VOR • 0.00, CT/SIGMA •
RPMR 1033, ALFSU • 0.0 lEG vVOR - 0.00_ CT/SICAdA ,,RPMR 1067. CT/SIGMA -
ALFSU - 0.00EG. VOR • 0.00, CT/81GMA -COLL - 10EG, N.FSU • 0.0
2P6._11.7, RIMs 10e7 AUF_U • 0.0 DEG. VOR - 0.00
1.7, RIPMm1087, COLL ,, S lEG, ALFSU - 0.0 DC-G
21=6+11.7, RIM,, 1087. C(_.L • 0 lEGp N.FSU -, 0.0 DEG+ VOR ,, 0.00, CT/S_1087, COLL - 20EG. ALFSU • 0.0 lEG, VOR • 0.00. CT/SIG
1087. COLL - 0 lEG LONG ,, 0.0 lEGRPM- 1086. VOR- 0.10. CT/SlGMA- .084RPM,, 10M, ALPHA "-0.111 lEG, VOR • 0.10, c'r/SIGMA - .087
1000, _ 1"1-80 lEG, VOR "0.15, CT/$1GMA" .085
1088o ALPHA "-1.51 DEG_VOR • 0.15, CT/_GMA • .087ALPHA'-O00 DEG VOR"000 CT/SIGMA•.000
ALPHA" 0.00 OEGvVOR - 0.00, CT/SiGMA -272, ALPHA" 0.00 OEG. VOR • 0.08. DYNAMICS321S,ALPHA • 0.00 OEG, VOR "0.00.17/14AMCS
RPM" M0. ALPHA- 0.00435 ALPHA ,, 0.08 lEG, _0R ,, 0.00. DY1NAMIC$
RPM- 48g, ALPHA - 0.08 lEG. VOR - 0.00. DYNNdlCS5'14, ALPHA - 0.00 lEG, VOR - 0.00, DYNNACS5M. ALPHA • 0.00 lEG
COLL ,, 0.00 OEG_DYNAMICSCOU. • 0.00 [ DYN/MCS
751, COLL ,, 0.00 lEG, D_COLL ', 0.00 lEG DYNAtAC$
1170.COLL • 0.00 lEG. DYNAMC$COLL • 0.00 DEG DYNAMI(_
OYN_
NULL CAM, RPM_ 1033, COI.L - 0.00 DEG_ DYNAMICSRPM,, 1087. COLL - 0.00 OEG
NULL CAM. RPM,, 272. COLL ,, 4.00 DEG, 0_NULL CAM, RPM• 326, COLL • 4.00 DEG OYNMACS
NULL CAM, RPI_ 380. COLL - 4JD0Dr=G, DYNNMICS
NULL CAM, RPMm435. COLL - 4.00 OEG_ OYNAMIC__EG DYNAM_
CAM, RPMm544 COLL•400DEG DYNAMICS
DYNAMICS,RPM" 652. COLL • 4.00 lEG. DYNAMICS
COLL - 4.00 DEG O_
COiL • 4.00 lEG, D_NULL CAM. RPMm 815. COLL • 4.00 DEG
COLL • 4.080EG. 0_
COLL - 4.00 DEG, DYNAMICSRPM-, 1087 COLL ,, 4.00 DEG, DYNAIj____ _
172
Mu Uft _tbs0,.2 908,¢03. 017.|0.2 8gO.S0.C 30.2o.© -1"O.C 15...,0.2 913.£0.2 920.|0.2 1058.40.2 105_A0.2 1040.4
0-2 1041.80.2 1023.80.2 1022.40.0 -22.70.0 -19J)
0.0 -56.50.0 910.60.0 -9.40.0 -19.70.0 -23.50.(:1 -26.50.O -28.20.0 -31.4O.O -27.80.0 -26.60.01 -25.50.0 -20.30.O -18.t
0.O 52.50.0 123.6
0.0 204.5O.G 297.00.0 404.30.G 4_.50.G 525.9O.G 753.50.0: 867.30.01 -11.90.0' 141.60.0' 151.80.01 141.(0.0_ 140.S0.0_ 2.30.11 788.4_
0.11 1030.740.1! 791.00.1i 10r_.3
0.0( 17.30.0( -18.60.01 4.7:,
0.0( 5._0.0( 6.4,0.(X 6.110.0( 5.210.0( 3.44
O.OC 2_o.0( 1.0'0.(X -1.1,O.(X -1.11
0.(X -2.0(0.0( -1.0;O.OC -1.3(
0.0( -2.5;0.0( -0.9_
O.OC 1.7C0.0C 28.11O.OC 38.4a0.0_ 43.g_0.01 53.610.02 53.810.01 76.620.02 Sin.150.02 108.3_0.0(] 120.570.02 141.0_0.02 162.080.01 188.320.02 214.740.02 244.910.01 275.650.02 308.050.00 -9.95
0.01 75.430.00 7.36
liP
4444,3633G
36,38.38,60.
50.
49.41.41.35.O.
36.88.36.
OJ
4.6,,
9J13J19.122.:2S_28:26;
28.:31.37;45.1
64.,'78;93:
110.'25:31J34J32J34.!20.:71.,
I03.:
83.!87.1O.C
24.(OJ1.'
1.12.;2]3.;
4.;5.S7"8J
10.(12.;IS+:17_21.(24.(
1.C1._
2.23.14.25.77.39-2
11.514.417.S21.32S.630.636.142.624.6
6.3
0.0
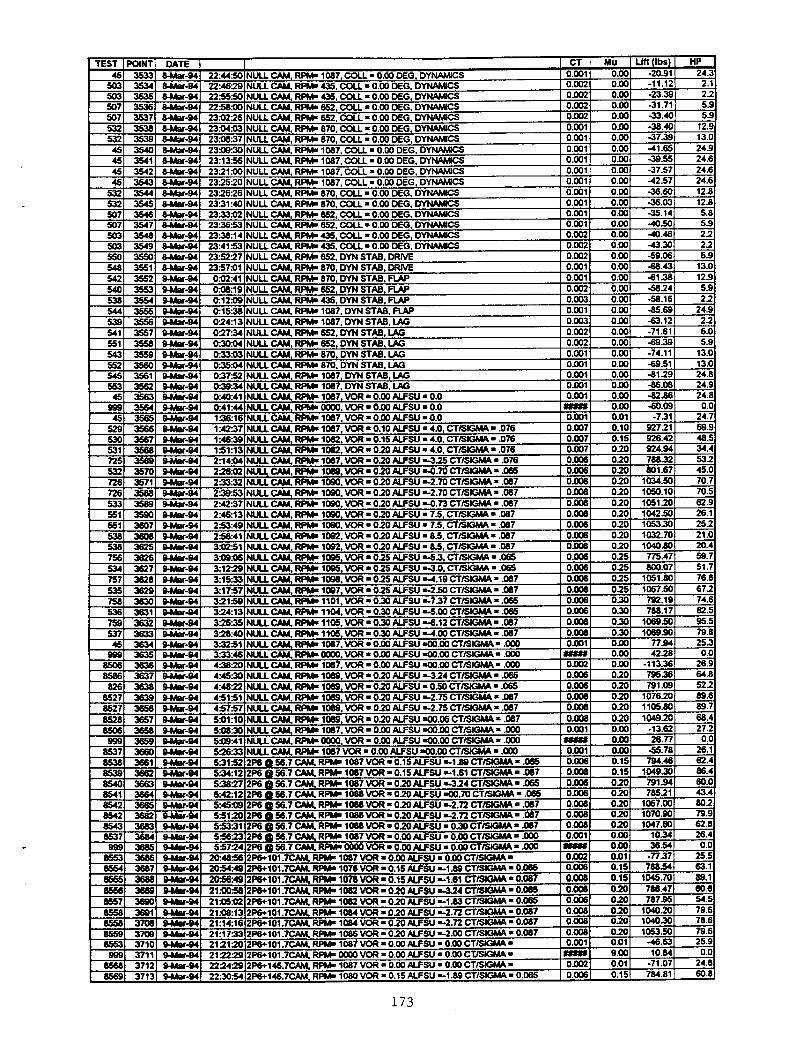
TEST46
5O35O3
507507
532532
46484648
532
532507_75O350355OS48
_2540538544539
65154355254555346
ggg48
52953O
725532726726533651551538538
750534757S35758536
759_746
9eg85068586
826
_276527852885O6
9998537
85386530
8540854185428542854385379ge
855385548555
85658557
mr_R
9ge8568855g
22:44.'5022:46:2922:55.'5022:58.'0023.'02:26
23.'O4.'0323.'08:3723.'(_:3023:13.'5623:21.'0023:25:2023'.26:2623:31:4023-33.'0223:36.'5323:38:1423:41:5323".52:27
23:57.'010.'02.'410.'08.'190:.12.'090:.15:380"24:130:27:34
O:.3O.'O40:33.'030:,35.'O40".37:520_39:340:40:410:41:441:36:161:42".371:46:3g1:51:132:14.1342_6.t_2:33:322"39:532:42:372:46:132:53:492:56:413.'O2:51
3:12:293:15:333:17:573:21_g3:24:13
3".26'.353".28:403".32:513:33:464".38".204:45".30
4:48"224:51::514:57.575:01:105.'08:305.t09:41
5:26:335".31.'525".34:125:38:275:42:125:48._5:51:205.'53".315:56:235:57:24
2O:48:5520:54.'4920:56.'4,1
21.'00:5821:05:0221.'08:1321:14:1621:17".3321:21".2021"_"_22:24:2922:30:54
NULL CAM RIM= 1087, COU.= 0.00 DEG, DYNAMICSiNULL CAM, RPM= 435. COIL = 0.00 DEG. DYNAMICSiNULL CAM, RPM= 435, COLL = 0.00 DEG, DYNAMICSNULL CAM, RPM,, 652, COIL" 0.00 DEG, DYNAMICSNULL CAM, RPM= 652, COiL = 0.00 DEG, DYNAMICSNULL CAM. RPM" 870, COLL = 0.50 DEG, DYNAMICSNULL CAM, RPM" 870, COLt. = 0.00 DEG, DYNAMICSNULL CAM. RPM= 1087, COLL = 0.00 DEG. DYNAMICS
NULL CAM, RPM= 1087, COIL = 0.50 DEG, DYNAMICSNULL CAM, RPM= 1087, COIL = 0.00 DEG. DYNAMICSNULL CAM, RPM= 1087, COLl. = 0.00 DEG, DYN/_ICSNULL CAM, RPM= 870, COLL = 0.00 DEG, DYNAMICSNULL CAM, RPM= 870, COLl. = 0.00 DEG, DYNAMICSNULL CAM, RPM= 652, COLL = 0.00 DEG. DYNAMICSNULL CAM, RPM= 652, COIL = 0.00 DEG. DYNAMICSNULL CAM, RPM= 435, COLL = 0.00 DEG, DYNAMICSNULL CAM, RPM= 435, COLL = 0.00 DEG, DYNAMICSNULL CAM, RPM- 652, DYN STAB, DRIVENULL CAM, RPM= 870, DYN STAB, DRIVENULL CAM, RPM= 870, DYN STAB. FLAPNULL CAM, RIM= 652, DYN STAB. FLAPNULL CAM, RIM= 435, DYN STAB, FLAPNULL CAM, RPM= 1087, OYN STAB, FLAP
NULL CAM, RPM= 1087, DYN STAB, LAGNULL CAM, RPM= 652, DYN STAB, LAGNULL CAM, RPM= 652, DYN STAB, LAGNULL CAM, RPM= 870, DYN STAB, LAGNULL CAM, RPM" 870. DYN STAB, LAGiNULL CAM. RPM= 1087. DYN STAB, LAGNULL CAM. RPM= 1087, DYN STAB. LAGNULL CAM, RPM= 1087, VOR - 0.00 ALFSU - 0.0NULL CAM, RPM- 0000. VOR - 0_0 ALFSU ,, 0.0NULL CAM, RPM,, 1087, VOR - 0.00 ALFSU -O.0
NULL _ RPM= 1087, VOR • 0.10 ALFSU • 4.0, CT/SIGMA - .075!NULL CAM, RPM- 1082, VOR - 0.15 AUFSU ,, 4.0. CT/SIC.JUlA- .076
!NULL CAM, RI=M= 1082, VOR • 0.20 ALFSU • 4.0, CT/SIGMA" .075iNULL CAM, RPM" 1087. VOR - 0.20 ALFSU =.3_5 CT/SIC-MA =' .076INULL _M. RPM= 108_, VOR" 020 NJ=SU =.0.70 c-r/S_ - .0_
NULL CAM. RPM= 1080, VOR - 020 ALFSU =-2.70 CT/SIGMA - .087NULL CNUl, RPM= 1090, VOR - 020 ALFSU =-2.70 CT/SIGMA - .087NULL CAM. RPM= 1090, VOR - 020 ALFSU _0.73 CT/SIGMA • .087
NULL CAM, RPM= 1000. VOR - 020 ALFSU - 7.5, CT/SIGMA = .087;NULL CAM, RPM= 10_0. VOR - 020 ALFSU = 7.5, CT/SIGMA - .087iNULL _ Rl:'_ 1082. VC_ - 020 ALFSU - 8:5, CT/S_GMA • .087
JNUU. CAM. RPM- 1092, VOR ,, 0.20 ALFSU ,, 8.5, CT/SIGMA = .087NULL CAM, RPt,e- 1085, VOR - 0.25 ALFSU ,,-5.3, CT/SIGIdA - .065NULL CAM, RPt,e- 1095, VOR ,, 02S ALFSU --3.0, CT/SIGidA ,, .065NULL CAM, RPM= 1098, VOR - 025 ALFSU =-4.19 CT/SIGMA - .087
NULL CAM, RPM= 1087, VOR = 0.25 ALFSU =-2.50 CT/SIGMA = .087NULL CAM, RPt_ 1101, VOR - 0.30 ALFSU =-7.37 CT/SIGMA - .06_NULL CAM. RPM= 1104, VOR • 0.30 ALFSU =.5.00 CT/SIGMA = .065
NULL CAM, RPM= 1105, VOR • 030 ALFSU =-6.12 c'r/SIGMA = .087klULLCNd, RPM- 1105, VOR - 030 ALFSU =-4.00 CT/SIC,MA = .087NULL CNd, RI=M= 1087. VOR ,=0.00 ALFSU ,_0.00 CT/SICJ_A - .000NULL CAM, RPM= 0000. VOR - 0.00 ALFSU =00.00 CT/SIGMA = .000
iNULL CAM. RIM= 1087, VOR = 0.00 ALFSU ,=(X).00CT/SlGMA = .000INULL _ RPM- 101_. VOR - 020 ALFSU =-324 CT/SIGMA - .085
INULL CAM, RPM- 10_, VOR - 020 ALFSU - 0.50 CT/S_3MA = .065!NULL CAM, RPM- 1089. VOR - 020 ALFSU =-2.75 CT/SIGMA = .087NULL CAM, RPM= 108_, VOR - 020 ALFSU =-2.75 CT/SIGMA - .087NULL CAM. RPM- 1089, VOR • 020 ALFSU =00.08 CT/SIGMA = .087
NULL CAM, RPM= 1087. VOR ,, 0.00 ALFSU =00.00 CT/SIGMA = .000NULL CAM. RPM= 0008, VOR - 0.00 ALFSU -00.00 CT/SIGMA = .000
NULL CAM, RPM= 1087 VOR - 0.00 ALFSU -00.00 CT/SIGMA - .000
2P6 O 56.7 CAM, RPM= 1087 VOR ,, 0.15 ALFSU =-1.8g CT/SIGMA = .06521=6Q 50.7 _ RPM_ 1087 VOR J 0.15 ALFSU =-1.61 CT/SIGMA ,, .08721=6_ 56.7 CAM, _ 1087 VOR ,, 0.20 ALFSU ,,-3.24 CT/SIGMA • .065
21=6_ 56.7 CAM. RPM• 1088 VOR ,, 0.20 ALFSU ,-00.70 CT/SIGMA ,, .06521:'60 56.7 CAM, RPM- 1088 VOR = 0.20 N.FSU =.2.72 CT/SIGMA = .087
21=6Q 56.7 C4_M,RPM= 1088 VOR ', 020 N.FSU =.2.72 CT/SIGMA = .08721=6_156.7 _ RPM" 1088 VOR - 020 ALFSU - 0,tl0 CT/S;GMA • .0872P6 Q 56.7 _ RPM= 1087 VOR - 0.00 ALFSU = 0.00 CT/SIGMA = .00021=6ql 65.7 C_M, RPM" 0000 VOR = 0.00 ALFSU" 0.00 CT/S;GMA" .0002P6+101 .TCAM, RPM= 1087 VOR • 0.00 ALFSU" 0.00 CT/SIGMA"21=6+101._ RPM= 1078 VOR "0.15 ALFSU =-1_) CT/SIGMA = 0_65
21=6+101.TCAM, RPM= 1078 VOR • 0.15 N.FSU "-1.61 CT/SIGMA • 0.0872P6+101.TCJ_, RPI_ 1062 VOR • 0.20 ALFSU =-324 CT/SIGMA - 0.06521=6+101.7CAM, RPM= 1062 VOR = 020 AUFSU =-1_3 CT/SIGMA" 0.00521=6+101.TCAM. RPM- 1084 VOR = 0_0 ALFSU =-2.72 CT_U_uu_" 0.0872P6+101.7CAM, RPM= 1084 VOR - 0_0 ALFSU =-2.72 CT___-_A- = 0.08721=6+101.7CAM, RPM= 1086 VOR = 0.20 ALFSU =-2.00 CT/SIGMA = 0.08721=6+101.TCJ_M,RPM= 1087 VOR = 0.00 ALFSU - 0.00 CT/S_-'_21=6+101.7CAM. RPM" 0000 VOR = 0.00 ALFSU • 0.00 CTJSIGMA =2P6+146.TCAM. RPM" 1087 VOR • 0.00 ALFSU • 0.00 CT/SIGMA -
2P6+146.7CAMt RPM= 1080 VOR - 0.15 ALFSU =-1.89 CTISIGMA • 0.065
173
CT
o.0010.0020.0020.002
0.0020.001o.oolo.oolo.oolo.oolo.001o.ool
o.oolo.oolo.001o.00_0.0020.002
0.0010.0010.0020.0030.0010.003
0.0020.0020.0010.0010.0010.0010.001
0.0010.0070.0070.0070.0060.0060.0080.0080.0080.0080.006
0.0080.0080.0060.0060.0080.0080.008
0.0060.0080.0080.001
0.002
0.0060.0060.0080.OO80.0080.001
0.001
0.0060.008
0.0060.0060.0080.0080.0080.001
m0.0020.0060,008
0.0080.0060.0080.0080.0080.001
0.0020.006
0.0(:0.0¢0.0¢0.0(]0.0_0._
0.000.000.0_0.000.0010.0010.0010.0010.O010.0010_010.001
0.0010.0810.0010.0010.00t0.001
0.0010.001
0.0010.000.0010.0_0.000.0C0.010.101 !0.15102010.2010201 I0201 1l
0201 1(0201 1(0201 1(0201 1(o201 1(
02510251 I0251 110251 1(o.3olo3010_3o] 1(
0.301 1(0.0_0.0_
02010201
0.201 1l0.201 1'0.201 110.0(:O.0C0.0¢0.151 :0.151 1102010291020l 1(0.201 1(0201 1(0.000.000.011 ,0.151 ;
0.2010.201
0201 1(0201 1(0.201 1(O.OlI
9.000.Ol I0.151
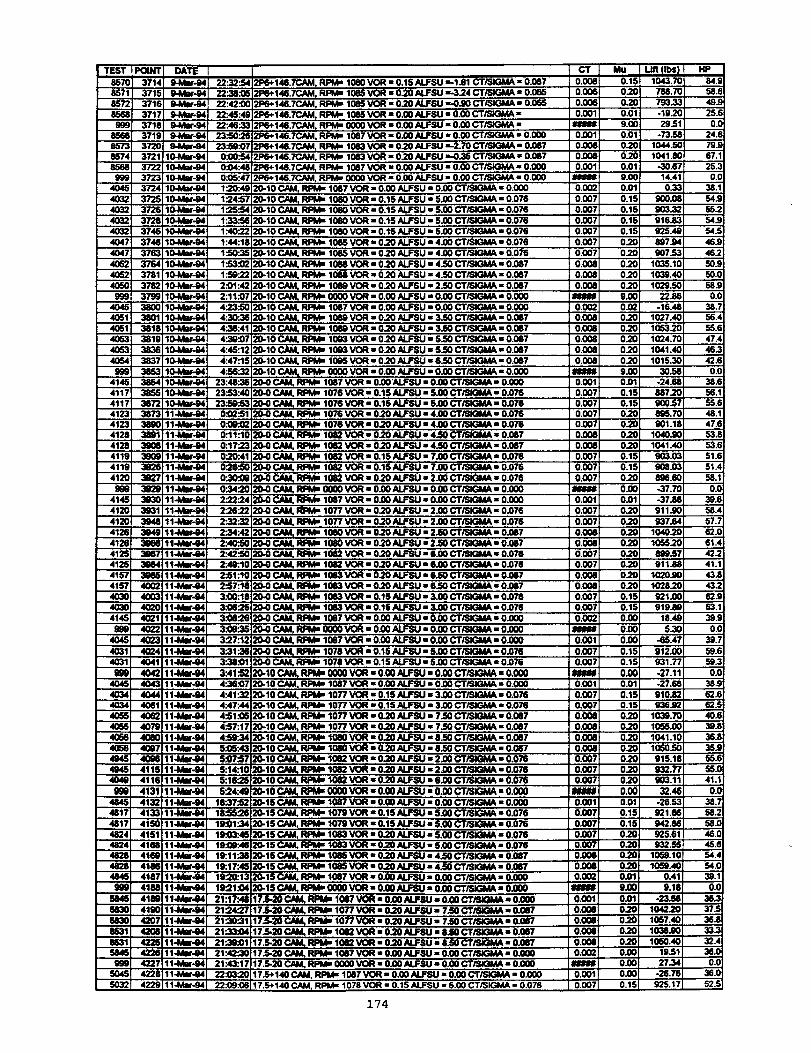
l
4
i
i
d
d
d
d
4
d
4
d
!
!
RPMm 1080 VOR - 0.15 ALFSU _.1.51CT/SIGMA = 0.087
RPM" 1085 VOR ,, 0.20 ALFSU =-324 CT/SIGMA - 0.065
RPM_ 1085 VOR - 020 ALFSU ,,4).90 CT/SIGMA - 0.065
2PG+146.7CAM, RPMn 1685 VOR • 0.00 ALFSU - 0.00 CT/SIGMA -
2P6+146.7CAM, RPM" 0OO0 VOR -, 0.00 ALFSU " 0.00 CT/SSGMA ,,RPM" 1087 VOR - 0_0 ALFSU" 0.00 CT/SIGMA" 0.OO0
RIM" 1083 VOR" 020 ALFSU --2.70 CT/SIGMA" 0_87
RPMm 1083 VOR" 0.20 ALFSU "-0.35 CT/SIGMA 'J 0.087
2P6+146.7CNd, RPMm 1087 VOR s 0.00 ALFSU • 0.00 CT/SIGMA ,, 0.000
2P6+146.7CAM, RPM- 0000 VOR ,, 0.00 ALFSU" 0.00 CT/S_3MA g O.OOO
RPM" 1087 VOR _' 0.00 ALFSU = 0.00 CT/SIGMA = 0.0OO
RPM" 1080 VOR" 0.16 ALFSU • 5.00 CT/SIGMA - 0.076
RPM_ 1080 VOR "0.15 ALFSU - 5.00 CT_.aMA" 0.076
RPMs 1080 VOR - 0.16 ALFSU - 5.00 CT/SIGMA - 0.076
RPMR 1080 VOR • 0.15 ALFSU ,, 5.00 CT/SIGMA - 0.076
RPM- 1065 VOR I" 0.20 ALFSU • 4.00 CT/SIGMA ,, 0.076
RPMw 1085 VOR - 0.20 ALFSU - 4.00 CT/SIGMA - 0.076
RPMs 1088 VOR - 0.20 ALFSU - 4.50 CT/SIGMA • 0.087
RPM- 1088 VOR ,, 0.20 ALFSU - 4.50 CTJSIGMA = 0.087
CAM. _ 108g VOR - 020 ALFSU - 2.50 CTJSIGMA - 0.087
RPM- 5000 VOR - 0.00 N.FSU - 0.00 CT/SIGMA • 0.000
.RPM• 1087 VOR - 0.00 ALFSU - 0.00 CTISIGI_ = 0.OO0
CaM, RPM_ 108g VOR ,, 0.20 ALFSU • 3.$0 CTr31GMA - 0.087
RPM_ 10_) VOR n 0.20 ALFSU • 3.50 CT,_IGA4A " 0.087
RPM_ 1093 VOR" 0.20 ALFSU s 5.50 CT/SIGACA = 0.087
RPM" 10g_ VOR • 0.20 ALFSU • S.S0 CT/SIGIA_ • 0.087
RPMs 108G VOR" 0_0 ALFSU " 6.50 CT/SIGMA" 0.087
C._¢, RPM" 0000 VOR • 0.00 ALFSU "0.00 CT/SIGMA" 0.000
RPMu 1087 VOR a, 0.00'ALFSU ,, 0.00 CT/SIGMA - 0.000
RPM" 1076 VOR" 0.16 ALFSU " 6.00 CT/SIGMA" 0.076RPMm 1076 VOR m 0.15 ALFSu m 5.00 CT/_GMA - 0.076
CAM, RPMm 1076 VOR • 0.20 ALFSU • 4.00 CT/SIGMA" 0.076RPM" 1002 VOR" 0.20 ALFSU " 4.50 CT/SIGMA" 0_87
RPMu 1062 VOR" 0_0 ALFSU • 4.50 CT/_SIGMA" 0.087
RPM" 1082 VOR" 0.15 ALFSU " 7.00 CT/SIGMA" 0.076
RPM" 1062 VOR - 0.15 ALFSU" 7.50 CT/SK3MA - 0.076
CAM, RPMm 1082 VOR ,, 0.26 N.FSU • 2.00 CT/SIGMA - 0.076
CN_. RR_ 0000 VOR • 0_0 ALFSU • 0.00 CT_-_GMA - 0.000
RPM,, 1087 VOR • 0.00 ALFSU • 0.00 CT/SIGMA - 0.000
20-0 C.M_ RPM- 1077 VOR - 0.20 ALFSU • 2.00 CT_IGMA ,, 0.076RPMm 1080 VOR ,, 020 ALFSU ,, 2.50 CT/SJGMA ,_ 0.087
RPM" 1000 VOR • 0.20 ALIFSU ,, 2.50 CT/S_MA a 0.Q67
20-0 CAM. RPM_ 1082 VOR - 0.20 AUFSU - 5.00 CT/SIGMA m 0.076RPM_ 1002 VOR" 0.20 N.FSU" 6.00 CT/$1GM_ * 0.075
20.0 CAM, RPM," 1083 VOR - 0.20 ALFSU - 6.50 CT/_GMA ,, 0.087
RPM_ 10e3 VOR" 0.20 ALFSU - 6.50 CT/SIGMA" 0.087
RPM_ 10G3 VOR" 0.16 ALFSU s 3.00 CT/SIG_A_ s 0.076
20-0 CAM, RPM_ 1083 VOR " 0.15 N.FSU "3.00 CT/SIGMA" 0.076
RPM" 1087 VOR - 0_0 ALFSU - 0_0 CT/SIGMA • 0.000
20-0 CAM, RPM" 0000 VOR" 0_0 N.FSU - 0_0 CT/SlGMA - 0.000
20-0 CAM, RPM" 1087 VOR - 0.00 ALFSU - 0_0 CT_M_ - 0.930
20-0 CAM, RPM" 1078 VOR "0.15 ALFSU • S_0 CT/S_MA" 0.076
20-0 CAM, RPM_ 1078 VOR" 0.15 ALFSU - 5.00 CT/S_MA • 0.076
20-10_ RPM- 0000VOR - 0.00 ALFSU- 0_0 CT/SGMA• 0.00020-10 CAM. R.qM" 1087 VOR - 0.00 ALFSU - 0.00 CT/SK3MA ,, 0.000
20-10 CAM, RPM_ 1077 VOR - 0.15 ALFSU - 3.00 CT/SIGMA - 0.076
20-10 CAM, RPM_ 1077 VOR - 0.15 ALIFSU _, 3.00 CT/S_3MA" 0.076
20-10 CAM, RiM" 1077 VOR" 0.20 ALFSU - 7.50 CT/SIGMA • 0.087
29-10 CAM. RPMm 1077 VOR • 0.20 ALIFSU • 7.50 CT/S_MA - 0.087
20-10 CAM. RPM" 1060 VOR • 0.20 ALFSU • 8.$0 CT/S_dA - 0.087
RIM- 1080 VOR - 0.20 ALFSU - 8.50 CT/SIGMA s 0.087
RPM- 1002 VOR - 0_0 N.FSU - 2_0 CT/SIGMA - 0.076
RPM- 1082 VOR • 020 ALFSU - 2_0 CT/SiGMA • 0_76
RPM,,0000VOR,, 0.00N.FSU -, 0.00GT/SlG_ ,, 0.000RPM_ 1087 VOR "0.00 ALFSU • 0.00 CT/StGMA • 0.000
20-15 CAM, RPM _ 1079 VOR - 0.15 _ - 5.00 CT/SIGMA • 0.076
20-15 CAM. RPM" 1079 VOR • 0.15 ALFSU - 6.00 CT/SIGMA =,0.076
20-16 CAM, RPM" 1093 VOR "0.20 N.FSU I S.00 CT/SIGMA - 0.076
20-15 CAM, RPM_ 1063 VOR "020 _ - 5.00 CT/SIGMA - 0.076
20-15 CAM, RPM_ 108_ VOR "0_0 _ - 4.50 CT/Sk3MA - 0_7
RPM" 1_5 VOR "020 N.FSU - 4_0 CT/SIGMA - 0.087
20-15 C,e_, RPM_ 1087 V_R" 0_0 ALFSU • 0_0 CT/SIGMA • 0.000
RPM" 0000 VOR - 0_0 N.FSU - 0_0 CT/$1GMA - 0_00
17.6-20 CAM, RP_ 1067 VOR n 0.00 N.FSU ,, 0.00 CT/SIGMA - 0.000
17.5-20 C,e_A, RPM_ 1077 VOR - 0.20 _ • 7.50 CT/_IGMA ,, 0.087
RPM= 1082 VOR _, 0.20 N.FSU ,. 8.50 CT/SK-'&M, u 0.087
17.S-20 CNd. RPM= 1082 VOR - 0.20.4LF8U - 8.50 CT/SIGMA • 0.087
17.5-20 C.4UA. RIM" 1087 VOR - 0.00 ALFSU - 0.00 CT_MA - 0.0Q0
_-26 C,_M, RPM- OO00 VOR - 0_0 ALFSU • 0_0 CT0_GMA - 0.008
17_.140 CAM. RPM_ 1087 VOR - 0.00 kLFSU ,, 0.00 _I'/S_MA ,, 0.000
17.5+140 CAM t RPM,, 1078 VOR - 0.15 ALFSU - 5.00 CT/SIGMA - 0.076
1"/4
r i Mu I Lm
0.15t 1043.7(:
020201 788.7¢
020201 793.33
0.011 -19_'_
9.00 26.510.011 -73_
020201 1044.5C
020201 1041.8(:
0.011 -30.67
9.00 14.41
0.01 0.33
0.151 g00.68
0.151 OO3.32
0.151 916.83
0.151 g25.4g
020201 897.64
020201 507.53
0.201 1035.10
0.201 1039.40
0.201 1029.50
9.00 22.86
0.021 -16.48
020201 1027.40
020201 I053.20
020201 1024.70
0.201 1041.40
0.261 1015.30
9.00 30.680.01 i -24.68
0.151 8872O
0.15t 9OO.67
020201 805.70
020201 901.18
0201 1040,.90
0.201 1041.40
0.15i 903.03
0.151 508.03
0201 8gG.60
0.00l -37.70
0.011 -37.M
020201 911.90
0201 937.64
0.201 1040.20
0201 1055.20
0201 899.57
0.201 911.88
0201 1020.00
0.201 1O2820
0.151 921.OO
0.15i 919.68
0.00 18.49
0.00 5.30
0.001 -65.47
0.ISI 912.00
0.151 931.77
0.001 -27.11
0.011 -27.68
0.151 910.82
0.15i g36J)2
0201 193g.70
0.201 1055.00
0.201 1041.10
0.201 1050.50
0.201 915.18
0.201 932.?'7
0.201 _03.11
0.00 32.460.011 -26.53
0.151 921.66
0.151 942.86
0.201 925.610.2OI 932.55
0201 1059.10
0.201 105_.40
0.01 0.41
9.00 9.16
0.011 -23._
0.201 1042.20
0.20l 1057.40
0.201 10M.00
0.2OI 1050.40
0.00 19.51
0.50 27.34
0.001 -26.76
0.151 925.17
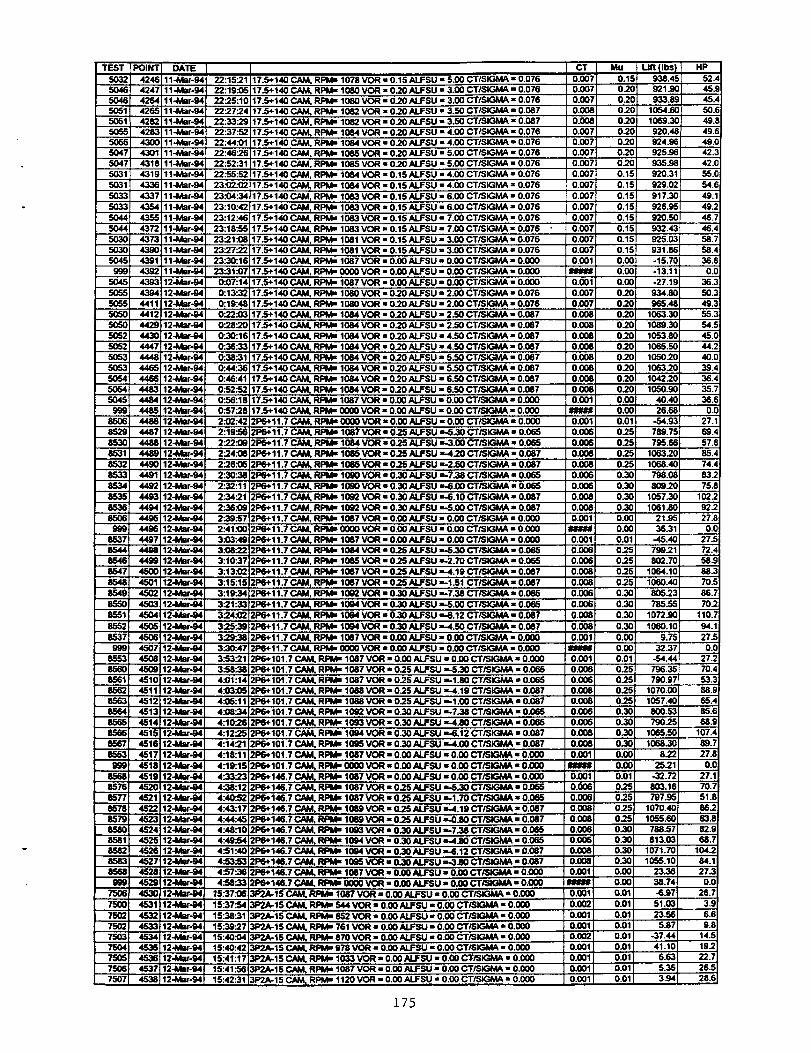
!TEST5032
5046504650515051505550_50475O47503150315O335O33
5O445O445O3O503O5045_9
504550555O555O5O505O
505250525053505350545O545046999
85068529853O8531853285338534
8535853685O6999
85378544
854685478548854985508551
85528537909
85_3856O8561856285638564856585668567
85539_
85688576857785788579858O858185828583
8568Sm
750675O075O2
75O276637504750575067507
ccC
CC
CcCCcC¢C22222
22
22223333333
33333344
4
151615
15
16
17.5+140 CAM. RPMR 1078 VOR - 0.15 ALFSU = 5.00 CT/SIGMA = 0.07617_._+140CAM, RPM= 1080 VOR • 0.20 ALFSU = 3.00 CT/SIGMA - 0.07617.5+140 CAM, RPM- 1080 VOR - 0_0 ALFSU - 3.00 CT/SIGMA - 0.07617.5+140 CAM, RPMu 1082 VOR • 0.20 ALFSU ,, 3.50 CT/SIGMA = 0.08717.5+140 CAM, RPM= 1082 VOR - 0_0 ALFSU - 3_0 CTJSIGMA - 0.08717.5+140 CAM, RPIdu 1084 VOR - 0-20 ALFSU - 4.00 CT/SIGMA - 0.07617.5+140 CAM, RPMu 1084 VOR - 020 ALFSU - 4.00 CT/SIGMA - 0.07617.5+140 CAM, RPM- 1085 VOR - 0.20 ALFSU - 5.00 CT/SIGMA = 0.07617.5+140 CAM, RPM- 1085 VOR • 0.20 ALFSU - 5.00 CT/SIGMA = 0.07617.5+140 CAM, RPMu 1084 VOR - 0.15 ALFSU - 4.00 CT/$1GMA - 0.07617.5+140 CAM, RPMu 1084 VOR - 0.15 ALFSU - 4.00 CT/SIGMA = 0.07617.5+140 CAM, RPMu 1083 VOR • 0.15 ALFSU - 6.00 CT/SIGMA • 0.07617.5+140 CAM, RPMm 1083 VOR = 0.15 ALFSU - 6.00 CT/SIGMA = 0.076
17.5+140 CAM, RPM- 1083 VOR - 0.15 ALFSU - 7.00 CT/SIGMA - 0.07617.5+140 CAM, RPM- 1083 VOR = 0.15 ALFSU = 7.00 CT/SIC:-MA = 0.076 •
RIM- 1081 VOR - 0.15 ALFSU - 3.00 CT/SIGMA • 0.076RPMu 1081 VOR • 0.15 ALFSU - 3.00 CT/SIGMA • 0.076
17.5+140 CAM, Rl=lq_ 1087 VOR - 0.00 ALFSU - 0.00 CT/SIGMA = 0.000
17.5+140 CAM, RPM_ 0000 VOR - 0.00 ALFSU - 0.00 CT/SiGMA - 0.00017.5+140 CAM, RIM- 1087 VOR - 0.00 ALFSU = 0.00 CT/SIGMA - 0.000
:17.5+140 CAM, RPM- 1080 VOR - 0_0 ALFSU - 2.00 CT/SIGMA - 0.076RPM- 1080 VOR • 0.20 ALFSU" 2.00 CT/Sk3MA = 0.076RIM= 1084 VOR • 0.20 ALFSU" 2.50 CT/'SIGMA - 0.087
17.5+140 CAM. RPM" 1084 VOR - 0.20 ALFSU ,' 2.50 CT/SIGMA • 0.087RPMu 1084 VOR • 0_0 ALFSU = 4.50 CT/SIGMA = 0.087RIM= 1084 VOR = 0_0 ALFSU = 4.50 CT/SIGMA = 0.087RPMu 1084 VOR • 0_0 ALFSU" 5.50 CT/SIGMA - 0.007RPM" 1084 VOR - 0_0 ALFSU - 5.50 CT/SiGMA - 0.007
17.5+140 CAM, RPM" 1084 VOR • 0-20 ALFSU = 6.50 CT/SIGMA - 0.08717,5+140 CAM, RPM" 1084 VOR = 0-20 ALFSU = 6.50 CT/SiC-MA - 0.087
1087 VOR - 0.00 ALFSU "0.00 CT/SIGMA ', 0.00017_+140 C_M, RPMm 0000 VOR - 0.00 ALFSU - 0.00 CT/SIGMA - 0.0002P5+11.7 C_M, RPMu 00(30VOR • 0.00 ALFSU - 0.00 CT/SIGMA • 0.0(30
21=6+11.7 CAM, RPMm 1007 VOR = 025 ALFSU "-5.30 CT/SIGMA - 0.06521=6+11.7 CAM, RPM" 1084 VOR" 025 ALFSU "-3.00 CT/SIGMA - 0.06521=6+11.7 C_M, RPM= 1085 VOR = 025 ALFSU =-420 CT/SIGMA = 0.00721=6+11.7 CAM, RPMR 1065 VOR = 025 ALFSU =-2.50 CT/SIGMA" 0.00721=6+11.7 CAM, RPM_ 1000 VOR - 020 ALFSU =-7.38 CT/SIGMA - 0.065
RPM" 1000 VOR - 0.30 ALFSU "-6.00 CT/SIGMA - 0.005RPMs 1092 VOR - 0.30 ALFSU =-6.10 CT/SIGMA - 0.007RPM_ 1092 VOR • 0.30 ALFSU --5.00 CT/SiGMA • 0.007RIM= 1087 VOR • 0.00 ALFSU =' 0.00 CT/SIGMA = 0.000RIM= 0000 VOR • 0.00 ALFSU - 0.00 CT,'SIGMA " 0.000RiM= 1087 VOR • 0.00 ALFSU" 0.00 CT/SIGMA" 0.000RPM- 1084 VOR • 0.25 ALFSU --5.30 CT/SiC4dA • 0.065RPM" 1085 VOR - 0-25 ALFSU ,,-2.70 CT/SIGMA - 0.005RIM= 1007 VOR - 0-25 ALFSU =-4.19 CT/SIGMA • 0.007RIM= 1007 VOR - 0.25 ALFSU "-1_,1 CT/SIGMA" 0.087RPM" 1092 VOR - 0.30 ALFSU ,,.7.38 CT/SIGMA - 0.065RPt_ 1094 VOR - 0.30 ALFSU "-5.00 CT/SIGMA = 0.065
RPM_ 1004 VOR = 0.30 ALFSU "-6.12 CT/SIGMA - 0.007RPM" 1004 VOR - 0.30 ALFSU --4.50 CT/SIGMA - 0.007
2P5+11.7 CAM, RJ=M" 1007 VOR" 0.00 ALFSU" 0.00 CT;Sk3MA - 0.0002P6+11.7 CJ_Io RPM- 0000 VOR - 0.00 ALFSU - 0.00 CT/Sk3MA - 0.0002P6+101.7 CAM, RPM" 1007 VOR - 0.00 ALFSU - 0.00 CT;SIGMA • 0.00021=6+101.7 CAM, RPM_ 1007 VOR • 0-25 ALFSU ',,6_30 CT/SIGMA - 0.0652P5+101.7 CAM, RPMu 1087 VOR - 0-25 ALFSU --1.80 CT/SIGMA - 0.0652P5+101.7 CAM, RPM_ 1088 VOR 8 0-25 ALFSU "-4.19 CT/SIGMA 8 0.0872P6+101.7 CAM, RPM" 1088 VOR = 025 ALFSU =-1.00 CT/SIGMA u 0.08721=6+101.7 CAM, RPM" 10Q2 VOR n 0.30 ALFSU "-7.38 CT/SIGMA = 0.065
RPM_ 1093 VOR = 0.30 ALFSU "-4.80 CT/SIGMA = 0.0052P6+101.7 CAM, RPM_ 1094 VOR • 0.30 ALFSU "-6.12 CT/SIGMA = 0.00721=6+101.7 CAM, RPM_ 1005 VOR = 0.30 ALFSU =-4.00 CT/SIGMA • 0.0072P6+101.7 CAM, RPM" 1007 VOR - 0.00 ALFSU • 0.00 CT/SIGMA • 0.00021=6+101.7 CAM, RiM= 0000 VOR • 0.00 ALFSU • 0.00 CT/Sk_*IA • 0.000
21=6+146.7 CAM, RPM" 1007 VOR • 0.00 ALFSU" 0.00 CT/SIGMA - 0.0002P6+146.7 CAM RPMu 1007 VOR - 025 ALFSU "-5.30 CT/SIGMA" 0.0652P_146.7 CAM _ 1007 VOR • 025 ALFSU =-1.70 CT;SIGMA • 0.005
21=6+146.7 CAM, RPM= 1089 VOR - 025 ALFSU --4.19 CT/SIGMA - 0.00721o6+146.7CAM, _ 100_ VOR = 025 ALFSU _0_0 CT/SIGMA = 0.0072P6÷146.7 CAM, RPM_ 10_3 VOR • 0.30 ALFSU _-7_38 CT/SIGMA = 0.0652P6+146.7 C._M, RPM_ 1094 VOR - 0.30 ALFSI.21=6+146.7 CAM, RPM- 1094 VOR - 0.30 ALFSU --6.12 CT/SIGMA - 0.0072P5+146.7 CAM, RPM- 10_5 VOR - 0.30 ALFSU ,,-3_0 CT/SIGMA - 0.0072Ja6+146.7 C4qM,RPM_ 1087 VOR • 0.00 ALFSU - 0.00 CT/SIGIdA - 0.0002P6_1M.7 CAM, _ 0000 VOR - 0.00 ALFSU • 0.00 CT/SIGMA • 0.000
RPMu 1007 VOR • 0.00 ALFSU • 0.00 CT/SlGk_ - 0.0003P2A-15 CAM. RPM" 544 VOR • 0.00 ALFSU - 0.00 CT/SIGMA" 0.0003P2A-15 CAM. RPM,, 652 VOR = 0.00 ALFSU - 0.00 CT/SIGMA - 0.0003P2A-15 CN_, RPM_ 761 VOR - 0.00 ALFSU - 0.00 CT/Sk3MA - 0.000
3P2A-15 C4NM_RPM_ 870 VOR - 0.00 ALFSU - 0.00 CT/SIGMA - O.0(X)3P2A-16 CAM, RPM_ 978 VOR - 0.00 ALFSU - 0.00 CT/SIGMA - 0.0003P2A-15 CAM, RPM_ 1033 VOR - 0.00 AI.FSU - 0.00 CTfSIGMA - 0.0003P2A-15 CAM, RPM_ 1087 VOR - 0.00 ALFSU - 0.00 CT/SIGMA - 0.000
3P2A-15 CAMr RPM_ 1120 VOR - 0.00 ALFSU - 0.00 CT/SIGMA - 0.000
175
I MU tUft).15t 938.4,4)201 921.9()-201 933.8_3.201 1054.6()-201 1069.3).201 920.4_).201 924.g()20 1 925 .9()20 1 935.gi).151 920.31).151 929._).151 917.3().151 926.9_
).151 920.5().151 932.4_).151 925.0_).151 931.8().00t -15.7C).OOl -13.11).001 -27.16)201 934.8£)201 965.4_)201 1063.3()201 1089.3(
)201 1053.8_).201 1065.5¢)201 1050.2C
)201 1003.2_).201 1042-2C)201 1050.9(:).OC 40,4C).OC 26._).011 -$4._)-251 789.7,').251 795.6_)251 1003_C)-251 1000.4_).301 798.0_).301 809.2£
).301 1057.3().301 1061.8(:|.00 21.9_).00 36.31L011 -45.4_1.251 799.21
1-251 802.7C1-251 1064.1(:1-251 1000._1.301 805-2_1.301 765._1.301 1072.9(;
L301 1060.1CL00 9.7_L00 32.371.011 -54.44125l 796.351.251 790.971-251 1070.001.251 1007.401.30i 800.53_.301 790_5_301 1065.50L30i 1008.30).(30 822L001 25-21
I11 0.011 ..32.721251 803.16
-25l 1070.40
13.03
11 0.001 23.36II 0.001 38.74I q 0.01 -6.97
._1.0311 0.011 23.5611 0.01 5.87
11 0.011 41.1011 0.01 6.6311 0.01 5.3511 0.01 3.94
1
1
I!I(
1(I

3P2A-1S CAM, RPM_ 1067 VOR" 0.90 ALFSU - 0.00 CT/SIGMA s 0.OO03P2A-15 CAM, RPMs 1087 C:(XL- 1.0
3P2A-1S GM4_ _ 1087 COLL - 2.9 DEG3P2A-15 CAM. RPMm 1087 COLL - 3.9 DEG3P2A-15 CAM, RPMm 1087 COLL - 4.0 DEG
3P2A-15 CAM, RPMm 1087 COLl." 5.00EG3P2A-15 CAM, RPMs 1007 COLl. - 6.9 DEG
3P2A-15 CAM, RPMs 1067 COLL - 7.0 DEG3P2A-15 CAM, RPIvI_ 1067 COLL" 8.9 DEG3P2A-15 CAM, RPM_ 0000 COLL - 0.9 DEG
RPMm 1007 COLL- 0.0 DEGRPM_ 1033 COLL" 0.0 DEGRPMs 978 CCILL= 0.9 DEGRPM" 070 COLl. ', 0.0 DEG
5P4A-9 CAM, RPM" 761COLL - 0.0 DEGSP4A_ CAM, RPM" 002 COLL - 0.9 DEG
g CAM, RPM_ 1067 _" 0.9 DEGRPMB 1087 COLL u 1.9 DEGRPM- 1007 COLL" 2.00EG
5P4A-9 CAM, RPM" 1087 COIL - 3.0 DEG5P4A-9 CAM, RPMm 1087 COIL- 4.90EG
RPM_ 1087 COIL - S.00EGRPM- 1087 COIL - 6.0 DEGRPMm 1087 COLl. • 7.0 DEGRPMs 1007 COLL = 8.90EGRPM" 1067 COLL - 0.9 DEGRPMm 1120 COLL" 0.0 DEGRPM- 1007 COLL 8 0.0 OEG
1087 COLL - 2.9 DEG
RJlq_ 1067 COLL • 2.0 DEG, LAT - 2.0 I_(_, RPM_ 1047 COLL" 2.0 DEG, LONG - 2.00EG
_ 1072 VOR_.I0 ALFSU"-0_I2RPMm 107S VORsO.16 ALFSUmlJI8RPMn 1077 VOR'020 ALFSU'-0.70
CAM, _ 1077 VORm0.20 ALFSU_0.?0 CT___._..-M__-O..087
5P4A+27,R CAM, RPM" 1098 VORe025 ALFSUm-3J00CT_'.a_J4,O.0655P4A+27J CAM, RPM_ 1_9 VOR_O_S AUFSU_2_O CT/__k_4A_0.087
5P4A+27S CAM, RpMe 1103 VOR_030 ALFSULS.00 CT __C_.._-_An0.0055P4A÷27.S CAM, RPM_ 1102 VOR'<)_O ALFSU"-4.00 CT/_IGMA'O.087
RPM" 1087 _.00 ALFSU_ 0.00 CT/S_.000
176
Lift (Ib,,13._80.,'
166.(261.E
357.|484.(
$842732."851.E50.ElO.e6._
IO_6.38.7
1o.1
111.4173.1
370.1483.5602.7716.0
974.9____
46.1193.5208J_206.639.&
793.1785_801.7,
1001_1
1055.31051.7t
799.9_1072.9(800.7_
1068._18.3'7.6(
7.T,797.7;,
1080.1(OOlJ_
1059.8(797J,
1058.4(1071.7(
787.5(1059.1(700.3_
1003_66JH
34.6_36.9_
OO0._1086.7(
S08.0S1057.5(
792._10732(
784._1007,5(
1004._7g_S39.7142.7!
786.4_
1041.5(:776.29
I_TJK)
784.221040.20
78S.071044.00
35.12
I HP
28
OO
0
19.13.g.
6.262g
67.:81.,
116.:
27.1
_.__.(OO__.(
7671._91 .(27.C
0.(27.C
100.__.?_.1_._67.4
_.171.'67_1___
27._Gt
_._
loo_57_
47.__.;
_.7_.8
_.1_.40.0
_n_.7_9
_J_3
_5
_.A_.1673
27.8
Form Approved
REPORT DOCUMENTATION PAGE OMB NO. 0704-0188
Public report,n1 burden for _hrs ¢o,lection of ,nforma_ion .. est,mated to average 1 hour per response, ind.uaing the time for rev_q_,n.g i nstruct,ons_ search,ng exi_n_g _,c.tSOofrC_r.gather,ng a r_. maintaining the data needed! and coml_etmg a_ ,ev,ew, ng the collect,on Of ,n.formatlor_..Jeno comments rec_aro, .ng tins ouraefl__es_t!ma_teor any2_ner " _.a_, o_T_n_£ollectlOn of in/of'matlo¢1, including sugg_stlor_ for re4uclng th,s burden, to Washington He_lquarters "Jef_ic_. utrectorate to, InTormatlon__u_oerazlons anu ____la_ _., •, a ac, ,o _,
Davis Highway. Suite 1204. Arlington. VA 22202-4302. and to the Office of Management and Budge. Paperwork ReducUon Pro ect (0704-01 _). Wasnmc_on. L_. ZU_U.I.
1. AGENCY USE ONLY (Leave blank) 2. REPORT DATE 3. REPORT TYPE AND DATES COVERED
July 1995 .Contr__eXor Repor-ti
4. TITLE AND SUBTITLE S. FUNDING NUMBERS
Blade Mounted Flap Control For BVI Noise Reduction C NASI--19060
Proof-of-Concept Test TA 8
6. AUTHORS)
Seth Dawson, Ahmed Hassan, Friedrich Straub and
Hormoz Tadghighi
7. PE_ORMING ORGANIZATION NAME(S) AND ADDRESS(ES)
McDonnell Douglas Aerospace
McDonne_l Douglas Helicopter Systems
5000 E. McDowell Rd.
Mesa, AZ 85215
9. SPONSORING/MONITORING AGENCYNAME(S) AND ADDRESS(ES)
National Aeronauctics and Space Administration
Langley Research Center
Hampton, VA 23681-0001
WIT 505-63-36-03
8. PERFORMING ORGANIZATIONREPORT NUMBER
L6BCK-FR-94001
10. SPONSORING / MONITORINGAGENCY REPORT NUMBER
NASA CR-195078
11. SUPPLEMENTARY NOTES
Langley Technical Monitor:
Final Report - Task 8
Michael A. Marcolini
12a. DISTRIBUTION/AVAILABILITY STATEMENT
Unclassified - Unlimited
Subject Category 71
12b. DISTRIBUTION CODE
13. ABSTRACT (Maximum 200 words)
This report describes a wind tunnel test of the McDonnell Douglas Helicopter
Systems (MDHS) Active Flap Model Rotor at the NASA Langley 14- by 22-Foot
Subsonic Tunnel. The test demonstrated that BVI noise reductions and
vibration reductions were possible with the use of an active flap.
Aerodynamic results supported the acoustic data trends, showing a reduction in
the strength of the tip vortex with the deflection of the flap. Acoustic
results showed that the flap deployment, depending on the peak deflection
angle and azimuthal shift in its deployment schedule, can produce BVI noise
reductions as much as 6 dB on the advancing and retreating sides. The noise
reduction was accompanied by an increase in low frequency harmonic noise and
high frequency broadband noise. A brief assessment of the effect of the flap
on vibration showed that significant reductions were possible. The greatest
vibration reductions (as much as 76%)were found in the four per rev pitching
moment at the hub. Performance improvement cam results were inconclusive, as
the improvements were predicted to be smaller than the resolution of the rotor
balance.
14. SUBJECT TERMS
Active Flap Rotor, Blade-Vortex Interaction, Active Controls,
Rotor Noise
17. SECURITY CLASSIFICATION 18. SECURITY CLASSIFICATIONOF REPORT OF THIS PAGE
Unclassified Unclassified
NSN 7540_ 1-280-5500
19. SECURITY CLASSIFICATIONOF ABSTRACT
15. NUMBER OF PAGES
19316. PRICE CODE
A09
20. LIMITATION OF ABSTRACT
Standard Form 298 (Rev 2-89)Prescribed by ANSI Std Z39-18298-102

1087 V(_.O0 ALFSU- 0.00 CT _t_._-".__.-0.650
. RPI_ 1090 VOR:O.10 ALFSU_0_2 CT/S1_._;;.-0.065
END OF TEST PROGRAM
Mu
O.C0.(]0.10.10.20.20.30.0
0.00.00.1_0.1_0_0.2_O_
0.0(0.0¢[email protected]'0._0.0"0.0_0.0_0.0_0.0_0.0_0._
0.0_0.01
0-01o.1_;
0.150.150.15
0.150.150.200.2O0.2O
O.20O.2OO.20000
000
000
HP
C256_58465467260
2667564652,65.27,
0.21.23.27.31.38.47.58.
6g83_
100._121.21_0.1
21.134.:'33.13g.I3_._
46?44;
31._30.(38.(37.._43.(42.S22._
O.C21.E34.c34.(:23.(:
22.525.524.123.0
o.0
177