Optimal Design of Reinforced Concrete Cantilever Retaining ...

Behavior of cantilever and counterfort retainingwalls subjected to lateral earth pressure
K. Senthil*, M. A. Iqbal and Amit Kumar
Three-dimensional (3D) finite element simulations have been performed in order to study the
response of cantilever and counterfort retaining walls subjected to lateral earth pressure using
ABAQUS/Standard. Four retaining walls with different geometrical configurations were analyzed
including three cantilever and one counterfort wall. The results thus obtained were compared, and
the mechanics involved in the behavior of the retaining wall was discussed. The lateral displacement,
vertical settlement, and stresses developed in each component of the retaining wall were studied and
compared with the other walls. The choice of the retaining wall based on the economic analysis was
also discussed and compared.
Keywords: Retaining wall, Reduced height counterfort, Lateral earth pressure, Economic analysis
IntroductionThe retaining walls are generally used to retain, eitherearth or water in a vertical position at locations where anabrupt change in ground level either exists or arisesbecause of transportation facilities, underground struc-tures, and storage tanks. In general, the failure of theretaining walls occurs because of sliding, overturning, andloss of bearing capacity. There are some important factorsresponsible for the failure of retaining walls such asexcessive earth pressure, reduced resistance against sliding,and unbalanced inertial force. As such there is nomethodology to identify the progressive effect of thesefactors on the retaining wall. However, the finite elementtechnique has emerged as an important tool to predictsuch problems.
Clough and Duncan (1971) computed the response of6?0-m high gravity retaining wall placed on 6?0-m deepsand foundation experimented earlier by Terzaghi (1934).The analysis was performed using one-dimensionalelements to simulate the interface between the wall andthe backfill. The minimum active and maximum passivepressures were found to be in good agreement with theresults of the classical earth pressure theory, whereas theamount of movement required to reach the full active andfull passive conditions was found to be in good agreementwith the results of Terzaghi (1934).
Matsuo et al. (1978) conducted experiments on 10-mhigh concrete wall retaining the silty sand and slag. Theearth pressure on the wall was continuously measured up
to 4 months. The measured static earth pressure wascompared with the results of finite element analysis. Thecomputed results were found to be insensitive to densityand young’s modulus, however were very sensitive to thePoisson’s ratio. Bhatia and Bakeer (1989) reproducednumerically the experimental results of Matsuo et al.(1978) and found that the predicted earth pressure issignificantly affected by the size of the element as well asthe boundary conditions employed.
Green et al. (2008) and Green and Ebeling (2003) con-ducted two-dimensional (2D) non-linear explicit dynamicanalysis to determine the response of 6?1-m high cantileverconcrete wall against earthquake motion. At very lowaccelerations, the induced pressures obtained by fastLagrangian analysis of continua (FLAC) were found tobe in agreement with those predicted by the Mononobe–Okabe approach. However, as the accelerations increasedto those expected in the region, the induced pressures werefound to be larger. The reason for the same was attributedto the relative flexibility of the structural block and non-monolithic motion of the driving soil wedge. The perma-nent relative displacement of the wall was in accord withthose predicted using the Newmark sliding block approach.
Chugh (2005) conducted finite element analysis for amodel of cantilever wall and prototype counterfort wallusing FLAC 2D and 3D. The discretization of the wallinto finite-difference grid affected the natural frequency offree vibrations; the grid size effects were more pronouncedfor vibratory response in the transverse direction than inthe axial direction. The numerical results of naturalfrequency were found to be in agreement with those ofthe known analytical solutions.
Liu et al. (2006) conducted two-dimensional finiteelement analysis on 5-m high reinforced concrete wall inorder to obtain the relationship between displacement and
Department of Civil Engineering, Indian Institute of Technology Roorkee,Roorkee 247667, India
*Corresponding author, email [email protected]; [email protected]
� 2014 W. S. Maney & Son LtdReceived 13 April 2013; accepted 21 June 2013DOI 10.1179/1938636213Z.00000000075
International Journal ofGeotechnical Engineering 2014 VOL 8 NO 2 167

maximum plastic strain distribution of the backfill undervarying friction angles (d50, 12?5, 17?5, and 25u). Thedeformed profile of backfill analyzed by ABAQUS andslip failure surface analyzed by Coulomb’s theory werecompared. The distance of failure position obtained fromthe numerical analysis was found to be smaller comparedto Coulomb’s theory. The effect of wall friction angle ondeformed profile was found to be insignificant.
Yoo and Kim (2008) carried out full-scale load test on a5-m high two-tier (3z2 m) geosynthetic-reinforced seg-mental retaining wall subjected to an incremental sur-charge load of maximum value 348 kN. Despite the factthat there was no provision for the surcharge load in thedesign, the maximum displacement was found to beinsignificant; 1?7 mm in the upper and 0?5 mm in thelower tier, while the maximum reinforcement strain was0?1%. Three-dimensional (3D) numerical simulationscarried out on ABAQUS finite element code predictedthe ultimate load carrying capacity and the allowablebearing pressure to be approximately 420 and 220 kPa,respectively.
Nisha et al. (2011) estimated the earth pressuredistribution behind a cantilever retaining wall usingPLAXIS finite element code. The behavior of soil wasconsidered to be elastoplastic with Mohr–Coulomb failurecriterion whereas that of the concrete, linear elastic. Theresults of the active pressure were found to be close to theclassical earth pressure theories proposed by Rankine andColoumb. The size and location of the shear key was alsovaried. The factor of safety against sliding was found to behigher when the shear key was located under the heel. Thefactor of safety increased from 2 to 7 by increasing the sizeof the shear key from 0?5 to 2 m.
Salman et al. (2011) estimated the earth pressuredistribution behind a 20-m high retaining wall employingthe two-dimensional finite element code, CRISP. Theresults showed oscillations in the values of earth pressureas a result of the application of line loads. Theseoscillations in the upper half of the wall were found toincrease with the increasing load and decrease with thedecreasing vicinity of the load. In the lower half of thewall, the lateral earth pressure was close to the lineardistribution with the maximum value at the base.The lateral earth pressure vanished when the distance ofthe line load becomes greater than 0?6 times the depth ofthe wall.
The studies available in the literature describe the effectof the lateral earth pressure on the gravity, diaphragm,and cantilever retaining walls. However, the studies onthe counterfort retaining walls are rather few. Further,most of the available numerical studies are based onthe plain concrete walls. The influence of reinforcement inthe retaining wall is rarely studied through numericalsimulations.
The present study describes the behavior of thecantilever and counterfort-reinforced concrete wallsretaining a compacted clay backfill and supported ondense foundation soils. The height of the cantilever wallwas varied as 5?5, 6?5, and 8?5 m. The size effect of theheel and toe was also investigated. The height of counter-fort in the counterfort wall was varied to study its effect on
the overall behavior of the wall. The 3D numericalsimulations were carried out using ABAQUS/standardfinite element code. The results thus obtained for thecantilever as well as counterfort retaining walls have beendiscussed and compared. The behavior of each element ofthe wall i.e. stem, heel, toe, counterfort, and the shear keywas studied in detail, and the influence thereon the overallbehavior of the wall was discussed. Among the cantileverwalls, the maximum horizontal and vertical displacementwas found to be 12?7 mm (at the top of the stem) and61?2 mm (at the toe free edge), respectively in 8?5-m highwall with less toe–more heel configuration. The same wasfound to be 15?96 mm (at the top of the stem) and67?44 mm (beneath the stem), respectively in case of thereduced height counterfort retaining wall that is almostdouble to that of the full height counterfort wall. Based onthe total quantity of steel and concrete consumed, the costanalysis of the walls was also carried out. It was foundthat among the cantilever walls, the one with the lowestheight, 5?5 m, is most economical. On the other hand, thecounterfort wall with reduced height of counterfort wasfound to be more economical compared to the one withfull height of counterfort.
Design of retaining wall based on theWorking Stress MethodThe design of the cantilever as well as counterfortretaining walls has been carried out using WorkingStress Method. The retaining walls were manuallydesigned for stability and section adequacy. The grade ofconcrete considered in this study is M30 and that of steel isFe500. In the grade of concrete, ‘‘M’’ represents mix and‘‘30’’ represents the compressive strength of 150-mm cubeof concrete in newton per millimeter square, after 28 daysof curing. In the grade of steel, ‘‘Fe’’ indicates ferrous and‘‘500’’ represents yield strength in newton per millimetersquare. The surcharge load was 1 T m22.
The clear cover to stem and the base slab was kept 40and 60 mm, respectively whereas that of the shear key andcounterfort 30 mm. The active and passive lateral earthpressure coefficients of soil were obtained as 0?33 and 3,respectively corresponding to the angle of repose 30u. Thefactor of safety against all the stability criteria wasconsidered as 1?5. The top of the backfill was consideredas leveled 300 mm below the top face of the wall. The finaldimensions of each component of the retaining wallsadopted as per the design are shown in Table 1.
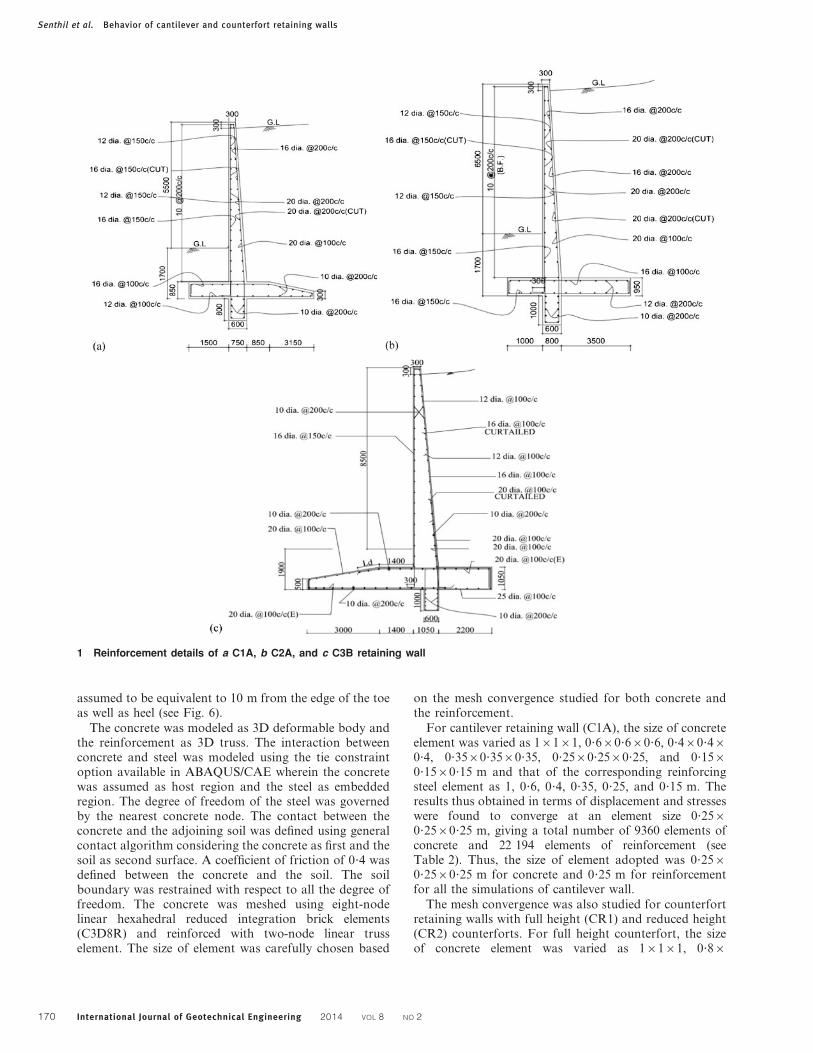
The cantilever walls studied herein were designated asC1, C2, and C3 based on their free height, 5?5, 6?5, and8?5 m, respectively, please see Fig. 1a–c for the geometricand reinforcement detail. The designation was furtherclassified as A for less toe–more heel and B for less heel–more toe configuration. The cantilever retaining wallsconsist of a vertical stem and a base slab comprising heeland toe. These three components (stem, heel, and toe)though act as a single unit, deform in a distinct manner toresist the earth pressure. The stem acts as a verticalcantilever under the lateral earth pressure and the heel slabas a horizontal cantilever under the weight of retainedearth. The stability of the wall is maintained essentially by
Senthil et al. Behavior of cantilever and counterfort retaining walls
International Journal of Geotechnical Engineering 2014 VOL 8 NO 2168

the weight of the earth on heel slab and self-weight ofconcrete. The toe slab acts as a cantilever under the actionof the resulting upward soil pressure.
The total free height of the counterfort walls studiedherein was 12?5 m; however, they were differentiatedbased on the height of the counterfort as 12?3 and 9?5 m,designated as CR1 and CR2, respectively (see Fig. 2a andb). The retaining walls beyond 8 m height are generallydesigned as counterfort walls in order to reduce thebending moments and thus the thickness of the sections.Each panel of the stem and the heel slab of a counterfortwall is considered as a two-way slab fixed on three sidesand free on one side. However, the toe slab is designed as acantilever wall. The counterforts are designed as T-beamswith the depth of section increasing linearly from top tobottom and considered as a vertical cantilever fixed atbase.
Both the cantilever and counterfort walls were providedwith a shear key because of their inadequate resistanceagainst sliding. The shear key is provided in an undis-turbed soil to mobilize the required factor of safety againstsliding and to provide considerable passive resistance. As aresult, an anti-clockwise moment develops at the joint ofbase slab and the shear key causing the bending of thelatter toward the heel. Therefore, the tensile stressesdevelop at the toe side of the key and compressive stressesat the heel side. However, the reinforcement in shear key isprovided both at the toe and heel face (Figs. 1 and 2).
Finite element modelingThe finite element model of the retaining walls was madeusing ABAQUS/CAE. The dimensions of the retainingwalls and reinforcement were modeled identical to thatobtained from the design (Figs. 1 and 2). Different viewsof the typical finite element model of cantilever wall areshown in Fig. 3a–e. The length of the wall considered was15 m, almost three times its width. The detailed finiteelement model for counterfort walls is shown in Figs. 4and 5 for CR1 and CR2, respectively. CR2 is a reducedcounterfort wall wherein the height of counterfort wasrestricted to 9?5 m in contrast to that of the 12?3 mcounterfort height considered in CR1. The length of thecounterfort retaining wall was modeled 17?1 m, with fivebays and six counterforts along the length at a clearspacing of 3 m. The depth of soil below the base slab wascalculated based on the stress distribution beneath thebase slab obtained from the Boussinesq equation
sy~q
p(azsin a)(1)
where sy is the stress in the vertical direction (see Fig. 3), qis the soil pressure at the center of the base obtained fromthe design calculations (163 kN m22), a is the anglebetween the footing edge and its center [a5tan21(B/10?8)516u] where B is half the width of base slab. At adepth of 10?8 m, the stress distribution was found to be15 kN m22 which is quite low compared to its intensity atthe base of the wall, 163 kN m22. The depth of 10?8 mwas thus considered appropriate to model the soil mass,based on which the width of the soil mass was alsoT
ab
le1
De
taile
dd
ime
ns
ion
so
fre
tain
ing
wa
ll
Descri
pti
on
C1
C2
C3
CR
Less
toe–m
ore
heel
(C1A
)L
ess
heel–
mo
reto
e(C
1B
)L
ess
toe–m
ore
heel
(C2A
)L
ess
heel–
mo
reto
e(C
2B
)L
ess
toe–m
ore
heel
(C3A
)L
ess
heel–
mo
reto
e(C
3B
)F
ull
heig
ht
co
un
terf
ort
(CR
1)
Red
uced
heig
ht
co
un
terf
ort
(CR
2)
Fre
eheig
ht
of
reta
inin
gw
all
ab
ove
gro
und
level/m
5?5
5?5
6?5
6?5
8?5
8?5
12
?512
?5
Overa
llheig
ht
of
reta
inin
gw
all/
m7
?27
?28
?28
?210
?410
?414
?414
?4Toe
wid
th/m
1?5
4?0
1?0
3?5
2?2
4?4
4?5
4?5
Heelw
idth
/m4
?01
?53
?51
?04
?42
?24
?54
?5Thic
kness
of
base
sla
bnear
toste
m/m
0?8
50
?85
0?9
50
?95
1?0
51
?05
0?9
0?9
Thic
kness
of
ste
mnear
tob
ase
sla
b/m
0?7
50
?75
0?8
0?8
1?0
51
?05
0?9
25
0?9
25
Siz
eof
shear
key
(leng
th6
heig
ht)
/m0
?66
0?8
0?66
0?8
0?66
1?0
0?66
1?0
0?66
1?0
0?66
1?0
0?96
1?0
0?96
1?0
Counte
rfort
thic
kness/m
––
––
––
0?3
50
?35
Heig
ht
of
counte
rfort
/m–
––
––
–12
?39
?5
Senthil et al. Behavior of cantilever and counterfort retaining walls
International Journal of Geotechnical Engineering 2014 VOL 8 NO 2 169
assumed to be equivalent to 10 m from the edge of the toeas well as heel (see Fig. 6).
The concrete was modeled as 3D deformable body andthe reinforcement as 3D truss. The interaction betweenconcrete and steel was modeled using the tie constraintoption available in ABAQUS/CAE wherein the concretewas assumed as host region and the steel as embeddedregion. The degree of freedom of the steel was governedby the nearest concrete node. The contact between theconcrete and the adjoining soil was defined using generalcontact algorithm considering the concrete as first and thesoil as second surface. A coefficient of friction of 0?4 wasdefined between the concrete and the soil. The soilboundary was restrained with respect to all the degree offreedom. The concrete was meshed using eight-nodelinear hexahedral reduced integration brick elements(C3D8R) and reinforced with two-node linear trusselement. The size of element was carefully chosen based
on the mesh convergence studied for both concrete andthe reinforcement.
For cantilever retaining wall (C1A), the size of concreteelement was varied as 16161, 0?660?660?6, 0?460?460?4, 0?3560?3560?35, 0?2560?2560?25, and 0?1560?1560?15 m and that of the corresponding reinforcingsteel element as 1, 0?6, 0?4, 0?35, 0?25, and 0?15 m. Theresults thus obtained in terms of displacement and stresseswere found to converge at an element size 0?2560?2560?25 m, giving a total number of 9360 elements ofconcrete and 22 194 elements of reinforcement (seeTable 2). Thus, the size of element adopted was 0?2560?2560?25 m for concrete and 0?25 m for reinforcementfor all the simulations of cantilever wall.
The mesh convergence was also studied for counterfortretaining walls with full height (CR1) and reduced height(CR2) counterforts. For full height counterfort, the sizeof concrete element was varied as 16161, 0?86
1 Reinforcement details of a C1A, b C2A, and c C3B retaining wall
Senthil et al. Behavior of cantilever and counterfort retaining walls
International Journal of Geotechnical Engineering 2014 VOL 8 NO 2170

0?860?8, 0?6560?6560?65, 0?6260?6260?62, and0?4860?4860?48 m and the corresponding steel elementas 1, 0?8, 0?65, 0?52, and 0?42 m. The mesh convergencein this case was achieved at the element size 0?48 60?4860?48 m for concrete and 0?42 m for steel (see Table 3).
Thus, the same size of element was adopted for thisretaining wall.
For the wall with reduced height counterfort, the elementsize of concrete varied as 16161, 0?660?660?6, 0?5260?5260?52, and 0?4660?4660?46 m and that of the
2 Reinforcement details of CR1 retaining wall at a wall section and b counterfort section
3 Finite element model of C1A cantilever retaining wall: a XY plane; b XZ plane; c YZ plane; d three-dimensional (3D) model
of retaining wall; e 3D model of reinforcement
Senthil et al. Behavior of cantilever and counterfort retaining walls
International Journal of Geotechnical Engineering 2014 VOL 8 NO 2 171

corresponding element of steel as 1, 0?6, 0?52, and 0?46 m.The convergence of the results was achieved at the elementsize 0?4660?4660?46 m (see Table 4). Therefore, the sameelement size was chosen for carrying out the numericalsimulations.
The results of the mesh convergence study for thecantilever and counterfort retaining walls are also shownin Fig. 7a and b for the maximum displacement at thestem top and maximum shear stress developed in the wall,
respectively. The displacement was found to decrease andthe stress increase, with the reduction in the size of theelement. It was further noticed that the mesh convergencefor the stresses was achieved at a more refined meshconfiguration compared to displacement. The soil was alsodiscretized into eight-node linear hexahedral reducedintegration brick elements (C3D8R) of 16161 m uni-form size throughout its volume (see Fig. 6).
Application of loadsThe active and the passive pressures assigned to theretaining wall along with the body force are highlighted inFig. 8. The numerical values of the active and passivepressures were computed using simple mathematicalexpressions that are function of the height of the wall(see Table 5). The self-weight of soil and concrete wasassigned as gravitational body force.
The Public Work Research Institute of Ministry ofConstruction of Japan (1975) studied the pressuredistribution of cohesive and sandy soils. The distributionof the earth pressure caused by cohesive soil was found tobe triangular whereas that of the sandy soil and gravel,almost trapezoid. Thus, the point of application ofresultant force was found to be located at (0?35–0?5)H,where H is the height of the wall. However, Clough andDuncan (1971), Green et al. (2008), and Green andEbeling (2003) found that the distribution of lateral earthpressure acting on the heel and wall sections wastriangular in shape, and the resultant force was acting atone-third of the height of the wall above the base.Therefore, in the present study also a triangular pressuredistribution has been considered with its resultant at H/3from the base.
Material modelingThe material behavior of steel, concrete, and soil wasconsidered linear elastic in the present study. For M30 gradeconcrete, the elastic modulus (E~4700
ffiffiffiffif ’c
p) was obtained
as per the guideline of ACI 318, density was considered2400 kg m23, and Poisson’s ratio 0?17 (see Table 6). Thereinforcing steel was also assigned the modulus of elasticity(261011 N m22), density (7850 kg m23), and Poisson’sratio (0?3). The characteristic strength of steel reinforcement
4 Finite element model of CR1: full height counterfort
retaining wall
5 Finite element model of CR2: reduced height counterfort
retaining wall
6 Finite element model of soil–wall system of earth pressure
Senthil et al. Behavior of cantilever and counterfort retaining walls
International Journal of Geotechnical Engineering 2014 VOL 8 NO 2172
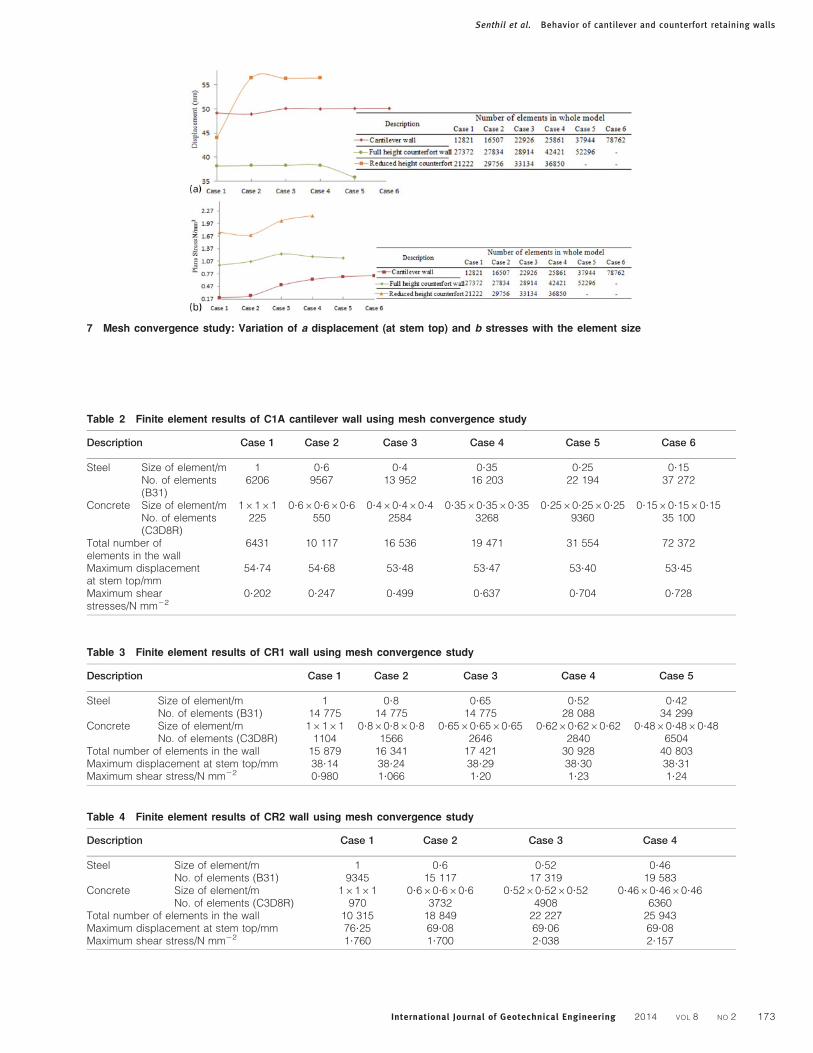
Table 2 Finite element results of C1A cantilever wall using mesh convergence study
Description Case 1 Case 2 Case 3 Case 4 Case 5 Case 6
Steel Size of element/m 1 0?6 0?4 0?35 0?25 0?15No. of elements(B31)
6206 9567 13 952 16 203 22 194 37 272
Concrete Size of element/m 16161 0?660?660?6 0?460?460?4 0?3560?3560?35 0?2560?2560?25 0?1560?1560?15No. of elements(C3D8R)
225 550 2584 3268 9360 35 100
Total number ofelements in the wall
6431 10 117 16 536 19 471 31 554 72 372
Maximum displacementat stem top/mm
54?74 54?68 53?48 53?47 53?40 53?45
Maximum shearstresses/N mm22
0?202 0?247 0?499 0?637 0?704 0?728
Table 3 Finite element results of CR1 wall using mesh convergence study
Description Case 1 Case 2 Case 3 Case 4 Case 5
Steel Size of element/m 1 0?8 0?65 0?52 0?42No. of elements (B31) 14 775 14 775 14 775 28 088 34 299
Concrete Size of element/m 16161 0?860?860?8 0?6560?6560?65 0?6260?6260?62 0?4860?4860?48No. of elements (C3D8R) 1104 1566 2646 2840 6504
Total number of elements in the wall 15 879 16 341 17 421 30 928 40 803Maximum displacement at stem top/mm 38?14 38?24 38?29 38?30 38?31Maximum shear stress/N mm22 0?980 1?066 1?20 1?23 1?24
Table 4 Finite element results of CR2 wall using mesh convergence study
Description Case 1 Case 2 Case 3 Case 4
Steel Size of element/m 1 0?6 0?52 0?46No. of elements (B31) 9345 15 117 17 319 19 583
Concrete Size of element/m 16161 0?660?660?6 0?5260?5260?52 0?4660?4660?46No. of elements (C3D8R) 970 3732 4908 6360
Total number of elements in the wall 10 315 18 849 22 227 25 943Maximum displacement at stem top/mm 76?25 69?08 69?06 69?08Maximum shear stress/N mm22 1?760 1?700 2?038 2?157
7 Mesh convergence study: Variation of a displacement (at stem top) and b stresses with the element size
Senthil et al. Behavior of cantilever and counterfort retaining walls
International Journal of Geotechnical Engineering 2014 VOL 8 NO 2 173

was considered as 500 MPa. For soil properties, modulusof elasticity (0?36108 N m22), density (1835 kg m23),and Poisson’s ratio (0?34) were also defined.
Results and discussionThree-dimensional finite element analysis has been carriedout in order to study the effect of lateral earth pressure on theflexible retaining walls. The deformation behavior of thedifferent components of the retaining wall such as base slab,stem, counterfort, and shear key was studied. Three cantileverwalls of heights 5?5, 6?5, and 8?5 m were studied with lessheel–more toe and less toe–more heel configurations. The
counterfort wall with two different sizes of counterfortswas also studied. The results thus obtained in terms ofdisplacement in different components of the wall andstresses developed therein were presented and discussed.The unit of the displacement contours was ‘‘meter,’’whereas that of the stress contours was ‘‘newton per metersquare.’’ The coordinate system shown in Fig. 3 representsthe positive direction for the displacement. The tension isrepresented by positive sign, whereas compression bynegative sign. The horizontal as well as vertical displace-ments of the stem have been found to increase with anincrease in the height of the cantilever wall (Table 7).Moreover, the displacement for less toe–more heel (A)configuration was found to be higher compared to lessheel–more toe (B) configuration (see Fig. 9).
The maximum horizontal displacement at the stem topwas found to be 6?17, 10?58, and 12?7 mm for C1A, C2A,and C3A, respectively and 1?51, 3?87, and 9?06 mm forC1B, C2B, and C3B, respectively. The horizontal dis-placement at the bottom of stem was comparatively low,and the difference between the A- and B-configurationswas insignificant. The horizontal deformation contours ofthe cantilever wall are plotted in Fig. 10. It was observedthat for A-configuration, the deformation of the key isdecreasing marginally with an increase in the height of thewall (see Fig. 10a–c). It may be because of the fact thatwith an increase in the height of the wall, the anti-clockwise couple acting at the bottom of the stem isincreasing and hence reducing the displacement of theshear key. However, the opposite behavior was observedin case of B-configuration of the wall because of lack ofsufficient heel width.
The vertical downward displacement of the cantileverretaining wall was significantly higher than the horizontaldisplacement (Table 7). It was found to increase with anincrease in the height of the wall. However, at the heel freeedge for A-configuration, the vertical displacement was
8 Typical details of the body forces and horizontal compo-
nent of earth pressure
Table 5 Analytical expressions for active and passive pressure distribution on wall
Description Base slab configuration
Active pressure Passive pressure
Wall Shear key Wall Shear key
C1 Less toe–more heel (C1A) 26116yz38 837 26116y24893 255 050yz46 793 255 050y246 793Less heel–more toe (C1B)
C2 Less toe–more heel (C2A) 26116yz44 341 26116y25810 255 050yz41 287 255 050y252 298Less heel–more toe (C2B)
C3 Less toe–more heel (C3A) 26116yz55 349 26116y26422 255 050yz46 793 255 050y257 803Less heel–more toe (C3B)
CR Full height counterfort (CR1) 26116yz82 413 26116y25657 255 050yz53 673 255 050y250 921Reduced height counterfort (CR2)
Table 6 Material parameters for the finite element model
S. no. Description Density/kg m23
Elastic constant
Young’s modulus/N m22 Poisson’s ratio
1 Concrete 2400 0?2461011 0?172 Steel reinforcement 7850 2?061011 0?303 Soil 1835 0?306108 0?34
Senthil et al. Behavior of cantilever and counterfort retaining walls
International Journal of Geotechnical Engineering 2014 VOL 8 NO 2174
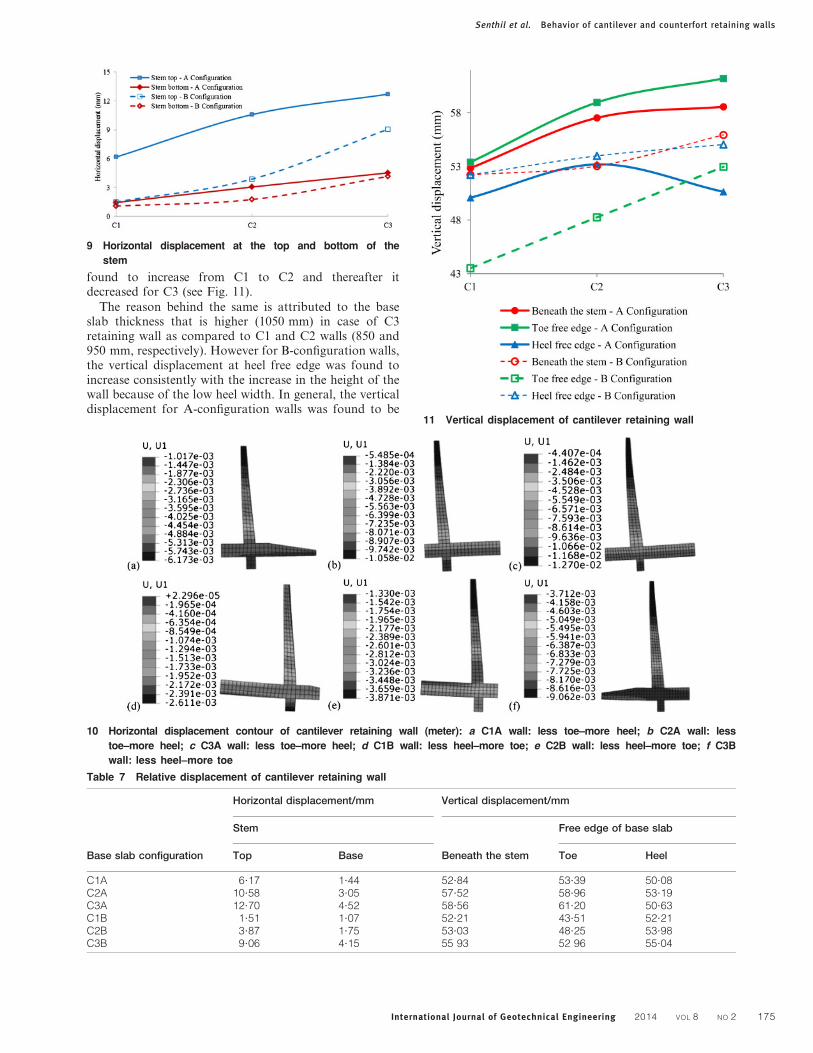
found to increase from C1 to C2 and thereafter itdecreased for C3 (see Fig. 11).
The reason behind the same is attributed to the baseslab thickness that is higher (1050 mm) in case of C3retaining wall as compared to C1 and C2 walls (850 and950 mm, respectively). However for B-configuration walls,the vertical displacement at heel free edge was found toincrease consistently with the increase in the height of thewall because of the low heel width. In general, the verticaldisplacement for A-configuration walls was found to be
9 Horizontal displacement at the top and bottom of the
stem
Table 7 Relative displacement of cantilever retaining wall
Base slab configuration
Horizontal displacement/mm Vertical displacement/mm
Stem
Beneath the stem
Free edge of base slab
Top Base Toe Heel
C1A 6?17 1?44 52?84 53?39 50?08C2A 10?58 3?05 57?52 58?96 53?19C3A 12?70 4?52 58?56 61?20 50?63C1B 1?51 1?07 52?21 43?51 52?21C2B 3?87 1?75 53?03 48?25 53?98C3B 9?06 4?15 55 93 52 96 55?04
10 Horizontal displacement contour of cantilever retaining wall (meter): a C1A wall: less toe–more heel; b C2A wall: less
toe–more heel; c C3A wall: less toe–more heel; d C1B wall: less heel–more toe; e C2B wall: less heel–more toe; f C3B
wall: less heel–more toe
11 Vertical displacement of cantilever retaining wall
Senthil et al. Behavior of cantilever and counterfort retaining walls
International Journal of Geotechnical Engineering 2014 VOL 8 NO 2 175
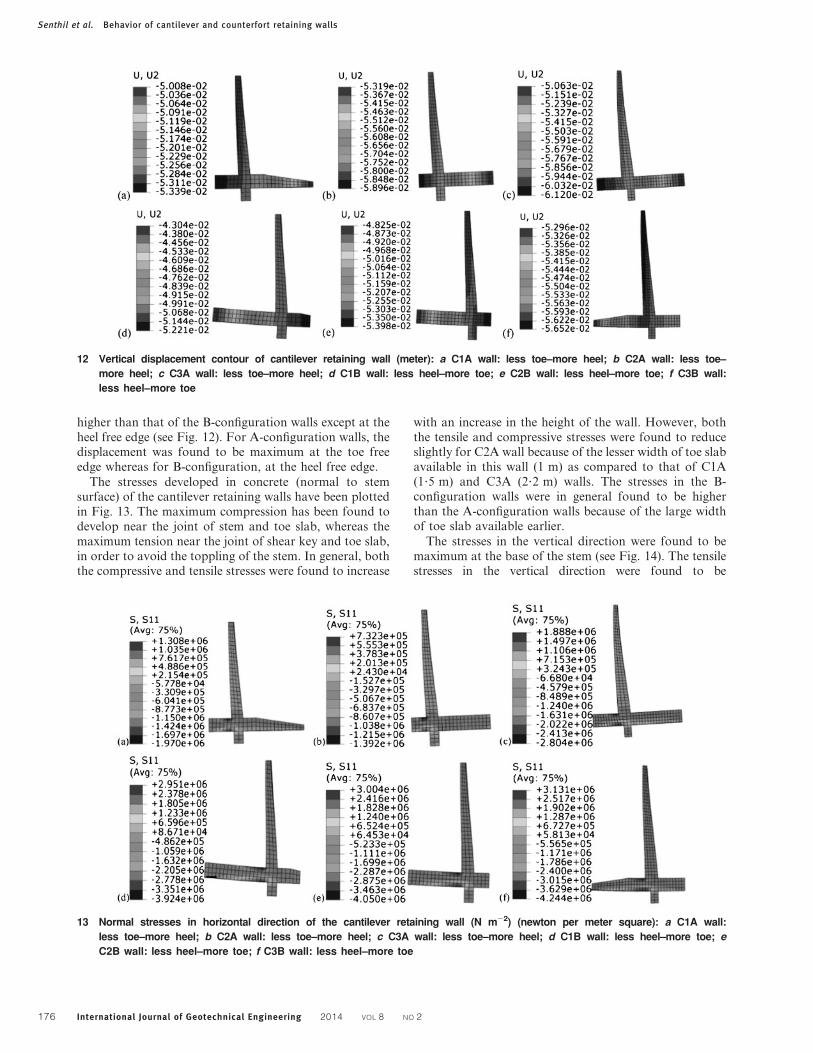
higher than that of the B-configuration walls except at theheel free edge (see Fig. 12). For A-configuration walls, thedisplacement was found to be maximum at the toe freeedge whereas for B-configuration, at the heel free edge.
The stresses developed in concrete (normal to stemsurface) of the cantilever retaining walls have been plottedin Fig. 13. The maximum compression has been found todevelop near the joint of stem and toe slab, whereas themaximum tension near the joint of shear key and toe slab,in order to avoid the toppling of the stem. In general, boththe compressive and tensile stresses were found to increase
with an increase in the height of the wall. However, boththe tensile and compressive stresses were found to reduceslightly for C2A wall because of the lesser width of toe slabavailable in this wall (1 m) as compared to that of C1A(1?5 m) and C3A (2?2 m) walls. The stresses in the B-configuration walls were in general found to be higherthan the A-configuration walls because of the large widthof toe slab available earlier.
The stresses in the vertical direction were found to bemaximum at the base of the stem (see Fig. 14). The tensilestresses in the vertical direction were found to be
12 Vertical displacement contour of cantilever retaining wall (meter): a C1A wall: less toe–more heel; b C2A wall: less toe–
more heel; c C3A wall: less toe–more heel; d C1B wall: less heel–more toe; e C2B wall: less heel–more toe; f C3B wall:
less heel–more toe
13 Normal stresses in horizontal direction of the cantilever retaining wall (N m22) (newton per meter square): a C1A wall:
less toe–more heel; b C2A wall: less toe–more heel; c C3A wall: less toe–more heel; d C1B wall: less heel–more toe; e
C2B wall: less heel–more toe; f C3B wall: less heel–more toe
Senthil et al. Behavior of cantilever and counterfort retaining walls
International Journal of Geotechnical Engineering 2014 VOL 8 NO 2176
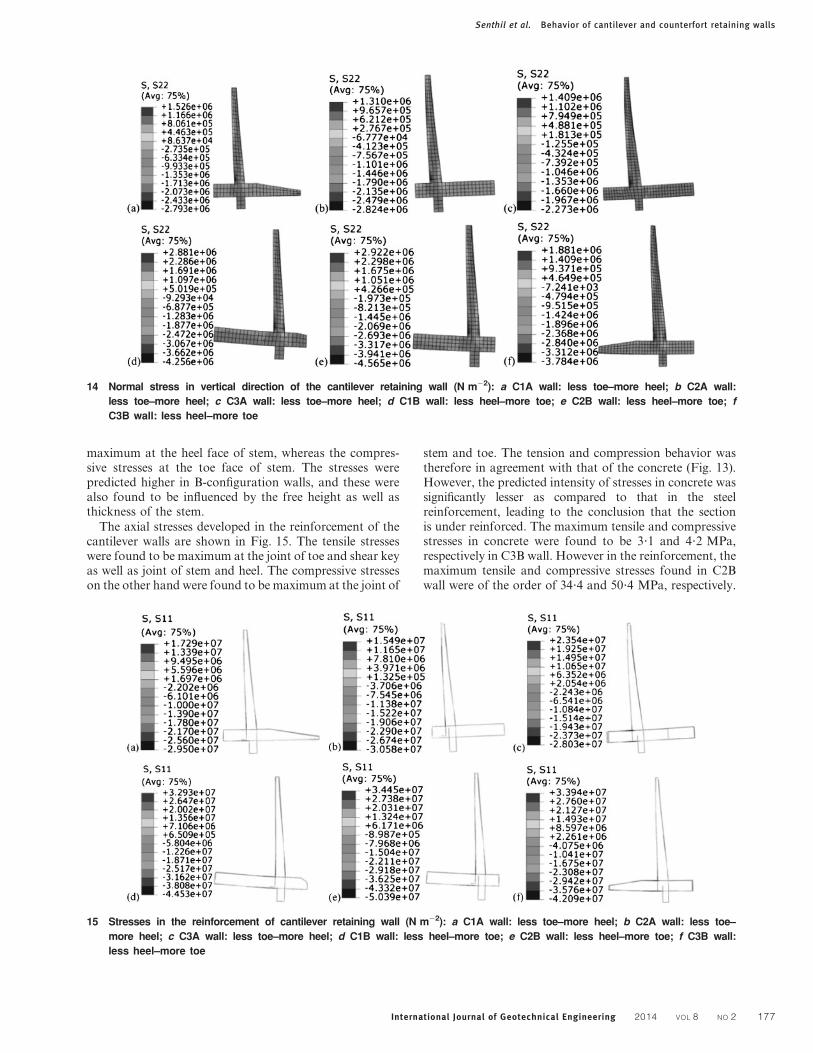
maximum at the heel face of stem, whereas the compres-sive stresses at the toe face of stem. The stresses werepredicted higher in B-configuration walls, and these werealso found to be influenced by the free height as well asthickness of the stem.
The axial stresses developed in the reinforcement of thecantilever walls are shown in Fig. 15. The tensile stresseswere found to be maximum at the joint of toe and shear keyas well as joint of stem and heel. The compressive stresseson the other hand were found to be maximum at the joint of
stem and toe. The tension and compression behavior wastherefore in agreement with that of the concrete (Fig. 13).However, the predicted intensity of stresses in concrete wassignificantly lesser as compared to that in the steelreinforcement, leading to the conclusion that the sectionis under reinforced. The maximum tensile and compressivestresses in concrete were found to be 3?1 and 4?2 MPa,respectively in C3B wall. However in the reinforcement, themaximum tensile and compressive stresses found in C2Bwall were of the order of 34?4 and 50?4 MPa, respectively.
14 Normal stress in vertical direction of the cantilever retaining wall (N m22): a C1A wall: less toe–more heel; b C2A wall:
less toe–more heel; c C3A wall: less toe–more heel; d C1B wall: less heel–more toe; e C2B wall: less heel–more toe; f
C3B wall: less heel–more toe
15 Stresses in the reinforcement of cantilever retaining wall (N m22): a C1A wall: less toe–more heel; b C2A wall: less toe–
more heel; c C3A wall: less toe–more heel; d C1B wall: less heel–more toe; e C2B wall: less heel–more toe; f C3B wall:
less heel–more toe
Senthil et al. Behavior of cantilever and counterfort retaining walls
International Journal of Geotechnical Engineering 2014 VOL 8 NO 2 177

In general, the intensity of stresses in reinforcement wasfound to be significantly higher in B-configuration wallsbecause of the larger toe width available in this case.
The horizontal and vertical displacement of the counter-fort retaining walls is presented in Table 8. As expected,the displacement of CR2 (reduced counterfort wall) wasfound to be higher compared to CR1 (full counterfortwall). The maximum horizontal displacement in CR2 wallwas found to be 70 and 174% higher at the top and bottom
of the stem, respectively because of 22?7% reduction(2?8 m) in the height of counterfort. The vertical displace-ment under the stem as well as the free edge of toe and heelwas found to be almost 100% higher in case of CR2 wall ascompared to that of CR1wall (Table 8).
The contour plots of the displacement shown in Fig. 16describe that the maximum horizontal displacement inCR2 wall is not exactly at the top of stem but near thejoint of stem and counterfort. The free height of 4 m in
16 Horizontal and vertical displacement of counterfort retaining wall (meter): a CR1 wall: horizontal displacement; b CR2
wall: horizontal displacement; c CR1 wall: vertical displacement; d CR2 wall: vertical displacement
Table 8 Relative displacement of counterfort retaining wall
Base slab configuration
Horizontal displacement/mm Vertical displacement/mm
Stem
Beneath the stem
Free edge of base slab
Top Base Toe Heel
CR1 9?42 2?71 34?65 28?02 31?34CR2 15?96 7?45 67?44 55?88 62?63
Senthil et al. Behavior of cantilever and counterfort retaining walls
International Journal of Geotechnical Engineering 2014 VOL 8 NO 2178

case of CR2 wall was found to deflect toward the earthside to a maximum of 5?40 mm at the top. The pattern ofthe vertical displacement, however, was found to be samein CR1 and CR2 except the fact that the magnitude washigher in the later.
The contour plots of the normal stresses in thehorizontal direction are shown in Fig. 17a and b for thecounterfort walls. The maximum compression was foundat the junction of toe and stem, whereas the maximumtension at the junction of toe and shear key, in the samemanner as noticed in the cantilever walls. However, themagnitude of stresses in counterfort walls was found to behigher particularly in CR2 wall. The normal stresses in thevertical direction are plotted in Fig. 18a and b. The tensilestresses were seen to be high at the top joint of stem and
the counterfort, whereas the compressive stresses at thejoint of stem and toe. In CR2 wall, high tension andcompression is seen to develop at the front and rear face ofthe stem at the top joint of the counterfort. This is becauseof the fact that the portion of stem above this joint isacting as cantilever.
The tensile stresses in the reinforcement of the counter-fort walls shown in Fig. 19 were found to be maximum atthe bottom of the toe slab. On the other hand, thecompressive stresses were found to be maximum at thetop of the toe slab, being under compression. Thesestresses were found to be in agreement to those developedin cantilever walls (Fig. 15). The compressive stress wasalso found to be high at both the faces of the shear keyfor CR1, however, only at the heel side of the shear key
17 Normal stresses in horizontal direction of the counterfort retaining wall (N m22): a CR1 counterfort wall; b CR2 counter-
fort wall
18 Normal stresses in vertical direction of the counterfort retaining wall (N m22): a CR1 counterfort wall; b CR2 counterfort
wall
Senthil et al. Behavior of cantilever and counterfort retaining walls
International Journal of Geotechnical Engineering 2014 VOL 8 NO 2 179

for CR2. However in the cantilever walls, such highstresses were not seen in the shear key reinforcement. Ascompared to CR1 wall, the stresses in CR2 were found tobe 63 and 47% higher in tension and compression,respectively.
The economy is also an important concern of thestructural design in addition to the stability of thestructure. Therefore in the present study, the cost analysisof all the retaining walls was also carried out to obtain themost economical section among the cantilever andcounterfort walls (Table 9). The cost of concrete andreinforcement was worked out to be $84 (Rs 4700)/cubicmeter and $930 (Rs 52 000)/t, respectively based on thesurvey of the local market.
The volume of each material was calculated in theretaining walls, and the total cost was evaluated. The laborand the formwork charges, however, were not included inthe analysis. The total material cost of the retaining wallwas found to be the highest for CR1 wall followed by C3,CR2, C2, and C1, respectively (see Fig. 20). Thus, C3 wallwas found to be 45 and 90% costlier compared to C2 andC1 walls, respectively. Moreover, it was also found to be0?7% costlier than the reduced height counterfort wall(CR2), in spite of the fact that the height of CR2 was 4 m
higher than C3 wall. CR1 wall on the other hand wasfound to be 7% costlier than CR2.
Conclusion
The present numerical study describes the behavior of thecantilever and counterfort walls subjected to lateral earthpressure. The influence of the stem height, base slab width,and height of the counterfort was studied. The results thusobtained led to the following conclusions.
The displacements and stresses in the cantilever wallwere found to increase with an increase in its height. Themaximum horizontal displacement was found to be higherin A-configuration (less toe–more heel), whereas themaximum stresses in B-configuration (less heel–moretoe) walls. The maximum compression (in concrete aswell as reinforcement) has been found to develop near thejoint of stem and toe, whereas maximum tension, near thejoints of stem and heel as well as shear key and toe.
The maximum horizontal displacement in CR2 (reducedheight counterfort) wall was found to be 70 and 174%higher at the top and bottom of the stem, respectively thanthat of the CR1 wall because of 2?8 m (22?7%) reductionin the height of counterfort. The vertical displacement
19 Stresses on reinforcement of counterfort retaining wall (N m22): a CR1 counterfort wall; b CR2 counterfort wall
Table 9 Economic analysis of different retaining walls
DescriptionVolume ofconcrete/m3
Volume ofsteel/m3 Cost of concrete Cost of steel Total cost
C1 127 1?02 USD 10 660 (Rs 596 900) USD 745 (Rs 41 630) USD 11 405 (Rs 638 530)C2 165 1?34 USD 13 850 (Rs 775 500) USD 975 (Rs 54 690) USD 14 825 (Rs 830 190)C3 231 2?96 USD 19 390 (Rs 1 085 700) USD 2160 (Rs 120 820) USD 21 550 (Rs 1 206 520)CR1 255 2?19 USD 21 400 (Rs 1 198 500) USD 1600 (Rs 89 390) USD 23 000 (Rs 1 287 890)CR2 235 2?30 USD 19 725 (Rs 1 104 500) USD 1675 (Rs 93 880) USD 21 400 (Rs 1 198 380)
USD: United States dollar; INR: Indian national rupee.
Senthil et al. Behavior of cantilever and counterfort retaining walls
International Journal of Geotechnical Engineering 2014 VOL 8 NO 2180

under the stem as well as the free edge of toe and heel wasfound to be almost 100% higher.
The maximum compression in concrete as well as rein-forcement of the counterfort walls was found to be at thejunction of toe and stem, whereas maximum tension, atthe junction of toe and shear key. However, the magnitudeof the stresses was found to be higher in CR2 wall.
In all the retaining walls studied herein, the predictedintensity of stresses in concrete was significantly lesser ascompared to that in the steel, leading to the conclusionthat the section is under reinforced.
The C3 wall was found to be 45 and 90% costlier than C2and C1 walls, respectively, and 0?7% costlier than the reducedheight counterfort wall, CR2. It should be noticed that theheight of CR2 is 4 m higher than C3 wall. On the other hand,CR1 wall was found to be 7% costlier than CR2.
ReferencesACI Committee 318. 1999. Building code requirements for structural concrete
(ACI 318M-11) and commentary, Detroit, American Concrete Institute.
Bhatia, S. K. and Bakeer, R. M. 1989. Use of the finite element method in
modeling a static earth pressure problem, Int. J. Numer. Anal.
Geomech., 13, 207–213.
Chugh, A. K. 2005. A counterfort versus a cantilever retaining wall – a
seismic equivalence, Int. J. Numer. Anal. Geomech., 29, 897–917.
Clough, G. W. and Duncan, J. M. 1971. Finite element analyses of
retaining wall behavior, J. Soil Mech. Found. Div., 97, 1657–1673.
Green, R. A. and Ebeling, R. M. 2003. Modeling the dynamic response of
cantilever earth-retaining walls using FLAC. Numerical modeling in
geomechanics, Proc. 3rd International FLAC Symposium, Canada,
Balkema, Lisse, 333–341.
Green, R. A., Olgun, C. G. and Cameron, W. I. 2008. Response and
modeling of cantilever retaining walls subjected to seismic motions,
Comput. Aided Civil Infrastruct. Eng., 23, 309–322.
Liu, N.-H., Chen, J.-W. and Liou, J.-Y. 2006. The deformed profile of the
horizontal backfill in active state, Int. Symp. Geohazards
Mitigation, Tainan, Taiwan, 174–179.
Matsuo, M., Kenmochi, S. and Yagi, H. 1978. Experimental study on
earth pressure of retaining wall by field test, Jpn. Soc. Soil Mech.
Found. Eng., 18, (3), 27–41.
Nisha, S., Shivashankar, R. and Ravi Shankar, A. U. 2011. Role of shear
keys in cantilever retaining wall, Proc. Indian Geotechnical
Conference, Kochi, Indian Geotechnical Society, 627–630.
Public Work Research Institute of Ministry of Construction of Japan. 1975.
Large scale model tests of a retaining wall, Research Data, No. 994.
Salman, F. A., Fattah, M. Y., Shirazi, S. M. and Mahrez, A. 2011.
Comparative study on earth pressure distribution behind retaining
wall subjected to line loads, Sci. Res. Essays, 6, (11), 2251–2267.
Terzaghi, K. 1934. Large retaining wall tests, Eng. News Rec., 112, 136–140.
Yoo, C. and Kim, C. 2008. Performance of a two-tier geosynthetic
reinforced segmental retaining wall under a surcharge load: full-
scale load test and 3D finite element analysis, Geotext.
Geomembranes, 26, 460–472.
20 Economic analysis of the cantilever and counterfort
retaining wall
Senthil et al. Behavior of cantilever and counterfort retaining walls
International Journal of Geotechnical Engineering 2014 VOL 8 NO 2 181
Copyright © 2022 FDOKUMEN