Beam-Machine Interaction Studies for the Phase II LHC ...
218
POUR L'OBTENTION DU GRADE DE DOCTEUR ÈS SCIENCES acceptée sur proposition du jury: Prof. N. Baluc, présidente du jury Prof. L. Rivkin, directeur de thèse Dr R. Assmann, rapporteur Prof. A. Bay, rapporteur Dr V. Vlachoudis, rapporteur Beam-Machine Interaction Studies for the Phase II LHC Collimation System THÈSE N O 4910 (2010) ÉCOLE POLYTECHNIQUE FÉDÉRALE DE LAUSANNE PRÉSENTÉE LE 13 DÉCEMBRE 2010 À LA FACULTÉ SCIENCES DE BASE LABORATOIRE DE PHYSIQUE DES ACCÉLÉRATEURS DE PARTICULES PROGRAMME DOCTORAL EN PHYSIQUE Suisse 2010 PAR Luisella LARI
-
Upload
khangminh22 -
Category
Documents
-
view
0 -
download
0
Transcript of Beam-Machine Interaction Studies for the Phase II LHC ...
POUR L'OBTENTION DU GRADE DE DOCTEUR ÈS SCIENCES
acceptée sur proposition du jury:
Prof. N. Baluc, présidente du juryProf. L. Rivkin, directeur de thèse
Dr R. Assmann, rapporteur Prof. A. Bay, rapporteur
Dr V. Vlachoudis, rapporteur
Beam-Machine Interaction Studies for the Phase II LHC Collimation System
THÈSE NO 4910 (2010)
ÉCOLE POLYTECHNIQUE FÉDÉRALE DE LAUSANNE
PRÉSENTÉE LE 13 DÉCEMBRE 2010
À LA FACULTÉ SCIENCES DE BASELABORATOIRE DE PHYSIQUE DES ACCÉLÉRATEURS DE PARTICULES
PROGRAMME DOCTORAL EN PHYSIQUE
Suisse2010
PAR
Luisella LARI

Abstract
Collimation is essential in a high Energy and Intensity hadron collider with Su-perConducting magnets, like the LHC at CERN. To improve the cleaning efficiencyand to reduce the LHC impedance budget in stable condition and at top Energy,additional 30 Phase II collimators are foreseen to be installed.
The work of this PhD analyses the beam-machine interactions in the LHC Be-tatron Cleaning Insertions for its upgrade with the Phase II collimators. Thesestudies aim at optimizing the collimation system layout from the machine protec-tion point of view, considering different options for the Phase II collimator designand focusing on heating damage and activation problems. The outcomes of thisPhD work have been used to support the Phase II design evolution and their pro-totype mechanical integration, and to point out possible critical points along theBetatron Cleaning Straight Section. Emphasis is on studying several configurationsand material choices for nominal and failure scenarios.
Keywords: LHC, collimation, FLUKA, machine protection.

Résumé
Le système de collimation est essentiel dans un collisionneur de hadrons d’énergieet d’intensité élevées comprenant des aimants supraconducteurs comme le LHC auCERN. Afin d’améliorer l’efficacité du système de nettoyage du faisceau et de ré-duire la marge d’impédance du LHC dans des conditions stables et à des énergiesmaximales, 30 collimateurs supplémentaires de type Phase II seront installés.
L’objectif de cette thèse est d’analyser les interactions du faisceau de particulesavec la matière au niveau des inserts de nettoyage bétatronique du LHC pour sanouvelle phase après l’installation des collimateurs de Phase II. Une telle étude viseà optimiser la disposition des collimateurs de Phase II pour une meilleure protectionde la machine. Les différentes options liées à leur conception, les détériorationscausées par l’échauffement ainsi que les problèmes d’activation sont considérés etévalués. Les résultats de cette étude ont été utiles non seulement pour le suivide la conception et l’intégration mécanique du prototype concerné par la PhaseII, mais aussi pour mettre en évidence des éventuels points critiques au niveau dunettoyage bétatronique de la Section Droite. L’accent est mis sur l’étude de plusieursconfigurations et matériaux pour des scénarios aussi bien nominaux que critiques.
Mot-clé: LHC, collimation, FLUKA, protection de la machine.

To my parents Jole & GinoTo my origins Giovanni, Maria & TeresaTo my friends Amalia and Beppe...and to myself


Contents
1 Introduction 1
2 The Large Hadron Collider 32.1 The LHC accelerator chain . . . . . . . . . . . . . . . . . . . . . . . . 32.2 The LHC experiments . . . . . . . . . . . . . . . . . . . . . . . . . . 42.3 The LHC main ring . . . . . . . . . . . . . . . . . . . . . . . . . . . . 62.4 The LHC SuperConducting Magnets . . . . . . . . . . . . . . . . . . 72.5 The LHC Cleaning Insertion Regions . . . . . . . . . . . . . . . . . . 9
2.5.1 The Momentum Cleaning Insertion IR3 . . . . . . . . . . . . . 92.5.2 The Betatron Cleaning Insertion IR7 . . . . . . . . . . . . . . 9
3 The LHC Collimation System 113.1 Why is the LHC collimation essential? . . . . . . . . . . . . . . . . . 113.2 The LHC Collimation System requirements . . . . . . . . . . . . . . . 12
3.2.1 Beam loss rates during regular operation . . . . . . . . . . . . 123.2.2 Abnormal proton losses . . . . . . . . . . . . . . . . . . . . . . 133.2.3 Cleaning Inefficiency . . . . . . . . . . . . . . . . . . . . . . . 143.2.4 Impedance . . . . . . . . . . . . . . . . . . . . . . . . . . . . . 143.2.5 Radiation constraints . . . . . . . . . . . . . . . . . . . . . . . 163.2.6 Additional requirements . . . . . . . . . . . . . . . . . . . . . 16
3.3 The multi-stage LHC Collimation System . . . . . . . . . . . . . . . . 163.4 The multi-phase LHC Collimation System . . . . . . . . . . . . . . . 18
3.4.1 The Phase I Collimation System . . . . . . . . . . . . . . . . . 193.4.2 The Phase II Collimation System . . . . . . . . . . . . . . . . 243.4.3 Further Phases . . . . . . . . . . . . . . . . . . . . . . . . . . 28
4 Simulation Framework 294.1 Purpose of the simulations . . . . . . . . . . . . . . . . . . . . . . . . 294.2 The simulation chain . . . . . . . . . . . . . . . . . . . . . . . . . . . 30
4.2.1 The MAD-X code . . . . . . . . . . . . . . . . . . . . . . . . . 314.2.2 The SixTrack code . . . . . . . . . . . . . . . . . . . . . . . . 334.2.3 The FLUKA code . . . . . . . . . . . . . . . . . . . . . . . . . 354.2.4 The FEM analysis . . . . . . . . . . . . . . . . . . . . . . . . 38
i

ii Contents
5 An overview of the FLUKA physics models 395.1 Proton-matter interaction: main framework . . . . . . . . . . . . . . 395.2 The FLUKA code: main features . . . . . . . . . . . . . . . . . . . . 40
5.2.1 Hadron-Nucleus and hadron-nucleon interactions . . . . . . . 415.2.2 E-M showers . . . . . . . . . . . . . . . . . . . . . . . . . . . . 435.2.3 Multiple Scattering . . . . . . . . . . . . . . . . . . . . . . . . 455.2.4 Energy loss by particle in matter . . . . . . . . . . . . . . . . 455.2.5 Residual nuclei production and Decay . . . . . . . . . . . . . . 475.2.6 Transport of neutrons . . . . . . . . . . . . . . . . . . . . . . 495.2.7 Variance reduction techiniques . . . . . . . . . . . . . . . . . . 49
6 Simulations of the IR7 region 516.1 The FLUKA Combinatorial Geometry . . . . . . . . . . . . . . . . . 516.2 The FLUKA modular approach used for IR7 . . . . . . . . . . . . . . 526.3 The IR7 FLUKA prototypes . . . . . . . . . . . . . . . . . . . . . . . 52
6.3.1 The IR7 magnet models . . . . . . . . . . . . . . . . . . . . . 536.3.2 The Phase I collimator models . . . . . . . . . . . . . . . . . . 586.3.3 The BLM models . . . . . . . . . . . . . . . . . . . . . . . . . 61
6.4 The Phase II collimators FLUKA prototypes . . . . . . . . . . . . . . 626.5 The IR7 input file and executable . . . . . . . . . . . . . . . . . . . . 62
7 First exploratory studies on Phase II collimators 657.1 Collimator materials . . . . . . . . . . . . . . . . . . . . . . . . . . . 657.2 Preliminary Phase II designs . . . . . . . . . . . . . . . . . . . . . . . 677.3 Loss maps . . . . . . . . . . . . . . . . . . . . . . . . . . . . . . . . . 687.4 First Phase II results . . . . . . . . . . . . . . . . . . . . . . . . . . . 697.5 Simulation accuracy . . . . . . . . . . . . . . . . . . . . . . . . . . . 727.6 Conclusions on Phase II first results . . . . . . . . . . . . . . . . . . . 73
8 The SLAC Phase II design 758.1 The evolution of the SLAC Phase II design . . . . . . . . . . . . . . . 75
8.1.1 The actual SLAC Phase II design . . . . . . . . . . . . . . . . 778.2 The SLAC Phase II FLUKA model . . . . . . . . . . . . . . . . . . . 788.3 FLUKA results for the most advanced SLAC Phase II design . . . . . 81
8.3.1 Operation conditions . . . . . . . . . . . . . . . . . . . . . . . 828.3.2 Asynchronous dump scenario . . . . . . . . . . . . . . . . . . 87
8.4 The SLAC Phase II jaw rotation mechanism . . . . . . . . . . . . . . 918.5 Conclusions on the SLAC Phase II design . . . . . . . . . . . . . . . 95
9 The CERN Phase II design 979.1 Main features of the CERN Phase II design . . . . . . . . . . . . . . 97
9.1.1 The back stiffener . . . . . . . . . . . . . . . . . . . . . . . . . 989.1.2 The cooling system . . . . . . . . . . . . . . . . . . . . . . . . 98
Contents iii
9.1.3 The jaw . . . . . . . . . . . . . . . . . . . . . . . . . . . . . . 989.2 The evolution of the CERN Phase II Copper based design . . . . . . 99
9.2.1 FLUKA results for operation conditions . . . . . . . . . . . . 1039.3 CERN Phase II jaw material comparison . . . . . . . . . . . . . . . . 1089.4 Conclusion on the CERN Phase II design . . . . . . . . . . . . . . . . 114
10 Collimator setting errors 11710.1 Beam-based alignment of the collimator jaws . . . . . . . . . . . . . . 11710.2 FLUKA results for operation conditions . . . . . . . . . . . . . . . . 12010.3 Conclusion . . . . . . . . . . . . . . . . . . . . . . . . . . . . . . . . . 124
11 Activation of collimator materials 12711.1 CERN radiation limits and constraints . . . . . . . . . . . . . . . . . 12711.2 Details of FLUKA calculations . . . . . . . . . . . . . . . . . . . . . . 12811.3 FLUKA results . . . . . . . . . . . . . . . . . . . . . . . . . . . . . . 12911.4 Conclusion . . . . . . . . . . . . . . . . . . . . . . . . . . . . . . . . . 133
12 Optimization of the IR7 layout 13512.1 New proposed IR7 Phase II layout . . . . . . . . . . . . . . . . . . . . 13512.2 FLUKA results for operation conditions . . . . . . . . . . . . . . . . 13812.3 Conclusion . . . . . . . . . . . . . . . . . . . . . . . . . . . . . . . . . 140
13 The prompt radiation effects 14113.1 Overview of LHC critical areas . . . . . . . . . . . . . . . . . . . . . 141
13.1.1 Radiation effects on electronics . . . . . . . . . . . . . . . . . 14413.2 Radiation to electronics FLUKA results . . . . . . . . . . . . . . . . . 145
13.2.1 Radiation to electronics in UJ76 and RR77 (& RR73) . . . . . 14513.3 The BPMs integration studies . . . . . . . . . . . . . . . . . . . . . . 15113.4 Conclusion . . . . . . . . . . . . . . . . . . . . . . . . . . . . . . . . . 152
14 Displacement Per Atom (DPA) calculations 15314.1 Brief description of theoretical background . . . . . . . . . . . . . . . 15314.2 The BNL experiment . . . . . . . . . . . . . . . . . . . . . . . . . . . 157
14.2.1 Simulation results with MCNPX . . . . . . . . . . . . . . . . 16114.2.2 The BNL experiment simulated with FLUKA . . . . . . . . . 16114.2.3 Results comparison . . . . . . . . . . . . . . . . . . . . . . . . 163
14.3 DPA calculations for LHC collimators . . . . . . . . . . . . . . . . . . 16414.4 Conclusions on DPA calculations . . . . . . . . . . . . . . . . . . . . 165
15 Conclusions 167
A The principle of 2 stage Betatron and Momentum collimation 171A.1 One-Dimensional Betatron Collimation . . . . . . . . . . . . . . . . . 171A.2 One-Dimensional Momentum Collimation . . . . . . . . . . . . . . . . 174

iv Contents
B Phase I and Phase II collimator database 177B.1 Beam1 . . . . . . . . . . . . . . . . . . . . . . . . . . . . . . . . . . . 177B.2 Beam2 . . . . . . . . . . . . . . . . . . . . . . . . . . . . . . . . . . . 180
C Database of LHC Beam 1 collimators with tilt jaws 183C.1 Operational conventions for the collimator jaws . . . . . . . . . . . . 183C.2 Operational conventions for the collimator jaws . . . . . . . . . . . . 184
List of Figures
2.1 LHC accelator chain. . . . . . . . . . . . . . . . . . . . . . . . . . . . 42.2 LHC Schematic layout. . . . . . . . . . . . . . . . . . . . . . . . . . . 62.3 LHC Main dipole. . . . . . . . . . . . . . . . . . . . . . . . . . . . . . 8
3.1 View along the beam line in a horizontal secondary collimator . . . . 153.2 Illustration of the multi-stage LHC cleaning concept . . . . . . . . . . 173.3 View into an open vacuum tank of a LHC Phase I collimator . . . . . 203.4 Mechanical integration of a horizontal secondary collimator . . . . . . 213.5 Stability diagram at top energy to compare Phase I and Phase II
collimators . . . . . . . . . . . . . . . . . . . . . . . . . . . . . . . . . 233.6 Illustration of the multi-stage LHC cleaning concept with the Phase
II secondary collimators . . . . . . . . . . . . . . . . . . . . . . . . . 253.7 Inefficiency versus tune shift for Phase II . . . . . . . . . . . . . . . . 263.8 LHC tunnel view with the ready empty Phase II slots . . . . . . . . . 27
4.1 The simulation chain . . . . . . . . . . . . . . . . . . . . . . . . . . . 304.2 MAD-X output plot . . . . . . . . . . . . . . . . . . . . . . . . . . . 314.3 Beam distribution at the TCP.C6L7.B1 location for the asynchronous
beam dump scenario . . . . . . . . . . . . . . . . . . . . . . . . . . . 324.4 Space distribution of Beam 1 losses for a perfect LHC machine at
TCSM.A6L7.B1 location for the nominal horizontal scenario . . . . . 344.5 LHC perfect machine loss map at low beta, including the Copper jaws
Phase II collimators and without cryo-collimators . . . . . . . . . . . 354.6 Example of a 3D power deposition map . . . . . . . . . . . . . . . . . 36
5.1 Traces of a 6GeV proton in liquid argon . . . . . . . . . . . . . . . . 405.2 FLUKA and experimantal data of p-p and p-n cross sections . . . . . 425.3 Examples of particle production from inelastic interaction at different
energies . . . . . . . . . . . . . . . . . . . . . . . . . . . . . . . . . . 425.4 A schematic view of an electromagnetic shower caused by an electron
hitting a target . . . . . . . . . . . . . . . . . . . . . . . . . . . . . . 445.5 Stopping power for positive muons in Copper . . . . . . . . . . . . . 465.6 Ionization fluctuation for 2GeV/c protons after a 100µm Si layer.
FLUKA and experimental data . . . . . . . . . . . . . . . . . . . . . 46
v
vi List of Figures
5.7 Residual nuclei production from 1GeV 208Pb + p reaction . . . . . . 485.8 Dose rate benchmark . . . . . . . . . . . . . . . . . . . . . . . . . . . 48
6.1 Real view and FLUKA model of a MBW warm magnet . . . . . . . . 546.2 Real view, technical drawing and FLUKA model of a MQW warm
magnet . . . . . . . . . . . . . . . . . . . . . . . . . . . . . . . . . . . 546.3 Real view, technical drawing and FLUKA model of a MB cold magnet 556.4 FLUKA model showing the MQTL cold magnets and a MCBC corrector 566.5 Transverse sections of geometry and magnetic fields as implemented
in FLUKA . . . . . . . . . . . . . . . . . . . . . . . . . . . . . . . . . 576.6 Cross plots of TCP, TCSG and TCLA FLUKA prototypes . . . . . . 596.7 Real view and cross FLUKA plots of the longest Passive Absorber . . 606.8 BLM real views and FLUKA model . . . . . . . . . . . . . . . . . . . 616.9 FLUKA geometry of the IR7 Straight Section . . . . . . . . . . . . . 64
7.1 Deposited energy density for one 7TeV proton with 100nm impactparameter versus mass length for different possible collimator jawmaterials . . . . . . . . . . . . . . . . . . . . . . . . . . . . . . . . . . 66
7.2 Metallic and Foil Collimator FLUKA descriptions . . . . . . . . . . . 677.3 Transverse view of the skew TCSM.A6L7.B1 jaws, where the loaded
losses are shown for all (z) values along the collimator length both forthe standard design and for the foil one . . . . . . . . . . . . . . . . . 68
7.4 The :500 kW power distribution for the 0.2h beam lifetime scenarioin the IR7 SS region for different Phase II collimator jaws . . . . . . . 69
7.5 Peak power density longitudinal profile at the most loaded Phase IIlocation (TCSM.A6L7.B1) referring to the 1h 7TeV low beta hori-zontal losses scenario for the different materials . . . . . . . . . . . . 70
8.1 Jaw-Hub-Shaft concept to minimize the jaw deflection toward the beam 768.2 Cutaway of SLAC jaw . . . . . . . . . . . . . . . . . . . . . . . . . . 788.3 Evolution of the SLAC FLUKA model and comparison with the Catia
technical drawing . . . . . . . . . . . . . . . . . . . . . . . . . . . . . 798.4 SLAC jaw prototype and FLUKA model . . . . . . . . . . . . . . . . 808.5 FLUKA model evolution of the SLAC tank . . . . . . . . . . . . . . . 818.6 Cut of the IR7 FLUKA model showing the Phase I primary collima-
tors and the first 3 Phase II ones . . . . . . . . . . . . . . . . . . . . 828.7 Power deposition map at 20 cm longitudinal depth and along the col-
limator length for the horizontal halo scenario . . . . . . . . . . . . . 848.8 Comparison between the power density peak values on the Glidcop
jaws and on the Molybdenum shafts for the 3 halo distributions inthe 1h steady-state case . . . . . . . . . . . . . . . . . . . . . . . . . 85
8.9 Power maps and cumulative power values inside the jaws and shafts . 86
List of Figures vii
8.10 Geometrical and phase space distributions of protons coming from anasychronous dump at the entrance of the indicated horizontal colli-mators . . . . . . . . . . . . . . . . . . . . . . . . . . . . . . . . . . . 88
8.11 Energy density peaks along the jaw length in the case of the primaryhorizontal collimator impacted in consequence of an asynchronousdump accident . . . . . . . . . . . . . . . . . . . . . . . . . . . . . . . 90
8.12 View of the shaft support showing the Geneva Mechanism for preci-sion jaw rotation . . . . . . . . . . . . . . . . . . . . . . . . . . . . . 92
8.13 Schematic view at one jaw end of the Phase I movement control andinstrumentation . . . . . . . . . . . . . . . . . . . . . . . . . . . . . . 93
8.14 Picture of the additional limit switch for one SLAC jaw during thefeasibility tests at SLAC laboratory . . . . . . . . . . . . . . . . . . . 93
8.15 Schematic view of the actions performed by the additional routinecreated to rotate the SLAC jaws . . . . . . . . . . . . . . . . . . . . . 94
8.16 Jaw sagitta and temperature distribution under 9 kW heat load, simualtedby ANSYS, on the basis of the FLUKA 3D model results . . . . . . . 95
9.1 CERN Phase II design modular design . . . . . . . . . . . . . . . . . 999.2 FLUKA model of the preliminary CERN Phase II design version . . . 1009.3 Evolution of the CERN Phase II FLUKA model with the jaw cut in
3 pieces . . . . . . . . . . . . . . . . . . . . . . . . . . . . . . . . . . 1019.4 Current CERN Phase II FLUKA model components . . . . . . . . . . 1029.5 Evolution of the elastic deflections for the CERN Phase II copper
based jaw design . . . . . . . . . . . . . . . . . . . . . . . . . . . . . 1039.6 Power load distribution on the 11 Phase II Copper based jaw colli-
mators CERN design (1h beam lifetime scenario, horizontal lossesdistribution) . . . . . . . . . . . . . . . . . . . . . . . . . . . . . . . . 104
9.7 TCSM.A6L7.B1 3D power deposition map cuts . . . . . . . . . . . . 1049.8 LHC loss maps for the Beam 1 horizontal scenario with and without
cryo-collimators . . . . . . . . . . . . . . . . . . . . . . . . . . . . . . 1059.9 Comparison between power density peaks for the most loaded Phase
II collimator using loss maps with and without cryo-collimators . . . 1069.10 Power density peak profile for the most loaded Phase II collimator
(1h beam lifetime) . . . . . . . . . . . . . . . . . . . . . . . . . . . . 1079.11 FLUKA model of the CERN non conductive jaw design for Phase II
collimators . . . . . . . . . . . . . . . . . . . . . . . . . . . . . . . . . 1089.12 Instantaneous energy deposition due to asynchronous dumps using
different Phase II CERN design jaw materials . . . . . . . . . . . . . 1099.13 Energy deposition distributions along the IR7 line for the 3 scenarios
of impact on horizontal collimators due to an asynchronous dumpaccident . . . . . . . . . . . . . . . . . . . . . . . . . . . . . . . . . . 110
viii List of Figures
9.14 Energy deposition peak comparison between the Phase II TCSM.B4L7.B1directly impacted on the external jaw for the considered asynchronousdump scenario and the resulting most loaded element (i.e. Phase IITCSM.A4L7.B1) . . . . . . . . . . . . . . . . . . . . . . . . . . . . . 111
9.15 Comparison between different jaw material energy deposition peaksfor the most loaded Phase II TCSM.A6L7.B1 resulting from the asyn-chronous dump scenario of TCP.C6L7.B1 directly impacted . . . . . . 112
9.16 Basic CERN Phase II jaw prototype . . . . . . . . . . . . . . . . . . 114
10.1 Procedure to centre the collimator jaws around the circulating beam . 11810.2 Sketch of a horizontal Phase I secondary collimator installed in the
LHC tunnel . . . . . . . . . . . . . . . . . . . . . . . . . . . . . . . . 11810.3 Illustration of set-up errors for the LHC collimation jaws used as input
for FLUKA simulations . . . . . . . . . . . . . . . . . . . . . . . . . . 11910.4 Comparison between power deposition on the SS IR7 Beam 1 elements
with and without LHC collimator jaw tilts . . . . . . . . . . . . . . . 12010.5 Reductions and increments on power deposition for the 11 Phase II
collimators in case of misaligned jaws . . . . . . . . . . . . . . . . . . 12110.6 Reductions and increments on power deposition for each Phase I pri-
mary and Phase II jaw in case of misalignement. . . . . . . . . . . . . 12210.7 Top: Total loads along the most impacted part of the IR7 Beam 1
line. Middle: Absolute reductions and increments. Bottom: Absolutepercentage reductions and increments (tilted jaw case vs. ideal jawcase) . . . . . . . . . . . . . . . . . . . . . . . . . . . . . . . . . . . . 123
10.8 Local Cleaning Inefficiency for various imperfection scenarios . . . . . 124
11.1 Irradiation profile assumed during residual dose rate FLUKA simula-tions . . . . . . . . . . . . . . . . . . . . . . . . . . . . . . . . . . . . 129
11.2 Ambient dose equivalent distribution after 185 days of continuousoperation and 1 day of cooling time along the all IR7 straight section 130
11.3 Ambient dose equivalent distribution for different Phase II designsafter 185 days of continuous operation and 1 day of cooling period . . 131
11.4 Ambient dose equivalent peaks for the 2 different Phase II designs atthe most loaded TCSM.A6L7.B1 location and using different coolingtimes . . . . . . . . . . . . . . . . . . . . . . . . . . . . . . . . . . . . 132
12.1 Proposed optimized layout for Phase II collimators along IR7 Beam1 line . . . . . . . . . . . . . . . . . . . . . . . . . . . . . . . . . . . . 137
12.2 Optimized layout vs. layout envisaging 11 Phase II CERN design Cujaw collimators: power deposition along the LSS7 . . . . . . . . . . . 139
12.3 Sketch of IR7 line in which the tunnel service areas UJ76 and RR77are shown . . . . . . . . . . . . . . . . . . . . . . . . . . . . . . . . . 140
List of Figures ix
13.1 A LHC graphical area classification by radiation levels, as well as,when known, by criticality of installed electronics . . . . . . . . . . . 143
13.2 High Energy Hadrons Fluence (> 20MeV ) along IR7 averaged in theorange area, close to the LHC tunnel wall . . . . . . . . . . . . . . . 146
13.3 High Energy Hadrons Fluence (> 20MeV ) in the UJ76 cavern, dueto Beam 1 line simulations . . . . . . . . . . . . . . . . . . . . . . . . 147
13.4 High Energy Hadrons Fluence (> 20MeV ) in the UJ76 cavern, dueto Beam 1 and Beam 2 line simulations . . . . . . . . . . . . . . . . . 148
13.5 High Energy Hadrons Fluence (> 20MeV ) in the RR77 cavern . . . 14913.6 Location of electronic racks in the RR77 and UJ76 caverns . . . . . . 150
14.1 Comparison between the partition functions for α particles on Silicon,calculated using the Lindhard (black line) or the Zieler (blue line)approximations . . . . . . . . . . . . . . . . . . . . . . . . . . . . . . 157
14.2 BNL experimental facility used in the material irradiation study . . . 15814.3 Cross section of the irradiated targets . . . . . . . . . . . . . . . . . . 15914.4 Specimen design for mechanical and physical property studies . . . . 15914.5 Front view of the target with the integration of different types of
specimens into the irradiation space . . . . . . . . . . . . . . . . . . . 16014.6 Real cross view of target irradiation assembly and the FLUKA model
implemented . . . . . . . . . . . . . . . . . . . . . . . . . . . . . . . . 16214.7 DPA peak values along the target assembly . . . . . . . . . . . . . . . 16314.8 DPA values along the CERN design Glidcop jaws for the most loaded
Phase II collimator location . . . . . . . . . . . . . . . . . . . . . . . 16514.9 DPA results form different MonteCarlo code for 130MeV/u 76Ge im-
pacting on 1.2mm thick Tungsten target . . . . . . . . . . . . . . . . 166
A.1 Proton hitting the primary collimator . . . . . . . . . . . . . . . . . . 172A.2 Secondary particles intercepted by secondary collimators . . . . . . . 173A.3 Phase space at primary collimator for momentum collimation . . . . . 174
C.1 Operational naming conventions for the collimator jaws . . . . . . . . 183

x List of Figures
List of Tables
2.1 LHC beam parameters . . . . . . . . . . . . . . . . . . . . . . . . . . 52.2 List of LHC SuperConducting magnets . . . . . . . . . . . . . . . . . 7
3.1 Specified beam lifetimes during operation . . . . . . . . . . . . . . . . 123.2 Overview on expected physical LHC aperture limits . . . . . . . . . . 183.3 Quantities and LHC locations for Phase I Collimation System com-
ponents . . . . . . . . . . . . . . . . . . . . . . . . . . . . . . . . . . 19
7.1 Density, Atomic number, Radiation length and Inelastic scatteringlength for possible Phase II candidate materials . . . . . . . . . . . . 66
7.2 Integral values of power on the most loaded Beam 1 Phase II colli-mator (TCSM.A6L7.B1) . . . . . . . . . . . . . . . . . . . . . . . . . 71
8.1 Simulated evolution performance of the different SLAC collimatorconcepts . . . . . . . . . . . . . . . . . . . . . . . . . . . . . . . . . . 77
8.2 Summary of Power deposition results on the collimator TCSM.A6L7.B1for the 3 halo scenarios . . . . . . . . . . . . . . . . . . . . . . . . . . 83
8.3 Summary of Power deposition results on the collimator TCSM.A6L7.B1components for the horizontal halo scenario . . . . . . . . . . . . . . 84
8.4 Energy deposition on the most loaded Beam 1 elements in the caseof TCP.C6L7.B1 directly impacted . . . . . . . . . . . . . . . . . . . 89
8.5 Energy deposition on the most loaded Beam 1 elements in the caseof TCSM.B4L7.B1 directly impacted . . . . . . . . . . . . . . . . . . 89
8.6 Energy deposition on the most loaded Beam 1 elements in the caseof TCSM.6R7.B1 directly impacted . . . . . . . . . . . . . . . . . . . 89
8.7 Energy density peaks and instantaneous increases of temperature forthe most loaded device for the 3 asynchronous dump scenarios . . . . 90
9.1 Physical properties of the most promising jaw materials for the CERNPhase II design . . . . . . . . . . . . . . . . . . . . . . . . . . . . . . 99
9.2 Energy density peaks and instantaneous increases of temperature (T)for asynchronous beam dump scenarios. Results refer only to CERNdesign Phase II collimators and to their most loaded jaw . . . . . . . 113
xi
xii List of Tables
12.1 Proposed layout for the 11 Phase II collimators located in IR7 alongthe Beam 1 line . . . . . . . . . . . . . . . . . . . . . . . . . . . . . . 136
13.1 High Energy Hadrons Fluence (> 20MeV ), 1MeV equivalent neu-tron Fluence and Dose values in the UJ76 and RR77 racks for Beam1 simulations with Glidcop jaw Phase II collimation . . . . . . . . . . 151
13.2 High Energy Hadrons Fluence (> 20MeV ), 1MeV equivalent neu-tron Fluence and Dose values in the most exposed Rack1 in bothUJ76 and RR77 for Beam 1 simulations with Glidcop jaw Phase IIand optimized Phase II layout . . . . . . . . . . . . . . . . . . . . . . 151
14.1 Typical values used in NJOY99 code . . . . . . . . . . . . . . . . . . 15614.2 DPA values for the BNL irradiation experiment calculated by MCNPS
and FLUKA MonteCarlo codes . . . . . . . . . . . . . . . . . . . . . 164
B.1 List of Phase I and Phase II (in red) collimators in the main ring forBeam1 . . . . . . . . . . . . . . . . . . . . . . . . . . . . . . . . . . . 177
B.2 List of Phase I and Phase II (in red) collimators in the main ring forBeam2 . . . . . . . . . . . . . . . . . . . . . . . . . . . . . . . . . . . 180
C.1 List of Beam 1 Phase I and Cu Phase II collimators with jaw tiltedat low beta . . . . . . . . . . . . . . . . . . . . . . . . . . . . . . . . 184
Chapter 1
Introduction
CERN’s Large Hadron Collider (LHC) has become on November 2009 the world’shighest energy particle accelerator, having accelerated its proton beams to an energyof 1.18TeV each. It marks an important milestone on the road toward the collisionsat nominal energy of 14TeV (7TeV per beam), aiming at the discovery of the Higgsparticle and the study of rare events.
A characteristic of the LHC is its large stored energy of 362MJ per proton beamat nominal scenario. The very intense LHC beam must be handled in a SuperCon-ducting (SC) environment with quench limits of the order of 10mWcm−3, whichrepresents a tiny fraction of the stored power. In order to prevent that unavoidableproton beam losses can bring to reach these limits in SC magnets, a sophisticatedsystem of collimators is needed to provide beam cleaning and passive machine pro-tection.
The LHC Collimation System is installed and commissioned in different phases,following the natural evolution of the machine performance. The full CollimationSystem (including the transfer lines) foresees more than 150 locations with the designgoal not only of avoiding quenches of SC magnets but also of protecting other LHCequipments from radiation damage and of minimizing the halo induced backgroundin the particle physics experiments. Due to the high beam power, LHC is the firstmachine which requires collimation through its whole operation cycle: from injectionup to physics and extraction.
The installation of the full first stage (Phase I) was completed for 2009 operationof the LHC, after the incident in Sector 3-4. This system is adequate for beamcommissioning but will not allow nominal beam Intensity. To improve CleaningEfficiency toward the end of the low beta squeeze at 7TeV , and in stable physicsconditions, it is foreseen to complement the 30 highly robust Phase I secondarycollimators with low impedance Phase II collimators. The Phase II collimators willbe located in the two insertions regions IR3 for the momentum cleaning, and IR7 forthe betatron cleaning, about 4-5 years after the first physics runs. These locations,where important beam losses are expected, will be among the most radioactive areasof LHC.
1

2 1. Introduction
As part of the evaluation of the different designs, the application of a parti-cle transport and interaction Monte-Carlo code, like FLUKA, is fundamental toestimate, before any Phase II collimator is installed in the machine, key physicalquantities such as the energy deposition in the irradiate materials, the dose releasedin delicate components and the environmental activation. These predictions have acrucial impact on the performance and luminosity of LHC.
This PhD thesis is addressing the issues of high power deposition (up to 500 kWimpacting power for continuous losses in nominal conditions) for their possible usein the LHC Collimator System upgrade. Using as input accelerator physics calcu-lations, the FLUKA Monte Carlo code was extensively used to evaluate the energydeposition due to the interaction of high energy protons with the various materialsof the collimators, the other beam elements and the surrounding tunnel environmentby performing full shower studies.
The first part of this PhD is dedicated to the description of the CollimationSystem as it is now installed, its limitations and the upgrade foreseen. Chapters4 and 5 describe the simulation set-up employed and the FLUKA physic modelsunderneath. Chapter 6 shows how the LHC Betatron cleaning insertion is describedin FLUKA. Results predicting the maximum equipment heating during the operationscenario and for abnormal beam losses, from the preliminary exploratory studiesthrough the most promising Phase II designs and prototypes evolution, are presentedin Chapters 7, 8 and 9. Additional effects related to the reduction of the jaw activelength, due to misalignment setting errors, are evaluated in Chapter 10. Chapter 11describes the activation of the collimator materials. On the basis of these results, acombination of different Phase II designs is proposed in Chapter 12 for the elevenpositions foreseen along the IR7 Straight Section. Finally, to estimate the radiationdamage amount in the Phase II jaws and in the sorrounding areas, Prompt Doseand Displacements Per Atom (DPA) calculations are performed and reported inChapters 13 and 14. To validate the DPA model used, the results are comparedto the available data from the Brookhaven National Laboratory (BNL) radiationdamage experiment.
The PhD results have been used by mechanical engineers as input for designingcollimators, shielding and optimizations at CERN and at SLAC National AcceleratorLaboratory in USA inside the framework of the international collaboration in chargeof the Collimation System Upgrade project.
On January the 8th (2010), the first basic Phase II prototype was installed in theSPS accelerator to test the feasibility of Beam Position Monitor buttons (BPMs)installed in the jaws.

Chapter 2
The Large Hadron Collider
The construction of the LHC machine and its detectors has been a project spanningalmost 15 years and involving scientists and engineers from all over the world [1]. Itconsists in a two-ring, SuperConducting accelerator and collider installed in a 27 kmlong circular tunnel at a depth ranging from 50 to 175m underground, betweenFrance and Switzerland. The LHC is designed to accelerate and collide two coun-terrotating proton beams up to 7TeV and, during a smaller part of the machineoperating time, heavy ion beams up to 574TeV . Each beam is guided around itscircular orbit by powerful SC magnets cooled in a bath of superfluid helium andbrought into collision in four huge detectors.
2.1 The LHC accelerator chainNo single machine can accelerate all alone a proton beam up to 7TeV : one needsa cascade of accelerators. Before reaching the LHC main ring, the protons areaccelerated in stages through 4 machines as it is shown in Fig. 2.1. After beingextracted from the source called Duoplasmatron at an energy of 50 keV , the protonsenter in the 35m long linear accelerator (LINAC), where their energy is increasedup to 50MeV . The next step is the BOOSTER synchrotron accelerator, whichthe protons leave at 1.4GeV to being injected in the Proton Synchrotron (PS). Inthis machine the particles are grouped into a train of bunches at the right nominalspacing of 25ns. Each bunch are accelerated up to 26GeV/c in the PS. The lastmachine in which the protons have to pass through is the Super Proton Synchrotron(SPS), where they are further accelerated up to 450GeV and then injected into theLHC, balancing the filling in both clockwise and counterclockwise rings. When thetwo rings are filled, the beams are accelerated by the radio frequency system andsimultaneously the magnetic field of the LHC is slowly ramped up to keeps themin the center of the vacuum chamber. After about 20 minutes the beams reach thenominal collision energy of 7TeV and they are steered into collision in each of the4 detectors.
3

4 2. The Large Hadron Collider
Figure 2.1: The LHC proton accelerator chain. Collisions take place in the fourInteraction Points (IP), the yellow dots.
When the LHC is used to collide heavy ions, they will be first accelerated by thelinear accelerator LINAC 3 and into the Low-Energy Ion Ring (LEIR) before beinginjected in the PS, SPS and finally in LHC, as for the proton beams.
2.2 The LHC experimentsThe LHC provides extraordinary opportunities in particle physics based both on itshigh beam Energies and high beam Intensities. It hosts six experiments to detectevents generated in its collisions.
The rate of these events is given by:
Nevent = Lσevent (2.1)
where σevent is the cross section of the event under study and L the machine Lumi-nosity. The Luminosity is an important value to characterize the performance of anaccelerator. The machine Luminosity is determinated by a set of beam parametersand it can be written for a Gaussian beam distribution as:
L = N2b nbfrevγr4πεnβ∗
F, (2.2)
2.2. The LHC experiments 5
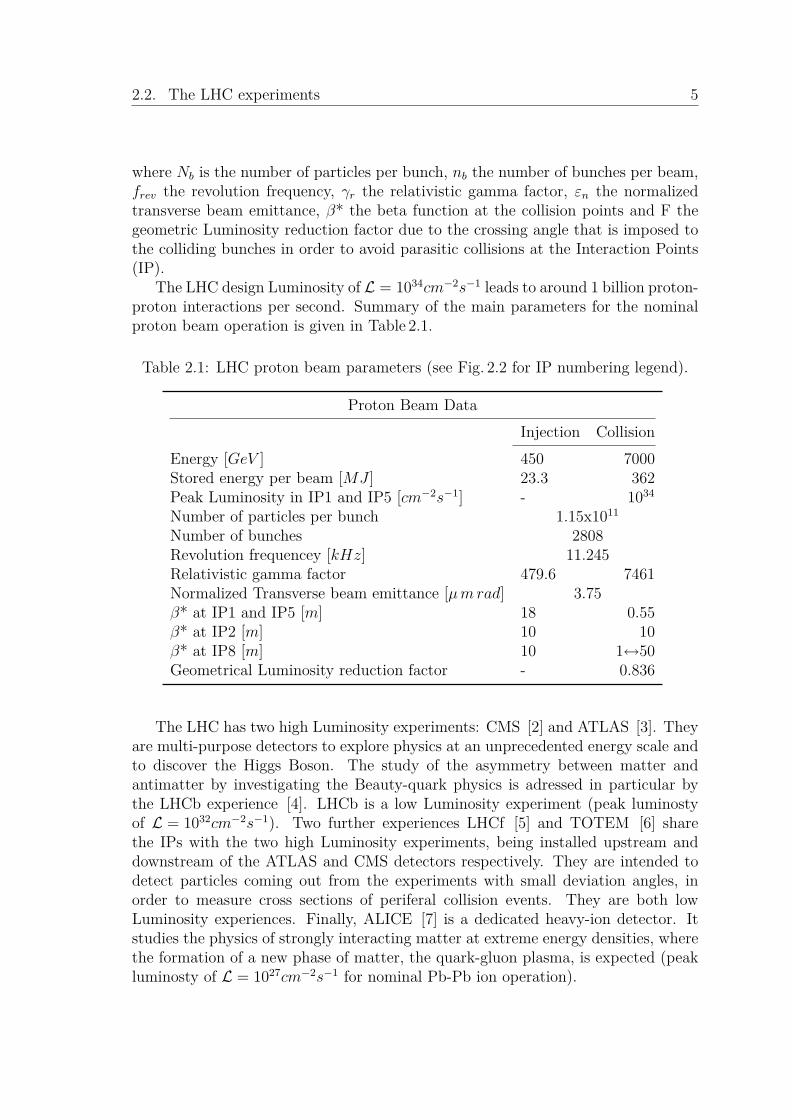
where Nb is the number of particles per bunch, nb the number of bunches per beam,frev the revolution frequency, γr the relativistic gamma factor, εn the normalizedtransverse beam emittance, β* the beta function at the collision points and F thegeometric Luminosity reduction factor due to the crossing angle that is imposed tothe colliding bunches in order to avoid parasitic collisions at the Interaction Points(IP).
The LHC design Luminosity of L = 1034cm−2s−1 leads to around 1 billion proton-proton interactions per second. Summary of the main parameters for the nominalproton beam operation is given in Table 2.1.
Table 2.1: LHC proton beam parameters (see Fig. 2.2 for IP numbering legend).
Proton Beam DataInjection Collision
Energy [GeV ] 450 7000Stored energy per beam [MJ ] 23.3 362Peak Luminosity in IP1 and IP5 [cm−2s−1] - 1034
Number of particles per bunch 1.15x10¹¹
Number of bunches 2808Revolution frequencey [kHz] 11.245Relativistic gamma factor 479.6 7461Normalized Transverse beam emittance [µmrad] 3.75β* at IP1 and IP5 [m] 18 0.55β* at IP2 [m] 10 10β* at IP8 [m] 10 1↔50Geometrical Luminosity reduction factor - 0.836
The LHC has two high Luminosity experiments: CMS [2] and ATLAS [3]. Theyare multi-purpose detectors to explore physics at an unprecedented energy scale andto discover the Higgs Boson. The study of the asymmetry between matter andantimatter by investigating the Beauty-quark physics is adressed in particular bythe LHCb experience [4]. LHCb is a low Luminosity experiment (peak luminostyof L = 1032cm−2s−1). Two further experiences LHCf [5] and TOTEM [6] sharethe IPs with the two high Luminosity experiments, being installed upstream anddownstream of the ATLAS and CMS detectors respectively. They are intended todetect particles coming out from the experiments with small deviation angles, inorder to measure cross sections of periferal collision events. They are both lowLuminosity experiences. Finally, ALICE [7] is a dedicated heavy-ion detector. Itstudies the physics of strongly interacting matter at extreme energy densities, wherethe formation of a new phase of matter, the quark-gluon plasma, is expected (peakluminosty of L = 1027cm−2s−1 for nominal Pb-Pb ion operation).
6 2. The Large Hadron Collider
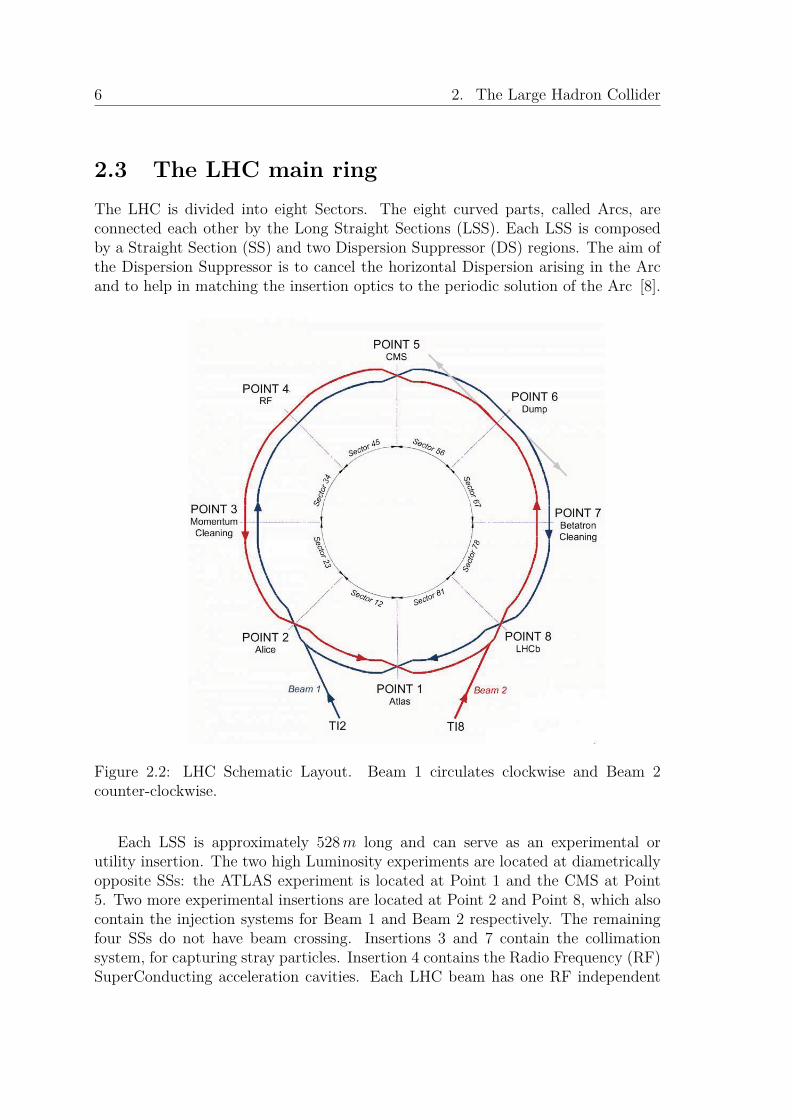
2.3 The LHC main ringThe LHC is divided into eight Sectors. The eight curved parts, called Arcs, areconnected each other by the Long Straight Sections (LSS). Each LSS is composedby a Straight Section (SS) and two Dispersion Suppressor (DS) regions. The aim ofthe Dispersion Suppressor is to cancel the horizontal Dispersion arising in the Arcand to help in matching the insertion optics to the periodic solution of the Arc [8].
Figure 2.2: LHC Schematic Layout. Beam 1 circulates clockwise and Beam 2counter-clockwise.
Each LSS is approximately 528m long and can serve as an experimental orutility insertion. The two high Luminosity experiments are located at diametricallyopposite SSs: the ATLAS experiment is located at Point 1 and the CMS at Point5. Two more experimental insertions are located at Point 2 and Point 8, which alsocontain the injection systems for Beam 1 and Beam 2 respectively. The remainingfour SSs do not have beam crossing. Insertions 3 and 7 contain the collimationsystem, for capturing stray particles. Insertion 4 contains the Radio Frequency (RF)SuperConducting acceleration cavities. Each LHC beam has one RF independent
2.4. The LHC SuperConducting Magnets 7
system. Acceleration is obtained by a longitudinal oscillating electric field at afrequency of 400MHz in a set of resonant cavities. The SS at Point 6 containsthe beam abort systems for the two beams, which allows the beams to be extractedsafely and deposited onto external dumps capable of absorbing the considerablestored energy.
Protons injected in the LHC main ring have to increase their energy from 0.45to 7TeV . SC magnets are necessary to steer, bend and focus the particle beams.
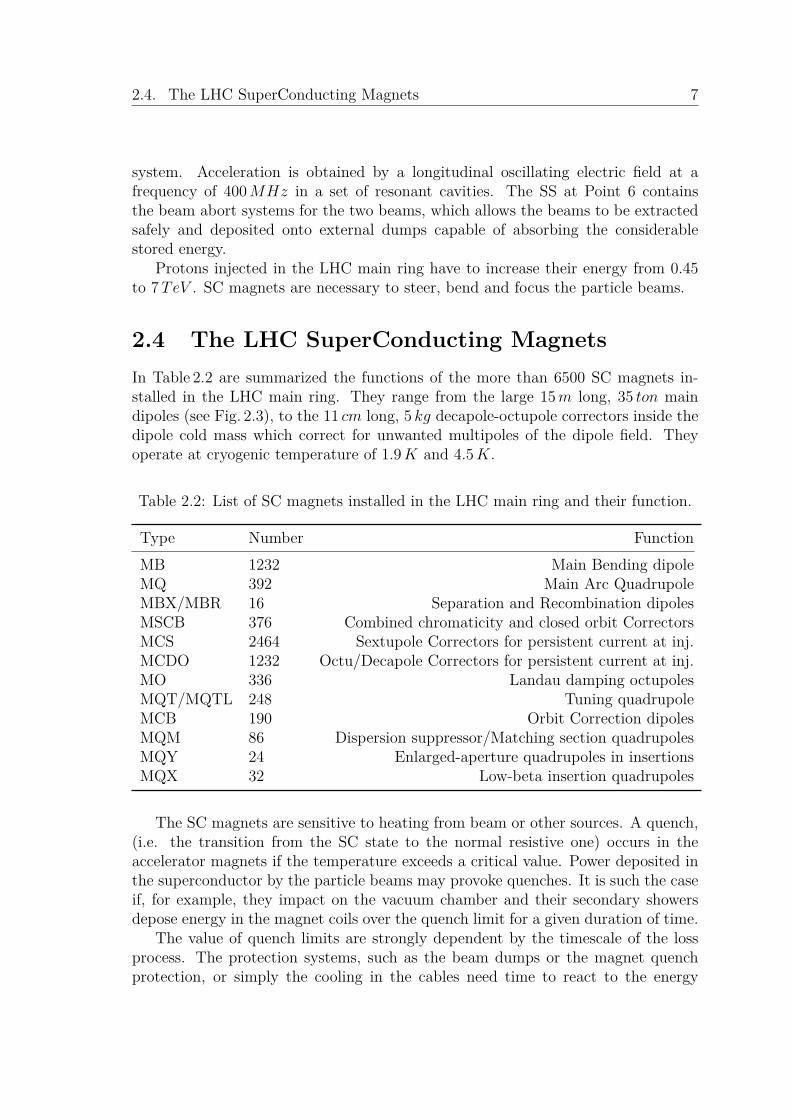
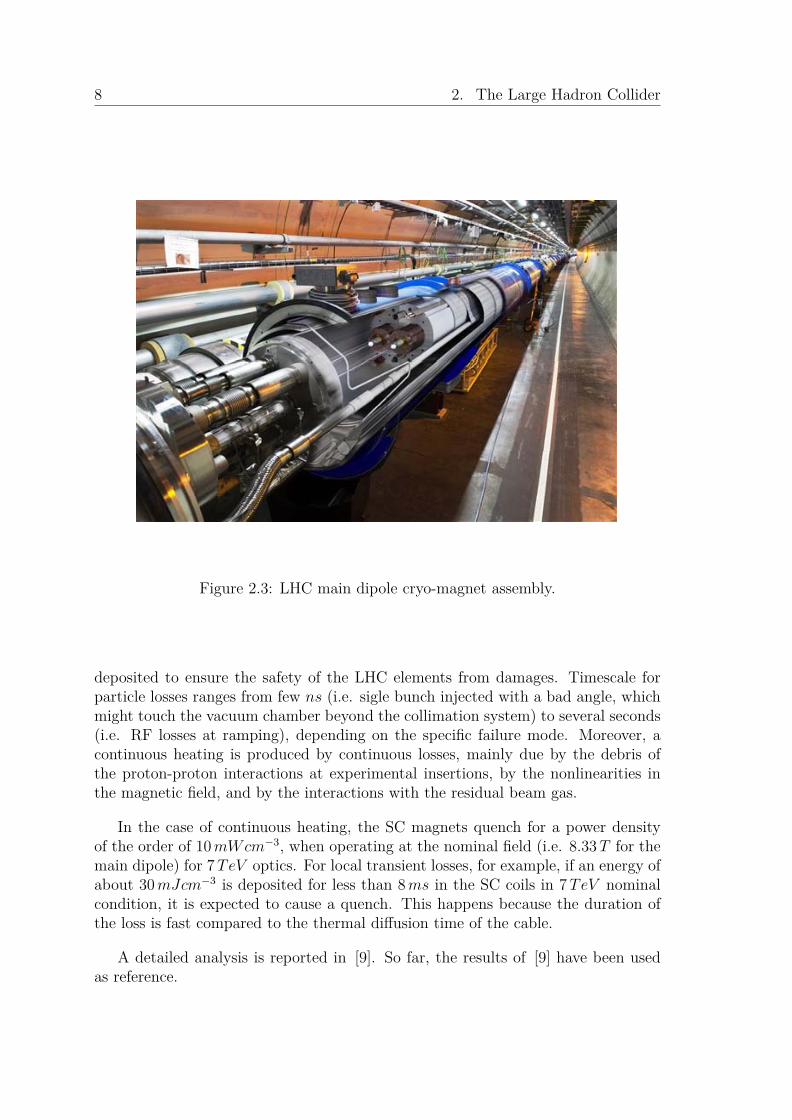
2.4 The LHC SuperConducting MagnetsIn Table 2.2 are summarized the functions of the more than 6500 SC magnets in-stalled in the LHC main ring. They range from the large 15m long, 35 ton maindipoles (see Fig. 2.3), to the 11 cm long, 5 kg decapole-octupole correctors inside thedipole cold mass which correct for unwanted multipoles of the dipole field. Theyoperate at cryogenic temperature of 1.9K and 4.5K.
Table 2.2: List of SC magnets installed in the LHC main ring and their function.
Type Number FunctionMB 1232 Main Bending dipoleMQ 392 Main Arc QuadrupoleMBX/MBR 16 Separation and Recombination dipolesMSCB 376 Combined chromaticity and closed orbit CorrectorsMCS 2464 Sextupole Correctors for persistent current at inj.MCDO 1232 Octu/Decapole Correctors for persistent current at inj.MO 336 Landau damping octupolesMQT/MQTL 248 Tuning quadrupoleMCB 190 Orbit Correction dipolesMQM 86 Dispersion suppressor/Matching section quadrupolesMQY 24 Enlarged-aperture quadrupoles in insertionsMQX 32 Low-beta insertion quadrupoles
The SC magnets are sensitive to heating from beam or other sources. A quench,(i.e. the transition from the SC state to the normal resistive one) occurs in theaccelerator magnets if the temperature exceeds a critical value. Power deposited inthe superconductor by the particle beams may provoke quenches. It is such the caseif, for example, they impact on the vacuum chamber and their secondary showersdepose energy in the magnet coils over the quench limit for a given duration of time.
The value of quench limits are strongly dependent by the timescale of the lossprocess. The protection systems, such as the beam dumps or the magnet quenchprotection, or simply the cooling in the cables need time to react to the energy
8 2. The Large Hadron Collider
Figure 2.3: LHC main dipole cryo-magnet assembly.
deposited to ensure the safety of the LHC elements from damages. Timescale forparticle losses ranges from few ns (i.e. sigle bunch injected with a bad angle, whichmight touch the vacuum chamber beyond the collimation system) to several seconds(i.e. RF losses at ramping), depending on the specific failure mode. Moreover, acontinuous heating is produced by continuous losses, mainly due by the debris ofthe proton-proton interactions at experimental insertions, by the nonlinearities inthe magnetic field, and by the interactions with the residual beam gas.
In the case of continuous heating, the SC magnets quench for a power densityof the order of 10mWcm−3, when operating at the nominal field (i.e. 8.33T for themain dipole) for 7TeV optics. For local transient losses, for example, if an energy ofabout 30mJcm−3 is deposited for less than 8ms in the SC coils in 7TeV nominalcondition, it is expected to cause a quench. This happens because the duration ofthe loss is fast compared to the thermal diffusion time of the cable.
A detailed analysis is reported in [9]. So far, the results of [9] have been usedas reference.
2.5. The LHC Cleaning Insertion Regions 9
2.5 The LHC Cleaning Insertion RegionsParticle losses can be minimized but cannot be completely eliminated. As the beamsare stored for many hours, a so-called primary beam halo of particles slowly buildsup around the core due to various dynamic processes and to magnetic field errors.If it is left uncontrolled, eventually particles would hit the vacuum chamber wall,producing unacceptable background in the detectors and risking a quench in someof the magnets.
It is thus necessary to "clean" the beam by this halo, removing it locally. Thisis done by a sophisticated system of collimators, mainly installed in the two LHCcleaning Insertions Regions (IR).
2.5.1 The Momentum Cleaning Insertion IR3The Insertion Region IR3 houses the Momentum Cleaning system for both beams.Particles with a large momentum offset are intercepted here.
The Momentum deviation of the nominal circulating beam does not exceed±10−3. Particles which are in the RF-bucket and have stable betatron oscillationsbelow the cut of the betatron cleaning are not intercepted.
In order to fulfill this requirement and to decouple the momentum collimationfrom the betatron collimation in IR7, the primary collimator jaws in IR3 were locatedin a position with large Dispersion, generated ad-hoc in IR3 by over compensatingthe natural dispersion suppression in the DSs. The primary collimator interceptdirectly the primary beam halo.
Since the off-momentum losses are all in the horizontal plane, the IR3 collimatorsare mostly horizontal.
2.5.2 The Betatron Cleaning Insertion IR7The Betatron system allows to limit the transverse extension of the beam halo by"cleaning" particles with large Betatron oscillation amplitude. This is optimised byinstalling primary collimators in a low Dispersion region, in order to reduce the effectof the off-momentum motion on the collimation.
It has to be noted that, while a pure betatron cleaning is achievable in regionsof the machine with Dispersion close to zero, like IR7, off-momentum particles hasgenerally a non negligible betatron component as well.

10 2. The Large Hadron Collider

Chapter 3
The LHC Collimation System
In nominal conditions the LHC foresees to store 362MJ in each proton beam andup to 1GJ in some upgrade scenarios. This is far beyond the present world recordof 2-3MJ in storage rings like HERA or TEVATRON. The high beam intensity inthe LHC requires a careful control of the beam losses around the ring. Stored energyof the order of mJcm−3 in the SC magnets can cause a quench.
A sophisticated multi-stage Collimation System is implemented with the mainfunctionality of beam cleaning to intercept efficiently the unavoidable losses dur-ing operation, passive machine protection to protect the accelerator elementsagainst abnormal beam losses and radiation, and minimization of halo-inducedbackground in the particle physics experiments to ensure a clear data acqui-sition [10].
3.1 Why is the LHC collimation essential?The evolution of the loss rate can be quantified by the so-called beam lifetime τ .The beam lifetime plays an important role in the storage rings.
For a beam containing N particles, τ is defined through its relative loss rate at agiven time as:
1τ
= − 1N
dN
dt(3.1)
τ represents the time needed to reduce the number of particles to a fraction 1/eof the initial intensity.
In operating conditions, the number of the LHC beam protons at initial nomi-nal intensity is about 3.2x10¹⁴ (equal to 1.15x10¹¹ particles per bunch, times 2808bunches (see Table 2.1)). Different beam lifetimes τ of 1h, 20h, 100h correspond tobeam loss rates dN
dtof the order of 1011, 5x10⁹, 109 protons/s, respectively.
It is quite likely that all these protons hit the vacuum chamber at one azimutalposition, where the beam, due to a combination of closed orbit, misalignment and
11

12 3. The LHC Collimation System
other errors, makes its closest approach to the pipe wall. It is unpredictable wherethis can occur and whether they will hit the vertical or the horizontal side of thechamber or both together in different locations where the beta function happensto be large. However, it is beyond doubt that the worst case of losses in a singlelocation is on a SC magnet, where they can cause a quench.
During steady physics conditions at 7TeV , combining the effects of collisions,residual gas and emittance growth, beam lifetimes of the order of 100h are unrealistic[11]. In this case, the losses are still two orders of magnitude by above the referenceSC quench limit ∼ 107 reported in [9].
A beam cleaning system is thus essential to avoid that this can happen.For its high intense beams, LHC requires that collimators are used from the
injection until nominal operation conditions.
3.2 The LHC Collimation System requirementsThe LHC is entering an unknown territory as far as are concerned beam lossesand collimation. The destructive potential of the LHC beams has imposed severalrequirements and constraints in designing its Collimation System [12].
3.2.1 Beam loss rates during regular operationRegular operation of the LHC beams requires a reasonable range of acceptable beamlifetimes without the collimators being damaged or the beam being dumped. Lowbeam lifetimes can occur due to orbit and optics changes during the whole operationcycle. The range of acceptable lifetimes for LHC is defined on the base of operationalexperience with various colliders (LEP, RHIC, TEVATRON and HERA). It mustbe large enough to allow commissioning of the machine and performance tuning innominal running.
Table 3.1 summarizes the specific lifetimes and the corresponding maximumpower deposition in the cleaning insertions. For period of up to 10 s, a beam lifetimeof 0.1h (injection) and 0.2h (top energy) has to be accepted. For continuous lossesa minimum possible lifetime of 1h is specified for both injection and top energy.
Table 3.1: Specified beam lifetimes τ during operation and corresponding durationT, proton loss rate Rloss and maximum power deposition Ploss.
Energy τ [h] T [s] Rloss [p/s] Ploss [kW ]Injection 450GeV 1.0 cont. 0.86x10¹¹ 6
0.1 10 8.6x10¹¹ 63Top Energy 7TeV 1.0 cont. 0.86x10¹¹ 97
0.2 10 4.3x10¹¹ 487

3.2. The LHC Collimation System requirements 13
3.2.2 Abnormal proton lossesAbnormal losses result from failure or irregular behaviour of accelerator components.Primary proton losses will occur at the collimators if they are at nominal positionsand they will be continuosly monitored with the fast Beam Loss Monitor (BLM).About 4000 BLMs are installed along the ring [15]. When irregular beam lossesare detected, a beam abort is initiated and completed within 2-3 turns in about150-300µs, without damages on any accelerator elements including collimators.
Here it is assumed that in case of equipment failure the disturbed beam willalways end up in the beam dump. However, this machine protection philosophydoes not protect against single turn problems, like irregularities of the beam dumpitself at top energy and at injection, or abnormal injected beam.
In these accidental scenarios, several bunches may be deflected on a collimatorjaw. The collimators jaws have to withstand these impacts.
3.2.2.1 Abnormal injected beam
During injection, transverse and longitudinal mis-matching between the end of thetransverse line and the injection point can cause the deflection of the full injectedbatch (288 bunches) on any downstream aperture limit.
3.2.2.2 Irregularities of the beam dump
Two causes of abnormal proton losses are identified for the faulty operation of theextraction resistive dump kickers magnets (i.e. MKDs) [16]:
• Asynchronous beam dump due to the all 15 MKDs mis-firing. In this case,all the 15 MKDs are triggered simultaneously but with the uncorrect phaserespect to the beam abort gap. Part of the LHC beam is thus swept acrossthe machine aperture by the rising kicker voltage.
• Asynchronous beam dump due to a spontaneous firing of 1 of the 15 MKDs.When this happens, the remaining 14 MKDs are re-triggered. Times of 1.2µsat injection and of 0.7µs at top energy are necessary for retriggering andrestoring the synchronized beam abort.
At 7TeV , the second case is the most severe one on the downstream components,since the deflection is smaller and more intensity will impact per σ, where σ =
√βε
is the local beam size calculated from beta function and the emittance ε.For Phase I it was required to withstand the hit of 8 nominal bunches on one
collimator jaw, in case of primary collimators not in their nominal position but ata distance of 5σx from the center of the beam. The range of the impact was from5σx to 10σx. Above 10σx, local dump protection devices were assumed to interceptall beam. Improvement on the protection devices has reduced the requirement toabout 5 impacting bunches.

14 3. The LHC Collimation System
The abnormal beam dump scenarios considered only affect the horizontal beamdistribution, so only horizontal collimators (and a few skew ones to a certain extent)are concerned by the dump errors.
3.2.3 Cleaning InefficiencyThe performance of the collimation system is measured by the global Cleaning In-efficiency ηc. At a given amplitude Ai of betatron motion, ηc is defined as theratio between the number of particles Np with an amplitude above Ai and the totalnumber of particles absorbed in the collimation system Nabs:
ηc = Np(A > Ai)Nabs
(3.2)
For the LHC Ai=10σ is considered a typical case (equal to the aperture of theabsorbers, see Appendix B). In case of LHC operating at top energy, ηc should besmaller than 10−3, corresponds to 99.9% Efficiency (Collimation Efficiency = 1-ηc)[13].
However, even if the requirement for global ηc is satisfied, the surviving particlesmay get lost locally in the machine and cause quenches. The so-called local CleaningInefficiency ηc [m−1] is thus introduced as:
ηc = 1∆s
Nloss
Nabs
(3.3)
where Nloss is the number of particles lost along a ∆s length.Powerful tracking tools [14] are used to calculate ηc every 10 cm along the whole
LHC ring. The value of ηc in critical regions (i.e. the locations of SC magnets) hasto be compared with the local inefficiency at the quench limit:
ηcq = Rqτ
Ntot
(3.4)
where Rq is the maximum allowed loss rate of protons per meter, τ is the beamlifetime and Ntot is the total beam intensity [13].
The most stringent value for ηcq is at top energy. In such a case, using theRq reference value of 7.8x10⁶m−1s−1 reported in [10], for the minimum beam life-time of 0.2h and with Ntot=3.2x10¹⁴ s−1, ηcq is equal to 1.7x10⁻⁵m−1. This is thedesign value for Cleaning Inefficiency in case of ideal LHC machine (i.e. withoutimperfections).
3.2.4 ImpedanceThe collimator jaws are the material closest to the LHC beam, separated one fromthe other by a gap as small as 2-3mm at 7TeV . When they are at their nominal
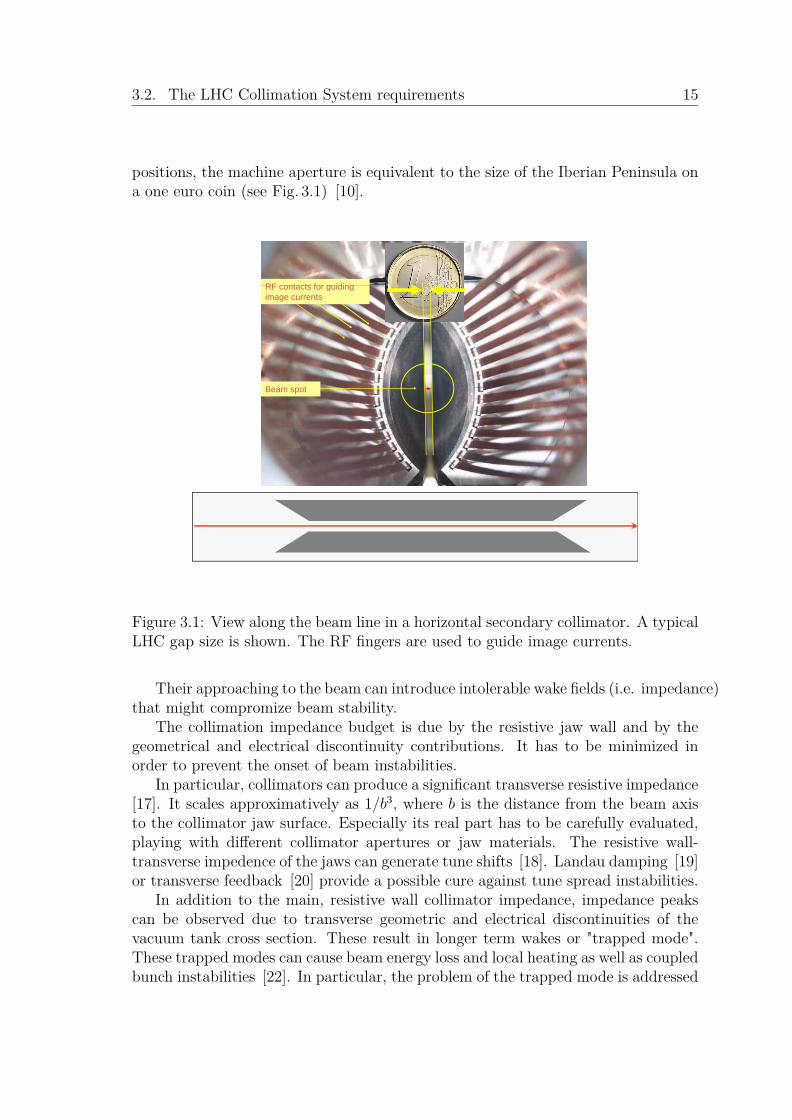
3.2. The LHC Collimation System requirements 15
positions, the machine aperture is equivalent to the size of the Iberian Peninsula ona one euro coin (see Fig. 3.1) [10].
RF contacts for guidingRF contacts for guiding image currents
Beam spot
5
Figure 3.1: View along the beam line in a horizontal secondary collimator. A typicalLHC gap size is shown. The RF fingers are used to guide image currents.
Their approaching to the beam can introduce intolerable wake fields (i.e. impedance)that might compromize beam stability.
The collimation impedance budget is due by the resistive jaw wall and by thegeometrical and electrical discontinuity contributions. It has to be minimized inorder to prevent the onset of beam instabilities.
In particular, collimators can produce a significant transverse resistive impedance[17]. It scales approximatively as 1/b3, where b is the distance from the beam axisto the collimator jaw surface. Especially its real part has to be carefully evaluated,playing with different collimator apertures or jaw materials. The resistive wall-transverse impedence of the jaws can generate tune shifts [18]. Landau damping [19]or transverse feedback [20] provide a possible cure against tune spread instabilities.
In addition to the main, resistive wall collimator impedance, impedance peakscan be observed due to transverse geometric and electrical discontinuities of thevacuum tank cross section. These result in longer term wakes or "trapped mode".These trapped modes can cause beam energy loss and local heating as well as coupledbunch instabilities [22]. In particular, the problem of the trapped mode is addressed

16 3. The LHC Collimation System
by the tapering of the jaw ends and by adding RF fingers [21], allowing for a smoothgeometrical transition from the flat jaws to the round flanges and beam pipe, whileguaranteeing electrical continuity for the beam image currents.
3.2.5 Radiation constraintsUnder the assumption of about 180 days per year of nominal operation, proton lossesare estimated 1.15x10¹⁶ and 3.15x10¹⁵ for each beam in IR7 and IR3 respectively[11].
The collimators and the neighboring accelerator elements should survive thebeam-induced prompt radiation. In addition, the induced radiation in the collimatorarea shall be fully compatible with the maintenance work in the tunnel. Of particularimportance for human interventions are estimates of residual dose rates from inducedradioactivity to foresee fast and remote handling where needed.
3.2.6 Additional requirementsParticular attention is given to the mechanical tolerances for collimation produc-tion, since they must act as precision devices with safe and accurate settings thatare remotely controlled and reproducible over weeks or even months. This trans-lates into strict requirements for surface flatness, step size in jaw movements andreproducibility of jaw settings in the 5-30µm range.
In addition, the choice of collimator materials has to be compatible with theultra-high vacuum of LHC (e.g. outgassing rates must remain acceptable).
Constraints related to the tunnel space availability also apply to the LHC Colli-mation System.
3.3 The multi-stage LHC Collimation SystemThe collimation of high energy rings, like the LHC, is based on the so-called multi-stage collimation system. The above mentioned goal for Cleaning Inefficiency canonly be achieved with a cleaning system that has at least two stages [23] [25].
The principle of multi-stage cleaning is the following. The jaws inserted closestto the beam are called primary collimators and define the primary aperture which isnormally chosen to be larger or equal to the dynamic aperture in order not to inter-cept stable particles. At LHC energies, not all the protons of the primary halo areabsorbed by the primary collimators, which intercept them. By multiple Coulombscattering many of these protons are scattered off with larger angular divergence.In addition, by inelastic processes, secondary particles may be produced, generatinghadronic showers. All these particles form the so-called secondary halo, which canalso induce quenches. Secondary jaws, installed downstream of the primary ones, arethus necessary to intercept the secondary halo and to remove it. The residual halo
3.3. The multi-stage LHC Collimation System 17
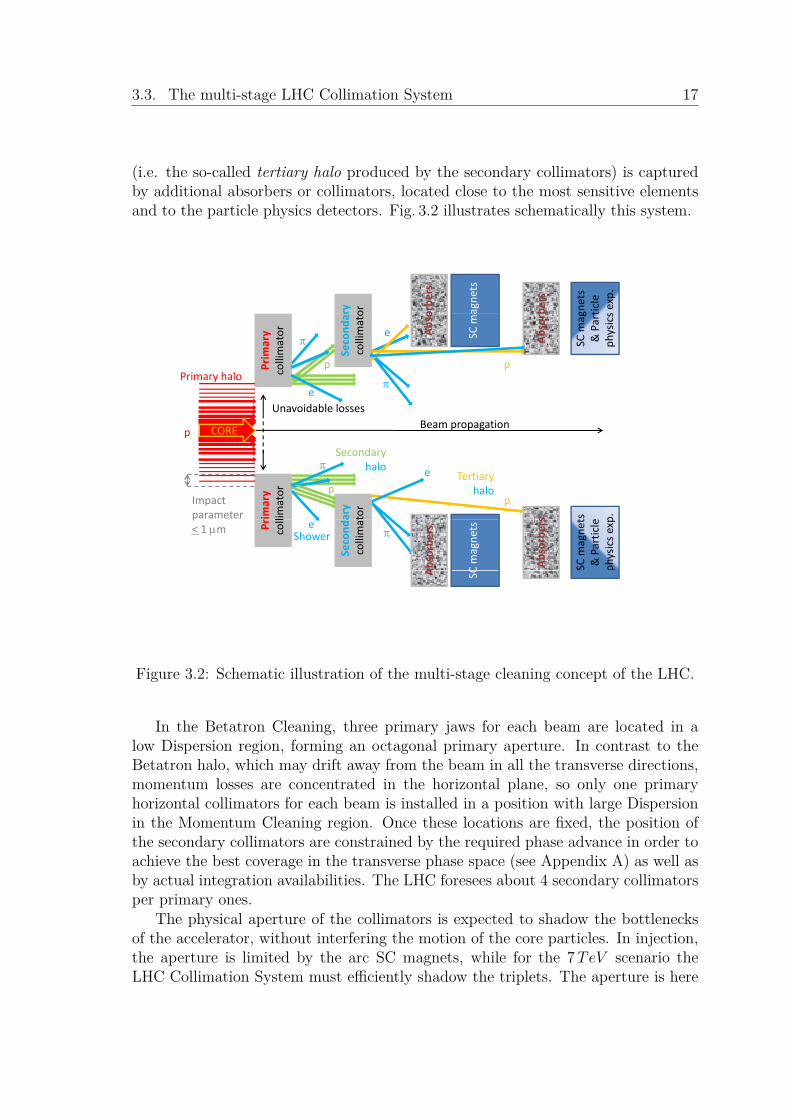
(i.e. the so-called tertiary halo produced by the secondary collimators) is capturedby additional absorbers or collimators, located close to the most sensitive elementsand to the particle physics detectors. Fig. 3.2 illustrates schematically this system.
ry or orbe
rs
bers
agne
ts
gnets
ticle
s exp.
Second
acollimato
Abso
Absor
SC m
a
SC m
ag& Part
physics
p
e
pPrim
ary
ollim
ator
Unavoidable losses
Primary halo p
e
pP co
Beam propagationCORE
Secondary halo
p
Impact parameter im
ary
limator
ary
tor
s ts
e p.
halo ep
p
Tertiary halo
p< 1 m Pr co
ll
Second
acollimat
Absorbe
rs
Absorbe
rs
C magne
ts
SC m
agne
t& Particle
physics expe
Shower
A SC
Figure 3.2: Schematic illustration of the multi-stage cleaning concept of the LHC.
In the Betatron Cleaning, three primary jaws for each beam are located in alow Dispersion region, forming an octagonal primary aperture. In contrast to theBetatron halo, which may drift away from the beam in all the transverse directions,momentum losses are concentrated in the horizontal plane, so only one primaryhorizontal collimators for each beam is installed in a position with large Dispersionin the Momentum Cleaning region. Once these locations are fixed, the position ofthe secondary collimators are constrained by the required phase advance in order toachieve the best coverage in the transverse phase space (see Appendix A) as well asby actual integration availabilities. The LHC foresees about 4 secondary collimatorsper primary ones.
The physical aperture of the collimators is expected to shadow the bottlenecksof the accelerator, without interfering the motion of the core particles. In injection,the aperture is limited by the arc SC magnets, while for the 7TeV scenario theLHC Collimation System must efficiently shadow the triplets. The aperture is here
18 3. The LHC Collimation System
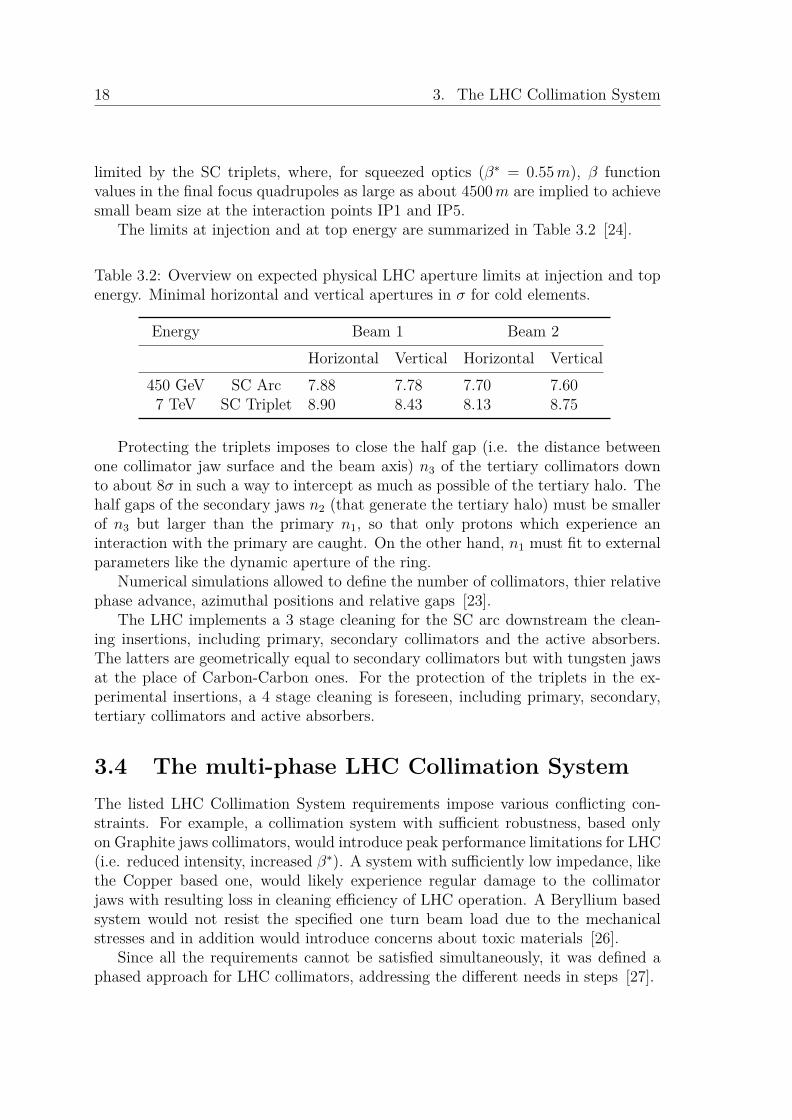
limited by the SC triplets, where, for squeezed optics (β∗ = 0.55m), β functionvalues in the final focus quadrupoles as large as about 4500m are implied to achievesmall beam size at the interaction points IP1 and IP5.
The limits at injection and at top energy are summarized in Table 3.2 [24].
Table 3.2: Overview on expected physical LHC aperture limits at injection and topenergy. Minimal horizontal and vertical apertures in σ for cold elements.
Energy Beam 1 Beam 2Horizontal Vertical Horizontal Vertical
450 GeV SC Arc 7.88 7.78 7.70 7.607 TeV SC Triplet 8.90 8.43 8.13 8.75
Protecting the triplets imposes to close the half gap (i.e. the distance betweenone collimator jaw surface and the beam axis) n3 of the tertiary collimators downto about 8σ in such a way to intercept as much as possible of the tertiary halo. Thehalf gaps of the secondary jaws n2 (that generate the tertiary halo) must be smallerof n3 but larger than the primary n1, so that only protons which experience aninteraction with the primary are caught. On the other hand, n1 must fit to externalparameters like the dynamic aperture of the ring.
Numerical simulations allowed to define the number of collimators, thier relativephase advance, azimuthal positions and relative gaps [23].
The LHC implements a 3 stage cleaning for the SC arc downstream the clean-ing insertions, including primary, secondary collimators and the active absorbers.The latters are geometrically equal to secondary collimators but with tungsten jawsat the place of Carbon-Carbon ones. For the protection of the triplets in the ex-perimental insertions, a 4 stage cleaning is foreseen, including primary, secondary,tertiary collimators and active absorbers.
3.4 The multi-phase LHC Collimation SystemThe listed LHC Collimation System requirements impose various conflicting con-straints. For example, a collimation system with sufficient robustness, based onlyon Graphite jaws collimators, would introduce peak performance limitations for LHC(i.e. reduced intensity, increased β∗). A system with sufficiently low impedance, likethe Copper based one, would likely experience regular damage to the collimatorjaws with resulting loss in cleaning efficiency of LHC operation. A Beryllium basedsystem would not resist the specified one turn beam load due to the mechanicalstresses and in addition would introduce concerns about toxic materials [26].
Since all the requirements cannot be satisfied simultaneously, it was defined aphased approach for LHC collimators, addressing the different needs in steps [27].

3.4. The multi-phase LHC Collimation System 19
3.4.1 The Phase I Collimation SystemA first sub-set of the Phase I Collimation System has been installed for the 2008 firstbeam commissioning of the LHC. It included 88 collimators and absorbers around thering and along the two injection lines. It constituted the largest and most complexcollimation system ever put into operation [28]. During the reparation of Sector3-4, additional devices were installed in order to maximize the LHC Intensity andLuminosity achievable. In June 2009, the Phase I installation was totally completedand ready for the LHC 2009 restart.
The Phase I Collimation System is composed by 108 collimators and absorbers,out of which 97 are precision movable devices (i.e. collimators), being controlled by388 stepping motors in total. Table 3.3 summarizes the Phase I components givingquantities per functional type and their specific locations along the ring.
Table 3.3: Quantities and LHC locations for Phase I Collimation System componentsin both beam lines.
Functional Type Phase IIR3 Primary Collimators 2IR3 Secondary Collimators 8IR3 Passive Absorbers 2IR3 High-Z Collimators 8IR7 Primary Collimators 6IR7 Secondary Collimators 22IR7 Passive Absorbers 6IR7 High-Z Collimators 10Injection Protection Collimators (IR2, IR8 and transfer lines TI2, TI8) 20Dump Protection Collimators and Diluter Elements (IR6) 4High-Z Collimators in experimental regions (IR1, IR2, IR5, IR8) 20Total 108
Total (movable only) 97
A number of design variations were developed. Primary (TCP), secondary(TCSG) and absorbing (TCLA) collimators are the main devices. They are locatedin the LHC cleaning insertion IR3 an IR7 for each beam line. In the same regionsare installed the different length passive absorbers (TCAP). They are immediatelyupstream of warm magnets that need protection from damage by particle showerscreated by the collimators. Injection protectors (TDI, TCLI, TCDD) are installedin IR2 for Beam 1 and in IR8 for Beam 2. The TCLI type A, have a "two beams inone tank" design, since they are installed in region with common beam pipe. Diluterelements (TCDQ) plus a TCSG protect the machine against miss-kicked beams inthe dumping region IR6. Tertiary collimators (TCT) are installed upstream of the
20 3. The LHC Collimation System
interaction regions to protect the triplet magnets. Tertiary vertical collimators inIR1 and IR5 have the classical one-beam design, while in IR2 and IR8 they have the"two beams in one tank" design. In addition, absorbers (TCL) are located down-stream of the IPs to catch the physics debris coming out from the experiments. TheTransfer Injection (TI) line collimators (TCDI) complete the Phase I CollimatorSystem.
Robust collimators (primary, secondary and some protection collimators) use aspecial fiber-reinforced Carbon material (CFC), which combines extreme robustnesswith good thermal, electrical and mechanical properties. Collimators for absorbingshowers use high-Z materials of Copper and/or Tungsten. They enhance efficiencywhile being sensitive to beam damage. Therefore, they are only used at largerdistances from the beam.
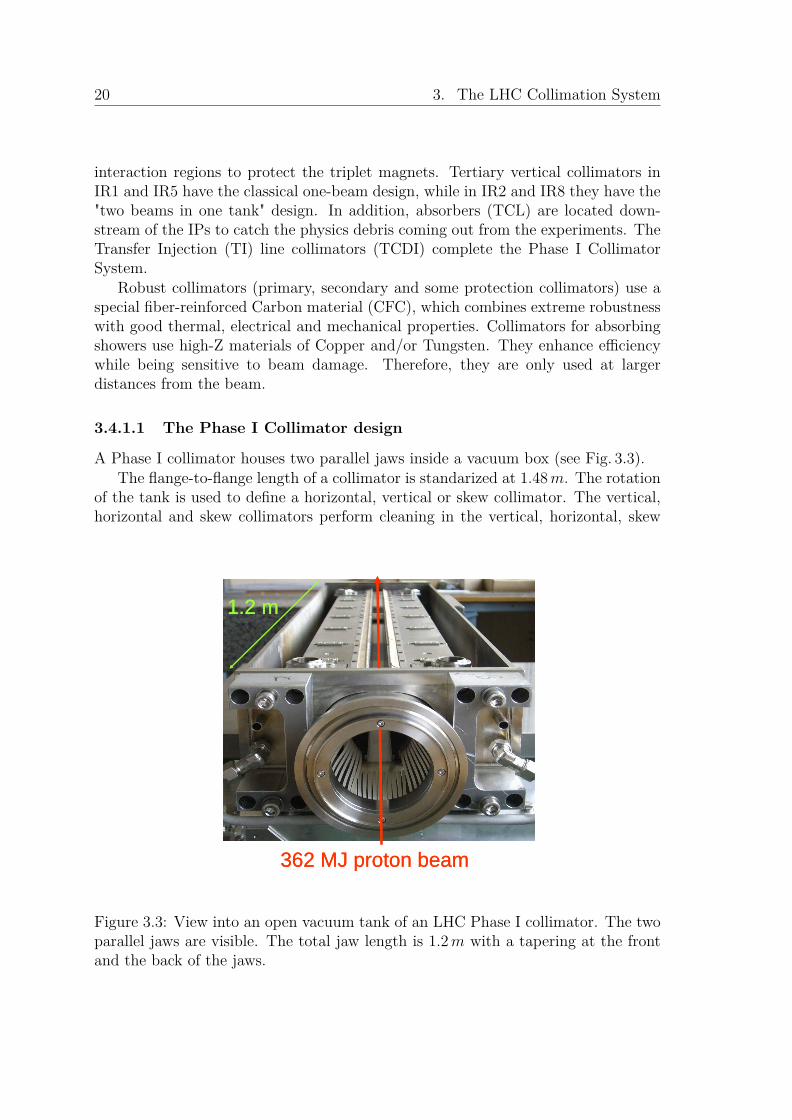
3.4.1.1 The Phase I Collimator design
A Phase I collimator houses two parallel jaws inside a vacuum box (see Fig. 3.3).The flange-to-flange length of a collimator is standarized at 1.48m. The rotation
of the tank is used to define a horizontal, vertical or skew collimator. The vertical,horizontal and skew collimators perform cleaning in the vertical, horizontal, skew
1 2 m1 2 m1.2 m1.2 m
362 362 MJ proton beamMJ proton beam
Figure 3.3: View into an open vacuum tank of an LHC Phase I collimator. The twoparallel jaws are visible. The total jaw length is 1.2m with a tapering at the frontand the back of the jaws.

3.4. The multi-phase LHC Collimation System 21
plane through jaws placed perpendicular to the cleaning plane.The jaws are the material blocks put closest to the beam. Different jaw materials
identify different collimation types. The jaw is constituted by a flat part, determiningthe jaw active length, and by 10 cm tapering at both ends to minimize impedanceeffects. The flat top length of the jaws is always 1.0m, except for primary (0.6m)and transfer line collimators (1.2m). Each jaw is supported at its two extremitiesand movable in order to be centered and aligned with respect to the beam envelopeand to follow the change of beam dimensions as a function of the energy.
Precise stepping motors are used to move the jaws. Four of these, located at eachjaw ends, are used for aperture and angular adjustments, while a fifth motor shiftstransversally the whole collimator tank. Movements are monitored independentlywith precision sensors (LVDT’s, resolvers) [30]. Excessive tilt of the jaw is prevent bya rack and pinion system. The return springs ensure a semi-automatic back-drivingof the jaw in case of motor failure.
Jaws and tank are cooled for extracting loads of up to 3 kW by the water ofthe general cooling circuit of LHC. The heat exchanger is constitued by two OFE-Copper pipes per jaw brazed on one side to a Copper plate and on the other tothe Glidcop bar. Each pipe has three turns to increase the heat exchange capabil-ity. The clamping system allows to enhance the thermal contact between jaw andheat exchanger without creating mechanical constraints between materials havingdifferent thermal expansion coefficient.
Linear guideways
Rack & pinion system
Stepper motor
Collimator jaws
Glidcop® supportbar
Cooling pipes
Glidcop® plates
Return spring
Clamping springs
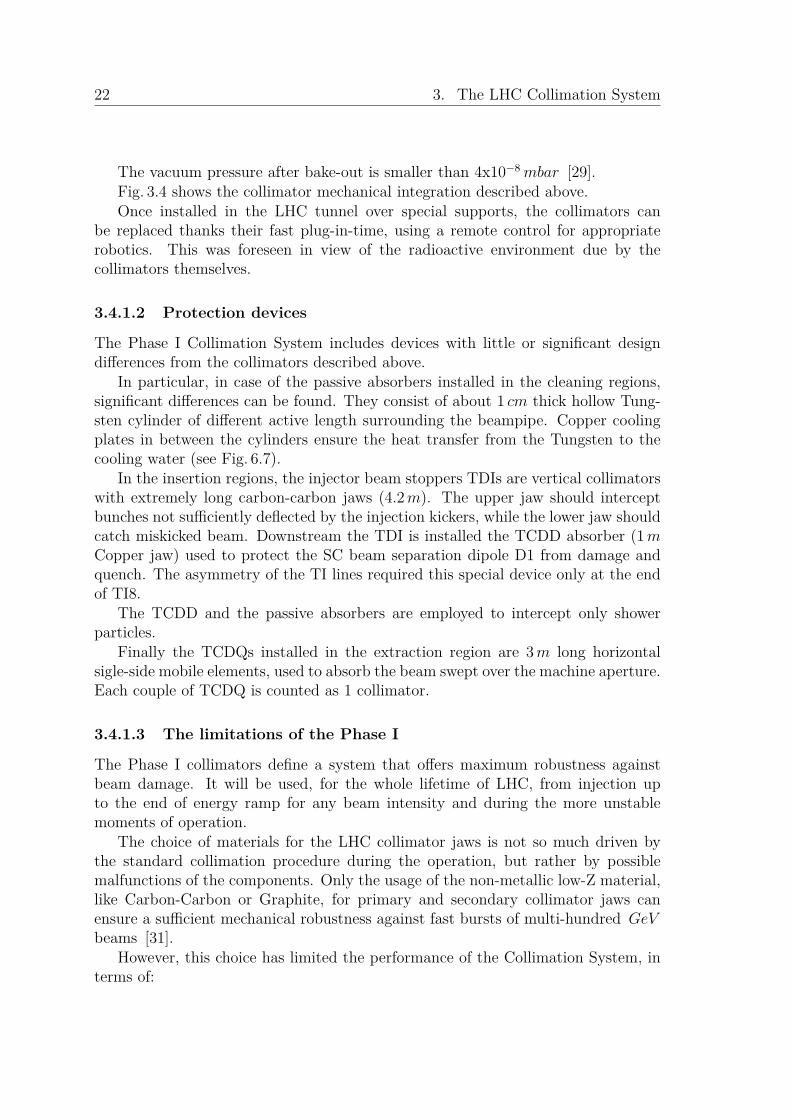
Figure 3.4: Mechanical Integration of a horizontal secondary collimator. Compo-nents including motorization and actuation system are shown.
22 3. The LHC Collimation System
The vacuum pressure after bake-out is smaller than 4x10⁻⁸mbar [29].Fig. 3.4 shows the collimator mechanical integration described above.Once installed in the LHC tunnel over special supports, the collimators can
be replaced thanks their fast plug-in-time, using a remote control for appropriaterobotics. This was foreseen in view of the radioactive environment due by thecollimators themselves.
3.4.1.2 Protection devices
The Phase I Collimation System includes devices with little or significant designdifferences from the collimators described above.
In particular, in case of the passive absorbers installed in the cleaning regions,significant differences can be found. They consist of about 1 cm thick hollow Tung-sten cylinder of different active length surrounding the beampipe. Copper coolingplates in between the cylinders ensure the heat transfer from the Tungsten to thecooling water (see Fig. 6.7).
In the insertion regions, the injector beam stoppers TDIs are vertical collimatorswith extremely long carbon-carbon jaws (4.2m). The upper jaw should interceptbunches not sufficiently deflected by the injection kickers, while the lower jaw shouldcatch miskicked beam. Downstream the TDI is installed the TCDD absorber (1mCopper jaw) used to protect the SC beam separation dipole D1 from damage andquench. The asymmetry of the TI lines required this special device only at the endof TI8.
The TCDD and the passive absorbers are employed to intercept only showerparticles.
Finally the TCDQs installed in the extraction region are 3m long horizontalsigle-side mobile elements, used to absorb the beam swept over the machine aperture.Each couple of TCDQ is counted as 1 collimator.
3.4.1.3 The limitations of the Phase I
The Phase I collimators define a system that offers maximum robustness againstbeam damage. It will be used, for the whole lifetime of LHC, from injection upto the end of energy ramp for any beam intensity and during the more unstablemoments of operation.
The choice of materials for the LHC collimator jaws is not so much driven bythe standard collimation procedure during the operation, but rather by possiblemalfunctions of the components. Only the usage of the non-metallic low-Z material,like Carbon-Carbon or Graphite, for primary and secondary collimator jaws canensure a sufficient mechanical robustness against fast bursts of multi-hundred GeVbeams [31].
However, this choice has limited the performance of the Collimation System, interms of:

3.4. The multi-phase LHC Collimation System 23
• Proton Cleaning Inefficiency.The simulated ideal performance of the Phase I Collimation System is about5x10−5m−1. This value has to be compared with the local inefficiency atquench limit for the same bin size, which is 1.7x10⁻⁵m−1 for nominal beamIntensity (see Section 3.2.3). This means that, since the LHC intensity is ininverse proportion to the cleaning inefficiency, the ideal intensity reachable bythe Phase I collimation system is limited to about 40% of the nominal LHCone.The limitation is related to a physics process (single-diffractive scattering) inthe CFC primary and secondary collimator jaws. A fraction of protons receivea small transverse kick which brings them to be lost after the first strongbending dipoles in the downstream SC arc.In case of the real machine, unavoidable imperfections (i.e. machine misalign-ments, deformed jaws, tilt, offset and gap errors) further reduce the perfor-mance by a factor of up to 11 [32].
• Resistive Impedance.
Phase II
Phase I
nominal gaps
Phase Inominal gaps
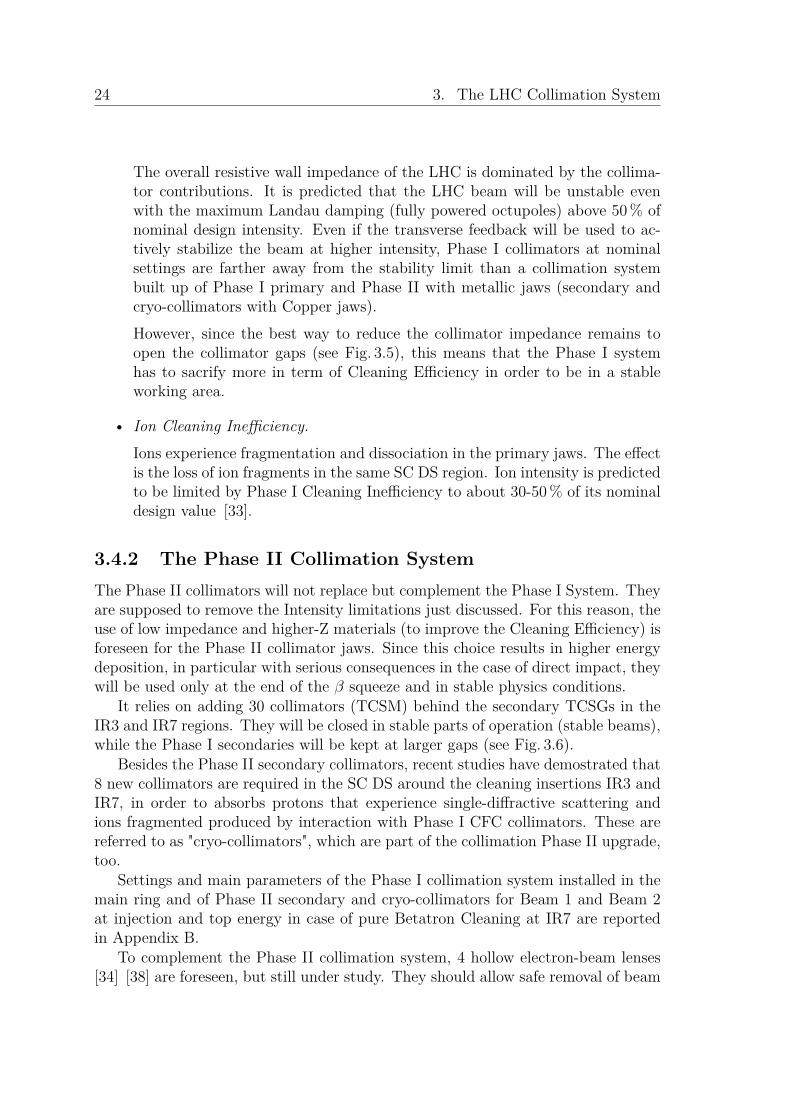
Figure 3.5: Stability diagram at top energy. Red and blue lines represent the stabilitylimit for maximum Landau octupole. Comparison between Phase I and Phase II withCopper secondary collimators and cryogenic collimators included is shown.
24 3. The LHC Collimation System
The overall resistive wall impedance of the LHC is dominated by the collima-tor contributions. It is predicted that the LHC beam will be unstable evenwith the maximum Landau damping (fully powered octupoles) above 50% ofnominal design intensity. Even if the transverse feedback will be used to ac-tively stabilize the beam at higher intensity, Phase I collimators at nominalsettings are farther away from the stability limit than a collimation systembuilt up of Phase I primary and Phase II with metallic jaws (secondary andcryo-collimators with Copper jaws).However, since the best way to reduce the collimator impedance remains toopen the collimator gaps (see Fig. 3.5), this means that the Phase I systemhas to sacrify more in term of Cleaning Efficiency in order to be in a stableworking area.
• Ion Cleaning Inefficiency.Ions experience fragmentation and dissociation in the primary jaws. The effectis the loss of ion fragments in the same SC DS region. Ion intensity is predictedto be limited by Phase I Cleaning Inefficiency to about 30-50% of its nominaldesign value [33].
3.4.2 The Phase II Collimation SystemThe Phase II collimators will not replace but complement the Phase I System. Theyare supposed to remove the Intensity limitations just discussed. For this reason, theuse of low impedance and higher-Z materials (to improve the Cleaning Efficiency) isforeseen for the Phase II collimator jaws. Since this choice results in higher energydeposition, in particular with serious consequences in the case of direct impact, theywill be used only at the end of the β squeeze and in stable physics conditions.
It relies on adding 30 collimators (TCSM) behind the secondary TCSGs in theIR3 and IR7 regions. They will be closed in stable parts of operation (stable beams),while the Phase I secondaries will be kept at larger gaps (see Fig. 3.6).
Besides the Phase II secondary collimators, recent studies have demostrated that8 new collimators are required in the SC DS around the cleaning insertions IR3 andIR7, in order to absorbs protons that experience single-diffractive scattering andions fragmented produced by interaction with Phase I CFC collimators. These arereferred to as "cryo-collimators", which are part of the collimation Phase II upgrade,too.
Settings and main parameters of the Phase I collimation system installed in themain ring and of Phase II secondary and cryo-collimators for Beam 1 and Beam 2at injection and top energy in case of pure Betatron Cleaning at IR7 are reportedin Appendix B.
To complement the Phase II collimation system, 4 hollow electron-beam lenses[34] [38] are foreseen, but still under study. They should allow safe removal of beam

3.4. The multi-phase LHC Collimation System 25
econ
dary
ollim
ator
orbe
rs
bers
agne
ts
gnets
ticle
s exp.
I or
Se co
Abso
Absor
SC m
a
SC m
ag& Part
physics
p
e
p
Phase I
collimato
Prim
ary
ollim
ator
Unavoidable losses
Primary halo p
e
pP co
Beam propagationCORE
Secondary halo Tertiary
p
Impact parameter im
ary
limator
s ts
e p.
halo
ep p
Tertiary halo
II tor
p< 1 m Pr co
ll
onda
ryim
ator
Absorbe
rs
Absorbe
rs
C magne
ts
SC m
agne
t& Particle
physics expe
Shower
Phase
collimat
Seco
coll A SC
Figure 3.6: Schematic illustration of the multi-stage cleaning concept of the LHCwith the Phase II secondary collimators.
tails and halo below collimators settings, reducing peak losses at the collimators.The Phase II collimation work is performed in collaboration between CERN, sev-
eral US labs (through the LHC Accelerator Research Program (LARP)) and severalEuropean partners in research institutes and universities (ColMat work package inthe EuCARD program funded by the EU through FP7).
3.4.2.1 Benefits of the Phase II secondary implementation
The study on Phase I performance with imperfections [32] has pointed out thatthe only Phase II secondary collimator implementation is not sufficient to reach thenominal Intensity in a realistic case.
It was predicted that the introduction of cryo-collimators in the cryogenic region,in addition to the secondary Phase II, improves the Cleaning Efficiency by a factor15 for a perfect machine and to a factor 90 for an imperfected machine [35].
Apart from the higher local radiation, due to the use of high-Z materials forthe collimator jaws (double dose peak to the cables running along both sides of thetunnel wall), the only implementation of secondary Phase II collimators is expected

26 3. The LHC Collimation System
to add various benefits:
• Lower Impedance.The 60 Phase II jaws if all in Copper based material reduce the collimatorinduced impedance of about a factor 2. It might be crucial for removing thelimit on β∗.In addition, the gain in Cleaning Inefficiency could be used to open the colli-mator gaps, in such a way to reach a stable working point during operation,without using any damping system (see Fig. 3.7).
Figure 3.7: Inefficiency versus tune shift (induced by the impedance) for Phase IIwith secondary collimators in copper opened at different gaps. The stable workingarea for nominal Intensity is shown.
• Longer collimator lifetime.Adding devices, that intercept losses, improves the lifetime of all the LHCCollimation System and of neighboring equipments, because the radiation loadwill be distribuite on more objects.
• Longer magnet lifetime.For the same reason reported above, the improvement of lifetime for warmmagnets (order of tens MGy are supposed to break some coil insulators) in

3.4. The multi-phase LHC Collimation System 27
cleaning insertion regions is about of a factor 3. It is to be noted that thelimited lifetime of warm magnets is not addressed elsewhere.
• Lower radiation to electronic equipment.
The complexity of the LHC accelerator demands the installation of the controlelectronics close to the beam lines. It is essential that the electronics does notseverely degrade or fail due to irradiation. In particular the Single EventErrors (SEE) are to be avoided. These errors are a flip of a logical gate valueinduced by an energetic particle traversing the electronics. The flip occurs if asufficient amount of energy is deposited in the active volume of the transistor inquestion. In addition, any electronic device operating in strong radiation fieldssuch as that of IR7 will undergo degradation through ionizing and nonionizingprocesses.
The radiation to the electronic equipment, installed close to the IR7 maintunnel, is reduced by the Phase II collimators (see Chapter 13 for more details).
• Faster and more accurate set-up.
Empty Phase II TCSM slots are ready in the LHC tunnel (see Fig. 3.8). Theywill reduce substantially the time needed for the Phase II installation, sincewater supply, long cables, supports, pumping domes, BLM’s are all alreadyinstalled.
Phase I TCSG slot all installed
Empty Phase II TCSM slot
Figure 3.8: LHC tunnel view with the ready empty slots for the installation ofsecondary Phase II collimators.

28 3. The LHC Collimation System
• Higher operation efficiency.On January 2010, the first basic Phase II collimator was installed in the SPS.The purpose is to test the BPMs which are integrated in the jaws. This is notthe case of Phase I collimators that use the BLMs for their beam alignment. Insuch a way, Phase II collimators can improve the operation efficiency, helpingthe collimator setup with fewer special calibration fills.
3.4.3 Further PhasesThe LHC upgrade program foresees a further increase of the beam Intensity. At thistime it cannot be guaranteed that the Phase II of the LHC collimator is sufficient forsupporting up to 1GJ stored per beam. A further upgrade of the LHC collimationbeyond Phase II has therefore been envisaged.
Novel techniques are pursued for further improved cleaning, for example crystalcollimation [36], non-linear solutions [37] and hollow e-beam lenses used as primarycollimators [38].

Chapter 4
Simulation Framework
In order to evaluate the performance of the LHC Phase II Collimation System interms of energy deposition and radiation issues, the distribution of the losses alongthe collimators and beam elements has to be as much realistic as possible.
The predictions on collimator thermal and radiation loads and on the inducedactivation are strongly dependent on inputs. They define the particle distributionduring the nominal beam operation conditions as well as during abnormal scenarios.
For these reasons, a simulation framework was built up to provide outputs suchas the expected thermal deformations, quantities for assessing the radiation damages(Dose, peak dose, DPA, etc.) and the evaluation of residual dose rates, starting fromthe MAD-X optic model.
4.1 Purpose of the simulationsThe collimator design must comply with the very demanding functional specifica-tions resulting from the highly energetic beams handled in the LHC rings.
Their design imposes that important questions are addressed:1) Which are the effects of particles showers generated by the inelastic interac-
tions of the primary protons on different jaw materials?2) Can the Phase II collimators withstand the energy density deposition induced
by the particle losses in the nominal operation scenarios?3) Which is the distribution of the thermal loads in the collimator components
during the most destructive possible failure mode?4) How high are the temperature peaks and where are they localized?5) Which are the consequences of different Phase II designs on the adjacent
equipments?6) How much is the influence of collimators on the residual ambient dose equiv-
alent levels in the region?7) How can we evaluate the degradation of the collimator materials, due by
radiation?
29
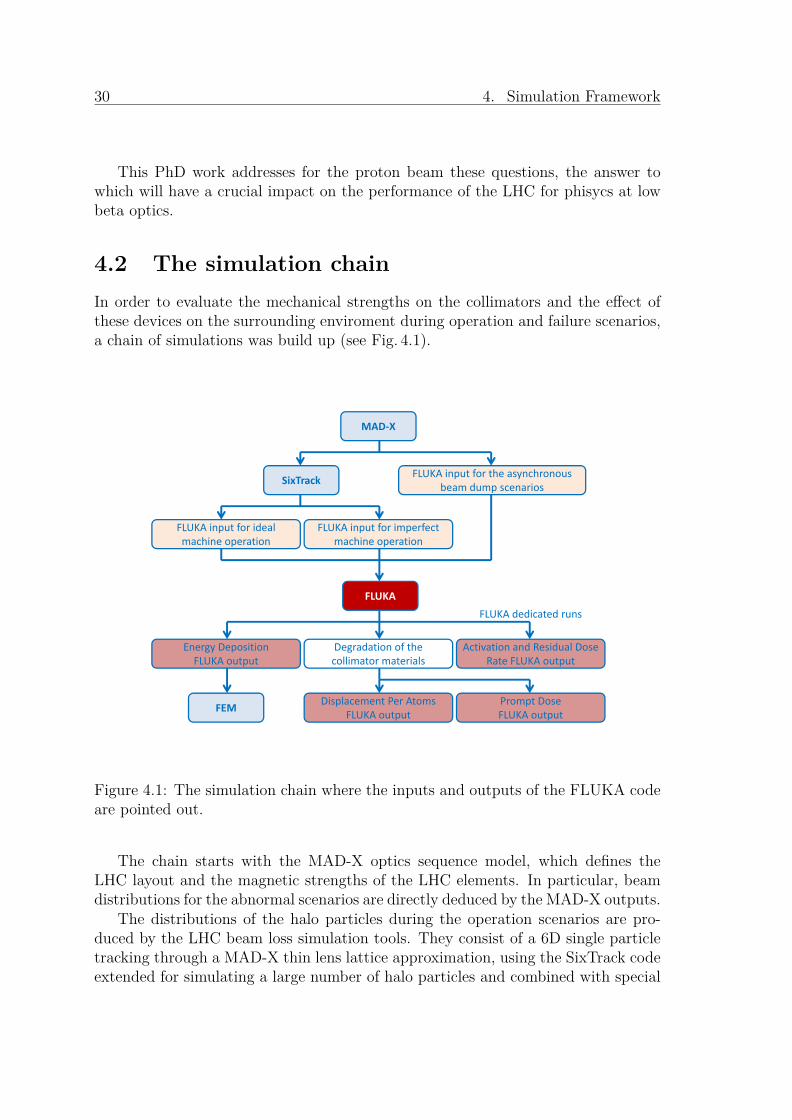
30 4. Simulation Framework
This PhD work addresses for the proton beam these questions, the answer towhich will have a crucial impact on the performance of the LHC for phisycs at lowbeta optics.
4.2 The simulation chainIn order to evaluate the mechanical strengths on the collimators and the effect ofthese devices on the surrounding enviroment during operation and failure scenarios,a chain of simulations was build up (see Fig. 4.1).
MAD‐X
SixTrackFLUKA input for the asynchronous
beam dump scenarios
FLUKA input for imperfect machine operation
FLUKA input for ideal machine operation
p
machine operationmachine operation
FLUKA
FLUKA dedicated runs
Activation and Residual Dose Rate FLUKA output
Degradation of the collimator materials
Energy Deposition FLUKA output
FEMPrompt Dose FLUKA output
Displacement Per Atoms FLUKA output
Figure 4.1: The simulation chain where the inputs and outputs of the FLUKA codeare pointed out.
The chain starts with the MAD-X optics sequence model, which defines theLHC layout and the magnetic strengths of the LHC elements. In particular, beamdistributions for the abnormal scenarios are directly deduced by the MAD-X outputs.
The distributions of the halo particles during the operation scenarios are pro-duced by the LHC beam loss simulation tools. They consist of a 6D single particletracking through a MAD-X thin lens lattice approximation, using the SixTrack codeextended for simulating a large number of halo particles and combined with special

4.2. The simulation chain 31
routines describing the proton scattering processes within the collimators jaws (i.e.the COLLTRACK/K2 routines). The recorded particle non-inelastic interactionswith arbitrarily placed collimators are the input for the FLUKA calculations.
The FLUKA Monte Carlo code performs full shower simulation and provides asoutput power distributions for further Finite Element Method (FEM) calculationsas well as quantities relevant for the radiation damage and activation evaluation.
4.2.1 The MAD-X codeThe MAD-X accelerator design code [39] is used to generate the official LHC beamoptics and the LHC lattice (each arc is composed of 23 FODO cells plus one Dis-persion Suppressor at each end). It delivers relevant values like the closed orbitcoordinates in each transverse plane and, for each element, the Twiss parameters(i.e. β(s), α(s) (α(s) = −β′(s)/2) and γ(s) (γ(s) = (1 + α2(s))/β(s)) optical func-tions at s locations along the ring which give a complete and compact description ofparticle trajectories). Fig. 4.2 shows an example of MAD-X outputs. The β function
Phase I secondary and Phase II collimators
s(km) from IP1Phase Iprimary collimators
Figure 4.2: MAD-X output plot. Horizontal and vertical β-functions (βx, βy) andDispersion (Dx, Dy) in the betatron cleaning insertion are shown as well as thepositions of the primary and secondary Phase I and Phase II collimators.
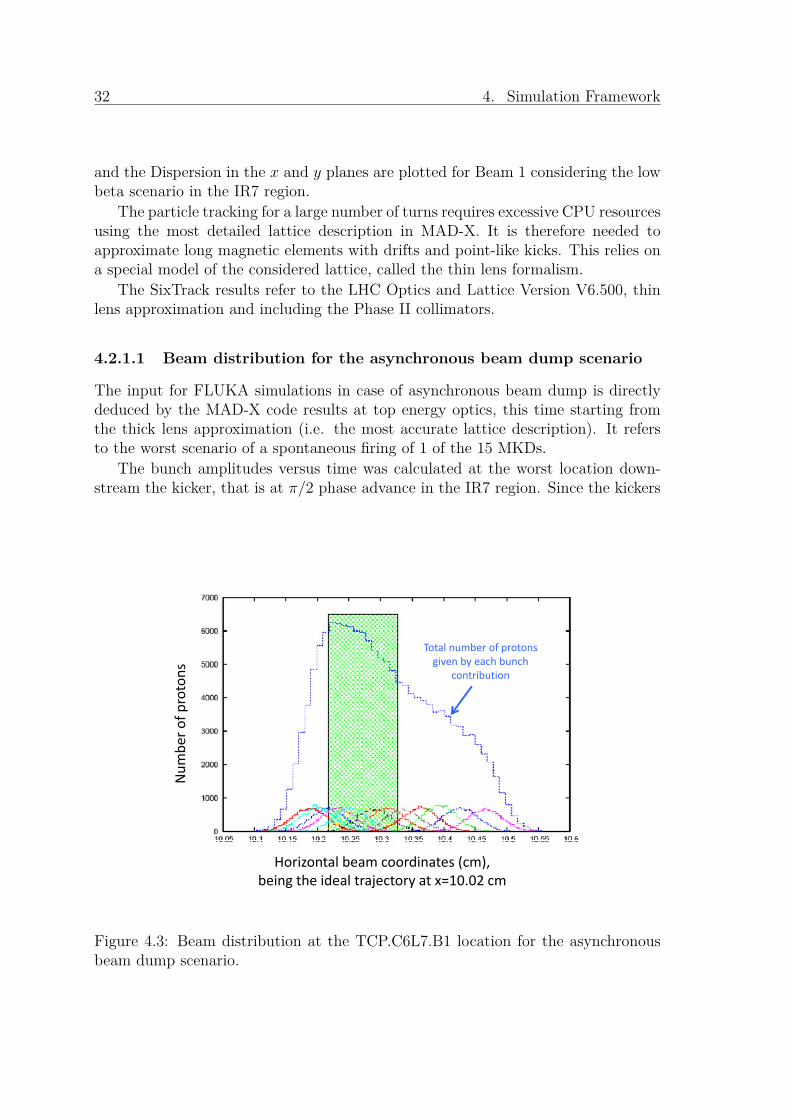
32 4. Simulation Framework
and the Dispersion in the x and y planes are plotted for Beam 1 considering the lowbeta scenario in the IR7 region.
The particle tracking for a large number of turns requires excessive CPU resourcesusing the most detailed lattice description in MAD-X. It is therefore needed toapproximate long magnetic elements with drifts and point-like kicks. This relies ona special model of the considered lattice, called the thin lens formalism.
The SixTrack results refer to the LHC Optics and Lattice Version V6.500, thinlens approximation and including the Phase II collimators.
4.2.1.1 Beam distribution for the asynchronous beam dump scenario
The input for FLUKA simulations in case of asynchronous beam dump is directlydeduced by the MAD-X code results at top energy optics, this time starting fromthe thick lens approximation (i.e. the most accurate lattice description). It refersto the worst scenario of a spontaneous firing of 1 of the 15 MKDs.
The bunch amplitudes versus time was calculated at the worst location down-stream the kicker, that is at π/2 phase advance in the IR7 region. Since the kickers
oton
s
Total number of protons given by each bunch
contribution
er of p
roNum
be
Horizontal beam coordinates (cm), being the ideal trajectory at x=10.02 cm
Figure 4.3: Beam distribution at the TCP.C6L7.B1 location for the asynchronousbeam dump scenario.

4.2. The simulation chain 33
act in the horizontal plane, it was supposed that any horizontal collimator may beat π/2 phase advance from the kicker when the mis-firing occurs, in such a way tointercept the maximum number of particles [42].
The horizontal Phase I collimator TCP.C6L7.B1 and the horizontal Phase IIcollimators TCSM.B4L7.B1 and TCSM.6R7.B1 were considered. In these collimatorpositions, each bunch is translated horizontally because of the mis-firing.
Fig. 4.3 gives an example of the bunches distribution on the front face of theprimary TCP.C6L7.B1 collimator. It is supposed to be hit up to 10σx (as alreadymentioned in Section 3.2.2.2, above 10σx local protections intercept all beam). AGaussian distribution is assumed for each bunch. The protons, which are in the greenarea, are impacting the primary collimator jaw. The 11500 particles contained ineach bunch are representative of the 1.15x10¹¹ protons of a real LHC bunch.
Similar beam distributions are produced for the Phase II collimators TCSM.B4L7.B1and TCSM.6R7.B1, taking into account the different value of the Twiss parametersat their locations.
4.2.2 The SixTrack code
Collimation and beam cleaning studies are carried out with the SixTrack code [40].It track particles which are transported through the lattice, element by element,and their phase space coordinates are trasformed according to the type of beam linedevice met. When a particle hits a collimator jaw, it potentially could interact withthe material and it is randomly scattered through matter. The effect of collimatorscattering is modeled using the COLLTRACK/K2 [41] [14] routines, now embeddedin the last version of the SixTrack code. This improvement makes possible to track alarge number of particles over hundreds of turns (typically 5x10⁶ halo particles whichare followed for 200 turns), to include the proton scattering in various collimatormaterials, to simulate various halo and diffusion models and to take care of multipleimperfections of the beam and the collimator properties (setting errors, tilts, orbiterrors, beta beat, etc.).
MAD-X produces "ready to use" input file for SixTrack, in which is defined thelattice of the machine without magnetic field errors. An input file called Collimationdatabase contains the details of collimator geometry, materials and settings (i.e.aperture of the collimators). The introduction of the optic parameter β in this fileallows studies of error scenarios. Tracking parameters like number of particles perturns, type of beam and type of halo are specified in another SixTrack input file. Inparticular, for Phase II collimation studies, the halo considered is a flat distributionin a selected plane, horizontal, vertical or transverse (for the skew case), plus aGaussian distribution cut at 3σ in the other planes and a longitudinal componentdefined through a rms bunch length (nominally 7.55 cm at 7TeV ) and a rms energyspread (1.13x10⁻⁴ ∆E/E at 7TeV ). The real distribution of losses is an average ofthe above three halo limit cases in the three planes.
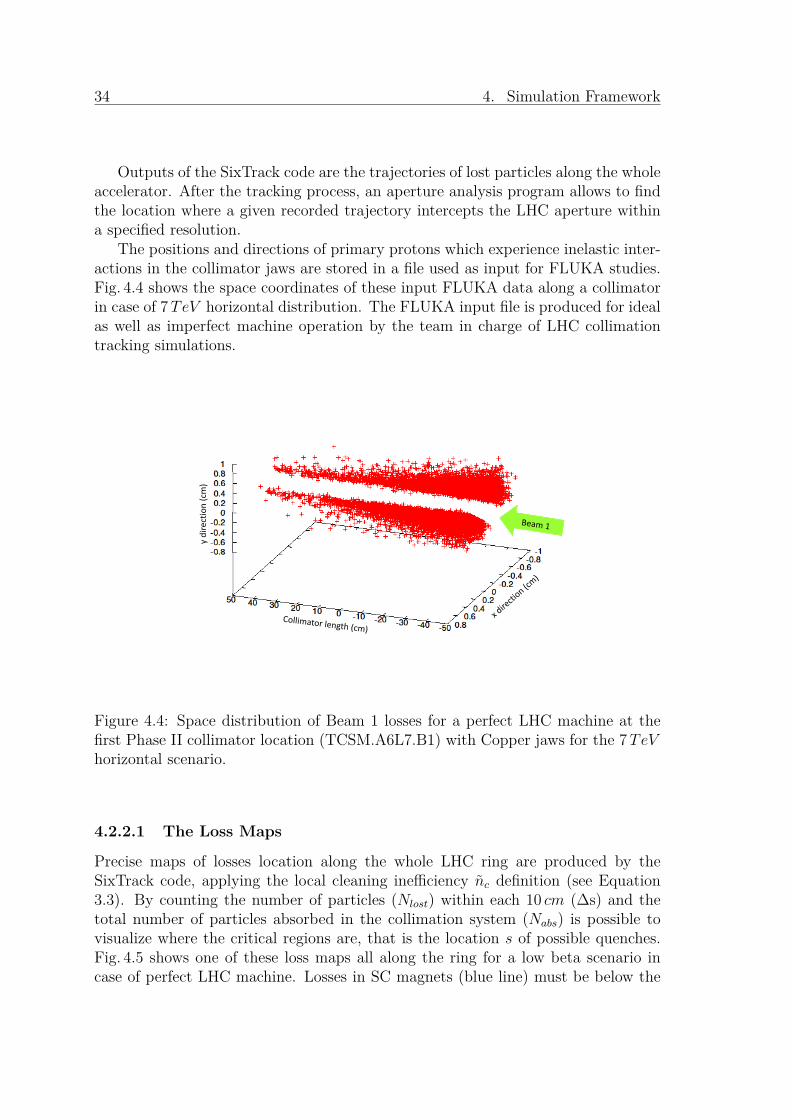
34 4. Simulation Framework
Outputs of the SixTrack code are the trajectories of lost particles along the wholeaccelerator. After the tracking process, an aperture analysis program allows to findthe location where a given recorded trajectory intercepts the LHC aperture withina specified resolution.
The positions and directions of primary protons which experience inelastic inter-actions in the collimator jaws are stored in a file used as input for FLUKA studies.Fig. 4.4 shows the space coordinates of these input FLUKA data along a collimatorin case of 7TeV horizontal distribution. The FLUKA input file is produced for idealas well as imperfect machine operation by the team in charge of LHC collimationtracking simulations.
on (cm)
y directio
Figure 4.4: Space distribution of Beam 1 losses for a perfect LHC machine at thefirst Phase II collimator location (TCSM.A6L7.B1) with Copper jaws for the 7TeVhorizontal scenario.
4.2.2.1 The Loss Maps
Precise maps of losses location along the whole LHC ring are produced by theSixTrack code, applying the local cleaning inefficiency nc definition (see Equation3.3). By counting the number of particles (Nlost) within each 10 cm (∆s) and thetotal number of particles absorbed in the collimation system (Nabs) is possible tovisualize where the critical regions are, that is the location s of possible quenches.Fig. 4.5 shows one of these loss maps all along the ring for a low beta scenario incase of perfect LHC machine. Losses in SC magnets (blue line) must be below the

4.2. The simulation chain 35
c[m
‐1]
~
0 5 10 15 20 25s [km]
Figure 4.5: LHC perfect machine loss map at low beta energy, including the Copperjaws Phase II collimators and without cryo-collimators.
quench limit.The loss maps show the foreseen losses in the LHC bottleneck regions where
following investigation with FLUKA is required. Loss maps are produced both forperfect and imperfect LHC machine.
4.2.3 The FLUKA codeDesigning and operating accelerator devices require the application of a particletransport and interaction Monte Carlo code, like FLUKA [43], [44].
In particular, FLUKA was used to support the Phase II collimator studies, start-ing from the maps of primary non-elastic collisions. The cascade starts by forcingthe FLUKA code to simulate an inelastic nuclear interaction of a proton inside thecollimator jaw at the position given by the tracking program. The FLUKA codesamples randomly one proton with its space and direction coordinates from the pro-vided loss list, and initiates the hadronic shower. Generally about 10000 primaryparticles per 10 following runs and per 10 parallel jobs are required to reach thestatistical FLUKA convergence for the evaluation of the peak power in the first IR7Phase II collimators for the adopted biasing settings. It corresponds to 6 days of
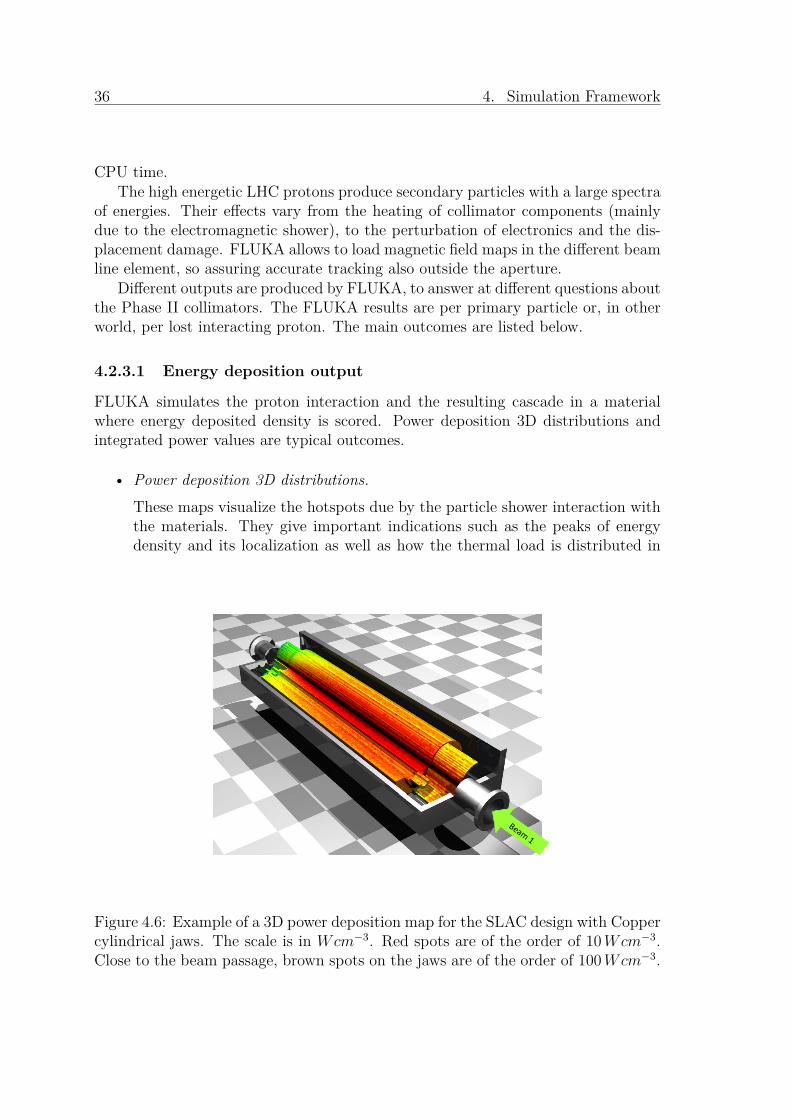
36 4. Simulation Framework
CPU time.The high energetic LHC protons produce secondary particles with a large spectra
of energies. Their effects vary from the heating of collimator components (mainlydue to the electromagnetic shower), to the perturbation of electronics and the dis-placement damage. FLUKA allows to load magnetic field maps in the different beamline element, so assuring accurate tracking also outside the aperture.
Different outputs are produced by FLUKA, to answer at different questions aboutthe Phase II collimators. The FLUKA results are per primary particle or, in otherworld, per lost interacting proton. The main outcomes are listed below.
4.2.3.1 Energy deposition output
FLUKA simulates the proton interaction and the resulting cascade in a materialwhere energy deposited density is scored. Power deposition 3D distributions andintegrated power values are typical outcomes.
• Power deposition 3D distributions.These maps visualize the hotspots due by the particle shower interaction withthe materials. They give important indications such as the peaks of energydensity and its localization as well as how the thermal load is distributed in
Figure 4.6: Example of a 3D power deposition map for the SLAC design with Coppercylindrical jaws. The scale is in Wcm−3. Red spots are of the order of 10Wcm−3.Close to the beam passage, brown spots on the jaws are of the order of 100Wcm−3.
4.2. The simulation chain 37
the device under study. Fig. 4.6 shows an example of these maps applying toa specific Phase II collimator design.
• Integrated power values.Integral values of power deposition are calculated in order to be better com-pared with the available cooling capacity. In particular, since the collimatorshave an active cooling system, rating the total power to be removed is a basicrequirement for their design.
4.2.3.2 Radiation damage output
Any device operating in strong radiation fields such as those expected in the LHCtunnel will undergo degradation due by radiation damage effects.
The FLUKA simulations allow to evaluate the impact of cumulative effects, likethe total dose in the materials and the damages due by dislocation of atoms in thematerial structure.
• Prompt Dose.The Prompt Dose is the dose released during irradiation. Long time irradiationat high intensity induces, over an operation given time, high dose values in thematerial through the shower propagate. This represents a concern for delicatecomponents which could experience breaks.
• Displacement Per Atoms (DPA).Long term employement of collimators will unavoidably result in structuralchange in the materials due to the displacement of atoms from their normalposition. The produced lattice defects can manifest themselves as dimensionalchanges (jaw surface quality) and change in electrical resistivity. In particular,the latter is responsible for the collimator induced impedance that can modifyin turn the LHC peak performance.The lattice defects are evaluated in terms of DPA produced through elastic andinelastic scattering reactions, in which projectile protons or secondary particlesand nuclear fragments impart some of their kinetic energy to a nucleus of thematerial under examination. The DPA is a function of the number of incidentper secondary particles rather than the total energy. This can justify theemployement of Monte Carlo algorithms tested on the data collected in highenergy proton beams for evaluating number of displacement produced in theLHC proton beam if particle production and transport algorithms at the LHCenergies can be considered as reliable. The FLUKA code is used to calculatethe number of DPA which are used as reference to the evaluation of changesof material proprieties, important for the functionality of a specific device.

38 4. Simulation Framework
4.2.3.3 Activation and Residual Dose Rates
Nuclear reactions induced by beam particle losses lead to the activation of materialsin the respective zone of the LHC. FLUKA is able to estimate the activity levelsas a function of the cooling time after the irradiation end. This is possible thanksto the calculation of the produced radionuclide yields and of time evolution of theirpopulation.
Residual dose rates are due to the activated equipments. Three-dimensionalmaps of dose equivalent rates at different cooling times after operation of the LHChave been also calculated with FLUKA through the transport of the decay electro-magnetic radiation.
An extended benchmark of the FLUKA prediction has been performed againstexperimental data acquired through a dedicated CERN beam test facility calledCERF [45].
4.2.4 The FEM analysisThe thermo-mechanical analysis [29] provides informations about the possible per-manent deformations and their shapes because of fast increase of temperature, inparticular during the abnormal beam scenario.
The energy distribution on the 3D ANSYS model of the whole jaw assembly isprovided by the FLUKA simulations on a 3D compatible model.
The size of the jaw deformations gives an estimate of the active lenght reductionof the collimators during operation (i.e. the so-called banana shape). Avoiding jawdeformations means to increase the LHC performance.

Chapter 5
An overview of the FLUKAphysics models
The FLUKA code is a general purpose Monte Carlo code for the interaction andthe transport of hadrons, heavy ions, and electromagnetic particles from few keV(or thermal energies for neutrons) to cosmic ray energies in whichever material. Itis built and maintained with the aim of including the best possible physical modelsin terms of completeness and precision and it is continuously upgraded and bench-marked against experimental data.
At CERN, the FLUKA code is extensively used by different projects such asLHC, CNGS, LINAC-4 and n_TOF. In particular, FLUKA is the main tool tocarry out beam-material interaction studies, e.g. for machine protection purposes.
5.1 Proton-matter interaction: main framework
When a proton hits a material block, all or part of its energy is dissipated throughdifferent processes. It could interact with a nucleus and produce many secondaryparticles, which later also interact, and so on, until the residual energy per particleis too small that is negligible for our studies. The result of this process is calledhadronic shower. It is combined to electromagnetic showers through the decay ofshort-lived products, typically neutral pions decaying into two photons. Or the pro-ton, such as any other charged particle, could ionise atoms along its path. Electronsare set free and release their kinetic energy to the lattice, or are excited and emitphotons in the atomic range of energy, which are absorbed and converted to phononslocally. Finally almost all the deposited energy is converted to heat.
The spatial distribution of heat deposition cannot be computed analytically witha good accuracy, but is calculated thanks to Monte Carlo programs, like FLUKA.
39
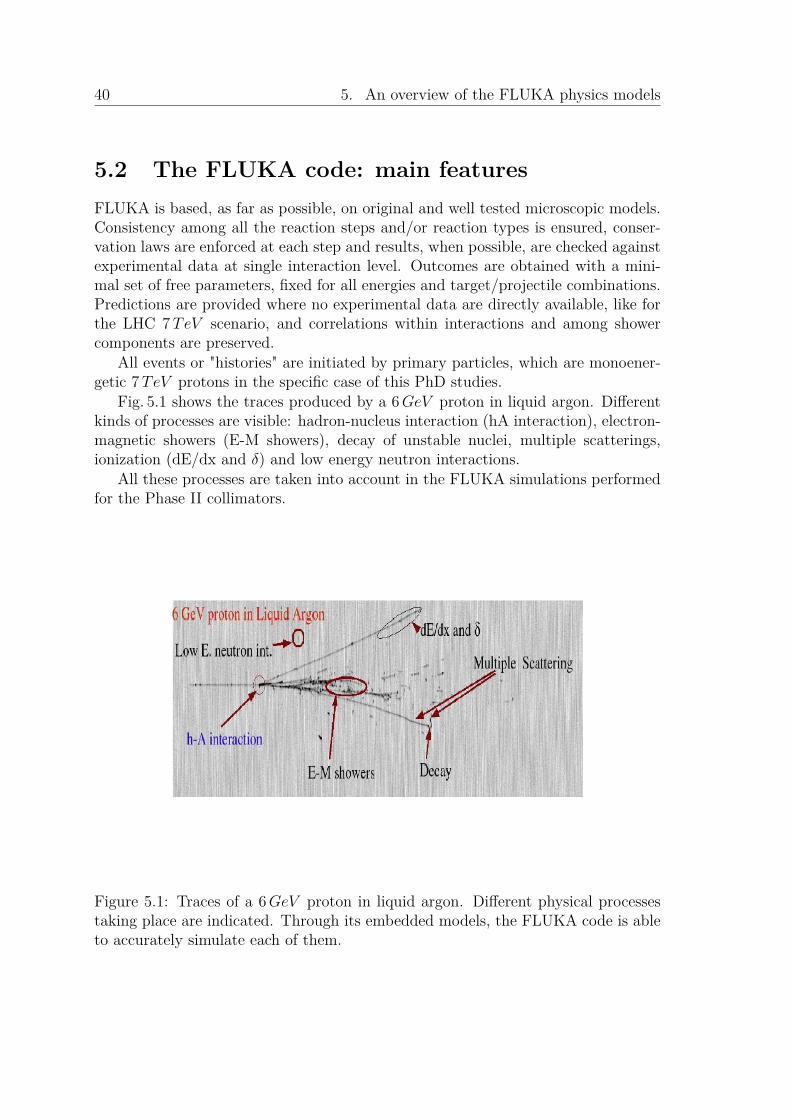
40 5. An overview of the FLUKA physics models
5.2 The FLUKA code: main featuresFLUKA is based, as far as possible, on original and well tested microscopic models.Consistency among all the reaction steps and/or reaction types is ensured, conser-vation laws are enforced at each step and results, when possible, are checked againstexperimental data at single interaction level. Outcomes are obtained with a mini-mal set of free parameters, fixed for all energies and target/projectile combinations.Predictions are provided where no experimental data are directly available, like forthe LHC 7TeV scenario, and correlations within interactions and among showercomponents are preserved.
All events or "histories" are initiated by primary particles, which are monoener-getic 7TeV protons in the specific case of this PhD studies.
Fig. 5.1 shows the traces produced by a 6GeV proton in liquid argon. Differentkinds of processes are visible: hadron-nucleus interaction (hA interaction), electron-magnetic showers (E-M showers), decay of unstable nuclei, multiple scatterings,ionization (dE/dx and δ) and low energy neutron interactions.
All these processes are taken into account in the FLUKA simulations performedfor the Phase II collimators.
Figure 5.1: Traces of a 6GeV proton in liquid argon. Different physical processestaking place are indicated. Through its embedded models, the FLUKA code is ableto accurately simulate each of them.

5.2. The FLUKA code: main features 41
5.2.1 Hadron-Nucleus and hadron-nucleon interactionsHadron-Nucleus (hN or hA) non-elastic interactions are described mostly in theframework of the IntraNuclear Cascade (INC) model. This model was developed atthe very beginning of the history of the energetic nuclear interaction modelling (theoriginal ideas go back at the end of the fourties). The model is intrinsically a MonteCarlo one, well suited for numerical applications. In the energy range going from thepion π production threshold (about 290MeV for a free nucleon, down to 200MeVfor nucleons in nuclei because of the Fermi motion) to high energies, INC modelsare pratically the only available tools to model hN interactions. At lower energies,a variety of pre-equilibrium models can do a good job. However, INC models, likethose developed in the seventies, become unreliable both at lower (< 100-200MeV )and higher (> 2-3GeV ) ends of the energy scale, and show limitations also whenused in the proper energy range. The basic assumption in calculations of INC isthat nuclear reaction involving incident particles of high energy can be described interms of hadron-nucleon (hn) collisions within the nucleus. Once suitable models fordescribing hn interactions were available, the high energy regime was properly han-dled, provided the spacetime characteristics of high energy interactions and multipleprimary collisions, according to the Glauber approach, were taken into account. Im-portant changes to the original INC approach were done also at the lowest energies.They are mainly related with quantum nuclear effects and multibody interactions,besides the introduction of a pre-equilibrium stage. The latter is a transition betweenthe first step of the reaction and the final thermalization at energies lower than the πproduction threshold. INC approaches which make use both of the high energy andlow energy extensions are called Generalized IntraNuclear Cascade (GINC) models.
The FLUKA hn interaction models are based on resonance production and decaybelow few GeV (i.e. isobar model) and on Dual Parton model (DPM) based oninteracting strings above.
Two models are also used for the hN interactions. Up to 3-5GeV the FLUKAPEANUT (Pre-Equilibrium Approach to NUclear Thermalization) package includesa very detailed GINC, based on "resonance" production and decay with smooth tran-sition to a pre-equilibrium stage performed with standard assumptions on excitonnumber or excitation energy. At high energies the Gribov-Glauber multiple col-lision mechanism aplies (also included in the FLUKA PEANUT). It is based onquark/parton string models, which provide reliable results up to several tens ofTeV .
In addition, to extend the higher FLUKA energy limit for hadronic interactions,the DPMJET-III package is implemented in the code. DPMJET-III is also usedas event generator for nucleus-nucleus (AA) interactions above 5GeV/c, whereasa Relativistic Molecular Dynamics (RQMD) approach and a model based on theBoltzmann Master Equation (BME) theory apply to AA reactions at intermadiate(down to 100MeV/c) and low (down to the Coulomb barrier) energies, respectively.
Fig. 5.2 shows the proton-proton and proton-neutron cross sections and the dis-

42 5. An overview of the FLUKA physics models
d ti
Particle production interactions based
p‐p and p‐n cross sectionFLUKA and data
on “resonance” production and decay,
cover the energy range up
totalenergy range up
to 3–5 GeV
Particle productionParticle production interactions based on
quark/partonstring models, provide
elasticreliable results up to several tens of TeV
Elastic, charge exchange and strangeness exchange reactions
Figure 5.2: FLUKA total and elastic cross sections for p-p and p-n scattering,together with experimental data.
+ Ch+/Ch X (250 G V/ )+ + p + + X (6 & 22 GeV/c) + + p Ch+/Ch- + X (250 GeV/c) + p + X (6 & 22 GeV/c)
Positive Negative hadrons X2 hadrons
Connected points: FLUKAConnected points: FLUKASymbols w. errors : DATA
Dots: Exp. DataHistos : FLUKA
6 GeV22GeV
Histos : FLUKA
22GeV
Figure 5.3: Examples of particle production from inelastic interaction at differentenergies. Left side: Feynman xF distribution of positive poins emitted for π+ onproton at various momenta (6 and 22GeV/c). Data from [46] and FLUKA results.Right side: the longitudinal distribution of positive and negative hadrons producedby 250GeV/c π+ on Hydrogen. Data from [47] and FLUKA results.
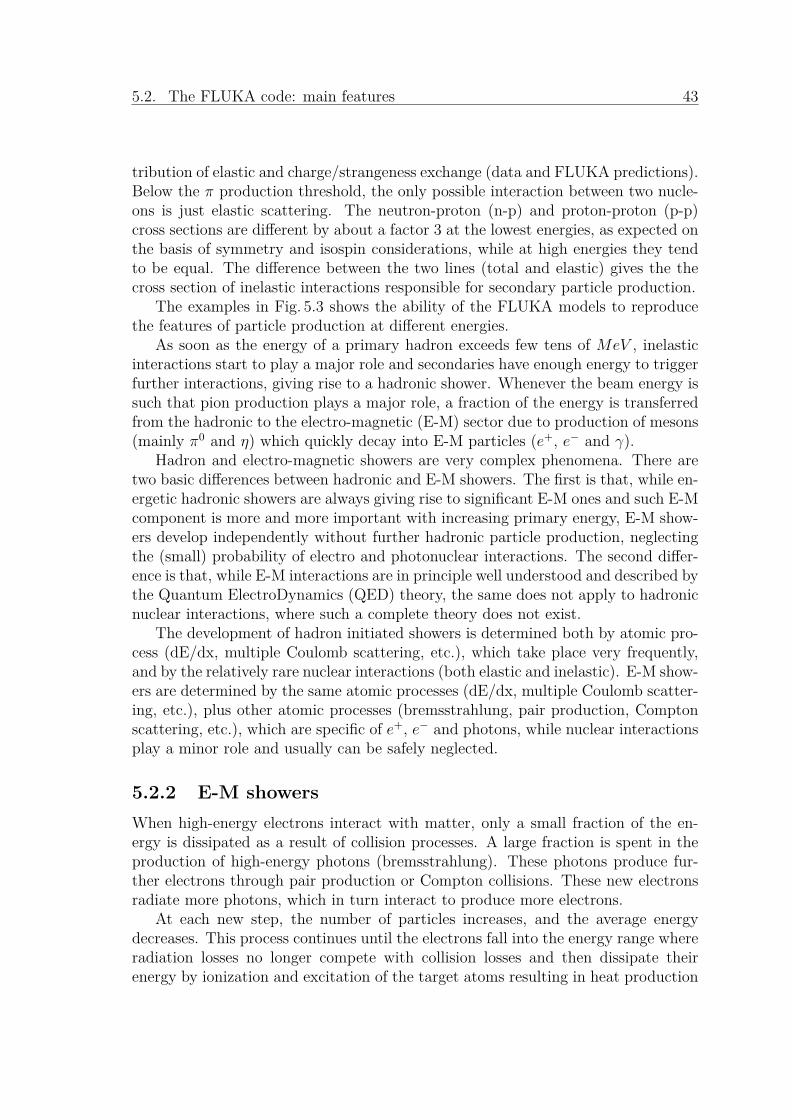
5.2. The FLUKA code: main features 43
tribution of elastic and charge/strangeness exchange (data and FLUKA predictions).Below the π production threshold, the only possible interaction between two nucle-ons is just elastic scattering. The neutron-proton (n-p) and proton-proton (p-p)cross sections are different by about a factor 3 at the lowest energies, as expected onthe basis of symmetry and isospin considerations, while at high energies they tendto be equal. The difference between the two lines (total and elastic) gives the thecross section of inelastic interactions responsible for secondary particle production.
The examples in Fig. 5.3 shows the ability of the FLUKA models to reproducethe features of particle production at different energies.
As soon as the energy of a primary hadron exceeds few tens of MeV , inelasticinteractions start to play a major role and secondaries have enough energy to triggerfurther interactions, giving rise to a hadronic shower. Whenever the beam energy issuch that pion production plays a major role, a fraction of the energy is transferredfrom the hadronic to the electro-magnetic (E-M) sector due to production of mesons(mainly π0 and η) which quickly decay into E-M particles (e+, e− and γ).
Hadron and electro-magnetic showers are very complex phenomena. There aretwo basic differences between hadronic and E-M showers. The first is that, while en-ergetic hadronic showers are always giving rise to significant E-M ones and such E-Mcomponent is more and more important with increasing primary energy, E-M show-ers develop independently without further hadronic particle production, neglectingthe (small) probability of electro and photonuclear interactions. The second differ-ence is that, while E-M interactions are in principle well understood and described bythe Quantum ElectroDynamics (QED) theory, the same does not apply to hadronicnuclear interactions, where such a complete theory does not exist.
The development of hadron initiated showers is determined both by atomic pro-cess (dE/dx, multiple Coulomb scattering, etc.), which take place very frequently,and by the relatively rare nuclear interactions (both elastic and inelastic). E-M show-ers are determined by the same atomic processes (dE/dx, multiple Coulomb scatter-ing, etc.), plus other atomic processes (bremsstrahlung, pair production, Comptonscattering, etc.), which are specific of e+, e− and photons, while nuclear interactionsplay a minor role and usually can be safely neglected.
5.2.2 E-M showersWhen high-energy electrons interact with matter, only a small fraction of the en-ergy is dissipated as a result of collision processes. A large fraction is spent in theproduction of high-energy photons (bremsstrahlung). These photons produce fur-ther electrons through pair production or Compton collisions. These new electronsradiate more photons, which in turn interact to produce more electrons.
At each new step, the number of particles increases, and the average energydecreases. This process continues until the electrons fall into the energy range whereradiation losses no longer compete with collision losses and then dissipate theirenergy by ionization and excitation of the target atoms resulting in heat production
44 5. An overview of the FLUKA physics models
rather than by generation of more shower particles. This entire process results ina cascade of photons, electrons, and positrons called an electromagnetic shower.Fig. 5.4 illustrates the various processes that take place within an electromagneticshower.
Figure 5.4: A schematic view of an electromagnetic shower caused by an electronhitting a target.
A shower is produced when the primary beam energy is much greater than thecritical energy. The latter is the electron energy at which the average energy lossdue to radiation equals that due to ionization.
The distance needed to reduce, by radiation, the average electron’s energy to1/e of its original value is called radiation length, X0. X0 is also defined as 7/9 ofthe mean free path for pair production by a high-energy photon. The longitudinaldevelopment is governed by the high-energy part of the cascade, and therefore scalesas the X0 in the material. The radiation length is a measure of the penetration ofthe electro-magnetic shower into the material. Its main dependencies are on theatomic number Z and the density ρ of the material.
The transverse development of electromagnetic showers in different materialscales fairly accurately with the Molière radius (RM).
The simulation of the electromagnetic cascade in FLUKA is very accurate, in-cluding the Landau-Pomeranchuk-Migdal effect and a special treatment of the tipof the bremsstrahlung spectrum. The electromagnetic part of FLUKA allows a reli-able physics in the range form 1 keV up to 1000TeV , including a precise databaseof photonuclear cross sections.
5.2. The FLUKA code: main features 45
Pair production and bremsstrahlung are treated sampling from the proper doubledifferential energy-angular distributions improving the common practice of usingaverage angles. In a similar way the three-dimensional shape of the electromagneticcascades is reproduced in detail by a rigorous sampling of correlated energy andangles in decay, scattering and multiple Coulomb scattering.
5.2.3 Multiple ScatteringA charged particle traversing a medium is deflected by many angle scatters.
Most of these deflections is due to Coulomb scattering from nuclei. The particleexperience numerous small deviations, the distribution of which is well representedby the theory of Molière [48]. It is roughly Gaussian for small deflection angles,while at larger angles it behaves like Rutherford scattering, with larger tails thandoes a Gaussian distribution.
However, the Gaussian is sufficient for many application for the central 98% ofthe projected angular distribution, with a width given by:
Θ0(x) = 13.6MeV
βcpz
√x
X0[1 + 0.038ln( x
X0)] (5.1)
where p, βc and z are the momentum, velocity and charge number of the incidentparticle and X0 the radiation length of the target.
Transport of charged particles is performed in FLUKA through an original Mul-tiple Coulomb scattering algorithm, supplemented by an optional single scatteringmethod.
Multiple scattering with inclusion of nuclear form factors is applied also to heavyion transport.
5.2.4 Energy loss by particle in matterModerately relativistic protons, and in general charged particles other than electrons,lose their energy primarily by ionization and excitation of the atoms of the materialthey pass through. The average rate of energy loss, the so-called stopping power, isgiven by the Bethe-Bloch equation [49]:
−dEdx
= Kz2Z
A
1β2 [12 ln
2mec2β2γ2TmaxI2 − β2 − δ
2] (5.2)
WhereK is a constant, Z and A are atomic number and atomic mass of the targetmaterial, z, β and γ are charge and relativistic factors of the incident particle, andme is the electron mass. I is the ionization potential, Tmax the maximum kineticenergy that an electron can gain in one single collision and δ is a correction factordepending on the density of the target.

46 5. An overview of the FLUKA physics models
The stopping power for muons on copper, considering all the different regimes,is shown by the solid curve in Fig. 5.5. At higher energies, radiative effects begin tobe important.
mean energy loss
ionization
bremsstrahlung
Figure 5.5: Stopping power for positive muons in Copper. Vertical bands indicateboundaries between different regimes.
Figure 5.6: Ionization fluctuation for 2GeV/c protons after a 100µm Si layer.FLUKA and experimental data from [50].
5.2. The FLUKA code: main features 47
The treatment of ionization energy loss in FLUKA is based on a stochasticalapproach alternative to the standard Landau and Vavilov ones that provides a verygood reproduction of average ionization and fluctuations. Fig. 5.6 shows the goodagreement between FLUKA and experimental data for 2GeV/c protons traversinga 100µm thick Silicon target.
5.2.5 Residual nuclei production and Decay
At the end of the reaction chain, the nucleus is a thermally equilibrated systemcharacterized by its excitation energy U . If U is higher than the separation energy,nucleons and light fragments can still be emitted. The emission process can bewell described as an evaporation from a hot system. The evaporation stage endswhen the nuclear excitation energy becomes lower than all separation energies fornucleons and fragments. This residual excitation energy is then dissipated throughemission of photons. In reality, γ emission occurs even during the pre-equilibriumand evaporation stages, in competition with particle emission, but its relative proba-bility is low. Gamma deexcitation proceeds through a cascade of consecutive photonemissions, until the ground state is reached.
The evaporation process is in competition with another equilibrium process, thatis fission. A fraction of the excitation energy may be spent to induce a collectivedeformation. The potential energy reaches a maximum at the deformation stagethat is called saddle point. Once a nucleus reaches the saddle points, the fissionoccurs, and the nucleus separates, most of the times into two heavy fragment.
All these equilibrium processes are critical for a correct calculation of residualnuclei distributions. They represent the last stage of a nuclear interaction and areresponsible for the exact nature of the residuals left after the interaction, which playthe main role in activation and residual dose rate studies.
The FLUKA evaporation model is based on the Weisskopf-Ewing approach. Forlight residual nuclei, where the excitation energy may overwhelm the total bindingenergy, a statistical fragmentation (Fermi break-up) model is implemented in thecode. The FLUKA evaporation/fission/break-up routines are used for the finaldeexcitation and "low" (in the excited residual rest frame) energy particle production.
Fig. 5.7 shows the experimental data and FLUKA prediction of the residual nucleiproduction in 1GeV 208Pb + p reaction. Residual mass distributions are very wellreproduced by FLUKA.
The time evolution of activation and residual dose rates, as given by FLUKA, hasbeen extensively benchmarked. Samples of different materials have been irradiatedin a CERN facility called CERF. Comparison (of dose rate curves) with FLUKAsimulations show a very nice agreement (see Fig. 5.8).
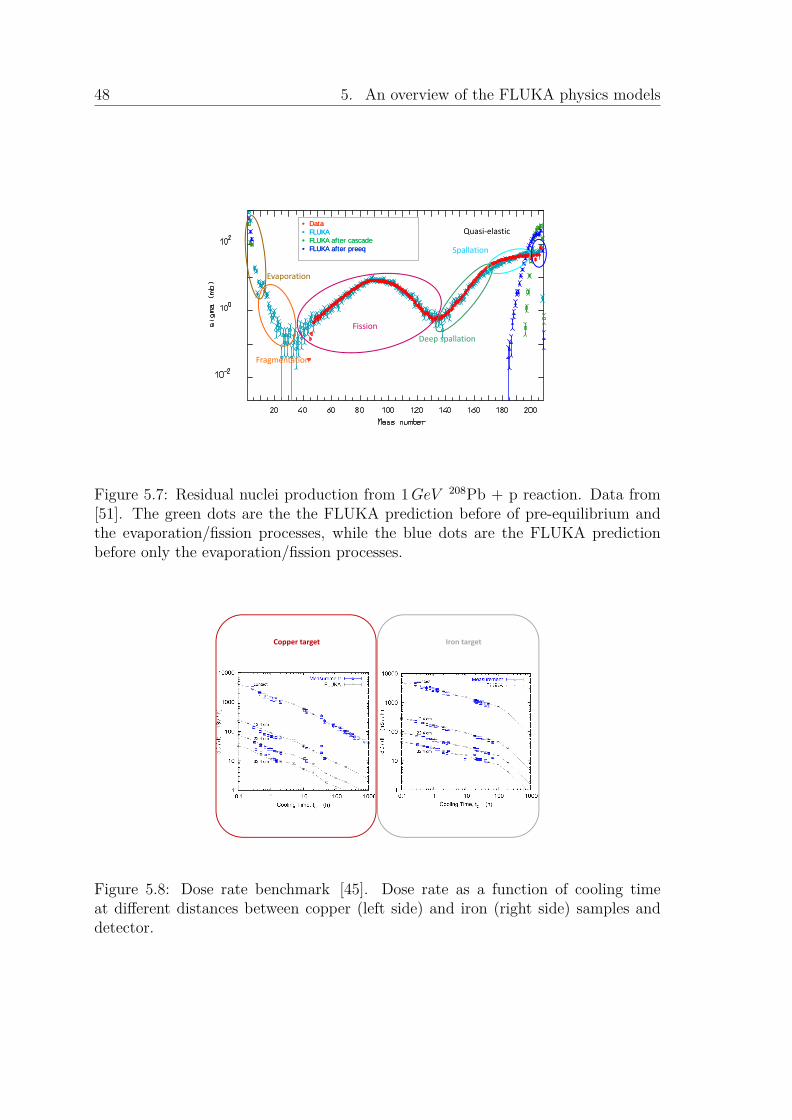
48 5. An overview of the FLUKA physics models
Quasi‐elastic
Spallation
•• DataData•• FLUKAFLUKA•• FLUKA after cascadeFLUKA after cascade•• FLUKA after FLUKA after preeqpreeq
Evaporation
Fission Deep spallation
Fragmentation
Figure 5.7: Residual nuclei production from 1GeV 208Pb + p reaction. Data from[51]. The green dots are the the FLUKA prediction before of pre-equilibrium andthe evaporation/fission processes, while the blue dots are the FLUKA predictionbefore only the evaporation/fission processes.
Copper target Iron target
Figure 5.8: Dose rate benchmark [45]. Dose rate as a function of cooling timeat different distances between copper (left side) and iron (right side) samples anddetector.
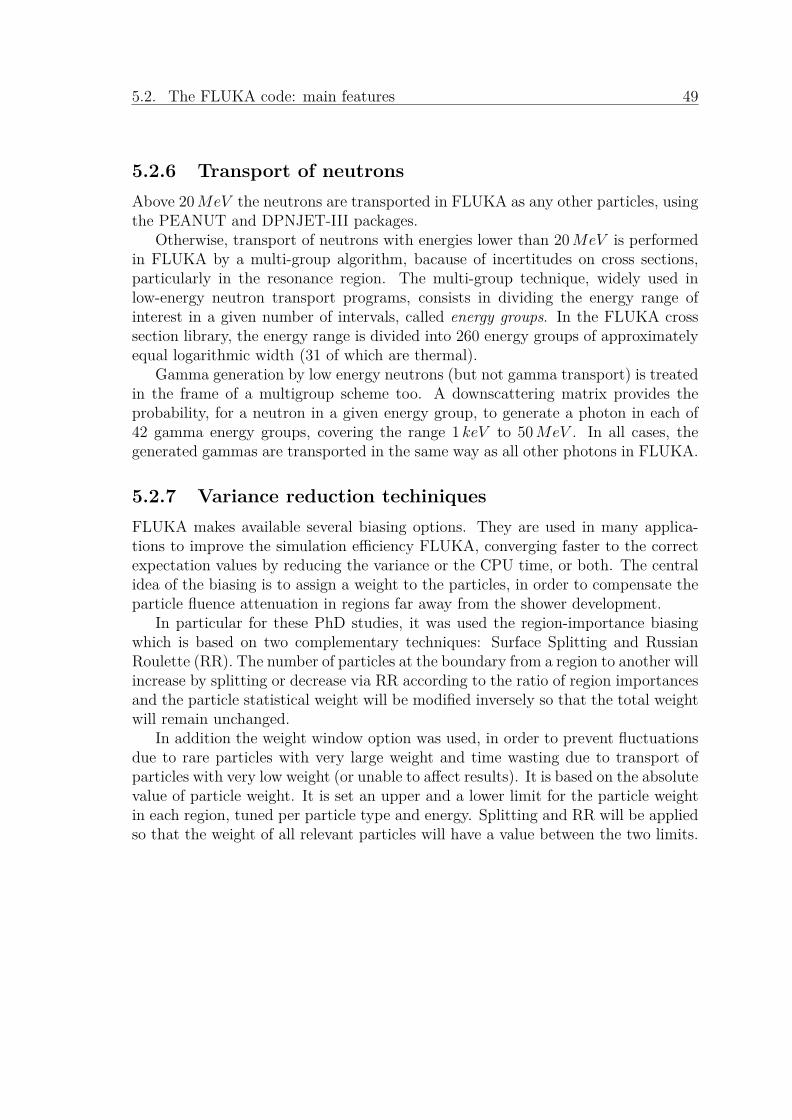
5.2. The FLUKA code: main features 49
5.2.6 Transport of neutronsAbove 20MeV the neutrons are transported in FLUKA as any other particles, usingthe PEANUT and DPNJET-III packages.
Otherwise, transport of neutrons with energies lower than 20MeV is performedin FLUKA by a multi-group algorithm, bacause of incertitudes on cross sections,particularly in the resonance region. The multi-group technique, widely used inlow-energy neutron transport programs, consists in dividing the energy range ofinterest in a given number of intervals, called energy groups. In the FLUKA crosssection library, the energy range is divided into 260 energy groups of approximatelyequal logarithmic width (31 of which are thermal).
Gamma generation by low energy neutrons (but not gamma transport) is treatedin the frame of a multigroup scheme too. A downscattering matrix provides theprobability, for a neutron in a given energy group, to generate a photon in each of42 gamma energy groups, covering the range 1 keV to 50MeV . In all cases, thegenerated gammas are transported in the same way as all other photons in FLUKA.
5.2.7 Variance reduction techiniquesFLUKA makes available several biasing options. They are used in many applica-tions to improve the simulation efficiency FLUKA, converging faster to the correctexpectation values by reducing the variance or the CPU time, or both. The centralidea of the biasing is to assign a weight to the particles, in order to compensate theparticle fluence attenuation in regions far away from the shower development.
In particular for these PhD studies, it was used the region-importance biasingwhich is based on two complementary techniques: Surface Splitting and RussianRoulette (RR). The number of particles at the boundary from a region to another willincrease by splitting or decrease via RR according to the ratio of region importancesand the particle statistical weight will be modified inversely so that the total weightwill remain unchanged.
In addition the weight window option was used, in order to prevent fluctuationsdue to rare particles with very large weight and time wasting due to transport ofparticles with very low weight (or unable to affect results). It is based on the absolutevalue of particle weight. It is set an upper and a lower limit for the particle weightin each region, tuned per particle type and energy. Splitting and RR will be appliedso that the weight of all relevant particles will have a value between the two limits.

50 5. An overview of the FLUKA physics models

Chapter 6
Simulations of the IR7 region
The dump caverns, the inner triplets, the experiments and the cleaning insertions,where the Phase II collimators are foreseen to be installed, are the LHC regionsfor which the highest loss densities are expected. In particular, the loss rate at theBetatron Cleaning region is higher by about a factor of 7 when compared to that atthe Momentum Cleaning one. The focus is thus put on the simulation of the IR7insertion which is the most critical region of LHC.
The SS and the DSs of IR7 are fully implemented in FLUKA up to a high de-gree of sophistication, including all relevant components and details up to a realisticlimit. A modular approach in the geometry definition and an extensive use of user-written programs allowed the detailed implementation of all magnets, collimatorsand absorbers, including the beam instrumentation, the beam pipeline, the inter-connections between SC magnets, the cables on each side of the LHC tunnel, steelsupports, and naturally the tunnel with its service caverns and bypasses.
6.1 The FLUKA Combinatorial Geometry
The Combinatory Geometry (CG) used by FLUKA is based on the original one byMAGI (Mathematical Application Group, Inc.) [52] [53]. Two concepts are funda-mental in CG: bodies and regions. In FLUKA the bodies are defined as finite portionof space completely delimited by surfaces of first or second degree. Moreover, infi-nite planes and cylinders are also available. The regions are combinations of bodiesthrough boolean operations. Each region is not necessary simply connected (it canbe made of two or more non contiguous parts), but must be of homogeneous materialcomposition. All the regions must be contained within a surrounding blackhole sothat all escaping particles are there absorbed.
51

52 6. Simulations of the IR7 region
6.2 The FLUKA modular approach used for IR7
The IR7 description in FLUKA consists of a 1.5 km long LHC tunnel section com-posed of the SS, the dispersion suppressor region and a part of the LHC arc onthe right side of the IP7. It includes more than 220 elements of about 30 differenttypes, such as SC bending magnets, SC quadrupoles, warm magnets, orbit correc-tors, beam loss monitors, primary and secondary collimators, passive and activeabsorbers. Each LHC magnet model has an associated magnetic field map.
Most of these elements appear several times in the IR7 layout. Sometimes allelements of the same type are completely identical (e.g. the MB) although commonlythey show some differences, like the orientation (e.g. the collimators), material (e.g.active absorbers and Phase I secondary collimators) and beam pipes (e.g. MBW).For this reason, it was decided to place all prototypes (i.e. each model representativeof all elements similar in IR7) in a parking area near the simulated geometry andreplicate them along the tunnel via the Lattice option of FLUKA. The cloning isperformed by allocating a bounding body in the input file for the replicated itemand defining the trasformation to superimpose it on the prototype [54].
Whenever a particle enters a replica in the tunnel, it is virtually transported tothe prototype in the parking. The change of reference system, including translation,rotation and reflection, is defined by the user in a routine (i.e. lattic.f). As soonas the particle escapes from the prototype, it is transported back to the replicaboundary in the tunnel. It is obviously possible to distinguish at scoring betweenevents occurring in two different replicas of the same prototype.
It has to be pointed out that all replicas of the same prototype share the sameproperties. In the special case of both Phase I and Phase II collimators, a dedicatedprototype is not created for each jaw gap, but their aperture, which follows theactual value of the β function, is adapted runtime through the same lattic.f routine.
6.3 The IR7 FLUKA prototypes
The layout of the IR7 geometry is in continuous development by the members of theFLUKA team, following the needs of new investigations with the addition of proto-types where necessary. For example, in consequence of the LHC accident in Sector3-4, the possibility of a simultaneous magnet and busbar quench was investigatedthanks to the addition of the interconnection and busbar models in the DS region ofIR7. Or following the radiation induced electronic equipment failure in the CNGSexperiment, a campaign of simulations has been built up to investigate if the samecould happen at the electronic devices installed in the IR7 tunnel or in its servicecaverns, and to add protecting shieldings or plan relocation (see Chapter 13).
The main IR7 prototypes are described in detail below.

6.3. The IR7 FLUKA prototypes 53
6.3.1 The IR7 magnet modelsThe DS segment extends from the SC quadrupole Q8 to Q11 (Q is a generic SCquadrupole identification in the optics files) on each side of the IP7. In additionto the DS, the first LHC arc cells 12 and 13 are also included in the FLUKA IR7description, since they are used for the matching procedure between the DS and theLHC arc. The DS cold quadrupoles Q8, Q9 and Q10 (plus the Q7in the SS) aremade of an assembly including a main quadrupole MQ plus a long tuning quadrupoleMQTL (MQ+2MQTLs for Q9). In between the DS quadrupole assemblies, 2 SCmain bending magnets (MB) are installed, while for the arc cell 3 MBs are placedin between the quadrupoles. Orbit correctors (MCB), sextupoles (MCS), octupoleand decapoles (MCDO) correctors are also implemented in the FLUKA geometry.
The straight section of the Betatron Cleaning insertion is mirror symmetric withrespect to the IP7. It includes mainly resistive magnets, to avoid quenches and highheat loads on cryogenics. Starting from Q7 left, the quadrupole Q6, made of 6 SCMQTL modules, is followed by a dog-leg structure made of two sets of MBW warmsingle bore wide aperture dipole magnets (2 warm modules each) which increase theinter-beam distance from 19.4 cm to 22.4 cm. Two further MBW pairs after 340mrestore the nominal distance. Four quadrupole (MQW) sets are installed in the SS.Each MQW set is in turn composed of 5 MQWA and 1 MQWB modules. Horizontaland vertical correctors (the MCBW dipoles) complete the total budget of the 114magnets included in the IR7 FLUKA description.
6.3.1.1 The warm magnet models
A total of 40 warm magnets of 3 different design families: MBW, MQW and MCBW,are implemented in the FLUKA geometry of the IR7 SS.
• Warm dipole magnets.A MBW is a warm dipole and it is often referred as a dogleg bending magnet.The MBW are 3.8m long, 1.08m wide and 0.74m high. Their magnetic lengthis 3.4m (see Fig. 6.1). The dipole is perfectly symmetric in x and y.The first and the last pairs are described by the same prototype in the parkingregion. The central axes of the vacuum chambers are at 19.4 cm distance fromeach other. The remaining pairs are described by another FLUKA prototypeand associated to a different magnetic field map. The distance between thebeams is in this case 22.4 cm.The MCBWs are also warm dipole magnets but they are used as correctorsand they act only on one beam. They can be vertical and horizontal, bothhaving a magnetic length of 1.7m. In the horizontal one the other beam passthrough a passive aperture and outside the magnet in the vertical version. Atotal of 8 MCBW are installed in the straight section.
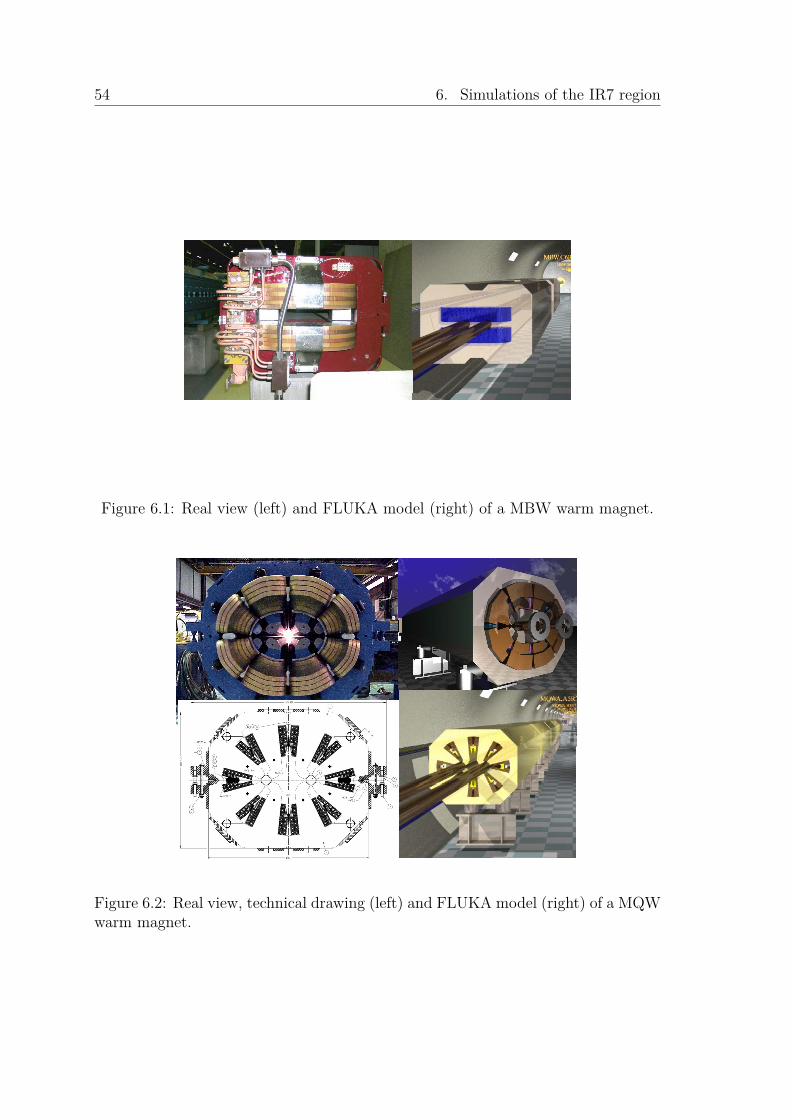
54 6. Simulations of the IR7 region
Figure 6.1: Real view (left) and FLUKA model (right) of a MBW warm magnet.
Figure 6.2: Real view, technical drawing (left) and FLUKA model (right) of a MQWwarm magnet.
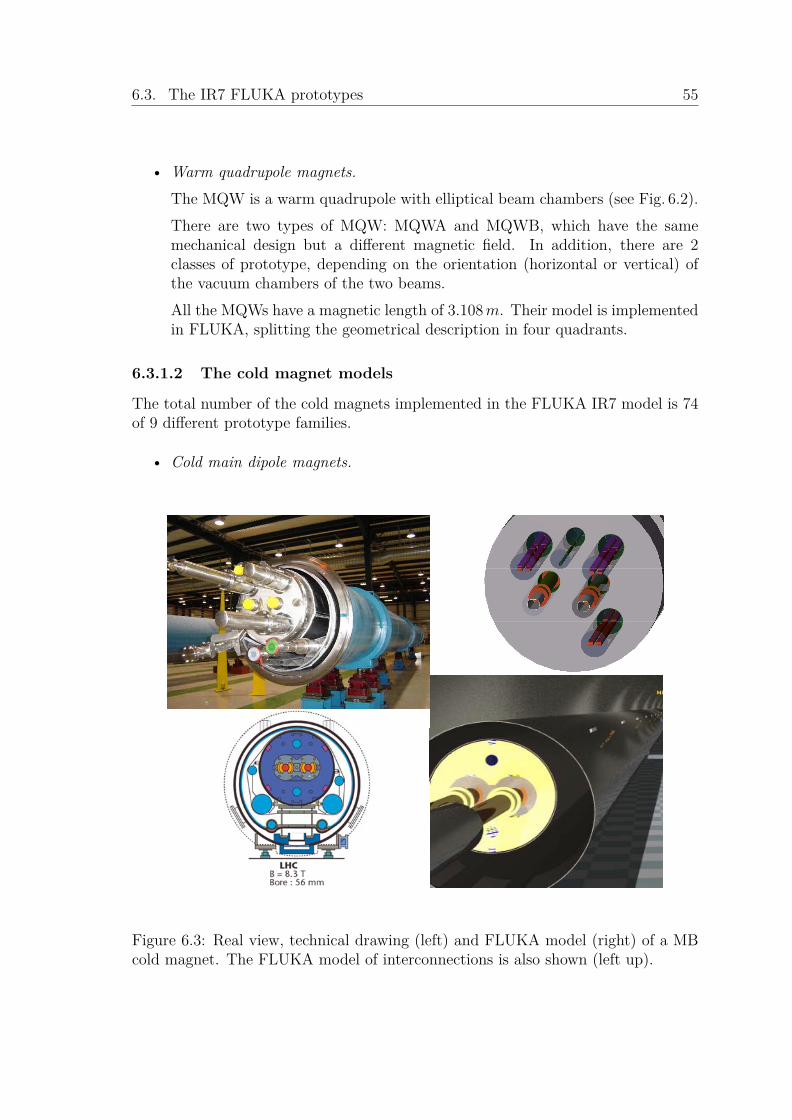
6.3. The IR7 FLUKA prototypes 55
• Warm quadrupole magnets.The MQW is a warm quadrupole with elliptical beam chambers (see Fig. 6.2).There are two types of MQW: MQWA and MQWB, which have the samemechanical design but a different magnetic field. In addition, there are 2classes of prototype, depending on the orientation (horizontal or vertical) ofthe vacuum chambers of the two beams.All the MQWs have a magnetic length of 3.108m. Their model is implementedin FLUKA, splitting the geometrical description in four quadrants.
6.3.1.2 The cold magnet models
The total number of the cold magnets implemented in the FLUKA IR7 model is 74of 9 different prototype families.
• Cold main dipole magnets.
Figure 6.3: Real view, technical drawing (left) and FLUKA model (right) of a MBcold magnet. The FLUKA model of interconnections is also shown (left up).

56 6. Simulations of the IR7 region
The MB are 14.3m long SC dipoles (see Fig. 6.3) with a magnetic field ofabout 8T at top energy, each bending the beam by 5mrad. Their sagitta is9,14mm. The FLUKA MB prototype is modelled by splitting the beam linesinto 4 tilted segments, in order to approximate the beam curvature.
• Cold quadrupole magnets.The 3.1m long MQs are the LHC main quadrupoles. There are 11 MQsimplemented with all the details in the FLUKA IR7 description.Upstream of each MQ in the LHC arc part considered in the FLUKA descrip-tion, the 36.5 cm long tuning SC quadrupoles MQT is placed.Additional 1.3m long tuning quadrupoles MQTL (see Fig. 6.4) are present inthe DS and SS regions. The MQTL magnets are SC quadrupoles grouped onenext to the other sharing the same cryostat at each end of the SS. The MQTLsare also present in the DS and in the LHC arc part close to the MQs.
MCBC
MQTL
MQTL
Figure 6.4: FLUKA model showing the MQTL cold magnets and a MCBC corrector.
• Cold Correctors magnets.Different kinds of cold corrector magnets are described in the FLUKA IR7geometry, for a total number of 40 devices.Close to each of the MQTL magnets in the DS region, 90 cm long SC dipoleorbit corrector magnets (MCBC) are installed. Vertical and horizontal 65 cm
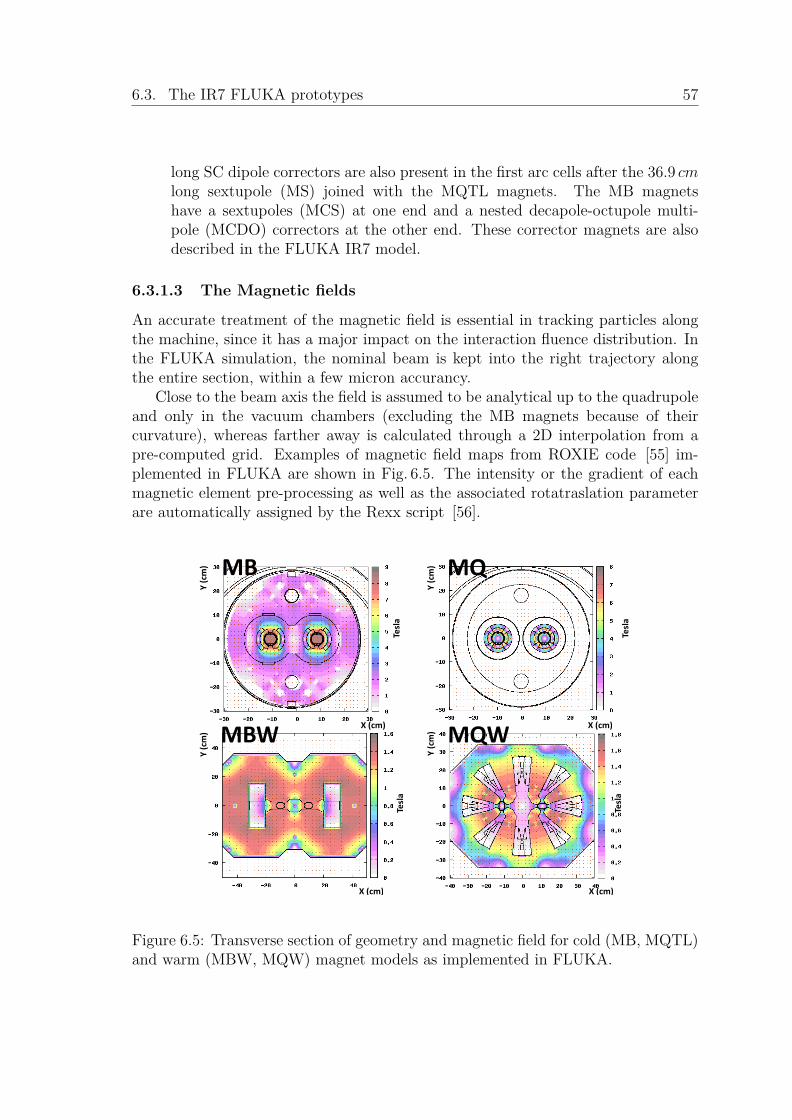
6.3. The IR7 FLUKA prototypes 57
long SC dipole correctors are also present in the first arc cells after the 36.9 cmlong sextupole (MS) joined with the MQTL magnets. The MB magnetshave a sextupoles (MCS) at one end and a nested decapole-octupole multi-pole (MCDO) correctors at the other end. These corrector magnets are alsodescribed in the FLUKA IR7 model.
6.3.1.3 The Magnetic fields
An accurate treatment of the magnetic field is essential in tracking particles alongthe machine, since it has a major impact on the interaction fluence distribution. Inthe FLUKA simulation, the nominal beam is kept into the right trajectory alongthe entire section, within a few micron accurancy.
Close to the beam axis the field is assumed to be analytical up to the quadrupoleand only in the vacuum chambers (excluding the MB magnets because of theircurvature), whereas farther away is calculated through a 2D interpolation from apre-computed grid. Examples of magnetic field maps from ROXIE code [55] im-plemented in FLUKA are shown in Fig. 6.5. The intensity or the gradient of eachmagnetic element pre-processing as well as the associated rotatraslation parameterare automatically assigned by the Rexx script [56].
MQMB
Y (cm)
Y (cm)
Tesla
Tesla
X (cm) X (cm)MBW MQW
Y (cm)
X (cm) X (cm)
Y (cm)
Tesla
Tesla
T T
X (cm) X (cm)
Figure 6.5: Transverse section of geometry and magnetic field for cold (MB, MQTL)and warm (MBW, MQW) magnet models as implemented in FLUKA.

58 6. Simulations of the IR7 region
6.3.2 The Phase I collimator modelsPrimary and secondary collimators as well as active absorbers are key elements inthe halo cleaning system. To complete the Phase I collimators system models, thepassive absorbers are also described below.
6.3.2.1 Phase I Primary collimator model
Three IR7 primary collimators (TCP) are located between the two dogleg warmbending magnet sets, on the left side of IP7 for Beam 1 and on the right side forBeam 2.
The TCP jaws are elongated blocks with conical tapering and about 12 cm su-perficial skimming, in order to leave an active length of 60 cm. The CFC jaws aresitting at 6σ from the beam axis for each TCP orientation. Moreover the tilt of thejaws follows the beam divergence at the location of the collimators. The first TCPis a vertical collimator, the second is horizontal and the third is a skew one (seeAppendix B for more details). They are installed in cascade on each beam line.
The TCP jaws are contained in a steel tank, implemented in FLUKA with itsentry and exit flanges for the connection with the beam pipeline.
Inside the tank the FLUKA TCP description includes two symmetric piecescomposed by a jaw, a support plaque, 6 longitudinal cooling water pipes on top oneof the other, a clamp support, a steel clamp, 5 x-transverse springs and RF fingers.
Two prototypes are implemented for the injection and the 7TeV scenario respec-tively, because the jaw gap variation between these two configurations is significant.Taking the low beta aperture prototype, at injection the moving planes, used to cutthe jaws in accordance with their actual gaps, would "eat" a good fraction of the jawmaterial, coming too deeply inside the jaw.
6.3.2.2 Phase I Secondary collimator model
The two FLUKA prototypes (for injection and 7TeV ) of the secondary collimators(TCSG) are almost identical to these of the primary ones, but in this case, theyhave 1m long CFC jaws (and no shimmed layers because the active length is thefull length). They are opened at 7σ from the beam orbit.
Eleven TCSGs for each beamline are implemented in the FLUKA LSS descrip-tion with different orientations (see Appendix B for more details). The first of thesecondary collimators is located 40m downstream of the last primary.
6.3.2.3 Active absorber model
The two FLUKA active absorber (TCLA) descriptions are almost like the secondaryones, but the base material of the jaws is Copper instead of CFC and the jaws have90 cm long and 3.4 cm wide Tungsten inserts. The jaws of the IR7 active absorbersare sitting at 10σ.
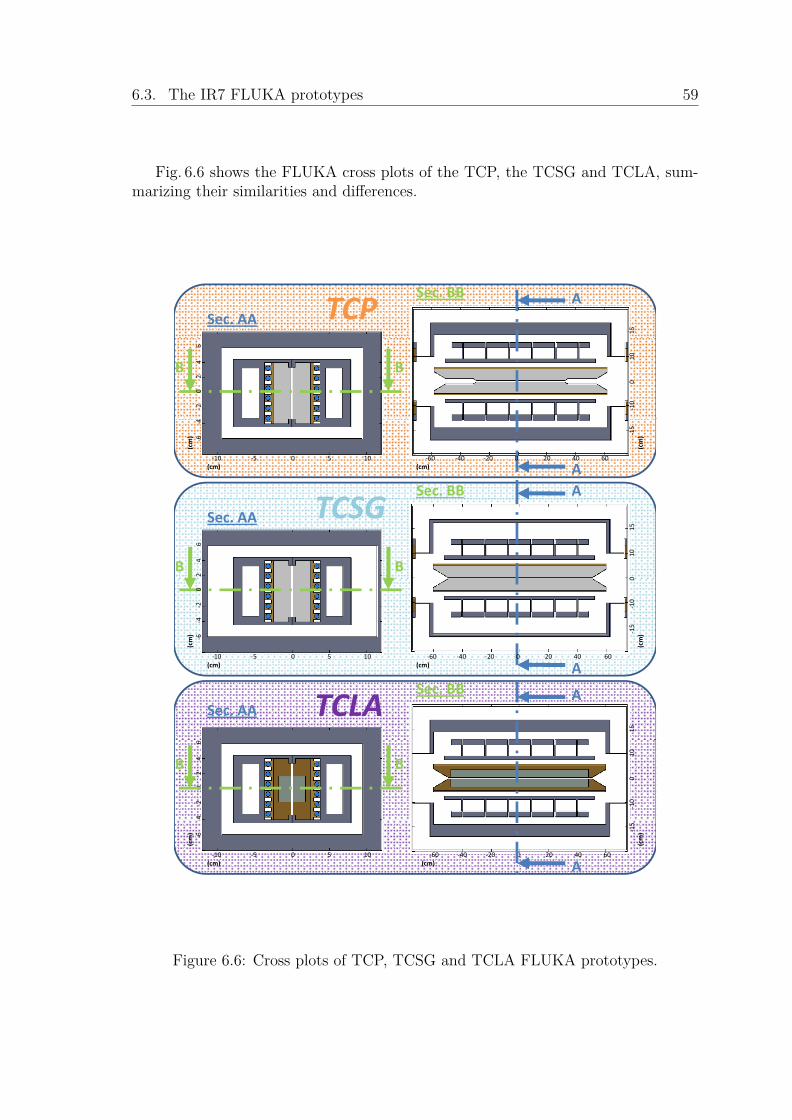
6.3. The IR7 FLUKA prototypes 59
Fig. 6.6 shows the FLUKA cross plots of the TCP, the TCSG and TCLA, sum-marizing their similarities and differences.
15
ASec. BB
Sec. AA TCP
‐10
0 10
‐2 0 2 4 6
BB
‐60 ‐40 ‐20 0 20 40 60(cm)
‐15
(cm)
‐10 ‐5 0 5 10 (cm)
(cm) ‐6 ‐4
AA
Sec. BBTCSG
2 4 6
0 10
15
BB
Sec. AA TCSG
‐10 ‐5 0 5 10
(cm) ‐6 ‐4
‐2 0
‐60 ‐40 ‐20 0 20 40 60
‐15 ‐10 0
(cm)
(cm) (cm)
15
A
ASec. BB Sec. AA TCLA
‐4 ‐2 0 2 4 6
‐1
0 0 10
BB
‐60 ‐40 ‐20 0 20 40 60(cm)
(cm) ‐6 ‐
‐10 ‐5 0 5 10 (cm)
‐15
(cm)
A
Figure 6.6: Cross plots of TCP, TCSG and TCLA FLUKA prototypes.
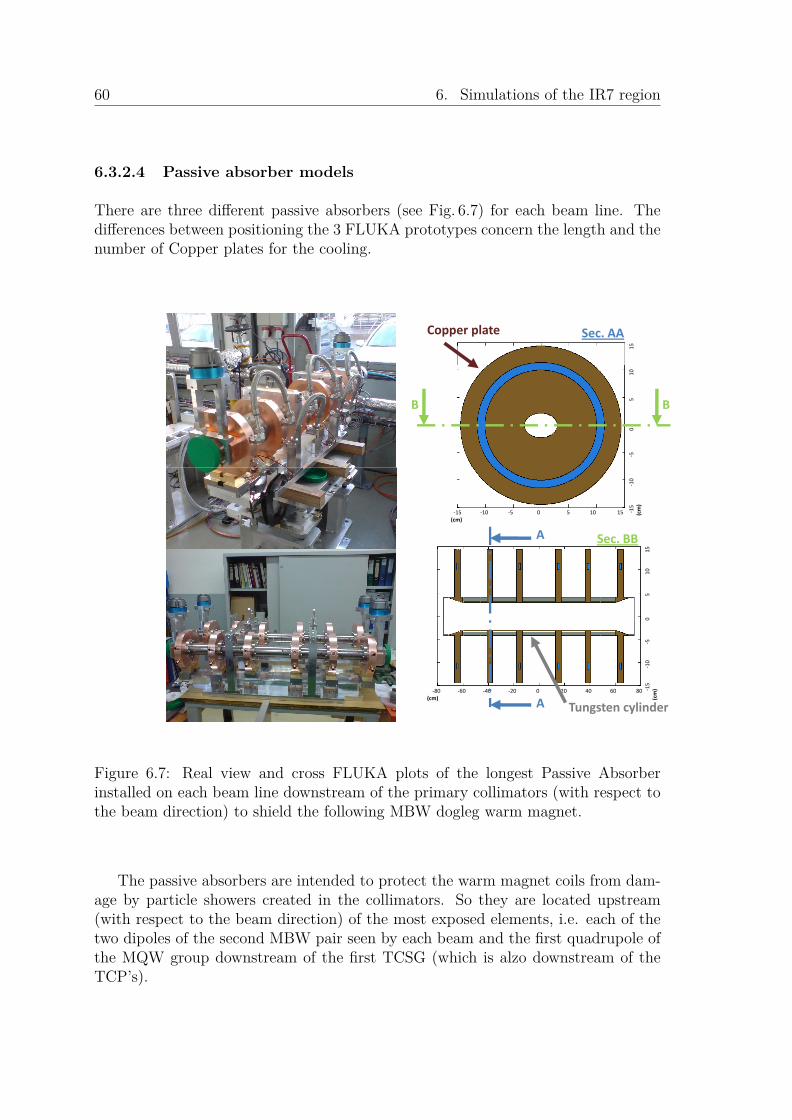
60 6. Simulations of the IR7 region
6.3.2.4 Passive absorber models
There are three different passive absorbers (see Fig. 6.7) for each beam line. Thedifferences between positioning the 3 FLUKA prototypes concern the length and thenumber of Copper plates for the cooling.
15
Sec. AACopper plate
5
10
BB
‐5
0
‐15
‐10
(cm)
‐15 ‐10 ‐5 0 5 10 15 (cm)
0 15
(cm)
Sec. BBA
0 5 10
‐10 ‐5
‐80 ‐60 ‐40 ‐20 0 20 40 60 80(cm)
‐15
(cm)
A Tungsten cylinder
Figure 6.7: Real view and cross FLUKA plots of the longest Passive Absorberinstalled on each beam line downstream of the primary collimators (with respect tothe beam direction) to shield the following MBW dogleg warm magnet.
The passive absorbers are intended to protect the warm magnet coils from dam-age by particle showers created in the collimators. So they are located upstream(with respect to the beam direction) of the most exposed elements, i.e. each of thetwo dipoles of the second MBW pair seen by each beam and the first quadrupole ofthe MQW group downstream of the first TCSG (which is alzo downstream of theTCP’s).

6.3. The IR7 FLUKA prototypes 61
6.3.3 The BLM models
In the FLUKA SS description the BLMs installed just after each collimators and be-low the beam pipe are modelled. This in principle allows to predict the longitudinalsequence of BLM signals associated to a given loss scenario.
Two different kind of BLMs are implemented in the IR7 line. The LHC BLMsystem uses Ionization chambers (i.e. BLMI) as standard detectors but in the areaswhere very high dose rates are expected, like in IR7 (the electronics of the BLMIsaturates at about 23Gy/s [57]), Secondary Emission Monitors (i.e. BLMS) areadded because of their high linearity, low sensitivity and fast response [58].
Each collimator has one BLMS and one BLMI installed below it on a suitablesupport shared with the vacuum pumps (see Fig. 6.8). Three different models for theBLM are implemented in FLUKA: the first and second differ by relative positioningof BLMI and BLMS, reflecting the actual installation in the tunnel. The third oneis a very detailed description of the ionization chamber used for specific simulations.
Secondary Emission Monitor SEM (BLMS) ( )
Figure 6.8: BLM real views and FLUKA model.

62 6. Simulations of the IR7 region
6.4 The Phase II collimators FLUKA prototypesIn the framework of this PhD, 11 Phase II collimators have been considered on eachbeam line, downstream of each of the 11 TCSGs.
In total 8 families of designs were investigated, starting with a preliminary modelup to the very detailed implementation of the two first prototypes now in phase ofproduction (see Chapter 8 and 9).
Each of the 8 Phase II FLUKA design types is contained in a 3D cylinder regionin the parking area. In order to reduce the number of FLUKA prototypes, onlyone Phase II model was created for each design family and adapted for all energyscenarios. Each prototype jaw is set at an average aperture typical of the case understudy. In addition, different jaw materials (e.g. Aluminum, Tungsten, Copper, etc)and different design details (e.g. jaw supports, tank shape, metallic foil onto thejaw, etc) are implemented for the same prototype and activated by the user duringthe pre-processing stage when a specific IR7 lay-out is produced through the scriptgo.sh.
6.5 The IR7 input file and executableAll the prototypes described above are contained in a file called ir7.fluka which isthe pre-processed version of the FLUKA input file. It includes all the IR7 geometry,the physics options and the scorings necessary for all the study cases.
In order to define the containers (i.e. the 3D volume portions where the pro-totypes are replicated), the respective transformations and the magnetic fields as-sociated to each magnet element, the mklattic.r REXX script is used. It produceseventually the FLUKA input file, that is ir7.inp and the lattic.f user routine whereall the rototranslations and the dynamic changes of the collimator gaps with theassociated possible jaw tilts are coded.
The mklattic.r takes as input several files. They include the optics informa-tions, which are the beam element sequence, position and magnetic parameters. Allthe IR7 prototype considered are listed in the prototype.pos file, which summarizesall FLUKA available models, their position in the parking area, their names andbounding boxes and the name of the Magnetic Field map files (from ROXIE) tobe coupled with each corresponding FLUKA prototype. For collimators, input fileincludes their rotation, half gaps and possible jaw tilts. The mklattic.r calculatesthe magnetic field intensity/gradient for the dipoles/quadrupoles, as a function ofthe beam magnetic rigidity.
The makefile is the configuration file in which are specified all the user routinesnecessary for the simulations, in particular, the source.f and the magfld.f routines.The first routine is responsible of loading the inelastic scattering positions of primaryprotons from SixTrack and, sampling randomly from this distribution, to force theirnon elastic interaction at the specified location with the collimator materials. The
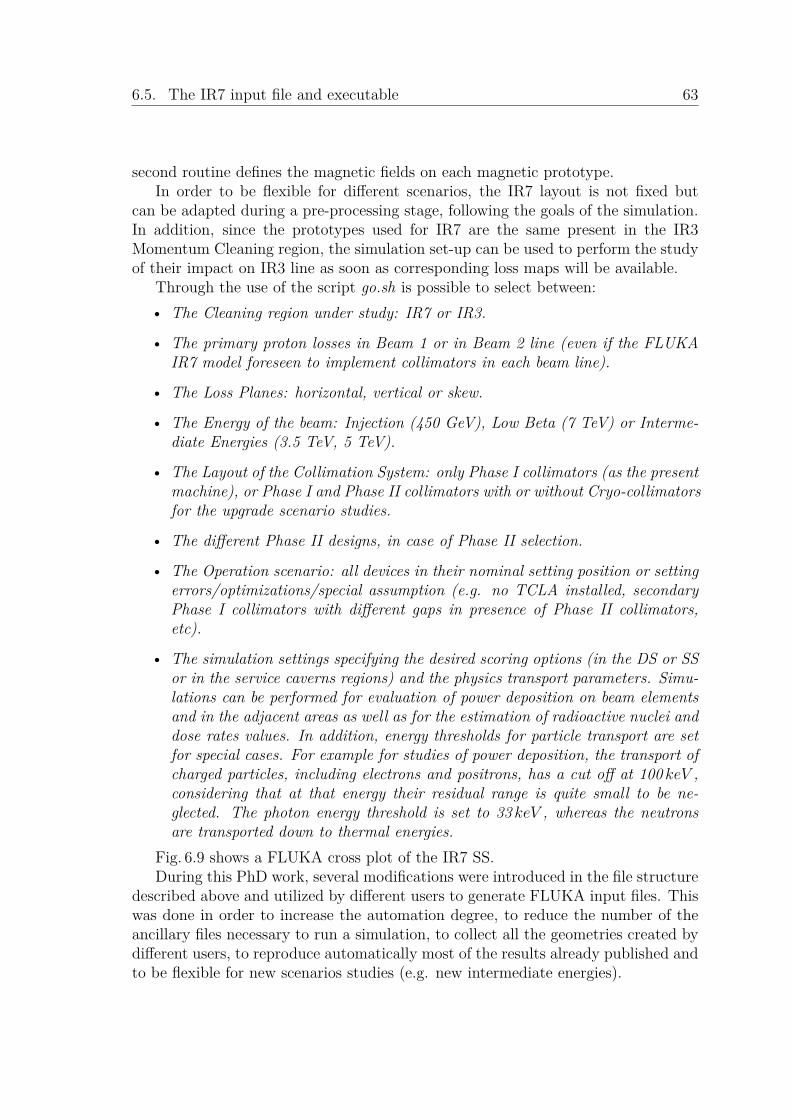
6.5. The IR7 input file and executable 63
second routine defines the magnetic fields on each magnetic prototype.In order to be flexible for different scenarios, the IR7 layout is not fixed but
can be adapted during a pre-processing stage, following the goals of the simulation.In addition, since the prototypes used for IR7 are the same present in the IR3Momentum Cleaning region, the simulation set-up can be used to perform the studyof their impact on IR3 line as soon as corresponding loss maps will be available.
Through the use of the script go.sh is possible to select between:• The Cleaning region under study: IR7 or IR3.
• The primary proton losses in Beam 1 or in Beam 2 line (even if the FLUKAIR7 model foreseen to implement collimators in each beam line).
• The Loss Planes: horizontal, vertical or skew.
• The Energy of the beam: Injection (450 GeV), Low Beta (7 TeV) or Interme-diate Energies (3.5 TeV, 5 TeV).
• The Layout of the Collimation System: only Phase I collimators (as the presentmachine), or Phase I and Phase II collimators with or without Cryo-collimatorsfor the upgrade scenario studies.
• The different Phase II designs, in case of Phase II selection.
• The Operation scenario: all devices in their nominal setting position or settingerrors/optimizations/special assumption (e.g. no TCLA installed, secondaryPhase I collimators with different gaps in presence of Phase II collimators,etc).
• The simulation settings specifying the desired scoring options (in the DS or SSor in the service caverns regions) and the physics transport parameters. Simu-lations can be performed for evaluation of power deposition on beam elementsand in the adjacent areas as well as for the estimation of radioactive nuclei anddose rates values. In addition, energy thresholds for particle transport are setfor special cases. For example for studies of power deposition, the transport ofcharged particles, including electrons and positrons, has a cut off at 100 keV ,considering that at that energy their residual range is quite small to be ne-glected. The photon energy threshold is set to 33 keV , whereas the neutronsare transported down to thermal energies.
Fig. 6.9 shows a FLUKA cross plot of the IR7 SS.During this PhD work, several modifications were introduced in the file structure
described above and utilized by different users to generate FLUKA input files. Thiswas done in order to increase the automation degree, to reduce the number of theancillary files necessary to run a simulation, to collect all the geometries created bydifferent users, to reproduce automatically most of the results already published andto be flexible for new scenarios studies (e.g. new intermediate energies).

64 6. Simulations of the IR7 region
cmBEAM2
MBW 1st set6 MQTL
MBW 2nd set
ers
MQWs
ctive Absorb
Beam
1
QMQWs
TCSG
BEAM2
A
IP7
UJ
TCSM
TCSM
TCSG
TCSG
TCSMTCSG
TCSM
orbe
rs1
MQWs
TCSGTCSM
TCSMTCSG
TCSMTCSG
M1Passive Abso
Beam
M
MQWs
MBW 1st set
BEAM
MBW 2nd set
3TCPs BEAM1
6 MQTL
BEAM1
cm
6 MQTL
Figure 6.9: FLUKA geometry of the IR7 Straight Section. The location of thePhase I and Phase II collimators are underlined in this cross plot for Beam1. TheBeam II is mirror symmetric with respect to the IP7, apart from the location of thecollimators inside the red frame.

Chapter 7
First exploratory studies on PhaseII collimators
A preliminary Phase II metallic collimator design proposed by CERN was inves-tigated with different jaw materials. This step provided valuable informations notonly for the power loads on the jaws themselves but also for those on the jaw supportstructures and on the collimator tanks, in the different SS locations.
The impacting power in the SS IR7 region in the 0.2h beam lifetime scenariofor the 7TeV low beta optics is up to 500 kW . The distribution of this load on theIR7 beam elements and on the surrounding devices is strongly dependent on thematerial of the jaws which are directly hit by the protons, determining the particleshower development.
General studies are thus necessary in order to evaluate these power distributionsand to put the basis for further investigations.
7.1 Collimator materialsIn order to compare candidate materials for collimator jaws, a simple exercise isenlightening. A single 92 cm long jaw of different homogeneous materials is impactedwith a pencil beam of 7TeV protons at 100nm from the jaw surface [59].
Table 7.1 summarizes for the 6 materials considered the physical quantities rul-ing the energy deposition: Beryllium, Carbon-Carbon (or CFC, it is a 2D carbonfibre reinforced carbon composite, chosen for primary and secondary Phase I colli-mator jaws because of its low-Z number along with good thermal and mechanicalproperties), Aluminum, Titanium, Copper and Tungsten. In particular, values ofradiation length X0 (mainly dependent on the atomic number Z and density ρ) andof inelastic scattering length λ (mainly dependent on ρ) are reported.
Fig. 7.1 shows the deposited energy density versus mass length per impactingproton for the scenario under study. The effect of normalizing x axis to the materialdensity is translated in an apparent different jaw length and pointed out the Z-
65
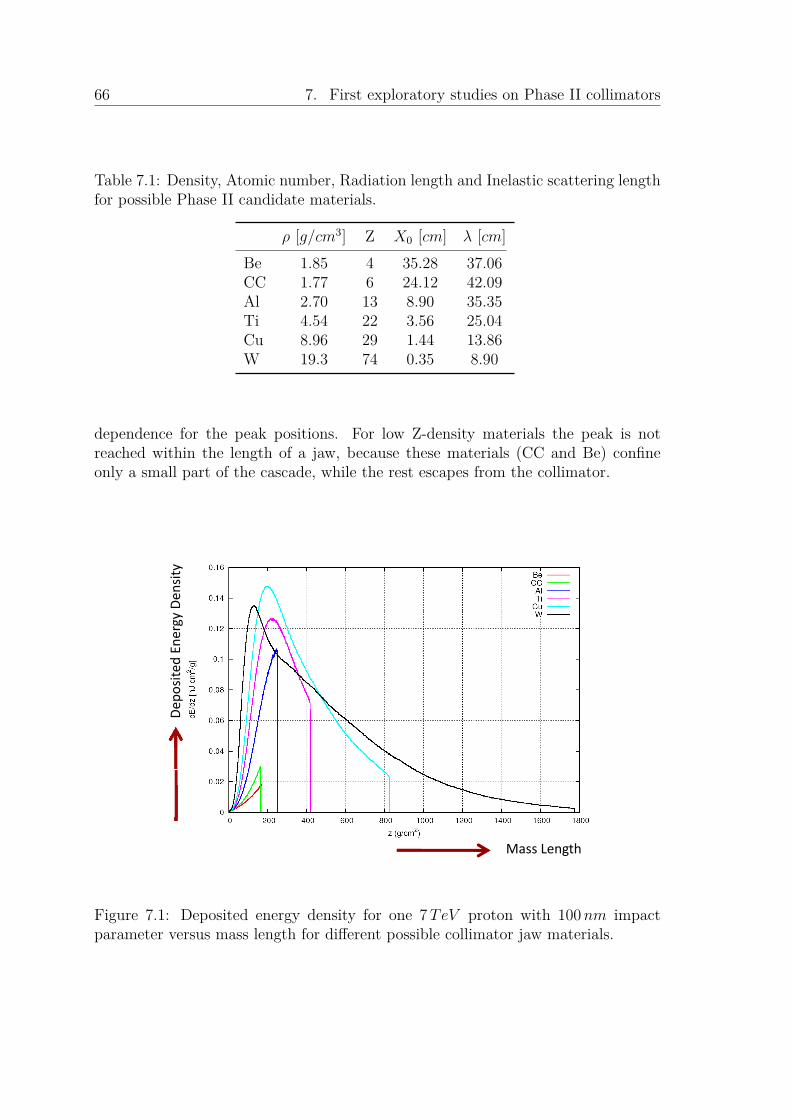
66 7. First exploratory studies on Phase II collimators
Table 7.1: Density, Atomic number, Radiation length and Inelastic scattering lengthfor possible Phase II candidate materials.
ρ [g/cm3] Z X0 [cm] λ [cm]Be 1.85 4 35.28 37.06CC 1.77 6 24.12 42.09Al 2.70 13 8.90 35.35Ti 4.54 22 3.56 25.04Cu 8.96 29 1.44 13.86W 19.3 74 0.35 8.90
dependence for the peak positions. For low Z-density materials the peak is notreached within the length of a jaw, because these materials (CC and Be) confineonly a small part of the cascade, while the rest escapes from the collimator.
ityrgy Den
sted Ener
Dep
osit
Mass Length
Figure 7.1: Deposited energy density for one 7TeV proton with 100nm impactparameter versus mass length for different possible collimator jaw materials.
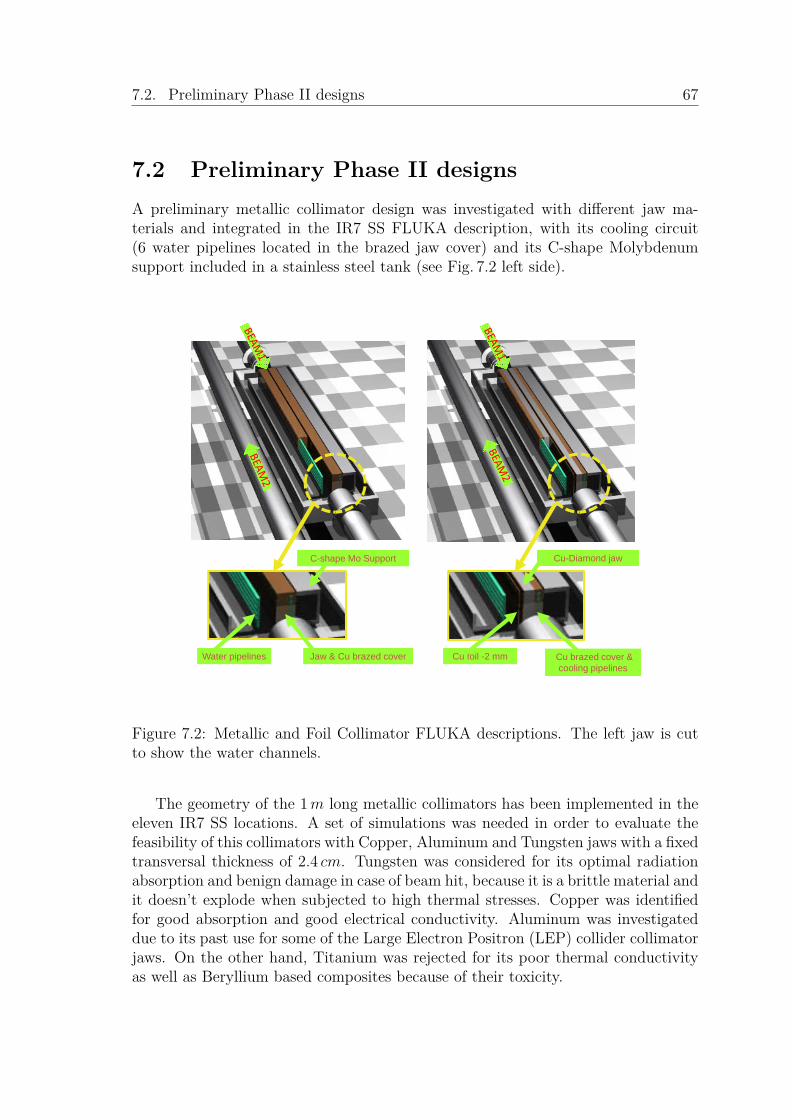
7.2. Preliminary Phase II designs 67
7.2 Preliminary Phase II designsA preliminary metallic collimator design was investigated with different jaw ma-terials and integrated in the IR7 SS FLUKA description, with its cooling circuit(6 water pipelines located in the brazed jaw cover) and its C-shape Molybdenumsupport included in a stainless steel tank (see Fig. 7.2 left side).
C-shape Mo Support Cu-Diamond jaw
Jaw & Cu brazed coverWater pipelines Cu foil -2 mm Cu brazed cover & cooling pipelines
Figure 7.2: Metallic and Foil Collimator FLUKA descriptions. The left jaw is cutto show the water channels.
The geometry of the 1m long metallic collimators has been implemented in theeleven IR7 SS locations. A set of simulations was needed in order to evaluate thefeasibility of this collimators with Copper, Aluminum and Tungsten jaws with a fixedtransversal thickness of 2.4 cm. Tungsten was considered for its optimal radiationabsorption and benign damage in case of beam hit, because it is a brittle material andit doesn’t explode when subjected to high thermal stresses. Copper was identifiedfor good absorption and good electrical conductivity. Aluminum was investigateddue to its past use for some of the Large Electron Positron (LEP) collider collimatorjaws. On the other hand, Titanium was rejected for its poor thermal conductivityas well as Beryllium based composites because of their toxicity.
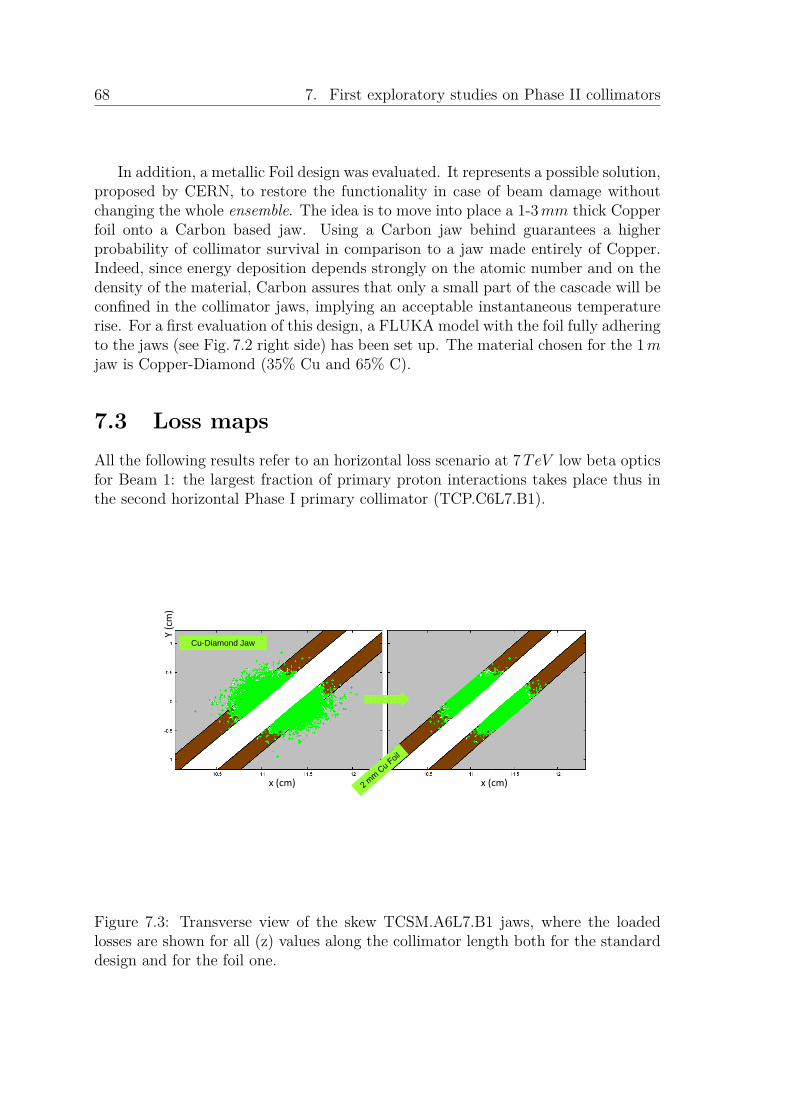
68 7. First exploratory studies on Phase II collimators
In addition, a metallic Foil design was evaluated. It represents a possible solution,proposed by CERN, to restore the functionality in case of beam damage withoutchanging the whole ensemble. The idea is to move into place a 1-3mm thick Copperfoil onto a Carbon based jaw. Using a Carbon jaw behind guarantees a higherprobability of collimator survival in comparison to a jaw made entirely of Copper.Indeed, since energy deposition depends strongly on the atomic number and on thedensity of the material, Carbon assures that only a small part of the cascade will beconfined in the collimator jaws, implying an acceptable instantaneous temperaturerise. For a first evaluation of this design, a FLUKA model with the foil fully adheringto the jaws (see Fig. 7.2 right side) has been set up. The material chosen for the 1mjaw is Copper-Diamond (35% Cu and 65% C).
7.3 Loss mapsAll the following results refer to an horizontal loss scenario at 7TeV low beta opticsfor Beam 1: the largest fraction of primary proton interactions takes place thus inthe second horizontal Phase I primary collimator (TCP.C6L7.B1).
Y (cm)
Cu-Diamond JawCu-Diamond Jaw
(cm) (cm)x (cm) x (cm)
Figure 7.3: Transverse view of the skew TCSM.A6L7.B1 jaws, where the loadedlosses are shown for all (z) values along the collimator length both for the standarddesign and for the foil one.

7.4. First Phase II results 69
In the case of the Foil design, the study was performed by loading a loss mapreferring to a whole Copper jaw and neglecting primary inelastic events outside ofthe 2mm thick foil considered (see Fig. 7.3). This cut corresponds to less than 1.5%of all losses and so it has a negligible impact on the integrated power calculation,shown in Fig. 7.4. However, the total power of specific Phase II device can be slightlyunderstimated.
The first Phase II location (TCSM.A6L7.B1) is the most loaded one, due to itsposition, it is expected that a significant part of the secondary shower developed inthe primary collimators will impact on it.
7.4 First Phase II resultsThe FLUKA simulations were performed in the SS region only, between the two
Figure 7.4: The :500 kW power distribution for the 0.2h beam lifetime scenario inthe IR7 SS region for different Phase II collimator jaws.

70 7. First exploratory studies on Phase II collimators
MQTL magnet groups. The Phase II collimators are introduced on the Beam 1line, while all the other beam elements are present on both lines at their foreseenpositions. The secondary Phase I collimators are set opened like at the injectionenergy. In correspondance of each Phase I primary and secondary collimators, theBLMs were considered.
The distribution of the about 500 kW power is shown in percentage in Fig. 7.4.Changing the Phase II collimator jaw materials significantly affects the power dis-tribution. The highest Z material (W) for the jaw doubles the power deposited inthe Phase II collimators in comparison to the case of the lowest Z one (Al). On theother hand the use of Phase II Tungsten jaws implies a reduction of 35% for thepower deposited in the IR7 magnets with respect to the Aluminum ones. Differentthermal loads can be observed also on the Phase I collimators, due to the effect thatPhase I secondary CFC collimators are more or less shielded by the Phase II jawmaterials.
FLUKA binnings, that are spatial meshes independent on the geometry, designedto score average or event-by-event quantities, are generally defined as Cartesianstructures parallel to the coordinate axes, or as cylindrical structures parallel tothe z-axis. A bin size of 0.2 x 0.2 x 1 cm3 was found to be the minimum required
W
m3
CuW/cm
Al
cm
Figure 7.5: Peak power density longitudinal profile at the most loaded Phase II loca-tion (TCSM.A6L7.B1) referring to the 1h 7TeV low beta horizontal losses scenariofor the different materials.
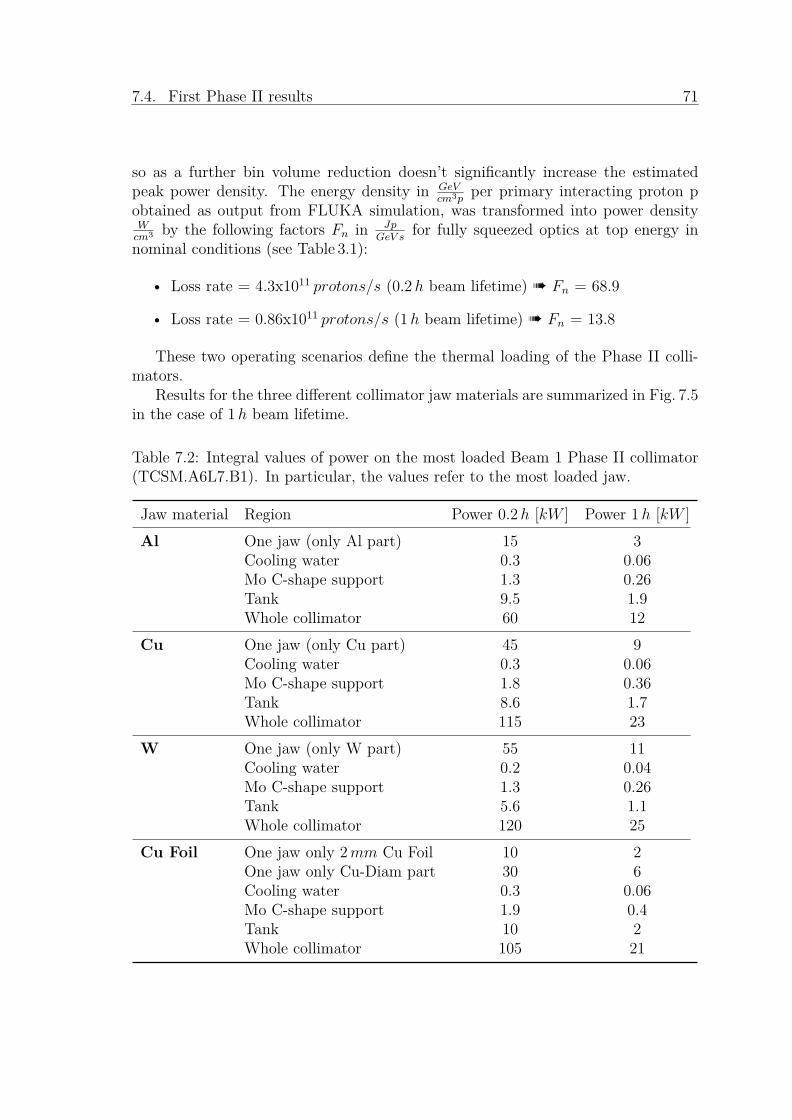
7.4. First Phase II results 71
so as a further bin volume reduction doesn’t significantly increase the estimatedpeak power density. The energy density in GeV
cm3pper primary interacting proton p
obtained as output from FLUKA simulation, was transformed into power densityWcm3 by the following factors Fn in Jp
GeV sfor fully squeezed optics at top energy in
nominal conditions (see Table 3.1):
• Loss rate = 4.3x10¹¹ protons/s (0.2h beam lifetime) à Fn = 68.9
• Loss rate = 0.86x10¹¹ protons/s (1h beam lifetime) à Fn = 13.8
These two operating scenarios define the thermal loading of the Phase II colli-mators.
Results for the three different collimator jaw materials are summarized in Fig. 7.5in the case of 1h beam lifetime.
Table 7.2: Integral values of power on the most loaded Beam 1 Phase II collimator(TCSM.A6L7.B1). In particular, the values refer to the most loaded jaw.
Jaw material Region Power 0.2h [kW ] Power 1h [kW ]Al One jaw (only Al part) 15 3
Cooling water 0.3 0.06Mo C-shape support 1.3 0.26Tank 9.5 1.9Whole collimator 60 12
Cu One jaw (only Cu part) 45 9Cooling water 0.3 0.06Mo C-shape support 1.8 0.36Tank 8.6 1.7Whole collimator 115 23
W One jaw (only W part) 55 11Cooling water 0.2 0.04Mo C-shape support 1.3 0.26Tank 5.6 1.1Whole collimator 120 25
Cu Foil One jaw only 2mm Cu Foil 10 2One jaw only Cu-Diam part 30 6Cooling water 0.3 0.06Mo C-shape support 1.9 0.4Tank 10 2Whole collimator 105 21
72 7. First exploratory studies on Phase II collimators
The position of the peak is on the jaw surface: at about 18 cm longitudinal depthfor the Copper jaw and the Copper Foil collimator, at 80 cm for the Aluminum oneand at 5 cm for the Tungsten one. The curves refer to the most loaded Phase IITCSM.A6L7.B1 jaw. The 1h scenario represents the reference nominal steady stateoperation condition. The transient case results in a 5-fold increase in the heat loadon the secondary collimators for a beam lifetime of about 12 minutes. However,after 10 s of the transient condition, it is assumed that the beam can be dumped.
Summary of integral power deposition results [60] for the most loaded Phase IIcollimator (TCSM.A6L7.B1) are reported in Table 7.2.
In addition, activation studies for collimators with different jaw materials [61]have shown that the activated cooling circuits, tank, and support structures con-tribute significantly to the residual dose rates (more than 60%). Nevertheless, theoverall activation level depends on the jaw material and, for example, is 20-50%higher for collimators with Tungsten jaws compared to those with Copper jaws.On the other hand, the cooling time dependence is found to be similar for all jawmaterials.
7.5 Simulation accuracyThe systematic error when simulating the cascade introduced by 7TeV beams onthe machine elements is a combination of several factors [62].
While the statistical uncertainties are generally below 10% for peak values andbelow 1% for integral values, further main sources of errors are systematic [63].
• Physics modeling uncertainties.In particular these uncertainties are due to the extrapolation of the inelastic p-A cross-sections at 7TeV and to the uncertainty in the interaction modelling.A factor 2.4 is to be taken into account for integral quantities scored like energydeposition, dose, and a factor 4 for peak values.
• Assumption used in the geometry and material description.The approximation introduced in the geometry and material description bringsto errors which are difficult to quantify. A factor 1.1 can be taken as a safelimit for integral values and a factor 1.5 for peak ones.
• Jaw roughness.In particular this refers to having beams grazing the surfaces of the collimators,where the surface roughness is not taken into account. A factor of 1.5 has tobe considered.
Furthermore, since the tracking loss pattern forms the basis of the FLUKA stud-ies (see Chapter 4), errors due to the assumptions used to generate the loss mapshave to be added to the uncertainties mentioned above.

7.6. Conclusions on Phase II first results 73
7.6 Conclusions on Phase II first resultsThe first exploratory studies have identified the most loaded position independentof the jaw material for the Phase II collimators, that is the first location after thePhase I primary ones.
For this particular position, simulation results gives the order of magnitude ofthermal loads distribution in the main collimator components. Preliminary evalu-ations of the major jaw deflection and of cooling requirements are calculated. Fol-lowing Phase II collimators mechanical integration optimization are based on thesecalculations.
In addition the results outline that the possible choice of Tungsten jaws for thisposition has to be avoided. Indeed already in operation conditions, its fuctionalitycould be limited because of the high values of the peak power density on the jawsurface.
Choice is therefore limited to Copper or Aluminum. Since the latter has rela-tively poor cleaning efficiency and the water channel fabrication has shown to bedifficult, further investigations are focalized in particular on Copper based materi-als such as Glidcop. It shows a good balance of cleaning efficiency, deflection andmanufacturability, in addition to its good electrical conductivity (important fromthe impedance point of view).
However introduction of other possible strategies and further jaw materials willbe not excluded at this stage. In particular, composite materials such as silicon car-bide or copper diamond have been proposed in an advanced phase of the mechanicalintegration studies as possible solution (see Chapter 9, Section 9.3).

74 7. First exploratory studies on Phase II collimators
Chapter 8
The SLAC Phase II design
Due to the high beam power involved, special attention is given to develop Phase IIcollimators that allow a new jaw surface to be moved into place, after possible beamdamage.
In the framework of this study, the SLAC laboratory, through the LARP programproposes a collimator built up of two cylindrical 91 cm long Glidcop jaws which canrotate, in order to move into place a new surface in case of beam damage.
This concept is an advanced development, specific for the LHC, of the Next Lin-ear Collider (NLC) rotatable collimator [64]. The NLC project was a SLAC proposedelectron-positron collider which has posed similar collimation problems, because ofits high energy density. Following the decision of SLAC laboratory to pursue a next-generation linear collider using superconducting RF technology (i.e. Internationallinear Collider (ILC)), the NLC project was cancelled in 2004. However, the con-siderable engineering, design and manufactoring efforts required to build and testthe NLC collimator have been carried over to the design of rotatable collimators forLHC.
8.1 The evolution of the SLAC Phase II designThe most critical issue in the design of the collimator is the non permanent thermaldeflection of the jaws due to the beam heat load, which brings to a reduction of theactive length and thus to a possible reduction of the cleaning efficiency.
On the basis of the preliminary evaluations of different materials, the use ofGlidcop instead of pure Copper was introduced.
Extensive simulations were performed using FLUKA and ANSYS to determinatethe maximum realistic heating and deflection of the jaws under steady state andtransient conditions. The ANSYS models were designed to duplicate the cylindricalcell structure of the FLUKA mesh for each jaw. At the beginning, the FLUKA modelwas composed only by two hollow cylindrical 75 cm and 14 cm diameter Glidcopjaws, set at 7σ from the axis of the beam at the TCSM.A6L7.B1 position. The jaw
75

76 8. The SLAC Phase II design
dimensions were chosen in such a way to be located both in the Phase I collimatortank (see the technical drawing (left down corner) in Fig. 8.3) and to use most of thePhase I components (i.e. jaw motors, cooling and electrical connections, collimatorhandling robots, etc).
These preliminary studies bring to the evaluation of the deflection limits for thisbaseline configuration in the case of the most loaded jaw: 426µm for the 1h beamlifetime (i.e. steady-state) and 1260µm for the 0.2h beam lifetime (i.e. transient)scenarios, when the jaw is constrained to deflect away from beam. An helical coolingchannel at about 2.5 cm from the jaw surface was chosen for these evaluations,because it was demostrated to result in less jaw deflection in comparison to an axialcooling channel option. However, the external jaw helical cooling tube connectionshave reduced the jaw length from 1m (as for the Phase I secondary collimators) to75 cm, in order to reutilize the Phase I tank. Simulations show a reduction of theactive length from 75 cm to 43 cm for the steady state and to 24 cm for the transientconditions respectively.
In order to minimize the jaw deflection, in particular for the TCSM.A6L7.B1position, different jaw design options were proposed [65].
As design work proceeded, it became evident that the jaw deflection, due todifferential thermal expansion of the hot beam side relative to the cooler side awayfrom the beam, can be relieved by providing a direct thermal path throught thejaw. The baseline configuration evolved into a so-called refined baseline design witha solid Copper shaft and a reduction of the pitch of the helical cooling tube.
A second conceptual brackthrough consisted of introducing a shaft and concentricjaw jointed only at the collimator center. This layout was called Jaw-Hub-Shaftconcept. It allowed the jaw ends to deflect away from the beam, eliminating the
Deflected surfaces
Beam 1
Figure 8.1: Jaw-Hub-Shaft concept to minimize the jaw deflection toward the beam.

8.1. The evolution of the SLAC Phase II design 77
need of flexible end supports (see Fig. 8.1).A third step was the replacement of the external helical cooling tube connections
at the jaw ends by twistable straight connections routed through the center of theshaft. This improvement allowed for longer jaws, from 75 to 91 cm active length, andeliminated concerns about interface between external helices and the shaft supportand vacuum tank to jaw RF shielding.
The final design change was a decision to make the shaft in Molybdenum. Theuse of Molybdenum for the central shaft is to increase the structural rigidity.
Table 8.1 reports the simulated perfomance of the baseline, refined baseline, Jaw-Hub-Shaft (actual design) under the two heating conditions. It does not include thestatic deflection due to gravity, which is 68µm in the case of the refined Jaw-Hub-Shaft concept. The table shows that the 1260µm total deflection of the jaw relativeto the shaft axis is reduced by roughly a factor of 5 to 236µm, or, in other word, toone beam σ.
Table 8.1: Simulated evolution performance of the different SLAC collimator con-cepts at the most loaded jaw position (collimator TCSM.A6L7.B1) [65].
Operation Jaw Ideal Actualcondition design Deflection active length active length
[µm] [cm] [cm]Steady state Baseline 426 75 43
Refined baseline 238 75 63Jaw-Hub-Shaft 84 91 74
Transient Baseline 1260 75 24Refined baseline 853 75 31Jaw-Hub-Shaft 236 91 39
8.1.1 The actual SLAC Phase II designThe actual SLAC Phase II design features cylindrical Glidcop jaws, 13.6 cm diam-eter, 93 cm long, with 1 cm, 15 degree tapers at each end, and an internal helicalcooling channel. Each Glidcop jaw consists of a Molybdenum shaft and concentricjaw joined via a Copper hub. There is a 2mm gap between the shaft and the outerjaw. This allows the jaw ends to deflect mostly away from the beam during heat-ing, reducing the jaw deflection toward the beam. The jaw shaft is supported oneach end by a stainless steel post. Each jaw shows 20 flat facets on the cylindricaljaw surface (see Fig. 8.2). The SLAC collimator can thus support 20 local damageswithout changing the total ensamble, but by rotating the jaw to introduce a cleansurface to the impacting beam halo.

78 8. The SLAC Phase II design
Figure 8.2: Cutaway of SLAC jaw showing outer jaw surfaces and cooling tuberouted through the center of the Molybdenum shaft.
The cooling circuit is composed by a 16m Copper tube, forming a helix within thejaw, with straight tails extending throught the center of the shaft. This eliminatesany vacuum to water joints and allows for the Copper tube to be twisted as the jawrotates. It requires a vacuum tank slighly larger in width and depth than the PhaseI unit.
8.2 The SLAC Phase II FLUKA modelFollowing the mechanical evolution of the SLAC Phase II design, a FLUKA de-scription of the collimator was created and then modified at each integration step,starting with a model composed only by the two cylindrical jaws (see Fig. 8.3).
It was developed during this PhD work to obtain distributed heat loads, whichwere used as primary scope for the evaluation of the jaw deflections.
Additional studies on the jaw motion mechanism are responsible of the mostrecent evolution concerning the stainless steel jaw supports and the RF transitionpieces (see Fig. 8.4). Fig. 8.4 shows the comparison between the jaw prototype builtin the SLAC laboratory and the FLUKA model.
Since the cylindrical SLAC jaws are bigger than the rectangular Phase I ones, asemi-cylindrical cross section tank at the place of the Phase I box was developed.The new tank rotates using the same Phase I external supports without interferenceswith the Beam 2 line. Fig. 8.5 shows the set-up problems caused by using a bigger

8.2. The SLAC Phase II FLUKA model 79
1 2 3
54 6
Technical drawingdrawing
Figure 8.3: Evolution of the SLAC FLUKA model and comparison with the Catiatechnical drawing. At the beginning, the model was composed only by the twoGlidcop jaws and the Molybdenum shaft (1). The cooling circuit was subsequentlyadded (2), as well as the stub shaft for the RF connection (3), the tank (4), the jawupbeam and downbeam asymmetric supports (5) and the refined Jaw-Hub-Shaftconfiguration with the 2mm gap and the central copper hub (6). Each time themodel was integrated in the IR7 FLUKA description to evaluate the collimatorperformance.

80 8. The SLAC Phase II design
Figure 8.4: SLAC jaw prototype (top) and FLUKA model (bottom).
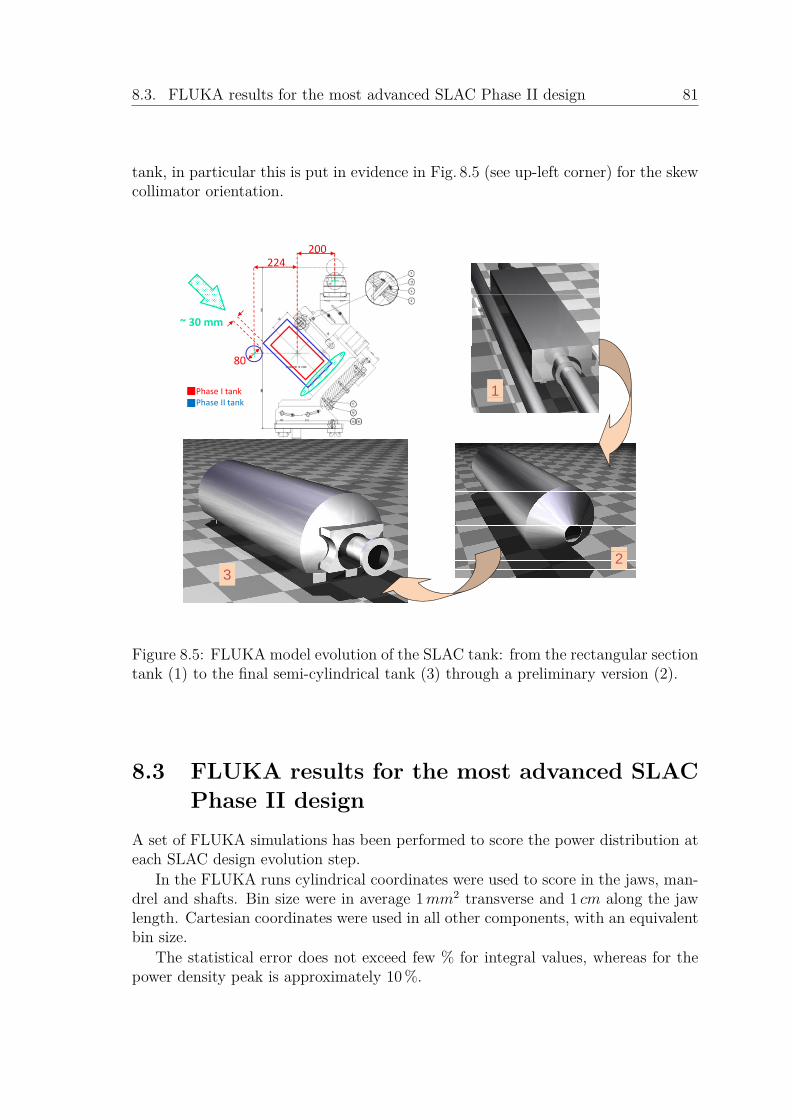
8.3. FLUKA results for the most advanced SLAC Phase II design 81
tank, in particular this is put in evidence in Fig. 8.5 (see up-left corner) for the skewcollimator orientation.
200224
~ 30 mm
1
80
Phase I tankPhase II tank
32
Figure 8.5: FLUKA model evolution of the SLAC tank: from the rectangular sectiontank (1) to the final semi-cylindrical tank (3) through a preliminary version (2).
8.3 FLUKA results for the most advanced SLACPhase II design
A set of FLUKA simulations has been performed to score the power distribution ateach SLAC design evolution step.
In the FLUKA runs cylindrical coordinates were used to score in the jaws, man-drel and shafts. Bin size were in average 1mm2 transverse and 1 cm along the jawlength. Cartesian coordinates were used in all other components, with an equivalentbin size.
The statistical error does not exceed few % for integral values, whereas for thepower density peak is approximately 10%.
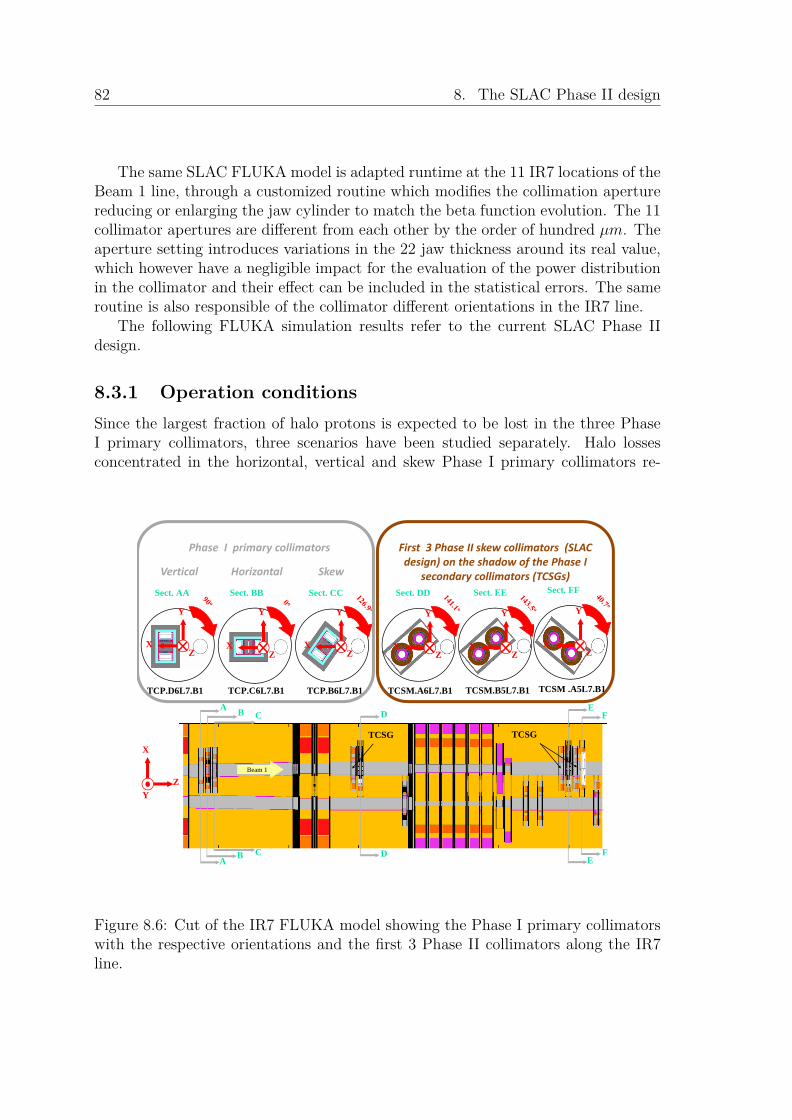
82 8. The SLAC Phase II design
The same SLAC FLUKA model is adapted runtime at the 11 IR7 locations of theBeam 1 line, through a customized routine which modifies the collimation aperturereducing or enlarging the jaw cylinder to match the beta function evolution. The 11collimator apertures are different from each other by the order of hundred µm. Theaperture setting introduces variations in the 22 jaw thickness around its real value,which however have a negligible impact for the evaluation of the power distributionin the collimator and their effect can be included in the statistical errors. The sameroutine is also responsible of the collimator different orientations in the IR7 line.
The following FLUKA simulation results refer to the current SLAC Phase IIdesign.
8.3.1 Operation conditionsSince the largest fraction of halo protons is expected to be lost in the three PhaseI primary collimators, three scenarios have been studied separately. Halo lossesconcentrated in the horizontal, vertical and skew Phase I primary collimators re-
Phase I primary collimators First 3 Phase II skew collimators (SLAC design) on the shadow of the Phase I
Sect. AA
Y
Sect. BB
Y
Sect. EE
Y
Sect. DD
Y
Sect. CC
Y
Sect. FF
Y
Vertical Horizontal Skewdesign) on the shadow of the Phase I
secondary collimators (TCSGs)
XZ
XZ
XZ
X
Y
ZX
ZX
Z
FCBA ED
TCP.D6L7.B1 TCP.C6L7.B1 TCSM.B5L7.B1TCSM.A6L7.B1TCP.B6L7.B1 TCSM .A5L7.B1
TCSGTCSG
Beam 1
X
Beam 1
ZY
FCA B E
D
Figure 8.6: Cut of the IR7 FLUKA model showing the Phase I primary collimatorswith the respective orientations and the first 3 Phase II collimators along the IR7line.
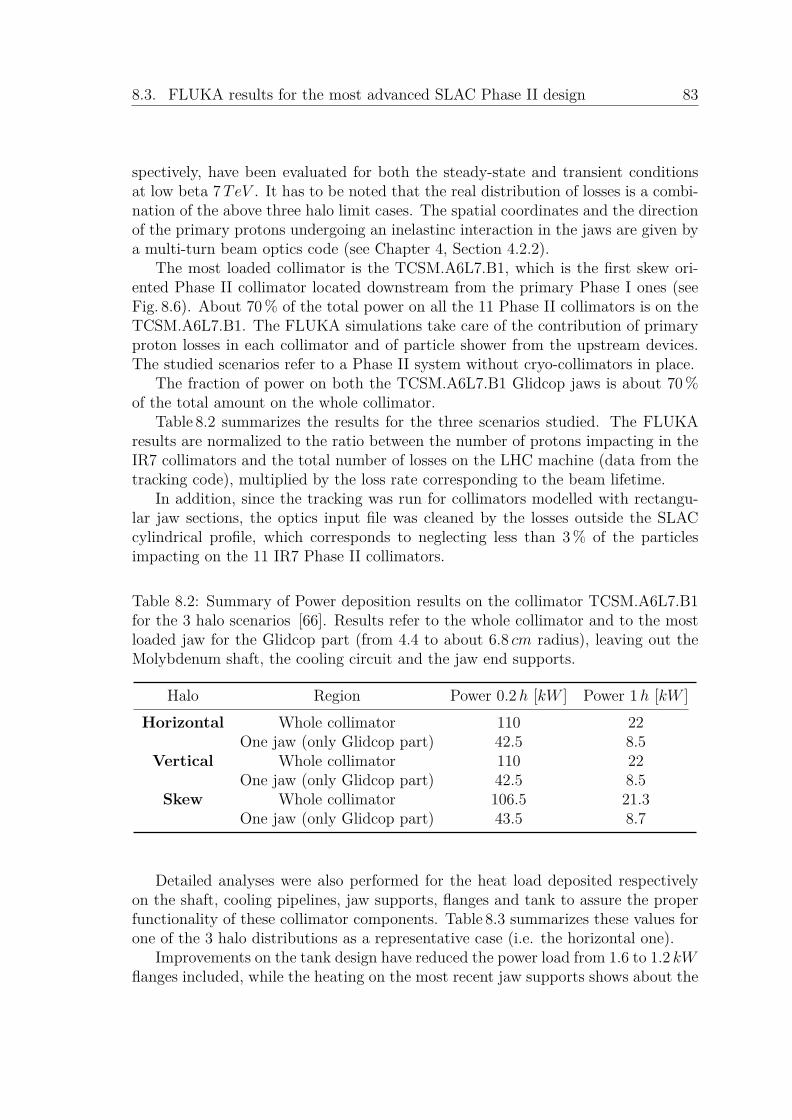
8.3. FLUKA results for the most advanced SLAC Phase II design 83
spectively, have been evaluated for both the steady-state and transient conditionsat low beta 7TeV . It has to be noted that the real distribution of losses is a combi-nation of the above three halo limit cases. The spatial coordinates and the directionof the primary protons undergoing an inelastinc interaction in the jaws are given bya multi-turn beam optics code (see Chapter 4, Section 4.2.2).
The most loaded collimator is the TCSM.A6L7.B1, which is the first skew ori-ented Phase II collimator located downstream from the primary Phase I ones (seeFig. 8.6). About 70% of the total power on all the 11 Phase II collimators is on theTCSM.A6L7.B1. The FLUKA simulations take care of the contribution of primaryproton losses in each collimator and of particle shower from the upstream devices.The studied scenarios refer to a Phase II system without cryo-collimators in place.
The fraction of power on both the TCSM.A6L7.B1 Glidcop jaws is about 70%of the total amount on the whole collimator.
Table 8.2 summarizes the results for the three scenarios studied. The FLUKAresults are normalized to the ratio between the number of protons impacting in theIR7 collimators and the total number of losses on the LHC machine (data from thetracking code), multiplied by the loss rate corresponding to the beam lifetime.
In addition, since the tracking was run for collimators modelled with rectangu-lar jaw sections, the optics input file was cleaned by the losses outside the SLACcylindrical profile, which corresponds to neglecting less than 3% of the particlesimpacting on the 11 IR7 Phase II collimators.
Table 8.2: Summary of Power deposition results on the collimator TCSM.A6L7.B1for the 3 halo scenarios [66]. Results refer to the whole collimator and to the mostloaded jaw for the Glidcop part (from 4.4 to about 6.8 cm radius), leaving out theMolybdenum shaft, the cooling circuit and the jaw end supports.
Halo Region Power 0.2h [kW ] Power 1h [kW ]Horizontal Whole collimator 110 22
One jaw (only Glidcop part) 42.5 8.5Vertical Whole collimator 110 22
One jaw (only Glidcop part) 42.5 8.5Skew Whole collimator 106.5 21.3
One jaw (only Glidcop part) 43.5 8.7
Detailed analyses were also performed for the heat load deposited respectivelyon the shaft, cooling pipelines, jaw supports, flanges and tank to assure the properfunctionality of these collimator components. Table 8.3 summarizes these values forone of the 3 halo distributions as a representative case (i.e. the horizontal one).
Improvements on the tank design have reduced the power load from 1.6 to 1.2 kWflanges included, while the heating on the most recent jaw supports shows about the
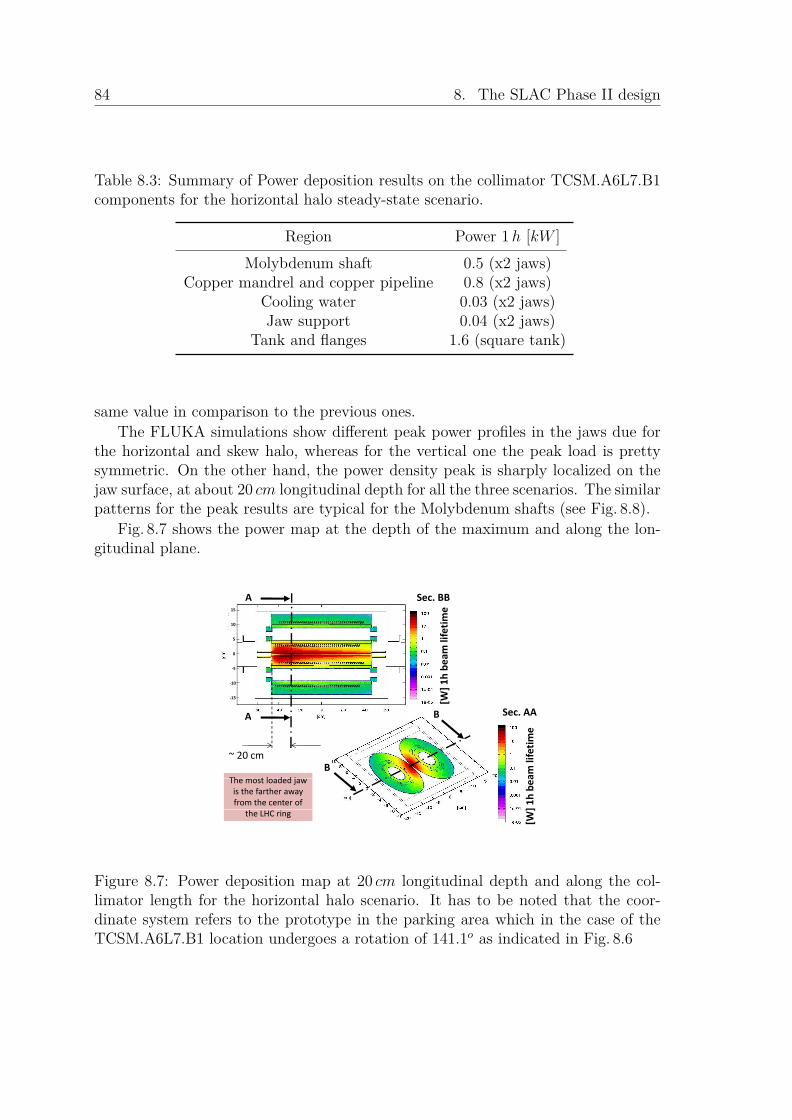
84 8. The SLAC Phase II design
Table 8.3: Summary of Power deposition results on the collimator TCSM.A6L7.B1components for the horizontal halo steady-state scenario.
Region Power 1h [kW ]Molybdenum shaft 0.5 (x2 jaws)
Copper mandrel and copper pipeline 0.8 (x2 jaws)Cooling water 0.03 (x2 jaws)Jaw support 0.04 (x2 jaws)
Tank and flanges 1.6 (square tank)
same value in comparison to the previous ones.The FLUKA simulations show different peak power profiles in the jaws due for
the horizontal and skew halo, whereas for the vertical one the peak load is prettysymmetric. On the other hand, the power density peak is sharply localized on thejaw surface, at about 20 cm longitudinal depth for all the three scenarios. The similarpatterns for the peak results are typical for the Molybdenum shafts (see Fig. 8.8).
Fig. 8.7 shows the power map at the depth of the maximum and along the lon-gitudinal plane.
A
ime
Sec. BB15
m lifeti10
5
0
1h bea
0
‐5
‐10
A B
[W]
Sec. AA
‐15
A B
time
~ 20 cmB
am lifet
Th t l d d j
] 1h be
aThe most loaded jaw is the farther away from the center of
[W]the LHC ring
Figure 8.7: Power deposition map at 20 cm longitudinal depth and along the col-limator length for the horizontal halo scenario. It has to be noted that the coor-dinate system refers to the prototype in the parking area which in the case of theTCSM.A6L7.B1 location undergoes a rotation of 141.1o as indicated in Fig. 8.6
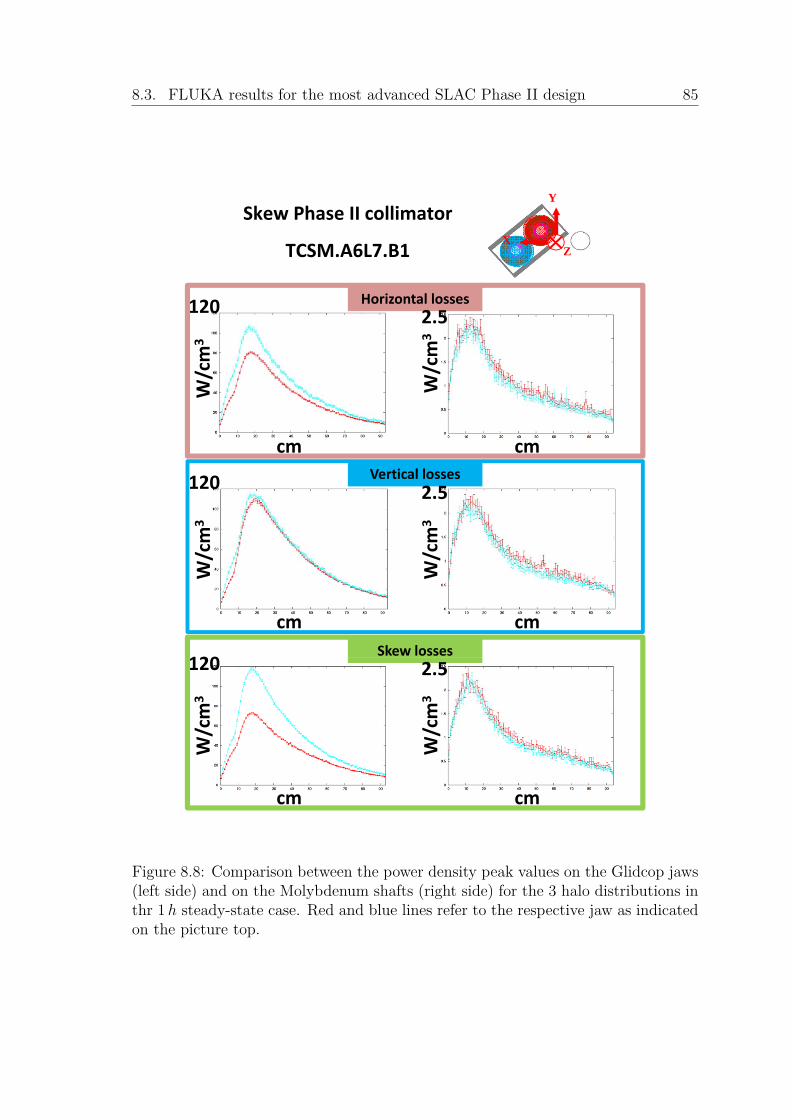
8.3. FLUKA results for the most advanced SLAC Phase II design 85
Skew Phase II collimator
TCSM.A6L7.B1
Y
ZX
Horizontal losses2.5120
m3
m3
W/cm
W/cm
Vertical losses120 2.5
cmcmW/cm
3
W/cm
3
Skew losses120
cmcm
120 2.5
/cm
3
/cm
3
W/
W/
cm cm
Figure 8.8: Comparison between the power density peak values on the Glidcop jaws(left side) and on the Molybdenum shafts (right side) for the 3 halo distributions inthr 1h steady-state case. Red and blue lines refer to the respective jaw as indicatedon the picture top.
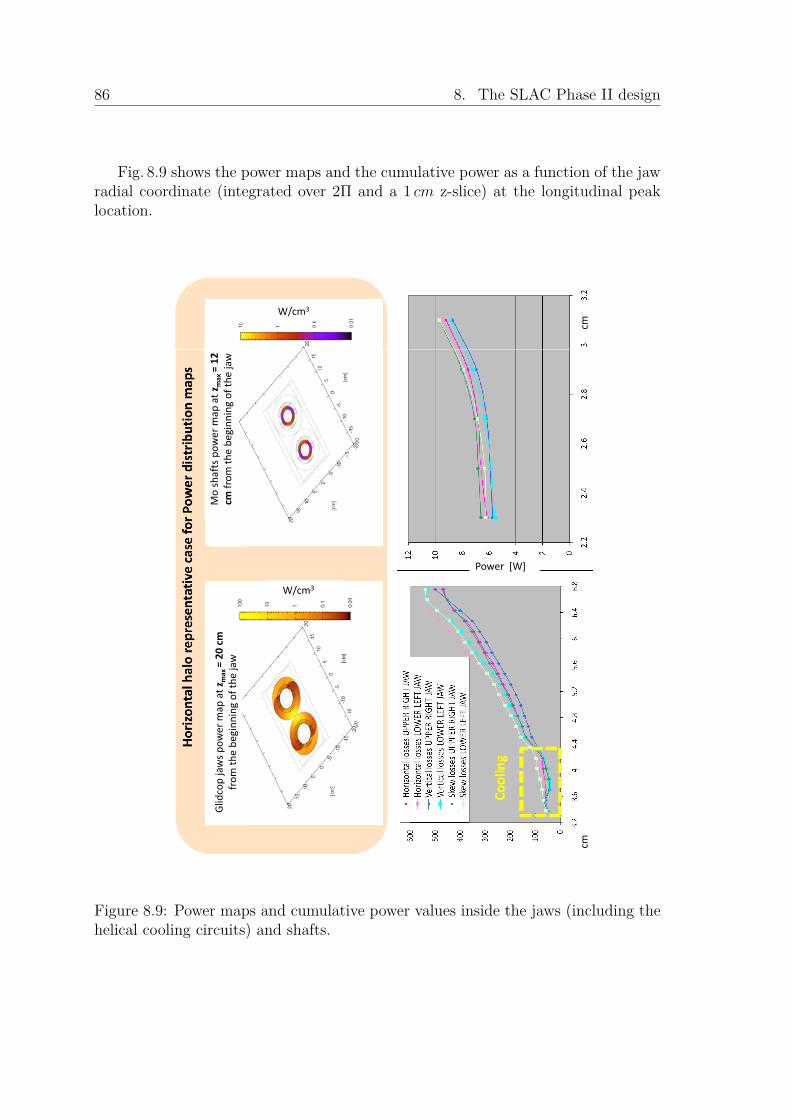
86 8. The SLAC Phase II design
Fig. 8.9 shows the power maps and the cumulative power as a function of the jawradial coordinate (integrated over 2Π and a 1 cm z-slice) at the longitudinal peaklocation.
W/cm3
cm
map
at z
max= 12
ning
of the
jaw
o shafts pow
er m
m from
the be
gin
Power [W]
Mo
cm
W/cm3
Power [W]
m
ap at z
max= 20
cm
ng of the
jaw
pjaws po
wer m
aom
the be
ginn
in
cm
Glidcop fro
Figure 8.9: Power maps and cumulative power values inside the jaws (including thehelical cooling circuits) and shafts.
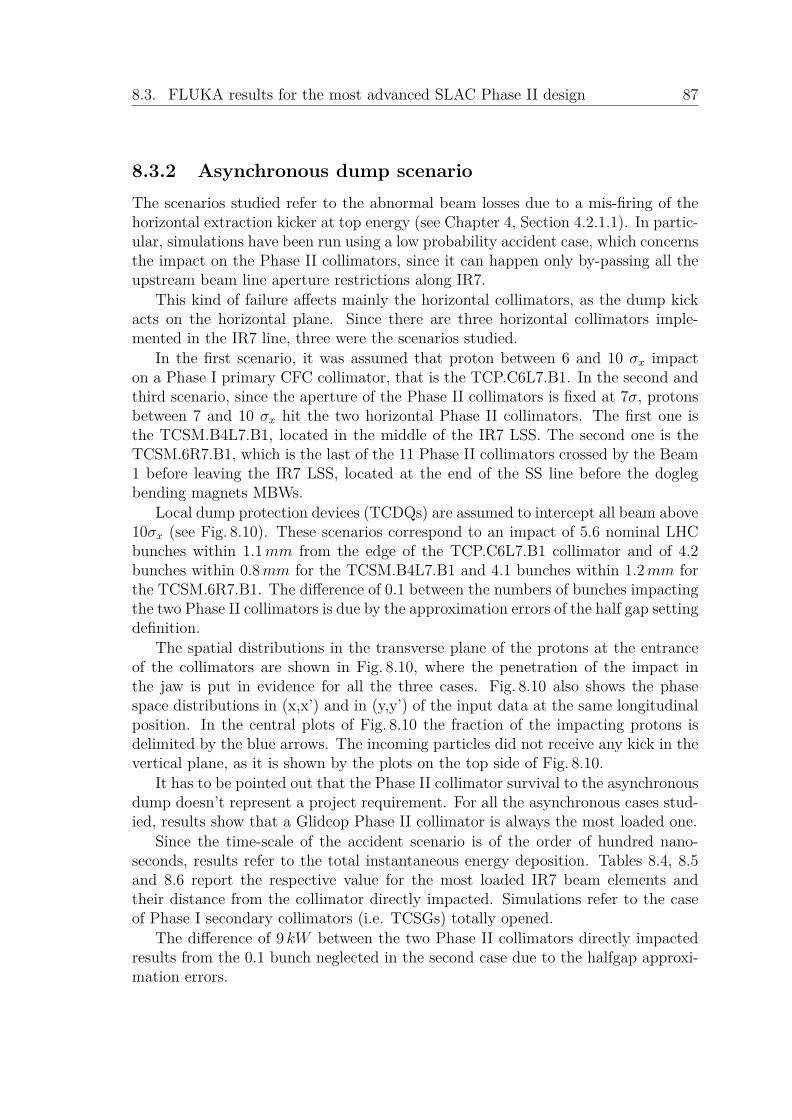
8.3. FLUKA results for the most advanced SLAC Phase II design 87
8.3.2 Asynchronous dump scenarioThe scenarios studied refer to the abnormal beam losses due to a mis-firing of thehorizontal extraction kicker at top energy (see Chapter 4, Section 4.2.1.1). In partic-ular, simulations have been run using a low probability accident case, which concernsthe impact on the Phase II collimators, since it can happen only by-passing all theupstream beam line aperture restrictions along IR7.
This kind of failure affects mainly the horizontal collimators, as the dump kickacts on the horizontal plane. Since there are three horizontal collimators imple-mented in the IR7 line, three were the scenarios studied.
In the first scenario, it was assumed that proton between 6 and 10 σx impacton a Phase I primary CFC collimator, that is the TCP.C6L7.B1. In the second andthird scenario, since the aperture of the Phase II collimators is fixed at 7σ, protonsbetween 7 and 10 σx hit the two horizontal Phase II collimators. The first one isthe TCSM.B4L7.B1, located in the middle of the IR7 LSS. The second one is theTCSM.6R7.B1, which is the last of the 11 Phase II collimators crossed by the Beam1 before leaving the IR7 LSS, located at the end of the SS line before the doglegbending magnets MBWs.
Local dump protection devices (TCDQs) are assumed to intercept all beam above10σx (see Fig. 8.10). These scenarios correspond to an impact of 5.6 nominal LHCbunches within 1.1mm from the edge of the TCP.C6L7.B1 collimator and of 4.2bunches within 0.8mm for the TCSM.B4L7.B1 and 4.1 bunches within 1.2mm forthe TCSM.6R7.B1. The difference of 0.1 between the numbers of bunches impactingthe two Phase II collimators is due by the approximation errors of the half gap settingdefinition.
The spatial distributions in the transverse plane of the protons at the entranceof the collimators are shown in Fig. 8.10, where the penetration of the impact inthe jaw is put in evidence for all the three cases. Fig. 8.10 also shows the phasespace distributions in (x,x’) and in (y,y’) of the input data at the same longitudinalposition. In the central plots of Fig. 8.10 the fraction of the impacting protons isdelimited by the blue arrows. The incoming particles did not receive any kick in thevertical plane, as it is shown by the plots on the top side of Fig. 8.10.
It has to be pointed out that the Phase II collimator survival to the asynchronousdump doesn’t represent a project requirement. For all the asynchronous cases stud-ied, results show that a Glidcop Phase II collimator is always the most loaded one.
Since the time-scale of the accident scenario is of the order of hundred nano-seconds, results refer to the total instantaneous energy deposition. Tables 8.4, 8.5and 8.6 report the respective value for the most loaded IR7 beam elements andtheir distance from the collimator directly impacted. Simulations refer to the caseof Phase I secondary collimators (i.e. TCSGs) totally opened.
The difference of 9 kW between the two Phase II collimators directly impactedresults from the 0.1 bunch neglected in the second case due to the halfgap approxi-mation errors.
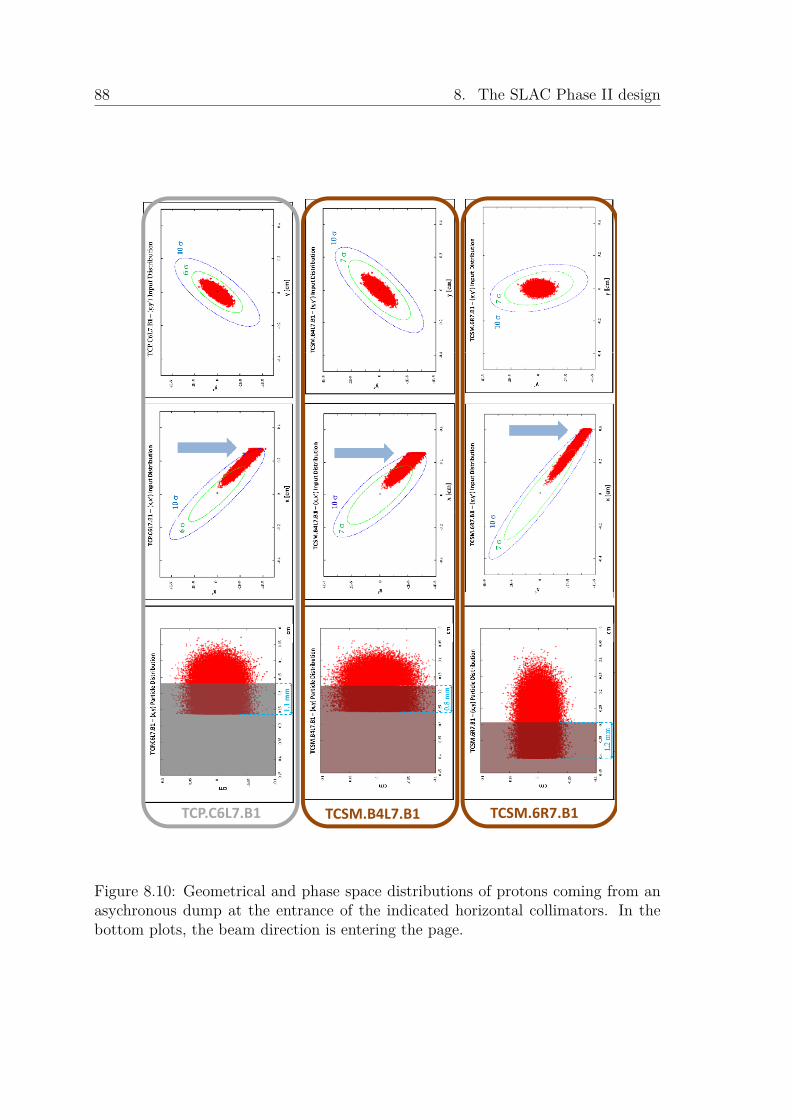
88 8. The SLAC Phase II design
TCP.C6L7.B1 TCSM.B4L7.B1 TCSM.6R7.B1
Figure 8.10: Geometrical and phase space distributions of protons coming from anasychronous dump at the entrance of the indicated horizontal collimators. In thebottom plots, the beam direction is entering the page.
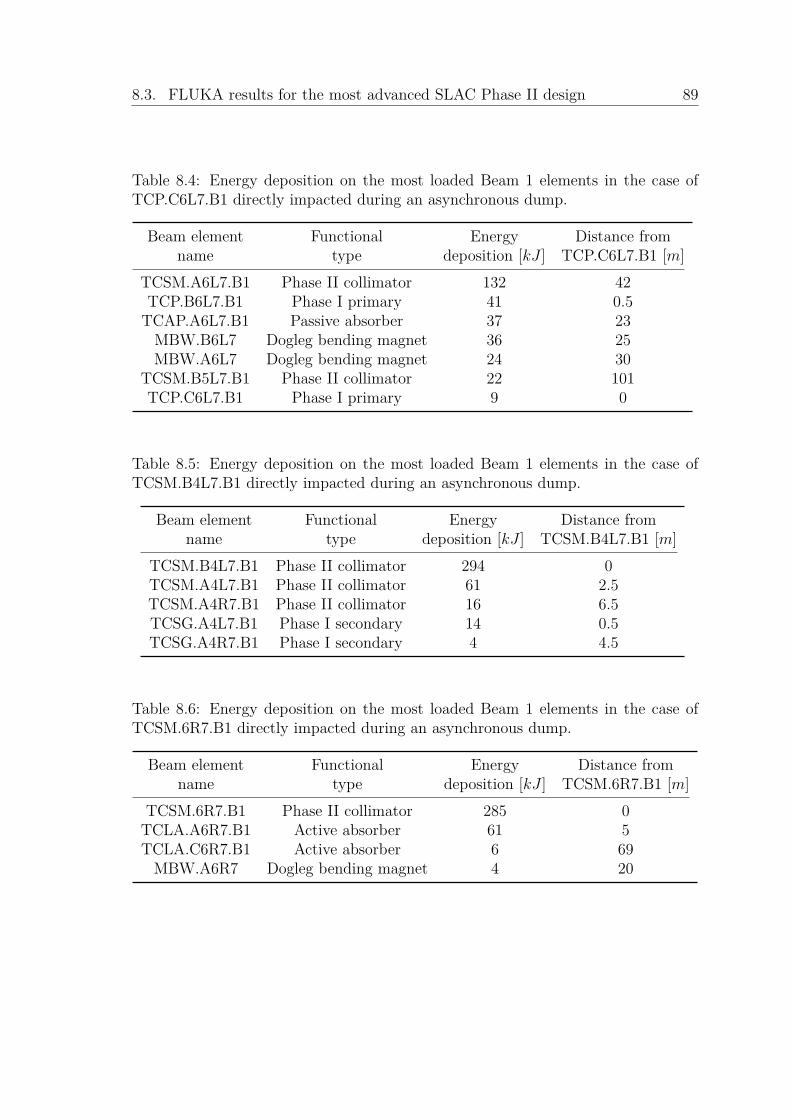
8.3. FLUKA results for the most advanced SLAC Phase II design 89
Table 8.4: Energy deposition on the most loaded Beam 1 elements in the case ofTCP.C6L7.B1 directly impacted during an asynchronous dump.
Beam element Functional Energy Distance fromname type deposition [kJ ] TCP.C6L7.B1 [m]
TCSM.A6L7.B1 Phase II collimator 132 42TCP.B6L7.B1 Phase I primary 41 0.5TCAP.A6L7.B1 Passive absorber 37 23MBW.B6L7 Dogleg bending magnet 36 25MBW.A6L7 Dogleg bending magnet 24 30
TCSM.B5L7.B1 Phase II collimator 22 101TCP.C6L7.B1 Phase I primary 9 0
Table 8.5: Energy deposition on the most loaded Beam 1 elements in the case ofTCSM.B4L7.B1 directly impacted during an asynchronous dump.
Beam element Functional Energy Distance fromname type deposition [kJ ] TCSM.B4L7.B1 [m]
TCSM.B4L7.B1 Phase II collimator 294 0TCSM.A4L7.B1 Phase II collimator 61 2.5TCSM.A4R7.B1 Phase II collimator 16 6.5TCSG.A4L7.B1 Phase I secondary 14 0.5TCSG.A4R7.B1 Phase I secondary 4 4.5
Table 8.6: Energy deposition on the most loaded Beam 1 elements in the case ofTCSM.6R7.B1 directly impacted during an asynchronous dump.
Beam element Functional Energy Distance fromname type deposition [kJ ] TCSM.6R7.B1 [m]
TCSM.6R7.B1 Phase II collimator 285 0TCLA.A6R7.B1 Active absorber 61 5TCLA.C6R7.B1 Active absorber 6 69MBW.A6R7 Dogleg bending magnet 4 20

90 8. The SLAC Phase II design
Table 8.7: Energy density peaks and instantaneous increases of temperature for themost loaded device for the 3 asynchronous dump accident scenarios [66].
TCP.C6L7.B1 impacted →TCSM.A6L7.B1 most loadedEnergy Density peak on the most loaded jaw 600 [J/cm3]
Istantaneous increase of temperature 180 [℃]TCSM.B4L7.B1 impacted →TCSM.B4L7.B1 most loadedEnergy Density peak on the most loaded jaw 50000 [J/cm3]
Istantaneous increase of temperature » melting pointTCSM.6R7.B1 impacted →TCSM.6R7.B1 most loaded
Energy Density peak on the most loaded jaw 50000 [J/cm3]Istantaneous increase of temperature » melting point
Figure 8.11: Energy density peaks along the jaw length in the case of the primaryhorizontal collimator (TCP.C6L7.B1) impacted in consequence of an asynchronousdump accident.

8.4. The SLAC Phase II jaw rotation mechanism 91
In addition, studies were performed for the evaluation of the energy densitypeak and the local instantaneous increase of temperature, calculated under adiabaticassumptions, for the most loaded Phase II collimators.
Since the impacting protons cover a small transverse area, suitable cylindricalthree dimensional grids were used for the scoring (i.e. 0.25mm2 x 1 cm (along z)bins on the jaw surface).
Table 8.7 reports the peak values for the three scenarios under study.Fig. 8.11 shows the energy density peak profiles along the collimator jaws in the
case of the TCP.C6L7.B1 directly impacted. The maximum peak values are almostthe same for the 60 cm long TCP directly impacted jaw and for the most loaded 92 cmlong Phase II jaw in the TCSM.A6L7.B1 position, but they are located at differentplaces along the jaw, because of the different jaw material radiation length. Whilethe Phase I jaws show a marked asymmetric heating (obvious for the TCP.C6L7.B1direcly impacted only on one jaw), in the Phase II jaws this asymmetry is lesspronounced because of the propagation of the particle shower generated by theprimary particle interactions.
The FLUKA simulations of the asynchronous dump scenario point out that theGlidcop Phase II collimators will be always the most loaded ones for this type offailure. Results show that, when a SLAC Phase II collimator is directly impacted, itis seriously damaged and most probably destroyed. Other possible design solutionsshall be investigated for these special locations.
8.4 The SLAC Phase II jaw rotation mechanismThe current SLAC jaw rotation mechanism is set up by an internally actuated drive,which utilizes a ratchet attached to a Geneva Mechanism, or Maltese cross (seeFig. 8.12). It translates a continuous rotation into an intermittent rotary motion,allowing for the precise rotation of the jaw in increments of 1/20th of a revolution,or one facet face. The mechanism effectively guarantees against the accidental over-rotating of the jaw because the jaw only begins to rotate after the 8th ratchet pastthe last rotation.
The ratcheting is performed by over-retracting the jaw whereby the ratchet hitsa hammer attached to the chamber wall. Successive over retracting rotates the jawwith a total of 512 ratchets resulting in one facet rotation when using a tri-lobedGeneva driver (see Fig. 8.12). The ratchet hammer must be pressed by roughly 3mmin order to advance the ratchet gear, therefore, during a rotation one end of the jawwill successively move in and out by about 3mm to ratchet the jaw. The other endof the jaw can remain still.
In the framework of this PhD, I have participated in the hardware upgrade andsoftware commissioning to adapt the Phase I jaws movement control and instrumen-tation in order to perform the SLAC jaw rotation, working 3 months at the SLAClaboratory in USA.

92 8. The SLAC Phase II design
Figure 8.12: View of the shaft support showing the Geneva Mechanism for precisionjaw rotation.
In Fig. 8.13 is shown the schematic view of the current precise system of motorsand position sensors for the accurate setting of the Phase I collimator jaws. Actually,four stepping motors are used to move the corners of the two jaws. Four resolvers areconnected to the stepping motors and monitor the number of steps performed. Sixposition sensor (four potentiometers and two linear variable differential transformersLVDT) are used to measure respectively the actual jaw positions and the upstreamand downstream gaps. Ten switches (one full-in and one full-out at each cornerplus two anti-collision switches) are installed to trigger motor steps and to protectthe collimator mechanical system [30]. Metrology measurements showed that thesystem has mechanical plays of the order of 30-40µm, that can be taken into accountfor jaw movements. Jaws positions are monitored with about ±20µm accuracy (i.e.better than the collimator alignment in the tunnel).
To rotate the SLAC jaw facet by over-retraction, it was chosen not to add ex-

8.4. The SLAC Phase II jaw rotation mechanism 93
Temperature sensors
Resolver
Gap opening (LVDT) Resolver
+ switches for IN, OUT, ANTI-COLLISION Potentiometer
Reference Reference
Sliding table
Vacuum tank
Motor Motor
Figure 8.13: Schematic view at one jaw end of the Phase I movement control andinstrumentation.
The additional limit switch
Figure 8.14: Picture of the additional limit switch for one SLAC jaw during thefeasibility tests at SLAC laboratory.
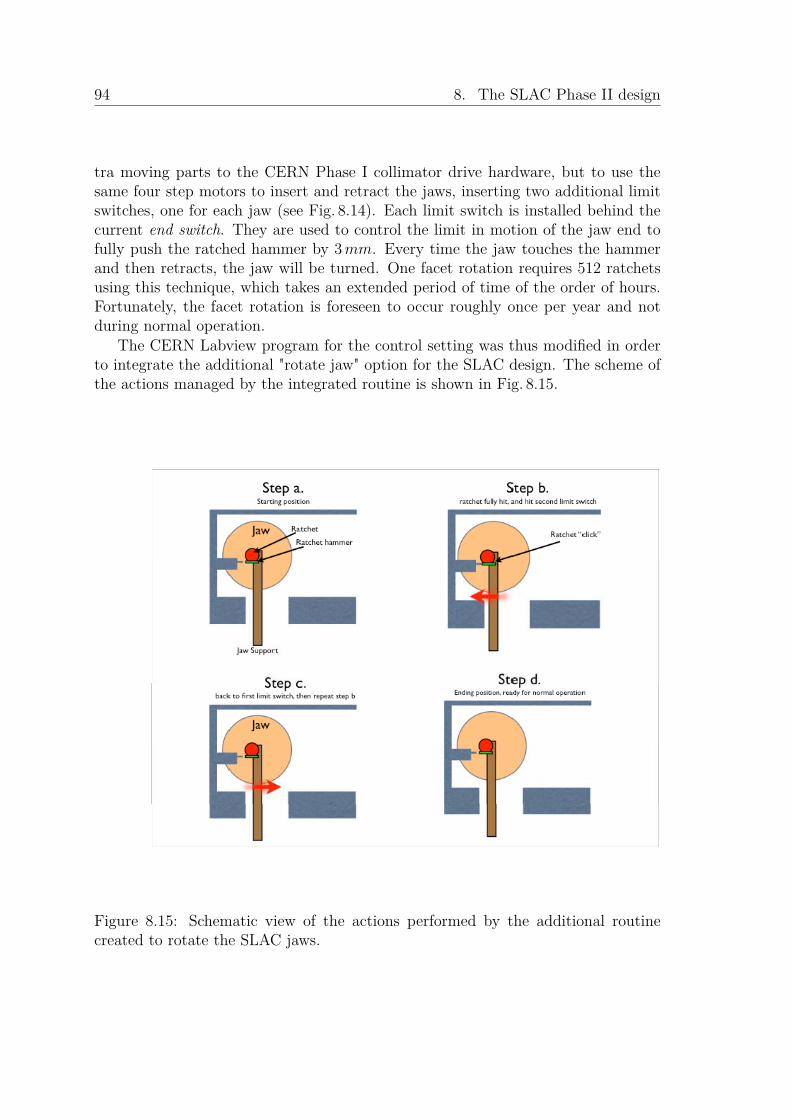
94 8. The SLAC Phase II design
tra moving parts to the CERN Phase I collimator drive hardware, but to use thesame four step motors to insert and retract the jaws, inserting two additional limitswitches, one for each jaw (see Fig. 8.14). Each limit switch is installed behind thecurrent end switch. They are used to control the limit in motion of the jaw end tofully push the ratched hammer by 3mm. Every time the jaw touches the hammerand then retracts, the jaw will be turned. One facet rotation requires 512 ratchetsusing this technique, which takes an extended period of time of the order of hours.Fortunately, the facet rotation is foreseen to occur roughly once per year and notduring normal operation.
The CERN Labview program for the control setting was thus modified in orderto integrate the additional "rotate jaw" option for the SLAC design. The scheme ofthe actions managed by the integrated routine is shown in Fig. 8.15.
Figure 8.15: Schematic view of the actions performed by the additional routinecreated to rotate the SLAC jaws.
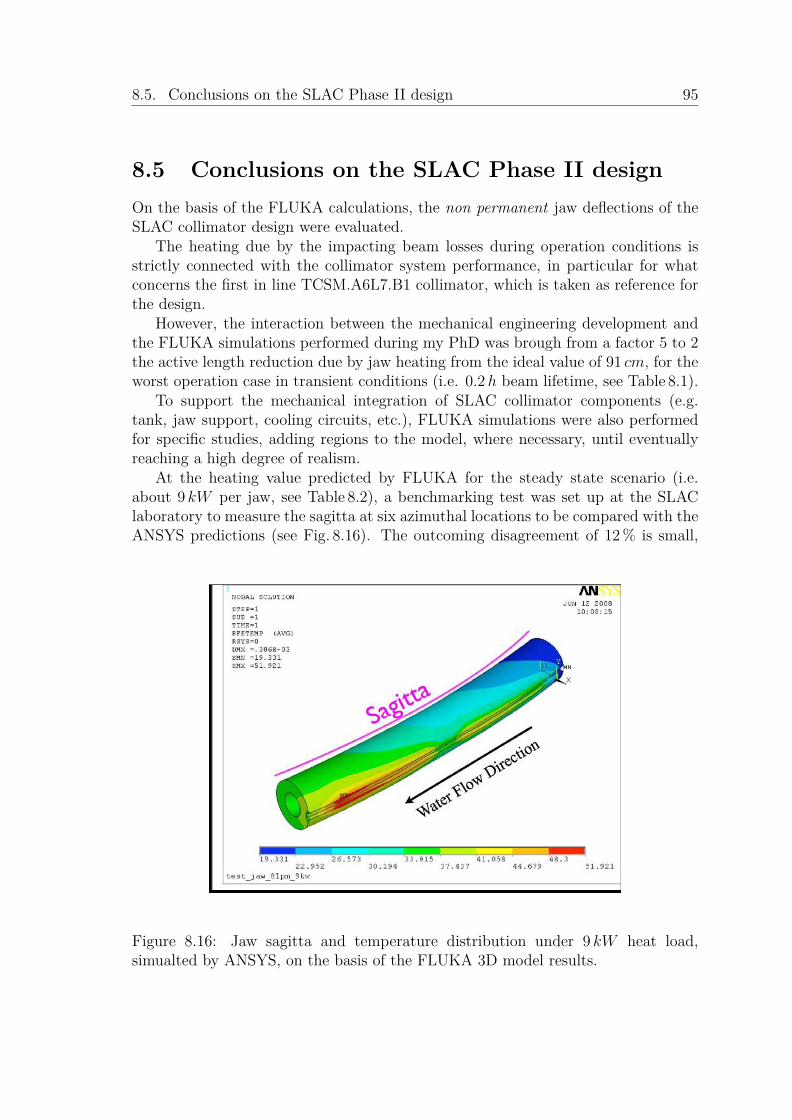
8.5. Conclusions on the SLAC Phase II design 95
8.5 Conclusions on the SLAC Phase II designOn the basis of the FLUKA calculations, the non permanent jaw deflections of theSLAC collimator design were evaluated.
The heating due by the impacting beam losses during operation conditions isstrictly connected with the collimator system performance, in particular for whatconcerns the first in line TCSM.A6L7.B1 collimator, which is taken as reference forthe design.
However, the interaction between the mechanical engineering development andthe FLUKA simulations performed during my PhD was brough from a factor 5 to 2the active length reduction due by jaw heating from the ideal value of 91 cm, for theworst operation case in transient conditions (i.e. 0.2h beam lifetime, see Table 8.1).
To support the mechanical integration of SLAC collimator components (e.g.tank, jaw support, cooling circuits, etc.), FLUKA simulations were also performedfor specific studies, adding regions to the model, where necessary, until eventuallyreaching a high degree of realism.
At the heating value predicted by FLUKA for the steady state scenario (i.e.about 9 kW per jaw, see Table 8.2), a benchmarking test was set up at the SLAClaboratory to measure the sagitta at six azimuthal locations to be compared with theANSYS predictions (see Fig. 8.16). The outcoming disagreement of 12% is small,
Figure 8.16: Jaw sagitta and temperature distribution under 9 kW heat load,simualted by ANSYS, on the basis of the FLUKA 3D model results.

96 8. The SLAC Phase II design
considering that the simulations give the jaw deformation a realistic beam heating[67].
Two SLAC prototypes are under final production and they are foreseen to be atCERN at the beginning of the next year (2011). They will be installed one in theSPS accelerator, to evaluate its performance with beam, and the other in a HighRadiation Material (HiRadMat) test facility, opportunely designed to perform beamshock and impact test for beam intercepting devices [68]. The aim is to evaluate thePhase II behaviour under extreme conditions similar to what was simulated for theasynchronous dump scenarios, in order to assure that even in the case of collimatordestruction, the downstream beam line devices are safe.
Chapter 9
The CERN Phase II design
On the basis of experience gained with the development and production of Phase I,CERN proposes for the Phase II collimators a modular design concept which foreseesa common baseline for the jaw assembly and allows the use of alternative materialsfor the jaws theirselves. This approach permits the development of diverse solutionswith a single supporting structure [69].
The CERN option focuses on the use of a linear collimator design (as for thePhase I) which can accomodate about 5 beam local damages in comparison to the20 ones of the SLAC design, but improving the thermal shock resistance and re-ducing the jaw elastic deflections in the most critical collimator positions, with theinvestigation of different materials than Copper or Glidcop and jaw support solutions[70].
The challenges posed by the development, experimental characterization andindustrialization of these advanced materials are tackled in a collaboration involvingacademic and industrial partners in the framework of the FP7 European researchprogram.
9.1 Main features of the CERN Phase II design
An intense effort is being devoted at CERN to material investigation, in particularby the Design Team, in order to identify new solutions that could comply withextremely demanding specifications of Phase II collimators. In addition, the choiceof promising materials was carried out considering the functionality of the differentPhase II collimator components.
For all the design solutions, the jaw assembly is composed of a rigid back stiffenerand an equipped jaw with the cooling circuit. The combined approach of materialand design optimization allowed the identification of potential materials for eachcomponent of the jaw assembly.
97

98 9. The CERN Phase II design
9.1.1 The back stiffener
The main function of the back stiffener is to ensure, through the fine adjustmentsystem, high geometrical stability to the jaw surface under thermal load. The ad-justable system allows jaw flatness control to compensate gravity sag and minimizethermal deflection.
The back stiffener should ideally have a very high thermo-mechanical stability(i.e. a high ratio Ek/α, where E is the Young’s modulus, k the thermal conductivityand α the Coefficient of Thermal Expansion (CTE)).
Upon these considerations and the FLUKA preliminary evaluations of the powerload on the jaw support, Molybdenum was considered as a promising choice, notonly for its suitable thermo-mechanical properties, but also from the manufactoringpoint of view and for its expected radiation hardness.
9.1.2 The cooling system
The use of higher-Z materials implies the increase of deposited energy.Different options were investigated to improve the cooling efficiency. A jaw back
casted pipe design as well as a cooling circuit directly machined from a solid blockwith brazed cover were evaluated as possible solutions.
In particular, in the latter proposal, OFE-Cu and Stainless Steel were consideredto ensure high reliability of the brazed joint and to avoid any problem concerningUltra-High-Vacuum (UHV) tightness of the cooler.
9.1.3 The jaw
Two options for the jaw material were identified in relation to the beam stabilizationmethod to be employed.
The first one concerns the use of highly conductive jaws, coupled with a Landauoctupoles stabilization system. This option requires the maximization of the electri-cal conductivity, therefore Copper or Glidcop represent typical solutions. However,in order to improve thermo-mechanical stability and thermal shock resistance whilekeeping a high electrical conductivity, advanced thermal management materials canrepresent valid candidates, particularly Copper-Diamond (Cu-CD).
The second option is focused on the investigation of jaw composed by a non con-ducting material to be bonded on a conductive support, coupled with the transversefeedback stabilization method. Tailored electrical resistivity in order to exploit atbest the inductive by-pass effect (see [71] and [72] for details), together with goodthermo-mechanical stability led to the choice of Silicon Carbide (SiC) material, whichin addition has a better thermal shock resistance with respect to Cu-CD.
Properties of relevant materials for the jaws are collected in Table 9.1 in compar-ison with the CFC used for the Phase I jaws.

9.2. The evolution of the CERN Phase II Copper based design 99
Table 9.1: Physical properties of the most promising jaw materials for the CERNPhase II design.
Jaw Density Thermal CTE Electricalmaterial [kg/m3] conductivity [Wm−1K−1] [K−1] resistivity [Ωm]
Cu 8900 395 17x10−6 17x10−9
Cu-CD 5500 500-600 6-7x10⁻⁶ 90x10−9
SiC 3200 250 3.5-5x10⁻⁶ 100-102
CFC 1650 60 1.5x10⁻⁶ 7x10⁻⁶
9.2 The evolution of the CERN Phase II Copperbased design
As already mentioned, the CERN design for Phase II is an evolution of Phase I,in which extensive re-designing has been carried out on jaw assemblies to respondto new requirements. Attention was devoted to flatness control, minimization of
Cooling�system
Jaw
Backstiffener
Fine�adjustment�system
Figure 9.1: CERN Phase II design baseline. Modular design including (from leftto right) equipped jaw, cooling system and back-stiffener. A cross section of thecollimator jaw and the location of the fine adjustment system in the middle of theback stiffener are also shown.
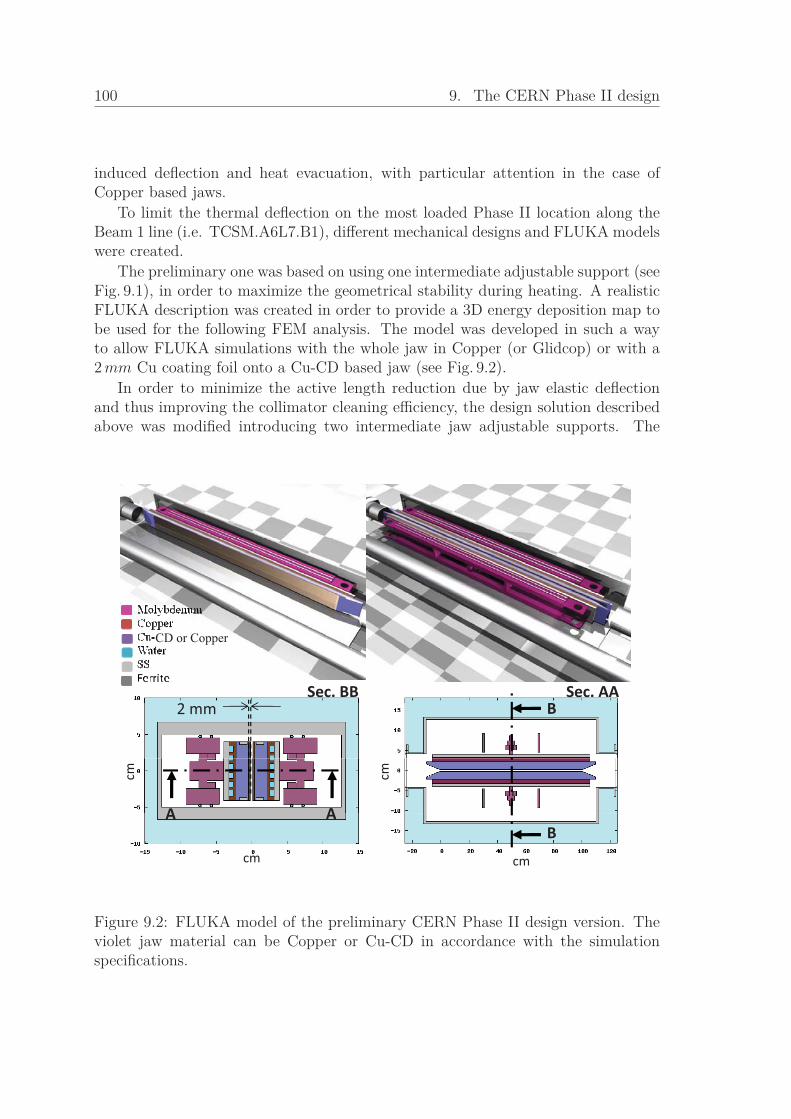
100 9. The CERN Phase II design
induced deflection and heat evacuation, with particular attention in the case ofCopper based jaws.
To limit the thermal deflection on the most loaded Phase II location along theBeam 1 line (i.e. TCSM.A6L7.B1), different mechanical designs and FLUKA modelswere created.
The preliminary one was based on using one intermediate adjustable support (seeFig. 9.1), in order to maximize the geometrical stability during heating. A realisticFLUKA description was created in order to provide a 3D energy deposition map tobe used for the following FEM analysis. The model was developed in such a wayto allow FLUKA simulations with the whole jaw in Copper (or Glidcop) or with a2mm Cu coating foil onto a Cu-CD based jaw (see Fig. 9.2).
In order to minimize the active length reduction due by jaw elastic deflectionand thus improving the collimator cleaning efficiency, the design solution describedabove was modified introducing two intermediate jaw adjustable supports. The
CD or Copper
2 BSec.�BB Sec.�AA
2 mm B
cmcm
AA
cmcm
AAB
Figure 9.2: FLUKA model of the preliminary CERN Phase II design version. Theviolet jaw material can be Copper or Cu-CD in accordance with the simulationspecifications.

9.2. The evolution of the CERN Phase II Copper based design 101
collimator jaw was cut in 3 pieces independently supported on the back stiffenerand independently cooled by 3 separate brazed coolers.
A preliminary analysis was performed using a FLUKA model with equal longcuts in a 1m long jaw. Additional FLUKA and FEM optimization studies broughtthen to fix the lengths of the 3 jaw pieces.
As already shown by the preliminary FLUKA calculation (see Chapter 7, Sec-tion 7.4), the power density peak is calculated to be at about 20 cm from the jawbeginning, in the case of a copper based jaw. The first cut was fixed at 24.4 cm,while the second and third pieces are 30 cm and 44.4 cm long respectively. Thisjaw division was considered valid for all the Phase II replica along the IR7 SS line,because it is expected that the peak will be located at about 20 cm (or less) in everycase. Between subsequent jaw pieces and between the lateral jaw pieces and thetapering parts, RF finger contacts were introduced to ensure electrical conductivity(see Fig. 9.3).
AB
B
Sec.�AABeam�1
A
B
Sec.�BB
Molybdenum
Beam�13�equally�long�jaw�pieces
y
Copper
SS
Ferrite
WaterSS (jaw supports)
SS (plate)
3�jaw�pieces�of�different�length
Figure 9.3: Evolution of the CERN Phase II FLUKA model with the jaw cut in 3pieces.
Fig. 9.4 shows the detailed FLUKA model created for the current and last versionof the CERN design, now in phase of prototyping.
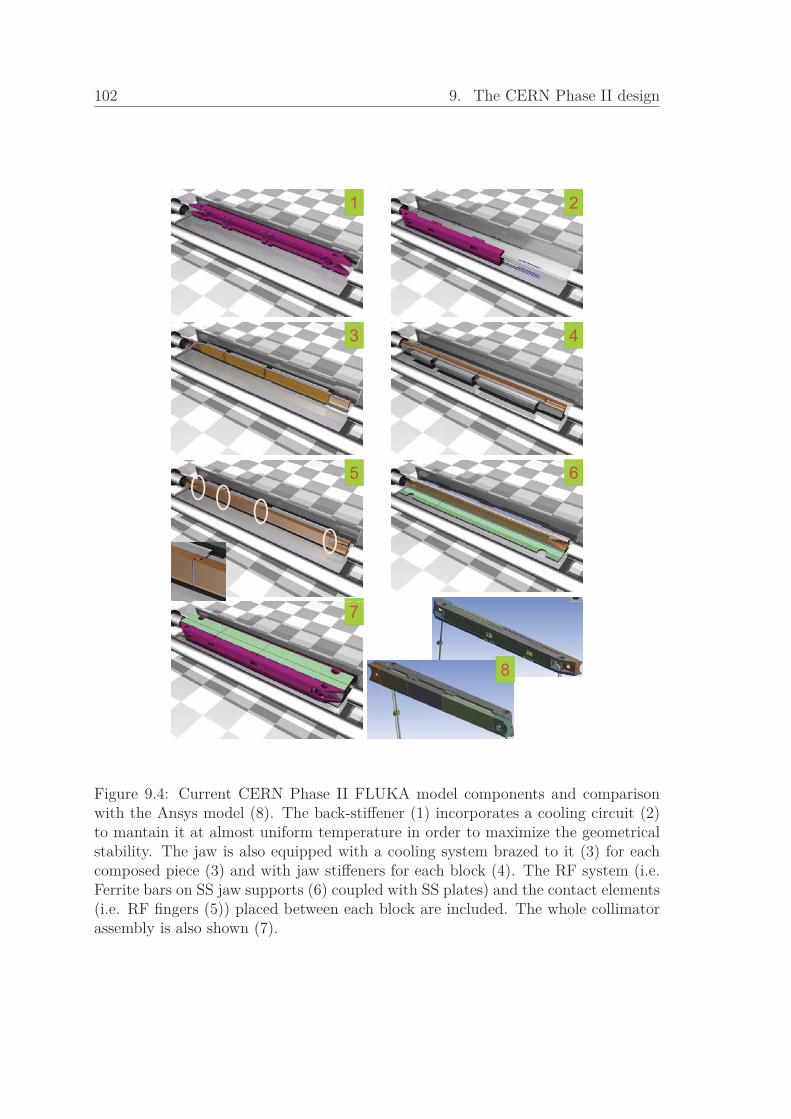
102 9. The CERN Phase II design
1 2
3 4
5 6
7
88
Figure 9.4: Current CERN Phase II FLUKA model components and comparisonwith the Ansys model (8). The back-stiffener (1) incorporates a cooling circuit (2)to mantain it at almost uniform temperature in order to maximize the geometricalstability. The jaw is also equipped with a cooling system brazed to it (3) for eachcomposed piece (3) and with jaw stiffeners for each block (4). The RF system (i.e.Ferrite bars on SS jaw supports (6) coupled with SS plates) and the contact elements(i.e. RF fingers (5)) placed between each block are included. The whole collimatorassembly is also shown (7).

9.2. The evolution of the CERN Phase II Copper based design 103
The iterative process between FLUKA simulations and FEM analyses has broughtto a reduction of a factor 3 of the largest deflection calculated for the Copper basedjaw solution, as displayed in Fig. 9.5 [73].
Max�deflection�~180���m
Glidcop jaw1�fine�adjustment�system
Max�deflection�~90��m
Cu�CD + 2 mm Cu coating jawCu�CD�+�2�mm�Cu�coating�jaw�1�fine�adjustment�system
Max�deflection�~50�60��m
Glid (3 t) jGlidcop (3�cut)�jaw2 fine�adjustment�systems
Figure 9.5: Evolution of the elastic deflections for the CERN Phase II copper basedjaw design. Results refer to the 1h beam lifetime scenario for horizontal beam lossesdistribution.
9.2.1 FLUKA results for operation conditionsThe FLUKA results used for the evaluation of the jaw elastic deflections reportedabove are depending on the 7TeV loss scenario used as input and the study isfocused on the most loaded Phase II device, which in the case of Copper basedjaw is the first Phase II met by each beam passing through the SS IR7 lines. Inthat particular position, the particle shower developed by the primary collimatorsbrings to almost equal integral power values for the most loaded Phase II jaw in the3 scenarios of losses (i.e. horizontal, vertical and skew). Moreover, power densitypeak values and their localizations on the most loaded jaw surface are similar (seeas reference Fig. 8.8 and Table 8.2 in Chapter 8). For these reasons it was assumedthat any distribution could be selected to perform the jaw deflection evaluations.
In these PhD studies it was chosen to use horizontal losses distribution as refer-ence for the Phase II jaw deflection studies as well as to support the integration ofthe collimator components in the case of operation condition simulations.
Fig. 9.6 shows the total power deposited in each Phase II collimator assemblyin the IR7 sequence order, where it is evident the factor of 5 between the first andsecond Phase II collimators located along the Beam 1 line.

104 9. The CERN Phase II design
Figure 9.6: Power load distribution on the 11 Phase II Copper based jaw collimatorsCERN design (1h beam lifetime scenario, horizontal losses distribution).
Fig. 9.7 shows two cuts of the power map used for the FEM analysis for the mostloaded Phase II collimator.
A
me
Sec.�BB
Tot�~�8.5�kW�
Each�jawcm3 ]�
m�lifetim
j
[W/
1h�beam
1 Sec.�AAB
A
B~�20�cm B
Th t l d d j ]� etim
e
The�most�loaded�jaw�is�the�farther�away�from�the�center�of�
[W/cm
3 ]eam�life
the�LHC�ring [1h
�be
Figure 9.7: TCSM.A6L7.B1 3D power deposition map cuts (1h beam lifetime sce-nario). Top (i.e. Sec.BB): longitudinal cut at the beam height. Bottom (i.e.Sec.AA): transverse cut at the depth of the maximum. It has to be noted thatthe coordinate system refers to the prototype in the parking, which in the case ofthis specific location undergoes a rotation of 142.5o as indicated in Appendix B.
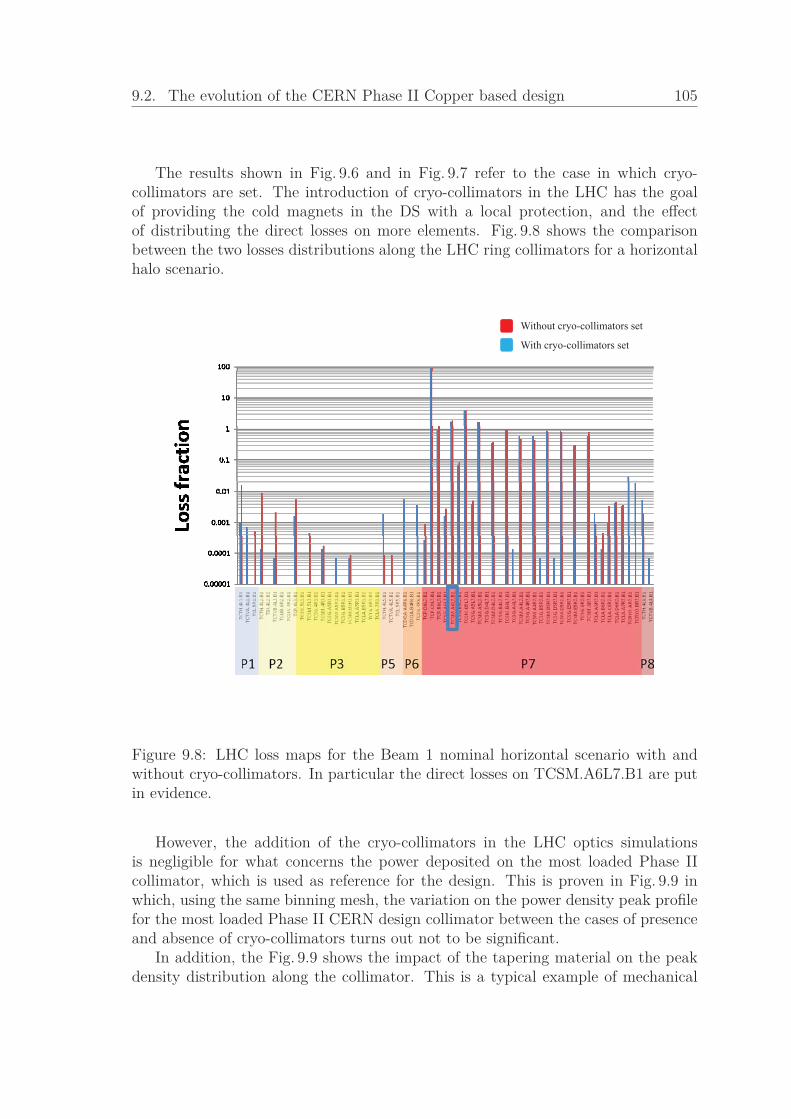
9.2. The evolution of the CERN Phase II Copper based design 105
The results shown in Fig. 9.6 and in Fig. 9.7 refer to the case in which cryo-collimators are set. The introduction of cryo-collimators in the LHC has the goalof providing the cold magnets in the DS with a local protection, and the effectof distributing the direct losses on more elements. Fig. 9.8 shows the comparisonbetween the two losses distributions along the LHC ring collimators for a horizontalhalo scenario.
Without cryo-collimators set
With cryo-collimators set
Figure 9.8: LHC loss maps for the Beam 1 nominal horizontal scenario with andwithout cryo-collimators. In particular the direct losses on TCSM.A6L7.B1 are putin evidence.
However, the addition of the cryo-collimators in the LHC optics simulationsis negligible for what concerns the power deposited on the most loaded Phase IIcollimator, which is used as reference for the design. This is proven in Fig. 9.9 inwhich, using the same binning mesh, the variation on the power density peak profilefor the most loaded Phase II CERN design collimator between the cases of presenceand absence of cryo-collimators turns out not to be significant.
In addition, the Fig. 9.9 shows the impact of the tapering material on the peakdensity distribution along the collimator. This is a typical example of mechanical

106 9. The CERN Phase II design
integration support studies performed with FLUKA during this PhD in order toindicate solutions and to investigate different material choices. In this particularcase, it was quantified how much Aluminum taperings are better than Copper ones,in order not to increase the power load in the first part of the jaw and especially onthe upstream tapering, which is not cooled as well as the downstream one.
Binning�used�in�all�cases:�0.1*0.1*1�cmgINPUT�FILE�with�Cryo�collimatorsAl TaperingGlidcop Tapering
INPUT�FILE�without Cryo�collimatorsNo�tapering
W/cm
3
cm1�m�long�jaw�9,7�cm�Tapering 9,7�cm�Tapering
Figure 9.9: Comparison between power density peaks for the most loaded Phase IIcollimator using loss maps with and without cryo-collimators. The blu line refers toa preliminary CERN FLUKA model in which the tapering part was not yet added.The light blue and pink lines refer to the actual CERN Phase II design for whichdifferent materials for the tapering were evaluated.
Many power distribution maps, referring to different geometries, were providedto FEM experts and specific FLUKA analyses not reported here were performedduring this PhD, before converging to the current CERN Phase II design.
9.2.1.1 The contribution of direct proton losses vs. upstream shower
In order to understand the origin of power load on the most loaded Phase II col-limator, the contribution of direct 7TeV proton losses has been disentangled fromthe one of the particle shower generated upstream.

9.2. The evolution of the CERN Phase II Copper based design 107
The study was performed scoring the power deposited on the TCSM.A6L7.B1for two different input loss maps. In the first case, horizontal halo distribution isused. In the second case, the direct losses on the Phase II collimator under studyare removed from the horizontal halo loss map, in such a way to consider only theparticles shower coming from the upstream elements.
Since the direct losses are localized close to the surface of the collimator jaws,their effect can be particularly appreciated in the evaluation of the power densitypeak, which is located on the jaw surface.
It has to be noted that the evaluation of the jaw elastic deformation is strictlydependent on the power density peak profile and in particular on its maximum.
Fig. 9.10 shows the power density peaks in the two cases. The contribution of theshower to the peak values is evidently higher in comparison with the contribution ofthe direct losses. The importance of the shower is even more evident when lookingat the total power for which the contribution of the direct losses is negligible.
Binning�used�in�all�cases:�0.1*0.1*1�cmg
Direct�losses�&�shower�Only�shower
W/cm
3
cm1�m�long�jaw�9,7�cm�Tapering 9,7�cm�Tapering
Figure 9.10: Power density peak profile for the most loaded Phase II collimator(1h beam lifetime). The contribution of the shower generated upstream is shown,pointing out its dominant role with respect to the contribution of direct losses (i.e.beam protons lost in the collimator jaws).

108 9. The CERN Phase II design
Similar results are obtained with the investigation of different halo distributions.
9.3 CERN Phase II jaw material comparisonDifferent Phase II jaw materials imply different power loads on the collimator itselfand on the LHC elements downstream, due to the different shower propagation.
To compare the behaviour of Phase II jaws composed by a non conductive ma-terial against the Copper based ones, the asynchronous dump scenario was used fora first evaluation (preliminary FLUKA calculations are reported in [74]).
The non conductive jaw, proposed by CERN, is composed by 47, 2 cm long,SiC tiles, with 1mm gap between each other, bonded on a Copper or a Cu-CDsupport. The CERN modular approach allows the implementation of these jawsusing the same design for what concerns the cooling system and the back stiffener(see Fig. 9.11).
SiC tiles�
Figure 9.11: FLUKA model of the CERN non conductive jaw design for Phase IIcollimators.
The input files used refer to an impact of 5.4 nominal LHC bunches on theTCP.C6L7.B1 primary collimator, of 4.1 bunches on the TCSM.B4L7.B1 first PhaseII horizontal collimator and of 4 bunches on the TCSM.6R7.B1 second and last (inthe SS IR7 line) Phase II horizontal collimator.
The numbers of impacting bunches differ from those used in the SLAC designsimulations (see Chapter 8, Section 8.3.2) because the aperture of the collimatorsrefers here to the layout in which cryo-collimators are set in the Beam 1 line. Therelaxed apertures in comparison to those calculated for the nominal 7TeV layoutwithout cryo-collimators, including approximation errors of the half gap setting,
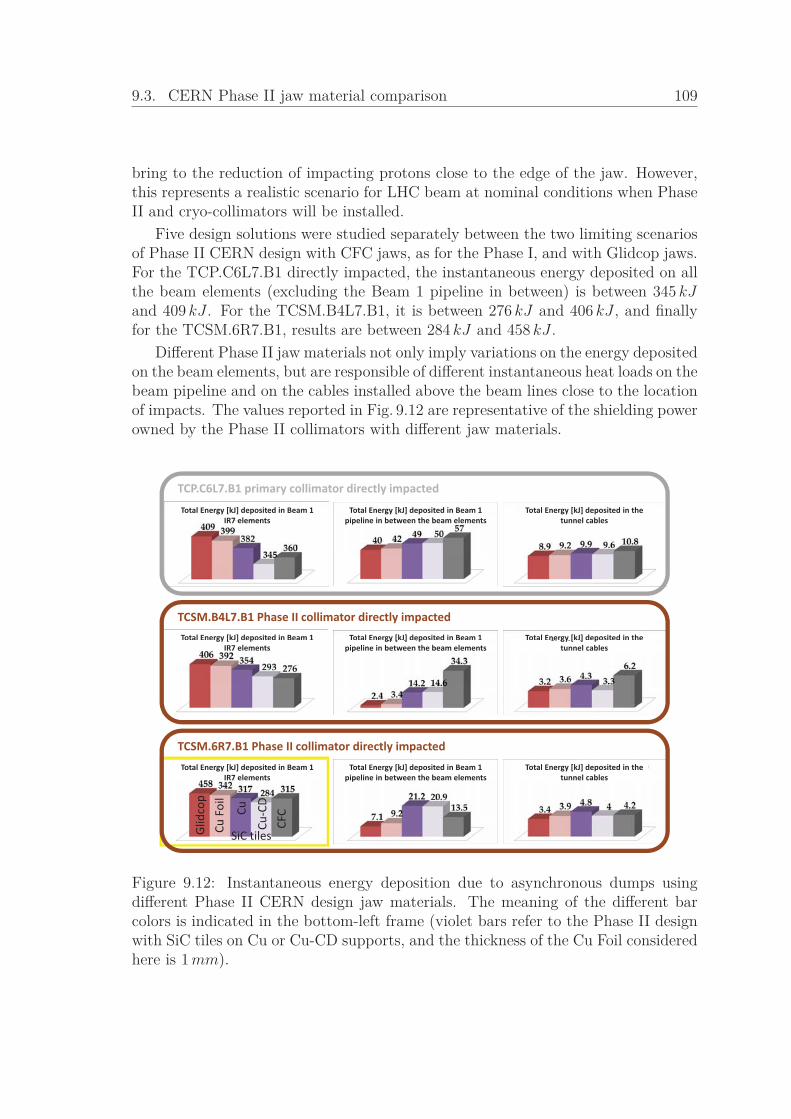
9.3. CERN Phase II jaw material comparison 109
bring to the reduction of impacting protons close to the edge of the jaw. However,this represents a realistic scenario for LHC beam at nominal conditions when PhaseII and cryo-collimators will be installed.
Five design solutions were studied separately between the two limiting scenariosof Phase II CERN design with CFC jaws, as for the Phase I, and with Glidcop jaws.For the TCP.C6L7.B1 directly impacted, the instantaneous energy deposited on allthe beam elements (excluding the Beam 1 pipeline in between) is between 345 kJand 409 kJ . For the TCSM.B4L7.B1, it is between 276 kJ and 406 kJ , and finallyfor the TCSM.6R7.B1, results are between 284 kJ and 458 kJ .
Different Phase II jaw materials not only imply variations on the energy depositedon the beam elements, but are responsible of different instantaneous heat loads on thebeam pipeline and on the cables installed above the beam lines close to the locationof impacts. The values reported in Fig. 9.12 are representative of the shielding powerowned by the Phase II collimators with different jaw materials.
TCP.C6L7.B1�primary�collimator�directly�impacted
Total Energy [kJ] deposited in Beam 1 Total Energy [kJ] deposited in Beam 1 Total Energy [kJ] deposited in theTotal�Energy�[kJ]�deposited�in�Beam�1�IR7�elements
Total�Energy�[kJ]�deposited�in�Beam�1�pipeline�in�between�the�beam�elements
Total�Energy�[kJ]�deposited�in�the�tunnel�cables�
TCSM.B4L7.B1�Phase�II�collimator�directly�impacted
Total�Energy�[kJ]�deposited�in�Beam�1� Total�Energy�[kJ]�deposited�in�the�Total�Energy�[kJ]�deposited�in�Beam�1�gy [ ] pIR7�elements
gy [ ] ptunnel�cables�
gy [ ] ppipeline�in�between�the�beam�elements
TCSM.6R7.B1�Phase�II�collimator�directly�impacted
Total Energy [kJ] deposited in Beam 1 Total Energy [kJ] deposited in theTotal Energy [kJ] deposited in Beam 1
cop
Foil
Cu CD C
Total�Energy�[kJ]�deposited�in�Beam�1�IR7�elements
Total�Energy�[kJ]�deposited�in�the�tunnel�cables�
Total�Energy�[kJ]�deposited�in�Beam�1�pipeline�in�between�the�beam�elements
Glidc
Cu�F C
Cu�
CFC
SiC tiles
Figure 9.12: Instantaneous energy deposition due to asynchronous dumps usingdifferent Phase II CERN design jaw materials. The meaning of the different barcolors is indicated in the bottom-left frame (violet bars refer to the Phase II designwith SiC tiles on Cu or Cu-CD supports, and the thickness of the Cu Foil consideredhere is 1mm).
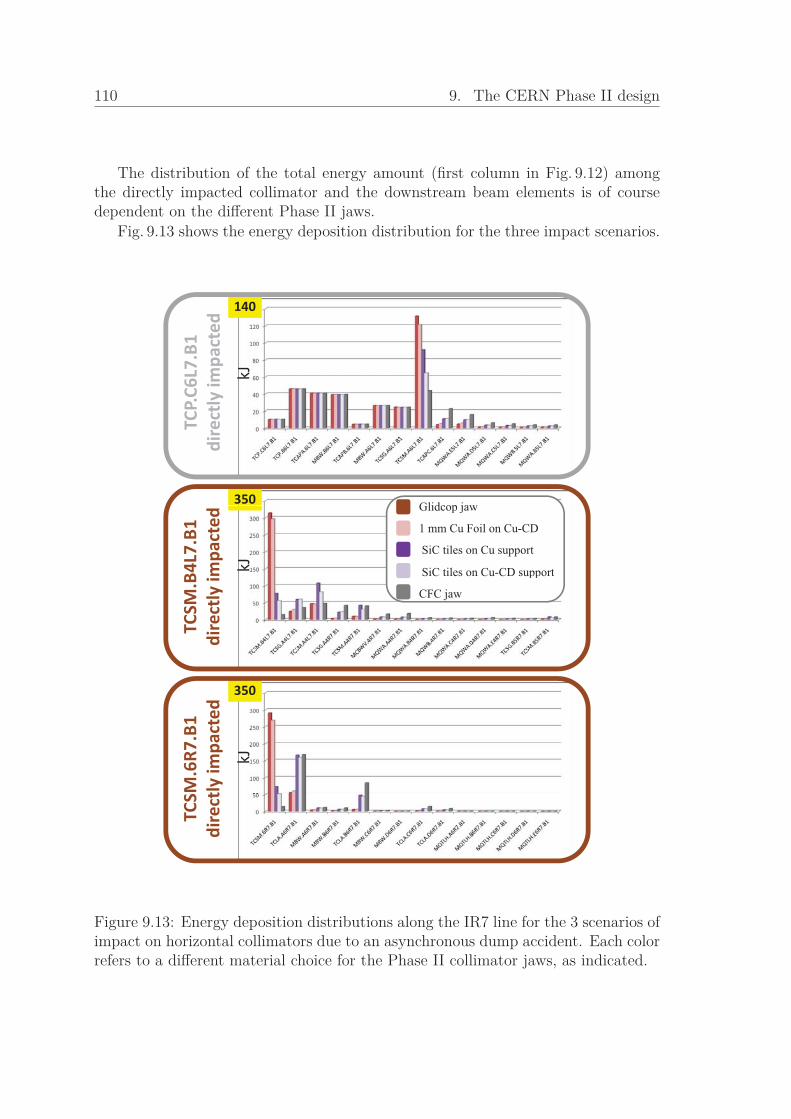
110 9. The CERN Phase II design
The distribution of the total energy amount (first column in Fig. 9.12) amongthe directly impacted collimator and the downstream beam elements is of coursedependent on the different Phase II jaws.
Fig. 9.13 shows the energy deposition distribution for the three impact scenarios.
7.B1
pacted
140
TCP.C6
L7rectly�im
p
kJ
dir
Glidcop jaw350
B4L7.B1
mpa
cted
Glidcop jaw
1 mm Cu Foil on Cu-CD
SiC tiles on Cu support
SiC tiles on Cu-CD supportkJ
TCSM
.Bdirectly�i pp
CFC jaw
1 ted
350
M.6R7
.B1
tly�im
pact
kJ
TCS
direc t
Figure 9.13: Energy deposition distributions along the IR7 line for the 3 scenarios ofimpact on horizontal collimators due to an asynchronous dump accident. Each colorrefers to a different material choice for the Phase II collimator jaws, as indicated.

9.3. CERN Phase II jaw material comparison 111
When a Glidcop or Copper foil jaws is used, the most loaded element is alwaysa Phase II collimator.
For the accidents in which a Phase II is directly impacted, if SiC tiles are used,the most loaded element is downstream, due to the particles shower propagation. Inparticular, when the TCSM.B4L7.B1 is impacted, the most loaded element is still aPhase II collimator (i.e. the skew TCSM.A4L7.B1), located about 3m downstream,while in the case of TCSM.6R7.B1 (last of the 11 TCSM in the SS IR7 region forBeam 1) the most loaded device is an active absorber (i.e. the TCLA.A6R7.B1),installed just behind it to protect the cold magnets. It has to be pointed out that inthese cases the energy deposition is spread over a bigger volume, in comparison towhat happens on the collimator directly impacted. The asynchronous dump accidentis thus less critical in terms of energy density peak in the downstream elements andin particular for the downstream Phase II collimators (see Fig. 9.14).
TCSM.B4L7.B1 - jaw directly impacted
TCSM.A4L7.B1
m3
kJ/cm
cm1�m�long�jaw�9,7�cm�Tapering 9,7�cm�Tapering
cm
Figure 9.14: Energy deposition peak comparison between the Phase IITCSM.B4L7.B1 directly impacted on the external jaw (red curve) for the consideredasynchronous dump scenario and the resulting most loaded element (i.e. Phase IITCSM.A4L7.B1). For each collimator, the peak profiles in the two jaws are shownseparately. The oscillations, particularly visible in the red curve, are due to theinhomogenous surface, alternating tiles and vacuum, since the tiles overhang theCu-CD support.

112 9. The CERN Phase II design
For the impact scenario on the primary collimator (i.e. the TCP.C6L7.B1), themost loaded element turns out to be the TCSM.A6L7.B1 for all the jaw designproposed, unless it is assumed to use CFC jaws, as for the Phase I. In this case, themaximum energy density is found on the skew primary collimator, installed behindthe horizontal TCP.C6L7.B1 impacted. Fig. 9.15 compares the different peak profileson the TCSM.A6L7.B1. While for the Glidcop and Copper foil jaws the localizationof the maximum is at about 20 cm from the beginning of the jaw and on the jawsurface, using SiC tiles the energy density maximum can be reached on the tilessurface or directly on the tiles support depending on the support material used. ForCopper behind the SiC tiles, it is localized at about 10 cm longitudinal depth in thesupport, while for more transparent material, like Cu-CD, it is found almost at theend of the jaw and on the SiC tiles surface.
Glidcop & 1 mm Cu Foil jawGlidcop & 1 mm Cu Foil jaw
SiC with Cu support jaw
SiC with Cu-CD support jaw
m3
kJ/cm
cm1�m�long�jaw�9,7�cm�Tapering 9,7�cm�Tapering
cm
Figure 9.15: Comparison between different jaw material energy deposition peaks forthe most loaded Phase II TCSM.A6L7.B1 resulting from the asynchronous dumpscenario of TCP.C6L7.B1 directly impacted.
Table 9.2 summarizes the maximum values and the corresponding istantaneousincreases of temperature on Phase II collimators, calculated under adiabatic condi-tions. In case of Phase II TCSM.6R7.B1 directly impacted, values are equivalent tothose referring to the TCSM.B4L7.B1 case. In addition, since the TCSM.6R7.B1is the last Phase II collimator on the SS IR7 line, no other Phase II devices are

9.3. CERN Phase II jaw material comparison 113
Table 9.2: Energy density peaks and instantaneous increases of temperature (T) forasynchronous beam dump scenarios. Results refer only to CERN design Phase IIcollimators and to their most loaded jaw.
TCP.C6L7.B1 impacted →TCSM.A6L7.B1 most loadedGlidcop jaw Energy on TCSM.A6L7.B1 jaw 49.5 [kJ ]
Energy density peak on the jaw 0.7 [kJ/cm3]Istantaneous increase of T 180 [℃]
1mm Cu Foil on Energy on TCSM.A6L7.B1 jaw 41.3 [kJ ]Cu-CD base jaw Energy density peak on the jaw 0.7 [kJ/cm3]
Istantaneous increase of T 180 [℃]SiC inserts on Energy on TCSM.A6L7.B1 jaw 31.3 [kJ ]Cu base jaw Energy density peak on the jaw on Cu 0.18 [kJ/cm3]
Istantaneous increase of T on Cu 50 [℃]SiC inserts on Energy on TCSM.A6L7.B1 jaw 25.7 [kJ ]Cu-CD base jaw Energy density peak on the jaw on SiC 0.1 [kJ/cm3]
Istantaneous increase of T on SiC 25 [℃]TCSM.B4L7.B1 impacted →different most loaded Phase II collimatorsGlidcop jaw Energy on TCSM.B4L7.B1 jaw 152.3 [kJ ]
Energy Density peak on the jaw 65 [kJ/cm3]Istantaneous increase of T » melting point
1mm Cu Foil on Energy on TCSM.B4L7.B1 jaw 133.9 [kJ ]Cu-CD base jaw Energy Density peak on the jaw 65 [kJ/cm3]
Istantaneous increase of T » melting pointSiC inserts on Energy on TCSM.B4L7.B1 jaw 35.3 [kJ ]Cu base jaw Energy Density peak on the jaw on SiC 6 [kJ/cm3]
Istantaneous increase of T on SiC �melting pointEnergy on TCSM.A4L7.B1 jaw 39.6 [kJ ]Energy Density peak on the jaw on SiC 0.36 [kJ/cm3]Istantaneous increase of T on SiC 150 [℃]
SiC inserts on Energy on TCSM.B4L7.B1 jaw 29.6 [kJ ]Cu-CD base jaw Energy Density peak on the jaw on SiC 6 [kJ/cm3]
Istantaneous increase of T on SiC �melting pointEnergy on TCSM.A4L7.B1 jaw 32.7 [kJ ]Energy Density peak on the jaw on SiC 0.35 [kJ/cm3]Istantaneous increase of T on SiC 145 [℃]
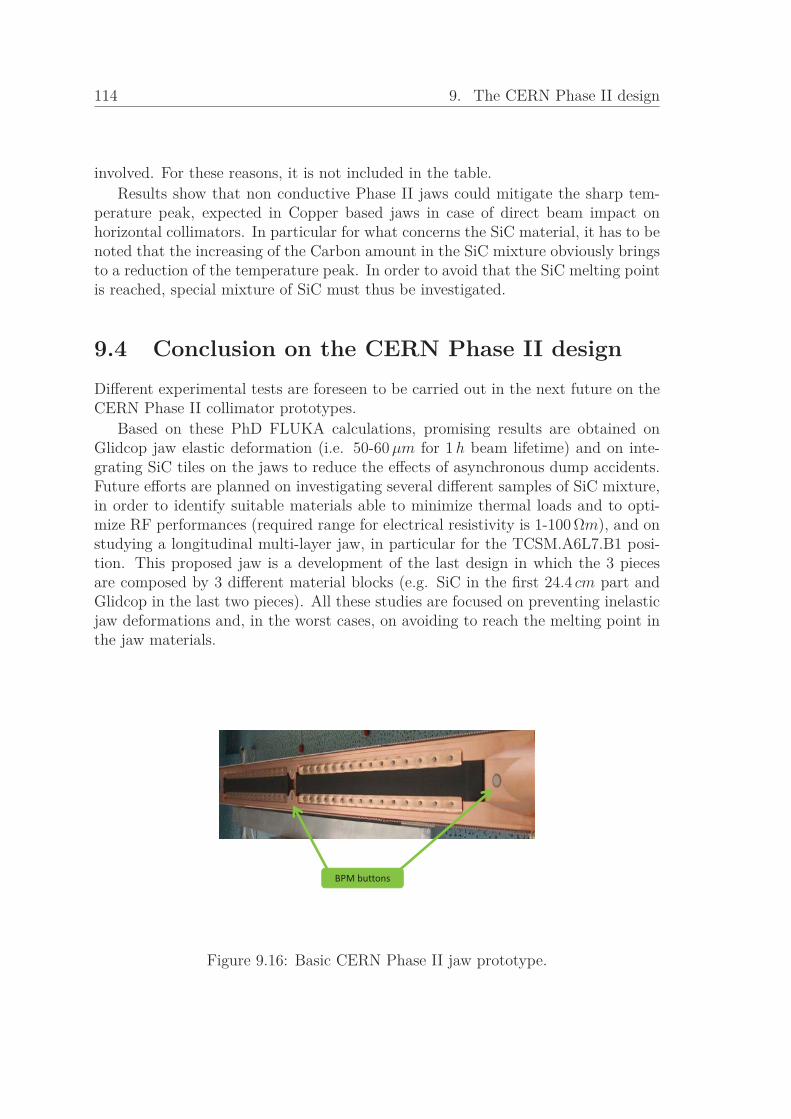
114 9. The CERN Phase II design
involved. For these reasons, it is not included in the table.Results show that non conductive Phase II jaws could mitigate the sharp tem-
perature peak, expected in Copper based jaws in case of direct beam impact onhorizontal collimators. In particular for what concerns the SiC material, it has to benoted that the increasing of the Carbon amount in the SiC mixture obviously bringsto a reduction of the temperature peak. In order to avoid that the SiC melting pointis reached, special mixture of SiC must thus be investigated.
9.4 Conclusion on the CERN Phase II design
Different experimental tests are foreseen to be carried out in the next future on theCERN Phase II collimator prototypes.
Based on these PhD FLUKA calculations, promising results are obtained onGlidcop jaw elastic deformation (i.e. 50-60μm for 1h beam lifetime) and on inte-grating SiC tiles on the jaws to reduce the effects of asynchronous dump accidents.Future efforts are planned on investigating several different samples of SiC mixture,in order to identify suitable materials able to minimize thermal loads and to opti-mize RF performances (required range for electrical resistivity is 1-100Ωm), and onstudying a longitudinal multi-layer jaw, in particular for the TCSM.A6L7.B1 posi-tion. This proposed jaw is a development of the last design in which the 3 piecesare composed by 3 different material blocks (e.g. SiC in the first 24.4 cm part andGlidcop in the last two pieces). All these studies are focused on preventing inelasticjaw deformations and, in the worst cases, on avoiding to reach the melting point inthe jaw materials.
BPM�buttons�
Figure 9.16: Basic CERN Phase II jaw prototype.

9.4. Conclusion on the CERN Phase II design 115
In addition, to support the final choice on CERN design jaw as regards collima-tion efficiency performance, a wide range of material tests and damage experimentsare planned in the CERN HiRadMat facility. Experimental tests on the SPS accel-erator at CERN are also foreseen.
Actually a basic CERN Phase II prototype (see Fig. 9.16) is installed in theSPS to verify the effectiveness of the jaw assembly, especially concerning the fineadjustment system. Furthermore, the SPS tests support the feasibility study ofintegrating Beam Position Monitor (BPMs) buttons on the jaw center and on thetapering parts of the jaw, in order to reduce the set-up time. The impact of showersand the thermal effects on these BPMs are under study as well as their operationalperformance.
As for the SLAC design, the prototyping phase of these LHC devices is foundedon these FLUKA results.

116 9. The CERN Phase II design

Chapter 10
Collimator setting errors
The results presented in the previous chapters refer to an ideal machine and per-fect collimators. However, unavoidable errors in accuracy affect the beam basedalignment for the set-up of the collimators.
On the basis of experimental evaluation from beam tests with Phase I collimators,specific set-up errors are identified and quantified. Namely rms and/or systematicjaw tilts, rms and/or systematic offsets of the collimator gap with respect to theideal position (i.e. the beam center) and rms errors on the size of collimator gapswith respect to their ideal value have been evaluated [75].
In order to give a more realistic estimation of the power deposited during opera-tion conditions on the IR7 collimators and beam elements, FLUKA simulations wereperformed focusing on symmetric and antisymmetric jaw tilts errors. Input files bythe SixTrack experts were provided using random errors on both Phase I and PhaseII jaw angles.
10.1 Beam-based alignment of the collimator jawsThe procedure for centering the collimator jaws with respect to the beam centre isthe following. A jaw, e.g. the right one, is moved towards the beam untilt it touchesit and left at a given distance from its center. Due to the betatron motion of thebeam particles, both beam sides are scraped and this provides a sharp referenceedge for the other jaw, which is then moved towards the beam in small steps. Thedownstream BLMs measure some proton losses only when the left jaw reaches thesame distance from the beam centre as the right jaw (see Fig. 10.1). This procedureprovides a centering of the jaw with a precision fixed by the motor step size. Smallerconsecutive steps allow a finer centering of the two jaws with respect to the beam[76].
In addition, this method was also proposed to adjust the jaw angle with respectto the beam envelope by moving one jaw corner per time. However, tests with beamshow that, when the second jaw corner is moved into place by adjustment stages (see
117

118 10. Collimator setting errors
Left jaw Left jaw
Left jawx
Beam based alignment
Left jaw
Beam edgeCirculating beam
sBeam propagation
Right jaw Right jaw
s
Right jaw
fProposed angular adjustment
Circulating beam
xLeft jaw
Left jaw Left jaw
p g j
Ri h j
Beam propagations
Right jaw Right jawRight jaw
(c)(b)(a)
Figure 10.1: Procedure to centre the collimator jaws around the circulating beam.The beam is scraped with one jaw and the other jaw is moved towards the beamuntil new signals are recorded by the BLMs. The proposed and for the momentdropped angular alignment system is also shown.
Figure 10.2: Sketch of a horizontal Phase I secondary collimator installed in the LHCtunnel. The two reference points located on the tank are used for the alignment of thecollimator with respect to the upstream and downstream elements of the machine.
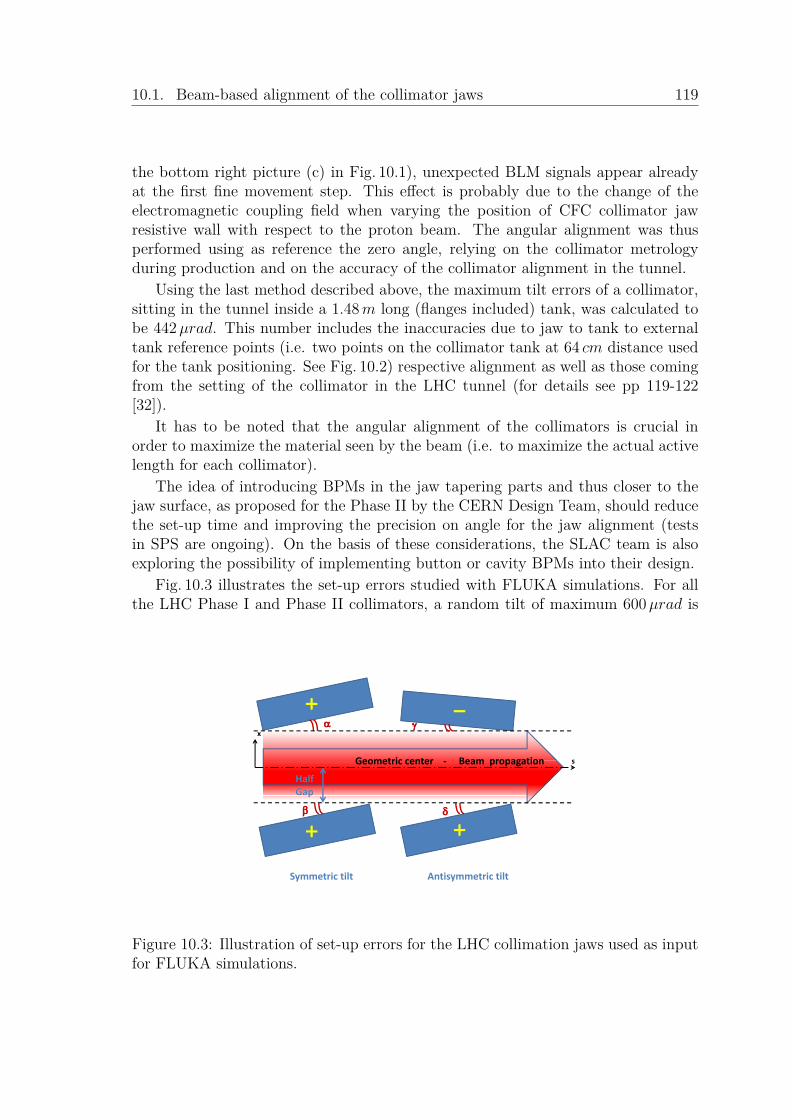
10.1. Beam-based alignment of the collimator jaws 119
the bottom right picture (c) in Fig. 10.1), unexpected BLM signals appear alreadyat the first fine movement step. This effect is probably due to the change of theelectromagnetic coupling field when varying the position of CFC collimator jawresistive wall with respect to the proton beam. The angular alignment was thusperformed using as reference the zero angle, relying on the collimator metrologyduring production and on the accuracy of the collimator alignment in the tunnel.
Using the last method described above, the maximum tilt errors of a collimator,sitting in the tunnel inside a 1.48m long (flanges included) tank, was calculated tobe 442µrad. This number includes the inaccuracies due to jaw to tank to externaltank reference points (i.e. two points on the collimator tank at 64 cm distance usedfor the tank positioning. See Fig. 10.2) respective alignment as well as those comingfrom the setting of the collimator in the LHC tunnel (for details see pp 119-122[32]).
It has to be noted that the angular alignment of the collimators is crucial inorder to maximize the material seen by the beam (i.e. to maximize the actual activelength for each collimator).
The idea of introducing BPMs in the jaw tapering parts and thus closer to thejaw surface, as proposed for the Phase II by the CERN Design Team, should reducethe set-up time and improving the precision on angle for the jaw alignment (testsin SPS are ongoing). On the basis of these considerations, the SLAC team is alsoexploring the possibility of implementing button or cavity BPMs into their design.
Fig. 10.3 illustrates the set-up errors studied with FLUKA simulations. For allthe LHC Phase I and Phase II collimators, a random tilt of maximum 600µrad is
s
x
Geometric center Beam propagation
sGeometric center ‐ Beam propagation
Half Gapp
Symmetric tilt Antisymmetric tilt
Figure 10.3: Illustration of set-up errors for the LHC collimation jaws used as inputfor FLUKA simulations.

120 10. Collimator setting errors
assigned to each jaw by the SixTrack program. Each LHC collimator experiencesthus a symmetric or an antisymmetric tilt with a different angle per jaw. Loss mapsused as FLUKA input reflect these jaw tilting (see Appendix C as reference for thecollimator setting used in the simulations).
The FLUKA collimator models were developed in order to allow these angularjaw variations.
10.2 FLUKA results for operation conditionsThe purpose of this study is to evaluate the variation in terms of power depositedin the SS IR7 region Beam 1 line due to the collimator beam-jaw misalignments,during nominal operation conditions at low beta, in particular focusing on the tilteffects on the Phase II collimator loads.
The reference collimator design considered is the most recent CERN one withAluminum tapering parts. The loss maps used refer to the horizontal halo distribu-
00Perfectly aligned LHC collimatorsWith LHC collimator jaw tilts
kW
90 m
IR7 SS region between the two MQTL SC groups ‐ Beam 1 elements
130 m
Figure 10.4: Comparison between power deposition on the SS IR7 Beam 1 elementswith and without LHC collimator jaw tilts.

10.2. FLUKA results for operation conditions 121
tion without cryo-collimators installed.Results show that, as a consequence of the tilts, the thermal load is reduced on
beam elements located in the first 90m of the SS IR7 region, excluding the smallincrement on the TCP.C6L7.B1 primary horizontal collimator, and it is increased inthe central and downstream SS parts (see Fig. 10.4).
Fig. 10.5 summarizes these effects on Phase II collimators for the 1h beam life-time steady state scenario. Negative W values have the meaning of reduction interms of power deposited in case of tilting jaws in comparison with the perfect par-allel collimator simulation results, while the positive ones represent the increments.
The jaw tilts mitigate the amount of power deposited on the most loaded PhaseII collimator. However this reduction is only of about 1% with respect to the no tiltscase. An increment of about 300W for the 1h beam lifetime scenario is expectedfor the second Phase II collimator on the Beam 1 line (total heat load of about 6%in average). Bigger percentage variations are found for Phase II collimators locatedin the central and downstream parts of the IR7 SS region. Nevertheless, since the
Total P on Phase IIW
% % with respect to not tilt jaws%
Figure 10.5: Reductions and increments on power deposition (absolute and absolutepercentage) for the 11 Phase II collimators in case of misaligned jaws (1h beamlifetime).

122 10. Collimator setting errors
calculated power deposited in the other Phase II elements is significantly lower incomparison to what is evaluated for the TCSM.A6L7.B1 collimator (see Fig. 9.6),these variations cannot be the cause of plastic deflections which could bring to amechanical Phase II design review.
In addition, a deeper analysis points out that each Phase II jaw experimentsa different behaviour because of the tilts. In particular for what concerns theTCSM.A6L7.B1 collimator, the external jaw (with respect to the LHC ring cen-ter) undergoes a decrease in terms of power deposited of about 0.1 kW , while on theinternal jaw, results point out a reduction ten times smaller (i.e. about 0.01 kW ).Both values are calculated for the 1h beam lifetime transient scenario.
Fig. 10.6 shows the tilt effect on each jaw for the steady state scenario. As before,differences are in absolute scale as well as in % (with respect to the parallel jawscase).
Beam 1
TCP.D6L7 TCP.C6L7 TCP.B6L7
WWExternal jawInternal jaw
l j
%
External jawInternal jaw
%
Figure 10.6: The same as in Fig. 10.5 for each jaw instead of the whole collimator.The tilt jaw orientation is also shows for the Phase II and Phase I primary colimators.

10.2. FLUKA results for operation conditions 123
Fig. 10.7 shows the tilt consequences on the most loaded Beam 1 elements, zoom-ing on the 130m long region indicated in Fig. 10.4). Two primary Phase I collimatorsand all 3 passive absorbers are considered as well as the first 4 Phase II collimatorswith the respective upstream Phase I secondary ones. Warm dogleg magnets andthe first SS group of resistive quadrupoles are also shown.
kW Perfectly aligned LHC collimatorsWith LHC collimator jaw tilted
W
P i Ph I%
Primary Phase I Secondary Phase IPassive absorberWarm magnet
Figure 10.7: Top: Total loads along the most impacted part of the IR7 Beam 1 line(i.e. the 130m long segment indicated in Fig. 10.4). Middle: Absolute reductionsand increments. Bottom: Absolute percentage reductions and increments (tiltedjaw case vs. ideal jaw case).
A beneficial effect of the collimator jaw tilts is found on the second set of thedogleg magnets at the beginning of the Beam 1 IR7 line, downstream the primarycollimators. About 200W for the 1h beam lifetime scenario is the amount of thepower reduction on the first MBW.B6L7.B1 and on the upstream passive absorber(i.e. the TCAPA.6L7.B1). However, this reduction corresponds to less than 5% ofthe load on these elements.

124 10. Collimator setting errors
10.3 ConclusionResults show a minor effects on the thermal load of the Beam 1 elements along thewarm section (i.e. the SS region).
In particular, the Phase II collimators are the most sensitive elements in termsof absolute increments in power deposition due to the beam-jaw misalignment. Forthe tilt scenario studied, the maximum growth is estimated to be of about 1.5 kWfor the transient case, on the second Phase II collimators along the Beam 1 line (i.e.the TCSM.B5L7.B1). However, even with this increase, the total power depositedon this Phase II collimator represents only ∼ 20% of the power deposited on themost loaded TCSM.A6L7.B1 for the same transient scenario.
It has to be pointed out that the beam-jaw misalignment evaluated in this chapteris only one of the possible errors which can affect an accelerator and in particularthe Collimation System.
Fig. 10.8 shows the evolution of the Phase I collimation system performancewhen several imperfections are applied. The 5th scenario, which is considered the
worse
e)~Leakage
ficiency (
ning
Ineff
c
ocal Clean
better
Lo
Local Inefficiency at the quench limit
Figure 10.8: Local cleaning inefficiency for various imperfection scenarios.

10.3. Conclusion 125
most realistic one, could limit the maximum intensity reach in collimation to < 5%of nominal Intensity. In addition, further imperfections, which are not taken intoaccount in the figure, have to be evaluated, namely effects for beta-beat, couplingand non-linearities in the LHC (for details see [32], Chapter 6).
Since, according to the beam tracking estimates of the imperfection impact re-ported in Fig. 10.8, the major role turns out to be played by the machine mis-alignment (i.e. magnet transverse displacement), the FLUKA team is actually work-ing on assessing the change of peak power deposition in the cold section (i.e. theDS regions) for this scenario.

126 10. Collimator setting errors

Chapter 11
Activation of collimator materials
Losses of the primary protons in beam line components generate nuclear reactionsthat produce unstable isotopes responsible of induced radioactivity.
Activation occurs mainly in beam line components exposed to large beam lossessuch as collimators. Depending on the average production cross section and on thehalf-life of the unstable nucleus produced, their radioactive dacays contribute to theresidual dose rate, after switching the machine off. In particular, since the highestnumber of proton losses are localized in the Betatron Cleaning insertion at Point7, this region is the most critical one for what concerns its impact on radiologicalquantities.
In this Chapter, the focus is put on the assessment of radiation exposure ofpersonel during maintenance at IR7 when the Phase II collimators will be in place.
Residual dose rates to be expected during later repair or maintenance interven-tions must be considered already at an early design stage of each beam element andin particular for collimators. This can support the choice of Phase II materials to beused in their design as well as to give an indication of the cooling period durationto optimize access to the IR7 tunnel after LHC shutdown.
11.1 CERN radiation limits and constraintsCERN’s guidelines for the protection of the enviroment and personnel are compiledin the CERN Radiation Safety Manual [77] which is related to the French andthe Swiss National Legislation and to the European Council Directive 96/29/EU-RATOM [78]. They all base radiation protection on three general principles: jus-tification, limitation and optimization of potential human exposure due to the useand operation of equipment emitting ionising radiation.
Therein the legal dose limit defines a value never to be exceeded nor to be reachedand differentiates between category B workers and category A workers.
However, these limits and constraints cannot be directly applied during the con-struction and design work of any accelerator. It is therefore useful to introduce a
127

128 11. Activation of collimator materials
design criterion in order to ensure that the above mentioned limits and constraintswill not be exceeded during operation. For high radiation areas a design criterion of2mSv per person and per intervention is applied. Estimated or calculated individ-ual doses getting close to 2mSv must raise awarness and imply further optimizationof design and work procedures.
11.2 Details of FLUKA calculationsThe simulation of residual dose rates employs the capability of FLUKA to simulatein the same calculation prompt particle showers as well as radioactive decay atdifferent cooling times and the transport of the associate radiation.
Dose equivalent due to induced radioactivity was calculated by folding duringthe simulation (at scoring time) particle fluence with energy-dependent fluence-to-ambient dose equivalent conversion factors [80] [81].
In addition, during a first successful full scale Phase I collimator test in theSPS-LHC transfert line (TT40), the applied FLUKA simulation method was bench-marked with measurements of residual dose rates for two different cooling times ofone week and one month [79]. Both agreed within 10% and confirmed the accu-racy of the simulation approach not only for the already existing benchmark dataof specific materials but also for complex objects and geometries like collimators.
In order to retrieve three dimensional maps of residual dose rate distributionsfor the Phase II collimators, FLUKA simulations were performed assuming 5 yearsin succession of LHC operation.
All results presented later in this chapter refer to the so-called loss at nominalIntensity of 1.15x10¹⁶ protons per beam per year. It has to be noted that one year ofcontinuous operation means about 185 days of machine on, or irradiation, each 365days. This number represents the loss intensity to be expected after the installationof Phase II collimators [11].
Results are presented for 4 different cooling times after each 185 days of machineoperation: 1 day, 1 week, 1 month and 4 months (see Fig. 11.1). These cooling timesrepresent typical situations during accelerator operation of fast inspections shortlyafter beam shutdown, minor repair during the operational period or at the beginningof a longer shutdown, and major work like machine upgrades, typically performedtowards the end of an annual shutdown.
Actually, due to recent changes in the operation period timeframe, a 1 year longshutdown after 2 years of non-stop operation at different beam energy (e.g. 3.5TeVand 5TeV ) is foreseen. However, even if this operation time slot is also aplied whenthe Phase II collimators will be installed, results in case of Copper based jaws forthe two different irradiation profiles will be equivalent after approximately 2 monthscooling time.
The residual dose rates calculated reflect the horizontal losses halo distribution.As mentioned earlier, in reality losses will be distributed over all three primary
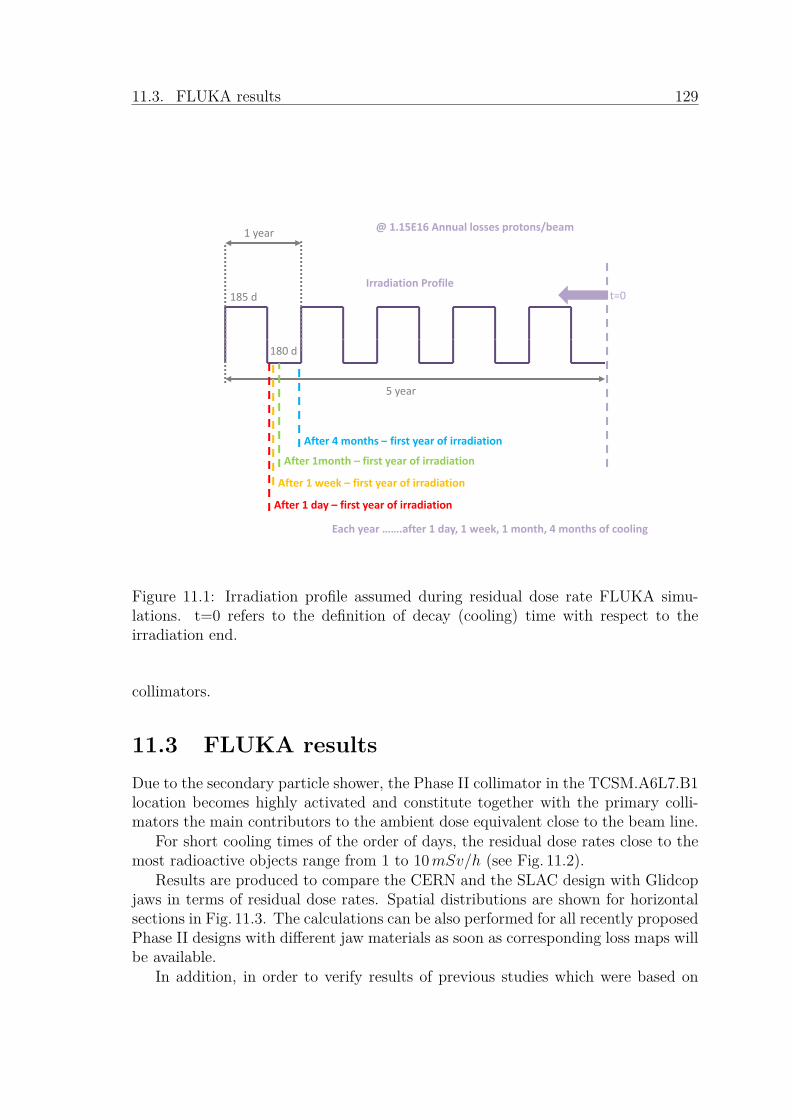
11.3. FLUKA results 129
1 year @ 1.15E16 Annual losses protons/beam 1 year
Irradiation Profile185 d t=0
180 d
5 year5 year
After 4 months – first year of irradiation
After 1month – first year of irradiation
After 4 months first year of irradiation
After 1 week – first year of irradiation
Each year …….after 1 day, 1 week, 1 month, 4 months of cooling
After 1 day – first year of irradiation
Figure 11.1: Irradiation profile assumed during residual dose rate FLUKA simu-lations. t=0 refers to the definition of decay (cooling) time with respect to theirradiation end.
collimators.
11.3 FLUKA resultsDue to the secondary particle shower, the Phase II collimator in the TCSM.A6L7.B1location becomes highly activated and constitute together with the primary colli-mators the main contributors to the ambient dose equivalent close to the beam line.
For short cooling times of the order of days, the residual dose rates close to themost radioactive objects range from 1 to 10mSv/h (see Fig. 11.2).
Results are produced to compare the CERN and the SLAC design with Glidcopjaws in terms of residual dose rates. Spatial distributions are shown for horizontalsections in Fig. 11.3. The calculations can be also performed for all recently proposedPhase II designs with different jaw materials as soon as corresponding loss maps willbe available.
In addition, in order to verify results of previous studies which were based on

130 11. Activation of collimator materials
M2
mSv/hB1
BEAM
–TCSM
.A6L7.B
e II collimator –
ary collimator
cm
Beam
1 Pha
se
1 Ph
ase I p
rima
First
3 TCPs Beam 1
BEAM1
cm
Figure 11.2: Ambient dose equivalent distribution after 185 days of continuous op-eration and 1 day of cooling time along the all IR7 straight section, shown for ahorizontal cut through the geometry at the height of the beam axes.

11.3. FLUKA results 131
a different geometry of IR7, dose equivalent rates were not only scored around thePhase II collimators but also around the horizontal Phase I primary collimator, thefirst Phase I secondary one and the 3 passive absorbers. These beam elements werechosen since they are the most loaded ones. The results agree with the previouscalculations reported in [82].
maxim
um
S /hSv/h
cmcm
cm
ent
cmcm
SLAC design
se Equ
ivale
cm
cm
c
Ambien
t Dos
cmcm
cm
A
CERN design
cm
After 1 day of cooling time @ 1.15E16 annual losses
C des g
Figure 11.3: Ambient dose equivalent distribution for different Phase II designs after185 days of continuous operation and 1 day of cooling period, shown for a horizontalcut through the geometry at the height of the beam axes for the most loaded PhaseII collimator location (i.e. TCSM.A6L7.B1).

132 11. Activation of collimator materials
Fig. 11.4 shown the values of ambient dose equivalent at different distances (i.e.35 cm, 55 cm and 75 cm) from the skew Phase II tank at the position of maximum,that is from the middle of the collimator itself (see Fig. 11.3). The distances take
About 35 cm from the Phase II collimator tank
About 55 cm from the Phase II collimator tank
SLAC design
mSv/h
TCSM.A6L7.B1
Beam 1
About 75 cm from the Phase II collimator tank
CERN designg
TCSM.A6L7.B1
Beam 1
Cooling time
Figure 11.4: Ambient dose equivalent peaks for the 2 different Phase II designs atthe most loaded TCSM.A6L7.B1 location and using different cooling times. Theskew layout for each design is also shown.
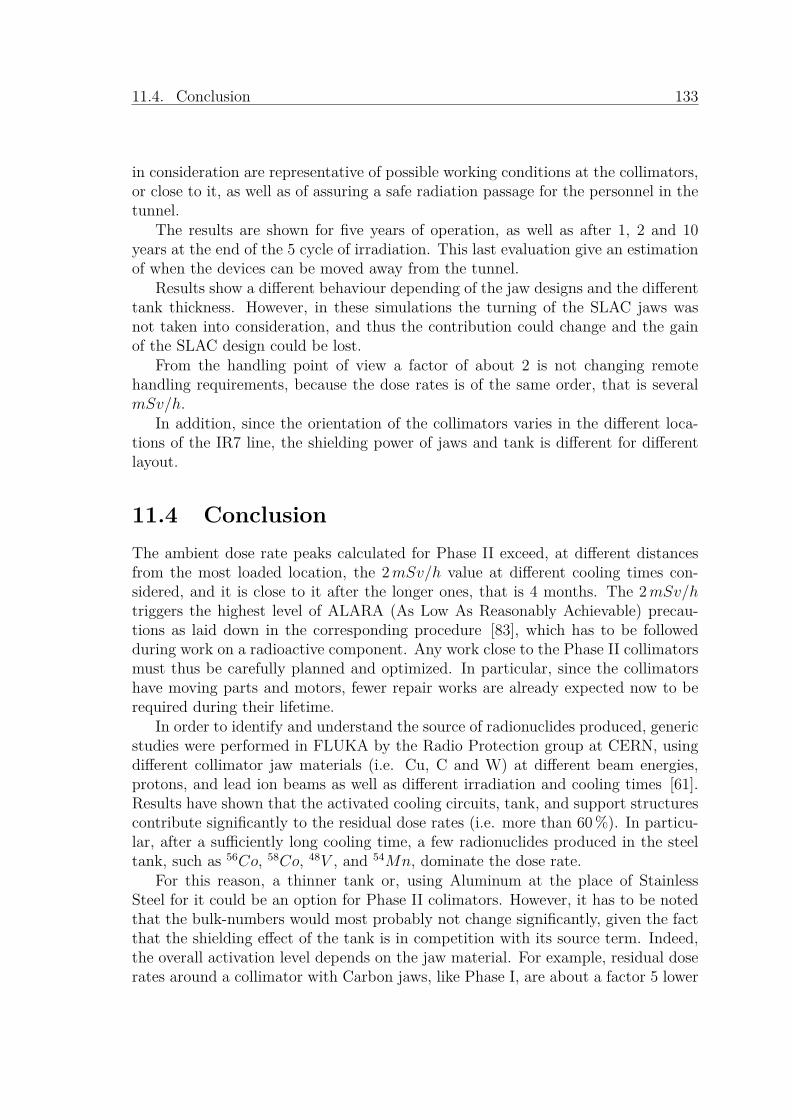
11.4. Conclusion 133
in consideration are representative of possible working conditions at the collimators,or close to it, as well as of assuring a safe radiation passage for the personnel in thetunnel.
The results are shown for five years of operation, as well as after 1, 2 and 10years at the end of the 5 cycle of irradiation. This last evaluation give an estimationof when the devices can be moved away from the tunnel.
Results show a different behaviour depending of the jaw designs and the differenttank thickness. However, in these simulations the turning of the SLAC jaws wasnot taken into consideration, and thus the contribution could change and the gainof the SLAC design could be lost.
From the handling point of view a factor of about 2 is not changing remotehandling requirements, because the dose rates is of the same order, that is severalmSv/h.
In addition, since the orientation of the collimators varies in the different loca-tions of the IR7 line, the shielding power of jaws and tank is different for differentlayout.
11.4 ConclusionThe ambient dose rate peaks calculated for Phase II exceed, at different distancesfrom the most loaded location, the 2mSv/h value at different cooling times con-sidered, and it is close to it after the longer ones, that is 4 months. The 2mSv/htriggers the highest level of ALARA (As Low As Reasonably Achievable) precau-tions as laid down in the corresponding procedure [83], which has to be followedduring work on a radioactive component. Any work close to the Phase II collimatorsmust thus be carefully planned and optimized. In particular, since the collimatorshave moving parts and motors, fewer repair works are already expected now to berequired during their lifetime.
In order to identify and understand the source of radionuclides produced, genericstudies were performed in FLUKA by the Radio Protection group at CERN, usingdifferent collimator jaw materials (i.e. Cu, C and W) at different beam energies,protons, and lead ion beams as well as different irradiation and cooling times [61].Results have shown that the activated cooling circuits, tank, and support structurescontribute significantly to the residual dose rates (i.e. more than 60%). In particu-lar, after a sufficiently long cooling time, a few radionuclides produced in the steeltank, such as 56Co, 58Co, 48V , and 54Mn, dominate the dose rate.
For this reason, a thinner tank or, using Aluminum at the place of StainlessSteel for it could be an option for Phase II colimators. However, it has to be notedthat the bulk-numbers would most probably not change significantly, given the factthat the shielding effect of the tank is in competition with its source term. Indeed,the overall activation level depends on the jaw material. For example, residual doserates around a collimator with Carbon jaws, like Phase I, are about a factor 5 lower

134 11. Activation of collimator materials
than around a collimator with Copper jaws [60].Measurements of residual dose rates, foreseen to be performed in the HiRad-
Mat facility, using the same two designs considered in my simulations, will allow averification of the results.
In the meanwhile, an easy plug-in system for Phase II collimators is alreadyforeseen, allowing a fast exchange with the remote bake-out equipment in case ofdamages.
In addition, all simulations presented in this chapter were performed only forBeam 1, as contribution to the residual dose rate coming from activation due toBeam 2 are negligligible at the most loaded devices locations. The same remark isfor Beam 2 at its most loaded locations, which are mirroring with respect to IP2.However, for what concerns the central region, results have to be multiplied by afactor of 2, since the contribution coming from the 2 beam lines is of the same order.
Finally, it has to be considered that the air in the accelerator tunnel will beactivated during the beam operation, due to the direct interactions between hadronicparticles and the stable nuclei of e.g. Oxygen, Nitrogen and Argon. For this reason,the air is monitored at the outlet and its confinement in the underground areas isachieved via pressure differences and static means (e.g. closing ducts, etc.). Becauseof Phase II collimators installation in the IR7 straight section, an increase of the airactivation in the tunnel is expected. This is not been quantified within this PhD,but it will be the subject of further following studies.

Chapter 12
Optimization of the IR7 layout
A combination of different Phase II designs and jaw materials for the 11 positionsforeseen in the IR7 Straight Section is proposed in this Chapter.
The purpose is to optimize the IR7 layout, on the basis of power deposition andactivation results. Mechanical constraints and warnings coming from the FLUKAsimulations for operation and abnormal beam losses scenarios are taken into account.
However, before any final decision could be taken, Cleaning Efficiency and col-limator driven Impedance have to be further estimated as well as heat conductingand radiation protection analyses have to be carried out where necessary.
In addition, the performances of collimators have to be validated by the exper-iments or diagnostic foreseen in the CERN test facility or SPS, before choosing animplementation solution. Only tested and fully qualified materials/collimators canbe installed into the operating LHC accelerator.
12.1 New proposed IR7 Phase II layoutIn order to choose how to arrange the 11 Phase II collimators along the IR7 line,different criteria were applied. The main ones are:
• To minimize the jaw deflections, in particular in the most loaded locations.
• To assure the reliability of the Phase II collimators system during abnormalbeam losses scenarios.
• To avoid frequent changes of the entire ensemble for collimators in the tunnel(i.e. to minimize the application of Radiation Protection constraints).
• To follow the mechanical characteristics of each design.
Table 12.1 summarizes the final proposed choice for each Phase II collimator,reported with respect to the sequence in the Beam 1 line. The justification for thechoice is also reported for each location.
135

136 12. Optimization of the IR7 layout
Table 12.1: Proposed layout for the 11 Phase II collimators located in IR7 along theBeam 1 line.
Name Design JustificationTCSM.A6L7.B1 CERN with Cu jaws to limit the jaw deflectionTCSM.B5L7.B1 SLAC with Cu jaws to avoid collimator change
in a high radiation areaTCSM.A5L7.B1 SLAC with Cu jaws to avoid collimator change
in a high radiation areaTCSM.D4L7.B1 CERN with Cu jaws because of mechanical constraints
due to the vertical collimator positionTCSM.B4L7.B1 CERN with CFC jaws to save the collimator against
the asynchronous dump accidentTCSM.A4L7.B1 CERN with Cu jaws -TCSM.A4R7.B1 SLAC with Cu jaws -TCSM.B5R7.B1 CERN with Cu jaws -TCSM.D5R7.B1 SLAC with Cu jaws -TCSM.E5R7.B1 CERN with Cu jaws -TCSM.6R7.B1 CERN with CFC jaws to save the collimator against
the asynchronous dump accident
At the first location, the CERN design with Glidcop jaws is proposed, since theFEM calculations show lower values of jaw deflections with respect to the SLACdesign in this most loaded Phase II location (see Table 8.1 and Fig. 9.5).
In the second and third position the SLAC design is set, because avoiding col-limator changes was preferred to limiting the jaw deflections. It has to be pointedout that in these positions the power deposited on the most loaded jaw is lower by afactor 5 for the TCSM.B5L7.B1 and more than a factor 10 for the TCSM.A5L7.B1with respect to the first location (see as reference Fig. 9.6). The jaw deflection val-ues are converging for the two designs in those locations. The peculiarity of SLACturning jaws design was thus preferred in order to accomodate more possible beamhits (20 against 5-7, see Chapter 9) before changing the collimator.
The fourth Phase II collimator in the line is a vertical one. Since the SLACdesign jaws are heavier in comparison to the CERN ones, for safety and reliabilityreasons the CERN design is preferred.
The fifth TCSM.B4L7.B1 as well as the last one, that is the TCSM.6R7.B1,are horizontal collimators. In order to protect the machine from the asynchronousaccident, Copper based jaw collimator are not considered here. In principle SiCcollimators would be a good choice for these locations in terms of thermal loadduring the accident. For a first estimation, a preliminary study is here performedusing CFC jaws, as for Phase I collimators. The reference design refers to entire
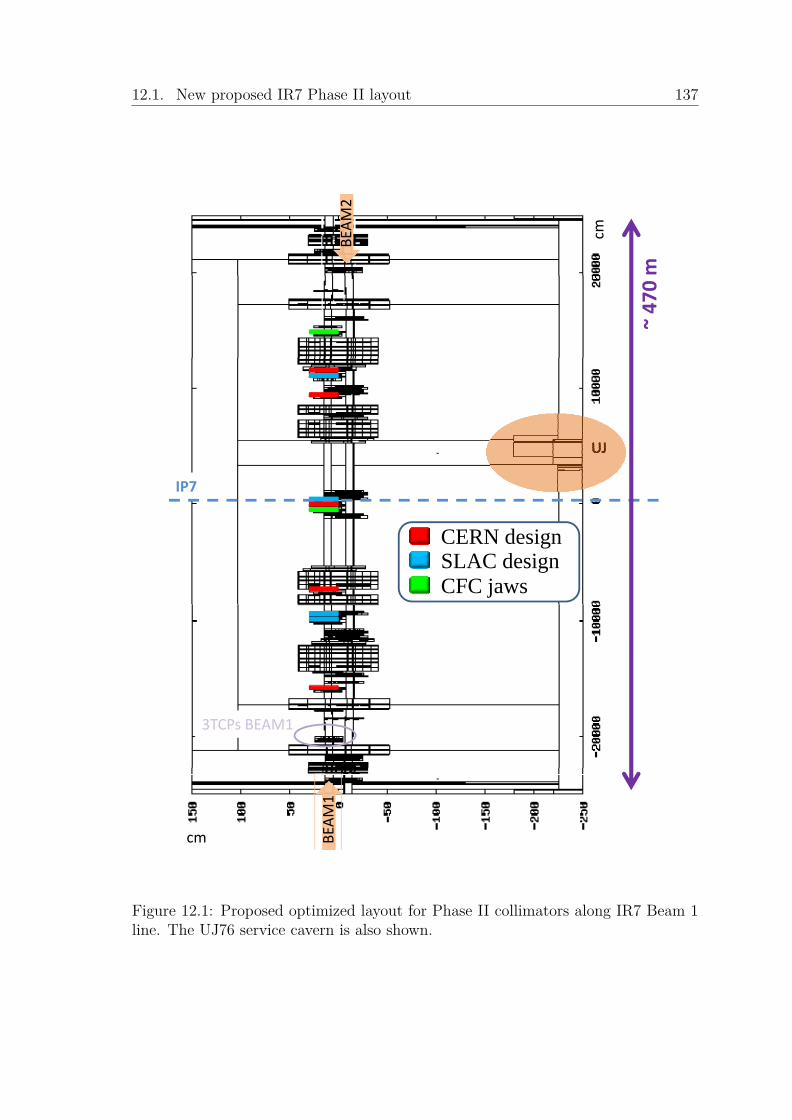
12.1. New proposed IR7 Phase II layout 137
cmBEAM2
m~ 47
0
IP7
UJ
CERN designSLAC designCFC jaws
3TCPs BEAM1
BEAM1
cm
Figure 12.1: Proposed optimized layout for Phase II collimators along IR7 Beam 1line. The UJ76 service cavern is also shown.

138 12. Optimization of the IR7 layout
jaws on a Molybdenum support. This is the developed Phase I secondary design,which was studied for Phase II at the beginning (see Fig. 9.2). As soon as loss mapswill be provided for SiC material, FLUKA simulations will be performed using thecorresponding Phase II design model.
For all the other 5 locations along the IR7 line, the two designs with Glidcopjaws are equivalent, using as terms of comparison the criteria listed above. TheCERN and SLAC collimators are thus alternating along the line, allowing to studythe different behaviour in adjacent locations, where the thermal load is similar.
Fig. 12.1 shows the IR7 optimized layout studied for Phase II. Since the Phase IIcollimators on Beam 2 are mirror set with respect to the IP7, the same layout canbe also applied to the Beam 2 line.
12.2 FLUKA results for operation conditions
The optimized IR7 layout proposed was studied using a horizontal loss map createdfor Beam 1 at low beta to match the Phase II jaw materials. The scenario refers tooperation condition without cryo-collimators installed.
Results for 1h beam lifetime are compared with the IR7 layout composed byPhase II CERN design collimators with Glidcop jaws in all the 11 foreseen locations.
In terms of power deposited, results on the TCSM.A6L7.B1 converge at about22 kW . This means that the redistribution of primary losses along the LHC colli-mators due to the introduction of 2 Phase II with CFC jaws has no effect on thepower deposited on the most loaded Phase II collimator.
The optimized layout proposed has its major effect downstream the most loadeddevices. In particular, due to the different material density and atomic number, thevalue of power deposited in the first TCSM.B4L7.B1 horizontal Phase II collimatorincreases form 10W to about 470W from using CFC to Glidcop materials for thejaws. The decrease obtained with CFC jaws on this device is compensated by anincrement on the following 3 Phase II with Glidcop jaws, up to a maximum of about120W on each.
In case of TCSM.6R7.B1, the effect of changing its jaws material (from Glidcopto CFC) is translated in a decrease from 370W to about 10W of power on it,compensated with increments on the downstream active absorbers. A variation ofabout 1-2 order of magnitude is the increment factor on the second one after theTCSM.6R7.B1, while smaller absolute increments are on the other 2 active absorbersat the end of the IR7 LSS line.
Fig. 12.2 summarizes all these results, with a focus on the region of major changes.
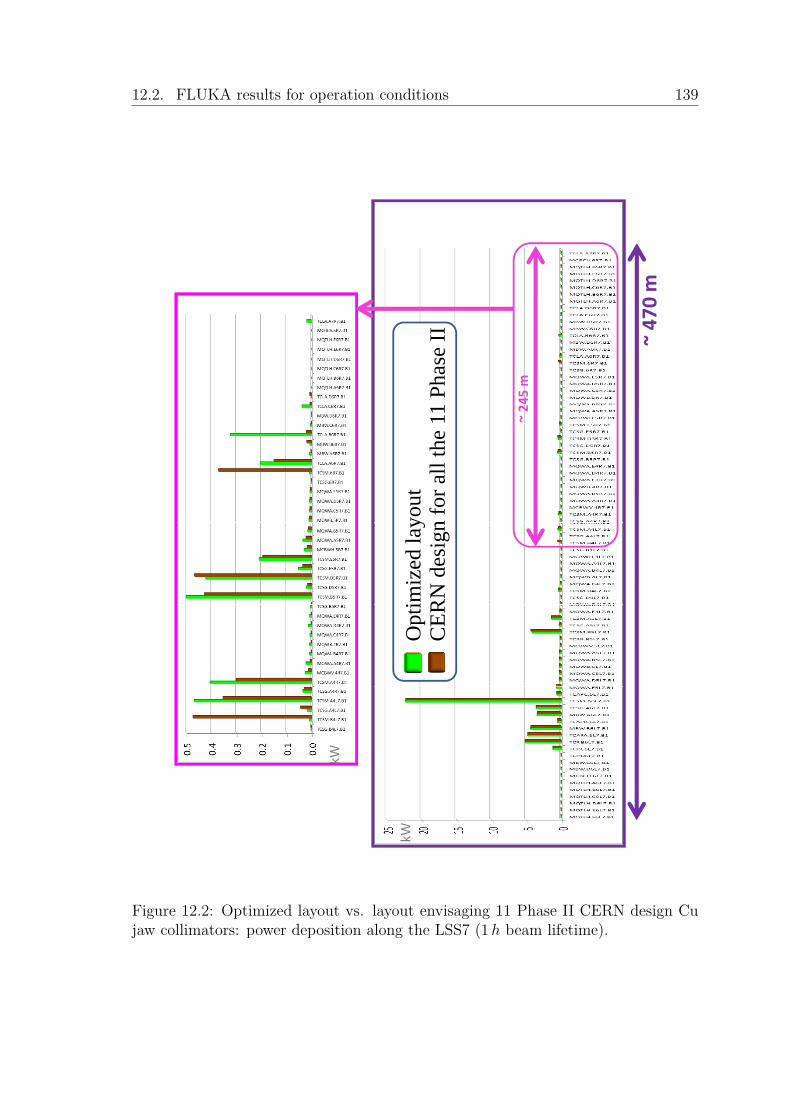
12.2. FLUKA results for operation conditions 139
m
se II ~ 47
0 m
~ 245 m
he 1
1 Ph
asyo
ut
n fo
r all
thim
ized
lay
RN
des
ign
Opt
iC
ER
kW
kW
Figure 12.2: Optimized layout vs. layout envisaging 11 Phase II CERN design Cujaw collimators: power deposition along the LSS7 (1h beam lifetime).
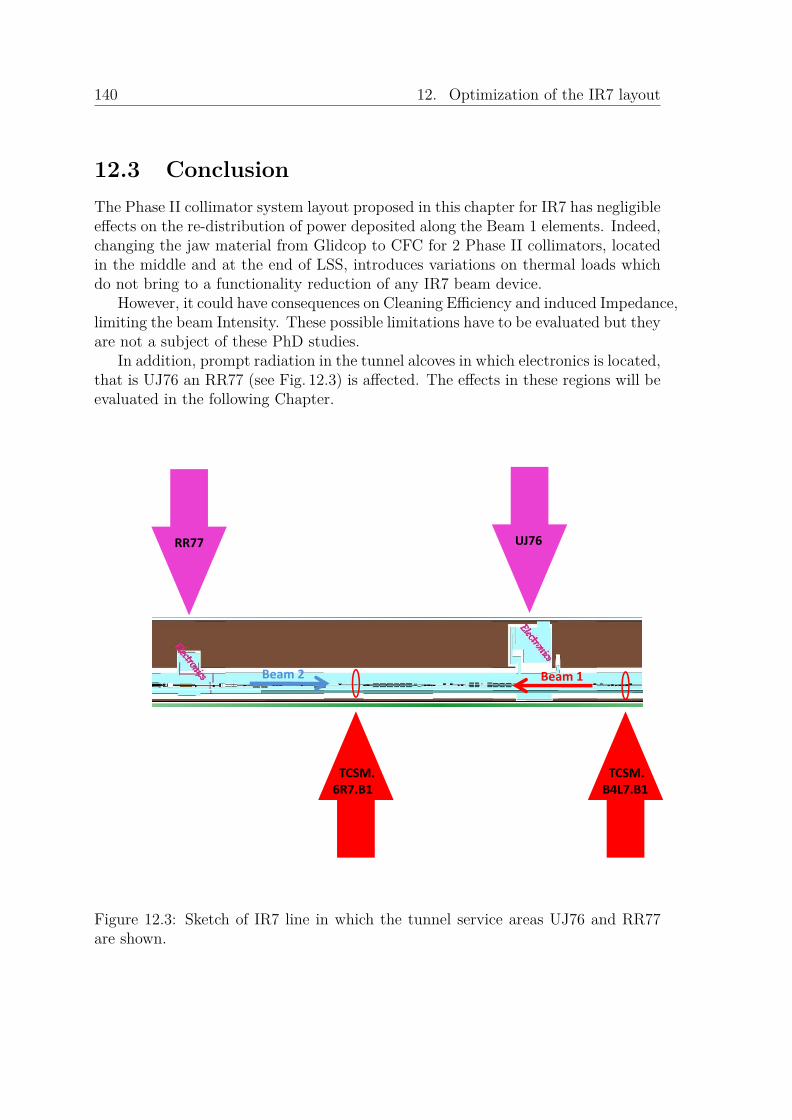
140 12. Optimization of the IR7 layout
12.3 ConclusionThe Phase II collimator system layout proposed in this chapter for IR7 has negligibleeffects on the re-distribution of power deposited along the Beam 1 elements. Indeed,changing the jaw material from Glidcop to CFC for 2 Phase II collimators, locatedin the middle and at the end of LSS, introduces variations on thermal loads whichdo not bring to a functionality reduction of any IR7 beam device.
However, it could have consequences on Cleaning Efficiency and induced Impedance,limiting the beam Intensity. These possible limitations have to be evaluated but theyare not a subject of these PhD studies.
In addition, prompt radiation in the tunnel alcoves in which electronics is located,that is UJ76 an RR77 (see Fig. 12.3) is affected. The effects in these regions will beevaluated in the following Chapter.
UJ76RR77
Beam 1Beam 2
TCSM.B4L7.B1
TCSM.6R7.B1
Figure 12.3: Sketch of IR7 line in which the tunnel service areas UJ76 and RR77are shown.

Chapter 13
The prompt radiation effects
The prediction of the radiation environment for the LHC machine is a very complexissue that strongly depends on many specific LHC parameters e.g residual gas den-sities, collimation settings, beam losses and beam-beam effects in the experiments.
The LHC radiation field varies between the different underground locations. Theprompt radiation, generated in the LHC main ring when the machine is on, couldlead to damage not only of the beam elements but also of electronic equipmentinstalled in the tunnel and in the adjacent service caverns.
Radiation damage to electronics is an important concern for the LHC operation.Both, in the LHC tunnel, as well as in adjacent caverns, electronics is exposed to amixed radiation field. Whereas the equipment in the tunnel was specifically designedaccording to the radiation requirements, most systems situated in the partly shieldedadjacent areas are based on Commercial Off the Shelf (COTS) components.
Given the short time of LHC operation at low Intensities and Luminosities, theknowledge of radiation levels to support the integration of instrumentations in thePhase II collimators as well as to evaluate the effect on the control system installedin the most LHC critical alcoves, such as UJ76 and RR77, is based on FLUKAsimulations.
On the basis of these results, possible scenarios to mitigate the risk will be takeninto account by the CERN management in order to avoid future problems.
13.1 Overview of LHC critical areasAlready in the early phase of the design of the LHC (1991-1996), it became clear thatdifferent areas of the rings would be exposed to high levels of radiation. In particular,for almost all the LHC experiments, it was decided to build custom designed rad-hard electronic circuits for the detectors, in order to resist to a total dose of 10Mradand fluence of 1014 neutrons/cm2 per 10 years [84]. These electronics are basedon a technology which is using deep submicron processes with enclosed transistortopologies and guard rings [85].
141
142 13. The prompt radiation effects
For what concern the LHC main ring, it has to be noted that even if the totalannual dose is quite low, control electronics in the tunnel can be exposed to highlevels of high energy hadrons. For this reason, in the LHC all the system directly setup in the tunnel (i.e. Quench Protection System (QPS) power converters, BLMs,BPMs, some cryogenic monitoring devices, etc.) have been tested in the CERNNeutrinos to Gran Sasso (CNGS) or in TCC2 facilities.
However, for what concerns the electronic equipments in some of the servicecaverns, their radiation tollerance was not considered. Following the failure in theventilation system installed in the CNGS service gallery due to radiation effects in theelectronics (i.e Single Event Upset (SEU) due to high energy hadron fluence), a taskforce was formed to evaluate the risk of possible damages in the LHC undergroundregions and to reduce it by means of shielding, relocation of electronics, creation ofnew safe areas or redesign certain critical systems.
According to the radiation levels and to the control system sensitivity and criti-cality, different LHC regions were identified. Fig. 13.1 shows the critical areas duringnominal operation scenarios, where the Point 7 and its adjacent caverns are put inevidence.
In particular, the UJ76 (i.e. the region underlined with a red circlet in Fig. 13.1)has been the first area in which an action plan was put in place, when the risk offailure, due to the high particle losses at collimators during the Betatron Cleaning,was evaluated in 2008 after the CNGS accident. A partial relocation of the mostsensitive equipment has already been prepared by enlarging the TZ76 (i.e. theregion underlined with a green circlet in Fig. 13.1) and installing part of the neededinfrastructure. The necessary relocation is planned to take place in the next longLHC shutdown (2012). In addition, in order to shield the instrumentation that fortheir specificity cannot be moved from UJ76, further improvements were alreadyperformed during 2009, including a lateral shielding iron wall for the UJ76 (seeFig. 13.2).
The mobile shielding plugs in Point 7, close to the RRs, were also finalized in2009 (see Fig. 13.2). Furthermore, different additional solutions were proposed forthe RR73 and RR77 caverns (i.e. the regions put in evidence with two blue circletsin Fig. 13.1) in which are installed the not radiation tolerant 120A and 600A powerconverters. The options of re-designing the most sensitive parts or of their relocationusing different technologies (i.e. warm cables, SuperConducting Links (SCLs), etc[86]) are evaluated at this stage.
In addition, to assure a long term solution, R&D work is currently carried outat CERN for the development of new SCLs and associated cold powering system[87] which could enable the removal of the LHC power converters from the tunnel tounderground or on surface radiation safe areas. In particular, the SCL technologycan be envisaged as a candidate solution for removing to the surface the powerconverters located in critical positions at Point 1 and 5, using vertical SCLs forpowering the SC magnets from surface. This option is not possible at Point 7, due

13.1. Overview of LHC critical areas 143
LH
C‘B
’
R622
R681
UJ67
UA
67
US
65
UW
65
UJ63
UD
62
UP
62
PM
65
TD
62
UJ6
2
R623
RA
63
UA
63
UJ6
4
UL
64
UL
66
R682
R683
UP
68
UD
68
TD
68
UJ6
8
RA
67
UJ6
6
RB
66
RB
64
UX
65
PX
64
PZ
65
TX
64
RE
68
R69,R
71
RE
72
R74,R
76
R72,R
73
R771
PM
76
TZ
76
R78,R
772
RE
78
R79,R
81
RE
82
R82
RB
86
RB
84
RA
83
RI1
32
R21,R
19
RE
18
R18
TI2
UJ2
2
RH
23
RA
23
UJ2
4
RB
24
PX
24
UX
25
RB
26
UJ2
6
RA
27
PM
18
UJ1
8
RR
17
RI1
72
UJ1
7
PX
16
PX
15
PX
14
US
15
UL
14
UJ14
UJ1
3
TAG
41
PG
C8
TT
40
EC
A4
PM
15
UX
15
RB
14
TI1
2
RB
16
PM
I2
RT
18
UJ16
UP
X16
UL
X15
US
A15
TI1
8
UL
16
RR
13
UJ1
2
RT
12
RI1
31,R
I12
R88
RE
88
RE
12
R12
R11
,R
89
UL
84
RR
77
UJ7
6RR
73
R572,R
58
R571
TU
56
UL
56
UJ5
7
R561
R562
RR
57
RE
58
RE
62
R59,R
61
R541
RR
53
UJ5
61
UJ5
6
PM
56
PX
56
PM
54
UP
53
RZ
54
UL
54 U
L55
UP
55
UP
X56
UX
451
UP
63
UJ5
3
R532
US
C55
UX
C55
RE
48
RE
52
R48
UJ47
RA
47
UJ4
6R
B46
UA
47
UL
46
US
45
UL
44
UX
45
PZ
45
PM
45
PX
46
TX
46
UW
45
R52,R
531
R49,R
51
RB
44
UJ4
4R
A43
UA
43
UJ43
UP
33
PZ
33
RZ
33
RE
42
R42
RE
38
R39,R
41
R34,R
36,
R37,R
38
PM
32
UJ3
3
TZ
32R
33
R32,R
31
UJ3
2
RE
28
R28
UA
27
UL
26
UP
25
PM
25
US
25
UW
25
UL
24 U
A23 U
J23
R22 R
E22
PG
C2
UJ27
R29
TN
B4
TN
D4
RH
87
RA
87
UJ8
6U
X85TX
84
PG
CN
TJ8
TI8
TN
4
UJ8
8
TC
C4
TS
G41
TC
V4
UA
87
US
85
UW
85
PM
85
PZ
85
PX
84
UJ8
4
UJ83
UA
83
UL
86
UJ87
Po
int
4
Po
int
2
Po
int
3.3
Po
int
5
Po
int
6
Po
int
7
Po
int
8
Po
int
1
CM
S
AL
ICE
ATL
AS
Po
int
3.2
SP
S
TA40
TAG
42
TS
G40
Po
int
1.8
YC
PS
01
=R
19
YC
PS
01
=Ti2
YC
PS
01
=R
34
YC
PS
01
=R
37
YC
PS
01
=R
A43
YC
PS
01
=R
A47
YC
PS
01
=R
51
YC
PS
01
=R
59
YC
PS
01
=R
A63
YC
PS
01
=R
A67
YC
PS
01
=R
74
YC
PS
01
=R
771
YC
PS
01
=U
J88
Dcum
959m
/IP
1C
ell
21R
1
Dcum
3010m
/IP
1C
ell
09L2
Dcum
6399.5
m/IP
1C
ell
07L3
Dcum
6935.6
m/
IP1
Cell
08R
3
Dcum
9753m
/IP
1C
ell
07
L4
Dcum
10241.9
m/
IP1
Cell
07R
4
Dcum
12381.9
m/
1IP
Cell
21L5
Dcum
14288.2
m/
Ip1
Ce
ll2
1R
5
Dcum
16430m
/IP
1C
ell
05
L6
Dcum
16905.5
m/
IP1
Cell
05R
6
Dcum
19753m
/IP
1C
ell
07
L7
Dcum
20235m
/IP
1C
ell
07
R7
Dcum
23649m
/IP
1C
ell
09R
8
RI1
71
YC
PS
01
=R
11D
cum
25701m
/IP
1C
ell
21L1
Low
Mediu
mH
igh
Unknow
n
No
Sa
fe
Critica
l
Radia
tion
Level
Ele
ctr
onic
s
Unknow
n
Figure 13.1: A LHC graphical area classification by radiation levels, as well as, whenknown, by criticality of installed electronics [88].

144 13. The prompt radiation effects
to integration and properly constraints, thus in terms of SCLs only a horizontal linkis studied with its cryogenic connections to be installed in the TZ76.
The change of the collimation system has been also considered at this stage,in order to reduce the radiation effects in UJ76, RR73 and RR77. An option is atemporary operational move of the Betatron Cleaning to Point 3. However, it has tobe pointed out that this solution could imply to use some of the positions reservedfor the Phase II collimators, introducing a first longterm limitation in the intensityand spoiling therefore the objective to increase it to the nominal value within fewyears. Moreover, the use of additional Phase II collimators as absorbers, as wellas their local installations and use for the for the collimation system upgrade, havebeen studied and are discussed in the following.
Many of these possible solutions imply not only high costs, but also importantinstallation times (e.g. SCLs) for which could be required possibly long LHC shut-down periods (e.g. two years).
13.1.1 Radiation effects on electronicsRadiation effects in electronic devices can be divided into two main categories: cu-mulative effects and Single Event Effects (SEE) [89].
The steady accumulation of defects causes measurable effects that can ultimatelylead to device failure. In particular, the Total Ionizing Dose (TID) is a cumulativeeffect of ionizing energy loss in the lattice by Coulomb scattering from energeticparticles or by gamma radiation. It is a quite predictable effect and should be testedfor equipment exposed to high level of dose (> few Grays), typically by exposingit to a 60Co calibrated source. Standard electronic normally fails at levels startingfrom a few Grays up to hundreds of Grays for rad-tolerant equipment. The NonIonizing Energy Loss (NIEL) is another cause of possible cumulitative damages. It ismanly due to accumulation of displacement damage in the lattice following collisionwith neutrons or very low energy heavy ions. It represents a reproducible and thuspredictable effect, espressed in fluence of 1MeV equivalent neutrons. Equipmentsare usually tested in reactors with neutrons at a fixed energy.
Stochastic failures, so called SEE, form an entirely different group as they aredue to the direct ionization by a single high energy hadron (> 20MeV ) from nu-clear reaction in the electronics itself, able to deposit sufficient energy through theionization process in order to disturb the operation of the device. They can only becharacterized in terms of their probability to occur, which will strongly depend onthe device as well as on the flux and nature of the particles [90].
Apart for electronics installed directly in the tunnel, where the TID and displace-ment damage from NIEL may represent a serious issue, the main risk for exposureto electronics to radiation in LHC underground areas comes from stochastic SEEeffects.
A distinction must be made between non-destructive and destructive SEEs events,as this has very different consequences on the accelerator operation. The first ones

13.2. Radiation to electronics FLUKA results 145
refer to recoverable soft SEEs which cause data corruption (e.g. Single Event Upset(SEU), Multiple Bit Upset (MBU), Single Event Transient (SET) or Single EventFunctional Interrupt (SEFI) events). The second ones are non-recoverable hard SEEswhich cause permanent loss of the data and sometimes even permanent damage ofthe circuit (e.g. Single Event Latch-up (SEL), Single Event Gate Rupture (SEGR)or Single Event Burn-out (SEB) events).
In addition, a certain sensitivity to thermal neutrons has been osserved, forexample in devices without specific precautions powered with low voltage (e.g. 3 V ).The low-energy neutron capture reaction (e.g. n-alpha) can create highly ionizingsecondary particles that are then also the source of SEEs.
As general indications and in order to minimize the risk of occurence of SEEs,currently employed mitigation aims to reduce the fluence of high energy hadrons (>20MeV ) below 107 hadrons/cm2 for every year of operation, that is equal to about200 days of machine on at nominal condition [91].
13.2 Radiation to electronics FLUKA resultsThe FLUKA results reported in this section refer to the classical collimation systemwith Phase II and its impact on the radiation level in IR7. The purpose is to showhow it effects the dose levels and the particles fluencies at nominal condition whenit performs a pure Betatron Cleaning at Point 7.
In particular, the high energy hadrons fluence is evaluated in the UJ76 and inthe RRs and the shielding contribution of Phase II is put in comparison with acollimation system built up of only Phase I collimators used at the same nominalscenario condition.
The results are normalized to 1.15x10¹⁶ protons per year, which is the estimatedlost primary protons of IR7 for each beam of the LHC machine during one year ofoperation (i.e. about 200 days of machine on) [11].
They refer to a horizontal halo loss maps for the 7TeV low beta scenario, sinceit is demostrated to be a conservative case [92]. In case, when operation data willbe available, corrections can be introduced.
13.2.1 Radiation to electronics in UJ76 and RR77 (& RR73)Fluencies of high energy hadrons (> 20MeV ) are evaluated first outside the cavernsat Point 7 to show the pure shielding effect of Phase II collimators and then insideboth UJ76 and RR77.
Fig. 13.2 shows the results for Beam 1 simulations all along the IR7 LSS. Thevalues of fluence are averaged in the orange region close to the caverns. The blueline refers to the case of only Phase I collimators implemented in the line. The redand green lines show the Phase II impact in both cases of collimators with Copperjaws and with the optimization layout proposed in Chapter 12.
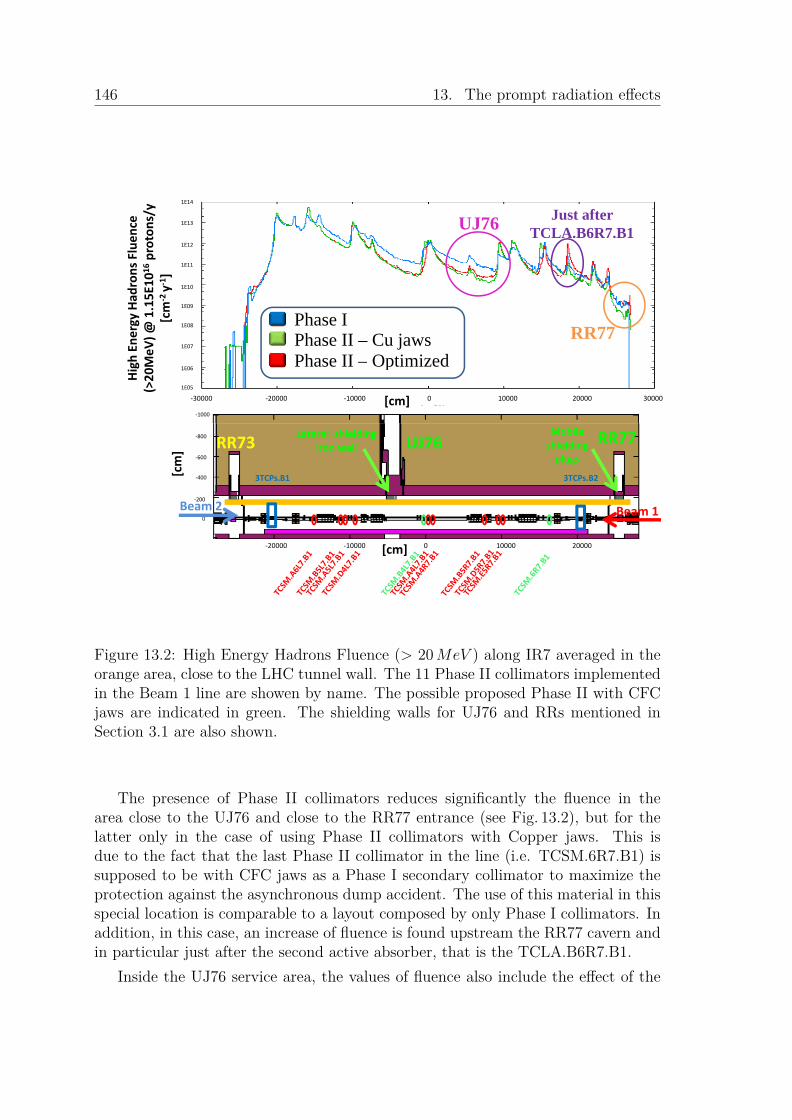
146 13. The prompt radiation effects
UJ76 Just after TCLA.B6R7.B1
1E14
1E13
1E12uence
oton
s/y
1E11
1E10
1E09Had
rons Flu
15E101
6pro
m‐2 y‐1]
Phase I Phase II – Cu jawsPhase II – Optimized
RR77
1E09
1E08
1E07
gh Ene
rgy H
MeV
) @ 1.1
[cm
Phase II Optimized
‐1000
1E06
1E05
Hig
(>20M
‐30000 ‐20000 ‐10000 0 10000 20000 30000[cm]
UJ76RR73 RR77
3TCPs.B2
‐800
‐600
‐400
Lateral shielding iron wall
Mobile shielding plugs
[cm]
3TCPs.B1
‐200
0Beam 1Beam 2
‐20000 ‐10000 0 10000 20000[cm]
Figure 13.2: High Energy Hadrons Fluence (> 20MeV ) along IR7 averaged in theorange area, close to the LHC tunnel wall. The 11 Phase II collimators implementedin the Beam 1 line are showen by name. The possible proposed Phase II with CFCjaws are indicated in green. The shielding walls for UJ76 and RRs mentioned inSection 3.1 are also shown.
The presence of Phase II collimators reduces significantly the fluence in thearea close to the UJ76 and close to the RR77 entrance (see Fig. 13.2), but for thelatter only in the case of using Phase II collimators with Copper jaws. This isdue to the fact that the last Phase II collimator in the line (i.e. TCSM.6R7.B1) issupposed to be with CFC jaws as a Phase I secondary collimator to maximize theprotection against the asynchronous dump accident. The use of this material in thisspecial location is comparable to a layout composed by only Phase I collimators. Inaddition, in this case, an increase of fluence is found upstream the RR77 cavern andin particular just after the second active absorber, that is the TCLA.B6R7.B1.
Inside the UJ76 service area, the values of fluence also include the effect of the
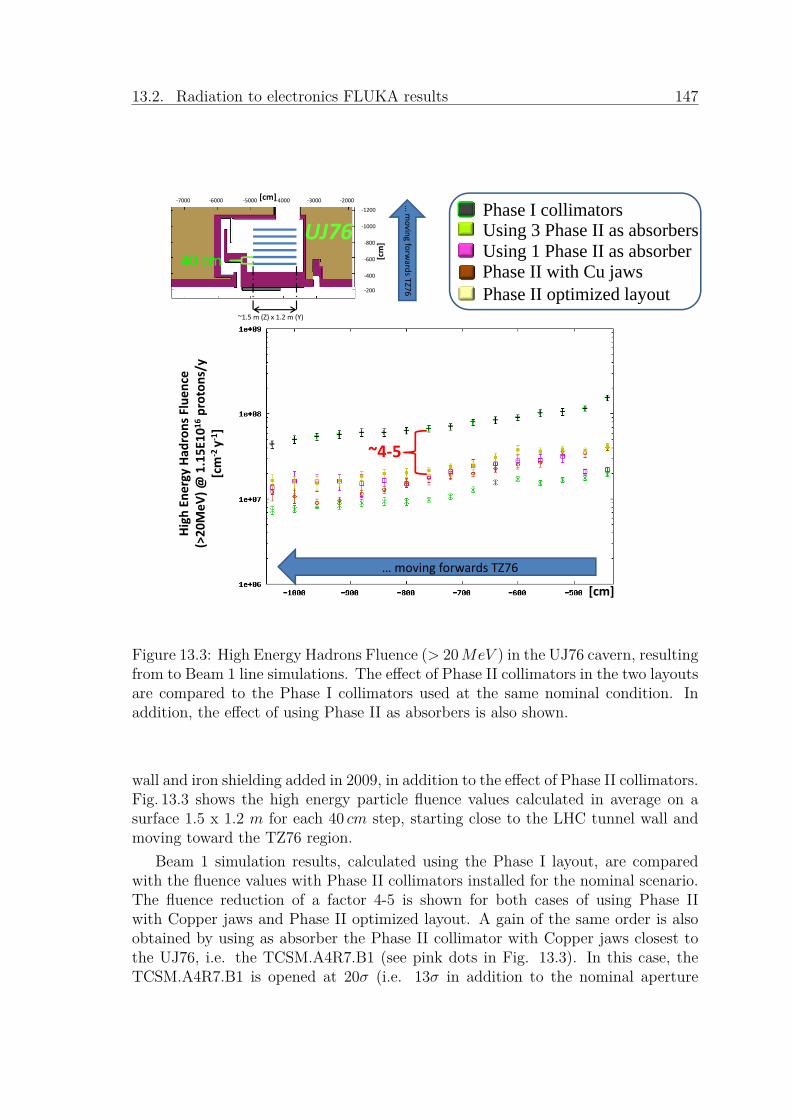
13.2. Radiation to electronics FLUKA results 147
UJ76
‐7000 ‐6000 ‐5000 ‐4000 ‐3000 ‐2000
‐1200
‐1000
‐800
[cm]
m]
Phase I collimators Using 3 Phase II as absorbersU i 1 Ph II b b
… m
oving fo
‐600
‐400
‐200
[cm Using 1 Phase II as absorber
Phase II with Cu jawsPhase II optimized layout
orwards TZ76
40 cm
~1.5 m (Z) x 1.2 m (Y)
ys Flue
nce
6proton
s/y
rgy Had
ron
@ 1.15E10
1
[cm
‐2 y‐1]
~4‐5
High En
er>20M
eV) @
(>
[cm]
… moving forwards TZ76
Figure 13.3: High Energy Hadrons Fluence (> 20MeV ) in the UJ76 cavern, resultingfrom to Beam 1 line simulations. The effect of Phase II collimators in the two layoutsare compared to the Phase I collimators used at the same nominal condition. Inaddition, the effect of using Phase II as absorbers is also shown.
wall and iron shielding added in 2009, in addition to the effect of Phase II collimators.Fig. 13.3 shows the high energy particle fluence values calculated in average on asurface 1.5 x 1.2 m for each 40 cm step, starting close to the LHC tunnel wall andmoving toward the TZ76 region.
Beam 1 simulation results, calculated using the Phase I layout, are comparedwith the fluence values with Phase II collimators installed for the nominal scenario.The fluence reduction of a factor 4-5 is shown for both cases of using Phase IIwith Copper jaws and Phase II optimized layout. A gain of the same order is alsoobtained by using as absorber the Phase II collimator with Copper jaws closest tothe UJ76, i.e. the TCSM.A4R7.B1 (see pink dots in Fig. 13.3). In this case, theTCSM.A4R7.B1 is opened at 20σ (i.e. 13σ in addition to the nominal aperture
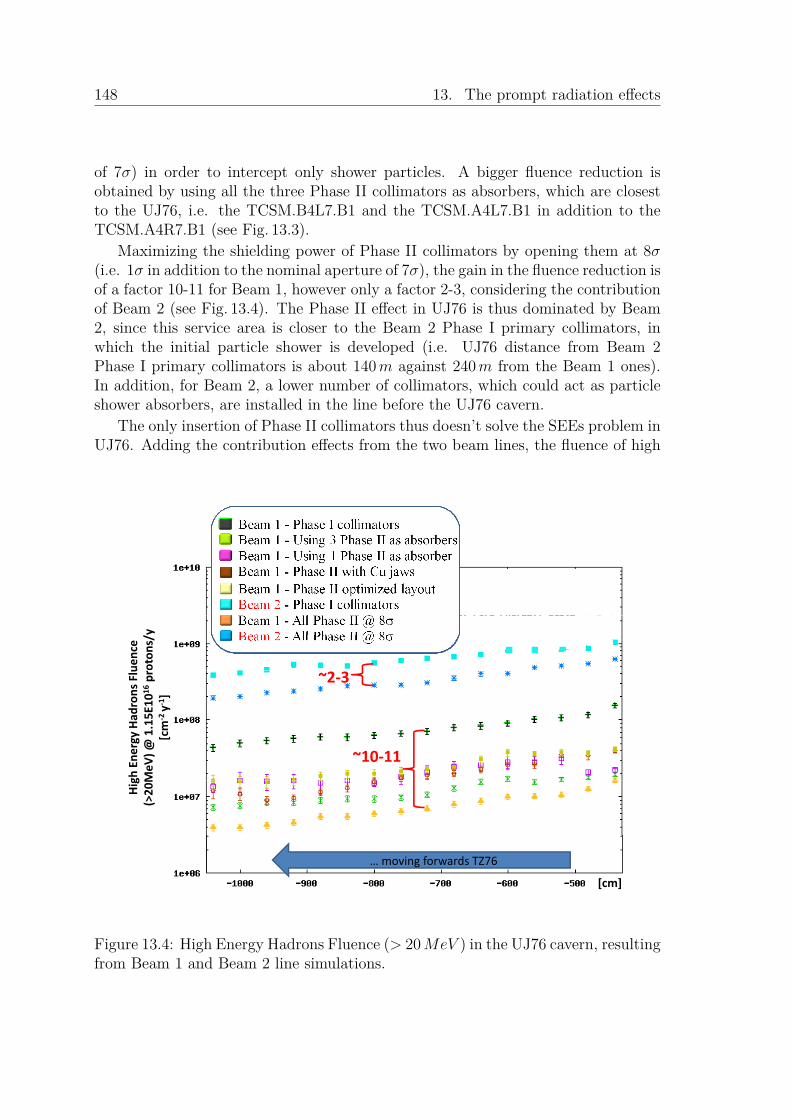
148 13. The prompt radiation effects
of 7σ) in order to intercept only shower particles. A bigger fluence reduction isobtained by using all the three Phase II collimators as absorbers, which are closestto the UJ76, i.e. the TCSM.B4L7.B1 and the TCSM.A4L7.B1 in addition to theTCSM.A4R7.B1 (see Fig. 13.3).
Maximizing the shielding power of Phase II collimators by opening them at 8σ(i.e. 1σ in addition to the nominal aperture of 7σ), the gain in the fluence reduction isof a factor 10-11 for Beam 1, however only a factor 2-3, considering the contributionof Beam 2 (see Fig. 13.4). The Phase II effect in UJ76 is thus dominated by Beam2, since this service area is closer to the Beam 2 Phase I primary collimators, inwhich the initial particle shower is developed (i.e. UJ76 distance from Beam 2Phase I primary collimators is about 140m against 240m from the Beam 1 ones).In addition, for Beam 2, a lower number of collimators, which could act as particleshower absorbers, are installed in the line before the UJ76 cavern.
The only insertion of Phase II collimators thus doesn’t solve the SEEs problem inUJ76. Adding the contribution effects from the two beam lines, the fluence of high
uence
oton
s/y
Had
rons Flu
15E101
6pr
m‐2 y‐1]
~2‐3
gh Ene
rgy H
MeV
) @ 1.
[cm
~10‐11
Hig
(>20M
… moving forwards TZ76
[cm]
Figure 13.4: High Energy Hadrons Fluence (> 20MeV ) in the UJ76 cavern, resultingfrom Beam 1 and Beam 2 line simulations.

13.2. Radiation to electronics FLUKA results 149
energy hadrons (> 20MeV ) is two order of magnitude higher than the maximumlimit in fluence of 107 hadrons/cm2, as reported above.
Fig. 13.5 shows the fluence values averaged on a 1 x 1.2 m2 surface each 40 cminside the RR77 cavern. The Phase II installation reduces of 1 order of magnitudethe fluence of high energy particles with respect of the nominal Phase I at 7TeV (seeFig. 13.5). However, some of the gain could be lost with the introduction of possibleasynchronous dump protections. It has to be pointed out that the reduction of afactor 6 as shown in Fig. 13.5 could be increased if, for example, non conductivePhase II collimators are used (see Chapter 9, Section 9.3). However, this possibleincrement, by using different than CFC suitable jaw materials, can not exceed thefactor 10-11 gained with the Copper or Glidcop jaws. Addition calculations wereperformed in order to evaluate the contribution of dose and the fluence of 1MeVequivalent neutrons in comparison to the high energy hadron fluence in the racksinside the caverns (see Fig. 13.6).
RR77Phase I collimators Using 3 Phase II as absorbersU i 1 Ph II b b
… m
oving40 cm
‐700
‐600
‐500
23500 24000 24500 25000 25500 26000 26500 27000 27500
m]
[cm]
Using 1 Phase II as absorberPhase II with Cu jawsPhase II optimized layout
g inside RR77
40 cm‐400
‐300
‐200
100
[cm
~1 m (Z) x 1.2 m (Y)
y
‐100
s Flue
nce
6proton
s/y
rgy Had
ron
@ 1.15E10
1
[cm
‐2 y‐1] ~10~6
High En
er>20M
eV) @
(>
[cm]
… moving inside RR77
Figure 13.5: High Energy Hadrons Fluence (> 20MeV ) in the RR77 cavern
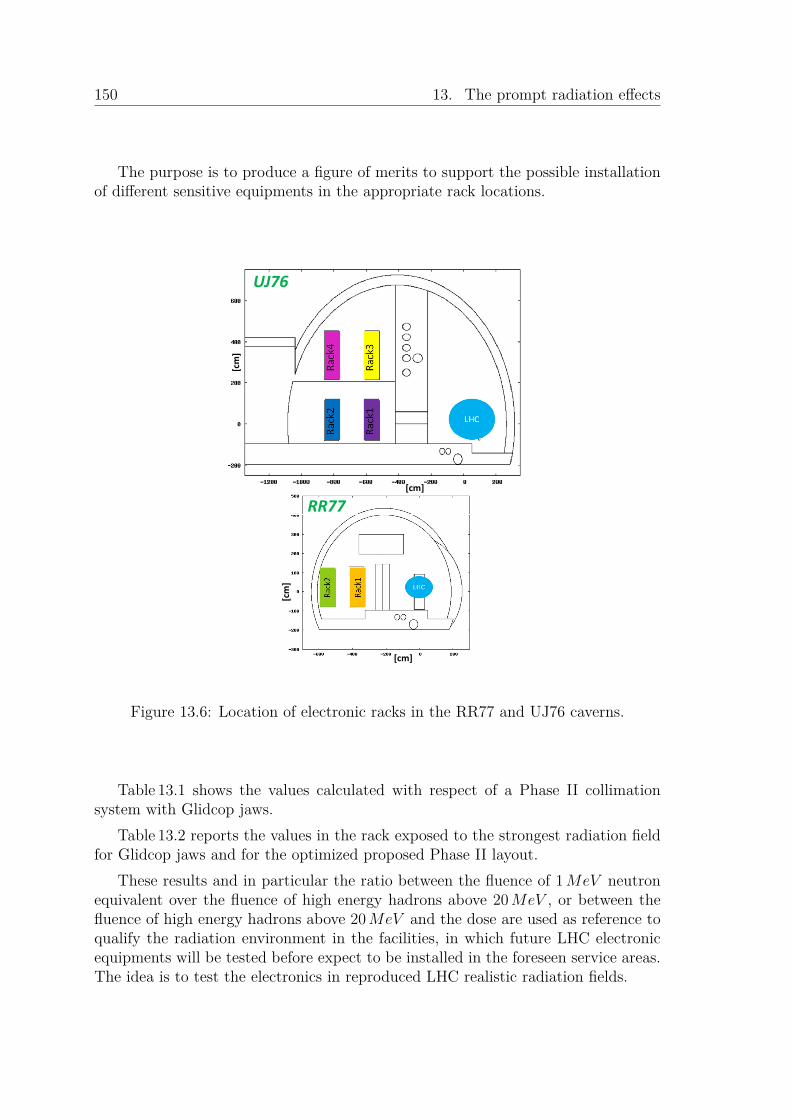
150 13. The prompt radiation effects
The purpose is to produce a figure of merits to support the possible installationof different sensitive equipments in the appropriate rack locations.
UJ76
cm]
[c
RR77[cm]
[cm]
[cm]
Figure 13.6: Location of electronic racks in the RR77 and UJ76 caverns.
Table 13.1 shows the values calculated with respect of a Phase II collimationsystem with Glidcop jaws.
Table 13.2 reports the values in the rack exposed to the strongest radiation fieldfor Glidcop jaws and for the optimized proposed Phase II layout.
These results and in particular the ratio between the fluence of 1MeV neutronequivalent over the fluence of high energy hadrons above 20MeV , or between thefluence of high energy hadrons above 20MeV and the dose are used as reference toqualify the radiation environment in the facilities, in which future LHC electronicequipments will be tested before expect to be installed in the foreseen service areas.The idea is to test the electronics in reproduced LHC realistic radiation fields.
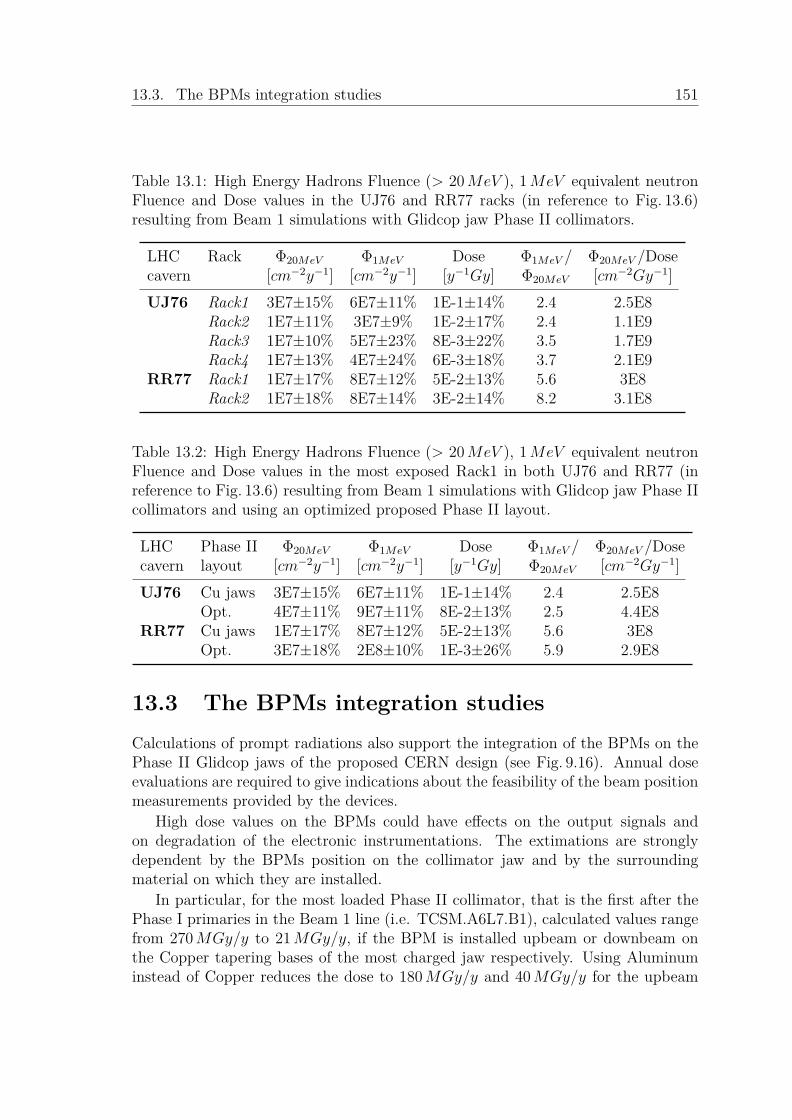
13.3. The BPMs integration studies 151
Table 13.1: High Energy Hadrons Fluence (> 20MeV ), 1MeV equivalent neutronFluence and Dose values in the UJ76 and RR77 racks (in reference to Fig. 13.6)resulting from Beam 1 simulations with Glidcop jaw Phase II collimators.
LHC Rack Φ20MeV Φ1MeV Dose Φ1MeV / Φ20MeV /Dosecavern [cm−2y−1] [cm−2y−1] [y−1Gy] Φ20MeV [cm−2Gy−1]UJ76 Rack1 3E7±15% 6E7±11% 1E-1±14% 2.4 2.5E8
Rack2 1E7±11% 3E7±9% 1E-2±17% 2.4 1.1E9Rack3 1E7±10% 5E7±23% 8E-3±22% 3.5 1.7E9Rack4 1E7±13% 4E7±24% 6E-3±18% 3.7 2.1E9
RR77 Rack1 1E7±17% 8E7±12% 5E-2±13% 5.6 3E8Rack2 1E7±18% 8E7±14% 3E-2±14% 8.2 3.1E8
Table 13.2: High Energy Hadrons Fluence (> 20MeV ), 1MeV equivalent neutronFluence and Dose values in the most exposed Rack1 in both UJ76 and RR77 (inreference to Fig. 13.6) resulting from Beam 1 simulations with Glidcop jaw Phase IIcollimators and using an optimized proposed Phase II layout.
LHC Phase II Φ20MeV Φ1MeV Dose Φ1MeV / Φ20MeV /Dosecavern layout [cm−2y−1] [cm−2y−1] [y−1Gy] Φ20MeV [cm−2Gy−1]UJ76 Cu jaws 3E7±15% 6E7±11% 1E-1±14% 2.4 2.5E8
Opt. 4E7±11% 9E7±11% 8E-2±13% 2.5 4.4E8RR77 Cu jaws 1E7±17% 8E7±12% 5E-2±13% 5.6 3E8
Opt. 3E7±18% 2E8±10% 1E-3±26% 5.9 2.9E8
13.3 The BPMs integration studiesCalculations of prompt radiations also support the integration of the BPMs on thePhase II Glidcop jaws of the proposed CERN design (see Fig. 9.16). Annual doseevaluations are required to give indications about the feasibility of the beam positionmeasurements provided by the devices.
High dose values on the BPMs could have effects on the output signals andon degradation of the electronic instrumentations. The extimations are stronglydependent by the BPMs position on the collimator jaw and by the surroundingmaterial on which they are installed.
In particular, for the most loaded Phase II collimator, that is the first after thePhase I primaries in the Beam 1 line (i.e. TCSM.A6L7.B1), calculated values rangefrom 270MGy/y to 21MGy/y, if the BPM is installed upbeam or downbeam onthe Copper tapering bases of the most charged jaw respectively. Using Aluminuminstead of Copper reduces the dose to 180MGy/y and 40MGy/y for the upbeam

152 13. The prompt radiation effects
and downbeam BPMs respectively. For this reason, the CERN Phase II collimatordesign employs Aluminum taperings.
Actually, tests on the BPMs signal are performed in the SPS accelerator atCERN. Experimental data will support the possible installation BPMs on the PhaseII jaws.
13.4 ConclusionThe technological complexity of the LHC has required several control systems for theoperation of the machine. Radiation tolerance has taken into account as a constraintfor the functionality and reliability of all these electronic systems installed in thetunnel. The radiation monitoring is improved in particular in the LHC tunnel andsurrounding areas in which important beam losses are intentionally genarated byinteractions of the primary beam with beam line componenet such as collimators.It shall to be noted that equipments installed in partly shielded adjacent areas arebased on COTS and they were not tested for radiation.
All the results presented in this Chapter for Point 7 are based on consideringonly the effects due to the collimation.
The layout of the collimation system strongly affects the radiation fields in UJ76and RRs. Maximum gain of a factor 10 could be obtained by using Phase II asabsorbers. However, this solution is not sufficient to solve the problem. Indeed,in the UJ76, the radiation field is dominated by the Beam 2 effect, which bringsthe high energy particle fluence to values of two order of magnitude higher thanthe maximum limit of 107 hadron/cm2. In the RRs, only in the case of a Phase IIcollimation system with Glidcop or Copper jaws, the fluence is in the order of thelimit value.
It has to be pointed out that radiation is also produced when protons interactwith the nuclei of the residual gas atoms in the beam pipeline. In particular thiseffect becomes dominant in the RRs. Indeed, inside these caverns the radiationlevel due by beam gas, in terms of high energy hadron fluence, reaches the value of5x108 cm−2y−1 [93] close to each shielding wall, becoming thus the major source ofpossible problems to electronics located there. The effect is negligible for what con-cerns UJ76, because each beam pipe close to it is coated with TiZrV non evaporablegetter (NEG) [94].
The prompt radiation effect is also an important parameter, which has to beevaluated before intergrating instrumentations in the Phase II collimators themself.Dose evaluations in nominal conditions support not only the choice of the electronicsto be implemented, but also their best locations in the device, which could bring inchanges of the mechanical design or of the support materials, as was for the taperingparts of the Phase II jaw. Tests with beam are now on the way in the SPS to studythe behaviour of the BPM buttons on a prelimary version of the Phase II jaws.
Chapter 14
Displacement Per Atom (DPA)calculations
Ideally, the performance of the LHC collimators in high radiation environmentshould not change with time. However, for long-term employment of collimatorssignificant microstructural alterations occur in the jaw materials due to displace-ment of atoms from their nominal position.
Major phenomena affecting structural materials are void swelling, irradiationcreep, phase stability and changes in mechanical properties such as the electricalresistivity. The latter is responsible for the collimator induced impedance that canmodify in turn the LHC performance.
The influence of proton damage, in particular on the structure and property ofthe jaw material, provides an input for estimating lifetime of collimators complyingwith required specifications. The prediction of the collimation lifetime allows toavoid premature replacements of the whole collimators or its components. Suchevaluation is rely upon models describing the structural damage due by radiationand is supported by test beam studies.
14.1 Brief description of theoretical backgroundThe defects, that can develop in any crystalline lattice under irradiation by neutralor charged particles and ions, can be distinguished according to the topology ofthe defect formation. Points defects (i.e. vacancies and interstitials), 1D or linedefects (i.e. dislocation lines), 2D or planar defects (i.e. dislocation loops) or 3Dor volume defects (i.e. voids, bubbles, etc.) are considered as destructive elementswhich contribute both to changes in physical properties and visible deformations ofirradiate material, ultimately leading to the material distruction.
The DPA is a measure of the ammount of radiation damage in the irradiatedmaterial. For example, 3 DPA means that each atom in the material has beendisplacement from its site within the structural lattice of the material an average of
153

154 14. Displacement Per Atom (DPA) calculations
3 times.Displacement damage can be induced by all particles produced in the hadronic
cascade, including high energy photons. The latter, however, have to initiate areaction producing charged particles, neutrons or ions.
The DPA quantity is directly related with the total number of defects, or Frenkelpairs, NF produced in the irradiated material. A Frenkel defect forms when an atomor ion leaves its place in the lattice (leaving a vacancy) and lodges nearby in thecrystal (becoming an interstitial).
DPA = 1ρ
∑i
NiNiF (14.1)
where ρ is the density of the material in unit of atoms/cm3, Ni is the total numberof incoming particles involved in the interaction channel i.
The calculation of NF in each channel is based on the Kinchin-Pease model [95],revised by Norgert, Robinson and Torrens [96]:
NF = kNRTf(Ep)Ep
2Eth(14.2)
where kNRT is the displacement efficiency and f(Ep) is the partition function intro-duced in the framework of the LSS theory [97] defining partition of Ep, that is thekinetic energy of the Primary Knock-on Atom (PKA), between electronic excitationand kinetic energies of atoms. Finally Eth is the value of the threshold displacementenergy averaged over all crystallographic directions or a minimum energy to producea defect.
The displacement efficiency kNRT can be considered as independent of Ep onlyfor Ep<1÷2 keV . In this energy range, it is set equal to 0.8. At higher energies,the development of collision cascades results in defect migration and recombina-tion of Frenkel pairs, due to overlapping of different branches of a cascade whichtranslates into decay of k(Ep). From Molecular Dynamic (MD) simulations of theprimary cascade [100], the number of surviving displacement NMD, normalized tothe number of those from NRT model NNRT decrease down to values about 0.2÷0.3at Ep::20÷100 keV . The efficiency in question only slightly depends on atomic num-ber Z and the temperature. An approximation of the [100] results are employed inthe following form:
NMD/NNRT = 0.3− 1.3(−9.57X
+ 17.1X4/3 −
8.81X5/3 ) (14.3)
where X = 20Ep.The product f(Ep)Ep describes the damage energy or the energy deposited by
the PKA (i.e. the removed atom) into elastic collisions of particles and nuclearfragmentations with a nucleus of the irradiated material.
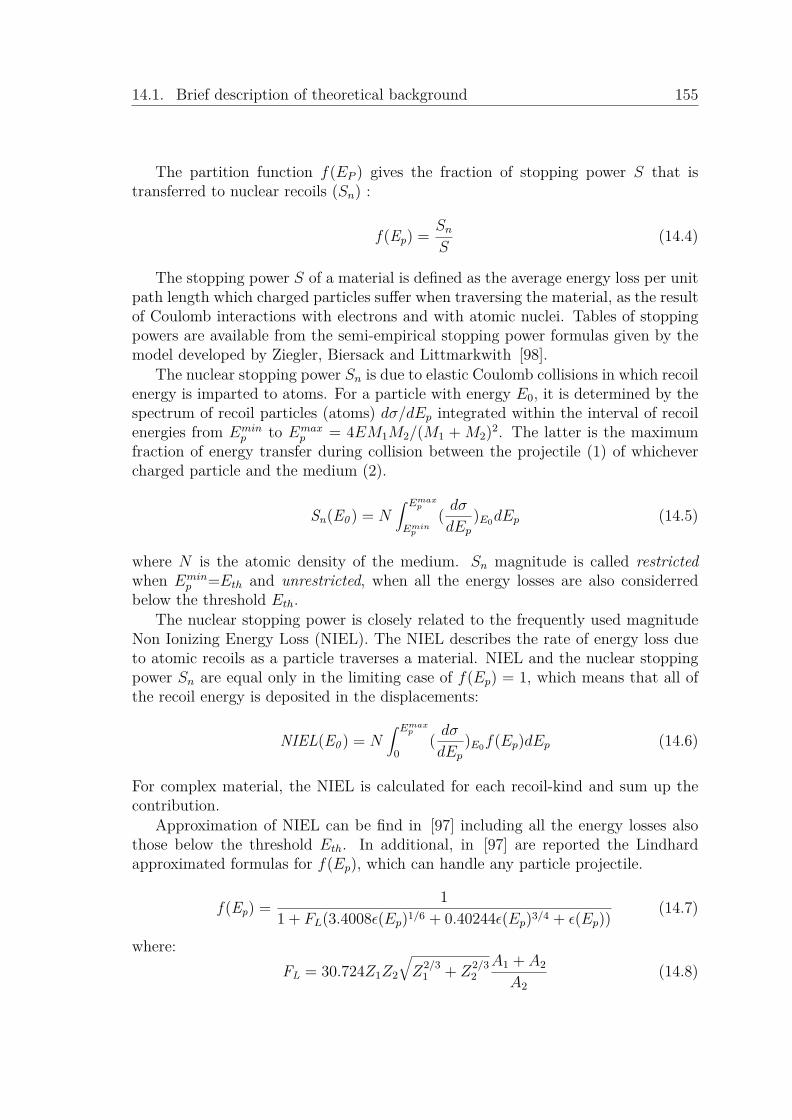
14.1. Brief description of theoretical background 155
The partition function f(EP ) gives the fraction of stopping power S that istransferred to nuclear recoils (Sn) :
f (Ep) = SnS
(14.4)
The stopping power S of a material is defined as the average energy loss per unitpath length which charged particles suffer when traversing the material, as the resultof Coulomb interactions with electrons and with atomic nuclei. Tables of stoppingpowers are available from the semi-empirical stopping power formulas given by themodel developed by Ziegler, Biersack and Littmarkwith [98].
The nuclear stopping power Sn is due to elastic Coulomb collisions in which recoilenergy is imparted to atoms. For a particle with energy E0, it is determined by thespectrum of recoil particles (atoms) dσ/dEp integrated within the interval of recoilenergies from Emin
p to Emaxp = 4EM1M2/(M1 + M2)2. The latter is the maximum
fraction of energy transfer during collision between the projectile (1) of whichevercharged particle and the medium (2).
Sn(E0 ) = N∫ Emaxp
Eminp
( dσdEp
)E0dEp (14.5)
where N is the atomic density of the medium. Sn magnitude is called restrictedwhen Emin
p =Eth and unrestricted, when all the energy losses are also considerredbelow the threshold Eth.
The nuclear stopping power is closely related to the frequently used magnitudeNon Ionizing Energy Loss (NIEL). The NIEL describes the rate of energy loss dueto atomic recoils as a particle traverses a material. NIEL and the nuclear stoppingpower Sn are equal only in the limiting case of f(Ep) = 1, which means that all ofthe recoil energy is deposited in the displacements:
NIEL(E0 ) = N∫ Emaxp
0( dσdEp
)E0f(Ep)dEp (14.6)
For complex material, the NIEL is calculated for each recoil-kind and sum up thecontribution.
Approximation of NIEL can be find in [97] including all the energy losses alsothose below the threshold Eth. In additional, in [97] are reported the Lindhardapproximated formulas for f(Ep), which can handle any particle projectile.
f (Ep) = 11 + FL(3.4008ε(Ep)1/6 + 0.40244ε(Ep)3/4 + ε(Ep))
(14.7)
where:FL = 30.724Z1Z2
√Z
2/31 + Z
2/32
A1 + A2
A2(14.8)

156 14. Displacement Per Atom (DPA) calculations
ε(Ep) = Ep
0.0793 Z2/31√Z2
(Z2/31 +Z2/32 )3/4
(A1 + A2)3/2
A3/21√A2
(14.9)
with A1 (A2) and Z1 (Z2) are the projectile (target) atomic weight and number,respectively.
Table 14.1 shows the typical values of Eth used in the NJOY99 code. The NuclearData Processing System NJOY [99] is a modular computer code designed to readevaluated data in Evaluated Nuclear Data Formats (ENDF), transform the data invarious ways, and output the results as libraries designed to be used in various ap-plications. The ENDF are used all over the world to encode nuclear data evaluationsfor use in research and nuclear technology.
Table 14.1: Typical values used in NJOY99 code.
Element Eth (eV )Lithium 10Carbon in SiC composite 20Graphite 30÷35Aluminum 27Iron 40Cobalt 40Copper 40Niobium 40Molybdenum 60Tungsten 90Lead 25
From 2009, new routines are implemented in FLUKA [101] in order to estimatethe DPA values in materials under radiation. During interactions, FLUKA cal-culates the recoil energy for all charged particles and heavy ions, which are thentrasported such as any other particle. During transport, FLUKA calculates thefraction of nuclear stopping power over the stopping power to estimate f(Ep) forprimary particles, with kinetic energies above the FLUKA particle thresholds whichare fixed by the users. Below them and, in addition for secondary particles, theLindhard approximated formulas for f(Ep) is used. This is done because of a strongdiscrepancy for high energies between the Lindhard approximated formulas for f(Ep)and the value of S and Sn obtained using the Ziegler semi-empirical approximation(see Fig. 14.1). For neutrons below 20MeV , the NIEL extimation, used to calculatethe DPA, is performed from the NJOY99 code during the library preparation. Theparticle thresholds introduced by the users are depending by the problem understudy.

14.2. The BNL experiment 157
Figure 14.1: Comparison between the partition functions for α particles on Silicon,calculated using the Lindhard (black line) or the Zieler (blue line) approximations.
14.2 The BNL experimentIn order to validate the FLUKA DPA implemented model, results are comparedto the DPA calculated with MCNPX MonteCarlo code [102] for the BrookhavenNational Laboratory (BNL) experiment, in which the exact same material used forLHC Phase I collimator jaw was irradiated.
In March 2004 a 2 week irradiation of targets took place using the BNL accel-erator complex. The 200MeV proton beam at the end of the Brookhaven LinacIsotope Producer (BLIP) was directed towards the Isotope Production Facility (seeFig. 14.2), where a special target station submerged in about 9m of water and withwater flowing through the assemblies has been designed and installed. A precisetracking of the beam intensity at the Linac side led to the estimation of the totalflux of 5.25x10²⁰ protons (or a current of 23,454µA/h).
The target array of interest were placed upstream of the isotope targets thattypically operate at 112MeV . It includes solid materials in the low-Z and mid-Z

158 14. Displacement Per Atom (DPA) calculations
Figure 14.2: BNL experimental facility used in the material irradiation study.
regimes, specifically selected for their possible use as accelerator targets or collimatorjaws. The special packaging of the different planes of irradiate meterial, which are incascade Vascomax, Ti-alloy (Ti-6Al-4V), AlBeMet, Beryllium, GumMetal, Graphite(IG-43), Carbon composite and the Ni-plated Aluminum, degrades the beam from200MeV down to what was desired by the isotope targets. The requirement thatthe beam entering the assembly with 200MeV must leave at a particular energyspecified by the isotope production targets downstream, makes the arrangement aserious challenges.
Fig. 14.3 shows the general layout of the two sets. The material samples werelocated in the first three Aluminum target boxes (also see Fig. 14.6).
The packing arrangements are composed by different layers, most of which are3mm thick with between each a 1mm water channel. Each 42 x 42mm cross sectionis made up by a tigh combination of 3mm thick specimens arranged together in thesame plane with three 1mm thick tensile specimens. Fig. 14.4 shows the two types ofspecimens used during irradiation for the evaluation of the mechanical and physicalproperties. Their particular shape has been chosen to satisfy the requirements
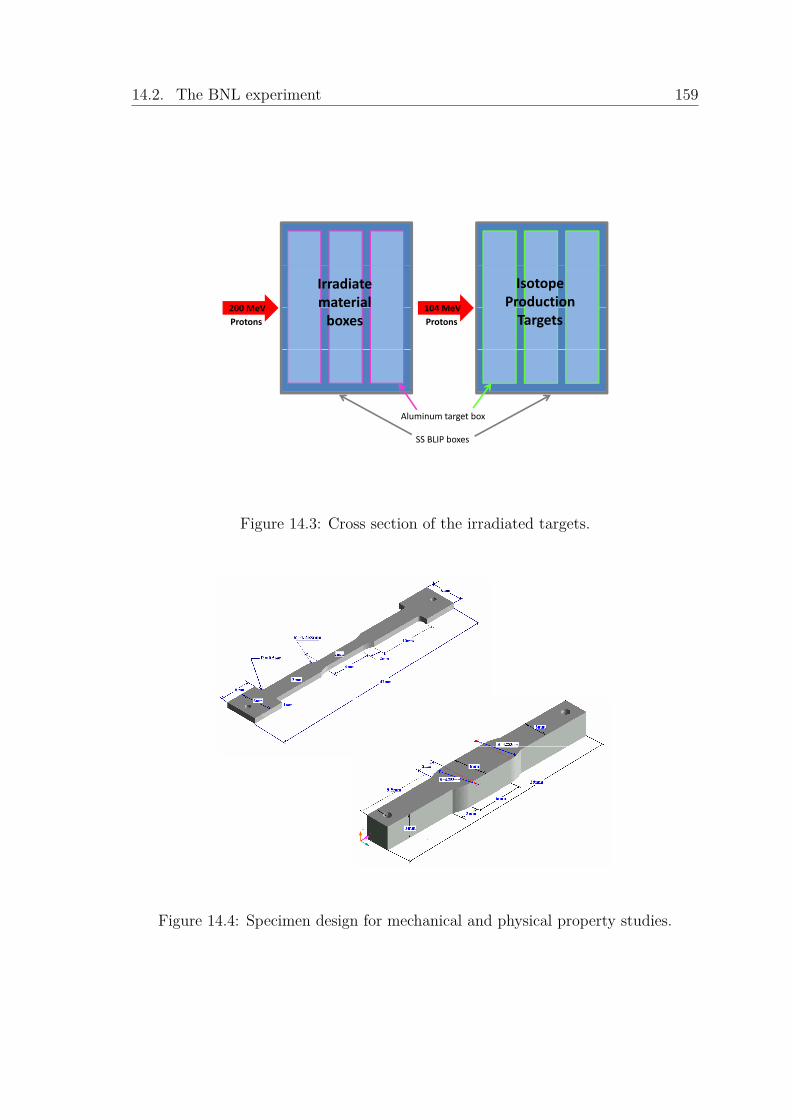
14.2. The BNL experiment 159
200 MeV 104 MeV
Isotope Production
Irradiate material 200 MeV 104 MeV
ProtonsProtons Targetsboxes
Aluminum target box
SS BLIP boxes
Figure 14.3: Cross section of the irradiated targets.
Figure 14.4: Specimen design for mechanical and physical property studies.

160 14. Displacement Per Atom (DPA) calculations
imposed by the isotope production. Only the Graphite and the Carbon compositeformed 6mm rather than 3mm thick layers.
In order to not affect the isotope production downstream, the Gaussian shape ofthe beam entering the irradiation target must to be maintained. Special Nickel foilsintegrated into the irradiation assemblies help to establish the beam spot size, shapeand location during irradiation. Beam spot sizes with full width at half maximumof about 15mm are typical. The proton beam is purposely de-focused in orderto expose as much as possible of the volume of the special targets for harvestingisotopes.
Fig. 14.5 shows an actual layer of the two types of specimens integrated and theposition of the beam on the target plane. The downstream Nickel films positionedwithin the irradiation matrix were autoradiographed to establish the beam profileand its relative position to the specimens (horizontal and vertical rms beam σ equalto 7.2 ±0.3mm).
Figure 14.5: Front view of the target with the integration of different types of spec-imens into the irradiation space. Superimposed is shown the approximate locationof the beam footprint and the discretization of the irradiation plane for the DPAcalculations used by both MCNPX and FLUKA codes.

14.2. The BNL experiment 161
14.2.1 Simulation results with MCNPXFollowing the irradiation, detailed DPA calculations were performed at BNL on allmaterial involved using MCNPX MonteCarlo code. The DPA values have been esti-mated as average number over discrete volumes both from protons and the secondaryneutrons. The 42 x 42 mm section was broken into unit volumes (i.e. 2mm (x) x2mm (y) x 1mm (z)). The importance of the space discretization is in that thelocation of rupture in the tensile specimens can be correlated with the distributionof the damage along the gauge length.
The analysis revealed that primarily the damage was the result of incident protonfluence. The contribution of neutrons was minimal.
For a total flux of 5.25x10²⁰ protons in the irradiation phase, the DPA peakscalculated with MCNPX for some of the material layer are:
• First Vascomax layer.The DPA peak values for Vascomax coming from protons was estimated to be0.27 and from neutrons 0.014.
• First Gum Metal layer.The DPA peaks estimated for the first 3mm thick layer of Gum Metal was0.23 DPA from protons and 0.015 DPA from neutrons.
• First Carbon composite layer.For the first layer of the Carbon composite (i.e. first of the two 6mm thicklayer, where the beam is impacting at about 130MeV ) the DPA peak valuesfrom protons are 0.012 and from neutrons 0.0004.
14.2.2 The BNL experiment simulated with FLUKAIn order to validate the FLUKA DPA model implemented, the BNL experiment wassimulated also with the FLUKA code. The geometry of the target layout as wellas the Gaussian beam were exactly reproduced, including the windows before thetarget boxes (see Fig. 14.6).
The proton beam coming from Linac, goes through some upstream windows (i.e.the two 0.3mm Beryllium and the 0.3mm Aluminum layers) and the 0.8mm thickSS box wall and the 1.59mm water channel, before impinging the first Aluminumtarget box.
Fig. 14.7 shows the peak DPA values along the target assembly due to protons,to neutrons and to all particle showers respectively. In addition, the location ofthe layers for which results are available from MCNPX code are also indicated (i.e.first Vascomax, first Gum Metal and first Carbon composite layers). The impactingprotons are the first cause of damages as already reported by the analysis of theMCNPX results.

162 14. Displacement Per Atom (DPA) calculations
VascomaxTi6Al4VBerylliumG M t lAlBeMetGum Metal
IG-43 GraphiteCarbon - carbonNi-plated Al
Figure 14.6: Real cross view of target irradiation assembly (right up corner) and theFLUKA model implemeted. A 3D picture of the target assembly and the protonbeam impacting position is also shown.

14.2. The BNL experiment 163
The FLUKA results are obtained using energy thresholds for electron and photonproduction set to 1MeV in all the target materials, while cuts at 1 keV were fixedfor protons, kaons and pions in all the regions. The kinetic energy transport cut-offsettings are applied in order to stop the tracking of particles which give negligiblecontributions to DPA values, saving CPU time.
All particle showerNeutronsProtons
DPA
omax
m M
etal
bon
posite
bon
posite
m M
etal
eMet
omax
l4V
l4V
ylliu
m
3 phite
cm
Vasco
Gum
Carb
comp
Carb
comp
Gum
AlBe
Vasco
Ti6A
Ti6A
Bery
IG‐43
Grap
Figure 14.7: DPA peak values along the target assembly.
14.2.3 Results comparisonThe DPA peak values from the MCNPX simulations are compared with the FLUKAones in Table 14.2. A factor of 2 in the DPA values is shown for the first Vascomaxlayer both for protons and neutrons. For what concerns the first Gum Metal layer,a factor of 3 in both cases is in between the two simulation results. Finally for thefirst Carbon composite layer, a factor of 2 is shown for protons, while a factor 10 isobtained for neutrons.
Incertitudes in the stopping power thresholds of the target materials and intheir chemical compositions used by the two codes, as well the particles thresholds

164 14. Displacement Per Atom (DPA) calculations
implemented could justify the factor 2 in the results. In particular the incertitudein the chemical composition of the Gum Metal used during the BNL irradiationexperiment could justify the factor 3 found comparing the results. Since the carboncomposite samples are installed at the end of the irradiated material boxes, thesum of the incertitude in the definition of each material layer, through which theproton beam have to pass before reaching them, could justify the factor 10 calculatedbetween the DPA values due to neutrons in the first Carbon composite layer.
Summarizing, discrepancies of the order of 2 are found between the FLUKA andMCNPX results, due to different kinds of incertitudes.
Table 14.2: DPA values for the BNL irradiation experiment calculated by MCNPSand FLUKA MonteCarlo codes.
Terget Material Particles DPA (MCNPX) DPA (FLUKA)Vascomax (first layer) protons 0.27 0.498
neutrons 0.014 0.037Gum Metal (first layer) protons 0.23 0.6
neutrons 0.015 0.0045Carbon composite (fist layer) protons 0.012 0.0269
neutrons 0.0004 0.0045
14.3 DPA calculations for LHC collimatorsFLUKA simulations to evaluate DPA were performed for the CERN design Phase IIcollimator with Glicop jaws in the most loaded position, that is the TCSM.A6L7.B1location.
Fig. 14.8 shows the DPA values along the Phase II collimator jaws due to neu-trons, protons and all particles showers generated by primary proton beam interac-tions with the upstream primary collimators and with the TCSM.A6L7.B1 itself at7TeV . Results are normalized to 1.15x10¹⁶ proton losses per year.
Value of the order of 0.001 DPA in Copper/Glidcop could be already a criticalissue for the Cleaning Efficiency and Impedance, since the radiation damages causesthe increase of the cluster density and resistivity in the jaw material. However,in order to fix a limit in the DPA value, above which the Glidcop collimator hasto be irremediably changed, DPA calculation has to be supported by experimentaldata. The incertitude in the DPA calculations and in the irradiation enviroment e.g.material properties and target temperature, could bring to errors if not supportedby irradiation tests.
For this reason, different experimental tests on material resistance to beam-induced radiation are foreseen in the framework of the EuCard project to support the

14.4. Conclusions on DPA calculations 165
All particle shower – external jawAll particle shower – internal jawProtons – external jawjProtons – internal jaw
Neutrons – internal jawNeutrons – external jaw
PA/year
DP
cm
Figure 14.8: DPA values along the CERN design Glidcop jaws for the most loadedPhase II collimator location.
prediction of the material life expectancy in particular for the Phase II collimatorsjaws. The tests in irradiation facilities on the different material samples proposedfor Phase II jaws are supposed to be coupled with MonteCarlo code simulations.Results will be used to fix the limits on the Phase II jaws without testing directlythe whole device.
14.4 Conclusions on DPA calculationsThe LHC performance at 7TeV are strongly dependent by its collimation system.Radiation damages on the Phase II jaws has to be evaluated in order to foreseensubstitution actions in time.
In particular for metallic jaws, the DPA caused by radiation is a critical issue.In order to support the damage evaluations, the experimental results on irradiatedmaterial samples are coupling with MonteCarlo code simulations for the DPA cal-culations. This avoids to test the whole device for having predictions about the
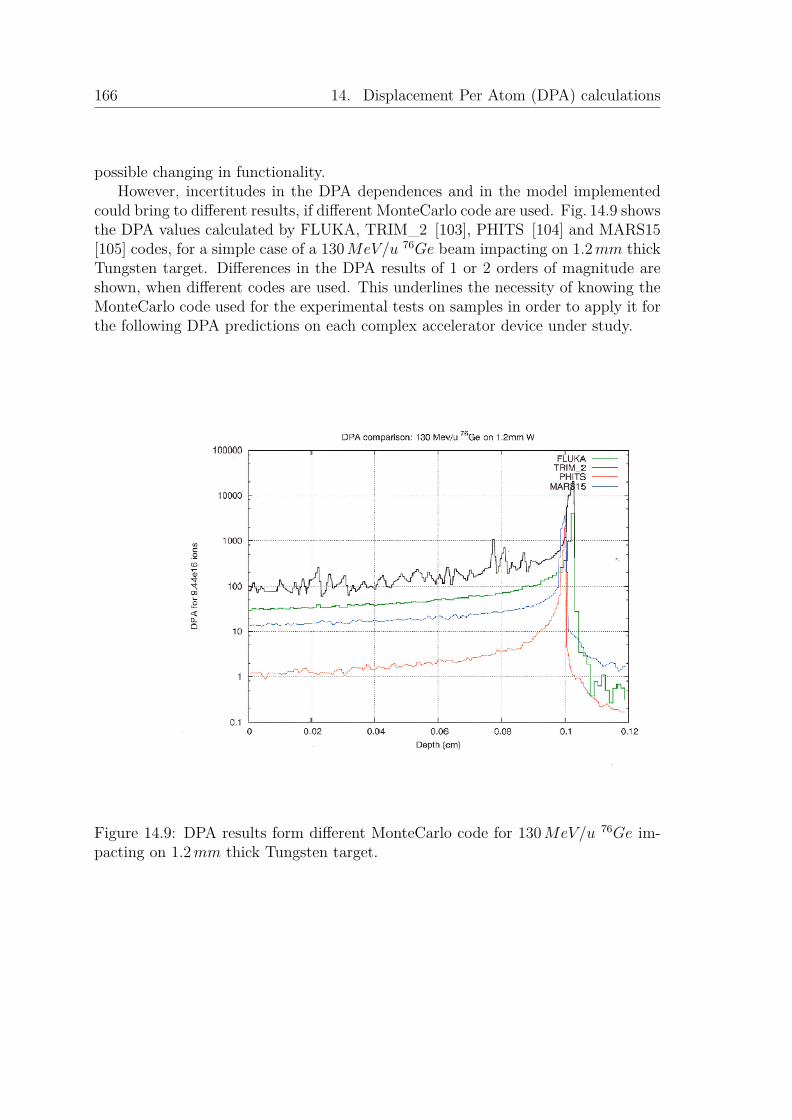
166 14. Displacement Per Atom (DPA) calculations
possible changing in functionality.However, incertitudes in the DPA dependences and in the model implemented
could bring to different results, if different MonteCarlo code are used. Fig. 14.9 showsthe DPA values calculated by FLUKA, TRIM_2 [103], PHITS [104] and MARS15[105] codes, for a simple case of a 130MeV/u 76Ge beam impacting on 1.2mm thickTungsten target. Differences in the DPA results of 1 or 2 orders of magnitude areshown, when different codes are used. This underlines the necessity of knowing theMonteCarlo code used for the experimental tests on samples in order to apply it forthe following DPA predictions on each complex accelerator device under study.
Figure 14.9: DPA results form different MonteCarlo code for 130MeV/u 76Ge im-pacting on 1.2mm thick Tungsten target.
Chapter 15
ConclusionsThe goal of this doctoral thesis was to provide directions on the final choice of thecollimator jaw materials, which have to survive to the LHC 7TeV proton beaminteractions. The calculations made in the frame of this PhD are not only usedas the basis for the Phase II collimator mechanical integration studies, but alsoto evaluate the activation and radiation field on the surrounding areas due to thePhase II installation in the LHC main ring. In particular, they were focused in theBetatron Cleaning region, where the particle losses are about 7 times higher thanin the Momentum Cleaning ones, in case of performing a pure Betatron Cleaning atIR7.
Starting from accelerator physics calculations, the FLUKA MonteCarlo codewas extensively used to perform simulations, primary directed at identify materialsand jaw geometries which would produce the best collimation surface, in terms ofCleaning Efficiency (better than 99.99%), jaw flatness (order of tens µm) and inorder to provide jaw cooling with a reasonable water flow in both the steady stateand transient conditions.
An iterative process between mechanical engineers and MonteCarlo experts fol-lows the first phase of the preliminary material selection, to support the mechanicalintegration of all the device components with respect to the maximization of itsworking performance.
Two options in relation to the beam stabilization method used were in partic-ular investigated for the jaw materials. The first one concerns the use of highlyconductive jaws (e.g. Copper based materials), coupled with a Landau octupolesstabilization system, while the second option was focused on the investigation ofjaw composed by a non conductive material (e.g. SiC) coupled with the transversefeedback stabilization method.
Copper based materials such as Glidcop were in particular studied since they havea good balance of Cleaning Efficiency performance, deflection and manufacturability,in addition to its good electrical conductivity.
If made of Copper, the most loaded Phase II secondary collimator in each beamline (i.e. the TCSM.A6L7.B1/B2), installed nearest to the Phase I primary collima-tors in the Betatron Cleaning region must survive head loading approximately 20
167
168 15. Conclusions
times than of its carbon Phase I secondary counterpart. Extensive FLUKA simula-tions of the power deposed at 7TeV low beta condition in the most loaded locationwere performed during this PhD, in order to support the mechanical design evolutionfocusing on minimize the Copper based jaw deformations.
The option of increasing the aperture of this first secondary collimator in orderto relax the cooling design and to pass the load to down-beam secondary collima-tors was also considered. In this particular case, the collimation efficiency wouldbe mantained by the remaining collimators. However, since the peak heat load onthis device is for the 90% due to the particle showers coming from primary protonsinteraction with the Phase I primary collimators downstream, this solution is noteffective. On the other hand, removing completely this first metal collimators ormoving to a non conductive jaw materials or to a longitudinal multi-layer compo-sition of different jaw materials for the Phase II have been shown to be promisingoptions.
Based on the accident scenarios, other possible Phase II collimator improvementsfrom Copper based jaw torwards more transparent materials were proposed andevaluated in this PhD for the most exposed locations.
The PhD results, obtained on the hypothesis of ideal performance of the LHCcollimation system, have oriented the mechanical development choices for the differetcomponents of the first two Phase II collimator prototypes with Glidcop jaws, onedeveloped at CERN and the other at SLAC laboratories. They will be tested withbeam at CERN in the next future (2011). A preliminary version of the designproposed by CERN implementing BPM buttons, for which the yearly nominal dosehas been calculated, is already installed in the SPS to provide data on their possibleintegration on the tapering parts of the Phase II jaws.
The study in nominal conditions was completed by taking into account, forthe first time, the impact of the misalignmet set-up collimator errors randomly se-lected for all the LHC collimation system within the alignement accurancy limit of600µrad. Results have shown their limited effect on the variation of the integratedpower deposited on the Phase II devices.
The impact on the tunnel environment of the different solutions proposed wereestimated. In particular the studies were focused on the evaluation of the radiationto personnel in the tunnel and on the radiation to the electronic equipments inthe adjacent service caverns. Close to the most loaded Phase II collimators, theambient dose rate peaks calculated exceed the 2mSv/h value at different coolingtimes. It triggers the highest level of ALARA precautions to be followed duringworks close to components. The importance of planning the foreseen interventionsin the closest areas was thus underlined. Moreover, the shielding effect of the PhaseII collimators was extensively studied to estimate the resulting protection to theelectronic equipments. Unfortunately their installation is not sufficient to fix theproblem. Additional solutions are on the way of evaluation, including moving part ofthe Betatron Cleaning to the Momentum region, in order to reduce the particle flux
169
towards the electronic equipments in the service areas. It includes the installation ofthe cryo-collimators with Tungsten jaws in the DS regions at IR3, at the place of theCopper ones in IR7 considered during this PhD. In addition, this option decreasethe thermal loads on the Phase II collimators themseves.
Finally, the last effort of the thesis was directed on a better understanding ofthe functionality limits imposed by the DPA mechanism caused by the beam impacton jaw materials, in particular important for metal materials. For this purpose, theDPA model implemented in FLUKA was tested against the MCNPX calculationsperformed for the BNL experiments. Discrepancies of a factor 2 were found betweenthe two code results, due to different kind of incertitudes (e.g. different DPA mod-eling, different geometry description, uncertainties in the chemical composition ofspecial sample materials irradiated, etc). In addition, DPA calculations were alsoperformed for the Phase II collimators with Glidcop jaws. Also taking into accountthe uncertainties, the DPA FLUKA results reach values which could be a criticalissues after one year of nominal operation in the most loaded location. The needof supporting the FLUKA calculations with testing Glidcop samples in a similarLHC irradiation field was pointed out, in order to provide more realistic predictionof the Phase II lifetime as well as to plan possible substitution of the whole PhaseII collimator only when necessary.
Agreements within 20% are found between LHC BLM signals and FLUKA cal-culations during tests in the SPS in operation condition at 450GeV , where a LHCPhase I collimator was installed with its downstream BLMs [106]. Studies are start-ing to benchmark the FLUKA results at different LHC operation energies at thebeginning for the Phase I collimation system installed and in the future for thePhase II collimators. Only benchmark experiments and iterations between the com-putational and the engineering team can ensure high quality results and limit therange of uncertainties.
In particular, the results presented in this PhD thesis have to be benchmarkedwhen experimental data will be available at 7TeV . This implies that the biggestmachine that mankind built will be into operation with the Phase II collimatorsystem already installed.

170 15. Conclusions

Appendix A
The principle of 2 stage Betatronand Momentum collimation
Principle and optimization of secondary collimators are presented here for the onedimensional collimation. In this case, as a first approximation, the proton scatteringis considered in the same plane of the analysed halo. It represents the theoreticallimit for a realistic scenario, where the particles interacting with a jaw collimator arescattered isotropically in the transverse plane. However, already in this case it showsthe need of two secondary per primary collimators. This is the minimum requiredin high intensity collider. More details about the two dimensional collimation canbe found [23].
The analysis is performed in normalized phase space. Let n1 and n2 the nor-malized aperture, in units of rms transverse beam size, of primary and secondarycollimators.
A.1 One-Dimensional Betatron CollimationThe Betatron cleaning allows to limit the transverse extension of the beam halo.
The proton, which drifts slowly outward, touches the collimators when being veryclose to its maximum spatial extension. Using the normalized coordinates (capitolletter): (
ZZ ′
)= 1σz
(1 0αz βz
)(zz′
)(A.1)
this happens when Z = n1 and Z ′ = 0, or in real coordinates when z = n1σz andz′ = (αz/βz)z. Thus, the coordinates in the real case are measured in units of σand the divergences in units of σ’, where σ and σ’ are transverse beam size anddivergence.
If it is not absorbed, the particle is suppose to be scattered along the verticalline Z = n1, receiving a positive or negative elastic kick (see Fig. A.1).
171
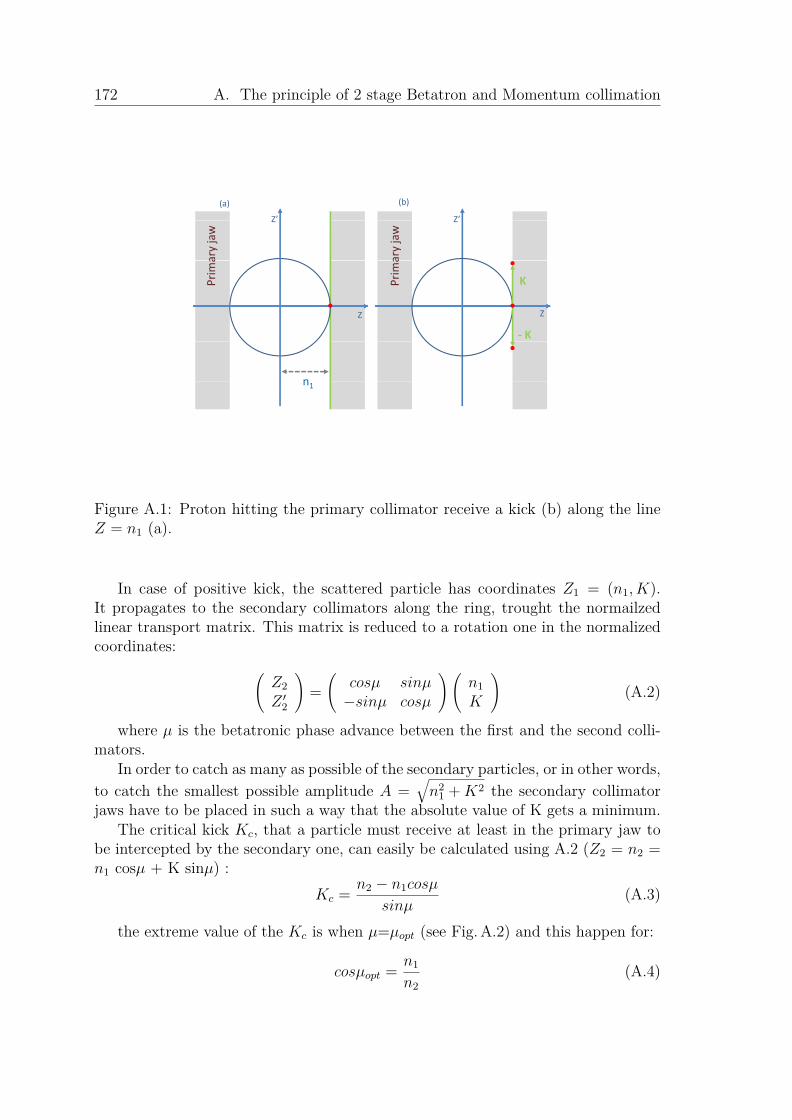
172 A. The principle of 2 stage Betatron and Momentum collimation
Z’ Z’
(a) (b)
Z Zary jaw
ary jaw
KPrim
a
Prim
a
Z Z
‐ K
nn1
Figure A.1: Proton hitting the primary collimator receive a kick (b) along the lineZ = n1 (a).
In case of positive kick, the scattered particle has coordinates Z1 = (n1, K).It propagates to the secondary collimators along the ring, trought the normailzedlinear transport matrix. This matrix is reduced to a rotation one in the normalizedcoordinates: (
Z2Z ′2
)=(
cosµ sinµ−sinµ cosµ
)(n1K
)(A.2)
where µ is the betatronic phase advance between the first and the second colli-mators.
In order to catch as many as possible of the secondary particles, or in other words,to catch the smallest possible amplitude A =
√n2
1 +K2 the secondary collimatorjaws have to be placed in such a way that the absolute value of K gets a minimum.
The critical kick Kc, that a particle must receive at least in the primary jaw tobe intercepted by the secondary one, can easily be calculated using A.2 (Z2 = n2 =n1 cosµ + K sinµ) :
Kc = n2 − n1cosµ
sinµ(A.3)
the extreme value of the Kc is when µ=µopt (see Fig.A.2) and this happen for:
cosµopt = n1
n2(A.4)
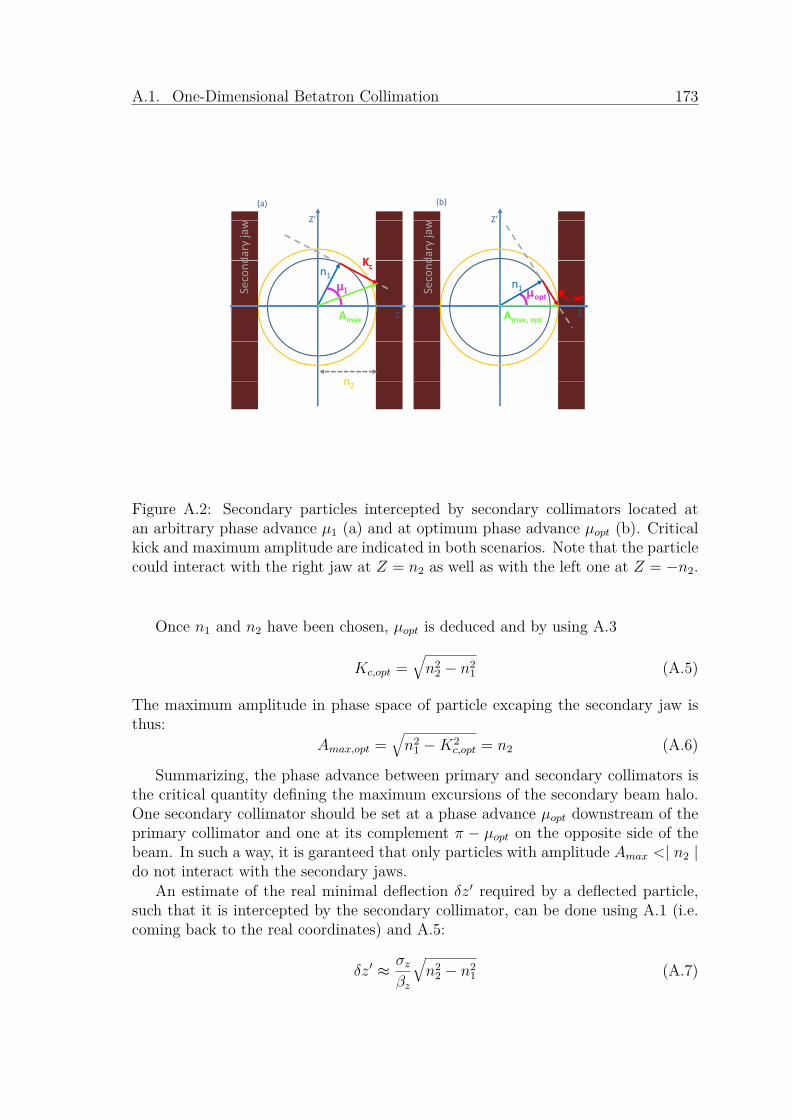
A.1. One-Dimensional Betatron Collimation 173
Z’ Z’
(a) (b)
Z Z
dary jaw
dary jaw
K
opt Kc, opt
n1
Second
SecondKc
n1
Z ZAmax Amax, opt
nn2
Figure A.2: Secondary particles intercepted by secondary collimators located atan arbitrary phase advance µ1 (a) and at optimum phase advance µopt (b). Criticalkick and maximum amplitude are indicated in both scenarios. Note that the particlecould interact with the right jaw at Z = n2 as well as with the left one at Z = −n2.
Once n1 and n2 have been chosen, µopt is deduced and by using A.3
Kc,opt =√n2
2 − n21 (A.5)
The maximum amplitude in phase space of particle excaping the secondary jaw isthus:
Amax,opt =√n2
1 −K2c,opt = n2 (A.6)
Summarizing, the phase advance between primary and secondary collimators isthe critical quantity defining the maximum excursions of the secondary beam halo.One secondary collimator should be set at a phase advance µopt downstream of theprimary collimator and one at its complement π − µopt on the opposite side of thebeam. In such a way, it is garanteed that only particles with amplitude Amax <| n2 |do not interact with the secondary jaws.
An estimate of the real minimal deflection δz′ required by a deflected particle,such that it is intercepted by the secondary collimator, can be done using A.1 (i.e.coming back to the real coordinates) and A.5:
δz′ ≈ σzβz
√n2
2 − n21 (A.7)
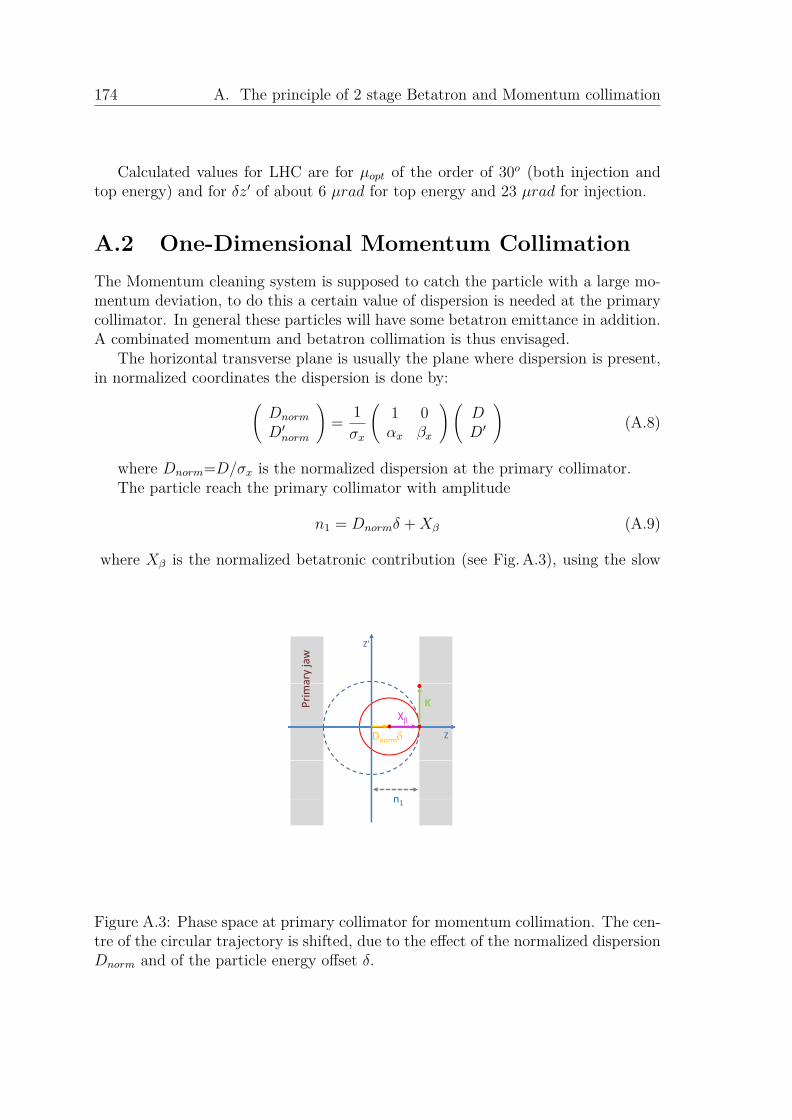
174 A. The principle of 2 stage Betatron and Momentum collimation
Calculated values for LHC are for µopt of the order of 30o (both injection andtop energy) and for δz′ of about 6 µrad for top energy and 23 µrad for injection.
A.2 One-Dimensional Momentum CollimationThe Momentum cleaning system is supposed to catch the particle with a large mo-mentum deviation, to do this a certain value of dispersion is needed at the primarycollimator. In general these particles will have some betatron emittance in addition.A combinated momentum and betatron collimation is thus envisaged.
The horizontal transverse plane is usually the plane where dispersion is present,in normalized coordinates the dispersion is done by:(
Dnorm
D′norm
)= 1σx
(1 0αx βx
)(DD′
)(A.8)
where Dnorm=D/σx is the normalized dispersion at the primary collimator.The particle reach the primary collimator with amplitude
n1 = Dnormδ +Xβ (A.9)
where Xβ is the normalized betatronic contribution (see Fig. A.3), using the slow
Z’Z
ary jaw
KPrim
a
XZDnorm
nn1
Figure A.3: Phase space at primary collimator for momentum collimation. The cen-tre of the circular trajectory is shifted, due to the effect of the normalized dispersionDnorm and of the particle energy offset δ.

A.2. One-Dimensional Momentum Collimation 175
diffusion approximation (i.e. considering the impact points at the surface of thecollimator while the betatronic oscillation is at its maximum).
If the particle touch the primary collimator with D′norm = 0 (or in real coor-dinates D′ = −(αx/βx)D), as in Fig.A.3, the critical kick is indipendent of themomentum change (for the mathematical demostration see [23]). This propertyis obtained by fixing a quantity at the primary jaw (namely D′norm = 0) and theoptimum phase advance of the secondary collimators respect to the primary is thesame for all off-momentum particles. Thus the location of the secondary collimatorscan be chosen indipendently of momentum collimation considerations and the purebetatron cleaning considerations (i.e. 2 secondary collimators for each primary inone dimensional approximation) are applicable also in this case.

176 A. The principle of 2 stage Betatron and Momentum collimation

Appendix B
Phase I and Phase II collimatordatabase
B.1 Beam1Table B.1: List of Phase I and Phase II (in red) collimators in the main ring forBeam1. Name, length, azimuthal angle, material and nominal settings at injectionand low beta energy are indicated. The devices both "out" at injection and low betaenergies are used only to intercept particle showers. The jaw materials for Phase IIare not indicated, because a final decision is still not taken as well as for the finalaperture and material for the cryo-collimators jaws.
Name Length Angle Material Half-gap[σz][m] [deg] injection low beta
TCL.5R1.B1 1.0 0.0 Cu out 10.0
TCTH.4L2.B1 1.0 0.0 Cu-W out 8.3TDI.4L2.B1 4.0 90.0 C-C 6.8 outTCDD.4L2 1.0 90.0 C out outTCTVB.4L2 1.0 90.0 Cu-W out 8.3TCLIA.4R2 1.0 90.0 CFC 6.8 out
TCLIB.6R2.B1 1.0 90.0 CFC 6.8 out
TCP.6L3.B1 0.6 0.0 CFC 8.0 15.0TCAPA.6L3.B1 1.0 0.0 W out outTCSG.5L3.B1 1.0 0.0 CFC 9.3 outTCSM.5L3.B1 1.0 0.0 out 18.0TCSG.4R3.B1 1.0 0.0 CFC 9.3 out
177

178 B. Phase I and Phase II collimator database
continued from previous pageName Length Angle Material Half-gap[σz]
[m] [deg] injection low betaTCSM.4R3.B1 1.0 0.0 out 18.0TCSG.A5R3.B1 1.0 170.7 CFC 9.3 outTCSM.A5R3.B1 1.0 170.3 out 18.0TCSG.B5R3.B1 1.0 10.8 CFC 9.3 outTCSM.B5R3.B1 1.0 11.4 out 18.0TCLA.A5R3.B1 1.0 90.0 Cu-W 10.0 20.0TCLA.B5R3.B1 1.0 0.0 Cu-W 10.0 20.0TCLA.6R3.B1 1.0 0.0 Cu-W 10.0 20.0TCLA.7R3.B1 1.0 0.0 Cu-W 10.0 20.0TCTH.4L5.B1 1.0 0.0 Cu-W out 8.3TCTVA.4L5.B1 1.0 90.0 Cu-W out 8.3TCL.5R5.B1 1.0 0.0 Cu out 10.0
TCDQA.A4R6.B1 3.0 0.0 CFC 8.0 8.0TCDQA.B4R6.B1 3.0 0.0 CFC 8.0 8.0TCSG.4R6.B1 1.0 0.0 CFC 7.0 7.5
TCRYO.BL7.B1 1.0 0.0 Cu ≥ 10.0 ≥ 10.0TCRYO.AL7.B1 1.0 0.0 Cu ≥ 10.0 ≥ 10.0TCP.D6L7.B1 0.6 90.0 CFC 5.7 6.0TCP.C6L7.B1 0.6 0.0 CFC 5.7 6.0TCP.B6L7.B1 0.6 127.5 CFC 5.7 6.0TCAPA.6L7.B1 1.0 0.0 W out outTCAPB.6L7.B1 0.1 0.0 W out outTCSG.A6L7.B1 1.0 141.1 CFC 6.7 outTCSM.A6L7.B1 1.0 142.5 out 7.0TCAPC.6L7.B1 0.6 0.0 W out outTCSG.B5L7.B1 1.0 143.5 CFC 6.7 outTCSM.B5L7.B1 1.0 141.6 out 7.0TCSG.A5L7.B1 1.0 40.7 CFC 6.7 outTCSM.A5L7.B1 1.0 42.7 out 7.0TCSG.D4L7.B1 1.0 90.0 CFC 6.7 outTCSM.D4L7.B1 1.0 90.0 out 7.0TCSG.B4L7.B1 1.0 0.0 CFC 6.7 outTCSM.B4L7.B1 1.0 0.0 out 7.0TCSG.A4L7.B1 1.0 134.6 CFC 6.7 outTCSM.A4L7.B1 1.0 135.7 out 7.0TCSG.A4R7.B1 1.0 46.3 CFC 6.7 out

B.1. Beam1 179
continued from previous pageName Length Angle Material Half-gap[σz]
[m] [deg] injection low betaTCSM.A4R7.B1 1.0 45.2 out 7.0TCSG.B5R7.B1 1.0 141.5 CFC 6.7 outTCSM.B5R7.B1 1.0 139.6 out 7.0TCSG.D5R7.B1 1.0 51.4 CFC 6.7 outTCSM.D5R7.B1 1.0 53.3 out 7.0TCSG.E5R7.B1 1.0 130.5 CFC 6.7 outTCSM.E5R7.B1 1.0 128.5 out 7.0TCSG.6R7.B1 1.0 0.5 CFC 6.7 outTCSM.6R7.B1 1.0 0.0 out 7.0TCLA.A6R7.B1 1.0 90.0 Cu-W 10.0 10.0TCLA.B6R7.B1 1.0 0.0 Cu-W 10.0 10.0TCLA.C6R7.B1 1.0 90.0 Cu-W 10.0 10.0TCLA.D6R7.B1 1.0 0.0 Cu-W 10.0 10.0TCLA.A7R7.B1 1.0 0.0 Cu-W 10.0 10.0TCRYO.AR7.B1 1.0 0.0 Cu ≥ 10.0 ≥ 10.0TCRYO.BR7.B1 1.0 0.0 Cu ≥ 10.0 ≥ 10.0
TCTH.4L8.B1 1.0 0.0 Cu-W out 8.3TCTVB.4L8 1.0 90.0 Cu-W out 8.3
TCTH.4L1.B1 1.0 0.0 Cu-W out 8.3TCTVA.4L1.B1 1.0 90.0 Cu-W out 8.3

180 B. Phase I and Phase II collimator database
B.2 Beam2Table B.2: List of Phase I and Phase II (in red) collimators in the main ring forBeam2. Name, length, azimuthal angle, material and nominal settings at injectionand low beta energy are indicated. The devices both "out" at injection and low betaenergies are used only to intercept particle showers. The jaw materials for Phase IIare not indicated, because a final decision is still not taken as well as for the finalaperture and material for the cryo-collimator jaws.
Name Length Angle Material Half-gap[σz][m] [deg] injection low beta
TCTH.4R8.B2 1.0 0.0 Cu-W out 8.3TCDD.4R8 1.0 90.0 C out outTDI.4R8.B2 4.0 90.0 C-C 6.8 outTCDD.4R8 1.0 90.0 C out outTCTVB.4R8 1.0 90.0 Cu-W out 8.3TCLIA.4L8 1.0 90.0 CFC 6.8 out
TCLIB.6L8.B2 1.0 90.0 CFC 6.8 out
TCRYO.BR7.B2 1.0 0.0 ≥ 10.0 ≥ 10.0TCRYO.AR7.B2 1.0 0.0 ≥ 10.0 ≥ 10.0TCP.D6R7.B2 0.6 90.0 CFC 5.7 6.0TCP.C6R7.B2 0.6 0.0 CFC 5.7 6.0TCP.B6R7.B2 0.6 127.5 CFC 5.7 6.0TCAPA.6R7.B2 1.0 0.0 W out outTCAPB.6R7.B2 0.1 0.0 W out outTCSG.A6R7.B2 1.0 141.1 CFC 6.7 outTCSM.A6R7.B2 1.0 142.5 out 7.0TCAPC.6R7.B2 1.0 0.0 W out outTCSG.B5R7.B2 1.0 143.5 CFC 6.7 outTCSM.B5R7.B2 1.0 141.6 out 7.0TCSG.A5R7.B2 1.0 40.7 CFC 6.7 outTCSM.A5R7.B2 1.0 42.7 out 7.0TCSG.D4R7.B2 1.0 90.0 CFC 6.7 outTCSM.D4R7.B2 1.0 90.0 out 7.0TCSG.B4R7.B2 1.0 0.0 CFC 6.7 outTCSM.B4R7.B2 1.0 0.0 out 7.0TCSG.A4R7.B2 1.0 134.6 CFC 6.7 outTCSM.A4R7.B2 1.0 135.7 out 7.0

B.2. Beam2 181
continued from previous pageName Length Angle Material Half-gap[σz]
[m] [deg] injection low betaTCSG.A4L7.B2 1.0 46.3 CFC 6.7 outTCSM.A4L7.B2 1.0 45.2 out 7.0TCSG.B5L7.B2 1.0 141.5 CFC 6.7 outTCSM.B5L7.B2 1.0 139.6 out 7.0TCSG.D5L7.B2 1.0 51.4 CFC 6.7 outTCSM.D5L7.B2 1.0 53.3 out 7.0TCSG.E5L7.B2 1.0 130.5 CFC 6.7 outTCSM.E5L7.B2 1.0 128.5 out 7.0TCSG.6L7.B2 1.0 0.5 CFC 6.7 outTCSM.6L7.B2 1.0 0.0 out 7.0TCLA.A6L7.B2 1.0 90.0 Cu-W 10.0 10.0TCLA.B6L7.B2 1.0 0.0 Cu-W 10.0 10.0TCLA.C6L7.B2 1.0 90.0 Cu-W 10.0 10.0TCLA.D6L7.B2 1.0 0.0 Cu-W 10.0 10.0TCLA.A7L7.B2 1.0 0.0 Cu-W 10.0 10.0TCRYO.AR7.B2 1.0 0.0 ≥ 10.0 ≥ 10.0TCRYO.BR7.B2 1.0 0.0 ≥ 10.0 ≥ 10.0
TCDQA.A4L6.B2 3.0 0.0 CFC 8.0 8.0TCDQA.B4L6.B2 3.0 0.0 CFC 8.0 8.0TCSG.4L6.B2 1.0 0.0 CFC 7.0 7.5TCTH.4R5.B2 1.0 0.0 Cu-W out 8.3TCTVA.4R5.B2 1.0 90.0 Cu-W out 8.3TCL.5L5.B2 1.0 0.0 Cu out 10.0
TCP.6R3.B2 0.6 0.0 CFC 8.0 15.0TCAPA.6R3.B2 1.0 0.0 W out outTCSG.5R3.B2 1.0 0.0 CFC 9.3 outTCSM.5R3.B2 1.0 0.0 out 18.0TCSG.4L3.B2 1.0 0.0 CFC 9.3 outTCSM.4L3.B2 1.0 0.0 out 18.0TCSG.A5L3.B2 1.0 170.7 CFC 9.3 outTCSM.A5L3.B2 1.0 170.3 out 18.0TCSG.B5L3.B2 1.0 10.8 CFC 9.3 outTCSM.B5L3.B2 1.0 11.4 out 18.0TCLA.A5L3.B2 1.0 90.0 Cu-W 10.0 20.0TCLA.B5L3.B2 1.0 0.0 Cu-W 10.0 20.0TCLA.6L3.B2 1.0 0.0 Cu-W 10.0 20.0
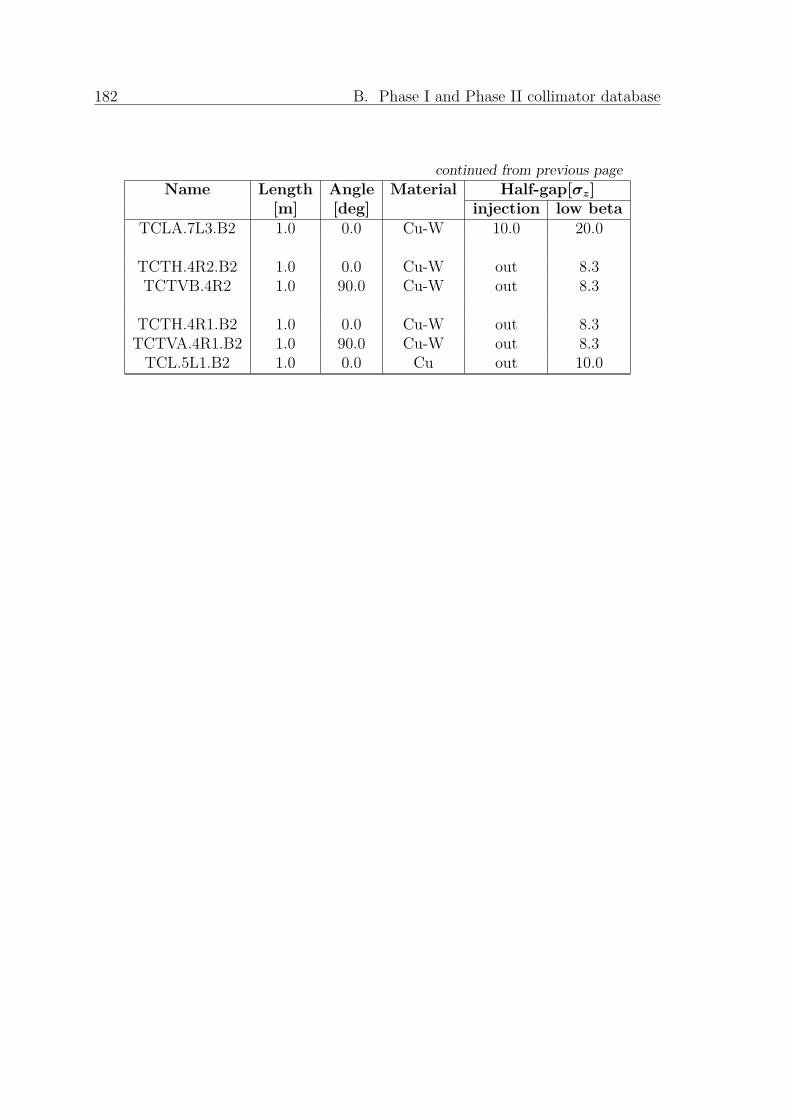
182 B. Phase I and Phase II collimator database
continued from previous pageName Length Angle Material Half-gap[σz]
[m] [deg] injection low betaTCLA.7L3.B2 1.0 0.0 Cu-W 10.0 20.0
TCTH.4R2.B2 1.0 0.0 Cu-W out 8.3TCTVB.4R2 1.0 90.0 Cu-W out 8.3
TCTH.4R1.B2 1.0 0.0 Cu-W out 8.3TCTVA.4R1.B2 1.0 90.0 Cu-W out 8.3TCL.5L1.B2 1.0 0.0 Cu out 10.0

Appendix C
Database of LHC Beam 1collimators with tilt jaws
C.1 Operational conventions for the collimator jawsThe oparational naming conventions are shown in figure C.1.
Beam axis
Left
jaw
Rig
ht ja
w
LU RU
LD RD
x
s
Up-stream side
Down-stream side
TOP view
+θ -θ
-θ +θ
Figure C.1: Operational naming conventions for the collimator jaws.
For each jaw four corners are defined: the Left jaw Ustream end (LU), the Leftjaw Downstream end (LD), the Right jaw Upstream end (RU) and the Right jawDownstream end (RD).
A positive tilt angle θx for the left jaw correspond to having the LU corner closerto the beam axis. For the right jaw θx is positive if RU is further away from thebeam axis.
183
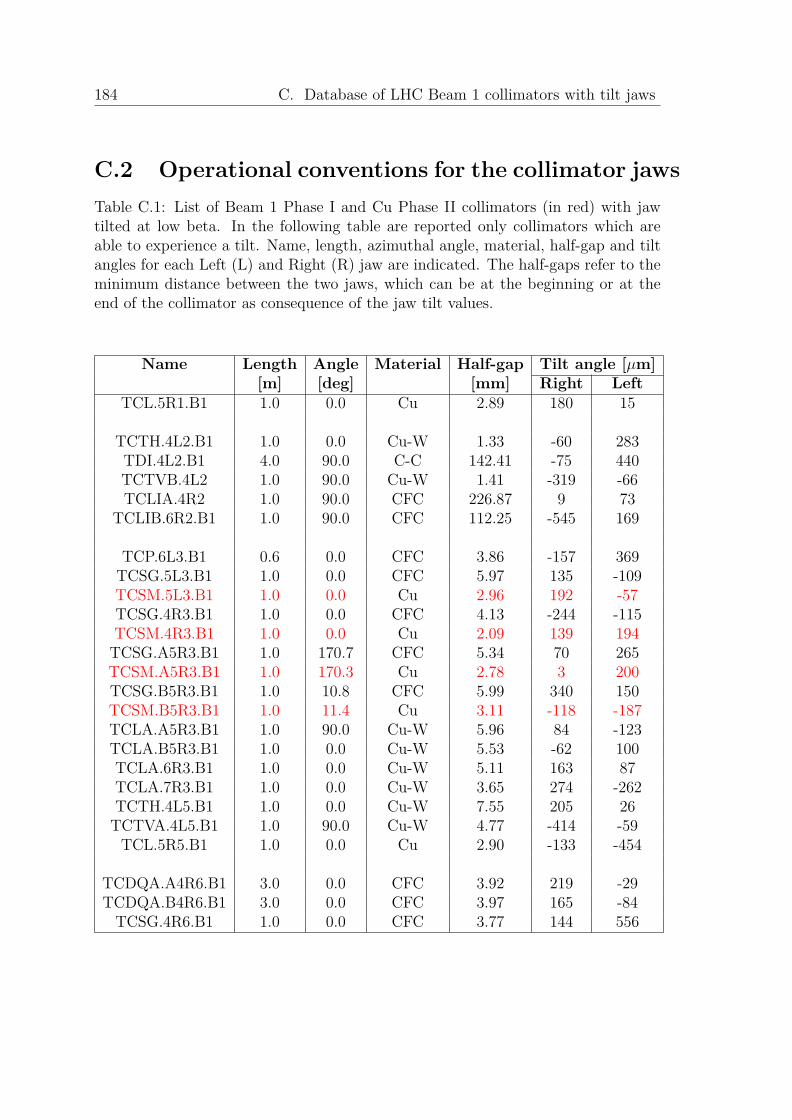
184 C. Database of LHC Beam 1 collimators with tilt jaws
C.2 Operational conventions for the collimator jawsTable C.1: List of Beam 1 Phase I and Cu Phase II collimators (in red) with jawtilted at low beta. In the following table are reported only collimators which areable to experience a tilt. Name, length, azimuthal angle, material, half-gap and tiltangles for each Left (L) and Right (R) jaw are indicated. The half-gaps refer to theminimum distance between the two jaws, which can be at the beginning or at theend of the collimator as consequence of the jaw tilt values.
Name Length Angle Material Half-gap Tilt angle [µm][m] [deg] [mm] Right Left
TCL.5R1.B1 1.0 0.0 Cu 2.89 180 15
TCTH.4L2.B1 1.0 0.0 Cu-W 1.33 -60 283TDI.4L2.B1 4.0 90.0 C-C 142.41 -75 440TCTVB.4L2 1.0 90.0 Cu-W 1.41 -319 -66TCLIA.4R2 1.0 90.0 CFC 226.87 9 73
TCLIB.6R2.B1 1.0 90.0 CFC 112.25 -545 169
TCP.6L3.B1 0.6 0.0 CFC 3.86 -157 369TCSG.5L3.B1 1.0 0.0 CFC 5.97 135 -109TCSM.5L3.B1 1.0 0.0 Cu 2.96 192 -57TCSG.4R3.B1 1.0 0.0 CFC 4.13 -244 -115TCSM.4R3.B1 1.0 0.0 Cu 2.09 139 194TCSG.A5R3.B1 1.0 170.7 CFC 5.34 70 265TCSM.A5R3.B1 1.0 170.3 Cu 2.78 3 200TCSG.B5R3.B1 1.0 10.8 CFC 5.99 340 150TCSM.B5R3.B1 1.0 11.4 Cu 3.11 -118 -187TCLA.A5R3.B1 1.0 90.0 Cu-W 5.96 84 -123TCLA.B5R3.B1 1.0 0.0 Cu-W 5.53 -62 100TCLA.6R3.B1 1.0 0.0 Cu-W 5.11 163 87TCLA.7R3.B1 1.0 0.0 Cu-W 3.65 274 -262TCTH.4L5.B1 1.0 0.0 Cu-W 7.55 205 26TCTVA.4L5.B1 1.0 90.0 Cu-W 4.77 -414 -59TCL.5R5.B1 1.0 0.0 Cu 2.90 -133 -454
TCDQA.A4R6.B1 3.0 0.0 CFC 3.92 219 -29TCDQA.B4R6.B1 3.0 0.0 CFC 3.97 165 -84TCSG.4R6.B1 1.0 0.0 CFC 3.77 144 556

C.2. Operational conventions for the collimator jaws 185
continued from previous pageName Length Angle Material Half-gap Tilt angle [µm]
[m] [deg] [mm] Right Left
TCP.D6L7.B1 0.6 90.0 CFC 1.18 130 78TCP.C6L7.B1 0.6 0.0 CFC 1.67 13 -78TCP.B6L7.B1 0.6 127.5 CFC 1.39 73 -115TCSG.A6L7.B1 1.0 141.1 CFC 6.32 -249 92TCSM.A6L7.B1 1.0 142.5 Cu 1.65 -337 34TCSG.B5L7.B1 1.0 143.5 CFC 7.50 -101 -105TCSM.B5L7.B1 1.0 141.6 Cu 2.01 293 -452TCSG.A5L7.B1 1.0 40.7 CFC 7.65 148 92TCSM.A5L7.B1 1.0 42.7 Cu 2.03 -254 72TCSG.D4L7.B1 1.0 90.0 CFC 4.95 37 -221TCSM.D4L7.B1 1.0 90.0 Cu 1.27 309 -169TCSG.B4L7.B1 1.0 0.0 CFC 6.95 -2 22TCSM.B4L7.B1 1.0 0.0 Cu 1.80 -106 1TCSG.A4L7.B1 1.0 134.6 CFC 6.90 102 249TCSM.A4L7.B1 1.0 135.7 Cu 1.82 50 -41TCSG.A4R7.B1 1.0 46.3 CFC 6.93 264 -82TCSM.A4R7.B1 1.0 45.2 Cu 1.83 -73 -113TCSG.B5R7.B1 1.0 141.5 CFC 7.98 6 33TCSM.B5R7.B1 1.0 139.6 Cu 2.13 -160 27TCSG.D5R7.B1 1.0 51.4 CFC 8.01 -4 18TCSM.D5R7.B1 1.0 53.3 Cu 2.09 74 147TCSG.E5R7.B1 1.0 130.5 CFC 8.02 336 371TCSM.E5R7.B1 1.0 128.5 Cu 2.09 -35 209TCSG.6R7.B1 1.0 0.5 CFC 10.97 -197 -175TCSM.6R7.B1 1.0 0.0 Cu 2.85 280 146TCLA.A6R7.B1 1.0 90.0 Cu-W 1.54 -108 62TCLA.B6R7.B1 1.0 0.0 Cu-W 2.84 266 225TCLA.C6R7.B1 1.0 90.0 Cu-W 2.77 -37 -114TCLA.D6R7.B1 1.0 0.0 Cu-W 1.79 42 267TCLA.A7R7.B1 1.0 0.0 Cu-W 1.76 -377 -182
TCTH.4L8.B1 1.0 0.0 Cu-W 1.28 181 -14TCTVB.4L8 1.0 90.0 Cu-W 1.35 215 -141
TCTH.4L1.B1 1.0 0.0 Cu-W 7.55 53 -258TCTVA.4L1.B1 1.0 90.0 Cu-W 4.77 121 -99

186 C. Database of LHC Beam 1 collimators with tilt jaws

Bibliography
[1] L. Evans “The Large Hadron Collider: A Marvel of Technology”, EPFL Press,2009.
[2] http://cms.cern.ch/iCMS/, CMS Collaboration.
[3] http://atlas.web.cern.ch/Atlas/internal/tdr.html, ATLAS Technical Design Re-ports.
[4] http://lhcb.web.cern.ch/lhcb/TDR/TDR.htm, LHCb Technical Design Reports.
[5] “LHCf experiment : Technical Design Report”, CERN Editorial Board, CERN-2006-004, 2006.
[6] http://totemtdr.web.cern.ch/totemtdr/, TOTEM Technical Design Reports.
[7] http://alice.web.cern.ch/Alice/TDR/, ALICE Technical Design Reports.
[8] “LHC Design Report, Volume I: The LHC Main Ring”, CERN Editorial Board,CERN-2004-003, 2004.
[9] J.B. Jeanneret, D. Leroy, L. Oberli and T. Trenckler, “Quench levels and tran-sient beam losses in the LHC magnets”, LHC Project Report 44, 1996.
[10] R. Assmann et al., “Requirements for the LHC collimation system”, proceedingsof the European Particle Accelerator Conference EPAC02, Paris, France, 2002.
[11] M. Lamont, Estimates of annual proton doses in the LHC, LHC Project Note375, 2005.
[12] R. Assmann et al., “Designing and building a collimation system for the highintensity LHC beam”, LHC Project Report 640.
[13] R. Assmann, “Collimators and cleaning: could that limit the LHC perfor-mance?”, proceedings of the Chamonix XII Workshop, 2003.
[14] G. Robert-Demolaize et al., “A new version of SixTrack with collimation andaperture interface”, proceedings of the 21st Particle Accelerator ConferencePAC05, Knoxville, TN, USA, 2005.
187

188 Bibliography
[15] E.B. Holzer et al., “Generation of 1.5 million beam loss threshold values”, pro-ceedings of the European Particle Accelerator Conference EPAC08, Genoa, Italy,2008.
[16] B. Goddard et al., “Protection of the LHC against unsynchronised beam aborts”,LHC Project Report 916, 2006.
[17] E. Metral et al., “Transverse impedance of LHC collimators”, LHC ProjectReport 1015, 2007.
[18] F. Zimmermann et al., “Tune shift induced by nonlinear resistive wall wake fieldof flat collimator”, proceedings of the European Particle Accelerator ConferenceEPAC06, Edinburgh, UK, 2006.
[19] J. Gareyte, J.P. Koutchouk, F. Ruggiero, “Landau Damping, Dynamic Apertureand Octupole in LHC”, LHC Project Report 91 (revised), 1997.
[20] G. Kotzian, W. Höfle, E. Vogel, “LHC transverse feedback damping efficiency”,LHC Project Report 1156, 2008.
[21] S. Calatroni, R. Perret, W. Vollenberg, “RF contacts for the LHC collimators”,Nuclear Instrumentation and Methods in Physics Research A566 (2006) 205-211.
[22] H. Burkhard et al., “Measurements of the LHC collimator Impedance with beamin the SPS”, Nuclear Instrumentation and Methods in Physics Research A566(2006) 205-211.
[23] T. Trenkler and J.B. Jeanneret, “The principles of two stage betatron and mo-mentum collimation in circular accelerators”, LHC note 312, 1995.
[24] S. Redaelli, R. Assmann and G. Robert-Deomlaize, “LHC aperture and com-missioning of the collimation system”, proceedings of the LHC Project Workshop“Chamonix XIV”, 2005.
[25] J.B. Jeanneret, “Optics of a two-stage collimation system”,Physical ReviewSpecial Topics: Accelerators and Beams, 1998.
[26] P. Sievers et al., “Appropriate materials for LHC-Collimators”, proceedings ofthe Chamonix XII Workshop, 2003.
[27] R. Assmann, “The Phased implementation of the LHC collimation”, HHH-2008Proceeding, 2008.
[28] R. Assmann, “Operational Experience with LHC Collimation”, proceedings ofthe 23rd Particle Accelerator Conference PAC09, Vancouver, Canada, 2009.
[29] A. Bertarelli et al., “The mechanical design for the LHC collimators”, LHCProject Report 786, 2004.
Bibliography 189
[30] A. Masi, R. Losito, “LHC Collimator Lower Level Control System”, 15th IEEENPSS Real Time Conference 2007.
[31] V. Vlachoudis et al. “Conseguences of Regular and Irregular Beam Impact on theLHC Collimators”, proceedings of the European Particle Accelerator ConferenceEPAC04, Lucerne, Switzerland, 2004.
[32] C. Bracco, “Commissioning Scenarios and Tests for the LHC Collimation Sys-tem”, PhD thesis, École Polytechnique Fédérale de Lausanne, 2008.
[33] H. Braun et al. “Collimation of Heavy Ion Beams in LHC”, proceedings of theEuropean Particle Accelerator Conference EPAC04, Lucerne, Switzerland, 2004.
[34] V. Shiltsev et al., “LHC particle collimation by hollow electron beams”, pro-ceedings of the European Particle Accelerator Conference EPAC08, Genoa, Italy,2008.
[35] R. Assmann, G. Bellodi, J.M. Jowett, E. Metral, T. Weiler, “Accelerator physicsconcept for upgraded LHC collimation performance”, proceedings of the 23rdParticle Accelerator Conference PAC09, Vancouver, Canada, 2009.
[36] W. Scandale, “Crystal collimation as an option for the LHC”, proceedings ofInternational Conference on Charged and Neutral Particles Channeling Phenom-ena, Frascati, Italy, 2006.
[37] J. Resta Lopez, R. Assmann, S. Redaelli, G. Robert-Demolaize, D. Schulte,F. zimmermann, A. Faus-Golfe “An alternative non linear collimation systemfor the LHC”, LHC-Project-Report-939, proceedings of the European ParticleAccelerator Conference EPAC06, Edinburgh, UK, 2006.
[38] J. Smith et al., “Prospect for integrating a hollow electron lens into the LHCCollimation system”, proceedings of the 23rd Particle Accelerator ConferencePAC09, Vancouver, Canada, 2009.
[39] H. Grote, F. Schmidt, “MAD-X − an upgrade from MAD8”, proceedings of the20th Particle Accelerator Conference PAC03, Portland, OR, USA, 2003.
[40] F. Schmidt, “SixTrack, user reference manual”, CERN SL/94-56, 1994.
[41] T. Trenkler, J.B. Jeanneret, “K2, a software package evaluating collimationsystems in circular colliders (manual)”, CERN SL/94105 (AP), 1994.
[42] R. Assmann, S. Redaelli, “Beam distribution on the collimators for vari-ous accident cases”, http://lhc-collimation-project.web.cern.ch/lhc-collimation-project/AccidentInput.htm
190 Bibliography
[43] G. Battistoni, S. Muraro, P.R. Sala, F. Cerutti, A. Ferrari, S. Roesler, A. Fassó,J. Ranft, “The FLUKA code: Description and benchmarking”, proceedings of theHadronic Shower Simulation Workshop 2006, Fermilab 6–8 September 2006, M.Albrow, R. Raja eds., AIP Conference Proceeding 896, 31-49, 2007.
[44] A. Fassó, A. Ferrari, J. Ranft, and P.R. Sala, “FLUKA: a multi-particle trans-port code”, CERN-2005-10, 2005, INFN/TC_05/11, SLAC-R-773.
[45] M. Brugger, H. Khater, S. Mayer, A. Prinz, S. Roesler, L. Ulrici, H. Vincke,“Benchmark studies of induced radioactivity produced in LHC materials, PartII: remanent dose rates”, proceedings of the 10th International Conference onRadiation Shielding ICRS10, Maidera Island, Portugal, 2004.
[46] M.E. Law et al., “A compilation of Data on Inclusive Reactions”, LBL-80(1972).
[47] M. Adamus et al., “Charged Particle Production in K+p, pi+p and pp Interac-tions at 250 GeV/c”, Z. Phys. C39 (1988) 311.
[48] H.A. Bethe, “Molière’s theory of multiple scattering”, Physical Review 89,pp.1256-1266, 1953.
[49] C. Amsler et al., “Passage of particles through matter”, Phys. Leet. B667,1(2008).
[50] J. Bak et al., NPB288 (1987) 681.
[51] T. Enqvist et al., “Primary-residue production cross sections and kinetic en-ergies in 1AGeV 208Pb on deuteron reactions”, Nuclear Physics A686 (2001)481.
[52] W. Guber, J. Nagel, R. Goldstein, P.S. Mettelman and M.H. Kalos, “A geo-metric description techinque suitable for computer analysis of both nuclear andconventional vulnerability of armored military vehicles”, Mathematical Applica-tion Group, Inc. Report MAGI-6701 (1967).
[53] H. Lichtenstein, M.O. Cohen, H.A. Steinberg, E.S. Troubetzkoy, M. Beer, “TheSAM-CE Monte Carlo system for radiation transport and criticality calcula-tions in complex configurations (Revision 7.0)”, RSIC Computer Code CollectionCCC-187 (1979)-/Lic79
[54] M. Santana Leitner et al., “Energy deposition studies for the Betatron Clean-ing insertion (IR7) of LHC”, LHC-Project-Report-825, proceedings of the 21stParticle Accelerator Conference PAC05, Knoxville, TN, USA, 2005.

Bibliography 191
[55] S. Russenschuck, “ROXIE - A Computer Code for the Integrated Design ofAccelerator Magnets”, LHC-Project-Report-276, proceedings of the EuropeanParticle Accelerator Conference EPAC98, Stockholm, Sweden, 1998.
[56] V. Vlachoudis, “BRexx Overview”, Rexx Symposium 2001, Researcg TrianglePark, NC, USA, 2001.
[57] D. Kramer, “Design and Implementation of a Detector for High Flux MixedRadiation Fields”, p. 98, CERN-THESIS-2008-090, 2008.
[58] D. Kramer et al., “Very High Radiation Detector for the LHC BLM SystemBased on Secondary Electron Emission”, IEEE Nuclear Science Symposium Con-ference Record, 2007.
[59] F. Cerutti, “Material choice from the point of view of energy deposition”, talkpresented at the 2nd Phase 2 Specification and Implementation meeting, CERN,Feb 8th, 2008.
[60] L. Lari et al., “Preliminary exploratory study of different Phase II collima-tors”, LHC-Project-Report-1114, proceedings of the European Particle Acceler-ator Conference EPAC08, Genoa, Italy, 2008.
[61] M. Brugger, D. Forkel-Wirth, S. Roesler, “Generic studies of radioactivity in-duced by high energy beams in different absorber materials”, talk presented atthe 11th International Conference on Radiation Shielding,ICRS-11, CallawaysGarden, GA, USA, April 13-18th, 2008.
[62] M. Brugger, F. Cerutti, A. Ferrari, L. Lari, M. Mauri, S. Roesler, L. Sarchi-apone, V. Vlachoudis, “LHC Accelerator design studies on the example of Pas-sive Absorbers”, proceedings of the 11th International Conference on RadiationShielding,ICRS-11, Callaways Garden, GA, USA, April 13-18th, 2008. Nucleartechnology, ISSN 0029-5450, 2008.
[63] F. Cerutti, “Energy deposition studies for the LHC Phase II collimation”, talkpresented at the Conceptual Design Review LHC Phase II Collimation, CERN,2009.
[64] J. Frisch et al., “Advanced collimator engineering for the NLC”, proceedings ofthe 19th Particle Accelerator Conference PAC01, Chicago, IL, USA, 2001.
[65] J. Amann, G. Anzalone, R. Assmann, C. Bracco, Y.Cai, E. Doyle, L. Keller, L.Lari, S. Lundgren, T. Markiewicz, T. Raubenheimer, R. Rogers, J. Smith, Th.Weiler, L. Xiao, “LHC Phase II Rotary Consumable Collimator - RC1 Concep-tual Design Report”, Rev 4, SLAC (2009).

192 Bibliography
[66] L. Lari et al., “Evaluation of Beam losses and enregy depositions for possiblePhase II design for LHC collimation”, LHC-Project-Report-1115, proceedings ofthe European Particle Accelerator Conference EPAC08, Genoa, Italy, 2008.
[67] J. Smith et al., “Mechanical and thermal prototype testing for a rotatable colli-mator for the LHC Phase II collimation upgrade”, proceedings of the EuropeanParticle Accelerator Conference EPAC08, Genoa, Italy, 2008.
[68] C. Hassler et al., “Beam line design for the CERN HiRadMat test facility ”,sLHC-Project-Report-0012, proceedings of the 23rd Particle Accelerator Confer-ence PAC09, Vancouver, Canada, 2009.
[69] A. Dallocchio et al., “Advanced material for future Phase II LHC collima-tors”, proceedings of the 23rd Particle Accelerator Conference PAC09, Vancouver,Canada, 2009.
[70] P. Collier, M. Ferro-Luzzi, N. Phinney, M. Seidel, P. Spiller, R. Van Weelderen,F. Willeke, “Conceptual design review of a Phase II collimation system for LHC- Report of the Review Committee”, CERN, March 2009.
[71] E. Metral et al., Minutes of the 6th Phase II Design Meeting, CERN, April2008.
[72] F. Caspers et al., Minutes of the 7th and 8th Phase II Design Meeting, CERN,April - June 2008. http:lhccollimationprojectmeeting_phase2_design.htm
[73] A. Dallocchio, “Phase II collimators: design status”, talk presented at the 12thPhase 2 Design meeting, CERN, May 20th, 2009.
[74] L. Lari et al., “Energy deposition studies for possible innovative Phase II colli-mator designs”, CERN-ATS-2009-128, proceedings of the 23rd Particle Acceler-ator Conference PAC09, Vancouver, Canada, 2009.
[75] S. Redaelli et al., “Operational experience with a LHC collimator prototype inthe CERN SPS”, proceedings of the 23rd Particle Accelerator Conference PAC09,Vancouver, Canada, 2009.
[76] S. Redaelli et al., “LHC aperture and commissioning of the Collimation system”,ChamonixXIV, CERN-AB-2005-014, 2005 pp. 268-277.
[77] Safety Code F, Radiation Safety Manual, Revision 2006, CERN.
[78] Council Directive 96/29/EURATOM of 13 May 1996, Office Journal of theEuropean Communities, Vol. 39, L159, 1996.
[79] H. Vincke et al., “Investigation of the radiation protection issues of the TI8injection and TT40 material tests”, CERN-SC-2005-038, 2005.

Bibliography 193
[80] S. Roesler, G. R. Stevenson, “deq99.f - A FLUKA user-routine converting flu-ence into effective dose and ambient dose equivalent”, CERN-SC-2006-070-RP-TN, 2006.
[81] M. Pelliccioni, “Overview of fluence-to-effective dose and fluence-to-ambientdose equivalent conversion coefficients for high energy radiation calculated usingthe FLUKA code”, Radiation Protection Dosimetry 88, 2000 pp. 279-297.
[82] M. Brugger, D. Forkel-Wirth, S. Roesler, “Radiological considerations for pas-sive absorbers in the LHC betatron cleaning insertion”, CERN-SC-2007-056-RP-TN, 2005.
[83] P. Bonnal, D. Forkel-Wirth, “Criteres et exigences ALARA applicables aux in-terventions”, Note d’information, RGE 9/S5-GSI1 (EDMS no. 810176), CERN2006.
[84] D.R. Alexander, “Design issues for radiation tolerant microcircuits for space”,short course presented at the Nuclear and Space Radiation Effects ConferenceNSREC, Indian Wells, Ca, USA, 1996.
[85] P. Jarron et al., “Deep Submicron CMOS technologies for the LHC experiment”,proceedings of the 6th International Conference on Advanced Technology andParticle Physics, Villa Olmo, Italy, 1998.
[86] V. Vuillemin, F. Faccio “Summary of the Chamonix 2010 on Radiation to elec-tronics”, proceedings of Chamonix 2010 workshop on LHC performance, 2010.
[87] A. Ballarino, “Design of anMgB2 feeder system to connect groups of SuperCon-ducting magnets to remote power converters”, proceedings of the 9th EuropeanConference on Applied Superconductivity Eucas 2009, Dresden, Germany, 2009.
[88] Radiation to Electronic R2E study group, “R2E Overview of Critical LHCUnderground Areas”, http://r2e.web.cern.ch/R2E/, Area Overview, 2010.
[89] T. Wijnands, et al., “Review of exposed equipment in the LHC: a global view”,proceedings of Chamonix 2010 workshop on LHC performance, 2010.
[90] M. Brugger et al., “Review of critial radiation areas for LHC electronics andmitigation actions. Radiation monitoring and first results”, proceedings of Cha-monix 2010 workshop on LHC performance, 2010.
[91] R. Losito, “Where are we with the long-term plans and the CERN wide radiationpolicy”, proceedings of Chamonix 2010 workshop on LHC performance, 2010.
[92] L. Lari, “Phase II collimation impact on IR7”, presented at the R2E workshop,CERN, 2010.
194 Bibliography
[93] M. Brugger, “Update on Beam-Gas and Radiation Levels”, presented at theR2E workshop, CERN, 2010.
[94] C. Benvenuti et al., “Vacuum properties of TiZrV non-evaporable getter films”,published in Vacuum 60,2001 pp 57-65.
[95] G.H. Kinchin, R.S. Pease, “The Displacement of Atoms in Solids by Radiation”,Rep. Prog. Phys. Volume 18, Issue 1, 1955.
[96] M.J. Norgett, M.T. Robinson, I.M. Torrens, “A proposed method of calculatingdisplacement dose rates”, Nuclear Engineering and Design Volume 33, Issue 1,1974 pp 50-54.
[97] J. Lindhard, V. Nielsen, M. Scharff, P.V. Thomsen, Mat. Fys. Medd. Dan. Vid.Selsk Volume 33, Issue 10, 1963.
[98] “Stopping powers and ranges for protons and alpha particles”, InternationalCommission on Radiation Unit (ICRU) and measurement Report 49, 1993.
[99] Nuclear Energy Agency, NJOY General Nuclear Data Processing System forFiles in ENDF Format, http://www.nea.fr/dbprog/njoy-links.html.
[100] R.E. Stoller et al., “Molecular Dynamics Simulations Of High Energy Cas-cades”, Microstructure of Irradiated Materials, Materials Research Society, Pitts-burgh, USA, 1995, pp. 21Ű26.
[101] V. Vlachoudis et al., “dpa for FLUKA”, presented at the FLUKA user meeting,Nov., 2008.
[102] L.S Waters et al., “MCNPX 2.6.0 Manual”, LA-CP-07-1473, LANL, LosAlamos, April, 2008.
[103] J. F. Ziegler, M. D. Ziegler, J. P. Biersack, “SRIM, The Stopping and rangesof Ions in Matter”, Chester, MD, SRIM.com., 2007.
[104] K. Niita, et al., “PHITS, A particle and heavy ion transport code system”,Radiat. Meas. 41, 2006.
[105] N. V. Mokhov, C. C. James, “The MARS Code System UserŠs Guide Version15”, pubblished by the Fermi National Accelerator Laboratory, 2009.
[106] T. T. Bohlen, “Beam Loss Patterns at the LHC Collimators”, CERN-THESIS-2008-092, 2008.

Curriculum Vitae
Luisella Lari
PERSONAL INFORMATION
Name Luisella LARI
E-mail [email protected]@slac.stanford.edu
Nationality Italian
Date of birth June 15th 1973
EDUCATION
2010 PhD in physics at the École Polytechnique Fédérale deLausanne (EPFL), Switzerland.
Dec. 2008 Project Management Professional (PMP) certificationat Project Management Institute (PMI), USA.
Mar. 2003 Attestation of Chartered Engineer in Italy at Politecnicodi Torino, Italy.
Mar. 2001 Master degree in Nuclear Engineer at Politecnico diTorino, Italy.
Thesis title “Cooling installations in living spatial sys-tems: modelling and verifying of a hydraulic test stand”Supervisors: Magnifico Rettore 2001-2005 Prof. G. DelTin, Prof. M. De Salve, Eng. M. Crivello.
(Sept. 1998 - Sept. 1999) - Scholarship for MeritoriousUniversity Students at Politecnico di Torino, Italy.
WORK EXPERIENCE
From Nov. 2002 Physicist & Project Engineer
CERN - European Organization for Nuclear Research -CH-1211 Geneva 23, Switzerland.
* Responsible for MonteCarlo calculations used to eval-uate energy deposition and radiation loads related tothe protection of the LHC machine (Collimation Sys-tem Upgrade project).* Invited for my experience in the collimation field atSLAC National Accelerator Laboratory, Stanford, USAfrom Feb. to May 2009.* Responsible for specific cold and warm tests and mea-surements on LHC SuperConducting magnets, in re-sponse to urgent concerns during fabrication.* Supervision of technicians and definition of proceduresfor laboratory tests on accelerator magnets.* Schedule Officer for the LHC construction and Instal-lation General Co-ordination schedule (baseline cost-to-completion 3.3 BCHF).* Responsible for Organization and Work Package plan-ning, Follow-up, Review and Resource Management forseveral LHC main ring Installation sub-projects, includ-ing the General Services phase.
Nov. 1999 - Sept. 2002 Testing Engineer
Thales Alenia Space - Sede di Torino Strada Antica diCollegno, 253, 10146 Turin, Italy.
* Responsible for acceptance, verification and calibra-tion of fluid supply line for the International Space Sta-tion ISS project.* Two NASA awards obtained for outstanding perfor-mance of Node2 activities.* Stage (Nov. 1999 - Jun. 2001). Practical trainingperiod to develop my Master’s degree thesis.

MAIN PUBLICATIONS
As main author:
L.Lari et al. “Energy Deposition studies for possible innovative Phase II colli-mator designs” PAC09, Vancouver, Canada.
L.Lari et al. “Preliminary exploratory study of different Phase II collimators”,EPAC08, Genoa, Italy.
L.Lari et al. “Evaluation of beam loss and energy deposition for one possiblePhase II design for LHC collimation”, EPAC08, Genoa, Italy.
L.Lari et al. “Scheduling the installation of the LHC injection lines”, EPAC04,Lucerne, Switzerland.
As co-author:
D. Wollmann et al. “First cleaning with LHC collimators”, IPAC10, Kyoto,Japan.
J.C.Smith et al. “Recent Progress on the Design of a Rotatable Copper Colli-mator for the LHC Collimation Upgrade” PAC09, Vancouver, Canada.
J. Amann, G. Anzalone, R. Assmann, C. Bracco, Y. Cai, E. Doyle, L. Keller,L. Lari, S. Lundgren, T. Markiewicz, T. Raubenheimer, R. Rogers, J. Smith,Th. Weiler, L. Xiao, “LHC Phase II Rotatable Collimator - RC1 ConceptualDesign Report”, March 2009, SLAC, USA.
J.C.Smith et al. “Design of a Rotatable Copper Collimator for the LHC PhaseII Collimation Upgrade” EPAC08, Genoa, Italy.
M.Brugger et al. “FLUKA LHC Engineering studies on the example of Pas-sive Absorbers” ICRS-11 & RPSD-2008, Callaway Gardens, Pine Mountain,Georgia, USA.
K.Foraz et al. “Scheduling the installation of the Large Hadron Collider”,EPAC04, Lucerne, Switzerland.


Acknowledgments
It was a pleasure for me to work with all the wonderful people at CERN, EPFLand SLAC during this PhD time.
First of all I would like to thank my supervisors: Vasilis Vlachoudis at CERNand Leonid Rivkin at EPFL for their support, their interest in my research as wellas for our fruitful discussions. Thanks for guiding me along all this period and forgiving me the chance to participate in several interesting conferences.
Special thanks to Ralph Assmann, the project leader of the LHC collimationsystem, in particular for supporting my intership at SLAC laboratory in USA. Mythanks for opening me the doors of the international collimation community and forteaching me all the secrets about collimation theory.
Special thanks to Tor Raubenheimer and Thomas Markiewicz, my SLAC super-visors, who made me feel part of the SLAC team from the first day of working atthe laboratory.
Special thanks also to Alfredo Ferrari. My thanks for giving me the change ofbenefit from his amazing knowledge in Physics.
A huge “thank you!!” to Francesco Cerutti who always helped me in finding andsolving errors in the FLUKA simulations. Thanks for your door always opened. Abig thank also for the time you spent in reading this thesis and for providing helpfulsuggestions and remarks in order to improve it.
Many thanks also to Markus Brugger for supporting with your experience in thefield my ambient dose rates & radiation to electronics calculations. Moreover I wantto thank you for accepting to check my thesis chapters on these subjects.
Special thanks also to Chiara Bracco, who made “SixTrack” much less mysteriousto my hears.
Thanks to all the EN department people with whom I have been working duringthese years. In particular I would like to thank my group leader Roberto Lositowho hosted me in his group during this PhD and all the FLUKA team who madeFLUKA simulation pleasant and also funny. Thanks to all to made me feel a partof the team!
Additionally, I would like to thank several people with whom I have been collab-orating for the development of the CERN and SLAC Phase II design. In particular,special thanks to Stefan Roesler for your support in the radiation protection sub-jects. Many thanks to Alessandro Bertarelli and Alessandro Dallocchio and theEN/MME design team at CERN. Many thanks also to Jeffry Smith, Luis Kellerand Steven Lundgren and to the other members of the SLAC collimation team.
Last but not least, I wish to thank my family and my friends for enjoying life &PhD time together with me.
Thanks again sincerely to all of you!!