
Simulation of Beam Backgrounds from the LHC Ring to the ...
26
Simulation of Beam Backgrounds from the LHC Ring to the ATLAS Experiment THANOS MANOUSOS (CERN & AUTH) On behalf of the ATLAS Collaboration & R. Bruce(CERN), R. Kwee-Hinzmann(RHUL) Comparing Simulations with 2012 ATLAS background data
-
Upload
khangminh22 -
Category
Documents
-
view
4 -
download
0
Transcript of Simulation of Beam Backgrounds from the LHC Ring to the ...
Simulation of Beam Backgrounds from the LHC Ring to the ATLAS Experiment
T H A N O S M A N O U S O S ( C E R N & A U T H )On behalf of the ATLAS Collaboration & R. Bruce(CERN), R. Kwee-Hinzmann(RHUL)
Comparing Simulations with 2012 ATLAS background data

LHC and ATLAS
03/11/2016Thanos Manousos2016 IEEE NSS/MIC Nuclear Science Symposium
2
} 27km in circumference} 2 high luminosity experiments (ATLAS, CMS)} LHC operation in 2012:
} Peak instantaneous luminosity: 7.7x1033 cm-2s-1
} Bunch Intensity: up to 1.6x10¹¹ protons} Beam energy: 4.0 TeV} Number of bunches: 1374/beam
} Each beam included 6 unpaired bunches, for background monitoring
25m
44m
7000t weight
LHC schematic layout
LHC Interaction Region
03/11/2016Thanos Manousos2016 IEEE NSS/MIC Nuclear Science Symposium
3
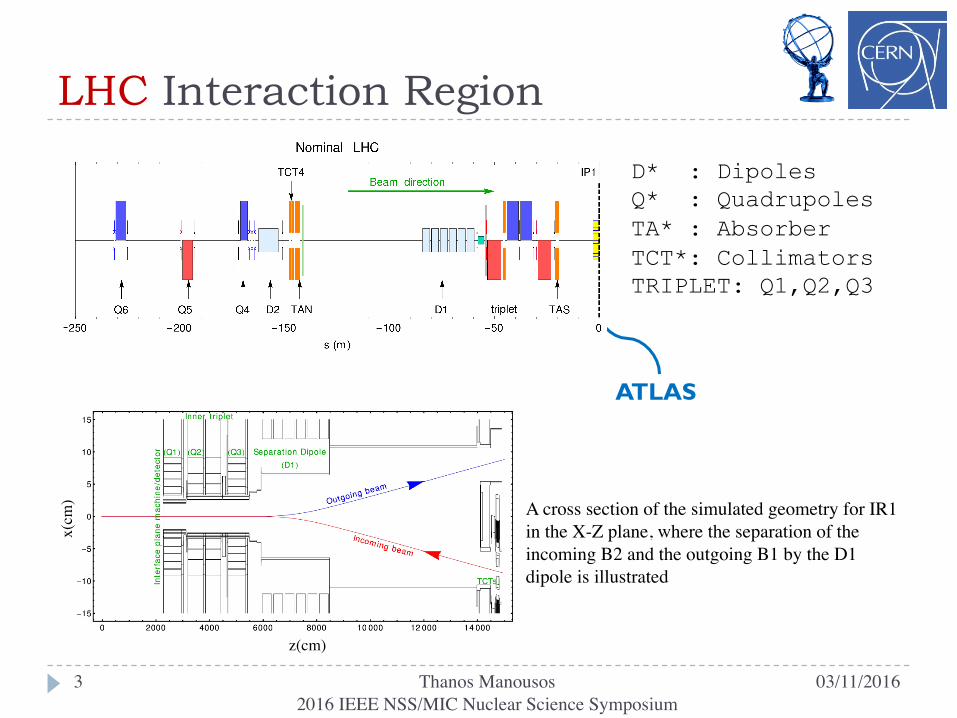
A cross section of the simulated geometry for IR1 in the X-Z plane, where the separation of the incoming B2 and the outgoing B1 by the D1 dipole is illustrated
D* : DipolesQ* : QuadrupolesTA* : AbsorberTCT*: CollimatorsTRIPLET: Q1,Q2,Q3
ATLAS
z(cm)
x(cm
)
-

LHC Beam Induced Backgrounds (BIB)
03/11/2016Thanos Manousos2016 IEEE NSS/MIC Nuclear Science Symposium
4
} The main sources of the BIB are:1. Elastic beam gas scattering around the ring, some of it hitting the TCTs
à recent tests verify it to be minor contribution2. Tertiary halo losses on the TCTs à per mil of total (confirmed by dedicated tests in 2015)3. Inelastic beam-gas events with contributions up to about 500m away from the Interaction
Point (IP) à dominant contribution (only these considered in this study)
Cold ArcPrimary
CollimatorSecondaryCollimators
ShowerAbsorbers
TertiaryCollimators
(TCTs) ATLAS
Circulating Beam
Primary Beam Halo
Secondary Beam Halo
Tertiary Beam Halo
Elastic Beam Gas Inelastic
Beam Gas
Cleaning Insertion
Cold Arc
Hadronic Showers
& Muons

AX+
AY+
AY-
AX-
} Four diamond modules per side arranged in a cross} Area: 0.8cm x 0.8cm, Thickness: 2 x 0.05cm} ±1.84m from the IP (TOF = 6.13ns)} +5.5cm from the beamline} 45deg tilt in z with respect to the beam pipe
} BCM background trigger: 1early + 1in-time hit } Early trigger time window at -6.25ns ± 2.73ns } In-time trigger time window at +6.25ns ± 2.73ns} IP-passage of the bunch is at 0
Background Monitoring Methods Beam Condition Monitors (BCMs)
03/11/2016Thanos Manousos2016 IEEE NSS/MIC Nuclear Science Symposium
5
BCM-C
Background Event
BCM-AIP
t = -6.13ns t = +6.13ns
Early trigger Window
In-Time triggerWindow
The BCM signal is histogramed into 64 bins, 390ps wide

Background Monitoring MethodsCalorimeter Jets in Background Analysis
03/11/2016Thanos Manousos2016 IEEE NSS/MIC Nuclear Science Symposium
6
} Hadronic Jet: is a collimated spray of hadrons from the pp-collision} Fake Jet: Local energy deposition due to radiative processes by a high-energy muon
that traverses the ATLAS calorimeters
} The components of the ATLAS Calorimetry system which measures the energy ofparticles are:} Liquid Argon (LAr) Calorimeter
} LAr electromagnetic barrel} LAr electromagnetic end-cap (EMEC)} LAr hadronic end-cap (HEC)} LAr forward (FCal)
} Tile Hadronic Calorimeter} Tile Barrel} Tile Extended Barrel
Tile Barrel
Tile Extended Barrel
FCal
LAr electromagneticbarrel
EMECHEC
Fake JetOutgoing
reconstructedmuon
Fake Jets backgrounds monitored with pT >10GeV jet trigger in unpaired bunches (*)
(*) pT is the component of momentum transverse to the beam line
μ

The pressure maps(*) used to normalisethe simulations have an uncertainty of a factor of ~2-3
(*) Provided by LHC vacuum group
Simulation MethodsFLUKA & Simulation Flowchart
03/11/2016Thanos Manousos2016 IEEE NSS/MIC Nuclear Science Symposium
7
} FLUKA is “a fully integrated particle physics MC simulation package”, with manyapplications in high energy physics, engineering, shielding detector design, etc.
} FLUKA simulations do not include the full ATLAS digitisation and reconstruction –thus simplified methods have been used to estimate the rates of observables

} BCM background trigger} Detailed geometry of the BCM modules in FLUKA } Record the arrival times (w.r. t. bunch crossing time)
of particles at the BCM modules} Charged particle with E>100keV(*) entering the
sensitive area of the BCM modules à hit} BCM triggers are formed by coincidences of hits
within BCM trigger windows
Simulation MethodsBackground Trigger Emulation
03/11/20168
(*) Results not very sensitive to this value
Thanos Manousos2016 IEEE NSS/MIC Nuclear Science Symposium
} Fake jet background trigger} Simulate local energy depositions
event-by-event in a binning with dr~10cm, dz~40cm, dφ=10deg
} After each event sum up energy of 27 bins around the bin with largest deposition
} Identify energy deposition clusters with pT >10GeV as fake jets

Data vs MCBCMs Trigger Rate
03/11/2016Thanos Manousos2016 IEEE NSS/MIC Nuclear Science Symposium
9
} The simulation gives a BCM background trigger rate of 0.678Hz/1011protons} Factor of ~1.4 higher than data but still within the uncertainties of the pressure map and of
the fill-to-fill spread
MC z=[22.6-546.6]m MC z=[0-22.6]m DATATrigger Rate
Hz/1011protons 0.669 0.09 0.48 (±0.16)
1374 bunches
Each point:one LHC fill
SimulatedTrigger Rate
NB: The simulations assume a LHC filling scheme with 1374 bunches. Therefore only data taken in suchconditions is included in the Data vs MC comparisons.

Data vs MCBCMs Time Distribution
03/11/2016Thanos Manousos2016 IEEE NSS/MIC Nuclear Science Symposium
10
} The histograms represent the hits of triggered events seen in one BCM module} The width of the simulated distribution has been adjusted by adding to the spread due to the 7.5cm LHC
bunch length (250ps) an instrumental resolution of 600ps, that agrees with the measured value from theBCM beam tests
} A time shift of -2 bins was determined by fitting the rising edge
Data MC z=[0-546.6]m MC z=[0-22.6]mIntegral 0.189 0.365 0.041
~90% of the background is from beam-gas events generated outside the ATLAS detector (z >22.6m)

Simulation ResultsMuons @ 22.6m away from IP
03/11/2016Thanos Manousos2016 IEEE NSS/MIC Nuclear Science Symposium
11
} Muons with E >20GeV are good candidates for generating a fake jet } The azimuthal distribution of muons reaching ATLAS is influenced by the beam-line
magnets (especially dipoles)} “Hot spots” in ±X mainly due to the D1 and D2 dipoles
Muons entering ATLAS cavern @ Interface Plane
Data vs MCFake Jets in the Calorimeters
03/11/2016Thanos Manousos2016 IEEE NSS/MIC Nuclear Science Symposium
12
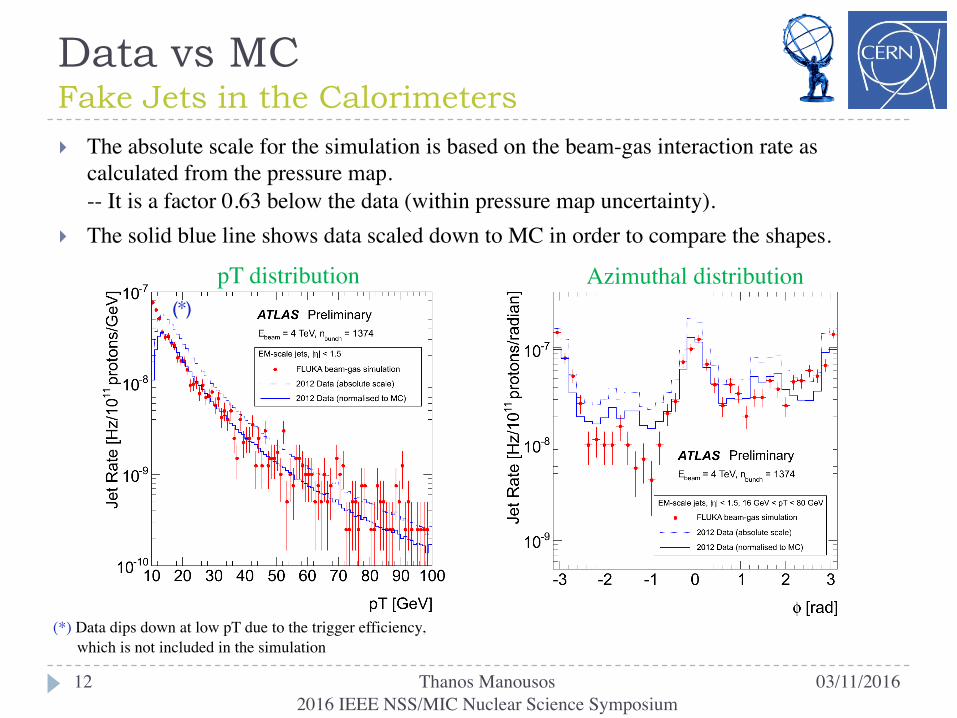
} The absolute scale for the simulation is based on the beam-gas interaction rate as calculated from the pressure map. -- It is a factor 0.63 below the data (within pressure map uncertainty).
} The solid blue line shows data scaled down to MC in order to compare the shapes.
Azimuthal distributionpT distribution
(*) Data dips down at low pT due to the trigger efficiency, which is not included in the simulation
(*)

TriggerWindow
Data vs MCFake Jets in the Calorimeters
03/11/2016Thanos Manousos2016 IEEE NSS/MIC Nuclear Science Symposium
13
} Rate of energy deposition clusters with pT >10GeV and the fake jet (pT >10GeV) distribution in the t-η plane (‘banana’ plot)
} The “pedestal” in ATLAS data is due to background from ghost charge (not in MC)} Entries falling outside of the trigger window are seen with reduced efficiency in data
Fake Jet ‘banana’ within trigger window
Beam direction
DATA Simulation
Early fake jets from next bunch crossingfalling into this trigger window
N. o
f Cou
nts

Simulation ResultsOrigin of BIBs
03/11/2016Thanos Manousos2016 IEEE NSS/MIC Nuclear Science Symposium
14
The generated events reflect the pressure distribution in the beam pipe
Beam-gas events giving a BCM BIB trigger originate from the Inner Triplet region (z ~22-55m) with a small contribution from the TCTs region (z ~150m)
Beam-gas events which have generated a fake jet in the calorimeters originate from beyond z ~150m.
BCM and Fake Jet rates probe pressure in different parts of the beam-pipePressure map uncertainties at these different z can be assumed to be almost uncorrelated

Conclusions & Summary
03/11/2016Thanos Manousos2016 IEEE NSS/MIC Nuclear Science Symposium
15
} First time that the LHC beam backgrounds in experiments are comparedwith simulations at a quantitative level
} FLUKA Simulations with simple “reconstruction” reproduce quite well theBCM and Fake Jet trigger rates seen in ATLAS data
} Simulation reproduce the shape of the time distribution of hits in the BCMs} The trigger rate is off by a factor <2, i.e. within the uncertainties of the pressure map
} Simulations reproduce the shape of the ’banana’ plots, the φ-distribution and the pT-distribution of fake jets} Simulation is a factor 0.63 below data, i.e. within the uncertainties of the pressure map
} Background seen by BCMs is originating from the Inner Triplet (z~22-55m)
} Fake jets are due to beam-gas events at z >150m

References1. ATLAS collaboration, “Beam-induced and cosmic-ray backgrounds observed in the ATLAS
detector during the LHC 2012 proton-proton running period”, Journal of Instrumentation 11 (2016) P05013
2. ATLAS collaboration, “The ATLAS Experiment at the CERN Large Hadron Collider” , Journal of Instrumentation 3 (2008) S08003
3. A. Ferrari, P.R. Sala, A. Fasso, and J. Ranft, “FLUKA: a multi-particle transport code”,CERN-2005-10 (2005), INFN/TC_05/11, SLAC-R-773
4. R. Bruce, R.W. Assmann, V. Boccone, G. Bregliozzi, H. Burkhardt, F. Cerutti, A. Ferrari, M. Huhtinen, A. Lechner, Y. Levinsen, A. Mereghetti, N.V. Mokhov, I.S. Tropin, V. Vlachoudis, “Sources of machine-induced background in the ATLAS and CMS detectors at the CERN Large Hadron Collider”, Nuclear Instruments and Methods in Physics Research A 729 (2013) 825 – 840
5. V. Cindro et al, “The ATLAS Beam Conditions Monitor”, Journal of Instrumentation 3 P02004
03/11/2016Thanos Manousos2016 IEEE NSS/MIC Nuclear Science Symposium
16

The End
03/11/201617 Thanos Manousos2016 IEEE NSS/MIC Nuclear Science Symposium

Backup Slides

Definitions / nomenclatureLHC: Large Hadron Collider
ATLAS: A Toroidal LHC ApparatuS
BIB: Beam-Induced Backgrounds (beam gas or collimator debris)
BCID: Group of 10 RF buckets, centered around the nominal bucket
ATLAS Side A: Incoming beam 1
ATLAS Side B: Incoming beam 2
Filled BCID: BCID containing a bunch
Ghost bunch: Any charge outside a filled BCID
θ: Polar angle w.r.t. the beam-line
η: Pseudorapidity = −ln(𝑡𝑎𝑛 )*)
pT: The component of momentum transverse to the beam line
ℒ: Luminosity = -./0/1
03/11/2016Thanos Manousos2016 IEEE NSS/MIC Nuclear Science Symposium
19

03/11/2016Thanos Manousos2016 IEEE NSS/MIC Nuclear Science Symposium
20
} The LHC RF system forms 35640 buckets. In 2012, every 20th bucket was filled
} The LHC bunches are grouped into 2 categories:} Paired: Both beams have protons à physics
} Unpaired: Only one beam has protons à beam background monitoring
} Most of the LHC buckets do not contain a bunch} These buckets still can contain small amount of particles, which are called satellite or ghost bunches,
depending on distance to a filled bunch
2.5 ns
RF Bucket
DE
time
LHC bunch spacing = 50 ns - 20 buckets in 2012
Ghost / SatelliteFilled bunch
NB: The simulations assume a LHC filling scheme with 1374 bunches. Therefore only data taken in suchconditions is included in the Data vs MC comparisons.
LHC Bunch Structure

ATLAS FLUKA Geometry
03/11/2016Thanos Manousos2016 IEEE NSS/MIC Nuclear Science Symposium
21
Transversal cut of the ATLAS FLUKA geometry | X-Z plane
ATLAS Trigger System
03/11/2016Thanos Manousos2016 IEEE NSS/MIC Nuclear Science Symposium
22
} The Level-1(L1) Trigger is the first stage of event selection in ATLAS
} The L1 Trigger fires on physics objects, such as:missing transverse energy, candidate electrons, photons, jets and muons
} It has a decision time less that 2.5μs and an output rate of ~75kHz in 2012
} For the study of beam backgrounds dedicated triggers on unpaired bunches areused:
} A Jet trigger with a pT >10GeV
} A background like trigger from the BCM detector

Normalisation with Pressure Map} Initial file (events reaching ATLAS interface plane)
created assuming uniform pressure of N2 between 22.6-546.5m
} For many events nothing is reaching the interface plane
} Prior to pressure normalisation have to ‘top–up’ with empty events (uniform distr. within 22.6-546.5m) to achieve the correct weighting for the MC
03/11/2016Thanos Manousos2016 IEEE NSS/MIC Nuclear Science Symposium
23
} p-N interaction probability calculated from pressure map profile (provided by LHC/VAC)
} New distribution by applying p-N interaction probability at the origin of the events.
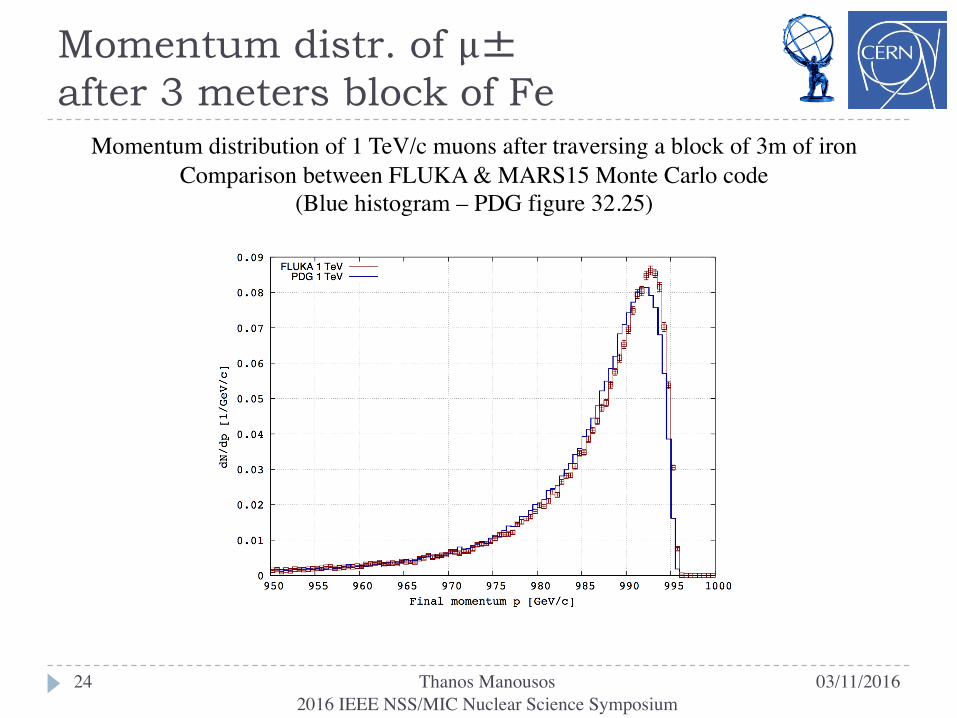
Momentum distr. of μ±after 3 meters block of Fe
03/11/2016Thanos Manousos2016 IEEE NSS/MIC Nuclear Science Symposium
24
Momentum distribution of 1 TeV/c muons after traversing a block of 3m of ironComparison between FLUKA & MARS15 Monte Carlo code
(Blue histogram – PDG figure 32.25)

Simulations Fake Jets in the Calorimeters
03/11/2016Thanos Manousos2016 IEEE NSS/MIC Nuclear Science Symposium
25
} The curvature of the ‘banana’ shapedepends on the radial position in thecalorimeter
} In the Downstream Endcap the clustersare almost in time with the collisionjets
} In the Upstream Endcap since allentries fall outside the trigger window(red lines) and would not be seen bydata

SimulationsFake Jets in the Calorimeters
03/11/2016Thanos Manousos2016 IEEE NSS/MIC Nuclear Science Symposium
26
} The normalisation by /cm3 removes thedependence of the exact calorimetergeometry, the amount of material along zand the radial bin size
Radial distribution of the rate of simulated energy deposition clusters with pT >10 GeVin the 4 calorimeters