Bayesian Robust Learning in Chain Graph Models for ... - arXiv
68
Bayesian Robust Learning in Chain Graph Models for Integrative Pharmacogenomics Moumita Chakraborty 1 , Veerabhadran Baladandayuthapani 2 , Anindya Bhadra 3 , and Min Jin Ha *1 1 Department of Biostatistics, The University of Texas MD Anderson Cancer Center, Houston, TX 2 Department of Biostatistics, University of Michigan, Ann Arbor, MI 3 Department of Statistics, Purdue University, West Lafayette, IN Abstract Integrative analysis of multi-level pharmacogenomic data for modeling depen- dencies across various biological domains is crucial for developing genomic-testing based treatments. Chain graphs characterize conditional dependence structures of such multi-level data where variables are naturally partitioned into multiple ordered layers, consisting of both directed and undirected edges. Existing literature mostly focus on Gaussian chain graphs, which are ill-suited for non-normal distributions with heavy-tailed marginals, potentially leading to inaccurate inferences. We propose a Bayesian robust chain graph model (RCGM) based on random transformations of marginals using Gaussian scale mixtures to account for node-level non-normality in continuous multivariate data. This flexible modeling strategy facilitates identifica- tion of conditional sign dependencies among non-normal nodes while still being able to infer conditional dependencies among normal nodes. In simulations, we demon- strate that RCGM outperforms existing Gaussian chain graph inference methods in data generated from various non-normal mechanisms. We apply our method to ge- nomic, transcriptomic and proteomic data to understand underlying biological pro- cesses holistically for drug response and resistance in lung cancer cell lines. Our analysis reveals inter- and intra- platform dependencies of key signaling pathways to monotherapies of icotinib, erlotinib and osimertinib among other drugs, along with shared patterns of molecular mechanisms behind drug actions. Keywords: Bayesian graphical models; Cancer; Data integration; Robust graphical models; Multi-platform genomics; Pharmacogenomics. * Email: [email protected] 1 arXiv:2111.11529v1 [stat.AP] 22 Nov 2021
-
Upload
khangminh22 -
Category
Documents
-
view
1 -
download
0
Transcript of Bayesian Robust Learning in Chain Graph Models for ... - arXiv

Bayesian Robust Learning in Chain GraphModels for Integrative Pharmacogenomics
Moumita Chakraborty1, Veerabhadran Baladandayuthapani2, AnindyaBhadra3, and Min Jin Ha∗1
1Department of Biostatistics, The University of Texas MD AndersonCancer Center, Houston, TX
2Department of Biostatistics, University of Michigan, Ann Arbor, MI3Department of Statistics, Purdue University, West Lafayette, IN
Abstract
Integrative analysis of multi-level pharmacogenomic data for modeling depen-dencies across various biological domains is crucial for developing genomic-testingbased treatments. Chain graphs characterize conditional dependence structures ofsuch multi-level data where variables are naturally partitioned into multiple orderedlayers, consisting of both directed and undirected edges. Existing literature mostlyfocus on Gaussian chain graphs, which are ill-suited for non-normal distributions withheavy-tailed marginals, potentially leading to inaccurate inferences. We propose aBayesian robust chain graph model (RCGM) based on random transformations ofmarginals using Gaussian scale mixtures to account for node-level non-normality incontinuous multivariate data. This flexible modeling strategy facilitates identifica-tion of conditional sign dependencies among non-normal nodes while still being ableto infer conditional dependencies among normal nodes. In simulations, we demon-strate that RCGM outperforms existing Gaussian chain graph inference methods indata generated from various non-normal mechanisms. We apply our method to ge-nomic, transcriptomic and proteomic data to understand underlying biological pro-cesses holistically for drug response and resistance in lung cancer cell lines. Ouranalysis reveals inter- and intra- platform dependencies of key signaling pathways tomonotherapies of icotinib, erlotinib and osimertinib among other drugs, along withshared patterns of molecular mechanisms behind drug actions.
Keywords: Bayesian graphical models; Cancer; Data integration; Robust graphical models;
Multi-platform genomics; Pharmacogenomics.∗Email: [email protected]
1
arX
iv:2
111.
1152
9v1
[st
at.A
P] 2
2 N
ov 2
021

1 Introduction
Pharmacogenomics encapsulates genomic mechanisms governing variable drug response and
has been implemented into drug development pipeline to improve drug effectiveness and
to reduce adverse drug reactions and toxicity (Squassina et al., 2010; Roden et al., 2019).
In cancer, utilizing the underlying genomic profile of tumors, especially the downstream
effects of genes and their products for better understanding drug mechanisms, can lead to
the development of more effective and robust treatment regimes (Kasarskis et al., 2011).
In non-small cell lung cancer (NSCLC) patients, for example, clinical trials have shown
that the epidermal growth factor receptor (EGFR) T790M mutation confers resistance to
first-generation tyrosine kinase inhibitors (TKIs), which has led to the development of new
EGFR inhibitors such as osimertinib that show efficacy superior to that of standard EGFR-
TKIs (Mok et al., 2017; Soria et al., 2018). Patients with atypical EGFR mutations, on
the other hand, show heterogeneous and reduced responses to EGFR inhibitors including
osimertinib, and there are currently no established guidelines for the uncommon muta-
tions (Robichaux et al., 2021). The basic underlying premise is that accounting for the
heterogeneity in drug sensitivity in relation to multiple molecular domains, while utilizing
preclinical models of human cancer, is a key step toward discovering holistic functional
mechanisms of anticancer drugs, which could facilitate better systems for classifying tumor
and more robust clinical trial designs (Bedard et al., 2013; Lim and Ma, 2019).
These efforts have been catalyzed through consortium-level efforts such as the Can-
cer Dependency Map (The DepMap Portal; www.depmap.org), which provides a rich data
repository for human cancer cell lines that encompass various types of primary cancers for
identifying targetable genes and their functional relations across diverse domains of biolog-
ical information. The portal includes multi-platform data such as copy number alteration
(CNA), mRNA expression, and reverse phase protein array (RPPA) based protein expres-
2

sion obtained from the Cancer Cell Line Encyclopedia (CCLE) (Ghandi et al., 2019). It
also contains drug sensitivity outcomes of more than 4, 000 drugs for these CCLE samples,
which are based on high-throughput growth-inhibitory drug activities screened using Pro-
filing Relative Inhibition Simultaneously in Mixtures (PRISM) technology (Corsello et al.,
2020). Most existing pharmacogenomic analyses are limited to identifying the associa-
tion of molecular features with drug sensitivity without characterization of within- and
cross-platform dependencies (Iorio et al., 2016; Corsello et al., 2020). A unified framework
that provides a detailed characterization of multi-platform regulatory behavior can help in
identifying key biological mechanisms of drug action to facilitate drug development.
To this end, we employ a graph-theoretic approach that captures dependencies among
biological variables, where a node represents information on each unit and an edge be-
tween two nodes is an indicator of interaction or dependence between the corresponding
biological units. For multi omic data, we assume that the entire set of nodes is partitioned
into multiple platforms that are ordered based on fundamental biological principles. The
platforms corresponding to datasets in our study are assumed to be ordered as: CNA →
mRNA→RPPA→ Drugs, so that platforms lower in the hierarchy regulate data in higher
platforms (Morris and Baladandayuthapani, 2017). This conceptual structure of our data is
explained through Figure 1a, which can be cast as a chain graph structure, where the set of
nodes can be naturally partitioned into disjoint subsets, called layers with a pre-established
order induced by biology. Edges between nodes within a layer are undirected and those
between layers are directed, pointing towards the layer placed higher in the hierarchy.
Joint modeling of the mixed dependency structure in a chain graph, containing hi-
erarchical multiple sub-graphs with directed and undirected edges, engenders substantial
methodological and technical challenges. Most existing approaches rely on Gaussian as-
sumptions on chain graphs, that simplify the methodological and computational complex-
ities. Two-layer Gaussian chain graph models (GCMs) have been studied in the frame-
3

work of multivariate Gaussian regressions or covariate adjusted Gaussian graphical models
(Rothman et al., 2010; Yin and Li, 2011; Bhadra and Mallick, 2013; Chen et al., 2016;
Li et al., 2021). GCMs with more than two layers have been considered by Lin et al.
(2016) through penalized maximum likelihood estimation of the coefficients and the preci-
sion matrix, and Ha et al. (2021) who proposed a Bayesian approach to coherently learn
chain graphs by variable selection on node-wise conditional likelihoods. More multi-layered
GCM estimation methods can be found in Drton and Eichler (2006), Drton and Perlman
(2008), McCarter and Kim (2014), and Petersen (2018) among others.
Although GCMs have been used (successfully) for a broad range of biological data that
are continuous (or transformed to be continuous), they are ill-suited when the underly-
ing variables exhibit considerable non-normal characteristics such as skewness, heavy tails
and multimodal marginal distributions. As a motivating example, Figure 1b,c display the
empirical density and normal quantile-quantile (Q-Q) plot respectively, of CNA levels of
MAPK1, a gene controlling several cell signaling processes such as proliferation and tran-
scriptional regulation in different cancers (Vicent et al., 2004), across the 104 lung cancer
cell lines in our case study (detailed in Section 5). There is clear evidence of a heavier-
than-normal tail due to extreme values observed in the right tail. We further quantify
the “degree of non-normality” for all nodes across the four layers, based on the score:
H(x) = 2 ∗ Φ(log(1 − pval(x))), where Φ is the cdf of standard normal distribution, and
pval(x) is the p-value of the Kolmogorov-Smirnov test for normality of x. The H-score
is between 0 and 1 with the higher value indicating the higher departure from normality.
CNA and drug nodes show significant levels of non-normalities. Moreover, high levels of
within-layer H-score variations are detected, which implies node-specific tail behavior.
Modeling background and the current state of the art. Modeling non-normality
in multivariate data has been performed using copulas (e.g., Nelsen, 2007; Genest and
Neslehova, 2014). Gaussian copula models that use a set of latent variables following a
4
Figure 1: (a) Chain graph structure for CNA, mRNA, RPPA and drug layers, with directedand undirected edges between nodes of different and same layers respectively.(b) Empiricaldensity plot of MAPK1 CNA levels. The H-score defined in the text as a measure ofnon-normality is equal to 0.988 for MAPK1 CNA. The red curve is the density of standardnormal distribution. (c) Normal q-q plot of data corresponding to MAPK1 CNA levels (d)H-scores across multi-platform genomic data and 20 drugs.
multivariate normal distribution, have been discussed by (Pitt et al., 2006; Dobra et al.,
2011). Liu et al. (2009) provide a semiparametric non-paranormal model and show that it is
equivalent to a Gaussian copula when all the variables are continuous. Estimation methods
for the non-paranormal model have been developed using various rank-based measures of
dependence (Liu et al., 2012; Xue and Zou, 2012). These methods assume the transforma-
tion of the original variables into latent Gaussian variables to be deterministic. Relatively
fewer works have focused on dependencies among variables under a random transformation.
In networks with non-normal continuous marginals with random transformations lead-
ing to Gaussian latent variables, early Bayesian works include Finegold and Drton (2011)
and Finegold and Drton (2014), who modeled the node marginals using the multivariate-t
or Dirichlet-t distributions. The multivariate-t model of Finegold and Drton (2011) that
assumes the same scaling transformation for each node can infer dependencies on the orig-
5

inal variables through conditional uncorrelatedness. This model is, however, less flexible
than their alternative-t model and the Dirichlet-t that allow different node-wise scaling fac-
tors. To infer dependencies on the original scale of data using a more flexible model such
as Dirichlet-t, Bhadra et al. (2018) proposed a Bayesian framework based on random scale
transformations that helps in modeling skewed and heavy-tailed continuous marginals while
allowing each node to have a different marginal distribution modeled in a data-dependent
manner. Moreover, Bhadra et al. (2018) introduced the property of conditional sign in-
dependence, which is weaker than conditional independence, but holds among observed
variables under non-normal marginals; we reserve formal definitions for Section 2. None of
the above mentioned methods however, are applicable to chain graphs. We build on the
approach of random scale-transformations in the context of non-Gaussian chain graphs, by
allowing appropriately scaled transformations of node-marginals to be normally distributed,
with the additional flexibility of inferring conditional (in)dependence on the observed data.
Summary of our novel contributions. In this article, we develop a Robust Chain
Graph Model (RCGM) for multilayered non-Gaussian chain graphs that allows modeling
of heavier-than-normal marginal tails in a flexible, data-dependent manner at each layer.
Our approach makes multiple contributions:
1. Methodological contributions : RCGM provides a highly practical way of bringing
non-normality to large graphs by employing Gaussian scale transformations. Node-
wise scaling factors are precisely calibrated using empirical marginal tail behaviors.
Structural estimation of RCGM uses selection priors on the edges that induce sparsity
in the network. RCGM therefore offers the computational advantages of fast high-
dimensional graph estimation methods, in addition to accurate adjustments for heavy-
tailed marginals in chain graphs.
2. Theoretical contributions : RCGM introduces a new Markov property of conditional
sign independence that allows for node-specific non-normalities in a chain graph and
6

interprets dependencies on the original scale of variables (Theorem 2.1). Edges be-
tween normal nodes can still be interpreted in terms of conditional independence.
3. Scientific contributions : RCGM addresses the growing need in cancer biology research
for delineating multiplatform functional drivers of networks underlying drug action.
RCGM is designed to handle data needed for such analyses, which come from multi-
ple platforms and often deviate significantly from normality. In our study, RCGM is
used to infer the dependency structure within and between CNA, mRNA, RPPA and
drug data platforms in lung cancer cell lines. Our analysis encompasses key signal-
ing pathways in human cancers, revealing pathway-level genomic features regulating
drug responses. Notable findings include the overall receptivity of the DNA Damage
Response (DDR) pathway to drugs, particularly associations of the protein levels of
Checkpoint Kinase 1 (CHK1), the main effector of DDR, with drug actions of EGFR
TKIs erlotinib and icotinib, which have considerable clinical utility.
The rest of the paper is organized as follows. In Section 2 we introduce the robust chain
graph model. Section 3 describes the Bayesian structural estimation procedure. Section 4
provides a comparison of the performance of RCGM with existing GCM alternatives. In
Section 5, we analyze the data involving four biological platforms of lung cancer cell lines,
to investigate driving mechanisms of drug sensitivities on major lung cancer drugs. Proofs
and additional relevant details are presented in the Supplementary Materials. The R codes
for the RCGM implementation and data are also available in the supplemental files.
2 Model
Data structure and notations. We consider independent and identically distributed data
across cell lines, with X = (X1, . . . , Xq)T denoting data corresponding to a cell line com-
prising of q coordinates. The q nodes can be partitioned into L disjoint subsets, each subset
to be called a layer. Due to existing biological hierarchies, the layers possess an inherent
7

ordering among themselves and are numbered following that order, such that data in higher
layers are regulated by data in lower layers. For instance, in our case study, L = 4 and the
ordering from layer 1 to 4 is: CNA<mRNA<RPPA<drugs. The dependency structure is
modeled by a chain graph, with directed and undirected edges between nodes belonging
to different and same layers, respectively. Let G = (V,E,L) denote the chain graph over
q nodes, where V = 1, . . . , q is the set of labeled nodes across L layers, E is the set of
directed (→) and undirected (–) edges between nodes in V , and L is a mapping of node
indices to their corresponding layers so that for v ∈ V , L(v) is the index of the layer in
which v is located. For layer l, let X(l) be the sub-vector of X with nodes in layer l. Let
X [1:l] denote the sub-vector of nodes in layers 1 to l. Let Tl be the set of nodes in layer l
and ql =∑l
j=1 |Tl|, where |A| is the number of elements in the set A. Depending on the
probability distribution of X, edges can be characterized in different ways.
2.1 Gaussian Chain Graph Models
A Gaussian chain graph model (GCM) is a multilayered graph where X follows a multi-
variate Gaussian distribution. It uses an undirected Gaussian graph to model within layer
interactions and a block recursive normal linear simultaneous equations-model to describe
dependencies of higher layers on lower layers. This way, the full model is composed of
layer-wise normal regression components described by:
X(1) ∼ Nq1(0,J −11 ), and X(l)|X [1:l−1] ∼ N|Tl|(βlX [1:l−1],J −1l ), l ≥ 2, (1)
where βl and Jl are respectively coefficient and precision matrices for the l-th regression
component. The model therefore consists of L− 1 multiple regressions and one undirected
graph in the first layer. Nonzero entries of βl and Jl respectively encode directed and
undirected edges in GCM G. Specifically, (u − v) ∈ E when the entry corresponding to
(u, v) in Jl equals zero for nodes u and v in the same layer l. Similarly, (u→ v) ∈ E when
βl’s entry for (v, u) is zero, for L(u) < L(v) and L(v) = l. By Remark 4.1 and Theorem
8

4.1 of Andersson et al. (2001), the chain graph G given by (1) follows the alternate Markov
property (AMP) where edges are characterized by conditional independence given the AMP
conditioning nodes (detailed in Section 2.3), when the true distribution ofX is multivariate
normal. Estimation methods for GCM can be found in Drton and Eichler (2006), McCarter
and Kim (2014), Lin et al. (2016), Petersen (2018) and Ha et al. (2021), among others.
Although GCMs capture dependencies in multi-level continuous multivariate data, they
are inappropriate in settings where marginal distributions are heavy-tailed so that the joint
multivariate distribution is no longer Gaussian. An example of a heavy-tailed undirected
graph to model such data is the multivariate t-distribution discussed by Finegold and
Drton (2011). In chain graphs with heavy-tailed marginals, using a Gaussian model can
result in incorrect inferences (Genest and Neslehova, 2014), and dependencies given by zero
structures of βl and Jl cannot be interpreted in terms of conditional independence based
on the AMP in Andersson et al. (2001). By modeling the marginal non-normal behaviors
of nodes, we resolve these issues in a new framework of robust chain graph models that can
accurately infer the network and yield interpretable notions of dependencies.
2.2 Robust Chain Graph Models (RCGM)
An effective way to incorporate non-normality arising due to heavy tails is by scale mixture
representations with appropriate factors so that the transformed data follow a multivariate
Gaussian distribution. Let dv denote the positive scaling factor for node v such that the
dv, v ∈ V are independent and have dv ∼ pv for positive scaling distributions pv with∫dvpv(dv) < ∞. Let D be a q × q diagonal matrix with entries (1/d1, 1/d2, . . . , 1/dq),
dv > 0. Given dv’s, the transformed data DX is assumed to follow a multivariate normal
distribution. These random scale transformations have been used in the context of single-
layer undirected graphs (Finegold and Drton, 2011, 2014; Bhadra et al., 2018). In our
framework of robust chain graphs, we allow flexibility in the marginal behavior through
9

scale transformations with node-specific degrees of tail-heaviness.
Let Dl and D[1:l] denote the sub-matrices of D corresponding to the nodes (ql−1 + 1)
to ql and from 1 to ql respectively. We define our Robust Chain Graph Model (RCGM) as
DlX(l) = BlD[1:l−1]X [1:l−1] + εl, εl ∼ N|Tl|(0,K−1l ), 2 ≤ l ≤ L,
ε1 = D1X(1), ε1 ∼ Nq1(0,K−11 ), (2)
where Kl is the |Tl|× |Tl| precision matrix for the transformed data in the l-th layer and
Bl is a |Tl| × ql−1 coefficient matrix, and the layer-specific error vectors εl are independent
of each other. The independence of εl’s ensures that the conditional distribution of DX
given D is a multivariate normal distribution given by DX∣∣D ∼ Nq(BDX,K−1), where
K is a q × q precision matrix with entries kuv, B is a q × q coefficient matrix, and the
sub-matrix of B corresponding to rows ql−1 + 1 to ql and columns 1 to ql−1 is equal to Bl,
while that of K for rows ql−1 + 1 to ql and columns ql−1 + 1 to ql is Kl. So given D, we have
DX = BDX+ε, ε ∼ Nq(0,K−1), so that DX∣∣D ∼ Nq (0,Ω−1), Ω = (I−B)TK(I−B).
Note that the RCGM in (2) is GCM on the transformed set of variables DX, and
includes GCM as a special case for unit scaling factors for all nodes. When the true
distribution is non-normal, dependencies in the E obtained from GCM or RCGM are no
longer determined in terms of AMP conditional independence of Andersson et al. (2001). In
Section 2.3, we characterize dependencies in the RCGM using a weaker Markov property.
2.3 Characterization of Dependencies in RCGM
The edge set E may hold different statistical interpretations of dependencies, depending
on the true probability distribution of the chain graph. The RCGM as described in (2) is
constructed in a way to satisfy AMP of Andersson et al. (2001) in a Gaussian population.
The AMP specifies a direct mode of data generation and provides an easily interpretable
statistical characterization of directed and undirected edges in chain graph models. In
non-normal populations, however, RCGM does not satisfy the AMP, as nonzero entries
10

of (B,K) may not imply conditional independence. Nevertheless, edges in RCGM can be
characterized in terms of the dependencies defined as follows:
Definition 2.1 We define four types of relations between random variables Y1 and Y2 with
a conditioning random vector Z.
(i) Y1 and Y2 are said to be conditionally sign-independent (CSI) given Z, denoted by
Y1 |= s Y2|Z, if P(Y1 < 0|Z) = P(Y1 < 0|Y2,Z) and P(Y2 < 0|Z) = P(Y2 < 0|Y1,Z),
whenever the conditional probabilities exist. Otherwise, Y1 and Y2 are conditionally sign-
dependent (CSD) given Z.
(ii) Y1 and Y2 are said to be conditionally independent (CI) given Z, denoted by Y1 |= Y2|Z,
if f(Y1|Z) = f(Y1|Y2,Z) and f(Y2|Z) = f(Y2|Y1,Z), where f denotes the corresponding
probability density functions, whenever the conditional probability densities exist. Other-
wise, Y1 and Y2 are conditionally dependent (CD) given Z.
As a simple illustration, consider Y1 ∼ N(0, 1), Y2 = UY1, Z ∼ N(0, 1), where U ∼
Unif(−1, 1), and U and Z are independent of Y1. Then (Y1, Y2) are conditionally sign-
independent given Z. The concept of CSI in Definition 2.1 (i) is defined in terms of
the sign rather than the magnitude, which was introduced in Bhadra et al. (2018) for
undirected networks, implying that sign of Y1 is independent from that of Y2, conditioned
on Z. Thus, CSI is weaker than CI. However, the advantage is that it applies to less
restrictive multivariate models where the normality assumption can be relaxed.
In our RCGM model (2) that allows both normal and non-normal nodes, we aim to
characterize the edges in terms of CSI and CI on the original random variables X. We
model the node-specific non-normality behavior by introducing indicators ωv that takes the
value 1 if Xv has tails heavier than normal (dv ∼ pv) and 0 if Xv is normal (dv = 1). Edge
interpretations can be obtained from Theorem 2.1.
Theorem 2.1 (i) (At least one node is non-normal). If ωu = 1 or ωv = 1, conditional
sign-independence follows from B and K as:
11

(a) (u and v in the same layer). Suppose L(u) = L(v) and ρ = kuv = kvu. Then ρ = 0 if
and only if Xu |= s Xv|Zu, where Zu = X [1:L(u)]\Xu, Xv.
(b) (u and v in different layers). Suppose L(u) < L(v) and ρ = Bvu. Then ρ = 0 if and
only if Xu |= s Xv|Zd, where Zd = X [1:L(v)−1]\Xu.
(ii) (Between normal nodes). Suppose ωu = ωv = 0, and ρ is as defined in part (i). Then
ρ = 0 if and only if Xu |= Xv|Zu for L(u) = L(v) and Xu |= Xv|Zd for L(u) < L(v).
The proof is in Supplementary Section S.1.1 - S.1.2. Note that the conclusion (ii) of
Theorem 2.1 is the same as the AMP of Andersson et al. (2001). Theorem 2.1 shows that
the interpretation of E given by RCGM depends on the node-specific marginal distributions
of the corresponding random variables. The types of dependencies and the way they are
related to each other are demonstrated in Figure 2 and summarized as follows:
• CSI and CI. A missing edge between two nodes is interpreted as conditional sign-
independence (CSI) when at least one of the nodes is non-normal by part (i) of
Theorem 2.1. When both nodes follow normal distributions, by part (ii) of the
theorem, the absence of an edge between two nodes is interpreted as conditional
independence (CI) which is a stronger form of the Markov property.
• CSD and CD. The non-zero entries of B and K are interpreted as conditional sign-
dependence (CSD) which implies conditional dependence (CD) when at least one of
the corresponding nodes is non-normal. Thus, edges connecting non-normal nodes
are considered to have stronger relation than edges between normal nodes.
Another notion of dependency, the partial correlation, is defined as the correlation
between variables after adjusting for the effects of conditioning variables, and the zero values
are equivalent to conditional independence in a Gaussian population. However, as the zero
structure is preserved under random and independent marginal scale transformations (see
Section 5.1 of Finegold and Drton (2011)), partial correlation interpretations of edges do
not hold in non-Gaussian populations, as explained in Remark 2.1.
12

Figure 2: The nested relation between CSI, CI, CD and CSD (Definition 2.1). For L(u) =L(v), ρ = Kuv. For L(u) < L(v), ρ = Bvu. ωv is the indicator of v being non-normal. Formissing edges (ρ = 0) in G, CI is the stronger form of independence as compared to CSIwhile for edges (ρ 6= 0) in G, CSD is stronger than CD in terms of dependence.
Remark 2.1 Neither of the edge sets E obtained under GCM or RCGM can be inter-
preted in terms of partial correlations between original variables under non-normal data,
as evaluating partial correlations involves the true probability distribution. RCGM yields
CSI interpretations of E, which is the main advantage of using RCGM over GCM in the
non-normal network estimation scenario.
2.4 Incorporating a Continuous Measure of Non-normality
To allow for more flexibility in the proposed framework, we incorporate a mixture model
for the amount of non-normality by introducing a variable πv for node v which quantifies
the departure of the node’s distribution from that of a normal distribution. We treat the
non-normality status ωv of each node as random, and model P (ωv = 1) = πv, a priori,
so that the larger πv indicates a higher degree of prior belief regarding departure from
normality for node v. We formulate our final model as
DX|D,ω,π ∼ N(BDX,K−1), dv|ω,π ∼ ωvpv + (1− ωv)δ1, ωv|πv ∼ Bern(πv), (3)
where πv ∈ [0, 1] for all v ∈ V and π = (π1, . . . , πq). By considering ωv as random under
model (3), the strength of dependencies are interpreted in a continuous scale calibrated by
probabilities rather than deterministically as in Theorem 2.1.
Model selection-based network inference methods commonly assign a probability score
guv to each edge, which indicates its probability of being present in the network. The
13

edge-wise probability score guv and node-wise non-normality scores (πu, πv) are combined
to characterize the dependence properties for a network, by the following corollary to
Theorem 2.1, with a proof in Supplementary Section S.1.3.
Corollary 2.2 Let gvu be the probability of edge (u − v) or (u → v) being present in
the model under L(u) = L(v) and L(u) < L(v) respectively. Then Xu |= s Xv|Z with
probability (1−gvu) and Xu |= Xv|Zu with probability at least (1−gvu)(1−πu−πv+πuπv) for
Z = X [1:L(u)]\Xu, Xv when L(u) = L(v) and Z = X [1:(L(v)−1)]\Xu when L(u) < L(v).
Corollary 2.2 provides a probabilistic characterization of edges in RCGM on the original
scale of nodes, from CSI to CI for missing edges, and equivalently CD to CSD for edges,
depending on the probabilities of edge inclusion and node non-normality. In summary, the
multilayered network inference using RCGM in (3) allows a robust structural recovery of
chain graphs when the marginals deviate from normal distributions, along with calibration
of node-specific marginal tail-heaviness through πv, and dependence characterization of the
network structures on the original variables weighted by the strength from CSD to CD.
3 Bayesian Estimation of RCGM
Estimation of the multilayered network incorporating uncertainty in node-wise normality
involves two parameters B and K for the graphical structure and π for the degree of non-
normality in model (3). We use a Bayesian framework with a Markov chain Monte Carlo
(MCMC) sampling scheme to draw posterior samples of the parameters. Since the RCGM is
formulated in layer-wise multivariate regressions (Equation (2)), we perform each regression
by imposing priors independently across layers. At each MCMC iteration, for each layer
l, we update the structural parameters Bl and Kl, following a scale transformation of the
data using sampled scaling factors with πl. For Sections 3.1 – 3.3, let xv and dv respectively
denote the n× 1 vectors of data X and scaling matrix D corresponding to node v.
14

3.1 Prior Calibration for Node-wise Non-normality
The prior specifications of node non-normality are conducted based on empirical marginal
distributions. We assume that πv follows a beta distribution
πv ∼ Beta(µvrv, (1− µv)rv),
where µv is the prior mean and rv is to control the variance. The mean and variance
are decided based on the degree of non-normality evaluated from data for each node.
Specifically, we set µv by the H score defined as H(xv) = 2∗Φ(log(1− pval(xv))) from the
p-value of the test for normality of the marginal distribution of Xv from the Kolmogorov-
Smirnov test. We choose rv to ensure a small variance (e.g., 0.01) for the prior distribution
to be concentrated around H(xv) on the unit interval.
The mixing distribution pv in the model (3) is determined by empirically evaluating the
tail behavior of marginals for each node. The marginal tail mass appearing as exponential
or polynomial decay is related to exponential or polynomial tail behavior of pv respectively
(Bhadra et al., 2018). We assume that every heavy-tailed marginal centered at its median
is a univariate-t or a double exponential distribution with non-centrality or a location
parameter of zero respectively, so that there are two categories of pv - polynomially decaying
such as an Inverse-Gamma, and exponentially decaying as in the Gamma and Exponential
distributions. We regress log f(xv), the log-transformed smoothed empirical probability
density estimate of the marginal distribution, on logxv and xv. We then determine for
which category (polynomial/exponential) the regression p-value is smaller and estimate the
coefficients for logxv and xv in this category. The estimated coefficients are then used to
derive the parameters of the chosen pv using Algorithm 2 in Supplementary Section S.4.
3.2 Priors on Model Selection Parameters
The scaling factors dv are generated using the non-normality parameters πv from Section
3.1. As RCGM becomes a GCM for the scaled variables when dv are given (Equation (2)),
B and K can be estimated based on the scaled data by building Gaussian and Wishart
15

priors for the layer-wise regression parameters Bl and Kl. However, in chain graphs with
multiple large layers, the set of parameters becomes extensive with the number and size
of layers, in addition to becoming increasingly sparse (Armstrong, 2005). Significant com-
putational challenges appear even in moderately large graphs. Instead, we simultaneously
select undirected and directed edges connected to a node v belonging to layer l, using a
stochastic search variable selection framework (SSVS) (George and McCulloch, 1993) after
coherently reparameterizing the precision parameter Kl into regression coefficients to yield
the node-conditional likelihoods (Ha et al., 2021). For v, the node-wise regression is
Xv
dv= (XD)T[1:l−1](bv −B
(v)l av) + (XD)TTl\vav + ev, (4)
where av = −kvvk(v)l , where k
(v)l is the vector of kvu, u ∈ Tl\v, and ev ∼ N(0, k−1vv ). The
parameters of interest in each node-conditional likelihood are bv, av, B(v)l , and kvv, where
the effect of nodes in layers 1 : (l− 1) on v is depicted by bv, while their effect on nodes in
Tl\v is denoted by B(v)l , and av is the effect of the neighbors of node v in Tl on v. Details
can be found in Supplementary Section S.2. However, as bv, av, and B(v)l are not jointly
identifiable (Supplementary Section S.3), we fix B(v)l at its current value in each MCMC
iteration and consider the node-conditional likelihood with parameters bv, av and kvv.
We set priors on the parameters of each node-wise regression for estimatingBl and Kl in
the model (3). As shown in the equation (10) of Ha et al. (2021), Wishart and independent
Gaussian priors on Bl and Kl respectively are equivalent to independent Gaussian and
Gamma priors on bv,av and kvv. We let γvw and ηvu be the indicator variables encoding
zero-structures of B and K, with P (γvu = 1) = pvw, and P (ηvu = 1) = qvu for pvw, qvu ∈
(0, 1). We use a spike-and-slab prior similar to Ha et al. (2021) to set priors as
bvw|γvw, kvv ∼ γvwN(0, c2vw/kvv) + (1− γvw)δ0,
avu|ηvu, kvv ∼ ηvuN(0, 1/(λlkvv)) + (1− ηvu)δ0,
kvv ∼ Gamma((δl + |Tl| − 1)/2, λl/2),
16

Algorithm 1: MCMC sampling steps for iteration t.
At iteration t, update D given current π for every subject by Metropolis-Hastingssampling using Equation (S.11).
for 1 ≤ l ≤ qL dofor v ∈ Tl do
Update πv using Metropolis Hastings sampling (Equation (S.12))Update the undirected edges:
1. Set response xv = xv/dv −XT[1:l−1]D[1:l−1]bv and covariates Zv as
DTl\vXTl\v −BTl\v,[1:l−1]D[1:l−1]X [1:l−1] = εTl\v.
2. Update ηw : w ∈ Tl by an add/delete/swap step and MH-selection thereafter.Set the neighborhood of v as neuv = w ∈ Tl : ηvw 6= 0. Set ηwv = ηvw for everyw ∈ neuv .
3. Update the coordinates of av that were selected into neuv and kkk using Gibbssampling through Equations (S.13) and (S.14).
Update the directed edges:
1. Set xv = xv/dv − εTTl\vav, Zv = D[1:l−1]X [1:l−1], where εTl\v is equal toDTl\vXTl\v −BTl\v,[1:l−1]D[1:l−1]X [1:l−1].
2. Update γw : w ∈ Pl using add/delete/swap and MH-selection. Setnedv = w ∈ Pl : γvw 6= 0, where Pl is the set of nodes in layers 1 to l − 1.
3. Update the coordinates of bv that were selected into nedv and kvv using Gibbssampling through Equations (S.15) and (S.16).
end
end
for cvw, λl, δl > 0 and δ0 denotes the degenerate distribution at 0. The MCMC algorithm
is run layer-wise at each iteration, wherein the scaled node-wise likelihoods corresponding
to nodes in Tl (in random order of nodes) are combined with the priors to yield posterior
samples for bv, av and kvv keeping B(v)l fixed.
3.3 Posterior Sampling
Posterior samples of B, K and π are constructed from the parameters bv, av, kvv and πv in
node-wise regressions (Equation (S.9)), which are drawn using the MCMC sampling scheme
17

summarized in Algorithm 1, with detailed derivations in Supplementary Section S.5. A
maximum a posteriori (MAP) estimate across the MCMC samples may be hard to derive
in huge model spaces, and provides no probabilistic quantification of uncertainty in the
parameters. Instead, we use the marginal posterior edge inclusion probability guv, which
is the proportion of times in MCMC runs after burn-in that the edge (u − v or u → v) is
included. Fixing the false discovery rate (FDR) α in (0, 1), we determine a cutoff Cα by
sorting all guv in decreasing order to obtain g(t), and setting Cα = g(ξ), where ξ = maxk :
k−1∑k
t=1(1−g(t)) < α. We then form the set of edge discoveries χα = (u, v) : guv > Cα.
We similarly evaluate the sign of an edge by the sign of coordinate-wise average of B
or K, and the non-normality probabilities πv, using the corresponding averages across
MCMC samples. We combine posteriors for the node non-normalities (πu, πv) and the
edge inclusion probability guv to assign weight for an edge between nodes u and v that
represents the strength of dependence from CSD to CD based on Corollary 2.2.
4 Simulations
We conduct simulation experiments to evaluate the performance of our RCGM framework,
in terms of graph structure recovery, as compared to other GCM-based methods, under
various non-normality mechanisms. We generate simulation datasets based on the model
in Equation (3) corresponding to random chain graphs with q nodes that are divided
into L ordered layers with similar sizes. The layer-wise undirected graphs are formed by
randomly connecting two nodes with probability pE independent of all other edges. We
then connect two nodes in different layers independently with probability pE/2, where the
directions follow the order among the L layers. Thus directed edges between layers are
less likely to be connected than the undirected edges within a layer. Given the chain
graph, we set the corresponding nonzero elements of B and K by random samples from
a uniform distribution in (−1.5,−0.5)⋃
(0.5, 1.5) and ensure positive definiteness of K
18

by imposing diagonal dominance. We consider pre-fixed non-normality score π ∈ [0, 1]
and scale-mixing distribution pv for coordinate v for each simulation dataset. For every
π and pv combination, we impose node-wise heavy tails on each sample by generating
ωv ∼ Bernoulli(π), dv ∼ pv if ωv = 1, dv = 1 otherwise and then transforming the sample
as (X1, . . . , Xq) 7→ (X1d1, . . . , Xqdq). We repeat this process for all the n samples generated
from the Gaussian chain graph model. We consider mixing distributions with two types of
tails - exponential with pv as the exponential distribution with mean 2.5, and polynomial
where pv is Inverse-Gamma with shape 3 and scale 6. We vary π across a range of values
in (0, 1) corresponding to low (π = 0.05), medium (π = 0.60) and high (π = 0.95) levels of
non-normality, expecting RCGM to perform better than GCMs for datasets with higher π.
We compare RCGM’s performance with that of the Bayesian node-wise Gaussian ap-
proach (Ha et al., 2021) and the penalized Gaussian likelihood approach (Lin et al., 2016),
using BANS and LBBM respectively to refer to these methods. We use 4, 000 burn-in sam-
ples and 10, 000 samples for posterior inference in both RCGM and BANS, and determine
the cutoffs on edge inclusion posterior probabilities in both methods by controlling the FDR
at 0.1. As suggested by Lin et al. (2016), we use glasso (Friedman et al., 2008) to estimate
the undirected graph in the first layer by LBBM. Table 1 displays the performance of the
three methods across three values of π in terms of the metrics described as Specificity =
TN/(TN + FP ), Sensitivity = TP/(TP + FN), and Matthew’s correlation coefficient
MCC = [(TP ×TN)− (FP ×FN)]/[(TP +FP )(TP +FN)(TN +FP )(TN +FN)1/2]
that ranges from -1 (complete non-concordance) to 1 (full concordance). Across various
tuning parameters for LBBM and cutoffs for the posterior probability of edge inclusion
for BANS and RCGM, the performance is evaluated based on area under the ROC curve
(AUC). We calculate the partial area under ROC curve (pAUC) by evaluating the area
under the curve between specificity ranging from 0.8 or 0.9 to 1 and dividing it by the
maximum possible AUC in that range.
19

(q, L, pE) = (50, 4, 0.08), pv : Exponential(mean = 2.5)Setting Method Specificity Sensitivity MCC AUC pAUC 0.9 pAUC 0.8
RCGM 0.965 (0.006) 0.812 (0.068) 0.759 (0.046) 0.902 (0.036) 0.755 (0.013) 0.795 (0.016)(π = 0.95) BANS 0.922 (0.005) 0.768 (0.088) 0.701 (0.062) 0.868 (0.042) 0.684 (0.011) 0.788 (0.016)
LBBM 0.905 (0.005) 0.672 (0.088) 0.655 (0.064) 0.874 (0.041) 0.731 (0.013) 0.760 (0.016)RCGM 0.948 (0.007) 0.838 (0.064) 0.787 (0.052) 0.916 (0.038) 0.752 (0.035) 0.791 (0.091)
(π = 0.60) BANS 0.939 (0.007) 0.783 (0.077) 0.738 (0.063) 0.851 (0.044) 0.735 (0.017) 0.780 (0.022)LBBM 0.940 (0.005) 0.780 (0.088) 0.731 (0.064) 0.858 (0.039) 0.738 (0.013) 0.780 (0.016)RCGM 0.945 (0.007) 0.850 (0.061) 0.821 (0.055) 0.962 (0.021) 0.828 (0.017) 0.874 (0.022)
(π = 0.05) BANS 0.955 (0.009) 0.848 (0.072) 0.820 (0.063) 0.945 (0.027) 0.820 (0.035) 0.871 (0.091)LBBM 0.912 (0.005) 0.802 (0.088) 0.792 (0.061) 0.919 (0.042) 0.795 (0.013) 0.851 (0.016)
(q, L, pE) = (50, 4, 0.08), pv : Inverse-Gamma(shape = 3, scale = 6)Setting Method Specificity Sensitivity MCC AUC pAUC 0.9 pAUC 0.8
RCGM 0.995 (0.007) 0.657 (0.064) 0.604 (0.052) 0.873 (0.044) 0.706 (0.035) 0.748 (0.091)(π = 0.95) BANS 0.996 (0.007) 0.528 (0.077) 0.553 (0.063) 0.833 (0.046) 0.698 (0.017) 0.734 (0.022)
LBBM 0.882 (0.019) 0.657 (0.041) 0.557 (0.059) 0.845 (0.052) 0.683 (0.043) 0.745 (0.036)RCGM 0.996 (0.006) 0.642 (0.078) 0.610 (0.056) 0.902 (0.029) 0.770 (0.032) 0.781 (0.089)
(π = 0.60) BANS 0.996 (0.009) 0.557 (0.075) 0.527 (0.068) 0.812 (0.052) 0.726 (0.018) 0.754 (0.025)LBBM 0.879 (0.036) 0.657 (0.052) 0.535 (0.071) 0.831 (0.051) 0.723 (0.074) 0.770 (0.076)RCGM 0.990 (0.006) 0.757 (0.081) 0.604 (0.051) 0.961 (0.025) 0.805 (0.020) 0.840 (0.018)
(π = 0.05) BANS 0.994 (0.007) 0.748 (0.091) 0.598 (0.062) 0.952 (0.027) 0.803 (0.017) 0.832 (0.019)LBBM 0.877 (0.032) 0.771 (0.044) 0.583 (0.036) 0.901 (0.034) 0.773 (0.059) 0.804 (0.061)
Table 1: Performance of RCGM as compared to BANS and LBBM under Exponential andInverse-Gamma scaling distributions pv, and low, medium and high levels of non-normalityindexed by π = 0.05, 0.60, 0.95 respectively, and (q, L, n, pE) = (50, 4, 200, 0.08) where q,L, n and pE denote the dimension of the graph, number of layers, sample size and sparsityrespectively. pAUC 0.9 is the (scaled) area under the ROC curve when specificity is fixedat 0.9 (1-specificity is fixed at 0.1). Results are summarized across 30 replications; standarderrors are within parentheses. The winning entry for each metric is displayed in bold.
We observe that performance of all the methods deteriorates gradually as more non-
normality is induced through increasing π. While the three methods almost coincide for
near-normal data when π = 0.05, RCGM performs significantly better than the Gaussian
methods for data with medium and high degree of non-normality (Table 1). Therefore
RCGM performs as good as GCMs in normal data, and consistently better than GCMs
as tails become heavier than normal. Analysis of ROC curves reveals a relatively weaker
performance of all the methods for medium non-normality (π = 0.60) as compared to high
non-normality (π = 0.95), and a bigger contrast between RCGM and GCM methods in
medium π as compared to that in high π (Figure 3). Simulations over an extended set of π
values with π = 0.01, 0.05, 0.4, 0.6, 0.8, 0.9, 0.95, 0.99 show a similar pattern (Figure S.2),
20

Figure 3: ROC curves for the simulation setting (q, L, n, pE) = (50, 4, 200, 0.08) acrosshigh, medium and low levels of non-normality π, where q, L and pE denote the dimensionof graph, number of layers and sparsity respectively. Panels (a) and (b) correspond toscaling by Exponential(mean = 2.5) and Inv-Gamma(shape = 3, rate = 6) respectively.
where the AUCs are lower for π = 0.4 to π = 0.8 than for π ≥ 0.9, and the maximum
contrast between RCGM and GCM AUCs is found in the medium non-normality range
π ∈ [0.4, 0.8]. The possible reason behind this could be the higher level of tail-heaviness in
the data induced by π in the range π = 0.2 to π = 0.8. Our algorithm is designed to tackle
data with heavy-tailed marginals, so the difference between performances of RCGM and
Gaussian methods becomes more prominent with increased tail-heaviness, which occurs in
the range π = 0.2 to π = 0.8. Further details can be found in Supplementary Section S.6.
5 Pharmacogenomics in Lung Cancer
Integrative data analysis and the use of network topology towards functional character-
ization of drug sensitivity is critical to the successful development of cancer treatments
21

(Kasarskis et al., 2011). Our aim is to understand mechanisms of drug action by modeling
the complex regulatory and interactive processes across various domains of the molecular
data. A public resource for high-throughput screening data on more than 4,000 drugs for
578 cell lines spanning 24 human tumor types was created by Corsello et al. (2020) from
the CCLE project (Barretina et al., 2012). Growth inhibitory activity defined as drug
sensitivity was measured in terms of log-transformed median fluoroscence intensity (MFI)
of barcoded cell lines after drugs were administered. Lower log-MFI values correspond
to lower cell viability and therefore higher drug sensitivity. We use these drug screening
data along with copy number aberration (CNA), mRNA expression (mRNA), and RPPA-
based protein expression (RPPA) (Ghandi et al., 2019) obtained from the DepMap Portal
(www.depmap.org). We select n = 104 lung cancer cell lines and match them across the
CNA, mRNA, RPPA and drug platforms. Sixteen drugs that have been evaluated in clin-
ical trials for different types of lung cancer, are found in the PRISM database and are
selected for the study. Based on the mechanism of action, these drugs can be catego-
rized into EGFR-TKIs, ALK-TKIs, tubulin polymerization inhibitors among several other
categories (Tables S.3 – S.4). Four of these drugs - Cisplatin, Sevoflurane, Carboplatin
and Sorafenib - that have been studied for potential combination therapies for NSCLC
(Liang et al., 2013; Langer et al., 1995; Gridelli et al., 2011), are also selected to explore
their functional mechanisms. Features in each platform constitute a layer, and the order
CNA<mRNA<RPPA<drugs is justified by the biological process that CNA affects mRNA
gene expressions, which are then translated into protein, and genes and proteins regulate
drug response as a phenotype (Morris and Baladandayuthapani, 2017).
We perform pathway-wise analyses that define multi-platform functional cancer net-
works for each pathway, based on literature outlining abnormalities of cell signaling path-
ways as etiology of cancers including lung (Vogelstein and Kinzler, 2004; Brambilla and
Gazdar, 2009). We select genes/proteins that are involved in the 10 most clinically tar-
22

getable signaling pathways in human cancers, as defined in Akbani et al. (2014). The gene
and antibody of RPPA membership for each pathway is provided in Table S.2. We apply
RCGM on each pathway-level multilayered data, using a burn-in sample size of 2, 000 and
10, 000 samples for posterior inference of edge-inclusion probabilities gvu and non-normality
scores πv. Controlling FDR at 0.1, we selected edges that have posterior probabilities of
edge inclusion greater than 0.55 across all pathways.
The size of the parameter space in each pathway-level network is fairly large - the average
number of nodes and number of parameters for edge inclusion and non-normality proba-
bilities has an average of 46.2 and 1090.32 across pathways respectively. The computation
time is reasonable, as the average time taken for estimating each network is 4.32 hours with
a standard deviation of 0.86 across pathways, on a 3.5 GHz Intel Core i7 processor.
In our robust multilayered networks, the edges are weighted and colored by the depen-
dence characterization of the RCGM discussed in Sections 2.3-2.4. Two nodes u and v are
connected and weighted by probability gvu, to represent the strength from CD to CSD based
on Corollary 2.2. With node labels for non-normal marginals if πv > 0.5, we further catego-
rize the edges as CD if both are normal and CSD otherwise. An inter-platform connectivity
analysis across pathways is displayed in Figure 4, and the pathway-level multilayered net-
works are displayed in Figure 5 and Figures S.6 – S.14. We further evaluate the extent of
non-normality in the data and find high variability in within-platform non-normal behavior
(Figure S.4), similar to the H-scores for empirical non-normalities (Figure 1d). The pos-
terior non-normality probabilities πv are positively correlated with H-scores (Figure S.15).
5.1 Inter-platform Regulatory Network
Based on the estimated networks across all 10 pathways, we investigate inter-platform
regulatory signaling patterns at the pathway-level in the Sankey diagram (Figure 4). It
demonstrates the connectivity between platforms within each pathway, and the drugs.
23

Figure 4: Sankey diagram showing connectivity between the 4 platforms across 10 path-ways. Each box in the left three columns is a pathway-molecular platform combination,and widths of the lines between them are proportional to the number of directed edgesconnecting them. Gray lines denote edges between pathway-platform blocks and drugs.
Each unit is a pathway-platform combination depicted by a box and the lines between
units are proportional to the number of directed edges between platforms within path-
ways. Sizes of the unit boxes are proportional to the degree, and larger boxes, therefore,
represent higher levels of regulatory signaling coming in and out the pathways and drugs.
The total number of directed edges between molecular platforms are 61 for CNA→mRNA,
56 for mRNA→RPPA and 13 for CNA→RPPA, indicating that as expected, the imme-
diate platforms are tightly connected across pathways. Apoptosis and PI3K/AKT path-
ways have the most cross-platform signaling, with 8, 6, and 4 edges for CNA→mRNA,
mRNA→RPPA and CNA→RPPA respectively in Apoptosis, and 8, 7, and 3 edges respec-
tively in PI3K/AKT. We investigate the regulatory factors to the drugs- CNA, mRNA
and RPPA have 8, 10, and 17 edges connected to any of the drugs, which implies that
proteins are the most relevant factors that directly affect drug sensitivity. This is expected
24

Figure 5: The estimated multilayered network for DNA Damage Response pathway. Blueand red edges indicate positive and negative dependencies, while CD and CSD stand forconditionally dependent and conditionally sign-dependent edges respectively. The width ofthe edges is proportional to the posterior inclusion probabilities.
as protein kinases serve as crucial targets for drug development (Davies et al., 2006). Pro-
teins in the cell cycle pathway show the most connectivity with drugs across pathway-wise
RPPA at 4 directed edges (Figure S.7). RPPA levels of Cyclin B1, E1 and E2 are found to
regulate drug actions; these are cyclin-dependent kinase (CDK) inhibitors in the cell cycle
that hold key significance in lung cancer cell proliferation (Baldi et al., 2011). Gemcitabine
has the maximum number of connections with genomic platforms across drugs, with 3
edges from mRNA and RPPA of CAV1 in core and breast reactive pathways (Figure S.13
– S.14). Dependence of gemcitabine on CAV1 and its products has been explored in cell
line studies and clinical trials which have shown that CAV1 over-expression can lead to
gemcitabine-resistance in lung cancer cells (Ho et al., 2008; Shi et al., 2020).
25

5.2 Multilayered Pathway-level Networks
Inter-platform connectivity analysis from Figure 4 shows that the DNA damage response
(DDR) pathway has the highest level of cross-platform signaling with drugs. Dysregulation
of DDR promotes mutations that lead to chemotherapy resistance in lung cancer, and the
understanding and characterization of inter- and intra- platform molecular mechanisms
that affect drug sensitivity are crucial to the development of targeted therapies in lung
cancer (Burgess et al., 2020). DDR molecular platforms are connected to drugs through
5 edges, with 1, 1, and 3 edges to drugs from CNA, mRNA and RPPA respectively (Fig-
ure 5). There are 10 and 6 edges respectively from CNA→mRNA and mRNA→RPPA,
while no edges from CNA→RPPA. We observe negative dependencies of cell viability on
protein levels of Checkpoint Kinase 1 (CHK1), the main effector of DDR, when cells are
administered with EGFR TKIs erlotinib and icotinib, indicating high sensitivity of CHK1
toward these two drugs. Further, the CHK1 protein has a positive dependency with RAD51
protein expression which has cis-acting regulatory elements at the mRNA and CNA lev-
els. Sensitivity towards pemetrexed and paclitaxel are found to be dependent on mRNA
expressions of DNA repair genes XRCC1 and XRCC5, whose polymorphisms may affect
DNA repair capacity and thus regulate cancer progression (Schneider et al., 2008).
Another interesting observation is on the positive dependencies between EGFR CNA,
mRNA and protein levels and the sensitivity of EGFR CNA to osimertinib (Figure S.11).
Higher levels of EGFR CNA are found to be associated with faster cell death when ad-
ministered with osimertinib. EGFR sensitivity to osimertinib can be explained by clini-
cal trials that show osimertinib successfully targets EGFR-mutant variants of NSCLC and
shows improved efficacy over mutation-resistant standard EGFR-TKIs and platimun-based
chemotherapies (Mok et al., 2017; Soria et al., 2018).
Several pairs of drug-drug dependencies appear in most of the pathways-level networks
(Figure S.5). For instance, the positive dependency between EGFR-TKIs icotinib and
26

osimertinib is present in all the pathways. Both these drugs target EGFR, and are therefore
expected to increase or decrease cell life span through similar patterns.
6 Discussion
In this article, we develop a multilayered network estimation framework, Robust Chain
Graph Model (RCGM), to estimate and interpret directed and undirected edges in chain
graphs under the presence of heavier-than-normal marginal tails. We incorporate the non-
normality by proposing a random Gaussian-scale transformation of the original variables so
that the transformed data is a Gaussian chain graph (GCM). The RCGM provides robust
learning frameworks for various types of graphical models as special cases of chain graphs
such as undirected networks by covariance/precision matrix specification and Bayesian
networks when the entire topological order is known.
The increased scope of our model across heavy-tailed distributions comes at the expense
of a Markov property weaker than conditional independence (CI), known as conditional
sign-independence (CSI), to characterize dependencies for non-normal nodes. We assign
each node a measure of its non-normality and use these scores to derive a probabilistic
interpretation of CI and CSI properties. We incorporate sparsity in the chain graph by
spike-and-slab priors on coefficients of the layer-wise regressions, and design the estima-
tion algorithm to overcome the computational challenges that come with high-dimensional
graphs using the node-wise likelihoods strategy (Ha et al., 2021). Furthermore, we show
that our algorithm outperforms GCM methods in terms of graph structural recovery under
various degrees of non-normality exhibited in the datasets.
From a scientific perspective, heterogeneity in drug responses, even for standard of care
for different cancers including lung, demands genomic-based drug treatments developed by
integrating molecular and clinical data across several biological domains. We perform inte-
grative network analysis using our RCGM algorithm on genomic, transcriptomic, proteomic
27

and drug response data for lung cancer cell lines, available in the Cancer Dependency Map
(www.depmap.org). We analyze the ways in which genomic features across key signaling
pathways interact with each other and with mono-drug actions. From a global analysis
of pathway-level networks, we identify pathways and genomic platforms most receptive to
drugs. We find the DNA Damage Response (DDR) pathway to be the most connected with
drugs and highlight its underlying dependencies.
In translational cancer research, diverse cancer models such as in vivo patient-derived
xenografts (PDXs) have emerged as preclinical models that offer more faithful represen-
tation of genomic landscape of tumor and clinical outcomes than cancer cell lines (Gao
et al., 2015; Woo et al., 2021). The growing number of PDX resources, e.g., PDXFinder,
pdxfinder.org (Conte et al., 2019) have facilitated systematic identification and validation
of druggable genomic events. The holistic characterization of information flow of relevant
mechanisms of drug sensitivity and resistance in various model systems of human cancer
can further the development of new targeted therapies including combination treatments.
Our integrative analysis framework is expected to aid in the identification of key molecular
processes that drive clinical outcomes across different cancer types and populations, which
can further help in developing genomic testing-based precision medicine.
SUPPLEMENTARY MATERIAL
The Supplementary Material contains proofs of Theorem 2.1 and Corollary 2.2, details on
the selection of mixing distributions, a description of MCMC sampling steps, and sup-
plementary tables and figures. For reproducibility, the data and the R codes used for
implementing our method are submitted with this paper.
FUNDING
MJH was supported by the National Institutes of Health grants R01CA244845-01A1 and
R21CA22029, and start-up funds from University of Texas MD Anderson Cancer Center.
28

VB was supported by the National Institutes of Health grants R01-CA160736, R01CA244845-
01A1, R21-CA220299, and P30 CA46592, US National Science Foundation grant 1463233,
and start-up funds from the U-M Rogel Cancer Center and School of Public Health. AB
was supported by US National Science Foundation Grant DMS-2014371.
References
Akbani, R., Ng, P. K. S., Werner, H. M., Shahmoradgoli, M., Zhang, F., Ju, Z., Liu, W.,
Yang, J.-Y., Yoshihara, K., Li, J., et al. (2014). A pan-cancer proteomic perspective on
the cancer genome atlas. Nature Communications, 5(1):1–15.
Andersson, S. A., Madigan, D., and Perlman, M. D. (2001). Alternative Markov properties
for chain graphs. Scandinavian Journal of Statistics, 28(1):33–85.
Armstrong, H. J. (2005). Bayesian estimation of decomposable Gaussian graphical models.
PhD thesis, University of New South Wales.
Baldi, A., De Luca, A., Esposito, V., Campioni, M., Spugnini, E. P., and Citro, G. (2011).
Tumor suppressors and cell-cycle proteins in lung cancer. Pathology Research Interna-
tional, 2011.
Barretina, J., Caponigro, G., Stransky, N., Venkatesan, K., Margolin, A. A., Kim, S.,
Wilson, C. J., Lehar, J., Kryukov, G. V., Sonkin, D., et al. (2012). The cancer cell
line encyclopedia enables predictive modelling of anticancer drug sensitivity. Nature,
483(7391):603–607.
Bedard, P. L., Hansen, A. R., Ratain, M. J., and Siu, L. L. (2013). Tumour heterogeneity
in the clinic. Nature, 501(7467):355–364.
Bhadra, A. and Mallick, B. K. (2013). Joint high-dimensional Bayesian variable and co-
variance selection with an application to eqtl analysis. Biometrics, 69(2):447–457.
29

Bhadra, A., Rao, A., and Baladandayuthapani, V. (2018). Inferring network structure in
non-normal and mixed discrete-continuous genomic data. Biometrics, 74(1):185–195.
Brambilla, E. and Gazdar, A. (2009). Pathogenesis of lung cancer signalling pathways:
roadmap for therapies. European Respiratory Journal, 33(6):1485–1497.
Burgess, J. T., Rose, M., Boucher, D., Plowman, J., Molloy, C., Fisher, M., O’leary, C.,
Richard, D. J., O’Byrne, K. J., and Bolderson, E. (2020). The therapeutic potential of
dna damage repair pathways and genomic stability in lung cancer. Frontiers in Oncology,
10:1256.
Chen, M., Ren, Z., Zhao, H., and Zhou, H. (2016). Asymptotically normal and efficient
estimation of covariate-adjusted Gaussian graphical model. Journal of the American
Statistical Association, 111(513):394–406.
Conte, N., Mason, J. C., Halmagyi, C., Neuhauser, S., Mosaku, A., Yordanova, G., Chatzi-
pli, A., Begley, D. A., Krupke, D. M., Parkinson, H., et al. (2019). Pdx finder: A
portal for patient-derived tumor xenograft model discovery. Nucleic Acids Research,
47(D1):D1073–D1079.
Corsello, S. M., Nagari, R. T., Spangler, R. D., Rossen, J., Kocak, M., Bryan, J. G.,
Humeidi, R., Peck, D., Wu, X., Tang, A. A., et al. (2020). Discovering the anticancer po-
tential of non-oncology drugs by systematic viability profiling. Nature Cancer, 1(2):235–
248.
Davies, M., Hennessy, B., and Mills, G. B. (2006). Point mutations of protein kinases and
individualised cancer therapy. Expert Opinion on Pharmacotherapy, 7(16):2243–2261.
Dobra, A., Lenkoski, A., et al. (2011). Copula Gaussian graphical models and their applica-
30

tion to modeling functional disability data. The Annals of Applied Statistics, 5(2A):969–
993.
Drton, M. and Eichler, M. (2006). Maximum likelihood estimation in Gaussian chain
graph models under the alternative Markov property. Scandinavian Journal of Statistics,
33(2):247–257.
Drton, M. and Perlman, M. D. (2008). A sinful approach to Gaussian graphical model
selection. Journal of Statistical Planning and Inference, 138(4):1179–1200.
Finegold, M. and Drton, M. (2011). Robust graphical modeling of gene networks using
classical and alternative t-distributions. The Annals of Applied Statistics, pages 1057–
1080.
Finegold, M. and Drton, M. (2014). Robust Bayesian graphical modeling using Dirichlet
t-distributions. Bayesian Analysis, 9(3):521–550.
Friedman, J., Hastie, T., and Tibshirani, R. (2008). Sparse inverse covariance estimation
with the graphical lasso. Biostatistics, 9(3):432–441.
Gao, H., Korn, J. M., Ferretti, S., Monahan, J. E., Wang, Y., Singh, M., Zhang, C., Schnell,
C., Yang, G., Zhang, Y., et al. (2015). High-throughput screening using patient-derived
tumor xenografts to predict clinical trial drug response. Nature medicine, 21(11):1318–
1325.
Genest, C. and Neslehova, J. G. (2014). Modeling dependence beyond correlation. In
Statistics in Action, pages 83–102. Chapman and Hall/CRC.
George, E. I. and McCulloch, R. E. (1993). Variable selection via Gibbs sampling. Journal
of the American Statistical Association, 88(423):881–889.
31

Ghandi, M., Huang, F. W., Jane-Valbuena, J., Kryukov, G. V., Lo, C. C., McDonald,
E. R., Barretina, J., Gelfand, E. T., Bielski, C. M., Li, H., et al. (2019). Next-generation
characterization of the cancer cell line encyclopedia. Nature, 569(7757):503–508.
Gridelli, C., Morgillo, F., Favaretto, A., De Marinis, F., Chella, A., Cerea, G., Mattioli, R.,
Tortora, G., Rossi, A., Fasano, M., et al. (2011). Sorafenib in combination with erlotinib
or with gemcitabine in elderly patients with advanced non-small-cell lung cancer: a
randomized phase II study. Annals of Oncology, 22(7):1528–1534.
Ha, M. J., Stingo, F. C., and Baladandayuthapani, V. (2021). Bayesian structure learn-
ing in multilayered genomic networks. Journal of the American Statistical Association,
116(534):605–618.
Ho, C.-C., Kuo, S.-H., Huang, P.-H., Huang, H.-Y., Yang, C.-H., and Yang, P.-C. (2008).
Caveolin-1 expression is significantly associated with drug resistance and poor prog-
nosis in advanced non-small cell lung cancer patients treated with gemcitabine-based
chemotherapy. Lung Cancer, 59(1):105–110.
Iorio, F., Knijnenburg, T. A., Vis, D. J., Bignell, G. R., Menden, M. P., Schubert, M.,
Aben, N., Goncalves, E., Barthorpe, S., Lightfoot, H., et al. (2016). A landscape of
pharmacogenomic interactions in cancer. Cell, 166(3):740–754.
Kasarskis, A., Yang, X., and Schadt, E. (2011). Integrative genomics strategies to elucidate
the complexity of drug response. Pharmacogenomics, 12(12):1695–1715.
Langer, C. J., Leighton, J. C., Comis, R. L., O’Dwyer, P. J., McAleer, C. A., Bonjo, C. A.,
Engstrom, P. F., Litwin, S., and Ozols, R. F. (1995). Paclitaxel and carboplatin in
combination in the treatment of advanced non-small-cell lung cancer: a phase ii toxicity,
response, and survival analysis. Journal of Clinical Oncology, 13(8):1860–1870.
32

Lauritzen, S. L. (1996). Graphical models, volume 17. Clarendon Press.
Li, Y., Datta, J., Craig, B. A., and Bhadra, A. (2021). Joint mean–covariance estimation
via the horseshoe. Journal of Multivariate Analysis, 183:104716.
Liang, H., Wang, H. B., Liu, H. Z., Wen, X. J., Zhou, Q. L., and Yang, C. X. (2013). The
effects of combined treatment with sevoflurane and cisplatin on growth and invasion of
human adenocarcinoma cell line a549. Biomedicine & Pharmacotherapy, 67(6):503–509.
Lim, Z.-F. and Ma, P. C. (2019). Emerging insights of tumor heterogeneity and drug resis-
tance mechanisms in lung cancer targeted therapy. Journal of Hematology and Oncology,
12(1):1–18.
Lin, J., Basu, S., Banerjee, M., and Michailidis, G. (2016). Penalized maximum likelihood
estimation of multi-layered Gaussian graphical models. Journal of Machine Learning
Research, 17(146):1–51.
Liu, H., Han, F., Yuan, M., Lafferty, J., and Wasserman, L. (2012). High-dimensional
semiparametric Gaussian copula graphical models. The Annals of Statistics, 40(4):2293–
2326.
Liu, H., Lafferty, J., and Wasserman, L. (2009). The nonparanormal: Semiparametric
estimation of high dimensional undirected graphs. Journal of Machine Learning Research,
10(10).
McCarter, C. and Kim, S. (2014). On sparse Gaussian chain graph models. Advances in
Neural Information Processing Systems, 27:3212–3220.
Mok, T. S., Wu, Y.-L., Ahn, M.-J., Garassino, M. C., Kim, H. R., Ramalingam, S. S.,
Shepherd, F. A., He, Y., Akamatsu, H., Theelen, W. S., et al. (2017). Osimertinib
33

or platinum–pemetrexed in egfr t790m–positive lung cancer. New England Journal of
Medicine, 376(7):629–640.
Morris, J. S. and Baladandayuthapani, V. (2017). Statistical contributions to bioinfor-
matics: Design, modelling, structure learning and integration. Statistical Modelling,
17(4-5):245–289.
Nelsen, R. B. (2007). An Introduction to Copulas. Springer Science & Business Media.
Petersen, L. (2018). Sparse learning in Gaussian chain graphs for state space models. In
International Conference on Probabilistic Graphical Models, pages 332–343. PMLR.
Pitt, M., Chan, D., and Kohn, R. (2006). Efficient Bayesian inference for Gaussian copula
regression models. Biometrika, 93(3):537–554.
Robichaux, J. P., Le, X., Vijayan, R., Hicks, J. K., Heeke, S., Elamin, Y. Y., Lin, H. Y.,
Udagawa, H., Skoulidis, F., Tran, H., et al. (2021). Structure-based classification predicts
drug response in egfr-mutant nsclc. Nature, 597(7878):732–737.
Roden, D. M., McLeod, H. L., Relling, M. V., Williams, M. S., Mensah, G. A., Peterson,
J. F., and Driest, S. L. V. (2019). Pharmacogenomics. The Lancet, 394(10197):521–532.
Rothman, A. J., Levina, E., and Zhu, J. (2010). Sparse multivariate regression with co-
variance estimation. Journal of Computational and Graphical Statistics, 19(4):947–962.
Schneider, J., Classen, V., and Helmig, S. (2008). Xrcc1 polymorphism and lung cancer
risk. Expert review of molecular diagnostics, 8(6):761–780.
Shi, Y.-B., Li, J., Lai, X.-N., Jiang, R., Zhao, R.-C., and Xiong, L.-X. (2020). Multifaceted
roles of caveolin-1 in lung cancer: a new investigation focused on tumor occurrence,
development and therapy. Cancers, 12(2):291.
34

Soria, J.-C., Ohe, Y., Vansteenkiste, J., Reungwetwattana, T., Chewaskulyong, B., Lee,
K. H., Dechaphunkul, A., Imamura, F., Nogami, N., Kurata, T., et al. (2018). Os-
imertinib in untreated egfr-mutated advanced non–small-cell lung cancer. New England
Journal of Medicine, 378(2):113–125.
Squassina, A., Manchia, M., Manolopoulos, V. G., Artac, M., Lappa-Manakou, C., Kark-
abouna, S., Mitropoulos, K., Zompo, M. D., and Patrinos, G. P. (2010). Realities and
expectations of pharmacogenomics and personalized medicine: impact of translating ge-
netic knowledge into clinical practice. Pharmacogenomics, 11(8):1149–1167.
Vicent, S., Garayoa, M., Lopez-Picazo, J. M., Lozano, M. D., Toledo, G., Thunnissen,
F. B., Manzano, R. G., and Montuenga, L. M. (2004). Mitogen-activated protein ki-
nase phosphatase-1 is overexpressed in non-small cell lung cancer and is an independent
predictor of outcome in patients. Clinical Cancer Research, 10(11):3639–3649.
Vogelstein, B. and Kinzler, K. W. (2004). Cancer genes and the pathways they control.
Nature Medicine, 10(8):789–799.
Woo, X. Y., Giordano, J., Srivastava, A., Zhao, Z.-M., Lloyd, M. W., de Bruijn, R., Suh,
Y.-S., Patidar, R., Chen, L., Scherer, S., et al. (2021). Conservation of copy number
profiles during engraftment and passaging of patient-derived cancer xenografts. Nature
genetics, 53(1):86–99.
Xue, L. and Zou, H. (2012). Regularized rank-based estimation of high-dimensional non-
paranormal graphical models. The Annals of Statistics, 40(5):2541–2571.
Yin, J. and Li, H. (2011). A sparse conditional Gaussian graphical model for analysis of
genetical genomics data. The Annals of Applied Statistics, 5(4):2630.
35

Supplementary Materials for
Bayesian Robust Learning in Chain Graph Models for
Integrative Pharmacogenomics
S.1 Proofs
This section consists of the proofs of Theorem 2.1 and Corollary 2.2. We adapt the proof
of Proposition 1 of Bhadra et al. (2018) to our chain graph context.
S.1.1 Proof of Theorem 2.1 (i)
(a) Let L(u) = L(v) = l. Let pal be the indices of nodes in layers 1 : (l−1). By construction
of the non-normal chain graph model in (2), X l given D and Xpal can be written as
DlX l|Xpal ,D ∼ N(Bl,palDpalXpal ,K−1l ).
Let gl be equal to Bl,palDpalXpal , so that E(DlX l|Xpal ,D) = gl. Note that gl is free
of X l and Dl. Also, let gl = ((g))j, j ∈ Tl. By properties of the multivariate normal
distribution,
(Xu
du,Xv
dv
) ∣∣X [1:l]\u,v,D ∼ N2
µuD
µvD
,K−1u,v
, (S.1)
where µjD = E(Xj/dj|X [1:l]\u,v,D), j = u, v, and
Ku,v =
kuu kuv
kvu kvv
.
S.1

When kuv = 0, the joint conditional likelihood factorizes into the product of the individual
conditional likelihoods, so that
f
(Xu
du,Xv
dv
∣∣∣∣X [1:l]\u,v,D
)=
(1√2π
)2
k1/2uu exp
(−1
2
(Xu
du− µuD
)Tkuu
(Xu
du− µuD
))
k1/2vv exp
(−1
2
(Xv
dv− µvD
)Tkvv
(Xv
dv− µvD
)).
(S.2)
From Proposition C.5 of Lauritzen (1996), µjD = E(Xj/dj|X [1:l]\u,v,D), j = u, v, can be
deduced as
µjD = gj −1
kjj
∑t6=u,v;t∈Tl
kjt
(Xt
dt− gt
), j = u, v.
From (S.2), (Xu/du) and (Xv/dv) are conditionally independent given (X [1:l]\u,v,D).
Therefore, when kuv = 0, (Yj/dj)|X [1:l]\u,v,D ∼ N(µjD, k−1jj ), j = u, v. For the rest
of the proof of part (i), we prove results involving Xu. The corresponding results for Xv
follow in an exact similar way. We evaluate
P(Xu < 0|X [1:l]\u,v,D) = P
(Xu
du< 0
∣∣∣∣X [1:l]\u,v,D
)= P
(k1/2uu
(Xu
du− µuD
)< −k1/2uu µuD
∣∣∣∣X [1:l]\u,v,D
)= Φ(−k1/2uu µuD). (S.3)
Note that since µuD is free of (Xu, Xv, du, dv), the RHS of (S.3) is free of those as well.
Similar calculation follows for Xv, so that P(Xv < 0|X [1:l]\u,v,D) = Φ(−k1/2vv µvD).
Next, by properties of multivariate normal distribution, we have that
(Xu/du)|X [1:l]\u,D ∼ N(µuD, k−1uu ),
S.2

where
µuD = gu −1
kuu
∑t6=u
kut
(Xt
dt− gt
).
Then it follows that
P(Xu < 0|X [1:l]\u,D) = P
(Xu
du< 0|X [1:l]\u,D
)= P
(k1/2uu
(Xu
du− µuD
)< −k1/2uu µuD|X [1:l]\u,D
)= Φ(−k1/2uu µuD). (S.4)
When kuv = 0, the term corresponding to t = v in the expression of µuD vanishes, so that
µuD = µuD.
Therefore, when kuv = 0, (S.3) and (S.4) are equal, so that P(Xu < 0|X [1:l]\u,v,D) is
equal to P(Xu < 0|X [1:l]\u,D).
Now note that the conditional likelihood of DX given D factorizes in terms of dv’s,
and dv ∼ pv are chosen independent of each other. Therefore π(D|X) factorizes into the
product of π(1/dv|Xv). Using this fact, we evaluate
P(Xu < 0|X [1:l]\u,v) =
∫P(Xu < 0|X [1:l]\u,v,D[1:l])dπ(D[1:l]|X [1:l]\u,v)
=
∫P(Xu < 0|X [1:l]\u,D[1:l])dπ(D[1:l]\u,v|X [1:l]\u,v)
=
∫P(Xu < 0|X [1:l]\u,D[1:l])
(∫dπ(d−1v |X [1:l]\u,v)
)dπ(D[1:l]\u,v|X [1:l]\u,v)
=
∫P(Xu < 0|X [1:l]\u,D[1:l])dπ(D[1:l]\u|X [1:l]\u)
=
∫P(Xu < 0|X [1:l]\u,D[1:l])dπ(D[1:l]|X [1:l]\u)
S.3

= P(Xu < 0|X [1:l]\u). (S.5)
The swapping of integrals is ensured by Fubini’s theorem which can be applied here as
0 < du <∞ and∫pu(du) <∞ by assumption on dvs.
(b) Let L(u) < L(v) and L(v) = l. Note that Xv∪[1:l−1]Dv∪[1:l−1]|D follows a
multivariate normal distribution. We then have,
(Xu
du,Xv
dv
) ∣∣X [1:l−1]\u,D ∼ N2
µuD
µvD
,K−1u,v
,
where µjD = E(Xj/dj|X [1:l−1]\u,D), j = u, v. Therefore,
(Xj/dj)|X [1:l−1]\u,D ∼ N(µjD, k−1jj ).
Also, for j = u, v,
(Xj/dj)|X [v∪[1:l−1]]\j,D ∼ N(µjD, k−1jj ),
where µjD = E(Xj/dj|X [v∪[1:l−1]]\j,D).
Therefore, for j = u, v,
P(Xj < 0|X [1:l−1]\u,D) = P
(Xj
dj< 0|X [1:l−1]\u,D
)= P
(k1/2jj
(Xj
dj− µjD
)< −k1/2jj µjD
∣∣∣∣X [1:l−1]\u,D
)= Φ(−k1/2jj µjD). (S.6)
Also,
P(Xj < 0|X [v∪[1:l−1]]\j,D) = P
(Xj
dj< 0|X [v∪[1:l−1]]\j,D
)
S.4
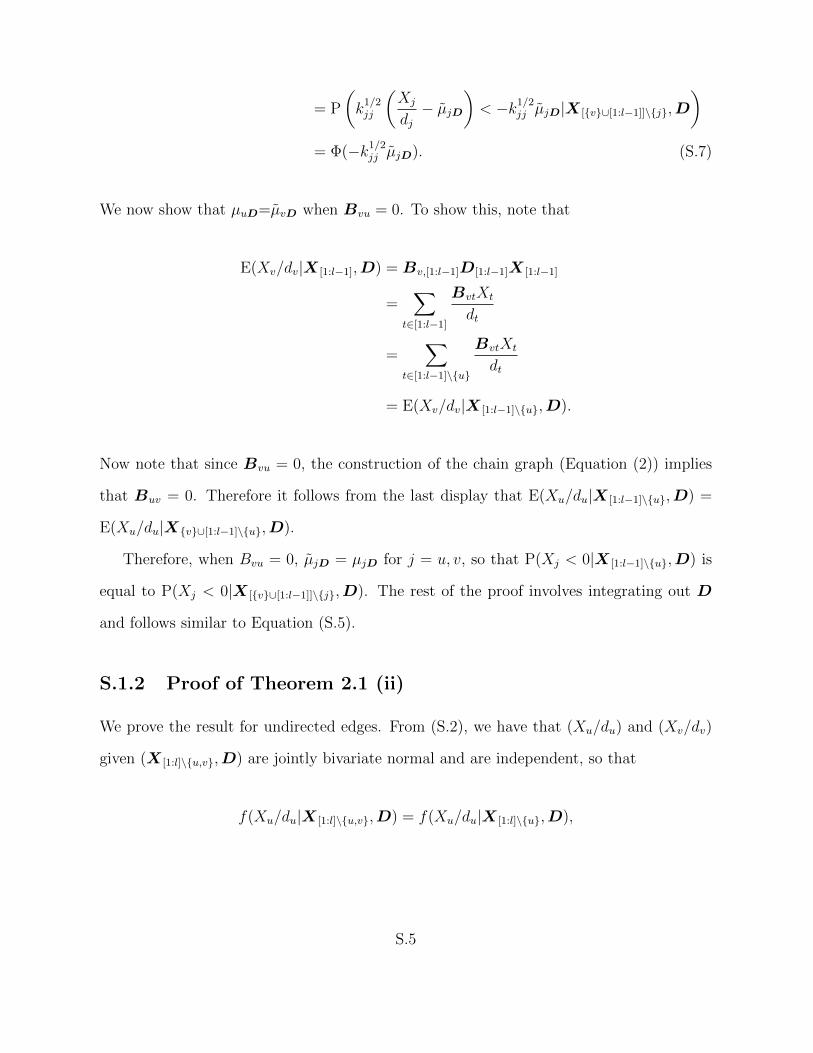
= P
(k1/2jj
(Xj
dj− µjD
)< −k1/2jj µjD|X [v∪[1:l−1]]\j,D
)= Φ(−k1/2jj µjD). (S.7)
We now show that µuD=µvD when Bvu = 0. To show this, note that
E(Xv/dv|X [1:l−1],D) = Bv,[1:l−1]D[1:l−1]X [1:l−1]
=∑
t∈[1:l−1]
BvtXt
dt
=∑
t∈[1:l−1]\u
BvtXt
dt
= E(Xv/dv|X [1:l−1]\u,D).
Now note that since Bvu = 0, the construction of the chain graph (Equation (2)) implies
that Buv = 0. Therefore it follows from the last display that E(Xu/du|X [1:l−1]\u,D) =
E(Xu/du|Xv∪[1:l−1]\u,D).
Therefore, when Bvu = 0, µjD = µjD for j = u, v, so that P(Xj < 0|X [1:l−1]\u,D) is
equal to P(Xj < 0|X [v∪[1:l−1]]\j,D). The rest of the proof involves integrating out D
and follows similar to Equation (S.5).
S.1.2 Proof of Theorem 2.1 (ii)
We prove the result for undirected edges. From (S.2), we have that (Xu/du) and (Xv/dv)
given (X [1:l]\u,v,D) are jointly bivariate normal and are independent, so that
f(Xu/du|X [1:l]\u,v,D) = f(Xu/du|X [1:l]\u,D),
S.5

when kuv = 0. We then have
f(Xu|X [1:l]\u,v) =
∫f(Xu|X [1:l]\u,v,D[1:l])dπ(D[1:l]\u|X [1:l]\u,v)
=
∫d−1u f(Xu/du|X [1:l]\u,v,D[1:l])dπ(D[1:l]\u|X [1:l]\u,v)
=
∫d−1u f(Xu/du|X [1:l]\u,D[1:l])dπ(D[1:l]\u|X [1:l]\u)
=
∫f(Xu|X [1:l]\u,D[1:l])dπ(D[1:l]\u|X [1:l]\u)
= f(Xu|X [1:l]\u). (S.8)
The interchange of integrals in dπ(D) in the last display follows from arguments similar
to (S.5). The relation in Equation (S.2) also holds when L(u) < L(v) and Bvu = 0, so the
proof in this case would follow similar to the last two displays.
S.1.3 Proof of Corollary 2.2
Let L(u) = L(v) = l. Let H1 denote the event of conditional sign independence:
H1 = P(Xu < 0|X [1:l]\u,v) = P(Xu < 0|X [1:l]\u).
Then P (H1) =∑
ωu,ωvP (H1|ωu, ωv)P (ωu, ωv), where ωu, ωv are 0 or 1. From part (i) of
Theorem 2.1, H1 is true whenever at least one of ωu, ωv is 1. From part (ii) of Theorem 2.1,
conditional independence is observed when ωu = ωv = 0. As conditional sign independence
is a weaker property, it is observed when ωu = ωv = 0. So when kuv = 0,
P (H1|ωu = 1, ωv = 1) = P (H1|ωu = 1, ωv = 0) = P (H1|ωu = 0, ωv = 1)
= P (H1|ωu = 0, ωv = 0) = 1,
S.6

so that P (H1) = 1.
For conditional independence, let H2 denote the event:
H2 = f(Xu|X [1:l]\u,v) = f(Xu|X [1:l]\u).
Then
P (H2) =∑ωu,ωv
P (H2|ωu, ωv)P (ωu, ωv)
≥ P (H2|ωu = ωv = 0)P (ωu = 0, ωv = 0).
From part (ii) of Theorem 2.1, P (H2|ωu = ωv = 0) = 1. As ωv ∼ Bern(πv) independently,
P (ωu = 0, ωv = 0) = 1− πu − πv + πuπv. Therefore P (H2) = 1− πu − πv + πuπv. Similar
calculations would follow for Xv, and for L(u) < L(v).
S.2 Node-wise Likelihood Equations
For a node v belonging to layer l, let bv be the entries in the row of Bl corresponding to
v, with bv = 0 if l = 1. Let av = −k−1vv k(v)l , where k
(v)l is the vector of kvu, u ∈ Tl\v. We
reparameterize the precision parameters to regression coefficients on residuals after taking
out the effects of previous layers, so that given D, we have
(Xv/dv) = (XD)T[1:L(v)−1]bv + εv,
where ε = (ε1, . . . , εq), εv = εTTl\vav + ev, and ev ∼ N(0, k−1vv ) is independent of εV \v.
Let B(v)l be the submatrix of Bl consisting of all but the row corresponding to the node
v. Applying the node-wise regression in Proposition 1 in Ha et al. (2021), for the scaled
S.7

random variables given D, we have the node-conditional equation
Xv
dv= (XD)T[1:l−1](bv −B
(v)l av) + (XD)TTl\vav + ev.
With the identifiability constraints imposed, given D, the v-th node-conditional regression
is of the form
(Xv/dv) = (XD)T[1:l−1]bv + εTTl\vav + ev,
where εTTl\v = (XD)TTl\v − (XD)T[1:l−1]B(v)l is assumed fixed given D. We reparameterize
av, bv, kvv for every v ∈ V and L(v) = l, to obtain the layer-wise estimates of B and K as
((Bl))vu = bvu,
((Kl))vu = −kvvavu, u ∈ Tl\v. (S.9)
S.3 Identifiability in Node-wise Likelihood Equation
Throughout this section, let Y = DX denote the scaled data. Let us examine a simple
case of the model as described in Figure S.1. The node-wise equation for Y3 would be
Y3 = (b31Y1 + b32Y2) + a34Y4 − a34b42Y2.
From the figure, it appears that b32 = 0, but b32 would still appear in the node-wise
regression equation. The previous equation can be re-written as
Y3 = b31Y1 + (b32 − a34b42)Y2 + a34Y4.
S.8

Now let b be the estimated coefficient for Y2. We assume a34 known when estimating b,
so b = b32 − a34b42 is one equation with two variables b32 and b42 which cannot be solved
uniquely. As an example, consider the two different sets of solutions:
1. (b32 = 0, b42 = −b/a34): graph on the left panel. There is no edge between Y3 and Y2.
2. (b32 = b, b42 = 0): graph on the right panel. There is no edge between Y4 and Y2.
Figure S.1: An example demonstrating the node-wise regressions for a two-layer chaingraph with two nodes in each layer
In this example, it is not possible to identify whether the effect of Y2 on Y3 is through
the directed edge b32 or via the indirect effect of Y4 (through a34b42). So the identifiability
problem can potentially lead to inconsistent edge detection.
S.4 Selection of Mixing Distributions
If v is a node with heavy tails such that ωv = 1, then
dv|(ωv = 1) ∼ pv,
f(Xv|ωv = 1) =
∫d−1v φ(Xv/dv)dpv(dv), (S.10)
S.9

Algorithm 2: Selection of mixing distribution pv’s
Given the multivariate data X with q coordinates,;while 1 ≤ i ≤ q do
Let x = [Xv −mean(Xv)]/s.d.(Xv);(double-exponential fitting). Evaluate pe, the p-value of the regressionlog f(x) = a0 + a1 log |x|+ a2|x|.;
(t-distribution fitting). Evaluate pt, the p-value of the regressionlog f(x) = a0 + a2|x|.;
(select category and parameters of pv). if pe < pt thenSet pv as Gamma(shape= (a1 + 1)/2, scale= a21/2)
endelse
Set pv as Inverse-Gamma(shape= (−a1 + 1)/2, scale= (−a1 + 1)/2)end
end
where φ(·) is the pdf of a standard normal distribution. From Lemma 1 of Bhadra et al.
(2018), if the tail of Xv decays polynomially as α|x|2λv−1 for some λ ≤ 0, ν ∈ IR, α ∈ (0, 1)
then the mixing density pv has the right-tail decaying as αdλv−1v . Further, if the marginal
decays exponentially as |x|2λv−1 exp−(2ψv)1/2|xv| for λ ∈ IR and ψ > 0, then pv has tail
decaying as dλv−1v exp(−ψvdv). So the rate of decay in marginal tails can be directly used
to set the parameters of the mixing distribution pv. Algorithm 2 describes the procedure
for setting the tail parameters of pv.
S.5 MCMC Sampling Steps Summary
We first choose pv for each node v using Algorithm 2. We then set the prior of πv as
Beta(µvrv, (1 − µv)rv), where µv = H(xv), H(xv) = 2 ∗ Φ(log(1 − pval(xv))), with Φ
and pval respectively being the cdf of standard normal distribution and the p-value of the
Kolmogorov-Smirnov test for normality, rv = [µv(1−µv)/ξv]−1, with the prior variance ξv
set to 0.01 if sv > 0.01 and 0.01sv otherwise, for sv = µv(1−µv). We center and scale each
S.10

coordinate of X before computation. At iteration t of the MCMC sampling, we generate
D for every subject i given current π as div ∼ πvpv + (1 − πv)δ1 for all v ∈ V . We then
accept the sampled div based on the ratio
R =φ(Xivdiv)pv(d
∗iv)
φ(Xivd∗iv)pv(div), (S.11)
where d∗iv is the current value of div and φ is the density of a standard normal distribution.
We accept div if U ∼ Unif(0, 1) is less than R. Next, for every layer l, we update the
normality measures and directed and undirected edges as described below.
To update the non-normality measure π, let πs be the current state of π. We generate
the new sample π∗ by generating π∗v for every v ∈ Tl from Beta(ξ0v(ξ0v/r
2v−1), (1−ξ0v)(ξ0v/r2v−
1)). For every v ∈ Tl, we look at the acceptance ratio
R =[π∗vφ(Xv/dv|µDv ,π∗, kvv)pv(dv) + (1− π∗v)φ(Xv|µv,π∗, kvv)]g(π∗v)
[πsvφ(Xv/dv|µDv ,π∗, kvv)pv(dv) + (1− πsv)φ(Xv|µv,π∗, kvv)]g(πsv), (S.12)
where g is the density function of Beta(ξ0v(ξ0v/r
2v−1), (1−ξ0v)(ξ0v/r2v−1)), and µv = XT
Pvbv−
XTl\vav + XPvBTTl\vav, µ
Dv = XT
Pvbv − (XD)Tl\vav + XPvB
TTl\vav. We then sample
U ∼ Unif(0, 1) and set πs+1 = π∗ if U ≤ R, and set πs+1 = πs otherwise.
To update undirected edges, given D, let yv = Xv/dv−XPvbv, and xv = XTl\vDTl\v−
XPvBTTl\v.
1. We first update the model selection parameters. Let s be the current state.
1.1. Add-delete or swap: with probability 1/2, sample w1 from Tl\v and set η∗vw1=
η∗w1v= 1−ηsvw1
. Else, sample w2 from w : ηvw = 0\v, w3 from w : ηvw = 1
and set η∗vw2= ηw2v = 1 and ηvw3 = ηw3v = 0.
1.2. Compute the acceptance ratio:
S.11

add/delete: R =∏
r∈v,w1f(yr|xr,η∗
r ,krr)p(η∗r)
f(yr|xr,ηsr,krr)p(η
sr)
;
swap: R =∏
r∈v,w2,w3f(yr|xr,η∗
r ,krr)p(η∗r)
f(yr|xr,ηsr,krr)p(η
sr)
,
where f(yv|xv,ηv, kvv) is the density function of a normal distribution with
mean 0 and variance
1
kvv
(I − xηv(xηTv xηv +G−1v )−1xηTv
)−1,
for Gv = I/λl and p(ηr) =∏
k∈C(r) pηrkrk (1− prk)1−ηrk.
1.3. Sample U ∼ Unif(0, 1) and set εs+1 = ε∗ if U ≤ R, and set εs+1 = εs otherwise.
2. Gibbs sampling for av: for all r in v, w1 or v, w2, w3,
ar|yr, xr,ηr, krr ∼ N
((xηTr x
ηr +G−1r )−1xηTr yr,
1
krr(xηTr x
ηr +G−1r )−1
). (S.13)
3. Gibbs sampling for krr: for all r in v, w1 or v, w2, w3,
p(krr|xr,xr,ηr,ar) = Gamma(A1, A2), (S.14)
where
A1 =n+ δl + |Tl| − 1 + ‖ηr‖0
2,
A2 =λl2
+1
2
[(yr − xηraηr)T (yr − xηraηr) + bγTr (I/λl)
−1bγr
+(λl + |Tl| − 1)aηTr aηr
],
and ‖ · ‖0 denotes the number of nonzero elements in the vector.
To update directed edges between layers, let G be the current graph and u1, u2, . . . be
vertices in the neighbor set of v in G. Set yv = Xv/dv − εTTl\vav, xv = D[1:l−1]X [1:l−1].
S.12

1. Metropolis-Hastings for edge selection: let s be the current state.
1.1. Add-delete or swap: with probability 1/2, sample k1 from X [1:l−1] and set γ∗vk1 =
1 − γsvk1 . Otherwise sample k2 from the parent nodes of v, k3 from the set of
nodes in [1 : l − 1] that are not connected to v, and set γ∗vk2 = 0 and γvk3 = 1.
1.2. Compute the acceptance ratio:
R =f(yv|xv,γ∗, kvv)p(γ∗)f(yv|xv,γs, kvv)p(γs)
,
where f(yv|xv,γ, kvv) is the density function of normal distribution with mean
0 and variance
1
kvv
(I − xγv(xγTv xγv +G−1v )−1xγv
)−1,
for Gv = I/λl and p(γ) =∏
v∈Tl,w∈T[1:l−1]qγvwvw (1− qvw)1−γvw .
1.3. Sample U ∼ Unif(0, 1) and set γs+1 = γ∗ if U ≤ R, and set γs+1 = γs otherwise.
2. Gibbs sampling for bv:
bv|yv, xv,γv, kvv ∼ N
((xγTv x
γv +G−1v )−1xγTv yv,
1
kvv(xγTv x
γv +G−1v )−1
). (S.15)
3. Gibbs sampling for kvv:
p(kvv|yv, xv,γv, bv) = Gamma(B1, B2), (S.16)
where
B1 =n+ δl + |Tl| − 1 + ‖γv‖0
2,
S.13

B2 =λl2
+1
2
[(yv − xγTv bγv)T (yv − xγTv bγv) + bγTv (I/λl)
−1bγv
+(λl + |Tl| − 1)bγTv bγv
],
and ‖ · ‖0 is the number of nonzero elements in the vector.
S.6 Additional Simulation Details
The most commonly used measure for the tail mass being heavier or lighter than that of
the normal distribution is the kurtosis. A standardized kurtosis > 0 indicates heavier-
than-normal tails. To analyze the performance of the three methods with respect to tail-
heaviness measured by the kurtosis, we empirically calculate the kurtosis of a random
variable following a mixture of normal and heavy-tailed distributions with the mixing factor
being π. We perform this procedure for a range of π in [0, 1]. Based on these π values,
we form the chain graph simulation datasets as described in Section 4 and evaluate the
AUC values for 30 replications of data, for each of the three methods RCGM, BANS and
LBBM. Figures S.2 – S.3 display the AUCs varying across different π and kurtosis levels
respectively.
S.7 Pathway-wise Networks for Molecular-drug Inter-
actions
We have pathway-level graphs obtained using RCGM for 10 key signaling pathways: apop-
tosis, cell cycle, DNA damage response, EMT, RAS/MAPK, RTK, PI3K/AKT, TSC/mTOR,
core reactive and breast reactive. The graph for DNA damage response is displayed in Fig-
ure 5. The rest of the pathway graphs are displayed in Figures S.6 – S.14. For each graph,
S.14

Figure S.2: Mean area under ROC curve across 30 replications for different levels ofmarginal tail-heaviness, measured by π. Interval of one standard deviation around eachmean AUC is displayed through vertical lines. Panels (a) and (b) correspond to scaling byExponential(mean = 2.5) and Inv-Gamma(shape = 3, rate = 6) respectively.
Figure S.3: Mean area under ROC curve across 30 replications for different levels ofmarginal tail-heaviness, measured by the kurtosis. Interval of one standard deviationaround each mean AUC is displayed through vertical lines. Panels (a) and (b) correspondto scaling by Exponential(mean = 2.5) and Inv-Gamma(shape = 3, rate = 6) respectively.
S.15

Figure S.4: Violin plot of the estimated node-wise non-normality πv across all pathways.
the edge width is proportional to the posterior edge inclusion probability obtained from
MCMC samples. The platform-wise violin plot of the estimated non-normality scores πv
are displayed in Figure S.4.
We display the between-drug edges detected across pathways in Figure S.5. Two clus-
ters of drugs emerge from this analysis - the first cluster consisting of icotinib, vinorelbine,
paclitexel, osimertinib, gemcitabine and carboplatin, and the second cluster including afa-
tinib, brigatinib, etoposide, sorafenib, alectinib, docetaxel and erlotinib. Dependencies of
icotinib with vinorelbine, paclitaxel and osimertinib and those of afatinib with sorafenib,
etoposide and brigatinib were detected in all 10 pathways. Strong dependencies between
drugs indicate that drugs’ individual effects on cell viability after scaling for robustness
and adjusting for effects of all other variables are strongly positively correlated.
S.16

Figure S.5: Dependent drug pairs captured across the 10 pathways. Each edge width isproportional to, and marked with the number of pathways (out of 10) the correspondingdrug-drug dependency is detected in.
S.17

Figure S.6: The estimated multilayered network for the apoptosis pathway. Blue and rededges indicate positive and negative dependencies, while CD and CSD stand for condition-ally dependent and conditionally sign-dependent edges respectively. The width of the edgesis proportional to the posterior inclusion probabilities.
S.18

Figure S.7: The estimated multilayered network for the cell cycle pathway. Blue and rededges indicate positive and negative dependencies, while CD and CSD stand for condition-ally dependent and conditionally sign-dependent edges respectively. The width of the edgesis proportional to the posterior inclusion probabilities.
S.19

Figure S.8: The estimated multilayered network for the EMT pathway. Blue and red edgesindicate positive and negative dependencies, while CD and CSD stand for conditionallydependent and conditionally sign-dependent edges respectively. The width of the edges isproportional to the posterior inclusion probabilities.
S.20

Figure S.9: The estimated multilayered network for the PI3K/AKT pathway. Blue andred edges indicate positive and negative dependencies, while CD and CSD stand for condi-tionally dependent and conditionally sign-dependent edges respectively. The width of theedges is proportional to the posterior inclusion probabilities.
S.21

Figure S.10: The estimated multilayered network for the RAS/MAPK pathway. Blueand red edges indicate positive and negative dependencies, while CD and CSD stand forconditionally dependent and conditionally sign-dependent edges respectively. The width ofthe edges is proportional to the posterior inclusion probabilities.
S.22

Figure S.11: The estimated multilayered network for the RTK pathway. Blue and red edgesindicate positive and negative dependencies, while CD and CSD stand for conditionallydependent and conditionally sign-dependent edges respectively. The width of the edges isproportional to the posterior inclusion probabilities.
S.23

Figure S.12: The estimated multilayered network for the TSC/mTOR pathway. Blueand red edges indicate positive and negative dependencies, while CD and CSD stand forconditionally dependent and conditionally sign-dependent edges respectively. The width ofthe edges is proportional to the posterior inclusion probabilities.
S.24

Figure S.13: The estimated multilayered network for the breast reactive pathway. Blueand red edges indicate positive and negative dependencies, while CD and CSD stand forconditionally dependent and conditionally sign-dependent edges respectively. The width ofthe edges is proportional to the posterior inclusion probabilities.
S.25

Figure S.14: The estimated multilayered network for the core reactive pathway. Blueand red edges indicate positive and negative dependencies, while CD and CSD stand forconditionally dependent and conditionally sign-dependent edges respectively. The width ofthe edges is proportional to the posterior inclusion probabilities.
S.26

Figure S.15: Pathway-wise H-score vs. π
S.27

S.8 Supplementary Tables
We display the names of pathways chosen in our study along with the count of gene and
protein memberships in each in Table S.1. The list of genes and proteins corresponding to
each pathway is given in Table S.2. Tables S.3 – S.4 display the target genes, mechanism
of action and primary diseases associated with the drugs used in our study.
Pathway CNA mRNA RPPAApoptosis 9 9 10Cell cycle 7 7 9DNA damage response 10 10 13EMT 7 7 9PI3K/AKT 10 10 15RAS/MAPK 10 10 19RTK 5 5 11TSC/mTOR 5 5 12Breast reactive 7 7 7Core reactive 5 5 7
Table S.1: Number of nodes in each platform of genomic information across 10 pathways.
S.28

Pathway Gene AntibodiesApoptosis BAD Bad pS112Apoptosis BAK1 Bak CautionApoptosis BAX BaxApoptosis BCL2 Bcl-2Apoptosis BCL2L1 Bcl-xLApoptosis BID Bid CautionApoptosis BCL2L11 Bim(CST2933), Bim(EP1036)Apoptosis CASP7 Caspase-7 cleavedD198 CautionApoptosis BIRC2 cIAP CautionCell cycle CDK1 CDK1Cell cycle CCNB1 Cyclin B1Cell cycle CCNE1 Cyclin E1Cell cycle CCNE2 Cyclin E2 CautionCell cycle FOXM1 FoxM1Cell cycle CDKN1B p27, p27 pT157 Caution, p27 pT198Cell cycle PCNA PCNA CautionDNA damage response TP53BP1 53BP1DNA damage response ATM ATMDNA damage response BRCA2 BRCA2 CautionDNA damage response CHEK1 Chk1 Caution, Chk1 pS345 CautionDNA damage response CHEK2 Chk2, Chk2 pT68 CautionDNA damage response XRCC5 Ku80 CautionDNA damage response MRE11A Mre11 CautionDNA damage response TP53 p53 CautionDNA damage response RAD50 RAD50DNA damage response RAD51 RAD51DNA damage response XRCC1 XRCC1 CautionEMT CTNNB1 alpha-Catenin, beta-Catenin,
beta-Catenin pT41 S45EMT CLDN7 Claudin-7EMT COL6A1 Collagen VIEMT CDH1 E-CadherinEMT FN1 FibronectinEMT CDH2 N-CadherinEMT SERPINE1 PAI-1
S.29

PI3K/AKT AKT1 Akt, Akt pS473, Akt pT308PI3K/AKT AKT2 Akt, Akt pS473, Akt pT308PI3K/AKT AKT3 Akt, Akt pS473, Akt pT308PI3K/AKT GSK3B GSK-3-beta Caution, GSK3-alpha-beta,
GSK3-alpha-beta pS21 S9, GSK3 pS9PI3K/AKT GSK3A GSK3 pS9, GSK3-alpha-beta,
GSK3-alpha-beta pS21 S9PI3K/AKT INPP4B INPP4BPI3K/AKT CDKN1B p27, p27 pT157 Caution, p27 pT198PI3K/AKT AKT1S1 PRAS40 pT246PI3K/AKT PTEN PTENPI3K/AKT TSC2 Tuberin, Tuberin pT1462RAS/MAPK ARAF A-Raf pS299 CautionRAS/MAPK JUN c-Jun pS73RAS/MAPK RAF1 C-Raf(BD610151) Caution, C-Raf(MP05-739),
C-Raf pS338RAS/MAPK MAPK1 ERK2 Caution, MAPK pT202 Y204RAS/MAPK MAPK8 JNK pT183 Y185RAS/MAPK MAPK3 MEK1RAS/MAPK MAP2K1 MEK1 pS217 S221, p38 alpha MAPKRAS/MAPK MAPK14 p38 MAPK, p38 pT180 Y182, p90RSK CautionRAS/MAPK RPS6KA1 p90RSK pT359 S363 Caution, p90RSK pT573 Caution,
RSK1-2-3 Caution, YB-1RAS/MAPK YBX1 c-Jun pS73, C-Raf(BD610151) CautionRTK EGFR EGFR, EGFR pY1068 Caution, EGFR pY1173RTK ERBB2 HER2, HER2 pY1248 CautionRTK ERBB3 HER3, HER3 pY1289 CautionRTK SHC1 Shc pY317RTK SRC Src, Src pY416 Caution, Src pY527TSC/mTOR EIF4EBP1 4E-BP1, 4E-BP1 pS65, 4E-BP1 pT37 T46,
4E-BP1 pT70TSC/mTOR MTOR mTOR, mTOR pS2448 CautionTSC/mTOR RPS6KB1 p70S6K, p70S6K pT389TSC/mTOR RB1 Rb Caution, Rb pS807 S811TSC/mTOR RPS6 S6 pS235 S236, S6 pS240 S244
S.30

Breast reactive CTNNB1 alpha-Catenin, beta-Catenin, beta-Catenin pT41 S45Breast reactive CAV1 Caveolin-1Breast reactive GAPDH GAPDH CautionBreast reactive MYH11 MYH11Breast reactive RBM15 RBM15Core reactive CTNNB1 alpha-Catenin, beta-Catenin, beta-Catenin pT41 S45Core reactive CAV1 Caveolin-1Core reactive CLDN7 Claudin-7Core reactive CDH1 E-CadherinCore reactive RBM15 RBM15
Table S.2: Antibodies and their target genes considered in RPPA analysis
S.31

Drug Mechanism of Action Target genes IndicationIcotinib EGFR inhibitor EGFR NSCLC
Osimertinib EGFR inhibitor EGFR NSCLCGefitinib EGFR inhibitor EGFR NSCLCAfatinib EGFR inhibitor EGFR,ERBB2,ERBB4 NSCLCErlotinib EGFR inhibitor EGFR, NR1I2 NSCLC, pancre-
atic cancerBrigatinib EGFR inhibitor, ALK
tyrosine kinase recep-tor inhibitor
ALK, EGFR NSCLC
Alectinib ALK tyrosine kinasereceptor inhibitor
ALK, MET NSCLC
Ceritinib ALK tyrosine kinasereceptor inhibitor
ALK, FLT3, IGF1R,INSR, TSSK1B
NSCLC
Crizotinib ALK tyrosine kinasereceptor inhibitor
ALK, MET NSCLC
Paclitaxel tubulin polymeriza-tion inhibitor
BCL2,MAP2,MAP4,MAPT,NR1I2,TLR4,TUBB,TUBB1
ovarian andbreast cancer,NSCLC
Docetaxel tubulin polymeriza-tion inhibitor
BCL2, MAP2, MAP4,MAPT,NR1I2,TUBB, TUBB1
NSCLC, breastand prostatecancer, gastricadenocarci-noma, HNSCC
Vindesine tubulin polymeriza-tion inhibitor
TUBB, TUBB1 NSCLC,melanoma,breast cancer
Vinorelbine tubulin polymeriza-tion inhibitor
TUBA1A, TUBA1B,TUBA1C, TUBA3C,TUBA3D, TUBA3E,TUBA4A, TUBB,TUBB1, TUBB2A,TUBB2B, TUBB3,TUBB4A, TUBB4B,TUBB6, TUBB8
NSCLC
Etoposide topoisomerase in-hibitor
TOP2A, TOP2B NSCLC
Table S.3: List of drugs used in our analysis along with their targets.
S.32

Drug Mechanism of action Target genes IndicationPemetrexed dihydrofolate re-
ductase inhibitor,thymidylate synthaseinhibitor
ATIC, DHFR, GART,TYMS
NSCLC,mesothelioma
Gemcitabine ribonucleotide reduc-tase inhibitor
CMPK1,RRM1,RRM2,TYMS
NSCLC,ovarian,breast and pan-creatic cancer
Sevoflurane membrane integrityinhibitor
ATP2C1, ATP5D,GABRA1, GABRA2,GABRA3, GABRA4,GABRA5, GABRA6,GABRB1, GABRB2,GABRB3, GABRD,GABRE, GABRG1,GABRG2, GABRG3,GABRP, GABRQ,GLRA1,GLRB,GRIA1,KCNA1, KCNK10,KCNK18,KCNK2,KCNK3,KCNK9,MT-ND1
anesthetic
Cisplatin DNA synthesis in-hibitor, DNA alkylat-ing agent
XIAP testicular carci-noma, ovarianand bladdercancer
Carboplatin DNA alkylating agent,DNA inhibitor
ovarian cancer
Sorafenib FLT3 inhibitor, KITinhibitor, PDGFR ty-rosine kinase recep-tor inhibitor, RAF in-hibitor, RET tyro-sine kinase inhibitor,VEGFR inhibitor
BRAF,DDR2,FGFR1,FLT3,FLT4,KDR,KIT,PDGFRB, RAF1,RET, FLT1
renal cell car-cinoma (RCC),thyroid cancer,hepatocellu-lar carcinoma(HCC)
Table S.4: List of drugs used in our analysis along with their targets.
S.33