Bathymetric distribution of the Chilean red sea urchin ( Loxechinus albus, Molina) in the inner seas...
8
This article appeared in a journal published by Elsevier. The attached copy is furnished to the author for internal non-commercial research and education use, including for instruction at the authors institution and sharing with colleagues. Other uses, including reproduction and distribution, or selling or licensing copies, or posting to personal, institutional or third party websites are prohibited. In most cases authors are permitted to post their version of the article (e.g. in Word or Tex form) to their personal website or institutional repository. Authors requiring further information regarding Elsevier’s archiving and manuscript policies are encouraged to visit: http://www.elsevier.com/copyright
Transcript of Bathymetric distribution of the Chilean red sea urchin ( Loxechinus albus, Molina) in the inner seas...
This article appeared in a journal published by Elsevier. The attachedcopy is furnished to the author for internal non-commercial researchand education use, including for instruction at the authors institution
and sharing with colleagues.
Other uses, including reproduction and distribution, or selling orlicensing copies, or posting to personal, institutional or third party
websites are prohibited.
In most cases authors are permitted to post their version of thearticle (e.g. in Word or Tex form) to their personal website orinstitutional repository. Authors requiring further information
regarding Elsevier’s archiving and manuscript policies areencouraged to visit:
http://www.elsevier.com/copyright
Author's personal copy
Fisheries Research 110 (2011) 305– 311
Contents lists available at ScienceDirect
Fisheries Research
jou rn al hom epage: www.elsev ier .com/ locate / f i shres
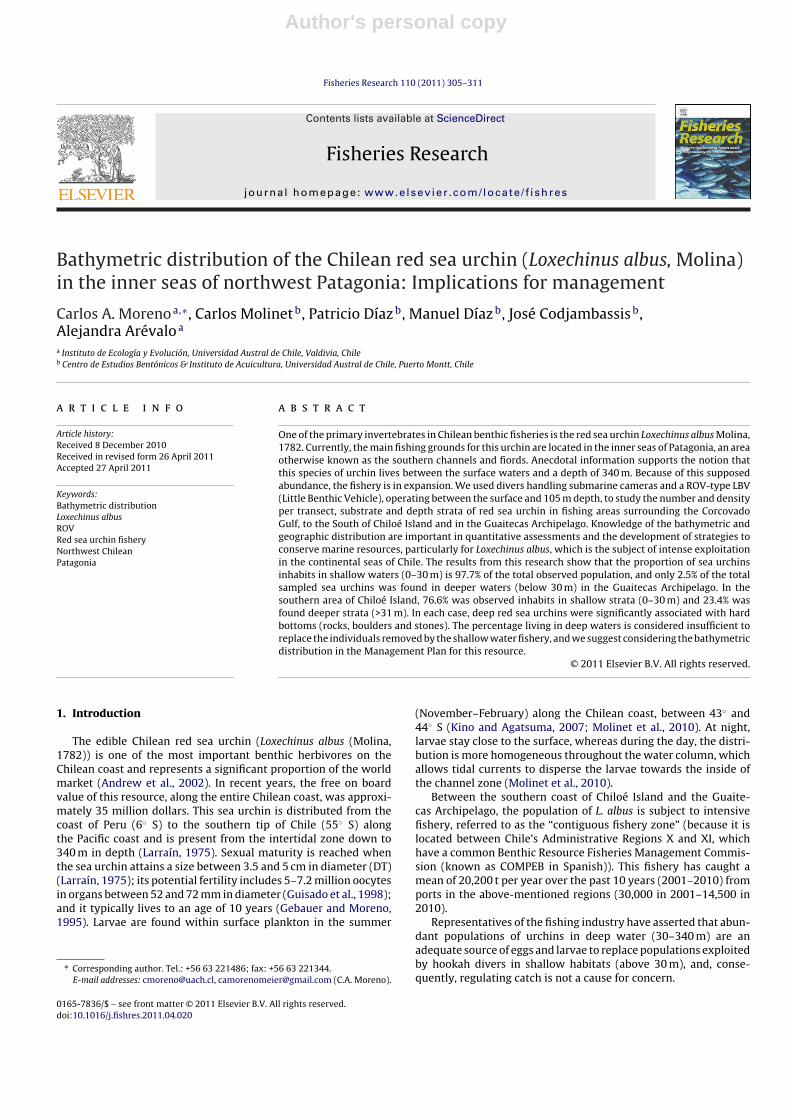
Bathymetric distribution of the Chilean red sea urchin (Loxechinus albus, Molina)in the inner seas of northwest Patagonia: Implications for management
Carlos A. Morenoa,∗, Carlos Molinetb, Patricio Díazb, Manuel Díazb, José Codjambassisb,Alejandra Arévaloa
a Instituto de Ecología y Evolución, Universidad Austral de Chile, Valdivia, Chileb Centro de Estudios Bentónicos & Instituto de Acuicultura, Universidad Austral de Chile, Puerto Montt, Chile
a r t i c l e i n f o
Article history:Received 8 December 2010Received in revised form 26 April 2011Accepted 27 April 2011
Keywords:Bathymetric distributionLoxechinus albusROVRed sea urchin fisheryNorthwest ChileanPatagonia
a b s t r a c t
One of the primary invertebrates in Chilean benthic fisheries is the red sea urchin Loxechinus albus Molina,1782. Currently, the main fishing grounds for this urchin are located in the inner seas of Patagonia, an areaotherwise known as the southern channels and fiords. Anecdotal information supports the notion thatthis species of urchin lives between the surface waters and a depth of 340 m. Because of this supposedabundance, the fishery is in expansion. We used divers handling submarine cameras and a ROV-type LBV(Little Benthic Vehicle), operating between the surface and 105 m depth, to study the number and densityper transect, substrate and depth strata of red sea urchin in fishing areas surrounding the CorcovadoGulf, to the South of Chiloé Island and in the Guaitecas Archipelago. Knowledge of the bathymetric andgeographic distribution are important in quantitative assessments and the development of strategies toconserve marine resources, particularly for Loxechinus albus, which is the subject of intense exploitationin the continental seas of Chile. The results from this research show that the proportion of sea urchinsinhabits in shallow waters (0–30 m) is 97.7% of the total observed population, and only 2.5% of the totalsampled sea urchins was found in deeper waters (below 30 m) in the Guaitecas Archipelago. In thesouthern area of Chiloé Island, 76.6% was observed inhabits in shallow strata (0–30 m) and 23.4% wasfound deeper strata (>31 m). In each case, deep red sea urchins were significantly associated with hardbottoms (rocks, boulders and stones). The percentage living in deep waters is considered insufficient toreplace the individuals removed by the shallow water fishery, and we suggest considering the bathymetricdistribution in the Management Plan for this resource.
© 2011 Elsevier B.V. All rights reserved.
1. Introduction
The edible Chilean red sea urchin (Loxechinus albus (Molina,1782)) is one of the most important benthic herbivores on theChilean coast and represents a significant proportion of the worldmarket (Andrew et al., 2002). In recent years, the free on boardvalue of this resource, along the entire Chilean coast, was approxi-mately 35 million dollars. This sea urchin is distributed from thecoast of Peru (6◦ S) to the southern tip of Chile (55◦ S) alongthe Pacific coast and is present from the intertidal zone down to340 m in depth (Larraín, 1975). Sexual maturity is reached whenthe sea urchin attains a size between 3.5 and 5 cm in diameter (DT)(Larraín, 1975); its potential fertility includes 5–7.2 million oocytesin organs between 52 and 72 mm in diameter (Guisado et al., 1998);and it typically lives to an age of 10 years (Gebauer and Moreno,1995). Larvae are found within surface plankton in the summer
∗ Corresponding author. Tel.: +56 63 221486; fax: +56 63 221344.E-mail addresses: [email protected], [email protected] (C.A. Moreno).
(November–February) along the Chilean coast, between 43◦ and44◦ S (Kino and Agatsuma, 2007; Molinet et al., 2010). At night,larvae stay close to the surface, whereas during the day, the distri-bution is more homogeneous throughout the water column, whichallows tidal currents to disperse the larvae towards the inside ofthe channel zone (Molinet et al., 2010).
Between the southern coast of Chiloé Island and the Guaite-cas Archipelago, the population of L. albus is subject to intensivefishery, referred to as the “contiguous fishery zone” (because it islocated between Chile’s Administrative Regions X and XI, whichhave a common Benthic Resource Fisheries Management Commis-sion (known as COMPEB in Spanish)). This fishery has caught amean of 20,200 t per year over the past 10 years (2001–2010) fromports in the above-mentioned regions (30,000 in 2001–14,500 in2010).
Representatives of the fishing industry have asserted that abun-dant populations of urchins in deep water (30–340 m) are anadequate source of eggs and larvae to replace populations exploitedby hookah divers in shallow habitats (above 30 m), and, conse-quently, regulating catch is not a cause for concern.
0165-7836/$ – see front matter © 2011 Elsevier B.V. All rights reserved.doi:10.1016/j.fishres.2011.04.020

Author's personal copy
306 C.A. Moreno et al. / Fisheries Research 110 (2011) 305– 311
Displaying considerable spatial complexity, the population isbelieved to live as deep as 340 m (Larraín, 1975); however, quanti-tative information on the bathymetric distribution is either scarceor limited to data obtained from depths accessible during divingsurveys. Moreover, the range of bathymetric distribution for thered sea urchin Loxechinus albus is based on 18th century expedi-tions (Larraín, 1975) that measured depth “sounding” but ignoredthe impact of ocean currents that can vary with depth in both inten-sity and direction. Clearly, these observations must be confirmedusing modern techniques. To address these issues, we tested, for thefirst time in the history of this fishery, the use of underwater cam-eras operated from a fishing boat and the use of an ROV equippedwith underwater video cameras and other digital devices, includ-ing a depth sounder. These new approaches can provide a reliableand abundant source of data on the bathymetric resource distribu-tion within the fishing areas in the Corcovado Gulf, from shallow todeep habitats. Additionally, this method provides data on both thesize distribution and substrate types inhabites by L. albus at differ-ent depths. Consequently, using these techniques we will try to testthe hypothesis that the deep populations are really very abundant.
2. Material and methods
2.1. Study area
The study areas selected for this research were south of ChiloéIsland and the Guaitecas Archipelago, which correspond to Poly-gons 6 and 7, respectively, according to the site classificationproposed by Molinet et al. (2008). These areas are located north andsouth of the Corcovado Gulf (Fig. 1). At each site, stratified samplingwas carried out via cluster sub-sampling in two stages. The firststage units corresponded to the selection of sites within the twoPolygons; the second stage units were in the deeper strata (shal-low 0–10 m, 11–30 m, 31–60 m medium–deep, and deep >60 m).The identification and selection of sampling sites was based on thefollowing available information: (a) the “Benthic Fisheries Moni-toring Program” database, which identifies sources of and meandepths reported for resource extraction between 1996 and 2005(Molinet et al., 2008); (b) throughout May and June 2008, a pollof divers, crew and skippers was carried out to identify fishingareas where sea urchins were observed according to depth, whichinvolved a total of 30 surveys from Quellón and 30 from Melinka(total N = 60) and (c) knowledge of the crewmembers on the fishingboat that was charted for this study, and strategies were devel-oped to implement sampling at the sites identified in (a) and(b).
From the zone South of Chiloé Island (Polygon 6), the follow-ing four areas were selected for our study: (1) Quellón (QuellónBay and channels between Laitec and Cailin islands); (2) South ofSan Pedro Island; (3) Icolma and (4) Guapiquilan. In the GuaitecasArchipelago (Polygon 7), the areas were as follows: (1) Southwestof Gran Guaitecas Island; (2) Southwest of Betecoi Island; (3) Northof Leucayec Island; (4) Grupo Peligroso Islands; (5) Tres Canales(intersection of Channels Lagreze, Puquitin and Cuervo); (6) Eastof Gran Guaiteca Island and Ascension Island; (7) Low Bay and (8)Southern Leucayec Island.
2.2. Survey execution
The survey methodology consisted of deploying a camera (Seav-iew, Sea Drop Model 950) and LBV-200 (ROV) along three transectsper stratum per sampling station (each transect began at the surfaceand continued down to the available depth at the site until 105 min depth. Equipment was deployed from artisanal boats (13–16 mlength) in each selected zone, and we took into consideration the
drift from wind or currents to maintain a maximum distance of15 m between the camera and the boat. This procedure was per-formed for each of the 4 depth strata. The distance travelled wasobtained by recording the navigation track for each transect using aGPS-sounder Garmin GPS Map model 420 S, marking the beginningand end points for each depth stratum as well as landmarks suchas the beginning and end points of a sea urchin patch. The field-of-view width, and therefore, the segment sampled, was estimatedbased on light levels at each depth and the presence of sea urchins,which were collected and subsequently measured. The measure ofthe view with was 1.0 m wide for stratum 1 (0–10 m) and stratum2 (11–30 m), 0.5 m for stratum 3 (31–60 m) and 0.3 m for stratum4 (61–100 m).
Additionally, we used a dredge to obtain size structure and sub-strate type data. The dredge was built following a 1:4 scale model,based on descriptions and pictures of a type of chain dredge, a“sweep chain”, used for collecting green sea urchins (Strongylocen-trotus droebachiensis) in Maine, USA (Campagna et al., 2005).
Image analyses from the video recordings provide informationon the presence or absence of sea urchins, the number of seaurchins in the trawl, and depth and substrate type (soft bottom,hard bottom, boulders, mixed bottom, i.e. stones over soft bottom).In surveys where the number of urchins was higher than 10-trawlind/100 m, a direct-sweep area assessment was carried out eitherby divers or using the little benthic vehicle LBV200.
For stratum 1 (0–10 m), direct assessment was performed usingtwo methods (divers and/or LBV) depending on the state of the seaand the presence of kelp forests (Macrocystis pyrifera), which havea mean distribution in this area of approximately 15 m in depth. Atdepth levels 2, 3 and 4, only the LBV was used.
To obtain a scale for the width of the trail over the sea floor, adiver carried a graduated ruler (scaled at 5 and 10 cm), which washeld in front of the camera’s field of view, providing a measure ofthe substrate. This procedure was also used to obtain the diameterfor sea urchins sampled in shallow areas.
The LBV (Seabotix model 200) was used in all strata and sam-pling sites. It has four independent motors, two digital pivotingcameras with 180◦ rotation and two laser pointers parallel to theoptical axis of the main camera. The swept area was calculatedbased on the distance travelled, measured using a Micron NavUSLB VRS tracking system. The estimated field-of-view width wasobtained following computer analysis of the lasers. The widths dif-fered for each depth strata, resulting in 0.66 m, 0.46 m, 0.51 m and0.56 m for depth stratum 1, 2, 3 and 4, respectively; this variationwas primarily from luminosity and water column transparency.Each transect was recorded in digital video format and analysed inthe laboratory by at least two observers. On screen, video presentedthe following data: date, hour, depth, speed and course, whichallowed the operator on board to control all of the LBV parameters.
2.3. Data analysis
In each video, the number of sea urchins per screen was trans-formed into number per square meter. Further, we took note ofthe substrate type over which sea urchins were recorded by divers,cameras or the LBV. From the same process, also we write down thevariable presence/absence of urchins per depth stratum, substratetype and Polygon for association analysis.
As the variance of the density of urchins was not constant andthe errors were not normally distributed, the variation in the den-sity of urchins per layer, Polygon and substrate was analysed usinga generalised linear model (GLM) based on the Gamma family witha log link function (Mc Cullough and Nelder, 1989). The Gammamodel was selected after a comparison with a negative binomialmodel, and we chose the model that best fit the data, in accordancewith Akaike’s Information Criterion (AIC). Further, we performed

Author's personal copy
C.A. Moreno et al. / Fisheries Research 110 (2011) 305– 311 307
Fig. 1. Study area. (+) Indicates shallow stations (0–30 m) with red sea urchins, and ( ) indicates deeper stations (30–105 m).
a diagnosis of both models using both residual vs. predicted valueand Q–Q plots.
Finally, for each GLM model, a deviance analysis was used toevaluate the relative contribution of each variable to the variabilityin response. The significance of each variable was determined usinga �2 test (Venables and Ripley, 1998). Statistical analyses were per-formed and graphics were compiled using the software R 2.11.0. (RDevelopment Core Team, 2010).
3. Results
Following the fisherman advice, we selected 147 sites withinPolygon 6 (north coast of the Corcovado Gulf), including 16 in theGuapiquilan area, 30 in Icolma, 69 in Quellón and 32 in San Pedro.Of all the visited sites, 45 corresponded to stratum 1, 37 to stratum2, 56 to stratum 3 and only 9 to stratum 4 (Fig. 1 and Table 1A). InPolygon 7 (north of the Guaitecas Archipelago and the south coastof Corcovado Gulf), the following 236 sites were visited across eight
areas: Low Bay (58 sites), west Guaitecas (21 sites), east Guaitecas(45 sites), Betecoi (3 sites), Tres Canales (31 sites), Grupo Peligroso(14 sites), north Leucayec (15 sites) and south Leucayec (37 sites).Of these, a total of 70 sites corresponded to depth level 1, 83 tolevel 2, 59 to level 3 and 24 to level 4 (Table 1B). It is notable thatfrom the stations below depth level two (indicated by a squarewith a central dot in Fig. 1), only five have urchin subpopulations(Tables 2 and 3), and, of the five, only one (located in Quellón Bay)has a significant number of L. albus, indicating that its presence isan exception.
We found that the estimated number of individuals and theirdensity (ind/m2), both in the south of Chiloé and GuaitecasArchipelago, was higher between the surface and 30 m deep, beinglower in the deeper strata (Tables 2 and 3). Further, in certaininstances, especially in the Guaitecas Archipelago, there were fewhabitats available for red urchins below 30 m deep within the chan-nels, as the shelf ends at 30 m at most of the sites and the bottomin certain sites is soft (sand or mud). Certain sites, such as those in

Author's personal copy
308 C.A. Moreno et al. / Fisheries Research 110 (2011) 305– 311
Table 1Number of sites sampled per locality and depth stratum along the coast of Polygons 6 and 7 surrounding the Corcovado Gulf.
Sites/strata 01–10 m 11–30 m 31–60 m 61–100 m Total
South of Chiloé Island (A)Guapiquilan 10 6 0 0 16Icolma 23 7 0 0 30Quellón 6 11 44 8 69San Pedro 6 13 12 1 32
Total 45 37 56 9 147
Guaitecas Archipelago (B)Low bay 13 29 9 7 58West Guaitecas 4 2 14 1 21East Guaitecas 13 20 11 1 45Betecoi 3 7 2 3 15Tres Canales 9 11 6 5 31Grupo Peligroso 4 3 5 2 14North Leucayec 7 1 5 2 15South Leucayec 17 10 7 3 37
Total 70 83 59 24 236
Table 2Estimated abundance, number of individuals per transect and density ind/m2 ± SD (parenthesis), for each depth stratum in Polygon 6 (South of Chiloé Island) (0 indicatesexplored depth, but no red urchins).
Site Abundance per depth stratum
0–10 m 11–30 m 31–60 m 61–100 m
Quellón 475 (3 ± 4.8) 1691 (3.1 ± 5) 1148 (0.8 ± 3.1) 386 (0.5 ± 0.7)San Pedro 1466 (3.0 ± 2.4) 100 (0.06 ± 0.19) 145 (0.2 ± 0.5) 0Icolma 1114 (3.0 ± 5.3) 245 (1.73 ± 3.77) 0 0Guapiquilan 399 (4.4 ± 5.7) 7 (0.2 ± 1.2) 0 0
Total numbers 3454 2043 1293 386Total percentage 48.13% 28.47% 18.01% 5.39%
Table 3Estimated abundance, number of individuals per transect and density ind/m2 ± SD (parenthesis), for depth stratum in Polygon 7 (Guaitecas Archipelago). (An absence of dataindicates the absence of depth in that particular locality.).
Locality Abundance per depth stratum
0–10 m 11–30 m 31–60 m 61–100 m
Low Bay 4422 (4.5 ± 8.8) 3710 (2.3 ± 5.6)West Guaitecas 832 (13.5 ± 7.1) 10 (0.03 ± 0.02)Grupo Peligroso 348 (2.31 ± 0.02) 200 (1.24 ± 0.01)South Betecoi 370 (3.7 ± 2.5) 11 (0.01 ± 0.01)East Guaitecas 2411 (4.5 ± 3.3) 2079 (2.56 ± 8.6) 177 (0.4 ± 0.9) 14 (0.1 ± 0.02)Leucayec 303 (2.0 ± 0.4 84 (0.2 ± 0.2) 51 (0.1 ± 0.14) 3 (0.0 ± 0.0)South Leucayec 2207 (3.38 ± 2.9) 121 (0.7 ± 0.01)Tres Canales 2151 (7.2 ± 8.3) 551 (0.73 ± 0.72) 280 (1.8 ± 2.7) 66 (0.4 ± 1.08)
Total numbers 13,044 6766 508 83Total percent 63.9% 33.2% 2.5% 0.4%
Table 4Deviance analysis with a generalised linear model (GLM) for the variable presence/absence of urchins per depth stratum, substrate type and Polygon, using a model from thefamily Binomial and link logit.
Degree of freedom Residual degree of freedom Residual deviance P (>�2)
NULL 382 530.2Depth stratum 3 379 426.64 <0.0001Substrate 3 376 398.25 <0.0001Polygon 1 375 395 0.07 ns
Table 5Deviance analysis of a generalised linear model (GLM) for the density of urchins per depth stratum substrate type and Polygon, using a model from the Gamma family and alog link function.
Degree of freedom Residual degree of freedom Residual deviance P (>�2)
NULL 188 453Stratum 3 185 389 <0.000001Substrate 3 182 353 <0.0004Polygon 1 181 352 0.608 ns

Author's personal copy
C.A. Moreno et al. / Fisheries Research 110 (2011) 305– 311 309
Fig. 2. Presence/absence of the red urchin (L. albus) per depth stratum and type of substrate in the sites surveyed.
the north and south of Guaitecas Island, have a higher proportionof sand and muddy substrate and are without urchins below 30 m.These findings are ecologically important, as the primary factorsassociated with the presence of urchins include rocky substrates(rocks, boulders or aisle stones), but rarely are they observed inproximity to soft bottoms (Fig. 2, Tables 4 and 5). Further, thisassociation with boulders or solid rocks may direct the aggregatedspatial distribution of urchins and, as a consequence, the highlyvariable density per stratum (the coefficient of variation betweensamples was between 20 and 40%).
The diameter frequency for the sea urchin samples collectedat all sites at each depth level (Fig. 3) were significantly differ-ent (P < 0.05), demonstrating that at shallower depths, urchins aresmaller (median of 38 mm in stratum 1) than those at lower depths(around 85 mm in level 3). We observed that the frequencies in thetwo upper strata were significantly different from those in deeperstrata. These differences are clearly an effect from the fishing activ-ities in recent years, but they also result from the presence of oneor two cohorts of recruits in recent years.
GLM analysis showed that stratum depth and the substratesignificantly contributed to the variability in red urchin pres-ence/absence; however, the specific polygon (south of Chiloé andGuaitecas) was not a significant contributor. The GLM analysisshowed significant effects from the variable stratum depth (15.4%of the Deviance) and substrate (5.2% of the Deviance) on the pres-ence of L. albus (Table 4). While red urchins were more frequent atthe surface and at sites with rocky substratum, a negative gradi-ent was observed at greater depth levels and on soft substratum.Urchin density variability showed the same pattern as observedfor urchin presence/absence and was also significantly related tostratum depth and substratum (Table 5). The presence/absenceand density of L. albus were not affected by the polygonvariable.
4. Discussion
The primary finding from this research was that over 75% ofLoxechinus albus individuals in the south of Chiloé Island and 97%from the Guaitecas Archipelago were registered (by cameras andan LBV) within the two superior strata (0–10 m and 11–30 m) andmost significantly associated with rocky and boulder substrates(P < 0.0003).
The number of individuals and their density, measured usingunderwater cameras and an ROV for the sea urchins below 30 m, isconsiderably lower than those present in areas accessible to diversthat exploit this resource, although in South Chiloé, we observedapproximately 25% of the population deeper than 30 m. These num-bers are lower than previously reported, which were based onphotographic observations of the sea floor within these channelsby Inostroza et al. (1983), who, in turn, described urchin abundanceas lower than expected. In other words, the population accessibleto fisherman is approximately 75–97% of the total population, and,consequently, within the studied area, this resource has few refugesat lower depths.
Additionally, we found that fishing intensity has produced aclear footprint in the urchin sizes observed a particular depth lev-els; the mean size is under 38 mm in areas accessible to the divers(Fig. 3), compared with the few urchins under 60 m that reachmean sizes of 80 mm. The fishing policies that usually apply tothe exploitation of invertebrates in Chile are aimed at maintainingspawning biomass levels at 30% of unfished abundance or higherby limiting the total catch, following a process of stock evaluation.In the sea urchin management plan, the number of urchins caughtover the past 15 years is included, although not the stock assess-ment. The annual total catch over the last 7 years in the studiedzone shows a decrease from 22,000 t in 2002 to 14,300 t in 2010.Within the last year, the fishing area has expanded towards the

Author's personal copy
310 C.A. Moreno et al. / Fisheries Research 110 (2011) 305– 311
Fig. 3. Distribution of the Loxechinus albus test diameter per depth stratum in the South of Chiloé Island (left) and the Guaitecas Archipelago (right). Only individuals measuredunderwater by the LBV are included. The vertical line indicates the minimal size of fishing allowed in the area (Guaitecas level 1 N = 1704; 2 N = 784; 3 N = 288; 4 N = 36. Southof Chiloé, level 1: 1696; 2 = 1006; 3 = 450; 4 = 117).
south (Archipelago of the Chonos) to maintain the capture rate nearthe quota (18,000 t).
In contrast, the CPUE (kg/diver/h) for this fishery, shows a dimin-ishing trend over the last 7 years, according to a report from theScientific Committee on L. albus to the COMPEB (in January 2011),for both polygons in which this research was carried out.
A minimum size has been set (60 mm in diameter for sea urchinsfrom the contiguous fishery zone and 70 mm for the rest of thecountry), but the percentage of urchins caught under the legalminimum size (7 cm) is between 25 and 48% (N. Barahona pers.commns.), and only 3% are under 6 cm. It is noteworthy that below30 m deep, the sizes (in diameter) are greater, but variable, imply-ing that other ecological processes can influence size at depth, suchas variability in recruitment, for example see Botsford, 2001 andBrewin et al., 2000. One of the deepest populations studied wassmaller in diameter and lower in abundance than the shallow waterpopulations. In agreement with this observation, of the total num-ber of the sea urchins, only 14% of the total area studied were indepths below 30 m. Thus, we conclude that the statement madeby fishermen and industry representatives for the COMPEB man-agement plan, which claimed that deep populations can maintainshallow ones, has insufficient foundation. The findings from thisresearch reinforce the need for COMPEB to implement the Biolog-
ical Sustainability indicator in the Management Plan, (a networkof permanent stations that monitor ecological parameters such asdensity, recruitment and spatial distribution) as soon as possible.
The selective removal of the largest individuals via intenseexploitation reduces the spawning season, as the larger individualslikely spawn first. This supposition is supported by the followingstudies. Kino and Agatsuma (2007) found larvae in the planktonover 4 months during 1986–1989. In contrast, recent research byMolinet et al. (2010) in the same study area after twenty yearsof intense exploitation, found larvae present in the plankton forapproximately one month, remaining at the surface at night anddispersed in the water column during the day; they were also lowerin abundance than that reported by Kino and Agatsuma (2007).
In field studies on population regulation, several authorshave discussed the need to distinguish between “source” and“sink” habitats. However, most theoretical treatment of popula-tion dynamics for species in spatially divided habitats have notexplicitly addressed populations in habitats where reproductionis insufficient to balance local mortality, as is likely the case herein(Pulliam, 1988; Holt, 1985).
The area in the present study covered almost the entire bathy-metric distribution range, with an area close to one-quarter of thetotal “contiguous fishery zone”. Given the limitation of food avail-

Author's personal copy
C.A. Moreno et al. / Fisheries Research 110 (2011) 305– 311 311
ability in deep habitats and the low abundance of the population,we reject the argument that deep populations can supply enoughlarvae to restock population densities in shallow habitats. Consid-ering the knowledge at present, there is no support for this claimuntil the processes for larval transport and recruitment are bet-ter understood and quantified. It also appears that gonad growth iscompromised to maintain metabolic functions when food becomesscarce in deeper habitats (Russell, 1998). Two aspects are relevantin this regard. (a) Macrocystis pirifera, or Kelp, in this study area havean annual life cycle (Buschmann et al., 2004) wherein they drift andsink after the maturation of sporofites, primarily during the monthsof March and April (fall in the southern hemisphere). (b) Whereasthe population at low depths has a maximum reproduction periodfrom May to August, the deeper populations have a slower repro-duction during the 2–3 months after August (Molinet et al., 2008);however, the proportion of males outnumbers females. Thus, wesuspect than the contribution to recruitment from the populationbelow 30 m is insignificant for the entire fishing area.
We intensely sampled transects from 0 to 105 m deep andover a large area (≈400 km2) that covers different habitats andenvironments and observed all types of bottom substrates. Fromthese data, we assert that it is not possible to develop a propermanagement plan for this important resource in Southern Chilewithout an accurate estimation of stock size within the first 30 mof depth (which contains most of the rocky substrate). The designprocess for the existing Management Plan did prove useful forproviding order and organization within this fishery, following aperiod of strong conflict (Moreno et al., 2006). However, the planshould evolve towards a new stage that ensures proper manage-ment based on stock assessment and the use of a biological pointof reference to either enhance sustainability in the fishery, or cre-ate MPAs for the protection of reproductive biomass or, take bothapproaches.
Acknowledgments
We express our gratitude to the Projects FIP 2007-44 andFONDECYT 1100931 for partially funding this research as well asall the fishermen who helped select the study sites for the LBVtransects and provided their boats and advice regarding the siteswhere the deep population could be observed. We further thank theChilean Under Secretariat of Fisheries for giving us the authoriza-tion (R. Ex. No. 2399) to carry out this research. Finally, we thankWilliam Duarte, Susannah Buchan and Oliver Yates, who kindlyreviewed the manuscript.
References
Andrew, N.L., Agatsuma, Y., Ballesteros, E., Bazhin, A.G., Creaser, E.P., Barnes, D.K.A.,Botsford, L.W., Bradbury, A., Campbell, A., Dixon, D., Einarsson, S., Gerring, P.K.,Herbert, K., Hunter, M., Hur, S.B., Johnson, P.K., Juinio-Menez, M.A., Kalvass, P.,Miller, R.J., Moreno, C.A., Palleiro, J.S., Rivas, D., Robinson, S.M., Schroeter, S.C.,Steneck, R.S., Vadas, R.L., Woodby, D.A., Xiaoqi, Z., 2002. Status and managementof world sea urchin fisheries. Oceanogr. Mar. Biol. Annu. Rev. 40, 343–425.
Botsford, L.W., 2001. Physical influences on recruitment to California Current inver-tebrates population on multiples scales. J. Mar. Sci. 58, 1081–1091.
Brewin, P.E., Lamare, M.D., Keogh, J.A., Mladenov, P.V., 2000. Reproductive variabil-ity over a four-year period in the sea urchin Evechinus chloroticus (Echinoidea:Echinodermata) from differing habitats in New Zealand. Mar. Biol. 137, 543–557.
Buschmann, A.H., Moreno, C., Vásquez, J.A., Hernández-Gonzalez, M.C., 2004. Pop-ulation and reproduction strategies of Macrocystis pyrifera (Phaeophyta) insouthern Chile. J. Appl. Phycol. 18, 575–582.
Campagna, S., Lambert, J., Archambault, P., 2005. Abondance et Distribution duConcombre de Mer (Cucumaria frondosa) et Prises Accidentelles Obtenuespar Dragage Entre Matane et Cap-Gaspé (Québec) en 2004. Institut Maurice-Lamontagne, Direction Régionale des Sciences Pêches et Océans Canada, Quebec.
Gebauer, P., Moreno, C.A., 1995. Experimental validation of the growth rings of Lox-echinus albus (Molina, 1872) in the southern Chile (Echinodermata: Echinoidea).Fish. Res. 21, 423–435.
Guisado, C., Arias, E., Perez, E., 1998. Estudio reproductivo del erizo en las RegionesI-VIII. Informe Final. Proyecto FIP-IT/96-44. Universidad Católica del Norte,Coquimbo.Chile (Available in Spanish in: www. Fip.cl /Research Projects).
Holt, R.D., 1985. Population dynamics in two-patch environments: some anomalousconsequences and optimal habitat distribution. Theor. Popul. Biol. 28, 181–208.
Inostroza, F., Robotham, H., Salas, R., Serey, R., 1983. Cartas de distribución de losrecursos bento-demersales de las aguas interiores de la X, XI y XII Region. Zona I,II. III, y V. Documentos CORFO & Instituto de Fomento Pesquero. Santiago, Chile,p. 182.
Kino, S., Agatsuma, Y., 2007. Reproduction of sea urchin Loxechinus albus in ChiloéIsland, Chile. Fish. Sci. 73 (6), 1265–1273.
Larraín, A.P., 1975. Los equinoideos regulares fósiles y recientes de Chile. GayanaZoología 35, 1–188.
Mc Cullough, P., Nelder, J.A., 1989. Generalized Linear Models. Chapman Hall, Lon-don.
Molinet, C., Moreno, C.A., Codjambassis, J., Díaz, M., Flores, L., Matamala, M., Almanza,V., Henriquez J., Neculman, M., Cortez, E., 2008. Estudio de poblaciones fuente(profundas) y flujo de dispersión larvaria y reclutamiento de erizos en la XIRegión (Fase I). Final Report of Project FIP No. 2007-44. p. 122 (Available inSpanish in: <www. Fip.cl> Research Projects 2007).
Molinet, C., Herrera, C., Gebauer, P., Landaeta, M., Moreno, C.A., 2010. Estados tem-pranos de Echinoidea en canal Lagreze, Islas Guaitecas, sur de Chile. Rev. Biol.Mar. Oceanogr. 45 (1), 19–33.
Moreno, C.A., Barahona, N., Molinet, C., Orensanz, J.M., Parma, A.M., Zuleta, A., 2006.From crisis to institutional sustainability in the Chilean sea urchin fishery. In:McClanahan, T., Castilla, J.C. (Eds.), Fisheries Management: Progress TowardsSustainability. Blackwell Publishing, Mombasa, pp. 43–67.
Pulliam, H.R., 1988. Sources, sinks, and population regulation. Am. Nat. 132,652–661.
R Development Core Team, 2010. R: A language and environment for statisticalcomputing. R Foundation for Statistic Computing. R2.11.0./Packaged=Stats.
Russell, M.P., 1998. Resource allocation plasticity in sea urchins: rapid, diet induced,phenotypic changes in the green sea urchin, Strongylocentrotus droebachiensis(Müller). J. Exp. Mar. Biol. Ecol. 220 (1), 1–14.
Venables, W.N., Ripley, B.D., 1998. Modern Applied Statistics with S-Plus. Springer,NY.