Basic Principles of - SpaceAge Control
288
AGARD-AG-160 Vol.1 (Issue 2) ADVISORY GROUP FOR AEROSPACE RESEARCH & DEVELOPMENT 7 RUE ANCELLE 92200 NEUILLY SUR SEINE FRANCE AGARDograph 160 Flight Test Instrumentation Series - Volume I (Issue 2) Basic Principles of Flight Test Instrumentation Engineering (Introduction G6n6rale aux Principes de Base de 'Instrumentation des Essais en Vol) Edited by R.W. Borek A. Pool 602 E. Ovington Leeuwerikstraat, 48 Lancaster 1171 TZ Badhoevedorp California 93534 The Netherlands United States This AGARDograph has been sponsored by the Flight Mechanics Panel of AGARD. Accesion For NTIS CRA&I North Atlantic Treaty Organization DTIC TAB El Organisation du Trait6 de I'Atlantique Nord Unannounced LI Justification Distribution I Availab~iity C•-•c-.,, Avail a-C( , ov Dist Speciai A- Document provided by SpaceAge Control, Inc. (http://spaceagecontrol.com/).
-
Upload
khangminh22 -
Category
Documents
-
view
5 -
download
0
Transcript of Basic Principles of - SpaceAge Control

AGARD-AG-160 Vol.1 (Issue 2)
ADVISORY GROUP FOR AEROSPACE RESEARCH & DEVELOPMENT
7 RUE ANCELLE 92200 NEUILLY SUR SEINE FRANCE
AGARDograph 160Flight Test Instrumentation Series - Volume I (Issue 2)
Basic Principles ofFlight Test Instrumentation Engineering(Introduction G6n6rale auxPrincipes de Base de 'Instrumentation des Essais en Vol)
Edited byR.W. Borek A. Pool602 E. Ovington Leeuwerikstraat, 48Lancaster 1171 TZ BadhoevedorpCalifornia 93534 The NetherlandsUnited States
This AGARDograph has been sponsored by the Flight Mechanics Panel of AGARD.Accesion For
NTIS CRA&INorth Atlantic Treaty Organization DTIC TAB ElOrganisation du Trait6 de I'Atlantique Nord Unannounced LI
Justification
Distribution I
Availab~iity C•-•c-.,,
Avail a-C( , ovDist Speciai
A-Document provided by SpaceAge Control, Inc. (http://spaceagecontrol.com/).

Preface
Soon after its founding in 1952, the Advisory Group for Aerospace Research and Development (AGARD) recognized the needfor a comprehensive publication on flight test techniques and the associated instrumentation. Under the direction of theAGARD Flight Test Panel (now the Flight Mechanics Panel) a Flight Test Manual was published in the years 1954 to 1956. Thatmanual was divided into four volumes: 1. Performance, 2. Stability and Control, 3. Instrumentation Catalog, and 4.Instrumentation Systems.
After about a decade, a study group was formed which gave advice on how to update the Flight Test Manual. Upon the advice ofthat group the Flight Mechanics Panel decided that updating of the instrumentation part was the most urgent. Volume 3 shouldnot be updated and volume 4 should no longer try to cover the total field of flight test instrumentation but should be replaced bya series of monographs on subjects in instrumentation which were of special interest. The Flight Test Instrumentation Group wasthen established, and has since then published 18 volumes in the Flight Test Instrumentation Series. Volume 1 of the series givesa general introduction to the basic principles of flight test instrumentation, the other volumes are more detailed treatments ofselected topics on flight test instrumentation.
In 1981, the Flight Mechanics Panel decided that the same working group should also supervise a new series of monographs inthe field of Volumes 1 and 2 of the Flight Test Manual. The Working Group was therefore renamed Flight Test TechniquesGroup, and it now coordinates the publication of volumes in both the Flight Test Instrumentation Series (AGARDograph 160)and the Flight Test Techniques Series (AGARDograph 300). The Annex at the end of this volume lists the volumes that havebeen published in both series and the volumes that were in preparation at the time when the present volume was published.
Volume 1 of the Flight Test Instrumentation Series (published in 1974) has been used extensively as an introduction forinstrumentation courses and symposia. In the middle 1980s it was realized that updating was necessary, and two editors wereappointed to organize the updating process: R.W. Borek Sr. (NASA-USA) and A. Pool (NLR-Netherlands, retired). It is hopedthat this second edition will be used with as much enthusiasm as the first edition.
iii
Document provided by SpaceAge Control, Inc. (http://spaceagecontrol.com/).
Foreword to the First Edition
Only a few decades ago the main source of flight test information was the subjective judgment of the test pilot. As the complexityof the aircraft increased and as more methods for detailed analysis during the design phase became available, the need arose formore objective information. This led to the use of increasingly complex data collection systems in the aircraft and to the use oflarge data processing centers in which the measured data are converted to a form in which they can be directly interpreted. Theindustry produces a large variety of transducers and electronic components which have been specially designed for flight testapplications. Engineers specialized in instrumentation, electronics, and data processing play an important part in the design andthe execution of the flight tests. The flight test engineers, who have the overall responsibility for conducting the flight tests, haveto coordinate the work of all these specialists, who often have a theoretical and practical background quite different from theirown.
The main purpose of the AGARD Flight Test Instrumentation Series is to provide monographs on the more important aspects offlight test instrumentation as a reference for the flight test engineer. The first monographs in the series discuss in-flighttemperature measurements, fuel flow and engine rotation speed measurements, open and closed-loop accelerometers, andmagnetic tape recording; they will be followed by others. In this introductory volume it has been attempted to highlight the mainlines along which a flight test instrumentation system is developed, to indicate the main steps which must be taken during thedesign and to define the basic concepts used by each specialist. Although the volume is mainly directed towards the flight testengineer and tries to provide knowledge about the disciplines of the instrumentation engineer, it is hoped that the otherspecialists involved in flight testing will also find useful information in it.
In this book a flight test system is considered to include both the data collection and data processing systems. In order to obtainan optimal data flow, the overall design of these two subsystems must be carefully matched; the detail development and theoperation can be done by separate groups of specialists. If a new data collection system has to be designed for use with an existingdata processing system, the characteristics of the latter will have an important impact on the design of the former and it may wellbe necessary to modify the existing system if an optimal solution is to be obtained.
The main emphasis will be on the large automated instrumentation systems used for the initial flight testing of modern militaryand civil aircraft. This is done because there, many of the problems, which are discussed here, are more critical. It does not imply,however, that smaller systems with manual data processing are no longer used. In general, the systems should be designed toprovide the required results at the lowest possible cost. For many tests which require only a few parameters, relatively simplesystems are justified, especially if no complex equipment is available to the user. Although many of the aspects discussed in thisvolume apply to both small and large systems, aspects of the smaller systems are mentioned only when they are of specialinterest.
The volume has been divided into three main parts. Part 1 defines the main starting points for the design of a flight testinstrumentation system, as seen from the points of view of the flight test engineer and the instrumentation engineer. In Part 2 thediscussion is concentrated on those aspects which apply to each individual measuring channel and in Part 3 the main emphasis ison the integration of the individual data channels into one data collection system and on those aspects of the data processingwhich apply to the complete system. The contents of these three parts will be briefly summarized below.
Part 1. General considerations about the design of a flight test instrumentation systemIn Chapter 1 a flight test engineer discusses the requirements of the system from the user's point of view. He mentions thedifferent types of flight tests which occur and indicates the special requirements for each of these. In Chapter 2 aninstrumentation engineer describes how the design of an instrumentation system should be organized and mentions the mostimportant aspects which determine the basic design of the system.
Part 2. Design of a single measuring channelChapter 3 gives a short introduction into measurement theory and defines and describes such concepts as error, accuracy,dynamic response, etc. Chapter 4 reviews the characteristics of transducers, which generate the (electrical) signals from whichthe measurements are generally derived. The emphasis in this chapter is on the transducer output characteristics, which mainlydetermine the requirements for the circuits to which they will be connected. In Chapter 5 the main signal conditioning circuitsare reviewed. These are the circuits which are used to adapt the transducer output signals to the input requirements of therecorder or telemetry transmitter. One important aspect of signal conditioning, the filtering required for the accuratereconstruction of a continuous signal from sampled data, is discussed separately in Chapter 6. Part 2 ends with a discussion ofcalibration in Chapter 7.
v
Document provided by SpaceAge Control, Inc. (http://spaceagecontrol.com/).

Part 3. Design of multi-channel instrumentation systemsChapter 8 reviews the general design aspects of multi-channel data collection systems. Chapter 9 gives a short discussion of thedifferent types of recorders and recording methods which are used in flight testing. Chapter 10 reviews the methods of telemetry.The special aspects of ground-based measurement equipment such as radar and kinetheodolites are mentioned in Chapter 11,together with the methods for synchronization of these measurement systems with on-board recorders. The final chapter isdevoted to the general design aspects of data processing systems.
To conclude this foreword, something should be said about the way in which this book was compiled. The editors have beenasked to prepare a comprehensive book covering the whole subject, not a collection of papers which would show manyduplications and in which some subjects might have been treated too briefly or not at all. Though all authors co-operated withgreat enthusiasm, it was found that the fact that they were scattered over five countries prevented detailed deliberation about thedetails of the partition of the subjects over the different chapters. The editors therefore found it necessary to rearrange some ofthe chapters and to move sections from one chapter to another. The editors would like to express their deep gratitude to theauthors both for the excellent work they did when writing their original draft chapters and for their friendly co-operation in therearrangements necessary for the final book. The editors are also very thankful for all the advice and encouragement which theyreceived from the members of the Flight Test Instrumentation Committee of the Flight Mechanics Panel of AGARD.
A. PoolD. BosmanAmsterdam, December 1973
viDocument provided by SpaceAge Control, Inc. (http://spaceagecontrol.com/).

Foreword to the Second Edition
Since the publication of this volume about 15 years ago, the AGARD Flight Test Instrumentation Series - to which this Volume1 is the introduction - has grown to 18 volumes covering many important aspects in the field of flight test engineering (see the listof volumes at the end of this book). This introductory volume has been extensively and successfully used as an introduction toflight test for those just starting in this field and as a reference volume for courses and symposia. When it was decided that itshould be updated, it was decided to retain as much as possible the qualities that were liked in the first edition. The new editorseven considered restricting the updating to adding material on modern developments to the existing texts. It was found, however,that many of the fundamental trends have changed so much during the last 15 years that a complete rewrite was unavoidable. Asfor the first edition, the editors and the authors of the individual chapters have tried to avoid duplications and omissions, i.e., toproduce an educational textbook.
The main division into three parts of this first edition has been retained:
1. General considerations about the design of a flight test instrumentation system. In the first edition this contained twochapters which showed the viewpoints of the flight test engineer and of the instrumentation engineer. Those chaptershave been updated to show the views that are now held, and a new chapter has been added to this part which reviews theviewpoint of the computer engineer, who has become a very important contributor to the design of an instrumentationsystem.
2. Design of a single measuring system. The setup of this part is the same as in the first edition, but the individual chaptershave been updated.
3. Design of multi-channel instrumentation systems. In the first edition of this part, data processing was discussed in the lastchapter, almost as an afterthought to the design of the instrumentation system. That may have been reasonable in 1974;now the design of data processing is highly integrated with that of the instrumentation. In this edition the chapter on dataprocessing follows, therefore, immediately behind that on the design of the instrumentation system.
With the exception of these changes, the general setup of the first edition of this book has been retained, although all chaptershave been rewritten to reflect the new developments that have come into use since the first edition was written.
We, therefore, want to emphasise our indebtedness to the authors of the first edition:
* B.L. Dove (NASA Langley Research Center)
* L.W. Gardenhire (Radiation Inc.)
SW.L. James (Flight Dynamics and Control Laboratory)
* H.L. Tollison and D.A. Tougas (Boeing Co.) and
* L.H. Weirather (NASA Flight Research Center) from the United States of America,
* M.L. Henney (British Aircraft Corp.) from the United Kingdom,
* J. ldrac and J. Perrochon (Centre d'Essais en Vol) and
* C. Roquefeuil (SFIM) from France,
• Dr A. Becker and Dr 0. Weber (DFVLR) from Germany,
* J.T.M. van Doorn and R.L. van der Velde (NLF) and the editors Prof. D. Bosman (Technical University Enschede) andA. Pool (NLR) from the Netherlands.
It will be noted that two authors (B.L. Dove and Dr A. Becker) and one editor (A. Pool) have taken part in the preparation of botheditions, 15 years apart.
The editors also thank the members of the AGARD Fight Test Techniques Group who supervised the preparation of this volumeand contributed many valuable suggestions - their names are mentioned in the Acknowledgement to this volume.
A. PoolR.W. BorekLancaster/Amsterdam, December 1992
vii
Document provided by SpaceAge Control, Inc. (http://spaceagecontrol.com/).

Acknowledgementto
Flight Test Techniques Group Members
Besides the two Editors, the members of the Flight Test Techniques Group listed below have taken an active part in thepreparation of the present volume:
En plus des deux r6dacteurs, le membres suivants du Groupe de travail sur les techniques des essais en vol ont particip6activement l'61aboration du present volume:
Adolph, C.E. OSD/USAAppleford, J.K. A&A/AEE/UKBever, G. NASA/USABogue, R.K. NASA/USABoischot, M. CEV/FranceBothe, H. DLR/GermanyCampos, L.M.B. IST/PortugalDelle Chiaie, S. DASRS/ItalyLangdon, G. A&AEE/UKNippress, K. A&AEE/UKPayze, T. MSB/TurkeyPool, A. (Consultant) NLR/NetherlandsRussell, R.A. NATC/USATresset, J. CEV/Francevan der Velde, R.L. NLR/Netherlands
R.R. Hildebrand, AFFTC/USAMember, Flight Mechanics PanelChairman, Flight Test Techniques Group
viiiDocument provided by SpaceAge Control, Inc. (http://spaceagecontrol.com/).

Contents
Page
Preface iii
Pr6face iv
Foreword to the First Edition v
Foreword to the Second Edition vii
Acknowledgement to Flight Test Techniques Group Members viii
Text Symbols and Abbreviations xvi
PART I - GENERAL CONSIDERATIONS ABOUT THE DESIGN OF AFLIGHT TEST INSTRUMENTATION SYSTEM
1.0 Planning of a Flight Test Programme 1-1by C.E. Adolph
1.1 Introduction 1-11.2 Test Planning 1-2
1.2.1 The Master Test Plan 1-21.2.2 Detailed Test Plans 1-2
1.3 Planning the Basic Design of the Flight Test System 1-31.3.1 General 1-31.3.2 The Method of Data Transmission 1-31.3.3 Real-time Processing 1-41.3.4 Tasks of the Ground Computers besides Direct Data Processing 1-41.3.5 Onboard Instrumentation Systems 1-51.3.6 Processing Techniques 1-5
1.4 References 1-61.5 Bibliography 1-6
2.0 Principles of Instrumentation System Design 2-1by V.H. Knight and B.L. Dove
2.1 Introduction 2-12.2 Factors Influencing Instrumentation System Design 2-2
2.2.1 Introductory Remarks 2-22.2.2 The Measurements List 2-22.2.3 The Overall Design of the Instrumentation System 2-42.2.4 Other Factors 2-7
2.3 Conclusion 2-102.4 Bibliography 2-10
3.0 Introduction to the Design of Computer Systems and Related Software 3-1by E.M. Hamlin and A. Lejeune
3.1 The Need for Computer Systems in Flight Testing 3-13.2 An Organized Approach to Software System Design 3-1
3.2.1 The Evolution of Systematic Software Design 3-13.2.2 Structured, Modular Programming Techniques 3-23.2.3 The Importance of Teamwork and Communication 3-2
ix
Document provided by SpaceAge Control, Inc. (http://spaceagecontrol.com/).

Page
3.3 The Design of Software Systems 3-23.3.1 The Elements of a Data Processing System 3-33.3.2 Design Personnel 3-33.3.3 Preliminary Design Phase 3-33.3.4 Functional Design Phase 3-43.3.5 Coding of Software Modules 3-43.3.6 Software Module Testing 3-53.3.7 Module Integration 3-53.3.8 Full System Implementation 3-53.3.9 Validation and Verification Testing 3-5
3.4 Production Phase 3-63.4.1 Configuration Control 3-63.4.2 Documentation 3-6
3.5 Conclusion 3-63.6 References 3-73.7 Bibliography 3-7
PART II - DESIGN OF A SINGLE MEASURING CHANNEL
4.0 The Metrological Characteristics of a Measuring Channel 4-1by Dr M.E. Eshelby
4.1 Introduction 4-14.2 The Measuring Channel 4-2
4.2.1 The Airborne System 4-24.2.2 The Ground Station 4-4
4.3 Errors in Measurements and Measurement Accuracy 4-54.4 Characteristics of Metrology 4-6
4.4.1 Static Characteristics 4-74.4.2 Dynamic Characteristics 4-104.4.3 System Characteristics 4-14
4.5 Bibliography 4-15
5.0 Transducers 5-1by R. Gregory
5.1 Introduction 5-15.1.1 Transducer Elements 5-15.1.2 Transducer Specifications 5-15.1.3 Parameters-definition and Calibration 5-2
5.2 Transducer Characteristics 5-25.2.1 Input Characteristics 5-25.2.2 Transfer Characteristics 5-35.2.3 Output Characteristics 5-4
5.3 Transfer Errors and Accuracy 5-55.3.1 Errors Due to Temperature Change 5-65.3.2 Errors Due to Shock and Vibration 5-65.3.3 Bandwidth and the Use of Filters 5-65.3.4 Errors from EMI 5-75.3.5 Other Error Sources 5-7
5.4 Electrical Characteristics 5-75.4.1 Data Levels, Impedance, and Matching 5-75.4.2 Bandwidth and Phase Relationships 5-85.4.3 Ground Connection 5-85.4.4 Output Data Formats 5-8
Document provided by SpaceAge Control, Inc. (http://spaceagecontrol.com/).

Page
5.5 Transducer Construction 5-105.5.1 Integrated Transducers 5-105.5.2 Integrated Package Devices 5-105.5.3 Micro-techniques 5-105.5.4 Integrated Circuit Techniques 5-105.5.5 Digital Transducers 5-115.5.6 The Micro-processor and Bus Control 5-115.5.7 Closed-looped Transducers 5-11
5.6 Optical Methods 5-135.6.1 Optical Sensors 5-135.6.2 Fibre Optics, Sensors, and Data Transmission 5-135.6.3 Laser Methods 5-135.6.4 Ring Laser Gyro (RLG) 5-135.6.5 Optical Gratings and Scales 5.145.6.6 Encoders 5-14
5.7 Transducer Applications 5-155.7.1 Mathematical Relationships 5-155.7.2 Electrical Principles Available 5-15
5.8 Displacement Measurement 5-165.8.1 Direct and Inertial Measurement 5-175.8.2 Potentiometers 5-175.8.3 Inductive Displacement Transducers 5-185.8.4 Synchros 5-195.8.5 Capacitive Displacement Transducers 5-215.8.6 The Piezo-electric Principle 5-225.8.7 Strain Gauges (Metallic) 5-235.8.8 Encoders 5-24
5.9 Velocity and Flow Measurement 5.245.9.1 Pitot/static Systems 5-255.9.2 Tachometers 5.255.9.3 Measurement of Flow 5-255.9.4 Anemometers 5-275.9.5 Flowmeter Performance 5-27
5.10 Acceleration Measurement 5-275.10.1 Practical Accelerometers 5-275.10.2 Force Balance Techniques (Servo Feedback Transducers) 5-295.10.3 Frequency Response versus Range and Damping 5-295.10.4 Vibration Measurement 5-29
5.11 Gyros 5-295.11.1 Free Gyros 5-305.11.2 Rate Gyros 5-305.11.3 Laser Gyro 5-315.11.4 Gyro Characteristics 5-31
5.12 Pressure 5-315.12.1 Capsules and Bellows (Altimeters and ASIs) 5-325.12.2 Diaphragms 5-325.12.3 Bourdon Tube 5-335.12.4 Performance and Damping 5-33
5.13 Temperature Measurement 5-345.13.1 Resistance Bulbs and RTDs 5-345.13.2 Thermistors 5-345.13.3 Thermocouples 5-345.13.4 Optical Methods 5-35
5.14 Bibliography 5-36Appendix 5-38Table I - Typical Transducers used for Flight Test Instrumentation
xi
Document provided by SpaceAge Control, Inc. (http://spaceagecontrol.com/).

Page
6.0 Signal Conditioning 6-1by R.K. Bogue
6.1 Introduction 6-16.1.1 Signal Conditioning Definition 6-16.1.2 Signal Conditioning Purpose 6-16.1.3 Principles of Signal Conditioning 6-26.1.4 Signal Conditioning Categories 6-4
6.2 Linear Operations 6-46.2.1 Amplification and Attenuation 6-46.2.2 Filtering (Signal Enhancing) 6-56.2.3 Zero Shifting 6-76.2.4 Compensation 6-7
6.3 Signal Conversion 6-76.3.1 Modulation 6-76.3.2 Demodulation 6-96.3.3 Commutation and Sampling 6-96.3.4 Analog-to-digital Conversion 6-96.3.5 Digital Processes 6-15
6.4 Concluding Remarks 6-186.5 References 6-18
7.0 Time Sampled Data and Aliasing Errors 7-1by D. W. Veatch
7.1 Introduction 7-17.2 Definition of Aliasing 7-17.3 Origins of Aliasing 7-1
7.3.1 Reduction of Aliasing Errors through System Design 7-27.3.2 Sampling Rate and Filters used as Anti-aliasing Tools 7-2
7.4 Understanding Aliasing Errors 7-27.5 Sampling Rates and Aliasing 7-87.6 Filters and the Errors they Introduce 7-97.7 Reconstruction Filters 7-147.8 Digital Filters 7-16
7.8.1 Infinite Impulse Response Digital Filters 7-177.8.2 Finite Impulse Response Digital Filters 7-177.8.3 Ground Stations and Digital Filters 7-17
7.9 Anti-Aliasing Techniques 7-197.9.1 Case 1: The Good Data Channel 7-197.9.2 Case 2: The Good Data Channel with a Remote Noise Spike 7-207.9.3 Case 3: White Noise Data 7-217.9.4 Case 4: Resolution of a Transient Event 7-227.9.5 Case 5: Ground Station Techniques 7-237.9.6 Combined Cases 7-23
7.10 Conclusions 7-237.11 References 7-24
8.0 Calibration 8-1by D.R. Crounse
8.1 Introduction 8-18.2 Basic Measuring Concept 8-18.3 The Real World Concept 8-18.4 The Measurement System 8-28.5 Data Use 8-3
8.5.1 Accommodation 8-48.6 Traceability 8-48.7 Unit Definition 8-48.8 Standard Induced Errors 8-5
xiiDocument provided by SpaceAge Control, Inc. (http://spaceagecontrol.com/).

Page
8.9 Calibration Procedures 8-58.9.1 Characteristics 8-58.9.2 Calibration Data Presentation Techniques 8-68.9.3 Visual Instrument Calibration 8-68.9.4 On-vehicle Calibration 8-78.9.5 Environmental Calibration 8-7
8.10 System vs. Component Calibration 8-78.10.1 Individual Component Calibration 8-78.10.2 System Calibration 8-88.10.3 Combination Component/System Calibration 8-8
8.11 Automated Calibration 8-88.12 Pre/Post/In-Flight Calibration 8-88.13 Planning 8-98.14 References 8-9Appendix 8-10
PART III - DESIGN OF A MULTI-CHANNEL INSTRUMENTATION SYSTEM
9.0 Technical Aspects in the Design of Multi-channel Data Collection Systems 9-1by H. Bothe and R. Crabij
9.1 Introduction 9-19.2 System Concept 9-2
9.2.1 System Modification versus New Development 9-29.2.2 Choice of the Major Components 9-29.2.3 Onboard Recording and/or Telemetry 9-49.2.4 Methods of Onboard Recording and Telemetry 9-5
9.3 Technical Design and Development Considerations 9-69.3.1 Introduction 9-69.3.2 Multiplexing and Normalization of Input Signals 9-79.3.3 Maintenance and Performance Monitoring of the Data Collection System 9-139.3.4 System Integration 9-149.3.5 Grounding 9-169.3.6 Electrical Power 9-179.3.7 Data Analysis Requirements of the Instrumentation Engineer 9-17
9.4 The Testing of Instrumentation Systems 9-189.4.1 Environmental Testing 9-189.4.2 Functional Testing 9-199.4.3 Total System Check-out in the Aircraft 9-199.4.4 Preflight and Postflight Checks 9-20
9.5 References 9-21
10.0 Data Processing (Part A) 1OA-1by R. Pozmantier
10.1 Introduction 1OA- 110.2 General 1OA-1
10.2.1 Types of Data Input 1OA-110.2.2 Functional Analysis of Data Processing 1OA-310.2.3 Quick-look and Instrumentation Checking 1OA-310.2.4 Preprocessing 1OA-410.2.5 Data Compression 10A-510.2.6 Post Processing 1OA-610.2.7 Presentation 10A-710.2.8 Validation and Interpretation 1OA-710.2.9 Short Description of a Few Processing Techniques 1OA-8
xiii
Document provided by SpaceAge Control, Inc. (http://spaceagecontrol.com/).

Page
10.3 Processing Hardware Configuration 10A- 1110.3.1 Computer Types 1OA-1110.3.2 Equipment for Quick-look and Instrumentation Checking 1OA-1210.3.3 Preprocessing Equipment for Magnetic Tape Inputs 1OA-1310.3.4 Equipment for Analyzing Photo-panel Recordings and 1OA-14
Continuous Trace Recordings10.4 Software Specifications and Development 1OA-1410.5 Data Files and Archiving 1OA-1510.6 Concluding Remarks 1OA-1510.7 References 1OA-16
10.0 Data Processing (Part B) 1OB-1by S. Yount
10.8 Operational Support Database 1OB- 110.8.1 Introduction 1OB- 110.8.2 General 1OB-110.8.3 System Objectives 1OB-210.8.4 Calibration Information 1OB-210.8.5 Parametric Information 1OB-310.8.6 Data Acquisition System Information 1OB-310.8.7 Lineup Information 1OB-310.8.8 History Information 1OB-310.8.9 System Considerations 1OB-410.8.10 Design Alternatives 1OB-810.8.11 Utilization Philosophy 1OB- 11
Appendix 1OB-1310.9 References 1OB-18
11.0 Onboard Data Recording Systems 11-1by L.A. Whalley, C.J. Brain and R. Grant
11.1 Introduction 11-111.2 Criteria for the Selection of the Recording System 11-111.3 The Major Types of Recording Systems 11-1
11.3.1 The Photo Panel 11-211.3.2 The Film Camera, Pulsed and Cin6 11-311.3.3 Trace Recorders 11-311.3.4 Evolution of Magnetic Recording 11-511.3.5 Instrumentation Recording 11-611.3.6 Video Recording 11-1311.3.7 The Magneto-optical Recording Systems 11-1711.3.8 The Solid-state Memory 11-19
11.4 Conclusions 11-2011.5 References 11-2011.6 Bibliography 11-21
12.0 Telemetry 12-1by A. Becker
12.1 Introduction 12-112.2 Basic Methods 12-2
12.2.1 Modulation 12-212.2.2 Multiplexing 12-612.2.3 The Radio Frequency Link 12-912.2.4 Ground Data Processing, Recording and Display 12-1312.2.5 Encryption of Data Information 12-14
xivDocument provided by SpaceAge Control, Inc. (http://spaceagecontrol.com/).

Page
12.3 IRIG-Standardized Telemetry Systems 12-1512.3.1 FM/FM'Systems 12-1512.3.2 PAM/FM Systems 12-1612.3.3 PCM/FM Systems 12-1612.3.4 Hybrid Systems 12-21
12.4 An Approved Uplink-Downlink Telemetry System 12-2212.5 References 12-2612.6 Bibliography 12-26
13.0 Measuring of Flightpath Trajectories 13-1by K. Hurrass
13.1 Introduction 13-113.2 Coordinate Systems 13-113.3 Mathematical Methods 13-3
13.3.1 Determination of Positions in x/y/z Coordinates 13-313.3.2 Method of Least Squares Adjustment 13-513.3.3 Kalman Filtering 13-713.3.4 Influence of Atmospheric Refraction 13-9
13.4 Instruments and Methods 13-1113.4.1 Cinetheodolites 13-1113.4.2 Tracking Radar 13-1313.4.3 Laser Tracker 13-1413.4.4 Radio Electric Ranging Systems 13-1513.4.5 Laser Ranging 13-1613.4.6 Video Tracking Systems 13-1713.4.7 Inertial Navigation Systems 13-1713.4.8 GPS 13-1813.4.9 Integrated Systems 13-20
13.5 Conclusion 13-2413.6 References 13-2513.7 Bibliography 13-25
ANNEX A
xv
Document provided by SpaceAge Control, Inc. (http://spaceagecontrol.com/).

Text Symbols and Abbreviations(Does not include Symbols used in Mathematical Derivations)
A amplitudeA-D, A/D, a-to-d analog to digitalAFES avionics flight evaluation systemAGARD Advisory Group for Aerospace Research and DevelopmentAGARDograph a paper or book sponsored by AGARDAM amplitude modulationARINC Aeronautical Research, Inc.ASI air speed indicatorAV anti-vibrationac ac currentB binary codeBFSL best fit straight lineBITE built in test equipmentBR bit rate/sbar unit of pressureC capacitance/conversion process/correction-to-add, correction from the calibrationC/A course/acquisitionCAD/CAE computer aided design/computer aided engineeringCB constant bandwidthCBW constant bandwidthCCD configuration control boardCDX differential control xmitterCRT cathode ray tube (workstation display)CT control transformerCX control xmitterc.g. center of gravitycm centimeterD diaphragm dampingD/A, d-to-a digital to analogDAS data acquisition systemDAT digital audio tapeDBMS data base management systemDLR Deutsche Forschungsanstalt fuir Luft- und Raumfahrt e.V. (German Aerospace
Research Establishment)DME distance measuring equipmentDSB double sidebandd gas viscositydB decibeldc dc currentEEO electro-explosive deviceEEPROM electrically erasable PROMEM electro magneticEMI electromagnetic interferenceEPROM electrically programmable read only memoryEU engineering unitsEma maximum phase error in the filter's pass bandF diaphragm stiffness (force)FFT fast Fourier transformFIR finite impulse responseFM frequency modulationFS full scaleFSK frequency shift keyingFSM frequency shift modulationFSR full scale range
xvi
Document provided by SpaceAge Control, Inc. (http://spaceagecontrol.com/).

fN Nyquist frequencyfR reconstructed frequencyf frequency, Hz
cut-off frequencyfm maximum frequency of interestfin natural frequencyfps frames per secondf• sampling rate, frequencyf0 zero frequencyG gray codeGDOP geometric dilution of precisionGF gauge factorGMT Greenwich mean timeGPS global positioning systemg force of gravity, 32 ft/sec/secgal gallon/sHDDR high density digital recorderHz hertz, cycles per secondI input, indicated readingIC integrated circuitIFF identification friend or foeIFR instrument flight regulations11R infinite impulse responseIN inertial navigationINS inertial navigation systemI/O input/outputIRIG Inter Range Instrument GroupIRIG-B timing format, IRIG-BJPT jet pipe temperatureKg kilogramKHz kilohertzLED light emitting diodeLRG laser ring gyroLSI large scale integrationLVDT linear variable differential transformerlb pound, avoirdupoisM megohm (one million ohms)MAPS microwave airplane position systemMSB most significant bitMUDAS modular universal data acquisition systemMUX multiplexerMW mega wattsm gas massmA milliamperemph miles per hourmV millivoltsN control force, NewtonsNACA National Advisory Committee for AeronauticsNRZ non-return to zeroNRZL non-return to zero levelNTC negative temperature coefficientNTSC national television system committeenm nanometersO outputOBDS onboard data systemOP amp operational amplifierOPSDB operational support data baseOS operating system
xvii
Document provided by SpaceAge Control, Inc. (http://spaceagecontrol.com/).
PAL phase alternation linePAM pulse amplitude modulationPB proportional bandwidthPBW proportional band widthPCM pulse code modulationPDM pulse duration modulationPLL phase locked loopPM phase modulationPO pick-offPPM pulse position (or phase) modulationPRN pseudo random noisePTC positive temperature coefficientPWM pulse width modulationppm parts per millionR resistance capacitanceRAM random access memoryRC resistanceR-DAT rotary (head)-DATRF radio frequencyRLG ring laser gyroRPM revolutions per minuteRTD resistance temperature detectorRX/RC resolver xmitter/controlRZ return to zerorms root mean squareS sensitivitySAR successive approximation registerSECAM sequential color and memorySNR signal to noise ratioSRAM static random access memorySSB single side bandT true valueTCP/IP telecommunications protocol/Internet protocolTSM time sharing modulationTX/TR transmit/receivet timeUTM universal transverse mecatorV voltsV & V validation and verificationVHS video home systemVOR vhf omni rangingVLSI very large scale integrationVTR video tape recorderVK voltage on capacitor "c"Vill voltage inputV.u, voltage outputV, voltage reference
V1K voltage inputW wattsWBFM wide band frequency modulationXmitter transmitter*? phase shift, degrees
power source
xviii
Document provided by SpaceAge Control, Inc. (http://spaceagecontrol.com/).

1-1
Chapter 1
PLANNING A FLIGHT TEST PROGRAMME
by
Charles E. AdolphDeputy Under Secretary of Defense (Acquisition)Research and Engineering (Test and Evaluation)
The Pentagon,Washington DC 20301-3110United States
1.1 INTRODUCTION
In order to place in context the function of test instrumentation in the development of aircraft, this first chapterwill review the test planning required for a new or modified aircraft type. Speaking very broadly, the develop-ment of an aircraft type-i.e., the phase before the aircraft is accepted for production by military or civil au-thorities-can be divided into two stages: a design stage (including the production of one or more prototypeaircraft) and a test phase. During the design phase, estimates of the aircraft characteristics must be based onprevious experience with similar aircraft, on wind tunnel tests of reduced-scale models, and on theoretical cal-culations. These design aids are quite sophisticated and are becoming very realistic. In wind tunnels the rangeof achievable Reynolds and Mach numbers increases, the effects of all kinds of errors become better known sothat corrections can be applied.
The increased capacity and speed of digital computers has tremendously stimulated the development of power-ful calculation methods in the fields of stress analysis and aerodynamics. These improved design aids signifi-cantly reduce the probability of large design errors. Nevertheless, the test phase is still essential to prove thatthe aircraft meets its design goals and to verify its performance.
Test programmes are not only essential for the development of new aircraft, they also satisfy a variety of ob-jectives of military services, other government agencies, manufacturers of engines and aircraft equipment, andcommercial airlines. The test results provide information:
- To provide product designers with feedback they need to evaluate the design's validity or to provide the ba-sis for design alterations.
- To evaluate whether or not the product is being built in accordance with the design specification. This is ofimportance for the organization acquiring the equipment.
- To provide insight into how well the system will work once fielded. Tests of military aircraft must determinewhether or not the system will be operationally effective and suitable for use in combat by typical militaryforces.
The planning of the test phase is slightly different for civil and military aircraft. The testing of civil aircraftwas originally regulated in detail in each country separately, whereby the FAR (Ref. 1.1) gradually became themain example for other countries. During the last decades the European countries have developed their ownjoint regulations (Ref.l.2) which have been set up along lines very similar to FAR, though there are severalimportant differences. A civil aircraft that has been shown to meet these requirements receives a Type Certifi-cation. For military aircraft the requirements, and therefore the test programme, are more specifically deter-mined by the use that is to be made of the aircraft.
A few decades ago the test phase consisted almost exclusively of flight testing, which is the most direct way tomeasure the performance of an aircraft. It has been found, however, that many of the tests which are essentialin the development of modern aircraft and equipment would require a tremendous amount of flight test timeand, in some cases, would be far too risky. Such tests are now generally executed as ground tests, though theresults must, in the end, be verified by a (reduced) flight test programme. The oldest ground test is probablythe structural test, where the structure of the aircraft is tested under simulated static loading-often until actualfailure occurs. Later came the dynamic ground testing of the fatigue characteristics of the wing-fuselage struc-ture and of other parts of the aircraft, such as the undercarriage. In recent years the tendency towards integrationof all kinds of (electronic) systems in the aircraft has started a new trend in ground testing. Testing digital hard-ware and software for integrated systems must cover, in principle, all conditions that can occur during flight
Document provided by SpaceAge Control, Inc. (http://spaceagecontrol.com/).

1-2
(including combinations of extreme attitude angles with electrical interference from radio, radar and munitionsrelease, and all kinds of flight directions and environmental extremes). "Integrated Test Facilities" are beingbuilt in many places for ground testing of such hardware and software. These ground tests do not replace theflight tests; the flight tests provide the final proof and they must show that the results of these ground tests aresufficiently realistic. In the ground test facilities (see e.g., Ref. 1.3), computers with detailed mathematical mod-els of the aircraft and its components can be tested together with actual components of the aircraft and even thecomplete aircraft itself, so that internal wiring and electro-magnetic interference are realistically represented.These integrated test facilities are an increasingly important aspect in the planning of flight tests.
1.2 TEST PLANNINGTest planning documentation falls within the broad categories of a master test plan and detailed test plans. Themaster test plan contains test management concepts and discusses the objectives of the tests that are to be exe-cuted, test locations and resources, and overall support requirements. Master test plans should contain enoughinformation on specific test particulars to allow test engineers to develop detailed test plans and instrumentationmeasurement lists.
1.2.1 The master test IlanThere should be an overall test and evaluation plan for any development test program. This plan should identify:
- The critical technical and operational characteristics to be evaluated during the tests and quantitative valuesfor success criteria.
- The division between ground tests and flight tests, and the specification of the flight tests required to verifythe results of ground tests.
- Whether real-time data analysis will be used and, if so, whether this will be done on the ground using a te-lemetry link between the aircraft and the ground processing station or using onboard computers. This subjectwill be discussed in some more detail in Section 1.3.3.
- The analysis techniques that will be used in processing the test data. Modern computer-based design tech-niques make extensive use of computer models. An important part of the flight testing will consist of veri-fication of those computer models. The modern analysis techniques available for this verification (parameteridentification techniques) often require very specific flight tests to provide optimal results.
- The number of aircraft to be used and the definition of the parts of the test program each of these aircraft isto execute.
- All key test resources that are to be used during the course of the test program and basic specifications forthose that must still be purchased.
- General requirements for the instrumentation systems (see below Section 1.3.5) and for the installation ofthe flight test instrumentation in the prototype aircraft. These latter are concerned with the integration ofthe normal operational wiring with the wiring required for the special flight test instrumentation and withsafety aspects in case the test instrumentation system must be connected to operational systems in theaircraft.
This Master Plan must be finalized at a very early stage in the design of the aircraft. It will be the basis forpurchasing the components for the ground simulators and the onboard measuring equipment, and for definingthe wiring and other provisions for the instrumentation system that must be incorporated in the prototype air-craft. It should be kept in mind that the same ground simulation computers can, in many cases, be used for sim-ulations during both the design stage and the test stage.
A few of the most important aspects that must be considered in the master plan are discussed in more detail inSection 1.3 of this chapter. General information about test planning is given in Ref.l.4, general informationabout ground testing is given in Ref.1.5.
1.2.2 Detailed test plansOn the basis of the Master Plan all those who require information from the test programme should provide testmanagement with descriptions of the tests they want to have executed. Such descriptions will be supplied, forinstance, by the authorities who must certify the aircraft, by future users who want verification of the perfor-mance claims of the manufacturer and information that may be essential for the future operation of the aircraft,
Document provided by SpaceAge Control, Inc. (http://spaceagecontrol.com/).

1-3
or by design engineers who want to verify theoretical or wind-tunnel results. The descriptions must indicate theprinciples of the test procedures, the number of tests, and the limitations and constraints which are essential toobtain usable results.
The test management must then integrate the requirements from different users, decide which tests must be doneby flight tests and which by ground tests, and establish a time sequence for the complete test programme. Thisinformation is then handed to groups of more specialised engineers for further development:
- Flight test engineers must work out the details of the flight procedures and write step-by-step instructionsfor the flight crews. They also specify what measurement parameters will be required for each specific testand what are the requirements regarding measuring range, accuracy, sampling rate, etc. They will also setup the sequence in which the tests are to be executed. A detailed description of these activities falls withinthe scope of this AGARDograph.
- Instrumentation engineers must work out the details of the instrumentation system that will be required toexecute these measurements and must select the individual parts that must be purchased and define the soft-ware that must be developed. The principles of these activities are discussed in some more detail in Chapter2 of this AGARDograph.
- Computer engineers must work out the details of the computer systems that will be required. This applies inthe first place to planning for the hardware and software of the main ground processing system, but can alsoinclude onboard computers and microprocessors, and computer systems for auxiliary ground equipment.This is a relatively new activity which was not discussed in detail in the first edition of this AGARDograph.For that reason a new Chapter 3 has been included which discusses the primary requirements for the designof an instrumentation system from the point of view of the computer engineers.
The brief review of the planning process given above may seem to indicate that the several stages of the masterplan and the detailed plans follow each other in a continuous sequence. In reality this is never the case. Duringthe whole design process there is continuous consultation between the test managers and all participating spe-cialists, so that new requirements that come up can be accommodated and the effect of new ideas in one spe-cialty can be considered in the light of the total project. Even while the flight tests are actually being executed,problems may come up which require new parameters, new software, new sampling rates, etc. A good relation-ship between the test managers and the many groups of specialists involved in the design and maintenance ofa flight test system is one of the critical aspects which determine the success of the programme.
1.3 PLANNING THE BASIC DESIGN OF THE FLIGHT TEST SYSTEM1.3.1-GeneraThe foregoing pages give a very broad introduction to flight test (and ground test) planning. It seems useful toconclude this introductory chapter by briefly discussing a few of the more critical decisions that must be madeat the very beginning of the test planning process. Questions of special concern are:
- the method of data transmission
- use of real-time data processing
- tasks of the ground computer besides direct data processing
- the onboard instrumentation system: can an existing system be used (if necessary after modification) or is anew design required, and must modern developments like standard data busses, local commutation, and fibreoptics be incorporated?
- will use be made of model-oriented data processing techniques?
1.3.2 The method of data transmissionDuring the last few decades digital data transmission and processing have become the standard methods for ac-quiring quantitative data in flight testing. Completely analog methods are only used on rare occasions for ex-tremely small ad-hoc measuring systems. In many modern systems analog transmission is used for a fewparameters which have to be sampled at frequencies much higher than those of the other parameters, which aretransmitted in digital format. Modern developments in helical and transverse scan recording allow the recordingof extremely high quantities of data on a given length of tape.
Document provided by SpaceAge Control, Inc. (http://spaceagecontrol.com/).

1-4
Until recently the transmission of pictures was done on film, which usually had to be developed after the aircrafthad landed. The fast development of video recording, first analog and recently also digital, has resulted in arapid increase in the use of those methods. Photo recording is now, in general, only used when a picture fre-quency is required which is higher than the 50 pictures/sec which standard video systems can attain.
For further information see Chapters 9 and 11.
1.3.3 Real-time nrocessidnReal-time data processing using telemetry has been used during the last few decades, especially for dangeroustests such as a flutter boundary survey. At first only a limited number of critical parameters were telemeteredduring the dangerous flights only, so that the specialists on the ground could warn the (minimal) crew in theaircraft when a dangerous boundary was approached (see Ref.1.6). In addition to enhancing the safety of thetest process for hazardous flights, telemetry now also provides the opportunity to improve the efficiency of thetest process. Modern telemetry and computer technology allow the transmission of hundreds of parameters andtheir processing in real time into data from which the adequacy of a test manoeuvre can be determined by aspecialist behind a monitor screen in a mission control room. These improvements are brought about by real-time, answer-oriented software which allows an immediate assessment of significant test results. In many casesthe ground specialist can directly give the go-ahead for the next test condition, which formerly could only begiven after the aircraft had landed and the data from its recorders had been processed off line. An additionalbenefit is that detailed results are available during the post-flight debriefing when all events are still fresh inthe minds of the flight crew and the engineers. A discussion of modern, telemetry-based systems is given inRef.1.7. A problem with telemetry is that the flight must be made in the immediate vicinity of a telemetry re-ceiver. A few major test centres have a number of interconnected receivers, which cover a large area and sendtheir information to a single ground computer centre. Another method to expand area coverage is to use a relayaircraft which flies at a sufficient height to both receive data from the test aircraft and to relay them to theground station.
Real-time processing is also possible using an onboard computer. The Specialist analyst must then fly in theaircraft, so that this is only possible when sufficient space is available. Several stages in the development ofsuch a system are described in Ref.1.8.
The decision on the use of real-time data processing has a large effect on the planning of a flight test pro-gramme, its cost, and time schedule. This decision must, therefore, be made at a high management level and ata very early planning stage.
1.3.4 Tasks of the ground computers besides direct data nrocessingThe large ground computer systems that are nowadays available to flight test programmes can be used with greatadvantage for administrative functions connected with the flight testing and for the storage of all kinds of an-cillary data, such as:
- the flight test programme itself, with detailed instructions for the execution of the test and a listing of specialinstrumentation requirements, etc.
- the list of available transducers and other kinds of instrumentation equipment, with the present status of thattransducer or equipment and the period(s) during which it was actually used in one of the aircraft taking partin the programme
- the calibrations of each transducer or other type of instrumentation equipment, with the periods duringwhich each calibration was valid
- archives of data from all previous tests with the same aircraft
- a library of all programmes that can be used for the processing of the data and for the presentation of theresults in different ways.
With such an integrated ground system all kinds of processes can be automated. For example, the data process-ing programme itself can find for each instrumentation item which calibration was valid at a certain date-thiseliminates manual work that is liable to errors. Also, engineers at their computer terminals can find all infor-mation they need for checking data and results, and for interpreting the results. The programming of such a
Document provided by SpaceAge Control, Inc. (http://spaceagecontrol.com/).

1-5
complex ground system must be done with great care, as software errors can have severe consequences. Moreinformation is given in Chapters 3 and 10.
1.3.5 Onboard instrumentation systemsOne decision which must be made at a very early date, and with an important input from management, is wheth-er an existing instrumentation system can be adapted for the new test programme or whether a newinstrumentation system must be designed. In the latter case it must be decided whether the new instrumentationsystem must meet only the needs of this one specific project or will be designed for future projects as well.There are advantages and disadvantages to each approach. Project unique systems are, from inception, tailoredto that project's needs. These instrumentation systems are usually developed concurrently with the system theymust test, and overall project schedule delays can occur if problems come up during the development of theinstrumentation. Their reutilization potential usually is limited and most of the instrumentation must be writtenoff on the one project. On the other hand, such a system can be designed to the specific needs and the availablespace for this one project, which can be an important advantage.
There have been numerous attempts to develop standard instrumentation equipment that meets a wide varietyof test requirements. Most programmes need measurements of temperature, pressure, flow, voltage, strain,acoustics, vibration, and time. The experience with such general purpose systems has been that the instrumen-tation technology improves so fast that after a period of about ten years the equipment was too heavy, too slow,and did not have sufficient capacity. Nevertheless, most such systems are designed as modular systems, so thatduring the time they meet the technology requirements they can be adapted to a number of flight test pro-grammes. The use of standardized modulation systems (IRIG standards, Ref.1.9) and of data bus formats de-veloped for use in the operational equipment of the aircraft (MIL-STD-1553 B and ARINC 429, Refs. 1.10 and1.11) help to make the system more generally usable.
There are a number of trends at present which make it possible to improve the reusability of the instrumentation.These must be considered at an early stage by management, in consultation with all specialists involved:
- Local digitizers and commutators-which only handle the data that are produced in the direct neighbourhoodof this local device which then send its (digital) data over one wire pair to a master commutator for finaldata formatting-can very much reduce the overall weight of the test wiring and increase system flexibility.See Ref.1.12.
- Fibre optics data transmission in the aircraft potentially provide many advantages over transmission overmetal wires. Although the application to airborne data transmissions has not been fully developed at the timethis text was written, it offers a potential for much reduction in weight and efficient operation. A review ofthe present state of fibre optics transmission in aircraft is given in Ref. 1.13.
1.3.6 Processing techniquesThe use of complex computer simulations of the aircraft has had an important effect on the methods of dataprocessing. Previously the flight test data were directly used for the calculation of the flight characteristics ofthe aircraft as single entities. Flight tests were executed to obtain, for instance, the optimal climb performanceof the aircraft as a function of altitude and power setting, or the takeoff and landing distances as a function ofpower setting. These flight characteristics were then entered into the flight instruction handbooks. In recentyears flight tests tend to be used more and more to validate and update the aerodynamic and structural modelsof the aircraft that were used during the design stage, so that the flight characteristics can be calculated fromthe models (see Ref. 1.14). These computer models are continuously updated while the flight tests still go on.This provides a better insight into the aircraft's characteristics and can improve the flight test planning. Anotheradvantage is that the equations to be used in flight simulators-which play an increasingly important part increw training-are available at an early date. This trend has an important effect on the methods of data process-ing and even on the planning of the flight tests themselves.
Until a few years ago the processing was based on flight tests executed under steady conditions. The instruc-tions connected with FAR and JAR (Refs.l.2 and 1.3) are also for a large part based on such flight tests. Inrecent years flight testing in non-steady flight has become increasingly popular. During such a non-steady flighta whole range of flight conditions are passed and, if planned with care and insight, a significant reduction inflight time can be obtained without loss of information and accuracy.
Document provided by SpaceAge Control, Inc. (http://spaceagecontrol.com/).

1-6
Processing methods have been adapted to this trend. The most important of these methods is "parameter iden-tification," in which statistical methods are used to determine the best fit of data from several flight tests to theexisting model and which update the model parameters where necessary. Literature about such methods is givenin Ref.1.15.
1.4 REFERENCES1.1 Code of Federal Regulations, Title 14, Aeronautics and Space.
- Part 23 Airworthiness Standards: Normal, utility, acrobatic and commuter category of airplanes.
- Part 25 Airworthiness Standards: Transport category airplanes.
1.2 JAR, Joint Aviation Requirements, published by the Civil Aviation Authority, Printing and PublicationServices, Cheltenham, UK.
1.3 Mackall, Dale A., Marlin D. Pickett, Lawrence J. Schilling, and Charles A. Wagner, The NASA IntegratedTest Facility and its Impact on Flight Research, NASA TM-100418, 1988.
1.4 Lyddane, G.H., The Impact of Automation on Flight Test, Conference Paper Issue 19, Proceedings of theAerospace Congress and Exposition, Warrendale, PA, Society of Automotive Engineers, Oct. 1982.
1.5 Schweikhart, William G., "Flight Test Planning from the Bottom Up-An Alternative Approach to FlightTesting," Cockpit (ISSN 0742-1508) Jan.-Mar. 1985, pp. 5-14.
1.6 van Nunen, J.W.G., and G. Piazzoli, Aeroelastic Flight Test Techniques and Instrumentation, AGARDFlight Test Instrumentation Series, AGARDograph 160, Vol. 9, 1979.
1.7 Strock, O.J., Telemetry Computer Systems-The New Generation, published by the Instrument Society ofAmerica, 1988.
i.8 Manders, P.J.H.M., The Onboard Computer System for the Fokker F-29 Prototype Flight Tests, NLR MP81034U, 1981.
1.9 van Doorn, J.T.M., P.J.H.M. Manders, 0. van Teunenbroek, H. Riebeek, and A. Voskes, MRVS-Systemfor Measuring, Recording and Processing of Flight Test Data, NLR MP 88034U,1988.
1.10 van de Leigraaf, R., W.A. van Dorp, S. Storm van Leeuwen, and R. Udo, Measurement System for Pro-duction Flight Tests of New Aircraft, NLR TP 89222L, 1989.
1.11 IRIG Telemetry Standards, IRIG Standard 106-86, Secretariat, Range Commanders Council, US ArmyWhite Sands Missile Range, NM, USA, May 1986, revised Sept. 1988.
1.12 MIL-STD-1553B, Aircraft Internal Time Division Command, Response Multiplex Data Bus, 1978.
1.13 MIL-STD-1553B, Decommutation Techniques and their Integration into Post-Flight Analysis Systems,G. Vitalone E.T.C., 1987.
1.14 MIL-STD-1553B, Acquisition and Recording on AMX AIC, Aeritalia Experience and Present Trends,S. Cattunai, E.T.C., 1987.
1.15 MIL-STD-1553B, Multiplex Applications Handbook, US Air Force System Command, 1982. SystemCommand, 1982. Available from SCI Systems Inc., Huntsville, AL, USA.
1.5 BIBLIOGRAPHYAeronautical Radio Inc., Mark 33 Digital Information Transfer System, DITS, ARINC-SPEC-429, ARINC Air-lines Electronic Engineering Committee.
Dekker, Marcel, 1988. Personick, S.D., Fiber Optics: Technology and Applications, Plenum Publishers, 1985.
Maine, Richard E. and Kenneth W. Iliff, Identification of Dynamic Systems-Applications to Aircraft, Part 1:The Output Error Approach, AGARDograph 300, AGARD Flight Test Techniques Series, Vol. 3, 1986. (Con-tains an 18-page bibliography on parameter identification subjects).
Document provided by SpaceAge Control, Inc. (http://spaceagecontrol.com/).

1-7
Murata, Hirosi, Handbook of Optical Fibers and Cables,
Optical Fiber Sensors, Vol. 1: Principles and Components, edited by J.P. Dakin and B. Culshaw, Artech House,1988.
Posner, J.M. and R.A. Kitchen, "AFFTC Instrumentation System: An Introduction for Flight Test Engineers andManagers," Key Issues and Technology for Future Programs, Society of Flight Test Engineers, 18th AnnualSymposium Proceedings, Lancaster, CA, USA, 1984, pp. 24.1-24.11.
Tappan, M.W., T.C. Dull, C.A. Hughes, and G.M. Tadych, "Integration of Flight Test Data into a Real-TimeSimulation," AIAA 84-0552, 22nd Aerospace Science Meeting, Reno, NV, Jan. 1984.
Document provided by SpaceAge Control, Inc. (http://spaceagecontrol.com/).

2-1
Chapter 2
PRINCIPLES OF INSTRUMENTATION SYSTEM DESIGN
by
V.H. KnightNASA Langley Research Center
5 North Dryden StreetHampton, VA 23681-0001
United States
and
B. L. DoveResearch Triangle Institute
Research Triangle Park, NCUnited States
2.1 INTRODUCTIONFlight tests programs invariably represent a significant investment of resources, and therefore, considerablecare must be devoted to identifying the specific requirements for the flight tests and to assure that the data sys-tem will yield the required information. The types of flight test information which can be obtained are discussedin Chapter 1 of this book. The first step towards the realization of a flight test instrumentation system then isa clear statement of the objectives of the flight test program. These objectives are drawn up by the specialistswhich require the information: for instance, the office which has designed a new aircraft or a new piece ofequipment which must be tested, or the operations office having a need to experiment with new military airtactics. On the basis of these objectives, the flight test organization will prepare a preliminary flight test pro-gram, a list of parameters which must be measured, and a basic outline for the instrumentation system design.This must be done in close cooperation between management, flight test engineers, instrumentation engineersand data processing specialists.
At this stage of the design process, various ways of organizing to accomplish the work are utilized, each withits own advantages. Should a project organization be created, an instrumentation systems engineer would nor-mally be assigned to the organization or to support the project along with flight test engineers and test pilots.Data processing specialists are rarely assigned to a specific project, but this decision depends upon the meritsof each case.
The instrumentation design phase which follows begins when the flight test engineers develop a measurementslist (see Section 2.2.2). Using this list, the instrumentation engineer produces an overall design approach forthe instrumentation system.
In the instrumentation development phase, the hardware and software of the instrumentation system are devel-oped by technical specialists. In this phase, commercially available parts are chosen and ordered, and thoseparts of the system which must be made in-house are designed. At the end of this phase, the actual hardwareand software have been produced.
When the total instrumentation system, or at least a major part is ready it passes into the test phase. The impor-tance of this phase is often under estimated, with the result that "teething troubles" sometimes cause delays inthe transitioning to the operational phase of the flight test program. It is very important to take integrated test-ing of the whole instrumentation system (with all software) into account when planning a flight test program,for in some cases it has required as much time as the design and development phases together. Many of theinitial tests can be done in the laboratory or in the aircraft, but experience has shown that actual flight testingof the airborne equipment is essential as it reveals weak points which were not apparent during integrated test-ing under simulated conditions. This phase can also be used to train equipment operators and maintenance per-sonnel, and to finalize maintenance schedules.
The procedure described above is generally applicable for the design of instrumentation systems used for test-ing modern high-performance aircraft.
Document provided by SpaceAge Control, Inc. (http://spaceagecontrol.com/).

2-2
2.2 FACTORS INFLUENCING INSTRUMENTATION SYSTEM DESIGN2.2.1 Introductory remarksThe main task of the design project group is flight test program planning which includes preparation of the mea-surements list and the determination of the instrumentation system design approach. Information contained inthe measurements list can help in making the main decision about the basic setup of the system such as:
"* Should a digital system be used exclusively or should analog techniques be included?
"* Should distributed commutation and digital data buses be designed into the system?
"* Can onboard recording be used as the sole means of acquiring data?
"* Is safety of flight telemetry required?
"* Is real-time processing via telemetry or onboard computing required?
"* Should a new system be developed with growth potential or can an older system be modified?
These are the type of decisions that often must be made at a stage where there is only a general idea of whatwill be in the measurements list.
The design selected for an instrumentation system is a reaction to requirements resulting from discussion of thelong-range plans of the flight test program, and the specific details of the current flight test plans which includeall topics discussed previously in Section 1.0.
In the normal course of events, several avenues to program success exist for the flight test engineer. From aninstrumentation point-of-view, some of the possible approaches to the flight program may require much morecomplicated instrumentation systems than others. For this reason flight test objectives must be specific and adiscussion of them at an early stage must allow for an inquiry into the reason behind their selection. Significantaspects can be, for instance, the division of flight test program between a number of aircraft and the plans whichexist for more or less similar flight tests with other types of aircraft.
2.2.2 The measurements listDefinition. A measurements list is a catalog of quantities to be measured in flight tests. Typically, a measure-ments list contains as a minimum: the measurement name, range of values expected, accuracy, resolution, fre-quency response, location on the aircraft, environmental conditions, phase correlation with othermeasurements, flight period of importance, measurement priority, and remarks. This is prepared by the flighttest engineer on the basis of the flight test program plan. The instrumentation engineer should be drawn in atan early stage and may contribute instrumentation oriented requirements to the list. Table 2.1 is an example ofa measurements list. The final form of the list may contain more or less information, depending on the com-plexity of the system such as measurements obtained directly from ARINC and MIL-STD data buses. The mea-surements list is a good indicator of system cost, schedule, amount of data processing required, etc. Ameasurement list, being the common link between the flight engineer and the instrumentation engineer, shouldbe kept up-to-date and reflect all agreed upon changes.
Use of the measurements list. Just why is a measurements list so vital to the instrumentation engineer? It con-tains the essential information needed by the instrumentation engineer to begin the detailed system design work.The final design approach can be completed only after considering requirements reflected in the list. The flighttest engineer should provide a measurements list as early as possible in the program, though its formulationshould not be rushed. It can be very helpful, if complete. If incomplete, it can initiate only a partial-and some-times false-start. Situations do occur where, in order to gain the advantage of lead time on development work,an early disclosure of even an incomplete list is advantageous. Such an incomplete list should be accompaniedby an indication of what, in general, may come later. The measurements list may also contain remarks, indicat-ing further experimental work will be needed before complete information can be supplied as, for example,wind tunnel test results.
The instrumentation engineer should assume responsibility for challenging the requirements imposed by themeasurements list. This validation process is a constructive practice in which the flight test engineer must par-ticipate, and even though the conversation may at times become heated, it should be encouraged to continue. Ithas often been experienced that such discussions have led to solutions which did not require costly specialequipment. The instrumentation engineer, arguing that position, acts to prevent excesses and special cases from
Document provided by SpaceAge Control, Inc. (http://spaceagecontrol.com/).

2-3
2* ac b.
I--I
0 am-Do 21 .1 0L2aC 0
* eW a zU-: c a a a s- 0a Ba 0 h. 0 Wi z0* j 00 hi o z z
hi hi J I-I I- aCOWu z z ean j 0
IL W Ua a Ug aWE C 22 am a c c £u U 10 a W Sw IL .
LC 00 L. L L L- L L L- "LL
-J a N z. -2 a h
wa x x-- a e z B.sz-- - * 4 .a hi hi xZ - 0 z z 5. a. a J 0
a £ Xa *L. 46 )U a a. a a
3-i-u
UW N
o1 o N x IWui a aNweN N j
Urns NI I X L* N I I ~
hisa I 11 11 ~ z II Z *0 IJ
us-u
3- 3- 20-3. - 3- 3 3 1
C CCB.z 1 0aL I
s-- LU - L I I - . 1 I - oCU 20 N N N N N M NNNN N N hG)~ ~~~~ ~~ .1 U ) U U I) N l U S N U55 w * 6 0 6 *6 -- 0 5. 6 ws w w
.................................. ...................
s- C L . . ia j j.j J 1 0 0 3 1 0 bo d z I J
i hi ai ii .% a- a IZ:I:3 3* w. Ni 1- 0 - $ . a " I.-
C 0 0 W - O zK I I - U a1 hi a - I
t--Z UUUU s-- U iw
C C CC L C a aa a a.
i- 00 UU U U Ua UC2 3U U C
0, hi 0 .. I- I- a a - B. Z Z0 o 00 0 0 (A15. . 20 0 22 a 2 0
CL~~ La aaa a hCiC Whi O ZW h
B. iZ UU U U U C 1. B1 J L hi WhiiK W O (A h U CL2
10~ hi A ,c a j . ,'L w t
1- h z I -0 a
a e " I- -Ii-
Document provided by SpaceAge Control, Inc. (http://spaceagecontrol.com/).

2-4
being imposed through default. It must be understood, however, that the instrumentation engineer does not, havethe last word about the measurements list. The flight test engineer can insist and will, though sometimes at avery high cost, get every measurement desired.
The instrumentation engineer will usually attempt to negotiate an adjustment of parameters on the measure-ments list (such as measuring range, accuracy, frequency response) so as to better match those of more com-monly supplied or stock transducers. This can reflect in savings in both cost and time by allowing the use ofunits already in hand and calibrated. It is not unusual for this to be done, for typically, some of the measurementparameter specifications result from analytical work only, and though calculated precisely, do not reflect actualflight test experience. Certainly, gross changes in parameter values are beyond the scope of this suggestion.
2.2.3 The overall design of the instrumentation systemIn this section, only the general and organizational aspects of the design of a flight test instrumentation systemwill be discussed. The more detailed aspects will come out in the later chapters of this book.
It is convenient for this purpose to view flight test instrumentation in a broader sense than just the onboardequipment, and to divide the system into two parts, which are physically distinct and which are generally de-veloped by different groups of engineers (Figure 2.1). They are the data collection subsystem and the data pro-cessing subsystem.
The data collection subsystem. This subsystem includes all measuring channels and their associated equipment,which must be designed to function under the often strenuous environmental conditions in the aircraft. Thissubsystem output usually ends up in a recorder, where the information is temporarily stored; some of the equip-ment used on the ground is often also regarded as part of this subsystem, for instance, the receivers and theground recorders of a radio frequency telemetry link, and even the measuring channels of any ground-basedmeasuring equipment such as radar or laser tracking devices.
An instrumentation engineer begins his work on the data collection subsystem by classifying the entries in themeasurements list according to their frequency response and accuracy requirements. These two factors heavilyinfluence the selection of the data acquisition approach. High accuracy requirements in combination with lowfrequency response requirements usually point to a digital design approach. High frequency response with lowaccuracy requirements, and not too large a number of parameters, can often be handled more easily with ananalog, wideband, frequency modulation (WBFM) subsystem. High accuracy and high frequency response fora large number of parameters are the indicators for a complex, costly system. Although a large capacity, highrate, parallel and serial format digital recorders are available which may permit a digital design approach, acareful reconsideration of the purpose of the flight tests may sometimes show that the objectives can also bereached with a, less complicated, combination digital and analog approach, in the same aircraft. In many casesboth digital and analog data can be handled more simply and cost-effectively using Inter Range InstrumentGroup (IRIG) data recorders (Chapter 11). A few high frequency, high accuracy, channels can often be accom-modated in a digital subsystem by using supercommutation. A large quantity of high frequency channels withlow accuracy requirements may be handled more effectively using an analog multiplexed FM subsystem.
Digital designs with distributed commutators (Figure 2.1) can greatly reduce the complexity and weight of air-craft wiring. Instrumentation interfaces with the avionics buses on advanced military or civil aircraft providean effective means of obtaining many flight performance measurements thus reducing the number of experimenttransducers required in a flight test. Onboard computers (Chapter 3) and standardized bus systems such as MIL-STD 1553 and ARINC 429 (Chapter 9) make possible easy connections to all kinds of commercially availabledata acquisition equipment. Although transducers are available with digital output; nevertheless, analog-to-dig-ital conversion will, in general, be required for many currently available transducers. Compact onboard displaysemploying onboard computers or microprocessors, driven from the aircraft digital subsystem measurements,facilitate multiple displays of engineering units to the aircraft crew. A major advantage of such in-flight dis-plays is the capability to readily change display format under software control.
Document provided by SpaceAge Control, Inc. (http://spaceagecontrol.com/).

2-5
I zI - - -
z C-
,I • z:I -z - w maI I m w .U - c€ - -" G Z I U IU
5-- - - -- -I I
I I - I- I • U :
A W1 WSw Z U)
I .. )-
a "I I
I X . WO
g.,_.u_ _
".i 'JU .J a 0 _
"I I I--
0 0 U
I z
I I
IL_ LL
- I
II--i
-0_ _ -""- ." " " 1'-'- %"
G r1; W I ,• C3
CII I a w"
m-I,
~ :Cd,LJ 0
Document provided by SpaceAge Control, Inc. (http://spaceagecontrol.com/).

2-6
By further sorting of the measurements list according to other requirements, such as the period in the test pro-gram when the parameter has to be recorded, its priority, etc., the instrumentation engineer will arrive at thenumber of parameters which must be recorded simultaneously. Here, two approaches are possible: the data col-lection subsystem can record all parameters during all flights and the selection of the relevant data for eachflight is done during data processing, or the subsystem can be designed to acquire only the relevant parametersduring each type of maneuver of a particular flight. If all parameters are recorded, a larger number of datachannels will be required, which generally means that the airborne equipment will require more space, power,etc.; however, it has the advantage that all parameters are being recorded when an unexpected phenomenon oc-curs. A telemetry uplink or onboard computer may be employed to change system configuration in flight, add-ing another dimension to system flexibility. If the second approach is used, different parameters can be recordedalternatively in the data recorder so that the digital subsystem concept becomes more attractive for collectingall flight data. Bandwidth and physical dimensions of the recording equipment can often be markedly reducedby employing a more complicated provision for switching (sampling) different parameters into the digital datasubsystem format during flight. Although the second approach often requires more time during preflight andpost-flight checks, readily available onboard and ground microprocessors permits automation of this task.
Another important step in the design of flight test instrumentation is the decision whether onboard recordingor telemetry (or both) will be used. This decision is based upon factors such as data turn-around time, aircraftrange during flight test, potential hazard, availability of telemetry facilities, and adverse weather conditionsnear the flight test facility. If safety data via telemetry is not required, onboard recording provides an alterna-tive means of acquiring flight data. With onboard recording the test program may be conducted out of remoteairports. In locations with adverse seasonal conditions, the aircraft can take-off in unacceptable flight testweather and fly to a location with acceptable weather then return to base after conducting the flight test. Real-time processing offers the advantage of instant feedback to the flight experimenter on how the test maneuveris progressing and whether the test objectives are being met. The use of onboard computers allow onboard ob-servers to determine if flight test objectives are being achieved in real-time without telemetry. Even if real-timeprocessing is used, the raw data will often also be recorded onboard the aircraft. With present-day technology,it is easier to do that in a computer compatible format, since environmentally rugged optical disk flight record-ers are now available. If a noncompatible format is used, a suitable data preprocessing capability must be pro-vided on the ground.
The more technical aspects of the data collection design are given in Chapter 9. It must be stressed that the datacollection subsystem development must be made in parallel with that of the data processing subsystem, so thatcompatibility between the two subsystems is ensured. Also, the general lines of calibration procedures must bespecified concurrently. When the general design of the data collection has been agreed upon, the detailed designof each data channel can be started (see Chapters 4 through 7), the calibration techniques (Chapter 8) and therecording or telemetry system (Chapter 11 and 12) can be chosen.
The data processing subsystem. The task of this subsystem (Figure 2.1) is to convert the collected data to a formwhich is suitable for interpretation. This interpretation is usually done in two stages: first, a limited analysis isdone, as quickly as possible, to find out whether the tests have gone well and whether the data collection equip-ment has functioned correctly, which is the basis for the planning of the next flight. A complete analysis fol-lows, which must provide the test results in their final form. The data processing equipment is generally housedin a well protected environment on the ground though, in many cases, part of the analysis is done onboard usingmicroprocessors or flight hardened computers. For simple tests involving fewer parameters, data processing canbe readily accomplished using personal computers. But, in most flight test programs, a large amount of dataprocessing equipment is used, including one or more computers with often complicated software.
The number of parameters which are recorded simultaneously at larger test facilities has typically reached alevel of one or two thousand parameters, while the turn-around time of the data processing has been reduced.The larger number of parameters per flight and the advances in computing and telemetry capability can be usedto reduce the number of test flights for a given program, or to flight test much more complicated aircraft in ashorter time. In the latest designs of systems for the flight testing of aircraft, telemetered data are processedon-line using high-speed, digital, parallel processors and the information is immediately displayed to humanobservers on the ground enabling them to give real-time directions to the flight crew from interpretation of thedata while the aircraft is still flying. If real-time processing is used, the ground calibration system must haveall its results readily available to the computer; the use of personal computers by instrumentation personnel
Document provided by SpaceAge Control, Inc. (http://spaceagecontrol.com/).

2-7
provides an efficient means of producing easily transferrable calibration coefficient data bases to the data pro-cessing computers.
It is convenient to break down further the data processing into two phases: the pre-processing phase and thecomputation phase. In the pre-processing phase, the data usually remain in the form of time histories of thedifferent parameters, but many kinds of operations are performed on these time histories, such as conversioninto a computer compatible format, application of calibration coefficients to produce engineering units, channelselection, digital filtering, etc. At the end of the pre-processing phase, the data are usually recorded on magnetictape, magnetic disk, or optical disk which is compatible with the input requirements of digital computers. Inthe computation phase, this data is then further processed to a final useful state. This is usually done in a cen-trally located mainframe digital computer, often shared with other users; although readily available, powerful,personal computer processing capabilities allow users the option of independent data processing. In many flighttest programs, a preliminary stage of processing is required for quick-look and instrumentation checking. Thisprovides time histories of a limited number of parameters, from which the quality of the flight tests can be es-timated, as a guideline for the planning of the next flight, and information from which anomalies in the instru-mentation system can be detected. Quick-look data are sometimes obtained by using a mobile station at remotetest sites, by telemetering a limited amount of data to the ground, or by a special computer run of data from theonboard recorders. Highly portable computers are often used in these quick-look operations.
Although data processing should not put any restrictions on flight instrumentation design (Chapter 10), dataprocessing equipment is seldom bought to service only a single flight test program and at many facilities it isavailable before the design of the flight test instrumentation begins. The main focus of data processing is, there-fore, the production of the necessary software (Chapter 10). During the design phase, plans for the data pro-cessing program must be closely correlated with the flight test program, the capabilities of the data collectionsubsystem, and the organization of the calibrations, etc. Generally the data processing group must only knowthe format of the message and the sequence of parameters in that data message. During the development phase,programming will be done by data processing specialists closely coordinated by the instrumentation engineerand flight experimenters. Software libraries at flight test facilities generally contain many standard programsin a variety of computer languages, from which the data processing specialist may select sub-routines, for con-venience in assembling the complete software for a flight test program. Ample time should always be reservedfor developing, testing, and optimizing the software, using inputs from the actual data collection hardware asit becomes available. The detailed aspects of data processing are given in Chapter 10.
2.2.4 Other factorsIn the design of an instrumentation system for flight testing, a number of things must be taken into accountwhich have not yet been discussed in detail. The most important of these are listed in Figure 2.2, and are brieflydiscussed below.
Cos. The cost of the flight test instrumentation system is directly related to the requirements imposed. An in-strumentation system designed to satisfy only the requirements of a given flight test program will have a basiccost. Below this basic cost, performance will be degraded or capability eliminated. Decisions on system designapproach should be carefully weighed against overall operational requirements. Initial up-front equipment ex-penditures for a flexible measurement capability can be more than offset by considerable savings in man-hoursachieved during the operational support phases of a flight test program. Accuracy has, perhaps, the most im-portant influence on cost. A 5% overall accuracy is relatively easy to obtain for analog FM telemetry or record-ing systems; 1% is a very difficult goal for analog systems, but is much easier to obtain from digital systems.Accuracies on the order of 0.05 or 0.25% or better, which are often requested by flight test engineers, are dif-ficult to obtain even with digital systems. Careful consideration of what accuracy is really needed should pre-cede the design of any new instrumentation system.
Document provided by SpaceAge Control, Inc. (http://spaceagecontrol.com/).

2-8
13ASICACCURACY
CAPACITY
SCHEDULE
ENVIRONMENTAL QUALIFICATION
RELIABIUTY
DESIGN. DEVELOP OR MODIFY
SKILLED MANPOWER - COST
AUTOMATIC DATA PROCESSING
OPTIONAL
FLEXIBILITY
AUTOMATED PRE-FLIGHT TESTING
CAD/CAE
ADVANCED TECHNOLOGY
Figure 2.2 Factors that affect system costs.
The inclusion of optional items may contribute significantly to the overall cost of the system. It must be keptin mind, however, that for a system which can be used for other tests as well, the initial cost may be higher, butthe cost per aircraft may be low. One of the difficulties of financing advances in instrumentation is the reluc-tance of flight test engineers to provide funds for requirements beyond their immediate needs. Separate battlesmust be waged by instrumentation organizations to get funds for improving the instrumentation capability. Ex-perience has taught that one of the best cost-control techniques is a careful review of the need for every datachannel requested, including an evaluation of its anticipated value. If the program can be accomplished usingconventional techniques, this should be seriously considered.
Development or modification. From an examination of all requirements, a decision must be made regarding howmuch of the requirements can be satisfied using existing systems or components of those systems. If existingsystem capabilities prove to be inadequate, modifications (such as the addition of channels, new signal condi-tioning, etc.) can be considered. Modifications are not always easy to implement, but the fact that the accumu-lated experience with the old system can be applied to the new test requirements is an enormous advantage.
With a new system development, risks are always involved especially when the development is scheduled. Am-ple time should be reserved to gain experience with a new system by testing it under laboratory and flight con-ditions.
Schedule. Flight test instrumentation systems are in many cases developed on a very tight schedule. In practice,it is usually very late in the development of an aircraft or of an operational procedure that the measurementslist can be made up. A flight test program schedule prepared without consultation with the instrumentation en-gineer is deficient from the outset. An adequate amount of time in the schedule must be allocated, especially ifnew systems are to be developed, because many unexpected delays tend to occur. In certain situations, it is ad-vantageous to make preliminary program requirements known to the instrumentation engineer as it permitsenough lead time to begin the development work.
Flight test programs dependent on the development of a new system must either provide time in the scheduleor sustain the additional cost of extra manpower and overtime work.
Personnel. The design phase must be executed by highly qualified personnel of the flight test instrumentationdepartment. For the development phase, subcontracts can be let to the industry, but a design team must be avail-able to supervise it.
Not only the personnel involved in the design and testing must be highly qualified, the same applies for thepersonnel which must maintain and check the instrumentation system during its operation. Ample time in thetest phase must be reserved for training personnel. Training must not be limited to just routine operations forexample; the maintenance crew should know as much as possible about any limitations in the system and be
Document provided by SpaceAge Control, Inc. (http://spaceagecontrol.com/).

2-9
alert to detect errors and system deficiencies. A qualified and well trained maintenance crew is an importantaspect of attaining program success.
Accuracy. The accuracy of flight test data does not result from the transducer accuracy alone, but is dependentupon maintaining accuracy throughout the instrumentation system. Verifying overall accuracy adds to the ana-lytical phase of the design in that special tests on all components processing the signal must be made, precisioncalibration methods must be developed, and the data collection, pre-processing and processing subsystems mustqualify to a more demanding specification. Experimental verification of the overall accuracy in the test phasewill also require much time and expenditure of funds.
Environmental qualifications. An important aspect of the overall accuracy is that it must be reached under theenvironmental conditions present in the aircraft. These include pressure, temperature, vibration and shock, butalso such other aspects as electrical and radio interference, power system noise, etc. The problem, especiallywith these latter effects, is that they are difficult to estimate beforehand. Although many precautions such asshielding and optimal points for ground connections can be taken during the design phase, only actual tests inthe aircraft can show whether these have succeeded and what further measures may be needed.
Reliability. Reliability is built into a flight test instrumentation system by using quality components that haveundergone a suitable qualification test program and have flight history similar to that of the intended applica-tion. Reliability is further ensured through good system design, good workmanship, and independent qualityassurance inspection.
Another aspect of reliability is safety. Flight tests vary in the dangers to which the aircraft and its occupantsare exposed. An attempt to minimize these dangers can place special requirements on the reliability of instru-mentation systems which will be reflected in cost and schedule. Special safety measures will also have to betaken when the instrumentation is connected to the circuits of the pilot's instruments or to essential avionicssystems in the aircraft. If flight parameter values are extremely critical, safety monitoring by telemetry or byonboard observers may be needed. Requirements such as this should be identified at the beginning of the pro-gram.
Maintenance. Every aircraft instrumentation system designed and built will require maintenance in its lifetime.Planning for this during system design is essential. Maintenance schedule should be set up early. The judiciousselection of places to install test points for performing electrical checks without disturbing the system will payfor the effort expended during the design. The placement of test points for convenience can be as important asthe existence of test points themselves. Routine maintenance such as cleaning recorder heads will, of course,be performed without using test points. Fault isolation is greatly aided through the use of appropriately locatedtest points, built-in test equipment (BITE) capable of generating calibration signals for diagnostic purposes,and through the location of functional portions of the subsystems in physically separate modules. In this way,complete functions can be expeditiously replaced. In order to support intensive flying, an efficient, computer-ized system for maintenance, preflight, and post-flight checking should be provided.
Accessibility. The efficiency of maintenance procedures can be impeded if the system components are inacces-sible in the aircraft. The location of test points and adjustable devices must be readily accessible for mainte-nance. In prototype aircraft, additional space is often provided for the instrumentation, which will not beavailable in production aircraft. Accessibility must be planned at an early stage, when production aircraft aremodified to permit instrumentation installation for flight testing.
Documentation. Quality instrumentation from the system development phase through the data collection phaseis an important element of an efficient flight test program. Documentation is required not only at the systemlevel, but also for equipment purchased or developed under independent contract. Accurate specifications anddrawings will significantly reduce overall hardware design and production errors, thereby, reducing programcost. Procedures should be developed for maintaining documentation (such as drawings and narrativedescriptions of equipment, etc.) which reflects the latest system configuration. Correct documentation will min-imize delays during the analysis and troubleshooting of equipment or software. Use of readily available andcost effective computer aided design and computer aided engineering (CAD/CAE) software and hardware toolswill make the documentation task much easier, as well as instrumentation design, simulation, and productiontasks.
Flexibility. Flexibility is the designed-in capability of an instrumentation system to be changed to meet differ-ing flight test requirements and situations. The objective of flexibility is to minimize the amount of change
Document provided by SpaceAge Control, Inc. (http://spaceagecontrol.com/).

2-10
required in an instrumentation system as a result of large changes in a flight test program and even to adapt itto other flight test programs, in other types of aircraft. For pre-processing and processing systems, which in-volve large capital investments, flexibility is essential. though a "universal" flight test instrumentation systemwould be both too costly and ineffective, a system designed to satisfy a number of flight test programs, in othertypes of aircraft can be cost effective and the least obstacle in a fast-paced schedule. Flexibility cannot by lim-ited to system capacity and electrical characteristics. If more than one aircraft type is to use it, the instrumen-tation system will also need flexibility in its physical design.
Standardization. Standardization of designs, components, and layout and construction at the subsystem level orlower, contribute to system flexibility. For example, a system designed and constructed in the form of acompatible set of modules or printed circuit plug-in cards can be used to assemble several flight test instrumen-tation units without the need for a completely new design. Standardization, in general, aids maintenance per-sonnel through familiarity gained by repeated use and contributes to lower cost through quantity purchases andfewer spare parts requirements. The repeated flight experience of components and subsystems provides realisticreliability information and increased confidence.
2.3 CONCLUSIONThe subjects introduced in this chapter represent the logical first order of business in the design of an instru-mentation system in that goals must be established before detailed design can begin. From this point forward,design specialists must decide how best to fulfill the stated requirements. There are many significant technicaldecisions to be made before a complete system can be realized. Sensors, transducers, signal conditioning tech-niques, and electronic hardware must undergo careful analysis and laboratory testing. Software must beprogrammed and tested. In the following chapters of this book, the detailed design of instrumentation systemswill be discussed.
2.4 BIBLIOGRAPHY1. Digital Time Division, Command/Response Multiplex Data Bus, MIL-STD-1553B, Sept. 21, 1978.
2. Funk, Donald G., Electronic Engineers Handbook, Second Edition, McGraw-Hill, 1982.
3. IRIG Telemetry Standard 106-86.
4. Law, Eugene L., Telemetry Applications Handbook, Pacific Missile Test Center, 1987.
5. Liptak, B.G., Instrument Engineers Handbook, Vol. I and II, Chilton Book Company, 1969.
6. Mark 33 Digital Information Transfer System (DITS), ARINC Specification 429-10, Mar. 16, 1987.
7. Stiltz, Harry L., Aerospace Telemetry, Vol. I, Prentice-Hall, Inc., 1961.
8. Stiltz, Harry L., Aerospace Telemetry, Vol. II, Prentice-Hall, Inc., 1966.
9. Taylor, James L., Computer Based Data Acquisition Systems, Instrument Society of America, 1986.
Document provided by SpaceAge Control, Inc. (http://spaceagecontrol.com/).

3-1
Chapter 3
INTRODUCTION TO THE DESIGN OF COMPUTER SYSTEMSAND RELATED SOFTWARE
by
Edmund M. HamlinNASA Ames Research Center
Dryden Flight Research FacilityPO Box 273
Edwards AFB, CA 93523-0273United States
andA. Lejeune
Centre d'Essais en Vol (CEV)Bretigny-sur-Orge
France
3-1 THE NEED FOR COMPUTER SYSTEMS IN FLIGHT TESTINGIn modern flight testing, computer systems are an integral part of the instrumentation system. Calibration func-tions with multiple coefficients and complex temperature dependencies, high-resolution digital sensors, con-catenated avionics bus data, and other complex requirements, unheard-of 10 years ago, are forcing the flighttest engineer into the use of ground processing systems of increasing complexity. The large quantity of parame-ters, combined with requirements for higher data rates, are compelling the designers to use ultra-high-speedprocessors. The expense of conducting flight test missions puts great pressure on the test engineers to avoidunnecessary repetition of flight conditions. The volume of information relating to flight test points can only bemanaged effectively by computer database techniques.
The subject of how to best utilize the computer is often a difficult one for the flight test engineer. What shouldbe expected from data processing and how can it best be used? To what extent is it necessary to understandprogramming languages? To what degree must this technology be understood to be able to define a system?How does the flight test engineer initiate a dialogue with computer experts?
The analysis which follows is an attempt to clarify the relationship between the world of flight testing and thecomputer experts. It presents a practical process for organizing an effective system design effort, with emphasison the software aspects of ground-based systems.
3.2 AN ORGANIZED APPROACH TO SOFTWARE SYSTEM DESIGNSince the advent of computer systems, particularly during the 1980s, there has evolved an organized approachfor defining, designing, testing, implementing, and maintaining data processing systems. The following para-graphs outline this organized approach and explain how it can be applied by the test engineer to flight test.
3.2.1 The evolution of systematic software designThe "good old days" are often referenced in many contexts. In computer engineering, those were the days whenan engineer could throw together a system without much forethought or planning. Software was created whilesitting in front of the terminal, and testing was what happened after the software was installed and run. If theresults looked good, the process was considered complete. Frequently there were problems later on. Sometimesthe users were fortunate in that the original designer had not departed for parts unknown and was able to findthe notes on the design and remember the logic of the faulty section of software. But often the users were notso lucky and the designer was unavailable. No one else was able to figure out the programming style, and thewhole section had to be rewritten by someone else.
While this casual approach to system design flourished, many managers and engineers pondered why computersystems should be an exception to the rule of sound design procedures. Common sense dictated that they weregoing about the whole process backwards. For example, when construction engineers design a bridge, they firstdetermine where the bridge will be located, how many vehicles it must accommodate, and so forth. In otherwords, the designer starts by defining the problem in the largest possible terms, and from there works throughmore detailed definitions until the bridge design is complete. In data processing, designers were performingdetailed structural design before they knew what the whole structure looked like. The result was a hodgepodgeof software that characterized the "good old days." Much of the discomfort with computers and software pos-sessed by non-computer professionals resulted from bad experiences with unstructured design processes.
Document provided by SpaceAge Control, Inc. (http://spaceagecontrol.com/).
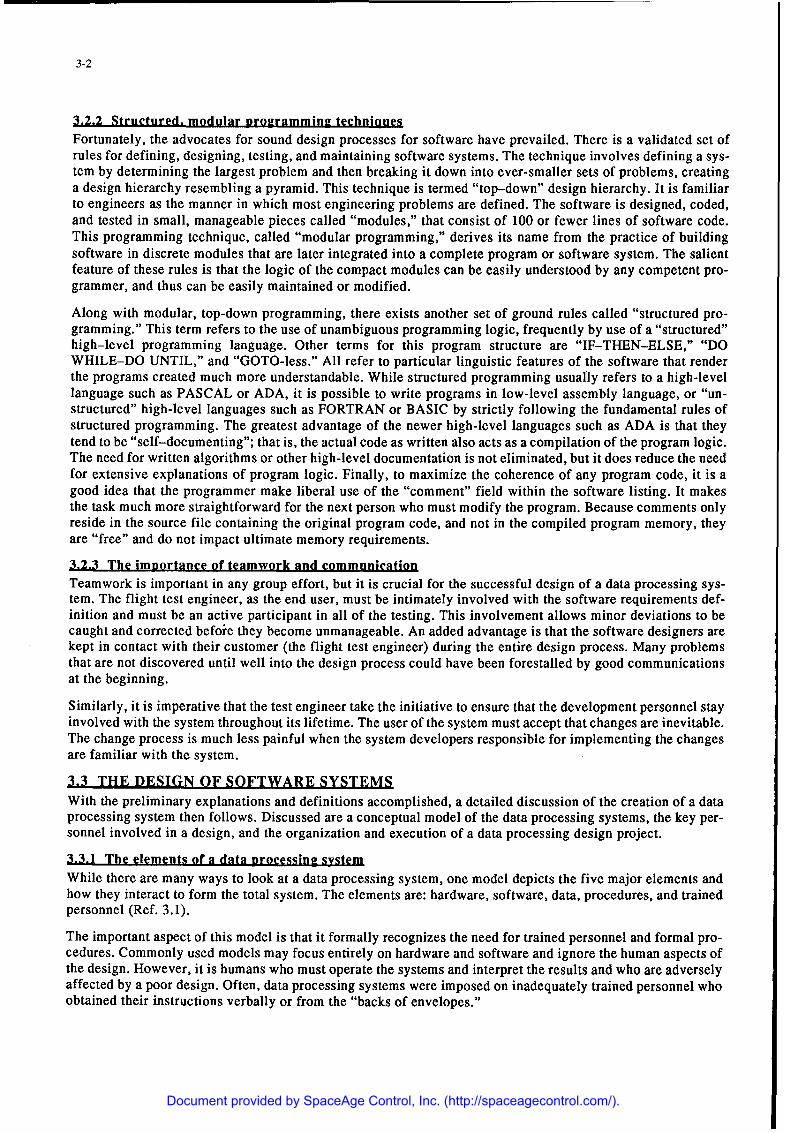
3-2
3.2.2 Structured, modular programming techniquesFortunately, the advocates for sound design processes for software have prevailed. There is a validated set ofrules for defining, designing, testing, and maintaining software systems. The technique involves defining a sys-tem by determining the largest problem and then breaking it down into ever-smaller sets of problems, creatinga design hierarchy resembling a pyramid. This technique is termed "top-down" design hierarchy. It is familiarto engineers as the manner in which most engineering problems are defined. The software is designed, coded,and tested in small, manageable pieces called "modules," that consist of 100 or fewer lines of software code.This programming technique, called "modular programming," derives its name from the practice of buildingsoftware in discrete modules that are later integrated into a complete program or software system. The salientfeature of these rules is that the logic of the compact modules can be easily understood by any competent pro-grammer, and thus can be easily maintained or modified.
Along with modular, top-down programming, there exists another set of ground rules called "structured pro-gramming." This term refers to the use of unambiguous programming logic, frequently by use of a "structured"high-level programming language. Other terms for this program structure are "IF-THEN-ELSE," "DOWHILE-DO UNTIL," and "GOTO-less." All refer to particular linguistic features of the software that renderthe programs created much more understandable. While structured programming usually refers to a high-levellanguage such as PASCAL or ADA, it is possible to write programs in low-level assembly language, or "un-structured" high-level languages such as FORTRAN or BASIC by strictly following the fundamental rules ofstructured programming. The greatest advantage of the newer high-level languages such as ADA is that theytend to be "self-documenting"; that is, the actual code as written also acts as a compilation of the program logic.The need for written algorithms or other high-level documentation is not eliminated, but it does reduce the needfor extensive explanations of program logic. Finally, to maximize the coherence of any program code, it is agood idea that the programmer make liberal use of the "comment" field within the software listing. It makesthe task much more straightforward for the next person who must modify the program. Because comments onlyreside in the source file containing the original program code, and not in the compiled program memory, theyare "free" and do not impact ultimate memory requirements.
3.2.3 The importance of teamwork and communicationTeamwork is important in any group effort, but it is crucial for the successful design of a data processing sys-tem. The flight test engineer, as the end user, must be intimately involved with the software requirements def-inition and must be an active participant in all of the testing. This involvement allows minor deviations to becaught and corrected befoie they become unmanageable. An added advantage is that the software designers arekept in contact with their customer (the flight test engineer) during the entire design process. Many problemsthat are not discovered until well into the design process could have been forestalled by good communicationsat the beginning.
Similarly, it is imperative that the test engineer take the initiative to ensure that the development personnel stayinvolved with the system throughout its lifetime. The user of the system must accept that changes are inevitable.The change process is much less painful when the system developers responsible for implementing the changesare familiar with the system.
3.3 THE DESIGN OF SOFTWARE SYSTEMSWith the preliminary explanations and definitions accomplished, a detailed discussion of the creation of a dataprocessing system then follows. Discussed are a conceptual model of the data processing systems, the key per-sonnel involved in a design, and the organization and execution of a data processing design project.
3.3.1 The elements of a data processing systemWhile there are many ways to look at a data processing system, one model depicts the five major elements andhow they interact to form the total system. The elements are: hardware, software, data, procedures, and trainedpersonnel (Ref. 3.1).
The important aspect of this model is that it formally recognizes the need for trained personnel and formal pro-cedures. Commonly used models may focus entirely on hardware and software and ignore the human aspects ofthe design. However, it is humans who must operate the systems and interpret the results and who are adverselyaffected by a poor design. Often, data processing systems were imposed on inadequately trained personnel whoobtained their instructions verbally or from the "backs of envelopes."
Document provided by SpaceAge Control, Inc. (http://spaceagecontrol.com/).

3-3
A professional data processing organization recognizes that training and documentation are an inherent part oftheir product, and a large share of the design effort is devoted to documentation and training. The flight testengineer should be aware that in an attempt to cut costs, one of the first places for reduction is the system doc-umentation. However, the flight test engineer must not allow this to occur. Experience has shown that theproject is much better off with a well-documented mediocre design than with a poorly documented superiordesign. Also, personnel who are well trained on the mediocre system perform better than those who are poorlytrained on the superior system.
3.3.2 Design RersonnelAs a layman who initiates the dialog with data processing experts, the flight test engineer relies most heavilyon the systems analyst to translate technical requirements into a system specification. In a sense, the systemsanalyst is bilingual, because this individual is expected to speak both flight test and programmer language. Agood systems analyst does not attempt to dictate project needs, but instead listens to the flight test experts'needs, stated in their own terminology. The flight test engineer and the systems analyst are the primary membersof the design team whose initial product is the functional specification. Simply put, systems analysts are dataprocessing experts who interface flight test engineers to the system designers. Systems analysts are selected asmuch on the basis of their people skills as by their technical prowess and organizational skills. The novice tothe world of data processing should be alert for programmers disguised as systems analysts. Their lack of in-trapersonal skills and insistence on the use of data processing jargon will soon reveal this pretense.
Whether they are called software designers, software engineers, or programmers, the key person in the dataprocessing world is the one who translates the design specification into actual program code. The programmerworks with the systems analyst to arrive at a solution to the requirements. While systems analysts deal primarilywith people, the programmer deals with hardware and *the instructions required to make it function. Program-mers are selected on the basis of their ability to create program codes accurately and quickly.
3.3.3 Preliminary design nhaseThe flight test engineer should complete this process with the systems analyst. Some of the steps may seem tobe a repetition of the flight test engineer's initial determination of requirements. Regardless, the following pro-cess should be used because it helps familiarize the systems analyst with the requirements.
A. Determine the requirements, in this order:
- What is needed (output)
- What is available to work with (input)
- What must happen in between (process)
Document the requirements in the language of flight test, avoiding computer terminology as much as possibleto end up with a clear definition between the flight test engineer and the systems analyst.
B. Determine if a computer can solve the problem.
Working with the systems analyst, examine the requirements and decide if a computer system is an advantagein solving the problem. (Occasionally, there are problems where the computer is more of a detriment than anasset. Beware of automating systems that are not working well manually. The addition of a computer makes itmore difficult to identify and correct problems.)
C. Define which software functions are required.
The object is to create a list of what functions need be performed by software. At this point in the process, soft-ware options are examined and the team is not ready to commit to a solution. If there is computer hardware inplace to utilize this new application, then the range of choices regarding software is limited to those programsthat operate in that particular hardware. If the hardware has not yet been selected, do the software requirementsstudy first and base the hardware selection on the combination of hardware and software that results in the bestperformance. Since equivalently performing hardware costs approximately the same, the final cost of a mediumsystem is determined by the software cost.
Software can be obtained in one of two ways: it can be purchased in final form, or it can be custom written forthe specific application. There is also a combination of the two, where commercially purchased software is
Document provided by SpaceAge Control, Inc. (http://spaceagecontrol.com/).

3-4
modified to meet some special requirements. The systems analyst determines if software for the application isavailable off the shelf or if it must be created. Buying software commercially has many advantages over cre-ating it or modifying a purchased program. When software is created or modified, the creator or modifier as-sumes all of the risks of success or failure and all of the responsibility for maintenance. Currently, mostcommercial software vendors are unwilling to provide their software in a modifiable format or to provide de-tailed documentation and program listings. Most vendors will not support software that has been modified byothers.
Examples of commercially purchased software useful in flight test are spreadsheets (such as LOTUS 1-2-3 orEXCEL) that are useful for data manipulation, analysis, and plotting; and database management programs (suchas DBASE III or RBASE) that are useful for manipulating large amounts of data, such as calibration or config-uration files.
Many flight test organizations have libraries of standard software for flight test data reduction and analysis.These programs have well-documented characteristics and have been tested thoroughly. Therefore, the flighttest engineer should consider using library resources before purchasing or creating new software. To avoidwasting valuable programming resources, the flight test engineer should take advantage of these existing pro-grams.
D. Perform a cost study.
Because cost is a significant factor in computer systems, this information is of value in choosing between hard-ware-software options. The systems analyst can estimate how many programmers are required, and for howlong. The analyst also has an idea of the purchase cost of commercial software and the update (software main-tenance) costs.
3.3.4 Functional design phaseThe detailed performance requirements are documented in the functional design phase. This requirements spec-ification is written partly in the language of the flight test engineer and partly in the lexicon of data processing.A good functional specification follows a "top-down" design where each function is in a pyramidal hierarchy,At the top of the pyramid is the overall system requirement, divided functionally into subsystems, and so on,much like an organizational chart. Frequently, the systems analyst can create a block diagram of the system.Each block has a functional specification following the model outlined previously; that is, output, input, pro-cess.
The systems analyst also specifies the overall system "throughput," that refers to how long the system requiresprocessing a given amount of raw data into information. In a real-time processing application, throughput is avery important design factor and can have a significant impact on hardware costs. Speed is expensive, becausethe speed of a system is determined by the speed of the processor and the size and speed of its memory.
From the block diagram and written performance requirements, the systems analyst can create the modularstructure for the software. Each block on the functional specification depicts a distinct software function. Thus,the system is integrated by this structure of modules that are related to both the actual software design and tothe functional specification. The modules can be assigned to programmers for creation, or can be fulfilled bypurchasing software commercially.
Another aspect of the design that is defined at this stage is formats. Formats can be for screens, printouts, anddata transfers. If the data processing system must interface with another system, the systems analyst can alsocreate interface control documents. These documents are similar to the specification but detail the data formatsbeing transferred from system to system and the media used to accomplish the transfer, whether it is by directelectronic transfer or on magnetic tape or magnetic disk.
The specification includes test requirements. The systems analyst requires the flight test engineer to providesample data and expected results of calculations to aid in module testing and evaluating system performance.
3.3.5 Coding of software modulesThe systems analyst works with one or more programmers to see that the software is created or purchased inaccordance with the specifications. The systems analyst, flight test engineer, and the programmer need to worktogether closely to clarify specific details of the functional specification that are complex and unique to flighttest technology. The specification must be kept up to date regarding any changes made during the designprocess.
Document provided by SpaceAge Control, Inc. (http://spaceagecontrol.com/).

3-5
The modules are created and tested in a development "environment," usually by use of a special software de-velopment computer system. It is typically more cost effective to use development systems and not the actualsystem in which the application is finally intended to reside. Frequently, the "target" system is already in usefor processing data and is not available to the software developers. Development systems also contain special-ized software tools for creating and debugging software that are usually not available in the target data process-ing system.
The modules should be coded so that they stand alone and only interact with other modules at the specifiedinterface points. This allows modules to be tested, maintained, updated, and modified without great impact onthe other modules. The long-term, or "project life" cycle costs are greatly reduced if changes in one module donot require complementary changes in several other modules.
3.3.6 Software module testingThe completed software modules are individually tested by the programmer to ensure that the modules are per-forming within the specification. The flight test engineer inspects the results of the tests to see how the screenand printout formats appear. Changes to these formats are the least expensive to implement prior to softwaremodule integration. Once the modules have been integrated together, changes will affect several modules,greatly increasing the cost of even a simple change.
3.3.7 Module integration
During module integration, the systems analyst and the programmers work together to combine the softwareinto one large program. The modules are linked together and run as one piece for the first time. Problems areprimarily caused by errors in the input and output data specifications. Often it is necessary to rewrite portionsof a few modules to make them compatible with the rest of the software. If several modules require majormodifications, it indicates that the detailed specifications were inadequate. Then, the systems analyst shouldcarefully review the specifications before proceeding.
3.3.8 Full system implementation
At this point, the entire set of software modules is installed in the computing system that is used for the appli-cation called the "target hardware." Problems occur at this stage because of differences between the specifiedhardware configuration and what is actually there, such as differences in input-output, memory size and loca-tions, and storage capacity.
Also, at this point training of the operations personnel begins. (In some cases it is important to start training atan even earlier stage in the process. The systems analyst is responsible for ensuring that operators are adequate-ly trained.)
The target system is tested by the software development personnel to determine if the system meets the opera-tional specification. This is viewed as a preliminary test. It is good practice to perform definitive testing bypersonnel other than those who perform the development.
3.3.9 Validation and verification testingValidation and verification testing (V&V) is the last process before releasing the system for routine use(Ref. 3.2). In most organizations, V&V is handled in one of two ways: either the V&V is performed by a ded-icated software test group, or it is performed by another design group not involved with the original design.Either way, it is a key concept of V&V that the personnel performing the tests be independent of the designeffort. Strangely, errors are more likely uncovered by test personnel who are not intimately familiar with thesystem and who do not have a vested interest in making the system work (Ref. 3.3, 3.4).
Verification determines if the logic of the software performs according to the specification; for example, ifequations are producing the expected results.
Validation determines if there are unexpected interactions, errors in the logic of the specification, or other un-desirable characteristics. At this stage, the test process pays for itself. Typically, the original programmer teststhe logic of the code extensively, but rarely looks for anything not belonging in the code. Validation is, in asense, the process of looking for things not belonging in the program.
The systems analyst works with the flight test engineer and the software test team to determine V&V specifi-cations. It is a good idea for members of the flight test team to personally take part in some of the testing.
Document provided by SpaceAge Control, Inc. (http://spaceagecontrol.com/).

3-6
3.4 PRODUCTION PHASEOnce the software has been released for routine use in an unmodifiable form, it is in the "production" phase.The key point to remember about the production phase is that changes are analogous to miniature designprojects where all the aforementioned design rules must be followed. Changes must have specifications, testplans, and module designs. The systems analyst is the focal point during the production phase. The systemsanalyst drafts the change requests and ensures that the design rules are followed for the changes. Changes mustbe documented, coded, tested, and put through V&V prior to release for production use.
Other aspects of system design that become particularly important to the maintenance of the system are config-uration control and documentation, covered next (Ref. 3.5).
3.4.1 Confisyuration controlConfiguration control describes the process of controlling and maintaining system documentation, and control-ling changes to the actual system. Although these rules apply equally to hardware or software, this discussionfocuses on the software aspects of configuration control (Ref. 3.1, 3.3, 3.4, 3.6-3.12).
Configuration control recognizes that changes will always occur, and thus provides an orderly and systematicmeans to control and implement the changes. At some point in the project, usually just prior to release for V&Vtesting, the flight test engineer and the systems analyst determine that the system configuration is the baseline.Any further changes, even to correct problems or errors, must be approved and tracked through a specific pro-cess. The design is frozen and cannot be changed by the design personnel without authorization. A configura-tion control board (CCB) is established and chaired by the flight test engineer. The CCB consists of personnelfrom both the flight test and designer teams, with the goal of projectwide representation. Any requests forchanges must be submitted to the CCB and approved before actual implementation. If there are several changesrequested, the CCB establishes an implementation schedule and assigns priorities. The CCB provides a forumfor discussing the impact of implementing or not implementing a change, and ensures that the flight test teamhas control of its software.
Many data processing organizations have implemented their own policies for configuration control, and mayeven have dedicated staff for helping to establish and administer the CCBs. The systems analyst is aware ofthese policies.
3.4.2 DocumentationMany managers erroneously view documentation as unproductive work, because when system design personnelare working on documentation, they are not producing code. Documentation is an essential part of the design,and a good systems analyst includes the time to create documentation in the time estimate for the overall design.Documentation includes, but is not limited to, the following items:
- specifications
- change requests and notifications
- software code listings
- operating procedures
- release notifications
- test specifications
- test results
The data processing organization has policies and practices for documentation that are provided by the systemsanalyst.
3.5 CONCLUSIONSoftware is the most labor-intensive and time-consuming aspect of computer system design, and thus the mostcostly. Therefore, the software design should be planned carefully, with consideration for testing, maintenance,and future requirements. The use of top-down, modular, structured design techniques has proven the most cost-effective method for creation of software systems. These techniques maximize the productivity of the designpersonnel and reduce errors stemming from misunderstood requirements. Techniques such as accurate
Document provided by SpaceAge Control, Inc. (http://spaceagecontrol.com/).

3-7
configuration control and systematic validation and verification provide a reliable means to assure softwarequality. Good communication between design team members ensures that the final product of the effort meetsthe specified requirements.
As the ultimate user of what is produced by the software designers, the flight test engineer has the responsibilityto be informed of the design policies followed. Therefore, the flight test engineer must insist that the bestdevelopment techniques be utilized.
3.6 REFERENCES3.1 NASA, Basic Operations Manual. App. 14, "Software Management Requirements," Dryden Flight Re-
search Facility, Edwards, CA, 1988.
3.2 Duke, Eugene L., "V&V of Flight and Mission-Critical Software," IEEE Software, Institute of Electricaland Electronic Engineers, Los Alamitos, CA, May 1989.
3.3 EIA, "Configuration Change Control for Digital Computer Programs," Configuration Management Bulle-tin no. 4-4, Electronic Industries Association, May 1982.
3.4 Petersen, Kevin L. and Christobal Flores, Software Control and System Configuration Management: A Sys-tems-Wide Approach, NASA TM-85908, 1984.
3.5 Earls, Michael R. and Joel R. Sitz, Initial Flight Qualification and Operational Maintenance of X-29AFlight Software, NASA TM-101703, 1989.
3.6 NASA, Basic Operations Manual, Main vol., "Policies and Guidelines," Dryden Flight Research Facility,Edwards, CA, 1988.
3.7 NASA, Basic Operations Manual, App. 13, "Configuration Management Requirements," Dryden FlightResearch Facility, Edwards, CA, 1988.
3.8 NASA, Basic Operations Manual, App. 22, "System Test Procedures," Dryden Flight Research Facility,Edwards, CA, 1988.
3.9 IEEE, "IEEE Guide for Software Quality Assurance Planning," ANSI/IEEE Std 983-1986, American Na-tional Standards Institute and Institute of Electrical and Electronic Engineers, 1986.
3.10 NASA, "Requirements for Establishment and Implementation of Software Assurance Programs," AHB5333-1, Ames Research Center, Moffett Field, CA, 1984.
3.11 U.S. Navy, "Military Standard Software Development," MIL-STD-1679A, Dec. 1978.
3.12 EIA, "Configuration Management Definitions for Digital Computer Programs," Configuration Manage-ment Bulletin no. 4-4A, Electronic Industries Association, Sept. 1984.
3.7 BIBLIOGRAPHYFeingold, Carl, Introduction to Data Processing, William C. Brown Publishers, Dubuque, IA, 1980.
Kroenke, David M. and Kathleen Dolan, Business Computer Systems-An Introduction, McGraw-Hill, NY, NY,1986.
Kroenke, David M. and Randolph P. Johnston, Computers-An Introduction, Mitchell Publishing, Inc., SantaCruz, CA, 1985.
Lucas, Henry C., Jr., Coping with Computers: A Manager's Guide to Controlling Information Processing, FreePress division of MacMillan, NY, NY, 1982.
Mandell, Steven L., Principles of Data Processing, West Publishing Co., St. Paul, MN, 1984.
Ort, Harry H., Structured Data Processing Design, Addison Wesley, Reading, MA, 1985.
Parker, Charles, Understanding Computers & Information Processing, Dryden Press division of Holt, Rinehart,& Winston, Inc., Hinsdale, IL, 1989.
Popkin, Gary S. and Arthur M. Pike, Introduction to Data Processing, Houghton-Mifflin, Boston, MA, 1980.
Document provided by SpaceAge Control, Inc. (http://spaceagecontrol.com/).

4-1
Chapter 4
THE METROLOGICAL CHARACTERISTICS OF A MEASURING CHANNEL
by
Dr Martin E. EshelbyCollege of Aeronautics
Cranfield UniversityCranfield, Bedfordshire
MK43 OALUnited Kingdom
4.1 INTRODUCTIONThe purpose of performing a flight trial in an aircraft is to prove that the aircraft, or a subsystem, meets itsperformance specification in its flight environment. The evidence for that proof is provided by the instrumen-tation system which measures and stores data during the test; that data can then be processed and used for thecomparison between the measured and required performance. The success of a trial depends on the qualityof the measured data in that it represents the value of the measurand at the moment of measurement withsufficient accuracy.
In a typical measurement process the measurand must be sensed, converted into an electrical signal suitablefor storage and stored in a permanent or semi-permanent form. Those data must then be recovered andreconstructed to represent the original measurand ready for the final data analysis. During these many processesthe character of the measurand must not be changed, neither must unwanted data be added, in any way thatmight affect the result of the final analysis.
In this chapter a single measuring channel will be used to describe the general principles of the process ofmeasurement and a typical system based on analogue measurement and subsequent digitisation is shown inblock diagram form in Figure 4.1. Although simplified, the basic elements, their function and their inter-relationship will be outlined here in general terms to serve as an introduction to the subsequent chapters whichwill deal with these elements in more detail. An analogue-based system has been chosen as an examplebecause it enables the stages of measurement to be separated and described conveniently. There are, however,transducers which produce digital data and may also include microprocessors to linearise their output. Alsodata may be collected from a bus system in which case it will be in digital form and probably scaled inengineering units. It must be remembered that any such digital data may have been through several stages ofthe measurement process, sensing, transducing, conditioning, sampling and digitisation, before it is receivedby the flight test instrumentation system and it will be important to remember this in the data reconstructionstage.
The complete measurement system extends from the measurand through to data processing and the groundsystem is as much a part of the measuring system as is the airbome system although it is physically separate.This means that there must be compatibility between them; it is for this reason that the ground station isincluded in Figure 4.1.
The main metrological characteristics of a measuring channel are:
(i) The static characteristics, including the measurement range, calibration characteristics, accuracy and longterm time dependent errors,
(ii) dynamic characteristics, covering the errors which are characteristic of the natural frequency and dampingof the system, and
(iii) The system characteristics of the system as installed in the aircraft and subject to the environment.
These characteristics will be considered after the general description of the measuring channel.
Document provided by SpaceAge Control, Inc. (http://spaceagecontrol.com/).

4-2
4.2 THE MEASURING CHANNELThe measuring channel is shown in block diagram form in Figure 4.1. It has been divided into two parts: theairborne station, which is installed in the aircraft under test, and the ground station in which the data analysiswill usually be performed.
The elements of the measuring channel and their inter-relationship can now be briefly discussed to describe theirbasic functions. It should be emphasised that since transducers produce signals in different forms, analogue,digital or optical, the stages in the measuring channel may differ from those shown in Figure 4.1 which isonly intended to be an illustration of a typical system and not necessarily definitive. The following chapterswill be more specific in their treatment of each element of the system.
4.2.1 The airborne station(The numbers preceding the sub-headings refer to the boxes in Figure 4.1).
1. The parameter or measurand
The parameter to be sensed may take many forms, e.g., displacement (linear or angular), force, pressure,temperature. In some cases the parameter can be sensed directly whilst in other cases it can only be sensedindirectly, or remotely; this is closely connected with the sensor and transducer and is best considered in thenext chapter.
Poýwer 7| •On-boa•rd 6c /-Supplies l ] Computing -
& Display Disc
z Parameter Signal and Multiplex :toFormat Recordingo Conditioning Transducer Conditioning 'Di
wi Address
S I6b
S.Caibration- ...... T eTelemetry Transmit
Disc Data lo [ Time 9a
Tape Recovery
0
2. Pre-sensor siProcessingtioning
Receive Telemetryz
Figure 4.1 Block diagram of a typical measurement system.
2. Pre-sensor signal conditioningIn many cases the sensor installation will affect the characteristic of the measurand, this may be deliberateor it may be accidental and unavoidable. For example, a pressure transducer may be installed with a plenumchamber to reduce the effect of surges in pressure, in this way the average pressure in a duct can be measuredwithout the transient ripples from the pump appearing, this is a deliberate introduction of signal conditioningprior to sensing. On the other hand a temperature sensor has a finite thermal capacity which, although it can
Document provided by SpaceAge Control, Inc. (http://spaceagecontrol.com/).

4-3
be minimised, is unavoidable and will limit the response to transients. Pre-signal conditioning should notbe confused with Finesse which is defined in Section 4.4.3, as the effect of the sensor on the value of themeasurand rather than the response of the sensor system to the measurand.
3. Sensor and transducer
Although often referred to as simply the transducer the separate functions of sensing the measurand andconverting the sensed parameter into an electrical signal must be recognised. In some cases the two functionsare virtually inseparable but they are often quite separate. For example, the level of fuel in a tank can bemeasured by the traditional float gauge, the float senses the fuel level and transmits the information through alinkage to the transducer which is mounted outside the tank; in this case the sensing and transducing functionsare quite separate although physically linked. In a capacitance type of sensor the fuel acts as the dielectric inthe capacitor and thus directly affects the electrical properties of the transducer. Optical sensors exist whichproduce either an analogue output (e.g., deflection of a light beam) or a form of digital optical output. In eachcase the signal would need to be converted into an electrical form for storage or telemetry unless photographicrecording was performed.
4: Signal conditioning
The output from the transducer will generally need to be tumed into a suitable form for the data recording,computing or display system. The transducer may, for example, convert the measurand into a change ofresistance. The transducer must be supplied with a current so that the resistance change can be detected andamplified; the signal may be filtered at this stage to remove any unwanted frequencies and if required in digitalform, sampled and digitised. In some transducers the signal conditioning is built into the device and it is onlynecessary to supply the transducer with power to obtain an output ready for recording.
5. Multiplexing and formatting
Before recording it will usually be necessary to combine many channels of data, this process is known asmultiplexing. The data must also be arranged in a specific order and labelled, or formatted, so that it can beidentified at the data recovery stage. The order in which these processes are performed will depend on theform of the signals produced by the preceding stages. Typically the data will be converted into digital formand read in sequential order to the recorder. Each block of data will be preceded by synchronisation wordswhich identify the start of the data stream and end with other synchronisation words ending the data stream;in this way the data block can be detected by the replay system.
6. Data recording and transmission
From the multiplex and formatting stage the data can be accepted by the recording system. There are severalways in which the data can be recorded for future analysis or otherwise transferred to the analysis system.
Data Recording
Firstly the data can be recorded on a permanent or semi-permanent medium such as magnetic tape or disc inthe case of digital data or on magnetic tape or paper trace in the case of analogue data. The recorders arecarried on the aircraft and, after the flight, the recording medium can be removed and transferred to the groundstation for replay. In some cases the recorder is also the replay unit and is removed from the aircraft completewith the recording medium.
Telemetry
The data can be transmitted directly to the ground station for processing and recording, this avoids the need tocarry the recorders on the aircraft if weight or space are at a premium. It also enables the data to be processedand displayed in real time so that the trial can be monitored and controlled by the ground station.
On-board computing and display
In conjunction with the recording and telemetry systems it is possible to process some of the data on boardin real time and to display the results for immediate analysis. Generally this is only possible in the case of
Document provided by SpaceAge Control, Inc. (http://spaceagecontrol.com/).

4-4
a large aircraft in which the flight-test engineer is a part of the test team on-board the aircraft and sufficientcomputing equipment can be carried. Data might also be written to disc for storage and transfer.
7. Power supplies
The on-board units of the instrumentation system will normally require electrical power. The quality of thepower supply is often critical to the operation of the system, if the supply frequency or voltage changes thenthe output of the system may be affected. In particular the effect of transients must be considered; shortduration changes in the instrumentation supply, due for example to changing demands on the aircraft powersystem, may produce loss of data or false data to be recorded.
8. Calibration
Before the data can be reconstructed the relationship between the parameter and the recorded signal must beestablished. The parameter will be sensed in terms of its physical property, for example, a displacement, apressure or a temperature, and recorded as an electrical signal in terms of voltage, a current or a frequency.The calibration relates the electrical signal to the physical property of the parameter.
The calibration may be performed in several ways, and applied at different points in the measuring channel.Although shown with the airborne system in Figure 4.1 for clarity, the calibration will usually be carried outon the ground using ground-based equipment.
(a) In some cases the parameter itself can be exercised and the output of the measuring channel recorded,for example a control surface can be moved against a calibration protractor fixed to the airframe and thecorresponding output recorded. This would produce a static calibration of the measuring channel.
(b) Alternatively the parameter may be simulated and fed to the sensor, for example static and total pressuresmay be fed directly to the sensors from a calibration pressure source to simulate airspeed and altitude.This, however, may not contain pre-sensor signal conditioning or the system pressure errors due to thelocation of the pitot-static ports.
(c) On occasions, when the sensor-transducer output is known in respect of an input, a simulated transduceroutput can be injected into the signal conditioning stage to relate the output to the simulated input. Anexample is the air thermometer in which the temperature-resistance characteristic of the device is wellknown. A resistance box can be used to replace the sensor for the calibration, although this will notinclude the effect of the installation recovery factor.
Where the measurand is likely to vary rapidly, or have a periodic characteristic, the response of the system tothe input may not be the same as in the quasi-steady case. Dynamic calibration may be necessary to determinethe lag and phase shift introduced by the measurement system.
9. Time
A time base may be required to synchronize the data or to identify a point at which a data stream starts.The time may be generated within the instrumentation system or it may be received from an outside sourcereferenced to GMT. Time may be recorded as part of the data stream so that data contain their own time baseand the data reconstruction does not have to rely on replay at the same rate as the recording. A time basemay also be required in the data reconstruction stage.
4.2.2 The ground stationAt the ground station the data are received from the airborne station, either directly by telemetry or indirectlyvia the recording medium, and reconstructed before it is processed. The ground station is a part of the wholesystem and must be fully compatible with the airborne station both in the hardware and in the data handling;the manner in which the data have been handled by the airborne system may influence the way in which it isreconstructed at the ground station.
10. Data Recovery
Data are received at the ground station either by telemetry or on recording medium.
Document provided by SpaceAge Control, Inc. (http://spaceagecontrol.com/).

4-5
The telemetered data are received at the ground station and fed directly to the data reconstruction stage. Inmost cases a safety back-up recording will also be made in case there is the need to perform further analysisat a later stage.
Data recorded on semi-permanent medium are taken from the aircraft, replayed and fed to the data reconstruc-tion stage. In the process the data may be re-formatted into a more convenient form for handling.
11. Data Reconstruction
The data as received will usually still be in electrical units and will need to be converted into physical unitsor engineering units before being processed. Furthermore the data must be reconstructed to represent themeasurand, in both value and characteristic, at the time of measurement. Since the measurand was sensed bythe sensor it may have been converted into an electrical analogue, had unwanted noise or frequencies filteredfrom it, have been sampled and digitised, recorded and replayed. In the reconstruction process all of theseprocesses must be taken into account and the characteristics of the original parameter reproduced as closelyas possible, bearing in mind the purpose for which the data are to be used; there is no point in reproducinghigh frequency characteristics of the measurand if only the quasi-static state is needed, however the effect ofthe high frequency filter on the quasi-static value must be considered.
12. Data Processing
The data are now ready for processing to the user's particular needs.
4.3 ERRORS IN MEASUREMENT AND MEASUREMENT ACCURACYWhen a parameter is sensed by a measuring system and the data are used to give a measurement of theparameter in engineering units the value of the measurement will not be exact but will contain a number oferrors which will have occurred in the measurement process. These errors will affect the confidence in thevalue of the measurement, the quality known as accuracy.
The errors may arise from many sources and some may be capable of being corrected in the measurementprocess if their source is known, for example a temperature effect on a sensor can be measured and a correctionapplied if the temperature of the sensor is known, or a correction can be made for the effects of the rate ofchange of a measurand if the dynamic characteristics of the measuring channel are known. When correctionsfor known errors have been made the remaining errors determine the accuracy of the measuring system. Theterm 'error' is used to describe each single effect influencing the measurement accuracy; the total error is thedifference between the true value and the measured (or most probable) value of the measurand and arises fromthe sum of the individual errors in the measuring chain.
Errors are stochastic quantities characterised by a probability distribution so that if the probability distributionsof all individual errors are known then the probability distribution of the total error can be determined bythe well established statistical methods for error analysis. Very briefly four important statistical characteristicsshould be mentioned.
(i) A systematic error occurs if the average value of the error differs from zero. Systematic errors can havea strong effect on the accuracy of the measurement, if the value of the systematic error can be determinedthen the measurement can be corrected so that the remaining error distribution has a zero average.
(ii) The distribution of the remaining error will depend on the origin of the error. Usually it will be close toa normal or Gaussian distribution but may well be nonGaussian in some cases. Unless there is evidenceto suggest otherwise a normal error distribution is assumed and the overall standard distribution is takento be the square root of the sum of the squares of the standard deviations of the individual errors.
rt = ý/(al2 + U222 + 0. ...... ) (4.1)
Equation (4.1) can only be used in the case of a Gaussian distribution of errors; if the error distribution isnonGaussian then the use of equation (4.1) can lead to serious error.
Document provided by SpaceAge Control, Inc. (http://spaceagecontrol.com/).

4-6
(iii) The individual errors must be independent. For example, if temperature affects errors in several partsof the system then those errors are not independent and equation (4.1) cannot be applied to those errordistributions.
(iv) A type of error that does not fall into the normal category is the mistake of isolated bad data. Thiscan occur as a result of a human error, electrical interference or any other random event which has noconnection with the measurement system. Usually any such data are sufficiently far from all other dataas to be obvious and can easily be eliminated; in automatic data processing some means of detectingsuch occurrences is necessary and the parity check on digital data is an example of such a method.
The accuracy of the measurement system is a quality which is determined by the value of the residual errorafter a reasonable amount of correction has been applied. From this definition it follows that the accuracy ofthe measuring channel is not a fixed quantity but depends on the degree to which the errors in the measuringsystem can be reduced. It will never be possible to eliminate all errors and a point will be reached beyond whichit will become uneconomic to improve the accuracy of the system. This point depends on the requirement forthe data; if the test is insensitive to the data then there is no need for high accuracy, however should the testbe highly sensitive to the data effort must be made to eliminate as much of the error as possible to attain theaccuracy needed.
4.4 CHARACTERISTICS OF METROLOGYWhen designing an instrumentation system one of the most fundamental tasks is to define the requirements ofeach measurement channel. For each parameter the following points must be considered:
(i) What range of measurement is required?(ii) To what accuracy must it be measured?(iii) Is an overload likely to occur, and what effect will it have on the measurement system?(iv) Is the parameter or measurement system sensitive to environmental conditions?(v) What is the best form of sensor-transducer to use?
To answer these questions a number of definitions of terms used in metrology need to be made and thecharacteristics of the measuring channel divided into three broad categories.
(a) Static characteristics.,
These are the characteristics which specify the performance of the measuring channel in respect of a steadystate input, these can be sub-divided into the following topics.
(i) Measurement range(ii) Calibration, [sensitivity, resolution, linearity](iii) Repeatability, [threshold, hysteresis, zero error, quantization error](iv) Long term errors, [nondynamic time dependent errors, drift, gain, stability](v) Accuracy
(b) Dynamic characteristics
These are the characteristics which specify the transient or frequency dependent performance of the measuringchannel.
(i) Natural frequency(ii) Frequency response(iii) Damping(iv) Phase shift or delay
(c) System characteristics
These are the characteristics which specify the overall performance of the measuring channel with respect tothe working environment.
Document provided by SpaceAge Control, Inc. (http://spaceagecontrol.com/).

4-7
(i) Finesse(ii) Electro-magnetic interference(iii) Environmental conditions.
These categories and sub-topics will be discussed as isolated subjects although some interdependence oftenoccurs.
4.4.1 Static characteristics
(i) Measurement rangeThe range over which the parameter can be measured within specified limits of accuracy, sensitivity andlinearity is known as the Full Scale Range (FSR) of the channel and the output is generally scaled so that themaximum output (e.g., volts) covers the full scale range. The output may be referenced to a zero state, withor without an offset, and specified as positive full scale (+FS) and negative full scale (-FS), (e.g., ±-5v, or0 - 10v). The normal measurement range over which the parameter is expected to vary will lie within the FSRalthough it may be necessary to design the system to operate over a greater range or Over-Range. Over-Rangespecifies both the amount of workable margin and the amount by which the parameter may exceed the FSRwithout permanent damage to the system. A simple example is the flying control which must operate betweenlimit stops but which may only be required to be measured over a small measurement range, Figure 4.2.In this case an absolute over-range exists across which the system must operate without damage. In somecases sensors may be damaged if they operate outside their stated measurement range. The damage may bepermanent if their maximum overload is exceeded or if the maximum overload is not exceeded then a recoverytime may be required before the sensor will regain its original calibration.
ABSOLUTE RANGE
M EASUREMENT_
TE RANGE
Figure 4.2 Flying control-range of measurement.
The range of environmental parameters under which the full-scale range is valid must be specified, this mayinclude limits of temperature, vibration, shock and pressure. Operation outside the environmental limits mayresult in degraded performance or, in extreme cases, damage; different environmental ranges may be statedfor nonoperating conditions, for example transport or storage.
(ii) Calibration [Sensitivity, Resolution, and Linearity]Sensitivity and resolution are often confused. Sensitivity refers to the ratio between the difference in theoutput of the measuring channel and the corresponding difference in the input (the measurand), this is a rateof change and is expressed, for example, as Volts/Newton. Resolution refers to the smallest change in themeasurand which can be detected by the measuring channel and result in a change of output, (see Fig. 4.5).
The sensitivity, S, can best be explained by reference to a static calibration curve, Figure 4.3, in which the out-put of the measuring channel in Volts is related to the input, (in this example a control force in Newtons), thusthe sensitivity at any given point P' on the calibration curve is the slope of the tangent to the curve at that pointand would be expressed in Volts/Newton in this case. The static calibration, which is determined by relat-ing the input to the output of the channel in steady state, may not be linear and the sensitivity may vary
Document provided by SpaceAge Control, Inc. (http://spaceagecontrol.com/).

4-8
I-MEASUREMENT RANGE-. 4 /,
-.. . .. .-__ . '__ _- . //
_•SENSITIVITY0 -S, VlN X o /
o 7' iI_ _ _ _ _ - _ _ -_ _ _ _ - - _
/ /.
S// //
/ Ln
/ASENSITIVITY
/ Aanub oU BFSL THROUGHi ZERO BFSLeWITH ZERO ERROR
P, . FORCE (N)
/ In)
5 t a+1% FS
BFS UNQA -)-eSNSTVT
Fiur 4. ttcclbaincre
data reconstruction method and conversion of the output back into engineering units. The difference betweenthe actual calibration and the average sensitivity BFSL is a measure of the linearity of the calibration and themaximum difference between the linear and actual calibration is expressed as a percentage of the full-scalerange (%FS). The nonlinearity can be accounted for by a correction function so that the value of the measurandcan be expressed in the form,
N - No = (V - Vo) + CMV (4.2)
where C(V) is the correction m odas a function of the output.
Where the opportunity exists to store data in digital form the calibration may be represented as a look-uptable of static calibration points and a polynomial used to interpolate the data. In this way the correction fornonlinearity is avoidearitca be aounted to specify the BFSL for the data.
Document provided by SpaceAge Control, Inc. (http://spaceagecontrol.com/).

4-9
(iii) RepeatabilityThis is the ability of the measuring channel to repeat its electrical output for repeated returns to a given valueof the measurand. This characteristic is a function of a number of sub-characteristics of the system whichmay be difficult to separate, these include hysteresis, zero error, threshold and, in digital systems, quantizationerror.
Hysteresis, which depends on the previous history of the parameter, produces a lag effect on the static calibrationcurves for increasing and decreasing values of the measurand, Figure 4.4. This effect may be caused by frictionor backlash in the measurement system or by previous stress within the mechanical components; electrical,thermodynamic and magnetic hysteresis also exist. The essential characteristic of hysteresis is that it hasdifferent values depending on the previous history of the parameter making it difficult to model.
+ OUTPUT
SOut put Resolution
_IP_ Threshold
Figure 4.4 A typical hysteresis loop. Figure 4.5 Threshold and resolution.
Threshold, Figure 4.5, is really tied to both resolution and hysteresis and is the maximum incremental inputwhich occurs before an electrical change takes place following a reversal of the parameter; the resolution refersto incremental inputs in one direction only. The difference between threshold and resolution is explained inFigure 4.5.
Zero error is the inability of the measurement channel to produce a zero electrical output for zero parameterinput; this is to be distinguished from the threshold which is the maximum incremental input of the parameterwhich can be made before an electrical change takes place. The zero error may be the result of drift with timeor change in the environmental state of the system, this will be referred to further under system characteristics.
In digital systems the measuring range of the parameter is divided into a discrete number of steps, 4096 ina 12 bit system, and the resolution and threshold are effectively replaced by the quantization error in whichthe minimum detectable change is the measurement range divided by the number of steps in the digitisation.In addition there is always doubt in the least significant bit, this can have its own form of hysteresis in thechanging of the last digit depending on the type of transducer used to sense the parameter.
The long-term time dependent errors, for example, drift or gain changes, are probably most likely to arisefrom system characteristics due to environmental effects, but degradation of reliability due to time may alsooccur. In the early life of the system there may be a settling down period ("running-in") during which theprobability of failure will decrease to a minimum value at which it will remain until components start todeteriorate with age and the reliability diminishes. The characteristic describing the drift errors of the sys-tem is known as its stability; this term is, however, also used to describe the characteristic of a system toreturn to its state of equilibrium and the distinction between these uses of the term must be recognised.
Document provided by SpaceAge Control, Inc. (http://spaceagecontrol.com/).

4-10
4.4.2 Dynamic characteristics
If a measuring channel is subjected to rapidly varying inputs, the relation between input and output becomesdifferent from that in the quasi-static case. The dynamic response of a measuring channel can be expressedas a differential equation. If this is a linear differential equation, the channel is dynamically linear. Becausethe analysis of dynamically nonlinear systems is much more difficult, the corrections obtainable with thesame amount of effort are much less accurate for dynamically nonlinear systems. Therefore the designerstry to achieve dynamic linearity in all instruments for which the dynamic response is important. Althoughabsolute linearity will never be completely achieved, it is sufficiently approached in most cases to make linearanalysis possible within the accuracies required. The basic dynamic characteristics depend on the order of thedifferential equation of the instrument.
First-order instruments (which include, for instance, many temperature probes) can be characterized by oneparameter, the time constant, r. The differential equation then becomes
rni + x = y(t) (4.3)
where y(t) = the time function of the input,x = the output of the instrument,
the time constant is expressed in seconds.
Many transducers have a second-order characteristic. They can be characterized by two parameters, forwhich the natural frequency wo and the damping coefficient A are normally used. With these parameters thedifferential equation takes the form
1 2. x y(t) (4.4)Wa WO
Here wo is expressed in rad/sec and A is nondimensional.
Higher order systems often occur when more than one lower order system is used in series: if the output of asecond-order transducer is fed to a second-order filter, the output of the filter will be related to the transducerinput by a fourth-order equation.
The parameters mentioned above for the first-order and second-order instruments are very useful whenanalysing the response to simple input time functions. This will be illustrated for three types of input functions:- a step input- a linear variation of the input with time (ramp input)- a sinusoidal input
The response to a step input of a first-order instrument is shown in Figure 4.6. The time constant is the timein which the error of the output function is reduced to a factor l/e or to 37%. After 2r the error of the outputfunction is reduced to about 14% of the step value and after 3r to about 5%. The response of a second-ordersystem to a step input has a different shape for different values of the damping coefficient, Figure 4.7. IfA > 1 the output approaches the input function without overshoot; the damping is aperiodic. If A < 1 theoutput overshoots the input and retums to it by a damped oscillation. If A = 1, it is said that the system iscritically damped. For A = 0 an undamped sinusoidal output is obtained with a frequency equal to the naturalfrequency.
The response to a ramp input of a first-order system is, after a short initial period, an output parallel to theinput function but delayed by a time equal to the time constant. For a second-order system the delay time isequal to 2A/wo.
Document provided by SpaceAge Control, Inc. (http://spaceagecontrol.com/).

4-11
100.0 STEP INPUT Ys
98.8 --------- -- _____95.0
86'.5
R - OUTPUTz 63.?
...... TANGENT AT THE ORIGIN
0 2T 3T 4T ST
STIMEFigure 4.6 Response of a first-order system with time constant r to a step input.
200
10.
ONLY FOR 0X1 5i' V1 ------2
-o0 V_
2 A 6 8 10 12 14 1
Woo ( RADIANS )
Figure 4.7 Response of a second-order system to a step input.
The response to a sinusoidal input of a first-order system in a sine wave which is shifted in phase relative tothe input function and has a different amplitude. The phase angle is equal to - arctan (-rw) (where w is theradial frequency of the input function in rad/sec) and the ratio of the output to input amplitude is equal to thecosine of the phase angle. The phase angle and the amplitude ratio can be read from the polar diagram devel-oped by Nyquist (Fig. 4.8). For a second-order system the amplitude ratio and the phase shift are given
C.) • o =0
PHASE ANGLE
-1
Figure 4.8 Polar representation of the frequency response of a first-order system.
Document provided by SpaceAge Control, Inc. (http://spaceagecontrol.com/).
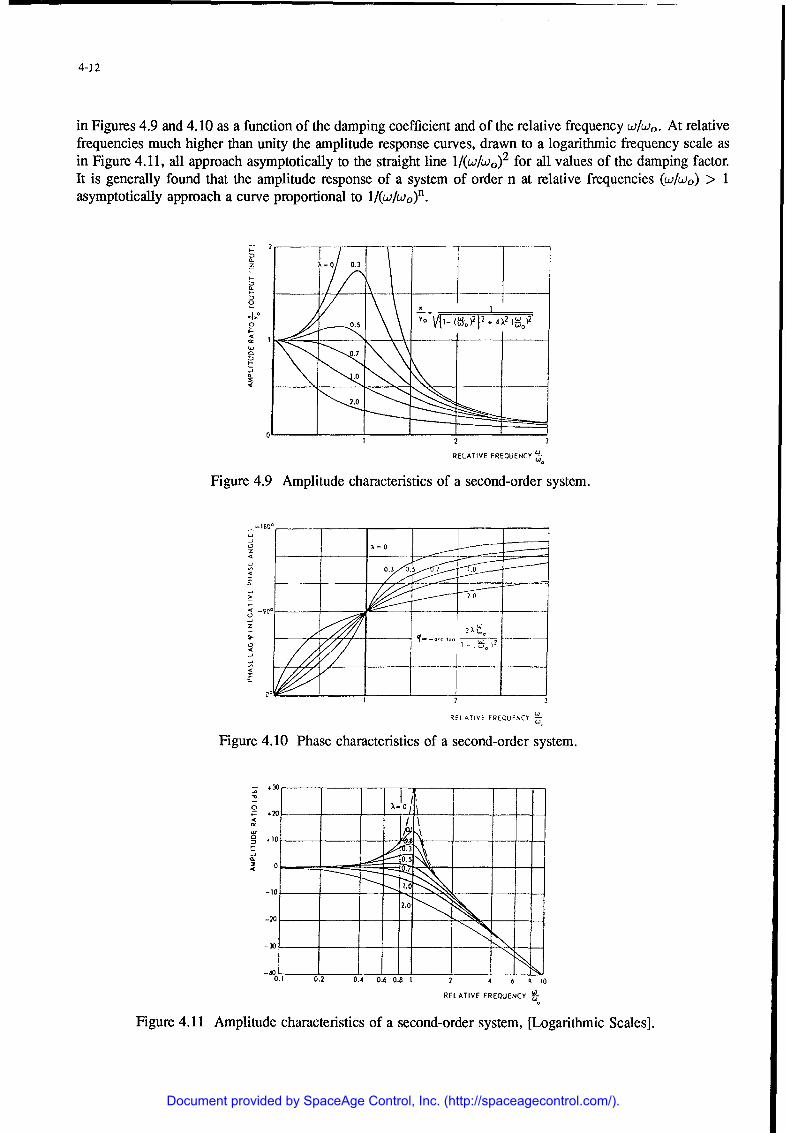
4-12
in Figures 4.9 and 4.10 as a function of the damping coefficient and of the relative frequency w/w0 . At relativefrequencies much higher than unity the amplitude response curves, drawn to a logarithmic frequency scale asin Figure 4.11, all approach asymptotically to the straight line 1/(w/w0 )2 for all values of the damping factor.It is generally found that the amplitude response of a system of order n at relative frequencies (w/wo) > 1asymptotically approach a curve proportional to 1/(w/wo)n.
Y. V1 (6 _91 _ 4__ 9
2
RELATIVE FREQUENCY
Figure 4.9 Amplitude characteristics of a second-order system.
A 0
12 3
RELATIVE FREQUENCY
Figure 4.10 Phase characteristics of a second-order system.
S.30 -
-10
-o 2.0
-4 0 -3.0
0.1 0.2 0.4 0.6 0.8 I 2 4 6 R 10
RELATIVE FREQUENCY -
Figure 4.11 Amplitude characteristics of a second-order system, [Logarithmic Scales].
Document provided by SpaceAge Control, Inc. (http://spaceagecontrol.com/).

4-13
Having considered the response of first- and second-order systems to specific types of input functions thegeneral case of the response of a linear system of any order to an arbitrary input will be considered. For everylinear instrument the dynamic response characteristics can be given by an amplitude curve and a phase curvesimilar to those shown in Figures 4.9 and 4.10. The input time function can be represented by means of theFourier integral;
S(w).eiv)(w) = 1 J G(t).eiwtdt (4.5)27r _00,1
Here G(t) is the input time function, S(w) is the modulus which represents the amplitude variations as afunction of the frequency and Ob(w) is the phase shift which is also a function of frequency.
The dynamic response of the system modifies the amplitude and phase of each sinusoid by the transfer function
H(iw) = A(w).eiw(w) (4.6)
The output time function of the instrument is then
00
Y(t) = J2r H(iw).S(w).e'O(W)dt (4.7)
or combining equations (4.6) and (4.7);
Y(t) = _ ] A(w)TS(w)'ei['(w)+•°(w)]dw (4.8)
It will be seen that Y(t) is a sum of sinusoids where the amplitude of each original sinusoid has been multipliedby a factor A(w) and the phase shifted by an amount Wp (w).
After corrections for the frequency response of the measuring channel have been applied dynamic errors fromother sources may still be present; these may be due to nonlinearities in the system or inaccuracies in thedetermination of the response characteristics.
The procedures described in this section can, in practical cases, often be simplified considerably by a properchoice of the dynamic characteristics of the measuring channel. From Figure 4.9 it can be seen that theamplitude response of a second-order measuring channel will be correct within 1% if the bandwidth of theinput signal does not exceed 20% of the natural frequency and if the damping factor is 0.7. Similarly, anamplitude response which is correct to within 5% can be obtained from a channel which has a damping factorof 0.6 in the range of relative frequencies between 0 and 1.
A sufficiently constant amplitude characteristic over the bandwidth of the input signal does not guarantee,however, that the input and output signals are similar to the required degree; phase distortion can also occur.An extreme example of phase distortion is shown in Figure 4.12. In Figure 4.12(a) an input signal is givencomposed of two sinusoids with a frequency ratio of 3. Figure 4.12(b) gives a correct output signal which hasonly lag relative to the input signal. Figure 4.12(c) shows the output signal if the phase angle of the higher ofthe two frequencies has been shifted by 1800. It will be seen that the signal is distorted although the amplituderesponse is correct at both frequencies. No phase distortion will occur if the phase angle varies linearly withfrequency, as is the case in Figure 4.10, in the range of relative frequencies between 0 and 1 for a dampingfactor of 0.7; then at all frequencies a constant time delay occurs called the group delay. If the group delay atall frequencies is constant no phase distortion will occur.
Document provided by SpaceAge Control, Inc. (http://spaceagecontrol.com/).

4-14
TIME LAG
a. INPUT b. OUTPUT WITHOUT c. OUTPUT WITH EXTREMEPHASE DISTORTION PHASE DISTORTION
Figure 4.12 Phase distortions in a signal with frequency components f and 3f.
In many cases the input signal consists of a frequency band which is of interest to the measurement and afrequency band which is not of interest to the measurement. This can occur, for example, if accelerometersare used for the measurements of the motions of an aircraft (frequency band 0 - 5 Hz). If the accelerometeris mounted on a part of the aircraft which vibrates at a frequency of 30 - 40 Hz this vibration will alsobe measured by the accelerometer but is of no interest to the measurement of the aircraft motion. If thesefrequency bands are sufficiently separated the frequency response characteristics of the measuring channelcan often be chosen so that the required signal bandwidth is reproduced without undue distortion while theamplitude of the unwanted part of the signal is reduced. This process, known as filtering, is discussed in alater chapter.
4.4.3 System characteristicsThe instrumentation system, as installed in the aircraft, must be capable of operating under a wide range ofphysical and environmental conditions. These will vary far more extensively and rapidly than those encounteredby normal measurement systems.
(i) The Physical Environment can be described by a number of characteristics.
The temperature of the atmosphere may range from Arctic to Tropical, -50'C to +30'C at sea level, and downto -60'C or less in the stratosphere.
The pressure of the atmosphere decreases to about 10% of its sea level value at 60,000 ft.
Moisture or humidity levels vary between saturated and very dry.
In the case of an airborne instrumentation system very high rates of change of these environmental states canoccur. Climb rates of high performance aircraft can lead to the full range of variation being experienced inabout one minute, this presents a severe test to the system and highlights the need to ensure that the calibrationsand characteristics of all parts of the system are known with respect to the environmental state.
The attitude of the instrumentation system with respect to the earth axes will not be constant. The aircraftwill rotate and take up new attitudes from time to time, and will also manoeuvre thus producing changes inthe acceleration vectors of the system. Any sensitivity of the system to its attitude needs to be known.
Apart from the quasi-steady acceleration changes that occur vibration is usually present. This can be importantin the aircraft environment as it can arise from several sources. Firstly it can arise from the aircraft itself,engines and other rotating machinery will produce a reasonably predictable frequency spectrum and the systemcan be designed with this knowledge in mind. Secondly the operating environment can induce a more randomvibration spectrum due to turbulence which is more difficult to predict. Care needs to be exercised in theinstallation of the system to ensure that resonance points are avoided and that the levels of vibration areacceptable.
Dirt and contamination are problems in the aircraft operating environment, all parts of the system will needto be protected from the ingress of water, oils, dust and other contaminants.
(ii) The Electrical Environment can also be hostile to the instrumentation system.
Document provided by SpaceAge Control, Inc. (http://spaceagecontrol.com/).

4-15
The electrical supplies to the instrumentation system can vary in voltage and frequency as other equipmentdemands supply from the aircraft electrical system. This could affect the measurement if the system dependson a very stable electrical supply.
Electrical interference from other systems can induce unwanted signals into the measuring system, care mustbe taken to screen the system from electromagnetic interference. This can be a difficult task since there aremany sources of possible interference, for example, radios, radar, power supplies, other instrumentation andstatic build-up on the airframe, each having its own characteristic form of interference.
(iii) Finesse is a characteristic of the installed instrumentation system. It is a measure of the effect that thesensor has on the measurand and could be called the intrusion error of the sensor. In many cases thesensor introduces a change in the local value of the property it is measuring and the true value cannotbe measured directly.
For example, a vibration sensor attached to a structure will change the mass distribution of the structure andthus affect the resonant frequencies, although in this case it might be possible to apply a correction to allowfor the presence of the sensor. There are cases in which correction would be practically impossible.
Other examples of finesse are:
The pressure probe which changes the pressure distribution in the flow field;The temperature probe which changes the calorific capacity of the object whose temperature is beingmeasured and hence its temperature;The micrometer which exerts a force on the object being measured and thus changes its dimensions.
These effects can influence both the static accuracy and the dynamic accuracy of the measuring system, ifthe errors produced are negligible it is said that the finesse of the system is high. Finesse is often the mostdifficult characteristic to establish because it is not usually possible to perform an absolute calibration on theparameter source with sufficient accuracy.
4.5 BIBLIOGRAPHY1. Borek, R.W., Practical Aspects of Instrumentation System Installation, AGARDograph No. 160, Vol. 13,
1981.
2. Doebelin, E.O., Measurement Systems, Application and Design, 3rd edition, McGraw Hill, 1983.
3. Morris, A.S., Principles of Measurement and Instrumentation, Prentice Hall, 1988.
4. Pool, A. and D. Bosman, Basic Principles of Flight Test Instrumentation Engineering, AGARDographNo. 160, Vol. 1, 1974.
5. van der Linden, J.C. and H.A. Mensink, Linear and Angular Position Measurement ofAircraft Components,AGARDograph No. 160, Vol. 8, 1977.
Document provided by SpaceAge Control, Inc. (http://spaceagecontrol.com/).

5-1
Chapter 5
TRANSDUCERS
by
R. GregoryCollege of Aeronautics
Cranfield UniversityCranfield, Bedfordshire
MK43 OALUnited Kingdom
5.1 INTRODUCTIONThe transducer is usually the first element of a measurement channel and has the function of responding tothe quantities of the measurand and transducing them into a form which may be useful as measurement data.Thus, for a typical flight data acquisition system, the transducer responds to the physical quantities beingmeasured and produces electrical data.
For purely visual data, such as required in the pilot's cabin, the traditional, all-mechanical type of instrumentmay still prevail, but test instrumentation demands that the data be suitable for transmission, recording, andcomputer processing and this almost exclusively demands that the data be in electrical form. Thus the vastmajority of transducers now in use produce data in the form of an electrical change; the exact nature of thisdata may take many forms as described in this chapter.
Many all-mechanical designs are still viable and in use; apart from the visual requirements, both pointer andnumeric, there are many applications in control systems, optical transducers, and also in trace recording usingeither optical or stylus systems. However, the emphasis in this chapter will be upon transducers with electricaloutput, although much of the discussion will apply directly to the other types.
5.1.1 Transducer elementsMany principles may be involved within a transducer, and also there may be a choice of principles availablefor a given parameter measurement. The implementation of these principles may constitute the elements ofa particular transducer. These principles may be physical, purely mechanical, or electrical; and the chapterwill endeavour to describe how these elements may provide a choice of characteristic to meet the variety ofapplications to be found in the aerospace industry.
On the assumption that the physical quantity is to be transduced into electrical data, the two major elementsof any transducer may be considered as:
The Sensor - The element normally and in direct contact with the physical quantityand responding to it, often producing displacement.
The Electrical Transducer - The element directly associated with the sensor and producing electricaldata, often a displacement transducer.
Some transducer principles, such as the thermocouple, provide these elements in a single transducing function,but many have the two distinct stages.
5.1.2 Transducer specificationsMany aspects of transducer performance are discussed below, and it should be evident that the characteristicsand overall performance are affected by many factors outside the transducer itself, for example, finesse andenvironment. It must be stressed, therefore, that a comprehensive specification and a good rapport with themanufacturer is vital in order to achieve accurate and meaningful results. A good transducer manufacturerwill always be willing to work with the user to meet particular circumstances which previously may not havebeen encountered.
Thus, a comprehensive transducer specification will include calibration data on static and dynamic performanceand the effects of environment. To this will be added the information gleaned from calibration during thesystem build; initially in the laboratory, then on the aircraft installation; and finally, during the flight test.
Document provided by SpaceAge Control, Inc. (http://spaceagecontrol.com/).

5-2
5.1.3 Parameters-definition and calibrationThis subject is covered in detail in the other chapters; however, it must again be emphasised that a measurementis meaningless without a precise calibration and definition of all parameters.
All scientific measurement must be defined by numeric values and therefore all measurands must be definedas "parameters," that is, between numerically defined limits. For example, a parameter of temperature maybe defined as -40 0C to +80 'C, or pressure 0 to 2 bar. To this must be added a numeric statement of theenvironment, particularly in terms of pressure, temperature, vibration, and acceleration.
5.2 TRANSDUCER CHARACTERISTICSThe overall characteristic of a transducer will be largely determined by the characteristics of the individualelements which make up the transducer. These elemental characteristics may be considered in three stages,namely:
Input,Transfer,Output.
These are treated separately below.
The performance of a transducer is not only controlled by the characteristics affecting the particular measure-ment, but also the responses to such factors as power supply variation and the signal conditioning function.Thus, the final choice of the transducer must encompass aspects such as installation and environmental con-ditions, cost, reliability, availability, maintenance, calibration requirements, and the applicability to othermeasurements. These aspects are discussed in more detail in the previous chapters.
Frequently, the cost, accuracy, and reliability of the complete instrumentation system may be largely determinedby the choice of the transducer in the following way:
(a) The transducer will determine the quality of the measurement and data.
(b) The transducer output data form will determine the sophistication of the signal conditioning necessary toproduce the desired data. For example, with an integrated electronics transducer there may be virtuallyno signal conditioning requirement.
(c) A smaller, perhaps more expensive transducer may well have greater finesse, for example, in vibration orshock measurement, or in pressure measurement, perhaps of an aerodynamic surface.
(d) A transducer with a good, well specified performance in terms of both accuracy and environmentalperformance will give greater confidence and may reduce the necessity to make further measurements.For example, an accelerometer with a good temperature coefficient of damping and a small cross sensitivitymay reduce the need for temperature or cross-axis acceleration measurements.
5.2.1 Input characteristicsThe most important input characteristics are
(a) The normal measuring range and the ranges of the environmental parameters. Generally, the best accuracywill be obtained if the range of the instrument is equal to the range of the measurand or slightly larger,this is because the errors in many types of transducer are proportional to their range.
(b) The finesse (defined in Chapter 4). This must be appropriate to the measurement, i.e., the effect of thetransducer on the physical process being measured should be small with respect to the allowable totalerror.
(c) Cross-axis sensitivity and cross-sensitivity. Many transducers which are designed to be sensitive to inputsalong only one input axis of the instrument also produce spurious outputs to inputs at normal to the sen-sitive axis. Accelerometers and rate gyroscopes are typical of this and an example may be found in an
Document provided by SpaceAge Control, Inc. (http://spaceagecontrol.com/).

5-3
accelerometer leaf-spring/mass principle. At rest, the system will respond to only one axis, but as soonas the spring/mass becomes deflected there is a sensitivity in a second axis (Fig. 5.1).
CASE
-', .MASS
LEAF SPRING X
DIRECTION OFDIRECTION OF CROSS-AXISNORMAL SENSITIVITYSENSITIVITY Z
Figure 5.1. Cross-axis effects in an accelerometer with a leaf spring and mass.
For a simple system with small internal deflections, the cross-axis error may be considered as a linearproduct of the inputs to the two axes, and if the law which governs the cross-axis sensitivity is known andthe other acceleration is measured separately, it is possible to apply a correction during data processing.However, for some types of transducer, for instance piezo-electric transducers, the cross-axis error is notalways proportional to the product of the two inputs.
There is a tendency for the cross-axis error to be small if the total internal deflection is small and hencethe generally superior performance of such instruments as force-balance accelerometers.
Another form of cross-sensitivity is where the transducer is sensitive to other parameters as well as thedesired parameter. A good example is the measurement of pressure where the sensing element, such asa diaphragm or capsule, is essentially a spring/mass system and therefore will respond to acceleration aswell as pressure. Additionally, the system may also be sensitive to temperature.
The cross-axis effect can often be reduced by a careful choice of the orientation of the instrument withrespect to the aircraft, i.e., avoiding noisy areas and aligning the least sensitive axis of the transducerwith any known more severe input axis. This again stresses the necessity for a well specified transducerand a knowledge of the environment.
Further discussion on this appears in Transducer errors and accuracy, Section 5.3.
(d) Error in the location or the alignment of the transducer. Knowledge of the precise location of themeasurement is often vital to the true meaning of the data. For example, in many flight tests the locationof the transducer relative to the centre of gravity of the aircraft, or the alignment of the sensitive axis ofthe transducer relative to the reference axis of the aircraft must be known precisely. Any uncertainty in thetransducer specification regarding centre of mass or alignment will increase the errors in the measurement.
5.2.2 Transfer characteristicsThe transfer characteristics define the relationship between the magnitude of the input quantity and the mag-nitude of the output quantity of the transducer. They are determined from the static calibration, the dynamicresponse characteristics (amplitude and phase), and the associated error distributions. These are defined anddescribed in Chapter 4. As already stated there, the transfer characteristics will, in general, change with theenvironmental conditions, and probably the most troublesome of these are temperature, shock and vibration,and electromagnetic interference.
5.2.2.1 DampingMany transducers and systems require to be damped in order to provide a satisfactory performance. This isparticularly relevant here to accelerometers and rate gyros where both the amplitude accuracy and the timerelationship of the data depends directly upon the damping ratio.
Damping does not directly apply to simple lag instruments such as displacement transducers or thermocouples,but to any system that constitutes a spring/mass system. These will have a resonant frequency (or naturalfrequency, fn) and at the frequencies around fn, the input to output characteristics will change as shown in
Document provided by SpaceAge Control, Inc. (http://spaceagecontrol.com/).

5-4
Chapter 4, Figures 4.9 and 4.11. This is for a simple second order system and is the basic characteristic foundin most inertial transducers, including accelerometers and rate gyros and in non-inertial instruments such aspressure transducers, galvanometers, and others. Thus it may be seen that an un-damped system may becomeuncontrollable and unpredictable atfn, and therefore these transducers require to be either damped or be usedwell below fn.
Damping may be achieved using friction, fluid (gas or liquid) or by electro-magnetic principles, as discussedbelow.
5.2.2.2 Damping requirements
The basic requirement is for velocity damping, and from the figures of Chapter 4, it may be seen that if adamping ratio of about 0.64 is chosen, there is a well controlled amplitude characteristic; and equally important,the phase relationship is virtually linear from zero frequency to fn, and hence the system is said to have aconstant group delay. The characteristic may then be considered as a simple time delay equating to 900 lagatfn.
As a general rule, a transducer with a damping ratio of 0.64 may be safely used up to frequencies of at least0.7 fn. However, it must be stressed that for many transducers the damping ratio changes markedly withtemperature such that over the working temperature range the ratio may typically vary from 0.3 to 0.9. Thisis particularly true of oil damped transducers, although the manufacturer's specifications do not always makethis clear.
It should be noted also that in general, it is not possible to damp piezo-electric transducers, but since theseusually have a high fn, this is not such a problem in practice; and the general rule here is to constrain themeasurement frequencies to below about 0.2 fn.
5.2.2.3 Damping methods
There are basically three ways in which damping may be added to a transducer system, namely:
(a) Friction. This is often a simple and cheap method; however, when used for damping it tends to be unpre-dictable and subject to stiction. It is therefore generally confined to the cheaper industrial transducersand is rarely used for precision instruments.
(b) Fluid Damping. This is a widely used principle and a typical method is to immerse the complete spring/mass assembly in silicon oil such that the viscosity of the oil coupled with the associated clearancesprovide the required damping. One major disadvantage of this method is that the oil viscosity is temper-ature sensitive, and therefore steps must be taken to compensate for changes of damping ratio with temper-ature; this may range from 0.9 under cold conditions to 0.3 when hot. Some transducers, notably rategyros which self heat, are fitted with temperature compensating mechanisms.
Gas has the advantage of being much less temperature sensitive, but because of the necessity to havemuch finer clearances than for oil, the transducers become more expensive and less competitive with theforce balance types and therefore tend to be limited to specialised situations.
(c) Electro-Magnetic Regeneration. This important method relies upon principles similar to the moving coilmeter (or galvanometer). The method has the advantage of not being so temperature sensitive, and alsothere is usually electrical control over the damping ratio. This principle is used extensively for forcebalance and servo transducers and also for mirror galvanometers in trace recorders.
5.2.3 Output characteristicsThese characteristics cover such topics as the data levels and the type of data produced by the transducer, i.e.,analogue or digital, and are often termed the data format or form (Section 5.4.4). From this, considerationmay be given to the general requirement for circuitry immediately around the transducer; this may includeelectrical filters.
Document provided by SpaceAge Control, Inc. (http://spaceagecontrol.com/).

5-5
In some respects, the output characteristic is a less important consideration in the choice of a transducer,because the signal conditioning functions can usually provide the conversion to a particular data requirement.
Most analogue data recorders and A-D converters fundamentally require a dc data input, and therefore thesimple dc analogue form of transducer, such as the potentiometer, may fundamentally be connected directly tothese equipments. However, in practice there is usually a need to add gain for scaling and frequency filteringto control noise and aliasing, etc., and therefore these signal conditioning functions must be provided, eitheras part of the recorder, or as a separate function.
It is frequently very advantageous to have a frequency modulation (FM) type of output. This is for two mainreasons. Firstly, FM provides a very error-free method for data transmission because of the relative immunityto amplitude variation. Secondly, the frequency to digital conversion process is fundamentally very accurate.
Before discussing details of transducer data, it should be recognised that transducers generally fall into eitherof the two categories, as follows:
(a) Passive change - where an electrical change takes place in response to the measurand, but is generallynot detectable as data until a polarising voltage or current is applied, for example, potentiometers orinductive displacement instruments. In these cases, the form of the data is directly related to the type ofpolarisation, i.e., dc polarisation would produce direct analogue data, or ac would produce a carrier typeof data.
(b) Active or self-generating types - where an electrical energy is generated in response to the measurand.Instruments such as thermocouples and electro-magnetic generators (tachos) generally produce a voltagewhich is representative of the data, although additional elements (such as a cold junction) may be required.Others, however, produce the energy in a less recognisable form, typically piezo-electric devices whichproduce charge, and a charge converter must be used in order to produce meaningful data.
This is further discussed in Output data formats, Section 5.4.4.
5.3. TRANSDUCER ERRORS AND ACCURACYTransducer errors largely stem from the effects of the environment. This may be stated because under tightlycontrolled conditions, most errors may be nullified by the calibration process. However, the mechanical effectsof installation and such things as temperature changes, vibration, and electrical interference, all add up to anerror situation which is to a large extent uncontrollable and unpredictable. Hence, most of this section isdevoted to the environment stimulated source of error.
Accuracy is discussed in Chapter 4 and is clearly a matter for many factors including what is discussedhere. Additionally, accuracy is affected by errors in the transduction process itself, an example might be thethermocouple, which is dependent upon the relationship between temperature and the particular alloys in use;this may not be linear nor consistent.
Thus the design of the transducer and its installation can have a very great effect upon the ultimate performance.For example, a pressure measurement may be achieved using a transducer based upon a diaphragm and strain-gauge system. However, problems may occur because the diaphragm may be very susceptible to vibrationintereference and the strain gauges would be susceptible to wet conditions unless specifically protected. Also,such things as clogging of the orifice by wet dust, etc., excessively long piping, and case distortion duringinstallation may all add up to a serious error condition.
Circumstances often demand that a number of environmental conditions have to be considered, for example,temperature, pressure, humidity/immersion, sand, dust, salt, and chemical spray. Radiation may also be aconsideration for specific applications. Therefore, the general rules should be observed, as follows:
(a) Choose a transducer which is inherently protected and generally capable of withstanding the situation.For example, the LVDT type of instrument may be inherently well sealed with no rubbing contacts,whereas the potentiometer is much more vulnerable.
Document provided by SpaceAge Control, Inc. (http://spaceagecontrol.com/).

5-6
(b) Protect the transducer from the situation, i.e., dust and moisture covers, temperature protection and possiblyheating/cooling, vibration isolation, etc.
(c) Follow good engineering practices and the manufacturer's recommendations for installation.
(d) Adhere to the standard rules for data connection, i.e., screened twisted pairs and selected grounding points.
5.3.1 Errors due to temperature changeThe main effects of temperature are zero and/or sensitivity shifts in the data output and a change in thedamping coefficient. Some transducers may be compensated for temperature error by using various electricaland mechanical techniques; however, beyond about 250 1C, temperature compensation becomes extremelydifficult to design and implement. Various methods are used to protect transducers from extreme temperaturevariations; these include temperature-controlled compartments, air-and liquid-cooled enclosures, heat sinks,integral heaters, and heater blankets.
One of the most insidious and often little recognised environmental effect is caused by temperature transients.These cause temperature gradients in the instruments which can produce temperature errors much larger thanthose which occur under (quasi-) static conditions in the same temperature range. It is practically impossiblefor the user to correct for the effects of these temperature gradients, their effect can only be reduced byisolating the transducer as much as possible from the temperature environment.
5.3.2 Errors due to shock and vibrationThe effects of shock and vibration are especially difficult to eliminate for inertial transducers such as ac-celerometers and rate gyros, because they act upon the transducer in the same way as the measurand. Forexample, an accelerometer used to measure the motion of the centre of gravity of an aircraft will also respondto any vibrations present at its mounting plate. If the signal to be measured and the spurious vibration signalsare in the same frequency band, it is impossible to separate them by filtering.
If the noise frequency is markedly different from the frequencies of interest, there are three possible methodsto reduce the spurious vibration signals:
(a) Choose a transducer with a frequency response which will transduce the signal of interest without distor-tion but which will be insensitive to the unwanted frequencies.
(b) Use a mechanical low-pass filter (i.e., pre-sensor signal conditioning, Chapter 4) between the source ofthe excitation and the transducer.
(c) Introduce an electrical filter in the output of the transducer.
In general, using a transducer with an optimal frequency response for the measurement is preferable to theother two methods mentioned; however, this is frequently not possible.
5.3.3 Bandwidth and the use of filtersMechanical filters, such anti-vibration (AV) mounts, frequently have the problem of non-linear frequencyresponse and will therefore distort the signal of interest. Reasonably linear vibration isolation mounts areavailable and are used on some inertial platforms; they are, however, costly and have to be specially designedfor each transducer. In some cases good results have been obtained by mounting the inertial transducer on awooden pad or a relatively large wooden board; wood provides a reasonably linear frequency response andmore damping than most other construction materials.
The use of electrical filters in the data output of a transducer may prove successful provided that there isconfidence that no transducer overload effects are possible which may drive the transducer outside its linearrange. If the vibration frequency is much higher than the cut-off frequency of the filter, but still within thebandwidth of the transducer, gross distortion due to transducer overload may be present, although the frequencywould not be evident at the filter output. An example of this effect would be the case where a closed-loopaccelerometer is used to measure aircraft motions. These transducers are chosen because of their inherentlyhigh accuracy; they have, however, a band-width of the order of 0 to 200 Hz, though the frequency range of
Document provided by SpaceAge Control, Inc. (http://spaceagecontrol.com/).

5-7
the signal of interest is of the order of 0 to 5 Hz. High-frequency vibration of the transducer mounting platemay then saturate the servo amplifier and thereby cause large distortion. In this case the only way to reducethe errors is to reduce the amplitude of the high-frequency vibration sensed by the transducer, and this canonly be done by using a mechanical filter between the vibrating mounting plate and the transducer.
The effect of shock and vibration on non-inertial transducers may be suppressed by the same methods asmentioned above; here, however, the most practical method is to use anti-vibration mounts. Also, transducerswith small movable masses and a stiff construction are generally less susceptible to vibration than others; forexample, a high-range pressure transducer should be less sensitive to vibration than a low-range instrument.
The detrimental effects of angular vibrations and especially angular accelerations on some transducers isfrequently overlooked. Angular accelerations can for instance affect the accuracy of rate gyroscopes to markeddegree.
Similar arguments apply to most other measurements. Also further discussion on bandwidth appears inSection 5.4.2.
5.3.4 Errors from EMITransducers are often required to operate in the presence of strong electro-magnetic interference (EMI), i.e.,power cables, generators, etc. Generally speaking, transducers with low output impedance, high output voltage,and short cable lengths are less susceptible to this type of interference. Other transducers may be used in thiskind of environment, but they must then have specially designed shielding and electrical grounding circuits(Section 5.4). This is one area where an optical approach has an advantage.
5.3.5 Other error sourcesClearly there may be both mechanical and electrical, or even chemical effects. Adjacent corroded surfaces mayeasily become electrical cells and may generate erroneous voltages into the data circuit. Corroded connectorsare a particular case, showing this type of unstable electrical performance (residue of coffee spillage hasbeen known!); also, for high impedance circuits such as for piezo-electric transducers, electrical leakage willdeteriorate the low frequency performance.
5.4 ELECTRICAL CHARACTERISTICS5.4.1 Data levels, impedance, and matchingThe output level is usually expressed in terms of the output voltage or current. The output voltages are roughlydivided into high-level outputs, 0 to 5 volts or higher, and low-level outputs, typically 0 to 20 millivolts. Oftendifferent signal conditioning equipment is provided for high-level and low-level outputs.
The impedance of an electrical circuit encompasses both the resistive and reactive components. However,many measurement and transducer situations are dealing with low frequencies, and therefore the electricallyreactive components of inductance and capacitance are of no significance; thus only the resistance is consid-ered. However, many comprehensive specifications employ the term "impedance" rather than "resistance" forcompleteness.
It is generally desirable that the output impedance be low, not more than a few ohms. This is importantbecause any subsequent loading effects by cables or the signal conditioning should not affect the transducerdata. Additionally, low output impedance is generally less sensitive to many types of electrical interference.
Low output impedance does not necessarily mean that a large power may be taken from the transducer, andthe load current is generally limited to around 100 mA and often much less. This is adequate for connectionto the normal form of signal conditioning which will generally have a high input impedance, perhaps in theregion of 1 megaohm.
The term "matching" is often used when connecting the transducer to subsequent circuitry. In the true sense,this would mean a power match, but for data systems this more usually means the maximum transfer ofvoltage data, i.e., a low impedance passing data into a high impedance. There are, however, occasions when a
Document provided by SpaceAge Control, Inc. (http://spaceagecontrol.com/).

5-8
specific matching is quoted, usually in order to achieve maximum data linearity, for example, in some inductivetransducers.
5.4.2 Bandwidth and phase relationshipsSome discussion regarding bandwidth appears under Bandwidth and the use of filters, Section 5.3.3, but furtherto this it must be stated that the bandwidth of all elements of the measuring channel, excepting the signalconditioning filter, should be at least as broad as the bandwidth of the transducer (with its in-built, outputfilter, if one is used). Similarly the transducer itself must be capable of responding to all frequencies of therequired measurement.
As with all frequency selective systems (including filters), there is a frequency phase relationship between themeasurand input and the data output. In the majority of cases the transducer produces a phase lag betweeninput and output, which increases with frequency, and generally the characteristic is that of either a simple lagor a second order system. However, there may be cases of phase lead, but this is rare and generally limitedto transducers which are low frequency limited.
As a general rule, the transducer should be capable of performing well beyond the required frequency range andthe overall system frequency response should then be accurately tailored by a well defined and stable signalconditioning filter. This approach provides a well-defined frequency response irrespective of any changeswhich may occur within the transducer, particularly with respect to temperature.
It should be noted that not all transducers are solely upper frequency limited; some, typically piezo-electricdevices, are also limited at low frequency, and therefore both high-pass and low-pass filter elements arenecessary in these cases.
5.4.3 Ground connectionAs discussed in Chapter 9, it is important to maintain a single point grounding system in order to reduce thepossibilities of interference injection from ground loops and other sources.
Many transducers designed for flight test have a floating data output, so that the grounding connections maybe made at the most suitable point in the circuit. Many other transducers, however, have one of the dataoutput terminals connected to either the power ground or to the transducer case and thus onto the aircraftstructure upon which it is mounted. In such cases special measures are required, usually as part of the signalconditioning circuitry.
5.4.4 Output data formatsThe data format or form generally expresses the type of data produced by the transducer, i.e., analogue, digital,frequency, and so on. This was introduced in Section 5.2.3, but to this must be added the general informationon the data levels and impedance.
The ultimate data requirements and the associated signal conditioning often leads to a decision for a particulartransducer or principle. For example, a resistive transducer principle would require only relatively simple dcpolarisation and signal conditioning, and would produce straight-forward dc analogue data. This may be themost simple and cheap approach, but also may be the most prone to error and noise problems. Conversely,frequency modulation (FM) is much more satisfactory for transmission and may be efficiently digitised, but thisrequirement would demand a transducer with some form of resonant or other frequency generating principle.Rotary speed is another good example where either a dc tacho may be used providing straight-forward dcanalogue, but with possibly not better than 1 percent accuracy, or a pulse tacho may be used, requiring morecomplex signal conditioning, but producing frequency and with a potential accuracy in the order of 0.001percent.
As discussed in Section 5.2.3, Output characteristics and Section 5.7.2, Electrical principles available, theoutput data form is largely determined by the elements used in the latter sections of the transducer and theseare frequently in the form of a displacement transducer. The data forms obtained from the various principlesrange from the straight-forward dc analogue to the fully bus compatible digital data stream. However, in
Document provided by SpaceAge Control, Inc. (http://spaceagecontrol.com/).

5-9
order to understand the performance of a given transducer, it is worth understanding the salient features of thedifferent data forms, as follows:
(a) dc Analogue - This is the directly coupled voltage or current analogue typically obtained from eitherpassive resistive transducers polarised by dc, or from active generators such as thermocouples, piezo, orelectro-magnetic generators with commutator/brush or rectifier systems. This may be considered the moststraight-forward data form, but the most susceptible to noise and other forms of error.
As previously stated, most A-D converters and analogue data recorders require a dc analogue voltageinput, and therefore for simple requirements, transducers in this class may be preferable. However, thedisadvantages of amplitude error, noise sensitivity, and so on, often preclude this.
(b) Amplitude Modulation (AM) - Typically obtained from either the passive inductive or capacitive trans-ducers when polarised from an ac source, or from ac electro-magnetic generators such as tachos. BecauseAM is an analogue amplitude method similar to dc, the data suffers similar error problems, but may bemore immune to noise and drift. The data must be associated with some form of sychronous demodulatorsystem if polarity is to be recognised.
(c) Frequency Modulation (FM) - This is probably the most desirable of the analogue data forms because ofthe relative immunity to noise, error free properties of transmission, and the compatibility with accurateand efficient analogue to digital (A-D) conversion.
Many transducing principles may be designed to produce frequency data, often by including a mechanicallyresonant element as part of data generating system. Examples of this include
- Pressure or temperature transducers where the natural frequency (fn) of an element such as quartz ischanged by the parameter.
- Pressure or density transducers where the fn of a cylinder is changed.
- Ice detection probes, which change fn as ice forms upon a resonant stub.
- Resonant strain-gauge wires, either as part of a transducer or as a direct structure measuring device,the latter is particularly used in the civil engineering industry.
To these may be added the direct frequency generating principles such as, pulse tachos, turbine flowmeters,and encoders, also Doppler and laser techniques used for displacement, flow measurement, and in the laserring gyro.
A number of packaged transducers are available, where electronic functions are included which may produceFM data from the transducer elements. This has been particularly used with transducers using capacitiveelements, where the capacitance becomes part of a timing or tuned circuit.
Because of the desirable nature of FM data, transducers producing FM may often be considered in preferenceto other types and development continues, particularly around piezo and optical principles. However, it mustbe stressed here that these frequency methods are frequency analogue, and the data does not become trulydigital until it has been quantised by an A-D conversion.
(d) PCM Analogue - Typical of these are PAM, PWM, PPM, and FSK. In terms of data systems these meth-ods have been used extensively in the past, but have generally been superceded by digital techniques.They do survive, however, as a result of a number of measurement processes, for example, event counting/timing, radiation monitoring, control/servo techniques and certain navigation techniques. Pulse ampli-tude modulation (PAM) occurs frequently, either as a result of sampling for multiplexing (MUX) or aspart of an A-D process. Also, there are occasions when power saving is required; for example, a smallstrain gauge may self-heat to extreme if polarised by a continuous dc, but would be satisfactory ifpulse polarised, thus producing PAM.
(e) PCM Digital - This refers to the specific form of data where the analogue measurement or data hasbeen sampled, quantised (samples expressed numerically), and the data finally expressed in the form ofan electrical pulse code, usually in binary. The only way in which this may be produced physically,
Document provided by SpaceAge Control, Inc. (http://spaceagecontrol.com/).

5-10
mechanically, or as a direct part of a transducer, is to use some form of encoding element such as anencoding disc or grating. By this method the analogue measurement may be converted into a digitalrepresentation.
5.5 TRANSDUCER CONSTRUCTIONThe traditional concept of transducer design is to assemble the sensor and electrical transducing elements intoa suitable package, but to exclude all balance circuitry and electronics. However, developments of the pasttwo decades or so now allow a great variety of options, ranging from the traditional designs through to thetotal data acquisition units.
Clearly, different package arrangements are required for the different measurement situations, both in terms ofthe mechanical construction and the electrical performance; this is discussed below.
5.5.1 Integrated transducersThere are two aspects of this: firstly, where the physical elements of the transducer are integrated, notablyhere are the pressure transducers with integrated silicon diaphragm and strain-gauge assemblies; secondly,where the transducer and the electronic functions, such as signal conditioning and filters, are integrated intoone package.
5.5.2 Integrated package devicesThese may range from the simple package containing the basic transducer plus the balance circuitry throughto the full electronic package containing the signal conditioning and power supplies. More recently, digitaland fully intelligent transducers have become available containing micro-processors.
Integrated package transducers have for many years included the force balance/servo controlled transducersand the integrated package piezo transducers. The latter frequently are arranged so that the data and powersupplies share just one pair of conductors, usually on a constant current/data voltage basis, and sometimesdesigned to meet the industrial 4-20 mA standards.
This general area of integrated package technology would seem the most likely to see major developments indigital transducer construction and already encompasses a wide range of avionics packages capable of beingbus controlled. It should be realised, however, that the more intense the integration in a given package, thegreater the cost. Additionally, these units may be unrepairable, and therefore, in the many circumstances wherethe transducer is subject to hazard, it is still a better option to go to the traditional form of construction.
5.5.3 Micro-techniquesMicro-transducers are generally recognised as being the very small devices associated with, for example, themedical field. These are often constructed on an integrated circuit basis. This technology is also used in theaero industry, particularly for pressure and temperature measurement, where small sensors may be embeddedin an aerodynamic surface or an engine component.
5.5.4 Integrated circuit techniquesIntegrated circuit semi-conductor techniques are becoming more common in transducer design. They arefrequently based upon silicon and the various derivatives and have been particularly developed in the pressuretransducer field where a silicon diaphragm is formed as the sensor complete with integrated silicon straingauges. Further integration allows the inclusion of the immediate circuitry for amplification, error correction,and temperature compensation. These developments have led on to the multi-port transducers, where typically,32 or so pressure measuring elements are integrated into a single package complete with signal conditioningand digital circuitry to provide a fully controllable digital data acquisition system. These transducers generallysupercede the mechanical multi-port pressure scanning systems used extensively in wind tunnel and otheraerodynamic work.
Other areas of development include temperature sensing, opto electronic devices, and strain-gauge beams foraccelerometers, etc.
Document provided by SpaceAge Control, Inc. (http://spaceagecontrol.com/).
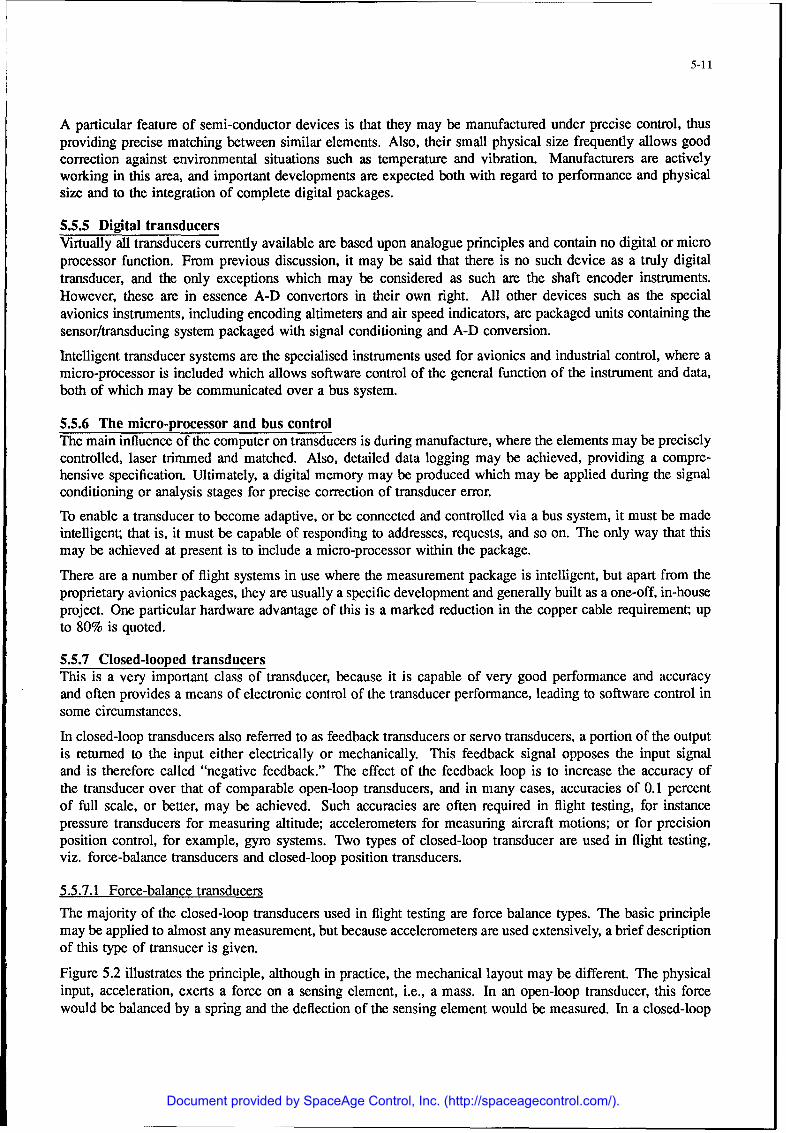
5-11
A particular feature of semi-conductor devices is that they may be manufactured under precise control, thusproviding precise matching between similar elements. Also, their small physical size frequently allows goodcorrection against environmental situations such as temperature and vibration. Manufacturers are activelyworking in this area, and important developments are expected both with regard to performance and physicalsize and to the integration of complete digital packages.
5.5.5 Digital transducersVirtually all transducers currently available are based upon analogue principles and contain no digital or microprocessor function. From previous discussion, it may be said that there is no such device as a truly digitaltransducer, and the only exceptions which may be considered as such are the shaft encoder instruments.However, these are in essence A-D convertors in their own right. All other devices such as the specialavionics instruments, including encoding altimeters and air speed indicators, are packaged units containing thesensor/transducing system packaged with signal conditioning and A-D conversion.
Intelligent transducer systems are the specialised instruments used for avionics and industrial control, where amicro-processor is included which allows software control of the general function of the instrument and data,both of which may be communicated over a bus system.
5.5.6 The micro-processor and bus controlThe main influence of the computer on transducers is during manufacture, where the elements may be preciselycontrolled, laser trimmed and matched. Also, detailed data logging may be achieved, providing a compre-hensive specification. Ultimately, a digital memory may be produced which may be applied during the signalconditioning or analysis stages for precise correction of transducer error.
To enable a transducer to become adaptive, or be connected and controlled via a bus system, it must be madeintelligent; that is, it must be capable of responding to addresses, requests, and so on. The only way that thismay be achieved at present is to include a micro-processor within the package.
There are a number of flight systems in use where the measurement package is intelligent, but apart from theproprietary avionics packages, they are usually a specific development and generally built as a one-off, in-houseproject. One particular hardware advantage of this is a marked reduction in the copper cable requirement; upto 80% is quoted.
5.5.7 Closed-looped transducersThis is a very important class of transducer, because it is capable of very good performance and accuracyand often provides a means of electronic control of the transducer performance, leading to software control insome circumstances.
In closed-loop transducers also referred to as feedback transducers or servo transducers, a portion of the outputis returned to the input either electrically or mechanically. This feedback signal opposes the input signaland is therefore called "negative feedback." The effect of the feedback loop is to increase the accuracy ofthe transducer over that of comparable open-loop transducers, and in many cases, accuracies of 0.1 percentof full scale, or better, may be achieved. Such accuracies are often required in flight testing, for instancepressure transducers for measuring altitude; accelerometers for measuring aircraft motions; or for precisionposition control, for example, gyro systems. Two types of closed-loop transducer are used in flight testing,viz. force-balance transducers and closed-loop position transducers.
5.5.7.1 Force-balance transducers
The majority of the closed-loop transducers used in flight testing are force balance types. The basic principlemay be applied to almost any measurement, but because accelerometers are used extensively, a brief descriptionof this type of transucer is given.
Figure 5.2 illustrates the principle, although in practice, the mechanical layout may be different. The physicalinput, acceleration, exerts a force on a sensing element, i.e., a mass. In an open-loop transducer, this forcewould be balanced by a spring and the deflection of the sensing element would be measured. In a closed-loop
Document provided by SpaceAge Control, Inc. (http://spaceagecontrol.com/).

5-12
transducer an electrical signal from the displacement detector is sent via an amplifier to an electrical forcegenerator which repositions the sensing element. The current required to drive the repositioning device toequilibrium is a measure of the physical input quantity and is the output of the transducer. The current maythen be converted into a voltage by means of a precision resistance. Although a finite deflection of the sensingelement is required in order to obtain an output from the displacement detector, this deflection is very muchsmaller than for equivalent open-loop transducers, and provided the loop gain is high, it may be consideredas zero for all practical purposes.
ACCELERATION
I DISPLACEMENT DETECTORI AMPIFIER
11HINGE MASSS ' OUTPUT CURRENT
OUTPUTFORCE RESISTOR VOLTAGEGENERATOR PRECISION
Figure 5.2. Force-balance acceleration transducer.
These basic principles may be applied to virtually any transducing system where the sensor produces displace-ment. Also, similar principles may be applied to the hot-wire anemometer (Section 5.9.4), where under openloop conditions a fine wire is heated by an electrical current and the flow of a gas or liquid is sensed bythe cooling effect. These cooling effects are subject to secondary errors, such as heating and cooling of thesupport posts, but by placing the hot-wire into a servo loop such that the wire is kept at constant temperatureby a feedback current change, these and other errors are reduced and the dynamic performance is increased.
Thus the force balance technique may be used for almost any measurement, but in practice it has foundparticular use for accelerometers, pressure transducers, rate gyros, and hot-wire anemometers.
5.5.7.2 Closed-loop position transducers
In closed-loop position transducers the physical input is not a force but a displacement. In these instrumentsthe servo amplifer is used to reposition the displacement detector until its output is zero. A prime example ofposition servos is the synchro family, described in Section 5.8.4, where the system is used for control synchros(Fig. 5.11). Similar servo systems are used in some closed-loop pressure transducers, bridge balance circuits,and analogue computer functions.
5.5.7.3 Performance of closed-loop transducers
The advantages of closed-loop transducers may be summarized as follows:
- Environmental factors have much less effect on the accuracy because of the null-seeking process. Forexample, the resistances of inter-connecting leads between synchros becomes less significant becauseat balance, no current flows.
- The sensing element travels only a minute distance before equilibrium is attained. Therefore, cross-axis sensitivity is much less than in equivalent open-loop transducers.
- The static accuracy may be much higher because friction effects are practically eliminated.
- Dynamic linearity may be increased because of the absence of friction effects and of nonlinear effectsin mechanical damping devices.
- The dynamic characteristics are stable because they mainly depend on the electrical characterisitcs ofthe feedback loop. Also, these characteristics may be externally changed by simple electrical controlsuch that in some cases, gain, frequency response, and damping may come under software control.
The disadvantages are mainly that they are more costly and often larger in size and weight than conventionaltransducers and also that overloading may cause very large errors. A characteristic which may be a disadvantage
Document provided by SpaceAge Control, Inc. (http://spaceagecontrol.com/).

5-13
under some circumstances is that the bandwidth is generally increased by this technique, and this may causeproblems when a low-frequency signal must be measured in the presence of high-amplitude, high-frequencynoise (see Section 5.3.3).
5.6 OPTICAL METHODSThe use of light for sensing and measurement, on an analogue basis, is fundamentally a very inaccurateprocess. This is because, firstly, it is very difficult to generate a stable light intensity, free from change dueto power input or temperature change. Secondly, most light sensors lack stability particularly with respect totemperature.
Optical methods do, however, have the advantages of no physical loading and large magnification factors, i.e.,the optical arms of galvos and lens systems. Thus there is an extensive usage in photographic recording andvisual techniques, for example, the cine-theodolight.
For measurement, optical methods are generally related to digitising techniques where there is a simple on/offrequirement and the absolute light value is not critical; this includes the variety of optical grating methods.
In situations where light is being used for analogue measurement, it is generally essential that it is performedon a parallel path process where the measurement path is related to a reference path such that changes in lightlevel equally affects both paths; thus the final quantitive value may be derived on a ratio basis.
5.6.1 Optical sensorsFor many years, optics have been used for tasks such as batch counting, tacho pick-offs (phonic wheels) andin tape recorders for end of tape sensors, etc.
Recent developments of optical sonsors have included the measurement of displacement, acceleration, pres-sure/density, and temperature, most of which have been initially aimed at the industrial control market. How-ever, together with the ring laser gyro (RLG or LRG) many are now becoming established in the aerospaceindustry and advances are being made in all other fields.
They all depend upon the modification of light transmission by the measureand, within some form of lightconductive element, usually connected by fibre optics. The light modulation ranges from a direct analogueintensity modulation, to frequency modulation, and to digital encoding techniques.
5.6.2 Fibre optics, sensors, and data transmissionOptical transmission of data is established as a safe and interference-free technique both within fibre opticcables and in free space as a means of telemetry. Thus, the extension to optical measurement extends theadvantages, particularly in regions of high electrical or magnetic field.
The fibre-optic itself may be used as a sensor, in particular where the measurand may create a physicaldistortion and thus change the light path. One particular use of this is where the fibres may be included aspart of a structure material and thus be used as a sensor of structural failure.
5.6.3 Laser methodsLasers produce a coherent source of light and thus may be used as a very powerful means of displacementmeasurement. In addition to the various surveillance systems, these principles may be used for velocity, flow,and non-contacting vibration measurement.
5.6.4 Ring laser gyro (RLG)The performance of these is similar to the rate gyro, although they do not in any way depend upon gyroscopicprinciples and there are fundamentally no moving parts; although in practice it is often necessary to have suchfunctions as dither and correction mechanisms (Fig. 5.3).
Document provided by SpaceAge Control, Inc. (http://spaceagecontrol.com/).
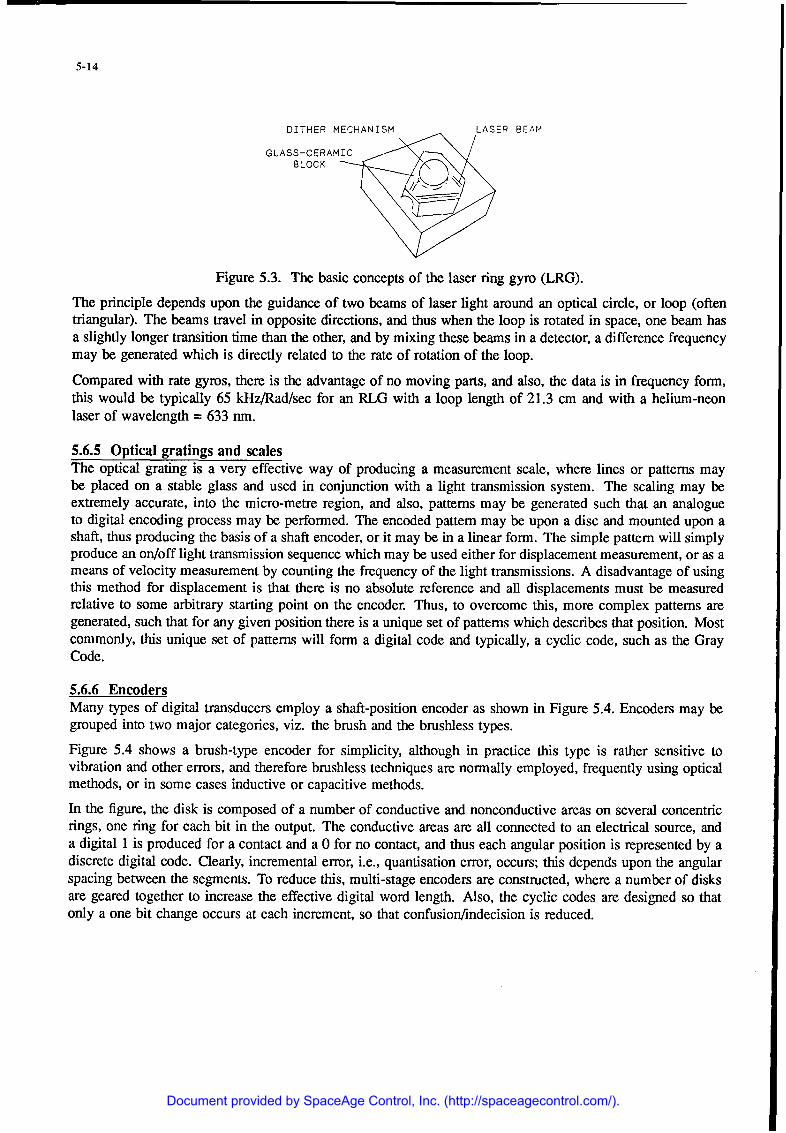
5-14
DITHER MECHANISM LASER BEAM
GLASS-CERAMICBLOCK
Figure 5.3. The basic concepts of the laser ring gyro (LRG).
The principle depends upon the guidance of two beams of laser light around an optical circle, or loop (oftentriangular). The beams travel in opposite directions, and thus when the loop is rotated in space, one beam hasa slightly longer transition time than the other, and by mixing these beams in a detector, a difference frequencymay be generated which is directly related to the rate of rotation of the loop.
Compared with rate gyros, there is the advantage of no moving parts, and also, the data is in frequency form,this would be typically 65 kHz/Rad/sec for an RLG with a loop length of 21.3 cm and with a helium-neonlaser of wavelength = 633 nm.
5.6.5 Optical gratings and scalesThe optical grating is a very effective way of producing a measurement scale, where lines or patterns maybe placed on a stable glass and used in conjunction with a light transmission system. The scaling may beextremely accurate, into the micro-metre region, and also, patterns may be generated such that an analogueto digital encoding process may be performed. The encoded pattern may be upon a disc and mounted upon ashaft, thus producing the basis of a shaft encoder, or it may be in a linear form. The simple pattern will simplyproduce an on/off light transmission sequence which may be used either for displacement measurement, or as ameans of velocity measurement by counting the frequency of the light transmissions. A disadvantage of usingthis method for displacement is that there is no absolute reference and all displacements must be measuredrelative to some arbitrary starting point on the encoder. Thus, to overcome this, more complex patterns aregenerated, such that for any given position there is a unique set of patterns which describes that position. Mostcommonly, this unique set of patterns will form a digital code and typically, a cyclic code, such as the GrayCode.
5.6.6 EncodersMany types of digital transducers employ a shaft-position encoder as shown in Figure 5.4. Encoders may begrouped into two major categories, viz. the brush and the brushless types.
Figure 5.4 shows a brush-type encoder for simplicity, although in practice this type is rather sensitive tovibration and other errors, and therefore brushless techniques are normally employed, frequently using opticalmethods, or in some cases inductive or capacitive methods.
In the figure, the disk is composed of a number of conductive and nonconductive areas on several concentricrings, one ring for each bit in the output. The conductive areas are all connected to an electrical source, anda digital 1 is produced for a contact and a 0 for no contact, and thus each angular position is represented by adiscrete digital code. Clearly, incremental error, i.e., quantisation error, occurs; this depends upon the angularspacing between the segments. To reduce this, multi-stage encoders are constructed, where a number of disksare geared together to increase the effective digital word length. Also, the cyclic codes are designed so thatonly a one bit change occurs at each increment, so that confusion/indecision is reduced.
Document provided by SpaceAge Control, Inc. (http://spaceagecontrol.com/).

5-15
. ,,• BRUSHES
" LEAST/ , SIGNIFICANT
",, N\\ ,. ,BIT
1Jij 'MOST # Z00
SIGNIFICANTBIT
Figure 5.4. Seven-bit brush-type digital shaft/position encoder.
5.7 TRANSDUCER APPLICATIONSThe following sections will endeavour to provide a brief guide towards the selection of the appropriatetransducer for a given parameter. Before discussing actual applications, it is necessary to provide some detailon parameter relationships, definitions, and related electrical principles.
5.7.1 Mathematical relationshipsDisplacement, velocity, and acceleration are mathematically linked, and it is common practice to derive onefrom the other by performing the functions of differentiation or integration by electronic means. Thus dis-placement signals may be differentiated to give velocity and then acceleration; similarly, acceleration may beintegrated to velocity or displacement. An example of the use of this is in a cg pack used for measuringan aircraft movement/displacement in flight, where, because of the necessity to use inertial techniques themeasurements are limited to linear acceleration (accelerometers) and angular velocity (rate gyros). Data onthe other parameters may be electronically calculated; this is the basis of an inertial navigation (IN) system.
5.7.2 Electrical principles availableIn order to transduce from the physical parameters to electrical data, one of the following electrical principlesmust be applied. In order to understand the relevance to the final data utput more fully, reference should bemade to Output data formats, Section 5.4.4 and also Signal Conditioning, Chapter 6.
The first four principles may be regarded as passive properties; that is, the electrical change is not detectableunless a polarising voltage or current is placed across the element.
(a) Resistance R. This obeys Ohms Law and may be polarised by either dc or ac. This principle may beused on a ratio basis, as with the potentiometer, or on a straight-forward resistive basis, as with theresistance temperature detector (RTD). In most cases, resistive elements are associated with some formof Wheatstone's Bridge (see also Section 5.13.1).
(b) Piezo-Resistance. This is the term generally given to the conductivity change exhibited by semi-conductormaterials, typically silicon, when physically distorted. This is a different phenomenon to the change instraight-forward resistance found in metallic conductors and generally shows a much greater change ofconductivity with respect to strain. This property is used extensively in semi-conductor strain gauges whichgive a much higher sensitivity than the metallic gauges; however, they are also very temperature sensitive.Electrically this is generally treated in the same manner as resistance (a) above. Note, piezo-resistancemust not be confused with the piezo-electric effect discussed in (f) in the following.
Document provided by SpaceAge Control, Inc. (http://spaceagecontrol.com/).

5-16
(c) Inductance L. This is essentially an electro-magnetic process involving current carrying wires and magneticmaterial. Because inductive reactance is only apparent when there is a changing magnetic flux, it isessential that the polarisingvoltage/currents are ac. Most inductive displacement transducers are basedupon transformer principles where the coupling between windings is modified by displacement. As withresistance the method may employ either ratio or a single element change, and the associated circuitry isnormally in some form of bridge.
(d) Capacitance C. This depends upon electro-static fields and the electrical charge carrying capacity betweentwo conductive plates. The electrical requirement is similar to inductance in the necessity for ac polar-isation and bridge circuitry, although in many circumstances resonant circuits are employed. Capacitancemay be insulant changed by the variation of platearea (over-lap), the distance between the plates, orthe property of the between the plates (the dielectric). All three methods are utilised in various waysto measure displacement and because of the complete lack of physical contact and the basic simplicityof the plate arrangement, high accuracy and high finesse are possible. However, the dielectric may bevery sensitive to change due to the ingress of moisture, dirt, or oil, so that extreme cleanliness mustbe maintained.
The next three may be considered as active elements; that is, the element self-generates electrical energyin response to the parameter.
(e) Electro-magnetic (EM) Generators. These differ from EM displacement devices in that the magneticelement; is replaced by a magnetised element; thus movement of the magnet with respect to the coilscauses electrical generation, this being the basis of many speed measuring transducers. This method,and optics, are very popular ways of obtaining frequency from moving objects, either to provide a nearsine-wave, or a pulse output. The normal process is to signal condition the waveform into a constantamplitude, variable frequency pulse train which may then be used in either analogue form (discriminated),or counted into digital form.
(f) Piezo-Electric Effect. Many materials show this effect, notably the natural element quartz, but also manyman-made crystals. The principle is that any physical distortion of the crystal will create a generation ofelectrical charge within the crystal, this may be detected as a voltage across the surfaces of the crystal,although it is usually preferable to detect the charge using a charge converter/amplifier. This principlemust not be confused with piezo-resistance, discussed previously in (b).
(g) Seebeck Effect. This simple effect is created when two metallic conductors of differing alloy are broughtinto contact. A potential is created between them which is directly related to the temperature of thatjunction. The hot junction must be related to a cold junction in order to create a complete thermocoupleand provide temperature data.
The following may be considered as interactive effects. There are many that may come under thisclassification, but the most significant is given.
(h) Optics. The usual method is to direct the light energy onto a photo-sensitive cell which then provideselectrical change. The cells are normally semi-conductor and are either photo resistive which produce aconductivity change with respect to light, or photo-voltaic, where an electrical energy is produced. Thecells may be single cell diode elements, or multiple cell arrays producing a television type of image.Many pulse generating systems utilise optical techniques, as well as a number of analogue applications,in particular the measurement of temperature and IR imaging.
5.8 DISPLACEMENT MEASUREMENTDisplacement may be considered as the primary measurement, firstly, because it may be either a discretemeasurement, or it may be part of a transducer. Secondly, it is the most frequent method of transducing frommechanical to electrical data. Because of these and the mathematical relationships (Section 5.7.1) it is logicalto consider displacement firstly, and in some detail, and then to follow with the other parameters.
Document provided by SpaceAge Control, Inc. (http://spaceagecontrol.com/).

5-17
5.8.1 Direct and inertial measurementsBefore discussing the transducers in detail, it is necessary to more clearly define displacement. There is afundamental difference between the direct methods used for small distances and the inertial methods used forthe larger distances, in particular in the areas of navigation.
A direct measurement is one where an attachment may be made to both the fixed and moving parts. This issatisfactory for relatively small displacements, possibly up to about 1 metre, such as may be required aboutthe aircraft structure. However, when it is necessary to measure the much larger distances found in navigation,it is impossible to make a direct attachment and inertial methods are necessary.
For linear inertial measurement it is normal to use an accelerometer producing acceleration data which maybe integrated twice to produce displacement data. For rotary movement, gyros are usually used, either the freegyro for angular displacement or the rate gyro for angular velocity.
Vibration and shock is frequently measured by inertial means using accelerometers, because, although dis-placements may be small, it is invariably impossible to establish a known fixed reference. By the nature ofvibration, the structure around the vibrating object usually absorbs some of the vibration energy and sets upvibration modes of its own. Similarly, with shock measurement, a reference is usually difficult to establish.
5.8.2 PotentiometersThe potentiometer (Fig. 5.5) is probably the most basic of displacement transducers, where a voltage isplaced across a resistive element and a moving wiper contact picks off a part of this voltage in proportion todisplacement.
RESISTANCE ELEMENTS
_0
LINEAR ROTARY SEMI-CIRCULAR SHAPED
Figure 5.5. Some basic potentiometer layouts.
This a simple and economic method which is widely used, but has a number of disadvantages, particularlyfor long term use. Because of the rubbing contact, there is friction, stiction, and always the possibility ofpoor contact because of dirt and vibration; all these degrade the accuracy and can produce noise (unwantedsignals). Additionally, in a permanent installation, wear becomes a problem, which would mean replacementand recalibration. Because of these disadvantages, alternative methods are often sought, in particular, inductivetransducers.
Potentiometers have been progressively developed, and various conductive plastic film and film/wire techniquesare available which provide greater resolution than the original wire-wound elements, whilst still retaining thegood linearity. Some, however, do show some nonlinearity error near to the connections. All types may beshaped to provide a nonlinear law, for example, a transducer square-law may be inverted to provide a linearparameter to data relationship.
Potentiometers find extensive use in instrumentation, both as an integral part of a transducer and as a discretedisplacement measuring instrument, particularly for the larger measurements. In angular measurement theyallow virtually a full 3600 of movement.
Another form of potentiometer is found in the dessyn system, discussed later in Section 5.8.4.1.
Document provided by SpaceAge Control, Inc. (http://spaceagecontrol.com/).

5-18
5.8.3 Inductive displacement transducersThese work on electro-magnetic principles in a similar manner to the electrical transformer(ref. Section 5.7.2(c)). Mechanically and magnetically there are many configurations including the E and Ipick-off, the rotary (angular) pick-off, and the linear LVDTs (Figs. 5.6, 5.7, and 5.8).
CORE MOVES WITHIRON CORE DISPLACEMENT
PRIsE PRI [ SEC PRIL SEC
BASICTRANSFORMER
ROTATING WINDING(SYNCHRO' PRINCIPLE) REVERSE WINDING
TO PROVIDE ZERO(LVDT PRINCIPLE)
Figure 5.6. How the basic transformer may be modified to measure displacement.
-- COIL S
MAGNETIC DSLCMN
CORE DIPACMN
SUPPLY OUTPUTVOLTAGE
Figure 5.7. Linear variable differential transformer (LVDT).
STATOR ASSEMBLY
PRIMARY WINDINGS
...EQUA FLUX~o.CANCELLATION
ROTOR SECONDARY WINDINGS
'INSTANTANEOUS' (Wound in opposition)
FLUX DIRECTIONS(ie ac)
Figure 5.8. The rotory (angular) pick-off.
The windings are frequently arranged so that there is zero secondary output at balance, and the output increaseslinearly with displacement of a magnetic (not magnetised) slug; the direction being indicated by the electrical,input to output phase relationships.
Document provided by SpaceAge Control, Inc. (http://spaceagecontrol.com/).

5-19
Inductive transducers frequently take the physical form of a potentiometer, although the electrical aspects areobviously very different. One of the major factors which may make this type of tranducer so rugged and relableis the fact that often the only moving parts are simple magnetic components with no electrical connections.
The measurement range might typically be from a few micro-metres or a few min's of arc for the most sensitiveinstruments, to 1 metre or so. However, rotary movement is usually limited to ±45'.
5.8.4 SynchrosThe traditional designs of synchro were for transmitting angular data, i.e., that two shafts may be synchronisedin angular position; this was one of the original positional force balance developments.
The basic synchro has similarities to the angular pick-off except that it has windings on both the rotor andstator assemblies; this allows a full 3600 of measurement, which is not possible with the pick-off. Also,the data is produced in ratio form which, because of this, the absolute amplitude of the data is of secondaryimportance and thus polarisation amplitude changes or transmission losses are less significant; all of whichconsiderably enhances the over-all accuracy.
The synchro is a much more precise, expensive, and delicate a device, is more applicable to the requirements ofcontrol systems or avionics, and has been developed into many variations, including linear versions. However,most are for rotary movement, where accuracies to sec's of arc are possible.
5.8.4.1 DessynsThe dc synchronous systems or dessyns were the fore-runners of the synchro and were based upon a two wiperrotary potentiometer principle and dc supplies (Fig. 5.9).
DESSYN INDICATORPOTENTIOMETER
Figure 5.9 The dessyn system.
The dc supply was applied to the two wipers, and the data output produced from three tappings placed at 120mechanical degrees on the resistive potentiometer track. The resulting dc ratio data was normally connectedto a visual pointer instrument, based on magnetic principles; and thus the angular position of the dessyntransmitter was directly repeated by the receiving instrument. Dessyns were usually used to transmit angulardata from various areas of the aircraft to the cockpit instrumentation.
5.8.4.2 Synchro torque transmitter/receivers (TX/TR)
The original design for synchros was to replace the dessyn and to transmit angular position. This is still usedas a control function or as a means of transmitting to cabin instruments; however, the electrical output isgenerally more valuable for instrumentation. The transmitter is conventionally given the symbol TX and thereceiver RX, and in basic principle there is no difference between the two instruments; the two shaft positionswould normally be synchronised in angular position. The electrical data is in the form of a ratio of three volt-ages, whose amplitude and phase relationship with respect to the polarising voltage is unique to every givenshaft position. Since synchros are extensively used in avionics and control, it is often convenient to tap intothe electrical data for measurement purposes, Figure 5.10. There are many products available to convert
Document provided by SpaceAge Control, Inc. (http://spaceagecontrol.com/).

5-20
synchro data to either analogue or digital data and because of the inherent accuracy of the synchro principle,data to at least 16 bit accuracy is possible.
TORQUE TRANSMITTER TORQUE RECEIVER
TXTR MECHANICAL
MECHANICAL OUTPUTINPUT-
SUPPLYVOLTAGE ELECTRICAL
OUTPUT
Figure 5. 10 Torque synchro circuit.
There are two general classes of synchro, viz, the torque type and the control type. In torque synchro circuits(Fig. 5.10) the rotors of the torque transmitter (TX) and the torque receiver (RX) are both connected to the acsupply voltage (in aircraft applications, usually 26 or 115 volt, 400 Hz). If the two rotors are not aligned, theinduced voltages are such that a current will flow in the stator circuit which will create a magnetic torque in thereceiver rotor in order to correct its position. The positioning accuracy of the receiver under static conditionsis about 0.250 (i.e., better than 0.1 percent of the 3600 full scale value), and because it is a force balanceprinciple, no current flows in the wires to the stators at balance (i.e., synchronism), and therefore the resistanceof these wires is of secondary importance at balance. However, due to the relatively low power, the slip-ringfriction and large inertia of the torque receiver rotor, the frequency response is rather poor. An electricalmeasurement of the transmitter position may be obtained by tapping the stator wires using high-impedancecircuits; in some signal conditioners, the rotor voltage is also required as a reference.
5.8.4.3 Control synchro transmitter/transformers (CX/CT)
In control synchro circuits (Fig. 5.11) only the rotor of the control transmitter (CX) is connected to the supplyvoltage. Currents in the stator circuit induce a voltage in the rotor of a control transformer (CT), which isthen amplified and fed to a servo motor which drives the control transformer rotor to its correct position.
CONTROL TRANSMITTER CONTROL TRANSFORMER
CX CT
INPUT
SUPPLYVOLTAGE
SELEC.TRICAL"-•OUTPUT
"XMECHANICALOUTPUT
Figure 5.11. Control synchro circuit.
The accuracy of the alignment of the rotor may be of the order of 0.05', and the dynamic response may bemuch better than for torque synchros. The output of the synchro chain is, as with torque synchros, a shaftposition and if an electrical output is required, this may be taken from the stator wires as in Figure 5.10. It is,however, often better and more accurate to mount an electrical transducer (e.g., a potentiometer or a digitalshaft encoder) on the axis of the servo motor and to use the output of this transducer.
Document provided by SpaceAge Control, Inc. (http://spaceagecontrol.com/).

5-21
5.8.4.4 Other synchro types (CDX, RX/RC)
A number of special synchro types have been developed; the more significant ones are as follows:
- Differential synchros (CDX). These are control transmitters which have a three-winding rotor as wellas a three-winding stator. The rotor is connected to the stator of a normal control transmitter. Thecontrol transformer connected to the stator will then be positioned to indicate the sum or the differenceof the angular positions of the shafts of control transmitter and of the differential transmitter.
- Brushless synchros. In these synchros the excitation of the rotor is achieved by inductive means,rather than by sliding contacts. This provides a modest improvementin both accuracy and dynamicresponse.
- Synchros with fixed rotors ('Synchrotel"). In these synchros the rotor winding does not move, butis wound on the same core as the stator windings. The coupling between the rotor winding and thestator is windings is controlled by the rotation of a small and low mass moving piece of metal. Asthis coupling is much less efficient, they require more supply power and are usually excited by 115volts, 400 Hz. The inertia and the friction of the rotor may be made so low that these synchros maybe used in sensitive altimeters and similar instruments to provide an electrical connection to a controltransformer.
- Resolvers or synchro resolvers (RX/RC). These are similar to synchros, but, have only two statorcoils, which produce ac voltages proportional to the sine and cosine of the angular position of therotor. The stator voltages may be tapped in the same way as for synchros; they are used in manyinertial platforms and occasionally in flight testing.
- Slab synchros. The principles are essentially the same except that the physical construction providesa much greater diameter for the rotor/stator assembly and thus may provide even greater accuracyand resolution; down to seconds-of-arc are possible.
- Linear instruments. A number of the principles described above have been produced in linear form.
5.8.5 Capacitive displacement transducersA capacitance is formed when two conductive plates are placed together and they have the ability to store tostore electrical charge (Section 5.7.2(d)). The amount of stored charge depends upon the area, the spacing,and the material between the plates (the dielectric); thus any one of these may be changed to give an electricalchange with respect to displacement. This principle is very simple to use mechanically, although it is notso easy to contend with electrically; however it has the particular advantage of minimal loading upon themeasurement (i.e., good finesse). For example, a capsule instrument such as an altimeter or a barometer isrelatively fragile, and any load applied would reduce the accuracy, but a capacitive pick-off (PO) may besimply applied in the form of a single plate, using the metallic surface of the capsule as the second plate. Anumber of precision altitude and airspeed transducers of this class are available, but the use of capacitanceas a means of direct displacement measurement is generally limited to situations requiring high precision andgiven clean conditions (Fig. 5.12).
"" •\ FIXED
XM M ELECTRODE
X DIAPHRAGM
Figure 5.12. Capacitive pressure transducer.
Document provided by SpaceAge Control, Inc. (http://spaceagecontrol.com/).
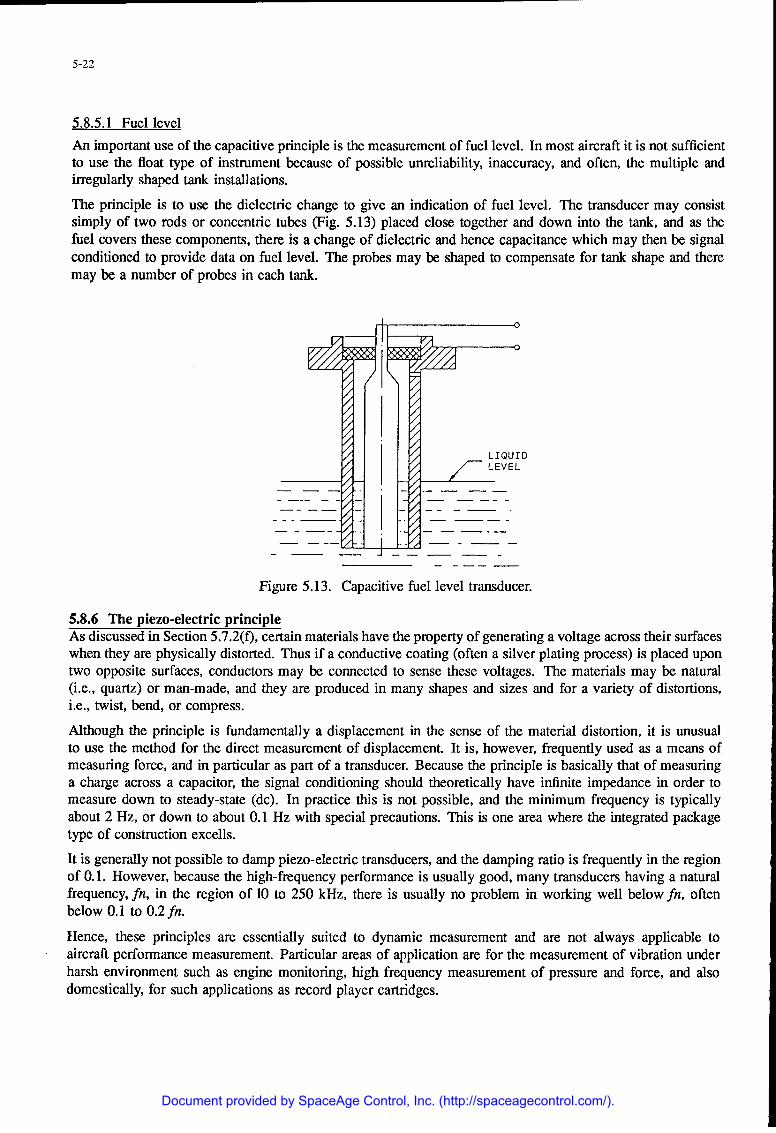
5-22
5.8.5.1 Fuel levelAn important use of the capacitive principle is the measurement of fuel level. In most aircraft it is not sufficientto use the float type of instrument because of possible unreliability, inaccuracy, and often, the multiple andirregularly shaped tank installations.
The principle is to use the dielectric change to give an indication of fuel level. The transducer may consistsimply of two rods or concentric tubes (Fig. 5.13) placed close together and down into the tank, and as thefuel covers these components, there is a change of dielectric and hence capacitance which may then be signalconditioned to provide data on fuel level. The probes may be shaped to compensate for tank shape and theremay be a number of probes in each tank.
Figure 5.13. Capacitive fuel level transducer.
5.8.6 The piezo-electric principleAs discussed in Section 5.7.2(0, certain materials have the property of generating a voltage across their surfaceswhen they are physically distorted. Thus if a conductive coating (often a silver plating process) is placed upontwo opposite surfaces, conductors may be connected to sense these voltages. The materials may be natural(i.e., quartz) or man-made, and they are produced in many shapes and sizes and for a variety of distortions,i.e., twist, bend, or compress.
Although the principle is fundamentally a displacement in the sense of the material distortion, it is unusualto use the method for the direct measurement of displacement. It is, however, frequently used as a means ofmeasuring force, and in particular as part of a transducer. Because the principle is basically that of measuringa charge across a capacitor, the signal conditioning should theoretically have infinite impedance in order tomeasure down to steady-state (dc). In practice this is not possible, and the minimum frequency is typicallyabout 2 Hz, or down to about 0.1 Hz with special precautions. This is one area where the integrated packagetype of construction excells.
It is generally not possible to damp piezo-electric transducers, and the damping ratio is frequently in the regionof 0.1. However, because the high-frequency performance is usually good, many transducers having a naturalfrequency, fn, in the region of 10 to 250 kHz, there is usually no problem in working well below fn, oftenbelow 0.1 to 0.2 fn.
Hence, these principles are essentially suited to dynamic measurement and are not always applicable toaircraft performance measurement. Particular areas of application are for the measurement of vibration underharsh environment such as engine monitoring, high frequency measurement of pressure and force, and alsodomestically, for such applications as record player cartridges.
Document provided by SpaceAge Control, Inc. (http://spaceagecontrol.com/).

5-23
It may be noted here that the process is reversible such that an applied voltage will create a physical distortion.This has found many uses in micro-positioning, for example, in optical equipment or within transducers suchas the RLG (Section 5.6.4) for creating dither.
5.8.7 Strain gauges (metallic)As the name implies, this device is for measuring strain, but by using mechanical cantilevers, diaphragms,etc., it may be considered as a displacement transducer. Fundamentally the strain gauge is a piece of metallicwire held between two points. This wire will have a resistance (R) and a length (f), but if the wire is stretchedslightly (well within the elastic limits) the length will increase and the area will decrease. This physical changecreates a resistance increase and because there are the two physical changes, the resistance change (AR) isapproximately twice the length change (At). This is known as the gauge factor (GF), and
GF = 2 (approximately)
for metallic materials.
The device described so far would be known as an unbonded strain gauge, and because of its fragility it wouldnormally be confined to uses within transducer assemblies. For structural stressing applications the bondedstrain gauge is normally used, where the strain-gauge wire is formed into a grid and adhered to an insulatingbacking material which in turn is cemented to the structure.
Many current bonded strain-gauges are constructed from foil rather than wire, (Fig. 5.14) rather like a smallprinted circuit. This generally provides a superior performance, in particular, to the cross-axis sensitivity, thisis because of the ability to make the return curves much thicker than the main strain-gauge conductors.
It is necessary to match the strain-gauge temperature coefficient with that of the measurand material andgenerally three compensations are readily available, namely:
Mild steel (12 ppm/C)Stainless steel (18 ppm/fC)Aluminium (23 ppm/!C)
The strain gauge may be extremely sensitive, ranging from around 2000 micro-strain (0.2 percent elongation),down to around 10 micro-strain (0.001 percent) under exceptional circumstances; however, great care isrequired with balance circuitry and temperature effects at the low levels.
: STRAINDIRECTION
ASSENSING AXIS
I T TRANSVERSEGAUGE T-R AXSLENGTH
BACKIN
WIRE FOILCONNECTIONS
Figure 5.14. Wire and foil strain gauges.
Document provided by SpaceAge Control, Inc. (http://spaceagecontrol.com/).

5-24
5.8.7.1 Semi-conductor strain gauges
These are similar in practice to the metallic strain gauge, except that the conductor is normally diffused insilicon and the change of conductivity is generally termed the piezo-resistive effect. This effect must not beconfused with the piezo-electric effect which is the generation of electrical charge within the body of the crystal.A number of so-called piezo transducers in fact use piezo-resistance strain-gauges and thus have the ability toperform down to dc; however, they do not have the frequency response or ruggedness of piezo-electric types.
The main reason for using silicon strain gauges is that they have a much higher gauge-factor, typically 400in their initial form, but because they also show a very great temperature sensitivity, the silicon is usuallymodified (doped) to reduce the temperature sensitivity; unfortunately this also reduces the gauge-factor toaround 100.
Gauges are available for structural use where the higher sensitivity and possibly small size is required andparticularly for purely dynamic situations where the temperature sensitivity is of less importance. However,the temperature sensitivity and fragility limit the general use, and the main application for this type of gauge isfor integral transducer construction, typically where the strain gauges are diffused within a silicon diaphragmor beam.
5.8.7.2 Resonant strain gauges
Many transducing principles use mechanical resonance as a means of producing FM data, and there is a smallfamily of unbonded strain-gauges used for structural work, mainly in civil engineering, where a substantiallyconstructed wire element is held in a state of tension and natural frequency oscillation. In application, changesof strain in the measurement structure are reflected by changes of frequency of the resonant strain gauge.
This basic principle is also employed in some transducers, particularly some precision pressure transducersand density transducers, where changes of pressure or density are applied to a resonant strain-gauge system.
5.8.7.3 Control column and pedal forces
Data on these are frequently obtained from strain gauged links. The pilot's stick force may be obtaineddirectly from a calibrated pole attached to the pilot's column, or more direct surface forces may be measuredby additional strain gauged links or by strain gauging the operating levers themselves. Pedal forces aresimilarly obtained from strain gauges on the pedal linkages.
5.8.8 EncodersThe term encoder refers broadly to a range of transducers which rely upon a mechanical scale or grating as areference and a means of translating displacement or velocity into electrical data. The scale is frequently inthe form of an optical grating, either circular, or in some linear form; this is discussed more fully in Section5.6.
Techniques using the basic grating may be used for high-accuracy displacement or velocity measurement; orby employing gratings with more complex pattems, true digital encoders (mechanical A-D converters) may beconstructed.
5.9 VELOCITY AND FLOW MEASUREMENTA primary measurement for aircraft is airspeed, normally measured by the pitot and static systems, thus givinga pressure difference.
More broadly, velocity encompasses the measurement of linear and rotary machinery components, typicallyinvolving a whole range of tachometers, ground speed, and all the related vehicle speed measurements. Tothese may be added the general of fluid subject flow.
Document provided by SpaceAge Control, Inc. (http://spaceagecontrol.com/).

5-25
5.9.1 Pitot/static systemsThese will not be discussed in detail here because there are many specialised publications on the subject.The basic concept is to measure the ram-head pressure from a tube facing into the airstream and to comparethis as a difference with a static pressure. Ideally, the static pressure is the ambient pressure distant fromany disturbance of the aircraft, but standard installations normally take an average of a number of static ventsmounted at various quiet positions on the aircraft surface. For research, it is common to have booms extendingbeyond the aircraft aerodynamic disturbance, or sometimes a trailing static is towed many metres behind theaircraft.
5.9.2 TachometersStandard tachometers are fundamentally electro-magnetic generators which provide a linear relationship be-tween speed and electrical output. It may be noted here that, in principle, the only difference between adisplacement transducer and a tachometer is the fact that for displacement the rotor is simply a piece of mag-netic material, and thus the transducer requires to be polarised, but for the tachometer, the rotor is magnetised,and thus the transducer becomes self-generating.
Typical aircraft engine tachos are ruggedly constructed and give a three-phase voltage which may be transmittedto the indicator on a ratio basis. Other types produce either ac or dc, the latter being more applicable to servorequirements. Further types give purely a frequency or pulse rate; these are more applicable to the moreaccurate requirements and to digital systems.
5.9.3 Measurement of flowBasically, this may be considered as an extension to velocity measurement, and in practice many of thetechniques are common.
The techniques generally group into liquid flow (fuel, coolant, etc.) and gas flow (air, etc.), although it isoften possible to use the same principle for both, i.e., pitots for air/gas flow and orifice plates/pressure dropfor liquid and similarly for turbine methods and anemometry principles.
5.9.3.1 Fuel and liquid flowFor engine performance measurement, the true requirement is to measure the mass flow passing into the engines,for example, the mass of fuel (i.e., Kg) being burned for a given performance. In practice the majority offlowmeters measure rate of flow (and hence volume) which is another form of velocity measurement. Hence,mass flow must be derived.
5.9.3.2 Turbine flowmeters
Many aircraft use the turbine flowmeter principle to measure fuel flow, one transducer for each engine. Thistype of transducer is fitted directly into the pipeline to the engine and contains a small turbine, which spinsround at a speed which is in proportion to the flow rate. Because fuel density changes are not usually significantin normal service, it is satisfactory to calibrate the transducer output in terms of mass flow. Compensationsfor temperature or fuel changes may be built into this type of flowmeter (Fig. 5.15).
A small pick-off is placed near to the turbine vanes which produces electrical pulses in proportion to the flowrate. The normal method is to pass these pulses into an electronic circuit which provides a meter indication inthe pilot's cabin. The relatively simple analogue approaches to processing these pulses only yield accuraciesof a percent or so and more accurate electronic logic methods are used for test instrumentation to provideeither a numeric read-out or digital data for such parameters as fuel consumed.
Document provided by SpaceAge Control, Inc. (http://spaceagecontrol.com/).

5-26
ELECTRICAL
OUTPT ,-PICK-OFF
N TURBINE
FUEL FLOW
Figure 5.15. Pulse generating turbine flowmeter.
5.9.3.3 Mass flowmeters
These tend to more complex and expensive and therefore limited to installation where there is a strict require-ment for mass flow measurement. The basic principle is to impart an annular velocity into the fuel as it passesthrough the transducer, and the torque required to achieve this annular motion is directly proportional to massflow.
5.9.3.4 Positive displacement flowmeters
These generally apply to the fuel dispensing and consumer industries, where the transducer measures volumesof the fuel dispensed.
5.9.3.5 Area/displacement flowmeters
This is where the flow forces against a spring loaded vane or cone (rotameter) and are generally known asvariable area or variable volume flowmeters, i.e., they essentially produce velocity/volume data.
5.9.3.6 Other flowmeter types
The electro-magnetic types are popular for measuring water flow, including sea water. They work on theprinciple of using the flowing liquid as an electrical conductor passing between the poles of a magnet. Thusas the liquid conductor cuts the magnetic flux, a voltage generation is created which is proportional to flowvelocity.
Vortex types have been used extensively for wind tunnel and atmospheric measurement and also water flowmeasurement. The principle is that a vortex flow pattern is created over specifically shaped bodies and changesin the pattern or frequency vary with rate of flow.Ultra-sonic methods are used for both anemometry (gas/air) and liquids. For liquid measurement, they have
the particular advantage that a system may be attached to a pipe-line without any mechanical intrusion.
Laser methods are similarly used for nonintrusive flow measurement and have been developed into a verysophisticated and powerful measurement tool. They are mainly applicable to the laboratory situation andprovide an effective method of studying of fluid flow and flow patterns.
Document provided by SpaceAge Control, Inc. (http://spaceagecontrol.com/).

5-27
5.9.4 AnemometersAnemometers were originally developed for the measurement of wind velocity, and many devices may comeunder this category. These may include, cup-anemometers, pitot/static systems, vortex and ultra-sonic instru-ments, but one of the major instruments is the hot-wire anemometer.
The basic principle is to measure the cooling effect of a heated wire when placed into the flow. The veryfine filament wire is held on supports and heated by an electrical current and thus the cooling effect of thewire may be measured by resistance change. However, this open-loop system has a number of disadvantages,including the secondary effect of heat flow in and out of the support wires, and therefore, the majority ofanemomenters are force balanced (Section 5.5.7.2). This is where the temperature is kept constant and thecurrent is varied with flow rate by a servo feedback system. These instruments are particularly used for thevarious aerodynamic measurements and will respond up to 100 kHz or more.
5.9.5 Flowmeter performanceAs a very general statement, there are no upper limits to the measurement of flow; it is simply a matter ofproviding areas, pipes, etc., large enough to accommodate the flow without choking and so on. Low flowrates may produce difficulties and are often limited by the dynamic range of the instrument, often to about 10percent or 15 percent of full scale. Generally the hot-wire anemometers, ultra-sonic, and laser methods showgood performance at low rates.
High-frequency performance is usually very limited for the mechanical instruments, but again the hot-wireand laser methods show the best performance.
5.10 ACCELERATION MEASUREMENTThis parameter is usually sensed by a spring/mass system as shown in principle in Figure 5.1, where the springis distorted under the influence of acceleration. The movement of the mass with respect to the case of thetransducer is then measured by a displacement transducer-, this in turn provides a signal in proportion to theacceleration.
5.10.1 Practical accelerometersThere are three basic types of accelerometer, namely:
(a) The conventional spring-mass accelerometer (Fig. 5.16). When used as a general purpose instrument,only nominal accuracies of 1% or so are obtained; also, there may be a high cross-sensitivity of 3% orso. There are a few instruments of greater precision, but the cost of these generally makes them lesscompetitive with the force balance class of transducer. In all cases, the frequency range is generally fromsteady-state to about 250 Hz.
The spring and mass configuration is constructed in a rigid manner so that ostensively only one axis issensitive to acceleration, frequently utilising leaf-springs, diaphragms, or cantilevers.
The mass is usually made of a stable material and may form part of the magnetic circuit of a displacementpick-off, whilst other designs use potentiometers, strain gauges, either wire or semi-conductor (piezo-resistive), or of fluid capacitive pick-offs.
Document provided by SpaceAge Control, Inc. (http://spaceagecontrol.com/).

5-28
SFM OUTPUT
MASS
- -LEAF SPRING
MAGNETICCORE I
I ICOIL _ >
ACCELERATION
Figure 5.16. Variable self-inductance accelerometer in an oscillator circuit.
(b) Piezo-electric accelerometers (Fig. 5.17). These are essentially for dynamic measurement, such as vibra-tion and shock. There is no steady-state response, but the top measurement frequencies may be in kilo-hertz to hundreds of kilohertz region.
In essence, the mass is directly attached to a piece of piezo material which provides both the spring andsignal output function, and this very stiff construction usually provides the very high natural frequencyfn. However, it is essential to isolate the piezo/mass system from the case of the instrument in order toprovide immunity from temperature and case distortion effects, and therefore, only the very cheapest ofinstruments have this basic construction.
DIRECTION OF NORMALSENSITIVITY
MASS
" I PIEZO-ELECrRIC
BASE
SHEAR TYPE COMPRESSION TYPE
Figure 5.17. Two types of piezo-electric acceleration transducer.
(c) Force balance accelerometers. These generally replace the spring-mass instrument when good performanceis required. They may be very expensive but may provide very good accuracy and frequency performance,ranging from steady-state to as high as 1 kHz or so. Generally this is the choice for such applications asinertial navigation systems. These are discussed in more detail below.
Document provided by SpaceAge Control, Inc. (http://spaceagecontrol.com/).
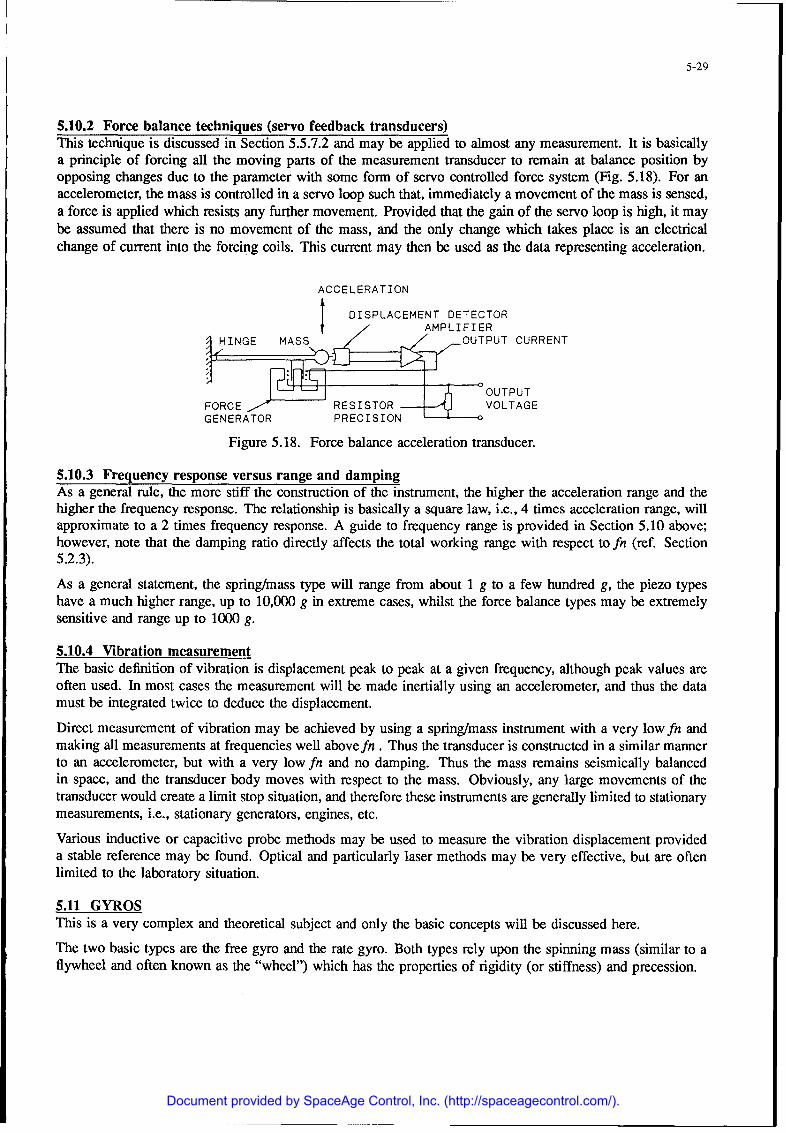
5-29
5.10.2 Force balance techniques (servo feedback transducers)This technique is discussed in Section 5.5.7.2 and may be applied to almost any measurement. It is basicallya principle of forcing all the moving parts of the measurement transducer to remain at balance position byopposing changes due to the parameter with some form of servo controlled force system (Fig. 5.18). For anaccelerometer, the mass is controlled in a servo loop such that, immediately a movement of the mass is sensed,a force is applied which resists any further movement. Provided that the gain of the servo loop is high, it maybe assumed that there is no movement of the mass, and the only change which takes place is an electricalchange of current into the forcing coils. This current may then be used as the data representing acceleration.
ACCELERATION
t DISPLACEMENT DETECTOR1 AMPLIFIER
SHINGE MASS OUTPUT CURRENT
S•-- ..••'•' • • OUTPUT
FORCE RESISTOR VOLTAGE
GENERATOR PRECISION -4 -
Figure 5.18. Force balance acceleration transducer.
5.10.3 Frequency response versus range and dampingAs a general rule, the more stiff the construction of the instrument, the higher the acceleration range and thehigher the frequency response. The relationship is basically a square law, i.e., 4 times acceleration range, willapproximate to a 2 times frequency response. A guide to frequency range is provided in Section 5.10 above;however, note that the damping ratio directly affects the total working range with respect to fn (ref. Section5.2.3).
As a general statement, the spring/mass type will range from about 1 g to a few hundred g, the piezo typeshave a much higher range, up to 10,000 g in extreme cases, whilst the force balance types may be extremelysensitive and range up to 1000 g.
5.10.4 Vibration measurementThe basic definition of vibration is displacement peak to peak at a given frequency, although peak values areoften used. In most cases the measurement will be made inertially using an accelerometer, and thus the datamust be integrated twice to deduce the displacement.
Direct measurement of vibration may be achieved by using a spring/mass instrument with a very low fn andmaking all measurements at frequencies well above fn. Thus the transducer is constructed in a similar mannerto an accelerometer, but with a very low fn and no damping. Thus the mass remains seismically balancedin space, and the transducer body moves with respect to the mass. Obviously, any large movements of thetransducer would create a limit stop situation, and therefore these instruments are generally limited to stationarymeasurements, i.e., stationary generators, engines, etc.
Various inductive or capacitive probe methods may be used to measure the vibration displacement provideda stable reference may be found. Optical and particularly laser methods may be very effective, but are oftenlimited to the laboratory situation.
5.11 GYROSThis is a very complex and theoretical subject and only the basic concepts will be discussed here.
The two basic types are the free gyro and the rate gyro. Both types rely upon the spinning mass (similar to aflywheel and often known as the "wheel") which has the properties of rigidity (or stiffness) and precession.
Document provided by SpaceAge Control, Inc. (http://spaceagecontrol.com/).

5-30
5.11.1 Free gyrosRigidity is a resistance to any force which attempts to change the spin axis and is the main property utilisedfor the free gyro (Fig. 5.19).
TWO FREE GIMBAL ASSEMBLIES
SPINNING MASS
Figure 5.19. Free gyro assembly (vertical).
The wheel is mounted within a gimbal assembly which allows angular movement of the instrument case withrespect to the wheel, thus the free gyro measures angular displacement and typically, in two planes. If thespin axis is vertical, the two angular planes are pitch and roll, and this would be known as a vertical gyro. Ifthe axis were horizontal, it would be known as an horizontal gyro, directional gyro or azimuth gyro becauseit would measure displacements in the horizontal plane, commonly known as azimuth.
It is not possible to make a very general statement about range and accuracy; one reason is that so manyinstruments are related to compensation techniques, i.e., vertical pendulous gyros designed to track towardsthe Earth's gravity, compass and flux-gate correction systems and so on. But, the range is potentially up to3600, although many vertical gyros are limited to less than +1 quadrant of arc; and the fundamental accuracyis normally related to a few deg/min. or less for precision instruments. Damping (ref. Section 5.2.2.1) doesnot apply to these instruments.
5.11.2 Rate gyrosA rate gyro is similar in principle except that it is designed to measure angular velocity and uses the propertyof precession to detect the rotational rate. The gimbal assembly has only one degree of freedom and even thisis restrained by a spring. When an angular input is applied in the axis which forces the wheel spin axis torotate, the precessional forces react at right angles and against the spring. Thus the sum of precessional forceand spring stiffness provides a calibrated means of measuring angular velocity.
In general, instruments are available to cover measurement from about 20 '/sec up to 1000 '/sec. Mostrate gyros are damped, and because most show considerable self heating, there is often an in-built temper-ature/damping coefficient compensation process. Accuracies are typically approaching the 0.1 percent rangefor good instruments. These instruments are normally optimally damped (ref. Section 5.2.2.1) although phaserequirements or dynamic requirements sometimes demand less or more damping respectively.
Document provided by SpaceAge Control, Inc. (http://spaceagecontrol.com/).

5-31
-NPUTAXIS
SPINNING MASS
SRESULTING PRECESSIONAGAINST SPRING
Figure 5.20. Rate gyro assembly.
5.11.3 Laser gyrosThese are optical equivalents to the rate gyro and are discussed further in Section 5.6.4.
5.11.4 Gyro characteristicsAll types of gyros have the property of not requiring a fixed reference, and therefore, like the accelerometer,they may be used anywhere in space and hence the use in navigational systems. Also, both mechanical typesrequire some form of displacement transducer to measure the gimbal movement; this may sometimes be asynchro.
The free gyro measures angular displacement, usually in two planes. The rate gyro will only measure in oneplane and thus may be considered as a form of tachometer, but has the important property of not requiring tobe at the centre of the rotation; it will measure the same rate of rotation at any point on the vehicle. Refer toFigure 5.20.
5.12 PRESSUREThis parameter may be fluid or gas (including air), and the three basic ways in which it may be sensed arediscussed below. Each method produces a displacement, and therefore there is always the dual choice, firstlyof how to sense the pressure and then of how to sense the displacement to provide electrical data. Mostof the displacement transducing principles have been employed throughout the range of pressure transducersavailable. Clearly such instruments as the traditional pilot's altimeter, ASI, and other pressure instruments donot require electrical output, and therefore the displacement is directly coupled to a pointer through mechanicallinkages.
All pressure measurements are fundamentally made as a difference of two pressures, (Fig. 5.21) and thereforethere are three concepts, i.e.,
Gauge pressure - Unknown pressure with respect to atmosphere (i.e., industrial measurement)
Absolute pressure - Unknown pressure with respect to a vacuum (or as near as possible) (i.e.,altimeters, barometers, etc.)
Differential pressure - The difference of two unknown pressures (i.e., ASI, flow, etc.)
Document provided by SpaceAge Control, Inc. (http://spaceagecontrol.com/).

5-32
EVACUATED
Ia ABSOLUTE
XT-P1 DIFFERENTIAL
Figure 5.21. Pressure concepts.
5.12.1 Capsules and bellows (altimeters and ASIs)This is probably the most sensitive method and is typically used for altimeters, ASIs, and barometers. Thesensing element basically comprises an evacuated chamber, usually cylindrical and with either corrugated sides(bellows) or a single flat capsule, or sometimes a number of capsules connected in series (Fig. 5.22).
CAPSULE
BELLOWS
Figure 5.22. Capsule and bellows.
A typical air speed indicator (ASI) would be similarly constructed and would measure the difference of thetwo pressures from the pitot and static system. Additionally, since pressure difference is proportional to thesquare of the speed, special linearising linkages are often used to give a near linear reading of air speed.
The above discussion has related mainly to the visual, cockpit type of instrument, but similar principles areused to provide electrical data, and it is one area where the capacitive type of displacement pick-off is of valuebecause of the minimal loading effects upon the sensor elements.
5.12.2 DiaphragmsThis is probably the most widely used principle in general instrumentation. The diaphragm may be metallic,plastic, or a semi-conductor material (usually silicon, ref. Section 5.5.4) and is usually formed as a thin circularmembrane mounted into a solid casing which is suitably fitted with pipe connections (or any other requirement).
As pressure is applied, the diaphragm begins to distort and the displacement of the diaphragm is measured bysome form of displace ment pick-off (PO). Many transducers are constructed with a diaphragm and inductivePO combination, but many other types are available, including capacitance, piezo, and strain gauge. In thelatter case silicon diaphragms and integrally diffused strain gauges are becoming increasingly available. SeeFigures 5.23 and 5.24.
Document provided by SpaceAge Control, Inc. (http://spaceagecontrol.com/).

5-33
ST PRESSURE
INLETS
FERROMAGNETICDIAPHRAGM
COILSFLAT
/I ,• dSUPPLY•-x• -,4 kj•// __L VOLTAGE
CORRUGATED OUTPUT
Figure 5.23. Figure 5.24. Variable self-inductivepressure transducer in a bridgecircuit.
5.12.3 Bourdon tubeThis type of instrument uses a length of curved tube to sense the pressure. Traditionally the tube is bent intoa C shape and the curve progressively unwinds as pressure is increased inside the tube; the displacement maythen be used as required. This instrument has established itself in industry to measure the medium to highpressures, many being the traditional brass bound pointer and dial gauge. For aircraft it is similarly found inthe pilot's cabin to indicate engine and hydraulic pressures (Fig. 5.25). Capsule and Bourdon tube instrumentsmay attain similar performance, although the sensitivity to acceleration must be recognised.
The instrumentation industry has developed the principle, sometimes with tubes of other shapes, and althoughthe general use is for the medium to higher pressures, there are exceptions used for lower pressures, even tocalibration equipment standards.
5.12.4 Performance and dampingThe most general purpose instruments are based upon the diaphragm and may range from a few millibar for thevery sensitive, up to 350 bar and much higher in extreme cases, particularly for the piezo-electric types. Basicaccuracies usually approach 0.1%, although there is usually a notable degradation with temperature change.
The sensor system usually has a natural frequency of around a few kilohertz up to a few hundred kilohertz forthe higher range instruments. Damping is rarely built into the transducer, but it may be achieved by externalflow/plenum control. Sensitive instruments are often very acceleration/vibration sensitive.
'C' TYPEý
TWISTED TUBE HELICAL
Figure 5.25. Some types of Bourdon tube.
Document provided by SpaceAge Control, Inc. (http://spaceagecontrol.com/).
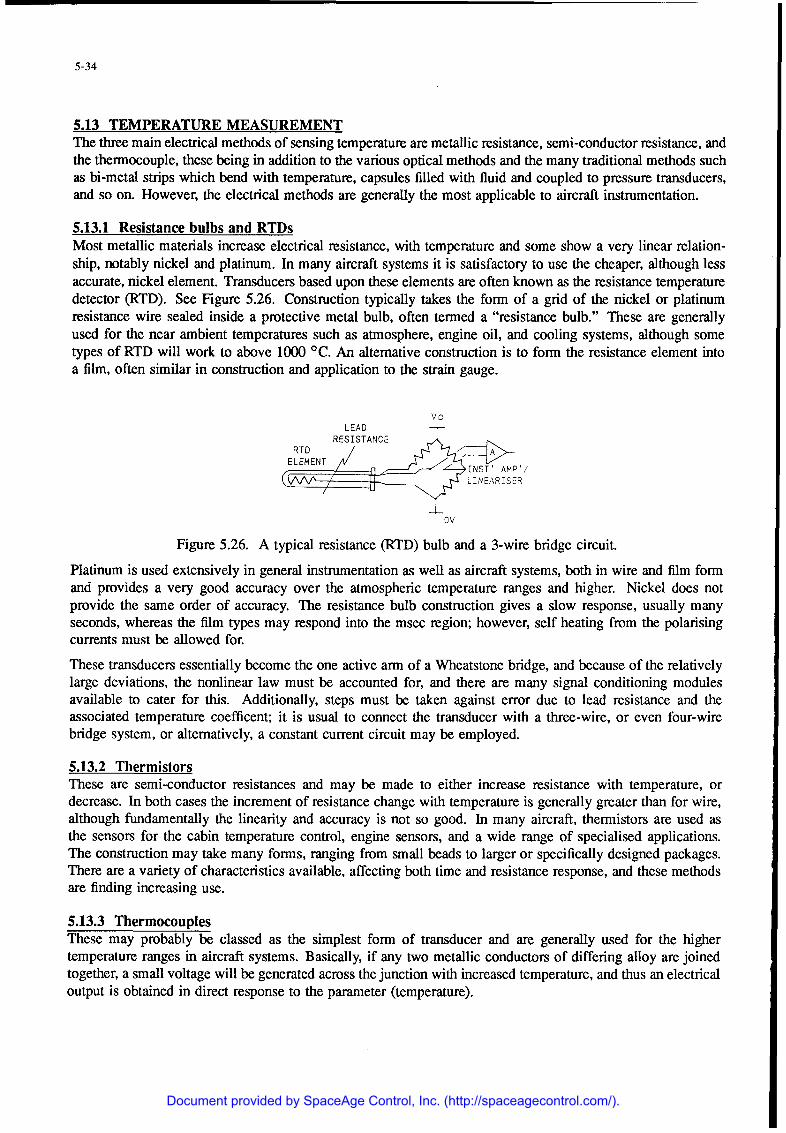
5-34
5.13 TEMPERATURE MEASUREMENTThe three main electrical methods of sensing temperature are metallic resistance, semi-conductor resistance, andthe thermocouple, these being in addition to the various optical methods and the many traditional methods suchas bi-metal strips which bend with temperature, capsules filled with fluid and coupled to pressure transducers,and so on. However, the electrical methods are generally the most applicable to aircraft instrumentation.
5.13.1 Resistance bulbs and RTDsMost metallic materials increase electrical resistance, with temperature and some show a very linear relation-ship, notably nickel and platinum. In many aircraft systems it is satisfactory to use the cheaper, although lessaccurate, nickel element. Transducers based upon these elements are often known as the resistance temperaturedetector (RTD). See Figure 5.26. Construction typically takes the form of a grid of the nickel or platinumresistance wire sealed inside a protective metal bulb, often termed a "resistance bulb." These are generallyused for the near ambient temperatures such as atmosphere, engine oil, and cooling systems, although sometypes of RTD will work to above 1000 'C. An altemative construction is to form the resistance element intoa film, often similar in construction and application to the strain gauge.
VLEAD-
RESISTANCE ..
ELEM ENT ,4/T A-MP '/ t
aq RTD-€
z--IN T A P/
g ;NNJ /1LINEARISER
OV
Figure 5.26. A typical resistance (RTD) bulb and a 3-wire bridge circuit.
Platinum is used extensively in general instrumentation as well as aircraft systems, both in wire and film formand provides a very good accuracy over the atmospheric temperature ranges and higher. Nickel does notprovide the same order of accuracy. The resistance bulb construction gives a slow response, usually manyseconds, whereas the film types may respond into the msec region; however, self heating from the polarisingcurrents must be allowed for.
These transducers essentially become the one active arm of a Wheatstone bridge, and because of the relativelylarge deviations, the nonlinear law must be accounted for, and there are many signal conditioning modulesavailable to cater for this. Additionally, steps must be taken against error due to lead resistance and theassociated temperature coefficent; it is usual to connect the transducer with a three-wire, or even four-wirebridge system, or alternatively, a constant current circuit may be employed.
5.13.2 ThermistorsThese are semi-conductor resistances and may be made to either increase resistance with temperature, ordecrease. In both cases the increment of resistance change with temperature is generally greater than for wire,although fundamentally the linearity and accuracy is not so good. In many aircraft, thermistors are used asthe sensors for the cabin temperature control, engine sensors, and a wide range of specialised applications.The construction may take many forms, ranging from small beads to larger or specifically designed packages.There are a variety of characteristics available, affecting both time and resistance response, and these methodsare finding increasing use.
5.13.3 ThermocouplesThese may probably be classed as the simplest form of transducer and are generally used for the highertemperature ranges in aircraft systems. Basically, if any two metallic conductors of differing alloy are joinedtogether, a small voltage will be generated across the junction with increased temperature, and thus an electricaloutput is obtained in direct response to the parameter (temperature).
Document provided by SpaceAge Control, Inc. (http://spaceagecontrol.com/).

5-35
A complete thermocouple consists of both a hot and a cold junction, this is because the generated voltageis the result of the difference in temperature between the hot (the measurement) and the cold (the reference)junctions; however, this is not a serious problem in practice, and there are many signal conditioning andintegrated circuits (IC) techniques available (Fig. 5.27).
Chrome] +re IHOT
JUNCTION Alumel -ye
COLDJUNCTION
Figure 5.27. The basic thermocouple circuit.
5.13.3.1 Thermocouple alloys and performance
Because of its simplicity and ruggedness, the thermocouple has a wide range of application and is particularlyuseful for rugged, high-temperature measurement, and specialised research functions. However, the datavoltages are small and the accuracy is not good, particularly at the lower temperature. Comprehensive dataare published for the various thermocouple alloys, but it is generally not possible to make a measurement tobetter than 3/4 'C, often worse.
The main alloys in use are as follows:
Chrome/Alumel (Type K), approx. 40 microvolts/°C.Generally the most accurate and widely used - up to about 1000 'C.
Iron/Constantan (Type J), approx. 46 microvolts/°CMore frequent in industrial applications - up to about 700 'C
Platinum/Rhodium-Platinum (Types R & S), approx. 9 microvolts/°CSpecifically for higher temperatures - up to about 1700 °C.
Additionally, copper/constantan is frequently used for inter-connection, this being less expensive than thethermocouple alloys, but having a similar characteristic.
The time response of the common wire thermocouple is normally in the order of many seconds; however, filmtechniques are possible which vastly increase this response.
5.13.3.2 Jet pipe temperature (JPT)
A typical jet-pipe temperature measuring system would consist of an array of thermocouples around the insideof the jet-pipe, all connected in parallel. This provides a good average measurement of gas temperature, plusintegrity, in that a number of thermocouples could fail, but still leave others to give the data. This is a valuablefeature for such a vital engine measurement and in such a harsh an environment. Typically the signals fromthe thermocouples are taken to a pilot's meter and also to the top temperature unit; both of these equipmentsare usually fitted with synthesised cold junctions.
5.13.4 Optical methodsWhen a body is heated, both heat and light energy is radiated and methods of sensing this as a means oftemperature measurement are briefly as follows;
Total radiation This is where the heat energy is focussed onto a thermo-couple or similar, and thus a data voltage may be pro-duced in response to energy radiation. This is generallymore useful for the higher temperatures.
Document provided by SpaceAge Control, Inc. (http://spaceagecontrol.com/).

5-36
Photon or continuous optical pyrometery - In these methods the measured radiation is totally fromlight energy, and thus the detector must be some form ofphotoelectric device. These methods are increasing in useand may include the various infrared (IR) image formingtechniques, all of which may be used with a fair amountof accuracy down to ambient temperatures.
Optical techniques are of particular value where noncontacting measurement is required; however, there are anumber of serious error sources, in particular with regard to the radiation qualities (emissivity) of the radiatingsurface. A perfect black body radiator is said to have an emissivity of 1.0, but in practice emissivities of aslow as 0.2 may be encountered, and the correct figure for a particular subject may not always be evident.
5.14 BIBLIOGRAPHY1. Allocca, John A. and A. Stuart, Transducers, Theory and Practice, Reston Publishing Company, 1984.
2. Atkinson, P., Feedback Control Theory for Engineers, Heinman Educational Books, 2nd Ed.,
London, 1983.
3. British Standards International Thermocouple Tables. BS4937: Part 4, 1973.
4. Cady, W.G., Piezoelectricity, McGraw Hill, 1946.
5. Doebelin, E.O., Measurement Systems, Application and Design, McGraw Hill, NY, 1983.
6. France, J.T., "The Measurement of Fuel Flow," AGARDograph 160, Vol. 3, Mar. 1972.
7. Gregory, B.A., Electrical Instrumentation and Measurement Systems, 2nd Ed., The MacMillonPress, 1981.
8. Herceg, E.E., Handbook of Measurement and Control, Revised Ed., Schaezitz Engineering.
9. Instrument Society of America, "Electrical Transducer Terminology," Rev. 1982, Document No. ANSI/ISA-$37, 1-75.
10. Instrument Society of America, "Standards and Practices for Instrumentation," Third Edition,1970, Document No. ISA-537.
11. "ISA Transducer Compendium, Parts 1, 2, 3," G.F. Harvey, editor, Plenum Press, 1969, 1970, 1972.
12. Kottkamp, E., H. Wilhelm, and D. Kohl, "Strain Gauge Measurements on Aircraft," AGARD-ograph
160, Vol. 7.
13. McLaren, I., "Open and Closed Loop Accelerometers," AGARDograph 160, Vol. 6, July 1974.
14. Nyquist, H., "The Regeneration Theory," Bell System Tech. Journal, 1932.
15. Sensor Selection Guide (SSG), H.N. Norton, editor, E. Sequoia S.A., Switzerland, 1984.
16. Stieler, B. and H. Wilhelm, "Gyroscopic Instruments and their Application to Flight Testing,"AGARD-ograph 106, Vol. 15.
17. Trenkle, F. and M. Reinhardt, "In-Flight Temperature Measurements," AGARDograph 160, Vol. 2,Feb. 1973.
Document provided by SpaceAge Control, Inc. (http://spaceagecontrol.com/).

5-37
18. van der Linden, J.C. and H.A. Mensink, "Linear and Angular Position Measurement of Aircraft
Components," AGARDograph 160, Vol. 8, Jan. 1977.
19. Vedrunes, M., "The Measurement of Engine Rotation Speed," AGARDograph 160, Vol. 4, Oct. 1973.
20. Wuest, W., "Pressure and Flow Measurement," AGARDograph 160, Vol. 11.
Document provided by SpaceAge Control, Inc. (http://spaceagecontrol.com/).

5-38
Appendix. Table of typical transducers used for flight test instrumentation.
Transducer Typicalcommon Transduction maximum
Measurand name principle range Accuracy*Acceleration Accelerometer Potentiometric +50g Medium
and vibration Strain gauge ±100g MediumPiezoelectric ±10,000g MediumForce balance +35g High
Acoustics and Microphone Capacitive 180 dB Mediumsound Piezoelectric 160 dB Low/medium
Air flow Vanes Potentiometric ±300 Mediumdirection Synchro ±300 Medium
Aerodynamic Diff. pressure ±300 Mediumprobe
Attitude Gyroscope Gyroscopic +450 Medium
Attitude rate Gyroscope Gyroscopic ±-2,000 deg/sec Medium
Displacement, Potentiometer Potentiometric 300 mm Mediumlinear LVDT Diff. transfmr. 300 mm Medium
Displacement, Potentiometer Potentiometric 3,6000 Mediumangular Synchro Inductive 3600 High
Shaft encoder 3600 High
Flow rate, vol. Flow meter Turbine 3,000 gal/hr MediumFlow rate, mass 20,000 lb/hr
Strain, loads Strain gauge Resistive 6,000 p in/in Low
Liquid level Capacitive 12 ft MediumNuclear 6 ft Medium
Pressure Pressure Potentiometric 500 psi; 350 N/cm2 Mediumtransducer Strain gauge 5,000 psi; 3,500 N/cm2 Medium
Capacitive 1,000 psi; 700 N/cm2 Med/HighPiezoelectric 10,000 psi; 7,000 N/cm 2 Medium
Rotary speed Tacho generator Inductive 100% RPM Medium
Temperature Resis. thermom. Resistive 1,000 °C HighThermistor Resistive 300 "C HighThermocouple Thermoelectric 1,200 "C Medium
*Low accuracy: error > 3% FS, medium accuracy: error < 1-3% FS, high accuracy: error < 1% FS.
Document provided by SpaceAge Control, Inc. (http://spaceagecontrol.com/).
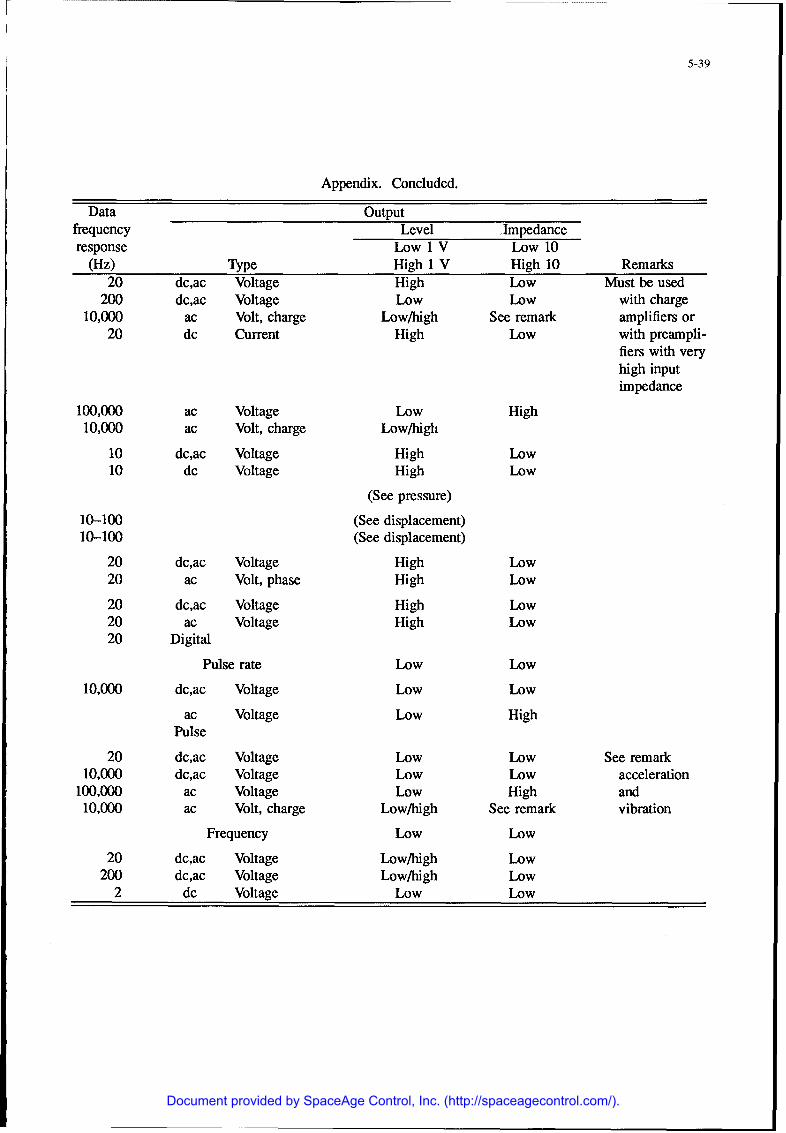
5-39
Appendix. Concluded.
Data Outputfrequency Level Impedanceresponse Low 1 V Low 10
(Hz) Type High 1 V High 10 Remarks20 dc,ac Voltage High Low Must be used
200 dc,ac Voltage Low Low with charge10,000 ac Volt, charge Low/high See remark amplifiers or
20 dc Current High Low with preampli-fiers with veryhigh inputimpedance
100,000 ac Voltage Low High10,000 ac Volt, charge Low/high
10 dc,ac Voltage High Low10 dc Voltage High Low
(See pressure)
10-100 (See displacement)10-100 (See displacement)
20 dc,ac Voltage High Low20 ac Volt, phase High Low
20 dc,ac Voltage High Low20 ac Voltage High Low20 Digital
Pulse rate Low Low
10,000 dc,ac Voltage Low Low
ac Voltage Low HighPulse
20 dc,ac Voltage Low Low See remark10,000 dc,ac Voltage Low Low acceleration
100,000 ac Voltage Low High and10,000 ac Volt, charge Low/high See remark vibration
Frequency Low Low
20 dc,ac Voltage Low/high Low200 dc,ac Voltage Low/high Low
2 dc Voltage Low Low
Document provided by SpaceAge Control, Inc. (http://spaceagecontrol.com/).

6-1
Chapter 6
SIGNAL CONDITIONING
by
Rodney K. BogueNASA Ames Research Center
Dryden Flight Research FacilityPO Box 273
Edwards AFB, CA 93523-0273United States
6.1 INTRODUCTIONIn the process of acquiring flight information, the ideal situation would use sensors providing perfect infor-mation, impedance-matched and formatted to fit follow-on processes. As used here "perfect" implies that theinformation is an exact replica of the physical parameter of interest. Common parameters include: pressure,temperature, angular rate, and control position. Information from aircraft sensors is usually in an electricalform. In this ideal situation, little or no signal conditioning would be required. It may be necessary to providefiltering to adjust the sensor bandwidth to that of interest to the user, but other signal conditioning wouldnot be needed. As with most real world situations, the ideal is rarely, if ever, achieved. In addition, sig-nal conditioning is almost always utilized to provide an improved match between the information and signalpeculiarities of the sensor and the follow-on stages of the flight information acquisition system. A hazardthat is common to all information acquisition systems is the contamination of the desired information withundesired information (usually called noise). Numerous sources of noise exist in an aircraft and signals arealmost always contaminated to a degree with undesirable noise information (see Ref. 6.1). The process offollowing accepted wiring practice to isolate noise sources, coupled with good signal conditioning practice,will minimize the noise contamination. Signal conditioning in the form of noise filters may be required toseparate undesired noise information from desired signal information.
6.1.1 Signal conditioning definitionAs defined in this chapter, signal conditioning is any operation performed on a parameter prior to the inputstage of a recording or display system. Signal conditioning is performed to adjust the data characteristics or tooptimize the transfer of data from one stage of conditioning to another. Normally the signal conditioning willbe performed after transduction has occurred; however, signal conditioning often occurs (either by accident orby design) prior to transduction.
6.1.2 Signal conditioning purposeSignal conditioning is performed to adjust signal characteristics or to optimize the signal transfer from onestage of conditioning to another. A different way to state the purpose is: to minimize the desirable informationdamage as the signal wends its way from the sensor through the various subsystems of the overall flightinstrumentation system. Examples of signal conditioning include:
1. Analog signal characteristic transformation, such as that performed in a charge amplifier circuit to convertthe information contained in the transducer charge into a voltage much more amenable to interfacing witha data acquisition system.
2. The amplification-attenuation and zero shifting of information in analog format to bring the signal spanand offset into a range that can be accommodated by the analog interface to the data acquisition system.
3. The conversion of analog format information to digital format in an analog-to-digital (A-to-D) converter.This is done to (a) preserve the accuracy and resolution of the data (data in digital form are much lesssusceptible to noise damage than data in analog form) and (b) facilitate the transfer and processing ofinformation in digital systems.
4. The conversion from one format of digital information into another format better suited to a particularsituation. Examples of this category include: conversion from parallel to serial form, or from RS-422 toa MIL 1553B form. (See Refs. 6.2 and 6.3.)
Document provided by SpaceAge Control, Inc. (http://spaceagecontrol.com/).

6-2
5. The compensation for effects of the physical environment on the operation of the sensor-transducer andassociated signal conditioning system. A common example is the compensation of the signal informationfor temperature effects encountered in the aircraft environment.
6.1.3 Principles of signal conditioningThere are several basic principles to observe during the design of a signal conditioning system. This is toassure that the resulting signal conditioning system will provide the highest quality information while meetingthe requirements of the flight program.
6.1.3.1 Treat the sensor-transducer as a system
Sensing and transduction operations include numerous parts. Together the parts have all the characteristics ofa system with associated transfer functions. The characteristics include frequency response and time delayswhich may require compensation in the signal conditioning. A pressure measurement system is a commonlyused example offering several opportunities to illustrate this principle. The pressure measurement system hastwo basic elements: the sensor-transducer element and the pressure network. The pressure network transfersthe pressure signal from the point of measurement to the sensor-transducer. The pressure network may bevery simple or extremely complex and usually is assessed and analyzed somewhat independently from thesensor-transducer. The effect of the pressure network (tubing and transducer internal volume) on the pressuresignal is an example of pretransduction signal conditioning.
d d d d 1
Pressurforce Tubing model Internal
Restoring Diaphragm ElectricalSystem variables force (F) mass output
d = Gas viscosity (stiffness) 0m = Gas massD = Diaphragm damping 0
F = Diaphragm stiffness Strain Transducer
gage excitationvoltage
Damping Diaphragm system(D)
Pressure transducer
900486
Figure 6.1-1. Pressure sensor system.
Figure 6.1-1 shows the interconnection of elements commonly encountered in a pressure sensor. A typicalpressure sensor is comprised of a diaphragm which deflects under the pressure force. Attached to this diaphragmis a resistance strain gage bridge which provides an electrical output proportional to the diaphragm deflection.Both the diaphragm and the strain gage respond to the effects of temperature. It is always a safe assumptionthat all elements respond to the effects of a temperature change. The need for temperature compensation mustbe assessed by the flight test instrumentation engineer after consideration of the expected flight environmenttogether with the accuracy requirements of the program. The diaphragm-strain gauge sensor subsystem also hasa frequency response which is determined by several factors. The basic mechanical response is determined bythe diaphragm stiffness, combined with the mass of the combined diaphragm and strain gauge. The dampingof this system is largely determined by the combined friction loss characteristics of the diaphragm and thedamping of the gas in contact with one or both sides of the diaphragm. Considerations of these factors wouldcomplete the first-order assessment of the sensor-transducer static and dynamic response.
Document provided by SpaceAge Control, Inc. (http://spaceagecontrol.com/).

6-3
The frequency response characteristics of a pressure measurement system are limited by the characteristicsof the pressure attachment network more often than they are limited by the sensor-transducer characteristics.High-frequency signals are rapidly attenuated by passage through long lengths of small-sized tubing. This isparticularly acute when the transducer itself contains a significant internal volume which must be "driven"(filled and vented) from the pressure attachment network. Other factors to consider with the pressure attachmentnetwork include the effects of changing altitude and temperature, which are associated with flight measurementsystems. As higher altitudes are achieved, the reduced ambient pressure and resulting reduction in densitylowers the frequency response of the system. Temperature increases cause changes in density and viscosity,which can have substantial effects on the frequency response of the pressure attachment network. Flight atsupersonic speeds causes the development of shock wave networks in the vicinity of the measurement orifices.These networks can inhibit the venting and filling of the pressure system, thus causing further changes inthe system response. This latter effect is highly dependent on system specific configurations and unlike theprevious effects it does not readily lend itself to mathematical analysis. The effects of the pressure attachmentnetwork on the signal characteristics are called pretransduction signal conditioning, since these effects areimposed on the pressure parameter prior to transduction.
The first-order effects on the strain-gauge electrical characteristics are usually limited to changes brought onby changes in ambient temperature. The commonly used bridge connection of the strain-sensing elements isdesigned to minimize and compensate for temperature-related changes. Since this type of pressure measuringdevice is nonself-generating, an excitation voltage must be supplied to the strain-gauge bridge. This is acritical factor which has a direct effect on the ultimate scale factor of the pressure measurement system.
6.1.3.2 Understand the flight environmentKnowing the flight environment can be a critical element in assessing malfunctions without any obvious cause.Significant environmental factors include: (1) temperature (especially low temperature at high altitudes or hightemperature at high speeds), (2) vibration (potentially of great importance when flexible mounting supportsare used), (3) electrical noise (frequently generated by the aircraft system), and (4) pressure (at low levels thepressure reduces system resistance to arcing). It is frequently prudent to include environmental sensors in themeasurement system to provide clues when unexplained difficulties arise with normally reliable sensors andtransducers. These environmental sensors often provide clues to the causes of malfunctions. This is done byproviding environmental information to assist in identifying differences in temperature or other environmentalparameters which may be affecting sensor operation. Often it is possible to correlate the onset of a malfunctionwith a particular environmental condition, such as a temperature level or a g level. When the environmentalproblem is understood, appropriate signal conditioning can be created to compensate for the environmentaleffect. Alternatively, environmental control capability may be added to avoid the malfunction. If neitherremedy is successful, it may be necessary to replace the sensor with one better suited to the environment. Anexample is the case of a piezoelectric accelerometer which stopped working under low-temperature conditions.It was determined that neither signal conditioning nor environmental control could be used to solve the problem.The only solution was to replace the accelerometer with a thoroughly tested unit, verified for operation in thecold environment.
6.1.3.3 Understand the physics behind the operation of the sensor-transducer systemIn concert with the principle of treating the sensor-signal conditioning as a system, recognize that each part ofthe sensor has its own response characteristics which must be accommodated in situations where its influencemay be felt. For example, a flush-diaphragm transducer does not have the usual cavity on both sides of thediaphragm. This may lead to a very lightly damped diaphragm that is sensitive to rapid pressure transients. Itmay be possible to provide damping from the back side of the transducer to bring the underdamped conditionto an acceptable level of performance. Another example of this principle is to understand that piezoelectrictransducers provide a charge output proportional to the sensed parameter. It is possible to use a voltageamplifier to condition the output signal. However, if it is understood that the critical output of the transduceris the electrical charge, it will be understood that the voltage output of the sensor is dependent on the straycapacitance associated with the transducer and connecting cabling. Therefore, a voltage amplifier will cause the
Document provided by SpaceAge Control, Inc. (http://spaceagecontrol.com/).

6-4
conditioned output to be a function, not only of the transducer output charge, but also of the stray capacitancein the system. The stray capacitance is usually an uncontrolled parameter sensitive to temperature and otherenvironmental effects. A charge amplifier, on the other hand, provides a conditioned output signal directlyproportional to the transducer output charge.
6.1.3.4 Signal condition appropriate to the basic transducer output characteristicFor example, if the transducer is a piezoelectric device whose output is an electrical charge, a charge amplifiershould be used to condition the output to a signal proportional to charge. Inappropriate signal conditioningwill add noise to the conditioned output and often decrease the sensor tolerance to changes in the environment.When the transducer output is an impedance change, signal conditioning should be provided to develop anoutput proportional to the respective impedance. In this case, an appropriate approach would be to use animpedance bridge configuration, or a constant current sensor excitation to minimize the effects of installationvariables.
6.1.4 Signal conditioning categoriesA so-called "linear" signal conditioning operation is one governed by a linear differential equation. Anotherway to specify a linear operation is to say that no frequency exists in the conditioned output which did notexist in the raw input signal. Most linear operations are analog in nature.
Nonlinear operations are all operations that do not fit the linear category. Most digital operations are of thenonlinear type. Analog operations that involve complex functions involving powers greater than one or productterms of algebraic functions are examples of nonlinear analog operations.
6.2 LINEAR OPERATIONSLinear signal conditioning operations are governed by linear differential equations (for example, ax" + bx' +cx + d = y). The term "linear" is derived from the fact that there are neither terms in the equation involvingthe product of x terms nor terms raised to powers other than one. Linear operations are characterized byhaving no frequency in the output from the operation which did not exist in the input to the operation.
6.2.1 Amplification and attenuationAmplification and attenuation are examples of linear signal conditioning operations. Amplification consistsof increasing the power of a signal by a factor. Considering the algebraic equation for linear operations (y =mx + b) with x the input variable and y the output variable, amplification would be represented as an increasein the m coefficient value. Amplification is necessary when the signal level from the sensor-transducer isinsufficient to provide an appropriate input to the follow-on stage. Amplification is accomplished by usingsome type of amplifier. Attenuation is an infrequently needed signal conditioning operation because signalsare, in general, low level. When necessary, attenuation is usually accomplished with a passive resistor network.
6.2.1.1 Types of amplifiersThe type of amplifier may be categorized into the input and output parameters upon which the unit operates.For example, a voltage input may result in a current output, or a charge input may result in a voltage output.As indicated by the examples, the output parameter may not be the same as the input. The most prevalentamplifier, however, is the voltage-input, voltage-output type. Occasionally, it may be necessary to use a specialpurpose amplifier to address a particular set of circumstances.
Matching the transducer output parameter is one of the most important situations where a special purposeinput amplifier is required. For example, when the transducer output is a current, an amplifier whose inputis designed to accept voltage as an input should not be used just because it happens to be readily accessible.As noted in Sections 6.1.3.3 and 6.1.3.4, the amplifier input parameter should be matched to the sensor outputparameter. In this example, a current amplifier should be used when the output from a sensor is a current.Another common situation occurs when it is necessary to match the charge output from a piezoelectric sensorto an amplifier designed to accept charge as an input. Most data acquisition systems accept voltage as aninput, so it is usually safe to use an amplifier whose output is a voltage for direct connection to these systems.
Document provided by SpaceAge Control, Inc. (http://spaceagecontrol.com/).

6-5
Compensating for line resistance fluctuations is a situation where the use of a current amplifier offers theopportunity to reduce induced noise pickup. This situation may occur when the signal leads pass through sliprings or through a high-temperature region which may appreciably change the line resistance as the temperaturefluctuates. In this case, driving the signal lines with a current amplifier and converting the line current tovoltage with a current-to-voltage amplifier may be a prudent approach to limiting the noise contamination fromline resistance effects.
6.2.1.2 Important amplifier characteristicsIt is important that an amplifier have well-controlled and stable characteristics for good performance in thesignal conditioning role. The most important characteristic that an amplifier should possess is linearity. Theoutput parameter should be a faithful reproduction of the input parameter at an increased magnitude. In otherwords, does the amplifier have the same gain for all signal levels, or does the gain change or the amplifiersaturate for signal levels within the range of interest? Another important characteristic is that the amplifiergain should not be affected by environmental conditions such as temperature.
6.2.2 Filtering (signal enhancing)Filtering is a linear operation often performed as part of signal conditioning to enhance a particular part ofthe information imbedded with other material within the overall signal. Filtering is done with the intent ofeliminating unwanted frequencies in the signal. However, if not used with great care filtering can also changeessential information.
6.2.2.1 Filtering examplesSeveral common examples of signal conditioning filtering are used to illustrate the widespread application offiltering. The first type of filtering, antialiasing filtering, is used to prepare the signal for A-to-D conversion. Ill-prepared signals converted to digital format may contain a mixture of frequency information which irretrievablydamages the information of interest. Chapter 7 of this document contains an extensive discussion of antialiasingfiltering. The type of low-pass filter should be chosen to provide adequate protection against aliasing and toavoid undue distortion of the signal wave shape, when that is an important consideration.
Figure 6.2-1 shows the frequency response of seventh-order Bessel, Butterworth, and Chebyshev filters. Thisinformation would indicate that the Chebyshev filter provides the most rapid attenuation and therefore the"best" antialiasing protection.
0 ............................................
-20- Common -3 dB response at f 11
-40-SIButterwor hl
4J) " - 60 _ _ _.__ _"k ....
SChebyshe.
-80-
- 100 - ' I ... ....
2 3 4 5 6789 2 3 4
Normalized cutoff frequency, Hz 900487
Figure 6.2-1. Seventh-order-filter frequency response comparison.
Document provided by SpaceAge Control, Inc. (http://spaceagecontrol.com/).

6-6
A look at Figure 6.2-2 shows that the wave shape of a noisy input square wave, at a frequency of half thefilter cut-off frequency, is severely distorted by the Chebyshev filter and is best preserved by the Bessel filter.Therefore, a review of the system information requirements must be conducted before an appropriate filter canbe selected.
0.6- Chebyshev
0.4-
m 0.2--
-,-
~0.0-
-0. It
-0.& utewrh
0 2 4 6 8 10
Time, sec 900488
Figure 6.2-2. Seventh-order-filter time response comparison.
A second type of filtering is used to remove an unwanted steady-state signal component so that more importantdynamic information may be assessed. This type is termed a high-pass filter. Filtering is used to removeunwanted noise information from a signal, but only after all other procedures (such as improving the groundnetwork) have been implemented. The noise contamination often arises from other airborne systems, whichradiate electric or magnetic fields that are collected by the sensor-transducer or its associated wiring and mustbe removed for optimum information analysis. Often this noise contamination is at a characteristic frequencysuch as might be used in aircraft 400-Hz power generators. This noise can be attenuated using a band-passfilter. Extra care must be exercised with the band-pass filter to avoid problems created by the often abruptphase change characteristics near the band-pass frequency. Abrupt phase change characteristics can causesubstantial wave-shape distortion in a signal.
6.2.2.2 Types of filters and characteristics
There are three basic types of filters used in signal conditioning applications. The first and probably the mostoften used is the low-pass filter which attenuates high-frequency signal components and minimally affects thelow-frequency information. This filter is used (as noted previously) for antialiasing applications. In addition,when the information of interest in a signal is contained in the low-frequency or quasi-steady-state regionof the spectrum, a low-pass filter is used to attenuate the unwanted high-frequency information. When theinformation of interest in a signal is found in the higher range of the spectrum, a high-pass filter is oftenused to attenuate the lower frequency components to facilitate the observation and analysis of the dynamicinformation. In the case where a single frequency or a band limited noise source adulterates the desiredsignal, it is possible to remove the offending information using a band-stop filter. In some circumstances, theinformation of interest is contained in a single frequency or a narrow band of frequencies. A band-pass filteris used in this situation to remove noise from the signal. Band-stop and band-pass filters often have highly
Document provided by SpaceAge Control, Inc. (http://spaceagecontrol.com/).

6-7
nonlinear phase characteristics and the use of these filters introduces the risk of substantially altering the signalwave-shape information.
6.2.3 Zero shiftingIn some cases a signal may contain a steady-state component which contains no information of interest. Anadditional difficulty with the steady-state component is that it makes ineffective use of the dynamic rangeof the signal conversion processes (A-to-D conversion, frequency modulation (FM) conversion, and so on).Under these circumstances, zero shifting may be used to bring the range of the signal excursion into a morefavorable range for conversion. Zero shifting is an operation often built into standardized signal conditioningmodules. Although zero shifting is a simple concept, it is not easy to mechanize, particularly when highresolution-accuracy is a requirement. Zero shifting is probably most necessary with bridge-type sensors suchas strain gauges. Sometimes, it is more effective to add trimming resistors to the bridge installation to achievethe correction of the zero offset. An alternative solution to the zero offset is to use a high-pass filter with avery low-frequency cutoff. The filter approach can compensate for slowly drifting steady-state levels and willpass the dynamic signal components, which are usually of more interest.
6.2.4 CompensationCompensation is often utilized to counteract the undesirable effects of environmental parameters on transducercharacteristics. Temperature is the most important parameter requiring compensation (often in the form of aso-called "ice bath reference"). Other parameters that sometimes require compensation are ambient pressureand transducer excitation level. Transducer zero offset and scale factor changes with temperature are oftencorrected to improve final data accuracy in critical situations where high accuracy is an absolute requirement.
6.3 SIGNAL CONVERSIONSignal conversion is performed to change the signal characteristics for one or more of the following reasons:
1. To decrease the susceptibility of the signal-to-noise contamination.
2. To enable telemetry transmission of the signal over a radio frequency link.
3. To enable the recording of the signal on magnetic recording media.
The first purpose is exemplified by the use of a carrier system with an impedance bridge (such as a strain gauge).This approach makes the modulated carrier signal resistant to the introduction of noise outside a bandwidthlocalized near the carrier frequency. Another more familiar example is the encoding of an analog signal intoa digital format, to limit noise susceptibility. Digital formats are particularly resistant to the introduction ofnoise.
The conversion of the analog signal to an FM format is an example of signal conversion performed to enablethe signal transmission over a radio-frequency (RF) link and to permit the magnetic recording of the signal.Modem systems typically use a double conversion to FM format. First, several channels are converted to FM.The channels are then multiplexed to a composite signal, and the signal is converted to an FM format. The firststep in this FM conversion process uses a separate subcarrier frequency for each data channel. This processis termed FM-FM. Conversion to digital format is another common example of a conversion performed fortransmission and recording purposes.
6.3.1 ModulationModulation is the process of using a characteristic of a so-called carrier signal to convey information, either fortransmission to a remote receiving site or for recording on magnetic media. The carrier signal characteristicsused most often for modulation purposes are the carrier amplitude, frequency, and phase. Strictly speaking,pulse code modulation (PCM) does not fit the traditional concept of modulation. Pulse code modulation is theconversion of analog information to a digital form through the use of an A-to-D converter.
Document provided by SpaceAge Control, Inc. (http://spaceagecontrol.com/).

6-8
6.3.1.1 Amplitude modulation
Amplitude modulation (AM) is rarely, if ever, used for telemetry purposes in modem flight data acquisitionsystems. The AM process is highly susceptible to noise contamination, although it makes effective use ofavailable bandwidth. Amplitude modulation telemetry is suitable only for signals where the dynamic andsteady-state accuracy requirements are very relaxed.
The AM process is well-suited to an individual sensor carrier system for noise suppression. A variableimpedance sensor is often used in a bridge configuration to provide a balanced output and a zero offsetcapability. It is common to provide steady-state, direct current (dc) excitation to an impedance sensor (such asa strain gauge) in the bridge configuration. This steady-state excitation provides acceptable performance wherethe environment is reasonably noise-free; however, any noise induced into the circuit is inseparable from thenormal signal and appears as an error voltage. It is advantageous to excite a bridge sensor configuration withan alternating current (ac) single frequency when it is important to reject noise pickup. In this situation, thebridge signal configuration performs as a balanced modulator whose output is in the form of a suppressedcarrier signal. With the ac excitation, the information in the output signal is contained in the amplitude of thecarrier. The noise voltages that may appear are outside the bandwidth of the carrier and are easily rejectedthrough proper application of filters. Another advantage of this technique is that the suppressed carrier signalmay be amplified using ac-coupled amplifiers, which are not susceptible to the drift and offset variations causedby temperature changes in dc amplifiers.
6.3.1.2 Frequency and phase modulation
Frequency modulation (FM) and phase modulation (PM) have excellent noise rejection characteristics, with FMbeing more widely used in flight systems. Frequency modulation is an attractive approach because tradeoffscan be made between modulated signal bandwidth and accuracy to cover a wide range of requirements: TheInter-Range Instrumentation Group (IRIG) has defined FM systems standards in proportional bandwidth (PB)and constant bandwidth (CB) forms (see Ref. 6.1). Proportional bandwidth systems include channels whosebandwidth is proportional to the subcarrier frequency to accommodate a mix of signals with a variety ofsignal bandwidths. Constant bandwidth systems are specified with all channels having the same bandwidthindependent of the subcarrier frequency. The CB systems are most useful where several channels havingsimilar bandwidth requirements must be accommodated.
An important index of FM system performance is the ratio of carrier deviation frequency to maximum signalfrequency (termed the deviation ratio). As a rule, an improved data signal-to-noise ratio (SNR) will be realizedwith higher deviation ratios. When the signal frequency increases, the sidebands (located on either side of themodulated carrier) are more widely spaced and thus fewer of these sidebands can be included in the bandwidthlimited modulated composite signal. The fidelity of the modulation-demodulation process is directly relatedto the number of sidebands included in the transmission. Accuracy studies have shown that a deviation ratioof 4 produces a data SNR of approximately 34 dB (2% rms error), while a ratio of 2 yields a data SNR ofapproximately 26 dB (5% rms error). The SNR for a data channel varies as the 1.5 inverse power of thedeviation ratio (Ref. 6.1). As with most systems, higher accuracy performance is achieved at the expense ofincreased bandwidth.
Although it is not widely recognized, an FM system is a sampled system with an infinite resolution. Since thesignal information is contained in the frequency of the modulated carrier, the frequency must be measured todetermine the signal level at any point. Measuring the frequency requires a finite time (however short it maybe) because the composite signal must be measured at two separate time points for frequency determination.It is very important to consider this effect to avoid aliasing as described in Chapter 7 of this document. Formore information refer to Reference 6.1, Chapter 5.
6.3.1.3 Pulse code modulation
Pulse code modulation (PCM) is a widely used technique for converting analog information into a digitalform, either for storage or for transmission over a telemetry link. The conversion from analog into digitalformat may be accomplished using a variety of techniques, some of which will be discussed in the following
Document provided by SpaceAge Control, Inc. (http://spaceagecontrol.com/).

6-9
narrative. As with FM, PCM systems can be tailored to accommodate a variety of requirements by trading-offsystem resolution against bandwidth. Increased measurement resolution is obtained by increasing the digitalword length of the converted digital data. In most situations, these digital data are transmitted in serial format.In the serial format, all else being equal, the increased data word length takes more time for transmission, thusreducing the channel bandwidth.
6.3.2 DemodulationDemodulation is the process of recovering the original information from a modulated signal.
6.3.2.1 Amplitude modulation signals (phase sensitive demodulation)
The AM signal information in an individual sensor system is contained in the suppressed carrier signal fromthe transducer bridge, which is acting as a balanced modulator. Normally, this information must be convertedinto a standard analog signal for analysis or further processing. This requires a balanced demodulator whichextracts the amplitude information. A balanced demodulator requires the availability of the original carrier asa reference. Devices which may be used for demodulating include analog multipliers and electronic choppercircuits. Both are driven by the reference carrier.
6.3.2.2 Discrimination
Discriminators are used to extract the information from FM signals. Several circuit configurations are used todiscriminate the FM signal and extract the information in an analog form. The details of these circuits are notimportant, but their performance in terms of linearity is critical to the operation of a high-quality data system.Any nonlinearity in the discriminator will appear directly as distortion or noise in the output.
6.3.2.3 Demodulation of pulse code modulationA PCM signal most often contains digital information from several channels. This information must beseparated and made available, still in digital form, for further processing (usually by digital computers). Thecommon PCM signal has what is called a frame of data, which is in turn imbedded into a cycle of data. Theframe is a repeating sequence of information from a selected set of channels. The cycle of data has at leastone sample from each channel in the system. To extract the digital information, it is necessary to recognizethe individual words in the data stream, as well as the beginning and ending of the data frame and cycle. Thisis achieved by using a word and frame synchronizer to identify and separate the digital information.
6.3.3 Commutation and samplingCommutation is the process of time multiplexing (or time sharing) a single transmission or conversion channelamong several data channels. The term commutation is derived from the electrical switch used in electricalmotors to switch the current from one winding to another. Commutation is most often performed to makemore effective use of expensive signal conversion and processing resources. Inherent in the commutationprocess is the sampling operation where "snapshots" are taken of a signal on a regular basis for subsequentinput to a sampled data conversion process. The most common process is the A-to-D converter. To avoiddata contamination as a result of the sampling process, it is important to adhere to specific rules regarding theratio of sampling frequency to data frequency. When these rules are violated, the data are subject to an effectcalled aliasing in which high-frequency data masquerades (or operates under an alias) as lower frequencyinformation. If this aliasing effect is permitted to occur, the high-frequency data are irretrievably intermixedwith lower frequency data and there is no process that can separate the information. Obviously, aliasing cancreate serious problems for the data user. This is particularly severe because there are no clues that the data arecontaminated, and incorrect conclusions may be drawn from the analysis. Chapter 7 of this volume discussesaliasing (as does Ref. 6.1) in more detail.
6.3.4 Analog-to-digital conversionAnalog-to-digital conversion is a key process in all flight test instrumentation systems. As used in thiscontext, the A-to-D conversion may be accomplished in a level-to-frequency converter, the more conventionalsuccessive approximation or dual-slope converter, a so-called flash A-to-D converter, or a delta-sigma converter.
Document provided by SpaceAge Control, Inc. (http://spaceagecontrol.com/).

6-10
successive approximation or dual-slope converter, a so-called flash A-to-D converter, or a delta-sigma converter.All of these converters perform the function of converting information in analog form into digital information.The digital output may be a frequency or a conventional serial or parallel digital word.
6.3.4.1 Pulse-rate conversion
Probably the simplest A-to-D converter is the dc-to-pulse-rate converter. This device converts an analog input(usually in the form of an analog voltage) into an output frequency proportional to the magnitude of the inputvoltage. This is a frequency modulation technique, however, it results in a sampled signal that has digitalcharacteristics and is therefore treated in this section. The advantages of this converter are its simplicity,high resolution, and continuous (free-running) operation. It is simple to convert back to an analog signalformat using a simple digital counter. An advantage is that with proper conditioning, the output signal maybe multiplexed with other signals to make good use of data channel capacity.
6.3.4.2 Commanded conversion (sampled)
The converters that require specific sampling operations are used to convert steady-state signals into digitalform. These types of converters typically operate when a "convert" or command signal is sent to the converter.Then the device enters its conversion cycle to transform the analog input into a digital word (either serial orparallel format).
6.3.4.2.1 Successive approximation conversionFigure 6.3-1 (see Ref. B1) illustrates successive approximation digital-to-analog (D-to-A) converters that usethe popular R-2R ladder circuit and are used as a feedback element in the A-to-D converter. The successiveapproximation A-to-D converter is illustrated in Figure 6.3-2 (see Ref. B1). The successive approximationA-to-D converter (as the title would indicate) encodes the analog voltage input through successive comparisonswith ever-smaller voltage increments, until the final value at the specified resolution is achieved. The successiveapproximation process begins with a comparison of the input voltage with the half-scale converter range as astandard. If the input exceeds the half-scale level, the most significant bit (MSB) is set to one, and the half-scale voltage is subtracted from the input to develop a residual voltage in preparation for the next conversionstep. If the input is less than the half-scale level, the MSB is set to zero and the unmodified input becomesthe residual for the next conversion step. This process is repeated for the next conversion step, except nowthe comparisons are made with one-quarter of full scale. This process continues until the prescribed numberof steps have been exhausted, at which time the conversion is complete. Commercially available successiveapproximation converters can typically provide resolutions from 8 to 16 bits at conversion times ranging from10 /Lsec to 25 nsec. The successive approximation converter is the most popular converter in use today.
Vr 22 2 2
1 \ 0 ---- 1 0 --- i \ 0 1 ----0-- -
22 R2 2R t
R R900489
(a) R-2R ladder network D-to-A converter.Figure 6.3-1. Successive approximation D-to-A converters.
Document provided by SpaceAge Control, Inc. (http://spaceagecontrol.com/).

6-11
V 2R R R 2Rr2
2 - 2 -2R 2 R
2R
900490
(b) R-2R ladder network D-to-A converter with buffer.
Figure 6.3-1. Concluded.
2 Comparatormp
Successiveapproximat ionregister (SAR)
D-to-a 1 Output
converter N
900491
Figure 6.3-2. Successive approximation A-to-D converter.
It is vitally important that the input voltage not be allowed to change during the conversion process. A slightchange in the input voltage during conversion potentially can result in very large conversion errors. Usually,a sample-and-hold amplifier is used ahead of the successive approximation converter to avoid this problem.High resolution (14 to 16 bits) successive approximation A-to-D converters have become feasible with the
advent of laser-trimmed resistance networks.
Document provided by SpaceAge Control, Inc. (http://spaceagecontrol.com/).

6-12
tch Clockoscil-
C omparator later
Integrato amp--
X V • Ou t pu t buffer
Strobe
Convert probe Digital output
tO tc t2
eTime
SFixed • - i etime s o e9004 2
Figure 6.3-3. Dual-slope, A-to-D converter.
6.3.4.2.2 Dual-slope conversion (formerly called ramp conversion)Figure 6.3-3 (see Ref. B2) illustrates the elements and the conversion process for the dual-slope converter.The dual-slope, A-to-D converter was one of the first high-resolution converters available commercially, and
was used first in digital voltmeters. This device begins the conversion process by integrating the unknowninput voltage for a known fixed interval. A second phase of the conversion process discharges the integratorby applying a precise reference voltage of the opposite polarity to the integrator while measuring the timerequired to complete the discharge.
Document provided by SpaceAge Control, Inc. (http://spaceagecontrol.com/).

6-13
1 ftl 1iftt2R I Vdt WC_ 1 Vrdt (6.3-1)
vrR• (ti - to) = -(t 2 - tl) (6.3-2)
_= Vr(t 2 -t) (6.3-3)(ti - to)
Equation (6.3-1) expresses the equality of these two phases, the left side of the equation shows the integratorcharge process, and the right side shows the discharge. Evaluating the integral yields equation (6.3-2). Thisequation shows that the RC factor appears on both sides of the equation and thus the process depends neitheron the absolute values of either R or C, nor on variations in either value from one conversion time to thenext. Simplifying equation (6.3-2) yields equation (6.3-3) which shows that the unknown voltage is directlyproportional to t2 (since the reference voltage is known, as well as the fixed phase one integration timet2 - tl). These two conversion procedures (dual slope) taken together provide error compensation andtogether are the preferred conversion process when high-accuracy conversions are required.
6.3.4.2.3 Parallel (flash) conversionFigure 6.3-4 (see Ref. B1) illustrates a flash A-to-D converter system. Where extremely high data conversionrates (up to 100 million conversions/sec or more) are required (for example, in airborne digital television signalconversions) the parallel or flash converter is used. These converters rarely offer higher than 8-bit resolutionbut perform the conversion. The flash converter performs its conversion in a single operation using an arrayof comparators and voltage references. Using as many as 256 reference voltages and voltage comparators,the input voltage is simultaneously compared with many reference voltages. The appropriate voltage 'rangeis quickly identified and encoded without successive conversion steps. This technique is effective only whenextremely high conversion rates are required.
6.3.4.2.4 Delta-sigma conversion
Delta-sigma conversion and its derivatives are used only when relatively high conversion rates, coupled withlow-accuracy requirements (such as might be associated with voice conversion) are needed. The basic delta-sigma conversion is a very simple "l-bit" PCM system which is sampled at a high rate. A single "flip-flop"drives a controlled voltage reference which (reflecting the state of the flip-flop) outputs either positive one-halfof full scale or negative one-half of full scale. A single comparator driving a one-shot multivibrator comparesthe input voltage with the voltage reference, driving the flip-flop to the "on" state if the input is above one-halfscale and turning the flip-flop "off' if the input is below one-half scale. If the existing state of the flip-flopis "correct" as specified previously, then the state is not changed. The successive conditions of the flip-flopprovide a digital sequence that is the serial encoded analog signal. Delta-sigma A-to-D conversion has limitedapplication in flight test, but serves quite well when the requirements of the program match the delta-sigmacharacteristics.
6.3.4.2.5 Oversampled conversion
An A-to-D conversion technique recently made practical through the availability of complex digital filters isknown by various names: over-sampled, sigma-delta, and "bit stream." This class of A-to-D converters ischaracterized by oversampling at a low-order resolution, noise shaping, and digital filtering. Oversamplingrefers to the fact that the analog input signal may be sampled at rates as much as 1 million times (calledoversampling ratio) the required Nyquist rate. Noise shaping concerns the effects of the A-to-D conversion,which adds a substantial amount of quantizing noise to the converted signal in the process of convertingthe signal to digital form at a very low resolution. The built-in digital filter removes the high level of thequantizing noise and serves to increase the resolution of the digital output by factors on the order of 100 timesthe oversampling ratio. As an example, a converter sampling with 1-bit resolution at a rate of 16 kHz can
Document provided by SpaceAge Control, Inc. (http://spaceagecontrol.com/).

6-14
provide an output sample 20 times/sec at a resolution of 16 bits. Another design sampling with 1-bit resolutionat a rate of 4 MHz can provide an output sample 1000 times/sec at a resolution of 20 bits.
V.-in
V0
R+
1 (Highest)R
2 - 2 2
R+3
Priority 21
encoder 2R
R + 6 -020
7 (Lowest)R
R
R
900493
Figure 6.3-4. Flash A-to-D converter.
Figure 6.3-5 is a diagram of a sigma-delta A-to-D converter. The input analog signal is first applied to asumming junction which subtracts a feedback signal from the output. The summing junction output is appliedto an integrator. The integrator output is digitized with a resolution of 1 bit, the 1-bit A-to-D output is thenconverted back to an analog form for application to the summing junction.
Among the advantages of this technique are
"* Linearity and excellent differential linearity
"* No or minimal antialiasing filtering requirements
Document provided by SpaceAge Control, Inc. (http://spaceagecontrol.com/).

6-15
Analog modulator
Integrator 1-bit comparat or
AnalogDita
Digital> output
' /~d-t°-a
920783
Figure 6.3-5. Sigma-delta A-to-D converter.
* No requirement for precisely matched analog components
* External sample-and-hold circuitry are not required
* Useful tradeoffs possible between resolution and sample rate
Most oversampling A-to-D converters use a 1-bit D-to-A converter in the feedback of the analog modulator.This converter switches between two reference points and the digital filter provides a straight-line interpolationbetween the two points and the 1-bit D-to-A converter. This technique provides nearly ideal linearity whenthe remainder of the converter design is of high quality.
The job of the digital filter is the removal of the unwanted out-of-band quantization noise. An attractivebyproduct of this process is the removal of aliasing frequencies at multiples of the output sample rate. It isimportant to note, however, that spectral components in the analog input signal near the oversampled rate orinteger multiples thereof are not attenuated by the digital filter. Depending upon the design of the digital filter,the converter may alias input signal components that are greater than half the output word rate. The applicationrequirements combined with the converter characteristics must be fully assessed to determine the antialiasingneeds. In some situations, no antialiasing filter is needed, while in other situations a simple resistor-capacitorfilter may suffice. When the effects of the oversampling process are considered, it may be understood whythe antialiasing filtering requirements may be reduced. As the input sampling rate is increased, the repeatedspectrums created are spread out at increasingly higher frequencies and the antialiasing filters (should they berequired at all) may have relaxed roll-off characteristics.
The digital filtering process effectively averages many samples taken over a period of time into a singleoutput. Thus, it is not necessary to "freeze" the input signal with a sample-and-hold device (as it is withother A-to-D converter concepts) since the converter output represents an average or an "integral" of the inputsignal between the converter outputs. The oversampled converters have been described as a signal trackingconversion process, because the output of the D-to-A converter is driven to the value of the summing amplifier.
6.3.5 Digital processesDigital processes in a flight instrumentation system conventionally have been limited to reformatting data orconverting a sequence of coded information to a second sequence using a different code. For example, testinformation may be converted to a serial telemetry bit stream, or information may be extracted from a 1553Bdata bus (see Ref. 6.3) and interleaved with a serial PCM bit stream.
Document provided by SpaceAge Control, Inc. (http://spaceagecontrol.com/).

6-16
6.3.5.1 Code conversion
Code conversion takes place primarily in two situations. The first is where a nonprogressive code (for example,a Gray code from a digital transducer) must be converted to a more usable progressive code (for example,a straight binary code which "progresses" in a normal count sequence). The second situation is where aformatted serial bit stream contains information that must be extracted and merged into a second formatted bitstream. The first situation is a relatively simple and straightforward process, which often can be accomplishedby the use of a combinatorial logic network or its equivalent. The second situation is substantially morecomplex. It may involve the decommutation and interpretation of a serial bit stream (bit, word, and framesynchronizers), storage, and subsequent interleaving into the second data stream.
6.3.5.1.1 Gray code conversion
The Gray code is a member of a class of nonprogressive digital codes which do not progress in a numericalorder (either in an up or down counting order). The Gray code is used most often when a mechanical positionmust be converted into a digital word. The advantage of a nonprogressive code in this situation is that inevery case when proceeding from one count to the next, only one bit changes state. This characteristic isuseful, for example, in encoding shaft position either mechanically or optically (see Fig. 6.3-6). It is virtuallyimpossible to align an array of mechanical switches or optical sensors so precisely that each switch changeof state occurs at the same position. A progressive digital code often changes several bit states when movingfrom one state to another (for example, when moving from position 011 to 100 all bit states change). Perfectarray alignment would find all bits changing simultaneously; however, slight misalignment would offer theopportunity for several incorrect intermediate states to create errors. For example, in moving from 011 to 100,the following sequence may occur: 011, 001, 101, 100. The intermediate states (001 and 101) will createmisleading information if no protection is provided.
010Oil
001 110
000 ill
100 101
900494
Figure 6.3-6. Rotary shaft encoder.
Document provided by SpaceAge Control, Inc. (http://spaceagecontrol.com/).

6-17
G2 • ] SB B2- -
2B2 2 W2
I,•B2 G2
Gl 1B
G 0 BB0 B GGO• B0
900495 900496
(a) Gray-to-binary code conversion. (b) Binary-to-Gray code conversion.
Figure 6.3-7. Gray code conversion networks.
Figure 6.3-7 illustrates logic networks for conversion of Gray code to binary code and binary code to Graycode. Provided here is an example of a simple 3-bit Gray code along with a corresponding straight binarycode.
Gray code 000 001 011 010 110 111 101 100
Binary code 000 001 010 011 100 101 110 111
6.3.5.1.2 System specific to pulse code modulation conversion
A system specific code to PCM conversion is often required when an aircraft system bus contains informationthat is needed by the real-time telemetry system for ground display of aircraft information, for example, a1553B (see Ref. 6.3) or ARINC 429 (see Ref. 6.5). In this case, it is necessary to extract the data from thesystem bus through the use of word identification hardware. This is no longer a trivial conversion and it maysometimes be accomplished most effectively through the use of microprocessor-based systems. In most cases,it is best to allow the conversion to proceed asynchronously, with the PCM system receiving the most recentinformation for inclusion. If the next PCM data window arrives with no "new" data having been received, the"old" data are supplied. This approach avoids the difficulties of synchronizing the operation of two systemswhen each has different requirements.
6.3.5.1.3 Encryption
Encryption is a process which is used to deny access to telemetered or recorded information to anyone nothaving access to the "key" used for the encryption process. The study of a data stream will reveal that itis highly correlated. It is a relatively simple process to determine the word and frame rates using computer-assisted analysis techniques. The encryption process is used to make the data stream appear uncorrelated ormake it seem like "white noise" to the unsanctioned listener. The process also frustrates the computer-assistedanalysis, or at the very least makes the cost unacceptably high (in terms of clock time and computer resourceusage) to the unauthorized listener. It should be noted that it is very difficult to encrypt data in such a waythat eventually the data cannot be decoded, given enough time and computer resources. The most commonencryption technique is to generate a "pseudorandom" bit pattern by processing the binary data stream with ashift register having feedback to a summing junction. This concept is discussed in detail in Chapter 12. Thisprocessing creates a data stream with pseudorandom characteristics. A pseudorandom bit pattern is one thatclosely approximates the characteristics of white noise and effectively masks the data from the unauthorizedlistener. Decoding this encrypted bit stream requires that the authorized receiver be given access to the structureof the shift register feedback architecture, along with synchronization timing, so that the encryption process
Document provided by SpaceAge Control, Inc. (http://spaceagecontrol.com/).

6-18
may be reversed to provide clear code data for analysis. It should be noted that errors in the transmission ofthe encoded information create multiple errors in the reconstruction process.
6.3.5.2 Data compression
Data compression is an effective technique for "enriching" data streams for the purpose of reducing thebandwidth required for transmission. It is the nature of the compression process that the data no longer appearas regular samples, but emerge from the compression algorithm as intermittent samples separated from oneanother by random time intervals. It is necessary (usually as a part of the compression process) to provide timeinformation as a part of the data. The inclusion of the "time tagging" in the data stream adds to the volume ofdata and negates a part of the benefits from the compression. This tradeoff must be assessed carefully duringthe selection of a compression algorithm, or the advantages of the use of data compression may be seriouslycompromised. The following data compression algorithms are in common use.
6.3.5.2.1 Pass on change
This is a conservative algorithm that does not sacrifice any data to the compression algorithm. Only data thatare different from the prior value are transmitted. This algorithm is effective only where the data are mostlystatic. Little or no benefit will be realized by using this algorithm on highly dynamic data.
6.3.5.2.2 Floating window
This algorithm effectively reduces the resolution of the data by defining a window (range of data values)and passing only the data for transmission which fall outside the window. When data are transmitted, a newwindow is created and the process begins again. This algorithm is effective for steady-state data that have adynamic component of little or no interest to the user.
6.3.5.2.3 Limit exceedance (fixed window)
This algorithm provides data only when the data exceed defined fixed limits. This process is useful whenwarnings are needed and corrective action is required when a parameter exceeds a preset maximum (orminimum). For example, when overshooting a temperature limit or pressure limit creates a dangerous situation.
6.4 CONCLUDING REMARKSSignal conditioning is a critical aspect of the overall flight test instrumentation process. It must receive properconsideration to assure that the data quality provided by the transducers is maintained. The design of signalconditioning is not a trivial job, particularly when the accuracy and reliability requirements are of a high leveltypical of those found in a flight test instrumentation system. As indicated by the title of this volume, onlythe basic principles and a few illustrative examples are covered in this chapter on signal conditioning.
6.5 REFERENCESBooks:
B 1. Malvino, Albert P., and Leach, Donald P., Digital Principles and Applications, Fourth ed. McGraw-Hill,New York City, NY, 1986.
B2. Strangio, Christopher E., Digital Electronics: Fundamental Concepts and Applications, Prentice Hall,Englewood Cliffs, NJ, 1980.
Technical Papers and Internal Documents:
6.1 Veatch, D.W. and R.K. Bogue, Analogue Signal Conditioning for Flight Test Instrumentation,AGARD-AG-160, Vol. 17, 1986.
6.2 Borek, R.W., Practical Aspects of Instrumentation System Installation, AGARD-AG-160, Vol. 13, 1981.
6.3 SCI Systems Inc., "Aircraft Internal Time Division Command/Response Multiplex Data Bus,"MIL-STD-1553B, Multiplex Applications Handbook, Huntsville, AL, Sept. 1978.
Document provided by SpaceAge Control, Inc. (http://spaceagecontrol.com/).

6-19
6.4 Electronic Industries Association, "Electrical Characteristics of Balanced Voltage Digital Interface Cir-
cuits," EIA RS-422, McGraw-Hill's Compilation of Data Communications Standards, McGraw-Hill, NY,NY, 1978.
6.5 ARINC, Mark 33 Digital Information Transfer System (DITS), ARINC Specification 429-9, AeronauticalRadio Incorporated, Annapolis, MD, 1985.
Document provided by SpaceAge Control, Inc. (http://spaceagecontrol.com/).

7-1
Chapter 7
TIME SAMPLED DATA AND ALIASING ERRORS
by
Donald W. Veatch*21627 Old Town RoadTehachapi CA 93561
United States
7.1 INTRODUCTIONThe purpose of this chapter is to acquaint the reader with the origins of aliasing errors and how to intelligentlyminimize these errors. Since all time-sampled data are susceptible to aliasing errors, anyone who uses time-sampled data must be aware of the nature of aliasing errors and the techniques used to reduce their effects. Par-ticular emphasis is placed on providing an intuitive understanding of aliasing and guidelines on how thesampling rate and the pre-sampling filter bandwidth are optimized to reduce aliasing errors.
Techniques are discussed which help reduce aliasing errors; unfortunately these techniques must be optimizedfor actual test conditions. The success of the optimization depends on the extent to which the data and noisespectra are known and since, in most flight test situations, the data and particularly the noise spectrum are notknown or sometimes even repeatable, this optimization process must be continually re-evaluated.
The use of detailed mathematical analysis has been avoided since it has been observed that almost all of thosewho have read such material still have no practical appreciation of how to deal with aliasing errors. Though anattempt is made to simplify terminology as much as possible, engineers and data users should be at least some-what familiar with Fourier analysis and the nature of frequency spectrums (there are many fine texts on Fourieranalysis and spectrum analysis). Some of the other technical terms, e.g., such as those associated with filters,are explained in the cited references.
7.2 DEFINITION OF ALIASINGThe dictionary defines an alias as an 'assumed name'. This essentially describes aliasing error. Aliasing errorsoccur when a periodic wave shape is time sampled and its basic frequency is greater than one-half the samplingrate. Basic frequency is here defined to mean that a 6-Hz sinusoid and a 6-Hz square wave have the same basicfrequency. See Section 7.4 for further discussion of basic frequency. For example, a data signal composed of a6-Hz and a 9-Hz signal is time sampled by a pulse duration modulation (PDM) or a pulse code modulation(PCM) system. If the sampling rate is 10 samples per second output signal reconstructed by the ground stationdata will be, respectively, a signal composed of 4-Hz and 1-Hz signals.
In other words, the 6-Hz and 9-Hz signals have now assumed new identities, or the aliases, of a 4-Hz and a 1-Hzsignal, respectively. Without other sources of identification there is no way to prove that the aliased identity isnot the true identity.
These types of error are called aliasing errors. The nature and causes of these types of errors are covered inmore detail in the rest of the chapter.
7.3 ORIGINS OF ALIASINGAliasing errors can be generated in any data which are time sampled. Time sampling of data is presently themost common multiplexing technique for the acquisition of airborne data.
Multiplexing of airborne data permits many channels of data to be mixed on a single recording or transmissionchannel. Time sampling of data channels is a multiplexing technique and is called time-division multiplexing.There are many ways to perform time-division multiplexing. The IRIG standards presently recognize only twoforms of time-division multiplexing, PDM and PCM. Pulse-amplitude modulation (PAM) is no longer recog-nized by the IRIG standards as a technique for acquiring time-sampled data; however, it is still used for someapplications.
Pulse-code modulation is the dominant multiplexing technique used in the acquisition of airborne and deep-space data. Two main advantages of PCM are its immunity to noise and the ease with which the data can beinterfaced to modern computerized ground stations and airborne systems. PCM's excellent noise immunity over
Retired from the NASA Dryden Flight Research Facility, Edwards, CA, USA.
Document provided by SpaceAge Control, Inc. (http://spaceagecontrol.com/).

7-2
long transmission paths is effectively used in the acquisition of deep-space data. Deep space and flight-test dataacquisition systems favor PCM because the data are easily interfaced with modern ground stations which usepowerful high-speed computers. The modern PCM systems are highly compact and economical due to the avail-ability and low cost of large-scale integrated digital circuitry.
A source of time-sampled data, which are encountered with increasing frequency, is the data output of an air-borne digital computer. The increased use of sophisticated airborne computer systems has made the use of datafrom these sources a necessity. Digital computer data output is always time-sampled data. While PCM samplingrates are normally periodic in nature, computer outputs are usually aperiodic. This absence of periodicity canlead to additional data reconstruction constraints which are not covered in this chapter.
In the above encoding techniques the time-sampled nature of the data is self-evident; however, data which arenot normally considered to be time sampled can produce aliasing errors. This is illustrated, for example, whena frequency modulation (FM) data acquisition system uses zero-crossing detection techniques in the ground sta-tion demultiplexers. Normally the carrier frequency is so much higher than the highest frequency passed by theband-limiting filters that aliasing errors are not a problem; however, if an FM discriminator is being pushed toachieve maximum bandwidth and a zero-crossing discriminator is used in the data recovery, aliasing errors canbe introduced.
7.3.1 Reduction of aliasing errors through system designThe first step toward minimization of aliasing errors in an instrumentation system is the construction of aninstrumentation system that embodies the best possible design practices. To reduce aliasing errors particularemphasis must be placed on designing a data acquisition system which minimizes all noise* sources. Thesetechniques are covered in other chapters of this volume and in the other AGARD Flight Test InstrumentationSeries, see Refs. 7.1 and 7.2.
This aspect of aliasing-error reduction cannot be emphasized enough. In many well designed data channels thedata information is the dominant signal and by far exceeds all the noise inputs. Of course this is not true for alldata channels and, in addition, even in good data channels noise can inadvertently corrupt data. These devia-tions from desirable data justify the close attention to techniques for reducing aliasing errors.
7.3.2 Sampling rate and filters used as anti-aliasing toolsOnce the design of the basic instrumentation system is completed the main tools available to the instrumentationengineer for controlling aliasing errors are the multiplexer's sampling rate, the pre-sampling filter, the recon-struction filter and the ground station data filters. The optimization of these tools for specific data and noisespectra is the main purpose of this chapter.
The most important of the above tools is the selection of the pre-sampling filter and the sampling rate, sincethese are used to prevent aliasing errors before they occur. The reconstruction filter and the ground station datafilters are applied after the time-sampling process and therefore after the aliasing errors have already beencreated. Any technique used to reduce aliasing errors after they have been introduced into the data has limitedusefulness.
The initial pre-flight selection of the sampling rates and the pre-sampling filters are based on reasonable esti-mates of the data and noise characteristics. This chapter deals almost exclusively with the use of sampling ratesand pre-sampling filters as a means of controlling aliasing.
If after a flight where aliasing is known or suspected to have occurred, and before changing the sampling rateor pre-sampling filters, refer back to Section 7.3.1. Section 7.3.1 emphasizes that the basic instrumentationpractices should be re-examined before increasing the complexity of the filter or raising the sampling rate.Careless instrumentation practices that permit mechanical or electrical noise to contaminate the data should beeliminated before considering higher sampling rates and more sophisticated pre-sampling filters.
7.4 UNDERSTANDING ALIASING ERRORSThe mathematical model of a time-division multiplexing system can be constructed by multiplying the data ofFigure 7. 1(a), shown as a sinusoid of frequency fl, with a Dirac delta function of periodicityf, (the Dirac delta
"In this chapter noise is defined to be any input to the data sampling device that is not of interest to the designated data requester. This means that the noisecould actually be data which is not pertinent to the problem at hand. See Ref. 7.1.
Document provided by SpaceAge Control, Inc. (http://spaceagecontrol.com/).

7-3
function is a mathematical concept that constrains the sampling aperture to be infinitely short). The resultantseries of time-sampled data points is shown in Figure 7.1(b). The wave form of Figure 7.1 (b) is a series of in-finitely narrow pulses whose amplitude represents the amplitude of the data at the time the sample was taken.In the example of Figure 7.1 (a) and 7.1 (b) the sampling rate (f,) is four times the data frequencyfj. Figure 7.1 (c)illustrates the wave form (fRi) which is reconstructed by the ground station. In this example the reconstructedfrequency,fRJ, is equal to the input frequency,f 1 .
Note: The dotted lines Indicate sampling Intervals taken at the sampling rate, f s,
__ "fI = input signalii'2(a) Input data signal (a sinusold of frequency fl)
__1f fs =sampling rate
- ME
Time 11
(b) The data of (a) sampled at fs
V i R1= reconstructedfrequencySR1= fl
Time -
(c) Reconstructed data of (b)
* f "=reconstructedCD•" R2V f frequency
Ef 2= Input signal
Time - 10
(d) Composite of data frequency, f2 ' sampled at f sand reconstructed as f R2
Figure 7.1 Effects of time sampling on two different frequencies.
The reconstruction process assumes that there are certain constraints on what happens between samples. As canbe seen from Figure 7.1(b) nothing is known about what happens between the data samples. The constraint
Document provided by SpaceAge Control, Inc. (http://spaceagecontrol.com/).
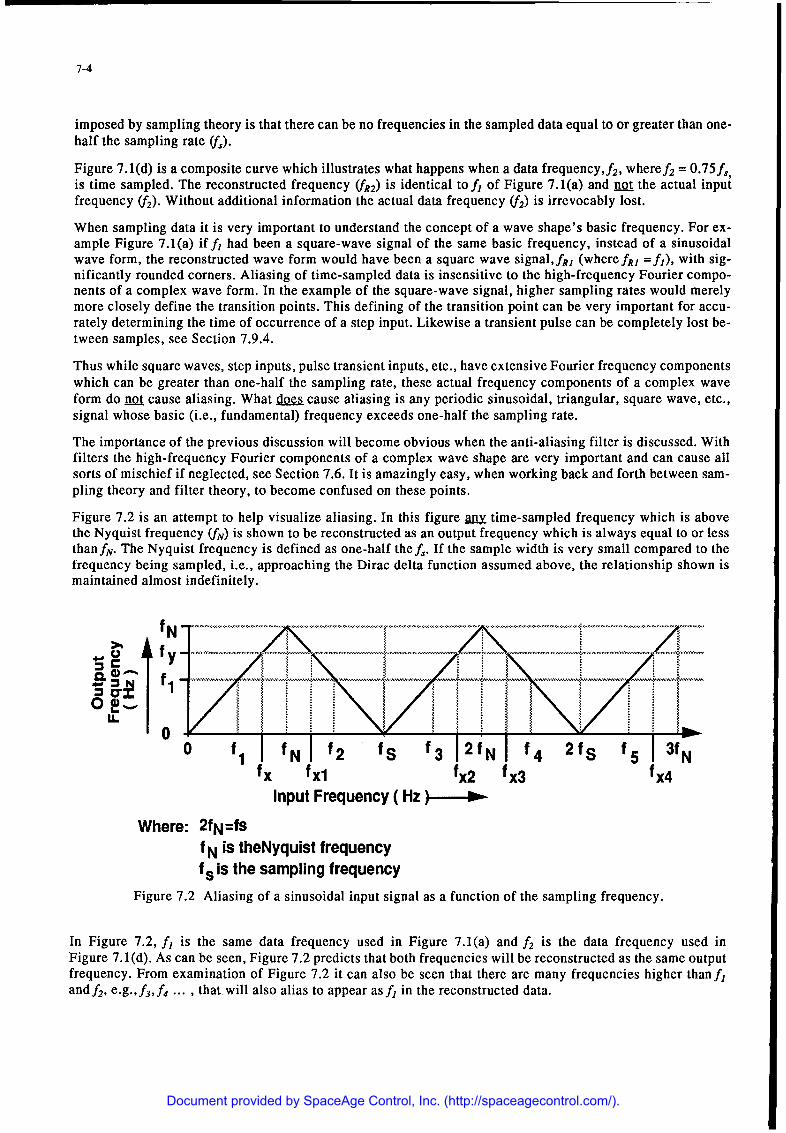
7-4
imposed by sampling theory is that there can be no frequencies in the sampled data equal to or greater than one-half the sampling rate (f,).
Figure 7.1(d) is a composite curve which illustrates what happens when a data frequency,f 2, wheref 2 = 0.75f,is time sampled. The reconstructed frequency (fR2) is identical to f, of Figure 7.1(a) and not the actual inputfrequency (f2). Without additional information the actual data frequency (f2) is irrevocably lost.
When sampling data it is very important to understand the concept of a wave shape's basic frequency. For ex-ample Figure 7.1(a) if f, had been a square-wave signal of the same basic frequency, instead of a sinusoidalwave form, the reconstructed wave form would have been a square wave signal,fRI (where fR1 =fj), with sig-nificantly rounded corners. Aliasing of time-sampled data is insensitive to the high-frequency Fourier compo-nents of a complex wave form. In the example of the square-wave signal, higher sampling rates would merelymore closely define the transition points. This defining of the transition point can be very important for accu-rately determining the time of occurrence of a step input. Likewise a transient pulse can be completely lost be-tween samples, see Section 7.9.4.
Thus while square waves, step inputs, pulse transient inputs, etc., have extensive Fourier frequency componentswhich can be greater than one-half the sampling rate, these actual frequency components of a complex waveform do not cause aliasing. What a= cause aliasing is any periodic sinusoidal, triangular, square wave, etc.,signal whose basic (i.e., fundamental) frequency exceeds one-half the sampling rate.
The importance of the previous discussion will become obvious when the anti-aliasing filter is discussed. Withfilters the high-frequency Fourier components of a complex wave shape are very important and can cause allsorts of mischief if neglected, see Section 7.6. It is amazingly easy, when working back and forth between sam-pling theory and filter theory, to become confused on these points.
Figure 7.2 is an attempt to help visualize aliasing. In this figure my time-sampled frequency which is abovethe Nyquist frequency (fN) is shown to be reconstructed as an output frequency which is always equal to or lessthanffN. The Nyquist frequency is defined as one-half the f,. If the sample width is very small compared to thefrequency being sampled, i.e., approaching the Dirac delta function assumed above, the relationship shown ismaintained almost indefinitely.
N .y ............ ............. :.. ...... ......... ... ......... .............. . .. ... . . .... ..... i.... . . ...... .[
N f.0-
U-
0 fl N f f2 fs f3 2 fN f1 4 2fS f 5 3fNfX fxl fx2 fx3 fx4
Input Frequency ( Hz
Where: 2fN=fS
f N is theNyquist frequencyf. is the sampling frequency
Figure 7.2 Aliasing of a sinusoidal input signal as a function of the sampling frequency.
In Figure 7.2, f1 is the same data frequency used in Figure 7.1(a) and f 2 is the data frequency used inFigure 7. 1(d). As can be seen, Figure 7.2 predicts that both frequencies will be reconstructed as the same outputfrequency. From examination of Figure 7.2 it can also be seen that there are many frequencies higher thanf1and f 2, e.g., f3, f 4 ... , that will also alias to appear as f, in the reconstructed data.
Document provided by SpaceAge Control, Inc. (http://spaceagecontrol.com/).

7-5
In Figure 7.2 an output frequency fy is shown. This frequency fy can be any frequency between zero and fN(where 2fN =-f,). If a horizontal line is drawn out from fy then wherever this horizontal line intercepts the saw-tooth wave form of Figure 7.2 these are the input frequencies that can generate the reconstructed output waveformfy. The frequencyf]' would be an unaliased input frequency, while the frequencies that could generate alias-es of fy would be fl, f,,2, f 1 f,4 . As explained all the aliased frequencies are input frequencies that aregreater than fN.
Figure 7.3 shows how an ideal time-sampled data signal would look in the frequency domain. In this and allspectral plots that follow, the negative half of the frequency domain, a mirror image of the positive plot shown,has been left out for simplicity. In Figure 7.3 all the data and noise are between fo and f, and since no datafrequencies exist at or abovefN there are no aliasing errors. This figure shows the data images generated by thetime-sampling process.
Data First data image Second data image... ' t ::.. .il .• ... .: .. .. :..:..
• ii• ... . ...........
0-0 f fN (f, 'fc) f's (fs'c) 2fN 2(f 'fc) 2fS 2(fs+ fc)
Frequency - -
fs= 4fc = sampling frequencyON= fSfc is the filter cut-off frequency
Figure 7.3 The frequency spectrum of a time-sampled ideal transducer output.
Figure 7.4(a) is the amplitude response of a second-order transducer, such as an accelerometer. All transducersbehave like filters and when excited by an acceleration the accelerometer behaves like a second-order filter,i.e., a -12 dB per octave eventual attenuation after its cut-off frequency, and thus is called a second-order trans-ducer.
This accelerometer is now excited by an input acceleration whose spectrum resembles white noise andFigure 7.4(a) is the resulting output frequency spectrum. When these data are time sampled, the frequency-do-main plot shown in Figure 7.4(b) is generated. This figure shows the data images generated by the time-sam-pling process; however, these images overlap each other. This overlap of the data image into the data spectrum,i.e., below fN, is what produces the aliasing errors.
Figure 7.4(b) shows how the higher order images produce aliasing; any portion of the images which extend be-lowfN (shown by the shaded areas) are aliased frequencies and contribute only noise to the bandwidth between0 andfN. Note that the errors depicted by the shaded areas have not been totaled in with the data bandwidth asyet, but when they are they will change the overall shape of the reconstructed data spectrum.
Theoretically every image contributes aliasing noise to the base band; however, in this example the noise con-tributions of images higher than the first contribute comparatively little noise when compared to the contribu-tions of the first image. It must be noted here that with other distributions of data and noise, to be discussedlater, the higher frequency-domain images can produce significant aliasing noise contributions.
When the data are sampled by a Dirac delta function the higher order images continue, as shown, at the sameamplitude out to infinity. When a finite sample width is used the higher order images are reduced in amplitudeas the image order increases, which further reduces the aliasing noise contributions of the higher order images.
Document provided by SpaceAge Control, Inc. (http://spaceagecontrol.com/).

7-6
S0 j --
.O Allasing noise contributionMS :from the first data Image.
Allasing noise contributionEC from the second data Image.
fo I 1 fN fs 2fN
Frequency--'-
(a) The output amplitude response of an accelerometer excited by a white-noise acceleration.Included are the pertinent sampling and data parameters.
Bfm
C
0-
100
ME
fo fc fN fs 2fN 2fs 3fN 3f s MfN
Frequency----.-
(b) Frequency-domain representation of the sampled data of (a)
SIfm
0
E
fo fc fN fs 2fN
Frequency----
(c) The effects of doubling the sampling rates of (a) and (b) in the above example.Where: fm= maximum data frequency of Interest
fc = cut-off frequency of the anti-allasing filterFigure 7.4 Using frequency-domain plots to illustrate how aliasing errors are generated.
Document provided by SpaceAge Control, Inc. (http://spaceagecontrol.com/).
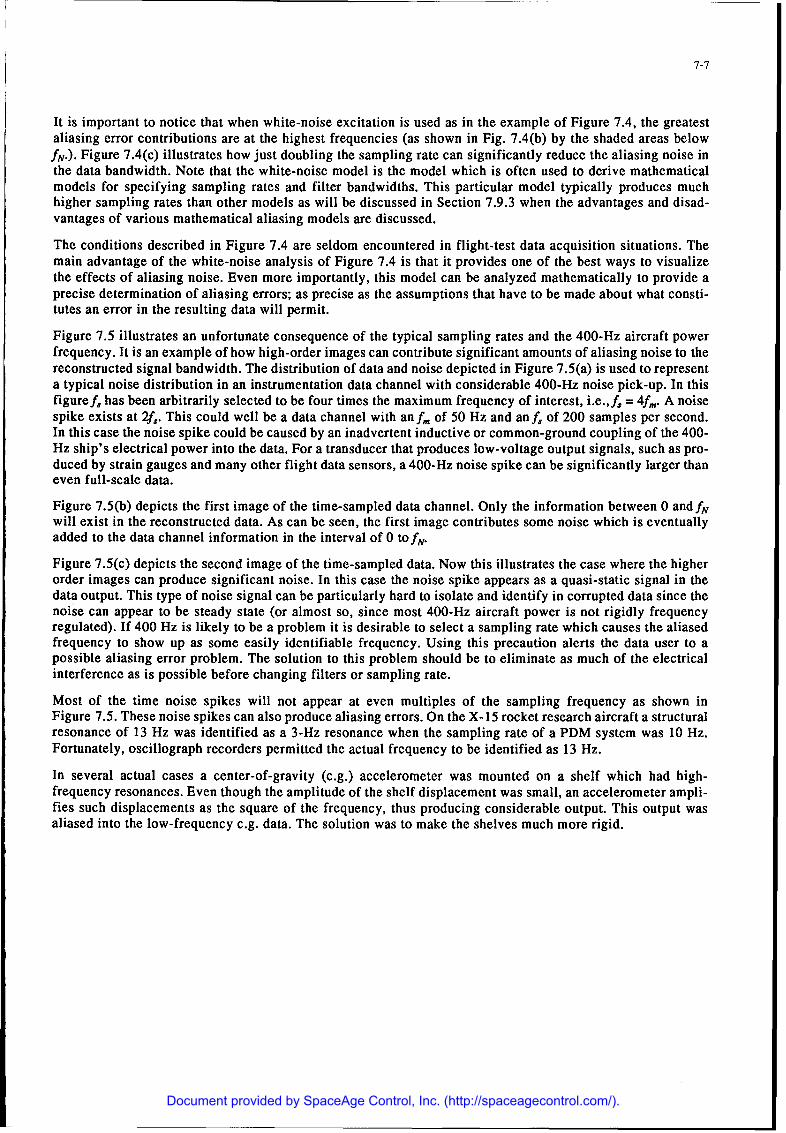
7-7
It is important to notice that when white-noise excitation is used as in the example of Figure 7.4, the greatestaliasing error contributions are at the highest frequencies (as shown in Fig. 7.4(b) by the shaded areas belowfN.). Figure 7.4(c) illustrates how just doubling the sampling rate can significantly reduce the aliasing noise inthe data bandwidth. Note that the white-noise model is the model which is often used to derive mathematicalmodels for specifying sampling rates and filter bandwidths. This particular model typically produces muchhigher sampling rates than other models as will be discussed in Section 7.9.3 when the advantages and disad-vantages of various mathematical aliasing models are discussed.
The conditions described in Figure 7.4 are seldom encountered in flight-test data acquisition situations. Themain advantage of the white-noise analysis of Figure 7.4 is that it provides one of the best ways to visualizethe effects of aliasing noise. Even more importantly, this model can be analyzed mathematically to provide aprecise determination of aliasing errors; as precise as the assumptions that have to be made about what consti-tutes an error in the resulting data will permit.
Figure 7.5 illustrates an unfortunate consequence of the typical sampling rates and the 400-Hz aircraft powerfrequency. It is an example of how high-order images can contribute significant amounts of aliasing noise to thereconstructed signal bandwidth. The distribution of data and noise depicted in Figure 7.5(a) is used to representa typical noise distribution in an instrumentation data channel with considerable 400-Hz noise pick-up. In thisfiguref2 has been arbitrarily selected to be four times the maximum frequency of interest, i.e.,fa = 4f,. A noisespike exists at 2f,. This could well be a data channel with an fm of 50 Hz and an f, of 200 samples per second.In this case the noise spike could be caused by an inadvertent inductive or common-ground coupling of the 400-Hz ship's electrical power into the data. For a transducer that produces low-voltage output signals, such as pro-duced by strain gauges and many other flight data sensors, a 400-Hz noise spike can be significantly larger thaneven full-scale data.
Figure 7.5(b) depicts the first image of the time-sampled data channel. Only the information between 0 and fNwill exist in the reconstructed data. As can be seen, the first image contributes some noise which is eventuallyadded to the data channel information in the interval of 0 tofN.
Figure 7.5(c) depicts the second image of the time-sampled data. Now this illustrates the case where the higherorder images can produce significant noise. In this case the noise spike appears as a quasi-static signal in thedata output. This type of noise signal can be particularly hard to isolate and identify in corrupted data since thenoise can appear to be steady state (or almost so, since most 400-Hz aircraft power is not rigidly frequencyregulated). If 400 Hz is likely to be a problem it is desirable to select a sampling rate which causes the aliasedfrequency to show up as some easily identifiable frequency. Using this precaution alerts the data user to apossible aliasing error problem. The solution to this problem should be to eliminate as much of the electricalinterference as is possible before changing filters or sampling rate.
Most of the time noise spikes will not appear at even multiples of the sampling frequency as shown inFigure 7.5. These noise spikes can also produce aliasing errors. On the X-15 rocket research aircraft a structuralresonance of 13 Hz was identified as a 3-Hz resonance when the sampling rate of a PDM system was 10 Hz.Fortunately, oscillograph recorders permitted the actual frequency to be identified as 13 Hz.
In several actual cases a center-of-gravity (c.g.) accelerometer was mounted on a shelf which had high-frequency resonances. Even though the amplitude of the shelf displacement was small, an accelerometer ampli-fies such displacements as the square of the frequency, thus producing considerable output. This output wasaliased into the low-frequency c.g. data. The solution was to make the shelves much more rigid.
Document provided by SpaceAge Control, Inc. (http://spaceagecontrol.com/).

7-8
Data Signal
CL -0 iSignal NoiseE fA J First sampled image
EJSecond sampled image0 fm fN is
Frequency--*-
(a) The data and noise spectrum of a datachannel.
IO. IIs a I I ICo r 0 .
E Ie
0 fm fN fs 2fsFrequency---
(b) The spectrum of the first image of the time-sampled data channel.
I I I
E 0....--.....,,• - •I I
.:
0 fm fN fs 2fs
Frequency---
(c) The spectrum of the second image of the time-sampled data channel illustrating howits noise spike can produce a quasi-static signal in the data.
Figure 7.5 How the data images overlap the data channel and produce aliasing.
7.5 SAMPLING RATES AND ALIASINGWhat is the optimum sampling rate? This has been the subject of much controversy in various texts on aliasing.Information theory sets the lower limit on the sampling rate while system limitations set the upper limit on sam-pling rates.
Aliasing theory sets the lowest sampling rate, since any frequency abovefN is aliased into the output as a newfrequency equal to or less than fN. Since the Nyquist frequency is defined to be one-half the sampling rate, it isobvious that the sampling rate must be at least equal to or greater than twice maximum frequency of interest tothe data user. The maximum frequency of interest to the data user will be calledf..
Now the term "maximum frequency of interest" to the data user also causes confusion. The maximum frequencyof interest (f.n) is often assumed to be synonymous with the cut-off frequency (f,) of the anti-aliasing filter. Inactual practice it would be very undesirable to place the highest frequency of interest atfc, particularly if there
Document provided by SpaceAge Control, Inc. (http://spaceagecontrol.com/).

7-9
were really significant amounts of data near f,. The f, of a filter is a point where the amplitude response andphase response of the filter are changing rapidly. The filter parameters are not as stable at this point as desired.
As a general rule f. should be 0.6 to 0.8 off,. The selection of the ratio depends how much important data arenearfm and the quality of the anti-aliasing filter. A less stable filter requires more latitude. If important dataare nearfm then a greater protection margin must be provided. The unfortunate side effect of this rule is that itproduces higher sampling rates than the simplefm =f.
Sampling rates are usually specified in terms of fr and this is appropriate sincef, establishes the point wherenoise will be decreasingly able to be aliased back into the data. The important thing to remember is that thefmis not to be carelessly set equal to the filterf,.
The upper limit on the sampling rate is often a system limit. For example, the bandwidth of the airborne trans-mission or recording system limits the amount of data and how often it can be sampled. High sampling ratesand many data channels can easily overload recording and transmission bandwidths.
On any reasonably large instrumentation system a main consideration is the data reduction time. Using a sam-pling rate that is 100 or 1000 times the highest frequency of interest produces an intolerable load on the dataprocessing system when many channels are involved.
Some data have justified sampling rates which were two times the highestfm when the data were to be used forstatistical analysis. In the author's opinion this is extremely risky.
Commonly a sampling rate of four to five times the filterf, is recommended. This recommendation is usuallybased on the attenuation characteristics of real fairly simple filters and certain assumptions about the data (dis-cussed in Section 7.9.1).
Mathematical analysis based on white-noise type input signals, such as that discussed in Reference 7.3 and anunpublished paper by L. W. Gardenhire, typically recommend sampling rates that are much higher than four tofive times f,.
Gardenhire, for example, recommends a sampling rate in excess of 1000f, to achieve a 1% accuracy when usinga first-order transducer with a fourth-order anti-aliasing filter. For a second-order transducer used with afourth-order filter Gardenhire recommends sample rates of about 10f, to achieve 1% data accuracies.
In actual practice some aircraft data acquisition systems have been flown without any anti-aliasing filters in themajority of the data channels. In many cases flight-test vehicles have been flown with most of the data channelsusing simple first-order filters and these flight-test programs have been highly successful. On the other handthere are innumerable documented cases which are horror stories of data which have been completely corruptedby aliasing errors.
Then what is the optimum sampling rate? The answer, of course, is that the sampling rate must be based on thenature of the data and noise spectrums. This will be discussed in specific detail later in Section 7.9, Anti-Aliasing Techniques.
7.6 FILTERS AND THE ERRORS THEY INTRODUCEFilters are one of the main tools used to reduce aliasing errors. Unfortunately filters also introduce errors intothe data. These errors are different from those introduced by aliasing and can cause quite significant data errors.The filter parameters that are of the most interest are amplitude response, phase response, and group delay. Theterms group delay and time delay are often used interchangeably.
In this chapter only the low-pass filter will be discussed, since it is the most commonly used anti-aliasing filter.A band pass filter is used when it is desirable to remove the dc response of some transducers. Sometimes a band-reject filter will be used in the data band pass to remove a specific noise frequency spike. This is normally anundesirable practice, since the phase distortion introduced by the band-reject filter causes large phase nonlin-earities in the data pass band.
* See Ref. 7.1 for a more complete definition of "orders of filters and transducers." For example, a second-order Butterworth filter would approach an even-tual attenuation of -12 dB/octave. Each 'order' is equivalent to -6 dB/octave. A transducer also behaves like a filter and therefore can be classified by itsorder also. Advanced complex filters often are not as simple as in the above examples.
Document provided by SpaceAge Control, Inc. (http://spaceagecontrol.com/).

7-10
Unlike aliasing errors the errors introduced by filters can theoretically be removed in the ground station if theextra time and effort is justified. This is accomplished by first determining the filter's transfer function andusing digital techniques to correct the data. This data correction process will not remove any aliasing errors thathave been introduced into the data by the sampling process; therefore, the results will still be in error dependingon the amount and nature of the aliasing errors.
To illustrate the nature of the errors introduce by filters, first consider the ideal low-pass filter's amplitude re-sponse shown in Figure 7.6(a). This filter has a pass band of 0 tofc, where the filter's cut-off frequency isf,.This filter passes all frequencies in its pass band, without amplitude modification, and completely rejects allfrequencies outside its pass band.
This ideal filter has a linear phase shift in the pass band, and since it does not pass any frequencies outside itspass band the phase shift outside the band pass is not important. Figure 7.6(b) illustrates the phase response ofthis ideal filter.
If a square-wave voltage wave form is applied to the filter of Figure 7.6 it provides the reader considerableinsight into the distortions that filters introduce into transient data and how best to avoid these distortions ifthey are important. A square wave is used since it approximates one of the more complex wave forms encoun-tered in flight-test data acquisition, the step input.
r 1 •1800°
0 0CO,
' 0 1 0 1Normalized Frequency, f/fc Normalized Frequency, f/f c
(a) Amplitude response of the (b) Phase response of the idealideal Iowpass filter. lowpass filter.
Figure 7.6 A proposed ideal filter.
A square wave can be represented by a Fourier series and is composed of a fundamental frequency and an infi-nite series of odd harmonics. The mathematical equation for the Fourier series for a square wave is shown inequation (7.1).
sin (2itnf)
Square wave = 2 : where all n are odd integers (7.1)E nn= 1
A square-wave input signal of 1.0 Hz is applied to the ideal filter of Figure 7.6. For the purposes of this examplethe filter's cut-off frequency isf, and the phase shift is 180' atf,. The resultant output wave shape is shown inFigure 7.7.
Document provided by SpaceAge Control, Inc. (http://spaceagecontrol.com/).

7-11
-~ Group DelayT0 (Time Delay)
0 -
E
Input-Signal Waveshape
Output-Signal Waveshape
Time --Figure 7.7 A 1-Hertz squarewave input signal (dotted-line curve) and the signal output after passing throughthe ideal 10-Hertz filter of Figure 7.6.
The filter passes the square wave's fundamental frequency, 1 Hz, and the next 4 odd harmonics, i.e., 3, 5, 7,and 9 Hz. It passes all five of the first Fourier series frequencies unchanged in amplitude, but shifts the fre-quencies in phase as specified in Figure 7.6(b). Notice that the filtered wave shape differs markedly from thefilter's input wave shape and exhibits a group delay relative to the input of 1/20th of a Hertz.
The amplitude characteristic of Figure 7.6(a) produces a loss of high-frequency information, that is, all har-monics higher than 9 Hz, and thus changes the shape of the complex signal. A linear phase shift as a functionof frequency produces a constant group delay.
An actual filter has an amplitude response which attenuates the amplitudes of the frequencies in the pass bandmore and the amplitude of the higher harmonics less abruptly than the proposed ideal filter. See Figure 7.8 fortwo common second-order filter amplitude responses compared to that of the ideal filter postulated inFigure 7.6(a).
The phase shifts of the Bessel and Butterworth filters of Figure 7.8 are never truly linear in the pass band. Thisnonlinear phase shift versus frequency characteristic causes wave shape distortion. It shifts the phase of eachindividual frequency of the Fourier series by a different amount and thus produces a new wave shape (note thatan ideal all-pass linear-phase-shift circuit would produce an output which differed from the input by only aconstant group delay).
If many data channels are used to compare broad-spectrum input signals then every data acquisition channelmust have the same phase characteristic (and, of course, the same amplitude response) or it will make compar-isons difficult if not impossible. Different filters with different phase responses, such as a Bessel and Butter-worth filter, can make complex wave forms look entirely different. Even if the same type of filters are used,but each of two different orders, the group delays and distortions can be significantly different. This is a veryimportant point when many channels must be compared and is too often overlooked.
- (cos) 2 (7.2)E rms 2
Reference 7.4 uses equation (7.2) to calculate the maximum error (E,,,) of a complex wave form. The termis the maximum deviation of the filter's phase response from linear phase in the filter's pass band. The equationis used to calculate the maximum observed error and the actual error is dependent on the wave shape.
Document provided by SpaceAge Control, Inc. (http://spaceagecontrol.com/).

7-12
Reference 7.4 states that the error of a typical complex wave shape is usually about one-half the error indicatedby equation (7.2) (note: a simple sine wave is not a complex wave form and therefore does not exhibit the errorof eq. (7.2)).
As an example, a sixth-order Butterworth low-pass filter has a maximum phase error in its pass band of 220.Thus a complex wave form passed through this filter can exhibit a maximum error in observed amplitude, E.,,,of 26.4% due to the phase distortions alone.
Equation (7.2) shows that when a complex wave shape, such as a step input, an impulse input, or a doublet, isto be analyzed it is crucial to have a linear phase shift. Furthermore if the effects of this disturbance are to beanalyzed on many channels it is important that all involved channels have the same overall transfer function.Often the filter's transfer function is the dominant system transfer function; however, as an example an accel-erometer's second-order transfer function can overwhelm that of a simple first-order anti-aliasing filter.
Only the digital finite impulse response (FIR) filters can be made to exhibit a truly linear-phase response in itspass band. FIR filters, for reasons to be covered later in Section 7.8, are difficult to implement for many air-borne applications.
The Bessel filter is an easily implemented discrete-component filter which has very good phase response lin-earity. Reference 7.4 points out that a fourth-order Bessel filter has a maximum phase error of only 0.171 in itspass band. Unfortunately the Bessel filter has a very poor pass band amplitude response. See Figure 7.8 for acomparison of the amplitude responses of a second-order Bessel and a second-order Butterworth filter. Despiteits very poor pass band amplitude response the Bessel filter is normally the best anti-aliasing filter for transientdata. The explanation for this is that decreasing the amplitude of a broad-spectrum wave form's higher harmon-ics reduces the sharp detail of the wave form, while a nonlinear phase response actually changes the waveform's shape.
1Ideal Filter
Butterworth Filter
0
Bessel Filter
E
0 I
0 0.5 1.0 1.5 2.0 2.5 3.0
Normalized Frequency, f f c
Figure 7.8 An ideal filter, a two-pole Bessel filter and a two-pole Butterworth filter compared.
With classical filters such as the Bessel, Butterworth, and Chebyshev filters, increasing the rate at which thefilter attenuates the signal outside the pass band also increases the filter's phase-response nonlinearities. Forexample the phase error for a second-order Butterworth filter is approximately 40, a sixth-order Butterworthfilter has a 22 0-error and an eighth-order Butterworth filter has approximately a 31l-error. For comparison aneighth-order 2-dB Chebyshev filter has a 94°-phase error in its pass band.
Loy, in Reference 7.4, provides a very useful comparison of linear-phase FIR filters and classical filters. Heestimates that a Butterworth filter with the same transition width, i.e., the bandwidth required to go from 5%
Document provided by SpaceAge Control, Inc. (http://spaceagecontrol.com/).

7-13
to 95% attenuation, as a linear-phase FIR filter will require about one-half the time delay. Thus the FIR filter'slinear phase is acquired by sacrificing time delay.
For a given level of attenuation per octave the Bessel filter has more attenuation in its pass band than theButterworth filter, and the Butterworth filter has more attenuation in its pass band than the Chebyshev filter.The phase-shift errors discussed above show that, with these classical filters, decreasing the signal attenuationin the pass band also increases the phase nonlinearities.
Reference 7.4 details two advanced fourth-order filter designs which improve pass band filter response whilemaintaining reasonable phase errors. These fourth-order filters have good pass band response and phase errorsof 1.80 and 40 respectively. The filter with a phase error of 4' has a particularly desirably flat pass bandresponse and is shown in Figure 7.9.
Figure 7.9 shows a filter f, and a maximum data fin. In general it is not desirable to place the highest f.o at thefilterf.. The filter parameters are not as stable at this point as is desirable. As a general rulefm probably shouldbe 0.6 to 0.8 of f,. This rule unfortunately increases the sampling rate.
Further, as the order of the filter increases the filter components require much closer matching and higher over-all accuracies. While ±10% components might be acceptable for a second-order filter, even ±1% resistors andcapacitors are often not sufficient for an airborne eighth-order filter.
Airborne filters are usually subjected to wider temperature extremes than ground-based filters. For this reasoncomponent matching and accuracies acceptable for ground based systems often are inadequate for airborneapplications. A filter which is sensitive to component matching can deteriorate the wave shape accuracy in se-rious ways. Figure 5.29 of Reference 7.4 shows an example of an eighth-order Butterworth filter which is con-structed with of ±5% components. The resultant amplitude response illustrated in that figure showsconsiderable deterioration of the typical Butterworth filter amplitude response. Reference 7.5 develops tech-niques for calculating a filter's sensitivity to component variations.
-f m/fc
Ideal Filter
0C.
I Composite Filiter
E
0 I
0 0.5 1.0 1.5 2.0 2.5 3.0
Normaiized Frequency, f/f cFigure 7.9 A special composite four-pole filter with a maximum passband phase-error of 4'.
Phase-lock-loop tracking filters are special filters that can recover a sinusoidal-type signal when it is buried innoise. They can be indispensable for these types of applications. Phase-lock-loop tracking filters are normallyused in the ground station or instrumentation laboratory to recover data.
Document provided by SpaceAge Control, Inc. (http://spaceagecontrol.com/).

7-14
7.7 RECONSTRUCTION FILTERSReconstruction filters are those techniques used to recover the original information from the sampled datapoints. While this is normally accomplished in the ground station, it is sometimes accomplished in the aircraftas part of a real-time application. Though all the reconstruction techniques discussed provide filtering, somemay not at first glance seem to be filters.
Figure 7.10(a) shows a series of time-sampled data points which are the same as in Figure 7.1 (b). As mentionedearlier these points can represent one frequency, fl, in the frequency range of 0 tofN or many possible frequen-cies (e.g., the frequencies f2,f3, f4 ,fs ... from Fig. 7.2) abovefN.
A simple sample-and-hold circuit produces the wave shape shown in Figure 7.10(b). If this wave shape is passedthrough a low-pass filter which has a cut-off frequency off, then the high-frequency 'step' information is fil-tered out and the frequency f, is the output shown in Figure 7.10(c). Notice thatf, has been shifted in time; theoriginal sinusoid passed through the origin. This shift is inherent in the sample-and-hold reconstruction tech-nique and in the subsequent low-pass filter stage.
A reconstruction technique which essentially provides another order of filtering is to join the points ofFigure 7.10(a) together with segments of straight lines as shown in Figure 7.10(d). Intuitively this techniqueprovides a closer approximation to the original wave shape. This wave shape can then be filtered to restoref,with less group delay than in the previous example.
A much better reconstruction of the original wave shape can be accomplished by using polynomial curve-fittingtechniques. If the time-sampled data points are all available to a computer, as they are in the ground station,then a multi-point polynomial-curve fitting approximation produces an excellent match to the original time-sampled data (assuming, of course, that there are no aliasing errors). Figure 7.10(e) illustrates this approach.
To use the multi-point polynomial-curve fitting approximation technique as a 'real-time' data reconstructiontechnique produces a time delay while the necessary points are accumulated. This delay is not necessarilytotally prohibitive when compared to the delays involved in the other techniques.
While the techniques illustrated in Figure 7.10 are analog in nature there are equivalent digital techniques whichproduce the same results.
Document provided by SpaceAge Control, Inc. (http://spaceagecontrol.com/).

7-15
E '
Time
(a) A sequence of time-sampled data points (sampling rate is f s.)
"0
E L
Time
(b) The effects of a sample-and-hold circuit on (a).
E
Time -(c) The effects of passing (b) through a low-pass filter.
E
Time ----
E
Time --
(e) A curve fitted to time-sampled data points by multi-point polynomial curve-fittingtechniques.
Figure 7.10 Various techniques for reconstucting time-sampled data.
Document provided by SpaceAge Control, Inc. (http://spaceagecontrol.com/).

7-16
7.8 DIGITAL FILTERSDigital techniques provide sophisticated tools to the engineer for manipulating and improving airborne data.The availability of extremely fast and powerful ground-based computers for ground-based data reduction andeven 'real-time' support of flight-test programs has forced the flight-test engineer to become familiar with themany advantages that computer techniques provide. In addition, the advent of small, fast airborne computershave opened the way to using airborne digital techniques to improve the data acquisition process.
A digital technique that is obviously applicable to the aliasing problem is the digital filter. Digital filters areoften described in texts on digital processing since they are really digital processors. The implementation of adigital filter requires digital multipliers, storage registers, data shift registers, and accumulators. One obstacleto the airborne application of airborne digital filters is that a typical micro-chip digital computer is not opti-mized for digital filter construction.
Recently digital processors using very large-scale integrated circuitry have been appearing which have theirarchitecture optimized for construction of digital filters, thus making digital filters much easier to construct forairborne applications. Several manufacturers are now making filter units in a single small package. One suchunit is a linear-phase eighth-order filter.
The engineer who is well versed in theoretical mathematics and computer techniques might read Reference 7.6and design digital filters. Even then being able to design digital filters and knowing the pitfalls in applying themare two different things.
The average engineer who has dealt largely with analog filters, and who is not primarily a mathematician, nor-mally will find discussions with the typical digital-filter expert to be a completely frustrating experience. Thetechnical terminology used by the people who design analog filters and digital filters is deceptively similar butonly masks the inherent dissimilarities. In some areas there is no common terminology.
A text that successfully makes the digital filter comprehensible to the average engineer is Reference 7.4, Loy's,"An Engineer's Guide to FIR Digital Filters." This reference deals mainly with the FIR filter, but covers theinfinite impulse response (IIR) filter to some extent. Not only does it help the engineer understand the strengthsand weaknesses of digital filters, it also explains their applicational strengths and weaknesses.
The data user should be aware of a serious difficulty that arises in the application of digital filters as airborneanalog-channel anti-aliasing filters. Airborne digital filters cannot be used to eliminate the analog filter. In fact,in an analog data channel, all good digital filters must be preceded by an outstanding analog filter. This is arequirement since all digital filters are sampling devices; therefore, an analog anti-aliasing filter must precedeit. This seems to be self defeating, and in many cases it is, even though a digital filter's advantages can be sooutstanding that the sacrifice may be warranted. For this reason the use of digital filters as anti-aliasing filtersin an airborne flight application can only be justified to meet very special requirements.
Note that a signal that is already in digital form does not have the limitation of requiring an analog anti-aliasingfilter to precede it. As an example many of the present applications of airborne filters are in computer channelswhere the data are already digitized. In these channels the data are assumed to be free of harmful aliasing errors.In any case if aliasing errors exist, they are already incorporated into the data.
The above statement should not be construed to mean that digital filters cannot introduce aliasing errors intothe digitized data. Digital filters are also sampling devices and have a sampling rate (Q') and therefore have aNyquist frequency (fN). Special techniques, such as decimation of data, must be used to reduce the number ofdata points if they exceed the desired amount. Data decimation techniques will be discussed in Section 7.8.3and are covered in greater detail in Reference 7.4.
Digital filters are already used in many sophisticated airborne applications, such as image enhancement andtarget acquisition. A general rule would be not to use digital filters in airborne applications unless the extratime, effort, and money are fully justified.
Digital filters can be very effective in ground station computers to help clean up a signal before data processing(Note that ordinary analog filters can do the same thing, but digital filters can do it better. This is particularlytrue if the data are already digitized as in PCM data.). The digital filter can be used to further reduce some ofthe high-frequency noise, aliasing, and other types that the airborne filter was unable to eliminate and stillintroduce very few errors of its own, see Section 7.8.3.
Document provided by SpaceAge Control, Inc. (http://spaceagecontrol.com/).

7-17
7.8.1 Infinite imnulse response digital filtersAs far as this chapter is concerned the IIR filter is mainly used to duplicate known discrete-component filters,such as the Bessel, Butterworth, and Chebyshev filters. The advantage of constructing a digital filter which ismathematically identical to a known discrete-component filter is that the digital filter can be a high-order filterwithout the problem of matching components to a high degree of accuracy and there is no problem with com-ponent drift. More importantly, if the data are already in digitized form such as PCM data, then why convertthe data to analog form so as to filter it and then digitize the data again?
7.8.2 Finite imnulse resnonse digital filtersIn this chapter the main emphasis on FIR filters is that they can be constrained to have an absolutely linearphase shift in their pass band. The FIR filter requires more data processing than an IIR filter, but, in additionto its linear phase, it is also absolutely stable and often easier to design.
7.8.3 Ground stations and digital filtersAs mentioned earlier the high-order discrete-component analog filter requires high-accuracy components andclose matching of these components. Lower order filters take longer to reach a given attenuation and thus permitmore aliasing errors to be introduced into the data. Analog filters with maximally flat amplitude response usu-ally have large phase errors.
Digital filters on the other hand can be constructed with very high out-of-bandwidth attenuations and still bestable and drift free. For example, an IIR digital simulation of an eighth-order Bessel filter would have excellentphase linearity and still provide rapid attenuation outside the filters pass band. An FIR digital filter could beconstructed with linear phase response in the pass band and still have an excellent amplitude response in thepass band.
Figure 7.11 illustrates how a digital filter can be used in the ground station to reduce aliasing noise.Figure 7.1 l(a) illustrates the output of a filter excited by a white-noise input signal. This filter is used to bandlimit the white-noise signal. The only information in the signal of interest to the data user is that in the band-width of 0 to f.n. The spectrum of the output of the filter would be that of Figure 7.11(a). If the output of thisfilter is time sampled by a system whose sampling time is very short, i.e., approaching a Dirac delta function,then a series of data images is created as in Figure 7.1 1(b). The data spectrum itself is actually not in the sam-pled data spectrum, but has been included to illustrate how and where the data images contribute noise to thedata.
Figure 7.11 (c) illustrates the data (0 toft), data noise (f.n to fN), and aliasing noise present in the ground stationinformation. Figure 7.11(d) shows how the standard ground station reconstruction filter (cut-off frequency off,) removes some of the aliasing noise. Figure 7.11(e) shows how the noise and aliasing noise can be furtherreduced by a ground station filter with a cut-off frequency nearfm. 'White-noise' data are particularly amenableto this type of noise reduction.
An example of what a digital filter can do that no analog filter can accomplish is the 'reverse' filter. If, in theground station, the data are passed 'backward' through an exact digital duplicate of the airborne analog filter,an IIR filter, the phase shift is completely eliminated and at the same time the amplitude attenuation is doubled.This is a particular advantage with some of the maximally flat amplitude response filters such as the Chebyshevand Cauer filters. These filters have very high-phase nonlinearities, but can have very flat amplitude responses.The use of the reverse filter technique eliminates one of the major objections to using these filters for transientdata; their very high-phase nonlinearities. Note however that for this technique to work the airborne filter musthave a known and stable transfer function.
The reverse filter technique is not a desirable technique for use with a Bessel filter. In this case the phase erroris so small that the errors caused by the nonlinear phase are very small. At first glance it might seem to be anadvantage to have zero phase shift; however, the Bessel filter has a large amount of attenuation in the band passand doubling this attenuation at each point in the band pass would produce a major amplitude reduction in thepass band.
As mentioned earlier the only true linear phase filter is the FIR digital filter. This characteristic, unique to theFIR filter, is the major reason for the popularity of the FIR filter, since they require more digital operations toaccomplish the same response than an IIR filter. The FIR filter is also always stable, which is not true of theIIR filter.
Document provided by SpaceAge Control, Inc. (http://spaceagecontrol.com/).

7-18
r4-.- f mII i. -f
I I
0
mm0*0 I I
I I
00 I:E. I I
o N fs 2fs 3fs
Frequency
(a) The output amplitude response of a filter excited by a white-noise Input signal.Included In the figure are the pertinent sampling and data parameters.
r--- f m
SFf•I(fs'fc)1 .iII I
0.e.Aliasing noise contributionC $4 i from the first data Image.
Aliasing noise contribution from
the second data Image.E
0 fN fs 2fs
Frequency(b) Sampled data Images Illustrating how the first and second data Images can contribute noise
to the reconstructed data, I.e., Information between 0 and f NI I I I I I
00 0CI II I
E E
• .. I 0ob
em em f* m I
0-®_ • 0-
- ~ii..K'$
Frequency Frequency Frequency
(c) Data, data noise and allasing (d) The effects of the ground (e) A ground station filter usednoise portion of (b). station reconstruction filter, to reduce the noise above fm.
Figure 7.11 Using ground station filters to reduce aliasing noise contributions.
The HR filter can be used to design exact duplicates of classical analog filters and, since the filter parametersare specified in common classical filter terminology, a person who is familiar with analog filters can be lulledinto a false belief that they understand digital filters. This only masks the actual digital filter from the user. The
Document provided by SpaceAge Control, Inc. (http://spaceagecontrol.com/).

7-19
linear-phase FIR filter on the other hand has no classical analog filter counterpart. In reading about digital fil-ters there are some differences in terminology. Two particularly confusing points of differing terminology arediscussed below.
1. Conventional filters are usually normalized with an f, of 1 Hz. Digital filters, on the other hand, are nor-malized at the sampling rate (f,) which is usually 1 Hz and therefore the Nyquist frequency is 1/2 Hz. Thusthe cut-off frequency of the digital filter is always something less than the Nyquist frequency.
2. Conventional analog filter designers usually refer to the order of a filter. The higher the order of a giventype of analog filter the higher the stop-band attenuation. Digital designers use transmission width, whichis the frequency required to produce an attenuation of 5 to 95%, to define the attenuation of a digital filter.The digital filters are also often defined in terms of the number of coefficients used to define the filter.
A digital filter, as has been mentioned, is very susceptible to aliasing. If a digital filter is used to filter digitaldata it should not have frequency components above the filter's Nyquist frequency. One way of reducing thesefrequencies for a low-pass filter is to decimate the data.
In digital filter terminology the word decimation does not mean to reduce by one-tenth, but merely a reductionin the number of data points. A desirable form of decimation is to take the average of a group of n data points.Reference 7.4 points out that the computer's task in taking this average is made much easier if n is a power of2 (i.e., 2,4, 8...) since a simple computer 'shift' operation then can be used instead of a division operation. Thistechnique reduces the number of data points and significantly reduces the number of operations required by thedigital filter. Decimation is a very important digital filter technique. For further reading on decimation an ex-cellent text on this subject is Reference 7.7.
7.9 ANTI-ALIASING TECHNIOUESThe data sampling rate and the anti-aliasing filter are major tools for reducing aliasing errors. The purpose ofthis section is to present various examples (i.e., cases) which demonstrate the most common data and noise com-binations. Strategies for dealing with these cases in an optimum manner will then be discussed.
The following discussions assume that the data user knows the maximum frequency of interest (f.o). As has al-ready been demonstrated any frequency higher than one-half the sampling rate (fN) will be aliased as a lowerfrequency; therefore, the highest f,, to the data user must absolutely be less than one-half fN. In a new flightprogram this is not a trivial problem. Particularly as an error in this estimation of f&, on the low side can causeloss of valuable data due to aliasing. A much more common mistake is to establish an estimate for f,, which ismuch too high and thus overload the recording and transmission channels.
7.9.1 Case 1: the good data channelThe most common flight test situation is one where the desired data are by far the most dominant signal in thetime-sampled data. Typically the noise is many decibels below the data signal's peak output and does not limitthe data accuracy. Many times this noise is a white-noise type of noise "floor." This noise floor limits the ac-curacy of the data when they are measured in an analog mode. It also limits the accuracy when the data are timesampled.
Figure 7.12(a) illustrates how this noise floor can extend out to very high frequencies. This noise is aliased backinto the data bandwidth and even further reduces the data accuracy; however notice if the noise is really white'noise, then the error is added in a root-mean-squared (rms) format and not as additive as one might at first sup-pose. Also, in a real system the higher order images eventually are reduced in amplitude due to the finite samplewidths. With the signal distribution shown in Figure 7.12(a), and when there is no filtering, increasing the sam-pling rate is not a efficient way to reduce aliasing error.
If the noise floor is low enough so that it will not effect the required channel accuracy then there is no reasonto worry about the noise. Simple filters are used with these systems in case the noise is not as well behaved athigher frequencies as expected, see Section 7.9.2 below.
Anti-aliasing filters are often constructed using operational amplifiers (Ref. 7.1). This type of filter is calledan active filter and often has an inherent noise floor which produces the characteristic of Figure 7.12(b). Thisproduces the same results as in Figure 7.12(a).
Document provided by SpaceAge Control, Inc. (http://spaceagecontrol.com/).

7-20
. - Data
&.oo0
-o --NoiseFloor
E0 fN f0 Is
Frequency -- 1
(a) Data which has a white-noise limit to accuracy.
0~ Filter
Charactel stic.• _•y f Noise
Floor
E0 fc N fs
Frequency
(b) A noise limited active filter.Figure 7.12 Two examples of noise-floor sources.
In the example involving a data signal with a white-noise floor a filter will reduce the effects of the imagesfolding back into the data. If the filter of Figure 7.12(b) is unacceptably noisy then a quieter filter should besubstituted.
In the case where the noise floor does not limit the desired data accuracy there is little advantage in an indis-criminate increase in the sampling rate. Sampling rates of four to five times the maximumf. can be quite ade-quate. If f. is low, e.g., much lower than 400 Hz, then acceptable results can often be achieved when only asimple first-order RC anti-aliasing filter is used to prevent coupling of power-line electrical noise into the data.
For example, a research vehicle which incorporated a great many PCM channels was flown with first-order RCfilters as the anti-aliasing filters in the majority of the data channels. One vehicle was flown with no anti-alias-ing filters in the majority of the channels. These two vehicles illustrate that many research vehicles do havewell-behaved data and that good acquisition of data is possible with minor amounts of filtering.
The selection of a sampling rate that is four to five times thefm is justified by the assumption that the airborneanti-aliasing filter is a low-order, first-to-fourth-order filter. This permits filter designs which require reason-able component accuracies and matching to achieve reproducible filter characteristics.
7.9.2 Case 2: the good data channel with a remote noise spikeOne of the most common sources of aliasing errors in flight test data is a data signal which has a prominentnoise spike that occurs at a frequency much higher than the required data information. Probably the single most
Document provided by SpaceAge Control, Inc. (http://spaceagecontrol.com/).
7-21
common source of this spike is the unintentional electro-magnetic or common-ground coupling of the aircraftpower signal, usually 400 Hz, into the signal to be sampled. Another example is an aircraft-body-motion accel-erometer which has been mounted on a flimsy shelf with a high-frequency resonance, Reference 7.2. Thesetypes of errors could be classified under poor system design, but a few similar examples always seem to occurin any large instrumentation system.
These spikes were never intended to be included in the data signal. If they had been anticipated, an attemptwould have been made to eliminate them. They often are at a frequency so much higher than the intended datasignal that they are aliased into the data by means of the second or higher signal frequency domain image. SeeFigure 7.5 for an example of a noise spike that is aliased into the data from the second data image.
Due to the nature of aliased information these spikes appear as lower frequencies and can appear in the databandwidth. As mentioned earlier these aliased frequencies now are indistinguishable from actual low-frequencynoise or data. Without additional information it will be difficult or impossible to determine the aliased originsof the information.
The coupling of aircraft power frequencies into the data can be particularly elusive. Most engineers tend tomake the sampling rates in convenient increments, such as 10, 20, 50, 100 samples per second, and thereforethe aliased 400-Hz noise appears as a pseudo-steady-state signal, i.e., a dc or slowly varying offset. These typesof signals may be particularly difficult or impossible to identify for transducers that have dc response.
In this example the solution is to use an anti-aliasing filter which has attenuated the spike by the desired amountbefore the data is sampled. This can be a relatively simple filter when the spike is widely separated from thedata.
When a large noise spike can exist near the data the first approach should be to eliminate the noise source. Ifthis is not possible then a more sophisticated anti-aliasing filter is required.
If the data are simple signals, such as sinusoid, the nonlinear phase of the filter is not critical and a Cauer filtermight be acceptable. A Cauer filter can be constructed which very closely approximates an ideal filter in itsamplitude response, Refs. 7.1 and 7.5.
A notch filter can be used to remove a noise spike; however, care must be taken when notch filters are used inor near the data since they introduce considerable phase nonlinearities in their vicinity. If the data have a spikewhich is slightly higher thanfc, then a Cauer filter has a zero (a point of infinite attenuation) located just beyondits cut-off frequency. This zero is what causes the filter's attenuation just after its cut-off frequency to be verysteep. Ideally the filter approaches infinite attenuation at this zero; however, in actual filters this attenuationseldom approaches this ideal attenuation). A Cauer filter rebounds from this zero and thus has ripple in its stopband; however, the zero can be designed so as to function as a notch filter for frequencies near the filter's cut-off frequency. Beware of relying too much on this type of spike filter; the spike may shift frequency, the Cauerhigh-attenuation point may shift due to filter parameter instabilities, or both.
If the data are a complex wave form then the first approach should be to examine a Bessel filter or the 'linear-phase' compound filters of Reference 7.4. The compound filter shown in Figure 7.9 has good amplitude re-sponse and a phase response which is acceptably linearity for most applications.
7.9.3 Case 3: white-noise dataWhite noise data are rarely encountered in flight test situations. While such data are rare, they do occur. Anexample of a signal which approximated this case was the output of a fluidic Mach probe used on the X- 15 rock-et aircraft. The output of this probe was a sinusoidal data signal which was 20 to 40 dB below the noise producedby the probe. The noise spectrum in this case closely approximated white noise. In the vehicle all the noise wasfiltered out except the frequency range that included the data. The channel was then direct recorded on a wide-band tape channel since the sampling rates would have been too high for the sampling systems available at thattime. The signal was recovered in the ground station using a phase-lock-loop tracking filter.
If the white-noise model of Figure 7.4 is used to analyze aliasing noise it is easy to understand why many ofthe mathematical treatises on aliasing recommend increasing the sampling rate as the primary technique for re-ducing aliasing errors. Figures 7.4(b) and 7.4(c) illustrates how a simple increase in the sampling rate can sig-nificantly reduce the aliasing error for this type of analysis. The results of Figure 7.4 are in stark contrast tothose produced by the signals of Figure 7.12.
Document provided by SpaceAge Control, Inc. (http://spaceagecontrol.com/).

7-22
Unfortunately the most common mathematical models used for analyzing aliasing use white-noise type inputsignals to determine the sampling and filtering requirements (see Ref. 7.3). This can lead to erroneously highsampling rates if this is not the actual model of the data channel being analyzed.
Since many of the mathematical models used for the prediction of aliasing errors are derived from premisessimilar to those used to generate Figure 7.4, it is very important to understand this particular model's limita-tions. The misinterpretation of how to apply this model has caused many airborne data acquisition systems tobe grossly over designed with regard to sampling rates. This particular mathematical model should never beapplied unless the signal or noise approximates a white-noise input.
Many texts have been written on how to optimize sampling rate versus filter bandwidth if the data signal is ofthe white-noise variety. Reference 7.3 and the unpublished paper of L. W. Gardenhire provide excellent cover-ages of the these types of inputs. These models are covered in considerable detail in these papers.
These models lead to very high sampling rates; however, the sampling rates used in the paper by Gardenhireare excessively high. This follows since the mathematical model used in this paper makes the assumption thatthe information in the bandwidth of Figure 7.4(a), including the information after the filter's cut-off frequency(f,) is all meaningful data and any modification of this bandwidth produces an error in the final results.
Actually the information abovefm and certainly abovef, (see Fig. 7.4(a)) is expendable and can be removed inthe reconstruction process. Since this model produces the highest aliasing errors at the highest frequencies, (seeFigs. 4(b) and 4(c)), the reduction of the aliasing errors at these frequencies will significantly lower the pre-dicted desirable sampling rates since the aliasing error has been significantly reduced.
As can be seen this type of data requires high sampling rates. However, the sampling rates for these types ofdata will be high, even when allowances have been made for some of the original mathematical assumptions.Fortunately these data distributions rarely occur, but when they do occur the recommendations of these analysesare very useful.
7.9.4 Case 4: resolution of a transient eventOne of the legitimate justifications for increasing the sampling rate is to increase the resolution of a transientevent. An example might be a step input or a transient spike. One of the first questions then becomes how closedoes the actual transient have to be resolved?
It is the author's personal opinion that too many data users request resolutions and accuracies that are unreal-istically high for this type of data. In a couple of actual cases involving reasonably large numbers of data chan-nels, the requested amount of data exceeded the recording, transmission and data reduction capabilities of anyreasonable data system. Techniques, other than PCM, exist to handle these types of problems, but too many datausers want the resolution and accuracy of a PCM system.
A general rule is to remember that it is almost impossible to justify resolving the amplitude of most aircraft fasttransients to accuracies better than the 2% available on FM/FM tape recorders. Hardly ever is it necessary toreproduce the fine detail of a fast transient with the high accuracies provided by most PCM systems.
The most common mistake made in trying to resolve a transient is that the data user assumes an infinitely fastrise time for such inputs and the resolution is determined by some overly idealized resolution requirements. Tocompound the problem the data user often requests that the amplitude information in these transients be mea-sured to the very high accuracies requested for the channels nontransient data. In actual practice the samplingrate can often be much lower than at first thought, since actual systems on an aircraft do not respond anywherenear a true infinitely fast rise-time transient input.
As an example it was desired to measure the effects of a shock wave produced as a supersonic vehicle passedanother vehicle which had been instrumented with pressure transducers. A shock wave has a very fast transition;however, after analysis of the preliminary data the actual required sampling rate was found to be substantiallylower that the original estimates. The actual transient was actually an order of magnitude slower than predicted.
Often when the transient detail and highly accurate data are required then the best solution is to use two differ-ent types of data channels to record the data. The high-frequency portion of the data can be recorded on a wide-band data recorder, such as a tape recorder or oscillograph. The high-accuracy portion of the data can then befiltered and sampled as quasi-static high-accuracy data by a PCM system. Usually when many data channels
Document provided by SpaceAge Control, Inc. (http://spaceagecontrol.com/).

7-23
are to be recorded which have transient details that require the wide-band recorders, a few well chosen channelswill often provide the knowledge required about how the transient appears on the remaining channels.
Only experience and careful analysis of the system under study can establish the optimum sampling rate forthese transient types of signal inputs. In these systems the desired resolution determines the sampling rate andthe filter must be selected so as to pass the information that must be resolved. Remember that a linear-phasefilter will preserve basic wave shapes and rise times; only the sharp detail will be lost. A nonlinear phase delaywill distort the data, sometimes beyond recognition.
However, if this transient event occurs once in a flight then the effect is a very high sample rate for a shortduration event. If many channels are involved the bandwidths may quickly become prohibitive.
One solution for a predictable transient such as that induced by an electrically explosive device (EED), is touse a deedicated high-speed PCM system which acquires the data in a short burst only at the time the inducedtransient is initiated and stores the burst of data in dedicated memory. This memory can then be clocked out ata slower rate into another data stream, for example, a PCM data stream or incremental tape recorder.
Another solution, particularly for nonpredictable events is to use a loop tape recorder, and save the transientevent when it occurs. The tape recorder can be used with time-sample data, but is often best used with FM/FMtechniques.
7.9.5 Case 5: ground station techniquesThe ground station can improve the quality of the data. As mentioned earlier a 'reverse' filter can correct forsystem phase errors and provide additional filtering. This additional filtering reduces the high-end aliasingnoise.
The interpolation techniques that are used to reconstruct the data, whether used for analog or digital output,function as filters. As explained earlier an analog interpolation filter can be as simple as sampling and holdingeach data point and passing these signals into a filter, drawing a straight line between each data point, or usingpolynomial curve fitting (see Fig. 7.10). Each mentioned technique, in order, is an increase in complexity andin effect adds another 'filter' order to smoothing the output wave form.
As fm is less than f, (see Fig. 7.4(a)), sophisticated high-order ground station digital filters can be used toremove noise, aliasing and otherwise, abovefm. The linear phase FIR filter could be used in this case. Rememberthe time delay introduced by these linear phase filters must be taken into account when comparing two datachannels.
Digital techniques, such as the FFT, can be used to correct for various system errors, but not for aliasing errors.
7.9.6 Combined casesOther cases could be constructed, but most of them are combinations of the above and can be solved by studyingthe individual cases.
7.10 CONCLUSIONSBlind faith in any one strategy or single technique to determine the optimum sample rate and filter bandwidthto reduce aliasing errors only leads to nonoptimum results. A reasonable approach is to first construct an in-strumentation system which embodies the best instrumentation practices; particular emphasis should be placedon reducing noise. Secondly, protect the bulk of the well behaved low-frequency channels with simple first- orsecond-order analog filters and reasonable sampling rates, i.e., sampling rates that are four to five times fc or
fin, to reduce the impact of inadvertently coupled aircraft electrical power frequencies into the sampled data.
Problem channels will require a more detailed knowledge of the noise and signal spectrums. These channelsrequire more sophisticated use of filters and sampling rates.
If certain data channels are absolutely critical and the possibility of aliasing must be completely eliminated thenthese channels may have to be sampled for accuracy and recorded by some broad-band recording technique. Thebroad-band recorder for instance could be an oscillograph or tape recorder.
The ground station can be used to further reduce aliasing errors and noise in the data. It is limited in what itcan do for data which are already corrupted with aliasing errors; however, it can reduce some of the aliasingnoise and correct for certain system problems.
Document provided by SpaceAge Control, Inc. (http://spaceagecontrol.com/).
7-24
7.11 REFERENCES7.1 Veatch, Donald W. and Rodney K. Bogue, "Analogue Signal Conditioning for Flight-Test Instrumenta-
tion," AGARDograph No. 160, Vol. 17, 1986.
7.2 Borek, Robert, "Practical Aspects of Instrumentation System Installation," AGARDograph No. 160, Vol.13, 1981.
7.3 Hagenauer, Joachin, AGARD-Crandfield Short Course, Flight Test Instrumentation, May 1979.
7.4 Loy, Nicholas John, "An Engineer's Guide to FIR Digital Filters," Prentice Hall, Englewood Cliffs, NJ,1988.
7.5 "Operational Amplifiers, Design and Applications," Jerald G. Graeme, Gene E. Tobey, and Lawrence P.Huelsman, editors, McGraw-Hill Book Co., Inc., NY, NY 1971.
7.6 Rabiner, Laurence R. and Bernard Gold, "Theory and Applications of Digital Signal Processing," PrenticeHall, Englewood Cliffs, NJ, 1975.
7.7 "Applications of Digital Signal Processing," Allen V. Oppenheimer, editor, Prentice-Hall, EnglewoodCliffs, NJ, 1975.
Document provided by SpaceAge Control, Inc. (http://spaceagecontrol.com/).

8-1
Chapter 8
CALIBRATION
by
D. R. CrounseFlight Test Instrumentation Engineer
Air Force Flight Test CenterEdwards AFB, CA
United States
8.1 INTRODUCTIONCalibration of flight test instrumentation is the process of determining the transfer function, i.e., the input-out-put characteristics. This transfer function can be for either individual components or a channel of a measuringsystem from beginning to end. Calibration normally involves: 1) application of known input stimuli from trace-able standards, under controlled or known conditions, 2) measuring and recording the component or system out-puts, 3) analyzing the recorded data and 4) providing the scaled data to a flight data reduction facility. Theinstrumentation system designer or calibration engineer is faced with three choices to obtain calibration data:1) have a calibration performed under their guidance as described, 2) utilize data from calibrations performedby the manufacturer of the device, or 3) utilize data derived from theory. Most major flight test facilities eitherhave on site facilities to perform the majority of the necessary calibrations or have access to a nearby facility.National metrological laboratories are often available for specialized calibrations and in addition, many privatecompanies provide calibration services. While this subject sounds simple, there are many considerations thatthe calibration engineer must satisfy to make the end product of the instrumentation system design-flight testdata-acceptable. This treatise will address the general aspects of calibration. Specific processes applicable toparticular devices are discussed elsewhere: in the AGARD series, available from manufacturers of instrumen-tation devices, or are available from manufacturers of calibration equipment.
8.2 BASIC MEASURING CONCEPT
A simplistic view of a measuring device or system would have an input (I), a conversion process (C), and anoutput (0) (see Fig. 1).
Figure 8.1 Simplistic device.
The transfer function of this simplistic device can be described by equation (8.1).
0 = f(I) (8.1)
8.3 THE REAL WORLD CONCEPTIn the real world, the conversion process is influenced by undesirable outside forces. These forces are such thatthe output (0) is a function of both the input (I) to be measured and these outside forces. Ernest Doebelin(Ref. 8.1) calls these forces interfering inputs or modifying inputs. (See Fig. 8.2).
Document provided by SpaceAge Control, Inc. (http://spaceagecontrol.com/).

8-2
v [
Figure 8.2 Real world device.
Examples of the outside forces are:
Environmental effects:TemperaturePressureHumidity
VibrationAcceleration
Power effects:
Noise
VariationElectromagnetic interference
The conversion process now is described by equation (8.2).
0 = f(I, E, P) (8.2)
Component designers occasionally attempt to correct the output of their devices through what Doebelin callsintentionally introduced interfering inputs (Ref. 2). The intent of these inputs is to be essentially equal to butopposite in sense to interfering input (see Section 8.4.1).
8.4 THE MEASUREMENT SYSTEMThe conversion process described above is applicable whether the conversion is an individual component (i.e.,acceleration IN / voltage OUT) or a complete measuring channel (i.e., acceleration IN / PCM counts OUT). Aflight test instrumentation system includes both an acquisition portion with sensing/conditioning components(Fig. 8.3) and processing system with decoding/display components (Fig. 8.4). Also refer to Chapter 2,Figure 2.1.
The system concept is reiterated because the system designer must be concerned with both aspects, while thecalibration engineer is in most instances concerned with only the acquisition system. As mentioned, the goal ofan instrumentation system is to provide data to the customer. A transfer function obtained from calibration ofthe acquisition system is utilized by the display system to reproduce the input function to the particular datachannel. Failure on the part of the system designer to consider the display system in the overall calibrationscheme can lead to problems in the interpretation of results and often leads to a "finger-pointing" exercise toplace the blame. The system designer must educate the calibration engineer on the nuances of the display systemto assure data integrity.
Document provided by SpaceAge Control, Inc. (http://spaceagecontrol.com/).

8-3
Ph e no m e non tob e ui, e a s u r e d(p a r a vi e t e rm e a s-li r e [ e n t-(Aeasura . d. etc.)
Changes phenoimenon r*-u1ni --j sensed! je, Pre-transducer
position error, pneU- _ oconditioningnJatic Jag, strutue[revibrat ion etc.
Converts phenoeneion r
to 'use{•[u I, noriallu Transducerelectrical output.
Hodifies output of ......transducer to changebasic charcteristics / Signal(Ie. Filter) or to cake oniocompatible ithditioningencoder (ie. amplifier,converter, etc.)
Converts signal cond-itioner output to arecordable or trans- Encodingmittable value (ie. PCH
1i, etc.)
Records or transuiitsthe encoded signal (ie. Recording/telemetry, magnetic transmissiontape recorder stripchart recorder. etc.)
Figure 8.3 Acquisition system.
Converts transrmitted/ Receiver/recorde d signal f or plIa 9- ba ekdecoding recorder
Converts signal fordispla~j or processing tecoder
Filters and displaujsraw decoded signal(rmeter, strip chart! Displayj/CRT, etc.) or processes processorsignal for engineeringunit displa-j or printing
Figure 8.4 Processing system.
8.5 DATA USEThe result of the calibration process, in addition to allowing the display system to accurately provide the infor-mation acquired during the operation of a complete system, is data that allow the system designer to determinethe acceptability of the acquisition system design. If the calibration data show unacceptable results for a com-ponent type, the system designer must: 1) select a different component, 2) change his design to accommodatethe component, or 3) inform the flight test engineer of system measurement limitations.
Document provided by SpaceAge Control, Inc. (http://spaceagecontrol.com/).

8-4
8.5.1 AccommodationOne approach at accommodation was mentioned earlier as intentionally introduced interfering inputs. Usingthis approach, a component within the measuring device modifies the output. Examples of this approach includevariable amplifier feedback (e.g., a thermistor as a feedback resistor to correct for temperature effects), filter-ing, and more recently, digital correction using microprocessors. Another approach is external to the device.Examples of external accommodation techniques include:
Controlling the EnvironmentPlace the device, or a portion of the device in an oven.Orient the device for minimum sensitivity to the environment.
Measuring the EnvironmentPerform multiple calibrations.Select the proper one during data processing based on the measured environment.
In general, accommodation of the errors that would be induced from a particular device require additional mea-surements and often require complex display computations to recover the flight data. The system designer mustcarefully weigh the time and costs for a redesign of the acquisition system or selection of different devices ver-sus the time and costs for addition of measurands to the acquisition system and the potential design of the dis-play system and/or software.
Changes in the system design that occur due to the review of calibration results will normally be very costly,both in resources and time. It is much better to make the right choice of transducers, etc., in the beginning.
8.6 TRACEABILITYThe calibration data must be traceable to acceptable standards. In metrology, traceability is the history of thetransfer of standards (length, mass, time, etc.) from the international definition to their final use. Each countryhas a department or bureau that maintains national standards from the basic physical quantities that define near-ly every measurement that an instrumentation system senses. These national standards are called primary stan-dards. Each government agency or private company must have a records system to assure that any data or testresults furnished to a customer can be traced back to these primary standards. The predominate system involvesa facility that maintains secondary standards. These standards are periodically sent to the national facility forcalibration (or are calibrated in-place by traveling standards). The individual users in a calibration facility forinstance in-turn send their tertiary standards to the secondary standards location. These tertiary standards arethen used to calibrate production standards or in some cases are production standards themselves. The produc-tion standards are then used on a daily basis to perform calibrations. Production standards are also used in themanufacture of special mounting fixtures for calibration. Calibrations in a laboratory will normally have welldefined traceability but calibrations that must be performed onboard the test vehicle will need careful designand analysis to assure traceability. With the advent of automation of test equipment, including many calibrationstandards, one subject that becomes part of traceability is the software that controls the equipment. The designermust assure that errors are not introduced in the calibration process due to software "bugs."
Traceability does not address the quality of the standard (i.e., accuracy, frequency response, stability, etc.)Traceability only addresses the path from the national standard to the data gathered during the calibration pro-cess. The system designer and the calibration engineer must be familiar with the specifications of all the equip-ment used and the procedures used to transfer the information from item to item. The age-old axiom, "measurewith a micrometer, mark with chalk, cut with an axe," can often be seen in the metrology world as a calibrationis passed from the universal definition of the phenomenon at a national facility to the production device in aninstrumentation calibration laboratory. For example, use of the absolute standard for length to calibrate a wood-en ruler (with a dull pencil) and then using the ruler to calibrate a micrometer will be traceable. But using themicrometer to measure distance will produce a measurement with the accuracy of the ruler, not the micrometer.
8.7 UNIT DEFINITIONBoth the data user and the calibration facility must be using the same units definition of the standard. This isseldom a problem in the classical measurements such as length, mass, time, etc. This definition must be care-fully watched in derived measurements such as altitude, fuel flow, etc. The pressure altitude relationship hasundergone several changes in the last 20 years (Ref. 8.3) Volumetric fuel flow (i.e., gallons/hour) involves den-sity and viscosity terms to convert to mass fuel flow (i.e., pounds/hour).
Document provided by SpaceAge Control, Inc. (http://spaceagecontrol.com/).

8-5
8.8 STANDARD INDUCED ERRORSIn general, calibration devices should be approximately 10 times better than the instrument (Ref. 8.4), and theinstrument 10 times better than the measurement requirements (other sources quote 5 or even 2). The importantpoint is that the measuring device must be better than the measurement requirements and that the calibrationdevice must be better than the measuring device. This requires that realistic characteristics (see Section 8.9.1)for the measurement be defined and communicated to everyone involved in the calibration process and that anyitem or action that lowers the ability of the instrumentation system to meet the characteristics be communicatedto everyone.
8.9 CALIBRATION PROCEDURESWritten calibration procedures are critical. The procedures must document the equipment necessary for the cal-ibration, the steps to follow, and the data to be recorded. From analysis of the data, the designer must be ableto ascertain the acceptability of both the device and the particular calibration and be able to provide the flighttest engineer with proof of acceptability. The procedures must assure that sufficient data, under the proper con-ditions are acquired and that the data are analyzed for the traits of the device that could result in flight testinaccuracies. A properly written procedure will provide for repeating the calibration. The procedure must besufficiently detailed so that the input-output relationship of the device will only vary due to the device charac-teristics, not operator or test/calibration equipment characteristics. Doebelin lists the following approach(Ref. 8.5).
1. Examine the construction of the instrument, and identify and list all the possible inputs.
2. Decide, as best possible, which of the inputs will be significant in the application for which the instrumentwill be calibrated.
3. Procure apparatus that will allow you to vary all significant inputs over the ranges considered necessary.
4. By holding some inputs constant, varying others, and recording the output(s), develop the desired static in-put-output relations.
Avoid verbal procedures: only written procedures can provide assurance of duplication of the calibration pro-cess and help the calibration engineer to, after-the-fact, determine if there is anything in the process or person-nel performing the calibration that creates errors.
The majority of calibrations are performed as static calibrations because the device selection process makes theeffect of dynamic response insignificant. Static calibrations must provide sufficient settling time for the inputstandard and the device under calibration. Equally important is the time required for any test equipment to sta-bilize.
Much dependence is placed on the definition of the dynamic response characteristics by the device manufac-turer. The system designer must be aware of both the dynamic response requirements for the measurements andthe ability of the device to meet those requirements. Dynamic calibrations can be performed to either determineor verify the dynamic characteristics. Chapter 4, Section 4.4.2 discusses in detail the dynamic characteristicsthat the designer must consider. Dynamic electrical signals whether sine, step, or ramp are easy to simulate,particularly with current generation, computer controlled signal generators. Also, current generation pressure,rate tables, etc., have sophisticated computer control systems that allow dynamic simulation. These devicesmust be carefully chosen as they are often capable of accurate performance only in relatively low frequencies.
Care must be taken to assure that the purity (distortion) of the signal is known; particularly distortion from me-chanical calibration equipment. An "almost-sine-waveform" can introduce unwanted frequencies in the calibra-tion. Recording of the instrument output during dynamic calibration is rather complex. Test equipment thatacquires data in the time domain must be used to solve the equations in Chapter 4. While signal analyzers areavailable that directly measure phase shift, their cost and infrequent usage often prohibit their availability inthe calibration laboratory.
8.9.1 CharacteristicsThe measurement "quality" requirement mentioned earlier must be mutually understood by the system designer,the calibration engineer, and the flight test engineer. Standard terminology (characteristics) is used to describeperformance so that the various personnel involved in the use of an instrumentation system can communicatetheir desires and concerns about the performance of the system and its individual components. It is imperative
Document provided by SpaceAge Control, Inc. (http://spaceagecontrol.com/).

8-6
that all concerned have the same understanding of the terms used. In describing the characteristics, the termpercent is often used. . . the "percent of what" must be clearly understood. Percent of reading (or value) andpercent of full scale are two different values. If the flight test engineer is thinking value while the systemsengineer is thinking full scale, someone will have a shock. Chapter 4 covers the definition of characteristics indetail.
8.9.2 Calibration data presentation techniquesThe universal presentation technique used to describe the results of a calibration is the calibration curve. Thecurve involves the following elements:
Vertical and horizontal axes
Individual data points- increasing- decreasing- average
"Best-fit" line through the data points
When environmental conditions require accommodation (see Section 8.5.1), a "family of curves" is required todescribe the results at each condition.
The curve allows a quick look at the general quality of the calibration and allows easy spotting of apparent er-rors. Detailed description of the quality requires a numerical analysis of the data to allow the user to determinethe fine nuances of difference between devices or in relation to the measurement requirements. No matter whichapproach is used, one requirement that must be met is comparison of any particular calibration with previouscalibrations on the device, previous calibrations of devices of the same model but different serial numbers, orprevious calibrations on similar type devices. Failures in test equipment can occur, devices can change charac-teristics, a modification to software can create a "bug" elsewhere, etc. These problems can create a conditionwhere a data set by itself looks good but has subtle errors. Comparison of calibration data can point to errorsthat can be corrected before flight data is compromised.
Refer to the appendix for figures Al, A2, A3, A4, and A5 with their associated tables of values for examplesof typical transducer calibration data and resultant data plots used for this purpose.
8.9.3 Visual instrument calibrationOne area that is often overlooked in training new instrumentation engineers is the use of readings from produc-tion, visual instruments for quick, limited data acquisition. This can be done either through voice transmissionof readings, hand recording of readings or photographic/video recording of readings (see Chapter 3). The ac-curacy of the data gathered can be improved through a process of instrument correction of the indicated values.Data for the calibration of the visual instrument is gathered as described before but the results are presented ina slightly different manner. The instrument error at each data point is calculated using equation (8.3).
C = T- I (8.3)
Where C = Correction - to - AddT = True ValueI = Indicated Reading
The analysis of the data involves plotting the correction versus the indicated reading and determining the rea-sonableness of the hysteresis and shape of the curve. The final curve used for correction of the test recordeddata is a plot of the average value at each data point. To instrument correct the test recorded data, the curve isentered with the instrument reading to determine the correction-to-add and then using equation (8.4) to deter-mine the actual value.
T = I + C (8.4)
Where T = True value of the readingI = Indicated readingC = Correction from the calibration
Document provided by SpaceAge Control, Inc. (http://spaceagecontrol.com/).

8-7
8.9.4 On-vehicle calibrationFor many measurements, laboratory calibrations are either impossible or impractical. Examples are surface po-sitions, control positions (throttle, control stick, actuators, etc.), yaw and pitch vanes, etc. In these cases thesystem designer and/or calibration engineer must acquire or design and construct mechanical devices to providethe input function. Care must be taken to assure that the input device has traceability (see Section 8.6) and thatit is periodically re-calibrated. The design must address environment differences between manufacture and use(machine shop versus flight line) that could cause errors. The calibration procedure must also address the po-tential difference in qualifications between laboratory and flight line technicians. Fixture alignment, settlingtime, etc., that are normal procedures for laboratory personnel might not be normal for flight line personnel.
Use of on-vehicle calibrations can also point to other problems such as electromagnetic interference (EMI), dirtor water in pressure tubing, anomalies in installed wiring, etc. (Ref. 8.6).
8.9.5 Environmental calibrationTo properly describe the characteristics of a device or system, the designer may additionally require that thecalibration be performed under various environmental conditions that the device will undergo in operation.Temperature, altitude, and acceleration are the most common conditions but the system designer and the cali-bration engineer must consider all potential factors in both selection of devices and the calibration procedure.In Section 8.2 the concept of intentionally introduced interfering inputs was presented. If the device utilizesthis approach, care must be taken to assure that the desired correction occurs over the environmental range thedevice will experience in use.
8.10 SYSTEM VS COMPONENT CALIBRATIONThe interface between various components of an acquisition system may be sufficiently defined that individualitem calibrations can be combined to provide a system calibration. Conversely, the interface may be so unde-fined that all the components, including the installed wiring, must be used to provide accurate data. Many fac-tors must be considered in making the decision of which approach to use, including organization policy,personal or organizational experience with the individual components or systems, cost and time involved, avail-ability of a calibration facility, access to portable/traceable standards, size and complexity of the installed ac-quisition system, computational capabilities to combine many individual calibration data sets, the datapresentation approach used, accuracy requirements, and the ability to repeat the test mission.
8.10.1 Individual component calibrationEven if a system calibration approach is planned, each component should always be individually calibrated.This allows the designer to allocate the error budget for the measurement and if it is insufficient, see whichdevice is the most likely target for improvement. The overall error for the channel can be estimated by statisticalcombination of the individual device errors. Since the data processing system usually requires a single calibra-tion for each data channel, the task of merging the several individual calibrations must be performed by thedesigner. If all the individual calibrations are linear and can be described by a first order equation (y = mx + b)the process is relatively easy. When one or more calibrations are not linear, the mathematical process becomesmore complex. One large advantage to individual calibrations is that when one item in the string fails, it can bereplaced immediately (assuming that a calibrated spare is available) and the test mission can proceed on or nearto schedule.
One big disadvantage to individual calibrations is that the bookkeeping task becomes larger to assure that thedata processing system has the current combined calibration for each measurement channel. System calibrationsreduce this task. This bookkeeping task can also be reduced when devices such as multiplexers, amplifiers, fil-ters, and even transducers have standardized calibrations.
The calibration procedures discussed so far simply involve determining and documenting the current conditionof the device. In the standardizing approach, a defined specification is used by the calibration facility as anadjunct to the requirement. Any deviation of the device from that requirement is adjusted out before final re-lease of the device. While this sounds simple, often components that allow adjustment are affected by the air-craft environment, particularly vibration, and the useability of the device is reduced.
Two other considerations of system calibrations are accuracy limitations and the ability to compare data withprevious data sets. Often the standard measurement device in system calibrations is the encoder. If it is used,it may become the limiting device in the overall accuracy obtainable for the calibrations. Also since the
Document provided by SpaceAge Control, Inc. (http://spaceagecontrol.com/).

8-8
measurement string will seldom have the same serial numbered devices installed for a statistically significantnumber of calibrations, comparison of calibrations to spot subtle changes is almost impossible.
8.10.2 System calibration
A system calibration allows the designer to know the overall performance of the measurement string. No math-ematical combination of calibrations is necessary as only the end-to-end data are gathered. But if any one devicein the string fails, a complete recalibration is required. If the failure is in a component at the measuredphenomenon end of the string, the recalibration may not be a serious problem. If the failure is in the encoderend of the string, the recalibration of a multitude of channels could cause significant deiay in test missions.Again, if standardized calibrations are used, replacement will only cause small errors.
Another consideration on system calibration is similar to finesse. The term finesse relates to the effect of thetransducer on the measurand. Another effect that must be considered in the calibration process is the effect ofthe measurement on the transducer. For example, turbine type flowmeters are susceptible to turbulence in thefluid. Manufacturers recommend "flow straighteners" and lengths of straight pipe be placed ahead of the device.Often this is not possible so calibration of the flowmeter must be done using production tubing. Other examplesof similar effects include: lag effects of pneumatic piping on pressure measurements, resonance of structureson vibration and acoustics measurements, bending of structures on acceleration, and rate or position measure-ments. While system calibration can find (or mask) some of these effects, others must be considered. To per-form a proper calibration, parts of the aircraft may need to be included in the procedure. If the procedure cannot be performed on the aircraft, the parts will need to be removed and included in the laboratory calibration.(see Chapter 4).
8,10.3 Combination comnonent/svstem calibration
It is often impossible to physically separate the various portions of the measurement string for individual cal-ibrations. For example, a linkage to translate control surface positions to an angular or linear motion may beeasier to calibrate using the transducer that measures the linkage motion (Ref. 8.7). In that case, a calibrationof the transducer in the laboratory to ascertain its acceptability followed by a field calibration using the com-plete acquisition system to read the information would be an appropriate approach. Another reason for com-bined calibration approaches is to determine once, prior to the first flight, the overall performance of themeasuring system. The results of the systems calibration can be compared to the statistical combination resultsto provide confidence in the design. A number of critical measurements may be selected for this purpose andthe appropriate input equipment obtained to calibrate them. Once these calibrations are completed and the de-signer has confidence in the approach, any subsequent calibrations are performed as individual component cal-ibrations and combined mathematically.
8.11 AUTOMATED CALIBRATIONMany calibration facilities are now becoming automated. The input function, output reading, data reduction,and even the insertion of results into the flight data processing system can and are being done automatically.This places more burden on the instrumentation engineer as he is forced to depend on the talents of the computerprogrammer to interpret both the engineer's requirements and the capabilities of the equipment that performsthe calibration.
This automation greatly improves the ability to handle the necessary record-keeping. Easy access to calibrationhistories of individual items or like items provide the designer with an early look at the capabilities of items hecan use in his design. The histories also provide a means of predicting the recalibration interval. Additionally,these histories provide a source of back-up data in the event the designer's personal filing system or the dataprocessing facility's files fail.
8.12 PRE/POST/IN-FLIGHT CALIBRATION
The emphasis of this section is on periodic calibration. One area that must not be overlooked is actions that canbe taken before, after, or during each flight to insure the integrity of each data channel. The system designer,in conjunction with the test engineer, can utilize known inputs from either the air vehicle or the environmentto verify operation. Measurement of ambient temperature and pressure conditions, performing preflight or postflight activities at a known latitude/longitude, etc., will allow related measurements to be verified. Movablesurfaces can be rigged or set to known positions for verification. Specific flight maneuvers can be conductedto exercise transducers and allow flight-by-flight comparison of specific channels or comparison of the rela-tionship of several channels. Transducers can be disconnected manually or through the use of relays from signal
Document provided by SpaceAge Control, Inc. (http://spaceagecontrol.com/).

8-9
conditioning and a precision voltage substituted, calibration resistors can be inserted to incrementally changetransducer output values or signal conditioning inputs can be shorted to verify the operation of the remainderof the devices in the channel. While breaking a connection will allow some information on the operation to bedetermined, it must be tempered with the knowledge that reconnection might not be performed properly,resulting in the loss of data (Ref. 8.8). Addition of components for voltage or resistor insertion or shorting in-puts must be tempered by the additional complexity of the system and its higher potential for failure.
8.13 PLANNINGPlanning for calibrations is often the most overlooked requirement. The designer needs to consider that time isrequired to:
- acquire the necessary calibration equipment (particularly that needed for dynamic calibrations),- have the equipment calibrated by a standards organization,- prepare and validate calibration procedures (as well as software),- train operating personnel and provide the space and utility connections in the calibration facility.
Failure to coordinate calibration requirements ahead of time often leads to schedule slips, poor quality data, orexcessive resource expenditures to compensate for the lack of planning. The system designer must not assumethat just because his organization has a particular device on hand, that the calibration facility has the capabilityto routinely calibrate it and routinely provide data to the customer. As each device is selected for the instru-mentation system, the designer must assure that it can be calibrated.
8.14 REFERENCES8.1 Doebelin, E.O., "Measurement Systems, Application and Design," McGraw-Hill, New York, 1983, p. 20.
8.2 ibid, p. 30.
8.3 Gracey, William, Measurement of Aircraft Speed and Altitude, NASA RP-1046, 1980.
8.4 Doebelin, p. 39
8.5 ibid
8.6 Borek, R.W., "Practical Aspects of Instrumentation System Installation," AGARDograph No. 160,Vol. 13, 1972, p. 123 and 132.
8.7 vander Linden, J.C. and H.A. Mensink, "Linear and Angular Position Measurement of Aircraft Compo-nents, AGARDograph No. 160, Vol 8, Jan. 1972, p. 38.
8.8 Borek, R.W., "Practical Aspects of Instrumentation System Installation," AGARDograph No. 160 Vol. 13,p. 27.
Document provided by SpaceAge Control, Inc. (http://spaceagecontrol.com/).

8-10
8.15 APPENDIX
ARSE INDICATOR CAUISIATIONWORK ORDER 026 SSML OM DATE.1iJN 9
10 1
8
4 =
0 o0
Ioo0~1
-20 o
-4o
O 10 r L L
0 100 200 300 400 500 600 700 800 900
IICATEM READING UNOTIS)UP , DOWN - AV AGE
Figure Al Airspeed Indicator Calibration.
Document provided by SpaceAge Control, Inc. (http://spaceagecontrol.com/).

8-11
INSTRUMENT CALIBRATION DATA REDUCTION6510 TEST WING / TSIS
EDWARDS AIR FORCE BASE, CALIFORNIA(805) 277-3600
AUTOVON 527-3600
Nomenclature : AIRSPEED Work Order # : 26641Type / Model : MOD-850 Requestor : MCMILLANPart Number : E0739110059 Calibrated By: NAKATASerial Number: 3210 Press.Amb : 27.758Manufacturer : KOLLSMAN Temp.Amb : 22.78
DATE CAL : 16 JUN 1989REMARKS : CAL PER TPS SPECS
*** RAW DATA LISTING *
Input Units : KNOTSOutput Units : KNOTSPOINT Input Reading(up) Correct(up) Reading(dn) Correct(dn) Hysteresis
1 50.0 61.000 -11.000 62.000 -12.000 1.0002 60.0 68.000 -8.000 68.000 -8.000 0.0003 70.0 74.000 -4.000 74.000 -4.000 0.0004 80.0 82.000 -2.000 82.000 -2.000 0.0005 90.0 92.000 -2.000 92.000 -2.000 0.0006 100.0 101.500 -1.500 101.500 -1.500 0.0007 110.0 113.000 -3.000 113.500 -3.500 0.5008 120.0 123.000 -3.000 125.000 -5.000 2.0009 130.0 133.000 -3.000 133.000 -3.000 0.000
10 140.0 142.000 -2.000 142.000 -2.000 0.00011 150.0 151.000 -1.000 151.000 -1.000 0.00012 160.0 162.000 -2.000 162.000 -2.000 0.00013 170.0 173.000 -3.000 172.500 -2.500 0.50014 180.0 182.000 -2.000 183.000 -3.000 1.00015 190.0 192.000 -2.000 192.000 -2.000 0.00016 200.0 201.000 -1.000 201.000 -1.000 0.00017 210.0 211.000 -1.000 211.000 -1.000 0.00018 220.0 222.000 -2.000 222.000 -2.000 0.00019 230.0 232.500 -2.500 233.000 -3.000 0.50020 240.0 244.000 -4.000 244.000 -4.000 0.00021 250.0 252.000 -2.000 253.000 -3.000 1.00022 260.0 261.000 -1.000 262.000 -2.000 1.00023 270.0 270.000 0.000 271.000 -1.000 1.00024 280.0 279.000 1.000 280.000 0.000 1.00025 290.0 288.000 2.000 290.000 0.000 2.00026 300.0 298.000 2.000 299.000 1.000 1.00027 310.0 308.000 2.000 310.000 0.000 2.00028 320.0 319.000 1.000 320.500 -0.500 1.50029 330.0 330.000 0.000 331.000 -1.000 1.00030 340.0 341.000 -1.000 343.000 -3.000 2.00031 350.0 352.000 -2.000 354.000 -4.000 2.00032 360.0 364.500 -4.500 365.000 -5.000 0.50033 370.0 373.000 -3.000 373.500 -3.500 0.50034 380.0 382.000 -2.000 382.000 -2.000 0.00035 390.0 391.000 -1.000 391.000 -1.000 0.00036 400.0 399.500 0.500 400.000 0.000 0.50037 410.0 408.000 2.000 409.500 0.500 1.50038 420.0 418.000 2.000 419.000 1.000 1.00039 430.0 428.000 2.000 429.000 1.000 1.00040 440.0 438.000 2.000 439.000 1.000 1.00041 450.0 448.000 2.000 449.000 1.000 1.00042 460.0 459.000 1.000 459.000 1.000 0.00043 470.0 469.000 1.000 470.000 0.000 1.000
Figure Al Continued.
Document provided by SpaceAge Control, Inc. (http://spaceagecontrol.com/).

8-12
Work Order # : 26641Serial # : 3210
RAW DATA LISTINGInput Units : KNOTSOutput Units : KNOTSPOINT Input Reading(up) Correct(up) Reading(dn) Correct(dn) Hysteresis
44 480.0 480.000 0.000 480.000 0.000 0.00045 490.0 493.000 -3.000 493.000 -3.000 0.00046 500.0 503.000 -3.000 504.000 -4.000 1.00047 510.0 512.000 -2.000 512.500 -2.500 0.50048 520.0 521.000 -1.000 522.000 -2.000 1.00049 530.0 530.000 0.000 530.000 0.000 0.00050 540.0 539.000 1.000 540.000 0.000 1.00051 550.0 548.000 2.000 549.000 1.000 1.00052 560.0 557.000 3.000 559.000 1.000 2.00053 570.0 567.000 3.000 568.000 2.000 1.00054 580.0 577.000 3.000 577.500 2.500 0.50055 590.0 587.000 3.000 588.000 2.000 1.00056 600.0 597.000 3.000 598.000 2.000 1.00057 610.0 607.500 2.500 609.000 1.000 1.50058 620.0 618.000 2.000 620.000 0.000 2.00059 630.0 628.000 2.000 630.000 0.000 2.00060 640.0 641.000 -1.000 641.000 -1.000 0.00061 650.0 650.000 0.000 653.000 -3.000 3.00062 660.0 660.000 0.000 662.500 -2.500 2.50063 670.0 670.000 0.000 672.000 -2.000 2.00064 680.0 678.000 2.000 682.000 -2.000 4.00065 690.0 689.000 1.000 692.000 -2.000 3.00066 700.0 699.000 1.000 701.000 -1.000 2.00067 710.0 708.500 1.500 712.000 -2.000 3.50068 720.0 719.000 1.000 722.500 -2.500 3.50069 730.0 729.000 1.000 733.000 -3.000 4.00070 740.0 738.000 2.000 742.500 -2.500 4.50071 750.0 748.000 2.000 752.000 -2.000 4.00072 760.0 757.000 3.000 762.000 -2.000 5.00073 770.0 766.000 4.000 771.000 -1.000 5.00074 780.0 776.000 4.000 780.500 -0.500 4.50075 790.0 786.000 4.000 790.000 0.000 4.00076 800.0 796.000 4.000 799.500 0.500 3.50077 810.0 806.000 4.000 809.000 1.000 3.00078 820.0 816.000 4.000 819.000 1.000 3.00079 830.0 827.000 3.000 828.000 2.000 1.00080 840.0 837.000 3.000 838.500 1.500 1.50081 850.0 847.000 3.000 848.000 2.000 1.000
Figure Al Concluded.
Document provided by SpaceAge Control, Inc. (http://spaceagecontrol.com/).

8-13
ALTMETER CALDRATIONWORK O1• R ,'26414 ERIAL R,1186 M DATEMMAY869
300 -' ' ' ' ' ' ' ' ' ' a a ' ' ' ' ' ' ' ' '
0 150
0 75
-75U-150
0 7500 15000 22500 30000 37500 45000
INICIATED READING (MEET.LP DOWN - AVERAGE
Figure A2 Altimeter Calibration.
Document provided by SpaceAge Control, Inc. (http://spaceagecontrol.com/).

8-14
INSTRUMENT CALIBRATION DATA REDUCTION6510 TEST WING / TSIS
EDWARDS AIR FORCE BASE, CALIFORNIA(805) 277-3600
AUTOVON 527-3600
Nomenclature : ALTIMETER Work Order # : 26414Type / Model : AAU34 - Requestor : KAISERPart Number : 3252022-0101 Calibrated By: NAKATASerial Number: 12536 Press.Amb : 27.758Manufacturer : KOLLSMAN Temp.Amb : 22.78
DATE CAL : 11 MAY 1989REMARKS : CAL PER TPS SPECS IN PNEU MODE
*** RAW DATA LISTING *Input Units : ALT FEETOutput Units : ALT FEETPOINT Input Reading(up) Correct(up) Reading(dn) Correct(dn) Hysteresis
1 0.0 -20.000 20.000 -10.000 10.000 10.0002 1000.0 980.000 20.000 1000.000 0.000 20.0003 1500.0 1480.000 20.000 1490.000 10.000 10.0004 1600.0 1580.000 20.000 1580.000 20.000 0.0005 1800.0 1780.000 20.000 1780.000 20.000 0.0006 2000.0 2000.000 0.000 2020.000 -20.000 20.0007 2200.0 2200.000 0.000 2210.000 -10.000 10.0008 2400.0 2380.000 20.000 2400.000 0.000 20.0009 2600.0 2580.000 20.000 2580.000 20.000 0.000
10 2800.0 2780.000 20.000 2800.000 0.000 20.00011 3000.0 2980.000 20.000 3000.000 0.000 20.00012 4000.0 3980.000 20.000 3980.000 20.000 0.00013 5000.0 4970.000 30.000 4980.000 20.000 10.00014 6000.0 5960.000 40.000 5980.000 20.000 20.00015 7000.0 6975.000 25.000 6980.000 20.000 5.00016 8000.0 7960.000 40.000 7980.000 20.000 20.00017 9000.0 8960.000 40.000 8970.000 30.000 10.00018 10000.0 9945.000 55.000 9965.000 35.000 20.00019 11000.0 10935.000 65.000 10960.000 40.000 25.00020 12000.0 11925.000 75.000 11950.000 50.000 25.00021 13000.0 12920.000 80.000 12950.000 50.000 30.00022 14000.0 13950.000 50.000 13965.000 35.000 15.00023 15000.0 14920.000 80.000 14950.000 50.000 30.00024 16000.0 15920.000 80.000 15945.000 55.000 25.00025 17000.0 16920.000 80.000 16940.000 60.000 20.00026 18000.0 17910.000 90.000 17920.000 80.000 10.00027 19000.0 18900.000 100.000 18920.000 80.000 20.00028 20000.0 19900.000 100.000 19920.000 80.000 20.00029 22000.0 21920.000 80.000 21950.000 50.000 30.00030 24000.0 23920.000 80.000 23950.000 50.000 30.00031 26000.0 25900.000 100.000 25915.000 85.000 15.00032 28000.0 27910.000 90.000 27940.000 60.000 30.00033 30000.0 29900.000 100.000 29940.000 60.000 40.00034 32000.0 31950.000 50.000 31980.000 20.000 30.00035 34000.0 33980.000 20.000 34000.000 0.000 20.00036 36000.0 36030.000 -30.000 36040.000 -40.000 10.00037 38000.0 38050.000 -50.000 38090.000 -90.000 40.00038 40000.0 40120.000 -120.000 40140.000 -140.000 20.00039 42000.0 42140.000 -140.000 42160.000 -160.000 20.00040 44000.0 44170.000 -170.000 44180.000 -180.000 10.00041 46000.0 46110.000 -110.000 46020.000 -20.000 90.00042 48000.0 48060.000 -60.000 48085.000 -85.000 25.00043 50000.0 50000.000 0.000 50025.000 -25.000 25.000
Figure A2 Concluded.
Document provided by SpaceAge Control, Inc. (http://spaceagecontrol.com/).

8-15
IqCHMETER CALIBRATIONM DER 26 SERIAL 86444 iATE:27WR198
.02
o .01 ,o 0
I-
x x % %0 -. 01 x x x x -- I x le
hI -.02 -- - - - -P
0. 03 4 I I
.5 .6 .7 .8 .9 1 1.1 1.2 1.3 1.4 1.5INDICATED READING (WO)
PLOT AVERAGE CUJRVE ONLY
0 FEET x 10000 FEET - 20000 FEET- CENTER LIME
Figure A3 Machmeter Calibration: 0-30,000 ft.
Document provided by SpaceAge Control, Inc. (http://spaceagecontrol.com/).

8-16
INSTRUMENT CALIBRATION DATA REDUCTION6510 TEST WING / TSIS
EDWARDS AIR FORCE BASE, CALIFORNIA(805) 277-3600
AUTOVON 527-3600
Nomenclature : MACHMETER Work Order # : 25588Type / Model : 950EX-4-03 Requestor : MCMILLANPart Number : N/A Calibrated By: NAKATASerial Number: 6444 Press.Amb : 27.758Manufacturer : KOLLSMAN Temp.Amb : 22.78
DATE CAL : 27 MAR 1989REMARKS : CAL PER TPS SPECS
*** RAW DATA LISTING ***Input Units : MACHOutput Units : MACHReadings for 0 feet altitudePOINT Input Reading(up) Correct(up) Reading(dn) Correct(dn) Hysteresis
1 0.5 0.500 0.000 0.500 0.000 0.0002 0.6 0.600 0.000 0.600 0.000 0.0003 0.7 0.700 0.000 0.700 0.000 0.0004 0.8 0.800 0.000 0.800 0.000 0.0005 0.9 0.900 0.000 0.900 0.000 0.0006 1.0 1.000 0.000 1.000 0.000 0.0007 1.1 1.100 0.000 1.100 0.000 0.0008 1.2 1.200 0.000 1.210 -0.010 0.0109 1.3 1.300 0.000 1.300 0.000 0.000
10 1.4 1.400 0.000 1.400 0.000 0.00011 1.5 1.490 0.010 1.490 0.010 0.000
Readings for 10000 feet altitudePOINT Input Reading(up) Correct(up) Reading(dn) Correct(dn) Hysteresis
12 0.5 0.510 -0.010 0.510 -0.010 0.00013 0.6 0.610 -0.010 0.610 -0.010 0.00014 0.7 0.710 -0.010 0.710 -0.010 0.00015 0.8 0.810 -0.010 0.810 -0.010 0.00016 0.9 0.900 0.000 0.910 -0.010 0.01017 1.0 1.000 0.000 1.010 -0.010 0.01018 1.1 1.110 -0.010 1.110 -0.010 0.00019 1.2 1.210 -0.010 1.210 -0.010 0.00020 1.3 1.310 -0.010 1.310 -0.010 0.00021 1.4 1.400 0.000 1.400 0.000 0.00022 1.5 1.490 0.010 1.490 0.010 0.000
Readings for 20000 feet altitudePOINT Input Reading(up) Correct(up) Reading(dn) Correct(dn) Hysteresis
23 0.5 0.520 -0.020 0.520 -0.020 0.00024 0.6 0.620 -0.020 0.620 -0.020 0.00025 0.7 0.720 -0.020 0.720 -0.020 0.00026 0.8 0.820 -0.020 0.820 -0.020 0.00027 0.9 0.910 -0.010 0.910 -0.010 0.00028 1.0 1.010 -0.010 1.010 -0.010 0.00029 1.1 1.110 -0.010 1.110 -0.010 0.00030 1.2 1.220 -0.020 1.220 -0.020 0.00031 1.3 1.310 -0.010 1.310 -0.010 0.00032 1.4 1.400 0.000 1.400 0.000 0.00033 1.5 1.490 0.010 1.490 0.010 0.000
Figure A3 Concluded.
Document provided by SpaceAge Control, Inc. (http://spaceagecontrol.com/).

8-17
CHd:ETFER CALIBRATIONM OR ER 1258 SERIAL 6444 WTE:2?AR1989
.01 , , , , , , , ,
0
-. o /01
o0 -. 02 -. . -
o -.03 "'-- - -- 04 x x x.
0 X05
.5 .6 .7 .8 .9 1 1.1 1.2 1.3 1.4 1.5INDICATED READING (lAM)
PLOT A CLURVE ONLY
--- 30000 FEET X 40000 FEET - 50000 FEET- CENTER LINE
Figure A4 Machmeter Calibration: 30-50,000 ft.
Document provided by SpaceAge Control, Inc. (http://spaceagecontrol.com/).

8-18
Work Order # : 25588Serial # : 6444
RAW DATA LISTINGInput Units : MACHOutput Units : MACHReadings for 30000 feet altitudePOINT Input Reading(up) Correct(up) Reading(dn) Correct(dn) Hysteresis
34 0.5 0.520 -0.020 0.530 -0.030 0.01035 0.6 0.625 -0.025 0.630 -0.030 0.00536 0.7 0.730 -0.030 0.730 -0.030 0.00037 0.8 0.825 -0.025 0.830 -0.030 0.00538 0.9 0.920 -0.020 0.920 -0.020 0.00039 1.0 1.020 -0.020 1.020 -0.020 0.00040 1.1 1.120 -0.020 1.120 -0.020 0.00041 1.2 1.225 -0.025 1.225 -0.025 0.00042 1.3 1.320 -0.020 1.320 -0.020 0.00043 1.4 1.410 -0.010 1.410 -0.010 0.00044 1.5 1.500 0.000 1.500 0.000 0.000
Readings for 40000 feet altitudePOINT Input Reading(up) Correct(up) Reading(dn) Correct(dn) Hysteresis
45 0.6 0.635 -0.035 0.640 -0.040 0.00546 0.7 0.740 -0.040 0.740 -0.040 0.00047 0.8 0.840 -0.040 0.840 -0.040 0.00048 0.9 0.930 -0.030 0.940 -0.040 0.01049 1.0 1.030 -0.030 1.040 -0.040 0.01050 1.1 1.140 -0.040 1.140 -0.040 0.00051 1.2 1.240 -0.040 1.250 -0.050 0.01052 1.3 1.335 -0.035 1.335 -0.035 0.00053 1.4 1.430 -0.030 1.430 -0.030 0.00054 1.5 1.520 -0.020 1.520 -0.020 0.000
Readings for 50000 feet altitudePOINT Input Reading(up) Correct(up) Reading(dn) Correct(dn) Hysteresis
55 0.7 0.730 -0.030 0.740 -0.040 0.01056 0.8 0.830 -0.030 0.830 -0.030 0.00057 0.9 0.920 -0.020 0.920 -0.020 0.00058 1.0 1.020 -0.020 1.030 -0.030 0.01059 1.1 1.120 -0.020 1.130 -0.030 0.01060 1.2 1.220 -0.020 1.230 -0.030 0.01061 1.3 1.320 -0.020 1.320 -0.020 0.00062 1.4 1.410 -0.010 1.410 -0.010 0.00063 1.5 1.500 0.000 1.500 0.000 0.000
Figure A4 Concluded.
Document provided by SpaceAge Control, Inc. (http://spaceagecontrol.com/).

8-19
SCECALIBRATIONMORF ORDER MU 6M02. 1 SERIAL 1881 3ATE:SLI1SSM
I I I I I I I I I
5
3
0III I I I I I I I I
-1 -. 8 -. 6 -,4 -. 2 0 .2 ,4 .6 .8 1RAWd DATA ----- ITJT : 6-I.ITS
x READING UF CRW - AG READING CUR o READIN6 ON CUFigure A5 Accelerometer Calibration.
Document provided by SpaceAge Control, Inc. (http://spaceagecontrol.com/).

8-20
INSTRUMENT CALIBRATION DATA REDUCTION6510 TEST WING / TSIS
EDWARDS AIR FORCE BASE, CALIFORNIA(805) 277-3600
AUTOVON 527-3600
Nomenclature : ACCEL Work Order # : 26602.1Type / Model : 971-4193-001 Requestor : MC MILLANPart Number : N/A Calibrated By : SHARPESerial Number : 861 Press. Amb : 27.526Manufacturer : SUNDSTRAND Temp. Amb : 22.22
DATE CAL : 9 JUN 1989REMARKS : Y-AXIS 28VDC EXT.
*** RAW DATA LISTING *Input Units : G-UNITSOutput Units : VDCPOINT Input Reading(up) Reading(dn) AvgReading Hysteresis
G-UNITS VDC VDC VDC VDC
1 -1.000 0.2064 0.2064 0.2064 0.00002 -0.800 0.6839 0.6839 0.6839 0.0000
3 -0.600 1.1650 1.1650 1.1650 0.00004 -0.400 1.6450 1.6450 1.6450 0.00005 -0.200 2.1220 2.1220 2.1220 0.00006 0.000 2.6370 2.6370 2.6370 0.00007 0.200 3.1110 3.1110 3.1110 0.00008 0.400 3.5810 3.5810 3.5810 0.00009 0.600 4.0560 4.0560 4.0560 0.0000
10 0.800 4.5310 4.5310 4.5310 0.000011 1.000 5.0030 5.0030 5.0030 0.0000
LINEAR MODEL Y=A+B*X
A=-1.086459
B= .4158144
Source Df SS MS RatioRegression 1 4.399766 4.399766 169129.9
Residual 9 2.341271E-04 2.601412E-05Total 10 4.4
Figure A5 Concluded.
Document provided by SpaceAge Control, Inc. (http://spaceagecontrol.com/).

9-1
Chapter 9
TECHNICAL ASPECTS IN THE DESIGN OF MULTICHANNEL DATA COLLECTIONSYSTEMS
by
Helmut BotheGerman Aerospace Research Establishment (DLR)
PO Box 326738108 Braunschweig
Germany
and
Ren6 CrabiWElectronique Serge Dassault
78, Quai Marcel Dassault92214 St Cloud
France
9.1 INTRODUCTIONChapters 4 to 8 have presented a discussion of design and calibration aspects of individual measuring channels.In actual flight test instrumentation systems a number of such channels are combined. That number can rangefrom a very few for simple ad-hoc tests to several thousands for prototype tests of large and complex aircraft.This chapter discusses the methods by which these channels are combined into one multichannel flight testsystem.
The design of a multichannel data system must begin by a specification of the test objectives and by establishinga first measurements list. Then the basic set-up of the system can be decided upon. This must be done inclose cooperation among management, flight test engineers, data processing specialists, and instrumentationengineers. In Section 9.2 aspects of this phase are discussed. When the main set-up has been defined, thesystem must be designed, built and prepared for installation in the aircraft (Section 9.3). During this phase alarge number of tests must be executed. The nature of those tests is discussed in Section 9.4.
The specification of a multichannel data collection system must be developed by an iterative process, in whichthe requirements of the individual channels must be weighed against those of the overall data system. Thecompromise reached in this way will often be a digital system with one basic data sampling frequency, whichcan in a limited way be adapted to the frequency requirements of the individual channels by supercommutationand/or subcommutation. If a few channels require much higher sampling rates than the majority of the channels,it is often useful to accommodate these in a separate analog system. Such composite systems need not becompletely independent: the power supplies and many of the signal conditioners can be used by both systems,their data can usually be recorded on different tracks of the same tape recorder and most of the test equipmentcan be used by both.
It is in principle possible to use transducers which already function in the operational system of the aircraftfor flight test purposes too. That can appreciably reduce the cost of the flight test system, but there are twoimportant requirements: the transducer must meet the requirements of the flight test system and adequatemeasures must be taken to ensure the integrity of the essential aircraft systems, even if a failure in the flighttest system should occur.
Often the flight test system must be designed in such a way that existing ground facilities for data demulti-plexing, processing, evaluation and presentation can be used without or with only minor additions. This canbe an important limitation in the development of a new system.
No simple rules can be given for these and many other problems with which the instrumentation engineer isconfronted when designing a flight test data collection system. It is the engineer's task to select the best com-promise which satisfies the requirements of the flight test program within the limits of the available resources.
Document provided by SpaceAge Control, Inc. (http://spaceagecontrol.com/).

9-2
Reliability and accuracy are the leading considerations in the choice of the components and of the designmethods for the system and its wiring. The final system must prove itself during intensive testing in the courseof the construction and the flight test operations, and the test equipment must be designed as part of the overallsystem. The efficiency of these tests will to a large degree depend on the knowledge and experience of thepeople who maintain and operate the system. The selection and training of these personnel, which must oftenwork under difficult circumstances on the ground or in flight, can have an important influence on the successof the data collection operation.
9.2 SYSTEM CONCEPT9.2.1 System modification versus new developmentUpdating an existing data system is generally more economical and requires less lead time than the developmentof a completely new system. One important aspect is that much experience will be available on the operation(and weak points) of the existing system. The existing system must then meet the requirements of the newtest program without or with little change. Such characteristics as size, weight, and capacity usually cannotbe changed economically.
If the encoder is programmable, it is often possible to modify an existing system to a considerable extent. Newtransducers and signal conditioners can then be incorporated. Sampling rate, frequency response, and accuracycan often be increased to a limited extent. Sampling rates can be increased or decreased by supercommutationor subcommutation. Higher frequency response can be obtained with continuous-trace recorders by usingfaster galvanometers and higher paper speeds, with FM recording by using higher sub-carrier frequencies andhigher tape speeds. If the existing system can meet the accuracy requirements of all but a very few channels,it may be possible to use coarse-fine techniques or variable word length.
If the test program is relatively small and the data rates are low, the use of photo-panel recording or continuous-trace recording may be adequate. If a computerized ground station is available, it will usually be moreeconomical to use onboard recording on tape or static memories or telemetry even for small-scale tests. Theadvantages of computer processing, such as reduced turn-around time, less manual processing, and betterpresentation of the results will often outweigh the higher cost of preparation and installation of the flyingequipment, and of the computer programming.
Though many data systems have a considerable growth potential, if the flight test programme differs signif-icantly from those previously made with the data system, it may be necessary to develop a completely newsystem. The development time and the cost of such a new system will often be considerable, but if the growthpotential of the new system is sufficient for several future applications, it may be the most economical solution.For larger systems, the possibilities of extensive automation should be carefully considered.
9.2.2 Choice of the major componentsAn important decision that must be made before the instrumentation system can be specified, is whether onlinedata processing will be required. Real-time processing has the following advantages:
"* Flight safety is increased by monitoring calculated and processed parameters by the test team.
"* Results acquired in real time can enable more tests to be performed in the course of a given flight.
"* Health monitoring of the test installations becomes possible during flight, hence the turn around timeis decreased.
"* The availability of test results allows a more efficient postflight debriefing.
Online processing can, in principle, be applied in two ways:
"* Online processing of a certain number of parameters carefully selected for the flight considered.
"* Online processing of all data, so that a complete analysis of the results is available by the time theaircraft lands.
Document provided by SpaceAge Control, Inc. (http://spaceagecontrol.com/).

9-3
The first method has been in use for a long time. It has been found that the flight time and the number offlights required for testing advanced aircraft can be considerably reduced if a number of important parameterscan be continuously observed in real time by specialists. In systems for small aircraft this is achieved bytelemetering these data to the ground, where they are displayed after online processing in a computer, but forlarge aircraft, systems using onboard computation and display are also beneficial. The need for such a systemshould be stated early in the development program, as it will have considerable effect on the general layoutof the instrumentation system.
The second method, i.e., online processing of all data, is technically possible using telemetry and a powerfulground computer station. Another approach only possible for large aircraft is sometimes accomplished bythe installation of a complete onboard computing system together with the necessary peripheral equipment. Itwould seem, however, that these approaches will, in some instances, not be economically justifiable. Espe-cially for the comparison of results against complex math models requiring a very extensive data processinginstallation, off line processing is usually preferred.
A measurements list defines the characteristics required of each individual measuring channel. On the basisof an analysis of all these requirements and of the equipment available on the market, it will then have to bedecided whether they can be handled by one system or whether a composite system is necessary, what kind(s)of system(s) will be used, and which parameters will be handled by each system. Eventually a choice willhave to be made from (a combination of) the following possibilities:
" Onboard recording (for details see Chapter 11)photo panel recordingtrace recording
analog strip chartdigital printer
magnetic tape recording (for details see Chapters 2 and 11)videoanalog FManalog directdigital direct (PCM)digital computer compatibledigital noncomputer compatible
"* Telemetry (for details see Chapter 12)analogdigital
• Onboard cameras or closed-circuit television (for the observation of external events such as flowpatterns, external store release, ice accretion)
* Onboard cameras for photogrammetric measurements (aircraft trajectories, position fixing)
* Ground based equipment (photo theodolites, laser trackers, radar, telemetry ground station, etc.) (fordetails see Chapter 13)
Except for small single-purpose tests, it is almost inevitable that more than one type of data collection systemwill be used during a flight test program. The unique capabilities of each system and the broad spectrumrequirements usually make it impossible for one system to handle all the data. For a typical flight test programa composite data collection system may be required which involves the simultaneous use of the followingsystems:
* A digital system for basic airplane and engine performance data
* An FM system for vibration and acoustic survey
9 Fuselage-mounted cameras for recording wool-tuft patterns on the wing
Document provided by SpaceAge Control, Inc. (http://spaceagecontrol.com/).
9-4
"* A continuous-trace recording system for quick-look purposes
"* Photo theodolites, laser trackers or radar for trajectory measurements during takeoff and landing tests
"* A timing system for the synchronization of data from different sources tests
Details on most of these systems are given in Chapters 11 to 13. A few words can be said here about theapplication of cameras. Film or photo cameras are used for flow investigations with wool tufts, investigationson the shape of ice formations on the wing, control surfaces, and engine intakes, measurements of wing andfuselage bending, observation of external store release, etc. Closed-circuit television is also used for someof these tasks, either for real-time monitoring by observers in the aircraft or on the ground (if video radiotransmission is possible), or for playback of video magnetic tapes after a flight. Photo cameras are also oftenused for the measurement of aircraft trajectories, both from the ground (photo theodolites) and from the aircraftas in some methods for takeoff and landing measurements.
9.2.3 Onboard recording and/or telemetryOne of the first choices that must be made is whether telemetry or onboard recording, or both, will be used.Even if telemetry is used during part or during the whole program, the data will, in most cases, also be recordedon board the aircraft. The choice of the telemetry is based on one or more of several specific reasons. Themost important are:
"* Hazardous flying, such as high-speed and flutter testing to expand the operational envelope of anairplane. This requires evaluation of data on each condition before going to the next, without exposingthe crew any more than necessary to the hazardous conditions.
"* Participation of qualified specialists in critical decisions. The data are also protected in the event ofan accident. In this type of testing, only a limited number of critical parameters need be telemetered.
"* Testing of a small vehicle. The fact that a telemetry transmitter usually is much smaller than arecorder with adequate data capacity may lead to the choice of a telemetry system.
"* Online processing of telemetered data. This has been discussed in Section 9.2.2.
Telemetry has, however, certain disadvantages:
"* The aircraft must be operated within "line of sight" of the receiving antenna. This may seriouslyrestrict the area in which flight tests can be made unless the operational range of the telemetry linkis considerably extended by the operation of a second relay aircraft.
"* The radiation pattern of the onboard antenna many times suffers from deep nulls in certain angularareas which deteriorates the continuous data transmission. A second antenna for space diversity canreduce this problem.
"* The radio link is susceptible to interference from other transmitters and man made noise. The resultingloss of data can have a very serious effect on the progress of the flight testing, especially if onlineprocessing is used. For this reason onboard recording is generally used as a back-up.
"* The total system is more complex and therefore more liable to malfunctioning. System checking ismore complicated for this reason and also because it must include both the airborne and the groundequipment, and the radio link between them.
"* Data security is compromised because others can also receive the signal unless advantage is taken oftechniques for signal hiding like, e.g., spreading the spectrum.
Detailed discussions of onboard recording and telemetry are given in Chapters 11 and 12.
If the use of telemetry is envisaged, the number of parameters to be transmitted and the sampling rate must beselected first since this can have a considerable impact on the choice of the onboard data acquisition equipment.In many cases the most economical solution is to use the same data acquisition electronics for recording andtelemetry.
Document provided by SpaceAge Control, Inc. (http://spaceagecontrol.com/).

9-5
In many flight test programs there is a requirement for protection of at least a limited part of the flight data inthe case of a crash. As mentioned before, this can be done by telemetry. If no telemetry is available, crash-proof containers can be used for the recording medium. This approach is applicable to cameras, magazinesof continuous trace recorders, and for tape recorders. In most cases, a separate crash-recording system of thecommercially available type adopted by airlines is used. These have still limited data recording capacity, butnew technology has resulted in high-capacity static memories (16 Mbits), and the use of data-compressionsystems with ratios lying between 6 and 12, depending on the type of aircraft and type of flight, has remarkablyimproved the performance of crash recorders.
9.2.4 Methods of onboard recording and telemetryAnalysis of any set of flight test parameters will show that a division into three main categories is possiblewith respect to required frequency spectrum and accuracy:
"* Low-frequency data (up to about 5 Hz); these are aircraft and system analog parameters, parametersobtained on data buses and discrete pulses. For some of these data a high accuracy may be required(e.g., 0.1% full-scale error), but for other low-frequency data a high accuracy will not be important.
"* Medium-frequency data (up to about 30 Hz); these are again aircraft and system analog parameters,especially from control systems, where proper phase transmission is important. For this type of dataerrors of about 1% full scale will usually be tolerated.
"* High-frequency data (up to several kHz); these are acceleration parameters for flutter tests and pa-rameters to measure stress and vibration. For these data a relatively low accuracy (2 to 10% full-scaleerror) is usually acceptable.
The first two categories are suitable for digital systems, and the third is usually handled by analog systems.In the case of a high-capacity system it may be possible to accommodate high-frequency parameters by cross-strapping a number of input channels, i.e., supercommutation, and low-frequency channels by subcommutation(Section 9.3).
Digital tape recording and telemetry (see Chapters 11 and 12) are mostly preferred in all large flight testprograms. The principal reason for this is that as soon as the signal has been digitized, there is no furtherloss of accuracy during the data manipulation, transmission, and storage. Digital recording and telemetry aretherefore especially suitable for high-accuracy data.
At first thought it would seem to be advantageous if the tapes recorded on board the aircraft could be readdirectly by a standard digital computer, i.e., if the onboard system produced a computer-compatible tape ordisc. In practice, this has a number of disadvantages which are:
* The tolerances of standard digital computer tapes with respect to bit density and skew are so closethat even good flight recorders often cannot remain within these tolerances when subjected to thelinear and angular accelerations normally encountered during flight tests.
* Disc drive systems usually do not meet the onboard acceleration and vibration requirements.
* Standard digital computers require half-inch tapes with data recorded in parallel on either seven ornine tracks at closely specified bit densities. At the bit densities achievable in parallel recording, thenumber of data points per tape is relatively low. In order to achieve a better utilization of the tapes,other formats are often preferable, for instance one inch wide tapes with 14, 16 or 31 tracks or serialrecording with extremely high bit densities.
* Standard digital computers require "inter record gaps" after a certain number of data words. Duringthese gaps no data must be recorded. The flight test data are, however, generated continuously. Somekind of buffer storage is then required which involves a considerable increase in the complexity ofthe airborne equipment.
Because in most data preprocessing stations a special computer is available for quick look and editing, it isgenerally possible to use this computer also for converting the flight tapes to a computer-compatible format.Engineering unit conversion of data can be included also at this stage.
Document provided by SpaceAge Control, Inc. (http://spaceagecontrol.com/).

9-6
Analog data collection systems are primarily used for recording and for transmission of high-frequency signals.Interpretation of these data is often more conveniently done using traces showing the time histories of themeasured parameters. Analog tape recording can also be more convenient if analog data processors are to beused, as for instance in some types of frequency analysers.
Analog systems can produce continuous data or sampled data; digital systems always produce sampleddata. Analog sampled data systems include photo panels, and pulse amplitude modulation (PAM) meth-ods. Continuous-trace recorders and direct-recording tape recorders produce continuous data. For all sampledsystems it must be kept in mind that the sampling frequency must always be higher (2x times and oftenappreciably higher) than the highest frequency which is of interest for the measurement, in order to reduce theeffect of aliasing errors (see Chapter 7).
The advantage of analog tape recording over trace recording and photo panels is that the signals can bereproduced in electrical form when the tape is replayed. This makes it possible to use automatic or near-automatic data processing, including digitizing on the ground. Direct recording and FM modulation techniquesare generally used for analog tape recording and, after modulation on an RF carrier, also for telemetry. Thesemodulation techniques are described in Chapters 11 and 12.
Combinations of different systems using the same tape recorder can be very efficient. PCM and FM data canbe recorded on different tracks of the same tape recorder as long as there is a suitable tape speed for bothsystems. For telemetry transmission of these signals usually two different carrier frequencies are required,unless the spectral distribution of both signals allows-in case of additional filtering or multiplexing-a linearmixing of the signals on one channel (Chapter 12).
In many systems slow analog sampled data after conversion to digital format are mixed with digital data fromavionics data buses or onboard computers (see Section 9.3.2.3). The composite PCM message is then usuallyorganized after the world-wide used IRIG Standard (Ref. 9.1), where the messages are arranged in long andshort cycles. These are of fixed length and the data channels are placed in assigned positions. There areknown other special systems with different organization, like the Daniel Standard (France, Ref. 9.2) which isorganized in long cycles. Data of analog origin and digital data are allocated in different zones, and the lengthof the digital zone varies with the volume of data to be acquired.
Photo panels are still used occasionally because of their extreme flexibility (which is an important advantage insmall ad-hoc tests) and because many types can be used for visual monitoring during the recording. Continuous-trace recorders can record up to 50 parameters at moderate cost and are still occasionally used for the recordingof dynamic data, especially if the measurements involve the phase relationship between two or more variables.This type of recorder is useful for those types of tests where the interpretation can be made directly from therecorded time histories.
9.3 TECHNICAL DESIGN AND DEVELOPMENT CONSIDERATIONS9.3.1 IntroductionAt a certain point of time, the system concept has been sufficiently finalized after discussions among aircraftdesigners, flight test engineers, data processing specialists, and instrumentation engineers to permit the initiationof the detailed development of the new components. It should be realized that all future possibilities aredetermined by the constraints of these choices.
The design of the individual channels has been discussed in some detail in Chapters 4, 5, and 6. Somegeneral and organizational aspects have been dealt with in Chapter 2. It is the intention of this chapter todiscuss in general terms some topics relevant to the design and development of a complete system and also todiscuss some of the problems which arise when the constituent parts of an instrumentation system are broughttogether (integrated) and when the complete instrumentation system is installed in the test aircraft. Some ofthese interface problems will be dealt with in separate sections.
It should be noted that instrumentation engineering has progressed a long way in the last few years. Attemptsto "connect a few components together" will almost surely result in a system that is inadequate for eventhe most rudimentary measurements. Adequate attention must be given to inter-element effects, including
Document provided by SpaceAge Control, Inc. (http://spaceagecontrol.com/).

9-7
impedance matching, frequency response, ground loops, and shielding. The analytical determination of overallsystem operating characteristics requires an intimate knowledge of the detailed, quantitative descriptions of the
characteristics of each element in the system. Instrumentation engineering is a profession, and a well-equipped,trained, and experienced team is an absolute requirement for the successful completion of a flight test program.
The range of requirements of the various programs and system capabilities is so diversified that it is verydifficult to buy a complete, off-the-shelf system that satisfies all needs of a particular flight test program. Asa consequence, program requirements are met in one of three ways, depending upon the in-house resourcesand capabilities available:
* The complete design and construction is done in-house.
* The components are procured and their integration is done in-house.
* The complete system is procured on contract.
Except for the number of people required, the involvement of the user's organization is about the same. Even if
the total system is procured, competent staff is needed to prepare the detailed technical specifications, monitor
the design and construction phases, and, after delivery, perform acceptance tests and then maintain and operatethe equipment.
9.3.2 Multiplexing and normalization of input signals9.3.2.1 Continuous data channels
For data collection systems which do not use commutated data, such as continuous trace recording systems andsystems using single-channel FM, each channel can more or less be designed separately. The main constraint isthat all channels have to be recorded at the same recording speed. For data collection systems with multiplexingthe general layout of the multiplex system must be determined at an early stage in the design.
The basic principles of multiplexing are described in Chapter 12. In systems with frequency-division multiplex-
ing the main concern is to divide the channels over the available (sub)carrier frequencies so that each channelobtains its best frequency response. If the frequency spectra of all channels are similar, a constant-bandwidthsystem will often provide optimal results. If the spectra of the signals differ and a few of the channels havefrequencies above about 300 Hz, a proportional-bandwidth system must be used.
9.3.2.2 Sampled data channels
Most modem flight test data collection systems mainly rely on time-division multiplexing. This is used in alldigital and pulse modulation systems, and can be used in FM and direct recording and FM and AM telemetry.The first step in designing such a system is to determine the required basic commutation rate. This is, inprinciple, the highest sampling rate required for any channel, though supercommutation may be used if afew channels require a higher sampling rate than all others. It must be stressed here again that the requiredsampling rate is always higher than the frequency range mentioned in the measurements list. It is determinedby the acceptable aliasing error in the channel. The methods to determine the required sampling rate for agiven frequency spectrum are described in Chapter 7.
Once the basic commutation rate has been fixed, the number of measurements per commutation cycle mustbe determined. It is often possible to reduce the required number of channels by selecting only those whichare essential for a particular flight by means of a patchboard. The number of measurements per cycle isdetermined by the highest number of channels required on any flight and by the amount of supercommutationand subcommutation required.
The basic commutation rate and the number of measurements are primary factors determining the design ofthe data collection system. They not only determine the commutation speed itself, but also the speed of theanalog-to-digital converter and the signal conditioning units. When designing a new system, they should beconsidered very carefully because they have a large influence on the growth potential of the system.
For the design of a data collection system a parameter sampling plan is very helpful. The number of therequired (e.g., 12 bit-) channels, if possible including future requirements, is plotted versus the individual
Document provided by SpaceAge Control, Inc. (http://spaceagecontrol.com/).

9-8
desired sampling rate. This figure usually exhibits at what sampling rates a concentration of channels occursand hence at what sampling rates main-, sub- and supercommutation rates are at all useful. The lowest possiblebit rate is achieved, if all channels are sampled exactly with the desired sampling frequency. But this usuallyleads to a very complex commutation system. It is the ability of the design engineer to select the samplingrates such that only one or two subcommutation rates are necessary, and at the same time the lowest possiblebit rate is not exceeded by more than a factor of about 1.5 in order to keep the bandwidth of recording and
transmitting equipment low.
As an example the parameter sampling plan of the DLR test aircraft ATTAS is shown in Figure 9.1. All
parameters including future extensions are illustrated according to the requirements of the applications, andthe lowest achievable bit rate would be 127.0 Kbit/sec including two channels for synchronisation. In this
example supercommutation is not recommended due to the considerable number of channels with high samplingrate. The different possibilities of subcommutation are listed in Table 1. It makes no big difference if asubcommutation rate of 32, 20 or 16 samples/sec per channel is chosen; the lowest bit rate is exceeded byabout 1.35 only. This bit rate versus lowest bit rate factor comes down to 1.2, if a second subcommutationrate is applied, and goes up to 1.9 without subcommutation. In this particular example a programmable
commutating system is available, and as long as the future expansion channels are unused no subcommutationis programmed, the bit rate being 148.2 Kbit/sec.
80 -
I - future expans.70 computer data
I0
fly by wire system
50
C avionics
- 40 -
""M TI
c'J II I"30 I I
.0, I I
E ~20
'0
0 21 01 30T60 6,25 10 16 30 40 60 samples I s 802 8 12,5 20 32 50 64
sampling rate (target) -
Figure 9.1. Parameter sampling plan of the DLR test aircraft ATTAS.
Document provided by SpaceAge Control, Inc. (http://spaceagecontrol.com/).

9-9
Table 1. ATTAS subcommutation and total bit rates (BR).
Commutation rate Each channel(samples/sec) 64 64 64 64 64 as required
Subcommutation rate 32 20 16 32 - --
(samples/sec) 16
Total BR(Kbit/sec) 175.0 171.4 172.0 152.0 241.1 127.0
Actual BRversus lowest BR 1.38 1.35 1.35 1.2 1.9 1
At the present state of the art, electronic switches are used almost exclusively in the commutators, even forlow-level signals. Electronic commutators are extremely versatile and can be made very small as severalswitches can be incorporated in one integrated circuit. Their design requires a few precautions. The resistanceof the switches in the closed condition is not very low (in the order of 100 ohms), and they produce a smallleakage current in the open position (in the order of 10 nanoamperes). In a properly designed circuit thesecharacteristics will, however, hardly effect the measuring accuracy. Crosstalk, i.e., changes in the signallevel of one channel caused by the signal level in another channel, can cause difficulties, especially whenintegrated circuits are used with many switches. This problem must be solved by proper grouping of theinput channels. Notwithstanding all these effects, good results can be obtained with well-designed electroniccommutators, even with low-level signals. In order to overcome in a more general manner the technologicalproblems inherent in this type of component, time isolation of channels with the reading of quiescent values(self-calibration) between interrogations solves all the problems mentioned.
9.3.2.3 Bus data channels
The avionics equipment of civil and military aircraft nowadays is linked together by data buses for the exchangeof sensor, computational or instructional information. For flight testing of the avionic systems the access ofthe flight test data collection system to this information is essential. Moreover many of the sensor parametersavailable on the buses like acceleration, velocity, and attitude information from inertial platforms, airdata fromdigital airdata computers, and navigational data from radio navigation systems, are also very useful for otherflight test purposes. By picking up these parameters from buses the integration of many additional sensors forflight testing purposes can be avoided.
There are high-frequency digital buses (operating at 1 to 3 Mbits/sec), medium speed digital buses(100 Kbits/sec), and low speed operation buses (12-14.5 Kbits/sec). Two types of protocol have been adopted:(1) Buses of the "message" type, such as the MIL-STD-1553 bus (Ref. 9.3), constituting several messageswith a header followed by data words (2) Buses of the "label" type on which each word possesses its ownaddress. The ARINC 429 bus is of the label type (Ref. 9.4). A digital bus acquisition unit is capable ofacquiring and multiplexing the digital parameters of several high-frequency buses and up to some 10 mediumspeed and slow buses.
In the case of a bus of the message type, a recognition table contains the various headers to be acquired anda selection table takes from the message the data words relating to the programmed test. In the case of abus of the label type, data recognition and acquisition are simpler, since each parameter has its own address.System management and the acquisition and processing of parameters are possible only by the use of microprocessors distributed in the various units.
Document provided by SpaceAge Control, Inc. (http://spaceagecontrol.com/).

9-10
9.3.2.4 General layout of the data collection system
When the basic commutation rate, the number of measurements per cycle, and the type and number of busparameters have been selected, the general layout of the data collection system can be planned in more detail.An important factor is at which stage the signals are commutated. The most straightforward method in adigital system with analog inputs is to place the commutator directly before the analog-to-digital converter(Fig. 9.2). Then each channel has its own signal conditioner, which transforms the transducer output signalinto the type of signal required by the analog-to-digital converter. This is usually a dc signal, either high-level(e.g., 0 to 5 V) or low-level (e.g., 0 to 30 mV). Other types of input signals have been used in the past (forinstance pulse duration modulated (PDM) signals), but these are not very common nowadays.
TRANSDUCERS
SIGNAL0' CONDITIONING TAPE RECORDER
i• lSIGNAL A-O-
SI CONDITIONING
Figure 9.2. Data acquisition system with separate signal conditioners.
The method illustrated in Figure 9.2 is ideal, since each channel is independent, the only common point beingthe analog-to-digital converter. Its major disadvantages, however, are its cost and above all its size. Thesignal conditioning circuits are not applied in a very economical fashion, as each one is only used during avery brief time period of each commutation cycle. Therefore a common signal conditioner is often used forall signals of the same type. A simple example of such a system is shown in Figure 9.3. The multiplexerconnects the signals from transducers with the same type of output to the associated signal conditioner, andthus the number of signal conditioners is equal to the number of types of signals. As this number may still bequite large, simple "preconditioning" circuits are sometimes provided to further reduce the number of signalconditioners. These preconditioners can include filters for individual channels, cold junction compensationfor thermocouples, amplifiers or voltage dividers which adapt the electrical range of the signal, etc. The finalchoice of what should be included in "preconditioning" and what in "conditioning" will depend on the numberof transducers of each type.
The system of Figure 9.3 still has the disadvantage that each commutation switch is connected to a predeter-mined signal conditioner and that, therefore, the possibilities of replacing a transducer by one with a differenttype of output are limited. Moreover, the problems of cost and size are not completely solved either. It is forthis reason that modem systems use input multiplexing with a single conditioning and encoding channel.
An example of such a system is shown in Figure 9.4. The sequence in which the channels are scanned, andthe scanning rate of each channel can be programmed separately for each flight. The single central signalconditioner will be adapted to each incoming type of signal by the program control. Automatic gain controlallows the conditioning of any input signal.
This method requires high performance of components with regard to reliability, measurement repeatability,reproducibility, etc. The bandwidth of the channel must be broad to allow satisfactory stabilization of circuitsbetween measurements. But with much care, an accuracy of the order of 3 x 10⁻⁴ can be achieved.
Document provided by SpaceAge Control, Inc. (http://spaceagecontrol.com/).

9-11
TRANS-
DUCERS PRECONDITIONERS SIGNALCONDITIONERS
TYPE I
FIRST-LEVEL SECOND-LEVEL
MULTIPLEXER MULTIPLEXER TAPE RECORDER
TYPE 2 (X1'i TYPE 2 C-ONVETE
SIGNALS CONVERTER
TYPE 3 K -FT . TYPE 3SIGNALS X L J
Figure 9.3. Data acquisition system with common signal conditioners.
FIRST-SLEVEL
0 - MULTI-I
ANALOG PEE ETA
TRANS- FOR SIGNAL - A-TO-DDUCERS ANALOG CONDITION- CONVERTER
-TO SECOND- RECORDER]DIGITAL -- rLEVEL I -
FREQUENCY CONVERTER MULTI-FREQENCYPLEXER
OR RATE FOR I
TRANSDUCERS DIGITALTIMEPER)OD SIGNALSI
O • TO
TDIGITALCONVERTER
DIGITAL 0 -
TRANS-DUCERS 0
PROGRAM CONTROL
MULTIPLEXER
ADDRESSING
Figure 9.4. Data acquisition system with a computer-assisted multiplexer and signal conditioner.
In each system, there are a number of channels which cannot be handled by the normal commutation system.This is, for instance, the case for those pulse-rate or frequency signals whose period is much longer than
Document provided by SpaceAge Control, Inc. (http://spaceagecontrol.com/).

9-12
the sampling time available for each channel (for example, engine tachometers and fuel flow meters). Themeasurement of such signals must have a duration of at least two periods of the lowest frequency that canoccur, and integration over a still longer period may be required. Such channels must have a separate analog-to-digital converter, which is sampled by the second-level multiplexer, as shown in Figure 9.4. Signals whichalready have the digital format are also scanned directly by this second-level multiplexer.
For large and complex flight test systems, the weight of the wiring for instrumentation can become prohibitive.This weight can be markedly reduced by remote multiplexing. Several systems like that of Figure 9.3 are thenmounted at locations in the aircraft where large numbers of transducers are concentrated. They are controlled
by a single program control unit. The digital output of each remote multiplexing unit can then be transmittedto the recording system by a single pair of wires, and only relatively few wires from the central program unitto each remote multiplexing unit are required.
In order to facilitate problems of installation in the aircraft and make use of available information on avionicsdata buses, especially in military aircraft, systems based on the principle of a distributed configuration are ofconsiderable importance. Their architecture is directly derived from that of modem avionics mentioned earlier.
Designed around a data bus known as the system bus, these systems interconnect different types of unitsperforming the following functions:
* Management
* Analog acquisition
* Digital acquisition
The installation block diagram is shown in Figure 9.5.
CONTROL DATA BUS (SYSTEM BUS)UNIT
] IANALOG DIGITAL]
• •PARAMETER PARAMETERPCM ACQUISITION ACQUISITION
(RECORDER,TELEMETRY) UNIT UNIT
ACQUISITION
SUBASSEMBLY BUS INPUTS(AVIONICS)
Figure 9.5. Distributed data acquisition system.
In this example the control unit performs the following main tasks:
"* Management of the system bus providing the link to the various acquisition units by means ofa microprocessor whose operation has been microprogrammed. This microprogram contains theprotocols for transferring data over the system bus between units coupled to this bus.
"* Distribution of acquisition programs defined by the test engineer, system initialization, informationdating, reading of parameters acquired by the acquisition units by means of a processing unit controlledby a microprocessor.
"* Generation of output messages for transmission to the telemetry or recording circuits by means of amicroprocessor whose task is to control and format the output signals.
All these microprocessors perform different tasks by means of specific microprograms, overall coordinationbeing provided by the processing unit microprocessor.
Document provided by SpaceAge Control, Inc. (http://spaceagecontrol.com/).

9-13
The analog parameter acquisition unit is also controlled by a microprocessor. A processing unit boardcontrolled by a microprocessor performs the functions:
* Loading of the acquisition program sent by the management unit
* Transmission of data acquired over the system bus
* Management of the whole unit
An additional microprocessor controls information obtained from the analog parameter conditioning and digi-tizing subassemblies.
The digital parameter acquisition unit has the same microprocessor-based processing unit board as the previousunit for:
* Loading of the acquisition program sent by the management unit
* Transmission of data acquired over the system bus
* Management of the whole unit
But the acquisition and processing of digital buses on which data appear in a random manner require muchmore care than the analog parameter acquisition previously mentioned. The recognition tables and read tablesrelating to each bus input are managed by a microprocessor.
The use of microprocessors and dialoguing interfaces such as dual-access transfer memories requires muchmore rigour in microprograms. But this makes the whole system highly flexible with regard to operation,modifications, and development.
9.3.3 Maintenance and performance monitoring of the data collection systemMaintenance and performance monitoring are required to prevent and to correct failures and performancedegradation. During the design phase measures must be taken to prepare for maintenance and performancemonitoring. The overall flight test schedule must allow specific periods for routine checkout and maintenanceof the instrumentation system.
Test connections necessary for a quick and efficient maintenance must be carefully planned. It is very difficultto determine in advance precisely what will have to be checked and where the weak points of the system are.Experience and familiarity with the performance of the components will provide a good basis for determiningwhat test points must be available and what test procedures must be used. As systems often give problems atpoints where they were not expected, it is advisable to design the maintenance system so that every conceivablefunction can be tested. During the operation it will be found which checks can be omitted or can be done atlonger time intervals. It is, however, very difficult to add test points or test equipment during the operationalphase.
Closely related to maintenance is the aspect of performance monitoring, either on the ground or in flight. Therequirements for special equipment for performance monitoring on the ground during preflight and postflightchecks depend on the time available between flights. Less time between flights means more sophisticatedcheckout equipment.
A valuable aid for monitoring the performance of the instrumentation equipment is BITE (Built-In-Test-Equipment), which is often incorporated by the manufacturers of major component parts. BITE, however,only tests the functioning of that specific component. Efficient overall monitoring of magnetic tape systemscan be achieved by the "read after write" method, i.e., the data are read from the tape immediately afterrecording. This data can then be displayed directly or can be used to check parity, code, timing, level, etc.A simpler method, which provides only slightly less coverage, is monitoring the data stream to the recorderwrite heads. Another effective technique is the use of calibration signals. Comparison of the measured valueswith the known calibration input values provides a fairly comprehensive check of the data acquisition process.
Another approach is the implementation of a health and fault management system. This is possible if a largenumber of parameters is acquired by the instrumentation system and is then made available in a powerful
Document provided by SpaceAge Control, Inc. (http://spaceagecontrol.com/).

9-14
onboard or ground computer system. By computer software the redundancy of the acquired parameters can beutilized to detect errors in the instrumentation system. For example, the information of an inertial navigationsystem can be checked against the data supplied by radio navigation equipment.
In-flight performance monitoring should be seriously considered. Both from a standpoint of instrumentationchecking and in-flight data interpretation it is desirable to be able to monitor in flight at least some of themeasurements being recorded. In most cases, some level of monitoring soon becomes cost effective, becausevaluable flight time can be saved in case of a failure in the instrumentation equipment. The complexity ofmonitoring and the method of presentation depend on the attention which can be provided by the flight testcrew. In a one-pilot aircraft a single go/no-go light is about the maximum that can be allowed. This lightcan, however, be the output of a comprehensive self-check system. In an aircraft carrying flight test observersthe necessity for such a fully automated system is less, as there is much more opportunity for improvisation.Even onboard repairs may then be feasible.
9.3.4 System integration9.3.4.1 Integration of main components into a complete system
For the part which is common to all channels the main components (commutators, encoders, sub-carriermodulators, recorders, telemetry transmitters, etc.) are usually bought as complete units. They are availablein a relatively large variety from specialized manufacturers. If special requirements exist which cannot besatisfied by commercially available units, these manufacturers can usually modify standard equipment toprovide acceptable performance. If the different modules have not been especially designed to be used together,interface problems may occur even though the specifications seem to indicate that the output characteristics ofone unit are matched to the input of the other unit. This is mainly because specifications are never completein all respects. A test system must be designed to be modular as far as possible such that changing an inputmodule does not affect system control and application programs. Sometimes characteristics not mentioned inthe specifications can be the cause of interface problems. Usually these problems have something to do withradiated or conducted noise, grounding, and shielding.
Ample time should be allowed for matching the different modules, transducers, etc., followed by adequatetesting. This is especially the case with components obtained from different manufacturers, or if specialequipment has been built in-house.
Early in the design stage, a decision must be made regarding the packaging of electronics constructed in-house.There is no need to dwell upon the advantages of standardization in this respect. In small aircraft, however,it may be difficult to adhere to existing standards for equipment boxes and racks. Often ad-hoc solutionswill have to be found to mount boxes in small comers. In combat aircraft, the sophistication of which iscontinuously increasing, it is increasingly difficult to solve the compromise between equipment performanceand equipment size even if the dimensions of components are continuously decreasing.
In systems involving more than one recorder time synchronization between the different recording systemsis very important. It is desirable to utilize the same time base and format if at all possible, to simplifydata correlation. If this is not possible, as in some non-automatic systems, it becomes necessary to provideadditional event marks on all systems, which can be used for time correlations between the individual timebases of the recorders. When airborne and ground based systems are used simultaneously time correlationmay require the use of a radio link, unless the required accuracies are low. On the other hand the applicationof atomic frequency standards exempts the transmission of a continuous timing signal.
9.3.4.2 Integration into the aircraft
Some factors influencing system design relating to the integration into the aircraft are:
* Accessibility
* Weight and size of boxes and wiring
* Unwanted interaction between instrumentation systems and the aircraft
Document provided by SpaceAge Control, Inc. (http://spaceagecontrol.com/).

9-15
Accessibility of the instrumentation equipment is an obvious requirement for maintenance. It is sometimesunavoidable that sensors and cabling are mounted in places which will not be accessible later. They arefor instance mounted during assembly of the (prototype) aircraft or during a major overhaul. This must beavoided as much as possible because considerable time and effort will have to be spent, should they becomeunserviceable. It is useful to provide very simple display systems enabling types of failure to be identified inthe event of malfunction like shorted sensor, sensor circuit open, etc., thereby simplifying disassembly.
Weight and size of boxes and wiring can constitute a problem in many aircraft especially in small fighter aircraft.Sometimes it is possible to install instrumentation equipment in locations normally occupied by standard aircraftequipment if this is not essential for the specific flight test. For instance, if armament and ammunition boxescan be removed, much space can become available. Another solution similar to that presented in paragraph9.3.2.4 consists in using a system divided into several functional units, thereby distributing tasks and improvingvolume-to-performance ratios. If no space is available inside the aircraft, or if the equipment must be easilyexchangeable between aircraft of the same type, the instrumentation system can be installed in an externallymounted pod. In large aircraft a considerable amount of cabling is required to connect all transducers to theinstrumentation equipment. Apart from the weight of the cabling, which can become excessive, long signalwires tend to decrease system accuracy. Remote signal conditioning and multiplexing, which has been treatedin Section 9.3.2, can provide an improvement in both respects.
Unwanted interaction between instrumentation and aircraft systems and vice versa can be caused by faults inthe electrical circuits or by electrical noise.
The system must be designed so that faults originating in the instrumentation equipment cannot degrade aircraftsystems performance. This is especially important, if basic aircraft equipment is tapped to pick off informationfor the flight tests. In particular, it is necessary to pay attention to the input impedances of monitoring circuitsto ensure they do not affect an aircraft system whether they are operating or not. A test installation is oftenprovided with a separate power supply and switching off the latter must not result in significant load changeson aircraft circuits.
Electrical noise can be defined as the unintentional and unwanted influence which one electrical circuit canhave on another by means of radiation or conduction. The instrumentation system should be designed so that itwill not cause interference by radiation or conduction. On the other hand, it should not be susceptible to suchinterference emanating from the aircraft and its systems. Several civil and military documents give guidanceand state requirements regarding this matter (Refs. 9.5 to 9.11).
Radiation can have a predominantly magnetic or electrical character. A conductor carrying a large current willmainly produce a magnetic field; a conductor with a high voltage will mainly produce an electrical field. Ingeneral, it can be said that the higher the frequency, the more problems can be expected from radiation. Theeffect of radiation can be minimized by:
* Shielding
* Proper grounding and bonding techniques
* Increasing the distance between conflicting circuits and lines
• Twisting wire pairs or using coax cables
* Avoiding the use of unnecessarily high frequencies and very sharp pulses
* Avoiding leaks in radio-frequency transmission lines
* Limiting the bandwidth of the instrumentation system as much as possible
* Using differential amplifiers to minimize common mode noise
* Using fiber-optic connections for sensitive data buses
Document provided by SpaceAge Control, Inc. (http://spaceagecontrol.com/).

9-16
The routing of wires through an aircraft should be carefully planned to separate as much as possible thesusceptible circuits from the circuits which cause interference. In principle three categories of wiring can bedistinguished:
"* Wiring that may cause interference, for instance: power wiring, transmitting antenna cables, wiringfor the operation of inductive devices, wiring carrying pulsed energy
"* Wiring that is susceptible to interference, for instance: amplifier inputs, low-level high-impedancecircuits, receiving antenna cables
"* The category in between, which is neither causing serious interference nor very susceptible to in-terference, for instance: low-impedance wiring, low-energy wiring, low-voltage power, and lightingcircuits (except fluorescent lighting)
Wires belonging to different categories should be kept apart as much as possible, unless it has been establishedthat no interference occurs (Ref. 9.12).
Conduction of electrical noise mainly takes place through power leads. It can be minimized using filters,voltage stabilizers, dc-to-dc converters or rotating inverters. The application of static inverters especially forthe generation of line voltages is problematic. In extreme cases it may be necessary to use separate batteries.Some more details are given in Sections 9.3.5 and 9.3.6.
9.3.5 GroundingIdeally, "ground" in an electrical or electronic system is a conductor with zero impedance throughout, whichis used for all return currents. In practice, however, small impedances exist in all ground conductors. Ifseveral circuits, which are otherwise independent, share a common ground conductor, the current of eachcircuit contributes to a voltage across that conductor. It is clear that the current from each circuit will affectthe currents in other circuits. It is therefore advisable to separate power currents from signal currents wheneverpossible.
Inside the instrumentation boxes this leads to the use to three distinct types of ground, i.e., power ground (dcand ac possibly separated), chassis ground, and signal ground.
Power ground is used for all return currents from power supplies and loads such as relays, heaters, motors,etc. The power ground must be brought out of the box on a separate connector pin, which must be tied to theaircraft structure with a low impedance lead or to a distinct ground point at the aircraft structure.
Chassis ground or case ground is safety ground which connects the metal structure of the equipment to theaircraft structure to protect personnel against electrical shock hazards in the event of a short circuit betweena high voltage and the equipment structure. The chassis ground must also be brought out of the equipmenton a separate connector pin which must be tied to the aircraft structure by a low impedance lead. If properlydesigned for that purpose, the cases can also provide radio-frequency shielding. The chassis ground connectionmust then have a low RF-impedance.
The signal ground is a high-quality ground. No return currents from power supplies are allowed through asignal ground, only small signal return currents. In more complex instrumentation systems it is advisableto specify galvanic isolation between the signal ground and the power ground inside the boxes. The powersupply unit of the instrumentation equipment must then contain a transformer in which the secondary windingis isolated from the primary. This is normally the case when the instrumentation equipment receives its powerfrom the ac supply of the aircraft. If the instrumentation system receives its power from 28-V dc supply of theaircraft, a dc-to-dc converter which contains such a transformer can provide galvanic isolation between powerand signal ground. The signal ground is also brought out of the equipment on a separate connector pin.
All aircraft electrical power systems use the aircraft structure as a return. This implies that each point ofthe structure has a different potential, which is not only dependent on currents but also on the resistanceof a large number of mechanical joints, which, in spite of electrical bonding straps, have unpredictable andvarying electrical characteristics. The potential difference between two points on the structure may consist ofa dc component, a 400-Hz component, switching transient spikes, radio-frequency noise, etc., up to a total
Document provided by SpaceAge Control, Inc. (http://spaceagecontrol.com/).

9-17
rms-value of several volts. It is clear that error voltages of this nature cannot be allowed to enter a signalpath. This can be avoided by connecting all signal grounds of the instrumentation system with each other andconnecting this common signal ground to the aircraft structure at one point only.
In practice this cannot always be realized. In some transducers and usually all antennas, RF transmitters, andreceivers the signal ground is connected to the case, and the instrumentation system may have to be connectedto operational circuits which are grounded elsewhere. Then ground loops occur, which can cause large errorsin the signal voltages. This can be avoided by using differential amplifiers (see Chapter 6), where a voltagedifference between the input and output signal grounds is rejected as a common mode voltage.
Even if all signal grounds are interconnected and grounded at one point, common mode voltages can occurdue to capacitive coupling with the aircraft systems. This can be reduced by shielded and/or twisted wire pairswith properly grounded shields and by using differential amplifiers.
9.3.6 Electrical powerWhenever possible the 28-V dc power supply of the aircraft should not be used for instrumentation systemsexcept for the least sensitive devices, such as heaters, motors, etc. This avoids a lot of trouble as the 28-Vdc supply is a notorious source of interference. Reference 9.9 gives a characteristic of its properties. Electricequipment that must be powered from this source should include very adequate voltage stabilization andfiltering circuitry. Most aircraft have a three-phase, 115/200-V, 400-Hz ac supply which can be used forinstrumentation equipment; 28-V dc instrumentation equipment should be powered from the ac supply via aseparate transformer-rectifier unit only used for the instrumentation equipment.
Airborne computers and microprocessors incorporated in the instrumentation system require precautions toprotect the memory during power interruptions or transients. Interruptions of about 50 msec in the ac powersupply are quite common during bus transfer in electrical systems. Battery buffering will normally be providedfor essential dc buses.
In electrical ac power systems with more than one generator and one bus, two versions are possible:
"* The generators have been coupled electrically (voltage, frequency, and phase) and are feeding allbuses in parallel.
"• Each generator is feeding its own bus and is running independently of the others with its own voltage,frequency, and phase.
All these considerations will affect the instrumentation system design. In general, it is best to feed the systemfrom one bus. The system designer should be aware of the possibility of a beat frequency if the generatorsare not coupled. Furthermore, he should take care that in the case of ac ratio signals the reference voltage istaken from the same phase from the same bus. This also applies to synchro and servo circuits.
In large systems there are usually subsystems with more or less important functions. It is then advisable toinstall an emergency power bus with backup-power supply driving only very important equipment like taperecorders and telemetry transmitters.
It is almost needless to say that the available power source must have adequate capacity to carry all possiblesimultaneous loads.
9.3.7 Data analysis requirements of the instrumentation engineerDuring design, realization, and operational stages, close cooperation among flight test engineers, instrumenta-tion engineers, and data processing specialists is necessary. Primary topics of discussion should include:
* Routines for data processing
* Project definition in terms of number and schedule of flights
* Amount of data and required turnaround time per flight
* Definition of flight data formats
Document provided by SpaceAge Control, Inc. (http://spaceagecontrol.com/).

9-18
"* Data presentation requirements
"* Data routines for instrumentation checking
The data processing equipment must be compatible with the requirements of the instrumentation engineersconcerning quick look and instrumentation checking (see also Chapter 12).
Typical requirements of a large instrumentation system are:
"* Quick-look facilities for postflight instrumentation check which can produce graphs or tables
"* Facilities for the printout of selected digital values in the code in which they were recorded (binary,octal, binary-coded decimal or hexadecimal) as an aid in error detection
"* Capability to observe the signals coming from the read amplifiers of the flight tape playback unit fortroubleshooting of the airborne recorders
"* Immediate access to the preprocessing facility in case of a failure in any part of the instrumentationequipment
"* Software for instrumentation checking (comparison of in-flight calibration values with the knownreference values, counting incorrect parities and other irregularities in the recorded codes, etc.) andfor maintenance and development tests such as described in Sections 9.4.1 and 9.4.2 - access tocomputer stored calibration files.
9.4 THE TESTING OF INSTRUMENTATION SYSTEMS9.4.1 Environmental testingAt various intermediate stages during the development and construction of an instrumentation system it isnecessary to check the hardware produced so far for proper functioning under the anticipated environmentalconditions. General information about the environmental conditions at different locations in aircraft is givenin literature (e.g., Ref. 9.5). The actual conditions must, however, be checked for each specific aircraft. Incase of unusual applications or locations of the instruments, for instance, if they are mounted in a pylon tankof a military aircraft, the environmental parameters will have to be decided at the earliest possible moment.Procedures and equipment for environmental tests are described in References 9.5 to 9.11.
The errors which the environmental conditions can be allowed to produce must be determined from the overallaccuracy requirements. The environmental conditions can also cause effects which are not directly related toaccuracy. Extreme temperatures or vibration can make the operation of certain components so marginal thatfailures will occur too often.
The objective of environmental testing is to obtain a high degree of confidence in the capability of theequipment to operate within its specified limits in the actual aircraft environment during its entire service life(MIL-STD-810, Ref. 9.6).
Depending on the application and location of the equipment in the aircraft a choice of the following tests orcombination of tests should be considered (some relevant topics are mentioned between parentheses):
"* Altitude (maximum, rapid decompression)
"* Temperature (low, high, shock, cycling)
"* Vibration (resonance search, resonance dwell, vibration cycling, fatigue)
"* Acceleration (linear and angular, frequency range, amplitude)
"* Shock
"* Humidity (condensation, corrosion, leakage paths)
"* Explosive atmosphere
"* Rain
"* Power input (voltage variations, transients, frequency variations, harmonic distortion)
Document provided by SpaceAge Control, Inc. (http://spaceagecontrol.com/).

9-19
* Radio frequency susceptibility (radiated and conducted)
* Hydraulic fluids
* Sand and dust
* Fungus resistance
* Salt spray
* Acoustic noise
9.4.2 Functional testingThe realization phase is characterized by a continuous flow of small functional tests and resulting debugging.The electronic engineers will test the detail circuits they designed. The instrumentation engineers will test themodules and major components as they come in from the manufacturers or from their own workshops.
Printed circuit boards are brought together in boxes. Boxes are connected together and to transducers, recorders,transmitters, cameras, etc. Each time a new part is added a functional test should be executed, for, nomatter how meticulous the preparations of the specification and fabrications have been, problems are liable tooccur. They may arise from inadequate noise suppression, missing ground-wires, capacitive or electromagneticcoupling, self-heating effects, mechanical or electrical tolerances, spurious signals, transients induced in powerlines, misinterpretation of specifications, plain mistakes, negligence or poor workmanship.
Integration of a number of measuring channels into a system implies that one channel is physically broughtinto proximity with others, which may result in electrical interactions. Signals fed to the same multiplexermay interact (cross talk) due to defects or a non-ideal insulation resistance. Residual charges in sample andhold circuits or signal conditioning amplifiers may affect the next measurements.
To check interchannel cross-talk the subsequent procedure can be followed:
Each data channel is provided with a constant input signal, the value of which can be varied. The electricalproperties of the signal sources should preferably be identical to the electrical properties of the transducers.The magnetic tape recorder is then switched on, and the constant signals of all channels are recorded. Thenthe input signals are varied, one at a time. The resulting tape can be processed using a special program. Foreach channel all values which are beyond a predetermined limit from the intended value should be displayed.
Another functional test is the determination of system accuracy. The static calibration of the data channelsmust be verified repeatedly over a longer period of time and under various environmental conditions, es-pecially temperature and vibration. A considerable improvement of accuracy is sometimes possible by theimplementation of reference channels which control automatic calibration systems.
It has often been found that a system which performed well under all kinds of tests in the laboratory failedwhen used under actual flight conditions. There can be technical reasons for this, which are often difficult topredict, but an important factor can be the human element. In the laboratory the equipment is usually operatedby engineers closely associated with the development. When it is installed in an aircraft it will be operatedby the people involved in the flight test operations. Experience has shown that it is necessary to test as greata part as possible of the equipment in flight before the complete system is finally installed. These flight testsneed not be done in the aircraft in which the instrumentation system is to be used. Apart from the technicalchecks on the equipment, such flight tests provide a very good opportunity for training the people who willhave to operate it. It is desirable to make a flight test with the total instrumentation system after its finalinstallation. This may, however, not always be possible, e.g., with prototype aircraft.
9.4.3 Total system check-out in the aircraftWhen environmental and functional tests have given sufficient confidence in the system, the complete systemis installed and a total system check-out is made. That will provide the basis for a final judgment of thefunctioning of the total system. It is the last phase before the system is used in the flight test program.
Document provided by SpaceAge Control, Inc. (http://spaceagecontrol.com/).

9-20
The first step is to check the stability and accuracy of all outputs. Stability checks can be done by recordingthe data under several conditions and to process them as described for the cross-talk tests in Section 9.4.2. Anyinstability should be traced and remedied. Accuracy of the channels which have already been calibrated in thelaboratory can be checked by overall calibration checks at one or more points of the measuring range of eachinput parameter. This is a very important check, and the input stimuli used should be as accurate as possible.Small, but significant, errors may otherwise remain undetected. Such errors can be caused, for instance, bywrong grounding connections, errors due to wrong matching of components or errors in the combination ofcomponent calibrations. In this phase also those calibrations must be performed which can only be done inthe aircraft, such as control surface deflection measurements.
A second important step is the investigation of the interactions between the instrumentation system and theaircraft systems. The effect of noise in the flight test equipment produced by the aircraft systems can bedetected by the method described in Section 9.4.2, but now all instrumentation input signals are kept constantand the aircraft systems are operated. Recordings can be made when the engines are running and whenradio and other aircraft equipment are switched on. Influence of the flight test instrumentation equipmenton aircraft systems can be detected by visual and aural monitoring the standard aircraft instrumentation andcommunication/navigation equipment while operating the flight test instrumentation equipment, as, for example,switching cameras, recorders, telemetry transmitters, blowers, heaters, power supplies, and disconnecting andconnecting the data acquisition and processing units.
Once the equipment has been pronounced ready, it is almost guaranteed that somebody will initiate a requestfor a change to the measurements list. The danger here is that too little concern will be given to the effect thismight have on the system performance. Small last minute changes are frequently made without proper checkingfor interactions and interference. The possibility exists that the qualification tests will be invalidated, and thiswill perhaps not be noticed until the first flight. Actually, appropriate tests should follow each alteration.
9.4.4 Preflight and postflight checksIf the instrumentation equipment successfully passes the final total system check out, the equipment enters itsoperational stage. From now on it will be in the hands of the engineers who operate and maintain it. Animportant part of their work is to prepare the equipment for each flight. An almost mandatory requirement isthe use of a preflight checklist for all projects, whether big or small. An aborted flight caused by the fact thatsome small preflight item was overlooked can in no way be justified.
The preflight check should start with the following items: tie down of equipment, all connectors in place,mechanical condition of transducers, boxes, cameras, recorders, cabling, tubing, and other equipment, check ofBITE output, etc. Then the cameras and recorders must be reloaded. Each channel output should be checkedfor proper indication with all inputs in a known condition. This can either be done manually using the onboarddisplays or by making a test recording (possibly by means of telemetry) which can be analyzed in the dataprocessing station. The preflight check should then be continued with a short functional test of the wholesystem. Finally, all switches and other controls must be put in the correct position.
A postflight check is advisable to ensure that the system has performed all over the flight and is still functioningproperly.
If the results of the flight test become available well before the next flight a postflight check may not benecessary.
After a flight, both the flight test engineer and the instrumentation engineer want to know, as soon as pos-sible, the results of the flight test. For the instrumentation engineer no test can replace the output from thepreprocessing phase as this will contain the ultimate evidence of proper functioning or failure.
Document provided by SpaceAge Control, Inc. (http://spaceagecontrol.com/).

9-21
9.5 REFERENCES9.1 U.S. Army, "IRIG Standard 106-86, Telemetry Standards," Secretariat, Range Commanders Council,
US Army White Sands Missile Range, New Mexico 88002, May 1986, Rev. Sept. 1988.
9.2 Digital Systems, "Daniel 90 System, Electronique Serge Dassault," 92214 St-Cloud Cedex, France,1987.
9.3 U.S. Department of Defense, MIL-STD-1553B, "Digital Time Division Command/Response Multi-plex Data Bus," Sept. 8, 1986.
9.4 Airlines Electronic Engineering Committee, "Mark 33 Digital Information Transfer System (DITS),ARINC Specification 429-9," Sept. 30, 1985.
9.5 U.S. Department of Defense, "Environmental Conditions and Test Procedures for Airborne Elec-tronic/Electrical Equipment and Instruments," RTCA Document DO-138. (Note: This document hasbeen superseded by RTCA-DO-160.)
9.6 U.S. Department of Defense, "Environmental Test Methods and Engineering Guidelines," MIL-STD-810E, July 14, 1989.
9.7 U.S. Department of Defense, "Electronic Equipment, Aerospace, General Specification for," MIL-E-5400T, Aug. 14, 1992.
9.8 U.S. Department of Defense, "Environmental Testing, Aeronautical and Associated Equipment, Gen-eral Specification for," MIL-E-5272B. (Note: This document has been superseded by MIL-STD-810.)
9.9 U.S. Department of Defense, "Aircraft Electric Power Characteristics," MIL-STD-704E, May 1, 1991.
9.10 "Guidance for Aircraft Electrical Power Utilization and Transient Protection," ARINC Report No. 413.
9.11 U.S. Department of Defense, "Electromagnetic Emission and Susceptibility Requirements for theControl of Electromagnetic Interferences," MIL-STD-461C, Aug. 4, 1986.
9.12 Borek, R.W, "Practical Aspects of Instrumentation System Installation," AGARDograph No. 160,Vol. 13, Paris, France, 1981.
Document provided by SpaceAge Control, Inc. (http://spaceagecontrol.com/).

10A-1
Chapter 10A
DATA PROCESSING
by
R. PozmantierRidley Mission Control Building
Air Force Flight Test CenterEdwards AFB, CA 93523
United States
10.1 INTRODUCTIONThe scope of data processing in flight testing has continued to expand in conjunction with advances in airborneand ground data acquisition systems (DAS) and with processing systems that are continually advancing andevolving. The traditional division of data acquisition in the air (or on the test range) and data processing at afixed location is no longer the "norm." Digital computers which were once large, relatively limited in process-ing power, and very costly, have now advanced to the point that they can be used anywhere airborne DAS arelocated. The process of computer data "processing" now occurs onboard single-seat fighter aircraft, in additionto the large multi-engine aircraft of the past. Data processing has proliferated into the smallest portions of someinstrumentation systems (signal conditioning, digital filtering, onboard data scaling, time tagging, and datacompression). Range sensors now preprocess their outputs or provide analyses-quality data by using dedicatedcomputers as their central control.
Tasks which were predominantly manual, (for example, selection of DAS channel assignments and formats, cal-ibration of sensors on and off the aircraft, and preflight instrumentation checks) are more often handled withcomputers as are the transfer of selected data to data processing centers.
With the proliferation of data processing and the attendant increase in complexity and scope of work, it is im-perative that engineering managers give most of these multiple areas as much as or more attention than the de-sign of the system themselves. Since it becomes more difficult to observe individual processes when they aredone with a computer (rather than manually or within discrete hardware), checking for validity of informationproducts from these various systems must also be considered. Self testing and checkout procedures/validationprocedures are essential and must be built into the affected system.
New disciplines of project mathematician (programmer), data engineer/data production, and real-time data en-gineer are added to the traditional flight test engineer/instrumentation engineer team. Good coordination andrecognition of the interdependence of each team member is imperative if a successful flight test program is tobe conducted in a timely manner.
The scope of data processing is too large to be covered in detail even in a full text devoted to this topic. It isthe intent of this chapter to identify major aspects of data processing with the goal that they will act as a focusto flight test and instrumentation engineers to make data processing concerns an integral part of their require-ments definition and design efforts.
10.2 GENERAL10.2.1 Tvyes of data inputA flight test data center receives several types of data:
- data measured and recorded in the aircraft or from ground-based range sensors,
- information from the flight test engineer on the required amount and kind of data to be processed (realtime/post flight), and
- information from the instrumentation department on the configuration of the recording system and on thecalibrations which have to be applied to each parameter.
The recorded data can be of many types. The most important are:
- analog magnetic tapes which may carry continuous or sampled data, using one or more modulation tech-niques such as pulse code modulation (PCM), frequency modulation (FM), pulse amplitude modulation
Document provided by SpaceAge Control, Inc. (http://spaceagecontrol.com/).

1OA-2
(PAM), or pulse duration modulation (PDM). The PCM tapes may be magnetic tapes with parallel or serialrecordings in several different codes,
- "predetection" recorded telemetry data (that is, still modulated on a carrier frequency or at least beforeseparation of the subcarriers),
- data from ground-based installations such as cinetheodolites, radars including real-time telemetry andrange-time space positioning information,
- computer-compatible media such as disks, 7- and 9-track tapes, memory (bubble, magnetic, EEPROM,
etc.),
- photo-panel data (manually processed and not in general use), and
- continuous-trace recordings (usually manually processed).
These data formats must be defined well before the start of the flight test, so that the processing, software, andequipment can be developed or configured. The information used to compile the required database includes thecode or modulation method, the number of channels, data formats, calibration data, etc. The most automatedthe handling of the database, the easier it is to alter these parameters and the closer to flight test one can finalizeinputs. Note that some software development or new hardware acquisitions can take over two years and that thedefinition of a schedule for when each type of information must be received is part of the data processing plan-ning.
The information from the flight test engineer must indicate:
- which parameters have to be processed and what operations have to be done on these parameters (bothreal time and post flight) and
- which parts of the recorded data have to be processed.
The first is usually coordinated with the data processing center some time before the flight, on a flight-by-flightbasis, so that the data processing personnel can make preparations to begin data processing as soon as the flighttest begins. As the decision on the type of flight test to be executed may depend on considerations such asweather conditions and status of the airframe, this information cannot be finalized at a very early stage. Thedata processing software and the storage of the data such as calibrations must therefore be designed in such away that the program and calibrations required for each type of test can be made available quickly.
The decisions on which portions of the recorded data are to be processed can only be made after the flight hasbeen completed. It will include conclusions drawn by the pilots and by observers (who were onboard during theflight) from on-line telemetered data, and often from observed quick-look data runs on preprocessing comput-ers.
The information from the instrumentation department should include the following items:
- the data formats of the DAS for which each parameter can be found: tape track assignments, etc., and
- the calibrations of each parameter (measurand).
Often a portion of this information becomes available only after the aircraft has taken off, because of lastminute changes during instrumentation checkout just before the flight. In many cases in-flight changes may bemade in the instrumentation. The calibration data may be given in two ways:
1. (a) A listing of the components used in measuring each parameter,
(b) The calibration data for each component,
2. As an aggregate calibration for the parameter (end-to-end).
For some real-time applications, changes in calibration data may not have to be incorporated unless they sig-nificantly affect the data value. As a late delivery of the calibration data can have a strong influence on theturnaround time of the~real-time processing and post flight processing, a rather sophisticated administrationsystem is required.
Document provided by SpaceAge Control, Inc. (http://spaceagecontrol.com/).

1OA-3
With large test projects that include multiple users (contractors, subcontractors, government), it is imperativeto plan data processing systematically. Hopefully a feasible set of requirements can be developed severalmonths before start of testing so that validation of processing capabilities can be made. Provisions for updatesof selected data should be part of the implementation.
10.2.2 Functional analysis of data processingPrevious standard data processing systems can be broken down into three operational areas and two supportareas.
Operational areas are:
1. preprocessing, the task of reading the data from its media and writing it onto computer-compatible media,
2. computation, (usually in many "generations") the task of reducing data to useful values, and,
3. data presentation, the task of reformatting that data and outputting it in a useful form (listings, plots, etc.)on various media (CRT, paper, or microfiche).
Support areas:
1. instrumentation checkout,
2. database creation/maintenance
These divisions are useful as a conceptual view of the sequence of events which occur in data processing. Manytypes of systems now accomplish all of the above operations. A more current data processing functional tasklist could be broadened to include the following:
databaseinstrumentation programming/setup,instrumentation checkout - checkout data presentation,real-time processing (onboard/ground),quick look,post flight data processing,post flight data presentation
Note that these task areas are not tied to hardware or systems configuration and may be performed by the samesystems or many different systems.
10.2.3 0uick-look and instrumentation checkingThese two operations must be completed as quickly as possible after the flight, before the main data processingis started. They have many requirements in common and are sometimes regarded as a single operation eventhough they are needed by different people. The quick-look data provide the flight test engineer with the infor-mation needed to determine whether the test objectives have been met and what parts of the flight data are mostsuitable for final processing. The engineer uses this information to decide on the final data processing instruc-tions for the data from the flight which has just ended and to plan the next flight. The instrumentation checkdata are used by the instrumentation engineer to identify any failures or deteriorations in the data collectionsystem which must be repaired before the next flight can start. Many engineers accomplish quick-look analysisduring real-time presentation of the telemetered data in a ground-based control room, or using data productsproduced during real-time monitoring onboard the aircraft.
The quick-look information can usually be obtained from the analysis of selected parameters. it can be obtainedon-line or off-line. Interactive data terminals which allow extensive manipulation of the data by the engineerare beneficial to both online and off-line techniques.
Online quick-look information can be obtained from onboard observers who follow the time history of the es-sential parameters on instrument panels, continuous-trace recorders, digital displays on CRTs, or airborneprinter/plotters, and telemetry of the essential parameters to the ground, where they can be displayed in realtime in a control room.
If the essential parameters have to be calculated from the measured data, additional computation can be doneeither by an onboard computer or on the ground prior to being displayed. With today's aircraft carrying
Document provided by SpaceAge Control, Inc. (http://spaceagecontrol.com/).

10A-4
significantly more instrumentation and doing concurrent, multidisciplinary testing, the use of real-time process-ing and display is the norm. Essential real-time information can also be obtained from reports by the pilot, real-time video telemetry, or processing of range sensor data.
Off-line quick-look information is obtained from a preliminary post flight analysis of the essential parametersrecorded during the flight. This is relatively easy to do from strip chart recordings. Quick-look analysis frommagnetic recordings requires more sophisticated equipment and more planning to decide which "time slices"need review.
Quick-look data can also be used for checking the functioning of the instrumentation; a failure or partial failurewill become immediately apparent from the analysis. If all data are recorded on continuous-trace recorders, theinstrumentation check and the quick-look information can usually be obtained simultaneously when the flighttest engineer (who knows how the aircraft should have flown) and the instrumentation engineer (who knowshow the instruments should react) examine the recordings together. For multiparameter systems recording onmagnetic tape, failures in channels are difficult to find without an exhaustive review. Aircraft or data centerpost flight, checkout using automated programs for limit checking, and testing measurement reasonableness aremaking this task much easier. It is also not uncommon for instrumentation engineers to have their own controlroom console with displays to access instrumentation health before a particular test point is flown. The instru-mentation engineers may require more detailed information than the flight test engineers.
10.2.4 PreprocessingThe division of data processing, or at least of automatic data processing, is in two parts: preprocessing and com-putation are generally accepted. There is, however, less agreement on the division of the different processesbetween these two parts. This is mainly because the division is usually made from the hardware point of view.The data collection subsystem of an automatic flight test instrumentation system usually provides the data onmagnetic tape in analog form or in digital format which cannot be fed directly into a computer. The data pro-cessing equipment then usually consists of two parts: the preprocessing equipment which has as its output acomputer-compatible data format, and a general purpose computer. The division of the different data processingtasks between these two systems depends on many considerations such as speed and memory, capacity of eachof the two systems, and availability of the general purpose digital installations. In this chapter the division ismade from a more functional point of view: "preprocessing will include all installations and processing opera-tions which are applied to each parameter individually in the same sequence as the information was acquired;"computation" will be used for operations which involve the combination of information from more than oneparameter and for operations on one channel which does not follow the original time sequence (such as frequen-cy analysis and statistical operations). In general, this division conforms with the functions of the preprocessingand computation hardware systems (though more and more preprocessors are being introduced with significantcomputational capabilities).
In nonautomatic data processing the processing functions are roughly similar to those in automatic processing,though differences occur because the operations are performed by human operators. Sometimes transitionsbetween nonautomatic and automatic processing occur in the automatic systems, when complex processing re-quires determination of reasonableness of results at intermediate stages.
The main preprocessing functions are:
copying of the original data recordings,selection of the parts that must be processed,analog-to-digital conversion, if required (FM, PAM, etc.),elimination of errors,filtering and smoothing,reduction of the sampling rate, data compression,applications of calibrations,time correlation between data sources and individual parameters, andconversion to computer-compatible media
These functions will be briefly characterized in the following material (in Section 10.3 a few of these functionswill be discussed in more detail). It must be stressed here that these functions are not always executed in thesequence given above and that, as stated before, they are not always executed by the preprocessing equipment.Filtering and smoothing, and the application of calibrations, for instance, are often part of the processing in a
Document provided by SpaceAge Control, Inc. (http://spaceagecontrol.com/).

1OA-5
general purpose computer, but as they functionally belong to the preprocessing as defined above, they will bementioned here.
The first preprocessing operation may be the copying of the original data recordings. It is extremely importantto ensure that the valuable information can under no circumstances be destroyed or lost. Magnetic tapes areoften copied immediately after they enter the data processing center and the original tapes are stored inarchives. All further operations are then done with the copy.
It is usually not necessary to process all data that have been recorded. An important part of the preprocessingis, therefore, the selection of the parts that must be processed. This selection can be made during the quick-lookprocessing. For both purposes it is necessary to examine all channels on which the main parameters for the testhave been recorded. If the preprocessing system is capable of processing all data in an efficient manner, thereis an advantage in preprocessing all the data to a computer-compatible disk format so that is can be easily pro-cessed further (quick look, analysis) without having to read the analog source tape.
Analog recordings will either be demultiplexed and displayed on strip charts or will be converted to digitalform. For the analog-to-digital conversion of analog recordings on magnetic tape, most preprocessors havestandard peripheral equipment, which usually will require a special interface unit for demodulation of the sig-nal. Analog recordings from continuous-trace recorders and photo-panel recorders are rarely used and are pro-cessed manually.
The operations which now follow must be applied to each channel individually. They are intended to convertthe data into such a form that they can be more easily processed. The first step must be to edit errors. If errorsare left in, serious difficulties in the final interpretation can occur, especially since the influence of these errorsis obscured in the final results. Several types of errors can occur. Some can be due to failures in the DASacquisition. Others can be errors of significant bits in a digital word. They can be detected by putting limits onthe jumps that can be allowed to occur between successive measurements of the same parameter. This processif often combined with smoothing (the elimination of random errors in the individual measurements). Computersmoothing is an intensive process which must be tailored to the a priori statistics of the specific parameters tobe smoothed. It is very important that the errors are removed before the actual smoothing process is executed;a single outlying blunder can cause large errors in the final smoothed curve. Though some filtering is done inthe data collection system, at least in sampled systems, it may be necessary to do some additional filtering inthe ground station. Filtering also plays an important part in the interpolation and reconstruction of sampleddata. In some cases channels have been over sampled. For those channels a reduction of the sampling rate canbe made to reduce the work to be done. This reduction of the sampling rate should be done after all smoothingand filtering operations have been finished.
10.2.5 Data compressionIn general, data compression was initially used to remove redundancy from data in a manner that retained allpertinent information needed to reconstruct a time history of the data.
Examples of this type of compression would be a zero-order-prediction algorithm which defines a "window" ofsome number of bits changed in a digital data word (e.g., PCM). If the last sample value transmitted comparedto the current sample value is less than the window, that sample is not used (i.e., don't transmit, don't write totape). Other criteria have been used, such as define min/max values and use samples only within window (givesdata only when one exceeds predefined limits). Many compression techniques and algorithms are available inmodern preprocessor systems. It is sometimes necessary to chain (cascade) compression methods to achieve thedesired results. As with "smoothing," one must be aware of the effects of the order in which compression isdone. Also, the entire downstream portion (after compression) of the data processing system must be designedto read the compressed data and restore the samples, if necessary. Data compression yields more efficient stor-age of data, but requires overhead data for time tagging so that it can be event correlated.
The most important operation on each individual parameter is the application of the calibrations, which convertsthe data to engineering units (EU). See Chapters 8 and 10B.
If the time difference between events in different parameters must be exactly known, time correlation may benecessary. The relative timing of the value in two channels may be shifted in the recordings because:
- different lags or phase shifts occurred in the measuring channels of the two parameters,
Document provided by SpaceAge Control, Inc. (http://spaceagecontrol.com/).

10A-6
- the two parameters were sampled at different times,
- the two channels were recorded on different recorders, these may have had different time bases, and
- different sources of data (airborne, ground) had different time bases.
The final operation in preprocessing usually is the conversion to a computer-compatible medium which can beread by a general-purpose computer. As the data at this stage are usually already digitized, only a digital formatconversion is required which can include one or more of the following operations:
- conversion from serial to parallel (or the reverse),
- change of the number of tracks of a parallel recording,
- digital code conversion (e.g., bi-phase/NRZL),
- arranging the data in standard-length blocks, separated by inter-record gaps (magnetic tape), and
- formatting of a disk.
As already stated, the preprocessing functions previously mentioned do not always coincide with the actual op-erations done in preprocessing equipment: in many data processing stations some of the preprocessing functions(such as digital filtering and applications of calibrations) are done in the general-purpose computer, but it isalso possible that some of the simpler computation functions (such as the calculation of Mach number fromstatic and total pressure) are done in a preprocessing computer. The conversion to computer-compatible media,though functionally the last step in preprocessing, is sometimes done at the very beginning to facilitate the otheroperations that have to be performed by the preprocessing computer. The hardware considerations of the pre-processing station are discussed in more detail in Section 10.3.
10.2.6 Post processingThe computation functions in post processing are aimed at transforming the corrected time histories suppliedby the preprocessing into quantities which are more readily adapted to interpretation. They may involve simpleoperations such as the determination of a minimum value of a certain parameter or a very complicated operationsuch as the determination of stability derivatives from simultaneous partial differential equations, or the statis-tical analysis or frequency analysis of a number of parameters.
Often computation is not necessary at all: if all required information can be read directly from the time history,post processing does not go beyond the preprocessing stage. Computation can be done by hand or by computingdevices. Computation by hand is still a universal method because the computation can be adopted to the inter-pretation which goes on simultaneously. Such things as the determination of the maximum value of a signal, orthe analysis of a pulse waveform in an electronic device, are easily done manually. Automatic methods are usedif the quantity of data is very large, or if too much calculation is involved.
Analog computers once were useful in online computation processing because they often were faster than theirdigital counterparts. They also had advantages in some computations involving models, and in some fields ofcomputation such as frequency analysis. For some tasks hybrid computation systems, involving both analog anddigital computers connected by analog-to-digital and digital-to-analog converters are still used. The digitalcomputer in use today will do 99% of the computing required.
The computation stage requires careful planning. A computer can easily produce a large quantity of numberswhich will require enormous manual labor when they have to be interpreted, as well as producing data whichwill never be rad. The planning should be done in three stages:
- the computations should be carefully prepared to ensure that the objectives of the flight tests can bederived from the results,
- the quantities which must be presented for interpretation and their form of presentation should be selected.Too much information will hamper the interpretation; however, overlooking a single parameter may resultin a costly rerun on the computer, and
- the method by which the quantities will be calculated should then be chosen in accordance with the char-acteristics and the capacity of the available computer. If this method and the corresponding computer
Document provided by SpaceAge Control, Inc. (http://spaceagecontrol.com/).
1OA-7
programs have not been carefully planned, the required memory space and calculation time can becometoo large.
The planning should be done at an early stage, as it may cause additional requirements for the parameters to bemeasured and for the preprocessing work to be done before the data are entered into the processing computer.Ample time must be allowed for the actual programming and for the testing of the programs. If possible theprograms should be tested using suitable simulated inputs. During the actual programming, close contact be-tween the programmer and the flight-test engineer should be maintained. Even though many facilities use gen-eral purpose programs for computation, they usually require reconfiguration and tailoring for the specific flighttesting. Thus, one should approach the use of existing software in the same manner as new programming, withappropriate planning.
10.2.7 PresentationThe presentation of the results of the computations can be in tables or on graphs. Tables are the easiest formatfor the flight-test engineer. They can be produced by standard peripheral units. With line printers, moderateoutput speeds can be obtained; for example, 2000 lines per minute, each line consisting of 132 characters. Anadvantage of using a table is that the full accuracy of the results can be retained. From the point of view of theengineer who has to do the interpretation, graphs are often easier to use. The automatic plotters which werepreviously used with digital computers were slower than line printers, and required careful planning of the scalevalues if sufficient accuracy was to be retained. Electrostatic mosaic printer/plotters, which are in general usenow, are much faster. They require digital inputs and can be accurate to 0.1% or better and can also print char-acters. Laser printers and other advanced printers now offer the production of tables and graphs with equalspeed (70 pages per minute).
Presentation of tabular data on microfiche as a direct computer output (no paper product) makes handling andstorage of tabular data much easier. Another interesting method of presentation is provided by interactive com-puter graphic display systems. The observer can operate the computer or terminal; the results of these opera-tions are immediately displayed. The computer results can thus be modified before the final graph or table isproduced. The introduction of capable personal computers and engineering workstations have made this tech-nique even more attractive as data can be manipulated off-line from the mainframe computer in some cases.The layout of the tables and figures should be programmed in such a way that they can be directly published intest reports.
10.2.8 Validation and interpretationThe task of the data processing department is not completed when the computer has produced an impressiveamount of data files, tables, and graphs. Before delivering these to the flight-test engineers, the data processingdepartment should check all output data for errors and should determine whether the requested accuracy hasbeen achieved. This process of validation of applied computer operation is, however, often neglected. If thisoccurs, then this work has to be done by the flight-test engineers who are often less well prepared for under-standing what could have gone wrong in computer processing.
The interpretation can, in fact, be considered to be a continuation of the validation. The flight-test engineerusually knows (from theoretical or simulation studies) what to expect from the test. Ideally, the test results willvalidate the theoretical models which were used. If the results differ from the predications, either the physicalphenomenon investigated was different from what it was though to be, or there has been some error in the mea-surements or in the data processing. Then the theoretical background of the predictions should be reconsidered,and the test and data processing procedures should be checked until the discrepancy has been found. The inves-tigation of unexpected results is often more difficult if automatic data collection and processing systems havebeen used. During manual processing, the human operator conscientiously follows every step in the data pro-cessing and will often find that something unpredicted has occurred long before the final result has been calcu-lated. In automatic systems the human interpreter often sees only the final results. It may be necessary to repeatthe processing and to have outputs at intermediate stages before the reasons for an unexpected result can befound.
Even if after interpretation the operation has been judged to be satisfactory, one final step should be takenbefore the results are published in a test report. The flight-test engineer should reconsider any remaining un-certainties in the conclusions of the text rather than have them discovered later by others.
Document provided by SpaceAge Control, Inc. (http://spaceagecontrol.com/).

1OA-8
10.2.9 Short descrintion of a few processing techniquesApplication of calibrations
The calibrations are used to convert the measured data from the units in which it was recorded (e.g., millimeterson a continuous-trace recording or counts from 0 to 1023 in a ten-bit digital recording) into the engineeringunits in which they must be interpreted.
When setting up the sequence of preprocessing operations, it should be kept in mind that large errors or inac-curacies can occur if the wrong sequence is chosen. Procedures should be checked to see whether or not theresulting errors can be neglected.
In Chapter 8, it was mentioned that the overall calibration of a measuring channel is usually determined fromthe individual calibrations of several components. The combination of these component calibrations must bedone with care and on the basis of a good understanding of the characteristics of each component. The numberof calibration points must be carefully chosen by the calibration engineer in relation to the required accuracy.
When preparing the calibration data for application during data processing, individual channels may have spe-
cial requirements due to the following reasons:
- the instrument has hysteresis,
- in-flight calibration points (standardization) have to be taken into account,
- the final calibration may depend on a variable which is measured in another channel. Such variables maybe the supply voltage, temperature, or a parameter which causes cross-axis errors, and
- the parameter is measured by a coarse-fine method on two channels.
These aspects will be separately discussed in the following paragraphs.
In case of hysteresis, the calibration will usually be made first by increasing the input parameter slowly to thedesired values and then decreasing it in the same way. The same values of the input parameter will be usedduring the increasing and the decreasing part of the calibration, though often not all values are taken during thedecreasing part (see Fig. 10.1A). The final calibration is usually determined by the average of the "increasing"and "decreasing" values of the input parameter. The points where no decreasing values have been taken areinterpolated. Usually the average calibration, so obtained, is sufficiently accurate. Only in cases where extremeaccuracy has to be obtained will it be necessary to use special calibration data which have been measured duringa simulation of the expected flight conditions (see Chapter 8). In some instrumentation systems in-flight cali-bration points are taken. Usually these are used to verify whether the calibration has changed and do not affectthe calibration values to be applied during data processing. Sometimes they are, however, used to adjust thezero points and/or the sensitivity of the original calibration. If that is necessary, the computer program for theapplication of the calibrations can be adapted to make these corrections.
I-
I--
o /
- / /I-.z
M - 0 INCREASING< -
Lu -6 DECREASING
-0/-0
ENGINEERING UNITS
Figure 10.1A Example of a calibration curve showing hysteresis.
Document provided by SpaceAge Control, Inc. (http://spaceagecontrol.com/).
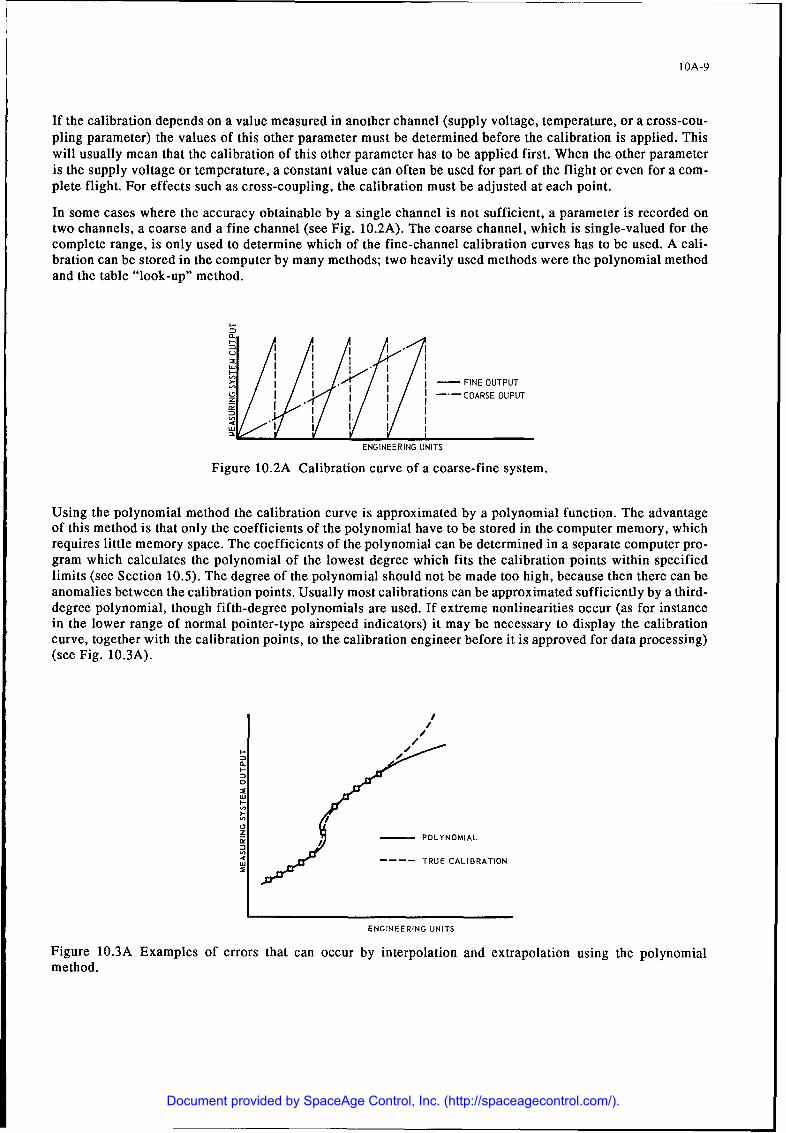
1OA-9
If the calibration depends on a value measured in another channel (supply voltage, temperature, or a cross-cou-pling parameter) the values of this other parameter must be determined before the calibration is applied. Thiswill usually mean that the calibration of this other parameter has to be applied first. When the other parameteris the supply voltage or temperature, a constant value can often be used for part of the flight or even for a com-plete flight. For effects such as cross-coupling, the calibration must be adjusted at each point.
In some cases where the accuracy obtainable by a single channel is not sufficient, a parameter is recorded ontwo channels, a coarse and a fine channel (see Fig. 10.2A). The coarse channel, which is single-valued for thecomplete range, is only used to determine which of the fine-channel calibration curves has to be used. A cali-bration can be stored in the computer by many methods; two heavily used methods were the polynomial methodand the table "look-up" method.
H
i / i -- FINE OUTPUT
j ---. COARSE OUPUT
z I
ENGINEERING UNITS
Figure 10.2A Calibration curve of a coarse-fine system.
Using the polynomial method the calibration curve is approximated by a polynomial function. The advantageof this method is that only the coefficients of the polynomial have to be stored in the computer memory, whichrequires little memory space. The coefficients of the polynomial can be determined in a separate computer pro-gram which calculates the polynomial of the lowest degree which fits the calibration points within specifiedlimits (see Section 10.5). The degree of the polynomial should not be made too high, because then there can beanomalies between the calibration points. Usually most calibrations can be approximated sufficiently by a third-degree polynomial, though fifth-degree polynomials are used. If extreme nonlinearities occur (as for instancein the lower range of normal pointer-type airspeed indicators) it may be necessary to display the calibrationcurve, together with the calibration points, to the calibration engineer before it is approved for data processing)(see Fig. 10.3A).
//
0
'U
/POLYNOMIAL
- TRUE CALIBRATION
ENGINEERING UNITS
Figure 10.3A Examples of errors that can occur by interpolation and extrapolation using the polynomialmethod.
Document provided by SpaceAge Control, Inc. (http://spaceagecontrol.com/).

10A-10
When the table method is used, the complete table of calibration points is stored in the memory of the computer.Generally, linear interpolation is used to determine the values between these points. This method requires morememory space and the actual computation may also take more time than with the polynomial method.
A careful check of the calibration must be made by the calibration engineer before it is released for use in dataprocessing. Whenever possible, this check should include the calibration data that are entered into the comput-er, as well as the form in which the application programs will use them, as discussed in Chapter 8.
Smoothing and filtering. As stated in Section 10.2.4, the term "smoothing" is used for reducing random fluctu-ations in the measurements, while filtering denotes modification of the frequency spectrum. These two conceptsare, however, closely related and smoothing can be done by means of a low-pass filter. The cutoff frequency ofthe filter should be below the sampling rate of the signals to be smoothed, but well above the frequencies ofinterest, because otherwise errors of omission (as defined in Chapter 7) will occur in the result. Both analogand digital filters can be used.
Smoothing and filtering are especially important if the data processing involves differentiation. The functioningof filters has been discussed in Chapters 4 and 8. For sampled data the discussion in Chapter 7 is of great im-portance. Frequencies higher than half the sampling frequency introduce aliasing errors. These cause spurioussignals at lower frequencies which cannot be eliminated. The sampling frequency in the data collection systemshould therefore, be chosen with care and additional pre-sampling filters should be applied in the data collectionsystem where necessary. Aliasing errors can, however, also be introduced during data processing if the data ratefrom a channel is reduced before filtering is applied.
Digital filters have, as do analog filters, an amplitude and a phase characteristic and the filters should be chosenso that the errors of omission as defined in Chapter 7 do not become significant. Digital filters are based onconvolution, either by means of time-domain algorithms or by means of the fast Fourier transform. Implemen-tation can be done with special-purpose hardware or in software for general-purpose computers. The advantagesof digital processing are the flexibility and the accurate drift-free operation, although quantization effects inboth signal and coefficients must be taken into account. There are also adaptive filtering methods in which thefilter characteristics automatically adapted to the frequency of the low-frequency part of the signal (seeRefs. 10.1A, 10.2A, and 10.3A).
Time correlation. Time correlation is required when the values of two parameters must be determined for thesame time interval when relative phases of two parameters must be determined. As in each individual measuringchannel a lag or phase shift can occur, it is necessary to reconstruct the original curve from available data onthe dynamic characteristics (see Chapter 4) before the time correlation can be established. In practice, threetypes of time correlation can be distinguished:
- the signals have been recorded by the same recorder or by different recorders with the same time base. Ifthe signals have been recorded continuously, the measurements in both channels can simply be read at thesame time. If the signals have been sampled, one of the signals has to be interpolated at the time at whichthe other was sampled as described in Chapter 7.
- the signals have been recorded by different recorders which do not have the same time base. This oftenoccurs when one recorder has been used on the ground (for instance with a cinetheodolite system) and theother has been used for making measurements in the aircraft at the same time, and
- most modern time code generators can be synchronized to a common time before the test begins. If theycannot, a "delta" time can be measured and used as a constant to correct each time source to standard time.
Linear or higher interpolation can be used as described in Chapter 7. In general the frequency of the commontime base can be less if higher order interpolation are used for obtaining the same accuracy. The computationsare, however, more time consuming.
When data from different recorders have to be synchronized, it is often difficult to find out which time-base onthe one recording can be correlated with those on the other recording. The use of coded time-base signals hasbecome universal, and the correlation can be established by reading the code. The time code must be selectedto have the required resolution (e.g., 1 msec or 0.1 msec). Many preprocessing systems can create finer timingintervals that are available in the code by dividing the code intervals. The ability of the time processing routinesto handle timing anomalies, such as time "drop outs," noisy timing code which cannot be accurately decoded,
Document provided by SpaceAge Control, Inc. (http://spaceagecontrol.com/).

10A-11
or re-initialization of the time at midnight, is one of the most critical items in allowing automated data process-ing to work without excessive manual intervention. If the normal correlation has failed, it is often possible torestore it by finding particular events, such as conspicuous maneuvers of the aircraft on both recordings and tostart counting pulses from there (see Chapter 13). This requires special features in processing software toaccommodate the time corrections.
10.3 PROCESSING HARDWARE CONFIGURATION
10.3.1 Computer typesThe major division between computers in the 1960's and the early 1970's was between analog computers anddigital computers. While both these technologies still exist, the intervening 20 years has seen the computer'ssize, interfacing capabilities, speed, and memory capacity make tremendous improvements. There are manycomputer workstations which have much more processing power than mainframe computers of only ten yearsago. However, as one progresses to more capable computers, increased capabilities become readily apparent.For example:
- multi-programming, executing more than one program at a time,
- multi-processing, servicing more than one user at a time,
- ability to support a large number of peripherals, large disk formats, and a variety of printer/plotters anddisplays,
- increased processing speed, and
- hot off-the-shelf software, eliminating the need for software redevelopment.
There is no "one" computer that is right for a program. A small personal computer may be sufficient to processall data for a report, but may not be easily interfaced with appropriate media produced by the pre-processingsystem. Not only must one select or use single computers to get the job done, but one must consider how tointerface data products from multiple computers doing distributed tasks. Interfacing computer media/systemsis not a trivial task. Many testers have fallen into the trap of thinking that because it "ought to be easy, straight-forward, etc.," it will be. It is the author's experience that data systems integration is one of the most challeng-ing jobs for flight testing. Although most organizations do not go out and acquire more computers for eachflight-test program, they may end up interfacing many different computer systems.
Acquisition of new computers should be thoroughly planned, (hopefully by experienced data processing per-sonnel) so that they fit in with the current requirements. If all current requirements can be met and future re-quirements can also be provisioned for, so much the better. However, emphasis should be on satisfying thecurrent requirements.
Special-purpose computers are usually more limited in their architecture and therefore, their applications, Someexamples of special-purpose computers are onboard computers such as those embedded in avionics systems (buscontrollers, flight-control computers). For ground applications integrated pre-processors for telemetry frontends, graphics workstations, and PCM system controllers and frequency analyzers are typical special-purposecomputers. These special-purpose computers may be a prime source of processed data from the test aircraft al-though some modifications of standard protocol may be required to access this data. It offers the potential foracquiring "engineering units" data in a computer-compatible form onboard the aircraft.
When selecting a computer system, the first choice is between a special purpose computer and a digital com-puter. Few, if any, data processing stations are without a digital computer at the present time. But often thereare, besides this digital computer, some special computing devices which may be either standard digital com-puters of special-purpose type such as frequency analyzers, etc. The main advantage of special computers istheir inherent speed. For this reason, they can sometimes be used in online operations for which the generalpurpose digital computers are not suitable. Examples are frequency analysis and computations with modelswhich have nonlinearities. As the speed and capacity of digital computers have increased, these advantageshave become less and less apparent. The present trend is toward the replacement of analog devices by digitalcomputers.
Document provided by SpaceAge Control, Inc. (http://spaceagecontrol.com/).

1OA-12
The choice of digital computer depends heavily on the amount and kind of work which must be done in therequired turnaround time. For computations involving a small amount of data, a desk computer or terminal toa large general-purpose computer system may be sufficient. For more demanding flight-test programs, a gener-al-purpose computer may be shared with others or even one or more computers may have to be reserved for thispurpose. The main aspects to be considered in the choice of a computer are:
- The hardware system. Even if a pre-processing computer is used for data reduction, the number of input/output (I/O) operations of the computer is usually larger for data processing than for many other computerapplications. Modern computers can have separate processors for peripherals such as tape-units, discs,drums, printers, plotters, etc., which can operate simultaneously with the central processing unit.
- The memory cycle time. This gives a general indication of the speed of the computer.
- Multi-programming capacity. Because of the large number of relatively slow I/O operations required inflight-test data processing, the central processor of the computer is rather inefficiently used. This can beimproved if the computer has multi-programming capability. In such computers several programs arestored in the memory and the computer will start working on the program with the highest priority untilan input or output has to be done for that program. Then the computer will switch to the program withsecond priority while a separate controller takes care of the input or output for the first program. Whenthis has finished, the computer will switch back to the first program while an I/O controller takes care ofthe input and output for the second program, etc. If the number of simultaneous programs is small, thiscan considerably improve the efficiency of the computer. If the number of simultaneous programsbecomes too large, excessive memory capacity and too long a turnaround time for the low-priority pro-grams will defeat the purpose.
- Online processing suitability. Online processing is used to a larger extend in modern real-time systems.The main problem from the point of view of computer technique is that the processing must on the averagebe as fast as the input data coming in. This gives additional requirements on the programming of the dataprocessing, and in some cases it may be necessary to do the programming in machine or assembly lan-guage because this will decrease the program execution time.
- The operating system. This is the total of all software programs which executes and monitors the computeroperations. It includes programs for management and arrangement of data streams, the drivers for variousperipherals, programs for protection, testing, and intervention. It performs all functions that a programmerwill use in the execution program.
- Compilers. Different programming languages can be used for programs such as online programs, pro-grams with much I/O, programs for certain complicated numerical calculations, etc. The compilers forthese languages are not yet available for all computers.
- Compatibility. There are several compatibility problems which can influence the choice of a computersystem. In the first place, it has been noted that a "computer-compatible" tape produced by one computer(for instance, a pre-processing computer) often cannot be read by other computers because of the extreme-ly narrow tolerances in tape readers. Also, there may be differences in compilers, even if they have beenmade nominally for the same computer language. This may require extensive and often difficult rewritingon already existing and proven programs.
- Access to the computer system. If the same computer is also used for other applications, the priorityassigned to the flight-test processing programs may heavily influence the turnaround time, and
- Possibility of human intervention. Though many imperfections in the test data can be foreseen and pro-grams to solve them can be made, it still happens that human decisions have to be taken during theexecution of the program. For this purpose, the computer should be equipped with displays so that thesedecisions can be made without too much delay.
A short discussion of data processing equipment follows.
10.3.2 Eguinment for quick-look and instrumentation checkingThe task of this type of equipment is discussed in Section 10.2.3 and can be summarized by saying that gener-ally for quick-look a rough trace of a few channels is necessary; for instrumentation checking it is necessary to
Document provided by SpaceAge Control, Inc. (http://spaceagecontrol.com/).

1OA-13
verify whether all channels have produced outputs which vary within predetermined limits and whether the cal-ibrations have not changed. As described in Chapter 8, a number of these instrumentation check requirementscan be fulfilled by counters and warning lights in the aircraft and by pre-flight and post-flight checks whichcan be recorded on the same tape as the data. In some cases, in-flight calibration data have also been recordedon tape.
While strip chart review is still a prime quick-look data source, the trend in quick-look checking is to do reviewand analysis on graphics workstations using history files created with real-time telemetry data. The same sys-tems can be used with a quick run through the onboard tape. Avionics testing also will use video recordings toreview test results for quick-look.
In most cases the pre-processing equipment is used for obtaining quick-look and instrumentation check data. Itis usually done in a preliminary run of the tape through the equipment and is often combined with the selectionof parts of the tape that must be further processed.
Special problems occur when the flight testing and the data processing are performed at different locations. Spe-cial transportable equipment is then used for quick-look and instrumentation checking, often mounted in a van.The equipment will generally be built along the same lines as the pre-processing equipment and will often usethe same components. With modems and satellite communications systems, transmittal of remote data to thedata center can easily be accomplished.
10.3.3 Pre-processing equipment for magnetic tapes inputThe equipment of a pre-processing ground station must be able to handle magnetic tapes which may vary in thefollowing aspects:
- Tape width and track arrangement. Tape widths from 1/8 in. and 1/4 in. (in commercially available cas-settes) to 2 in. are in use in both airborne and ground equipment. Flight-test standards have been made bythe Inter-Range Instrumentation Group (IRIG), (Ref. 10.1A) for 1/2 in. tape with 7 or 14 tracks and for Iin. tape with 14 or 28 tracks. Mot tape recorders specially manufactured for airborne applications are con-structed according to these IRIG standards,
- Modulation methods for analog recording. The signals are recorded on tape by direct recording or FM.Several types of FM recording are in use (see Chapters 11 and 12). IRIG has only tape recording standardsfor single-carrier FM for several combinations of carrier frequency and tape speed. The multi-subcarriersystems standardized for telemetry are also used for tape recording. These include proportional-band-width and constant-bandwidth systems,
- Modulation methods for PCM digital recording. Digital tapes can be recorded in parallel or in serial byseveral modulation methods (for example, NRZ or bi-phase). Parallel recordings can have different num-bers of bits per character. Serial recordings can have different word and frame synchronization methods.The detection of words and frames can be done by either hardware or software. The hardware methods arenormally faster, software methods are more flexible. New preprocessors offer both techniques in a methodtransparent to the user, and
- Different types of telemetry tapes. These may be recorded in the telemetry ground station with a carrier(pre-detection recording) or after detection (post detection recording). In analog and digital telemetrymost of the modulation methods mentioned for analog and digital flight tapes may occur, though some-times in other variations than are used for flight tapes by the same flight-test center.
Important design characteristics of the pre-processing station are:
- The degree of versatility. Will the center have specialized pre-processing equipment for each of the vari-ants mentioned above, or should all types be handled by one versatile piece of equipment? Although thereis a tendency toward less specialization in this respect, it has in some cases been found that significantdelays can occur because the pre-processing equipment is engaged in time-consuming processing of otherinputs, and
- The degree of automation. In early quick-look and pre-processing computer systems it has been found thatthe manual preparation of these systems and manual test procedures and fault detection require consider-able time. In modern systems, a high degree of automation of these functions is normally specified.
Document provided by SpaceAge Control, Inc. (http://spaceagecontrol.com/).

1OA-14
In most modern flight-test data processing stations separate "pre-processing" and "computation" computers areused. The main reason for this is that many of the pre-processing functions (such as copying of flight tapes,channel selection, data reduction within each channel, digital format conversion, and the production of com-puter-compatible tapes) require relatively long computer I/O time but only very little computation time. Assmall computers with the same I/O speed as the large computers have become relatively inexpensive, the bestcost effectiveness is obtained if these functions are done by such small computers. The large computers, whichare often used for many purposes, other than flight-test data processing, are then more efficiently utilized. Thedivision of the pre-processing functions between the two computers depends on many considerations, such asthe availability of the large computer, the turnaround time required, etc. In some cases, all pre-processing func-tions mentioned in Section 10.2.4 are executed in a pre-processing computer, if necessary, in several consecu-tive runs. In other cases the more complex pre-processing functions, such as filtering and the application ofcalibrations, are done in the large computer.
As the flight tapes usually do not have inter-record gaps, the input tape unit to the pre-processing computer hasto run continuously. This means that the pre-processing computer functions in an "online" mode even if furtherprocessing is not online. The problems mentioned for online operation in Section 10.3.1, therefore, always ap-ply to pre-processing computers. This online operation need not, however, be done at the same speed as the datawere recorded. It is possible to read the tapes at a higher or lower speed than they were recorded.
10.3.4 Equipment for analyzing photo-panel recordings and continuous-trace recordingsThe reading of photo-panel recordings is a purely manual process. The film frames are projected one by oneand the relevant instrument dials have to be read in a pre-determined sequence. Channel selection is possible,that is, the operator only reads the instruments which are necessary for a particular analysis. The data read fromthe film can be collected in tables or can be manually entered for further analysis in a computer. It is possibleto read about 50 data points per hour.
Many attempts have been made to automate the reading of continuous-trace recordings, but without much suc-cess. Semi-automatic equipment is now generally used which provides a desk with a film transport mechanism,on which the film can be laid or projected. The operator can move cross hairs to the point to be measured. Whenthe cross hairs coincide with the point, the operator pushes a button and the coordinates of the point are auto-matically recorded on paper or magnetic tape. These devices make it possible to read 1000 to 2000 points perhour. Similar devices are also used for reading cinetheodolite film (see Chapter 13).
10.4 SOFTWARE SPECIFICATIONS AND DEVELOPMENTThis section will deal with issues in the specification development and applications of software and firmware(for microcomputers). The assumption made in the following is that the hardware suite to be used is alreadyfinalized. There is nothing more difficult than trying to do software and hardware concurrently.
Software development really is the writing of a set of computer programs to accomplish the goals of the project.Systematic or structured programming is needed to thoroughly define the input variables, the output variables,and the intervening algorithms to be executed by the program. Because the measurement lists for test programsare constantly evolving in the early stages of a program, and test teams are being formed, it is often difficult toget the previously mentioned items defined. Usually the projects are well enough organized to discuss broadclasses of measurand types and resulting data products required. For example, one may know that performanceand flying qualities testing is to be done. Thus, one can estimate that certain standard data products associatedwith performance testing (for example, drag polars) will be produced.
For most average or larger programs, the planning of the data processing warrants the attention of a programmanager, who should be assigned the responsibility for gathering requirements, identifying significant mile-stones, proposing and managing schedules, etc. The manager should manage an iterative process which worksto refine the definition of the available data sources (airborne and range instrumentation and simulations) ofthe flight-test maneuvers to be flown (test plan) and obtain from the flight-test engineers the data productsrequired. This program manager must perform requirements control, validating requirements and not allowcasual, unofficial changes in them. At some point, the requirements must be "frozen" and development ofdetailed software requirements completed. The project mathematicians, data engineers, data production ana-lysts, etc., must form a cohesive team to work on the software development.
No distinction has been made here between use of already existing software programs and new developmentbecause existing software must be reviewed against the requirements to see if it will do the job. If the
Document provided by SpaceAge Control, Inc. (http://spaceagecontrol.com/).

1OA-15
modification is required, is it worthwhile or is new software required? Validation of modified software repre-sents the same challenge as for new software. In any case, there must be effective communication between theinstrumentation engineer, the flight-test engineer and the software development team if adequate software is tobe developed and delivered to meet test schedules. Changes in requirements must be treated as "new" until itseffect on the development effort can be assessed.
Pre-processing software may be straightforward, with completion easily attained, when the aircraft data formatis identified. If, however, the format is unique, new routines may be required to demultiplex the data. If unusu-ally accurate time correlation is required (for example, for navigation systems testing) the new method or mod-ified software may be required.
10.5 DATA FILES AND ARCHIVINGA related problem is the long-term storage of data. For some types of flight tests, such as an investigation ofad-hoc problems in operational aircraft, the raw data can be destroyed when the data processing and interpre-tation is finished. Only the essential processed test results are retained in a test report. However, most flight-test data have to be stored for longer periods, especially those from prototype flight tests and tests with exper-imental aircraft. When unexpected characteristics of the aircraft or of its systems are found, it is usually lesscostly to look for corroborative evidence in the data of previous flights than to make a series of new flights.When the nonsteady flight-test techniques mentioned in Chapter 1 are used, the availability of earlier flight-test data is even an essential characteristic of the data analysis procedures. many manufacturers keep theirflight-test data as long as aircraft of that type are flying; they can often be of great assistance when a solutionhas to be found for problems that only become apparent after the aircraft are in operation. The data (which arekept) are always the original flight data because they contain the maximum amount of information. New massstorage systems will soon offer the potential for converting original flight data to computer-compatible form,which is safer to store than magnetic tapes, and is more easily accessed.
Data file/archive management is a unique task that is often unplanned and many times occurs by default. Past(and present) practice was to archive the original analog tapes and test reports. When one needed to referenceold data, one either had to read through stacks of test reports or try to process the raw data tapes. Unfortunately,if the old calibration databases were not maintained in historical order or were unavailable, one could not pro-cess the data. With aircraft staying in inventory longer and longer, these practices lead to expensive, unneces-sary re-flys of tests to recover data or to redefine the baseline.
The time to determine data file management and archiving requirements and to formulate an approach to meet-ing them is well before flight testing begins. A focal point organization must be selected to do this task. Usersof the data must identify their requirements for access (amount, frequency, data products required, contingencyplans, etc.). It would be desirable to preprocess the entire suite of data collected on a flight, along with databaseinformation, so that it was available to engineers via random access time. Any time one needed to access dataone could call it up and process it on a workstation or a computer. Even though mass storage technology hasmade gigabyte disk storage a reality, one cannot store much more than one full flight's data on a disk. Storageof raw data rather than EU data can potentially double the capacity, but a 200-flight program still would use aprohibitive amount of disks. A reasonable compromise would seem to be to store all data which was processedpost flight on disk (or tape), and keep the analog tapes for bulk storage. Large data processing facilities arehaving significant problems with this approach since it still generates large numbers of digital tapes as well asretaining all the analog tapes. However, since new technologies such as optical disks are maturing and acknowl-edging the storage problems discussed above and making provisions to deal with them is a double task. In thenear future optical storage techniques and other tape media (special cassette juke-box storage) offer some reliefto the archiving problem. However, new DAS and increased instrumentation data rates and requirements (forexample, 50 Mbit/sec avionics data bus) may outpace the growth in storage capacity/density.
10.6 CONCLUDING REMARKS
Only the basic principles of the operation of a data processing station for flight testing could be reviewed. Themain emphasis has been on medium-sized and large stations with a relatively large amount of automation,though many of the principles also apply to small-scale tests.
A successful operation can only be realized when the planning of the data processing is started at a very earlystage and when there is good cooperation between the flight-test engineer, the instrumentation engineer and thecomputer specialist.
Document provided by SpaceAge Control, Inc. (http://spaceagecontrol.com/).

1OA-16
10.7 REFERENCES10.1A. Nowak, D.J. and P.E. Schmid, Introduction to Digital Filters, IEEE Trans. on EMC, Vol. 10, No. 2, June
1968.
10.2A. Oppenheim, A.V. and C.J. Weinstein, Effects of Finite Register Length in Digital Filtering and the FastFourier Transform, Proc IEEE, Vol. 60, No. 8, Aug. 1972.
10.3A. Gold, B. and C.M. Rader, "Digital Processing of Signals," McGraw-Hill, NY, 1969.
10.4A. Telemetry Standards, document 106-71, Inter-Range Instrumentation Group, Range CommandersCouncil, White Sands, Missile Range, NM.
10.5A. Cameron, Bruce T., "General Calculation Capability in a Production Data Reduction Environment-Batch Processing," Society of Flight Test Engineers (SFTE) sponsored symposium on computer aidedflight testing, Oct. 1970.
10.6A. Stinson, J.J., "An Automatic Telemetry Data Acquisition System," presented at ISA Aerospace Instru-mentation Symposium, NV, 1971.
Document provided by SpaceAge Control, Inc. (http://spaceagecontrol.com/).

10B-1
Chapter 10B
DATA PROCESSING
by
Stan YountNASA Ames Research Center
Dryden Flight Research FacilityPO Box 273
Edwards AFB, CA 93523-0273United States
10.8 OPERATIONAL SUPPORT DATABASE
10.8.1 IntroductionData are collected for flight research and test programs during flight activities for subsequent analysis and reportpurposes. The instrumentation installed on a test vehicle collects the data for ultimate recording on a computerlegible medium such as magnetic tape or disk. Software systems that are generally user specific have been devel-oped for the analysis requirements. The analysis requirements have become more complex because of the increas-ing numbers of parameters and associated data that are measured by airborne data acquisition systems (DAS). Thesoftware systems developed to handle this data tend to consist of two distinct functional elements. The first, orprocessing element converts sampled data to engineering units (EU), then analyzes the resulting information. Thesecond, or support element consists of the collection, organization, and management of the data required to sup-port those functions performed by the processing element. Some software systems of 25 years ago combined theprocessing and support elements into a single processing package. This was caused in part by the technology inairborne DAS. Older systems incorporated recording devices such as oscillographs, whose bulk and weight alonelimited the numbers of parameters recorded. Today's technology, which includes pulse code modulation (PCM)data encoding, transmission, and recording techniques, enables the recording of parameters and their data manytimes over that of the earlier systems. The increased data handling capacities of PCM and other technologicallysimilar airborne DAS have brought about growth in the support function. This growth includes complexity of thesupport function that may makb it desirable to separate it from the processing function. This separation may in-volve a computing system dedicated solely to accomplishing the support function. This section will provide guid-ance in developing an operational support database (OPSDB) function that serves as the support element in flight-test data processing activities.
The essential elements in the processing of data measured during flight-test operations are vehicle calibration,parametric, DAS definition information, and parameter lists (lineups). With these essential elements, the OPSDBenables the location, identification, and EU conversion of data collected during flight-test activities into mean-ingful results. One additional element in an OPSDB system is the ability to reconstruct the calibration, parametric,DAS, and lineup information data sets as they existed for any given operation. An OPSDB system essentially con-sists of
(1) calibration information to enable EU conversions,
(2) parametric information which defines the parameters measured by the DAS,
(3) specifications defining the functional characteristics of the DAS,
(4) instrumentation schemes, or parameters lists, which locate and identify measured parameters associated witheach DAS, and
(5) history information to reconstruct calibration, parametric, DAS, and lineup configuration for specificoperations.
The OPSDB data sets are derived from information originating with the instrumentation engineer and from cali-bration data applicable to the instrumentation installed on a test vehicle. The instrumentation engineer developsthe DAS specifications in response to user requirements. Instrumentation is installed and interfaced to the DASon a test vehicle, and is later calibrated for data reduction purposes.
The OPSDB system is a key element in the conduct of any flight project. The organization, content, and data man-agement functions of the basic OPSDB should be determined by a development team familiar with end-to-end
Document provided by SpaceAge Control, Inc. (http://spaceagecontrol.com/).

1OB-2
data flow: an instrumentation engineer, a calibrations specialist, real-time and post-operative software develop-ers, and a data management specialist. Utility functions to be applied to the OPSDB system should be developedbased on requirements not only from the development team, but from a broader cross section of OPSDB informa-tion users as well.
10.8.3 System objectives
This section presents three objectives to consider when developing a general purpose OPSDB. These are generalobjectives and are not intended to include all of those one might wish to satisfy with an OPSDB.
10.8.3.1 Information consolidation
The first objective is to consolidate the calibration, parametric, DAS, and lineup information required for test datareduction onto a single computer system. Consolidating existing OPSDB functions will require planning to limitproblems that may occur during the transition from current to OPSDB system. Test projects originating afterOPSDB development is complete will be consolidated by design.
10.8.3.2 Elimination of redundant informationThe second objective is to eliminate redundant information. Unconsolidated systems often maintain similar infor-mation in various locations which may allow discrepancies in data processing. Consolidation helps eliminate re-dundant information. In addition, if transcribed ledgers are seen as a form of redundancy (for example, handwritten parameter lists developed during the buildup phase of a project) it is possible to provide an OPSDB systemthat limits data transcription by allowing users to perform those transcriptions electronically where the resultswill be more readily accessible to other users.
10.8.3.3 Limiting manual data entryThe third objective is to reduce, and where possible, eliminate the manual entry of data into an OPSDB system.Automating the data collection and distribution procedures will help satisfy this objective. For example, the cal-ibration function could be done under computer control with results stored in machine readable form. This wouldeliminate transcribing the calibration data to data sheets for manual entry into the OPSDB system. If the OPSDBsystem were a computer other than the calibration controller, required data transfers could be accomplishedthrough hard media (for example, magnetic tape and hard or floppy disk) or electronic link.
10.8.4 Calibration information
Calibration information, in the OPSDB context, falls into one of the two following general categories, laboratorycalibrations, and hangar calibrations. Laboratory calibrations are performed on a new instrument for acceptancepurposes and to establish a health profile of the instrument. The instrument's profile is updated when it is returnedto the laboratory and recalibrated. The primary purpose of this monitoring is to reaffirm the instrument's flight-worthiness. Laboratory calibrations may be used for data reduction purposes while performing spot checks or tocheck calibrations of the instruments after they are installed on a test vehicle to verify the instruments' condition.
Hangar calibrations are conducted in the static environment of the hangar and consist of information collectedfrom instruments installed on a test vehicle. Stimuli applied to the instruments over a predetermined range of testpoints are recorded for later use in data reduction activities. Check calibrations, as noted in the previous para-graph, may also be periodically performed on instruments. Malfunctioning instruments are returned to the labo-ratory for more stringent testing and disposed of properly thereafter. The hangar calibration technique is howcalibration data are collected and processed to yield results applied later in the EU conversion of test data.
For OPSDB purposes, calibrations consist of:
(1) polynomial coefficients derived through curve-fits of recorded test points, or direct inputs to accommodatepredetermined equations (for example, strain gages and thermocouples).
(2) interpolation tables consisting of data points from the calibration process, and
(3) look-up tables for discrete bit and digital word decoding (collectively referred to as "discretes").
Using these EU conversion processes in data reduction software would then depend on determining the type ofcalibration information being represented and invoking a corresponding conversion algorithm.
Document provided by SpaceAge Control, Inc. (http://spaceagecontrol.com/).

1OB-3
10.8.5 Parametric informationParametric, or parameter information pertains to the data being measured by the DAS and consists primarily ofinformation specific to parameters themselves and is noncalibration in nature. Examples of parametric informa-tion include:
(1) parameter description (ASCII text),
(2) names of other parameters used to apply voltage or temperature corrections values to the parameter being de-fined, and
(3) information enabling the chaining, or concatenation, of parameter components to yield a single parameter (amethod used to measure parameters whose bit resolution exceeds the word size of the DAS, necessitating theuse of two or more DAS words).
These examples do not represent all the information pertaining to parameters that should be included in this area.The developers of the OPS DB system should work closely with the instrumentation engineer, other data reductionsoftware developers, and the end-users to determine what information is required to satisfy overall projectobjectives.
Parameter information should be viewed separately from calibration information, since all parameters on a DASneed not be calibrated. For instance, parameters measured using unique instrumentation could have their conver-sion algorithms embedded in data reduction software, thereby eliminating the need for that information in the cal-ibration area.
10.8.6 Data acguisition system informationThe DAS information, in the OPSDB context, consists of specifications which define the onboard data system(s)(OBDS) or commutator(s). For example, OBDS specifications consist of data elements that can be used to set upground station equipment for the decommutation of PCM bit streams, or identifying constant/proportional band-width channels for FM/FM data processing. The OBDS specifications for a PCM DAS would include such dataitems as bit rate, word and frame sizes, subcommutator information, etc. The OBDS information could also beused to develop a parameter list, or lineup, to identify parameters, their locations, and associated calibrations:(A PCM DAS is the type of DAS implied by the acronym "DAS" in the OPSDB context).
10.8.7 Lineup informationLineups consist of parameter lists whose order is determined by the instrumentation engineer, usually by frameword position and frame number, or alphabetically by parameter name. Frame word position is the numeric sam-pling sequence value of a data channel within a DAS cycle. Frame number is the numeric value of the frame cyclecontaining the word in which a specific measurement appears. Frame number is meaningful only for DASs thatinclude one or more subcommutators.
Figure 10.1B is a block diagram of the frame word position and frame number concept. A DAS consisting of amainframe and one subcommutator that measures a total of 14 parameters, P1 though P14, is shown. The main-frame consists of eight data sampling positions and two sync words. The subcommutator is four deep and consistsof two subframes (occupying frame word positions 1 and 2) which are used to measure parameters P1 though P8.Parameters P9 through P14 are measured in frame word positions 3 through 8, respectively. Using the frame wordposition/frame number technique to locate parameters, parameter P6 would be at frame word position two, framenumber two. Parameters confined to the mainframe (that is, P9 through P14) would always be referenced by theirframe word position and frame number one.
The lineup identifies parameters appearing in the various positions based on DAS specifications and calibrationto be applied to the identified parameters. Lineups enable both real-time and post-operative data reduction func-tions to locate specific parameters and provide identifiers for calibration information required to perform the EUconversions of those parameters.
10.8.8 History informationHistory information is the archival/retrieval mechanism of OPSDB information. As operations occur, informationregarding each DAS and lineup used, including parameter and calibration associations with each lineup, is unique-ly identified and retained. This identification enables those configurations to be specifically reconstructed by lo-cating the history for a desired operation and assembling the information into a prescribed format for follow-onuse.
Document provided by SpaceAge Control, Inc. (http://spaceagecontrol.com/).

10B-4
FRAME WORDPOSITION - 1 2 3 4 5 G 7 8 9 10
FRAME NUMBER
1 P-1 l5 P- P10 P1 PA2 P13 P-4 SYNC SYNCI2
2 P2 P-G
3 P-3 P_7
4 P4 P-8
Figure 10.1B. Sample frame map.
10.8.9 System considerationsThe OPSDB software system can take any of several forms. One key to implementing an adaptable system is theestablishment of a requirements team whose members have a thorough understanding of the flight-test activitiesthat will be supported by the following OPSDB software system. Some of the factors this team might consider arediscussed in the following subsections.
10.8.9.1 Hardware system considerationsThe hardware system available for OPSDB support will probably have the greatest influence on the OPSDB sys-tem to be developed. The characteristics and features of the hardware system will impact such items as:
(1) operating system software and utility software subsystems capable of being used for OPSDB support,
(2) the amount of OPSDB information capable of being maintained on-line and in the form in which that infor-mation can be maintained off-line,
(3) communication techniques that may be used to effect data transfers between the OPSDB system and othersystems in the overall processing chain, and
(4) the number of users that can be supported concurrently.
The OPSDB functional capabilities could be influenced and, possibly, limited if an existing hardware system waschosen to implement the OPSDB system. Ideally, OPSDB system development would take place on a computingsystem whose existence was based on specifications designed to satisfy overall OPSDB design requirements.
10.8.9.2 Operating system considerationsThe operating system (OS) on the OPSDB computer can influence the amount and complexity of user developedsoftware required to support the OPSDB system. The OS also determines at what level software routines can beand need to be developed. An OS that provides limited user interface capabilities and minimal utility functionswill require more applications software development to accomplish required tasks. A larger, more sophisticatedOS, on the other hand, will provide extended capabilities that can minimize and simplify applications develop-ment. Developing procedures that use the capabilities of an extensive OS is also time consuming, however.
10.8.9.3 Number of computing systems involved in the collection and distribution of OPSDB informationIt should be emphasized that the OPSDB information set should be generated and maintained in a manner as sim-ple and straightforward as possible, regardless of computing system configuration. Some projects may have
Document provided by SpaceAge Control, Inc. (http://spaceagecontrol.com/).

10B-5
access to limited computing resources for performing both OPSDB functions and data processing tasks (similarto the configuration implied by Fig. 10.2B). Other projects may consist of multiple computing systems whereOPSDB functions can be separated from other data processing tasks (Fig. 10.3B). The methods by which data areacquired and distributed by the OPSDB system should be considered here also, taking care to allow for alternatemeans of data acquisition and transfer.
DAASHEET
Digitized and iInformationTest DaLta ParametricI= n== fo (Lineup)
DATA REDUCTION/OPSDB R C
SYSTEM
T ST OPSDB
Figure 10.2B. OPSDB system with limited resources.
CAlLIBRAlTION an nomtoSYSTEMPaaerc(iup
OPSDB
SYSTEMi OPSDB
FILES
NETWORK LINK •
DATA REDUCTION DATA REDUICTION
SYSTEM SYSTEM
Figure 10.3B. Stand alone OPSDB system.
Document provided by SpaceAge Control, Inc. (http://spaceagecontrol.com/).

1OB-6
10.8.9.4 Operational and functional characteristics of end-to-end data handlingThe operational and functional characteristics of end-to-end data handling should be considered to help developOPSDB system specifications. This exercise can help scope the desired OPSDB by identifying: (1) OPSDB func-tions currently performed by other system components, and (2) additional functions to be handled by the OPSDBsystem. Ideally, the OPSDB system should function similarly on single and multicomputer configurations. Theinput/output interfaces required to process information collected from and distributed to other system componentswill work regardless of configuration with proper planning and design. Inter-computer information transfer prob-lems can be minimized by adopting interface standards applicable to all system components (for example,generation and delivery of ASCII data files regardless of transfer medium, allowable record lengths and blockingfactors, etc.). ETHERNET is a desirable networking medium for satisfying inter-computer communications andfile transfer requirements. The Telecommunications Protocol/Internet Protocol (TCP/IP) and DECNet are com-munications protocols that handle inter-computer tasks well.
10.8.9.5 Archival and retrieval requirementsThe ability to retrieve or reconstruct configurations applicable to various test operations is necessary to anyOPSDB system. At one extreme, OPSDB information files generated and maintained using a text editor can bearchived on magnetic tape using a filing convention for easy location of the physical media and information there-on. There are off-the-shelf filing systems that will do such archival/retrieval tasks, or they may be developed asa part of the OPSDB system using utility functions available on the computer's OS. At the other extreme, OPSDBsystems using a commercial database management system (DBMS) for file generation and maintenance can bedeveloped with archival and retrieval functions inherent in the system.
10.8.9.6 Proiect life expectancy and operational frequency
Project life expectancy and operational frequency should be considered. There may be no need to create a large,sophisticated OPSDB software system for a projected short-life project. At the same time, long-term projectsscheduled to conduct test operations frequently will accumulate large quantities of OPSDB information. TheOPSDB software should be designed to simplify information retrieval and reconstruction of information relevantto operations conducted at any time during the project.
How information is collected, handled, and exchanged between the OPSDB system and other system elements canbe a limiting factor to operational frequency. The keyboard input of information from transcribed forms and datasheets would more adversely impact operational frequency than would higher speed, machine-readable inputs ofthat same data through magnetic tapes, disks, networks, or other peripheral devices.
10.8.9.7 Possibility of supporting additional projects with OPSDB software. current and futureIt is important to consider supporting other projects with the OPSDB software system. An evaluation of the typesof information required to support other projects should be performed when it is expected that ongoing and futureprojects would benefit from a tailored OPSDB system. Calibration and parametric information is fairly static instructural form and content regardless of project, as is history information. However, DAS capabilities and spec-ifications may vary between projects and, over time, may change entirely. The DAS changes may also influencethe structure and content of the lineup. The DAS and lineup areas, therefore, require particular attention duringthe OPSDB design.
10.8.9.8 Data items required to be maintained in each of the OPSDB categoriesIt is important to develop a list of data items to be maintained in the OPSDB before design efforts begin. The listwill consist of items relevant to data collection and reduction activities. Construction of the data item list by therequirements team will give all members a better understanding of the organization's end-to-end test data han-dling, which will benefit OPSDB system development. The data items identified by the team should be catego-rized as calibrations, parameters, DAS, lineup, or history, A definition of each data item is required to explain itsfunction within the OPSDB. The number of data items identified during this process will influence the choice ofOPSDB maintenance mechanism (text editor or commercial DBMS) and help determine the amount of utility soft-ware that will be required.
10.8.9.9 Complexity of the DAS (commutation schemes, instrumentation, and lineupsThe DAS characteristics, instrumentation, and influence on ensuing lineups should be considered in detail. TheDAS complexity (for example, number of prime commutators, subcommutators and subcommutation techniques,and supercommutation) is a critical factor. The OPSDB must be able to accommodate any DAS configuration and
Document provided by SpaceAge Control, Inc. (http://spaceagecontrol.com/).

1OB-7
instrumentation encountered. In turn, lineup definitions reflecting a DAS specification must be attainable andsupportable.
Lineups are based on the data sampling characteristics of the DAS. It is through the lineup that data reductionactivities are made possible. Lineup maintenance in the OPSDB should be as simple and error free as possible.There are several ways to maintain lineup information, ranging from the use of text editors (usually simple, butnot error free) to commercial DBMS which require special software development but permit a high level of datareliability. Lineup functionality should be a major factor in determining the means used to support and maintainan OPSDB.
10.8.9.10 Number of calibrated and discrete/digital parametersThe number of parameters to which calibrations will be applied, including discrete/digital parameters, and thequantity of information expected to be required for individual calibration and parameter definitions should beconsidered. Using a text editor to maintain OPSDB information becomes more cumbersome and unreliable as thenumber of calibrations, parameters, and their data quantities increase. A DBMS becomes a likely candidate forOPSDB maintenance when these data quantities are expected to periodically increase.
10.8.9.11 Expected frequency of parametric changes, calibration checks, and project operationsThe frequency of changes expected in the OPSDB and operational schedules should be considered. Rapid turn-around in operations performed on a test vehicle may involve minimal changes in the calibration, parametric, andlineup configurations in which case maintenance activity on the OPSDB would be almost nonexistent. On the oth-er hand, such changes performed during periods of rapid turnaround may require short response times in terms ofOPSDB maintenance. The lack of error checking and data validation capabilities make text editors a poor choicefor maintenance purposes in stressful situations. However, the ability to perform and provide for error checks andreasonable levels of data validation are standard features of DBMSs, making them reasonable candidates for in-corporation into an OPSDB software system.
10.8,9.12 Database management system considerationsDatabase management systems can be grouped into three types depending on the characteristics of the data struc-ture supported by the DBMS:
(1) hierarchical - consists of record sets structured in one or more hierarchies, or areas, stored and accessed in atop-down manner,
(2) networking - similar to hierarchical but capable of establishing links between other records in the same ordifferent hierarchies, simplifying both data correlation and access, and
(3) relational - consists of records viewed logically in a two-dimensional sense by row (to establish record rela-tionships) and column (to differentiate between relationships).
The type of DBMS to use for OPSDB support is a significant concern if a DBMS will be used to control the entry,modification, and access to OPSDB information. Any of the DBMS types previously noted could be used to im-plement the database. The choice of DBMS type will depend on previously mentioned system considerations andthe desired functional capabilities of the overall OPSDB system.
The separation of information types (for example, calibrations, parameters, DAS, lineup, and history) is a desir-able feature of the OPSDB system and can be done with a hierarchical DBMS. However, the limitations of a purelyhierarchical DBMS might make this type of DBMS less desirable than one of the other types (that is, the inabilityto establish relationships between records of the same or other hierarchies, except through applications softwareroutines).
A networking DBMS can also separate information types. Additionally, the networking DBMS enables links tobe established between records in different areas. This capability enables the correlation of data from one recordwith current data in one or more other records (for example, associating the latest parameter and calibration spec-ifications with a specific lineup location). The networking DBMS is a good choice for OPSDB information man-agement. Figure 10.4B shows an OPSDB system based on a networking DBMS. Information in one data area islinked to information in another data area based on dependency information in one of those areas. Link-dependentinformation resides in the area from which a line is extended to a link (circle) on another area (refer to Fig. 10.4B).Once established, the links are bidirectional and can be used to traverse various paths through the database.
Document provided by SpaceAge Control, Inc. (http://spaceagecontrol.com/).
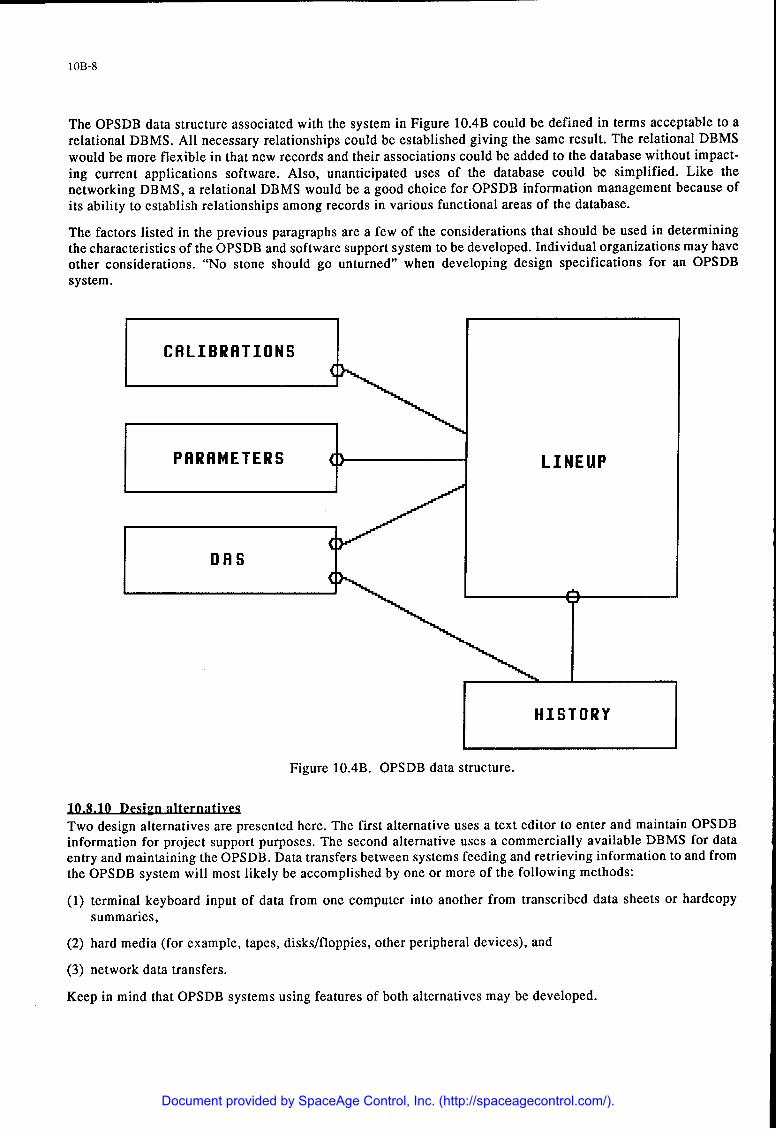
1OB-8
The OPSDB data structure associated with the system in Figure 10.4B could be defined in terms acceptable to arelational DBMS. All necessary relationships could be established giving the same result. The relational DBMSwould be more flexible in that new records and their associations could be added to the database without impact-ing current applications software. Also, unanticipated uses of the database could be simplified. Like thenetworking DBMS, a relational DBMS would be a good choice for OPSDB information management because ofits ability to establish relationships among records in various functional areas of the database.
The factors listed in the previous paragraphs are a few of the considerations that should be used in determiningthe characteristics of the OPSDB and software support system to be developed. Individual organizations may haveother considerations. "No stone should go unturned" when developing design specifications for an OPSDBsystem.
CALIBRRTIONS
PRRRMETERS LINEUP
DRS
HISTORY
Figure 1O.4B. OPSDB data structure.
10.8.10 Design alternativesTwo design alternatives are presented here. The first alternative uses a text editor to enter and maintain OPSDBinformation for project support purposes. The second alternative uses a commercially available DBMS for dataentry and maintaining the OPSDB. Data transfers between systems feeding and retrieving information to and fromthe OPSDB system will most likely be accomplished by one or more of the following methods:
(1) terminal keyboard input of data from one computer into another from transcribed data sheets or hardcopy
summaries,
(2) hard media (for example, tapes, disks/floppies, other peripheral devices), and
(3) network data transfers.
Keep in mind that OPSDB systems using features of both alternatives may be developed.
Document provided by SpaceAge Control, Inc. (http://spaceagecontrol.com/).

1OB-9
10.8.10.1 Text editor alternativesTest data and OPSDB information for a project might be resident, managed, and accessible on a single computeras in Figure 10.2B with data reduction and OPSDB functions being distinctly separate. In this example, calibra-tion procedures are performed on the instrumentation system of a test vehicle and results are transcribed to datasheets. The transcribed information is then input, along with complete sets of parametric and lineup information,into one or more OPSDB files. The means used to build and subsequently maintain the OPSDB files is a text editoror more simply, an editor.
Some means of correlating the data entries between files will be required when separate OPSDB files aregenerated for the various types of information. A data key identifying the information type must be included in
each record where more than one type of information is stored in any one OPSDB file. In addition, assuming an80-character record length (for editing convenience), it should be expected that more than one line, or record, ofeditor output will be required to fully define specific OPSDB entities. When multiple editor lines are required todefine an OPSDB entity, collating information must be included in each record to identify the occurrence se-quence of the data for the entry.
Calibration data would be handled in two phases. The first phase would be the entry of the transcribed data intoa raw data file for subsequent processing. The second phase would involve the processing of that raw data file togenerate EU conversion information. (For example, equation coefficients and lookup tables). Output of the cali-bration second phase processor would be an editor-compatible ASCII file. The file would include the necessaryEU conversion information along with information type identifiers and data keys, and would be merged with anyexisting calibration file to reflect the current state of calibrations. Any existing calibration file could provide cur-rent information by making an editing pass to eliminate inactive entries.
A parametric data file would be generated and maintained solely with the editor. This file would include specifi-cations pertinent to each parameter along with information type identifiers and data keys. Parameter recordswould be added, modified, and deleted as necessary to maintain currency with respect to the lineup.
An editor-compatible initial lineup file for each DAS would be generated using a specially developed softwareroutine. Each initial lineup would be empty except for mapping information (frame word position and frame num-ber), information type identifiers, and data keys. The lineup would be completed by editing the initial lineup (asoften as necessary) to insert or modify calibration and parametric information in the appropriate frame word andframe number positions. The amount of information required to be inserted or modified in the lineup records willhave been determined during the OPSDB requirements specifications process and must satisfy real-time and post-operative data reduction needs. If separate files of information exist for the calibration, parametric, and lineupinformation, then only identifiers might be required to be inserted in the lineup file to establish correlationsbetween DAS measurement locations, parameters measured, and calibration information pertinent to the measuredparameters. Conversely, a lineup file containing all of the required calibration, parametric, and DAS informationcould be correlated by design.
Use of the OPSDB information by real-time and post-operative support functions is simplified when calibration,parametric, and lineup information are correlated by DAS and consolidated into a single file. A correlation prob-lem will not exist if the OPSDB system is designed to maintain information in a single file. However, if the OPS-DB system consists of separate files (to simplify OPSDB data maintenance), information from the various filesmight require a correlation pass prior to use. Setup and processing functions performed by the real-time and post-operative systems would then access a correlated file to determine data tagging values for parameter identificationpurposes (lineup-parameter correlations) and EU conversion algorithms.
Consolidating the OPSDB information also simplifies data archiving. The information can be retained for near-term use on mass storage for rapid retrieval, or it can be saved on a more permanent medium such as magnetictape for long term retention.
10.8.10.2 Database management system alternativeThe second alternative consists of a computer system dedicated to OPSDB data management (Fig. 10.3B). Cali-brations in this example are gathered through one or more smaller systems (noted as the hangar calibration sys-tem). Information is collected by the OPSDB system over an electronic link as well as through interactive terminalinputs. An electronic forms system is used to control the interactive inputs while network file transfers from thehangar calibration system to the OPSDB system use commercially available protocol software.
Document provided by SpaceAge Control, Inc. (http://spaceagecontrol.com/).

1OB-10
Each hangar calibration system can maintain a substantial amount of information in addition to the data obtainedduring the calibration processes. However, it is the data gathered during the calibration processes that is relevantto the OPSDB system. The OPSDB information consists of raw data points, their corresponding EU values, ap-plicable parameters (instruments), and background information relating to the process itself (for example, equip-ment used, data, time the procedure was conducted, who conducted the procedure). Only pertinent data istransferred to the OPSDB system.
As noted, this alternative uses a commercially available DBMS to maintain OPSDB information. The DBMS is anetworking system which enables data records in hierarchical data structures to be linked with data records inother structures defined within the database. Figure 10.4B is a diagram of a database structure that could be usedin OPSDB development. There are five major data structures, or areas, in the database which include informationpertaining to
(1) calibrations,
(2) parameters,
(3) lineups,
(4) OBDS specifications, and
(5) operational histories.
The design shown in Figure 10.4B will accommodate one or more projects for each database. A single databaseis defined for each test vehicle. Multiple projects can be supported by a single database when more than oneproject uses a single test vehicle.
The calibration and parametric information areas are designed and used as pools for relevant data storage andaccess. There are three basic hierarchical levels to both the calibrations and parameters areas which enable
(1) identification to each set of calibration and parameter information,
(2) periodic updates (revisions) of calibrations and parameters,
(3) post operative corrections of calibration and parametric information.
The OBDS area consists of records defining physical characteristics of a DAS (for example, bits/frame, bits/word,subframe information) that can be used in setting up ground station equipment. The OBDS information for a DASis also used to construct a dummy lineup that will later be edited to assign parameters and applicable calibrationsto measurement slots within the DAS. (A dummy lineup contains no parameter or calibration information and con-sists primarily of sync word locations, ID subcom counters, frame word position, and frame number entries ini-tialized to predetermined status values).
The lineup area is edited to contain calibration and parameter identifiers associated with measurement slots withinthe DAS. The calibration and parameter identifiers are entered using specially written editing routines that acceptinputs through the electronic forms system. Data are checked for consistency and validated before they are stored,and specified calibrations and parameters are linked to the slots. The lineup area is a dynamic area that reflectsthe current state of a DAS configuration. The lineup is placed on hold for support of a test operation by reproduc-ing a limited version of its current state in the history area (see the following). Updates are disabled on the lineupwhile it is in hold status.
The history area contains reproduced lineup information pertinent to test operations. Each reproduced lineup inthe history area is a subset of the lineup that existed in the lineup area when placed on hold. The reproduced line-ups contain accounting information applicable to the related operation and minimal OBDS information. A partialset of accounting information relevant to an operation is generated during the lineup hold process and completedduring an operation log process. Operations logged complete cause the release of lineups to further update activ-ities. The history area provides the archival capabilities for operations internal to the database. Each operationwill have a history entry.
Document provided by SpaceAge Control, Inc. (http://spaceagecontrol.com/).

IOB-11
User developed software required to maintain this database would typically include routines to
(1) enter/edit and check calibration and parameter data, performing curve-fits that result in equation coefficientsor construction of lookup tables for calibrations,
(2) enter and check OBDS specifications for relevant DASs,
(3) generate and edit lineup specifications for defined DASs, establishing data links between OBDS, lineup, cal-ibrations, and parameters,
(4) construct history entries with data links to OBDS and lineup areas, provide history area editing capability,and generate a consolidated setup file containing information required for data reduction activities,
(5) provide summary and status information pertinent to each database area, and
(6) perform special functions outside routine entry and editing capabilities (for example, database build, databaseload/unload, special data manipulations, and other OPSDB utility functions).
The data links mentioned in 3 and 4 in the previous paragraph provide the archival mechanism of the database(Fig. 10.4B). When a lineup is held, a link is established between each of the slots in the history area and its coun-terpart in the lineup area. When the lineup is later edited to reflect changes for future operations, information inthe lineup that is attached to the history area is removed from the current lineup but not deleted from the database.The edited position, filled with updated information, is then inserted into the lineup and becomes current. Notethat an archival link has been established with the OBDS information area. The OBDS link enables access to op-erational support information in a top-down manner, whereas the lineup links provide a means for bottom-upaccess.
10.8.11 Utilization philosonhyThe usage philosophy for OPSDB systems patterned after either of those presented in the design alternativeswould be similar. Functionally and procedurally, such systems would be identical for all practical purposes. Op-erationally, however, the systems would differ because of the software mechanisms (DBMS or text editor based)used. This section is concerned only with the procedural aspects of such systems and can, therefore, be equallyapplied to either.
Generation and maintenance of OPSDB information could begin early in a project with the entry of parametricspecifications into the OPSDB as they become known. This can be one of the most time consuming functions inOPSDB data management because the information is obtained only through human input. Once a complete set ofparameter specifications has been established in the OPSDB, this activity will settle to more reasonable levelswith respect to other OPSDB maintenance activities.
The DAS configurations can be defined to the OPSDB once they are known. Defining these configurations willenable the construction of dummy lineups which can be edited to include parametric and calibration informationas they become available. Redefinition of a DAS will be necessary only when structural changes in the DAS occur(for example, addition/deletion of a subcommutator, relocation of frame words in which subcommutator data ap-pears). A redefined DAS must be accompanied by another dummy lineup which is edited to reflect parameters andcalibrations associated with the new DAS definition.
Calibration data are entered into the OPSDB system and processed appropriately as the data become available.As with the entry of parametric data into the OPSDB, calibration data entry can be time consuming if keyboardinput through a data terminal is required. Hangar calibration systems used to collect calibration data and transferthe information to the OPSDB by way of network link or hard media would minimize data entry time, reducing itto that required to monitor the process and obtain summary information.
The lineup requires only minimal inputs for each measurement location. The required inputs consist of identifyingappropriate revisions of both parameters and calibrations and the bit group (within the related data word) associ-ated with the identified parameter. Once parameters and calibration have been defined within the OPSDB, it is asimple matter to build a fully functional lineup. (A lineup complete with parametric and calibration identifierscan be created before parameter and calibration specifications are entered in the database, but it would not befunctional).
Document provided by SpaceAge Control, Inc. (http://spaceagecontrol.com/).
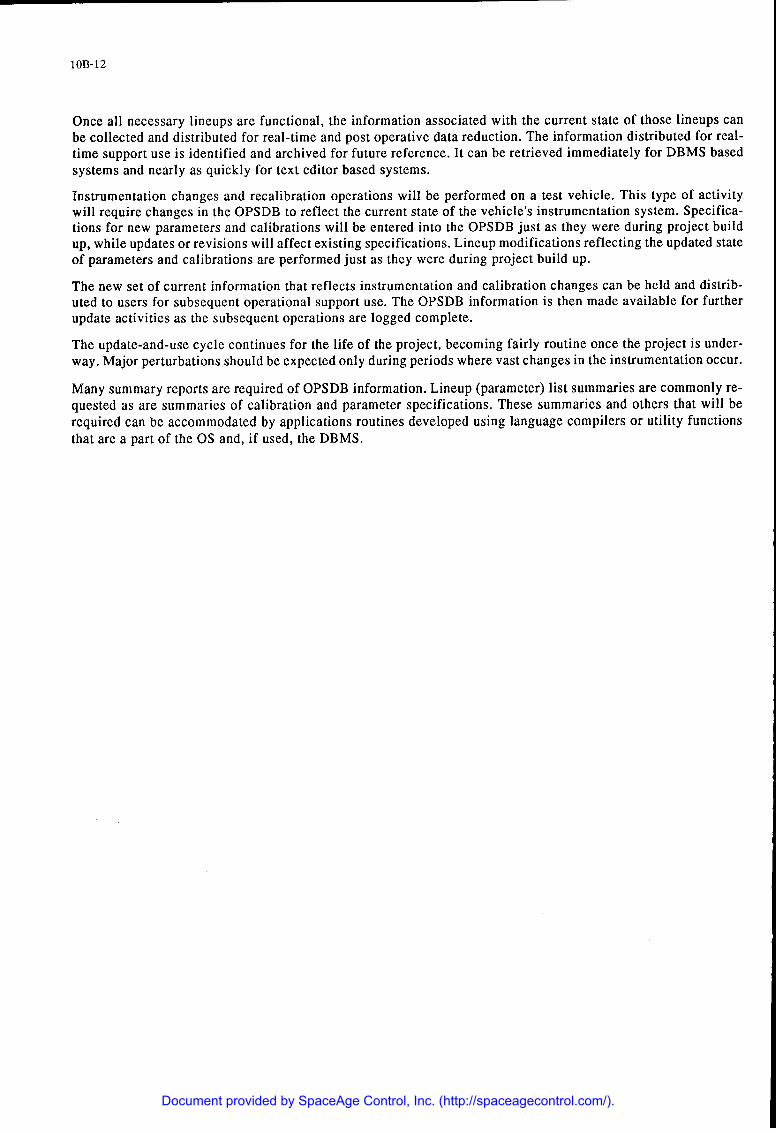
1OB-12
Once all necessary lineups are functional, the information associated with the current state of those lineups canbe collected and distributed for real-time and post operative data reduction. The information distributed for real-time support use is identified and archived for future reference. It can be retrieved immediately for DBMS basedsystems and nearly as quickly for text editor based systems.
Instrumentation changes and recalibration operations will be performed on a test vehicle. This type of activitywill require changes in the OPSDB to reflect the current state of the vehicle's instrumentation system. Specifica-tions for new parameters and calibrations will be entered into the OPSDB just as they were during project buildup, while updates or revisions will affect existing specifications. Lineup modifications reflecting the updated stateof parameters and calibrations are performed just as they were during project build up.
The new set of current information that reflects instrumentation and calibration changes can be held and distrib-uted to users for subsequent operational support use. The OPSDB information is then made available for furtherupdate activities as the subsequent operations are logged complete.
The update-and-use cycle continues for the life of the project, becoming fairly routine once the project is under-way. Major perturbations should be expected only during periods where vast changes in the instrumentation occur.
Many summary reports are required of OPSDB information. Lineup (parameter) list summaries are commonly re-quested as are summaries of calibration and parameter specifications. These summaries and others that will berequired can be accommodated by applications routines developed using language compilers or utility functionsthat are a part of the OS and, if used, the DBMS.
Document provided by SpaceAge Control, Inc. (http://spaceagecontrol.com/).

1OB-13
10.8.12 AnrpendixDescription of an onerational supnort databaseThis appendix describes a functional OPSDB. The OPSDB diagram, Figure A-I, shows the database, which is anetworking database. It was developed on a Digital Equipment Corporation (DEC) VAX-I 1/780 using DEC's Da-tabase Management System, Common Data Dictionary, and FORTRAN Compiler with Data Definition Languageoption software packages.
ON- on DATA BY T H.4
PRJHIATA CAL
TheP osistoffi aoPThesr a rconn a
(pSona s t p irame me sTyaAS,
PRFIT PROINTT CA 00 TOL
(3) calbord ation (CALs OS) - contains information toeabetesEUiconversion ofa measeured paramete rsun (that-s
tion equipment and is used to construct a dummy lineup,
(4) lineups - describes each channel, or slot, in a lineup ordered by frame word position and frame number, and
(5) history (HIST) - contains information relevant to each project that uses the calibrations and parameters de-fined in an occurrence of the OPSDB, and maintains a reduced version of each lineup as it existed wheni usedfor operational support.
Document provided by SpaceAge Control, Inc. (http://spaceagecontrol.com/).

1OB-14
The OPSDBs are generally created on a one-for-one basis with respect to the projects they support. However, oneOPSDB can support multiple projects when those projects are conducted using the same test vehicle anddrawing on essentially the same parametric and calibration specifications.
Calibrations and parameters are collected in "pools" and are available to one or more projects sharing a singledatabase. Calibration and parametric information need not be project specific for multiple projects conductedon the same test vehicle.
The OBDS, lineup, and history information is project specific. For projects using the same test vehicle, thesetypes of information are collected in hierarchical sets beginning with records identifying and separatingprojects within each of these areas. The OBDS, lineup, and history information is related to specific projectsthrough the OBDSID, LUPID, and PROJID records, respectively.
Internreting the OPSDB diagramEach of the data area blocks in the OPSDB diagram contains a group of labeled blocks which represent names ofdata records that appear in that data area, or area. Lines connect the blocks in a hierarchical manner. Records arecollected in named sets, with a set of records belonging to, or owned by, the record appearing above it in a hier-archy. Records at the top of the hierarchy also occur in named sets but are considered owned by the system (theDBMS). Note that some records in an area (for example, LINEUP) own more than one type of record set (for ex-ample, the LINEUP record can own both SLOT and SPRCOM records), while other records occur in more thanone set (for example, the SLOT record can occur in sets owned by both LINEUP and SPRCOM records). [Thediagram does not indicate the criteria used for storing records in specific sets (for example, access order of recordswithin a set, sets in which a record automatically becomes a member as a result of storage, and sets to which arecord must be connected before becoming a member of that set)].
Networking of the areas takes place where lines connect records between areas in a hierarchical manner. The net-working hierarchy is interpreted in a top-down manner for records with lines extending from the underside of onerecord into the top side of a record in another area. Conversely, a bottom-up hierarchy is assumed for records withlines extending from their top sides into the undersides of records in another area.
The general set naming convention is that set names are the plural of the records names which occur in, or aremembers of, the set (for example, the REV record appearing in the CALS area is a member of the set REVS).When a record is a member of more than one set, the names of the set(s) other than those following the generalnaming convention appear on the hierarchical connecting line(s) between the subject record and any record(s) thatmay own a set in which the subject record can be a member. For example, the SLOT record in the LINEUP areabelongs to the set SLOTS (owned by the LINEUP record), and may also belong to the set SPRSLOTS (owned bythe record SPRCOM and identified on the hierarchical connecting line).
Note that PRJHISTS occurring in the HISTORY area is to be interpreted as a set name. The OPHIST records oc-curring as members of the PRJHISTS set are directly accessible as members of a system level set (that is, top ofthe hierarchy). This enables a more direct path to specific operation histories than when database entry is throughthe PROJID record.
Database definition and creationThe database portion of the OPSDB is defined using a text editor. The definition, or schema, conforms to speci-fication guidelines associated with the DBMS being used. The schema is compiled and stored in a data dictionary.The information thus stored is used to generate a database consisting of files required for data storage and main-tenance. The OPSDB is ready for data loading and maintenance activities once database generation is complete.
Data area structure and contentThe OPSDB consists of five major data areas. This section describes the general structure and content of eacharea.
Calibration areaThe calibration area supports calibrations, revisions to calibrations, and corrections to those revisions. This isdone through three basic levels of record-set hierarchy (that is, CAL, REV, and REVCOR). Calibrations are iden-tified numerically in the CAL record. Revisions and corrections are identified numerically also, and collected insets owned by calibrations (CALs) and revisions (REVs), respectively. Additionally, each correction (REVCOR)
Document provided by SpaceAge Control, Inc. (http://spaceagecontrol.com/).

1OB-15
contains information common to all calibration [for example, EU name, number of bits in calibrated range, datatype (offset binary, floating point, twos complement, ones complement, sign magnitude), calibration date, andtime].
Next in the calibration hierarchy is the BFLINK record. The BFLINK record may indicate the EU conversion in-formation in the form of equation coefficients has been generated from calibration data. Alternatively, theBFLINK record may indicate that calibration data reside in a lookup table for EU conversion purposes. A BFBrecord is created to which the BFLINK record is connected when equation coefficients are derived. For lookuptables, an LTBLB record is created to which the BFLINK record is connected.
Equation coefficients hierarchyThe BFB record is the top of the hierarchy for calibration data used to derive coefficients for EU conversions ofraw test data. The BFB record contains overall information on the equation derived (for example, counts and EUsrange, and extrapolated counts and EUs range). The BFB record also owns information sets composed of recordsthat: (1) specify equation coefficients for segmented curves; and, (2) contain raw calibration data consisting ofthe point pairs (EU data as a function of counts) obtained from the calibration process.
The number of BFIT records is equal to the number of segments into which the calibrated points for an instrumentare divided for coefficients derivation. A BFIT record contains minimum and maximum EU data values, minimumand maximum counts data values, number of coefficients derived, and coefficients for an individual segment. TheBFIT records are ordered 1 through "n" with segments being defined and processed consecutively over the countsand EU ranges specified in the BFB record.
The number of POINT records is equal to the points measured during the calibration of an instrument. The pointrecords contain counts and equivalent EU data with an ordering sequence the same as that used during the cali-bration process.
Lookup table hierarchyThe LTBLB record is the top of a hierarchy for lookup table information. The LTBLB record contains flags usedto identify the type of information in the table and the number of input (raw data) values defined in the table. Thelookup table being defined may be used for interpolation purposes. The primary use of lookup tables in the de-scribed OPSDB, however, is for the conversion of data values to ASCII strings. For example, a two-bit data mea-surement describing landing gear status may assume the following values
Binarydata Interpretation
00 Gear up
01 Gear down
10 Gear locked
11 In transit
There is one LTBL record for each input data value being defined. Each LTBL record contains the input data valueto which its information applies, and the number of output values that may be associated with it. There is generallyonly one output value for each input value as in the previous landing gear status example. Some applications mayrequire a list of outputs based on a single input, however. An example of this would be the identification of agroup of parameters currently being sampled by a multiple or ganged scanivalve.
One or more DTOV records exist for each LTBL record. Each DTOV record contains an ASCII value to be asso-ciated with the input value specified in the owner LTBL record.
The REVCOR record can also be the owner of SUB SLOT record occurring in the LINEUP area. This associationis discussed more thoroughly in the lineup area description.
An "information only" set of data is available in the CALs area (CODETBL-CODETYP-CODEVAL record se-ries) to aid in the assignment and interpretation of codes required in the calibrations specification. The CODETBLrecord contains the name to be associated with a code word or group of bits. Each CODEVAL record defines acode as a numeric value and the ASCII data assigned to that value.
Document provided by SpaceAge Control, Inc. (http://spaceagecontrol.com/).

1OB-16
Parameters areaThe parameters area supports parameters, revisions to parameters, and corrections to those revisions. This is donethrough three levels of record-set hierarchy (that is, PARM, PARMREV, and PARMCOR). Parameters are iden-tified using ASCII values in the PARM record. Revisions and corrections are identified numerically and collectedin sets owned by parameters (PARMs) and revisions (PARMREVs), respectively. Additionally, each correction(PARMCOR) contains information common to all parameters (for example, parameter definition, multiplexer in-formation relevant to the parameter, accuracy requirements, alternate parameter name, reference parametername(s), concatenation information, data compression algorithm identifications, and filtering information).
The PARMCOR record can also be the owner of SUBSLOT records occurring in the LINEUP area. This associa-tion is discussed more thoroughly in the lineup area description.
Onboard data system (OBDS) areaThe OBDS area supports OBDS specifications. The hierarchy in the OBDS structure consists of a maximum offive record levels (that is, OBDSID, OBDSTEM, PCMBFR, PCMSF, and PCMSFI). An OBDSID record is con-structed for a project when the first OBDS for that project is generated. Additional OBDS specifications for theproject are created in that project's OBDS hierarchy. Information in the OBDSID record consists of a project iden-tifier and flags word used for status indicators.
The remainder of the OBDS hierarchy is used to define features and characteristics of each DAS used by a project.The OBDSTEM records identify and separate OBDS specifications. Each OBDSTEM record numerically identi-fies an OBDS, designates the OBDS type (that is, PCM or FM/FM), and contains a revision number applicable tothe remainder of the OBDS specification. Format count, status indicators, and accounting information are alsoincluded in the OBDSTEM record. The OBDSTEM record is at the bottom of the hierarchy for FM/FM systems.
The OBDSTEM records may own LINEUP records (in the lineup area) and OPHOBD records (in the history area).These associations are discussed in the lineup and history area descriptions.
For PCM systems, each format supported by an OBDS requires a PCMBFR record and PCMSF and PCMSFIrecords when subcoma exist. The PCMBFR records contain information specific to a particular OBDS (for exam-ple, TM frequency, bit rate, PCM receiver code, data polarity, frame size, word size, sync word information, dataparity, and subcom count). Subcoms designated in the PCMBFR records are defined by information in PCMSFrecords [for example, subcom type, number of mainframe words occupied by the subcom (subframe count), syn-chronization scheme (for example, ID or recycle)]. The mainframe word positions (subframe locations) occupiedby subcoms and subframe depths are specified in PCMSFI records.
Lineup areaThe lineup area supports lineup specifications. Lineups are generated and initialized based on information fromexisting OBDS specifications. A LUPID record is constructed for a project when the first lineup for that projectis generated. Additional lineups for the project are created in that project's lineup hierarchy. Information in theLUPID record consists of project identifier and a flags word for project related lineup status indicators.
The number of LINEUP records is equal to the format count specified by the OBDSTEM record whose hierarchywas used to generate the lineup(s). The LINEUP record is connected to the LUPID record for its project and tothe OBDSTEM record in the generating OBDS hierarchy when a lineup is generated. The LINEUP-OBDSTEMconnection links the lineup and the appropriate OBDS. The LINEUP records contain OBDS relevant information[for example, related OBDS type (that is, PCM or FM/FM), OBDS number, and OBDS revision number], account-ing information, and status indicators.
The SPRCOM records accommodate two specialized instrumentation schemes: (1) supercommutated, or su-percommed, data (parameters sampled multiple times in the mainframe); and, (2)scanivalve data. An SPRCOMrecord is created for each supercommed parameter and scanivalve appearing on an OBDS. The SPRCOM recordsupplies configuration information and serves as a collection point for SLOT records in the supercommutation orscanivalve scheme. The SPRCOM records contain information specific to a supercommutated parameter or scani-valve definition [for example, slot identifier from SLOT records, function (that is, supercom or scanivalve), frameword count used to satisfy function, frame word position of scanivalve data, frame word position of first in su-percom, frame word sampling frequency of supercommed parameters, and function status flags)].
Document provided by SpaceAge Control, Inc. (http://spaceagecontrol.com/).

1OB-17
The SLOT records correspond to slots in the OBDS and are ordered by frame word position and frame numberwithin a lineup. They contain sampling frequency location (frame word position and frame number), slot param-eter count, and other control information. The SLOT records are connected to LINEUP records and, while con-nected, are considered active within the lineup. Those SLOT records taking part in supercommed data orscanivalve schemes will also be connected to the appropriate SPRCOM record. Inactive SLOT records within alineup are disconnected from the LINEUP and SPRCOM record as necessary, but remain active within the OPSDBif connected to an OPHSLOT record in the history area.
A SLOT can hold a portion of a parameter (for example, a concatenated parameter spread over two or more slots),a single parameter, or multiple parameters (that is, discrete bits or bit combinations). The SUBSLOT records arecreated to define parameters, their calibrations, size, and locations within a slot. One or more SUBSLOT recordsoccur in sets owned by SLOTs for those slots containing measured data destined for processing. A parameter iden-tifier (for example, parameter name, revision, and correction numbers) is stored in the SUBSLOT record, as inany related calibration identifier (for example, calibration, revision, and correction numbers). The parameter andcalibration identifiers are used to connect SUBSLOT records to the designated parameter and calibration infor-mation, thereby enabling rapid access of that information during operational support data builds.
The FMEXT records exist only for lineups defining FM/FM systems. Minimal use is made of SLOT and SUB-SLOT records in the lineup hierarchy for FM/FM systems. Each channel on an FM/FM system is described by thecontents of an FMEXT record [for example, channel ID, channel type (constant or proportional bandwidth), min-imum and maximum EUs and deviation, parameter description, and status flags word].
HlistoryA=The history area supports project descriptions and history information on an operational basis. A PROJID recordis constructed for a project when an OPSDB is created and when additional projects are added to that OPSDB.Information contained in the PROJID record consists of a project identifier and a flags word for project relatedlineup status indicators.
The PROJECT records contain information describing a project (for example, project start and completion dates,engineering personnel responsible for test data activities, and brief project description). One PROJECT recordmay be updated over the life of a project to show changes, or additional PROJECT records may be added as in-formation changes to create an historical account of those changes.
The OPHUSE records are generated for the first group of lineup configurations held for operational support pur-poses, and later when differing lineup configurations are held (that is, different revisions of similar lineups ordifferent lineup groupings). The OPHUSE records contain a count of the number of operations that use the asso-ciated configurations, date and time the configurations were initially held, identification of the user who per-formed the hold, and the number of OBDSs involved.
The OPHIST records are generated for operations made known to the OPSDB. Each OPHIST record is initiallystored in the PRJHISTS set and then connected to an OPHUSE record. The OPHUSE record to which the OPHISTrecord is connected will already exist if the required configuration has been previously defined; only the "usecounter" in the OPHUSE record is updated in addition to the record connection that is established. An OPHUSErecord must be generated for OPHIST connection when new or modified lineup configurations are held.
The OPHOBD records identify the OBDSs used for operational support. This record contains OBDS number,OBDS revision number, and format count. It is connected to the OBDSTEM record in the OBDS area throughwhich, hierarchically, additional OBDS information may be obtained.
The OPHLUP record is a copy of the LINEUP record (associated with the OBDS specified in the owner OPHOBDrecord) that existed when the lineup was held. One OPHLUP for each format of related OBDS will be written.
The OPHSPR records serve the same purpose in the history area as do SPRCOM records in the lineup area. TheOPHSPR records are copies of the SPRCOM records from those lineups where supercoms or scanivalves exist.
The OPHSLOT records may be copies of corresponding SLOT records in the associated lineup, or may contain asubset of SLOT information. The function of OPHSLOT records is to define slots for a lineup as they exist at thetime the lineup is held. This is accomplished by copying all, or a portion of, a lineup's SLOT records to the historyarea as OPHSLOT records. The copied OPHSLOT record is connected to the correct OPHLUP record and to anOPHSPR record if it measures supercommed or scanivalve data. The OPHSLOT record is then connected to the
Document provided by SpaceAge Control, Inc. (http://spaceagecontrol.com/).

1OB-18
progenitor SLOT to recover all parameters and their calibrations associated with the slot. As previously noted,SLOTs to which OPHSLOTs are connected may be removed from an active lineup but will remain in the lineuparea of the OPSDB to enable the reconstruction of lineup configurations which are no longer current.
The OPHSLOT records connected to OPHIST records (as members of the OPMSLOTS set) are used to make postoperative changes in a lineup (for example, redesignation of parameter and calibration specifications). This isdone by creating an appropriate SLOT record in the lineup area and creating the corrected SUBSLOTs with linksestablished to designated parameters (PLS) and calibrations (CLS). An OPHSLOT record is created based on therevised SLOT information and connected to the new SLOT. The OPHSLOT is also connected to the OPHISTrecord for the operation to which the change applies, but it is not connected to the OPHLUP or OPHSPR records.Lineup reconstructions applicable to "as flown" conditions are obtained through the normal hierarchy (OPHISTto OPHUSE-OPHOBD-OPHLUP-OPHSLOT). Corrected lineups are constructed in the same manner but useOPHSLOT information from an operation's OPMSLOTS set to replace corresponding OPHSLOT information inthe original hierarchy.
Zero correction information is accommodated for post operative data processing activities through OPHZEROrecords owned by an OPHSLOT record. The OPHZERO record contains the name of the parameter to which zerocorrection information is to be applied and the zero correction information. A parameter specified in an OPHZE-RO record must be defined in a SUBSLOT owned by the SLOT to which the OPHZERO's owner OPHSLOT isconnected. Zero correction information can exist globally for all operations using a specific configuration, or se-lectively through a post operative correction specification.
10.9 Bibliography
1 Aeronautical Radio Inc., "Mark 33 Digital Information Transfer System, DITS," ARINC-SPEC-429, ARINCAirlines Electronic Engineering Committee.
2 Code of Federal Regulations, Title 14, Aeronautics and Space. Part 23 Airworthiness Standards: NormalUtility, Acrobatic and Commuter category of airplanes. Part 25 Airworthiness Standards: Transport categoryairplanes.
3 IRIG Telemetry Standards, IRIG Standard 106-86, Secretariat, Range Commanders Council, U.S., ArmyWhite Sands Missile Range, NM, USA, May 1986 (revised Sept. 1988).
4 JAR, Joint Aviation Requirements, published by the Civil Aviation Authority, Print and Publications Servic-es, Cheltenham, U.K.
5 Lyddane, G.H., "The Impact of Automation on Flight Test," Conference Paper Issue 19, Society of Automo-tive Engineers, Proceedings of the Aerospace Congress and Exposition, Warrendale, PA, Oct. 1982.
6 Mackall, Dale A., Marlin D. Pickett, Lawrence J. Schilling, and Charles A. Wagner, "The NASA IntegratedTest Facility and its Impact on Flight Research," NASA TM-100418, 1988.
7 Maine, Richard E. and Kenneth W. Iliff, "Identification of Dynamic Systems-Applications to Aircraft, PartI: The Output Error Approach," AGARDograph 300, AGARD Flight Test Techniques Series, Vol. 3, 1986.(Contains 18-page bibliography on parameter identification subjects).
8 Manders, P.J.H.M., "The On-board Computer System for the Fokker F-29 Prototype Flight Tests," NLR MP
81034U, 1981.
9 MIL-STD-1553B, "Aircraft Internal Time Division Command, Response Multiplex Data Bus," 1978.
10 MIL-STD-1553B, G. Vitalone, E.T.C., "Decommutation Techniques and Their Integration into Post FlightAnalysis Systems," 1987.
11 MIL-STD-1553B, "Multiplex Applications Handbook," U.S. Air Force Systems Command, 1982, (availablefrom SCI Systems, Inc., Huntsville, AL, USA).
12 MIL-STD-1553B, S. Cattunai, E.T.C., "Acquisition and Recording on AMX A/C, Aeritalia Experience and
Present Trends," 1987.
13 Murata, Hirosi, "Handbook of Optical Fibers and Cables," 1988.
Document provided by SpaceAge Control, Inc. (http://spaceagecontrol.com/).

1OB-19
14 Personick, S.D., "Fiber Optics: Technology and Applications," Plenum Publishers, 1985.
15 Posner, J.M. and R.A. Kitchen, "AFFTC Instrumentation System: An Introduction for Flight Test Engineersand Managers," Society of Flight Test Engineers, 18th Annual Symposium Society Proceedings, Lancaster,CA, USA, 1984, pp. 24.1-24.11.
16 "Principles and Components, Optical Fibers Sensors," J. Dakin and B. Culshaw, editors, published by ArtechHouse, Vol. 1, 1988.
17 Schweikhart, W.G., "Flight Test Planning from the Bottom Up-An Alternative Approach to Flight Testing,"Cockpit (ISSN 0742-1508), Jan-Mar 1985, pp. 5-14.
18 Strock, O.J., "Telemetry Computer Systems-the New Generation," published by the Instrument Society ofAmerica, 1988.
19 Tappan, M.W., T.C. Dull, C.A. Hughes, and G.M. Tadych, "Integration of Flight Test Data into a Real-TimeSimulation," AIAA 84-0552, 22nd Aerospace Sciences Meeting, Reno, NV, USA, Jan. 1984.
20 van de Leijgraaf, R., W.A. van Dorp, S. Storm van Leeuwen, and R. Udo, "Measurement System for Produc-tion Flight Tests of New Aircraft," NLR TP 89222L, 1989.
21 van Doorn, J.T.M, P.J.H.M. Manders, 0. van Teunenbroek, H. Riebeek, and A. Voskes, "MRVS-System forMeasuring, Recording and Processing of Flight Test Data," NLR MP 88034U, 1988.
22 van Nunen, J.W.G. and G. Piazzoli, "Aeroelastic Flight Test Techniques and Instrumentation," AGARDFlight Test Instrumentation Series, AGARDograph 160, Vol. 9, 1979.
Document provided by SpaceAge Control, Inc. (http://spaceagecontrol.com/).

11-1
Chapter 11
ONBOARD DATA RECORDING SYSTEMS
by
L. A. Whalley C. J. Brain Rex GrantFlight Test Instrumentation Department Aircraft & Armament SPARTA, Inc.
British Aerospace Defence Experimental Establishment 43210 Gingham Avenue, 221Military Aircraft Division Instrumentation Section Lancaster, CA 93535
Warton Aerodrome A&AEE Boscombe Down United StatesPreston, Lancs. PR4 1AX Salisbury, Wiltshire SP4 OJF
United Kingdom United Kingdom
11.1 INTRODUCTIONIn general, data obtained onboard an aircraft during flight test operations are delivered to the users and analystsin one of three ways: real-time data transmission from the aircraft to the ground facility through the use ofdown-link telemetry with redundant onboard recording, by the use of onboard recorded data which is hand-carried to the ground facility after landing, and by real-time data transmission to the ground facility withoutany onboard recording of any kind. It is the intent of this chapter to address the first two considerations whichinvolve onboard recording systems.
The need for onboard recording has arisen from the advancing complexity of aircraft structures, systems, en-gines, and the flight test engineers insatiable demands for more information to validate flight performance dur-ing prototype development, trend characterisation and condition monitoring during production service.
The developing requirement to study trend characteristics such as "in-service" structure and engine fatigueanalysis and maintenance data recording has been justified by economic and safety benefits. To satisfy theserequirements efficiently, low cost, reliable data acquisition and recording systems are necessary. These systemswill be operated in a production or in-service environment as opposed to the flight test instrumentation used ina development aircraft environment only.
11.2 CRITERIA FOR THE SELECTION OF THE RECORDING SYSTEMThe optimum choice of an onboard recording system for the aircraft flight test program is determined by a widerange of factors. Generally, these factors are: environmental considerations, the type of data to be recorded, thedata rate, required data record time, program duration and economics, and weight/size form factor constraintsof the record system hardware.
11.3 THE MAJOR TYPES OF RECORDING SYSTEMSIn general onboard data gathering can be viewed as existing of two types: the first is data that must be "ob-served" so that continuous measurement analysis can be made of the occurrence. This is done through the pro-cess of the cin6/pulsed camera and video. The second type of data is electrical in nature and is generated by ananalogue or digital transducer. It is interesting to note that over the years these two types of data have evolvedinto data outputs suitable for magnetic tape recording, thus, in some respects simplifying the onboard complex-ity of recorder type instruments. Accordingly, it will be noted that the bulk of this chapter is devoted to theintricacies of the magnetic tape recorder.
Historical perspectiveThe early flight testing of aircraft relied upon the pilots' five senses as data sensors, his knowledge and expe-rience for real-time analysis and his memory to store data for post-flight analysis.
Document provided by SpaceAge Control, Inc. (http://spaceagecontrol.com/).

11-2
Because of the limitations in human observation and memory, pilots' aids quickly grew from thigh-strappednote pads to the use of dedicated transducers and automatic methods as listed here:
Photo panel recorders/cin6 cameras circa 1930
Continuous trace recorders circa 1940
Analogue magnetic recorders circa 1950
Digital magnetic recorders circa 1960
Video magnetic recorders circa 1975
Solid-state recorders circa 1985
All of these methods are in current use, justified by a combination of economics, technical performance, andlead-time available.
11.3.1 The Rhoto oanelThe use of a specially designed enclosure to create ideal lighting conditions for the use of photographing agroup of "pointer type instruments" was still in use until the late 1960's. As with most data gathering techniquesthe concept was developed to a very high degree of refinement.
PIP
Figure 11.1. Typical photo panel.
Figure 11.1 illustrates one type of photo panel commonly used. A panel of sufficient size to accommodate therequired number of panel indicators of various display functions is housed in an appropriate cabinet and illu-minated sufficiently to support photographing with a 35-mm movie camera modified to provide the desirednumber of frames per minute. In this figure a mirror arrangement is employed to reduce the space requirements.
As shown in the figure the instruments are reflected in a mirror and when photographed will appear reversed.Some sophisticated systems actually manufactured instruments that worked in reverse (with reverse numbering)so when photographed they appeared to be "normal" when reflected and viewed on film. The figure also showsthe problem of light reflection from the instrument glass. This problem was alleviated when nonglare spray and
Document provided by SpaceAge Control, Inc. (http://spaceagecontrol.com/).

11-3
eventually nonglare glass was developed. Data analysis was labor intensive and archival storage required con-siderable space as well as environmental considerations (Ref. 11.1).
11.3.2 The film camera. pulsed and cin6The use of the film camera has long endured and is still considered a part of today's instrumentation inventory.However, it is slowly being replaced by the video technology.
Some examples of current applications are:
- Stores carriage, launch, and jettison
- Stores trajectory tracking
- Chaff dispenser dispersion patterns
- Gun cartridge ejection
- Chase aircraft observation
- Reconnaissance system performance with large format film
- Air flow over wool tufts
- Ice accretion
Frame rates and durationDependent upon the rate of movement on the image, the accuracy required from the analysis and the test dura-tion, a suitable frame rate and film capacity can be chosen.
Typical cameras provide frame rates pulsed at intervals determined by an intervalometer or cind rates from5 frames per second (fps) to 500 fps. Duration from several hours of recording, to less than a minute are avail-able with 16-mm film and a 200-ft magazine.
LensesA variety of lenses are available, selection involves consideration of object distance, field of view, acceptabledistortion, and ability to accept automatic exposure controls, e.g., linear iris control.
Shutter speedsCurrent generation of medium speed cameras (5-500 fps) use rotary shutters that are specified in degrees of arcsuch that the shutter speed is a function of frame rate, e.g., 1600 shutter at 16 fps gives 28-msec exposure or a90 shutter at 500 fps provides 50 gsec.
Film typeMedium and medium-high speed airborne cind cameras mostly use 16-mm colour film. Larger formats are notgenerally desirable because of the bulk and power requirements.
For particular applications such as reconnaissance testing larger formats (typically 70 mm) at relatively lowspeeds (up to 12 fps) are used. Infrared film is also available for ground thermal imaging.
Film developingThe bulk of film development is now automated, there being specific machines for each film process. The pro-cessing speed is fixed typically at 35 ft/min for 16-mm Electroframe process and 6 ft/min for 70-mm FP4 mono-chrome film.
PowerMost pulse/cin6 cameras place a very heavy demand on aircraft power supplies.
Some factors to be considered are:
- Camera/film heater requirements
- Blower requirements to maintain a "nonfoggy" lens
Document provided by SpaceAge Control, Inc. (http://spaceagecontrol.com/).

11-4
- Surge currents during start-up and pulsed operation
- EMC, line filters, separate routing of cables, separation of power/signal/grounding references
- Maintain short power supply cable runs
ControlMulti-camera systems may require pilot control to provide start-up and stopping of groups of cameras and mayrequire indicator lamps depicting camera/film status.
Time correlationInstrumentation camera design incorporates a frame synchronization capability whereby an intervalometer ormaster clock controls the instant of frame exposure. An interesting use of pulse synchronization (phase locking)is the 100% coverage of an event by using 3 cameras having 1200 shutters driven in a phase lock mode 120'out of phase with each other.
AnalysisFilm viewers are available for frame-by-frame analysis as are tele-cind systems that have the advantage of al-lowing computer assisted trajectory analysis (Ref. 11.2)
DevelopmentAlthough wet film with cind photography is still superior to video in resolution of the image and the range offilm speeds available . . .both of these advantages are gradually being overtaken by video techniques in spe-cialized applications.
Onboard recording of visual imagery shows an advantage for the replacement of cin6 photography with mag-netic tape video recording. Some of these advantages are:
- Real time and/or immediate post-flight viewing thus avoiding the processing delay of wet film. Videocameras permit onboard display or transmission to a ground facility for display, recording and real-timeanalysis.
- Smaller installation volume is required for video cameras permitting more remote installation separation
of camera "head" and electronics.
- Video cameras do not require access in the way that cin6 cameras do for film magazine changing.
- Power requirements for video cameras and video tape recorder (VTR) systems are less.
- The VTR data are more compatible with computer data processing for analysis than film.
11.3.3 Trace recordersTrace recorders (oscillographs) provide an economical means of recording a relatively small amount of data toa modest accuracy.
Pen or photographic (light beam), trace records provide a 'time history' by the continuous scribing of a linealong a strip/roll of paper or film with the lateral excursion of the line being proportional to the amplitude ofthe signal. A time base normally generated by an internal clock mechanism may be projected onto the edge ofthe paper with the photographic recorder or inscribed by pen.
The paper/film feed speed and the photographic emulsion speed of the film or paper is chosen to delineate aninput signal in time and amplitude in a readable manner, compromised only by the duration of recording.
The main attribute of continuous trace recording, is to provide an easily understood time history of amplitudevariation or a signal which can quickly be compared with other parameters recorded at the same time. If severalrecorders are used in a system a common time base is usually used.
Trace recorders suffer from a limitation in the number of channels that can be discerned on a multi-trace re-cording of large amplitude signals. Identification can be difficult even though trace identifiers/trace interruptsor colour have been used.
Document provided by SpaceAge Control, Inc. (http://spaceagecontrol.com/).

11-5
The earlier photographic paper and films required post-flight developing which delayed the analysis, later typesof ultra-violet sensitivity paper alleviated the delay and could be used in larger aircraft. Some types of recordersalso used a "real-time" developer take-up magazine which unfortunately was prone to clogging during the de-veloping of the emulsion.
The photographic elements or pens also suffer from acceleration sensitivity particularly those electro-magneticelements responding to micro-ampere signals. The more robust elements generally required large current sig-nals to provide sufficient deflections of a 'stiff' suspension.
These electro-magnetic elements could generally be characterized by a 2nd order differential equation wherethe damping term is provided by the electro-magnetic coil or moving iron galvanometer, each having a mirrorattached to the suspension. The mirrors reflect the light source onto a slit past which the paper/film traverse ata constant speed. See Chapter 4.4.2.
Typical features of a photographic trace recorder are:
Accuracy: 0.5 to 3% of full-scale deflection, the finer accuracy being achieved by coarse/finemulti-mirror devices particularly used for airspeed and altitude.
Bandwidth Usually of the order to 70 Hz but stiffer suspension galvanometers are available for sev-eral kHz recording.
Data channels 36 or 50 traces.
Physical size 13 in. high/15 in. wide/27 in. long, 145 lb (with 250-ft magazine).
Magazine size 250-ft paper or film.
Paper size 12-in. wide paper/film.
Record speed 16 speeds from 0.1 to 100 in/sec.
Power Either 26 V dc or 115 V ac.
Timing Timing lines at 0.01-sec intervals.
Magnet blocks Two, thermostatically heated.
It is interesting to note that the record time of low-frequency data signals can still be best achieved by a tracerecorder. The NACA-designed Airspeed, Acceleration, Altitude Recorder, circa 1940 was still being used upinto the 1970's. Its advantage was a 200-ft long roll of recording film with a speed of 2 ft/hr.
Airspeed 0 to 350 mph
Acceleration -2 to + 4 g
Altitude 0 to 30,000 ft
Overall weight was 20 lb, including acceleration transducer. Power requirement was 24 V, dc, 1 amp(Ref. 11.3).
11.3.4 Evolution of magnetic recordingThe traditional systems using magnetically coated tape, heads, and longitudinal magnetization have dominatedsince the late 1940's. The first major application was for audio recording which was founded on linear analogmethods based on ac biasing. Many instrumentation applications have also used ac bias. The requirements forproviding high signal-to-noise ratios while increasing recording densities have kept instrumentation applica-tions at the leading edge of high-density magnetic recording technology.
Extensions of tape recording to the storage of digital data were developed using unbiased nonlinear recording(Ref. 11.4). New tape devices were required to operate at high tape speeds and provide fast access to storeddata. Even after 40 years, tape drive systems continue to be the primary removable storage technology for dig-ital data. Attempts to extend stationary-head tape machines to video recording failed because they required ex-cessive tape speed to record the very high frequencies involved. This problem was solved in 1956 with the
Document provided by SpaceAge Control, Inc. (http://spaceagecontrol.com/).

11-6
introduction of the scanning-head machine. This major innovation was initially applied to video recording usinghigh-speed transverse scanning of a slow moving tape. Subsequent evolution of helical scanning techniques ex-panded the application to lower cost drives and resulted in a world-wide acceptance of video recording.
Another significant development was the introduction of the rotating rigid disk in 1957 for digital storage ofdata. This rigid disk innovation has become the ubiquitous "diskette" used by every personal computer.
The combination of higher linear density, greater head-medium velocity, and multi-track recording has provid-ed an increase in the upper limit of recording bandwidth of 9 orders of magnitude over the last 35 years.Progress in providing faster access to the stored data has also been impressive, particularly in rigid-disk sys-tems. Further improvements in accessing by providing more heads, for example, a head per track on a disk, areno longer competitive with low-cost large-scale integration (LSI) electronic memories. Magnetic bubble storesare superior in access speed to fixed-head disk files but, in general, are also not cost-performance competitivewith LSI memory. The combination of high-performance memory and moderate-performance direct access diskstorage is preferred for on-line data storage.
Some of the difficult challenges for heads and media are circumvented in the emerging optical-beam storagetechnology (Ref. 11.5). Laser beam writing and reading on magnetic media provides a significant improvementin narrow-track operation.
11.3.5 Instrumentation recordingInstrumentation recording covers the broad field of data recording in which analog or encoded information isstored in other than standard audio, video, or computer formats. In the United States the practice was initiatedin the early 1950's when flight test programs required capacities and rates beyond those possible with oscillo-graphic recorders, and the national security effort required ever-increasing surveillance bandwidths. The earli-est instrumentation recorders were adapted from professional audio machines to accommodate frequencymodulation (FM) and other higher-than-audio-frequency electronics. The bandwidth of the audio reproducingheads was increased by replacing the center conductor of the coaxial head cables with fine piano wire, therebyreducing the parallel capacity and raising the resonant frequency. After a time, the audio equipment manufac-turers developed recorders specifically for the requirements of the instrumentation users, and standards evolvedsuch as those of the Inter-Range Instrumentation Group (IRIG) (Ref. 11.6).
Although some instrumentation recording is done on disks, (floppies and optical) the dominant formats at thistime still utilize tapes. Fixed-head recorders are usually multi-track and use wide tapes, typically 1 in., althoughsome are as wide as 2 in.
Rotary head machines allow the highest packaging density and are now primarily of the helical-scan configu-ration. Early rotary-head machines for wide bandwidth analog signals were adapted from transverse-scan broad-cast video recorders, with signal processing to provide time alignment of the signal overlap where it wasinterrupted at the end of one headscan and the beginning of another. Rotary-head machines today use high den-sity digital recording and the interruption is easily accommodated by digital buffering.
Various modes of recording are used for instrumentation, depending upon the type of data accessed. Pulse codemodulation (PCM) is probably the dominant technique for telemetry, satellite downlink, and laboratory typemeasurements, in many cases replacing FM recording.
Instrumentation recorders differ from other recorders in a number of ways, particularly in the method of opti-mizing the record current and in equalizing the reproduced signals. In analog machines, the record head andreproduce head are separate and each is optimized for its function. The value of the ac bias is optimized at bandedge, the highest signal frequency of interest, to obtain the maximum bandwidth. Bulk erasure is commonlyused in instrumentation recording since the necessity for overwriting is seldom used. Linear densities up to3000 frames/mm (wavelength of 0.67 gm) are achieved with partial penetration recording of the relatively thickmagnetic tape coating. Small record gaps of fractions of a micron create little phase shift during the record pro-cess and are increasingly being used as their advantages become better understood. Tape speeds can be veryhigh with multi-track recorders having the capability of storing data at gigabits per second. Burst-efficient er-ror-detection and -correction codes such as the Reed-Solomon code, are used to correct errors down to 10-12.
11.3.5.1 System componentsAll magnetic recorder/reproducer systems consist of five essential elements:
Document provided by SpaceAge Control, Inc. (http://spaceagecontrol.com/).

11-7
1. Fixed magnetic heads 4. Record amplifier
2. Magnetic tape 5. Reproduce amplifier
3. Tape transport
The fixed magnetic headThe fixed magnetic head may be divided into three categories:
- record head
- reproduce head
- erase head
The record headThe function of the record head is to change the current produced by the record amplifier into magnetic flux.As record current varies, so also will the magnetic flux. The change will be affected by both the amplitude andthe direction changes of the record current. The changing current through the head produces a proportionalchanging magnetic force in the head. The magnetic force in turn produces magnetic flux in the tape. As may beexpected there are some losses to be considered in the conversion process. These are (1) the hysteresis effectof the head and tape materials, (2) eddy-current losses in the record head, and (3) partial demagnetization. Ac-cordingly, there will always be less magnetic flux left in the tape than was originally produced by the magneticforce.
Head-stock placement-1.5+-0-001"'
I ITrack width 0.050" I Shield
Track spacing - Gap Tracks interleavedwithin head stack --------- --Z0.140" - . ...- - -- -_
Track spacing .. . Guard band 0020"antape 0.070" f
ontoe 0.70._F___ C=== e_ Even -head slackOdd- head stock Head Dose
(a)
Direction of tape movement
+ minute of arcMean gap azimuth Head - stock tiltreproduce head t ( -3minutes
( . of arc
900±I in 1 O°*Reproduce measurement
Gap scatter for taken of center of gapa record headmax 0.001"
(b) (c) (d)
Figure 11.2. Instrumentation head-stack parameters.
Figure 11.2 illustrates some of the head stack parameters for instrumentation recorders. Figure 11.2(a) showsthat the heads are not in line, but are mounted so that the heads in the odd stack are opposite the shields of theeven stack (and vice versa). This type of head construction is called interleaving. It permits the heads to be
Document provided by SpaceAge Control, Inc. (http://spaceagecontrol.com/).

11-8
spaced farther apart in the individual stacks. In this way crosstalk is reduced. Standard instrumentation longi-tudinal heads contain 50-mil tracks spaced 140 mils apart, thus track spacing on the tape will be 70 mils.
Some of the other head-stack parameters are gap scatter, gap azimuth, and head-stack tilt. These are shown inFigure 11.2(b), (c), and (d).
Gap scatter is defined as the distance between two parallel lines that enclose the trailing edge of the record-head gaps or the center lines of the reproduce-head gaps, between which all the gap edges or centerlines fall.It can be seen from Figure 11.2(b) that if a number of data signals were recorded simultaneously, some signalswould be physically positioned on the tape ahead of others. Thus resulting in timing errors in the data signalsupon reproduction since the time correlation would be incorrect.
In Figure 11.2(c), if all the center lines of the reproduce heads are not perpendicular to the movement of tape,signals which were recorded simultaneously on magnetic tape would be reproduced with a time difference.Wideband heads are fitted with azimuth-adjustment screws that are used to compensate for this type of error.Figure 11.2(d) shows the amount of forward or backward tilt permitted in any instrumentation head. This pa-rameter is controlled during the manufacturing process.
Old standard IRIG standard
2 7 63 r--- 5 r ---- -4 4r-r-5 3 -
7 1 r -
1 2 142 cZ• 13r- --3 4 11 12
45- - 10 I6 EZZI:: 9 •
7 r-- -- 7 89 8 r-- -•7 r--6-r-10 5 6
-- 4 r- - --12 3 2 E::i14 1
Head base Head base
Figure 11.3. Instrumentation head-numbering systems.
Figure 11.3 shows the two instrumentation head-numbering systems in general use. Until about 1962, headsusing the old standard numbering system were in use. Today, the IRIG Standard numbering system is used. Itis obvious from the two different numbering patterns that some confusion could exist.
The reproduce headThe basic function of the reproduce head is to change the magnetic field pattern found in the magnetic tape intoa voltage. The reproduce head acts as a miniature generator following Faraday's law. The voltage created in thereproduce head "approximates" a 6-dB/octave curve. That is, as the frequency doubles, so will the value of volt-age output from the head. Thus, if a constant level of input were fed to the reproduce amplifier at increasingfrequencies, the output of the reproduce head would not be constant, but would increase at a 6-dB/octave rate.The approximation is caused by losses associated with head construction, magnetic tape characteristics, thespeed of tape movement, and other factors (Ref. 11.7). It is sufficient to state that most of the correction neededto "straighten out" the reproduce curve to one comparable with the record curve will be done by circuits calledequalizers, which are mounted in the reproduce heads.
The erase headThe purpose of an erase head is to demagnetize the magnetic signal on tape. A very high-frequency alternatingcurrent (100 mA or more) is fed through the head. This current drives the tape into saturation first in one di-rection and then in the other. As the tape is pulled away from the head, a slowly diminishing cyclic field ispresented to the tape. This field leaves the magnetic vectors on the tape in a completely random state, resultingin demagnetizing or degaussing of the tape. The erase head is usually not a part of the instrumentation tape
Document provided by SpaceAge Control, Inc. (http://spaceagecontrol.com/).

11-9
transport although some high-density digital recording machines show excellent overwrite capabilities. Thecomplication arises when the leakage field from unerased portions of tape is anhysterectically (magnetizationthat occurs without hystereis effects) recorded by the decaying field from the erase head. This re-recording ef-fect can cause some major undulations in a partially erased signal spectrum (Ref. 11.8). The use of double-gapped erase heads and a sufficiently high erase field is the practical solution.
In general, the medium for magnetic recording is a tape consisting of a backing coated with particles of thegamma form of ferric oxide. The backing material, an acetate or polyester film, provides the base to which themagnetic particles are fixed with a resin binder. Each particle forms an elemental magnet. The north and southpoles of these magnets lie along some axis of the iron oxide crystal lattice, which axis depends upon the crys-talline structure of the oxide used. There will be specific types of oxides used for specific bandwidths of datasignals and types of recording techniques, i.e., analog, digital, and video.
Like the heads, magnetic tape has often been taken for granted. Yet, the manufacturing processes of magnetictape are full of contradictions. Many of the design considerations appear to be in direct conflict with each other.For example, magnetic tape should be strong and pliable. Strength is generally associated with thickness andstiffness and pliability is associated with thinness and limpness. In order for magnetic tape to have high record-ing (and reproduce) resolution, the magnetic particles should be in intimate contact with the head. For goodheadwear, however, the magnetic particles which are extremely abrasive should not contact the head. In orderto have a high signal-to-noise ratio, the tape should have as many magnetic particles per unit volume as possible(high density); whereas, to have good pliability the tape should have few magnetic particles per unit volume.These conflicts tend to explain why many of the techniques and materials used by the tape manufacturers areclassed as proprietary.
The tape transportThe tape transport must move tape across the record and reproduce heads at a constant linear velocity, with theleast amount of disturbance to tape motion. It must also provide some means of tape storage, either in a formof loop, bin, reel, magazine, or cassette. If speed or tension of tape varies, dynamic time-base errors will beintroduced into the system. These will adversely affect the amplitude, phase, and frequency response of themagnetic recorder.
The design of the tape transport is directed toward instantaneous and long term speed control of the magnetictape. Instantaneous tape-speed errors (flutter and wow) and long term errors (drift) are introduced by inaccura-cies of the drive system and are usually expressed as percentage variations from absolute selected speed.
In general, eight criteria should be followed when selecting a tape transport mechanism:
1. Cost: does it fit the budget?
2. Performance: will it record (and reproduce) without error?
3. Bandwidth: is there sufficient bandwidth for the data?
4. Reliability: will it perform for reasonable periods without failure?
5. Compatibility: is it compatible with existing systems?
6. Standardization: Is it an industry standard? Are spares, tapes, and cassettes readily available? Does it havestandard speeds, tape widths, reel, and cassette sizes?
7. Flexibility: can it be expanded, modified, or upgraded?
8. Maintenance: what level of expertise is required?
Transport componentsThe baseplate assemblyIn order to move the magnetic tape across the heads at exactly the right angle, the components that are used toguide the tape and mount the head assemblies must be referenced to some form of precision surface. In generalit is provided by a precision ground plate or a series of reference points established by milling and/or grinding.This provides for easy interchangeability of tapes between machines without introducing guiding errors.
Document provided by SpaceAge Control, Inc. (http://spaceagecontrol.com/).

11-10
Some of the components that are mounted on the baseplate are the capstan assembly, pinch-roller assembly,turnaround idlers, tape guides, and magnetic heads. Where zero-loop and optimum-loop drive systems are used,pinch rollers and turnaround idlers are not included in the tape path.
Longitudinal drive systemsThe most common types of drive systems used to move the magnetic tape recording medium across the headsare the open-, closed-, optimum-, and zero-loop drive systems, as well as the rotating-head (transverse-scan),helical scan, and disc-recorder drive systems.
Each of these drive systems is used in one or more of the audio, video, instrumentation, or digital recordingfields. Each has its advantage and disadvantage.
C
PH H H H
I CH H Pc C
(a) "
(b) (c)
H H
(d) He)
Figure 11.4. Common tape-drive configurations.
H = head, C = capstan, I = idler, P = pinch roller.
The professional audio configuration of Figure 3.4(a) isolates the head from the take-up reel disturbances, butthe tension variations from the supply reel are magnified since the tension at the input to the capstan is increasedby the wrap around the heads. The friction at the head-tape interfaces increases the tape tension over a combinedhead-wrap surface area. For typical wrap angles of 100 per head and a friction coefficient of 0.2, the input-reeltension disturbances are increased by about 15% across the head stack.
Figure 11.4(b) shows the closed-loop approach developed as an attempt to isolate the heads from reel distur-bances by clamping the tape to the capstan surface by two pinch rollers. Variations of this approach used astepped capstan and pinch rollers to establish a fixed-tension differential.
Figure 11.4(c) has no pinch rollers since the capstan has a large wrap angle. The free idler is coated with a high-friction layer so that there is no slippage between it and the tape after the tape is up-to-speed.
Figure 11.4(d) shows a two-capstan drive with differential speed between the two capstans to maintain tensionat the heads. Usually, pinch rollers are used to prevent tape slippage. Figure 11.4(e) shows a typical capstanarrangement designed to permit high-speed servoing of the tape speed for time-base error correction. Variousdevices for achieving compliance have been interposed between the capstan-head region and the reels, includ-ing vacuum columns and moving arms. Often, the reel speed is servoed from compliance structure to maintainconstant tape tension.
Document provided by SpaceAge Control, Inc. (http://spaceagecontrol.com/).

11-11
Handling open-reel tapesMany magnetic tape problems can be avoided if the user follows a few simple guidelines: do not rewind thetape after recording or replay and store it immediately in its container, standing on edge. Many tape failuresand dropouts are a result of not following these practices. When winding or rewinding a tape, the recorder mayproduce an uneven "wind" with protruding layers which are subject to damage in handling. By holding the reelthe flanges are quite often squeezed against the tape and protruding layers may be nicked, torn, or permanentlydeformed.
A transport winding mechanism may also wind the tape without sufficient tension. Later handling will thencause the pack to shift from side to side against the flanges leading to tape edge damage. A loose pack is alsosubject to tangential slippage between layers, called cinching. Cinching is likely to occur in a reel of tape withone or more regions of too low tension, especially if subjected to a rapid angular acceleration or decelerationwhich occurs during starting and stopping of a tape handler. During such slippage the tape may actually foldover on itself so that permanent creases form immediately or perhaps later when tension is applied and the tapeattempts to return to its original position. Creases cause dropouts by introducing a separation between tape andheads.
For storage of tape the following is suggested:
- Tape should always be stored in its container with the reel on edge rather than in a flat position. This willtend to eliminate the sideways shifting of the pack up against the flanges.
- Tape should be stored under controlled environment conditions. It is desirable to maintain temperaturebetween 40 and 90 IF and the relative humidity between 20 and 80%. In addition, sudden changes in thisenvironment should be avoided.
- Tape which has been stored under less than ideal environmental conditions should be conditioned by al-lowing it to remain in a suitable environment for at least 24 hours prior to use.
- When large changes in temperature cannot be avoided, the probability of damage to the tape can be min-imized if the reel hub has a thermal coefficient of expansion similar to that of the base film. Most plasticreels have a thermal coefficient about twice that of the polyester base film, while the thermal coefficientof aluminum is nearly equal to that of polyester.
The record amplifierThe record amplifier must change the incoming data signal into a form that is suitable for recording on magnetictape. That is, the amplifier must change the incoming data signal voltage into a current which, when fed to themagnetic heads, will be converted into magnetic flux. The magnetic flux will be used to magnetize the tape sothat a given amplitude, a given polarity, a given point on the tape represents the data signal voltage at a giveninstant of time.
Direct recordingThe direct record amplifier will produce current that is analogous to the frequency and amplitude of the incom-ing ac data signal (the exception to this being the audio record amplifier, where pre-emphasis is added to in-crease the low- and high-frequency current so that when the tape is reproduced, the sound is more compatibleto the human ear which is nonlinear).
Bias must be added to the record signal to place it in the linear portion of the magnetic tape response curve.Both ac and dc bias are used with audio recorders, but in almost all cases ac bias only is used with instrumen-tation and video recorders. Direct recording uses the maximum bandwidth capability of the recorder and tape,but is limited in low-frequency response due to the reproduction losses that cannot be compensated for.
Frequency-modulation recording (FM)The function of the FM record amplifier (FM modulator) is to convert the input data into a series of frequencies(carriers and sidebands). A particular frequency is selected as the center (carrier) frequency corresponding toa zero data input signal. A +dc signal will deviate the carrier frequency a given percentage in one direction,while a -dc signal will deviate the carrier frequency a given percentage in the opposite direction. An ac signalwill deviate the carrier alternately on both sides of the center frequency at a rate equal to the frequency of theinput signal. The amount of deviation is controlled by the amplitude of the input signal, while the rate of devi-ation is controlled by the frequency of the deviating signal.
Document provided by SpaceAge Control, Inc. (http://spaceagecontrol.com/).

11-12
Pulse-type record amplifiersRecording processes that use coding techniques are somewhat different from direct and FM recording. In thesesystems the pulse-type amplifiers produce pulses of current or frequencies that are used to designate one of twobinary states, 1 or 0, or the beginning and end of a pulse of definite length.
Some of the pulse type record amplifiers used are:
1. Frequency-shift modulation (FSM)
2. Pulse-duration modulation (PDM)
3. Time-sharing modulation (TSM)
4. Nonreturn-to-zero (NRZ) digital
5. Return-to-zero (RZ) digital
6. Pulse-code modulation (PCM)
Digital data and direct recording combine to make up an indispensable technology within the fields of instru-mentation and video recording. Digital recording provides the ultimate in signal-to-noise ratio, accuracy of sig-nal waveforms and freedom from tape transport flutter.
The criteria for digital recording is not a larger dynamic range and linearity, but the ability to distinguish be-tween recorded pulses. The NRZ/RZ systems are basic to digital recording.
Rather than recording and reproducing a signal that continuously varies in amplitude and duration (analog), thesignal is changed in an "analog-to-digital" (A/D) converter so that the record signal has discrete levels only.The output signal from an A/D converter is, by definition of digital logic circuitry, a PCM signal (pulse codemodulation) in the NRZ format (nonreturn-to-zero). This implies that all "V"s are high voltage and all "O"s ata zero voltage. This NRZ signal contains a strong dc-component and it is partly or completely removed by re-coding the signal by using such codes as the Miller or Miller-squared (Ampex), Enhanced NRZ (Bell & How-ell), NRZI (Honeywell) and Randomized NRZ (Sangamo-Schlumberger).
PCM recording has several advantages over analog and FM recording-playback:
- High degree of linearity.
- Theoretical limitless signal-to-noise ratio.
- Immunity against data degradation due to changes in the overall tape flux level which occur after repeatedplayback passes or duplication.
- Errors caused by single drop-outs can often be corrected.
- Immunity against crosstalk.
- Excellent phase and transient response.
- Complete removal of flutter by clocking the PCM data out of the buffers.
- Computer compatible format.
- Few operational adjustments.
These advantages however, have a penalty. High-density digital recording (HDDR) often exceeds the band-width of existing instrumentation recorders. The problem is solved by converting the serial bit stream into par-allel streams and the number of tracks required can be determined once the bit rate per channel has beendetermined.
The reproduce amplifierThe reproduce amplifier should provide an output that is the same as or similar to that fed to the record ampli-fier. The present trend for airborne record-only applications is to eliminate these amplifiers in preference for
Document provided by SpaceAge Control, Inc. (http://spaceagecontrol.com/).

11-13
weight and form factor. The magnetic tape is played back in the ground facility where laboratory quality am-plifier systems can be used.
The following reference is suggested for source material concerning reproduce amplifiers: Ref. 11.9.
11.3.6 Video recordingIn 1956, Ampex Corporation announced their newly developed rotating head video recorder using 2-in. widetape (Ref. 11.10). Rotating head technology afforded a high head-to-tape speed of about 1500 in/sec, whichmade it possible to record sufficient bandwidth of the video by using super high band FM recording.
The rotary-head recorder used a transverse format in which recording was done by four heads mounted on arotating drum; this was called the quadraplex head. However, experience with the transverse-scanning systemrevealed some difficulties that required horizontal synchronization switching during reproduction of the record-ed signal. As a consequence, helical-scan systems were proposed as a solution.
In the beginning stages helical scan was conceived of as using a single video head in the drum and wrappingthe tape around the drum in such a manner that the signal is recorded in a slanted or diagonal locus on the sur-face of the tape.
11.3.6.1 Typical color video systemsInitially it was necessary for television transmission equipment to be synchronized with commercial main pow-er frequency. In countries such as the United States and Canada, 30 frames (pictures in Europe) are transmittedeach second at the vertical scanning rate of 60 Hz, while 25 frames are transmitted each second in Europe, Aus-tralia, China, and other 50-Hz countries. Japan has both 50- and 60-Hz systems. The rate of 25 frames per sec-ond is rather close to the minimum number of frames that the eye will accept as a continuous picture withoutflicker. This presents a serious dilemma because the frame rate should be kept as low as possible in order tokeep the bandwidth narrow.
The number of horizontal lines determines the bandwidth of the television signal as well as the vertical defini-tion of the television picture. Following a lengthy history of development, unified standards of 625 lines and50 fields per second were established for western Europe color transmissions, including the United Kingdom.The other countries including the United States and Japan using 60-Hz power adopted 525 lines (Ref. 11.11).
Color television systems can be classified into three main types: NTSC (National Television System Commit-tee), PAL (phase alternation line), and SECAM (sequential color and memory). The major differences amongthese variations are in the specific modulation processes used for encoding and transmitting chrominance sig-nal. Refer to the comparisons in table 11.1.
NTSCThe basic idea of color television derives from the NTSC system developed by RCA in 1953, it has been usedin the United States since 1954 and in Japan since 1960. In order to transmit the three primary R, G, B colorsignals, a frequency bandwidth three times wider than that needed for monochrome is required. However, theNTSC system can transmit the luminance signal Y and the chrominance signals C within the same frequencyband as monochrome and is thus compatible with monochrome television signals. This composite system usestwo carriers of the same frequency, 3.58 MHz, having a phase displacement of 90 degrees, amplitude-modulatedby color-component signals. These two color signals are represented by two vector signals I and Q. Color hueis determined by the phase of the combined color subcarrier signal, and color intensity is determined by theamplitude of the color subcarrier.
PALThe PAL system, developed by Telefunken in 1962 is similar to the NTSC system, with the exception that thecolor-difference signals are represented by U and Y, which have equal bandwidths and are transmitted on a 4.43MHz subcarrier, with the V signal reversing in phase on alternate lines. In the NTSC system, phase distortioncauses an incorrect color transmission, but in the PAL system the V color-difference signal reverses in everyother line. The reproduced color signal distortion can be averaged out by means of a single-horizontal-line delayline. Or in the case of cheaper receivers it is averaged out by the viewers eye.
Document provided by SpaceAge Control, Inc. (http://spaceagecontrol.com/).

11-14
SECAMThe SECAM system was first developed in France in 1967. This method of color transmission is quite differentfrom NTSC and PAL. The color difference signals are transformed into frequency modulation signals with dif-ferent subcarriers and transmitted successively on alternate lines. Simultaneous color-difference signals are re-produced using a horizontal scanning period delay line in the television receiver, thus, the system is notinfluenced by phase distortion in transmitted color signals.
High-definition television systemsThe amount of information which can be transmitted over the television system has increased dramatically inrecent years. Future needs indicate the necessity for pictures of higher definition than NTSC, PAL, and SE-CAM. The development of high-definition television has been guided by dictates of the three main parameters:picture size, number of scanning lines, and visual impact. The major characteristics are compared in table 11.1.
Table 11.1. Comparison of the major television systems.
NTSC PAL SECAM High definition
Fields, per second 60 50 50 60
No. of horizontal lines 525 625 625 1125
Aspect ratio 4:3 4:3 4:3 16:9
Subcarrier, MHz 3.58 4.43 4.254.40
Luminance bandwidth 4.2 5.0 6.0 20Y, MHz
Chrominance band- 1: 1.3 U: 1.3 DR: 1.3 Cw: 7.0width C, MHz Q: 0.4 V: 1.3 DB: 1.3 CN: 5.5
Color system AM by two-color sig- (Similar to NTSC) U Color-difference sig- Color-difference signalsnals having 90° and V color- nals (R - Y and B - (C, and CN) arephase displacement difference signals Y) are transmitted processed by
reverse in phase on by FM on alternate componentalternate lines lines
Development of video tapeIn the early stages of development, standard audio tape was used for the recording of video signals. When videorecording became commercially feasible it was necessary to develop a special video tape. The standard audiotape was not well adapted to the relative high head-to-tape speed of rotary equipment nor to the necessity ofrecording short-wavelength signals on an extremely narrow track. Increasingly stringent requirements wereadded to the video tape with the adoption of helical scan. The complex tape path also required the tape to beextremely smooth and with the development of miniaturized cassette-loading mechanisms the conditions towhich the video tape was to be subjected were very severe.
The type of magnetic tape that eventually was developed was the result of many compromises . . . a well-balanced solution to conflicting demands.
Video tapes must meet the requirements of both instrumentation and computer tapes. They must have a highsignal-to-noise ratio and few drop outs. An often highlighted feature of helical-scan video recorders is theirstill-frame capability. With the tape motion stopped, the rotating head assembly will scan a particular portionof the recorded tape and display it. A very high temperature is generated in the contact area between the rapidlymoving head and the tape (in the order of several hundred degrees C) and this may wear out the tape or causeclogging of the head gap. Some tapes have a still-frame capability of only a few seconds and are rated "poor"while others will last in excess of one hour. As a consequence the still-frame test is usually used as a figure ofmerit for video tape.
Document provided by SpaceAge Control, Inc. (http://spaceagecontrol.com/).

11-15
Tape loading mechanismsIn general, a container with two reels is called a cassette and one with only a single reel, a cartridge. Videocartridges have all but disappeared from use. When the tape is in a cassette, it is necessary that the tape be phys-ically pulled out from the container and wound around the rotary-head drum. The two disadvantages of the car-tridge are that the tape cannot be removed from the machine until the rewind is completed and there is a risk ofdamaging the exposed tape if not fully rewound.
As magnetic recording technology developed, reel size diminished and two reels could be put into a single con-tainer. Thus the cassette gradually came into use. There are two types of cassettes: one is the tandem cassettein which the two reels are stacked one over the other coaxially; the other is the parallel two-reel cassette. Sincethe supply and take-up reels in the tandem cassette are on different levels, the tape obviously has to travel in adiagonal path from one reel to the other. Although this diagonal tape path is easily adapted to wrapping aroundthe head drum, as required for helical-scan recording techniques, the more complex tape path here necessitatesa correspondingly more complex reel drive mechanism. This tandem cassette is now obsolete.
Rotary headsThe primary advantage of rotary-head transports over fixed-head transports is their greater areal informationpacking density. For tape-noise-limited systems, the signal-to-noise ratio is reduced 3 dB for each track-widthhalving, but the bandwidth is doubled since two tracks can be accommodated in the same area. The net gain is3 dB in information handling capacity each time the track-width is halved. Rotary head transports can handlewell over 6 x 105 bits per square millimeter, and can theoretically handle densities beyond optical limits. Theyare, however, restricted by head constraints in the bandwidth they can handle in one track. Bandwidths beyond300 Mb/s per track are rather difficult to achieve and will most likely require multiple rotary heads. Rotaryhead-tape machines are now primarily of the helical-scan configuration similar to those used for professionalvideo recording. HDDR is in general use and the track interruption is easily accommodated by digital buffering.
Digital video recordingConventional analog devices record the video signal by means of frequency modulation, and the analog infor-mation is converted to differences in distance between the zero-crossing points of the FM signal. The most com-monly used coding method in digital video recording is PCM. For a number of reasons, digital recording is theideal recording method for use in magnetic recording (see pages 11-17), but it does have two disadvantages.First, HDDR is required because of the wide frequency range involved. Second, a great number of circuits arerequired for digital encoding and decoding, as well as for error correction.
The home video tape recorderThe history of home video recording is a series of significant reductions in both head drum and tape sizes. In1964, 1/2-in. wide tape was first used to record a 1-hr program on a 7-in. reel of tape using the two-head helicalscan method. In order to solve the playing time problem, azimuth recording was developed. This technique in-volves the use of two heads with different inclined gaps. This produces an azimuth loss of sufficient magnitudeto enable the guard bands between tracks to be eliminated. The result was a black-and-white video recorderdeveloped by Panasonic that provided 90-min. playing time on a 7-in. reel.
The Beta format was then introduced by Sony in 1975, followed by JVC VHS format in 1978, the V-2000 byPhillips for the European market, and then in 1984 the 8-mm video format was introduced by internationalagreement at the 1984 "8-mm Video Conference." As a result, the tape cost of video recording per hour hasbecome less than that of audio recording on tape. The development of new recording media, improved headsand solid-state electronics has produced a complete color quality video camera/record product that when rug-gedized is worthy of use in most flight test applications. Recorder data are shown in table 11.2.
Document provided by SpaceAge Control, Inc. (http://spaceagecontrol.com/).

11-16
Table 11.2. Recorder comparisons of the cassette video systems.
VHS Beta 8-mm video
SP LP ELP 0-1 0-II 0-III SP LP
Recording 120 240 360 60 120 180 120 240time, min
Tape speed, 33.3 16.7 11.1 40 20 13.3 14.3 7.2mm/s
Track pitch, Am 58 29 19 58 29 19 20 10H-Alignmentdifference (a,) 1.5H 0.75H 0.5H 1.5H 0.75H 0.5H 1.0H 0.5H
Head drum 62 75 40diameter, mm
Luminance FM 3.4-4.4 4.0-5.2t 4.2-5.4carrier, MHz 3.6-4.8
(4.4-5.6)1
Color-under carrier, 0.63 0.69 0.74MHz
Cassette 25HX188WX104D 25HX156WX96D 15HX95WX62.5Ddimensions, mm
Tape length, m 240 150 108Tape thickness, jam 20 20 10Relative tape speed, 5.8 7.0 3.8
mA/Tracking method Control signal Control signal 4 Freq. pilot
Azimuth, degrees ±6 ±7 ±10Track angle 5958'99 5001'42' 4"54'13.2?
(numing)Fixed-head audio 1 or 2 1 or 2 1channels
Audio track width, L00 or 0.35X2 1.05 or 0.35X2 0.6mm
Rotary.head audio FM 2 FM 2 FM 1channels
(Double component) (Freq. division) (Freq. division)PCM 2 (8-bit withnoise reduction)
VHS Beta V-2000 8-mm video
Recording time, mrin 180/360 130 360 (both ways) 90/180Tape speed, mm/s 23.4/11.7 18.7 24.4 20/10Cassette size, mm 25HX108WX104D 25HX156WX96D 26HX183WX62D 1HX95WX105DHead drum diameter, 62 75 65 40
mmLuminance FM carrier, 3.8-4.8 3.8-5.2 3.3-4.7 4.2-5.4
MHzColor-under carrier 0.63 0.69 0.63 0.74
MHzSECAM color-recording Color-under Color-under Color-under PAL/SECAMmethod Trans Coder
Tape length, m 258 150 260 108Tape thickness, ism 20 20 15 10Track pitch, pm 49/24.5 33 23 34/17H-alignment difference 1.5H/0.75H 1.5H ± 0.5H 1.5H 2H/IH(a.)
Relative tape speed, 4.8 5.8 5.0 3.1m/a
Tracking method Control signal Control signal 4 freq. pilot 4 freq. pilotAzimuth, degrees ±6 ± 7 ±15 ±10Track angle (running) 5057'50.3' 5"00'583 2°63'50" 454,58.8'Fixed-head audio I or 2 1 or 2 1 or 2 1
channelsAudio track width, mm 1.00 or 0.35X2 1.05 or 0.35X2 0.65 or 0.25X2 0.6Rotary-head audio FM 2 (double FM 2 (double ... FM I (freq. division)
channels component) component) PCM 2 (8-bit withnoise reduction)
Document provided by SpaceAge Control, Inc. (http://spaceagecontrol.com/).

11-17
The ruggedized 8-mm cassette recorderThe first PCM data recorders using helical scan appeared about 1980, and by 1985 the digital audio tape (DAT)machines were being marketed. During the next two years the standard DAT was modified to record PCM data,analog, MIL-STD-1553, voice, and IRIG timing. This technology, including the magnetic tape, has continuedto be improved to the point that now it is quite common place to be able to select an 8-mm record format froma variety of off-the-shelf recorders readily capable of providing storage for up to 5 gigabytes of formatted data.
In the rotary head digital audio tape recorder (R-DAT) format, a recording density of 129 Mb/in 2 has beenachieved by a combination of azimuth recording and track following-servo. This permits 2 to 3 hours of record-ing. Typical vendor specifications are shown in table 11.3.
Table 11.3. Typical vendor specifications.FEATURES Record/Reproduce System:
Multiplex PCM providing analog inputand output
13 Flight Qualified Tape: Conforms to DAT standards.O] 8 mm Digital Helical Scan Technology Recommended tapes:
Maxell DM120 (tape length: 60nm)5 of Storage Maxell DM60 (tape length: 3Orn)Recording Format: Helical scanning R-DATMulti-Stream PCM Inputs to 4 Mbps ouantzton 16-bit
C Compact Size and Light Weight Recording Data Length: Upper 14 bitsRecord/Reproduce Head:
] 68340 Microprocessor for Flexible Control 4 (record/reproduce heads x 2, heads for error-checking x 2) (erasure is by overwriting)1i IRIG A/B Time Tag Error Correction Method: Double Reed-Solomon
C3 Optional Interface Types Include: Tape Speed & Drum Rotation:16.3mm/sec (5/s'/sec),4ooOrpm
Voice m 8.15mm/sec (5/16r/secF200rpmMIL-STD-1553 Recording Time: lhr (16.3mm/sec.DM120)2hrs (8.15mmisecDM120)
The 8-mm tape cassette differs somewhat from the standard VHS/Beta cassettes due to built-in tape guides. SeeFigure 11.5.
____Tape
Closed
S",
Open
95 mm
Figure 11.5. The 8-mm cassette.
11.3.7 Magneto-ootical recording systemsAn alternative type of magnetic recording system uses an optical beam read-write device instead of an inductiveor flux-sensing head. Writing is achieved via a change in the magnetic properties of the media when heated bythe beam. Reading is accomplished with a lower intensity beam using the magneto-optical rotation of the planeof polarization. Very high recording densities are possible. This recording method has the advantage ofavoiding close proximity between heads and media, while offering a higher record density than currentlyachievable in magnetic recorders.
Document provided by SpaceAge Control, Inc. (http://spaceagecontrol.com/).

11-18
The basic concept of the optical head and disk are shown in Figure 11.6. The focusing and tracking lens abovethe disk can be mechanically accessed with a small electromagnetic actuator of the type used for magnetic re-cording on disks. Writing is achieved by modulating the beam in the presence of a perpendicular magnetic fieldapplied from a current carrying coil underneath the disk. Recording takes place in physically pre-grooved tracksmolded into the substrate. Reading of the magnetized track is achieved at reduced beam power and without thefield applied.
SignalPhotodetectors
Focus and TrackingDiode . ' , [ DetectorsLaser -
Tracking Mirror
MagnetoopticalFocusing Lens • Storage Disk
Magnetic Bias Coil,/ k' _.\
Figure 11.6. Optical read-write head used with magnetic media.
Magneto-optical recording combines very high storage density, low cost, random access, erasability, and re-movability. The areal storage densities of 0.5 x 10⁶ b/mm 2 that are easily attainable with magneto-optical re-cording are one order of magnitude greater than most currently available magnetic recording products.
The ability to read and write small bits with a large mechanical clearance leads to many favorable attributes ofmagneto-optical systems. First, it enables second-surface operation, which greatly improves immunity to sur-face dirt and scratches, and allows good isolation of the active film from the atmosphere. This in turn permitsthe removal of media, consequently enabling the drive to be used with any medium (erasable, nonerasable, andread-only). Removability requires little additional servo performance because embedded servos are in any eventrequired at high track densities. Second, there is no possibility of data-destroying head "crashes" and magneto-optical drives should be relatively immune to shock and vibration. A shock large enough to cause loss of focuswould only delay disk I/O by a fraction of a second.
Again, as with audio and video, the technological drive for magneto-optics originated with the commercial con-sumer. The commercial success of these drives required the development of inexpensive diode lasers, optics,actuators, servos, photo-diodes, VLSI error correction, and preformatted substrates. Some of these werecurrently available from digital audio players (compact discs) and were incorporated in magneto-optical sys-tems with very little alteration.
Ruggedized magneto-optical systems have already been developed for airborne applications and are presentlybeing flown on high-performance fighter type aircraft.
Document provided by SpaceAge Control, Inc. (http://spaceagecontrol.com/).

11-19
11.3.8 The solid-state memoryThe types of recorders discussed so far are electro-mechanical machines that move the recording medium pasta stationary optical system or a static or rotating magnetic head assembly. These machines require careful fit-ting, operation, and servicing, and can easily be damaged by mishandling. In contrast, solid-state recorders haveno moving parts and are engineered to withstand a more severe environment. This form of recorder is not re-stricted by mechanical delays and can therefore record data at a higher rate. The data capacity for this type ofrecorder is typically less than 10 Mbytes which is rather low when compared to magnetic tape recording sys-tems.
There are three basic types of solid-state recorders which are defined by the type of memory used:
a. Random access memory (RAM), static random access memory (SRAM) and dynamic random access mem-ory (DRAM).
b. Electrically programmable read only memory (EPROM), and electrically erasable EPROMs, (EEPROM).
c. Magnetic-bubble memory.
The circuit elements used to build the first two types of solid-state recorders are undergoing development byseveral manufacturers. Encouraged by competition in the microcomputer field it is expected that the capacity/volume ratio will continue to improve. In comparison the magnetic-bubble memory has minimal support, duein part to the extensive external circuitry required for its support.
All forms of the solid-state recorder are usually constructed so that the memory elements mounted on theirprinted circuit cards are detachable for transporting to the replay facility.
The random access memoryThis type of storage device will accept the highest data rate, 300 Mbits/sec for a system organized 2 bytes wide,the device requires constant power during the storage of data. On some systems a backup battery is providedfor the integrated circuits to provide a practical storage duration. Each data bit is stored in a separate bi-stablecircuit for which a standby mode of operation is often provided for a typical SRAM package of 4 Mbits of mem-ory in less than 1.3 in3.
DRAMS require refresh circuitry, and refresh operation slightly restricts memory access. Typical is the syn-chronous DRAM since it is still composed of dynamic cells that lose their charge. But another option, self-refresh, appears on many of the newer byte wide DRAMs. This new, simpler refresh mode is completely con-trolled on the chip and retains data in a low power mode. The self-refresh option is expected to be available onall synchronous DRAMs. It is reasonable to assume that the DRAM, once considered too slow for high-performance applications, will replace the more costly SRAM.
For example, these types of memory storage devices have been used for the following purposes:
- Aircraft wheel hub temperature measurements (4 Kbytes).
- Man-carried parachute performance (4 Kbytes to 912 Kbytes).
- Aircraft computer dumps (4 Kbytes to 64 Kbytes).
The erasable programmable read-only memoryThis type of device is slower than the RAM, but has the advantage of being nonvolatile. Data rate is about 1000bits/sec. Each bit is stored as an electrical charge on a miniature capacitor. As the name implies, erasure is pos-sible, either by exposing the EPROM to an ultra-violet lamp or electrically erasing the EPROM with a voltage.EPROMs will only accept a finite number of read-write cycles. With continuous improvement this life span isbeing improved. This is unlikely to be a future problem except in applications where the same memory unitsare used repeatedly. A further problem with the EPROM is that its ceramic package with a quartz window forerasure significantly adds to the cost.
EEPROM technology was introduced as an improvement to EPROM. The main advantage of the EEPROM overthe EPROM is system flexibility since it can be programmed and/or erased while in position. The disadvantageis that its cell size is larger than the EPROM. Flash EEPEOM technology offers nearly the same cell size asEPROM and also provides electrical erasure. FLASH refers to the entire memory, or a large block of it, being
Document provided by SpaceAge Control, Inc. (http://spaceagecontrol.com/).

11-20
erased at the same time. This can be advantageous, but, it can also be a disadvantage because single bytes cannotbe erased.
The magnetic-bubble memoryThe magnetic bubble stores its data in a solid piece of magnetic material. Complicated electronic managementand control is required to use this technique. Data is stored in a nonvolatile way. Both its maximum data rateand its operating temperature range are narrower than the RAM. The data rate for a typical storage device ofthis form is 75 Kbits/sec. Each magnetic structure has a data capacity of 4 Mbits. Construction uses integratedcircuits for the control system and the magnetic bubble memories mounted on printed circuit boards.
Playback processA small, cheap microprocessor can provide the necessary replay for solid-state memories, but this is not a re-quirement. This type of storage device can be examined by a simple LED array, however, some form of specialinterface electronics is usually necessary for replaying solid-state memories.
The erase and test modes are carried out as part of the replay process. Data may be archived on the computer'sstandard nonvolatile storage system. For replay of a magnetic bubble memory the control circuitry can be ar-ranged to present the data as a serial bit stream or in a byte wide form, but the data will always be in sequentialorder.
11.4 CONCLUSIONSA brief review of existing airborne recording systems has been presented. Although some of the technologyreviewed is considered by some to be obsolete it is never-the-less still being used by flight test agencies whereeconomics is the prime concern. These techniques are still highly valid and are only limited by the minimalnumber of data channels recorded and by the labor intensive data reduction requirements.
Present trends indicate a nearly universal acceptance of magnetic recording of onboard data with the data re-cording media migrating from the open reel to the cassette.
Although relatively new to airborne applications, magneto-optical recording will probably replace magnetictape recording in the future.
In a few circumstances solid-state recording is employed but it is presently limited because of data rate andcapacity, although weight and size make it useful for some applications.
11.5 REFERENCES11.1 NATO AGARD Flight Test Manual, Instrumentation catalog, Pergamon Press, Oxford London, U.K., Li-
brary of Congress Card No. 59-13097. Section C-2. December 1961. Revised 1962.
11.2 NLR MP 86010 U, "Trajectory Measurement of the Fokker 100 Aircraft During Auto-Land Testing,"date.
11.3 NATO AGARD Flight Test Manual, Instrumentation catalog, Pergamon Press, Oxford London, U.K., Li-brary of Congress Card No. 59-13097. Section C-1. December 1961. Revised 1962.
11.4 Harris, J.P., W.B. Phillips, J.F. Wells, and W.D. Winger, "Innovations in the Design of Magnetic TapeSubsystems," IBM J. Res. Dev., Vol. 25, 691, 1981.
11.5 Kryder, M., "Magneto-Optic Recording Technology," J. Appl. Phys., Vol. 57, 3913, 1985.
11.6 IRIG Standards.
11.7 Lowman, C.E., "Magnetic Recording," McGraw-Hill Book Co., New York, New York, 1972.
11.8 McKnight, J.G., "Erasure of Magnetic Tape," J. of Audio Eng. Soc., Vol. 11, Oct. 1963, pp. 223-223.
11.9 Mee, C.D. and E.D. Daniel, "Magnetic Recording, Vol. III Video, Audio, and Instrumentation Record-ing," McGraw-Hill Book Co., New York, New York, 1988.
11.10 Howard, J.A. and L.N. Ferguson, "Magnetic Recording Handbook," Hewlett Packard Application Note89, Palo Alto, CA, 1970.
Document provided by SpaceAge Control, Inc. (http://spaceagecontrol.com/).

11-21
11.11 Ginsburg, C.P., "Development of the Video Tape Recorder," in Videotape Recording, Ampex Corpora-tion, Redwood City, CA, 1986.
11.6 BIBLIOGRAPHY
1. Kalil, F., Magnetic Tape Recording for the Eighties, NASA RP-1075, U.S. Government PrintingOffice, Washington, D.C., 1982.
2. Kalil, F., High-Density Digital Recording, NASA RP-1111, U.S. Government Printing Office,Washington, D.C., 1985.
3. Newby, P.S. and J.L. Yen, "High Density Digital Recording Using Videocassette Recorders," IEEETrans. Magn., MAG-19, 2245, 1983.
4. Weber, P.J., "The Tape Recorder as an Instrumentation Device," Ampex Corporation, Redwood City,CA, 1967.
5. Carasso, M.G., J.B.H. Peek, and J.P. Sinjou, "The Compact Disc Digital Audio System," Phillips TechRev., Vol. 40(6), 151, 1982.
6. Hunt, R.P., "Magneto-optics, Lasers and Memory Systems," IEEE Trans. Magn., MAG-5 700, 1969.
7. Sugaya, H., "The Videotape Recorder: Its Evolution and the Present State of the Art of VTR Technolo-gy," J. SMPTE, Vol. 95, 301, Mar. 1986.
8. Kihara, N., F.Kohno, and Y. Ishigaki, "Development of a New System of Cassette Type ConsumerVTR," IEEE Trans. Consumer Electron., Vol. 22, 1, 1976.
9. Givone, Donald D. and R.P. Roesser, "Microprocessors-Microcomputers, An Introduction," McGraw-Hill Book Co., New York, 1980.
Document provided by SpaceAge Control, Inc. (http://spaceagecontrol.com/).

12-1
Chapter 12
TELEMETRY
by
Alfred BeckerDLR/FF-FL
PO Box 326738108 Braunschweig
Germany
12.1 INTRODUCTIONA telemetry measuring system in general makes use of the following components and functional blocks (seeFig. 12.1)
on board the aircraft:
- transducers for conversion of physical data into electric signals (see Chapter 5)
- signal conditioners for matching the transducer output signal to the normalized inputs of the multiplexer(see Chapter 6)
- a multiplexer for combining the N normalized data signals to a single output signal in a reversible process
- an onboard magnetic tape recorder for recording the multiplexed data signal (optional)
- a radio frequency transmitter for transmitting the multiplexer output signal by means of a modulated RFcarrier
- a transmitting antenna for radiating the modulated RF carrier
R ECORDERSCHANNEL I CHANNEL 1 AND QUICK LOOK
TRANSMITTING RECENING INSTRUMENTS/DANTENNA ANTENNA DISPLAYS
CNON -LINE
DAATLMTYLN9 DATAPRCSIG
R E OPROCESSINGRN
['• RCORDE I RFREEE
a- ON BOARD X SPACE r ON GROUND
Figure 12.1 Block diagram of a telemetry measuring system.
Document provided by SpaceAge Control, Inc. (http://spaceagecontrol.com/).

12-2
- on the ground:
- a receiving antenna for converting the electromagnetic field at the ground station into an electrical receiv-er input signal
- a receiving system for selecting and amplifying the weak wanted input signal out of the background ofunwanted signals and noise
- a tape recorder for storing the multiplexed data signals on magnetic tape
- a demultiplexer for converting the multiplexer output signal back into the original N data signals
- a data distributor for providing the subsequent data processing and display units with the required datasignals
- an on-line data processing facility for processing a selected set of data which are important for a quickanalysis of flight test results in order to respond by corrective commands while the test aircraft is still inthe air
- recorders and quick-look facilities for on-line display of original data and processed data
- an off-line data processing facility for detailed processing of the test data in order to get the final testresults.
This chain of components and functional blocks is displayed in Figure 12.1. Only those topics in the above list-ing are considered in the paragraphs of this chapter which are not referenced to another chapter.
First, however, some more general remarks should be given. In comparison to on-board recording telemetry offlight test data is advantageous in many applications (see also Section 9.2.3). The main advantages are:
"* less weight and volume of the onboard equipment
"• less sensitive to extreme environmental conditions like shock and temperature
"* better quick-look and on-line data processing capabilities; access of experts on the ground to the on-line testresults provides a better flight test efficiency
"* further improvement of flight-test efficiency possible by use of an additional up-link telemetry system fortransmission of relevant ground data to the test aircraft (e.g., precise ground radar position data and com-mands)
On the other hand there are a few drawbacks which may prevent the use of telemetry or make the use of onboardrecording recommendable in some applications:
"* the range is limited by the physical characteristics of wave propagation to line of sight conditions
"* the positioning of onboard antennas may be difficult
"* dropouts of data reception due to fading in the radio frequency channel which can be caused by shadowingof the onboard antenna by the aircraft structure a certain flight attitudes or by multipath wave propagation.A powerful means against these perturbances is available by the use of diversity techniques (see Section12.2.3).
Conclusively it can be stated that a well-designed telemetry system is of great importance for the performancequality and efficiency of flight testing.
12.2 BASIC METHODSPrior to the discussion of today's telemetry systems some general considerations of basic methods which are ofimportance in telemetry will be given. These methods pertain to the principles of modulation and multiplexing.
12.2.1 ModulationFour different objectives of modulation which are relevant for telemetry are illustrated by Figure 12.2. Theseare:
Document provided by SpaceAge Control, Inc. (http://spaceagecontrol.com/).

12-3
SPECTRAL
DN ITYETU MODULATEDS CFIR.F. CARRIER
(a) shifting the signal spectrum to the frequency band SPETRU
of the transmission channel; e.g. shifting the voice .....spectrum by amplitude modulation to the assigned FREQUENCY
radio-frequency voice communication channel, A. SHIFTING THE SIGNAL SPECTRUM TO THE TRANSMISSION FREQUENCY BAND
SPECTRALDENSITY
I SIGNAL SPECTRUM MODULATEDRF. CARRIER
(b) widening the shifted signal spectrum in order to get NOISE
better protection against channel noise; e.g., by ....using frequency modulation),* --- FREQUENCY
B. WIDENING THE SHIFTED SIGNAL SPECTRUM
DENSITY MODULATED MODULATEDSUBCARRIERS R.F. CARRIER
(c) grouping a set of signals by means of modulatedsubcarriers or pulses and modulating the RF-carrierby this composite signal (frequency-division multi- FREQUENCYplexing or time-division multiplexing, respectively), UR OONR..C RER
C. MODULATING SEVER•AL SUBCARRIERS ON ONE R.F. CARRIER
( FREQUENCY-DIVISION MULTIPLEXING )
SPECTRAL FREQUENCY RESPONSE OF
(d) matching a signal to a specific channel, e.g., to a tape DENSITY 7SGNAL SPECTRUM A TAPE RECORDERMODULATED Drecorder direct channel (overcoming the lack of CARRIER SPECTRUM
dc-response and the inconstancy in amplitudetransmission of this channel, see Chapter 9). FREQUENCY
Ic • FREQUENCY
D. MATCIING THE SIGNAL TO THE RESPONSE CHARACTERISTICS OF,E.G., A TAPE RECORDER
Figure 12.2 Objectives of modulation.
The usual modulation methods are shown in Figures 12.3 and 12.4. We have to distinguish between the contin-uous modulation methods and the pulse modulation methods. In the first case the parameters of a sinusoidalcarrier (amplitude, frequency, or phase) are controlled by the signal voltage. The modulated carrier can be de-scribed best in the frequency domain by its spectrum (see Fig. 12.3). In the second case the parameters of apulse carrier (amplitude, duration phase) are controlled by the signal voltage (see Fig. 12.4). In this case themodulated carrier can be displayed more clearly in the time domain by its time function.
12.2.1.1 Continuous modulation methodsIn the case of amplitude modulation (AM) the time function of the modulated carrier is
u(t) AM = Uc" [1 +m. s(t)] • cos(toc, t) (12.1)
with the carrier wave UC cos ((o" -t). The normalized signal time function s (t) is bounded by +1. The rangeof the modulation factor m usually is < 1. The spectrum of the modulated wave consists of one line at the carrierfrequency toc and an upper and lower sideband. The upper sideband is obtained by shifting the signal spectrumbytoc along the wo-axis. The lower sideband is the image of the upper sideband, symmetrical to toc. Therefore,
* Some modulation methods make use of the well-known trade-off between signal-to-noise ratio and
bandwidth. They obtain better signal-to-noise ratios at the output of the demodulator by manipulatingbandwidth and shape of the spectrum. As a rule it will be advantageous to use a modulation methodwhich occupies all the available channel.
Document provided by SpaceAge Control, Inc. (http://spaceagecontrol.com/).

12-4
the bandwidth of the AM spectrum is twice the bandwidth of the original signal spectrum (see Refs. 12.1, 12.2,and 12.3).
The main drawback of AM is that most of the power of the modulated wave is required for the carrier. In thedemodulator the carrier is used only for switching the AM wave in order to recover the demodulated signal. Itcontains no signal information. Since it is possible to obtain the switching signal for the demodulation processin other ways, e.g., by manipulating the sidebands, it is more efficient to suppress the carrier before transmis-sion (double-sideband suppressed-carrier modulation (DSB)). However, the hardware of DSB is more complexthan that of the simple AM. In the case of AM and DSB all the signal information is contained in each of thetwo sidebands. Therefore, one sideband may be suppressed by filters and the single-sideband suppressed-carriermodulation (SSB) is obtained. The bandwidth of SSB is equal to that of the signal, and half the bandwidth ofAM and DSB. The signal-to-noise ratio is equal to that of DSB but, because of the smaller bandwidth, one canhandle twice as many data channels in a given frequency range as with AM and DSB. The main drawbacks ofSSB are the high degree of hardware complexity and the lack of dc response. The spectra of DSB and SSB mayeasily be derived from the AM spectrum display in Figure 12.3.
SPECTRAL/SPECTRAL CARRIER DENTRAL LOWER CARRIERSPCTA CARRE SENGINALSIDEBAND SPECTRUM OF THE
DNIYIDENSITY SIGNAL ,ýEI ' SECTRUM OF THE SETUSIGNAL SPECRMO H MODULATED SIGNAL
_0SPECTRUM LOWER ýýODULATED SIGNAL ETUSIDEBANDXI ."UPPER UPPER SIDEBANDSIDEBAND
Im C IC fc÷I r + - -+
FREQUENCY
AMPLITUDE MODULATION (AM) h FREQUENCY MODULATION (FM) FREQUENCY
Figure 12.3 Continuous modulation methods.
For a deeper understanding of modulation it may be worth mentioning that a close connection exists with thesampling theorem, which is discussed in Chapter 7. We assume a signal spectrum with an upper frequency fr'"If the carrier frequency f, is less than 2 fin' there will be a range of frequencies where the unmodulated and themodulated signal spectrum overlap. This will cause aliasing errors when the signal is demodulated. The AMprocess may be regarded as the sampling of a signal s (t) by the sine wave.
Frequency modulation (FM) (Fig. 12.3(b)) is a wideband modulation method which makes use of an extendedbandwidth in order to improve the signal-to-noise ratio. Because of the relatively simple hardware FM is ofgreat importance for flight testing. In FM the frequency of the carrier wave is modulated in the following way
fFM = f7 + AF. s (t) (12.2)
where f, is the frequency of the modulated carrier, F is the frequency deviation and s (t) is the normalized sig-nal (see above). It can be shown (see Refs. 12.1, 12.2, 12.3, 12.4, and 12.5) that the increase of the signal--to-noise ratio is proportional to the ratio
AFM=-fYm (12.3)
M is the so called modulation index andfm the highest frequency component of the signal spectrum (see Fig.12.3(b)). With FM subcarriers (Section 12.3) modulation indices of 5 preferably are used in practice for flighttesting.
Unfortunately, the bandwidth of the FM-spectrum also increases as a linear function of Af, thus limiting theobtainable gain because of the general restrictions on available bandwidth.
A special case of FM is the phase modulation (PM). This is accomplished by letting the signal s (t) control thecarrier phase instead of the carrier frequency. Its special feature is a preemphasis which increases the amplitudeof the signal spectrum linearly with frequency.
Document provided by SpaceAge Control, Inc. (http://spaceagecontrol.com/).

12-5
12.2.1.2 Pulse modulation methods
In pulse amplitude modulation (PAM) (Fig. 12.4(a)) the signal s(1) is sampled at discrete points in time. This
process is described in detail in Chapter 7. All considerations of that chapter apply directly to PAM.
Pulse duration modulation (PDM) (Fig. 12.4(b)) is obtained by converting the amplitude of the PAM samplesinto a pulse duration. Thus a train of pulses with variable width is generated, and the dynamic range of the signal
is transformed from the amplitude domain to the time domain. The minimum value of the signal s (t) corre-
sponds to the shortest pulse duration; the maximum value corresponds to the longest pulse duration. The am-
plitude of the PDM pulse train remains constant. PDM, as FM, is a wideband modulation method. In the past it
has been used for simple systems but since some years it is not any longer an IRIG-standardized system (seeRef. 12.6).
For the sake of completeness, pulse position modulation, or pulse phase modulation (PPM), is also displayedin Figure 12.4(c), though it is not a standard modulation method in telemetry. In this case the relative position
of a pulse is controlled by the signal. A time reference is required for demodulation.
Due to the great technological progress in integrated circuits, the use of pulse code modulation (PCM) has be-come increasingly important during the last two decades. In this method the PAM samples are coded in a "word"of N pulses, using only the levels 0 and 1. Being a digital method, any required accuracy can be obtained byproper choice of the word length N. Besides, PCM makes excellent use of the law of exchangeability betweensignal-to-noise ratio, and bandwidth. PCM is widely used in time domain multiplexing systems. Serial formatPCM can be derived from a PAM signal by an analog-to-digital converter with a serial output. The clock fre-
quency for the A/D converter must be N-times the PAM sampling frequency. This obviously shows the increasein bandwidth. N, the number of bits for each sample, is determined by the required amplitude resolution. Onthe other hand it is clear that PCM is less sensitive to errors due to noise because only two levels of the signalhave to be discriminated.
AA4PLI -
"TUOE AMPLI - 1pY MAX. TUDE MIN. MAX.DYNAMICr" -- -. . . SIGNAL,(,) / I i"
RANGE PN -
DYNAMIC TIMETIME -- RANGE
c. PULSE PHASE MODULATION (PPM)
o. PULSE AMPLITUDE MODULATION (PAM)
AMPLI- MAX. AMPLI-1 11TUDE I TC DE 11111I 01010110 000 11 100
________ ____tll IT~T
STIME - TIME
RANGE d. PULSE CODE MODULATIONb. PULSE DURATION MODULATION (POM)
Figure 12.4 Pulse modulation methods.
There are various formats for encoding the two levels 0 and 1. The IRIG standardized formats (see Ref. 12.7)are given in table 12.1. In Figure 12.4(d) the "non return to zero-level (NRZ-L)" format has been used. For fur-ther details see Para 12.3 as well as Ref. 12.6 and Ref. 12.7.
Document provided by SpaceAge Control, Inc. (http://spaceagecontrol.com/).

12-6
Table 12.1 PCM codes (see Ref. 12.6)
LOGICCODE WAVEFORM
DESIGNATION LEVELS CODE WAVEFORMS CODE DEFINITIONS
I 0 1 l l ln n I In 1 1 n0 NON RETURlN l0 ZERO LEVEL
I 1 ' 11010101 I 0 I "ONE- IS REPRESENIED BY ONE LEVELNRZ0 I I I I 1 "ZERO" IS REPRESENTED BY THE OIHER LEVEL
I I I I I I I I I I I I NON RETURNTO ZERO MARK
I I I I I I I I " I I 'ONE" IS REPRESENTED BY A CHANGE IN LEVEL
NRZ M -- I II I -ZERO- IS REPRESENTED BY NO CHANGE IN LEVELr-- -' I I I I I I I I
I I I I I NON RETURN TO ZERO SPACEI I I I I I I I I I "ONE" IS REPRESENTED BY NO CHANGE IN LEVEL
NRZ - , FZ 'ZERO" IS REPRESENTED BYA CHANGE IN LEVEL0 ----- II ,I I I I I B1 PHASE LEVEL (SPLIT PHASE)
I I I I rLEVEL CHANGE OCCURS AT CENTER OF EVERY BIT"I ONE" IS REPRESENTED BY A ONE * LEVEL WITH TRANSITION TO THE "ZERO LEVEl
BI- L")q [ I [jJFIi I-IF "ZERO" IS REPRESENTED BY A "ZERO' LEVEL WITH TRANSITION TO TIE ONE I EVEL
S', I8I I PHASE MARKI LEVEL CHANGE OCCURS AT THE BEGINNING OF EVERY BIT PERIOD
Bl10 M 'f--f-l "ONE" IS REPRESENTED BY A MIIlfIII LEVEL CHANGE
0 " I ZERO" IS REPRESENTED BY NO MOB1IL LEVEL CHANGE
I I I I I I I I1i I I I I I 81IPHASE SPACE
I r~rr~r~r.~lrr.,H LEVEL CHANGE OCCURS AT THlE BEGINNING OF EVERY BIT PERIODBIO S 0- "JL LJJLJ1 ONE" IS REPRESENTED BY A NO MI(1II LEVEL CHANGE
"ZERO" IS REPRESENTED BY MDOBIT LEVEL CHIANGEI I I I I I I I I I Ii _ I i DIFFERENTIALBI. PHASE MARK
DBI00 MM I LEVEL CIHANGE OCCURS AT THE CENTER Of EACH BIT PERIOD0 -ONE"S 1 REPRESENTED BY NO LEVEL CIIANGE AT TIlE BEGINNING Of TIlE fill PERIIDII
ZERO IS REPRESENIED} BY A LEVEL CHANGE Al TIHE BEGINNING OF TIl[ OIl I'[ H101)
I - - I I -I I DIFFERENTIAL BiPIIASE SPACEDBIA Sit) I LEVEL CHANGE OCCUIRS AT TIE CENTER OF EACH BIT PERIOD
0 .... 'ONE" IS REPRESENTED BY A LEVEL CHANGE AT THE BEGINNING OF TlE BIT PERIIOD)I I I l I i I I l I iI I 'ZERO" IS REPRESENTED BY NO LEVEL CIIANGE AT THE BEGINNING OF TliE HIl VI 1410111
(IlThese codes may be derived horn lie cofiespoilidiv NRZ codes by inveilin) the level lto the list ball of ewch hil ioilerval
12.2.2 MultlplexingThe objective of multiplexing is to manipulate the group of N data signals in the airborne telemetry station insuch a way that these signals can be combined in a reversible process to one composite signal (multiplexingprocess). Thus, this composed signal can be transmitted to the receiver via a single transmission channel. In theground station the composed signal is converted back into the N original data signals. The main error sourceswith the technique of multiplexing are data signal distortion and crosstalk between the data channels which haveto be avoided by proper system design.
Two multiplexing principles are used in telemetry, namely frequency division multiplexing and time divisionmultiplexing.
12.2.2.1 Frequency-division multiplexingThe method of frequency-division multiplexing (see Fig. 12.5) generally makes use of continuous modulationmethods, such as AM, DSB, SSB or FM. Each data signal modulates a subcarrier with a different frequency.By proper selection of the subcarrier frequencies, overlapping of the modulation spectra can be avoided. At thereceiver end of the transmission link the individual subcarriers are separated by bandpass filters. The data sig-nals are recovered by demodulation of the subcarriers.
Distortion and crosstalk of the data signals generally can be kept low by a good linearity of the transmissionchannel by a sufficient subcarrier separation and by a sufficient selectivity of the channel bandpass filters. Inorder to get an equal signal-to-noise ratio for all output data signals a preemphasis must be applied to the am-plitudes of the subcarriers within the summing amplifier. This preemphasis depends on the subcarrierfrequency, the subcarrier channel bandwidth and the modulation method applied to the RF-channel (for moredetails see Section 12.3.1).
Document provided by SpaceAge Control, Inc. (http://spaceagecontrol.com/).

12-7
MULTIPLEXER IDEMULTIPLEXER
o <
0
SsSMMNGTRNSISIO
COMMUTATORE BNPSHDECOMMUTATOR
CHNE C HANLLTO N ELTRN CANE
AMPLITUDER _ __-. TA-.-
NORMLIZD DTA IGNL 1OUTUTCHANNELAL
SYNC. SYC SYYNC
TRNMISO f
CHANNEL
Figre12. Pincpl oftie-dviionmutipexng
Document provided by SpaceAge Control, Inc. (http://spaceagecontrol.com/).

12-8
15
14 ,lmy 16
SECOND SUB- _ •fcCOMMUTATOR 13A J '11
5 6ITO TRANSMISSION CHANNEL
4 7 17
1 MAINCOMMUTATOR TO T I _10 71
a. SUPERCOMMUTATION b. SUBCOMMUTATION
WITHOUT SUPERCOMMUTATION :WITHOUT SUBCOMMUTATION:24 CHANNELS SAMPLED AT T I 6 CHANNELS SAMPLED AT fc
WITH SUPERCOMMUTAT1ON WITH SUBCOMMUTATIONCHANNELS SAMPLED AT CHANNELS . SAMPLED AT
1,5 4 fc 1+ 5 fc2, 4, 6 3 fc 6 + 10 f Ic
3, 8 2 fc 11 16 f.9, 10 fe
Figure 12.7 Examples of supercommutation and subcommutation.
12.2.2.2 Time-division multiplexingThe method of time-division multiplexing is illustrated by Figure 12.6. Generally, this method makes use ofpulse modulation methods, such as PAM, PDM, PPM, and PCM. The illustration in Figure 12.6 is based onPAM.
A commutator, e.g., a rotary switch, samples n different data signals with the same sampling frequency f,, butat consecutive points in time. Thus a train of non-overlapping pulses is generated which may be decommutatedby a synchronously running switch at the receiver end of the transmission channel. In order to obtain the re-quired synchronism, a synchronisation signal must be inserted in the pulse train, which can be detected by thedecommutator and can be used for synchronizing the position of the switch. Therefore, the parameters of thesynchronization pulse, i.e., amplitude or width, must be chosen differently from those of the data pulses. InFigure 2.6 the amplitude is outside the dynamic range of the data pulses. Sometimes a combination of pulses isused in order to get error-free synchronisation. For more details see Section 12.3.2.
For the sake of bandwidth optimisation, a premodulation lowpass filtering has to be applied to the multiplexeroutput signal before it modulates the RF transmitter. By this means the steep edges of the pulses are roundedand the width of the pulse spectrum is reduced. The optimum corner frequency of the premodulation filter de-pends on the pulse rate of the multiplex pulse train and the type of modulation. Further, crosstalk due to insuf-ficient corner frequencies must be avoided. (Details see Section 12.3.2).
Time-division multiplexing makes use of the available transmission channel bandwidth very effectively. More-over, it allows a simple exchange between data channel bandwidth and the number of channels by supercom-mutation and subcommutation techniques. Both methods are shown in Figure 12.7.
Supercommutation increases the sampling frequency of a channel by sampling the data signal more than onceper frame. This can be done by paralleling some channels of the commutator. Obviously, the number of channelsdecreases. The example in Figure 12.7(a) shows the substitution of 24 channels with a sampling frequency offc by 10 channels with different sampling frequencies ranging from fc to 4 "fc"
Document provided by SpaceAge Control, Inc. (http://spaceagecontrol.com/).

12-9
Subcommutation means the decrease of the channel sampling frequency by substituting one channel of the mainframe sampling frequency f, by n channels of a subframe using a sampling frequency f/n. The example in Fig-ure 12.7(b) shows the increase of the number of channels from 6 channels using a sampling frequency f, to 16channels using sampling frequencies ranging from f, down to f,/36 by means of two subcommutation processesin cascade. It should be mentioned that mechanically rotating switches as drawn in Figures 12.6 and 12.7 arehardly used any more in flight test systems. Electronic switches are now usual.
12.2.3 The radio freuuency linkThe r.f. link connects the output of the airborne multiplexer and the input of the demultiplexer on the ground.Because of the following reasons, relatively high transmission frequencies must be used:
(a) The electrical length of an antenna must be a significant fraction of the wavelength in order to obtain areasonable radiation efficiency. Thus, the size restrictions for airborne antennas require wavelengths small-er than about 3 m (frequencies greater than 100 MHz).
(b) The high bandwidth required for data transmission is only available at high frequencies.
According to the IRIG-standards in the USA the following frequency bands are with certain restrictions avail-able for telemetry (for more details see Ref. 12.6).
(a) 225- to 260-MHz band
* 16 channels for special military applications can be made on a nonprotective basis.
(b) 1435- to 1535-MHz band:
* 100 channels. Channel center frequency spacing in increments of 1 MHz (narrow band channels)
* medium band channels (3-MHz bandwidth) can be inserted in the channel plan by omitting the adjacentnarrow band channels or by keeping a medium band channel spacing of 3 MHz
* wide band channels can be provided by omitting five adjacent narrow band channels below as well asabove the wide band center frequency or by keeping a wide band channel spacing of 10 MHz.
(c) 2200- to 2300-MHz band:
0 100 narrow band channels in increments of 1 MHz
. medium band channels (3-MHz bandwidth) can be used by omitting the adjacent narrow band channelsor by keeping a medium band channel spacing of 3 MHz
• wide band channels can be used by omitting five adjacent channels below as well as above the wide bandchannel center frequency or by keeping a wide band channel spacing of 10 MHz.
(d) 2310- to 2390-MHz band:
0 80 narrow band channels in increments of 1 MHz
. medium band channels (3-MHz bandwidth) can be used by omitting the adjacent narrow band channelsor by keeping a medium band channel spacing of 3 MHz
0 wide band channels (5-MHz bandwidth) can be used by omitting two adjacent channels below as well asabove the wide band channel center frequency or by keeping a wide band channel spacing of 5 MHz.
This frequency allocation plan in general is true for the USA. In Europe the situation is different because ofdifferent usage of frequency bands in the European countries. In comparison to the above mentioned frequencybands ((a) to (d)) it can be stated:
(a) no frequencies available since 1/92
(b) for military applications a few selected channels can be made available by the responsible authorities
(c) no frequencies available
(d) no frequencies available
Document provided by SpaceAge Control, Inc. (http://spaceagecontrol.com/).
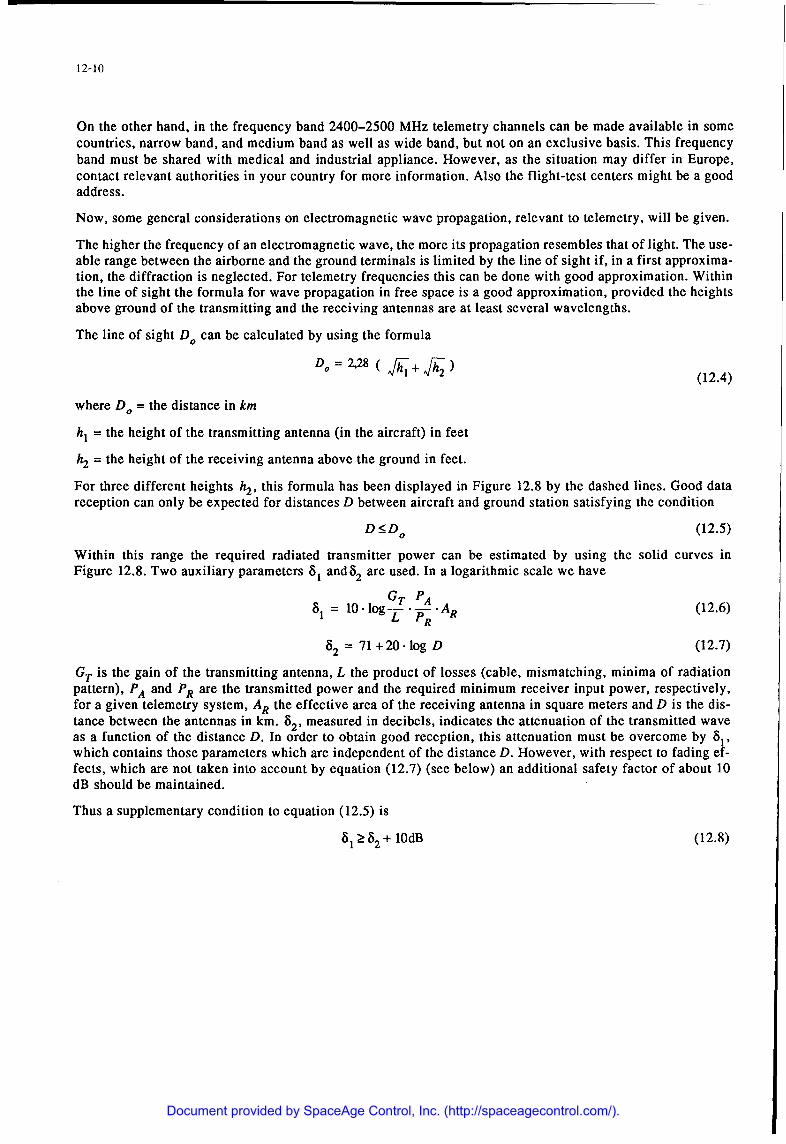
12-10
On the other hand, in the frequency band 2400-2500 MHz telemetry channels can be made available in somecountries, narrow band, and medium band as well as wide band, but not on an exclusive basis. This frequencyband must be shared with medical and industrial appliance. However, as the situation may differ in Europe,contact relevant authorities in your country for more information. Also the flight-test centers might be a goodaddress.
Now, some general considerations on electromagnetic wave propagation, relevant to telemetry, will be given.
The higher the frequency of an electromagnetic wave, the more its propagation resembles that of light. The use-able range between the airborne and the ground terminals is limited by the line of sight if, in a first approxima-tion, the diffraction is neglected. For telemetry frequencies this can be done with good approximation. Withinthe line of sight the formula for wave propagation in free space is a good approximation, provided the heightsabove ground of the transmitting and the receiving antennas are at least several wavelengths.
The line of sight Do can be calculated by using the formula
Do = 2,28 ( 51+ h2 )(12.4)
where Do = the distance in km
hI = the height of the transmitting antenna (in the aircraft) in feet
h2 = the height of the receiving antenna above the ground in feet.
For three different heights h2 , this formula has been displayed in Figure 12.8 by the dashed lines. Good datareception can only be expected for distances D between aircraft and ground station satisfying the condition
D: <Do (12.5)
Within this range the required radiated transmitter power can be estimated by using the solid curves inFigure 12.8. Two auxiliary parameters 81 and8 2 are used. In a logarithmic scale we have
GT PA81 = 10. log- . - .AR (12.6)
82 = 71 +20. log D (12.7)
GT is the gain of the transmitting antenna, L the product of losses (cable, mismatching, minima of radiationpattern), PA and PR are the transmitted power and the required minimum receiver input power, respectively,for a given telemetry system, AR the effective area of the receiving antenna in square meters and D is the dis-tance between the antennas in km. 82, measured in decibels, indicates the attenuation of the transmitted waveas a function of the distance D. In order to obtain good reception, this attenuation must be overcome by 81,which contains those parameters which are independent of the distance D. However, with respect to fading ef-fects, which are not taken into account by equation (12.7) (see below) an additional safety factor of about 10dB should be maintained.
Thus a supplementary condition to equation (12.5) is
I _> 82 + 10dB (12.8)
Document provided by SpaceAge Control, Inc. (http://spaceagecontrol.com/).

12-11
140 8 (dB) hi (feet)
PA= -1 W
I 2 0A 1W 100000120 PA = o.1 W
100 02 0 10 000
S.. .. ... -1 .......... 1000
1000/ '-
/ / / A 0
40 /,-" / /
-~/ 1020 '--h2 =0 /h 2 =lOft h2 =lOOft
S/ / •
0 I I I ,I I I I I I I I 1 11 2 3456 8 2 3 4 56 8102 2 3 4 56 8
10 Do D (km) ow 1
Figure 12.8 Simplified range calculation chart.
The plot of equation (12.6) in Figure 12.8 is based on a PCM/FM-system using an IF-bandwidth of 1 MHz andthe parameters GT = 1; L = 10; PR -- 1 • 10-13 W; AR = 1 m 2 and transmitter powers PA of 0.1 W, 1 W, and 10W. This is often a good approximation to the practical conditions.
Instead of the effective area of the receiving antenna often its gain GR is specified. The AR can be calculatedby using the formula
GA R X2 (12.9)
(X is the wavelength).
The use of Figure 12.8 will be made clear by the following example (see dotted lines): for a height of the aircraftof 1000 ft and a height of the receiving antenna of 3.3 m (10 ft) (see point 1), the line of sight is 80 km (point 2).
In order to fulfill equation (12.8), a transmitter power of about 1 W must be applied. (Compare point 3 and 4).The safety margin between 81 and 82 should be sufficient, especially when diversity reception techniques areused (see the following).
One of the fading effects mentioned above is the so called fading due to multipath propagation. Sometimes theantenna not only receives the wave coming directly from the transmitter but also a reflected wave (reflectedfrom the ground or from buildings), the phase of which is shifted with respect to the direct wave. Dependingon the heights and the distances of the antennas the phase shift may reach 1800. Thus the received signal powermay from time to time decrease considerably (see Ref. 12.5, Ref. 12.8, and Ref. 12.9).
It should be mentioned also that the curve 82 (D) at the limit of the line of sight is too optimistic. Beyond thislimit the wave-attenuation increases very rapidly. Therefore, little or no increase in range can be obtained evenif the transmitter power is substantially increased. On the other hand, the example shows that within the line ofsight reliable communication with relatively low transmitter power is possible.
An effective way to overcome the difficulties caused by fading is to use diversity reception techniques. Thistechnique uses two r.f. receivers (see Fig. 12.9). Each receiver is connected to a diversity coupler, which picksup waves of different polarization (polarization diversity), of different frequencies (frequency diversity) or atdifferent locations (space diversity) from at least two or more antennas. A predetection or post detection
Document provided by SpaceAge Control, Inc. (http://spaceagecontrol.com/).

12-12
combiner at the output of the receivers combines the weighted sum of both input signals. The weighting coef-ficients are controlled by the signal-to-noise ratio of the two receiver inputs, in such a way that the coefficientapproaches 1 for a good signal and 0 for a bad signal. Because of the different conditions of wave reflection itis not very probable that a loss of signal occurs at both inputs simultaneously. The probability of good recep-tion, therefore, is substantially increased (see Ref. 12.5 and Ref. 12.9).
ANTENNAS TAPE•[/ RECORDER
PREAMPLI- RECEIVER\ / FIER I I Of:
_j
D 010 0 OUTPUT
r•- (MULTIPLEXCn Cf SIGNAL)wH h0 PREAMPLI- RECEIVER
FI ER fl II
Figure 12.9 Principle of diversity reception.
The onboard transmitting antennas are mounted in a fixed position with respect to the vehicle. The axes of theseantennas may, therefore, have different directions with respect to the ground during a flight. Therefore, an om-nidirectional radiation pattern is desirable but cannot be achieved exactly. The freespace radiation patterns ofthe antenna systems that can be used on aircraft always show minima. In addition, the aircraft itself distorts theradiation pattern. Parts other than the antenna may re-radiate signals (parasitic radiation) which will interferewith the original signal. Furthermore, at some attitudes of the aircraft, the wing or the fuselage may interceptthe radiation to the ground station (shadow effects). Therefore, the layout of the airborne antennas must be donevery carefully, taking into account the expected attitudes of the aircraft during flight (see Ref. 12.8).
The airborne antennas are often X/4-stub or blade antennas, which have a linear polarization. Most of theground receiving antennas are circularly polarized in order to obtain a reception independent of the orientationof the airborne antenna. Turnstile or helical antennas are used for the 225-260 MHz band frequencies; circu-larly polarized feeds with a parabolic reflector are preferred for the higher frequency bands. For the latter fre-quencies higher gains GR must be used than for the lower frequency band in order to get the same effectiveantenna area AR. This is shown by equation (12.9). Considering the wavelength ratio of the highest and thelowest telemetry frequency of more than 10 a gain ratio of about 10 must be provided. The corresponding higherdirectivity at the higher frequency may cause problems with manual tracking of the receiving antennas, espe-cially with aircraft which fly at high speed near the ground antenna (high angular velocity). Therefore, auto-matic tracking (e.g., monopulse tracking) often is preferred, despite the higher complexity of the ground station.
At the receiving end of the telemetry link superheterodyne receivers with plug-in techniques are mostly used.Therefore, the receivers can easily be matched to different telemetry systems by choosing the proper tuningheads, intermediate frequency filters, and RF demodulators. In order to obtain good receiver input sensitivity(low value of PR in eq. (12.6)) the noise figure of the receiver must be kept low. A low-noise preamplifier sit-uated at the antenna is recommended, if it is not possible to locate the antenna near the receiver (see Fig. 12.9).The low-noise figure of the preamplifier then determines the noise figure of the receiving system. Special tun-ing heads are available for standardized telemetry receivers (IRIG-standard). Frequency converters of theantenna output can be used to convert non-standard frequency bands into an IRIG standardized band. Most te-lemetry receivers can be equipped with an accessory unit for postdetection or predetection diversity combining.
Document provided by SpaceAge Control, Inc. (http://spaceagecontrol.com/).

12-13
12.2.4 Ground data processing, r lcrding. and disolayThe recovered data signals on the ground must be manipulated with respect to different aspects. They have to be
- displayed for quick-look and documentation
- processed, on-line as well as off-line, in order to get the wanted information out of the mass of raw data
- stored for off-line data processing and repetitive trials.
These different aspects shall be explained shortly by the use of Figure 12.10.
Receiving ODemulti- Data -O line -Pointer lnstr.-I SRcevigtemulti Data D---ta -Stripchart: Rec. tlS plexer Distributer I- -xy Record.
L ProcessingI L-Llectr. Displays'
r- TopeT-- --Ipu1e7 --Predletection . Postdetectjon - Computer Off -line
Tape Tape Data IRecorder Recorder . Recorder Processing I
Figure 12.10 Block diagram of ground data processing, recording and display.
Display: Quick-look display usually is done with pointer instruments as well as with strip-chart recorders, X-Yrecorders, and electronic displays. Data signals containing frequency components higher than 100 Hz may berecorded by oscillographic recorders. These papers recorders have the advantage of being both a display and astorage equipment. On the other hand, the storage capacity does not meet the high requirements of modern flighttests. Moreover, the stored information can only be converted back into an electrical signal with great difficulty.
Data processing: Selected sets out of the quantity of demultiplexed data must be processed on-line or off-line,respectively, in order to separate the essential information of a flight test from the large amount of raw datawhich are of little or no interest for the flight-test engineer.
As the data measured in the aircraft are immediately available in the ground station, on-line data processingmakes it possible to gain relevant test results while the flight is in progress. Thus, modifications to the flighttest programme can be made during the flight. Experience has shown that this can reduce the number of flightsrequired in a test programme and can increase the efficiency considerably.
Often, in addition to on-line data processing, off-line data processing must be used. Limitations with respect tothe available on-line computing operations may restrict the on-line processing to those parameters which areessential for the successful control of the flight test. Detailed investigations with time consuming computationsthen have to be done off-line.
Nowadays, the computers in the ground station are exclusively digital. Besides the tasks of on-line/off-line dataprocessing, they can be used advantageously for other tasks in the ground station such as
- decommutation of PCM signals
- automatic control of the receiving antenna, applying automatic search patterns with high-directivity an-tennas and switch-over to autotracking when acquisition is obtained etc.
- setup of the telemetry system units (receivers, decoders, distributors).
The problems of on-line and off-line data processing are discussed in more detail in Chapter 10.
Recording: For recording of the received data signals magnetic tape recorders have excellent properties andthey are therefore standard equipment in telemetry ground stations. Mainly the method of post-detection record-in is used, in which the frequency-multiplexed signal (FM/FM-system) or the time-multiplexed signal (PAM/-FM and PCM/FM system) at the output of the IF-demodulator is recorded on one track of the tape recorder in
Document provided by SpaceAge Control, Inc. (http://spaceagecontrol.com/).

12-14
the direct mode or in the FM mode. The demultiplexing is done during playback. This method allows the re-cording of a great many of data channels. However, it is also possible to do the demultiplexing of the receivedsignal on-line, and to record the individual data signals directly on different tracks of the tape recorder. Thismethod obviously is limited by the maximum number or tracks of the recorder (generally 14 tracks with 1-in.tape width).
With the availability of recorders with continuous recording capabilities up to frequencies of 2 MHz the directrecording of the receiver intermediate frequency (third IF; maximum 900 kHz; see Ref. 12.7) prior to demod-ulation became possible. The main advantage of this so called predetection recording is that operation as wellas maintenance of ground stations is simplified, especially for those using several telemetry methods (FM/FM,PAM/FM, PCM/FM). This is the case, because the recording method is the same regardless of the type of mul-tiplexing used. In post-detection recording, on the other hand, the recording method (direct recording or FMrecording) must be matched to the type of multiplexing.
Another benefit of predetection recording is given with respect to the signal-to-noise ratio, for it is advanta-geous to record the signal as early in the transmission chain as possible. The optimization of the playback chan-nel with respect to the signal-to-noise ratio (e.g., varying the IF bandwidth and consequently the demodulatorthreshold) needs to be done prior to reception but can be performed later by repetitive trial and error, while, inpost-detection recording, the IF bandwidth must be chosen on the basis of an expected RF signal bandwidthbefore the test begins.
The bandwidth requirement of the predetection recording process, however, supercedes that of the post-detec-tion recording process by far. Therefore, in high data rate systems only post-detection recording can be used.
In connection with on-line data processing a further method of data recording is important. Those data, whichare of relevance to the situations of the flight test to be investigated are fed to the ground on-line computingsystem (see above). Here they are transferred into a computer compatible format and stored on a computer com-patible tape recorder. These data, in general, are sufficient for on-line as well as for off-line data processing.Thus, off-line investigations can be done by using these data, i.e., the telemetry system itself is not needed.Only in the case of unexpected situations like failures in the modules to be investigated will the original tapecontaining all telemetered data be used and the demultiplexer of the telemetry system is needed.
12.2.5 Encryption of data informationIn flight testing it is often required to keep the test data and results secret. But, as the telemetry signals areradiated in the free space, the reception of the r.f. signal by unauthorized parties can not be avoided. In contrastto the reception of speech as well as of pictures or written text, however, telemetry signals are subject by natureto a certain secret coding. In the case of PCM the receiver has to know the frame length, the synchronizationpattern, the word length, the physical representation of the data words, and the scaling factors in order to makethe message readable. But, most of these parameters can be found out by using more or less intelligent methods.Only the physical meaning of the data words and the scaling factors are difficult to deliberate.
A further protection of the data can be obtained by using the methods of encryption. Very refined methods havebeen developed (see Ref. 12.10). A relatively simple principle is shown in Figure 12.11.
It uses an n-stage shift register and a feedback network of modulo 2 adders (exclusive OR-gates), with the coderas well as with the decoder. The coder transforms the PCM data bit stream into a pseudo-random bit sequence,while the decoder re-transforms this bit sequence into the original bit stream. The main advantage of the chosenprinciple is that no special synchronization signals are needed. When the decoder is switched on, at the latest,after n clock periods the decoded bit stream is error-free.
The switches in the coder and the decoder can have the state "on" or "off." In order to get a correct decoding,however, the switches in the decoder must be set exactly in the same pattern as in the coder. Therefore, theauthorized receiver must know the length n of the shift register and the switching pattern of the coder. Thereare 2`1 different possibilities.
A further refinement of this method can be obtained in the following way. By use of programmable switchesthe switching pattern can be changed several times during a flight test. The change can be initiated by the con-tents of a frame counter at pre-programmed numbers. As the frame counter word is transmitted with the telem-etry data frame the change of the switching pattern can also be done by the authorized receiver in the groundstation. Thus, the decoding of the coded data stream by unauthorized receivers is still more difficult.
Document provided by SpaceAge Control, Inc. (http://spaceagecontrol.com/).

12-15
clock clock
coded N-stage N-stoge
bchwv, shiftregister shiftregister I
uncoded'
nccoded
channel nose 3h N-2 N-1o rat ismlilented coded by 2 ceti N-2or This mutpiai Nfatri
mod 2 \S S 21 \ S3 SN-2 SN-1 Sinl ~ 2 S32 N
adder decoded
Coder Decoder
Figure 12.11 PCM-data encryption by randomization of data bits.
The main advantage of the described method is its simplicity and its ability of self synchronization. One draw-backnhowever, should be mentioned. In the case of bit errors in the received data stream, for instance due tochannel noise, the bit error rate is multiplied in the decoder by a certain factor. This multiplication factor ismA+ where meis the number of feedback paths in use If one switch in the coder/decoder is closed, i.e., m = 2,the multiplication factor is 3. Thus, it is not recommendable to use many feedback paths simultaneously. Thisrestriction can reduce the number of coding possibilities considerably.
It should further be mentioned that the described coder/decoder principles in a special configuration are usedfor recording of NRZ-L coded PCM-signals on magnetic tape (see Ref. 12.11) in order to randomize the dataand to reduce by this way dc-components in the signalg, In this application n = 15 is chosen and only the path
1n - an is closed. The bit error multiplication factor is 3.
Another method, recommendable for encryption of telemetry data, is the use of spread spectrum techniques. Atthe cost of raised RF spectrum width, some further advantages can be obtained, besides the encryption effect,e.g.,
- rejection of background noise and of interference signals
- rejection of jamming signals
- independence of the type of telemetry system; analog systems can be used as well as digital systems.
The basic principles used in spread spectrum techniques are phase hopping and frequency hopping. For moredetails see (Ref. 12.11).
12.3 TRIG-STANDARDIZED TELEMETRY SYSTEMS
The layout of telemetry systems used for flight testing, follows nearly exclusively, after the standards of theInter Range Instrumentation Group (IRIG, see Ref. 12.7). These standards were continuously adapted to thepractical needs and the state of the art within a period of a few years. Thus, standards were extended with re-spect to the number as well as the bandwidth of available data channels. On the other hand, some systems likePDM/FM and DSB/FM were removed from the standards. The latest version of the standards contains threebasic telemetry systems, which are shortly described in the following. Combinations of the basic systems arealso possible.
12.3.1 FM/FM SystemsThese systems make use of frequency modulated subcarriers for multiplexing (frequency division multiplexing,see paragraph 12.2.2.1). The multiplexer output signal modulates the RF carrier also by frequency modulation.Two different subcarrier channel plans are established. In the first plan the bandwidths of the available channels
* The use of a baseline restoration circuitry with the bit synchronizer is mandatory.
Document provided by SpaceAge Control, Inc. (http://spaceagecontrol.com/).
12-16
increase in proportion to the center frequency. In the second plan the bandwidths of the data channels are con-stant and do not vary with the center frequency.
The channel plan of the Proportional Bandwidth FM Subcarriers (PBW) encloses 25 channels. The subcarriercenter frequencies range from 400 Hz to 560 kHz. In order to get a good adaptability to varying data bandwidthrequirements three groups are established using different frequency deviations; namely +7.5% of +15% and+30% of the subcarrier frequency. When the higher frequency deviations are used the number of channels mustbe reduced in order to prevent crosstalk between adjacent channels.
The channels of the three groups also can be used in a mixed configuration. Then, the omission of frequenciesmust be done in accordance to the type of neighbour channels.
The Constant Bandwidth FM Subcarrier (CBW) channel plan presents seven groups. The data channels in eachgroup have equal frequency deviation and, in consequence, equal data bandwidth.
In the first group (A channels) the frequency deviation is +2 kHz and the nominal frequency response is 0,4 kHz. The maximum number of channels in this group is 21.
In the second group (B channels), the deviation as well as the frequency response is doubled. In order to avoidchannel interference some carrier frequencies of the group A must not be used for group B channels. Elevengroup B channels are available (32 B to 192 B; the numbers indicate the carrier frequency in kHz).
By using the same principle further groups (C to G) are derived. The highest defined subcarrier frequency is1024 kHz. The highest nominal data frequency response of 25,6 kHz is provided by channel 1024 G.
Tape Speed Control and Flutter Compensation. The received data signals in general are stored on magnetic tapein the ground station. Because in FM systems, the data information is translated into a frequency deviation thetape speed must be exactly the same during recording and reproduce. Every tape speed difference will cause anerror in the reproduced signal.
It can be distinguished between two groups of errors:
(a) long-term tape speed errors, which cause frequency offsets
(b) short-term tape speed error or flutter, which cause noise in the demodulated data signal
The long-term tape speed error can be minimized by applying a reference signal to the tape during record. Dur-ing reproduce this reference signal is used to servo-control the reproducer tape speed.
The same method can be used for compensating the flutter components of the tape speed error. However, in thiscase a special discriminator demodulates the erroneous reference frequency, thus generating an error signal.This signal is fed to the flutter compensation input ports of the data discriminators in order to compensate theflutter noise. For more details see Ref. 12.6.
12.3.2 PAM/FM SystemsPAM/FM is a comparatively simple and effective analog telemetry method. The analog data signals are sampledby the PAM encoder and serially ordered to a data frame (time division multiplexing). This multiplex signalthen frequency modulates the RF carrier. The IRIG-standards distinguish between two different PAM patterns.These are the 50% duty cycle PAM and the 100% duty cycle PAM. They are also called return to zero PAM(RZ-PAM) and non return to zero PAM (NRZ-PAM). For more details see Ref. 12.6.
12.3.3 PCM/FM SystemsBecause of their accuracy, efficiency, and flexibility nowadays PCM/FM-systems are in wide-spread use(Ref. 12.12). The data signals are multiplexed by the time-division method (see Section 12.2.2.2) and encodedby PCM (see Section 12.2.1.2). The serial bit stream then frequency-modulates the RF-carrier. Sometimes,however, phase modulation (i.e., a derivative of frequency modulation) is used.
12.3.3.1 Overall system considerationsThe basic functional blocks of the PCM encoding and decoding systems are illustrated by Figures 12.12 and12.13, respectively.
Document provided by SpaceAge Control, Inc. (http://spaceagecontrol.com/).

12-17
In Figure 12.12 the data encoder is shown. Two groups of data signals can be applied to the input connectors,i.e., analog signals and digital signals. The normalized analog signals are sampled and aligned by an analogmultiplexer. An A/D-converter converts the analog samples into bit-parallel digital words which are fed intothe merger. The second group of data signals consists of parallel digital data words. Also signals from digitaldata buses (see Chapter 9.3.2.3 and 9.3.2.4) can be integrated into the set of digital data words. All these aremultiplexed by the digital multiplexer. The bit-parallel and word-serial output signal of this multiplexer also isfed into the merger, which combines the series of bit-parallel data words stemming from the digital sources withthose from the analog sources. The merger is followed by a parallel-to-serial converter in order to generate aword-serial and bit-serial bit stream. Finally, a code converter provides the appropriate codes for RF-modula-tion and magnetic tape recording, respectively (e.g., biphase level and scrambled NRZ). All these different pro-cesses must be performed in exact synchronism. A system control unit takes care of this.
a0Q1
C 0
.0 0
E •to On- Board
F 1M a Tape Recorder
Ero -eeie Bi Fr.m tod Dta DitChbuter
C ne ergr l Converter
Signals from Digital Data Buses
Figure 12.12 PCM data encoder.
from Receiver [Bit Frame
O utp ut S yn ch ro n . - - - Sy n ch ro n . - - to D ata D istrib u te r,.• .... •-Word Number
SCode System
JConverter Control
to PostdletectionTape Recorder
Figure 12.13 PCM data decoder.
Document provided by SpaceAge Control, Inc. (http://spaceagecontrol.com/).
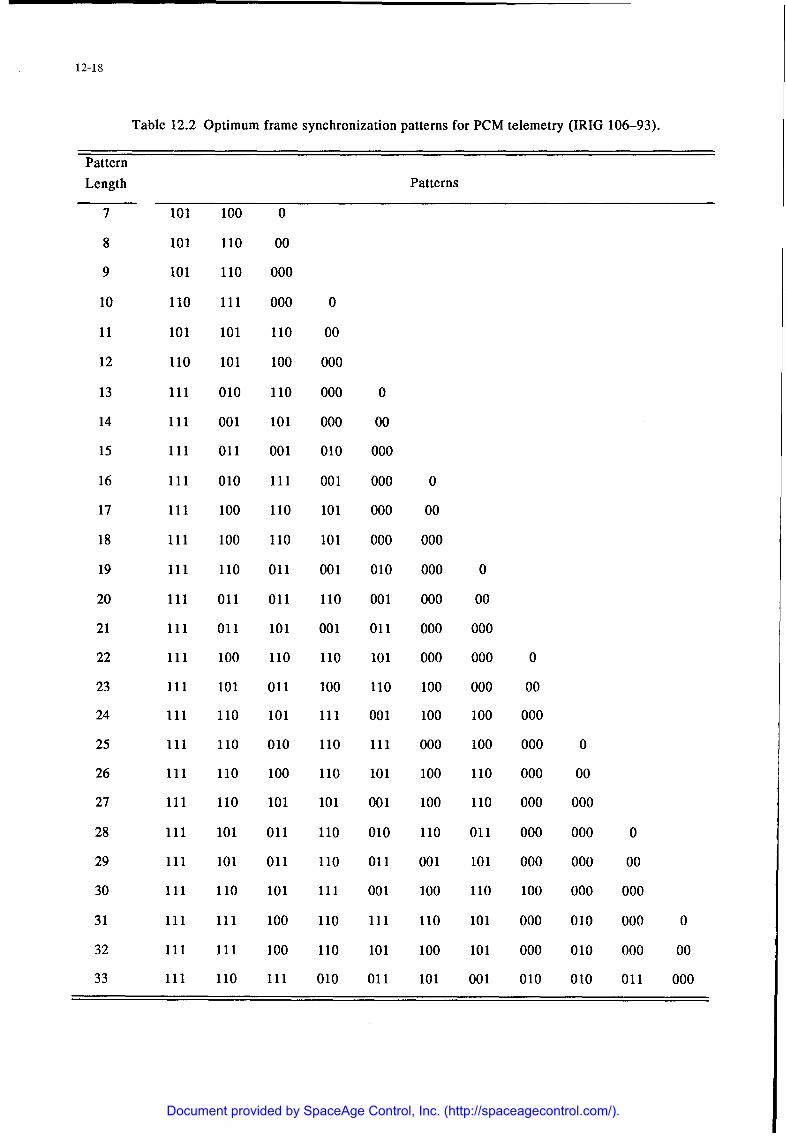
12-18
Table 12.2 Optimum frame synchronization patterns for PCM telemetry (IRIG 106-93).
Pattern
Length Patterns
7 101 100 0
8 101 110 00
9 101 110 000
10 110 111 000 0
11 101 101 110 00
12 110 101 100 000
13 111 010 110 000 0
14 111 001 101 000 00
15 111 011 001 010 000
16 111 010 111 001 000 0
17 111 100 110 101 000 00
18 111 100 110 101 000 000
19 111 110 011 001 010 000 0
20 111 011 011 110 001 000 00
21 111 011 101 001 011 000 000
22 111 100 110 110 101 000 000 0
23 111 101 011 100 110 100 000 00
24 111 110 101 111 001 100 100 000
25 111 110 010 110 111 000 100 000 0
26 111 110 100 110 101 100 110 000 00
27 111 110 101 101 001 100 110 000 000
28 111 101 011 110 010 110 011 000 000 0
29 111 101 011 110 011 001 101 000 000 00
30 111 110 101 111 001 100 110 100 000 000
31 111 111 100 110 111 110 101 000 010 000 0
32 111 111 100 110 101 100 101 000 010 000 00
33 111 110 111 010 011 101 001 010 010 011 000
Document provided by SpaceAge Control, Inc. (http://spaceagecontrol.com/).

12-19
Figure 12.13 illustrates the basic functions of the PCM data decoder. At the RF-receiver output the serial PCMbit stream is available. With bad receiving conditions, however, the received bit stream may be contaminatedconsiderably by noise compared to the transmitted bit stream. It is the task of the bit synchronizer to decide foreach noise-contaminated bit to represent a one or a zero. At the output of the bit synchronizer the bit stream isnoise-free but some bits may be false because of a false decision of the bit synchronizer. However, the proba-bility of false decisions decreases rapidly with increasing S/N ratio at the input of the bit synchronizer.
A second task of the bit synchronizer is the regeneration of the clock frequency out of the noisy bit stream. Thisclock frequency is needed by the system control unit in order to control the different processes in the framesynchronizer.
MINOR FRAMEMAX LENGTH
CLASS I - 8.192 Bits or 512 WORDSCLASS II - 16.384 Bits
MINR RAE SNC 1 2 (W. 1) *ii~i 1
CD0
I*
u MAJOR FRAME
MINOR FRAME SYNCH 11 2 NWZ, -1
"* BY DEFINITION A MAJOR FRAME CONTAINS N * Z WORDS."-Z- =TTHE NUMBER OF WORDS IN LONGEST SUBFRAME. (Max.256)"N" = THE NUMBER OF WORDS IN MINOR FRAME.
"• MINOR FRAME SYNCH IS CONSIDERED ONE WORD, REGARDLESS OF LENGTH.
Figure 12.14 PCM frame structure.
The main task of the frame synchronizer is to detect the frame synchronization word which is embedded in thedata bit stream. After detection, the consecutive data words in the data frame can be identified easily by count-ing the clock pulses as the word length is known.
While the bit format in the bit synchronizer as well as in the frame synchronizer normally is NRZ-L, anotherformat must be provided for post-detection tape recording, e.g., biphase, scrambled-NRZ or Miller code. There-fore, a code converter must be provided.
Figure 12.14 illustrates some definitions which are given by the IRIG standards (see Ref. 12.6). The "minorframe" is the basic frame in the system. It contains N words. The first word is the synchronization word. Whilethe N-i data words are of equal length, the length of the synchronization word can be freely chosen. The rec-ommended synchronization patterns are given in Table 12.2. In general, the stability of synchronization increas-es with the length of the synchronization word at the cost of data bits. The synchronization process is discussedin some more detail in the next paragraph.
Document provided by SpaceAge Control, Inc. (http://spaceagecontrol.com/).

12-20
In the last edition of the IRIG-standard two classes of PCM-systems are defined. While the Class I-standardscover the basic and simpler systems which normally are used and are close to the former standards, Class II-standards are new. They cover special and more complicated applications. Therefore, they are not explained inthis chapter. If required, see Ref. 12.6.
In Class I PCM systems the upper limit of N is 512 or 8192 bits, whatever is greater. If one or more subframesare used, a major frame can be defined. Supposedly, the longest subframe contains Z words (Zmax = 256) themajor frame length takes N. Z words.
The synchronization of the subframe can be done easily by the use of a minor frame counter. It starts withnumber 1 when the first data word of the subframe is taken into the minor frame. Thus, the counter contains thenumber of the subframe data word. When the counter number equals Z a counter reset takes place.
12.3.3.2 Special system aspectsFor the bit detection process in the bit synchronizer in general two methods are in use, i.e., the filter and samplemethod and the integrate and dump method. With the first method the noise-contaminated bit stream is passedthrough a low pass filter having a corner frequency of 0,7 x bit rate*. Towards the end of the bit period thefilter output signal is sampled and the decision for a one or a zero is derived from this sample. With the secondmethod the noisy bit stream is fed into an integrator which is set to zero at the beginning of a bit interval by asuited timing signal. The one/zero decision is derived from the amplitude of the integrator output signal at theend of the bit interval right before the signal is set back to zero again. The required timing signals for bothmethods are gained from the noisy bit stream by a phase lock loop (PLL) bit rate generator.
The precise detection of the location of the frame synchronization word is of utmost importance for thedecommutation process in PCM. Displacements in the order of half a bit disturb the correlation of bits and theirpositions in the data words which leads to a complete system breakdown. Therefore, powerful synchronizationmethods must be applied. Figure 12.15 shows the principle of frame synchronization by correlation. The select-ed synchronization word is stored in a correlator. The serial bit stream which was cleaned from noise in the bitsynchronizer is fed into a shift register under control of the bit clock. A comparator compares the status of theshift register cells for each shift step with the corresponding cells in the correlator. When the contents of allo-cated cells are equal the comparator output signal level is raised by one step for each correspondence. Thus,the maximum level is M steps, supposing a synch word length of M bits. This situation occurs when the exactsynchronization word is loaded in the shift register. A shift of one bit will cause a drastic reduction of the crosscorrelation function because the recommended synchronization patterns are selected with respect to this behav-ior. The comparator output signal is fed to the threshold detector. This unit provides the frame synchronizationpulse, when a preselected threshold is surpassed. The highest allowed threshold level is M-1 steps. However,with regard to bit errors caused by the noisy transmission channel a few bit errors should be allowed. Thus thethreshold level would be M-1-k steps, when k is the number of allowed bit errors in the synchronization word.
Synchr. Pattern
S11 011 1111 0 0 0 0 Error Allowance
.Frame Synchr.Comparator Threshold Detector Puls
Shift lol 10 01 0l 011 1 K0 ilol 1 1 10 0 10 0 0 0 1 0 111 11 ShiftDirection Data Bit Synchr. Pattern--- Data Bits Direction
Shift Register
Figure 12.15 Frame synchronization.
NRZ-bit format presupposed.
Document provided by SpaceAge Control, Inc. (http://spaceagecontrol.com/).

12-21
In Figure 12.16 some more details are visualized. For a 22-bit pseudo random bit pattern which is embedded inthe data bit stream, two cross correlation functions are plotted. In the first case, called best case, it is assumedthat the data bits which are loaded in the shift register during the shift process are the complement of the cor-responding bits of the loaded synchronization word. In the second case, called worst case, it is assumed thatthey are equivalent. In reality the cross correlation function must be between the worst case and the best casecurve. From Figure 12.16 the following conclusions can be drawn.
1. The correct position of the synchronization word can be identified because of the distinct peak of the crosscorrelation function at zero shift
2. The same correlation level can occur in principle with mere data bits with regard to the worst case curve.However, the probability of occurrence is very low and decreases with the length of the synchronizationword
3. Even the synchronization pattern in the PCM data stream is not error-free, e.g., because of wrong decisionof the bit synchronizer at extreme noise situations, an exact detection of the synchronization pattern posi-tion can be expected when a few errors are allowed in the frame synchronizer.
22
20 -worst case
18
16
14
12
10
8
6
4 •best case2
0-20 -15 -10 -5 0 +5 +10 +15 +20 to n Bit
Figure 12.16 Cross-correlation function of the pseudo random bit pattern 11100010010 + complement (22 bit)embedded in the data bitstream.
12.3.4 Hybrid SystemsIn order to get a better adaption of the telemetry system to the requirements of the flight test, combinations ofthe methods which are described in Sections 12.2.1 to 12.3.3 can be advantageous. Thus, a better system per-formance with respect to number, bandwidth, and accuracy of the data channels can be obtained. This matterwill be illustrated in the following by some examples.Because of the complex structure of hybrid systems a clear nomenclature should be applied. In this paragraph
the following form is used
Example: (PAM/FM-FM) / FM
Multiplexing/RF-carriermethod modulation
The combination of multiplexing methods is taken in parenthesis. The RF carrier modulation method is sepa-rated by a / from the multiplexing method, as usual. In addition, some more explanations must be given in orderto exactly specify the multiplexing method, i.e., RZ/NRZ for PAM and proportional bandwidth (PBW) orconstant bandwidth (CBW) for FM subcarriers and the code designation for PCM.
Document provided by SpaceAge Control, Inc. (http://spaceagecontrol.com/).

12-22
(PAM/FM-FM)/FM Systems: This designation assigns the FM modulation to the r.f. carrier. The multiplexer issplit into two parts. One part uses conventional FM-subcarriers (see section 12.3.1). These may be PWB- oiCBW-subcarriers. One (or more) of these subcarriers is modulated by a PAM-multiplex signal. Thus, the num-ber of available channels can be enlarged considerably. The following example will illustrate this method.
FM/FM-part PWB-FM channels 1 to 17; ±7.5% frq. dev.; Modulation Index M = 5; data frequencyresponse from 6 Hz to 790 Hz; 17 channels
PAM/FM/FM-part PBW-FM channel 18 is modulated by the output signal of an 18 channel/25 frame/sPAM-multiplexer; 16 data channels (+2 synchr.) are available, offering about 5 Hz fre-quency response each.
Thus, the channel plan of the FM/FM-system is extended to lower frequencies by a set of 16 constant bandwidthchannels, offering a frequency response of about 5 Hz.
(PCM-FM)/FM Systems: In this group of systems a PCM/FM-system is combined with an FM/FM-system, uti-lizing the same RF transmitter.
In a first configuration the PCM part covers the bulk of the channel requirements, while a few wide band FM--subcarrier channels are added in order to process and transmit a correspondent number of high-frequency data.This method is illustrated by Figure 12.17. The low pass filter is tuned to 200 kHz.
PC - V lp exer LwPsF PCM - Multplex F~~ter 8tr ite - x(125+5)wordm x2 5 o fram•_e=256kb/s
j i 250 FCrmeS/s
U \(
FM - Subcarrier
/
"CCh 256 C; M=4
C ',_ __ _ _ __ _ _
I-, FM - Subcorrner
Ch. 288 C; M=4
Figure 12.17 Extension of a PCM/FM system by two FM-subcarrier channels (PCM/FM-FM)/FM system.
With only slight modifications a second configuration can be derived from Figure 12.17. The main part is anFM CBW subcarrier system, i.e., to be used for flutter investigations on aircraft. Instead of only two FM-sub-carriers a complete set of 11 CBW B-channels, offering a data frequency response of 1 kHz at M = 4, is used.The rest of the data with less demanding frequency response are processed by a PCM-multiplexer with the fol-lowing features: bit-frequency 26 Kb/s; format NRZ-L; 8 bit/word; 32 words/minor frame; 100 frames/s. Whenmore low-frequency channels are required a subframe can be provided. The low pass filter between the PCM--multiplexer and the summing amplifier is tuned to a corner frequency of 20 kHz.
12.4 AN APPROVED UPLINK-DOWNLINK TELEMETRY SYSTEMA telemetry system will be described which is very similar to the approved system used for flight tests by theGerman Aerospace Research Organization DLR in Braunschweig.
Document provided by SpaceAge Control, Inc. (http://spaceagecontrol.com/).

12-23
In flight testing the origin of the bulk of the data usually arise from sensors onboard the aircraft. These data,analog as well as digital, may be related to the position of the aircraft (from navigational sensors, e.g. INS,GPS, VOR, DME) or to performance parameters of avionic components under test or to house-keeping param-eters of the aircraft or to other sources. In general the corner frequencies of these parameters are within the lowand medium frequency region. In the system under discussion additionally two wide band channels are provid-ed. The first is used for the transmission of the IRIG-B time code signal and the second carries the onboardintercommunication signal which proved to be a very useful information in the quick-look station on the ground.
However, often there are data sources on the ground the information of which are needed or may be helpfulonboard the aircraft. These are data concerning the flight path (from RADAR or Laser tracker) or the wind (di-rection and speed) or special data out of the ground data processing facility. These parameters, again, are oflow to medium frequency contents. In the system under discussion two wide band channels are provided alsoin the uplink. These are used for the IRIG-B time code channel and the speech signal of the ground controlcenter, which may be helpful for the flight test engineer onboard the aircraft.
As previously discussed (see Section 12.2.3) in flight testing often severe problems arise due to shadowing ofthe onboard antennas and due to multipath wave propagation. In order to get a reliable data connection, withthe uplink as well as with the downlink, diversity techniques are applied extensively. In the uplink the spacediversity principle is applied by using two receiving antennas at opposite locations at the aircraft, i.e., one atthe bottom of the fuselage and one on the top of the fin. Thus, shadowing of both antennas at the same time isvery unlikely. In the downlink more effort has to be spent. Two transmitting antennas are positioned about atthe locations of the receiving antennas. So, again the space diversity principle is effective. But, in order to pre-vent interferences of the electromagnetic radiation of both antennas different carrier frequencies must be ap-plied. Therefore, the frequency diversity principle is also effective. In practice, this design has proved to bevery reliable even at very dynamic maneuvers of the aircraft.
The block diagrams of the onboard system and of the ground system are plotted in Figures 12.18 and 12.19,respectively.
Jptirk Downlink
Wide Bond Data Avionic Data On-Board Data Wide Bond Data
;ntercom Time Code ARINC 429 Bus, Digital Analog Time Code Intercomground on-board
Quic Loo Intr me t nd Cosplay teerto
Ao~oo Di ogital t AalogOn-board Data Processing Facility r
m., V .,itte mit
Comb. Antenna 1 Comb. Antenna 2
Figure 12.18 Telemetry on-board system.
Document provided by SpaceAge Control, Inc. (http://spaceagecontrol.com/).

12-24
UI•ok Downlirk
Steerobre Parabolic Disk Antennas
L-dna S-Band
Tr? P-
Groundnalog
IRI FoM Lo~it•o
or irom anFM s iin or Coder
II-tiecdsIgnal.o Theemheeod sinl r obndito bynao sm in ampifie andk fntuednto the modula| Itiron
Mroznare used).r
eh Ground Data processing FacilityFigur 12.9 Teemetr grond sstem
Dwnlink: The rounbd data, alog ael tansitaldotegou, are properly conditioned by the goe ngoa
dtprcsigfcility. The PCM encoder genrats thePM serialPM bitstream uigtebpasecdiabng princfiplterinit the sm atansmittocur signa thedowrin. Howtevr bechause ofeisd the lower biparte of 8,btsthersetu islontar tohe dowevn-ar
to wide bandspchan nes Th usd tworteieco-gnladorn FM subcarriersaeudwihrepitod abovder the PCMnspectrum.
TheB time code signalt Thmes thime poportionalbianadwi ch annel Ao anIdte gru nd Dinteommpuniation
groun are used)
speech signal of the proporsi ty recioinal bandw mi h ce l C. The Pis lim ied by a lo w pass filter andtcom
tranptsmitter two tr147 tMez (in the case of the considered system the transiteis antenna ao eis anparabolic
provides the ground data processing facility as well as the quick look facility with the required data signals.
Uclyink: The ground data, analog as well as digital, are properly conditioned by the ground data processing fa-cility. The PCM encoder generates the PCM serial bitstream using the biphase coding principle in the same wayas it occurs in the downlink. However, because of the lower bit rate of 8,3 Kbit/s there is, contrary to the down-link, no sufficient spectrum bandwidth available below the relevant PCM biphase spectrum for positioning thetwo wide band channels. Thus, two FM subcarriers are used, which are positioned above the PCM spectrum.The time code signal modulates the proportional bandwidth channel A and the ground intercommunicationspeech signal the proportional bandwidth channel C. The PCM spectrum is limited by a low pass filter and com-bined with the two wide band channels by a summing amplifier. The combined signal modulates the groundtransmitter (fc = 1479,5 MHz in the case of the considered system). The transmitting antenna also is a parabolicdisk which is mounted at the pedestal of the autotrack receiving antenna. Thus, the radiated beam is automati-cally directed to the aircraft.
Document provided by SpaceAge Control, Inc. (http://spaceagecontrol.com/).

12-25
Onboard the RF signal is received by two monopole antennas, as already explained, and processed by the di-versity receiving system. The wide band channels then are filtered out and demodulated by the associated dis-criminators while the PCM bit stream are filtered out and demodulated by the associated discriminators whilethe PCM bit stream is selected by a low pass filter. The PCM decoder (the bit synchronizer is assumed to beincorporated) feeds the data into the onboard data processing facility as well as into the quick-look facility. Thelatter also displays selected processed data, which are useful for the flight test engineer.
The Figures 12.18 and 12.19 show that the data processing facilities, onboard as well as on the ground, are used
for the uplink and for the downlink simultaneously. The same is the case with the tape recorders (computer re-
corders as well as analog recorders for the multiplexed output/input signals). The latter proved to be useful as
a backup in th& case of unexpected RF signal lost or post-flight investigations of the transmitted uplink/down-link data.
The master time code is generated on the ground. The onboard time code generator, however, is synchronizedby the received time code signal from the ground. In the ground data processing facility the correspondence ofthe master time code and the received onboard time code is checked and adjusted if necessary. Thus, all data,uplink as well as downlink, can be associated with the corresponding time of occurrence even when interrup-tions in the RF reception occur.
The design of the system may be cleared up further by the following list of system parameters.
Downlink:
" PCM-part
- 210 words/frame (208 data + 2 synchr.)
- 12 bit/word .- 2520 bit/frame
- 54 frames/s ,- 2520 . 54 = 136080 bit/s
- biphase coding " fu = 1,4 1 = 190,5 kHz
" fL =0,3 fbit = 40,8 kHz
"wide band channels (allocated below the PCM spectrum)
- timecode IRIG-B: risetime of coded pulses _< lms required
, IRIG prop. bandwidth channel A:fcarrier = 22 kHz; mod. index m = 1
upper frequency limit fu 22 kHz • [1 + 0.15(1 + 1)] = 28,6 kHz
lower frequency limit fL 22 kHz • [1 - 0.15(1 + 1)] = 15,4 kHz
- intercommunication signal, ranging from 100 Kz to 6 kHz
Thus, sufficient guard bands between the different spectrums are given.
Uplink:
"* PCM-part
- 16 words/frame (14 data + 2 synchr.)
- 13 bit/word (12 data + 1 parity) -- 208 bit/frame
- 40 frame/s -* 8,32 kbit/s
- biphase coding fu = 1, 4 fbit= 11,65 kHz
"fL = 0, 3 1 = 2,50 kHz
"* Contrary to the situation with the downlink, the frequency band below fL cannot be used for the wide bandchannels.
Document provided by SpaceAge Control, Inc. (http://spaceagecontrol.com/).

12-26
- Wide band channels (allocated above the PCM spectrum)
- time code IRIG-B again, IRIG prop. bandwidth channel A is used
'" sufficient guard band between
fu pCM = 11,65 kHz and fL = 15,4 kHz (see above)
- intercommunication signal ground
IRIG prop. bandwidth channel C is used (fcarrier = 40 kHz)
(channels A and C are allowed to be used simultaneously)
12.5 REFERENCES12.1 Nichols, Myron H. and Lawrence L. Rauch, Radio Telemetry, 2nd Edition, John Wiley and Sons, Inc.,
NY, NY, 1956.
12.2 Aerospace Telemetry, Vol. I, Harry L. Stiltz, editor, Prentice-Hall, Inc., Englewood Cliffs, NJ, 1961.
12.3 Handbook of Telemetry and Remote Control, Elliot L. Gruenberg, editor in chief, McGraw-Hill BookCompany, NY, NY, 1967.
12.4 Aerospace Telemetry, Vol. 2, Harry L. Stiltz, editor, Prentice-Hall, Inc., Englewood Cliffs, NJ, 1966.
12.5 Becker, A., "The Role of Telemetry in the Modern In-Flight Measuring Techniques," presented at the26th AGARD Flight Mechanics Panel Meeting, Paris, France, 1965.
12.6 "Telemetry Standards," IRIG Document 106-93, Secretariat Range Commanders Council, U.S. ArmyWhite Sands Missile Range, NM, 88002.
12.7 "Telemetry Applications Handbook," IRIG Document 119-88, Secretariat Range Commanders Council,U.S. Army White Sands Missile Range, NM, 88002, Feb. 1988.
12.8 Bothe, H. and D. Macdonald, Determination of Antennae Patterns and Radar Reflection Characteristicsof Aircraft, AGARD-AG-300-Vol. 4, AGARD Flight Test Techniques Series, A. Pool, editor, Paris,France, 1986.
12.9 Bothe, H., Telemetry RF Transmission with Diversity Operation, European Telemetry Conference, Gar-
misch-Partenkirchen, Germany, June 1988.
12.10 Special Section on Cryptology, G. J. Simmons, editor, Proceedings of the IEEE, May 1988.
12.11 "Spread Spectrum Communications," AGARD-LS-58, Neuilly-sur-Seine, France, 1973.
12.12 Strock, 0. J., Telemetry Computer Systems, An Introduction, Instrument Society of America (ISA), NY,1983.
12.6 BIBLIOGRAPHY1. Becker, A., B. Gartung, and H. Meyer, "Comparison of Systems," AGARD 32, presented at the 30th
AGARD Flight Mechanics Panel Meeting, Montreal, Canada, 1967.
2. Masters, George W., Communications System Test and Evaluation, U.S. Naval Test Pilot School, U.S.Department of Commerce, National Technical Information Service (NTIS), Springfield, VA, 22161, Jan.1981.
Document provided by SpaceAge Control, Inc. (http://spaceagecontrol.com/).

13-1
Chapter 13
MEASURING OF FLIGHTPATH TRAJECTORIES
by
Karlheinz HurrassDLR/FF-FLPO Box 3267
38108 BraunschweigGermany
13.1 INTRODUCTIONIn modem flight testing, most measuring equipment can be carried on board the aircraft. In many cases,however, ground-based equipment should be used, often in combination with onboard measurements. Themost important type of measurements which needs equipment on the ground is trajectory measurement. Thetendency of using more and more hybrid systems can be observed during the last years. This is possibledue to the improvements in the field of computer technology. A typical example of a hybrid system is anintegrated system, which consists of an inertial navigation system on board the aircraft and ground systems,e.g., a tracking radar.
Typical applications for flightpath measuring are takeoff and landing performance measurements, testing ofnew radio navigation systems, analysis of the effect of improved navigation and guidance systems on overallflight performance, measuring of flight performance, study of the navigation behaviour of IFR-flights fordetermining separation standards, testing the performance of ballistic objects, analysis of the performance ofparachutes and ejection seats, etc.
There are many test ranges in the world which use permanent equipment for measuring the trajectory ofaircraft or other flying objects. Some measurements, however, need mobile equipment, e.g., cinetheodolitesor tracking radars. This requires careful planning and often improvisation.
13.2 COORDINATE SYSTEMSThere are mainly two different coordinate systems which are used for the representation of flightpath trajecto-ries: Cartesian coordinates and geographical coordinates. For many applications the use of a local Cartesiancoordinate system has some advantages. They are sufficient if the measurements are carried out in a relativelysmall area with a size of some kilometers. Examples are takeoff and landing performance measurements,measurements on parachutes and ejection seats, and ballistic measurements at small ranges.
When using Cartesian coordinates in most cases the transformation of the measured units into x/y/z-coordinates is relatively simple. In the case of a tracking radar which is sited in the origin of the coordinatesystem, the x/y/z-coordinates are obtained using the following equations:
x = pcosysina
y = pcosycosor
z = psin-y (13.1)
p: radar rangea: azimuth-y : elevation
In some cases it is advantageous to align one axis of the Cartesian coordinate system with an axis which isof certain importance in connection with the measurements in question. A typical example for such an axis isthe centre line of a runway.
If, however, a navigation system like VOR, a satellite navigation system or an inertial navigation system usedtogether with ground based systems will be tested, a relation between the positions of the trajectory measuring
Document provided by SpaceAge Control, Inc. (http://spaceagecontrol.com/).

13-2
system and the navigation system has to be established. The easiest way to do this is the use of globalgeographical coordinates. This is meaningful especially for measurements in the aviation field, because inaviation all positions are given in geographical coordinates.
The transformation of local Cartesian coordinates into geographical coordinates can be performed by thefollowing method. As a first step, a coordinate transformation of the x/y/z-system into the Earth-centeredsystem Z1, z2, Z3 (Fig. 13.1) is necessary:
Z3
0 0 Z2
Z- -' X O/ X = 9 0 0
Equator I
Figure 13. 1. Geographical and x, y, z-coordinates.
Z1 Z1lO -- sin.\, -sinV),,oCS,\o cosbo~coS'\o x
Z2 = Z20 + cOSos -sinbocoS,\o cosbosin.o ,z3 z30 0 cos bosin •oz
Z1O = (No + Ho) cos 01o cos \o
z20 = (No + H,) cos4 0 , sin,\,
z30 = [No(I - e2) + H.] sin.o, N. = a/ /(1 - e2sin2 1o) (13.2)
Ao, 11o, H0 : geographical coordinates of the center of the x/y/z-coordinate systema : semimajor axis of the reference ellipsoidb : semiminor axis of the reference ellipsoide : eccentricity of the reference ellipsoid (e2 = (a 2 - b2)/a 2 )
Document provided by SpaceAge Control, Inc. (http://spaceagecontrol.com/).

13-3
The geographical coordinates are obtained using the following equations:
cotan)\p = Zl/Z2
1 + 2
cotanop = / 2 1 eZ3 I + 1-IN
HI = +12 2 COS + Z3 sin7pp - a V(1-e2 sin2 p) (13.3)
When computing op there is a difficulty because Hp and N can only be calculated if Op is known. Oneshould use an interative method beginning with Hp = 0 or using the altitude from an altimeter. After thefirst calculation of op a first approximation of Hp and N can be determined. Using these approximations animproved value for ip can be obtained. This method converges very rapidly.
Besides geographical and local x/y/z-coordinates, other coordinate systems are also used, e.g., UTM-coordinates, Gauss-Kruger coordinates for ordinance survey of Germany. Details concerning these systemscan be found in Ref. 13.1.
13.3 MATHEMATICAL METHODS
13.3.1 Determination of positions in x/y/z-coordinates
The measurements of many instruments are angles or distances. For most applications these measurementscannot directly be used but have to be converted into x/y/z-coordinates. Often an additional transformationinto geographical coordinates (Section 13.2) or other coordinate systems is necessary.
Tracking radar, laser trackerThe equations for transforming tracking radar or laser tracker data into x/y/z-coordinates are given inSection 13.2.
CinetheodolitesWhen using two cinetheodolites the following procedure can be used: First, the horizontal distance betweencinetheodolite number 1 and the target should be calculated (Fig. 13.2):
el :-- b12 sin(3 12 - U2 ) (13.4)sin(al - a2 )
In a second step the x/y/z-coordinates can be determined using only the data from cinetheodolite number 1similar to tracking radar measurements:
x-=-x 1 + eI COS 01
y = Yl + el sina 1
z = zi + eltgy1 (13.5)
The disadvantage of this method is that the elevation angle of cinetheodolite number 2 is not taken intoaccount. A method which uses all measurements is described in Section 13.3.2.
Ranging SystemsIn the case of three range measurements the following equation is valid:
Pk = /(x - Xk) 2 + (Y - Yk) 2 + (z - Zk) 2 (13.6)
Ic :1,2,3Pk : range measurement of station kXk, Yk, zk : position of the ranging station k in the x/y/z-coordinate systemx, y, z : position of the target to be measured
Document provided by SpaceAge Control, Inc. (http://spaceagecontrol.com/).

13-4
FLIGHTPATH
NORTH NORTH
CINE- [IE
THEQOOLITE 1 THEODOLITE 2
SYNCHRONIZATION
Figure 13.2. Trajectory measurement by means of two cinetheodolites.
Because the terms of equation (13.6) are nonlinear an iteration is necessary in order to determine the coordinatesx, y, z. After starting with an approximate value xo, yo, zo a linearization of equations (13.6) can be performed:
APk = Pk - v(Xo - Xk)2 + (Yo - Yk) 2 + (zo -Zk) 2
= Axhlk + Ayh 2k + Azh3khlk - Xo - Xk
Rk
h21 -- Yo - YkRk
h3k Zo - Zk
Rk
Rk = V(xo- Xk) 2 + (Yo - Yk) + (Zo- Zk) 2
k = 1,2,3 (13.7)
The correction values Ax, Ay, and Az are obtained by using:
Ax hl, h21 h31 - Ap 1Ay = h12 h2 2 h32 x Ap2Az h 13 h2 3 h33 AP3 (13.8)
Document provided by SpaceAge Control, Inc. (http://spaceagecontrol.com/).

13-5
Ax, Ay, and Az now can be used for calculating a better position estimate:
X = Xo + Ax
Y=Yo + Ay
z = zo + Az (13.9)
This position can be used again for a new iteration step. The iterations should be stopped when the calculatedcorrections Ax, Ay, and Az are below a predetermined threshold.
13.3.2 Method of least squares adjustment
For the determination of one position at a certain time only three measurements are necessary, e.g., three rangemeasurements. In many cases there are more measurements available. The following question arises: Howshould such redundant measurements be computed? The most suitable method is the so-called method of least
squares adjustment.
When using this method for computing flightpath positions in a first step approximate values xo, yo, zo haveto be calculated. This can be done using one of the methods described in Chapter 13.3.1. The most probableposition is calculated by using equation (13.9):
X -X + AX
Y = Yo + Ay
z = zo + Az
The essential part of the method is the determination of Ax, Ay, and Az. The next step for doing this is theformulation of observation equations. In the case of using two cinetheodolites and one tracking radar or lasertracker these equations are as follows :
= - arctg X -
= -artg jCinetheodolite 1
V3 = a 2 - arctg Yo - Y2 1v4 = Y2 - arctg Zo - zi Cinetheodolite 2
V5 = 0'3 - arctg Xo - x2
Yo -- Y2
V6 = -y3 - arctg -- z3d3 Radar
V7 = P3 - V(Xo-- X3 )2 + (yo - X3 )2 + (Zo- Z3 )2
dk = V/(xo - xk) 2 + (Yo - Yk) 2 k = 1, 2,3 (13.10)
xk, Yk, zk : positions of cinetheodolites and of the radar, respectivelyak : measured azimuth angles
'Yk : measured elevation anglesP3 : measured range
The values v1 ... v7 on the left side of the equations in (13.10) are measurement contradictions. They are zeroif the first approximation for the position is correct and if there are no measurement errors. In reality these
Document provided by SpaceAge Control, Inc. (http://spaceagecontrol.com/).

13-6
contradictions can never be zero because of measurement errors. Method of least squares adjustment calculatesthe corrections Ax, Ay, and Az under the condition that the resulting weighted square sum of the residualsVT R- 1 v becomes a minimum.
v: vector which contains the contradictions vn after applying the corrections Ax, Ay, and AzR: covariance matrix of the measurement errors
The diagonal elements of the covariance matrix R contain the squared standard deviations of the measurementerrors. Therefore, the a priori accuracies of the measurements are taken into account.
Because equations (13.10) are nonlinear a linearizatio:n is necessary:
v, = H1,1Ax + H2,1Ay + H3,1Az 1v2 = H1,2 Ax + H2,2Ay + H3,2Az Cinetheodolite 1
v3 = H1,3 Ax + H2,3Ay + H3,3Az 1v4 H1,4Ax + H2,4 Ay + H3,4 Az Cinetheodolite 2
v5 = H1,5 Ax + H2,5 Ay + H3,5 Az 1V6= H1,6Ax + H2,6Ay + H3,6Az Radar
v7 = H11,Ax + H 2 ,7Ay + H 3 ,7 Az (13.11)
or
Axv =H Ay
Az
The elements of matrix H are as follows:
Azimuth measurements:
Hn Yo 2 Yk H 2 , -- Xo-xkD D 2
k k
n = 1,3,5 k = 1,2,3
Elevation measurements:
S- (Zo - zk)(Xo - Xk) _ (Zo-Zk)(Yo-Yk) Dk
Dkp2 H2 ,k =k k Pk
n = 2,4,6 k = 1,2,3
Range measurement:
H X - X3 Yo - Y3 H3,7 = - Z3HI7-H 2 ,7 - /-3,3P3 P3 P3
Dk = /(xo - Xk)2 + (Yo - Yk) 2
Pk VX/(Xo- xk)2 + (yo- Yk) 2 + (Zo- Zk) 2
Document provided by SpaceAge Control, Inc. (http://spaceagecontrol.com/).

13-7
The correction values Ax, Ay, Az are obtained by solving the following matrix equations:
AXAy PHT R-1 vAz
P = (HTR-1H)-1 (13.12)
P is the error covariance matrix for the computed position. The vector v is calculated using equations in(13.10).
In some cases it may be necessary to repeat the calculations and start with the approximation
IXo = Xo + AX
IYo=yo + Ay
zo = Zo + Az
Advantages of the method of least squares adjustment:
- All measurements from different measurement systems are used in an optimal manner.
- Different measurement accuracies of the sensors are taken into account.
- The number of measurement equations in (13.10) can be expanded for any number of instruments. Therefore,this method can be used for the integration of a great variety of different measurement systems.
- Together with the most probable positions the error covariance matrices are automatically estimated. Thisis useful when integrating positions from classical instruments for flightpath determination with onboardsensors like inertial navigation systems with the aid of Kalman filters.
Disadvantages:
- There is the need for carrying out a great amount of calculations. But this is no problem with modemcomputers. Typical computing times for calculating one position are in the order of milliseconds.
13.3.3 Kalman filtering
Before each test all sensors for flightpath determination have to be calibrated in order to minimize bias errors.Therefore, the measured positions contain mainly random errors with small correlation times. For examplein the case of tracking radar measurements these errors are due to the fluctuation of the radar cross sectionarea. Smoothing of such type of errors may be performed with the aid of least square polynomial filtering.The disadvantage of this method is that, together with the noise, also high frequent movements of the targetare smoothed out. A combination of redundant navigation information from inertial navigation systems (INS)on board the test aircraft with sensors for flightpath trajectories allows the separation of the above mentionednoise and the maneuvers of the aircraft. Inertial navigation systems have low frequency position errors so thatit seems quite logical to combine them with instruments for flightpath measurements.
The optimal integration of an inertial navigation system can be carried out by means of the Rauch-Tung-Striebel algorithm, which consists of a Kalman filter and a backward smoother. The forward filter can takeinto account previous measurements only. The smoothed estimate utilizes all measurements. It is obvious thatthe smoothed positions are thus always at least as accurate as the forward filtered positions. In most cases,the smoothed positions are considerably more accurate than the filtered ones. It is evident that backwardsmoothing can only be done off-line.
The filter estimates the so-called state vector x together with the error covariance matrix P. The state vectorcontains in this application the error components of the inertial navigation system. The smoothed trajectoriesand also accurate velocities are obtained by adding the state vector to the measurements delivered by theinertial navigation system.
Document provided by SpaceAge Control, Inc. (http://spaceagecontrol.com/).

13-8
The equations of the Rauch-Tung-Striebel algorithm are:
Forward filter
x(k)- = 0(k, k- 1) x (k- 1)+
x(k)+ = x(k)- + K(k)(y(k) - H(k) x (k)-)
P(k)- = 0(k, k - 1)P(k - 1)+ q(k, k - I)T + Q(k - 1)
K(k) = P(k)-H(k)T (H(k)P(k)-H(k)T + R(k))-1
P(k)+ = (I - K(k)H(k))P(k)-(I - K(k)H(k)) T + K(k)R(k)K(k) T (13.13)
where
x(k) : state vectorx(k)-, x(k)+ : filtered estimates of x(k) immediately before and after measurement kP(k)-, P(k)+ : covariance matrices of (x(k)- - x(k)) and (x(k)+ - x(k))K(k) : optimal gain of forward filtery(k) : measurement vectorH(k) : measurement matrixR(k) : covariance matrix of the measurement k (e.g., calculated with equation (13.2))Q(k - 1) : covariance matrix representing the noise inputs between measurement k - 1 and k0(k, k - 1) : transition matrix
The measurements y(k) are the differences between the measured positions from the ground sensors and the po-sitions determined by the INS. The measurement matrix H(k) relates these measurements to the correspondingelements of the state vector.
Backward filter
x(k,N) =x(k)+ + C(k)(x(k + 1,N) - O(k + 1, k)x(k)+)
C(k) = P(k) +¢(k + 1, k)T(P(k + 1)-)-1
P(k, N) = (I - C(k);(k + 1, k))P(k)+(I - C(k)b(k + 1, k))T
+ C(k)(P(k + 1, N) + Q(k))C(k)T (13.14)
with
x(N, N) = x(N)+
P(N, N) = P(N)+
where
N : total number of iterationsx(k, N) : smoothed estimateP(k, N) : error-covariance matrix of smoothed estimateC(k) : optimal gain of backward filter
The smoothing process consists of two steps:
1. Forward filteringThe Kalman filter equations are solved for the flight time in consideration. The results are the estimatesx(k)+ and the corresponding covariance matrices P(k)+.
2. Backward smoothingThe backward smoother equations are solved backward in time, utilizing and improving the estimates x(k)+of the forward filter and the corresponding covariance matrix P(k)+.
Document provided by SpaceAge Control, Inc. (http://spaceagecontrol.com/).

13-9
Advantages:
- An integration between sensors for flightpath measuring and onboard navigation systems is possible.
- High frequency movements of the aircraft are not smoothed out.
- The position accuracies obtained due to the integration are higher than the accuracies obtained from thesensors for flightpath determinations alone.
- The velocities are obtained automatically with a high degree of accuracy.
- Both the positions and the velocities are nearly continuously available. This is also true when the timeinterval between the measurements is relatively great (e.g., 1 min).
Disadvantages:
- It is necessary to carry out a great amount of calculations and to store much data for the backward filter.With modem computers there is no problem in doing this. Typical computing times for one iteration are inthe order of 50 msec.
13.3.4 Influence of atmospheric refractionWhen transmitting or receiving electromagnetic waves it is necessary to take into account the influence ofthe troposphere on the propagation. Due to atmospheric refraction, radio and optical waves are bent andsystematic errors are introduced in the measurements of elevation angles. An error is also caused in the rangemeasurements due to the influence of tropospheric refraction.
The reason for these effects is the index of refraction, n, which changes with altitude. For microwavefrequencies this index can be calculated using
(n )0' N~ ý77.6p 3.73 105eT T2 (13.15)
N modified index of refractionp : air pressure (hektoPascal)e partial pressure of water vapor (hektoPascal)T: absolute temperature (degree Kelvin)
'For light the index N is given by the following equation:
N r 83.32 k - 11.2e (13.16)T T(1.6
For the purpose in question here, a simple exponential profile for the refraction index is sufficient:
N(h) = Noexp(-h/Ht) (13.17)
h : height above groundNo: surface value of NHt : tropospheric scale height
The parameters No and Ht may be calculated using observed meteorological data (e.g., from balloon ascents).
In the case of measuring elevation angles a correction angle can be calculated using an approximation. Figure13.3 shows the geometry of the refractive effect. y, is the measured elevation angle. The correct value isapproximately:
6-Y : 7o - 6 (radian)PO (13.18)
Po : range to vehicle
Document provided by SpaceAge Control, Inc. (http://spaceagecontrol.com/).

13-10
09
RO
Figure 13.3. Geometry of refractive effect.
The correction value 6 can be calculated using the radii of curvature. They depend on 7 and the change ofthe index of refraction with altitude:
nr dn
T cos -Y (13.19)
The angle -y of the ray direction can be reduced to the initial angle y7, by Snell's law of refraction.
nRcos-y = noRo cos-y0 (13.20)
A practical solution to calculate 6 is a recursive method which needs the curvature for range intervals Ap.Starting at the ground the following recursive equation is a practical solution:
bi bi-, + Api (1/2 Asi + si)
Si= si-1 + Asi- 1
Asi= Api/ri
i = 1,2,3...
SO= 060 = OAso = 0 (13.21)
When using range intervals of about 0.5 km the accuracy of the calculated corrections is much higher thanthe accuracy of all instruments for flightpath measurements which are used today. Typical correction anglesare between 0.001' and 0.10.
The range error AR denotes the difference of the range which is determined along the propagation path p andthe correct slant range Po. The measured range along the so-called phase path is defined by
Document provided by SpaceAge Control, Inc. (http://spaceagecontrol.com/).
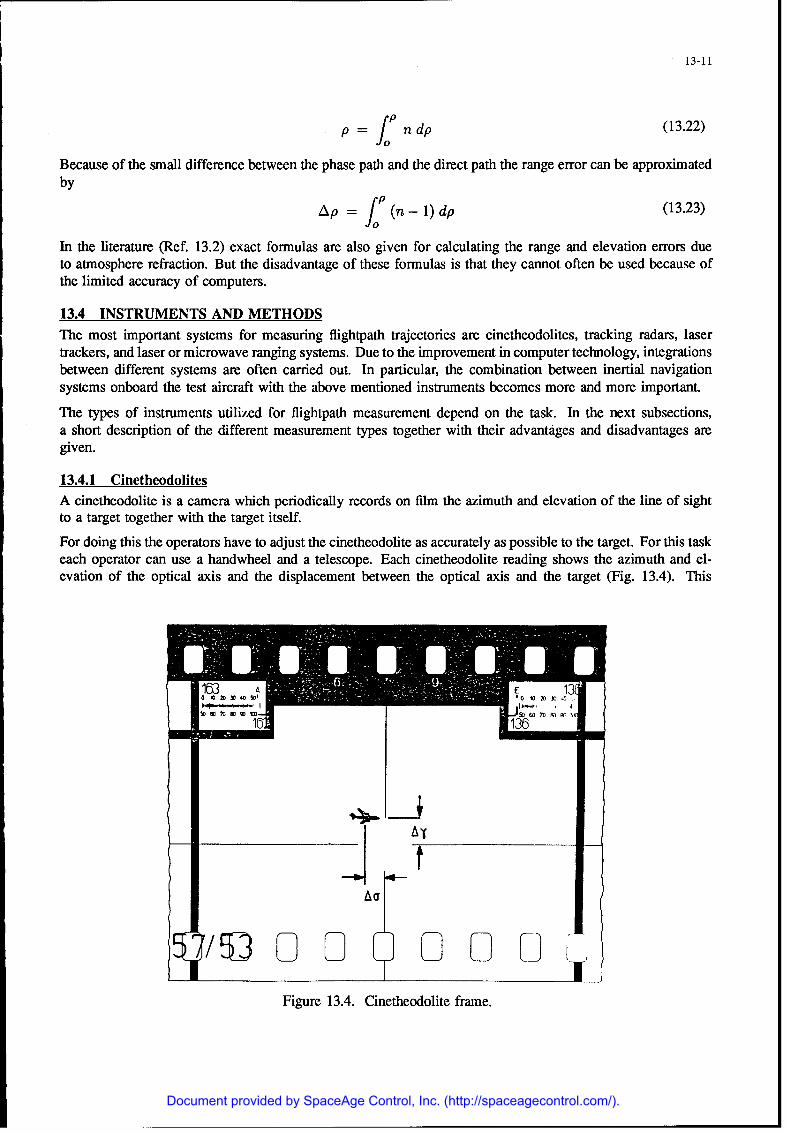
13-11
p = n dp (13.22)
Because of the small difference between the phase path and the direct path the range error can be approximatedby
Ap = (n- 1) dp (13.23)
In the literature (Ref. 13.2) exact formulas are also given for calculating the range and elevation errors dueto atmosphere refraction. But the disadvantage of these formulas is that they cannot often be used because ofthe limited accuracy of computers.
13.4 INSTRUMENTS AND METHODSThe most important systems for measuring flightpath trajectories are cinetheodolites, tracking radars, lasertrackers, and laser or microwave ranging systems. Due to the improvement in computer technology, integrationsbetween different systems are often carried out. In particular, the combination between inertial navigationsystems onboard the test aircraft with the above mentioned instruments becomes more and more important.
The types of instruments utilized for flightpath measurement depend on the task. In the next subsections,a short description of the different measurement types together with their advantages and disadvantages aregiven.
13.4.1 CinetheodolitesA cinetheodolite is a camera which periodically records on film the azimuth and elevation of the line of sightto a target together with the target itself.
For doing this the operators have to adjust the cinetheodolite as accurately as possible to the target. For this taskeach operator can use a handwheel and a telescope. Each cinetheodolite reading shows the azimuth and el-evation of the optical axis and the displacement between the optical axis and the target (Fig. 13.4). This
A0 136 • •
AY
Figure 13.4. Cinetheodolite frame.
Document provided by SpaceAge Control, Inc. (http://spaceagecontrol.com/).

13-12
displacement occurs due to the fact that the operators generally are not able to align the optical axis exactlyto the target. Therefore, a correction of the recorded azimuth and elevation angles is necessary using thisdisplacement.
Because a cinetheodolite only measures two angles at least two separate instruments are necessary for thedetermination of three coordinates of the target (Fig. 13.2). However, three separate theodolites are desirable forincreasing the accuracy and reliability. Before cinetheodolites can be used for the determination of flightpaths,their sites need to be surveyed. The next step is the determination of the so-called index errors. These are biaserrors which give the difference between the correct angles to a target and the angles which were processedfrom the cinetheodolite readings. The index errors can be determined by taking pictures from a surveyedpoint in the normal and the plunged position. In the plunged position the azimuth is changed by 1800 and theelevation by 1800 - 2-y".
Advantages:
The systematic and random errors can be kept below 0.01 if the acceleration of the cinetheodolite iswithin reasonable limits (Ref. 13.3). This equipment is, therefore, suitable for absolute measurements. Thereference points on the aircraft must be well defined.
- The initial cost and amortization of this system are lower than for some other equipment, e.g., a trackingradar, if the tracking device of the cinetheodolite is simple and only a film is used for data storage.
- Targets on the ground or in the vicinity of the horizon can be measured, as well as those at higher elevations.
- The cinetheodolites take a picture of the target at each measurement, and thus valuable additional informationis obtained which often renders the employment of another camera unnecessary. Examples of additionalinformation are external events such as the separation of a parachute, or a rough estimate of the attitude ofthe target.
- Two cinetheodolites are necessary for determination of three dimensional coordinates. This disadvantagecan be removed by adding a laser ranger.
Disadvantages:
- Two operators are necessary during the measurement at each cinetheodolite. For modem instruments actuatorshave been developed which allows one operator to control both azimuth and elevation.
- Tracking targets near the zenith can lead to intolerably high angular velocities.
- The target must be acquired and tracked visually by the operators. Track acquisition can be accomplishedby slaving cinetheodolites to other tracking devices such as for example tracking radars. Some modeminstruments are combined with video or infrared trackers which can take the operator out of the loop.
- The visibility is an upper limit and the acquisition range, particularly for high speed aircraft at large distances,is somewhat smaller than the visibility. Visibilities below 10 km are common in Central Europe. Even ifthe visibility is much higher, the acquisition range is often below 10 km for an aircraft whose flightpath isnot well known. The recognition of an aircraft in twilight or at night can be significantly increased whencontinuously radiating lamps or flashing lights are mounted onboard the aircraft.
- The processing of cinetheodolite measurements using classical methods is expensive and tedious. Thereading of the azimuth, elevation and displacement stored on one frame of cinetheodolite film will takeabout 1 min. Appreciably higher rates of reading are possible when cinetheodolites with digital presentationof elevation and azimuth are used together with special semi-automatic reading equipment. For the reading itis necessary to choose a reference point on the aircraft which is recognizable on every frame. This may, forexample, be the rudder of the aircraft or a wheel of the landing gear. Most well identifiable reference pointshave the disadvantage of not coinciding with the center of gravity or another important point of the target.The transformation from the employed to the desired reference point, however, depends on the attitude ofthe target. In some cases, transformation difficulties can be decreased by putting strikingly coloured marksin the vicinity of the desired reference points. This is, however, only effective at relatively short ranges.
Document provided by SpaceAge Control, Inc. (http://spaceagecontrol.com/).

13-13
Online storage and processing of azimuth and elevation of the optical axis is an integral part of modemcinetheodolites, but this problem has not yet been solved for the displacement of a target with a complexpattern.
- In some cinetheodolite systems the azimuth and elevation angles of the optical axis are stored in electricallyretrievable form, so that they can be processed automatically. Even with such systems, the displacement ofthe aircraft from the optical axis must be measured manually from the film picture.
Range of applications:
- Cinetheodolite systems are ideal for measuring the trajectory of targets near the horizon or on the ground.Targets at short or medium slant ranges can be measured with high absolute accuracy if the slant visibilityis satisfactory.
13.4.2 Tracking radarA tracking radar can automatically track a target and measure azimuth, elevation, and slant range to theinstantaneous center of the radar cross section or transponder antenna (Ref. 13.4).
Tracking radars for purposes of flightpath measurements are able to align their antenna beam continuously tothe target by a servomechanism actuated by an error signal. The antenna must first be directed to the targetso that a range gate can be brought in near coincidence with the echo of the target before the tracking radarcan track. This acquisition can be done by slaving the tracking radar to an IFF track.
There are different methods of generating the error signals for the servomechanism: conical scan, sequentiallobing, and monopulse. In the case of conical scan and sequential lobing a train of pulses is necessary forprocessing an error signal. If there is a fluctuation of the pulses in the train an error occurs due to thisfluctuation. Monopulse radars avoid this disadvantage because they can process an error signal from eachindividual echo signal.
Tracking in range is performed by measuring the travel time between transmitting and receiving the pulses.For generating the error signals, only those echo signals are used which are received within the range gate. Inthe tracking mode this gate is automatically centered around the echo pulse from the target in question. Thedata of three typical tracking radars are listed in table 13.1.
Table 13.1. Typical tracking radars.
Radar type L4/3 ANJTPQ-39(V) AN/MPS-36Characteristic HSA RCA RCA
Type of tracking Conical scan Sequential lobing Monopulse
Antenna size (m) 1.50 1.83 3.66
Frequency X-band C-band C-bandPeak power (kW) 50 250 1000
Pulse width (pisec) 0.5 1.5 0.25-1.0
Pulse repetitionfrequency (kHz) 1.6 0.16-0.64 0.16-0.64
AccuracyRange (m, lor) 10 2 3Angle (0, la) 0.1 0.03 0.02
Maximum range 50 234 59304(km)
The accuracies given in table 13.1 can only be achieved when the radars are carefully calibrated before eachmeasurement. This can be done with the help of a boresight tower or by tracking a target together with
Document provided by SpaceAge Control, Inc. (http://spaceagecontrol.com/).

13-14
cinetheodolites or a laser tracker. Concerning the accuracy in elevation it is important to take the refractionof radar waves in the atmosphere into account.
Modem tracking radars with phased array antennas are able to track many targets simultaneously, and includesearch modes for acquisition.
Advantages:
- The target can be acquired and tracked even if it is masked by fog or clouds.
- Large slant ranges are possible.
- Only one radar is necessary for determining three dimensional coordinates.
- Two operators are often sufficient during the measurement.
- Online data storage and processing is a common procedure.
- The error of the slant range can be kept low and nearly independent of the range (about 2 to 10 m).
Disadvantages:
- Targets on the ground or in the vicinity of the horizon cannot be tracked.
- The reference point on the target is random for skin tracking. By the addition of a transponder to the aircraft,not only the reference point can be better fixed, but also a considerably larger range can be obtained. However,difficulties in installing the antennas have to be overcome.
- The angular errors are small only for high precision radars, but these are very expensive. The calibration ofthe elevation angle of a radar is difficult.
Range of application:
- Tracking radars are ideal for determining the trajectory of targets at medium or large ranges under nearly
all weather conditions. The effect of angular errors has to be considered.
13.4.3 Laser tracker
The principle of laser trackers is very similar to that of a tracking radar. The main difference lies in thefrequencies which are used for the emitted pulses. The frequencies of most present-day laser trackers are inthe infrared region.
Similar to tracking radars, laser trackers automatically measure elevation, azimuth, and slant range after theyare brought into the track mode. In order to align the optical axis of the laser tracker to the target, errorsignals for controlling the laser pedestal are generated from the received pulses. The range is determined bymeasuring the travel time of the laser pulses.
Because of the small amount of laser energy which is returned to the laser optics, a "comer reflector" isnormally mounted on the test aircraft. Reflective tape is also used for this purpose, but then more laser poweris necessary to obtain the same reflected power.
The reflector for the laser pulses can be an assembly of so-called comer or retro reflectors in order to reflectthe laser pulses from all directions back to the laser tracker. Some reflectors contain 24 single retro reflectors.
Most transmitters of laser trackers are Nd:YAG lasers or use GaAs laser diodes. The range of transmittedpeak power ranges from 25 W to about 10 MW. A typical beam width is in the order of 0.10.
Typical diameters of the receiver optics are about 0.2 m. Most laser trackers use photodiodes as a sensor forthe received laser pulses. Cathode-ray tubes and photo multipliers are also used for this purpose.
For all laser trackers, precautions are necessary to provide a fail-safe, fully responsive eye safety system.Therefore, all laser trackers with a radiated pulse power greater than about 100 W contain a transmit powerprogramming system to ensure eye safety.
Document provided by SpaceAge Control, Inc. (http://spaceagecontrol.com/).

13-15
Before a laser tracker can be switched into track mode the tracker should be directed to the retro reflectorsof the test aircraft. This is often carried out manually by using a television screen which displays the imagefrom a television camera that moves with the laser beam. In some cases it is also possible to acquire the targetautomatically using information from a tracking radar (e.g., the French STRADA system and the DLR lasertracker).
Advantages:
- The position of a test aircraft can be measured very accurately. Considering the angles, an accuracy can bereached which is higher than 0.010. Range accuracies of better than 1 m are possible.
- Aircraft position coordinates are immediately available. Therefore, online processing is normal procedure.
- Only two operators are necessary.
- In contrast to tracking radars tracking down to the ground is possible with no degradation of accuracy.
- One instrument is sufficient for determining the position in three coordinates.
- Accurate calibration is possible by using fixed retro reflectors with known positions.
Disadvantages:
- Maximum ranges are about 30 km.
- Tracking is only possible during weather conditions with good visibility.
- The laser pulses can be dangerous to human eyes unless special precautions are undertaken.
- A laser reflector is required on the test aircraft.
Range of applications:
- Takeoff and landing measurement.- Test of instrument landing systems.
- Dynamic tests of precision navigation systems, e.g., satellite systems (GPS).
13.4.4 Radio electric ranging systemsThere are different systems in use which are only based on range measurements. These measurements shouldbe carried out from at least three different ground stations. In most cases to improve the accuracy and forredundancy reasons more than three measurements for calculating one position are used.
All electric ranging systems consist of measuring units which are located on the ground and one unit locatedin the target which is being tracked. Most systems use a transponder in the target and interrogators on theground. The opposite procedure is also possible; one interrogator is on board the target and the transpondersare on the ground.
In order to determine the range between a ground unit and the target, the travel time between transmitted radiosignals from the interrogator to the transponder and back to the interrogator is measured. Some systems usephase measurements for doing this; others use time measurements between transmitted and received pulses.The radio frequencies are in the VHF or C-band. A typical radiated power is 10 W.
Before measurements can be performed the positions of all ground units should be determined. The calculationof the positions concerning all systems is carried out using the methods described in Section 13.3. Under goodgeometrical conditions typical position accuracies are in the order of 3 to 10 m (2a).
The geometry of ground unit locations relative the vehicle being tracked is an important factor in assessingthe accuracy of positions determined by radio ranging systems. This usually is described by the so-calledgeometric dilution of precision (GDOP).
Document provided by SpaceAge Control, Inc. (http://spaceagecontrol.com/).

13-16
A typical example for a radio electric ranging system is the microwave airplane position system (MAPS)developed by the Boeing Company for aircraft certification tests. This system is based on Cubic's CR-100precision ranging system. The battery powered transponders sited on the ground are equipped with omni-directional antennas. The airborne portion consists of an interrogator, an omni-directional antenna, a distancemeasuring unit, and a computer for computing the positions. The radio signals are frequency modulated. Therange is determined by measuring the phase shift of four harmonically related modulation tones. The Dopplershift of the carrier frequency allows the computation of the range rate. The different transponders are seriallyinterrogated. Therefore, each transponder requires an identification code. The transponders are interrogatedat time intervals of 25 msec. Because eight transponders are typically used, five positions can be calculatedeach second.
Other systems use pulse modulated systems, e.g., the Motorola Mini Ranger. This system uses a transponderon board the test aircraft and interrogators on the ground. Therefore, the measured ranges and positions areobtained on the ground.
Most systems calculate the positions using a Kalman filter. The measurements are the ranges and in somecases the range rates which are determined from the Doppler shift. -In the case of the MAPS the state vectorof the Kalman filter contains six elements for each dimension of position and velocity. The system modelassumes an unaccelerated motion which is disturbed by noise.
Advantages:
- Online evaluation is possible.
- The complete system can accompany the aircraft to any test range because of its relative small size andweight.
- The systems can be used under any weather condition.
- Highly accurate position data are obtained within about a 10-km radius. The horizontal position accuracyin each direction is in the order of 0.3 to 0.5 m. In the case of higher elevation angles, the same accuracyis possible.
Disadvantages:
- The determination of altitude in most conditions is relatively poor. Only in the case of high elevation anglesare precise altitude measurements possible.
- On board the test aircraft or each target a transponder or interrogator is necessary.
- Before the measurements, the positions of at least three ground stations have to be determined.
Range of applications:
- Radio electric ranging systems are typically used at test ranges for aircraft because the installation of theonboard unit in an aircraft is normally not a problem. This also concerns the determination of positions forthe ground units. The effect of great altitude errors in the case of low elevation angles has to be considered.
- Aircraft performance measurements.
- Measurements for aircraft certification.
13.4.5 Laser ranging
In Section 13.4.3 the principle of laser trackers was described. Due to the limited accuracy of the measuredelevation and azimuth angles, the position error increases with range. In the case of angle accuracies of 0.010and a distance of 10 km the resulting position error is about 2 m. The high range accuracy of laser radarstherefore, is not fully exploited. To overcome this disadvantage a set of at least three laser trackers can beused. The laser tracker data can be combined using the method of least squares adjustment (Section 13.3.2)or the technique of Kalman filtering (Section 13.3.3) in order to estimate the positions.
Document provided by SpaceAge Control, Inc. (http://spaceagecontrol.com/).

13-17
Advantages:
- The position of a test aircraft can be determined very accurately (less than 1 m).
- See laser tracker.
Disadvantages:
- See laser tracker.
- All locations of the laser trackers should be determined with high accuracy.
- Each laser tracker normally needs two operators.
- The total system is very expensive.
Range of application:
- Flight trials at test ranges. An example of a typical application is the initial flight test of the GPS at the USArmy Yuma Proving Ground, Yuma, Arizona.
13.4.6 Video tracking systemsTracking of targets can also be performed using video data. For this purpose a reference pattern is used whichis stored in a computer. The tracking algorithm determines the displacement of the received video signals fromthe reference pattern. This displacement can be used as an error signal which controls the pedestal carryingthe video system. Most systems contain a tracking window which is centered in the middle of the videopicture. Only the information inside this window is used for generating the tracking signals. Some systemsare adaptive. This means that the reference pattern is changing if the aspect angle or the size of the target ischanging. Concerning the tracking algorithm, different modes are possible: tracking of positive or negativecontrast targets, tracking of center, top, bottom, right or left.
Advantages:
- Each target with sufficient contrast can be tracked.
- No cooperative equipment on board the target is necessary.
- Easy to operate.
Disadvantages:
- Only elevation and azimuth can be measured. Therefore, at least two trackers are necessary to determine athree-dimensional position.
- Maximum range is limited and depends on visibility.
- A reference point on the target cannot be precisely determined. Therefore, the tracking accuracy is limited.
Range of application:
- Guidance, e.g., of cinetheodolites.
13.4.7 Inertial navigation systemsInertial navigation systems (INS) are increasingly used for performance flight testing and in experimentalaircraft.
An INS continuously determines the velocity, position and attitude with respect to an Earth-related coordinatesystem; usually these are geographical coordinates. However, the resolution of the horizontal position outputsof widely used INS systems is only in the order of 20 m. Therefore, the velocity outputs of the INS shouldbe used in order to calculate the horizontal positions. For calculating the altitude, the measured verticalacceleration should be used. But one has to consider that all unaided navigation systems are unstable in thevertical channel since any error in measured vertical acceleration or in the compensation for gravity wouldcause an unbounded altitude error.
Document provided by SpaceAge Control, Inc. (http://spaceagecontrol.com/).

13-18
One major disadvantage of INS systems is that due to unavoidable sensor errors the position errors graduallyincrease with time. Therefore, in order to maintain the errors below a certain threshold it is necessary tocorrect the INS data using redundant measurements. For doing this the methods described in Section 13.3.2or 13.3.3 can be used. Sometimes also more simple methods are sufficient, e.g., in the case of short test times(less than 1 min).
Different measurements are used for correcting or aiding INS systems:
- Zero velocities during standstill immediately before takeoff or/and immediately after landing of an aircraft
- Positions of the aircraft during holding at known positions before takeoff or/and immediately after landing
- Heights of the runway during the acceleration phase of the aircraft prior to liftoff
- Video measurements from clearly defined patterns, e.g., threshold markings
- Measurements from radio navigation system, e.g., VOR, DME, GPS
- Tracking radar measurements
- Laser tracker measurements
- Measurements from radio altimeters
The accuracy depends mainly on the measurements which are used for aiding the INS and the elapsed timeafter an update or before an update.
A typical accuracy of a system which only updates the INS during standstill and during the acceleration phaseon the ground, is 1 m for a 1-min period in the horizontal plane, and in the order of 0.3 m for altitude (NLRSTALINS Method for Takeoff and Landing Trajectory Measurements). In Section 13.4.9 an integrated systemis described which uses tracking radar data, laser tracker data, and DME measurements for correcting the INS.
Advantages:
- Besides the positions, the velocities and attitude angles are also determined. When using a Kalman filterthese quantities can be estimated with a high degree of accuracy.
- All relevant data from the INS are nearly continuously determined.
- High frequency motions of the aircraft can be measured very accurately.
Disadvantages:
- Due to the weight and the relatively high price of an INS only measurements in connection with aircraft orhelicopters are meaningful.
- Before the measurements an alignment procedure is necessary.
- In order to get the highest accuracy, online evaluation is not possible.
Range of applications:
- Measurements for certification of takeoff and landing performance of aircraft.
- In connection with updates from systems like DME, radio altimeters, and video systems testing of radionavigation systems.
- Using a tracking radar and/or laser tracker for updating the INS testing of all kinds of navigation systems.
13.4.8 GPSPerhaps GPS will have a great influence concerning flightpath determination in the future; therefore, a shortdescription of this system will be given here.
Document provided by SpaceAge Control, Inc. (http://spaceagecontrol.com/).

13-19
The US Department of Defense has been developing a GPS (global positioning system) satellite system sincethe seventies. Although the GPS was originally planned for military purposes only, it can also be used fornavigation in civil aviation.
The GPS is based on range measurements between satellites and the users. Accurate clocks are installed onboard the satellites. These clocks are used for continuously transmitting time information and orbital datato the users via a so-called pseudo random noise (PRN) code. The onboard equipment of the user containsan accurate time standard so that the transit time of the signals from the satellites to the user can be usedto calculate the range. Range measurements from at least four satellites are necessary for determination of athree dimensional position. To determine the position itself, three measurements are needed and the fourthmeasurement is required for being able to determine the clock error of the user. Modem GPS receivers areusing eight satellites for position determination in connection with methods described in Sections 13.3.2 and13.3.3.
Two different codes are available for determining the transit time between the satellites and the users. TheGPS signals are shown in table 13.2.
Table 13.2. GPS signals.Precision code (P + code):
Bit frequency 10.23 MHzRepetition period of the PRN code 7 daysCarrier frequencies 1575.42 MHz and
1227.50 MHz
Course acquisition code (C/A code):Bit frequency 1.023 MHzRepetition period of the PRN code 1 msecCarrier frequency 1575.42 MHz
Included in the transmitted signals, at a rate of 50 kps, are data on the satellite ephemeris and clock parameters.These data are necessary for calculating the positions of the satellites in the GPS receivers.
Normally only the C/A code can be used. According to the system specification the C/A code gives a systemaccuracy of about 100 m if the so-called selective availability is switched on. This feature degrades theaccuracy to the value which is given above. Without the selective availability the accuracy with modemreceivers is less than 10 m (lo, C/A code). This accuracy was demonstrated by DLR flight tests carried outin the summer of 1991.
The GPS system error is mainly caused by atmospheric and ionospheric effects, inaccurate satellite positions,and clock errors. These errors remain constant during a certain time period and for a limited region and canbe taken into account. The so-called differential GPS uses a second receiver which is located on a knownposition and can therefore determine correction data. These data are transmitted to the receiver on board thevehicle for correcting the positions. The position accuracies which are possible with such a system are betterthan I m.
Advantages:
- Position accuracy using the differential mode is better than 1 m.
- Great range down to the ground.
- Relatively low price.
- Online evaluation is common practice.
- No operators on the ground.
Document provided by SpaceAge Control, Inc. (http://spaceagecontrol.com/).

13-20
Disadvantages:
- The system is operated by the US Department of Defense and therefore the availability depends only on thisinstitution.
Range of application:
- All applications which were given in the previous chapters. Many additional applications are possible.
13.4.9 Integrated systemsThe greatest accuracies for determination of trajectories are possible with integrated systems, which use acombination of different sensors. As an example a short description of the DLR Avionics Flight EvaluationSystem (AFES) is given. This system uses a tracking radar and a laser tracker on the ground, an inertialnavigation system (INS), and a DME interrogator on board a test aircraft. The data of these sensors arecombined by optimal filters.In order to perform real-time evaluation, computers are used at different locations. All elements of this
measurement system are linked together by an efficient data transfer system.
AFES consists of the following subsystems:
- reference system,- telemetry and data system,- system for measuring multi-path effects, and- system for measuring the effect of traffic load, e.g., concerning DME.
The most important subsystem is the reference system. The main components of the reference system are:
- a tracking radar and a laser tracker on ground,- an inertial navigation system, and- a DME interrogator on board the aircraft.
The tracking radar is an RCA ANiTPQ-39(V). The laser tracker was developed by DLR. The main specifica-tions are summarized in table 13.3.
Table 13.3. DLR laser tracker.Specifications of the laser tracker
Wave length 904 10-9 mPulse power 80 WPulse length 30 nsecPulse repetition frequency 400 HzReceiver band width 3 10-9 m(wave length of visual light420 - 760 10-9 m)Maximum range 10 kmAccuracy (lcr) angle 0.010
range 0.5 m
The microwave radar and the laser tracker are linked together via a serial data line. While a target is out ofrange of the laser tracker, the laser tracker is guided by the tracking radar. A computer takes into accountthe parallax between the tracking radar and the laser tracker. When the target enters the range of the lasertracker, the tracker automatically switches to track mode; this means that slant range, elevation, and azimuthare measured by the laser tracker.
One important part of the reference system is an inertial navigation system on board the test aircraft. The LTN90 was chosen because this system is used by Lufthansa, and therefore, its maintenance can easily be done bythis airline.
Document provided by SpaceAge Control, Inc. (http://spaceagecontrol.com/).

13-21
If no data from the tracking radar or the laser tracker are available, a DME-interrogator is used. Thisinterrogator (Collins DME-700) is able to measure distances from the aircraft to five different ground stationssimultaneously.
The main specifications are:
maximum range 600 km
accuracy (la) 100 m
(determined by DLR)
A combination of positions measured by the ground sensors and the inertial navigation system is used in orderto determine the reference trajectories. The errors of the tracking radar and the laser tracker consist mainlyof noise. The INS has low-frequency position errors so it seems quite logical to combine the INS with theground sensors in order obtain a high-precision reference system. This combination is achieved on board thetest aircraft by means of a Kalman filter. The filtered reference trajectories are found by adding the INS errorsto the navigational results measured by the INS (open loop filter).
One great advantage of this method is that the flightpath trajectories and the velocities can be measured with ahigh degree of accuracy. The same is true as far as the time intervals between the measurements of the groundsensors are concerned. Flightpath trajectories can even be obtained, when neither the tracking radar nor thelaser tracker can track the aircraft for a certain period of time. In this case the flightpath is determined by theINS, where the errors predicted by the Kalman filter have been considered.
When using Kalman filtering, no future but only actual and previous measurements by the ground sensorscan be used. The greatest accuracy can be reached by using all acquired measurements. For this purposethe Rauch-Tung-Striebel-Algorithm is used. Obviously, it can only be calculated offline. Therefore, a greatamount of data has to be stored during a test flight. The Rauch-Tung-Striebel-Algorithm consists of a normalKalman filter and a backward smoother (Section 13.3.3).
The high degree of position accuracy, which can be achieved by using the tracking radar or the laser tracker,is not really necessary for many tests. In such a case, the INS can be supported by DME measurements fromdifferent ground stations. Usually five stations are used.
The cycle time of the Kalman filter is 2 sec. Only one DME measurement is used for each cycle. Wheninterrogating five DME-stations, a complete sequence takes 10 sec. The Kalman filter in the onboard computercan estimate the DME biases which refer to the individual ground stations. Therefore, the filter has fiveadditional elements in the state vector.
Many flight tests made over Northern Germany have proved that there are enough ground stations. Whenreaching an altitude of more than 4500 ft, the distance to at least five different stations could be measured.
Concerning the INS a simplified error model is used. The state vector contains the following elements:
AA, AV: the position errors in eastern or northern direction, respectivelyAV,, vy : the velocity errors in eastern or northern directiona, #, -y : the misalignment angles of the platform
A block diagram of the error model is shown in Figure 13.5. It contains the Schuler loops, couplings of Earthrate, velocity and acceleration. The gyro drifts are modeled as random walk processes. Earlier flight testshave shown that this simplified error model is sufficient for the case in question.
As far as the tracking radar or the laser tracker is concerned, only random errors are modeled. The systematicerrors of the ground sensors are determined precisely. Therefore, there is no need for including elements forthese errors in the state vector.
Regarding DME measurements, a bias error and a random noise error are taken into account. A great amountof DME data from test flights is available to DLR. The standard deviation (la) of the DME errors was alwaysapproximately 100 m. The standard deviation of the systematic errors of the various ground stations was about150 m. These values have also been verified by other organisations.
Document provided by SpaceAge Control, Inc. (http://spaceagecontrol.com/).

13-22
-IhR
IDy ax !r
- ~ f -g f Rcostp
Figure 13.5. Simplified INS error model.
One important measurement is taken before each test flight. In order to do so, the test aircraft stays at anaccurate surveyed marker. At this particular point, the preflight alignment of INS is made. When using thebackward smoother, this surveyed marker is used as a precise position update, if the test aircraft stops here.
Figure 13.6 shows a block diagram of the total system. Immediately after the test aircraft takes off, the trackingradar as well as the laser tracker switch over to track mode. The data of these two ground sensors are checkedand transformed to geographical coordinates. In addition, the covariance matrices of the measured positionsare determined. These data are then transmitted to a computer in the central control station, and from thereby telemetry to the aircraft. The onboard computer being programmed with the Kalman filter uses this datato support INS. The covariance matrices of the ground sensors are calculated using the method described inSection 13.3.2 and are used as the measurement covariance matrices R(k) for the Kalman filter.
The positions being transmitted from the INS are given in increments of about 20 m. This resolution is notsufficient for the determination of the reference trajectories. Therefore, the integration of the INS velocitycomponents is repeated in the onboard computer. The integration interval is 0.05 sec. This means that thepositions are calculated at a rate of 20 Hz. As already mentioned before, the cycle time of the Kalman filteris 2 sec. Only the prediction of two elements of the state vector, representing the position errors, is made ata rate of 20 Hz.
The results of the online Kalman filtering process are used to correct the positions of the INS. These correctedpositions are transmitted to the central control station via a telemetry down-link, and used for quick-lookpresentations.
The different data on board the aircraft are acquired with the aid of the interface system called MUDAS(modular universal data acquisition system). MUDAS enables fast transfer of data between the different datasources and the onboard computer. All MUDAS functions are controlled by a processor. Apart from thefunctions for the total test system, MUDAS can also accept data from the avionic systems to be tested. Forthis purpose, the interface system MUDAS is equipped with some extra input/output modules. These modulesare suitable for the following data formats:
- ARINC 429- synchro signals
Document provided by SpaceAge Control, Inc. (http://spaceagecontrol.com/).

13-23
- parallel digital data- analogue voltages
During the test flights, all significant data are recorded on magnet tapes. Immediately after each test flight, byusing the Rauch-Tung-Striebel backward filter algorithm it is possible to use the recorded data for improvingthe online trajectories.
TEST AIRCRAFT
SYSTEM UNDER TEST
TELEMETRY COMPUTER
TELEMETRYTEEETYLASER RADAR
4CENTRAL S4TATION COMPUTER
Figure 13.6. AFES block diagram.
The computer in the central station is mainly used for calculating all relevant values for quick-look presenta-tions. The most important peripheral devices are four x - y plotters.
Typical plots are:
- flight track-position errors of the tested system in northern and southern direction-diagnostic plot
The diagnostic plot shows the status of all subsystems, e.g., the status of tracking radar.
Table 13.4 indicates the accuracy of the reference system. The errors refer to a polar coordinate system. Itsorigin is the laser tracker. The correlation time of these errors is relatively long (more than 1 min). Therefore,it is possible to monitor high frequency errors of navigation systems, which are smaller than those shown intable 13.4.
Document provided by SpaceAge Control, Inc. (http://spaceagecontrol.com/).

13-24
Table 13.4. Accuracy of AFES.
Distance, Distance error, Azimuth error,m m deg.
0
500 0.5 0.0101 000 0.5 0.0062 000 0.5 0.0033 000 0.5 0.004
10 000 0.5 0.00520 000 5.0 0.008
In the near future the GPS satellite navigation system will be available. In the differential mode, this systemhas a high navigation accuracy. Therefore, it seems to be logical to use this system for aiding the inertialnavigation system instead of the tracking radar.
Today most GPS receivers carry out phase measurements of the carrier frequencies for increasing the navigationaccuracy. This technique in connection with the differential mode enables position accuracies below 1 m withthe less accurate C/A code.
For aiding the inertial navigation system on board the test aircraft it is intended to use pseudo ranges. This canbe done in the same manner as with the DME distances. Instead of the positions of the DME ground stationsthe position of the GPS satellites will be used. The time uncertainty in the GPS receiver can be modeled as abias error for the pseudo ranges.
Advantages:
- Online presentation of test results.
- High accuracy for positions, velocities and attitude angles.
- High frequency movements of the test aircraft are not smoothed out.
- Great measurement range.
Disadvantages:
- Many persons are necessary to operate the system.
- Only a well-equipped test aircraft can be used as a test platform.
- High costs for the total system.
Range of applications:
- Testing of a great variety of avionics systems.
13.5 CONCLUSIONS
In this chapter classical mathematical methods for determining flightpath trajectories (method of least squaresadjustment) and also modem methods (Kalman filtering) are described. The same is true for the instruments.Cinetheodolites and tracking radars are classical instruments which are still needed for non-cooperative targets.Such targets cannot be equipped with transponders, inertial navigation systems, or other onboard systems.
Concerning cooperative targets like test aircraft, integrated systems are used more and more. This trend issupported due to the availability of modem computers. Online evaluation with such integrated systems is acommon practice.
A new generation of sensors will be the GPS. Especially in the so-called differential mode extremely highaccuracies are possible. But this system also needs a special GPS equipment on board the target to be tracked.
Document provided by SpaceAge Control, Inc. (http://spaceagecontrol.com/).

13-25
One important point is not covered in this chapter. This concerns the time synchronization of the differentdata. It is necessary to look very carefully to this point. In the case of target velocities of 100 m/sec, forexample, a time error of 10 msec may cause a position error of 1 m.
13.6 REFERENCES13.1 Augath, Von Wolfgang and Klaus Kummer, "Die Bezugssysteme der Grundlagenvermessung," Nach-
richten der Niedersachs Vermessungs und Katasterverwaltung, 38. Jahrgang, Nr. 4, Hannover, Dec. 1988.
13.2 Edenhofer, P., "A Digital Program Computing the Atmospheric Angle, Range, and Range Rate Error ofSatellite Observations," XIXth International Astronautical Congress, Vol. 2, Pergamon Press, 1970.
13.3 Weber, 0. and A. Wallenhauer, "Die Flugbahnmessanlagen der DFL - Ausbau, Einsatz und Vergleich,"DFL-Bericht Nr. 169, Braunschweig, 1961.
13.4 Skolnik, Merrill I., Introduction to Radar Systems, McGraw-Hill Book Company, Inc., New York, 1962.
13.7 BIBLIOGRAPHY
1. Ashkenazi, V., T. Moore, and C. Hill, "Datum: A Report and Software Package for the Transformationand Projection of Coordinates," EUROCONTROL Experimental Centre, EEC Report No. 237, Bretigny-sur-Orge, Dec. 1990.
2. Brokof, U. and H. Haensel, "Das Referenzbahnsystem des Avionik-Flugerprobungssystems (AFES),"DFVLR-IB 112-86/11, Aug. 1986.
3. Brokof, Ulrich and Karlheinz Hurrass, "Integrated Navigation Systems Based on Multiple DME," AGARDConference Proceedings No. 298, Precision Positioning and Inertial Guidance Sensors, Technology andOperational Aspects, London, Oct. 1980, pp. 14-1, 14-10.
4. Campbell, Steven D. and Raymond R. LaFrey, "Flight Test Results for an Experimental GPS C/A-codeReceiver in a General Aviation Aircraft," Navigation; Journal of The Institute of Navigation, Vol. 30,No. 4, 1983-1984.
5. Deutsche Gesellschaft fur Ortung und Navigation, "DGPS '91: First International Symposium Real TimeDifferential Applications of the Global Positioning System," Vol. I and II, Verlag TUV Rheinland, 1991.
6. Fricke, Kurt, "Grenzen von Genauigkeit und Reichweite beim Laserradar," Optik-Perspektiven forMesstechnik und Signalverarbeitung in der Flugfuihrung. DLFVR-Mitt. 87-21, Nov. 1987.
7. Gelb, Arthur (Ed.), Applied Optimal Estimation, The MIT Press, Cambridge, 1974.
8. Hurrass, Karlheinz and Peter Schulz, "Das Avionik-Flugerprobungssystem (AFES) der DFVLR,"DFVLR-Mitt. 85-01, 1985.
9. Hurrass, Karlheinz, "Erprobung eines GPS-Empftingers," DFVLR-Mitt. 88-30, 1988.
10. Kayton, Myron and Walter R. Fried, (Eds.), Avionics Navigation Systems, John Wiley & Sons, Inc., NewYork, 1969.
11. Kranenburg, C.G., A. Pool, and A.J.L. Willekens, "STALINS Method for Takeoff and Landing TrajectoryMeasurements," AIAA J. Aircraft, Vol. 23, No. 3, 1985, pp. 220-225.
12. Latham, R., "Aircraft Positioning with Multiple DME," Navigation: Journal of The Institute of Navigation,Vol. 21, No. 2, 1974.
13. Motorola Inc., "Mini-Ranger Falcon 492 Positioning System, User's Manual and Maintenance Manual,"Motorola Document No. 68-P20006U, Motorola, Inc., Tempe, AZ, Sept. 1983.
14. Pool, A., J.L. Simons, G.J.H. Wensink, and A.J.J. Willeken, "A Method for Measuring Take-off andLanding Performance of Aircraft Using an Inertial Sensing System," NLR Report MP 80036 U, Okt.1980.
Document provided by SpaceAge Control, Inc. (http://spaceagecontrol.com/).

13-26
15. Rawlings, R.C. and R.A. Harlow, "Flight Trials to Determine the Overall System Performance of DistanceMeasuring Equipment," Royal Aircraft Establishment, TR 79140, Nov. 1979.
16. Rawlings, R.C., "The Flight Assessment and Applications of DME/DME," The Journal of Navigation,Vol. 34, No. 1, Jan. 1981.
17. Stieler, Bernhard and Karlheinz Hurrass, "Borden-und satellitengestiitzte Flugbahnvermessung am Beispieldes Avionik-Flugerprobungssystems AFES," Sammelband des Wissenschaftlichen Seminars des InstitutfUr Flugfiihrung der DLR, Braunschweig, 1991.
18. Stieler, B. and H. Winter, "Gyroscopic Instruments and Their Application to Flight Testing," AGARDo-graph No. 160, Vol. 15, 1982.
19. Torge, Wolfgang, Geodasie, Walter de Gruyter, Berlin, 1975.
20. "World Geodetic System 1984 (WGS84) - Auszug aus dem DMA Technical Report," Herausgegeben vomAmt fir Militdrisches Geowesen, 1988.
Document provided by SpaceAge Control, Inc. (http://spaceagecontrol.com/).
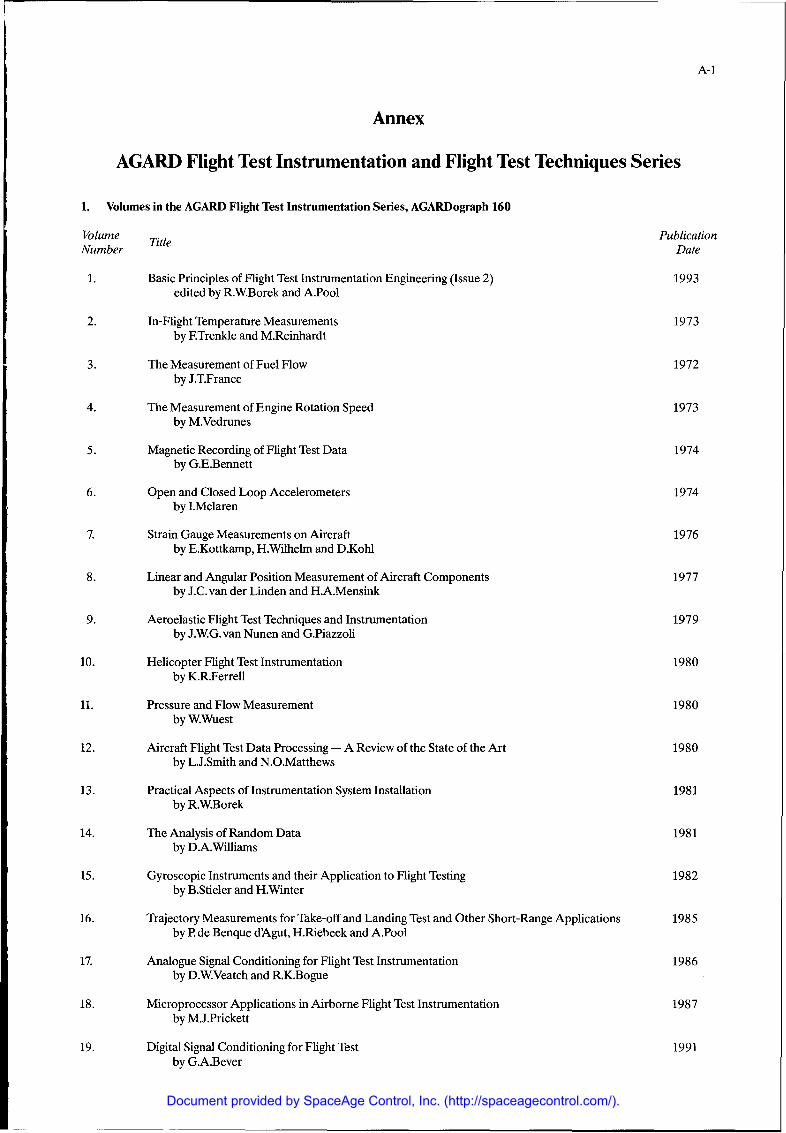
A-1
Annex
AGARD Flight Test Instrumentation and Flight Test Techniques Series
1. Volumes in the AGARD Flight Test Instrumentation Series, AGARDograph 160
Volume PublicationNumber Date
1. Basic Principles of Flight Test Instrumentation Engineering (Issue 2) 1993edited by R.WBorek and A.Pool
2. In-Flight Temperature Measurements 1973by E.Trenkle and M.Reinhardt
3. The Measurement of Fuel Flow 1972by J.T.France
4. The Measurement of Engine Rotation Speed 1973by M.Vedrunes
5. Magnetic Recording of Flight Test Data 1974by G.E.Bennett
6. Open and Closed Loop Accelerometers 1974by I.Mclaren
7. Strain Gauge Measurements on Aircraft 1976by E.Kottkamp, H.Wilhelm and D.Kohl
8. Linear and Angular Position Measurement of Aircraft Components 1977by J.C. van der Linden and H.A.Mensink
9. Aeroelastic Flight Test Techniques and Instrumentation 1979by J.W.G. van Nunen and G.Piazzoli
10. Helicopter Flight Test Instrumentation 1980by K.R.Ferrell
11. Pressure and Flow Measurement 1980by WWuest
12. Aircraft Flight Test Data Processing - A Review of the State of the Art 1980by L.J.Smith and N.O.Matthews
13. Practical Aspects of Instrumentation System Installation 1981by R.WBorek
14. The Analysis of Random Data 1981by D.A.Williams
15. Gyroscopic Instruments and their Application to Flight Testing 1982by B.Stieler and H.Winter
16. Trajectory Measurements for Take-off and Landing Test and Other Short-Range Applications 1985by P de Benque dAgut, H.Riebeek and A.Pool
17. Analogue Signal Conditioning for Flight Test Instrumentation 1986by D.WVeatch and R.K.Bogue
18. Microprocessor Applications in Airborne Flight Test Instrumentation 1987by M.J.Prickett
19. Digital Signal Conditioning for Flight Test 1991by G.A.Bever
Document provided by SpaceAge Control, Inc. (http://spaceagecontrol.com/).

A-2
2. Volumes in the AGARD Flight Test Techniques Series
Number Title PublicationDate
AG237 Guide to In-Flight Thrust Measurement of Turbojets and Fan Engines by the MIDAP 1979Study Group (UK)
The remaining volumes are published as a sequence of Volume Numbers of AGARDograph 300.
Volume PublicationNumber Date
1. Calibration of Air-Data Systems and Flow Direction Sensors 1983by J.A.Lawford and K.R.Nippress
2. Identification of Dynamic Systems 1985by R.E.Maine and K.W.Iliff
3. Identification of Dynamic Systems - Applications to Aircraft 1986Part 1: The Output Error Approach
by R.E.Maine and K.W.Iliff
4. Determination of Antenna Patterns and Radar Reflection Characteristics of Aircraft 1986by H.Bothe and D.McDonald
5. Store Separation Flight Testing 1986by R.J.Arnold and C.S.Epstein
6. Developmental Airdrop Testing Techniques and Devices 1987by H.J.Hunter
7. Air-to-Air Radar Flight Testing 1988by R.E.Scott
8. Flight Testing under Extreme Environmental Conditions 1988by C.L.Henrickson
9. Aircraft Exterior Noise Measurement and Analysis Techniques 1991by H.Heller
10. Weapon Delivery Analysis and Ballistic Flight Testing 1992by R.J.Arnold and J.B.Knight
11. The Testing of Fixed Wing Tanker & Receiver Aircraft to Establish their 1992Air-to-Air Refuelling Capabilities
by J.Bradley and K.Emerson
At the time of publication of the present volume the following volumes were in preparation:
Identification of Dynamic Systems. Applications to Aircraft.Part 2: Nonlinear Model Analysis and Manoeuvre Design
by J.A.Mulder and J.H.Breeman
Flight Testing of Terrain Following Systemsby C.Dallimore and M.K.Foster
Reliability and Maintainabilityby J.Howell
Testing of Flight Critical Control Systems on Helicoptersby J.D.L.Gregory
Flight Testing of Air-to-Air Refuelling of Fixed Wing Aircraftby J.Bradley and K.Emerson
Introduction to Flight Test EngineeringEdited by EStoliker
Space System Testingby A.Wisdom
Flight Testing of Radio Navigation Systemsby H.Bothe and H.J.Hotop
Simulation in Support of Flight Testingby L.ShillingDocument provided by SpaceAge Control, Inc. (http://spaceagecontrol.com/).