Basic principles of heredity.
31
Black Urine and First Cousins Voiding black urine is a rare and peculiar trait. In 1902, Archibald Garrod discovered the hereditary basis of black urine and, in the process, contributed to our understanding of the nature of genes. Garrod was an English physician who was more inter- ested in chemical explanations of disease than in the practice of medicine. He became intrigued by several of his patients who produced black urine, a condition known as alkap- tonuria. The urine of alkaptonurics contains homogentisic acid, a compound that, on exposure to air, oxidizes and turns the urine black. Garrod observed that alkaptonuria appears at birth and remains for life. He noted that often several children in the same family were affected: of the 32 cases that he knew about, 19 appeared in only seven families. Furthermore, the parents of these alkaptonurics were fre- quently first cousins. With the assistance of geneticist William Bateson, Garrod recognized that this pattern of inheritance is precisely the pattern produced by the trans- mission of a rare, recessive gene. Garrod later proposed that several other human disor- ders, including albinism and cystinuria, are inherited in the same way as alkaptonuria. He concluded that each gene Basic Principles of Heredity 45 __RRH __CT • Black Urine and First Cousins • Mendel: The Father of Genetics Mendel's Success Genetic Terminology • Monohybrid Crosses What Monohybrid Crosses Reveal Predicting The Outcomes of Genetic Crosses The Testcross Incomplete Dominance Genetic Symbols • Multiple-Loci Crosses Dihybrid Crosses The Principle of Independent Assortment The Relationship of the Principle of Independent Assortment to Meiosis Applying Probability and the Branch Diagram to Dihybrid Crosses The Dihybrid Testcross Trihybrid Crosses • Observed and Expected Ratios The Goodness of Fit Chi-square Test Penetrance and Expressivity Basic Principles of Heredity 3 Alkaptonuria results from impaired function of homogentisate dioxygenase (shown here), an enzyme required for catabolism of the amino acids pheny- lalanine and tyrosine. (Courtesy of David E. Timm, Department of Molecular Biology, Indiana School of Medicine, and Miguel Penalva, Centro de Investigaciones. Biológicas CSIC, Madrid, Spain.) 45
Transcript of Basic principles of heredity.

Black Urine and First CousinsVoiding black urine is a rare and peculiar trait. In 1902,Archibald Garrod discovered the hereditary basis of blackurine and, in the process, contributed to our understandingof the nature of genes.
Garrod was an English physician who was more inter-ested in chemical explanations of disease than in the practiceof medicine. He became intrigued by several of his patientswho produced black urine, a condition known as alkap-tonuria. The urine of alkaptonurics contains homogentisicacid, a compound that, on exposure to air, oxidizes and
turns the urine black. Garrod observed that alkaptonuriaappears at birth and remains for life. He noted that oftenseveral children in the same family were affected: of the 32cases that he knew about, 19 appeared in only seven families.Furthermore, the parents of these alkaptonurics were fre-quently first cousins. With the assistance of geneticistWilliam Bateson, Garrod recognized that this pattern ofinheritance is precisely the pattern produced by the trans-mission of a rare, recessive gene.
Garrod later proposed that several other human disor-ders, including albinism and cystinuria, are inherited in thesame way as alkaptonuria. He concluded that each gene
Basic Principles of Heredity 45 __RRH
__CT
• Black Urine and First Cousins
• Mendel: The Father of GeneticsMendel's Success
Genetic Terminology
• Monohybrid CrossesWhat Monohybrid Crosses Reveal
Predicting The Outcomes of GeneticCrosses
The Testcross
Incomplete Dominance
Genetic Symbols
• Multiple-Loci CrossesDihybrid Crosses
The Principle of IndependentAssortment
The Relationship of the Principle ofIndependent Assortment to Meiosis
Applying Probability and the BranchDiagram to Dihybrid Crosses
The Dihybrid Testcross
Trihybrid Crosses
• Observed and Expected RatiosThe Goodness of Fit Chi-square Test
Penetrance and Expressivity
BBaassiicc PPrriinncciipplleess ooff HHeerreeddiittyy3
Alkaptonuria results from impaired function of homogentisate dioxygenase(shown here), an enzyme required for catabolism of the amino acids pheny-lalanine and tyrosine. (Courtesy of David E. Timm, Department of Molecular Biology, IndianaSchool of Medicine, and Miguel Penalva, Centro de Investigaciones. Biológicas CSIC, Madrid, Spain.)
45

encodes an enzyme that controls a biochemical reaction.When there is a flaw in a gene, its enzyme is deficient,resulting in a biochemical disorder. He called these flaws“inborn errors of metabolism.” Garrod was the first to applythe basic principles of genetics, which we will learn about inthis chapter, to the inheritance of a human disease. Hisidea — that genes code for enzymes — was revolutionaryand correct. Unfortunately, Garrod’s ideas were not recog-nized as being important at the time and were appreciatedonly after they had been rediscovered 30 years later.
This chapter is about the principles of heredity: howgenes are passed from generation to generation. These prin-ciples were first put forth by Gregor Mendel, so we begin byexamining his scientific achievements. We then turn to sim-ple genetic crosses, those in which a single characteristic isexamined. We learn some techniques for predicting the out-come of genetic crosses and then turn to crosses in whichtwo or more characteristics are examined. We will see howthe principles applied to simple genetic crosses and theratios of offspring that they produce serve as the key forunderstanding more complicated crosses. We end the chap-ter by considering statistical tests for analyzing crosses andfactors that vary their outcome.
Throughout this chapter, a number of concepts areinterwoven: Mendel’s principles of segregation and inde-pendent assortment, probability, and the behavior of chro-mosomes. These might at first appear to be unrelated, butthey are actually different views of the same phenomenon,because the genes that undergo segregation and indepen-dent assortment are located on chromosomes. The principleaim of this chapter is to examine these different views andto clarify their relations.
Archibald Garrod’s originalpaper on the genetics of alkaptonuria
Mendel: The Father of GeneticsIn 1902, the basic principles of genetics, which ArchibaldGarrod successfully applied to the inheritance of alkap-tonuria, had just become widely known among biologists.Surprisingly, these principles had been discovered some 35years earlier by Johann Gregor Mendel (1822 – 1884).
Mendel was born in what is now part of the CzechRepublic. Although his parents were simple farmers withlittle money, he was able to achieve a sound education andwas admitted to the Augustinian monastery in Brno in Sep-tember 1843. After graduating from seminary, Mendel wasordained a priest and appointed to a teaching position in alocal school. He excelled at teaching, and the abbot of themonastery recommended him for further study at the Uni-versity of Vienna, which he attended from 1851 to 1853.There, Mendel enrolled in the newly opened Physics Insti-tute and took courses in mathematics, chemistry, entomol-ogy, paleontology, botany, and plant physiology. It was
probably here that Mendel acquired the scientific method,which he later applied so successfully to his genetics experi-ments. After 2 years of study in Vienna, Mendel returned toBrno, where he taught school and began his experimentalwork with pea plants. He conducted breeding experimentsfrom 1856 to 1863 and presented his results publicly atmeetings of the Brno Natural Science Society in 1865.Mendel’s paper from these lectures was published in 1866.In spite of widespread interest in heredity, the effect of hisresearch on the scientific community was minimal. At thetime, no one seems to have noticed that Mendel had discov-ered the basic principles of inheritance.
In 1868, Mendel was elected abbot of his monastery,and increasing administrative duties brought an end to histeaching and eventually to his genetics experiments. He diedat the age of 61 on January 6, 1884, unrecognized for hiscontribution to genetics.
The significance of Mendel’s discovery was unappreci-ated until 1900, when three botanists—Hugo de Vries, Erichvon Tschermak, and Carl Correns—began independentlyconducting similar experiments with plants and arrived atconclusions similar to those of Mendel. Coming acrossMendel’s paper, they interpreted their results in terms of hisprinciples and drew attention to his pioneering work.
46 Chapter 3
Mendel’s SuccessMendel’s approach to the study of heredity was effective forseveral reasons. Foremost was his choice of experimental sub-ject, the pea plant Pisum sativum ( FIGURE 3.1), whichoffered clear advantages for genetic investigation. It is easy tocultivate, and Mendel had the monastery garden and green-house at his disposal. Peas grow relatively rapidly, completingan entire generation in a single growing season. By today’sstandards, one generation per year seems frightfully slow—fruit flies complete a generation in 2 weeks and bacteria in 20minutes—but Mendel was under no pressure to publishquickly and was able to follow the inheritance of individualcharacteristics for several generations. Had he chosen to workon an organism with a longer generation time—horses, forexample—he might never have discovered the basis of inher-itance. Pea plants also produce many offspring—theirseeds—which allowed Mendel to detect meaningful mathe-matical ratios in the traits that he observed in the progeny.
The large number of varieties of peas that were availableto Mendel was also crucial, because these varieties differed invarious traits and were genetically pure. Mendel was thereforeable to begin with plants of variable, known genetic makeup.
◗
ConceptsGregor Mendel put forth the basic principles ofinheritance, publishing his findings in 1866. Thesignificance of his work did not become widelyappreciated until 1900.
www.whfreeman.com/pierce

Much of Mendel’s success can be attributed to the sevencharacteristics that he chose for study (see Figure 3.1). Heavoided characteristics that display a range of variation;instead, he focused his attention on those that exist in twoeasily differentiated forms, such as white versus gray seedcoats, round versus wrinkled seeds, and inflated versusconstricted pods.
Finally, Mendel was successful because he adopted anexperimental approach. Unlike many earlier investigatorswho just described the results of crosses, Mendel formu-lated hypotheses based on his initial observations and thenconducted additional crosses to test his hypotheses. Hekept careful records of the numbers of progeny possessingeach type of trait and computed ratios of the differenttypes. He paid close attention to detail, was adept at seeingpatterns in detail, and was patient and thorough, conduct-ing his experiments for 10 years before attempting to writeup his results.
Mendel’s original paper (inGerman, with an English translation), as well as references,essays, and commentaries on Mendel’s work
Genetic TerminologyBefore we examine Mendel’s crosses and the conclusionsthat he made from them, it will be helpful to review someterms commonly used in genetics (Table 3.1). The term genewas a word that Mendel never knew. It was not coined until1909, when the Danish geneticist Wilhelm Johannsen firstused it. The definition of a gene varies with the context ofits use, and so its definition will change as we explore differ-ent aspects of heredity. For our present use in the context ofgenetic crosses, we will define a gene as an inherited factorthat determines a characteristic.
Genes frequently come in different versions calledalleles ( FIGURE 3.2). In Mendel’s crosses, seed shape wasdetermined by a gene that exists as two different alleles: oneallele codes for round seeds and the other codes for wrin-kled seeds. All alleles for any particular gene will be found ata specific place on a chromosome called the locus for thatgene. (The plural of locus is loci; it’s bad form in genetics —and incorrect — to speak of locuses.) Thus, there is a spe-cific place — a locus — on a chromosome in pea plants
◗
Basic Principles of Heredity 47
3.1 Mendel used the pea plant Pisum sativum in his studies ofheredity. He examined seven characteristics that appeared in the seeds andin plants grown from the seeds. (Photo from Wally Eberhart/Visuals Unlimited.)
◗
Term Definition
Gene A genetic factor (region of DNA)that helps determine a characteristic
Allele One of two or more alternateforms of a gene
Locus Specific place on a chromosomeoccupied by an allele
Genotype Set of alleles that an individualpossesses
Heterozygote An individual possessing twodifferent alleles at a locus
Homozygote An individual possessing two ofthe same alleles at a locus
Phenotype or The appearance or manifestationtrait of a character
Character or An attribute or featurecharacteristic
Summary of important genetic termsTable 3.1
www.whfreeman.com/pierce
WrinkledRound WhiteGray
Terminal(at tip ofstem)
Axial(alongstem)
Short Tall
Seed shape
Constricted Inflated
Pod shape
Seed coatcolor
Flower position Stem length
GreenYellow
GreenYellow
Seed (endosperm)color
Pod color

where the shape of seeds is determined. This locus might beoccupied by an allele for round seeds or one for wrinkledseeds. We will use the term allele when referring to a specificversion of a gene; we will use the term gene to refer moregenerally to any allele at a locus.
The genotype is the set of alleles that an individualorganism possesses. A diploid organism that possesses twoidentical alleles is homozygous for that locus. One that pos-sesses two different alleles is heterozygous for the locus.
Another important term is phenotype, which is themanifestation or appearance of a characteristic. A pheno-type can refer to any type of characteristic: physical, physio-logical, biochemical, or behavioral. Thus, the condition ofhaving round seeds is a phenotype, a body weight of 50 kgis a phenotype, and having sickle-cell anemia is a pheno-type. In this book, the term characteristic or character refersto a general feature such as eye color; the term trait or phe-notype refers to specific manifestations of that feature, suchas blue or brown eyes.
A given phenotype arises from a genotype that devel-ops within a particular environment. The genotype deter-mines the potential for development; it sets certain limits,or boundaries, on that development. How the phenotypedevelops within those limits is determined by the effects ofother genes and environmental factors, and the balancebetween these influences varies from character to character.For some characters, the differences between phenotypesare determined largely by differences in genotype; in otherwords, the genetic limits for that phenotype are narrow.Seed shape in Mendel’s peas is a good example of a charac-teristic for which the genetic limits are narrow and the phe-notypic differences are largely genetic. For other characters,environmental differences are more important; in this case,the limits imposed by the genotype are broad. The heightthat an oak tree reaches at maturity is a phenotype that isstrongly influenced by environmental factors, such as theavailability of water, sunlight, and nutrients. Nevertheless,
the tree’s genotype still imposes some limits on its height:an oak tree will never grow to be 300 m tall no matter howmuch sunlight, water, and fertilizer are provided. Thus, eventhe height of an oak tree is determined to some degree bygenes. For many characteristics, both genes and environ-ment are important in determining phenotypic differences.
An obvious but important concept is that only the geno-type is inherited. Although the phenotype is determined, atleast to some extent, by genotype, organisms do not transmittheir phenotypes to the next generation. The distinction be-tween genotype and phenotype is one of the most importantprinciples of modern genetics. The next section describesMendel’s careful observation of phenotypes through severalgenerations of breeding experiments. These experiments al-lowed him to deduce not only the genotypes of the individualplants, but also the rules governing their inheritance.
488 Chapter 3
3.2 At each locus, a diploid organism possessestwo alleles located on different homologouschromosomes.
◗
Monohybrid CrossesMendel started with 34 varieties of peas and spent 2 yearsselecting those varieties that he would use in his experi-ments. He verified that each variety was genetically pure(homozygous for each of the traits that he chose to study)by growing the plants for two generations and confirmingthat all offspring were the same as their parents. He thencarried out a number of crosses between the different vari-eties. Although peas are normally self-fertilizing (each plantcrosses with itself), Mendel conducted crosses between dif-ferent plants by opening the buds before the anthers werefully developed, removing the anthers, and then dusting thestigma with pollen from a different plant.
Mendel began by studying monohybrid crosses —those between parents that differed in a single characteristic.In one experiment, Mendel crossed a pea plant homozygousfor round seeds with one that was homozygous for wrinkledseeds ( FIGURE 3.3). This first generation of a cross is theP (parental) generation.
After crossing the two varieties in the P generation,Mendel observed the offspring that resulted from the cross.In regard to seed characteristics, such as seed shape, thephenotype develops as soon as the seed matures, becausethe seed traits are determined by the newly formed embryowithin the seed. For characters associated with the plantitself, such as stem length, the phenotype doesn’t developuntil the plant grows from the seed; for these characters,Mendel had to wait until the following spring, plant theseeds, and then observe the phenotypes on the plants thatgerminated.
◗
Allele R Allele r
1 Genes exist in differentversions called alleles.
2 One allele codes for round seeds…
3 …and a different allele codes for wrinkled seeds.
4 Different alleles occupy the same locus on homologous chromosomes.
ConceptsEach phenotype results from a genotypedeveloping within a specific environment. Thegenotype, not the phenotype, is inherited.

The offspring from the parents in the P generation arethe F1 (first filial) generation. When Mendel examined theF1 of this cross, he found that they expressed only one of thephenotypes present in the parental generation: all the F1
seeds were round. Mendel carried out 60 such crosses andalways obtained this result. He also conducted reciprocalcrosses: in one cross, pollen (the male gamete) was takenfrom a plant with round seeds and, in its reciprocal cross,pollen was taken from a plant with wrinkled seeds. Recipro-cal crosses gave the same result: all the F1 were round.
Mendel wasn’t content with examining only the seedsarising from these monohybrid crosses. The followingspring, he planted the F1 seeds, cultivated the plants that ger-minated from them, and allowed the plants to self-fertilize,producing a second generation (the F2 generation). Both ofthe traits from the P generation emerged in the F2; Mendelcounted 5474 round seeds and 1850 wrinkled seeds in the F2
(see Figure 3.3). He noticed that the number of the roundand wrinkled seeds constituted approximately a 3 to 1 ratio;that is, about of the F2 seeds were round and werewrinkled. Mendel conducted monohybrid crosses for allseven of the characteristics that he studied in pea plants, andin all of the crosses he obtained the same result: all of the F1
resembled only one of the two parents, but both parentaltraits emerged in the F2 in approximately a 3:1 ratio.
What Monohybrid Crosses RevealMendel drew several important conclusions from the resultsof his monohybrid crosses. First, he reasoned that, althoughthe F1 plants display the phenotype of only one parent, theymust inherit genetic factors from both parents because theytransmit both phenotypes to the F2 generation. The pres-ence of both round and wrinkled seeds in the F2 could beexplained only if the F1 plants possessed both round andwrinkled genetic factors that they had inherited from the Pgeneration. He concluded that each plant must thereforepossess two genetic factors coding for a character.
The genetic factors that Mendel discovered (alleles) are,by convention, designated with letters; the allele for roundseeds is usually represented by R, and the allele for wrinkledseeds by r. The plants in the P generation of Mendel’s crosspossessed two identical alleles: RR in the round-seeded par-ent and rr in the wrinkled-seeded parent ( FIGURE 3.4a).
A second conclusion that Mendel drew from his mono-hybrid crosses was that the two alleles in each plant separatewhen gametes are formed, and one allele goes into eachgamete. When two gametes (one from each parent) fuse toproduce a zygote, the allele from the male parent uniteswith the allele from the female parent to produce the geno-type of the offspring. Thus, Mendel’s F1 plants inherited anR allele from the round-seeded plant and an r allele fromthe wrinkled-seeded plant ( FIGURE 3.4b). However, onlythe trait encoded by round allele (R) was observed in theF1 — all the F1 progeny had round seeds. Those traits thatappeared unchanged in the F1 heterozygous offspring
◗
◗
1�43�4
Basic Principles of Heredity 49
Homozygousround seeds
Homozygouswrinkled seeds
5474 Round seeds
1850 Wrinkled seeds
�
�
�
3/4 Round
1/4 Wrinkled
Fraction ofprogeny seeds
Method
Results
Cross
Cross
Intercross
P generation
F1 generationSelf-fertilized
F2 generation
Mendel’s firstexperiment
�Flower
Anthers
Stigma
�Flower
Mendel’s secondexperiment
1 To cross differentvarieties of peas,remove the anthersfrom flowersto preventself-fertilization…
5 Mendel crossedtwo homozygousvarieties of peas.
3 The pollen fertilizesova within theflower, whichdevelop into seeds.
4 The seeds growinto plants.
2 …and dust thestigma withpollen from adifferent plant.
6 All F1 seedswere round.
7 Mendel allowedthe plants toself-fertilize.
8 3/4 of F2 seedswere roundand 1/4 werewrinkled, a3:1 ratio.
Question: When peas with two different traits—round andwrinkled seeds—are crossed, will their progeny exhibit one of those traits, both of those traits, or a “blended”intermediate trait?
Experiment
Conclusion: The traits of the parent plants do not blend. Although F1 plants display the phenotype of one parent, both traits are passed to F2 progeny in a 3:1 ratio.
3.3 Mendel conducted monohybrid crosses.◗

50 Chapter 3
Many people agree that no one shouldbe forced to have a genetic testwithout his or her consent, yet forobvious reasons this ethical principleis difficult to follow when dealing withthose who are deceased. There are allsorts of reasons why genetic testingon certain deceased persons mightprove important, but one of theprimary reasons is for purposes ofidentification. In anthropology, geneticanalysis might help tell us whether wehave found the body of a Romanov,Hitler, or Mengele. In cases of war orterrorist attacks, such as those onSeptember 11, 2001, there might beno other way to determine the identifyof a deceased person except bymatching tissue samples withpreviously stored biological tissue orwith samples from close relatives.
One historically interesting case,which highlights the ethical issuesfaced when determining genetic factsabout the dead, is that which centerson Abraham Lincoln. Medicalgeneticists and advocates for patientswith Marfan syndrome have longwondered whether President Lincolnhad this particular genetic disease.After all, Lincoln had the tall ganglybuild often associated with Marfan’ssyndrome, which affects theconnective tissues and cartilage of thebody. Biographers and students of thisman, whom many consider to be ourgreatest president, would like to knowwhether the depression that Lincolnsuffered throughout his life might havebeen linked to the painful, arthritis-likesymptoms of Marfan syndrome.
Lincoln was assassinated on April14, 1865, and died early the nextmorning. An autopsy was performed,and samples of his hair, bone, andblood were preserved and stored atthe National Museum of Health andMedicine; they are still there. Thepresence of a recently found geneticmarker indicates whether someone hasMarfan syndrome. With this
advancement, it would be possible touse some of the stored remains of AbeLincoln to see if he had this condition.However, would it be ethical toperform this test?
We must be careful about genetictesting, because often too muchweight is assigned to the results ofsuch tests. There is a temptation tosee DNA as the essence, theblueprint, of a person—that the factorthat forms who we are and what wedo. Given this tendency, should societybe cautious about letting peopleexplore the genes of the deceased?And, if we should not test withoutpermission, then how can we obtainpermission in cases where the personin question is dead? In Honest Abe’scase, the “patient” is deceased and hasno immediate survivors; there is noone to consent. But allowing testingwithout consent sets a dangerousprecedent.
It may seem a bit strange to applythe notions of privacy and consent tothe deceased. But, considering thatmost people today agree that consentshould be obtained before these testsare administered, do researchers havethe right to pry into Lincoln’s DNAsimply because neither he nor hisdescendants are around to say thatthey can’t? Are we to say that anyone’sbody is open to examination whenevera genetic test becomes available thatmight tell us an interesting fact aboutthat person's biological makeup?
Many prominent people from thepast have taken special precautions torestrict access to their diaries, papersand letters; for instance, SigmundFreud locked away his personal papersfor 100 years. Will future Lincolns andFreuds need to embargo their mortalremains for eternity to preventunwanted genetic snooping bysubsequent generations?
And, when it comes right down toit, what is the point of establishingwhether Lincoln had Marfan syndrome?After all, we don’t need to inspect hisgenes to determine whether he waspresidential timber—Marfan or noMarfan, he obviously was. The realquestions to ask are, Do weadequately understand what he did aspresident and what he believed? Howdid his actions shape our country, andwhat can we learn from them that willbenefit us today?
In the end, the genetic basis forLincoln’s behavior and leadershipmight be seen as having no relevance.Some would say that genetic testingmight divert our attention fromLincoln’s work, writings, thoughts, anddeeds and, instead, require that wesee him as a jumble of DNA output.Perhaps it makes more sense toencourage efforts to understand andappreciate Lincoln’s legacy through hisactions rather than throughreconstituting and analyzing his DNA.
The New GeneticsETHICS • SCIENCE • TECHNOLOGY
Abraham Lincoln had the tall, ganglybuild often associatedwith Marfan syndrome.(Cartoon by Frank Billew,1864. Bettmann/Corbis.)
by Art CaplanShould Genetics ResearchersProbe Abraham Lincoln’s Genes?

Mendel called dominant, and those traits that disappearedin the F1 heterozygous offspring he called recessive. Whendominant and recessive alleles are present together, therecessive allele is masked, or suppressed. The concept ofdominance was a third important conclusion that Mendelderived from his monohybrid crosses.
Mendel’s fourth conclusion was that the two alleles ofan individual plant separate with equal probability into thegametes. When plants of the F1 (with genotype Rr) pro-duced gametes, half of the gametes received the R allele forround seeds and half received the r allele for wrinkled seeds.The gametes then paired randomly to produce the follow-ing genotypes in equal proportions among the F2: RR, Rr,rR, rr ( FIGURE 3.4c). Because round (R) is dominant overwrinkled (r), there were three round progeny in the F2 (RR,Rr, rR) for every one wrinkled progeny (rr) in the F2. This3:1 ratio of round to wrinkled progeny that Mendelobserved in the F2 could occur only if the two alleles of agenotype separated into the gametes with equal probability.
The conclusions that Mendel developed about inheri-tance from his monohybrid crosses have been further devel-oped and formalized into the principle of segregation andthe concept of dominance. The principle of segregation(Mendel’s first law) states that each individual diploidorganism possesses two alleles for any particular character-istic. These two alleles segregate (separate) when gametesare formed, and one allele goes into each gamete. Further-more, the two alleles segregate into gametes in equal pro-portions. The concept of dominance states that, when twodifferent alleles are present in a genotype, only the trait ofthe dominant allele is observed in the phenotype.
Mendel confirmed these principles by allowing his F2
plants to self-fertilize and produce an F3 generation. Hefound that the F2 plants grown from the wrinkled seeds —those displaying the recessive trait (rr) — produced an F3
in which all plants produced wrinkled seeds. Because hiswrinkled-seeded plants were homozygous for wrinkledalleles (rr) they could pass on only wrinkled alleles to theirprogeny ( FIGURE 3.4d).
The F2 plants grown from round seeds — the domi-nant trait — fell into two types (Figure 3.4c). On self-fertil-ization, about of the F2 plants produced both round andwrinkled seeds in the F3 generation. These F2 plants wereheterozygous (Rr); so they produced RR (round), Rr(round), and rr (wrinkled) seeds, giving a 3:1 ratio ofround to wrinkled in the F3. About of the F2 plants wereof the second type; they produced only the dominantround-seeded trait in the F3. These F2 plants were homozy-gous for the round allele (RR) and thus could produce onlyround offspring in the F3 generation. Mendel planted theseeds obtained in the F3 and carried these plants throughthree more rounds of self-fertilization. In each generation,
of the round-seeded plants produced round andwrinkled offspring, whereas produced only roundoffspring. These results are entirely consistent with theprinciple of segregation.
1�3
2�3
1�3
1�4
1�21�4
2�3
◗
◗
Basic Principles of Heredity 51
Gamete formation Gamete formation
R r
Gamete formation
Self–fertilization
R r
Gamete formation
R R R R rrrr
Self–fertilization
(a)
(b)
(c)
(d)
Gametes
Gametes
Gametes
Round RoundRound
Wrinkled Wrinkled
Round3/4 Round1/4 Wrinkled
Round Wrinkled
Round seeds
Homozygousround seeds
Homozygouswrinkled seeds
1/4 RR 1/4 Rr 1/4 rR 1/4 rr
�
P generation
F1 generation
F2 generation
F3 generation
RR rr
Fertilization
Rr
RR RRRr rR
rrrr
1 Each plant possessedtwo alleles codingfor the character.
2 Mendel crossed a plant homozygousfor round seeds (RR) with a planthomozygous for wrinkled seeds (rr).
3 The two alleles in eachplant separated whengametes were formed;one allele went intoeach gamete.
5 Gametes fused toproduce heterozygousF1 plants that hadround seeds.
4 Because round isdominant overwrinkled, all the F1had round seeds.
8 Mendel also self-fertilized the F2…
6 Mendel self-fertilizedthe F1 to producethe F2,…
7 …which appearedin a 3:1 ratio ofround to wrinkled.
9 …to produceF3 seeds.
Homozygous roundpeas producedplants with onlyround peas.
These heterozygousplants producedround and wrinkledseeds in a 3:1 ratio.
Homozygouswrinkled peasproduced plants withonly wrinkled peas.
3.4 Mendel’s monohybrid crosses revealed the prin-ciple of segregation and the concept of dominance.◗

Predicting the Outcomes of Genetic CrossesOne of Mendel’s goals in conducting his experiments on peaplants was to develop a way to predict the outcome ofcrosses between plants with different phenotypes. In thissection, we will first learn a simple, shorthand method forpredicting outcomes of genetic crosses (the Punnett square),and then we will learn how to use probability to predict theresults of crosses.
The Punnett square To illustrate the Punnett square,let’s examine another cross that Mendel carried out. Bycrossing two varieties of peas that differed in height, Mendelestablished that tall (T) was dominant over short (t). Hetested his theory concerning the inheritance of dominanttraits by crossing an F1 tall plant that was heterozygous (Tt)with the short homozygous parental variety (tt). This typeof cross, between an F1 genotype and either of the parentalgenotypes, is called a backcross.
sequences of DNA in the chromosomes that code forparticular phenotypes. The two alleles of a genotype arefound on different but homologous chromosomes. Dur-ing the S stage of meiotic interphase, each chromosomereplicates, producing two copies of each allele, one oneach chromatid ( FIGURE 3.5a). The homologous chro-mosomes segregate during anaphase I, thereby separat-ing the two different alleles ( FIGURE 3.5b and c). Thischromosome segregation is the basis of the principle ofsegregation. During anaphase II of meiosis, the twochromatids of each replicated chromosome separate; soeach gamete resulting from meiosis carries only a singleallele at each locus, as Mendel’s principle of segregationpredicts.
If crossing over has taken place during prophase I ofmeiosis, then the two chromatids of each replicatedchromosome are no longer identical, and the segregationof different alleles takes place at anaphase I and anaphaseII (see Figure 3.5c). Of course, Mendel didn’t know any-thing about chromosomes; he formulated his principlesof heredity entirely on the basis of the results of thecrosses that he carried out. Nevertheless, we should notforget that these principles work because they are basedon the behavior of actual chromosomes during meiosis.
◗
◗
52 Chapter 3
Connecting ConceptsRelating Genetic Crosses to Meiosis
We have now seen how the results of monohybrid crossesare explained by Mendel’s principle of segregation. Manystudents find that they enjoy working genetic crosses butare frustrated by the abstract nature of the symbols. Per-haps you feel the same at this point. You may be asking“What do these symbols really represent? What does thegenotype RR mean in regard to the biology of the organ-ism?” The answers to these questions lie in relating theabstract symbols of crosses to the structure and behaviorof chromosomes, the repositories of genetic information(Chapter 2).
In 1900, when Mendel’s work was rediscovered and bi-ologists began to apply his principles of heredity, therelation between genes and chromosomes was still unclear.The theory that genes are located on chromosomes (thechromosome theory of heredity) was developed in theearly 1900s by Walter Sutton, then a graduate student atColumbia University. Through the careful study of meiosisin insects, Sutton documented the fact that each homolo-gous pair of chromosomes consists of one maternal chro-mosome and one paternal chromosome. Showing thatthese pairs segregate independently into gametes in meio-sis, he concluded that this process is the biological basis forMendel’s principles of heredity. The German cytologist andembryologist Theodor Boveri came to similar conclusionsat about the same time.
Sutton knew that diploid cells have two sets of chro-mosomes. Each chromosome has a pairing partner, itshomologous chromosome. One chromosome of eachhomologous pair is inherited from the mother and theother is inherited from the father. Similarly, diploid cellspossess two alleles at each locus, and these alleles consti-tute the genotype for that locus. The principle of segrega-tion indicates that one allele of the genotype is inheritedfrom each parent.
This similarity between the number of chromo-somes and the number of alleles is not accidental — thetwo alleles of a genotype are located on homologouschromosomes. The symbols used in genetic crosses, suchas R and r, are just shorthand notations for particular
ConceptsThe principle of segregation states that eachindividual organism possesses two alleles codingfor a characteristic. These alleles segregate whengametes are formed, and one allele goes into eachgamete. The concept of dominance states that, whendominant and recessive alleles are present together,only the trait of the dominant allele is observed.
ConceptsThe chromosome theory of inheritance states thatgenes are located on chromosomes. The two allelesof a genotype segregate during anaphase I ofmeiosis, when homologous chromosomes separate.The alleles may also segregate during anaphase IIof meiosis if crossing over has taken place.

To predict the types of offspring that result from thiscross, we first determine which gametes will be produced byeach parent ( FIGURE 3.6a). The principle of segregationtells us that the two alleles in each parent separate, and oneallele passes to each gamete. All gametes from the homozy-gous tt short plant will receive a single short (t) allele. Thetall plant in this cross is heterozygous (Tt); so 50% of itsgametes will receive a tall allele (T) and the other 50% willreceive a short allele (t).
A Punnett square is constructed by drawing a grid,putting the gametes produced by one parent along the
◗
upper edge and the gametes produced by the other parentdown the left side ( FIGURE 3.6b). Each cell (a blockwithin the Punnett square) contains an allele from each ofthe corresponding gametes, generating the genotype of theprogeny produced by fusion of those gametes. In the upperleft-hand cell of the Punnett square in Figure 3.6b, a ga-mete containing T from the tall plant unites with a gametecontaining t from the short plant, giving the genotype ofthe progeny (Tt). It is useful to write the phenotype ex-pressed by each genotype; here the progeny will be tall, be-cause the tall allele is dominant over the short allele.
◗
Basic Principles of Heredity 53
(a)
(b) (c)
Crossing overNo crossing over
R
R r RR R
r
r r
R R
R R
rr
R R rr
rr
r
R r
R r
rR
rR
Chromosomereplication
Prophase I
Anaphase I
Anaphase IIAnaphase II
Anaphase I
Anaphase II Anaphase II
2 …which replicate during S phase of meiosis.
4 During anaphase I, the chromosomes separate.
5 If no crossing takes place,the two chromatids of eachchromosome separate inanaphase II and are identical.
1 The two alleles of genotypeRr are located onhomologous chromosomes,…
3 During prophase I of meiosis,crossing over may or may nottake place.
6 If crossing over takes place,the two chromatids are nolonger identical, and thedifferent alleles segregatein anaphase II.
3.5 Segregation happens because homologous chromosomes separate in meiosis.◗

This process is repeated for all the cells in the Punnettsquare.
By simply counting, we can determine the types of prog-eny produced and their ratios. In Figure 3.6b, two cells con-tain tall (Tt) progeny and two cells contain short (tt) progeny;so the genotypic ratio expected for this cross is 2 Tt to 2 tt(a 1:1 ratio). Another way to express this result is to say thatwe expect of the progeny to have genotype Tt (and phe-notype tall) and of the progeny to have genotype tt (andphenotype short). In this cross, the genotypic ratio and thephenotypic ratio are the same, but this outcome need notbe the case. Try completing a Punnett square for the cross inwhich the F1 round-seeded plants in Figure 3.4 undergo self-fertilization (you should obtain a phenotypic ratio of 3 roundto 1 wrinkled and a genotypic ratio of 1 RR to 2 Rr to 1 rr).
1�2
1�2
Probability as a tool in genetics Another method fordetermining the outcome of a genetic cross is to use therules of probability, as Mendel did with his crosses. Proba-bility expresses the likelihood of a particular event occur-ring. It is the number of times that a particular eventoccurs, divided by the number of all possible outcomes. Forexample, a deck of 52 cards contains only one king ofhearts. The probability of drawing one card from the deckat random and obtaining the king of hearts is , becausethere is only one card that is the king of hearts (one event)and there are 52 cards that can be drawn from the deck (52possible outcomes). The probability of drawing a card andobtaining an ace is , because there are four cards that areaces (four events) and 52 cards (possible outcomes). Proba-bility can be expressed either as a fraction ( in this case)or as a decimal number (0.019).
The probability of a particular event may be deter-mined by knowing something about how the event occursor how often it occurs. We know, for example, that the prob-ability of rolling a six-sided die (one member of a pair ofdice) and getting a four is , because the die has six sidesand any one side is equally likely to end up on top. So,in this case, understanding the nature of the event — theshape of the thrown die — allows us to determine the prob-ability. In other cases, we determine the probability ofan event by making a large number of observations. Whena weather forecaster says that there is a 40% chance of rainon a particular day, this probability was obtained by observ-ing a large number of days with similar atmospheric condi-tions and finding that it rains on 40% of those days. In thiscase, the probability has been determined empirically (byobservation).
The multiplication rule Two rules of probability are use-ful for predicting the ratios of offspring produced in geneticcrosses. The first is the multiplication rule, which statesthat the probability of two or more independent eventsoccurring together is calculated by multiplying their inde-pendent probabilities.
To illustrate the use of the multiplication rule, let’sagain consider the roll of dice. The probability of rollingone die and obtaining a four is . To calculate the probabil-ity of rolling a die twice and obtaining 2 fours, we can applythe multiplication rule. The probability of obtaining a fouron the first roll is and the probability of obtaining afour on the second roll is ; so the probability of rolling afour on both is � � ( FIGURE 3.7a). The key indi-cator for applying the multiplication rule is the word and;
◗1�361�6
1�6
1�6
1�6
1�6
1�6
1�52
4�52
1�52
54 Chapter 3
(a)
(b)
Tall Short
TtTtTtTt Tt
ttTall
Short
Tt
ttTall
Short
�
Gametes
P generation
F1 generation
ttTt
tt
Fertilization
tT
T
t
tt
Conclusion: Genotypic ratio 1Tt :1ttPhenotypic ratio 1Tall:1Short
3.6 The Punnett square can be used fordetermining the results of a genetic cross.◗
ConceptsThe Punnett square is a short-hand method ofpredicting the genotypic and phenotypic ratios ofprogeny from a genetic cross.

in the example just considered, we wanted to know theprobability of obtaining a four on the first roll and a four onthe second roll.
For the multiplication rule to be valid, the events whosejoint probability is being calculated must be independent —the outcome of one event must not influence the outcomeof the other. For example, the number that comes up onone roll of the die has no influence on the number that
Basic Principles of Heredity 55
Roll 1
Roll 2
(a) The multiplication rule
(b) The addition rule
1 If you roll a die,…
1 If you roll a die,…
2 …in a large number of samplerolls, on average, one out of sixtimes you will obtain a four…
2 …on average, one out ofsix times you'll get a three…
3 …and one out of sixtimes you'll get a four.
5 …your probability ofgetting four is again 1/6…
6 …so the probability of gettinga fouron two sequential rolls is 1/6 � 1/6 = 1/36 .
4 That is, the probability of getting either a three or a four is 1/6 + 1/6 = 2/6 = 1/3.
3 …so the probability of obtaininga four in any roll is 1/6.
4 If you roll thedie again,…
3.7 The multiplication and addition rules can beused to determine the probability of combinationsof events.
◗
comes up on the other roll, so these events are independent.However, if we wanted to know the probability of being hiton the head with a hammer and going to the hospital on thesame day, we could not simply multiply the probability ofbeing hit on the head with a hammer by the probabilityof going to the hospital. The multiplication rule cannot beapplied here, because the two events are not independent —being hit on the head with a hammer certainly influencesthe probability of going to the hospital.
The addition rule The second rule of probability fre-quently used in genetics is the addition rule, which statesthat the probability of any one of two or more mutuallyexclusive events is calculated by adding the probabilities ofthese events. Let’s look at this rule in concrete terms. Toobtain the probability of throwing a die once and rollingeither a three or a four, we would use the addition rule,adding the probability of obtaining a three ( ) to the prob-ability of obtaining a four (again, ), or � = �( FIGURE 3.7b). The key indicator for applying the additionrule are the words either and or.
For the addition rule to be valid, the events whoseprobability is being calculated must be mutually exclusive,meaning that one event excludes the possibility of the otheroccurring. For example, you cannot throw a single die justonce and obtain both a three and a four, because only oneside of the die can be on top. These events are mutuallyexclusive.
◗
1�32�6
1�61�6
1�6
1�6
The application of probability to genetic crosses Themultiplication and addition rules of probability can be usedin place of the Punnett square to predict the ratios of prog-eny expected from a genetic cross. Let’s first consider a crossbetween two pea plants heterozygous for the locus thatdetermines height, Tt � Tt. Half of the gametes producedby each plant have a T allele, and the other half have a t allele; so the probability for each type of gamete is .
The gametes from the two parents can combine in fourdifferent ways to produce offspring. Using the multiplica-tion rule, we can determine the probability of each possibletype. To calculate the probability of obtaining TT progeny,for example, we multiply the probability of receiving a Tallele from the first parent ( ) times the probability of1�2
1�2
ConceptsThe multiplication rule states that the probabilityof two or more independent events occurringtogether is calculated by multiplying theirindependent probabilities. The addition rule statesthat the probability that any one of two or moremutually exclusive events occurring is calculatedby adding their probabilities.

receiving a T allele from the second parent ( ). The multi-plication rule should be used here because we need theprobability of receiving a T allele from the first parent and aT allele from the second parent — two independent events.The four types of progeny from this cross and their associ-ated probabilities are:
TT (T gamete and T gamete) � � tallTt (T gamete and t gamete) � � talltT (t gamete and T gamete) � � talltt (t gamete and t gamete) � � short
Notice that there are two ways for heterozygous progeny tobe produced: a heterozygote can either receive a T allele fromthe first parent and a t allele from the second or receive at allele from the first parent and a T allele from the second.
After determining the probabilities of obtaining eachtype of progeny, we can use the addition rule to determinethe overall phenotypic ratios. Because of dominance, a tallplant can have genotype TT, Tt, or tT; so, using the additionrule, we find the probability of tall progeny to be � �
� . Because only one genotype codes for short (tt), theprobability of short progeny is simply .
Two methods have now been introduced to solve ge-netic crosses: the Punnett square and the probabilitymethod. At this point, you may be saying “Why bother withprobability rules and calculations? The Punnett square iseasier to understand and just as quick.” For simple monohy-brid crosses, the Punnett square is simpler and just as easyto use. However, when tackling more complex crosses con-cerning genes at two or more loci, the probability method isboth clearer and quicker than the Punnett square.
The binomial expansion and probability When proba-bility is used, it is important to recognize that there may beseveral different ways in which a set of events can occur.Consider two parents who are both heterozygous foralbinism, a recessive condition in humans that causesreduced pigmentation in the skin, hair, and eyes ( FIGURE
3.8). When two parents heterozygous for albinism mate (Aa� Aa), the probability of their having a child with albinism(aa) is and the probability of having a child with normalpigmentation (AA or Aa) is . Suppose we want to knowthe probability of this couple having three children withalbinism. In this case, there is only one way in which theycan have three children with albinism — their first child hasalbinism and their second child has albinism and their thirdchild has albinism. Here we simply apply the multiplicationrule: � � � .
Suppose we now ask, What is the probability of thiscouple having three children, one with albinism and twowith normal pigmentation. This situation is more compli-cated. The first child might have albinism, whereas the sec-ond and third are unaffected; the probability of thissequence of events is � � � . Alternatively, the9�64
3�43�4
1�4
1�641�4
1�41�4
3�4
1�4
◗
1�4
3�41�4
1�41�4
1�41�2
1�2
1�41�2
1�2
1�41�2
1�2
1�41�2
1�2
1�2
first and third children might have normal pigmentation,whereas the second has albinism; the probability of this se-quence is � � � . Finally, the first two childrenmight have normal pigmentation and the third albinism;the probability of this sequence is � � � .Because either the first sequence or the second sequence orthe third sequence produces one child with albinism andtwo with normal pigmentation, we apply the addition ruleand add the probabilities: � � � .
If we want to know the probability of this couple hav-ing five children, two with albinism and three with normalpigmentation, figuring out the different combinations ofchildren and their probabilities becomes more difficult.This task is made easier if we apply the binomial expansion.
The binomial takes the form (a � b)n, where a equalsthe probability of one event, b equals the probability of thealternative event, and n equals the number of times theevent occurs. For figuring the probability of two out of fivechildren with albinism:
a � the probability of a child having albinism �
b � the probability of a child having normalpigmentation �
The binomial for this situation is (a � b)5 because there arefive children in the family (n � 5). The expansion is:
(a � b)5 � a5 � 5a4b � 10a3b2 � 10a2b3 � 5ab4 � b5
3�4
1�4
27�649�64
9�649�64
9�641�4
3�43�4
9�643�4
1�43�4
56 Chapter 3
3.8 Albinism in human beings is usually inher-ited as a recessive trait. (Richard Dranitzke/SS/PhotoResearchers.)`
◗

The first term in the expansion (a5) equals the probability ofhaving five children all with albinism, because a is the proba-bility of albinism. The second term (5a4b) equals the proba-bility of having four children with albinism and one withnormal pigmentation, the third term (10a3b2) equals theprobability of having three children with albinism and twowith normal pigmentation, and so forth.
To obtain the probability of any combination of events,we insert the values of a and b; so the probability of havingtwo out of five children with albinism is:
10a2b3 � 10( )2( )3 � � .26
We could easily figure out the probability of any desiredcombination of albinism and pigmentation among five chil-dren by using the other terms in the expansion.
How did we expand the binomial in this example? Ingeneral, the expansion of any binomial (a � b)n consists of aseries of n � 1 terms. In the preceding example, n � 5; sothere are 5 � 1 � 6 terms: a5, 5a4b, 10a3b2, 10a2b3, 5ab4, andb5. To write out the terms, first figure out their exponents. Theexponent of a in the first term always begins with the power towhich the binomial is raised, or n. In our example, n equals 5,so our first term is a5. The exponent of a decreases by one ineach successive term; so the exponent of a is 4 in the secondterm (a4), 3 in the third term (a3), and so forth. The exponentof b is 0 (no b) in the first term and increases by 1 in each suc-cessive term, increasing from 0 to 5 in our example.
Next, determine the coefficient of each term. The coef-ficient of the first term is always 1; so in our example thefirst term is 1a5, or just a5. The coefficient of the secondterm is always the same as the power to which the binomialis raised; in our example this coefficient is 5 and the term is5a4b. For the coefficient of the third term, look back at thepreceding term; multiply the coefficient of the precedingterm (5 in our example) by the exponent of a in that term(4) and then divide by the number of that term (secondterm, or 2). So the coefficient of the third term in our exam-ple is (5 � 4)/2 � � 10 and the term is 10a3b2. Followthis same procedure for each successive term.
Another way to determine the probability of any partic-ular combination of events is to use the following formula:
where P equals the overall probability of event X withprobability a occurring s times and event Y with probabil-ity b occurring t times. For our albinism example, event Xwould be the occurrence of a child with albinism and eventY the occurrence of a child with normal pigmentation;s would equal the number of children with albinism(2) and t, the number of children with normal pigmenta-tion (3). The ! symbol is termed factorial, and it meansthe product of all the integers from n to 1. In this example,
P �n!
s!t! asbt
20�2
270�10243�4
1�4
n � 5; so n! � 5 � 4 � 3 � 2 � 1. Applying this formulato obtain the probability of two out of five children havingalbinism, we obtain:
This value is the same as that obtained with the binomialexpansion.
The TestcrossA useful tool for analyzing genetic crosses is the testcross,in which one individual of unknown genotype is crossedwith another individual with a homozygous recessive geno-type for the trait in question. Figure 3.6 illustrates a test-cross (as well as a backcross). A testcross tests, or reveals, thegenotype of the first individual.
Suppose you were given a tall pea plant with no infor-mation about its parents. Because tallness is a dominanttrait in peas, your plant could be either homozygous (TT)or heterozygous (Tt), but you would not know which. Youcould determine its genotype by performing a testcross. Ifthe plant were homozygous (TT), a testcross would produceall tall progeny (TT � tt : all Tt); if the plant were het-erozygous (Tt), the testcross would produce half tall prog-eny and half short progeny (Tt � tt : Tt and tt).When a testcross is performed, any recessive allele in theunknown genotype is expressed in the progeny, because itwill be paired with a recessive allele from the homozygousrecessive parent.
1�21�2
P �5 � 4 � 3 � 2 � 1
2 � 1 � 3 � 2 � 1(1�4)
2(3�4)3 � .26
P �5!
2!3!(1�4)
2(3�4)3
Basic Principles of Heredity 57
Incomplete DominanceThe seven characters in pea plants that Mendel chose tostudy extensively all exhibited dominance, but Mendel didrealize that not all characters have traits that exhibit domi-nance. He conducted some crosses concerning the length oftime that pea plants take to flower. When he crossed twohomozygous varieties that differed in their floweringtime by an average of 20 days, the length of time taken bythe F1 plants to flower was intermediate between those of
ConceptsThe bionomial expansion may be used todetermine the probability of a particular set ofof events. A testcross is a cross between anindividual with an unknown genotype and onewith a homozygous recessive genotype. Theoutcome of the testcross can reveal the unknowngenotype.

the two parents. When the heterozygote has a phenotypeintermediate between the phenotypes of the two homozy-gotes, the trait is said to display incomplete dominance.
Incomplete dominance is also exhibited in the fruitcolor of eggplants. When a homozygous plant that producespurple fruit (PP) is crossed with a homozygous plant thatproduces white fruit (pp), all the heterozygous F1 (Pp) pro-duce violet fruit ( FIGURE 3.9a). When the F1 are crossedwith each other, of the F2 are purple (PP), are violet(Pp), and are white (pp), as shown in FIGURE 3.9b. This1:2:1 ratio is different from the 3:1 ratio that we wouldobserve if eggplant fruit color exhibited dominance. When a
◗1�4
1�21�4
◗
trait displays incomplete dominance, the genotypic ratiosand phenotypic ratios of the offspring are the same, becauseeach genotype has its own phenotype. It is impossible toobtain eggplants that are pure breeding for violet fruit,because all plants with violet fruit are heterozygous.
Another example of incomplete dominance is feathercolor in chickens. A cross between a homozygous blackchicken and a homozygous white chicken produces F1
chickens that are gray. If these gray F1 are intercrossed, theyproduce F2 birds in a ratio of 1 black: 2 gray: 1 white. Leop-ard white spotting in horses is incompletely dominant overunspotted horses: LL horses are white with numerous darkspots, heterozygous Ll horses have fewer spots, and llhorses have no spots ( FIGURE 3.10). The concept of domi-nance and some of its variations are discussed further inChapter 5.
◗
58 Chapter 3
(a)
(b)
�
Purple fruit White fruit
P p p
p
PGametes
Gametes
P generation
F1 generation
F2 generation
P
Violet
White
Purple
Violet
PP Pp
Pp pp
P
ppPP
�
Violet fruit Violet fruit
PpPp
Fertilization
Fertilization
p
p
P
Conclusion: Genotypic ratio 1PP :2Pp :1ppPhenotypic ratio 1purple:2violet:1white
3.9 Fruit color in eggplant is inherited as anincompletely dominant trait.◗
3.10 Leopard spotting in horses exhibitsincomplete dominance. (Frank Oberle/Bruce Coleman.)
◗
Genetic SymbolsAs we have seen, genetic crosses are usually depicted with theuse of symbols to designate the different alleles. Lowercaseletters are traditionally used to designate recessive alleles,and uppercase letters are for dominant alleles. Two or threeletters may be used for a single allele: the recessive allele forheart-shaped leaves in cucumbers is designated hl, and therecessive allele for abnormal sperm head shape in mice isdesignated azh.
The normal allele for a character — called the wild typebecause it is the allele most often found in the wild — is of-
ConceptsIncomplete dominance is exhibited when theheterozygote has a phenotype intermediatebetween the phenotypes of the two homozygotes.When a trait exhibits incomplete dominance,a cross between two heterozygotes producesa 1:2:1 phenotypic ratio in the progeny.
ten symbolized by one or more letters and a plus sign (�).The letter(s) chosen are usually based on the phenotype ofthe mutant. The first letter is lowercase if the mutant phe-notype is recessive, uppercase if the mutant phenotype isdominant. For example, the recessive allele for yellow eyesin the Oriental fruit fly is represented by ye, whereas theallele for wild-type eye color is represented by ye�. At times,the letters for the wild-type allele are dropped and the alleleis represented simply by a plus sign. Superscripts and sub-scripts are sometimes added to distinguish between genes:Lfr1 and Lfr2 represent dominant alleles at different loci thatproduce lacerate leaf margins in opium poppies; ElR repre-sents an allele in goats that restricts the length of the ears.
A slash may be used to distinguish alleles present in anindividual genotype. The genotype of a goat that is het-erozygous for restricted ears might be written El�/ElR orsimply �/ElR. If genotypes at more than one locus are pre-sented together, a space may separate them. A goat het-erozygous for a pair of alleles that produce restricted earsand heterozygous for another pair of alleles that producegoiter can be designated by El�/ElR G/g.
Basic Principles of Heredity 59
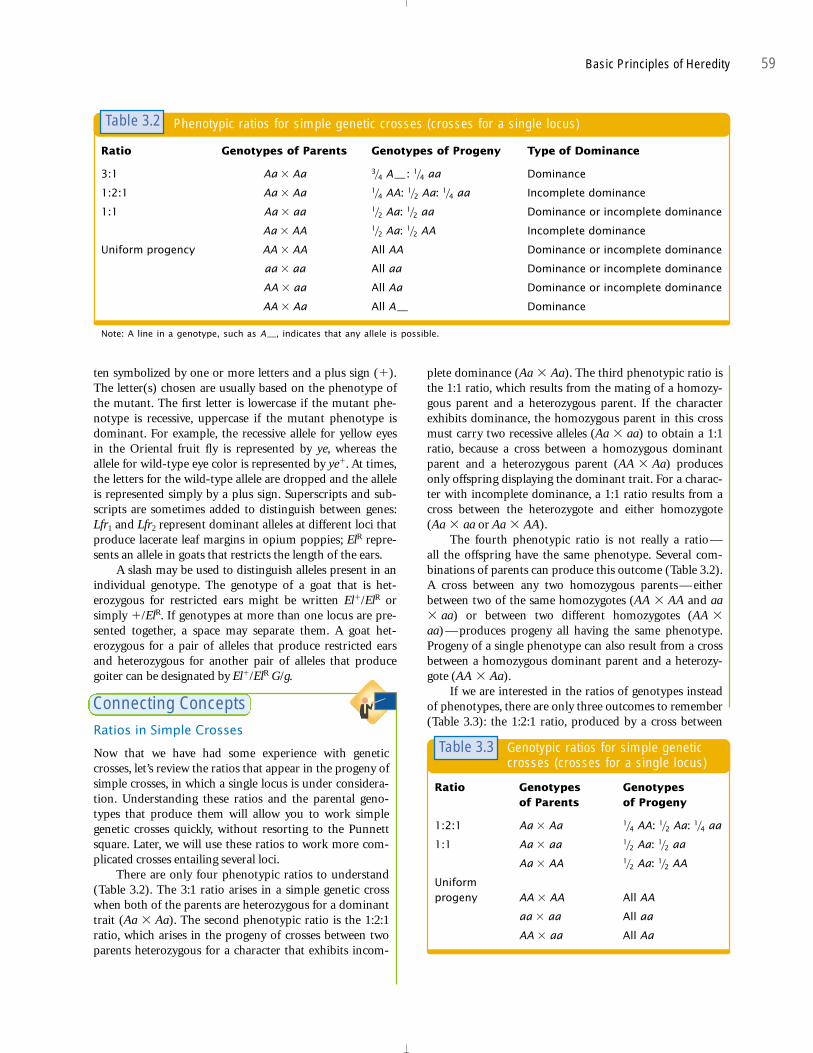
plete dominance (Aa � Aa). The third phenotypic ratio isthe 1:1 ratio, which results from the mating of a homozy-gous parent and a heterozygous parent. If the characterexhibits dominance, the homozygous parent in this crossmust carry two recessive alleles (Aa � aa) to obtain a 1:1ratio, because a cross between a homozygous dominantparent and a heterozygous parent (AA � Aa) producesonly offspring displaying the dominant trait. For a charac-ter with incomplete dominance, a 1:1 ratio results from across between the heterozygote and either homozygote(Aa � aa or Aa � AA).
The fourth phenotypic ratio is not really a ratio —all the offspring have the same phenotype. Several com-binations of parents can produce this outcome (Table 3.2).A cross between any two homozygous parents — eitherbetween two of the same homozygotes (AA � AA and aa� aa) or between two different homozygotes (AA �aa) — produces progeny all having the same phenotype.Progeny of a single phenotype can also result from a crossbetween a homozygous dominant parent and a heterozy-gote (AA � Aa).
If we are interested in the ratios of genotypes insteadof phenotypes, there are only three outcomes to remember(Table 3.3): the 1:2:1 ratio, produced by a cross between
Ratios in Simple Crosses
Now that we have had some experience with geneticcrosses, let’s review the ratios that appear in the progeny ofsimple crosses, in which a single locus is under considera-tion. Understanding these ratios and the parental geno-types that produce them will allow you to work simplegenetic crosses quickly, without resorting to the Punnettsquare. Later, we will use these ratios to work more com-plicated crosses entailing several loci.
There are only four phenotypic ratios to understand(Table 3.2). The 3:1 ratio arises in a simple genetic crosswhen both of the parents are heterozygous for a dominanttrait (Aa � Aa). The second phenotypic ratio is the 1:2:1ratio, which arises in the progeny of crosses between twoparents heterozygous for a character that exhibits incom-
Connecting Concepts
Ratio Genotypes of Parents Genotypes of Progeny Type of Dominance
3:1 Aa � Aa A—: aa Dominance
1:2:1 Aa � Aa AA: Aa: aa Incomplete dominance
1:1 Aa � aa Aa: aa Dominance or incomplete dominance
Aa � AA Aa: AA Incomplete dominance
Uniform progency AA � AA All AA Dominance or incomplete dominance
aa � aa All aa Dominance or incomplete dominance
AA � aa All Aa Dominance or incomplete dominance
AA � Aa All A— Dominance
Note: A line in a genotype, such as A__, indicates that any allele is possible.
1�21�2
1�21�2
1�41�2
1�4
1�43�4
Phenotypic ratios for simple genetic crosses (crosses for a single locus)Table 3.2
Ratio Genotypes Genotypes of Parents of Progeny
1:2:1 Aa � Aa AA: Aa: aa
1:1 Aa � aa Aa: aa
Aa � AA Aa: AA
Uniform progeny AA � AA All AA
aa � aa All aa
AA � aa All Aa
1�21�2
1�21�2
1�41�2
1�4
Genotypic ratios for simple geneticcrosses (crosses for a single locus)
Table 3.3

two heterozygotes; the 1:1 ratio, produced by a crossbetween a heterozygote and a homozygote; and the uni-form progeny produced by a cross between two homozy-gotes. These simple phenotypic and genotypic ratios andthe parental genotypes that produce them provide the keyto understanding crosses for a single locus and, as you willsee in the next section, for multiple loci.
tion indicates that the alleles for each locus separate, andone allele for each locus passes to each gamete. The gametesproduced by the round, yellow parent therefore containalleles RY, whereas the gametes produced by the wrinkled,green parent contain alleles ry. These two types of gametesunite to produce the F1, all with genotype RrYy. Because
60 Chapter 3
Multiple-Loci CrossesWe will now extend Mendel’s principle of segregation tomore complex crosses for alleles at multiple loci. Under-standing the nature of these crosses will require an addi-tional principle, the principle of independent assortment.
Dihybrid CrossesIn addition to his work on monohybrid crosses, Mendelalso crossed varieties of peas that differed in two character-istics (dihybrid crosses). For example, he had one homozy-gous variety of pea that produced round seeds and yellowendosperm; another homozygous variety produced wrin-kled seeds and green endosperm. When he crossed the two,all the F1 progeny had round seeds and yellow endosperm.He then self-fertilized the F1 and obtained the followingprogeny in the F2: 315 round, yellow seeds; 101 wrinkled,yellow seeds; 108 round, green seeds; and 32 wrinkled,green seeds. Mendel recognized that these traits appearedapproximately in a 9:3:3:1 ratio; that is, of the progenywere round and yellow, were wrinkled and yellow,were round and green, and were wrinkled and green.
The Principle of Independent AssortmentMendel carried out a number of dihybrid crosses for pairs of characteristics and always obtained a 9:3:3:1 ratio in the F2. This ratio makes perfect sense in regard to segregationand dominance if we add a third principle, which Mendelrecognized in his dihybrid crosses: the principle of inde-pendent assortment (Mendel’s second law). This principlestates that alleles at different loci separate independently ofone another.
A common mistake is to think that the principle of seg-regation and the principle of independent assortment referto two different processes. The principle of independent as-sortment is really an extension of the principle of segrega-tion. The principle of segregation states that the two allelesof a locus separate when gametes are formed; the principleof independent assortment states that, when these two al-leles separate, their separation is independent of the separa-tion of alleles at other loci.
Let’s see how the principle of independent assortmentexplains the results that Mendel obtained in his dihybridcross. Each plant possesses two alleles coding for each char-acteristic, so the parental plants must have had genotypesRRYY and rryy ( FIGURE 3.11a). The principle of segrega-◗
1�16
3�163�16
9�16
3.11 Mendel conducted dihybrid crosses.◗
F1 generation
�
Round, yellowseeds
P generation
F2 generation
Wrinkled, greenseeds
Gametes
Gametes
RY ry
RR YY
Round, yellowseeds
Rr Yy
rr yy
Fertilization
Self–fertilization
RR YY Rr Yy RR Yy Rr YY
Rr Yy rr yy rr Yy
RR Yy Rr yy Rr Yy
Rr YY rr Yy Rr Yy rr YY
Rr yy
RR yy
ryRY Ry rY
RY
RY
ry
rY
ry Ry
Ry
rY
(a)
(b)
(c)
Conclusion: Phenotypic ratio9 round, yellow:3 round, green:3 wrinkled,yellow :1 wrinkled, green

round is dominant over wrinkled and yellow is dominantover green, the phenotype of the F1 will be round and yellow.
When Mendel self-fertilized the F1 plants to producethe F2, the alleles for each locus separated, with one allelegoing into each gamete. This is where the principle of inde-pendent assortment becomes important. Each pair of allelescan separate in two ways: (1) R separates with Y and r sepa-rates with y to produce gametes RY and ry or (2) R separateswith y and r separates with Y to produce gametes Ry and rY.The principle of independent assortment tells us that the al-leles at each locus separate independently; thus, both kindsof separation occur equally and all four type of gametes(RY, ry, Ry, and rY) are produced in equal proportions ( FIGURE 3.11b). When these four types of gametes arecombined to produce the F2 generation, the progeny consistof round and yellow, wrinkled and yellow, roundand green, and wrinkled and green, resulting in a 9:3:3:1phenotypic ratio ( FIGURE 3.11c).
The Relation of the Principle of IndependentAssortment to MeiosisAn important qualification of the principle of independentassortment is that it applies to characters encoded by locilocated on different chromosomes because, like the principleof segregation, it is based wholly on the behavior of chromo-somes during meiosis. Each pair of homologous chromo-somes separates independently of all other pairs in anaphaseI of meiosis (see Figure 2.18); so genes located on differentpairs of homologs will assort independently. Genes thathappen to be located on the same chromosome will traveltogether during anaphase I of meiosis and will arrive at thesame destination—within the same gamete (unless crossingover takes place). Genes located on the same chromosometherefore do not assort independently (unless they are locatedsufficiently far apart that crossing over takes place every mei-otic division, as will be discussed fully in Chapter 7).
◗
1�16
3�163�16
9�16
◗
Rr � Rr, which yields a 3:1 phenotypic ratio ( round andwrinkled progeny, see Table 3.2). Next consider the other
characteristic, the color of the endosperm. The cross was Yy� Yy, which produces a 3:1 phenotypic ratio ( yellow and
green progeny).We can now combine these monohybrid ratios by
using the multiplication rule to obtain the proportion ofprogeny with different combinations of seed shape andcolor. The proportion of progeny with round and yellowseeds is (the probability of round) � (the probabilityof yellow) � . The proportion of progeny with roundand green seeds is � � ; the proportion of progenywith wrinkled and yellow seeds is � � ; and the3�16
3�41�4
3�161�4
3�4
9�16
3�43�4
1�4
3�4
1�4
3�4
Basic Principles of Heredity 61
Applying Probability and the Branch Diagramto Dihybrid CrossesWhen the genes at two loci separate independently, a dihy-brid cross can be understood as two monohybrid crosses.Let’s examine Mendel’s dihybrid cross (RrYy � RrYy) byconsidering each characteristic separately ( FIGURE 3.12a).If we consider only the shape of the seeds, the cross was
◗
(a)
(b)
�
Rr Yy
Round, yellow
Rr Yy
Round, yellow
Expectedproportions
for bothtraits
3/4 R_Round
1/4 rrWrinkled
3/4 Y_Yellow
R_ Y_ 3/4 � 3/4 = 9/16Round, yellow
R_ y y 3/4 � 1/4 = 3/16Round, green
1/4 yy Green
3/4 Y_Yellow
1/4 yyGreen
rr Y_1/4 � 3/4 = 3/16Wrinkled, yellow
rr yy1/4 � 1/4 = 1/16Wrinkled, green
Expectedproportionsfor secondtrait (color)
�Yy
3/4 Y_Yellow
1/4 yyGreen
Yy
Expectedproportions
for firsttrait (shape)
�Rr Rr
3/4 R_Round
1/4 rr Wrinkled
�Rr Yy Rr Yy
Cross Cross
1 The dihybrid cross is brokeninto two monohybrid crosses…
2 …and the probability ofeach trait is determined.
3 The individual traits and the associated probabilitiesare then combined by using the branch method.
4 These proportions are determinedfrom the cross in part a.
3.12 A branch diagram can be used for determin-ing the phenotypes and expected proportions ofoffspring from a dihybrid cross (RrYy � RrYy).
◗
ConceptsThe principle of independent assortment states thatgenes coding for different characteristics separateindependently of one another when gametes areformed, owing to independent separation ofhomologous pairs of chromosomes during meiosis.Genes located close together on the samechromosome do not, however, assort independently.

proportion of progeny with wrinkled and green seeds is � � .
Branch diagrams are a convenient way of organizingall the combinations of characteristics ( FIGURE 3.12b). Inthe first column, list the proportions of the phenotypes forone character (here, round and wrinkled). In the sec-ond column, list the proportions of the phenotypes for thesecond character ( yellow and green) next to each ofthe phenotypes in the first column: put yellow and green next to the round phenotype and again next to thewrinkled phenotype. Draw lines between the phenotypes inthe first column and each of the phenotypes in the secondcolumn. Now follow each branch of the diagram, multiply-ing the probabilities for each trait along that branch. Onebranch leads from round to yellow, yielding round and yel-low progeny. Another branch leads from round to green,yielding round and green progeny, and so on. The proba-bility of progeny with a particular combination of traits iscalculated by using the multiplicative rule: the probabilityof round ( ) and yellow ( ) seeds is � � . Theadvantage of the branch diagram is that it helps keep trackof all the potential combinations of traits that may appearin the progeny. It can be used to determine phenotypic orgenotypic ratios for any number of characteristics.
Using probability is much faster than using the Punnettsquare for crosses that include multiple loci. Genotypic andphenotypic ratios can quickly be worked out by combining,with the multiplication rule, the simple ratios in Tables 3.2and 3.3. The probability method is particularly efficient ifwe need the probability of only a particular phenotype orgenotype among the progeny of a cross. Suppose we neededto know the probability of obtaining the genotype Rryy inthe F2 of the dihybrid cross in Figure 3.11. The probabilityof obtaining the Rr genotype in a cross of Rr � Rr is andthat of obtaining yy progeny in a cross of Yy � Yy is (seeTable 3.3). Using the multiplication rule, we find the proba-bility of Rryy to be � � .
To illustrate the advantage of the probability method,consider the cross AaBbccDdEe � AaBbCcddEe. Suppose wewanted to know the probability of obtaining offspring withthe genotype aabbccddee. If we used a Punnett square todetermine this probability, we might be working on thesolution for months. However, we can quickly figure theprobability of obtaining this one genotype by breaking thiscross into a series of single-locus crosses:
Progeny Cross genotype Probability
Aa � Aa aaBb � Bb bbcc � Cc ccDd � dd ddEe � Ee ee
The probability of an offspring from this cross having genotypeaabbccddee is now easily obtained by using the multiplication
1�4
1�2
1�2
1�4
1�4
1�81�4
1�2
1�4
1�2
9�163�4
3�43�4
3�4
1�43�4
1�43�4
1�43�4
◗
1�161�4
1�4
rule: � � � � � . This calculation as-sumes that genes at these five loci all assort independently.
1�2561�4
1�21�2
1�41�4
62 Chapter 3
The Dihybrid TestcrossLet’s practice using the branch diagram by determining thetypes and proportions of phenotypes in a dihybrid testcrossbetween the round and yellow F1 plants (Rr Yy) that Mendelobtained in his dihybrid cross and the wrinkled and greenplants (rryy) ( FIGURE 3.13). Break the cross down into aseries of single-locus crosses. The cross Rr � rr yields round (Rr) progeny and wrinkled (rr) progeny. The crossYy � yy yields yellow (Yy) progeny and green (yy)1�2
1�2
1�2
1�2
◗
Cross Cross
Rr Yy
Round, yellow
rr yy
Wrinkled, green
Expectedproportions forboth characters
1/2 RrRound
1/2 rrWrinkled
1/2 YyYellow
Rr Yy 1/2 � 1/2 = 1/4Round, yellow
Rr yy 1/2 � 1/2 = 1/4Round, green
1/2 yy Green
1/2 YyYellow
1/2 yyGreen
rr Yy1/2 � 1/2 = 1/4Wrinkled, yellow
rr yy1/2 � 1/2 = 1/4Wrinkled, green
Expectedproportions for
second character
�Yy
1/2 YyYellow 1/2 yyGreen
yy
Expectedproportions forfirst character
�Rr rr
1/2 RrRound 1/2 rrWrinkled
�Rr Yy rr yy
�
3.13 A branch diagram can be used for determin-ing the phenotypes and expected proportions ofoffspring from a dihybrid testcross (RrYy � rryy).
◗
ConceptsA cross including several characteristics can beworked by breaking the cross down into single-locuscrosses and using the multiplication rule to determinethe proportions of combinations of characteristics(provided the genes assort independently).
progeny. Using the multiplication rule, we find the propor-tion of round and yellow progeny to be (the probabilityof round) � (the probability of yellow) � . Four com-binations of traits with the following proportions appear inthe offspring: RrYy, round yellow; Rryy, round green;
rrYy, wrinkled yellow; and rryy, wrinkled green.
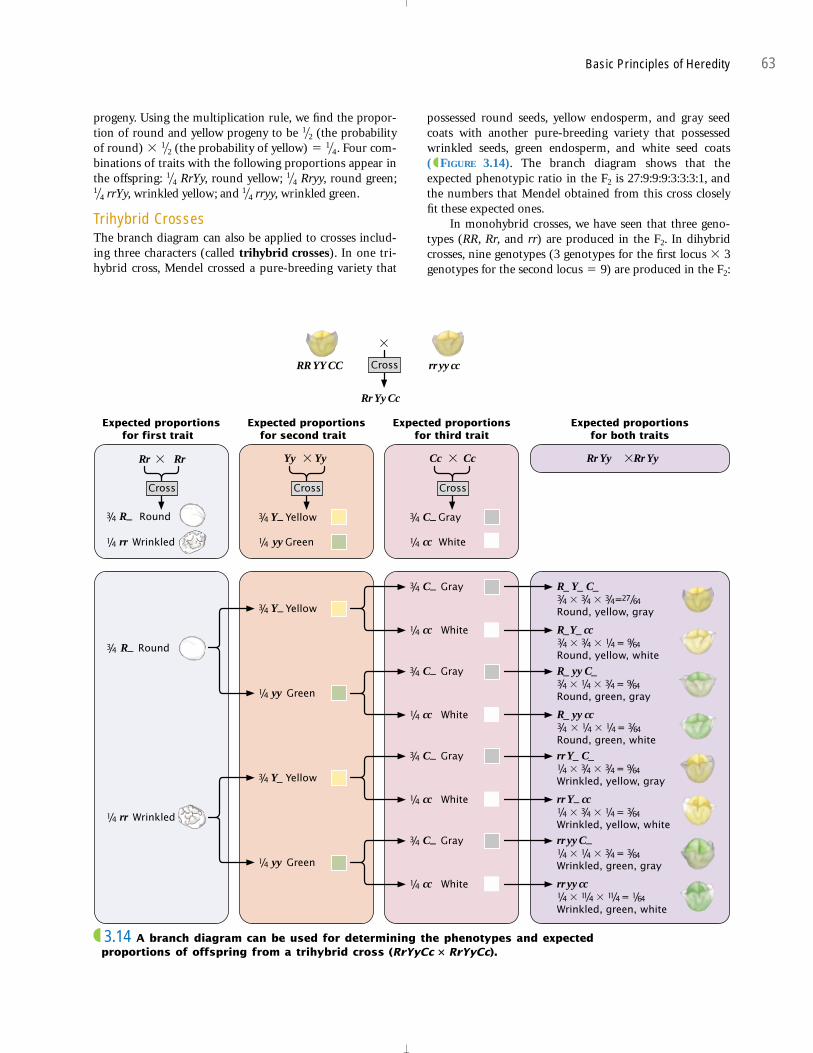
Trihybrid CrossesThe branch diagram can also be applied to crosses includ-ing three characters (called trihybrid crosses). In one tri-hybrid cross, Mendel crossed a pure-breeding variety that
1�41�4
1�41�4
1�41�2
1�2
possessed round seeds, yellow endosperm, and gray seedcoats with another pure-breeding variety that possessedwrinkled seeds, green endosperm, and white seed coats ( FIGURE 3.14). The branch diagram shows that theexpected phenotypic ratio in the F2 is 27:9:9:9:3:3:3:1, andthe numbers that Mendel obtained from this cross closelyfit these expected ones.
In monohybrid crosses, we have seen that three geno-types (RR, Rr, and rr) are produced in the F2. In dihybridcrosses, nine genotypes (3 genotypes for the first locus � 3genotypes for the second locus � 9) are produced in the F2:
◗
Basic Principles of Heredity 63
RR YY CC
Rr Yy Cc
rr yy cc
R_ Y_ C_ 3/4 � 3/4 � 3/4 =27/64Round, yellow, gray
R_Y_ cc 3/4 � 3/4 � 1/4 = 9/64Round, yellow, white
3/4 C– Gray
1/4 cc White
�
3/4 R– Round
1/4 rr Wrinkled
Expected proportionsfor both traits
�Rr Yy Rr Yy
Expected proportionsfor second trait
Expected proportionsfor third trait
�Yy
3/4 Y– Yellow
1/4 yy Green
Yy �Cc
3/4 C– Gray
1/4 cc White
Cc
Expected proportionsfor first trait
�Rr Rr
3/4 R– Round
1/4 rr Wrinkled
3/4 Y– Yellow
R_ yy C_ 3/4 � 1/4 � 3/4 = 9/64Round, green, gray
R_ yy cc3/4 � 1/4 � 1/4 = 3/64Round, green, white
3/4 C– Gray
1/4 cc White
1/4 yy Green
rr Y_ C_ 1/4 � 3/4 � 3/4 = 9/64Wrinkled, yellow, gray
rr Y– cc 1/4 � 3/4 � 1/4 = 3/64Wrinkled, yellow, white
3/4 C– Gray
1/4 cc White
3/4 Y_ Yellow
rr yy C–1/4 � 1/4 � 3/4 = 3/64Wrinkled, green, gray
rr yy cc1/4 � 11/4 � 11/4 = 1/64Wrinkled, green, white
3/4 C– Gray
1/4 cc White
1/4 yy Green
Cross
Cross Cross Cross
3.14 A branch diagram can be used for determining the phenotypes and expectedproportions of offspring from a trihybrid cross (RrYyCc � RrYyCc).◗

RRYY, RRYy, RRyy, RrYY, RrYy, Rryy, rrYY, rrYy, and rryy.There are three possible genotypes at each locus (whenthere are two alternative alleles); so the number of genotypesproduced in the F2 of a cross between individuals heterozy-gous for n loci will be 3n. If there is incomplete dominance,the number of phenotypes also will be 3n because, withincomplete dominance, each genotype produces a differentphenotype. If the traits exhibit dominance, the number ofphenotypes will be 2n.
about the dominance relations of the characters and aboutthe mice being crossed. Black is dominant over brown andsolid is dominant over white spotted. Furthermore, thegenes for the two characters assort independently. In thisproblem, symbols are provided for the different alleles(B for black, b for brown, S for solid, and s for spotted);had these symbols not been provided, you would need tochoose symbols to represent these alleles. It is useful torecord these symbols at the beginning of the solution:
B — black S — solidb — brown s — white-spotted
Next, write out the crosses given in the problem.
P homozygous � homozygousblack, spotted brown, solid
pF1 black, solid
Testcross black, solid � brown, spotted
Step 3: Write down any genetic information that can bedetermined from the phenotypes alone. From the pheno-types and the statement that they are homozygous, youknow that the P-generation mice must be BBss and bbSS.The F1 mice are black and solid, both dominant traits, sothe F1 mice must possess at least one black allele (B) andone spotted allele (S). At this point, you cannot be certainabout the other alleles, so represent the genotype of the F1
as B?S?. The brown, spotted mice in the testcross must bebbss, because both brown and spotted are recessive traitsthat will be expressed only if two recessive alleles arepresent. Record these genotypes on the crosses that youwrote out in step 2:
P homozygous � homozygousblack, spotted brown, solid
BBss � bbSS
pF1 black, solid
B?S?
Testcross black, solid � brown, spottedB?S? � bbss
Step 4: Break down the problem into smaller parts.First, determine the genotype of the F1. After this geno-type has been determined, you can predict the results ofthe testcross and determine the genotypes and pheno-types of the progeny from the testcross. Second, becausethis cross includes two independently assorting loci, itcan be conveniently broken down into two single-locuscrosses: one for coat color and another for spotting.
64 Chapter 3
Worked ProblemNot only are the principles of segregation and indepen-dent assortment important because they explain howheredity works, but they also provide the means for pre-dicting the outcome of genetic crosses. This predictivepower has made genetics a powerful tool in agricultureand other fields, and the ability to apply the principlesof heredity is an important skill for all students of genet-ics. Practice with genetic problems is essential for mas-tering the basic principles of heredity — no amount ofreading and memorization can substitute for the experi-ence gained by deriving solutions to specific problems ingenetics.
Students may have difficulty with genetics problemswhen they are unsure where to begin or how to organizethe problem and plan a solution. In genetics, every prob-lem is different, so there is no common series of steps thatcan be applied to all genetics problems. One must uselogic and common sense to analyze a problem and arriveat a solution. Nevertheless, certain steps can facilitate theprocess, and solving the following problem will serve to il-lustrate these steps.
In mice, black coat color (B) is dominant over brown(b), and a solid pattern (S) is dominant over white spotted(s). Color and spotting are controlled by genes that assortindependently. A homozygous black, spotted mouse iscrossed with a homozygous brown, solid mouse. All the F1
mice are black and solid. A testcross is then carried out bymating the F1 mice with brown, spotted mice.
(a) Give the genotypes of the parents and the F1 mice.
(b) Give the genotypes and phenotypes, along with theirexpected ratios, of the progeny expected from the testcross.
• SolutionStep 1: Determine the questions to be answered. Whatquestion or questions is the problem asking? Is it askingfor genotypes, genotypic ratios, or phenotypic ratios? Thisproblem asks you to provide the genotypes of the parentsand the F1, the expected genotypes and phenotypes of theprogeny of the testcross, and their expected proportions.
Step 2: Write down the basic information given in theproblem. This problem provides important information

Third, use a branch diagram to determine the proportionof progeny of the testcross with different combinations ofthe two traits.
Step 5: Work the different parts of problem. Start bydetermining the genotype of the F1 progeny. Mendel’s firstlaw indicates that the two alleles at a locus separate, onegoing into each gamete. Thus, the gametes produced bythe black, spotted parent contain Bs and the gametes pro-duced by the brown, spotted parent contain bS, whichcombine to produce F1 progeny with the genotype BbSs:
P homozygous � homozygousblack, spotted brown, solid
BBss � bbss
p pGametes
F1 BbSs
Use the F1 genotype to work the testcross (BbSs � bbss),breaking it into two single-locus crosses. First, considerthe cross for coat color: Bb � bb. Any cross between a het-erozygote and a homozygous recessive genotype producesa 1:1 phenotypic ratio of progeny (see Table 3.2):
BB � bb
pBb black
bb brown
Next do the cross for spotting: Ss � ss. This cross also isbetween a heterozygote and a homozygous recessive geno-type and will produce solid (Ss) and spotted (ss)progeny (see Table 3.2).
Ss � ss
pSs solid
ss spotted
Finally, determine the proportions of progeny withcombinations of these characters by using the branchdiagram.
Ss solid 9: BbSs black, solid
Bb black
ss spotted 9: Bbss black, spotted1�2 � 1�2 � 1�4
1�2
1�21�2 � 1�2 � 1�4
1�2
1�2
1�2
1�21�2
1�2
1�2
bsBs
Basic Principles of Heredity 65
Observed and Expected RatiosWhen two individuals of known genotype are crossed, weexpect certain ratios of genotypes and phenotypes in theprogeny; these expected ratios are based on the Mendelianprinciples of segregation, independent assortment, anddominance. The ratios of genotypes and phenotypes actuallyobserved among the progeny, however, may deviate fromthese expectations.
For example, in German cockroaches, brown bodycolor (Y) is dominant over yellow body color (y). If we crossa brown, heterozygous cockroach (Yy) with a yellow cock-roach (yy), we expect a 1:1 ratio of brown (Yy) and yellow(yy) progeny. Among 40 progeny, we would therefore expectto see 20 brown and 20 yellow offspring. However, theobserved numbers might deviate from these expected val-ues; we might in fact see 22 brown and 18 yellow progeny.
Chance plays a critical role in genetic crosses, just as itdoes in flipping a coin. When you flip a coin, you expect a1:1 ratio — heads and tails. If you flip a coin 1000times, the proportion of heads and tails obtained wouldprobably be very close to that expected 1:1 ratio. However, ifyou flip the coin 10 times, the ratio of heads to tails mightbe quite different from 1:1. You could easily get 6 heads and4 tails, or 3 and 7 tails, just by chance. It is possible that youmight even get 10 heads and 0 tails. The same thing hap-pens in genetic crosses. We may expect 20 brown and 20yellow cockroaches, but 22 brown and 18 yellow progenycould arise as a result of chance.
The Goodness-of-Fit Chi-Square TestIf you expected a 1:1 ratio of brown and yellow cockroachesbut the cross produced 22 brown and 18 yellow, you proba-bly wouldn’t be too surprised even though it wasn’t a per-fect 1:1 ratio. In this case, it seems reasonable to assume thatchance produced the deviation between the expected andthe observed results. But, if you observed 25 brown and 15yellow, would the ratio still be 1:1? Something other thanchance might have caused the deviation. Perhaps the
1�21�2
˚9˚9
Ss solid 9: bbss brown, solid
bb brown
ss spotted 9: bbss brown, spotted
Step 6: Check all work. As a last step, reread the problem,checking to see if your answers are consistent with theinformation provided. You have used the genotypes BBssand bbSS in the P generation. Do these genotypes code forthe phenotypes given in the problem? Are the F1 progenyphenotypes consistent with the genotypes that you assigned?The answers are consistent with the information.
1�2 � 1�2 � 1�4
1�2
1�21�2 � 1�2 � 1�4
1�2˚
9˚9

inheritance of this character is more complicated than wasassumed or perhaps some of the yellow progeny died beforethey were counted. Clearly, we need some means of evaluat-ing how likely it is that chance is responsible for the devia-tion between the observed and the expected numbers.
To evaluate the role of chance in producing deviationsbetween observed and expected values, a statistical testcalled the goodness-of-fit chi-square test is used. This testprovides information about how well observed values fitexpected values. Before we learn how to calculate the chisquare, it is important to understand what this test does anddoes not indicate about a genetic cross.
The chi-square test cannot tell us whether a geneticcross has been correctly carried out, whether the results arecorrect, or whether we have chosen the correct geneticexplanation for the results. What it does indicate is the prob-ability that the difference between the observed and theexpected values is due to chance. In other words, it indicatesthe likelihood that chance alone could produce the devia-tion between the expected and the observed values.
If we expected 20 brown and 20 yellow progeny from agenetic cross, the chi-square test gives the probability thatwe might observe 25 brown and 15 yellow progeny simplyowing to chance deviations from the expected 20:20 ratio.When the probability calculated from the chi-square test ishigh, we assume that chance alone produced the difference.When the probability is low, we assume that some factorother than chance — some significant factor — producedthe deviation.
To use the goodness-of-fit chi-square test, we first de-termine the expected results. The chi-square test must al-ways be applied to numbers of progeny, not to proportionsor percentages. Let’s consider a locus for coat color in do-mestic cats, for which black color (B) is dominant over gray(b). If we crossed two heterozygous black cats (Bb � Bb), wewould expect a 3:1 ratio of black and gray kittens. A seriesof such crosses yields a total of 50 kittens — 30 black and 20gray. These numbers are our observed values. We can obtainthe expected numbers by multiplying the expected propor-tions by the total number of observed progeny. In this case,the expected number of black kittens is � 50 � 37.5 andthe expected number of gray kittens is � 50 � 12.5. Thechi-square (�2) value is calculated by using the followingformula:
�2
where means the sum of all the squared differencesbetween observed and expected divided by the expected val-ues. To calculate the chi-square value for our black and gray kittens, we would first subtract the number of expectedblack kittens from the number of observed black kittens(30 � 37.5 � �7.5) and square this value: �7.52 � 56.25.We then divide this result by the expected number of blackkittens, 56.25/37.5, � 1.5. We repeat the calculations on thenumber of expected gray kittens: (20 � 12.5)2/12.5 � 4.5.To obtain the overall chi-square value, we sum the (obser-ved � expected)2/expected values: 1.5 � 4.5 � 6.0.
�
� �(observed � expected)2
expected
1�4
3�4
66 Chapter 3
P
df .995 .975 .9 .5 .1 .05 .025 .01 .005
1 .000 .000 0.016 0.455 2.706 3.841 5.024 6.635 7.879
2 0.010 0.051 0.211 1.386 4.605 5.991 7.378 9.210 10.597
3 0.072 0.216 0.584 2.366 6.251 7.815 9.348 11.345 12.838
4 0.207 0.484 1.064 3.357 7.779 9.488 11.143 13.277 14.860
5 0.412 0.831 1.610 4.351 9.236 11.070 12.832 15.086 16.750
6 0.676 1.237 2.204 5.348 10.645 12.592 14.449 16.812 18.548
7 0.989 1.690 2.833 6.346 12.017 14.067 16.013 18.475 20.278
8 1.344 2.180 3.490 7.344 13.362 15.507 17.535 20.090 21.955
9 1.735 2.700 4.168 8.343 14.684 16.919 19.023 21.666 23.589
10 2.156 3.247 4.865 9.342 15.987 18.307 20.483 23.209 25.188
11 2.603 3.816 5.578 10.341 17.275 19.675 21.920 24.725 26.757
12 3.074 4.404 6.304 11.340 18.549 21.026 23.337 26.217 28.300
13 3.565 5.009 7.042 12.340 19.812 22.362 24.736 27.688 29.819
14 4.075 5.629 7.790 13.339 21.064 23.685 26.119 29.141 31.319
15 4.601 6.262 8.547 14.339 22.307 24.996 27.488 30.578 32.801
P, probability; df, degrees of freedom.
Critical values of the �2 distributionTable 3.4

The next step is to determine the probability associatedwith this calculated chi-square value, which is the probabil-ity that the deviation between the observed and theexpected results could be due to chance. This step requiresus to compare the calculated chi-square value (6.0) withtheoretical values that have the same degrees of freedom ina chi-square table. The degrees of freedom represent thenumber of ways in which the observed classes are free tovary. For a goodness-of-fit chi-square test, the degrees offreedom are equal to n � 1, where n is the number of differ-ent expected phenotypes. In our example, there are twoexpected phenotypes (black and gray); so n � 2 and thedegree of freedom equals 2 � 1 � 1.
Now that we have our calculated chi-square value andhave figured out the associated degrees of freedom, we areready to obtain the probability from a chi-square table(Table 3.4). The degrees of freedom are given in the left-hand column of the table and the probabilities are given atthe top; within the body of the table are chi-square valuesassociated with these probabilities. First, find the row forthe appropriate degrees of freedom; for our example with 1degree of freedom, it is the first row of the table. Findwhere our calculated chi-square value (6.0) lies among thetheoretical values in this row. The theoretical chi-squarevalues increase from left to right and the probabilities de-crease from left to right. Our chi-square value of 6.0 fallsbetween the value of 5.024, associated with a probability of.025, and the value of 6.635, associated with a probabilityof .01.
Thus, the probability associated with our chi-squarevalue is less than .025 and greater than .01. So, there is lessthan a 2.5% probability that the deviation that we observedbetween the expected and the observed numbers of blackand gray kittens could be due to chance.
Most scientists use the .05 probability level as their cutoffvalue: if the probability of chance being responsible for thedeviation is greater than or equal to .05, they acceptthat chance may be responsible for the deviation between theobserved and the expected values. When the probability isless than .05, scientists assume that chance is not responsibleand a significant difference exists. The expression significantdifference means that some factor other than chance isresponsible for the observed values being different from theexpected values. In regard to the kittens, perhaps one of thegenotypes experienced increased mortality before the prog-eny were counted or perhaps other genetic factors skewed theobserved ratios.
In choosing .05 as the cutoff value, scientists haveagreed to assume that chance is responsible for the devia-tions between observed and expected values unless there isstrong evidence to the contrary. It is important to bear inmind that even if we obtain a probability of, say, .01, there isstill a 1% probability that the deviation between theobserved and expected numbers is due to nothing morethan chance. Calculation of the chi-square value is illus-trated in ( FIGURE 3.15).◗
Basic Principles of Heredity 67
+
+
+
P generation
F1 generation
F2 generation105 Purple
45 White
Purple flowers
Purple flowers
Whiteflowers
Cross
Intercross
Phenotype Observed Expected
Purple
White
Total 150
45 1/4 �150 = 37.5
105 3/4 �150 = 112.5
�2 =(O – E)2
E�
�2 =(105–112.5)2
112.5(45–37.5)2
37.5
�2 =56.25112.5
56.2537.5
�2 = 0.5 1.5 = 2.0
�
Degrees of freedom = n –1Degrees of freedom = 2–1=1
Probability (from Table 3.4)
.1 < P< .5
A plant with purple flowersis crossed with a plant withwhite flowers, and the F1 areself-fertilized….
…to produce 105 F2progeny with purple flowersand 45 with white flowers(an apparent 3:1 ratio).
The probability associated withthe calculated chi-square valueis between .10 and .50,indicating a high probabilitythat the difference betweenobserved and expected valuesis due to chance.
…and then the chi-squarevalue is calculated.
The expected values areobtained by multiplyingthe expected proportion by the total…
Conclusion: No significant differencebetween observed and expected values.
3.15 A chi-square test is used to determine theprobability that the difference between observedand expected values is due to chance.
◗
Penetrance and ExpressivityIn the genetic crosses considered thus far, we have assumedthat every individual with a particular genotype expresses
ConceptsDifferences between observed and expected ratioscan arise by chance. The goodness-of-fit chi-squaretest can be used to evaluate whether deviationsbetween observed and expected numbers are likely tobe due to chance or to some other significant factor.

68 Chapter 3
the expected phenotype. We assumed, for example, that thegenotype Rr always produces round seeds and that thegenotype rr always produces wrinkled seeds. For some char-acters, such an assumption is incorrect: the genotype doesnot always produce the expected phenotype, a phenomenontermed incomplete penetrance.
Incomplete penetrance is seen in human polydactyly, thecondition of having extra fingers and toes ( FIGURE 3.16).There are several different forms of human polydactyly, butthe trait is usually caused by a dominant allele. Occasionally,people possess the allele for polydactyly (as evidenced by thefact that their children inherit the polydactyly) but neverthe-less have a normal number of fingers and toes. In these cases,the gene for polydactyly is not fully penetrant. Penetrance isdefined as the percentage of individuals having a particulargenotype that express the expected phenotype. For example,if we examined 42 people having an allele for polydactyly andfound that only 38 of them were polydactylous, the pene-trance would be 38/42 � 0.90 (90%).
A related concept is that of expressivity, the degree towhich a character is expressed. In addition to incompletepenetrance, polydactyly exhibits variable expressivity. Somepolydactylous persons possess extra fingers and toes that arefully functional, whereas others possess only a small tag ofextra skin.
Incomplete penetrance and variable expressivity aredue to the effects of other genes and to environmental fac-tors that can alter or completely suppress the effect of a par-ticular gene. A gene might encode an enzyme that producesa particular phenotype only within a limited temperaturerange. At higher or lower temperatures, the enzyme wouldnot function and the phenotype would not be expressed;the allele encoding such an enzyme is therefore penetrantonly within a particular temperature range. Many charac-ters exhibit incomplete penetrance and variable expressivity,
◗
3.16 Human polydactyly (extra digits) exhibitsincomplete penetrance and variable expressivity.(Biophoto Associates/Science Source/Photo Researchers.)
◗
emphasizing the fact that the mere presence of a gene doesnot guarantee its expression.
Connecting Concepts Across Chapters
This chapter has introduced several important conceptsof heredity and presented techniques for making predic-tions about the types of offspring that parents will pro-duce. Two key principles of inheritance were introduced:the principles of segregation and independent assort-ment. These principles serve as the foundation for under-standing much of heredity. In this chapter, we alsolearned some essential terminology and techniques fordiscussing and analyzing genetic crosses. A critical con-cept is the connection between the behavior of chromo-somes during meiosis (Chapter 2) and the seemingly ab-stract symbols used in genetic crosses.
The principles taught in this chapter provide impor-tant links to much of what follows in this book. In Chap-ters 4 through 7, we will learn about additional factorsthat affect the outcome of genetic crosses: sex, interac-tions between genes, linkage between genes, and environ-ment. These factors build on the principles of segregationand independent assortment. In Chapters 10 through 21,where we focus on molecular aspects of heredity, the im-portance of these basic principles is not so obvious, butmost nuclear processes are based on the inheritance ofchromosomal genes. In Chapters 22 and 23, we turn toquantitative and population genetics. These chaptersbuild directly on the principles of heredity and can onlybe understood with a firm grasp of how genes are inher-ited. The material covered in the present chapter thereforeserves as a foundation for almost all of heredity.
Finally, this chapter introduces problem solving,which is at the heart of genetics. Developing hypothesesto explain genetic phenomenon (such as the types andproportions of progeny produced in a genetic cross) andtesting these hypotheses by doing genetic crosses andcollecting additional data are common to all of genetics.The ability to think analytically and draw logical conclu-sions from observations are emphasized throughout thisbook.
ConceptsPenetrance is the percentage of individuals havinga particular genotype who express the associatedphenotype. Expressivity is the degree to which atrait is expressed. Incomplete penetrance andvariable expressivity result from the influence ofother genes and environmental factors on thephenotype.

Basic Principles of Heredity 69
CONCEPTS SUMMARY
• Gregor Mendel, an Austrian monk living in what is now theCzech Republic, first discovered the principles of heredity byconducting experiments on pea plants.
• Mendel’s success can be attributed to his choice of the peaplant as an experimental organism, the use of characters witha few, easily distinguishable phenotypes, his experimentalapproach, and careful attention to detail.
• Genes are inherited factors that determine a character.Alternate forms of a gene are called alleles. The alleles arelocated at a specific place, a locus, on a chromosome, and theset of genes that an individual possesses is its genotype.Phenotype is the manifestation or appearance of acharacteristic and may refer to physical, biochemical, orbehavioral characteristics.
• Phenotypes are produced by the combined effects of genesand environmental factors. Only the genotype — not thephenotype — is inherited.
• The principle of segregation states that an individualpossesses two alleles coding for a trait and that these twoalleles separate in equal proportions when gametes areformed.
• The concept of dominance indicates that, when dominantand recessive alleles are present in a heterozygote, only thetrait of the dominant allele is observed in the phenotype.
• The two alleles of a genotype are located on homologouschromosomes, which separate during anaphase I of meiosis.The separation of homologous chromosomes brings aboutthe segregation of alleles.
• The types of progeny produced from a genetic cross can bepredicted by applying the Punnett square or probability.
• Probability is the likelihood of a particular event occurring.The multiplication rule of probability states that theprobability of two or more independent events occurringtogether is calculated by multiplying the probabilities of theindependent events. The addition rule of probability states
that the probability of any of two or more mutually exclusiveevents occurring is calculated by adding the probabilities ofthe events.
• The binomial expansion may be used to determine theprobability of a particular combination of events.
• A testcross reveals the genotype (homozygote orheterozygote) of an individual having a dominant trait andconsists of crossing that individual with one having thehomozygous recessive genotype.
• Incomplete dominance occurs when a heterozygote has aphenotype that is intermediate between the phenotypes ofthe two homozygotes.
• The principle of independent assortment states that genescoding for different characters assort independently whengametes are formed.
• Independent assortment is based on the random separationof homologous pairs of chromosomes during anaphase I ofmeiosis; it occurs when genes coding for two characters arelocated on different pairs of chromosomes.
• When genes assort independently, the multiplication rule ofprobability can be used to obtain the probability of inheritingmore than one trait: a cross including more than one traitcan be broken down into simple crosses, and the probabilitiesof obtaining any combination of traits can be obtained bymultiplying the probabilities for each trait.
• Observed ratios of progeny from a genetic cross may deviatefrom the expected ratios owing to chance. The goodness-of-fit chi-square test can be used to determine the probabilitythat a difference between observed and expected numbers isdue to chance.
• Penetrance is the percentage of individuals with a particulargenotype that exhibit the expected phenotype. Expressivity isthe degree to which a character is expressed. Incompletepenetrance and variable expressivity result from the influenceof other genes and environmental effects on the phenotype.
IMPORTANT TERMS
gene (p. 47)allele (p. 47)locus (p. 47)genotype (p. 48)homozygous (p. 48)heterozygous (p. 48)phenotype (p. 48)monohybrid cross (p. 48)P (parental) generation (p. 48)F1 (filial 1) generation (p. 49)reciprocal crosses (p. 49)
F2 (filial 2) generation (p. 49)dominant (p. 51)recessive (p. 51)principle of segregation
(Mendel’s first law) (p. 51)concept of dominance (p. 51)chromosome theory of
heredity (p. 52)backcross (p. 52)Punnett square (p. 53)probability (p. 54)
multiplication rule (p. 54)addition rule (p. 55)testcross (p. 57)incomplete dominance (p. 58)wild type (p. 58)dihybrid cross (p. 59)principle of independent
assortment (Mendel’s secondlaw) (p. 60)
trihybrid cross (p. 63)
goodness-of-fit chi-square test(p. 66)
incomplete penetrance (p. 68)
penetrance (p. 68)expressivity (p. 68)

70 Chapter 3
Worked Problems
1. Short hair in rabbits (S) is dominant over long hair (s). Thefollowing crosses are carried out, producing the progeny shown.Give all possible genotypes of the parents in each cross.
Parents Progeny
(a) short � short 4 short and 2 long(b) short � short 8 short(c) short � long 12 short(d) short � long 3 short and 1 long(e) long � long 2 long
• SolutionFor this problem, it is useful to first gather as much informationabout the genotypes of the parents as possible on the basis oftheir phenotypes. We can then look at the types of progenyproduced to provide the missing information. Notice that theproblem asks for all possible genotypes of the parents.
(a) short � short 4 short and 2 longBecause short hair is dominant over long hair, a rabbit havingshort hair could be either SS or Ss. The two long-hairedoffspring must be homozygous (ss) because long hair is recessiveand will appear in the phenotype only when both alleles forlong hair are present. Because each parent contributes one ofthe two alleles found in the progeny, each parent must becarrying the s allele and must therefore be Ss.
(b) short � short 8 shortThe short-haired parents could be SS or Ss. All 8 of the offspringare short (S_), and so at least one of the parents is likely to behomozygous (SS); if both parents were heterozygous, long-haired (ss) progeny would be expected, but we do not observeany long-haired progeny. The other parent could be homozygous(SS) or heterozygous (Ss); as long as one parent is homozygous,all the offspring will be short haired. It is theoretically possible,although unlikely, that both parents are heterozygous (Ss � Ss).If this were the case, we would expect 2 of the 8 progeny to belong haired. Although no long-haired progeny are observed, it ispossible that just by chance no long-haired rabbits would beproduced among the 8 progeny of the cross.
(c) short � long 12 shortThe short-haired parent could be SS or Ss. The long-hairedparent must be ss. If the short-haired parent were heterozygous(Ss), half of the offspring would be expected to be long haired,but we don’t see any long-haired progeny. Therefore this parentis most likely homozygous (SS). It is theoretically possible,although unlikely, that the parent is heterozygous and just bychance no long-haired progeny were produced.
(d) short � long 3 short and 1 longOn the basis of its phenotype, the short-haired parent could behomozygous (SS) or heterozygous (Ss), but the presence of onelong-haired offspring tells us that the short-haired parent
1�4
must be heterozygous (Ss). The long-haired parent must behomozygous (ss).
(e) long � long 2 longBecause long hair is recessive, both parents must be homozygousfor a long-hair allele (ss).
2. In cats, black coat color is dominant over gray. A femaleblack cat whose mother is gray mates with a gray male. If thisfemale has a litter of six kittens, what is the probability thatthree will be black and three will be gray?
• SolutionBecause black (G) is dominant over gray (g), a black cat may behomozygous (GG) or heterozygous (gg). The black female in thisproblem must be heterozygous (Bb) because her mother is gray(gg) and she must inherit one of her mother’s alleles. The graymale is homozygous (gg) because gray is recessive. Thus thecross is:
Gg � ggblack female gray male
pGg blackgg gray
We can use the binomial expansion to determine the probabilityof obtaining three black and three gray kittens in a litter of six.Let a equal the probability of a kitten being black and b equalthe probability of a kitten being gray. The binomial is (a � b)6,the expansion of which is:
(a � b)6 � a6 � 6a5b � 15a4b2 � 20a3b3 � 15a2b4 � 6a1b5 � b6
(See text for an explanation of how to expand the binomial.)The probability of obtaining three black and three gray kittensin a litter of six is provided by the term 20a3b3. The probabilitiesof a and b are both , so the overall probability is 20( )3( )3
� � .
3. The following genotypes are crossed: AaBbCdDd � AaBbCcDd.Give the proportion of the progeny of this cross having thefollowing genotypes: (a) AaBbCcDd, (b) aabbccdd, (c) AaBbccDd.
• SolutionThis problem is easily worked if the cross is broken down intosimple crosses and the multiplication rule is used to find thedifferent combinations of genotypes:
Locus 1 Aa � Aa � AA, Aa, aaLocus 2 Bb � Bb � BB, Bb, bb1�4
1�21�4
1�41�2
1�4
5�1620�64
1�21�2
1�2
1�2
1�2

Basic Principles of Heredity 71
Locus 3 Cc � Cc � CC, Cc, ccLocus 4 Dd � Dd � DD, Dd, dd
To find the probability of any combination of genotypes, simplymultiply the probabilities of the different genotypes:
(a) AaBbCcDd (Aa) � (Bb) � (Cc) � (Dd) �
(b) aabbccdd (aa) � (bb) � (cc) � (dd) �
(c) AaBbccDd (Aa) � (Bb) � (cc) � (Dd) �
4. In corn, purple kernels are dominant over yellow kernels,and full kernels are dominant over shrunken kernels. A cornplant having purple and full kernels is crossed with a planthaving yellow and shrunken kernels, and the following progenyare obtained:
purple, full 112purple, shrunken 103yellow, full 91yellow, shrunken 94
What are the most likely genotypes of the parents and progeny?Test your genetic hypothesis with a chi-square test.
• SolutionThe best way to begin this problem is by breaking the crossdown into simple crosses for a single characteristic (seed coloror seed shape):
P purple � yellow full � shrunken
F1 112 � 103 � 215 purple 112 � 91 � 203 full91 � 94 � 185 yellow 103 � 94 � 197 shrunken
Purple � yellow produces approximately purple and yellow.A 1�1 ratio is usually caused by a cross between a heterozygoteand a homozygote. Because purple is dominant, the purpleparent must be heterozygous (Pp) and the yellow parent must behomozygous (pp). The purple progeny produced by this crosswill be heterozygous (Pp) and the yellow progeny must behomozygous (pp).
Now let’s examine the other character. Full � shrunkenproduces full and shrunken, or a 1:1 ratio, and so theseprogeny phenotypes also are produced by a cross between aheterozygote (Ff ) and a homozygote (ff ); the full-kernel progenywill be heterozygous (Ff ) and the shrunken-kernel progeny willbe homozygous (ff ).
Now combine the two crosses and use the multiplicationrule to obtain the overall genotypes and the proportions of eachgenotype:
P purple, full � yellow, shrunkenPpFf � ppyy
F1 PpFf � purple � full � purple, fullPpff � purple � shrunken � purple, shrunkenppFf � yellow � full � yellow, fullppff � yellow � shrunken � yellow shrunken1�4
1�21�2
1�41�2
1�2
1�41�2
1�2
1�41�2
1�2
1�21�2
1�21�2
1�321�2
1�41�2
1�2
1�2561�4
1�41�4
1�4
1�161�2
1�21�2
1�2
1�41�2
1�4
1�41�2
1�4Our genetic explanation predicts that, from this cross, we shouldsee purple, full-kernel progeny; purple, shrunken-kernelprogeny; yellow, full-kernel progeny; and yellow, shrunken-kernel progeny. A total of 400 progeny were produced; so �400 � 100 of each phenotype are expected. These observednumbers do not fit the expected numbers exactly. Could thedifference between what we observe and what we expect be dueto chance? If the probability is high that chance alone isresponsible for the difference between observed and expected, wewill assume that the progeny have been produced in the 1�1�1�1ratio predicted by the cross. If the probability that the differencebetween observed and expected is due to chance is low, theprogeny are not really in the predicted ratio and some other,significant factor must be responsible for the deviation.
The observed and expected numbers are:
Phenotype Observed Expected
purple full 112 � 400 � 100purple shrunken 103 � 400 � 100yellow full 91 � 400 � 100yellow shrunken 94 � 400 � 100
To determine the probability that the difference between observedand expected is due to chance, we calculate a chi-square valuewith the formula �2 � [(observed � expected)2/expected]:
Now that we have the chi-square value, we must determine theprobability of this chi-square value being due to chance. To obtainthis probability, we first calculate the degrees of freedom, which fora goodness-of-fit chi-square test are n � 1, where n equals thenumber of expected phenotypic classes. In this case, there are fourexpected phenotypic classes; so the degrees of freedom equal 4 �1 � 3. We must now look up the chi-square value in a chi-squaretable (see Table 3.4). We select the row corresponding to 3 degreesof freedom and look along this row to find our calculated chi-square value. The calculated chi-square value of 2.7 lies between2.366 (a probability of .5) and 6.251 (a probability of .1). Theprobability (P) associated with the calculated chi-square value istherefore .5 � P � .1. This is the probability that the differencebetween what we observed and what we expect is due to chance,which in this case is relatively high, and so chance is likelyresponsible for the deviation. We can conclude that the progeny doappear in the 1�1�1�1 ratio predicted by our genetic explanation.
� 1.44 � 0.09 � 0.81 � 0.36 � 2.70
�144
100�
9
100�
81
100�
36
100
�122
100�
32
100�
92
100�
62
100
�(94 � 100)2
100
�2 �(112 � 100)2
100�
(103 � 100)2
100�
(91 � 100)2
100
�
1�4
1�4
1�4
1�4
1�4
1�41�4
1�41�4

72 Chapter 3
1. Why was Mendel’s approach to the study of heredity sosuccessful?
2. What is the relation between the terms allele, locus, gene, andgenotype?
3. What is the principle of segregation? Why is it important?
4. What is the concept of dominance? How does dominancediffer from incomplete dominance?
5. Give the phenotypic ratios that may appear among theprogeny of simple crosses and the genotypes of the parentsthat may give rise to each ratio.
6. Give the genotypic ratios that may appear among theprogeny of simple crosses and the genotypes of the parentsthat may give rise to each ratio.
COMPREHENSION QUESTIONS
7. What is the chromosome theory of inheritance? Why was itimportant?
8. What is the principle of independent assortment? How is itrelated to the principle of segregation?
9. How is the principle of independent assortment related tomeiosis?
10. How is the goodness-of-fit chi-square test used to analyze genetic crosses? What does the probability associated with achi-square value indicate about the results of a cross?
11. What is incomplete penetrance and what causes it?
*
*
*
APPLICATION QUESTIONS AND PROBLEMS
12. In cucumbers, orange fruit color (R) is dominant over creamfruit color (r). A cucumber plant homozygous for orangefruits is crossed with a plant homozygous for cream fruits.The F1 are intercrossed to produce the F2.
(a) Give the genotypes and phenotypes of the parents, the F1,and the F2.
(b) Give the genotypes and phenotypes of the offspring of abackcross between the F1 and the orange parent.
(c) Give the genotypes and phenotypes of a backcrossbetween the F1 and the cream parent.
13. In rabbits, coat color is a genetically determinedcharacteristic. Some black females always produce blackprogeny, whereas other black females produce black progenyand white progeny. Explain how these outcomes occur.
14. In cats, blood type A results from an allele (IA) that isdominant over an allele (iB) that produces blood type B. Thereis no O blood type. The blood types of male and female catsthat were mated and the blood types of their kittens follow.Give the most likely genotypes for the parents of each litter.
Male parent Female parent Kittens
(a) blood type A blood type B 4 kittens with bloodtype A, 3 with blood type B
(b) blood type B blood type B 6 kittens with bloodtype B
(c) blood type B blood type A 8 kittens with bloodtype A
(d) blood type A blood type A 7 kittens with bloodtype A, 2 kittens withblood type B
Male parent Female parent Kittens
(e) blood type A blood type A 10 kittens with bloodtype A
(f) blood type A blood type B 4 kittens with bloodtype A, 1 kitten withblood type B
15. In sheep, lustrous fleece (L) results from an allele that is dominant over an allele for normal fleece (l). A ewe (adultfemale) with lustrous fleece is mated with a ram (adult male)with normal fleece. The ewe then gives birth to a single lambwith normal fleece. From this single offspring, is it possible todetermine the genotypes of the two parents? If so, what aretheir genotypes? If not, why not?
16. In humans, alkaptonuria is a metabolic disorder in whichaffected persons produce black urine (see the introductionto this chapter). Alkaptonuria results from an allele (a) thatis recessive to the allele for normal metabolism (A). Sallyhas normal metabolism, but her brother has alkaptonuria.Sally’s father has alkaptonuria, and her mother has normalmetabolism.
(a) Give the genotypes of Sally, her mother, her father, andher brother.
(b) If Sally’s parents have another child, what is theprobability that this child will have alkaptonuria?
(c) If Sally marries a man with alkaptonuria, what is the probability that their first child will have alkaptonuria?
17. Suppose that you are raising Mongolian gerbils. You noticethat some of your gerbils have white spots, whereas othershave solid coats. What type of crosses could you carry outto determine whether white spots are due to a recessive or adominant allele?
*
*
*
*
*

18. Hairlessness in American rat terriers is recessive to thepresence of hair. Suppose that you have a rat terrier withhair. How can you determine whether this dog ishomozygous or heterozygous for the hairy trait?
19. In snapdragons, red flower color (R) is incompletelydominant over white flower color (r); the heterozygotesproduce pink flowers. A red snapdragon is crossed with awhite snapdragon, and the F1 are intercrossed to produce the F2.(a) Give the genotypes and phenotypes of the F1 and F2,along with their expected proportions.
(b) If the F1 are backcrossed to the white parent, what willthe genotypes and phenotypes of the offspring be?
(c) If the F1 are backcrossed to the red parent, what are thegenotypes and phenotypes of the offspring?
20. What is the probability of rolling one six-sided die andobtaining the following numbers?(a) 2 (c) An even number
(b) 1 or 2 (d) Any number but a 6
21. What is the probability of rolling two six-sided dice and obtaining the following numbers?(a) 2 and 3
(b) 6 and 6
(c) At least one 6
(d) Two of the same number (two 1s, or two 2s, or two 3s, etc.)
(e) An even number on both dice
(f) An even number on at least one die
22. In a family of seven children, what is the probability ofobtaining the following numbers of boys and girls?
(a) All boys
(b) All children of the same sex
(c) Six girls and one boy
(d) Four boys and three girls
(e) Four girls and three boys
23. Phenylketonuria (PKU) is a disease that results from arecessive gene. Two normal parents produce a child withPKU.
(a) What is the probability that a sperm from the fatherwill contain the PKU allele?
(b) What is the probability that an egg from the motherwill contain the PKU allele?
(c) What is the probability that their next child will havePKU?
(d) What is the probability that their next child will beheterozygous for the PKU gene?
24. In German cockroaches, curved wing (c�) is recessive tonormal wing (c��). A homozygous cockroach having normal
wings is crossed with a homozygous cockroach having curvedwings. The F1 are intercrossed to produce the F2. Assume thatthe pair of chromosomes containing the locus for wing shapeis metacentric. Draw this pair of chromosomes as it wouldappear in the parents, the F1, and each class of F2 progeny atmetaphase I of meiosis. Assume that no crossing over takesplace. At each stage, label a location for the alleles for wingshape (c� and c��) on the chromosomes.
25. In guinea pigs, the allele for black fur (B) is dominant overthe allele for brown (b) fur. A black guinea pig is crossedwith a brown guinea pig, producing five F1 black guineapigs and six F1 brown guinea pigs.
(a) How many copies of the black allele (B) will be presentin each cell from an F1 black guinea pig at the followingstages: G1, G2, metaphase of mitosis, metaphase I of meiosis,metaphase II of meiosis, and after the second cytokinesisfollowing meiosis? Assume that no crossing over takes place.
(b) How may copies of the brown allele (b) will be presentin each cell from an F1 brown guinea pig at the same stages?Assume that no crossing over takes place.
26. In watermelons, bitter fruit (B) is dominant over sweet fruit(b), and yellow spots (S) are dominant over no spots (s). Thegenes for these two characteristics assort independently. Ahomozygous plant that has bitter fruit and yellow spots iscrossed with a homozygous plant that has sweet fruit and nospots. The F1 are intercrossed to produce the F2.
(a) What will be the phenotypic ratios in the F2?
(b) If an F1 plant is backcrossed with the bitter, yellowspotted parent, what phenotypes and proportions areexpected in the offspring?
(c) If an F1 plant is backcrossed with the sweet, nonspottedparent, what phenotypes and proportions are expected inthe offspring?
27. In cats, curled ears (Cu) result from an allele that is dominantover an allele for normal ears (cu). Black color results from anindependently assorting allele (G) that is dominant over anallele for gray (g). A gray cat homozygous for curled ears ismated with a homozygous black cat with normal ears. All theF1 cats are black and have curled ears.
(a) If two of the F1 cats mate, what phenotypes andproportions are expected in the F2?
(b) An F1 cat mates with a stray cat that is gray andpossesses normal ears. What phenotypes and proportions ofprogeny are expected from this cross?
28. The following two genotypes are crossed: AaBbCcddEe �AabbCcDdEe. What will the proportion of the followinggenotypes be among the progeny of this cross?
(a) AaBbCcDdEe
(b) AabbCcddee
(c) aabbccddee
(d) AABBCCDDEE
Basic Principles of Heredity 73
*
*
**
**
**
**
29. In mice, an allele for apricot eyes (a) is recessive to an allele for brown eyes (a�). At an independently assorting locus, anallele for tan (t) coat color is recessive to an allele for black(t�) coat color. A mouse that is homozygous for brown eyesand black coat color is crossed with a mouse having apricoteyes and a tan coat. The resulting F1 are intercrossed toproduce the F2. In a litter of eight F2 mice, what is theprobability that two will have apricot eyes and tan coats?
30. In cucumbers, dull fruit (D) is dominant over glossy fruit(d), orange fruit (R) is dominant over cream fruit (r), andbitter cotyledons (B) are dominant over nonbitter cotyledons(b). The three characters are encoded by genes located ondifferent pairs of chromosomes. A plant homozygous for dull, orange fruit and bitter cotyledons is crossed with a plant that has glossy, cream fruit and nonbitter cotyledons.The F1 are intercrossed to produce the F2.
(a) Give the phenotypes and their expected proportions inthe F2.
(b) An F1 plant is crossed with a plant that has glossy,cream fruit and nonbitter cotyledons. Give the phenotypesand expected proportions among the progeny of this cross.
31. A and a are alleles located on a pair of metacentricchromosomes. B and b are alleles located on a pair ofacrocentric chromosomes. A cross is made betweenindividuals having the following genotypes: AaBb � aabb.
(a) Draw the chromosomes as they would appear in eachtype of gamete produced by the individuals of this cross.
(b) For each type of progeny resulting from this cross, drawthe chromosomes as they would appear in a cell at G1, G2,and metaphase of mitosis.
32. Ptosis (droopy eyelid) may be inherited as a dominant humantrait. Among 40 people who are heterozygous for the ptosis allele, 13 have ptosis and 27 have normal eyelids.
(a) What is the penetrance for ptosis?
(b) If ptosis exhibited variable expressivity, what would itmean?
33. In sailfin mollies (fish), gold color is due to an allele (g) that is recessive to the allele for normal color (G). A gold fish is crossed with a normal fish. Among the offspring, 88are normal and 82 are gold.
(a) What are the most likely genotypes of the parents inthis cross?
(b) Assess the plausibility of your hypothesis by performinga chi-square test.
34. In guinea pigs, the allele for black coat color (B) is dominant over the allele for white coat color (b). At anindependently assorting locus, an allele for rough coat (R) isdominant over an allele for smooth coat (r). A guinea pig that is homozygous for black color and rough coat is crossed with a guinea pig that has a white and smooth coat.In a series of matings, the F1 are crossed with guinea pigshaving white, smooth coats. From these matings, the following phenotypes appear in the offspring: 24 black,rough guinea pigs; 26 black, smooth guinea pigs; 23 white,rough guinea pigs; and 5 white, smooth guinea pigs.
(a) Using a chi-square test, compare the observed numbersof progeny with those expected from the cross.
(b) What conclusions can you draw from the results of thechi-square test?
(c) Suggest an explanation for these results.
74 Chapter 3
*
35. Dwarfism is a recessive trait in Hereford cattle. A rancher inwestern Texas discovers that several of the calves in his herdare dwarfs, and he wants to eliminate this undesirable traitfrom the herd as rapidly as possible. Suppose that therancher hires you as a genetic consultant to advise him onhow to breed the dwarfism trait out of the herd. Whatcrosses would you advise the rancher to conduct to ensurethat the allele causing dwarfism is eliminated fromthe herd?
36. A geneticist discovers an obese mouse in his laboratorycolony. He breeds this obese mouse with a normal mouse.All the F1 mice from this cross are normal in size. When heinterbreeds two F1 mice, eight of the F2 mice are normal insize and two are obese. The geneticist then intercrosses twoof his obese mice, and he finds that all of the progeny fromthis cross are obese. These results lead the geneticist toconclude that obesity in mice results from a recessive allele.
A second geneticist at a different university also discovers an obese mouse in her laboratory colony. She carries out the same crosses as the first geneticist did and obtains the same results. She also concludes that obesity inmice results from a recessive allele. One day the two geneticists meet at a genetics conference, learn of each other’s experiments, and decide to exchange mice. They both find that, when they cross two obese mice from the different laboratories, all the offspring are normal; however,when they cross two obese mice from the same laboratory,all the offspring are obese. Explain their results.
37. Albinism is a recessive trait in humans. A geneticist studies a series of families in which both parents are normal and atleast one child has albinism. The geneticist reasons that bothparents in these families must be heterozygotes and that albinism should appear in of the children of these families. To his surprise, the geneticist finds that the
1�4
CHALLENGE QUESTIONS

frequency of albinism among the children of these families is considerably greater than . There is no evidence that normal pigmentation exhibits incomplete penetrance. Canyou think of an explanation for the higher-than-expected frequency of albinism among these families?
38. Two distinct phenotypes are found in the salamanderPlethodon cinereus: a red form and a black form. Some biologists have speculated that the red phenotype is due to an autosomal allele that is dominant over an allele for black. Unfortunately, these salamanders will not mate in captivity; so the hypothesis that red is dominant over blackhas never been tested.
One day a genetics student is hiking through the forestand finds 30 female salamanders, some red and some black,
1�4
laying eggs. The student places each female and her eggs(about 20 – 30 eggs per female) in separate plastic bags andtakes them back to the lab. There, the student successfullyraises the eggs until they hatch. After the eggs have hatched,the student records the phenotypes of the juvenilesalamanders, along with the phenotypes of their mothers.Thus, the student has the phenotypes for 30 females andtheir progeny, but no information is available about thephenotypes of the fathers.
Explain how the student can determine whether red isdominant over black with this information on thephenotypes of the females and their offspring.
Basic Principles of Heredity 75
Corcos, A., and F. Monaghan. 1985. Some myths about Mendel’sexperiments. The American Biology Teacher 47:233 – 236.
An excellent discussion of some misconceptions surroundingMendel’s life and discoveries.
Dronamraju, K. 1992. Profiles in genetics: Archibald E. Garrod.American Journal of Human Genetics 51:216 – 219.
A brief biography of Archibald Garrod and his contributionsto genetics.
Dunn, L. C. 1965. A Short History of Genetics. New York:McGraw-Hill.
An older but very good history of genetics.
Garrod, A. E. 1902. The incidence of alkaptonuria: a study inchemical individuality. Lancet 2:1616 – 1620.
Garrod’s original paper on the genetics of alkaptonuria.
Henig, R. M. 2001. The Monk in the Garden: The Lost and FoundGenius of Gregor Mendel, the Father of Genetics. Boston:Houghton Mifflin.
A creative history of Gregor Mendel, in which the author hasused historical research to create a vivid portrait of Mendel’slife and work.
Monaghan, F. V., and A. F. Corcos. 1987. Reexamination of thefate of Mendel’s paper. Journal of Heredity 78:116 – 118.
A good discussion of why Mendel’s paper was unappreciatedby his peers.
Orel, V. 1984. Mendel. Oxford: Oxford University Press.
An excellent and authoritative biography of Mendel.
Weiling, F. 1991. Historical study: Johann Gregor Mendel1822 – 1884. American Journal of Medical Genetics 40:1 – 25.
A fascinating account that contains much recent research onMendel’s life as a scientist.
SUGGESTED READINGS