BASELINE ASSESSMENT - City and County of Denver
77
September 2020 Healthy Food for Denver’s Kids BASELINE ASSESSMENT
-
Upload
khangminh22 -
Category
Documents
-
view
4 -
download
0
Transcript of BASELINE ASSESSMENT - City and County of Denver
September 2020
Healthy Food for Denver’s Kids
BASELINE ASSESSMENT

H F D K B a s e l i n e A s s e s s m e n t | 2
Suggested Citation: Oppenheimer, S., Lacy, K., & Kathlene, L. (2020). Healthy Food for Denver’s Kids Baseline Assessment. Change Matrix Healthy Food for Denver’s Kids Evaluation. Change Matrix. Retrieved from (https://changematrix.org/wp-content/uploads/HFDK_Baseline_2020.pdf) Contributing Authors: Sophie Oppenheimer, MS, MPH Kristin Lacy, MDP, Change Matrix Lyn Kathlene, PhD, LK Consulting LLC Technical Support/Graphic Design: Annie VanDan, MBA, Change Matrix Alina Taniuchi, BA, Change Matrix Acknowledgements: The HFDK Evaluation Team would like to acknowledge assistance and contributions that came from HFDK staff, HFDK commission members, and data from numerous state and local departments that contributed to the development of this document. This work was supported by the City and County of Denver.
H F D K B a s e l i n e A s s e s s m e n t | 3
Click below to jump to the section.
04
Introduction Healthy Food for Denver’s Kids
Baseline Objectives
06
Summary of Key Takeaways
10
Objective 1: Health Equity, Key Findings
15
Objective 2: Current State of Child Food Insecurity, Key Findings
32
Objective 3: Best Practices, Key Findings
44
Objective 4: Existing Efforts, Key Findings
50
Objective 5: Gaps in the Local System, Key Findings
55 Lessons from COVID-19
57 References
65 Appendices

H F D K B a s e l i n e A s s e s s m e n t | 4
The Denver Department of Public Health and Environment (DDPHE) contracted with Change Matrix and partners to serve as evaluator for the Healthy Food for Denver’s Kids (HFDK) initiative. This baseline assessment is the critical first step in HFDK evaluation and strategy for 2020-2021, by providing a landscape analysis of the current state of child food security in Denver. The key objectives of the assessment are to:
The baseline assessment draws on the following sources of information:
secondary data at the neighborhood, county, and state levels;
qualitative data from community members and organizations;
reports, strategic plans, and other documents related to existing food security efforts;
interviews with agency leaders and HFDK commission members;
organizational data and literature related to evidence-based practices and policies; and
primary data collected from the Colorado Blueprint to End Hunger/HFDK COVID-19 Emergency Response Grants and the DDPHE Emergency Food Needs Assessment survey.
Understand how food insecurity affects different populations with respect to health equity, including healthy food access and nutrition-related health outcomes.
Understand and document the current state of food insecurity, diet quality and nutrition, and food skills and food systems education for children and youth in the City and County of Denver.
Identify evidence-based practices and policies that may inform HFDK strategy.
Understand existing efforts and initiatives in place to support child food security and identify opportunities to leverage that work.
Identify gaps and shortcomings in current programs at the local level.
1
2
3
4
5
The Healthy Food for Denver’s Kids (HFDK) Initiative (Ordinance 302) was approved by voters in November 2018 and went into effect in January 2019. The 0.08% increase in sales and use tax within the City and County of Denver is expected to generate approximately $11 million dollars annually for ten years, with the money disbursed through competitive grants to agencies of local government and non-profit organizations. The funding will be aimed primarily at low-income and at-risk youth, and funding decisions will be made by a Commission made up of non-profit, government, and community member volunteer appointees.
H F D K B a s e l i n e A s s e s s m e n t | 5
Limitations of the Baseline Assessment In general, secondary data is helpful in capturing a broad view of systems at a moment in time and reviewing a variety of indicators that can be used to measure progress in the future. However, secondary data can also sometimes be outdated or lack specificity in terms of location (for example, some sources lack neighborhood-level data) or target population (for example, some data is not disaggregated by all races and ethnicities). Additionally, work on the baseline began in February 2020, and has been greatly impacted by the COVID-19 pandemic. Most of the data in the Baseline Assessment is drawn from pre-COVID-19 information, as post-COVID-19 data is just emerging, and the extent of impacts will not be fully understood for years. Still, incoming COVID-19-related data and learnings are integrated into the baseline as appropriate and feasible and are beginning to reveal strengths and weaknesses of the food system under exceptionally challenging health and economic crises.
Supporting materials As part of the overall evaluation, the Baseline Assessment is coupled with three important components to inform the HFDK strategy: (1) HFDK Systems Map that visually represents connections (or lack thereof) of actors in the local system; (2) Theory of Change Strategic Roadmap which outlines the intended strategy of HFDK (available Summer 2020); and (3) HFDK Macro Evaluation Plan with specific indicators to track over time and measure impact.
How this report is structured Findings from the Baseline Assessment are organized by the five baseline objectives (see above). Each objective includes a summary data box at the beginning (in yellow boxes), followed by a narrative description of the findings for that objective. Importantly, the data points in the yellow summary boxes are not the macro-level indicators for the overall evaluation; rather, they are data points used to gain an understanding of the current landscape of child food insecurity for the Baseline Assessment. Some of these points may be used in the Macro Evaluation Plan, coming Summer 2020, but not necessarily all will be used. A full list of references is included at the end of the report, and additional maps and materials are included in the appendices.
H F D K B a s e l i n e A s s e s s m e n t | 6
This HFDK Baseline Assessment draws upon a myriad of data to lay a foundation of understanding of health inequities, give a broad view of the current state of child food insecurity in Denver1 and review some existing strategies and best practices. Overall, the HFDK commissioners may consider the following key takeaways from the data as they begin their strategic grantmaking:
Neighborhoods with higher populations of people of color, immigrants and refugees are most heavily impacted by food insecurity. The city has a culturally-diverse population of children, including ~37% of children living in immigrant family households often located in at-risk neighborhoods.2 Also, children of color are more likely to live in Denver neighborhoods lacking healthy food options and with higher rates of diet-related health conditions (i.e. obesity, diabetes, heart disease). Namely the regions of West, Southwest, North and Far Northeast Denver are neighborhoods with higher populations of children of color as well as higher rates of food insecurity (see more in Objective 1). Recognizing the stark, consistent disparities along race and ethnicity lines in the data, it will be important to center and explicitly highlight racial inequities in funding decisions. Funding criteria and evaluations should develop metrics that track progress toward undoing racial disparities and their underlying causes. Programs must be responsive to the cultural food choices of racially- and ethnically-diverse families in order to effectively influence dietary choices and behaviors. Funding opportunities should be accessible through various communication channels and be posted in languages other than English. Collaborations with community-based models that represent the cultural diversity of populations most affected should be strongly encouraged.
Child food insecurity is tied to a complex web of socioeconomic indicators, most notably poverty and race. Food insecurity is often a result of other systemic inequities affecting a family’s ability to purchase food, including low wages, lack of stable employment, and high medical and housing costs. Funding approaches should support programs that respond to the complexity of factors contributing to household food insecurity, like income, employment and housing. Also, funding should consider the inherent family and household nature of the drivers of food insecurity by supporting holistic programming including “whole child”, “2-generation”, and parent/care-giver approaches.
Federal food assistance programs are often not reaching children who need it most. The Supplemental Nutrition Assistance Program (SNAP) is one of the most effective programs for reducing food insecurity, one of the quickest responding programs in economic recessions, and two-thirds of SNAP benefits go to families with children. Similarly, the Special Supplemental Nutrition Program for Women, Infants and Children (WIC) has shown improvements in birth outcomes, infant feeding practices, and child nutrition and food security (see more on page 18). Yet,
1 For the purposes of this report, the term “child food insecurity” is synonymous with “children living in households experiencing food insecurity,” which is consistent with Feeding America’s definition. However, it should be noted that this is not always accurate, as children are often shielded from disrupted eating patterns and reduced food intake (USDA Economic Research Service, 2018). 2 The HFDK Commission’s working definition of at-risk is defined as: “Individuals who demonstrate status including but not limited to: racial/ethnic minority, low socioeconomic status, low income, refugee/immigrant, transgender or gender non-confirming, LGBTQ+, differently abled, experiencing homelessness.” Additionally, an At-Risk Rank index is used later in the report (see page 9); when referring to this specific index, capital letters will be used (e.g. At-Risk Rank).

H F D K B a s e l i n e A s s e s s m e n t | 7
many families experiencing food insecurity in Denver do not qualify for federal food assistance because their incomes are just over the threshold; many families who do qualify for assistance are not enrolled (an estimated 45,000 Denver residents eligible but not enrolled in SNAP). There is a strong need for funding to support ongoing SNAP and WIC enrollment, which includes:
ensuring materials are responsive to cultural, linguistic, and literacy needs of clients; aligning SNAP outreach and enrollment with other social supports (e.g., Medicaid); engaging community-based partners to support SNAP outreach and enrollment; and better aligning outreach efforts with the demographic diversity of Denver, focusing on
populations with high rates of eligible-but-not-enrolled individuals.
Improved coordination among food access programs and partners is needed (e.g., food pantry-bank connections, delivery trucks, storage). Last mile organizations (e.g., neighborhood food pantries) face difficulty in attracting grants to support operations, which leads to limited pantry hours, heavy reliance on unpaid volunteers who turnover frequently; and limited cold storage for perishable foods. Larger food rescue and distribution organizations are not always working together which creates an inefficient patchwork of distribution across the city (see more on page 53). The HFDK initiative can address resource and infrastructure needs of food access organizations by encouraging and funding collaborative models among programs.
Participation in free school meals is low among eligible Denver Public School (DPS) students. On average across the district, Free and Reduced Lunch eligible students participate in free lunch 65% of the time, and only 45% of the time for breakfast; participation rates drop even lower in high schools (see more in Appendix B). Participation in school meals offered during the COVID-19 pandemic was lower still, decreasing from about 45,000 to 9,000 meals per day. Participation challenges may be related to outreach (i.e., ensuring materials are in families’ native language and with effective marketing strategies), transportation access (during the COVID-19 pandemic a mile may be too far to walk for food), and food quality (i.e., repetitive meals and low-quality ingredients cause families/students to opt out). The HFDK initiative could boost school meal participation by supporting promising practices such as Breakfast after the Bell, increasing the lunch time at schools, or improving marketing and outreach strategies (see more on page 35).
Participation in supplemental food programs for out-of-school time (weekend, summer and after-school programs) is low among Denver’s children. Colorado ranks 40th nationally in daily participation in the Summer Food Service Program (SFSP), providing summer lunch to only 9 out of every 100 children receiving Free and Reduced Lunch (see more on page 22). HFDK funding could support increased participation in these programs through bolstering best practices, including:
intensive outreach, especially to neighborhoods with low participation rates; intentional site recruitment for SFSP and After-School Snack program sponsors; allowing out-of-school time sponsors (e.g., Big Brothers, Big Sisters, YMCA) to provide meals
year-round through the SFSP to reduce unnecessary and burdensome administrative work for sponsor sites;
increasing funding for Pandemic Electronic Benefits Transfer (P-EBT) and Summer Electronic Benefits Transfer (S-EBTC ) to give families additional resources to purchase healthy food during the summer, which would complement the SFSP; and
increasing investments in summer learning programs in general in order to provide platforms for SFSP food distribution.
Denver’s local food system is robust, diverse, and filled with passionate organizations and individuals already advancing work to address child food insecurity. Working closely with frontline organizations and communities already doing this work will be critical to ensuring the HFDK initiative has a grassroots understanding of root causes of food insecurity and its potential solutions. Review

H F D K B a s e l i n e A s s e s s m e n t | 8
of best practices to reduce child food security indicated that many programs are already underway in Denver that the HFDK initiative could leverage or provide supplemental support to, including:
Farm to School (FTS) activities, including school gardens, education, and local procurement, have shown to increase fruit and vegetable consumption, improve food choices, improve food access, and increase school meal participation.
Caregiver/Parent-focused nutrition education programs contribute to increased food security and diet quality for children, as evidenced by the impact of programs like SNAP-Ed, Cooking Matters and Culture of Wellness in Preschool programs.
Federally-funded programs, like the USDA Fresh Fruit and Vegetable Programs and the At-Risk snack programs provide healthy snacks to kids in school and after school
Programs connecting farmers and food assistance programs like the Colorado Food Pantry Assistance grant (helps food pantries directly source from local farmers) and the Colorado Double Up Food Bucks (doubles SNAP dollars when used to purchase local fruits and vegetables) provide multiple wins by paying fair wages to farmers while getting food pantries the nutritious food they need to feed communities.
Policy-focused initiatives, like the Blueprint to End Hunger and the Denver Sustainable Food Policy Council, advance systems changes to make child food security programs more resilient.
Mobile markets are extending food access resources into hard-to reach neighborhoods.
As a significant new source of funds for child food security the HFDK Commission should consider the following best practices for equitable grantmaking to ensure trusted relationships are built with community-based organizations, including:
embedding capacity-building opportunities in grant-making; encouraging and facilitating collaboration among funded organizations to build the system; being a flexible and reliable partner to organizations in the system; providing multi-year funding for increased stability of grantees; providing robust learning and evaluation support to grantees; using a racial equity lens in grantmaking and strategy development; engaging community perspectives in decision-making; and considering the internal equity of the commission itself, including looking at representation
on the commission, establishing key diversity, equity and inclusion goals for the commission, and actively addressing power in the funding process (see more on page 43).
The current context of the COVID-19 pandemic demands flexibility, adaptability, and proactive planning that uses learning from COVID-19 to build a more resilient food system for Denver’s most vulnerable children. The HDFK initiative may consider several crisis grantmaking practices other funders are committing to, including:
funding intermediary organizations (i.e, capacity-building organizations) that play vital roles in connecting nonprofits, disseminating timely information, and leading collective actions - all essential during crises;
improving emergency and disaster preparedness in non-profits that may lack time to consider implications of major disruptions like COVID-19; and
tracking impacts of vulnerable populations to understand the extent of socially-disparate spillover effects on people’s economic well-being and safety during the pandemic.

HEALTH EQUITY
AT RISK RANKNorth, Far Northeast, South, and Southwest areas of Denver have higher At-Risk Ranks1
CHILD WELL-BEING INDEXObstacles faced by children vary greatly between Denver neighborhoods3,4
COVID-19 CASESBlack, Hispanic/Latinx, and Native Hawaiian or Pacific Islanders have higher percentage of COVID-19 positive cases compared to White or Asian Coloradans5
MINORITY POPULATIONSAt-risk neighborhoods correlate with higher minority populations3,6
CHILDREN IN IMMIGRANT FAMILIES37% of Denver’s children in 2017, at risk neighborhoods correlate with higher percentages of children in immigrant families3,4
CHILDREN OF COLORAt-risk neighborhoods correlate with high percentages of children of color3,4
OTHER LANGUAGE HOUSEHOLDS (BESIDES ENGLISH)At-risk neighborhoods correlate with high percentages of Language Other Than English Spoken in Home3,4
AGE UNDER 18At-risk neighborhoods correlate with high percentages of people under the age of 181,2
SINGLE PARENT FAMILIESAt-risk neighborhoods have high percentages of single-parent families1,2
CHILD FOOD INSECURITY
OVERALL FOOD INSECURITY RATE11.9% (roughly 80,800 people) in 20177
CHILD FOOD INSECURITY RATE 15% (roughly 20,740 children) in 20177
FOOD-INSECURE POPULATION INELIGIBLE FOR FOOD ASSISTANCE 21% in 20177
FOOD-INSECURE CHILDREN INELIGIBLE FOR FOOD ASSISTANCE 34% in 20177
LOW-INCOME POPULATION ENROLLED IN SUPPLEMENTAL NUTRITIONAL ASSISTANCE PROGRAM (SNAP)66% in 20198
HOUSEHOLDS RECEIVING SNAPNeighborhoods with higher At-Risk Ranks correlate with households receiving SNAP9
CHILDREN UNDER 18 IN HOUSEHOLDS RECEIVING PUBLIC BENEFITS21% (roughly 30,000) in 2017, higher in neighborhoods with high At-Risk Ranks10
DPS STUDENTS ELIGIBLE FOR FREE- AND REDUCED-PRICE LUNCH65% (roughly 60,000) in 2018, higher in neighborhoods with high At-Risk Ranks11
LOCATIONS OF SCHOOL MEAL SITES DURING COVID-19Most meals sites are in North, Far Northeast, West, and Southwest, correlating with neighborhoods with higher At-Risk Ranks12
LOCATIONS OF FOOD STORES, BY TYPEAt-risk areas, especially North Denver, have fewer full-service grocery stores12
LOCATIONS OF FOOD PANTRIES Some neighborhoods with high At-Risk-Ranks lack food pantries within walking distance13
DIET QUALITY AND NUTRITION
UNHEALTHY WEIGHT STATUS, BY RACE IN DENVER5.6% of White children 15.2% for Black children 21.9% for Latinx children14
UNHEALTHY WEIGHT STATUS BY AGE IN DENVER10% ages 2-5 15% ages 6-11 21% ages 12-1714
VEGETABLE CONSUMPTION AMONG DENVER HIGH SCHOOL STUDENTS36.8% eat 1+ vegetables per day 25.6% eat 2+ vegetables per day15
FRUIT CONSUMPTION AMONG DENVER HIGH SCHOOL STUDENTS36.9% eat 1+ fruits per day 27.5% eat 2+ fruits per day15
FRUIT AND VEGETABLE CONSUMPTION AMONG CHILDREN, BY RACE ACROSS COLORADOWhite children consume above average fruits and vegetables; Black and Latinx children consume below average fruits and vegetables15
CONSUMPTION OF SUGAR-SWEETENED BEVERAGES (SSB) AMONG CHILDREN ACROSS COLORADO13% of children consume at least one SSB per day15
CONSUMPTION OF AT LEAST ONE SSB PER DAY AMONG CHILDREN, BY RACE ACROSS COLORADO6.4% of White children; 13.3% of Hispanic children; 20.8% of Black children15
FOOD SKILLS AND FOOD SYSTEMS EDUCATION
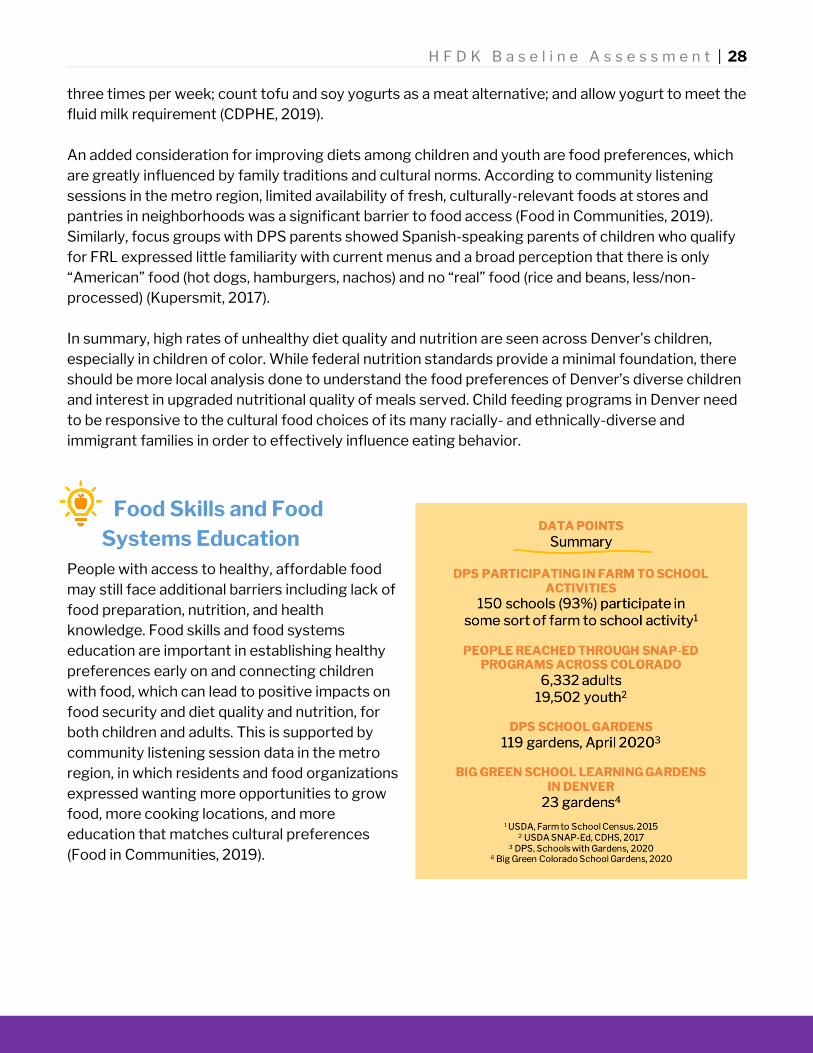
DPS PARTICIPATING IN FARM TO SCHOOL ACTIVITIES150 schools (93%) participate in some sort of farm to school activity16
PEOPLE REACHED THROUGH SNAP-ED PROGRAMS ACROSS COLORADO6,332 adults | 19,502 youth17
DPS SCHOOL GARDENS 119 gardens (April 2020)18
PEOPLE REACHED THROUGH SNAP-ED PROGRAMS6,332 adults | 19,502 youth19
1 American Community Survey, 2014-20182 Five Points Geoplanning LLC GIS Map3 American Community Survey 2013-20174 Denver Office of Children’s Affairs (OCA), 20195 CDPHE COVID-19 Data, April 20206 CDPHE Community Health Equity Map7 Feeding America, Map the Meal Gap8 Hunger Free Colorado, 2019
9 ACS, 2014-2018; Five Points Geoplanning LLC GIS Map 10 ACS, 2008-2017; OCA, 201911 Denver Public Schools [DPS], 2018-2019; OCA, 201912 DDPHE Denver Food Assets and Emergency Access Map, 202013 Hunger Free Colorado Food Pantry List, 2020;
Five Points Geoplanning LLC GIS Map14 DPS, 2012-2018; DPH, 201915 CDPHE, Healthy Kids Colorado Survey, 2013-201716 USDA, Farm to School Census, 201517 USDA SNAP-Ed, CDHS, 201718 DPS, Schools with Gardens, 202019 DPS, Sustainability Program, 2020
SUMMARY OF DATA POINTSThese data points are in reference to the City and County of Denver (unless otherwise specified)
and are from the yellow summary boxes at the beginning of each objective.
REFERENCES
HFDK Baseline Assessment | 9

H F D K B a s e l i n e A s s e s s m e n t | 10
Objective 1 - Health Equity Understand how food insecurity affects different populations with respect to health equity, including healthy food access and nutrition-related health outcomes.
Especially in a cross-cutting system such as the food system, a fundamental understanding of structural inequities is the gateway to unpacking disparities and moving toward a true, root cause analysis of dysfunctional systems. As such, two key indices are used to show social determinants of health (SDoH) across the City and County of Denver — At-Risk Rank and Child Well-Being Index — to highlight issues of health equity across the multiple sources of data in the Baseline Assessment.

H F D K B a s e l i n e A s s e s s m e n t | 11
By looking at the maps of the two indices3,4 used to set a foundation for SDoH, it is evident the same neighborhoods with the highest At-Risk Ranks also experience the greatest obstacles to child well-being, including food insecurity risks, which are explored in the next section, Objective 2. Figure 1 highlights neighborhoods in West and North Denver experiencing higher At-Risk Rank scores (in red), which contribute to negative outcomes, including food insecurity and nutrition-related health. Specifically, West, Southwest and Northeast neighborhoods are at highest risk, with some limited neighborhoods in East and Southeast also at high risk. As At-Risk Rank is measured at the block group level, it is important to note that some neighborhoods with wide diversity of at-risk scores, for example North Park Hill, may be attributed to the rapidly changing demographics of Denver’s neighborhoods. Figure 2 shows dark blue areas where children experience more obstacles to well-being, including
3 At-Risk Rank (ARR) is an index of eight socioeconomic indicators: households in poverty, median household income, unemployment, household owner occupancy, population with a high school diploma, population with at least a bachelor’s degree, and population employed in professional occupations. This index was created by Five Points Geoplanning and overlaps greatly with the indicators and sources in Denver’s Neighborhood Equity Index. ARR Index was chosen as a foundational measure of health equity for several reasons. Economic status, measured by many of the indicators in the ARR, has been shown to correlate with diet-related health outcomes, including obesity, diabetes, and cardiovascular disease, which have been correlated with diet quality and food access (McLaren, 2007; Vlismas, Stavrinos, & Panagiotakos, 2009; Berkowitz, 2014; Wang et al., 2014; Jansen, 2017). Additionally, four of the eight indicators in the index are used in Feeding America’s measure of food insecurity (Feeding America Map the Meal Gap, 2017). The ARR map provides more nuance as it is reported by census block, helping derive deeper understanding of the differences within neighborhoods, especially as gentrification continues to impact Denver neighborhoods. 4 The Child Well-Being Index is a combination of eleven indicators: Births to Women without a High School Diploma; Teen Births; Overweight or Obese Children; Kindergarten Readiness; Third Graders NOT Reading at Grade Level; Ninth Graders Chronically Absent; Adults without a High School Diploma; Children in Single-Parent Families; Child Poverty; Violent Crime; and Unemployment. The index was created by the Denver Office of Children’s Affairs (OCA) and is used in OCA’s annual Status of Denver’s Children report.
Figure 1. Geographic Distribution of At-Risk Rank
Figure 2. Geographic Distribution of Child Well-Being Index

H F D K B a s e l i n e A s s e s s m e n t | 12
higher percentages of children who are overweight and poorer educational outcomes. In addition to geographic distribution of SDoH, it is important to understand other demographic variables of these neighborhoods. Appendix A shows several Geographical Information Systems (GIS) maps that demonstrate the same neighborhoods with higher At-Risk Ranks and lower Child Well-Being indices are also neighborhoods with more racially- and ethnically-diverse populations, more youth, and more single-parent households. These areas have more minority populations,5 children in immigrant families, children of color, Spanish-language households, and households speaking a language other than English in the home. While age is distributed more evenly across the city, there are high percentages of children and youth under the age of 18 in these same neighborhoods at higher At-Risk Ranks and low Child Well-Being indices. Similarly, single-parent families are slightly more evenly dispersed across the city, but there are still higher numbers of single parent households in the same neighborhoods.
5 Minority populations are defined as non-white in the Denver Office of Children’s Affairs report.

H F D K B a s e l i n e A s s e s s m e n t | 13
COVID-19: An example of health disparities in Denver As of April 30th, 2020, data from Denver Health shows lower-income neighborhoods with higher populations of Latinx and Black residents are the most affected by COVID-19 infections and deaths, as seen in Figures 3 and 4 below (Roberts, May 2020; Hernandez, May 2020). These patterns mirror many of the patterns seen in the At-Risk Rank and Child Well-Being indices reviewed above. Disparities are emerging in the data even with the limitations that race and ethnicity were not collected initially. As the pandemic continues, the picture of how many people of color are affected may be incomplete. Historically, the Latinx population has been miscounted and undercounted,6 and marginalized communities having less access to testing and healthcare facilities skew reported case numbers (Daniels & Morial, 2020). What is clear is that in Denver and across the U.S., communities of color and impoverished populations will bear the brunt of the economic repercussions and hardships from COVID-19. In many ways, the pandemic is laying bare systemic inequities and structural racism that has been long known (Shriver Center on Poverty Law, April 2020; Travers, April 2020).
6 Demographic data was not collected initially in COVID-19 cases. Moreover, Latinx individuals are often miscounted or undercounted due to a long history of changing and inconsistent categories ("white, Hispanic" to "white, Non-Hispanic") (Cohn, 2014); categories not matching Hispanic self-view (Gonzalez-Barrera, July 2015); barriers including language, poverty, education, and immigration status (The Leadership Conference Education Fund, 2018); fading of Hispanic identity across generations (Lopez, Gonzalez-Barrera & Lopez, 2017); and fears of being discriminated against or deported especially under the Trump administration (Daily News, 2020).
Figure 4. COVID-19 Positive Cases in Denver by Race and Ethnicity as of April 30, 2020
Figure 3. COVID-19 Cases per 1,000 Persons by Denver Neighborhoods as of April 30, 2020

H F D K B a s e l i n e A s s e s s m e n t | 14
As we dive into the review of indicators of food security over the next sections, it is important to note the consistent patterns of inequities along racial and poverty lines we see across the City. Neighborhoods in West, Southwest, North and Far Northeast Denver (West of I-25 and North of I-70) are consistently lower in terms of socioeconomic status, opportunity, and health indicators, while also being the most racially-, ethnically- and economically-diverse neighborhoods. Targeted investments to populations and neighborhoods most at-risk will be important for addressing food insecurity among Denver's youth.

H F D K B a s e l i n e A s s e s s m e n t | 15
Objective 2 – Current State Understand and document the current state of food insecurity, diet quality and nutrition, and food skills and food systems education for children and youth in the City and County of Denver. Food insecurity can be broadly defined as a lack of reliable access to affordable, nutritious, and culturally-relevant food. The field currently recognizes the multitude of geographic, economic, sociocultural, and informational factors that contribute to food insecurity (Gundersen & Ziliak, 2018), and measuring food insecurity includes distance to stores, self-reported coping mechanisms (e.g. skipping meals), food assistance program eligibility, among others. In the following section, we consider multiple indicators and perspectives to provide a more holistic picture of the current state of child food insecurity in Denver, including:
Geographic and economic factors
that influence food security
Sociocultural aspects of healthy food access that
affect diet quality and nutrition
Food skills and food systems
education supporting healthy food consumption
Current State – Food Security Food insecurity has many complex drivers linked to limited resources, and has been
correlated to poor health outcomes, higher healthcare costs and utilization, poor educational outcomes, and low school readiness (Banyan, 2017). Children in food-insecure households, or households that struggle to afford food for their families, are at an increased risk for numerous health problems and added emotional and physical stress that may affect a child’s ability to succeed in school.

H F D K B a s e l i n e A s s e s s m e n t | 16
Furthermore, low-income neighborhoods7 have been shown to have higher rates of obesity (The Colorado Health Foundation, 2008), fewer full-service supermarkets, and more small markets with high-priced, low-quality produce, and processed, energy-dense foods (The Colorado Health Foundation, 2009).
In the U.S. overall, food security has been generally declining over the last decade. Still, certain populations experience food security at much higher rates (see below), and the rate of very low food security8 has stayed consistent since 1999 (Coleman-Jensen, Rabbitt, Gregory & Singh, 2018; 2019).
Despite a decline in food insecurity among households with children from 2017 (15.7%) to 2018 (13.9%, the lowest rate since 1998) children of color consistently have higher rates than White children, as seen in Figure 5 below (USDA Economic Research Service, 2020a). The gap between Latinx and White children has improved in recent years, while the gap between Black and White children has increased. Overall, the COVID-19 crisis will likely impact the declining trend in child food security, as Hunger Free America reports an estimated five-fold increase in child hunger since March 2020 (Hunger Free America, April 2020).
7 Low income is defined as 80% of the median daily income for a given geographic area, adjusted for family size and unusually high housing costs (US Department of Housing and Urban Development, 1998). 8Two levels of food insecurity, as defined by USDA, are (1) Low Food Security: Households were, at times, unable to acquire adequate food for one or more household members because they had insufficient money and other resources for food, and (2) Very Low Food Security: Households were food insecure to the extent that eating patterns for one or more household members were disrupted and their food intake reduced, at least some time during the year, because they could not afford enough food. (Coleman-Jensen, Rabbitt, Gregory & Singh, 2018).

H F D K B a s e l i n e A s s e s s m e n t | 17
In Denver, the overall food insecurity rate is 11.9% for the general population and 15% for children (Feeding America, 2017). 9 This represents a significant drop from the estimated 27% of children experiencing food insecurity in 2009, but there is still much to be done. According to the Healthy Kids Colorado Survey, 14% of high school students in Denver in 2017 felt hungry due to a lack of food at home (CDPHE, 2018). A local study of over 1,000 food pantry users in Denver found a wide distribution of food security experiences, as seen below (Brock & Gregory, 2018).10 Food pantry users who responded to the survey were much more likely to have children than the metro area average, 56% were experiencing moderate to severe food insecurity, and many food pantry users were not connected to federal food assistance programs like the Supplemental Nutrition Assistance Program (SNAP) and the supplemental nutrition program for Women, Infants and Children (WIC) provided by the USDA.
9 Feeding America calculates food insecurity in the general population using several variables, including the USDA Food Security Survey data and several associated factors from the Current Population Survey, the Bureau of Labor Statistics, and the American Community Survey. They also published a model estimate of food-insecurity for children using the following indicators at the county, congressional district and state levels: unemployment rates; child-poverty rates; median income for families with children; homeownership rates for families with children; African American children; and Hispanic children. 10 In the food pantry user study, a “food insecurity score” was calculated for survey participants based on responses to four indicators: (1) worried that food would run out before you can buy more, (2) ran out of food before you could buy more, (3) had to skip a meal so that someone else in the household could eat, (4) went to bed hungry.
Figure 5. Food Insecurity Among Children Across the U.S. by Race and Ethnicity of Household Head

H F D K B a s e l i n e A s s e s s m e n t | 18
SNAP and WIC are important tools for food access for individuals experiencing food insecurity. SNAP provides nutrition benefits (money on a debit-like card) to supplement the food budget of families so they can purchase healthy foods, and research has shown that SNAP improves food security and health while contributing positive impacts to local economies (see more in Objective 3). 69% of SNAP participants in Colorado are in families with children, demonstrating a major point of food access for child food insecurity.
However, Colorado ranks 43rd in the nation for ensuring people who are financially-insecure are connected to SNAP, and only 66% Denver residents who are low-income were enrolled in SNAP in 2017, leaving an estimated 45,000+ Denver residents likely eligible for SNAP but not participating (Hunger Free Colorado, 2019). Based on the local study with food pantry users in Denver referenced above, respondents were much more likely have to have children than the Denver Metro average family, yet nearly half (47% of respondents) were not receiving SNAP benefits, and 80% of those had either applied and been turned down or had previously received SNAP but stopped, indicating a major gap in SNAP eligibility to enrollment (Brock & Gregory, 2018). Challenges to SNAP enrollment include income eligibility restrictions, stigma associated with public assistance, and lack of information about how to apply. Additional research suggests immigrant families have lower SNAP enrollment rates, even though their children may be eligible regardless of the parents’ citizenship status, due to fear of the “public charge” in which the use of public benefits affects immigration cases (Bovell-Ammon, et al., 2019) (see more in Objective 5). Especially for young children (0-5), the WIC program is important for improving access to nutritious foods. WIC provides states with grant funding for food, health care referrals, and nutrition education for low-income pregnant, breastfeeding, and non-breastfeeding postpartum women, as well as for infants and children up to age five who may be at nutritional risk (Office of Children’s Affairs, 2019). In 2019, there were 13,358 children under age 5 in Denver participating in the WIC program (which represents 31.2% of the total number of children under 5 in Denver)11 (Annie E. Casey Foundation Kids Count Data Center, 2019). Overall, as of 2017, 46% of eligible individuals (including pregnant women, infants and children ages 1-4) participated in WIC across Colorado; the Colorado WIC program has set a goal to increase enrollment to 60% of eligible individuals by 2020 (WIC Colorado, 2017).
11 This number is defined by the Colorado WIC website as “Children under age 5 receiving vouchers from the Special Supplemental Nutrition Program for WIC during the calendar year. The number reflects unduplicated count of children. Note: Some local WIC programs provide services to children from other counties. The percentages are based on population projections from the Colorado State Demography Office. Data Source: Governor’s Office of Information Technology.”

H F D K B a s e l i n e A s s e s s m e n t | 19
As seen below, Denver neighborhoods with higher rates of households receiving SNAP (Figure 6, dark green) and higher rates of households with children under 18 receiving public benefits (Figure 7, dark blue) have patterns similar to the neighborhoods with higher At-Risk Rank and lower Child Well-Being indices seen in Objective 1. However, some at-risk areas have lower-than-expected enrollment, suggesting a high rate of eligible-but-not-enrolled households (ACS, 2014-2018; Five Points Geoplanning LLC, GIS Maps, 2020).
Figure 7. Geographic Distribution of Households Receiving Public Benefits
Figure 6. Geographic Distribution of Denver Households Receiving SNAP

H F D K B a s e l i n e A s s e s s m e n t | 20
For many children, school meals are crucial daily food security. The National School Lunch Program (NSLP) and the School Breakfast Program (SBP) are the two most common school meal programs, in which the USDA provides cash subsidies for reimbursable meals to participating schools. Additionally, some children qualify for free- or reduced-price lunches (FRL) based on their participation in SNAP or on their status of being a migrant, runaway or foster child, or experiencing homelessness (USDA Food & Nutrition Services, 2017). In Denver Public Schools (DPS), which serves an estimated 92,000 total students, the Food and Nutrition Services (FNS) department served a total 5,947,225 FRL meals in the 2018-2019 year (Colorado Department of Education, 2019), which is an average of 45,000 FRL meals per school day. Across Denver, an average of 65% (~60,000) DPS children were eligible for FRL, with higher eligibility rates in North, Northeast, West, and Southwest Denver, following the similar pattern to neighborhoods with higher At-Risk Ranks, as seen in Figure 8.
When looking at participation in free meals by FRL-eligible students in DPS, there are some interesting trends to note, as seen in Table 1 (DPS Food and Nutrition Services, Summary of Lunch Participation FY18-19). Overall, participation across the district is low, and seems to drop off in higher grades (middle schools and high schools). While this data is not available in map form; a table of participation by individual schools is included in Appendix B and could be used to drive more focused efforts at schools with high FRL eligibility and low FRL participation.
Figure 8. DPS Children Eligible for Free or and Reduced-Price Lunch by Home Neighborhood
Table 1. Participation in Free Meals by FRL-Eligible DPS Students
Lunch Breakfast Total Elementary Schools 76% 57% Total K-8 Schools 71% 48% Total Middle Schools 62% 31% Total High Schools 37% 21% Total Charter Schools 65% 45% Total Alternative Schools 20% 20%
Total District 65% 45%

H F D K B a s e l i n e A s s e s s m e n t | 21
School closures due to the COVID-19 pandemic contributed to the reported five-fold increase in child food insecurity (Hunger Free America, 2020). In response, DPS launched an extensive food program providing grab-and-go breakfast and lunch at 25 school sites, 36 delivery sites serviced by school buses, expanding distribution to housing complexes, recreation centers, parks, and some street corners (DPS, 2020). The 25 meal sites were selected by using data from DPS FNS, focusing on geographic regions with high concentrations of FRL eligibility within one mile of the site (Peña, 2020). Most DPS feeding sites were in Northeast and Southwest areas, following the pattern of neighborhoods with higher At-Risk Ranks and low Child Well-Being indices, seen in Figures 9 and 10.
DPS experienced participation challenges during the COVID-19 feeding program as well, where DPS went from serving roughly 45,000 FRL meals per day across the district to only about 9,000 meals per day during the COVID-19 feeding program. Globeville-Elyria Swansea neighborhood has one of the highest rates of FRL eligibility, yet had one of the lowest participation rates during the COVID-19 DPS feeding program. Fairview Elementary in the Sun Valley neighborhood normally has one of the highest participation rates for school meals, yet only served about 20 meals a day during the COVID-19 DPS feeding program. These challenges may be related to a variety of factors including lack of awareness (communication and outreach is difficult when children are not in school, and language accessibility), transportation challenges (even one mile can be too much for families to walk), and quality (meals are often repetitive and perceived as low quality by families). The DPS sites with the highest participation during the COVID-19 feeding program were all located in the West and Northeast regions: Abraham Lincoln, Joe Shoemaker, Eve Dennis, Montbello Campus, and Valverde (Peña, 2020; Kupersmit, 2017, 2019).
Figure 9. Geographic Distribution of DPS COVID-19 Food Distribution Sites
Figure 10. DPS COVID-19 Food Distribution by Sector
H F D K B a s e l i n e A s s e s s m e n t | 22
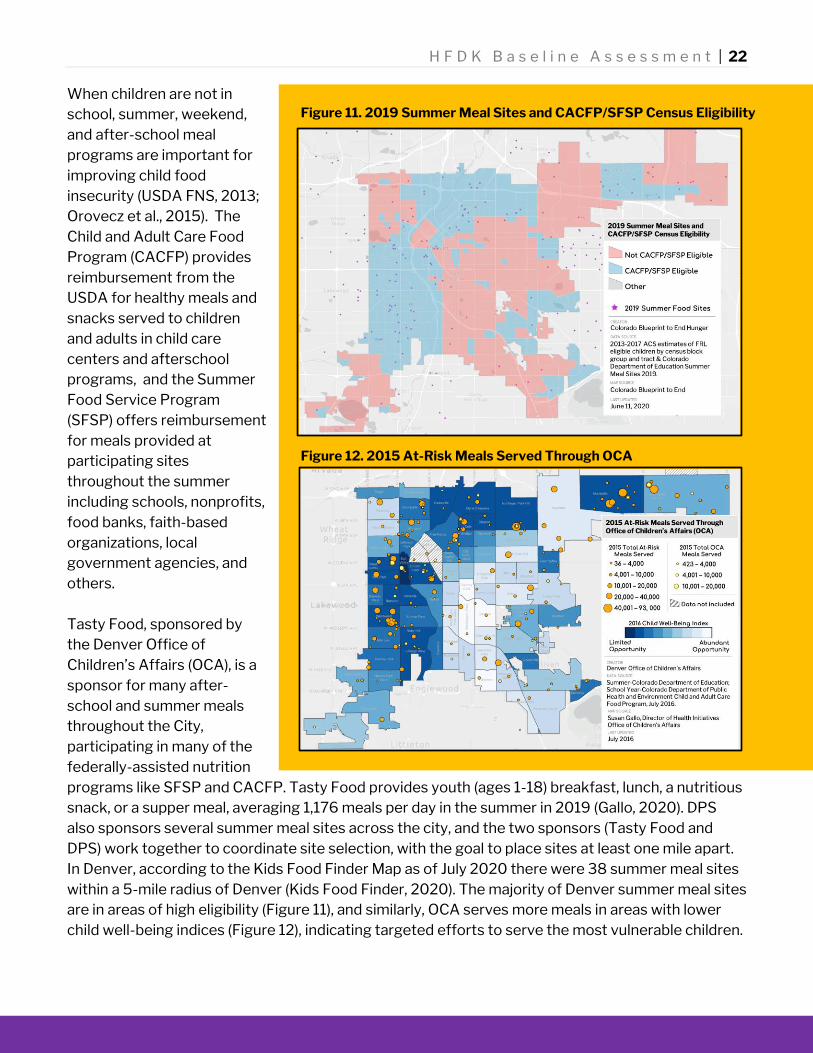
When children are not in school, summer, weekend, and after-school meal programs are important for improving child food insecurity (USDA FNS, 2013; Orovecz et al., 2015). The Child and Adult Care Food Program (CACFP) provides reimbursement from the USDA for healthy meals and snacks served to children and adults in child care centers and afterschool programs, and the Summer Food Service Program (SFSP) offers reimbursement for meals provided at participating sites throughout the summer including schools, nonprofits, food banks, faith-based organizations, local government agencies, and others. Tasty Food, sponsored by the Denver Office of Children’s Affairs (OCA), is a sponsor for many after-school and summer meals throughout the City, participating in many of the federally-assisted nutrition programs like SFSP and CACFP. Tasty Food provides youth (ages 1-18) breakfast, lunch, a nutritious snack, or a supper meal, averaging 1,176 meals per day in the summer in 2019 (Gallo, 2020). DPS also sponsors several summer meal sites across the city, and the two sponsors (Tasty Food and DPS) work together to coordinate site selection, with the goal to place sites at least one mile apart. In Denver, according to the Kids Food Finder Map as of July 2020 there were 38 summer meal sites within a 5-mile radius of Denver (Kids Food Finder, 2020). The majority of Denver summer meal sites are in areas of high eligibility (Figure 11), and similarly, OCA serves more meals in areas with lower child well-being indices (Figure 12), indicating targeted efforts to serve the most vulnerable children.
Figure 11. 2019 Summer Meal Sites and CACFP/SFSP Census Eligibility
Figure 12. 2015 At-Risk Meals Served Through OCA

H F D K B a s e l i n e A s s e s s m e n t | 23
Overall, participation in these out-of-school time programs is low, especially for summer meals. Colorado ranks 40th in the nation for summer nutrition program participation, reaching only nine out of every 100 children eligible for FRL with summer meal programs (Hayes, Rosso, & FitzSimons, 2019). Low participation rates may be related to a variety of factors including language accessibility, outreach and marketing material, and quality of the food offered at sites (see more in Objective 5). In addition to nutrition assistance and food programming for children, geographic access to healthy food is an important component of food security. Often, low-income neighborhoods have fewer full-service grocery stores and fresh foods, and more fast-food restaurants and convenience stores with limited produce options. Access to food is not evenly distributed in Denver, and several lower-income neighborhoods with high At-Risk Ranks lack healthy food options close to where they live (The Food Trust, 2009; Denver Food Access Task Force, 2011). As seen in Figure 13 below, North Denver neighborhoods especially have fewer full-service grocery stores and more small food markets and convenience stores when compared to other neighborhoods. (DDPHE Denver Food Assets and Emergency Access Map).
It is important that food resources, other than full-service grocery stores, offer affordable healthy options and are close to where people live and work. Figure 14 shows many of Denver’s food pantries and banks are located in high-risk neighborhoods (dark red) throughout Denver; however, there are still many neighborhoods with higher At-Risk Ranks lacking pantries altogether, and of those that do have pantries, many are currently closed due to COVID-19.
Figure 13. Geographic Distribution of Food Retail Sites

H F D K B a s e l i n e A s s e s s m e n t | 24
Furthermore, Figure 15 shows food pantry locations and their ¼ mile radius (average preferable walking distance), highlighting that some neighborhoods with high At-Risk Ranks are severely lacking in food pantries within walking distance, making it difficult for food-insecure people with limited mobility (due to age, disability, transportation access) to reach food assistance programs. (Five Points Geoplanning LLC, GIS Maps, 2020; Hunger Free Colorado Food Pantry List, April 2020). These findings are reinforced by insights from community listening sessions from the Food in
Communities project in 2019, which showed that key barriers to food access for individuals include limited availability of fresh, culturally-relevant foods at stores and pantries in neighborhoods; limited and costly transportation options to distant stores; and mobility challenges for older adults and those with disabilities (Food in Communities, 2019). Overall, the data for the current state of food access among Denver kids highlights key gaps in food assistance reaching those who need it. First, many food-insecure families are restricted in access because of income eligibility requirements for food assistance programs. Second, many families who do qualify for assistance are not enrolled in these programs. Third, neighborhoods with higher At-Risk Ranks and higher populations of children of color are lacking in fresh, healthy food within walking distance. This suggests food access programs should consider partnering with programs addressing other SDoH to support families that
are ineligible for food assistance, and should target enrollment outreach resources to high-risk neighborhoods. Additionally, these data suggest programs should take into consideration resource and infrastructure needs of food assistance organizations and encourage collaborative models among food assistance programs to help facilitate food access.
Figure 14. Food Pantries in At-Risk Areas
Figure 15. Food Pantries and ¼ Mile Radius

H F D K B a s e l i n e A s s e s s m e n t | 25
Current State - Diet Quality and Nutrition
Diet quality and nutrition are strongly linked to food security, which not only encompasses access to food, but to high-quality nutritious and culturally-relevant foods. People who have access to healthier diets generally have lower rates of chronic illness and diet-related diseases (such as obesity, hypertension, asthma, cardiovascular disease, and diabetes) that are found in areas with fast-food venues with higher use of saturated fats and sugars (Denver Food Access Task Force, 2011). Data from Denver Public Health (DPH) collected from 50,000 DPS students from 2012-2018 clearly shows certain neighborhoods experience higher rates of childhood obesity, especially those neighborhoods with higher populations of children of color, as seen in Figure 16 below. DPH found unhealthy weight among youth was 15.9% (at or above the 95th percentile) and 13.8% (between the 85th and 95th percentile) across the city. The frequency of too much weight for health ranged greatly across regions of the city, from 2.1% in some neighborhoods to 26.4% in others, demonstrating grave geographic disparities that correlate with neighborhoods with higher At-Risk Ranks. More Black and Latinx children had too much weight for health than White children in Denver,12 and rates of
unhealthy weight increased as children age: 10% of children ages 2-5 had unhealthy weight; 15% of children 6-11 had unhealthy weight, and 21% of children ages 12-17 had unhealthy weight (DPH, 2019). This highlights a need to intervene early on to establish healthy eating habits at a young age to maintain a healthy lifestyle through adulthood.
12 The Denver Public Health study disaggregated their data by White, Black and Hispanic (Latinx) children only. The HFDK evaluation team recommends disaggregation of key metrics for additional races including Native American/Alaskan Native, and Asian American/Pacific Islanders. For the purposes of this report the data reported from DPH is left as reported in their original publication.

H F D K B a s e l i n e A s s e s s m e n t | 26
Consuming a healthy diet rich in fruits and vegetables with limited junk foods, including sugar-sweetened beverages (SSBs), is critical for children’s diet quality and nutrition. In 2017, the Healthy Kids Colorado survey found low rates of fruit and vegetable consumption among Denver high school students (see below), with racial disparities highlighted. White students generally consume above average fruits/vegetables; Black and Latinx students generally consume below average fruits/vegetables. The survey also found 13% of Colorado children consume at least one SSB per day, with less for White children than for Latinx and Black and children (CDPHE, 2018). Participating in school meal programs can help address food insecurity and low food access for at-risk children. Access to healthy meals during the school day is critical for academic success. To receive federal reimbursements, school meal programs (e.g. NSLP and SBP) must offer meals that meet the federal nutrition standards set by the USDA, a balance of fruits, vegetables, low-fat or fat-free milk, whole grains and lean protein with every meal.
Figure 16. Percentage of Youth (ages 2-17) With Too Much Weight for Health by Denver Neighborhood
H F D K B a s e l i n e A s s e s s m e n t | 27
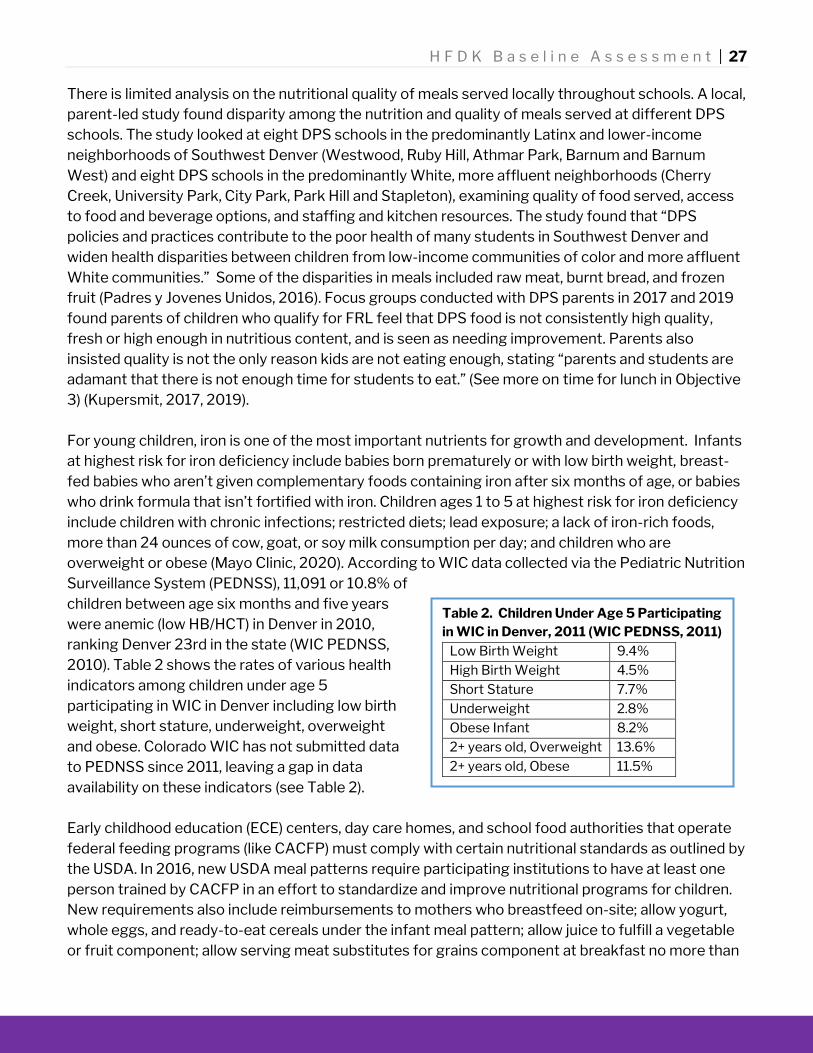
There is limited analysis on the nutritional quality of meals served locally throughout schools. A local, parent-led study found disparity among the nutrition and quality of meals served at different DPS schools. The study looked at eight DPS schools in the predominantly Latinx and lower-income neighborhoods of Southwest Denver (Westwood, Ruby Hill, Athmar Park, Barnum and Barnum West) and eight DPS schools in the predominantly White, more affluent neighborhoods (Cherry Creek, University Park, City Park, Park Hill and Stapleton), examining quality of food served, access to food and beverage options, and staffing and kitchen resources. The study found that “DPS policies and practices contribute to the poor health of many students in Southwest Denver and widen health disparities between children from low-income communities of color and more affluent White communities.” Some of the disparities in meals included raw meat, burnt bread, and frozen fruit (Padres y Jovenes Unidos, 2016). Focus groups conducted with DPS parents in 2017 and 2019 found parents of children who qualify for FRL feel that DPS food is not consistently high quality, fresh or high enough in nutritious content, and is seen as needing improvement. Parents also insisted quality is not the only reason kids are not eating enough, stating “parents and students are adamant that there is not enough time for students to eat.” (See more on time for lunch in Objective 3) (Kupersmit, 2017, 2019). For young children, iron is one of the most important nutrients for growth and development. Infants at highest risk for iron deficiency include babies born prematurely or with low birth weight, breast-fed babies who aren’t given complementary foods containing iron after six months of age, or babies who drink formula that isn’t fortified with iron. Children ages 1 to 5 at highest risk for iron deficiency include children with chronic infections; restricted diets; lead exposure; a lack of iron-rich foods, more than 24 ounces of cow, goat, or soy milk consumption per day; and children who are overweight or obese (Mayo Clinic, 2020). According to WIC data collected via the Pediatric Nutrition Surveillance System (PEDNSS), 11,091 or 10.8% of children between age six months and five years were anemic (low HB/HCT) in Denver in 2010, ranking Denver 23rd in the state (WIC PEDNSS, 2010). Table 2 shows the rates of various health indicators among children under age 5 participating in WIC in Denver including low birth weight, short stature, underweight, overweight and obese. Colorado WIC has not submitted data to PEDNSS since 2011, leaving a gap in data availability on these indicators (see Table 2). Early childhood education (ECE) centers, day care homes, and school food authorities that operate federal feeding programs (like CACFP) must comply with certain nutritional standards as outlined by the USDA. In 2016, new USDA meal patterns require participating institutions to have at least one person trained by CACFP in an effort to standardize and improve nutritional programs for children. New requirements also include reimbursements to mothers who breastfeed on-site; allow yogurt, whole eggs, and ready-to-eat cereals under the infant meal pattern; allow juice to fulfill a vegetable or fruit component; allow serving meat substitutes for grains component at breakfast no more than
Table 2. Children Under Age 5 Participating in WIC in Denver, 2011 (WIC PEDNSS, 2011)
Low Birth Weight 9.4% High Birth Weight 4.5% Short Stature 7.7% Underweight 2.8% Obese Infant 8.2% 2+ years old, Overweight 13.6% 2+ years old, Obese 11.5%
H F D K B a s e l i n e A s s e s s m e n t | 28
three times per week; count tofu and soy yogurts as a meat alternative; and allow yogurt to meet the fluid milk requirement (CDPHE, 2019). An added consideration for improving diets among children and youth are food preferences, which are greatly influenced by family traditions and cultural norms. According to community listening sessions in the metro region, limited availability of fresh, culturally-relevant foods at stores and pantries in neighborhoods was a significant barrier to food access (Food in Communities, 2019). Similarly, focus groups with DPS parents showed Spanish-speaking parents of children who qualify for FRL expressed little familiarity with current menus and a broad perception that there is only “American” food (hot dogs, hamburgers, nachos) and no “real” food (rice and beans, less/non-processed) (Kupersmit, 2017). In summary, high rates of unhealthy diet quality and nutrition are seen across Denver’s children, especially in children of color. While federal nutrition standards provide a minimal foundation, there should be more local analysis done to understand the food preferences of Denver’s diverse children and interest in upgraded nutritional quality of meals served. Child feeding programs in Denver need to be responsive to the cultural food choices of its many racially- and ethnically-diverse and immigrant families in order to effectively influence eating behavior.
Food Skills and Food Systems Education
People with access to healthy, affordable food may still face additional barriers including lack of food preparation, nutrition, and health knowledge. Food skills and food systems education are important in establishing healthy preferences early on and connecting children with food, which can lead to positive impacts on food security and diet quality and nutrition, for both children and adults. This is supported by community listening session data in the metro region, in which residents and food organizations expressed wanting more opportunities to grow food, more cooking locations, and more education that matches cultural preferences (Food in Communities, 2019).

H F D K B a s e l i n e A s s e s s m e n t | 29
While the HFDK initiative is focused on children, adult caregivers play a crucial role in providing healthy meals. Educational programs offered to adults around healthy food shopping and nutrition
have shown increased fruit and vegetable consumption and improved shopping behaviors (Cooking Matters, 2019, USDA FNS, 2013).
SNAP-Ed is the nutrition education and obesity prevention component of SNAP, with a goal to improve the likelihood
that SNAP-eligible families will make nutritious food choices within a limited budget and choose physically active lifestyles. In 2017, Colorado was allocated more than $4.2 million for SNAP-Ed activities for thousands of Coloradans, implemented through three partners: (1) the Integrated Nutrition Education Program (INEP), (2) the Culture of Wellness in Preschools program, and (3) the Cooking Matters program (CDHS, 2018).
The INEP is a pre-K through 5th grade program of hands-
on lessons that involve food preparation/tasting while reinforcing literacy, social studies, science, and math
standards. Classroom teachers receive curriculum training followed by bi-monthly deliveries of food and education materials to support lessons that promote increased fruit and vegetable consumption, overall healthy eating, willingness to try new foods, and increased physical activity. Currently, INEP is delivered in eight Denver schools: Amesse Elementary, Cole Arts and Science Academy, Green Valley Elementary, Maxwell Elementary, Place Bridge Academy, Ashley Elementary, Escalante, Biggs Academy, Gust Elementary, McGlone Academy, and Swansea Elementary (Integrated Nutrition Education Program, n.d.). Culture of Wellness in Preschools is a comprehensive, multi-level early childhood obesity prevention program that focuses not only on the children, but also on parents and teachers, and making the preschool environments health-promoting settings. The program offers creative, fun, and experiential ways for children to learn healthy eating and healthy habits, and involves food preparation, tasting, and healthy recipes and newsletters for the whole family. The goals of the program are to 1) increase fruit and vegetable consumption, 2) improve children’s willingness to try new foods, and 3) encourage and foster healthy eating in preschool-aged children (Culture of Wellness in Preschools Program, n.d.).
Cooking Matters Colorado, a part of the national non-profit Share Our Strength, provides cooking courses and grocery store tours for SNAP- participating families at no cost, teaching participants to shop smarter, use nutrition information to make healthier choices, and cook delicious, affordable meals. Participants include a diverse population of low-income families, many of whom are enrolled in federal assistance programs like SNAP and WIC, with a priority to offer programming for parents and caregivers of children age 0-5 living in communities with the highest needs in Colorado. In 2018-19, Cooking Matters reached 9,893 individuals across the state, and worked with 105 organizations to host classes in the City and County of Denver (Cooking Matters, 2019; Warner, 2020).

H F D K B a s e l i n e A s s e s s m e n t | 30
Similar to SNAP-Ed programming listed above, the Expanded Food and Nutrition Education Program (EFNEP), implemented through Colorado State University Extension, “teaches participants healthy food choices for their families, how to be physically active, and how to stretch their food dollars”, reaching 1,301 adults, 1,566 third graders, and 416 high school students in 2017 across Colorado (Colorado State University Extension, 2017, 2018). Farm to School (FTS) activities (including school gardens, education, and local procurement) have shown to increase fruit and vegetable consumption, improve food choices, improve food access, and increase school meal participation (National FTS Network, 2017). Approximately 150 (93%) DPS schools participated in some sort of FTS activity in the 2013-2014 school year (USDA, FTS Census, 2015), including 119 school gardens (Figure 17) across the city. The Garden-to-Cafeteria (GTC) program through DPS Food & Nutrition Services is a unique opportunity for DPS students to grow fresh vegetables in their school gardens with the aim of supplying some of their harvest to the school cafeterias to be used at lunch services. In 2019, thirteen schools participated in GTC, harvesting 1134 pounds of produce including cucumbers, kale, squash, tomatoes, and much more. The GTC program works with several community-based partners including Denver Urban Gardens, Big Green, Learning Landscapes, and Slow Food Denver (see below) to implement education programs alongside the gardens. For parents of young children, child care professionals can request a training from Cooking Matters in collaboration with the CACFP. The training teaches caregivers with limited food budgets to shop for and cook healthy meals while meeting the CACFP meal patterns, including whole grain identification and calculating sugar limits in yogurt and cereal. Additionally, CACFP runs a program funded by the USDA Team Nutrition Training grant called Colorado Cooking up Healthy Options with Plants (CHOP), which is a three-year program for child-care providers. The goal of the program is to encourage children in childcare settings to eat more seasonal fresh fruits and vegetables and/or on-site garden produce.
Figure 17. Locations of DPS Gardens
H F D K B a s e l i n e A s s e s s m e n t | 31
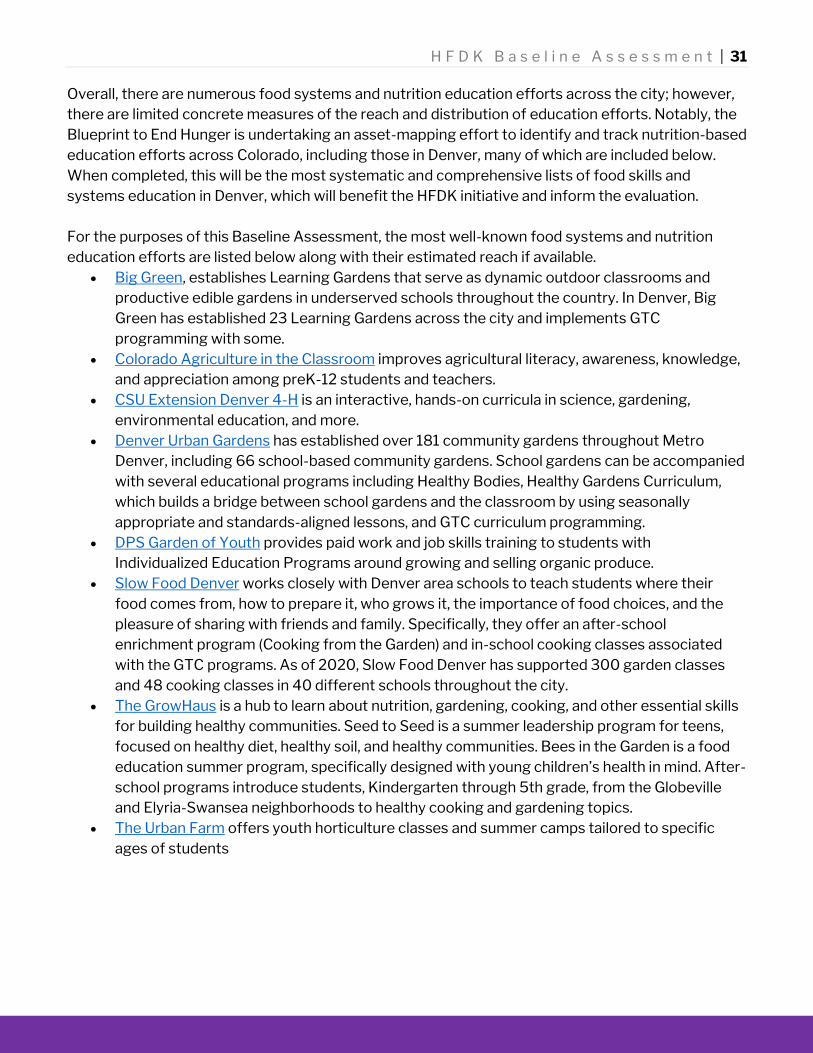
Overall, there are numerous food systems and nutrition education efforts across the city; however, there are limited concrete measures of the reach and distribution of education efforts. Notably, the Blueprint to End Hunger is undertaking an asset-mapping effort to identify and track nutrition-based education efforts across Colorado, including those in Denver, many of which are included below. When completed, this will be the most systematic and comprehensive lists of food skills and systems education in Denver, which will benefit the HFDK initiative and inform the evaluation. For the purposes of this Baseline Assessment, the most well-known food systems and nutrition education efforts are listed below along with their estimated reach if available.
Big Green, establishes Learning Gardens that serve as dynamic outdoor classrooms and productive edible gardens in underserved schools throughout the country. In Denver, Big Green has established 23 Learning Gardens across the city and implements GTC programming with some.
Colorado Agriculture in the Classroom improves agricultural literacy, awareness, knowledge, and appreciation among preK-12 students and teachers.
CSU Extension Denver 4-H is an interactive, hands-on curricula in science, gardening, environmental education, and more.
Denver Urban Gardens has established over 181 community gardens throughout Metro Denver, including 66 school-based community gardens. School gardens can be accompanied with several educational programs including Healthy Bodies, Healthy Gardens Curriculum, which builds a bridge between school gardens and the classroom by using seasonally appropriate and standards-aligned lessons, and GTC curriculum programming.
DPS Garden of Youth provides paid work and job skills training to students with Individualized Education Programs around growing and selling organic produce.
Slow Food Denver works closely with Denver area schools to teach students where their food comes from, how to prepare it, who grows it, the importance of food choices, and the pleasure of sharing with friends and family. Specifically, they offer an after-school enrichment program (Cooking from the Garden) and in-school cooking classes associated with the GTC programs. As of 2020, Slow Food Denver has supported 300 garden classes and 48 cooking classes in 40 different schools throughout the city.
The GrowHaus is a hub to learn about nutrition, gardening, cooking, and other essential skills for building healthy communities. Seed to Seed is a summer leadership program for teens, focused on healthy diet, healthy soil, and healthy communities. Bees in the Garden is a food education summer program, specifically designed with young children’s health in mind. After-school programs introduce students, Kindergarten through 5th grade, from the Globeville and Elyria-Swansea neighborhoods to healthy cooking and gardening topics.
The Urban Farm offers youth horticulture classes and summer camps tailored to specific ages of students

H F D K B a s e l i n e A s s e s s m e n t | 32
Objective 3 – Best Practices Identify evidence-based practices & policies that may inform the HFDK initiative As the HFDK initiative is new, with potential for significant systems change, this Baseline Assessment draws on research from other programs to glean lessons learned and inform the HFDK strategy. Below is a summary of evidence-based practices and policies to improve child food insecurity, a review of some emerging models, and highlights of best practices for equitable grantmaking. The icons for Food Access ( ), Diet Quality and Nutrition ( ), and Food Systems Education ( ) introduced in Objective 2 are used to show where best practices align with these components of overall food security. A review of tax-funded health-equity funds may offer additional lessons and is summarized in Appendix C.
Increasing Enrollment in SNAP and WIC The Supplemental Nutrition Assistance Program (SNAP) is one of the
most effective programs for reducing food insecurity, and one of the most important programs to quickly respond in economic recessions (Greenstein, Keith-Jennings & Rosenbaum, 2018). Two-thirds of SNAP benefits across the U.S. go to families with children and more than half to families with very young children (infants, toddlers, and preschoolers) (Center on Budget and Policy Priorities, April 2017), highlighting SNAP as an important tool for improving child food security. While benefits are modest, (averaging $1.29 per meal, per person in 2019 in Colorado) (Nchako and Cai, 2020) research shows SNAP is associated with:
a reduction in poverty, an improvement in food security, and is linked with improved health (Keith-Jennings, Llobrera & Dean, 2019);
gains in reading and math skills among elementary school children, especially girls, and increased likelihood of graduation from high school (Center on Budget and Policy Priorities, April 2017);
a reduction in food insecurity by as much as 30%, and more effective among the most vulnerable, including children;
a reduction in medical costs (25% less per year for SNAP participants than for low-income, non-participants), especially for those with hypertension and coronary heart disease; and
an additional $410.5 million in federal funds to Denver, generating $19 million in economic activity in 2016 (Denver SNAP Task Force, 2018).
Similarly, participation in WIC has shown significant improvements in birth outcomes, infant feeding practices, child nutrition, food security, and neighborhood food environments. One study shows
Reports supporting this practice: - SNAP Linked to Improved Nutritional
Outcomes 2018 - Impacts of WIC 2017 - Closing the SNAP Gap - Maryland Case Study 2014 - Making WIC Work Better 2019

H F D K B a s e l i n e A s s e s s m e n t | 33
adding healthier foods to WIC packages boosts vegetable purchases by 9%, fruits by 26%, reduced-fat milk by 56%, and whole grain breads by 211% (Carlson and Neuberger, 2017). Another study finds that access to SNAP for pregnant mothers and young children under age 5 leads to significant reductions in metabolic syndrome conditions in adulthood, such as obesity, high blood pressure, heart disease, and diabetes; as well as increased economic self-sufficiency, including educational attainment, earnings, income, and decreases in welfare participation among women (Hoynes, 2016). Recommendations for increasing enrollment in SNAP and WIC include:
improving and simplifying the application and recertification process; ensuring materials are responsive to cultural, language, and literacy needs of clients; improving methods and clarity of communication with clients; partnering with other programs that serve similar populations to simplify SNAP enrollment; promoting skills development, capacity, and retention among staff; and engaging community-based partners to support SNAP.
Maryland employs many of these tactics and was recognized by the USDA in 2014 as the number one state in the nation for individuals with low-income participating in SNAP, and awarded $3.4M to support ongoing programming. Maryland’s successful strategies include outreach using simple and targeted language; in-depth application support using a contact call center approach; proactive follow-up and dissemination to ensure applications are complete; and evaluation and dissemination to identify ways to improve. Research indicates many factors are associated with SNAP participation, from the macro- to the micro-level, as seen in the table below (Pinarda, et a., 2017). To better understand how these factors play a role in local SNAP participation, the table was adapted to include information about Denver’s context, if available, in the third column.
Macro-Level Approaches
Factors that Increase (+) or Decrease (-) SNAP Participation
City and County of Denver Context
Society Level
Higher unemployment and poverty rates (+) Increased enrollment occurred with the onset of the Great Recession, from 2008-2014.
Strong economy (-) A few years after the Great Recession ended, Denver saw a decline in SNAP enrollment, beginning in 2015 (Federal Reserve Bank of St. Louis Economic Research, 2019).
Federal / State Policy Level
Broad-based Categorical Eligibility (BBCE) standards (+) Align SNAP policy with Temporary Assistance for Needy Families (TANF) and Medicaid (+)
Colorado uses BBCE standards with a 200% FPL threshold to increase eligibility for more households. Households eligible for TANF or Medicaid are categorically eligible for SNAP regardless of income.
Simplified enrollment and reporting (+) Shorter recertification periods (+) Shorter time frame between application and benefit start date (+)
PEAK (Colorado’s application system) has one online application to determine eligibility for multiple assistance programs. MyCOBenefits mobile app provides a secure way to apply and manage benefits, recertify and request support. An interview must be completed every 12 months to determine ongoing eligibility. Average 30 days from application received
Table 3. Macro- and Micro- Level Factors Influencing SNAP Participation
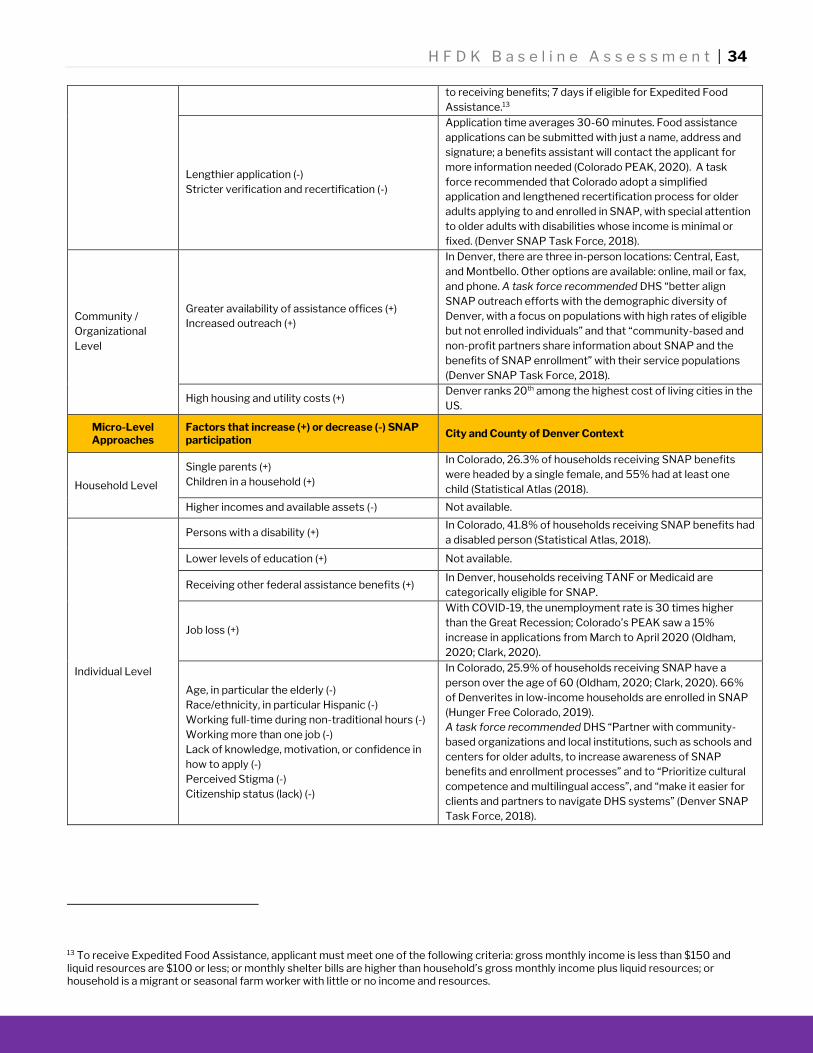
H F D K B a s e l i n e A s s e s s m e n t | 34
to receiving benefits; 7 days if eligible for Expedited Food Assistance.13
Lengthier application (-) Stricter verification and recertification (-)
Application time averages 30-60 minutes. Food assistance applications can be submitted with just a name, address and signature; a benefits assistant will contact the applicant for more information needed (Colorado PEAK, 2020). A task force recommended that Colorado adopt a simplified application and lengthened recertification process for older adults applying to and enrolled in SNAP, with special attention to older adults with disabilities whose income is minimal or fixed. (Denver SNAP Task Force, 2018).
Community / Organizational Level
Greater availability of assistance offices (+) Increased outreach (+)
In Denver, there are three in-person locations: Central, East, and Montbello. Other options are available: online, mail or fax, and phone. A task force recommended DHS “better align SNAP outreach efforts with the demographic diversity of Denver, with a focus on populations with high rates of eligible but not enrolled individuals” and that “community-based and non-profit partners share information about SNAP and the benefits of SNAP enrollment” with their service populations (Denver SNAP Task Force, 2018).
High housing and utility costs (+) Denver ranks 20th among the highest cost of living cities in the US.
Micro-Level Approaches
Factors that increase (+) or decrease (-) SNAP participation
City and County of Denver Context
Household Level
Single parents (+) Children in a household (+)
In Colorado, 26.3% of households receiving SNAP benefits were headed by a single female, and 55% had at least one child (Statistical Atlas (2018).
Higher incomes and available assets (-) Not available.
Individual Level
Persons with a disability (+) In Colorado, 41.8% of households receiving SNAP benefits had a disabled person (Statistical Atlas, 2018).
Lower levels of education (+) Not available.
Receiving other federal assistance benefits (+) In Denver, households receiving TANF or Medicaid are categorically eligible for SNAP.
Job loss (+)
With COVID-19, the unemployment rate is 30 times higher than the Great Recession; Colorado’s PEAK saw a 15% increase in applications from March to April 2020 (Oldham, 2020; Clark, 2020).
Age, in particular the elderly (-) Race/ethnicity, in particular Hispanic (-) Working full-time during non-traditional hours (-) Working more than one job (-) Lack of knowledge, motivation, or confidence in how to apply (-) Perceived Stigma (-) Citizenship status (lack) (-)
In Colorado, 25.9% of households receiving SNAP have a person over the age of 60 (Oldham, 2020; Clark, 2020). 66% of Denverites in low-income households are enrolled in SNAP (Hunger Free Colorado, 2019). A task force recommended DHS “Partner with community-based organizations and local institutions, such as schools and centers for older adults, to increase awareness of SNAP benefits and enrollment processes” and to “Prioritize cultural competence and multilingual access”, and “make it easier for clients and partners to navigate DHS systems” (Denver SNAP Task Force, 2018).
13 To receive Expedited Food Assistance, applicant must meet one of the following criteria: gross monthly income is less than $150 and liquid resources are $100 or less; or monthly shelter bills are higher than household’s gross monthly income plus liquid resources; or household is a migrant or seasonal farm worker with little or no income and resources.

H F D K B a s e l i n e A s s e s s m e n t | 35
Expanding School and Summer Feeding Program Participation Participation in the National School Lunch Program (NSLP) decreases prevalence of food insecurity among households with children in school by 2.3-9% (Gundersen, Kreider &
Pepper, 2018). During summer months, more than 80% of students have limited access to meals, which means the loss of up to ten meals per week per child (RTI, 2014). Expanding access to and participation in these programs will have a significant impact on child food insecurity in Denver. One of the best practices to expanding school meal participation is through the Community Eligibility Provision (CEP), which reimburses free meals for all students when at least 40% of students in the area served are eligible for other programs (e.g. SNAP, Temporary Assistance for Needy Families), helping reduce stigma for assistance programs. In Vermont, after participating in the CEP program, school meal participation increased across the state and 65+ schools now serve universal school meals, ensuring students are not singled out for relying on school meals. DPS has considered applying for CEP, but does not meet the 40% eligibility threshold as a district (currently 31% of DPS students are eligible). The individual schools that meet the 40% threshold are concerned about impacts to Title 1 funding if they apply for CEP. According to the Regional Coordinator for Outreach and Engagement at DPS Food & Nutrition Services, Theresa Peña, “Preliminary analysis indicates that CEP qualification (compared to qualifying families via the current electronic School Meal Application, which has increased participation among DPS families in recent years) would negatively impact Title 1 funding to DPS and the financial trade-offs are too great to take that risk” (Peña, 2020). Another best practice for increasing school meal participation is implementing Breakfast After the Bell (BAB) programs, which extend the reach of the School Breakfast Program and enable more students to have the nutrients necessary to perform their best in the classroom. Especially through innovative serving models like grab and go breakfasts distributed in high traffic areas, second chance breakfasts served during extended breaks, and breakfasts delivered directly to classrooms, BAB programs help incorporate breakfast as part of schools’ morning routine. DPS provides breakfast to all DPS students, through a variety of methods (schools are given options to meet the requirement) including some BAB practices like Breakfast in the Classroom (BIC), grab and go meals, and hospitality carts. A study looking at the impacts of BIC in DPS schools found positive impact on the overall proportion of elementary grade students with chronic absences, chronic tardiness, and office referrals, although the study did not find any statistically significant difference in academic performance for students receiving BIC (Wass et al., 2015). One of the most promising practices for increasing summer feeding program participation is the Summer Electronic Benefits Transfer for Children (SEBTC) demonstration by the USDA, in which monthly benefits for the summer months were distributed on EBT cards for children enrolled in FRL the prior school year. The demonstration found that a benefit of $60 monthly per child reached 75% of eligible children and reduced the prevalence of very low food security among children by 33% in participating schools. The program also showed increased fruit and vegetable consumption by 12% and whole grains by 23% among children who received SEBTC (Collins et al., 2015). Additional research on summer nutrition programming in Maryland schools offering summer meals saw 2.5%

H F D K B a s e l i n e A s s e s s m e n t | 36
more students achieve math proficiency, 2% more students achieve reading proficiency, and up to 5.3% more students graduate from high school (Orovecz et al., 2015).14 In general, to address low participation rates in school and summer feeding program participation, best practices include increased investment, intensive outreach, site recruitment, and reducing barriers to participation, including: allowing out-of-school time sponsors (e.g. Big Brothers, Big Sisters, YMCA) to provide meals
year-round through the SFSP to increase the number of sponsors and reduce unnecessary and burdensome administrative work;
lowering the CACFP program area eligibility threshold from 50% to 40% to enroll more food-insecure children;
increasing funding for the SEBTC or similar programs to give families additional resources to purchase healthy food during the summer, which would complement the SFSP; and
increasing investments in summer learning programs in general in order to provide platforms for Summer Nutrition Programs (Hayes, Rosso, & FitzSimons, 2019).
Linking Farmer Interests to Food Assistance Needs Programs that support local food through economic mechanisms help increase access to locally-grown produce for individuals and families in low-income households. Three key
programs in this area have had significant impacts: The Double Up Food Bucks (DUFB) program
matches SNAP dollars 1:1, allowing shoppers to redeem up to $20 per day to purchase Colorado-grown fresh fruits and vegetables. DUFB originated in Michigan and has grown nationally with its success. In Colorado in 2018, DUFB supported 400+ farms, 4,401 SNAP consumers (56% of whom have at least one child under 18), and redeemed $165,358 match dollars, with 80% of customers reporting buying and eating more fruits and vegetables. Over the last two years, DUFB quadrupled SNAP participation at farmers markets and significantly increased healthy, fresh food in low-income households (Colorado Blueprint to End Hunger presentation to HFDK Commission, January 2020).
14 In 2020, the U.S. congress approved the Pandemic EBT program (P-EBT) which is similar to the SEBTC program in that families with children eligible and enrolled in FRL are given a debit-like card with money in the amount equivalent to the value of school meals children may have missed when schools closed due to the pandemic. As of publication of this Baseline Assessment, P-EBT in Colorado had not begun yet; data around the utilization and impact of P-EBT cards will be important to build the evidence base of what works best for EBT programs boosting school and summer food program participation.
Report supporting this practice: - Double Up Food Bucks Colorado
Evaluation Report 2018
Reports supporting this practice:
- Evidence-Based Strategies to End Childhood Food Insecurity and Hunger in Vermont 2019
- Summer Electronic Benefits Transfer for Children (SEBTC) Report Summary 2016
- Summer Nutrition Program Social Impact Analysis in Maryland 2015
- School Breakfast After the Bell; Equipping Students for Success
-

H F D K B a s e l i n e A s s e s s m e n t | 37
The Food Pantry Assistance Grant is designed to increase fresh food available at food pantries and improve economic impact for local farmers. The Colorado General Assembly invested $500k in 2018 and another $100k in 2019, which was used to support pantries across the state in buying product from Colorado farmers and fill a gap in availability of products most desired by food pantry users, including protein, produce, and dairy (Hunger-Free Colorado, 2020). Farm-to-Pantry initiatives in other states that have been going on longer have seen significant impacts. In Washington, there has been a consistent increase in participating farms, pounds of produce purchased, and pounds of produce donated through its Farm to Food Pantry program over the last few years (Bobanick, 2019).
Farm to School (FTS) programs connect communities to healthy, fresh, and local food by influencing where and how food is purchased, nutrition and agricultural education, and school garden programs. FTS programs show significant impacts including increased student meal participation from 3% to 16%; increased fruit and vegetable consumption at school and home; increased willingness to try and consume fruits and vegetables at an older age due to gardening at a young age; and an average 5% increase in farmer income from FTS sales. In general, impacts are stronger when multiple FTS activities are implemented together. DPS reported benefits across pre-K through 12th grade after implementing FTS, including greater acceptance of the new meal patterns, greater community support for school meals, and more awareness of source of ingredients in foods at school (USDA, Farm to School Census, 2015).
Increasing Time for Lunch In conjunction with healthy meals, children need
time to consume foods to improve nutritional outcomes. According to the Center for Disease Control, providing more time for lunch in schools can lead to increased consumption of food and key nutrients, increased selection of a fruit, increased consumption of fruits and vegetables, and decreased plate waste. In a recent study of 1000 elementary and middle school students in an urban, low-income school district where lunch period lengths varied, students with 20 minutes or less consumed 13% less of their entrée, 10% less of their milk, and 12% less of their vegetable compared with students who had at least 25 minutes to eat (Cohen et al., 2016). The Colorado Department of Education generally recommends increasing lunch time for all schools, based on the research noted above. However, in DPS, there is no district-wide regulation of required time for school lunch and each school principal makes decisions on lunch time. Focus groups with DPS parents showed that time for lunch is the second biggest concern for parents (behind quality) (Kupersmit, 2019), and a local effort engaged DPS parents to recommend that principals increase
Reports supporting this practice: - Washington State 2019 Farm to Food
Pantry Partnership - Colorado Food Pantry Assistance Grant
Reports supporting this practice: - CDC: Making Time for School Lunch
- Time to eat lunch associated with children’s selection and consumption
- Time to eat school lunch affects elementary students’ nutrient consumption
Report supporting this practice: - Farm to School Benefits 2017

H F D K B a s e l i n e A s s e s s m e n t | 38
lunch time to 30 minutes, beginning at the time students sit down, not the time they get in line (Action for Healthy Kids, 2019).
Community-Driven Strategies Community-driven strategies are particularly important when focusing
efforts on racially- and ethnically-diverse populations. As an example, the Promotora model is successful in reaching Spanish-speaking, Latinx communities (Promotoras are community health workers who work in Spanish-speaking communities and conduct outreach around health initiatives). UnidosUS Promotores de Salud reaches Latinx low-income communities through cooking, shopping and SNAP education, seeing a 47.2% increase in fruit intake, 54.9% increase in vegetable intake, and 62.9% increase in healthy meals prepared at home among participants (Gepp, 2018). Locally, the Health and Wellness Southwest Parent Advisory Committee was organized with support from Action for Healthy Kids and DPS Food and Nutrition Services. Parents from eight schools in southwest Denver are meeting regularly with district staff to discuss student health, unite their voices, and advocate for healthy changes to their schools’ wellness policies and practices. Some successes of this committee include increased family engagement and community involvement, increased student access to water, more culturally-relevant items in lunch menus, improved customer service, and increased attention given to quality concerns related to food temperature (Action for Healthy Kids, 2019).
Family-Centered Approaches and Adult Education
Food skills and nutrition education programs focused on caregivers contribute to increased food security and diet quality for children. SNAP-Ed, referenced above, is
an evidence-based program sponsored by the USDA that partners with organizations to teach families who are eligible for SNAP skills around buying and preparing healthy foods on tight budgets; introduce kids to fruits and vegetables through nutrition classes, school gardens, and healthier lunchrooms; and teach families how to make healthy changes in policies, systems, and environments where families live. Positive behavior changes among SNAP-Ed participants include adopting healthier meals, comparing food prices, using nutrition food labels, drinking fewer sugary-sweetened beverages, eating more family meals together, and overall increased consumption of fruits and vegetables. Cooking Matters, an implementation partner of SNAP-Ed in Colorado, is featured as an evidence-based program in the USDA’s SNAP-Ed Strategies and Interventions: An Obesity Prevention Toolkit for States, and is recognized by the USDA for excellence in nutrition education. According to a national, long-term impact evaluation by Cooking Matters, 83% of participants report feeling ready to adopt healthier, budget-saving shopping techniques and 68% of participants receiving WIC
Reports supporting this practice: - SNAP-Ed in Colorado - Cooking Matters Evaluation Report 2015
Report supporting this practice: - Community-Driven Strategies to Reduce
Food Insecurity and Hunger among Latinos

H F D K B a s e l i n e A s s e s s m e n t | 39
report the ability to maximize benefits towards buying fruits and vegetables. Overall, participants are more confident in their cooking abilities, see fewer barriers to cooking healthy meals, make healthier and more budget-friendly meals, eat more vegetables, and feel more food secure and more confident in stretching food dollars. The Culture of Wellness in Preschools (COWP) program, another implementation partner of SNAP-Ed in Colorado, engages children in early childhood to develop healthy eating and physical activity, while also engaging parents in nutrition education, wellness, and policy change. After three years of COWP programming, children demonstrate a 20% increase in moderate to vigorous physical activity and average a 12% increase in fruit and vegetable consumption (Culture of Wellness in Preschools Program, n.d.). Family-style dining is one approach ECE programs use to address childhood obesity and support developmentally-appropriate mealtime experiences. Family-style dining is recognized as a meal service option for programs in the CACFP Handbook for Independent Child Care Centers and the Family Day Care Monitor Handbook, and the Healthy Kids Healthy Future program offers a toolkit for family-style dining for family childcare or early education programs (The Nemours Foundation Healthy Kids Healthy Future, 2020).
Promising Practices In addition to evidence-based practices, promising practices are included in the Baseline Assessment, defined as interventions that are new or innovative and hold promise, yet have not been sufficiently tested to deem a “best practice.”
Healthy Corner Store Initiatives address healthy food access in neighborhoods with
limited access to full-service grocery stores and other healthy food options. Studies have shown these initiatives increase number and healthier products, economic impact, and
sales of fresh produce (Almaguer Sandoval, Law, & Young, 2014); however, there is limited evidence of long-term impact on healthy food consumption and related health outcomes. Variability in outcomes may be due to different implementation approaches of healthy corner store programs, which include offering cold storage and infrastructure improvements to stores, developing community buy-in, and increasing motivations of store owners to provide healthier food in their cornerstores. From 2014-2018, with funding from the Colorado Health Foundation, DDPHE implemented the Healthy Corner Store Program to help corner store owners expand and promote healthy and fresh food selection. The program is no longer active, but resources, materials and infrastructure in stores continue to support store owners.
Increasing grocery stores in low food access neighborhoods has led to conflicting findings. A multi-study analysis found a correlation between access to supermarkets and healthier eating, especially among Black people and broadly among SNAP recipients (Treuhaft
& Karpyn, 2010). Other studies found mixed results of increasing geographic access to healthier foods, and suggested budget constraints, mobility, and other factors must also be considered

H F D K B a s e l i n e A s s e s s m e n t | 40
(Jablonski, Thilmany McFadden, & Colpaart, 2016). Additionally, full-service supermarkets can face market barriers in entering low-income neighborhoods (Widener, Metcalf, & Bar-Yam, 2012). The Denver Food Access Task Force recommended bringing grocery stores into underserved neighborhoods as a strategy to increase food security in 2011, yet many low food access areas continue to exist in many Denver neighborhoods (see more in Objective 5).
Community Supported Agriculture (CSA) programs offer individuals and families a chance to invest in local farmers and receive boxes of produce throughout the growing season (usually May to October in Colorado). Several models use strategies to make CSA
programs accessible to low-income families, including offering subsidized shares, accepting SNAP and DUFB payments, offering payment plans, and allowing workdays as payment (Local Food Research Center, 2013; Hammonds, 2017). In Colorado, several CSA models accept SNAP and DUFB, though many farms need assistance in enrolling in the program and getting Electronic Benefits Transfer machines to accept SNAP payments.
Mobile markets in low-income areas aim to improve access for people living in food deserts and with limited mobility/ transportation, providing an innovative solution in underserved neighborhoods while supporting economic growth. Mobile grocery retailers
travel via movable carts or vehicles between neighborhoods, selling grocery items like fresh produce, dairy, eggs, and meat, thereby increasing availability of healthy food while decreasing reliance on transportation. Evidence of mobile markets’ impact on food security is limited. Some studies show increased food access while others reveal challenges to sustainability of the program without public subsidies supporting the markets (EcoDistricts, 2014). A mobile market pilot project in Washington, D.C. reported anecdotal increases in physical access and knowledge around healthy food (Bartley & Best, 2012), and a mobile farmers market in Pittsburgh found 13%-20% increase in vegetable consumption among participants in two neighborhoods (Gary-Webb, et al., 2018). Additionally, No Kid Hungry’s Center for Best Practices recommends launching mobile meals programs to reach low-income children, especially in the summer (No Kid Hungry Website). In 2018, the Denver Sustainable Food Policy Council recommended regulatory agencies (including DDPHE, Excise and License, and the Denver Fire Department) update and streamline the licensing and permitting process for mobile grocery retailers to encourage more mobile markets.
Holistic, community-based models address food access and education through a multipronged approach that is often focused on justice and equity. These emerging practices may have a larger impact on community health. Re:Vision (in Denver’s
Westwood neighborhood) aims “to work with people in economically marginalized neighborhoods to develop resident leaders, cultivate community food systems, and create an economy owned by the community.” Re:Vision’s approach includes backyard gardens, a co-working space, community promotoras, a community-owned food cooperative, and an extensive network of partners. Figure 18 below shows Re:Vision’s partner reach from its first-degree connections (left) through its third-degree network (right). Re:Vision is an example of an embedded community organization with well-connected partners, thereby having the ability to help more people and leverage more resources.

H F D K B a s e l i n e A s s e s s m e n t | 41
Figure 18. Re:Vision’s First-, Second-, and Third-Degree Connections

H F D K B a s e l i n e A s s e s s m e n t | 42
Best practices for equitable grantmaking The principle of equity among grantmakers has become paramount to address disparities in population health outcomes, evolved to address internal and external processes, and moved toward power-building to shift systemic oppression and inequalities. Recognizing the HFDK initiative’s commitment to equity, best and emerging practices in equitable grantmaking can guide the building of a more equitable food system to reach more children.

H F D K B a s e l i n e A s s e s s m e n t | 43
Capacity Building
Capacity Building: Strong programs exist in strong organizations, and capacity building allows nonprofits to build skills and expertise to tackle important issues. Funding capacity building and technical assistance helps nonprofits increase specific capacities to deliver stronger programs, take risks, build connections, innovate, and iterate.
Collaboration Collaboration takes place in many forms (networks, movements, collective impact) and in many funding possibilities (such as co-funding or pooled funds).
Flexible, Reliable, Multi-year Funding
Flexible Reliable Funding / Multi-year Funding: When funders give flexible, long-term funding, nonprofits worry less about their own survival and focus more on responding to shifts in their environment and creating real results for the communities they serve.
Learning and Evaluation
A learning mindset focuses on continuously improving, and evaluation can be used for more than accountability. Data is used for learning which encourages strategic experimentation, and failures are opportunities to grow.
Strengthening Relationships
Strengthening Relationships: When trust is built and knowledge and perspective of nonprofits and the communities is tapped, better solutions emerge.
Using a Racial Equity Lens
A racial equity lens sharpens grantmakers’ insights and improves outcomes of their work. Grantmakers should pay attention to race and ethnicity while analyzing problems, looking for solutions, and defining success.
Address Power in the Funding Process
The Trust-Based Philanthropy Project reimagines traditional funder-grantee relationships through a set of six key principles that put trust-based values into action.
Best Practices in Diversity, Equity, Inclusion
Analysis of Policies, Practices, and Programs for Advancing Diversity, Equity, and Inclusion is a comprehensive scan to help funders successfully advance DEI.
Advancing Internal Equity Practices
Annie E. Casey Foundation’s Advancing the Mission Toolkit: Tools for Equity, Diversity and Inclusion uses cases to show concrete steps taken by different organizations and practical tools for any organization.
Diversifying the Workplace
Step-by-Step: A Guide to Achieving Diversity and Inclusion in the Workplace brings together best practices of many organizations, including resources to diversify staff, Boards, and Commissions.
Grantees and Stakeholders as Partners
Do Nothing About Me Without Me: An Action Guide for Engaging Stakeholders. This guide helps funders better understand how to engage community stakeholders and grantees as partners in problem solving. Knowledge of how to effectively address a problem resides in affected communities.
Developing Trusted Relationships
Great Funder-Nonprofit Relationships: A Toolkit for Funders helps funders understand the hallmarks of a great funder-nonprofit relationship, assess their competencies, and identify ways to improve.
Relationships Matter: Program Officers, Grantees, and the Keys to Success addresses inherent power imbalances between those who have the resources and those who need them, guiding funders to strengthen relationships with grantees.
How to Show Up in a Trust-Based Way offers six trust-based principles to help funders set the tone for more balanced and equitable grantee relationships.
Meetings with Grantees
Building Trust Through Regular Check-Ins: A Resource for Funders covers steps to do before, during, and after a meeting or grantee check-in, that will lead to deepening the grantee/funder relationship.
Fun
din
g P
ract
ices
fro
m a
n E
qui
ty
Per
spec
tive
Inte
rnal
Eq
uity
P
ract
ices
Ext
erna
l Org
aniz
atio
nal
Eq
uity
Pra
ctic
es
Table 4. Best practices and resources for bringing equity into grantmaking

H F D K B a s e l i n e A s s e s s m e n t | 44
Objective 4 – Existing Efforts Understand existing efforts and initiatives currently in place to support increased child food security in Denver and identify opportunities to leverage that work. To support systems change, the Baseline Assessment reviews existing food security work in Denver to explore how HFDK can most strategically fit into the existing system. Denver’s food systems work has grown in size and impact over the last decade, most notably with the development of the Denver Food Vision, subsequent growth of the DDPHE Food Systems team, and the HFDK initiative. The image below summarizes some grant programs, government programs, and advocacy/policy initiatives most relevant to the HFDK initiative, with links to programs.
Below, a deeper narrative description is provided for these programs, using the icons below to indicate specific leverage opportunities for given efforts.
Community
Engagement Evaluation
& Data Co-funding
Partnerships Policy
Advocacy Share Best Practices
Technical Assistance
Food in Communities At the Table Food Access in Globeville and Elyria-Swansea DDPHE Food Matters Denver Community Food Access Coalition Double Up Food Bucks USDA Fresh Fruit and Vegetable Program
Local School Food Purchasing Program Food Pantry Assistance Grant Healthy Beverage Partnership Healthy Eating, Active Living in Child Care School Feeding Programs
Colorado Food Systems Advisory Council Denver Sustainable Food Policy Council Denver Food Vision Colorado Blueprint to End Hunger

H F D K B a s e l i n e A s s e s s m e n t | 45
Grant Programs and Initiatives
Food Matters DDPHE, Natural Resources Defense Council | Funding from the Rockefeller Foundation
The Food Matters project is exploring work with the City and County of Denver to advance strategies to prevent food waste, rescue surplus food for those in need, and recycle food scraps. Partners will engage stakeholders over the next two years to identify, design (or modify as needed), adopt, and in some cases implement programs and policies to address food waste.
Food in Communities DDPHE, Tri County Health Department & Jefferson County Public Health | Funding from the Colorado Department of Public Health and Environment
A collaborative project among health departments in the metro region, Food in Communities (FIC) supports neighborhoods to develop “complete neighborhood food environments” to meet the food needs of everyone in the community through: (1) identification of food needs, assets, barriers, and opportunities; (2) designing, testing, and launching community-based solutions; and (3) advocating for policies that support local food needs and improve food options. FIC focuses on the neighborhoods/regions of Southwest Adams County, Wheat Ridge/South Arvada, Sheridan Corridor/West Colfax, and Northwest Aurora/East Colfax. FIC community listening sessions with residents showed ideas for improving food access including: (1) increasing the acceptance and use of WIC, SNAP, and DUFB at markets; (2) developing mobile markets and pantries; and (3) coordinating food assistance with clinics, schools, and human services. The program is funded for three years (2019-2022).
At the Table Food Access in Globeville and Elyria-Swansea Uncharted & DDPHE | Funding from the Colorado Department of Transportation
At the Table is a food access program created to support projects improving the local food system so that every person has access to healthy, affordable, and culturally relevant food—for themselves, their families, and their communities. At the Table first identifies drivers of food security, then identifies people who can make a dent in the issue, and ultimately gets them to collaborate and supports them with mentors. At the Table focuses on neighborhoods of Globeville & Elyria-Swansea, and will offer some grants (~$50K) for two to three projects.
Denver Community Food Access Coalition Community-based organizations, DDPHE, Hunger Free Colorado
A collaborative group formed in January 2018, the Coalition aims to ensure residents in neighborhoods and communities across Denver can access affordable, healthy, nutritious food through a variety of mechanisms including community-based organizations and government programs. The Coalition will develop a comprehensive community plan to address Goals 2 and 3 of the Colorado Blueprint to End Hunger (see below), and use the “winnable goals” from the Denver Food Vision (see below) as a framework for identifying areas of current overlap in organizations’

H F D K B a s e l i n e A s s e s s m e n t | 46
work. Ten community-based organizations comprise the group including Re:Vision, Growhaus, Denver Food Rescue, Metro Caring, Montbello Organizing Committee, Sprout City Farms, and Denver Urban Gardens, in conjunction with residents with lived experience.
Double Up Food Bucks LiveWell Colorado | Funding from the Colorado General Assembly
DUFB doubles the value of SNAP benefits spent at participating markets (including farmers markets, farm stands, CSAs and some supermarkets like Lowe’s Mercado), encouraging three-fold wins - more families have access to fruits and vegetables, local farmers gain new customers, and more food dollars stay in the local economy. LiveWell coordinates the effort with numerous partners from farms to farmers markets, some retail stores, and Lowes markets. SNAP consumers spend up to $20 at participating markets and receive a dollar for dollar match for up to $20 in additional incentive dollars to buy Colorado fruits and veggies.
Government Programs
Local School Food Purchasing Program – HB19-1132 Grants administered through the Colorado Department of Education
HB19-1132, passed in 2019 by the Colorado General Assembly, created a three-year pilot program incentivizing school districts to purchase more food grown, raised, or produced in Colorado. Districts accepted into program receive $.05 per meal to purchase more Colorado products. This provides school kids healthy, Colorado food while also stimulating the economy by increasing demand for local producers. The program has a 7 million meal per year cap for districts, making DPS ineligible.
Food Pantry Assistance Grant Funding allocated from Colorado General Assembly, grants administered through the Onward Foundation
A product of Hunger Free Colorado’s efforts to increase access to healthy foods for all Coloradans, the grant supports food banks and pantries to purchase more local meat, dairy, and produce from Colorado farmers. In 2018, $500,000 was allocated to the program; in 2019, funding was greatly reduced to $100K. Hunger Free Colorado, the Blueprint to End Hunger, and the Food Pantry Network continue to advocate for increased funding in future years.
Healthy Beverage Partnership Denver Public Health (DPH)
A regional collaborative of six local public health agencies in Metro Denver serving nearly 60% of Colorado’s population, the Healthy Beverage Partnership (HBP) addresses health inequities and the urgent issue of childhood obesity experienced by children and communities of color. HBP accomplishes this by (1) decreasing deceptive sugary drink marketing in public spaces and restaurants, (2) decreasing targeted availability of harmful sugary drinks to children, especially

H F D K B a s e l i n e A s s e s s m e n t | 47
children of color, and (3) improving healthy norms and options for all families. DPH, in coordination with local partners ViVe Wellness, American Heart Association, and Westwood Unidos, leads implementation efforts in the City and County of Denver. In 2018, DPH supported efforts to ensure the Denver Promoting Healthier Foods and Beverages Proclamation included language that sugary drinks are harmful to children. Additionally, HBP supported the adoption of the Denver Executive Order No. 70, Healthier City Vending Machines, signed by Mayor Hancock on May 25, 2018, which established a policy to provide healthier food and beverage options in City vending machines.
Healthy Eating, Active Living in Child Care Program DDPHE in partnership with the Culture of Wellness in Preschools Program
This is a voluntary and free program committed to supporting childcare providers in creating a healthy environment for children and staff. The program focuses on five key areas: (1) Get Kids Moving, (2) Reduce Screen Time, (3) Nurture Healthy Eaters, (4) Provide Healthy Beverages, and (5) Support Breastfeeding. DDPHE works with individual providers one-on-one to conduct a baseline assessment and develop a personalized list of suggested healthy practices to implement. Resources provided can include no-cost trainings for staff and families, health lessons for children, sample policies, healthy recipes, and information posters.
In-School Food Programs Funding from USDA, administered through Colorado Department of Education (CDE) & Department of Public Health and Environment (CDPHE)
Denver schools participate in several nutrition programs:
National School Lunch Program (NSLP) provides nutritious, low-cost or free lunches to students each day of school. Specific meal patterns and nutrition standards are required. Overall, 65% of FRL-eligible students are participating in the NSLP program across the DPS district.
School Breakfast Program (SBP) provides reimbursement to schools that serve breakfast to students. In 2013, Colorado House Bill 13-1006 required schools to offer breakfast after the school day begins if 70% or more of the student body is eligible for FRL. In DPS, 140 schools serve Breakfast After the Bell which maximizes breakfast participation for all students (through innovative service models like grab and go, hospitality carts, and breakfast in the classroom), and most other DPS schools make breakfast available in the cafeteria before the school bell. Overall, 45% of FRL-eligible students are participating in the SBP across the DPS districts.
Special Milk Program (SMP) provides milk to children in schools, residential child care institutions, and camps that do not participate in any other federal child nutrition meal service program or any child at a participating school or half-day pre-kindergarten program. Schools apply through CDE to receive reimbursements for each half pint of milk served.
Fresh Fruit and Vegetable Program (FFVP) is a federal grant that provides free fruits and vegetables for students at elementary schools. Eligible schools (at least 50% FRL-eligible students) apply through CDE to receive funding to provide fresh fruits and vegetable snacks during the school day. The goal is to promote consumption of fruits and vegetables among school-aged children, educate students about the benefits of fruits and vegetables, and

H F D K B a s e l i n e A s s e s s m e n t | 48
introduce them to new varieties. Additionally, teachers may request a nutrition education presentation for their class. In 2019-2020 school year, 61 DPS elementary schools (64% of total) participated in FFVP, serving approximately 23,300 students per day (Peña, 2020).
Farm to School (FTS) programming in DPS is widespread, in which schools partner with local community organizations to establish school gardens, implement nutrition education curriculum, and operationalize garden-to-cafeteria programs. The most recent counts include 119 gardens, 13 Garden-to-Cafeteria programs, and 3 urban farms in DPS schools (DPS website).
Out-of-School Nutrition Programs Funding from USDA, administered through CDE and CDPHE
Denver organizations participate in a number of feeding programs, offered to youth when they are not in school (weekends, after school, summer), through a variety of community sponsor sites including non-profits, churches, camps, and enrichment programs.
The Child and Adult Care Food Program (CACFP) provides reimbursement for healthy meals and snacks served in child care centers and homes, afterschool programs, emergency and homeless shelters, Head Start, Early Head Start, outside-school-hours programs, and adult day care centers. Childcare centers can apply through CDPHE to receive reimbursements for nutrition meals and snacks served to children up to age 18. Several waivers are being provided to give additional flexibility to the program during COVID-19.
The At-Risk After-School Meal Program (ARAS), a component of the CACFP, offers reimbursements to after-school enrichment programs in low-income areas that serve meals and/or a snack to participants up to age 18. A site is eligible if (1) it is located in the area where at least 50% of students are eligible for FRL, and (2) the site provides educational or enrichment activities. The meal must consist of two different servings of fruits and/or vegetables, one serving of grains, one serving of a meat or meat alternative, and one serving of milk. Snacks must consist of two different components.
Afterschool Snack Program (ASP) provides cash reimbursement to help schools provide a nutritional boost to children enrolled in afterschool activities to help fill the afternoon hunger gap for school children up to age 18. Afterschool care programs may apply through CDE to receive reimbursements for snacks that meet federal nutrition requirements and are provided with organized, regularly scheduled activities for education or enrichment.
Summer Food Service Program (SFSP) provides free breakfast, lunch, snack, and supper to youth up to age 18 at participating sites throughout the summer. Sites are operated by diverse partners including schools, nonprofits, food banks, faith-based organizations, local government agencies, and others. Sites apply through CDE. In 2020, according to the Kids Food Finder, there were 38 sites within a 5-mile radius of Denver.
Policies & Advocacy Initiatives
Colorado Food Systems Advisory Council (COFSAC) Funding from the Colorado General Assembly, support from LiveWell Colorado and several partners
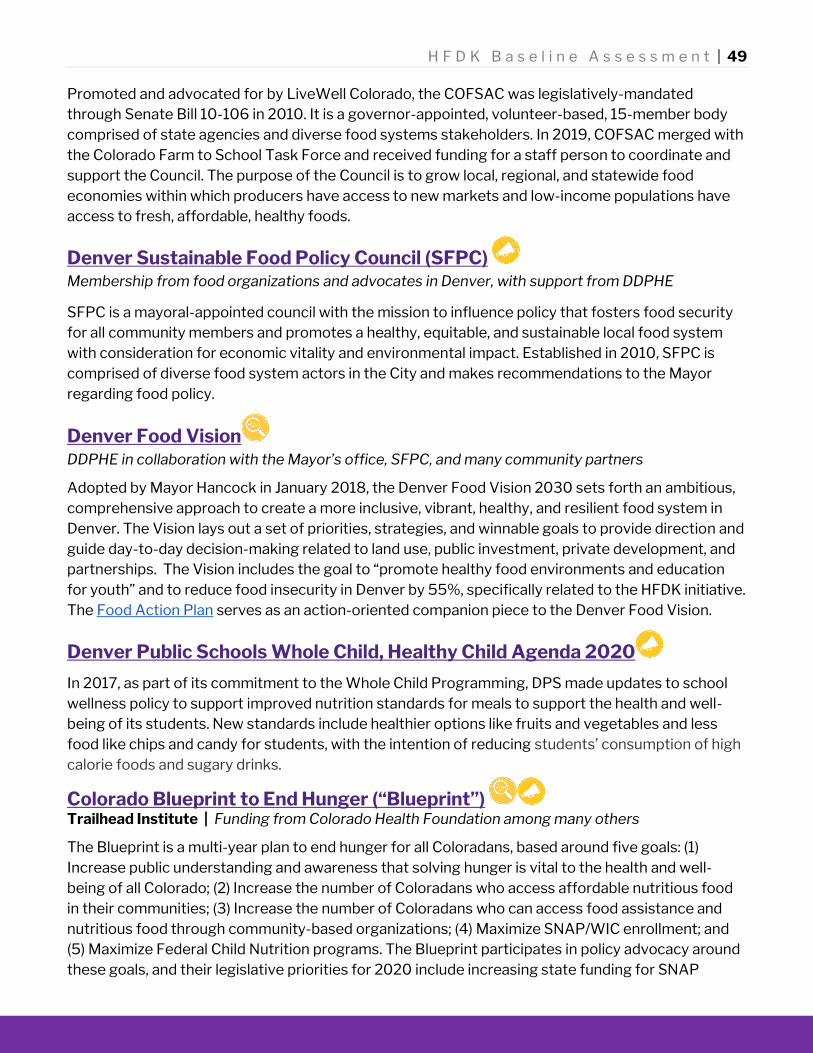
H F D K B a s e l i n e A s s e s s m e n t | 49
Promoted and advocated for by LiveWell Colorado, the COFSAC was legislatively-mandated through Senate Bill 10-106 in 2010. It is a governor-appointed, volunteer-based, 15-member body comprised of state agencies and diverse food systems stakeholders. In 2019, COFSAC merged with the Colorado Farm to School Task Force and received funding for a staff person to coordinate and support the Council. The purpose of the Council is to grow local, regional, and statewide food economies within which producers have access to new markets and low-income populations have access to fresh, affordable, healthy foods.
Denver Sustainable Food Policy Council (SFPC) Membership from food organizations and advocates in Denver, with support from DDPHE
SFPC is a mayoral-appointed council with the mission to influence policy that fosters food security for all community members and promotes a healthy, equitable, and sustainable local food system with consideration for economic vitality and environmental impact. Established in 2010, SFPC is comprised of diverse food system actors in the City and makes recommendations to the Mayor regarding food policy.
Denver Food Vision DDPHE in collaboration with the Mayor’s office, SFPC, and many community partners
Adopted by Mayor Hancock in January 2018, the Denver Food Vision 2030 sets forth an ambitious, comprehensive approach to create a more inclusive, vibrant, healthy, and resilient food system in Denver. The Vision lays out a set of priorities, strategies, and winnable goals to provide direction and guide day-to-day decision-making related to land use, public investment, private development, and partnerships. The Vision includes the goal to “promote healthy food environments and education for youth” and to reduce food insecurity in Denver by 55%, specifically related to the HFDK initiative. The Food Action Plan serves as an action-oriented companion piece to the Denver Food Vision.
Denver Public Schools Whole Child, Healthy Child Agenda 2020
In 2017, as part of its commitment to the Whole Child Programming, DPS made updates to school wellness policy to support improved nutrition standards for meals to support the health and well-being of its students. New standards include healthier options like fruits and vegetables and less food like chips and candy for students, with the intention of reducing students’ consumption of high calorie foods and sugary drinks.
Colorado Blueprint to End Hunger (“Blueprint”) Trailhead Institute | Funding from Colorado Health Foundation among many others
The Blueprint is a multi-year plan to end hunger for all Coloradans, based around five goals: (1) Increase public understanding and awareness that solving hunger is vital to the health and well-being of all Colorado; (2) Increase the number of Coloradans who access affordable nutritious food in their communities; (3) Increase the number of Coloradans who can access food assistance and nutritious food through community-based organizations; (4) Maximize SNAP/WIC enrollment; and (5) Maximize Federal Child Nutrition programs. The Blueprint participates in policy advocacy around these goals, and their legislative priorities for 2020 include increasing state funding for SNAP
https://www.denvergov.org/content/dam/denvergov/Portals/771/documents/CH/Final_FoodVision_120717.pdf

H F D K B a s e l i n e A s s e s s m e n t | 50
outreach, focused on student population; supporting healthy food incentives for WIC/SNAP Produce Boxes; and increasing allocation for the food pantry assistance grant.
Objective 5 – Gaps in the Local System Identify gaps and shortcomings in current programs at the local level The Baseline Assessment explores gaps in the system at the local level, including some programmatic, some policy-related gaps, and gaps related to connections among actors. As a note, the HFDK Systems Map was built on information in the Baseline Assessment, and visually mapped organizations, programs, and stakeholders in the Denver food system to facilitate further exploration of how the system is working, not working, and interconnections among actors.
Summer Nutrition Program Participation As discussed, summer nutrition programs are an important source of nutritious meals for children, especially low-income children. In addition to providing healthy meals, summer nutrition programs are often implemented in conjunction with educational and enrichment programming, helping to protect low-income children against food insecurity, unhealthy weight gain, and learning loss. According to the Food Research and Action Center, only one out of seven children in the U.S. receiving FRL also participated in the Summer Nutrition Program in 2017-18. Colorado is ranked 40th in average daily participation in the Summer Food Service Program, providing summer lunch to only 9 out of every 100 children receiving FRL, highlighting a significant gap in the system. In July 2018, Colorado had 76 sponsors and 552 sites (Hayes, Rosso, & FitzSimons, 2019). For Denver, the Kids Food Finder is an online interactive map where families can go to find summer meal sites from May through August (Kids Food Finder). Summer Nutrition Programs are administered through the Colorado Department of Education, where organizations can apply to be summer meal sites. All children 18 years or younger can receive free meals at approved sites, without any requirement to show identification or be associated with the sites’ programming (CDE, 2020).
SNAP Enrollment The need to increase SNAP enrollment among eligible populations is critical for addressing food insecurity in Denver, and numerous groups and reports have called for closing the SNAP gap in Colorado (Banyan, 2018, in the Blueprint to End Hunger - Hunger Free Colorado’s annual SNAP

H F D K B a s e l i n e A s s e s s m e n t | 51
Impact Report; The Colorado Health Foundation 2009 in Food Access in Colorado; The Denver SNAP Task Force report Closing the SNAP Gap in Denver).
Denver consistently ranks near or at the bottom for SNAP participation nationally, with only 66% of eligible
Denverites enrolled (Colorado similarly ranks low in the
nation, with only 60% enrollment) (Denver
Food Access Task Force, 2011; Banyan, 2017). This leaves millions of unutilized federal dollars,
including $235 million in lost grocery revenue
for the state (Hunger Free Colorado, 2019).
Many Americans vulnerable to food insecurity are ineligible for SNAP, including working adults and college students15 because of income thresholds, household status, and specific work requirements (Keith-Jennings & Chaudhry, 2018; Treisman, 2019). Many Denverites who are food-insecure (21% of adults and 34% of children) are ineligible for nutrition assistance programs due to household incomes above 200% of the FPL, or about $52,400 for a family of four in Colorado (Feeding America, Map the Meal Gap, 2017). This points to challenges in measuring poverty in the U.S., which is currently based on 1950s data when households spent one-third of income on food and one-third on housing. In 2020, housing typically accounts for 60% or more of low-income budgets, leaving little money for food (Fisher, 1997; USDA Economic Research Service, 2020b). For decades, attempts have been made to reform the federal measurement of poverty, but have only resulted in only marginal changes that do not fully address the reality of household expenditures in the 21st century. Until these measurements of poverty are updated federally, many low-income and food-insecure families will remain ineligible for food assistance and other benefits. Much of the high rate of SNAP-eligible-but-not-enrolled residents in Denver can be tied to federal regulations around SNAP for immigrants. The Pew Research Center estimates 130,000 people who are undocumented live in the Denver-Aurora-Lakewood cities making it one of the top 20 metro
15 College students must meet income and asset limits and immigration status. In addition, a student must meet one of a number of criteria such as household qualifications (e.g., being responsible for a dependent child younger than six), work at least 20 hours a week in paid employment, receive Temporary Assistance for Needy Families (TANF), participate in an on-the-job training program, be outside the 18-49 age range, and/or be unable to work for health reasons.

H F D K B a s e l i n e A s s e s s m e n t | 52
areas with the highest number of immigrants who are undocumented (Pew Research Center, May 2019). An estimated 53% of residents who are undocumented have incomes below 149% FPL (Migration Policy Institute, n.d.), which would generally qualify them for SNAP; however, many immigrants do not apply for SNAP for different reasons. First, complex federal regulations make it challenging to understand eligibility. Immigrants who have been in the country for less than five years are generally not eligible for SNAP, although some asylees, refugees, and victims of trafficking can qualify.16 Second, immigrants who are undocumented are completely ineligible for SNAP (Bovell-Ammon et al., 2019); however, US-born children are eligible for SNAP regardless of the immigration status of their parents. Many immigrant families with mixed citizenship statuses in the home (parents are undocumented with US-born children, for example) never apply either because of lack of information or fear of the “public charge”, in which parents fear their immigration status will be affected by the use of public benefits (Hunger Free Colorado, 2020). According to the USDA, more than four million Latinx across the country who are eligible for SNAP do not participate (Gepp, 2018).
Many other systemic factors contribute to low enrollment and participation rates, including: barriers to completing enrollment or recertification for people with disabilities; language barriers in application and recertification requirements; eligibility confusion as state systems deny or cut benefits; confusion between SNAP and
other safety net benefit eligibility; and applications (Keith-Jennings, Llobrera & Dean, 2019); costs associated with an applicant’s time and resources to apply or recertify, especially for
households with higher income eligibility where benefits would be low (~$16/month) (Gundersen & Ziliak, 2018); and
stigma and fear of negative community perception (Gundersen & Ziliak, 2018).
Lack of Supermarkets
Denver’s low-income communities need grocery stores to impact child food insecurity, as access to supermarkets is linked to increased healthy food consumption and decreased diet-related diseases. Supermarkets not only bring fresh food to a neighborhood, but often serve as the anchor business that attracts other retail services, which has been credited with revitalizing some neighborhoods. Consequently, residents benefit from both access to healthy food and access to jobs. (Denver Food Access Task Force, 2011).
16 Other non-citizens eligible for SNAP after five year waiting period include those paroled for at least one year under section 212(d)(5) of INA; those granted conditional entry under 203(a)(7) of INA; and a battered spouse, child or parent with a petition pending under 204(a)(1)(A) or (B) or 244(a)(3) of INA. Certain non-citizens are eligible for SNAP benefits without a waiting period, including qualified alien children under 18 years old; refugees admitted under section 207 of INA; victims of trafficking; asylees under Section 208 of INA; etc. To see the full list of eligible categories, go to https://www.fns.usda.gov/snap/eligibility/citizen/non-citizen-policy.

H F D K B a s e l i n e A s s e s s m e n t | 53
A national study found the lowest-income areas had 30% fewer supermarkets than higher-income neighborhoods; and most recent rankings stated Colorado was 37th in the nation for supermarket density per population (The Food Trust, 2009). In 2011, the Denver Food Access Task Force made several recommendations which were supported by Governor Hickenlooper and Mayor Hancock, including “establishing supermarket and grocery development” for increasing food retail in underserved areas (Denver Food Access Task Force, 2011).17 While progress was made on all the food access strategies, the lack of grocery stores in low food access areas has persisted, especially in West, North, and far Northeast neighborhoods of Denver: Globeville, Elyria-Swansea, Skyland, Clayton, Northeast Park Hill, Montbello, and Green Valley Ranch, and smaller clusters in Sun Valley, West Colfax, and Villa Park (Dean, October 2019). The dearth of supermarkets in some areas is related to challenges of large supermarket chains in meeting required margins in low-income areas. More importantly, and less well known, are legal and policy restrictions that have caused food deserts, including large chains with restrictive covenants that make it illegal for other supermarkets to move in for 10+ years. Chicago, Illinois and Madison, Wisconsin have ordinances banning these restrictive covenants and Washington D.C. City Council unanimously passed the Grocery Store Restrictive Covenant Prohibition Act of 2018, making land covenants or restrictions void and unenforceable (Goldchain, M. May 2018). Greeley, Colorado was unsuccessful in fighting a similar restriction banning incoming markets for 20 years, which, following the closing of a Safeway, left their downtown as a food desert (Balonon-Rosen, 2018; Holt, 2018; Peters, 2017). This is not uncommon across Colorado, as seen in 2014 when Cerberus Capital Management merged Safeway with Albertsons, leading to the closing of 40 stores across the state. These losses especially impacted low-income areas, including staff layoffs, decreased sales for nearby businesses, and creation of food deserts (Jones & Hernandez, 2019). Increasing access to grocery stores may require policy changes at the city/state level and more public-private partnerships that find innovative ways for markets to meet their margins while also serving low-income neighborhoods.
Food Access Ecosystem Coordination Denver food pantry users are more likely to have children than the average metro household (Brock and Gregory, 2018) and therefore improving child food security must address food pantry coordination. Denver’s food rescue system has been growing rapidly, making important advances; but at the same time faced with stubborn challenges. Strengths in the system include the rise of intermediaries (food rescue organizations - FROs) that facilitate the pick-up, transportation, and delivery between donating organizations and Last Mile Organizations (LMOs) accepting rescued food, like food banks, pantries, and soup kitchens. FROs have carved out niches in the food system - We Don’t Waste works largely with sport venues and institutions, Denver Food Rescue’s bike
17 Other food access strategies endorsed by the Task Force were improving fresh food offerings at corner stores, more farmers markets, expand local agriculture, and innovate fresh food retail ventures like urban micro-farms (Denver Food Task Force, 2011).
H F D K B a s e l i n e A s s e s s m e n t | 54
transport model attracts many volunteers, and Food Bank of the Rockies consolidated relationships with chain grocery stores and manufacturers. Challenges in the food rescue system lay in the coordination between FROs and LMOs, which is critical to reaching end-users (Brock & Gregory, 2018). LMOs are faced with challenges larger organizations may not experience, such as difficulty in attracting grants to support operations, which leads to limited pantry hours, heavy reliance on unpaid volunteers who turnover frequently; and limited cold storage for perishable food. Community listening sessions in the metro area highlighted barriers for food organizations, including high rent, lack of capital, limited commercial kitchen, storage and refrigeration space, and overall limited coordination across agencies for the best use of available resources (Food in Communities, 2019). Robust communication between FROs and LMOs is needed, as well as among LMOs themselves, in order to increase rescue of surplus food from donors. The Colorado Food Pantry Network, convened by Hunger Free Colorado and Food-1-1 Coalition, has made progress towards these efforts on a state and regional level, but has been less helpful to local, Denver LMOs. Supporting a Denver-specific communication network, similar to the Emergency Food Access calls coordinated weekly by DDPHE during the COVID-19 crisis,18 could help address
challenges of coordination among LMOs and FROs. DDPHE has begun this work, partly, through the Food Matters program, which includes coordination among food rescue organizations.
18 Data from this group is limited, but the HFDK evaluation team is staying engaged with DDPHE on this effort and will do its best to incorporate data from this group as appropriate.

H F D K B a s e l i n e A s s e s s m e n t | 55
The impact of the COVID-19 pandemic has been highlighted throughout this assessment, including:
its estimated effect on child food insecurity; racial disparities in rates of infection and death; fragility of the emergency food system including closures of food pantries; and redirected funding by philanthropic organizations and government to shore up a social safety
net unprepared to address the worst social and economic crisis since the Great Depression. During the research and development of the Baseline Assessment, the HFDK initiative responded to emergency hunger relief needs rising out of the COVID-19 pandemic. In March 2020, the HFDK Commission approved $894,215 in emergency feeding grants to 52 organizations to feed youth in Denver during the pandemic, covering a multitude of expenses, including, but not limited to food purchasing, food delivery/transportation, supplies for packing food, personal protection equipment, sanitation and cleaning supplies, payroll, and client communications. Organizations funded by HFDK emergency grants are located across Denver, including in communities of color and areas of high poverty and food insecurity. As the programs funded by these emergency grants are still underway, an analysis of outcomes and impacts is not included in the Baseline Assessment.
COVID-19 demands both immediate response, which is underway, and pivoting to a new world, which is yet to be imagined or appreciated but will fundamentally determine the direction of Denver and the HFDK initiative. Past economic recessions reveal that poverty rates lag behind unemployment rate changes (Greenstein Keith-Jennings & Rosenbaum, 2018), so significant increases in child food insecurity can be expected to sustain even long after the pandemic threat subsides. Leaders across the country are beginning to identify steps to better protect under-resourced populations in the future, including:
Advocating for stronger safety nets. Nonprofits spend more time responding to failing systems instead of rallying to change them. It is time to work for universal healthcare, paid sick leave, and increased minimum wage. Widespread misunderstanding about nonprofits allowance to do advocacy has led to a default of inaction (Vu, March 2020).
Funding for intermediary organizations. Capacity-building organizations play vital roles in connecting nonprofits, disseminating timely information, and leading collective actions - all essential during crises. Also, some intermediary organizations play pivotal “upstream” roles in a system. Yet, these organizations are often not funded because their work is harder to explain, and more difficult measure.
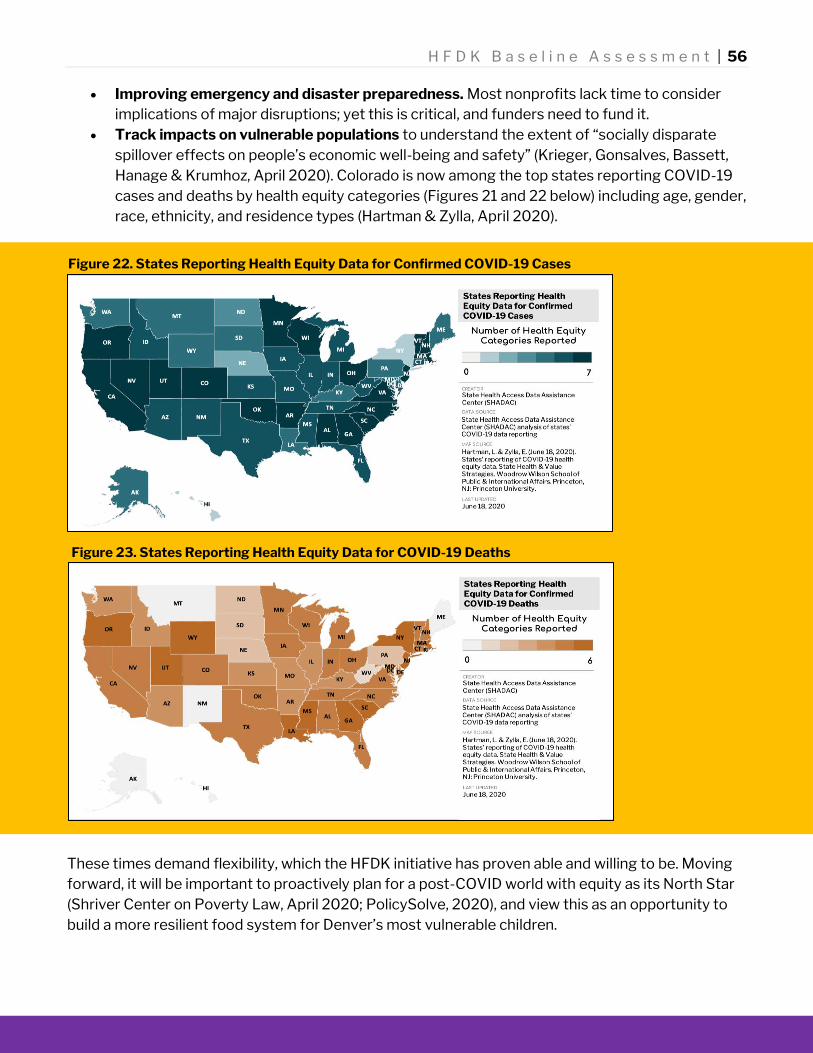
H F D K B a s e l i n e A s s e s s m e n t | 56
Improving emergency and disaster preparedness. Most nonprofits lack time to consider implications of major disruptions; yet this is critical, and funders need to fund it.
Track impacts on vulnerable populations to understand the extent of “socially disparate spillover effects on people’s economic well-being and safety” (Krieger, Gonsalves, Bassett, Hanage & Krumhoz, April 2020). Colorado is now among the top states reporting COVID-19 cases and deaths by health equity categories (Figures 21 and 22 below) including age, gender, race, ethnicity, and residence types (Hartman & Zylla, April 2020).
These times demand flexibility, which the HFDK initiative has proven able and willing to be. Moving forward, it will be important to proactively plan for a post-COVID world with equity as its North Star (Shriver Center on Poverty Law, April 2020; PolicySolve, 2020), and view this as an opportunity to build a more resilient food system for Denver’s most vulnerable children.
Figure 22. States Reporting Health Equity Data for Confirmed COVID-19 Cases
Figure 23. States Reporting Health Equity Data for COVID-19 Deaths

H F D K B a s e l i n e A s s e s s m e n t | 57
ACS (American Community Survey). (2014-2018). American Community Survey 2014-2018 5 Year Data Release. U.S. Census. GIS maps accessed at www.census.gov/newsroom/press-kits/2019/acs-5-year.html
ACS (2013-2017). American Community Survey 2013-2017 5 Year Data Release. U.S. Census. GIS maps accessed at www.census.gov/newsroom/press-kits/2018/acs-5year.html
Action for Healthy Kids (2019). Health And Wellness Parent Advisory Committee One-Page Poster. Action for Healthy Kids and DPS Food & Nutrition Services. Retrieved from www.actionforhealthykids.org/wp-content/uploads/2020/06/AFHK-DPS-Promising-Practice-Poster-2019-ENG-SPAN.pdf
Almaguer Sandoval B., Law Y., and Young C. (2014). Healthier Corner Stores: Positive Impacts and Profitable Changes. Philadelphia, PA: The Food Trust. Retrieved from http://thefoodtrust.org/uploads/media_items/healthier-corner-stores-positive-impacts-and-profitable-changes.original.pdf
Annie W. Casey Foundation, Kids Count Data Center. (2019). Children under 5 enrolled in WIC in Colorado. Retrieved from https://datacenter.kidscount.org/data/tables/9841-children-under-5-enrolled-in-wic?loc=7&loct=5#detailed/5/1214-1277/false/1729,37,871,870,573,869,36,868,867/any/19148,19147
Balonon-Rosen, P. (January 12, 2018). When grocery stores close, this legal phrase can prevent new ones from opening. Marketplace. Retrieved from www.marketplace.org/2018/01/12/when-grocery-stores-close-little-legal-phrase-can-prevent-new-ones-opening
Banyan, J. (2017). State Plans to End Hunger: An Opportunity for Colorado. Denver, CO: The Colorado Health Foundation. Retrieved from https://www.coloradohealth.org/sites/default/files/documents/2017-06/EndHunger_FINAL_June13.pdf
Banyan, J. (January, 2018). Colorado Blueprint to End Hunger: A Five-Year Plan. Denver, CO: The Colorado Health Foundation. Retrieved from https://static1.squarespace.com/static/59d7ac0712abd915ac75cec9/t/5a5cc22b71c10bca1347846a/1516028480722/Colorado+Blueprint+to+End+Hunger+Final.pdf
Bartley, B., & Best, A. (2012). Mobile Markets: Applying the Food Truck Model to Food Access. Arcadia Center for Sustainable Food and Agriculture. Retrieved from https://livewellcolorado.org/wp-content/uploads/2015/09/re_5_11.pdf
Baskfield, H. (April 19, 2020). Opinion: The coronavirus exploits vulnerabilities associated with inequality and health disparities. The Colorado Sun. Retrieved from https://coloradosun.com/2020/04/19/colorado-coronavirus-childrens-hospital-opinion/?fbclid=IwAR1qoBY9B6BWETgUVSW41t-mwMBrYjogDGG2aPgIMEZ-dnL7LUeK0H24XOM
Berkowitz, S.A., Gao, X., & Tucker, K.L. (2014). Food Insecure Dietary Patterns Are Associated With Poor Longitudinal Glycemic Control in Diabetes: Results from the Boston Puerto Rican Health Study. Diabetes Care, 37(9):2587-2592. Retrieved from https://doi.org/10.2337/dc14-0753
Big Green Colorado (2020). 80 Learning Gardens since 2011. Retrieved from https://biggreen.org/where-were-growing/colorado
Bobanick, D. (2019). 2019 Farm to Food Pantry. Harvest Against Hunger. Retrieved from https://cms.agr.wa.gov/WSDAKentico/Documents/Pubs/749-FarmToFoodPantryHAHAnnualReport-2019.pdf
Bovell-Ammon, A., Ettinger de Cuba, S., Coleman, S., Ahmad, N., Black, M.M., Frank, D.A., Ochoa Jr., E., & Cutts, D.B. (April 2019). Trends in food insecurity and SNAP participation among immigrant families of U.S.-born young children. Children, 6(4):55. Retrieved from https://doi.org/10.3390/children6040055
Brock, A. & Gregory, R. (2018). Strengthening Denver's Food Rescue Ecosystem. NRDC. Retrieved from https://www.nrdc.org/sites/default/files/denver-food-rescue-assessment-20190814.pdf
Carlson, S., & Keith-Jennings, B. (2018). SNAP Is Linked with Improved Nutritional Outcomes and Lower Health Care Costs. Center on Budget and Policy Priorities. Retrieved from www.cbpp.org/sites/default/files/atoms/files/1-17-18fa.pdf
Carlson, S., & Nueberger, Z. (2017). WIC Works: Addressing the Nutrition and Health Needs of Low-Income Families for 40 Years. Center on Budget and Policy Priorities. Retrieved from www.cbpp.org/research/food-assistance/wic-works-addressing-the-nutrition-and-health-needs-of-low-income-families
CDPHE (Colorado Department of Public Health and the Environment) Community Health Equity Map (2013-2017). GIS map accessed at www.cohealthmaps.dphe.state.co.us/cdphe_community_health_equity_map
CDPHE (2018). Healthy Kids Colorado Survey. Retrieved from www.colorado.gov/pacific/cdphe/healthy-kids-colorado-survey-data

H F D K B a s e l i n e A s s e s s m e n t | 58
CDPHE. (2019). Meal Pattern policies and memorandums. Retrieved from www.colorado.gov/pacific/cdphe/meal-pattern-policies-and-memorandums
CDPHE (2020). COVID-19 case data. Retrieved from https://covid19.colorado.gov/data/case-data Center for Disease Control and Prevention (CDC) (2019). Making Time for School Lunch. U.S. Department of Health and Human
Services. Retrieved from www.cdc.gov/healthyschools/nutrition/school_lunch.htm Center on Budget and Policy Priorities (April 26, 2017). SNAP helps millions of children. Washington, DC: Author. Retrieved from
www.cbpp.org/research/food-assistance/snap-helps-millions-of-children Clark, M. (May 22, 2020). Food assistance requests keep soaring in Colorado despite slowing coronavirus unemployment claims.
Colorado Sun. https://coloradosun.com/2020/05/22/colorado-food-assistance-coronavirus-increasing Cohen, J.F.W., Jahn, J.L., Richardson, S., Cluggish, S.A., Parker, E., & Rimm, E.B. (January 2016). Amount of time to eat lunch is
associated with children's selection and consumption of school meal entree, fruits, vegetables, and milk. Journal of the Academy of Nutrition and Dietetics, 116 (1): 123-128. DOI: https://doi.org/10.1016/j.jand.2015.07.019
Cohn, D. (May 5, 2014). Millions of Americans change their racial or ethnic identity from one census to the next. Fact Tank: News in the Numbers. Washington, DC: Pew Research Center. Retrieved from www.pewresearch.org/fact-tank/2014/05/05/millions-of-americans-changed-their-racial-or-ethnic-identity-from-one-census-to-the-next
Coleman-Jensen, A., Rabbitt, M.P., Gregory, C.A., & Singh, A. (September 2019). Household Food Security in the United States in 2018. Economic Research Service Report # 270. Washington, D.C.: U.S. Department of Agriculture. Retrieved from www.ers.usda.gov/webdocs/publications/94849/err-270.pdf?v=963.1
Coleman-Jensen, A., Rabbitt, M.P., Gregory, C.A., & Singh, A. (September 2018). Household Food Security in the United States in 2017. Economic Research Service Report # 256. Washington, D.C.: U.S. Department of Agriculture. Retrieved from www.ers.usda.gov/webdocs/publications/90023/err-256.pdf?v=0
Collins, A.M., Briefel, R., Klerman, J.A., Wolf, A., Rowe, G., Logan, C, et al. (May 2016). Summer Electronic Benefit Transfer to Children (SEBTC) Demonstration: Summary Report. Prepared by Abt Associates and Mathematical Policy Research Maximus. Alexandria, VA: U.S. Department of Agriculture Food and Nutrition Service. Retrieved from https://fns-prod.azureedge.net/sites/default/files/ops/sebtcfinalreport.pdf
Colorado Department of Education (CDE) (2019). Meal Counting and Claiming Data, SY 2018-2019. Retrieved from www.cde.state.co.us/nutrition/data
Colorado Department of Education (CDE) (2020). Help ensure all Colorado children have access to healthy summer meals. Denver, CO: Colorado State Government. Retrieved from www.colorado.gov/ensuring-healthy-summer-kids-meals
Colorado Department of Human Services (CDHS) (2017). Colorado SNAP-Ed State Impact Reports: SNAP-Ed Works in Colorado. USDA SNAP-Ed Connection. Retrieved from https://snaped.fns.usda.gov/library/materials/colorado-snap-ed-state-impact-reports
Colorado Department of Human Services (CDHS) (March 28, 2018). CDHS's SNAP Education program reaches 400,000 Coloradans. Denver, CO. Retrieved from www.colorado.gov/pacific/cdhs/2018-03-28-cdhs-snap-education-reaches-400000-coloradans
Colorado Farm to School (2015). Colorado schools engaged in farm to school activities. Google map accessed at www.google.com/maps/d/u/0/edit?mid=1FmpdiRtvod88ASxCPW8dLTlveKI&ll=39.710148483015345%2C-105.14014254646793&z=10
Colorado PEAK (2020). Welcome to Colorado PEAK. https://coloradopeak.secure.force.com Colorado State University (2018). Expanded Food and Nutrition Education Program. Retrieved from
http://efnep.colostate.edu/efnep-mission.html. Colorado State University Extension (2017). Expanded Food and Nutrition Education Program 2017 Annual Report. Retrieved
from https://community-nutrition-education.extension.org/category/state-impact-reports/ Cooking Matters (2019). Colorado Impact Report July 1, 2018 – June 30, 2019. Cooking Matters of Share our Strength.
Retrieved from http://cookingmatters.org/sites/default/files/Impact_Report.pdf Cooking Matters (2015). A Long-Term Impact Evaluation Report. Retrieved from
https://cookingmatters.org/sites/default/files/CM_LongTermStudy_singlepages.pdf Cronquist, K. & Lauffer, S. (2019). Characteristics of Supplemental Nutrition Assistance Program households: Fiscal year 2017.
Mathematica Policy Research Reports. Retrieved from https://ideas.repec.org/p/mpr/mprres/9ceac00f7e0f49ef85d3cc7ebfd2496b.html
Culture of Wellness Preschools Program. (n.d.). Colorado Department of Human Services SNAP-ED. Retrieved from http://cowpprogram.com

H F D K B a s e l i n e A s s e s s m e n t | 59
Daily News (February 12, 2020). Latinos’ fear of the 2020 census persists. Be Latina. Retrieved from https://belatina.com/naleo-fights-back-against-census-fears
Daniels, R.J. & Morial, M.H. (April 23, 2020). The COVID-19 racial disparities could be even worse than we think. The Washington Post. Retrieved from www.washingtonpost.com/opinions/2020/04/23/covid-19-racial-disparities-could-be-even-worse-than-we-think
Dean, A. (October 19, 2016). Here’s where Denver’s food deserts are, and what the city is doing about them. Denverite. Retrieved from https://denverite.com/2016/10/19/denver-food-deserts
Denver Department of Public Health and Environment (DDPHE) (2020). Denver Food Assets and Emergency Access Map. Retrieved from https://geospatialdenver.maps.arcgis.com/apps/webappviewer/index.html?id=485f05da88094d67ad911ef202688aee
Denver Food Access Task Force (December 2011). Healthy food for all: Encouraging grocery investment in Colorado. Denver, CO: The Colorado Health Foundation.
Denver Public Health. (2019). Unhealthy Weight Among Young People in Denver - 2012-2018. Denver Public Schools (2020). Food distribution. Retrieved from www.dpsk12.org/coronavirus/food-distribution Denver Public Schools (n.d.) Schools with gardens. Google map accessed at www.google.com/maps/@39.7260735,-
104.9286771,12z/data=!4m3!11m2!2sVaFbF3LIqc8HiRP-oWopPlGgn55UKw!3e3 Denver SNAP Task Force (2018). Closing the SNAP Gap in Denver. Retrieved from www.hungerfreecolorado.org/snapgap Double Up Food Bucks Colorado (2018). Double Up Food Bucks Evaluation Report. LiveWell Colorado. Retrieved from
https://doubleupcolorado.org/wp-content/uploads/2020/03/double-up-food-bucks-eval-short-report-year-three.pdf EcoDistricts (2014). Case Study: Mobile Grocery Units. Retrieved from https://ecodistricts.org/information-exchange/mobile-
grocery-store-units/ Franklin, B., Jones, A., Love, D., Puckett, S., Macklin, J., White-Means, S. (2012). Exploring Mediators of Food Insecurity and
Obesity: A Review of Recent Literature. Journal of Community Health 37:253-264. Retrieved from DOI 10.1007/s10900-011-9420-4
Federal Reserve Bank of St. Louis Economic Research (Dec 13, 2019). SNAP Benefits Recipients in Denver, CO. https://fred.stlouisfed.org/series/CBR08031COA647NCEN
Feeding America. (2017). Map the Meal Gap. Food Insecurity Estimates for Denver County, Colorado. Retrieved from https://map.feedingamerica.org/county/2017/overall/colorado/county/denver
Fisher, G.M. (September 1997). The development of the Orshansky poverty thresholds and their subsequent history as the official U.S. poverty measure. U.S. Department of Health and Human Services. Retrieved from https://www.census.gov/content/dam/Census/library/working-papers/1997/demo/orshansky.pdf
Food in Communities (2019). Year One Key Findings Report. Tri-County Health Department; Jefferson County Colorado Public Health; Denver Public Health and Environment.
Food and Nutrition Service (FNS) (2013). Snap Education and Evaluation Study Wave Two Summary. USDA. Retrieved from www.fns.usda.gov/snap/supplemental-nutrition-assistance-program-education-and-evaluation-study-wave-ii
FNS (2016). Summer Electronic Benefit Transfer for Children (SEBTC) Demonstration: Summary Report 2011-2014. USDA. Retrieved from www.fns.usda.gov/sfsp/summer-electronic-benefit-transfer-children-sebtc-demonstration-summary-report
Food Research and Action Center (2019). Making WIC Work Better: Strategies to Reach More Women and Children and Strengthen Benefits Use. Retrieved from https://frac.org/wp-content/uploads/Making-WIC-Work-Better-Full-Report.pdf
Gallo, S. Director of Health Initiatives, Denver Office of Children’s Affairs. (June 2, 2020). Personal communication. Gary-Webb, T.L., Bear, T.M., Mendez, D.D., Schiff, M.D., Keenan, E., & Fabio, A. (2018). Evaluation of a Mobile Farmer’s Market
Aimed at Increasing Fruit and Vegetable Consumption in Food Deserts: A Pilot Study to Determine Evaluation Feasibility. Healthy Equity, 2.1. Retrieved from http://online.liebertpub.com/doi/10.1089/heq.2018.0003
Gepp, A. (2018). Community-Driven Strategies to Reduce Food Insecurity and Hunger among Latinos. UnidosUS. Stronger Communities. Stronger America, 29. Retrieved from http://publications.unidosus.org/bitstream/handle/123456789/1868/ib29_comprandoricoysano_53018.pdf?sequence=1&isAllowed=y
Goldchain, M. (May 8, 218). D.C. council passes critical grocery store legislation. Washington City Paper. Retrieved from www.washingtoncitypaper.com/food/article/21003899/dc-council-passes-critical-grocery-store-legislation

H F D K B a s e l i n e A s s e s s m e n t | 60
Gonzalez-Barrera, A. (July 10, 2015). ‘Mestizo’ ad ‘mulatto’: Mixed-race identities among U.S. Hispanics. Fact Tank: News in the Numbers. Washington, DC: Pew Research Center. Retrieved from www.pewresearch.org/fact-tank/2015/07/10/mestizo-and-mulatto-mixed-race-identities-unique-to-hispanics
Grantmakers for Effective Organizations (GEO). Access resources at www.geofunders.org Greenstein, R., Keith-Jennings, B., & Rosenbaum, D. (August 8, 2018). Factors affecting SNAP caseloads. Washington, DC:
Center for Budget and Policy Priorities. Retrieved from www.cbpp.org/research/food-assistance/factors-affecting-snap-caseloads
Gundersen, C., Kreider, B., & Pepper, J. (2018). Reconstructing SNAP to more effectively alleviate food insecurity in the U.S. Journal of Sciences 4(2): 113-130.
Gundersen, C., & Ziliak, J.P. (2018). Food Insecurity Research in the United States: Where We Have Been and Where We Need to Go. Applied Economic Perspectives and Policy, 40(1):119-135. Doi: https://doi.org/10.1093/aepp/ppx058
Hammonds, T. (2017). Successful CSAs in Low-Income Communities. Cornell Small Farms Program. Retrieved from https://smallfarms.cornell.edu/2017/04/successful-csas
Hartman, L. & Zylla, E. (April 22, 2020). States’ reporting of COVID-19 health equity data. State Health & Value Strategies. Woodrow Wilson School of Public & International Affairs. Princeton, NJ: Princeton University. Retrieved from www.shvs.org/states-reporting-of-covid-19-health-equity-data
Hayes, C., Rosso, R., & FitzSimons, C. (2019). Hunger Doesn’t Take a Vacation: Summer Nutrition Status Report. Food Research and Action Center. Retrieved from https://co.chalkbeat.org/2019/8/6/21108587/colorado-ranks-low-nationwide-in-providing-summer-meals-to-kids-who-need-free-lunch-at-school-report
Hernandez, E.L. (May 1, 2020). The coronavirus disproportionately affects Latinos and Blacks in Denver, but experts aren’t sure why. Denverite. Retrieved from https://denverite.com/2020/05/01/the-coronavirus-disproportionately-affects-latinos-and-blacks-in-denver-but-experts-arent-sure-why
Hildebrand, D., Millburg, C., Betts, N.M., & Gates, G.E. (2018). Time to eat school lunch affects elementary students’ nutrient consumption. Journal of Child Nutrition & Management, 42 (2). Retrieved from https://schoolnutrition.org/uploadedFiles/5_News_and_Publications/4_The_Journal_of_Child_Nutrition_and_Management/Fall_2018/Fall2018-Time-To-Eat-Lunch.pdf
Hoeflich, N. (April 15, 2020). Smarter grantmaking practices during - and beyond - COVID-19. GEO Funders. Retrieved from www.geofunders.org/about-us/perspectives/140
Holt, S. (January 29, 2018). How leaving stores closed for years helps grocery chains and hurts communities. PRI. Retrieved from www.pri.org/stories/2018-01-29/how-leaving-stores-closed-years-helps-grocery-chains-and-hurts-communities
Hoynes, H., Schanzenbach, D.W., & Almond, D. (2016). Long-Run Impacts of Childhood Access to the Safety Net. American Economic Review, 106(4): 903-934. Retrieved from gspp.berkeley.edu/assets/uploads/research/pdf/Hoynes-Schanzenbach-Almond-AER-2016.pdf
Hunger Free America (April 13, 2020). As child hunger soars across USA, national poll finds nearly one in four parents reducing food for children. New York, NY: Author. Retrieved from www.hungerfreeamerica.org/blog/child-hunger-soars-across-usa-national-poll-finds-nearly-one-four-parents-reducing-food
Hunger Free Colorado (2019). Denver County - 2019 SNAP Impact Report. Retrieved from http://www.dropbox.com/sh/yl0zsluc9c30gd7/AAD5YjwTlENXsgjZuZGlRdUka/Large%20Counties?dl=0&preview=Denver+County+-+2019+SNAP+Impact+Report.pdf&subfolder_nav_tracking=1
Hunger Free Colorado (2019). Food Stamps Fuel a Healthy Colorado. Denver County. Hunger Free Colorado (2020). Getting food stamp benefits. Retrieved from www.hungerfreecolorado.org/snap-
benefits/#wheretogo Hunger Free Colorado (2020). New state funding will improve access to fresh produce for food pantries and food banks.
Retrieved from https://blog.hungerfreecolorado.org/news/new-state-funding-for-food-pantries Integrated Nutrition Education Program. (n.d.) INEP About Schools. Retrieved from:
http://www.thenutritionprogram.org/about/schools Jablonski, BBR; Thilmany MfFadden, D; Colpaart, A. (2016). Analyzing the Role of Community and Individual Factors in Food
Insecurity: Identifying Diverse Barriers Across Clustered Community Members. Journal of Community Health, 41, 910–923. Retrieved from www.ncbi.nlm.nih.gov/pubmed/26910340
Jansen, E.C., Kasper, N., Lumeng, J.C., Herb, H.E.B., Horodynski, M.A., Miller, A.L., Contreras, D., & Peterson, K.E. (2017). Changes in household food insecurity are related to changes in BMI and diet quality among Michigan Head Start preschoolers in a sex-specific manner. Social Science & Medicine, 181:168-176. Retrieved from doi: 10.1016/j.socscimed.2017.04.003

H F D K B a s e l i n e A s s e s s m e n t | 61
Johnson, T. (January 14, 2020). Nonprofit emergency plans: What you need to know. Volunteer Pro. Retrieved from https://volpro.net/nonprofit-emergency-plans/
Jones, K., & Hernandez, M. (2019). Why Safeways Keep Closing in Colorado. The Colorado Trust. Retrieved from https://www.coloradotrust.org/content/story/why-safeways-keep-closing-colorado
Keith-Jennings, B. & Chaudhry, R. (March 15, 2018). Most working-age SNAP participants work, but often in unstable jobs. Washington, DC: Center for Budget and Policy Priorities. Accessed at www.cbpp.org/research/food-assistance/most-working-age-snap-participants-work-but-often-in-unstable-jobs
Keith-Jennings, B., Llobrera, J., & Dean, S. (December 2019). Links of the Supplemental Nutrition Assistance Program with food insecurity, poverty, and health: Evidence and potential. American Journal of Public Health 109 (12): 1636-1640. DOI: 10.2105/AJPH.2019.305325 Retrieved from www.ncbi.nlm.nih.gov/pmc/articles/PMC6836787
Kids Food Finder (2020). Find Meals for Kids. http://kidsfoodfinder.org Krieger, N., Gonsalves, G., Bassett, M.T., Hanage, W., & Krumholz, H.M. (April 14, 2020). The fierce urgency of now: Closing
glaring gaps in US surveillance data on COVID-19. Health Affairs. Retrieved from www.healthaffairs.org/do/10.1377/hblog20200414.238084/full
Kupersmit, B. (October 2017). Parent Focus Groups. DPS Food & Nutrition Services and Kupersmit Research. Kupersmit, B. (April 2019). Parent Focus Groups. DPS Food & Nutrition Services and Kupersmit Research. Le, V. (March 8, 2020). A few things for nonprofits and foundations to consider in light of the Coronavirus. Nonprofit AF.
Retrieved from https://nonprofitaf.com/2020/03/a-few-things-for-nonprofits-and-foundations-to-consider-in-light-of-the-coronavirus
Local Food Research Center. (2013). CSAs as a Strategy to Increase Food Access: Models of Success. Asheville, NC. Appalachian Sustainable Agriculture Project. Retrieved from https://asapconnections.org/downloads/csas-as-a-strategy-to-increase-food-access.pdf
Lopez, M.H., Gonzalez-Barrera, A., & Lopez, G. (December 20, 2017). Hispanic identity fades across generations as immigrant connections fall away. Hispanic Trends. Washington, DC: Pew Research Center. Retrieved from www.pewresearch.org/hispanic/2017/12/20/hispanic-identity-fades-across-generations-as-immigrant-connections-fall-away
Mayo Clinic. (2020). Iron deficiency in children: Prevention tips for parents. Retrieved from https://www.mayoclinic.org/healthy-lifestyle/childrens-health/in-depth/iron-deficiency/art-20045634
McLaren, L. (2007). Socioeconomic Status and Obesity. Epidemiologic Reviews, 29(1):29-48. Retrieved from https://doi.org/10.1093/epirev/mxm001
Migration Policy Institute (n.d.). Profile of the unauthorized population: Colorado. Washington, DC: Author. Retrieved from www.migrationpolicy.org/data/unauthorized-immigrant-population/state/CO
National Farm to School Network (2017). The Benefits of Farm to School. Retrieved from www.farmtoschool.org/Resources/BenefitsFactSheet.pdf
National Institute of Food and Agriculture (2018). 2018 Impacts EFNEP: Improving Nutritional Security through Education. Retrieved from https://nifa.usda.gov/sites/default/files/efnep-2018-annual-report.pdf
Nchako, C. and Cai, L. (March 16, 2020). A closer look at Who Benefits from SNAP : State-by-state fact Sheets. Center on Budget and Policy Priorities. Retrieved from www.cbpp.org/research/food-assistance/a-closer-look-at-who-benefits-from-snap-state-by-state-fact-sheets#Colorado
No Kid Hungry Share Our Strength (2014). Case Study: A Data-Driven Strategy to Reduce Hunger and Increase Stability in Maryland. Retrieved from http://bestpractices.nokidhungry.org/sites/default/files/a-data-driven-strategy-to-reduce-hunger-and-increase-stability-in-maryland_0.pdf
Noelke, C., McArdle, N., Baek, M., Huntington, N., Huber, R., Hardy, E., & Acevedo-Garcia, D. (January 15, 2020). Child Opportunity Index 2.0: Technical Documentation. Institute for Child, Youth and Family Policy. The Heller School for Social Policy and Management. Waltham, Massachusetts: Brandeis University. Retrieved from www.diversitydatakids.org/sites/default/files/2020-02/ddk_coi2.0_technical_documentation_20200212.pdf
Office of Children’s Affairs (OCA) of Denver (2019). The Status of Denver’s Children: A Community Resource 2019. Office of Children’s Affairs. Denver, CO: City and County of Denver. Retrieved from www.denvergov.org/content/dam/denvergov/Portals/713/documents/data-resources/StatusOfDenversChildren_ ADA_2019.pdf
Office of School Nutrition (2016). Child Nutrition Program Overview Resource. Colorado Department of Education. Retrieved from www.cde.state.co.us/nutrition/nutriprograms

H F D K B a s e l i n e A s s e s s m e n t | 62
Oldham, J. (April 4, 2020). The COVID-19 Pandemic is Creating Unprecedented Food Insecurity in Colorado. The Colorado Trust. www.coloradotrust.org/content/story/covid-19-pandemic-creating-unprecedented-food-insecurity-colorado;
Orovecz, K., Pincus, E., & Todd, N. (2015). Summer Nutrition Program Social Impact Analysis. No Kid Hungry Share Our Strength. Retrieved from http://bestpractices.nokidhungry.org/sites/default/files/download-resource/Summer%20Nutrition%20Program%20Social%20Impact%20Analysis.pdf
Padres y Jovenes Unidos. (2016). Health Justice Report II: A community Analysis of Food, Race and Class in Denver Public Schools. Padres y Jovenes Unidos & the Grassroots Action Support Team. Retrieved from: https://padresunidos.org/wp-content/uploads/2016/11/HJ.PrintFinal10.pdf
Pardo-Crespo, M.R., Narla, N.P., Williams, A.R., Beebe, T.J., Sloan, J. (2013). Comparison of individual-level versus area-level socioeconomic measures in assessing health outcomes of children in Olmstead County, Minnesota. Journal of Epidemiology and Community Health; London, 67(4):305. Retrieved from DOI.org/10.1136/jech-2012-201742
Peña, T. Regional Coordinator for Outreach and Engagement, Denver Public Schools Food & Nutrition Services (June, 2020). Personal communication.
Peters, A. (2017). How Closing Grocery Stores Perpetuate Food Deserts Long After They’re Gone. Fast Company. Retrieved from www.fastcompany.com/40499246/how-closing-grocery-stores-perpetuate-food-deserts-long-after-theyre-gone
Pew Research Center (March 11, 2019). Estimates of U.S. unauthorized immigrant population, by metro area, 2016 and 2007. Hispanic Trends. Washington, DC: Author. Retrieved from www.pewresearch.org/hispanic/interactives/unauthorized-immigrants-by-metro-area-table
Pinarda, C.A., Bertmann, F.M.W., Byker Shanks, C., Schober, D.J., Smith, T.M., Carpenter, L.C. & Yaroch, A.L. (2017). What factors influence SNAP participation? Literature reflecting enrollment in food assistance programs from a social and behavioral science perspective. Journal of Hunger & Environmental Nutrition 12 (2): 151-168
PolicySolve (2020). Resources for Transformation in this COVID Moment. Retrieved from www.policysolve.com/resources Popkin, S.J., Gilbert, B., Harrison, E., Arena, O., DuBois, N., & Waxman, E. (2019). Evidence-Based Strategies to End Childhood
Food Insecurity and Hunger in Vermont. Urban Institute. Retrieved from www.urban.org/sites/default/ files/publication/99831/evidence-based_strategies_to_end_childhood_food_insecurity_and_hunger_in_vt_1.pdf
Robert Wood Johnson Foundation (May 1, 2017). What is health equity? Retrieved from www.rwjf.org/en/library/research/2017/05/what-is-health-equity-.html
Roberts, M. (May 1, 2020). COVID-19: Denver neighborhoods with most cases, shocking rise. Westword. Retrieved from www.westword.com/news/covid-19-denver-neighborhoods-with-the-most-cases-update-11702611
Ross, Eric, Five Points Geoplanning, LLC (2020). Statewide COVID-19 Socioeconomic Response Map. GIS mapped accessed at https://fpgp.maps.arcgis.com/apps/webappviewer/index.html?id=cc01eacded574163bdb42e26d6463f7c
RTI International Center for Health and Environmental Modeling. (2014). Current and Prospective Scope of Hunger and Food Security in America: A Review of Current Research, July 2014, p. 4-9. Retrieved from http://www.rti.org/pubs/full_hunger_report_final_07-24-14.pdf
School Nutrition Unit (2015). Summer Food Service Program Fact Sheet. Colorado Department of Education. Retrieved from www.hungerfreecolorado.org/summer
Seaman, J., Bradbury, S., & Burness, A. (April 13, 2020). People of color in Colorado disproportionately impacted by coronavirus, state’s first racial data shows. The Denver Post. Retrieved from www.denverpost.com/2020/04/13/colorado-coronavirus-covid-racial-breakdown
Share Our Strength, Cooking Matters. (2015). A Long-Term Impact Evaluation. Retrieved from https://cookingmatters.org/node/2463
Shriver Center on Poverty Law (April 15, 2020). Racism laid bare with COVID-19: Relief from this health crisis must include system change centered on equity. Chicago, IL: Author. Retrieved from www.povertylaw.org/article/racism-laid-bare-with-covid-19
Statistical Atlas (2018). Food Stamps in Colorado, American Community Survey 2012-2016. https://statisticalatlas.com/state/Colorado/Food-Stamps
The Colorado Health Foundation (2009). Food Access In Colorado. Denver, CO: Author. Retrieved from www.coloradohealth.org/sites/default/files/documents/2017-01/TCHF_Food_Access_Report_web-Food%20Access%20in%20CO.pdf
The Colorado Health Foundation (2008). Obesity: What the research shows. 2008 Supplement to the Colorado Health Report Card. Denver, CO: Author. Retrieved from www.coloradohealth.org/sites/default/files/documents/2017-01/Obesity_Lit_Rev_Final-Obesity%20What%20the%20Research%20Shows.pdf

H F D K B a s e l i n e A s s e s s m e n t | 63
The Food Trust (2009). Healthy food, healthy Coloradans: The need for more supermarkets in Colorado. Denver, CO: The Colorado Health Foundation. Retrieved from www.coloradohealth.org/sites/default/files/documents/2017-01/Food_ Trust_Rpt-Colorado-Special%20Report%20the%20Need%20for%20More%20Supermarkets%20in%20CO.pdf
The Leadership Conference Education Fund (April 17, 2018). Will you count? Latinos in the 2020 census. Economic Security and Opportunity Initiative. Center on Poverty and Inequality. Washington, DC: Georgetown Law. Retrieved from http://civilrightsdocs.info/pdf/census/2020/Fact-Sheet-Latino-HTC.pdf
The Nemours Foundation. Healthy Kids, Healthy Future. (2020). Resources for Nurturing Healthy Eaters. Retrieved from https://healthykidshealthyfuture.org/5-healthy-goals/nurture-healthy-eaters/resources
Travers, J. (April 2, 2020). The hardest hit: Who is communities of color during COVID-19? Inside Philanthropy. Retrieved from www.insidephilanthropy.com/home/2020/4/2/the-hardest-hit-who-is-supporting-communities-of-color-during-covid-19
Treuhart, S. & Karpyn, A. (2010). The Grocery Gap: Who Has Access to Healthy Food and Why It Matters. Policy Link & Food Trust. Retrieved from http://thefoodtrust.org/uploads/media_items/grocerygap.original.pdf
Trust-Based Philanthropy Project. Access resources at https://trustbasedphilanthropy.org USDA (United States Department of Agriculture). (2015). Farm to School Census. USDA Food and Nutrition Services.
Washington, DC: Author. Retrieved from https://farmtoschoolcensus.fns.usda.gov USDA Economic Research Service. (2018). Current Population Survey Food Security Supplements, U.S. Census Bureau. U.S.
Households with Children by Food Security Status of Adults and Children, 2018. United States Department of Agriculture. Retrieved from https://www.ers.usda.gov/topics/food-nutrition-assistance/food-security-in-the-us/key-statistics-graphics.aspx
USDA Economic Research Service. (2020a). Current Population Survey Food Security Supplements, U.S. Census Bureau, 2008-2018. Trends in U.S. Food Security: Interactive Charts and Highlights 2008-2018. United States Department of Agriculture. Retrieved from https://www.ers.usda.gov/topics/food-nutrition-assistance/food-security-in-the-us/interactive-charts-and-highlights/#trends
USDA Economic Research Service. (2020b). Current Population Survey Food Security Supplements, U.S. Census Bureau, 2008-2018. Trends in U.S. Food Security: Interactive Charts and Highlights 2008-2018. United States Department of Agriculture. Retrieved from https://www.ers.usda.gov/topics/food-nutrition-assistance/food-security-in-the-us/interactive-charts-and-highlights/#trends
USDA Food Access Research Atlas. (2020). GIS map on low income and low food access census tracks. Access map at www.ers.usda.gov/data-products/food-access-research-atlas/go-to-the-atlas.aspx
USDA Food and Nutrition Service (FNS). (2017). National School Lunch Program Fact Sheet. Retrieved from https://www.fns.usda.gov/nslp/nslp-fact-sheet
USDA FNS. (2013). Supplemental Nutrition Assistance Program Education and Evaluation Study Wave II Summary. Retrieved from https://fns-prod.azureedge.net/sites/default/files/SNAPEdWaveII_Summary.pdf
US Department of Housing and Urban Development (January 7, 1998). Transmittal of Fiscal year (FY) 1998 Public Housing/Section 8 Income Limits. Washington, DC: Author. Retrieved from www.huduser.gov/portal/ datasets/il/fmr98/sect8.html
Vlismas, K. Stavrinos, V., Pangiotakos, D.B. (2009). Socio-Economic status, Dietary Habits, and Health-related Outcomes in Various Parts of the World: A Review. Central Europe Journal of Public Health 17(20):55-63. Retrieved from http://pubmed.ncbi.nlm.nih.gov/19662821
Vu, L (March 8, 2020). A few things for nonprofits and foundations to consider in light of the Coronavirus. Nonprofit AF. Retrieved from https://nonprofitaf.com/2020/03/a-few-things-for-nonprofits-and-foundations-to-consider-in-light-of-the-coronavirus
Wang, D.D., Leung, C.W., Li, Y., Ding, L., Chiuve, S.E., Hu, F.B., Willett, W.C. (2014). Trends in Dietary Quality Among Adults in the United States, 1999 Through 2010. JAMA Internal Medicine, 174(10):1587-1595. Retrieved from doi:10.1001/jamainternmed.2014.3422
Warner, G. Associate Director, Cooking Matters Colorado. (May, 2020). Personal Communication. Wass, T., McGuire, S., Gallagher, K. (November 2015). Breakfast in the Classroom: Student Outcome Study, preliminary findings.
Center for Research Strategies, prepared for Denver Public Schools. Retrieved from https://foodservices.dpsk12.org/pdfs/BICAcademicFindings-1-5-16.pdf
Welch, C. (April 24, 2020). COVID-19 and food security. Center for Strategic & International Studies. Retrieved from www.csis.org/programs/global-food-security-program/covid-19-and-food-security
WIC Colorado. (2017). Percent Eligible Enrolled data. Retrieved from

H F D K B a s e l i n e A s s e s s m e n t | 64
https://drive.google.com/file/d/1JvyMexQeyCM9BoBllAu3smDnPJoyFg4n/view WIC Data, Pediatric Nutrition Surveillance System (PEDNSS). (2010). WIC Local Agency Tables 2010. Retrieved from
https://drive.google.com/drive/folders/1vm9AxWIwD6KhOZ0WJkAta2gdWI1rB17J WIC Data, Pediatric Nutrition Surveillance System (PEDNSS). (2011). WIC Local Agency Tables 2011. Retrieved from
https://drive.google.com/drive/folders/1XWeWobPvUWsngXtHD6PzL6fcqpkqOe1L Widener, M.J., Metcalf, S.S., & Bar-Yam, Y. (2012). Developing a Mobile Produce Distribution System for Low-Income Urban
Residents in Food Deserts. J Urban Health,89(5): 733–745. Doi: 10.1007/s11524-012-9677-7 Woodburn, C. Sustainability Program Specialist, Denver Public Schools. (April, 2020). Personal communication.
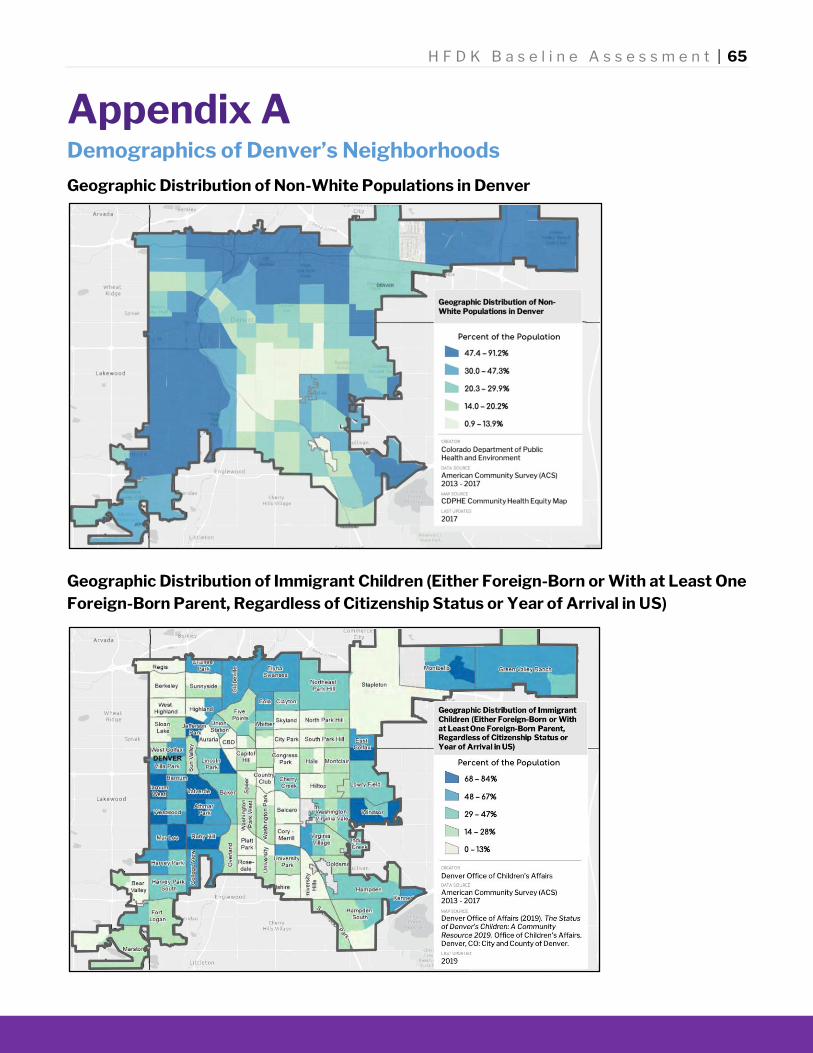
H F D K B a s e l i n e A s s e s s m e n t | 65
Appendix A Demographics of Denver’s Neighborhoods Geographic Distribution of Non-White Populations in Denver
Geographic Distribution of Immigrant Children (Either Foreign-Born or With at Least One Foreign-Born Parent, Regardless of Citizenship Status or Year of Arrival in US)

H F D K B a s e l i n e A s s e s s m e n t | 66
Geographic Distribution of Children of Color
Geographic Distribution of Households with Language Other Than English Spoken in the Home
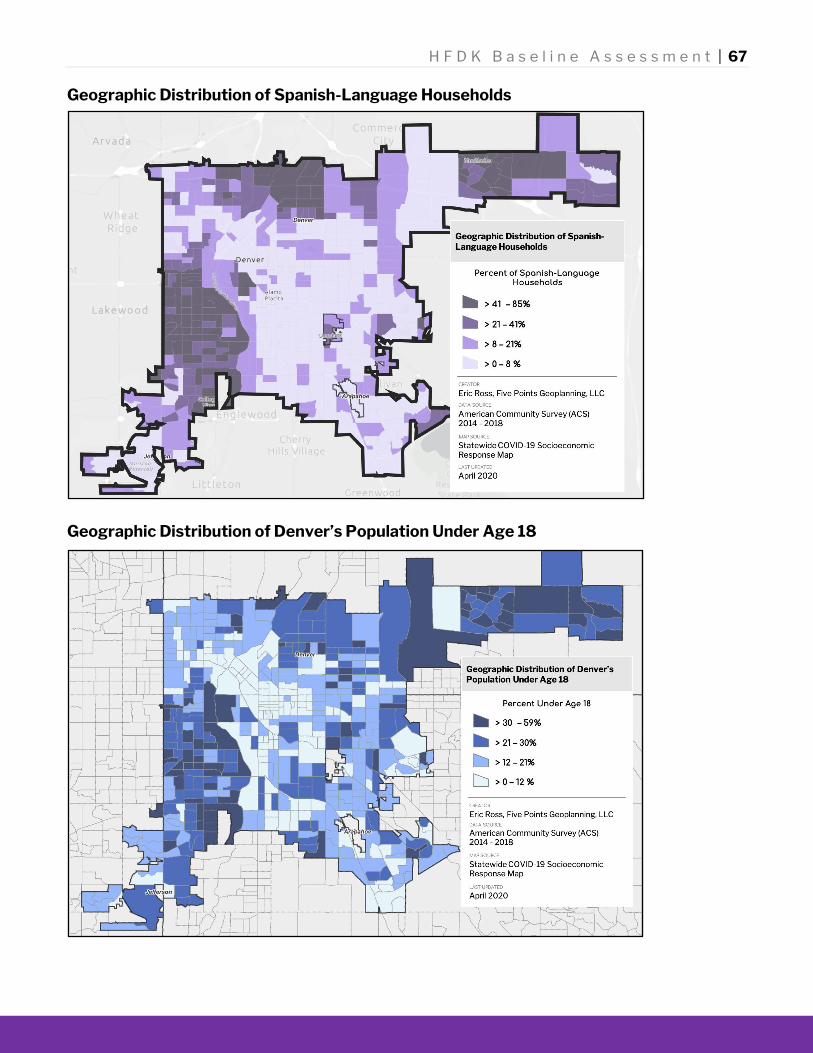
H F D K B a s e l i n e A s s e s s m e n t | 67
Geographic Distribution of Spanish-Language Households
Geographic Distribution of Denver’s Population Under Age 18

H F D K B a s e l i n e A s s e s s m e n t | 68
Geographic Distribution of Single Parent Families

H F D K B a s e l i n e A s s e s s m e n t | 69
Appendix B Denver Public Schools 2019 Participation in Free Meals by Eligible Children, by School
ELEMENTARY SCHOOLS LUNCH BREAKFAST OAKLAND ELEMENTARY (150) 72.71% 59.92% PASCUAL LEDOUX ACADEMY (158) 79.48% 72.24% DCIS AT FAIRMONT ELEMENTARY (159) 68.16% 68.13% JOE SHOEMAKER ELEMENTARY (162) 93.79% 83.07% CREATIVITY CHALLENGE COMMUNITY (C3) (165) 60.61% 10.14% DCIS AT FORD ELEMENTARY (166) 81.46% 76.20% HIGH TECH ELEMENTARY (170) 50.65% 26.41% GREENLEE ELEMENTARY (172) 82.04% 40.03% SWIGERT INTERNATIONAL ELEMENTARY (174) 57.70% 28.80% STEPHEN KNIGHT CENTER FOR EARLY EDUCATION ELEMENTARY (178) 45.09% 16.62% ESCALANTE-BIGGS ACADEMY ELEMENTARY (179) 61.75% 19.94% MATH AND SCIENCE LEADERSHIP ACADEMY (186) 82.46% 73.42% COLE ARTS & SCIENCE ACADEMY ELEMENTARY (188) 73.89% 84.79% TREVISTA AT HORACE MANN ELEMENTARY (189) 84.29% 84.05% LENA ARCHULETA ELEMENTARY (199) 68.98% 76.49% ACADEMIA ANA MARIE SANDOVAL ELEMENTARY (201) 53.44% 21.29% ASBURY ELEMENTARY (203) 61.40% 23.12% VALDEZ (205) 75.58% 23.97% ASHLEY ELEMENTARY (206) 68.43% 64.67% BARNUM ELEMENTARY (207) 79.87% 27.60% BEACH COURT ELEMENTARY (209) 72.52% 23.03% LOWRY ELEMENTARY (210) 76.26% 32.10% BRADLEY INTERNATIONAL ELEMENTARY (213) 70.83% 19.07% BROMWELL ELEMENTARY (214) 57.43% 8.84% BROWN INTERNATIONAL ACADEMY (215) 76.45% 25.46% CARSON ELEMENTARY (217) 58.44% 24.63% CHELTENHAM ELEMENTARY (218) 89.90% 60.92% COLFAX ELEMENTARY (219) 72.25% 32.37% COLLEGE VIEW ELEMENTARY (220) 77.66% 62.36% COLUMBIAN ELEMENTARY (221) 68.40% 28.52% COLUMBINE ELEMENTARY (222) 71.00% 71.17% CORY ELEMENTARY (223) 51.93% 6.95%
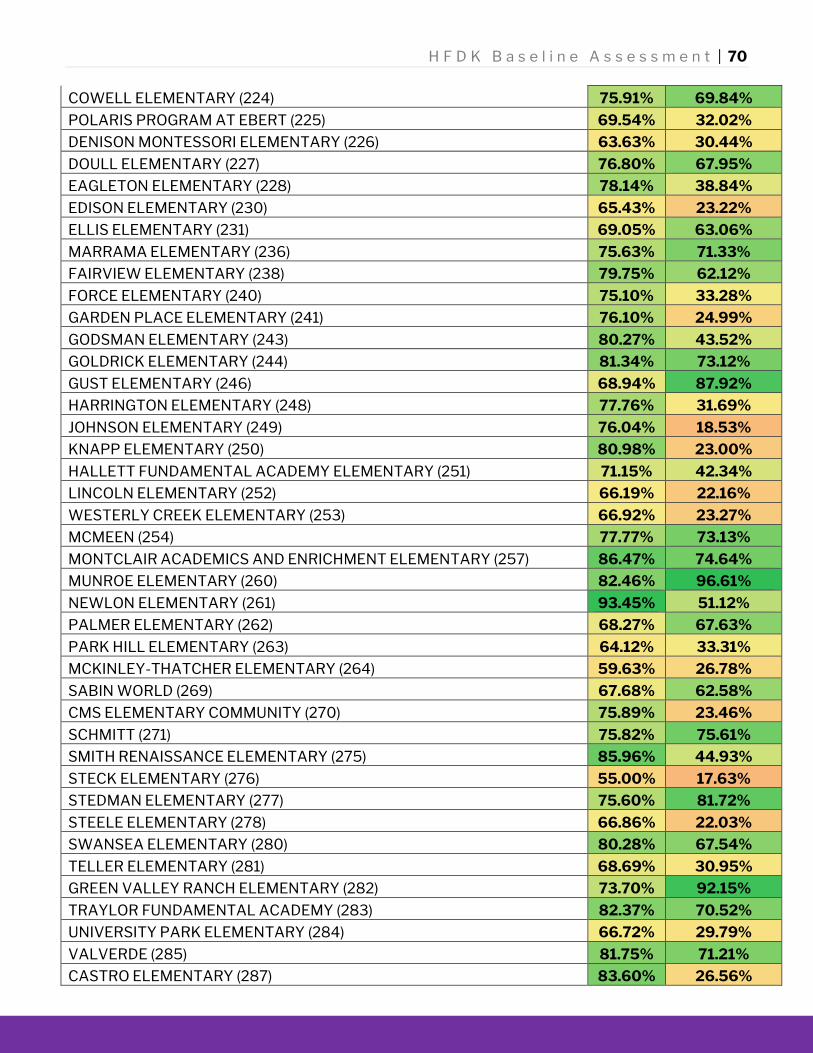
H F D K B a s e l i n e A s s e s s m e n t | 70
COWELL ELEMENTARY (224) 75.91% 69.84% POLARIS PROGRAM AT EBERT (225) 69.54% 32.02% DENISON MONTESSORI ELEMENTARY (226) 63.63% 30.44% DOULL ELEMENTARY (227) 76.80% 67.95% EAGLETON ELEMENTARY (228) 78.14% 38.84% EDISON ELEMENTARY (230) 65.43% 23.22% ELLIS ELEMENTARY (231) 69.05% 63.06% MARRAMA ELEMENTARY (236) 75.63% 71.33% FAIRVIEW ELEMENTARY (238) 79.75% 62.12% FORCE ELEMENTARY (240) 75.10% 33.28% GARDEN PLACE ELEMENTARY (241) 76.10% 24.99% GODSMAN ELEMENTARY (243) 80.27% 43.52% GOLDRICK ELEMENTARY (244) 81.34% 73.12% GUST ELEMENTARY (246) 68.94% 87.92% HARRINGTON ELEMENTARY (248) 77.76% 31.69% JOHNSON ELEMENTARY (249) 76.04% 18.53% KNAPP ELEMENTARY (250) 80.98% 23.00% HALLETT FUNDAMENTAL ACADEMY ELEMENTARY (251) 71.15% 42.34% LINCOLN ELEMENTARY (252) 66.19% 22.16% WESTERLY CREEK ELEMENTARY (253) 66.92% 23.27% MCMEEN (254) 77.77% 73.13% MONTCLAIR ACADEMICS AND ENRICHMENT ELEMENTARY (257) 86.47% 74.64% MUNROE ELEMENTARY (260) 82.46% 96.61% NEWLON ELEMENTARY (261) 93.45% 51.12% PALMER ELEMENTARY (262) 68.27% 67.63% PARK HILL ELEMENTARY (263) 64.12% 33.31% MCKINLEY-THATCHER ELEMENTARY (264) 59.63% 26.78% SABIN WORLD (269) 67.68% 62.58% CMS ELEMENTARY COMMUNITY (270) 75.89% 23.46% SCHMITT (271) 75.82% 75.61% SMITH RENAISSANCE ELEMENTARY (275) 85.96% 44.93% STECK ELEMENTARY (276) 55.00% 17.63% STEDMAN ELEMENTARY (277) 75.60% 81.72% STEELE ELEMENTARY (278) 66.86% 22.03% SWANSEA ELEMENTARY (280) 80.28% 67.54% TELLER ELEMENTARY (281) 68.69% 30.95% GREEN VALLEY RANCH ELEMENTARY (282) 73.70% 92.15% TRAYLOR FUNDAMENTAL ACADEMY (283) 82.37% 70.52% UNIVERSITY PARK ELEMENTARY (284) 66.72% 29.79% VALVERDE (285) 81.75% 71.21% CASTRO ELEMENTARY (287) 83.60% 26.56%

H F D K B a s e l i n e A s s e s s m e n t | 71
MAXWELL ELEMENTARY (290) 68.73% 78.12% AMESSE ELEMENTARY (292) 78.19% 76.35% HOLM ELEMENTARY (294) 71.29% 57.68% KAISER ELEMENTARY (295) 63.59% 40.18% SAMUELS ELEMENTARY (296) 79.28% 34.88% CENTENNIAL ELEMENTARY (297) 75.94% 88.72% SOUTHMOOR ELEMENTARY (298) 58.39% 20.30% MCGLONE ELEMENTARY (299) 79.68% 77.33% ISABELLA BIRD ELEMENTARY (301) 76.11% 29.28% SANDRA TODD-WILLIAMS ACADEMY (308) 62.93% 84.18%
INSPIRE ELEMENTARY (311) 62.72% 29.12%
K-8 SCHOOLS LUNCH BREAKFAST DENVER GREEN (177) 66.74% 28.85% PLACE BRIDGE ACADEMY (190) 80.81% 54.41% WILLIAM (BILL) ROBERTS (194) 62.49% 27.31% FLORIDA PITT WALLER (195) 71.50% 77.51% FARRELL B. HOWELL (197) 73.37% 51.82% BRYANT-WEBSTER DUAL LANGUAGE ECE-8 (216) 63.26% 48.00% GRANT RANCH (235) 62.50% 50.23% MARIE L. GREENWOOD ACADEMY (258) 73.23% 61.16% DORA MOORE (259) 73.00% 57.89% SLAVENS (279) 65.60% 27.04% WHITTIER (289) 83.28% 39.57%
KUNSMILLER CREATIVE ARTS ACADEMY HIGH (465) 62.69% 16.10%
MIDDLE SCHOOLS LUNCH BREAKFAST BEAR VALLEY INTERNATIONAL (338) 81.75% 33.16% KEPNER BEACON MIDDLE (384) 76.64% 76.21% MCAULIFFE MANUAL MIDDLE (385) 51.40% 26.19% DENVER PUBLIC MONTESSORI MS (390) 53.74% 41.69% MCAULIFFE INTERNATIONAL MIDDLE (395) 59.83% 32.86% DENVER CENTER FOR 21ST-CENTURY LEARNING AT WYMAN MS (398) 25.33% 41.48% GRANT BEACON (405) 72.87% 44.92% HAMILTON (406) 58.48% 24.53% HILL CAMPUS OF ARTS & SCIENCES (407) 56.25% 19.56% MERRILL CAMPUS (412) 54.77% 31.70% MOREY MIDDLE (413) 60.05% 23.29% SKINNER (416) 58.78% 15.62% DENVER DISCOVERY (442) 55.42% 10.21%
LAKE INTERNATIONAL (448) 66.14% 18.45%

H F D K B a s e l i n e A s s e s s m e n t | 72
HIGH SCHOOLS LUNCH BREAKFAST MARTIN LUTHER KING, JR./ HIGH (419) 41.73% 19.67% BRUCE RANDOLPH MIDDLE (423) 44.06% 38.78% ABRAHAM LINCOLN HIGH (450) 44.43% 16.25% EAST HIGH(451) 10.52% 4.52% GEORGE WASHINGTON HIGH (452) 26.08% 10.08% JOHN F. KENNEDY HIGH (453) 29.57% 13.31% NORTH HIGH (455) 24.71% 15.12% SOUTH HIGH (456) 40.97% 23.87% THOMAS JEFFERSON HIGH (457) 42.60% 15.77% DENVER CENTER FOR INTERNATIONAL STUDIES HS (461) 47.05% 25.33% MANUAL HIGH 464) 34.05% 27.38% DCIS AT MONTBELLO HIGH (466) 42.47% 41.69% NOEL COMMUNITY ARTS HIGH (467) 47.22% 19.73% COLLEGIATE PREPARATORY ACADEMY (468) 30.79% 19.32% DELTA HIGH (470) 18.00% 4.79% HIGH TECH EARLY COLLEGE (471) 49.70% 19.48% DENVER SCHOOL OF THE ARTS HIGH (475) 37.45% 19.90% DENVER SCHOOL OF INNOVATION AND SUSTAINABLE DESIGN (504) 28.09% 6.83% RESPECT ACADEMY (506) 11.85% 1.41% NORTH HIGH SCHOOL ENGAGEMENT CENTER (507) 17.82% 23.95% MONTBELLO CAREER AND TECH HS (509) 14.57% 7.59% WEST EARLY COLLEGE (510) 46.26% 24.10% WEST LEADERSHIP ACADEMY HIGH (511) 50.37% 24.12% COMPASSION ROAD ACADEMY (515) 52.06% 35.62% EXCEL ACADEMY HIGH (516) 31.07% 16.52% NORTHFIELD HIGH (519) 29.79% 7.27% LEGACY OPTIONS HIGH (522) 48.61% 24.58% SUMMIT ACADEMY HIGH (604) 20.57% 5.83% CAREER EDUCATION CENTER EARLY COLLEGE OF DENVER (605) 36.51% 29.74%
VISTA ACADEMY HIGH (609) 13.27% 9.35%
ALTERNATIVE SCHOOLS LUNCH BREAKFAST FLORENCE CRITTENTON (473) 24.29% 20.51% P.R.E.P. ACADEMY MIDDLE (477) 40.15% 19.13% DENVER ONLINE HIGH (484) 2.16% 0.04% EMILY GRIFFITH TECHNICAL COLLEGE (602) 0.00% 7.13% CONTEMPORARY LEARNING ACADEMY (682) 38.67% 38.51% ROCKY MOUNTAIN SCHOOL OF EXPEDITIONARY LEARNING (750) 46.22% 0.00%

H F D K B a s e l i n e A s s e s s m e n t | 73
CHARTER SCHOOLS LUNCH BREAKFAST HIGHPOINT ACADEMY (117) 59.40% 82.32% MONARCH MONTESSORI (161) 66.19% 77.39% UNIVERSITY PREPARATORY (168) 79.57% 73.68% SOAR AT GREEN VALLEY RANCH (175) 77.48% 26.70% DENVER LANGUAGE (176) 65.30% 31.36% DENVER LANGUAGE AT CALVARY TEMPLE (1761) 58.42% 27.83% ACADEMY 360 (181) 83.49% 79.41% HIGHLINE ACADEMY NORTHEAST (183) 77.27% 91.66% STRIVE PREP - RUBY HILL (187) 84.27% 81.56% REACH (192) 63.47% 52.53% OMAR D. BLAIR (196) 73.39% 33.70% ODYSSEYOF DENVER (211) 59.40% 1.73% WYATT ACADEMY (212) 28.98% 26.52% KIPP NORTHEAST ELEMENTARY (306) 80.86% 84.74% UNIVERSITY PREPARATORY STEELE STREET (309) 76.14% 71.65% KIPP SUNSHINE PEAK ELEMENTARY (316) 83.24% 81.87% HIGHLINE ACADEMY SOUTHEAST (328) 53.87% 48.81% STRIVE MS KEPNER (331) 81.18% 81.19% DSST: HENRY MIDDLE (333) 82.46% 84.38% DSST MS @ NOEL CAMPUS 80.21% 38.44% THE BOYS SCHOOL OF DENVER (383) 77.28% 52.95% COMPASS ACADEMY MS (386) 73.38% 21.59% DSST: CONSERVATORY GREEN MIDDLE (388) 62.05% 52.28% STRIVE PREP - MONTBELLO (392) 74.72% 34.24% STRIVE PREP - GREEN VALLEY RANCH (393) 71.58% 69.44% DSST: COLLEGE VIEW MIDDLE (394) 72.52% 31.29% STRIVE PREP - FEDERAL (428) 86.16% 24.54% STRIVE PREP - WESTWOOD (429) 73.11% 25.66% KIPP NORTHEAST DENVER MIDDLE (435) 74.32% 71.46% DSST: COLE MS (436) 63.74% 48.87% DSST: BYERS MS (437) 60.62% 31.60% DSST: STAPLETON MIDDLE (438) 68.97% 29.45% DSST: GREEN VALLEY RANCH MIDDLE (443) 70.93% 46.94% STRIVE PREP - LAKE (444) 79.58% 51.01% STRIVE PREP SUNNYSIDE (445) 73.79% 21.49% GIRLS ATHLETIC LEADERSHIP MIDDLE (446) 66.59% 40.81% KIPP NORTHEAST DENVER LEADERSHIP ACADEMY HIGH (460) 66.51% 12.85% DSST: GREEN VALLEY RANCH HIGH (462) 53.05% 68.53%

H F D K B a s e l i n e A s s e s s m e n t | 74
DSST: COLE HIGH (472) 57.98% 67.41% DSST: STAPLETON HIGH (481) 52.31% 26.21% SOUTHWEST EARLY COLLEGE (485) 14.61% 20.94% ACADEMY OF URBAN LEARNING (488) 39.00% 19.17% DENVER JUSTICE CHARTER (497) 59.02% 53.51% KIPP DENVER COLLEGIATE HIGH (498) 56.92% 11.87% STRIVE PREP - SMART ACADEMY (513) 40.82% 15.28% STRIVE PREP - EXCEL (517) 39.15% 8.83% DSST: BYERS HIGH (518) 53.93% 24.80% GIRLS ATHLETIC LEADERSHIP HIGH (520) 49.01% 40.90% DSST: COLLEGE VIEW HIGH (521) 45.34% 38.00% DSST: CONSERVATORY GREEN HIGH (523) 62.83% 34.37% STRIVE PREP - RISE (525) 50.56% 14.45%
5280 HIGH SCHOOL (532) 51.82% 45.59%
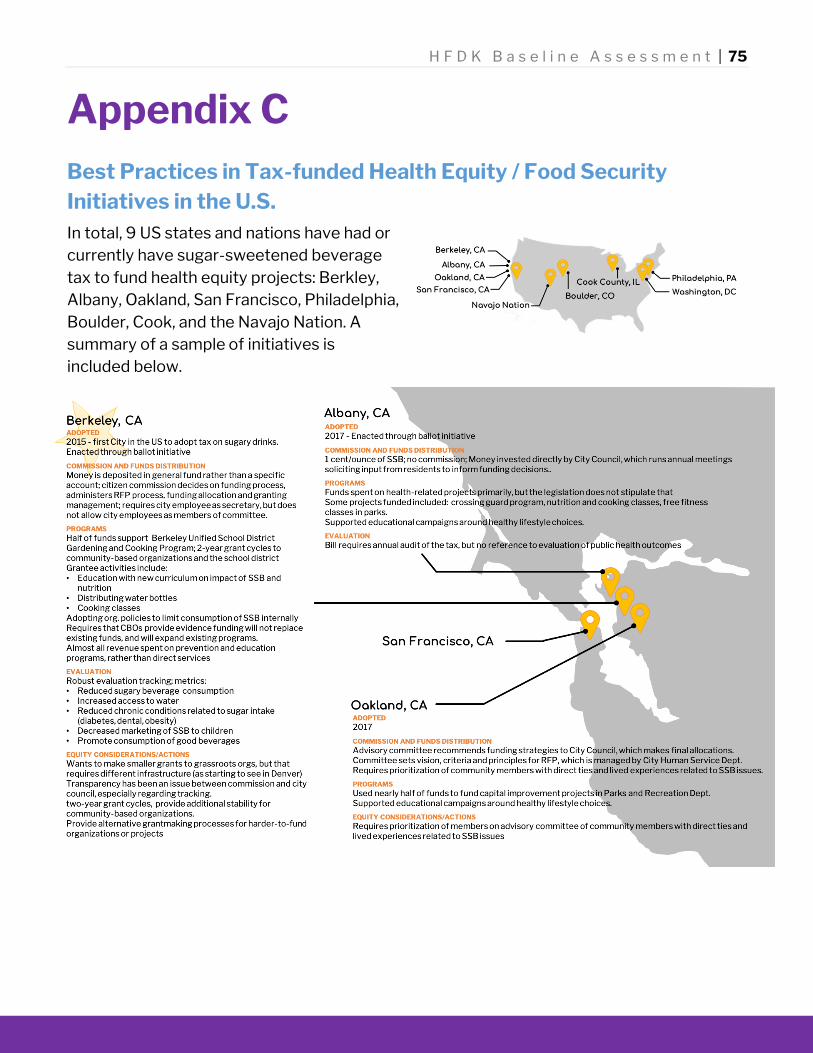
H F D K B a s e l i n e A s s e s s m e n t | 75
Appendix C Best Practices in Tax-funded Health Equity / Food Security Initiatives in the U.S. In total, 9 US states and nations have had or currently have sugar-sweetened beverage tax to fund health equity projects: Berkley, Albany, Oakland, San Francisco, Philadelphia, Boulder, Cook, and the Navajo Nation. A summary of a sample of initiatives is included below.
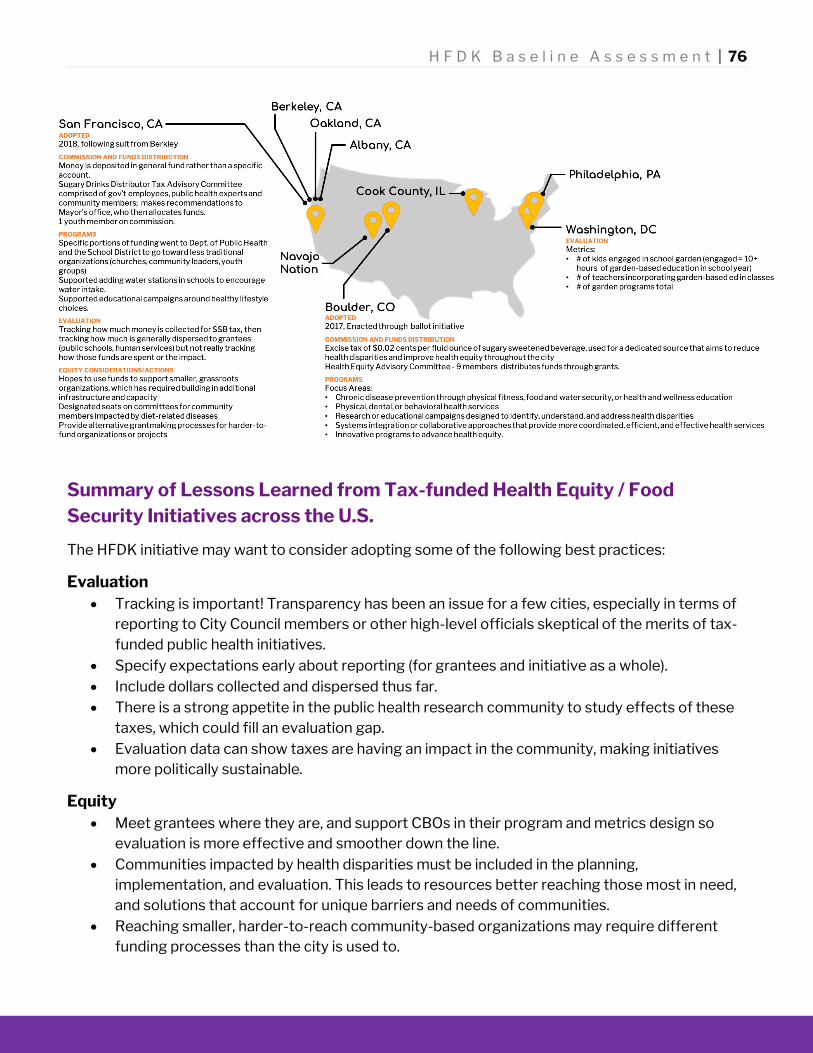
H F D K B a s e l i n e A s s e s s m e n t | 76
Summary of Lessons Learned from Tax-funded Health Equity / Food Security Initiatives across the U.S.
The HFDK initiative may want to consider adopting some of the following best practices:
Evaluation Tracking is important! Transparency has been an issue for a few cities, especially in terms of
reporting to City Council members or other high-level officials skeptical of the merits of tax-funded public health initiatives.
Specify expectations early about reporting (for grantees and initiative as a whole). Include dollars collected and dispersed thus far. There is a strong appetite in the public health research community to study effects of these
taxes, which could fill an evaluation gap. Evaluation data can show taxes are having an impact in the community, making initiatives
more politically sustainable.
Equity Meet grantees where they are, and support CBOs in their program and metrics design so
evaluation is more effective and smoother down the line. Communities impacted by health disparities must be included in the planning,
implementation, and evaluation. This leads to resources better reaching those most in need, and solutions that account for unique barriers and needs of communities.
Reaching smaller, harder-to-reach community-based organizations may require different funding processes than the city is used to.
H F D K B a s e l i n e A s s e s s m e n t | 77
Consider using alternative phrases for “Request for Proposals (RFPs)” such as “accepting ideas,” “accepting applications,” or “encouraging applications from the community.”
Two-year grant cycles offer more sustainability for community-based and smaller organizations.
Grantees and Programs Funded Education and prevention programs may have stronger impact on lifestyle changes. Direct service programs may have more impact on nutrition and food access for low-income
individuals.
Commission Structure Engage residents with lived experience on the Commission and/or proposal reviewing team. Make sure to get City Commission and/or Mayor buy-in to the evaluation. Include youth to ensure success, while recognizing this requires intentionality - few
teenagers are comfortable attending a meeting of adult experts. Helpful techniques include having more than one youth, or creating and supporting a separate youth advisory group.
Consider how inherent power dynamics arise from differences in expertise levels of commissioners, or between city and non-city commission members. Prioritizing community voices creates more grassroots, community-driven approach and lived expertise; while prioritizing public health experts, doctors, and city administrators will promote expertise. Be intentional in creating a space for both expertise to feel welcome, included, and valued.