Barrios and hyper barrios: how Latino neighborhoods changed the urban built environment
29
This article was downloaded by: [J.S Onesimo Sandoval] On: 10 July 2012, At: 11:25 Publisher: Routledge Informa Ltd Registered in England and Wales Registered Number: 1072954 Registered office: Mortimer House, 37-41 Mortimer Street, London W1T 3JH, UK Journal of Urbanism: International Research on Placemaking and Urban Sustainability Publication details, including instructions for authors and subscription information: http://www.tandfonline.com/loi/rjou20 Barrios and hyper barrios: how Latino neighborhoods changed the urban built environment J.S. Onésimo Sandoval a & Joel Jennings a a Saint Louis University, Saint Louis, USA Version of record first published: 04 Jul 2012 To cite this article: J.S. Onésimo Sandoval & Joel Jennings (2012): Barrios and hyper barrios: how Latino neighborhoods changed the urban built environment, Journal of Urbanism: International Research on Placemaking and Urban Sustainability, 5:2-3, 111-138 To link to this article: http://dx.doi.org/10.1080/17549175.2012.693124 PLEASE SCROLL DOWN FOR ARTICLE Full terms and conditions of use: http://www.tandfonline.com/page/terms-and-conditions This article may be used for research, teaching, and private study purposes. Any substantial or systematic reproduction, redistribution, reselling, loan, sub-licensing, systematic supply, or distribution in any form to anyone is expressly forbidden. The publisher does not give any warranty express or implied or make any representation that the contents will be complete or accurate or up to date. The accuracy of any instructions, formulae, and drug doses should be independently verified with primary sources. The publisher shall not be liable for any loss, actions, claims, proceedings, demand, or costs or damages whatsoever or howsoever caused arising directly or indirectly in connection with or arising out of the use of this material.
-
Upload
independent -
Category
Documents
-
view
0 -
download
0
Transcript of Barrios and hyper barrios: how Latino neighborhoods changed the urban built environment
This article was downloaded by: [J.S Onesimo Sandoval]On: 10 July 2012, At: 11:25Publisher: RoutledgeInforma Ltd Registered in England and Wales Registered Number: 1072954 Registered office:Mortimer House, 37-41 Mortimer Street, London W1T 3JH, UK
Journal of Urbanism: International Researchon Placemaking and Urban SustainabilityPublication details, including instructions for authors and subscriptioninformation:http://www.tandfonline.com/loi/rjou20
Barrios and hyper barrios: how Latinoneighborhoods changed the urban builtenvironmentJ.S. Onésimo Sandoval a & Joel Jennings aa Saint Louis University, Saint Louis, USA
Version of record first published: 04 Jul 2012
To cite this article: J.S. Onésimo Sandoval & Joel Jennings (2012): Barrios and hyper barrios: how Latinoneighborhoods changed the urban built environment, Journal of Urbanism: International Research onPlacemaking and Urban Sustainability, 5:2-3, 111-138
To link to this article: http://dx.doi.org/10.1080/17549175.2012.693124
PLEASE SCROLL DOWN FOR ARTICLE
Full terms and conditions of use: http://www.tandfonline.com/page/terms-and-conditions
This article may be used for research, teaching, and private study purposes. Any substantialor systematic reproduction, redistribution, reselling, loan, sub-licensing, systematic supply, ordistribution in any form to anyone is expressly forbidden.
The publisher does not give any warranty express or implied or make any representation that thecontents will be complete or accurate or up to date. The accuracy of any instructions, formulae,and drug doses should be independently verified with primary sources. The publisher shall notbe liable for any loss, actions, claims, proceedings, demand, or costs or damages whatsoever orhowsoever caused arising directly or indirectly in connection with or arising out of the use of thismaterial.
Barrios and hyper barrios: how Latino neighborhoods changed theurban built environment
J.S. Onésimo Sandoval* and Joel Jennings
Saint Louis University, Saint Louis, USA
This paper examines the trends in Latino neighborhoods located in a metropolitan sta-tistical area. We focused on Latino neighborhoods because they are important featuresof the urban built environment. The change in this urban space from non-Latino toLatino identity has significant implications. The analysis focused on four researchquestions: (1) how many Latino neighborhoods exist in the US? (2) which metropoli-tan regions had Latino neighborhoods? (3) what was the spatial relationship of Latinoneighborhoods within each region? and (4) what factors were associated with Latinoneighborhoods? We provide empirical evidence to answer these questions. First,Latino neighborhoods have increased by 232% from 1980 to 2010. Second, there were13 metropolitan regions that had more than 100 Latino neighborhoods in 2010. Third,the majority of the Latino neighborhoods in each region were highly clustered inspace with each other. Fourth, the proportion of Latino immigrations, Latino poverty,and Latinos who speak another language at home (other than English) were associatedwith the densification of Latino neighborhoods (i.e. hyper barrios). Our research sug-gests that Latino neighborhoods offer an important analytical lens into understandingthe social, economic and political forces that make the city function on a day-to-daybasis.
Keywords: Latino; neighborhoods; Mexican; Cuban; Puerto Rican; Pan-Latino
Introduction
The American city is the heart and soul of urban studies. The city conjures up imagesof the downtown skyline, open spaces, ethnic neighborhoods and diverse populations.The city is also spatially organized to support the social order of the built environment.One of the concepts that scholars have used to study the social order of the city is theconcept of a neighborhood (Keller 1968). In practice, city officials, elites, businessesand community organizations have used the neighborhood to organize the city and giveit meaning (Park and Burgess 1925). We know our city through our neighborhoods. Atone extreme, individuals and institutions have used the neighborhood to segregate anddisenfranchise certain populations (Massey and Denton 1993). At the other extreme,they have used the neighborhood to assimilate and unite city dwellers (Brown-Saracino2009). From an academic perspective, to comprehend the city and to make sense ofthis great invention, scholars have used the concept of a neighborhood to explore thesocial, economic and spatial organization of the city. Methodologically the concept ofthe neighborhood is used to study inequality, crime, racial discrimination, poverty andeducational attainment.
*Corresponding author.
Journal of UrbanismVol. 5, Nos. 2–3, July–November 2012, 111–138
ISSN 1754-9175 print/ISSN 1754-9183 online� 2012 Taylor & Francishttp://dx.doi.org/10.1080/17549175.2012.693124http://www.tandfonline.com
Dow
nloa
ded
by [
J.S
One
sim
o Sa
ndov
al]
at 1
1:25
10
July
201
2
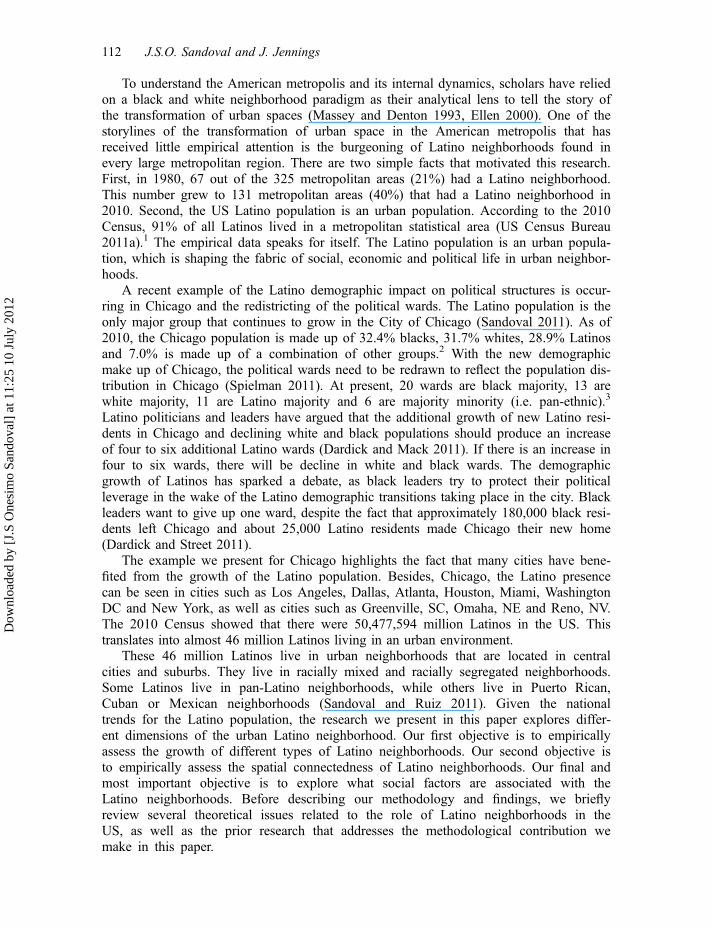
To understand the American metropolis and its internal dynamics, scholars have reliedon a black and white neighborhood paradigm as their analytical lens to tell the story ofthe transformation of urban spaces (Massey and Denton 1993, Ellen 2000). One of thestorylines of the transformation of urban space in the American metropolis that hasreceived little empirical attention is the burgeoning of Latino neighborhoods found inevery large metropolitan region. There are two simple facts that motivated this research.First, in 1980, 67 out of the 325 metropolitan areas (21%) had a Latino neighborhood.This number grew to 131 metropolitan areas (40%) that had a Latino neighborhood in2010. Second, the US Latino population is an urban population. According to the 2010Census, 91% of all Latinos lived in a metropolitan statistical area (US Census Bureau2011a).1 The empirical data speaks for itself. The Latino population is an urban popula-tion, which is shaping the fabric of social, economic and political life in urban neighbor-hoods.
A recent example of the Latino demographic impact on political structures is occur-ring in Chicago and the redistricting of the political wards. The Latino population is theonly major group that continues to grow in the City of Chicago (Sandoval 2011). As of2010, the Chicago population is made up of 32.4% blacks, 31.7% whites, 28.9% Latinosand 7.0% is made up of a combination of other groups.2 With the new demographicmake up of Chicago, the political wards need to be redrawn to reflect the population dis-tribution in Chicago (Spielman 2011). At present, 20 wards are black majority, 13 arewhite majority, 11 are Latino majority and 6 are majority minority (i.e. pan-ethnic).3
Latino politicians and leaders have argued that the additional growth of new Latino resi-dents in Chicago and declining white and black populations should produce an increaseof four to six additional Latino wards (Dardick and Mack 2011). If there is an increase infour to six wards, there will be decline in white and black wards. The demographicgrowth of Latinos has sparked a debate, as black leaders try to protect their politicalleverage in the wake of the Latino demographic transitions taking place in the city. Blackleaders want to give up one ward, despite the fact that approximately 180,000 black resi-dents left Chicago and about 25,000 Latino residents made Chicago their new home(Dardick and Street 2011).
The example we present for Chicago highlights the fact that many cities have bene-fited from the growth of the Latino population. Besides, Chicago, the Latino presencecan be seen in cities such as Los Angeles, Dallas, Atlanta, Houston, Miami, WashingtonDC and New York, as well as cities such as Greenville, SC, Omaha, NE and Reno, NV.The 2010 Census showed that there were 50,477,594 million Latinos in the US. Thistranslates into almost 46 million Latinos living in an urban environment.
These 46 million Latinos live in urban neighborhoods that are located in centralcities and suburbs. They live in racially mixed and racially segregated neighborhoods.Some Latinos live in pan-Latino neighborhoods, while others live in Puerto Rican,Cuban or Mexican neighborhoods (Sandoval and Ruiz 2011). Given the nationaltrends for the Latino population, the research we present in this paper explores differ-ent dimensions of the urban Latino neighborhood. Our first objective is to empiricallyassess the growth of different types of Latino neighborhoods. Our second objective isto empirically assess the spatial connectedness of Latino neighborhoods. Our final andmost important objective is to explore what social factors are associated with theLatino neighborhoods. Before describing our methodology and findings, we brieflyreview several theoretical issues related to the role of Latino neighborhoods in theUS, as well as the prior research that addresses the methodological contribution wemake in this paper.
112 J.S.O. Sandoval and J. Jennings
Dow
nloa
ded
by [
J.S
One
sim
o Sa
ndov
al]
at 1
1:25
10
July
201
2
The role of Latino neighborhoods
Latino neighborhoods are as diverse as the populations that comprise them, and they areintegral to the formation of an increasingly urban US Latino population. Latino popula-tion growth in both urban and suburban areas reflects the larger societal trends that haveemerged since the mid-1960s, shifts driven by changes in US immigration laws that con-tributed to high levels of both documented and undocumented immigration to many partsof the country (Massey 1993, Bean and Stevens 2003). Despite the importance of immi-gration in driving Latino population growth, domestic births are even more important forpopulation expansion, particularly among the second generation, which during the 1990soutpaced even the high rates of immigration of that decade (Suro and Passel 2003).Latino immigrants and the subsequent generations are concentrating in urban areas totake advantage of economic and cultural opportunities, as part of a process which seesthe continually growing importance of urban and suburban landscapes across the US(Singer et al. 2008, Wherry 2011).
The barrio has been described as a point of departure for recent Latino immigrants, aspace of opportunity for Latino residents and protection from the cultural norms of themajority population, and even critiqued as a space of dependence that can limit theopportunities of barrio dwellers. Geographers define a neighborhood as:
a district within an urban area ... it is frequently applied in general usage for any small resi-dential district irrespective of the degree of social integration there. A neighborhood sensustricto is a defined area within which there is an identifiable subculture to which the majorityof its residents conform. (Johnston et al. 2000, p. 540)
In this research, a Latino barrio is defined as a census tract in which Latinos comprise50% or greater of the total population (Jargowsky 1997, Iceland 2009) and the hyper-bar-rio is defined as a neighborhood that has a Latino population equal or greater than 75%.
While there is a vast corpus of literature that utilizes the concept of Latino neighbor-hoods (ranging from the neighborhood as a spatial backdrop to understandings of the bar-rio as liminal and even formative space), the concept is often engaged as a secondaryframework in analyses of other social phenomena. We organize this overview of the liter-ature into four subsections: the first part examines existing research that focuses on therole of the barrio as an ethnic neighborhood; the second part focuses on factors associ-ated with the organization of Latino neighborhoods; and the third outlines the spatialcharacteristics that comprise Latino neighborhoods around the US. The first three sectionsprovide a foundation for studies related to our key argument in the fourth sub-section,which highlights studies that suggest a need for demarcating and formalizing Latinoneighborhoods based on densification. We draw on clues from existing research suggest-ing a need to quantitatively differentiate between neighborhood types to advance an argu-ment for introducing the concept of the hyper-barrio.
The ethnic neighborhood: the barrio as point of departure
Ethnic neighborhoods can be conceptualized as the spatial and material manifestation ofan ethnic population in an urban landscape. The ethnic enclave model, originally devel-oped at the University of Chicago and based on European immigrant groups, postulatesthat ethnic neighborhoods represent spaces within the city that are recognized as ‘jumpingoff’ points for newly arrived immigrants. Logan et al. (2002) have argued that: “In thebeginning, people’s limited market resources and ethnically bound cultural and social
Journal of Urbanism 113
Dow
nloa
ded
by [
J.S
One
sim
o Sa
ndov
al]
at 1
1:25
10
July
201
2
capital are mutually reinforcing; they work in tandem to sustain ethnic neighborhoods”(p. 299). In previous generations, immigrant groups arrived and initially lived in theurban core, but as their social capital and economic welfare increased, they eventuallymoved out of the neighborhood, often to be replaced by a more recent generation ofimmigrants (Martin 2007). The ethnic enclave model of immigrant integration is basedon the notion that immigration patterns would end once immigration from abroadstopped, but also explained residential settlement for new ethnic immigrant groups asthey repeated the cycle of neighborhood transition from the previous generation. Thismodel of immigration integration continues to satisfactorily explain many Latino settle-ment patterns in urban centers.
Latino neighborhoods, however, are not solely concentrated in inner cities but areincreasingly located in suburban areas, and may have different characteristics than the eth-nic enclave (Sandoval and Ruiz 2011). Logan et al. (2002) suggested the importance ofethnic communities, or communities where immigrants with greater market choice chooseto live. They argued that “some groups are now able to establish enclaves in desirablelocations, often in suburbia, and group members may choose these locations even whenspatial assimilation is feasible” (p. 300). The evolution of Latino neighborhoods in thesuburbs also reflects the fact that unlike enclave communities formed by other ethnicgroups, Latino immigration since the second half of the twentieth century has not ended,but rather increased in volume and in geographic diffusion (Bean and Stevens 2003, Jime-nez 2010). Even in traditional urban Latino destination cities such as Chicago where theethnic neighborhood model was originated, barrios have been shaped by continuous flowsof immigration that have helped shape ever-expanding Latino neighborhoods (Padilla1985). These high levels of continuous immigration have led to population growth in bothurban and suburban Latino neighborhoods and require new conceptual models includingmodels that will account for factors associated with ethnic concentration.
Re-imagining the barrio: planning, poverty and people
The growing demographic power and presence of the Latino population in neighborhoodsaround the US is also bringing a shift in the way that urban theorists, planners and geog-raphers, among others, conceptualize the city. David Diaz (2005) highlighted the waysthat Chicano urbanism, including Latino neighborhoods, have been widely marginalizedand overlooked in studies of Los Angeles and the Southwestern cites of the US. Theurban barrio of the 1950s and 1960s often offered a social support function, as well asintegrating Latinos from various socio-economic statuses. The barrio values of “walking,communal relationships, sharing, active use of public space, taking time to talk, celebra-tion of children, opening the home for food, play and socialization” (Diaz 2005, p. 16)were and are key values that underpin the social functions of the barrio. With the flightof the Latino middle class to the suburbs during the 1970s and 1980s, the social net-works that comprised the barrio became spatially extended, and Diaz argued that the bar-rio became as much a ‘state of mind’ as a physical place (2005, p. 20). Despite socialchanges during the late twentieth century that served to concentrate poverty in barrios,Latino population growth and diffusion in cities across the US have made questions ofurban planning and the social fabric of barrio life increasingly important in cities, notonly in the Southwest, but across the US.
Latino neighborhoods may also serve to concentrate the effects of urban poverty, par-ticularly in the context of economic restructuring, deindustrialization and other factorsassociated with the spatial reorganization due to economic globalization. Economic
114 J.S.O. Sandoval and J. Jennings
Dow
nloa
ded
by [
J.S
One
sim
o Sa
ndov
al]
at 1
1:25
10
July
201
2
restructuring has played a critical role in limiting the economic opportunities available toresidents of Latino urban dwellers across the US (Moore and Pinderhughes 1993, Diaz2005). Although ethnic enclaves have historically allowed recent immigrants the opportu-nity to build social and economic capital, the realities of economic restructuring duringthe 1970s and 1980s greatly reduced the number of well-paid jobs that were available tolower skilled immigrants. The end result was that the economic restructuring undercut theintergenerational accumulation of wealth and human capital. Moreover, reductions in themanufacturing sector have contributed to the concentration of poverty within ethnicLatino neighborhoods (Moore and Pinderhughes 1993). While economic restructuringhad differential effects on Latino populations across the country, many Latino neighbor-hoods suffered by the outsourcing of US well-paid manufacturing jobs.
Recent research has also highlighted the importance of residential poverty and segre-gation in the Latino barrio. South et al. (2005) found that Latinos were less likely thanwhites to exit high-poverty neighborhoods, as well as finding variation among Mexicans,Cubans and Puerto Ricans in terms of their likelihood of moving from lower povertyareas to higher poverty areas. While social mobility research is relatively under-developedfor Latino neighborhoods, this type of research highlights the need for more tools forunderstanding how spatial and social processes in the barrio vary. National origin isanother key variable that may shape the material representations of culture and sense ofplace within a particular barrio. The Latino neighborhoods of East Los Angeles, forexample, are more likely to reflect Mexican, Chicano and increasingly Central Americaninfluences, while the Washington Heights neighborhood of New York highlights the cul-tural influences of Caribbean culture and the influences of the large Dominican popula-tion in that neighborhood (Leclerc et al. 1999, Aparicio 2006). Neighborhood boundariesthat are organized along nation-of-origin lines may inspire or exacerbate fragmentationwithin the Latino population, as in the context of the Puerto Rican and Mexican commu-nities in Chicago (De Genova and Ramos-Zaya 2003). Neighborhood succession, or thereplacement of one ethnic group by another within a neighborhood, may also play animportant role in the transformation of a particular barrio over-time (Massey 1993), butin the context of Latino neighborhoods the process may occur between various Latinogroups of differing national origins within Latin America, instead of between immigrantgroups of different ethnic or linguistic origins (Martin 2007).
Latino neighborhoods may influence a host of other life factors for Latino residents,ranging from health and wellness (Almeida et al. 2009), to access to quality education(Portes and Rumbaut 2006), to economic opportunities and business networks (Oberle2004). Understanding the composition of Latino neighborhoods will be integral toanswering questions about Latino economic and social opportunity, residential segrega-tion, health, education and a wide range of other factors for coming generations of anincreasingly large percentage of the US population.
Latino neighborhoods: quantitative measures of evaluation
There have been few time-series studies that examine the state of Latino neighborhoodsfor the entire US. While there are ethnographic accounts of the Latino neighborhood(Padilla 1985, De Genova and Ramos-Zaya 2003, Ricourt and Ruby 2003, Perez 2004,Diaz 2005), we had little success in finding contemporary literature that specificallyaddressed our questions on the US scale. Since the publication of The Hispanic Popula-tion of the United States by Bean and Tienda (1987), there has been a paucity of researchthat empirically examines the trends of Latino neighborhoods for the entire US. Maria
Journal of Urbanism 115
Dow
nloa
ded
by [
J.S
One
sim
o Sa
ndov
al]
at 1
1:25
10
July
201
2
Enchautegui published an article in 1997 that explored the economic status and impover-ished nature of Latino neighborhoods in 1980 and 1990 (Enchautegui 1997). Her studyfocused on Latino majority census tracts to develop an economic and poverty profile ofLatino majority spaces, and her research design included both urban and rural Latinomajority tracts. Another study by the Pew Hispanic Research Center measured the dis-persal and concentration of Latinos living in Latino majority neighborhoods in 2000(Suro and Tafoya 2004). The primary focus of that study was not the neighborhood, butrather the Latinos living in Latino neighborhoods. For example, no empirical evidencewas presented on how many Latino neighborhoods there were in the urban areas. Finally,several books have addressed that state of the Latino neighborhood directly or indirectly.Michael Martin (2007) explored the residential segregation patterns of Latinos living in ametropolitan statistical region from 1990 to 2000. He found that segregation betweenLatinos and whites had increased because of the growth of Latino immigration. Paul Jar-gowsky (1997) also explored the state of high poverty Latino neighborhoods. He pre-sented a series of tables that highlighted the vulnerability and geography of Latino highpoverty tracts. Finally, a book by John Iceland examined the relationship between resi-dential segregation and assimilation among Hispanics and its overall relationship withimmigration (Iceland 2009). Iceland’s work is probably the closest work to our research,where he examined the social and economic characteristics of the Latino neighborhoods.Even the book entitled Latinas/os in the United States (Rodriguez et al. 2007), which isthe most contemporary look at Latinos contributions to the US, failed to address theempirical reality of Latino neighborhoods in urban America.4 In all of these works, wehave no baseline to measure the empirical reality of Latino neighborhoods. It is importantto note, however, that although there are few studies that explore the questions we pres-ent in this paper, we have benefited greatly from these studies in our effort to examinehow the Latino neighborhood has shaped the American metropolis.
Spatial differentiation: the barrio and hyper-barrio
A walk through a heavily Mexican neighborhood in south Los Angeles is likely to offera considerably different sense of place than a middle-class suburban pan-Latino neighbor-hood in New York (Jones-Correa 1998, Davis 2001). Yet as we have noted, most existingquantitative analysis of Latino neighborhoods treat the barrio as a single entity withoutregard for internal differentiation that might alter the cultural landscape. While ethnogra-phers may be able to identify and theorize differences between these two neighborhoods,quantitative researchers generally have not examined the implications of the densificationof residential segregation in Latino neighborhoods, but rather have often treated them asempirically undifferentiated neighborhoods. A key aspect of this paper is to argue for for-malizing a quantitative measure that accounts for differences in ethnic concentrationamong various Latino neighborhoods.
There are a number of reasons to think that researchers should revisit their assump-tions about the undifferentiated composition of Latino neighborhoods. Recent researchexamining immigrant assimilation, for example, has highlighted the influence of neigh-borhood composition on the opportunities of immigrant young people. Studies of seg-mented assimilation have documented what are termed ‘neighborhood effects’, or theways that neighborhood characteristics may shape the opportunities of the children ofimmigrants in the US (Portes et al. 2005). These investigations have focused on the qual-ity of relationships built in immigrant neighborhoods and suggest, “community socialcapital depends less on the economic or occupational success of immigrants than on the
116 J.S.O. Sandoval and J. Jennings
Dow
nloa
ded
by [
J.S
One
sim
o Sa
ndov
al]
at 1
1:25
10
July
201
2
density of ties among them” (p. 1013). These neighborhood influences have particularlybeen explored in terms of children’s educational attainment (Portes and Hao 2004, Fer-nandez-Kelly and Konczal 2005), but similar approaches are also being used to studyneighborhood effects in other contexts. Frank et al. (2007), for example, in a study ofsubstance abuse and delinquent behavior, found that “the negative effect of residing inneighborhoods with above-county-average levels of Latinos was particularly pronouncedin the case of U.S.-born Latinos,” while similar neighborhood effects seem to have a pro-tective effect on the children of Latino immigrants (p. 295).
Likewise, clues suggesting the importance of Latino residential concentration can befound in qualitative geographic studies of Latino neighborhoods. James Curtis (2005), forexample, in a study of the shifting structure of the Southeast Los Angeles neighborhoods,documented the change in structure of the neighborhoods through a four phase modeldeveloping across the twentieth century. Through contemporary processes of reindustriali-zation and barrioization which has entailed high Latino residential densities, the South-east neighborhoods have seemingly attained some community stability. Curtis noted that:
… despite high densities and signs of deterioration in some neighborhoods, the district’s res-idential areas are relatively stable and attractive when compared with their metropolitancounterparts … through such forms of Latino cultural expression, a kind of place conscious-ness and sense of spatial attachment have been engendered that contest the socioeconomicand environmental marginalization of these barrios. (p. 141)
Curtis (2005) stated that the combination of high levels of residential concentration andeconomic processes are creating a distinctive form in these Latino neighborhoods.
Godfrey’s (2005) account of the Mission District of San Francisco identified similarfactors to those found in Southeast Los Angeles neighborhoods (Godfrey 2005). Like theSoutheast LA neighborhoods, the Mission District also underwent a rapid rise in thenumber of Latino residents. High rent and redevelopment projects brought processes ofgentrification during the 1990s, but the Latino population remained relatively level due torent stabilization and community efforts to protect the neighborhood. “Ethnic patterns ofimmigration, work and housing, community art and public space, and anti-displacementpolitics have created a defensive sense of place in the city’s primary Hispanic barrio”(Godfrey 2005, p. 102). We see again the concentration of Latino residents as a key ele-ment in shaping the sustainability of the (suburban) neighborhood.
Despite the disparate origins of these studies, they suggest the need for a more refinedquantitative means of understanding Latino neighborhoods. The place-based differencesfound in ethnic neighborhoods generally suggest that the densification of Latino neigh-borhoods provides important qualities in terms of shaping the Latino urban landscape.Common variables in these studies would also seem to suggest that high levels of immi-gration and poverty also play key roles in shaping neighborhoods that have been identi-fied due to their densification. We explore these variables, in the context of urbandensification, and hypothesize that higher density Latino neighborhoods will have differ-ent demographic characteristics than lower density barrios.
Research question and data
The analysis presented in this paper was organized around four research questionsfocused on the Latino neighborhood. First, how many Latino neighborhoods were locatedin a metropolitan statistical area in 1980, 1990, 2000 and 2010? Second, in whatmetropolitan regions were these Latino neighborhoods located? Third, what was the spa-
Journal of Urbanism 117
Dow
nloa
ded
by [
J.S
One
sim
o Sa
ndov
al]
at 1
1:25
10
July
201
2
tial relationship of the Latino neighborhoods in each metropolitan region? Finally, whatfactors were associated with Latino neighborhoods and the densification of Latinos livingin these neighborhoods? To our knowledge, this will be the first paper that explores thesequestions and our findings will make a significant contribution to the fields of urban stud-ies and Latino studies.
The data used in this study came from the GeoLytics Neighborhood Change Data-base, which contains US Census data for 1980, 1990 and 2000 (GeoLytics Inc. 2004),the 2010 Census Summary File 1, and the 2006–2010 American Community Survey5-Year Estimates. We used the census tract as a proxy for a neighborhood. This is themost common practice in social science research when conducting an analysis for theentire US (Jargowsky 1997, Iceland 2009). Our first step was to identify Latino neighbor-hoods. A Latino neighborhood was defined as a census tract where 50% or more of theresidents in the census tracts self-identified ethnically as a Latino. Our second step was toselect Latino neighborhoods that were located in a metropolitan statistical area defined bythe US Census for the four time-periods. According to our calculations, in 1980, 31% ofthe total Latino population in the US lived in the 1811 Latino neighborhoods; in 1990,36% of the total Latino population lived in the 2602 Latino neighborhoods; in 2000,40% of the total Latino population lived in the 3951 Latino neighborhoods; and in 2010,41% of the total Latino population lived in the 6018 Latino neighborhoods.5
Our third step was to identify two types of Latino neighborhoods: (1) the barrio and(2) the hyper barrio. The argument we make in this paper is that Latino neighborhoodsvary by the concentration of Latinos living in the neighborhood. The weakness of theprevious studies was that they viewed Latino neighborhoods a dichotomous variable (i.e.Latino neighborhood vs. non-Latino neighborhood). In this paper, we advance the argu-ment that there are different types of Latino neighborhoods. The densification of Latinobarrios may reflect the historic patterns of social and economic processes that augmentresidential settlement patterns that contribute to the forces of de facto segregation. Aneighborhood that is 95% Latino may be located in different parts of the city comparedto a neighborhood that is 51% Latino. Both types of neighborhoods are important, butwe do not understand how they are related to the spatial hierarchy found in many Ameri-can cities. A barrio was defined when the Latino population comprised 50% and lessthan 75% of the total population in the census tract. A hyper barrio was defined whenthe Latino population comprised 75% or more of the total population in the census tract.We also wanted to study the distribution of barrios and hyper barrios by Latino sub-group. The data limitations allowed us to examine three subgroups: (1) Mexican, (2)Puerto Rican and (3) Cuban. To classify the census tracts into the subgroups, the sub-group had to comprise 50% or more of the Latino population. We created a fourth cate-gory called ‘Other’ Latino.
Findings
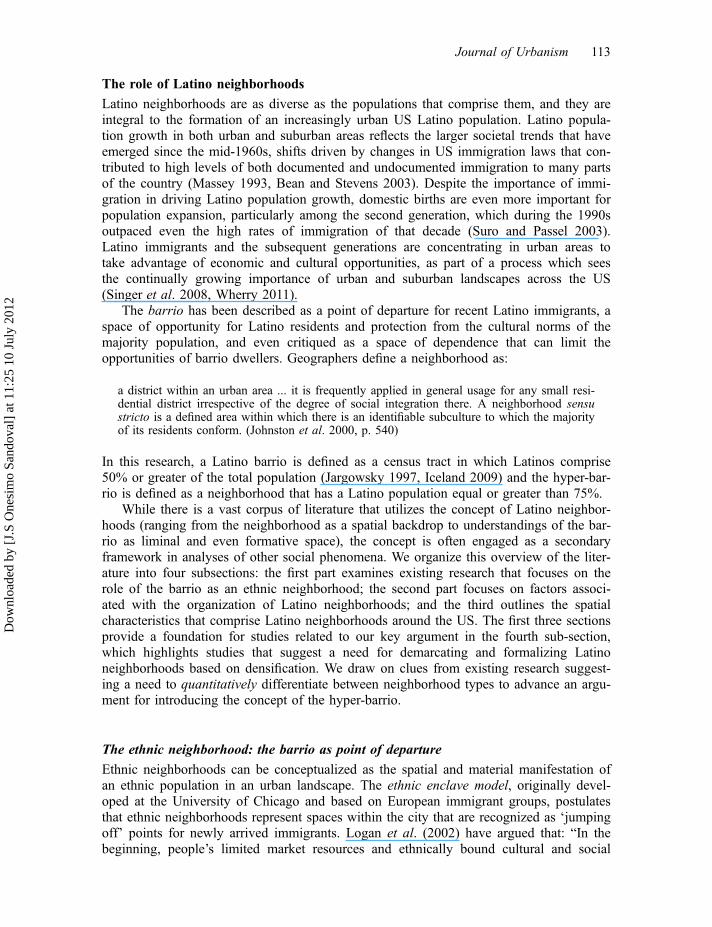
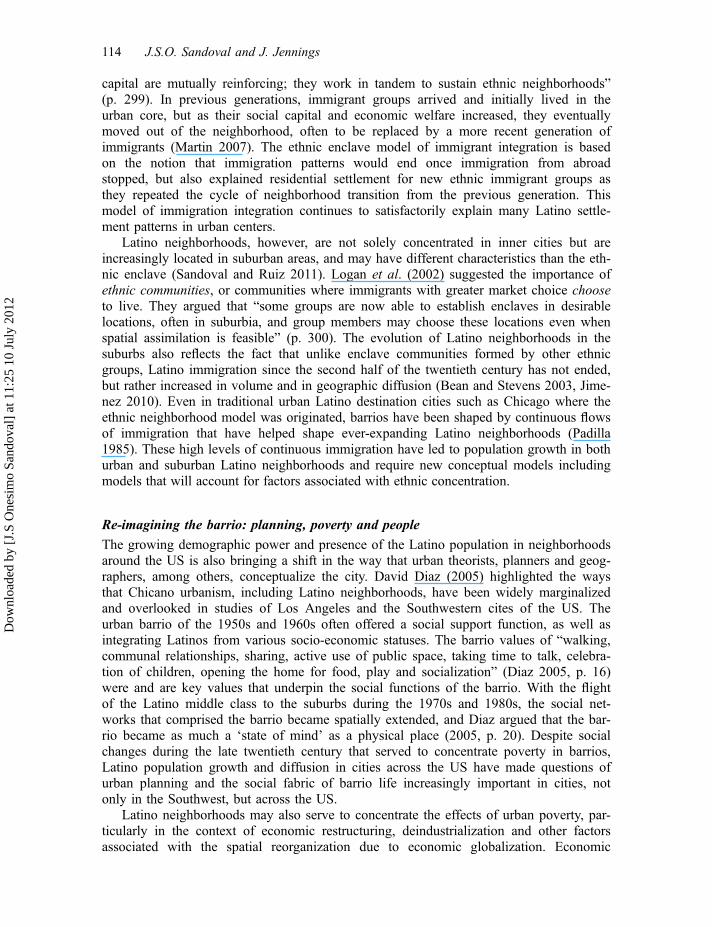
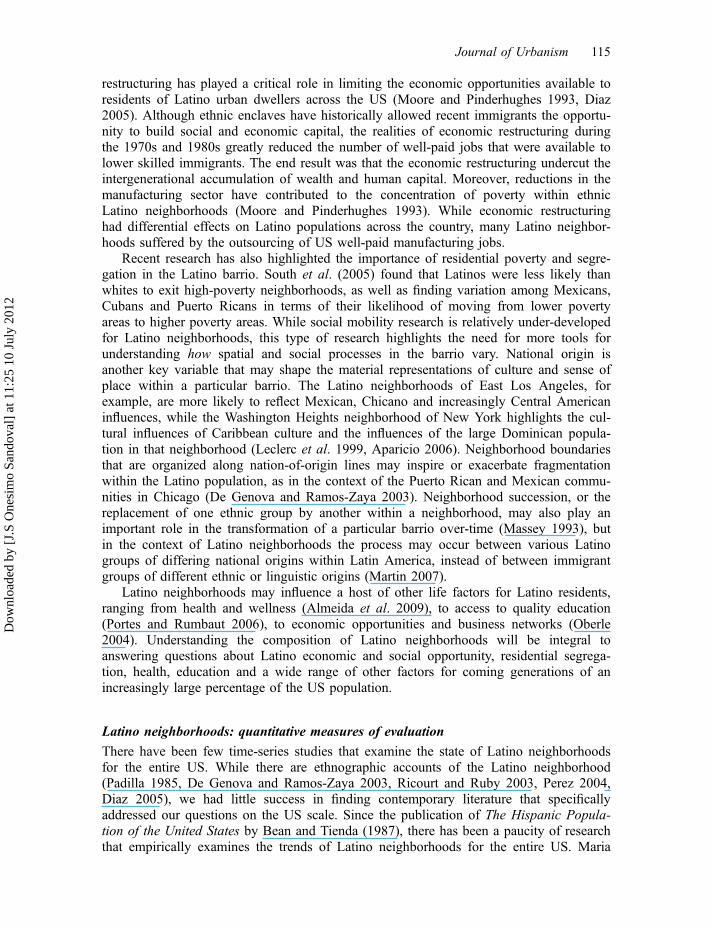
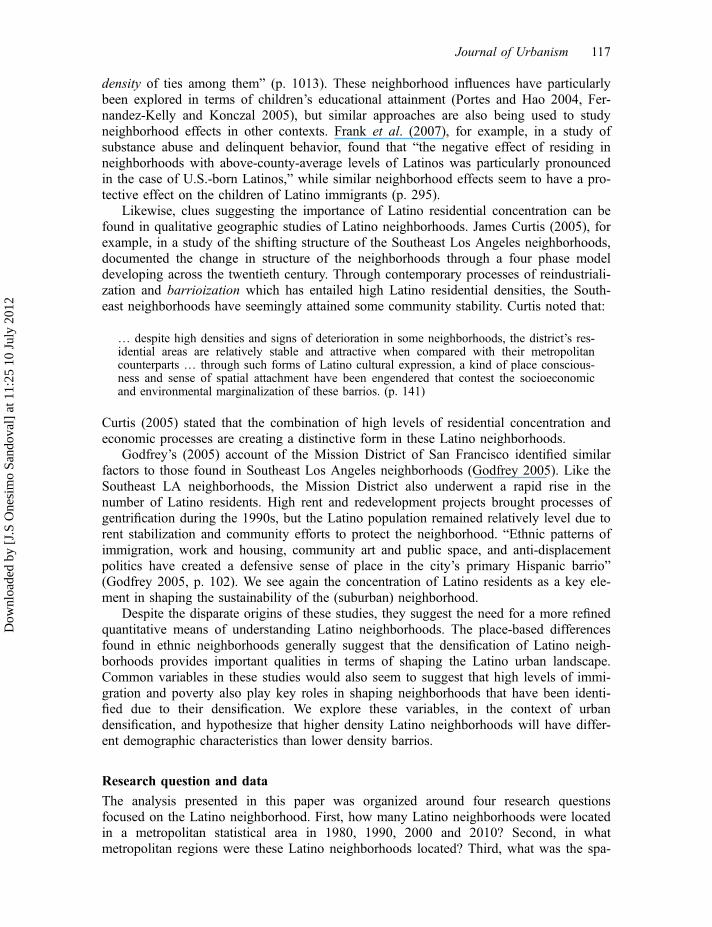
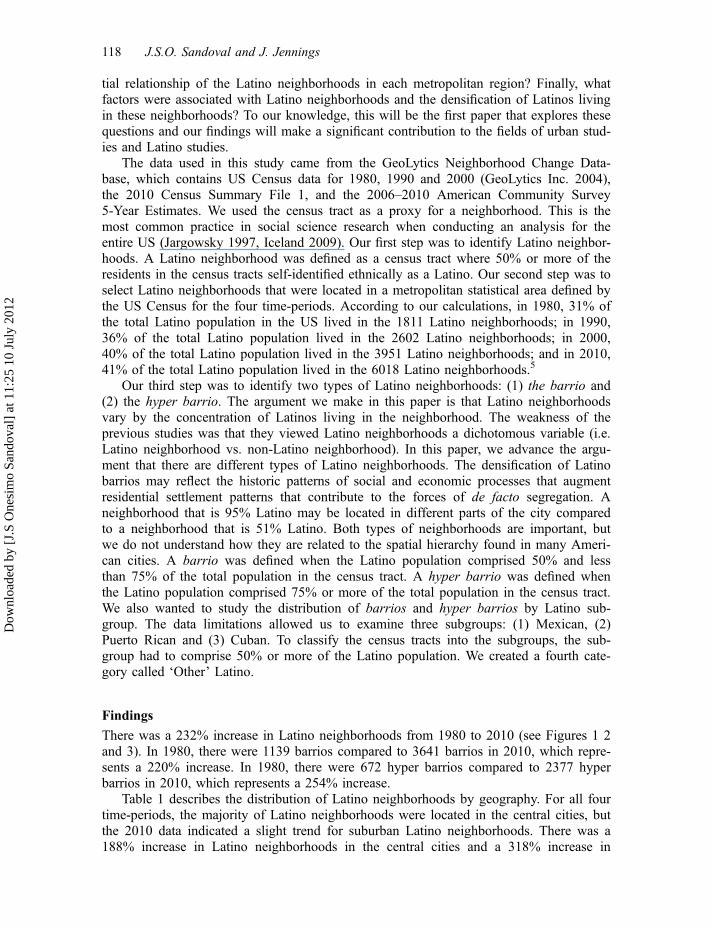
There was a 232% increase in Latino neighborhoods from 1980 to 2010 (see Figures 1 2and 3). In 1980, there were 1139 barrios compared to 3641 barrios in 2010, which repre-sents a 220% increase. In 1980, there were 672 hyper barrios compared to 2377 hyperbarrios in 2010, which represents a 254% increase.
Table 1 describes the distribution of Latino neighborhoods by geography. For all fourtime-periods, the majority of Latino neighborhoods were located in the central cities, butthe 2010 data indicated a slight trend for suburban Latino neighborhoods. There was a188% increase in Latino neighborhoods in the central cities and a 318% increase in
118 J.S.O. Sandoval and J. Jennings
Dow
nloa
ded
by [
J.S
One
sim
o Sa
ndov
al]
at 1
1:25
10
July
201
2
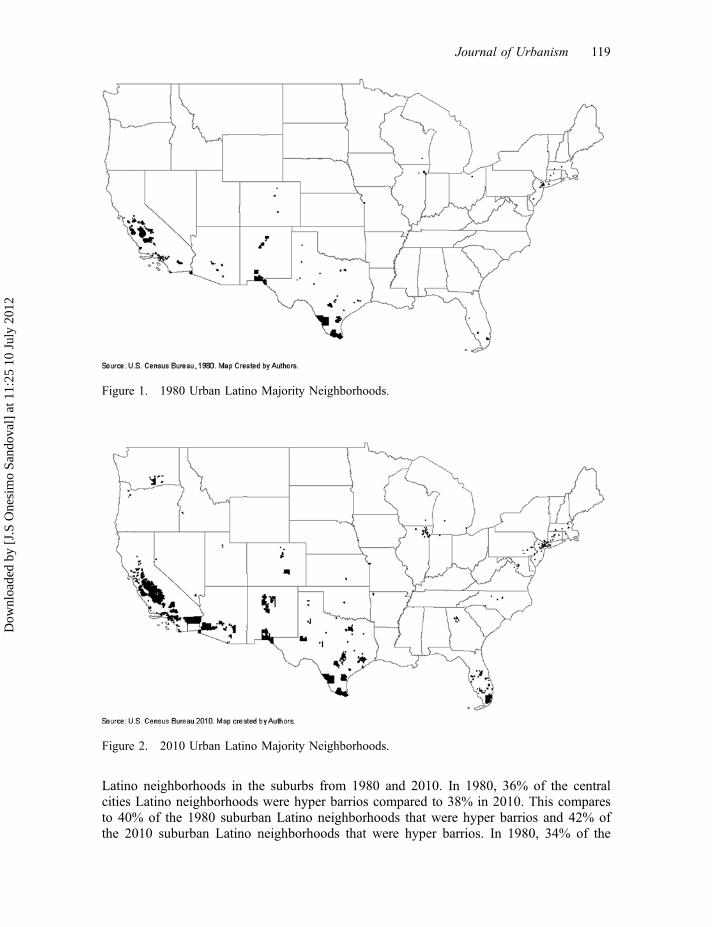
Latino neighborhoods in the suburbs from 1980 and 2010. In 1980, 36% of the centralcities Latino neighborhoods were hyper barrios compared to 38% in 2010. This comparesto 40% of the 1980 suburban Latino neighborhoods that were hyper barrios and 42% ofthe 2010 suburban Latino neighborhoods that were hyper barrios. In 1980, 34% of the
Figure 1. 1980 Urban Latino Majority Neighborhoods.
Figure 2. 2010 Urban Latino Majority Neighborhoods.
Journal of Urbanism 119
Dow
nloa
ded
by [
J.S
One
sim
o Sa
ndov
al]
at 1
1:25
10
July
201
2
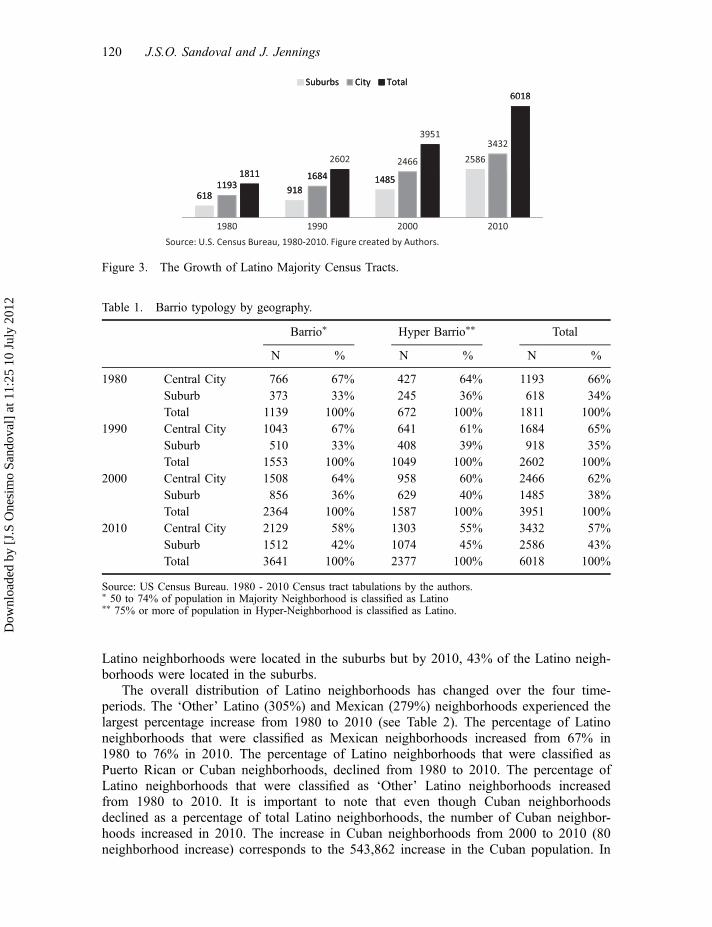
Latino neighborhoods were located in the suburbs but by 2010, 43% of the Latino neigh-borhoods were located in the suburbs.
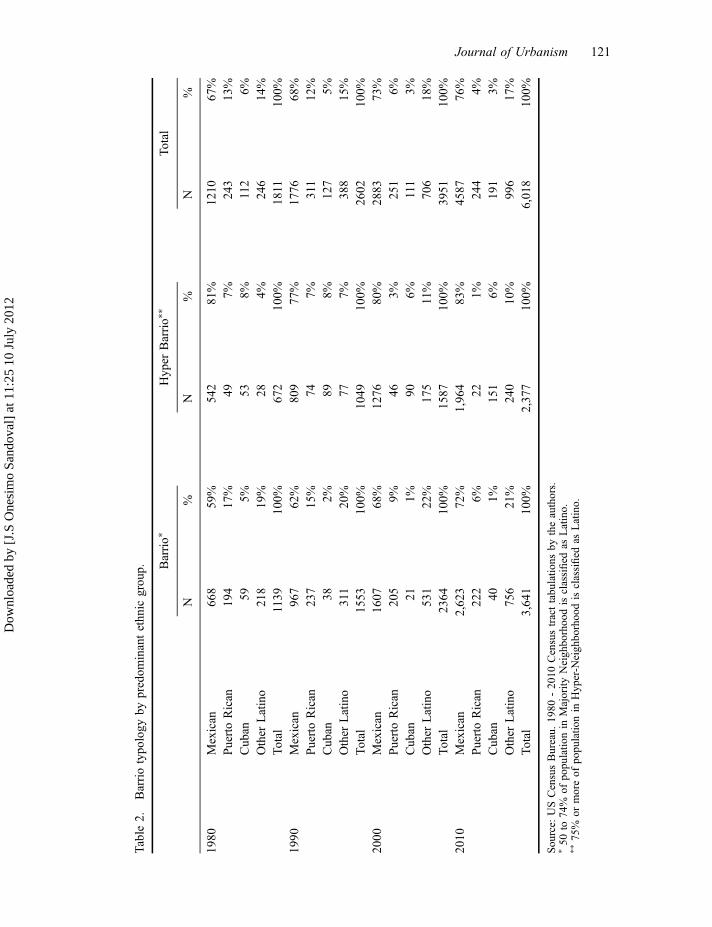
The overall distribution of Latino neighborhoods has changed over the four time-periods. The ‘Other’ Latino (305%) and Mexican (279%) neighborhoods experienced thelargest percentage increase from 1980 to 2010 (see Table 2). The percentage of Latinoneighborhoods that were classified as Mexican neighborhoods increased from 67% in1980 to 76% in 2010. The percentage of Latino neighborhoods that were classified asPuerto Rican or Cuban neighborhoods, declined from 1980 to 2010. The percentage ofLatino neighborhoods that were classified as ‘Other’ Latino neighborhoods increasedfrom 1980 to 2010. It is important to note that even though Cuban neighborhoodsdeclined as a percentage of total Latino neighborhoods, the number of Cuban neighbor-hoods increased in 2010. The increase in Cuban neighborhoods from 2000 to 2010 (80neighborhood increase) corresponds to the 543,862 increase in the Cuban population. In
Table 1. Barrio typology by geography.
Barrio⁄ Hyper Barrio⁄⁄ Total
N % N % N %
1980 Central City 766 67% 427 64% 1193 66%Suburb 373 33% 245 36% 618 34%Total 1139 100% 672 100% 1811 100%
1990 Central City 1043 67% 641 61% 1684 65%Suburb 510 33% 408 39% 918 35%Total 1553 100% 1049 100% 2602 100%
2000 Central City 1508 64% 958 60% 2466 62%Suburb 856 36% 629 40% 1485 38%Total 2364 100% 1587 100% 3951 100%
2010 Central City 2129 58% 1303 55% 3432 57%Suburb 1512 42% 1074 45% 2586 43%Total 3641 100% 2377 100% 6018 100%
Source: US Census Bureau. 1980 - 2010 Census tract tabulations by the authors.⁄ 50 to 74% of population in Majority Neighborhood is classified as Latino⁄⁄ 75% or more of population in Hyper-Neighborhood is classified as Latino.
Figure 3. The Growth of Latino Majority Census Tracts.
120 J.S.O. Sandoval and J. Jennings
Dow
nloa
ded
by [
J.S
One
sim
o Sa
ndov
al]
at 1
1:25
10
July
201
2
Table
2.Barriotypology
bypredom
inantethnic
group. B
arrio⁄
Hyper
Barrio⁄
⁄To
tal
N%
N%
N%
1980
Mexican
668
59%
542
81%
1210
67%
PuertoRican
194
17%
497%
243
13%
Cuban
595%
538%
112
6%Other
Latino
218
19%
284%
246
14%
Total
1139
100%
672
100%
1811
100%
1990
Mexican
967
62%
809
77%
1776
68%
PuertoRican
237
15%
747%
311
12%
Cuban
382%
898%
127
5%Other
Latino
311
20%
777%
388
15%
Total
1553
100%
1049
100%
2602
100%
2000
Mexican
1607
68%
1276
80%
2883
73%
PuertoRican
205
9%46
3%251
6%Cuban
211%
906%
111
3%Other
Latino
531
22%
175
11%
706
18%
Total
2364
100%
1587
100%
3951
100%
2010
Mexican
2,623
72%
1,964
83%
4587
76%
PuertoRican
222
6%22
1%244
4%Cuban
401%
151
6%191
3%Other
Latino
756
21%
240
10%
996
17%
Total
3,641
100%
2,377
100%
6,018
100%
Sou
rce:
USCensusBureau.
1980
-20
10Censustracttabu
latio
nsby
theauthors.
⁄50
to74
%of
popu
latio
nin
Majority
Neigh
borhoo
disclassified
asLatino.
⁄⁄75
%or
moreof
popu
latio
nin
Hyp
er-N
eigh
borhoo
disclassified
asLatino.
Journal of Urbanism 121
Dow
nloa
ded
by [
J.S
One
sim
o Sa
ndov
al]
at 1
1:25
10
July
201
2

fact, 186 of 191 Cuban neighborhoods were in Miami in 2010, compared to 86 out 96Cuban neighborhoods in 1980. Despite the fact that the Puerto Rican populationincreased from 2000 to 2010 (1,217,538) Puerto Rican neighborhoods have declined dur-ing this same time period (7 neighborhood decline). In 1980, 53% of Cuban majorityneighborhoods were classified as barrios and 47% were classified as hyper barrios. Thiscompares to 21% of Cuban neighborhoods that were classified as barrios in 2010 and79% that were classified as hyper barrios. Approximately one out of 10 (11%) of the‘Other’ Latino neighborhoods were hyper barrios in 1980 compared to one out of four(24%) in 2010.
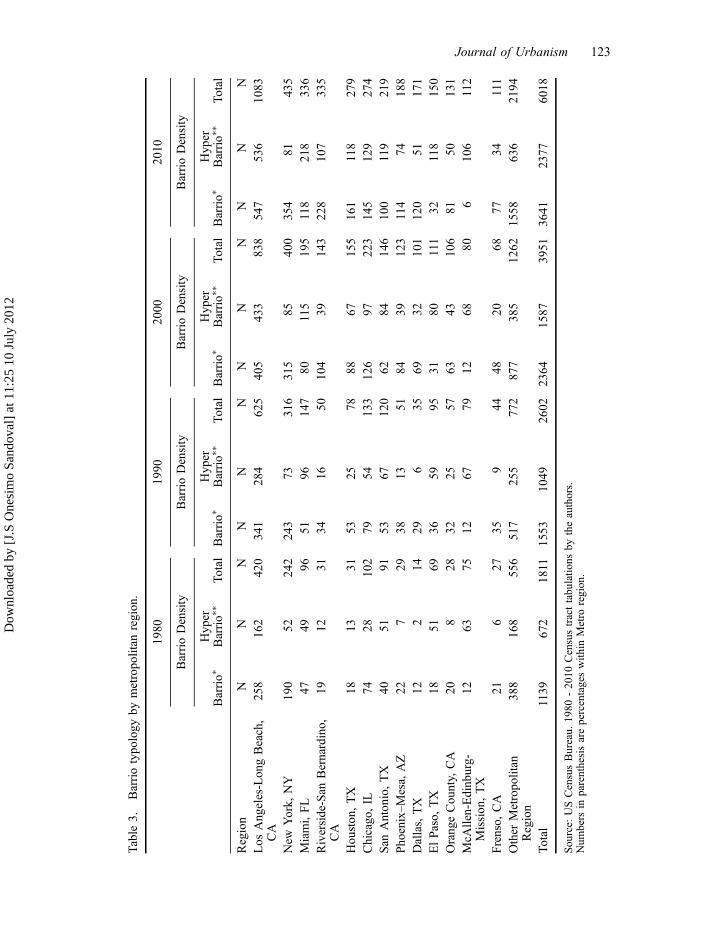
Table 3 shows the barrio typology and Latino subgroup type by metropolitan statisti-cal region. We only included regions that had 100 or more Latino neighborhoods in 2010for this Table. In 1980, 69% of Latino neighborhoods were found in 13 metropolitanregions. This number has fallen to 64% in 2010. For 1980, 1990 and 2000, Los Angeles,New York and Chicago, respectively, were home to the largest concentration of Latinoneighborhoods. By 2010, Miami replaced Chicago and Houston and Riverside surpassedChicago, which fell to 5th place for the number of Latino neighborhoods. The Table alsoshows some interesting shifts in the type of Latino neighborhoods for each region. Forall four census counts, there were four regions where the majority of Latino neighbor-hoods were hyper barrios (i.e. Miami, San Antonio, El Paso and McAllen). Dallas experi-enced the largest percentage increase (1121%) in total Latino neighborhoods from1980 to2010, followed by Riverside–San Bernardino (980%) and Houston (800%). Los Angeleshad the most hyper barrios in 2010 (536) followed by Miami (218) and Chicago (129).
For all four census counts, the vast majority of Latino neighborhoods in Los Angeleswere Mexican neighborhoods. In 2010, only 89 Latino neighborhoods were classified as‘Other’ Latino neighborhoods. In New York in 1980, 72% of the Latino neighborhoodswere classified as Puerto Rican neighborhoods and 28% were classified as ‘Other’ Latinoneighborhoods. However, in 2010, the majority of Latino neighborhoods were classifiedas ‘Other’ Latino neighborhoods (83%). The percentage of Puerto Rican neighborhoodsin New York fell to 15%. There were only eight Mexican neighborhoods in New Yorkand there were no Cuban neighborhoods in 2010. In Miami in 2010, 55% of the Latinoneighborhoods were Cuban majority and 44% were ‘Other’ Latino neighborhoods. Therewas one Mexican neighborhood in 2010. Chicago was the only metropolitan region thathad a significant number of neighborhoods for two subgroups from 1980 through to2000. However, the data show that the Mexican neighborhoods have outpaced the PuertoRican neighborhoods. In 1980, 50% of the Latino neighborhoods were Mexican and 30%were Puerto Rican. In 2010, 96% of the Latino neighborhoods were Mexican and 2%were Puerto Rican. The decline in Puerto Rican neighborhoods was significant. Chicagohad 30 Puerto Rican neighborhoods in 1980 compared to four in 2010.
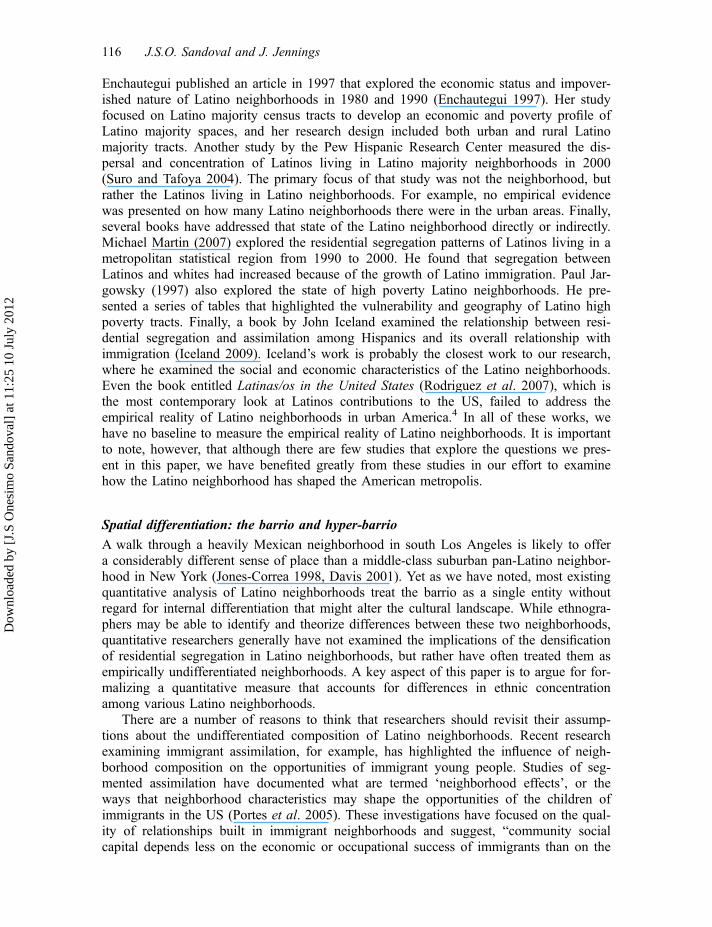
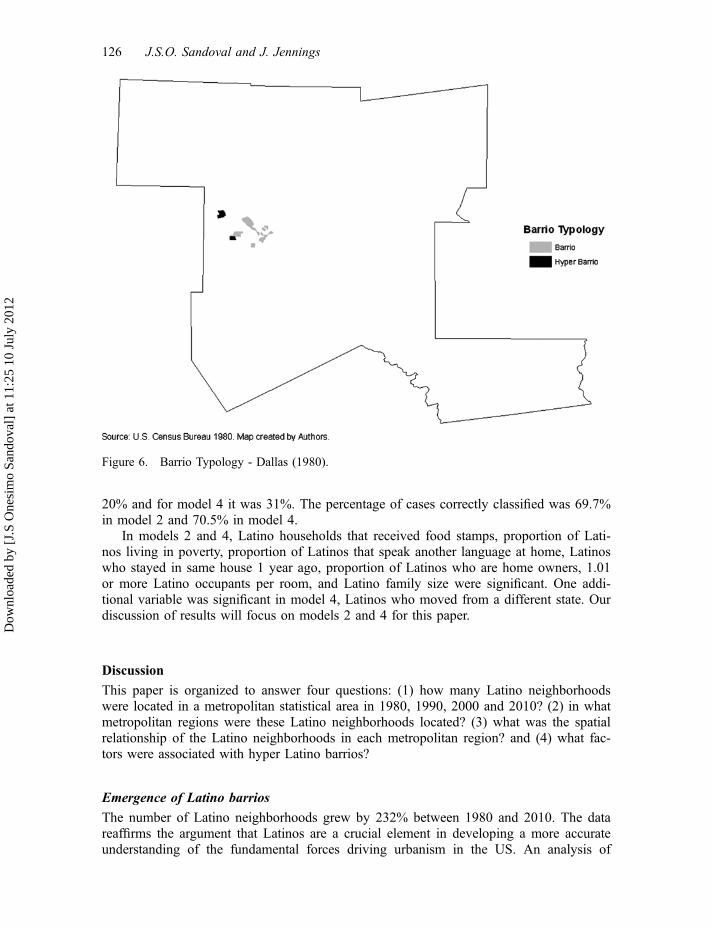
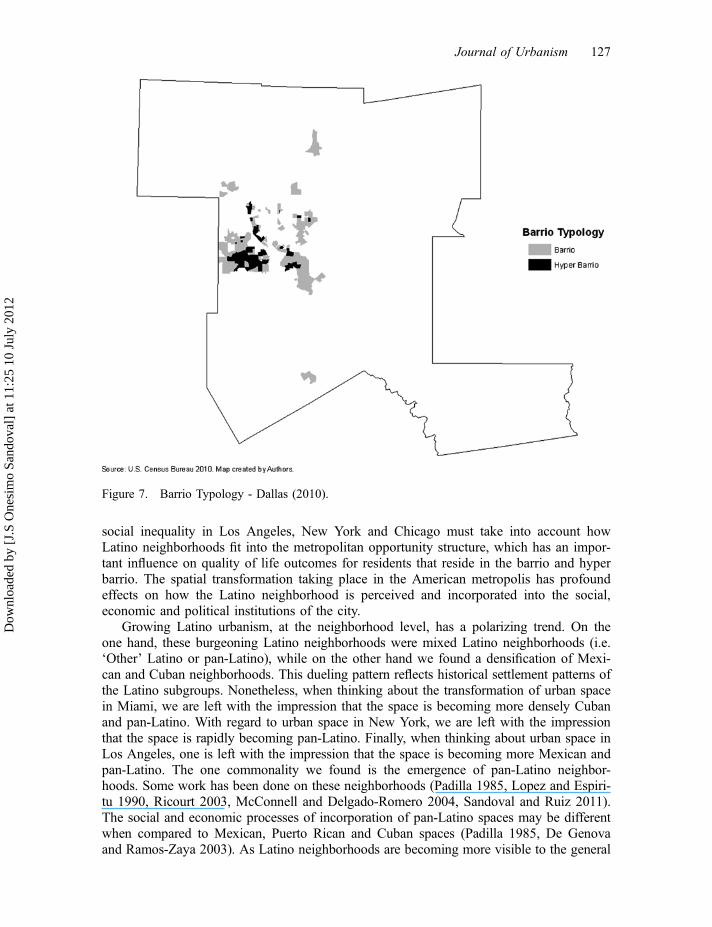
Table 4 shows the Moran’s I statistic for each metropolitan region. A high positivevalue of Moran’s I suggests that the neighborhoods were not randomly distributedthroughout the region. To measure the spatial connectedness and the magnitude of spatialclustering, we computed a Moran’s I statistic that measured the spatial autocorrelation ofthe Latino neighborhoods. The Moran’s I showed that the Latino neighborhoods weresignificantly clustered in space. For 2010, with the exception of El Paso, TX, all themetropolitan regions had a Moran I greater than 0.50. We provide four maps, which illus-trate how Latino neighborhoods cluster in space. The first region we want to highlight isLos Angeles, which is home to the largest number of Latino neighborhoods (Figures 4and 5). The second region we want to highlight is Dallas, which is home to the largestpercentage increase in Latino neighborhoods from 1980 to 2010 (Figures 6 and 7). The
122 J.S.O. Sandoval and J. Jennings
Dow
nloa
ded
by [
J.S
One
sim
o Sa
ndov
al]
at 1
1:25
10
July
201
2
Table
3.Barriotypology
bymetropolitan
region.
1980
1990
2000
2010
BarrioDensity
BarrioDensity
BarrioDensity
BarrioDensity
Barrio⁄
Hyper
Barrio⁄
⁄To
tal
Barrio⁄
Hyper
Barrio⁄
⁄Total
Barrio⁄
Hyper
Barrio⁄
⁄To
tal
Barrio⁄
Hyper
Barrio⁄
⁄To
tal
Region
NN
NN
NN
NN
NN
NN
Los
Angeles-LongBeach,
CA
258
162
420
341
284
625
405
433
838
547
536
1083
New
York,
NY
190
52242
243
73316
315
85400
354
81435
Miami,FL
4749
9651
96147
80115
195
118
218
336
Riverside-San
Bernardino,
CA
1912
3134
1650
104
39143
228
107
335
Houston,TX
1813
3153
2578
8867
155
161
118
279
Chicago,IL
7428
102
7954
133
126
97223
145
129
274
San
Antonio,TX
4051
9153
67120
6284
146
100
119
219
Phoenix–M
esa,
AZ
227
2938
1351
8439
123
114
74188
Dallas,TX
122
1429
635
6932
101
120
51171
ElPaso,
TX
1851
6936
5995
3180
111
32118
150
OrangeCounty,
CA
208
2832
2557
6343
106
8150
131
McA
llen-Edinburg-
Mission,TX
1263
7512
6779
1268
806
106
112
Frenso,
CA
216
2735
944
4820
6877
34111
Other
Metropolitan
Region
388
168
556
517
255
772
877
385
1262
1558
636
2194
Total
1139
672
1811
1553
1049
2602
2364
1587
3951
3641
2377
6018
Sou
rce:
USCensusBureau.
1980
-20
10Censustracttabu
latio
nsby
theauthors.
Num
bers
inparenthesisarepercentageswith
inMetro
region
.
Journal of Urbanism 123
Dow
nloa
ded
by [
J.S
One
sim
o Sa
ndov
al]
at 1
1:25
10
July
201
2
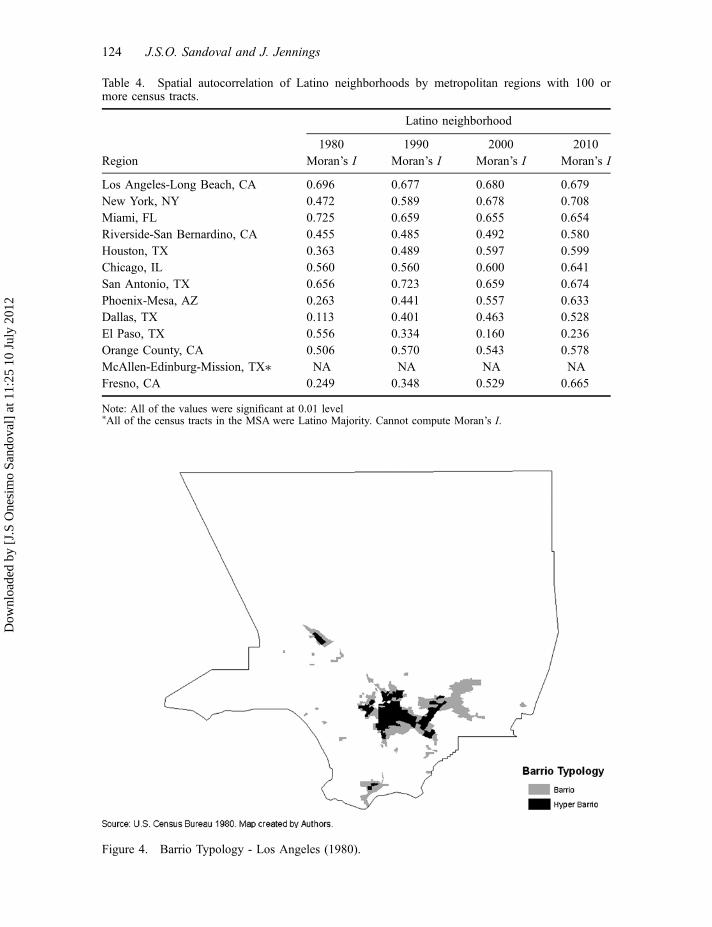
Figure 4. Barrio Typology - Los Angeles (1980).
Table 4. Spatial autocorrelation of Latino neighborhoods by metropolitan regions with 100 ormore census tracts.
Latino neighborhood
1980 1990 2000 2010Region Moran’s I Moran’s I Moran’s I Moran’s I
Los Angeles-Long Beach, CA 0.696 0.677 0.680 0.679New York, NY 0.472 0.589 0.678 0.708Miami, FL 0.725 0.659 0.655 0.654Riverside-San Bernardino, CA 0.455 0.485 0.492 0.580Houston, TX 0.363 0.489 0.597 0.599Chicago, IL 0.560 0.560 0.600 0.641San Antonio, TX 0.656 0.723 0.659 0.674Phoenix-Mesa, AZ 0.263 0.441 0.557 0.633Dallas, TX 0.113 0.401 0.463 0.528El Paso, TX 0.556 0.334 0.160 0.236Orange County, CA 0.506 0.570 0.543 0.578McAllen-Edinburg-Mission, TX⁄ NA NA NA NAFresno, CA 0.249 0.348 0.529 0.665
Note: All of the values were significant at 0.01 level⁄All of the census tracts in the MSA were Latino Majority. Cannot compute Moran’s I.
124 J.S.O. Sandoval and J. Jennings
Dow
nloa
ded
by [
J.S
One
sim
o Sa
ndov
al]
at 1
1:25
10
July
201
2

four maps augment the Moran’s I score and suggest that the growth of Latino neighbor-hoods reflects de facto residential segregation patterns.
Using newly released data from the US Census Bureau, we estimated a general logis-tic regression model. Our goal was to explore the differences between barrios and hyperbarrios and how they were related to other socio-economic characteristics measured at theneighborhood level. We identified several variables that might explain the differencesbetween barrios and hyper barrios. These variables included: (1) Latino economic disad-vantage; (2) place of birth (i.e. foreign born Latino); (3) Latino geographic mobility; (4)speak another language, other than English, at home; (5) Latino family size; (6) Latinohome ownership rate; (7) Latino occupants per room; and (8) geographic location ofLatino neighborhood. In Table 5 we provide the descriptive statistics for variables usedin the Logistic regression models. Tables 6 and 7 provide the Logistic regression esti-mates for the 2010 hyper barrios. We estimated four models. Models 1 and 3 are baselinemodels and models 2 and 4 are the full models, which included MSA dummy variables.The key theoretical difference in the models presented in Tables 6 and 7 are the variables(1) place of birth (i.e. foreign born Latino) and (2) speak another language, other thanEnglish, at home. The two variables were highly correlated with each other. Therefore,we did not include these variables in the same model. All the variables were the same,but in models 1 and 2 we included speak another language, other than English, at home.In models 3 and 4 we included proportion of Latinos who are foreign born. Models 2and 4 were the best performing models. The improvement in prediction for model 2 was
Figure 5. Barrio Typology - Los Angeles (2010).
Journal of Urbanism 125
Dow
nloa
ded
by [
J.S
One
sim
o Sa
ndov
al]
at 1
1:25
10
July
201
2
20% and for model 4 it was 31%. The percentage of cases correctly classified was 69.7%in model 2 and 70.5% in model 4.
In models 2 and 4, Latino households that received food stamps, proportion of Lati-nos living in poverty, proportion of Latinos that speak another language at home, Latinoswho stayed in same house 1 year ago, proportion of Latinos who are home owners, 1.01or more Latino occupants per room, and Latino family size were significant. One addi-tional variable was significant in model 4, Latinos who moved from a different state. Ourdiscussion of results will focus on models 2 and 4 for this paper.
Discussion
This paper is organized to answer four questions: (1) how many Latino neighborhoodswere located in a metropolitan statistical area in 1980, 1990, 2000 and 2010? (2) in whatmetropolitan regions were these Latino neighborhoods located? (3) what was the spatialrelationship of the Latino neighborhoods in each metropolitan region? and (4) what fac-tors were associated with hyper Latino barrios?
Emergence of Latino barrios
The number of Latino neighborhoods grew by 232% between 1980 and 2010. The datareaffirms the argument that Latinos are a crucial element in developing a more accurateunderstanding of the fundamental forces driving urbanism in the US. An analysis of
Figure 6. Barrio Typology - Dallas (1980).
126 J.S.O. Sandoval and J. Jennings
Dow
nloa
ded
by [
J.S
One
sim
o Sa
ndov
al]
at 1
1:25
10
July
201
2
social inequality in Los Angeles, New York and Chicago must take into account howLatino neighborhoods fit into the metropolitan opportunity structure, which has an impor-tant influence on quality of life outcomes for residents that reside in the barrio and hyperbarrio. The spatial transformation taking place in the American metropolis has profoundeffects on how the Latino neighborhood is perceived and incorporated into the social,economic and political institutions of the city.
Growing Latino urbanism, at the neighborhood level, has a polarizing trend. On theone hand, these burgeoning Latino neighborhoods were mixed Latino neighborhoods (i.e.‘Other’ Latino or pan-Latino), while on the other hand we found a densification of Mexi-can and Cuban neighborhoods. This dueling pattern reflects historical settlement patterns ofthe Latino subgroups. Nonetheless, when thinking about the transformation of urban spacein Miami, we are left with the impression that the space is becoming more densely Cubanand pan-Latino. With regard to urban space in New York, we are left with the impressionthat the space is rapidly becoming pan-Latino. Finally, when thinking about urban space inLos Angeles, one is left with the impression that the space is becoming more Mexican andpan-Latino. The one commonality we found is the emergence of pan-Latino neighbor-hoods. Some work has been done on these neighborhoods (Padilla 1985, Lopez and Espiri-tu 1990, Ricourt 2003, McConnell and Delgado-Romero 2004, Sandoval and Ruiz 2011).The social and economic processes of incorporation of pan-Latino spaces may be differentwhen compared to Mexican, Puerto Rican and Cuban spaces (Padilla 1985, De Genovaand Ramos-Zaya 2003). As Latino neighborhoods are becoming more visible to the general
Figure 7. Barrio Typology - Dallas (2010).
Journal of Urbanism 127
Dow
nloa
ded
by [
J.S
One
sim
o Sa
ndov
al]
at 1
1:25
10
July
201
2
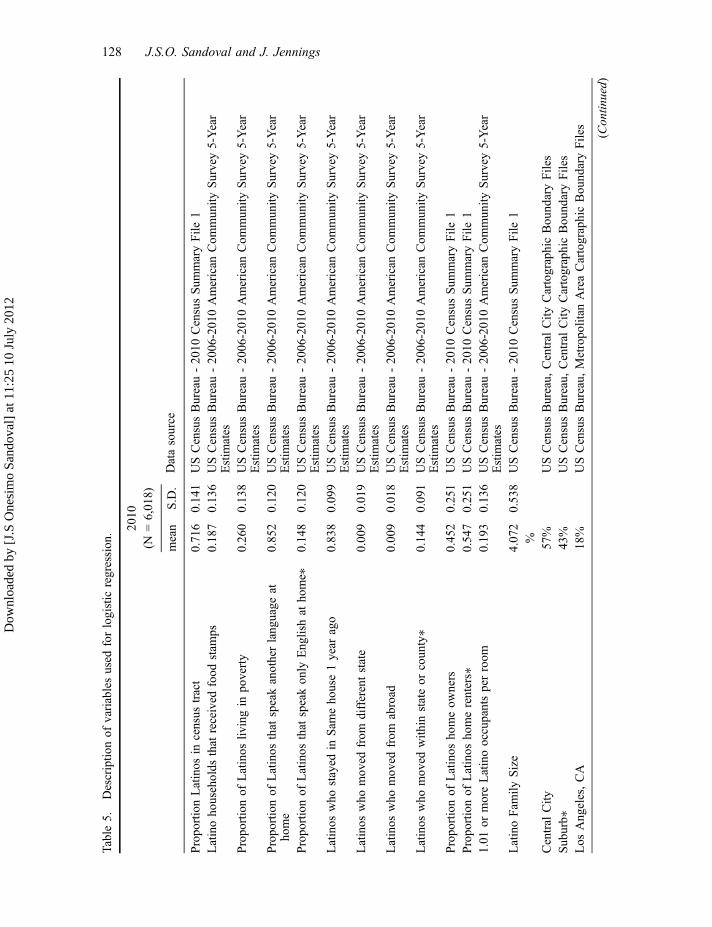
Table5.
Descriptio
nof
variablesused
forlogistic
regression. 20
10
Datasource
(N=6,018)
mean
S.D.
ProportionLatinos
incensus
tract
0.716
0.141
USCensusBureau-2010
CensusSum
maryFile
1Latinohouseholds
that
received
food
stam
ps0.187
0.136
USCensusBureau-2006-2010American
Com
munity
Survey5-Year
Estim
ates
Proportionof
Latinos
livingin
poverty
0.260
0.138
USCensusBureau-2006-2010American
Com
munity
Survey5-Year
Estim
ates
Proportionof
Latinos
that
speakanotherlanguage
athome
0.852
0.120
USCensusBureau-2006-2010American
Com
munity
Survey5-Year
Estim
ates
Proportionof
Latinos
that
speakonly
Englishat
home⁄
0.148
0.120
USCensusBureau-2006-2010American
Com
munity
Survey5-Year
Estim
ates
Latinos
who
stayed
inSam
ehouse1year
ago
0.838
0.099
USCensusBureau-2006-2010American
Com
munity
Survey5-Year
Estim
ates
Latinos
who
moved
from
differentstate
0.009
0.019
USCensusBureau-2006-2010American
Com
munity
Survey5-Year
Estim
ates
Latinos
who
moved
from
abroad
0.009
0.018
USCensusBureau-2006-2010American
Com
munity
Survey5-Year
Estim
ates
Latinos
who
moved
with
instateor
county⁄
0.144
0.091
USCensusBureau-2006-2010American
Com
munity
Survey5-Year
Estim
ates
Proportionof
Latinos
homeow
ners
0.452
0.251
USCensusBureau-2010
CensusSum
maryFile
1Proportionof
Latinos
homerenters⁄
0.547
0.251
USCensusBureau-2010
CensusSum
maryFile
11.01
ormoreLatinooccupantsperroom
0.193
0.136
USCensusBureau-2006-2010American
Com
munity
Survey5-Year
Estim
ates
LatinoFam
ilySize
4.072
0.538
USCensusBureau-2010
CensusSum
maryFile
1%
Central
City
57%
USCensusBureau,
Central
City
CartographicBoundaryFiles
Suburb⁄
43%
USCensusBureau,
Central
City
CartographicBoundaryFiles
Los
Angeles,CA
18%
USCensusBureau,
Metropolitan
AreaCartographicBoundaryFiles
(Contin
ued)
128 J.S.O. Sandoval and J. Jennings
Dow
nloa
ded
by [
J.S
One
sim
o Sa
ndov
al]
at 1
1:25
10
July
201
2
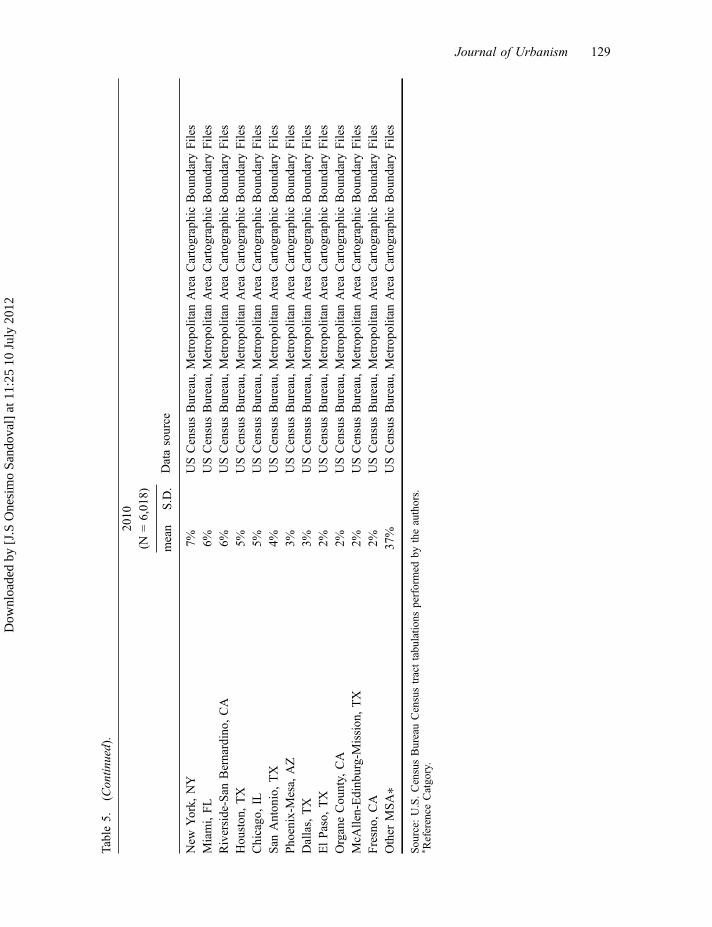
Table5.
(Contin
ued).
2010
Datasource
(N=6,018)
mean
S.D.
New
York,
NY
7%USCensusBureau,
Metropolitan
AreaCartographicBoundaryFiles
Miami,FL
6%USCensusBureau,
Metropolitan
AreaCartographicBoundaryFiles
Riverside-San
Bernardino,
CA
6%USCensusBureau,
Metropolitan
AreaCartographicBoundaryFiles
Houston,TX
5%USCensusBureau,
Metropolitan
AreaCartographicBoundaryFiles
Chicago,IL
5%USCensusBureau,
Metropolitan
AreaCartographicBoundaryFiles
San
Antonio,TX
4%USCensusBureau,
Metropolitan
AreaCartographicBoundaryFiles
Phoenix-M
esa,
AZ
3%USCensusBureau,
Metropolitan
AreaCartographicBoundaryFiles
Dallas,TX
3%USCensusBureau,
Metropolitan
AreaCartographicBoundaryFiles
ElPaso,
TX
2%USCensusBureau,
Metropolitan
AreaCartographicBoundaryFiles
OrganeCounty,
CA
2%USCensusBureau,
Metropolitan
AreaCartographicBoundaryFiles
McA
llen-Edinburg-Mission,TX
2%USCensusBureau,
Metropolitan
AreaCartographicBoundaryFiles
Fresno,
CA
2%USCensusBureau,
Metropolitan
AreaCartographicBoundaryFiles
Other
MSA⁄
37%
USCensusBureau,
Metropolitan
AreaCartographicBoundaryFiles
Sou
rce:
U.S.CensusBureauCensustracttabu
latio
nsperformed
bytheauthors.
⁄ Reference
Catgo
ry.
Journal of Urbanism 129
Dow
nloa
ded
by [
J.S
One
sim
o Sa
ndov
al]
at 1
1:25
10
July
201
2
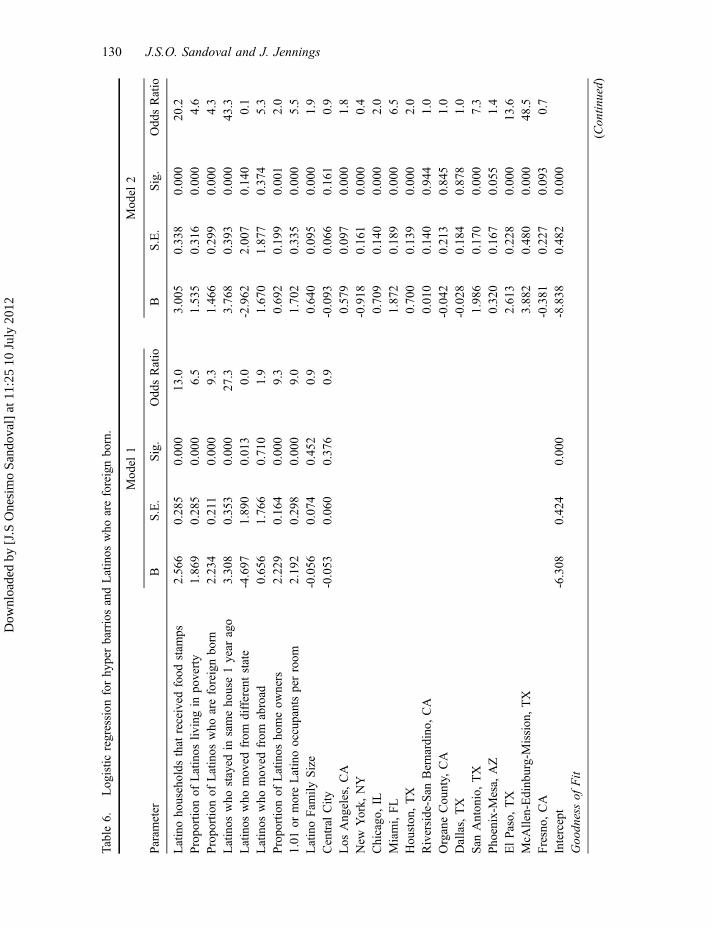
Table6.
Logistic
regression
forhyperbarriosandLatinos
who
areforeignborn.
Model
1Model
2
Param
eter
BS.E.
Sig.
OddsRatio
BS.E.
Sig.
OddsRatio
Latinohouseholds
that
received
food
stam
ps2.566
0.285
0.000
13.0
3.005
0.338
0.000
20.2
Proportionof
Latinos
livingin
poverty
1.869
0.285
0.000
6.5
1.535
0.316
0.000
4.6
Proportionof
Latinos
who
areforeignborn
2.234
0.211
0.000
9.3
1.466
0.299
0.000
4.3
Latinos
who
stayed
insamehouse1year
ago
3.308
0.353
0.000
27.3
3.768
0.393
0.000
43.3
Latinos
who
moved
from
differentstate
-4.697
1.890
0.013
0.0
-2.962
2.007
0.140
0.1
Latinos
who
moved
from
abroad
0.656
1.766
0.710
1.9
1.670
1.877
0.374
5.3
Proportionof
Latinos
homeow
ners
2.229
0.164
0.000
9.3
0.692
0.199
0.001
2.0
1.01
ormoreLatinooccupantsperroom
2.192
0.298
0.000
9.0
1.702
0.335
0.000
5.5
LatinoFam
ilySize
-0.056
0.074
0.452
0.9
0.640
0.095
0.000
1.9
Central
City
-0.053
0.060
0.376
0.9
-0.093
0.066
0.161
0.9
Los
Angeles,CA
0.579
0.097
0.000
1.8
New
York,
NY
-0.918
0.161
0.000
0.4
Chicago,IL
0.709
0.140
0.000
2.0
Miami,FL
1.872
0.189
0.000
6.5
Houston,TX
0.700
0.139
0.000
2.0
Riverside-San
Bernardino,
CA
0.010
0.140
0.944
1.0
OrganeCounty,
CA
-0.042
0.213
0.845
1.0
Dallas,TX
-0.028
0.184
0.878
1.0
San
Antonio,TX
1.986
0.170
0.000
7.3
Phoenix-M
esa,
AZ
0.320
0.167
0.055
1.4
ElPaso,
TX
2.613
0.228
0.000
13.6
McA
llen-Edinburg-Mission,TX
3.882
0.480
0.000
48.5
Fresno,
CA
-0.381
0.227
0.093
0.7
Intercept
-6.308
0.424
0.000
-8.838
0.482
0.000
Goodnessof
Fit
(Contin
ued)
130 J.S.O. Sandoval and J. Jennings
Dow
nloa
ded
by [
J.S
One
sim
o Sa
ndov
al]
at 1
1:25
10
July
201
2
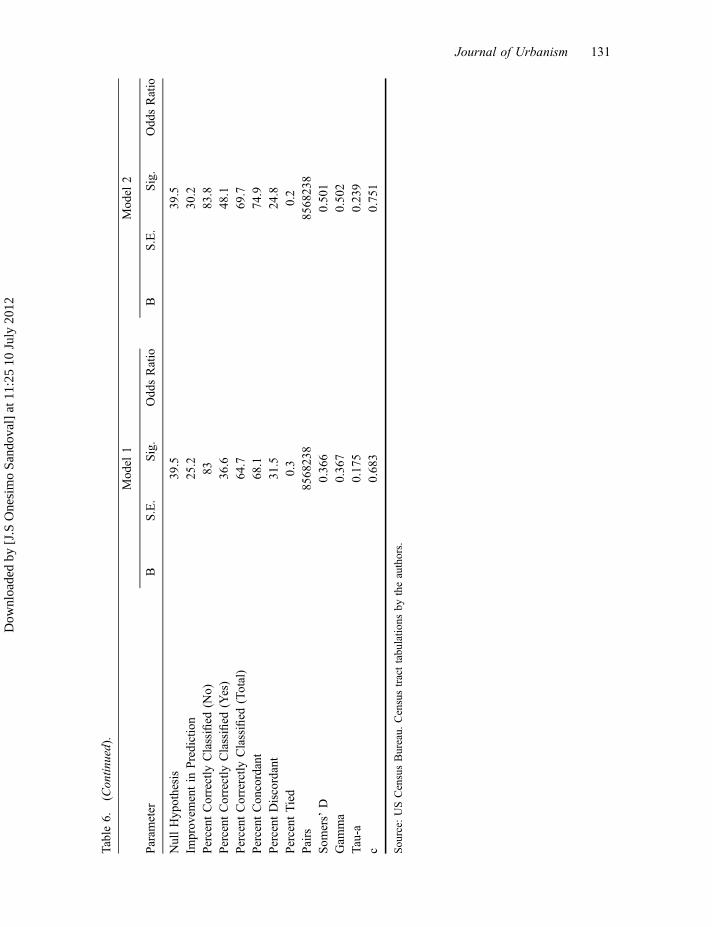
Table6.
(Contin
ued).
Model
1Model
2
Param
eter
BS.E.
Sig.
OddsRatio
BS.E.
Sig.
OddsRatio
NullHypothesis
39.5
39.5
Improvem
entin
Prediction
25.2
30.2
Percent
Correctly
Classified
(No)
8383.8
Percent
Correctly
Classified
(Yes)
36.6
48.1
Percent
Correrctly
Classified
(Total)
64.7
69.7
Percent
Concordant
68.1
74.9
Percent
Discordant
31.5
24.8
Percent
Tied
0.3
0.2
Pairs
8568238
8568238
Som
ers’
D0.366
0.501
Gam
ma
0.367
0.502
Tau-a
0.175
0.239
c0.683
0.751
Sou
rce:
USCensusBureau.
Censustracttabu
latio
nsby
theauthors.
Journal of Urbanism 131
Dow
nloa
ded
by [
J.S
One
sim
o Sa
ndov
al]
at 1
1:25
10
July
201
2
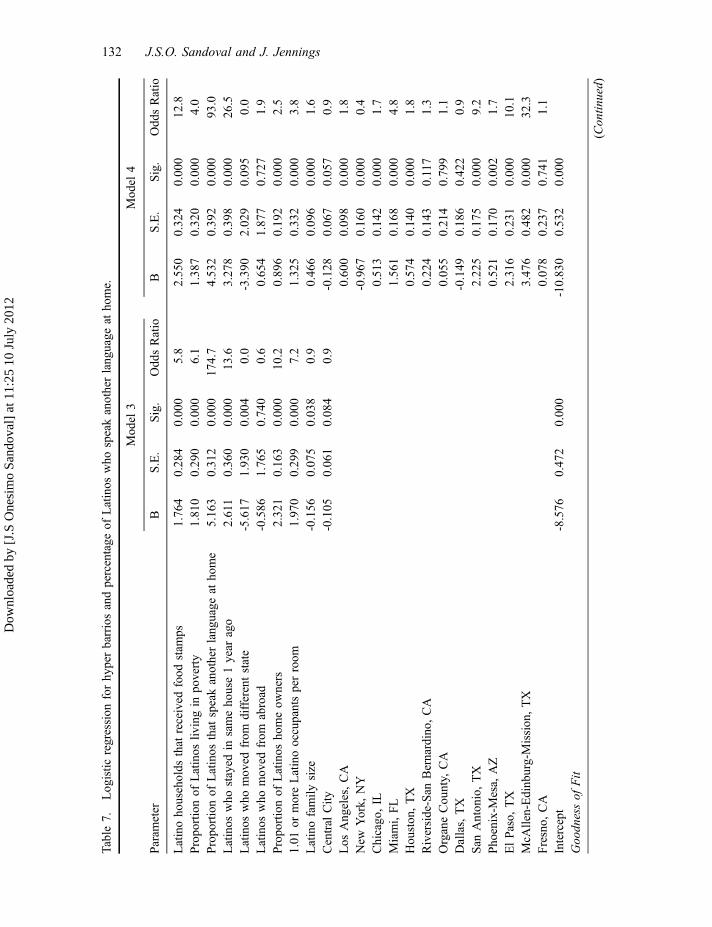
Table7.
Logistic
regression
forhyperbarriosandpercentage
ofLatinos
who
speakanotherlanguage
athome.
Model
3Model
4
Param
eter
BS.E.
Sig.
OddsRatio
BS.E.
Sig.
OddsRatio
Latinohouseholds
that
received
food
stam
ps1.764
0.284
0.000
5.8
2.550
0.324
0.000
12.8
Proportionof
Latinos
livingin
poverty
1.810
0.290
0.000
6.1
1.387
0.320
0.000
4.0
Proportionof
Latinos
that
speakanotherlanguage
athome
5.163
0.312
0.000
174.7
4.532
0.392
0.000
93.0
Latinos
who
stayed
insamehouse1year
ago
2.611
0.360
0.000
13.6
3.278
0.398
0.000
26.5
Latinos
who
moved
from
differentstate
-5.617
1.930
0.004
0.0
-3.390
2.029
0.095
0.0
Latinos
who
moved
from
abroad
-0.586
1.765
0.740
0.6
0.654
1.877
0.727
1.9
Proportionof
Latinos
homeow
ners
2.321
0.163
0.000
10.2
0.896
0.192
0.000
2.5
1.01
ormoreLatinooccupantsperroom
1.970
0.299
0.000
7.2
1.325
0.332
0.000
3.8
Latinofamily
size
-0.156
0.075
0.038
0.9
0.466
0.096
0.000
1.6
Central
City
-0.105
0.061
0.084
0.9
-0.128
0.067
0.057
0.9
Los
Angeles,CA
0.600
0.098
0.000
1.8
New
York,
NY
-0.967
0.160
0.000
0.4
Chicago,IL
0.513
0.142
0.000
1.7
Miami,FL
1.561
0.168
0.000
4.8
Houston,TX
0.574
0.140
0.000
1.8
Riverside-San
Bernardino,
CA
0.224
0.143
0.117
1.3
OrganeCounty,
CA
0.055
0.214
0.799
1.1
Dallas,TX
-0.149
0.186
0.422
0.9
San
Antonio,TX
2.225
0.175
0.000
9.2
Phoenix-M
esa,
AZ
0.521
0.170
0.002
1.7
ElPaso,
TX
2.316
0.231
0.000
10.1
McA
llen-Edinburg-Mission,TX
3.476
0.482
0.000
32.3
Fresno,
CA
0.078
0.237
0.741
1.1
Intercept
-8.576
0.472
0.000
-10.830
0.532
0.000
Goodnessof
Fit
(Contin
ued)
132 J.S.O. Sandoval and J. Jennings
Dow
nloa
ded
by [
J.S
One
sim
o Sa
ndov
al]
at 1
1:25
10
July
201
2
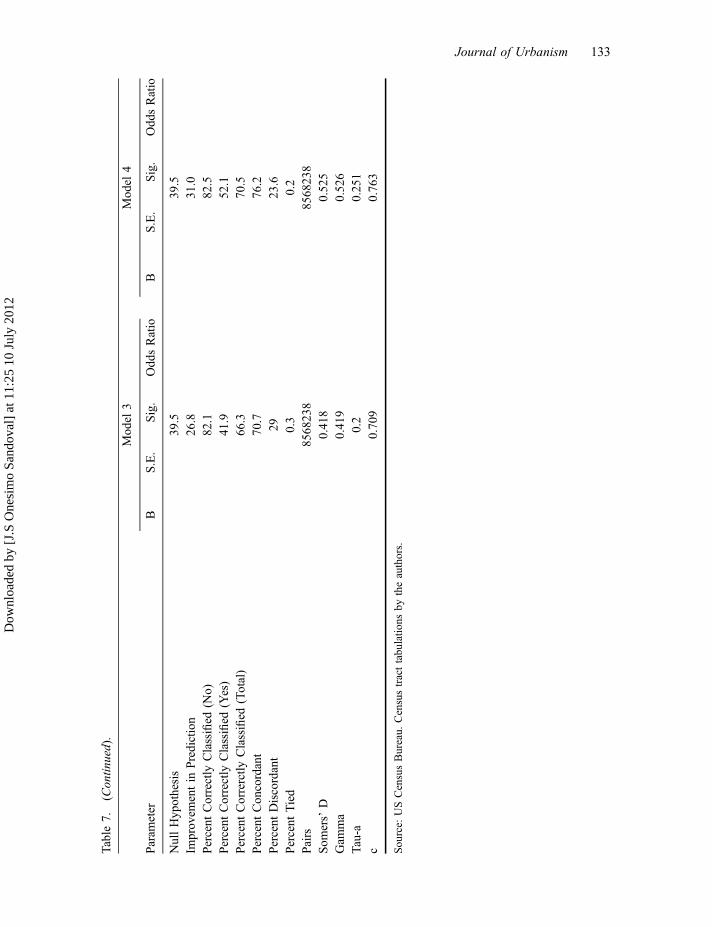
Table7.
(Contin
ued).
Model
3Model
4
Param
eter
BS.E.
Sig.
OddsRatio
BS.E.
Sig.
OddsRatio
NullHypothesis
39.5
39.5
Improvem
entin
Prediction
26.8
31.0
Percent
Correctly
Classified
(No)
82.1
82.5
Percent
Correctly
Classified
(Yes)
41.9
52.1
Percent
Correrctly
Classified
(Total)
66.3
70.5
Percent
Concordant
70.7
76.2
Percent
Discordant
2923.6
Percent
Tied
0.3
0.2
Pairs
8568238
8568238
Som
ers’
D0.418
0.525
Gam
ma
0.419
0.526
Tau-a
0.2
0.251
c0.709
0.763
Sou
rce:
USCensusBureau.
Censustracttabu
latio
nsby
theauthors.
Journal of Urbanism 133
Dow
nloa
ded
by [
J.S
One
sim
o Sa
ndov
al]
at 1
1:25
10
July
201
2
public, there may be a tendency to have a quixotic image of pan-Latino neighborhoodsand pejorative image of the Mexican, Puerto Rican and Cuban space.
The geography and spatial relationship of Latino neighborhoods
One of the dimensions to study the spatial hierarchy of the region is to explore the spatiallocation of Latino neighborhoods. Barrios and hyper barrios can be found in the centralcities and in the suburbs. They can be found in our largest and smallest cities. The sym-bolic image of the barrio as a central city phenomenon is not supported by the data. Bar-rios and hyper barrios are increasingly located in the suburbs. In fact the number ofsuburban barrios and hyper barrios more than tripled from 1980 to 2010. However, thedata remind us of the stark reality of the spatial segregation of Latinos living in Latinospaces. The data are a sad reminder that the weighted influence of de facto and de juresegregation has forever changed the urban landscape of exclusion (Massey and Denton1993). The data for most of the large metropolitan regions showed us that the growth ofnew Latino neighborhoods merely was an extension of the spatial clustering of estab-lished Latino neighborhoods from 1980. Moreover, if a region experienced new growthin Latino neighborhoods that was not connected to a 1980 Latino neighborhood cluster,the new growth itself was clustered in space (i.e. Latino suburban clusters in Chicagoand New York). An understanding and appreciation of how these different types ofLatino spaces impact the spatial hierarchy of cities and suburbs will improve our under-standing of the active processes of racialization and spatial segregation of Latinos andLatino neighborhoods.
Barrios vs. hyper barrios
The densification of Latino space is of great concern to urban scholars. The emergenceand magnitude of hyper barrios provide scholars with an analytical lens to study the pro-cesses at work in the urban social structure that augment the processes associated withthe densification of Latino spaces. Our results showed that hyper barrios were distinctlydifferent than barrios in the socio and economic make up of the neighborhood. The firstmajor distinction was the foreign born population. The odds ratio for proportion of Lati-nos who are foreign born was 4.3. However, when we switched the variable to propor-tion of Latinos that speak another language at home (other than English), the odds ratioincreased to 93. According to the 2010 American Community Survey, 38% of all Latinoswere foreign born (US Census Bureau 2011b). These two results support the theoreticalview that the densification of Latino neighborhoods tends to be the residential choice ofimmigrants (Logan et al. 2002, Ricourt 2003, South et al. 2005). The densification of theLatino neighborhoods transforms the space into a Latino economic enclave that providesthe economic and social infrastructure to allow the immigrant to culturally adapt to theurban environment (Logan 2002, Shihadeh and Barranco 2010).
The second major distinction is the concentration of economic disadvantage. In mod-els 2 and 4, the odds ratio for proportion of Latinos living in poverty was 4.6 and 4.0,respectively. In addition, the odds ratio for Latino households that received food stampswas 20.2 (model 1) and 12.8 (model 2). These two results support the theoretical viewthat the concentration of economic disadvantage was more likely to be found in hyperbarrios (Massey 1993, Correa-Jones and Leal 1996, Enchautegui 1997, Jargowsky 1997).Despite the fact that these findings can be pessimistically interpreted as the failing oppor-tunity structure in hyper Latino barrios, research has shown that highly dense ethnic
134 J.S.O. Sandoval and J. Jennings
Dow
nloa
ded
by [
J.S
One
sim
o Sa
ndov
al]
at 1
1:25
10
July
201
2
neighborhoods do provide meaningful social networks (Godfrey 2005, Portes et al.2005). Moreover, these economic findings may simply reflect the reality that the Latinoforeign born population may be at a higher economic risk than the native Latino popula-tion that live in the barrios or racially mixed neighborhoods.
The third major distinction is the geographic mobility of Latinos. In models 2 and 4,the odds ratio for Latinos who stayed in same house 1 year ago was 43.3 and 26.5,respectively. This finding indicates that the Latino population living in hyper barrios is amore stable population and it is an important factor slowing down neighborhood change.One of the issues that impacts Latino neighborhoods is the possibility of gentrification(Godfrey 2005). The idea is that with more densification of Latinos in a neighborhoodthe likelihood of gentrification decreases. However, recent work by a journalist in Chi-cago has shown that hyper barrios (i.e. the Pilsen neighborhood in Chicago) may not beimmune from the beginning processes of gentrification (Williams 2011).
Implications
We began this paper by describing the city as the heart and soul of urban studies. Weargued that to understand the city we must study how the built environment is organizedto support a social hierarchy that is spatially organized. We argued that if we focused ouranalysis on the narrow theme of Latino neighborhoods we would gain some insight intothe spatial organization of the city. The Latino population is the fastest growing popula-tion in the US. As the demographic transitions continue to take place within each metro-politan region, it is clear that Latino neighborhoods will emerge in spaces that wereformerly white or black neighborhoods (Sandoval and Ruiz 2011).
The first implication for nearly all of the major metropolitan regions is that the trans-formation of the built environment mirrors a pattern of racial segregation. Among theregions with at least 100 census tracts in 2010, 10 out of 13 regions experienced anincrease in spatial segregation. The top three regions (Fresno, CA, Dallas, TX, Phoenix-Mesa, AZ) have experienced a rapid growth in the Latino population since 1980, whichhas been the engine that fosters the growth of Latino majority neighborhoods.6
The second implication is that scholars need to move beyond a white and black para-digm of the built environment. In Los Angeles, the issue is not white and black segrega-tion; the issue is Latino and non-Latino segregation. In Chicago, the issue is not whiteand black segregation; the issue is Latino and black segregation (Sandoval 2011). Schol-ars need to include Latino neighborhoods into their analyses, but they need to be carefulnot to assume that Latino neighborhoods are homogenous spaces (Sandoval and Ruiz2011). When possible, we need to parse out the analyses by ethnic subgroups. Moreover,we need more attention devoted to the emergence of pan-Latino spaces (McConnell andDelgado-Romero 2004, Sandoval and Ruiz 2011). These neighborhoods may offer a moresanguine theory of solidarity and identity within Latino spaces. Unfortunately, quantita-tive research can only tell us so much about these pan-Latino spaces. The real work ofdescribing these pan-Latino neighborhoods is at the feet of the urban ethnographer.
The third implication is that scholars need to critically examine and explore the trendof the Latino suburbanization of the barrio and hyper barrio. The traditional urban eco-logical framework, which compares central city and suburban spaces, with the assump-tion that suburban barrios should be better off than city barrios, may help to explain thedemographic transitions taking place in the suburbs (Clark 2006, Wen et al. 2009, Halland Lee 2010). The percentage of suburban Latino neighborhoods grew by 9 points from1980 to 2010. This increase in Latino suburbs reflects the fact that 47% of the net new
Journal of Urbanism 135
Dow
nloa
ded
by [
J.S
One
sim
o Sa
ndov
al]
at 1
1:25
10
July
201
2
growth of Latino neighborhoods occurred in the suburbs. Likewise, the percentage ofhyper barrios located in the suburbs increased by 9 percentage points from 1980 to 2010.Finally, suburban Latino neighborhoods were more likely to be hyper barrios (42%) com-pared to city hyper barrios (38%). The economic disadvantage between the hyper barriosand barrios exists in the city and suburbs.7
Conclusion
The American metropolis has undergone a significant transformation over the past 40years. Barrios and hyper barrios are permanent features of the urban landscape of exclu-sion. Any meaningful theory about New Urbanism needs to account for the growth of thespatial concentration of barrios and hyper barrios. This study highlights the urgent needfor urban scholars to properly and more accurately document how different types ofLatino spaces impact and shape the urban built environment. There are different interpre-tations of Latino contributions to the city and the built environment, but we argue that ifwe are to write a narrative of the city and the built environment, our first story must befocused on the transformation of the neighborhood to a barrio and the transformation ofthe barrio to the hyper barrio.
Notes on contributorsJ.S. Onésimo Sandoval PhD is an assistant professor of sociology in the Department of Sociologyand Criminal Justice at Saint Louis University. His research interests focus on urban sociology,demography, spatial statistics, social-environmental synthesis, racial inequality and Latino sociology.
Joel Jennings is an assistant professor in the Department of Sociology and Criminal Justice atSaint Louis University. His research focuses on immigration, citizenship, geographic scale andLatinos/as in the United States. He is trained as a geographer and earned his doctorate at theUniversity of Cambridge, England.
Notes1. Calculations performed by authors.2. In 1980, Latinos made up 20% of Chicago’s population.3. Information for each ward can be found at http://www.cityofchicago.org/city/en/about/wards/
01.html4. It is possible that we might have missed other research related to our research questions. The
works could be in an edited book or in a journal that is not indexed.5. It is important to note that the number of Latino tracts may be undercut due to the fact there is a
history of undercounting Latinos in metropolitan regions (Ronzio 2007, Martin 2010). The num-bers we present in this paper should be interpreted as the low end of Latino neighborhoods.
6. In 1990, Latinos made up 13% of the population in the Dallas MSA. This number grew to 28%in 2010. A similar pattern was found in the Fresno MSA (Latinos made up 35% of the populationin 1990, but by 2010 they made up 50% of the population), and Phoenix MSA, (Latinos made up16% of the population in 1990, but by 2010 they made up 29% of the population).
7. The Latino poverty in suburban barrios and hyper barrios was 21% and 28%, respectively.The Latino poverty in city barrios and hyper barrios was 24% and 30%, respectively.
ReferencesAlmeida, J., et al., 2009. A multilevel analysis of social ties and social cohesion among Latinos
and their neighborhoods: results from Chicago. Journal of Urban Health, 86 (5), 745–759.Aparicio, A., 2006. Dominican-Americans and the politics of empowerment, new world diasporas.
Gainesville, FL: University Press of Florida.
136 J.S.O. Sandoval and J. Jennings
Dow
nloa
ded
by [
J.S
One
sim
o Sa
ndov
al]
at 1
1:25
10
July
201
2
Bean, F.D. and Stevens, G., 2003. America’s newcomers and the dynamics of diversity. New York:Russell Sage Foundation.
Bean, F.D. and Tienda, M., 1987. The Hispanic population of the United States. New York: Rus-sell Sage Foundation.
Brown-Saracino, J., 2009. A neighborhood that never changes. Universtiy of Chicago Press.Clark, W.A.V., 2006. Race, class, and space. outcomes of suburban access for Asians and Hispan-
ics. Urban Geography, 27 (6), 489–506.Correa-Jones, M. and Leal, D.L., 1996. Becoming ‘Hispanic’: secondary panethnic identification
among Latin American-origin populations in the United States. Hispanic Journal of BehavioralSciences, 18 (2), 214–254.
Curtis, J.R., 2005. Barrio space and place in Southeast Los Angeles, California. In: D.D. Arreola,ed. Hispanic spaces, Latino places: community and cultural diversity in contemporary Amer-ica. Austin, TX: University of Texas Press, 125–141.
Dardick, H. and Mack, K., 2011. Latino aldermen want more Chicago City Council seats. ChicagoTribune, 8 September.
Dardick, H. and Street, C., 2011. African-American aldermen propose new Chicago ward map.Chicago Tribune, 19 September.
Davis, M., 2001. Magical urbanism: Latinos reinvent the US city. New York: Verso.De Genova, N. and Ramos-Zaya, A.Y., 2003. Latino crossings: Mexicans, Puerto Ricans, and the
politics of race and citizenship. New York: Routledge.Diaz, D.R., 2005. Barrio urbanism: Chicanos, planning, and American cities. New York: Routl-
edge.Ellen, I.G., 2000. Sharing America’s neighborhoods: the prospect for stable racial integration.
Cambridge, MA: Harvard University Press.Enchautegui, M.E., 1997. Latino neighborhoods and Latino neighborhood poverty. Journal of
Urban Affairs, 19 (4), 445–467.Fernandez-Kelly, P. and Konczal, L., 2005. ‘Murdering the alphabet’: identity and entreprenueur-
ship among second-generation Cubans, West Indians and Central Americans. Ethnic and RacialStudies, 28 (6), 1153–1181.
Frank, R., Cerda, M., and Rendon, M., 2007. Barrios and burbs: residential context and health-riskbehaviours among Angeleno adolescents. Journal of Health and Social Behaviour, 48 (3),283–300.
GeoLytics Inc., 2004. Neighborhood change database. East Brunswick: NJ.Godfrey, B.J., 2005. Barrio under siege: Latino sense of place in California. In: D.D. Arreola, ed.
Hispanic spaces, Latino places: community and cultural diversity in contemporary America.Austin: University of Texas Press.
Hall, M. and Lee, B., 2010. How diverse are US suburbs? Urban Studies, 47 (1), 3–28.Iceland, J., 2009. Where we live now: immigration and race in the United States. Berkeley, CA:
University of California Press.Jargowsky, P.A., 1997. Poverty and place. ghettos, barrios, and the American city. New York:
Russell Sage Foundation.Jimenez, T.R., 2010. Replenished ethnicity: Mexican Americans, immigration, and identity. Berke-
ley, CA: University of California Press.Johnston, R.J., et al., eds., 2000. The dictionary of human geography. 4th ed. Oxford: Blackwell
Publishing.Jones-Correa, M., 1998. Between two nations: the political predicament of Latinos in New York
City. Ithaca: Cornell University Press.Keller, S., 1968. The urban neighborhood: a sociological perspective. Princeton University.Leclerc, G., Villa, R., and Dear, M.J., 1999. Urban Latino cultures: la vida Latina en L.A. Thou-
sand Oaks, CA: Sage.Logan, J.R., Alba, R.D., and Zhang, W., 2002. Immigrant enclaves and ethnic communities in
New York and Los Angeles. American Sociological Review, 67 (2), 299–322.Lopez, D. and Espiritu, Y., 1990. Panethnicity in the United States: a theoretical framework. Ethnic
and Racial Studies, 13 (2), 198–224.Martin, D., 2010. Understanding the social geography of census undercount. Environment and
Planning A, 42 (11), 2753–2770.Martin, M.E., 2007. Residential segregation patterns of Latinos in the United States, 1990–2000:
testing the ethnic enclave and inequality theories, Latino communities. New York: Routledge.
Journal of Urbanism 137
Dow
nloa
ded
by [
J.S
One
sim
o Sa
ndov
al]
at 1
1:25
10
July
201
2
Massey, D.S., 1993. Latinos, poverty, and the underclass: a new agenda for research. HispanicJournal of Behavioral Sciences, 15, 449–475.
Massey, D.S. and Denton, N.A., 1993. American apartheid: segregation and the making of theunderclass. Cambridge, MA: Harvard University Press.
McConnell, E.D. and Delgado-Romero, E., 2004. Latino panethnicity: reality or methodologicalconstruction? Sociological Focus, 37 (4), 297–312.
Moore, J.W. and Pinderhughes, R., 1993. In the barrios: Latinos and the underclass debate. NewYork: Russell Sage Foundation.
Oberle, A., 2004. Se Venden Aqui: Latino commercial landscapes in Phoenix, Arizona. In: D.D.Arreola, ed. Hispanic spaces, Latino places. Austin, TX: University of Texas Press.
Padilla, F.M., 1985. Latino ethnic consciousness: the case of Mexican Americans and PuertoRicans in Chicago. South Bend, IN: University of Notre Dame.
Park, R.E. and Burgess, E.W., 1925. The city: suggestions for investigation of human behavior inthe urban environment. University of Chicago Press.
Perez, G.M., 2004. The near Northwest side story: migration, displacement, and Puerto Ricanfamilies. Berkeley, CA: University of California Press.
Portes, A. and Hao, L., 2004. The schooling of children of immigrants: contextual effects on theeducational attainment of the second generation. Proceedings of the National Academy of Sci-ences of the United States of America, 101 (33), 11920–11927.
Portes, A. and Rumbaut, R.G., 2006. Immigrant America: a portrait. 3rd ed. Berkeley, CA: Uni-versity of California Press.
Portes, A., Fernandez-Kelly, P., and Haller, W., 2005. Segmented assimilation on the ground: thenew second generation in early adulthood. Ethnic and Racial Studies, 28 (6), 1000–1040.
Ricourt, M. and Ruby, D., 2003. Hispanas de Queens: Latino panethnicity in a New York neigh-borhood. In: R. Sanjek, ed. The anthropology of contemporary issues. Ithaca, NY: Cornell Uni-versity Press.
Rodriguez, H., Saenz, R., and Menjivar, C., eds., 2007. Latinas/os in the United States: changingthe face of América. New York: Springer.
Ronzio, C.R., 2007. Ambiguity and discord in US. Census data on the undercount, race/ethnicityand SES: responding to the challenge of complexity. International Journal of Critical Statis-tics, 1 (1), 11–18.
Sandoval, J.S.O., 2011. Neighborhood diversity and segregation in the Chicago MetropolitanRegion, 1980–2000. Urban Geography, 32 (5), 609–640.
Sandoval, J.S.O. and Ruiz, B., 2011. Pan-Latino neighborhoods: contemporary myth or reality?Sociological Focus, 44 (4), 295–313.
Shihadeh, E.S. and Barranco, R.E., 2010. Leveraging the power of the ethnic enclave: residentialinstability and violence in Latino communities. Sociological Spectrum, 30 (3), 249–269.
Singer, A., Hardwick, S.H., and Brettell, C.B., eds., 2008. Twenty-first century gateways: immi-grant incorporation in suburban America, immigrant incorporation in suburban America.Washington, DC: Brookings Institution Press.
South, S.J., Crowder, K., and Chavez, E., 2005. Exiting and entering high-poverty neighborhoods:Latinos, blacks and Angles compared. Social Forces, 84 (2), 873–900.
Spielman, F., 2011. Loss of 180,000 black residents will complicate Chicago ward remap. ChicagoSun-Times, 6 July.
Suro, R. and Passel, J.S., 2003. The rise of the second generation: changing patterns in Hispanicpopulation growth. Washington, DC: Pew Hispanic Center.
Suro, R. and Tafoya, S., 2004. Dispersal and concentration: patterns of Latino residential settle-ment. Washington DC: Pew Hispanic Center.
US Census Bureau, 2011a. Total population in urban areas. American Community Survey.US Census Bureau, 2011b. Sex by age citizenship status (Hispanic or Latino). American Commu-
nity Survey.Wen, M., Lauderdale, D.S., and Kandula, N.R., 2009. Ethnic neighborhoods in multi-ethnic
America, 1990–2000: resurgent ethnicity in the ethnoburbs? Social Forces, 88 (1), 425–460.Wherry, F.F., 2011. The Philadelphia barrio: the arts, branding and neighborhood transformation.
Chicago and London: University of Chicago Press.Williams, A., 2011. Latino population shrinks in some Chicago neighborhoods, grows in others.
MEDILL Reports.
138 J.S.O. Sandoval and J. Jennings
Dow
nloa
ded
by [
J.S
One
sim
o Sa
ndov
al]
at 1
1:25
10
July
201
2