Barkmann Et Al2008Ecol Econ
16
This article was published in an Elsevier journal. The attached copy is furnished to the author for non-commercial research and education use, including for instruction at the author’s institution, sharing with colleagues and providing to institution administration. Other uses, including reproduction and distribution, or selling or licensing copies, or posting to personal, institutional or third party websites are prohibited. In most cases authors are permitted to post their version of the article (e.g. in Word or Tex form) to their personal website or institutional repository. Authors requiring further information regarding Elsevier’s archiving and manuscript policies are encouraged to visit: http://www.elsevier.com/copyright
-
Upload
uni-goettingen -
Category
Documents
-
view
0 -
download
0
Transcript of Barkmann Et Al2008Ecol Econ

This article was published in an Elsevier journal. The attached copyis furnished to the author for non-commercial research and
education use, including for instruction at the author’s institution,sharing with colleagues and providing to institution administration.
Other uses, including reproduction and distribution, or selling orlicensing copies, or posting to personal, institutional or third party
websites are prohibited.
In most cases authors are permitted to post their version of thearticle (e.g. in Word or Tex form) to their personal website orinstitutional repository. Authors requiring further information
regarding Elsevier’s archiving and manuscript policies areencouraged to visit:
http://www.elsevier.com/copyright

Author's personal copy
METHODS
Confronting unfamiliarity with ecosystem functions: The casefor an ecosystem service approach to environmental valuationwith stated preference methods
J. Barkmanna,⁎, K. Glenka,1, A. Keila,2, C. Leemhuisb,3, N. Dietrichc,4,G. Geroldb, R. Marggrafa
aDepartment of Agricultural Economics and Rural Development, Environmental & Resource Economics, Georg-August-Universität Göttingen,D-37073 Göttingen, GermanybInstitute of Geography, Landscape Ecology, Georg-August-Universität Göttingen, D-37077 Göttingen, GermanycInstitute of Geography, Social and Cultural Geography, Georg-August-Universität Göttingen, D-37077 Göttingen, Germany
A R T I C L E I N F O A B S T R A C T
Article history:Received 9 January 2006Received in revised form18 November 2007Accepted 2 December 2007Available online 14 January 2008
Ecosystem functions are a central topic of environmental valuation research. Layrespondents are usually unfamiliar with the implications of scientific descriptions ofecosystem functioning. Thus, the applicability of stated preference methods for thevaluation of ecosystem functions is a matter of debate. In the general discourse on theeconomic valuation of ecosystem functions, it was suggested to valuate ecosystemfunctions via the ecosystem services they provide. In this contribution, we argue that therecognition of this principle is the key also for the applicability of stated preferencemethodsto the valuation of ecosystem functions. Successful application requires a precisedifferentiation between the descriptive realm of ecosystem functions and the evaluativerealm of ecosystem services. On this basis, an ecosystem service approach for the economicvaluation of ecosystem functions is introduced.We illustrate the ecosystem service approach by the valuation of a hydrological ecosystemfunction in rural Indonesia. Identification and representation of the ecosystem serviceswere based on extensive investigations of respondent perception of hydrologicalphenomena. The availability of irrigation water during the dry season turned out to be alocally decisive ecosystem service. Within the case study, willingness-to-pay (WTP) valueswere estimated for changes in the availability of irrigation water, rattan, shading in cacaoplantations, and in the population of an endemic mammal by Nested Logit (NL) analysis ofchoice experiment data. Only few respondents lacked sufficient familiarity of the
Keywords:Ecosystem servicesEcosystem functionsWillingness-to-payStated preference methodsInformation andmisspecification biasData requirements
E C O L O G I C A L E C O N O M I C S 6 5 ( 2 0 0 8 ) 4 8 – 6 2
⁎ Corresponding author. Department of Agricultural Economics and Rural Development, Environmental and Resource Economics,Georg-August-Universität Göttingen, Platz der Göttinger Sieben 5, D-37073 Göttingen, Germany. Tel.: +49 551 39 14492; fax: +49 551 39 14812.
E-mail address: [email protected] (J. Barkmann).1 Present address: Socio-Economics Group, Macaulay Institute, Craigiebuckler, Aberdeen, AB15 8QH UK.2 Present address: Institute of Agricultural Economics and Social Sciences in the Tropics and Subtropics, University of Hohenheim,
D-70593 Stuttgart, Germany.3 Present address: Center for Development Research (ZEF), Div. Ecology and Natural Resources, Walter-Flex-Str. 3, D-53113 Bonn,
Germany.4 Present address: International Hydrological Programme, Division of Water Sciences UNESCO, 1 rue Miollis, F-75732 Paris Cedex 15,
France.
0921-8009/$ – see front matter © 2007 Elsevier B.V. All rights reserved.doi:10.1016/j.ecolecon.2007.12.002
ava i l ab l e a t www.sc i enced i rec t . com
www.e l sev i e r. com/ l oca te /eco l econ

Author's personal copy
environmental goods to be valued. WTP for a reduction in water scarcity by one month was~39–40,000 Indonesian Rupiah/household/year. A rating of respondent comprehensioncorrelates with preferences for water availability. For respondents with above averagecomprehension (rated 4 versus mean of 3.12 at a 5-point scale), NL analysis predicts a 14.1%increase in WTP. Interactions of attitudinal constructs support the notion that the WTPestimate is an expression of underlying values and risk perceptions.The ecosystem service approach comes at a cost. Because ecosystem services relevant tolocal respondents are valued rather than scientifically described ecosystem functions,typical ‘basic science’ models that represent ecosystem functioning cannot be used for theanalysis of valuation scenarios with direct policy relevance. Engineering-type models thatembody technical and, in our case study, agronomic knowledge are necessary to bridge thegap between ecosystem functioning and their practical implications. A lack of this kind ofinformation also hinders a meaningful application of alternative valuation approaches.
© 2007 Elsevier B.V. All rights reserved.
1. Introduction
Ecosystem functions and the benefits humans derive fromthem have become a central topic of research at the interfaceof social and natural systems (Costanza et al., 1997; Daily,1997; Carpenter and Turner, 2000; Farber et al., 2002; Alcamoet al., 2003; Heal et al., 2005). Along with the recognition oftheir economic importance, there is an intensive debate on theeconomic valuation of ecosystem functions and the servicesthey provide (Costanza and Farber, 2002).
In particular, there is substantial disagreement on thesuitability of stated preferencemethods (contingent valuation,choice modeling) for the economic valuation of ecosystemfunctions.5 TheMillennium Ecosystem Assessment, for exam-ple, relies on contingent valuation as a “commonly used”valuation method for the quantification of indirect use valuesto which ecosystem functions belong (Alcamo et al., 2003). Incontrast, de Groot et al. (2002, p. 404; Table 2) suggest to restrictstated preference methods to a valuation of “informationservices”, such as ecosystem services for recreation andtourism.While theGermanCouncil of Environmental Advisorsdemands non-optimizing “categorical” valuation methods for“essential” ecosystem functions (WBGU, 1999), stated prefer-encepractitioners regularly include ecosystemfunctions alongwith other passive use values in the set of suitable objects forstated preference studies (e.g., Carson et al., 1999).
Echoing earlier critical assessments (e.g., Diamond andHausman, 1994), one particularly serious challenge for theapplicability of stated preference methods to ecosystem func-tions was put forward by Nunes and Bergh (2001). They stressthat lay respondents surveyed in stated preference studies willusually lack sufficient insight into ecosystem life supportfunctions and processes such as photosynthesis or biogeo-chemical matter cycling. Without sufficient familiarity withecosystem functions, respondents are not able to make mean-ingful preference statements. Although the critique is welltaken with regard to the valuation of ecosystem functions, it isless clear, however, that the critique also applies to the
ecosystem services that the ecosystem functions provide. Infact, it is the main purpose of this paper to show that statedpreference techniques can be successfully applied to thevaluation of ecosystem functions if they are translated intoecosystem services. In line with the most recent recommenda-tions by Heal et al. (2005, p. 121), this effort can be viewed as anextension of insights of the general debate on the economicvaluation of ecosystem functions where it is stressed that theeconomic value of ecosystem functions should be judged by thevalue of the ecosystem service flows they provide (Freeman,1998).
In this paper, we first outline the unfamiliarity critique atstated preference methods, and sketch corresponding pro-blems of alternative valuation approaches (Section 2). InSection 3, we propose to regard the difference betweenecosystem functions and ecosystem services as an epistemo-logical difference, which results in the proposal for theecosystem service approach. Based on these ideas, Sections 4and 5 present and discuss a case study from Central Sulawesi,Indonesia, focusing on the valuation of hydrological ecosys-tem functioning via a central ecosystem service it provides.
2. Valuingecosystemfunctions— the challenges
Unfamiliarity with an environmental good can result innumerous biases that may distort valuation results. In parti-cular, it can result in
• information bias: The less respondents are familiar with thegood to be valued, the more their response will be affectedby inaccurate, imprecise or even spurious information.
• methodologicalmisspecification bias: Even if the informationprovided is precise and accurate, there is a risk thatrespondents do not understand the presented informationas intended. Other things being equal, it must be expectedthat any distortion is the more severe the less familiar thegood is.
It is undisputed that these biases have to be taken intoaccount with high priority in the design of stated preferencesurvey instruments (Bateman et al., 2002, p. 76, p. 81, pp. 119ff).For ecosystem functions, unfamiliarity is likely amajor problem
5 Restricting this paper to a discussion of unfamiliarity effectsshould not be construed as a denial of further issues thatcontinue to be a matter of intensive debate (e.g., Diamond andHausman, 1994; Sugden, 2005).
49E C O L O G I C A L E C O N O M I C S 6 5 ( 2 0 0 8 ) 4 8 – 6 2

Author's personal copy
as non-expert respondents usually have very restricted know-ledge of ecosystem functioning. For ecosystem functions thatfall into the indirect use category – including regulationfunctionsof thewater cycle –, the suitability of statedpreferencetechniques was explicitly challenged on misspecification biasgrounds (Nunes and Bergh, 2001. p. 205). Stated preferencemethods will fail to “value categories that the general public isnot informed about nor has experience with”, creating aproblematic situation for the valuation of changes in thesegoods that are “far removed from human perceptions” (Nunesand Bergh, 2001, p. 208, p. 217). Because of the complexity of theecological interactions that give rise to ecosystem functions, themisspecification problems are unlikely to be remedied byimproved design of the survey instrument, Nunes and Berghclaim. Thus, the case against the direct valuation of mostecosystem functions of the indirect use value type by statedpreference techniques appears conclusive.
Revealed preference valuation methods provide an alter-native valuation approach. These methods rely directly orindirectly onmarket data. Reliablemarket data are rare and/ordifficult to interpret for many ecosystem functions, however.Thus, it can be expected that revealed preference methodsfeature their own set of restrictions and imperfections. Forexample, travel cost and hedonic pricing techniques can onlybe applied to ecosystem support functions related to tourismand housing. For most ecosystem functions, this relation isabsent. For replacement cost calculations, Bockstael et al.(2000) require compliance with three seldom met conditions:
(i) the replacement system provides functions that arequantitatively and qualitatively equivalent to the origi-nal ecosystem functions,
(ii) the investigated replacement system is the least cost-option of all potential replacement systems, and
(iii) aggregate willingness-to-pay for the replacement actu-ally exceeds the cost for the replacement in face of theloss of the original ecosystem functions.
A parallel line of reasoning holds for averting costs. Theaverting measure must be effective in all regards, the leastcost-option must be identified, and its costs may not exceedaggregate WTP. According to the review by Heal et al. (2005,p. 191), replacement cost andavoided cost analysis are justifiedunder restrictive conditions only. Production functionapproaches suffer from the fact that the opportunity costs ofswitching to the second-best production technology must beknown. This can be difficult to achieve if complex substitutionand adaptation processes occur, or if policy or productionimpacts are strongly non-linear. Combined with complexecological models, considerable progress has been achievedhere (Heal et al., 2005, pp. 113ff). However, many functionalecosystembenefits include non-marketed, public option valueor insurance value components (Barkmann and Marggraf,2004). Production functions approaches do structurally notaccount for these value components.
Althoughwecannot provideanextensive reviewof currentlyavailable methods for the economic valuation of ecosystemfunctions and/or services here, we conclude that each methodcomes with a specific profile of advantages and disadvantages.In practical terms, this suggests that no single approach should
be dismissed prematurely as non-applicable— including statedpreference techniques.
3. Making sense from ecosystem functions viaan ecosystem service approach
3.1. The background problem
Because of the multitude of different meanings of the functionconcept among different sciences, ‘ecosystem function’ can beinterpreted in several, at times conflicting ways (de Groot et al.,2002). The most important conflict exists between a descriptiveinterpretation and a normative interpretation (cf. Whigham,1996). In a descriptive interpretation, ecosystem functionmerely relates to some ecosystem phenomenon that can bethought of as contributing to something else. Accepting thescientific fact of such a contribution does not entail any valuejudgment. The complication arises, however, that manyphenomena to which ecosystem states, processes or structurescontribute can have some – sometimes essential – importancefor human well-being. Consequently, there exists a normativeinterpretation, in which an ecosystem function is regarded asan environmental value, as a source of ecosystem benefits insocial and/or economic terms. Both interpretations are, assuch, legitimate and ultimately a matter of terminologicaltaste. Problems can easily arise, however, in form of a seriouscategory error. This happens if the existence of a decision-relevant normative ecosystem function is inferred directly fromthe existence of a related ecosystem function in descriptiveterms.
Where ecosystem function is explicitly defined in the recentliterature, a descriptive interpretation dominates (e.g., Whig-ham,1996; Costanza etal., 1997; Freeman,1998;Heal etal., 2005).If a descriptive notion is favored, a decisively normative notionof ecosystem services suggests itself. In a proposal for asystematic description and valuation of the functions, goodsand services of ecological systems, de Groot et al. (2002)“reconceptualise” or “translate” descriptive ecosystem func-tions into the normative concepts of ecosystem goods andservices if and only if humanneedsor values are affected. Alongthese lines, several valuation approaches focus on ecosystemservices. The Millennium Ecosystem Assessment (MA; Alcamoet al., 2003), for example, concentrates nearly exclusively onecosystem services (also see, Toman, 1996; Heal et al., 2005).
In the MA, ecosystem services are defined as
“the benefits people obtain from ecosystems. Theseinclude provisioning services such as food and water;regulating services such as regulation of floods, drought,land degradation, and disease; supporting services such assoil formation and nutrient cycling; and cultural servicessuch as recreational, spiritual, religious and other non-material benefits.” (Box 1, Key Definitions, Alcamo et al.,2003, p. 3)
In linewithMAterminology,we regardecosystemservices asimmaterial economic goods provided by ecological systemsincluding their elements, structures, processes, states, dynamicsetc. If anecosystemprovides amaterial good, suchaswaterused
50 E C O L O G I C A L E C O N O M I C S 6 5 ( 2 0 0 8 ) 4 8 – 6 2
Author's personal copy
for irrigation, the process of provisioning thematerial good is anecosystem service.
In their ecosystemandbiodiversity valuation critique,Nunesand Bergh (2001) develop a detailed classification of biodiversityvalues. They do not differentiate systematically, though,between functions and services. For example, “functionaldiversity” (Nunes and Bergh, 2001, p. 204) encompasses“primary ecosystem processes” (photosynthesis and biogeo-chemical cycling) – ecosystem functions in a descriptive sense.Functional diversity also encompasses “ecosystem life supportfunctions”, e.g., the regulation of water and carbon cycles – asregularly included in lists of ecosystem services (e.g., Heal et al.,2005, pp. 80–83). If combinedwith the unfamiliarity critique, thelack of a clear differentiation may foster the impression thatstated preference methods are principally unsuitable for thevaluation of ecosystem functions.
3.2. The ecosystem service approach
Lay respondents are utterly unfamiliar with scientific descrip-tions of the processes, structures and states that make upecosystem functions. Thus, it is virtually impossible to samplemeaningful economic preference statements for ecosystemfunctions described by basic science models (Fig. 1a). As anexample, we included an exceedence time graph in thefollowing case study section that represents a central hydro-logical ecosystem function in a small Central Sulawesi catch-ment (Fig. 3). Although simple to interpret for the scientificallytrained analyst, very few stated preference respondents willmuster thepatience to learn enough abouthydrologyduring thevaluation interview to do so.
Even worse, without additional engineering and agricul-tural data, even experts can only make an educated guesshow changes in the exceedence time graph may correlatewith improved water availability for wet rice cultivation inthe dry season in a heterogeneous multi-catchment projectarea. Mismatches between the ecosystem function output ofbasic science models and the requirements for economicanalysis are rather common (see example by Freeman, 1998,p. 249f).
The situation improves if we employ an ecosystem serviceapproach to environmental valuation (Fig. 1b). Precursors ofthe ideas presented here are provided by Carson et al. (1999),Pattanayak and Kramer (2001), and Bennett (2002). Using theecosystem service approach, we invest a certain measure ofnormativity that allows us to differentiate between ecosystemstates, structures and processes that do in fact contribute tohuman production and consumption, and those that – to thebest of our knowledge andwith reference to the valuation taskat hand – donot.With this differentiation inmind, engineeringmodels can be constructed that are concerned with sociallyrelevant ecosystem services (ecosystem services I). Theunfamiliarity of respondents with model outputs decreases.For communication with lay stakeholders, however, modeloutputs are often still not suitable because engineeringmodelsthemselves are usually expert models. An additional step isrequired to translate ecosystem services I into the language ofthe interests, concepts and perceptions of lay respondents(transdisciplinary model; ecosystem services II). This steprequires substantial qualitative social science research into thesubjective, pre-theoretic patterns of perception and valuationof the natural phenomena at stake (Barkmann et al., 2005a).
Fig. 1 –Valuation of ecosystem functions versus valuation of ecosystem services: advantages and disadvantages in the face ofunfamiliarity of lay respondents with detailed scientific knowledge; (a) stated preference valuation of ecosystem functions;(b) stated preference valuation of ecosystem services II (oringinal graph).
51E C O L O G I C A L E C O N O M I C S 6 5 ( 2 0 0 8 ) 4 8 – 6 2

Author's personal copy
Thorough qualitative investigations of the pre-theoreticconcepts, beliefs and values that non-expert respondents arelikely to bring to the valuation task are a standard requirementfor any lege artis empirical stated preference study (e.g., Arrowet al., 1993; Bateman et al., 2002). The ecosystem serviceapproach differs from standard procedures in terms of anadditional restriction on commodity definition and the ensu-ing quantitative description of CE attribute levels or CValternatives. First, the good to be valued must be described asan ecosystem service, i.e. in terms of a benefit obtained fromecological systems that respondents actually care for. Thisrequirement excludes those functional ‘commodities’ (i.e.,ecosystem functions) from valuation for which the analyst isunable to clearly identify such benefits. In consequence, thequantitative description of stated preference attribute/alter-natives levels must be given in benefit terms. A quantificationin bio-physical terms will usually not be sufficient. If valua-tions are relative to some status quo situation, the benefitsassociated with the status quo must also be spelled out.
4. Case study: valuating a hydrologicalecosystem service in rural Indonesia
Being aware of the criticism expressed at the application ofstatedpreferencemethods tohydrological ecosystemfunctions,a valuation study was designed that aimed at minimizinginformation and misspecification biases by a careful differen-tiation between ecosystem structures and processes, and theecosystem services they generate (Barkmann and Marggraf,2003, p. 248). Although the presentation below focuses onhydrologic aspects, the case study itself deals with fourecosystem services of which only one is related to ecosystemhydrology (see Table 1). This broader scope ismainly due to theinstitutional framework of the Indonesian-German collabora-tive research project “Stability of Rainforest Margins in Indone-sia” (www.storma.de). Here, not only hydrological but alsomicro-climatical, pedological, zoological and botanical impactsof forest conversion and agroforestry intensification are inves-tigated (Steffan-Dewenter et al., 2007).
With only one choice experiment attribute devoted to hydro-logical ecosystem services, the case study cannot providepreference estimations for the full range of services that depend
on local hydrologic ecosystem functioning. Instead, the casestudy (i) illustrates how the ecosystem service approach can beimplemented, and (ii) tests its applicability with a focus on anecosystem function for which the applicability of statedpreference methods has explicitly been challenged.
4.1. Description of the research area
The economic valuation exercise took place in the area of theLore Lindu National Park in Central Sulawesi, Indonesia. Theproject area of about 7220 km2 is inhabited by ~137,000 people,mostly agricultural smallholders (data from 2001; Maertenset al., 2004). The area is part of the globally importantWallaceabiodiversity hotspot.
The research area is characterized by substantial environ-mental heterogeneity. The altitude ranges from just above sealevel up to 2500 m, and rainfall varies from 500 mm to2500 mm/year (Maertens, 2003). For example, some villagesare located in the intensively used Palu River Valley, close tothe provincial capital and well connected to national markets.The intensity of agricultural land use – including moreintensive cacao agroforestry devoid of a dense shading treecanopy (Steffan-Dewenter et al., 2007) – decreases via villagesin the northeast of Lore LinduNational Park (Palolo Valley) andthe immediate east and west (Napu and Kulawi valleys) stillaccessible by paved roads to upland villages in the remotewest not even accessible by motor bike. These differencescoincide partly with the local degree of rattan exploitation,and with an altitude gradient that severely restricts cacaoproduction, e.g., in the mountainous west. Furthermore, thelocal availability of irrigation water differs markedly depend-ing on rainfall differences (semi arid climate in the Palu valley)and on the type of irrigation systems available. While severalvillages in the Palu River Valley are connected to the(technical) Gumbasa Watershed Irrigation System, all othervillages use semi-technical or traditional irrigation systemsfed from local water sources.
In one of the research villages, Nopu (Palolo Valley), Keil et al.(2003) investigated the effects of forest conversion on wateravailability and local water use. For approximately ten years,smallholders have cultivated cacao in the floodplains of thecatchment, where the village is located. Between 650 and 950mabove sea level, the tropical forest is rapidly being replaced by
Table 1 – Attributes and attribute levels of the Central Sulawesi choice experiment
Attribute Levels Ecosystem servicecategory
Value type(TEV)
Rattan Availability of rattan (Calamus spp.)expressed in distance from village
5, 10, 15, 20 [km] Provisioning service Direct use/option value
Water Availability of irrigation water for wet ricecultivation
0, 1, 2, 3 [number of monthswith water shortage]
Regulating service Indirect use value
Cocoa Preponderance of cocoa plantations differingalong a shade tree gradient
5, 35, 65, 95 [% under shade] Regulating services Indirect use/option value
Anoa Population size of the endemic dwarf buffaloanoa (Bubalus depressicornis/quarlesi)
10, 180, 350§, 520 [No. ofanimals]
Cultural service (Predominantly) Existence value
Cost Extra taxes or donation to village fund 0, 18, 36, 54, 72 [1000 IDR/yr$] – –
§ present state; $ split sampled attribute: cards with a monthly payment scheme display 1/12 of the yearly amounts; 1 €~11,500 IDR (winter/spring 2005).
52 E C O L O G I C A L E C O N O M I C S 6 5 ( 2 0 0 8 ) 4 8 – 6 2

Author's personal copy
patches of slash-and-burn agriculture, pasture, secondaryforest, and cacao agroforestry. To varying degrees, these pro-cesses characterise the entire project area around Lore LinduNational Park.
Since September 2001 the Nopu catchment is instrumentedwith water level recorders, hydrologic parameter sensors, raingauges, and meteorological stations. As an example ofscientific key findings on hydrologic ecosystem functions,we present data from 2002 that were already available whenthe economic valuation study started in July 2003. The riverdischarge distribution (minimum daily runoff) shows aseasonal pattern with a peak in June and a low in Novemberreflecting a spring/early summer peak in precipitation (max-imum daily runoff (Fig. 2). Between months with a peak inprecipitation and months with a peak in minimum discharge,there is a time lag of about two months.
One of the most appropriate scientific descriptions of thehydraulic ecosystem functions with relevance to water supplyare exceedence time graphs (Fig. 3). Exceedence time graphsindicate the number of days of a year in which river dischargeexceeds the values indicated by the ordinate of the graph.Daily discharge values of Nopu river below 0.05 m3 indicatelow water availability for about 2/3 of the year.
4.2. Design and application of the choice experiment
4.2.1. Design of the attributesBlamey et al. (1997) differentiate between demand-relevanceand policy-relevance of goods included in stated preferencestudies. Demand-driven goods are expected to show up spon-taneously in focus groups or semi-structured interviewsbecause respondents perceive the natural resource manage-ment issue as pressing. If the issue is not mentioned sponta-neously, there is a higher risk that respondents are not familiarwith the issue. Consequently, information andmisspecificationbiases are a more serious threat to validity than for demand-driven attributes.
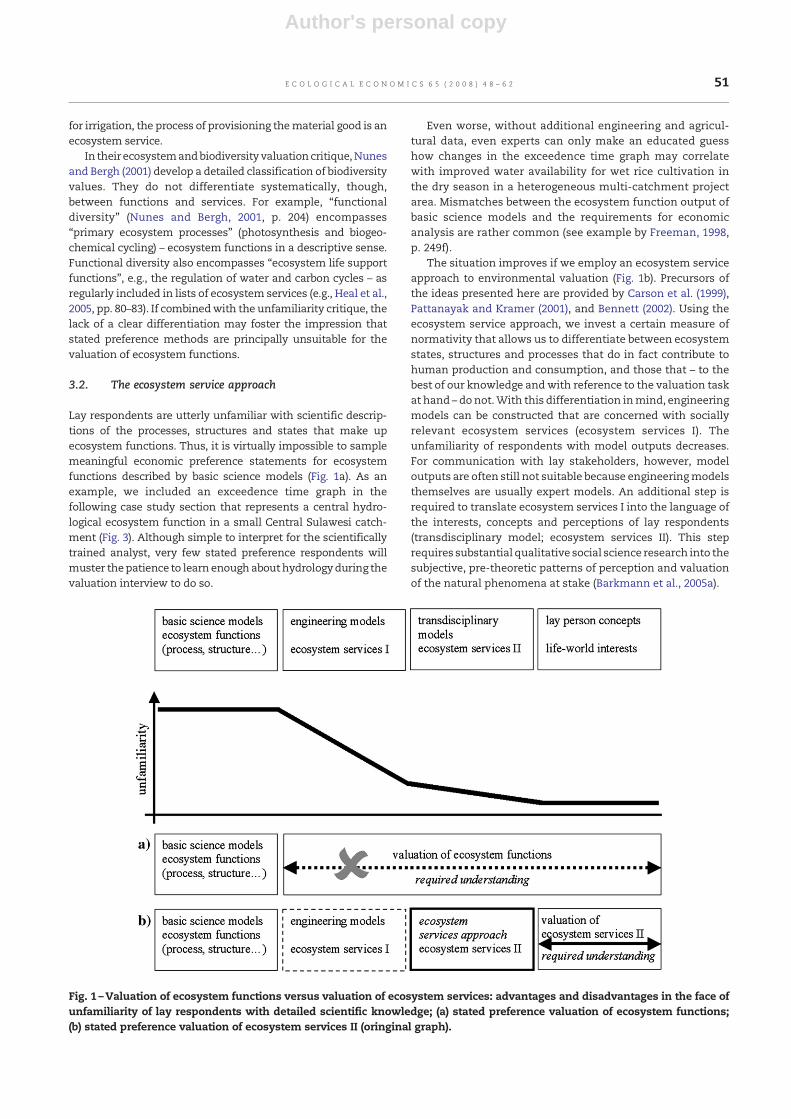
Information gathered from 120 households in 12 villages ofthe project region did already suggest in 2002 that there is ahigh awareness of drought and flooding related problems(Birner and Mappatoba, 2002). Keil et al. (2003) specificallyaddressed perceived water availability in a one-day Participa-tory Rural Appraisal (PRA) held in Nopu in May 2002.Participants were asked to assess monthly rainfall and localwater availability for a ‘normal’ year (Fig. 4). The subjectiveassessment of water availability follows perceived rainfallpatterns with a delay of up to two months. Although the
Fig. 2 –Monthly minimum, maximum and mean daily runoff of Nopu catchment, Central Sulawesi, in 2002 (Keil et al., 2003).
Fig. 3 –Exceedence time graph 2002, Nopu catchment, Central Sulawesi (Keil et al., 2003).
53E C O L O G I C A L E C O N O M I C S 6 5 ( 2 0 0 8 ) 4 8 – 6 2
Author's personal copy
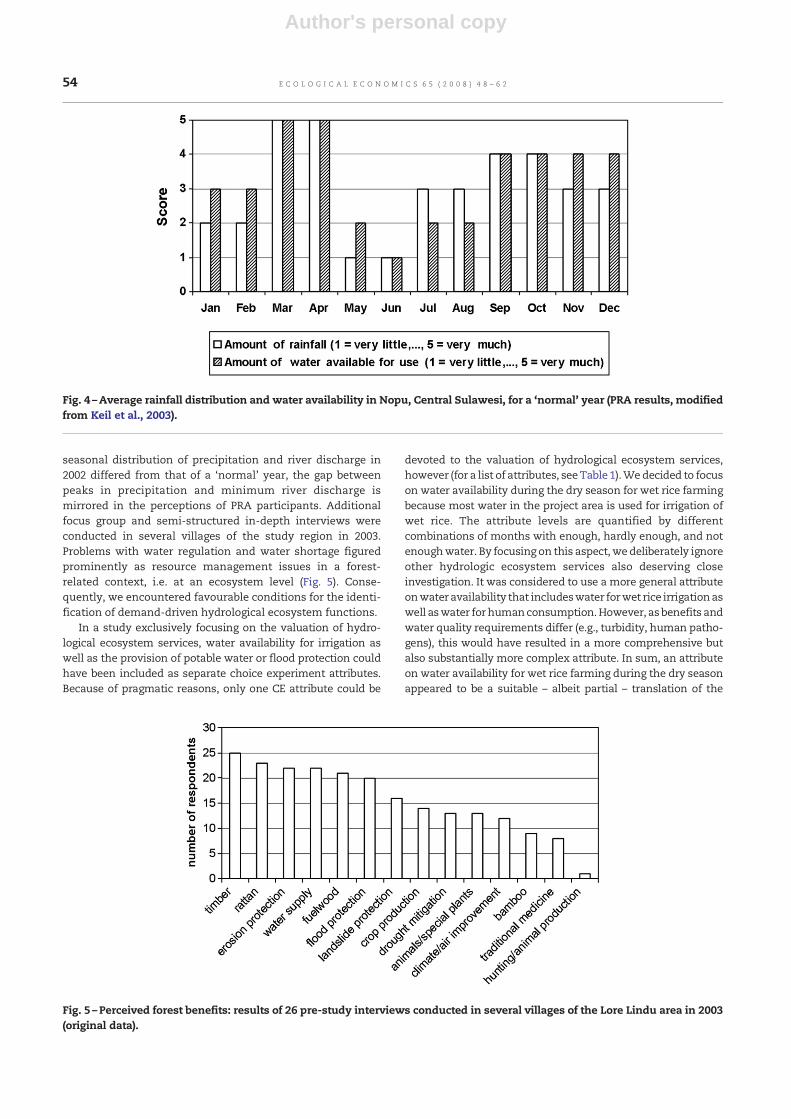
seasonal distribution of precipitation and river discharge in2002 differed from that of a ‘normal’ year, the gap betweenpeaks in precipitation and minimum river discharge ismirrored in the perceptions of PRA participants. Additionalfocus group and semi-structured in-depth interviews wereconducted in several villages of the study region in 2003.Problems with water regulation and water shortage figuredprominently as resource management issues in a forest-related context, i.e. at an ecosystem level (Fig. 5). Conse-quently, we encountered favourable conditions for the identi-fication of demand-driven hydrological ecosystem functions.
In a study exclusively focusing on the valuation of hydro-logical ecosystem services, water availability for irrigation aswell as the provision of potable water or flood protection couldhave been included as separate choice experiment attributes.Because of pragmatic reasons, only one CE attribute could be
devoted to the valuation of hydrological ecosystem services,however (for a list of attributes, seeTable 1).Wedecided to focuson water availability during the dry season for wet rice farmingbecause most water in the project area is used for irrigation ofwet rice. The attribute levels are quantified by differentcombinations of months with enough, hardly enough, and notenoughwater. By focusing on this aspect, wedeliberately ignoreother hydrologic ecosystem services also deserving closeinvestigation. It was considered to use a more general attributeonwater availability that includeswater forwet rice irrigationaswell aswater forhumanconsumption.However, asbenefits andwater quality requirements differ (e.g., turbidity, human patho-gens), this would have resulted in a more comprehensive butalso substantially more complex attribute. In sum, an attributeon water availability for wet rice farming during the dry seasonappeared to be a suitable – albeit partial – translation of the
Fig. 4 –Average rainfall distribution and water availability in Nopu, Central Sulawesi, for a ‘normal’ year (PRA results, modifiedfrom Keil et al., 2003).
Fig. 5 –Perceived forest benefits: results of 26 pre-study interviews conducted in several villages of the Lore Lindu area in 2003(original data).
54 E C O L O G I C A L E C O N O M I C S 6 5 ( 2 0 0 8 ) 4 8 – 6 2

Author's personal copy
scientific description of hydrological processes into a demand-driven ecosystem service.
In addition to the water availability attribute, we selectedthe population size of an endemic local species, the dwarfbuffalo Bubalus depressicornis/B. quarlesi (‘anoa’), the amount ofshade in local cacao plantations, and the availability of rattanas additional attributes (Table 1). In exact analogy to the waterattribute, the rattan attribute was operationalised via theecosystem service approach (distance to next commerciallyexploitable rattan site in km). Due to conservation policyinterest in the local economic perception of varying cacaoshading levels by Central Sulawesi small holders (cf. Steffan-Dewenter et al., 2007), the cacao attribute was not operatio-nalised via the ecosystem service attribute but presented instructural terms. For the anoa attribute, the ecosystem serviceapproach was inappropriate as the anoa population is notvalued because of any ecosystem function in the sense of anindirect use value but mainly for existence value reasons.Although hunting anoa is illegal, we cannot rule out that somerespondents also attributed a direct use value to the anoapopulation. In any case, this direct use service can beconsidered highly familiar to respondents, and not in needof a specific translation into respondent ‘benefit language’.
Although most respondents are involved in agriculturalsubsistence production, pre-studies had shown that virtuallyall households are also involved in money-based economictransactions, either via the purchase of agricultural inputs, orvia selling raw materials for internationally traded commod-ities cacao and rattan. Thus, we opted to use the monetarystandard version of the payment vehicle. Because of thesevere poverty of many respondents, we restricted maximummonetary levels – accepting an underestimation of WTP byignoring potentially higher WTP of a low percentage of ratherwell-off respondents. The ‘cost’ attribute was double split-sampled. One half of respondents were confronted with a rise
in “house-and-land” tax (Pajak Bumi Bangunan), the other halfwith a donation to a village fund (Iuran dana pembangunan desa)affecting every household of the research region. Bothpayment vehicles are familiar and widely accepted withinthe region. The second split sample involved monthly versusyearly payments. Results of the split sample analysis will notbe reported here.
To alleviate the cognitive burden of the choice task, weused visualizations for the attributes and attribute levelscrafted by a local artist. The choice task was framed as aselection between different versions of a village developmentprogram to which a financial contribution was required ifimplemented.
4.2.2. Administration and analysis of the choice experimentThe choice experiment (CE) instrument was pre-tested andpiloted (n=96) in 2004. The main survey was conducted fromDecember 2004 to March 2005 as a random face-to-face surveyin 12 of the about 120 villages in the project area (n=301). Theinterviews were conducted by six well-trained local enumera-tors. Thirteen respondents consistently chose the status quowithout quoting lack of money or low attractiveness of theoffered alternatives as reasons. These respondents wereclassified as not responding to the CE task and omitted fromparameter estimation (Adamowicz et al., 1998, p. 68). Quanti-tative analysis is performed on a subset of 249 households forwhich an extensive set of socio-demographic variables isavailable (for descriptive statistics, see Table 2).
Because of the variability of ecological conditions acrossthe project region, the choice sets presented to a respondentincluded a self-explicated status quo (Bennett and Blamey,2001, p. 138; for details of application, see Glenk et al., 2006a).Because of these pronounced differences in the project regionwith regard to the water, the rattan and the cacao attribute,respondents were asked which of the attribute levels (see
Table 2 – Socio-economic and attitudinal description of the sample of Central Sulawesi respondents/respondent households
Variable Type Coding Scale construction Mean S.D.
Respondent age SD n.a. 45.8 14.0Respondent education [years]§ SD n.a. 7.6 3.2Relative poverty SD see Zeller et al. (2003) 0.02 0.81Rattan collector$ SD 0;1 n.a. 0.12 0.33Wet rice involvement$ SD 0;1 n.a. 0.60 0.49Cacao farmer$ SD 0;1 n.a. 0.76 0.43Perception of % shading inlocal cacao plots
SSQ respondents choose from cacao shadingattribute levels (5%; 35%; 65%; 95%)
42.8 18.2
Rattan value PMT 1;…; 4 mean of two items 1.55 1.05Probability of rattan loss PMT 1;…; 4 mean of two items 2.26 0.97Water value PMT 1;…; 4 one item 3.10 1.34Severity of forest loss PMT 1;…; 4 one item 3.25 0.98Cacao shade value PMT 1;…; 4 one item 1.51 0.96Probability of cacao problems PMT 1;…; 4 one item 3.00 1.06Severity of anoa extinction PMT 1;…; 4 one item 1.29 0.59Government response efficacy PMT 1;…; 5 mean of two items 4.08 0.47Respondent comprehension rating RCR 1;…; 5 n.a. 3.12 0.85
SD: socio-demographic variable; SSQ: self-explicated status quo; PMT: Protection Motivation Theory (Rogers and Prentice-Dunn 1997); RCR:rating of respondent comprehension performed by enumerators immediately after the choice experiment; § of the mean, 6 years are primaryschool; $ mean indicates share of households involved in respective activities; n=249.
55E C O L O G I C A L E C O N O M I C S 6 5 ( 2 0 0 8 ) 4 8 – 6 2
Author's personal copy
Table 1) most closely described the local situation of theirvillage.6 For each respondent, these levels were individuallyaffixed to the status quo choice card. For the anoa populationof the research region, an expert estimate of 300 animals wasuniformly used as the status quo level.
For all attributes, linear utility functions were assumed. Forcacao shading, an additional quadratic term was included inorder to allow for a shading optimum at intermediate shadelevels. Preliminary analyses indicated the risk of violations ofthe independence from irrelevant alternatives (IIA) conditionnecessary for the application of multi-nomial logit analysis.Because Nested Logit (NL) analysis does not rely on the IIA
assumption, an eligible NL tree structure was identified, andthe corresponding models estimated with NLOGIT 3.0. Theinclusive value was set to 1.0 for the degenerated branch, andthe model initiated with starting values obtained from a non-nested NL model (Hensher et al., 2005, pp. 530ff). All scaleparameters were normalized at the lowest level (RU1). Will-ingness-to-pay calculations are based on extrapolations frommean marginal WTP values. Individual self-explicated statusquo levels were accounted for in calculation of WTP values ofthe cacao attribute: (i) For respondents perceiving 5% shading,scenario change was restricted to −5%; (ii) mean scenarioWTP/household was calculated separately for each group ofrespondents with differing status quo self-explications; (iii)average scenario WTP per household is the weighed mean ofthe WTP values across the groups. For the final aggregation ofWTP across the households of the project region, we regarded13 non-responding participants as filing protest statementsindicating zero WTP.
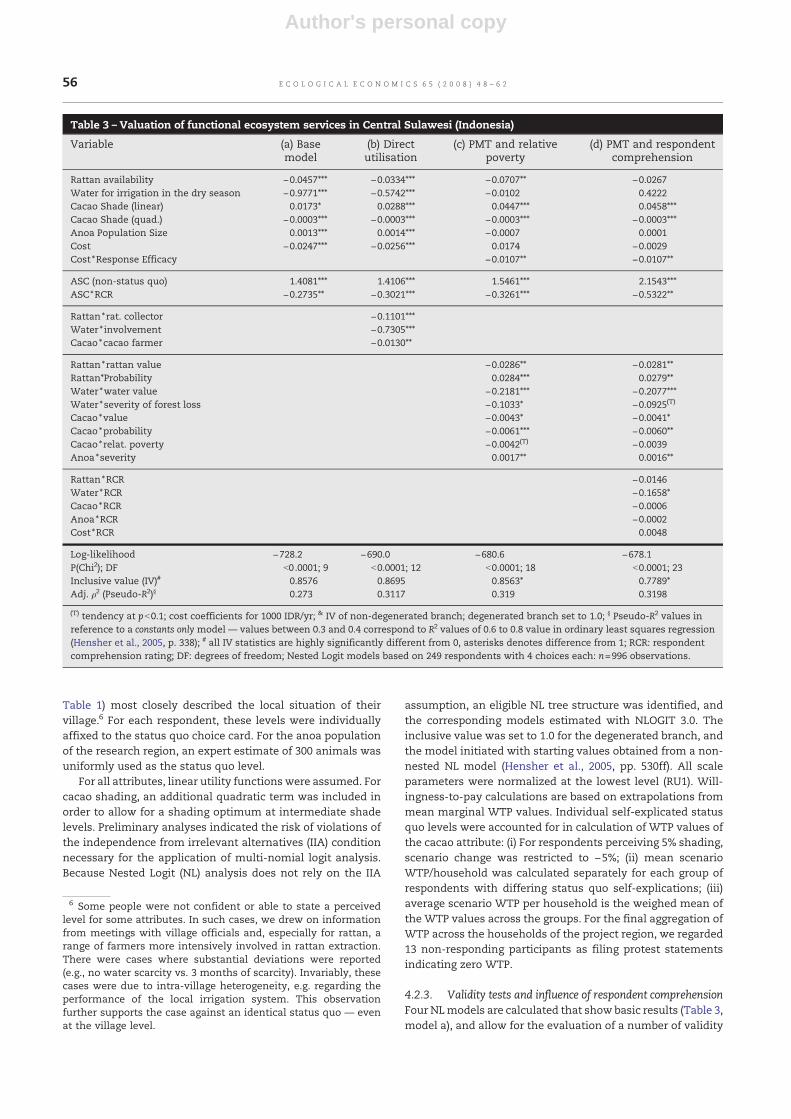
4.2.3. Validity tests and influence of respondent comprehensionFour NLmodels are calculated that show basic results (Table 3,model a), and allow for the evaluation of a number of validity
6 Some people were not confident or able to state a perceivedlevel for some attributes. In such cases, we drew on informationfrom meetings with village officials and, especially for rattan, arange of farmers more intensively involved in rattan extraction.There were cases where substantial deviations were reported(e.g., no water scarcity vs. 3 months of scarcity). Invariably, thesecases were due to intra-village heterogeneity, e.g. regarding theperformance of the local irrigation system. This observationfurther supports the case against an identical status quo — evenat the village level.
Table 3 – Valuation of functional ecosystem services in Central Sulawesi (Indonesia)
Variable (a) Basemodel
(b) Directutilisation
(c) PMT and relativepoverty
(d) PMT and respondentcomprehension
Rattan availability −0.0457⁎⁎⁎ −0.0334⁎⁎⁎ −0.0707⁎⁎ −0.0267Water for irrigation in the dry season −0.9771⁎⁎⁎ −0.5742⁎⁎⁎ −0.0102 0.4222Cacao Shade (linear) 0.0173⁎ 0.0288⁎⁎⁎ 0.0447⁎⁎⁎ 0.0458⁎⁎⁎Cacao Shade (quad.) −0.0003⁎⁎⁎ −0.0003⁎⁎⁎ −0.0003⁎⁎⁎ −0.0003⁎⁎⁎Anoa Population Size 0.0013⁎⁎⁎ 0.0014⁎⁎⁎ −0.0007 0.0001Cost −0.0247⁎⁎⁎ −0.0256⁎⁎⁎ 0.0174 −0.0029Cost ⁎Response Efficacy −0.0107⁎⁎ −0.0107⁎⁎
ASC (non-status quo) 1.4081⁎⁎⁎ 1.4106⁎⁎⁎ 1.5461⁎⁎⁎ 2.1543⁎⁎⁎ASC ⁎RCR −0.2735⁎⁎ −0.3021⁎⁎⁎ −0.3261⁎⁎⁎ −0.5322⁎⁎
Rattan ⁎rat. collector −0.1101⁎⁎⁎Water ⁎ involvement −0.7305⁎⁎⁎Cacao ⁎cacao farmer −0.0130⁎⁎
Rattan ⁎rattan value −0.0286⁎⁎ −0.0281⁎⁎Rattan⁎Probability 0.0284⁎⁎⁎ 0.0279⁎⁎Water ⁎water value −0.2181⁎⁎⁎ −0.2077⁎⁎⁎Water ⁎severity of forest loss −0.1033⁎ −0.0925(T)
Cacao ⁎value −0.0043⁎ −0.0041⁎Cacao ⁎probability −0.0061⁎⁎⁎ −0.0060⁎⁎Cacao ⁎relat. poverty −0.0042(T) −0.0039Anoa ⁎severity 0.0017⁎⁎ 0.0016⁎⁎
Rattan ⁎RCR −0.0146Water ⁎RCR −0.1658⁎Cacao ⁎RCR −0.0006Anoa ⁎RCR −0.0002Cost ⁎RCR 0.0048
Log-likelihood −728.2 −690.0 −680.6 −678.1P(Chi2); DF b0.0001; 9 b0.0001; 12 b0.0001; 18 b0.0001; 23Inclusive value (IV)# 0.8576 0.8695 0.8563⁎ 0.7789⁎Adj. ρ2 (Pseudo-R2)§ 0.273 0.3117 0.319 0.3198
(T) tendency at pb0.1; cost coefficients for 1000 IDR/yr; & IV of non-degenerated branch; degenerated branch set to 1.0; § Pseudo-R2 values inreference to a constants only model — values between 0.3 and 0.4 correspond to R2 values of 0.6 to 0.8 value in ordinary least squares regression(Hensher et al., 2005, p. 338); # all IV statistics are highly significantly different from 0, asterisks denotes difference from 1; RCR: respondentcomprehension rating; DF: degrees of freedom; Nested Logit models based on 249 respondents with 4 choices each: n=996 observations.
56 E C O L O G I C A L E C O N O M I C S 6 5 ( 2 0 0 8 ) 4 8 – 6 2

Author's personal copy
issues (Table 3, models b–d). The validity tests address threepotential challenges to the results of the case study.
First, it could be claimed thatwe donotmeasure the value offunctional indirect use benefits at the ecosystem level, but thevalue of direct use benefits at the level of the individual farmhousehold that, e.g., directly uses irrigationwater. Although theactual irrigation water needs to be “produced” from the wateravailable at the ecosystem level by the construction andmaintenance of irrigation systems and, thus, cannot be useddirectly for irrigation, we decided to conduct a simple test ifpreferences are exclusively linked to the economic activities ofthe individual households (model b). We do so by including aninteraction term with a dummy variable indicating if a house-hold is involved in wet rice farming, extracts rattan, or owns acacao plot.
The second challenge refers to the general validity of CEresults in face of the hypothetical character of statedpreference methods. In model (c), we use attitudinal itemsthat operationalise risk and coping appraisal variables fromProtection Motivation Theory (PMT, Rogers and Prentice-Dunn, 1997). PMT is a social-psychological action theory thathas been used successfully for the explanation of economicpreferences calculated from stated preference data (Menzel,2003; Barkmann et al., 2005b). An additional set of PMT itemswas sampled on forest-related attitudes. Six items weresampled that refer to respondent attitudes towards thegovernment's ability to use taxpayer money successfully andresponsibly for village development. For quantitative analysis,we use a two-item subscale singled out by factor analysis thatfocuses on attitudes beyond village government (for details,see Table 2).
A standard procedure to test for validity in statedpreference studies relies on the expected positive influenceof income on WTP. Under the semi-subsistence conditionsprevalent in the project area, we tested for more broadlydefined wealth effects on preferences using a relative povertyindex (Glenk et al., 2006b; Zeller et al., 2003).
The third challenge refers to respondent unfamiliaritywith the ecosystem services sampled. Unfamiliarity mayresult in poor comprehension of the subject matter of thechoice experiment. Enumerators rated respondent compre-hension directly after the choice experiment on a scale from1 (= insufficient understanding) to 5 (= very good under-standing). The average comprehension rating was 3.12 withonly four respondents in the ‘insufficient’ category (Table 2).With this indicator of respondent comprehension, we testthree hypotheses:
1. Respondent comprehension influences preferences forecosystem services. Influences are tested by constructinginteraction terms between attributes and comprehensionrating.
2. Inclusion of the interaction terms does not result inmaterially differing preference estimates.Both hypotheses are tested in model (d), into which theinteraction terms are introduced in addition to the inter-action terms from model (c).
3. Lower comprehension as a result of unfamiliarity results ina less thorough cognitive integration of the informationgiven in the choice sets. We test this hypothesis
a. by observing the sign of a dummy variable representingthe non-status quo alternatives (‘ASC’). If respondentsfeel ill-informedwith regard to the costly alternatives tothe status quo, one would expect a negative sign of theASC (Kontoleon and Yabe, 2004);
b. by constructing an interaction term between therespondent comprehension rating and the ASC. Ifhypothesis 3 is true, the interaction term should becomea significant predictor of choice, and its sign should beopposite to the sign of the ASC.
The ASC dummy and the interaction term with the ASCdummy are included in all four models. Details on theeconometric treatment of interaction terms in utility andWTP calculation can be found in Barkmann et al. (2007).
4.3. Results
4.3.1. Base model, validity testsAll NL models are highly significant (P≤0.0001; Table 3). Thebase model (a) displays the expected signs for the attributeterms: disutility for longer distance to the next rattan site,disutility of decline in water availability, positive utility forbigger anoa populations, disutility of higher costs. For shadingin cacao plots, we find positive utility for more shade alongwith a negative sign of the quadratic term indicating anunimodal response to shade. The attribute on preferences forthe hydrological ecosystem service availability of irrigationwater in the dry season is highly significant (Pb0.0001).
Model (b) reveals that for rattan, water and cacao shade, thedirect utilization terms become highly significant; the non-interacted attributes indicating non-production preferencesare also highly significant. Taking the fraction of householdsinto account that are involved in rattan extraction andwet ricefarming (Table 3), a comparison of the rattan-and water-related coefficients suggests that about 71% of the preferencesfor improved rattan availability are attributable to non-production benefits of the individual household; for improvedavailability of irrigation water, about 57% are attributable tonon-production benefits.
Comparing model (c) with the base model (a), inclusion ofsignificant interaction terms with PMT variables and withrelative poverty improves adjusted Pseudo-R2 by more thanfour percentage points to a very reasonable value of 31.9%. LogLikelihoodratio-tests showthatmodel specification (c) improvesmodel fit compared to models (a) and (b) (Pb0.0001; P=0.027).Significant interaction terms are found for all attributes. Twointeractionswith thewater attribute are significant, water value(Pb0.0001) and severity of forest loss (P=0.037). The morerespondents agree on average with the statement that they“very much need water for irrigation in the dry season” (watervalue) the higher is the disutility ofmoremonthswith lowwateravailability. Likewise, amore concerned attitude towards loss of“trees on the hillsides” correlates with higher preferences forwater availability. Both interaction terms explain variation inchoicebehavior asexpected. In fact, theyexplain thevariationsowell that the non-interacted water attribute becomes statisti-cally andmaterially insignificant. The cost attribute displays thesamepatternwith ahighly significant influence of theperceivedresponse efficacy of government (P=0.0039).
57E C O L O G I C A L E C O N O M I C S 6 5 ( 2 0 0 8 ) 4 8 – 6 2
Author's personal copy
Under model specifications (c) and (d), none of thetheoretically expected linear influences of relative povertyon preferences could be detected at standard significancelevels. Only the interaction with the cacao attribute displays atendency (P=0.075) in model (c); only the interactions withcacao are retained in the final models.
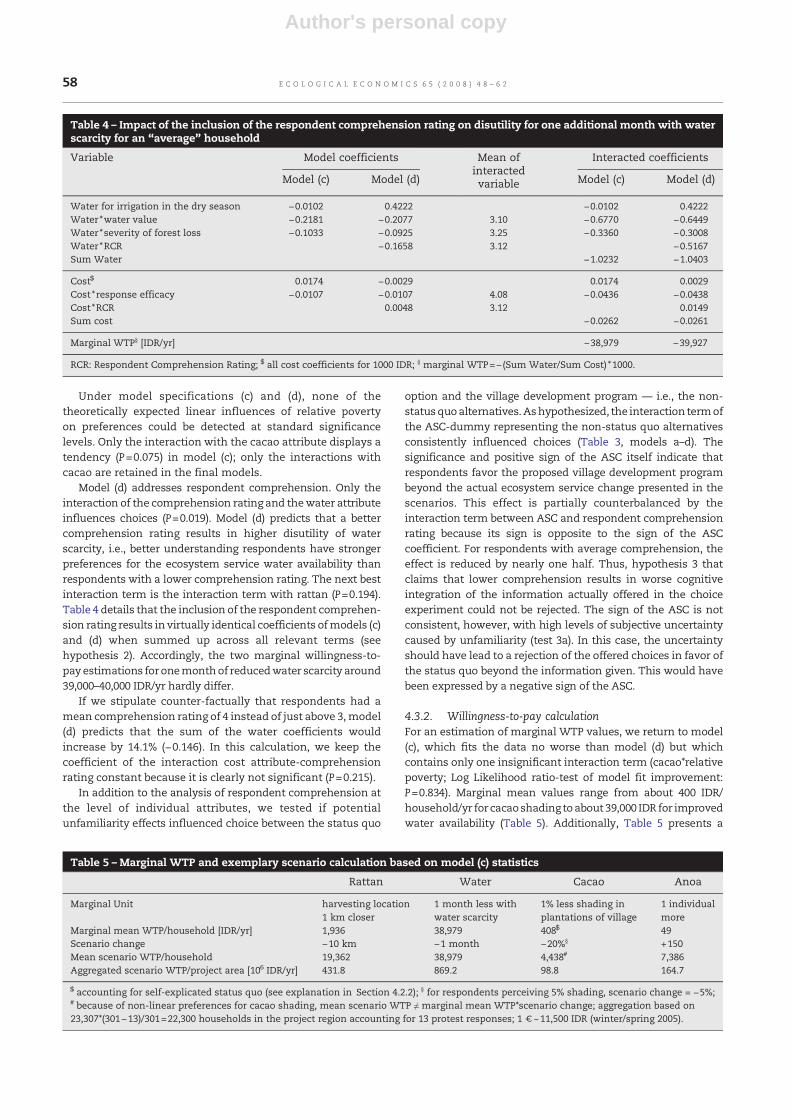
Model (d) addresses respondent comprehension. Only theinteraction of the comprehension rating and thewater attributeinfluences choices (P=0.019). Model (d) predicts that a bettercomprehension rating results in higher disutility of waterscarcity, i.e., better understanding respondents have strongerpreferences for the ecosystem service water availability thanrespondents with a lower comprehension rating. The next bestinteraction term is the interaction term with rattan (P=0.194).Table 4 details that the inclusion of the respondent comprehen-sion rating results in virtually identical coefficients ofmodels (c)and (d) when summed up across all relevant terms (seehypothesis 2). Accordingly, the two marginal willingness-to-pay estimations foronemonthof reducedwater scarcity around39,000–40,000 IDR/yr hardly differ.
If we stipulate counter-factually that respondents had amean comprehension rating of 4 instead of just above 3,model(d) predicts that the sum of the water coefficients wouldincrease by 14.1% (−0.146). In this calculation, we keep thecoefficient of the interaction cost attribute-comprehensionrating constant because it is clearly not significant (P=0.215).
In addition to the analysis of respondent comprehension atthe level of individual attributes, we tested if potentialunfamiliarity effects influenced choice between the status quo
option and the village development program — i.e., the non-statusquoalternatives.Ashypothesized, the interaction termofthe ASC-dummy representing the non-status quo alternativesconsistently influenced choices (Table 3, models a–d). Thesignificance and positive sign of the ASC itself indicate thatrespondents favor the proposed village development programbeyond the actual ecosystem service change presented in thescenarios. This effect is partially counterbalanced by theinteraction term between ASC and respondent comprehensionrating because its sign is opposite to the sign of the ASCcoefficient. For respondents with average comprehension, theeffect is reduced by nearly one half. Thus, hypothesis 3 thatclaims that lower comprehension results in worse cognitiveintegration of the information actually offered in the choiceexperiment could not be rejected. The sign of the ASC is notconsistent, however, with high levels of subjective uncertaintycaused by unfamiliarity (test 3a). In this case, the uncertaintyshould have lead to a rejection of the offered choices in favor ofthe status quo beyond the information given. This would havebeen expressed by a negative sign of the ASC.
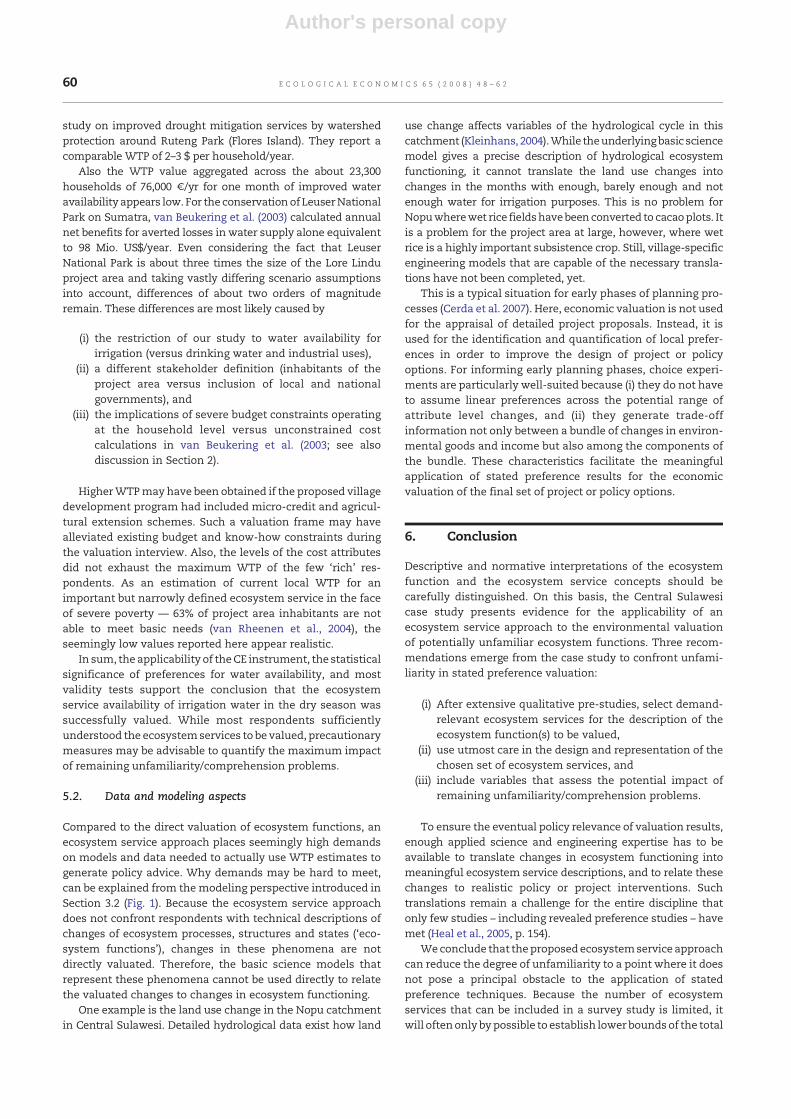
4.3.2. Willingness-to-pay calculationFor an estimation of marginal WTP values, we return to model(c), which fits the data no worse than model (d) but whichcontains only one insignificant interaction term (cacao⁎relativepoverty; Log Likelihood ratio-test of model fit improvement:P=0.834). Marginal mean values range from about 400 IDR/household/yr for cacaoshading toabout39,000 IDR for improvedwater availability (Table 5). Additionally, Table 5 presents a
Table 4 – Impact of the inclusion of the respondent comprehension rating on disutility for one additional month with waterscarcity for an “average” household
Variable Model coefficients Mean ofinteractedvariable
Interacted coefficients
Model (c) Model (d) Model (c) Model (d)
Water for irrigation in the dry season −0.0102 0.4222 −0.0102 0.4222Water ⁎water value −0.2181 −0.2077 3.10 −0.6770 −0.6449Water ⁎severity of forest loss −0.1033 −0.0925 3.25 −0.3360 −0.3008Water ⁎RCR −0.1658 3.12 −0.5167Sum Water −1.0232 −1.0403
Cost$ 0.0174 −0.0029 0.0174 0.0029Cost ⁎response efficacy −0.0107 −0.0107 4.08 −0.0436 −0.0438Cost ⁎RCR 0.0048 3.12 0.0149Sum cost −0.0262 −0.0261
Marginal WTP§ [IDR/yr] −38,979 −39,927
RCR: Respondent Comprehension Rating; $ all cost coefficients for 1000 IDR; § marginal WTP=− (Sum Water/Sum Cost) ⁎1000.
Table 5 –Marginal WTP and exemplary scenario calculation based on model (c) statistics
Rattan Water Cacao Anoa
Marginal Unit harvesting location1 km closer
1 month less withwater scarcity
1% less shading inplantations of village
1 individualmore
Marginal mean WTP/household [IDR/yr] 1,936 38,979 408$ 49Scenario change −10 km −1 month −20%§ +150Mean scenario WTP/household 19,362 38,979 4,438# 7,386Aggregated scenario WTP/project area [106 IDR/yr] 431.8 869.2 98.8 164.7
$ accounting for self-explicated status quo (see explanation in Section 4.2.2); § for respondents perceiving 5% shading, scenario change = −5%;# because of non-linear preferences for cacao shading, mean scenario WTP ≠ marginal mean WTP⁎scenario change; aggregation based on23,307⁎(301−13)/301=22,300 households in the project region accounting for 13 protest responses; 1 €~11,500 IDR (winter/spring 2005).
58 E C O L O G I C A L E C O N O M I C S 6 5 ( 2 0 0 8 ) 4 8 – 6 2

Author's personal copy
simplified scenario calculation to indicate the magnitude ofpotential policy implications. The scenario assumes that thenext commercially exploitable rattan sites are 10 km closer tothe villages, water shortage is reduced by one month, cacaoshading is reduced by 20%, and anoa numbers increase by 150.With respect to scenario WTP values, the improvement ofhydrological ecosystem services is the most valued change. Amethodologically more intricate WTP and scenario analysiswith three differing scenarios is provided by Glenk et al. (2006a).Extrapolating household WTP/year to the entire project regionof approximately 23,300 households based on the abovescenario results in an aggregated annual WTP of about 870Mio. IDR (~76,000€) for improvedavailability of irrigationwater,and about 1,560 Mio. IDR (~136,000€) for an implementation ofall improvements.
5. Discussion
5.1. Unfamiliarity aspects
The case study documents that unfamiliarity of lay respon-dents with the scientific details of ecosystem functioning is noprincipal objection against the application of stated prefer-ence techniques for a monetary quantification of ‘functional’indirect use values. In particular, we showed that unfamiliar-ity with technical descriptions of a hydrological ecosystemfunction represented by the discharge characteristics of asmall catchment does not prevent a meaningful economicvaluation of a closely related ecosystem service.
Apart from statistical evidence such as the high signifi-cance of all calculated NL models and the water availability-related attributes, we base this optimistic view on severalobservations. At the most fundamental level, water avail-ability is clearly a demand-driven environmental valuationissue of high economic and social relevance in the projectregion. This is an important factor that helps avoidinginformation and misspecification biases. The relevance andrealism of the entire valuation exercise is mirrored by the factthat only 13 protest responses were filed by 301 respondents.
We investigated if the ecosystem services at hand could beexplained completely bymotivations for direct resource use atthe household level. If so, the need to apply stated preferencetechniques could be questioned. In particular, for the avail-ability of irrigation water, a substantial share of benefits (57%)could not be attributed directly to wet rice productionactivities at the household level. Thus, the measured prefer-ences are likely to include non-use and/or indirect use valuesnot captured by standard production economic analysis.
Two variables from Protection Motivation Theory inter-acted with the water attribute, water value and severity offorest loss, explain variations in choice behavior so well thatthe water attribute itself became insignificant. Thus, prefer-ences stated in response to the chosen representation of wateravailability relate well to underlying values and risk percep-tions of respondents derived from social-psychological theory.
Preferences for the availability of water and rattan, and fora larger anoa population did not increase linearly with relativepoverty. In more detailed analyses to be published elsewhere(Glenk et al., 2006b), preferences for shading in cacao had
displayed a (negative) linear correlation with relative poverty.This tendency is also visible here in model (c). As there areindications for a systematically non-linear relationshipbetween relative poverty and preferences for these ecosystemservices (‘middle class goods’), the results of this validityanalysis are inconclusive.
To test for unfamiliarity effects, the comprehension ofrespondents was rated directly after the CE by local, well-trained enumerators. Only four respondents were rated tohave insufficient comprehension. The average comprehen-sion rating was 3.12 with about 80% of respondents in theaverage to very high comprehension range. Although thecomprehension rating influenced the probability with whichthe village development alternatives were chosen over the “donothing”-status quo option, the sign of the non-status quodummy does not give any indication of comprehensionproblems. With unfamiliarity issues looming, one wouldhave expected a status quo bias (negative sign of the non-status quo ASC) as respondents choose the save haven of thecurrent situation instead of paying for a change in a goodtroubled by unfamiliarity. Instead, respondents favored thenon-status quo alternatives strongly (for a more detaileddiscussion, see Glenk et al. 2006a).
When interacted with the water attribute, the comprehen-sion rating significantly influenced choices. Potential unfami-liarity effects were stronger for the hydrological ecosystemservice than for other ecosystem services, such as availabilityof rattan or shading in cacao plantations. While the inclusionof the comprehension rating had hardly any effect on WTPestimates, improved familiaritymay result in different – in ourcase higher – WTP estimates. If we attribute comprehensiondeficits completely to persisting unfamiliarity – which iscertainly an exaggeration –, the comprehension rating indi-cates that unfamiliarity may continue to be a problem forabout 20% of respondents. NL model (d) predicts thatrespondents with a comprehension rating of 4 are expectedto value improved water availability by about 14% more thanrespondents with an average rating.While perceived responseefficacy of government activities strongly impacts monetarypreferences via an influence on the cost attribute, no evidencewas found that unfamiliarity exerts a similar influence.
The comprehension analysis suggests that our implemen-tation of the ecosystem service approach solved the compre-hension problems sufficiently when applied to a respondentsample with an average of 7.6±3.2 years of formal education(Table 2). For remaining comprehension problems caused byunfamiliarity, the inclusion of a comprehension rating vari-able allows for an assessment of the maximum unfamiliarityimpact — and a correction of WTP estimates if desired.
The calculatedWTP values per household of a few Euro/yearappear low. However, WTP for improving water availability byonemonth equals about 1%ofmean cash incomeof householdsin the project area (total mean income including non-cashfarming income in 2002: ~5.9 Mio IDR; Schwarze and Zeller,2005). WTP for the implementation of all scenario improve-ments covers the basic needs of one household member forabouthalf amonth (vanRheenenetal., 2004). Toour knowledge,the only stated preference study on the valuation of a similarecosystem service in Indonesia was conducted by Pattanayakand Kramer (2001). They conducted a contingent valuation
59E C O L O G I C A L E C O N O M I C S 6 5 ( 2 0 0 8 ) 4 8 – 6 2
Author's personal copy
study on improved drought mitigation services by watershedprotection around Ruteng Park (Flores Island). They report acomparable WTP of 2–3 $ per household/year.
Also the WTP value aggregated across the about 23,300households of 76,000 €/yr for one month of improved wateravailability appears low. For the conservationof LeuserNationalPark on Sumatra, van Beukering et al. (2003) calculated annualnet benefits for averted losses in water supply alone equivalentto 98 Mio. US$/year. Even considering the fact that LeuserNational Park is about three times the size of the Lore Linduproject area and taking vastly differing scenario assumptionsinto account, differences of about two orders of magnituderemain. These differences are most likely caused by
(i) the restriction of our study to water availability forirrigation (versus drinking water and industrial uses),
(ii) a different stakeholder definition (inhabitants of theproject area versus inclusion of local and nationalgovernments), and
(iii) the implications of severe budget constraints operatingat the household level versus unconstrained costcalculations in van Beukering et al. (2003; see alsodiscussion in Section 2).
HigherWTPmay have been obtained if the proposed villagedevelopment program had included micro-credit and agricul-tural extension schemes. Such a valuation frame may havealleviated existing budget and know-how constraints duringthe valuation interview. Also, the levels of the cost attributesdid not exhaust the maximum WTP of the few ‘rich’ res-pondents. As an estimation of current local WTP for animportant but narrowly defined ecosystem service in the faceof severe poverty — 63% of project area inhabitants are notable to meet basic needs (van Rheenen et al., 2004), theseemingly low values reported here appear realistic.
In sum, the applicability of theCE instrument, the statisticalsignificance of preferences for water availability, and mostvalidity tests support the conclusion that the ecosystemservice availability of irrigation water in the dry season wassuccessfully valued. While most respondents sufficientlyunderstood the ecosystemservices to be valued, precautionarymeasures may be advisable to quantify the maximum impactof remaining unfamiliarity/comprehension problems.
5.2. Data and modeling aspects
Compared to the direct valuation of ecosystem functions, anecosystem service approach places seemingly high demandson models and data needed to actually use WTP estimates togenerate policy advice. Why demands may be hard to meet,can be explained from themodeling perspective introduced inSection 3.2 (Fig. 1). Because the ecosystem service approachdoes not confront respondents with technical descriptions ofchanges of ecosystem processes, structures and states (‘eco-system functions’), changes in these phenomena are notdirectly valuated. Therefore, the basic science models thatrepresent these phenomena cannot be used directly to relatethe valuated changes to changes in ecosystem functioning.
One example is the land use change in the Nopu catchmentin Central Sulawesi. Detailed hydrological data exist how land
use change affects variables of the hydrological cycle in thiscatchment (Kleinhans, 2004).While theunderlyingbasic sciencemodel gives a precise description of hydrological ecosystemfunctioning, it cannot translate the land use changes intochanges in the months with enough, barely enough and notenough water for irrigation purposes. This is no problem forNopuwherewet rice fieldshavebeenconverted to cacaoplots. Itis a problem for the project area at large, however, where wetrice is a highly important subsistence crop. Still, village-specificengineering models that are capable of the necessary transla-tions have not been completed, yet.
This is a typical situation for early phases of planning pro-cesses (Cerda et al. 2007). Here, economic valuation is not usedfor the appraisal of detailed project proposals. Instead, it isused for the identification and quantification of local prefer-ences in order to improve the design of project or policyoptions. For informing early planning phases, choice experi-ments are particularly well-suited because (i) they do not haveto assume linear preferences across the potential range ofattribute level changes, and (ii) they generate trade-offinformation not only between a bundle of changes in environ-mental goods and income but also among the components ofthe bundle. These characteristics facilitate the meaningfulapplication of stated preference results for the economicvaluation of the final set of project or policy options.
6. Conclusion
Descriptive and normative interpretations of the ecosystemfunction and the ecosystem service concepts should becarefully distinguished. On this basis, the Central Sulawesicase study presents evidence for the applicability of anecosystem service approach to the environmental valuationof potentially unfamiliar ecosystem functions. Three recom-mendations emerge from the case study to confront unfami-liarity in stated preference valuation:
(i) After extensive qualitative pre-studies, select demand-relevant ecosystem services for the description of theecosystem function(s) to be valued,
(ii) use utmost care in the design and representation of thechosen set of ecosystem services, and
(iii) include variables that assess the potential impact ofremaining unfamiliarity/comprehension problems.
To ensure the eventual policy relevance of valuation results,enough applied science and engineering expertise has to beavailable to translate changes in ecosystem functioning intomeaningful ecosystem service descriptions, and to relate thesechanges to realistic policy or project interventions. Suchtranslations remain a challenge for the entire discipline thatonly few studies – including revealed preference studies – havemet (Heal et al., 2005, p. 154).
Weconclude that theproposedecosystemservice approachcan reduce the degree of unfamiliarity to a point where it doesnot pose a principal obstacle to the application of statedpreference techniques. Because the number of ecosystemservices that can be included in a survey study is limited, itwill oftenonly bypossible to establish lower boundsof the total
60 E C O L O G I C A L E C O N O M I C S 6 5 ( 2 0 0 8 ) 4 8 – 6 2
Author's personal copy
economic value of an ecosystem function. Still, it wouldconstitute an unwarranted limitation of the diverse set ofeconomic valuation techniques to exclude stated preferencemethods from the valuation of ecosystem functions onunfamiliarity grounds.
Acknowledgements
WethankDeutsche Forschungsgemeinschaft (DFGSFB 552) andBMBF (DEKLIMC) for financial support, andourCentral Sulawesirespondents for their patience with our inquiries. Most appre-ciated advice and assistance was received from M. Bos, G.Burkard, D. Darusman, M. Fremerey, W. Lorenz, S. Schwarze, L.Sudawati, A.T. Tellu, M. Zeller, and our local enumerator team.Comments of two anonymous reviewers substantially helpedimproving the manuscript.
R E F E R E N C E S
Adamowicz, W., Boxall, P., Williams, M., Louviere, R., 1998. Statedpreferences approaches to measuring passive use values:choice experiments and contingent valuation. AmericanJournal of Agricultural Economics 80, 64–75.
Alcamo, J., et al., 2003. Millennium EcosystemAssessment – Ecosystems and Human Well-Being:A Framework for Assessment. Island Press, Washington.245 pp.
Arrow, K., Solow, R., Portney, P.R., Leamer, E.E., Radner, R.,Schuman, H., 1993. Report of the NOAA Panel on ContingentValuation. May 9, 2001. http://www.darrp.noaa.gov/library/pdf/cvblue.pdf.
Barkmann, J., Marggraf, R., 2003. Project A5 — Biological diversityof the rainforest margin as an economic good. Stability ofRainforest Margins, Fortsetzungsantrag 2003–2006,Georg-August-Universität Göttingen, pp. 229–263.
Barkmann, J., Marggraf, R., 2004. Ökologische Schäden durchVernachlässigung des Vorsorgeprinzips im nachhaltigenLandschaftsmanagement — eine umweltökonomischePerspektive. In: Potthast, T. (Ed.), Ökologische Schäden.Peter Lang, Frankfurt/M., pp. 57–76.
Barkmann, J., Cerda, C., Marggraf, R., 2005a. InterdisziplinäreAnalyse von Naturbildern: Notwendige Voraussetzung für dieökonomische Bewertung der natürlichen UmweltUmweltpsychologie 9, 10–29.
Barkmann, J., Cerda, C., Marggraf, R., 2005b. Trading-off ecologicalinsurance in an uncertain world: Economicpreferences for species-diversity ensuring fundamentalecosystem functioning. Paper presented at DIVERSITAS 1stOpen Science Conference, 9–12 November 2005,Oaxaca, Mexico.
Barkmann, J., Glenk, K., Handi, H., Sundawati, L., Witte, J.-P.,Marggraf, R., 2007. Assessing economic preferencesfor biological diversity and ecosystem services at theCentral Sulawesi rainforest margin — a choice experimentapproach. In: Tscharntke, T., Leuschner, C., Zeller, M.,Guhardja, E., Bidin, A. (Eds.), Stability of Tropical RainforestMargins. Linking ecological, economic and social constraints ofland use and conservation. Springer, Berlin, pp. 181–208.
Bateman, I.J., Carson, R.T., Day, D., Hanemann, M., Hanley, N.,Hett, T., Lones-Lee, M., Loomes, G., Mourato, S., Özdemiroglu,E., Pearce, D.W., Sugden, R., Swanson, J., 2002. EconomicValuation with Stated Preference Techniques — A Manual.Edward Elgar, Cheltenham, UK. 458 pp.
Bennett, J., 2002. Non-Market Valuation Scoping Study — A reportprepared for the Murray Darling Basin Commission, The LivingMurray Project, September 2002. [http://www.thelivingmurray.mdbc.gov.au/__data/page/259/Non-market_valuation_scoping_report1.pdf].
Bennett, J., Blamey, R. (Eds.), 2001. The Choice Modelling Approachto Environmental Valuation. Edgar Elgar, Cheltenham (UK).
Birner, R., Mappatoba, M., 2002. Community-Based Agreements onConservation in Central Sulawesi – A Coase Solution toExternalities or a Case of Empowered DeliberativeDemocracy? STORMA Discussion Paper Series, No. 3, Göttingenand Bogor.
Blamey, R., Rolfe, J., Bennett, J., Morrison, M., 1997. Environmentalchoice modeling: issues and qualitative insights. ResearchReport No. 4. Canberra, Australia: School of Economics andManagement. The University of New South Wales.
Bockstael, N.E., Freeman, A.M., Kopp, R.J., Portney, P.R., Smith, V.K.,2000. Onmeasuring economic values for nature. EnvironmentalScience and Technology 34, 1384–1389.
Carpenter, S.R., Turner, M., 2000. Opening the black boxes:ecosystem science and economic valuation. Ecosystems 3, 1–3.
Carson, R.T., Flores, N.E., Mitchell, R.C., 1999. The theory andmeasurement of passive use value. In: Bateman, I.J., Willis, K.G.(Eds.), Valuing Environmental Preferences. Oxford UniversityPress, Oxford, pp. 95–130.
Cerda, C., Diafas, I., Barkmann, J., Marggraf, R., 2007. WTP/WTAdesign strategies for choice experiments in early planningstages: experiences from Chile and Kenya. In: Meyerhoff, J.,Lienhoff, N., Elsasser, P. (Eds.), Stated Preference Methods forEnvironmental Valuation: Applications from Austria andGermany. Metropolis Verlag, Marburg, pp. 139–173.
Costanza, R., Farber, S., 2002. Introduction to the special issue onthe dynamics and value of ecosystem services: integratingeconomic and ecological perspectives. Ecological Economics41, 367–373.
Costanza, R., d'Arge, R., de Groot, R.S., Farber, S., Grasso, M.,Hannon, B., Naem, S., Limburg, K., Paruelo, J., O'Neill, R.V.,Raskin, R., Sutton, P., van den Belt, M., 1997. The value of theworld's ecosystem services and natural capital.Nature 387, 253–260.
Daily, G. (Ed.), 1997. Nature's services: societal dependence onnatural ecosystems. Island Press, Washington, DC. 392 pp.
de Groot, R.S., Wilson, M.A., Boumans, R.M.J., 2002. A typology forthe classification, description and valuation of ecosystemfunctions, goods and services. Ecological Economics 41,393–408.
Diamond, P.A., Hausman, J.A., 1994. Contingent valuation: is somenumber better than no number? Journal of EconomicPerspectives 8, 45–64.
Farber, S.C., Costanza, R., Wilson, M.A., 2002. Economic andecological concepts for valuing ecosystem services. EcologicalEconomics 41, 375–392.
Freeman, A.M., 1998. On valuing the services and functions ofecosystems. In: Freeman III, A.M. (Ed.), The economic approachto environmental policy: the selected essays of A. MyrickFreeman III. Edward Elgar, Cheltenham (UK).
Glenk, K., Barkmann, J., Marggraf, R., 2006a. Locally PerceivedValues of Biological Diversity in Indonesia — A ChoiceExperiment Approach. [http://www.ucl.ac.uk/bioecon/8th_paper/Glenk.pdf].
Glenk, K., Barkmann, J., Schwarze, S., Zeller, M., Marggraf, R.,2006b. Differential Influence of Relative Poverty onPreferences for Ecosystem Services: Evidence from RuralIndonesia. Paper presented at the 26th Conference of theInternational Association of Agricultural Economists (IAAE),Queensland, Australia, August 12–18, 2006.
Heal, G.M., Barbier, E.B., Boyle, K.J., Covich, A.P., Gloss, S.P., Hershner,C.H., Hoehn, J.P., Pringle, C.M., Polasky, S., Segerson, K.,Shrader-Frechette, K., Committee on Assessing and Valuing the
61E C O L O G I C A L E C O N O M I C S 6 5 ( 2 0 0 8 ) 4 8 – 6 2

Author's personal copy
Services of Aquatic and Related Terrestrial Ecosystems, 2005.Valuing Ecosystem Services: Toward Better EnvironmentalDecision-making. National Academies Press. 277 pp.
Hensher, D.A., Rose, J.M., Greene, W.H., 2005. Applied choiceanalysis: a primer. Cambridge University Press, New York.717 pp.
Keil, A., Kleinhans, A., Schwarze, S., Birner, R., Gerold, G., Lipu, S.,2003. Forest conversion, water availability and water use inCentral Sulawesi, Indonesia. Die Erde 134, 411–427.
Kleinhans, A., 2004. Einfluß von Landnutzung undpedohydrologischer Gebietsvarianz auf den Wasser-undNährstoffumsatz in einem tropischen Einzugsgebiet(Zentralsulawesi). Dissertation, Georg-August-UniversitätGöttingen.
Kontoleon, A., Yabe, M., 2004. Assessing the impacts of alternative‘opt-out’ formats in choice experiment studies. Journal ofAgricultural Policy Research 5, 1–32.
Maertens, M., Zeller, M., Birner, R., 2004. Does technical progress inagriculture have a forest saving or a forest clearing effect?Theory and evidence from Central Sulawesi. In: Gerold, G.,Fremerey, M., Guhardja, E. (Eds.), Land Use, NatureConservation and the Stability of Rainforest Margins inSoutheast Asia. Springer, Berlin, pp. 179–197.
Maertens, M., 2003. Economic modeling of agricultural land-usepatterns in forest frontier areas: theory, empirical assessmentand policy implications for Central Sulawesi, Indonesia.dissertation.de, Berlin.
Menzel, S., 2003. Der Beitrag der Protection Motivation Theoryfür die Zahlungsbereitschaftsäußerungen zur Erhaltungbiologischer Vielfalt. Umweltpsychologie 7, 92–112.
Nunes, P.A.L.D., Bergh, J.C.J.M., 2001. Economic valuation ofbiodiversity: sense or nonsense? Ecological Economics39, 203–222.
Pattanayak, S., Kramer, R.A., 2001. Pricing ecological services:willingness to pay for drought mitigation from watershedprotection in eastern Indonesia. Water Resources Research37, 771–778.
Rogers, R.W., Prentice-Dunn, S., 1997. Protection motivationtheory. In: Gochman, D.S. (Ed.), Handbook of Health BehaviorResearch. Plenum, New York, pp. 113–132.
Schwarze, S., Zeller, M., 2005. Income diversification of ruralhouseholds in Central Sulawesi, Indonesia. Quarterly Journalof International Agriculture 44, 61–74.
Steffan-Dewenter, I., Kessler, M., Barkmann, J., Bos, M., Buchori, D.,Erasmi, S., Faust, H., Gerold, G., Glenk, K., Gradstein, S.R.,Guhardja, E., Harteveld, M., Hertel, D., Höhn, P., Kappas, M.,Köhler, S., Leuschner, C., Maertens, M., Marggraf, R.,Migge-Kleian, S., Mogea, J., Pitopang, R., Schaefer, M.,Schwarze, S., Sporn, S.G., Steingrebe, A., Tjitrosoedirdjo, S.S.,Tjitrosoemito, S., Twele, A., Weber, R., Woltmann, L., Zeller, M.,Tscharntke, T., 2007. Tradeoffs between income, biodiversity,and ecosystem functioning during tropical rainforestconversion and agroforestry intensification. Proceedings of theNational Academy of Sciences of the United States of America(PNAS) 104, 4973–4978.
Sugden, R., 2005. Anomalies and stated preference techniques: aframework for a discussion of coping strategiesEnvironmental and Resource Economics 32, 1–12.
Toman, M.A., 1996. Ecosystem valuation: an overview of issuesand uncertainties. In: Simpson, R.D., Christensen Jr., N.L. (Eds.),Ecosystem Function & Human Activities. Chapman & Hall,New York, pp. 26–44.
van Beukering, P.J.H., Cesar, H.S.J., Janssen, M.A., 2003. Economicvaluation of the Leuser National Park on Sumatra, Indonesia.Ecological Economics 44, 43–62.
van Rheenen, T., Elbel, C., Schwarze, S., Nuryartono, N., Zeller, M.,Sanim,B., 2004. Encroachments onprimary forest: are they reallydrivenbydespair? In:Gerold, G., Fremerey,M., Guhardja, E. (Eds.),Land Use, Nature Conservation and the Stability of RainforestMargins in Southeast Asia. Springer, Berlin, pp. 199–213.
WBGU [Wissenschaftlicher Beirat der Bundesregierung GlobaleUmweltveränderungen], 1999. Welt im Wandel – Umwelt undEthik. Metropolis, Marburg. 149 pp.
Whigham,D.F., 1996. Ecosystemfunctionsandecosystemvalues. In:Simpson, R.D., Christensen Jr., N.L. (Eds.), Ecosystem Function &Human Activities. Chapman & Hall, New York, pp. 225–239.
Zeller, M., Wollni, M., Shaban, A., 2003. Evaluating the povertyoutreach of development programs: empirical evidence fromIndonesia and Mexico. Quarterly Journal of InternationalAgriculture 42, 371–383.
62 E C O L O G I C A L E C O N O M I C S 6 5 ( 2 0 0 8 ) 4 8 – 6 2