Econ Dev Ch7 Summer 2012
36
Copyright © 2012 Pearson Addison-Wesley. All rights reserved. Chapter 7 Urbanization and Rural-Urban Migration
Transcript of Econ Dev Ch7 Summer 2012
Copyright © 2012 Pearson Addison-Wesley. All rights reserved.
Chapter 7
Urbanization and Rural-Urban Migration
Copyright © 2012 Pearson Addison-Wesley. All rights reserved. 7-2
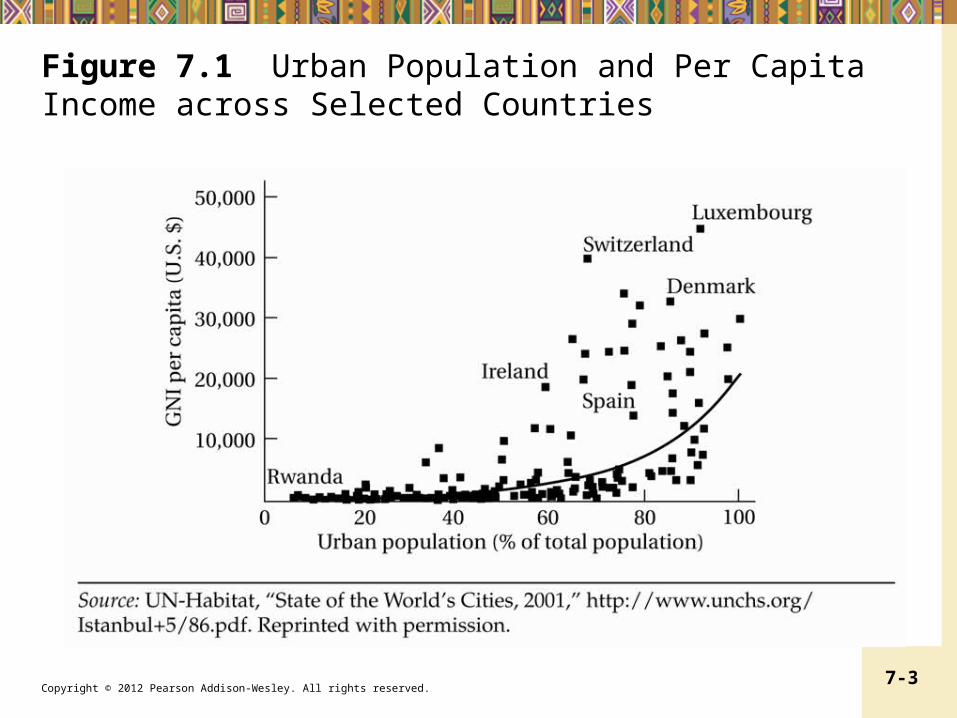
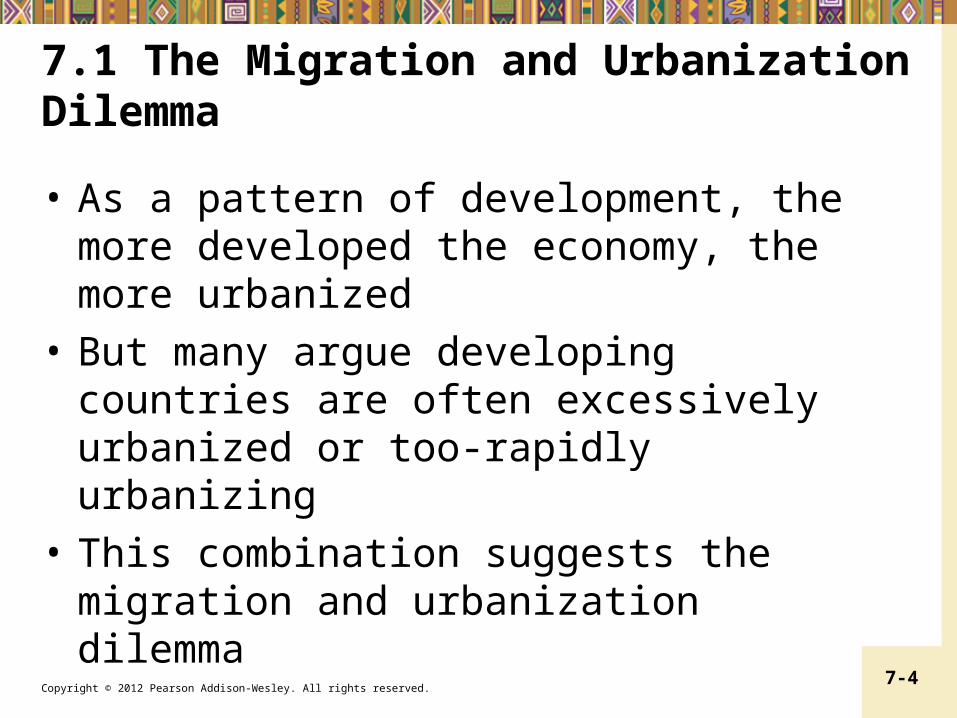
7.1 The Migration and Urbanization Dilemma• As a pattern of development, the more developed the economy, the more urbanized
Copyright © 2012 Pearson Addison-Wesley. All rights reserved. 7-3
Figure 7.1 Urban Population and Per Capita Income across Selected Countries
Copyright © 2012 Pearson Addison-Wesley. All rights reserved. 7-4
7.1 The Migration and Urbanization Dilemma• As a pattern of development, the more developed the economy, the more urbanized
• But many argue developing countries are often excessively urbanized or too-rapidly urbanizing
• This combination suggests the migration and urbanization dilemma
Copyright © 2012 Pearson Addison-Wesley. All rights reserved. 7-5
Figure 7.2 Urbanization across Time and Income Levels
Copyright © 2012 Pearson Addison-Wesley. All rights reserved. 7-6
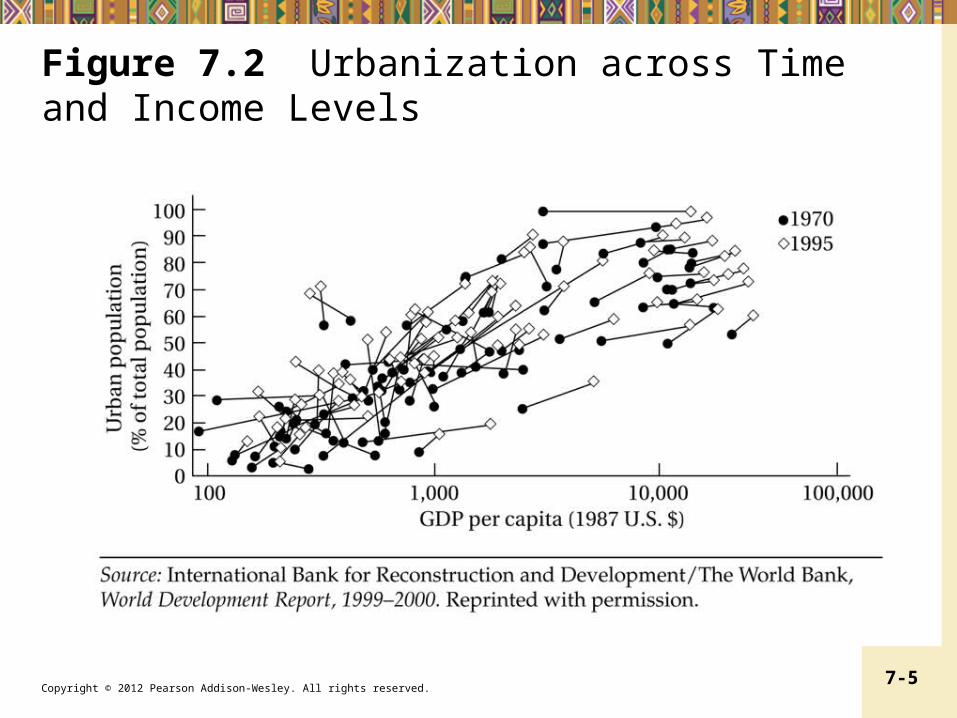
Figure 7.3 Proportion of Urban Population by Region, 1950-2050
Copyright © 2012 Pearson Addison-Wesley. All rights reserved. 7-7
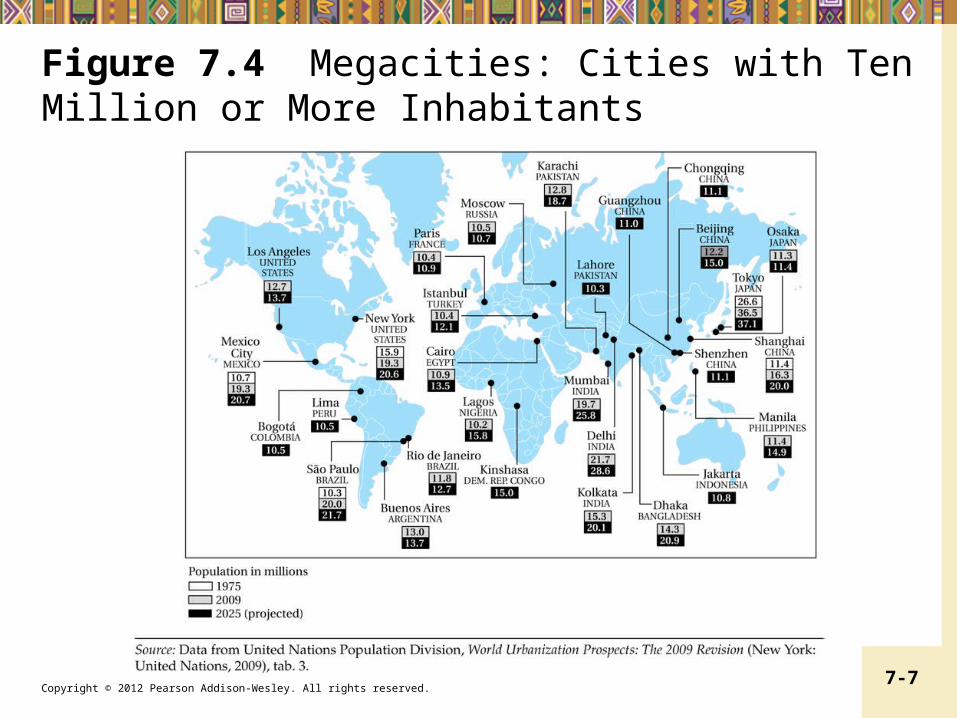
Figure 7.4 Megacities: Cities with Ten Million or More Inhabitants
Copyright © 2012 Pearson Addison-Wesley. All rights reserved. 7-8
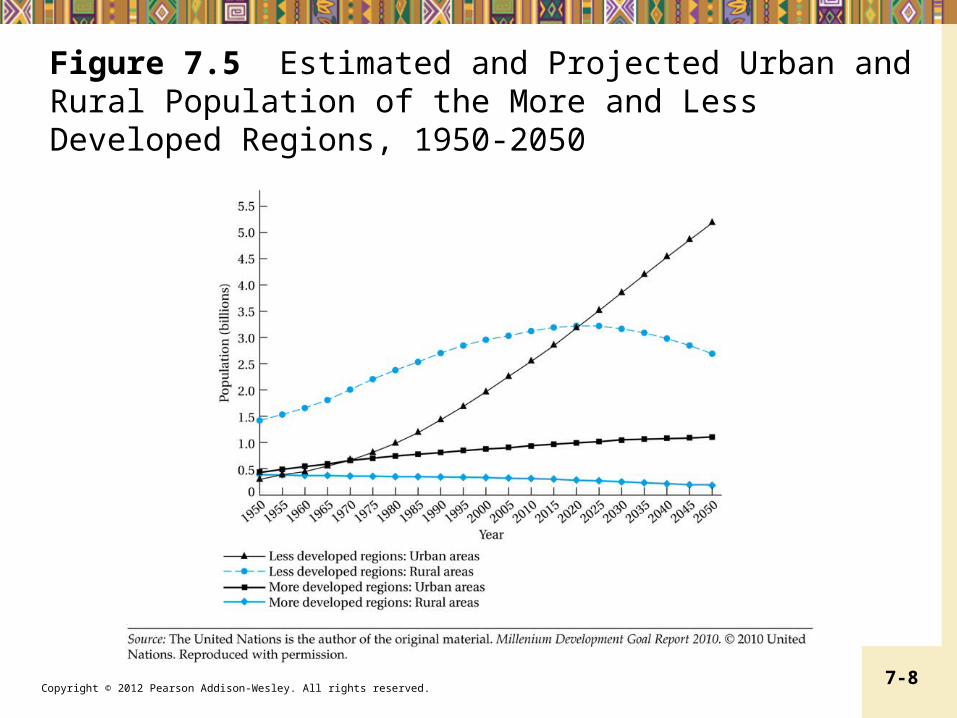
Figure 7.5 Estimated and Projected Urban and Rural Population of the More and Less Developed Regions, 1950-2050
Copyright © 2012 Pearson Addison-Wesley. All rights reserved. 7-9
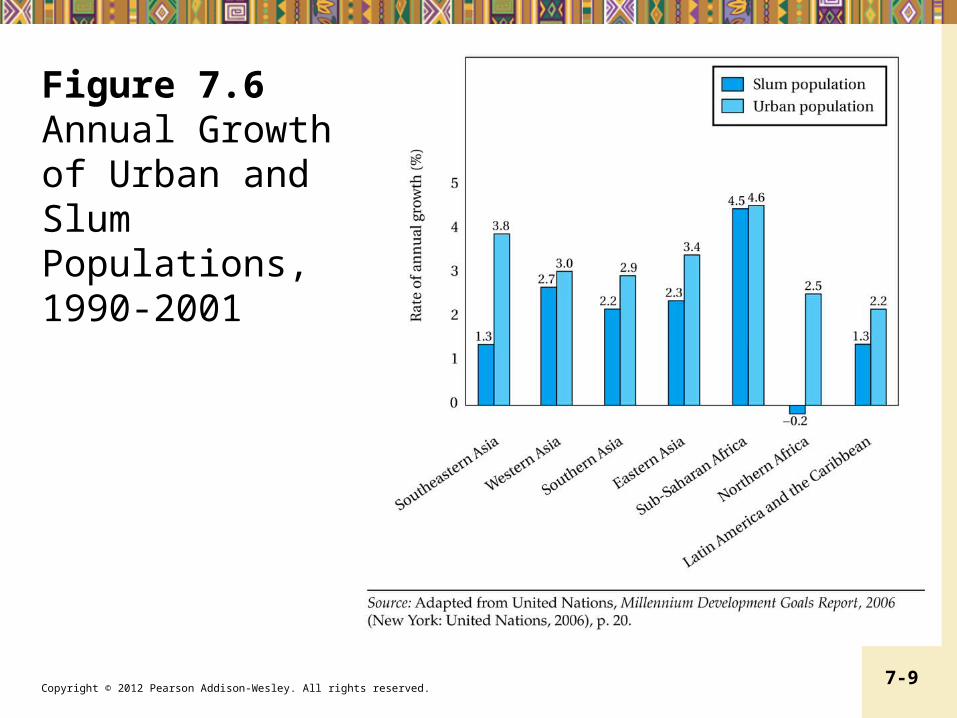
Figure 7.6 Annual Growth of Urban and Slum Populations, 1990-2001
Copyright © 2012 Pearson Addison-Wesley. All rights reserved. 7-10
7.2 The Role of Cities
• What are the benefits?
Copyright © 2012 Pearson Addison-Wesley. All rights reserved. 7-11
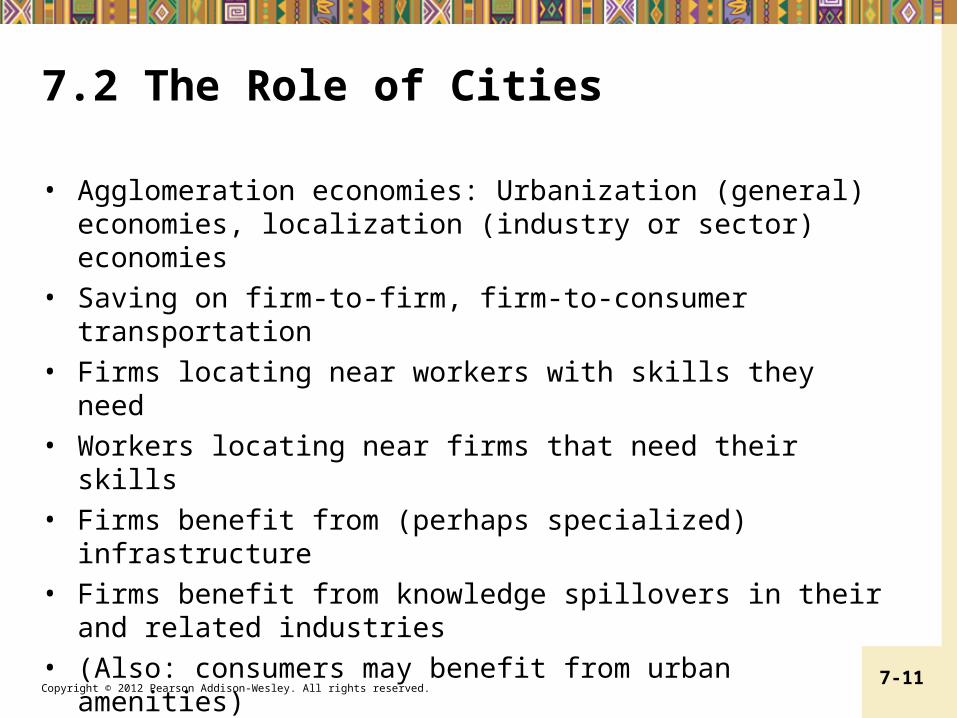
7.2 The Role of Cities
• Agglomeration economies: Urbanization (general) economies, localization (industry or sector) economies
• Saving on firm-to-firm, firm-to-consumer transportation
• Firms locating near workers with skills they need
• Workers locating near firms that need their skills
• Firms benefit from (perhaps specialized) infrastructure
• Firms benefit from knowledge spillovers in their and related industries
• (Also: consumers may benefit from urban amenities)
Copyright © 2012 Pearson Addison-Wesley. All rights reserved. 7-12
Industrial Districts and Clustering• Quality of clusters, or Industrial Districts, is a
key to sectoral efficiency• Unfortunately a majority of developing countries
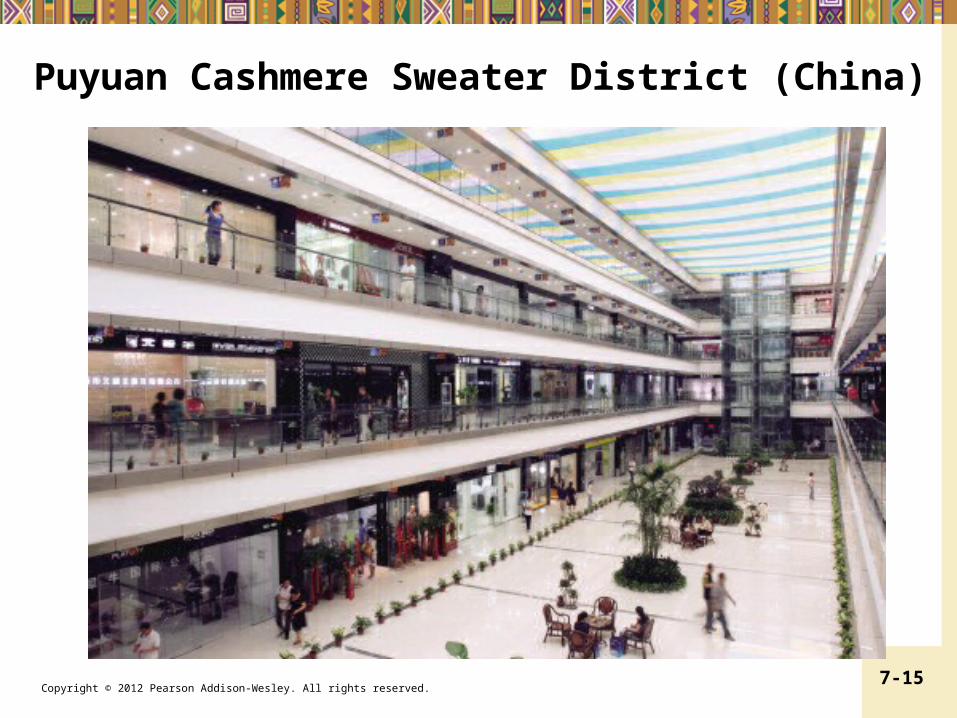
have made only limited progress• China: a country that has made huge strides in
generating industrial districts over the last decade (Findings Box 7.1)
Copyright © 2012 Pearson Addison-Wesley. All rights reserved. 7-13
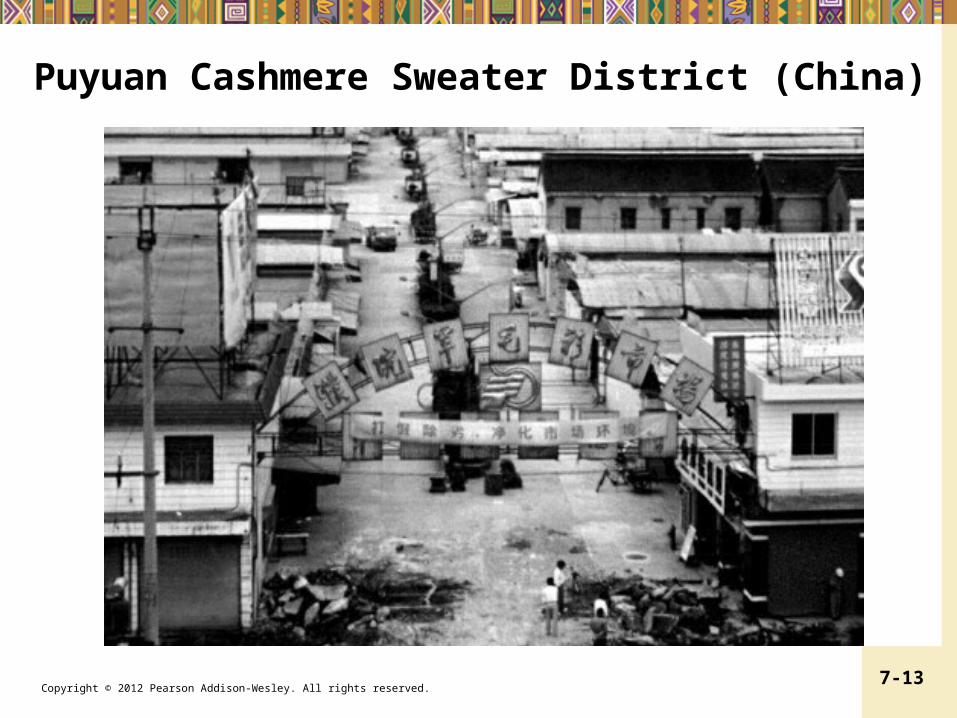
Puyuan Cashmere Sweater District (China)
Copyright © 2012 Pearson Addison-Wesley. All rights reserved. 7-14
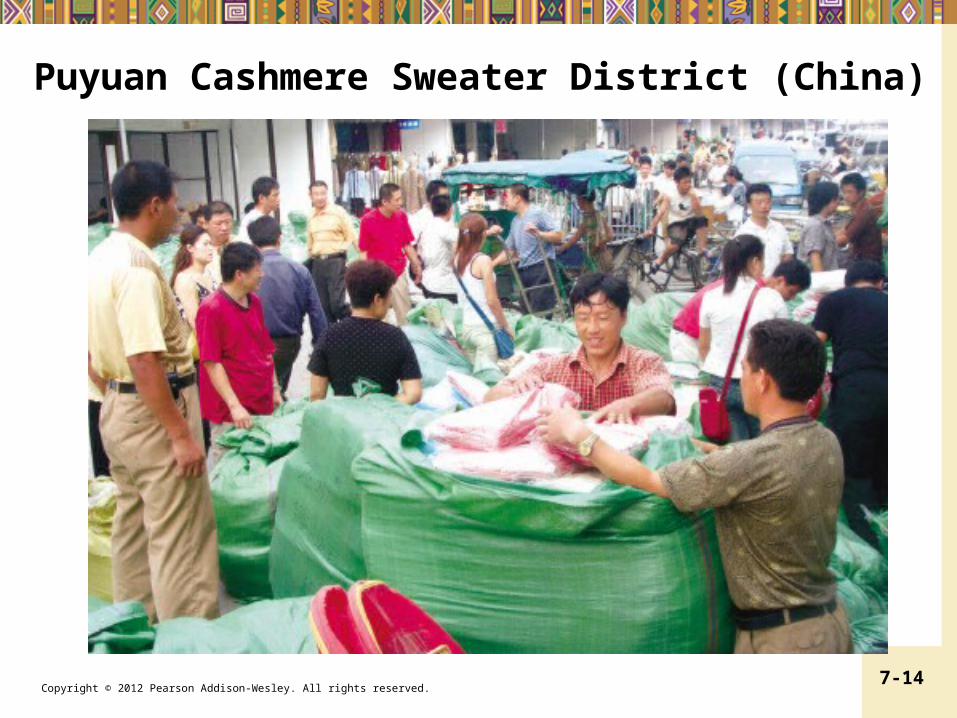
Puyuan Cashmere Sweater District (China)
Copyright © 2012 Pearson Addison-Wesley. All rights reserved. 7-15
Puyuan Cashmere Sweater District (China)
Copyright © 2012 Pearson Addison-Wesley. All rights reserved. 7-16
Urbanization Costs, and Efficient Urban Scale• But, cities also entail “congestion costs”• Economically efficient urban scale (from point of view of productive efficiency): average costs for industries are lowest
• Generally, differing efficient scales for different industrial specializations imply different city sizes
Copyright © 2012 Pearson Addison-Wesley. All rights reserved. 7-17
7.3 The Urban Giantism Problem
There may be general urban bias• Political factor• Economic factor Multi-core metropolitan regions in developed
countries Cities in developing countries tend to be over-
sized
Copyright © 2012 Pearson Addison-Wesley. All rights reserved. 7-18
7.3 The Urban Giantism Problem
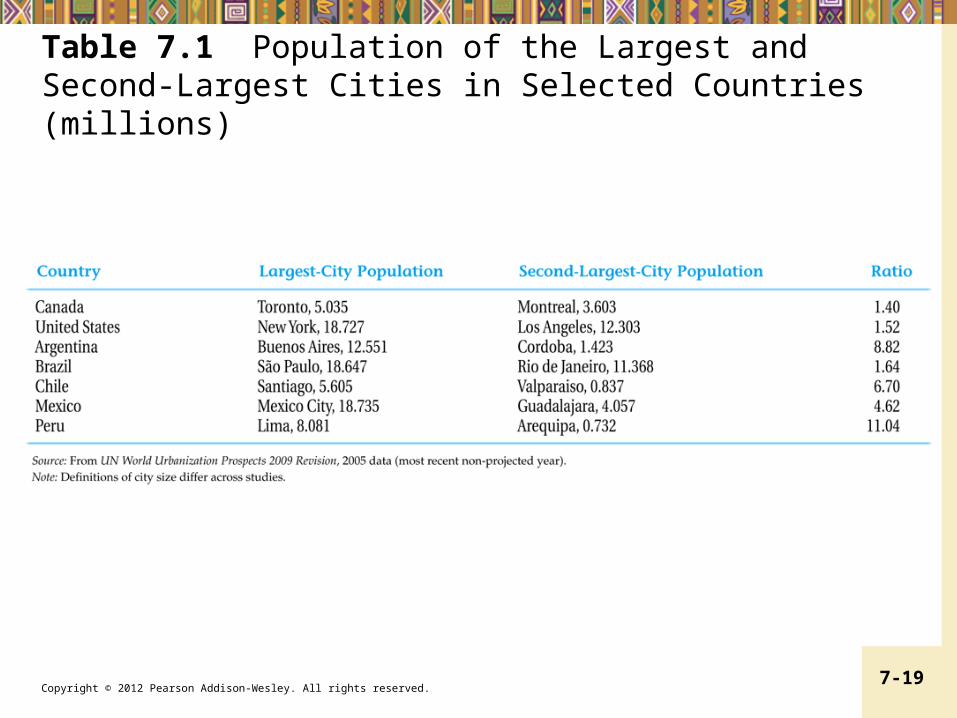
• There may be First-City Bias (favoring largest city)
Copyright © 2012 Pearson Addison-Wesley. All rights reserved. 7-19
Table 7.1 Population of the Largest and Second-Largest Cities in Selected Countries (millions)
Copyright © 2012 Pearson Addison-Wesley. All rights reserved. 7-20
7.3 The Urban Giantism Problem
• There may be First-City Bias (favoring largest city)
• Causes of Urban Giantism:– International trade restriction: less trade, incentive to concentrate in a single city largely to avoid transportation costs
– It becomes advantageous for firms to be located where they have easy access to government officials
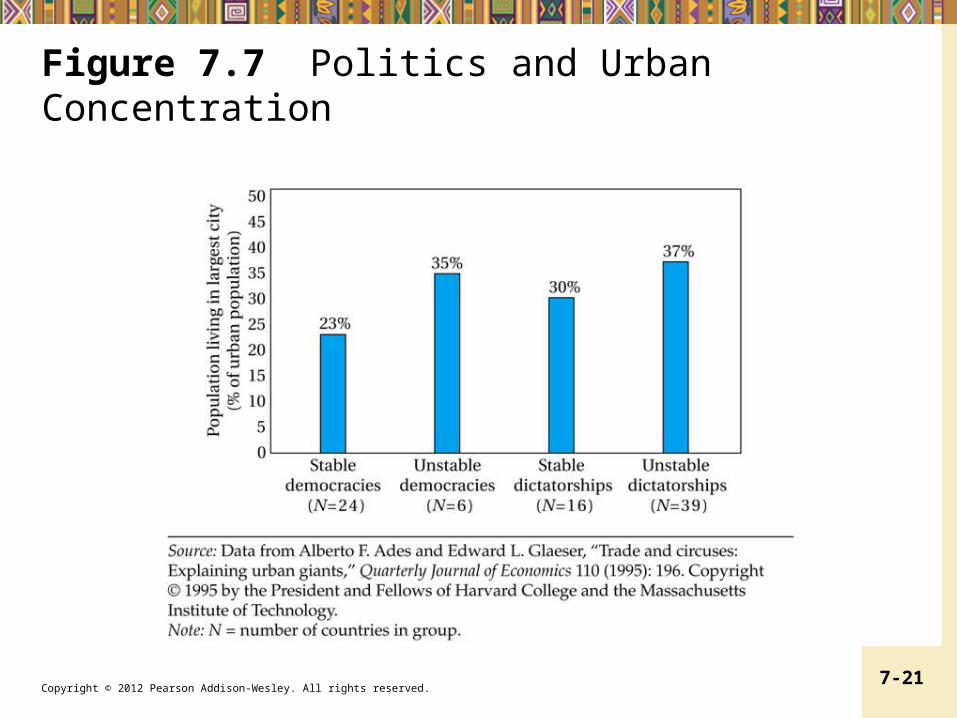
– “Bread and circuses” to prevent unrest (evidence: stable democracies vs unstable dictatorships)
Copyright © 2012 Pearson Addison-Wesley. All rights reserved. 7-21
Figure 7.7 Politics and Urban Concentration
Copyright © 2012 Pearson Addison-Wesley. All rights reserved. 7-22
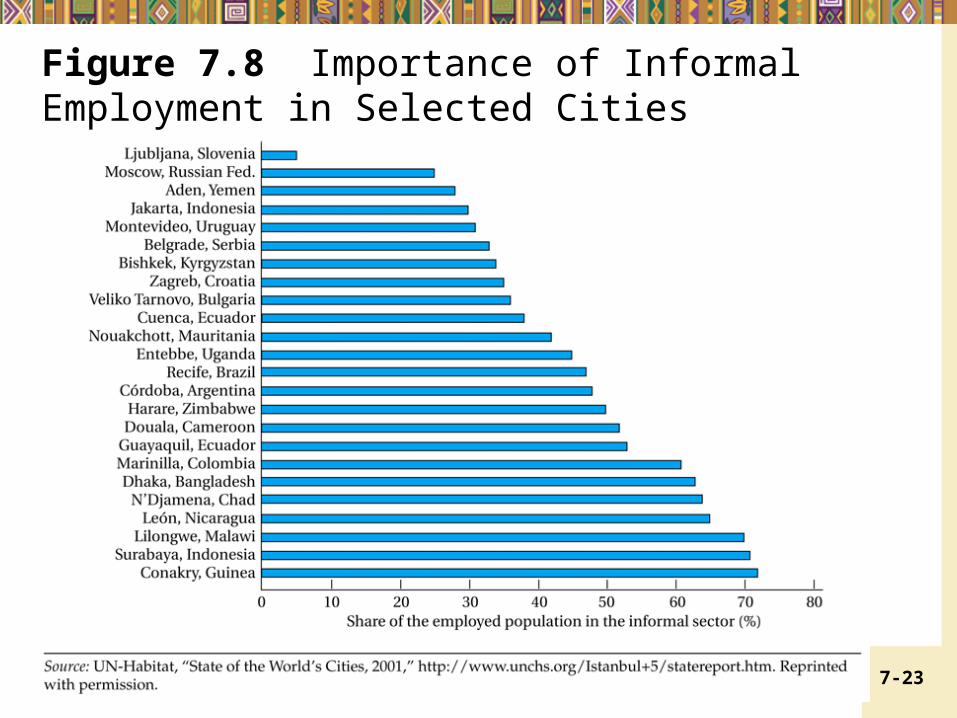
7.4 The Urban Informal Sector
• Urban informal sector: Unregistered family owned enterprises Labor intensive Small scale Lower income
• Why promote the urban informal sector?
Copyright © 2012 Pearson Addison-Wesley. All rights reserved. 7-23
Figure 7.8 Importance of Informal Employment in Selected Cities
Copyright © 2012 Pearson Addison-Wesley. All rights reserved. 7-24
7.4 The Urban Informal Sector
• Why promote the urban informal sector?– Generates surplus despite hostile environment– Creating jobs due to low capital intensivity– Access to (informal) training, and apprenticeships
– Creates demand for less- or un- skilled workers– Uses appropriate technologies, local resources– Recycling of waste materials– More benefits to poor, especially women who are concentrated in the informal sector

Copyright © 2012 Pearson Addison-Wesley. All rights reserved. 7-25
7.4 The Urban Informal Sector
• PoliciesFacilitate business registration:– Delay: Ecuador(240 days); Venezuela(310 days); Guatemala (525 days)
– Until recently, Brazil, Mexico, and Chile required more than 20 applications before a company could be approved to do business
Training– Areas that are most beneficial to urban economy– May promote legal activities as well– Generate taxes
Copyright © 2012 Pearson Addison-Wesley. All rights reserved. 7-26
7.5 Migration and Development
• Rural-to-urban migration was viewed positively until recently
• The current view is that this migration is greater than the urban areas’ abilities to– Create jobs– Provide social services
Copyright © 2012 Pearson Addison-Wesley. All rights reserved. 7-27
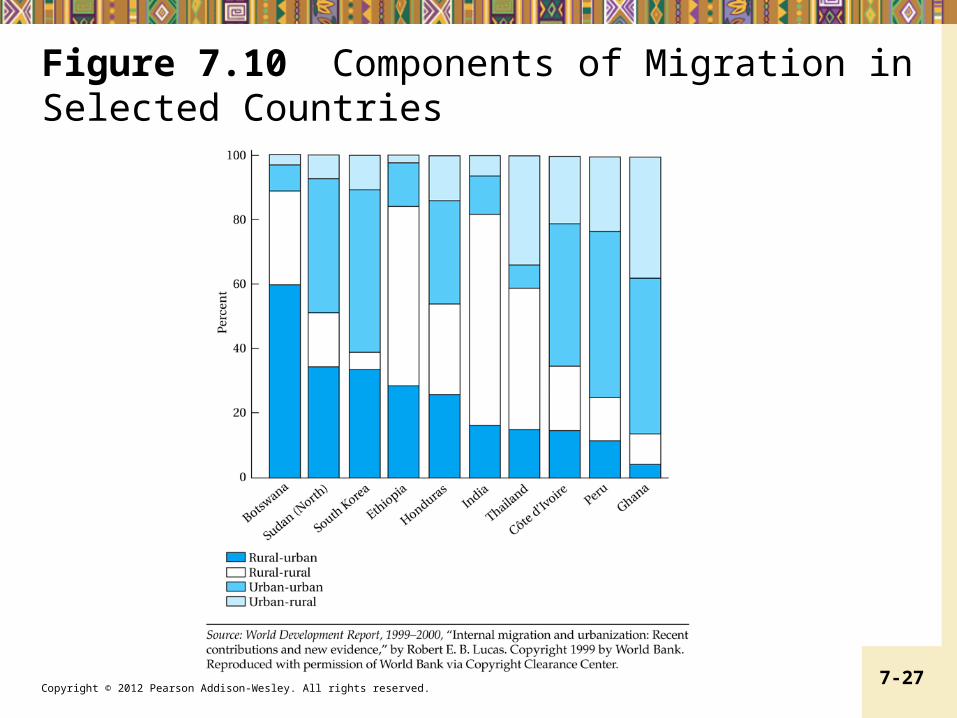
Figure 7.10 Components of Migration in Selected Countries
Copyright © 2012 Pearson Addison-Wesley. All rights reserved. 7-28
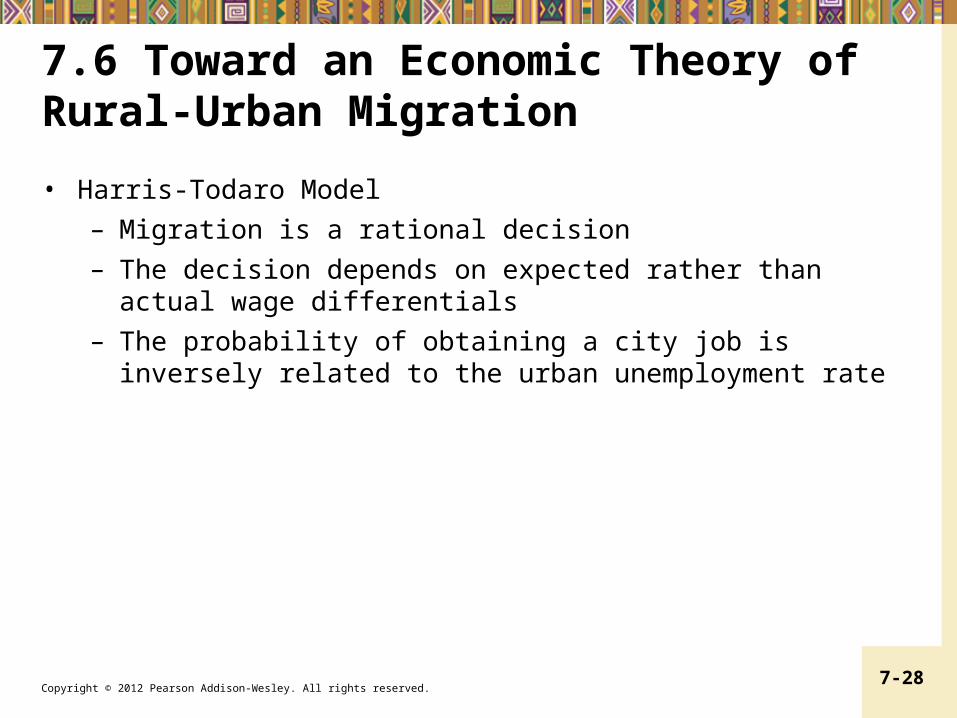
7.6 Toward an Economic Theory of Rural-Urban Migration• Harris-Todaro Model
– Migration is a rational decision– The decision depends on expected rather than actual wage differentials
– The probability of obtaining a city job is inversely related to the urban unemployment rate
Copyright © 2012 Pearson Addison-Wesley. All rights reserved. 7-29
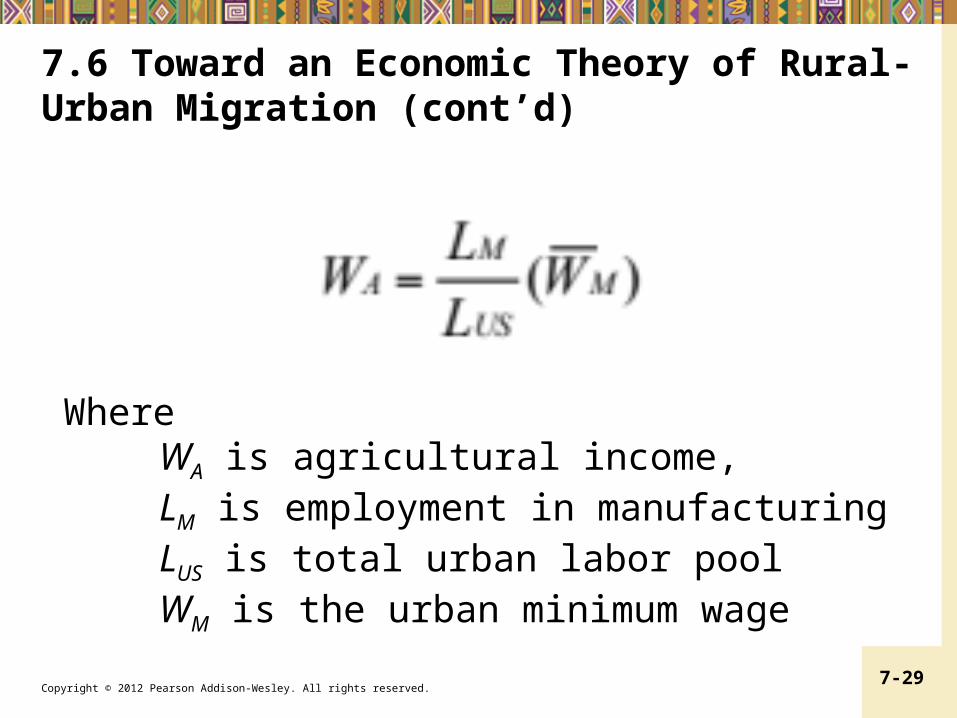
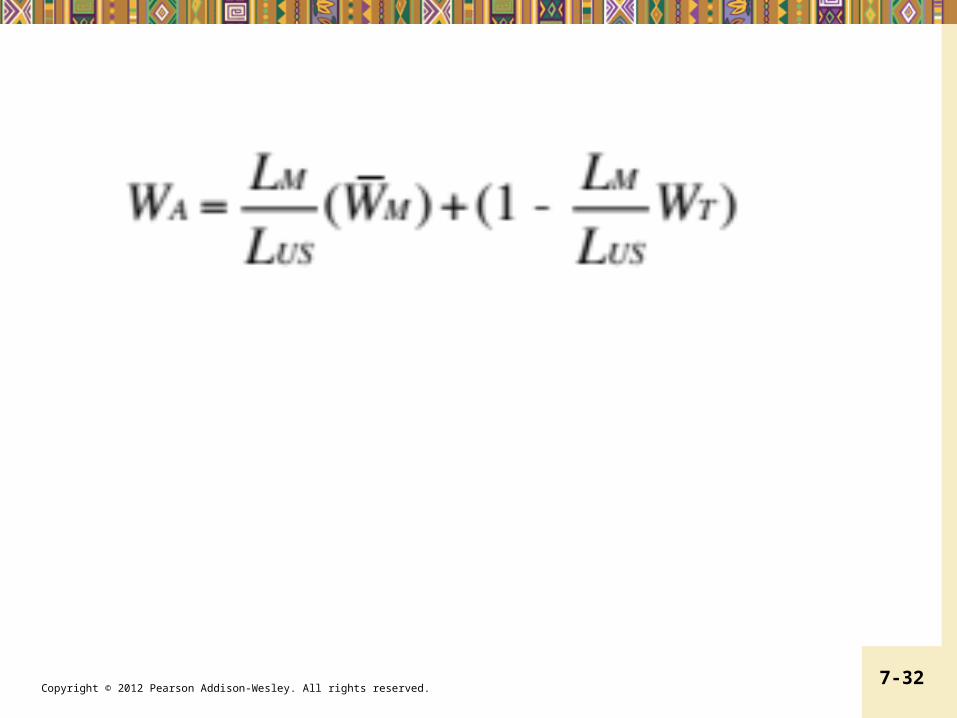
7.6 Toward an Economic Theory of Rural-Urban Migration (cont’d)
WhereWA is agricultural income, LM is employment in manufacturingLUS is total urban labor poolWM is the urban minimum wage
Copyright © 2012 Pearson Addison-Wesley. All rights reserved. 7-30
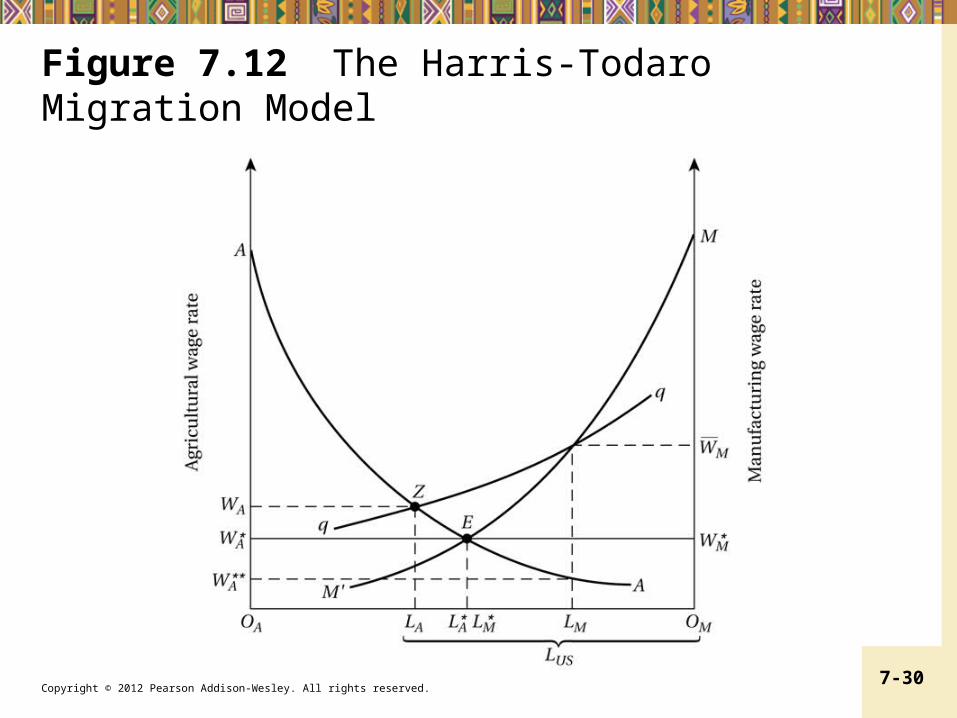
Figure 7.12 The Harris-Todaro Migration Model
Copyright © 2012 Pearson Addison-Wesley. All rights reserved. 7-31
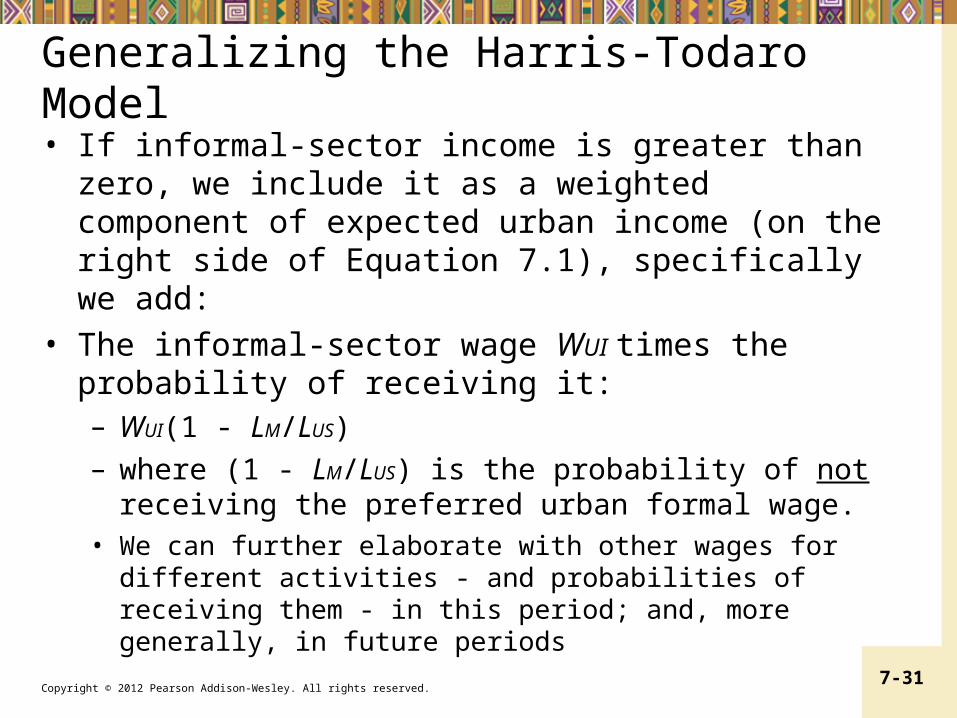
Generalizing the Harris-Todaro Model• If informal-sector income is greater than zero, we include it as a weighted component of expected urban income (on the right side of Equation 7.1), specifically we add:
• The informal-sector wage WUI times the probability of receiving it: – WUI(1 - LM/LUS)– where (1 - LM/LUS) is the probability of not receiving the preferred urban formal wage.
• We can further elaborate with other wages for different activities - and probabilities of receiving them - in this period; and, more generally, in future periods
Copyright © 2012 Pearson Addison-Wesley. All rights reserved. 7-32
Copyright © 2012 Pearson Addison-Wesley. All rights reserved. 7-33Copyright © 2009 Pearson Addison-Wesley. All rights reserved. 7-33
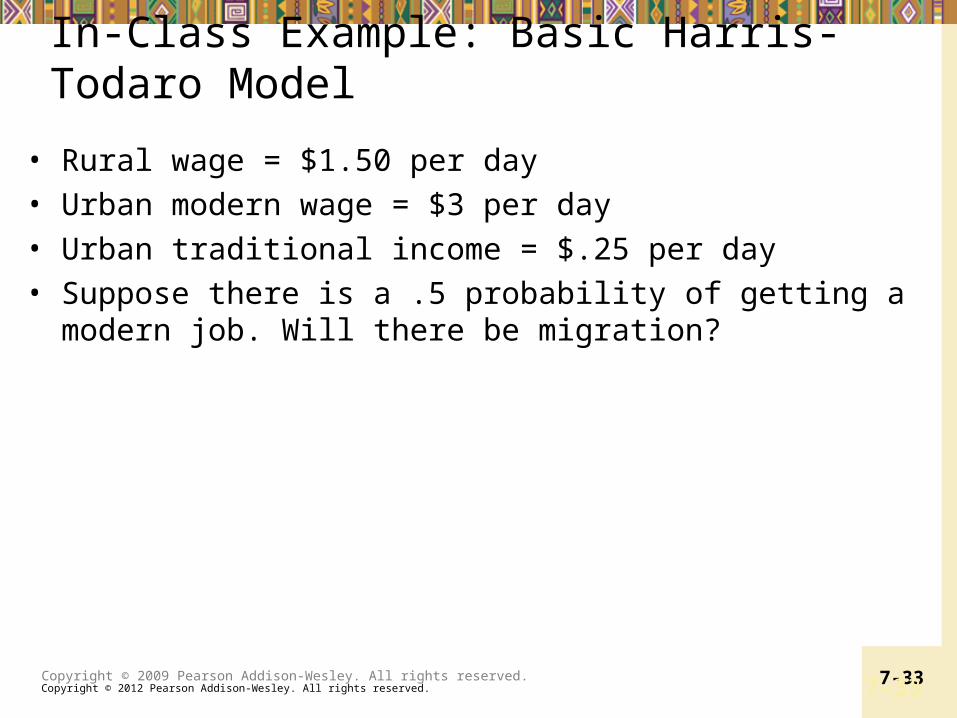
In-Class Example: Basic Harris-Todaro Model
• Rural wage = $1.50 per day• Urban modern wage = $3 per day• Urban traditional income = $.25 per day• Suppose there is a .5 probability of getting a modern job. Will there be migration?
Copyright © 2012 Pearson Addison-Wesley. All rights reserved. 7-34Copyright © 2009 Pearson Addison-Wesley. All rights reserved. 7-34
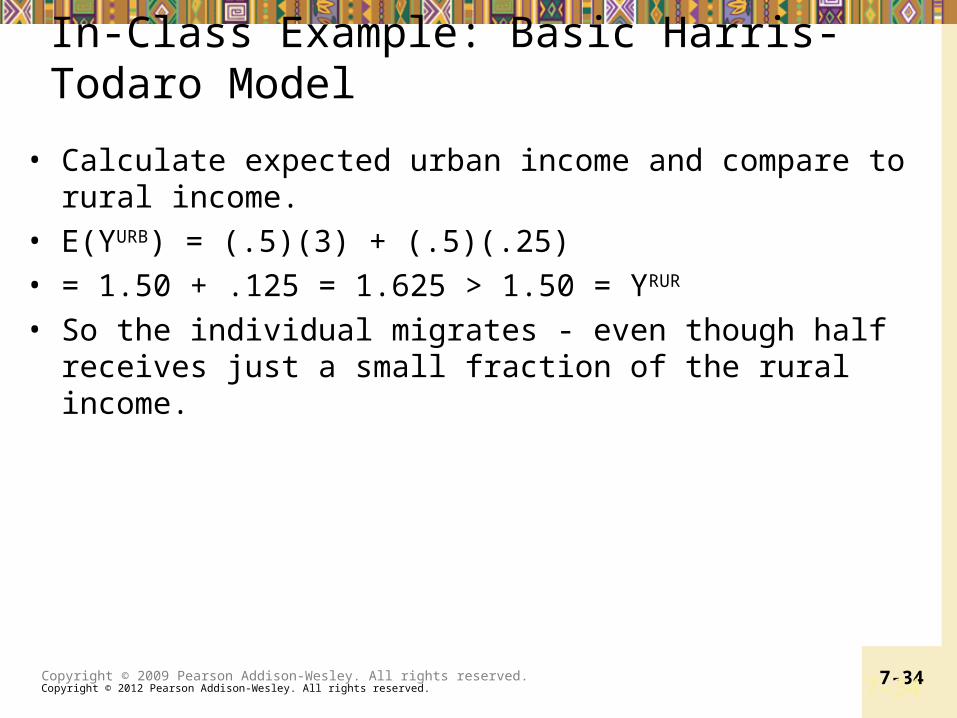
In-Class Example: Basic Harris-Todaro Model
• Calculate expected urban income and compare to rural income.
• E(YURB) = (.5)(3) + (.5)(.25) • = 1.50 + .125 = 1.625 > 1.50 = YRUR
• So the individual migrates - even though half receives just a small fraction of the rural income.
Copyright © 2012 Pearson Addison-Wesley. All rights reserved. 7-35Copyright © 2009 Pearson Addison-Wesley. All rights reserved. 7-35
Generalizing the Harris-Todaro Model
• Traditional sector wage WT is greater than zero as above
• Probability of employment may not be simply ratio of jobs to job seekers
• For example the probability of employment may increase the longer the time spent in the city
• Migrants may consider expected utility, not just average income; they may not be risk-neutral
• There may also be risk to income in rural areas
• Moving costs may be significant• Migration network effects• Keep these in mind as simplifying assumptions of basic model
Copyright © 2012 Pearson Addison-Wesley. All rights reserved. 7-36
The Market Failure Case for Policy• Migration can be understood as rational (even if the outcome is sometimes regret), so why would we need a policy? When market failures are present
• Negative externality to cities e.g. infrastructure, schools
• Inefficiently large city scales• Unemployed resources• Policies that follow:
• Reduction of urban bias in its various forms; • Programs of integrated rural development should be
encouraged
Copyright © 2009 Pearson Addison-Wesley. All rights reserved. 7-36