Bank Supervision Report
119
Bank Supervision Report 2019/20 Nepal Rastra Bank Bank Supervision Department Kathmandu, Nepal June 2021
-
Upload
khangminh22 -
Category
Documents
-
view
1 -
download
0
Transcript of Bank Supervision Report

Bank Supervision Report
2019/20
Nepal Rastra Bank
Bank Supervision Department
Kathmandu, Nepal
June 2021

Bank Supervision Report, 2020 i
©Nepal Rastra Bank
All rights reserved. No part of this publication may be reproduced, stored in a retrieval
system, or transmitted in any form or by any means- electronic, mechanical, photocopying,
and recording without fully acknowledging the Annual Report of Bank Supervision
Department of Nepal Rastra Bank (NRB) as a source. The contents of this publication are
intended for general information only and are not intended to serve as financial or other
advice.
The Bank Supervision Report, 2019/2020 is the annual report of the Bank Supervision
Department of the Nepal Rastra Bank. It reviews policy and operational issues affecting the
banking sector and its regulators/supervisors and aims at disseminating information on the
supervision of commercial banks and other issues affecting the financial sector. The Annual
Report of Bank Supervision Department focuses mainly on the developments in 2019/20
A.D. However, selected developments up to the time of report finalization are also
incorporated.
All inquiries about this publication should be directed to the Policy and Planning Division
and the Executive Director of the Bank Supervision Department.
Nepal Rastra Bank,
Bank Supervision Department
Central Office,
P.O. Box No.73
Baluwatar, Kathmandu, Nepal
Telephone: 00-977-14222127
Fax: 00-977-14412306
E-mail: [email protected]

Bank Supervision Report, 2020 ii
Message from the Executive Director
Dear Valued Readers,
Bank supervision is one of the major functions of Nepal Rastra Bank (NRB). NRB is
committed in fulfilling its objective of maintaining financial stability through effective
supervision of banks and financial institutions. As per NRB organizational structure, Bank
Supervision Department is responsible for supervising commercial banks, including Nepal
Infrastructure Bank Limited.
Bank Supervision Department conducts supervision primarily through On-site inspection and
Off-site surveillance. The On-site inspection is generally conducted once a year in each bank.
The Department started adopting a risk-based approach in its On-site inspection since
FY2014/15. Under this approach, On-site examiners evaluate the quantity of risk and quality
of risk management for major risk types. Likewise, under Off-site surveillance, the
Department analyses data sent by all banks and assesses their soundness.
The COVID-19 has posed an unprecedented challenge to the banking system. The challenges
remain in ensuring the quality of assets, flowing financial resources to the employment
generating sectors, managing liquidity and stabilizing the interest rate. The Department,
through its continuous monitoring, plays an important role in dealing with these issues.
NRB has adopted best practices to strengthen the domestic financial system. In pursuing
these measures, it has inevitably come under pressure to lead by example through its adoption
of improved management and transparency practices. Further, NRB enjoys operational
independence in the execution of its duties. To build trust among its stakeholders, adequate
transparency and disclosures are very important. This report disseminates information in this
regard.
Finally, I would like to express my sincere thanks to my colleagues at the Policy and
Planning Unit for their effort in bringing this report in the present form. Finally, I would like
to thank all staff of the Department for their continuous effort in fulfilling their
responsibilities.
Thank you,
Dr. Gunakar Bhatta
Executive Director

Bank Supervision Report, 2020 iii
Table of Contents
CHAPTER I .....................................................................................................................................1
1. NEPALESE BANKING INDUSTRY .................................................................................1
1.1 Nepal Rastra Bank as a regulator and supervisor ..............................................2
1.2 The Commercial Banking .................................................................................3
1.3 Ownership and Control .....................................................................................4
1.4 Scope of Operations: Public Vs. Private ...........................................................4
1.5 Branch Network ................................................................................................5
1.6 Asset Share of Banks and Financial Institutions ...............................................6
1.7 Employment in the Banking Industry ...............................................................7
1.8 Review of the Guiding Documents ...................................................................7
1.9 Access to Banking Services and Financial Inclusion ........................................8
CHAPTER II ....................................................................................................................................9
2 BANK SUPERVISION .......................................................................................................9
2.1 Supervision Function.........................................................................................9
2.2 Bank Supervision Department (BSD) ...............................................................9
2.3 Supervision Methodology .................................................................................9
2.4 Organization Structure of BSD .......................................................................10
CHAPTER III ................................................................................................................................16
3 OPERATIONAL PERFORMANCES OF COMMERCIAL BANKS ...................................16
3.1 Assets of the commercial banks .............................................................................16
3.2 Composition of Assets ...........................................................................................17
3.3 Composition of Liabilities .....................................................................................17
3.4 Capital ....................................................................................................................18
3.5 Deposit ...................................................................................................................18
3.6 Loan and Advances ................................................................................................19
3.7 Non-Performing Loans (NPL) ...............................................................................21
3.8 Non-Banking Assets (Investment in Property) ......................................................22
3.9 Investment ..............................................................................................................23
3.10 Earnings ...............................................................................................................24
3.11 Liquidity ...............................................................................................................25
3.12 Deprived Sector Lending .....................................................................................27
3.13 Electronic Banking...............................................................................................27

Bank Supervision Report, 2020 iv
CHAPTER IV ................................................................................................................................30
4 CURRENT INITIATIVES IN SUPERVISION ................................................................30
4.1 International Initiatives: ..................................................................................30
4.1.1 Initiatives by Basel Committee on Banking Supervision (BCBS) ..................30
4.1.2 Initiatives by Financial Stability Board (FSB) ................................................32
4.1.3 Initiatives by other authorities ............................................................................33
4.2 National Initiatives: .........................................................................................35
4.3 Covid-19 Crisis ..................................................................................................................37
4.3.1 International Response (Central Bank’s Perspective).........................................37
4.3.2 National Response (NRB’s perspective) ............................................................39
CHAPTER V .................................................................................................................................41
5 KEY ONSITE OBSERVATIONS, ISSUES AND CHALLENGES ................................41
5.1 Key Onsite Observations .......................................................................................41
5.1.1 Board and Senior Management Oversight ..........................................................41
5.1.2 Capital and Earnings ...........................................................................................41
5.1.3 Audit Function ....................................................................................................42
5.1.4 Credit Risk ..........................................................................................................42
5.1.5 Liquidity Risk .....................................................................................................43
5.1.6 Market Risk (including interest rate and foreign exchange risk) ........................44
5.1.7 Operation risk......................................................................................................45
5.1.8 AML/CFT ...........................................................................................................46
5.2 Issues: ..............................................................................................................47
5.3 Challenges: ......................................................................................................49
ANNEXURES ...............................................................................................................................53
Annex 1: Growth of Financial Institutions (numbers) ...............................................................53
Annex 2: Province-Wise Distribution of BFIs branches (Mid-July 2019/20) ...........................53
Annex 3: Organisation Chart of BSD ........................................................................................54
Annex 4: Onsite Inspections in FY 2019/20 ..............................................................................55
Annex 5: Circulars issued in FY 2019/20 ..................................................................................56
Annex 6: Capital adequacy ratios of Commercial Banks ..........................................................57
Annex 7: Special Inspection of Commercial Banks in FY 2019/20 ..........................................57
Annex 8: International Training/Seminar Participation from BSD in FY 2019/20 ...................58
Annex 9: Financial Figures of Banks .........................................................................................60

Bank Supervision Report, 2020 v
Annex 10: Financial Details of Commercial Banks ...................................................................65
Annex 11: Useful websites for supervisors ..............................................................................112

Bank Supervision Report, 2020 vi
List of Tables
Table 1-1: Number of BFIs in last 5 years in Nepal…………….…………………………….1
Table 1-2: List of Commercial Banks in Nepal……………………………………………….3
Table 1-3: Branches of Commercial Banks…..……………………………………………….5
Table 1-4: Asset Share of Banks and Financial Institutions…………………………………..6
Table 2-1: Important Directives regarding Capital, Credit and Liquidity……………………14
Table 3-1: Sector-wise loan and advances of the Commercial Banks.....................................20
Table 3-2: Security-wise Loan and Advances of Commercial Banks......................................20
Table 3-3: Product wise Loan and Advances...........................................................................21
Table 3-4: Electronic banking in Nepalese Commercial banking industry..............................27
List of Charts
Chart 1-1: Number of BFIs in last five years in Nepal...……………………………………...2
Chart 1-2: Number of Bank Branches (as of mid-July 2020)…..…………………………......6
Chart 3-1: Total Assets of the Commercial Banks (mid-July, 2018 to 2020)..........................16
Chart 3-2: Composition of Assets of Commercial Banks (mid-July2020)..............................17
Chart 3-3: Composition of Liabilities of Commercial Banks (mid-July 2020).......................17
Chart 3-4: Capital Funds of the Commercial Banks (mid-July, 2018 and 2020).....................18
Chart 3-5 (A): Deposit Mix of the Commercial Banks (mid-July, 2018 to 2020)...................18
Chart 3-5 (B): Deposit Mix of the Commercial Banks (mid-July 2020).................................19
Chart 3-6: Loan and Advances of the Commercial Banks (mid-July, 2018 to 2020)..............19
Chart 3-7 (A): NPL Ratio of the Commercial Bank (mid-July, 2018 to 2020).......................22
Chart 3-7 (B): Non-Performing Loan of Commercial Banks (mid-July, 2018 to 2020).........22
Chart 3-8: Non-banking assets of the Commercial Banks (mid-July 2018 to 2020)...............23
Chart 3-9: Investment Portfolio of the Commercial Banks (mid-July 2020)..........................24
Chart 3-10 (A): Operating Efficiency of the Commercial Banks (mid-July, 2018 to 2020)...24
Chart 3-10 (B): Interest Spread of the Commercial Banks (mid-July, 2018 to 2020).............25
Chart 3-11 (A): Liquid Assets to Total Deposit (mid-July, 2018 to 2020)..............................26
Chart 3-11 (B): Liquid Assets to Total Assets (mid-July, 2018 to 2020)................................26

Bank Supervision Report, 2020 1
CHAPTER I
1. NEPALESE BANKING INDUSTRY
The establishment of Nepal Bank Limited in 1937 AD marked the beginning of the formal
banking sector in Nepal. Since then, the Nepalese banking industry has undergone significant
changes in terms of size, complexity, functions, and roles in the economy.
In the late 1980s, financial liberalization policies were introduced in Nepal to spur the
country's economic growth. Foreign investments poured in soon after, which led to the
establishment of several joint venture banks in the country. Likewise, a large number of
domestic investors also started investing in the banking industry. Banks and financial
institutions (BFIs) proliferated and by the end of the fiscal year 2011, there were 218 BFIs in
Nepal (Refer to Annex 1: Growth of Financial Institutions (numbers) for details). However, a
significant consolidation in the banking industry has taken place with the moratorium on new
licenses, introduction of merger and acquisition policy and a mandatory provision to increase
paid-up capital almost by four-fold.
As of mid-April 2021, there are a total of 155 BFIs in operation (including 1 Infrastructure
Development Bank). There are 27 Commercial Banks, 18 Development Banks, 20 Finance
Companies and 74 Microfinance Financial Institutions. In FY 2019/20, the number of BFIs
decreased from 171 to 155 and the total number of branches has increased from 8,686 to
9,765. And in the nine months of 2020/21, 30 BFIs have been merged/acquired. Similarly,
the number of BFIs branches stand 10,546 in mid-April 2021.
There is a dominance of the banking sector in Nepal’s financial system. Several large projects
are being financed through bank loans. Likewise, banks' role is essential for the import and
export of goods and services from and to other countries. Further, with technological
advancement, more and more people are adopting electronic cards, digital wallets, internet,
quick response (QR) code and mobile banking services to perform financial transactions
which indicate that Nepal is moving towards a less cash economy.
Table 1-1: Number of BFIs in last five years in Nepal (mid-July, 2020)
BFIs 2016 2017 2018 2019 2020
Commercial Banks 28 28 28 28 27
Development Banks 67 40 33 29 20
Finance Companies 42 28 25 23 22
Microfinance Financial
Institutions
42 53 65 90 85
Infrastructure Development Bank 0 0 0 1 1

Bank Supervision Report, 2020 2
Chart 1-1: Number of BFIs in last five years in Nepal
(Source: Bank and Financial Institutions Regulation Department, NRB)
1.1 Nepal Rastra Bank as a regulator and supervisor
Nepal Rastra Bank, as the central bank of Nepal, has been entrusted with carrying out the
duties of regulating and supervising banks and financial institutions in the country. There has
been an adequate legislative provision in place that authorizes NRB to perform such duties.
The Nepal Rastra Bank Act, 2002, has made NRB an autonomous institution empowered to
regulate and supervise Nepalese banking industry. Similarly, the Bank and Financial
Institution Act, 2017 reiterates that institutions established under this Act are subject to
NRB's regulation and supervision.
NRB has been continuously issuing various directives, guidelines, and policies to the licensed
institutions, considering domestic banking conditions and international best practices. There
is a separate Department named Banks and Financial Institutions Regulation Department
assigned with such responsibility.
NRB supervises the activities of banks and financial institutions based on the existing legal
framework, regulations issued through the Banks and Financial Institutions Regulation
Department, internal manuals, and major international guiding policies issued by the Basel
Committee on Banking Supervision (BCBS). To make supervision more effective, NRB has
set up four different supervision departments. Among the four supervision departments, Bank
Supervision Department supervises commercial banks as well as Infrastructure Development
Bank. Additionally, Development Bank Supervision Department, Finance Company
Supervision Department, and Micro Finance Supervision Department supervise development
banks, finance companies and microfinance institutions respectively.
NRB aims at becoming more proactive by applying supervisory methods that are forward-
looking and analytical. Banks are supervised through onsite inspection and offsite
surveillance. Since 2014, it has started conducting an onsite inspection under risk-based
supervision (RBS) approach. While this approach has been applied fully on commercial
banks, NRB is planning to gradually adopt this approach on all the BFIs. Under this method,

Bank Supervision Report, 2020 3
major risk areas as well as other important areas of banks are assessed, risk profiles are
developed/created on the basis of quantity of the risk, quality of the risk management
procedures and direction of the risks, and significant issues are communicated to the
concerned bank for necessary corrective action and improvement in the coming days. Under
the RBS approach major risk faced by banks are categorised into six different categories
namely Credit risk, Liquidity risk, Market risk, Operational risk, Interest rate risk and Foreign
exchange risk and the on-site examiners examines the quantity of these risks, risk
management quality as well as assesses the direction of the risk and suggest the appropriate
supervisory response. NRB's supervisory strategy with regards to the utilization of limited
supervisory resources relies on the assessments made during these onsite inspections. Further,
there have been major efforts in implementing Supervisory Information System (SIS) for
onsite inspection process, offsite supervision, receiving regulatory returns/report from banks
and analysing the returns/data receive. The system will gradually apply to most of the entities
licensed by the NRB in the due course of time.
1.2 The Commercial Banking
There are 27 Commercial banks at present. Commercial banks comprise the largest share of
assets in the banking industry. Due to the size and importance of these banks, they are more
strictly regulated than other categories of institutions. Owing to the liberalization in the
banking sector, there was a dramatic increase in the number of private sector commercial
banks. However, three public sector commercial banks still have a considerable market share
in the industry. Nevertheless, the share of private sector banks on total deposits, loans, and
total assets has been increasing gradually.
Table 1-2: List of Commercial banks in Nepal (mid-July, 2020)
S.No. Name Operation
Date (A.D.) Head Office
1 Nepal Bank Ltd. 1937/11/15 Dharmapath, Kathmandu
2 Agricultural Development Bank Ltd. 1968/01/21 Ramshahpath, Kathmandu
3 Nabil Bank Ltd. 1984/07/12 Beena Marg, Kathmandu
4 Nepal Investment Bank Ltd. 1986/03/09 Durbarmarg, Kathmandu
5 Standard Chartered Bank Nepal Ltd. 1987/02/28 Nayabaneshwor, Kathmandu
6 Himalayan Bank Ltd. 1993/01/18 Kamaladi, Kathmandu
7 Nepal SBI Bank Ltd. 1993/07/07 Kesharmahal, Kathmandu
8 Nepal Bangladesh Bank Ltd. 1994/06/06 Kamaladi, Kathmandu
9 Everest Bank Ltd. 1994/10/18 Lazimpat , Kathmandu
10 Kumari Bank Ltd. 2001/04/03 Durbarmarg, Kathmandu
11 Laxmi Bank Ltd. 2002/04/03 Hattisar, Kathmandu
12 Citizens Bank International Ltd. 2007/04/20 Narayanhitipath, Kathmandu
13 Prime Commercial Bank Ltd. 2007/09/24 Kamalpokhari, Kathmandu
14 Sunrise Bank Ltd. 2007/10/12 Gairidhara, Kathmandu
15 Century Commercial Bank Ltd. 2011/03/10 Putalisadak , Kathmandu
16 Sanima Bank Ltd. 2012/02/15 Nagpokhari, Kathmandu
17 Machhapuchhre Bank Ltd. 2012/07/09* Lazimpat, Kathmandu

Bank Supervision Report, 2020 4
18 NIC Asia Bank Ltd. 2013/06/30* Thapathali, Kathmandu
19 Global IME Bank Ltd. 2019/09/04* Kamaladi, Kathmandu
20 NMB Bank Ltd. 2015/10/18* Babarmahal, Kathmandu
21 Prabhu Bank Ltd. 2016/02/12* Babarmahal, Kathmandu
22 Siddhartha Bank Ltd. 2016/07/21* Hattisar, Kathmandu
23 Bank of Kathmandu Ltd. 2016/07/14* Kamalpokhari, Kathmandu
24 Civil Bank Ltd. 2016/10/17* Kamaladi, Kathmandu
25 Nepal Credit and Commerce Bank Ltd. 2017/01/01* Bagbazar, Kathmandu
26 Rastriya Banijya Bank Ltd. 2018/05/02* Singhadurbar Plaza, Kathmandu
27 Mega Bank Nepal Ltd. 2018/05/13* Kamaladi, Kathmandu
*Joint operation date after merger.
(Source: Bank and Financial Institutions Regulation Department, NRB)
1.3 Ownership and Control
Commercial banks in Nepal can be broadly categorized into two groups as public (state-
owned) and private banks (non-state-owned) based on ownership and control. As of mid-
April 2021, there are 3 public and 24 private sector banks in operation. Rastriya Banijya
Bank Limited is the largest bank of Nepal in terms of deposit mobilization and is fully owned
by the Government of Nepal. The Government of Nepal owns 62.21 percent ownership in the
equity capital of Nepal Bank Limited, another public bank. Likewise, the Government of
Nepal owns 51 percent equity shares of Agricultural Development Bank Limited which was
initially established as a development bank, specialising in agricultural sector, with 100
percent government ownership and it was upgraded to commercial bank in 2006.
Privately-owned banks in Nepal can be further re-grouped into domestically-owned banks
and foreign joint-venture banks. As on the Mid-April 2021, there were five foreign joint
ventures banks out of 24 privately-owned banks. Furthermore, as per the section 9 sub-
section 1 of the Banks and Financial Institution Act, 2073 banks are required to issue
minimum 30 percent of the issued share capital to the general public.
1.4 Scope of Operations: Public Vs. Private
Although the number of commercial banks have slightly decreased in the last few years due
to the consolidation policy adopted by the Nepal Rastra Bank through the promotion of
merger and acquisition, substantial increment in minimum capital requirement, increase in
bank branches and the total volume of loans and deposits demonstrate a considerable increase
in access/outreach and business. Total deposits of the commercial banks has increased from
Rs.2,878.80 billion in 2018/19 to Rs. 3,489.39billion in the 2019/20 The deposits of public
banks grew by 0.93 percent while those of private banks (non-state owned banks) has
increased staggeringly by 25.63 percent.
Similarly, loans and advances of the Commercial banks has reached to Rs. 2,903.59 billion as
of mid-July 2020, compared to a total of Rs. 2,482.16 billion as of mid-July 2019 and is the
increment of 16.98 percentage. The loans and advances of public banks grew by 9.66 percent
while those of private banks have increased by 18.20 percent.

Bank Supervision Report, 2020 5
The total assets of commercial banks have increased by 19.67 percent to Rs. 4,246.83 billion
when compared to Rs. 3,548.82 billion of the previous year. Total assets grew by 14.95
percent in public banks while it grew by 20.54 percent in private banks.
1.5 Branch Network
The total number of branches of commercial banks increased from 3,585 in mid-July 2019 to
4,436 in mid-July 2020 (Refer to Annex 2: Province-Wise Distribution of BFIs branches (Mid-July
2019/20) and it has reached to 4,632 at the mid-April 2021. NRB has been promoting
financial access through policies that encourage banks to open a larger number of branches in
rural areas. While the increase in bank branches is overwhelming, most banking services are
still concentrated / confined in/to the urban and semi-urban areas.
Table 1-3: Branches of Commercial banks
S.No. Name of Banks
2016 2017 2018 2019 2020 2021
Mid-July Mid-
April
1 Nepal Bank Limited (NBL) 130 130 140 173 211 247
2 Rastriya Banijya Bank Limited (RBBL) 174 185 212 245 271 278
3 NABIL Bank Limited (NABIL) 52 52 74 81 124 125
4 Nepal Investment Bank Limited (NIBL) 46 61 89 105 109 116
5 Standard Chartered Bank Nepal Ltd. (SCBN) 19 15 15 15 15 15
6 Himalayan Bank Limited (HBL) 45 45 58 54 67 76
7 Nepal SBI Bank Limited (NSBI) 73 66 83 108 108 108
8 Nepal Bangladesh Bank Limited (NBBL) 35 46 72 97 105 107
9 Everest Bank Limited (EBL) 61 60 90 95 99 106
10 Bank of Kathmandu Limited (BOK) 69 75 83 96 99 101
11 Nepal Credit and Commerce Bank Limited
(NCCBL) 22 96 108 129 133
137
12 NIC Asia Bank Limited (NICA) 67 118 237 330 424 428
13 Machhapuchchhre Bank Limited (MBL) 57 56 88 132 165 167
14 Kumari Bank Limited (KBL) 36 74 88 93 186 200
15 Laxmi Bank Limited (LBL) 50 66 96 110 126 133
16 Siddhartha Bank Limited (SBL) 62 70 121 156 186 189
17 Agriculture Development Bank (ADBL)* 245 249 250 264 268 282
18 Global IME Bank Limited (GIBL)# 87 113 132 163 294 318
19 Citizens Bank International Limited (CBIL) 56 60 79 75 110 110
20 Prime Commercial Bank Limited (PCBL) 32 53 63 67 198 199
21 Sunrise Bank Limited (SRBL) 67 70 92 118 145 152
22 NMB Bank Limited (NMB) 71 80 118 114 172 189
23 Janata Bank Nepal Limited (JBNL) 123 88 121 145 - -
24 Mega Bank Nepal Limited (MBNL) 37 47 105 121 236 218
25 Civil Bank Limited (CBL) 40 51 69 90 115 121
26 Century Commercial Bank Limited (CCBL) 42 67 103 121 123 133
27 Sanima Bank Limited (SBL) 31 46 74 79 88 103
28 Prabhu Bank Limited (PRVU) 40 135 164 214 259 274
Total 1,869 2,274 3,024 3,590 4,436 4,632 * Also includes branches with development banking functions. # Janata Bank Nepal Limited merged with Global IME Bank Limited

Bank Supervision Report, 2020 6
Note: The above data includes Commercial Banks’ Banking Branch, City Office, Corporate Office, Extension Counter and
Head Office.
(Source: Bank and Financial Institutions Regulation Department, NRB)
The private sector bank NIC Asia Bank Limited has the largest number of branches (424)
followed by GIBL (294). The public sector banks RBBL, ADBL and NBL has 271, 268 and
211 branches respectively. Commercial banks branches are are concentrated in Bagmati
Province with 1,553 branches (35.01 percent of total branches). This is followed by Province
1 with 687 and the Lumbini Province with 657 branches. Karnali Province has the lowest
number of bank branches i.e. 177 (only 3.99 percent of total bank branches). Due to higher
level of economic activities at the Bagmati province bank’s branches and services are
concentrated here.
The chart below demonstrates the province-wise presence of BFIs.
Chart 1-2: Number of BFIs Branches (As of mid-July 2020) Province-wise
1.6 Asset Share of Banks and Financial Institutions
The respective shares of banks and financial institutions in the total assets of the banking
industry as of mid-July for eight consecutive years are depicted in the Table 1-4.
Table 1-4: Asset share of banks and financial institutions (mid-July, 2013 to 2020)
Bank and
Financial
Institutions
% Share as on mid-July
2013 2014 2015 2016 2017 2018 2019 2020
Commercial
Banks
78.20 78.00 78.73 79.74 83.41 82.76 80.88 83.61
Development
Banks
13.00 13.60 13.34 12.81 9.71 9.99 10.67 7.83
Finance
Companies
6.60 5.80 4.79 3.78 2.63 2.56 2.47 2.40
Micro Finance
Institutions
2.20 2.60 3.14 3.68 4.26 4.69 5.99 6.16
Total 100 100 100 100 100 100 100 100
(Source: Bank and Financial Institutions Regulation Department, NRB)
Table 1-3 shows the dominance of Commercial banks, with the share of 83.61 percent of total
assets of the Nepalese banking industry at the mid-July of 2020, such share was 80.88 percent
in the previous year. Share of development banks has decreased from 10.67 percent in FY

Bank Supervision Report, 2020 7
2018/2019 to 7.83 percent in FY 2019/2020. Likewise, the share of finance companies has
decreased to 2.40 percent from 2.47 percent during the review period. The share of
microfinance financial institutions increased from 5.99 percent to 6.16 percent in mid-July
2020. The decrease in the share of the Development banks and the Finance companies can be
attributed to the merger and acquisition where several development banks are merged with or
get acquired by commercial banks and finance companies are also merged with or get
acquired either by development banks or commercial banks. The table above reveals that the
consolidation of BFIs has the greatest impact on the development banks and finance
companies by reducing its number as well as decreasing its shares in the total assets of the
banking sector. Similarly, increase in the share of the microfinance institutions is due to the
increasing number of microfinance financial institutions which has taken place as a result of
the liberal licensing policy adopted by the NRB for the microfinance financial institutions.
1.7 Employment in the Banking Industry
Commercial banks have employed 40,938 individuals as of mid-July 2020. The numbers of
staff working in three public banks were 6,300 and the private bank employs 34,638 persons
as on the date it shows that the three public sector banks still employ 15.39 percent of total
people working in the commercial banking industry. The banking sector is considered as a
lucrative sector for work after completing Management and Economics related degrees.
Hence, many graduates aspire to enter this sector. However, there is still a lack of skilled
manpower in the industry. The human resource in the industry is expected to improve once
the industry gets fully matured.
1.8 Review of the Guiding Documents
As the central bank of Nepal, NRB has been given a clear mandate to regulate and supervise
banks and financial institutions in Nepal. To discharge its regulatory responsibilities, NRB
issues directives and guidelines to the licensed BFIs. Likewise, NRB continuously conducts
onsite inspections and offsite supervision both on regular and need-based ways to assess their
risk profiles and their compliance with the existing laws, regulations, and prudential norms.
The following are the key documents which guide the NRB’s regulatory and supervisory
function:
• Nepal Rastra Bank Act, 2002,
• Bank and Financial Institutions Act, 2017
• Company Act, 2017
• Nepal Rastra Bank Inspection and Supervision Bylaws, 2074
• Unified Directives published annually, and Circulars issued from time to time
• Capital Adequacy Frameworks
• Nepal Rastra Bank Prompt Corrective Actions Bylaws, 2012
• Monetary Policy Announcements,
• Assets (Money) Laundering Prevention Act, 2008
• Several Guidelines issued by Nepal Rastra Bank
• Risk-Based Supervision Manual, Volume I & II
• Off-site Supervision Manual, 2060

Bank Supervision Report, 2020 8
1.9 Access to Banking Services and Financial Inclusion
NRB is the main agency that is involved in promoting financial access in the country.
Through its policies, NRB has been working for expanding banking services and increasing
financial inclusion of the general public. All commercial banks have been directed to
open/expand their branches in all local bodies of the country. As of mid-July 2020, 747 out of
753 local levels had the presence of commercial bank branches. A provision has been made
to allow BFIs to open a branch in Kathmandu valley only after opening three branches
outside the Kathmandu valley. Two out of these three branches must be opened in
municipality or rural municipality. Further, BFIs do not need to take permission from NRB to
open a new branch in places other than metropolitan and sub-metropolitan cities.
Besides, NRB is working to promote branchless banking and mobile banking to increase
access to the banking service/system by the rural and unbanked people. As of mid-July 2020,
there were 1,574 branchless banking centres of 'A' class banks are in operation. Likewise, the
number of mobile-banking customers reached to 10,115,313 as of mid-July 2020.
As of mid-July 2020, the total number of branches of commercial banks reached 4,436 and
population per branch was 6,7621. The population per branch was 8,148 in the previous year.
The population per branch when considering all categories of BFIs comes down to 3,072 as
of mid-July 2020 compared to 3,363 as of mid-July 2019.
1 Population 29,996,478 calculated on yearly basis based on five yearly population projection Source :
http://cbs.gov.np/image/data/Population/Population%20projection%202011-2031/PopulationProjection2011-
2031.pdf

Bank Supervision Report, 2020 9
CHAPTER II
2 BANK SUPERVISION
2.1 Supervision Function
NRB regulates and supervises banks and financial institutions as mandated by the Nepal
Rastra Bank Act, 2002 and the Bank and Financial Institutions Act, 2017. Regular
supervision provides important insights and information about the banking system that feeds
into the decision-making process such as formulation of monetary policy, updates on
regulations, and for taking timely corrective measures of issues that may arise in BFIs.
Continuous monitoring of the indicators related to financial soundness and stability as well as
watching for the early warning signals and conducting on-site inspections to ensure that BFIs
are managing all their material risks adequately along with the compliance of regulatory
norms are the major supervisory functions performed by NRB.
2.2 Bank Supervision Department (BSD)
BSD is responsible for executing the supervisory policies and practices as per governing
laws, regulations, and policies to all Commercial banks (Class ‘A’ Banks) and Infrastructure
Development Bank. The Department prepares an annual supervision plan before the start of
the new fiscal year and supervises banks as per the approved plan. The supervisory process
includes full-scope on-site inspection, targeted inspection, special inspection and inspection
related to the Anti-Money Laundering/ Combating the Financing of Terrorism (AML/CFT).
The on-site inspection is supported by an off-site supervision function which is responsible
for the analysis of data submitted by banks.
2.3 Supervision Methodology
BSD continues to adopt and implement the Core Principles prescribed by the Basel
Committee. Supervision is done through both on-site and off-site programs. NRB's traditional
on-site inspection was based on compliance check and CAMELS (Capital Adequacy, Asset
Quality, Management competence, Earning, Liquidity, and Sensitivity to Market Risk)
ratings. The Risk Based Supervision approach which was adopted by BSD since 2014 puts
more emphasis on assessing the quantity of risks and the quality of risk management.
However, the team of on-site examiners also examines other key areas including capital
adequacy, AML/ CFT and compliance to prudential norms issued by the NRB from time to
time. Further, on-site examiners also propose additional risk weights and provisioning under
the Supervisory Review Process (SRP) if they are not satisfied with risk weights assigned and
asset classification and provisioning provided by the Management.
On-site examiners rely on Onsite Inspection Manual for guidance with risk assessment and
profiling. Risk profiling enables NRB to decide upon the supervisory regime for each bank
and helps NRB to orient/focus/channel its resources in high-risk areas. Subsequent on-site
inspections are being planned and conducted in accordance with the risk profile of the bank.
This methodology mainly focuses on the 'probability/chance of failure' of the bank and the

Bank Supervision Report, 2020 10
risk management practices of the bank. Off-site surveillance function involves continuous
monitoring of the banks by analysing the returns/reports received from banks. It is also an
important source of input for onsite inspection process. Likewise, the Enforcement function
oversees implementation of supervisory directions given for corrective action on issues
identified during the on-site examination/inspection process.
2.4 Organization Structure of BSD
The Department comprises On-site Inspection and Enforcement Division, Off-site
Supervision, and Money Laundering Monitoring and Special Inspection Division. (Refer to
Annex 3: Organisation Chart of BS). These Divisions are further divided into various units to
facilitate effective execution of the Department’s functions. On-site inspection team is
formed under the leadership of Deputy Director of the Department team members include
staffs from any divisions/units and the team is formed for the duration of assigned inspection.
2.4.1 Onsite Inspection and Enforcement Division
On-site Inspection and Enforcement Division has four On-site Inspection and Enforcement
Units. On-site inspection of banks are conducted as per the approved annual plan of the
department. The department strive to conduct onsite inspection of each commercial bank at
least once a year. NRB has initiated the practice of conducting targeted inspections from FY
2017-18 focusing on specific areas of risks/operation that have been identified as major risk
areas during the previous full scope (comprehensive) inspection. Full-scope or targeted onsite
inspections are performed in accordance with the risk profile of the banks. Onsite inspections
are carried out as per the Risk Based Supervision (RBS) approach as guided by the prevailing
RBS manual and inspection report of the bank is prepared accordingly. Generally, an
inspection team comprises/includes a team leader (Deputy Director) and three to four others
members (Assistant Directors). One IT Officer from IT Department is deployed for a limited
number of days to examine IT-related areas of the concerned bank (Annex 4: Onsite
Inspections in FY 2019/20).
The Onsite Inspection function is specially focused on conducting onsite examinations which
include:
• Initial examination, which is generally conducted within six months of the
commencement of operation by a new bank.
• Routine full-scope inspection is the regular examination, generally carried out once a
year.
• Targeted inspection addresses specific areas of risks/operation of a bank e.g. credit,
trade finance, etc. that have been identified as major risk areas in the previous full
scope onsite inspection and is conducted as per the approved plan of the department.
There are currently twelve officers working in these four units. All four units are headed by a
Deputy Director who oversees works related to seven banks each.

Bank Supervision Report, 2020 11
Enforcement function is responsible for ensuring the compliance of supervisory directions
given to the individual banks through the onsite reports, directions given to banks while
approving proposed dividend and providing NRB’s consent on bank’s financial statement to
present it in the Annual General Meeting (AGM) for approval and any other directions, if
any, given to bank from time to time. The Enforcement division prepares periodic
enforcement reports to communicate the status of compliance by each concerned bank. Each
unit also prepares quarterly report of the individual bank focusing on the major financial
indicators and the compliance status of the given directions.
However, due to limited number of dedicated staff, officers from other units are mobilized
from time to time to form an inspection team and conduct onsite examination.
2.4.2 Offsite Supervision Division
Off-site Supervision Division comprises four units: Compliance Unit, SIS Project, Financial
Analysis Unit and Internal Administration Unit. The Off-site Division, especially compliance
and financial analysis unit, carries out off-site surveillance of the banks. The Department is in
the process of revising the offsite manual to guide the procedures of offsite function. The
functions of each unit are described below:
Compliance Unit
Compliance Unit is responsible for supervising bank operations based on data and reports
submitted by banks. The unit ensures that bank comply with the provisions such as cash
reserve ratio (CRR), statutory liquidity ratio (SLR), credit to core capital and deposit ratio
(CCD), capital adequacy ratio (CAR), interest rate spread, priority/targeted sector lending
(agriculture, energy and small and medium enterprises sector lending) and deprived sector
lending (DSL) and the unit also initiate regulatory action for non-compliance. It also provides
feedback to the onsite inspection teams and identifies red flag areas that need to be focused
during onsite inspections.
Cash Reserve Ratio (CRR)
Commercial banks are the backbone of the payment system and are the main conduits of
monetary policy. As an indirect monetary instrument, NRB uses CRR to control money
supply in the economy, which was set at minimum 3 percent of total local currency deposit
liabilities in the review period. While the minimum is to be kept for every two weeks, 70% of
the minimum requirement (3%) has to be kept by each bank on daily basis. The average CRR
maintained by the commercial banks in the last period of the review year is 6 percentage.
Banks that fail to maintain such reserves face monetary penalties based on the bank rate.
During the review period, one bank was penalised for not maintaining the required CRR.
Deprived Sector Lending (DSL)
Commercial banks are required to disburse 5 percent of their total loan portfolio in the
deprived sector. The average deprived sector lending of the commercial banks stood at 6.26
percentage in the last quarter of the review year. Banks that fail to maintain the minimum

Bank Supervision Report, 2020 12
requirement in deprived sector lending as prescribed by the NRB are imposed monetary
penalty on the basis of highest lending rate of the bank during the quarter in which shortfall
are observed.
Statutory Liquidity Ratio (SLR)
Banks are required to maintain SLR of 10 percentage of their total domestic deposit
liabilities. Failing to meet such obligation results in monetary penalties computed on the basis
of the bank rate. During the review year, all banks complied with the Statutory Liquidity
Ratio standard. The average SLR of the commercial banks in the last month of the review
year was 24.02 percent.
Capital Adequacy Ratio (CAR)
The New Capital Adequacy Framework requires the banks to maintain minimum capital
requirements based on total risk weighted assets. As per the framework, Commercial banks
need to maintain at least 6 percent Tier I capital and 11 percent Total Capital Fund (Tier I &
Tier II) including Capital Conservation buffer. The minimum capital adequacy requirements
are based on the risk-weighted exposures (RWE) of banks to credit risk, market risk and
operational risk. The capital adequacy ratios of banks are monitored on a monthly basis. The
average capital adequacy ratio of the commercial banks in the last month of the review year
was 14.01 percent.
Refer to Annex 6: Capital adequacy ratios of Commercial Banksduring the last month of the
review period.
SIS Project
SIS project is responsible for the development, implementation and the back-office support
function of the Supervisory Information System (SIS) post implementation period. The
project team includes three officers who coordinate with other NRB staff, support providers
and the vendor. Currently, the System has gone live for the initial phase that involves
submission of some returns/input by the commercial banks and use of On-site Module for the
onsite inspection purpose. The team members have also been involved in training other NRB
staff and bankers, as well as, collecting feedback for the continuous improvement and
customization of the system.
Financial Analysis Unit
Financial Analysis Unit reviews and analyses the financial performance of banks using
prudential reports, statutory returns and other relevant information. It monitors the trend and
development of financial indicators of the banking sector as a whole and generates industry
reports on a quarterly basis. The unit helps with assessing the health of individual bank and
the overall commercial banks. The unit monitors, reviews, and analyses return of banks and
prepares reports to detect emerging problems and early warning indicators/signals. The
returns are used to evaluate the exposure to risks and the effect this could have on profits. The
statutory returns are the basis for computing basic ratios to analyse capital adequacy, assets

Bank Supervision Report, 2020 13
quality, earnings, liquidity and sensitivity to market risk (CAELS). The unit also compiles
and analyses financial data and prepare reports on a regular, as well as specific case basis.
Further, the unit is also responsible for approving dividend proposed & providing NRB’s
consent on the bank’s annual financial statement to present it in the Annual General Meeting
of the bank.
Internal Administration Unit
The Internal Administration Unit performs the functions related to management of human
resources and internal administration within the department. Its tasks include providing
logistics within the department, issuance of travel orders, maintaining leave records and also
serving as the back office. It also keeps the records of the staff participation in international
trainings and seminars (Refer to Annex 8: International Training/Seminar Participation from BSD
in FY 2019/20). This unit is responsible for looking after procurement for the BSD such as
supply of office logistics and stationery in coordination with the Asset and Service
Management Department of NRB. This unit also helps in coordination between other units to
carry out the functions more smoothly and effectively. There are seven personnel, including
two support-level staff, fulfilling the unit’s duties.
2.4.3 Money Laundering Monitoring and Special Inspection Division
Money Laundering Monitoring and Special Inspection Division comprise three units: Money
Laundering Monitoring Unit, Policy and Planning Unit and Special Inspection Unit.
Money Laundering Monitoring Unit
Money Laundering Monitoring Unit is a newly formed unit that is responsible for overseeing
AML/CFT related compliance and risk assessment. The unit consists of two Deputy Directors
and two Assistant Directors. The unit is responsible for developing ML/CFT risk profile of
the banks, conducting risk-based onsite inspections, and also support national risk assessment
task. The unit has started AML/CFT on-site inspection. The Unit also coordinates with
Financial Information Unit (FIU), Office of the Prime Minister, Department of Money
Laundering Investigation and other public sector agencies and public sector entities for their
works.
Policy and Planning Unit
The Policy and Planning Unit regularly monitors the developments in international financial
environment, the guidelines issued by the Basel Committee of Banking Supervision and
emerging issues in banking regulation and supervision. It incorporates the findings to propose
required changes in the existing policies and in preparing the annual plan of the Department,
as well. The unit also undertakes studies for improving supervisory tools and techniques and
coordinates with international regulators and supervisory agencies to share knowledge and
bring best practices in the banking supervision in the country. The unit exchanges
information with international regulators and supervisors in matters related to banking
supervision.

Bank Supervision Report, 2020 14
Further, the unit also reviews and formulates the annual plans of the department in line with
NRB’s strategic plan, conducts and coordinates interaction programs, seminars and
workshops on the supervision-related issues. However, due to Covid-19 pandemic, none of
the scheduled programs were conducted in the year 2020. It also prepares the annual report of
the department as prescribed in the Inspection and Supervision Bylaw.
Special Inspection Unit
The special inspection unit deals with, including inquiring and follow up, the banking-related
complaints made directly at NRB, coming through public, media and government authorities
as well as upon the findings of offsite surveillance and need felt by NRB. The unit arranges
special inspection teams for onsite examination if found necessary. It also keeps the records
of the special inspection reports. (Refer to Annex 7: Special Inspection of Commercial Banks
in FY 2019/20).
The following table shows important directives for compliance during the review year:
(Annex 5: Circulars issued in FY 2019/20).
Table 2-1: Important Directives regarding Capital, Credit and Liquidity
(Effective for the FY 2019-20) SN Particulars Current Rate or Percentage Days/
Month
Remarks I Remarks II
1. Minimum Capital fund
"IDB" and "A" class
Core Capital = 6% &
Capital Fund including
capital conservation
buffer= 11% of Total Risk
Weighted Exposure
Minimum capital
fund to be
maintained based
on the risk-
weight assets
(percent)
As per Capital
Adequacy
Framework,
2018 for IDB,
Capital
Adequacy
Framework 2015
for for Class ‘A’
Banks and
Capital
Adequacy
Framework,
2007 (Updated
July 2008) for
"B" and "C"
class.
"B" class &
"C" class
Core Capital = 6% &
Capital Fund = 10% of
Total Risk Weighted
Exposure
2. Refinance Facility
(i) Micro, Cottage
&Small Enterprises
Refinance (limit up to
1.5million)
2%
Max. 1
year
Cannot charge
more than 5%
i. Max. Limit per
client is 50
million for
wholesale
refinance
facilities
provided via
BFIs.
ii. Max. Limit

Bank Supervision Report, 2020 15
(ii) Special Refinance
Export, Small business
run by women,
deprived community,
differently able person
and sectors affected by
the natural calamities.
1%
For
Covid-
19
affected
sector:
Min. 6
months
to max.
1 year.
Cannot charge
more than 3%
per client is 200
million for client
specific
refinance
facilities
provided via
BFIs.
iii. Max. 10 % of
total refinance
facilities are
provided to
MFIs.
(iii) General Refinance
Refinances not included
in (i) and (ii) and all
other refinances which
this bank asks to
categorize into.
3% Cannot charge
more than 5%
3. Bank Rate 5%
4. SLF Rate (For A, B &
C)
Bank rate (5%) Max. 5
days
For Merger, 30
days
upto 90%
Against Govt. T-
Bills and Govt.
Bonds
5. Lender of Last Resort Bank rate (5%) Max. 6
months
Against deposit
at NRB for CRR
Purpose / Govt.
Securities and
Pass Loan
6. Repo & Reverse Repos As determined by Open
Market Operation
Committee.
7. CRR
"IDB" Class
"A" class
"B" class
"C" class
1%
3%
3%
3%
8. SLR
"IDB" Class
"A" class
"B" class (taking call
and current deposit)
"C" class (taking call
and current deposit)
12%
10%
8%
7%
9. Deprived Sector
"A" class
"B" class
"C" class
5%
5 %
5%
10. Priority Sector lending
"A" class in:
Agriculture, MSME,
Energy & Tourism.
"B" class in priority
"C" class in priority
40% (Deadline BS 2080
Asar for Agriculture, 2081
Asar for others.) in
Productive sector:
Min.11% in Agriculture,
11% in MSME, 6% in
Energy.
11. Net Liquid asset to
Deposit Ratio
20%

Bank Supervision Report, 2020 16
CHAPTER III
3 OPERATIONAL PERFORMANCES OF COMMERCIAL BANKS
Nepal started the practice of publishing financial statements in conformity with the
International Financial Reporting Standards (IFRS) from 2013 onwards. Nepal Accounting
Standards (NASs) has been converged with IFRS to form new standards, Nepal Financial
Reporting Standards (NFRS). These standards (NFRSs) are developed and issued by the
Accounting Standard Board (ASB) and made effective by the Institute of Chartered
Accountants of Nepal (ICAN).
NFRSs comprises broad standards covering Nepal Accounting Standards (NAS) developed
by ASB before 2013, Nepal Financial Reporting Standards (NFRS) developed after 2013,
Standard Interpretation Committee’s (SIC) Interpretations by the then Standard Interpretation
Committee (SIC) under IFRS Foundation and International Financial Reporting Interpretation
Committee’s (IFRIC) interpretations published by IFRIC.
As per the directive issued by the NRB, Commercial Banks have started to publish their
financial statements as per Nepal Financial Reporting Standards (NFRSs) since FY 2017/18
A.D. The operational performance of the commercial banks as reported to the BSD are as
follows:
3.1 Assets of the commercial banks
The total assets of the commercial banks have increased by 19.67 percent to Rs. 4,246.83
billion in the FY 2019/20 compared to a growth of 19.56 percent in FY 2018/19. In the
review year, the total assets increased by 14.95 percentage in public banks and by 20.54
percentage in case of the privately owned banks. The major contribution in the increment in
total assets of the Commercial banks comes from the increase in the total loan portfolio,
which is the largest component of assets in the Commercial banks.
Please refer to Annex 9.1: Banking Operation for details.
Chart 3-1: Total Assets of the Commercial Banks (mid-July, 2018 to 2020)

Bank Supervision Report, 2020 17
3.2 Composition of Assets
The major portion/chunk of the assets of the commercial banks is in the form of loans &
advances which amounts to Rs.2,903.59 billion (Rs.2,888.39 billion as per Nepal Financial
Reporting Standards which is 68.01% of total assets). The second and third largest
components are investment in securities (12.33%) and cash and cash equivalent (6.42%)
respectively.
Refer to Annex 9.2: Composition of Assets for details.
Chart 3-2: Composition of Assets of Commercial Banks (mid-July 2020)
3.3 Composition of Liabilities
The largest source of fund of the Commercial banks in mid-July 2020 was deposit, which
amounts to Rs.3,489.39 billion (82.16%) the total deposit was Rs.2,906.56 billion at the mid-
July 2019. In the review period deposit has increased by 20.22 percentage compared to the
FY ended on mid-July 2019. The second and third largest sources of resources were Share
capital and Reserves which amounts to Rs. 284.81 billion (6.71%) and Rs.156.32 billion
(3.68%) respectively in the review period.
Refer to Annex 9.3: Composition of Liabilities and Equity for details.
Chart 3-3: Composition of Liabilities of Commercial Banks (mid-July 2020)

Bank Supervision Report, 2020 18
3.4 Capital
The consolidated capital fund of the Commercial banks showed a significant growth during
the review year. Capital fund has increased by 15.12 percentage to Rs.506.47 billion in the
review year. Capital fund of privately owned banks grew by 16.50 percent to Rs. 429.75
billion and that of the public banks has increased only by 7.99 percentage and reached to Rs
76.72 billion. Increment in the paid-up capital due to issuance of bonus shares and increase in
the statutory reserves have mostly contributed to such growth in the capital funds of the bank.
Refer to Annex 9.4: Capital Fund for details.
Chart 3-4: Capital Funds of the Commercial Banks (mid-July, 2018 and 2020)
3.5 Deposit
Total deposits of the commercial banks as per unaudited figures increased significantly by
21.21 percentage to Rs.3,489.39 billion in the review year compared to a growth of 16.48
percent in the previous fiscal year.
Chart 3-5 (A): Deposit Mix of the Commercial Banks (mid-July, 2018 to 2020)

Bank Supervision Report, 2020 19
The above chart depicts that savings and fixed deposits are the major components in the
deposits of the banks. In the review year, the current deposits increased with the highest rate
of 29.23 percentage and reached to Rs.3,89.70 billion followed by fixed deposits which
increased by 25.93 percentage and reached to Rs.1,645.92 billion. Across all the three years
presented, fixed deposits have covered the highest portion of commercial banks' total
deposits.
Refer to Annex 9.5: Deposit Mix for details.
Chart 3-5 (B): Deposit Mix of the Commercial Banks (mid-July 2020)
3.6 Loan and Advances
Loan and advances of the banks has increased by 16.98 percentage and stood at Rs.2,903.59
billion at the end of FY 2019/20 compared to growth of 19.29 percentage in the previous
fiscal year. Loans and advances of public banks) banks (state-owned banks) has increased by
9.66 percent to Rs.389.11 billion, and that of private banks (non-state-owned banks) rose by
18.20 percent to Rs. 2,514.48 billion during the review year compared to the previous year.
Refer to Annex 9.6 Loans and Advances for details.
Chart 3-6: Loan and Advances of the Commercial Banks (mid-July, 2018 to 2020)

Bank Supervision Report, 2020 20
3.6.1 Sector-wise Loan and Advances
Commercial banks have disbursed loans and advances to different sectors of the economy.
Wholesalers & Retailers sector is the dominant sector of lending with a share of 20.84
percentage in the total loans and advances, followed by Non-Food Production sector
(13.17%) and Construction (10.16%) sector at the end of FY2019/20.
Table 3-1: Sector-wise loan and advances of the Commercial Banks
SN Sector % of Total Loan (mid-July)
2018 2019 2020
1 Agriculture Forest 4.60 5.26 5.75
2 Fishery 0.11 0.14 0.16
3 Mining 0.21 0.28 0.21
4 Agriculture, Forestry & Beverage Prod. Related 6.00 5.66 5.43
5 Non-food Production Related 12.85 13.70 13.17
7 Construction 10.06 10.06 10.16
8 Electricity, Gas and Water 3.89 4.79 5.40
9 Metal Products, Machineries, Elec. and Installation 1.41 1.29 1.48
10 Transport, Warehousing and Communication 2.71 2.55 2.60
11 Wholesalers and Retailers 22.90 22.06 20.84
12 Finance, Insurance and Real Estate 8.51 8.03 7.66
13 Hotel and Restaurant 3.77 4.24 4.61
14 Other Services 4.50 4.38 4.73
15 Consumable Loans 6.69 5.50 4.75
16 Local Government 0.07 0.06 0.05
17 Others 11.72 12.00 12.99
Total Loan 100 100 100
Source: Offsite Supervision Division, BSD
3.6.2 Security-wise Loan and Advances
Almost all the loans and advances disbursed by the Commercial banks are secured by some
form of collateral. As of mid-July 2020, about 89.50 percent of the total loans and advances
are secured by the property. This category includes all those loans and advances that are
provided against security of fixed assets like real estate and current assets like stocks and
receivables as well.
Table 3-2: Security-wise Loan and Advances of Commercial Banks
S.N. Security % of Total Loan (mid-July)
2018 2019 2020
1 Gold and Silver 1.54 1.28 1.18
2 Government Bonds 0.02 0.01 0.02
3 Non-Government Securities 1.44 1.11 1.10
4 Fixed Deposit Receipts 0.64 0.76 0.58
5 Property as Collateral 88.29 89.53 89.50
6 Security of Bills 0.86 0.93 1.16
7 Guarantee 3.04 3.21 3.02

Bank Supervision Report, 2020 21
8 Credit Card 0.06 0.07 0.06
9 Others 4.11 3.11 3.38
Total 100 100 100
Source: Offsite Supervision Division, BSD
3.6.3 Product-wise Loans and Advances
Major part of the loan and advances, i.e. 23.58 percent of the total loan, as of mid-July 2020,
is related to demand and other working capital nature. The proportion of such loan in the
previous year was 23.96 percent. Similarly, 21.47 percent and 14.51 percent of loans were
extended as term and overdraft loans respectively. There is no significant change in the
product-wise mix when compared with the previous year.
Table 3-3: Product wise Loan and Advances
S.N. Loan Products % of total loan (Mid July)
2018 2019 2020
1 Term Loan 17.46 19.08 21.47
2 Overdraft 16.53 15.00 14.51
3 Trust Receipt Loan/Import Loan 5.41 5.09 4.76
4 Demand and Other Working Capital Loan 22.74 23.96 23.58
5 Personal Residential Home Loan 7.91 7.47 7.18
6 Real Estate Loan 5.43 4.76 4.87
7 Margin Loan 1.57 1.42 1.42
8 Hire Purchase Loan 6.50 5.68 4.99
9 Deprived Sector Loan 5.41 5.69 5.82
10 Bills Purchased 0.14 0.13 0.11
11 Other Product 10.9 11.71 11.28 Total 100 100 100
Source: Offsite Supervision Division, BSD
3.7 Non-Performing Loans (NPL)
The total volume of non-performing loans of the commercial banks increased by 41.85
percent in the fiscal year 2019/20 and reached to Rs. 52.57 billion. Non-performing loans of
private sector banks increased by 61.31 percentage to Rs. 39.04 billion and that of public
sector banks increased by 5.25 percent to Rs. 13.54 billion during the review period. The
non-performing loan of the banking industry has increased from 1.49 percent to 1.81
percentage during the review period.
Refer to annex 9.7: Non-Performing Loans for the details.

Bank Supervision Report, 2020 22
Chart 3-7 (A): NPL Ratio of the Commercial Bank (mid-July, 2018 to 2020)
Chart 3-7 (B): Non-Performing Loan of Commercial Banks (mid-July, 2018 to 2020)
3.8 Non-Banking Assets (Investment in Property)
The level and structure of Non-Banking Assets (NBA) during the last three years is presented
in the Chart 3-8. The overall NBA of the Commercial banks increased by 22.23 percentage in
the FY 2019/20. Privately owned banks accounted for the increase in NBA by 25.45 percent
to Rs.5.55 billion, whereas state owned banks accomplished decrease in NBA by 7.98 percent
to Rs.433.42 Million.
Refer to Annex 9.8 Non-Banking Assets for details.

Bank Supervision Report, 2020 23
Chart 3-8: NBA of the Commercial Banks (mid-July 2018 to mid-July 2020)
3.9 Investment
Commercial banks predominantly has invested in government securities like treasury bills
and bonds. The other areas of investment include inter-bank placement and investment in
shares and debentures.
The composition of investment of commercial banks shows a high concentration in
government securities, with 75.73 percentage of the total investment, while investment in
shares, debentures, interbank lending, fixed deposit and other investment accounted for 6.11
percent, 2.47 percent, 1.18 percent and 14.46 percentage respectively. Banks have the similar
investment pattern in the portfolio of the previous year. Banks are not allowed to invest in
shares and debentures of Banks and Financial Institutions licensed by the NRB, except that of
D Class Microfinance Financial Institutions. Chart 3-9 shows the investment portfolio of the
commercial banks at the FY ended in mid-July 2020.
Refer to Annex 9.9: Investment Portfolios for details.

Bank Supervision Report, 2020 24
Chart 3-9: Investment Portfolio of the Commercial Banks (mid-July 2020)
3.10 Earnings
The total net profit of commercial banks decreased from Rs. 63.80 billion to Rs. 54.32 billion
(decrement of 14.87%) in FY 2019/20. The net profit of private banks were decreased by
15.17 percentage whereas that of the public banks has decreased by 13.56 percentage. The
total interest income, which is the largest component of total income of banks showed growth
of 7.97 percent. The total net interest income rose by 1 percent, whereas the operating profit
decreased by 16.63 percent in the review period.
Refer to Annex 9.10: Operating Efficiencyfor details.
Chart 3-10 (A): Operating Efficiency of the Commercial Banks (mid-July, 2018 to 2020)

Bank Supervision Report, 2020 25
Interest income of the commercial banks is the main source and the contributors in their
profitability. The net interest spread of the banks has decreased from 4.09 percent in the
previous FY 2018/19 and reached to 3.43 percentage in the FY 2019/20. The net interest
spread of private banks and public banks is 3.34 percent and 3.96 percentage respectively in
the review period.
Refer to Annex 9.11: Net Interest Spread for details.
Chart 3-10 (B): Interest Spread of the Commercial Banks (mid-July, 2018 to 2020)
3.11 Liquidity
The sum of cash balance, balance at NRB and other BFIs, money at call and the investment
in the government securities are considered as the total liquid assets of the banks. The total
liquid assets of the banks increased significantly from Rs.699 billion at the end of FY
2018/19 to Rs.959 billion at the end of FY 2019/20. Furthermore, the total liquid asset to
deposit ratio has also increased from 23.89 percent to 27.49 percent in the review period.
Likewise, total liquid assets to total assets ratio has increased from 19.12 percent to 21.95
percent in the period.
Detailed figures are shown in:

Bank Supervision Report, 2020 26
Annex 9.12: Liquid Assets to Total Deposit and Annex 9.13 Liquid Assets to Total Assets.
Chart 3-11 (A) and (B) show the liquidity position of the commercial banks to its total assets
and total deposits.
Chart 3-11 (A): Liquid Assets to Total Deposit (mid-July, 2018 to 2020)
Chart 3-11 (B): Liquid Assets to Total Assets (mid-July, 2018 to 2020)

Bank Supervision Report, 2020 27
3.12 Deprived Sector Lending
The average deprived sector lending of commercial banks for the last quarter of FY 2019/20
stood at 6.26 percentage. The deprived sector lending is above the NRB’s minimum
requirement of 5 percent in the review year.
Refer to Annex 9.14 Deprived Sector Lending of Commercial Banks for details.
3.13 Electronic Banking
Nepalese commercial banks are providing following types of electronic banking services:
a) Internet Banking
b) Mobile Banking
c) Card Services (Debit Cards, Credit Cards, Prepaid Cards)
d) Cash and Cheque Deposit Kiosks
e) Automated Teller Machines (ATMs)
f) Branchless Banking
Table below shows the present status of electronic banking in Nepalese commercial banking
industry. This depicts a growing trend in the use of electronic banking services in the
industry.
Table 3-4: Electronic banking in Nepalese Commercial banking industry
S.N. Particulars Mid-July
2016 2017 2018 2019 2020
1) Number of
branchless banking
centre
812
1008
1248
1529
1574
2) Number of mobile
banking customer 1,604,578
2,438,222
4,711,097
7,406,802
10,115,313
3) Number of Internet
banking customer 489,835
766,958
810,674
888,268
1,001,866
4) Total number of
ATM 1,661
1,874
2,252
2,951
3,759
5) Number of debit
card holder 4,142,390
4,694,066
5,307,970
6,454,285
7,062,472
6) Number of credit
card holder 52,014
68,966
104,721
123,146
160,297
7) Number of prepaid
card holder 82,797
101,458
96,816
67,386
63,775
Source: Bank and Financial Institutions Regulation Department, NRB

Bank Supervision Report, 2020 28
3.13.1 Internet Banking
Kumari Bank Limited was the first bank to introduce Internet Banking in Nepal (in 2002).
Currently, all the Commercial banks are offering Internet Banking services to their
customers. As on mid-July 2020, there were 1,001,866 internet banking users of commercial
banks in Nepal. The number was 888,268in the last year. So far, commercial banks in Nepal
are providing the service of utility payments, fund transfers within and between selected
banks and the generation of account statements as internet banking services.
3.13.2 Mobile Banking
Nepalese banks are providing services like balance inquiry, mini statement, current
transactions information, withdrawal alerts, cheque book inquiry/request, inter-bank and
intra-bank fund transfer, utility bill payments, payment via Quick Response (QR) code etc.
through mobile banking. As of mid-July 2020, there were 10,115,313users of mobile
banking, which were 7,406,802in the previous year. Since mobile service has a very high
penetration ratio in the Nepalese population, it can be a very effective way to provide
financial services to the domestic consumers.
3.13.3 Debit Card
All Nepalese banks are providing debit card services to their customers. There are 7,062,472
debit card users in the commercial banks as on mid-July 2020, which were 6,454,285 in the
previous year. The debit card issued by the banks can also be used in India.
3.13.4 Automated Teller Machines (ATMs)
Himalayan Bank Limited introduced the first ATM in Nepal in the year 1995. All
commercial banks have installed ATMs and allowed customer to access it. Through ATMs,
customers can withdraw cash up to certain limit at any time free of service or at minimal
charge. As at the mid-July of 2020, there are 3,759 ATMs installed by commercial banks.
3.13.5 Credit Card
Credit card service in Nepal was first introduced by Nabil Bank Ltd (then Nepal Arab Bank
Ltd) in the early 1990s. As on mid-July 2020, there are 160,297 active credit card customers
in the Nepalese banking industry. There were 123,146 credit card customers as on mid-July
2019. Domestic currency credit issued by banks can also be used in India.

Bank Supervision Report, 2020 29
3.13.6 Branchless Banking
Branchless banking is a distribution channel strategy used for delivering financial services
without relying on bricks and mortar branches. Banks provide service through Point Of
Transaction (POT) machine by using smart cards. It is an agent-based service. The services
include deposit, withdrawal, balance enquiry, and fund transfer. As on mid-July 2020, there
are 1574 branchless banking outlet/centres in the country, number of which were 1529 in the
previous year. Increasing number of banks introducing branchless banking services especially
in the rural areas which has contributed to the growth in the number of branchless banking
outlet/centres and access to the formal financial services for those people who were unbanked
previously.

Bank Supervision Report, 2020 30
CHAPTER IV
4 CURRENT INITIATIVES IN SUPERVISION
This chapter presents the initiatives taken in the field of banking supervision and regulation in
both domestic as well as international arena. It provides a brief outlook to the valued readers
about the developments regarding oversight in the financial sector recently.
4.1 International Initiatives:
4.1.1 Initiatives by Basel Committee on Banking Supervision (BCBS)2
4.1.1.1 Supplemental notes to External audits of banks
The Basel Committee on Banking Supervision (BCBS) issued the supplemental note,
External audits of banks in December 2020 to contribute to the high-quality audit of banks.
This note deals with the audit of the expected credit loss (ECL) accounting estimate within
the overall financial statement audit. ECL frameworks bring significant change for banks and
their external auditors. High-quality implementation and ongoing application require
considerable effort from all involved parties – management, audit committees and external
auditors.
The Committee is issuing this supplemental note to help banks’ audit committees in their role
of overseeing banks’ external audits (including the audit work on ECL), which is one of their
key responsibilities. The note does so by first setting out,
(i) The Committee’s expectations for the external auditor, alongside questions that an
audit committee may ask the external auditor.
(ii) Then elaborates on those expectations in the context of key components of ECL
(models, for example).
Credit loss provisioning is a key accounting issue because it reflects changing exposure to
credit risk and impact reported profits and regulatory capital. It is also a key area of focus for
external auditors and users of financial statements. Credit loss provisioning has typically been
a source of significant rRisks Of Material Misstatement (ROMM) in a bank’s financial
statements. ECL frameworks, however, change the accounting for credit losses and also
require changes to the work that external auditors carry out. ECL frameworks raise new
challenges for a bank’s management (amounts and disclosures may require significant
judgment to make estimate and present fairly), as well as for auditors (amounts and
disclosures are difficult to objectively evaluate and are at greater risk of material
misstatement from management bias or error). These changes bring new challenges to audit
committees. An effective audit of the ECL estimate and related disclosures is an important
aspect of high-quality financial reporting and disclosure by banks.
2 Source: BIS, BCBS http://www.bis.org
for the publications http://www.bis.org/bcbs/publications.htm?m=3%7C14%7C566

Bank Supervision Report, 2020 31
4.1.1.2 Benchmark rate reforms
The Basel Committee on Banking Supervision issued Benchmark rate reforms in February
2020 which fully supports the global efforts to strengthen the robustness and reliability of
existing Inter-Bank Offered Rates (IBORs) and promote the development of alternative
reference rates. It is critically important that banks consider the effects of benchmark rate
reform on their businesses and make the necessary preparations for the transition to the
alternative rates. In doing so, they should maintain a close dialogue with their supervisory
authorities regarding their plans and transition progress, including impediments that may be
identified. In this regard, as the London Inter-Bank Offered Rate (LIBOR) is not expected to
exist past year-end 2021, market participants should consider carefully the economic, legal
and reputational risks associated with continuing to write new contracts based on LIBOR.
Public authorities may also wish to consider the actions they can take to help ensure a smooth
transition.
In cases where banks continue to use IBORs, the Basel Committee encourages them to
include in their contracts robust fallback language that determines how the replacement of a
discontinued reference rate would be handled. Banks should also plan carefully to ensure that
internally developed and vendor-provided systems and services that they use are prepared
fully to accommodate the alternative reference rates.
4.1.1.3 The digital economy and financial innovation
The monetary and economic department of BIS has published BIS Papers on The digital
economy and financial innovation in February 2020. It highlighted about personal data
protection. Nowadays, a lot of financial firms are processing customers’ data and how the
economic value derived from use of personal data, or the “digital dividend”, is shared. At the
moment, it is not shared with the customers whose data are being used. This is something we
should think about. The paper also stressed the challenges of the big techs’ entry into finance,
this will require a more comprehensive approach in public policy that draws on financial
regulation, competition policy and data privacy regulation, and these three levels of
authorities will have to really come together and talk. It also argued that the digital
innovations affect vulnerabilities and the resilience of the financial system. In this regard, it is
interesting to note that some new providers of digital financial services, such as big techs, are
not funded through deposits and are well capitalized. This may – a priori – mitigate financial
stability concerns. However, these companies might venture into the realm of “traditional”
financial services such as deposit-taking and lending or innovatively bundle existing services
and products to create a new product.
4.1.1.4 Revisions of the principles for sound management of operational risk
In August 2020, the Basel committee issued consultative version of revisions to the principles
for the sound management of operational risk. The purpose of this review was to (i) assess
the extent to which banks had implemented the principles; (ii) identify significant gaps in
implementation; and (iii) highlight emerging and noteworthy operational risk management

Bank Supervision Report, 2020 32
practices at banks not currently addressed by the Principles. The 2014 review identified that
several principles had not been adequately implemented, and further guidance would be
needed to facilitate their implementation in the following areas:
a) Risk identification and assessment tools, including risk and control self-
assessments (RCSA), key risk indicators, external loss data, business process
mapping, comparative analysis, and the monitoring of action plans generated
from various operational risk management tools.
b) Change management programs and processes (and their effective monitoring).
c) Implementation of the three lines of defense, especially by refining the
assignment of roles and responsibilities.
d) Board of directors and senior management oversight.
e) Articulation of operational risk appetite and tolerance statements; and
f) Risk disclosures.
4.1.2 Initiatives by Financial Stability Board (FSB)3
4.1.2.1 FSB reports on its work to develop a roadmap to enhance global cross-border
payments.
In April 2020, the Financial Stability Board (FSB) published the Stage 1 report of its project
to develop a roadmap to enhance cross-border payments. This report, which is being
delivered to the G20 provides an assessment of existing arrangements and challenges for
global cross-border payments.
Enhancing cross-border payments requires addressing frictions in existing cross-border
payment processes. These frictions include: fragmented data standards or lack of
interoperability; complexities in meeting compliance requirements, including for Anti-Money
Laundering and Countering the Financing of Terrorism (AML/CFT), and data protection
purposes; different operating hours across different time zones; and outdated legacy
technology platforms. A number of public sector initiatives have sought to address these
challenges and frictions by enhancing existing payment arrangements.
Financial innovation is creating opportunities to make payment mechanism more efficient.
Technological innovation could build on existing cross-border and domestic payment
arrangements or take the form of new structures and ecosystems. However, the use of new
technologies and business models in cross-border payments also involves challenges and
risks.
Global cross-border payments are carried out through a diverse multi-layered set of networks.
A roadmap for enhancing cross-border payments, therefore, will need to encompass a variety
of approaches and time horizons.
3 Source: FSB, http://www.financialstabilityboard.org/

Bank Supervision Report, 2020 33
4.1.2.2 FSB sets out progress on interest rate benchmark reform
The FSB roadmap sets out a timetable of actions in November 2020 for financial and non-
financial sector firms to take in order to ensure a smooth LIBOR transition by end-2021.
With only one year left, all market participants–both financial and non-financial firms across
the globe must now ensure they follow the necessary steps to avoid disruption to the
performance of their contracts. For transition to occur on time, market participants will need
to cease use of LIBOR as a benchmark in all new activity across global markets as soon as
possible and this needs to be a key priority for the months ahead.
There have been a number of proposals by authorities and national working groups including
in the US, UK and EU to help manage an orderly wind-down of LIBOR and, in particular,
provide a legislative solution for tough legacy contracts. However, market participants should
continue to progress their transition efforts and plans proactively, particularly through active
conversion and the insertion of robust and workable fallbacks where feasible.
4.1.3 Initiatives by other authorities4
4.1.3.1 European Central Bank (ECB) launches public consultation on its guide on
climate-related and environmental risks
In May 2020, the European Central Bank (ECB) published a guide for consultation that
explains how it expects banks to safely and prudently manage climate-related and
environmental risks and disclose such risks transparently under the current prudential
framework. The ECB wants banks to account for these risks given that they drive existing
prudential risk categories and can substantially impact the real economy and banks.
The guide specifies how ECB Banking Supervision expects banks to consider climate-related
and environmental risks in their governance and risk management frameworks and when
formulating and implementing their business strategy. It also outlines how the ECB expects
banks to become more transparent by enhancing their climate-related and environmental
disclosures.
The ECB acknowledges that banks face significant challenges as a consequence of the
coronavirus (COVID-19) pandemic. While the ECB’s immediate attention is on the
pandemic, it remains committed to further advancing the management and disclosure of
climate-related and environmental risks in the banking sector.
4Source: ECB, https://www.ecb.europa.eu/pub/pubbydate/2018/html/index.en.html
PRA, http://www.bankofengland.co.uk/pra/Pages/default.aspx
RBI, https://www.rbi.org.in/

Bank Supervision Report, 2020 34
4.1.3.2 European Central Bank (ECB) finalizes guide to assessing how banks calculate
counterparty credit risk
The European Central Bank (ECB) published (on September 2020) the finalized guide
outlining the methodology it uses to assess how euro area banks calculate their exposure to
Counterparty Credit Risk (CCR) and advanced Credit Valuation Adjustment (CVA) risk.
These two risk types arise in derivatives trading and in transactions where securities are used
to borrow or lend cash, such as repurchase agreements. Both activities entail the possibility
that the counterparty may default. The global financial crisis has shown this to be one of the
key financial risks a bank faces, since counterparty defaults can unleash systemic effects.
Under European Union law, banks are allowed to use internal models to calculate the value of
their exposures to CCR and CVA risk as long as these models meet regulatory requirements.
The guide published explains the methodology the ECB uses to assess the validity of such
models, especially in internal model investigations.
4.1.3.3 Bank of England publishes The Internal Capital Adequacy Assessment Process
(ICAAP) and the Supervisory Review and Evaluation Process (SREP)
The Prudential Regulation Authority (PRA) published supervisory statement regarding, the
Internal Capital Adequacy Assessment Process (ICAAP) and the Supervisory Review and
Evaluation Process (SREP) in December 2020. It provides further detail in relation to the
high-level expectations outlined in ‘PRA’s approach to banking supervision’.
‘Expectations of firms undertaking an ICAAP’ sets out the expectations the PRA has in
relation to the ICAAP and the requirements set out in the Internal Capital Adequacy
Assessment (ICAA) Part of the PRA Rulebook. It sets out the PRA’s expectations regarding
firms’ coverage and treatment of interest rate risk in the non-trading book (more commonly
referred to as interest rate risk in the banking book or IRRBB), market risk, group risk,
operational risk, pension obligation risk and foreign currency lending to unhedged retail and
SME borrowers.
It includes stress testing, scenario analysis, capital planning and reverse stress testing sets out
in the PRA’s expectations of firms in relation to them.
‘The SREP’ sets out the factors that the PRA takes into consideration to assess a firm’s
ICAAP. It explains the setting of firm specific capital requirements and the PRA buffer, the
consequences in the event a firm fails to meet its Total Capital Requirement (TCR) or uses
the PRA buffer, and disclosure. It also sets out the factors that the PRA takes into
consideration to assess a firm’s reverse stress-testing approach including the PRA response to
weaknesses in the process.
4.1.3.4 Bank of England sets out The PRA’s methodologies for setting Pillar 2 capital
Bank of England published the Statement of Policy in December 2020 that sets out the
methodologies in that the Prudential Regulation Authority (PRA) uses to inform the setting of

Bank Supervision Report, 2020 35
Pillar 2 capital for all PRA-regulated banks, building societies, designated investment firms
and all PRA-approved or PRA-designated holding companies.
• Pillar 2A methodologies sets out the methodologies the PRA will use to inform the
setting of a firm’s Pillar 2A capital requirement for credit risk, market risk,
operational risk, counterparty credit risk, credit concentration risk, interest rate risk in
the non-trading book (hereafter referred to as interest rate risk in the banking book
(IRRBB)), pension obligation risk and group risk, including Ring Fenced Bank (RFB)
group risk.
• Pillar 2B provides information on the purpose of the PRA buffer, how it is
determined and how it relates to the Capital Requirements Directive (CRD) buffers. It
also provides details on the PRA’s approach to tackling weak governance and risk
management under Pillar 2B and group risk, including RFB group risk.
Firms are required by the Reporting Pillar 2 part of the PRA Rulebook, or may be asked, to
submit data to inform the PRA’s approach to setting Pillar 2A capital requirements. Data may
be requested on an individual, consolidated and/or sub-consolidated basis as applicable.
4.1.3.5 Reserve Bank of India (RBI) advices automation of income recognition, asset
classification and provisioning processes in banks
In September 2020, RBI advised banks to have Automation of Income Recognition, Asset
Classification and Provisioning Processes. Banks were asked to have appropriate Information
Technology (IT) system in place for identification of Non-Performing Assets (NPA) and
generation of related data/returns, both for regulatory reporting and bank’s own Management
Information System (MIS) requirements. All borrower accounts, including temporary
overdrafts, irrespective of size, sector or types of limits, should be covered in the automated
IT based system (System) for asset classification, upgradation, and provisioning processes.
Banks’ investments should also be covered under the System. Asset classification rules shall
be configured in the System in compliance with the regulatory stipulations.
RBI further elaborates; the System should handle both down-grade and upgrade of accounts
through Straight Through Process (STP) without manual intervention. The System based
asset classification should be an ongoing exercise for both down-gradation and up-gradation
of accounts. Banks should ensure that the asset classification status is updated as part of day
end process. Banks should also be able to generate classification status report at any given
point of time with actual date of classification of assets as NPAs.
4.2 National Initiatives:
4.2.1 Individual Bank Supervisor (IBS)
Since Covid-19 pandemic, NRB has adopted one bank one supervisor approach for effective
bank surveillance. Each supervisor is assigned with one bank to communicate, supervise,
monitor and for periodic reporting related to Key Financial Indicators (KFIs) which indicates
the financial condition and health of the bank. It is expected to be instrumental mechanism

Bank Supervision Report, 2020 36
when on-site inspection of the bank is at pause due to lockdown and prohibitory orders issued
by the government to prevent further spread of the corona virus are in place.
4.2.2 Stress Testing Guidelines
Stress testing is designed to test the resilience of banks to severe but plausible/probable
shocks, and it will take into account hypothetical adverse macroeconomic and financial
market scenarios e.g. severe recessions resulting credit downgrade, decrease in remittances or
liquidity dried up in the market or financial crises on bank’s profitability and balance sheets.
Stress Testing is designed to determine whether the BFI’s has enough capital to withstand the
financial and economic shocks. To make this stress test more relevant by adopting pragmatic
approach, NRB is in the process of revising and updating the Stress Testing Guideline 2012.
4.2.3 Money Laundering Monitoring Unit
To make money laundering prevention and compliance effective, NRB has established
Money Laundering Monitoring Unit at the Bank Supervision Department. The Bank has also
developed AML/CFT Supervision Manual which also includes Money Laundering
Vulnerability Assessment Tool. NRB has also started AML/CFT targeted on-site inspection
which helps to measure, analyze and help prevent underlying AML/CFT related risks in the
banks.
4.2.4 ICAAP Guidelines
For banks internal assessment of capital to ascertain whether it is adequate to cover all
material risks to which it is exposed is paramount. NRB is revising and updating the Internal
Capital Adequacy Assessment Process (ICAAP) Guidelines, 2012 in a timely manner by
adopting of the international best practices established especially in the areas of managing
risk and capital level. The revision and update of the ICAAP Guidelines is also in its final
stage.
4.2.5 Supervisory Information System (SIS)
NRB has developed a Supervisory Information System (SIS) with the financial assistance of
DFID to enhance the timeliness and effectiveness of supervisory data collection and analysis
process. The project is under pilot test phase with all reporting formats being finalized and
being made available to the reporting entity. Class ‘A’ banks have been using the system
since January 2020 in parallel to the existing reporting system (reporting.nrb.org.np). The
system will be fully operationalized within FY 2020/21 by incorporating other Class of BFIs.
4.2.6 Financial Soundness Indicators (FSIs)
NRB is publishing the 12 set of core indicators and 8 set of encouraged FSIs of deposit
takers, 2 sets of Other Financial Corporations (OFC), one indicator of households and 2
indicators related to real estate markets Financial Soundness Indicators (FSIs) on the website
of the International Monetary Fund (IMF) on quarterly basis. These FSIs are prepared based
on the Financial Soundness Indicators Compilation Guide, 2006 issued by the IMF. So far,

Bank Supervision Report, 2020 37
these FSIs covers the data from the commercial banks and the department is planning to
include the data from the development banks and Other Financial Corporations (OFCs) e.g.
Employee Provident Fund (EPF), Citizen Investment Trust (CIT), Insurance Companies etc.
and compile FSIs in accordance with the updated Financial Soundness Indicators
Compilation Guide, 2019 issued by the IMF.
4.2.7 NRB Handbook for Risk Based Supervision (RBS) Onsite Inspection, 2020
NRB has prepared A Handbook for Risk Based Supervision Onsite Inspection 2020 to
reinforce risk-based supervision practice. The supervisors can learn why RBS is necessary
and what it demands for with the help of this handbook. This handbook provides guidance to
the on-site examiners on the aspects of credit, liquidity, market, operational risk of BFIs. This
also spells out the technique to follow for CAMELS rating.
4.2.8 Merger and Acquisition (M & A)
NRB has adopted the policy of consolidating the financial sector through promotion of
mergers and acquisitions (M & A) between bank and financial institutions. M & A activities
took place in the country after the bank and financial institutions were required by the NRB
to raise their paid-up capital by up to fourfold. A total of 196 BFIs have undergone through
the process as of mid-July 2020. Out of these, the license of 150 institutions has been revoked
thereby forming 46 institutions. 22 BFIs are in the process of merger and acquisition. NRB
has also provided forbearances to encourage big merger between commercial banks.
4.3 Covid-19 Crisis
4.3.1 International Response (Central Bank’s Perspective)
4.3.1.1 Central Bank of Sri Lanka
In response to Covid-19 pandemic, the declaration of holidays, curfew, restricted public
services and other measures were undertaken to contain human movement including the
shutdown of airports and seaports and halt in the passenger traffic has affected several key
economic factors/activities of the Sri Lanka.
In relation to monetary measures, the Central Bank of Sri Lanka, thus far, has reduced the
key policy interest rates, namely the Standing Deposit Facility Rate (SDFR) and Standing
Lending Facility Rate (SLFR). The Statutory Reserve Ratio (SRR) on all rupee deposit
liabilities of licensed commercial banks was reduced by 1.00 percentage point thereby
injecting permanent liquidity of around Rs. 65 billion to the market. A large surplus has been
maintained in the domestic money market through open market operations of various types
and maturities. In April 2020, the Central Bank reduced the bank rate by 500 basis points
from 15 percent to 10 percent. In addition, measures have been introduced to reduce the
pressure on the balance of payments (BOP) and the exchange rate. Financial institutions were
requested to reschedule non-performing loans, while capital conservation buffers and loan
classification rules have been relaxed. Accordingly, directions were issued to licensed banks
to suspend the facilitation of importation of several categories of motor vehicles and other

Bank Supervision Report, 2020 38
non-essential goods. Thus, Central Bank of Sri Lanka has supported the efforts of
government to implement relief measures while providing direct financing to the government,
considering national interest.
4.3.1.2 Bangladesh Bank (BB)
The Covid-19 pandemic led the country wide lockdown till May 2020 which stalled the
economic activities during the lockdown period as the government enforced closure of offices
and factories including ban on transportation.
However, the government immediately undertook massive stimulus packages which acted as
a buffer against economic losses. The main component of the stimulus packages was to
channel fresh working capital at a subsidized rate to the industry and service sectors severely
hit by the pandemic. The packages also included funds for workers’ salary which aimed to
uphold consumption demand of workers and employees. Special credit allocation was made
for the agriculture sector. In order to ensure food grains availability to the low-income
population, the government provided funds as subsidy.
BB announced its expansionary monetary policy which was accommodative for all growth
support needs while ensuring inflation target as well. The prime objective of such monetary
policy was to achieve economic recovery from the adversity of pandemic and rehabilitation
of production capacity. BB further adopted various strategies to provide adequate financial
support to the priority sectors like agriculture, Cottage, Micro, Small and Medium Enterprise
(CMSMEs), and manufacturing industries.
In addition, BB has taken measures to delay non-performing loan classification, relax loan
rescheduling policy for Non-BFIs, waive credit card fees and interests, suspend loan interest
payments, impose restrictions on bank dividend payments, extend tenures of trade
instruments, and ensure access to financial services. Recently, BB imposed an additional 1.0
percent general provision against loans that have enjoyed deferral/time extension facilities.
4.3.1.3 Reserve Bank of India (RBI)
In the wake of Covid-19, lockdowns and the requirement of social distancing have provided
an impetus to the wider adoption of digital payments. The Reserve Bank has facilitated the
promotion and development of offline payment solutions to further deepen the digital
payments across the country. Other initiatives include encouraging authorized payment
system operators to put in place Online Dispute Resolution (ODR) system for failed
transactions. Another objective has been to drive down the cost of digital transactions.
In addition to this, RBI undertook liquidity management measures by reducing Cash Reserve
Ratio (CRR) and widening of monetary policy rate corridor. RBI further announced special
refinance facilities for All India Financial Institutions (AIFIs) and opened special liquidity
facility for mutual funds. Moreover, regulatory measures were introduced to mitigate the
burden of debt servicing brought about by disruption on account of Covid-19 and to ensure
the continuity of viable business. These included rescheduling of payment of term loans and

Bank Supervision Report, 2020 39
working capital facilities, easing of working capital financing, deferment of implementation
of Net Stable Funding Ratio (NSFR), deferment of last tranche of Capital Conservation
Buffer, limit on group exposures of large exposure framework, etc.
4.3.1.4 State Bank of Pakistan
The State Bank of Pakistan (SBP) has responded to the crisis by cutting the policy rate. The
SBP has expanded the scope of existing refinancing facilities and introduced three new ones
to: (i) support hospitals and medical centers to purchase COVID-19 related equipment; (ii)
stimulate investment in new manufacturing plants and machinery, as well as modernization
and expansion of existing projects; (iii) incentivize businesses to avoid laying off their
workers during the pandemic. These facilities have been extended beyond their original
deadline of June 2020 to September or December 2020.
Moreover, the SBP introduced temporary regulatory measures to maintain banking system
soundness and sustain economic activity. These include: (i) reducing the capital conservation
buffer by 100 basis points to 1.5 percent; (ii) increasing the regulatory limit on extension of
credit to SMEs by 44 percent to PRs 180 million ; (iii) relaxing the debt burden ratio for
consumer loans from 50 percent to 60 percent; (iv) allowing banks to defer clients’ payment
of principal on loan obligations by one year; (v) relaxing regulatory criteria for restructured
loans for borrowers who require relief beyond the extension of principal repayment for one
year; and (vi) suspending bank dividends for the first two quarters of 2020 to shore up
capital. The SBP has also introduced mandatory targets for banks to ensure loans to
construction activities account for at least 5 percent of the private sector portfolios by
December 2021.
4.3.2 National Response (NRB’s perspective)
Due to Covid-19 pandemic, the challenges for banks have intensified in the current fiscal
year of 2019/20 as there were frequent restrictions on people movement due to which there is
squeeze in economic activities. Post lockdown, major income sources of banks such as
interest income, LC income, foreign exchange trading income, guarantee fees income, card
income have slowed down and less letter of credit (LC) were issued. During the locked down
and prohibitory restrictions period demand for loans have declined sharply and liquidity in
the banking system kept on piling up which indeed was a great challenge for banks.
Furthermore, non-repayment of loans caused increase in non-performing asset of the banks.
Nevertheless, digital banking showed very promising improvements during this pandemic
situation.
In order to lessen further impact of Covid-19 in the banking sector, NRB has taken some
unconventional approaches as a COVID-19 response measures along with some regular ones
which are listed below:

Bank Supervision Report, 2020 40
• 10% interest discount for those credit customers making regular payments of
monthly/quarterly installment/interest by mid-April 2020. However, such discount
should not be below the base rate.
• 100 basis point reduction in Cash Reserve Ratio (CRR) from 4% to 3%.
• Reduction of Countercyclical Capital Buffer (CCyB) to 0% from March 29, 2020.
Such reduction frees up bank capital to support further lending to businesses and
households and help alleviate adverse economic impact of COVID-19.
• 2% discount in the interest rate for COVID-19 impacted sectors given that discounted
interest rate doesn’t become lower than the base rate of the bank.
• Provision for the moratorium period of 1 year for highly affected sector, 9 months for
moderately affected sector and 6 months for least affected sector.
• Moratorium period can be extended up to 2 years for the Tourist Standard Hotels.
• Restructuring and Rescheduling of the loan and allowing such restructured and
rescheduled loan to be classified as good loan with 5% provisioning.
• Extension of the working capital loan by 20% and term loan by 10% for those not
availing working capital loans.
• Loan classified under pass category in mid-Jan 2020 and loan disbursed thereafter can
be categorized under pass category till mid-July 2020 by maintaining loan loss
provisioning of 5%.
• Refinance facilities for COVID-19 impacted sectors.
Bank Supervision Report, 2020 41
CHAPTER V
5 KEY ONSITE OBSERVATIONS, ISSUES AND CHALLENGES
5.1 Key Onsite Observations
5.1.1 Board and Senior Management Oversight
1. Board level committees periodically submit their minutes to its Board Of Directors
(BOD). Minutes of Board in almost all banks show that they are basically
acknowledging the decision summary of such committees. It was observed that such
decisions were perceived as information rather than making discussions on the
identification, measurement, monitoring and control of inherent risks across the bank
along with further direction to the management.
2. Board minutes of commercial banks present brief review of previous meeting's
discussion. However, Board has no practice of making self-assessment considering
the effectiveness of their governance practices, management of conflicts of interest,
strengths and weaknesses in terms of strategic values.
3. BOD minutes of few banks revealed the involvement of BOD in operational activities
such as HR activities, contract renewal activities of rental building, involvement in
procurement process by being member of subcommittee.
4. Board of almost all banks have not reviewed and appraised the following tasks at least
annually:
• Effectiveness of the Board and Board-involved committees.
• Chief Executive Officer’s (CEO’s) performance as per appointment
contract/agreement.
• Compliance status of the regulatory measures and internal controls, and existing
policies/procedures/guidelines.
5.1.2 Capital and Earnings
1. Some banks have classified the loan to an individual person or persons or to a small
business as RRP (regulatory retail portfolio) and assigned lower risk weight (75%)
however such classification into RRP does not correspond with the criteria stipulated
in the The Capital Adequacy Framework. In some cases where the counterparty is
availing multiple credit facilities, bank has classified some facilities (under absolute
threshold of Rs. 10 million) as RRP while other credit facilities has assigned different
risk weight by classifying them in high risk or other categories such practice of
classification into RRP does not meet the criteria outlined in the capital adequacy
framework.
2. Credit files are reviewed based on sampling during the on-site inspections period.
There is a possibility of inappropriate classification of the loan and provisioning

Bank Supervision Report, 2020 42
accordingly by the bank for those credit files which are not covered by the selected
sample files and are not reviewed during on-site inspection. Thus, the inappropriate
classification might result in overstatement of bank’s profitability and understatement
of bank’s impaired assets.
5.1.3 Audit Function
1. One of the key responsibilities of the Audit Committee, as required by NRB Unified
Directive # 6 (7)/2075, among others, is to review the status of
implementation/compliance of the comments raised by NRB Inspection and inform
the same to the Board. But in many banks, such committee has not discussed and
reviewed the status of implementation of the comments satisfactorily that is evident
from the repetition of the previous comments in each NRB Inspection Reports.
2. As per the Risk Management Guidelines 2018, clause number 1.3.3: Risk Governance
& Organization-“the third line of defense viz. Internal Audit should perform
independent periodic reviews of first two lines of defense, provide assurance and
inform the two first lines of strengths and potential weaknesses.” However, this
practice has not been started yet in fewer banks.
3. Audit staff are not trained periodically and adequately in order to enable them in
understanding the bank’s business activities, operating procedures, risk management
and internal control systems and MIS.
4. NRB Risk Management Guideline, 2018 requires that the internal auditor has to
report status of risks assessment and risks monitoring to Risk Management
Committee. However, internal auditors have not prepared and submitted such report
to the Risk Management Committee in certain banks.
5.1.4 Credit Risk
1. Most of the banks have developed and implemented the Internal Credit Risk Grading
(ICRG) for the risk assessment of all credit exposures. However, scores obtained
through credit risk grading are not correlated with probability of default by the
customer and hence pricing (interest rate) of credit facilities provided. In addition,
such risk grades have no impact on the approval and monitoring level (frequency) of
the customer after disbursement as this system is based on subjective only. Bank also
has not identified number of customers that have assigned same grades, in accordance
with ICRG, who have defaulted the credit facilities provided, simply banks are using
customer grades to map it with the regulatory loan classification.
2. The timely stock inspection, calculation of drawing power and verification of
genuineness of stock statement and receivables aged less than 90 days is found to be
poor in most of the commercial banks.

Bank Supervision Report, 2020 43
3. Repayment sources of borrower are not properly assessed, analyzed and verified in
fewer banks. Supporting documents substantiating sources of income are lacking.
Further, fresh short term loan is disbursed to settle overdue trust receipt loan, which
reflects ever-greening of loans in most of the banks.
4. Several instances were observed where fund have been frequently transferred to the
director’s account and in the accounts of sister concerns which states bank has poor
monitoring on utilization of loan. The intended purpose of the loan is also not clear in
many cases.
5. Credit assessment of the borrower has been made on the basis of unreliable financials
in several instances. Sales and income figures in the audited, provisional and
projected financials vary significantly but banks rarely examine such discrepancies.
6. Loan monitoring functions performed by some of the banks were found weak; for
instance; loan provisioning is based on ageing of loans rather than actual quality of
credit and performance of the business.
7. For some banks, monitoring of transactions and ensuring that the purchase limits
haven’t been breached by the foreign currency card holder enjoying such facilities is
found to be very weak.
8. Credit administration and post disbursal monitoring functions were found to be
inadequate in some banks. The proactive post disbursal loan monitoring is very rarely
done by such banks.
9. There is delay in timely review and revision of the credit policies, guidelines and
manual by few banks.
10. In some cases, it was found that credit facilities were given to the company owned by
family members of employees.
11. Normally, most of the banks do not have adequate automated MIS report generation
software that can provide information on the risk profile and the structure of credit
portfolios (including off-balance sheet items also) so that the board and management
get adequate and timely information on the performance of lending operations and
activities. For example: Problem Loan report, Loan concentration report, Risk Rating
Report, Exception report etc.
5.1.5 Liquidity Risk
1. Board oversight of most of the banks on managing the liquidity risk is considered to
be weak since no periodic reports are submitted to the Board Level Risk Management
Committee and the Board itself.
2. Review of ALCO minutes reveals that the meetings were mostly focused on interest
rate determination and other charges. No other discussions related to liquidity position
and liquidity management was observed in almost all of the commercial banks. Banks
are found to be weak in having their short term and medium term liquidity plan.

Bank Supervision Report, 2020 44
3. Most of the banks have conducted stress testing as per the requirement of central
bank. It has not customized bank specific stress testing parameters for comprehensive
liquidity testing to identify potential liquidity crunch. Results of stress tests are not
timely discussed in ALCO meeting.
4. Gap Analysis report and interest sensitive report are prepared monthly and quarterly
to closely monitor composition of assets and liabilities to maintain liquidity at
optimum level but there were instances whereby certain banks have made no
comments and/ or taken any corrective measures noted in the ALCO minutes
regarding the same.
5. Deposit growth rate of fewer banks is lower than the lending growth which is not
favorable for the liquidity position and Credit to Core capital and Deposit (CCD)
ratio.
6. MIS of certain banks were not adequate to analyze and monitor daily liquidity
position and to control the risk rather it is being used to keep daily status of the
liquidity position of the bank.
5.1.6 Market Risk (including interest rate and foreign exchange risk)
1. Most of the banks have not prepared policy for determination of interest rates, pricing
is based on market trend and rates are determined through ad-hoc analysis based on
prevailing market situation. Prevailing rates are more intuitive rather than analytical.
2. All banks adopt base rate plus premium model in case of loan pricing. Such banks,
however, has no policy and procedure regarding fixing premium rate for the client;
the level of premium is not based on associated risk of the customer but solely on
management discretion.
3. Board oversight at banks seems to be weak regarding the market risks, foreign
exchange and interest rate risk as board has not conducted enough discussions
regarding the matter.
4. Banks do not use interest rate risk measurement system, except Gap Analysis as
prescribed by the Nepal Rastra Bank. Further, few banks do not have practice of
monitoring Risk Sensitive Assets (RSA), Risk Sensitive Liabilities (RSL) and its
trend so as to analyse interest sensitivity accurately. Moreover, certain banks do not
have clear assumptions while determining RSA and RSL.
5. Certain banks have recently established ‘Middle Office’ however it is yet to function
to identify, measure and manage all treasury specific financial risk on a day to day
basis as per NRB circular dated 2074.08.13, Directive no. 5 (7)2.

Bank Supervision Report, 2020 45
6. Foreign Exchange Directives 2074 no. 20 Point no. 1 (Cha and Ja) has not been
complied with by few banks regarding independent foreign exchange risk
identification, measurement, monitoring and control system. Such banks further do
not monitor short term and long term foreign investment portfolio, long term foreign
currencies investment to agency balance ratio, total Import L/C value and foreign
currencies liabilities to agency balance ratio.
7. Many banks still do not have strategy, development plan and business plan relating to
the foreign exchange operations of the bank. Furthermore, they do not have policy
and procedures for using foreign currency products to hedge their investments or
capital against foreign exchange risk.
5.1.7 Operation risk
1. Various remarks of the previous reports received from Nepal Rastra Bank, external
auditor, internal audit department as well as special audit reports reveal that many
banks still have several operational lapses and they are being repeated frequently over
the period of time. This reflects negligence from the side of the bank to correct its
lapses while conducting daily business operations.
2. No error reporting mechanisms and relevant system to identify potential
vulnerabilities related to business operations.
3. There is no institutional memory or log sheet for loss occurred due to operational risk.
Furthermore, there is no adequate database of operational loss for a specific period.
4. There is no business continuity plan which decreases chances of smooth functioning
of bank if crisis situation occurs.
5. Non submission of the description/details of grievance received by the bank and
solved cases within 15 days of each fiscal year to Bank Supervision Department and
Bank and Financial Institutions Regulation Department and publish the details in the
Annual Report of the bank as per NRB Directive no 21 (10) (Ka) and (Gha).
6. There is no mid-term and long-term human resource plan in place. Succession plan is
not in practice. HR related policies and procedure such as: Transfer Policy, Retention
Policy, Staff Training Policy etc. are not available.
7. Approach of human resource management is traditional. Advanced HR practices such
as: Talent Management, Competency Assessment, Satisfaction Survey etc. are not
taken in practice yet.
8. Regular job rotation/transfer is crucial for career development, reducing operational
risks and increasing employee morale in the bank. NRB Unified Directives #5(5)
necessitates implementing effective HR practices including posting and transfer in

Bank Supervision Report, 2020 46
order to reduce HR related risks arising from over-dependence on particular
employee/s and collusion among them. However, said provisions of Unified
Directives and Staff by-law of the bank per se have not been complied with.
5.1.8 AML/CFT
1. There is still no separate AML/CFT unit or division in few banks as required by NRB
Directive number 19. Many banks have kept AML /CFT under Compliance
department.
2. There is no mechanism to ensure and identify Politically Exposed Person (PEP), high
profile professionals, as per NRB Unified Directives 2076 #19 (4) (1) in certain banks.
Moreover, there is no practice of obtaining and collecting public notices, self-
declaration of account holders, extraction of professionally available data and data
from public enterprises as per NRB Unified Directives 2076 #19 (4) (2).
3. Non availability of updated uniform KYC form as per NRB Directives 19 (Anusuchi
19.1). KYC form was not duly filled e.g. nominee details are not obtained, location
map either blank or ambiguous, no annual expected turnover, name of organization,
designation of customer, no risk categorization on KYC form has been observed.
4. Suspicious transaction reporting is very low in comparison to business network and
business volume of the bank.
5. No periodic enhanced customer due diligence of all high-risk customers conducted in
many banks.
6. Staff responsible for compliance function is unaware about generic terms related to
compliance in most of the banks e.g. PEPs, STR, TTR, and Risk Categorization. The
serious issue of KYC update was entrusted to interns in most of the branches who are
completely unknown about the gravity and seriousness of the AML/CFT issues.
7. Current Core Banking System of certain banks does not generate live indicators (red
flags, alerts) to detect suspicious transactions. Real time transaction surveillance is yet
to be adopted. There is no appropriate software which can monitor day to day STR
transactions on real time basis and generate red flags or alerts whenever unusual
transactions take place. This is non-compliance of NRB Unified Directives 2076 #19
(6) (1) (kha).

Bank Supervision Report, 2020 47
5.2 Issues:
5.2.1 Credit growth
In recent times the rapid growth in credit has been observed in the banking industry.
Banks pursue for higher profitability and greater shareholder’s return which may lead the
banks to take risk beyond their risk-taking propensity. In order to increase business
adequate due diligence of the customers and credit underwriting standards are found to be
compromised. When the customer due diligence and credit underwriting standard is
compromised, the risk of default becomes high at the same time the lending may turn into
predatory in nature. Instead of short-term gain banks should go for the long-term value
creation. The banks should increase the shareholder’s value in a sustainable way by
equally contributing to the financial sector stability.
5.2.2 Utilization of the subsidized loan
Proper utilization of the subsidized loan for its intended purpose has emerged as a major
issue in the banking sector as a whole. It has been noted that the subsidized loan does not
seem benefiting those for whom it has been targeted to. The objective of the subsidized
loan is meagerly reflected in the projects financed by such loan. It has been observed that
proper and adequate screening of the borrower applying for such loan is rarely done by
the banks and post disbursal monitoring of such loans seems neglected to some extent.
5.2.3 Consolidation of BFIs
The consolidation of the BFIs has been one of the major agenda in the banking industry.
More specifically, consolidation of the commercial banks through merger and acquisition
(M&A) has been highly encouraged by the central bank. There is reluctance and delays in
accelerating merger and acquisition process by the banks. The wait and see approach of
the banks has made only little progress in M & A process of commercial banks. The latest
merger of a few commercial banks has shown some silver lining in the M & A of the
commercial banks. NRB has been successful in lowering the number of development
banks and finance companies. However, there were only a few mergers among
commercial banks. NRB has announced forbearances for commercial banks and
microfinance financial institutions taking part in merger with other commercial banks and
microfinance financial institutions respectively.
5.2.4 Digital Banking
Nepal’s banking sector is transitioning towards a less cash society through promotion of
digital banking. Internet banking, mobile banking and QR payment are gaining
momentum among the customers. The ongoing pandemic has also propelled the rapid
growth of digital banking and has helped to create less cash society. Digital banking has
made it easier and cheaper to expand the consumer base for financial services providers.
It is believed that the promotion of digital banking will discourage the growth of the
informal economy which has become the major challenge for the Nepalese economy. But

Bank Supervision Report, 2020 48
digital finance also exposes less financially literate customers to greater risks. The issue
of the digital dividend and consumer privacy is also evolving as a major issue with the
growth in the digital banking. Hence, NRB has adopted the policy of balancing the need
for risk management without stifling innovation and growth in this area.
5.2.5 AML/CFT Compliance
Complying with AML/CFT rules and standards remains one of the major priorities in the
recent years. Failure to abide by AML related rules can result in various kinds of risks.
NRB has issued AML/CFT related directive (Directive No.19), which supplements the
Money Laundering Prevention Act and Rules. NRB expects that bank’s board members
and senior management officials have adequate knowledge and awareness in this area.
NRB also believe that banks have taken adequate initiative to train staffs to acknowledge
the importance of AML/CFT compliance, however bank staffs are not adequately trained
in the subject. Further, banks lack information systems infrastructure to identify and
monitor money laundering activities that are not conducted through banking channels.
5.2.6 Ever-greening of Risk Assets
The major proportion of the loans and advances of the banking industry is of the
revolving nature. Moreover, banks have the practice of lending some short-term loans on
an ad-hoc basis as well as extending the maturity dates and renewing the facilities that
ultimately help in meeting the debt-service needs of the borrower. Nepal’s banking
industry has no practice of clean-up for the revolving loans due to which problems such
as: maturity mismatch and ever-greening are still prevalent in the banks.
5.2.7 Quality of Human Resource
Now the Nepalese banking industry has become more complex with the development of
new products and the adoption of advanced information and communication technology
(ICT). Additionally, the international and national prudential norms, regulatory standards
as well as risk management practices are also demanding proactive efforts from the bank
management. This has resulted in the need for a competent skill set in the industry. It is
crucial that banks have taken initiative to adequately train and develop their employees to
adapt to emerging technology and innovation in the financial services industry.
5.2.8 Risk Management in Banks
BSD has fully implemented the Risk Based Supervision of the commercial banks. The
risk profile of banks is being prepared and updated during the full scope on-site
inspection. The on-site inspection reports reveal that banks fall short of adopting
recommendations outlined in the Risk Management Guidelines issued by the NRB. Most
of the risk management practices are found to be traditional, and effective risk
management mechanisms are in early stages of development. While most banks have now

Bank Supervision Report, 2020 49
formulated risk-related policies, their implementation remains weak. Both the Board and
senior management need to develop and promote risk management culture in all banks.
5.3 Challenges:
5.3.1 Deterioration of the asset quality and default
The ongoing global pandemic of the COVID-19 had brought economic activities at
standstill. Shutdowns of the business, loss of the source of income and economic
slowdown have shown adverse impact on the loan repayment which will eventually
deteriorate the asset quality of the banks. Even though the central bank has provided a
moratorium period for the COVID-19 impacted business, there still exists a probability of
extensive default. The value of the collateral held by the banks has also weathered by the
overall economic impact of the crisis. The major challenge for NRB is to safeguard the
banking sector as well as its consumers who are severely affected by the ongoing
pandemic.
5.5.2 IT Risk supervision
The adoption and introduction of the new technology has made banking services faster
and easier than ever before. The convenience and facilities brought by the technology has
also made the banking sector vulnerable to the Information Technology (IT) related risks.
Nepalese banking industry has witnessed the incidence of cyber-attack and hacking. The
incidence of tempering ATMs, hacking SWIFT system and credit cards has been recorded
in Nepalese banking industry. Frequent phishing and password attack has alarmed cyber
security of the banking industry. The utmost priority of the banking industry should be
strengthening the cyber security level. Nepalese banks have also been extensively using
the IT system in the areas of Core Banking System, Management Information System,
Payment System, and data management. Banks need to ensure that these IT systems are
adequately secured and robust. IT losses can be huge and may even endanger the stability
of the whole financial system, in addition to the soundness of the individual banks.
5.3.3 Operation amid crisis
The operation amid COVID-19 crisis is a serious challenge for the banks. The new
normal of wearing masks, using sanitizers and maintaining social distance will continue
in coming days as well. As banking facilities have been listed among most essential
services by the government, it is highly likely that the banks can become hotspot of the
corona virus infection which increases operational risk of banks. Therefore, catering
banking services to the people and ensuring safety of the staff is a very challenging.

Bank Supervision Report, 2020 50
5.3.4 Implementation of SIS
For NRB to be more modern and dynamic digitization of the work process and reporting
is of utmost importance. For that, full-scale implementation of the Supervisory
Information System (SIS) is very crucial and challenging for NRB. The main challenges
for the implementation of SIS is inculcating the feeling of ownership of SIS in Bank and
Financial Institutions staff and preparing adequate manpower for operating this system
smoothly. The successful implementation of SIS will bring some level of automation and
changes be a paradigm shift in the supervisory function of the NRB.
5.3.5 Reliability and validity of the reported data
The reporting to NRB at various frequencies of time is the regular function of the banks.
Inconsistencies in the data reported by banks have been observed at some instances. The
challenge faced by NRB is in the verification of the data reported by banks. The data
source considered and taken by banks as an input is very difficult to verify and validate
whether it is correct or not. This makes reporting vulnerable to the data manipulations by
banks.
5.3.6 Consumer Protection
It is a well-known fact that the banking industry is built on trust and confidence. The
unshakeable belief and trust towards the banking sector is very important for the financial
sector stability and for overall economic growth. In this regard, NRB has the major
responsibility of the consumer protection which ensures that there is equitable and fair
treatment, adequate complaints handling and redressal mechanisms, protection of
consumer data and privacy and broad-based financial education and information
dissemination mechanism are in place. In the absence of the conduct supervision,
consumer protection has emerged as a challenge for the NRB to protect the interest of the
vulnerable people and groups. The promotion and advertisement issued by the banks may
sometime mislead such customers with exaggerated advantages and benefits of the
offered product and services. The customers generally do not have a tendency to read all
the terms and conditions before signing contracts with the banks. This will create a major
problem when contracts have any special covenants and consumers are unaware of it. So,
the banks should clearly communicate all the terms and conditions before offering any
products and services to the consumer. It has been noted that in many cases, consumers
are unaware of the appropriate procedures for lodging complaints and grievance redressal
structures and their functions. Therefore, for consumer protection educating the
consumer is utmost important.
5.3.7 Climate Change
Climate change is one of the most pressing issues which pose major risk to the economy
and eventually to the financial sector. In Nepal, rapid urbanization, has contributed to
pollution of the environment. The air and water quality of the urban area has deteriorated

Bank Supervision Report, 2020 51
to the hazardous level which will have severe impact on biodiversity as well. The poor
solid waste and industrial emission management is a serious concern which will have a
knock-on effect in the overall economy. Nepal’s banking industry should be prepared to
tackle the adverse impact of climate change on its business and on its customers. NRB
has already introduced Guidelines on Environment and Social Risk Management (ESRM)
for BFIs which will act as a steppingstone towards the greener economy. The proper
implementation and proactive initiative to deal with climate change is the major
challenge. The network of the 83 central banks, namely Network for Greening the
Financial System (NGFS) has started green initiative for development of environment and
climate risk management in the financial sector and to mobilize mainstream finance to
support the transition toward a sustainable economy. The Nepalese banking industry
should move towards green financing by mobilizing the fund towards the sector having
low carbon or zero carbon emission.
5.3.8 Directed Lending
The liberalization in the banking industry of Nepal has provided greater freedom for
banks to make major business decisions. This has created competition among banks
which has benefitted the ultimate customers. On the contrary, directed lending is one of
the major characteristics of the banking sector of the developing countries. Generally,
there is unbalanced development in developing countries. Banks are not much motivated
to allocate their funds in the less profitable sector which results in the shortage of the fund
in that sector which are already backward and vulnerable. In order to address this
problem, NRB has directed banks for mandatory lending in some of the sectors. The
major challenge for NRB is to find the optimum balance between directed lending and
lending made on bank’s own discretion.
5.3.9 Non-banking Financial Institutions
The non-banking financial Institutions in Nepal like provident funds, investment trust and
cooperative sectors are relatively less regulated. These sectors are not adequately and
regularly scrutinized so there is the risk of financial mismanagement and irregularities. If
financial stress appears in these non-banking financial institutions, there will be a greater
chance of spillover effect being felt by the banking sector. As a guardian of the banking
sector this is a challenge for NRB to minimize the adverse impact of such potential
spillover from non-banking financial institutions.
5.3.10 Effective Enforcement of Supervisory Directions
Effective enforcement function is important to ensure that banks are complying with the
supervisory directions and are making necessary changes and corrections. Sometimes,
banks make commitments for corrections at a later date. It has been challenges for the
BSD to follow up on all commitments made by banks and ensure that appropriate
corrections are made on time, especially because of limited supervisory resources.

Bank Supervision Report, 2020 52
5.3.11 Co-ordination with other Regulators
Enhancing coordination between banking supervisors and other regulators of the financial
sector is important. Supervisory effectiveness can be further enhanced through proper
coordination among different regulators and the concerned authorities such as the
Ministry of Finance (Government), Securities Board of Nepal (SEBON), Insurance
Board, Credit Information Bureau (CIB), Debt Recovery Tribunal (DRT), and Credit
Rating Agencies. With the growing complexity in the financial system, systemic risks are
also building up due to which the need for coordination among regulators and
policymakers is becoming a must.
***

Bank Supervision Report, 2020 53
Bank Supervision Report, 2020
ANNEXURES
Annex 1: Growth of Financial Institutions (numbers)
Types of
Financial
Institutions
Mid-July
2007 2008 2009 2010 2011 2012 2013 2014 2015 2016 2017 2018 2019 2020
Commercial
Banks 20 25 26 27 31 32 31 30 30 28 28 28 28 27
Development
Banks 38 58 63 79 87 88 86 84 76 67 40 33 29 20
Finance
Companies 74 78 77 79 79 69 59 53 48 42 28 25 23 22
Micro-finance
Financial
Institutions
12 12 15 18 21 24 31 37 38 42 53 65 90 85
Infrastructure
Development
Bank
- - - - - - - - - - - - 1 1
Total 144 173 181 203 218 213 207 204 192 179 149 151 172 155
Source: Bank and Financial Institutions Regulation Department, NRB
Annex 2: Province-Wise Distribution of BFIs branches (Mid-July 2019/20)
S. N. Province Class A Class B Class C Class D
1 Province – 1 687 165 45 682
2 Province – 2 514 69 31 790
3 Province - 3 (Bagmati) 1553 275 92 608
4 Province - 4 (Gandaki) 555 179 29 525
5 Province – 5 657 262 36 917
6 Province - 6 (Karnali) 177 17 4 186
7 Province -7 (Sudur Paschim) 293 62 6 349
Total 4,436 1,029 243 4,057
Source: Bank and Financial Institutions Regulation Department, NRB

Bank Supervision Report, 2020
Annex 3: Organisation Chart of BSD
54

Bank Supervision Report, 2020 55
Annex 4: Onsite Inspections in FY 2019/20
A. Full-Scope Onsite Inspection
FY 2019/20
SN 1st Quarter 2nd Quarter 3rd Quarter 4th Quarter
1 Himalayan bank Ltd. Sunrise Bank Ltd. Nepal Bank Ltd. Covid-19 Pandemic
2 Sanima Bank Ltd. NCC Bank Ltd. Prabhu Bank Ltd.
3 Everest Bank Ltd. Nepal Investmant Bank Ltd. Machhapuchchhre Bank
Ltd.
4 NIC Asian Bank Ltd. Agriculture Dev. Bank Ltd.
5
6
7
8
9
B. Targeted Onsite Inspection
FY 2019/20
SN 1st Quarter 2nd Quarter 3rd Quarter 4th Quarter
1 Mega Bank Ltd. Kumari Bank Ltd. Civil Bank Ltd. Covid-19 Pandemic
2 NMB Bank Ltd. Laxmi Bank Ltd. Nabil Bank Ltd.
3 Bank of Kathmandu
Ltd.
Nepal Infrastructure Bank
Ltd.
4 Standard Chartered Bank Ltd.
5
6

Bank Supervision Report, 2020 56
Annex 5: Circulars issued in FY 2019/20
SN Name and Link to the Circular Issued to A, B & C Class Financial Institutions
1 Circular 01-Interest Income Recognition Related-new
2 Circular 02-Monetary Policy & BOD, CEO Age Related-new
2.1 Circular 02-Attachment Amendment to Directive to Microfinance FIs, 2075-new
3 Circular 03-Changes Unified Directive, 2075-new
3.1 Circular 03- Attachment Amendment to Unified Directive, 2075-new
4 Circular 04- Amendment to Unified Directive, 2075-new
4.1 Circular 04- Attachement Amendment to Unified Directive, 2075-new
5 Circular 05- Unified Directive, 2076-new
6 Circular 06-AMLCFT Merger and Retained Earnings Related-new
7 Circular 07-Amendment in Interest Subsidy-new
8 Circular 08-Interest Subsidy-new
9 Circular 09-DTI, Deprived Sector, & AML related
10 Circular 10-NRB Refinance Procedure related
10.1 Circular 10- Attachment To NRB Refinance Procedure related
11 Circular 11-DTI CCD related
12 Circular 12-Gold Deposit related
13 Circular 13-Monetary Policy Mid Term Review Related
14 Circular 14 – Circular for “ABC” Class BFIs
15 Circular 15 – Circular for “ABC” Class BFIs

Bank Supervision Report, 2020 57
Annex 6: Capital adequacy ratios of Commercial Banks
S. No Bank's name
Mid-July 2018 Mid-July 2019 Mid-July 2020
Capital
Core
Capital
Total
Capital
Fund
Core
Capital
Total
Capital
Fund
Core
Capital
Total
Capital
Fund
1 Nepal Bank Limited 16.52% 17.58% 16.49% 17.41% 15.93% 16.68%
2 Rastriya Banijya Bank Limited 12.65% 14.02% 12.01% 13.19% 12.00% 12.68%
3 Nabil Bank Limited 11.99% 13.18% 11.58% 12.71% 10.69% 12.81%
4 Nepal Investment Bank Limited 12.17% 13.34% 11.74% 13.65% 11.52% 13.23%
5 Standard Chartered Bank Limited 22.12% 23.68% 18.52% 19.90% 16.92% 18.54%
6 Himalayan Bank Limited 11.95% 13.03% 11.77% 12.73% 11.76% 14.89%
7 Nepal SBI Bank Limited 13.51% 15.26% 12.63% 14.01% 12.28% 15.42%
8 Nepal Bangladesh Bank Limited 13.68% 14.36% 11.16% 13.75% 10.45% 13.17%
9 Everest Bank Limited 12.99% 14.56% 12.38% 13.75% 11.86% 13.32%
10 Bank of Kathmandu Limited 13.57% 15.05% 13.47% 14.58% 13.27% 14.16%
11 Nepal Credit and Commerce Bank
Limited 10.44% 11.38% 13.22% 14.04% 12.38% 13.40%
12 NIC Asia Bank Limited 8.78% 12.37% 8.22% 13.28% 8.18% 13.16%
13 Machhapuchchhre Bank Limited 14.62% 15.60% 11.98% 12.88% 9.54% 13.00%
14 Kumari Bank Limited 12.99% 13.90% 11.20% 12.07% 11.13% 14.42%
15 Laxmi Bank Limited 11.55% 12.54% 10.33% 11.32% 10.02% 12.62%
16 Siddhartha Bank Limited 11.11% 12.43% 9.94% 12.49% 9.06% 12.97%
17 Agricultural Development Bank
Nepal 19.16% 20.18% 19.29% 20.31% 17.63% 20.46%
18 Global IME Bank Limited 10.15% 11.67% 10.44% 12.31% 10.96% 12.41%
19 Citizens Bank International Limited 14.13% 15.48% 12.35% 13.19% 12.10% 15.45%
20 Prime Bank Limited 11.75% 12.53% 12.05% 12.78% 12.71% 13.40%
21 Sunrise Bank Limited 12.95% 13.93% 11.28% 13.14% 10.21% 14.60%
22 NMB Bank Limited 14.90% 15.88% 13.03% 15.32% 12.51% 14.56%
23 Prabhu Bank Limited 11.33% 12.66% 10.48% 11.58% 9.76% 11.59%
24 Mega Bank Limited 17.28% 18.35% 14.56% 15.48% 12.02% 12.88%
25 Civil Bank Limited 19.67% 20.65% 17.01% 17.97% 13.83% 15.00%
26 Century Commercial Bank Limited 15.28% 16.22% 13.30% 14.10% 13.80% 14.53%
27 Sanima Bank Limited 11.54% 12.90% 10.55% 13.11% 10.33% 12.97%
Annex 7: Special Inspection of Commercial Banks in FY 2019/20
SN Name of Bank No. of Inspections
1 Agricultural Development Bank Ltd 1
2 Bank Of Kathmandu Ltd 1
3 Century Commercial Bank Ltd 1
4 Citizens Bank International Bank 2
5 Global IME Bank Ltd 1
6 Himalayan Bank Limited 3
7 Janata Bank Nepla Ltd 1
8 Kumari Bank Limited 1
9 Laxmi Bank Limited 2
10 Mega Bank Nepal Ltd 2
11 Nabil Bank Limited 1
12 NCC Bank Ltd 1
13 Nepal Bangladesh Bank Ltd 1

Bank Supervision Report, 2020 58
14 Nepal Investmet Bank Ltd 2
15 NIC Asia Bank Ltd 3
16 NMB Bank Limited 1
17 Prime Commercial Bank Ltd 2
18 Rastriya Banijya Bank Limited 1
Total 27
Annex 8: International Training/Seminar Participation from BSD in FY 2019/20
SN Course Organizer Country Person Days
1
Prudential supervision of The
Banking Sector and Macroprudential
Regulations
ISCB Istanbul,
Turkey 3 4
2
SEACEN Couurse on Bank Analysis
and Supervision SEACEN Seoul, Korea 1 3
3
SEACEN Course on Off-site
Monitoring SEACEN
Taipei,
Taiwan 1 6
4
Expected Credit Losses and
Provisioning SEACEN Cambodia 1 5
5
Expected Credit Losses and
Provisioning SEACEN Cambodia 1 5
6
SEACEN Course on Off-site
Monitoring SEACEN
Taipei,
Taiwan 2 6
7
Proportionate Application of Global
Standards Working Group Meeting AFI
Kigali,
Rwanda 1 4
8
Current Issues on Technological Risk
Management in Financial System Bank Indonesia
Bali,
Indonesia 2 5
9
SEACEN Course on Financial Cycles
and Crises SEACEN Mongolia 1 6
10 Anti-Money Laundering for Nepal
Yunnan Intl
Center for Eco.
& Tech.
Exchange
Kunming,
China
1 10
11
SEACEN Course on Off-site
Monitoring SEACEN
Taipei,
Taiwan 2 6
12
Monetary Policy Strategies and
Monetary Operations SEACEN
Siem Reap,
Cambodia 1 5
13 Emerging Trends in Good State Bank of Islamabad, 1 3

Bank Supervision Report, 2020 59
Governance of Banking Sector in
SAARC Region
Pakistan Pakistan
14
SEACEN Course on Financial
Stability and Macroprudential
Supervision SEACEN
Yogyakarta,
Indonesia 1 5
15
FSI-EMEAP Meeting on
Implementation of Expected Credit
Loss Provisioning: Implication for
Regulation and Supervision BIS
Jakarta,
Indonesia
1 2
16
ST 1.26 Macro Stress Testing II
(Advanced) IMF STI Singapore 3 5
17
SEACEN Course on Financial
Stability and Macroprudential
Supervision SEACEN
Yogyakarta,
Indonesia 1 5
18
SEACEN Course on Financial
Liquidity Risk Measurement and
Management SEACEN
Cebu,
Philippines 1 5
19
SEACEN-BOJ Course on Problem
Bank Intervention and Resolution SEACEN Sri Lanka 1 6
20
SEACEN -Bank of Japan Course on
Information and communication
Tech.Risks SEACEN Vietnam 1 5

Bank Supervision Report, 2020 60
Annex 9: Financial Figures of Banks
Annex 9.1: Banking Operation
Rs. in Billion Percentage Change
2017/18 2018/19 2019/20 2018/19 2019/20
Deposits
Private 2,014.18 2,363.75 2,969.54 17.36% 25.63%
Public 457.33 515.05 519.85 12.62% 0.93%
Total 2471.51 2878.80 3,489.39 16.48% 21.21%
Loans and Advances
Private 1,780.08 2,127.33 2,514.48 19.51% 18.20%
Public 300.28 354.83 389.11 18.17% 9.6%
Total 2,080.36 2,482.16 2,903.59 19.29% 16.98%
Assets
Private 2,502.06 2,995.33 3,610.59 23.30% 20.54%
Public 466.22 553.49 636.23 18.72% 14.95%
Total 2,968.28 3,548.82 4,246.83 19.56% 19.67%
Annex 9.2: Composition of Assets
Assets Category 2018/19
(Rs in Million) 2019/20
(Rs in Million)
Percentage
Change
Cash and Cash Equivalent 252,806 272,716 7.88%
Due from NRB 195,296 260,534 33.40%
Placements with BFIs 68,732 71,532 4.07%
Loan and Advances to BFIs 91,041 106,218 16.67%
Loans and advances to customers 2,391,117 2,782,181 16.35%
Investment securities 365,124 523,541 43.39%
Others 184,701 230,106 24.58%
Total Assets 3,548,817 4,246,826 19.67%
Annex 9.3: Composition of Liabilities and Equity
Particulars 2018/19
(Rs in Million)
2019/20
(Rs in Million)
Percentage
Change
Due to Bank and Financial Institutions 116,687 119,377 2.30%
Deposits from customers 2,789,871 3,489,390 25.07%
Share capital 252,260 284,811 12.90%
Retained Earnings 47,718 38,252 -19.84%
Reserves 132,990 156,316 17.54%
Others 209,291 158, 681 -24.18%
Total 3,548,817 4,246,826 19.67%

Bank Supervision Report, 2020 61
Annex 9.4: Capital Fund
Particulars / Years
Rs. in Billion Percentage Change
2017/18
2018/19
2019/20
2018/19
2019/20
Private 310.44 368.89 429.75 18.83% 16.50%
Public 61.58 71.04 76.72 15.37% 7.99%
Industry 372.02 439.93 506.47 18.25% 15.12%
Annex 9.5: Deposit Mix
Particulars
Rs. in Billion Percentage Change
2017/18
2018/19
2019/20
2018/19
2019/20
Current 249.248 301.557 389.700 20.99% 29.23%
Saving 811.668 901.298 1087.517 11.04% 20.66%
Fixed 1070.787 1307.032 1645.920 22.06% 25.93%
Other 339.81 368.915 366.254 8.57% -0.72%
Total 2,471.51 2,878.80 3,489.39 16.48% 21.21%
Source: Unaudited figures from Offsite Supervision Division, BSD
Annex 9.6 Loans and Advances
Particulars / Years
Rs. in Billion Percentage Change
2017/18 2018/19 2019/20 2018/19 2019/20
Public Banks 300.28 354.83 389.11 18.16% 9.66%
Private Banks 1,780.56 2,127.33 2,514.48 19.48% 18.20%
Total Banks 2,080.84 2,482.16 2,903.59 19.29% 16.98%
Annex 9.7 Non Performing Loans
Banks/ Year
Rs. in Billion Percentage change of
Amount
2018/19 2019/20 2018/19 2019/20
Rs. NPL % Rs. NPL %
Private Banks 24.2 6.82 39.04 10.03 32.62% 61.31%
Public Banks 12.86 0.60 13.54 0.54 10.83% 5.25%
Industry 37.06 1.49 52.57 1.81 24.16% 41.85%

Bank Supervision Report, 2020 62
Annex 9.8 Non-Banking Assets
Amount in Rs Millions Percentage change
Banks/ Year 2017/18 2018/19 2019/20 2018/19 2019/20
Private 2,199.86 4,424 5,549.78 101.10% 25.45%
Public 384.59 471 433.41 22.47% -7.98%
Industry 2,584.45 4,895 5,983.19 89.40% 22.23%
Source: Unaudited figures from Offsite Supervision Division, BSD
Annex 9.9: Investment Portfolios
Particulars 2019/20
Rs. in Million
Proportion
Nepal Government 496,959 75.73%
NRB Bonds - 0.00%
Shares & Debenture 40,081 6.11%
Interbank Investment 16,217 2.47%
Fixed Deposit Investment 7,731 1.18%
Other Investment 94,880 14.46%
Gold, Real Estate 332 0.05%
Total Investments 656,200 100%
Source: Unaudited figures from Offsite Supervision Division, BSD
Annex 9.10: Operating Efficiency
Particulars/
Year 2018/19 2019/20
Public Private Public Private
Rs. in
Billion
% on
Total
Operating
Income
Rs. in
Billion
% on
Total
Operating
Income
Rs. in
Billion
% on
Total
Operating
Income
Rs. in
Billion
% on
Total
Operating
Income
Interest Income 41.06 144.11% 263.41 195.95% 43.90 167.42% 284.85 204.30%
Net Interest
Income 24.03 84.35% 103.44 76.95% 21.17 80.73% 107.58 77.16%
Operating
Profit 16.79 58.91% 74.19 55.19% 14.06 53.62% 61.79 44.32%
Net Profit 12.12 42.53% 51.68 38.45% 10.48 39.95% 43.84 31.44%
Annex 9.11: Net Interest Spread
Banks/Year 2017/18 2018/19 2019/20
Private 4.43% 3.85% 3.34%
Public 5.13% 5.48% 3.96%
Industry 4.50% 4.09% 3.43%
Source: Unaudited figures from Offsite Supervision Division, BSD

Bank Supervision Report, 2020 63
Annex 9.12: Liquid Assets to Total Deposit
Particulars / Year
Rs. in Billion
2017/18 2018/19 2019/20
Liquid Assets 652 699 959
Total Deposit 2,382 2,879 3,489
Liquid Assets/ Total Deposit 27.37% 23.89% 27.49%
Source: Unaudited figures from Offsite Supervision Division, BSD
Annex 9.13 Liquid Assets to Total Assets
Particulars / Year
Rs. in Billion
2017/18 2018/19 2019/20
Liquid Assets 652 699 959
Total Assets 2,968 3,660 4,371
Liquid Assets/Total Assets 21.97% 19.12% 21.95%
Source: Unaudited figures from Offsite Supervision Division, BSD

Bank Supervision Report, 2020 64
Annex 9.14 Deprived Sector Lending of Commercial Banks
Rs.in Million
S.N. BANKS
6 Months
prior Loan &
Advances
Required
Lending in
Deprived
Sector
(5%)
Actual Lending in
Deprive Sector
Excess /
Shortfall
Amount Amount % Amount Amount
1 NBL 103,906 5,195 8.30% 8,619 3.30%
2 RBB 152,514 7,626 5.45% 8,309 0.45%
3 NABIL 140,556 7,028 5.21% 7,321 0.21%
4 NIBL 140,878 7,044 5.17% 7,288 0.17%
5 SCB 56,676 2,834 5.69% 3,227 0.69%
6 HBL 102,912 5,146 5.31% 5,467 0.31%
7 NSBI 98,051 4,903 5.82% 5,705 0.82%
8 NBB 60,015 3,001 5.43% 3,258 0.43%
9 EBL 120,253 6,013 6.22% 7,478 1.22%
10 BOKL 82,495 4,125 5.13% 4,235 0.13%
11 NCC 68,911 3,446 5.15% 3,547 0.15%
12 NIC Asia 165,247 8,262 13.06% 21,577 8.06%
13 MBL 90,055 4,503 5.05% 4,545 0.05%
14 Kumari 84,719 4,236 6.39% 5,411 1.39%
15 Laxmi 86,332 4,317 5.57% 4,809 0.57%
16 SBL 123,056 6,153 6.36% 7,822 1.36%
17 ADBL 117,756 5,888 7.90% 9,308 2.90%
18 Global 198,679 9,934 5.61% 11,142 0.61%
19 Citizens 75,513 3,776 5.76% 4,352 0.76%
20 Prime 113,895 5,695 5.11% 5,816 0.11%
21 Sunrise 77,488 3,874 6.65% 5,156 1.65%
22 NMB 19,919 996 5.35% 6,412 0.35%
23 Prabhu 98,681 4,934 5.17% 5,101 0.17%
24 Mega 105,646 5,282 6.93% 326 1.93%
25 Civil 50,016 2,501 5.71% 2,855 0.71%
26 Century 62,562 3,128 5.28% 3,305 0.28%
27 Sanima 91,488 4,574 5.60% 5,120 0.60%
Grand Total 2,688,219 134,411 6.26% 167,511 1.26%
Source: Unaudited figures from Offsite Supervision Division, BSD

Bank Supervision Report, 2020 65
Annex 10: Financial Details of Commercial Banks
1. Nepal Bank Limited Rs. in Million
Particulars 2017-18 2018-19 2019-20
Cash and cash equivalent 5,780.88 10,418.97 4,965.06
Due from Nepal Rastra Bank 6,283.66 10,178.32 2,472.90
Placement with Bank and Financial Institutions 2,965.49 5,427.68 6,117.45
Derivative financial instruments 18.63 5,594.62 6,526.46
Other trading assets - - -
Loan and advances to B/FIs 2,739.47 3,303.28 3,223.30
Loans and advances to customers 75,556.51 92,421.64 104,588.24
Investment securities 16,247.77 16,425.73 32,083.79
Current tax assets 521.83 991.50 1,522.34
Investment in subsidiaries - - -
Investment in associates - - -
Investment property 87.01 113.31 103.11
Property and equipment 11,638.33 11,828.22 12,007.75
Goodwill and Intangible assets 14.24 25.99 39.45
Deferred tax assets - - -
Other assets 11,613.37 14,786.38 16,776.71
TOTAL ASSETS 133467.201 171515.65 190,426.56
Due to Bank and Financial Institutions 290.65 1,074.50 874.96
Due to Nepal Rastra Bank 34.52 41.84 23.92
Derivative financial instruments - 5,504.43 6,419.10
Deposits from customers 99,540.73 117,200.79 142,114.28
Borrowing 109.50 950.00 1,000.00
Current Tax Liabilities - - -
Provisions 63.28 131.44 123.71
Deferred tax liabilities 3,226.45 3,650.97 3,782.50
Other liabilities 7,230.07 13,680.34 5,906.05
Debt securities issued - - -
Subordinated Liabilities - - -
Equity 22,971.99 29281.33 30,182.03
Share capital 8,042.66 9,811.15 11,282.82
Share premium 132.84 3,262.81 1,788.70
Retained earnings (437.19) 2,895.69 4,125.07
Reserves 15,233.69 13,311.68 12,985.44
TOTAL EQUITY AND LIABILITIES 133,467.20 171,515.65 190,426.56
Interest Income 9,229.44 10,375.69 11,526.97
Interest Expenses 2,841.69 4,186.15 5,908.02

Bank Supervision Report, 2020 66
Particulars 2017-18 2018-19 2019-20
Net Interest Income 6,387.75 6,189.54 5,618.95
Fee and commission income 983.02 1,039.34 788.51
Fee and commission expense 76.76 45.36 43.96
Net Fee and commission income 906.26 993.98 744.56
Net Interest, Fee and commission income 7,294.01 7,183.52 6,363.50
Net trading income 207.28 342.41 412.56
Other operating income 18.89 210.78 369.98
Total operating income 7,520.18 7,736.72 7,146.05
Impairment charge/(reversal) for loans and other losses (86.34) 477.10 545.16
Net operating income 7,606.52 7,259.61 6,600.89
Personnel expenses 2,148.83 2,077.40 2,199.64
Other operating expenses 511.32 549.79 683.74
Depreciation &Amortization 97.59 122.37 151.07
Operating Profit 4,848.78 4,510.05 3,566.43
Non-operating income 81.89 101.61 275.81
Non-operating expense 0.20 - -
Profit before income tax 4,930.48 4,611.66 3,842.24
Income Tax Expense
1,285.80
Current Tax 1,479.49 1,080.43 877.61
Deferred Tax 235.30 934.49 408.20
Profit/Loss for the period 3,215.68 2,596.74 2,556.44
2. Rastriya Banijya Bank Rs. in Million
Particulars 2017-18 2018-19 2019-20
Cash and cash equivalent 28,333.12 27,028.52 7,093.86
Due from Nepal Rastra Bank 9,645.49 15,772.41 17,905.69
Placement with Bank and Financial Institutions - - 48.12
Derivative financial instruments - - -
Other trading assets - - -
Loan and advances to B/FIs 4,045.98 4,554.44 4,456.75
Loans and advances to customers 117,414.16 144,454.64 150,808.04
Investment securities 24,469.66 21,136.97 74,770.09
Current tax assets 624.46 1,882.58 2,635.53
Investment in subsidiaries 200.00 200.00 200.00
Investment in associates 230.09 202.01 97.86
Investment property 57.27 114.81 109.38

Bank Supervision Report, 2020 67
Particulars 2017-18 2018-19 2019-20
Property and equipment 919.04 1,068.69 1,550.87
Goodwill and Intangible assets 23.73 53.85 43.35
Deferred tax assets 1,102.28 341.10 471.99
Other assets 10,266.70 13,707.61 6,199.39
TOTAL ASSETS 197,332.00 230,517.62 266,390.91
Due to Bank and Financial Institutions 178,261.23 206,975.13 242,943.87
Due to Nepal Rastra Bank 5,291.53 7,953.35 2,278.46
Derivative financial instruments 92.97 352.04 251.99
Deposits from customers - - -
Borrowing 164,210.30 190,031.47 230,827.71
Current Tax Liabilities 171.50 60.49 60.06
Provisions - - -
Deferred tax liabilities - - 294.80
Other liabilities - - -
Debt securities issued 8,494.93 8,577.78 9,230.84
Subordinated Liabilities - - -
Equity - - -
Share capital 19,070.77 23,542.49 23,447.05
Share premium 9,004.80 9,004.79 9,004.80
Retained earnings - - -
Reserves (3,936.37) 800.94 1,353.42
TOTAL EQUITY AND LIABILITIES 14,002.35 13,736.75 13,088.83
Interest Income 12,097.66 15,204.45 17,026.92
Interest Expenses 2,983.43 4,974.94 7,711.77
Net Interest Income 9,114.23 10,229.51 9,315.15
Fee and commission income 1,233.82 1,453.28 828.48
Fee and commission expense 183.71 141.05 174.58
Net Fee and commission income 1,050.11 1,312.23 653.90
Net Interest, Fee and commission income 10,164.34 11,541.74 9,969.05
Net trading income 58.90 69.35 54.73
Other operating income (23.99) 120.58 578.02
Total operating income 10,199.25 11,731.67 10,601.80
Impairment charge/(reversal) for loans and other losses 1,293.05 452.42 85.15
Net operating income 8,906.20 11,279.24 10,516.66
Personnel expenses 3,132.45 3,119.08 2,911.89
Other operating expenses 783.52 1,042.66 1,356.99
Depreciation &Amortization 252.66 183.56 214.42

Bank Supervision Report, 2020 68
Particulars 2017-18 2018-19 2019-20
Operating Profit 4,737.57 6,933.94 6,033.35
Non-operating income 222.67 154.74 297.62
Non-operating expense 9.16 0.63 -
Profit before income tax 4,951.08 - 6,330.97
Income Tax Expense
1,878.44
Current Tax 2,455.71 968.80 1,313.95
Deferred Tax (1,163.90) 790.88 564.49
Profit/Loss for the period 3,659.27 5,328.37 4,452.53
3. Nabil Bank Limited Rs. in Million
Particulars 2017-18 2018-19 2019-20
Cash and cash equivalent 7,952.35 12,479.70 19,371.81
Due from Nepal Rastra Bank 7,372.28 6,191.83 5,448.85
Placement with Bank and Financial Institutions 10,160.28 11,078.73 10,230.58
Derivative financial instruments - 8,539.06 10,859.60
Other trading assets - - -
Loan and advances to B/FIs 4,565.79 6,058.49 5,836.37
Loans and advances to customers 109,059.36 127,500.24 148,231.39
Investment securities 18,388.08 25,303.07 33,471.81
Current tax assets 246.38 137.52 283.02
Investment in subsidiaries 78.00 78.00 78.00
Investment in associates 40.00 80.00 80.00
Investment property 8.22 8.22 8.22
Property and equipment 986.26 1,051.79 1,318.39
Goodwill and Intangible assets 50.33 41.40 71.75
Deferred tax assets - - -
Other assets 2,070.72 2,590.77 2,431.48
TOTAL ASSETS 160,978.07 201,138.82 237,721.26
Due to Bank and Financial Institutions 1,168.66 1,419.04 2,228.86
Due to Nepal Rastra Bank 32.52 88.47 53.29
Derivative financial instruments 53.84 8,335.07 10,764.20
Deposits from customers 134,810.67 162,953.99 190,806.47
Borrowing - - -
Current Tax Liabilities - - -
Provisions - - -
Deferred tax liabilities 1,009.76 851.54 1,320.92
Other liabilities 3,256.26 4,302.10 4,705.49
Debt securities issued 60.00 - 2,040.55
Subordinated Liabilities - - -
Equity 20,586.36 23,188.61 25,801.48
Share capital 8,043.22 9,011.85 10,097.50
Share premium 0.07 0.07 0.07

Bank Supervision Report, 2020 69
Particulars 2017-18 2018-19 2019-20
Retained earnings 3,254.81 3,735.33 3,042.24
Reserves 9,288.25 10,441.36 12,661.67
TOTAL EQUITY AND LIABILITIES 160,978.07 201,138.82 237,721.26
Interest Income 11,349.87 15,243.80 16,499.52
Interest Expenses 5,087.81 8,084.53 9,479.25
Net Interest Income 6,262.06 7,159.25 7,020.27
Fee and commission income 1,053.29 1,291.01 1,305.23
Fee and commission expense 21.91 64.46 63.25
Net Fee and commission income 1,031.38 1,226.54 1,241.98
Net Interest, Fee and commission income 7,293.44 8,385.80 8,262.25
Net trading income 390.65 448.34 468.09
Other operating income 558.80 494.67 430.41
Total operating income 8,242.89 9,328.81 9,160.75
Impairment charge/(reversal) for loans and other losses 175.86 405.17 744.56
Net operating income 8,067.03 8,923.64 8,416.18
Personnel expenses 1,727.71 1,949.61 2,169.79
Other operating expenses 562.44 777.20 1,037.41
Depreciation &Amortization 123.92 170.17 115.36
Operating Profit 5,652.96 6,026.65 5,093.63
Non-operating income 11.19 17.01 4.45
Non-operating expense 6.81 2.34 (2.50)
Profit before income tax 5,657.34 6,041.32 5,095.57
Income Tax Expense 1,528.90
Current Tax 1,682.47 1,810.17 1,528.90
Deferred Tax (7.02) (7.71) -
Profit/Loss for the period 3,981.89 4,238.85 3,566.67
4. Nepal Investment Bank Limited Rs. in Million
Particulars 2017-18 2018-19 2019-20
Cash and cash equivalent 10,610.89 13,520.57 10,013.89
Due from Nepal Rastra Bank 7,389.71 10,860.92 14,321.97
Placement with Bank and Financial Institutions 10,246.40 8,498.97 7,964.99
Derivative financial instruments 30.86 436.89 133.98
Other trading assets - - -
Loan and advances to B/FIs 2,502.93 4,274.42 4,920.06
Loans and advances to customers 118,322.57 122,866.55 135,457.51
Investment securities 17,154.38 16,973.47 23,582.66
Current tax assets 346.85 501.18 748.91
Investment in subsidiaries 238.16 171.50 171.50
Investment in associates 33.29 82.36 82.36

Bank Supervision Report, 2020 70
Particulars 2017-18 2018-19 2019-20
Investment property 16.56 214.09 265.98
Property and equipment 3,727.97 4,042.46 4,010.76
Goodwill and Intangible assets 61.46 90.63 124.62
Deferred tax assets - - -
Other assets 1,211.52 3,307.98 1,354.77
TOTAL ASSETS 171,893.55 185,841.99 203,153.97
Due to Bank and Financial Institutions 3,742.41 2,790.96 2,462.22
Due to Nepal Rastra Bank 505.85 940.27 2.72
Derivative financial instruments - - -
Deposits from customers 136,585.58 149,392.28 166,362.13
Borrowing - - -
Current Tax Liabilities - - -
Provisions - - -
Deferred tax liabilities 868.93 865.21 973.60
Other liabilities 4,069.77 3,024.07 2,783.05
Debt securities issued 1,250.00 3,250.00 3,250.00
Subordinated Liabilities - -
Equity 24,871.02 25,579.20 27,320.25
Share capital 10,645.60 12,869.75 14,248.95
Share premium 1,718.45 105.65 32.60
Retained earnings 2,735.03 2,064.66 1,623.10
Reserves 9,771.94 10,539.14 11,415.59
TOTAL EQUITY AND LIABILITIES 171,893.55 185,841.99 203,153.97
Interest Income 13,574.10 14,975.21 15,183.85
Interest Expenses 7,723.92 8,801.71 9,423.66
Net Interest Income 5,850.18 6,173.51 5,760.20
Fee and commission income 1,429.75 1,442.87 1,513.16
Fee and commission expense 211.92 339.74 316.00
Net Fee and commission income 1,217.83 1,103.13 1,197.17
Net Interest, Fee and commission income 7,068.01 7,276.64 6,957.36
Net trading income 654.48 890.84 871.87
Other operating income 208.30 180.33 230.12
Total operating income 7,930.79 8,347.81 8,059.36
Impairment charge/(reversal) for loans and other losses 675.21 1,596.61 1,880.14
Net operating income 7,255.58 6,751.20 6,179.22
Personnel expenses 1,467.84 1,546.16 1,426.74
Other operating expenses 641.03 854.24 856.81
Depreciation &Amortization 187.80 217.42 259.53

Bank Supervision Report, 2020 71
Particulars 2017-18 2018-19 2019-20
Operating Profit 4,958.92 4,133.37 3,636.14
Non-operating income 48.28 650.92 3.32
Non-operating expense 66.98 297.76 6.29
Profit before income tax 4,940.22 4,486.53 3,633.17
Income Tax Expense
1,061.52
Current Tax 1,464.51 1,153.11 1,054.03
Deferred Tax (183.61) 9.31 7.49
Profit/Loss for the period 3,659.32 3,324.11 2,571.65
5. Standard Chartered Bank Nepal Limited Rs. in Million
Particulars 2017-18 2018-19 2019-20
Cash and cash equivalent 22,048.33 12,626.99 39,248.55
Due from Nepal Rastra Bank 3,982.46 2,454.91 1,980.95
Placement with Bank and Financial Institutions 4,831.20 9,902.70 4,210.50
Derivative financial instruments 9.21 43.34 40.58
Other trading assets - - -
Loan and advances to B/FIs 2,134.85 2,541.47 3,010.90
Loans and advances to customers 44,561.33 53,092.12 53,911.29
Investment securities 4,660.99 11,535.16 13,061.72
Current tax assets 936.87 50.08 173.88
Investment in subsidiaries - - -
Investment in associates - - -
Investment property - - -
Property and equipment 115.90 147.74 175.51
Goodwill and Intangible assets - - -
Deferred tax assets 75.55 71.80 35.17
Other assets 674.87 797.90 585.01
TOTAL ASSETS 84,031.55 93,264.18 116,434.05
Due to Bank and Financial Instituions 326.71 505.84 799.71
Due to Nepal Rastra Bank - - -
Derivative financial instruments - - -
Deposits from customers 67,061.05 75,731.53 98,467.60
Borrowing - - -
Current Tax Liabilities 976.57 - -
Provisions 120.68 42.38 36.62
Deferred tax liabilities - - -
Other liabilities 1,621.05 2,057.37 2,028.55
Debt securities issued - - -

Bank Supervision Report, 2020 72
Particulars 2017-18 2018-19 2019-20
Subordinated Liabilities - - -
Equity 13,925.50 14,927.07 15,101.57
Share capital 8,011.43 8,011.43 8,011.43
Share premium - - -
Retained earnings 1,403.04 1,807.88 1,521.08
Reserves 4,511.03 5,107.77 5,569.05
TOTAL EQUITY AND LIABILITIES 84,031.55 93,264.18 116,434.05
Interest Income 4,940.67 6,500.04 6,626.70
Interest Expenses 1,642.64 2,978.18 3,113.44
Net Interest Income 3,298.03 3,521.86 3,513.26
Fee and commission income 724.40 873.84 732.71
Fee and commission expense 60.64 45.10 40.96
Net Fee and commission income 663.76 828.75 691.75
Net Interest, Fee and commission income 3,961.79 4,350.61 4,205.01
Net trading income 594.27 729.05 580.80
Other operating income 124.50 131.95 179.23
Total operating income 4,680.56 5,211.61 4,965.05
Impairment charge/(reversal) for loans and other losses 74.89 88.24 439.07
Net operating income 4,605.67 5,123.37 4,525.98
Personnel expenses 997.88 1,084.36 1,102.47
Other operating expenses 564.32 525.70 530.17
Depreciation &Amortization 26.01 35.70 51.90
Operating Profit 3,017.46 3,477.63 2,841.44
Non-operating income 4.03 - 0.76
Non-operating expense - 2.95 9.63
Profit before income tax 3,021.49 3,474.68 2,832.56
Income Tax Expense
848.64
Current Tax 976.68 1,022.94 808.85
Deferred Tax (145.08) 17.07 39.79
Profit/Loss for the period 2,189.90 2,434.66 1,983.93
6. Himalayan Bank Limited Rs. in Million
Particulars 2017-18 2018-19 2019-20
Cash and cash equivalent 4,741.36 4,658.55 7,231.14
Due from Nepal Rastra Bank 5,159.26 4,883.54 12,407.82
Placement with Bank and Financial Institutions 4,989.52 5,231.24 6,342.17
Derivative financial instruments 33.44 127.14 115.62
Other trading assets - - -

Bank Supervision Report, 2020 73
Particulars 2017-18 2018-19 2019-20
Loan and advances to B/FIs 3,685.22 4,772.75 4,998.08
Loans and advances to customers 82,474.99 92,697.32 101,653.35
Investment securities 11,654.17 16,466.20 18,241.67
Current tax assets 154.31 224.95 370.48
Investment in subsidiaries - 200.00 200.00
Investment in associates 195.79 195.79 195.79
Investment property 2.30 109.13 379.80
Property and equipment 2,222.68 2,391.83 2,411.79
Goodwill and Intangible assets 85.85 117.68 151.10
Deferred tax assets - - -
Other assets 1,063.41 1,075.02 1,125.82
TOTAL ASSETS 116,462.30 133,151.14 155,824.62
Due to Bank and Financial Institutions 754.25 3,702.92 6,595.87
Due to Nepal Rastra Bank - 560.81 155.74
Derivative financial instruments 9.11 6.54 75.54
Deposits from customers 98,988.79 109,387.06 125,264.38
Borrowing - - -
Current Tax Liabilities - - -
Provisions 2.30 - -
Deferred tax liabilities 131.26 98.84 95.97
Other liabilities 1,814.33 2,777.02 3,528.17
Debt securities issued 623.36 623.15 2,563.66
Subordinated Liabilities - - -
Equity 14,138.90 15,994.80 17,545.30
Share capital 8,114.53 8,520.26 9,372.28
Share premium - - -
Retained earnings 1,500.41 2,171.15 2,503.06
Reserves 4,523.96 5,303.39 5,669.96
TOTAL EQUITY AND LIABILITIES 116,462.30 133,151.14 155,824.62
Interest Income 9,724.87 11,625.42 12,113.63
Interest Expenses 5,403.05 6,594.07 7,356.99
Net Interest Income 4,321.82 5,031.35 4,756.65
Fee and commission income 772.04 821.31 748.67
Fee and commission expense 64.24 65.07 61.91
Net Fee and commission income 707.80 756.24 686.76
Net Interest, Fee and commission income 5,029.62 5,787.58 5,443.41
Net trading income 718.90 718.16 764.97
Other operating income 104.85 175.12 146.30

Bank Supervision Report, 2020 74
Particulars 2017-18 2018-19 2019-20
Total operating income 5,853.38 6,680.86 6,354.68
Impairment charge/(reversal) for loans and other losses 679.92 133.62 303.10
Net operating income 5,173.46 6,547.23 6,051.58
Personnel expenses 1,322.25 1,638.13 1,644.24
Other operating expenses 694.27 796.69 878.18
Depreciation &Amortization 168.28 170.19 180.32
Operating Profit 2,988.67 3,942.21 3,348.84
Non-operating income 309.53 49.33 398.08
Non-operating expense 533.01 58.38 251.58
Profit before income tax 2,765.18 3,933.16 3,495.33
Income Tax Expense
952.75
Current Tax 877.61 1,192.12 960.26
Deferred Tax 11.96 (22.81) (7.52)
Profit/Loss for the period 1,875.61 2,763.85 2,542.59
7. Nepal SBI Bank Limited Rs. in Million
Particulars 2017-18 2018-19 2019-20
Cash and cash equivalent 10,480.24 8,243.37 15,111.52
Due from Nepal Rastra Bank 5,647.35 9,309.36 7,580.53
Placement with Bank and Financial Institutions - - -
Derivative financial instruments - 122.89 -
Other trading assets 20.40 23.77 50.98
Loan and advances to B/FIs 2,872.20 4,258.39 4,819.69
Loans and advances to customers 72,363.66 84,386.34 89,615.50
Investment securities 8,646.15 9,269.82 12,322.76
Current tax assets 219.49 261.70 293.92
Investment in subsidiaries 188.89 188.89 188.89
Investment in associates - - -
Investment property - - -
Property and equipment 843.97 941.03 913.29
Goodwill and Intangible assets 4.53 3.93 2.68
Deferred tax assets 236.21 315.10 325.77
Other assets 1,015.58 989.64 1,148.76
TOTAL ASSETS 102,538.67 118,314.23 132,374.29
Due to Bank and Financial Institutions 2,709.59 2,270.00 1,865.90
Due to Nepal Rastra Bank - 761.43 -
Derivative financial instruments 6.81 - 20.61
Deposits from customers 84,227.33 97,924.44 110,445.87

Bank Supervision Report, 2020 75
Particulars 2017-18 2018-19 2019-20
Borrowing - - -
Current Tax Liabilities - - -
Provisions - - -
Deferred tax liabilities - - -
Other liabilities 1,793.84 2,203.91 2,268.21
Debt securities issued 1,000.00 1,000.00 3,028.34
Subordinated Liabilities - - -
Equity 12,801.10 14,154.45 14,745.35
Share capital 8,046.91 8,449.25 8,956.21
Share premium 381.76 - -
Retained earnings 1,218.77 1,853.74 1,412.45
Reserves 3,153.67 3,851.46 4,376.70
TOTAL EQUITY AND LIABILITIES 102,538.67 118,314.23 132,374.29
Interest Income 9,069.78 11,276.81 11,644.87
Interest Expenses 4,924.81 6,571.72 7,395.11
Net Interest Income 4,144.97 4,705.08 4,249.76
Fee and commission income 912.86 993.64 884.59
Fee and commission expense 84.66 89.92 99.15
Net Fee and commission income 828.20 903.72 785.44
Net Interest, Fee and commission income 4,973.17 5,608.80 5,035.20
Net trading income 233.51 306.27 269.86
Other operating income 42.88 19.29 31.46
Total operating income 5,249.56 5,934.36 5,336.53
Impairment charge/(reversal) for loans and other losses 272.27 146.62 272.34
Net operating income 4,977.29 5,787.75 5,064.19
Personnel expenses 1,375.42 1,618.61 1,883.62
Other operating expenses 703.07 880.73 804.30
Depreciation &Amortization 137.13 164.52 180.05
Operating Profit 2,761.67 3,123.89 2,196.22
Non-operating income 38.87 196.08 27.52
Non-operating expense - 3.75 3.33
Profit before income tax 2,800.54 3,316.22 2,220.41
Income Tax Expense 689.63
Current Tax 942.06 1,072.17 720.85
Deferred Tax (165.03) 48.48 (31.23)
Profit/Loss for the period 2,023.51 2,292.52 1,530.78

Bank Supervision Report, 2020 76
8. Nepal Bangladesh Bank Limited Rs. in Million
Particulars 2017-18 2018-19 2019-20
Cash and cash equivalent 3,706.00 2,613.36 3,179.29
Due from Nepal Rastra Bank 6,890.13 6,762.11 13,485.57
Placement with Bank and Financial Institutions 2,259.78 3,535.63 2,503.88
Derivative financial instruments 30.81 31.23 29.99
Other trading assets 93.21 95.22 89.03
Loan and advances to B/FIs 1,380.57 1,768.83 1,686.99
Loans and advances to customers 40,878.52 52,729.58 58,966.52
Investment securities 4,766.33 5,923.67 7,023.08
Current tax assets 61.03 26.99 120.47
Investment in subsidiaries 200.00 200.00 220.00
Investment in associates - - -
Investment property 87.83 346.44 367.78
Property and equipment 371.54 1,502.20 1,541.87
Goodwill and Intangible assets 23.84 20.43 48.45
Deferred tax assets 22.31 6.39 2.85
Other assets 605.25 2,562.48 500.08
TOTAL ASSETS 61,377.14 78,124.56 89,765.84
Due to Bank and Financial Institutions - - 6,757.60
Due to Nepal Rastra Bank 333.99 745.79 143.21
Derivative financial instruments - - -
Deposits from customers 48,052.95 59,827.53 66,435.05
Borrowing - 329.10 -
Current Tax Liabilities - - -
Provisions - - -
Deferred tax liabilities - - -
Other liabilities 1,252.65 2,780.66 1,339.89
Debt securities issued - 1,992.98 1,993.68
Subordinated Liabilities - - -
Equity 11,737.55 12,448.50 13,096.41
Share capital 8,088.30 8,088.30 8,495.81
Share premium - - -
Retained earnings 941.46 1,039.76 488.39
Reserves 2,707.79 3,320.44 4,112.20
TOTAL EQUITY AND LIABILITIES 61,377.14 78,124.56 89,765.84
Interest Income 5,427.43 6,938.71 7,446.39
Interest Expenses 3,456.81 4,024.37 4,601.65

Bank Supervision Report, 2020 77
Particulars 2017-18 2018-19 2019-20
Net Interest Income 1,970.62 2,914.33 2,844.74
Fee and commission income 935.87 1,018.84 1,139.05
Fee and commission expense 36.99 47.93 41.41
Net Fee and commission income 898.88 970.91 1,097.64
Net Interest, Fee and commission income 2,869.50 3,885.24 3,942.38
Net trading income 157.89 228.80 229.06
Other operating income 40.25 93.71 50.71
Total operating income 3,067.63 4,207.75 4,222.15
Impairment charge/(reversal) for loans and other losses 298.88 357.49 796.48
Net operating income 2,768.75 3,850.26 3,425.67
Personnel expenses 755.66 1,015.22 1,069.02
Other operating expenses 340.73 394.08 433.91
Depreciation &Amortization 72.28 101.42 122.18
Operating Profit 1,600.08 2,339.53 1,800.56
Non-operating income 16.76 25.53 4.28
Non-operating expense 6.70 3.88 44.05
Profit before income tax 1,610.14 2,361.18 1,760.78
Income Tax Expense
516.20
Current Tax 494.78 708.35 528.24
Deferred Tax (28.67) 33.31 (12.03)
Profit/Loss for the period 1,144.04 1,619.52 1,244.58
9. Everest Bank Limited Rs. in Million
Particulars 2017-18 2018-19 2019-20
Cash and cash equivalent 10,065.42 7,759.12 9,646.95
Due from Nepal Rastra Bank 18,938.75 23,304.57 19,972.67
Placement with Bank and Financial Institutions 3,291.00 548.50 3,125.20
Derivative financial instruments - 1,486.22 14.54
Other trading assets - - -
Loan and advances to B/FIs 4,254.68 7,362.98 6,857.50
Loans and advances to customers 89,927.57 104,644.20 112,195.37
Investment securities 15,292.31 21,434.20 28,813.51
Current tax assets 10.92 75.09 234.11
Investment in subsidiaries - - -
Investment in associates 259.67 314.44 368.84
Investment property 2.20 21.04 21.04
Property and equipment 1,862.23 2,116.00 2,093.44
Goodwill and Intangible assets 12.93 37.77 45.15

Bank Supervision Report, 2020 78
Particulars 2017-18 2018-19 2019-20
Deferred tax assets - - -
Other assets 893.47 973.41 1,630.48
TOTAL ASSETS 144,811.15 170,077.53 185,018.81
Due to Bank and Financial Institutions 916.08 609.22 1,182.83
Due to Nepal Rastra Bank 26.71 1,206.07 32.89
Derivative financial instruments 0.02 1,446.39 -
Deposits from customers 115,511.71 129,568.15 143,545.48
Borrowing - - -
Current Tax Liabilities - - -
Provisions - - -
Deferred tax liabilities 77.26 92.88 140.98
Other liabilities 11,076.02 18,460.92 20,426.68
Debt securities issued 1,068.85 1,068.85 1,068.85
Subordinated Liabilities - - -
Equity 16,134.51 17,625.06 18,621.11
Share capital 8,106.86 8,106.86 8,510.21
Share premium 238.47 238.47 238.47
Retained earnings 1,739.04 2,324.15 1,727.53
Reserves 6,050.14 6,955.58 8,144.90
TOTAL EQUITY AND LIABILITIES 144,811.15 170,077.53 185,018.81
Interest Income 10,103.45 13,019.44 13,956.19
Interest Expenses 5,233.69 7,320.85 8,645.78
Net Interest Income 4,869.76 5,698.59 5,310.41
Fee and commission income 945.38 1,025.00 1,144.44
Fee and commission expense 123.29 133.61 128.50
Net Fee and commission income 822.09 891.39 1,015.93
Net Interest, Fee and commission income 5,691.85 6,589.99 6,326.35
Net trading income 195.90 306.92 263.57
Other operating income 92.64 99.54 110.42
Total operating income 5,980.39 6,996.45 6,700.33
Impairment charge/(reversal) for loans and other losses 132.12 136.76 548.47
Net operating income 5,848.28 6,859.69 6,151.86
Personnel expenses 1,492.67 1,653.30 1,636.28
Other operating expenses 584.53 726.83 793.32
Depreciation &Amortization 85.37 127.44 149.84
Operating Profit 3,685.70 4,352.12 3,572.43
Non-operating income - - -
Non-operating expense 3.61 4.34 0.61

Bank Supervision Report, 2020 79
Particulars 2017-18 2018-19 2019-20
Profit before income tax 3,682.09 4,347.78 3,571.81
Income Tax Expense
1,071.82
Current Tax 1,137.56 1,298.36 1,071.82
Deferred Tax (37.15) (4.70) -
Profit/Loss for the period 2,581.68 3,054.12 2,499.99
10. Bank of Kathmandu Amt. in Rs. Million
Particulars 2017-18 2018-19 2019-20
Cash and cash equivalent 3,422.84 3,115.53 2,373.97
Due from Nepal Rastra Bank 5,264.47 4,978.10 9,363.28
Placement with Bank and Financial Institutions 1,846.73 2,237.46 2,361.19
Derivative financial instruments - 100.87 76.22
Other trading assets 25.26 355.32 10.26
Loan and advances to B/FIs 1,831.83 3,270.19 3,519.44
Loans and advances to customers 65,789.08 70,476.86 75,915.26
Investment securities 11,521.90 14,762.65 14,170.25
Current tax assets 114.04 - 141.31
Investment in subsidiaries 140.00 140.00 140.00
Investment in associates - - -
Investment property 24.66 24.66 24.66
Property and equipment 935.25 831.36 832.88
Goodwill and Intangible assets 20.50 15.94 16.70
Deferred tax assets - - -
Other assets 270.24 609.68 637.71
TOTAL ASSETS 91,206.81 100,918.63 109,583.13
Due to Bank and Financial Institutions - 605.67 1,181.13
Due to Nepal Rastra Bank 18.60 1,110.84 162.26
Derivative financial instruments - - -
Deposits from customers 76,913.75 82,722.03 92,103.30
Borrowing - - -
Current Tax Liabilities - 58.16 -
Provisions 17.44 15.17 18.09
Deferred tax liabilities 172.67 312.04 192.84
Other liabilities 571.90 1,088.68 990.14
Debt securities issued - 1,040.02 624.82
Subordinated Liabilities 1,041.22 - -
Equity 12,471.24 13,966.02 14,310.56
Share capital 7,072.90 8,063.10 8,546.89

Bank Supervision Report, 2020 80
Particulars 2017-18 2018-19 2019-20
Share premium 929.93 - -
Retained earnings 858.23 1,374.92 955.20
Reserves 3,610.19 4,528.00 4,808.47
TOTAL EQUITY AND LIABILITIES 91,206.81 100,918.63 109,583.13
Interest Income 8,365.62 9,807.55 9,988.56
Interest Expenses 5,306.50 6,027.66 6,405.72
Net Interest Income 3,059.13 3,779.89 3,582.84
Fee and commission income 539.95 520.28 543.66
Fee and commission expense 50.32 60.13 54.35
Net Fee and commission income 489.64 460.16 489.32
Net Interest, Fee and commission income 3,548.76 4,240.05 4,072.16
Net trading income 225.71 322.25 322.27
Other operating income 140.66 100.23 52.22
Total operating income 3,915.13 4,662.53 4,446.65
Impairment charge/(reversal) for loans and other losses 465.94 64.56 537.68
Net operating income 3,449.19 4,597.98 3,908.97
Personnel expenses 1,030.30 1,159.36 1,114.24
Other operating expenses 442.10 528.45 564.08
Depreciation &Amortization 102.90 165.32 115.45
Operating Profit 1,873.89 2,744.84 2,115.20
Non-operating income 19.53 35.61 12.50
Non-operating expense 0.19 - -
Profit before income tax 1,893.23 2,780.45 2,127.70
Income Tax Expense 652.13
Current Tax 566.14 905.19 676.17
Deferred Tax 5.90 (21.70) (24.04)
Profit/Loss for the period 1,321.19 1,896.96 1,475.57
11. Nepal Credit and Commerce Bank Limited Rs. in Million
Particulars 2017-18 2018-19 2019-20
Cash and cash equivalent 3,461.98 5,125.40 8,606.16
Due from Nepal Rastra Bank 4,826.76 6,893.48 8,472.93
Placement with Bank and Financial Institutions
636.55 -
Derivative financial instruments
1,040.84 1,192.39
Other trading assets
- -
Loan and advances to B/FIs 55,318.63 2,382.57 2,797.81
Loans and advances to customers
60,850.93 65,107.49
Investment securities 8,812.27 8,875.73 7,498.36

Bank Supervision Report, 2020 81
Particulars 2017-18 2018-19 2019-20
Current tax assets
- 73.81
Investment in subsidiaries
- -
Investment in associates
34.50 54.66
Investment property
890.71 956.78
Property and equipment 716.78 942.41 867.44
Goodwill and Intangible assets 2.16 12.54 11.78
Deferred tax assets
130.67 70.50
Other assets 3,606.83 902.52 1,162.90
TOTAL ASSETS 76,745.41 88,718.84 96,873.01
Due to Bank and Financial Institutions
6,352.63 5,830.17
Due to Nepal Rastra Bank
1,244.46 975.71
Derivative financial instruments
962.69 1,134.47
Deposits from customers 63,519.76 67,035.62 73,786.88
Borrowing 684.91 - -
Current Tax Liabilities
59.21 -
Provisions
- -
Deferred tax liabilities
- -
Other liabilities 2,699.37 1,056.17 1,965.30
Debt securities issued
- -
Subordinated Liabilities
- -
Equity
12,008.05 13,180.48
Share capital 4,679.85 7,018.59 9,353.92
Share premium
172.44 -
Retained earnings
1,320.60 888.73
Reserves 5,161.52 3,496.43 2,937.84
TOTAL EQUITY AND LIABILITIES 76,745.41 88,718.84 96,873.01
Interest Income 7,010.29 7,899.64 8,466.67
Interest Expenses 5,119.96 4,932.02 5,247.39
Net Interest Income 1,890.33 2,967.62 3,219.28
Fee and commission income 475.17 598.34 590.93
Fee and commission expense 21.65 25.80 23.84
Net Fee and commission income 453.52 572.54 567.09
Net Interest, Fee and commission income 144.14 3,540.16 3,786.37
Net trading income 2,487.99 129.09 184.76
Other operating income 747.10 63.81 60.84
Total operating income 3,235.08 3,733.06 4,031.98
Impairment charge/(reversal) for loans and other losses 747.10 (127.14) 328.24
Net operating income 3,235.08 3,860.20 3,703.74

Bank Supervision Report, 2020 82
Particulars 2017-18 2018-19 2019-20
Personnel expenses 967.10 1,243.87 1,261.26
Other operating expenses 516.82 542.02 561.93
Depreciation &Amortization
111.58 138.19
Operating Profit 1,751.16 1,962.73 1,742.35
Non-operating income
6.01 1.50
Non-operating expense
- -
Profit before income tax 1,751.16 1,968.74 1,743.85
Income Tax Expense 510.55
612.87
Current Tax
749.76 553.74
Deferred Tax
197.75 59.13
Profit/Loss for the period 1,240.61 1,021.23 1,130.98
12. NIC Asia Bank Limited Rs. in Million
Particulars 2017-18 2018-19 2019-20
Cash and cash equivalent 8,132.49 20,214.54 12,294.51
Due from Nepal Rastra Bank 15,860.73 16,097.92 18,721.48
Placement with Bank and Financial Institutions 313.93 383.95 -
Derivative financial instruments 1,266.02 7,006.01 5,636.25
Other trading assets - - 9.44
Loan and advances to B/FIs 4,658.15 6,923.29 12,708.08
Loans and advances to customers 115,804.62 142,582.77 160,185.66
Investment securities 14,132.77 18,152.96 29,317.24
Current tax assets - - 4,889.07
Investment in subsidiaries 270.00 1,204.50 1,264.50
Investment in associates - - -
Investment property 74.38 275.94 496.06
Property and equipment 1,759.42 2,583.72 3,223.64
Goodwill and Intangible assets 49.83 110.49 112.85
Deferred tax assets - - -
Other assets 8,620.84 2,166.17 2,994.10
TOTAL ASSETS 170,943.18 217,702.26 251,852.89
Due to Bank and Financial Institutions 11,629.51 8,535.65 9,271.52
Due to Nepal Rastra Bank 742.27 314.54 -
Derivative financial instruments 1,721.81 6,913.41 5,601.04
Deposits from customers 139,589.61 176,820.69 201,630.38
Borrowing - - -
Current Tax Liabilities 25.03 240.29 1,258.31
Provisions - - -

Bank Supervision Report, 2020 83
Particulars 2017-18 2018-19 2019-20
Deferred tax liabilities 2.81 209.40 298.13
Other liabilities 2,073.78 1,992.37 6,902.32
Debt securities issued 3,487.91 7,710.10 9,655.64
Subordinated Liabilities - - -
Equity 11,670.46 14,965.81 17,235.54
Share capital 8,031.12 8,834.23 9,717.65
Share premium - - -
Retained earnings 943.65 2,251.12 1,693.78
Reserves 2,695.68 3,880.46 5,824.11
TOTAL EQUITY AND LIABILITIES 170,943.18 217,702.26 251,852.89
Interest Income 13,545.82 19,345.59 20,723.32
Interest Expenses 9,336.16 12,385.56 13,118.48
Net Interest Income 4,209.66 6,960.03 7,604.83
Fee and commission income 966.15 2,248.91 2,643.71
Fee and commission expense 96.50 127.60 159.90
Net Fee and commission income 869.65 2,121.31 2,483.80
Net Interest, Fee and commission income 5,079.31 9,081.34 10,088.63
Net trading income 195.21 348.92 339.61
Other operating income 83.62 75.97 298.16
Total operating income 5,358.14 9,506.24 10,726.41
Impairment charge/(reversal) for loans and other losses 304.83 590.15 1,120.47
Net operating income 5,053.30 8,916.09 9,605.94
Personnel expenses 1,782.11 2,486.79 2,913.81
Other operating expenses 1,237.09 1,649.86 1,971.78
Depreciation &Amortization 115.80 204.03 252.74
Operating Profit 1,918.29 4,575.41 4,467.61
Non-operating income 2.50 28.96 19.85
Non-operating expense 110.19 104.16 57.38
Profit before income tax 1,810.60 4,500.20 4,430.08
Income Tax Expense
1,308.59
Current Tax 525.43 1,366.00 1,265.59
Deferred Tax (49.68) 80.90 43.00
Profit/Loss for the period 1,334.86 3,053.30 3,121.49
13. Machhapuchchhre Bank Limited Amt. in Rs. Million
Particulars 2017-18 2018-19 2019-20
Cash and cash equivalent 3,706.00 9,442.90 9,778.36

Bank Supervision Report, 2020 84
Particulars 2017-18 2018-19 2019-20
Due from Nepal Rastra Bank 6,890.13 3,226.96 4,552.00
Placement with Bank and Financial Institutions 2,259.78 1,458.03 81.14
Derivative financial instruments 30.81 72.60 67.42
Other trading assets 93.21 358.70 212.02
Loan and advances to B/FIs 1,380.57 2,440.17 2,471.15
Loans and advances to customers 40,878.52 75,095.77 92,336.30
Investment securities 4,766.33 10,306.08 11,932.41
Current tax assets 61.03 209.98 277.85
Investment in subsidiaries 200.00 200.00 200.00
Investment in associates - - -
Investment property 87.83 78.46 174.95
Property and equipment 371.54 1,122.93 1,335.80
Goodwill and Intangible assets 23.84 49.01 65.13
Deferred tax assets 22.31 21.42 35.13
Other assets 605.25 1,163.04 1,020.76
TOTAL ASSETS 61,377.14 105,246.05 124,540.41
Due to Bank and Financial Institutions - 6,361.84 2,649.48
Due to Nepal Rastra Bank 333.99 1,020.52 13.72
Derivative financial instruments - - -
Deposits from customers 48,052.95 85,198.40 104,098.90
Borrowing - - 1,214.22
Current Tax Liabilities - - -
Provisions - - -
Deferred tax liabilities - - -
Other liabilities 1,252.65 1,428.41 1,999.57
Debt securities issued - - 2,992.93
Subordinated Liabilities - - -
Equity 11,737.55 11,236.88 11,571.59
Share capital 8,088.30 8,055.70 8,458.48
Share premium - 30.88 30.88
Retained earnings 941.46 1,293.47 924.33
Reserves 2,707.79 1,856.83 2,157.91
TOTAL EQUITY AND LIABILITIES 61,377.14 105,246.05 124,540.41
Interest Income 5,427.43 10,177.52 11,352.89
Interest Expenses 3,456.81 6,627.77 7,490.99
Net Interest Income 1,970.62 3,549.76 3,861.90
Fee and commission income 935.87 790.52 947.59
Fee and commission expense 36.99 69.98 101.24

Bank Supervision Report, 2020 85
Particulars 2017-18 2018-19 2019-20
Net Fee and commission income 898.88 720.54 846.35
Net Interest, Fee and commission income 2,869.50 4,270.30 4,708.25
Net trading income 157.89 303.33 282.16
Other operating income 40.25 28.14 70.13
Total operating income 3,067.63 4,601.77 5,060.54
Impairment charge/(reversal) for loans and other losses 298.88 117.17 604.00
Net operating income 2,768.75 4,484.60 4,456.54
Personnel expenses 755.66 1,230.38 1,501.24
Other operating expenses 340.73 723.55 888.61
Depreciation &Amortization 72.28 130.39 161.26
Operating Profit 1,600.08 2,400.28 1,905.43
Non-operating income 16.76 121.90 8.07
Non-operating expense 6.70 94.89 67.52
Profit before income tax 1,610.14 2,427.29 1,845.98
Income Tax Expense - 730.21 593.94
Current Tax 494.78 760.91 610.48
Deferred Tax (28.67) 30.71 (16.54)
Profit/Loss for the period 1,144.04 1,697.09 1,252.04
14. Kumari Bank Limited Rs. in Million
Particulars 2017-18 2018-19 2019-20
Cash and cash equivalent 3,780.64 8,821.14 9,248.39
Due from Nepal Rastra Bank 5,582.76 3,580.51 5,914.62
Placement with Bank and Financial Institutions 714.10 384.38 852.45
Derivative financial instruments - 143.29 7,416.21
Other trading assets - - -
Loan and advances to B/FIs 1,778.93 3,066.05 3,796.21
Loans and advances to customers 60,596.58 73,120.31 111,092.71
Investment securities 8,802.90 9,121.57 12,747.00
Current tax assets 113.78 16.11 327.53
Investment in subsidiaries 200.00 200.00 220.00
Investment in associates 20.00 20.00 130.06
Investment property 134.17 88.42 60.35
Property and equipment 434.30 661.73 1,274.50
Goodwill and Intangible assets 110.45 97.39 122.08
Deferred tax assets - 47.80 140.82
Other assets 454.92 887.97 468.53
TOTAL ASSETS 82,723.55 100,256.68 153,811.47

Bank Supervision Report, 2020 86
Particulars 2017-18 2018-19 2019-20
Due to Bank and Financial Institutions 10,104.19 12,168.48 7,475.89
Due to Nepal Rastra Bank 539.56 1,433.25 225.36
Derivative financial instruments 6.11 - 7,369.69
Deposits from customers 59,546.34 73,201.35 116,547.03
Borrowing - - -
Current Tax Liabilities - - -
Provisions 2.23 2.23 2.31
Deferred tax liabilities 20.76 - -
Other liabilities 1,963.67 1,583.82 2,110.26
Debt securities issued - - 2,995.12
Subordinated Liabilities - - -
Equity 10,540.70 11,867.54 17,085.81
Share capital 7,163.39 8,685.57 12,520.05
Share premium 54.80 54.80 -
Retained earnings 1,527.64 977.46 743.00
Reserves 1,794.86 2,149.71 3,822.76
TOTAL EQUITY AND LIABILITIES 82,723.55 100,256.68 153,811.47
Interest Income 6,804.01 9,217.98 10,588.88
Interest Expenses 4,771.33 6,198.52 6,958.73
Net Interest Income 2,032.68 3,019.46 3,630.15
Fee and commission income 396.82 454.87 529.32
Fee and commission expense 27.32 31.87 33.93
Net Fee and commission income 369.49 423.01 495.39
Net Interest, Fee and commission income 2,402.17 3,442.47 4,125.54
Net trading income 148.95 258.90 355.32
Other operating income 100.16 92.71 21.96
Total operating income 2,651.29 3,794.08 4,502.82
Impairment charge/(reversal) for loans and other losses 31.95 212.09 422.25
Net operating income 2,619.34 3,581.99 4,080.57
Personnel expenses 801.84 1,013.30 1,442.70
Other operating expenses 380.92 523.80 707.29
Depreciation &Amortization 79.21 120.10 177.91
Operating Profit 1,357.37 1,924.80 1,752.66
Non-operating income 24.53 11.84 23.34
Non-operating expense - 1.03 (0.03)
Profit before income tax 1,381.90 1,935.61 1,776.03
Income Tax Expense - 601.56 549.47
Current Tax 411.55 667.03 577.25

Bank Supervision Report, 2020 87
Particulars 2017-18 2018-19 2019-20
Deferred Tax (71.55) (65.47) (27.78)
Profit/Loss for the period 1,041.89 1,334.05 1,226.56
15. Laxmi Bank Limited Rs. in Million
Particulars 2017-18 2018-19 2019-20
Cash and cash equivalent 6,324.17 10,425.00 9,423.98
Due from Nepal Rastra Bank 3,454.93 4,805.69 9,431.45
Placement with Bank and Financial Institutions - - -
Derivative financial instruments 35.08 5,122.32 6,224.51
Other trading assets 23.52 67.52 16.12
Loan and advances to B/FIs 1,656.12 1,935.60 1,590.06
Loans and advances to customers 59,834.78 74,615.90 89,439.82
Investment securities 7,411.39 7,025.46 10,289.89
Current tax assets 53.88 14.20 83.96
Investment in subsidiaries 287.00 417.00 417.00
Investment in associates - - -
Investment property 37.49 37.33 108.98
Property and equipment 1,241.94 1,345.86 1,391.83
Goodwill and Intangible assets 35.07 54.66 90.19
Deferred tax assets - - -
Other assets 564.91 1,129.18 294.86
TOTAL ASSETS 80,960.28 106,995.72 128,802.65
Due to Bank and Financial Institutions 2,472.86 6,554.76 501.74
Due to Nepal Rastra Bank 677.80 1,229.86 500.46
Derivative financial instruments - 5,046.11 6,181.98
Deposits from customers 65,561.48 80,324.63 100,864.40
Borrowing - - 3,618.81
Current Tax Liabilities - - -
Provisions - - -
Deferred tax liabilities 142.16 98.91 211.52
Other liabilities 546.57 690.01 958.58
Debt securities issued 401.40 401.40 2,008.20
Subordinated Liabilities - -
Equity 11,158.01 12,650.04 13,956.97
Share capital 8,221.67 8,920.51 9,812.56
Share premium - - -
Retained earnings 760.75 1,453.37 1,600.08
Reserves 2,175.59 2,276.16 2,544.33
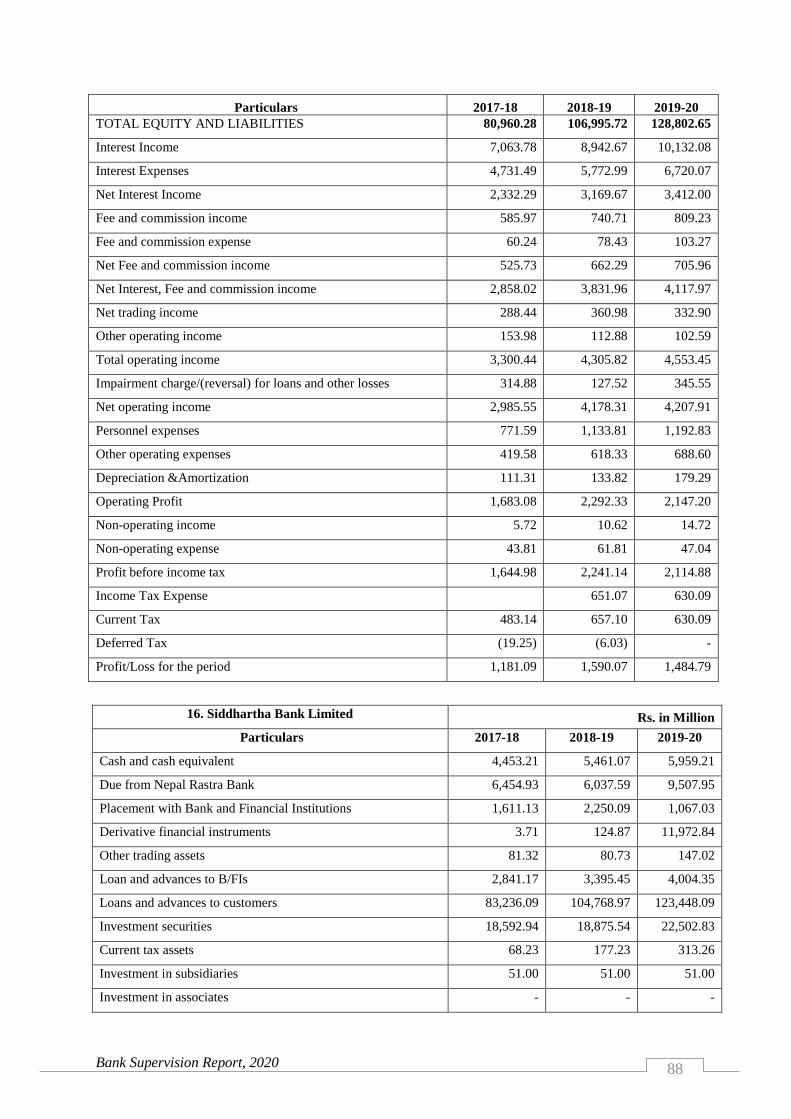
Bank Supervision Report, 2020 88
Particulars 2017-18 2018-19 2019-20
TOTAL EQUITY AND LIABILITIES 80,960.28 106,995.72 128,802.65
Interest Income 7,063.78 8,942.67 10,132.08
Interest Expenses 4,731.49 5,772.99 6,720.07
Net Interest Income 2,332.29 3,169.67 3,412.00
Fee and commission income 585.97 740.71 809.23
Fee and commission expense 60.24 78.43 103.27
Net Fee and commission income 525.73 662.29 705.96
Net Interest, Fee and commission income 2,858.02 3,831.96 4,117.97
Net trading income 288.44 360.98 332.90
Other operating income 153.98 112.88 102.59
Total operating income 3,300.44 4,305.82 4,553.45
Impairment charge/(reversal) for loans and other losses 314.88 127.52 345.55
Net operating income 2,985.55 4,178.31 4,207.91
Personnel expenses 771.59 1,133.81 1,192.83
Other operating expenses 419.58 618.33 688.60
Depreciation &Amortization 111.31 133.82 179.29
Operating Profit 1,683.08 2,292.33 2,147.20
Non-operating income 5.72 10.62 14.72
Non-operating expense 43.81 61.81 47.04
Profit before income tax 1,644.98 2,241.14 2,114.88
Income Tax Expense
651.07 630.09
Current Tax 483.14 657.10 630.09
Deferred Tax (19.25) (6.03) -
Profit/Loss for the period 1,181.09 1,590.07 1,484.79
16. Siddhartha Bank Limited Rs. in Million
Particulars 2017-18 2018-19 2019-20
Cash and cash equivalent 4,453.21 5,461.07 5,959.21
Due from Nepal Rastra Bank 6,454.93 6,037.59 9,507.95
Placement with Bank and Financial Institutions 1,611.13 2,250.09 1,067.03
Derivative financial instruments 3.71 124.87 11,972.84
Other trading assets 81.32 80.73 147.02
Loan and advances to B/FIs 2,841.17 3,395.45 4,004.35
Loans and advances to customers 83,236.09 104,768.97 123,448.09
Investment securities 18,592.94 18,875.54 22,502.83
Current tax assets 68.23 177.23 313.26
Investment in subsidiaries 51.00 51.00 51.00
Investment in associates - - -

Bank Supervision Report, 2020 89
Particulars 2017-18 2018-19 2019-20
Investment property 154.64 123.35 136.61
Property and equipment 1,072.32 1,279.32 1,379.73
Goodwill and Intangible assets 12.09 33.94 101.99
Deferred tax assets - - -
Other assets 1,236.45 1,820.60 2,076.91
TOTAL ASSETS 119,869.22 144,479.76 182,668.81
Due to Bank and Financial Institutions 279.86 8,422.83 6,759.24
Due to Nepal Rastra Bank 692.43 984.06 20.05
Derivative financial instruments 73.75 - 11,862.13
Deposits from customers 101,748.24 114,904.86 139,609.50
Borrowing - - -
Current Tax Liabilities - - -
Provisions - - -
Deferred tax liabilities 261.91 82.81 130.27
Other liabilities 1,906.67 2,030.93 3,149.24
Debt securities issued 1,203.52 2,966.80 5,162.56
Subordinated Liabilities - - -
Equity 13,702.83 15,088.18 15,975.82
Share capital 8,464.39 8,887.60 9,787.77
Share premium 122.09 122.09 -
Retained earnings 1,184.43 1,663.63 944.69
Reserves 3,931.93 4,414.86 5,243.36
TOTAL EQUITY AND LIABILITIES 119,869.22 144,479.76 182,668.81
Interest Income 10,057.00 12,971.18 15,445.93
Interest Expenses 6,620.74 8,305.21 9,858.02
Net Interest Income 3,436.26 4,673.96 5,587.91
Fee and commission income 779.70 1,016.55 1,073.84
Fee and commission expense 127.90 171.26 188.58
Net Fee and commission income 651.80 845.29 885.26
Net Interest, Fee and commission income 4,088.06 5,519.25 6,473.17
Net trading income 258.68 461.66 511.72
Other operating income 308.50 111.88 161.59
Total operating income 4,655.24 6,092.80 7,146.47
Impairment charge/(reversal) for loans and other losses 230.39 180.59 727.82
Net operating income 4,424.84 5,912.20 6,418.65
Personnel expenses 1,085.84 1,693.34 2,236.95
Other operating expenses 490.92 762.40 919.11
Depreciation &Amortization 118.45 141.40 196.95

Bank Supervision Report, 2020 90
Particulars 2017-18 2018-19 2019-20
Operating Profit 2,729.62 3,315.06 3,065.64
Non-operating income 0.40 17.60 0.21
Non-operating expense - 1.02 39.22
Profit before income tax 2,730.02 3,331.65 3,026.63
Income Tax Expense
933.86
Current Tax 819.70 1,035.90 981.44
Deferred Tax 6.26 13.11 (47.58)
Profit/Loss for the period 1,904.06 2,308.85 2,092.77
17. Agricultural Development Bank Rs. in Million
Particulars 2017-18 2018-19 2019-20
Cash and cash equivalent 11,227.27 11,500.46 8,504.50
Due from Nepal Rastra Bank 8,270.67 4,993.66 12,561.91
Placement with Bank and Financial Institutions - 2,858.70 5,007.61
Derivative financial instruments - 118.55 133.76
Other trading assets - - 37.21
Loan and advances to B/FIs 495.00 1,285.27 1,149.05
Loans and advances to customers 100,030.11 108,806.70 123,052.28
Investment securities 12,246.65 16,846.61 24,379.55
Current tax assets - 206.42 853.53
Investment in subsidiaries 28.84 28.84 28.84
Investment in associates 69.38 69.38 69.38
Investment property 240.31 258.42 220.93
Property and equipment 1,213.60 1,264.19 1,292.66
Goodwill and Intangible assets 50.01 69.40 289.80
Deferred tax assets - - -
Other assets 1,547.77 3,151.12 1,836.05
TOTAL ASSETS 135,419.61 151,457.73 179,417.06
Due to Bank and Financial Institutions 551.89 478.37 103.13
Due to Nepal Rastra Bank 195.16 38.42 9.67
Derivative financial instruments - - -
Deposits from customers 104,216.46 118,884.92 143,648.27
Borrowing 360.45 60.92 12.06
Current Tax Liabilities 156.23 - -
Provisions - - -
Deferred tax liabilities 139.36 113.54 145.01
Other liabilities 2,881.77 3,528.83 4,544.83
Debt securities issued 460.00 - 2,494.65

Bank Supervision Report, 2020 91
Particulars 2017-18 2018-19 2019-20
Subordinated Liabilities - - -
Equity 13,937.93 28,352.73 28,459.44
Share capital - 14,448.24 14,989.17
Share premium 2,598.64 - -
Retained earnings 9,921.74 3,422.04 2,100.46
Reserves - 10,482.45 11,369.81
TOTAL EQUITY AND LIABILITIES 135,419.61 151,457.73 179,417.06
Interest Income 13,603.75 15,480.12 15,349.07
Interest Expenses 6,966.29 7,865.13 9,113.28
Net Interest Income 6,637.47 7,614.99 6,235.79
Fee and commission income 949.77 1,081.48 1,912.61
Fee and commission expense 6.06 11.01 99.14
Net Fee and commission income 943.71 1,070.47 1,813.47
Net Interest, Fee and commission income 7,581.18 8,685.46 8,049.26
Net trading income 188.13 318.87 391.15
Other operating income 45.98 18.90 34.85
Total operating income 7,815.28 9,023.23 8,475.26
Impairment charge/(reversal) for loans and other losses (822.35) (289.85) 344.65
Net operating income 8,637.64 9,313.08 8,130.62
Personnel expenses 3,060.56 2,928.86 2,540.62
Other operating expenses 712.32 876.31 914.52
Depreciation &Amortization 131.93 166.19 215.53
Operating Profit 4,732.83 5,341.72 4,459.95
Non-operating income 235.83 382.28 80.73
Non-operating expense 4.32 - 0.04
Profit before income tax 4,964.33 5,723.99 4,540.64
Income Tax Expense 1,522.01 1,532.41 1,072.61
Current Tax 1,500.23 1,565.73 1,071.41
Deferred Tax 21.78 (33.32) 1.21
Profit/Loss for the period 3,442.32 4,191.59 3,468.03
18. Global IME Bank Limited Rs. in Million
Particulars 2017-18 2018-19 2019-20
Cash and cash equivalent 8,027.50 11,531.56 8,722.43
Due from Nepal Rastra Bank 4,768.99 5,217.31 11,775.49
Placement with Bank and Financial Institutions - - 9,459.38
Derivative financial instruments - 4,112.52 8,876.12
Other trading assets - - -

Bank Supervision Report, 2020 92
Particulars 2017-18 2018-19 2019-20
Loan and advances to B/FIs 3,474.26 4,054.63 7,660.46
Loans and advances to customers 88,878.10 108,977.61 189,388.66
Investment securities 16,320.65 13,153.15 28,018.61
Current tax assets 1,010.33 1,259.70 1,639.87
Investment in subsidiaries 219.78 219.78 557.10
Investment in associates 298.06 319.58 404.22
Investment property 91.92 118.69 335.30
Property and equipment 1,324.47 1,373.57 2,543.21
Goodwill and Intangible assets 31.95 28.29 240.27
Deferred tax assets 177.85 212.08 279.84
Other assets 1,223.60 1,075.10 4,181.97
TOTAL ASSETS 125,847.43 151,653.57 274,082.96
Due to Bank and Financial Institutions 1,659.93 4,410.88 14,327.70
Due to Nepal Rastra Bank 1,034.65 1,231.80 1,339.36
Derivative financial instruments 45.26 3,879.90 8,773.44
Deposits from customers 104,850.51 120,088.44 212,315.39
Borrowing - - 2,404.00
Current Tax Liabilities 948.52 1,202.57 1,294.77
Provisions - - -
Deferred tax liabilities - - -
Other liabilities 3,329.90 3,011.35 3,113.28
Debt securities issued 400.00 1,496.45 1,497.06
Subordinated Liabilities - - -
Equity 13,578.68 16,332.18 29,017.95
Share capital 8,888.38 10,310.52 18,975.88
Share premium - - 5.39
Retained earnings 1,460.83 2,663.62 1,618.56
Reserves 3,229.47 3,358.04 8,418.12
TOTAL EQUITY AND LIABILITIES 125,847.43 151,653.57 274,082.96
Interest Income 11,481.73 13,530.88 20,459.46
Interest Expenses 7,604.85 8,288.54 12,267.39
Net Interest Income 3,876.88 5,242.35 8,192.08
Fee and commission income 933.46 1,181.10 1,472.14
Fee and commission expense 174.78 216.43 242.01
Net Fee and commission income 758.68 964.66 1,230.13
Net Interest, Fee and commission income 4,635.56 6,207.01 9,422.21
Net trading income 261.96 412.13 579.52
Other operating income 198.16 163.06 206.65

Bank Supervision Report, 2020 93
Particulars 2017-18 2018-19 2019-20
Total operating income 5,095.69 6,782.19 10,208.37
Impairment charge/(reversal) for loans and other losses (289.84) 198.19 1,740.62
Net operating income 5,385.52 6,584.00 8,467.75
Personnel expenses 1,314.22 1,579.66 2,486.11
Other operating expenses 766.48 859.41 1,272.27
Depreciation &Amortization 243.74 238.30 304.12
Operating Profit 3,061.07 3,906.63 4,405.25
Non-operating income 1.89 27.29 0.64
Non-operating expense 150.98 - 58.52
Profit before income tax 2,911.98 3,933.92 4,347.37
Income Tax Expense - - 1,259.33
Current Tax 948.52 1,202.57 1,294.77
Deferred Tax (137.90) (30.61) (35.44)
Profit/Loss for the period 2,101.36 2,761.95 3,088.04
19. NMB Bank Limited Rs. in Million
Particulars 2017-18 2018-19 2019-20
Cash and cash equivalent 5,183.94 8,096.35 11,101.11
Due from Nepal Rastra Bank 6,840.51 10,829.18 15,250.10
Placement with Bank and Financial Institutions 276.41 2,172.97 3,304.24
Derivative financial instruments 7,506.75 8,595.48 10,066.30
Other trading assets 321.72 340.39 266.89
Loan and advances to B/FIs 2,497.57 3,317.96 4,641.00
Loans and advances to customers 72,711.77 88,485.03 115,703.26
Investment securities 9,448.45 10,316.35 14,998.76
Current tax assets 763.88 - 55.89
Investment in subsidiaries 248.55 248.55 372.49
Investment in associates - - -
Investment property 59.77 102.92 79.65
Property and equipment 1,559.57 1,577.90 1,758.44
Goodwill and Intangible assets 22.05 115.42 122.87
Deferred tax assets 66.87 70.04 270.79
Other assets 4,883.61 1,201.87 1,431.60
TOTAL ASSETS 112,391.43 135,470.41 179,423.37
Due to Bank and Financial Institutions 1,036.27 624.36 3,150.01
Due to Nepal Rastra Bank 660.07 3,203.52 4,832.50
Derivative financial instruments 7,477.48 8,458.37 10,008.21
Deposits from customers 83,970.87 97,892.30 131,660.37

Bank Supervision Report, 2020 94
Particulars 2017-18 2018-19 2019-20
Borrowing - 3,468.06 3,416.31
Current Tax Liabilities 824.30 35.58 -
Provisions 9.08 - -
Deferred tax liabilities - - -
Other liabilities 1,406.00 2,145.96 3,209.68
Debt securities issued 517.55 2,239.24 2,279.83
Subordinated Liabilities - - -
Equity 16,489.81 17,403.02 20,866.45
Share capital 7,603.29 9,618.16 13,950.99
Share premium 4,061.37 2,512.80 120.17
Retained earnings 2,339.18 1,780.33 964.01
Reserves 2,485.97 3,491.73 5,831.29
TOTAL EQUITY AND LIABILITIES 112,391.43 135,470.41 179,423.37
Interest Income 8,728.70 11,082.06 14,472.37
Interest Expenses 5,824.69 6,838.04 8,946.75
Net Interest Income 2,904.01 4,244.02 5,525.61
Fee and commission income 794.25 1,003.53 914.17
Fee and commission expense 62.71 93.96 106.92
Net Fee and commission income 731.54 909.58 807.25
Net Interest, Fee and commission income 3,635.56 5,153.60 6,332.86
Net trading income 299.61 352.05 384.16
Other operating income 164.96 210.37 218.04
Total operating income 4,100.12 5,716.02 6,935.05
Impairment charge/(reversal) for loans and other losses (219.65) 166.27 1,619.61
Net operating income 4,319.78 5,549.75 5,315.45
Personnel expenses 1,021.57 1,415.79 1,706.50
Other operating expenses 589.39 708.66 932.26
Depreciation &Amortization 147.70 176.80 242.02
Operating Profit 2,561.12 3,248.50 2,434.66
Non-operating income 43.14 17.10 627.15
Non-operating expense 37.94 17.60 59.90
Profit before income tax 2,566.32 3,248.00 3,001.91
Income Tax Expense - - 731.24
Current Tax 829.62 994.17 731.24
Deferred Tax (117.09) (3.44) -
Profit/Loss for the period 1,853.79 2,257.28 2,270.67

Bank Supervision Report, 2020 95
20. Citizens Bank International Limited Rs. in Million
Particulars 2017-18 2018-19 2019-20
Cash and cash equivalent 5,046.24 6,740.70 10,841.97
Due from Nepal Rastra Bank 3,690.19 2,596.97 2,430.00
Placement with Bank and Financial Institutions 1,989.88 394.77 302.68
Derivative financial instruments 36.39 44.10 -
Other trading assets 76.24 567.25 83.33
Loan and advances to B/FIs 1,420.65 1,581.90 1,534.10
Loans and advances to customers 55,601.77 62,911.97 79,169.82
Investment securities 5,616.86 10,822.60 11,834.47
Current tax assets 114.65 14.62 147.09
Investment in subsidiaries 117.20 167.20 167.20
Investment in associates 17.95 17.95 18.95
Investment property 287.55 222.55 195.53
Property and equipment 2,121.59 2,302.85 2,491.64
Goodwill and Intangible assets 70.53 93.35 77.83
Deferred tax assets - 20.24 -
Other assets 1,502.27 1,622.34 1,169.87
TOTAL ASSETS 77,709.95 90,121.36 110,464.48
Due to Bank and Financial Institutions 3,335.29 3,926.66 3,688.90
Due to Nepal Rastra Bank 695.04 1,212.59 567.58
Derivative financial instruments -
0.55
Deposits from customers 60,696.03 70,509.08 88,516.23
Borrowing -
-
Current Tax Liabilities -
-
Provisions 5.31 5.31 5.31
Deferred tax liabilities 17.68
3.03
Other liabilities 1,447.98 1,473.95 1,340.50
Debt securities issued 498.72 499.15 2,974.16
Subordinated Liabilities -
-
Equity 11,013.91 12,494.62 13,368.23
Share capital 8,033.24 8,371.06 9,089.82
Share premium 0.43 46.82 4.12
Retained earnings 132.23 1,251.27 877.47
Reserves 2,848.01 2,825.47 3,396.81
TOTAL EQUITY AND LIABILITIES 77,709.95 90,121.36 110,464.48
Interest Income 7,109.39 8,532.28 9,486.24
Interest Expenses 4,887.32 5,843.82 6,604.55
Net Interest Income 2,222.07 2,688.46 2,881.69

Bank Supervision Report, 2020 96
Particulars 2017-18 2018-19 2019-20
Fee and commission income 559.88 568.57 582.24
Fee and commission expense 50.84 67.39 65.88
Net Fee and commission income 509.05 501.18 516.36
Net Interest, Fee and commission income 2,731.12 3,189.64 3,398.05
Net trading income 181.07 277.32 270.84
Other operating income 120.70 30.47 99.67
Total operating income 3,032.89 3,497.43 3,768.56
Impairment charge/(reversal) for loans and other losses 89.32 138.37 677.30
Net operating income 2,943.57 3,635.80 3,091.26
Personnel expenses 784.06 900.24 928.37
Other operating expenses 347.36 464.65 496.38
Depreciation & Amortization 126.53 170.50 211.77
Operating Profit 1,685.63 2,100.40 1,454.74
Non-operating income 37.96 77.79 122.57
Non-operating expense 16.72 0.58 -
Profit before income tax 1,706.87 2,177.61 1,577.31
Income Tax Expense - - 461.27
Current Tax 536.35 776.35 462.85
Deferred Tax 63.59 61.95 (1.58)
Profit/Loss for the period 1,234.10 1,463.22 1,116.04
21. Prime Commercial Bank Limited Rs. in Million
Particulars 2017-18 2018-19 2019-20
Cash and cash equivalent 4,502.74 5,304.76 10,379.97
Due from Nepal Rastra Bank 8,815.84 7,807.98 8,716.15
Placement with Bank and Financial Institutions 1,960.45 1,118.73 2,260.12
Derivative financial instruments - - -
Other trading assets - - -
Loan and advances to B/FIs 2,829.04 3,014.81 4,122.88
Loans and advances to customers 67,137.82 72,545.40 110,454.30
Investment securities 8,428.08 10,142.16 13,684.28
Current tax assets 153.62 112.53 172.84
Investment in subsidiaries - - -
Investment in associates 28.00 51.02 60.02
Investment property 15.53 242.56 495.84
Property and equipment 606.76 743.98 1,065.44
Goodwill and Intangible assets 5.28 7.71 16.00
Deferred tax assets 33.16 74.33 48.83

Bank Supervision Report, 2020 97
Particulars 2017-18 2018-19 2019-20
Other assets 527.67 1,089.86 743.01
TOTAL ASSETS 95,043.98 102,255.83 152,219.67
Due to Bank and Financial Institutions 8,668.49 9,217.76 10,350.29
Due to Nepal Rastra Bank 1,269.89 1,269.35 121.20
Derivative financial instruments - - -
Deposits from customers 72,635.99 77,040.07 119,441.61
Borrowing - - -
Current Tax Liabilities - - -
Provisions - - -
Deferred tax liabilities - - -
Other liabilities 1,261.90 1,324.65 1,760.63
Debt securities issued - - -
Subordinated Liabilities - - -
Equity 11,207.71 13,403.99 20,545.94
Share capital 8,033.30 9,318.63 13,985.25
Share premium - - 0.64
Retained earnings 1,335.89 1,575.65 1,764.35
Reserves 1,838.52 2,509.72 4,795.69
TOTAL EQUITY AND LIABILITIES 95,043.98 102,255.83 152,219.67
Interest Income 8,559.69 9,822.37 12,210.42
Interest Expenses 5,893.78 6,237.76 7,592.61
Net Interest Income 2,665.92 3,584.61 4,617.81
Fee and commission income 666.14 766.87 902.55
Fee and commission expense 46.53 51.28 69.66
Net Fee and commission income 619.61 715.60 832.89
Net Interest, Fee and commission income 3,285.53 4,300.20 5,450.70
Net trading income 177.88 234.44 267.53
Other operating income 161.73 70.41 61.86
Total operating income 3,625.14 4,605.05 5,780.08
Impairment charge/(reversal) for loans and other losses 223.99 135.34 782.96
Net operating income 3,401.15 4,469.71 4,997.12
Personnel expenses 631.65 888.34 1,080.28
Other operating expenses 273.54 350.95 505.88
Depreciation &Amortization 70.13 80.92 140.73
Operating Profit 2,425.84 3,149.52 3,270.23
Non-operating income 21.59 - -
Non-operating expense - - -

Bank Supervision Report, 2020 98
Particulars 2017-18 2018-19 2019-20
Profit before income tax 2,447.42 3,149.52 3,270.23
Income Tax Expense - - 977.43
Current Tax 728.86 990.82 977.43
Deferred Tax (7.68) (40.09) -
Profit/Loss for the period 1,726.25 2,198.80 2,292.80
22. Sunrise Bank Limited Rs. in Million
Particulars 2017-18 2018-19 2019-20
Cash and cash equivalent 2,442.01 6,356.73 8,011.84
Due from Nepal Rastra Bank 5,033.06 3,241.04 7,806.30
Placement with Bank and Financial Institutions 3,869.63 1,165.35 1,206.00
Derivative financial instruments - 93.86 68.02
Other trading assets - - -
Loan and advances to B/FIs 999.59 1,149.78 2,395.07
Loans and advances to customers 59,213.55 68,865.81 81,040.37
Investment securities 9,720.46 11,724.18 13,112.95
Current tax assets 43.09 84.94 206.38
Investment in subsidiaries 157.14 157.14 157.14
Investment in associates - - -
Investment property 119.25 398.18 433.36
Property and equipment 730.25 918.84 1,064.64
Goodwill and Intangible assets 76.42 68.49 48.07
Deferred tax assets 53.15 2.85 15.49
Other assets 325.33 383.55 1,065.78
TOTAL ASSETS 82,782.91 94,610.74 116,631.41
Due to Bank and Financial Institutions 2,126.89 3,809.33 5,191.81
Due to Nepal Rastra Bank 526.57 839.81 743.47
Derivative financial instruments 23.32 - -
Deposits from customers 67,366.13 75,432.15 90,223.27
Borrowing - - 1,202.50
Current Tax Liabilities - - -
Provisions - - -
Deferred tax liabilities - - -
Other liabilities 1,185.66 1,263.19 1,754.87
Debt securities issued - 996.11 3,986.60
Subordinated Liabilities - - -
Equity 11,554.34 12,270.15 13,528.90
Share capital 8,152.56 8,152.56 8,967.81

Bank Supervision Report, 2020 99
Particulars 2017-18 2018-19 2019-20
Share premium 127.16 127.16 -
Retained earnings 941.86 1,175.25 1,091.29
Reserves 2,332.77 2,815.18 3,469.80
TOTAL EQUITY AND LIABILITIES 82,782.91 94,610.74 116,631.41
Interest Income 7,647.36 9,206.43 10,038.11
Interest Expenses 4,776.43 5,621.44 6,160.01
Net Interest Income 2,870.93 3,584.99 3,878.10
Fee and commission income 619.91 782.28 990.03
Fee and commission expense 159.34 120.23 130.26
Net Fee and commission income 460.57 662.05 859.77
Net Interest, Fee and commission income 3,331.50 4,247.04 4,737.87
Net trading income - 264.60 222.77
Other operating income 227.69 64.61 76.96
Total operating income 3,559.19 4,576.25 5,037.60
Impairment charge/(reversal) for loans and other losses 48.59 103.52 837.21
Net operating income 3,510.60 4,472.72 4,200.39
Personnel expenses 908.49 1,150.27 1,363.28
Other operating expenses 442.24 630.40 686.13
Depreciation &Amortization 112.41 141.43 179.16
Operating Profit 2,047.45 2,550.63 1,971.83
Non-operating income 68.20 1.18 5.56
Non-operating expense 164.38 45.91 4.87
Profit before income tax 1,951.27 2,505.89 1,972.51
Income Tax Expense - - 579.63
Current Tax 615.00 762.04 592.28
Deferred Tax (140.71) 37.75 (12.65)
Profit/Loss for the period 1,476.97 1,706.10 1,392.88
23. Civil Bank Limited Rs. in Million
Particulars 2017-18 2018-19 2019-20
Cash and cash equivalent 2,334.38 3,958.59 4,725.49
Due from Nepal Rastra Bank 2,337.62 3,525.08 3,949.89
Placement with Bank and Financial Institutions 663.70 659.10 803.36
Derivative financial instruments 0.48 1,732.50 3,361.08
Other trading assets - - -
Loan and advances to B/FIs 1,868.15 1,805.00 1,767.33
Loans and advances to customers 38,254.79 42,593.69 51,512.72
Investment securities 5,526.47 6,755.98 8,197.29

Bank Supervision Report, 2020 100
Particulars 2017-18 2018-19 2019-20
Current tax assets 21.51 16.88 274.53
Investment in subsidiaries 120.62 201.87 260.06
Investment in associates - - -
Investment property 177.16 227.98 208.58
Property and equipment 255.89 501.01 611.87
Goodwill and Intangible assets 40.58 38.38 34.02
Deferred tax assets - - -
Other assets 323.87 451.69 1,493.08
TOTAL ASSETS 51,925.23 62,467.74 77,199.29
Due to Bank and Financial Institutions 6,549.78 6,517.06 3,130.18
Due to Nepal Rastra Bank 548.72 531.25 728.57
Derivative financial instruments - 1,673.81 3,381.45
Deposits from customers 34,222.60 41,993.30 57,512.41
Borrowing - - -
Current Tax Liabilities - - -
Provisions 1.06 - -
Deferred tax liabilities 149.02 155.43 151.48
Other liabilities 604.13 1,445.55 2,222.99
Debt securities issued - -
Subordinated Liabilities - -
Equity 9,849.92 10,151.34 10,072.21
Share capital 7,259.31 8,003.39 8,003.39
Share premium 36.39
-
Retained earnings 1,069.62 540.23 264.74
Reserves 1,484.60 1,607.72 1,804.08
TOTAL EQUITY AND LIABILITIES 51,925.23 62,467.74 77,199.29
Interest Income 4,441.86 5,727.89 6,198.10
Interest Expenses 3,033.46 3,526.41 3,959.67
Net Interest Income 1,408.40 2,201.47 2,238.43
Fee and commission income 242.34 221.89 299.05
Fee and commission expense 23.10 24.00 27.03
Net Fee and commission income 219.24 197.89 272.02
Net Interest, Fee and commission income 1,627.64 2,399.36 2,510.45
Net trading income 156.58 197.96 229.85
Other operating income 43.15 51.74 50.88
Total operating income 1,827.37 2,649.06 2,791.18
Impairment charge/(reversal) for loans and other losses (125.83) 58.89 442.03
Net operating income 1,953.20 2,590.17 2,349.15

Bank Supervision Report, 2020 101
Particulars 2017-18 2018-19 2019-20
Personnel expenses 558.41 792.92 1,014.73
Other operating expenses 351.55 556.11 551.35
Depreciation &Amortization 59.61 66.52 108.78
Operating Profit 983.62 1,174.62 674.29
Non-operating income 42.09 16.95 -
Non-operating expense 130.46 120.84 29.75
Profit before income tax 895.25 1,070.73 644.54
Income Tax Expense - - 187.54
Current Tax 273.31 350.52 193.36
Deferred Tax (7.96) 12.80 (5.82)
Profit/Loss for the period 629.90 707.41 457.00
24. Prabhu Bank Limited Rs. in Million
Particulars 2017-18 2018-19 2019-20
Cash and cash equivalent 13,155.09 15,163.38 7,677.02
Due from Nepal Rastra Bank 6,172.04 6,668.57 20,028.38
Placement with Bank and Financial Institutions 2,215.41 - 769.05
Derivative financial instruments - 82.87 5,353.76
Other trading assets - - -
Loan and advances to B/FIs 3,181.81 3,931.85 3,897.66
Loans and advances to customers 72,990.23 86,415.90 99,692.11
Investment securities 8,035.89 14,572.08 20,280.79
Current tax assets 38.57 5.99 50.22
Investment in subsidiaries 116.96 116.96 116.96
Investment in associates - - -
Investment property 464.80 439.18 517.58
Property and equipment 2,107.74 2,280.26 2,355.48
Goodwill and Intangible assets 17.23 39.77 47.76
Deferred tax assets - - 257.05
Other assets 4,090.39 4,189.34 6,682.67
TOTAL ASSETS 112,586.17 133,906.16 167,726.50
Due to Bank and Financial Institutions - - 7,785.25
Due to Nepal Rastra Bank 702.21 801.79 4,794.41
Derivative financial instruments 45.85 - 5,311.76
Deposits from customers 97,259.66 112,393.45 128,494.35
Borrowing - 1,100.40 495.18
Current Tax Liabilities - - -
Provisions 23.32 23.33 23.32

Bank Supervision Report, 2020 102
Particulars 2017-18 2018-19 2019-20
Deferred tax liabilities 387.17 417.76 -
Other liabilities 1,597.70 4,602.86 4,215.40
Debt securities issued - - 1,000.00
Subordinated Liabilities - - -
Equity - 14,566.58 15,606.82
Share capital 8,233.95 8,892.68 10,315.51
Share premium 151.95 - -
Retained earnings 773.63 1,795.54 1,105.82
Reserves 3,410.72 3,878.37 4,185.50
TOTAL EQUITY AND LIABILITIES 112,586.17 133,906.16 167,726.50
Interest Income 8,244.60 10,934.93 11,920.87
Interest Expenses 5,426.59 6,365.00 7,275.06
Net Interest Income 2,818.00 4,569.32 4,645.81
Fee and commission income 614.14 731.92 925.05
Fee and commission expense 70.96 72.38 105.84
Net Fee and commission income 543.18 659.55 819.20
Net Interest, Fee and commission income 3,361.18 5,228.87 5,465.02
Net trading income 341.15 366.92 393.48
Other operating income 54.69 197.66 73.56
Total operating income 3,757.02 5,793.45 5,932.05
Impairment charge/(reversal) for loans and other losses (154.55) 84.44 252.94
Net operating income 3,911.58 5,877.89 5,679.12
Personnel expenses 1,348.63 1,789.21 2,090.16
Other operating expenses 617.80 994.46 1,228.72
Depreciation & Amortization 201.13 226.52 267.55
Operating Profit 1,744.01 2,867.69 2,092.68
Non-operating income 6.50 8.71 5.58
Non-operating expense 400.06 167.32 31.07
Profit before income tax 1,350.45 2,709.09 2,067.19
Income Tax Expense - - 700.22
Current Tax 288.04 622.95 701.46
Deferred Tax 95.37 35.58 (1.25)
Profit/Loss for the period 967.03 2,050.56 1,366.97
25. Mega Bank Nepal Limited Rs. in Million
Particulars 2017-18 2018-19 2019-20
Cash and cash equivalent 6,604.22 8,109.86 18,717.43
Due from Nepal Rastra Bank 5,349.40 2,964.97 3,599.95

Bank Supervision Report, 2020 103
Particulars 2017-18 2018-19 2019-20
Placement with Bank and Financial Institutions 883.61 739.54 51.33
Derivative financial instruments 3,284.58 1,057.62 517.81
Other trading assets - - -
Loan and advances to B/FIs 1,591.79 2,675.25 3,323.59
Loans and advances to customers 55,528.64 69,861.33 110,604.13
Investment securities 7,068.83 11,496.08 15,451.74
Current tax assets 22.06 50.53 350.65
Investment in subsidiaries 200.00 200.00 200.00
Investment in associates - 13.60 38.60
Investment property 243.94 201.48 219.90
Property and equipment 673.14 734.92 1,379.78
Goodwill and Intangible assets 25.95 53.97 67.68
Deferred tax assets - 78.19 102.59
Other assets 588.80 528.42 499.68
TOTAL ASSETS 82,064.95 98,765.76 155,124.85
Due to Bank and Financial Institutions 986.65 3,858.04 4,214.93
Due to Nepal Rastra Bank 603.57 731.80 614.53
Derivative financial instruments 3,258.18 973.92 440.70
Deposits from customers 63,499.00 78,684.86 127,894.61
Borrowing - - 2,440.27
Current Tax Liabilities - - -
Provisions 11.49 - -
Deferred tax liabilities 73.53 - -
Other liabilities 998.29 1,005.24 1,915.51
Debt securities issued - - -
Subordinated Liabilities - - -
Equity 12,634.23 13,511.90 17,604.29
Share capital 10,285.53 10,388.62 13,138.62
Share premium 2.56 - 27.90
Retained earnings 708.63 1,221.87 1,117.18
Reserves 1,637.51 1,901.41 3,320.59
TOTAL EQUITY AND LIABILITIES 82,064.95 98,765.76 155,124.85
Interest Income 6,022.14 9,374.68 10,383.07
Interest Expenses 3,648.58 5,578.93 6,212.02
Net Interest Income 2,373.56 3,795.75 4,171.05
Fee and commission income 320.27 531.12 522.19
Fee and commission expense 24.55 46.49 50.85
Net Fee and commission income 295.72 484.62 471.34

Bank Supervision Report, 2020 104
Particulars 2017-18 2018-19 2019-20
Net Interest, Fee and commission income 2,669.28 4,280.37 4,642.39
Net trading income 152.10 277.92 328.09
Other operating income 52.00 102.53 140.14
Total operating income 2,873.38 4,660.83 5,110.61
Impairment charge/(reversal) for loans and other losses 12.41 426.62 888.54
Net operating income 2,860.96 4,234.21 4,222.08
Personnel expenses 698.94 1,154.14 1,250.83
Other operating expenses 370.67 629.16 665.68
Depreciation &Amortization 79.24 116.44 151.07
Operating Profit 1,712.11 2,334.46 2,154.50
Non-operating income 145.14 8.15 9.95
Non-operating expense 14.25 19.67 8.15
Profit before income tax 1,843.00 2,322.95 2,156.29
Income Tax Expense - - 635.70
Current Tax 454.05 709.30 646.06
Deferred Tax 71.59 16.04 (10.36)
Profit/Loss for the period 1,317.35 1,629.69 1,520.59
26.Century Commercial Bank Limited Rs. in Million
Particulars 2017-18 2018-19 2019-20
Cash and cash equivalent 4,437.24 5,402.67 5,297.28
Due from Nepal Rastra Bank 6,897.64 5,447.29 7,549.39
Placement with Bank and Financial Institutions 1,192.32 1,099.00 635.95
Derivative financial instruments 7.25 - -
Other trading assets - - -
Loan and advances to B/FIs 1,634.59 2,140.93 2,373.90
Loans and advances to customers 52,844.02 57,089.33 58,044.42
Investment securities 3,961.47 5,060.14 6,734.57
Current tax assets 58.90 263.12 177.86
Investment in subsidiaries 171.50 171.50 171.50
Investment in associates - 27.50 27.50
Investment property 22.79 17.66 17.66
Property and equipment 483.28 620.72 632.84
Goodwill and Intangible assets 10.04 13.73 11.94
Deferred tax assets 37.93 25.84 16.89
Other assets 978.93 929.20 1,466.85
TOTAL ASSETS 72,737.90 78,308.62 83,158.55
Due to Bank and Financial Institutions 7,989.93 5,212.10 5,028.34

Bank Supervision Report, 2020 105
Particulars 2017-18 2018-19 2019-20
Due to Nepal Rastra Bank 586.57 834.59 417.14
Derivative financial instruments - 37.54 288.47
Deposits from customers 53,331.62 60,276.50 65,340.39
Borrowing - 800.00 -
Current Tax Liabilities - - -
Provisions - 51.04 88.67
Deferred tax liabilities - - -
Other liabilities 1,359.71 1,104.54 1,328.49
Debt securities issued - - -
Subordinated Liabilities - - -
Equity
9,992.31 10,667.05
Share capital 8,063.43 8,415.47 8,415.47
Share premium 7.44 34.37 34.37
Retained earnings 480.78 533.85 682.10
Reserves 918.41 1,008.62 1,535.10
TOTAL EQUITY AND LIABILITIES 72,737.90 78,308.62 83,158.55
Interest Income 6,174.04 7,888.55 8,012.65
Interest Expenses (4,254.75) 5,296.51 5,150.65
Net Interest Income 1,919.28 2,592.04 2,862.00
Fee and commission income 346.54 352.03 265.37
Fee and commission expense (13.62) 29.48 16.61
Net Fee and commission income 332.92 322.55 248.75
Net Interest, Fee and commission income 2,252.20 2,914.59 3,110.75
Net trading income 176.32 180.42 174.50
Other operating income 24.28 36.36 28.14
Total operating income 2,452.79 3,131.37 3,313.39
Impairment charge/(reversal) for loans and other losses (38.23) 574.32 534.60
Net operating income 2,414.57 2,557.04 2,778.79
Personnel expenses - 854.94 918.54
Other operating expenses (651.88) 553.54 490.20
Depreciation & Amortization (400.77) 122.60 141.17
Operating Profit (87.97) 1,025.97 1,228.87
Non-operating income 1,273.94 39.30 75.29
Non-operating expense 50.68 68.18 5.57
Profit before income tax 1,324.62 997.08 1,298.60
Income Tax Expense - - 392.27
Current Tax (402.07) 306.75 392.27
Deferred Tax (10.27) 13.93 -

Bank Supervision Report, 2020 106
Particulars 2017-18 2018-19 2019-20
Profit/Loss for the period 912.28 676.41 906.32
27. Sanima Bank Limited Rs. in Million
Particulars 2017-18 2018-19 2019-20
Cash and cash equivalent 4,530.15 4,636.42 5,190.30
Due from Nepal Rastra Bank 5,608.17 2,781.20 5,325.68
Placement with Bank and Financial Institutions 649.16 827.70 2,827.09
Derivative financial instruments - 85.07 40.22
Other trading assets 478.05 484.42 443.45
Loan and advances to B/FIs 1,645.22 2,020.42 2,655.93
Loans and advances to customers 67,598.13 81,418.86 90,566.10
Investment securities 9,413.44 13,611.19 15,018.42
Current tax assets - - 40.80
Investment in subsidiaries 250.00 250.00 250.00
Investment in associates - - -
Investment property - - -
Property and equipment 881.85 1,150.52 1,159.09
Goodwill and Intangible assets 56.55 70.32 60.53
Deferred tax assets 50.15 14.77 26.85
Other assets 661.07 1,713.60 2,531.17
TOTAL ASSETS 91,821.95 109,064.49 126,135.64
Due to Bank and Financial Institutions 1,346.96 3,694.46 3,690.39
Due to Nepal Rastra Bank 358.95 1,018.92 86.29
Derivative financial instruments 18.85 - -
Deposits from customers 77,849.38 89,373.73 106,835.79
Borrowing - - -
Current Tax Liabilities 66.29 24.77 -
Provisions 11.82 27.17 33.09
Deferred tax liabilities - - -
Other liabilities 1,011.81 1,211.17 1,018.58
Debt securities issued 370.00 1,724.71 1,724.71
Subordinated Liabilities - - -
Equity 10,787.89 11,989.56 12,746.79
Share capital 8,001.26 8,001.26 8,801.38
Share premium - - -
Retained earnings 1,136.68 1,751.51 1,119.72
Reserves 1,649.95 2,236.79 2,825.69
TOTAL EQUITY AND LIABILITIES 91,821.95 109,064.49 126,135.64

Bank Supervision Report, 2020 107
Particulars 2017-18 2018-19 2019-20
Interest Income 8,107.98 10,757.98 11,495.49
Interest Expenses 5,092.45 6,549.28 7,280.03
Net Interest Income 3,015.52 4,208.70 4,215.46
Fee and commission income 706.39 785.12 694.97
Fee and commission expense 50.15 73.25 75.95
Net Fee and commission income 656.24 711.87 619.02
Net Interest, Fee and commission income 3,671.76 4,920.56 4,834.48
Net trading income 298.41 392.82 388.77
Other operating income 38.96 44.23 59.66
Total operating income 4,009.13 5,357.62 5,282.91
Impairment charge/(reversal) for loans and other losses 239.22 218.24 883.46
Net operating income 3,769.92 5,139.38 4,399.45
Personnel expenses 865.56 1,259.77 1,252.55
Other operating expenses 383.73 515.55 572.27
Depreciation &Amortization 105.46 139.17 156.02
Operating Profit 2,415.17 3,224.90 2,418.61
Non-operating income 0.90 2.08 1.41
Non-operating expense 0.73 6.83 1.52
Profit before income tax 2,415.34 3,220.16 2,418.50
Income Tax Expense - - 715.13
Current Tax 774.25 957.82 715.13
Deferred Tax (56.42) 4.27 -
Profit/Loss for the period 1,697.50 2,258.07 1,703.37
Consolidated Financials of the Public Banks Rs. in Million
Particulars 2017-18 2018-19 2019-20
Cash and cash equivalent 45,341.28 48,947.95 20,563.42
Due from Nepal Rastra Bank 24,199.81 30,944.39 32,940.49
Placement with Bank and Financial Institutions 2,965.49 8,286.38 11,173.18
Derivative financial instruments 18.63 5,713.17 6,660.22
Other trading assets - - 37.21
Loan and advances to B/FIs 7,280.45 9,142.99 8,829.10
Loans and advances to customers 293,000.79 345,682.98 378,448.56
Investment securities 52,964.08 54,409.31 131,233.42
Current tax assets 1,146.30 3,080.50 5,011.41
Investment in subsidiaries 228.84 228.84 228.84
Investment in associates 299.47 271.39 167.24
Investment property 384.59 486.54 433.41

Bank Supervision Report, 2020 108
Particulars 2017-18 2018-19 2019-20
Property and equipment 13,770.97 14,161.10 14,851.28
Goodwill and Intangible assets 87.99 149.24 372.61
Deferred tax assets 1,102.28 341.10 471.99
Other assets 23,427.84 31,645.11 24,812.14
TOTAL ASSETS 466,218.82 553,491.00 636,234.53
Due to Bank and Financial Institutions 6,134.07 9,506.22 3,256.55
Due to Nepal Rastra Bank 322.65 432.30 285.58
Derivative financial instruments - 5,504.43 6,419.10
Deposits from customers 367,967.49 426,117.18 516,590.27
Borrowing 641.44 1,071.41 1,072.12
Current Tax Liabilities 156.23 - -
Provisions 63.28 131.44 418.50
Deferred tax liabilities 3,365.82 3,764.51 3,927.51
Other liabilities 18,606.77 25,786.95 19,681.72
Debt securities issued 460.00 - 2,494.65
Subordinated Liabilities - - -
Equity 55,980.69 81,176.55 82,088.51
Share capital 17,047.46 33,264.18 35,276.79
Share premium 2,731.48 3,262.81 1,788.70
Retained earnings 5,548.18 7,118.67 7,578.96
Reserves 29,236.03 37,530.88 37,444.07
TOTAL EQUITY AND LIABILITIES 466,218.82 553,491.00 636,234.53
Interest Income 34,930.85 41,060.26 43,902.97
Interest Expenses 12,791.41 17,026.22 22,733.08
Net Interest Income 22,139.44 24,034.04 21,169.89
Fee and commission income 3,166.60 3,574.10 3,529.61
Fee and commission expense 266.52 197.42 317.68
Net Fee and commission income 2,900.08 3,376.68 3,211.92
Net Interest, Fee and commission income 25,039.52 27,410.72 24,381.82
Net trading income 454.31 730.63 858.44
Other operating income 40.88 350.26 982.86
Total operating income 25,534.72 28,491.62 26,223.11
Impairment charge/(reversal) for loans and other losses 384.36 639.67 974.96
Net operating income 25,150.35 27,851.93 25,248.16
Personnel expenses 8,341.84 8,125.34 7,652.15
Other operating expenses 2,007.15 2,468.76 2,955.25
Depreciation &Amortization 482.18 472.12 581.03
Operating Profit 14,319.18 16,785.71 14,059.73

Bank Supervision Report, 2020 109
Particulars 2017-18 2018-19 2019-20
Non-operating income 540.39 638.63 654.16
Non-operating expense 13.68 0.63 0.04
Profit before income tax 14,845.88 10,335.65 14,713.86
Income Tax Expense 1,522.01 1,532.41 4,236.85
Current Tax 5,435.43 3,614.96 3,262.96
Deferred Tax (906.82) 1,692.05 973.89
Profit/Loss for the period 10,317.27 12,116.70 10,477.01

Bank Supervision Report, 2020 110
Consolidated Financials of the Private Banks Rs. in Million
Particulars 2017-18 2018-19 2019-20
Cash and cash equivalent 162,051.53 203,857.99 252,152.54
Due from Nepal Rastra Bank 163,909.49 164,351.43 227,593.41
Placement with Bank and Financial Institutions 58,605.19 60,446.11 60,358.34
Derivative financial instruments 12,275.37 40,308.53 72,063.46
Other trading assets 1,220.54 2,379.52 1,328.53
Loan and advances to B/FIs 113,280.48 81,897.93 97,388.63
Loans and advances to customers 1,667,278.22 2,045,434.11 2,403,732.14
Investment securities 243,415.82 310,714.29 392,307.08
Current tax assets 4,613.42 3,536.77 11,447.70
Investment in subsidiaries 3,654.79 4,983.89 5,403.34
Investment in associates 936.36 1,200.35 1,461.01
Investment property 2,199.86 4,367.47 5,504.61
Property and equipment 28,275.94 34,456.68 37,833.32
Goodwill and Intangible assets 918.09 1,320.44 1,691.41
Deferred tax assets 810.32 1,156.06 1,628.57
Other assets 38,619.47 34,914.23 38,697.85
TOTAL ASSETS 2,502,064.89 2,995,325.78 3,610,591.93
Due to Bank and Financial Institutions 69,750.86 107,180.96 116,119.98
Due to Nepal Rastra Bank 11,097.05 24,636.04 16,530.45
Derivative financial instruments 12,751.39 37,733.75 71,214.24
Deposits from customers 2,014,181.71 2,363,753.39 2,858,201.79
Borrowing 684.91 5,697.56 14,791.29
Current Tax Liabilities 2,864.61 1,620.58 2,553.08
Provisions 204.73 166.63 207.42
Deferred tax liabilities 3,314.93 3,184.82 3,518.74
Other liabilities 50,782.73 65,843.99 77,035.39
Debt securities issued 10,881.30 27,008.95 50,846.70
Subordinated Liabilities 1,041.22 - -
Equity 292,627.78 358,499.81 399,572.86
Share capital 201,333.48 218,996.15 249,533.82
Share premium 7,832.88 3,445.55 494.62
Retained earnings 30,074.11 40,599.02 30,672.90
Reserves 85,269.00 95,459.14 118,871.53
TOTAL EQUITY AND LIABILITIES 2,502,064.89 2,995,325.78 3,610,591.93
Interest Income 205,592.70 263,411.41 284,846.26
Interest Expenses 118,957.73 159,980.82 177,264.02

Bank Supervision Report, 2020 111
Particulars 2017-18 2018-19 2019-20
Net Interest Income 78,125.47 103,437.93 107,582.25
Fee and commission income 17,660.87 21,368.85 22,173.88
Fee and commission expense 1,706.35 2,196.71 2,307.31
Net Fee and commission income 15,927.28 19,172.17 19,866.58
Net Interest, Fee and commission income 91,853.04 122,610.09 127,448.83
Net trading income 8,864.05 8,999.53 9,016.47
Other operating income 3,902.76 2,816.57 2,961.67
Total operating income 104,475.71 134,425.40 139,426.97
Impairment charge/(reversal) for loans and other losses 4,631.26 6,322.13 17,729.41
Net operating income 100,515.09 128,548.89 121,697.56
Personnel expenses 25,345.44 33,538.52 36,686.53
Other operating expenses 11,849.57 17,188.93 19,036.64
Depreciation &Amortization 2,288.50 3,626.95 4,183.36
Operating Profit 57,476.40 74,194.46 61,791.03
Non-operating income 2,139.43 1,419.07 1,366.72
Non-operating expense 1,789.19 1,083.24 723.47
Profit before income tax 58,015.98 74,530.32 62,429.27
Income Tax Expense 510.55 1,982.84 18,590.17
Current Tax 16,327.60 22,799.54 18,674.58
Deferred Tax (1,062.70) 387.75 (84.40)
Profit/Loss for the period 41,543.02 51,683.58 43,839.10

Bank Supervision Report, 2020 112
Annex 11: Useful websites for supervisors
Name of Agency Web address
Australian Prudential Regulatory Authority www.apra.gov.au
Asian Development Bank www.adb.org
Association for financial professionals www.afponline.org
American Bankers Association www.aba.com
Association of German Banks www.german-banks.com
Asian Clearing Union www.asianclearingunion.org
Bank Administration Institute (BAI) www.bai.org
Banking Federation of the European Union www.fbe.be
Bank for International Settlement www.bis.org
Bank Negara Malaysia www.bnm.gov.my
Conference of State Bank Supervisors, USA www.csbsdal.org
China Banking Regulatory Commission www.cbrc.gov.cn
European Committee for Banking Standards (ECBS) www.ecbs.org
European Bank for Reconstruction and Development www.ebrd.org
European Banking Authority www.eba.europa.eu
Financial Services Authority UK www.fsa.gov.uk
Federal Reserve Board USA www.federalreserve.gov
Federal Reserve Bank Boston www.bos.frb.org
Federal Reserve Bank St. Louis www.stls.frb.org
Federal Reserve Bank Kansas City www.kc.frb.org
Federal Reserve Bank Philadelphia www.phil.frb.org
Federal Reserve Bank Minneapolis www.mpls.frb.fed.us
Federal Reserve Bank San Francisco www.frbsf.org
Federal Reserve Bank Richmond www.richmondfed.org
Federal Reserve Bank Atlanta www.frbatlanta.org
Federal Reserve Bank New York www.newyorkfed.org
Federal Reserve Bank Dallas www.dallasfed.org
Federal Reserve Bank Cleveland www.clevelandfed.org
Federal Deposit Insurance Corporation, USA www.fdic.gov
Federal Financial Institutions Examination Council, USA www.ffiec.gov
Financial Services Agency, Japan www.fsa.go.jp
FSI Connect www.fsiconnect.org
International Accounting Standard Board www.iasb.org
International Monetary Fund (IMF) www.imf.org
Korea Financial Supervisory Commission www.fsc.go.kr
Monetary Authority of Singapore www.mas.gov.sg
Office of the superintendent of financial institutions, Canada www.osfi-bsif.gc.ca
Office of the Comptroller of the Currency, USA www.occ.treas.gov
Reserve Bank of India www.rbi.org.in
SEACEN Center, Malaysia www.seacen.org
The Risk Management Association, USA www.rmahq.org
World Bank Group www.worldbank.org