Annual Report 2020 - JS Bank
372
Annual Report 2020
-
Upload
khangminh22 -
Category
Documents
-
view
4 -
download
0
Transcript of Annual Report 2020 - JS Bank

Annual Report 2020


JS Bank is one of the fastest-growing Banks in Pakistan, with both a domestic and international presence. The Bank is a leader in the digital financial services, SME & consumer loans space. JS Bank has been recognized on multiple international and national forums including the prestigious AsiaMoney, Asian Banking and Finance, DIGI and Pakistan Banking Awards. The Bank is part of JS Group, one of Pakistan’s most diversified and progressive financial services groups.

Contents
02 Vision
02 Mission
04 Corporate Values
04 Code of Conduct
ORGANIZATIONAL OVERVIEW 05 Products and Services
08 Company Information
10 Entity Credit Rating
11 Operating Structure
12 Profile of the Board of Directors
16 Staff Strength
17 Our Presence
18 Organizational Structure
19 Corporate Profile of the Bank
20 Chairman’s Review
23 Directors’ Report
PERFORMANCE & POSITION 45 Six Years’ Financial Summary
46 Six Years’ Vertical Analysis
47 Six Years’ Horizontal Analysis
48 Financial Performance 2015- 2020
50 Graphical Presentation of Financial Statements
51 Financial Ratios
52 DuPont Analysis
53 Economic Value-Added Statement
54 Summary of Cash Flows
54 Free Cash Flows
55 Analysis of Capital Adequacy Ratio
56 Category of Investments
57 Non-Performing Loans
58 Advances by Segmentation
59 Funding Mix
60 Deposits Breakdown
60 Deposits Composition
61 Quarterly Performance
92 Quarterly Analysis of NIM & PBT
63 Markup & Non-Markup Income
65 Market Share Information
66 Share Price Trend
67 Calendar of Major Events During 2020
STRATEGY & RESOURCE ALLOCATION 68 Strategic Objectives and KPIs
69 Strategy to Overcome Liquidity Gap
IDENTIFICATION AND MITIGATION OF RISKS AND OPPORTUNITIES 73 Sources of Risk and its Assessment
74 Risk Management Framework
74 Risk Governance Structure
74 Inadequacy in the Capital Structure and Plans to Address such Inadequacy
74 Sensitivity Analysis Due to Foreign Currency Fluctuations
74 Information about Default in Payment of any Debts and Reasons Thereof
CORPORATE GOVERNANCE
76 Role & Responsibilities of the Board
80 Management Committees
82 Salient Features of Board Committees’ TOR
85 IT Governance

89 Human Resource Management Policy
92 Sustainability & Corporate Social Responsibility
94 Business Model
STAKEHOLDERS RELATIONSHIP97 Steps to Encourage Minority
Shareholders Participation in AGM
97 Investor Relation Section on Corporate Website
97 Investors Relations Policy
97 Corporate Briefing Session
98 Excellence in Corporate Reporting
99 Statement and Distribution of Value Added
100 Auditors’ Review Report to the Members on Statement of Compliance
101 Statement of Compliance with Listed Companies (CCG Regulations, 2019)
UNCONSOLIDATED FINANCIAL STATEMENTS 104 Auditors’ Report to the Members on
Unconsolidated Financial Statements
109 Unconsolidated Statement of Financial Position
110 Unconsolidated Profit and Loss Account
111 Unconsolidated Statement of Comprehensive Income
112 Unconsolidated Statement of Changes in Equity
113 Unconsolidated Cash Flow Statement
114 Notes to the Unconsolidated Financial Statements
CONSOLIDATED FINANCIAL STATEMENTS 217 Directors’ Report on Consolidated
Financial Statements
222 Auditors’ Report to the Members on Consolidated Financial Statements
227 Consolidated Statement of Financial Position
228 Consolidated Profit and Loss Account
229 Consolidated Statement of Comprehensive Income
230 Consolidated Statement of Changes in Equity
231 Consolidated Cash Flow Statement
232 Notes to the Consolidated Financial Statements
345 Annexure I
346 Annexure II
347 Branch Network
353 Pattern of Shareholding
355 Notice of Fifteenth Annual General Meeting
Form of Proxy

MissionOur mission is to be a world class bank providing innovative financial services to our customers through a motivated team of professionals, supported by the latest technology, whilst maintaining high ethical standards, creating value for all our stakeholders, and contributing to the society through responsible and sustainable development.
VisionTo be the most innovative, customer centric and responsible bank in Pakistan.


�������������������
�������������������������������������������� �������������������������
�����������������������������
�����������������������������������������
������������������������������������
�������������������������������������������������� �
������������������������������������������������������������������������������������������������������������� �
������������������������������
�������������������������
����������������������������������������
������������������������������������ ������������
�����������������������������������������
��������������������������� ����
������������������������������������
����������� ����� ���������������������
���������������������������������������������������������������
���������������������������������������������������������������������������������������������������������
����������
���������������������������������������������������������������������������������������������������������������������������������������������������������������������������������������� �����������������������������
�����������
Code of Conduct
Corporate Values
JS Bank’s Code of Conduct is designed to guide the personal business ethics of its employees and does not tolerate any conduct which might be considered detrimental to the Bank and its reputation.
The Bank considers honesty and integrity as cornerstones of ethical behavior for lasting business relationships. The Bank aims to deliver products and services in a fair, transparent, and ethical manner. Our Code of Conduct emphasizes upholding ethical standards across all business dealings and relationships. The Bank aims to be transparent in all its dealings and enhance customer banking knowledge and inform them about banking services in a wholistic manner.
The complete Code of Conduct is handed over to all employees and is available on the Bank’s website as well.
4Annual Report 2020

Products and ServicesJS Current Deposit ProductsFor complete day-to-day banking needs, JS Current Deposit menu to provides our valued customers with transactional convenience and flexibility for all their financial dealings.
JS Savings Deposit ProductsWe offer a wide array of savings products that cater to short term investment and transactional needs.
JS Term Deposit ProductsJS Term Deposits offer attractive short and medium to long-term investment options with flexibility, convenience and security. With various tenure options, customers can choose the one that suits their needs.
Foreign Currency AccountsThe customers can save in any foreign currency accounts and enjoy attractive returns. A wide range of account types are offered for personal and business clients.
Corporate BankingJS Corporate Banking is focused on providing a range of diverse financial services (including tailor made solutions) to corporate clients (including multinational and public entities) by partnering with them and build long-term sustainable relationships.
JS Private BankingJS Private Banking takes our customers on a journey of rewarding experiences and a diverse product suite of deposits, lending and investment solutions.
Employee Banking and Cash ManagementWe offer superior payroll and cash management solutions to corporates across Pakistan. In addition to the best set of product features, our payroll customers enjoy unmatched rates on consumer loans, free of cost insurance coverage and facilities such as Advance Salary, Personal Loans & Charge Cards.
JS Consumer Lending ProductsJS Consumer Banking offers a full suite of consumer lending products to our valued customers. The Bank’s Current product portfolio consists of Credit Cards, Auto loans, Home loans and Personal loans.
JS Digital Banking Products and ServicesJS Mobile and Internet Banking offer customers unprecedented control over their transactions. Customers can make real time payments, set up standing instructions and even find their favourite Discounts with a few clicks.
We provide Mastercard Debit Cards with EMV chip and NFC capabilities to our customers. Mastercard is accepted worldwide and offers added benefits, including travel and dining. For the ease of our valued customers, we are now also offering Debit Card activation via IVR and JS Bank ATMs.
As part of its drive to digitize Public to Government (P2G) payments, JS Bank partnered with KPK & Islamabad Traffic Police for issuance and payment of Digital challan. JS Bank facilitates over 6 million annual traffic violation payments through instant fine payment and real-time SMS-based notifications. JS Bank has also digitized the driving license fee process for all districts of KPK.
JS ATMsWe have a widespread ATM network placed at both Bank branches and commercial locations for consumers’ convenience. JS ATMs provide customers with 24-hour convenience to withdraw cash, view mini-statement, and make fund transfers and much more.
JS SMS AlertsWe continually update our valued customers with financial transaction and information alerts via SMS.
5 Annual Report 2020

JS Mobile WalletJS Mobile wallet allows users to open instant mobile wallet by downloading the J-Cash wallet app. The wallet offers customers services including funds transfers, bill payments, mobile recharge, online payments and e-commerce opportunities. The wallet can be topped up via multiple channels including physical locations (JCash Agents/JS Bank branches) or digital means (IBFT).
We are one of the leading players in Government to Public (G2P) payments. From remote areas of Baluchistan to Interior Sindh and from Gilgit Baltistan to along the Line of Control, JSBL agents have serviced BISP, Ehsas Kifalat, EOBI Pension and Khidmat Card Program beneficiaries in all provinces and territories of Pakistan.
JS Call CentreWe offer customers a 24/7 call center designed to enhance service delivery and support across multiple channels. Our Call Centre is equipped with trained professionals who offer a wide array of information and problem resolution support around the clock. The customers are further facilitated through self-service modes like Interactive Voice Response (IVR) and Telephonic Personal Identification Number (TPIN).
Home RemittancesWe offer customers a multitude of Home Remittance offerings and are committed to contributing towards the national interest of promoting remittances through legal channels.
We are the first bank in Pakistan which allows remittances to be sent to any cell number domestically in alliance with international remittance partners. Remittances can be collected from any JCash agent or through ATM/Debit Card.
Safe Deposit LockersWe pride ourselves in offering our customers ease of mind and this is yet another service that highlights our commitment in providing everything necessary to accommodate their needs. We offer various types of lockers depending on customer requirement to protect their documents, jewelry or any other valuables.
SME BankingWe are one of the leading banks in the SME lending space, with a variety of loans available geared towards development and expansion of SMEs across the country. We offer a diverse portfolio of lending facilities, including SBP initiatives offering rebated loans to specific target segments.
JS School Development FinanceJS School Development Finance, offers educational institutions with financing of up to Rs. 50 million to fulfil all their financial and non-financial needs.
JS Hospital FinancingJS Hospital Financing, based on State Bank’s Refinance Facility for Combating COVID-19 (RFCC), is a loan facility for Hospitals, Medical Centres and entities planning to engage in manufacturing of medical equipment to combat COVID-19 and allows them to buy local /imported medical equipment so that they are fully prepared and adequately equipped to deliver quality services.
JS Green FinancingWe offer Solar Panel financing solutions to individuals and businessmen for residential, agriculture and commercial needs. As one of Pakistan’s leading Banks in green financing, we ensure end to end comprehensive installation of solar solutions through a network of over 40 AEDB-certified partners across Pakistan.
JS Agri Financing ProductsAgriculture finance business of the Bank has embraced a new and progressive outlook as a result of various Initiatives. A well-equipped, trained & experienced team has been put in place to facilitate customers on their door steps.
JS Gold FinanceWe are one of the leading banks offering loans against gold ornaments for business and agricultural requirements. We provide one of the most swift turnaround times, with loans being processed as quickly as 100 minutes from the time of application.
6Annual Report 2020

JS Kamyab Jawan Youth Entrepreneurship Scheme (PMYES)In October 2020, we launched the Prime Minister’s Kamyab Jawan Youth Entrepreneurship Scheme (PMYES). The scheme aims at empowering the youth of Pakistan by providing them highly subsidized loans to set up or expand their business. Through its strategic alliance based model, we have partnered with various local and international organizations in the ride hailing, dairy farming and transportation segment in addition to financing individuals business loans. In the coming years, strategic partnerships in the Agri value chain, Education, Business Incubation, Economic Development, and Manufacturing sectors are being explored as we look to transform lives throughout the country.
JS Khud MukhtarA financing solution based on State Bank of Pakistan’s Refinance and Credit Guarantee Scheme for Women Entrepreneurs, JS Khud Mukhtar enables empowerment and financial stability for women entrepreneurs in Pakistan.
JS Naya Aghaaz The JS Naya Aghaaz SME Loan has been designed to enable personal development of the differently abled individuals in Pakistan through term finance based on State Bank of Pakistan’s Small Enterprise (SE) Financing and Credit Guarantee Scheme for Special Persons.
7 Annual Report 2020

Board of Directors
Mr. Kalim-ur-Rahman ChairmanMr. Adil Matcheswala Non-Executive DirectorMr. Ashraf Nawabi Non-Executive DirectorMr. G.M. Sikander Independent DirectorMr. Hassan Afzal Non-Executive DirectorMr. Munawar Alam Siddiqui Non-Executive DirectorMs. Nargis Ghaloo Independent DirectorMr. Sohail Aman Independent DirectorMr. Basir Shamsie President & CEO
Audit Committee
Ms. Nargis Ghaloo Chairperson Mr. Adil Matcheswala Member Mr. G.M. Sikander MemberMr. Munawar Alam Siddiqui Member
Human Resource, Remuneration & Nomination Committee
Mr. Sohail Aman Chairman Mr. Adil Matcheswala MemberMr. G.M. Sikander MemberMr. Kalim-ur-Rahman Member
Risk Management Committee
Mr. Ashraf Nawabi ChairmanMr. Munawar Alam Siddiqui MemberMs. Nargis Ghaloo MemberMr. Basir Shamsie Member
Board IT Committee
Mr. Hassan Afzal ChairmanMr. Kalim-ur-Rahman MemberMr. Sohail Aman MemberMr. Basir Shamsie Member
Chief Financial Officer
Mr. Hasan Shahid
Company Secretary
Mr. Ashraf Shahzad
Auditors
EY Ford Rhodes, Chartered Accountants(Member firm of Ernst & Young Global Limited)
Legal Advisors
Bawaney & Partners Haidermota & Co. Liaquat Merchant Associates
Share Registrar
CDC Share Registrar Services Limited CDC House, 99 – B, Block ‘B’, S.M.C.H.S., Main Shahra-e-Faisal, Karachi
Registered office
JS Bank Limited Shaheen Commercial Complex Dr. Ziauddin Ahmed Road P.O. Box 4847, Karachi-74200, Pakistan UAN: +92 21 111 JS Bank (572-265) 111-654-321 www.jsbl.com
Company Information
8Annual Report 2020

9 Annual Report 2020

Long Term
Short Term
AA-
A1+
(Double A Minus)
(A One Plus)
(Assigned by Pakistan Credit Rating Agency)
Entity Credit Rating
10Annual Report 2020

Operating Structure
Jahangir Siddiqui & Co. Ltd. (JSCL)
JS Bank Limited(JSCL holds 75.02% of JSBL)
JS Global Capital Limited (JSBL
holds 83.53% of JSGCL)
JS Investments Limited (JSBL
holds 84.56% of JSIL)
11 Annual Report 2020

Profile of the Board of DirectorsComposition of the Board
S.No Name of Directors Status
1 Mr. Kalim-ur-Rahman - Chairman Non- Executive Director
2 Mr. Adil Matcheswala Non- Executive Director
3 Mr. Ashraf Nawabi Non- Executive Director
4 Mr. G.M. Sikander Independent Director
5 Mr. Hassan Afzal Non- Executive Director
6 Mr. Munawar Alam Siddiqui Non- Executive Director
7 Ms. Nargis Ghaloo Independent Director
8 Mr. Sohail Aman Independent Director
9 Mr. Basir Shamsie- President & CEO Non-Elected Executive Director
The Board of Directors of JS Bank presently has three (3) directors as Independent Directors including one Female Independent Director. The Independent Directors meet the criteria of independence as defined in the Companies Act, 2017 and the State Bank of Pakistan’s directives. Further, the Board also has five Non-Executive Directors. The President & CEO of the Bank is a non-elected Executive Director.
12Annual Report 2020

Mr. Kalim-ur-Rahman Non-Executive Director – Chairman
Mr. Kalim-ur-Rahman was formerly President & CEO of JS Bank Limited from 2010 to 2013 and has been a Director of the Bank since then. He was elected Chairman of the Board of Directors in August 2019.
He is a seasoned banker with 50 years of experience in both international and domestic banking. He started his banking career with National & Grindlays Bank in 1963 as a Management trainee. After nearly three years of banking training in Pakistan and London, he was appointed as a covenanted officer of the Bank in 1966, and served in Karachi, Peshawar and London in senior positions till 1978, when he resigned and joined Middle East Bank, Dubai as Chief Manager, and subsequently promoted as Assistant General Manager - UAE Operations.
During his tenure with Middle East Bank in Dubai, he conceived and implemented the online computerization of the UAE branches in 1980, being one of the first in UAE banking. In 1985, he was posted to Karachi as General Manager – South Asia, and till 1991 saw Middle East Bank, Pakistan grow its profitability by 35% per annum CAGR from only three branches in the country. After 1991, Mr. Kalim-ur-Rahman served in several Pakistani banks in senior positions, including as the President & CEO of Askari Commercial Bank from 1999 to 2006, during which period the Bank saw a phenomenal growth in its assets (40% CAGR) and profitability (47% CAGR). He subsequently served as the General Manager of Arab Emirates Investment, Dubai 2007-2008.
Mr. Kalim-ur-Rahman was the first Secretary General of the Pakistan Banks Association 2006- 2007.
Mr. Kalim-ur-Rahman did his Senior Cambridge from Burn Hall School, Abbottabad and B.Sc. (Hons) from Government College, Lahore. He had a first class academic career throughout, and his name is inscribed on the College Roll of Honor. He is a Fellow of the Institute of Bankers in Pakistan and holds the Director’s certification from the Pakistan Institute of Corporate Governance as well as the Institute of Directors, London.
Mr. Kalim-ur-Rahman is a member of the Board’s IT Committee and the HR, Remuneration & Nomination Committee.
Directorships in Other Companies: Excel Labs (Pvt) Limited
Mr. Adil Matcheswala Non-Executive Director
Mr. Adil Matcheswala is the CEO and founding Director of Speed (Private) Limited, a retail and distribution company that is incorporated in Pakistan. The Company’s portfolio includes numerous leading international brands such as Nike, Adidas, Under Armour, Tag Heuer, Charles & Keith, Pedro and Timex.
He started his professional career in the financial services industry in 1992 and was the Head of the Equity Sales Division of Jahangir Siddiqui & Co. Ltd. (formerly Bear Stearns Jahangir Siddiqui Limited).
He has previously served as the Chairman of the Board and Chairman of the Audit Committee of JS Global Capital Ltd. as well as a Director of JS Value Fund.
He has served on the Board of JS Bank Limited since 2012. He is also a member of the Board’s Audit Committee and HR, Remuneration & Nomination Committee of the Bank.
Mr. Matcheswala graduated from Brown University with an A.B. in Economics.
Directorships in Other Companies:
Speed (Private) LimitedJOMO Technologies (Private) Limited
Mr. Ashraf Nawabi Non-Executive Director
Mr. Ashraf Nawabi is a seasoned banker, working in United Arab Emirates since 1967. He has worked in United Bank Limited/BCCI, as CEO for their Middle East Regions. Presently he is working as Advisor in Emirates NBD Bank PSC, which is largest Commercial Bank in the Middle East & Africa.
Mr. Nawabi is also Board Member of Alliance Insurance P.S.C Dubai. He was also a Board member of Union National Bank Abu Dhabi, the third largest Bank of U.A.E. for almost ten years. Apart from this he is CEO/Director of First Jamia Services Limited Lahore and Chairman Alif Noon Parents Foundation.
Mr. Nawabi, in coordination with Dubai ruling family members and businessmen established International School of Choueifat in Lahore in 1991. This school is one of its kind in the entire subcontinent, imparting high quality education to students for entry into leading Universities
Mr. G.M. Sikander Independent Director
Mr. G.M. Sikander has been a career civil servant having served the Government of Pakistan in various capacities for 39 years. He retired as Federal Secretary of the Housing and Works Division.
He has served as Assistant Commissioner and Deputy Commissioner in various districts of Punjab and contributed significantly towards social sector development. While serving as Deputy Commissioner of Kasur he single handedly established a public school on self-help basis which has now become a degree college with almost 5,000 students.
Mr. Sikander has previously served as Secretary to the Government of the Punjab and (KPK) provinces and headed the departments of Services, Establishment, Information & Tourism, Housing & Physical Planning, Baitul Maal, Social Security and Cooperatives. He also served as Principal Secretary to five Chief Ministers in the Punjab for a record period of nearly 10 years.
Mr. Sikander is also a Trustee of the Hamza
of Europe and America. Further branches of International School of Choueifat are planned to be opened in different cities of Pakistan in next few years.
On his own, with an upto date personal contribution of almost Rs. 200 million he has established KPSS School in Chakwal, specifically to impart quality education to under privileged children of the area. This School has enrolment of over 400 pupils which will gradually increase to 1500 students in next few years. To accommodate increase in students, substantial expansion is underway to increase the capacity of school.
Global institutions, Pakistani corporates, businessmen and individuals from Pakistan and abroad continue to donate substantial amounts for this noble cause. Further schools are also planned to be opened in less developed areas.
Mr. Nawabi has served on the Board of JS Bank Limited since 2007. He is also a Chairman of the Board’s Risk Management Committee.
Directorships in Other Companies: First Jamia Services Limited, Lahore Alliance Insurance Co. P.S.C. Dubai.
13 Annual Report 2020

Foundation in Lahore which is a foundation dedicated to supporting and educating deaf and mute students and a Life Trustee of the Marafie Foundation Pakistan which is engaged in the development of public health and education sectors in Gilgit-Baltistan.
Mr. Sikander has served on the Board of JS Bank Limited since 2013. He is also a member of the Board’s Audit Committee and HR, Remuneration & Nomination Committee of the Bank.
Mr. Sikander received his M.A. in Political Science from Punjab University and completed a Diploma in Development Administration from the University of Birmingham. He has also completed the Advanced National Management Course from the former Pakistan Administrative Staff College Lahore and a special course in Development Administration from The National Institute of Public Administration. Furthermore, he also holds the Director’s Certification from the Institute of Chartered Accountants of Pakistan (ICAP).
Directorships in Other Companies: Nil
Information Systems from the University of Pennsylvania and a BS in Electrical Engineering from the University of Virginia.
Directorships in Other Companies: Nil
Mr. Hassan Afzal Non-Executive Director
Mr. Hassan Afzal is the Chief Technology Officer of Afiniti, a company that offers AI products to transform how enterprises pair employees and customers. Mr. Afzal has been responsible for the company’s product engineering, professional services, and production support areas since 2007. Prior to joining the Afiniti team, Mr. Hassan held senior management positions with Deloitte Consulting, Commerce One and American Management Systems. At Deloitte Consulting, Mr. Afzal advised the CIOs of Fortune 500 companies on technology strategy, merger integration, and enterprise system implementations. As Senior Principal at American Management Systems (AMS), Mr. Afzal was responsible for the systems deployment function of AMS’s Healthcare product offering. As Senior Director at Commerce One, Mr. Afzal was responsible for professional services engagements in the Oil and Gas sector.
Mr. Afzal was elected as director on the Board of JS Bank Limited in 2019. He is also the Chairman of the Board’s Information Technology Committee of the Bank.
Mr. Afzal holds a MSE in Computer and
Mr. Munawar Alam Siddiqui Non-Executive Director
Mr. Munawar Alam Siddiqui, retired as an Air Commodore from the Pakistan Air Force (PAF) in 2003. His last post was Assistant Chief of Air Staff (Administration) at Pakistan Air Force Headquarters. For his meritorious services to the PAF, he was awarded Tamgha-e-Imtiaz (Military) and Sitara-e-Imtiaz (Military).
He was commissioned in the GD (P) Branch of the Pakistan Air Force in 1974. He is a qualified flying instructor and has flown over 8000 hours on different aircraft types including C-130, Boeing and Dassault aircraft. He has served as a VVIP and Presidential Pilot during his tenure of service and has held various key command and staff appointments in the PAF. He served as Director of Air Transport at Air Headquarters from 1996 to 1998 and commanded an operational air force base with over 8,500 personnel from 2000 to 2002.
Presently Mr. Siddiqui is Advisor to JS Investments Limited and was Chairman of JS Investments Limited from 2004 to 2013. Currently, he is Chairman of Peregrine Aviation (Pvt.) Limited.
As part of his social commitment, he works as a director on the boards of Fakhr-e-Imdad Foundation, Karachi Education Initiative, Karachi School for Business & Leadership and Karigar Training Institute. He is also a Trustee of the Cardiovascular Foundation.
Mr. Siddiqui has served on the Board of JS Bank Limited since 2016. He is also a member of the Board’s Audit Committee and Risk Management Committee of the Bank.
Mr. Siddiqui holds a B.Sc. (Honours) in War Studies from Karachi University, a B.Sc. Avionics from Peshawar University, an M. Sc. in Defence and Strategic Studies from Quaide-Azam University and an M. Sc. in Strategic Studies from Karachi University. He is also an alumnus of the National Defence University.
Ms. Nargis Ghaloo Independent Director
Ms. Nargis Ghaloo is a retired senior civil servant having served the Government of Pakistan in various capacities for 36 years. She retired as the Managing Director Public Procurement Regulatory Authority, Government of Pakistan. Ms. Ghaloo was Chairperson of State Life Insurance Corporation of Pakistan, Pakistan’s largest life assurer, from 2014 to 2016. She is also the Chairperson of Alpha Insurance Company Limited.
Ms. Ghaloo joined the Civil Services of Pakistan in 1982, has many years of professional experience serving in senior management positions with provincial as well as federal government departments in diversified fields such as public sector management, administration, financial, judicial, health, insurance and planning.
Ms. Ghaloo did her Masters in English from University of Sindh in 1981 and is a Certified Director from The Pakistan Institute of Corporate Governance (PICG) and holds Certificate of Corporate Governance from INSEAD and also holds a Certificate in Company Direction from Institute of Directors, UK.
Ms. Ghaloo has served on the Board of JS Bank Limited since 2016. She is also a member of the Board’s Audit Committee and Risk Management Committee of the Bank.
Directorships in Other Companies: Alpha Insurance Company Limited
Hinopak Motors Limited
Directorships in Other Companies: Jahangir Siddiqui & Sons Limited
Fakhr-e-Imdad Foundation
JS ABAMCO Commodities Limited
Karachi Education Initiative
Peregrine Aviation (Private) Limited
Karigar Training Institute.
14Annual Report 2020

Mr. Sohail Aman Independent Director
Born in 1959, Air Chief Marshal Sohail Aman received his intermediate and graduate education at PAF College, Sargodha. Subsequently, he joined Pakistan Air Force and graduated from PAF Academy in 1980. He is a graduate of Pakistan Air Force War College and has two Masters Degrees: Strategic Studies from Karachi University and International Relations from Kings College, London. He is also a proud alumnus of Royal College of Defence Studies United Kingdom and has attended National & International Security Course at Harvard Kennedy School USA.
During his career, ACM Sohail Aman has flown various types of fighter aircraft including F-16s and has a grand total of over 3000 fighter hours to his credit. As a distinguished fighter pilot and Combat Commander, he has also evaluated modern fighter aircraft like SU27, SU30, Gripen and Euro fighter Typhoon. He has commanded a Fighter Squadron, Combat Commanders’ School, a Fighter Base and a Regional Air Command of Pakistan Air Force.
Air Chief Marshal also has a rich staff experience and has served as Director Operations, Director Plans, Assistant Chief of Air Staff Operations, Deputy Chief of Air Staff Training and Deputy Chief of Air Staff Operations at Air Headquarters. As Deputy Chief of Air Staff Training, he focused on the concept of Education for All; especially to the underprivileged children. In this regard he introduced various scholarship schemes for deserving PAF as well as civilian children. He also developed two medical colleges and three air university campuses across the country during his tenure as the Chief. As Deputy Chief of the Air Staff Operations, he was the main architect of Pakistan Air Force’s campaign in support of successful Counter Terrorism Operation Zarb-e-Azb that proved pivotal in eliminating the menace of terrorism from Pakistan and restoration of peace in the country. He personally led anti-terrorists missions in F16 aircraft depicting the nation’s resolve to combat terrorism.
ACM Sohail Aman is also highly regarded for orchestration and actualization of Pakistan Air Force’s modernization plan. His relentless pursuit of indigenization and focus on Human Resource development through industry academia linkage is evident in shape of development of “Aviation City” in PAF. The establishment of “PAF Airpower Centre of Excellence” is yet another strategic initiative by the Air Chief Marshal. This unique institution aims to
Mr. Basir Shamsie President & CEO
Mr. Basir Shamsie has received his Bachelors in Business Administration from University of Texas at Austin. He has also completed the Program for Leadership Development from Harvard Business School.
Mr. Shamsie joined Bear Stearns Jahangir Siddiqui & Co. (now Jahangir Siddiqui & Co. Ltd.) in 1994 in the Money and Bond Markets business. His particular expertise is in Treasury and Investment Banking and he is credited with over 60 capital market deals, many of which have been landmark transactions for Pakistan.
He was part of the core team responsible for acquisition of American Express Bank’s Pakistan operations in 2006 and its merger into JS Bank Limited Mr. Shamsie has since been associated with JS Bank in various senior roles such as Group Head of Treasury, Wholesale & International Banking which he held till May of 2017. His last assignment was Deputy CEO, JS Bank.
He has previously served as Chairman, JS Investments Limited and JS Global Capital Limited and Director of JS Bank Limited.
He is also a member of the Board’s Risk Management Committee and Information Technology Committee of the Bank.
Directorships in Other Companies: Nil
share PAF’s rare experiences in Counter Terrorism Air Operations (CT) with friendly air forces. The institute also lays special focus on Research and Development (R&D) in the field of ‘Airpower Application in Contemporary Warfare’. ACE’s R&D is closely linked to development of modern aviation hardware at Aviation City, especially Project ‘Azm’ which was initiated by him as the PAF effort to manufacture fifth generation fighter aircraft. He envisioned and developed PAF Base Bholari near Hyderabad and developed it at a record speed as a fighter base.
Owing to his experience in security related issues and Leadership, Sohail Aman has extensively lectured at think tanks and audience at various high-ranking universities and Staff & War colleges; both inland and abroad.
Sohail Aman is also a man of great compassion which is evident from the monumental steps he has undertaken for the welfare of families of martyrs, Personnel with Special Needs (PSN) and education and wellbeing of low paid employees of PAF.
In recognition of his meritorious and exceptionally dedicated services, he has been decorated with awards of Nishan-i-Imtiaz (Military), Hilal-i-Imtiaz (Military), Sitara-i-Imtiaz (Military) and Tamgha-i-Imtiaz (Military). He is also recipient of “The Legion of Merit” of Turkish Armed Forces, “King Abdul Aziz Medal of Excellence” by the Kingdom of Saudi Arabia and United States “Legion of Merit”, the highest military award of US Armed forces awarded to any foreign military official. Air Chief Marshal is currently studying Leadership, Policy formulation and Governance and is undertaking projects relating philanthropic work.
Mr. Aman was appointed as director on the Board of JS Bank Ltd in 2019. He is also the Chairman of the Board’s HR, Remuneration & Nomination Committee and member Board IT Committee of the Bank.
Directorships in Other Companies: Nil
15 Annual Report 2020

Staff Strength
New Joining in 2020
311Women
Joining in 2020
1212Men
Joining in 2020
Number of employees as on
December 31, 2020
5,311Average number of
employees as on December 31, 2020
5,111
20 %
80 %Women
Men
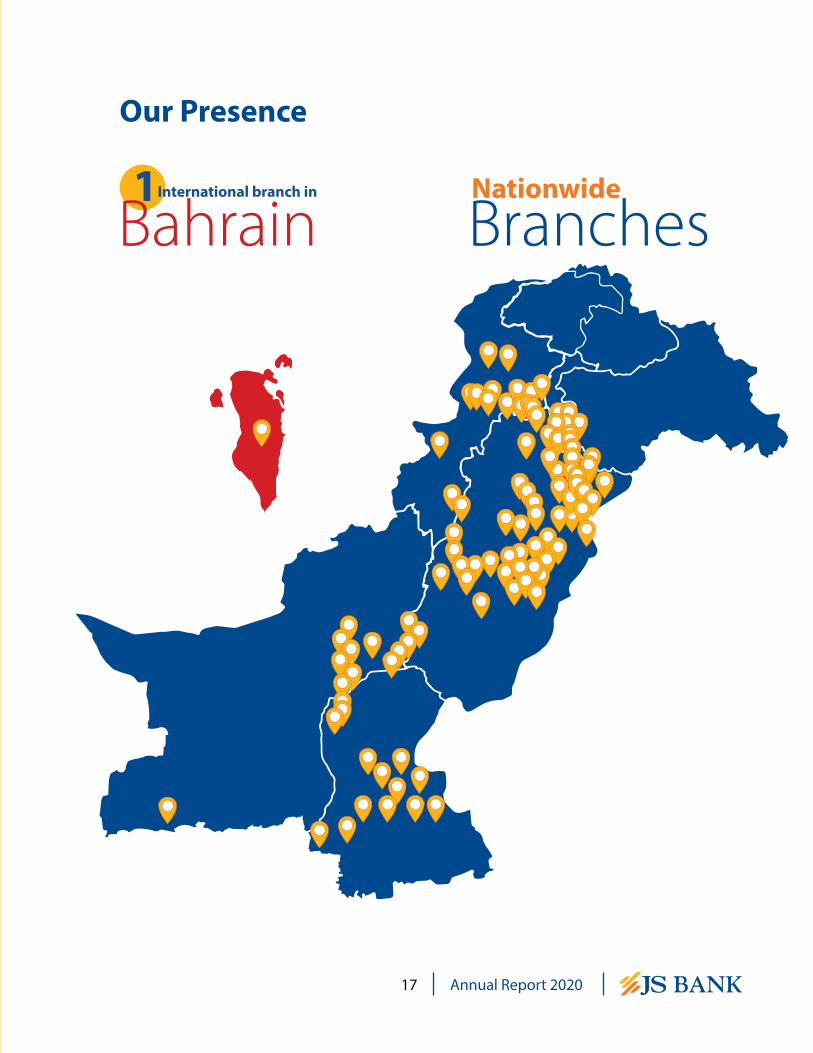
Our Presence
Nationwide
BranchesInternational branch in
Bahrain1
17 Annual Report 2020

Organizational Structure
��������������������
���������������������
��� �����������
������������
���������������
����������������
���������������������������� �������
�����������������
������������ ���
��� ���
��������� ���� ���� ��������
������������������
����������������� �
��������� ��������� ��������
�����������������
����������������
18Annual Report 2020

Corporate Profile of the BankJS Bank Limited (the Bank / JSBL) is a banking company incorporated in Pakistan as a public limited company on March 15, 2006. The Bank is a subsidiary company of Jahangir Siddiqui & Co. Ltd. (JSCL) and its shares are listed on Pakistan Stock Exchange Limited (PSX). The Bank commenced its banking operations on December 30, 2006 and its registered office is situated at Shaheen Commercial Complex, Dr. Ziauddin Ahmed Road, Karachi.
The Bank is a scheduled bank, engaged in commercial banking and related services as described in the Banking Companies Ordinance, 1962 and is operating through 307 (December 31, 2019: 360) branches / sub-branches in Pakistan and one wholesale banking
branch in Bahrain (December 31, 2019: one). The Pakistan Credit Rating Agency Limited (PACRA) has assigned the long-term entity rating of the Bank to AA- (Double A Minus) whereas short-term rating is maintained at A1+ (A One Plus), which is the highest possible short-term rating. The ratings denote a very low expectation of credit risk and indicate very strong capacity for timely payment of financial commitments.
Subsidiaries
JS Global Capital Limited
Holding 83.53%Profile: JS Global Capital Limited is one of the largest securities brokerage and investment banking firms in
Pakistan with a leadership position in the domestic capital markets. It is in the business of equity, fixed income, currencies and commodities brokerage and investment banking. It was incorporated in Pakistan on June 28, 2000 and is the successor to the securities business of Jahangir Siddiqui & Co. Ltd. formerly Bear Stearns Jahangir Siddiqui Limited.
JS Investments Limited
Holding 84.56%Profile: JS Investments Limited is a licensed Investment Adviser and Asset Management Company under the Non-Banking Finance Companies (Establishment and Regulation) Rules, 2003 (the NBFC Rules) and the Non-
Banking Finance Companies and Notified Entities Regulations, 2008 (the NBFC Regulations). In addition, the Company is also a licensed Pension Fund Manager under the Voluntary Pension System Rules 2005. Recently, JSIL also acquired the Private Equity and Venture Capital Fund Management Services license and RIET management services license from the Securities and Exchange Commission of Pakistan. Further, JS ABAMCO Commodities Limited is a wholly owned subsidiary of JS Investments Limited.
19 Annual Report 2020

Chairman’s ReviewI am pleased to present this report to the valued stakeholders of JS Bank Limited (the “Bank”) on the overall performance of the Bank and efficacy of the role played by the Board in driving the Bank’s objectives.
The Bank’s principal market strengths were acknowledged by the Pakistan Credit Rating Agency (PACRA) and the Bank has been assigned a short-term credit rating of A1+(A One Plus), the highest possible in the category, while long-term credit rating was maintained at AA- (Double A Minus). The ratings denote very high credit quality, low expectation of credit risk and strong capacity for timely payment of financial commitments.
The Bank is committed to its role of acting as a catalyst of progress within the financial industry, by providing customers with innovative and value-added financial products and services designed to make their lives simple, easy, and convenient. The Bank’s deposit and advances have continued to show remarkable stability, and we continue to engage with customers facing economic shocks at an individual level.
As of December 2020, JS Bank was ranked as one of the top SME banks in Pakistan. It continued to enhance current SME relationships while introducing innovative financial products with customized financial offerings. Based on the Country’s goal of increasing exports, JS Bank established itself as a one-window solution by financing trade and servicing the cash management & payroll needs of the SME client-base.
Responsibility to the community is a cornerstone of the Bank’s activities through sustainable development and responsible business. In the effort to fight and respond to COVID-19, in November 2020 JS Bank, in partnership with Future Trust, has launched Future Labs, a highly advanced robotic mobile COVID-19 laboratory in Islamabad. Future Trust is a non-profit philanthropic organization, set up by the JS Group that seeks to use advanced technology to address the problems caused by poverty.
In 2020 the Bank has been recognized for its commitment to excellence on a national and international level. The prestigious awards that JS Bank received in the year 2020 include Asiamoney Award - Best Bank for SMEs – Pakistan, Asiamoney Award - Best Bank for CSR – Pakistan, Asian Banking Finance Awards 2020 - SME Bank of the Year – Pakistan and Certificate of Merit – Best Corporate Report Award 2019 by ICAP/ICMA. These global acknowledgments bear testimony to our customer centricity and outreach, driving us to deliver value added offerings and services that surpass expectations.
Based on an extensive market analysis and business efficiency ratios, the Bank conducted a branch network review and successfully merged 51 branches during the year.
The Board of JS Bank is committed to ensuring good corporate governance through ethical and professional business conduct as well as effective risk and audit management. The Board continually reviews the Bank’s financial and operational soundness, and significant policies in-line with regulatory requirements. The Board has constituted its sub-committees for oversight of all key areas of the Bank covering risk management, audit related matters, information technology and human resources for achieving the Bank’s strategic objectives. The Pakistan Institute of Corporate Governance (PICG) has been engaged to perform annual evaluation(s) of the Board, its committees and its respective members as per regulatory guidelines and international best practices.
In 2021, the Bank will continue to play its innovative role in Pakistan’s banking system. The shifting customer preference for digital products has driven banks to transform the traditional way of banking. Our strategic priorities in the years ahead include continuous focus on operational digitalization and transformation to enhance the customer service experience.
Core strategies are based on identifying and fulfilling customer needs through product innovation,
20Annual Report 2020

alliances, and automation of service delivery. Simplification of banking through digitized products and secure payment enablement are among our key priorities. Several technology initiatives have been rolled out to support business growth while improving the speed and accuracy of credit decision-making. The Bank is making continuous efforts to strengthen its ability to prevent, detect and respond to cyber-attacks by improving governance and leveraging technology advancements.
We believe that our people are our strength and by investing in their capacities and enriching their experience, it boosts both our productivity and customer satisfaction. We continue to provide best learning interventions, including a wide range of e-learning modules.
I am confident that with our diversified Board of Directors, value added offerings, unique emphasis on customer satisfaction and dedication towards excellence, we will succeed and thrive, no matter what the conditions or environment.
On behalf of the Board of Directors, I would like to extend appreciation for the continuous co-operation extended by the regulatory bodies including the State Bank of Pakistan, the Securities and Exchange Commission of Pakistan and Federal Board of Revenue. I would also like to thank our shareholders, for their continued commitment and confidence in our long-term strategic vision.
Sincerely,
Kalim-ur-Rahman
February 24, 2021
21 Annual Report 2020

Muhammad Kamran
I believe art is something which cannot be verbally explained but only felt and expressed in your paintings. since art has no boundaries and totally depends upon one’s creativeness.
Institute: FAST University

Directors’ ReportWe are pleased to present herein the 15th Annual Report of JS Bank Limited (“JSBL”) along with the audited accounts and auditors’ report for the year ended December 31, 2020.
Economic Review Pakistan, much like other countries across the globe, witnessed the socio-economic impact of the COVID-19 pandemic during the first half of CY20. Nonetheless, the timely relief measures taken by the Government of Pakistan and the State Bank of Pakistan (SBP) provided due support to the economy and the masses through various measures including Monetary Policy, Regulatory Framework, Health, Investments, Loans, Employment, and Availability and Continuity of Financial Services. Among the key relief measures were the cut in interest rates, subsidized lending to businesses, deferment options for loan repayments, a cash disbursement program for low-income families etc. Hence, the economy not only began to show signs of recovery during 2HCY20, while the second wave of COVID-19 not significantly hindered the country’s economic activity.
After a decline in Large Scale Manufacturing Index during 1HCY20, recovery was reflected in the second half of the year. Resumption of economic activity and materialization of the construction package announced by the Honorable Prime Minister in the earlier part of CY20 have been among the key factors that drove the rebound in LSM. During 5MFY21, LSM has already reported 7.4% YoY growth.
On the external front, the country’s current account has reported a surplus of USD 1.13 billion in 1HFY21 as against a deficit of USD 2.03 billion during the same period last year. Key contributors to the surplus have been a remarkable growth remittances and controlled imports. Resultantly the Foreign Exchange reserves increased by more than USD 2.5 billion during the year under review and closed at USD 20.51 billion at CY20 end. Despite the pandemic situation considerably weakening the currencies of several regional countries, the Rupee closed the year with only 3% depreciation against the greenback. On the fiscal side, where Pakistan had a deficit of 2.5% of GDP during 1HFY21, the country is still in a surplus on the primary balance front.
Although volatile food prices pushed inflation upward during CY20, the high base could harness inflation in the coming months. Furthermore, despite the recent increase in energy tariffs, the SBP’s view of 7-9 percent inflation for FY21 remains unchanged.
Banking Sector ReviewThe year under review witnessed numerous developments for Pakistan’s banking sector. The SBP took relevant measures to curb the potential impact of the pandemic during the first half of the year, which included sharp monetary easing – drop in the Policy Rate from 13.25% to 7.00%, subsidized loans offered for investments and preventing layoffs, and other relief packages to consumers and the SME segment.
During the same period, the banking sector’s deposits witnessed a robust growth of 22% YoY, marking the highest growth the sector has witnessed in the past fifteen years, reaching PKR 17,876 billion. Meanwhile, the sector’s Investments crossed PKR 11,500 billion, reporting 31% YoY growth, and increasing the Investments-to-Deposit Ratio (IDR) by 447 basis points, from CY19, to 65%. Total Advances witnessed muted growth, expanding by 4% YoY and clocking in at PKR 8,497 billion. The sector’s Advances-to-Deposit Ratio (ADR) declined to 48%, as compared to 56% in CY19. Concurrently, private sector credit also reported slow growth of 5% YoY during CY20. Non-Performing Loans (NPLs) grew to PKR 852 billion during 9MCY20, taking the infection ratio to 10.5%.
Financial Performance In 2020, the Bank launched multiple targeted offerings aimed at a diverse customer base while undertaking organization redesign and cost economization.
The Bank’s earnings during the year remain strong despite a challenging operating environment. The Bank reported a profit before tax of PKR 2,023 million (profit after tax of PKR 1,150 million) for the year ended December 31, 2020 as compared to a profit before tax of PKR 133 million (profit after tax of PKR 25 million) in the corresponding period last year.
On the revenue side, the Bank reported total mark-up revenue of PKR 43,099 million compared to PKR 41,595 million from the corresponding period last year, an
23 Annual Report 2020

improvement of 3.6%. Net interest income was 39.1% higher than the corresponding period last year and closed at PKR 9,777 million. Non-markup income stood at PKR 6,676 million, higher by 69.3%, with major contribution from capital gains of PKR 1,873 million, FX income of PKR 1,010 million and fee & commission income of PKR 3,596 million despite slower resumption in economic activities in the country due to the pandemic lockdowns.
Administrative expenses were PKR 13,019 million compared to PKR 10,792 million for the corresponding period last year, up by 20.6%. The cost to income ratio of the Bank improved to 79.1% as compared to 98% during the corresponding period last year, showing the Bank’s focus on cost rationalization.
Earnings per Share (EPS)The EPS for the year ended December 31, 2020 is PKR 0.8864 per share as compared to EPS of PKR 0.0004 per share by December 31, 2019.
Capital AdequacyAs of December 31, 2020, JS Bank’s Capital Adequacy Ratio (CAR) stood at 12.77% as compared to 12.93% in 2019. Minimum required CAR (including Capital Conservation Buffer) as prescribed by SBP is 12.50%. However, the State Bank of Pakistan as a regulatory relief to dampen the effects of COVID-19, for the time being, has reduced the requirement of CAR for banks by 1%.
Summarized financial data for the last six years is given below:
PKR ‘million’2020 2019 2018 2017 2016 2015
ParticularsDeposits 433,063 369,790 321,413 290,078 226,099 141,840Equity 20,592 17,333 15,617 16,669 16,650 15,968Total Assets 532,168 469,821 456,754 391,479 264,700 218,476Investments-Net 201,698 142,568 148,690 169,612 133,727 116,030Advances- Net 250,199 242,944 251,991 184,140 93,794 76,666Gross Mark-up Income 43,099 41,595 29,997 20,381 15,081 15,328Net Mark-up Income 9,777 7,028 8,809 6,242 5,728 5,590Non-Mark-up Income 6,676 3,943 2,141 4,051 4,861 3,290Profit Before Tax 2,023 133 905 1,621 3,390 3,174Profit After Tax 1,150 25 562 973 2,077 2,026Earnings Per Share (Basic) – PKR 0.8864 0.0004 0.30 0.74 1.77 1.74 Return on Avg. Assets (ROAA) 0.23% 0.01% 0.13% 0.30% 0.86% 1.03%Return on Avg. Equity (ROAE) 6.06% 0.16% 3.49% 5.84% 12.74% 13.95%Capital Adequacy Ratio (CAR) 12.85% 12.93% 12.01% 11.95% 14.05% 12.50%Advances to Deposits Ratio (ADR) 57.8% 65.70% 78.40% 63.48% 41.48% 54.05%Branches 308 360 345 323 307 277Employees 5,311 4,904 5,127 4,998 4,163 2,946
Business OverviewThe year witnessed continued steady balance sheet growth, backed by prudent expansion in advances, aggressive deposit mobilization and diversified fee business. The Bank’s overall product strategy is to promote access to financial services for financial inclusion as well as identifying and fulfilling needs of customers across all customer segments while also catering to niche market needs in an effort to stand apart from the competition.
24Annual Report 2020

DepositsJS Bank remained focused on core deposit mobilization, particularly targeting growth in low-cost deposits (Current Accounts – CA). The Bank was able to close CY2020 with a deposit base of PKR 433 billion, registering growth of 17.1% over CY2019. Significant growth in the CA deposit base has been augmented by focusing on affluent and mass affluent market segments, providing greater stability and strength to the Bank. The Bank embarked on several key initiatives to expand its deposit relationships in various segments including business accounts, employee banking, cash management relationships, corporate deposits and technology-based solutions.
AdvancesOn the assets side, the bank’s strategy involved prudent and coherent expansion through a holistic product range designed around customers’ needs.
In addition to traditional lending segments, the Bank enhanced its focus on the SME landscape through a relationship lending model, operating through several SME hub branches. Furthermore, the secured consumer lending volumes remained strong through 2020. The leasing business also developed a healthy portfolio catering to all industrial sectors of the economy.
The Bank grew its Gold Finance and Solar Panel financing portfolios by forming multiple alliances to promote the products within their value chains. JS Bank met its agriculture credit targets with a clean portfolio, paving the way for sustainable expansion in the coming years.
Fee BusinessThe Bank made concerted efforts to optimize the revenue mix between interest and fee-based income through parallel growth by cross selling various fee-based products to new and existing customers alongside traditional fee income streams.
The Investment Banking Group (IBG) continued its focus on advisory business and building the Bank’s asset base by extending services to entities across microfinance, construction, oil & gas, and power sectors. Trustee and Agency services together with Bankers-to-the-Issue business continued to yield positive outcome. Going forward, IBG is to continue its focus on the advisory business, capital market and privatization transactions.
Service Management and Fair Treatment of Customers JS Bank is committed to providing its customers with the highest level of service quality and satisfaction. The Bank has established an independent service management function that oversees service quality, phone banking, problem resolution and the fair treatment of customers. The Bank’s Complaint Handling Policy and Grievance Redressal Mechanism ensure that complaints are resolved in a timely manner and recurrence of complaints is prevented where possible. Customers have the option of registering their complaints at the Bank’s branches, phone banking center, JS Bank’s website or via email.
The Bank reviews all service level complaint reports and initiatives and focuses on simplifying processes for improvement in service levels and overall customer satisfaction. ‘Fair Treatment of Customers’ is an integral part of our corporate culture. We also focus on financial literacy of our customers, for promoting responsible conduct and informed financial decisions by consumers, through our ‘Consumer Education and Financial Literacy Program’.
Sustainable Finance JS Bank continued its efforts towards national sustainability and green project support. After successfully becoming an accredited entity of the executing Green Climate Fund (GCF), despite COVID, JS Bank has been working with GCF to develop and finance multiple projects to help mitigate the climate change impact in Pakistan. GCF is the world’s largest climate fund and JS Bank, as an accredited entity, can apply to fund projects up to USD 250 million. Over the year, the Bank also focused its efforts towards plantation drives pan-Pakistan in association with renowned entities as well as its operating locations worldwide. Being a responsible lender, the Bank implemented SBP’s Green Banking Guidelines which focus on risk management, own impact reduction and promotion of renewable and energy efficient products.
Risk Management The Board is committed to adopting the best risk management practices in letter and spirit. To maintain effective risk management oversight, the Bank follows an appropriate risk management framework according to the regulatory directives issued by SBP and other related guidelines under the Basel II / III framework. In
25 Annual Report 2020

this regard, the Bank has a comprehensive set of risk management policies, practices and procedures in place which enable the Bank to take into consideration, in an appropriate manner, all major kinds of risks including credit, market, liquidity, operational, technology and information security.
The overall risk management framework of the Bank is under the supervision of the Board of Directors (BoD)/Board Risk Management Committee (BRMC) while the operational level day-to-day functioning is carried out by the senior management of the Bank. In order to develop a holistic integrated risk management approach, a dedicated and independent Risk Management Group is in place to manage various aspects of risk management in the Bank. To formalize and strengthen the risk management approach within the Bank, the following significant policies were developed / reviewed and approved by the Board:
• Risk Management Policy• Credit Policy• Collateral Management Policy• Market Risk Management Policy• Operational Risk Management Policy• Liquidity Risk Management Policy• Country Risk Management Policy• Business Continuity Policy• Information Security Policy
BRMC keeps an eye on the overall risk profile of the Bank. The Integrated Risk Management Committee (IRMC), Credit Risk Committee (CRC), Operational Risk Management Committee (ORMC), IT Steering Committee (ITSC) and Assets & Liabilities Committee (ALCO) of the management operate within an established framework in order to monitor the Bank’s activities and maintain the risk level within predefined limits. These Committees meet on a regular basis to review market developments and the level of financial and security risk exposures of the Bank.
Risk Management plays a vital role in ensuring that an appropriate balance is struck between risk and reward throughout the Bank. Towards this end, the risk management function and framework has been significantly strengthened in the year under review. This includes but is not limited to the formation of management committees for monitoring credit portfolio and operational risks, introducing the concept of enterprise risk management, undertaking the automation of various processes, and incorporating
the Information Security function into the risk management group.
Market risk measurement, monitoring and management reporting is done on a regular basis. The Market Risk & Basel Unit supported by the Treasury Middle Office is involved in daily monitoring of all related financial risk exposures in the form of interest rate risk, equity exposure risk, currency or foreign exchange risk, cross border or country risk, financial institutions (FI) exposure risks, liquidity risk and capital adequacy. The Bank is in the process of upgrading its system capabilities and has implemented the market risk module of Temenos Insight Risk Intelligence Solutions to enhance analytical capabilities and plans to implement modules for regulatory capital and asset & liability management in the coming year.
On capital management side, the Bank’s practices ensure that it has sufficient capital to cover the risks associated with its activities. It is the prime objective of the Bank’s capital management to ensure that the Bank complies with all regulatory capital requirements and at the same time maintains strong credit ratings and healthy capital ratios in order to support its business and to maximize shareholders’ value.
Apart from usual monitoring of Risks and Control Self-Assessment (RCSA), operational loss data and Key Risk Indicators (KRI), Operational risk management function also maintains the Business Continuity Policy and facilitates the annual testing of mission-critical systems and services that may be disrupted due to any eventuality or disaster. The Bank has also developed a Disaster Recovery (DR) site to ensure maximum availability of system and services to customers and partners for critical (time sensitive) and support functions.
Credit risk management is an ongoing process. The overall credit policy and the credit risk management guidelines are approved by the Board of Directors. In this regard, a Central Credit Committee (CCC) is entrusted with the responsibility of monitoring and controlling credit risk in the Bank. CCC meets regularly to actively supervise credit risk across the lending portfolio. In order to maintain a healthy growth of the credit portfolio, the Bank’s Credit Risk Management processes are consistently upgraded and improved to meet future challenges. Further, in order to bolster credit risk management monitoring activities, a Credit Risk Monitoring Unit is in place for regular portfolio monitoring, formulating and implementing credit risk
26Annual Report 2020

management tools, including setting up of industry, geographic and sectorial limits, and devising credit risk quantification / statistical techniques to meet SBP and Basel II/III requirements. The health of the credit portfolio is being monitored through Credit Administration, which is responsible for house-keeping elements along with management of credit limits.
The management of risks and uncertainties associated with problem credit requires a different and more intense approach than normal management. In this regard, a Special Asset Management Unit is in place following SBP’s regulatory guidelines to focus on remedial management issues, take ownership of classified portfolio for effective management and to determine the work-out modes for rehabilitation and settlements, as stipulated in the Remedial Asset Management Policy of the Bank.
In terms of Information Security, the Information Security Department performs security/risk assessments, as well as vulnerability assessment, and monitors critical IT and information security-specific risks across the bank. To further improve the information security posture Advance/Zero-Day Threat Protection solution is being evaluated for implementation.
Statement on Internal Controls The Bank places the utmost emphasis on establishing stringent controls across all its operations. It is the cornerstone of the Bank’s policies to adhere to the best industry practices, ethical standards and regulatory requirements. In this context, the Board of Directors has promulgated policies that provide for assessing the overall effectiveness of the internal control environment. It is the responsibility of senior management to evolve systems and procedures that ensure overall comprehensive controls in the light of Board of Directors guidelines.
Internal controls are intended to provide a reasonable measure of assurance regarding the effectiveness and efficiency of the Bank’s operations, reliability of financial information and compliance with applicable laws and regulations. However, it is acknowledged that the systems put in place can only provide reasonable but not absolute assurances against material misstatement or loss since they are designed to manage, rather than eliminate, the risk of unforeseen loss is seeking to achieve the business objectives.
To ensure effective management of risk, the governance structure of internal control functions at the Bank consists of three levels of defense. The first line of defense is the business itself which owns its risks, including its operational risk and is responsible for its management. The second line of defense is the oversight provided by the Risk Management, Compliance and control functions who identify and assess risks impacting existing and new business initiatives, coordinate risk mitigation with risk specialists and business and then report and escalate it to the Risk Management Function for appropriate corrective measures. The last line of defense is an independent and effective Internal Audit Function which reviews the effectiveness and adequacy of internal controls and continues to monitor compliance with policies and procedures.
The Board of Directors is regularly kept up to date about the state of compliance through the Board Audit Committee. As a priority, all significant and material findings of the internal and external auditors and regulators are addressed by the management ensuring that appropriate corrective actions have been implemented. Adequate systems are in place to minimize breaches repetition of mistakes and strengthen the control environment. In addition, the Compliance Function is performing its due role to ensure regulatory compliance across the Bank.
The Bank diligently follows SBP’s Guidelines on Internal Control to evaluate the effectiveness of the overall set of internal controls including financial reporting controls. A detailed documentation of bank-wide processes and controls has been completed. Furthermore, the Bank has developed a comprehensive management testing and reporting framework for ensuring operating effectiveness of key controls and has significantly addressed the identified design improvement opportunities.
Upon satisfactory completion of the Internal Control over Financial Reporting (ICFR) Roadmap, SBP granted exemption to the Bank in August 2016 from the submission of a Long Form Report (LFR) by external auditors. Annual assessment report for December 31, 2020 on efficacy of ICFR shall henceforth be submitted to SBP duly approved by the Board Audit Committee.
The management considers that the internal control system presently existing is adequate, implemented effectively and continuously monitored. This statement is also endorsed by the Board of Directors. The management will endeavor to continue
27 Annual Report 2020

enhancing its coverage and compliance with the SBP guidelines on Internal Controls and thereby strengthening its control environment on an ongoing basis.
Corporate GovernanceThe Bank prides itself on good corporate governance by maintaining high levels of professional and business conduct, implementing effective internal controls and audit functions, including risk management framework and complying strictly with both local and international codes of practice.
The Board closely reviews policy-related matters with long-term implications as per regulatory obligations which also meet the Bank’s operational requirements. The Management and the Board Committees have been duly constituted with a defined scope of work to ensure that they perform their prescribed functions precisely and efficiently as per their mandate and respective terms of reference.
Corporate and Financial Reporting FrameworkThe Directors confirm compliance with the Corporate and Financial Reporting Framework of the Securities & Exchange Commission of Pakistan’s Code of Corporate Governance for the following:
• The financial statements prepared by the management present fairly the state of affairs of the Bank, the results of its operations, cash flow statement and statement of changes in equity.
• Proper books of accounts of the Bank have been maintained.
• Accounting policies as stated in the notes to the accounts have been consistently applied in the preparation of financial statements and
accounting estimates are based on reasonable and prudent judgment.
• International Accounting Standards as applicable to banks in Pakistan have been followed in preparation of the financial statements.
• The system of internal controls is sound in design and has been effectively implemented and monitored.
• There are no doubts about the Bank’s ability as a going concern.
• There has been no material departure from the best practices of corporate governance, as detailed in the listing regulations.
• The details of outstanding statutory payments, if any, have been adequately disclosed in the financial statements.
Holding CompanyJahangir Siddiqui & Co. Limited, listed on the Pakistan Stock Exchange Limited, is the holding company of JS Bank Limited, owning 75.02% of the ordinary shares.
Subsidiary CompaniesJS Global Capital Limited and JS Investments Limited are subsidiaries of JS Bank with shareholdings of 83.5% and 84.5% respectively. Performance of these companies has been reviewed under the consolidated Directors’ Report.
Attendance of Directors in the Board meetingsSix meetings of the Board of Directors were held during the year 2020. The attendance of directors at Board Meetings was as follows:
Name of Director Eligible to attend Meetings attendedMr. Kalim-ur-Rahman – Chairman 6 6Mr. Adil Matcheswala 6 6Mr. Ashraf Nawabi 6 5Mr. G.M. Sikander 6 6Mr. Hassan Afzal 6 6Mr. Munawar A. Siddiqui 6 6Ms. Nargis Ghaloo 6 6Mr. Sohail Aman 6 6Mr. Basir Shamsie, President & CEO 6 6
28Annual Report 2020

The attendance of directors at Board Committees meetings was as follows:
Name of Director Audit Committee Risk Committee HR Committee IT Committee
Eligible to attend
Meetings attended
Eligible to attend
Meetings attended
Eligible to attend
Meetings attended
Eligible to attend
Meetings attended
Mr. Kalim–ur-Rahman - - 7 7 4 4
Mr. Adil Matcheswala 4 4 7 7 - -
Mr. Ashraf Nawabi - - 4 3 - -
Mr. G.M Sikander 4 4 7 6 - -
Mr. Hassan Afzal - - 4 4
Mr. Munawar A. Siddiqui 4 4 4 4 - -
Ms. Nargis Ghaloo 4 4 4 4 - -
Mr. Sohail Aman - - 7 7 4 4Mr. Basir Shamsie President & CEO
- - 4 4 - - 4 4
Election of DirectorsThe election of directors of the Bank was held on March 28, 2019 at the AGM wherein eight directors were elected by the shareholders for a period of three years.
Directors RemunerationThe remuneration of directors is fixed by the Board of Directors in accordance with applicable laws. The remuneration for attending meetings of the Board and/or Board Committees is within the scale as is reasonably determined by the Board of Directors, provided that an Executive Director shall not be paid any remuneration for attending Board/Board Sub Committee meetings.
Pattern of ShareholdingThe pattern of shareholding at the close of December 31, 2020 as required u/s 227(f ) of the Companies Act, 2017 is given on page number 353.
Related Party TransactionsRelated party transactions are disclosed at note # 43 to the unconsolidated financial statements and the consolidated financial statements of the Bank for the year ended December 31, 2020.
Corporate & Social ResponsibilityThe Statement of Corporate & Social Responsibility is included in the Annual Report.
Credit RatingsThe Pakistan Credit Rating Agency Limited (PACRA)
has maintained the long term rating of the Bank at ‘AA-‘ (Double A Minus) and the short-term rating of “A1+” (A One Plus) which is the highest possible short-term rating.
Dividend to ShareholdersNo dividend is being paid to the shareholders on the ordinary shares for the year 2020.
Employee Benefit Schemes JS Bank operates a Staff Provident Fund (the Fund) and funded Gratuity Scheme (the Scheme) covering all its permanent employees.
The contribution made toward the Fund during the year 2020 is PKR 229 million (2019 PKR 209.87 million). Un-audited balance of the asset of the Fund as of December 31, 2020 was PKR 2,278 million (2019: PKR 1,795 million).
The contribution to be made to the Scheme is PKR 152 million for 2020 (2019: PKR 102 million). The un-audited balance of the assets of the Scheme as of December 31, 2020 was PKR 1,392 million (2019: PKR 705 million).
AuditorsThe present auditors, EY Ford Rhodes, Chartered Accountants (a member firm of Ernst & Young Global Limited), retire and cannot, in compliance of the Listed Companies (Code of Corporate Governance) Regulations, 2019, be re-appointed as having completed a term of five years.
The Board of Directors, on the recommendation of the
29 Annual Report 2020

Audit Committee of the Bank, has recommended the appointment of KPMG Taseer Hadi & Co. Chartered Accountants as auditors for the year ending December 31, 2021 at the upcoming Annual General Meeting of the Bank.
Auditors have confirmed that the firm is fully compliant with the International Federation of Accountants’ Guidelines of Code of Ethics, as adopted by the Institute of Chartered Accountants of Pakistan (ICAP) and have satisfactory rating under Quality Control Review Program of the ICAP.
Evaluation of the Board’s PerformanceThe Board of Directors of JS Bank sets the Bank’s strategic direction and ensures that the organization stays true to this direction - enabling it to achieve its long-term objectives while ensuring regulatory compliance. To discharge its fiduciary responsibility of safeguarding the stakeholders’ interests, a formal and effective mechanism is put in place for an annual evaluation of the Board’s own performance, members of the Board and of its Committees as required by the State Bank of Pakistan and the Securities and Exchange Commission of Pakistan.
The Board of Directors of JS Bank has a good mix of skills, core competencies, diversity, experience, and knowledge and is at the same time committed to strong corporate governance to protect the overall interests of the Bank and its stakeholders. The Board continually reviews the Bank’s financial and operational soundness, governance, internal controls, and significant policies as per regulatory requirements. Further, the Board Committees have been constituted, each with a prescribed mandate and terms of reference.
In line with the best practices of corporate governance, the Board conducts a self-evaluation exercise on an annual basis by engaging Pakistan Institute of Corporate Governance (PICG) as an external facilitator which is the lead on Corporate Governance and has a team of qualified consultants to conduct board evaluations for companies and banks. The Board of JS Bank in compliance with SBP’s Guidelines on Performance Evaluation of Board of Directors and Listed Companies (Code of Corporate Governance) Regulations, 2019 has conducted its self-evaluation by engaging PICG. The evaluation covered various aspects of the performance of the Board including but not limited to: Board Composition, Strategic Planning, Control Environment, Committees, CEO & Chairman etc.
The evaluation was carried out using quantitative method, based on subjective assessment, and was conducted via questionnaires developed by the consultants. The quantitative technique has the advantage of being specific and measurable. Measurement scale used in the Banks’s board evaluation is the summated rating depending on how strongly they agree or disagree with a given statement. The use of this method ensures specific and measurable data that can be benchmarked over time.
Compliance with the Listed Companies (Code of Corporate Governance) Regulations, 2019.The requirements of the Listed Companies (Code of Corporate Governance) Regulations, 2019 set out by the Securities & Exchange Commission of Pakistan (SECP) have been adopted by the Bank and have been duly complied with. A Statement to this effect is annexed with the report.
Events after the Date of Statement of Financial PositionThere have not been any material events that occurred after the date of the Statement of Financial Position that require adjustments to the enclosed financial statements.
AcknowledgementsOn behalf of JS Bank, we would like to express our gratitude to our valued stakeholders for their continued patronage and support. We would also like to thank the Ministry of Finance, the State Bank of Pakistan, the Securities & Exchange Commission of Pakistan and other regulatory authorities for their guidance and support to our Bank. At the close, we extend our appreciation to all our colleagues at JS Bank for their commitment towards ever greater success and growth.
For and on behalf of the Board,
Basir Shamsie Kalim-ur-RahmanPresident & CEO Chairman
February 24, 2021
30Annual Report 2020

31 Annual Report 2020
32Annual Report 2020

43
353
33 Annual Report 2020

4 4 7 7 - - - -
- - 7 7 4 4
- - 3 4 - -
- - 6 7 4 4
4 4 - -
- - 4 4 4 4
- - 4 4 4 4
4 4 7 7 - -
4 4 - - 4 4 - -،
34Annual Report 2020

35 Annual Report 2020

36Annual Report 2020

37 Annual Report 2020

38Annual Report 2020

39 Annual Report 2020

40Annual Report 2020

12.77
41 Annual Report 2020

42Annual Report 2020

43 Annual Report 2020

Ahwar Nasir
I am a 19 year old aspiring artist who paints to make herself and others happy. Painting to me is to communicate love.
Institute: Indus Valley School of Art and Architecture

Six Years’ Financial SummaryRs. in million
2020 2019 2018 2017 2016 2015Statement of Financial PositionCash and balances with treasury banks 30,421 25,589 32,111 17,334 15,509 11,159 Balances with other banks 1,106 463 969 1,034 753 584 Lendings to financial institutions 23,240 30,321 1,937 3,116 11,334 3,581 Investments - net 201,698 142,568 148,690 169,612 133,727 116,030 Advances - net 250,199 242,945 251,991 184,140 93,794 76,666 Operating fixed assets 10,086 11,964 8,415 7,113 5,837 4,574 Deferred tax assets - 9 287 - - - Other assets 14,678 16,194 12,354 9,131 6,490 5,882 Assets held for sale 739 374 - - - - Total Assets 532,168 470,427 456,754 391,479 267,444 218,476
Bills payable 4,982 3,804 3,520 3,824 2,544 1,609 Borrowings 48,303 54,468 96,559 64,557 10,320 54,638 Deposits and other accounts 433,063 369,790 321,413 290,078 226,099 141,840 Sub-ordinated loans 7,493 7,495 7,497 4,999 3,000 - Deferred tax liabilities 1,194 - - 797 1,205 1,695 Other liabilities 16,541 17,536 12,148 10,555 7,626 2,724 Total Liabilities 511,576 453,094 441,137 374,810 250,794 202,508
Net Assets 20,592 17,333 15,617 16,669 16,650 15,968
Share capital 12,975 12,975 12,975 12,225 12,225 12,225 Discount on issue of shares (2,855) (2,855) (2,855) (2,105) (2,105) (2,105)Preference shares - - - 1,500 1,500 1,500Reserves 1,991 1,750 1,712 1,541 1,334 919 Unappropriated profits 6,148 4,828 4,821 4,519 3,973 2,529 Surplus / (deficit) of assets - net of tax 2,334 637 (1,036) 490 1,223 2,401 Total Equity 20,592 17,333 15,617 16,669 16,650 15,968
Profit & Loss AccountMark-up / return / interest earned 43,099 41,595 29,997 20,381 15,081 15,328 Fee, commission and brokerage income 3,596 2,860 2,669 2,124 1,427 1,124 Gain/ (loss) on sale of securities - net 1,873 (711) (1,434) 1,234 2,965 1,799 Income from dealing in foreign currencies 1,040 1,010 688 357 313 288 Dividend income 98 300 109 167 98 85 Other Income 70 484 109 169 59 (6)Total Gross Income 49,775 45,538 32,138 24,433 19,942 18,618
Mark-up / return / interest expensed 33,322 34,566 21,188 14,139 9,353 9,738 Provision/ (reversal) against non- performing loans and advances 681 360 406 203 (64) 675 Provision / (reversal) of diminution in value of investments 275 (345) (220) 123 415 141 Other provisions/ (reversal)/ write-off 324 (107) 52 45 - - Workers’ welfare fund & Other Charges 132 139 (149) 46 99 65 Operating expenses 13,019 10,792 9,859 8,347 6,848 4,890 Total Expenses 47,752 45,405 31,136 22,902 16,652 15,509
Profit Before tax 2,023 133 905 1,621 3,390 3,174 Taxation 873 108 342 647 1,313 1,148 Profit After Taxation 1,150 25 562 973 2,077 2,026
45 Annual Report 2020

Six Years’ Vertical AnalysisRs. in million
Vertical Analysis2020 % 2019 % 2018 % 2017 % 2016 % 2015 %
Statement of Financial PositionCash and balances with treasury banks 30,421 6% 25,589 5% 32,111 7% 17,334 4% 15,509 6% 11,159 5%Balances with other banks 1,106 0% 463 0% 969 0% 1,034 0% 753 0% 584 0%Lendings to financial institutions 23,240 4% 30,321 6% 1,937 0% 3,116 1% 11,334 4% 3,581 2%Investments - net 201,698 38% 142,568 30% 148,690 33% 169,612 43% 133,727 50% 116,030 53%Advances - net 250,199 47% 242,945 52% 251,991 55% 184,140 47% 93,794 35% 76,666 35%Operating fixed assets 10,086 2% 11,964 3% 8,415 2% 7,113 2% 5,837 2% 4,574 2%Deferred tax assets - 0% 9 0% 287 0% - 0% - 0% - 0%Other assets 14,678 3% 16,194 3% 12,354 3% 9,131 2% 6,490 2% 5,882 3%Assets held for sale 739 0% 374 0% - 0%Total Assets 532,168 100% 470,427 100% 456,754 100% 391,479 100% 267,444 100% 218,476 100%
Bills payable 4,982 1% 3,804 1% 3,520 1% 3,824 1% 2,544 1% 1,609 1%Borrowings 48,303 9% 54,468 12% 96,559 21% 64,557 16% 10,320 4% 54,638 25%Deposits and other accounts 433,063 81% 369,790 79% 321,413 70% 290,078 74% 226,099 85% 141,840 65%Sub-ordinated loans 7,493 1% 7,495 2% 7,497 2% 4,999 1% 3,000 1% - 0%Deferred tax liabilities 1,194 0% - 0% - 0% 797 0% 1,205 0% 1,695 1%Other liabilities 16,541 3% 17,536 4% 12,148 3% 10,555 3% 7,626 3% 2,724 1%Total Liabilities 511,576 96% 453,094 96% 441,137 97% 374,810 96% 250,794 94% 202,508 93%
Net Assets 20,592 4% 17,333 4% 15,617 3% 16,669 4% 16,650 6% 15,968 7%
Represented by:Share capital 12,975 2% 12,975 3% 12,975 3% 12,225 3% 12,225 5% 12,225 6%Discount on issue of shares (2,855) 1% (2,855) -1% (2,855) -1% (2,105) -1% (2,105) -1% (2,105) -1%Preference shares - 0% - 0% - 0% 1,500 1% 1,500 1% 1,500 1%Reserves 1,991 0% 1,750 0% 1,712 0% 1,541 0% 1,334 0% 919 0%Unappropriated profits 6,148 1% 4,828 1% 4,821 1% 4,519 1% 3,973 1% 2,529 1%Surplus / (Deficit) on revaluation of assets - net of tax 2,334 0% 637 0% (1,036) -0% 490 0% 1,223 0% 2,401 1%Total Equity 20,592 4% 17,333 4% 15,617 3% 16,669 4% 16,650 6% 15,968 7%
Profit & Loss Account
Mark-up / return / interest earned 43,099 87% 41,595 91% 29,997 93% 20,381 83% 15,081 76% 15,328 82%Fee, commission and brokerage income 3,596 7% 2,860 6% 2,669 8% 2,124 9% 1,427 7% 1,124 6%Gain on sale of securities - net 1,873 4% (711) -2% (1,434) -4% 1,234 5% 2,965 15% 1,799 10%Income from dealing in foreign currencies 1,040 2% 1,010 2% 688 2% 357 1% 313 2% 288 2%Dividend income 98 0% 300 1% 109 0% 167 1% 98 0% 85 0%Other Income 70 0% 484 1% 109 0% 169 1% 59 0% (6) -0%Total Gross Income 49,775 100% 45,538 100% 32,138 100% 24,433 100% 19,942 100% 18,618 100%
Mark-up / return / interest expensed 33,322 67% 34,566 76% 21,188 66% 14,139 58% 9,353 47% 9,738 52%Provision/ (reversal) against non- performing loans and advances 681 1% 360 1% 406 1% 203 1% (64) -0% 675 4%Provision / (reversal) of diminution in value of investments 275 1% (345) -1% (220) -1% 123 1% 415 2% 141 1%Other provision / (reversal) / write-off 324 0% (107) 0% 52 0% 45 0% - 0% - 0%Worker’s welfare fund & Other Charges 132 0% 139 0% (149) 0% 46 0% 99 0% 65 0%Operating expenses 13,019 26% 10,792 24% 9,956 31% 8,256 34% 6,748 34% 4,824 26%Total Operating Expenses 47,752 96% 45,405 100% 31,233 97% 22,812 93% 16,552 83% 15,444 83%
Profit Before tax 2,023 4% 133 0% 905 3% 1,621 7% 3,390 17% 3,174 17%
Taxation 873 2% 108 0% 342 1% 647 3% 1,313 7% 1,148 6%
Profit After Taxation 1,150 2% 25 0% 562 2% 973 4% 2,077 10% 2,026 11%
46Annual Report 2020

Six Years’ Horizontal AnalysisRs. in million
Horizontal Analysis6 Years 2020 2019 2018 2017 2016 2015CAGR
Statement of Financial PositionCash and balances with treasury banks 22% 30,421 25,589 32,111 17,334 15,509 11,159 Balances with other banks 18% 1,106 463 969 1,034 753 584 Lendings to financial institutions 13% 23,240 30,321 1,937 3,116 11,334 3,581 Investments - net 16% 201,698 142,568 148,690 169,612 133,727 116,030 Advances - net 26% 250,199 242,945 251,991 184,140 93,794 76,666 Operating fixed assets 18% 10,086 11,964 8,415 7,113 5,837 4,574 Deferred tax assets 0% - 9 287 - - - Other assets 17% 14,678 16,194 12,354 9,131 6,490 5,882 Assets held for sale 100% 739 374 - - - - Total Assets 20% 532,168 470,427 456,754 391,479 267,444 218,476
Bills payable 24% 4,982 3,804 3,520 3,824 2,544 1,609 Borrowings -1% 48,303 54,468 96,559 64,557 10,320 54,638 Deposits and other accounts 26% 433,063 369,790 321,413 290,078 226,099 141,840 Sub-ordinated loans 16% 7,493 7,495 7,497 4,999 3,000 - Deferred tax liabilities 18% 1,194 - - 797 1,205 1,695 Other liabilities 37% 16,541 17,536 12,148 10,555 7,626 2,724 Total Liabilities 21% 511,576 453,094 441,137 374,810 250,794 202,508
Net Assets 8% 20,592 17,333 15,617 16,669 16,650 15,968
Represented by:Share capital -3% 12,975 12,975 12,975 12,225 12,225 12,225 Discount on issue of shares -100% (2,855) (2,855) (2,855) (2,105) (2,105) (2,105)Preference shares 0% - - - 1,500 1,500 1,500Reserves 25% 1,991 1,750 1,712 1,541 1,334 919 Unappropriated profits 34% 6,148 4,828 4,821 4,519 3,973 2,529 Surplus / (deficit) on revaluation of assets - net of tax 9% 2,334 637 (1,036) 490 1,223 2,401 Total Equity 8% 20,592 17,333 15,617 16,669 16,650 15,968
Profit & Loss Account
Mark-up / return / interest earned 25% 43,099 41,595 29,997 20,381 15,081 15,328 Fee, commission and brokerage income 28% 3,596 2,860 2,669 2,124 1,427 1,124 Gain on sale of securities - net 4% 1,873 (711) (1,434) 1,234 2,965 1,799 Income from dealing in foreign currencies 25% 1,040 1,010 688 357 313 288 Dividend income -5% 98 300 109 167 98 85 Other Income 100% 70 484 109 169 59 (6)Total Gross Income 24% 49,775 45,538 32,138 24,433 19,942 18,618
Mark-up / return / interest expensed 29% 33,322 34,566 21,188 14,139 9,353 9,738 Provision/ (reversal) against non-performing loans and advances 1% 681 360 406 203 (64) 675 Provision / (reversal) of diminution in value of investments 9% 275 (345) (220) 123 415 141 Other provision/ (reversal) / write-off 86% 324 (107) 52 45 - - Worker’s welfare fund & Other Charges 15% 132 139 (149) 46 99 65 Operating expenses 22% 13,019 10,792 9,956 8,256 6,748 4,824 Total Expenses 26% 47,752 45,405 31,233 22,812 16,552 15,444
Profit Before Tax 4% 2,023 133 905 1,621 3,390 3,174 Taxation 8% 873 108 342 647 1,313 1,148 Profit After Taxation 1% 1,150 25 562 973 2,077 2,026
47 Annual Report 2020

Financial Performance 2015 - 2020
��������������������� ��������� ����������
���� ���� ���� ���� ���� ����
��������
����������
������
��������
��������
�������
���� ���� ���� ���� ���� ����
���� ���� ���� ���� ���� ���� ���� ���� ���� ���� ���� ����
������������� ��������� ���������� ����������
��������
����������������
�������
���������
������
��������������
�������
�������
�������
�������
79,3
89
96,4
53
186,
879 25
5,14
7
246,
453
254,
402
Rs. in million
Rs. in million
Rs. in million
Rs. in million
48Annual Report 2020

���������������������� ����
���� ���� ���� ���� ���� ����
�����
�����
�����
�����
�����
�����
���������������������� ���
���� ���� ���� ���� ���� ����
���� ���� ���� ���� ���� ���� ���� ���� ���� ���� ���� ����
�����
�����
�����
�����
�����
�����
��������������������� ��� �������������������� ���
�����
�����
�����
���
���
�����
�����
�����
���
���
��
�����
Rs. in million
Rs. in million
Rs. in million
Rs. in million
49 Annual Report 2020

Graphical Presentation of Financial Statements
�������� �������� �������� �������� ��������
�� �� ��� ��� ���
����������
��� �������
������
�������������������������
���� ������������� �������������������
� � ���� ����������������� ���
���������
��� ����������
������������
�������������
����������
�����������
���������
�������������
���������
������������
���������
����������������
���������������
���
���
50Annual Report 2020

Financial Ratios 2020 2019 2018 2017 2016 2015
Profitability Ratios (Percentage)Profit before tax ratio (PBT / Total Income) 12.29% 1.22% 8.26% 15.74% 32.02% 35.75%Gross yield on earning ratio 9.07% 10.00% 7.45% 5.71% 6.31% 7.81%Non Interest income to total income 40.58% 35.94% 19.55% 39.36% 45.91% 37.05%Cost/Income ratio 79.13% 98.36% 90.92% 80.21% 63.72% 54.33%Return on Equity (PAT / Average Equity) 6.06% 0.15% 3.48% 5.84% 12.74% 13.95%
Investors’ Ratios Market Price per share (Rs.) 6.30 5.40 7.37 7.52 10.81 7.75 Earning per share (Rs.) 0.89 0.00 0.30 0.74 1.77 1.74 Break Value or Net assets per share (Rs.) 15.87 13.36 12.04 15.54 15.52 14.89 Market capitalisation (Rs. in million) 8,174.02 7,006.31 9,562.31 8,064.93
11,593.34 8,311.60 Number of shares (Number in million) 1,297.46 1,297.46 1,297.46 1,072.46 1,072.46 1,072.46 Price to Book Ratio 39.69% 40.42% 61.23% 48.38% 69.63% 52.05%
Assets Quality and Liquidity Ratios (Percentage / Times)Gross Advances to Deposits ratio 58.74% 66.65% 79.38% 64.42% 42.66% 55.97%Net Advances to Deposits ratio 57.77% 65.70% 78.40% 63.48% 41.48% 54.05%Investments to Deposits ratio 46.57% 38.55% 46.26% 58.47% 59.15% 81.80%Infection Ratio (NPLs to Gross Advances) 4.61% 4.20% 3.26% 1.74% 3.45% 3.76%NPLs to Net Advances Ratio 4.69% 4.26% 3.30% 1.77% 3.55% 3.89%Coverage ratio (Specific provisions to NPLs) 35.64% 32.26% 35.98% 81.00% 78.68% 90.72%Deposits to shareholders’ equity 21.0 Times 21.3 Times 20.6 Times 17.4 Times 13.6 Times 8.9 Times Assets to shareholders’ equity 25.8 Times 27.1 Times 29.2 Times 23.5 Times 16.1 Times 13.7 Times Earning assets to total assets ratio 89.28% 88.47% 88.15% 91.16% 89.31% 89.84%
Capital Adequacy (Rs. in million / Percentage)Tier 1 Capital 18,478 17,120 15,917 14,351 13,181 10,525 Total Eligible Capital 23,099 21,426 20,178 18,943 16,721 11,399 Risk Weight Assets (RWA) 180,889 165,774 168,020 158,458 118,992 91,189 RWA to Total Assets 34.14% 35.27% 36.79% 40.48% 44.49% 41.74%Tier 1 to RWA 10.21% 10.33% 9.47% 9.06% 11.08% 11.54%Capital adequacy ratio 12.77% 12.93% 12.01% 11.95% 14.05% 12.50%
Financial Ratios (Percentage)Net Operating Margin (PAT / Total Income) 6.99% 0.22% 5.13% 9.45% 19.62% 22.82%Return on capital employed 4.35% 0.10% 2.51% 4.71% 11.66% 13.95%Return on Assets (PAT / Average Assets) 0.23% 0.01% 0.13% 0.30% 0.86% 1.03%Debt to Equity Ratio (Long term Debt / Equity) 0.4 Times 0.4 Times 0.5 Times 0.3 Times 0.2 Times 0.0 Times
Liquidity Ratios (Percentage / Times)Advances to deposits ratio 57.77% 65.70% 78.40% 63.48% 41.48% 54.05% Cash to Current Liabilities 57.09% 43.91% 32.09% 25.35% 120.56% 19.84%
Others (Number)Number of branches 308 360 345 323 307 277 Number of Employees 5,311 4,904 5,127 4,998 4,163 2,946
Six Years’ Financial Performance
51 Annual Report 2020

DuPont Analysis
��������������������������������� ������� ��������������������� ��������������������� ����������������������
���� ���� ���� ���� ���� ����
�����
����� �����
�����
������
������
�����
�����
�����
�����
�����
�����
��
��
���
���
���
���
���� ���� ���� ���� ���� ����
�������
������� ������� ������� �������
�������
�������
�������
�������
�������
�������
������
������
���
���� ���� ������
������
������ �������� ��������������
Dupont model is a financial ratio based on the return on equity ratio that is used to analyze Bank’s ability to increase its return on equity. This is the method of breaking down the original equation for ROE into three components: operating efficiency, asset efficiency, and leverage.
Operating efficiency is measured by Net Profit Margin and indicates the amount of net income generated after taking account all the expenses.
Asset efficiency is measured by the Total Asset Turnover and represents how much revenue has been generated by optimum utilization of the assets. Finally, financial leverage is determined by the Equity Multiplier
Net operating margin for the year has improved significantly indicating an increase in customer trust, product and service quality.
Improved Leverage ratio explains the Bank is well equipped to meet its financial obligation and commitments.
2020 2019 2018 2017 2016 2015Net Operating Margin PAT / Total Income A 6.99% 0.22% 5.14% 9.45% 19.61% 22.82%
Asset Utilization Total Income / Average Assets B 3.28% 2.37% 2.58% 3.12% 4.36% 4.49%
Return on Assets C = A X B 0.23% 0.01% 0.13% 0.30% 0.85% 1.03%Leverage Ratio / Equity Multiplier
Average Assets / Average Equity D 26.42 28.12 26.27 19.78 14.90 13.60
Return on Equity C X D 6.06% 0.15% 3.48% 5.84% 12.74% 13.95%
Rs. in million
52Annual Report 2020

Economic Value-Added StatementEconomic value added is a measure based on the residual income technique that serves as an indicator of the profitability. It takes into account all costs including the opportunity cost of equity and it does not stick to accounting profits only.
2020 2019Rs. in million
Invested CapitalAverage shareholders’ equity 18,963 16,475 Add: Cumulative provision against assets 5,121 4,030 Invested Capital 24,084 20,505
Return on Invested CapitalProfit after taxation 1,150 25 Add: (Reversals) / provision against write offs - net 1,280 (92)Total return on invested capital 2,430 (67)
Economic cost (12 months average Treasury Bill rate plus 2% premium) 10.75 % 14.60%Opportunity cost of invested capital 2,589 2,994
Economic Value-Added 21,495 17,512
20192020
24,084
2,430
2,589
21,495
20,505
(67)
2,994
17,512
������ ������� ������� ������� �������
Invested Capital
Total return on invested capital
Opportunity cost of invested capital
Economic Value-Added
53 Annual Report 2020

Rs. in million2020 2019 2018 2017 2016 2015
Profit before taxation 2,023 133 905 1,621 3,390 3,174 Adjustment for non-cash items 3,476 1,457 537 834 891 1,312 Operating assets/liabilities changes 89,589 (30,495) (39,026) 95,848 (21,052) 30,506 Net cash generated from operations 95,088 (28,905) (37,583) 98,303 (16,771) 34,992 Capital expenditure 1,076 (2,032) (1,367) (1,290) (1,850) (1,305)Free cash flows 94,012 (30,937) (38,951) 97,013 (18,621) 33,687
Free Cash Flows
Rs. in million2020 2019 2018 2017 2016 2015
Cash flows from operating activities 95,088 (28,905) (37,583) 98,303 (16,771) 34,992 Cash flows from investing activities (87,981) 22,775 49,674 (96,188) 21,484 (32,598)Cash flows from financing activities (1,138) (1,033) 2,318 (180) (180) (156)Cash and cash equivalents at beginning of the year 25,415 32,578 18,169 16,221 11,688 9,450 Cash and cash equivalents at end of the year 31,384 25,415 32,578 18,169 16,221 11,688
Summary of Cash Flows
������������������������������������������������������������
�� ����
� ���� �� ����
�� ����
�� ����
�� ���
�� ����
����
�� ����
�� ����
� ����
� ����
� ���� � ����
����
���� ���� ����
���� ���� ���� ���� ���� ����
54Annual Report 2020

Analysis of Capital Adequacy Ratio 2020 2019
Minimum Capital Requirement (MCR): Rs. in million
Paid-up capital (net of losses) 10,119 10,119
Eligible Common Equity Tier 1 (CET 1) Capital 16,229 14,620 Eligible Additional Tier 1 (ADT 1) Capital 2,251 2,500 Total Eligible Tier 1 Capital 18,479 17,120 Eligible Tier 2 Capital 4,621 4,307 Total Eligible Capital (Tier 1 + Tier 2) 23,100 21,426
Risk Weighted Assets (RWAs):Credit Risk 155,762 144,381 Market Risk 1,145 925 Operational Risk 23,982 20,468 Total 180,889 165,774
Total Eligible Capital 23,100 21,426 Risk Weighted Assets (RWAs) 180,889 165,774 Capital Adequacy Ratio 12.77% 12.93%
����������� ����������� ����������������
�������� �����������
���������������� �������� ��������
������� ������� ������� �������
������ ���� ������ ������
���� ���� ����� ����� ����� �����
��������
�������
������ ������
������� �������
��������������������
���
���
��
��
���
���
�����������
�����������
����������������
55 Annual Report 2020

Category of Investments
Rs. in million2020 2019 2018 2017 2016 2015
T-bills 115,052 67,669 44,375 22,254 70,643 24,488 PIBs - floating rate 19,424 22,927 - - - - PIBs - fixed rate 54,044 44,881 92,252 135,536 49,835 82,704 TFCs and Sukuks 6,639 2,963 1,526 1,992 1,754 2,008 Shares 4,264 1,966 2,557 3,547 4,388 3,649 Associates and subsidiaries 2,161 2,120 2,099 1,919 1,919 1,919 Others 114 41 5,882 4,364 5,188 1,261
201,698 142,568 148,690 169,612 133,727 116,030
�
������
������
������
������
�������
�������
�������
������������������������
������� �������� �������� ���������������� �������������� ������
����������������������� Rs. in million
56Annual Report 2020

Non-Performing LoansRs. in million
2020 2019 Variance 2020NPLs Provision NPLs Provision NPLs Provision Coverage
Categorywise
OAEM 297 - 841 2 -64.71% 100.00% 0.13%Substandard 1,178 156 1,159 65 1.62% 141.33% 13.25%Doubtful 3,264 724 2,442 426 33.66% 69.94% 22.19%Loss 6,995 3,301 5,911 2,847 18.34% 15.93% 47.19%Total 11,734 4,182 10,353 3,340 13.33% 25.21% 35.64%
������������������������
��������������
��� ��������� ��������������
��� ���
�����
�����
�����
������
�����������
����
�����
�� ���
�����
�� ���
������
������
� ����
������
����
�����
Rs. in million
57 Annual Report 2020

Advances Segmentation
�������������
�������������
�������������
������������������������
������������
������������
�����������
�����������
�����������
�����������
�����������
����������������������
����������� ����������
�������
� �� � �� ������� �� ��������
��� ������
���
��� �
��������������
����
� �����
���������� ����� �
����� ������ ������� �� ����
����������
������
���
�� ����� ������ ����
������� ������
���� �����
���� ������� ����� ������ ��
����������
�� �������� �������
������
�������������� ���� ������ �������
58Annual Report 2020

Funding Mix
Deposit Mix
���
��
��
��
��
���
��
��
��
��
��������
��� �
����
���
������
�����������������������
���� ����
������������������������
������������� �������������� �����������
��������� ������
���� � � ��� ��� ��� ��
������� ��� � �
��� ���
�������� ���� � ��
�������
�����������
��������������� �������������� ������� ����
��
��
��
��
��
��
������
������
������
������
������
������
������
������
������
������
������
������
������
������
������
������
������
������
�� ��� ��� ��� ��� ����
����
59 Annual Report 2020

Deposits Breakdown
Deposits Composition
Rs. in billion
DEPOSIT TYPE 2020 2019 2018 2017 2016 2015
Term Deposit 210 197 148 132 106 62
Saving Account 115 90 91 83 66 44
Current Account 108 83 82 75 54 36
433 370 321 290 226 142
���
��
��
��
��
���
��
��
��
��
��������
��� �
����
���
������
�����������������������
���� ����
������������������������
������������� �������������� �����������
��������� ������
���� � � ��� ��� ��� ��
������� ��� � �
��� ���
�������� ���� � ��
�������
Rs. in billion
60Annual Report 2020

Quarterly PerformanceRs. in million
2020 20194th Quarter 3rd Quarter 2nd Quarter 1st Quarter 4th Quarter 3rd Quarter 2nd Quarter 1st Quarter
Profit and loss accountMark-up earned 9,213 9,536 11,426 12,923 11,336 11,199 9,722 9,339 Mark-up expensed (6,737) (7,385) (8,818) (10,382) (9,593) (9,625) (8,075) (7,274)Net mark-up income 2,476 2,151 2,609 2,542 1,743 1,574 1,647 2,065 Non mark-up income 2,218 1,483 1,769 1,207 1,622 749 803 768 Total Income 4,694 3,634 4,377 3,749 3,365 2,324 2,450 2,833 Non-mark-up expenses (3,815) (3,129) (3,291) 2,917 (3,027) (2,618) (2,736) (2,550)Profit before provisions 879 505 1,086 832 338 (294) (286) 283 Provisions and write off 822 (12) 243 204 593 92 (365) (229)Profit before taxation 58 493 844 628 932 (202) (651) 55 Taxation (73) (184) (370) (246) (329) 66 176 (21)Profit after taxation (15) 309 474 383 603 (136) (475) 33
Statement of Financial PositionAssetsCash and balance with treasury banks 30,421 33,588 32,726 27,431 25,589 21,094 34,742 19,973 Balances with other banks 1,106 618 1,133 1,316 463 1,140 2,315 1,131 Lendings to Financial Institutions 23,240 8,780 9,977 3,845 30,321 1,229 4,598 58,976 Investments 201,698 168,386 180,783 183,241 142,568 140,692 136,623 118,020 Advances 250,199 241,852 241,608 235,140 242,945 238,393 250,021 255,665 Fixed assets 7,600 8,835 9,182 9,393 9,693 11,736 11,578 6,349 Intangible assets 2,487 2,419 2,349 2,280 2,271 2,272 2,128 2,226 Deferred tax assets - - - - 9 612 471 111 Other assets 14,678 13,513 16,829 15,011 15,588 12,999 13,627 13,100 Assets held for sale 739 - 374 374 374 - - -
532,168 477,990 494,961 478,030 469,821 430,167 456,103 475,550
LiabilitiesBills payable 4,982 4,341 4,259 4,465 3,804 3,174 3,914 3,740 Borrowings 48,303 34,317 36,567 49,834 54,468 59,923 52,589 115,366 Deposits and other accounts 433,063 391,953 405,832 379,246 369,790 327,064 361,105 319,779 Subordinated debt 7,493 7,495 7,495 7,495 7,495 7,496 7,496 7,497 Deferred tax liabilities 1,194 1,217 1,621 171 - - - - Other liabilities 16,541 18,625 18,962 18,785 16,930 16,628 15,173 12,995
511,576 457,947 474,736 459,996 452,488 414,285 440,277 459,377
Net assets 20,592 20,043 20,225 18,035 17,333 15,883 15,826 16,173
Represented by:Share capital 10,119 10,119 10,119 10,119 10,119 10,119 10,119 10,119 Reserves 1,991 2,012 1,958 1,854 1,750 1,751 1,764 1,723 Unappropriated profit 6,148 5,864 5,521 5,137 4,828 4,237 4,366 4,829 Surplus / (deficit) on revaluation of assets - net of tax 2,334 2,047 2,627 925 637 (225) (423) (498)
20,592 20,043 20,225 18,035 17,333 15,883 15,826 16,173
���� ����
�����
�����
�����
�����
�����
������ ��
����
�����
��
���� ����
��� ���
��� ��� ��� ��� ��� ��� ��� ��
�� �� �� ��
������
������
������
������
������ ������
������
������
���
����
����
����
����
�����
�����
���
�������������Rs. in million
61 Annual Report 2020

Quarterly Analysis of NIM & PBT
�� ���� ��
���������
����
�������������
NIM PBT
PBT
NIM
2,065
1647
(651)
1,574
1,743
932
55
(202)
Q1
Q4
Q2
Q3
2,476
2,15149358
2,609
844
2,542
628
Q2
Q1
Q4
Q3
NIM & PBT Q1 Q2 Q3 Q4
NIM 2,542 2,609 2,151 2,476
PBT 628 844 493 58
NIM & PBT Q1 Q2 Q3 Q4
NIM 2,065 1647 1,574 1,743
PBT 55 (651) (202) 932
Rs. in million
Rs. in million
62Annual Report 2020

Markup and Non-Markup IncomeRs. in million
2020 2019 2018 2017 2016 2015Markup and Non-Markup Income
Mark-up/return/interest earnedLoans and advances 25,288 30,945 19,657 10,007 6,220 5,942 Investments 16,509 9,683 10,071 10,118 8,758 9,207 Lendings to financial institutions 33 53 111 78 1 1 Balances with others banks 10 55 20 4 20 9 Securities purchased under resale agreements 1,259 859 137 174 82 169
43,099 41,595 29,997 20,381 15,081 15,328
Mark-up/return/interest expensedDeposits 29,390 28,415 15,099 11,775 7,531 6,447 Borrowings 1514 1,804 705 401 318 400 Securities sold under repurchase agreements 1,112 2,811 4,976 1,735 1,504 2,891 Sub-ordinated loans 900 1,029 408 228 - - Lease liability against right-of-use assets 406 507 - - - -
33,322 34,566 21,188 14,139 9,353 9,738
Net Markup income 9,777 7,028 8,809 6,242 5,728 5,590
Non-markup / interest incomeFee and commission income 3,596 2,860 2,669 2,124 1,426 1,124 Dividend income 98 300 109 167 98 85 Foreign exchange income 1,010 963 671 357 313 288 Income from derivatives 29 47 17 94 19 (41)Gain / (loss) on securities 1,873 (711) (1,434) 1,234 2,965 1,799 Other income 70 484 109 75 40 35
6,676 3,943 2,141 4,051 4,861 3,290
������������������������
������������������������������������� ��� �
������������������������������������� ����������������������������������������
���
�����
� ��
������
������
����
������
������ ��� �
����� ����
����
Rs. in million
63 Annual Report 2020

����
25,288
16,509 1,259 33 1043,099
����
30,945
9,683 859 55 53 41,595
���� 3,596
1,873
1,010 98 70 29
6,676
����
2,860
963
484300 47
-711
3,943
Loans andadvances
Investments Securitiespurchased
under resaleagreements
Lendings tofinancial
institutions
Balances with other
banks
Total Loans andadvances
Investments Securitiespurchased
under resaleagreements
Lendings tofinancial
institutions
Balances with other
banks
Total
Fee andcommission
income
Gain / (loss)on securities
Foreignexchangeincome
Dividendincome
Otherincome
Incomefrom
derivatives
Total Fee andcommission
income
Gain / (loss)on securities
Foreignexchangeincome
Dividendincome
Otherincome
Incomefrom
derivatives
Total
Markup Income
Non-Markup Income
Rs. in million
64Annual Report 2020

Market Share InformationBelow is a list of some key factors that can influence the share price of JS Bank Limited. Some of the major factors can include the following:
Regulatory / Policy Changes All policy and regulatory level changes that are directly related to the overall environment within banking industry are likely to influence the bank’s stock price. These can include several things such as a change in monetary policy stance of SBP (which directly impacts the yield on investment portfolio of the bank). Furthermore, any change within reserve requirement specifications can also impact the available pool of funds for onward usage as advances and investments by the bank. This can have a positive or negative effect on the overall profitability of the bank which can then lead to changes in stock price.
Additionally new policy initiatives by SBP to encourage initiatives such as those geared towards encouraging digital banking, increasing financial inclusion of the country’s population can also affect share price of the bank.
Investor and Market Sentiment Stock market within Pakistan is largely sentiment driven. There have been several instances where market returns skyrocketed as a result of increased investor interest at PSX. These trends not only impact the overall market dynamics of the stock market but they can also have a dynamo impact on individual shares including JS Bank stock.
Moreover, market dynamics can also change due to new PSX regulations such as those that are pertaining to increasing investor base. For instance, the initiatives of current government to increase interest of expatriates within local market through the Roshan Digital Account framework is an example of one such policy measure which can influence the ongoing market sentiment at PSX thereby affecting individual share prices including JSBL share.
Change in Macro Environment The macro-economic environment factors including those that affect the ongoing law and order situation within the country, deviations within the political climate, stability in government policies regarding financial markets can also influence share price movements at PSX. JSBL share is also liable to be driven by these macro level changes both in the short and the long term.
65 Annual Report 2020

Share Price Trend100%
54.1%
High Price (Rs. / share)
Market Price ( Dec 31, 2020)
Low Price (Rs. / share)
7.30
6.30
3.95
0
100
200
300
�����������
����
���������������
�����
1.62M
247 251
Days traded No. of trading days
���������������������������������������� ������ ������������
���������� ����������
100%
54.1%
High Price (Rs. / share)
Market Price ( Dec 31, 2020)
Low Price (Rs. / share)
7.30
6.30
3.95
0
100
200
300
�����������
����
���������������
�����
1.62M
247 251
Days traded No. of trading days
���������������������������������������� ������ ������������
���������� ����������
Share Price SensitivityThe share price remained fairly sensitive during the calendar year 2020 with share recording high of Rs. 7.30 and low of Rs.3.95 following the overall market fluctuation within PSX. Liquidity within the share was significant as evidenced by 1.6 million shares being traded on average during the year.
Description Value
% of days traded 98.40
Average volume (shares) 1,623,512
Days traded 247
High Price (Rs. / share) 7.30
Low Price (Rs. / share) 3.95
66Annual Report 2020

Calendar of Major Events During 2020
Annual Results – 2019 approved by the Board
February 27, 2020
1st Quarter Results – 2020 approved by the Board
May 28, 2020
Board Meeting for other Matters June 15, 2020
2nd Quarter Results – 2020 approved by the Board
August 26, 2020
3rd Quarter Results – 2020 approved by the Board
October 28, 2020
Budget - 2021 approved by the Board
December 28, 2020
Corporate Briefing Session December 30, 2020
Annual General Meeting March 27, 2020
67 Annual Report 2020
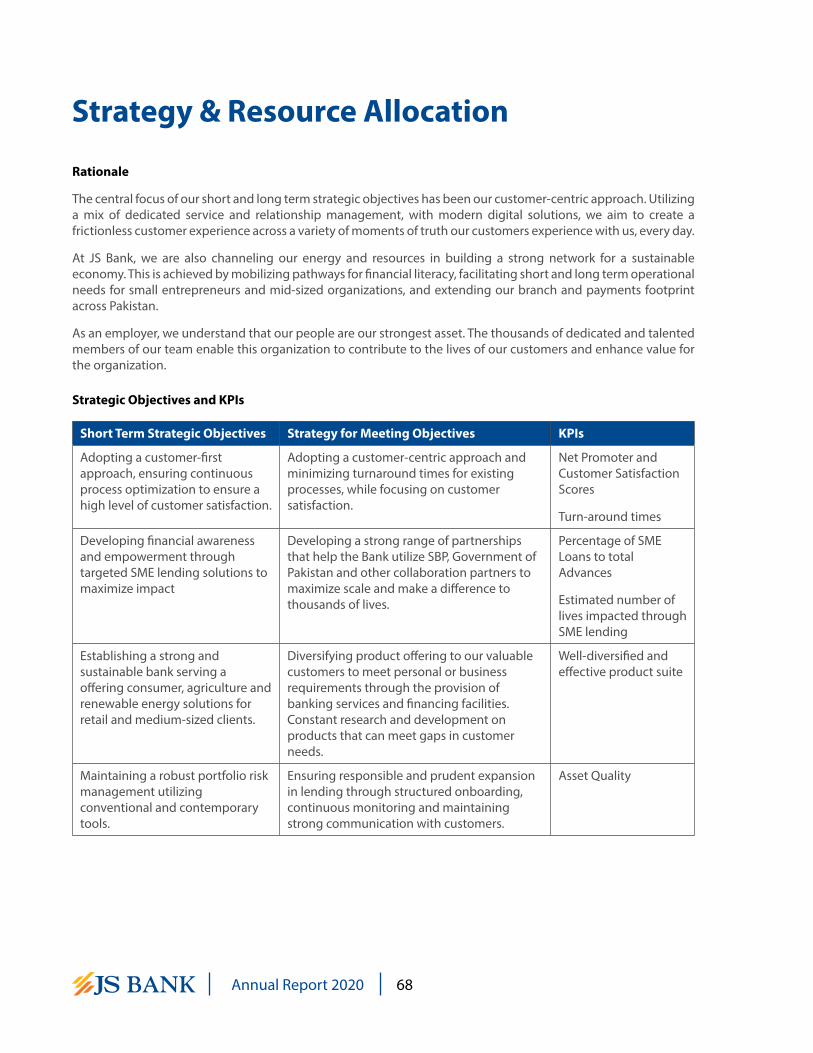
Strategy & Resource Allocation
Rationale
The central focus of our short and long term strategic objectives has been our customer-centric approach. Utilizing a mix of dedicated service and relationship management, with modern digital solutions, we aim to create a frictionless customer experience across a variety of moments of truth our customers experience with us, every day.
At JS Bank, we are also channeling our energy and resources in building a strong network for a sustainable economy. This is achieved by mobilizing pathways for financial literacy, facilitating short and long term operational needs for small entrepreneurs and mid-sized organizations, and extending our branch and payments footprint across Pakistan.
As an employer, we understand that our people are our strongest asset. The thousands of dedicated and talented members of our team enable this organization to contribute to the lives of our customers and enhance value for the organization.
Strategic Objectives and KPIs
Short Term Strategic Objectives Strategy for Meeting Objectives KPIs
Adopting a customer-first approach, ensuring continuous process optimization to ensure a high level of customer satisfaction.
Adopting a customer-centric approach and minimizing turnaround times for existing processes, while focusing on customer satisfaction.
Net Promoter and Customer Satisfaction Scores
Turn-around times
Developing financial awareness and empowerment through targeted SME lending solutions to maximize impact
Developing a strong range of partnerships that help the Bank utilize SBP, Government of Pakistan and other collaboration partners to maximize scale and make a difference to thousands of lives.
Percentage of SME Loans to total Advances
Estimated number of lives impacted through SME lending
Establishing a strong and sustainable bank serving a offering consumer, agriculture and renewable energy solutions for retail and medium-sized clients.
Diversifying product offering to our valuable customers to meet personal or business requirements through the provision of banking services and financing facilities. Constant research and development on products that can meet gaps in customer needs.
Well-diversified and effective product suite
Maintaining a robust portfolio risk management utilizing conventional and contemporary tools.
Ensuring responsible and prudent expansion in lending through structured onboarding, continuous monitoring and maintaining strong communication with customers.
Asset Quality
68Annual Report 2020

Long Term Strategic Objectives Strategy for Meeting Objectives KPIs
JS Bank aims to develop a user experience that transcends conventional banking norms and embeds deeply within the financial transaction ecosystem of our customers and economy at large.
Investment in digitization and agile way of work, to help bring more relevant solutions to customers with minimal times to market.
Migration to self-served solutions
Time to market
Customer satisfaction score
We aspire to creating an organizational culture which harbors innovation, diversity and drive for economic sustainability, built around the needs of our customers and stakeholders.
Encourage gender equality and diversity. Provide opportunities and investing in employees for their career growth. Create a structure that rewards entrepreneurial spirit.
Employee Retention
Employee Satisfaction
JS Bank strives to support environmental, social and good governance initiatives for economic growth, social progress and environmental protection.
Promotion of sustainable ventures and community development along with minimizing our carbon footprint.
Measuring impact created in terms of carbon footprint, lives impacted and communities supported through interventions.
We aim to partner with like-minded organizations & entities in strengthening the economy for all stakeholders, with a vision to build an environment of prosperity, security and economic independence for the people of Pakistan.
Building a network of partners across the country to bring value through solutions to our customers, utilizing the benefits of various synergies created between such partnerships.
Lives impacted
Wealth creation
Economic activity creation
Strategy to Overcome Liquidity Gap
The Bank’s Current, Savings and Term deposit base indicates a stable and sound liquidity position. The Bank has also a reasonable portfolio of marketable securities that can be realized in the event of stress. The Bank’s Liquidity Coverage Ratio and Net Stable Funding Ratio are well above the regulatory requirement. The Bank has a well-defined Liquidity Contingency Plan for liquidity crisis management, and detail aspect of liquidity risks are discussed under risk management section of the report.
CEO presentation video on the organization’s website explaining the business overview, performance, strategy and outlook.
Web link: https://jsbl.com/mr-basir-shamsie-president-ceo-js-bank/
69 Annual Report 2020

Alizey Lateef
I am a self taught artist who’s in her final year of MBBS. Illustration and water colour is the perfect medium for me to highlight the details I appreciate in all things around me.
Institute: Ziauddin Medical University
Identification and Mitigation of Risks and OpportunitiesCredit RiskMeasurement: Credit Risk Management function under Risk Management Group identifies, measures, manages, monitors, and mitigates credit risk. Credit Risk is measured and estimated through detailed quantitative financial and qualitative factors analyses, internal and external credit risk ratings including of facility risk ratings, and customers’ behavior analysis.
Monitoring: Credit Risk function carries out review of counterparties through credit proposals and the Credit Admin Department (CAD) function performs post disbursement monitoring including security documentation and limits monitoring. Business functions continuously remain in contact with customers for updated information about the clients.
Management: The Bank has a diversified loan portfolio spread over public and private sectors with different industries. Credit Risk Function ensures to minimize credit risk associated with borrowers. Risk Management Group has a defined structure with credit approving authorities with Central Credit Committee in place to approve large credit exposures. The Bank is in the process of implementing Loan Originating System (LOS) for automated credit approval process in a paperless environment to optimize the Turn Around Time with effective credit and control polices.
To further enhance the credit risk analysis, the Bank has in place Internal Credit Risk Rating (ICRR) model for Obilgor Risk Ratings (ORR) and Facility Risk Ratings (FRR) for corporate, commercial, and small & medium enterprise borrowers. In addition to it, the Bank will implement Risk Based Pricing model to augment the credit decisioning.
The Bank has Portfolio Management Committee (PMC) at management level and Board Risk Management Committee (BRMC) at board level for discussions and deliberations on key risk issues on portfolio level. Periodic meetings are conveyed to oversee the risk exposures at portfolio level.
Market RiskMeasurement: The Bank is exposed to market risk through its trading and other investment activities
including derivatives and options. VaR methodologies augmented by sensitivity analyses, notional limits, management action triggers and stop loss triggers at a script and portfolio level, and stress testing are used to capture and report the various aspects of market risk.
Monitoring: The Bank has a separate Market Risk Unit under Risk Management Group that ensures market risk limits will not exceed the tolerance levels set by the Board. Assets & Liability Committee (ALCO) is entrusted to monitor the market risk exposures and limits through meetings on a periodic basis.
Management: The Bank is following a balanced approach towards risk taking in the market risk area. The robust risk management architecture ensures that the exposures remain within the defined risk appetite. Dashboards for money market and foreign exchange exposures are being presented to manage the limits and exposures within defined levels.
Liquidity RiskMeasurement: The Bank measures Liquidity Risk as part of its liquidity monitoring activities. The purpose of the liquidity risk assessments and stress tests is to ensure sufficient liquidity for the Bank under normal and stress conditions.
Monitoring: In line with SBP’s directives under Liquidity Risk framework and Basel III guidelines, the Bank regularly monitors liquidity monitoring tools along with Net Stable Funding Ratio (NSFR) and Liquidity Coverage Ratio (LCR). The Bank has also in place Early Warning Indicators and Liquidity Risk Analysis tools to trigger any point for management attention.
Management: The Bank is following liquidity risk management approach to manage funding sources and intraday liquidity management. The Bank’s deposit base indicates fair liquidity position and Bank’s NSFR and LCR are well above the regulatory requirement.
ALCO has the responsibility for liquidity management and contingency funding plan. Underlying policies are approved by the Board in respect of liquidity, investment, and treasury.
71 Annual Report 2020

Operational RiskMeasurement: The Bank has a defined Operational Risk Management Policy and framework in place. In line with, the Bank has a database of operational risks/losses, and Key Risk Indicators (KRI). The Bank analyzes key risks and controls through Risk and Control Self-Assessment (RCSA) exercise covering all critical functions of the Bank. Analysis of operational loss and results of KRIs and RCSAs help the Bank to mitigate risks.
Monitoring: The Bank as a practice to present updates on operational risk and loss events on a periodic basis to senior management and relevant board sub-committee.
Management: The Bank has an Operational Risk Management unit under Risk Management Group responsible for managing operational risk tools. There is an Operational Risk Management Committee (ORMC) at management level to oversee various operational risk events. The Bank has initiated awareness programs through workshops and training sessions to build and inculcate risk culture across the Bank.
Capital Adequacy RiskMeasurement: The Bank has a capital base above regulatory limits and Basel requirements and is following the predefined format and criteria mentioned in the Basel II and III guidelines.
Monitoring: The Bank assesses current and future capital requirements and ensures that the minimum capital requirements specified by the State Bank are adhered to. Regular assessment of capital enables the Bank to evaluate adequacy of the amount, type and distribution of capital required to cover various risks.
Management: The Bank total Capital Adequacy Ratio is above the requirement of 12.50% (including capital conservation buffer of 2.50%). The Bank’s Common Equity Tier-1 (CET1) to total risk weighted assets ratio is also above the requirement of 6%. The Bank maintains a leverage ratio above the regulatory limit of 3.0%. The Bank will continue to retain and accumulate profits to capitalize opportunities in short, medium, and long term.
Country RiskMeasurement: The Bank’s Country Risk exposure is assessed against the Bank’s cross border trade and treasury activities. Risk Tolerance Limits are set for various countries with different country ratings.
Monitoring & Management: Market Risk Unit and ALCO are responsible for regular monitoring of risk exposure. Country Exposure Limits both for Trade and Treasury exposures are in place, which broadly capture direct exposure on sovereigns and foreign domiciled counterparties.
Information Security RiskMonitoring & Management: The Bank focuses on providing simplified banking solutions to its customers through innovative technology applications security while protecting the client information from vulnerabilities and threats. The Bank has embedded various controls on the information security and consistently developing more controls.
The Bank has developed Information Technology Risk Assessment Framework which enables better management of technology risk, especially information security risks, properly.
Regulatory RiskMeasurement: The Bank takes into consideration all regulatory risks for effective management of changes in legislature and regulatory requirements that may affect the Bank.
Monitoring & Management: Compliance Function of the Bank reviews key regulatory developments to anticipate changes and their potential impact on its performance. The Bank aims to keep continued compliance with regulatory requirements.
Opportunities 1. Increasing the Bank’s advances portfolio with
focus on agriculture, SME and other segments through special focus on untapped markets and clients, reducing the process time.
2. Sound equity provides the opportunity of exploring new markets to expand the Bank’s business in different products through feasibility studies and market check.
3. Developing new deposit products to strengthen the existing product mix and to take advantage of the growing branchless and digital banking opportunities through automation of various processes and through alliances.
External1. Facilitating non-resident Pakistanis to increase
the flow of home remittances through new contracts and foreign agents along with exploring new markets to increase customer base.
72Annual Report 2020

Sources of Risk and its Assessment
The Board of Directors carries out continual assessment of the primary risks the Bank is facing to analyze on an on-going basis, including those that would arise and threaten the businesses and/or Bank’s performance, solvency or liquidity.
The Bank looks at the following risks after analyzing the external and internal factors:
Factors Source Primary Risks
Economic External Credit Risk, the risk of loss to the Bank from its borrowers and counterparties in the event of failure to fulfill their obligations, including of whole or partial settlement of principal, mark-up, collateral and other receivables.
External Market Risk, the risk of loss arising from potential unfavorable change in the Bank’s assets and liabilities from market variables including, but not limited to, interest rates, foreign exchange rates, equity prices, commodity prices, spreads, and market volatilities.
External/ Internal Liquidity Risk, the risk that the Bank is unable to offset certain positions at market price or the inability of the Bank to convert assets to cash or obtain funding from other sources.
External Capital Adequacy, the risk the Bank has an insufficient capital to support its business activities and to meet the regulatory requirements under normal and stressed situations.
System /
Information
External/ Internal Operational Risk, the risk of loss to the Bank from inadequate or failed processes, systems, people and / or from external events (e.g; fraud or natural disasters).
Information Security Risk, the risk comprises the impacts to the Bank and its stakeholders that could occur due to the threats and vulnerabilities associated with the operation and use of information systems and the environments in which those systems operate.
The Bank mitigates such risks through the selection, implementation, maintenance, and continuous monitoring of preventive, detective, and corrective security controls.
Political External Country Risk, the risk of likelihood of a country unable to fulfill its obligations towards one or more foreign lenders/ investors. The Bank engages in international lending and having cross border exposure is exposed to country risk. Political stability plays a vital role in country ratings and may negatively impact the economy if rating is downgraded.
Regulator External/ Internal Regulatory Risk, the risk of loss arises due to imposition of any penal action against the Bank in the event of failure to meet the regulatory or contractual obligations.
The Bank foresees the uncertainty in respect of implementation of IFRS-9, which may adversely impact the financial position.
Social External/ Internal Reputation Risk, the risk to the earnings and capital arising from negative perception among the stakeholders. This may have an impact on customer base the Bank’s ability to capture new markets.
73 Annual Report 2020

Risk Management Framework
The Bank has a well-defined Risk Management Framework that governs the risk management structure to ensure that the Bank is continuously evaluating and monitoring the associated risks and ensuring the mitigating controls. The Bank always remain committed to ensure appropriate balance between risk and reward throughout the Bank. The following structure is being followed in the Bank;
Risk Governance Structure
• Board of Directors
• Board Risk Management Committee
• Integrated Risk Management Committee
• Management Committees for Risks; including Portfolio Management Committee, ALCO, Operational Risk Management Committee, Remedial Management Committee and ITSC to review IS related matters.
• Risk Management Function under the CRO, which broadly covers Credit Risk Heads including Agri Risk, Market & Basel, Enterprise Risk Management Operational and Environmental Risk, Consumer Risk, Credit Administration, Information Security, Special Assets Management and Strategic Projects and Quantitative Analysis.
The Bank has a well-structured risk management framework which is based on three lines of defense; Business and support functions directly involved in risk taking activities constitute the first line of defense, Risk and Compliance, being the second line of defense, are responsible for ensuring policies, procedures and limits are within strategic objectives and regulatory requirements, and audit function plays an independent part for over sighting as the third line of defense.
Inadequacy in the capital structure and plans to address such inadequacyThe Bank is not facing any kind of inadequacy in the capital structure and has capital adequacy over and above the regulatory requirement.
Sensitivity Analysis Due to Foreign Currency FluctuationsThe regional currency trends for the start of the year 2020 showed downward pressure as the COVID-19 took hold and Pak rupee followed course as per SBP avowed goal to let market determine exchange rate. Following the challenging situation in the aftermath of pandemic, the rupee showed volatility and traded in a wide band of 154-168 but since the rebound in economic activity and relative success in dealing with COVID, after reaching a low of 168 in August 2020, we have seen a steady appreciation in Pak Rupee to 159.83 by the end of year. To combat the negative impact of COVID related lockdowns, SBP also reduced SCR requirements to enhance economic activity.
The market has subsequently settled around the 160 level. The astute management of our dealings in foreign currency has ensured no volatility in our earnings. The risk appetite of our bank is determined by the Board and monitored by the risk team. The treasury team proactively manages day to day liquidity, net open positions and Foreign Exchange Exposure Limits (FEEL) of the Bank.
The risk management team ensures adherence to Liquidity Coverage Ratio (LCR) and Net Stability Fund Ratio (NSFR) as per SBP guidelines. The bank ensures full implementation of BASEL III liquidity standards and liquidity ratios.
Information about default in payment of any debts and reasons thereofThere were no default in the payment of any borrowing/ debt during the year. Bank has sufficient liquidity to fulfill all its commitments.
74Annual Report 2020

Ahwar Nasir
I am a 19 year old aspiring artist who paints to make herself and others happy. Painting to me is to communicate love.
Institute: Indus Valley School of Art and Architecture

Corporate GovernanceRole & Responsibilities of the Board Role, responsibilities, prohibitions and restrictions relevant to the directors of JS Bank Limited, as contained in the existing laws and regulations have been prepared and approved by the Board as Directors’ Handbook.
The Board is responsible for formulating broad goals and strategies for the Bank. It is also responsible to define and determine policies of the Bank regarding the execution of its functions and approve internal rules for their implementation. The formulation of clear objectives and policies supplies a framework for the management to work within defined parameters. The Board also helps to set priorities for the Bank. One of the key functions of the Board is to monitor the performance of senior management and its function.
The Board establishes its sub-committees to discharge its responsibilities. For each sub-committee, the Board adopts a formal Terms of Reference (ToRs) setting out the matters relevant to the composition, roles, functions, responsibilities and administration of such committees. All Board sub-committee meetings are held sufficient number of times in a year to discharge its duties.
The Board presently has the following sub-committees:
1. Board Audit Committee2. Board Risk Management Committee3. Board Human Resource, Remuneration and
Nomination Committee4. Board Information Technology Committee
All the Board sub-committees have access to the appropriate external and professional advice if needed to assist the committee in fulfilling its role.
Annual Evaluation of the Board’s Performance The Board of Directors of JS Bank sets the Bank’s strategic direction and ensures that the organization stays true to this direction - enabling it to achieve its long-term objectives while ensuring regulatory compliance. To discharge its fiduciary responsibility of safeguarding the stakeholders’ interests, a formal and effective mechanism is put in place for an annual
evaluation of the Board’s own performance, members of the Board and of its sub-committees as required by the State Bank of Pakistan and the Securities and Exchange Commission of Pakistan.
The Board of Directors of JS Bank is enriched with skills, core competencies, diversity, experience and knowledge and at the same time committed to strong corporate governance to protect the overall interests of the Bank and its stakeholders. The Board continually reviews the Bank’s financial and operational soundness, governance, internal controls and significant policies as per regulatory requirements. Further, Sub-Committees were constituted with a prescribed mandate and respective terms of reference.
In line with the best practices of the corporate governance the Board has conducted self-evaluation exercise on an annual basis by engaging Pakistan Institute of Corporate Governance (PICG) as an external facilitator which is the lead on Corporate Governance and has a team of qualified consultants to conduct board evaluations for companies and banks. The Board of JS Bank in compliance with the SBP’s Guidelines on Performance Evaluation of Board of Directors and Listed Companied (Code of Corporate Governance) Regulation, 2019 has conducted its self-evaluation for the year 2020 by engaging PICG. The evaluation covered various aspects of the performance of the Board including but not limited to: Board Composition. Strategic Planning, Control Environment, Committees, CEO & Chairman etc.
The evaluation was carried out using quantitative method, based on subjective assessment and was conducted via questionnaires developed by the consultants. The quantitative technique has the advantage of being specific and measurable. Measurement scale used in the Bank’s board evaluation is the summated rating depending on how strongly they agree or disagree with a given statement. The use of this method ensures specific and measurable data that can be benchmarked over time.
External Consultant’s Board Performance EvaluationThe State Bank of Pakistan (SBP), through BPRD
76Annual Report 2020

circular no. 11 of 2016 dated August 22, 2016, has mandated that the Board of every bank, must carry out a formal annual performance evaluation of the Board, its Committees, and individual directors. The circular also required performance evaluation to be carried out by an external independent evaluator at least once in every three years. During the year, Pakistan Institute of Corporate Governance carried out performance evaluation of the Board, its Committee and the Directors.
Directors Orientation CoursesThe Board Members are regularly provided with update on new applicable laws, rules and regulations including amendments thereto to apprise them with their powers, duties and responsibilities. At the time of induction of any new director, he/she is provided with the detailed written material in the shape of extracts from relevant laws, rules & regulations on Role, Obligations, Powers and Responsibilities of the Board of Directors.
Directors’ TrainingThe members of the Board are fully conversant with their duties and responsibilities as directors of the Bank. Out of nine directors, six directors have completed Director’s Training Program and two directors of the Bank are exempted from the requirement of Directors’ Training Program, as per the Listed Companies (Code of Corporate Governance) Regulations, 2019.
The Bank has effective system to carry out orientation for its directors to acquaint them with the Code, applicable laws and their duties and responsibilities to enable them to effectively govern the affairs of the Bank for and on behalf of shareholders.
Directors’ Remuneration PolicyThe Bank has a formal Directors’ Remuneration Policy for non-executive directors including independent directors, which has been approved by the shareholders.
The remuneration of directors is fixed in accordance with the applicable laws. The remuneration for attending meetings of the Board and/or Board Committees is within the scale as is reasonably determined by the Board of Directors, provided that
Executive Director shall not be paid any remuneration for attending Board or its sub Committees meetings.
Security Clearance of Foreign DirectorIn accordance with the regulatory requirements clearance of foreign director(s) is being obtained from the Interior Ministry, Government of Pakistan.
Governance Practices Exceeding Legal RequirementsJS Bank’s Board always considers and ensures meticulous compliance of applicable laws, rules and regulations. The Board never encourages any sort of noncompliance and considers it as reputational risk.
Board’s Policy on Diversity and InclusionWe have approved policy to ensure fair representation of females in the workforce and to provide a nurturing and enabling environment to all genders with equal opportunity to contribute and grow within the organization. To achieve this objective the Bank has formulated and implemented following policy;
• All Bank job advertisements that can be applicable to all genders will carry the statement, “We are an equal opportunity employer.”
• The language of the advertisement will be gender sensitive.
• Position profiles will be developed to ensure gender concerns are built in.
• Interviews will be conducted in a gender sensitive manner.
• There shall be no gender discrimination on positions, promotions, or salary levels, except for those positions where a particular gender is necessary because of the nature of the job.
• No harassment of any sort will be tolerated, and any such incidents reported will be handled through the Head Office in consultation with the Human Resources Department.
• Commitment of senior management to gender sensitivity issues will be ensured through training, workshops and seminars.
• Reporting will be done of the total number of female employees and those who are in senior management positions.
77 Annual Report 2020

• Development/mentoring programs for the professional development of female employees will be introduced.
• Opportunities will be explored to directly address some of the new and emerging issues for female employees.
The Bank strongly believes that a diverse and inclusive workplace can earn deeper trust and more commitment from its people. Our emphasis is more on making the numbers count than counting numbers by respecting the unique needs, perspectives, and potential of the teams.
The Bank has embarked on a three-year journey to keep up to its commitment for building a diverse and inclusive organization. This includes multiple initiatives ranging from policy review for inclusiveness, talent attraction and retention targets for leadership team, building organization standing against Global Diversity and Inclusion Benchmarks (GDIB) and concrete measures for communicating organization’s commitment to D&I through educational sensitization sessions.
In consideration of the Bank’s commitment to build an inclusive organization, an exclusive and elaborate program has been kicked off. This starts from an internship program for persons with disabilities (PWDs) which will include infrastructure readiness, sensitization sessions, building recruitment and retention capabilities that also ensure compliance with Govt. Laws and Regulations and industry benchmarks.
No. of Companies in which the Executive Director is serving as Non-Executive DirectorPresident & CEO, the Executive Director is not serving as director in any other company.
Board Meetings Outside Pakistan Board meetings were not held outside Pakistan during the year.
Policy Disclosure for Conflict of InterestThe Bank has an effective system in place to deal with conflicts of interest relating to the Board members. Under this mechanism, any director who has a business or other interest in a matter being presented at a Board meeting does not participate in neither the
discussion nor the decision on that matter. The procedure to handle conflict of interest in the Board meetings is followed strictly and no breach was occurred during the year.
Investors’ Grievance PolicyThe Bank had strived for a better understanding and committed to provide its customers/investors with the highest level of service quality and satisfaction and has therefore set-up an independent Service Quality function that manages service quality, phone banking, problem resolution, quality assurance and the fair treatment of customers.
As per SBP Consumer Grievances Handling Mechanism the Bank holds surveys aiming to measure its customer’s satisfaction with regard to grievance handling mechanism in place at their end. This is done at least once in two years and the report thereof is to the Board and SBP. Remedial steps are taken to address the defective service areas.
Our focus is to maintain fairness in our customer dealings, clarity in communication, develop a service culture and design an effective grievance handling mechanism. We also focus on financial literacy of our customers, for promoting responsible conduct and informed financial decisions by consumers, through our Consumer Education and Financial Literacy Program.
To create enhanced visibility of its complaint handling function, the Bank has incorporated awareness messages in several customer’s communications such as account statements, ATM screens, and letters sent to the customers. For increased accessibility of the recourse mechanism for the customers, the Bank has made the information available on social media and has send SMS messages and E-Shots to its customers every quarter.
Records Safety PolicySafe keeping and retention of official documents is imperative to make records readily available as and when required. The Bank’s record retention / destruction policy is in accordance with all the stipulated and applicable laws and for as long as they are required in the conduct of the Bank’s business while complying with the regulatory requirements.
78Annual Report 2020
Dedicated department is responsible for maintenance of records in form of hard copies at a data storage warehouse built on international standards. Internal policies on how the data is maintained and retrieved is aligned with the guidelines set by the State Bank of Pakistan, The Securities and Exchange Commission of Pakistan, and any other applicable regulatory authority.
The Bank aims to comply with the regulations of State Bank of Pakistan and other regulatory bodies to align its policies for retaining records. Un-necessary records for which the retention period has expired are destroyed as per each department’s respective guidelines.
Role & Responsibilities of the Chairman The Chairman of the Board of Directors is responsible for leadership of the Board of Directors and for ensuring that the Board plays an effective role in fulfilling its responsibilities. The Chairman’s role entails the following:
• Preside as the chairman at general meetings of the Bank
• Set the agenda of the Board meetings and ensure that reasonable time is available for discussion of the same
• Ensure that minutes of the meetings truly reflect what transpired during the meeting.
• Ensure that the minutes of the meetings are kept in accordance with the requirements of the law
• Ensure that the Board discharges its role effectively and swiftly in line with the regulatory requirements.
Role & Responsibilities of the President & CEOThe President & CEO’s role constitutes an absolutely engaged position, demanding complete involvement and shepherding of the organization. The role entails the following:
• Ensure execution of the strategy approved by the Board.
• Effectively allocate and manage organizational resources and budgets to ensure achievement of short and mid-term objectives that contribute to the achievement of the long-term strategic goals.
• Establish a system of checks and controls to supplement the growth of the Bank.
• Provide liaison between the Board and the Bank’s Management to ensure placement of managerial efforts with Board’s directives.
• Encourage a culture of professionalism and high ethical standards within the Bank.
• Facilitate an organizational culture of development of innovative products and services to meet the growing needs of a diverse range of customers.
Name of external search consultancy that has been used in the appointment of the Chairman or a non-Executive DirectorNo external search consultancy has been used in the appointment of the chairman or a Non- Executive Director.
79 Annual Report 2020

����������������
����������������
������� �������������
�����
�� �����������
���������������
��������������������
�����
� ������������
�� ���� ������������
������
�������� ��������
�� ���� ������������������
������������ ���� ������������
��������������������
���������������� ������ ���������
�������� ��������� �
���������������
���� ����������������������
�����
��������� �����������
� ����������� �����������
��� ���������� ����� �
���������
���������� ���� �����������
��� ����� �����������
��� ��
Management Committees
80Annual Report 2020

Muhammad Kamran
I believe art is something which cannot be verbally explained but only felt and expressed in your paintings. since art has no boundaries and totally depends upon one’s creativeness.
Institute: FAST University

Board Audit Committee (BAC) The Audit Committee shall review the effectiveness of the Bank’s internal control and operational controls, integrity and adequacy of financial reporting and appraise the audit efforts of the Bank’s external auditors and internal audit function (IAF); and review the Bank’s process for monitoring compliance with relevant laws and regulations.
• Monitoring compliance with the best practices of corporate governance and identification of significant violations thereof.
• Consideration of any issue or matter as may be assigned by the Board of Directors.
• Report to the Board any significant matter(s) identified by the IAF / External Auditors that warrant Board’s immediate attention.
• Review of BAC performance on annual basis against the defined roles & responsibilities.
• Ascertaining that the internal control system including financial and operational controls, accounting system and reporting structure are adequate and effective.
• Determination of appropriate measures to safeguard the Bank’s assets.
• Determination of compliance with relevant statutory requirements.
• Review the Bank’s statement on internal controls prior to endorsement by the Board of Directors.
• Consider and approve the Internal Audit Charter.
• Review and approve Risk Based Annual Audit Plan.
• Review scope and adequacy of IAF and ensure that IAF has adequate resources and is appropriately placed within the Bank.
• The BAC shall ensure that IAF remains equipped with the necessary financial, human, operational, physical, and technological resources to carry out its mandated responsibilities.
• Review major findings of special reviews, internal and external frauds, internal control deficiencies and significant audit issues, and ensure audit
recommendations have been effectively implemented.
• Review action taken by Business and Support Groups for implementation of Audit Committee observations on issues deliberated in Committee meetings.
• The BAC shall formulate and document ‘Key Performance Indicators’ (KPIs) for CIA and evaluate his/her performance against the set KPIs on annual basis.
• Consider and recommend to the Board regarding promotions, increments and rewards for Chief Internal Auditor (CIA).
• The BAC shall ensure independence of any investigations/disciplinary actions against CIA and Internal Auditors.
• Review quarterly, half-yearly and annual financial statements of the Bank, prior to their approval by the Board of Directors and any announcements to be made in the public domain with regard to these accounts.
• The committee shall review the Related Party transactions and recommend the same for review and approval by the Board of Directors.
• Consider annual review report on the Bank’s Internal Controls over Financial Reporting (ICFR) for effectiveness and efficiency of Financial Reporting.
• Recommend to the Board of Directors the appointment of External Auditors and consider any questions of their resignation or removal, audit fees and provision of other services in addition to audit of financial statements.
• Discuss with External Auditors, major observations arising from interim and final audits and any matter that the auditors may wish to highlight (in the absence of management, where necessary).
• Review the Management Letter issued by the External Auditors and Management’s response thereto.
• Ensure coordination between the Internal and External Auditors of the Bank.
Salient Features of Board Committees’ TOR
82Annual Report 2020
• Compliance Department shall periodically, on quarterly basis, report to the Board Audit Committee on the Bank’s management of its compliance risk and identified gaps, in such a manner as to assist the Committee to make an informed judgment on whether the Bank is managing its compliance risk effectively. Compliance Risk to include risks emanating from Money Laundering (ML) / Terrorist Financing (TF), AML/CFT obligations and its allied elements.
• Audit Committee is a committee of Board of Directors of JS Bank Ltd from which it derives its authority and to which it regularly reports. In discharging its oversight role, the Committee is empowered to investigate any matter brought to its attention, with full power to retain outside counsel or other experts for this purpose.
Board Human Resource Remuneration & Nomination Committee (BHRRNC)• Recommending Human Resource management
policies to the Board
• Review and recommend to the Board selection, evaluation, compensation, increments, performance bonuses, succession planning, fringe benefits including service end benefits of the Executive Directors, CEO, Key Executives and any other employee or group of employees institution wide (as required by the Board).
• Consideration and approval on recommendation of CEO on such matters for key management positions who report directly to the Chief Executive Officer or Chief Operating Officer or Deputy Chief Executive Officer.
• The Committee shall assess whether the remuneration policy is aligned with the significant regulatory requirements including Guidelines on Remuneration Practices issued by the State Bank of Pakistan (SBP). The review may focus on the following:
� Criteria for identification of personnel who may subject the Bank to significant risks i.e. Material Risk Takers (MRTs) and Material Risk Controllers (MRCs).
� Remuneration principles including concept of fixed and variable remuneration, risk adjusted balanced scorecard mechanism to ensure alignment of remuneration with long-term and short-term business objectives of
the Bank and incorporate necessary risk adjustments.
� Major types of risks and how these are taken into account for determination of risk adjusted compensation.
� Separate structures of remuneration for MRTs and MRCs.
� Review of scorecards for MRTs and MRCs and their performance evaluation mechanisms.
� Criteria for determining the variable portion of remuneration to be deferred, the period of deferral for different types and levels of employees identified as MRTs or MRCs and payout structure of deferred remuneration.
� Ensure that institution wide remuneration policy should take into account all cadres of employees. The remuneration policy should specifically take into account the pay-gap between the highest paid and the lowest paid employees, across various levels as well as across the organization.
• Review the Bank-wide program for implementation of Guidelines on Remuneration Practices, including necessary awareness and change management initiatives, review, progress against roadmap for onward reporting to State Bank of Pakistan (SBP).
• Review the remuneration policy and remuneration setting mechanism at least once every three years. Amongst other factors, the review of remuneration framework may include but not limited to the effectiveness of remuneration policy and mechanism.
• Review and obtain approval for fixed and variable compensation pools from the Board of Directors.
• Approve development of a fund for deferred compensation pool management and monitoring progress there against.
• Role of BHRRNC in facilitating enablement of Internal Audit and Compliance role in implementation reviews, as per Guidelines on Remuneration Practices.
• Receive and consider information from the Bank’s risk management, compliance and internal audit functions, to assess the appropriateness of the compensation system relative to the organizational goals and risk profile of the Bank.
83 Annual Report 2020

• Grievance handling & Disciplinary Action Policy
• Guidance for performance management, annual increment and employee recognition programs.
• Monitoring the utilization of training and development budget, and implementation of approved training and development policy.
• Review and approval of Provident Fund, Gratuity Fund policies and any other separation benefits or schemes.
• Those matters wherein ratification/ approval of the Board will be required, the Secretary BHRRNC with the approval of its Chairman shall forward Memoranda to the Company Secretary for placing before the Board of Directors.
Board Risk Management Committee (BRMC) The BRMC shall review and recommend the establishment of and revision to the bank’s risk governance framework and oversee its implementation by senior management. The BRMC may also constitute different sub-committees to facilitate in difference areas.
• Ensure implementation of all Risk Management Policies approved by the Board and subsequent monitoring thereof and periodically oversee updating of the risk policies (if the same have not already been approved / reviewed by the BOD) based on changing business requirements as well as SBP guidelines.
• Portfolio Reviews including NPLs, remedial actions and strategy for the same.
• To approve / review list of shares and margins to be accepted as collateral for Financing against Shares (FAS). Also to approve / ratify any exceptions to existing FAS requirements as laid down in Credit Policy of the Bank.
• Approve/review Sector / Industry Concentration guidelines for the overall credit portfolio of the Bank.
• To approve / ratify credit bulletins issued by RMG from time to time for effective implementation of Credit Policy / Risk Management Framework.
• To ratify any other urgent matter which has been approved by the management subject to subsequent ratification by the Committee.
• Review the Market / Liquidity limits as recommended by ALCO / IRMC / CCC as when required.
• Delegation of powers to the President / CEO & Group Head Risk Management to appoint credit officers, based on their experience and ability to understand associated risks while approving the credits;
• Review any other risk related matters / regulatory changes that warrant discussion at the committee.
Board Information Technology Committee (BITC)The Board IT Committee shall be mainly responsible for advising and reporting to the Board on the status of technology related activities, major IT projects and digital initiatives within JS Bank including but not limited to the following:
• To review IT and Digital strategies and relevant policies before submission to the Board and make recommendations for strategic decisions on IT related matters.
• To review progress and implementation of the IT Strategic Plan and deliberate changes to it, as and when required.
• To ensure the alignment of IT strategy with business strategy, optimization of resources, value delivery and performance measurement to achieve business objectives and effective technology risk management.
• To ensure that risk management strategies are designed and implemented which have the capability to respond to wide-scale disruptions, including cyber-attacks and attacks on multiple critical infrastructure sectors
• To review progress and implementation of various IT projects
• To make recommendations on major IT investment decisions and ensure that investments are aligned with IT Strategy approved by the Board.
• To review and approve cloud-based outsourcing arrangements in line with the policy approved by the Board of Directors.
• To review and approve TORs of IT Steering Committee.
84Annual Report 2020

IT GovernanceIT Governance PolicyTechnology governance is an integral part of Bank’s corporate governance framework consisting of the leadership and organizational structures to ensure the alignment of IT strategy with business strategy, optimization of resources, value delivery and performance measurement to achieve business objectives and effective technology risk management. It is now recognized that technology plays a pivotal role in improving corporate governance and in this context, the need to govern technology and technology enabled business developments to have never been so greater.
A comprehensive enterprise technology governance framework based on prudent practices can help bank in better development of innovative products and services by enabling them to manage technology issues and identify, measure, mitigate, monitor and report technology-based risks and threats. The
underlying principle for an enterprise technology governance framework is that technology requirements of an institution follow a pre-defined process that begins with a business need and ends with a technology solution that conforms to the policies approved by the board of directors and senior management. As such, technology governance is an ongoing activity that shall not be considered a one-time effort in the fast-changing technology environment.
The purpose of the technology governance framework is to evaluate the current and future use of technology, direct the preparation and implementation of plans and policies to ensure that use of technology meets business objectives and monitor compliance to policies and performance against the plans. The basic principles of strategic alignment of IT and the business, value delivery to businesses, risk management, resource management
85 Annual Report 2020

(including project management) and performance management shall form the basis of this technology governance framework. Technology governance framework shall be closely aligned with Bank’s corporate governance framework and shall cover, among other things, policies and procedures to provide oversight and transparency in the use of technology. Bank is encouraged to adopt relevant aspects of international standards/best practices for effective and efficient enterprise technology governance.
Scope Technology governance aims at fully aligning technology and business strategies with each other so that technology risks are identified and controlled as part of the enterprise risk management process. It spans the culture, organizational policies and procedures which provide oversight and transparency to optimize the costs and enable trust, teamwork and confidence in the use of technology itself and the people trusted with technology services. Therefore, the processes for technology governance need to be integrated with the bank’ overall corporate governance framework.
The evolving role of technology and automation in the banking services sector has become increasingly complex. Bank employs the advances in technology which drives the efficiency of operations and financial soundness of these institutions by improving overall decision-making process. As technology becomes an integral part of the business and operations of financial institutions, such technology usage and dependence, if not properly managed, may heighten various risks. Bank has developed this policy aimed to enable themselves to keep abreast with the aggressive and widespread adoption of technology.
An IT governance framework comprises definitions, principles and a model for governing IT.
The board should govern IT through two main tasks:
a) Evaluate the current and future use of IT, including strategies, proposals and other arrangements (internal, external, or both).
b) Monitor the performance of IT against plans and business objectives; and, that the use of IT conforms to internal policies and conforms to external obligations (regulatory, legislation, common law, contractual).
This Policy suggests guidelines for defining the roles and responsibilities pertaining to Information Technology throughout the bank.
A comprehensive IT Governance Framework shall enable bank to evaluate the current and future use of IT, direct the preparation and implementation of plans and policies to ensure that use of IT meets business objectives and monitor conformance to policies, and performance against the plans. IT Governance framework entails an IT strategy, organizational structures, roles of the board and senior management and IT policy framework.
Broadly an enterprise IT Governance Framework of the bank shall aim to achieve the following institutional objectives:
Strategic Alignment – Alignment of the strategic direction of IT with the business with respect to services & projects and verifying strategic compliance, i.e. achievement of organizational objectives through strategic IT objectives.
Benefit Realization (Value Delivery) – Ensuring that IT delivers the promised benefits against the strategy, concentrating on optimizing costs & proving the intrinsic value of IT. Bank’s IT processes with IT portfolio management shall provide effective and efficient delivery of the IT components of programs and early warning of any deviations from plan, including cost, schedule or functionality that may impact the expected outcomes of the programs. It shall be ensured that the expected business outcomes of technology based investments are understood; that comprehensive and aligned business cases are created and approved by stakeholders; with active management of the benefit realization; and efforts required in objectives are achieved.
86Annual Report 2020

IT Risk ManagementEnsuring that processes are in place and effective to assess, manage and monitor the associated risks in IT investments, developments and operations. Bank ensure that the IT risks do not exceed the enterprise risk appetite.
Resource Optimization – Ensuring that there is an adequate IT capability and infrastructure assessment to support current and expected future business requirements.
Performance Management - Reviewing the measurement of IT performance and the contribution of IT to the business (i.e. delivery of promised business value).
Adequate Policies Framework and its independent assurance – ensure that the appropriate policy controls are in place and the processes are standardized and documented.
Independent assurance (internal or external) should be acquired about the conformance of IT with relevant laws and regulations, bank’s policies, standards and procedures and relevant accepted practices.
To ensure that information technology is properly governed and aligned with business objective, all the bank associates must understand and comply with the responsibilities identified in this document when their duties entail one or more of the roles described below.
The Technology Policy is strategized under following FOUR (4) sections.
Planning the IT EnvironmentPolicies related to this section ensure that the IT Plans are properly aligned with the business goals, objective and Strategies.
Developing and Delivering IT Solutions Acquire develop, deliver and maintain new or enhanced business solutions involving IT architecture
to enable the bank to meet its changing business requirements.
Enterprise Technology Operations This section provides maintenance standards for the operation of the IT Environment while ensuring the availability, confidentiality and integrity of information systems to meet the business requirements.
Organizing and Monitoring the IT Processes Policies pertaining to this section helps managing the above three sections.
Project Management Effective project management manages the possibility of loss resulting from inadequate processes, personnel or systems. Losses can result from errors, fraud or an inability to deliver products or services, maintain a competitive position or manage information.
The purpose of this policy is to define a methodology for Management of all technology Projects in the bank’s IT Department. The Bank has established Project Management Office (PMO) which works closely with-it project management function, as the key strategic partner to achieve organizational benefits and is charged for delivering continuous incremental improvement in projects and programs success delivery.
Independent Audit To increase confidence level in the business systems, benefit from global best practices and have an unbiased review of the information technology setup of bank, an independent IT audit is essential. This allows management to take proactive measures for safeguarding the information assets of the bank in view of the emerging threats and to exploit the opportunities as they present themselves.
87 Annual Report 2020

Ahwar Nasir
I am a 19 year old aspiring artist who paints to make herself and others happy. Painting to me is to communicate love.
Institute: Indus Valley School of Art and Architecture

Human Resources Management Policy At JS Bank, we understand that the right talent is crucial to succeed in today’s hyper-competitive and increasingly complex global economy. Hence along with understanding the need to hire, develop, and retain talented people, we understand that we must manage talent as a critical resource to achieve the best possible results.
From day one, we went with the Talent First Approach, where we put our people at the center of all aspects of business infrastructure: its digital and physical spaces, processes, and culture. Our latest Talent Management Framework is a testimony of this, genuinely increasing the talent pool’s efficiency levels, expanding the retention rate, and attracting potential leaders.
We believe in developing talent selflessly and believe that everyone has the potential to grow and develop into indispensable talent if provided the right tools and resources. Hence here at JS Bank, we see a distinctive talent pipeline, precise talent gap analyses and talent development roadmaps as the core of our talent management philosophy.
If we spell-out what our Talent Management Framework, job rotation, secondment, succession planning and 360-degree feedback would be the few among the whole lot. We are also adding some specialized tools like Workforce Planning, Talent Development Journeys, and Rapid Talent Audit in our system to match the organization’s contemporary talent needs.
Last year we went further ahead and executed an unparalleled five-step succession planning scheme for the most critical leadership positions. Not only this, we engaged our MANCOM as well through international leadership development and coaching program, making sure that real challenges at every level of the organization are addressed through the right interventions.
Moving forward in the year 2021, we are not only aiming to launch a succession planning scheme across second leadership tier and build an internal talent pipeline, we are also striving to launch performance accelerators, leadership huddles, learning clubs and innovation labs. On the strategy front, teams are busy developing EVPs, forward-focused learning paths and a prudent employer branding strategy. Through each action, we ensure that the organization moves towards sustained growth in the years to come.
Remuneration PolicyThe Bank’s remuneration framework aims to comply with the revised guidelines on remuneration practices issued by State Bank of Pakistan. All compensation matters, and overall compliance with regulatory requirements, are overseen by the Board Human Resource Remuneration & Nomination Committee (BHRRNC) and approved by the Board of Directors thereafter.
Staff Remuneration StrategyThe Bank’s basic compensation philosophy is to provide a competitive level of total compensation to attract and retain qualified and competent employees who are committed to maintaining a career with the Bank, and who will perform their role in the long-term interests of the Bank.
The Bank’s variable remuneration policy is driven primarily by a performance-based culture that aligns employee interests with those of the Bank’s shareholders. These elements support the achievement of the Bank’s objectives, through balancing rewards for both short-term results and long-term sustainable performance. The Bank’s reward package on cash awards is comprised of the following key elements:
1. Fixed pay;
2. Benefits; and
3. Annual performance bonus (variable remuneration).
The Bank’s remuneration policy, in particular, considers the role of each employee and sets guidance on whether an employee is a “Material Risk Taker (MRT)” and/or a “Material Risk Controller (MRC)” in a business line, control or support function.
An employee is considered as Material Risk Taker if he/ she has authority and is a decision maker having appropriate level of power and control related to the products, portfolios, transactions and processes, which may pose serious risks to the Bank. Whereas, an employee is considered Material Risk Controller (MRC) who is primarily tasked with reviewing and assessing the idiosyncratic and systemic risks, and controls pertaining to functions and processes, to determine and recommend the ways to mitigate those risks, and to minimize the probability of occurrence of loss to
89 Annual Report 2020

the Bank. These employees are not directly involved in business or risk-taking activities of the Bank.
The Bank uses Risk Adjusted Balanced Scorecard to measure the performance of MRTs and MRCs.
Variable Remuneration Variable remuneration is performance related and consists of annual performance bonus award which is connected to achievement of operational and financial targets set out at beginning of the year and employees’ contribution to delivering the Bank’s strategic objectives.
In the framework adopted for determining the variable remuneration pool, the BHRRNC aims to balance the distribution of the Bank’s profits between shareholders and employees.
Key performance metrics in Risk adjusted Balanced Scorecard at the Bank level include a combination of short-term and long-term measures, and include profitability, solvency, liquidity and growth indicators. The performance management process ensures that all goals are appropriately cascaded down to respective business units and employees.
The Bank uses a formalized and transparent process to adjust the bonus pool for quality of earnings. It is the Bank’s objective to pay bonuses out of realized and sustainable profits. If the quality of earnings is not strong, the profit base may be adjusted at the discretion of the BHRRNC.
Remuneration for MRTsThe compensation mix for MRTs is appropriately balanced and the amount of fixed remuneration is sufficiently high in order to ensure that the reduction of the variable remuneration down to zero would be possible.
Further, the variable remuneration of MRTs will be compensated on achieving the pre-determined qualitative and quantitative objectives considering the risk-adjusted performance and long-term health of the bank. The qualitative factors may override the achievements of quantitative factors in order to discourage undue/ excessive risk taking.
Remuneration for MRCsThe remuneration level of staff in the control and support functions/ MRCs allows the bank to employ qualified and experienced personnel in these functions. The Bank ensures that the mix of fixed and variable remuneration for control and support function personnel is weighted in favor of fixed remuneration. The variable remuneration of control functions is to be based on function-specific objectives and is not determined by the financial performance of the business areas they monitor. This compensation structure is designed to ensure that objectivity and independence of these functions is not compromised.
Deferral of variable remuneration The variable compensation of all MRTs, MRCs, and in case of Bahrain operations, approved persons (APs) is subject to mandatory deferrals and malus/ claw back in accordance with the below table
Employees Element of Variable Pay Constitution Vesting Period Malus Claw Back
MRTs Upfront cash 70% Immediate - No
MRTs Deferred cash 30% 3 Years Yes No
MRCs Upfront cash 75% Immediate - No
MRCs Deferred cash 25% 3 Years Yes No
MRTs and APs (Bahrain)* Upfront cash 40% Immediate - No
MRTs and APs (Bahrain)* Deferred cash 60% 3 Years Yes Yes
* MRTs and approved persons earning over BHD 100,000 in total compensation.
90Annual Report 2020

Deferred variable remuneration is paid proportionately over the three years, even if the person is no more employee of the Bank (subject to the malus provisions).
Malus and Claw backThe Bank has devised malus and claw back provisions in the relevant policies that allows forfeiture / adjustment of paid variable remuneration in certain adverse business situations. Any decision to hold or claw back individual’s award can only be made by the BHRRNC of the Bank as per events set out in detail in the Bank’s remuneration framework and accountability framework.
Whistle Blowing PolicyDisclosure of Whistle blowing policy was established to receive, handle complaints in a fair and transparent manner and providing protection to the complainant against victimization, and disclosure of the number of such incidences reported to the Audit Committee during the year.
HR has clear Disciplinary Procedure policy according to which Disciplinary Action Committee explicitly handles all complaints in a fair and transparent manner via a standard process to remove all kinds of biasness and ensure victims and witness’s protection. This is also supported by Grievance Redressal and Harassment at Workplace policies.
Business Continuity PlanThe Bank has a Board of Directors’ approved Business Continuity Planning Policy ensuring the clear plan is available and maintained for all critical functions of the Bank. Regular periodic testing of BCP has given a confidence to the management that business will continue to work in the event of any disruption occurs.
The Business Continuity Plan (BPC) for the Bank aims to enable it to continue offering critical services in the event of a disruption and to survive a disastrous interruption to their information systems. The main objective of developing a BC Policy and BCP is to ensure “Business Continuity (BC)” at all times by pre-empting or avoiding a crisis and/or managing it in such a manner that it causes the least amount of damage/disruption.
JSBL is committed to ensuring the continuity of its critical business and support functions. The BCP helps the Bank in understanding the criticality of entity’s operations and processes under each business,
operations and support unit which enables the entity to plan and develop the relevant backup sites, determine financial resource, manpower, critical documents and system resource commitments.
The core objective of the plan is to ensure that the Bank is prepared to effectively respond to business interruptions by developing a recovery plan which ensures the safety of employees, assets and continuity of business functions in the event of disaster or crisis. Effective business continuity planning is an integral part of the Bank’s daily business activities.
91 Annual Report 2020

Sustainability and Corporate Social Responsibility
JS Bank remains committed to partnering with industry and other stakeholders to find innovative solutions that open opportunities for economically, socially, and environmentally sustainable solutions. We do this by dedicating a significant number of resources to contribute to the wellbeing of society. JS Bank creates value by contributing to sustainable development and responsible business within our spheres of operation. Some of our key on-going initiatives and past projects include:
Green Climate Fund (GCF)GCF is the world’s largest dedicated fund helping developing countries reduce their greenhouse gas emissions and enhance their ability to respond to climate change. It was set up by the United Nations Framework Convention on Climate Change (UNFCCC) in 2010. The Fund is unique in its ability to engage directly with both the public and private sectors in transformational climate-sensitive investments. Key investment Themes for GCF include:
� Clean Energy Generation & Access � Green Transport Solutions � Empowering/Financing green initiatives
� Mitigating Forest/Land use � Health, food, water & security � Livelihoods of people & communities � Ecosystem services � Infrastructure and the built environment
Compliance with State Bank of Pakistan - Green Banking Guidelines (GBG)Green Banking Guidelines (GBG) acknowledges the responsibility of the financial sector in supporting policy initiatives for aimed at a low carbon and climate resilient economy. As of 2020, the Bank is fully compliant with the GBGs having undertaken:
� Introduction of an Environmental and Social Risk Management (ESRM) Framework to create awareness towards the environmental and social (E&S) risks involved in extension of credit and the procedures and authorities which have been established to manage these risks.
� Means to identify, assess and mitigate environmental risks for clients. While the primary responsibility of ensuring compliance
92Annual Report 2020

with environmental laws and regulations rests with the borrowers, JS Bank goes above pre-established standards to create a holistic eco-system of environmental risk management for all concerned.
� Introduction of carbon reduction measures in self operations. This extensive exercise including measurement of energy (on and off grid power) and paper consumption of all of JS Bank operating locations. Recognition of gaps was followed by a rectification exercise through promulgation of energy efficient appliances (Inverter and LED based), increased usage of solar power (for technical equipment) and process automation to cut down on documentation.
Renewables Energy SolutionsJS Bank has continued its efforts to create environmentally friendly products for its customers. The Bank has been the first to develop specialized products to make solar panels more accessible to citizens across the country. In CY2020 despite COVID, JS Bank has financed over 112 (Rs. 393 Million) solar projects for commercial, residential and agriculture purposes. Collectively the bank has been working aggressively to reduce the carbon footprint and has deployed over 11.8 MW of solar power units in the country.
Partnering with World Wind Energy AssociationJS Bank has partnered with World Wind Energy Association – Pakistan (WWEA) under the State Bank of Pakistan’s (SBP) renewable energy scheme to improve access to clean energy generation for commercial and residential customers. Based on SBP’s scheme, financing for generation of clean energy is offered at a subsidized mark-up rate of 6% per annum.
Partnering with Federal Government to Combat Pollution and LandfillsTo support the federal government, initiatives aimed at combating climate change and its impacts, the Federal Minister for Climate Change – Zartaj Gul, Islamabad Capital Territory Administration and JS Bank distributed canvas as an alternative to polythene shopping bags. The amount of plastic waste has been increasing by 10pc each year for the past 20 years, and its accumulation poses grave threats to the well-being of all people worldwide.
Partnering with Women Chamber of Commerce JS Bank signed a Memorandum of Understanding (MoU) with the Women’s Chamber of Commerce and Industry (South) on Women’s Equality Day. JS Bank will provide financial tools and resources to women across Pakistan, to help them set up and grow their businesses under the JS Khud-Mukhtar program. This one-window solution provides women with easy access to business loans of up to Rs. 1.5 million, at a subsidized markup rate of 5% per annum, based on State Bank of Pakistan’s refinance scheme for women entrepreneurs.
Green Office Accreditation – 4 Years and CountingJS Bank is one of the few commercial institutions to be Green-Office certified and was the first commercial bank in Pakistan to attain this certification. A practical Environmental Management System developed specifically for office conditions, the Green Office initiative aims to reduce greenhouse gas emissions and decrease the ecological footprint at the workplace by reducing electricity consumption and paper waste. Furthermore, JS Bank continued to play its role in “Tree a thon” - a project by WWF to plant over 1.3 million saplings as part of its Rung Do Pakistan campaign in 2020.
Fight Against COVID 2019In the wake of the pandemic, JS Bank along with its partners donated over PKR 110 Million to counter and combat the impact of the Corona Virus (COVID-19) in Pakistan. Based on a pledge matching initiative wherein JS Bank equally matched all support pledges made by its partners, this fund was rooted in JS Bank’s philanthropic philosophy of collaborative efforts and focused on addressing some of the immediate and long-term issues related to the pandemic. These funds were deployed using a three-tiered strategy centered around on providing immediate relief, pandemic control and future response capacity building.
JS Bank also took the initiative to support the establishment of a Robot operated COVID-19 testing lab in Islamabad. Built in the United Kingdom by Opencell UK, the laboratory is a Biosafety Level 2 plus (BSL-2+) facility built to ISO 15189 standards. The state-of-art lab is specified to meet the requirements for high throughput Covid-19 RT-qPCR testing. Due to the use of 5 liquid handling robots, this lab requires as little as 6 staff members to operate all the shifts and has the ability to process over 2,000 tests per day. The facility was inaugurated by British High Commissioner Dr. Christian Turner.
93 Annual Report 2020

Business ModelKey Inputs
Share Capital Rs.10,119 millionTotal Equity Rs.20,592 million
Deposits Rs.433,062 millionSubordinated Debts Rs.7,493 million
FINANCIAL CAPITAL
Clear Vision and Mission and policiesDiversified and experienced BoardWell directed and competent ManagementEfficient Infrastructure framework
INTELLECTUAL CAPITAL
Long-term credit rating AA-Short-term credit rating A1+
INSTITUTIONAL CAPITAL
Health and Safety policies implemented at all premises
NATURAL CAPITAL
Staff Strength 5,311 Place where talented people thrive
Great values and work ethics practices
HUMAN CAPITAL
Branches network 308 Intangible assets Rs.2,487 million
ATMS 334 Property and equipments
Rs.250,199 million
MANUFACTURED CAPITAL
Active Social media PlatformWell managed websiteProactive Complaint handling mechanism
SOCIAL AND RELATIONSHIP CAPITAL
94Annual Report 2020

Key Outputs
Profit after tax Rs.1,150 million
Earnings per Share Rs. 0.89
Return on Equity 5.6%CAR 12.77%
Return on Assets 0.32%
TO SHAREHOLDERS
Salaries and Benefit Rs.6,262 millionTraining and DevelopmentEmployees trained in serviceInternship programsStrong team building and motivational activities
TO HUMAN CAPITAL
Compliance with all regulatory requirements
Good corporate governance policies and their implementation
TO REGULATOR
Deposits Growth 17.11%
Advances Growth 3.12%
TO CUSTOMERS
Contribution to CSR Rs.118 million
Customer relationsSafety and health
Improving workplace culture and
environment
TO SOCIETY
Business activitiesOur Principles to Operate
Green Office
Initiatives
Adroit Risk Management
Melioration of Customer Experience
Employee Training and
Development
Employee Satisfaction
and Motivation
Compliance with
regulatory framework
Innovation and
Digitalization
Adding value to society
through CSR
D & I at workplace
Ethics, values & integrity
95 Annual Report 2020

Stakeholders Engagement
Shareholders We engage with our shareholders in several ways. This includes quarterly earnings statements and Director’s Reports, annual reports, annual general meetings (AGMs) with shareholders and through our online presence such as our website and on social media.
Regulators Our principal regulator is the State Bank of Pakistan (SBP). JS Bank is committed to meeting its regulatory compliance obligations in an effective manner and fulfilling the regulators’ expectations in this regard. For this purpose, the Bank has a well-structured and comprehensive Compliance Program in place and ensures its effective implementation. The Bank is in constant contact with SBP and is committed to providing them with complete and accurate information as and when required. Our senior management commits a significant amount of their time to meeting with SBP for their guidance and support and to keep them well informed on current market events. The regulator is provided with full access to the Bank’s records and information in line with the regulatory framework, and the Bank pro-actively seeks SBP’s feedback regarding any clarifications or information that is required. Our other regulators are Securities and Exchange Commission of Pakistan (SECP) and Pakistan Stock Exchange (PSX) and we are also complying with their directives.
Clients/
Customers
We welcome feedback from our customers and use various forums for them to make suggestions so that we can evaluate and improve upon our own performance. The Bank’s Complaint Handling Policy and Grievance Redressal Mechanism ensures that complaints are resolved in a timely & fair manner and the recurrence of complaints is prevented where possible. Customers have the option of registering their complaints at the JS Bank’s branches, 24/7 phone banking center, its website, via email and post mail.
The bank performs various exercises such as rolling out SMS & emails to customers and awareness through social media in order to maximize the utilization of these channels to further increase the visibility & accessibility.
Communities We are committed to the communities where we are our present. From providing meals during the Holy Month of Ramadan to supporting social and cultural events to making sure that we live in a cleaner and greener country. JS Bank is an active participant in ensuring that we are responsible community members and global citizens.
Employees Our most important stakeholders are our employees. We engage with them through town hall forums, bank-wide events and by providing them with learning-and-development opportunities
96Annual Report 2020

Step to Encourage Minority Shareholders’ Participation in AGMsJS Bank Limited always provides a forum for two-way engagement with the shareholders, particularly the minority shareholders. To ensure meaningful participation of minority shareholders in AGM, the Bank takes the following measures:
• Notice of AGM is sent to every member of the Bank at least 21 days before the meeting. The notice was published in both English & Urdu newspapers having nationwide circulation.
• Annual Report of the Bank is sent to each member of the Bank on their registered address before AGM in electronic (CD, email) or hard form (on request).
• During AGM, a detailed briefing on the Bank’s performance and future plans is given to the shareholders.
• The shareholders are encouraged to raise queries and give suggestions relating to the Bank’s operations.
Investor’s Relations Section on Corporate WebsiteCorporate information including quarterly, semiannual and annual reports of the Bank can be accessed on following URL; https://jsbl.com/knowledge-centre/investor-relations/
The Company disseminates information to its investors and shareholders through a mix of information exchange platforms, including its corporate website, maintained in both English and Urdu Languages under the applicable regulatory framework. The website is updated regularly to provide detailed and latest company information including but not limited to financial highlights, investor information, dividend and other requisite information.
Investor Relations PolicyThe Bank has a very proactive and interactive Investor Relations Policy that is driven by the following principles:
1. The Bank reports its financial results and material developments to the Exchange, its shareholders, and other stakeholders in an open and comprehensive manner.
2. The Bank uses its website as an additional primary communications channel.
3. The Bank proactively addresses reports and rumors, to avoid unnecessary speculation in its securities.
4. The Bank endeavors to meet with its shareholders at least once in each fiscal year as to inform them and obtain feedback on the Bank.
Quarterly reports of interim financial results are issued to the Exchange on the day of approval by the Board, in the format required by the Exchange.
The Annual Report is published and distributed to the shareholders. A summary of financial results and other information is announced at PSX. An electronic copy of the Annual Report is also be made available on the Bank’s website.
Notice for the Annual General Meeting (AGM) are announced on the Exchange and in a daily newspaper according to the Listing Requirements. The AGM provide an opportunity for shareholders to engage with the Board and senior management, and to gain a fuller understanding of the Bank’s affairs.
Corporate Briefing Session Bank has the practice to conduct annual corporate and investor’s briefing session. During the year 2020, an online session was held on Dec 31, 2020. Notice was issued to the stakeholders through Pakistan stock exchange’s website to encourage them to attend online session.
JS bank by complying the regulatory requirement has made presentation available on the website https://jsbl.com/knowledge-centre/investor-information/.
97 Annual Report 2020

Excellence in Corporate ReportingUnreserved Compliance of International Financial Reporting Standards (IFRS)The management of the Bank strongly believes in adherence to unreserved compliance with all the applicable International Financial Reporting Standards (IFRSs) issued by International Accounting Standards Board (IASB) for true and fair presentation of financial statements.
Financial statements for the year have been prepared in accordance with the accounting and reporting standards, issued by IASB as are applicable in Pakistan. IFRS adoption status is detailed in note 2 of the unconsolidated financial statements.
Adoption and Statement of Adherence with the International Integrated Reporting FrameworkTo deliver relevant and useful information to the Bank’s stakeholders, the Bank’s reporting encompasses its strategic focus and future direction. In order to achieve this the reporting incorporates organizational overview and external environment, governance, risks and opportunities, strategy and resource and allocation including outlook. The adoption of integrated thinking approach has resulted in a periodic and wholistic report by the Bank and its value creation over time. The reporting links financial and non-financial information to give complete view on the Bank’s performance for all relevant stakeholders.
98Annual Report 2020

Statement and Distribution of Value Added2020 2019
Value Added Rs. in million Rs. in millionNet mark-up / interest income 9,777 7,028 Non mark-up / interest income 6,676 3,943
Operating expenses excluding Staff cost, depreciation, amortization, donation and WWF (4,895) (3,776)Provision against advancs, lending, Investments and others (1,280) 92
Value added availble for addition 10,279 7,287
Distribution of Value added 2020 2019
Rs. in million % Rs. in million %To EmployeesRemuneration , provident fund and other benefits 6,263 60.92% 5,237 71.87%
To Government Worker Welfare Fund 40 0.39% 1 0.01%Income Tax 873 8.49% 108 1.49%
913 8.89% 109 1.50%To Society Donations 118 1.15% 3 0.04%
To Growth and expansionDepreciation 1,590 15.47% 1,681 23.07%Amortization 113 1.10% 93 1.28%Retained Earnings 1,282 12.47% 163 2.24%
2,986 29.04% 1,938 26.59% 10,279 100.00% 7,287 100.00%
���� ����
������������ ������������ ������� � ������ ��������������
������
����������
������
������
����� �����
������
99 Annual Report 2020

INDEPENDENT AUDITORS’ REVIEW REPORT

Statement of Compliancewith Listed Companies (Code of Corporate Governance) Regulations, 2019 (the ‘Regulations’)
Name of company: JS Bank Limited (the ‘bank’)Year ended: December 31, 2020
The Bank has complied with the requirements of the Regulations in the following manner:
1. The total number of directors are nine as per the following:
a. Male: Eight (Including CEO) b. Female: One
2. The composition of the Board is as follows:
Category Names Independent Directors
Mr. G.M. SikanderMs. Nargis GhalooMr. Sohail Aman
Non-Executive Directors
Mr. Kalim-ur-Rahman - ChairmanMr. Adil MatcheswalaMr. Ashraf NawabiMr. Hassan AfzalMr. Munawar Alam Siddiqui
Executive Director
Mr. Basir Shamsie – President & CEO (Non-elected deemed director)
Female Director Ms. Nargis Ghaloo(Independent Director)
3. The directors have confirmed that none of them is serving as a director on more than seven listed companies, including this Bank.
4. The Bank has prepared a code of conduct and has ensured that appropriate steps have been taken to disseminate it throughout the Bank along with its supporting policies and procedures.
5. The Board has developed a vision/mission statement, overall corporate strategy and significant policies of the Bank. The Board has ensured that complete record of particulars of the significant policies along with their date of approval or updating is maintained by the Bank.
6. All the powers of the Board have been duly exercised and decisions on relevant matters have been taken by the Board/ shareholders as empowered by the relevant provisions of the
Companies Act, 2017 (Act) and the Regulations.
7. The meetings of the Board were presided over by the Chairman and, in his absence, by a director elected by the Board for this purpose. The Board has complied with the requirements of Act and the Regulations with respect to frequency, recording and circulating minutes of meeting of the Board.
8. The Board have a formal policy and transparent procedures for remuneration of directors in accordance with the Act and the Regulations.
9. Out of nine directors, six directors have completed Director’ Training Program and two directors of the Bank are exempted from the requirement of Directors’ Training Program in accordance with the Regulations. Whereas, remaining one director will certify himself in due course.
10. The Board has approved appointment of CFO, Company Secretary and Head of Internal Audit, including their remuneration and terms and conditions of employment and complied with relevant requirements of the Regulations. No new appointment has been made during the financial year except that of CFO. Mr. Hasan Shahid has been appointed CFO of the Bank in place of Mr. Muhammad Yousuf Amanullah w.e.f. July 01, 2020.
11. Chief Financial Officer and Chief Executive Officer duly endorsed the financial statements before approval of the Board.
12. The Board has formed committees comprising of members given below-
a. Audit Committee:
Ms. Nargis Ghaloo (Independent Director)
Chairperson
Mr. Adil Matcheswala (Non-Executive Director)
Member
Mr. G.M. Sikander (Independent Director)
Member
Mr. Munawar Alam Siddiqui (Non-Executive Director)
Member
101 Annual Report 2020

b. HR Remuneration & Nomination Committee:
Mr. Sohail Aman(Independent Director)
Chairman
Mr. Adil Matcheswala(Non-Executive Director)
Member
Mr. G.M. Sikander(Independent Director)
Member
Mr. Kalim-ur-Rahman(Non-Executive Director)
Member
c. Risk Management Committee:
Mr. Ashraf Nawabi (Non-Executive Director)
Chairman
Mr. Munawar Alam Siddiqui(Non-Executive Director)
Member
Ms. Nargis Ghaloo (Independent Director)
Member
Mr. Basir Shamsie (Executive Director and CEO)
Member
d. IT Committee:
Mr. Hassan Afzal (Non-Executive Director)
Chairman
Mr. Kalim ur Rehman (Non-Executive Director)
Member
Mr. Sohail Aman(Independent Director)
Member
Mr. Basir Shamsie (Executive Director and CEO)
Member
13. The terms of reference of the aforesaid committees have been formed, documented and advised to the committees for compliance.
14. The frequency of meetings of the committee was as per following:
Committees Meetings held during the year
Audit Committee Four
HR Remuneration & Nomination Committee
Seven
Risk Management Committee Four
IT Committee Four
15. The Board has set up an effective internal audit function comprising of suitably qualified and experienced for the purpose and are conversant with the policies and procedures of the Bank.
16. The statutory auditors of the Bank have confirmed that they have been given a satisfactory rating under the Quality Control Review program of the Institute of Chartered Accountants of Pakistan and registered with Audit Oversight Board of Pakistan, that they and all their partners are in compliance with International Federation of Accountants (IFAC) guidelines on code of ethics as adopted by the Institute of Chartered Accountants of Pakistan and that they and the partners of the firm involved in the audit are not a close relative (spouse, parent, dependent and non-dependent children) of the chief executive officer, chief financial officer, head of internal audit, company secretary or director of the Bank.
17. The statutory auditors or the persons associated with them have not been appointed to provide other services except in accordance with the Act, these Regulations or any other regulatory requirement and the auditors have confirmed that they have observed IFAC guidelines in this regard.
18. We confirm that all requirements of regulations 3, 6, 7, 8, 27, 32, 33 and 36 of the Regulations have been complied with.
For and behalf of the Board
Basir Shamsie President & CEO Kalim-ur-Rehman Chairman
Karachi: February 24, 2021
102Annual Report 2020

UnconsolidatedFinancial Statements

INDEPENDENT AUDITORS’ REPORT


109 Annual Report 2020
__________________President and
Chief Executive Officer
___________________Chief Financial Officer
___________Director
___________Director
___________Chairman
Unconsolidated Statement of Financial PositionAs at December 31, 2020
2019202020192020 ----- Rupees in ‘000 ----- Note ----- USD in ‘000 -----
ASSETS
25,589,349 30,421,231 6Cash and balances with treasury banks 160,099 190,330 462,836 1,105,969 7Balances with other banks 2,896 6,919
30,320,540 23,239,672 8Lendings to financial institutions 189,700 145,398 142,568,470 201,698,473 9Investments 891,976 1,261,922 242,944,509 250,199,166 10Advances 1,519,976 1,565,365
9,692,701 7,599,538 11Fixed assets 60,642 47,546 2,271,360 2,486,725 12Intangible assets 14,211 15,558
8,756 - 18Deferred tax assets 55 - 16,194,444 14,678,428 13Other assets 101,320 91,835
374,000 739,200 11.3Assets held for sale 2,340 4,625 470,426,965 532,168,402 2,943,215 3,329,498
LIABILITIES
3,804,491 4,981,983 14Bills payable 23,803 31,170 54,468,283 48,303,412 15Borrowings 340,779 302,209
369,789,964 433,062,593 16Deposits and other accounts 2,313,582 2,709,445 - - Liabilities against assets subject to finance lease - -
7,494,800 7,492,800 17Subordinated debt 46,891 46,879 - 1,194,252 18Deferred tax liabilities - 7,472
17,536,172 16,541,154 19Other liabilities 109,715 103,488 453,093,710 511,576,194 2,834,770 3,200,663
17,333,255 20,592,208 NET ASSETS 108,445 128,835
REPRESENTED BY
10,119,242 10,119,242 20Share capital - net 63,311 63,311 1,749,673 1,991,170 Reserves 10,947 12,458
636,700 2,334,123 21Surplus on revaluation of assets 3,983 14,603 4,827,640 6,147,673 Unappropriated profit 30,204 38,463
17,333,255 20,592,208 108,445 128,835
22 CONTINGENCIES AND COMMITMENTS
The annexed notes from 1 to 50 and annexure I & annexure II form an integral part of these unconsolidated financial statements.

110Annual Report 2020
__________________President and
Chief Executive Officer
___________________Chief Financial Officer
___________Director
___________Director
___________Chairman
Unconsolidated Profit and Loss AccountFor the year ended December 31, 2020
2020 2019 2020 2019 ----- USD in ‘000 ----- Note ----- Rupees in ‘000 -----
269,648 260,236 Mark-up / return / interest earned 24 43,098,990 41,594,699 208,476 216,263 Mark-up / return / interest expensed 25 33,321,699 34,566,342
61,172 43,973 Net mark-up / interest income 9,777,291 7,028,357
NON MARK-UP / INTEREST INCOME
22,498 17,893 Fee and commission income 26 3,595,952 2,859,942 612 1,880 Dividend income 97,844 300,497
6,321 6,026 Foreign Exchange Income 1,010,345 963,190 184 295 Income from derivatives 29,374 47,120
11,719 (4,449) Gain / (loss) on securities 27 1,873,047 (711,145) 437 3,026 Other income 28 69,795 483,600
41,771 24,671 Total non mark-up / interest income 6,676,357 3,943,204
102,943 68,644 Total Income 16,453,648 10,971,561
NON MARK-UP / INTEREST EXPENSES
81,453 67,518 Operating expenses 29 13,019,000 10,791,708 253 7 Workers’ welfare fund 30 40,460 1,065 573 861 Other charges 31 91,639 137,643
82,279 68,386 Total non-mark-up / interest expenses 13,151,099 10,930,416 20,664 258 Profit before provisions 3,302,549 41,145
8,006 (575) Provisions and write offs - net 32 1,279,608 (91,930) - - Extraordinary / unusual items - -
12,658 833 PROFIT BEFORE TAXATION 2,022,941 133,075
5,461 678 Taxation 33 872,881 108,422
7,197 155 PROFIT AFTER TAXATION 1,150,060 24,653
----- US Dollar ----- ----- Rupee -----
0.0055 0.0001 Basic and diluted earnings per share 34 0.8864 0.0004
The annexed notes from 1 to 50 and annexure I & annexure II form an integral part of these unconsolidated financial statements.

111 Annual Report 2020
Unconsolidated Statement of Comprehensive IncomeFor the year ended December 31, 2020
2020 2019 2020 2019 ----- USD in ‘000 ----- ----- Rupees in ‘000 -----
7,197 155 Profit after taxation 1,150,060 24,653
Other comprehensive income / (loss)
Items that may be reclassified to profitand loss account in subsequent periods
72 204 Effect of translation of net investment in foreign branch 11,485 32,571
Movement in surplus on revaluation of 10,562 10,773 investments - net of tax 1,688,237 1,721,854
Movement in general provision under 499 (366) IFRS 9 - net of tax 79,793 (58,510)
11,061 10,407 1,768,030 1,663,344 11,133 10,611 1,779,515 1,695,915
18,330 10,766 2,929,575 1,720,568
Items that will not be reclassified toprofit and loss account in subsequent periods
Remeasurement gain / (loss) on defined 1,821 (70) benefit obligations - net of tax 290,980 (11,160)
Movement in surplus on revaluation of - 194 operating fixed assets - net of tax - 30,985
Movement in surplus on revaluation of 240 - non-banking assets - net of tax 38,398 -
2,061 124 329,378 19,825
20,391 10,890 Total comprehensive income 3,258,953 1,740,393
The annexed notes from 1 to 50 and annexure I & annexure II form an integral part of these unconsolidated financial statements.
__________________President and
Chief Executive Officer
___________________Chief Financial Officer
___________Director
___________Director
___________Chairman
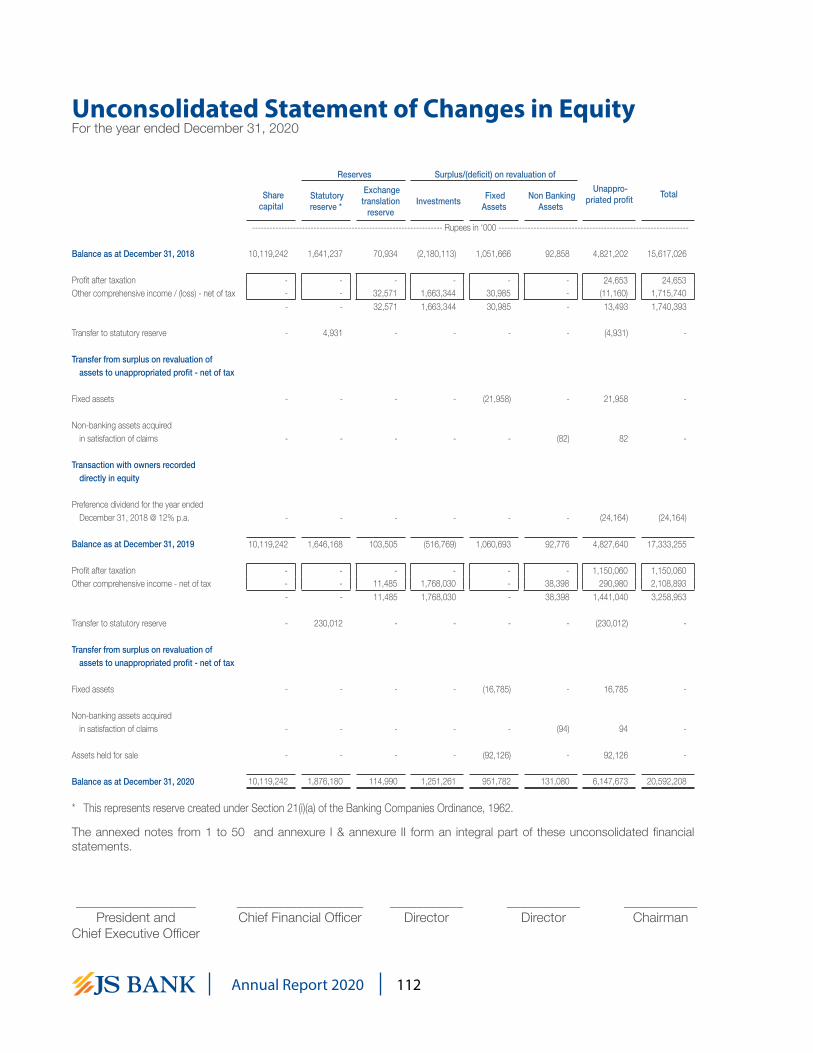
112Annual Report 2020
Unconsolidated Statement of Changes in EquityFor the year ended December 31, 2020
__________________President and
Chief Executive Officer
___________________Chief Financial Officer
___________Director
___________Director
___________Chairman
Reserves Surplus/(deficit) on revaluation of Unappro-
priated profit Total Share capital
Statutory reserve *
Exchange translation
reserve Investments Fixed
Assets Non Banking
Assets
----------------------------------------------------------------- Rupees in ‘000 -----------------------------------------------------------------
Balance as at December 31, 2018 10,119,242 1,641,237 70,934 (2,180,113) 1,051,666 92,858 4,821,202 15,617,026
Profit after taxation - - - - - - 24,653 24,653 Other comprehensive income / (loss) - net of tax - - 32,571 1,663,344 30,985 - (11,160) 1,715,740
- - 32,571 1,663,344 30,985 - 13,493 1,740,393
Transfer to statutory reserve - 4,931 - - - - (4,931) -
Transfer from surplus on revaluation ofassets to unappropriated profit - net of tax
Fixed assets - - - - (21,958) - 21,958 -
Non-banking assets acquiredin satisfaction of claims - - - - - (82) 82 -
Transaction with owners recordeddirectly in equity
Preference dividend for the year ended December 31, 2018 @ 12% p.a. - - - - - - (24,164) (24,164)
Balance as at December 31, 2019 10,119,242 1,646,168 103,505 (516,769) 1,060,693 92,776 4,827,640 17,333,255
Profit after taxation - - - - - - 1,150,060 1,150,060 Other comprehensive income - net of tax - - 11,485 1,768,030 - 38,398 290,980 2,108,893
- - 11,485 1,768,030 - 38,398 1,441,040 3,258,953
Transfer to statutory reserve - 230,012 - - - - (230,012) -
Transfer from surplus on revaluation ofassets to unappropriated profit - net of tax
Fixed assets - - - - (16,785) - 16,785 -
Non-banking assets acquiredin satisfaction of claims - - - - - (94) 94 -
Assets held for sale - - - - (92,126) - 92,126 -
Balance as at December 31, 2020 10,119,242 1,876,180 114,990 1,251,261 951,782 131,080 6,147,673 20,592,208
* This represents reserve created under Section 21(i)(a) of the Banking Companies Ordinance, 1962.
The annexed notes from 1 to 50 and annexure I & annexure II form an integral part of these unconsolidated financial statements.
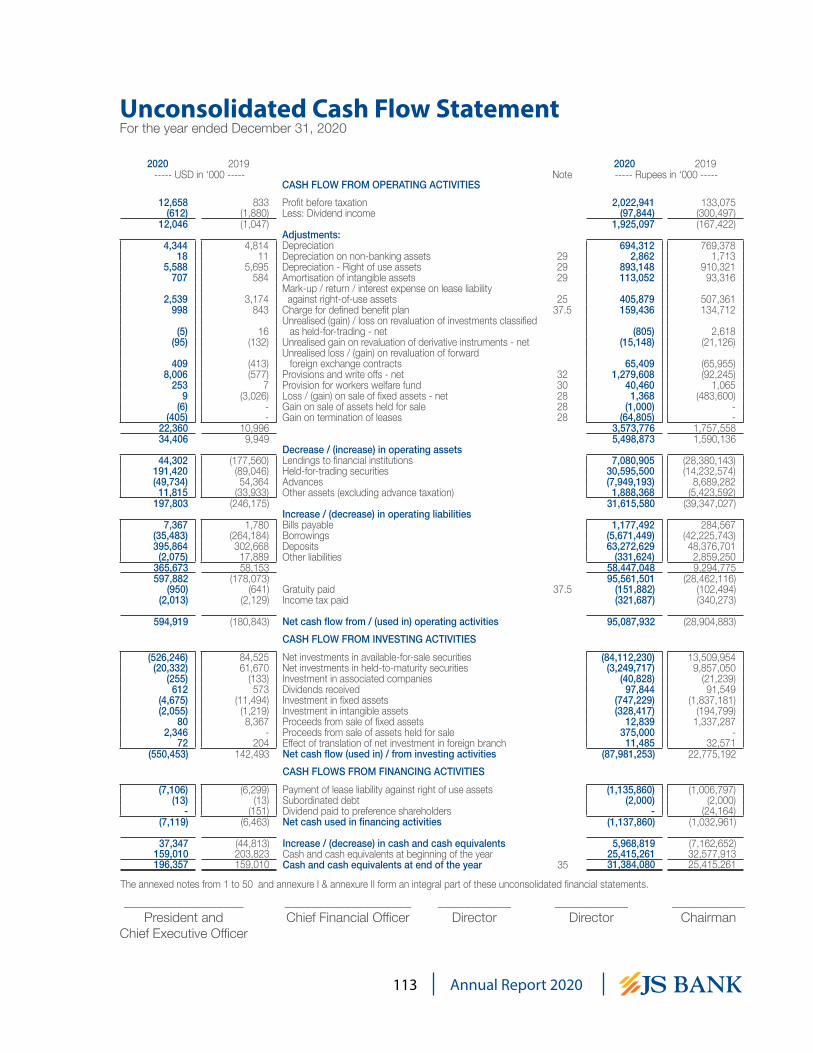
113 Annual Report 2020
Unconsolidated Cash Flow StatementFor the year ended December 31, 2020
2020 2019 2020 2019 ----- USD in ‘000 ----- Note ----- Rupees in ‘000 -----
CASH FLOW FROM OPERATING ACTIVITIES 12,658 833 Profit before taxation 2,022,941 133,075
(612) (1,880) Less: Dividend income (97,844) (300,497) 12,046 (1,047) 1,925,097 (167,422)
Adjustments: 4,344 4,814 Depreciation 694,312 769,378
18 11 Depreciation on non-banking assets 29 2,862 1,713 5,588 5,695 Depreciation - Right of use assets 29 893,148 910,321
707 584 Amortisation of intangible assets 29 113,052 93,316 Mark-up / return / interest expense on lease liability
2,539 3,174 against right-of-use assets 25 405,879 507,361 998 843 Charge for defined benefit plan 37.5 159,436 134,712
Unrealised (gain) / loss on revaluation of investments classified (5) 16 as held-for-trading - net (805) 2,618
(95) (132) Unrealised gain on revaluation of derivative instruments - net (15,148) (21,126)Unrealised loss / (gain) on revaluation of forward
409 (413) foreign exchange contracts 65,409 (65,955) 8,006 (577) Provisions and write offs - net 32 1,279,608 (92,245)
253 7 Provision for workers welfare fund 30 40,460 1,065 9 (3,026) Loss / (gain) on sale of fixed assets - net 28 1,368 (483,600)
(6) - Gain on sale of assets held for sale 28 (1,000) - (405) - Gain on termination of leases 28 (64,805) -
22,360 10,996 3,573,776 1,757,558 34,406 9,949 5,498,873 1,590,136
Decrease / (increase) in operating assets 44,302 (177,560) Lendings to financial institutions 7,080,905 (28,380,143)
191,420 (89,046) Held-for-trading securities 30,595,500 (14,232,574) (49,734) 54,364 Advances (7,949,193) 8,689,282
11,815 (33,933) Other assets (excluding advance taxation) 1,888,368 (5,423,592) 197,803 (246,175) 31,615,580 (39,347,027)
Increase / (decrease) in operating liabilities 7,367 1,780 Bills payable 1,177,492 284,567
(35,483) (264,184) Borrowings (5,671,449) (42,225,743) 395,864 302,668 Deposits 63,272,629 48,376,701
(2,075) 17,889 Other liabilities (331,624) 2,859,250 365,673 58,153 58,447,048 9,294,775 597,882 (178,073) 95,561,501 (28,462,116)
(950) (641) Gratuity paid 37.5 (151,882) (102,494) (2,013) (2,129) Income tax paid (321,687) (340,273)
594,919 (180,843) Net cash flow from / (used in) operating activities 95,087,932 (28,904,883)CASH FLOW FROM INVESTING ACTIVITIES
(526,246) 84,525 Net investments in available-for-sale securities (84,112,230) 13,509,954 (20,332) 61,670 Net investments in held-to-maturity securities (3,249,717) 9,857,050
(255) (133) Investment in associated companies (40,828) (21,239) 612 573 Dividends received 97,844 91,549
(4,675) (11,494) Investment in fixed assets (747,229) (1,837,181) (2,055) (1,219) Investment in intangible assets (328,417) (194,799)
80 8,367 Proceeds from sale of fixed assets 12,839 1,337,287 2,346 - Proceeds from sale of assets held for sale 375,000 -
72 204 Effect of translation of net investment in foreign branch 11,485 32,571 (550,453) 142,493 Net cash flow (used in) / from investing activities (87,981,253) 22,775,192
CASH FLOWS FROM FINANCING ACTIVITIES (7,106) (6,299) Payment of lease liability against right of use assets (1,135,860) (1,006,797)
(13) (13) Subordinated debt (2,000) (2,000) - (151) Dividend paid to preference shareholders - (24,164)
(7,119) (6,463) Net cash used in financing activities (1,137,860) (1,032,961)
37,347 (44,813) Increase / (decrease) in cash and cash equivalents 5,968,819 (7,162,652) 159,010 203,823 Cash and cash equivalents at beginning of the year 25,415,261 32,577,913 196,357 159,010 Cash and cash equivalents at end of the year 35 31,384,080 25,415,261
The annexed notes from 1 to 50 and annexure I & annexure II form an integral part of these unconsolidated financial statements.__________________
President andChief Executive Officer
___________________Chief Financial Officer
___________Director
___________Director
___________Chairman

114Annual Report 2020
Notes to the Unconsolidated Financial StatementsFor the year ended December 31, 2020
1. STATUS AND NATURE OF BUSINESS
1.1 JS Bank Limited (the Bank / JSBL) is a banking company incorporated in Pakistan as a public limited company on March 15, 2006. The Bank is a subsidiary company of Jahangir Siddiqui & Co. Ltd. (JSCL) and its shares are listed on Pakistan Stock Exchange Limited (PSX). The Bank commenced its banking operations on December 30, 2006 and its registered office is situated at Shaheen Commercial Complex, Dr. Ziauddin Ahmed Road, Karachi.
The Bank is a scheduled bank, engaged in commercial banking and related services as described in the Banking Companies Ordinance, 1962 and is operating through 307 (2019: 359) branches / sub-branches in Pakistan and one wholesale banking branch in Bahrain (2019: one). The Pakistan Credit Rating Agency Limited (PACRA) has assigned the long-term entity rating of the Bank to AA- (Double A Minus) whereas short-term rating is maintained at ‘A1+’ (A One Plus), which is the highest possible short-term rating. The ratings denote a very low expectation of credit risk and indicate very strong capacity for timely payment of financial commitments.
1.2 Jahangir Siddiqui Investment Bank Limited, JSIBL, (formerly Citicorp Investment Bank Limited which was acquired by JSCL on February 01, 1999), and its holding company, JSCL, entered into a Framework Agreement with American Express Bank Limited, New York (AMEX) on November 10, 2005 for acquisition of its American Express Bank Limited - Pakistan Branches, (AEBL). Consequently, a new banking company, JSBL was incorporated on March 15, 2006 and a restricted Banking License was issued by the State Bank of Pakistan (SBP) on May 23, 2006.
A Transfer Agreement was executed on June 24, 2006 between JSIBL and JSBL for the transfer of entire business and undertaking of JSIBL to JSBL and a separate Transfer Agreement was also executed on June 24, 2006, between AMEX and JSBL for the transfer of AEBL’s commercial banking business in Pakistan with all assets and liabilities (other than certain excluded assets and liabilities) (AEBL business). The shareholders of JSIBL and JSBL in their respective extra-ordinary general meetings held on July 31, 2006 approved a Scheme of Amalgamation (the Scheme) under Section 48 of the Banking Companies Ordinance, 1962. The Scheme was initially approved by the Securities and Exchange Commission of Pakistan (SECP) vide its letter No. SC/NBFC(J)-R/JSIBL/2006/517 dated September 28, 2006. Subsequently, the Scheme was sanctioned by the SBP vide its order dated December 02, 2006 and, in accordance therewith, the effective date of amalgamation was fixed at December 30, 2006.
1.3 The Bank is the holding company of JS Investments Limited, JS Global Capital Limited and JS ABAMCO Commodities Limited (Indirect subsidiary).
2. BASIS OF PRESENTATION
These unconsolidated financial statements are separate financial statements of the Bank in which the investments in subsidiaries and associates are stated at cost and are accounted for on the basis of direct equity interest rather than on the basis of reported results. The consolidated financial statements of the Bank are being issued separately.
These unconsolidated financial statements have been presented in Pakistan Rupees (PKR), which is the currency of the primary economic environment in which the Bank operates and functional currency of the Bank, in that environment as well. The amounts are rounded to nearest thousand except as stated otherwise.
The US Dollar amounts shown on the statement of financial position, profit and loss account, statement of comprehensive income and cash flow statement are stated as additional information solely for the convenience of readers and have not been subject to audit by the external auditors. For the purpose of conversion to US Dollars, the rate of Rs. 159.8344 to 1 US Dollar has been used for 2020 and 2019 as it was the prevalent rate as on December 31, 2020.
2.1 Statement of compliance
These unconsolidated financial statements have been prepared in accordance with the accounting and reporting standards as applicable in Pakistan. These comprise of:

115 Annual Report 2020
- International Financial Reporting Standards (IFRSs) issued by the International Accounting Standards Board (IASB) as are notified under the Companies Act, 2017;
- Provisions of and directives issued under the Banking Companies Ordinance, 1962;
- Provisions of and directives issued under the Companies Act, 2017; and
- Directives issued by the SBP and the SECP from time to time.
Whenever the requirements of the Banking Companies Ordinance, 1962, the Companies Act, 2017, or the directives issued by the SBP and the SECP differ with the requirements of IFRS, the requirements of the Banking Companies Ordinance, 1962, the Companies Act, 2017 and the said directives shall prevail.
The SBP has deferred the applicability of International Accounting Standard (IAS) 39, ‘Financial Instruments: Recognition and Measurement’ and International Accounting Standard (IAS) 40, ‘Investment Property’ for banking companies vide BSD Circular Letter No. 10 dated August 26, 2002 till further instructions. Further, the SECP has deferred the applicability of International Financial Reporting Standard (IFRS) 7, ‘Financial Instruments: Disclosures’ on banks vide its notification S.R.O 411(I)/2008 dated April 28, 2008. Accordingly, the requirements of these standards have not been considered in the preparation of these unconsolidated financial statements. However, investments have been classified and valued in accordance with the requirements prescribed by the SBP through various circulars.
IFRS10 “Consolidated Financial Statements” was made applicable from period beginning on or after January 01, 2015 vide S.R.O 633(I)/2014 dated July 10, 2014 by SECP. However, SECP has directed through S.R.O56(I)/2016 dated January 28, 2016, that the requirement of consolidation under section 228 of the Companies Act, 2017 and IFRS-10 “Consolidated Financial Statements” is not applicable in case of investment by companies in mutual funds established under trust structure. Accordingly, the requirements of these standards have not been considered in the preparation of these unconsolidated financial statements.
Through S.R.O. 229 (I)/2019 dated February 14, 2019, the SECP has deferred the applicability of the IFRS 9 ‘Financial Instruments’ for all companies required to prepare their financial statements in accordance with the requirements of IFRS for reporting period/year ending on or after June 30, 2019 (earlier application is permitted). However, SBP has extended the effective date of applicability of IFRS 9 to annual periods beginning on or after January 01, 2021 vide SBP BPRD Circular No.4 dated October 23, 2019. Therefore, the Bank has not considered the impact of IFRS 9 for its Pakistan operations in these unconsolidated financial statements.
Further, the Bank considers that as the Prudential Regulations and other SBP directives currently provide the accounting framework for the measurement and valuation of investments and provision against non-performing loans and advances, the implementation of IFRS 9 may require changes in the regulatory regime and for this SBP would issue guidance and instruction on the application of IFRS 9 for the banking sector of Pakistan.
2.2 Standards, interpretations of and amendments to published approved accounting standards that areeffective in the current year
The Bank has adopted the following accounting standards, interpretations and amendments of IFRSs and the improvements to accounting standards which became effective for the current year:
- Amendments to IAS 1 Presentation of Financial Statements and IAS 8 Accounting Policies, Changes in Accounting Estimates and Errors. The amendments were intended to make the definition of material in IAS 1 easier to understand and are not intended to alter the underlying concept of materiality in IFRS Standards. In addition, the IASB has also issued guidance on how to make materiality judgements when preparing their general purpose financial statements in accordance with IFRS Standards.
Notes to the Unconsolidated Financial StatementsFor the year ended December 31, 2020

116Annual Report 2020
- Amendment to IFRS 3 ‘Business Combinations’ – Definition of a Business. IASB has issued amendments aiming to resolve the difficulties that arise when an entity determines whether it has acquired a business or a group of assets. The amendments clarify that to be considered a business, an acquired set of activities and assets must include, at a minimum, an input and a substantive process that together significantly contribute to the ability to create outputs. The amendments include an election to use a concentration test.
- IFRS 14 ‘Regulatory Deferral Accounts’ permits an entity to continue to account, with some limited changes, for ‘regulatory deferral account balances’ in accordance with its previous reporting framework, both on initial adoption of standard and in subsequent financial statements. Regulatory deferral account balances, and movements in them, are presented separately in the statement of financial position and profit and loss account and statement of other comprehensive income, and specific disclosures are required.
- IASB has also issued the revised Conceptual Framework for Financial Reporting (the Conceptual Framework) in March 2018 which became effective during the year for preparers of financial statements who develop accounting policies based on the Conceptual Framework. The revised Conceptual Framework is not a standard, and none of the concepts override those in any standard or any requirements in a standard. The purpose of the Conceptual Framework is to assist IASB in developing standards, to help preparers develop consistent accounting policies if there is no applicable standard in place and to assist all parties to understand and interpret the standards.
The adoption of the above standards / amendments to accounting standards are not considered to be relevant or did not have any significant effect on the Bank’s operations.
2.3 Standards, interpretations of and amendments to published approved accounting standards that are notyet effective
The following standards, amendments and interpretations of approved accounting standards will be effective for accounting periods beginning on or after January 01, 2021:
- IFRS 9 ‘Financial Instruments’ - SBP vide its BPRD Circular No. 04 of 2019 dated 23 October 2019 directed the banks in Pakistan to implement IFRS 9 with effect from 01 January 2021. IFRS 9 replaced the existing guidance in IAS 39 Financial Instruments: Recognition and Measurement. IFRS 9 includes revised guidance on the classification and measurement of financial instruments, a new expected credit loss model for calculating impairment on financial assets, and new general hedge accounting requirements. It also carries forward the guidance on recognition and derecognition of financial instruments from IAS 39. The Bank has been complying with the requirement of BPRD Circular Letter No. 15 of 2020 to have parallel run of IFRS 9 from July 01, 2020.
- COVID-19-Related Rent Concessions (Amendment to IFRS 16) – the International Accounting Standards Board (the Board) has issued amendments to IFRS 16 (the amendments) to provide practical relief for lessees in accounting for rent concessions. The amendments are effective for periods beginning on or after June 01, 2020, with earlier application permitted. Under the standard’s previous requirements, lessees assess whether rent concessions are lease modifications and, if so, apply the specific guidance on accounting for lease modifications. This generally involves remeasuring the lease liability using the revised lease payments and a revised discount rate. In light of the effects of the COVID-19 pandemic, and the fact that many lessees are applying the standard for the first time in their financial statements, the Board has provided an optional practical expedient for lessees. Under the practical expedient, lessees are not required to assess whether eligible rent concessions are lease modifications, and instead are permitted to account for them as if they were not lease modifications. Rent concessions are eligible for the practical expedient if they occur as a direct consequence of the COVID-19 pandemic and if all the following criteria are met:- the change in lease payments results in revised consideration for the lease that is substantially the
same as, or less than, the consideration for the lease immediately preceding the change;
- any reduction in lease payments affects only payments originally due on or before 30 June 2021; and
Notes to the Unconsolidated Financial StatementsFor the year ended December 31, 2020

117 Annual Report 2020
- there is no substantive change to the other terms and conditions of the lease.
- Interest Rate Benchmark Reform – Phase 2 which amended IFRS 9, IAS 39, IFRS 7, IFRS 4 and IFRS 16 is applicable for annual financial periods beginning on or after January 01, 2021, with earlier application permitted. The amendments introduce a practical expedient to account for modifications of financial assets or financial liabilities if a change results directly from IBOR reform and occurs on an ‘economically equivalent’ basis. In these cases, changes will be accounted for by updating the effective interest rate. A similar practical expedient will apply under IFRS 16 for lessees when accounting for lease modifications required by IBOR reform. The amendments also allow a series of exemptions from the regular, strict rules around hedge accounting for hedging relationships directly affected by the interest rate benchmark reforms. The amendments apply retrospectively with earlier application permitted. Hedging relationships previously discontinued solely because of changes resulting from the reform will be reinstated if certain conditions are met.
- Onerous Contracts – Cost of Fulfilling a Contract (Amendments to IAS 37) effective for the annual period beginning on or after January 01, 2022 amends IAS 1 by mainly adding paragraphs which clarifies what comprise the cost of fulfilling a contract, Cost of fulfilling a contract is relevant when determining whether a contract is onerous. An entity is required to apply the amendments to contracts for which it has not yet fulfilled all its obligations at the beginning of the annual reporting period in which it first applies the amendments (the date of initial application). Restatement of comparative information is not required, instead the amendments require an entity to recognize the cumulative effect of initially applying the amendments as an adjustment to the opening balance of retained earnings or other component of equity, as appropriate, at the date of initial application.
The following annual improvements to approved accounting standards 2018-2020 are effective for annual reporting periods beginning on or after January 01, 2022.
- IFRS 9 – The amendment clarifies that an entity includes only fees paid or received between the entity (the borrower) and the lender, including fees paid or received by either the entity or the lender on the other’s behalf, when it applies the ‘10 percent’ test in paragraph B3.3.6 of IFRS 9 in assessing whether to derecognize a financial liability.
- IFRS 16 – The amendment partially amends Illustrative Example 13 accompanying IFRS 16 by excluding the illustration of reimbursement of leasehold improvements by the lessor. The objective of the amendment is to resolve any potential confusion that might arise in lease incentives.
- IAS 41 – The amendment removes the requirement in paragraph 22 of IAS 41 for entities to exclude taxation cash flows when measuring the fair value of a biological asset using a present value technique.
- Property, Plant and Equipment: Proceeds before Intended Use (Amendments to IAS 16) effective for the annual period beginning on or after 1 January 2022. Clarifies that sales proceeds and cost of items produced while bringing an item of property, plant and equipment to the location and condition necessary for it to be capable of operating in the manner intended by management e.g. when testing etc., are recognized in profit or loss in accordance with applicable Standards. The entity measures the cost of those items applying the measurement requirements of IAS 2. The standard also removes the requirement of deducting the net sales proceeds from cost of testing. An entity shall apply those amendments retrospectively, but only to items of property, plant and equipment that are brought to the location and condition necessary for them to be capable of operating in the manner intended by management on or after the beginning of the earliest period presented in the financial statements in which the entity first applies the amendments. The entity shall recognize the cumulative effect of initially applying the amendments as an adjustment to the opening balance of retained earnings (or other component of equity, as appropriate) at the beginning of that earliest period presented.
Notes to the Unconsolidated Financial StatementsFor the year ended December 31, 2020

118Annual Report 2020
- Reference to the Conceptual Framework (Amendments to IFRS 3) - Reference to the Conceptual Framework, issued in May 2020, amended paragraphs 11, 14, 21, 22 and 23 of and added paragraphs 21A, 21B, 21C and 23A to IFRS 3. An entity shall apply those amendments to business combinations for which the acquisition date is on or after the beginning of the first annual reporting period beginning on or after January 01, 2022. Earlier application is permitted if at the same time or earlier an entity also applies all the amendments made by Amendments to References to the Conceptual Framework in IFRS Standards, issued in March 2018.
- Classification of liabilities as current or non-current (Amendments to IAS 1) effective for the annual period beginning on or after January 01, 2022. These amendments in the standards have been added to further clarify when a liability is classified as current. The standard also amends the aspect of classification of liability as non-current by requiring the assessment of the entity’s right at the end of the reporting period to defer the settlement of liability for at least twelve months after the reporting period. An entity shall apply those amendments retrospectively in accordance with IAS 8.
- Sale or Contribution of Assets between an Investor and its Associate or Joint Venture (Amendments to IFRS 10 and IAS 28) – The amendment amends accounting treatment on loss of control of business or assets. The amendments also introduce new accounting for less frequent transaction that involves neither cost nor full step-up of certain retained interests in assets that are not businesses. The effective date for these changes has been deferred indefinitely until the completion of a broader review.
Further, following new standards have been issued by IASB which are yet to be notified by the SECP for the purpose of applicability in Pakistan.
IASB Effective date (annual periods beginning on or
after)Standard
IFRS 1 – First time adoption of IFRSs January 01, 2004
IFRS 17 – Insurance Contracts January 01, 2023
2.4 Critical accounting estimates and key sources of estimation uncertainty
The preparation of financial statements in conformity with approved accounting standards requires the use of certain critical accounting estimates. It also requires management to exercise its judgment in the process of applying the Bank’s accounting policies. Estimates and judgments are continually evaluated and are based on historic experience and other factors, including expectations of future events that are believed to be reasonable under the circumstances. Revisions in accounting estimates are recognised in the period in which the estimate is revised and in any future periods affected.
The areas where various assumptions and estimates are significant to the Bank’s financial statements or where judgment was exercised in application of accounting policies are as follows:
i) Classification of investments
- In classifying investments as ‘held-for-trading’ the Bank has determined securities which are acquired with an intention to trade by taking advantage of short-term market / interest rate movements and are to be sold within 90 days of acquisition.
- In classifying investments as ‘held-to-maturity’ the Bank follows the guidance provided in SBP circulars on classifying non-derivative financial assets with fixed or determinable payments and fixed maturity. In making this judgment, the Bank evaluates its intention and ability to hold such investments to maturity.
- The investments which are not classified as ‘held-for-trading’ or ‘held-to-maturity’ are classified as ‘available-for-sale’.
Notes to the Unconsolidated Financial StatementsFor the year ended December 31, 2020

119 Annual Report 2020
Notes to the Unconsolidated Financial StatementsFor the year ended December 31, 2020
ii) Provision against non performing loans and advances
The Bank reviews its loan portfolio to assess amount of non-performing loans and advances and provision required there-against. While assessing this requirement various factors including the delinquency in the account, financial position of the borrowers, the value of securities and the requirements of the Prudential Regulations are considered. For portfolio impairment / provision on consumer advances, the Bank follows requirements set out in Prudential Regulations.
iii) Impairment on investments
The Bank determines that investments are impaired when there has been a significant or prolonged decline in the fair value below its cost. This determination of what is significant or prolonged requires judgment. In making this judgment, the Bank evaluates among other factors, the normal volatility in securities price. In addition, impairment may be appropriate when there is an evidence of deterioration in the financial health of the investee, industry and sector performance, changes in technology and operational and financing cash flows.
iv) Income taxes
In making the estimates for income taxes currently payable by the Bank, the management considers the current income tax laws and the decisions of appellate authorities on certain issues in the past. In making the provision for deferred taxes, estimates of the Bank’s future taxable profits are taken into account.
v) Depreciation of fixed assets and amortization of intangible assets
In making estimates of the depreciation / amortisation method, the management uses a method which reflects the pattern in which economic benefits are expected to be consumed by the Bank. The method applied is reviewed at each financial year end and if there is a change in the expected pattern of consumption of the future economic benefits embodied in the underlying assets, the method is changed to reflect the change in pattern. Such change is accounted for as change in accounting estimates in accordance with International Accounting Standard - 8, “Accounting Policies, Changes in Accounting Estimates and Errors”.
vi) Defined benefits plans and other benefits
Liability is determined on the basis of actuarial advice using the Projected Unit Credit Method.
vii) Impairment of Goodwill
Impairment testing involves a number of judgmental areas which are subject to inherent significant uncertainty, including the preparation of cash flow forecasts for the periods that are beyond the normal requirements of management reporting and the assessment of the discount rate appropriate to the business. The carrying amount of goodwill at the balance sheet date was Rs.1,464 million. The detailed assumptions underlying impairment testing of goodwill are given in note 12.5 to these unconsolidated financial statements.
viii) Lease term
The Bank applies judgement to determine the lease term for some lease contracts in which it is a lessee that include renewal options.The assessment of whether the Bank is reasonably certain to exercise such options impacts the lease term, which significantly affects the amount of lease liabilities and right-of-use assets recognised and its recoverable amount which is determined as higher of value-in-use and fair value less cost to sell.
3. BASIS OF MEASUREMENT
These unconsolidated financial statements have been prepared under the historical cost convention except for:

120Annual Report 2020
Notes to the Unconsolidated Financial StatementsFor the year ended December 31, 2020
- Certain classes of fixed assets and non-banking assets acquired in satisfaction of claims which are stated at revalued amounts less accumulated depreciation.
- Investments classified as held-for-trading and available-for-sale and derivative financial instruments, which are measured at fair value.
- Net obligations in respect of defined benefit schemes which are carried at their present values.
4. SUMMARY OF SIGNIFICANT ACCOUNTING POLICIES
The principal accounting policies applied in the preparation of these unconsolidated financial statements are consistent with those of previous financial year.
4.1 Cash and cash equivalents
Cash and cash equivalents represent cash and balances with treasury banks and balances with other banks net of any overdrawn nostro accounts.
4.2 Lendings to / borrowings from financial institutions
The Bank enters into transactions of lendings to / borrowings from financial institutions at contracted rates for a specified period of time. These are recorded as under:
(a) Sale under repurchase obligation
Securities sold subject to a repurchase agreement (repo) are retained in the financial statements as investments and liability to counter party is included in borrowings. The difference in sale and repurchase value is accrued over the period of the contract and recorded as an expense using effective interest rate method.
(b) Other lendings
Other lendings include term lendings and unsecured lendings to financial institutions. These are stated net of provision. Mark-up on such lendings is charged to profit and loss account on a time proportionate basis using effective interest rate method except mark-up on impaired/delinquent lendings, which are recognized on receipt basis in accordance with the requirements of the Prudential Regulations of the SBP.
(c) Purchase under resale obligation
Securities purchased under agreement to resell (reverse repo) are not included in statement of financial position as the Bank does not obtain control over the securities. Amount paid under these agreements is included in lendings to financial institutions or advances as appropriate. The difference between the contracted price and resale price is amortised over the period of the contract and recorded as income using effective interest method.
(d) Other borrowings
Other borrowings include borrowings from the SBP and unsecured call borrowings which are recorded at the proceeds received. Mark-up paid on such borrowings is charged to the profit and loss account over the period of borrowings on time proportionate basis using effective interest method.

121 Annual Report 2020
Notes to the Unconsolidated Financial StatementsFor the year ended December 31, 2020
4.3 Investments
4.3.1 Initial recognition and measurement
4.3.1.1 The Management determines the appropriate classification of its investments at the time of purchase in held-for-trading, available-for-sale or held-to-maturity as per SBP guidelines vide BSD circular No. 10 of 2004 dated July 13, 2004. These are initially recognised at cost, being the fair value of the consideration given plus, in the case of investments not held-for-trading, directly attributable acquisition costs.
(a) Held-for-trading
These are securities which are either acquired for generating profit from short-term fluctuations in market prices, interest rate movements, dealer’s margin or are securities included in a portfolio in which a pattern of short-term profit taking exists. These securities are carried at fair value with any related gain or loss being recognized in profit and loss account.
(b) Held-to-maturity
These are securities with fixed or determinable payments and fixed maturities that are held with the intention and ability to hold till maturity. Investments classified as held-to-maturity are carried at amortised cost.
(c) Available-for-sale
These are investments that do not fall under the held-for-trading or held-to-maturity categories. These are initially recognised at cost, being the fair value of the consideration given including the acquisition cost. These securities are carried at fair value with any related surplus or deficit on revaluation shall be taken to other comprehensive income.
4.3.1.2 Associates
Associate is an entity over which the Bank has significant influence but not control. Investment in associate is carried at cost less accumulated impairment losses, if any.
4.3.1.3 Subsidiaries
Subsidiary is an entity over which the Bank has control. Investment in subsidiary is carried at cost less accumulated impairment losses, if any.
4.3.1.4 Regular way contracts
All ‘regular way’ purchases and sales of financial assets are recognised on the trade date, i.e. the date on which commitment to purchase / sale is made by the Bank. Regular way purchases or sales of financial assets are those, the contract for which requires delivery of assets within the time frame generally established by regulation or convention in the market place.
4.3.1.5 Premium or discount on acquisition of investments
Premium or discount on acquisition of investments is capitalised and amortised through the profit and loss account using effective yield over the remaining period of the investment.

122Annual Report 2020
Notes to the Unconsolidated Financial StatementsFor the year ended December 31, 2020
4.3.2 Subsequent measurement
In accordance with the requirements of the SBP, quoted securities other than those classified as ‘held-to-maturity’ and investment in associates and subsidiaries, are subsequently remeasured on portfolio basis i.e. in case of government securities at PKRV and PKFRV rates whereas in case of other securities at market value. Investments classified as ‘held-to-maturity’ are carried at amortised cost using the effective interest method (less impairment, if any).
Further, in accordance with the requirements of the SBP, gain or loss on revaluation of the Bank’s held-for-trading investments is taken to the profit and loss account. In case of investments classified as available-for-sale, surplus or deficit is taken directly to equity. The surplus or deficit arising on these securities is taken to the profit and loss account when actually realised upon disposal.
Unquoted equity securities, excluding investment in subsidiaries and associates are valued at lower of cost and the break-up value in accordance with the requirements of the Prudential Regulations issued by the SBP. Break-up value of equity securities is calculated with reference to the net assets of the investee company as per the latest available audited financial statements. Investment in subsidiaries and associates are carried at cost, less accumulated impairment losses, if any.
4.3.3 Impairment / diminution in the value of securities
Impairment loss in respect of quoted equity securities classified as available for sale, associates, subsidiaries and held to maturity is recognised based on management’s assessment of objective evidence of impairment as a result of one or more events that may have an impact on the estimated future cash flows of the investments. Objective evidence that the cost may not be recovered, in addition to qualitative impairment criteria, includes a significant or prolonged decline in the fair value below average cost. A decline to be considered as:
- Significant if the fair value is below the weighted average cost by more than 30 percent.- Prolonged if the fair value is below the weighted average cost for a period of more than one year.
(a) Available-for-sale
If an available-for-sale equity security is impaired, the cumulative loss that had been recognised in equity, shall be reclassified from equity to profit and loss as a reclassification adjustment even though the financial asset has not been derecognised, any further decline in the fair value at subsequent reporting dates is recognised as impairment. Therefore, at each reporting period, for an equity security that was determined to be impaired, additional impairments is recognised for the difference between the fair value and the original cost basis, less any previously recognised impairment.
If, in subsequent period, impairment losses recognised in profit and loss for an investment in an equity instrument classified as available for sale shall not be reversed through profit and loss except in case of derecognition.
(b) Held to maturity, subsidiaries and associates
Impairment losses are incurred if, and only if, there is objective evidence of impairment after initial recognition of the investment. The impairment loss is recognised in the profit and loss account. If, in a subsequent period, any indication that an impairment loss recognised in prior periods no longer exist or may have decreased, the impairment loss shall be reversed, with the amount of the reversal recognised in profit or loss.
(c) Debt Securities
PTCs, TFCs, Sukuk and other debt securities will be classified on the valuation date on the basis of default in their repayment in line with the criteria prescribed for classification of short, medium and long-term facilities in accordance with the requirements of the Prudential Regulations issued by the SBP.

123 Annual Report 2020
Notes to the Unconsolidated Financial StatementsFor the year ended December 31, 2020
4.4 Financial instruments
4.4.1Financial assets and financial liabilities
Financial assets and financial liabilities are recognized at the time when the Bank becomes party to the contractual provision of the instrument. Financial assets are de-recognized when the contractual right to future cash flows from the asset expires or is transferred along with the risk and reward of the asset. Financial liabilities are de-recognized when obligation specified in the contract is discharged, cancelled or expired. Any gain or loss on de-recognition of the financial asset and liability is recognized in the profit and loss account at the time of de-recognition. The particular recognition and subsequent measurement method for significant financial assets and financial liabilities are disclosed in the individual policy statements associated with them.
4.4.2Derivative financial instruments
Derivative financial instruments are initially recognised at fair value on the date on which the derivative contract is entered into and are subsequently re-measured at fair value using valuation techniques. All derivative financial instruments are carried as assets when fair value is positive and liabilities when fair value is negative. Any change in the fair value of derivative financial instruments is taken to the profit and loss account.
4.5 Off-setting of financial assets and financial liabilities
Financial assets and financial liabilities are set off and the net amount is reported in the financial statements when there is a legally enforceable right to set off and the Bank intends either to settle the assets and liabilities on a net basis or to realise the assets and to settle the liabilities simultaneously. Income and expenses arising from such assets and liabilities are accordingly offset.
4.6 Advances
4.6.1 Loan and advances
Advances are stated net of general and specific provisions. General and specific provisions against funded loans are determined in accordance with the requirements of the Prudential Regulations issued by the SBP and charged to the profit and loss account. Advances are written off when there are no realistic prospects of recovery.
4.6.2 Finance lease receivables
Leases, where the bank transfers substantially all the risks and rewards incidental to ownership of an asset to the lessee are classified as finance leases. A receivable is recognised at an amount equal to the present value of the lease payment including any guaranteed residual value, if any. Net investment in finance lease is included in loans and advances to customers.
4.7 Fixed assets
4.7.1 Property and equipment
Operating fixed assets except office premises are shown at historical cost less accumulated depreciation and accumulated impairment losses, if any. Historical cost includes expenditures that are directly attributable to the acquisition of the items. Office premises (which includes leasehold land and buildings) are stated at revalued amount less accumulated depreciation and impairment loss, if any.

124Annual Report 2020
Notes to the Unconsolidated Financial StatementsFor the year ended December 31, 2020
Depreciation is calculated and charged to profit and loss account using the straight-line method so as to write down the cost of the assets to their residual values over their estimated useful lives at the rates given in note 11.A full month’s depreciation is charged from the month in which assets are brought into use and no depreciation is charged for the month in which the disposal is made. The residual values, useful lives and depreciation methods are reviewed and changes, if any, are treated as change in accounting estimates, annually.
Subsequent costs are included in the asset’s carrying amount or recognised as a separate asset, as appropriate, only when it is probable that future economic benefits associated with the item will flow to the Bank and the cost of the item can be measured reliably. The carrying amount of the replaced part is de-recognised. All other repairs and maintenance are charged to the profit and loss account during the period in which they are incurred.
An item of property and equipment is de-recognised upon disposal or when no future economic benefits are expected from its use or disposal. Any gain or loss arising on de-recognition of the asset is recognised in the profit and loss account in the year the asset is de-recognised.
4.7.2 Surplus / deficit on revaluation of fixed assets
The surplus arising on revaluation is credited to other comprehensive income. However, the increase shall be recognised in profit and loss to the extent that it reverses a revaluation decrease of the same asset previously recognised in profit and loss account.
The deficit arising on a particular property as a result of a revaluation is recognised in profit and loss account as an impairment. However, the decrease to be recognised in other comprehensive income to the extent of any credit balance existing in the revaluation surplus in respect of that asset.
Depreciation on buildings which are revalued is determined with reference to the value assigned to such assets on revaluation and depreciation charge for the year is taken to the profit and loss account; and an amount equal to incremental depreciation for the year net of deferred taxation is transferred from “Surplus on Revaluation of Fixed Assets Account” to unappropriated profit through Statement of Changes in Equity to record realization of surplus to the extent of the incremental depreciation charge for the year.
Gains or losses on disposal of assets are included in the profit and loss account currently, except that the related surplus on revaluation of fixed assets (net of deferred tax) is transferred directly to equity.
4.7.3 Capital work-in-progress
Capital work-in-progress is stated at cost less impairment losses, if any. These are transferred to specified assets as and when assets are available for use.
4.8 Intangible assets
Intangible assets are stated at cost less accumulated amortisation and impairment, if any. Intangible assets are amortised from the month when the assets are available for use, using the straight line method, whereby the cost of the intangible asset is amortised over its estimated useful life over which economic benefits are expected to flow to the Bank. The useful life and amortisation method are reviewed and adjusted, if appropriate, annually.
Intangible assets having an indefinite useful life are carried at cost less any impairment in value and are not amortised. However, these are reviewed for impairment annually or more frequently if events or changes in circumstances indicate that the carrying value may be impaired.

125 Annual Report 2020
Notes to the Unconsolidated Financial StatementsFor the year ended December 31, 2020
4.9 Non-banking assets acquired in satisfaction of claims
4.9.1 Non-banking assets acquired in satisfaction of claims under Debt Property Swap (DPS) transactions, against the loans in category of loss, are initially carried at cost and subsequently at revalued amounts at each year-end date of the statement of financial position, being the fair value at the date of revaluation less subsequent accumulated depreciation and subsequent accumulated impairment losses, if any. The valuation of properties acquired are conducted regularly, so as to ensure that their net carrying value does not materially differ from their fair value.
All direct cost including legal fees, valuation and transfer costs of acquiring title to property shall be expensed when incurred through profit and loss account.
Subsequent costs are included in the asset’s carrying amounts only when it is probable that future benefits associated with the item will flow to the Bank and the cost of the item can be measured reliably. All other subsequent costs including repair and maintenance are charged to the profit and loss account as and when incurred.
Depreciation on assets acquired in satisfaction of claims is charged to the profit and loss account in line with the depreciation charged on operating fixed assets.
Any reductions in non-performing loans and corresponding reductions in provisions held against non-performing loans, as a result of the recognition of such assets, are disclosed separately in the notes to these unconsolidated financial statements.
These assets are generally intended for sale. Gains and losses realised on the sale of such assets are disclosed separately from gains and losses realised on the sale of operating fixed assets in the notes to these un-consolidated financial statements. If such asset is subsequently used by the Bank for its own operations, the asset, along with any related surplus, is transferred to operating fixed assets.
4.9.2 Surplus / deficit on revaluation of non banking assets
Revaluation of non-banking assets acquired in satisfaction of claims under DPS transactions is carried out under criteria given in regulations for DPS issued by SBP vide BPRD Circular 01 dated January 01, 2016 i.e. valuation of property shall be done on individual property basis and not on portfolio basis, whereas accounting treatment of revaluation is accounted for in accordance with applicable financial reporting standards i.e. International Accounting Standard (IAS) 16 as referred in note no. 4.7.2.
Furthermore, revaluation surplus on such assets shall not be admissible for calculating Bank’s Capital Adequacy Ratio and exposure limits under the Prudential Regulations. However, the surplus can be adjusted upon realization of sale proceeds.
4.10 Impairment other than investments and deferred tax
At each balance sheet date, the Bank reviews the carrying amounts of its assets (other than investment and deferred tax asset) to determine whether there is an indication that those assets have suffered an impairment loss. If any such indication exists, the recoverable amount of the assets is estimated in order to determine the extent of the impairment loss, if any. Recoverable amount is the higher of net selling price (being fair value less cost to sell) and value-in-use. If the recoverable amount of an asset is estimated to be less than its carrying amount, the carrying amount of the assets is reduced to its recoverable amount. Impairment losses are recognised as an expense in profit and loss account immediately.

126Annual Report 2020
Notes to the Unconsolidated Financial StatementsFor the year ended December 31, 2020
Where impairment loss subsequently reverses, the carrying amount of the asset is increased to the revised recoverable amount but limited to the extent of the amount which would have been determined had there been no impairment. Reversal of impairment loss is recognized as income.
4.11 Borrowings / Deposits and their cost
Borrowing / deposits are initially recorded at the amount of proceeds received. Borrowing / deposits are recognised as an expense in the period in which these are incurred.
4.12 Subordinated debt
Subordinated debt is recorded at the amount of proceeds received. Mark-up accrued on subordinated debt is recognised separately as part of other liabilities and is charged to the profit and loss account over the period on an accrual basis.
4.13 Taxation
4.13.1 Current
The charge for current taxation is based on taxable income at the current rate of taxation after taking into account applicable tax credit, rebates and exemptions available, if any, or minimum tax on turnover, whichever is higher. The charge for current tax also includes adjustments, where considered necessary, relating to prior years arising from assessments made during the year.
4.13.2 Deferred
Deferred tax is recognised using the balance sheet liability method on all temporary differences arising between tax bases of assets and liabilities and their carrying amounts appearing in the financial statements. Deferred tax liability is recognized on taxable temporary differences. Deferred tax asset is recognised for all deductible temporary differences and carry forward of unused tax losses, if any only to the extent that it is probable that future taxable profits will be available against which the asset can be utilised. Deferred tax assets are reduced to the extent that it is no longer probable that the related tax benefits will be realised.
Deferred tax is calculated at the rates that are expected to apply to the period when the differences are expected to reverse, based on tax rates that have been enacted or substantively enacted by the balance sheet date. Deferred tax is charged or credited to the profit and loss account.
Deferred tax, if any, on revaluation of investments is recognised as an adjustment to surplus / (deficit) arising on revaluation in accordance with the requirements of IAS-12 “Income Taxes”.
4.14 Provisions
Provisions are recognised when the Bank has a legal or constructive obligation as a result of past events, it is probable that an outflow of resources will be required to settle the obligation and a reliable estimate of the amount can be made. Provisions are reviewed at each balance sheet date and are adjusted to reflect the current best estimate.
Provision against identified non-funded losses is recognised when intimated and reasonable certainty exists for the Bank to settle the obligation. The loss is charged to profit and loss account net of expected recovery.

127 Annual Report 2020
Notes to the Unconsolidated Financial StatementsFor the year ended December 31, 2020
4.15 Staff retirement benefits
4.15.1 Defined contribution plan
The Bank has established a provident fund scheme for all permanent employees effective from January 01, 2007. Equal monthly contributions are made, both by the Bank and the employees, to the fund at the rate of 7.1 percent with effect from July 01, 2015 due to change in salary structure. Contribution by the Bank is charged to profit and loss account.
4.15.2 Defined benefit plan
The Bank operates an approved funded gratuity scheme covering all its eligible employees who have completed minimum qualifying period. An actuarial valuation of defined benefit scheme is conducted at the end of every year or on occurrence of any significant change. The most recent valuation in this regard was carried out as at December 31, 2020, using the projected unit credit actuarial valuation method. Under this method cost of providing for gratuity is charged to profit and loss account so as to spread the cost over the service lives of the employees in accordance with the actuarial valuation. Past-service costs are recognised immediately in profit and loss account and actuarial gains and losses are recognised immediately in other comprehensive income.
4.16 Revenue recognition
Revenue is recognized to the extent that economic benefits will flow to the Bank and the revenue can be reliably measured. These are recognized as follows:
- Advances and investmentsMark-up income / interest / profit on performing advances and debt securities is recognized on a time proportion basis as per the terms of the contract.
Mark-up income / interest / profit on non-performing advances and debt securities is recognized on a receipt basis in accordance with the requirements of the Prudential Regulations issued by the State Bank of Pakistan.
Interest / returns / mark-up income/ profit on rescheduled / restructured advances and debt securities are recognised as permitted by the State Bank of Pakistan or by the regulatory authorities of the countries where the Bank operates, except where, in the opinion of the management, it would not be prudent to do so.
Premium or discount on acquisition of debt investments is capitalised and amortised through the profit and loss account over the remaining maturity of the debt security using the effective yield method.
- Lease financing
Financing method is used in accounting for income from lease financing. Under this method, the unearned lease income (defined as the excess of the sum of total lease rentals and estimated residual value over the cost of leased assets) is deferred and taken to income over the term of the lease period so as to produce a constant periodic rate of return on the outstanding net investment in lease.
Unrealised finance income in respect of non-performing lease finance is held in suspense account, where necessary, in accordance with the requirements of the Prudential Regulations issued by the SBP.
Gains / losses on termination of lease contracts, documentation charges, front-end fees and other lease income are recognized as income on receipt basis.

128Annual Report 2020
Notes to the Unconsolidated Financial StatementsFor the year ended December 31, 2020
- Non Mark-up / interest income
- Commission is recognised as income at the time of affecting the transaction to which it relates. Fees are recognised when earned.
- Financial advisory fee is recognised when the right to receive the fee is established.
- Dividend income from investments is recognised when the Bank’s right to receive the dividend is established.
4.17 Dividend and appropriation to reserves
Dividend and appropriation to reserves, except for statutory reserves, are recognised in the financial statements in the periods in which these are approved.
4.18 Foreign currencies
4.18.1 Functional and presentation currency
Items included in the financial statements are measured using the currency of the primary economic environment in which the Bank operates. The financial statements are presented in Pakistani Rupees, which is the Bank’s functional and presentation currency.
4.18.2 Transactions and balances
Transactions in foreign currencies are translated into Pakistani rupees at the exchange rates prevailing on the transaction date. Foreign exchange gains and losses resulting from the settlement of such transactions and from the translation at year-end exchange rates of monetary assets and liabilities denominated in foreign currencies are recognised in the profit and loss account.
Forward contracts relating to foreign currency deposits are valued at forward rates applicable to the respective maturities of the relevant foreign exchange contract. The forward cover received / paid on forward purchase contracts relating to foreign currency deposits are realised / charged directly to profit and loss account.
4.18.3 Foreign operations
Assets and liabilities of foreign operations are translated into rupees at the exchange rate prevailing at the reporting date. The results of foreign operations are translated at average rate of exchange for the year.
4.18.4 Translation gains and losses
Translation gains and losses arising on revaluations of net investment in foreign operations are taken to Exchange Translation Reserve in the statement of comprehensive income. These are recognised in the profit and loss account on disposal.
4.18.5 CommitmentsCommitments for outstanding forward foreign exchange contracts disclosed in these financial statements are translated at contracted rates. Contingent liabilities/commitments for letters of credit and letters of guarantee denominated in foreign currencies are expressed in rupee terms at the rates of exchange ruling on the balance sheet date.

129 Annual Report 2020
Notes to the Unconsolidated Financial StatementsFor the year ended December 31, 2020
4.19 Goodwill
Goodwill acquired in a business combination before July 01, 2009 is initially measured at cost, being the excess of the cost of the business combination over the Bank’s interest in the net fair value of the identifiable assets, liabilities and contingent liabilities acquired. Following initial recognition, goodwill is measured at cost less any accumulated impairment losses. Goodwill is reviewed for impairment, annually or more frequently if events or changes in circumstances indicate that the carrying value may be impaired.
For the purpose of impairment testing, goodwill acquired in a business combination is, from the acquisition date, allocated to each of the Bank’s cash-generating units, or groups of cash-generating units, that are expected to benefit from the synergies of the combination, irrespective of whether other assets or liabilities of the acquirer are assigned to those units or groups of units.
4.20 Earnings per share
The Bank presents basic and diluted earnings per share (EPS). Basic EPS is calculated by dividing the profit or loss attributable to ordinary equity holders of the Bank (less preferrence dividend, if any) by the weighted average number of ordinary shares outstanding during the period / year. Diluted EPS is determined by adjusting the profit or loss attributable to ordinary equity holders of the Bank by dividing the weighted average number of shares outstanding, for the effects of all dilutive potential ordinary shares, if any.
4.21 Non-current assets held for sale and associated liabilities
The Bank classifies an asset as held for sale if its carrying amount will be recovered principally through a sale transaction rather than through continuing use. For this to be the case, the asset must be available for immediate sale in its present condition subject only to terms that are usual and customary for sales of such assets and its sale must be highly probable. For the sale to be highly probable, the appropriate level of management must be committed to a plan to sell the asset (or disposal group), and an active programme to locate a buyer and complete the plan must have been initiated. Further, the asset must be actively marketed for sale at a price that is reasonable in relation to its current fair value. In addition, the sale should be expected to qualify for recognition as a completed sale within one year from the date of classification and actions required to complete the plan should indicate that it is unlikely that significant changes to the plan will be made or that the plan will be withdrawn. A held for sale asset is carried at the lower of its carrying amount and the fair value less costs to sell. Impairment losses are recognised in the unconsolidated profit and loss account for any initial or subsequent write down of the asset to fair value less costs to sell. Subsequent gains in fair value less costs to sell are recognised to the extent these do not exceed the cumulative impairment losses previously recorded. An asset is not depreciated while classified as held for sale.
4.22 Segment reporting
A segment is a distinguishable component of the Bank that is subject to risks and rewards that are different from those of other segments. A business segment is one that is engaged either in providing certain products or services, whereas a geographical segment is one engaged in providing certain products or services within a particular economic environment.
Segment information is presented as per the Bank’s functional structure and the guidance given under International Financial Reporting Standard (IFRS) 8. For management purposes, the Bank has been organised into five operating segments based on products and services, as follows:

130Annual Report 2020
Notes to the Unconsolidated Financial StatementsFor the year ended December 31, 2020
4.22.1 Business segments
Corporate financeThis includes investment banking activities such as mergers and acquisitions, underwriting, privatization, securitization, Initial Public Offers (IPOs), specialised financial advice and trading and secondary private placements.Trading and sales
This segment undertakes the Bank’s treasury, money market and capital market activities.
Retail banking
Retail banking provides services to small borrowers i.e. consumers, small and medium enterprises (SMEs) and agricultural sector. It includes loans, deposits and other transactions with retail customers.
Commercial banking
This includes loans, deposits and other transactions with corporate customers.
OthersThis includes the head office related activities and other functions which canot be classified in any of the above segments.
The Executive Management Committee (ManCom) monitors the operating results of its business units separately for the purpose of making decisions about resource allocation and performance assessment. Segment performance is evaluated based on operating profits or losses and is measured consistently with operating profits or losses in the unconsolidated financial statements. However, income taxes are managed on a group basis and are not allocated to operating segments.
Interest income is reported net as management primarily relies on net interest revenue as a performance measure, along with the gross income and expense.
Transfer prices between operating segments are based on the Bank’s internal pricing framework.
No revenue from transactions with a single external customer or counterparty amounted to 10% or more of the Bank’s total revenue in 2019 or 2020.
4.22.2 Geographical segment
The Bank operates with 307 (December 31, 2019: 359) branches / sub-branches in Pakistan region and one wholesale banking branch in Bahrain (December 31, 2019: one).
4.23 Fiduciary assets
Assets held in a fiduciary capacity are not treated as assets of the Bank in statement of financial position.
5. FINANCIAL RISK MANAGEMENT
The financial risk management objectives and policies adopted by the Bank are consistent with those disclosed in the unconsolidated financial statements for the year ended December 31, 2019 except for the following additional considerations due to the COVID-19.
5.1 COVID - 19 outbreak and it’s impactThe COVID-19 and the measures to reduce its spread has impacted the economy of Pakistan significantly. Regulators and governments across the globe have introduced fiscal and economic stimulus measures to mitigate its impact.

131 Annual Report 2020
Notes to the Unconsolidated Financial StatementsFor the year ended December 31, 2020
The State Bank of Pakistan (SBP) has responded to the crisis by cutting the policy rate by 625 basis points to 7 percent and by introducing regulatory measures to maintain banking system’s soundness and to sustain economic activity. These include:
(i) reducing the capital conservation buffer by 100 basis points to 1.5 percent;(ii) increasing the regulatory limit on extension of credit to SMEs by 125 million to Rs 180 million;(iii) relaxing the debt burden ratio for consumer loans from 50 percent to 60 percent(iv) allowing banks to defer clients’ payment of principal and profit on financing obligations by one year; and(v) relaxing regulatory criteria for restructured/rescheduled loans for borrowers who require relief beyond
the extension of principal repayment for one year.(vi) Relaxing credit requirements for exporters and importers; and (vii) Refinance schemes to support employment to prevent layoff of workers and health sector to combat
COVID-19 Pandemic.
COVID 19 has impacted the banks in Pakistan from various facets which includes increase in overall credit risk pertaining to loans and advances portfolio in certain sectors, reduced fee income due to slowdown in economic activity, operational issues such as operations of Branches, managing cyber security threat and managing investment banking activities including arrangement of syndicate loans, debt and capital advisory services etc. We have discussed below the major aspects of COVID 19 on the Bank’s risk management policies.
5.1.1 Assets quality and credit risk
The Risk department of the Bank is regularly conducting assessments to identify borrowers operating in various sectors which are most likely to get affected. The Bank has further strengthened its credit review procedures in the light of COVID-19. The Bank has conducted various stress tests on the Credit portfolio and is confident that the CAR buffer currently maintained is sufficient.
5.1.2 Liquidity management
Bank has received applications for deferral of principal and / or restructuring / rescheduling and is expected to receive further such applications. These applications are being reviewed by the Bank as per its established policies. The Asset and Liability Committee (ALCO) of the Bank is continuously monitoring the liquidity position and is taking due precautionary measures where needed. The Bank has conducted various stress testing on its liquidity ratios and is confident that the liquidity buffer currently maintained by the Bank is sufficient to cater any adverse movement in cash flow maturity profile.
5.1.3 Equity investments
SBP has given relaxation in recognition of impairment on equity securities in phased manner equally on quarterly basis during calendar year ending on December 31, 2020. The Bank has taken the impact of impairment on the basis of that relaxation in these unconsolidated financial statements.
5.1.4 Foreign Exchange Risks
Due to recent economic slowdown, the PKR has devalued against USD significantly from December 31, 2019 and the USD / PKR parity stood at Rs.159.8344 as at December 31, 2020. The exchange rate is expected to remain volatile till the uncertainty around COVID-19 resolves. The Bank has reviewed its Net Open Position and has had no significant impact on profitibility.
5.1.5 Operations
The Bank is closely monitoring the situation and has invoked required actions to ensure safety and security of Bank staff and an uninterrupted service to our customers. The senior management of the Bank is continuously monitoring the situation and is taking timely decisions to resolve any concerns. Business Continuity Plans (BCP)

132Annual Report 2020
Notes to the Unconsolidated Financial StatementsFor the year ended December 31, 2020
for respective areas are in place and tested. The Bank has significantly enhanced monitoring for all cyber security risk during these times from its information security protocols. The remote work capabilities were enabled for staff and related risk and control measures were assessed to make sure they are fully protected using virtual private network (“VPN”) connections. Further, the Bank has also ensured that its remote access systems are sufficiently resilient to any unwanted cyber attacks.
The Bank is communicating with its customers on how they can connect with the Bank through its full suite of channels including digital and online channels. The Bank has taken all measures to ensure that service levels are maintained, customer complaints are resolved as per SLAs and the Bank continues to meet the expectations of their clients as they would in a normal scenario.
5.1.6 Capital Adequacy Ratio
Under the current scenario, the banks are under pressure to extend further credit to its borrowers, while overall deteriorating credit risk and increased NPL may also put additional pressures on the Bank from Capital Adequacy Ratio perspective. The SBP has relaxed the Capital Conversion Buffer (CCB) requirements for the Banks to 1.5%, resulting in an overall CAR requirement of 11.5%. The reduced CCB has also provided an additional limit to the bank for its tier 2 capital. Further, the regulatory limit for retail loans has also increased by SBP to 180 million, which will now result in reduced Risk Weighted Assets for some of its loans. In addition to the measures by SBP, the Senior management of the Bank is continuously monitoring the impacts of various decisions on its CAR and taking further lending decisions based on the overall impacts on RWA. The Bank also believes that it has buffer in its CAR requirement to meet any adverse movements in credit, market or operational risks.
2020 2019Note ----- Rupees in ‘000 -----
6. CASH AND BALANCES WITH TREASURY BANKS
In handLocal currency 6,337,089 5,572,604 Foreign currencies 1,301,503 896,523
7,638,592 6,469,127
With State Bank of Pakistan in:Local currency current account 6.1 16,268,165 13,292,331 Foreign currency current account - non remunerative 6.2 1,086,874 831,532 Foreign currency deposit account - remunerative 6.3 2,261,337 2,566,714
19,616,376 16,690,577 With National Bank of Pakistan in:Local currency current accounts 2,609,635 2,286,205
National Prize Bonds 556,628 143,440
30,421,231 25,589,349
6.1 These include local currency current accounts maintained with SBP as per the requirements of Section 22 of the Banking Companies Ordinance, 1962.
6.2 As per BSD Circular No. 9 dated December 03, 2007, cash reserve of 5% is required to be maintained with the State Bank of Pakistan in deposits held under the New Foreign Currency Accounts Scheme (FE-25 deposits).
6.3 This represents deposit accounts maintained with SBP under the requirements of BSD Circular No. 14 dated June 21, 2008 and mandatory reserve maintained to facilitate collection and settlement of foreign currency accounts under FE-25, as prescribed by the SBP, carrying a mark-up rate 0% (2019: 0.70%) as per specific circular issued by SBP at year end.

133 Annual Report 2020
Notes to the Unconsolidated Financial StatementsFor the year ended December 31, 2020
2020 2019Note ----- Rupees in ‘000 -----
7. BALANCES WITH OTHER BANKS
In PakistanIn current accounts 125,677 143,754 In deposit accounts 73 67
125,750 143,821 Outside PakistanIn current accounts 7.1 980,669 319,083
1,106,419 462,904 Less: General provision under IFRS 9 7.2 (450) (68)
Balances with other banks - net of provision 1,105,969 462,836
7.1 This includes amount held in Automated Investment Plans. The Bank is entitled to earn interest from the correspondent banks at agreed upon rates when the balance exceeds a specified amount which comes 0% per annum (2019: 1.05% per annum).
7.2 This represents general provision held under IFRS 9 by Bahrain branch of the Bank.
2020 2019Note ----- Rupees in ‘000 -----
8. LENDINGS TO FINANCIAL INSTITUTIONS
Call money lendings 8.2 2,237,682 283,887 Repurchase agreement lendings (Reverse Repo) 8.3 21,003,215 30,037,915
23,240,897 30,321,802
Less: General provision under IFRS 9 8.4 (1,225) (1,262)
Lending to Financial Institutions - net of provision 23,239,672 30,320,540
8.1 Particulars of lendings - gross
In local currency 21,003,215 30,037,915 In foreign currencies 2,237,682 283,887
23,240,897 30,321,802
8.2 These represent unsecured call money lendings to financial institutions carrying interest at the rates ranging from 1% to 1.1% (2019: 2.50% to 4.52%) per annum. These will mature between January 11, 2021 and January 28, 2021 (2019: January 30, 2020 and September 22, 2020).
8.3 These are secured short-term lendings to various financial institutions, carrying mark-up rate from 6.75% to 7.40% (2019: 12.00% to 13.60%) per annum. These are collateralized by Market Treasury Bills and Pakistan Investment Bonds as shown in note 8.3.1 below.

134Annual Report 2020
Notes to the Unconsolidated Financial StatementsFor the year ended December 31, 2020
8.3.1 Market value of securities held as collateral against Lending to financial institutions
2020 2019Further Further
Held by given as Held by given as bank collateral Total bank collateral Total
--------------------------------------------- Rupees in ‘000 ---------------------------------------------
Market Treasury Bills - - - 24,252,002 - 24,252,002 Pakistan Investment Bonds 21,160,868 - 21,160,868 2,081,639 3,673,117 5,754,756
21,160,868 - 21,160,868 26,333,641 3,673,117 30,006,758
8.4 This represents general provision held under IFRS 9 by Bahrain branch of the Bank.
2020 2019
Cost / Amortised
cost
Provision for diminution
Surplus / (Deficit)
Carrying Value
Cost / Amortised
cost
Provision for diminution
Surplus / (Deficit) Carrying Value
9. INVESTMENTS -------------------------------------------------------------- Rupees in ‘000 ----------------------------------------------------------------
9.1 Investments by type
Held-for-trading securitiesFederal Government Securities 25,002,969 - 805 25,003,774 55,601,087 - (2,618) 55,598,469
Available-for-sale securitiesFederal Government Securities 127,308,516 - 97,527 127,406,043 47,828,618 - (809,244) 47,019,374 Shares 2,995,123 (411,955) 1,692,166 4,275,334 2,092,667 (136,589) 20,675 1,976,753 Non Government Debt Securities 3,020,950 (370,051) (1,142) 2,649,757 3,367,738 (370,051) (6,461) 2,991,226 Foreign Securities 4,079,070 (122,758) 136,466 4,092,778 2,406 - - 2,406
137,403,659 (904,764) 1,925,017 138,423,912 53,291,429 (506,640) (795,030) 51,989,759 Held-to-maturity securitiesFederal Government Securities 36,109,599 - - 36,109,599 32,859,882 - - 32,859,882
Associates 242,067 - - 242,067 201,239 - - 201,239
Subsidiaries 1,919,121 - - 1,919,121 1,919,121 - - 1,919,121
Total Investments 200,677,415 (904,764) 1,925,822 201,698,473 143,872,758 (506,640) (797,648) 142,568,470
9.1.1 Investments include certain approved / government securities which are held by the Bank to comply with the Statutory Liquidity Requirement determined on the basis of the Bank’s demand and time liabilities as set out under section 29 of the Banking Companies Ordinance, 1962.

135 Annual Report 2020
Notes to the Unconsolidated Financial StatementsFor the year ended December 31, 2020
2020 2019 Cost /
Amortised cost
Provision for diminution
Surplus / (Deficit)
Carrying Value
Cost / Amortised
cost
Provision for diminution
Surplus / (Deficit) Carrying Value
Note
9.2 Investments by segments: ------------------------------------------------------------ Rupees in ‘000 --------------------------------------------------------------
Held-for-trading securitiesFederal Government Securities
Market Treasury Bills 9.4.1 25,002,969 - 805 25,003,774 55,601,087 - (2,618) 55,598,469 Pakistan Investment Bonds 9.4.1 - - - - - - - -
25,002,969 - 805 25,003,774 55,601,087 - (2,618) 55,598,469
Available-for-sale securities
Federal Government Securities:Market Treasury Bills 9.5.1 90,027,949 - 20,041 90,047,990 12,071,266 - (364) 12,070,902 Pakistan Investment Bonds 9.5.1 37,280,567 - 77,486 37,358,053 35,757,352 - (808,880) 34,948,472
127,308,516 - 97,527 127,406,043 47,828,618 - (809,244) 47,019,374
Shares:Listed CompaniesOrdinary shares 9.5.2 2,847,534 (275,366) 1,692,166 4,264,334 1,945,078 - 20,675 1,965,753 Preference shares 9.5.2 136,589 (136,589) - - 136,589 (136,589) - - Unlisted CompaniesOrdinary shares 9.5.2.3 11,000 - - 11,000 11,000 - - 11,000
2,995,123 (411,955) 1,692,166 4,275,334 2,092,667 (136,589) 20,675 1,976,753 Non Government Debt Securities Listed Term Finance Certificates 9.5.3.1 305,182 (155,169) (13) 150,000 305,183 (155,169) (14) 150,000 Sukuk Certificates 9.5.3.2 308,583 - (1,129) 307,454 396,750 - (6,447) 390,303 UnlistedTerm Finance Certificates 9.5.3.3 1,014,348 (214,882) - 799,466 1,179,739 (214,882) - 964,857 Sukuk Certificates 9.5.3.3 1,365,104 - - 1,365,104 1,458,333 - - 1,458,333 Preference shares 9.5.3.4 27,733 - - 27,733 27,733 - - 27,733
3,020,950 (370,051) (1,142) 2,649,757 3,367,738 (370,051) (6,461) 2,991,226
Foreign SecuritiesGovernment Debt Securities * 9.5.4.1 3,633,601 (120,619) 130,420 3,643,402 - - - - Non Government Debt Securities * 9.5.4.2 379,654 (2,139) (3,628) 373,887 - - - - Ordinary shares 9.5.2 65,815 - 9,674 75,489 2,406 - - 2,406
4,079,070 (122,758) 136,466 4,092,778 2,406 - - 2,406 Held-to-maturity securities
Federal Government Securities:Pakistan Investment Bonds 9.6.1 36,109,599 - - 36,109,599 32,859,882 - - 32,859,882
Associates
Omar Jibran Engineering Industries Limited 9.7 180,000 - - 180,000 180,000 - - 180,000 Veda Transit Solutions (Private) Limited 9.7 41,800 - - 41,800 972 - - 972 Intercity Touring Company (Private) Limited 9.7 20,267 - - 20,267 20,267 - - 20,267
242,067 - - 242,067 201,239 - - 201,239
SubsidiariesJS Global Capital Limited 9.7 1,357,929 - - 1,357,929 1,357,929 - - 1,357,929 JS Investments Limited 9.7 561,192 - - 561,192 561,192 - - 561,192
1,919,121 - - 1,919,121 1,919,121 - - 1,919,121
Total Investments 200,677,415 (904,764) 1,925,822 201,698,473 143,872,758 (506,640) (797,648) 142,568,470
* Provision for diminution against foreign debt securities represents expected credit loss provisioning under IFRS 9 on portfolio pertaining to Bahrain Branch.

136Annual Report 2020
Notes to the Unconsolidated Financial StatementsFor the year ended December 31, 2020
2020 2019Cost Market value Cost Market value
--------------------------- Rupees in ‘000 -------------------------- 9.2.1 Investments given as collateral
Held-for-trading securities
Federal Government SecuritiesMarket Treasury Bills 4,864,464 4,864,680 - -
Available-for-sale securities
Federal Government SecuritiesMarket Treasury Bills 4,902,054 4,902,811 4,453,165 4,452,597 Pakistan Investment Bonds - - 22,232,264 21,475,720
4,902,054 4,902,811 26,685,429 25,928,317
9,766,518 9,767,491 26,685,429 25,928,317
2020 2019 Note ----- Rupees in ‘000 -----
9.3 Provision for diminution in value of investments
Opening balance 506,640 851,940
Charge during the year 276,202 251,675 Reversal during the year (836) (596,975)Charge/ (reversal) during the year 32 275,366 (345,300)Impairment under IFRS 9 in Bahrain branch 122,758 -
Closing Balance 904,764 506,640
9.3.1 Particulars of provision against debt securities
2020 2019Category of classification NPI Provision NPI Provision
--------------------------- Rupees in ‘000 --------------------------
DomesticOther assets especially mentioned - - - - Substandard - - - - Doubtful - - - - Loss 370,051 370,051 370,051 370,051
370,051 370,051 370,051 370,051

137 Annual Report 2020
9.4 Quality of Held-for-Trading Securities
Details regarding quality of Held-for-Trading (HFT) securities are as follows:
2020 2019Cost Market value Cost Market value
9.4.1 Federal Government SecuritiesGovernment guaranteed Note --------------------------- Rupees in ‘000 --------------------------
Market Treasury Bills 9.4.1.1 25,002,969 25,003,774 55,601,087 55,598,469
9.4.1.1 Principal terms of investment in Federal Government Securities
Name of investment Note Maturity Redemption Coupon
Market treasury bills 9.4.1.2 January 14, 2021 to January 28, 2021 On maturity On maturity
9.4.1.2 Market Treasury Bills are for the period of three to twelve months. The effective rates of profit on Market Treasury Bills range from 7.07% to 7.12% per annum (2019: 13.04% to 13.70% per annum).
9.5 Quality of Available-for-Sale Securities
Details regarding quality of Available-for-Sale (AFS) securities are as follows:
2020 2019Cost Market value Cost Market value
9.5.1 Federal Government SecuritiesGovernment guaranteed
Note --------------------------- Rupees in ‘000 ---------------------------
Market Treasury Bills 90,027,949 90,047,990 12,071,266 12,070,902 Pakistan Investment Bonds 37,280,567 37,358,053 35,757,352 34,948,472
8.5.1.1 127,308,516 127,406,043 47,828,618 47,019,374
9.5.1.1 Principal terms of investment in Federal Government Securities
Name of investment Note Maturity Redemption Coupon
Market treasury bills 9.5.1.2 January 14, 2021 to June 03, 2021 On maturity On maturityPakistan investment bonds 9.5.1.3 April 21, 2021 to September 19, 2029 On maturity Half yearly
9.5.1.2 Market Treasury Bills are for the period of three to twelve months. The effective rates of profit on Market Treasury Bills range from 6.90% to 11.77% per annum (2019: 13.02% to 13.75% per annum).
9.5.1.3 Pakistan Investment Bonds (PIBs) are for the period of three to twenty years. The rates of profit ranging from 7% to 12% per annum (2019: 6.40% to 14.27% per annum).
Notes to the Unconsolidated Financial StatementsFor the year ended December 31, 2020

138Annual Report 2020
Notes to the Unconsolidated Financial StatementsFor the year ended December 31, 2020
Rating Industry Sector Shares Cost Market value Cost Market value2020 2019 2020 2019
9.5.2 Shares ------- Number ------- ------------------------ Rupees in ‘000 ------------------------
Listed Companies
Ordinary sharesMatco Foods Limited A- Food & Personal Care Products - 1,078,500 - - 31,795 27,707 Shifa International Hospitals AA- Miscellaneous 264,300 264,300 68,273 52,857 68,273 88,509 Pakistan Petroleum Limited Unrated Oil & Gas Marketing Companies 841,800 949,800 123,382 76,041 139,212 130,256 National Foods Limited - Food & Personal Care Products - 742,968 - - 153,492 164,946
Investment in related partiesEFU General Insurance Limited AA+ Insurance 5,455,675 5,440,575 647,129 654,681 645,414 600,095 EFU Life Assurance Limited AA+ Insurance 1,189,600 1,189,600 250,735 248,650 250,735 275,476 Sitara Chemical Industries Limited A+ Chemical 1,790,250 1,790,250 548,781 554,978 548,781 534,318 TRG Pakistan Limited Unrated Technology & Communication 24,583,760 5,883,760 566,875 2,247,202 107,376 144,446 Hum Network Limited A+ Technology & Communication 79,030,303 - 642,359 429,925 - -
2,847,534 4,264,334 1,945,078 1,965,753
Foreign securitiesDeutche Post AG A3 Logistics 8,100 - 56,525 64,706 - - Microsoft Corporation Limited AAA Technology & Communication 220 - 6,884 8,377 - -
63,409 73,083 - - -
Preference SharesAgritech Limited (note 9.5.2.1 & 9.5.2.3) Unrated Chemical 4,823,746 4,823,746 48,236 - 48,236 - Chenab Limited (note 9.5.2.2 & 9.5.2.3) Unrated Textile Composite 12,357,000 12,357,000 88,353 - 88,353 -
136,589 - 136,589 -
Break-up value per share
Name of Chief Executive / Managing Director Shares Cost Breakup
value Cost Breakup value
Unlisted Companies 2020 2019 2020 2019 2020 2019------- Rupee ------- ------- Number ------- ------------------ Rupees in ‘000 ------------------
Ordinary shares- ISE Towers REIT Management Limited
(formerly Islamabad StockExchange Limited) (note 9.5.2.4) * 15.45 14.49 Mr. Sagheer Mushtaq 1,213,841 1,213,841 11,000 18,754 11,000 17,592
Foreign securities
Ordinary shares- Society for Worldwide Interbank **786,254 638,551 Mr. Javier Pervez Tasso 6 6 2,406 4,718 2,406 3,831
Financial Telecommunication(SWIFT) (note 9.5.2.5)
* Based on audited accounts as of June 30, 2020** Based on audited accounts as of December 31, 2019

139 Annual Report 2020
Notes to the Unconsolidated Financial StatementsFor the year ended December 31, 2020
9.5.2.1 These are non-voting cumulative preference shares, carrying preference dividend @ 10% p.a and are convertible into ordinary shares at the option of the Bank after five years from the date of issuance i.e. February 2012. The investee company also has the option to redeem these preference shares plus any unpaid dividend in full or in part, within ninety days after expiry of each anniversary of the issue date. The Bank has recognised full impairment on these shares amounting to Rs. 48.236 million (2019: Rs. 48.236 million) due to weak financial position of the company.
9.5.2.2 These are cumulative preference shares, carrying preference dividend @ 9.25% p.a and are redeemable in part after four years from the date of issuance i.e. August 2008. The investee company also has an option to redeem, in part, cumulative preference shares after August 2008. The Bank has recognized full impairment on these shares amounting to Rs. 88.353 million (2019: Rs. 88.353 million) due to weak financial position of the company.
9.5.2.3 Surplus arising due to re-measurement of these shares to the market value has not been recognized as the management believes that the market value may not be realized while selling them in open market.
9.5.2.4 In accordance with the requirements of the Stock Exchanges (Corporatization, Demutualization and Integration) Act, 2012 (the Act), the Bank has received 3,034,603 shares of Rs.10 each including trading right entitlement certificate (TREC) of the Islamabad Stock Exchange (ISE), in lieu of its Membership Card held by the Bank. Further, upon integration of Islamabad Stock Exchange under the “ISE Scheme of Integration” in 2016 TRE Certificates holders of ISE have been issued 1,213,841 shares of “ISE Towers REIT Management Limited”.
9.5.2.5 The Bank qualified as a member based on the financial contribution to SWIFT for network-based services. The Bank has made an investment as per the requirements of By-Laws of SWIFT, under the Share Re-allocation Process, as a result becoming entitled to invest in for six shares. The participation is mandatory to avail the desired network-based services for financial message transmission for cross-border payments and receipt. Further, the share re-allocation occurs every three years and will result in either an increase, decrease, or a status quo in individual shareholding.
Cost2020 2019
----- Rupees in ‘000 ----- 9.5.3 Non Government Debt Securities / Preference Shares (Debt Securities)
ListedUnrated 155,169 155,169 A 150,013 150,014 AAA 308,583 396,750
613,765 701,933 UnlistedAAA 71,429 142,857 AA+, AA, AA- 200,037 - A+, A, A- 1,749,104 1,992,333 Unrated 386,615 530,615
2,407,185 2,665,805
3,020,950 3,367,738

140Annual Report 2020
Notes to the Unconsolidated Financial StatementsFor the year ended December 31, 2020
Certificates Rating 2020 2019
2020 2019 2020 2019 Cost Market value Cost Market
value9.5.3.1 Term finance certificates - listed * ---- Numbers ---- ---------------- Rupees in ‘000 ----------------
Worldcall Telecom Limited (note 9.5.3.1.2) 90,650 90,650 Unrated Unrated 155,169 - 155,169 - Soneri Bank Limited 30,000 30,000 A A 150,013 150,000 150,014 150,000
305,182 150,000 305,183 150,000
* Secured and have a face value of Rs.5,000 each unless specified otherwise.
9.5.3.1.1 Other particulars of listed term finance certificates are as follows:
Name of the company Note Repayment frequency Profit rate per annum Maturity date
Worldcall Telecom Limited 9.5.3.1.2 Semi-annually 6 Month KIBOR ask rate plus 1.60% September 20, 2026Soneri Bank Limited Semi-annually 6 Month KIBOR ask rate plus 2.00%. December 06, 2028
9.5.3.1.2 Due to weak financial position of the company the Bank has recognised full impairment loss on these term finance certificates.
Certificates Rating 2020 2019
2020 2019 2020 2019 Cost Market value Cost Market
value---- Numbers ---- -------------- Rupees in ‘000 --------------
9.5.3.2 Sukuk certificates - listed
Byco Petroleum Pakistan Limited 5,290 5,290 AAA AAA 308,583 307,454 396,750 390,303
308,583 307,454 396,750 390,303
9.5.3.2.1 Unlisted sukuk certificates are as follows:
Name of the company Repayment frequency Profit rate per annum Maturity date
Byco Petroleum Pakistan Limited Quarterly3 Month KIBOR
ask rate plus 1.05%.
January 18, 2022
(Chief Executive: Mr. Amir Abbassciy)
Certificate Rating Face value per certificate Cost2020 2019 2020 2019 2020 2019
9.5.3.3 Term finance certificates - unlisted ----- Numbers ----- ----- Rupees ----- ---- Rupees in ‘000 ----
Azgard Nine Limited - related party (note 9.5.3.3.1) 29,998 29,998 Unrated Unrated 5,000 65,022 65,022 Agritech Limited (note 9.5.3.3.1) 30,000 30,000 Unrated Unrated 5,000 149,860 149,860 Pakistan Water & Power Development Authority (WAPDA) 100,000 100,000 AAA AAA 5,000 71,429 142,857 Khushhali Microfinance Bank Limited - 1,500 - A 100,000 - 150,000 Airlink Communication Private Limited 384 384 A- A- 1,000,000 384,000 384,000 Secure Logistics Group Private Limited 288 288 Unrated Unrated 1,000,000 144,000 288,000 Bank Al Habib Limited 40,000 - AA- - 5,000 200,037 -
1,014,348 1,179,739

141 Annual Report 2020
Notes to the Unconsolidated Financial StatementsFor the year ended December 31, 2020
9.5.3.3.1 Due to weak financial position of the company the Bank has recognised full impairment loss on these term finance certificates.
9.5.3.3.2 Other particulars of unlisted term finance certificates are as follows:
Name of the company Repayment frequency Profit rate per annum Maturity date
Azgard Nine Limited - related party(Chief Executive: Mr. Ahmed H. Shaikh) Semi-annually 6 Month KIBOR ask rate plus 1.75%. December 04, 2017
Agritech Limited(Chief Executive: Mr. Faisal Muzammil) Semi-annually 6 Month KIBOR ask rate plus 1.75%. November 29, 2019
Pakistan Water & Power Development Authority (WAPDA)(Chairman: Lieutenant General Muzammil Hussain (Retd.)) Semi-annually 6 Month KIBOR ask rate plus 1.00%. September 27, 2021
Airlink Communication Private Limited(President & CEO: Mr. Muzaffar Hayat Piracha) Quarterly 3 Month KIBOR ask rate plus 1.00%. January 7, 2022
Secure Logistics Group Private Limited (see note 9.5.3.3.2.1)(President & CEO: Mr. Gulraiz A. Khan) Quarterly 3 Month KIBOR ask rate minus 1.00%. January 2, 2024
Bank Al Habib Limited(President & CEO: Mr. Mansoor Ali Khan ) Semi-annually 3 Month KIBOR ask rate plus 1.50%. December 20, 2027
9.5.3.3.2.1 During the year, the borrower has taken the deferment of payment as per the guidelines of SBP circular letter No. 13 dated March 26, 2020.
Certificates Rating Face value per certificate Cost
Note 2020 2019 2020 2019 2020 2019 2020 20199.5.3.3 Sukuk certificates - unlisted --------- Numbers --------- --------- Rupees --------- ---- Rupees in ‘000 ----
Ghani Gases Limited 9.5.3.3.2.1 2,000 2,000 A A- 87,500 100,000 108,333 Pakistan Services Limited 9.5.3.3.2.1 1,350 1,350 A A 90,000 1,265,104 1,350,000
1,365,104 1,458,333
9.5.3.3.1 Other particulars of unlisted sukuk certificates are as follows:
Name of the company Repayment frequency Profit rate per annum Maturity date
Ghani Gases Limited(Chief Executive: Mr. Atique Ahmad Khan) Quarterly 3 Month KIBOR ask rate plus 1.00%. February 03, 2023
Pakistan Services Limited(Chief Executive: Mr. Murtaza Hashwani) Semi-annually 6 Month KIBOR ask rate plus 1.00%. January 17, 2024
Certificates Rating Face value per certificate Cost2020 2019 2020 2019 2020 2019 2020 2019
9.5.3.4 Preference shares - unlisted --------- Numbers --------- ------------------ Rupees in ‘000 ------------------
Intercity Touring Company Private Limited 1,848,888 1,848,888 - - 100,000 100,000 27,733 27,733 (associated company)

142Annual Report 2020
Notes to the Unconsolidated Financial StatementsFor the year ended December 31, 2020
9.5.4 Foreign Securities
Name of Bond Rating Coupon rate per annum
Date of Maturity 2020 2019
2020 % Cost Market Value Cost Market
Value--------------- Rupees in ‘000 ---------------
9.5.4.1 Government debt securities
The Third Pakistan International Sukuk Co Ltd B- 5.50% October 13, 2021 159,186 161,516 - - The Third Pakistan International Sukuk Co Ltd B- 5.63% December 5, 2022 163,296 163,443 - - Islamic Republic Of Pakistan B- 6.88% December 5, 2027 508,091 498,909 - - Oman Government International Bond Ba3 6.00% August 1, 2029 419,735 411,374 - - Republic of Turkey B+ 4.88% October 9, 2026 158,289 161,350 - - Republic of Turkey B+ 6.13% October 24, 2028 313,692 340,588 - - Republic of Turkey B+ 7.63% April 26, 2029 90,973 92,129 - - Arab Republic of Egypt B 6.59% February 21, 2028 510,058 525,769 - - Arab Republic of Egypt B 7.60% March 1, 2029 350,286 366,718 - - Republic of Kenya B+ 7.25% February 28, 2028 257,393 268,347 - - Republic of Nigeria B2 6.50% November 28, 2027 248,288 257,666 - - Oman Government International Bond Ba3 5.63% January 17, 2028 243,815 244,036 - - Republic of Srilanka Caa1 5.75% April 18, 2023 210,499 151,557 - -
3,633,601 3,643,402 - -
9.5.4.2 Non Government debt securities
Bank of Ireland Ba2 - 6.00% March 1, 2026 39,828 42,502 - - Petroleos Mexicanos Ba2 - 6.84% October 23, 2029 339,826 331,385
379,654 373,887 - -
9.6 Quality of Held to Maturity Securities
Details regarding quality of Held to Maturity (HTM) securities are as follows
Cost2020 2019
9.6.1 Federal Government Securities - Government guaranteed ---- Rupees in ‘000 ----
Pakistan Investment Bonds 36,109,599 32,859,882
9.6.1.1 Principal terms of investment in Federal Government Securities
Security type Maturity Redemption Coupon
Pakistan investment bonds April 21, 2021 to August 22, 2029 On maturity Half yearly
9.6.1.2 Pakistan Investment Bonds (PIBs) having maturity of five to fifteen years. The rates of profits ranging from 7.75% to 12% per annum (2019: 7.75% to 14.69% per annum). The market value of securities as at December 31, 2020 amounted Rs. 35,862.699 million (2019: Rs. 31,341.410 million).

143 Annual Report 2020
Notes to the Unconsolidated Financial StatementsFor the year ended December 31, 2020
9.7 Investment in subsidiary and associated companies
Shares Percentage holding CostNote 2020 2019 2020 2019 2020 2019
-------- Numbers -------- ------ Rupees in ‘000 ------Subsidiary companiesJS Global Capital Limited 9.7.1 25,525,169 25,525,169 83.53% 83.53% 1,357,929 1,357,929 JS Investments Limited 9.7.2 & 9.7.3 52,236,978 52,236,978 84.56% 84.56% 561,192 561,192
1,919,121 1,919,121 Associated company - unlisted companiesOmar Jibran Engineering
Industries Limited 9.7.4 7,200,000 7,200,000 9.60% 9.60% 180,000 180,000 Veda Transit Solutions
Private Limited 9.7.4 & 9.7.4.1 2,064,187 48,000 9.12% 8.00% 41,800 972 Intercity Touring Company
Private Limited 9.7.4 1,351,111 1,351,111 9.12% 9.12% 20,267 20,267 242,067 201,239
9.7.1 The Bank acquired effective controlling interest in JS Global Capital Limited (JSGCL) on December 21, 2011,
April 15, 2016 and October 01, 2019 of 51.05%, 16.11% and 16.37% respectively. The ownership interest has increased by 32.42%, without any change in the cost of investment, due to the fact that JSGCL has bought back its 11,993,000 shares in April 15, 2016 and 7,450,000 shares in October 02, 2019.
9.7.2 The Bank acquired effective controlling interest in JS Investments Limited (JSIL) on November 01, 2012, December 22, 2015 and August 31, 2019 of 52.24%,12.92% and 19.40% respectively. The ownership interest has increased by 32.32% without any change in the cost of investment, due to the fact that JSIL has bought back its 19,828,182 shares in December 22, 2015 and 18,397,562 shares in August 31, 2019.
9.7.3 The Bank also controls JS ABAMCO Commodities Limited (JSACL) indirectly through its subsidiary JS Investments Limited which has 100% holding in JSACL.
9.7.4 The investments classified as asscociate on account of it’s significant influence over the investee company.
9.7.4.1 During the year, Veda Transit Solutions Private Limited, an associate of the Bank, has issued shares against advance subscription of Rs. 40.828 million made by the Bank. Resultantly, shareholding of the Bank increased to 9.12% (2019: 8%). The Bank has classified the investment as associate on account of it’s significant influence over the investee company.
9.7.5 All subsidiaries and associated companies are incorporated in Pakistan.
9.7.6 The following is summarised audited financial information before inter-company eliminations with other companies in the group.

144Annual Report 2020
Notes to the Unconsolidated Financial StatementsFor the year ended December 31, 2020
Subsidiary companiesJS Global Capital Limited JS Investments Limited
December 31, December 31, December 31, December 31,2020 2019 2020 2019
-------------------------- Rupees’ in 000 --------------------------
Total income / sales 727,409 718,541 348,467 408,539 Profit / (loss) after tax 206,954 47,248 (39,801) (86,645)Other comprehensive (loss) / income 5,932 (2,649) - -
Total assets 5,390,731 4,091,855 2,305,289 2,562,025 Total liabilities 2,944,292 1,858,302 530,302 747,237 Net assets 2,446,439 2,233,553 1,774,987 1,814,788
Cash flow from / (used in) operating activities 798,327 (308,598) (18,808) (158,745)Cash flow (used in) / from investing activities (471,364) 427,747 324,209 522,027 Cash flow from / (used in) financing activities 91,523 (487,693) (309,407) (372,856)Net increase / (decrease) in cash and cash equivalents 418,486 (368,544) (4,006) (9,574)
Rating AA AA AM2 AM2
Associated companies
Omar Jibran Engineering Industries Limited
Veda Transit Solutions Private Limited
Intercity Touring Company Private Limited
June 30, June 30, June 30, June 30, June 30, June 30,2020 2019 2020 2019 2020 2019
------------------------------- Rupees’ in 000 -------------------------------
Total income / sales 1,950,375 2,628,975 785,016 922,200 3,796 290 (Loss) / profit after tax (137,700) 117,796 19,797 47,436 (38,961) (21,636)Other comprehensive income 7,560 343,881 - - - -
Total assets 3,752,367 3,727,961 609,304 688,142 404,028 191,414 Total liabilities 2,043,290 1,888,745 429,690 743,324 302,129 50,879 Net assets 1,709,077 1,839,216 179,614 (55,182) 101,899 140,535
Cash flow from / (used in) operating activities 108,972 (73,759) 85,040 152,254 (2,105) (62,405)Cash flow (used in) / from investing activities (75,100) (233,038) (10,237) (189) - (141,183)Cash flow (used in) / from financing activities (39,955) 212,791 (54,777) (137,300) - 219,994 Net increase / (decrease)
in cash and cash equivalents (6,083) (94,006) 20,026 14,765 (2,105) 16,406

145 Annual Report 2020
Notes to the Unconsolidated Financial StatementsFor the year ended December 31, 2020
Performing Non Performing Total 2020 2019 2020 2019 2020 2019
10. ADVANCES Note ----------------------------------------------- Rupees in ‘000 -----------------------------------------------
Loans, cash credits, running finances, etc. 10.1 231,066,384 224,986,858 11,733,555 10,353,164 242,799,939 235,340,022 Bills discounted and purchased 11,602,390 11,113,114 - - 11,602,390 11,113,114 Advances - gross 242,668,774 236,099,972 11,733,555 10,353,164 254,402,329 246,453,136
Provision against advancesGeneral - (161,166) - - - (161,166)General provision - under IFRS-9 10.4.4 (21,327) (7,520) - - (21,327) (7,520)Specific - - (4,181,836) (3,339,941) (4,181,836) (3,339,941)
10.4 (21,327) (168,686) (4,181,836) (3,339,941) (4,203,163) (3,508,627)
Advances - net of provision 242,647,447 235,931,286 7,551,719 7,013,223 250,199,166 242,944,509
2020 2019
Not later than
one year
Later than one and less
than five years
Over fiveyears Total Not later than
one year
Later than one and less than
five years
Over fiveyears Total
----------------------------------------------------------- Rupees in ‘000 -----------------------------------------------------------10.1 Particulars of net investment in finance lease
Lease rentals receivable 4,923,114 5,173,453 2,318 10,098,885 6,860,218 6,637,949 3,527 13,501,694 Guaranteed residual value 1,008,381 2,449,909 2,248 3,460,538 1,599,605 2,538,848 10,783 4,149,236 Minimum lease payments 5,931,495 7,623,362 4,566 13,559,423 8,459,823 9,176,797 14,310 17,650,930
Finance charges for future periods (991,822) (1,286,416) (1,443) (2,279,681) (1,468,867) (1,098,697) (259) (2,567,823)
Present value of minimum lease payments 4,939,673 6,336,946 3,123 11,279,742 6,990,956 8,078,100 14,051 15,083,107
2020 201910.2 Particulars of advances (gross) ----- Rupees in ‘000 -----
In local currency 245,005,622 237,733,122 In foreign currencies 9,396,707 8,720,014
254,402,329 246,453,136
10.3 Advances include Rs. 11,733.555 million (2019: Rs. 10,353.164 million) which have been placed under non-performing status as detailed below:
2020 2019Non
Performing Loans
ProvisionNon
Performing Loans
Provision
Category of Classification ---------------------- Rupees in ‘000 ----------------------
DomesticOther Assets Especially Mentioned 296,799 394 841,058 1,721 Substandard 1,177,804 156,095 1,159,072 64,681 Doubtful 3,264,335 724,426 2,442,270 426,283 Loss 6,994,617 3,300,921 5,910,764 2,847,256 Total 11,733,555 4,181,836 10,353,164 3,339,941

146Annual Report 2020
Notes to the Unconsolidated Financial StatementsFor the year ended December 31, 2020
10.4 Particulars of provision against advances
2020 2019
Specific GeneralGeneral
provision - under IFRS-9
Total Specific GeneralGeneral
provision - under IFRS-9
Total
Note ------------------------------------------------------------- Rupees in ‘000 -------------------------------------------------------------
Opening balance 3,339,941 161,166 7,520 3,508,627 2,989,888 155,661 10,746 3,156,295 Exchange adjustments - - 71 71 - - 1,095 1,095
Charge for the year 1,087,212 - 13,736 1,100,948 880,994 5,505 - 886,499 Reversals 10.4.1 (245,317) (161,166) - (406,483) (526,146) - (4,321) (530,467)
841,895 (161,166) 13,736 694,465 354,848 5,505 (4,321) 356,032
Amounts written off 10.5 - - - - (4,795) - - (4,795)
Closing balance 4,181,836 - 21,327 4,203,163 3,339,941 161,166 7,520 3,508,627
10.4.1 This includes reversal of provision of Rs. 8.604 million (2019: Rs. 277.078 million) against non-performing loans of certain borrowers under ‘Debt Property Swap’ transactions, as disclosed in note 13.2.
10.4.2 Particulars of provision against advances2020 2019
Specific General Total Specific General Total--------------------------------------- Rupees in ‘000 ---------------------------------------
In local currency 4,181,836 - 4,181,836 3,339,941 161,166 3,501,107 In foreign currency - 21,327 21,327 - 7,520 7,520
4,181,836 21,327 4,203,163 3,339,941 168,686 3,508,627
10.4.3 The Bank, in accordance with BPRD circular letter No. 31 of 2020 dated July 10, 2020, has taken the benefit of general provision to make good the specific provision requirement of the consumer financing portfolio till December 31, 2021.
10.4.4 This represents general provision held under IFRS 9 by Bahrain branch of the Bank.
10.4.5 The State Bank of Pakistan through various circulars has allowed benefit of the forced sale value (FSV) of Plant and Machinery under charge, pledged stock and mortgaged residential, commercial and industrial properties (land and building only) held as collateral against non-performing loans (NPLs) for a maximum of five years from the date of classification. As at December 31, 2020, the Bank has availed cumulative benefit of FSV of Rs. 4,655.818 million (2019: Rs. 4,120.009 million) under the directives of the SBP. Had the benefit not been taken the unappropriated profit after tax would have reduced by Rs. 3,026.282 million (2019: Rs. 2,678.006 million). Further, as required by the SBP directives, this unappropriated profit will not be available for distribution as dividend or other appropriations.

147 Annual Report 2020
Notes to the Unconsolidated Financial StatementsFor the year ended December 31, 2020
10.4.6 Advances - Deferred & Restructured / Rescheduled
The SBP vide BPRD circular letter number 13 of 2020 dated March 26, 2020, has relaxed certain classification criteria of SBP Prudential Regulation R-8 (Classification and Provisioning of Assets). Accordingly, certain exposures as at December 31, 2020 relating to facilities of customers have not been classified as non-performing on account of such relaxation.
2020 201910.5 Particulars of Write Offs ----- Rupees in ‘000 -----
10.5.1 Against provisions - 4,795 Directly charged to profit and loss account - 315
- 5,110
10.5.2 Write offs of Rs.500,000 and above - Domestic - 4,795 Write offs of below Rs.500,000 - 315
- 5,110
10.6 Details of loan write off of Rs. 500,000 and above
In terms of sub-section (3) of Section 33A of the Banking Companies Ordinance, 1962 the Statement in respect of written-off loans or any other financial relief of rupees five hundred thousand or above allowed to a person(s) during the year ended is given in Annexure-1.
2020 2019Note ---- Rupees in ‘000 ----
11. FIXED ASSETS
Capital work-in-progress 11.1 291,402 138,167 Property and equipment 11.2 &11.3 4,925,430 5,961,042 Right-of-use assets 11.4 2,382,706 3,593,492
7,599,538 9,692,701
11.1 Capital work-in-progress
Civil works 225,220 116,365 Advance for purchase of furniture and fixtures 1,013 290 Advance for purchase of equipment 61,794 21,512 Advance for purchase of vehicle 3,375 -
291,402 138,167

148Annual Report 2020
Notes to the Unconsolidated Financial StatementsFor the year ended December 31, 2020
11.2 Property and equipment 2020
Leasehold land
Building on leasehold
land
Leasehold improvements
Furniture and fixture
Electrical, office and computer equipment
Vehicles Total
Note -------------------------------------------------- Rupees in ‘000 --------------------------------------------------At January 1, 2020Cost / Revalued amount 1,520,254 2,093,587 1,499,313 623,007 3,310,440 131,961 9,178,562 Accumulated depreciation - (190,898) (701,210) (341,029) (1,956,984) (27,399) (3,217,520)Net book value 1,520,254 1,902,689 798,103 281,978 1,353,456 104,562 5,961,042 Year ended December 2020Opening net book value 1,520,254 1,902,689 798,103 281,978 1,353,456 104,562 5,961,042 Additions - - 168,683 49,910 378,028 49 596,670
DisposalsCost - - (1,852) (14,146) (45,929) (4,313) (66,240)Accumulated Depreciation - - (399) 10,089 40,566 1,777 52,033
- - (2,251) (4,057) (5,363) (2,536) (14,207)Depreciation charge - (71,747) (119,046) (60,398) (425,702) (17,419) (694,312)
Exchange rate adjustmentsCost - - (885) (276) (210) (152) (1,523)Accumulated Depreciation - - 280 101 105 58 544
- - (605) (175) (105) (94) (979)
Write offsCost - - (246,248) (35,053) (158,301) (2,904) (442,506)Accumulated Depreciation - - 134,307 20,480 104,869 963 260,619
- - (111,941) (14,573) (53,432) (1,941) (181,887)
Transferred / other adjustmentsCost (739,200) (2,126) - - - - (741,326)Accumulated Depreciation - 429 - - - - 429
11.3 (739,200) (1,697) - - - - (740,897)Closing net book value 781,054 1,829,245 732,943 252,685 1,246,882 82,621 4,925,430
At December 31, 2020Cost / Revalued amount 781,054 2,091,461 1,419,011 623,442 3,484,028 124,641 8,523,637 Accumulated depreciation - (262,216) (686,068) (370,757) (2,237,146) (42,020) (3,598,207)Net book value 781,054 1,829,245 732,943 252,685 1,246,882 82,621 4,925,430 Rate of depreciation (percentage) - 1.01 - 4.78 10 12.5 12.5 - 33.3 20

149 Annual Report 2020
Notes to the Unconsolidated Financial StatementsFor the year ended December 31, 2020
2019
Leasehold land
Building on leasehold
land
Leasehold improvements
Furniture and fixture
Electrical, office and computer equipment
Vehicles Total
Note -------------------------------------------------- Rupees in ‘000 --------------------------------------------------At January 1, 2019Cost / Revalued amount 1,457,289 1,920,603 1,285,074 547,573 2,846,077 1,064,359 9,120,975 Accumulated depreciation - (167,577) (591,448) (286,876) (1,661,236) (330,703) (3,037,840)Net book value 1,457,289 1,753,026 693,626 260,697 1,184,841 733,656 6,083,135
Year ended December 2019Opening net book value 1,457,289 1,753,026 693,626 260,697 1,184,841 733,656 6,083,135 Additions - 649,228 221,721 78,546 559,189 349,137 1,857,821 Movement in surplus on assets revalued during the year 21.2 62,965 (49,200) - - - - 13,765
DisposalsCost - - (10,382) (4,034) (95,467) (1,282,023) (1,391,906)Accumulated Depreciation - - 7,444 3,493 87,218 440,064 538,219
- - (2,938) (541) (8,249) (841,959) (853,687)Depreciation charge - (76,365) (116,392) (57,353) (382,678) (136,591) (769,379)
Exchange rate adjustmentsCost - - 2,900 922 641 488 4,951 Accumulated Depreciation - - (814) (293) (288) (169) (1,564)
- - 2,086 629 353 319 3,387
Transferred / other adjustmentsCost - (427,044) - - - - (427,044)Accumulated Depreciation - 53,044 - - - - 53,044
11.3 - (374,000) - - - - (374,000)Closing net book value 1,520,254 1,902,689 798,103 281,978 1,353,456 104,562 5,961,042
At December 31, 2019Cost / Revalued amount 1,520,254 2,093,587 1,499,313 623,007 3,310,440 131,961 9,178,562 Accumulated depreciation - (190,898) (701,210) (341,029) (1,956,984) (27,399) (3,217,520)Net book value 1,520,254 1,902,689 798,103 281,978 1,353,456 104,562 5,961,042 Rate of depreciation (percentage) - 1.01 - 4.78 10 12.5 12.5 - 33.3 20

150Annual Report 2020
Notes to the Unconsolidated Financial StatementsFor the year ended December 31, 2020
2020 201911.2.1 The cost of fully depreciated property and equipment still in use ---- Rupees in ‘000 ----
Leasehold improvements 265,850 323,271 Furniture and fixture 156,677 139,146 Electrical, office and computer equipment 1,135,788 992,625 Vehicles 2,258 11,921
1,560,573 1,466,963
11.2.2 The details of disposals of assets to related parties are given in Annexure II to these unconsolidated financial statements.
11.2.3 The properties of the Bank were revalued by independent professional valuers as at December 31, 2019. The revaluation was carried out by M/s. Tristar International Consultants Pvt Ltd. on the basis of professional assessment of present market values.
Had there been no revaluation, the carrying value of revalued land and building on land as at December 31, 2020 would have been lower by Rs. 505.342 million and Rs. 686.830 million respectively, and net surplus on revaluation of fixed assets, deferred tax liability and incremental depreciation expense would have been lower by Rs. 951.782 million, Rs. 240.391 million and Rs. 25.823 million respectively.
2020 2019Note ---- Rupees in ‘000 ----
11.3 Assets held for sale
Leasehold land 11.3.1 739,200 - Building on leasehold land 11.3.2 - 374,000
739,200 374,000
11.3.1 In 2020, the Board of Directors accorded its in-principle approval and authorised the management of the Bank to explore the possibility to sell a land located at Plot No. 201, situated at Upper Mall, Lahore, Pakistan of the following reasons:
i) The property is available for immediate sale and can be sold in its current condition subject to completion of certain legal formalities.
ii) The actions to complete the sale were initiated and expected to be completed within one year from the date of classification.
iii) The Bank expects the legal and procedural formalities for the sale to be completed by the end of 2021.
Immediately before the classification of the property as a held for sale, the Property was revalued by independent professional valuer by M/s. Tristar International Consultants (Private) Limited as at December 31, 2020 and resulted no significant change is observed in valuations of the property.
11.3.2 In 2019, Bank had entered into an agreement to sell the Bank property located at 13th floor of Ocean Tower, plot No. G-3, Khayaban-e-Iqbal, Block 9, KDA Scheme No. 5, Clifton Karachi, Pakistan (“Property”) of Rs. 375 million and therefore, measured the property as a non-current asset held for sale. In this respect, during the period end the sale proceeds were realised on August 11, 2020.

151 Annual Report 2020
Notes to the Unconsolidated Financial StatementsFor the year ended December 31, 2020
2020 201911.4 The carrying amounts of right-of-use assets Note ---- Rupees in ‘000 ----
Opening balance 3,593,492 4,461,250 Additional impact arised during the year - net 31,080 42,563 Termination impact arised during the year - net (348,718) - Depreciation 29 (893,148) (910,321)
2,382,706 3,593,492
12. INTANGIBLE ASSETS
Capital work-in-progress 12.1 213,312 97,744 Computer software 12.2 809,789 709,992 Goodwill 12.2 &12.4 1,463,624 1,463,624
2,486,725 2,271,360
12.1 Capital work-in-progressAdvance for purchase of software 213,312 97,744
2020Computer software Goodwill Total
12.2 Computer software and goodwill ----------------- Rupees in ‘000 -----------------
At January 1, 2020Cost 1,152,900 1,463,624 2,616,524 Accumulated amortisation and impairment (442,908) - (442,908)Net book value 709,992 1,463,624 2,173,616
Year ended December 2020Opening net book value 709,992 1,463,624 2,173,616 Additions: - directly purchased 212,692 - 212,692 Amortisation charge (113,052) - (113,052)
Exchange rate adjustmentsCost 230 - 230 Accumulated Amortisation (73) - (73)
157 - 157
Write offsCost 68 - 68 Accumulated Amortisation (68) - (68)
- - - Closing net book value 809,789 1,463,624 2,273,413
At December 31, 2020 Cost 1,365,754 1,463,624 2,829,378 Accumulated amortisation and impairment (555,965) - (555,965)Net book value 809,789 1,463,624 2,273,413 Rate of amortisation (percentage) 10 Useful life (year) 10 See note 12.4

152Annual Report 2020
Notes to the Unconsolidated Financial StatementsFor the year ended December 31, 2020
2019Computer software Goodwill Total
--------- Rupees in ‘000 ---------At January 1, 2019Cost 979,872 1,463,624 2,443,496 Accumulated amortisation and impairment (349,379) - (349,379)Net book value 630,493 1,463,624 2,094,117
Year ended December 2019Opening net book value 630,493 1,463,624 2,094,117 Additions: - directly purchased 172,381 - 172,381 Amortisation charge (93,316) - (93,316)
Exchange rate adjustmentsCost 647 - 647 Accumulated Amortisation (213) - (213)
434 - 434 Closing net book value 709,992 1,463,624 2,173,616
At December 31, 2019Cost 1,152,900 1,463,624 2,616,524 Accumulated amortisation and impairment (442,908) - (442,908)Net book value 709,992 1,463,624 2,173,616
Rate of amortisation (percentage) 10 Useful life (year) 10 See note 12.4
2020 2019 ---- Rupees in ‘000 ----
12.3 The cost of fully amortised computer software still in use 160,694 146,687
12.4 Goodwill is recorded by the Bank upon the event fully disclose in note 1.2. For impairment testing, goodwill has been allocated to ‘Trading and Sales’ Segment as Cash Generating Unit (CGU), which is also a reportable segment.
12.5 Key assumptions used in value in use calculation
The recoverable amount of the CGU has been determined based on value in use calculation, using cash flow projections based on business plan approved by the Board of Directors of the Bank covering a five year period. The discount rates applied to cash flows beyond five years are extrapolated using a terminal growth rate. The following rates are used by the Bank.
2020 2019Percentages
Discount rate 17.41 22.87 Terminal growth rate 12.51 10.00
The calculation of value in use is most sensitive to following assumptions:
a) Interest margins
Interest margins are based on prevailing industry trends and anticipated market conditions.
b) Discount ratesDiscount rates reflect management estimates of the rate of return required for each business and are calculated after taking into account the prevailing risk free rate, industry risk and business risk. Discount rates are calculated by using cost of equity of the Bank.

153 Annual Report 2020
Notes to the Unconsolidated Financial StatementsFor the year ended December 31, 2020
c) Key business assumptions
The assumptions are important as they represent management assessment of how the unit’s position might change over the projected period. Based on the expansion plans, management expects aggressive growth in advances, investments and deposits during the projected periods and thereafter stabilisation in line with industry trends.
Management believes that any significant change in key assumptions, on which CGU’s recoverable amount is based, may impact the carrying amount to further exceed its recoverable amount. Value in use calculation of the CGU are sensitive to changes in assumptions for interest rate spreads, Non Funded Income (NFI), long term growth rates and discount rates.
d) Sensitivity to changes in assumption
The estimated recoverable amount of the ‘Trading and Sales’ CGU exceeds its carrying amount by approximately Rs. 5,345 million (2019: 5,554 million). Management has identified two key assumptions for which there could be a reasonably possible change that could cause the carrying amount to exceed the recoverable amount. The following table shows the amount that these two assumptions are required to change individually in order for the estimated recoverable amount to be equal to the carrying amount.
Changes required for carrying amount to equal recoverable
amount (%)2020 2019
- Discount rate 3.16 4.85 - Terminal growth rate (4.88) 9.00
2020 2019Note ---- Rupees in ‘000 ----
13. OTHER ASSETS
Income / mark-up accrued in local currency 6,879,923 8,731,263 Income / mark-up accrued in foreign currencies 93,950 48,511 Advances, deposits, advance rent and other prepayments 477,717 446,321 Acceptances 3,603,192 3,221,212 Dividend receivable - 208,948 Taxation (payments less provision) 84,522 573,873 Defined benefit plan assets - net 37.5 317,581 - Receivable against bancassurance / bancatakaful 30,660 67,952 Stationery and stamps in hand 22,730 23,290 Receivable in respect of home remittance 30,656 37,139 Due from State Bank of Pakistan 245,310 116,489 Rebates receivable from SBP and others 13.1 305,331 465,965 Non-banking assets acquired in satisfaction of claims 13.2 & 13.3 1,176,143 1,088,682 Mark to market gain on derivative instruments 23.2 175,454 22,899 Mark to market gain on forward foreign exchange contracts 334,735 441,182 Advance for subscription of shares - 40,828 Inter bank fund transfer settlement - 14,477 Credit card settlement 140,899 29,924 Insurance 7,636 39,100 Others 628,121 496,226
14,554,560 16,114,281 Less: Provision held against other assets 13.4 (11,241) (13,580)Other assets (net of provisions) 14,543,319 16,100,701
Surplus on revaluation of non-banking assetsacquired in satisfaction of claims 135,109 93,743
Other assets - total 14,678,428 16,194,444

154Annual Report 2020
Notes to the Unconsolidated Financial StatementsFor the year ended December 31, 2020
13.1 This includes an amount of Rs. 297.218 million (2019: Rs. 455.370 million) receivable from State Bank of Pakistan in respect of home remittance services provided by the Bank.
13.2 During the year, the Bank acquired a property of Rs. 90.178 million (2019: Rs. 998.848 million) against debt swap transaction with a borrower resulting in reversal of provision of Rs. 8.604 million (2019: 277.078 million) (refer note 10.4.1).
2020 2019Note ---- Rupees in ‘000 ----
13.3 Market value of non-banking assets acquired in satisfaction of claims 1,311,252 1,182,425
13.3.1 Movement of Non banking assets acquired insatisfaction of claims at market value
As at January 01 1,182,425 185,290 Addition during the year 13.2 90,178 998,848 Surplus recognised during the year 21.3 41,511 -Transferred during the year - - Depreciation during the year 29 (2,862) (1,713)
1,311,252 1,182,425
13.3.2 Non-banking assets acquired in satisfaction of claims are carried at revalued amount according to the requirements of the ‘Regulation for Debt Property Swap’ (the regulations) issued by SBP vide the BPRD Circular No. 1 of 2016, dated January 01, 2016.
Non-banking assets acquired in satisfaction of claims have been revalued by independent professional valuers as at December 31, 2020. The revaluation was carried out by M/s. bfa (Pvt) Ltd. and Engineering Pakistan International (Pvt) Ltd. on the basis of professional assessment of present market values.
Had there been no revaluation, the carrying value of non-banking assets acquired in satisfaction of claims would have been lower by Rs. 135.254 million (2019: Rs. 93.743 million), and surplus on revaluation of assets net, deferred tax liability and depreciation expense would have been lower by Rs. 131.080 million (2019: Rs. 92.776 million), and Rs. 0.145 million (2019: Rs. 0.126 million) respectively.
2020 201913.3.3 Particulars of Non banking assets Note ----- Rupees in ‘000 -----
Leasehold land 944,946 866,695 Building on leasehold land 231,197 221,987
1,176,143 1,088,682
13.4 Movement in provision held against other assets
Opening balance 13,580 15,860 Charge for the year 100 - Reversal for the year (2,439) (2,280)Net charge for the year 32 (2,339) (2,280)Closing balance 11,241 13,580

155 Annual Report 2020
Notes to the Unconsolidated Financial StatementsFor the year ended December 31, 2020
2020 2019Note ---- Rupees in ‘000 ----
14. BILLS PAYABLE
In Pakistan 4,752,985 3,583,500 Outside Pakistan 228,998 220,991
4,981,983 3,804,491
15. BORROWINGS
SecuredBorrowings from State Bank of Pakistan under:
Export Refinancing Scheme (ERF) 15.2.1 21,496,075 17,792,778 Long-Term Finance Facility (LTFF) 15.2.2 1,985,038 1,877,760
Other borrowingsFinancing Facility for Storage of Agricultural Produce (FFSAP) 193,029 166,032 Financing Facility for Renewable Energy Projects 433,085 133,633 Refinance and credit guarantee scheme for women entrepreneurs 32,900 775 Refinance for Wages & Salaries 11,543,118 - Refinance facility for modernization of Small and Medium Enterprises (SMEs) 96,192 - Refinance facility for combating COVID-19 229,984 - Refinance facility for working capital of SMEs 33,901 - Temporary economic refinance facility (TERF) 51,871 -
15.2.3 12,614,080 300,440 Repurchase agreement borrowings - 16,849,097
36,095,193 36,820,075
Borrowing from financial institutionsRepurchase agreement borrowings 15.2.4 9,667,181 12,746,732 Refinancing facility for mortgage loans 15.2.5 2,397,468 1,961,128
12,064,649 14,707,860
Total secured 48,159,842 51,527,935
UnsecuredCall borrowings - 2,303,356 Overdrawn nostro accounts 143,570 636,992
Total unsecured 143,570 2,940,348
48,303,412 54,468,283
15.1 Particulars of borrowings
In local currency 48,159,842 51,527,935 In foreign currencies 143,570 2,940,348
48,303,412 54,468,283

156Annual Report 2020
Notes to the Unconsolidated Financial StatementsFor the year ended December 31, 2020
15.2.1 The Bank has entered into agreement with the SBP for extending export finance to customers. As per the terms of the agreement, the Bank has granted SBP the right to recover the outstanding amount from the Bank at the date of maturity of finances by directly debiting the current account maintained by the Bank with SBP. These borrowings are repayable on a quarterly basis and to be matured between July 28, 2020 and February 08, 2027 (2019: January 02, 2020 and February 08, 2027). These carry mark-up at the rate from1% to 3% (2019: 1% to 3%) per annum.
15.2.2 These borrowings have been obtained from the SBP for providing financing facilities to exporters for adoption of new technologies and modernization of their plant and machinery. These borrowings will mature between November 30, 2020 and November 18, 2030 (2019: November 30, 2020 and August 08, 2029). These carry mark-up at rates ranging from 2.00% to 3.50% (2019: 2.00% to 3.50%) per annum.
15.2.3 Other borrowings have been obtained from SBP under various facilities on particulars mentioned below:
Markup rate Matured
Per annum From To
Financing Facility for Storage of Agricultural Produce (FFSAP) 2% January 1, 2022 October 27, 2027Financing Facility for Renewable Energy Projects 2% August 1, 2021 August 29, 2029Refinance and credit guarantee scheme for women entrepreneurs 0% October 30, 2021 February 28, 2026Refinance for Wages & Salaries 0% October 1, 2022 December 31, 2022Refinance facility for modernization of Small and Medium Enterprises (SMEs) 0% October 1, 2022 June 16, 2025Refinance facility for combating COVID-19 0% April 1, 2025 October 1, 2025Refinance facility for working capital of SMEs 0% September 16, 2021 October 1, 2022Temporary economic refinance facility (TERF) 1% November 22, 2025 November 22, 2025
15.2.4 This represents borrowing against Market Treasury Bills (2019: Market Treasury Bills, Pakistan Investment Bonds and Bai Muajjal) carrying mark-up at the rates ranging upto 6.70% (2019:12.70% to 13.19%) per annum and will be matured between January 11, 2020 and January 12, 2020 (2019: January 02, 2020 and March 26, 2020). The cost and market value of securities given as collateral of amounting to Rs. 9,767,491 million (2019: Rs. 9,200.503 million) and Rs. Nil (2019: Rs. 9,122.620 million) respectively.
15.2.5 The Bank has entered into agreement with the Pakistan Mortgage Refinance Company Limited (PMRC) for extending housing finance facilities to the Bank’s customers on the agreed terms and conditions. The borrowing carries mark-up rate of 3 years PKRV less 100bps and will be matured on February 28, 2022 and December 09, 2025.

157 Annual Report 2020
Notes to the Unconsolidated Financial StatementsFor the year ended December 31, 2020
2020 2019 ---- Rupees in ‘000 ----
16.1 Composition of deposits
- Individuals 147,143,479 135,583,867 - Government (Federal and Provincial) 92,317,151 73,503,161 - Public Sector Entities 52,156,536 37,475,517 - Banking Companies 2,950,286 2,926,436 - Non-Banking Financial Institutions 19,865,194 32,283,984 - Private Sector 118,629,947 88,016,999
433,062,593 369,789,964
16.2 This includes deposits eligible to be covered under insurance arrangements amounting to Rs. 143,210.503 million (2019: Rs. 87,425.180 million).
2020 2019Note ----- Rupees in ‘000 -----
17. SUBORDINATED DEBT
Term Finance Certificates - First Issue 17.1 2,995,200 2,996,400 Term Finance Certificates - Second Issue 17.2 1,997,600 1,998,400 Term Finance Certificates - Third Issue 17.3 2,500,000 2,500,000
7,492,800 7,494,800
17.1 In 2016, the Bank has issued Rs. 3 billion of rated, privately placed, unsecured and subordinated term finance certificates (“TFCs” or “the Issue”) as an instrument of redeemable capital under Section 120 of the Companies Ordinance, 1984 and as outlined by State Bank of Pakistan, SBP, under the BPRD circular No. 06 dated August 15, 2013 and Basel III guidelines. Summary of terms and conditions of the issue are:
Purpose: To contribute toward the Bank’s Tier II Capital for complying with the Capital Adequacy Ratio requirement and to utilize the funds in the Bank’s business operations as permitted by its Memorandum & Articles of Association.
16. DEPOSITS AND OTHER ACCOUNTS
2020 2019In Local Currency
In Foreign Currencies Total In Local
CurrencyIn Foreign Currencies Total
---------------------------------------- Rupees in ‘000 ---------------------------------------- CustomersCurrent deposits 90,714,627 9,668,068 100,382,695 70,341,319 6,412,941 76,754,260 Savings deposits 98,103,956 3,944,797 102,048,753 73,442,779 2,898,794 76,341,573 Term deposits 186,691,026 15,203,881 201,894,907 164,602,876 11,409,815 176,012,691 Margin deposits 5,920,595 163 5,920,758 5,455,786 15,234 5,471,020
381,430,204 28,816,909 410,247,113 313,842,760 20,736,784 334,579,544
Financial InstitutionsCurrent deposits 1,281,700 435,683 1,717,383 859,151 - 859,151 Savings deposits 12,831,324 - 12,831,324 13,450,440 - 13,450,440 Term deposits 8,266,773 - 8,266,773 20,900,829 - 20,900,829
22,379,797 435,683 22,815,480 35,210,420 - 35,210,420
403,810,001 29,252,592 433,062,593 349,053,180 20,736,784 369,789,964

158Annual Report 2020
Notes to the Unconsolidated Financial StatementsFor the year ended December 31, 2020
Issue date: December 14, 2016
Tenure: Up to Seven years from the Issue date.
Maturity Date: December 14, 2023
Rating: A + (Single A Plus)
Profit Rate: Floating rate of return at Base rate + 1.4 percent per annum;
Base rate is defined as the average six months KIBOR prevailing on the Base Rate setting date. The Base Rate will be set for the first time on the last working day prior to the Issue Date and subsequently on the immediately preceding business day before the start of each six monthly period.
Profit payment: Semi-annual
Redemption: The instrument is structured to redeem 0.24% of the Issue amount during the first six years after the Issue date and the remaining Issue amount of 99.76% in two equal semi-annual installments of 49.88% each in the last year.
Security: The Issue is unsecured and subordinated as to payment of Principal and profit to all other indebtedness of the Bank.
Call Option: Exercisable in part or in full on or after the 10th redemption, subject to SBP’s approval.
Lock-in-clause: Principal and profit will be payable subject to compliance with MCR or CAR set by SBP.
Loss absorbency clause:
Upon the occurrence of a Point of Non-Viability event as defined by SBP’s Basel III Capital Rule vide BPRD Circular # 6 of 2013 dated August 15, 2013, SBP may at its option, fully and permanently convert the TFCs into common shares of the Bank and/or have them immediately written off (either partially or in full). Number of shares to be issued to TFC holders at the time of conversion will be equal to the ‘Outstanding Face Value of the TFCs’ divided by market value per share of the Bank’s common share on the date of trigger as declared by SBP of the non-viability event as declared by SBP, subject to a cap of 467,836,257 shares.
17.2 In 2017, the Bank has issued Rs. 2 billion of rated, privately placed and listed, unsecured and subordinated term finance certificates (“TFCs” or “the Issue”) as an instrument of redeemable capital under Section 66 of the Companies Act, 2017 and as outlined by State Bank of Pakistan, SBP, under the BPRD circular No. 06 dated August 15, 2013 and Basel III guidelines. Summary of terms and conditions of the Issue are:
Purpose: To contribute toward the Bank’s Tier II Capital for complying with the capital adequacy requirement and to utilize the funds in the Bank’s business operations as permitted by its Memorandum & Articles of Association.
Issue date: December 29, 2017
Tenure: Up to Seven years from the Issue date.
Maturity Date: December 29, 2024

159 Annual Report 2020
Notes to the Unconsolidated Financial StatementsFor the year ended December 31, 2020
Rating: A + (Single A Plus)
Profit Rate: Floating rate of return at Base rate + 1.4 percent per annum;
Base rate is defined as the average six months KIBOR prevailing on the Base Rate setting date. The Base Rate will be set for the first time on the last working day prior to the Issue Date and subsequently on the immediately preceding business day before the start of each six monthly period.
Profit payment: Semi-annual
Redemption: The instrument is structured to redeem 0.24% of the Issue amount during the first six years after the Issue date and the remaining Issue amount of 99.76% in two equal semi-annual installments of 49.88% each in the last year.
Security: The Issue is unsecured and subordinated as to payment of Principal and profit to all other indebtedness of the Bank.
Call Option: Exercisable in part or in full on or after the 10th redemption, with prior approval of SBP.
Lock-in-clause: Principal and profit will be payable subject to compliance with MCR or CAR set by SBP.
Loss absorbency clause:
Upon the occurrence of a Point of Non-Viability event as defined under SBP BPRD Circular # 6 of 2013 dated August 15, 2013, SBP may at its option, fully and permanently convert the TFCs into common shares of the Bank and/or have them immediately written off (either partially or in full). Number of shares to be issued to TFC holders at the time of conversion will be equal to the ‘Outstanding Face Value of the TFCs’ divided by market value per share of the Bank’s common share on the date of trigger of Point of Non-Viability (PONV) as declared by SBP, subject to a cap of 319,982,544 shares.
17.3 In 2018, the Bank has issued Rs. 2.5 billion of rated, privately placed and listed, unsecured, subordinated, perpetual and non-cumulative additional Tier I capital term finance certificates (“TFCs” or “the Issue”) as an instrument of redeemable capital under Section 66(1) of the Companies Act, 2017 and as outlined by State Bank of Pakistan, SBP, under the BPRD circular No. 06 dated August 15, 2013 (the “Circular”) and Basel III guidelines. Summary of terms and conditions of the Issue are:
Purpose: To contribute toward the Bank’s Tier I Capital for complying with the capital adequacy requirement and to utilize the funds in the Bank’s business operations as permitted by its Memorandum & Articles of Association.
Issue date: December 31, 2018
Maturity date: Perpetual
Rating: A (Single A)
Profit Rate: Floating rate of return at Base rate + 2.25 percent per annum;
Base rate is defined as the average six months KIBOR prevailing on the Base Rate setting date. The Base Rate will be set for the first time on the last working day prior to the Issue Date and subsequently on the immediately preceding business day before the start of each six monthly period.

160Annual Report 2020
Notes to the Unconsolidated Financial StatementsFor the year ended December 31, 2020
Profit payment frequency: Semi-annually on a non-cumulative basis
Redemption: Not applicable
Security: The Issue is unsecured and subordinated as to payment of Principal and profit to all other claims except common shares.
Call Option: Exercisable in part or in full at a par value on or after five years from the issue date, with prior approval of SBP. The Bank shall not exercise the call option unless the called instrument is replaced with capital of same or better quality.
Lock-in-clause: Payment of profit will me be made from current year’s earning and subject to compliance with MCR or CAR set by SBP.
Loss absorbency clause:
Pre-Specified Trigger (“PST”)
Upon the occurrence of a Pre-Specified Trigger as defined under SBP BPRD Circular # 6 of 2013 dated August 15, 2013 which stipulates that if an Issuer’s Common Equity Tier 1 (“CET 1”) ratio falls to or below 6.625% of Risk Weighted Assets (“RWA”), the Issuer will have full discretion to determine the amount of TFCs to be permanently converted into common shares or written off, subject to SBP regulations / instructions, and the cap specified below. The Bank will be able to exercise this discretion subject to:
- If and when Bank’s CET 1 reaches the loss absorption trigger point, the aggregate amount of Additional Tier-1 capital to be converted must at least be the amount sufficient to immediately return the CET 1 ratio to above 6.625% of total RWA (if possible);
- The converted amount should not exceed the amount needed to bring the CET 1 ratio to 8.5% of RWA (i.e. minimum CET 1 of 6.0% plus capital conservation buffer of 2.5%); and
- In case, conversion of Additional Tier-1 capital Instrument is not possible following the trigger event, the amount of the Instrument must be written off in the accounts resulting in increase in CET 1 of the Issuer.
Point of Non-Viability (“PONV”)
Upon the occurrence of a Point of Non-Viability event as defined under SBP BPRD Circular # 6 of 2013 dated August 15, 2013, which stipulates that SBP may, at its option, fully and permanently convert the TFCs into common shares of the Issuer and / or have them immediately written off (either partially or in full). Number of shares to be issued to TFC holders at the time of conversion will be equal to the ‘Outstanding Value of the TFCs’ divided by market value per share of the Issuer’s common / ordinary share on the date of the PONV trigger event as declared by SBP, subject to the cap specified below:
The PONV trigger event is the earlier of:- A decision made by SBP that a conversion or temporary / permanent write-off is necessary
without which the Issuer would become non-viable;
- The decision to make a public sector injection of capital, or equivalent support, without which the Issuer would have become non-viable, as determined by SBP; and
- The maximum number of shares to be issued to TFC holders at the Pre-Specified Trigger and / or Point of Non Viability (or otherwise as directed by SBP) will be subject to a specified cap of 329,595,476 ordinary shares, or such other number as may be agreed to in consultation with SBP.

161 Annual Report 2020
Notes to the Unconsolidated Financial StatementsFor the year ended December 31, 2020
18. DEFERRED TAX (ASSETS) / LIABILITIES2020
Balance as at January 01,
2020
Recognised in profit and loss
account
Recognised in other
comprehensive income
Balance as at December 31,
2020
Note ------------------------- Rupees in ‘000 ------------------------- Deferred tax debits arising from:Provision against investments (57,149) - - (57,149)Provision against loans and advances (132,305) (155,535) - (287,840)General provision under IFRS-9 (3,097) (40,455) - (43,552)Intangible other than Goodwill (2,514) (390) - (2,904)Mark to market gain / (loss) on forward foreign exchange contracts 23,085 (45,978) - (22,893)Other assets (628,569) 628,569 - -
(800,549) 386,211 - (414,338)
Deferred tax credits arising due to:Fixed assets 250,858 (78,296) - 172,562 Goodwill 512,268 - - 512,268 Surplus on revaluation of operating fixed assets 21 299,034 (58,643) - 240,391 Surplus on revaluation of non-banking
assets acquired in satisfaction of claims 21 967 (51) 3,113 4,029 Unrealized gain on revaluation of derivative instruments 8,145 (2,843) - 5,302
Unrealised (loss) / gain on revaluation ofinvestments classified as held for trading (1,218) 1,500 - 282 (Deficit) / surplus on revaluation of investments
classified as available for sale 21 (278,261) - 952,017 673,756 791,793 (138,332) 955,130 1,608,590
(8,756) 247,879 955,130 1,194,252
2019
Balance as at January 01,
2019
Recognised in profit and loss
account
Recognised in other
comprehensive income
Balance as at December 31,
2019
---------------------------- Rupees in ‘000 ---------------------------- Deferred tax debits arising from:
Provision against investments (57,149) - - (57,149)Provision against loans and advances (34,278) (98,027) - (132,305)Other assets (124,078) (504,491) - (628,569)General provision under IFRS-9 (36,820) 33,723 - (3,097)Intangible other than Goodwill (2,246) (268) - (2,514)Unrealised loss on revaluation ofinvestments classified as held for trading (4,517) 3,299 - (1,218)Deficit on revaluation of investments classified as available for sale 21 (1,173,907) - 895,646 (278,261)
(1,432,995) (565,764) 895,646 (1,103,113)Deferred tax credits arising due to:Fixed assets 225,855 25,003 - 250,858 Goodwill 512,268 - - 512,268 Surplus on revaluation of operating fixed assets 21 328,079 (11,825) (17,220) 299,034 Surplus on revaluation of non-banking
assets acquired in satisfaction of claims 21 1,010 (43) - 967 Mark to market gain on forward foreign
exchange contracts 74,177 (51,092) - 23,085 Unrealized gain on revaluation of
derivative instruments 4,544 3,601 - 8,145 1,145,933 (34,356) (17,220) 1,094,357
(287,062) (600,120) 878,426 (8,756)

162Annual Report 2020
Notes to the Unconsolidated Financial StatementsFor the year ended December 31, 2020
2020 2019Note ----- Rupees in ‘000 -----
19. OTHER LIABILITIES
Mark-up / return / interest payable in local currency 2,994,596 4,092,845 Mark-up / return / interest payable in foreign currencies 52,729 72,782 Unearned income on guarantees 176,270 99,505 Accrued expenses 669,383 304,086 Acceptances 3,603,192 3,221,212 Unclaimed dividends 4,214 4,214 Mark to market loss on derivative instruments 160,306 491 Mark to market loss on forward foreign exchange contracts 400,144 375,227 Payable in respect of defined benefit obligation - net 37.5 - 151,881 Withholding taxes payable 401,303 414,407 Government challan collection 94,510 66,867 Donation payable 29.2.1 - 1,991 Security deposits against leases, lockers and others 3,490,704 4,172,975 Sindh Workers’ Welfare Fund 33.2 114,237 73,777 Payable in respect of home remittance 831,042 446,387 Retention money payable 42,044 34,248 Lease liability against right-of-use assets 19.1 2,583,947 3,696,371 Advance against assets held for sale 11.3.2 - 37,500 Insurance payable 10,137 12,693 Payable to vendors against SBS goods 93,634 185 Debit card settlement 65,855 73,084 Inter bank fund transfer settlement 159,136 - Others 593,771 183,444
16,541,154 17,536,172
19.1 Lease liabilities
The carrying amounts of lease liabilities and the movements during the year is as below:
Opening balance 3,696,371 4,153,244 Additional impact arised during the year - net 31,080 42,563 Termination impact arised during the year - net (417,536) - Markup on Lease liability against right-of-use assets 25 405,879 507,361 Payments (1,131,847) (1,006,797)Closing balance 2,583,947 3,696,371

163 Annual Report 2020
Notes to the Unconsolidated Financial StatementsFor the year ended December 31, 2020
20. SHARE CAPITAL - NET
20.1 Authorised capital
20.1.1 Ordinary shares
2020 2019 2020 2019 ------ Number of shares ------ ----- Rupees in ‘000 -----
2,350,000,000 2,350,000,000 Ordinary shares of Rs.10 each 23,500,000 23,500,000
20.1.2 Preference shares
150,000,000 150,000,000 Convertible preference shares of Rs.10 each 1,500,000 1,500,000
20.2 Issued, subscribed and paid-up capital
Ordinary shares 763,558,965 763,558,965 Fully paid in cash 7,635,590 7,635,590 533,905,297 533,905,297 Issued for consideration other than cash 5,339,053 5,339,053
1,297,464,262 1,297,464,262 12,974,643 12,974,643 - - Less: Discount on issue of shares (2,855,401) (2,855,401)
1,297,464,262 1,297,464,262 10,119,242 10,119,242
20.3 As at December 31, 2020, Jahangir Siddiqui & Co. Limited (the parent company) held 973,307,324 (December 31, 2019: 973,307,324) ordinary shares of Rs.10 each i.e. 75.02% holding (December 31, 2019: 75.02%).
2020 201921. SURPLUS ON REVALUATION OF ASSETS Note ----- Rupees in ‘000 -----
Surplus / (deficit) on revaluation ofAvailable-for-sale securities 9.1 & 21.1 1,925,017 (795,030)Fixed assets 21.2 1,192,173 1,359,727 Non-banking assets acquired in satisfaction of claims 21.3 135,109 93,743
3,252,299 658,440 Deferred tax on surplus / (deficit) on revaluation of
Available-for-sale securities (673,756) 278,261 Fixed assets (240,391) (299,034)Non-banking assets acquired in satisfaction of claims (4,029) (967)
(918,176) (21,740) 2,334,123 636,700
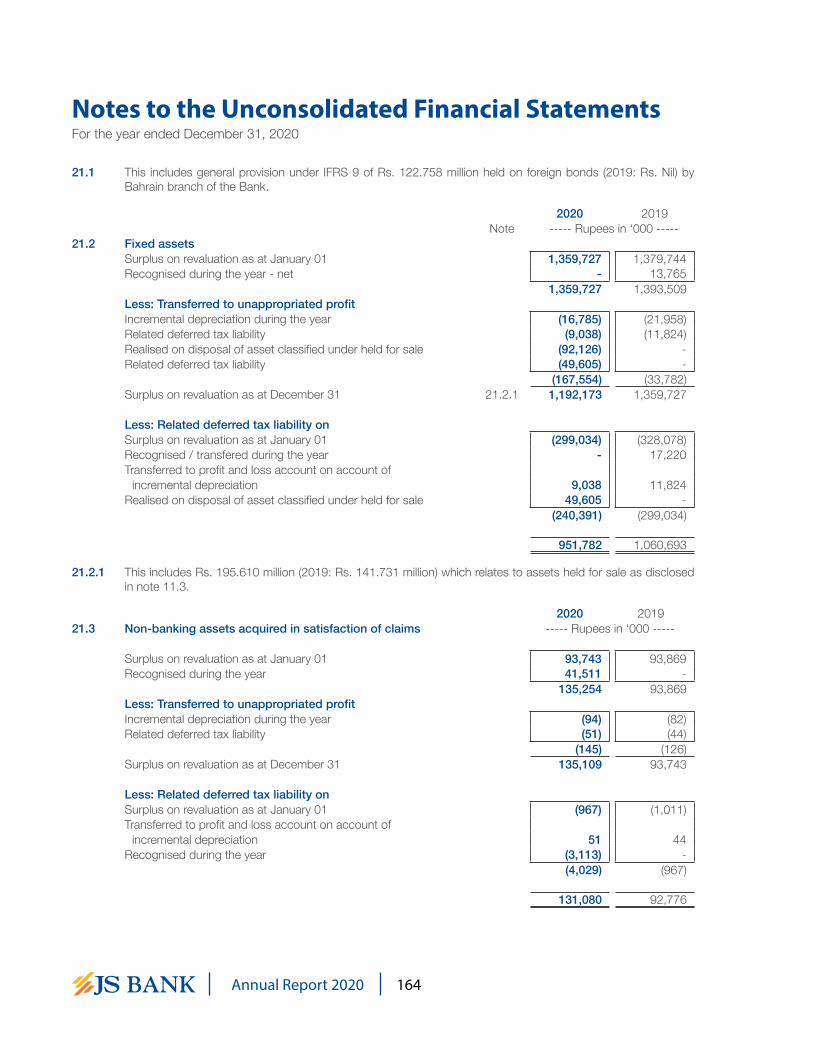
164Annual Report 2020
Notes to the Unconsolidated Financial StatementsFor the year ended December 31, 2020
21.1 This includes general provision under IFRS 9 of Rs. 122.758 million held on foreign bonds (2019: Rs. Nil) by Bahrain branch of the Bank.
2020 2019Note ----- Rupees in ‘000 -----
21.2 Fixed assetsSurplus on revaluation as at January 01 1,359,727 1,379,744 Recognised during the year - net - 13,765
1,359,727 1,393,509 Less: Transferred to unappropriated profitIncremental depreciation during the year (16,785) (21,958)Related deferred tax liability (9,038) (11,824)Realised on disposal of asset classified under held for sale (92,126) - Related deferred tax liability (49,605) -
(167,554) (33,782)Surplus on revaluation as at December 31 21.2.1 1,192,173 1,359,727
Less: Related deferred tax liability onSurplus on revaluation as at January 01 (299,034) (328,078)Recognised / transfered during the year - 17,220 Transferred to profit and loss account on account of
incremental depreciation 9,038 11,824 Realised on disposal of asset classified under held for sale 49,605 -
(240,391) (299,034)
951,782 1,060,693
21.2.1 This includes Rs. 195.610 million (2019: Rs. 141.731 million) which relates to assets held for sale as disclosed in note 11.3.
2020 201921.3 Non-banking assets acquired in satisfaction of claims ----- Rupees in ‘000 -----
Surplus on revaluation as at January 01 93,743 93,869 Recognised during the year 41,511 -
135,254 93,869 Less: Transferred to unappropriated profitIncremental depreciation during the year (94) (82)Related deferred tax liability (51) (44)
(145) (126)Surplus on revaluation as at December 31 135,109 93,743
Less: Related deferred tax liability onSurplus on revaluation as at January 01 (967) (1,011)Transferred to profit and loss account on account of
incremental depreciation 51 44 Recognised during the year (3,113) -
(4,029) (967)
131,080 92,776

165 Annual Report 2020
Notes to the Unconsolidated Financial StatementsFor the year ended December 31, 2020
2020 2019Note ----- Rupees in ‘000 -----
22. CONTINGENCIES AND COMMITMENTS
Guarantees 22.1 58,779,594 45,650,803 Commitments 22.2 65,262,832 76,025,492
124,042,426 121,676,295
22.1 GuaranteesFinancial guarantees 1,024,422 2,464,411 Performance guarantees 36,678,881 21,483,841 Other guarantees 21,076,291 21,702,551
22.1.1 58,779,594 45,650,803
22.1.1 Included herein are outstanding guarantees of Rs. 29.054 million (2019: Rs.14.217 million) of related parties.
2020 2019Note ----- Rupees in ‘000 -----
22.2 CommitmentsDocumentary credits and short-term trade-related transactions- letters of credit 22.2.1 21,111,360 13,965,258
Commitments in respect of- Forward foreign exchange contracts 22.2.2 38,178,262 55,111,366 - Derivative instruments 22.2.3 5,362,948 6,745,592 - Forward lending 22.2.4 384,230 72,183
Commitments for acquisition of- Fixed assets 22.2.5 226,032 131,093
65,262,832 76,025,492
22.2.1 Included herein are the outstanding letter of credits of Rs. 86.543 million (2019: Rs. 44.368 million) of related parties.
2020 2019 ----- Rupees in ‘000 -----
22.2.2 Commitments in respect of forward foreign exchange contractsPurchase 23,137,733 33,104,108 Sale 15,040,529 22,007,258
38,178,262 55,111,366
The Bank utilises foreign exchange instruments to meet the needs of its customers and as part of its asset and liability management activity to hedge its own exposure to currency risk. At year end, all foreign exchange contracts have a remaining maturity of less than one year.
2020 2019 ----- Rupees in ‘000 -----
22.2.3 Commitments in respect of derivative instrumentsPurchase 1,760,637 3,622,107 Sale 3,602,311 3,123,485
5,362,948 6,745,592 22.2.3.1 Interest rate swaps (notional principal)
Purchase 1,176,824 2,099,175 Sale 1,176,824 2,100,175
2,353,648 4,199,350

166Annual Report 2020
Notes to the Unconsolidated Financial StatementsFor the year ended December 31, 2020
2020 2019Note ----- Rupees in ‘000 -----
22.2.3.2 Options (notional principal)Purchase 582,419 1,023,310 Sale 2,425,487 1,023,310
3,007,906 2,046,620
22.2.3.3 Commitments in respect of forward securitiesPurchase 1,394 499,622
22.2.4 Commitments in respect of forward lending
Undrawn formal standby facilities, credit lines andother commitments to lend 21.2.4.1 384,230 72,183
22.2.4.1 These represent commitments that are irrevocable because they cannot be withdrawn at the discretion of the Bank without the risk of incurring significant penalty or expense.
22.2.5 Commitments for acquisition of fixed assets 226,032 131,093
22.2.6 Tax related contingencies are disclosed in notes 33.2 to 33.5.
23. DERIVATIVE INSTRUMENTS
Derivative instruments, such as Forward Exchange Contracts, Interest Rate Swaps and Options, are forward transactions that provide market making opportunities / hedge against the adverse movement of interest and exchange rates. Derivatives business also provides risk solutions for the existing and potential customers of the Bank.
The Bank has entered into a Cross Currency Swap transaction with its customer on back-to-back basis with an Authorized Derivative Dealer (ADD) without carrying any open position in its books. Specific approvals for the transactions have been granted by State Bank of Pakistan. Policies in line with SBP instructions have been formulated and are operative.
The Bank has also entered into Foreign Currency & Commodity Options from its Wholesale Banking Branch Bahrain for market making activities.
These transactions cover the aspects of both market making and hedging. The risk management related to derivative is disclosed in note 45.
Accounting policies in respect of derivative financial instruments are described in note 4.4.2.

167 Annual Report 2020
Notes to the Unconsolidated Financial StatementsFor the year ended December 31, 2020
2020Interest Rate Swaps Options Forward securities
Notional principal
Mark to Market
Notional principal
Mark to Market
Notional principal
Mark to Market
23.1 Product analysis ------------------------------------------ Rupees in ‘000 ------------------------------------------
With Banks for Hedging 2,353,648 4,943 3,007,906 10,205 - - Market making - - - - - -
With FIs other than banksHedging - - - - - - Market making - - - - 1,394 -
TotalHedging 2,353,648 4,943 3,007,906 10,205 - - Market making - - - - 1,394 -
2019
Interest Rate Swaps Options Forward securitiesNotional principal
Mark to Market
Notional principal
Mark to Market
Notional principal
Mark to Market
------------------------------------------ Rupees in ‘000 ------------------------------------------With Banks for Hedging 4,199,350 13,327 - 8,885 - - Market making - - - - 499,622 196
With FIs other than banksHedging - - - - - - Market making - - - - - -
TotalHedging 4,199,350 13,327 - 8,885 - - Market making - - - - 499,622 196
23.1.1 The notional value of options includes Nil (2019: Rs. 1,023.310 million) and the Bank has entered back to back arrangement to close the position at year end.
23.2 Maturity analysis 2020
Remaining maturity of Contracts Number of contracts
Notional principal
Mark to marketPositive Negative Net
------------------------ Rupees in ‘000 ------------------------
Upto 1 month 5 669,991 29,685 (28,769) 916 1 to 3 months 1 317,656 - (889) (889)3 to 6 months 7 1,345,571 13,001 (5,296) 7,705 6 months to 1 year 10 2,914,453 121,563 (114,748) 6,815 1 to 2 years 2 115,277 11,205 (10,604) 601
25 5,362,948 175,454 (160,306) 15,148

168Annual Report 2020
Notes to the Unconsolidated Financial StatementsFor the year ended December 31, 2020
2019
Remaining maturity of Contracts Number of contracts
Notional principal
Mark to marketPositive Negative Net
------------------------ Rupees in ‘000 ------------------------
Upto 1 month - - - - - 1 to 3 months 1 499,622 196 - 196 6 months to 1 year 4 - 9,376 (491) 8,885 1 to 2 years 3 2,516,330 7,785 - 7,785 2 to 3 years 1 1,683,020 5,542 - 5,542
9 4,698,972 22,899 (491) 22,408
2020 2019Note ----- Rupees in ‘000 -----
24. MARK-UP / RETURN / INTEREST EARNED
On:Loans and advances 25,287,865 30,944,739 Investments 16,509,138 9,683,494 Lendings to financial institutions 32,855 52,679 Balances with other banks 9,824 54,857 Securities purchased under resale agreements 1,259,308 858,930
43,098,990 41,594,699
25. MARK-UP / RETURN / INTEREST EXPENSED
Deposits 29,390,170 28,414,651 Borrowings 25.1 1,889,363 3,678,116 Subordinated debt 900,310 1,029,228 Cost of foreign currency swaps against
foreign currency deposits / borrowings 735,977 936,986 Markup on Lease liability against right-of-use assets 19.1 405,879 507,361
33,321,699 34,566,342
25.1 Borrowings
Export Refinancing Scheme (ERF) 357,578 337,916 Long-Term Finance Facility (LTFF) 46,242 35,388 Other Borrowings from State Bank Bank of Pakistan 10,941 3,942 Securities sold under repurchase agreements 1,111,507 2,810,910 Other borrowings 363,095 489,960
1,889,363 3,678,116

169 Annual Report 2020
2020 2019Note ----- Rupees in ‘000 -----
26. FEE AND COMMISSION INCOME
Branch banking customer fees 240,908 174,723 Consumer finance related fees 39,700 21,098 Card related fees (debit and credit cards) 652,096 594,713 Credit related fees 358,650 328,927 Investment banking fees 97,520 47,997 Commission on trade 671,804 570,108 Commission on guarantees 393,993 266,999 Commission on cash management 4,755 5,966 Commission on remittances including home remittances 26.1 252,078 111,288 Commission on bancassurance 180,460 180,770 Commission on distribution of mutual funds 29,008 117,298 Commission on online Services 372,892 186,396 Postage & Courier income 24,096 22,143 Rebate income 250,355 224,598 Rebate on primary dealership 27,637 6,918
3,595,952 2,859,942
26.1 This includes Rs.149.305 million (2019: Rs. 82.373 million) in respect of commission income from home remittance services provided by the Bank. The amount is earned from State Bank of Pakistan at the rate of Saudi Riyal 20 (2019: Saudi Riyal 20) per transaction over USD 200 (2019: USD 200) and is shared between the Bank and various exchange companies as per terms of agreement with them.
2020 2019Note ----- Rupees in ‘000 -----
27. GAIN / (LOSS) ON SECURITIES
Realised 27.1 1,872,242 (708,527)Unrealised - held for trading 805 (2,618)
1,873,047 (711,145)27.1 Realised gain / (loss) on
Federal government securitiesMarket treasury bills 76,894 3,518 Pakistan investment bonds 1,379,114 (248,555)Ijara sukuk certificates 71 633
1,456,079 (244,404)
SharesListed companies 414,716 (393,203)
Non Government Debt SecuritiesTerm finance certificates - (19)Sukuk certificates 450 150
450 131
Mutual fund units 4,355 3,272 Foreign currency bonds (3,358) (74,323)
1,872,242 (708,527)
28. OTHER INCOME - NET
(Loss) / gain on sale of operating fixed assets - net (1,368) 483,600 Gain on sale of assets held for sale 11.3.2 1,000 - Gain on termination of leases 28.1 64,805 - Others 5,358 -
69,795 483,600
Notes to the Unconsolidated Financial StatementsFor the year ended December 31, 2020

170Annual Report 2020
28.1 This represents, gain on termination of leases against closure of fifty one branches under the Bank’s branch rationalisation strategy.
2020 2019Note ----- Rupees in ‘000 -----
29. OPERATING EXPENSES
Total compensation expense 29.1 6,262,594 5,237,267
Property expenseRent & taxes 24,555 28,522 Insurance 2,638 10,550 Utilities cost 343,963 345,722 Security (including guards) 335,688 295,201 Repair & maintenance (including janitorial charges) 213,589 176,677 Depreciation 190,794 192,757 Depreciation - Right of Use Assets 11.4 893,148 910,321 Depreciation on non banking assets 13.3.1 2,862 1,713
2,007,237 1,961,463 Information technology expensesSoftware maintenance 749,848 233,349 Hardware maintenance 176,495 166,549 Depreciation 204,326 173,734 Amortisation 113,052 93,316 Network charges 121,682 115,973
1,365,403 782,921 Other operating expensesDirectors’ fees and allowances 19,950 12,050 Legal & professional charges 166,570 114,265 Insurance 281,757 203,412 Outsourced services costs 36 152,468 131,109 Travelling & conveyance 90,010 93,640 NIFT clearing charges 45,199 40,394 Depreciation 299,192 402,887 Training & development 19,121 33,742 Postage & courier charges 99,622 81,069 Communication 171,275 119,523 Stationery & printing 259,670 271,491 Marketing, advertisement & publicity 452,925 324,628 Donations 29.2 117,841 2,609 Auditors’ Remuneration 29.3 13,011 10,804 Staff Auto fuel & maintenance 200,842 220,510 Bank Charges 59,970 63,284 Stamp Duty 17,148 55,533 Online verification charges 18,802 21,870 Brokerage, fee and commission 57,739 33,786 Card related fees (debit and credit cards) 6,906 8,662 CDC and other charges 4,975 5,306 Consultancy fee 55,905 30,949 Deposit protection corporation 29.4 128,144 139,761 Entertainment expenses 73,303 63,921 Repair and maintenance 67,988 66,161 Cash handling charges 239,732 69,625 Fee and Subscription 124,516 65,861 Employees social security 10,556 8,124 Generator fuel & maintenance 76,415 79,858 Others 52,214 35,223
3,383,766 2,810,057 13,019,000 10,791,708
Notes to the Unconsolidated Financial StatementsFor the year ended December 31, 2020

171 Annual Report 2020
2020 2019Note ----- Rupees in ‘000 -----
29.1 Total compensation expenseFees and Allowances etc. 180,157 162,077 Managerial Remunerationi) Fixed 3,984,843 3,689,496 ii) Variable
of which;a) Cash Bonus / Awards etc. 29.1.1 606,678 306,849 b) Commission 261,352 224,474
Charge for defined benefit plan 159,436 134,712 Contribution to defined contribution plan 229,001 209,871 Leaving indemnity 6,479 4,246 Medical 385,956 357,269 Conveyance 413,648 81,851 Insurance staff 35,044 66,422
6,262,594 5,237,267
29.1.1 The Bank operates a short term employee benefit scheme which includes cash awards / special bonus for all employees. Under this scheme, the bonus for all employees, including the Chief Executive Officer (CEO) is determined on the basis of employees’ evaluation and the Bank’s performance during the year.
2020 201929.2 Donations Note ----- Rupees in ‘000 -----
Future Trust 29.2.1 112,841 1,991 Hope Uplift Foundation - 618 Agha Khan Foundation 5,000 -
117,841 2,609
29.2.1 This represents donation to a related party, wherein below mentioned persons are trustees. The registered office of the donee is located at 20th Floor, The Centre, Plot No. 28, SB-5, Abdullah Haroon Road, Saddar, Karachi- 74400, Pakistan.
- Mr. Suleman Lalani Chief Executive Officer of the Jahangir Siddiqui & Co. Ltd. (the parent company) - Mr. Kalim-ur-Rehman Chairman of the Bank- Mr. Hasan Shahid Chief Financial Officer of the Bank and Director of JS Investments Limited, subsidiary company- Mr. Najmul Hoda Khan Chief Financial Officer of the Jahangir Siddiqui & Co. Ltd. (the parent company) - Mr. Tariq Usman Bhatti Head of Money Market And Forex of JS Global Capital Limited, subsidiary company
2020 201929.3 Auditors’ remuneration Note ----- Rupees in ‘000 -----
Audit fee - Pakistan 1,794 1,794 Audit fee - Bahrain 1,717 1,640 Half-yearly review 619 619 Fee for audit of employees funds 143 143 Fee for other statutory certifications 1,010 591 Special certification and sundry advisory services 5,413 4,103 Taxation services 270 275 Out of pocket expenses and sales tax on services 2,045 1,639
29.3.1 13,011 10,804
Notes to the Unconsolidated Financial StatementsFor the year ended December 31, 2020

172Annual Report 2020
2020 2019Note ----- Rupees in ‘000 -----
29.3.1 Geographical analysis
Pakistan 10,406 8,651 Bahrain 2,605 2,153
13,011 10,804
29.4 Under the provision of section 5(2) of the Deposit Protection Corporation Act, 2016 (the Act), and DPC Circular No. 04 of 2018, the Bank is liable to pay annual premium, on quarterly basis, to the Deposit Protection Corporation, a subsidiary company of State Bank of Pakistan, @ 0.16% on eligible deposits as of December 31 of each preceding calendar year.
The Bank’s eligible deposits as of December 31, 2019 are amounting to Rs. 87,425.180 million on which total premium is payable of Rs. 139.880 million per annum (Rs. 34.970 million per quarter).
2020 2019 ----- Rupees in ‘000 -----
30. WORKERS’ WELFARE FUND
Charge during the year 40,460 1,065
30.1 Provision held at @ 2% of the higher of profit before tax or taxable income under Sindh Workers’ Welfare Act, 2014 and the Punjab Workers’ Welfare Fund Act, 2019.
Notes to the Unconsolidated Financial StatementsFor the year ended December 31, 2020
2020 2019Note ----- Rupees in ‘000 -----
31. OTHER CHARGES
Penalties imposed by State Bank of Pakistan 91,639 131,444 Others - 6,199
91,639 137,643
32. PROVISIONS AND WRITE OFFS - NET
Provisions for diminution in value of investments 9.3 275,366 (345,300)Provisions against loans & advances - specific 10.4 841,895 354,848 Provisions against loans & advances - general 10.4 (161,166) 5,505 Provisions / (reversals) under IFRS-9 - general 32.1 138,345 (105,018)Fixed assets written off 11.2 181,887 - Other assets written off 5,620 - Other reversals 13.4 (2,339) (2,280)Bad debts written off directly - 315
1,279,608 (91,930)
32.1 Provisions / (reversals) under IFRS-9 - general
Charge / (reversal) during the yearBalances with other banks 384 (71)Lendings to financial institutions (79) (3,434)Investments 124,303 (97,192)Advances 13,737 (4,321)
138,345 (105,018)

173 Annual Report 2020
Notes to the Unconsolidated Financial StatementsFor the year ended December 31, 2020
2020 2019 ----- Rupees in ‘000 -----
33. TAXATION
Current 623,291 708,542 Prior years 1,711 - Deferred 247,879 (600,120)
872,881 108,422
33.1 Relationship between income tax expense and accounting profit
Profit before taxation 2,022,941 133,075
Tax on income @ 35% (2019: 35%) 708,029 46,576 Effect of permanent differences 32,074 46,005 Effects of prior year deferred taxation - - Effects of prior year current tax 140,471 20,559 Others (7,693) (4,718)Tax charge for the year 872,881 108,422
33.2 Income Tax
The income tax returns filed under Section 114 of the Income Tax Ordinance, 2001 for the tax years 2007 through 2020. These returns filed were deemed to have been assessed in terms the provisions prevailing under income tax laws as applicable in Pakistan. However, the Officers of Inland Revenue Services (OIR) conducted the proceedings for making certain amendments in the deemed assessments for tax years 2008 to 2017. This was done by taking recourse of conducting tax audit or alternatively a direct amendment in the assessment contending that certain matters in the deemed assessments were not admissible as not conforming to the law and prejudiced the interest of revenue.
Based on the amended assessments in tax year 2008 to tax year 2018, the department had made certain dis-allowances of expenses and tax deductible claims besides creating minimum tax and Workers’ Welfare Fund liabilities in the tax years 2010, 2011 & 2012 and tax years 2009, 2012 & 2013 respectively.
In respect of WWF, the Supreme Court of Pakistan has held in Judgement, PLD 2017 SC 28, that the amendments made in the WWF Ordinance through Finance Act, 2006 and 2008 were illegal and without lawful authority i.e. the banks do not fall into definition of Industrial Undertaking and thus, not liable to pay WWF. Therefore based on this, the Bank’s contention is mandated and it is likely that its pending appeals in this will be decided favorably. The Bank has obtained appeal effect orders of respective years except 2013 and resultantly no demand is payable in this respect.
As a consequence of the 18th amendment to the Constitution, levy for the WWF was introduced by the Government of Sindh and Punjab through the Sindh WWF Act, 2014 (“the Act”) and the Punjab Workers Welfare Fund Act, 2019 respectively. As per the Acts, the Bank is liable to pay WWF in both provinces. However in this respect:
- The Bank has challenged the issue of jurisdiction claimed by Sindh Revenue Board before the Honorable High Court of Sindh (SHC) through Constitutional Petition 1546/2017 on grounds that banking companies cannot be considered as industrial establishment and that the Act will be applied to trans-provincial entities to the extent that the obligation under the provincial law is to make distribution to the extent of the proportionate profit of the Sindh Province. The Court has restrained the Sindh Revenue Board to collect / recover Sindh WWF till the next date of hearing.
- The Bank will challenge the recovery of Punjab WWF in the court of law on same grounds in case of SWWF.

174Annual Report 2020
Notes to the Unconsolidated Financial StatementsFor the year ended December 31, 2020
In 2018, Based on decision of the Supreme Court of Pakistan, the Bank had reassessed the provision of WWF which was previously held on the entire operating results of the Bank (including all provinces, part of Pakistan, AJK and Bahrain Operations) and maintained WWF only to the extent of its operations within Sindh Province till 2019. In 2020 after promulgation of Punjab WWF, the Bank has again decided prudently to maintained provision on the entire results of the Bank.
In respect of minimum tax, the Commissioner Inland Revenue-Appeals (the CIR(A)) has the not accepted the Bank’s contentions of gross loss position and also decided that non-mark-up income is the fall in the definition of turnover including capital gains and dividend income. As result the demand of Rs. 38.907 million has been payable. The Bank has contested the matter in further appeals before Appellate Tribunal Inland Revenue (ATIR) which are pending for hearing.
For tax year 2008-2018, the Bank has not accepted the amendments of Rs. 6.57 billion and have filed appeals before the Commissioner Inland Revenue-Appeals (the CIRA).
CIR(A) has admitted the contention of the Bank in case of tax year 2008 that the amended order is barred by time and decided that any addition made in impugned order is annulled and not required to be further adjudicated. However, the department has filed an appeal against the decision of CIR(A) in ATIR which has been partly heard.
With regard to appeals filed for tax year 2009 to 2017, the CIR(A) has decided the appeals accepting the Bank’s contentions in respect of significant issues, and certain disallowance including amortization claim of goodwill have been decided in favor of department in all tax years. However, the Bank and the tax department are contesting the matters in further appeals before Appellate Tribunal Inland Revenue (ATIR) which are pending for adjudication.
The tax department passed appeal effect/rectification orders and allowed deleted and set-aside issues in the light of CIR(A) orders for tax year 2008 to 2014. As a result of these orders, the Bank’s taxable losses has increased to Rs. 3.464 billion and reduced the demand of Rs. 1.212 billion in relevant tax years after adjustment of these losses.
Further for the tax year 2013, the ATIR has decided appeal filed by tax department in respect of calculating the amount of provisions against advances as allowable under Rule 1(c) of Seventh Schedule to the Income Tax Ordinance, 2001 and has maintained the CIR(A) decision that the allowability of provision for advances to be calculated at 1% of gross amount of advances as against the tax department contention that the same is to be calculated on net advances after deducting the amount of provisions created and allowed against advances.
The matter of allowability of amortization relating to goodwill is contentious issue, therefore based on the opinion of lawyer there are arguments available to contend that goodwill on merger is an allowable deduction for tax purposes. Especially in the recent decision given by the High Court of Sindh in the case of merger of another bank in Pakistan where the Court has ruled in favour of taxpayer that goodwill generated in merger is ‘intangible’ and amortization relating to goodwill is allowable deduction.
The Sindh High Court has dismissed the Bank’s petitions for tax years 2016 through 2019 wherein the Bank alongwith other taxpayers challenged the levy of super tax on constitutional grounds. Based on the opinion of legal counsel, the Bank has appealed before the Supreme Court against the decision of the Sindh High Court. The Supreme Court has allowed interim relief to the taxpayers subject to the payment of 50% of the super tax liability. However, the Bank has adjusted full amount of super tax liability for Tax year 2016 and 2019 against the available tax refunds. Further, the bank has obtained stay from the Sindh High Court on other technical grounds regarding the levy of Super Tax for tax years 2017 and 2018.
33.3 Withholding tax monitoring
Withholding tax monitoring was initiated against the Bank for tax year 2014-2019. Orders in respect of tax years 2014, 2015 and 2017 has been passed against which appeals have been filed before the CIR(A). CIR(A) has reminded back the matters for rectification in respect of tax years 2014 and 2015 against which rectified orders has been passed and demands have been rectified. Appeal for tax year 2017 has been heard and reserved for order. In respect of tax year 2018 and 2019, proceedings are pending.

175 Annual Report 2020
Notes to the Unconsolidated Financial StatementsFor the year ended December 31, 2020
33.4 Sales tax
The Bank as a registered person under Sindh Sales Tax on Services Act, 2011 has been issued a Sales Tax Order from the Sindh Revenue Board (SRB) creating a demand of Rs. 48.838 million (besides Rs. 4.440 million is charged as penalty) against the Bank for allegedly non-payment of Sindh sales tax on certain ‘presumed non-taxable services / incomes’(i.e. Bancassurance, Home Remittances under Pakistan Remittance Initiative Scheme, SBP rebates on Government securities, Rebates from foreign correspondent Banks, and FX gain on remittance by Western Union)’ on total amounting to Rs. 277.488 million for the tax periods July 2011 to December 2013. An appeal was filed before Commissioner (Appeals) Sindh Revenue Board, CA-SRB against the decision of AC-SRB which was decided in favor of the tax department except tax imposed on FX gain on remittance by Western Union. Thereafter, both the Bank and AC-SRB filed appeals before the Appellate Tribunal SRB against the decision of CA-SRB. Through its Order dated April 18, 2019, the Appellate Tribunal SRB quashed the demand raised by deciding the Bank’s appeal in the Bank’s favour and dismissing the AC-SRB’s appeal. The Bank and tax department have filed appeals before Appellate Tribunal which are pending for hearing.
The management of Bank is confident that the appeals filed in respect of the above matter will be decided in the Bank’s favor and accordingly no demand for payment would arise.
33.5 Azad Jammu & Kashmir Operations
The Bank has commenced operations in Azad Jammu & Kashmir from tax year 2009 and has filed returns for the tax years 2009 to 2019 with the tax authorities of such region. The Commissioner has issued notices for amendment of assessment under section 122 of the Income Tax Ordinance, 2001 (as adopted in AJK Region) for the tax year 2011 to 2017. All assessments orders are rectified and no additional demand has been raised.
2020 201934. BASIC AND DILUTED EARNINGS PER SHARE Note ----- Rupees in ‘000 -----
Profit after taxation for the year - attributable to ordinary equity holders of the Bank 1,150,060 24,653
Preference dividend paid for the year December 31, 2018 @ 12% p.a - (24,164)
Profit after taxation for the year - attributable to ordinary equity holders of the Bank 1,150,060 489
----- Numbers -----Weighted average number of outstanding ordinary
shares during the year 1,297,464,262 1,297,464,262
----- Rupee -----
Basic and diluted earnings per share 0.8864 0.0004
35. CASH AND CASH EQUIVALENTS
Cash and balances with treasury banks 6 30,421,231 25,589,349 Balances with other banks 7 1,106,419 462,904 Overdrawn nostro accounts 15 (143,570) (636,992)
31,384,080 25,415,261 Less: General provision under IFRS 9 (450) (68)
31,383,630 25,415,193

176Annual Report 2020
Notes to the Unconsolidated Financial StatementsFor the year ended December 31, 2020
2020 201936. STAFF STRENGTH ----------- Number -----------
Permanent 3,773 3,607 On Bank’s contract 1,055 825 Bank’s own staff strength at the end of the year 4,828 4,432 Third party contract (other guards and janitorial) 483 472
5,311 4,904
36.1 Geographical segment analysis
Pakistan 5,304 4,897 Bahrain 7 7
5,311 4,904
37. DEFINED BENEFIT PLAN
37.1 General description
The Bank operates a recognized gratuity fund for all employees who opted for this scheme introduced by the management with effect from January 01, 2007.
The defined benefit is administered by a separate fund that is legally separate from the Bank. The plan is governed by the trust deed dated September 01, 2007. The trustees of the gratuity fund are composed of representatives from employers. The trustees of the gratuity fund are required by the trust deed to act in the interest of the fund and of all relevant stakeholders in the scheme, i.e. active employees, inactive employees, retirees and employers. The trustees of the gratuity fund are responsible for the investment policy with regard to the assets of the fund.
37.2 The plan in Pakistan typically exposes the Bank to actuarial risks such as: salary risk, discount rate risk, mortality risk and investment risk defined as follow:
- Salary increase risk:
The risk that the final salary at the time of cessation of services is greater than assumed. Since the benefit is calculated on the final salary (which will closely reflect inflation and other macroeconomic factors), the benefit amount increases as salary increases.
- Discount rate risk
The discount rate is based on the yield on government bonds. If the market yield of bonds varies, the discount rate would vary in the same manner and would affect the present value of obligation and fair value of assets.

177 Annual Report 2020
Notes to the Unconsolidated Financial StatementsFor the year ended December 31, 2020
- Demographic Risks
- Withdrawal risk:The risk of actual withdrawals experience is different from assumed withdrawal probability. The significance of the withdrawal risk varies with the age, service and the entitled benefits of the beneficiary.
- Longevity RiskThe risk that the actual mortality experience is different than the assumed mortality. This effect is more pronounced in schemes where the age and service distribution is on the higher side.
- Investment riskThis is the risk that the assets are under-performing and are not sufficient to meet the liabilities.
37.3 Number of employees under the schemes
The number of employees covered under defined benefit scheme (gratuity fund) is 3,756 (2019: 3,595).
37.4 Principal actuarial assumptions
Principal actuarial assumptions at the end of the reporting period expressed as weighted averages. The actuarial valuations were carried out on December 31, 2020 based on the Projected Unit Credit Method, using the following significant assumptions:
2020 2019
Valuation discount rate for year end obligation per annum 9.75% 11.75%
Interest cost on defined benefit obligation per annum 11.75% 13.75%
Interest income on plan assets per annum 11.75% 13.75%
Future salary increase rate- upto one years per annum 8.00% 8.00%- from two to three years per annum 10.00% 10.00%- more than three years per annum 9.75% 11.75%
The average duration of the defined benefit obligation years 10 10
Normal retirement age years 60 60
Withdrawal rates Moderate Moderate
Mortality rates SLIC 2001-2005, Setback
1 Year
SLIC 2001-2005, Setback
1 Year

178Annual Report 2020
Notes to the Unconsolidated Financial StatementsFor the year ended December 31, 2020
37.5 Movement in defined benefit obligations, fair value of plan assets and their components
Defined benefitobligations
Fair value ofplan assets
Net defined benefitliability / (asset)
2020 2019 2020 2019 2020 2019 ---------------------------------------- Rupees in ‘000 ----------------------------------------
Balance as at January 01, 2020 844,212 649,062 692,331 546,568 151,881 102,494
Included in profit or lossCurrent service cost 148,693 125,676 - - 148,693 125,676 Past service cost 1,820 2,113 - - 1,820 2,113 Interest cost / income 97,343 87,892 88,420 80,969 8,923 6,923
247,856 215,681 88,420 80,969 159,436 134,712 Included in other comprehensive income Actuarial gains / losses arising from:- financial assumptions 14,025 (8,792) - - 14,025 (8,792)- experience adjustments (266) 7,956 - - (266) 7,956 Return on plan assets - - 490,776 (18,005) (490,776) 18,005
13,759 (836) 490,776 (18,005) (477,017) 17,169 Other movements Contribution made during the year - - 151,881 102,494 (151,881) (102,494)Benefits paid during the year (31,529) (19,695) (31,529) (19,695) - -
(31,529) (19,695) 120,352 82,799 (151,881) (102,494)
Balance as at December 31, 2020 1,074,298 844,212 1,391,879 692,331 (317,581) 151,881
37.6 The composition of the plan assets at the end of the reporting period for each category, are as follows:
Cost Fair value of plan assets2020 2019 2020 2019 2020 2019------------------- Rupees in ‘000 -------------------- Percentage
Cash and cash equivalentsCash at Bank 82,793 171,000 82,793 171,000 5.9% 24.6%Term deposits receipts 150,000 - 161,806 - 11.6% 0.0%
232,793 171,000 244,599 171,000 17.6% 24.6%Debt securities - - - Pakistan Investment Bonds 388,863 304,064 411,079 297,918 29.5% 42.9%Market treasury bills 53,815 114,508 53,660 117,399 3.9% 16.9%Term finance certificates 50,503 100,590 50,370 94,459 3.6% 13.6%
493,181 519,162 515,109 509,776 37.0% 73.4%Ordinary Shares of listed companies 448,506 14,929 632,172 13,346 45.4% 1.9%
1,174,480 705,091 1,391,880 694,122 100% 100%
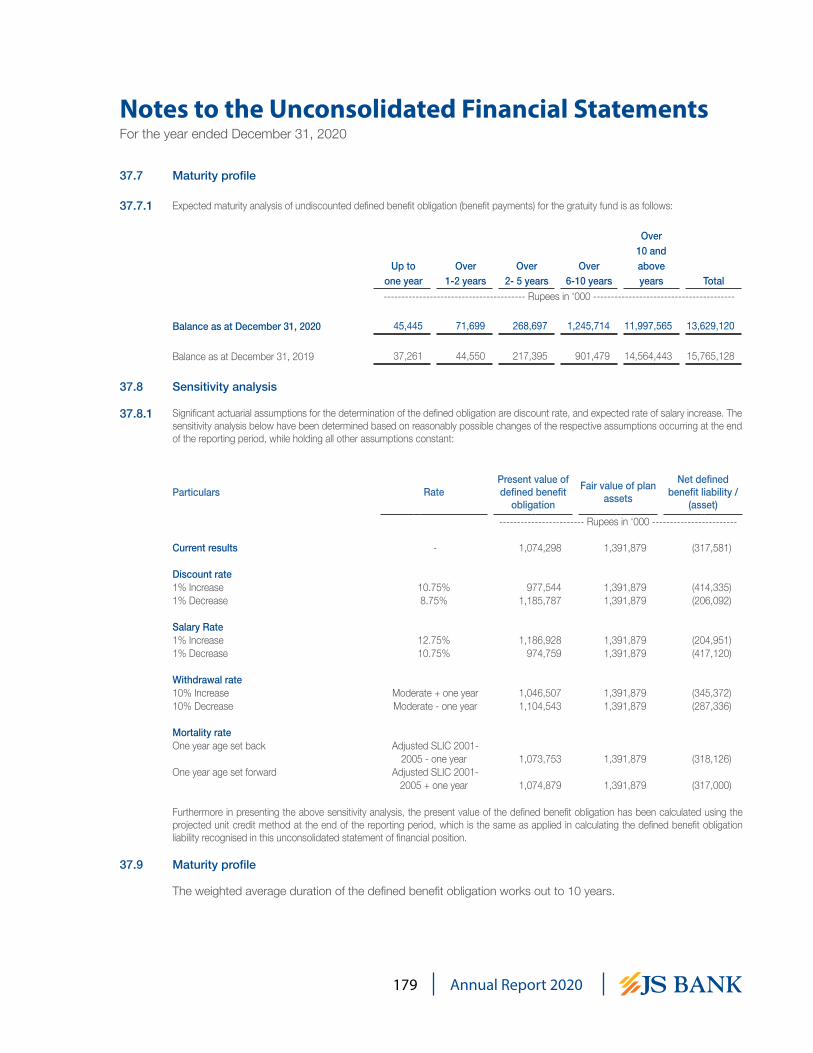
179 Annual Report 2020
Notes to the Unconsolidated Financial StatementsFor the year ended December 31, 2020
37.7 Maturity profile
37.7.1 Expected maturity analysis of undiscounted defined benefit obligation (benefit payments) for the gratuity fund is as follows:
Over10 and
Up to Over Over Over above one year 1-2 years 2- 5 years 6-10 years years Total ---------------------------------------- Rupees in ‘000 ----------------------------------------
Balance as at December 31, 2020 45,445 71,699 268,697 1,245,714 11,997,565 13,629,120
Balance as at December 31, 2019 37,261 44,550 217,395 901,479 14,564,443 15,765,128
37.8 Sensitivity analysis
37.8.1 Significant actuarial assumptions for the determination of the defined obligation are discount rate, and expected rate of salary increase. The sensitivity analysis below have been determined based on reasonably possible changes of the respective assumptions occurring at the end of the reporting period, while holding all other assumptions constant:
Particulars RatePresent value of defined benefit
obligation
Fair value of plan assets
Net defined benefit liability /
(asset)------------------------ Rupees in ‘000 ------------------------
Current results - 1,074,298 1,391,879 (317,581)
Discount rate1% Increase 10.75% 977,544 1,391,879 (414,335)1% Decrease 8.75% 1,185,787 1,391,879 (206,092)
Salary Rate1% Increase 12.75% 1,186,928 1,391,879 (204,951)1% Decrease 10.75% 974,759 1,391,879 (417,120)
Withdrawal rate10% Increase Moderate + one year 1,046,507 1,391,879 (345,372)10% Decrease Moderate - one year 1,104,543 1,391,879 (287,336)
Mortality rateOne year age set back Adjusted SLIC 2001-
2005 - one year 1,073,753 1,391,879 (318,126)One year age set forward Adjusted SLIC 2001-
2005 + one year 1,074,879 1,391,879 (317,000)
Furthermore in presenting the above sensitivity analysis, the present value of the defined benefit obligation has been calculated using the projected unit credit method at the end of the reporting period, which is the same as applied in calculating the defined benefit obligation liability recognised in this unconsolidated statement of financial position.
37.9 Maturity profile
The weighted average duration of the defined benefit obligation works out to 10 years.

180Annual Report 2020
Notes to the Unconsolidated Financial StatementsFor the year ended December 31, 2020
37.10 Experience Adjustments
The re-measurement gains / losses arise due to actual experience varying from the actuarial assumptions for the year.
2020 2019 2018 2017 2016-------------------------------- Rupees in ‘000 --------------------------------
ParticularsDefined benefit obligation 1,074,298 844,212 649,062 550,729 367,635 Fair value of plan assets (1,391,879) (692,331) (546,568) (375,611) (249,327)
Net defined benefit liability (317,581) 151,881 102,494 175,118 118,308
Re-measurement loss / (gain) on obligation 13,759 (836) (52,391) 75,269 56,598 Re-measurement (gain) / loss on plan assets (490,776) 18,005 25,329 10,273 393
Other comprehensive income (477,017) 17,169 (27,062) 85,542 56,991
37.11 The average duration of the payment of benefit obligation at December 31, 2020 is within one year.
37.12 The Bank contributes to the gratuity fund as per actuarial’s valuation of the year.
37.13 Based on actuarial advice and management estimates, profit and loss account charge in respect of defined benefit obligation for the next one year works out to be Rs.139.866 million. The amount of re-measurements to be recognised in other comprehensive income for year ending December 31, 2020 will be worked out as at the next valuation.
38. DEFINED CONTRIBUTION PLAN
The Bank operates a contributory provident fund for all permanent employees. The employer and employee both contribute 7.1% of the basic salaries (2019: 7.1% of the basic salaries) to the funded scheme every month. Number of employees covered under this plan are 3,164 (2019: 3,092). During the year, the Bank has made a contribution of Rs. 229.001 million (2019: Rs. 209.871 million) to the fund. The employees have also made a contribution of equal amount to the fund.
39. COMPENSATION OF DIRECTORS AND EXECUTIVES
39.1 The aggregate amount charged in the financial statements for the year in respect of the remuneration and benefits to the President and Chief Executive Officer, Directors and Executives are as follows:
2020 Directors
President / CEO
Key Management
Personnel
Other Material
Risk Takers/ Controllers
Items Chairman Non-Executives
-------------------------------- Rupees in ‘000 --------------------------------
Fees and Allowances etc. 2,850 17,100 - - - Managerial Remunerationi) Fixed - - 39,818 294,664 436,946 ii) Total Variable - Cash Bonus / Awards - - 10,500 52,199 66,626 Charge for defined benefit plan - - 2,430 17,415 25,824 Contribution to defined contribution plan - - 2,827 20,780 24,789 Medical - - 3,982 29,466 43,695 Conveyance - - 300 654 - Car allowance - - - 31,715 68,138 Others - - 190 5,522 17,748 Total 2,850 17,100 60,047 452,415 683,766
Number of persons 1 7 1 30 85

181 Annual Report 2020
Notes to the Unconsolidated Financial StatementsFor the year ended December 31, 2020
2019 Directors
President / CEO
Key Management
Personnel
Other Material Risk Takers/ Controllers
Items Chairman Non-Executives
-------------------------------- Rupees in ‘000 --------------------------------
Fees and Allowances etc. 1,950 10,100 - - - Managerial Remunerationi) Fixed - - 32,727 249,705 365,567 ii) Total Variable - Cash Bonus / Awards - - - - 1,440 Charge for defined benefit plan - - 1,934 14,757 20,606 Contribution to defined contribution plan - - 3,279 20,306 30,326 Medical - - 3,273 24,934 36,557 Conveyance - - 667 11,196 32,466 Car allowance - - - 4,924 11,852 Others - - 300 912 1,885 Total 1,950 10,100 42,180 326,734 500,699
Number of persons 1 7 1 24 87
39.1.1 The CEO and deputy CEO are provided with free use of Bank maintained cars in accordance with their entitlement.
39.1.2 Managerial remuneration includes joining related payments made to certain Executives in line with their terms ofemployment.
39.1.3 All Executives, including the CEO of the Bank, are also entitled to certain short term employee benefits which are disclosed in note 39.1 to these unconsolidated financial statements.
39.1.4 The SBP, vide its BPRD Circular No. 01 dated January 25, 2017, issued Guidelines on Remuneration Practices, where the Bank is required to defer a certain portion of variable compensation of the Material Risk Takers (MRTs) and Material Risk Controllers (MRCs) subject to mandatory deferrals for a defined period. In this respect, deferral amount shall be withheld for a period of three years whereas remaining portion of the variable compensation shall be paid upfront to the MRTs and MRCs. The deferred remuneration shall vest proportionately over the deferral period following the year of variable remuneration award. The deferred portion of the variable remuneration shall be paid to the MRTs and MRCs on vesting, proportionally through yearly instalments, during the deferred period, in case no malus triggers are applicable. Details of MRTs and MRCs are given below:
2020 2019Employees Covered under: ---------- Numbers ----------
Marterial Risk Takers (MRTs) 66 78 Marterial Risk Controllers (MRCs) 39 31
105 109
2020 2019 ---------- Rupees ‘000 ----------
Movement of deferred remunerationOpening 218 - Deferred during the year 48,350 218 Paid during the year (73) - Closing 48,495 218

182Annual Report 2020
Notes to the Unconsolidated Financial StatementsFor the year ended December 31, 2020
2020
Board Meetings
Board Committees
Audit Committee
Human Resource,
Remuneration & Nomination
Committee
Risk Management Committee
I.T Committee
Total Amount Paid
--------------------------------------------- Rupees in ‘000 ---------------------------------------------39.2 Meeting Fees and Allowances Paid
Name of Director1 Mr. Kalim-ur-Rahman 1,500 - 850 - 500 1,350 2 Mr. Adil Matcheswala 1,500 500 850 - - 1,350 3 Mr. Ashraf Nawabi 1,250 - - 400 - 400 4 Mr. G.M. Sikander 1,500 500 750 - - 1,250 5 Mr. Hassan Afzal 1,500 - - - 500 500 6 Mr. Munawar Alam Siddiqui 1,500 500 - 500 - 1,000 7 Ms. Nargis Ghaloo 1,500 500 - 500 - 1,000 8 Mr. Sohail Aman 1,500 - 850 - 500 1,350
Total amount paid 11,750 2,000 3,300 1,400 1,500 8,200
2019
Board Meetings
Board Committees
Audit Committee
Human Resource,
Remuneration & Nomination Committee
Risk Management Committee
I.T Committee
Total Amount Paid
--------------------------------------------- Rupees in ‘000 ---------------------------------------------Meeting Fees and Allowances Paid
Name of Director1 Mr. Kalim-ur-Rahman 1,250 - 200 200 300 700 2 Mr. Adil Matcheswala 1,000 300 300 - - 600 3 Mr. Ashraf Nawabi 1,000 - - 200 - 200 4 Mr. G.M. Sikander 1,250 300 400 - - 700 5 Mr. Hassan Afzal 750 - - - 300 300 6 Mr. Munawar Alam Siddiqui 1,250 300 300 - - 600 7 Ms. Nargis Ghaloo 1,250 200 100 200 - 500 8 Mr. Sohail Aman 250 - - - 100 100 9 Mr. Shahab Anwar Khawaja 250 100 - - - 100
Total amount paid 8,250 1,200 1,300 600 700 3,800

183 Annual Report 2020
Notes to the Unconsolidated Financial StatementsFor the year ended December 31, 2020
40. FAIR VALUE OF FINANCIAL INSTRUMENTS
IFRS 13 “Fair Value Measurement” defines fair value as the price that would be received to sell an asset or paid to transfer a liability in an orderly transaction between market participants at the measurement date.
The fair value of quoted securities other than those classified as held to maturity, is based on quoted market price. Fair value of fixed term loans, other assets, other liabilities and fixed term deposits cannot be calculated with sufficient reliability due to absence of current and active market for assets and liabilities and reliable data regarding market rates for similar instruments. The provision for impairment of loans and advances has been calculated in accordance with the Bank’s accounting policy as stated in note 4.6 to the annual unconsolidated financial statements for the year ended December 31, 2020.
The repricing profile, effective rates and maturity are stated in note 45.2.4 to these financial statements.
In the opinion of the management, the fair value of the remaining financial assets and liabilities are not significantly different from their carrying values since assets and liabilities are either short term in nature or in the case of customer loans and deposits are frequently repriced.
Fair value hierarchy
IFRS 13 requires the Bank to classify fair value measurement using a fair value hierarchy that reflects the significance of the inputs used in making the measurements. The fair value hierarchy has following levels:
Level 1: Fair value measurements using quoted prices (unadjusted) in active markets for identical assets or liabilities that the entity can access at the measurement date.
Level 2: Fair value measurements using inputs other than quoted prices included within Level 1 that are observable for the asset or liability, either directly or indirectly.
Level 3: Fair value measurements using unobservable inputs for the asset or liability.
40.1 Valuation techniques used in determination of fair values within level
Item Valuation approach and input usedFinancial Instruments- Level 1Shares of listed companies Fair values of investments in listed equity securities are valued
on the basis of closing quoted market prices available at the Pakistan Stock Exchange.
Financial instruments - Level 2Units of mutual funds Fair values of investments in units of mutual funds are determined
based on redemption prices disclosed at the Mutual Funds Association of Pakistan (MUFAP) as at the close of the business days.
Market Treasury Bills(MTB) / Pakistan Investment Bonds(PIB), and GoP Sukuks (GIS)
Fair values of Pakistan Investment Bonds and Market Treasury Bills are derived using PKRV and PKFRV rates (Reuters page).
Debt Securities (TFCs) and Sukuk other than Government
Investments in debt securities (comprising Term Finance Certificates, Bonds and any other security issued by a company or a body corporate for the purpose of raising funds in the form of redeemable capital) are valued on the basis of the rates announced by the Mutual Funds Association of Pakistan (MUFAP) in accordance with the methodology prescribed by the SECP.

184Annual Report 2020
Notes to the Unconsolidated Financial StatementsFor the year ended December 31, 2020
Overseas Government Sukuks, Overseas and Euro Bonds
The fair value of Overseas Government Sukuks, and Overseas Bonds are valued on the basis of price available on Bloomberg.
Forward foreign exchange contractsThe valuation has been determined by interpolating the foreign exchange revaluation rates announced by the State Bank of Pakistan.
Derivatives
The fair values of derivatives which are not quoted in active markets are determined by using valuation techniques. The valuation techniques take into account the relevant underlying parameters including foreign currencies involved, interest rates, yield curves, volatilities, contracts duration, etc.
Financial instruments in level 3Currently, no financial instruments are classified in level 3.
The fair value of unquoted debt securities, fixed term loans, other assets, other liabilities, fixed term deposits and borrowings cannot be calculated with sufficient reliability due to the absence of a current and active market for these assets and liabilities and reliable data regarding market rates for similar instruments.
Non- financial assets- Level 3Fixed assets - Land and building
Fixed assets and Non-banking assets under satisfaction of claims are carried at revalued amounts determined by professional valuers based on their assessment of the market values as disclosed in note 11 and 13 respectively. The valuations are conducted by the valuation experts appointed by the Bank which are also on the panel of State Bank of Pakistan. The valuation experts used a market based approach to arrive at the fair value of the Bank’s properties. The market approach used prices and other relevant information generated by market transactions involving identical or comparable or similar properties. These values are adjusted to reflect the current condition of the properties. The effect of changes in the unobservable inputs used in the valuations cannot be determined with certainty, accordingly a qualitative disclosure of sensitivity has not been presented in these financial statements.
Non-banking assets under satisfactionof claims
40.2 The Bank’s policy is to recognise transfers into and out of the different fair value hierarchy levels at the date the event or change in circumstances that caused the transfer occurred. There were no transfers between levels 1 and 2 during the year.
40.3 The following table provides an analysis of financial assets that are measured subsequent to initial recognition at fair value, grouped into Levels 1 to 3 based on the degree to which the fair value is observable.

185 Annual Report 2020
Notes to the Unconsolidated Financial StatementsFor the year ended December 31, 2020
2020Level 1 Level 2 Level 3 Total
On balance sheet financial instruments ------------------------- Rupees in ‘000 -------------------------
Financial assets - measured at fair value
Held-for-trading securitiesInvestments
Federal Government Securities - 25,003,774 - 25,003,774
Available-for-sale securitiesInvestmentsFederal Government Securities - 127,406,043 - 127,406,043 Shares 4,264,334 - - 4,264,334 Non Government Debt Securities - 457,454 - 457,454 Foreign Securities - 4,017,289 - 4,017,289
4,264,334 131,880,786 - 136,145,120 Financial assets - disclosed but not measured at fair value Investments
Federal Government Securities - 36,109,599 - 36,109,599 4,264,334 192,994,159 - 197,258,493
Non-Financial assets - measured at fair valueRevalued fixed assets - - 2,610,299 2,610,299 Non-banking assets acquired in satisfaction of claims - - 1,311,252 1,311,252
- - 3,921,551 3,921,551 Off balance sheet financial instruments
Commitments in respect of:
Forward foreign exchange contractsPurchase - 22,942,707 - 22,942,707 Sale - 14,910,910 - 14,910,910
Derivative instruments:Forward securitiesPurchase - 1,394 - 1,394
Interest rate swapsPurchase - 1,120,607 - 1,120,607 Sale - 1,125,550 - 1,125,550
OptionsPurchase - 581,042 - 581,042 Sale - 2,437,068 - 2,437,068

186Annual Report 2020
Notes to the Unconsolidated Financial StatementsFor the year ended December 31, 2020
2019Level 1 Level 2 Level 3 Total
On balance sheet financial instruments ------------------------- Rupees in ‘000 -------------------------
Financial assets - measured at fair value
Held-for-trading securitiesInvestments
Federal Government Securities - 55,598,469 - 55,598,469
Available-for-sale securitiesInvestments
Federal Government Securities - 47,019,374 - 47,019,374 Shares 1,965,753 - - 1,965,753 Non Government Debt Securities - 540,303 - 540,303
1,965,753 47,559,677 - 49,525,430 Financial assets - disclosed but not measured at fair value Investments
Federal Government Securities - 31,341,410 - 31,341,410 1,965,753 134,499,556 - 136,465,309
Non-Financial assets - measured at fair valueRevalued fixed assets - - 3,797,180 3,797,180 Non-banking assets acquired in satisfaction of claims - - 1,182,425 1,182,425
- - 4,979,605 4,979,605 Off balance sheet financial instruments
Commitments in respect of:
Forward foreign exchange contractsPurchase - 32,885,546 - 32,885,546 Sale - 21,722,741 - 21,722,741
Derivative instruments
Forward securitiesPurchase - 499,818 - 499,818
Interest rate swapsPurchase - 1,474,016 - 1,474,016 Sale - 2,738,661 - 2,738,661
OptionsPurchase - 1,024,638 - 1,024,638 Sale - 1,030,868 - 1,030,868

187 Annual Report 2020
Notes to the Unconsolidated Financial StatementsFor the year ended December 31, 2020
41. SEGMENT INFORMATION
41.1 Segment details with respect to business activities:
2020Corporate Finance
Trading and Sales
Retail Banking
Commercial Banking Others Total
------------------------------------------ Rupees in ‘000 ------------------------------------------Profit & Loss
Net mark-up / return /profit / (loss) - 14,285,475 (8,543,152) 4,034,968 - 9,777,291 Inter segment revenue - net - (17,035,715) 16,914,719 120,996 - - Non mark-up / return / interest income 93,161 2,905,042 2,349,650 1,258,710 69,794 6,676,357 Total Income 93,161 154,802 10,721,217 5,414,674 69,794 16,453,648
Segment direct expenses 33,286 149,059 6,711,460 1,081,529 314,749 8,290,083 Inter segment expense allocation - 334,127 2,664,330 1,862,559 - 4,861,016 Total expenses 33,286 483,186 9,375,790 2,944,088 314,749 13,151,099 Provisions - 344,219 124,158 811,231 - 1,279,608 Profit before tax 59,875 (672,603) 1,221,269 1,659,355 (244,955) 2,022,941
Statement of Financial Position
Cash & Bank balances - 20,722,345 10,804,855 - - 31,527,200 Investments 2,891,836 198,806,637 - - - 201,698,473 Net inter segment lending - - 129,898,985 109,429,008 11,732,961 251,060,954 Lendings to financial institutions - 23,239,672 - - - 23,239,672 Advances - net
Advances - performing - - 52,152,981 190,515,793 - 242,668,774 Advances - non-performing - - 4,760,888 6,972,667 - 11,733,555 Advances - (Provisions)/reversals - Net - - (938,040) (3,265,123) - (4,203,163)
- - 55,975,829 194,223,337 - 250,199,166 Others - 4,590,700 3,570,545 3,315,506 14,027,140 25,503,891 Total Assets 2,891,836 247,359,354 200,250,214 306,967,851 25,760,101 783,229,356
Borrowings - 12,208,219 1,996,091 34,099,102 - 48,303,412 Subordinated debt - 7,492,800 - - - 7,492,800 Deposits & other accounts - - 166,087,049 266,975,544 - 433,062,593 Net inter segment borrowing 2,891,836 227,156,281 21,012,836 - - 251,060,953 Others - 502,054 11,154,238 5,893,204 5,167,893 22,717,389 Total liabilities 2,891,836 247,359,354 200,250,214 306,967,850 5,167,893 762,637,147 Equity - - - - 20,592,208 20,592,208 Total Equity & liabilities 2,891,836 247,359,354 200,250,214 306,967,850 25,760,101 783,229,355
Contingencies & Commitments - 60,973,417 44,793,723 18,141,644 133,642 124,042,426

188Annual Report 2020
Notes to the Unconsolidated Financial StatementsFor the year ended December 31, 2020
2019Corporate Finance
Trading and Sales
Retail Banking
Commercial Banking Others Total
------------------------------------------ Rupees in ‘000 ------------------------------------------Profit & Loss
Net mark-up / return / profit / (loss) - 5,005,807 (7,592,022) 9,614,572 - 7,028,357 Inter segment revenue - net - (11,813,244) 19,091,812 (7,278,568) - - Non mark-up / return / interest income 59,843 437,628 1,996,345 965,788 483,600 3,943,204 Total Income 59,843 (6,369,809) 13,496,135 3,301,792 483,600 10,971,561
Segment direct expenses 115,306 136,150 5,506,958 719,110 852,887 7,330,411 Inter segment expense allocation - 323,430 2,003,084 1,273,491 - 3,600,005 Total expenses 115,306 459,580 7,510,042 1,992,601 852,887 10,930,416 Provisions - (424,361) (251,729) 584,160 - (91,930)Profit before tax (55,463) (6,405,028) 6,237,822 725,031 (369,287) 133,075
Statement of Financial Position
Cash & Bank balances - 17,153,413 8,898,772 - - 26,052,185 Investments - 142,568,470 - - - 142,568,470 Net inter segment lending - - 202,362,517 - 8,089,077 210,451,594 Lendings to financial institutions - 30,320,540 - - - 30,320,540 Advances - net
Advances - performing - - 94,201,743 141,898,229 - 236,099,972 Advances - non-performing - - 3,508,735 6,844,429 - 10,353,164 Advances (Provisions) - Net - - (469,382) (3,039,245) - (3,508,627)
- - 97,241,096 145,703,413 - 242,944,509 Others - 5,206,833 3,925,690 5,017,351 14,391,387 28,541,261 Total Assets - 195,249,256 312,428,075 150,720,764 22,480,464 680,878,559
Borrowings - 36,295,878 7,090,687 11,081,718 - 54,468,283 Subordinated debt - 7,494,800 - - - 7,494,800 Deposits & other accounts - - 295,347,351 74,442,613 - 369,789,964 Net inter segment borrowing - 150,619,213 - 59,832,381 - 210,451,594 Others - 839,365 9,990,037 5,364,052 5,147,209 21,340,663 Total liabilities - 195,249,256 312,428,075 150,720,764 5,147,209 663,545,304 Equity - - - - 17,333,255 17,333,255 Total Equity & liabilities - 195,249,256 312,428,075 150,720,764 22,480,464 680,878,559
Contingencies & Commitments - 59,810,338 43,939,275 17,795,589 131,093 121,676,295

189 Annual Report 2020
Notes to the Unconsolidated Financial StatementsFor the year ended December 31, 2020
41.2 Segment details with respect to geographical locations2020
Pakistan Bahrain TotalProfit & Loss ---------- Rupees in ‘000 ----------
Net mark-up / return / profit 9,442,805 334,486 9,777,291 Inter segment revenue - net 20,830 (20,830) - Non mark-up / return / interest income 6,513,962 162,395 6,676,357 Total Income 15,977,597 476,051 16,453,648
Segment direct expenses 12,951,890 199,209 13,151,099 Inter segment expense allocation - - - Total expenses 12,951,890 199,209 13,151,099 Provisions 1,141,263 138,345 1,279,608 Profit before tax 1,884,444 138,497 2,022,941
Statement of Financial PositionCash & Bank balances 29,191,991 2,335,209 31,527,200 Investments 197,608,101 4,090,372 201,698,473 Net inter segment lending 216,780,433 - 216,780,433 Lendings to financial institutions 23,239,672 - 23,239,672 Advances - performing 238,236,892 4,431,882 242,668,774 Advances - non-performing 11,733,555 - 11,733,555 Advances - (Provisions) / reversals - Net (4,181,836) (21,327) (4,203,163)
245,788,611 4,410,555 250,199,166 Others 25,335,531 168,360 25,503,891 Total Assets 737,944,339 11,004,496 748,948,835
Borrowings 48,211,222 92,190 48,303,412 Subordinated debt 7,492,800 - 7,492,800 Deposits & other accounts 425,531,719 7,530,874 433,062,593 Net inter segment borrowing 214,438,859 2,341,574 216,780,433 Others 22,638,412 78,977 22,717,389 Total liabilities 718,313,012 10,043,615 728,356,627 Equity 19,631,328 960,880 20,592,208 Total Equity & liabilities 737,944,340 11,004,495 748,948,835
Contingencies & Commitments 115,794,298 8,248,128 124,042,426

190Annual Report 2020
Notes to the Unconsolidated Financial StatementsFor the year ended December 31, 2020
2019Pakistan Bahrain Total
Profit & Loss ---------- Rupees in ‘000 ----------
Net mark-up / return / profit 6,778,252 250,105 7,028,357 Inter segment revenue - net (21,863) 21,863 - Non mark-up / return / interest income 3,937,975 5,229 3,943,204 Total Income 10,694,364 277,197 10,971,561
Segment direct expenses 7,157,913 172,498 7,330,411 Inter segment expense allocation 3,600,005 - 3,600,005 Total expenses 10,757,918 172,498 10,930,416 Provisions 13,088 (105,018) (91,930)Profit before tax (76,642) 209,717 133,075
Statement of Financial PositionCash & Bank balances 25,973,213 78,972 26,052,185 Investments 142,568,470 - 142,568,470 Net inter segment lending 208,787,632 1,663,962 210,451,594 Lendings to financial institutions 30,037,273 283,267 30,320,540 Advances - performing 232,347,686 3,752,286 236,099,972 Advances - non-performing 10,353,164 - 10,353,164 Advances - (Provisions) / reversals - net (3,508,627) - (3,508,627)
239,192,223 3,752,286 242,944,509 Others 28,416,470 124,791 28,541,261 Total Assets 674,975,281 5,903,278 680,878,559
Borrowings 53,452,873 1,015,410 54,468,283 Subordinated debt 7,494,800 - 7,494,800 Deposits & other accounts 365,972,359 3,817,605 369,789,964 Net inter segment borrowing 210,203,389 248,205 210,451,594 Others 21,293,138 47,525 21,340,663 Total liabilities 658,416,559 5,128,745 663,545,304 Equity 16,558,722 774,533 17,333,255 Total Equity & liabilities 674,975,281 5,903,278 680,878,559
Contingencies & Commitments 118,862,446 2,813,849 121,676,295
42. TRUST ACTIVITIES
The Bank under takes Trustee and other fiduciary activities that result in the holding or placing of assets on behalf of individuals and other organisations.These are not assets of the Bank and, therefore, are not included as such in these unconsolidated financial statements. Assets held under trust are shown in the table below:

191 Annual Report 2020
Notes to the Unconsolidated Financial StatementsFor the year ended December 31, 2020
2020
No. of IPS Accounts
Securities Held (Face Value)
TotalMarket Treasury Bills
Pakistan Investment
Bonds
Government Ijara Sukuk
-------------------- Rupees in ‘000 --------------------CategoryAssets Management Companies 1 23,000 - - 23,000 Charitable Institutions 1 - 142,000 - 142,000 Companies 13 2,373,860 25,560,800 - 27,934,660 Employees Funds 51 7,194,410 17,927,950 69,000 25,191,360 Individuals 43 919,290 431,500 - 1,350,790 Insurance Companies 8 24,076,000 84,255,700 1,621,500 109,953,200 Others 11 15,370,700 7,882,700 - 23,253,400 Total 128 49,957,260 136,200,650 1,690,500 187,848,410
2019
No. of IPS Accounts
Securities Held (Face Value)
TotalMarket Treasury Bills
Pakistan Investment
Bonds
Government Ijara Sukuk
-------------------- Rupees in ‘000 --------------------CategoryAssets Management Companies 7 320,000 1,843,000 - 2,163,000 Charitable Institutions 1 35,000 - - 35,000 Companies 15 4,709,075 9,099,300 - 13,808,375 Employees Funds 56 11,200,690 12,887,550 - 24,088,240 Individuals 48 1,135,755 404,400 - 1,540,155 Insurance Companies 10 16,930,900 99,466,700 597,500 116,995,100 Others 12 16,305,465 3,126,200 - 19,431,665 Total 149 50,636,885 126,827,150 597,500 178,061,535
43. RELATED PARTY TRANSACTIONS
The Bank has related party transactions with its parent, subsidiaries, associates, directors and Key Management Personnel and other related parties.
The Banks enters into transactions with related parties in the ordinary course of business and on Arm’s Length basis i.e. substantially the same terms as for comparable transactions with person of similar standing. Contributions to and accruals in respect of staff retirement benefits and other benefit plans are made in accordance with the actuarial valuations / terms of the contribution plan. Remuneration to the executives / officers is determined in accordance with the terms of their appointment.

192Annual Report 2020
Notes to the Unconsolidated Financial StatementsFor the year ended December 31, 2020
Details of transactions with related parties, other than those which have been specially disclosed elsewhere in these unconsolidated financial statements are as follows:
As at December 31, 2020 As at December 31, 2019
Parent DirectorsKey
management personnel
Subsidiaries Associates Other related parties Parent Directors
Key management
personnelSubsidiaries Associates Other related
parties
--------------------------------------------------------------------------------- (Rupees in ‘000) ---------------------------------------------------------------------------------Statement of Financial PositionLendings to financial institutionsOpening balance - - - - - - - - - - - - Addition during the year - - - - - 4,100,000 - - - - - - Repaid during the year - - - - - (4,100,000) - - - - - - Closing balance - - - - - - - - - - - -
Investments
Opening balance - - - 1,919,121 228,972 1,617,327 - - -
1,919,121 180,000 1,964,110
Investment made during the year - - - - 40,828 4,009,279 - - - - 48,972 1,542,991 Investment redeemed / disposed off during the year - - - - - (2,905,705) - - - - - (1,889,774)Closing balance - - - 1,919,121 269,800 2,720,901 - - - 1,919,121 228,972 1,617,327
Provision for diminution in value of investments - - - - - 277,456 - - - - - 65,022
Advances Opening balance - - 596,257 - - 1,946,481 - 5,230 448,575 - - 2,823,598Addition during the year - 58 265,948 193,550 153,128 6,402,913 - 316 322,590 - - 5,086,823Repaid during the year - (832) (150,821) - (2,235) (5,488,750) - (5,546) (120,115) - - (6,320,068)Transfer in / (out) - net - 122,880 68,271 - 219,875 1,232,786 - - (54,793) - - 356,128Closing balance - 122,106 779,655 193,550 370,768 4,093,430 - - 596,257 - - 1,946,481
Fixed AssetsPurchase of building - - - - - - - - - 607,299 - -
Cost of disposal - - - - - - - - 43,410 - - 17,657 Accumulated depreciation of disposal - - - - - - - - (12,927) - - (8,002)WDV of disposal - - - - - - - - 30,483 - - 9,655
Other AssetsInterest mark-up accrued - 2,801 6 1,253 954 52,998 - 48 473 - - 49,640 Receivable against bancassurance / bancatakaful - - - - - 28,051 - - - - - 67,952 Advance for subscription of TFC - unsecured - - - - - - - - - - 40,828 - Net defined benefit plan - - - - - 317,581 - - - - - - Prepaid insurance - - - - - - - - - - - 97,806 Dividend Receivable - - - - - - - - - 208,948 - - Other receivable - - - - - 379 - - - 6,133 - 1,000 Provision against other assets - - - - - 379 - - - - - 2,438

193 Annual Report 2020
Notes to the Unconsolidated Financial StatementsFor the year ended December 31, 2020
As at December 31, 2020 As at December 31, 2019
Parent DirectorsKey
management personnel
Subsidiaries Associates Other related parties Parent Directors
Key management
personnelSubsidiaries Associates Other
related parties
----------------------------------------------------------------------------- (Rupees in ‘000) -----------------------------------------------------------------------------BorrowingsOpening balance - - - - - - - - - - - 4,800,000 Borrowings during the year - - - - - 11,105,705 - - - - - 174,209,491 Settled during the year - - - - - (11,105,705) - - - - - (179,009,491)Closing balance - - - - - - - - - - - -
Deposits and other accountsOpening balance 271,648 24,444 59,593 1,246,363 23,104 8,622,201 336,515 24,308 74,950 1,606,413 - 9,656,833 Received during the year 5,511,316 511,942 973,685 499,101,485 861,135 160,825,941 4,332,699 160,210 1,437,872 538,270,222 1,023,592 235,460,531 Withdrawn during the year (5,610,945) (324,417) (869,813) (498,707,020) (834,486) (159,215,607) (4,364,266) (137,680) (1,450,123) (538,630,272) (1,042,362) (236,784,614)Transfer in / (out) - net - 366 (87,228) (2,058) - 132,631 (33,300) (22,394) (3,106) - 41,874 289,451 Closing balance 172,019 212,335 76,237 1,638,770 49,753 10,365,166 271,648 24,444 59,593 1,246,363 23,104 8,622,201
Subordinated debt - - - - - 889,432 - - - - - 889,588
Other LiabilitiesInterest / return / mark-up payable on deposits - - 85 - - 153,374 - - 114 - - 286,949 Interest / return / mark-up payable on borrowings - - - - - - - - - - - - Interest / return / mark-up payable on subordinated debt - - - - - 1,308 - - - - - 2,220 Payable to defined benefit plan - - - - - - - - - - - 147,885 Others payable - - - 353 - - - - - 5,638 - -
Represented ByShare Capital 9,733,073 19,180 12,223 - - 45,323 9,733,073 17,330 900 - - 81,765
Contingencies and CommitmentsLetter of guarantee - - - - - 29,054 - - - - - 14,217 Letter of Credit - - - - - 86,543 - - - - - 44,368
Profit and loss accountIncowmeMark-up / return / interest earned - 3,279 42,627 1,851 5,816 178,695 - 212 14,846 - - 322,478 Fee and commission income - 11 784 - - 227,206 - 29 368 - - 330,904 Dividend income - - - - - 90,633 - - - 208,948 - 85,332 Gain on sale of securities - net - - - - - 242,439 - - - - - 155,288 Other income - - - - - - - - 13,456 - - -
ExpenseMark-up / return / interest paid 46,099 3,490 3,204 156,221 2,600 1,135,034 35,406 2,227 4,309 232,715 2,930 1,383,816 Commission / charges paid - - - 9,215 - - - - - 4,670 - - Preference dividend paid - - - - - - 23,419 161 - - - 38 Remuneration paid - 54,790 414,220 - - - - - 343,874 - - - Non-executive directors’ fee - 19,950 - - - - - 11,000 - - - - Net charge for defined contribution plans - - - - - 159,436 - - - - - 209,871 Net charge / (reversal) for defined benefit plans - - - - - 229,001 - - - - - 134,313 Fee and subscription - - - - - - 9,588 - - - - - Donation - - - - - 112,841 - - - - - - Rental expense - - - - - 195 - - - 2,945 - - Advisory fee - - - - - - - - - - - 15,000 Other expenses 2,036 - - - - 1,899 - - - - - 2,162
Reimbursement of expenses - 869 5,679 6,632 - 30,598 1,886 1,240 - 1,145 - -
Payments made during the yearInsurance premium paid - - - - - 405,171 - - - - - 345,092 Insurance claims settled - - - - - 6,339 - - - - - 8,036 Defined benefit plans paid - - - - - 151,881 - - - - - 102,494
Other TransactionsSale of Government SecuritiesPurchase of Government Securities 585,477 1,645 - - - 113,055,811 1,605,975 2,968 - 83,216 - 295,412,399 Sale of Foreign Currencies - - - - - 43,560,278 - 1,352 - 25,045 - 12,797,839 Purchase of Foreign Currencies - - - - - 36,509,253 - - - - - 26,836,227
- - - - - 60,142,942 - - - - - 19,213,481

194Annual Report 2020
Notes to the Unconsolidated Financial StatementsFor the year ended December 31, 2020
2020 2019 ----- Rupees in ‘000 -----
44. CAPITAL ADEQUACY, LEVERAGE RATIO & LIQUIDITY REQUIREMENTS
Minimum Capital Requirement (MCR)Paid-up capital (net of losses) 10,119,242 10,119,242
Capital Adequacy Ratio (CAR)Eligible Common Equity Tier 1 (CET 1) Capital 16,227,512 14,619,607 Eligible Additional Tier 1 (ADT 1) Capital 2,251,350 2,500,000 Total Eligible Tier 1 Capital 18,478,862 17,119,607 Eligible Tier 2 Capital 4,621,001 4,306,756
Total Eligible Capital (Tier 1 + Tier 2) 23,099,863 21,426,363
Risk Weighted Assets (RWAs)Credit Risk 155,761,884 144,380,673 Market Risk 1,144,972 924,762 Operational Risk 23,981,730 20,468,251 Total 180,888,586 165,773,686
The SBP through its BSD Circular No. 07 dated April 15, 2009 has prescribed the minimum paid-up capital (net of accumulated losses) for banks to be raised to Rs.10,000 million by the year ending December 31, 2013. The paid-up capital of the Bank as at December 31, 2020 stood at Rs. 10,119.242 million (2019: Rs. 10,119.242 million) and is in compliance with SBP requirements.
The Banks are also required to maintain a minimum Capital Adequacy Ratio (CAR) of 10.0% plus capital conservation buffer of 1.5% of the risk weighted exposures of the Bank. Further, under Basel III instructions, Banks are also required to maintain a Common Equity Tier 1 (CET 1) ratio and Tier 1 ratio of 6.5% and 7.5%, respectively, as at December 31, 2020. As at December 31, 2020 the Bank is fully compliant with prescribed ratios, as the Bank’s CAR is 12.77% whereas CET 1 and Tier 1 ratios stood at 8.97% and 10.22% respectively. The Bank has complied with all capital requirements throughout the year.
Under the current capital adequacy regulations, credit risk and market risk exposures are measured using the Standardized Approach and operational risk is measured using the Basic Indicator Approach. Credit risk mitigants are also applied against the Bank’s exposures based on eligible collateral under comprehensive approach.
2020 2019 ----- Rupees in ‘000 -----
Common Equity Tier 1 Capital Adequacy ratio 8.97% 8.82%
Tier 1 Capital Adequacy Ratio 10.22% 10.33%
Total Capital Adequacy Ratio 12.77% 12.93%
Leverage Ratio (LR):Eligible Tier-1 Capital 18,478,862 17,119,607 Total Exposures 605,685,437 501,440,747 Leverage Ratio 3.05% 3.41%
Liquidity Coverage Ratio (LCR):Total High Quality Liquid Assets 157,850,263 83,221,592Total Net Cash Outflow 57,017,766 55,819,412Liquidity Coverage Ratio 276.84% 149.09%
Net Stable Funding Ratio (NSFR):Total Available Stable Funding 357,021,802 308,715,925Total Required Stable Funding 256,068,898 274,288,642Net Stable Funding Ratio 139.42% 112.55%
44.1 The link to the full disclosure is available at https://jsbl.com/knowledge-centre/investor-information/

195 Annual Report 2020
Notes to the Unconsolidated Financial StatementsFor the year ended December 31, 2020
45. RISK MANAGEMENT
Risk Management is a discipline at the core of every financial institution and encompasses all the activities that affect its risk profile. At the Bank, it involves identification, measurement, monitoring and controlling risks to ensure that:
a) The individuals who take or manage risks clearly understand it;b) The Bank’s Risk exposure is within the limits established by Board of Directors (BoD);c) Risk taking decisions are in line with the business strategy and objectives set by BoD;d) The expected payoffs compensate for the risks taken;e) Risk taking decisions are explicit and clear;f) Sufficient capital as a buffer is available to take risk; andg) Risk management function is independent of risk taking unit.
The Bank has a comprehensive set of Risk Management policies, practices and procedures which enable the Bank to take into consideration, in an appropriate manner, all major kinds of risks mainly credit, market, liquidity, operational and IT security risks. Keeping in view the dynamics of internal and external environment, we regularly review and update our Risk Management policies and procedures in accordance with regulatory environment and international standards.
Risk Management activities remain at the forefront of all activities of the Bank which places the highest priority on conducting its business in a prudent manner in line with the relevant laws and regulatory requirements.
Risk management framework of the Bank includes:
a) Clearly defined risk management policies and procedures covering risk identification, acceptance, measurement, monitoring, reporting and control;
b) Well constituted organizational structure, defining clearly roles and responsibilities of individuals involved in risk taking as well as managing it. The Bank, in addition to risk management functions for various risk categories, has instituted an Integrated Risk Management Committee (IRMC), Credit Risk Committee (CRC), Operational Risk Management Committee (ORMC), Remedial Management Committee (RMC) as well as Central Credit Committee (CCC). IRMC oversees the overall risk management at the Bank and provides guidance in setting strategic targets as well as concentration limits and monitor progress related to earnings growth, keeping in view the capital constraints and also adheres to the concentration limits. The IRMC monitors the strategic target and aggregate limits at the Business Group level and concentration limits (by industry, geography, size, tenor) so that one category of assets or dimension of risk cannot materially harm the performance of the Bank. CRC monitors the advances portfolio, concentrations limits, aggregate limits at business level and various house keeping elements under Credit Administration. ORMC oversees the effectiveness of operational risk management for maintenance and implementation of operational risk management framework. It also monitors the Business Continuity Planning and reviews findings of any other management or board’s sub committee. Remedial Management Committee (RMC) oversees the progress of non performing loans and cases under litigation along with the recommendation of transferring of any NPL to Corporate Restructuring Company (CRC). Whereas, Central Credit Committee (CCC) is entrusted with the responsibility of monitoring lending risk profile of the Bank. CCC meets regularly to actively supervise credit risk across its lending portfolio.
c) An effective management information system that ensures flow of information from operational level to top management and a system to address any exceptions observed; and
d) A mechanism to ensure an ongoing review of systems, policies and procedures for risk management and procedures to adopt changes.

196Annual Report 2020
Notes to the Unconsolidated Financial StatementsFor the year ended December 31, 2020
While the overall responsibility of risk management rests with the BoD, it is the duty of Senior Management to devise risk management strategy by setting up well defined policies and procedures for mitigating / controlling risks, duly approved by the Board.
Giving due consideration to the above, the Bank has put in place the following hierarchy of Risk Management:
- Board Risk Management Committee (BRMC);
- Integrated Risk Management Committee (IRMC) comprises of the President / Chief Executive Officer (CEO), Deputy CEO, Chief Risk Officer, Chief Financial Officer, Group Head Investment Banking & Emerging Business, Group Head Operations & Technology, Head of Compliance, Chief of Staff, Head of Treasury and Head Internal Audit (guest member).
- Asset - Liability Committee (ALCO) comprises of the President / Chief Executive Officer (CEO), Deputy CEO, Treasurer, Chief Risk Officer, Chief Financial Officer and attended by Other Business Heads.
- Central Credit Committee (CCC) comprising of the President / CEO, Deputy CEO, Chief Risk Officer, Chief Financial Officer, Group Head Investment Banking & Emerging Business, Chief of Staff and Head of Operational and Environmental Risk (for environmental risk only).
- Credit Risk Committee (CRC) comprises of President/CEO, Deputy CEO, Chief Risk Officer, Chief Financial Officer, Group Head Investment Banking & Emerging Business, Regional Credit Heads, Head CAD, Head of Consumer Risk, Head Enterprise Risk Management and Head Internal Audit (guest member).
- Operational Risk Management Committee (ORMC) comprises of the Deputy CEO, Chief Risk Officer, Group Head Operations & Technology, Country Head Branch Banking Operations, Group Head Human Resources Head of Compliance, Head of Service Management, Head Enterprise Risk Management and Head Internal Audit (guest member).
- Remedial Management Committee (RMC) comprises of President/CEO, Deputy CEO, Chief Risk Officer, Chief Operating Officer, Chief Financial Officer, Head of SAM, Credit Risk Heads and Head of Legal.
- IT Steering Committee (ITSC) comprises of President/CEO, Deputy CEO, Chief Risk Officer, Chief Financial Officer, Group Head Operations & Technology, Chief Information Officer, Chief Information Security Officer, Chief of Staff, Group Head Investment Banking & Emerging Business, Chief Digital Officer, Country Head Branch Banking Operations and Head Product Development & Consumer Business.
- Risk Management Group (RMG), a dedicated and independent set-up headed by Chief Risk Officer and comprises of Regional Credit Heads, Heads of Market & Liquidity Risks, Operational Risk and Treasury Middle Office, Consumer Risk, Credit Administration, Special Assets Management, Information Security, Strategic Projects & Quantitative Analysis and Enterprise Risk Management.
RMG is managed by Chief Risk Officer to supervise the following Divisions:
a) Credit Risk Management (CRM) covering Corporate / Commercial, Agricultural and Retail Banking Risksb) Operational Risk Management (ORM)c) Market Risk Management (MRM)d) Treasury Middle Officee) Basel II / III Implementation Unitf) Credit Administration Department (CAD)g) Special Assets Management (SAM)h) IS Risk Managementi) Consumer Riskj) Strategic Projects & Quantitative Analysis

197 Annual Report 2020
Notes to the Unconsolidated Financial StatementsFor the year ended December 31, 2020
The Bank’s RMG generates the requisite risk reporting for the different tiers of management. These are also subjected to internal audit review.
Risk Matrix / Categories
The Bank, in common with other banks, generates its revenues by accepting Country, Credit, Liquidity, Interest Rate Risk in the Banking Book, Market, Operational and other risks. Effective management of these risks is the decisive factor in the Bank’s profitability.
Risk Appetite
The Bank’s risk appetite is reflected in its endeavours to maintain a favourable credit rating and encompasses the following:
- The business strategy - The expectations of stakeholders at different time horizons - The characteristics of the risk-bearing entities - The nature and characteristics of the risks undertaken - The possible spread of risk situations across organizational units, assets-at-risk, and future time horizons.
Risk appetite drives business activity. It combines anticipations in risk and profitability with management preferences to control capital and resource allocation, as well as the distribution of exposure across activities and portfolios.
The Bank’s hedging strategy is embedded in its risk management practices for addressing material categories of risk.
45.1 Credit Risk
Credit risk is the risk which arises with the possibility that one party to a financial instrument will fail to discharge its obligation and cause the other party to incur a financial loss. Credit risk is managed in terms of credit policies, approved by the BoD and regulations issued by the SBP. The bank is exposed to credit risk on loans and advances, fund placements with financial institutions and certain investments.
Credit risk management is an ongoing process. The overall credit policy and the credit risk instructions are issued by the Board of Directors. In this regards, a Central Credit Committee (CCC) is entrusted with the responsibility of monitoring lending risk profile of the bank. In order to maintain healthy growth of the credit portfolio, the Bank’s Credit Risk Management processes are consistently upgraded and improved to meet future challenges.
The Bank’s strategy is to minimise credit risk through product, geography, industry and customer diversification. Credit limits are established for all counter-parties after a careful assessment of their credit worthiness. An effective credit granting procedure, which requires pre-sanction evaluation of credit proposal, adequacy of security and pre-disbursement examination of charge documents is in place and managed by Risk Management Group (RMG) & Credit Administration Department (CAD). The Bank maintains a sound portfolio diversified in nature to counter the risk of credit concentration and further confines risk through diversification of its assets by geographical and industrial sector. For managing impaired assets in the portfolio, the Bank follows the Prudential Regulations and Risk Management guidelines issued by SBP and the Remedial Management Policy approved by the Board.

198Annual Report 2020
Notes to the Unconsolidated Financial StatementsFor the year ended December 31, 2020
45.1.1 Credit risk: Standardised approach
The Bank has adopted the Standardised Approach of Basel II for risk weighing its Credit Risk Exposures.
The following table illustrates the approved External Credit Assessment Institutions (ECAIs) whose ratings are being utilised by the Bank with respect to material categories of exposures:
Exposures JCR-VIS PACRA MOODY’S FITCH S&P
Corporate - - -Banks SME’s (retail
exposures) - - -Sovereigns Securitisations N/A N/A N/A N/A N/AOthers (specify) N/A N/A N/A N/A N/A
The Bank has used Issue Specific Ratings for rating / risk weighing Issue Specific Exposures and Entity Ratings for rating / risk weighing claims against specific counterparties. Both short and long term ratings have been used to rate corresponding short and long term exposures. For this purpose, Mapping Grid provided by SBP as given below:
Long - Term Ratings Grades Mapping
SBP Rating Grade PACRA JCR-VIS Fitch Moody’s S&P ECA Scores
1 AAAAA+AAAA-
AAAAA+AAAA-
AAAAA+AAAA-
AaaAa1Aa2Aa3
AAAAA+AAAA-
1
2 A+AA-
A+AA-
A+AA-
A1A2A3
A+AA-
2
3 BBB+BBBBBB-
BBB+BBBBBB-
BBB+BBBBBB-
Baa1Baa2Baa3
BBB+BBBBBB-
3
4 BB+BBBB-
BB+BBBB-
BB+BBBB-
Ba1Ba2Ba3
BB+BBBB-
4
5 B+BB-
B+BB-
B+BB-
B1B2B3
B+BB-
5,6
6 CCC+ and below
CCC+ and below
CCC+ and below
Caa1 and below
CCC+ and below
7
Short - Term Ratings Grades Mapping
SBP PACRA JCR-VIS Fitch Moody’s S&P
S1 A-1 A-1 F-1 P-1 A-1+, A-1
S2 A-2 A-2 F-2 P-2 A-2
S3 A-3 A-3 F-3 P-3 A-3
S4 Others Others Others Others Others

199 Annual Report 2020
Notes to the Unconsolidated Financial StatementsFor the year ended December 31, 2020
45.1.2 Policies and processes for collateral valuation and management as regards Basel II;
For Credit Risk Mitigation purposes the Bank uses only the eligible collaterals under Comprehensive Approach of Credit Risk Mitigation under Standardised Approach as prescribed by SBP under Circular No. 8 of 2006, which includes Cash and Cash Equivalent Securities including Government Securities (like Cash Margins, Lien on Bank Accounts, Foreign Deposit Receipts, Term Deposit Receipts, Pledge of Defense Saving Certificates, Regular Income Certificates, Special Saving Certificates, T-Bills and Pakistan Investment Bonds etc.) and Shares, TFCs and Mutual Funds Listed on the Main Index.
Under the Bank’s policy all collaterals are subject to periodic valuations to monitor the adequacy of margins held. Shares / Marketable securities are valued by the Bank on daily basis to calculate the Drawing Power (DP). In case of any shortfall in the requisite margins, the DP is adjusted to the appropriate level and the business units are informed to take appropriate action as per the agreement with the customer.
Particulars of bank’s significant on-balance sheet credit risk in various sectors are analysed as follows:
Gross lendings Non-performing lendings Provision held2020 2019 2020 2019 2020 2019
45.1.3 Lendings to financial institutions ------------------------------------- Rupees in ‘000 -------------------------------------
Credit risk by public / private sector Public/ Government - - - - - - Private 23,240,897 30,321,802 - - 1,225 1,262
23,240,897 30,321,802 - - 1,225 1,262
Gross investments Non-performing investments Provision held 2020 2019 2020 2019 2020 2019
45.1.4 Investment in debt securities -------------------------------------------- Rupees in ‘000 --------------------------------------------
Credit risk by industry sector Textile 65,022 65,022 65,022 65,022 65,022 65,022 Chemical and Pharmaceuticals 249,860 258,193 149,860 149,860 149,860 149,860 Power (electricity), Gas, Water, Sanitary 71,429 142,857 - - - - Refinery 307,454 390,303 - - - - Transport, Storage and Communication 710,902 854,902 155,169 155,169 155,169 155,169 Financial 4,367,326 300,000 - - - - Services 1,265,104 1,350,000 - - - -
7,037,097 3,361,277 370,051 370,051 370,051 370,051
Gross investments Non-performing investments Provision held 2020 2019 2020 2019 2020 2019
-------------------------------------------- Rupees in ‘000 --------------------------------------------Credit risk by public / private sectorPublic/ Government 3,643,402 - - - - - Private 3,393,695 3,361,277 370,051 370,051 370,051 370,051
7,037,097 3,361,277 370,051 370,051 370,051 370,051

200Annual Report 2020
Notes to the Unconsolidated Financial StatementsFor the year ended December 31, 2020
Gross Advances Non-performing Advances Provision held 2020 2019 2020 2019 2020 2019
45.1.5 Advances ---------------------------------- Rupees in ‘000 ----------------------------------
Credit risk by industry sector Agri finance 7,797,960 5,285,334 433,949 207,192 107,329 397 Automobile and transportation equipment 3,912,821 3,854,727 117,937 227,878 64,829 69,596 Brokerage 8,866,882 6,929,558 - - - - Cement 2,236,379 2,958,936 - - - - Chemical 1,422,319 1,910,636 314,405 314,405 - - Construction 356,077 5,806,032 - 112,803 - 3,236 Electronics and electrical appliances 823,973 237,458 5,991 35,911 - - Engineering, IT and other services 9,453,353 5,013,829 82,124 38,738 31,683 26,325 Fertilizer 3,484,915 4,446,138 1,367,103 1,348,824 1,349,130 1,348,943 Financial 1,635,853 2,110,683 - - - - Food / confectionery / beverages 34,253,338 32,353,949 1,057,765 157,010 351,621 63,221 Individuals 33,122,827 31,512,186 2,041,082 1,533,451 506,898 238,185 Insurance and security 10,451 176,116 - - - - Metal and steel 9,966,050 8,824,579 2,607,092 1,614,845 722,969 339,372 Mining and quarrying 137,220 159,069 - - - - Paper / board / furniture 1,674,874 1,506,878 82,782 8,000 2,608 - Petroleum, oil and gas 5,122,089 4,135,890 95,053 80,053 37,160 29,618 Pharmaceuticals 5,289,290 5,722,234 4,577 4,577 - - Plastic 1,962,424 2,001,738 561,763 538,745 - 483 Power and water 23,897,355 27,878,617 156,241 159,806 19,130 - Real estate 4,203,207 3,493,350 1,306,057 1,300,000 13 - Shipbreaking 300,214 1,074,589 - 805,000 - 256,706 Storage 82,245 103,525 20,000 - - - Sugar 2,042,589 2,609,984 200,000 200,000 200,000 200,000 Tele-communication 2,838,926 2,709,181 - - - - TextileComposite 7,573,233 6,639,722 322,262 339,310 304,345 303,094 Ginning 1,281,801 1,612,059 34,539 48,949 9,065 20,157 Spinning 5,768,619 5,349,247 278,441 278,441 278,441 278,441 Weaving 8,669,251 9,988,010 47,284 47,284 19,653 3,726
23,292,904 23,589,038 682,526 713,984 611,504 605,418 Transportation 35,246,740 39,397,687 73,283 127,290 53,958 53,493 Trust and non-profit organisations 56,043 475,240 - - - - Tyre 267,203 288,551 - - - - Wholesale and retail trade 12,161,474 10,671,924 372,302 502,852 106,964 64,928 Others 18,484,334 9,215,480 151,523 321,800 16,040 40,020
254,402,329 246,453,136 11,733,555 10,353,164 4,181,836 3,339,941
Credit risk by public / private sector
Public/ Government 52,248,485 56,471,970 - - - - Private 202,153,844 189,981,166 11,733,555 10,353,164 4,181,836 3,339,941
254,402,329 246,453,136 11,733,555 10,353,164 4,181,836 3,339,941

201 Annual Report 2020
Notes to the Unconsolidated Financial StatementsFor the year ended December 31, 2020
Contingencies and commitments
2020 201945.1.6 Credit risk by industry sector -------- Rupees in ‘000 --------
Automobile and transportation equipment 2,371,968 2,163,575 Brokerage 850,500 796,500 Cement 779,749 247,368 Chemical 1,126,160 779,205 Construction 22,694,392 18,350,913 Electronics and electrical appliances 496,139 190,170 Engineering, IT and other services 3,293,028 3,033,858 Fertilizer 2,350,294 4,262,960 Financial 43,920,788 62,151,629 Food / confectionery / beverages 2,855,033 3,054,819 Individuals 592,229 989,889 Insurance and security 28,234 12,197 Metal and steel 4,629,296 3,709,350 Mining and quarrying - - Paper / board / furniture 808,302 888,015 Petroleum, oil and gas 656,214 586,136 Pharmaceuticals 856,079 721,858 Plastic 715,399 324,356 Power and water 795,807 495,534 Real estate 16,516,933 4,299,209 Shipbreaking 56,758 77,614 Sugar 8,601 24,301 Tele-communication 1,172,080 1,460,186 TextileComposite 1,384,271 1,037,819 Ginning 277,552 369,793 Spinning 3,497,170 1,485,788 Weaving 1,532,406 1,118,339
6,691,399 4,011,739 Transportation 30,537 24,896 Trust and non-profit organisations 116,293 217,780 Tyre 89,489 9,584 Wholesale and retail trade 3,320,259 4,328,745 Others 6,220,466 4,463,909
124,042,426 121,676,295
Credit risk by public / private sector
Public/ Government - - Private 124,042,426 121,676,295
124,042,426 121,676,295

202Annual Report 2020
Notes to the Unconsolidated Financial StatementsFor the year ended December 31, 2020
45.1.7.1 There are no classified advances placed under top 10 exposures.
45.1.7.2 The sanctioned limits against these top 10 exposures aggregated to Rs. 107,031.73 million (2019: 85,937.967 million).
45.1.8 Advances - Province / Region-wise Disbursement & Utilization
2020
DisbursementsUtilization
Punjab Sindh KPK & FATA Balochistan Islamabad AJK & Gilgit-Baltistan Bahrain
----------------------------------------------------------------- Rupees in ‘000 -----------------------------------------------------------------Province / RegionPunjab 87,425,286 87,425,286 - - - - - - Sindh 152,675,348 - 152,675,348 - - - - - KPK including FATA 1,055,415 - - 1,055,415 - - - - Balochistan 244,399 - - - 244,399 - - - Islamabad 16,845,491 - - - - 16,845,491 - - AJK including Gilgit-Baltistan 247,017 - - - - - 247,017 - Bahrain 8,441,218 - - - - - - 8,441,218 Total 266,934,174 87,425,286 152,675,348 1,055,415 244,399 16,845,491 247,017 8,441,218
2019
DisbursementsUtilization
Punjab Sindh KPK & FATA Balochistan Islamabad AJK & Gilgit-Baltistan Bahrain
----------------------------------------------------------------- Rupees in ‘000 -----------------------------------------------------------------Province / RegionPunjab 80,305,925 80,305,925 - - - - - - Sindh 146,330,605 - 146,330,605 - - - - - KPK including FATA 1,456,326 - - 1,456,326 - - - - Balochistan 111,734 - - - 111,734 - - - Islamabad 13,423,194 - - - - 13,423,194 - - AJK including Gilgit-Baltistan 197,627 - - - - - 197,627 - Bahrain 4,727,124 - - - - - - 4,727,124 Total 246,552,535 80,305,925 146,330,605 1,456,326 111,734 13,423,194 197,627 4,727,124
45.2 Market Risk
Market risk is the risk of loss due to adverse changes in interest rates, foreign exchange rates, equity prices and market conditions. From the perspective of the Bank, market risk comprises of interest rate risk, foreign exchange risk and equity position risk, which the Bank is exposed to in its trading book.
The Bank has an approved market risk policy wherein the governance structure for managing market risk, measurement tools used and the market risk exposure limits have been addressed. The Bank’s strategy for managing market risk is to relate the level of risk exposures to their risk appetite and the capital at hand.
45.1.7 Concentration of Advances
The bank top 10 exposures on the basis of total (funded and non-funded exposures) aggregated to Rs. 95,329.829 million (2019: Rs. 85,937.967 million) are as following:
2020 2019 Note ----- Rupees in ‘000 -----
Funded 45.1.7.1 64,985,417 65,309,390 Non Funded 45.1.7.2 30,344,412 20,628,577 Total Exposure 95,329,829 85,937,967

203 Annual Report 2020
Notes to the Unconsolidated Financial StatementsFor the year ended December 31, 2020
The Board of Directors (BoD) and the Asset and Liability Committee (ALCO) are responsible for addressing market risk from a strategic perspective and are assisted by the market risk function in meeting these objectives.
The Market Risk Unit reports directly to Head ERM and is responsible for ensuring the implementation of market risk policy in line with the Bank’s strategy.
Risk reporting undertaken by the market risk function includes:
a) Portfolio Reportsb) Limit monitoring reportsc) Sensitivity analysis; andd) Stress testing of the portfolio
Currently, the Bank is using the market risk standardised approach for the purpose of computing regulatory capital, the details of which are set out above.
45.2.1 Balance sheet split by trading and banking books
2020 2019Banking book Trading book Total Banking book Trading book Total
------------------------------------------------------- Rupees in ‘000 ----------------------------------------
Cash and balances with treasury banks 30,421,231 - 30,421,231 25,589,349 - 25,589,349 Balances with other banks 1,105,969 - 1,105,969 462,836 - 462,836 Lendings to financial institutions 23,239,672 - 23,239,672 30,320,540 - 30,320,540 Investments 176,694,699 25,003,774 201,698,473 86,970,001 55,598,469 142,568,470 Advances 250,199,166 - 250,199,166 242,944,509 - 242,944,509 Fixed assets 7,599,538 - 7,599,538 9,692,701 - 9,692,701 Intangible assets 2,486,725 - 2,486,725 2,271,360 - 2,271,360 Deferred tax assets - - - 8,756 - 8,756 Other assets 14,678,428 - 14,678,428 16,194,444 - 16,194,444 Assets held for sale 739,200 - 739,200 374,000 - 374,000
507,164,628 25,003,774 532,168,402 414,828,496 55,598,469 470,426,965
45.2.2 Foreign Exchange Risk
Main objective of foreign exchange risk management is to ensure that the foreign exchange exposure of the Bank lies within the defined appetite of the Bank.
Daily reports are generated to monitor the internal and regulatory limits with respect to the overall foreign currency exposures. The overall net open position, whether short or long has the potential to negatively impact the profit and loss depending upon the direction of movement in foreign exchange rates.
Foreign exchange open and mismatched positions are marked to market on a daily basis.
Currency risk arises where the value of financial instruments changes due to changes in foreign exchange rates. In order to manage currency risk exposure the bank enters into ready / spot, forward and swap transactions with SBP and in the interbank market. The Bank’s foreign exchange exposure comprises of forward contracts, foreign currencies cash in hand, balances with banks abroad, foreign placement with SBP and foreign currencies assets and liabilities. The net open position is managed within the statutory limits, as fixed by SBP. Counter parties limit are also fixed to limit risk concentration. Appropriate segregation of duties exists between the front and back office functions while compliance with the net open position limit is independently monitored on an ongoing basis.

204Annual Report 2020
Notes to the Unconsolidated Financial StatementsFor the year ended December 31, 2020
2020Net foreign
Off-balance currencyAssets Liabilities sheet items exposure
---------------------- Rupees in ‘000 ---------------------
United States Dollar 20,731,596 28,340,649 7,925,120 316,067 Great Britain Pound 690,248 2,767,203 1,692,641 (384,314)Euro 2,028,206 1,324,879 (938,258) (234,931)Other currencies 542,006 397,092 (96,962) 47,952
23,992,056 32,829,823 8,582,541 (255,226)
2019Net foreign
Off-balance currencyAssets Liabilities sheet items exposure
---------------------- Rupees in ‘000 ---------------------
United States Dollar 12,248,588 20,805,267 8,586,023 29,344 Great Britain Pound 879,840 2,696,794 1,778,936 (38,018)Euro 585,843 901,267 326,018 10,594 Other currencies 41,154 34,019 4,829 11,964
13,755,425 24,437,347 10,695,806 13,884
2020 2019Banking
bookTrading book
Banking book
Tradingbook
------------------ Rupees in ‘000 ------------------
Impact of 1% change in foreign exchange rates on - Profit and loss account - 2,552 - 159 - Other comprehensive income - - - -
45.2.3 Equity position Risk
Equity positions in the banking book include Investment in equities that are available-for-sale or held for strategic investment purposes. These investments are generally regarded as riskier relative to fixed income securities owing to the inherent volatility of stock market prices. The Bank mitigates these risks through diversification and capping maximum exposures in a single company, compliance with regulatory requirement, and following the guidelines laid down in the Bank’s Investment Policy as set by the Board of Directors (BoD). The Bank follows a delivery versus payment settlement system thereby minimizing risk available in relation to settlement risk.
Equity price risk is managed by applying trading limit and scrip-wise and portfolio wise nominal limits.
2020 2019Banking
bookTradingbook
Banking book
Tradingbook
------------------ Rupees in ‘000 ------------------
Impact of 5% change in equity prices on - Profit and loss account - - - - - Other comprehensive income 221,940 - 105,788 -

205 Annual Report 2020
Notes to the Unconsolidated Financial StatementsFor the year ended December 31, 2020
45.2.4 Yield / Interest Rate Risk in the Banking Book (IRRBB)-Basel II Specific
Yield/ Interest rate sensitivity position for on-balance sheet instruments is based on the earlier of contractual re-pricing or maturity date and for off-balance sheet instruments is based on settlement date. This also refers to the non-trading market risk. The gap analysis between the market rate sensitive assets and liabilities as per the table given below:
2020 2019Banking
bookTradingbook
Banking book
Tradingbook
------------------ Rupees in ‘000 ------------------
Impact of 1% change in interest rates on - Profit and loss account 20,570 235,507 301,595 534,770 - Other comprehensive income 1,033,253 - 248,246 -

206Annual Report 2020
Notes to the Unconsolidated Financial StatementsFor the year ended December 31, 2020
45.3
Mism
atch o
f inter
est r
ate se
nsitiv
e ass
ets an
d liab
ilities
Intere
st rat
e risk
is the
risk t
hat th
e valu
e of a
finan
cial in
strum
ent w
ill fluc
tuate
due t
o cha
nges
in th
e mark
et int
erest
rates
. The
Bank
is ex
pose
d to i
nteres
t / ma
rk-up
rate
risk a
s a re
sult o
f mism
atche
s or g
aps in
the a
moun
t of in
teres
t / ma
rk up
base
d ass
ets an
d liab
ilities
that
matur
e or
re-pri
ce in
a give
n peri
od. T
he Ba
nk m
anag
es th
is risk
by m
atchin
g/re-p
ricing
of as
sets
and l
iabiliti
es. T
he as
sets
and l
iabiliti
es co
mmitte
e (AL
CO) o
f the B
ank m
onito
rs an
d man
ages
the in
teres
t rate
risk w
ith th
e obje
ctive
of lim
iting t
he po
tentia
l adve
rse eff
ects
on th
e profi
tability
of th
e Ban
k.
20
20No
n-int
erest
Effec
tive
Over
1Ov
er 3
Over
6Ov
er 1
Over
2Ov
er 3
Over
5be
aring
yie
ldUp
to 1
to 3
to 6
month
s to
to 2
to 3
to 5
to 10
Abov
efin
ancia
lint
erest
Total
month
month
smo
nths
1 yea
rye
arsye
arsye
arsye
ars10
years
instru
ment
rate -
%---
------
------
------
------
------
------
------
------
------
------
------
------
------
------
------
Rupe
es in
‘000
-----
------
------
------
------
------
------
------
------
------
------
------
------
------
------
----
On-b
alanc
e she
et fin
ancia
l instr
umen
ts
Asse
ts
Cash
and b
alanc
es w
ith tre
asury
bank
s -
30,42
1,231
2,
261,3
37
- -
- -
- -
- -
28,15
9,894
Ba
lance
s with
othe
r ban
ks -
1,10
5,969
-
- -
- -
- -
- -
1,10
5,969
Le
nding
s to fi
nanc
ial ins
titutio
ns 6.
56
23,23
9,672
18
,351,9
72
4,88
7,700
-
- -
- -
- -
- Inv
estm
ents
8.03
20
1,698
,473
33,36
8,890
92
,486,0
42
42,99
7,826
13
,795,3
54
7,24
1,191
1,
386,4
21
135,5
86
3,74
7,419
-
6,53
9,744
Ad
vanc
es 8.
36
250,1
99,16
6 20
4,905
,144
20,32
6,844
10
,212,5
82
641,4
83
263,8
40
695,6
74
1,88
5,879
1,
674,4
15
2,97
4,156
6,
619,1
49
Othe
r ass
ets -
12,86
6,729
-
- -
- -
- -
- -
12,86
6,729
51
9,531
,240
258,8
87,34
3 11
7,700
,586
53,21
0,408
14
,436,8
37
7,50
5,031
2,
082,0
95
2,02
1,465
5,
421,8
34
2,97
4,156
55
,291,4
85
Liabil
ities
Bills p
ayab
le -
4,98
1,983
-
- -
- -
- -
- -
4,98
1,983
Bo
rrowin
gs 2.
88
48,30
3,412
12
,866,7
68
13,31
6,211
4,
720,0
46
70,98
0 13
,221,8
57
540,6
72
2,38
7,895
1,
178,9
83
- -
Depo
sits a
nd ot
her a
ccou
nts 6.
94
433,0
62,59
3 16
4,808
,483
54,86
6,725
35
,168,6
21
64,71
6,449
2,
264,2
41
82,72
3 3,
134,5
15
- -
108,0
20,83
6 Su
bordi
nated
debt
10.12
7,
492,8
00
7,49
2,800
-
- -
- -
- -
- -
Othe
r liab
ilities
- 16
,541,1
54
- -
- -
- -
- -
- 16
,541,1
54
510,3
81,94
2 18
5,168
,051
68,18
2,936
39
,888,6
67
64,78
7,429
15
,486,0
98
623,3
95
5,52
2,410
1,
178,9
83
- 12
9,543
,973
On-b
alanc
e she
et fin
ancia
l instr
umen
ts 9,
149,2
98
73,71
9,292
49
,517,6
50
13,32
1,741
(5
0,350
,592)
(7,98
1,067
) 1,
458,7
00
(3,50
0,945
) 4,
242,8
51
2,97
4,156
(7
4,252
,488)
Comm
itmen
ts in
respe
ct of
forwa
rd pu
rchas
e, cu
rrenc
y swa
ps,
optio
ns an
d com
mitm
ents
to ex
tent c
redits
24,89
8,370
8,
127,5
00
11,41
9,586
3,
996,6
59
1,29
6,986
57
,639
- -
- -
-
Comm
itmen
ts in
respe
ct of
forwa
rd sa
le, cu
rrenc
y swa
ps an
dop
tions
conta
cts (1
8,642
,840)
(10,7
02,20
6) (3
,031,3
87)
(2,61
9,805
) (2
,231,8
03)
(57,6
39)
- -
- -
-
Off-b
alanc
e she
et ga
p 6,
255,5
30
(2,57
4,706
) 8,
388,1
99
1,37
6,854
(9
34,81
7) -
- -
- -
-
Total
yield
/ inte
rest r
isk se
nsitiv
ity ga
p 71
,144,5
86
57,90
5,849
14
,698,5
95
(51,2
85,40
9) (7
,981,0
67)
1,45
8,700
(3
,500,9
45)
4,24
2,851
2,
974,1
56
(74,2
52,48
8)
Cumu
lative
yield
/ inte
rest r
isk se
nsitiv
ity ga
p 71
,144,5
86
129,0
50,43
5 14
3,749
,030
92,46
3,621
84
,482,5
54
85,94
1,254
82
,440,3
09
86,68
3,160
89
,657,3
16

207 Annual Report 2020
Notes to the Unconsolidated Financial StatementsFor the year ended December 31, 2020
20
19No
n-inte
rest
Effec
tiveOv
er 1
Over
3Ov
er 6
Over
1Ov
er 2
Over
3Ov
er 5
beari
ng
yield
Up to
1to
3to
6mo
nths t
oto
2to
3to
5to
10Ab
ove
finan
cial
intere
stTo
talmo
nthmo
nths
month
s1 y
ear
years
years
years
years
10 ye
arsins
trume
nt
rate -
%---
------
------
------
------
------
------
------
------
------
------
------
------
------
------
------
Rupe
es in
‘000
-----
------
------
------
------
------
------
------
------
------
------
------
------
------
------
----
On-b
alanc
e she
et fin
ancia
l instr
umen
ts
Asse
ts
Cash
and b
alanc
es w
ith tre
asury
bank
s -
25,58
9,349
2,
566,7
14
- -
- -
- -
- -
23,02
2,635
Ba
lance
s with
othe
r ban
ks 0.
17
462,8
36
97,65
9 -
- -
- -
- -
- 36
5,177
Le
nding
s to fi
nanc
ial ins
titutio
ns 11
.80
30,32
0,540
30
,192,0
74
- -
128,4
66
- -
- -
- -
Inves
tmen
ts - n
et 9.
73
142,5
68,47
0 66
,158,2
25
41,04
6,043
58
2,500
1,
656,0
84
20,37
8,927
7,
910,8
50
503,6
46
204,9
43
- 4,
127,2
52
Adva
nces
- net
12.89
24
2,944
,509
197,8
64,61
4 20
,967,6
30
9,39
3,863
48
8,932
35
6,955
49
4,838
2,
397,8
94
1,25
6,532
2,
710,0
28
7,01
3,223
Ot
her a
ssets
- 14
,542,4
08
- -
- -
- -
- -
- 14
,542,4
08
456,4
28,11
2 29
6,879
,286
62,01
3,673
9,
976,3
63
2,27
3,482
20
,735,8
82
8,40
5,688
2,
901,5
40
1,46
1,475
2,
710,0
28
49,07
0,695
Lia
bilitie
sBil
ls pay
able
- 3,
804,4
91
- -
- -
- -
- -
- 3,
804,4
91
Borro
wings
9.26
54
,468,2
83
31,97
7,964
13
,068,2
80
4,69
3,216
19
3,571
20
7,839
2,
120,7
79
1,17
9,549
1,
027,0
85
- -
Depo
sits a
nd ot
her a
ccou
nts 8.
70
369,7
89,96
4 13
1,156
,503
47,29
6,616
29
,670,5
50
68,67
0,264
6,
673,4
36
1,51
5,724
1,
722,4
40
- -
83,08
4,431
Su
bordi
nated
debt
13.73
7,
494,8
00
- -
2,99
6,400
4,
498,4
00
- -
- -
- -
Othe
r liab
ilities
- 17
,536,1
72
60,98
3 12
1,966
18
2,949
36
5,898
73
1,796
68
2,219
1,
168,8
57
381,7
03
- 13
,839,8
01
453,0
93,71
0 16
3,195
,450
60,48
6,862
37
,543,1
15
73,72
8,133
7,
613,0
71
4,31
8,722
4,
070,8
46
1,40
8,788
-
100,7
28,72
3 On
-bala
nce s
heet
finan
cial in
strum
ents
3,33
4,402
13
3,683
,836
1,52
6,811
(2
7,566
,752)
(71,4
54,65
1) 13
,122,8
11
4,08
6,966
(1
,169,3
06)
52,68
7 2,
710,0
28
(51,6
58,02
8)
Comm
itmen
ts in
respe
ct of
forwa
rd pu
rchas
e con
tacts
and
comm
itmen
ts to
exten
t cred
its 24
,679,2
38
10,90
2,900
8,
103,0
44
4,03
7,072
45
8,398
1,
120,1
85
57,63
9 -
- -
-
Comm
itmen
ts in
respe
ct of
forwa
rd ex
chan
ge co
ntrac
ts - s
ale (3
5,203
,283)
(10,8
34,90
5) (7
,721,5
76)
(10,4
50,30
5) (5
,019,6
73)
(1,11
9,185
) (5
7,639
) -
- -
-
Off-b
alanc
e she
et ga
p (1
0,524
,045)
67,99
5 38
1,468
(6
,413,2
33)
(4,56
1,275
) 1,
000
- -
- -
-
Total
yield
/ inte
rest r
isk se
nsitiv
ity ga
p 13
3,751
,831
1,90
8,279
(3
3,979
,985)
(76,0
15,92
6) 13
,123,8
11
4,08
6,966
(1
,169,3
06)
52,68
7 2,
710,0
28
(51,6
58,02
8)
Cumu
lative
yield
/ inte
rest r
isk se
nsitiv
ity ga
p 13
3,751
,831
135,6
60,11
0 10
1,680
,125
25,66
4,199
38
,788,0
10
42,87
4,976
41
,705,6
70
41,75
8,357
44
,468,3
85
2020
2019
2020
2019
------
--- Ru
pees
in ‘0
00 --
------
----
------
Rupe
es in
‘000
-----
----
Reco
ncilia
tion t
o tota
l ass
etsRe
conc
iliatio
n to t
otal li
abilit
ies
Balan
ce as
per b
alanc
e she
et 53
2,168
,402
470,4
26,96
5 Ba
lance
as pe
r bala
nce s
heet
511,5
76,19
4 45
3,093
,710
Less
: Non
finan
cial a
ssets
Less
: Non
finan
cial lia
bilitie
sDe
ferred
tax li
abiliti
es - n
et 1,
194,2
52
- Fix
ed as
sets
7,59
9,538
9,
692,7
01
Intan
gible
asse
ts 2,
486,7
25
2,27
1,360
De
ferred
tax a
ssets
- net
- 8,
756
Othe
r ass
ets 1,
811,6
99
1,65
2,036
As
sets
held
for sa
le 73
9,200
37
4,000
12
,637,1
62
13,99
8,853
51
9,531
,240
456,4
28,11
2 51
0,381
,942
453,0
93,71
0

208Annual Report 2020
Notes to the Unconsolidated Financial StatementsFor the year ended December 31, 2020
45.4
Liqu
idity
risk
Liqu
idity
risk
is th
e ris
k th
at th
e Ba
nk w
ill no
t be
able
to ra
ise fu
nds
to m
eet i
ts c
omm
itmen
ts. T
he B
ank’s
Ass
et a
nd L
iabilit
y Co
mm
ittee
(ALC
O)
man
ages
the
liqui
dity
pos
ition
on a
con
tinuo
us b
asis.
The
Bank
’s po
licy
to li
quid
ity m
anag
emen
t is
to m
ainta
in a
dequ
ate
liqui
dity
at a
ll tim
es a
nd in
all
curre
ncies
und
er b
oth
norm
al an
d st
ress
co
nditio
ns, t
o m
eet o
ur c
ontra
ctua
l and
pot
entia
l pay
men
t obl
igat
ions
with
out i
ncur
ring
addi
tiona
l and
una
ccep
tabl
e co
st to
the
busin
ess.
Trea
sury
is re
spon
sible
for t
he m
anag
ing
liqui
dity
risk
und
er th
e gu
idan
ce o
f Ass
et-L
iabilit
y Co
mm
ittee
of t
he B
ank.
The
Ban
k’s li
quid
ity ri
sk
man
agem
ent a
ppro
ach
star
ts a
t the
intra
day
level
(ope
ratio
nal li
quid
ity) m
anag
ing
the
daily
pay
men
ts q
ueue
and
fact
orin
g in
our
acc
ess
to th
e qu
alify
ing
secu
rities
of S
tate
Ban
k of
Pak
istan
. It t
hen
cove
rs ta
ctica
l liqu
idity
risk
man
agem
ent d
ealin
g w
ith th
e ac
cess
to u
nsec
ured
fund
ing
sour
ces
and
the
liqui
dity
cha
ract
erist
ics o
f our
ass
et in
vent
ory
(ass
et liq
uidi
ty).
Fina
lly, t
he s
trate
gic
pers
pect
ive c
ompr
ises
the
mat
urity
pro
file o
f all
ass
ets
and
liabi
lities
on
our s
tate
men
t of fi
nanc
ial p
ositio
n.
For m
onito
ring
and
cont
rollin
g liq
uidi
ty ri
sk, t
he B
ank
gene
rate
s a
scen
ario
sen
sitive
mat
urity
sta
tem
ent o
f fina
ncial
pos
ition,
and
run
cont
rolle
d m
ismat
ches
that
are
mon
itore
d an
d di
scus
sed
by A
LCO
mem
bers
regu
larly.
The
Ban
k pr
epar
es v
ario
us ty
pes
of re
ports
and
ana
lysis
for
assis
ting
ALCO
in t
akin
g ne
cess
ary
stra
tegi
c ac
tions
for
man
agin
g liq
uidi
ty r
isk in
the
Ban
k. T
hese
inclu
de li
quid
ity r
atio
s, C
once
ntra
tion
analy
sis, G
ap re
ports
, Stre
ss te
stin
g, L
iqui
dity
Cov
erag
e ra
tio &
Net
Sta
ble
Fund
ing
Ratio
ana
lysis
etc.
45.4
.1M
atur
ities
of A
sset
s an
d Li
abili
ties
- bas
ed o
n co
ntra
ctua
l mat
urity
of t
he a
sset
s an
d lia
bilit
ies
of th
e Ba
nk
2020
Ove
r 1
Ove
r 7
Ove
r 14
Ove
r 1
Ove
r 2
Ove
r 3
Ove
r 6
Ove
r 9
Ove
r 1
Ove
r 2
Ove
r 3
Upto
1
to 7
to 14
da
ys to
1 to
2 to
3 to
6 to
9 m
onths
to 1
to 2
to 3
to 5
Ove
r 5
Total
da
y da
ys
days
m
onth
mon
ths
mon
ths
mon
ths
mon
ths
yea
r y
ears
yea
rs y
ears
years
---
------
------
------
------
------
------
------
------
------
------
------
------
------
------
------
Rupe
es in
‘000
-----
------
------
------
------
------
------
------
------
------
------
------
------
------
------
----
Asse
tsCa
sh an
d bala
nces
with
treas
ury ba
nks
30,42
1,231
30
,421,2
31
- -
- -
- -
- -
- -
- -
Balan
ces w
ith ot
her b
anks
1,10
5,969
1,
105,9
69
- -
- -
- -
- -
- -
- -
Lend
ings t
o fina
ncial
institu
tions
23,23
9,672
2,
485,8
29
3,50
0,000
3,
291,0
63
9,07
5,080
-
4,88
7,700
-
- -
- -
- -
Inves
tmen
ts 20
1,698
,473
- -
13,78
6,643
16
,960,2
23
4,52
4,776
71
,635,3
78
44,44
6,234
12
,966,7
51
1,00
6,802
7,
947,7
13
4,77
2,925
3,
470,7
64
20,18
0,264
Ad
vanc
es 25
0,199
,166
91,70
6,484
2,
515,2
94
1,26
2,175
9,
566,8
16
14,00
7,429
13
,560,8
23
19,56
5,688
9,
544,8
29
13,08
7,897
31
,914,2
64
21,52
0,367
13
,641,9
89
8,30
5,111
Fix
ed as
sets
7,59
9,538
1,
999
11,09
2 12
,941
78,86
2 12
1,156
41
1,539
35
6,226
35
2,328
32
0,673
1,
198,1
83
947,9
31
967,6
73
2,81
8,935
Int
angib
le as
sets
2,48
6,725
33
5 2,
008
2,34
3 5,
356
10,04
3 22
3,310
29
,820
29,61
2 29
,598
117,6
64
115,4
29
198,2
84
1,72
2,923
De
ferred
tax a
ssets
- net
- -
- -
- -
- -
- -
- -
- -
Othe
r ass
ets 14
,678,4
28
- -
433,8
35
13,11
5,780
51
8,574
41
,047
534,0
67
35,12
5 -
- -
- -
Asse
ts he
ld for
sale
739,2
00
- -
- -
- -
- -
739,2
00
- -
- -
532,1
68,40
2 12
5,721
,847
6,02
8,394
18
,789,0
00
48,80
2,117
19
,181,9
78
90,75
9,797
64
,932,0
35
22,92
8,645
15
,184,1
70
41,17
7,824
27
,356,6
52
18,27
8,710
33
,027,2
33
Liabil
ities
Bills p
ayab
le 4,
981,9
83
166,0
66
1,16
2,463
2,
324,9
25
1,32
8,529
-
- -
- -
- -
- -
Borro
wings
48,30
3,412
23
4,381
36
8,146
9,
724,1
81
2,54
0,060
5,
539,4
00
7,77
6,811
4,
720,0
46
26,29
2 44
,687
13,22
1,857
54
0,672
2,
387,8
95
1,17
8,984
De
posit
s and
othe
r acc
ounts
433,0
62,59
3 21
7,192
,381
9,13
5,642
21
,400,6
84
19,17
9,855
29
,458,6
73
25,40
8,052
35
,168,6
21
13,99
5,688
56
,641,5
19
2,26
4,241
82
,723
3,13
4,514
-
Su
bordi
nated
debt
7,49
2,800
-
- -
- -
- 1,
000
- 1,
000
2,00
0 5,
493,6
00
1,99
5,200
-
Liabili
ties a
gains
t ass
ets su
bject
to fin
ance
leas
e -
- -
- -
- -
- -
- -
- -
- De
ferred
tax li
abiliti
es - n
et 1,
194,2
52
- -
- 1,
913
(70,3
29)
(3,50
2) (3
5,557
) (3
5,292
) (4
2,574
) 11
0,333
17
6,118
15
8,819
93
4,323
Ot
her li
abiliti
es 16
,541,1
54
- -
- 38
5,097
10
,561,1
65
266,2
83
502,4
14
101,1
65
700,8
28
1,77
8,734
1,
311,4
59
827,3
29
106,6
80
511,5
76,19
4 21
7,592
,828
10,66
6,251
33
,449,7
90
23,43
5,454
45
,488,9
09
33,44
7,644
40
,356,5
24
14,08
7,853
57
,345,4
60
17,37
7,165
7,
604,5
72
8,50
3,757
2,
219,9
87
Net a
ssets
20,59
2,208
(9
1,870
,981)
(4,63
7,857
) (1
4,660
,790)
25,36
6,663
(2
6,306
,931)
57,31
2,153
24
,575,5
11
8,84
0,792
(4
2,161
,290)
23,80
0,659
19
,752,0
80
9,77
4,953
30
,807,2
46
Share
capit
al 10
,119,2
42
Statut
ory re
serve
1,99
1,170
Su
rplus
on re
valua
tion o
f a
ssets
- net
of tax
2,33
4,123
Un
appro
priate
d profi
t 6,
147,6
73
20,59
2,208
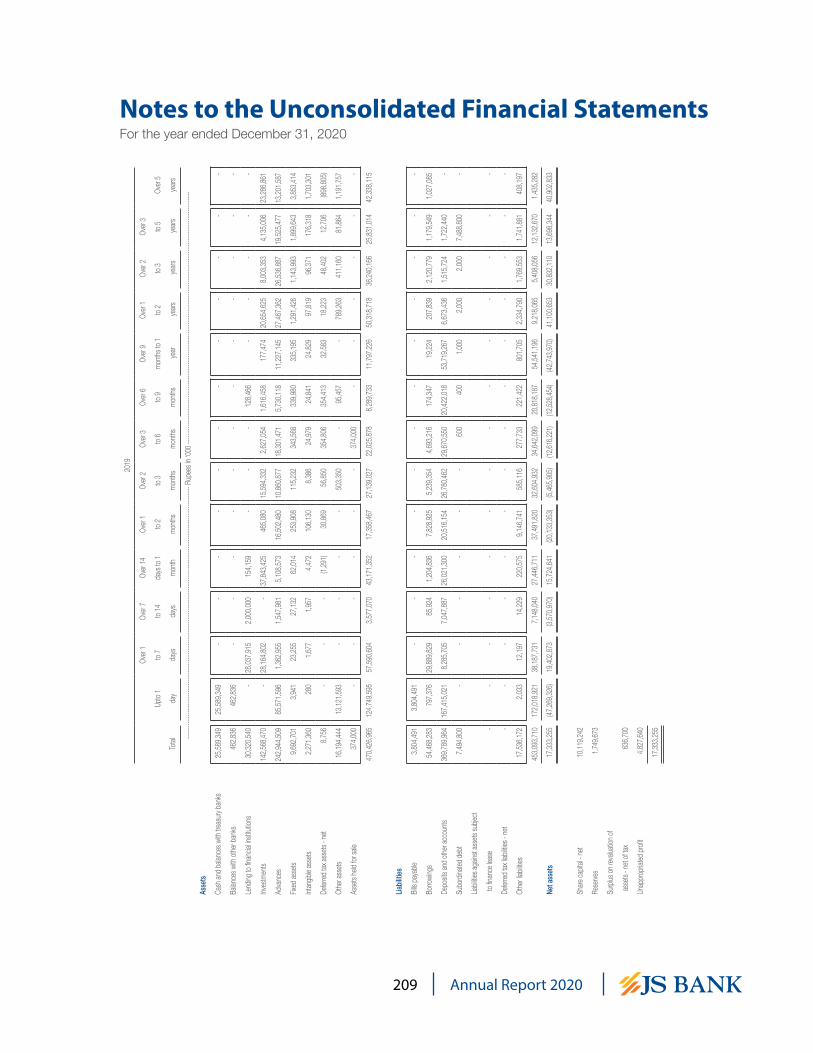
209 Annual Report 2020
Notes to the Unconsolidated Financial StatementsFor the year ended December 31, 2020
2019
Ove
r 1
Ove
r 7
Ove
r 14
Ove
r 1
Ove
r 2
Ove
r 3
Ove
r 6
Ove
r 9
Ove
r 1
Ove
r 2
Ove
r 3
Upto
1
to 7
to 14
da
ys to
1 to
2 to
3 to
6 to
9 m
onths
to 1
to 2
to 3
to 5
Ove
r 5
Total
da
y da
ys da
ys m
onth
mon
ths
mon
ths
mon
ths
mon
ths
yea
r y
ears
yea
rs y
ears
years
------
------
------
------
------
------
------
------
------
------
------
------
------
------
------
------
------
------
------
Rupe
es in
‘000
-----
------
------
------
------
------
------
------
------
------
------
------
------
------
------
------
------
------
------
-
Asse
ts
Cash
and b
alanc
es w
ith tre
asury
bank
s 25
,589,3
49
25,58
9,349
-
- -
- -
- -
- -
- -
-
Balan
ces w
ith ot
her b
anks
462,8
36
462,8
36
- -
- -
- -
- -
- -
- -
Lend
ing to
finan
cial in
stitut
ions
30,32
0,540
-
28,03
7,915
2,
000,0
00
154,1
59
- -
- 12
8,466
-
- -
- -
Inves
tmen
ts 14
2,568
,470
- 28
,164,8
02
- 37
,843,4
25
465,0
80
15,59
4,332
2,
627,0
54
1,61
6,458
17
7,474
20
,654,6
25
8,00
3,353
4,
135,0
06
23,28
6,861
Adva
nces
242,9
44,50
9 85
,571,5
96
1,36
2,955
1,
547,9
81
5,10
8,573
16
,502,4
80
10,86
0,877
18
,301,4
71
5,73
0,118
11
,227,1
45
27,46
7,362
26
,536,8
87
19,52
5,477
13
,201,5
87
Fixed
asse
ts 9,
692,7
01
3,94
1 23
,255
27,13
2 62
,014
253,9
08
115,2
32
343,5
68
339,9
80
335,1
95
1,29
1,426
1,
143,9
93
1,89
9,643
3,
853,4
14
Intan
gible
asse
ts 2,
271,3
60
280
1,67
7 1,
957
4,47
2 10
6,130
8,
386
24,97
9 24
,841
24,82
9 97
,819
96,37
1 17
6,318
1,
703,3
01
Defer
red ta
x ass
ets - n
et 8,
756
- -
- (1
,291)
30,86
9 56
,850
354,8
06
354,4
13
32,58
3 18
,223
48,40
2 12
,706
(898
,805)
Othe
r ass
ets 16
,194,4
44
13,12
1,593
-
- -
- 50
3,350
-
95,45
7 -
789,2
63
411,1
60
81,86
4 1,
191,7
57
Asse
ts he
ld for
sale
374,0
00
- -
- -
- -
374,0
00
- -
- -
- -
470,4
26,96
5 12
4,749
,595
57,59
0,604
3,
577,0
70
43,17
1,352
17
,358,4
67
27,13
9,027
22
,025,8
78
8,28
9,733
11
,797,2
26
50,31
8,718
36
,240,1
66
25,83
1,014
42
,338,1
15
Liabil
ities
Bills p
ayab
le 3,
804,4
91
3,80
4,491
-
- -
- -
- -
- -
- -
-
Borro
wings
54,46
8,283
79
7,376
29
,889,8
29
85,92
4 1,
204,8
36
7,82
8,925
5,
239,3
54
4,69
3,216
17
4,347
19
,224
207,8
39
2,12
0,779
1,
179,5
49
1,02
7,085
Depo
sits a
nd ot
her a
ccou
nts 36
9,789
,964
167,4
15,02
1 8,
285,7
05
7,04
7,887
26
,021,3
00
20,51
6,154
26
,780,4
62
29,67
0,550
20
,422,0
18
53,71
9,267
6,
673,4
36
1,51
5,724
1,
722,4
40
-
Subo
rdina
ted de
bt 7,
494,8
00
- -
- -
- -
600
400
1,00
0 2,
000
2,00
0 7,
488,8
00
-
Liabili
ties a
gains
t ass
ets su
bject
to fin
ance
leas
e -
- -
- -
- -
- -
- -
- -
-
Defer
red ta
x liab
ilities
- net
- -
- -
- -
- -
- -
- -
- -
Othe
r liab
ilities
17,53
6,172
2,
033
12,19
7 14
,229
220,5
75
9,14
6,741
58
5,116
27
7,733
22
1,422
80
1,705
2,
334,7
90
1,76
9,553
1,
741,8
81
408,1
97
453,0
93,71
0 17
2,018
,921
38,18
7,731
7,
148,0
40
27,44
6,711
37
,491,8
20
32,60
4,932
34
,642,0
99
20,81
8,187
54
,541,1
96
9,21
8,065
5,
408,0
56
12,13
2,670
1,
435,2
82
Net a
ssets
17,33
3,255
(4
7,269
,326)
19,40
2,873
(3
,570,9
70)
15,72
4,641
(2
0,133
,353)
(5,46
5,905
)(12
,616,2
21)
(12,52
8,454
) (4
2,743
,970)
41,10
0,653
30
,832,1
10
13,69
8,344
40
,902,8
33
Share
capit
al - n
et 10
,119,2
42
Rese
rves
1,74
9,673
Surpl
us on
reva
luatio
n of
ass
ets - n
et of
tax 63
6,700
Unap
propri
ated p
rofit
4,82
7,640
17,33
3,255

210Annual Report 2020
Notes to the Unconsolidated Financial StatementsFor the year ended December 31, 2020
45.4
.2M
atur
ity o
f ass
ets
and
liabi
lities
- Ba
sed
on w
orkin
g pr
epar
ed b
y th
e As
set a
nd L
iabilit
y Co
mm
ittee
(ALC
O) o
f the
Ban
k
2020
Ove
r 1
Ove
r 3
Ove
r 6
Ove
r 1
Ove
r 2
Ove
r 3
Ove
r 5
Upto
1
to 3
to 6
mon
ths to
to
2 to
3 to
5 to
10
Abov
e To
tal
mon
th m
onths
m
onths
1
year
yea
rs y
ears
yea
rs y
ears
10 ye
ars
------
------
------
------
------
------
------
------
------
------
------
------
------
------
------
--- Ru
pees
in ‘0
00 --
------
------
------
------
------
------
------
------
------
------
------
------
------
------
------
-As
sets
Cash
and b
alanc
es w
ith tre
asury
bank
s 30
,421,2
31
30,42
1,231
-
- -
- -
- -
- Ba
lance
s with
othe
r ban
ks 1,
105,9
69
1,10
5,969
-
- -
- -
- -
- Le
nding
s to fi
nanc
ial ins
titutio
ns 23
,239,6
72
18,35
1,972
4,
887,7
00
- -
- -
- -
- Inv
estm
ents
201,6
98,47
3 30
,746,8
66
76,16
0,154
44
,446,2
34
13,97
3,553
7,
947,7
13
4,77
2,925
3,
470,7
64
20,18
0,264
-
Adva
nces
250,1
99,16
6 33
,881,1
97
31,25
3,743
26
,199,5
71
80,55
7,471
31
,914,2
64
17,82
6,671
13
,641,9
89
5,18
2,115
9,
742,1
45
Fixed
asse
ts 7,
599,5
38
104,8
94
532,6
95
356,2
26
673,0
01
1,19
8,183
94
7,931
96
7,673
66
8,086
2,
150,8
49
Intan
gible
asse
ts 2,
486,7
25
10,04
2 23
3,353
29
,820
59,21
0 11
7,664
11
5,429
19
8,284
25
9,299
1,
463,6
24
Defer
red ta
x ass
ets - n
et -
- -
- -
- -
- -
- Ot
her a
ssets
14,67
8,428
13
,549,6
15
559,6
21
534,0
67
35,12
5 -
- -
- -
Asse
ts he
ld for
sale
739,2
00
- -
- 73
9,200
-
- -
- -
532,1
68,40
2 12
8,171
,786
113,6
27,26
6 71
,565,9
18
96,03
7,560
41
,177,8
24
23,66
2,956
18
,278,7
10
26,28
9,764
13
,356,6
18
Liabil
ities
Bills p
ayab
le 4,
981,9
83
4,98
1,983
-
- -
- -
- -
- Bo
rrowin
gs 48
,303,4
12
12,86
6,768
13
,316,2
11
4,72
0,046
70
,979
13,22
1,857
54
0,672
2,
387,8
95
1,17
8,984
-
Depo
sits a
nd ot
her a
ccou
nts 43
3,062
,593
54,27
5,887
61
,275,5
17
43,74
7,135
80
,264,1
50
18,19
9,605
13
,101,0
50
162,1
99,24
9 -
- Su
bordi
nated
debt
7,49
2,800
-
- 1,
000
1,00
0 2,
000
5,49
3,600
1,
995,2
00
- -
Liabili
ties a
gains
t ass
ets su
bject
to fin
ance
leas
e -
- -
- -
- -
- -
- De
ferred
tax li
abiliti
es - n
et 1,
194,2
52
1,91
3 (7
3,831
) (3
5,557
) (7
7,866
) 11
0,333
17
6,118
15
8,819
93
4,323
-
Othe
r liab
ilities
16,54
1,154
38
5,097
10
,827,4
48
502,4
14
801,9
93
1,77
8,734
1,
311,4
59
827,3
29
106,6
80
- 51
1,576
,194
72,51
1,648
85
,345,3
45
48,93
5,038
81
,060,2
56
33,31
2,529
20
,622,8
99
167,5
68,49
2 2,
219,9
87
- Ne
t ass
ets 20
,592,2
08
55,66
0,138
28
,281,9
21
22,63
0,880
14
,977,3
04
7,86
5,295
3,
040,0
57
(149
,289,7
82)
24,06
9,777
13
,356,6
18
Share
capit
al - n
et 10
,119,2
42
Rese
rves
1,99
1,170
Su
rplus
on re
valua
tion o
f a
ssets
- net
of tax
2,33
4,123
Un
appro
priate
d profi
t 6,
147,6
73
20,59
2,208

211 Annual Report 2020
Notes to the Unconsolidated Financial StatementsFor the year ended December 31, 2020
2019
Ove
r 1
Ove
r 3
Ove
r 6
Ove
r 1
Ove
r 2
Ove
r 3
Ove
r 5
Upto
1
to 3
to 6
mon
ths to
to
2 to
3 to
5 to
10
Abov
e To
tal
mon
th m
onths
m
onths
1
year
yea
rs y
ears
yea
rs y
ears
10 ye
ars
------
------
------
------
------
------
------
------
------
------
------
------
------
------
------
--- Ru
pees
in ‘0
00 --
------
------
------
------
------
------
------
------
------
------
------
------
------
------
------
-As
sets
Cash
and b
alanc
es w
ith tre
asury
bank
s 25
,589,3
49
25,58
9,349
-
- -
- -
- -
- Ba
lance
s with
othe
r ban
ks 46
2,836
46
2,836
-
- -
- -
- -
- Le
nding
to fin
ancia
l insti
tution
s 30
,320,5
40
30,19
2,074
-
- 12
8,466
-
- -
- -
Inves
tmen
ts 14
2,568
,470
66,00
8,226
16
,059,4
13
2,62
7,054
1,
793,9
32
20,65
4,625
8,
003,3
53
4,13
5,006
23
,286,8
61
- Ad
vanc
es 24
2,944
,509
24,26
2,803
30
,936,9
80
24,73
3,994
76
,279,4
19
27,46
7,362
26
,536,8
87
19,52
5,477
3,
898,6
57
9,30
2,930
Fix
ed as
sets
9,69
2,701
11
6,342
36
9,140
34
3,568
67
5,175
1,
291,4
26
1,14
3,993
1,
899,6
43
1,18
1,797
2,
671,6
17
Intan
gible
asse
ts 2,
271,3
60
8,38
6 11
4,516
24
,979
49,67
0 97
,819
96,37
1 17
6,318
23
9,677
1,
463,6
24
Defer
red ta
x ass
ets - n
et 8,
756
(1,29
1) 87
,719
354,8
06
386,9
96
18,22
3 48
,402
12,70
6 (3
86,51
9) (5
12,28
6)Ot
her a
ssets
16,19
4,444
13
,121,5
93
503,3
50
- 95
,457
789,2
63
411,1
60
81,86
4 1,
191,7
57
- As
sets
held
for sa
le 37
4,000
-
- 37
4,000
-
- -
- -
- 47
0,426
,965
159,7
60,31
8 48
,071,1
18
28,45
8,401
79
,409,1
15
50,31
8,718
36
,240,1
66
25,83
1,014
29
,412,2
30
12,92
5,885
0.
01
Liabil
ities
Bills p
ayab
le 3,
804,4
91
3,80
4,491
-
- -
- -
- -
- Bo
rrowin
gs 54
,468,2
83
31,97
7,964
13
,068,2
80
4,69
3,216
19
3,571
20
7,839
2,
120,7
79
1,17
9,549
1,
027,0
85
- De
posit
s and
othe
r acc
ounts
369,7
89,96
4 44
,619,4
83
52,17
5,941
36
,130,8
12
81,51
3,876
18
,875,6
34
12,49
1,223
12
3,982
,995
- -
Subo
rdina
ted de
bt 7,
494,8
00
- -
600
1,40
0 2,
000
2,00
0 7,
488,8
00
- -
Liabili
ties a
gains
t ass
ets su
bject
to fin
ance
leas
e -
- -
- -
- -
- -
- De
ferred
tax li
abiliti
es - n
et -
- -
- -
- -
- -
- Ot
her li
abiliti
es 17
,536,1
72
249,0
34
9,73
1,857
27
7,733
1,
023,1
27
2,33
4,790
1,
769,5
53
1,74
1,881
40
8,197
-
453,0
93,71
0 80
,650,9
72
74,97
6,078
41
,102,3
61
82,73
1,974
21
,420,2
63
16,38
3,555
13
4,393
,225
1,43
5,282
-
Net a
ssets
17,33
3,255
79
,109,3
46
(26,9
04,96
0) (1
2,643
,960)
(3,32
2,859
) 28
,898,4
55
19,85
6,611
(1
08,56
2,211
) 27
,976,9
48
12,92
5,885
Share
capit
al - n
et 10
,119,2
42
Rese
rves
1,74
9,673
Su
rplus
on re
valua
tion o
f a
ssets
- net
of tax
636,7
00
Unap
propri
ated p
rofit
4,82
7,640
17
,333,2
55
45.4
.3To
iden
tify
the
beha
viou
ral m
atur
ities
of n
on-c
ontra
ctua
l ass
ets
and
liabi
litie
s, th
e Ba
nk h
as u
sed
the
follo
win
g m
etho
dolo
gy:
For d
eter
min
ing
the
core
por
tion
of n
on c
ontra
ctua
l liab
ilities
(non
-vol
atile
por
tion)
, the
ban
k ha
s us
ed th
e av
erag
e m
etho
d w
here
by a
vera
ge b
alanc
e m
ainta
ined
ove
r pas
t five
yea
r has
be
en c
lassifi
ed a
s co
re a
nd h
as b
een
plac
ed in
‘ove
r 3 to
5 ye
ars’
mat
urity
buc
ket.
Non
cont
ract
ual a
sset
s an
d re
main
ing
volat
ile p
ortio
n of
non
con
tract
ual li
abilit
ies h
ave
been
stra
tified
in
relev
ant m
atur
ity b
ucke
t usin
g bu
cket
wise
per
cent
ages
det
erm
ined
by
usin
g av
erag
e vo
latilit
y in
resp
ectiv
e pe
riod
/ buc
ket.

212Annual Report 2020
Notes to the Unconsolidated Financial StatementsFor the year ended December 31, 2020
45.5 Operational risk
The Bank currently uses Basic Indicator Approach to Operational Risk for regulatory capital calculations. We define operational risk as the risk of loss resulting from inadequate or failed internal processes, people and system or from external events. With the evolution of Operational Risk Management into a separate distinct discipline, the Bank’s strategy is to further strengthen its risk management system along new industry standards. Accordingly the Bank has set up a separate Operational Risk Management (ORM) Unit. ORM Unit resides within Risk Management Group (RMG). Its responsibility is to implement Operational Risk management framework across the bank for effective measurement and monitoring of operational risk faced by different areas of the Bank.
Bank’s operational risk management process involves a structured and uniform approach across the Bank. It includes risk identification and assessments, the monitoring of Key Risk Indicators (KRIs) and Risk & Control Self-Assessment (RCSA) activities for key operational risks. In order to build a robust operational risk monitoring mechanism, an Operational Risk Management Committee (ORMC) has been constituted to effectively address operational risk issues.
The bank has implemented a comprehensive “Operational Risk Management Policy” which has also been approved by the Board of Directors. The purpose of bank-wide Operational Risk Management Policy is aimed at laying out clearly defined roles and responsibilities of individuals / units across different functions of the Bank that are involved in performing various operational risk management tasks. Operational risk is much more pervasive in a financial institution and every operating unit is exposed to operational risk, regardless of whether it is a business or a support function. This policy has been devised to explain the various building blocks of the operational risk management functions and their inter-relationships. The policy also captures both qualitative and quantitative guidelines for managing and quantifying operational risks across the Bank.
The ORM Unit conducts operational risk assessment for all major functions of the Bank and assists various functions of the Bank in developing RCSA and KRIs which are monitored against predefined thresholds. Findings from KRIs are used as predictive indicators of potential operational risks.
Operational risk incidents and loss data collection is governed by Bank’s Operational Risk Management Policy and process documents which have been developed and implemented to collate operational losses and near misses in a systematic and organized way.
The Bank’s Business Continuity (BCP) Policy includes risk management strategies to mitigate inherent risks and prevent interruption of mission critical services caused by disaster events. The resilience of BCP is tested and rehearsed on an annual basis by the Bank.
46. DERIVATIVE RISK
The policy guidelines for taking derivative exposures are approved by the Board of Directors (BOD). Bank’s Asset & Liability Committee (ALCO) is responsible for reviewing and managing associated risks of the transactions.
The nature, scope and purpose of derivatives business, for trading purposes or hedging purpose and the types of derivative in which they deal.
The overall responsibility for offering derivative products and sustaining profitability lies with the Treasurer and in his absence with his delegate. The Market Risk Unit / Treasury Middle Office of the Bank responsible for measurement & monitoring of the market risk exposures, analysis of present and potential risk factors.

213 Annual Report 2020
Notes to the Unconsolidated Financial StatementsFor the year ended December 31, 2020
The Market Risk Unit also monitors associated Credit, Market and Liquidity Risk in line with Board of Directors approved limit framework. The unit coordinates with the business regarding approvals for derivatives risk limits and produces various reports / analysis for ALCO / BRMC on periodic basis. These reports provide details of outstanding un-hedged positions, profitability and status of compliance with limits. Treasury Operations records derivatives activity in the Bank’s books and is responsible for reporting to the SBP.
The derivative transaction such as Cross Currency Swaps carries credit risk which is the risk that a party to a derivative contract will fail to perform its obligation. There are two types of credit risk associated with derivative transactions; 1) settlement, and 2) pre-settlement risk. Bank’s Central Credit Committee is responsible for reviewing and managing associated Counterparty Credit Risks of the transaction.
The Bank has also entered into Foreign Currency & Commodity Options from its Wholesale Banking Branch Bahrain for market making activities. The Bank can hedge its risk by taking on & off-balance sheet position in interbank market, where available.
47. CUSTOMER SATISFACTION AND FAIR TREATMENT
The Bank is committed to providing its customers with the highest level of service quality and satisfaction. The Bank has established an independent Customer Experience function that oversees customer care, branch services, contact centre, customer insights and business conduct. The Bank’s Complaint Handling Policy and Grievance Redressal Mechanism ensure that complaints are resolved in a timely manner and recurrence of complaints is prevented where possible. Customers have the option of registering their complaints at the Bank’s branches, contact center, the Bank’s website or via email.
The complaint handling policy and grievance redressal mechanism ensures that complaints are resolved in a timely manner and recurrence of complaints is prevented where possible. Customers have the option of registering their complaints at our Branches, contact centre, the Bank’s website and via email. Complaint management process is kept as transparent as possible through registration, acknowledgement, interim response where applicable and resolution of complaints. Customers are also given the option of contacting the Banking Mohtasib office in case they are dissatisfied with the response received from the Bank.
To create enhanced visibility of the recourse mechanism available to its customers, the Bank has incorporated awareness messages of its complaint handling function in several customer communications such as account statements, ATM screens and SMS messages. Complete grievance redressal mechanism, touchpoints and online feedback forms have been made available through the Bank’s website, and email broadcasts have been sent to the customers for customer education and awareness.
Fair Treatment of Customers is an integral part of our corporate culture. The Bank has institutionalized a ‘Consumer Protection Framework’. Our priority is to keep customer benefits in mind while designing, selling and managing products and services, without any discrimination. Our focus is to maintain fairness in our customer dealings, clarity in communication, develop a service culture and design an effective grievance handling mechanism. We also focus on financial literacy of our customers, for promoting responsible conduct and informed financial decisions by consumers, through our consumer education and Financial Literacy Program.
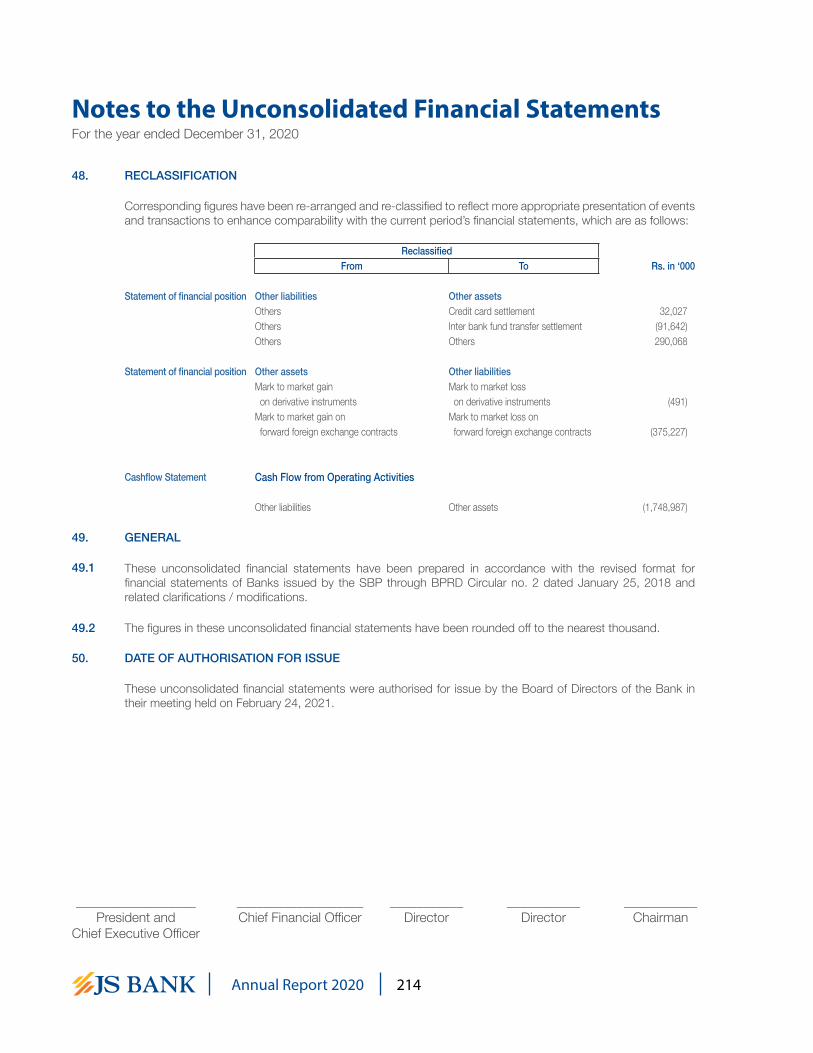
214Annual Report 2020
Notes to the Unconsolidated Financial StatementsFor the year ended December 31, 2020
48. RECLASSIFICATION
Corresponding figures have been re-arranged and re-classified to reflect more appropriate presentation of events and transactions to enhance comparability with the current period’s financial statements, which are as follows:
ReclassifiedFrom To Rs. in ‘000
Statement of financial position Other liabilities Other assetsOthers Credit card settlement 32,027Others Inter bank fund transfer settlement (91,642)Others Others 290,068
Statement of financial position Other assets Other liabilitiesMark to market gain Mark to market loss on derivative instruments on derivative instruments (491)Mark to market gain on Mark to market loss on forward foreign exchange contracts forward foreign exchange contracts (375,227)
Cashflow Statement Cash Flow from Operating Activities
Other liabilities Other assets (1,748,987)
49. GENERAL
49.1 These unconsolidated financial statements have been prepared in accordance with the revised format for financial statements of Banks issued by the SBP through BPRD Circular no. 2 dated January 25, 2018 and related clarifications / modifications.
49.2 The figures in these unconsolidated financial statements have been rounded off to the nearest thousand.
50. DATE OF AUTHORISATION FOR ISSUE
These unconsolidated financial statements were authorised for issue by the Board of Directors of the Bank in their meeting held on February 24, 2021.
__________________President and
Chief Executive Officer
___________________Chief Financial Officer
___________Director
___________Director
___________Chairman

Muhammad Alee Raput
Write Up: A 23 year old artist for whom Art is a representation and exploration of the human condition and the attempt to experience a deeper understanding of life.
Institute: Indus Valley School of Art & Architecture

ConsolidatedFinancial Statements

217 Annual Report 2020
For the year ended December 31, 2020On behalf of the Board of Directors, we are pleased to present the Annual Report on the audited consolidated financial statements of JS Bank Limited (the ‘Bank) and its subsidiaries and the auditors’ report thereon for the year ended December 31, 2020.
Consolidated financial highlights 2020 2019
(PKR million)
Profit/(Loss) before taxation 2,169 (86)Taxation (1,060) 171Profit /(Loss) after taxation 1,108 (257)Profit /(Loss) attributable to non-controlling interest (2) 11Profit /(Loss) attributable to equity holders of the Bank 1,110 (245)Profit /(Loss) per share - Basic (Rupees) 0.8558 (0.2077)Investments – net 201,808 143,125Total assets 536,077 473,213Deposits 431,424 368,544Shareholders’ equity 22,916 19,481
Directors’ Report on Consolidated Financial Statement
Pattern of ShareholdingThe pattern of shareholding as of December 31, 2020 is included in the Annual Report.
Subsidiary Companies
JS Global Capital LimitedJS Global Capital Limited is one of the largest securities brokerage and investment banking firms in Pakistan with a leadership position in the domestic capital markets. It is in the business of equity, fixed income, currencies and commodities brokerage and investment banking. It was incorporated in Pakistan on June 28, 2000 and is the successor to the securities business of Jahangir Siddiqui & Co. Ltd. and Bear Stearns Jahangir Siddiqui Limited. JS Bank has 83.5% ownership in the company.
JS Global has a paid-up capital of PKR 305.570 million and shareholder equity of PKR 2,446 million as at December 31, 2020. It is listed on the Pakistan Stock Exchange.
PACRA has assigned long-term and short-term entity ratings to JS Global of “AA” (Double A) and “A1+” (A One plus), respectively. The ratings denote a very low expectation of credit risk emanating from very strong
capacity for timely payment of financial commitments.
Summarized results of the company are set out below:
PKR million
ParticularsDecember
31,2020 (Audited)
December 31,2019
(Audited)
Profit Before Tax 290 107
Profit After Tax 207 47
EPS (Rupees) 6.77 1.31
JS Investments Limited JS Investments has a paid-up capital of PKR 617,742 million and shareholder equity of PKR 1,775 million as on December 31, 2020. It is listed on the Pakistan Stock Exchange. JS Bank has 84.56% ownership in the company.
The company is a licensed Investment Adviser and Asset Management Company under the Non-Banking Finance Companies (Establishment and Regulation) Rules, 2003 (the NBFC Rules) and the Non-Banking Finance Companies and Notified Entities Regulations, 2008 (the NBFC Regulations). In addition, JSIL also has

218Annual Report 2020
a license for Pension Fund Manager under the Voluntary Pension System Rules 2005 and the Private Equity & Venture Capital Fund Management Services license from the Securities and Exchange Commission of Pakistan.
Summarized results of the Company are set out below:
PKR million
ParticularsDecember
31,2020 (Audited)
December 31,2019
(Audited)
Loss before tax (23) (59)
Loss after tax (40) (87)
EPS (Rupees) (0.64) (1.17)
JS ABAMCO Commodities Limited (Sub-Subsidiary)The company has not commenced commercial operations with source of income being realized from short term investment in Collective Investment Schemes (CIS) and saving account interest.
Summarized results of the company are set out below:
PKR million
ParticularsDecember
31,2020 (Audited)
December 31,2019
(Audited)
Profit before tax 5.0 5.1
Profit after tax 4.2 4.2
EPS (Rupees) 1.11 1.13
For and on behalf of the Board,
Basir Shamsie Kalim-ur-Rahman President & CEO Chairman
February 24, 2021

219 Annual Report 2020

220Annual Report 2020

221 Annual Report 2020

222Annual Report 2020
INDEPENDENT AUDITORS’ REPORT

223 Annual Report 2020

224Annual Report 2020

225 Annual Report 2020

226Annual Report 2020

227 Annual Report 2020
__________________President and
Chief Executive Officer
___________________Chief Financial Officer
___________Director
___________Director
___________Chairman
Consolidated Statement of Financial PositionAs at December 31, 2020
2020 2019 2020 2019 ----- USD in ‘000 ----- Note ----- Rupees in ‘000 -----
ASSETS 190,332 160,104 Cash and balances with treasury banks 6 30,421,531 25,590,173
7,058 2,980 Balances with other banks 7 1,128,135 476,302 145,398 189,700 Lendings to financial institutions 8 23,239,672 30,320,540
1,262,605 895,456 Investments 9 201,807,654 143,124,623 1,566,969 1,522,109 Advances 10 250,455,534 243,285,308
56,476 66,906 Fixed assets 11 9,026,764 10,693,945 15,738 14,405 Intangible assets 12 2,515,549 2,302,474
- 787 Deferred tax assets 18 - 125,857 104,753 109,641 Other assets 13 16,743,107 17,524,249
4,625 2,340 Assets held for sale 11.3 739,200 374,000 3,353,954 2,964,428 536,077,146 473,817,471
LIABILITIES 31,170 23,803 Bills payable 14 4,981,983 3,804,491
302,209 340,779 Borrowings 15 48,303,412 54,468,283 2,699,193 2,305,784 Deposits and other accounts 16 431,423,822 368,543,603
- - Liabilities against assets subject to finance lease - - 46,879 46,891 Subordinated debt 17 7,492,800 7,494,800
6,779 - Deferred tax liabilities 18 1,083,590 - 124,353 125,286 Other liabilities 19 19,875,838 20,024,982
3,210,583 2,842,543 513,161,445 454,336,159
143,371 121,885 NET ASSETS 22,915,701 19,481,312
REPRESENTED BY 63,311 63,311 Share capital - net 20 10,119,242 10,119,242 12,458 10,947 Reserves 1,991,169 1,749,672 20,318 8,187 Surplus on revaluation of assets 21 3,247,593 1,308,531 43,978 36,260 Unappropriated profit 7,029,251 5,795,596
140,065 118,705 22,387,255 18,973,041 3,306 3,180 Non-controlling interest 528,446 508,271
143,371 121,885 22,915,701 19,481,312 CONTINGENCIES AND COMMITMENTS 22
The annexed notes from 1 to 50 and annexure I & annexure II form an integral part of these consolidated financial statements.

228Annual Report 2020
__________________President and
Chief Executive Officer
___________________Chief Financial Officer
___________Director
___________Director
___________Chairman
Consolidated Profit and Loss AccountFor the year ended December 31, 2020
2020 2019 2020 2019 ----- USD in ‘000 ----- Note ----- Rupees in ‘000 -----
270,230 260,842 Mark-up / return / interest earned 24 43,192,069 41,691,587 208,224 215,830 Mark-up / return / interest expensed 25 33,281,347 34,497,048 62,006 45,012 Net mark-up / interest income 9,910,722 7,194,539
NON MARK-UP / INTEREST INCOME
27,365 21,348 Fee, commission and brokerage income 26 4,373,942 3,412,160 845 1,241 Dividend income 135,120 198,432
6,321 6,026 Foreign exchange income 1,010,345 963,208 107 295 Income from derivatives 17,045 47,210
12,016 (4,167) Gain / (loss) on securities 27 1,920,510 (665,997) (95) 26 Share of (loss) / profit from associates (15,257) 4,180 684 3,161 Other income 28 109,306 505,189
47,243 27,930 Total non mark-up / interest income 7,551,011 4,464,382 109,249 72,942 Total Income 17,461,733 11,658,921
NON MARK-UP / INTEREST EXPENSES 86,973 73,587 Operating expenses 29 13,901,226 11,761,773
291 (413) Workers’ welfare fund 30 46,472 (65,991) 573 861 Other charges 31 91,639 137,643
87,837 74,035 Total non-mark-up / interest expenses 14,039,337 11,833,425 21,412 (1,093) Profit / (loss) before provisions 3,422,396 (174,504) 7,843 (555) Provisions / (reversals) and write offs - net 32 1,253,585 (88,703)
- - Extraordinary / unusual items - -
13,569 (538) PROFIT / (LOSS) BEFORE TAXATION 2,168,811 (85,801)
6,634 1,069 Taxation 33 1,060,376 170,807
6,935 (1,607) PROFIT / (LOSS) AFTER TAXATION 1,108,435 (256,608)
Attributable to: 6,947 (1,536) Equity holders of the Bank 1,110,373 (245,285)
(12) (71) Non-controlling interest (1,938) (11,323) 6,935 (1,607) 1,108,435 (256,608)
----- US Dollar ----- ----- Rupee -----
0.0054 (0.0013) Basic and diluted earnings / (loss) per share 34 0.8558 (0.2077)
The annexed notes from 1 to 50 and annexure I & annexure II form an integral part of these consolidated financial statements.
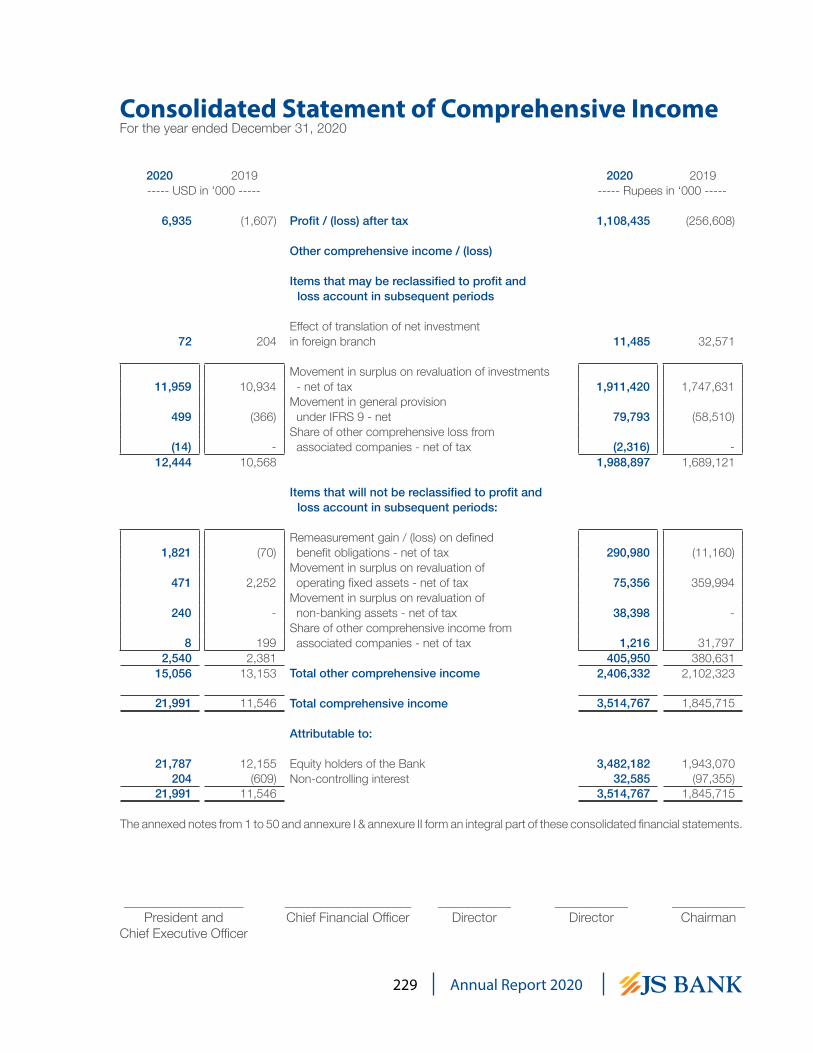
229 Annual Report 2020
Consolidated Statement of Comprehensive IncomeFor the year ended December 31, 2020
__________________President and
Chief Executive Officer
___________________Chief Financial Officer
___________Director
___________Director
___________Chairman
2020 2019 2020 2019 ----- USD in ‘000 ----- ----- Rupees in ‘000 -----
6,935 (1,607) Profit / (loss) after tax 1,108,435 (256,608)
Other comprehensive income / (loss)
Items that may be reclassified to profit and loss account in subsequent periods
Effect of translation of net investment 72 204 in foreign branch 11,485 32,571
Movement in surplus on revaluation of investments 11,959 10,934 - net of tax 1,911,420 1,747,631
Movement in general provision 499 (366) under IFRS 9 - net 79,793 (58,510)
Share of other comprehensive loss from (14) - associated companies - net of tax (2,316) -
12,444 10,568 1,988,897 1,689,121
Items that will not be reclassified to profit and loss account in subsequent periods:
Remeasurement gain / (loss) on defined 1,821 (70) benefit obligations - net of tax 290,980 (11,160)
Movement in surplus on revaluation of 471 2,252 operating fixed assets - net of tax 75,356 359,994
Movement in surplus on revaluation of 240 - non-banking assets - net of tax 38,398 -
Share of other comprehensive income from 8 199 associated companies - net of tax 1,216 31,797
2,540 2,381 405,950 380,631 15,056 13,153 Total other comprehensive income 2,406,332 2,102,323
21,991 11,546 Total comprehensive income 3,514,767 1,845,715
Attributable to:
21,787 12,155 Equity holders of the Bank 3,482,182 1,943,070 204 (609) Non-controlling interest 32,585 (97,355)
21,991 11,546 3,514,767 1,845,715
The annexed notes from 1 to 50 and annexure I & annexure II form an integral part of these consolidated financial statements.

230Annual Report 2020
Consolidated Statement of Changes in EquityFor the year ended December 31, 2020
__________________President and
Chief Executive Officer
___________________Chief Financial Officer
___________Director
___________Director
___________Chairman
Attributable to shareholders of the Bank
Share capital
Reserves Surplus / (Deficit) on revaluation ofUnappro-
priated profit
Sub-totalNon-
controlling interest
Total Statutory reserve *
Exchange translation Investments Fixed
assets
Non banking assets
---------------------------------------------------------------------- Rupees in ‘000 ------------------------------------------------------------------
Balance as at December 31, 2018 10,119,242 1,641,236 70,934 (2,080,364) 1,164,974 92,858 5,825,742 16,834,622 1,604,197 18,438,819
Loss after taxation - - - - - - (245,285) (245,285) (11,323) (256,608)Other comprehensive income / (loss) - net of tax - - 32,571 1,714,569 452,297 - (11,082) 2,188,355 (86,032) 2,102,323
- - 32,571 1,714,569 452,297 - (256,367) 1,943,070 (97,355) 1,845,715
Transfer to statutory reserve - 4,931 - - - - (4,931) - - -
Transfer from surplus on revaluation ofassets to unappropriated profit - net of tax
Fixed assets - - - - (35,721) - 35,721 - - -
Non-banking assets acquiredin satisfaction of claims - - - - - (82) 82 - - -
Transaction with owners recorded directly in equity
Preference dividend paid for the yearended December 31, 2018 @ 12% p.a. - - - - - - (24,164) (24,164) - (24,164)
Buy-back of shares by subsidiary from NCI - - - - - - - - (1,001,653) (1,001,653)
Interim cash dividend to non-controlling interestby subsidiary company @ Rs. 4 per share - - - - - - - - (38,152) (38,152)
Gain arised on buy back of shares by subsidiary - - - - - - 219,513 219,513 41,234 260,747
Balance as at December 31, 2019 10,119,242 1,646,167 103,505 (365,795) 1,581,550 92,776 5,795,596 18,973,041 508,271 19,481,312
Profit / (loss) after taxation - - - - - - 1,110,373 1,110,373 (1,938) 1,108,435 Other comprehensive income / (loss) net of tax - - 11,485 1,956,690 76,572 38,398 288,664 2,371,809 34,523 2,406,332
- - 11,485 1,956,690 76,572 38,398 1,399,037 3,482,182 32,585 3,514,767
Transfer to statutory reserve - 230,012 - - - - (230,012) - - -
Transfer from surplus on revaluation ofassets to unappropriated profit - net of tax
Fixed assets - - - - (40,378) - 40,378 - - -
Non-banking assets acquiredin satisfaction of claims - - - - - (94) 94 - - -
Assets held for sale - - - - (92,126) - 92,126 - - -
Pre-acquisition surplus (net) on available-for-sale investments realised during the year - - - - - - (67,968) (67,968) (12,410) (80,378)
Balance as at December 31, 2020 10,119,242 1,876,179 114,990 1,590,895 1,525,618 131,080 7,029,251 22,387,255 528,446 22,915,701
*This represents reserve created under Section 21(i)(a) of the Banking Companies Ordinance, 1962.
The annexed notes from 1 to 50 and annexure I & annexure II form an integral part of these consolidated financial statements.

231 Annual Report 2020
Consolidated Cash Flow StatementFor the year ended December 31, 2020
__________________President and
Chief Executive Officer
___________________Chief Financial Officer
___________Director
___________Director
___________Chairman
2020 2019 2020 2019 ------- USD in ‘000 ------- Note ------- Rupees in ‘000 -------
CASH FLOWS FROM OPERATING ACTIVITIES13,569 (538) Profit / (loss) before taxation 2,168,811 (85,801)
(845) (1,241) Less: Dividend income (135,120) (198,432) 95 (26) Add / (less): Share of loss / (profit) from associates 15,257 (4,180)
12,819 (1,805) 2,048,948 (288,413)Adjustments:
4,888 5,356 Depreciation 781,330 856,131 18 11 Depreciation on non-banking assets 29 2,862 1,713
5,970 6,166 Depreciation - right of use assets 29 954,275 985,498 738 613 Amortisation of intangible assets 29 118,032 97,968 998 843 Charge for defined benefit plan 37.5 159,436 134,712
Unrealised gain on revaluation of investments classified (89) (52) as held-for-trading - net (14,202) (8,368)
Unrealised loss / (gain) on revaluation of forward 409 (413) foreign exchange contracts 65,409 (65,955) (18) (132) Unrealised gain on revaluation of derivative instruments - net (2,819) (21,126)
7,843 (557) Provisions and write offs - net 32 1,253,585 (89,018) 291 (413) Provision for workers welfare fund 30 46,472 (65,991)
Mark-up / return / interest expense on lease liability 2,822 3,633 against right-of-use assets 25 451,047 580,610
(67) (3,089) Gain on sale of fixed assets - net 28 (10,682) (493,680) (6) - Gain on sale of assets held for sale 28 (1,000) -
(405) - Gain on termination of leases 28 (64,805) - 23,392 11,966 3,738,940 1,912,494 36,211 10,161 5,787,888 1,624,081
Decrease / (increase) in operating assets 44,302 (177,560) Lendings to financial institutions 7,080,905 (28,380,143)
194,164 (85,463) Held-for-trading securities 31,034,008 (13,659,848) (49,206) 54,217 Advances (7,864,762) 8,665,682
7,142 (31,024) Other assets (excluding advance taxation) 1,141,538 (4,959,078) 196,402 (239,830) 31,391,689 (38,333,387)
Increase / (decrease) in operating liabilities 7,367 1,780 Bills payable 1,177,492 284,567
(35,483) (264,184) Borrowings (5,671,449) (42,225,743) 393,409 304,920 Deposits and other accounts 62,880,219 48,736,751
4,873 14,273 Other liabilities 778,760 2,281,258 370,166 56,789 59,165,022 9,076,833 602,779 (172,880) 96,344,599 (27,632,473)
(950) (641) Gratuity paid (151,882) (102,494) (2,593) (2,790) Income tax paid (414,455) (445,904)
599,236 (176,311) Net cash flow from / (used) in operating activities 95,778,262 (28,180,871)CASH FLOW FROM INVESTING ACTIVITIES
(525,318) 83,861 Net investment in available-for-sale securities (83,963,914) 13,403,936 (20,332) 61,670 Net investment in held-to-maturity securities (3,249,717) 9,857,050
(255) (133) Investment in associated companies (40,828) (21,239) 838 1,241 Dividend received 134,017 198,432
(9,643) (8,651) Investments in fixed assets (1,541,230) (1,382,668) (2,072) (1,234) Investments in intangible assets (331,107) (197,157)
227 8,458 Proceeds from sale of fixed assets 36,312 1,351,903 2,346 - Proceeds from sale of assets held for sale 375,000 -
72 204 Effect of translation of net investment in foreign branch 11,485 32,571 (554,137) 145,416 Net cash flows (used in) / from investing activities (88,569,982) 23,242,828
CASH FLOW FROM FINANCING ACTIVITIES - (151) Dividend paid on preference shares - (24,164)
(7,691) (8,852) Payment of lease liability against right of use assets (1,229,285) (1,414,882) (13) (13) Subordinated debt (2,000) (2,000)
- (239) Dividend paid to non-controlling interest - (38,152) - (4,635) Shares bought back from non-controlling interest - (740,906)
(7,704) (13,890) (1,231,285) (2,220,104) 37,395 (44,785) Increase / (decrease) in cash and cash equivalents 5,976,995 (7,158,147)
159,099 203,884 Cash and cash equivalents at beginning of the year 35 25,429,551 32,587,698 196,494 159,099 Cash and cash equivalents at end of the year 31,406,546 25,429,551
The annexed notes from 1 to 50 and annexure I & annexure II form an integral part of these consolidated financial statements.

232Annual Report 2020
Notes to the Consolidated Financial StatementsFor the year ended December 31, 2020
1. STATUS AND NATURE OF BUSINESS
1.1 The “Group” consists of:
1.1.1 Holding Company: JS Bank Limited
JS Bank Limited (the Bank / JSBL) is a banking company incorporated in Pakistan as a public limited company on March 15, 2006. The Bank is a subsidiary company of Jahangir Siddiqui & Co. Ltd. (JSCL) and its shares are listed on Pakistan Stock Exchange Limited (PSX). The Bank commenced its banking operations on December 30, 2006 and its registered office is situated at Shaheen Commercial Complex, Dr. Ziauddin Ahmed Road, Karachi.
The Bank is a scheduled bank, engaged in commercial banking and related services as described in the Banking Companies Ordinance, 1962 and is operating through 307 (2019: 359) branches / sub-branches in Pakistan and one wholesale banking branch in Bahrain (2019: one). The Pakistan Credit Rating Agency Limited (PACRA) has assigned the long-term entity rating of the Bank to AA- (Double A Minus) whereas short-term rating is maintained at ‘A1+’ (A One Plus), which is the highest possible short-term rating. The ratings denote a very low expectation of credit risk and indicate very strong capacity for timely payment of financial commitments.
1.1.2 Jahangir Siddiqui Investment Bank Limited, JSIBL, (formerly Citicorp Investment Bank Limited which was acquired by JSCL on February 01, 1999), and its holding company, JSCL, entered into a Framework Agreement with American Express Bank Limited, New York (AMEX) on November 10, 2005 for acquisition of its American Express Bank Limited - Pakistan Branches, (AEBL). Consequently, a new banking company, JSBL was incorporated on March 15, 2006 and a restricted Banking License was issued by the State Bank of Pakistan (SBP) on May 23, 2006.
A Transfer Agreement was executed on June 24, 2006 between JSIBL and JSBL for the transfer of entire business and undertaking of JSIBL to JSBL and a separate Transfer Agreement was also executed on June 24, 2006, between AMEX and JSBL for the transfer of AEBL’s commercial banking business in Pakistan with all assets and liabilities (other than certain excluded assets and liabilities) (AEBL business). The shareholders of JSIBL and JSBL in their respective extra-ordinary general meetings held on July 31, 2006 approved a Scheme of Amalgamation (the Scheme) under Section 48 of the Banking Companies Ordinance, 1962. The Scheme was initially approved by the Securities and Exchange Commission of Pakistan vide its letter No. SC/NBFC(J)-R/JSIBL/2006/517 dated September 28, 2006. Subsequently, the Scheme was sanctioned by the SBP vide its order dated December 02, 2006 and, in accordance therewith, the effective date of amalgamation was fixed at December 30, 2006.
The ultimate parent of the Group is Jahangir Siddiqui & Co. Limited which holds 75.02% shares of the Bank.
1.1.3 Composition of the GroupOwnership interest andvoting power held by
2020 2019The Group NCI The Group NCI
SubsidiaryJS Global Capital Limited 83.53% 16.47% 83.53% 16.47%JS Investment Limited 84.56% 15.44% 84.56% 15.44%JS ABAMCO Commodities Limited 84.56% 15.44% 84.56% 15.44%
1.1.4 Composition of the Associated Companies
Ownership interest andvoting power held by Bank
2020 2019AssociatesOmar Jibran Engineering Industries Limited 9.60% 9.60%Veda Transit Solutions (Private) Limited 9.12% 8.00%Intercity Touring Company (Private) Limited 9.12% 9.12%

233 Annual Report 2020
Notes to the Consolidated Financial StatementsFor the year ended December 31, 2020
1.1.5 Subsidiary Companies
JS Global Capital Limited (JSGCL)
JS Global Capital Limited is principally owned by the Bank, holding 83.53% of its equity interest. The Bank acquired effective controlling interest in JSGCL on December 21, 2011, April 15, 2016 and October 03, 2019 of 51.05%, 16.11% and 16.37% respectively. The ownership interest has increased by 32.42%, without any change in the cost of investment, due to the fact that JSGCL has bought back its 19,443,000 ordinary shares out of its 50 million ordinary shares. JSGCL is a public listed company incorporated in Pakistan under the repealed Companies Ordinance, 1984. The shares of the JSGCL are listed on Pakistan Stock Exchange (PSX). Further, the JSGCL is a corporate member of PSX and member of Pakistan Mercantile Exchange. The principal business of the JSGCL is to carry out share brokerage, money market, forex and commodity brokerage, advisory and consultancy services. Other activities include investment in a mix of listed and unlisted equity and debt securities and reverse repurchase transactions. The registered office of the Company is situated at 17th Floor, The Centre, Plot No. 28, SB-5, Abdullah Haroon Road, Saddar, Karachi, Pakistan. The Company has eight branches (2019: ten) in seven cities of Pakistan.
JS Investments Limited (JSIL)
JS Investments Limited is principally owned by the Bank, holding 84.56% of its equity interest. The Bank acquired effective controlling interest in JS Investments Limited (JSIL) on November 01, 2012, December 22, 2015 and August 31, 2019 of 52.24%,12.92% and 19.40% respectively. The ownership interest has increased by 32.32% without any change in the cost of investment, due to the fact that JSIL has bought back its 38,225,744 ordinary shares out of its 100 million ordinary shares. JSIL is a public listed company incorporated in Pakistan on February 22, 1995 under the repealed Companies Ordinance, 1984. The shares of the JSIL are listed on the Pakistan Stock Exchange (PSX), formerly since April 24, 2007. The registered office of the Company is situated at The Centre, 19th Floor, Plot No. 28, SB-5, Abdullah Haroon Road, Saddar, Karachi.
The JSIL has obtained the license of an “Investment Advisor” and “Asset Management Company” (AMC) under the Non-Banking Finance Companies (Establishment and Regulation) Rules, 2003 (the NBFC Rules) and the Non-Banking Finance Companies and Notified Entities Regulations, 2008 (the NBFC Regulations). In addition, JSIL has also obtained registration to act as Pension Fund Manager under the Voluntary Pension System Rules, 2005.
JSIL is an asset management company of the following funds:
Open end funds: Private Equity & Venture Capital fund:- JS Value Fund - JS Motion Picture Fund- JS Growth Fund- Unit Trust of Pakistan Pension funds:- JS Income Fund - JS Pension Savings Fund- JS Islamic Fund - JS Islamic Pension Savings Fund- JS Fund of Funds- JS Islamic Income Fund- JS Cash Fund - JS Large Cap. Fund - JS Islamic Hybrid Fund of Funds (JSIHFOF)- JS Islamic Hybrid Fund of Funds -2 (JSIHFOF2)- JS Islamic Hybrid Fund of Funds -3 (JSIHFOF3)- JS Islamic Dedicated Equity Fund- JS Islamic Daily Dividend Fund
These funds have been treated as related parties in these consolidated financial statements.

234Annual Report 2020
Notes to the Consolidated Financial StatementsFor the year ended December 31, 2020
JS ABAMCO Commodities Limited (JSACL)
JS Bank owns JS ABAMCO Commodities Limited indirectly through its subsidiary JS Investment Limited (JSIL) which has 100% holding in JSACL. JSACL was incorporated on September 25, 2007 as a public unlisted company under the repealed Companies Ordinance, 1984 and is a wholly owned subsidiary company of JSIL (a subsidiary of Holding Company). The principal activities of JSACL are to deal and effectuate commodity contracts; to become member of commodity exchange including National Commodity Exchange Limited (NCEL) and to carry on the business as brokers, advisory and consultancy services, dealers and representative of all kinds of commodity contracts and commodity backed securities. The registered office of JSACL is situated at The Centre, 19th Floor, Plot No. 28, SB-5, Abdullah Haroon Road, Saddar, Karachi.
1.1.6 Associated Companies
Omar Jibran Engineering Industries Limited (OJEIL)
The Bank has invested in the shares of Omar Jibran Engineering Industries Limited (OJEIL), a public unlisted company. The Bank has classified the investment as an associate on account of its significant influence over the investee company. OJEIL was incorporated on June 25, 1987 in Pakistan as an unquoted public limited company under the repealed Companies Ordinance, 1984. The registered office of the OJEIL is situated at DSU-10, Pakistan Steel Industries Estate Bin Qasim, Karachi. The OJEIL is mainly engaged in the manufacture and sale of automotive parts and armoring of vehicles.
Veda Transit Solutions (Private) Limited
The Bank has invested in the shares of VEDA Transit Solutions (Private) Limited (VEDA), a private limited company. The Bank has classified the investment as an associate on account of its significant influence over the investee company. VEDA was incorporated on June 10, 2016 in Pakistan as private limited company under the repealed Companies Ordinance, 1984. The registered office of the VEDA is situated at Raaziq Logistics Centre 16 KM, Multan Road, Near Dina Nath Stop, Lahore. The VEDA is mainly engaged in the rural / urban, intracity / intercity transportation of passenger and goods.
Intercity Touring Company (Private) Limited
The Bank has invested in the shares of Intercity Touring Company (Private) Limited (ITC), a private limited company. The Bank has classified the investment as an associate on account of its significant influence over the investee company. ITC was incorporated on April 25, 2014 in Pakistan as private limited company under the repealed Companies Ordinance, 1984. The registered office of the ITC is situated at 147-P Gulberg III, Lahore. The ITC is mainly engaged in the transportation, touring and logistics related services.
2. BASIS OF PRESENTATION
2.1 These consolidated financial statements include financial statements of JS Bank Limited and its subsidiary companies, (the “Group”) and share of the profit / reserves of associates.
These consolidated financial statements have been presented in Pakistan Rupees(PKR), which is the currency of the primary economic environment in which the Holding Company operates and functional currency of the Holding Company, in that environment as well. The amounts are rounded off to the nearest thousand rupees except as stated otherwise.
The US Dollar amounts shown on the statement of financial position, profit and loss account, statement of comprehensive income and cash flow statement are stated as additional information solely for the convenience of readers and have not been subject to audit by the external auditors. For the purpose of conversion to US Dollars, the rate of Rs. 159.8344 to 1 US Dollar has been used for 2019 and 2020 as it was the prevalent rate as on December 31, 2020.

235 Annual Report 2020
Notes to the Consolidated Financial StatementsFor the year ended December 31, 2020
2.2 Statement of Compliance
These consolidated financial statements have been prepared in accordance with the accounting and reporting standards as applicable in Pakistan. These comprise of:
- International Financial Reporting Standards (IFRSs) issued by the International Accounting Standards Board (IASB) as are notified under the Companies Act, 2017;
- Provisions of and directives issued under the Banking Companies Ordinance, 1962;
- Provisions of and directives issued under the Companies Act, 2017; and
- Directives issued by the SBP and the Securities & Exchange Commission of Pakistan (SECP) from time to time.
Whenever the requirements of the Banking Companies Ordinance, 1962, the Companies Act, 2017, or the directives issued by the SBP and the SECP differ with the requirements of IFRS, the requirements of the Banking Companies Ordinance, 1962, the Companies Act, 2017 and the said directives shall prevail.
The SBP has deferred the applicability of International Accounting Standard (IAS) 39, ‘Financial Instruments: Recognition and Measurement’ and International Accounting Standard (IAS) 40, ‘Investment Property’ for banking companies vide BSD Circular Letter No. 10 dated August 26, 2002 till further instructions. Further, the SECP has deferred the applicability of International Financial Reporting Standard (IFRS) 7, ‘Financial Instruments: Disclosures’ on banks vide its notification S.R.O 411(I)/2008 dated April 28, 2008. Accordingly, the requirements of these standards have not been considered in the preparation of these consolidated financial statements. However, investments have been classified and valued in accordance with the requirements prescribed by the SBP through various circulars.
IFRS10 “Consolidated Financial Statements” was made applicable from period beginning on or after January 01, 2015 vide S.R.O 633(I)/2014 dated July 10, 2014 by SECP. However, SECP has directed through S.R.O56(I)/2016 dated January 28, 2016, that the requirement of consolidation under section 228 of the Companies Act, 2017 and IFRS-10 “Consolidated Financial Statements” is not applicable in case of investment by companies in mutual funds established under trust structure. Accordingly, the requirements of these standards have not been considered in the preparation of these consolidated financial statements.
Through S.R.O. 229 (I)/2019 dated February 14, 2019, the SECP has extended the applicability of the IFRS 9 ‘Financial Instruments’ for all companies required to prepare their financial statements in accordance with the requirements of IFRS for reporting period/year ending on or after June 30, 2019 (earlier application is permitted). However, SBP has further extended the effective date of applicability of IFRS 9 from annual period beginning on or after January 01,2021 vide SBP BPRD Circular No.4 dated October 23,2019. Therefore, the Group has not considered the impact of IFRS 9 for its Pakistan operations in these consolidated financial statements.
Further, the Holding Company considers that as the Prudential Regulations and other SBP directives currently provide the accounting framework for the measurement and valuation of investments and provision against non performing loans and advances, the implementation of IFRS 9 may require changes in the regulatory regime and for this SBP would issue guidance and instruction on the application of IFRS 9 for the Holding Companying sector of Pakistan.
2.3 BASIS OF CONSOLIDATION
2.3.1 Subsidiary
- The consolidated financial statements include the financial statements of the Bank (The Holding Company) and its subsidiary companies together - “the Group”.

236Annual Report 2020
Notes to the Consolidated Financial StatementsFor the year ended December 31, 2020
- Subsidiaries are entities controlled by the Group. Control exists when the Group is exposed, or has rights, to variable returns from its investment with investee and has the ability to effect those return through its power over the investee except investment in mutual funds established under trust structure where IFRS 10 ‘Consolidated Financial Statements’ is not applicable in case of investment by companies in mutual funds established under Trust structure.
- These consolidated financial statements incorporate the financial statements of subsidiaries from the date that control commences until the date that control ceases.
- The financial statements of the subsidiary companies are prepared for the same reporting year as the holding company for the purpose of consolidation, using consistent accounting policies.
- The assets, liabilities, income and expenses of subsidiary companies have been consolidated on a line by line basis.
- Non-controlling interests are that part of the net results of operations and of net assets of subsidiaries attributable to interest which are not owned by the holding company.
- Material intra-group balances and transactions are eliminated.
2.3.2 Associate
Associates are those entities in which the Group has significant influence, but not control, over the financial and operating polices. Associates are accounted for using the equity method.
2.3.3 Acquisition of business not under common control
Acquisitions of businesses not under common control are accounted for using the acquisition method. The consideration transferred in a business combination is measured at fair value, which is calculated as the sum of the acquisition-date fair values of the assets transferred by the bank, liabilities incurred by the bank to the former owners of the acquiree and the equity interests issued by the bank in exchange for control of the acquiree. Acquisition-related costs are recognised in profit and loss account as incurred.
At the acquisition date, the identifiable assets acquired and the liabilities assumed are recognised at their fair value at the acquisition date.
Goodwill on acquisition after July 01, 2009 is measured as the excess of the sum of the consideration transferred, the amount of any non-controlling interests in the acquiree, and the fair value of the acquirer’s previously held equity interest in the acquiree (if any) over the net of the acquisition-date amounts of the identifiable assets acquired and the liabilities assumed. If, after reassessment, net of the acquisition-date amounts of the identifiable assets acquired and liabilities assumed exceeds the sum of the consideration transferred, the amount of any non-controlling interests in the acquiree and the fair value of the acquirer’s previously held interest in the acquiree (if any), the excess is recognised immediately in profit or loss as a bargain purchase gain.
Goodwill acquired in a business combination before July 01, 2009 is initially measured at cost, being the excess of the cost of business combination over the Bank’s interest in the net fair value of the identifiable assets, liabilities and contingent liabilities acquired.
Non-controlling interests that are present ownership interests and entitle their holders to a proportionate share of the Group’s net assets in the event of liquidation is measured at proportionate share of net assets of the acquiree at the date of the acquisition.
237 Annual Report 2020
Notes to the Consolidated Financial StatementsFor the year ended December 31, 2020
2.3.4 Acquisition of business under common control
Acquisition of business under common control are accounted for under ‘pooling of interest method’. The assets and liabilities of the combining businesses for the period in which the combination occurs are merged on the date of combination at their respective book values. Appropriate adjustments are made to the book values to reflect application consistent accounting policies in the combining businesses. Any difference between the amount of net assets merged and consideration transferred in form of cash or other assets are adjusted against equity.
Expenditure incurred in relation to the business combination are recognized as expenses in the period in which they are incurred.
2.4 Standards, interpretations of and amendments to published approved accounting standards that are effective in the current year
The Holding Compnay has adopted the following accounting standards, interpretations and amendments of IFRSs and the improvements to accounting standards which became effective for the current year:
- Amendments to IAS 1 Presentation of Financial Statements and IAS 8 Accounting Policies, Changes in Accounting Estimates and Errors. The amendments were intended to make the definition of material in IAS 1 easier to understand and are not intended to alter the underlying concept of materiality in IFRS Standards. In addition, the IASB has also issued guidance on how to make materiality judgements when preparing their general purpose financial statements in accordance with IFRS Standards.
- Amendment to IFRS 3 ‘Business Combinations’ – Definition of a Business. IASB has issued amendments aiming to resolve the difficulties that arise when an entity determines whether it has acquired a business or a group of assets. The amendments clarify that to be considered a business, an acquired set of activities and assets must include, at a minimum, an input and a substantive process that together significantly contribute to the ability to create outputs. The amendments include an election to use a concentration test.
- IFRS 14 ‘Regulatory Deferral Accounts’ permits an entity to continue to account, with some limited changes, for ‘regulatory deferral account balances’ in accordance with its previous reporting framework, both on initial adoption of standard and in subsequent financial statements. Regulatory deferral account balances, and movements in them, are presented separately in the statement of financial position and profit and loss account and statement of other comprehensive income, and specific disclosures are required.
- IASB has also issued the revised Conceptual Framework for Financial Reporting (the Conceptual Framework) in March 2018 which became effective during the year for preparers of financial statements who develop accounting policies based on the Conceptual Framework. The revised Conceptual Framework is not a standard, and none of the concepts override those in any standard or any requirements in a standard. The purpose of the Conceptual Framework is to assist IASB in developing standards, to help preparers develop consistent accounting policies if there is no applicable standard in place and to assist all parties to understand and interpret the standards.
The adoption of the above standards / amendments to accounting standards are not considered to be relevant or did not have any significant effect on the Holding Company’s operations.
2.5 Standards, interpretations of and amendments to published approved accounting standards that are not yet effective
The following standards, amendments and interpretations of approved accounting standards will be effective for accounting periods beginning on or after January 01, 2021:

238Annual Report 2020
Notes to the Consolidated Financial StatementsFor the year ended December 31, 2020
- IFRS 9 ‘Financial Instruments’ - SBP vide its BPRD Circular No. 04 of 2019 dated 23 October 2019 directed the banks in Pakistan to implement IFRS 9 with effect from 01 January 2021. IFRS 9 replaced the existing guidance in IAS 39 Financial Instruments: Recognition and Measurement. IFRS 9 includes revised guidance on the classification and measurement of financial instruments, a new expected credit loss model for calculating impairment on financial assets, and new general hedge accounting requirements. It also carries forward the guidance on recognition and derecognition of financial instruments from IAS 39. The Holding Company has been complying with the requiremnt of BPRD Circular Letter No. 15 of 2020 to have parallel run of IFRS 9 from July 01, 2020.
- COVID-19-Related Rent Concessions (Amendment to IFRS 16) – the International Accounting Standards Board (the Board) has issued amendments to IFRS 16 (the amendments) to provide practical relief for lessees in accounting for rent concessions. The amendments are effective for periods beginning on or after 1 June 2020, with earlier application permitted. Under the standard’s previous requirements, lessees assess whether rent concessions are lease modifications and, if so, apply the specific guidance on accounting for lease modifications. This generally involves remeasuring the lease liability using the revised lease payments and a revised discount rate. In light of the effects of the COVID-19 pandemic, and the fact that many lessees are applying the standard for the first time in their financial statements, the Board has provided an optional practical expedient for lessees. Under the practical expedient, lessees are not required to assess whether eligible rent concessions are lease modifications, and instead are permitted to account for them as if they were not lease modifications. Rent concessions are eligible for the practical expedient if they occur as a direct consequence of the COVID-19 pandemic and if all the following criteria are met:
- the change in lease payments results in revised consideration for the lease that is substantially the same as, or less than, the consideration for the lease immediately preceding the change;
- any reduction in lease payments affects only payments originally due on or before 30 June 2021; and
- there is no substantive change to the other terms and conditions of the lease.
- Interest Rate Benchmark Reform – Phase 2 which amended IFRS 9, IAS 39, IFRS 7, IFRS 4 and IFRS 16 is applicable for annual financial periods beginning on or after 1 January 2021, with earlier application permitted. The amendments introduce a practical expedient to account for modifications of financial assets or financial liabilities if a change results directly from IBOR reform and occurs on an ‘economically equivalent’ basis. In these cases, changes will be accounted for by updating the effective interest rate. A similar practical expedient will apply under IFRS 16 for lessees when accounting for lease modifications required by IBOR reform. The amendments also allow a series of exemptions from the regular, strict rules around hedge accounting for hedging relationships directly affected by the interest rate benchmark reforms. The amendments apply retrospectively with earlier application permitted. Hedging relationships previously discontinued solely because of changes resulting from the reform will be reinstated if certain conditions are met.
- Onerous Contracts – Cost of Fulfilling a Contract (Amendments to IAS 37) effective for the annual period beginning on or after 1 January 2022 amends IAS 1 by mainly adding paragraphs which clarifies what comprise the cost of fulfilling a contract, Cost of fulfilling a contract is relevant when determining whether a contract is onerous. An entity is required to apply the amendments to contracts for which it has not yet fulfilled all its obligations at the beginning of the annual reporting period in which it first applies the amendments (the date of initial application). Restatement of comparative information is not required, instead the amendments require an entity to recognize the cumulative effect of initially applying the amendments as an adjustment to the opening balance of retained earnings or other component of equity, as appropriate, at the date of initial application.
The following annual improvements to approved accounting standards 2018-2020 are effective for annual reporting periods beginning on or after 1 January 2022.

239 Annual Report 2020
- IFRS 9 – The amendment clarifies that an entity includes only fees paid or received between the entity (the borrower) and the lender, including fees paid or received by either the entity or the lender on the other’s behalf, when it applies the ‘10 percent’ test in paragraph B3.3.6 of IFRS 9 in assessing whether to derecognize a financial liability.
- IFRS 16 – The amendment partially amends Illustrative Example 13 accompanying IFRS 16 by excluding the illustration of reimbursement of leasehold improvements by the lessor. The objective of the amendment is to resolve any potential confusion that might arise in lease incentives.
- IAS 41 – The amendment removes the requirement in paragraph 22 of IAS 41 for entities to exclude taxation cash flows when measuring the fair value of a biological asset using a present value technique.
- Property, Plant and Equipment: Proceeds before Intended Use (Amendments to IAS 16) effective for the annual period beginning on or after 1 January 2022. Clarifies that sales proceeds and cost of items produced while bringing an item of property, plant and equipment to the location and condition necessary for it to be capable of operating in the manner intended by management e.g. when testing etc., are recognized in profit or loss in accordance with applicable Standards. The entity measures the cost of those items applying the measurement requirements of IAS 2. The standard also removes the requirement of deducting the net sales proceeds from cost of testing. An entity shall apply those amendments retrospectively, but only to items of property, plant and equipment that are brought to the location and condition necessary for them to be capable of operating in the manner intended by management on or after the beginning of the earliest period presented in the financial statements in which the entity first applies the amendments. The entity shall recognize the cumulative effect of initially applying the amendments as an adjustment to the opening balance of retained earnings (or other component of equity, as appropriate) at the beginning of that earliest period presented.
- Reference to the Conceptual Framework (Amendments to IFRS 3) - Reference to the Conceptual Framework, issued in May 2020, amended paragraphs 11, 14, 21, 22 and 23 of and added paragraphs 21A, 21B, 21C and 23A to IFRS 3 . An entity shall apply those amendments to business combinations for which the acquisition date is on or after the beginning of the first annual reporting period beginning on or after 1 January 2022. Earlier application is permitted if at the same time or earlier an entity also applies all the amendments made by Amendments to References to the Conceptual Framework in IFRS Standards, issued in March 2018.
- Classification of liabilities as current or non-current (Amendments to IAS 1) effective for the annual period beginning on or after 1 January 2022. These amendments in the standards have been added to further clarify when a liability is classified as current. The standard also amends the aspect of classification of liability as non-current by requiring the assessment of the entity’s right at the end of the reporting period to defer the settlement of liability for at least twelve months after the reporting period. An entity shall apply those amendments retrospectively in accordance with IAS 8.
- Sale or Contribution of Assets between an Investor and its Associate or Joint Venture (Amendments to IFRS 10 and IAS 28) – The amendment amends accounting treatment on loss of control of business or assets. The amendments also introduce new accounting for less frequent transaction that involves neither cost nor full step-up of certain retained interests in assets that are not businesses. The effective date for these changes has been deferred indefinitely until the completion of a broader review.
Further, following new standards have been issued by IASB which are yet to be notified by the SECP for the purpose of applicability in Pakistan.
IASB Effective date(annual periods beginning on or after)Standard
IFRS 1 – First time adoption of IFRSs January 01, 2004
IFRS 17 – Insurance Contracts January 01, 2023
Notes to the Consolidated Financial StatementsFor the year ended December 31, 2020

240Annual Report 2020
2.6 Critical accounting estimates and key sources of estimation uncertainty
The preparation of these consolidated financial statements in conformity with approved accounting standards requires the use of certain critical accounting estimates. It also requires management to exercise its judgment in the process of applying the Group’s accounting policies. Estimates and judgments are continually evaluated and are based on historic experience and other factors, including expectations of future events that are believed to be reasonable under the circumstances. Revisions in accounting estimates are recognised in the period in which the estimate is revised and in any future periods affected.
The areas where various assumptions and estimates are significant to the Group’s financial statements or where judgment was exercised in application of accounting policies are as follows:
i) Classification of investments
- In classifying investments as ‘held-for-trading’ the Group has determined securities which are acquired with an intention to trade by taking advantage of short-term market / interest rate movements and are to be sold within 90 days of acquisition.
- In classifying investments as ‘held-to-maturity’ the Group follows the guidance provided in SBP circulars on classifying non-derivative financial assets with fixed or determinable payments and fixed maturity. In making this judgment, the Group evaluates its intention and ability to hold such investments to maturity.
- The investments which are not classified as ‘held-for-trading’ or ‘held-to-maturity’ are classified as ‘available-for-sale’.
ii) Provision against non performing loans and advances
The Holding Company reviews its loan portfolio to assess amount of non-performing loans and advances and provision required there-against. While assessing this requirement various factors including the delinquency in the account, financial position of the borrowers, the value of securities and the requirements of the Prudential Regulations are considered. For portfolio impairment / provision on consumer advances, the Bank follows requirements set out in Prudential Regulations.
iii) Impairment on investments
The Group determines that investments are impaired when there has been a significant or prolonged decline in the fair value below its cost. This determination of what is significant or prolonged requires judgment. In making this judgment, the Bank evaluates among other factors, the normal volatility in securities price. In addition, impairment may be appropriate when there is an evidence of deterioration in the financial health of the investee, industry and sector performance, changes in technology and operational and financing cash flows.
iv) Income taxes
In making the estimates for income taxes currently payable by the Group, the management considers the current income tax laws and the decisions of appellate authorities on certain issues in the past. In making the provision for deferred taxes, estimates of the Group’s future taxable profits are taken into account.
v) Depreciation of fixed assets and amortization of intangible assets
In making estimates of the depreciation / amortisation method, the management uses a method which reflects the pattern in which economic benefits are expected to be consumed by the Bank. The method applied is reviewed at each financial year end and if there is a change in the expected pattern of consumption of the future economic benefits embodied in the underlying assets, the method is changed to reflect the change in pattern. Such change is accounted for as change in accounting estimates in accordance with International Accounting Standard - 8, “Accounting Policies, Changes in Accounting Estimates and Errors”.
Notes to the Consolidated Financial StatementsFor the year ended December 31, 2020

241 Annual Report 2020
vi) Defined benefits plans and other benefits
Liability is determined on the basis of actuarial advice using the Projected Unit Credit Method.
vii) Impairment of Goodwill
Impairment testing involves a number of judgmental areas which are subject to inherent significant uncertainty, including the preparation of cash flow forecasts for the periods that are beyond the normal requirements of management reporting and the assessment of the discount rate appropriate to the business. The carrying amount of goodwill at the balance sheet date was Rs.1,464 million. The detailed assumptions underlying impairment testing of goodwill are given in note 12.7 to these consolidated financial statements.
viii) Lease term
The Group applies judgement to determine the lease term for some lease contracts in which it is a lessee that include renewal options.The assessment of whether the Bank is reasonably certain to exercise such options impacts the lease term, which significantly affects the amount of lease liabilities and right-of-use assets recognised and its recoverable amount which is determined as higher of value-in-use and fair value less cost to sell.
3. BASIS OF MEASUREMENT
These consolidated financial statements have been prepared under the historical cost convention except for:
- Certain classes of fixed assets and non-banking assets acquired in satisfaction of claims which are stated at revalued amounts less accumulated depreciation.
- Investments classified as held-for-trading and available-for-sale and derivative financial instruments, which are measured at fair value.
- Net obligations in respect of defined benefit schemes which are carried at their present values.
4. SUMMARY OF SIGNIFICANT ACCOUNTING POLICIES
The principal accounting policies applied in the preparation of these consolidated financial statements are consistent with those of previous financial year.
4.1 Cash and cash equivalents
Cash and cash equivalents represent cash and balances with treasury banks and balances with other banks net of any overdrawn nostro accounts.
4.2 Lendings to / borrowings from financial institutions
The Group enters into transactions of lendings to / borrowings from financial institutions at contracted rates for a specified period of time. These are recorded as under:
(a) Purchase under resale obligation
Securities purchased under agreement to resell (reverse repo) are not included in statement of financial position as the Bank does not obtain control over the securities. Amount paid under these agreements is included in lendings to financial institutions or advances as appropriate. The difference between the contracted price and resale price is amortised over the period of the contract and recorded as income using effective interest method.
Notes to the Consolidated Financial StatementsFor the year ended December 31, 2020

242Annual Report 2020
(b) Other lendings
Other lendings include term lendings and unsecured lendings to financial institutions. These are stated net of provision. Mark-up on such lendings is charged to profit and loss account on a time proportionate basis using effective interest rate method except mark-up on impaired/delinquent lendings, which are recognized on receipt basis in accordance with the requirements of the Prudential Regulations of the SBP.
(c) Sale under repurchase obligation
Securities sold subject to a repurchase agreement (repo) are retained in the financial statements as investments and liability to counter party is included in borrowings. The difference in sale and repurchase value is accrued over the period of the contract and recorded as an expense using effective interest rate method.
(d) Other borrowings
Other borrowings include borrowings from the SBP and unsecured call borrowings which are recorded at the proceeds received. Mark-up paid on such borrowings is charged to the profit and loss account over the period of borrowings on time proportionate basis using effective interest method.
4.3 Investments
4.3.1 Initial recognition and measurement
4.3.1.1 The Management determines the appropriate classification of its investments at the time of purchase in held-for-trading, available-for-sale or held-to-maturity as per SBP guidelines vide BSD circular No. 10 of 2004 dated July 13, 2004. These are initially recognised at cost, being the fair value of the consideration given plus, in the case of investments other than held-for-trading, directly attributable acquisition costs.
(a) Held-for-trading
These are securities which are either acquired for generating profit from short-term fluctuations in market prices, interest rate movements, dealer’s margin or are securities included in a portfolio in which a pattern of short-term profit taking exists. These securities are carried at fair value with any related gain or loss being recognized in profit and loss account.
(b) Held-to-maturity
These are securities with fixed or determinable payments and fixed maturities that are held with the intention and ability to hold till maturity. Investments classified as held-to-maturity are carried at amortised cost.
(c) Available-for-sale
These are investments that do not fall under the held-for-trading or held-to-maturity categories. These are initially recognised at cost, being the fair value of the consideration given including the acquisition cost. These securities are carried at fair value with any related surplus or deficit on revaluation shall be taken to other comprehensive income.
4.3.1.2 Associates
Associates are all entities over which the Group has significant influence but not control. These are accounted for using the equity method of accounting.
Notes to the Consolidated Financial StatementsFor the year ended December 31, 2020

243 Annual Report 2020
Under the equity method, the investment in associates are initially recognised at cost and the carrying amount of investment is increased or decreased to recognise the investor’s share of the post acquisition profits or losses, share of other comprehensive income or loss and share of the post acquisition movement in other reserves. When the Group’s share of losses in an associate equals or exceeds its interest in the associate, including any other unsecured receivables, the Group does not recognize further losses, unless it has incurred obligations or made payments on behalf of the associate. However, in case where associates are considered as fully impaired and financial statements are not available these investments are stated at cost less provision.
4.3.1.3 Regular way contracts
All ‘regular way’ purchases and sales of financial assets are recognised on the trade date, i.e. the date on which commitment to purchase / sale is made by the Group. Regular way purchases or sales of financial assets are those, the contract for which requires delivery of assets within the time frame generally established by regulation or convention in the market place.
4.3.1.4 Premium or discount on acquisition of investments
Premium or discount on acquisition of investments is capitalised and amortised through the consolidated profit and loss account using effective yield over the remaining period of the investment.
4.3.2 Subsequent measurement
In accordance with the requirements of the State Bank of Pakistan, SBP, quoted securities other than those classified as ‘held-to-maturity’ and investment in associates and subsidiaries, are subsequently remeasured on portfolio basis i.e. in case of Government securities at PKRV and PKFRV rates whereas in case of other securities at market value. Investments classified as ‘held-to-maturity’ are carried at amortised cost using the effective interest method (less impairment, if any).
Further, in accordance with the requirements of the SBP, gain or loss on revaluation of the Group’s held-for-trading investments is taken to the profit and loss account. In case of investments classified as available-for-sale, surplus or deficit is taken directly to equity. The surplus or deficit arising on these securities is taken to the profit and loss account when actually realised upon disposal.
Unquoted equity securities, excluding investment in subsidiaries and associates are valued at lower of cost and the break-up value in accordance with the requirements of the Prudential Regulations issued by the SBP. Break-up value of equity securities is calculated with reference to the net assets of the investee company as per the latest available audited financial statements. Investment in subsidiaries and associates are carried at cost, less accumulated impairment losses, if any.
4.3.3 Impairment / diminution in the value of securities
Impairment loss in respect of quoted equity securities classified as available for sale, associates, subsidiaries and held to maturity is recognised based on management’s assessment of objective evidence of impairment as a result of one or more events that may have an impact on the estimated future cash flows of the investments. Objective evidence that the cost may not be recovered, in addition to qualitative impairment criteria, includes a significant or prolonged decline in the fair value below average cost. A decline to be considered as:
- Significant if the fair value is below the weighted average cost by more than 30 percent.- Prolonged if the fair value is below the weighted average cost for a period of more than one year.
(a) Available-for-sale
If an available-for-sale equity security is impaired, the cumulative loss that had been recognised in equity, shall be reclassified from equity to profit and loss account as a reclassification adjustment even though the financial asset has not been derecognised, any further decline in the fair value at subsequent reporting
Notes to the Consolidated Financial StatementsFor the year ended December 31, 2020

244Annual Report 2020
dates are recognised as impairment. Therefore, at each reporting period, for an equity security that was determined to be impaired, additional impairment is recognised for the difference between the fair value and the original cost basis, less any previously recognised impairment.
If, in subsequent period, impairment losses recognised in profit and loss for an investment in an equity instrument classified as available for sale shall not be reversed through profit and loss except in case of derecognition.
(b) Held to maturity, Subsidiaries and Associates
Impairment losses are incurred if, and only if, there is objective evidence of impairment after initial recognition of the investment. The impairment loss is recognised in the profit and loss account. If, in a subsequent period, any indication that an impairment loss recognised in prior periods no longer exist or may have decreased, the impairment loss shall be reversed, with the amount of the reversal recognised in profit or loss.
(c) Debt Securities
PTCs, TFCs, Sukuk and other debt securities will be classified on the valuation date on the basis of default in their repayment in line with the criteria prescribed for classification of short, medium and long-term facilities in accordance with the requirements of the Prudential Regulations issued by the SBP.
4.4 Financial instruments
4.4.1 Financial assets and financial liabilities
Financial assets and financial liabilities are recognized at the time when the Bank becomes party to the contractual provision of the instrument. Financial assets are de-recognized when the contractual right to future cash flows from the asset expires or is transferred along with the risk and reward of the asset. Financial liabilities are de-recognized when obligation specified in the contract is discharged, cancelled or expired. Any gain or loss on de-recognition of the financial asset and liability is recognized in the profit and loss account at the time of de-recognition. The particular recognition and subsequent measurement method for significant financial assets and financial liabilities are disclosed in the individual policy statements associated with them.
4.4.2 Derivative financial instruments
Derivative financial instruments are initially recognised at fair value on the date on which the derivative contract is entered into and are subsequently re-measured at fair value using valuation techniques. All derivative financial instruments are carried as assets when fair value is positive and liabilities when fair value is negative. Any change in the fair value of derivative financial instruments is taken to the profit and loss account.
4.5 Off-setting of financial assets and financial liabilities
Financial assets and financial liabilities are set off and the net amount is reported in the financial statements when there is a legally enforceable right to set off and the Group intends either to settle the assets and liabilities on a net basis or to realise the assets and to settle the liabilities simultaneously. Income and expenses arising from such assets and liabilities are accordingly offset.
4.6 Advances
4.6.1 Loan and advances
Advances are stated net of general and specific provisions. General and specific provisions against funded loans are determined in accordance with the requirements of the Prudential Regulations issued by the SBP and charged to the profit and loss account. Advances are written off when there are no realistic prospects of recovery.
Notes to the Consolidated Financial StatementsFor the year ended December 31, 2020

245 Annual Report 2020
4.6.2 Finance lease receivables
Leases, where the bank transfers substantially all the risks and rewards incidental to ownership of an asset to the lessee are classified as finance leases. A receivable is recognised at an amount equal to the present value of the lease payment including any guaranteed residual value, if any. Net investment in finance lease is included in loans and advances to customers.
4.7 Fixed assets
4.7.1 Property and equipment
Fixed assets except office premises are shown at historical cost less accumulated depreciation and accumulated impairment losses, if any. Historical cost includes expenditures that are directly attributable to the acquisition of the items. Office premises (which includes leasehold land and buildings) are stated at revalued amount less accumulated depreciation and impairment loss, if any.
Depreciation is calculated and charged to profit and loss account using the straight-line method so as to write down the cost of the assets to their residual values over their estimated useful lives at the rates given in note 11. A full month’s depreciation is charged from the month in which assets are brought into use and no depreciation is charged for the month in which the disposal is made. The residual values, useful lives and depreciation methods are reviewed and changes, if any, are treated as change in accounting estimates, annually.
Subsequent costs are included in the asset’s carrying amount or recognised as a separate asset, as appropriate, only when it is probable that future economic benefits associated with the item will flow to the Group and the cost of the item can be measured reliably. The carrying amount of the replaced part is de-recognised. All other repairs and maintenance are charged to the profit and loss account during the period in which they are incurred.
An item of property and equipment is de-recognised upon disposal or when no future economic benefits are expected from its use or disposal. Any gain or loss arising on de-recognition of the asset is recognised in the profit and loss account in the year the asset is de-recognised.
4.7.2 Surplus / deficit on revaluation of fixed assets
The surplus arising on revaluation is credited to other comprehensive income. However, the increase shall be recognised in profit or loss to the extent that it reverses a revaluation decrease of the same asset previously recognised in profit and loss account.
The deficit arising on a particular property as a result of a revaluation is recognised in profit and loss account as an impairment. However, the decrease to be recognised in other comprehensive income to the extent of any credit balance existing in the revaluation surplus in respect of that asset.
Depreciation on buildings which are revalued is determined with reference to the value assigned to such assets on revaluation and depreciation charge for the year is taken to the profit and loss account; and an amount equal to incremental depreciation for the year net of deferred taxation is transferred from “Surplus on Revaluation of Fixed Assets Account” to unappropriated profit through Statement of Changes in Equity to record realization of surplus to the extent of the incremental depreciation charge for the year.
Gains or losses on disposal of assets are included in the profit and loss account currently, except that the related surplus on revaluation of fixed assets (net of deferred tax) is transferred directly to equity.
4.7.3 Capital work-in-progress
Capital work-in-progress is stated at cost less impairment losses, if any. These are transferred to specified assets as and when assets are available for use.
Notes to the Consolidated Financial StatementsFor the year ended December 31, 2020

246Annual Report 2020
4.8 Intangible assets
Intangible assets are stated at cost less accumulated amortisation and impairment, if any. Intangible assets are amortised from the month when the assets are available for use, using the straight line method, whereby the cost of the intangible asset is amortised over its estimated useful life over which economic benefits are expected to flow to the Group. The useful life and amortisation method are reviewed and adjusted, if appropriate, annually.
Intangible assets having an indefinite useful life are carried at cost less any impairment in value and are not amortised. However these are reviewed for impairment annually or more frequently if events or changes in circumstances indicate that the carrying value may be impaired.
4.9 Assets subject to finance leases
Assets held under finance leases are initially recorded at the lower of the present value of minimum lease payments under the lease agreements and the fair value of the leased assets. The related obligations under the lease, net of financial charges allocated to future periods, are shown as a liability.
The financial charges are allocated to accounting periods in a manner so as to provide a period rate of interest on the outstanding liability.
4.10 Non-banking assets acquired in satisfaction of claims
4.10.1 Non-banking assets acquired in satisfaction of claims under Debt Property Swap (DPS) transactions, against the loans in category of loss, are initially carried at cost and subsequently at revalued amounts at each year-end date of the statement of financial position, being the fair value at the date of revaluation less subsequent accumulated depreciation and subsequent accumulated impairment losses, if any. The valuation of properties acquired are conducted regularly, so as to ensure that their net carrying value does not materially differ from their fair value.
All direct cost including legal fees, valuation and transfer costs of acquiring title to property shall be expensed when incurred through profit and loss account.
Subsequent costs are included in the asset’s carrying amounts only when it is probable that future benefits associated with the item will flow to the Bank and the cost of the item can be measured reliably. All other subsequent costs including repair and maintenance are charged to the profit and loss account as and when incurred.
Depreciation on assets acquired in satisfaction of claims is charged to the profit and loss account in line with the depreciation charged on operating fixed assets.
Any reductions in non-performing loans and corresponding reductions in provisions held against non-performing loans, as a result of the recognition of such assets, are disclosed separately in the notes to these consolidated financial statements.
These assets are generally intended for sale. Gains and losses realised on the sale of such assets are disclosed separately from gains and losses realised on the sale of fixed assets in the notes to these consolidated financial statements. If such asset is subsequently used by the Bank for its own operations, the asset, along with any related surplus, is transferred to fixed assets.
4.10.2 Surplus / deficit on revaluation of non banking assets
Revaluation of non-banking assets acquired in satisfaction of claims under Debt Property Swap (DPS) transactions are carried out under criteria given in regulations for DPS issued by State Bank of Pakistan vide BPRD Circular 01 dated January 01, 2016 i.e. valuation of property shall be done on individual property basis and not on portfolio basis, whereas accounting treatment of revaluation is accounted for in accordance with applicable financial reporting standards i.e. International Accounting Standard (IAS) 16.
Notes to the Consolidated Financial StatementsFor the year ended December 31, 2020

247 Annual Report 2020
Furthermore, revaluation surplus on such assets shall not be admissible for calculating the Group’s Capital Adequacy Ratio and exposure limits under the Prudential Regulations. However, the surplus can be adjusted upon realization of sale proceeds.
4.11 Impairment other than investments and deferred tax
At each balance sheet date, the Bank reviews the carrying amounts of its assets (other than investment and deferred tax asset) to determine whether there is an indication that those assets have suffered an impairment loss. If any such indication exists, the recoverable amount of the assets is estimated in order to determine the extent of the impairment loss, if any. Recoverable amount is the higher of net selling price (being fair value less cost to sell) and value-in-use. If the recoverable amount of an asset is estimated to be less than its carrying amount, the carrying amount of the assets is reduced to its recoverable amount. Impairment losses are recognised as an expense in profit and loss account immediately.
Where impairment loss subsequently reverses, the carrying amount of the asset is increased to the revised recoverable amount but limited to the extent of the amount which would have been determined had there been no impairment. Reversal of impairment loss is recognized as income.
4.12 Borrowings / deposits and their cost
Borrowings / deposits are recorded at the proceeds received. Borrowing / deposit costs are recognised as an expense in the period in which these are incurred to the extent that they are not directly attributable to the acquisition of or construction of qualifying assets. Borrowing costs that are directly attributable to the acquisition, construction or production of a qualifying asset (one that takes a substantial period of time to get ready for use or sale) is capitalised as part of the cost of the asset.
4.13 Subordinated debt
Subordinated debt is initially recorded at the amount of proceeds received and subsequently measured at amortised cost. Mark-up accrued on subordinated debt is recognised separately as part of other liabilities and is charged to the profit and loss account over the period on an accrual basis.
4.14 Taxation
4.14.1 Current
Provision for current taxation is based on taxable income for the year determined in accordance with the prevailing laws for taxation on income. For income covered under final tax regime, taxation is based on applicable tax rate under such regime. The charge for current tax also includes adjustments, where considered necessary, relating to prior years arising from assessments made during the year.
4.14.2 Deferred
Deferred tax is recognised using the balance sheet liability method on all temporary differences arising between tax bases of assets and liabilities and their carrying amounts appearing in the consolidated financial statements. Deferred tax liability is recognized on taxable temporary differences. Deferred tax asset is recognised for all deductible temporary differences and carry forward of unused tax losses, if any only to the extent that it is probable that future taxable profits will be available against which the asset can be utilised. Deferred tax assets are reduced to the extent that it is no longer probable that the related tax benefits will be realised.
Deferred tax is calculated at the rates that are expected to apply to the period when the differences are expected to reverse, based on tax rates that have been enacted or substantively enacted by the balance sheet date. Deferred tax is charged or credited to the profit and loss account.
Notes to the Consolidated Financial StatementsFor the year ended December 31, 2020

248Annual Report 2020
Deferred tax, if any, on revaluation of investments, fixed assets and non banking assets is recognised as an adjustment to surplus / (deficit) arising on revaluation in accordance with the requirements of IAS-12 “Income Taxes”.
4.15 Provisions
Provisions are recognised when the Group has a legal or constructive obligation as a result of past events, it is probable that an outflow of resources will be required to settle the obligation and a reliable estimate of the amount can be made. Provisions are reviewed at each balance sheet date and are adjusted to reflect the current best estimate.
Provision against identified non-funded losses is recognised when intimated and reasonable certainty exists for the Group to settle the obligation. The loss is charged to consolidated profit and loss account net of expected recovery.
4.16 Staff retirement benefits
Defined contribution plan - the Group
The Group has established a provident fund scheme for all its permanent employees in accordance with the trust deed and rules made there under. Equal monthly contributions are made, both by the Group and the employees, to the fund at the rate defined below of basic salary. Contribution by the Group is charged to profit and loss account.
- The Bank (Holding Company) 7.10%- JS Global Capital Limited (Subsidiary) 7.33%- JS Investment Limited (Subsidiary) 7.33%
4.16.1 Defined benefit plan as revised (Holding Company)
The Bank operates an approved funded gratuity scheme covering all its eligible employees who have completed minimum qualifying period. An actuarial valuation of defined benefit scheme is conducted at the end of every year or on occurrence of any significant change. The most recent valuation in this regard was carried out as at December 31, 2020, using the projected unit credit actuarial valuation method. Under this method cost of providing for gratuity is charged to profit and loss account so as to spread the cost over the service lives of the employees in accordance with the actuarial valuation. Past-service costs are recognised immediately in profit and loss account and actuarial gains and losses are recognised immediately in other comprehensive income.
4.17 Revenue recognition
Revenue is recognized to the extent that economic benefits will flow to the Group and the revenue can be reliably measured. These are recognized as follows:
- Advances and investments
Mark-up income / interest / profit on performing advances and debt securities is recognized on a time proportion basis as per the terms of the contract.
Mark-up income / interest / profit on non-performing advances and debt securities is recognized on a receipt basis in accordance with the requirements of the Prudential Regulations issued by the State Bank of Pakistan.
Interest / returns / mark-up income / profit on rescheduled / restructured advances and debt securities are recognised as permitted by the State Bank of Pakistan or by the regulatory authorities of the countries where the Bank operates, except where, in the opinion of the management, it would not be prudent to do so.
Notes to the Consolidated Financial StatementsFor the year ended December 31, 2020

249 Annual Report 2020
Premium or discount on acquisition of debt investments is capitalised and amortised through the profit and loss account over the remaining maturity of the debt security using the effective yield method.
Unrealised interest income in respect of non-performing loans and advances are held in suspense account, where necessary, in accordance with the requirements of the Prudential Regulations issued by the SBP.
- Lease financing
Financing method is used in accounting for income from lease financing. Under this method, the unearned lease income (defined as the excess of the sum of total lease rentals and estimated residual value over the cost of leased assets) is deferred and taken to income over the term of the lease period so as to produce a constant periodic rate of return on the outstanding net investment in lease.
Unrealised finance income in respect of non-performing lease finance is held in suspense account, where necessary, in accordance with the requirements of the Prudential Regulations issued by the SBP.
Gains / losses on termination of lease contracts, documentation charges, front-end fees and other lease income are recognized as income on receipt basis.
- Non Mark-up / interest income
- Commission is recognised as income at the time of affecting the transaction to which it relates. Fees are recognised when earned.
- Financial advisory fee is recognised when the right to receive the fee is established.
- Dividend income from investments is recognised when the Bank’s right to receive the dividend is established.
4.18 Dividend and appropriation to reserves
Dividend and appropriation to reserves except for statutory reserves are recognised in the consolidated financial statements in the periods in which these are approved.
4.19 Foreign currencies
4.19.1 Functional and presentation currency
Items included in the consolidated financial statements are measured using the currency of the primary economic environment in which the Group operates. The consolidated financial statements are presented in Pakistani Rupees, which is the Group’s functional and presentation currency.
4.19.2 Transactions and balances
Transactions in foreign currencies are translated into Pakistani rupees at the exchange rates prevailing on the transaction date. Foreign exchange gains and losses resulting from the settlement of such transactions and from the translation at year-end exchange rates of monetary assets and liabilities denominated in foreign currencies are recognised in the profit and loss account.
Forward contracts relating to foreign currency deposits are valued at forward rates applicable to the respective maturities of the relevant foreign exchange contract. The forward cover received / paid on forward purchase contracts relating to foreign currency deposits are realised / charged directly to profit and loss account.
Notes to the Consolidated Financial StatementsFor the year ended December 31, 2020

250Annual Report 2020
4.19.3 Foreign operations
Assets and liabilities of foreign operations are translated into rupees at the exchange rate prevailing at the reporting date. The results of foreign operations are translated at average rate of exchange for the year.
4.19.4 Translation gains and losses
Translation gains and losses arising on revaluations of net investment in foreign operations are taken to Exchange Translation Reserve in the statement of comprehensive income. These are recognised in the profit and loss account on disposal.
4.19.5 Commitments
Commitments for outstanding forward foreign exchange contracts disclosed in these consolidated financial statements are translated at contracted rates. Contingent liabilities / commitments for letters of credit and letters of guarantee denominated in foreign currencies are expressed in rupee terms at the rates of exchange ruling on the consolidated statement of financial position date.
4.20 Goodwill
Goodwill acquired in a business combination before July 01, 2009 is initially measured at cost, being the excess of the cost of the business combination over the Holding Company’s interest in the net fair value of the identifiable assets, liabilities and contingent liabilities acquired. Following initial recognition, goodwill is measured at cost less any accumulated impairment losses. Goodwill is reviewed for impairment, annually or more frequently if events or changes in circumstances indicate that the carrying value may be impaired.
For the purpose of impairment testing, goodwill acquired in a business combination is, from the acquisition date, allocated to each of the Holding Company’s cash-generating units, or groups of cash-generating units, that are expected to benefit from the synergies of the combination, irrespective of whether other assets or liabilities of the acquirer are assigned to those units or groups of units.
4.21 Earnings per share
The Group presents basic and diluted earnings per share (EPS). Basic EPS is calculated by dividing the profit or loss attributable to ordinary equity holders of the Bank (less preferrence dividend, if any) by the weighted average number of ordinary shares outstanding during the period / year. Diluted EPS is determined by adjusting the profit or loss attributable to ordinary equity holders of the Bank by dividing the weighted average number of shares outstanding, for the effects of all dilutive potential ordinary shares, if any.age number of ordinary shares outstanding for the effects of all dilutive potential ordinary shares, if any.
4.22 Non-current assets held for sale and discontinued operations
The Holding Company classifies an asset as held for sale if its carrying amount will be recovered principally through a sale transaction rather than through continuing use. For this to be the case, the asset must be available for immediate sale in its present condition subject only to terms that are usual and customary for sales of such assets and its sale must be highly probable. For the sale to be highly probable, the appropriate level of management must be committed to a plan to sell the asset (or disposal group), and an active programme to locate a buyer and complete the plan must have been initiated. Further, the asset must be actively marketed for sale at a price that is reasonable in relation to its current fair value. In addition, the sale should be expected to qualify for recognition as a completed sale within one year from the date of classification and actions required to complete the plan should indicate that it is unlikely that significant changes to the plan will be made or that the plan will be withdrawn. A held for sale asset is carried at the lower of its carrying amount and the fair value less costs to sell. Impairment losses are recognised in the consolidated profit and loss account for any initial or subsequent write down of the asset to fair value less costs to sell. Subsequent gains in fair value less costs to sell are recognised to the extent these do not exceed the cumulative impairment losses previously recorded. An asset is not depreciated while classified as held for sale.
Notes to the Consolidated Financial StatementsFor the year ended December 31, 2020

251 Annual Report 2020
4.23 Segment reporting
A segment is a distinguishable component of the Group that is subject to risks and rewards that are different from those of other segments. A business segment is one that is engaged either in providing certain products or services, whereas a geographical segment is one engaged in providing certain products or services within a particular economic environment.
Segment information is presented as per the Group’s functional structure and the guidance given under International Financial Reporting Standard (IFRS) 8. For management purposes, the Group has been organised into Seven operating segments based on products and services, as follows:
4.23.1 Business segments
Corporate finance
This includes investment banking activities such as mergers and acquisitions, underwriting, privatization, securitization, Initial Public Offers (IPOs), specialised financial advice and trading and secondary private placements.
Trading and salesThis segment undertakes the Group’s treasury, money market and capital market activities.
Retail bankingRetail banking provides services to small borrowers i.e. consumers, small and medium enterprises (SMEs) and agricultural sector. It includes loans, deposits and other transactions with retail customers.
Commercial bankingThis includes loans, deposits and other transactions with corporate customers.
BrokerageThis includes brokerage commission earned on transactions in capital, money, foreign exchange and commodity markets.
Asset managementThis includes fee for services rendered in connection with advisory and management of mutual funds.
The Executive Management Committee (ManCom) monitors the operating results of its business units separately for the purpose of making decisions about resource allocation and performance assessment. Segment performance is evaluated based on operating profits or losses and is measured consistently with operating profits or losses in the consolidated financial statements. However, income taxes are managed on a group basis and are not allocated to operating segments.
Interest income is reported net as management primarily relies on net interest revenue as a performance measure, along with the gross income and expense
Transfer prices between operating segments are based on the group’s internal pricing framework.
No revenue from transactions with a single external customer or counterparty amounted to 10% or more of the Bank’s total revenue in 2019 and 2020.
OthersThis includes the headoffice related activities and other functions which cannot be classified in any of the above segments.
Notes to the Consolidated Financial StatementsFor the year ended December 31, 2020

252Annual Report 2020
4.23.2 Geographical segment
The Holding Company operates with 307 (2019: 359) branches / sub-branches in Pakistan region and one wholesale banking branch in Bahrain (2019: one).
4.24 Fiduciary assetsAssets held in a fiduciary capacity are not treated as assets of the Bank in statement of financial position.
5. FINANCIAL RISK MANAGEMENT
The financial risk management objectives and policies adopted by the Holding Company are consistent with those disclosed in the unconsolidated financial statements for the year ended December 31, 2019 except for the following additional considerations due to the COVID-19.
5.1 COVID - 19 outbreak and it’s impact
The COVID-19 and the measures to reduce its spread has impacted the economy of Pakistan significantly. Regulators and governments across the globe have introduced fiscal and economic stimulus measures to mitigate its impact.
The State Holding Company of Pakistan (SBP) has responded to the crisis by cutting the policy rate by 625 basis points to 7 percent and by introducing regulatory measures to maintain Holding Companying system’s soundness and to sustain economic activity. These include:
(i) reducing the capital conservation buffer by 100 basis points to 1.5 percent;(ii) increasing the regulatory limit on extension of credit to SMEs by 125 million to Rs 180 million;(iii) relaxing the debt burden ratio for consumer loans from 50 percent to 60 percent(iv) allowing Holding Companys to defer clients’ payment of principal and profit on financing obligations by one year; and(v) relaxing regulatory criteria for restructured/rescheduled loans for borrowers who require relief beyond the extension of principal repayment for one year.(vi) Relaxing credit requirements for exporters and importers; and(vii) Refinance schemes to support employment to prevent layoff of workers and health sector to combat COVID-19 Pandemic.
COVID 19 has impacted the Holding Companys in Pakistan from various facets which includes increase in overall credit risk pertaining to loans and advances portfolio in certain sectors, reduced fee income due to slowdown in economic activity, operational issues such as operations of Branches, managing cyber security threat and managing investment Holding Companying activities including arrangement of syndicate loans, debt and capital advisory services etc. We have discussed below the major aspects of COVID 19 on the Holding Company’s risk management policies.
5.1.1 Assets quality and credit risk
The Risk department of the Holding Company is regularly conducting assessments to identify borrowers operating in various sectors which are most likely to get affected. The Holding Company has further strengthened its credit review procedures in the light of COVID-19. The Holding Company has conducted various stress tests on the Credit portfolio and is confident that the CAR buffer currently maintained is sufficient.
Notes to the Consolidated Financial StatementsFor the year ended December 31, 2020

253 Annual Report 2020
5.1.2 Liquidity management
Holding Company has received applications for deferral of principal and / or restructuring / rescheduling and is expected to receive further such applications. These applications are being reviewed by the Holding Company as per its established policies. The Asset and Liability Committee (ALCO) of the Holding Company is continuously monitoring the liquidity position and is taking due precautionary measures where needed. The Holding Company has conducted various stress testing on its liquidity ratios and is confident that the liquidity buffer currently maintained by the Holding Company is sufficient to cater any adverse movement in cash flow maturity profile.
5.1.3 Equity investments
SBP has given relaxation in recognition of impairment on equity securities in phased manner equally on quarterly basis during calendar year ending on December 31, 2020. The Holding Company has taken the impact of impairment on the basis of that relaxation in these consolidated financial statements.
5.1.4 Foreign Exchange Risks
Due to recent economic slowdown, the PKR has devalued against USD significantly from December 31, 2019 and the USD / PKR parity stood at Rs.159.8344 as at December 31, 2020. The exchange rate is expected to remain volatile till the uncertainty around COVID-19 resolves. The Holding Company has reviewed its Net Open Position and has had no significant impact on profitibility.
5.1.5 Operations
The Holding Company is closely monitoring the situation and has invoked required actions to ensure safety and security of Holding Company staff and an uninterrupted service to our customers. The senior management of the Holding Company is continuously monitoring the situation and is taking timely decisions to resolve any concerns. Business Continuity Plans (BCP) for respective areas are in place and tested. The Holding Company has significantly enhanced monitoring for all cyber security risk during these times from its information security protocols. The remote work capabilities were enabled for staff and related risk and control measures were assessed to make sure they are fully protected using virtual private network (“VPN”) connections. Further, the Holding Company has also ensured that its remote access systems are sufficiently resilient to any unwanted cyber attacks.
The Holding Company is communicating with its customers on how they can connect with the Holding Company through its full suite of channels including digital and online channels. The Holding Company has taken all measures to ensure that service levels are maintained, customer complaints are resolved as per SLAs and the Holding Company continues to meet the expectations of their clients as they would in a normal scenario.
5.1.6 Capital Adequacy Ratio
Under the current scenario, the Holding Companys are under pressure to extend further credit to its borrowers, while overall deteriorating credit risk and increased NPL may also put additional pressures on the Holding Company from Capital Adequacy Ratio perspective. The SBP has relaxed the Capital Conversion Buffer (CCB) requirements for the Holding Companys to 1.5%, resulting in an overall CAR requirement of 11.5%. The reduced CCB has also provided an additional limit to the Holding Company for its tier 2 capital. Further, the regulatory limit for retail loans has also increased by SBP to 180 million, which will now result in reduced Risk Weighted Assets for some of its loans. In addition to the measures by SBP, the Senior management of the Holding Company is continuously monitoring the impacts of various decisions on its CAR and taking further lending decisions based on the overall impacts on RWA. The Holding Company also believes that it has buffer in its CAR requirement to meet any adverse movements in credit, market or operational risks.
Notes to the Consolidated Financial StatementsFor the year ended December 31, 2020

254Annual Report 2020
Notes to the Consolidated Financial StatementsFor the year ended December 31, 2020
2020 2019Note ----- Rupees in ‘000 -----
6. CASH AND BALANCES WITH TREASURY BANKS
In hand:Local currency 6,337,389 5,573,428 Foreign currencies 1,301,503 896,523
7,638,892 6,469,951 With State Bank of Pakistan in:Local currency current account 6.1 16,268,165 13,292,331 Foreign currency current account - non remunerative 6.2 1,086,874 831,532 Foreign currency deposit account - remunerative 6.3 2,261,337 2,566,714
19,616,376 16,690,577 With National Bank of Pakistan in:Local currency current accounts 2,609,635 2,286,205
National Prize Bonds 556,628 143,440 30,421,531 25,590,173
6.1 These include local currency current accounts maintained with SBP as per the requirements of Section 22 of the Banking Companies Ordinance, 1962.
6.2 As per BSD Circular No. 9 dated December 03, 2007, cash reserve of 5% is required to be maintained with the State Bank of Pakistan in deposits held under the New Foreign Currency Accounts Scheme (FE-25 deposits).
6.3 This represents deposit accounts maintained with SBP under the requirements of BSD Circular No. 14 dated June 21, 2008 and mandatory reserve maintained to facilitate collection and settlement of foreign currency accounts under FE-25, as prescribed by the SBP, carrying a mark-up rate 0% (2019: 0.70%) as per specific circular issued by SBP at year end.
2020 2019Note ----- Rupees in ‘000 -----
7. BALANCES WITH OTHER BANKS
In PakistanIn current accounts 123,526 150,722 In deposit accounts 7.1 24,390 6,565
147,916 157,287
Outside PakistanIn current accounts 7.2 980,669 319,083
1,128,585 476,370 Less: General provision under IFRS 9 7.3 (450) (68)Balances with other banks - net of provision 1,128,135 476,302
7.1 These carry mark-up at the rate of 2.75% to 13.70% (2019: 6.75% to 12.75%) per annum.
7.2 This includes amount held in Automated Investment Plans. The Holding Company is entitled to earn interest from the correspondent banks at agreed upon rates when the balance exceeds a specified amount which comes 0% per annum (2019: 1.05% per annum).
7.3 This represents general provision held under IFRS 9 by Bahrain branch of the Holding Company.

255 Annual Report 2020
Notes to the Consolidated Financial StatementsFor the year ended December 31, 2020
8. LENDINGS TO FINANCIAL INSTITUTIONS
2020 2019Note ----- Rupees in ‘000 -----
Call money lendings 2,237,682 283,887 Repurchase agreement lendings (Reverse Repo) 21,003,215 30,037,915
23,240,897 30,321,802 Less: General provision under IFRS 9 8.4 (1,225) (1,262)Lending to Financial Institutions - net of provision 23,239,672 30,320,540
8.1 Particulars of lendings - gross
In local currency 21,003,215 30,037,915 In foreign currencies 2,237,682 283,887
23,240,897 30,321,802
8.2 These represent unsecured call money lendings to financial institutions carrying interest at the rates ranging from 1% to 1.1% (2019: 2.50% to 4.52%) per annum. These will mature between January 11, 2021 and January 28, 2021 (2019: January 30, 2020 and September 22, 2020).
8.3 These are secured short-term lendings to various financial institutions, carrying mark-up rate from 6.75% to 7.40% (2019: 12.00% to 13.60%) per annum. These are collateralized by Market Treasury Bills and Pakistan Investment Bonds as shown in note 8.3.1 below.
8.3.1 Market value of securities held as collateral against Lending to financial institutions
2020 2019Further Further
Held by given as Held by given as bank collateral Total bank collateral Total
--------------------------------------------- Rupees in ‘000 ---------------------------------------------
Market Treasury Bills - - - 24,252,002 - 24,252,002 Pakistan Investment Bonds 21,160,868 - 21,160,868 2,081,639 3,673,117 5,754,756
21,160,868 - 21,160,868 26,333,641 3,673,117 30,006,758

256Annual Report 2020
Notes to the Consolidated Financial StatementsFor the year ended December 31, 2020
8.4 This represents general provision held under IFRS 9 by Bahrain branch of the Holding Company.
9. INVESTMENTS - NET2020 2019
Cost / Amortised
cost
Provision for diminution
Surplus / (Deficit) Carrying Value Cost /
Amortised cost Provision for diminution
Surplus / (Deficit) Carrying Value
-------------------------------------------------------------------- Rupees in ‘000 --------------------------------------------------------------------
9.1 Investments by type
Held-for-trading securities
Federal Government Securities 25,002,969 - 805 25,003,774 55,601,087 - (2,618) 55,598,469
Shares 194,428 - 12,981 207,409 486,634 - 551 487,185
Open end mutual funds 310,221 - 416 310,637 444,902 - 11,070 455,972
25,507,618 - 14,202 25,521,820 56,532,623 - 9,003 56,541,626
Available-for-sale securities
Federal Government Securities 127,308,516 - 97,527 127,406,043 47,828,618 - (809,244) 47,019,374
Shares 3,018,184 (411,955) 1,701,753 4,307,982 2,115,728 (136,589) 25,107 2,004,246
Non Government Debt Securities 3,579,278 (696,507) (420) 2,882,351 3,931,294 (696,507) (6,889) 3,227,898
Open end mutual funds 826,188 - 390,100 1,216,288 969,276 (26,023) 279,616 1,222,869
Foreign Securities 4,079,070 (122,758) 136,466 4,092,778 2,406 - - 2,406
138,811,236 (1,231,220) 2,325,426 139,905,442 54,847,322 (859,119) (511,410) 53,476,793
Held-to-maturity securities
Federal Government Securities 36,109,599 - - 36,109,599 32,859,882 - - 32,859,882
Associates 270,793 - - 270,793 246,322 - - 246,322
Total Investments 200,699,246 (1,231,220) 2,339,628 201,807,654 144,486,149 (859,119) (502,407) 143,124,623
9.1.1 Investments include certain approved / government securities which are held by the Bank to comply with the Statutory Liquidity Requirement determined on the basis of the Bank’s demand and time liabilities as set out under section 29 of the Banking Companies Ordinance, 1962.

257 Annual Report 2020
Notes to the Consolidated Financial StatementsFor the year ended December 31, 2020
2020 2019 Cost /
Amortised cost
Provision for diminution
Surplus / (Deficit)
Carrying Value
Cost / Amortised
cost
Provision for diminution
Surplus / (Deficit) Carrying Value
9.2 Investments by segments: Note ------------------------------------------------------------ Rupees in ‘000 ------------------------------------------------------------
Held-for-trading securities
Federal Government SecuritiesMarket Treasury Bills 9.4.1 25,002,969 - 805 25,003,774 55,601,087 - (2,618) 55,598,469 Pakistan Investment Bonds 9.4.1 - - - - - - - -
25,002,969 - 805 25,003,774 55,601,087 - (2,618) 55,598,469 Shares:Listed CompaniesOrdinary shares 9.4.2 194,428 - 12,981 207,409 486,634 - 551 487,185
Open End Mutual Funds 9.4.3 310,221 - 416 310,637 444,902 - 11,070 455,972
Available-for-sale securities
Federal Government Securities:Market Treasury Bills 9.5.1 90,027,949 - 20,041 90,047,990 12,071,266 - (364) 12,070,902 Pakistan Investment Bonds 9.5.1 37,280,567 - 77,486 37,358,053 35,757,352 - (808,880) 34,948,472
127,308,516 - 97,527 127,406,043 47,828,618 - (809,244) 47,019,374 Shares:Listed CompaniesOrdinary shares 9.5.2 2,870,595 (275,366) 1,701,753 4,296,982 1,968,139 - 25,107 1,993,246 Preference shares 9.5.2 136,589 (136,589) - - 136,589 (136,589) - - Unlisted CompaniesOrdinary shares 9.5.2 11,000 - - 11,000 11,000 - - 11,000
3,018,184 (411,955) 1,701,753 4,307,982 2,115,728 (136,589) 25,107 2,004,246 Non Government Debt SecuritiesListedTerm Finance Certificates 9.5.3.1 442,682 (155,169) (147) 287,366 445,183 (155,169) (134) 289,880 Sukuk Certificates 9.5.3.2 402,955 - (273) 402,682 493,850 - (6,755) 487,095 UnlistedTerm Finance Certificates 9.5.3.3 1,340,804 (541,338) - 799,466 1,506,195 (541,338) - 964,857 Sukuk Certificates-unlisted 9.5.3.4 1,365,104 - - 1,365,104 1,458,333 - - 1,458,333 Preference shares 9.5.3.5 27,733 - - 27,733 27,733 - - 27,733
3,579,278 (696,507) (420) 2,882,351 3,931,294 (696,507) (6,889) 3,227,898
Open End Mutual Funds 9.5.4 826,188 - 390,100 1,216,288 969,276 (26,023) 279,616 1,222,869
Foreign SecuritiesGovernment Debt Securities 9.5.5.1 3,633,601 (120,619) 130,420 3,643,402 - - - - Non Government Debt Securities 9.5.5.2 379,654 (2,139) (3,628) 373,887 - - - - Ordinary shares 9.5.2 65,815 - 9,674 75,489 2,406 - - 2,406
4,079,070 (122,758) 136,466 4,092,778 2,406 - - 2,406 Held-to-maturity securities
Federal Government Securities:Pakistan Investment Bonds 9.6.1 36,109,599 - - 36,109,599 32,859,882 - - 32,859,882
AssociatesOmar Jibran Engineering Industries Limited 9.7 215,793 - - 215,793 224,782 - - 224,782 Veda Transit Solutions (Private) Limited 9.7 54,302 - - 54,302 4,774 - - 4,774 Intercity Touring Company (Private) Limited 9.7 698 - - 698 16,766 - - 16,766
270,793 - - 270,793 246,322 - - 246,322
Total Investments 200,699,246 (1,231,220) 2,339,628 201,807,654 144,486,149 (859,119) (502,407) 143,124,623
* Provision for diminution against foreign debt securities represents expected credit loss provisioning under IFRS 9 on portfolio pertaining to Bahrain Branch

258Annual Report 2020
Notes to the Consolidated Financial StatementsFor the year ended December 31, 2020
2020 2019Cost Market value Cost Market value
9.2.1 Investments given as collateral ----------------------- Rupees in ‘000 -----------------------
Held-for-trading securities
Federal Government SecuritiesMarket Treasury Bills 4,864,464 4,864,680 - -
Available-for-sale securitiesFederal Government Securities:Market Treasury Bills 4,902,054 4,902,811 4,453,165 4,452,597Pakistan Investment Bonds - - 22,232,264 21,475,720
4,902,054 4,902,811 26,685,429 25,928,317Foreign SecuritiesGovernment Debt Securities - - - - Non Government Debt Securities - - - -
- - - -
9,766,518 9,767,491 26,685,429 25,928,317
2020 20199.3 Provision for diminution in value of investments ----- Rupees in ‘000 -----
9.3.1 Opening balance 859,119 1,204,419
Charge during the year 276,202 251,675 Reversal during the year (26,859) (596,975)Charge / (reversals) during the year 249,343 (345,300)
Impairment under IFRS 9 in Bahrain branch 122,758 -
Closing balance 1,231,220 859,119
9.3.2 Particulars of provision against debt securities2020 2019
Category of classification NPI Provision NPI Provision----------------------- Rupees in ‘000 -----------------------
DomesticOther assets especially mentioned - - - - Substandard - - - - Doubtful - - - - Loss 696,507 696,507 696,507 696,507
696,507 696,507 696,507 696,507
9.4 Quality of Held-for-Trading Securities
Details regarding quality of Held-for-Trading (HFT) securities are as follows
2020 2019Cost Market Value Cost Market Value
9.4.1 Federal Government Securities - Government guaranteed Note ----------------------------- Rupees in ‘000 -----------------------------
Market Treasury Bills 25,002,969 25,003,774 55,601,087 55,598,469 Pakistan Investment Bonds - - - -
9.4.1.1 25,002,969 25,003,774 55,601,087 55,598,469
9.4.1.1 Principal terms of investment in Federal Government Securities
Name of investment Note Maturity Redemption Coupon
Market treasury bills 9.4.1.2 January 14, 2021 to January 28, 2021 On maturity On maturity Half yearly

259 Annual Report 2020
Notes to the Consolidated Financial StatementsFor the year ended December 31, 2020
9.4.1.2 Market Treasury Bills are for the period of three to twelve months. The effective rates of profit on Market Treasury Bills range from 7.07% to 7.12% per annum (2019: 13.04% to 13.70% per annum).
Rating Industry Sector Shares 2020 20192020 2019 Cost Market value Cost Market value
9.4.2 Shares ------- Numbers ------- ------------------------ Rupees in ‘000 ------------------------
Listed Companies
Ordinary shares- Pak Elektron Limited A+ Cable & Electrical Goods 130,000 513,000 5,019 5,217 13,662 13,887 - Cherat Cement Company Limited A Cement 2,000 - 294 292 - - - D.G. Khan Cement Limited - Cement - 633,000 - - 47,315 47,013 - Fauji Cement Company Limited - Cement - 253,000 - - 3,980 3,937 - Lucky Cement Limited AA+ Cement 1,416 - 873 986 - - - Maple Leaf Cement Factory Limited - Cement - 190,000 - - 4,188 4,397 - Pioneer Cement Limited A Cement 1,000 153,500 106 103 4,585 4,680 - Power Cement Limited A- Cement 1,000,000 - 9,470 9,880 - - - Descon Oxychem Limited - Chemical - - - - - - - Engro Polymer & Chemicals Limited - Chemical - 549,000 - - 18,788 18,232 - Lotte Chemical Pakistan Limited Unratted Chemical 77,000 227,000 1,209 1,160 3,154 3,183 - D.G. Khan Cement Company Limited AA- Cement 1,791 - 194 205 - - - Maple Leaf Cement Factory Limited A Cement 3,429 - 133 154 - - - Askari Bank Limited - Commercial Bank - - - - - - - Bank Alfalah Limited AA+ Commercial Bank 448 - 15 16 - - - United Bank Limited AAA Commercial Bank 2,095 3,500 256 264 587 576 - Habib Bank Limited AAA Commercial Bank 1,293 6,000 158 171 950 945 - National Bank of Pakistan Limited AAA Commercial Bank 4,000 519,500 176 172 22,854 22,494 - The Bank of Punjab - Commercial Bank - 598,500 - - 6,881 6,781 - MCB Bank Limited AAA Commercial Bank 601 - 98 111 - - - Bank Al Habib Limited AA+ Commercial Bank 581 - 33 40 - - - Meezan Bank Limited AA+ Commercial Bank 104 - 8 11 - - - National Refinery Limited - Refinery - 5,000 - - 720 705 - Attock Refinery Limited AA Refinery 19,000 420,000 3,359 3,459 47,857 46,910 - Pakistan Refinery Limited A- Refinery 358,000 - 7,544 8,517 - - - Amreli Steels Limited A- Engineering 145,500 227,500 6,947 7,022 8,323 8,217 - Mughal Iron and Steel Industries Limited - Engineering - 19,000 - - 751 778 - International Steels Limited A+ Engineering 119,500 638,000 11,255 11,142 53,700 54,127 - Meezan Pakistan Exchange Traded Fund Unratted Exchange Traded Funds 251,000 - 2,597 2,676 - - - NBP Pakistan Growth Exchange Traded Fund Unratted Exchange Traded Funds - - 207 224 - - - NIT Pakistan Gateway Exchange Traded Fund Unratted Exchange Traded Funds 17,000 - 164 200 - - - UBL Pakistan Enterprise Exchange Traded Fund Unratted Exchange Traded Funds 16,500 - 225 225 - - - The General Tyre and Rubber - Automobile Parts and Accessories - 12,000 - - 668 669 - The Hub Power Company Limited AA+ Power Generation And Distribution 6,628 61,000 510 526 5,483 5,694 - K-Electric Limited AA Power Generation And Distribution 321,500 1,985,500 1,223 1,257 8,182 8,677 - Nishat Chunian Limited - Power Generation And Distribution - 40,500 - - 1,714 1,727 - NetSol Technologies Limited Unratted Technology and Communication 75,500 75,500 13,589 14,973 4,953 4,972 - Avanceon Limited Unratted Technology and Communication 288,500 - 26,627 26,787 - - - Pakistan International Bulk Terminal Limited A- Transport 1,020,000 - 13,108 13,117 - - - Engro Corporation Limited AA+ Fertilizer 2,424 - 715 745 - - - Engro Fertilizers Limited AA Fertilizer 4,916 316,500 305 311 22,967 23,241 - Fatima Fertilizers Company Limited - Fertilizer - 21,500 - - 2,191 2,182 - Fauji Fertilizer Bin Qasim Limited A+ Fertilizer 31,500 211,500 776 798 4,039 4,128 - Fauji Fertilizer Company Limited AA+ Fertilizer 1,205 - 119 131 - - - Engro Foods Limited - Food & Personal Care Products - 3,500 - - 280 278 - Fauji Foods Limited - Food & Personal Care Products - 158,500 - - 2,255 2,293 - Oil & Gas Development Company Limited AAA Oil & Gas Exploration Companies 15,262 153,000 1,616 1,584 21,283 21,775 - Pakistan Oilfields Limited Unratted Oil & Gas Exploration Companies 1,046 18,000 366 414 8,162 8,041 - Pakistan Petroleum Limited Unratted Oil & Gas Exploration Companies 11,647 85,000 1,062 1,052 11,531 11,657 - Pakistan State Oil Company Limited AA+ Oil & Gas Marketing Companies 5,639 382,500 1,166 1,214 72,233 73,302 - Sui Northern Gas Pipelines Limited AA- Oil & Gas Marketing Companies 8,088 - 386 359 - - - Sui Southern Gas Company Limited - Oil & Gas Marketing Companies - 559,500 - - 12,365 12,040 - Hascol Petroleum Limited BB+ Oil & Gas Marketing Companies 806,837 - 11,898 11,852 - - - The Searle Company Limited AA- Pharmaceuticals 12,431 319,500 3,054 3,098 61,227 60,302 - Gul Ahmed Textile Mills Limited - Textile Composite - - - - - - - Nishat Mills Limited AA Textile Composite 1,000 17,000 101 102 1,810 1,805 - Unity Foods Limited A- Vanaspati & Allied Industries 2,395,500 468,000 67,423 76,800 6,996 7,540 - Dawood Hercules Corporation Limited AA Investment Company 347 - 44 42 - -
194,428 207,409 486,634 487,185

260Annual Report 2020
Notes to the Consolidated Financial StatementsFor the year ended December 31, 2020
9.4.3 Open End Mutual FundNet asset
valueName of fund Units Rating per unit 2020 2019
2020 2019 2020 2019 Rupees Cost Market value Cost Market value ------- Numbers ------- ---------------------------- Rupees in ‘000 -----------------------------
Investment in related partiesJS Income Fund 1,129,255 3,541,402 A+(f) A+ (f) 98.99 110,989 111,785 344,902 355,982 JS Motion Picture Fund 1,000,000 1,000,000 - - 97.7 99,990 97,700 100,000 99,990 JS Islamic Hybrid Fund of Funds - Mufeed 76,142 - - - 48.05 3,000 3,659 - - JS Islamic Hybrid Fund of Funds - Mutanasib 49,068 - - - 75.37 3,000 3,698 - - JS Islamic Hybrid Fund of Funds - Mustehkam 3,305 - - - 65.95 288 218 - - JS Islamic Fund 123,571 - - - 100.08 12,000 12,367 - - JS Islamic Income Fund 382,292 - AA- (f) - 105.77 40,179 40,435 - - JS Islamic Daily Dividend Fund 407,754 - AA(f) - 100 40,775 40,775 - -
310,221 310,637 444,902 455,972
9.5 Quality of Available-for-Sale Securities
Details regarding quality of Available-for-Sale (AFS) securities are as follows:
2020 2019Cost Market Value Cost Market Value
Note ----------------------- Rupees in ‘000 -----------------------9.5.1 Federal Government Securities -
Government guaranteed
Market Treasury Bills 90,027,949 90,047,990 12,071,266 12,070,902 Pakistan Investment Bonds 37,280,567 37,358,053 35,757,352 34,948,472
9.5.1.1 127,308,516 127,406,043 47,828,618 47,019,374
9.5.1.1 Principal terms of investment in Federal Government Securities
9.4.1.1 Principal terms of investment in Federal Government Securities
Name of investment Note Maturity Redemption Coupon
Market treasury bills 9.5.1.2 January 14, 2021 to June 03, 2021 On maturity On maturityHalf yearlyPakistan investment bonds 9.5.1.3 April 21, 2021 to September 19, 2029 On maturity
9.5.1.2 Market Treasury Bills are for the period of three to twelve months. The effective rates of profit on Market Treasury Bills range from 6.90% to 11.77% per annum (2019: 13.02% to 13.75% per annum).
9.5.1.3 Pakistan Investment Bonds (PIBs) are for the period of three to twenty years. The rates of profit ranging from 7% to 12% per annum (2019: 6.40% to 14.27% per annum).

261 Annual Report 2020
Notes to the Consolidated Financial StatementsFor the year ended December 31, 2020
Break-up value per shareName of Chief Executive /
Managing DirectorBreakup
valueCost Breakup
valueshares Cost2020 2019 2020 2019 2020 2019
Un-listed Companies --------- Rupee --------- --------- Numbers --------- -------------------------- Rupees in ‘000 ---------------------------
Ordinary shares- ISE Towers REIT Management Limited
(formerly Islamabad StockExchange Limited) (note 8.5.2.4) * 15.45 * 14.49 Mr. Sagheer Mushtaq 1,213,841 1,213,841 11,000 17,592 11,000 17,592
Foreign securities
Ordinary shares- Society for Worldwide Interbank ** 786,254 ** 638,551 Mr. Javier Pervez Tasso 6 6 2,406 4,718 2,406 3,831
Financial Telecommunication(SWIFT) (note 9.5.2.5)
* Based on audited accounts as of June 30, 2019** Based on audited accounts as of December 31, 2019
9.5.2.1These are non-voting cumulative preference shares, carrying preference dividend @ 10% p.a and are convertible into ordinary shares at the option of the Bank after five years from the date of issuance i.e. February 2012. The investee company also has the option to redeem these preference shares plus any unpaid dividend in full or in part, within ninety days after expiry of each anniversary of the issue date. The Holding Company has recognised full impairment on these shares amounting to Rs. 48.236 million (2019: Rs.48.236 million) due to weak financial position of the company.
9.5.2 Shares
Rating Industry Sector Shares Cost Market value Cost Market valueListed Companies 2020 2019 2020 2019
--------- Numbers --------- ------------------------------ Rupees in ‘000 ------------------------------ Ordinary shares
- Matco Foods Limited A- Food & Personal Care Products - 1,078,500 - - 31,795 27,707 - Shifa International Hospitals AA- Miscellaneous 264,300 264,300 68,273 52,857 68,273 88,509 - Pakistan Petroleum Limited Unrated Oil & Gas Marketing Companies 841,800 949,800 123,382 76,041 139,212 130,256 - Pakistan Stock Exchange
Limited (PSXL) Unrated Investment Company 2,202,953 23,061 23,061 32,648 23,061 27,493 - National Foods Limited - Food & Personal Care Products - 742,968 - - 153,492 164,946
Investment in related parties- EFU General Insurance Limited AA+ Insurance 5,455,675 5,440,575 647,129 654,681 645,414 600,095 - EFU Life Assurance Limited AA+ Insurance 1,189,600 1,189,600 250,735 248,650 250,735 275,476 - Sitara Chemical Industries Limited A+ Chemical 1,790,250 1,790,250 548,781 554,978 548,781 534,318 - TRG Pakistan Limited Unrated Technology & Communication 24,583,760 5,883,760 566,875 2,247,202 107,376 144,446 - Hum Network Limited A+ Technology & Communication 79,030,303 - 642,359 429,925 - -
2,870,595 4,296,982 1,968,139 1,993,246
Foreign securitiesDeutche Post AG A3 Logistics 8,100 - 56,525 64,706 - - Microsoft Corporation Limited AAA Technology & Communication 220 - 6,884 8,377 - -
63,409 73,083 - -
Preference SharesAgritech Limited (note 9.5.2.1 & 9.5.2.3) Unrated Chemical 4,823,746 4,823,746 48,236 - 48,236 - Chenab Limited (note 9.5.2.2 & 9.5.2.3) Unrated Textile Composite 12,357,000 12,357,000 88,353 - 88,353 -
136,589 - 136,589 -

262Annual Report 2020
Notes to the Consolidated Financial StatementsFor the year ended December 31, 2020
Number of certificates Rating
2020 20192020 2019 2020 2019 Cost Market value Cost Market value
9.5.3.1 Term finance certificates - listed * ---- Numbers ---- ---------------- Rupees in ‘000 ----------------
Worldcall TelecomLimited (note 9.5.3.1.2) 90,650 90,650 Unrated Unrated 155,169 - 155,169 - Jahangir Siddiqui & Co. Ltd. - XI
- related party 3,000 3,000 AA+ AA+ 12,500 12,366 15,000 14,880 Bank Al Habib Limited 25,000 25,000 AA- - 125,000 125,000 125,000 125,000 Soneri Bank Limited 30,000 30,000 A A 150,013 150,000 150,014 150,000
442,682 287,366 445,183 289,880
* Secured and have a face value of Rs.5,000 each unless specified otherwise.
9.5.2.2 These are cumulative preference shares, carrying preference dividend @ 9.25% p.a and are redeemable in part after four years from the date of issuance i.e. August 2008. The investee company also has an option to redeem, in part, cumulative preference shares after August 2008. The Bank has recognized full impairment on these shares amounting to Rs. 88.353 million (2019: Rs.88.353 million) due to weak financial position of the company.
9.5.2.3 Surplus arising due to re-measurement of these shares to the market value has not been recognized as the management believes that the market value may not be realized while selling them in open market.
9.5.2.4 In accordance with the requirements of the Stock Exchanges (Corporatization, Demutualization and Integration) Act, 2012 (the Act), the holding company has received 3,034,603 shares of Rs.10 each including trading right entitlement certificate (TREC) of the Islamabad Stock Exchange (ISE), in lieu of its Membership Card held by the Bank. Further, upon integration of Islamabad Stock Exchange under the “ISE Scheme of Integration” in 2016 TRE Certificates holders of ISE have been issued 1,213,841 shares of “ISE Towers REIT Management Limited”.
9.5.2.5 The Holding Company qualified as a member based on the financial contribution to SWIFT for network-based services. The Holding Company has made an investment as per the requirements of By-Laws of SWIFT, under the Share Re-allocation Process, as a result becoming entitled to invest in for six shares. The participation is mandatory to avail the desired network-based services for financial message transmission for cross-border payments and receipt. Further, the share re-allocation occurs every three years and will result in either an increase, decrease, or a status quo in individual shareholding.
Cost9.5.3 Non Government Debt Securities 2020 2019
------ Rupees in ‘000 ------ListedAAA 309,750 398,250 AA+, AA, AA- 210,700 235,600 A+, A, A- 170,018 150,014 Unrated 155,169 155,169
845,637 939,033 UnlistedAAA 71,429 142,857 AA+, AA, AA- 200,037 - A+, A, A- 1,749,104 1,992,333 Unrated 713,071 857,071
2,733,641 2,992,261
3,579,278 3,931,294

263 Annual Report 2020
Notes to the Consolidated Financial StatementsFor the year ended December 31, 2020
9.5.3.1.1 Listed term finance certificates are as follows:
Name of the company Repayment frequency Profit rate per annum Maturity date
Worldcall Telecom Limited Semi-annually 6 Month KIBOR ask rate plus 1.60% September 20, 2026Jahangir Siddiqui & Co. Ltd. - XI - related party Semi-annually 6 Month KIBOR ask rate plus 1.75% March 06, 2023Bank Al Habib Limited Semi-annually 6 Months KIBOR ask rate plus 1.50% PerpetualSoneri Bank Limited Semi-annually 6 Month KIBOR ask rate plus 2.00%. December 06, 2028
9.5.3.1.2 Due to weak financial position of the company, the group has recognised full impairment loss on these term finance certificates.
Number of certificates Rating 2020 2019
2020 2019 2020 2019 Cost Market value Cost Market value9.5.3.2 Sukuk certificates - listed ---- Numbers ---- ---------------- Rupees in ‘000 ----------------
Byco Petroleum Pakistan Limited 5,310 5,310 AAA AAA 309,750 308,616 398,250 391,779 Dawood Hercules Corporation Limited - Sukuk - I 520 520 AA AA 31,200 31,542 41,600 41,492 Dawood Hercules Corporation Limited - Sukuk - II 600 600 AA AA 42,000 42,519 54,000 53,824 Bank Islami Pakistan Limited - Ehad Sukuk 4,001 - A- - 20,005 20,005 - -
402,955 402,682 493,850 487,095
9.5.3.2.1 Other particulars of listed sukuk certificates are as follows:
Name of the company Repayment frequency Profit rate per annum Maturity date
Byco Petroleum Pakistan Limited(Chief Executive: Mr. Amir Abbassciy) Quarterly 3 Month KIBOR ask rate plus 1.05%. January 18, 2022
Dawood Hercules Corporation Limited - Sukuk - I(Chief Executive: Inam ur Rahman) Quarterly 3 month kibor +1.00% November 16, 2022
Dawood Hercules Corporation Limited - Sukuk - II(Chief Executive: Inam ur Rahman) Quarterly 3 month kibor +1.00% March 01, 2023
Bank Islami Pakistan Limited - Ehad Sukuk(Chief Executive: Syed Amir Ali) Monthly 3 Months Kibor + 2.75% Perpetual
Number of Face value percertificates Rating certificate Cost
2020 2019 2020 2019 2020 20199.5.3.3 Term finance certificates - ----- Rupees ----- ----- Rupees ----- --- Rupees in ‘000 ---
unlisted, secured
Azgard Nine Limited - related party (note 8.5.3.3.1) 29,998 29,998 Unrated Unrated 5,000 65,022 65,022 Azgard Nine Limited (related party)(privately placed TFCs) (note 8.5.3.3.2) 12 12 Unrated Unrated 5,000 326,456 326,456 Agritech Limited (note 8.5.3.3.1) 30,000 30,000 Unrated Unrated 5,000 149,860 149,860 Pakistan Water & Power Development Authority (WAPDA) 100,000 100,000 AAA AAA 5,000 71,429 142,857 Khushhali Microfinance Bank Limited - 1,500 - A 100,000 - 150,000 Airlink Communication Private Limited 384 384 A- A- 1,000,000 384,000 384,000 Secure Logistics Group Private Limited 288 288 Unrated Unrated 1,000,000 144,000 288,000 Bank Al Habib Limited 40,000 - AA- - 5,000 200,037 -
1,340,804 1,506,195
9.5.3.3.1 Due to weak financial position of the company the Bank has recognised full impairment loss on these term finance certificates.

264Annual Report 2020
Notes to the Consolidated Financial StatementsFor the year ended December 31, 2020
9.5.3.3.2 These PPTFCs are held by JS Global Capital Limited has recognised full provision considering the financial position of the issuer amounting to Rs. 326.456 million (2019: Rs.326.456 million).
9.5.3.3.3 Other particulars of unlisted term finance certificates are as follows:
Name of the company Repayment frequency Profit rate per annum Maturity date
Azgard Nine Limited - related party(Chief Executive: Mr. Ahmed H. Shaikh) Semi-annually 6 Month KIBOR ask rate plus 1.75% and 11%. December 04, 2017 and
October 19, 2020
Agritech Limited(Chief Executive: Mr. Faisal Muzammil) Semi-annually 6 Month KIBOR ask rate plus 1.75%. November 29, 2019
Pakistan Water & Power Development Authority (WAPDA)(Chairman: Lieutenant General Muzammil Hussain (Retd.)) Semi-annually 6 Month KIBOR ask rate plus 1.00%. September 27, 2021
Airlink Communication Private Limited(President & CEO: Mr. Muzaffar Hayat Piracha) Quarterly 3 Month KIBOR ask rate plus 1.00%. January 7, 2022
Secure Logistics Group Private Limited (see note 9.5.3.3.3.1)(President & CEO: Mr. Gulraiz A. Khan) Quarterly 3 Month KIBOR ask rate minus 1.00%. January 2, 2024
Bank Al Habib Limited(President & CEO: Mr. Mansoor Ali Khan ) Semi-annually 3 Month KIBOR ask rate plus 1.50%. December 20, 2027
9.5.3.3.3.1 During the year, the Borrower has taken the deferment of payment as per the guidelines of SBP BPRD Letter No. 13 dated March 26, 2020.
Number of certificates
Face value per certificateRating Cost
2020 2019 2020 2019 2020 2019Note -------- Numbers -------- --------- Rupees --------- ----- Rupees in ‘000 -----
9.5.3.4 Sukuk certificates - unlisted
Ghani Gases Limited 9.5.3.3.3.1 2,000 2,000 A A 87,500 100,000 108,333 Pakistan Services Limited 9.5.3.3.3.1 1,350 1,350 A+ A+ 90,000 1,265,104 1,350,000
1,365,104 1,458,333
9.5.3.4.1 Other particulars of unlisted sukuk certificates are as follows:
Name of the company Repayment frequency Profit rate per annum Maturity date
Ghani Global Limited(Chief Executive: Mr. Atique Ahmad Khan) Quarterly 3 Month KIBOR ask rate plus 1.00%. February 03, 2023
Pakistan Services Limited(Chief Executive: Mr. Murtaza Hashwani) Semi-annually 6 Month KIBOR ask rate plus 1.00%. January 17, 2024
Face value per certificateShares Rating Cost
2020 2019 2020 2019 2020 2019 2020 20199.5.3.5 Preference shares - unlisted ------ Numbers ------ ------------------ Rupees in ‘000 ------------------
Intercity Touring Company Private Limited(related party) 1,848,888 1,848,888 Unrated Unrated 10 10 27,733 27,733

265 Annual Report 2020
Notes to the Consolidated Financial StatementsFor the year ended December 31, 2020
9.5.4 Open End Mutual FundNet asset
valueName of fund Units per unit 2020 2019
2020 2019 Rupees Cost Market value Cost Market value --------- Numbers --------- ----------------------- Rupees in ‘000 -----------------------
Related partiesJS ICPAP4 - 157,204 - - - 15,720 16,840 JS ICPAP4 - 153,647 - - - 15,365 16,609 JS Value Fund 1,343,094 1,716,379 213.42 249,115 286,643 341,336 341,336 JS Growth Fund 1,937,116 1,903,901 179.88 323,937 348,448 336,417 322,483 JS Fund of Funds 2,822,294 2,772,987 64 148,838 179,583 146,286 162,774 JS Islamic Pension SavingsFund - Equity 182,354 182,354 657.89 16,567 119,969 18,235 104,609
JS Islamic Pension SavingsFund - Debt 213,852 213,852 242.89 21,385 51,942 21,385 49,088
JS Islamic Pension SavingsFund - Money Market 222,303 222,303 212.14 22,230 47,159 22,230 44,232
JS Pension Savings Fund - Money Market 177,463 177,463 242.72 17,746 43,074 17,746 39,425
JS Pension Savings Fund - Debt 137,349 137,349 300.98 13,735 41,339 13,735 38,531 JS Pension Savings Fund - Equity 205,210 205,210 478.20 12,635 98,131 20,521 86,654 JS Islamic Capital Preservation - 3,305 - - - 300 288
826,188 1,216,288 969,276 1,222,869
9.5.5 Foreign Securities
Name of Bond Rating Coupon rate per annum Date of Maturity 2020 2019
2020 2019 % Cost Market value Cost Market value--------------------- Rupees in ‘000 ---------------------
9.5.5.1 Government Debt securitiesThe Third Pakistan International Sukuk Co Ltd B- - 5.50% October 13, 2021 159,186 161,516 - - The Third Pakistan International Sukuk Co Ltd B- - 5.63% December 5, 2022 163,296 163,443 - - Islamic Republic Of Pakistan B- - 6.88% December 5, 2027 508,091 498,909 - - Oman Government International Bond Ba3 - 6.00% August 1, 2029 419,735 411,374 - - Republic of Turkey B+ - 4.88% October 9, 2026 158,289 161,350 - - Republic of Turkey B+ - 6.13% October 24, 2028 313,692 340,588 - - Republic of Turkey B+ - 7.63% April 26, 2029 90,973 92,129 - - Arab Republic of Egypt B - 6.59% February 21, 2028 510,058 525,769 - - Arab Republic of Egypt B - 7.60% March 1, 2029 350,286 366,718 - - Republic of Kenya B+ - 7.25% February 28, 2028 257,393 268,347 - - Republic of Nigeria B2 - 6.50% November 28, 2027 248,288 257,666 - - Oman Government International Bond Ba3 - 5.63% January 17, 2028 243,815 244,036 - - Republic of Srilanka Caa1 - 5.75% April 18, 2023 210,499 151,557 - -
3,633,601 3,643,402 - -
9.5.5.2 Non Government Debt securitiesBank of Ireland Ba2 - 6.00% March 1, 2026 39,828 42,502 - - Petroleos Mexicanos Ba2 6.84% October 23, 2029 339,826 331,385
379,654 373,887 - -
9.5.5.3 The Holding Company has recognised general provision (expected credit loss) under IFRS 9 of Rs. 122.758 million (2019: Rs. Nil) held on foreign debt securities by Bahrain branch. However, the loss allowance is recognised in other comprehensive income and have not reduce the carrying amount of these securities.

266Annual Report 2020
Notes to the Consolidated Financial StatementsFor the year ended December 31, 2020
9.6.1.1 Security type Maturity Redemption Coupon
Pakistan investment bonds April 21, 2021 to August 22, 2029 On maturity Half yearly
9.6.1.2 Pakistan Investment Bonds (PIBs) having maturity of five to fifteen years. The rates of profits ranging from 7.75% to 12% per annum (2019: 7.75% to 14.69% per annum). The market value of securities as at December 31, 2020 amounted Rs. 35,862.699 million (2019: Rs. 31,341.410 million)
9.7 Investment in associated company
Shares Percentage holding Cost Note 2020 2019 2020 2019 2020 2019
--- Numbers --- ----- Rupees in ‘000 -----Omar Jibran Engineering
Industries Limited 9.7.1 7,200,000 7,200,000 9.60% 9.60% 215,793 224,782 Veda Transit Solutions
Private Limited 9.7.1 & 9.7.2 48,000 48,000 9.12% 8.00% 54,302 4,774 Intercity Touring Company
Private Limited 9.7.1 1,351,111 1,351,111 9.12% 9.12% 698 16,766 270,793 246,322
9.7.1 The investments classified as asscociate on account of it’s significant influence over the investee companies. All
associated companies are incorporated in Pakistan.
9.7.2 During the year, Veda Transit Solutions Private Limited, an associate of the Bank, has issued shares against advance subscription of Rs. 40.828 million made by the Bank. Resultantly, shareholding of the Bank increased to 9.12% (December 31, 2019: 8%). The Bank has classified the investment as associate on account of it’s significant influence over the investee company.
9.7.3 The following is summarised financial information before inter-company eliminations with other companies in the group:
Associated companiesOmar Jibran Engineering
Industries LimitedVeda Transit Solutions
Private LimitedIntercity Touring Company
Private LimitedJune 30, June 30, June 30, June 30, June 30, June 30,
2020 2019 2020 2019 2020 2019------------------------------------------ Rupees in ‘000 ------------------------------------------
Total income / sales 1,950,375 2,628,975 785,016 922,200 3,796 290 (Loss) / profit after tax (137,700) 117,796 19,797 47,436 (38,961) (21,636)Total comprehensive income 7,560 343,881 - - - -
Total assets 3,752,367 3,727,961 609,304 688,142 404,028 191,414 Total liabilities 2,043,290 1,888,745 429,690 743,324 302,129 50,879 Net assets 1,709,077 1,839,216 179,614 (55,182) 101,899 140,535
Cash flow from / (used in) operating activities 108,972 (73,759) 85,040 152,254 (2,105) (62,405)Cash flow (used in) / from investing activities (75,100) (233,038) (10,237) (189) - (141,183)Cash flow (used in) / from financing activities (39,955) 212,791 (54,777) (137,300) - 219,994 Net increase / (decrease)
in cash and cash equivalents (6,083) (94,006) 20,026 14,765 (2,105) 16,406
9.6 Quality of Held to Maturity Securities
Details regarding quality of Held to Maturity (HTM) securities are as followsCost
9.6.1 Federal Government Securities - Government guaranteed 2020 2019------ Rupees in ‘000 ------
Pakistan Investment Bonds 36,109,599 32,859,882

267 Annual Report 2020
Notes to the Consolidated Financial StatementsFor the year ended December 31, 2020
Performing Non Performing Total 2020 2019 2020 2019 2020 2019
10. ADVANCES Note ------------------------------------------------ Rupees in ‘000 ------------------------------------------------
Loans, cash credits, running finances, etc. 10.1 231,322,752 225,327,657 11,733,555 10,353,164 243,056,307 235,680,821 Bills discounted and purchased 11,602,390 11,113,114 - - 11,602,390 11,113,114 Advances - gross 242,925,142 236,440,771 11,733,555 10,353,164 254,658,697 246,793,935
Provision against advancesGeneral - (161,166) - - - (161,166)General provision - under IFRS-9 10.4.4 (21,327) (7,520) - - (21,327) (7,520)Specific - - (4,181,836) (3,339,941) (4,181,836) (3,339,941)
10.4 (21,327) (168,686) (4,181,836) (3,339,941) (4,203,163) (3,508,627)
Advances - net of provision 242,903,815 236,272,085 7,551,719 7,013,223 250,455,534 243,285,308
10.1 Particulars of net investment in finance lease
2020 2019
Not later than
one year
Later than one and less
than five years
Over five years Total Not later than
one year
Later than one and less
than five years
Over five years Total
------------------------ Rupees in ‘000 ------------------------ ------------------------ Rupees in ‘000 ------------------------
Lease rentals receivable 4,923,114 5,173,453 2,318 10,098,885 6,860,218 6,637,949 3,527 13,501,694 Guaranteed residual value 1,008,381 2,449,909 2,248 3,460,538 1,599,605 2,538,848 10,783 4,149,236
Minimum lease payments 5,931,495 7,623,362 4,566 13,559,423 8,459,823 9,176,797 14,310 17,650,930 Finance charges for future periods (991,822) (1,286,416) (1,443) (2,279,681) (1,468,867) (1,098,697) (259) (2,567,823)Present value of minimum lease payments 4,939,673 6,336,946 3,123 11,279,742 6,990,956 8,078,100 14,051 15,083,107
2020 201910.2 Particulars of advances (gross) ----- Rupees in ‘000 -----
In local currency 245,261,990 238,073,921 In foreign currencies 9,396,707 8,720,014
254,658,697 246,793,935
10.3 Advances include Rs. 11,733.555 million (2019: Rs. 10,353.164 million) which have been placed under non-performing status as detailed below:
2020 2019Non
Performing Loans
ProvisionNon
Performing Loans
Provision
Category of classification -------------------------- Rupees in ‘000 --------------------------
DomesticOther Assets Especially Mentioned 296,799 394 841,058 1,721 Substandard 1,177,804 156,095 1,159,072 64,681 Doubtful 3,264,335 724,426 2,442,270 426,283 Loss 6,994,617 3,300,921 5,910,764 2,847,256 Total 11,733,555 4,181,836 10,353,164 3,339,941

268Annual Report 2020
Notes to the Consolidated Financial StatementsFor the year ended December 31, 2020
10.4 Particulars of provision against non-performing advances
2020 2019
Specific General
General provision
under IFRS-9
Total Specific General
General provision
underIFRS-9
Total
Note --------------------------------------------------------- Rupees in ‘000 ---------------------------------------------------------
Opening balance 3,339,941 161,166 7,520 3,508,627 2,989,888 155,661 10,746 3,156,295 Exchange adjustments - - 71 71 - - 1,095 1,095 Charge for the year 1,087,212 - 13,736 1,100,948 880,994 5,505 - 886,499 Reversals for the year 10.4.2 & 10.4.5 (245,317) (161,166) - (406,483) (526,146) - (4,321) (530,467)
841,895 (161,166) 13,736 694,465 354,848 5,505 (4,321) 356,032 Amount written off fromthe opening balance 10.5 - - - - (4,795) - - (4,795)
Closing Balance 4,181,836 - 21,327 4,203,163 3,339,941 161,166 7,520 3,508,627
10.4.1 Particulars of provision against non-performing advances
2020 2019Specific General Total Specific General Total
------------------------------------------------ Rupees in ‘000 ------------------------------------------------
In local currency 4,181,836 - 4,181,836 3,339,941 161,166 3,501,107 In foreign currency - 21,327 21,327 - 7,520 7,520
4,181,836 21,327 4,203,163 3,339,941 168,686 3,508,627
10.4.2 This also includes reversal of provision of Rs. Rs. 8.604 million (2019: 277.078 million) against non-performing loans of a borrower under ‘Debt Property Swap’ transactions, as disclosed in note 13.2.
10.4.3 The Holding Company, in accordance with BPRD circular letter No. 31 of 2020 dated July 10, 2020, has taken the benefit of general provision to make good the specific provision requirement of the consumer financing portfolio till December 31, 2021.
10.4.4 This represents general provision held under IFRS 9 by Bahrain branch of the Holding company.
10.4.5 The State Bank of Pakistan through various circulars has allowed benefit of the forced sale value (FSV) of Plant and Machinery under charge, pledged stock and mortgaged residential, commercial and industrial properties (land and building only) held as collateral against non-performing loans (NPLs) for a maximum of five years from the date of classification. As at December 31, 2020, the Holding Company has availed cumulative benefit of FSV of Rs. 4,655.818 million (2019: Rs. 4,120.009 million) under the directives of the SBP. Had the benefit not been taken the unappropriated profit after tax would have reduced by Rs. Rs. 3,026.282 million (2019: Rs. 2,678.006 million). Further, as required by the SBP directives, this unappropriated profit will not be available for distribution as dividend or other appropriations.
10.4.6 Advances - Deferred & Restructured / Rescheduled
The SBP vide BPRD circular letter number 13 of 2020 dated March 26, 2020, has relaxed certain classification criteria of SBP Prudential Regulation R-8 (Classification and Provisioning of Assets). Accordingly, certain exposures of the Holding Company as at December 31, 2020 relating to facilities of customers have not been classified as non-performing on account of such relaxation.

269 Annual Report 2020
Notes to the Consolidated Financial StatementsFor the year ended December 31, 2020
2020 2019 -------- Rupees in ‘000 --------
10.5 Particulars of Write Offs:
10.5.1 Against provisions - 4,795 Directly charged to profit and loss account - 315
- 5,110
10.5.2 Write offs of Rs.500,000 and above - 5,110 Write offs of below Rs.500,000 - -
- 5,110
10.6 Details of loan write off of Rs. 500,000/- and above
In terms of sub-section (3) of Section 33A of the Banking Companies Ordinance, 1962 the Statement in respect of written-off loans or any other financial relief of rupees five hundred thousand or above allowed to a person(s) during the year ended is given in Annexure-I.
2020 201911. FIXED ASSETS Note ----- Rupees in ‘000 -----
Capital work-in-progress 11.1 298,971 146,181 Property and equipment 11.2 6,099,025 6,438,632 Right-of-use assets 11.4 2,628,768 4,109,132
9,026,764 10,693,945
11.1 Capital work-in-progress
Civil works 232,789 124,350 Advance for purchase of furniture and fixtures 1,013 290 Advance for purchase of vehicles 61,794 - Advance for purchase of equipment and software 3,375 21,541
298,971 146,181

270Annual Report 2020
Notes to the Consolidated Financial StatementsFor the year ended December 31, 2020
11.2 Property and equipment2020
Leasehold land
Buildingon free
hold land
Buildingon leasehold land
Lease hold improvements
Furnitureand fixture
Electrical, office and computer equipment
Vehicles Total
-------------------------------------------------------------- Rupees in ‘000 --------------------------------------------------------------
At January 01, 2020Cost / Revalued amount 1,520,254 - 2,187,969 1,650,673 955,778 3,522,707 253,832 10,091,213 Accumulated depreciation - - (285,735) (734,004) (443,155) (2,106,270) (83,417) (3,652,581)Net book value 1,520,254 - 1,902,234 916,669 512,623 1,416,437 170,415 6,438,632
Year ended December 2020Opening net book value 1,520,254 - 1,902,234 916,669 512,623 1,416,437 170,415 6,438,632 Additions - - 766,725 190,950 50,484 382,908 49 1,391,116
DisposalsCost - - - (1,852) (14,501) (47,037) (25,741) (89,131)Accumulated Depreciation - - - (399) 10,444 41,535 11,921 63,501
- - - (2,251) (4,057) (5,502) (13,820) (25,630)Depreciation charge - - (76,542) (152,821) (66,364) (452,015) (33,588) (781,330)
Exchange rate adjustmentsCost - - - (885) (276) (210) (152) (1,523)Accumulated Depreciation - - - 280 101 105 58 544
- - - (605) (175) (105) (94) (979)
Write offsCost - - - (246,248) (35,053) (158,301) (2,904) (442,506)Accumulated Depreciation - - - 134,307 20,480 104,869 963 260,619
- - - (111,941) (14,573) (53,432) (1,941) (181,887)
Transferred / other adjustmentsCost (739,200) - (2,126) - - - - (741,326)Accumulated Depreciation - - 429 - - - - 429
(739,200) - (1,697) - - - - (740,897)
Closing net book value 781,054 - 2,590,720 840,001 477,938 1,288,291 121,021 6,099,025
At December 31, 2020Cost / Revalued amount 781,054 - 2,952,568 1,592,638 956,432 3,700,067 225,084 10,207,843 Accumulated depreciation - - (361,848) (752,637) (478,494) (2,411,776) (104,063) (4,108,818)Net book value 781,054 - 2,590,720 840,001 477,938 1,288,291 121,021 6,099,025
Rate of depreciation (percentage) - - 1.01 - 4.78 10 12.5 12.5 - 33.3 20

271 Annual Report 2020
Notes to the Consolidated Financial StatementsFor the year ended December 31, 2020
2019
Leasehold land
Buildingon free
hold land
Buildingon leasehold land
Lease hold improvements
Furnitureand fixture
Electrical, office and computer equipment
Vehicles Total
-------------------------------------------------------------- Rupees in ‘000 --------------------------------------------------------------
At January 01, 2019Cost / Revalued amount 1,457,289 - 2,293,263 1,288,065 602,028 3,070,323 1,196,462 9,907,430 Accumulated depreciation - - (252,978) (594,439) (322,718) (1,852,560) (376,207) (3,398,902)Net book value 1,457,289 - 2,040,285 693,626 279,310 1,217,763 820,255 6,508,528
Year ended December 2019Opening net book value 1,457,289 - 2,040,285 693,626 279,310 1,217,763 820,255 6,508,528 Additions - - 41,929 349,196 310,749 617,147 353,254 1,672,275 Movement in surplus on assets
revalued during the year 62,965 - 279,809 - - - - 342,774 Adjustments in surplpus - - - - - - - -
DisposalsCost - - 12 10,512 42,079 (165,404) (1,296,372) (1,409,173)Accumulated Depreciation - - - (13,141) (42,783) 156,842 450,032 550,950
- - 12 (2,629) (704) (8,562) (846,340) (858,223)Depreciation charge - - (85,801) (125,610) (77,361) (410,264) (157,073) (856,109)
Exchange rate adjustmentsCost - - - 2,900 922 641 488 4,951 Accumulated Depreciation - - - (814) (293) (288) (169) (1,564)
- - - 2,086 629 353 319 3,387
Transferred / other adjustmentsCost - - (427,044) - - - - (427,044)Accumulated Depreciation - - 53,044 - - - - 53,044
- - (374,000) - - - - (374,000)
Closing net book value 1,520,254 - 1,902,234 916,669 512,623 1,416,437 170,415 6,438,632
At December 31, 2019Cost / Revalued amount 1,520,254 - 2,187,969 1,650,673 955,778 3,522,707 253,832 10,091,213 Accumulated depreciation - - (285,735) (734,004) (443,155) (2,106,270) (83,417) (3,652,581)Net book value 1,520,254 - 1,902,234 916,669 512,623 1,416,437 170,415 6,438,632
Rate of depreciation (percentage) - - 1.01 - 4.78 10 12.5 12.5 - 33.3 20
2020 2019 ----- Rupees in ‘000 -----
11.2.1 The cost of fully depreciated property and equipment still in use
Lease hold improvements 268,841 326,262 Furniture and fixture 195,614 147,216 Electrical, office and computer equipment 1,192,927 1,104,265 Vehicles 10,669 19,752
1,668,051 1,597,495
11.2.2 The details of disposals of assets to related parties are given in annexure II these consolidated financial statements.

272Annual Report 2020
Notes to the Consolidated Financial StatementsFor the year ended December 31, 2020
11.2.3 The properties of the group were revalued by independent professional valuers as at December 31, 2019. The revaluation was carried out by M/s. Tristar International Consultants Pvt Ltd. on the basis of professional assessment of present market values.
Had there been no revaluation, the carrying value of revalued land and building on land as at December 31, 2020 would have been lower by Rs. 505.342 million and Rs. 1,020.276 million respectively, and net surplus on revaluation of fixed assets, deferred tax liability and incremental depreciation expense would have been lower by Rs. 1,525.618 million, Rs. 240.391 million and Rs. 49,416 million respectively.
2020 201911.3 Assets held for sale Note ----- Rupees in ‘000 -----
Leasehold land 11.3.1 739,200 - Building on leasehold land 11.3.2 - 374,000
739,200 374,000
11.3.1 In 2020, the Board of Directors accorded its in-principle approval and authorised the management of the Bank to explore the possibility to sell a land located at Plot No. 201, situated at Upper Mall, Lahore, Pakistan of the following reasons:
i) The property is available for immediate sale and can be sold in its current condition subject to completion of certain legal formalities.
ii) The actions to complete the sale were initiated and expected to be completed within one year from the date of classification.
iii) The Bank expects the legal and procedural formalities for the sale to be completed by the end of 2021.
Immediately before the classification of the property as a held for sale, the Property was revalued by independent professional valuer by M/s. Tristar International Consultants (Private) Limited as at December 31, 2020 and resulted no significant change is observed in valuations of the property.
11.3.2 In 2019, the Holding Company had entered into an agreement to sell the Bank property located at 13th floor of Ocean Tower, plot No. G-3, Khayaban-e-Iqbal, Block 9, KDA Scheme No. 5, Clifton Karachi, Pakistan (“Property”) of Rs. 375 million and therefore, measured the property as a non-current asset held for sale. In this respect, during the period end the sale proceeds were realised on August 11, 2020.
2020 201911.4 The carrying amounts of right-of-use assets Note ----- Rupees in ‘000 -----
Opening balance 4,109,132 5,068,076 Additional impact / adjustments arised during the period - net 31,080 26,553 Termination of leases (557,169) (985,497)Depreciation 29 (954,275) - Closing balance 2,628,768 4,109,132
12. INTANGIBLE ASSETS
Capital work-in-progress 12.1 223,901 107,533 Computer software 12.2 828,024 731,316 Goodwill 12.2 & 12.6 1,463,624 1,463,625
2,515,549 2,302,474
12.1 Capital work-in-progress
Advance for purchase of software 223,901 107,255

273 Annual Report 2020
Notes to the Consolidated Financial StatementsFor the year ended December 31, 2020
2020
Trading right entitlement certificate
(TREC)
Membership card - Pakistan
Mercantile Exchange
Limited
Computer software Goodwill Total
12.2 INTANGIBLE ASSETS ---------------------------------------- Rupees in ‘000 ----------------------------------------
At January 1, 2020Cost 5,727 3,500 1,222,657 1,463,624 2,695,508 Accumulated amortisation and impairment (3,227) - (497,340) - (500,567)Net book value 2,500 3,500 725,317 1,463,624 2,194,941
Year ended December 2020Opening net book value 2,500 3,500 725,317 1,463,624 2,194,941 Additions: - directly purchased - - 214,582 - 214,582 Impairment loss recognised in the profit and loss account - net - - - - - Amortisation charge - - (118,032) - (118,032)
Exchange rate adjustmentsCost - - 230 - 230 Accumulated Amortisation - - (73) - (73)
- - 157 - 157
Write offsCost - - 68 - 68 Accumulated Amortisation - - (68) - (68)
- - - - - Other adjustments - - - - - Closing net book value 2,500 3,500 822,024 1,463,624 2,291,648
At December 31, 2020Cost 5,727 3,500 1,437,401 1,463,624 2,910,252 Accumulated amortisation and impairment (3,227) - (615,377) - (618,604)Net book value 2,500 3,500 822,024 1,463,624 2,291,648 Rate of amortisation (percentage) - - 10%
See note 12.6 Useful life (year) - - 10

274Annual Report 2020
Notes to the Consolidated Financial StatementsFor the year ended December 31, 2020
2019
Trading right entitlement certificate
(TREC)
Membership card - Pakistan
Mercantile Exchange
Limited
Computer software Goodwill Total
------------------------------ Rupees in ‘000 ------------------------------At January 1, 2019Cost 5,727 3,500 1,046,019 1,463,624 2,518,870 Accumulated amortisation and impairment - - (399,159) - (399,159)Net book value 5,727 3,500 646,860 1,463,624 2,119,711
Year ended December 2019Opening net book value 5,727 3,500 646,860 1,463,624 2,119,711 Additions: - directly purchased - - 175,991 - 175,991 Impairment loss recognised in the profit and loss account - net (3,227) - - - (3,227)Amortisation charge - - (97,968) - (97,968)
Exchange rate adjustmentsCost - - 647 - 647 Accumulated Amortisation - - (213) - (213)
- - 434 - 434 Closing net book value 2,500 3,500 725,317 1,463,624 2,194,941
At December 31, 2019Cost 5,727 3,500 1,222,657 1,463,624 2,695,508 Accumulated amortisation and impairment (3,227) - (497,340) - (500,567)Net book value 2,500 3,500 725,317 1,463,624 2,194,941 Rate of amortisation (percentage) - - 10%
See note 12.6 Useful life (year) - - 10
2020 ----- Rupees in ‘000 -----
12.3 The cost of fully amortized computer software still in use 173,623 146,687
12.4 This represents Trading Right Entitlement Certificate (TREC) received from PSX in accordance with the requirements of the Stock Exchanges (Corporatisation, Demutalization and integration) Act, 2012 (the Act). The company has also received shares of PSX after completion of the demutualisation process.
12.5 This represents membership cards of Pakistan Mercantile Exchange. It has an indefinite useful life and is carried at cost.
12.6 Goodwill is recorded by the group upon the event fully disclose in note 1.1.2. For impairment testing, goodwill has been allocated to ‘Trading and Sales’ Segment as Cash Generating Unit (CGU), which is also a reportable segment.

275 Annual Report 2020
Notes to the Consolidated Financial StatementsFor the year ended December 31, 2020
12.7 Key assumptions used in value in use calculation
The recoverable amount of the CGU has been determined based on value in use calculation, using cash flow projections based on business plan approved by the Board of Directors of the Holding Company covering a five year period. The discount rates applied to cash flows beyond five years are extrapolated using a terminal growth rate. The following rates are used by the Holding Company.
2020 2019Percentages
Discount rate 17.41 22.87 Terminal growth rate 12.51 10.00
The calculation of value in use is most sensitive to following assumptions:
a) Interest margins
Interest margins are based on prevailing industry trends and anticipated market conditions.
b) Discount rates
Discount rates reflect management estimates of the rate of return required for each business and are calculated after taking into account the prevailing risk free rate, industry risk and business risk. Discount rates are calculated by using cost of equity of the Bank.
c) Key business assumptions
The assumptions are important as they represent management assessment of how the unit’s position might change over the projected period. Based on the expansion plans, management expects aggressive growth in advances, investments and deposits during the projected periods and thereafter stabilisation in line with industry trends.
Management believes that any significant change in key assumptions, on which CGU’s recoverable amount is based, may impact the carrying amount to further exceed its recoverable amount. Value in use calculation of the CGU are sensitive to changes in assumptions for interest rate spreads, Non Funded Income (NFI), long term growth rates and discount rates.
d) Sensitivity to changes in assumption
The estimated recoverable amount of the ‘Trading and Sales’ CGU exceeds its carrying amount by approximately Rs. 5,345 million (2019: 5,554 million). Management has identified two key assumptions for which there could be a reasonably possible change that could cause the carrying amount to exceed the recoverable amount. The following table shows the amount that these two assumptions are required to change individually in order for the estimated recoverable amount to be equal to the carrying amount.
Changes required for carrying amount to equal recoverable
amount (%)2020 2019
- Discount rate 3.16 4.85 - Terminal growth rate (4.88) 9.00

276Annual Report 2020
Notes to the Consolidated Financial StatementsFor the year ended December 31, 2020
2020 201913. OTHER ASSETS Note ----- Rupees in ‘000 -----
Income / mark-up accrued in local currency 6,885,407 8,746,909 Income/ mark-up accrued in foreign currencies 93,950 48,511 Trade receivable from brokerage and advisory business - net 1,515,019 976,902 Advances, deposits, advance rent and other prepayments 1,082,525 1,040,356 Acceptances 3,603,192 3,221,212 Dividend receivable 1,103 - Taxation (payments less provision) 292,053 794,463 Net defined benefit plan 317,581 - Balances due from funds under management 109,501 123,074 Receivable against bancassurance / bancatakaful 30,660 67,952 Stationery and stamps in hand 22,730 23,290 Receivable in respect of home remittance 30,656 37,139 Due from State Bank of Pakistan 245,310 116,489 Rebates receivable from SBP and others 13.2 305,331 465,965 Non-banking assets acquired in satisfaction of claims 13.1 & 13.2 1,176,143 1,088,682 Mark to market gain on derivative instruments 22.2 175,454 22,989 Mark to market gain on forward foreign exchange contracts 334,735 441,182 Advance for subscription of investments securities 1,645 63,108 Inter bank fund transfer settlement - 14,477 Credit card settlement 140,899 29,924 Insurance 7,636 39,100 Others 667,037 501,690
17,038,567 17,863,414 Less: Provision held against other assets 13.3 (430,569) (432,908)Other assets (net of provisions) 16,607,998 17,430,506 Surplus on revaluation of non-banking
assets acquired in satisfaction of claims 135,109 93,743 16,743,107 17,524,249
13.1 This includes an amount of Rs. 297.218 million (2019: Rs. 455.370 million) receivable from State Bank of Pakistan in respect of home remittance services provided by the Bank.
13.2 During the year, the Holding Company acquired a property of Rs. 90.178 million (2019: Rs. 998.848 million) against debt swap transaction with the borrower resulting in reversal of provision of Rs. 8.604 million (2019: 277.078 million) (refer note 10.4.2).
2020 2019Note ----- Rupees in ‘000 -----
13.2 Non banking assets acquired in satisfaction of claims
Market value of non-banking assets acquired in satisfaction of claims 1,311,252 1,182,425
13.2.1 Movement of Non banking assets acquired insatisfaction of claims at market value:
As at January 01 1,182,425 185,290 Addition during the year 13.2 90,178 998,848 Surplus recognised during the year 21.3 41,511 Depreciation during the year 29 (2,862) (1,713)
1,311,252 1,182,425
13.2.2 Non-banking assets acquired in satisfaction of claims are carried at revalued amount according to the requirements of the ‘Regulation for Debt Property Swap’ (the regulations) issued by SBP vide the BPRD Circular No. 1 of 2016, dated January 01, 2016.

277 Annual Report 2020
Notes to the Consolidated Financial StatementsFor the year ended December 31, 2020
Non-banking assets acquired in satisfaction of claims have been revalued by independent professional valuers as at December 31, 2020. The revaluation was carried out by M/s. bfa (Pvt) Ltd. and Engineering Pakistan International (Pvt) Ltd. on the basis of professional assessment of present market values.
Had there been no revaluation, the carrying value of non-banking assets acquired in satisfaction of claims would have been lower by Rs. 93.743 million (2019: Rs. 93.743 million), and surplus on revaluation of assets net, deferred tax liability and depreciation expense would have been lower by Rs. 92.694 million (2019: Rs. 92.776 million), Rs. 0.126 million (2019: Rs.0.967 million) and Rs. 0.126 million (2019: Rs. 0.126 million) respectively.
2020 2019Note ----- Rupees in ‘000 -----
Written down value:
Leasehold Land 944,946 866,695 Building on leasehold land 231,197 221,987
1,176,143 1,088,682
13.3 Provision held against other assets
Trade receivable from brokerage and advisory business - net 403,318 403,318 Others 27,251 29,590
430,569 432,908
13.3.1 Movement in provision held against other assets
Opening balance 432,908 435,188 Charge for the year 100 - Reversal for the year (2,439) (2,280)
Net (reversal) / charge for the year 32 (2,339) (2,280)Closing balance 430,569 432,908
14. BILLS PAYABLE
In Pakistan 4,752,985 3,583,500 Outside Pakistan 228,998 220,991
4,981,983 3,804,491

278Annual Report 2020
Notes to the Consolidated Financial StatementsFor the year ended December 31, 2020
2020 2019Note ----- Rupees in ‘000 -----
15. BORROWINGSSecuredBorrowings from State Bank of Pakistan under: Export refinancing scheme (ERF) 15.2.1 21,496,075 17,792,778 Long-Term Finance Facility (LTFF) 15.2.2 1,985,038 1,877,760
Other borrowingsFinancing Facility for Storage of Agricultural produce (FFSAP) 193,029 166,032 Financing Facility for Renewable Energy Projects 433,085 133,633 Refinance and credit guarantee scheme for women entrepreneurs 32,900 775 Refinance for Wages & Salaries 11,543,118 - Refinance facility for modernization of Small and Medium Enterprises (SMEs) 96,192 - Refinance facility for combating COVID-19 229,984 - Refinance facility for working capital of SMEs 33,901 - Temporary economic refinance facility 51,871 - Temporary economic refinance facility 15.2.3 12,614,080 300,440 Repurchase agreement borrowings - 16,849,097
36,095,193 36,820,075 Borrowing from financial institutionsRepurchase agreement borrowings 15.2.4 9,667,181 12,746,732 Refinancing facility for mortgage loans 15.2.5 2,397,468 1,961,128
12,064,649 14,707,860
Total secured 48,159,842 51,527,935
UnsecuredCall borrowings - 2,303,356 Overdrawn nostro accounts 143,570 636,992 Total unsecured 143,570 2,940,348
48,303,412 54,468,283 15.1 Particulars of borrowings
In local currency 48,079,656 51,527,935 In foreign currencies 143,570 2,940,348
48,223,226 54,468,283
15.2.1 The Bank has entered into agreement with the State Bank of Pakistan (SBP) for extending export finance to customers. As per the terms of the agreement, the Bank has granted SBP the right to recover the outstanding amount from the Bank at the date of maturity of finances by directly debiting the current account maintained by the Bank with SBP. These borrowings are repayable on a quarterly basis and to be matured between July 28, 2020 and February 08, 2027 (2019: January 02, 2020 and February 08, 2027 ). These carry mark-up at the rate from 1% to 3% (2019: 1% to 3%) per annum.

279 Annual Report 2020
Notes to the Consolidated Financial StatementsFor the year ended December 31, 2020
15.2.2 These borrowings have been obtained from the SBP for providing financing facilities to exporters for adoption of new technologies and modernization of their plant and machinery. These borrowings will mature between November 30, 2020 and November 18, 2030 (2019: November 30, 2020 and August 08, 2029). These carry mark-up at rates ranging from 2.00% to 3.50% (2019: 2.00% to 3.50%) per annum.
15.2.3 Other borrowings have been obtained from SBP under various facilities on particulars mentioned below:
Markup rate MaturedPer annum From To
Financing Facility for Storage of Agricultural Produce (FFSAP) 2%2%0%0%0%0%0%1%
January 1, 2022 October 27, 2027Financing Facility for Renewable Energy Projects August 1, 2021 August 29, 2029Refinance and credit guarantee scheme for women entrepreneurs October 30, 2021 February 28, 2026Refinance for Wages & Salaries October 1, 2022 December 31, 2022Refinance facility for modernization of Small and Medium Enterprises (SMEs) October 1, 2022 June 16, 2025Refinance facility for combating COVID-19 April 1, 2025 October 1, 2025Refinance facility for working capital of SMEs September 16, 2021 October 1, 2022Temporary economic refinance facility (TERF) November 22, 2025 November 22, 2025
15.2.4 This represents borrowing against Market Treasury Bills, (2019: Market Treasury Bills, Pakistan Investment Bonds and Bai Muajjal) carrying mark-up at the rates ranging upto 6.70% (2019:12.70% to 13.19%) per annum and will be matured between January 11, 2020 and January 12, 2020 (2019: January 02, 2020 and March 26, 2020). The cost and market value of securities given as collateral of amounting to Rs. 9,767,491 million (2019: Rs. 9,200.503 million) and Rs. Nil (2019: Rs. 9,122.620 million) respectively.
15.2.5 The Holding Company has entered into agreement with the Pakistan Mortgage Refinance Company Limited (PMRC) for extending housing finance facilities to the Bank’s customers on the agreed terms and conditions. The borrowing carries mark-up rate of 3 years PKRV less 100bps and will be matured on February 28, 2022 and December 09, 2025.
16. DEPOSITS AND OTHER ACCOUNTS
2020 2019In Local In Foreign In Local In ForeignCurrency currencies Total Currency currencies Total
---------------------------------------------- Rupees in ‘000 ----------------------------------------------CustomersCurrent deposits 90,714,627 9,668,068 100,382,695 70,341,319 6,412,941 76,754,260 Savings deposits 98,103,956 3,944,797 102,048,753 73,442,779 2,898,794 76,341,573 Term deposits 186,691,026 15,203,881 201,894,907 164,602,876 11,409,815 176,012,691 Margin deposits 5,920,595 163 5,920,758 5,455,786 15,234 5,471,020
381,430,204 28,816,909 410,247,113 313,842,760 20,736,784 334,579,544 Financial InstitutionsCurrent deposits 1,281,453 435,683 1,717,136 858,905 - 858,905 Savings deposits 11,192,800 - 11,192,800 12,204,325 - 12,204,325 Term deposits 8,266,773 - 8,266,773 20,900,829 - 20,900,829
20,741,026 435,683 21,176,709 33,964,059 - 33,964,059
402,171,230 29,252,592 431,423,822 347,806,819 20,736,784 368,543,603

280Annual Report 2020
Notes to the Consolidated Financial StatementsFor the year ended December 31, 2020
2020 2019Note -------- Rupees in ‘000 --------
16.1 Composition of deposits
- Individuals 147,143,479 135,583,867 - Government (Federal and Provincial) 92,317,151 73,503,161 - Public Sector Entities 52,156,536 37,475,517 - Banking Companies 2,950,286 2,926,436 - Non-Banking Financial Institutions 18,226,423 31,037,623 - Private Sector 118,629,947 88,016,999
16.2 431,423,822 368,543,603
16.2. This includes deposits eligible to be covered under insurance arrangements amounting to Rs. 143,210.503 million (2019: Rs. 87,425.180 million).
2020 2019Note -------- Rupees in ‘000 --------
17. SUB-ORDINATED DEBT
Term Finance Certificates - First Issue 17.1 2,995,200 2,996,400 Term Finance Certificates - Second Issue 17.2 1,997,600 1,998,400 Term Finance Certificates - Third Issue 17.3 2,500,000 2,500,000
7,492,800 7,494,800
17.1 In 2016, the Holding company has issued Rs.3 billion of rated, privately placed, unsecured and subordinated term finance certificates (“TFCs” or “the Issue”) as an instrument of redeemable capital under Section 120 of the Companies Ordinance, 1984 and as outlined by State Bank of Pakistan, SBP, under the BPRD circular No. 06 dated August 15, 2013 and Basel III guidelines. Summary of terms and conditions of the Issue are:
Purpose: To contribute toward the Bank’s Tier II Capital for complying with the Capital Adequacy Ratio requirement and to utilize the funds in the Bank’s business operations as permitted by its Memorandum & Articles of Association.
Issue date: December 14, 2016
Tenure: Up to Seven years from the Issue date.
Maturity Date: December 14, 2023
Rating: A + (Single A Plus)
Profit Rate: Floating rate of return at Base rate + 1.4 percent per annum;
Base rate is defined as the average six months KIBOR prevailing on the Base Rate setting date. The Base Rate will be set for the first time on the last working day prior to the Issue Date and subsequently on the immediately preceding business day before the start of each six monthly period
Profit payment: Semi-annual
Redemption: The instrument is structured to redeem 0.24% of the Issue amount during the first six years after the Issue date and the remaining Issue amount of 99.76% in two equal semi-annual installments of 49.88% each in the last year.
Security: The Issue is unsecured and subordinated as to payment of Principal and profit to all other indebtedness of the Bank.

281 Annual Report 2020
Call Option: Exercisable in part or in full on or after the 10th redemption, subject to SBP’s approval.
Lock-in-clause: Principal and profit will be payable subject to compliance with MCR or CAR set by SBP.
Loss absorbency clause: Upon the occurrence of a Point of Non-Viability event as defined by SBP’s Basel III Capital Rule vide BPRD Circular # 6 of 2013 dated August 15, 2013, SBP may at its option, fully and permanently convert the TFCs into common shares of the Bank and/or have them immediately written off (either partially or in full). Number of shares to be issued to TFC holders at the time of conversion will be equal to the ‘Outstanding Face Value of the TFCs’ divided by market value per share of the Bank’s common share on the date of trigger as declared by SBP of the non-viability event as declared by SBP, subject to a cap of 467,836,257 shares.
17.2 In 2017, the Holding company has issued Rs. 2 billion of rated, over the counter listed, unsecured and subordinated term finance certificates (“TFCs” or “the Issue”) as an instrument of redeemable capital under Section 66 of the Companies Act, 2017 and as outlined by State Bank of Pakistan, SBP, under the BPRD circular No. 06 dated August 15, 2013 and Basel III guidelines. Summary of terms and conditions of the Issue are:
Purpose: To contribute toward the Bank’s Tier II Capital for complying with the capital adequacy requirement and to utilize the funds in the Bank’s business operations as permitted by its Memorandum & Articles of Association.
Issue date: December 29, 2017
Tenure: Up to Seven years from the Issue date.
Maturity Date: December 29, 2024
Rating: A + (Single A Plus)
Profit Rate: Floating rate of return at Base rate + 1.4 percent per annum;
Base rate is defined as the average six months KIBOR prevailing on the Base Rate setting date. The Base Rate will be set for the first time on the last working day prior to the Issue Date and subsequently on the immediately preceding business day before the start of each six monthly period.
Profit payment: Semi-annual
Redemption: The instrument is structured to redeem 0.24% of the Issue amount during the first six years after the Issue date and the remaining Issue amount of 99.76% in two equal semi-annual installments of 49.88% each in the last year.
Security: The Issue is unsecured and subordinated as to payment of Principal and profit to all other indebtedness of the Bank.
Call Option: Exercisable in part or in full on or after the 10th redemption, subject to SBP’s approval.
Lock-in-clause: Principal and profit will be payable subject to compliance with MCR or CAR set by SBP.
Loss absorbency clause: Upon the occurrence of a Point of Non-Viability event as defined under SBP BPRD Circular # 6 of 2013 dated August 15, 2013, SBP may at its option, fully and permanently convert the TFCs into common shares of the Bank and/or have them immediately written off (either partially or in full). Number of shares to be issued to TFC holders at the time of conversion will be equal to the ‘Outstanding Face Value of the TFCs’ divided by market value per share of the Bank’s common share on the date of trigger of Point of Non-Viability (PONV) as declared by SBP, subject to a cap of 319,982,544 shares.
Notes to the Consolidated Financial StatementsFor the year ended December 31, 2020

282Annual Report 2020
17.3 In 2018, the Holding company has issued Rs.2.5 billion of rated, privately placed, unsecured, subordinated, perpetual and non-cumulative term finance certificates (“TFCs” or “the Issue”) as an instrument of redeemable capital under Section 66(1) of the Companies Act, 2017 and as outlined by State Bank of Pakistan, SBP, under the BPRD circular No. 06 dated August 15, 2013 (the “Circular”) and Basel III guidelines. Summary of terms and conditions of the Issue are:
Purpose: To contribute toward the Bank’s Tier I Capital for complying with the capital adequacy requirement and to utilize the funds in the Bank’s business operations as permitted by its Memorandum & Articles of Association.
Issue date: December 31, 2018
Maturity Date: Perpetual
Rating: A (Single A)
Profit Rate: Floating rate of return at Base rate + 2.25 percent per annum;
Base rate is defined as the average six months KIBOR prevailing on the Base Rate setting date. The Base Rate will be set for the first time on the last working day prior to the Issue Date and subsequently on the immediately preceding business day before the start of each six monthly period
Profit payment frequency: Semi-annually on a non-cumulative basis
Redemption: Not applicable
Security: The Issue is unsecured and subordinated as to payment of Principal and profit to all other claims except common shares.
Call Option: Exercisable in part or in full at a par value on or after five years from the issue date, with prior approval of SBP. The Bank shall not exercise the call option unless the called instrument is replaced with capital of same or better quality.
Lock-in-clause: Payment of profit will me be made from current year’s earning and subject to compliance with MCR or CAR set by SBP.
Loss absorbency clause:
Pre-Specified Trigger(“PST”)
Upon the occurrence of a Pre-Specified Trigger as defined under SBP BPRD Circular # 6 of 2013 dated August 15, 2013 which stipulates that if an Issuer’s Common Equity Tier 1 (“CET 1”) ratio falls to or below 6.625% of Risk Weighted Assets (“RWA”), the Issuer will have full discretion to determine the amount of TFCs to be permanently converted into common shares or written off, subject to SBP regulations / instructions, and the cap specified below. The Bank will be able to exercise this discretion subject to:
- If and when Bank’s CET 1 reaches the loss absorption trigger point, the aggregate amount of Additional Tier-1 capital to be converted must at least be the amount sufficient to immediately return the CET 1 ratio to above 6.625% of total RWA (if possible);
- The converted amount should not exceed the amount needed to bring the CET 1 ratio to 8.5% of RWA (i.e. minimum CET 1 of 6.0% plus capital conservation buffer of 2.5%);
- In case, conversion of Additional Tier-1 capital Instrument is not possible following the trigger event, the amount of the Instrument must be written off in the accounts resulting in increase in CET 1 of the Issuer;
Notes to the Consolidated Financial StatementsFor the year ended December 31, 2020

283 Annual Report 2020
Point of Non-Viability(“PONV”)
Upon the occurrence of a Point of Non-Viability event as defined under SBP BPRD Circular # 6 of 2013 dated August 15, 2013, which stipulates that SBP may, at its option, fully and permanently convert the TFCs into common shares of the Issuer and / or have them immediately written off (either partially or in full). Number of shares to be issued to TFC holders at the time of conversion will be equal to the ‘Outstanding Value of the TFCs’ divided by market value per share of the Issuer’s common / ordinary share on the date of the PONV trigger event as declared by SBP, subject to the cap specified below;
The PONV trigger event is the earlier of:
- “A decision made by SBP that a conversion or temporary / permanent write-off is necessary without which the Issuer would become non-viable;
- The decision to make a public sector injection of capital, or equivalent support, without which the Issuer would have become non-viable, as determined by SBP.
- The maximum number of shares to be issued to TFC holders at the Pre-Specified Trigger and / or Point of Non Viability (or otherwise as directed by SBP) will be subject to a specified cap of 329,595,476 ordinary shares, or such other number as may be agreed to in consultation with SBP.
18. DEFERRED TAX (ASSETS) / LIABILITIES
18.1 Movement in temporary differences during the year:2020
Balance as at January 01,
2020
Recognised in profit and loss
account
Recognised in other
comprehensive income
Balance as at December 31,
2020
Note -------------------------- Rupees in ‘000 -------------------------- Deductible Temporary Differences on:Provision against investments (57,149) - - (57,149)Provision against loans and advances (132,305) (155,535) - (287,840)Other assets (845,243) 725,913 - (119,330)General provision under IFRS-9 (3,097) (40,455) - (43,552)Intangible other than Goodwill (2,507) (397) - (2,904)Liability against assets subject to finance lease - net (7,082) (4,299) - (11,381)Mark to market gain / (loss) on forward foreign exchange contracts (51,092) 28,199 - (22,893)Provision for workers' welfare fund (3,143) 2,964 - (179)
(1,101,618) 556,390 - (545,228)Taxable Temporary Differences on:Operating fixed assets 260,103 (71,570) - 188,533 Goodwill 512,268 - - 512,268 Surplus on revaluation of operating fixed assets 21 374,394 (58,646) (75,357) 240,391 Surplus on revaluation of non-banking assets acquired in satisfaction of claims 21 967 (51) 3,113 4,029 Unrealised (loss) / gain on revaluation of derivative financial instruments 82,321 (77,019) - 5,302 Unrealised loss / (gain) on revaluation of investments classified as held for trading (665) 4,697 - 4,032 Government Grant - 1,888 - 1,888 (Deficit) / surplus on revaluation of investments classified assets as available for sale 21 (253,627) (26,142) 952,144 672,375
975,761 (226,843) 879,900 1,628,818
18.1.1 (125,857) 329,547 879,900 1,083,590
Notes to the Consolidated Financial StatementsFor the year ended December 31, 2020

284Annual Report 2020
2019
Balance as at January 01,
2019
Recognised in profit and loss
account
Recognised in other
comprehensive income
Balance as at December 31,
2019
Note -------------------------- Rupees in ‘000 -------------------------- Deferred tax debits arising from:Provision against investments (57,149) - - (57,149)Provision against loans and advances (147,207) 14,902 - (132,305)Provision against other assets (171,011) (674,232) - (845,243)General provision under IFRS-9 (36,820) 33,723 - (3,097)Intangible other than Goodwill (2,235) (272) - (2,507)Unrealised (loss) / gain on revaluation of investments classified as held for trading (3,976) 3,575 (264) (665)Surplus / (deficit) on revaluation of investments classified assets as available for sale (1,188,415) - 934,788 (253,627)Provision for donation (186) 186 - - Mark to market gain on forward foreign exchange contracts - (51,092) - (51,092)Liability against assets subject to finance lease - net - (7,082) - (7,082)Provision for workers' welfare fund (17,114) 13,971 - (3,143)
(1,624,113) (666,321) 934,524 (1,355,910)
Deferred tax credits arising due to:Operating fixed assets 232,731 27,372 - 260,103 Goodwill 512,268 - - 512,268 Surplus on revaluation of operating fixed assets 21 390,391 1,223 (17,220) 374,394 Surplus on revaluation of non-banking assets acquired in satisfaction of claims 21 1,010 (43) - 967 Unrealized (loss) / gain on revaluation of derivative financial instruments 21 78,721 3,600 - 82,321
1,215,121 32,152 (17,220) 1,230,053
18.1.1 (408,992) (634,169) 917,304 (125,857)
18.1.1 As of December 31, 2020, the JSIL has accumulated losses of Rs. 359.015 million (2019: Rs. 239.238 million). The deferred tax on such losses works out to Rs. 104.751 million (2019: Rs. 69.379 million), however, the JSIL has recognised deferred tax asset on such losses to the extent of deferred tax liability of Rs. 0.637 million (2019: Rs. 24.352 million). Unrecognized deferred tax asset on carried forward business losses as at December 31, 2020 amounted to Rs. 104.011 million 2019 (Rs. 45.027 million).
As of December 31, 2019, the JSIL has accumulated losses of Rs. 239.238 million. The deferred tax on such losses works out to Rs. 69.379 million, however, the JSIL has recognised deferred tax asset on such losses to the extent of deferred tax liability of Rs.24.352 million. Unrecognized deferred tax asset on carried forward business losses as at December 31, 2019 amounted to Rs.45.027 million.
Notes to the Consolidated Financial StatementsFor the year ended December 31, 2020

285 Annual Report 2020
Notes to the Consolidated Financial StatementsFor the year ended December 31, 2020
2020 201919. OTHER LIABILITIES Note ----- Rupees in ‘000 -----
Mark-up / return / interest payable in local currency 3,132,699 4,166,772 Mark-up / return / interest payable in foreign currencies 52,729 72,782 Unearned commision income on guarantees 176,270 99,505 Accrued expenses 809,789 415,112 Acceptances 3,603,192 3,221,212 Trade payable from brokerage business 2,353,304 1,426,057 Unclaimed dividends 7,576 7,576 Mark to market loss on derivative instruments 172,635 491 Mark to market loss on forward foreign exchange contracts 400,144 375,227 Dividend payable 5,183 41,102 Payable in respect of defined benefit obligation - net 37.5 - 151,881 Withholding taxes payable 599,853 539,702 Government challan collection 94,510 66,867 Donation payable 29.2.1 - 1,991 Security deposits against leases, lockers and others 3,490,704 4,172,975 Provision for Workers’ Welfare Fund 160,165 113,795 Payable in respect of home remittance 831,042 446,387 Retention money payable 42,044 34,248 Lease liability against right-of-use assets 2,891,226 4,260,358 Advance against assets held for sale 11.3.2 - 37,500 Insurance payable 10,137 12,693 Payable to vendors against SBS goods 93,634 185 Debit card settlement 65,855 73,084 Inter bank fund transfer 159,136 - Others 724,011 287,480
19,875,838 20,024,982 19.1 Lease liabilities
The carrying amounts of lease liabilities and the movements during the year is as below:
Opening balance 4,260,358 4,781,777 Additional impact arised during the year - net 22,284 24,333 Termination impact arised during the year-net (613,771) - Markup on Lease liability against right-of-use assets 25 451,047 580,688 Payments (1,203,822) (1,126,440)Closing balance 2,916,096 4,260,358

286Annual Report 2020
Notes to the Consolidated Financial StatementsFor the year ended December 31, 2020
20.3 As at December 31, 2020, Jahangir Siddiqui & Co. Limited. (the parent company) held 973,307,324 (2019: 973,307,324) ordinary shares of Rs.10 each i.e. 75.02% holding (2019: 75.02%).
2020 201921. SURPLUS ON REVALUATION OF ASSETS Note -------- Rupees in ‘000 --------
Surplus / (deficit) on revaluation of:Available-for-sale securities 21.1.1 2,325,426 (591,788)Operating fixed assets 21.2 1,766,009 1,955,940 Non-banking assets acquired in satisfaction of claims 21.3 135,109 93,743
4,226,544 1,457,895
Deferred tax on (surplus) / deficit on revaluation of:Available-for-sale securities (672,375) 253,627 Operating fixed assets (240,391) (374,390)Non-banking assets acquired in satisfaction of claims (4,029) (967)
(916,795) (121,730) 3,309,749 1,336,165
21.1 Group’s share 3,247,593 1,308,531 Non-controlling interest 62,156 27,634
3,309,749 1,336,165
20. SHARE CAPITAL
20.1 Authorised capital
19.1.1 Ordinary shares2020 2019
2020 2019 ----- Rupees in ‘000 ----- ----- Number of shares -----
2,350,000,000 2,350,000,000 Ordinary shares of Rs.10 each 23,500,000 23,500,000
19.1.2 Preference shares
150,000,000 150,000,000 Convertible preference shares of Rs.10 each 1,500,000 1,500,000
20.2 Issued, subscribed and paid-up capital
Ordinary shares 763,558,965 763,558,965 Fully paid in cash 7,635,590 7,635,590 533,905,297 533,905,297 Issued for consideration other than cash 5,339,053 5,339,053 1,297,464,262 1,297,464,262 12,974,643 12,974,643
- - Less: Discount on issue of shares (2,855,401) (2,855,401)1,297,464,262 1,297,464,262 10,119,242 10,119,242
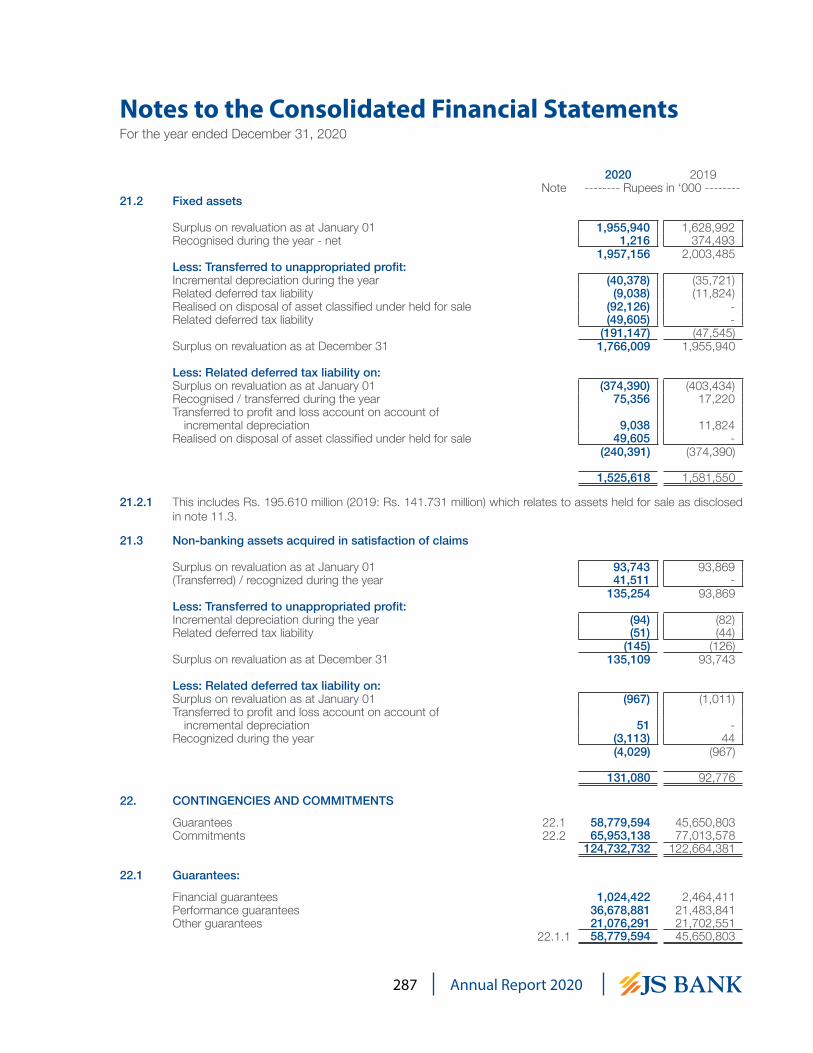
287 Annual Report 2020
Notes to the Consolidated Financial StatementsFor the year ended December 31, 2020
2020 2019Note -------- Rupees in ‘000 --------
21.2 Fixed assets
Surplus on revaluation as at January 01 1,955,940 1,628,992 Recognised during the year - net 1,216 374,493
1,957,156 2,003,485 Less: Transferred to unappropriated profit:Incremental depreciation during the year (40,378) (35,721)Related deferred tax liability (9,038) (11,824)Realised on disposal of asset classified under held for sale (92,126) - Related deferred tax liability (49,605) -
(191,147) (47,545)Surplus on revaluation as at December 31 1,766,009 1,955,940
Less: Related deferred tax liability on:Surplus on revaluation as at January 01 (374,390) (403,434)Recognised / transferred during the year 75,356 17,220 Transferred to profit and loss account on account of
incremental depreciation 9,038 11,824 Realised on disposal of asset classified under held for sale 49,605 -
(240,391) (374,390)
1,525,618 1,581,550
21.2.1 This includes Rs. 195.610 million (2019: Rs. 141.731 million) which relates to assets held for sale as disclosed in note 11.3.
21.3 Non-banking assets acquired in satisfaction of claims
Surplus on revaluation as at January 01 93,743 93,869 (Transferred) / recognized during the year 41,511 -
135,254 93,869 Less: Transferred to unappropriated profit:Incremental depreciation during the year (94) (82)Related deferred tax liability (51) (44)
(145) (126)Surplus on revaluation as at December 31 135,109 93,743
Less: Related deferred tax liability on:Surplus on revaluation as at January 01 (967) (1,011)Transferred to profit and loss account on account of
incremental depreciation 51 - Recognized during the year (3,113) 44
(4,029) (967)
131,080 92,776
22. CONTINGENCIES AND COMMITMENTS
Guarantees 22.1 58,779,594 45,650,803 Commitments 22.2 65,953,138 77,013,578
124,732,732 122,664,381
22.1 Guarantees:
Financial guarantees 1,024,422 2,464,411 Performance guarantees 36,678,881 21,483,841 Other guarantees 21,076,291 21,702,551
22.1.1 58,779,594 45,650,803

288Annual Report 2020
Notes to the Consolidated Financial StatementsFor the year ended December 31, 2020
22.1.1 Included herein are outstanding guarantees of Rs. 29.054 million (2019: Rs.14.217 million) of related parties.
2020 2019Note ----- Rupees in ‘000 -----
22.2 Commitments:
Documentary credits and short-term trade-related transactions- letters of credit 22.2.1 21,111,360 13,965,258
Commitments in respect of:- Forward foreign exchange contracts 22.2.2 38,178,262 55,111,366 - Derivative instruments 22.2.3 5,564,000 7,238,695 - Forward lending 22.2.4 384,230 72,183 - Bank Guarantee from a commercial Bank in favorof National Clearing Company of Pakistan Limited 22.2.5 400,000 400,000 - Outstanding settlements against margin financing contracts - net 22.2.6 57,411 5,305
Commitments for acquisition of:- operating fixed assets 22.2.7 257,875 220,771
65,953,138 77,013,578
22.2.1 Included herein are the outstanding letter of credits of Rs. 86.543 million (2019: Rs.44.368 million) of related parties.
2020 201922.2.2 Commitments in respect of forward foreign exchange contracts ----- Rupees in ‘000 -----
Purchase 23,137,733 33,104,108 Sale 15,040,529 22,007,258
38,178,262 55,111,366
The Holding company utilises foreign exchange instruments to meet the needs of its customers and as part of its asset and liability management activity to hedge its own exposure to currency risk. At period ended, all foreign exchange contracts have a remaining maturity of less than one year.
2020 201922.2.3 Commitments in respect of derivative instruments ----- Rupees in ‘000 -----
Purchase 1,760,637 3,622,107 Sale 3,803,363 3,616,588
5,564,000 7,238,695
22.2.3.1 Interest rate swaps (notional principal)
Purchase 1,176,824 2,099,175 Sale 1,176,824 2,100,175
2,353,648 4,199,350
22.2.3.2 Options (notional principal)
Purchase 582,419 1,023,310 Sale 2,425,487 1,023,310
3,007,906 2,046,620

289 Annual Report 2020
Notes to the Consolidated Financial StatementsFor the year ended December 31, 2020
2020 2019Note ----- Rupees in ‘000 -----
22.2.3.3 Commitments in respect of forward securities
Purchase 1,394 499,622 Sale 201,052 493,103
202,446 992,725
22.2.4 Commitments in respect of forward lending
Undrawn formal standby facilities, credit lines andother commitments to lend 22.2.4.1 384,230 72,183
22.2.4.1 These represent commitments that are irrevocable because they cannot be withdrawn at the discretion of the bank without the risk of incurring significant penalty or expense.
2020 2019 ----- Rupees in ‘000 -----
22.2.5 Bank Guarantee from a commercial Bank in favorof National Clearing Company of Pakistan Limited 400,000 400,000
22.2.6 Outstanding settlements against margin financing contracts - net 57,411 5,305
22.2.7 Commitments for acquisition of operating fixed assets 257,875 220,771
22.2.8 Tax related contingencies are disclosed in note 33.2 to 33.4.
23. DERIVATIVE INSTRUMENTS
Derivative instruments, such as Forward Exchange Contracts, Interest Rate Swaps and Options, are forward transactions that provide market making opportunities / hedge against the adverse movement of interest and exchange rates. Derivatives business also provides risk solutions for the existing and potential customers of the Group.
The Group has entered into a Cross Currency Swap transaction with its customer on back-to-back basis with an Authorized Derivative Dealer (ADD) without carrying any open position in its books. Specific approvals for the transactions have been granted by State Bank of Pakistan. Policies in line with SBP instructions have been formulated and are operative.
The Holding company has also entered into Foreign Currency & Commodity Options from its Wholesale Banking Branch Bahrain for market making activities.
These transactions cover the aspects of both market making and hedging. The risk management related to derivative is disclosed in note 45.
Accounting policies in respect of derivative financial instruments are described in note 4.4.2.

290Annual Report 2020
Notes to the Consolidated Financial StatementsFor the year ended December 31, 2020
2020Interest rate swaps Options Forward securities
Notional principal
Mark to market
Notional principal
Mark to market
Notional principal
Mark to market
23.1 Product Analysis ---------------------------------- Rupees in ‘000 ----------------------------------
With BanksHedging 2,353,648 4,943 3,007,906 10,205 - - Market making - - - - 201,052 (12,329)
With FIs other banksHedging - - - - - - Market making - - - - 1,394 -
TotalHedging 2,353,648 4,943 3,007,906 10,205 - - Market making - - - - 202,446 (12,329)
2019
Interest rate swaps Options Forward securitiesNotional principal
Mark to market
Notional principal
Mark to market
Notional principal
Mark to market
---------------------------------- Rupees in ‘000 ----------------------------------With BanksHedging - 8,885 4,199,350 13,327 - - Market making - - - - 992,725 286
With FIs other banksHedging - - - - - - Market making - - - - - -
TotalHedging - 8,885 4,199,350 13,327 - - Market making - - - - 992,725 286

291 Annual Report 2020
Notes to the Consolidated Financial StatementsFor the year ended December 31, 2020
23.2 Maturity Analysis2020
Number of contracts
Notional principal
Mark to marketRemaining maturity of contracts Positive Negative Net
---------------------- Rupees in ‘000 ----------------------
Upto 1 month 6 871,043 29,685 (41,098) (11,413)1 to 3 months 1 317,656 - (889) (889)3 to 6 months 7 1,345,571 13,001 (5,296) 7,705 6 months to 1 year 10 2,914,453 121,563 (114,748) 6,815 1 to 2 years 2 115,277 11,205 (10,604) 601
26 5,564,000 175,454 (172,635) 2,819
2019Number of contracts
Notional principal
Mark to marketRemaining maturity of contracts Positive Negative Net
---------------------- Rupees in ‘000 ----------------------
Upto 1 month 34 493,103 90 - 90 1 to 3 months 1 499,622 196 - 196 3 to 6 months - - - - - 6 months to 1 year 4 - 9,376 (491) 8,885 1 to 2 years 3 2,516,330 7,785 - 7,785 2 to 3 years 1 1,683,020 5,542 - 5,542
43 5,192,075 22,989 (491) 22,498
2020 201924. MARK-UP / RETURN / INTEREST EARNED Note ----- Rupees in ‘000 -----
On:Loans and advances 25,277,186 31,003,043 Investments 16,537,576 9,717,118 Lendings to financial institutions 32,855 52,679 Balances with other banks 85,144 59,817 Securities purchased under resale agreements 1,259,308 858,930
43,192,069 41,691,587
25. MARK-UP / RETURN / INTEREST EXPENSED
On:Deposits 29,376,526 28,272,108 Borrowings 25.1 1,817,487 3,678,116 Subordinated debt 900,310 1,029,228 Cost of foreign currency swaps against foreigncurrency deposits / borrowings 735,977 936,986 Markup on Lease liability against right-of-use assets 19.1 451,047 580,610
33,281,347 34,497,048

292Annual Report 2020
Notes to the Consolidated Financial StatementsFor the year ended December 31, 2020
2020 2019Note ----- Rupees in ‘000 -----
25.1 BorrowingsExport refinancing scheme (ERF) 357,578 337,916 Long-Term Finance Facility (LTFF) 46,242 35,388 Other Borrowings from State Bank Bank of Pakistan 10,941 3,942 Securities sold under repurchase agreements 1,111,507 2,810,910 Other short term borrowings 291,219 489,960
1,817,487 3,678,116
26. FEE, COMMISSION AND BROKERAGE INCOME
Branch banking customer fees 240,843 174,557 Consumer finance related fees 39,700 21,098 Card related fees (debit and credit cards) 652,096 594,713 Credit related fees 358,650 328,927 Investment banking fees 119,315 86,244 Commission on trade 671,804 570,108 Commission on guarantees 393,993 266,999 Commission on cash management 4,755 5,966 Commission on remittances including home remittances 26.1 252,078 111,288 Commission on bancassurance 180,460 180,770 Commission on distribution of mutual funds 29,008 93,343 Commission on online Services 372,892 186,396 Postage & Courier income 24,096 22,143 Rebate income 250,355 224,598 Rebate on primary dealership 27,637 6,918 Brokerage income 582,761 327,604 Management fee 173,499 210,488
4,373,942 3,412,160
26.1 This includes Rs.149.305 million (2019: Rs. 82.373 million) in respect of commission income from home remittance services provided by the Bank. The amount is earned from State Bank of Pakistan at the rate of Saudi Riyal 20 (2019: Saudi Riyal 20) per transaction over USD 200 (2019: USD 200) and is shared between the Bank and various exchange companies as per terms of agreement with them.

293 Annual Report 2020
Notes to the Consolidated Financial StatementsFor the year ended December 31, 2020
2020 2019Note ----- Rupees in ‘000 -----
27. GAIN / (LOSS) ON SECURITIES - NET
Realised 27.1 1,906,308 (674,365)Unrealised - held for trading 14,202 8,368
1,920,510 (665,997)
27.1 Realised gain on:Federal government securitiesMarket treasury bills 76,912 3,671 Pakistan investment bonds 1,381,058 (247,329)Ijara sukuk certificates 71 633
1,458,041 (243,025)SharesListed companies 429,881 (386,856)
Non Government Debt Securities Term finance certificates 32,832 21,443 Sukuk certificates 450 150
33,282 21,593 Mutual fund units (11,538) 8,246 Foreign currency bonds (3,358) (74,323)
1,906,308 (674,365)
28. OTHER INCOME - NET
Rent on Property - 4,079 Gain on sale of fixed assets - net 10,682 493,680 Gain on sale of assets held for sale 11.3.2 1,000 - Gain on termination of leases 28.1 64,805 - Others 32,819 7,430
109,306 505,189
28.1 This represents, gain on termination of leases against closure of fifty one branches under the Bank’s branch rationalisation strategy.

294Annual Report 2020
Notes to the Consolidated Financial StatementsFor the year ended December 31, 2020
2020 2019Note ----- Rupees in ‘000 -----
29. OPERATING EXPENSES
Total compensation expense 29.1 6,735,714 5,713,741
Property expenseRent & taxes 24,143 39,856 Insurance 2,641 10,553 Utilities cost 365,121 365,688 Security (including guards) 337,223 296,671 Repair & maintenance (including janitorial charges) 241,197 204,875 Depreciation 243,485 247,053 Depreciation on right-of-use assets 11.4 954,275 985,498 Depreciation on non banking assets 13.2.1 2,862 1,713
2,170,947 2,151,907 Information technology expensesSoftware maintenance 762,263 241,700 Hardware maintenance 189,878 182,710 Depreciation 215,310 184,504 Amortisation 118,032 97,968 Network charges 133,243 125,505
1,418,726 832,387 Other operating expensesDirectors’ fees and allowances 23,100 15,625 Legal & professional charges 191,690 151,056 Insurance 290,204 209,998 Outsourced services costs 36 156,524 135,005 Travelling & conveyance 129,968 145,186 NIFT clearing charges 45,199 40,394 Depreciation 322,535 424,574 Depreciation on right-of-use assets - - Training & development 19,520 35,074 Postage & courier charges 100,484 82,010 Communication 182,699 134,965 Stationery & printing 265,023 276,707 Marketing, advertisement & publicity 461,634 338,130 Donations 29.2 122,341 2,809 Auditors remuneration 29.3 16,697 14,293 Staff auto fuel & maintenance 205,187 224,923 Bank charges 60,168 63,468 Stamp duty 17,238 55,570 Online verification charges 18,802 21,870 Brokerage, fee and commission 56,849 34,658 Card related fees (debit and credit cards) 6,906 8,662 CDC and other charges 27,250 31,186 Consultancy fee 61,605 36,949 Deposit protection corporation 29.4 128,144 139,761 Entertainment expenses 76,957 67,337 Repair and maintenance 67,988 66,161 Cash handling charges 239,732 65,778 Fee and Subscription 160,950 106,166 Employees social security 11,444 9,035 Generator fuel & maintenance 76,467 80,002 Fee and allowances to Shariah Board 74 46 Royalty 29.5 30,000 30,000 Others 54,693 38,026
3,628,072 3,085,424 13,953,459 11,783,459
Less: Reimbursement of selling and distribution expenses 29.6 (52,233) (21,686) 13,901,226 11,761,773

295 Annual Report 2020
Notes to the Consolidated Financial StatementsFor the year ended December 31, 2020
2020 2019 ----- Rupees in ‘000 -----
29.1 Total compensation expense
Fees and Allowances etc. 204,736 191,025 Managerial Remuneration:i) Fixed 4,316,171 4,031,190 ii) Variable of which;a) Cash Bonus / Awards etc. 656,678 344,693 b) Commission 292,603 252,556 Charge for defined benefit plan 159,436 134,712 Contribution to defined contribution Plan 251,053 233,459 Leaving indemnity 6,479 4,246 Medical 387,404 357,750 House rent allowance 1,694 1,581 Utilities 188 176 Conveyance 415,478 81,851 Insurance Staff 41,259 74,941 Others 2,535 5,561
6,735,714 5,713,741
29.1.1 The Group operates a short term employee benefit scheme which includes cash awards / special bonus for all employees. Under this scheme, the bonus for all employees, including the Chief Executive Officer (CEO) is determined on the basis of employees’ evaluation and the Bank’s performance during the year.
2020 2019Note ----- Rupees in ‘000 -----
29.2 Donations
Future Trust 29.2.1 117,341 1,991 Hope Uplift Foundation - 618 Bait-ul-Sukoon Cancer Hospital - 200 Agha Khan Foundation 5,000 -
122,341 2,809
29.2.1 This represents donation to a related party, wherein below mentioned persons are trustees. The registered office of the donee is located at 7th Floor, The Forum, Block 9, Clifton, Karachi.
- Mr. Suleman Lalani Chief Executive Officer of Jahangir Siddiqui & Co. Ltd. (the parent company)
Mr. Kalim-ur-Rehman Chairman of the Bank
- Mr. Hasan Shahid Chief Financial Officer of the Bank and Director of JS Investments Limited, the Subsidiary Company
- Mr. Najmul Hoda Khan Chief Financial Officer of Jahangir Siddiqui & Co. Ltd. (the parent company)
- Mr. Tariq Usman Bhati Head of Money Market And Forex of JS Global Capital Limited, subsidiary company

296Annual Report 2020
Notes to the Consolidated Financial StatementsFor the year ended December 31, 2020
2020 2019Note ----- Rupees in ‘000 -----
29.3 Auditors’ remuneration
Audit fee - Pakistan 3,672 3,442 Audit fee - Bahrain 1,717 1,640 Half-yearly review 1,228 1,169 Fee for audit of employees funds 143 143 Fee for other statutory certifications 1,177 753 Special certification and sundry advisory services 5,783 4,473 Taxation services 270 275 Out of pocket expenses and sales tax on services 2,707 2,398
29.3.1 16,697 14,293 29.3.1 Geographical analysis
Pakistan 14,092 12,140 Bahrain 2,605 2,153
16,697 14,293
29.4 Under the provision of section 5(2) of the Deposit Protection Corporation Act, 2016 (the Act), and DPC Circular No. 04 of 2018, the Bank is liable to pay annual premium, on quarterly basis, to the Deposit Protection Corporation, a subsidiary company of State Bank of Pakistan, @ 0.16% on eligible deposits as of December 31 of each preceding calendar year.
The Bank’s eligible deposits as of December 31, 2019 are amounting to Rs. 87,425.180 million on which total premium is payable of Rs. 139.880 million per annum (Rs. 34.970 million per quarter).
29.5 Royalty represents amounts payable to Mr. Jahangir Siddiqui on account of use of name in the subsidiary of the Bank.
29.6 The SECP vide Circular 40/2016 dated December 30, 2016, prescribed certain conditions on Asset Management Companies (AMC) for charging of selling and marketing expenses to open end equity funds, for opening of new branches in cities, except Karachi, Lahore, Islamabad and Rawalpindi. Expenses can be charged to the extent of 0.4% per annum of net assets of fund or actual expenses whichever is lower.
2020 2019Note ----- Rupees in ‘000 -----
30. WORKER’S WELFARE FUND
Charge during the year 30.1 46,472 3,358
30.1 Provision held at @ 2% of the higher of profit before tax or taxable income under Sindh Workers’ Welfare Act, 2014 and the Punjab Workers’ Welfare Fund Act, 2019.
2020 201931. OTHER CHARGES ----- Rupees in ‘000 -----
Penalties imposed by State Bank of Pakistan 91,639 131,444 Others - 6,199
91,639 137,643

297 Annual Report 2020
Notes to the Consolidated Financial StatementsFor the year ended December 31, 2020
2020 2019Note ----- Rupees in ‘000 -----
32. PROVISIONS / (REVERSALS) AND WRITE OFFS - NET
Provisions for diminution in value of investments 9.3.1 249,343 (345,300)Provisions against loans & advances 10.4 841,895 354,848 Provisions against loans & advances - general (161,166) 5,505 Provisions / (reversals) under IFRS-9 -general 32 138,345 (105,018)Fixed assets written off 11.2 181,887 - Other assets written off 5,620 - Other reversals (2,339) (2,280)Bad debts written off directly - 315 Impairment loss against intangible assets - 3,227
1,253,585 (88,703)
32.1 Provisions / (reversals) under IFRS-9 - general
Charge / (reversal) during the year 384 (71)Balances with other banks (79) (3,434)Lendings to financial institutions 124,303 (97,192)Investments 13,737 (4,321)Advances 138,345 (105,018)
33. TAXATION
Current 745,311 791,261 Prior years (14,482) 13,715 Deferred 329,547 (634,169)
1,060,376 170,807
33.1 Relationship between income tax expense and accounting profit
Profit before taxation 1,108,435 (256,608)
Tax at applicable rates in the Group 793,461 80,035 Effect of permanent differences (50,923) 34,014 Tax effect of income charged at different tax rates-net 50,442 18,617 Tax effect of exempt capital gains - - Effect of prior year deferred taxation 46,783 11,251 Effects of current and prior year super tax 228,459 31,608 Deferred tax recognised at higher rate - - Others (7,846) (4,718)
33.1.1 1,060,376 170,807
33.1.1 The Group has recognised taxation impact on the basis of deemed tax return to be file on applicable tax rate with tax authorities, which are as follows:
Tax Rate2020 2019
JS Bank Limited 35% 35%JS Investments Limited 29% 29%JS Global Capital Limited 29% 29%JS ABAMCO Commodities limited 29% 29%

298Annual Report 2020
Notes to the Consolidated Financial StatementsFor the year ended December 31, 2020
33.2 JS Bank Limited (Holding Company, the Bank)
33.2.1 Income Tax
The income tax returns filed under Section 114 of the Income Tax Ordinance, 2001 for the tax years 2007 through 2020. These returns filed were deemed to have been assessed in terms the provisions prevailing under income tax laws as applicable in Pakistan. However, the Officers of Inland Revenue Services (OIR) conducted the proceedings for making certain amendments in the deemed assessments for tax years 2008 to 2017. This was done by taking recourse of conducting tax audit or alternatively a direct amendment in the assessment contending that certain matters in the deemed assessments were not admissible as not conforming to the law and prejudiced the interest of revenue.
Based on the amended assessments in tax year 2008 to tax year 2018, the department had made certain dis-allowances of expenses and tax deductible claims besides creating minimum tax and Workers’ Welfare Fund liabilities in the tax years 2010, 2011 & 2012 and tax years 2009, 2012 & 2013 respectively.
In respect of WWF, the Supreme Court of Pakistan has held in Judgement, PLD 2017 SC 28, that the amendments made in the WWF Ordinance through Finance Act, 2006 and 2008 were illegal and without lawful authority i.e. the Holding Companys do not fall into definition of Industrial Undertaking and thus, not liable to pay WWF. Therefore based on this, the Holding Company’s contention is mandated and it is likely that its pending appeals in this will be decided favorably. The Holding Company has obtained appeal effect orders of respective years except 2013 and resultantly no demand is payable in this respect.
As a consequence of the 18th amendment to the Constitution, levy for the WWF was introduced by the Government of Sindh and Punjab through the Sindh WWF Act, 2014 (“the Act”) and Punjab Workers Welfare Fund Act, 2019 respectively. As per the Acts, the Holding Company is liable to pay WWF in both provinces. However in this respect:
the Holding Company has challenged the issue of jurisdiction claimed by Sindh Revenue Board before the Honorable High Court of Sindh (SHC) through Constitutional Petition 1546/2017 on grounds that banking companies cannot be considered as industrial establishment and that the Act will be applied to trans-provincial entities to the extent that the obligation under the provincial law is to make distribution to the extent of the proportionate profit of the Sindh Province. The Court has restrained the Sindh Revenue Board to collect / recover Sindh WWF till the next date of hearing.
the Holding Company will challenge the recovery of Punjab WWF in the court of law on same grounds in case of SWWF.
In 2018, Based on decision of the Supreme Court of Pakistan, the Bank had reassessed the provision of WWF which was previously held on the entire operating results of the Bank (including all provinces, part of Pakistan, AJK and Bahrain Operations) and maintained WWF only to the extent of its operations within Sindh Province till 2019. In 2020 after promulgation of Punjab WWF, the Bank has again decided prudently to maintained provision on the entire results of the Bank.
In respect of minimum tax, the Commissioner Inland Revenue-Appeals (the CIR(A)) has the not accepted the Holding Company’s contentions of gross loss position and also decided that non-mark-up income is the fall in the definition of turnover including capital gains and dividend income. As result the demand of Rs. 38.907 million has been payable. The Holding Company has contested the matter in further appeals before Appellate Tribunal Inland Revenue (ATIR) which are pending for hearing.
For tax year 2008-2018, the Holding Company has not accepted the amendments of Rs. 6.57 billion and have filed appeals before the Commissioner Inland Revenue-Appeals (the CIRA).
CIR(A) has admitted the contention of the Holding Company in case of tax year 2008 that the amended order is barred by time and decided that any addition made in impugned order is annulled and not required to be further adjudicated. However, the department has filed an appeal against the decision of CIR(A) in ATIR which has been partly heard.

299 Annual Report 2020
Notes to the Consolidated Financial StatementsFor the year ended December 31, 2020
With regard to appeals filed for tax year 2009 to 2017, the CIR(A) has decided the appeals accepting the Holding Company’s contentions in respect of significant issues, and certain disallowance including amortization claim of goodwill have been decided in favor of department in all tax years. However, the Holding Company and the tax department are contesting the matters in further appeals before Appellate Tribunal Inland Revenue (ATIR) which are pending for adjudication.
The tax department passed appeal effect/rectification orders and allowed deleted and set-aside issues in the light of CIR(A) orders for tax year 2008 to 2014. As a result of these orders, the Holding Company’s taxable losses has increased to Rs. 3.464 billion and reduced the demand of Rs. 1.212 billion in relevant tax years after adjustment of these losses.
Further for the tax year 2013, the ATIR has decided appeal filed by tax department in respect of calculating the amount of provisions against advances as allowable under Rule 1(c) of Seventh Schedule to the Income Tax Ordinance, 2001 and has maintained the CIR(A) decision that the allowability of provision for advances to be calculated at 1% of gross amount of advances as against the tax department contention that the same is to be calculated on net advances after deducting the amount of provisions created and allowed against advances.
The matter of allowability of amortization relating to goodwill is contentious issue, therefore based on the opinion of lawyer there are arguments available to contend that goodwill on merger is an allowable deduction for tax purposes. Especially in the recent decision given by the High Court of Sindh in the case of merger of another Holding Company in Pakistan where the Court has ruled in favour of taxpayer that goodwill generated in merger is ‘intangible’ and amortization relating to goodwill is allowable deduction.
The Sindh High Court has dismissed the Holding Company’s petitions for tax years 2016 through 2019 wherein the Holding Company alongwith other taxpayers challenged the levy of super tax on constitutional grounds. Based on the opinion of legal counsel, the Holding Company has appealed before the Supreme Court against the decision of the Sindh High Court. The Supreme Court has allowed interim relief to the taxpayers subject to the payment of 50% of the super tax liability. However, the Holding Company has adjusted full amount of super tax liability for Tax year 2016 and 2019 against the available tax refunds. Further, the Holding Company has obtained stay from the Sindh High Court on other technical grounds regarding the levy of Super Tax for tax years 2017 and 2018.
33.2.2 Withholding tax monitoring
Withholding tax monitoring was initiated against the Holding Company for tax year 2014-2019. Orders in respect of tax years 2014, 2015 and 2017 has been passed against which appeals have been filed before the CIR(A). CIR(A) has reminded back the matters for rectification in respect of tax years 2014 and 2015 against which rectified orders has been passed and demands have been rectified. Appeal for tax year 2017 has been heard and reserved for order. In respect of tax year 2018 and 2019, proceedings are pending.
33.2.3 Sales tax
The Holding Company as a registered person under Sindh Sales Tax on Services Act, 2011 has been issued a Sales Tax Order from the Sindh Revenue Board (SRB) creating a demand of Rs.48.838 million (besides Rs.4.440 million is charged as penalty) against the Holding Company for allegedly non-payment of Sindh sales tax on certain ‘presumed non-taxable services / incomes’(i.e. Bancassurance, Home Remittances under Pakistan Remittance Initiative Scheme, SBP rebates on Government securities, Rebates from foreign correspondent Holding Companys, and FX gain on remittance by Western Union)’ on total amounting to Rs.277.488 million for the tax periods July 2011 to December 2013. An appeal was filed before Commissioner (Appeals) Sindh Revenue Board, CA-SRB against the decision of AC-SRB which was decided in favor of the tax department except tax imposed on FX gain on remittance by Western Union. Thereafter, both the Holding Company and AC-SRB filed appeals before the Appellate Tribunal SRB against the decision of CA-SRB. Through its Order dated April 18, 2019, the Appellate Tribunal SRB quashed the demand raised by deciding the Holding Company’s appeal in the Holding Company’s favour and dismissing the AC-SRB’s appeal. The Holding Company and tax department have filed appeals before Appellate Tribunal which are pending for hearing.

300Annual Report 2020
Notes to the Consolidated Financial StatementsFor the year ended December 31, 2020
The management of Holding Company is confident that the appeals filed in respect of the above matter will be decided in the Holding Company’s favor and accordingly no demand for payment would arise.
33.2.4 Azad Jammu & Kashmir Operations
The Holding Company has commenced operations in Azad Jammu & Kashmir from tax year 2009 and has filed returns for the tax years 2009 to 2019 with the tax authorities of such region. The Commissioner has issued notices for amendment of assessment under section 122 of the Income Tax Ordinance, 2001 (as adopted in AJK Region) for the tax year 2011 to 2017. All assessments orders are rectified and no additional demand has been raised.
33.3 JS Global Capital Limited (Subsidiary, the Company)
33.3.1 Income tax
Except for tax year 2009, 2014, 2015, 2016, 2017 and 2018 income tax assessments have been filed and are deemed to have been assessed under the Income Tax Ordinance, 2001 (the Ordinance) unless selected by taxation authorities for audit purposes.
For tax year 2009, an ITRA no. 07/2013 was filed by the Commissioner Inland Revenue against an order passed by the Learned Appellate Tribunal Inland Revenue (ATIR) in ITA no. 923/KB/2011 dated August 28, 2012 which was related to the apportionment of expenses, allowability of expenses and claiming of tax deducted at source aggregating to Rs. 61.16 million. However, the same is pending for decision before the Sindh High Court (SHC).
For tax year 2014, an amended assessment order dated April 28, 2016, has been passed under section 122 (5A) of the Ordinance by the Additional Commissioner Inland Revenue (ACIR). Through said order, the ACIR raised demand amounting to Rs. 20.081 million. The Company has filed rectification application identifying various errors / details not considered by the ACIR and requested ACIR to rectify the same. In addition to that, the Company has also filed an appeal to the Commissioner Inland Revenue Appeals (CIR-A) which is pending. The Company has also obtained stay against recovery of demand from SHC till the decision of CIR-A.
For tax year 2015, an order dated November 23, 2016 was passed under section 4B of the Ordinance by the Deputy Commissioner Inland Revenue (DCIR). Through said order, an income of Rs.810.584 million was computed under section 4B of the Ordinance and resultant demand of super tax of Rs. 24.318 million was raised. An appeal was filed against the above order before CIR-A on December 01, 2016 identifying various errors / details not considered. The CIR-A, has confirmed DCIR’s order vide his order dated May 30, 2017. In pursuance of the order of CIR-A, the Company has filed appeal before ATIR along with application for stay against recovery of demand. The appeal before ATIR has been heard and order is reserved whilst ATIR vide order dated July 18, 2017 has granted stay for 60 days and subsequently the said stay was further extended vide various orders by ATIR. Subsequently, recovery of aforesaid tax demand was previously stayed by the Honorable Sindh High Court (SHC) through C.P No 4915 of 2018 vide order dated June 28, 2018 with direction to the Department not to enforce recovery of tax demand till the decision of ATIR. However, based on its order dated July 21, 2020, the SHC has dismissed the afrementioned C.P and has declared the super tax for TY 2015 to be contitutionally vires. The Company has however filed an Income Tax Reference Application (ITRA) No. 52 of 2020 before SHC which is pending adjudication.
For tax year 2016 and 2017, notices dated December 27, 2016 and January 3, 2018 were issued under section 4B of the Ordinance by the DCIR. In the said notices the DCIR has contended that the Company is liable to pay Super Tax amounting to Rs. 24.483 million and Rs. 19.490 million on ‘income’ of Rs. 816.122 million and Rs. 649.676 million for Tax Years 2016 and 2017 respectively. The Company has challenged both notices through writ petition before SHC on constitutional grounds wherein the SHC has, vide its orders dated January 16, 2017 and January 11, 2018 for Tax Years 2016 and 2017 respectively, has stated that no coercive action shall be taken against the Company. The DCIR passed the orders under section 4B vide order dated April 23, 2018 and

301 Annual Report 2020
Notes to the Consolidated Financial StatementsFor the year ended December 31, 2020
May 4, 2018 for tax years 2016 and 2017 respectively to levy Super tax of above mentioned amounts under the view that SHC has not restrained the department from passing the orders. In pursuance of the said orders, Company filed appeals which were rejected by CIR-A vide its order dated October 12, 2018 for both years. As a result, the Company has filed appeals before Appellant Tribunal Inland Revenue (ATIR) against the orders of CIR-A. Meanwhile, the Company paid 50% of tax demand of both tax years to maintain the above suits in light of judgment of Hon’able Supreme Court of Pakistan (Civil Appeals No. 1171/2017 and other connected appeals) wherein, the pending suits are declared to be entertained on the condition that a minimum of 50% of tax demand is deposited with tax authorities during the pendency of appeal. During the year the appeal has been heard before ATIR and is reserved for order. The Company has however filed an Income Tax Reference Application (ITRA) No. 53 and 54 of 2020 before SHC which is pending adjudication.
For tax year 2018, a notice under section 4B of the Ordinance by the DCIR dated December 7, 2018 was issued, contending that the Company is liable to pay Super Tax amounting to Rs. 45.211 million on ‘income’ of Rs. 1,507.039 million. The Company had challenged the notice on constitutional grounds before SHC through C.P. No. 8670 of 2018. The SHC, vide its order dated December 14, 2018, had stated that no coercive action shall be taken against the Company. However the SHC based on its order issued in September 2020 has dismissed the aforementioned C.P. The Company is hence awaiting the conclusion of ATIR on the above matter before it files a reference application for TY 2018. To date, no order has been passed by the Department, consequently, no outstanding tax demand exists to date.
For tax year 2016, an amended assessment order has been passed under section 122(5A) of the Ordinance by the Additional Commissioner Inland Revenue (ACIR). Through the said order, the ACIR raised demand amounting to Rs. 241.217 million. Upon appeal filed, CIR-A confirmed the ACIR’s order vide its order dated December 12, 2017. In pursuance of the order of CIR-A, the Company had filed an appeal before ATIR. During last year ATIR vide its order dated March 29, 2019 had annulled ClRA’s action on confirming disallowances made in the order passed by ACIR dated November 02, 2017, with directions to CIRA to pass speaking and reasoned order after providing due opportunity of being heard. As a result, the likely assessment position after appeal effect of ATIR’s order under section 124 of the Ordinance is that only tax demand on account of undistributed reserves is outstanding, which has also been stayed by SHC vide interim order in CP No. 0-2343 of 2019 dated April 09, 2019. Furthermore during last year, a rectification application was filed for erroneously considered share premium reserves while computing excess reserves under section 5A of the Ordinance by the AClR, in its order dated November 2, 2017. As a result of which tax demand under section 5A would be reduced to Rs. 7.523 million.
For tax year 2017, an amended assessment order has been passed under section 122(5A) of the Ordinance by the Tax Officer. Through the said order, the Tax Officer raised a demand amounting to Rs. 17.649 million. The Company has filed an appeal before CIR-A which has been heard, however, no order has been passed till date. The total tax demand was partially stayed by the order of SHC vide CP No. 5431 of 2017 dated August 16, 2017, while the remaining liability was adjusted from the available refunds as declared in the return for tax year 2017.
Furthermore, the case of the Company has been selected for income tax audit under section 214C of the Ordinance and a notice dated April 12, 2019 under section 177 of the Ordinance has been issued requiring submission of details and documents. Partial details have been submitted and extension is requested for submission of remaining details.
For tax year 2017, a show-cause notice under section 161/205 of the Ordinance has been issued by tax authority. Through the said order, the Company was alleged for non-deduction of tax under section 150 of the Ordinance on payment made to shareholders in respect of buy back of shares. The said notice has been challenged before Sindh High Court (SHC) through legal counsel of the Company and SHC has prohibited tax department from passing any order without its permission. On the directions of court, detailed reply to show-cause notice has also been submitted vide our letter dated January 26, 2018. Tax authorities have issued a subsequent notice dated March 6, 2018, requesting to provide certain factual details which have also been submitted vide our letter dated March 16, 2018 and the matter is now pending adjudication before the SHC.

302Annual Report 2020
Notes to the Consolidated Financial StatementsFor the year ended December 31, 2020
33.3.2 Sales Tax
During 2013, the Company received a show cause notice from the Sindh Revenue Board (SRB) under section 47 of the Sindh Sales Tax on Services Act, 2011. Subsequently, an order was passed reducing the demand to Rs. 9.86 million along with default surcharge. The Company filed an appeal before the CIR-A and after being decided against the Company, it subsequently filed an appeal before Appellate Tribunal SRB. During the year 2014, the Company paid an amount of Rs. 7.15 million in respect of the abovementioned liability before June 25, 2014 under the notification SRB 3-4/8/2014 to avail the exemption from application of penalty and 75% of default surcharge. Appellate Tribunal SRB vide order dated November 29, 2017 decided the issue of Sindh Sales Tax (SST) in favor of the Company. However, the issue of SST on advisory and consultancy services and commission earned on purchase/sale of mutual funds have been remanded back whilst the issue relating to SST on commission on foreign exchange dealing, services rendered outside Sindh and levy of default surcharge and penalty have been decided against the Company. The Company has filed a reference application before SHC in respect of the issues decided against the Company and remanded back.
During 2014, the Company also received another show cause notice from SRB under section 47 of the Sindh Sales Tax on Services Act, 2011. Subsequently, an order was passed raising a tax demand amounting to Rs. 10.77 million. The Company has filed an appeal against the order with CIR-A which is pending. Further, in respect of the same, rectification application has also been filed with the department. The Company and other stock brokers have also filed petition with the SHC and has been granted interim stay against recovery of demand. However, the Company has paid an amount of Rs. 9.24 million before June 25, 2014 under the notification SRB 3-4/8/2014 to avail the exemption of penalty and 75% of default surcharge.
Furthermore, for fiscal year 2014 and 2015, SRB alleged short payment of SST vide Notice dated February 02, 2017. The Company has submitted all the required details in response to the notice and no order in this respect has been passed.
SRB has also issued an order in another proceeding for tax periods January 2014 to December 2016, which were confronted, vide notice dated August 15, 2017, levying sales tax on certain services and disallowance of input tax of Rs. 35,877,012. In pursuance of the said order the Company filed an appeal before Commissioner (Appeals), SRB which has been partly heard. However the recovery of the of aforesaid tax demand has been stayed by the Hon’able SHC in Suit no 767 of 2018 vide order dated April 13, 2018.
33.3.3 Federal Excise Duty (FED)
Tax department issued a show cause notice dated June 08, 2015 confronting (alleged) non payment of Federal Excise Duty (FED) on Company’s services under Federal Excise Act, 2005 and subsequently issued an order raising a demand amounting to Rs.78.003 million for tax year 2010 to tax year 2013. The Company filed a rectification appeal, in addition, to filing an appeal to the SHC, through Stockbroker Association (of which the Company is also the member) against aforementioned order on the grounds that after 18th amendment to the Constitution, the services that were previously subjected to FED under the federal laws are now subject to the provincial sales tax and the Company has accordingly discharged its tax obligation. The SHC initially, stayed Federal Board of Revenue from demanding sales tax on services from stockbrokers and subsequently, disposed of the order in Company’s favor. However, CIR-A on the matter of appeal filed by the Company issued an order in favor of the department vide its order dated January 31, 2017. In pursuance of the order of CIR-A the Company had filed an appeal before Appellate Tribunal SRB along with application for stay of demand which was granted initially for 30 days and was subsequently extended vide various orders. Appellate Tribunal SRB has decided the matter vide order dated December 20, 2017, received by the Company on April 09, 2018, whereby ATIR decided that FED is applicable only on the commission earned from trading of shares and no other type of commission comes under the ambit of FED. With this opinion, ATIR has remanded back the issue related to pre amendment era. For post amendment era, ATIR has relied upon the decision of SHC (stated above) and declared the charge of FED after July 01, 2011 null and void.

303 Annual Report 2020
Notes to the Consolidated Financial StatementsFor the year ended December 31, 2020
33.4 JS Investments Limited (Subsidiary, the Company)
33.4.1 Income tax
In respect of the appeals filed by the Company before Commissioner Inland Revenue (Appeals) [CIR (Appeals)] against orders passed for tax years 2006 and 2009 against demand of Rs.162 million and 66 million respectively, the CIR (Appeals) had not accepted the basis of additions by tax authorities and set aside both the orders in respect of allocation of expenses between various sources of income for fresh proceedings with the directions to apportion the common expenditure according to actual incurrence of expenditure to the various sources of income.
In respect of the appeals filed by the Company before Commissioner Inland Revenue (Appeals) [CIR (Appeals)] against orders passed for tax years 2006 and 2009 against demand of Rs.162 million and 66 million respectively, the CIR (Appeals) had not accepted the basis of additions by tax authorities and set aside both the orders in respect of allocation of expenses between various sources of income for fresh proceedings with the directions to apportion the common expenditure according to actual incurrence of expenditure to the various sources of income.
The Appellate Tribunal Inland Revenue vide order dated May 21, 2016 was deleted the additions of tax amortization of management rights and remand back the issues of disallowed provisions and advertisement expenses for the tax year 2009.
The tax authorities issued orders giving effect (hereinafter referred collectively as ‘appeal effect orders’) to the order of CIR (Appeals) for both tax year 2006 and 2009 whereby demands for these tax years were reduced at Rs.77.33 million and Rs.59.93 million respectively. As the allocation of expenditure in the said appeal effect orders were not made according to actual incurrence of expenditure to the various sources of income, therefore, the Company again filed appeals before the CIR (Appeals) against the said orders.
In respect of second round of appeal filed by the Company before CIR (Appeals) against appeal effect orders for tax year 2006 and 2009, the CIR (Appeals) for tax year 2006 confirmed apportionment of expenditure made by the tax authorities in appeal effect order, however, adjustment of allowable expenses were set aside. For tax year 2009, CIR (Appeals) had set aside the appeal effect order in entirety for fresh assessment, which is yet to be made by tax authorities.
The CIR (Appeals) also rectified the order passed by his predecessor for tax Year 2006, whereby the addition regarding the portion of capital gain included in dividend received from mutual funds was held deleted. Resulted appeal effect order reflects refund of Rs.29 million. The tax authorities have filed an appeal before ATIR against said order of CIR (Appeals) in respect of deletion of addition regarding the portion of capital gain included in dividend. The ATIR vide order dated December 07, 2016 set-aside with the direction that the ACIR should examine the issue in the light of FBR Circular letter dated September 10, 2002.
In respect of tax year 2006, management contends, based on views of its tax advisor, that amendment of assessment for such tax year by tax authorities is time barred. Accordingly, the Company has filed an appeal before the Appellate Tribunal Inland Revenue. The ATIR of the view that the amendment of assessment is not time bared however, the ATIR deleted the addition of tax amortization of management right vide order dated February 10, 2017.
Order under section 122(1)/(5) dated December 30, 2017 for the tax year 2015 passed by the DCIR created demand of Rs.40 million against which Company filed appeal before the CIR(A). The DCIR consider our request for rectification and passed order under section 221 dated February 27, 2017 as a result of the above order the demand reduced to Rs.36.904 million.The CIR(A) vide order dated May 6, 2019 was partly considered our submissions put before him. The DCIR passed appeal effect order dated February 17, 2020 determined refund of Rs 30.66 million. The company submitted appeal before the CIR (Appeal) against the appeal effect order. The Company also submitted appeal before the ATIR against the order of the CIR(A).

304Annual Report 2020
Notes to the Consolidated Financial StatementsFor the year ended December 31, 2020
The DCIR passed order under section 122(1)/(5) of the Income Tax Ordinance, 2001 dated June 23, 2014 and reduce the refund claimed of Rs.8.499 million to Rs.3.102 million for the tax year 2012. The learned CIR (Appeal) vide order dated May 06, 2019 was confirmed the ACIR’s order and held that the appeal was not entertainable being barred by time limitation for the tax year 2012. Company submitted appeal before the ATIR against the order of the CIR(A).
Management, based on views of its legal counsel, is confident of a favorable outcome in respect of above matters.
34. BASIC AND DILUTED EARNINGS / (LOSS) PER SHARE 2020 2019 ----- Rupees in ‘000 -----
Profit / (loss) after taxation for the year - attributable to ordinaryequity holders of the holding company 1,110,373 (245,285)
Preference dividend for the yearDecember 31, 2018 @ 12% p.a - (24,164)
Profit / (loss) after taxation for the year - attributable to ordinaryequity holders of the holding company 1,110,373 (269,449)
------- Numbers ------- Weighted average number of basic outstanding
ordinary shares during the year 1,297,464,262 1,297,464,262
------- Rupee --------
Basic and diluted earnings / (loss) per share 0.856 (0.208)
35. CASH AND CASH EQUIVALENTS 2020 2019Note ----- Rupees in ‘000 -----
Cash and balances with treasury banks 6 30,421,531 25,590,173 Balances with other banks 7 1,128,585 476,370 Overdrawn nostro accounts 15 (143,570) (636,992)
31,406,546 25,429,551 Less: General provision under IFRS 9 (450) (68)
31,406,096 25,429,483
36. STAFF STRENGTH ----------- Numbers ----------
Permanent 4,038 3,904 On Group’s contract 1,057 832 Group’s own staff strength at the end of the year 5,095 4,736 Outsourced services 36.1 483 472
5,578 5,208
36.1 This represents thrid party contracts other than guards andjanitorial services.
36.2 Geographical segment analysis
Pakistan 5,571 5,201 Bahrain 7 7
5,578 5,208

305 Annual Report 2020
Notes to the Consolidated Financial StatementsFor the year ended December 31, 2020
37. DEFINED BENEFIT PLAN
37.1 General description
The Bank operates a recognized gratuity fund for all employees who opted for this scheme introduced by the management with effect from January 01, 2007.
The defined benefit is administered by a separate fund that is legally separate from the Bank. The plan is governed by the trust deed dated September 01, 2007. The trustees of the gratuity fund are composed of representatives from employers. The trustees of the gratuity fund are required by the trust deed to act in the interest of the fund and of all relevant stakeholders in the scheme, i.e. active employees, inactive employees, retirees and employers. The trustees of the gratuity fund are responsible for the investment policy with regard to the assets of the fund.
37.2 The plan in Pakistan typically exposes the Bank to actuarial risks such as: salary risk, discount rate risk, mortality risk and investment risk defined as follow:
- Salary increase risk:The risk that the final salary at the time of cessation of services is greater than assumed. Since the benefit is calculated on the final salary (which will closely reflect inflation and other macroeconomic factors), the benefit amount increases as salary increases.
- Discount rate riskThe discount rate is based on the yield on government bonds. If the market yield of bonds varies, the discount rate would vary in the same manner and would affect the present value of obligation and fair value of assets.
- Demographic Risks
Withdrawal risk:The risk of actual withdrawals experience is different from assumed withdrawal probability. The significance of the withdrawal risk varies with the age, service and the entitled benefits of the beneficiary.
Longevity RiskThe risk that the actual mortality experience is different than the assumed mortality. This effect is more pronounced in schemes where the age and service distribution is on the higher side.
- Investment riskThis is the risk that the assets are under-performing and are not sufficient to meet the liabilities.
37.3 Number of employees under the schemes
The number of employees covered under defined benefit scheme (gratuity fund) is 3,756 (2019: 3,595).
37.4 Principal actuarial assumptions
Principal actuarial assumptions at the end of the reporting period expressed as weighted averages. The actuarial valuations were carried out on December 31, 2020 based on the Projected Unit Credit Method, using the following significant assumptions:

306Annual Report 2020
Notes to the Consolidated Financial StatementsFor the year ended December 31, 2020
2020 2019
Valuation discount rate for year end obligation per annum 9.75% 11.75%
Valuation discount rate for interest cost for the year per annum 11.75% 13.75%
Expected return on plan assets per annum 11.75% 13.75%
Future salary increase rate- upto one years per annum 8.00% 8.00%- from two to three years per annum 10.00% 10.00%- more than three years per annum 9.75% 11.75%
The average duration of the defined benefit obligation years 10 10
Normal retirement age years 60 60
Withdrawal rates Moderate Moderate
Mortality rates SLIC2001-2005,
Setback1 Year
SLIC 2001-2005,
Setback1 Year
37.5 Movement in defined benefit obligations, fair value of plan assets and their components
Defined benefit obligations
Fair value of plan assets
Net defined benefit liability (asset)
2020 2019 2020 2019 2020 2019 ---------------------------------------- Rupees in ‘000 ----------------------------------------
Balance as at January 01, 2020 844,212 649,062 692,331 546,568 151,881 102,494
Included in profit or lossCurrent service cost 148,693 125,676 - - 148,693 125,676 Past service cost 1,820 2,113 - - 1,820 2,113 Interest cost / income 97,343 87,892 88,420 80,969 8,923 6,923
247,856 215,681 88,420 80,969 159,436 134,712 Included in other comprehensive incomeActuarial gains / losses arising from:- financial assumptions 14,025 (8,792) - - 14,025 (8,792)- experience adjustments (266) 7,956 - - (266) 7,956 Return on plan assets - - 490,776 (18,005) (490,776) 18,005
13,759 (836) 490,776 (18,005) (477,017) 17,169 Other movementsContribution made during the year - - 151,881 102,494 (151,881) (102,494)Benefits paid during the year (31,529) (19,695) (31,529) (19,695) - -
(31,529) (19,695) 120,352 82,799 (151,881) (102,494)
Balance as at December 31, 2020 1,074,298 844,212 1,391,879 692,331 (317,581) 151,881

307 Annual Report 2020
Notes to the Consolidated Financial StatementsFor the year ended December 31, 2020
37.6 The composition of the plan assets at the end of the reporting period for each category, are as follows:
Cost Fair value of plan assets2020 2019 2020 2019 2020 2019
------------------------ Rupees in ‘000 ------------------------ Percentage
Cash and cash equivalentsCash at Bank 82,793 171,000 82,793 171,000 5.9% 24.6%Term deposits receipts 150,000 - 161,806 - 11.6% 0.0%
232,793 171,000 244,599 171,000 17.5% 24.6%Debt securitiesPakistan Investment Bonds 388,863 304,064 411,079 297,918 29.5% 42.9%Market treasury bills 53,815 114,508 53,660 117,399 3.9% 16.9%Term finance certificates 50,503 100,590 50,370 94,459 3.6% 13.6%
493,181 519,162 515,109 509,776 37.0% 73.4%Ordinary Shares of listed companies 448,506 14,929 632,172 13,346 45.4% 1.9%
1,174,480 705,091 1,391,880 694,122 100% 100%
37.7 Maturity profile
37.7.1 Expected maturity analysis of undiscounted defined benefit obligation (benefit payments) for the gratuity fund is as follows:
Over
Total10 and
Up to Over Over Over above one year 1-2 years 2- 5 years 6-10 years years
------------------------------ Rupees in ‘000 ------------------------------
Balance as at December 31, 2020 45,445 71,699 268,697 1,245,714 11,997,565 13,629,120
Balance as at December 31, 2019 37,261 44,550 217,395 901,479 14,564,443 15,765,128
37.8 Sensitivity analysis
37.8.1 Significant actuarial assumptions for the determination of the defined obligation are discount rate, and expected rate of salary increase. The sensitivity analysis below have been determined based on reasonably possible changes of the respective assumptions occurring at the end of the reporting period, while holding all other assumptions constant:

308Annual Report 2020
Notes to the Consolidated Financial StatementsFor the year ended December 31, 2020
Present value of defined benefit
obligation
Fair value of any plan assets
Net defined benefit liability /
(assets)Particulars Rate ------------- Rupees in ‘000 -------------
Current results - 1,074,298 1,391,879 (317,581)
Discount rate1% Increase 8.75% 977,544 1,391,879 (414,335)1% Decrease 10.75% 1,185,787 1,391,879 (206,092)
Salary Rate1% Increase 12.75% 1,186,928 1,391,879 (204,951)1% Decrease 10.75% 974,759 1,391,879 (417,120)
Withdrawal rate10% Increase Moderate + one year 1,046,507 1,391,879 (345,372)10% Decrease Moderate - one year 1,104,543 1,391,879 (287,336)
Mortality rateOne year age set back Adjusted SLIC 2001-2005 - one year 1,073,753 1,391,879 (318,126)One year age set forward Adjusted SLIC 2001-2005 + one year 1,074,879 1,391,879 (317,000)
Furthermore in presenting the above sensitivity analysis, the present value of the defined benefit obligation has been calculated using the projected unit credit method at the end of the reporting period, which is the same as applied in calculating the defined benefit obligation liability recognised in this unconsolidated statement of financial position.
37.9 Maturity profile
The weighted average duration of the defined benefit obligation works out to 10 years.

309 Annual Report 2020
Notes to the Consolidated Financial StatementsFor the year ended December 31, 2020
37.10 Experience Adjustments
The re-measurement gains / losses arise due to actual experience varying from the actuarial assumptions for the year.
2020 2019 2018 2017 2016-------------------------- Rupees in ‘000 --------------------------
ParticularsDefined benefit obligation 1,074,298 844,212 649,062 550,729 367,635 Fair value of plan assets (1,391,879) (692,331) (546,568) (375,611) (249,327)
Net defined benefit liability (317,581) 151,881 102,494 175,118 118,308
Re-measurement loss / (gain) on obligation 13,759 (836) (52,391) 75,269 56,598 Re-measurement loss / (gain) on plan assets (490,776) 18,005 25,329 10,273 393
Other comprehensive income (477,017) 17,169 (27,062) 85,542 56,991
37.11 The average duration of the payment of benefit obligation at December 31, 2020 is within one year.
37.12 The Bank contributes to the gratuity fund as per actuarial’s valuation of the year.
37.13 Based on actuarial advice and management estimates, profit and loss account charge in respect of defined benefit obligation for the next one year works out to be Rs.139.866 million. The amount of re-measurements to be recognised in other comprehensive income for year ending December 31, 2020 will be worked out as at the next valuation.
38. DEFINED CONTRIBUTION PLAN
The Group operates a contributory provident fund scheme for all permanent employees. The employer and employee both make a contribution of equal amount to the fund as follows:
Contribution basic salary
Contribution made during the yearNumber of employees
2020 2019 2020 2019Percentages ------- Numbers ------- ----- Rupees in ‘000 -----
Holding company- JS Bank Limited 7.1% 3,164 3,092 229,001 209,871
Subsidiary companies- JS Global Capital Limited 10.0% 165 163 13,277 13,596
- JS Investments Limited 8.0% 77 102 8,775 9,990
39. COMPENSATION OF DIRECTORS AND EXECUTIVES
39.1 The aggregate amount charged in the financial statements for the year in respect of the remuneration and benefits to the President / Chief Executive, Directors and Executives are as follows:
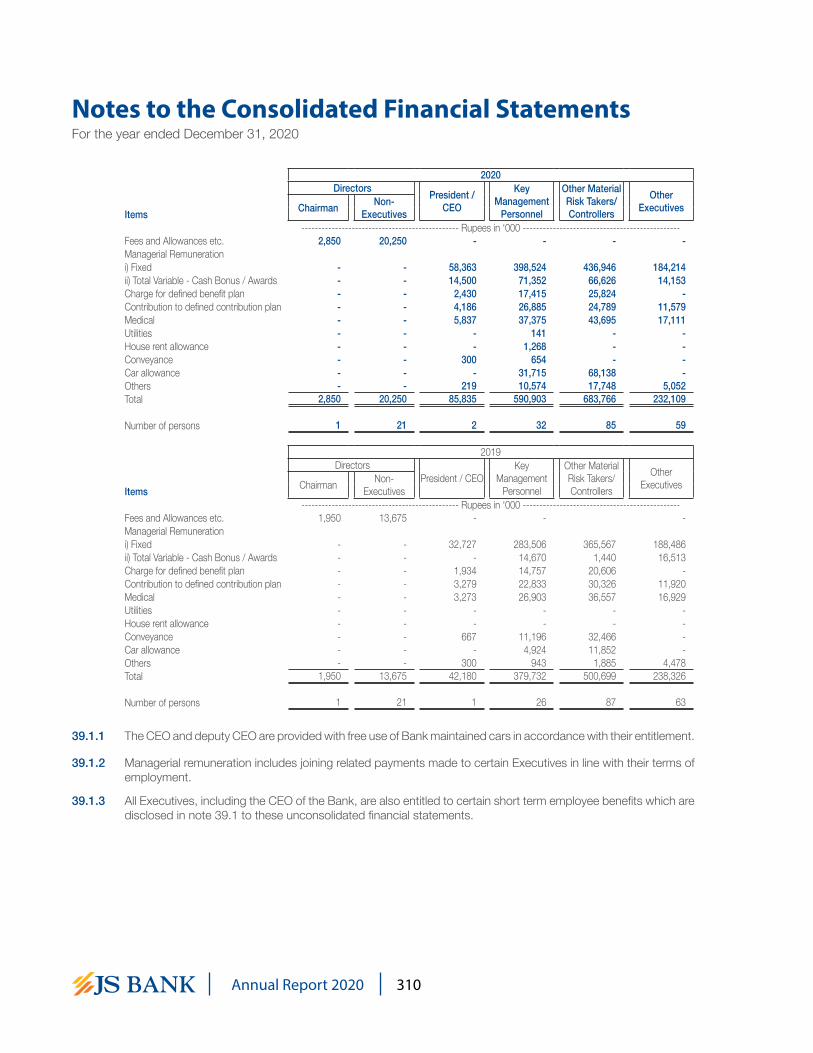
310Annual Report 2020
Notes to the Consolidated Financial StatementsFor the year ended December 31, 2020
2020 Directors President /
CEO
Key Management
Personnel
Other Material Risk Takers/ Controllers
Other ExecutivesChairman Non-
Executives Items----------------------------------------------- Rupees in ‘000 -----------------------------------------------
Fees and Allowances etc. 2,850 20,250 - - - - Managerial Remunerationi) Fixed - - 58,363 398,524 436,946 184,214 ii) Total Variable - Cash Bonus / Awards - - 14,500 71,352 66,626 14,153 Charge for defined benefit plan - - 2,430 17,415 25,824 - Contribution to defined contribution plan - - 4,186 26,885 24,789 11,579 Medical - - 5,837 37,375 43,695 17,111 Utilities - - - 141 - - House rent allowance - - - 1,268 - - Conveyance - - 300 654 - - Car allowance - - - 31,715 68,138 - Others - - 219 10,574 17,748 5,052 Total 2,850 20,250 85,835 590,903 683,766 232,109
Number of persons 1 21 2 32 85 59
2019 Directors
President / CEOKey
Management Personnel
Other Material Risk Takers/ Controllers
Other ExecutivesChairman Non-
Executives Items----------------------------------------------- Rupees in ‘000 -----------------------------------------------
Fees and Allowances etc. 1,950 13,675 - - - Managerial Remunerationi) Fixed - - 32,727 283,506 365,567 188,486 ii) Total Variable - Cash Bonus / Awards - - - 14,670 1,440 16,513 Charge for defined benefit plan - - 1,934 14,757 20,606 - Contribution to defined contribution plan - - 3,279 22,833 30,326 11,920 Medical - - 3,273 26,903 36,557 16,929 Utilities - - - - - - House rent allowance - - - - - - Conveyance - - 667 11,196 32,466 - Car allowance - - - 4,924 11,852 - Others - - 300 943 1,885 4,478 Total 1,950 13,675 42,180 379,732 500,699 238,326
Number of persons 1 21 1 26 87 63
39.1.1 The CEO and deputy CEO are provided with free use of Bank maintained cars in accordance with their entitlement.
39.1.2 Managerial remuneration includes joining related payments made to certain Executives in line with their terms of employment.
39.1.3 All Executives, including the CEO of the Bank, are also entitled to certain short term employee benefits which are disclosed in note 39.1 to these unconsolidated financial statements.

311 Annual Report 2020
Notes to the Consolidated Financial StatementsFor the year ended December 31, 2020
39.1. Meeting Fees and Allowances Paid2020
Board Meetings
Board Committees
Audit Committee
Human Resource,
Remuneration & Nomination
Committee
Risk Management Committee
I.T Committee
Executive Committee
Total Amount Paid
---------------------------------------------------- Rupees in ‘000 ----------------------------------------------------Name of Director
1 Mr. Kalim-ur-Rahman 1,500 - 850 - 500 - 1,350 2 Mr. Adil Matcheswala 1,500 500 850 - - - 1,350 3 Mr. Ashraf Nawabi 1,250 - - 400 - - 400 4 Mr. G.M. Sikander 1,500 500 750 - - - 1,250 5 Mr. Hassan Afzal 1,500 - - - 500 - 500 6 Mr. Munawar Alam Siddiqui 1,500 500 - 500 - - 1,000 7 Ms. Nargis Ghaloo 1,500 500 - 500 - - 1,000 8 Mr. Sohail Aman 1,500 - 850 - 500 - 1,350 9 Mr. Abdul Hamid Mihrez 350 - - 250 - - 250
10 Mr. Munir Hassan 350 250 - - - - 250 11 Mr. Iftikhar Ahmed Rao 350 - 100 - - - 100 12 Mr. Shahab Anwar Khawaja 350 250 - - - - 250 13 Mr. Asif Raza Sana 200 100 - - - - 100 14 Ms. Aisha Fariel Salahuddin 250 100 25 - - - 125 15 Mr. Tahir Ali Shaikh 200 - - - - 25 25
Total amount paid 13,800 2,700 3,425 1,650 1,500 25 9,300
39.1.4 The SBP, vide its BPRD Circular No. 01 dated January 25, 2017, issued Guidelines on Remuneration Practices, where the Bank is required to defer a certain portion of variable compensation of the Material Risk Takers (MRTs) and Material Risk Controllers (MRCs) subject to mandatory deferrals for a defined period. In this respect, deferral amount shall be withheld for a period of three years whereas remaining portion of the variable compensation shall be paid upfront to the MRTs and MRCs. The deferred remuneration shall vest proportionately over the deferral period following the year of variable remuneration award. The deferred portion of the variable remuneration shall be paid to the MRTs and MRCs on vesting, proportionally through yearly instalments, during the deferred period, in case no malus triggers are applicable. Details of MRTs and MRCs are given below:
2020 2019Employees Covered under: ----- Numbers -----
Marterial Risk Takers (MRTs) 66 78 Marterial Risk Controllers (MRCs) 39 31
105 109
2020 2019 ----- Rupees ‘000 -----
Movement of deferred remunerationOpening 218 - Deferred during the year 48,350 218 Paid during the year (73) - Closing 48,495 218

312Annual Report 2020
Notes to the Consolidated Financial StatementsFor the year ended December 31, 2020
40. FAIR VALUE OF FINANCIAL INSTRUMENTS
IFRS 13 “Fair Value Measurement” defines fair value as the price that would be received to sell an asset or paid to transfer a liability in an orderly transaction between market participants at the measurement date.
The fair value of quoted securities other than those classified as held to maturity, is based on quoted market price. Fair value of fixed term loans, other assets, other liabilities and fixed term deposits cannot be calculated with sufficient reliability due to absence of current and active market for assets and liabilities and reliable data regarding market rates for similar instruments. The provision for impairment of loans and advances has been calculated in accordance with the Bank’s accounting policy as stated in note 4.6 to these consolidated financial statements.
The repricing profile, effective rates and maturity are stated in note 45.2.4 to these financial statements.
In the opinion of the management, the fair value of the remaining financial assets and liabilities are not significantly different from their carrying values since assets and liabilities are either short term in nature or in the case of customer loans and deposits are frequently repriced.
Fair value hierarchy
IFRS 13 requires the Bank to classify fair value measurement using a fair value hierarchy that reflects the significance of the inputs used in making the measurements. The fair value hierarchy has following levels:
Level 1: Fair value measurements using quoted prices (unadjusted) in active markets for identical assets or liabilities that the entity can access at the measurement date.
Level 2: Fair value measurements using inputs other than quoted prices included within Level 1 that are observable for the asset or liability, either directly or indirectly.
Level 3: Fair value measurements using unobservable inputs for the asset or liability.
2019
Board Meetings
Board Committees
Audit Committee
Human Resource,
Remuneration & Nomination Committee
Risk Management Committee
I.T Committee
Executive Committee
Total Amount Paid
---------------------------------------------------- Rupees in ‘000 ----------------------------------------------------Name of Director
1 Mr. Kalim-ur-Rahman 1,250 - 200 200 300 - 700 2 Mr. Adil Matcheswala 1,000 300 300 - - - 600 3 Mr. Ashraf Nawabi 1,000 - - 200 - - 200 4 Mr. G.M. Sikander 1,250 300 400 - - - 700 5 Mr. Hassan Afzal 750 - - - 300 - 300 6 Mr. Munawar Alam Siddiqui 1,250 300 300 - - - 600 7 Ms. Nargis Ghaloo 1,250 200 100 200 - - 500 8 Mr. Sohail Aman 250 - - - 100 - 100 9 Mr. Shahab Anwar Khawaja 250 100 - - - - 100
10 Mr. Abdul Hamid Mihrez 300 - 100 - - 100 200 11 Mr. Munir Hassan 300 - - - - 100 100 12 Mr. Ammar Talib Hajeyah 300 100 - - - - 100 13 Mr. Khurshid Hadi 500 600 300 - - - 900 14 Mr. Asif Raza Sana 250 125 - - - - 125 15 Mr. Ahsen Ahmed 300 100 75 - - 25 200
Total amount paid 10,200 2,125 1,775 600 700 225 5,425

313 Annual Report 2020
Notes to the Consolidated Financial StatementsFor the year ended December 31, 2020
40.1 Valuation techniques used in determination of fair values within level
Item Valuation approach and input usedFinancial Instruments- Level 1Shares of listed companies
Fair values of investments in listed equity securities are valued on the basis of closing quoted market prices available at the Pakistan Stock Exchange.
Financial instruments - Level 2Units of mutual funds Fair values of investments in units of mutual funds are determined based on
redemption prices disclosed at the Mutual Funds Association of Pakistan (MUFAP) as at the close of the business days.
Market Treasury Bills(MTB) / Pakistan Investment Bonds(PIB), and GoP Sukuks (GIS)
Fair values of Pakistan Investment Bonds and Market Treasury Bills are derived using PKRV and PKFRV rates (Reuters page).
Debt Securities (TFCs) and Sukuk other than Government
Investments in debt securities (comprising Term Finance Certificates, Bonds and any other security issued by a company or a body corporate for the purpose of raising funds in the form of redeemable capital) are valued on the basis of the rates announced by the Mutual Funds Association of Pakistan (MUFAP) in accordance with the methodology prescribed by the SECP.
Overseas Government Sukuks, Overseas and Euro Bonds
The fair value of Overseas Government Sukuks, and Overseas Bonds are valued on the basis of price available on Bloomberg.
Forward foreign exchange contracts
The valuation has been determined by interpolating the foreign exchange revaluation rates announced by the State Bank of Pakistan.
Derivatives
The fair values of derivatives which are not quoted in active markets are determined by using valuation techniques. The valuation techniques take into account the relevant underlying parameters including foreign currencies involved, interest rates, yield curves, volatilities, contracts duration, etc.
Non- financial assets- Level 3Fixed assets - Land and building
Fixed assets and Non-banking assets under satisfaction of claims are carried at revalued amounts determined by professional valuers based on their assessment of the market values as disclosed in note 11 and 13 of these consolidated annual financial statements. The valuations are conducted by the valuation experts appointed by the Bank which are also on the panel of State Bank of Pakistan. The valuation experts used a market based approach to arrive at the fair value of the Bank’s properties. The market approach used prices and other relevant information generated by market transactions involving identical or comparable or similar properties. These values are adjusted to reflect the current condition of the properties. The effect of changes in the unobservable inputs used in the valuations cannot be determined with certainty, accordingly a qualitative disclosure of sensitivity has not been presented in these financial statements.
Non-banking assets under satisfaction of claims
Financial instruments in level 3Currently, no financial instruments are classified in level 3.
The fair value of unquoted debt securities, fixed term loans, other assets, other liabilities, fixed term deposits and borrowings cannot be calculated with sufficient reliability due to the absence of a current and active market for these assets and liabilities and reliable data regarding market rates for similar instruments.

314Annual Report 2020
Notes to the Consolidated Financial StatementsFor the year ended December 31, 2020
2020Level 1 Level 2 Level 3 Total
------------------------- Rupees in ‘000 -------------------------On balance sheet financial instruments
Financial assets - measured at fair value
Held-for-trading securitiesInvestments
Federal Government Securities - 25,003,774 - 25,003,774 Shares 207,409 - - 207,409 Open end mutual funds - 244,002 - 244,002
207,409 25,247,776 - 25,455,185
Available-for-sale securitiesInvestments
Federal Government Securities - 127,406,043 - 127,406,043 Shares 4,296,982 - - 4,296,982 Non Government Debt Securities - 690,048 - 690,048 Foreign Securities - 4,017,289 - 4,017,289 Open end mutual funds - 1,216,288 - 1,216,288
4,296,982 133,329,668 - 137,626,650
Financial assets - disclosed but not measured at fair value
InvestmentsFederal Government Securities - 36,109,599 - 36,109,599
4,504,391 194,687,043 - 199,191,434
Non-Financial assets - measured at fair value
Revalued fixed assets - - 2,610,299 2,610,299 Non-banking assets acquired in satisfaction of claims - - 1,311,252 1,311,252
- - 3,921,551 3,921,551
Off balance sheet financial instruments
Commitments in respect of:
Forward foreign exchange contractsPurchase - 22,942,707 - 22,942,707 Sale - 14,910,910 - 14,910,910
Derivative instruments
Forward investments securitiesSale 188,723 - - 188,723
Interest rate swaps (notional principal)Purchase - 1,120,607 - 1,120,607 Sale - 1,125,550 - 1,125,550
OptionsPurchase - 581,042 - 581,042 Sale - 2,437,068 - 2,437,068
40.2 The Group’s policy is to recognise transfers into and out of the different fair value hierarchy levels at the date the event or change in circumstances that caused the transfer occurred. There were no transfers between levels 1 and 2 during the year.
40.3 The following table provides an analysis of financial assets that are measured subsequent to initial recognition at fair value, grouped into Levels 1 to 3 based on the degree to which the fair value is observable.

315 Annual Report 2020
Notes to the Consolidated Financial StatementsFor the year ended December 31, 2020
2019Level 1 Level 2 Level 3 Total
------------------------- Rupees in ‘000 -------------------------On balance sheet financial instruments
Financial assets - measured at fair value
Held-for-trading securitiesInvestments
Federal Government Securities - 55,598,469 - 55,598,469 Shares 487,185 - - 487,185 Open end mutual funds - 455,902 - 455,902
487,185 56,054,371 - 56,541,556
Available-for-sale securitiesInvestments
Federal Government Securities - 47,019,374 - 47,019,374 Shares 1,993,246 - - 1,993,246 Non Government Debt Securities - 776,975 - 776,975 Open end mutual funds - 1,222,869 - 1,222,869
1,993,246 49,019,218 - 51,012,464
Financial assets - disclosed but not measured at fair value
InvestmentsFederal Government Securities - 31,341,410 - 31,341,410
2,480,431 136,414,999 - 138,895,430
Non-Financial assets - measured at fair value
Revalued fixed assets - - 3,797,180 3,797,180 Non-banking assets acquired in satisfaction of claims - - 1,182,425 1,182,425
- - 4,979,605 4,979,605
Off balance sheet financial instruments
Commitments in respect of:
Forward foreign exchange contractsPurchase - 32,885,546 - 32,885,546 Sale - 21,722,741 - 21,722,741
Derivative instruments
Forward investments securitiesPurchase - 499,818 - 499,818 Sale - 493,193 - 493,193
Interest rate swaps (notional principal)Purchase - 1,474,016 - 1,474,016 Sale - 2,738,661 - 2,738,661
OptionsPurchase - 1,024,638 - 1,024,638 Sale - 1,030,868 - 1,030,868

316Annual Report 2020
Notes to the Consolidated Financial StatementsFor the year ended December 31, 2020
41. SEGMENT INFORMATION
41.1. Segment Details with respect to Business Activities:
2020Corporate Trading and Retail Commercial
Brokerage Asset managementfinance sales banking banking Others Total
----------------------------------------------------------------- Rupees in ‘000 -----------------------------------------------------------------
Profit & LossNet mark-up / return / profit - 14,372,945 (8,543,152) 4,034,968 66,628 (20,667) - 9,910,722 Inter segment revenue - net - (17,035,715) 16,914,719 120,996 - - - - Non mark-up / return / interest income 93,161 2,889,785 2,349,650 1,258,710 700,131 189,780 69,794 7,551,011 Total Income 93,161 227,015 10,721,217 5,414,674 766,759 169,113 69,794 17,461,733
Segment direct expenses 33,286 129,646 6,711,460 1,081,529 570,320 337,332 314,748 9,178,321 Inter segment expense allocation - 334,127 2,664,330 1,862,559 - - - 4,861,016 Total expenses 33,286 463,773 9,375,790 2,944,088 570,320 337,332 314,748 14,039,337 Provisions / (reversals) - 344,219 124,158 811,231 - (26,023) - 1,253,585 Profit before tax 59,875 (580,977) 1,221,269 1,659,355 196,439 (142,196) (244,954) 2,168,811
Statement of Financial PositionCash & Bank balances - 20,722,345 10,804,855 - 19,153 3,313 - 31,549,666 Investments 2,891,836 196,878,742 - - 347,651 1,689,425 - 201,807,654 Net inter segment lending - - 129,898,985 109,429,008 - - 11,732,961 251,060,954 Lendings to financial institutions - 23,239,672 - - - - - 23,239,672
Advances - performing - - 52,152,981 190,515,793 332,723 (76,355) - 242,925,142
Advances - non-performing - - 4,760,888 6,972,667 - - - 11,733,555 Advances - (provisions) / reversals - net - - (938,040) (3,265,123) - - - (4,203,163)
- - 55,975,829 194,223,337 332,723 (76,355) - 250,455,534 Others - 4,590,700 3,570,545 3,315,506 2,854,534 666,196 14,027,140 29,024,619 Total Assets 2,891,836 245,431,459 200,250,214 306,967,851 3,554,061 2,282,579 25,760,099 787,138,099
Borrowings - 12,208,219 1,996,091 34,099,102 - - - 48,303,412 Subordinated debt - 7,492,800 - - - - - 7,492,800 Deposits & other accounts - - 166,087,049 265,336,773 - - - 431,423,822 Net inter segment borrowing 2,891,836 227,156,281 21,012,836 - - - - 251,060,953 Others - 551,556 11,154,238 5,893,204 2,728,064 446,461 5,167,888 25,941,411 Total Liabilities 2,891,836 247,408,856 200,250,214 305,329,079 2,728,064 446,461 5,167,888 764,222,398 Equity - - - - - - 22,387,255 22,387,255 Non-controlling interest - - - - - - 528,446 528,446 Total Equity & Liabilities 2,891,836 247,408,856 200,250,214 305,329,079 2,728,064 446,461 28,083,589 787,138,099
Contingencies & Commitments - 60,973,417 44,793,723 18,141,644 690,306 - 133,642 124,732,732

317 Annual Report 2020
Notes to the Consolidated Financial StatementsFor the year ended December 31, 2020
2019Corporate Trading and Retail Commercial
Brokerage Asset managementfinance sales banking banking Others Total
----------------------------------------------------------------- Rupees in ‘000 -----------------------------------------------------------------Profit & Loss
Net mark-up / return / profit - 5,152,276 (7,592,022) 9,614,572 40,939 (21,226) - 7,194,539 Inter segment revenue - net - (11,813,244) 19,091,812 (7,278,568) - - - - Non mark-up / return / interest income 59,843 232,860 1,975,153 965,788 491,846 285,936 452,956 4,464,382 Total Income 59,843 (6,428,108) 13,474,943 3,301,792 532,785 264,710 452,956 11,658,921
Segment direct expenses 115,306 136,150 5,506,958 719,110 561,393 372,260 822,243 8,233,420 Inter segment expense allocation - 323,430 2,003,084 1,273,491 - - - 3,600,005 Total expenses 115,306 459,580 7,510,042 1,992,601 561,393 372,260 822,243 11,833,425 (Reversals) / provisions - (424,361) (251,729) 584,160 3,227 - - (88,703)Profit before tax (55,463) (6,463,327) 6,216,630 725,031 (31,835) (107,550) (369,287) (85,801)
Statement of Financial PositionCash & Bank balances - 17,153,412 8,898,772 - 11,141 3,150 - 26,066,475 Investments - 140,656,932 - - 626,350 1,841,341 - 143,124,623 Net inter segment lending - - 202,362,517 - - - 8,089,077 210,451,594 Lendings to financial institutions - 30,320,540 - - - - - 30,320,540 Advances - performing - - 94,201,743 141,898,229 336,821 3,978 - 236,440,771 Advances - non-performing - - 3,508,735 6,844,429 - - - 10,353,164 Advances - (provisions) / reversals - net - - (469,382) (3,039,245) - - - (3,508,627)
- - 97,241,096 145,703,413 336,821 3,978 - 243,285,308 Others - 4,831,115 3,925,690 5,017,351 1,933,157 548,024 14,189,285 30,444,622 Total Assets - 192,961,999 312,428,075 150,720,764 2,907,469 2,396,493 22,278,362 683,693,162
Borrowings - 36,295,878 7,090,687 11,081,718 - - - 54,468,283 Subordinated debt - 7,494,800 - - - - - 7,494,800 Deposits & other accounts - - 295,347,351 73,196,252 - - - 368,543,603 Net inter segment borrowing - 150,619,213 - 59,832,381 - - - 210,451,594 Others - 513,149 9,990,037 5,364,052 1,858,304 762,518 4,765,510 23,253,570 Total Liabilities - 194,923,040 312,428,075 149,474,403 1,858,304 762,518 4,765,510 664,211,850 Equity - - - - - - 18,973,041 18,973,041 Non-controlling interest - - - - - - 508,271 508,271 Total Equity & Liabilities - 194,923,040 312,428,075 149,474,403 1,858,304 762,518 24,246,822 683,693,162
Contingencies & Commitments - 59,810,338 43,939,275 17,795,589 988,086 - 131,093 122,664,381

318Annual Report 2020
Notes to the Consolidated Financial StatementsFor the year ended December 31, 2020
41.2. Segment details with respect to geographical locations
2020Pakistan Bahrain Total
Profit & Loss ---------- Rupees in ‘000 ----------
Net mark-up / return / profit 9,576,236 334,486 9,910,722 Inter segment revenue - net 20,830 (20,830) - Non mark-up / return / interest income 7,388,616 162,395 7,551,011 Total Income 16,985,682 476,051 17,461,733
Segment direct expenses 8,979,112 199,209 9,178,321 Inter segment expense allocation 4,861,016 - 4,861,016 Total expenses 13,840,128 199,209 14,039,337 Provisions 1,115,240 138,345 1,253,585 Profit before tax 2,030,314 231,580 2,168,811
Statement of Financial PositionCash & Bank balances 29,214,457 2,335,209 31,549,666 Investments 197,717,282 4,090,372 201,807,654 Net inter segment lending 251,060,954 - 251,060,954 Lendings to financial institutions 23,239,672 - 23,239,672 Advances - performing 238,493,260 4,431,882 242,925,142 Advances - non-performing 11,733,555 - 11,733,555 Advances - (Provisions)/reversals - Net (4,181,836) (21,327) (4,203,163)
246,044,979 4,410,555 250,455,534 Others 30,276,259 168,360 29,024,619 Total Assets 776,133,603 11,004,496 787,138,099
Borrowings 48,211,222 92,190 48,303,412 Subordinated debt 7,492,800 - 7,492,800 Deposits & other accounts 423,892,948 7,530,874 431,423,822 Net inter segment borrowing 248,719,379 2,341,574 251,060,953 Others 25,862,434 78,977 25,941,411 Total Liabilities 754,178,783 10,043,615 764,222,398 Equity 21,426,375 960,880 22,387,255 Non-controlling interest 528,446 - 528,446 Total Equity & Liabilities 776,133,604 11,004,495 787,138,099
Contingencies & Commitments 116,484,604 8,248,128 124,732,732

319 Annual Report 2020
Notes to the Consolidated Financial StatementsFor the year ended December 31, 2020
2019Pakistan Bahrain Total
Profit & Loss ---------- Rupees in ‘000 ----------
Net mark-up/return/profit 6,922,571 250,105 7,194,539 Inter segment revenue - net (21,863) 21,863 - Non mark-up / return / interest income 4,489,797 5,229 4,464,382 Total Income 11,390,505 277,197 11,658,921
Segment direct expenses 8,091,566 172,498 8,233,420 Inter segment expense allocation 3,600,005 - 3,600,005 Total expenses 11,691,571 172,498 11,833,425 Provisions 16,315 (105,018) (88,703)Profit before tax (317,381) 209,717 (85,801)
Statement of Financial PositionCash & Bank balances 25,987,503 78,972 26,066,475 Investments 143,124,623 - 143,124,623 Net inter segment lending 208,787,632 1,663,962 210,451,594 Lendings to financial institutions 30,037,273 283,267 30,320,540 Advances - performing 232,688,485 3,752,286 236,440,771 Advances - non-performing 10,353,164 - 10,353,164 Advances - (Provisions)/reversals - Net (3,508,627) - (3,508,627)
239,533,022 3,752,286 243,285,308 Others 30,519,833 124,789 30,644,622 Total Assets 677,989,886 5,903,276 683,893,162
Borrowings 53,452,873 1,015,410 54,468,283 Subordinated debt 7,494,800 - 7,494,800 Deposits & other accounts 364,725,998 3,817,605 368,543,603 Net inter segment borrowing 210,203,389 248,205 210,451,594 Others 23,406,045 47,525 23,453,570 Total liabilities 659,283,105 5,128,745 664,411,850 Equity 18,198,508 774,533 18,973,041 Non-controlling interest 508,271 - 508,271 Total Equity & liabilities 677,989,884 5,903,278 683,893,162
Contingencies & Commitments 119,787,187 2,877,194 122,664,381

320Annual Report 2020
Notes to the Consolidated Financial StatementsFor the year ended December 31, 2020
42. TRUST ACTIVITIES
The Holding Company under takes Trustee and other fiduciary activities that result in the holding or placing of assets on behalf of individuals and other organisations.These are not assets of the Holding Company and, therefore, are not included as such in these consolidated financial statements. Assets held under trust are shown in the table below:
2020Securities Held ( Face Value)
TotalNo. of IPS Accounts
Market Treasury Bills
Pakistan Investment
Bonds
Government Ijara Sukuk
---------------------------- (Rupees in ‘000) ----------------------------CategoryAssets Management Companies 1 23,000 - - 23,000 Charitable Institutions 1 - 142,000 - 142,000 Companies 13 2,373,860 25,560,800 - 27,934,660 Employees Funds 51 7,194,410 17,927,950 69,000 25,191,360 Individuals 43 919,290 431,500 - 1,350,790 Insurance Companies 8 24,076,000 84,255,700 1,621,500 109,953,200 Others 11 15,370,700 7,882,700 - 23,253,400
Total 128 49,957,260 136,200,650 1,690,500 187,848,410
2019Securities Held ( Face Value)
TotalNo. of IPS Accounts
Market Treasury Bills
Pakistan Investment
Bonds
Government Ijara Sukuk
---------------------------- (Rupees in ‘000) ----------------------------CategoryAssets Management Companies 7 320,000 1,843,000 - 2,163,000 Charitable Institutions 1 35,000 - - 35,000 Companies 15 4,709,075 9,099,300 - 13,808,375 Employees Funds 56 11,200,690 12,887,550 - 24,088,240 Individuals 48 1,135,755 404,400 - 1,540,155 Insurance Companies 10 16,930,900 99,466,700 597,500 116,995,100 Others 12 16,305,465 3,126,200 - 19,431,665
Total 149 50,636,885 126,827,150 597,500 178,061,535

321 Annual Report 2020
Notes to the Consolidated Financial StatementsFor the year ended December 31, 2020
43. RELATED PARTY TRANSACTIONSThe Group has related party transactions with its parent, associates, directors & Key Management Personnel and other related parties.The Group enters into transactions with related parties in the ordinary course of business and on arm’s length basis i.e. substantially the same terms as for comparable transactions with person of similar standing. Contributions to and accruals in respect of staff retirement benefits and other benefit plans are made in accordance with the actuarial valuations / terms of the contribution plan. Remuneration to the executives / officers is determined in accordance with the terms of their appointment.The details of transactions with related parties, other than those which have been specifically disclosed elsewhere in these consolidated financial statements are as follows:
As at December 31, 2020 As at December 31, 2019
Parent DirectorsKey
management personnel
Associates Other related parties Parent Directors
Key management
personnelAssociates Other related
partiesStatement of Financial Position ---------------------------------------------------------------------------------- (Rupees in ‘000) ----------------------------------------------------------------------------------Lendings to financial institutionsOpening balance - - - - - - - - - - Addition during the year - - - - 4,100,000 - - - - - Repaid during the year - - - - (4,100,000) - - - - - Closing balance - - - - - - - - - -
InvestmentsOpening balance 15,000 - - 228,972 3,234,272 20,250 - - 180,000 3,230,125 Investment made during the year - - - 40,828 4,298,203 - - - 48,972 3,498,164 Investment redeemed / disposed off during the year (2,500) - - - (3,331,279) (5,250) - - - (3,494,017)Closing balance 12,500 - - 269,800 4,201,196 15,000 - - 228,972 3,234,272
Provision for diminution in value of investments - - - - 277,456 - - - - 65,022
Advances Opening balance - - 596,257 - 1,946,481 - 5,230 448,575 - 2,823,598Addition during the year - 58 284,284 153,128 6,402,913 - 316 322,590 - 5,086,823Repaid during the year - (832) (157,785) (2,235) (5,488,750) - (5,546) (120,115) - (6,320,068)Transfer in / (out) - net - 122,880 68,271 219,875 1,232,786 - - (54,793) - 356,128Closing balance - 122,106 791,027 370,768 4,093,430 - - 596,257 - 1,946,481
Fixed AssetsPurchase of property - - - - 748,845 - - - - - Cost of disposal - - - - - - - 43,410 - 17,657 Accumulated depreciation of disposal - - - - - - - (12,927) - (8,002)WDV of disposal - - - - - - - 30,483 - 9,655
Other AssetsInterest mark-up accrued 344 2,801 6 954 52,998 736 48 473 - 49,640 Receivable against bancassurance / bancatakaful - - - - 28,051 - - - - 67,952 Advance for subscription of TFC - unsecured - - - - - - - - 40,828 - Net defined benefit plan - - - - 317,581 Trade receivable 73,455 - 80 - 158,590 80,255 2 - - 134,238 Prepaid insurance - - - - - - - - - 97,806 Advance against purchase of property - - - - - - - - - 26,261 Other receivable 281 - - - 8,889 296 - - - 12,095
Provision against other assets - - - - - - - - - 2,438

322Annual Report 2020
Notes to the Consolidated Financial StatementsFor the year ended December 31, 2020
As at December 31, 2020 As at December 31, 2019
Parent DirectorsKey
management personnel
Associates Other related parties Parent Directors
Key management
personnelAssociates Other related
parties ---------------------------------------------------------------------------------- (Rupees in ‘000) ----------------------------------------------------------------------------------
BorrowingsOpening balance - - - - - - - - - 4,800,000 Borrowings during the year - - - - 11,105,705 - - - - 174,209,491 Settled during the year - - - - (11,105,705) - - - - (179,009,491)Closing balance - - - - - - - - - -
Deposits and other accountsOpening balance 271,648 24,444 59,593 23,104 8,622,201 336,515 24,308 74,950 - 9,656,833 Received during the year 5,511,316 511,942 973,685 861,135 160,825,941 4,332,699 160,210 1,437,872 1,023,592 235,460,531 Withdrawn during the year (5,610,945) (324,417) (869,813) (834,486) (159,215,607) (4,364,266) (137,680) (1,450,123) (1,042,362) (236,784,614)Transfer in / (out) - net - 366 (87,228) - 132,631 (33,300) (22,394) (3,106) 41,874 289,451 Closing balance 172,019 212,335 76,237 49,753 10,365,166 271,648 24,444 59,593 23,104 8,622,201
Subordinated debt - - - - 889,432 - - - - 889,588
Other LiabilitiesInterest / return / mark-up payable on deposits - - 85 - 153,374 - - 114 - 286,949 Interest / return / mark-up payable on subordinated debt - - - - 1,308 - - - - 2,220 Trade payable - - 6,314 - 783 - 1,306 3,115 - 1,176 Donation Payable - - - - 4,500 - - - - - Payable to defined benefit plan - - - - - - - - - 147,885 Others payable 75 - - - 1,571 - - - - 1,464
Represented ByShare Capital 9,733,073 19,180 12,223 - 45,323 9,733,073 17,330 900 - 81,765
Contingencies and CommitmentsLetter of guarantee - - - - 29,054 - - - - 14,217 Letter of Credit - - - - 86,543 - - - - 44,368
For the year ended December 31, 2020 For the year ended December 31, 2019
Parent DirectorsKey
management personnel
Associates Other related parties Parent Directors
Key management
personnelAssociates Other related
parties ---------------------------------------------------------------------------------- (Rupees in ‘000) ----------------------------------------------------------------------------------
Profit and loss accountIncomeMark-up / return / interest earned 1,522 3,279 42,627 5,816 178,695 1,912 212 14,846 - 322,607 Fee, commission and brokerage income 8,710 11 4,557 - 444,432 1,360 134 368 - 558,898 Dividend income - - - - 106,277 - - - - 105,945 Gain on sale of securities - Net - - - - 251,482 1,230 - - - 166,803 Rental income - - - - - - - - - 3,953 Other income - - - - - - - 13,456 - -
ExpenseMark-up / return / interest paid 46,099 3,490 3,204 2,600 1,135,034 35,406 2,227 4,309 2,930 1,383,816 Preference Dividend Paid - - - - - 23,419 161 - - 38 Commission, charges and brokerage paid - - - - - - - - - 455 Remuneration paid - 85,851 646,812 - - - - 558,923 - - Non-executive directors’ fee - 23,100 - - - - 14,575 - - - Net charge for defined contribution plans - - - - 181,488 - - - - 233,159 Net charge / (reversal) for defined benefit plans - - - - 229,001 - - - - 134,313 Fee and subscription - - - - - 13,785 - - - - Donation - - - - 117,341 - - - - 746 Rental expense 225 - - - 38,135 - - - - 36,422 Advisory fee - - - - - - - - - 15,000 Royalty - - - - 30,000 - - - - 30,000 Other expenses 2,036 - - - 17,070 - - - - 2,225
Reimbursement of expenses 7,205 869 - 98,459 1,886 1,240 - - -
Payments made during the yearInsurance premium paid - - - - 420,957 - - - - 365,298 Insurance claims settled - - - - 6,471 - - - - 9,936 Defined benefit plans paid - - - - 151,881 - - - - 102,494
Other TransactionsSale of Government Securities 585,477 1,645 - - 113,055,811 1,605,975 2,968 - - 295,412,399 Purchase of Government Securities - - - - 43,560,278 - 1,352 - - 12,797,839 Sale of Foreign Currencies - - - - 36,509,253 - - - - 26,836,227 Purchase of Foreign Currencies - - - - 60,142,942 - - - - 19,213,481

323 Annual Report 2020
Notes to the Consolidated Financial StatementsFor the year ended December 31, 2020
2020 201944. CAPITAL ADEQUACY, LEVERAGE RATIO & LIQUIDITY REQUIREMENTS ----- Rupees in ‘000 -----
Minimum Capital Requirement (MCR):Paid-up capital (net of losses) 10,119,242 10,119,242
Capital Adequacy Ratio (CAR):Eligible Common Equity Tier 1 (CET 1) Capital 17,433,159 16,145,623 Eligible Additional Tier 1 (ADT 1) Capital 1,965,291 2,118,958 Total Eligible Tier 1 Capital 19,398,450 18,264,581 Eligible Tier 2 Capital 5,558,052 4,965,069 Total Eligible Capital (Tier 1 + Tier 2) 24,956,502 23,229,650
Risk Weighted Assets (RWAs):Credit Risk 154,573,487 142,862,324 Market Risk 3,835,995 4,219,399 Operational Risk 25,579,240 22,096,563 Total 183,988,722 169,178,286
The SBP through its BSD Circular No. 07 dated April 15, 2009 has prescribed the minimum paid-up capital (net of accumulated losses) for banks to be raised to Rs.10,000 million by the year ending December 31, 2013. The paid-up capital of the Bank as at December 31, 2020 stood at Rs. 10,119.242 million (2019: Rs. 10,119.242 million) and is in compliance with SBP requirements.
The Banks are also required to maintain a minimum Capital Adequacy Ratio (CAR) of 10.0% plus capital conservation buffer of 1.5% of the risk weighted exposures of the Bank. Further, under Basel III instructions, Banks are also required to maintain a Common Equity Tier 1 (CET 1) ratio and Tier 1 ratio of 6.5% and 7.5%, respectively, as at December 31, 2020. As at December 31, 2020 the Bank is fully compliant with prescribed ratios, as the Bank’s CAR is 13.56% whereas CET 1 and Tier 1 ratios stood at 9.48% and 10.54% respectively. The Bank has complied with all capital requirements throughout the year.
Under the current capital adequacy regulations, credit risk and market risk exposures are measured using the Standardized Approach and operational risk is measured using the Basic Indicator Approach. Credit risk mitigants are also applied against the Bank’s exposures based on eligible collateral under comprehensive approach.
2020 2019 ----- Rupees in ‘000 -----
Common Equity Tier 1 Capital Adequacy ratio 9.48% 9.54%
Tier 1 Capital Adequacy Ratio 10.54% 10.80%
Total Capital Adequacy Ratio 13.56% 13.73%
Leverage Ratio (LR):Eligiblle Tier-1 Capital 19,398,450 18,264,581Total Exposures 623,856,077 544,436,725Leverage Ratio 3.11% 3.35%
Liquidity Coverage Ratio (LCR):Total High Quality Liquid Assets 166,890,275 83,221,592Total Net Cash Outflow 57,575,341 55,819,412Liquidity Coverage Ratio 289.86% 149.09%
Net Stable Funding Ratio (NSFR):Total Available Stable Funding 358,895,534 308,715,925Total Required Stable Funding 259,861,191 274,288,642Net Stable Funding Ratio 138.11% 112.55%
324Annual Report 2020
Notes to the Consolidated Financial StatementsFor the year ended December 31, 2020
44.1 The link to the full disclosure is available at https://jsbl.com/knowledge-centre/investor-information/
45 RISK MANAGEMENT
Risk Management is a discipline at the core of every financial institution and encompasses all the activities that affect its risk profile. At the Bank, it involves identification, measurement, monitoring and controlling risks to ensure that:
a) The individuals who take or manage risks clearly understand it;
b) The Bank's Risk exposure is within the limits established by Board of Directors (BoD);
c) Risk taking decisions are in line with the business strategy and objectives set by BoD;
d) The expected payoffs compensate for the risks taken;
e) Risk taking decisions are explicit and clear;
f) Sufficient capital as a buffer is available to take risk; and
g) Risk management function is independent of risk taking unit.
The Group has a comprehensive set of Risk Management Policies, practices and procedures which enable the Holding Company to take into consideration, in an appropriate manner, all major kinds of risks mainly credit, market, liquidity, operational and IT security risks. Keeping in view the dynamics of internal and external environment, we regularly review and update our Risk Management policies and procedures in accordance with regulatory environment and international standards.
Risk Management activities remain at the forefront of all activities of the Group which places the highest priority on conducting its business in a prudent manner in line with the relevant laws and regulatory requirements.
Risk management framework of the Group includes:
a) Clearly defined risk management policies and procedures covering risk identification, acceptance, measurement, monitoring, reporting and control;
b) Well constituted organizational structure, defining clearly roles and responsibilities of individuals involved in risk taking as well as managing it. The Group, in addition to risk management functions for various risk categories, has instituted an Integrated Risk Management Committee (IRMC), Credit Risk Committee (CRC), Operational Risk Management Committee (ORMC), Remedial Management Committee (RMC) as well as Central Credit Committee (CCC). IRMC oversees the overall risk management at the Bank and provides guidance in setting strategic targets as well as concentration limits and monitor progress related to earnings growth, keeping in view the capital constraints and also adheres to the concentration limits. The IRMC monitors the strategic target and aggregate limits at the Business Group level and concentration limits (by industry, geography, size, tenor) so that one category of assets or dimension of risk cannot materially harm the performance of the Bank. CRC monitors the advances portfolio, concentrations limits, aggregate limits at business level and various house keeping elements under Credit Administration. ORMC oversees the effectiveness of operational risk management for maintenance and implementation of operational risk management framework. It also monitors the Business Continuity Planning and reviews findings of any other management or board’s sub committee. Remedial Management Committee (RMC) oversees the progress of non performing loans and cases under litigation along with the recommendation of transferring of any NPL to Corporate Restructuring Company (CRC). Whereas, Central Credit Committee (CCC) is entrusted with the responsibility of monitoring lending risk profile of the Bank. CCC meets regularly to actively supervise credit risk across its lending portfolio.
c) An effective management information system that ensures flow of information from operational level to top management and a system to address any exceptions observed; and

325 Annual Report 2020
Notes to the Consolidated Financial StatementsFor the year ended December 31, 2020
d) A mechanism to ensure an ongoing review of systems, policies and procedures for risk management and procedures to adopt changes.
While the overall responsibility of risk management rests with the BoD, it is the duty of Senior Management to devise risk management strategy by setting up well defined policies and procedures for mitigating / controlling risks, duly approved by the Board.
Giving due consideration to the above, the Group has put in place the following hierarchy of Risk Management:
- Board Risk Management Committee (BRMC);
- Integrated Risk Management Committee (IRMC) comprises of the President / Chief Executive Officer (CEO), Deputy CEO, Chief Risk Officer, Chief Financial Officer, Group Head Investment Banking & Emerging Business, Group Head Operations & Technology, Head of Compliance, Chief of Staff, Head of Treasury and Head Internal Audit (guest member).
- Asset - Liability Committee (ALCO) comprises of the President / Chief Executive Officer (CEO), Deputy CEO, Treasurer, Chief Risk Officer, Chief Financial Officer, Group Head Investment Banking & Emerging Business, Head of Product Management & Business Head Consumer Banking and attended by Other Business Heads.
- Central Credit Committee (CCC) comprising of the President / CEO, Deputy CEO, Chief Risk Officer, Chief Financial Officer, Group Head Investment Banking & Emerging Business, Chief of Staff and Head of Operational and Environmental Risk (for environmental risk only)
- Credit Risk Committee (CRC) comprises of President/CEO, Deputy CEO, Chief Risk Officer, Chief Financial Officer, Group Head Investment Banking & Emerging Business, Regional Credit Heads, Head CAD, Head of Consumer Risk, Head Enterprise Risk Management and Head Internal Audit (guest member)
- Operational Risk Management Committee (ORMC) comprises of the Deputy CEO, Chief Risk Officer, Group Head Operations & Technology, Country Head Branch Banking Operations, Group Head Human Resources Head of Compliance, Head of Service Management, Head Enterprise Risk Management and Head Internal Audit (guest member).
- Remedial Management Committee (RMC) comprises of President/CEO, Deputy CEO, Chief Risk Officer, Chief Operating Officer, Chief Financial Officer, Head of SAM, Credit Risk Heads and Head of Legal.
- IT Steering Committee (ITSC) comprises of President/CEO, Deputy CEO, Chief Risk Officer, Chief Financial Officer, Group Head Operations & Technology, Chief Information Officer, Chief Information Security Officer, Chief of Staff, Group Head Investment Banking & Emerging Business, Chief Digital Officer, Country Head Branch Banking Operations and Head Product Development & Consumer Business.
- Risk Management Group (RMG), a dedicated and independent set-up headed by Chief Risk Officer and comprises of Regional Credit Heads, Heads of Market & Liquidity Risks, Operational Risk and Treasury Middle Office, Consumer Risk, Credit Administration, Special Assets Management, Information Security, Strategic Projects & Quantitative Analysis and Enterprise Risk Management.

326Annual Report 2020
Notes to the Consolidated Financial StatementsFor the year ended December 31, 2020
RMG is managed by Chief Risk Officer to supervise the following Divisions:
a) Credit Risk Management (CRM) covering Corporate / Commercial, Agricultural and Retail Banking Risks
b) Operational Risk Management (ORM)
c) Market Risk Management (MRM)
d) Treasury Middle Office
e) Basel II / III Implementation Unit
f) Credit Administration Department (CAD)
g) Special Assets Management (SAM)
h) Information Security
i) Consumer Risk
j) Strategic Projects & Quantitative Analysis
The Holding Company’s RMG generates the requisite risk reporting for the different tiers of management. These are also subjected to internal audit review.
Risk Matrix / Categories
The Bank, in common with other banks, generates its revenues by accepting Country, Credit, Liquidity, Interest Rate Risk in the Banking Book, Market, Operational and other risks. Effective management of these risks is the decisive factor in the Bank’s profitability.
Risk Appetite
The Group’s risk appetite is reflected in its endeavours to maintain a favourable credit rating and encompasses the following:
- The business strategy
- The expectations of stakeholders at different time horizons
- The characteristics of the risk-bearing entities
- The nature and characteristics of the risks undertaken
- The possible spread of risk situations across organizational units, assets-at-risk, and future time horizons.
Risk appetite drives business activity. It combines anticipations in risk and profitability with management preferences to control capital and resource allocation, as well as the distribution of exposure across activities and portfolios.
The Group’s hedging strategy is embedded in its risk management practices for addressing material categories of risk.

327 Annual Report 2020
Notes to the Consolidated Financial StatementsFor the year ended December 31, 2020
45.1 Credit Risk
Credit risk is the risk which arises with the possibility that one party to a financial instrument will fail to discharge its obligation and cause the other party to incur a financial loss. Credit risk is managed in terms of credit policies, approved by the BoD and regulations issued by the SBP. The bank is exposed to credit risk on loans and advances, fund placements with financial institutions and certain investments.
Credit risk management is an ongoing process. The overall credit policy and the credit risk instructions are issued by the Board of Directors. In this regards, a Central Credit Committee (CCC) is entrusted with the responsibility of monitoring lending risk profile of the bank. In order to maintain healthy growth of the credit portfolio, the Groups Credit Risk Management processes are consistently upgraded and improved to meet future challenges.
The Group’s strategy is to minimise credit risk through product, geography, industry and customer diversification. Credit limits are established for all counter-parties after a careful assessment of their credit worthiness. An effective credit granting procedure, which requires pre-sanction evaluation of credit proposal, adequacy of security and pre-disbursement examination of charge documents is in place and managed by Risk Management Group (RMG) & Credit Administration Department (CAD). The Bank maintains a sound portfolio diversified in nature to counter the risk of credit concentration and further confines risk through diversification of its assets by geographical and industrial sector. For managing impaired assets in the portfolio, the Bank follows the Prudential Regulations and Risk Management guidelines issued by SBP and the Remedial Management Policy approved by the Board.
45.1.1 Credit risk: Standardised approach
The Holding Company has adopted the Standardised Approach of Basel II for risk weighing its Credit Risk Exposures.
The following table illustrates the approved External Credit Assessment Institutions (ECAIs) whose ratings are being utilised by the Bank with respect to material categories of exposures:
Exposures JCR-VIS PACRA MOODY’S FITCH S&P
Corporate P P - - -Banks P P P P PSME’s (retailexposures) P P - - -Sovereigns P P P P PSecuritisations N/A N/A N/A N/A N/AOthers (specify) N/A N/A N/A N/A N/A
The Bank has used Issue Specific Ratings for rating / risk weighing Issue Specific Exposures and Entity Ratings for rating / risk weighing claims against specific counterparties. Both short and long term ratings have been used to rate corresponding short and long term exposures. For this purpose, Mapping Grid has been provided by SBP as given below:

328Annual Report 2020
Notes to the Consolidated Financial StatementsFor the year ended December 31, 2020
Long - Term Ratings Grades Mapping
45.1.2 Policies and processes for collateral valuation and management as regards Basel II;
For Credit Risk Mitigation purposes the Bank uses only the eligible collaterals under Comprehensive Approach of Credit Risk Mitigation under Standardised Approach as prescribed by SBP under Circular No. 8 of 2006, which includes Cash and Cash Equivalent Securities including Government Securities (like Cash Margins, Lien on Bank Accounts, Foreign Deposit Receipts, Term Deposit Receipts, Pledge of Defense Saving Certificates, Regular Income Certificates, Special Saving Certificates, T-Bills and Pakistan Investment Bonds etc.) and Shares, TFCs and Mutual Funds Listed on the Main Index.
Under the Bank’s policy all collaterals are subject to periodic valuations to monitor the adequacy of margins held. Shares / Marketable securities are valued by the Bank on daily basis to calculate the Drawing Power (DP). In case of any shortfall in the requisite margins, the DP is adjusted to the appropriate level and the business units are informed to take appropriate action as per the agreement with the customer.
Particulars of bank’s significant on-balance sheet and off-balance sheet credit risk in various sectors are analysed as follows:
SBP Rating Grade PACRA JCR-VIS Fitch Moody’s S&P ECA Scores
1 AAAAA+AAAA-
AAAAA+AAAA-
AAAAA+AAAA-
AaaAa1Aa2Aa3
AAAAA+AAAA-
1
2 A+AA-
A+AA-
A+AA-
A1A2A3
A+AA-
2
3 BBB+BBBBBB-
BBB+BBBBBB-
BBB+BBBBBB-
Baa1Baa2Baa3
BBB+BBBBBB-
3
4 BB+BBBB-
BB+BBBB-
BB+BBBB-
Ba1Ba2Ba3
BB+BBBB-
4
5 B+BB-
B+BB-
B+BB-
B1B2B3
B+BB-
5,6
6 CCC+ and below
CCC+ and below
CCC+ and below
Caa1 and below
CCC+ and below
7
Short - Term Ratings Grades Mapping
SBP PACRA JCR-VIS Fitch Moody’s S&P
S1 A-1 A-1 F-1 P-1 A-1+, A-1
S2 A-2 A-2 F-2 P-2 A-2
S3 A-3 A-3 F-3 P-3 A-3
S4 Others Others Others Others Others

329 Annual Report 2020
Notes to the Consolidated Financial StatementsFor the year ended December 31, 2020
Gross lendings Non-performing lendings Provision held2020 2019 2020 2019 2020 2019
45.1.3 Lendings to financial institutions ------------------------------------------- Rupees in ‘000 -------------------------------------------
Credit risk by public / private sector
Public/ Government - - - - - - Private 23,240,897 30,321,802 - - 1,225 1,262
23,240,897 30,321,802 - - 1,225 1,262
Gross investments Non-performing
investments Provision held 2020 2019 2020 2019 2020 2019
45.1.4 Investment in debt securities ------------------------------------------- Rupees in ‘000 -------------------------------------------
Credit risk by industry sector
Textile 391,478 391,478 391,478 391,478 391,478 391,478 Chemical and Pharmaceuticals 249,860 258,193 149,860 149,860 149,860 149,860 Construction - - - - - - Power (electricity), Gas, Water, Sanitary 71,429 142,857 - - - - Refinery 308,616 390,303 - - - - Transport, Storage and Communication 710,902 854,902 155,169 155,169 155,169 155,169 Financial 4,512,331 536,672 - - - - Services 1,351,531 1,350,000 - - - -
7,596,147 3,924,405 696,507 696,507 696,507 696,507
Gross investments Non-performing
investments Provision held 2020 2019 2020 2019 2020 2019
Credit risk by public / private sector ------------------------------------------- Rupees in ‘000 -------------------------------------------
Public/ Government 3,643,402 - - - - - Private 3,952,745 3,924,405 696,507 696,507 696,507 696,507
7,596,147 3,924,405 696,507 696,507 696,507 696,507

330Annual Report 2020
Notes to the Consolidated Financial StatementsFor the year ended December 31, 2020
Gross Advances Non-performing Advances Provision held 2020 2019 2020 2019 2020 2019
45.1.5 Advances ------------------------------------------- Rupees in ‘000 -------------------------------------------
Credit risk by industry sector
Agri finance 7,797,960 5,285,334 433,949 207,192 107,329 397 Automobile and transportation equipment 3,912,821 3,854,727 117,937 227,878 64,829 69,596 Brokerage 8,866,882 6,929,558 - - - - Cement 2,236,379 2,958,936 - - - - Chemical 1,422,319 1,910,636 314,405 314,405 - - Construction 356,077 5,806,032 - 112,803 - 3,236 Electronics and electrical appliances 823,973 237,458 5,991 35,911 - - Engineering, IT and other services 9,453,353 5,013,829 82,124 38,738 31,683 26,325 Fertilizer 3,484,915 4,446,138 1,367,103 1,348,824 1,349,130 1,348,943 Financial 1,442,302 2,110,683 - - - - Food / confectionery / beverages 34,253,338 32,353,949 1,057,765 157,010 351,621 63,221 Individuals 33,122,827 31,512,186 2,041,082 1,533,451 506,898 238,185 Insurance and security 10,451 176,116 - - - - Metal and steel 9,966,050 8,824,579 2,607,092 1,614,845 722,969 339,372 Mining and quarrying 137,220 159,069 - - - - Paper / board / furniture 1,674,874 1,506,878 82,782 8,000 2,608 - Petroleum, oil and gas 5,122,089 4,135,890 95,053 80,053 37,160 29,618 Pharmaceuticals 5,289,290 5,722,234 4,577 4,577 - - Plastic 1,962,424 2,001,738 561,763 538,745 - 483 Power and water 23,897,355 27,878,617 156,241 159,806 19,130 - Real estate 4,203,207 3,493,350 1,306,057 1,300,000 13 - Shipbreaking 300,214 1,074,589 - 805,000 - 256,706 Storage 82,245 103,525 20,000 - - - Sugar 2,042,589 2,609,984 200,000 200,000 200,000 200,000 Tele-communication 2,838,926 2,709,181 - - - - TextileComposite 7,573,233 6,639,722 322,262 339,310 304,345 303,094 Ginning 1,281,801 1,612,059 34,539 48,949 9,065 20,157 Spinning 5,768,619 5,349,247 278,441 278,441 278,441 278,441 Weaving 8,669,251 9,988,010 47,284 47,284 19,653 3,726
23,292,904 23,589,038 682,526 713,984 611,504 605,418 Transportation services 35,246,740 39,397,687 73,283 127,290 53,958 53,493 Trust and non-profit organisations 56,043 475,240 - - - - Tyre 267,203 288,551 - - - - Wholesale and retail trade 12,161,474 10,671,924 372,302 502,852 106,964 64,928 Others 18,934,253 9,556,279 151,523 321,800 16,040 40,020
254,658,697 246,793,935 11,733,555 10,353,164 4,181,836 3,339,941
Credit risk by public / private sector
Public/ Government 52,248,485 56,471,970 - - - - Private 202,410,212 190,321,965 11,733,555 10,353,164 4,181,836 3,339,941
254,658,697 246,793,935 11,733,555 10,353,164 4,181,836 3,339,941

331 Annual Report 2020
Notes to the Consolidated Financial StatementsFor the year ended December 31, 2020
Contingencies and commitments
2020 201945.1.6 Credit risk by industry sector ------- Rupees in ‘000 -------
Automobile and transportation equipment 2,371,968 2,163,575 Brokerage 1,540,806 796,500 Cement 779,749 247,368 Chemical 1,126,160 779,205 Construction 22,694,392 18,350,913 Electronics and electrical appliances 496,139 190,170 Engineering, IT and other services 3,293,028 3,033,858 Fertilizer 2,350,294 4,262,960 Financial 43,920,788 62,551,629 Food / confectionery / beverages 2,855,033 3,054,819 Individuals 592,229 989,889 Insurance and security 28,234 12,197 Metal and steel 4,629,296 3,709,350 Mining and quarrying - - Paper / board / furniture 808,302 888,015 Petroleum, oil and gas 656,214 586,136 Pharmaceuticals 856,079 721,858 Plastic 715,399 324,356 Power and water 795,807 495,534 Real estate 16,516,933 4,299,209 Shipbreaking 56,758 77,614 Sugar 8,601 24,301 Tele-communication 1,172,080 1,460,186 TextileComposite 1,384,271 1,037,819 Ginning 277,552 369,793 Spinning 3,497,170 1,485,788 weaving 1,532,406 1,118,339
6,691,399 4,011,739 Transportation 30,537 24,896 Trust and non-profit organisations 116,293 217,780 Tyre 89,489 9,584 Wholesale and retail trade 3,320,259 4,328,745 Others 6,220,466 5,051,995
124,732,732 122,664,381
Credit risk by public / private sector
Public/ Government - - Private 124,732,732 122,664,381
124,732,732 122,664,381

332Annual Report 2020
Notes to the Consolidated Financial StatementsFor the year ended December 31, 2020
45.1.7 Concentration of Advances
The Holding Company top 10 exposures on the basis of total (funded and non-funded exposures) aggregated to Rs. 95,329.829 million (2019: Rs. 85,937.967 million) are as following:
2020 2019Note ----- Rupees in ‘000 -----
Funded 45.1.7.1 64,985,417 65,309,390 Non Funded 30,344,412 20,628,577 Total Exposure 45.1.7.2 95,329,829 85,937,967
45.1.7.1 There are no classified advances placed under top 10 exposures.
45.1.7.2 The sanctioned limits against these top 10 exposures aggregated to Rs. 107,031.73 million (2019: 85,937.967 million).
45.1.8 Advances - Province / Region-wise Disbursement & Utilization
2020
Disburs-ements
Utilization
Punjab Sindh KPK & FATA Balochistan Islamabad AJK & Gilgit - Baltistan Bahrain
---------------------------------------------------------------- Rupees in ‘000 ----------------------------------------------------------------Province / RegionPunjab 87,425,286 87,425,286 - - - - - - Sindh 152,726,852 - 152,726,852 - - - - - KPK including FATA 1,055,415 - - 1,055,415 - - - - Balochistan 244,399 - - - 244,399 - - - Islamabad 16,845,491 - - - - 16,845,491 - - AJK including Gilgit-Baltistan 247,017 - - - - - 247,017 - Bahrain 8,441,218 - - - - - - 8,441,218 Total 266,985,678 87,425,286 152,726,852 1,055,415 244,399 16,845,491 247,017 8,441,218
2019
Disburs-ements
Utilization
Punjab Sindh KPK & FATA Balochistan Islamabad AJK & Gilgit-Baltistan Bahrain
---------------------------------------------------------------- Rupees in ‘000 ----------------------------------------------------------------Province / RegionPunjab 80,305,925 80,305,925 - - - - - - Sindh 146,335,149 - 146,335,149 - - - - - KPK including FATA 1,456,326 - - 1,456,326 - - - - Balochistan 111,734 - - - 111,734 - - - Islamabad 13,423,194 - - - - 13,423,194 - - AJK including Gilgit-Baltistan 197,627 - - - - - 197,627 - Bahrain 4,727,124 - - - - - - 4,727,124 Total 246,557,079 80,305,925 146,335,149 1,456,326 111,734 13,423,194 197,627 4,727,124
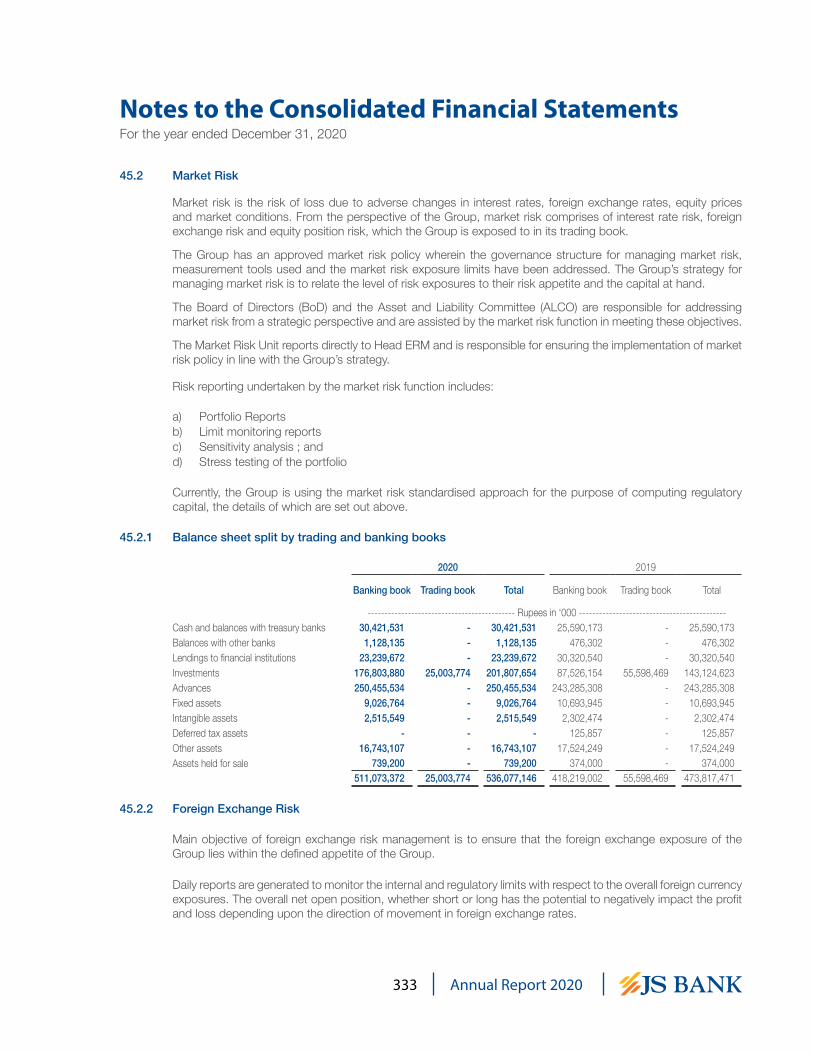
333 Annual Report 2020
Notes to the Consolidated Financial StatementsFor the year ended December 31, 2020
45.2 Market Risk
Market risk is the risk of loss due to adverse changes in interest rates, foreign exchange rates, equity prices and market conditions. From the perspective of the Group, market risk comprises of interest rate risk, foreign exchange risk and equity position risk, which the Group is exposed to in its trading book.
The Group has an approved market risk policy wherein the governance structure for managing market risk, measurement tools used and the market risk exposure limits have been addressed. The Group’s strategy for managing market risk is to relate the level of risk exposures to their risk appetite and the capital at hand.
The Board of Directors (BoD) and the Asset and Liability Committee (ALCO) are responsible for addressing market risk from a strategic perspective and are assisted by the market risk function in meeting these objectives.
The Market Risk Unit reports directly to Head ERM and is responsible for ensuring the implementation of market risk policy in line with the Group’s strategy.
Risk reporting undertaken by the market risk function includes:
a) Portfolio Reportsb) Limit monitoring reportsc) Sensitivity analysis ; andd) Stress testing of the portfolio
Currently, the Group is using the market risk standardised approach for the purpose of computing regulatory capital, the details of which are set out above.
45.2.1 Balance sheet split by trading and banking books
2020 2019
Banking book Trading book Total Banking book Trading book Total
-------------------------------------------- Rupees in ‘000 --------------------------------------------Cash and balances with treasury banks 30,421,531 - 30,421,531 25,590,173 - 25,590,173 Balances with other banks 1,128,135 - 1,128,135 476,302 - 476,302 Lendings to financial institutions 23,239,672 - 23,239,672 30,320,540 - 30,320,540 Investments 176,803,880 25,003,774 201,807,654 87,526,154 55,598,469 143,124,623 Advances 250,455,534 - 250,455,534 243,285,308 - 243,285,308 Fixed assets 9,026,764 - 9,026,764 10,693,945 - 10,693,945 Intangible assets 2,515,549 - 2,515,549 2,302,474 - 2,302,474 Deferred tax assets - - - 125,857 - 125,857 Other assets 16,743,107 - 16,743,107 17,524,249 - 17,524,249 Assets held for sale 739,200 - 739,200 374,000 - 374,000
511,073,372 25,003,774 536,077,146 418,219,002 55,598,469 473,817,471
45.2.2 Foreign Exchange Risk
Main objective of foreign exchange risk management is to ensure that the foreign exchange exposure of the Group lies within the defined appetite of the Group.
Daily reports are generated to monitor the internal and regulatory limits with respect to the overall foreign currency exposures. The overall net open position, whether short or long has the potential to negatively impact the profit and loss depending upon the direction of movement in foreign exchange rates.

334Annual Report 2020
Notes to the Consolidated Financial StatementsFor the year ended December 31, 2020
Foreign exchange open and mismatched positions are marked to market on a daily basis.
Currency risk arises where the value of financial instruments changes due to changes in foreign exchange rates. In order to manage currency risk exposure the bank enters into ready / spot, forward and swap transactions with SBP and in the interbank market. The Group’s foreign exchange exposure comprises of forward contracts, foreign currencies cash in hand, balances with banks abroad, foreign placement with SBP and foreign currencies assets and liabilities. The net open position is managed within the statutory limits, as fixed by SBP. Counter parties limit are also fixed to limit risk concentration. Appropriate segregation of duties exists between the front and back office functions while compliance with the net open position limit is independently monitored on an ongoing basis.
2020Net foreign
Off-balance currencyAssets Liabilities sheet items exposure
-------------------- Rupees in ‘000 ------------------
United States Dollar 20,731,596 28,340,649 7,925,120 316,067 Great Britain Pound 690,248 2,767,203 1,692,641 (384,314)Euro 2,028,206 1,324,879 (938,258) (234,931)Other currencies 542,006 397,092 (96,962) 47,952
23,992,056 32,829,823 8,582,541 (255,226)
2019Net foreign
Off-balance currencyAssets Liabilities sheet items exposure
-------------------- Rupees in ‘000 ------------------
United States Dollar 12,248,588 20,805,267 8,586,023 29,344 Great Britain Pound 879,840 2,696,794 1,778,936 (38,018)Euro 585,843 901,267 326,018 10,594 Other currencies 41,154 34,019 4,829 11,964
13,755,425 24,437,347 10,695,806 13,884
2020 2019
Banking book Trading book Bankingbook
Tradingbook
------------------ Rupees in ‘000 ------------------Impact of 1% change in foreign exchange rate on - Profit and loss account - 2,552 - 159 - Other comprehensive income - - - -
45.2.3 Equity position Risk
Equity positions in the banking book include Investment in equities that are available-for-sale or held for strategic investment purposes. These investments are generally regarded as riskier relative to fixed income securities owing to the inherent volatility of stock market prices. The Group mitigates these risks through diversification and capping maximum exposures in a single company, compliance with regulatory requirement, and following the guidelines laid down in the Group’s Investment Policy as set by the Board of Directors (BoD). The Bank follows a delivery versus payment settlement system thereby minimizing risk available in relation to settlement risk.

335 Annual Report 2020
Notes to the Consolidated Financial StatementsFor the year ended December 31, 2020
Equity price risk is managed by applying trading limit and scrip-wise and portfolio wise nominal limits.
2020 2019Banking
bookTrading book
Banking book
Tradingbook
------------------ Rupees in ‘000 ------------------Impact of 5% change in equity prices on
- Profit and loss account - - - - - Other comprehensive income 211,938 15,750 105,788 29,943
45.2.4 Yield / Interest Rate Risk in the Banking Book (IRRBB)-Basel II Specific
Yield/ Interest rate sensitivity position for on-balance sheet instruments is based on the earlier of contractual re-pricing or maturity date and for off-balance sheet instruments is based on settlement date. This also refers to the non-trading market risk. Apart from the gap analysis between the market rate sensitive assets and liabilities as per the table given below:
2020 2019Banking
bookTrading book
Banking book
Tradingbook
------------------ Rupees in ‘000 ------------------Impact of 1% change in interest rates on
- Profit and loss account 20,570 235,507 301,595 534,770 - Other comprehensive income 1,033,253 - 248,246 -

336Annual Report 2020
Notes to the Consolidated Financial StatementsFor the year ended December 31, 2020
45.2.
5Mi
smatc
h of in
teres
t rate
sens
itive a
ssets
and l
iabilit
ies
Intere
st rat
e risk
is th
e risk
that
the va
lue of
a fin
ancia
l instr
umen
t will fl
uctua
te du
e to c
hang
es in
the m
arket
intere
st rat
es. T
he G
roup i
s exp
osed
to in
teres
t / ma
rk-up
rate
risk a
s a re
sult o
f mism
atche
s or g
aps i
n the
amou
nt of
intere
st / m
ark
up ba
sed a
ssets
and l
iabiliti
es th
at ma
ture o
r re-pr
ice in
a giv
en pe
riod.
The G
roup m
anag
es th
is risk
by m
atchin
g/re-p
ricing
of as
sets
and l
iabiliti
es. T
he as
sets
and l
iabiliti
es co
mmitte
e (AL
CO) o
f the B
ank m
onito
rs an
d man
ages
the i
nteres
t rate
risk w
ith th
e obje
ctive
of lim
iting t
he po
tentia
l adv
erse e
ffects
on th
e profi
tability
of th
e Grou
p.
2020
Non-
intere
stEff
ectiv
eOv
er 1
Over
3Ov
er 6
Over
1Ov
er 2
Over
3Ov
er 5
beari
ng
yield
Up to
1to
3to
6mo
nths t
oto
2to
3to
5to
10Ab
ove
finan
cial
intere
stTo
talmo
nthmo
nths
month
s1 y
ear
years
years
years
years
10 ye
arsins
trume
ntrat
e - %
------
------
------
------
------
------
------
------
------
------
------
------
------
------
------
--- Ru
pees
in ‘0
00 --
------
------
------
------
------
------
------
------
------
------
------
------
------
------
------
-
On-b
alanc
e she
et fin
ancia
l instr
umen
ts
Asse
ts
Cash
and b
alanc
es w
ithtre
asury
bank
s -
30,42
1,531
2,
261,3
37
- -
- -
- -
- -
28,16
0,194
Ba
lance
s with
othe
r ban
ks -
1,12
8,135
24
,317
- -
- -
- -
- -
1,10
3,818
Le
nding
s to fi
nanc
ial ins
titutio
ns 6.
56
23,23
9,672
18
,351,9
72
4,88
7,700
-
- -
- -
- -
- Inv
estm
ents
8.03
20
1,807
,654
33,36
8,890
92
,486,0
42
42,99
7,826
13
,940,3
59
7,27
3,895
1,
428,9
40
135,5
86
3,75
9,785
-
6,41
6,331
Ad
vanc
es 8.
36
250,4
55,53
4 20
4,908
,975
20,77
2,932
10
,019,0
31
641,4
83
263,8
40
695,6
74
1,88
5,879
1,
674,4
15
2,97
4,156
6,
619,1
49
Othe
r ass
ets -
14,32
6,600
-
- -
- -
- -
- -
14,32
6,600
52
1,379
,126
258,9
15,49
1 11
8,146
,674
53,01
6,857
14
,581,8
42
7,53
7,735
2,
124,6
14
2,02
1,465
5,
434,2
00
2,97
4,156
56
,626,0
92
Liabil
ities
Bills p
ayab
le -
4,98
1,983
-
- -
- -
- -
- -
4,98
1,983
Bo
rrowin
gs 2.
88
48,30
3,412
12
,866,7
68
13,31
6,211
4,
720,0
46
70,98
0 13
,221,8
57
540,6
72
2,38
7,895
1,
178,9
83
- -
Depo
sits a
nd ot
her a
ccou
nts 6.
94
431,4
23,82
2 16
4,775
,712
54,81
7,591
35
,103,1
03
64,63
4,567
2,
133,2
46
(15,5
88)
1,95
4,602
-
- 10
8,020
,589
Subo
rdina
ted de
bt 10
.12
7,49
2,800
7,
492,8
00
- -
- -
- -
- -
- Lia
bilitie
s aga
inst a
ssets
s
ubjec
t to fin
ance
leas
e -
- -
- -
- -
- -
- -
- Ot
her li
abiliti
es -
19,87
5,838
-
- -
- -
- -
- -
19,87
5,838
51
2,077
,855
185,1
35,28
0 68
,133,8
02
39,82
3,149
64
,705,5
47
15,35
5,103
52
5,084
4,
342,4
97
1,17
8,983
-
132,8
78,41
0 On
-bala
nce s
heet
finan
cial in
strum
ents
9,30
1,271
73
,780,2
11
50,01
2,872
13
,193,7
08
(50,1
23,70
5) (7
,817,3
68)
1,59
9,530
(2
,321,0
32)
4,25
5,217
2,
974,1
56
(76,2
52,31
8)
Comm
itmen
ts in
respe
ct of
forwa
rd pu
rchas
e a
nd co
mmitm
ents
to ex
tend c
redits
24,89
8,370
8,
127,5
00
11,41
9,586
3,
996,6
59
1,29
6,986
57
,639
- -
- -
-
Comm
itmen
ts in
respe
ct of
forwa
rd e
xcha
nge c
ontra
cts - s
ale (1
8,843
,892)
(10,9
03,25
8) (3
,031,3
87)
(2,61
9,805
) (2
,231,8
03)
(57,6
39)
- -
- -
-
Off-b
alanc
e she
et ga
p 6,
054,4
78
(2,77
5,758
) 8,
388,1
99
1,37
6,854
(9
34,81
7) -
- -
- -
-
Total
yield
/ inte
rest r
isk se
nsitiv
ity ga
p 71
,004,4
53
58,40
1,071
14
,570,5
62
(51,0
58,52
2) (7
,817,3
68)
1,59
9,530
(2
,321,0
32)
4,25
5,217
2,
974,1
56
(76,2
52,31
8)
Cumu
lative
yield
/ inte
rest r
isk se
nsitiv
ity ga
p 71
,004,4
53
129,4
05,52
4 14
3,976
,086
92,91
7,564
85
,100,1
96
86,69
9,726
84
,378,6
94
88,63
3,911
91
,608,0
67

337 Annual Report 2020
Notes to the Consolidated Financial StatementsFor the year ended December 31, 2020
2019
Non-i
nteres
tEff
ective
Over
1Ov
er 3
Over
6Ov
er 1
Over
2Ov
er 3
Over
5be
aring
yie
ldUp
to 1
to 3
to 6
month
s to
to 2
to 3
to 5
to 10
Abov
efin
ancia
lint
erest
Total
mon
th mo
nths
month
s1 y
ear
years
years
years
years
10 ye
arsins
trume
ntrat
e - %
------
------
------
------
------
------
------
------
------
------
------
------
------
------
------
---- R
upee
s in ‘0
00 --
------
------
------
------
------
------
------
------
------
------
------
------
------
------
------
-On
-bala
nce s
heet
finan
cial in
strum
ents
Asse
tsCa
sh an
d bala
nces
with
treas
ury ba
nks
- 25
,590,1
73
2,56
6,714
-
- -
- -
- -
- 23
,023,4
59
Balan
ces w
ith ot
her b
anks
0.17
47
6,302
97
,659
- -
- -
- -
- -
378,6
43
Lend
ings t
o fina
ncial
institu
tions
11.80
30
,320,5
40
30,19
2,074
-
128,4
66
- -
- -
- -
- Inv
estm
ents
9.73
14
3,124
,623
66,15
8,225
41
,046,0
43
707,5
00
1,65
6,084
20
,378,9
27
8,02
2,522
50
3,646
20
4,943
-
4,44
6,733
Ad
vanc
es 12
.89
243,2
85,30
8 19
7,864
,614
20,96
7,630
9,
393,8
63
488,9
32
356,9
55
835,6
37
2,39
7,894
1,
256,5
32
2,71
0,028
7,
013,2
23
Othe
r ass
ets -
15,27
8,178
-
- -
- -
- -
- -
15,27
8,178
45
8,075
,124
296,8
79,28
6 62
,013,6
73
10,22
9,829
2,
145,0
16
20,73
5,882
8,
858,1
59
2,90
1,540
1,
461,4
75
2,71
0,028
50
,140,2
36
Liabil
ities
Bills p
ayab
le -
3,80
4,491
-
- -
- -
- -
- -
3,80
4,491
Bo
rrowin
gs 9.
26
54,46
8,283
31
,977,9
64
13,06
8,280
4,
693,2
16
193,5
71
207,8
39
2,12
0,779
1,
179,5
49
1,02
7,085
-
- De
posit
s and
othe
r acc
ounts
8.70
36
8,543
,603
129,9
10,14
2 47
,296,6
16
29,67
0,550
68
,670,2
64
6,67
3,436
1,
515,7
24
1,72
2,440
-
- 83
,084,4
31
Subo
rdina
ted de
bt 13
.73
7,49
4,800
-
- 2,
996,4
00
4,49
8,400
-
- -
- -
- Lia
bilitie
s aga
inst a
ssets
s
ubjec
t to fin
ance
leas
e -
- -
- -
- -
- -
- -
- Ot
her li
abiliti
es -
20,02
4,982
(6
9,111
) 12
1,966
18
2,949
36
5,898
73
1,796
68
2,219
1,
168,8
57
381,7
03
- 16
,458,7
05
454,3
36,15
9 16
1,818
,995
60,48
6,862
37
,543,1
15
73,72
8,133
7,
613,0
71
4,31
8,722
4,
070,8
46
1,40
8,788
-
103,3
47,62
7 On
-bala
nce s
heet
finan
cial in
strum
ents
3,73
8,965
13
5,060
,291
1,52
6,811
(2
7,313
,286)
(71,5
83,11
7) 13
,122,8
11
4,53
9,437
(1
,169,3
06)
52,68
7 2,
710,0
28
(53,2
07,39
1)
Comm
itmen
ts in
respe
ct of
forwa
rd pu
rchas
e a
nd co
mmitm
ents
to ex
tend c
redits
24,67
9,238
10
,902,9
00
8,10
3,044
4,
037,0
72
458,3
98
1,12
0,185
57
,639
- -
- -
Comm
itmen
ts in
respe
ct of
forwa
rd
exc
hang
e con
tracts
- sale
(35,2
03,28
3) (1
0,834
,905)
(7,72
1,576
) (1
0,450
,305)
(5,01
9,673
) (1
,119,1
85)
(57,6
39)
- -
- -
Off-b
alanc
e she
et ga
p (1
0,524
,045)
67,99
5 38
1,468
(6
,413,2
33)
(4,56
1,275
) 1,
000
- -
- -
-
Total
yield
/ inte
rest r
isk se
nsitiv
ity ga
p 13
5,128
,286
1,90
8,279
(3
3,726
,519)
(76,1
44,39
2) 13
,123,8
11
4,53
9,437
(1
,169,3
06)
52,68
7 2,
710,0
28
(53,2
07,39
1)
Cumu
lative
yield
/ inte
rest r
isk se
nsitiv
ity ga
p 13
5,128
,286
137,0
36,56
5 10
3,310
,046
27,16
5,654
40
,289,4
65
44,82
8,902
43
,659,5
96
43,71
2,283
46
,422,3
11
2020
2019
2020
2019
Rupe
es in
‘000
Rupe
es in
‘000
Reco
ncilia
tion t
o tota
l ass
etsRe
conc
iliatio
n to t
otal lia
bilitie
s
Balan
ce as
per b
alanc
e she
et 47
3,213
,218
473,8
17,47
1 Ba
lance
as pe
r bala
nce s
heet
513,1
61,44
5 45
4,336
,159
Less
: Non
finan
cial a
ssets
Less
: Non
finan
cial lia
bilitie
sFix
ed as
sets
9,02
6,764
10
,693,9
45
Othe
r liab
ilities
- -
Intan
gible
asse
ts 2,
515,5
49
2,30
2,474
De
ferred
tax li
abiliti
es - n
et 1,
083,5
90
- De
ferred
tax a
ssets
- net
- 12
5,857
1,
083,5
90
- Ot
her a
ssets
2,41
6,507
2,
246,0
71
Asse
ts he
ld for
sale
739,2
00
374,0
00
14,69
8,020
15
,742,3
47
458,5
15,19
8 45
8,075
,124
512,0
77,85
5 45
4,336
,159

338Annual Report 2020
Notes to the Consolidated Financial StatementsFor the year ended December 31, 2020
45.3
Liquid
ity ris
k
Liquid
ity ris
k is t
he ris
k tha
t the G
roup w
ill not
be ab
le to
raise
fund
s to m
eet it
s com
mitm
ents.
The G
roup’s
Asse
t and
Liab
ility C
ommi
ttee (
ALCO
) man
ages
the l
iquidit
y pos
ition o
n a co
ntinu
ous b
asis.
The G
roup’s
policy
to liq
uidity
mana
geme
nt is t
o main
tain a
dequ
ate liq
uidity
at all
times
and i
n all c
urren
cies u
nder
both
norm
al an
d stre
ss co
nditio
ns, to
mee
t our
contr
actua
l and
poten
tial p
ayme
nt ob
ligatio
ns w
ithou
t incu
rring a
dditio
nal a
nd un
acce
ptable
cost
to the
busin
ess.
Treas
ury is
respo
nsible
for th
e man
aging
liquid
ity ris
k und
er the
guida
nce o
f Ass
et-Lia
bility
Comm
ittee o
f the G
roup.
The G
roup’s
liquid
ity ris
k man
agem
ent a
pproa
ch st
arts a
t the i
ntrad
ay le
vel (o
perat
ional
liquidit
y) ma
nagin
g the
daily
paym
ents
queu
e and
facto
ring i
n our
acce
ss to
the
qualif
ying s
ecuri
ties o
f Stat
e Ban
k of P
akist
an. It
then
cove
rs tac
tical
liquidit
y risk
man
agem
ent d
ealing
with
the a
cces
s to u
nsec
ured f
undin
g sou
rces a
nd th
e liqu
idity c
harac
terist
ics of
our a
sset
inven
tory (
asse
t liqu
idity).
Fina
lly, th
e stra
tegic
persp
ective
comp
rises
the m
aturity
profi
le of
all as
sets
and l
iabiliti
es on
our s
tatem
ent o
f fina
ncial
posit
ion.
For m
onito
ring a
nd co
ntrolli
ng liq
uidity
risk,
the G
roup g
enera
tes a
scen
ario s
ensit
ive m
aturity
state
ment
of fin
ancia
l pos
ition,
and r
un co
ntrolle
d mism
atche
s tha
t are
monit
ored a
nd di
scus
sed b
y ALC
O me
mbers
regu
larly.
The G
roup p
repare
s vari
ous t
ypes
of re
ports
and a
nalys
is for
as
sistin
g ALC
O in
taking
nece
ssary
strat
egic
actio
ns fo
r man
aging
liquid
ity ris
k in t
he G
roup.
Thes
e inc
lude l
iquidit
y rati
os, C
once
ntrati
on an
alysis
, Gap
repo
rts, S
tress
testi
ng, L
iquidit
y Cov
erage
ratio
& Ne
t Stab
le Fu
nding
Ratio
analy
sis et
c.
45.3.
1Ma
turitie
s of A
ssets
and L
iabilit
ies - b
ased
on co
ntrac
tual m
aturity
of th
e ass
ets an
d liab
ilities
of th
e Ban
k20
20 O
ver 1
O
ver 7
O
ver 1
4 O
ver 1
O
ver 2
O
ver 3
O
ver 6
O
ver 9
O
ver 1
O
ver 2
O
ver 3
U
pto 1
to
7 to
14
days
to 1
to 2
to 3
to 6
to 9
mon
ths to
1 to
2 to
3 to
5 O
ver 5
To
tal
day
days
da
ys
mon
th m
onths
m
onths
m
onths
m
onths
y
ear
yea
rs y
ears
yea
rs ye
ars
------
------
------
------
------
------
------
------
------
------
------
------
------
------
------
------
------
------
------
------
- Rup
ees in
‘000
-----
------
------
------
------
------
------
------
------
------
------
------
------
------
------
------
------
------
------
------
--As
sets
Cash
and b
alanc
es w
ith tre
asury
bank
s 30
,421,5
31
30,42
1,531
-
-
-
-
-
-
-
-
-
-
-
-
Ba
lance
s with
othe
r ban
ks 1,
128,1
35
1,12
8,135
-
-
-
-
-
-
-
-
-
-
-
-
Le
nding
s to fi
nanc
ial ins
titutio
ns 23
,239,6
72
2,48
5,829
3,
500,0
00
3,29
1,063
9,
075,0
80
-
4,88
7,700
-
-
-
-
-
-
-
Inv
estm
ents
201,8
07,65
4 -
-
13
,786,6
43
17,16
7,632
4,
524,7
76
73,16
2,303
44
,507,6
08
12,96
6,751
1,
151,8
07
7,98
0,417
4,
815,4
44
3,47
0,764
18
,273,5
09
Adva
nces
250,4
55,53
4 91
,706,4
84
2,51
5,294
1,
262,1
75
9,56
6,816
14
,457,3
48
13,56
0,823
19
,372,1
37
9,54
4,829
13
,087,8
97
31,91
4,264
21
,520,3
67
13,64
1,989
8,
305,1
11
Fixed
asse
ts 10
,055,8
81
1,03
1,116
11
,092
12,94
1 78
,862
121,1
56
411,5
39
356,2
26
352,3
28
320,6
73
1,19
8,183
94
7,931
2,
394,8
99
2,81
8,935
Int
angib
le as
sets
2,53
0,060
15
,846
2,00
8 2,
343
5,35
6 10
,043
223,3
10
29,82
0 29
,612
29,59
8 11
7,664
11
5,429
22
6,108
1,
722,9
23
Defer
red ta
x ass
ets - n
et -
-
-
-
-
-
-
-
-
-
-
-
-
-
Ot
her a
ssets
16,74
3,107
2,
064,6
79
-
433,8
35
13,11
5,780
51
8,574
41
,047
534,0
67
35,12
5 -
-
-
-
-
As
sets
held
for sa
le 73
9,200
-
-
-
-
-
-
-
-
73
9,200
-
-
-
-
53
7,120
,774
128,8
53,62
0 6,
028,3
94
18,78
9,000
49
,009,5
26
19,63
1,897
92
,286,7
22
64,79
9,858
22
,928,6
45
15,32
9,175
41
,210,5
28
27,39
9,171
19
,733,7
60
31,12
0,478
Lia
bilitie
sBil
ls pay
able
4,98
1,983
16
6,066
1,
162,4
63
2,32
4,925
1,
328,5
29
-
-
-
-
-
-
-
-
-
Borro
wings
48,30
3,412
23
4,381
36
8,146
9,
724,1
81
2,54
0,060
5,
539,4
00
7,77
6,811
4,
720,0
46
26,29
2 44
,687
13,22
1,857
54
0,672
2,
387,8
95
1,17
8,984
De
posit
s and
othe
r acc
ounts
431,4
23,82
2 21
7,192
,381
9,13
5,642
21
,400,6
84
19,14
7,079
29
,458,6
73
25,35
8,911
35
,103,0
94
13,99
5,688
56
,559,6
28
2,13
3,228
(1
5,603
) 1,
954,4
17
-
Subo
rdina
ted de
bt 7,
492,8
00
-
-
-
-
-
-
1,00
0 -
1,
000
2,00
0 5,
493,6
00
1,99
5,200
-
Lia
bilitie
s aga
inst a
ssets
subje
ct to
finan
ce le
ase
-
-
-
-
-
-
-
-
-
-
-
-
-
-
Defer
red ta
x liab
ilities
- net
1,08
3,590
-
-
-
5,
722
(70,2
76)
(3,58
7) (9
9,650
) (9
9,702
) (4
2,802
) 11
0,765
17
6,412
15
9,820
94
6,888
Ot
her li
abiliti
es 19
,875,8
38
3,33
4,684
-
-
38
5,097
10
,561,1
65
266,2
83
502,4
14
101,1
65
700,8
28
1,77
8,734
1,
311,4
59
827,3
29
106,6
80
513,1
61,44
5 22
0,927
,512
10,66
6,251
33
,449,7
90
23,40
6,487
45
,488,9
62
33,39
8,418
40
,226,9
04
14,02
3,443
57
,263,3
41
17,24
6,584
7,
506,5
40
7,32
4,661
2,
232,5
52
Net a
ssets
23,95
9,329
(9
2,073
,892)
(4,63
7,857
) (1
4,660
,790)
25,60
3,039
(2
5,857
,065)
58,88
8,304
24
,572,9
54
8,90
5,202
(4
1,934
,166)
23,96
3,944
19
,892,6
31
12,40
9,099
28
,887,9
26
Share
capit
al - n
et 10
,119,2
42
Rese
rves
1,99
1,169
Su
rplus
on re
valua
tion o
f a
ssets
- net
of tax
3,24
7,593
Un
appro
priate
d profi
t 7,
029,2
51
Non-c
ontro
lling i
nteres
t 52
8,446
22
,915,7
01

339 Annual Report 2020
Notes to the Consolidated Financial StatementsFor the year ended December 31, 2020
Matur
ity of
asse
ts an
d liab
ilities
- bas
ed on
contr
actua
l matu
rities
of as
sets
and l
iabilit
ies of
the B
ank
2019
Ove
r 1
Ove
r 7
Ove
r 14
Ove
r 1
Ove
r 2
Ove
r 3
Ove
r 6
Ove
r 9
Ove
r 1
Ove
r 2
Ove
r 3
Upto
1
to 7
to 14
da
ys to
1 to
2 to
3 to
6 to
9 m
onths
to 1
to 2
to 3
to 5
Ove
r 5
Total
da
y da
ys da
ys m
onth
mon
ths
mon
ths
mon
ths
mon
ths
yea
r y
ears
yea
rs y
ears
years
------
------
------
------
------
------
------
------
------
------
------
------
------
------
------
------
------
------
------
------
- Rup
ees in
‘000
-----
------
------
------
------
------
------
------
------
------
------
------
------
------
------
------
------
------
------
------
--
Asse
ts
Cash
and b
alanc
es w
ith tre
asury
bank
s 25
,590,1
73
25,59
0,173
-
- -
- -
- -
- -
- -
-
Balan
ces w
ith ot
her b
anks
476,3
02
476,3
02
- -
- -
- -
- -
- -
- -
Lend
ing to
finan
cial in
stitut
ions
30,32
0,540
-
- -
28,03
7,915
2,
000,0
00
154,1
59
- -
- 12
8,466
-
- -
Inves
tmen
ts 14
3,124
,623
- 28
,164,8
02
- 37
,843,4
25
465,0
80
15,70
6,004
4,
945,5
73
1,61
6,458
17
7,474
20
,654,6
25
8,00
3,353
2,
260,9
68
23,28
6,861
Adva
nces
243,2
85,30
8 85
,571,5
96
1,36
2,955
1,
547,9
81
5,10
8,573
16
,502,4
80
11,19
7,698
18
,301,4
71
5,73
0,118
11
,227,1
45
27,46
7,362
26
,540,8
65
19,52
5,477
13
,201,5
87
Fixed
asse
ts 10
,693,9
45
3,94
1 23
,255
27,13
2 62
,014
253,9
08
115,2
32
343,5
68
339,9
80
335,1
95
1,29
1,426
1,
143,9
93
2,37
5,452
4,
378,8
49
Intan
gible
asse
ts 2,
302,4
74
280
1,67
7 1,
957
4,47
2 10
6,130
8,
386
24,97
9 24
,841
24,82
9 97
,819
96,37
1 19
2,919
1,
717,8
14
Defer
red ta
x ass
ets - n
et 12
5,857
-
- -
(1,29
1) 30
,869
56,85
0 35
4,806
35
4,413
32
,583
18,22
3 16
5,503
12
,706
(898
,805)
Othe
r ass
ets 17
,524,2
49
14,45
3,316
-
- -
- 50
1,432
-
95,45
7 -
789,2
63
411,1
60
81,86
4 1,
191,7
57
Asse
ts he
ld for
sale
374,0
00
- -
- -
- -
374,0
00
- -
- -
- -
473,8
17,47
1 12
6,095
,608
29,55
2,689
1,
577,0
70
71,05
5,108
19
,358,4
67
27,73
9,761
24
,344,3
97
8,16
1,267
11
,797,2
26
50,44
7,184
36
,361,2
45
24,44
9,386
42
,878,0
63
Liabil
ities
Bills p
ayab
le 3,
804,4
91
3,80
4,491
-
- -
- -
- -
- -
- -
-
Borro
wings
54,46
8,283
79
7,376
29
,889,8
29
85,92
4 1,
204,8
36
7,82
8,925
5,
239,3
54
4,69
3,216
17
4,347
19
,224
207,8
39
2,12
0,779
1,
179,5
49
1,02
7,085
Depo
sits a
nd ot
her a
ccou
nts 36
8,543
,603
166,1
68,66
0 8,
285,7
05
7,04
7,887
26
,021,3
00
20,51
6,154
26
,780,4
62
29,67
0,550
20
,422,0
18
53,71
9,267
6,
673,4
36
1,51
5,724
1,
722,4
40
-
Subo
rdina
ted de
bt 7,
494,8
00
- -
- -
- -
600
400
1,00
0 2,
000
2,00
0 7,
488,8
00
-
Liabili
ties a
gains
t ass
ets su
bject
to fin
ance
leas
e -
- -
- -
- -
- -
- -
- -
-
Defer
red ta
x liab
ilities
- net
- -
- -
- -
- -
- -
- -
- -
Othe
r liab
ilities
20,02
4,982
2,
492,7
61
12,19
7 14
,229
220,5
75
9,14
6,741
58
3,198
27
7,733
22
1,422
80
1,705
2,
334,7
90
1,76
9,553
1,
741,8
81
408,1
97
454,3
36,15
9 17
3,263
,288
38,18
7,731
7,
148,0
40
27,44
6,711
37
,491,8
20
32,60
3,014
34
,642,0
99
20,81
8,187
54
,541,1
96
9,21
8,065
5,
408,0
56
12,13
2,670
1,
435,2
82
Net a
ssets
19,48
1,312
(4
7,167
,680)
(8,63
5,042
) (5
,570,9
70)
43,60
8,397
(1
8,133
,353)
(4,86
3,253
) (1
0,297
,702)
(12,65
6,920
) (4
2,743
,970)
41,22
9,119
30
,953,1
89
12,31
6,716
41
,442,7
81
Share
capit
al - n
et 10
,119,2
42
Rese
rves
1,74
9,672
Surpl
us on
reva
luatio
n of
ass
ets - n
et of
tax 1,
308,5
31
Unap
propri
ated p
rofit
5,79
5,596
Non-c
ontro
lling i
nteres
t 50
8,271
19,48
1,312
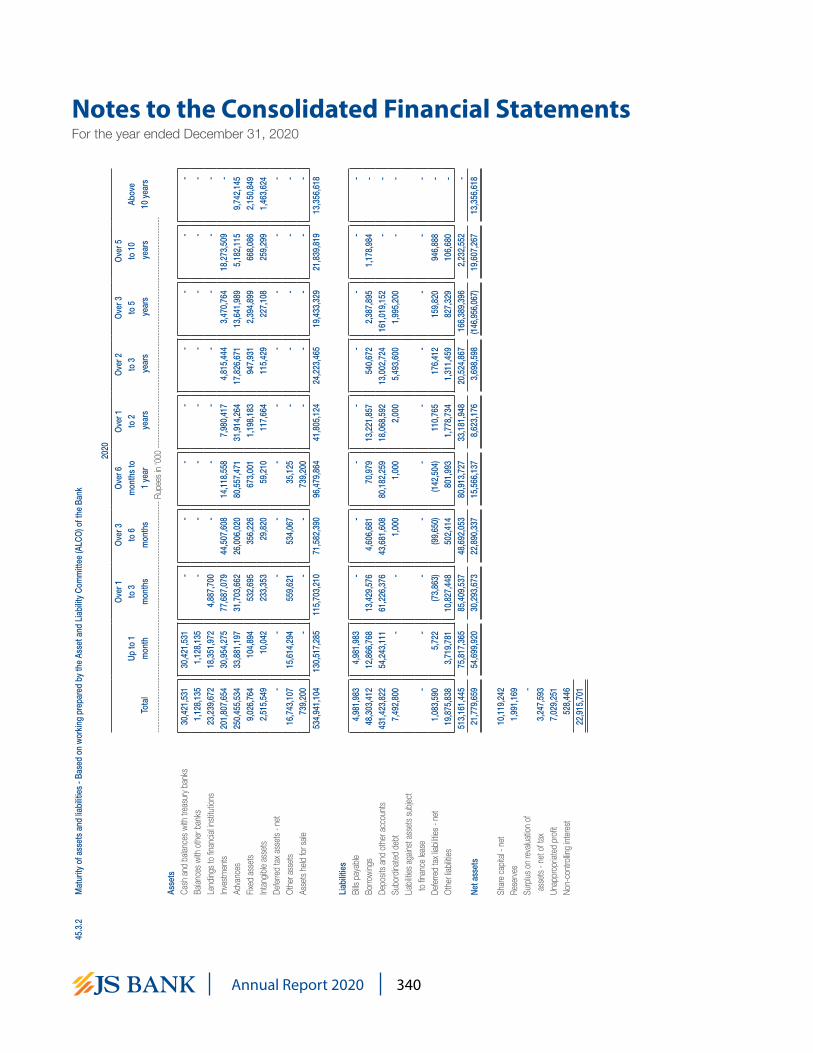
340Annual Report 2020
Notes to the Consolidated Financial StatementsFor the year ended December 31, 2020
45.3.
2Ma
turit
y of a
ssets
and l
iabilit
ies -
Base
d on w
orkin
g prep
ared b
y the
Ass
et an
d Liab
ility C
ommi
ttee (
ALCO
) of t
he B
ank
2020
Ove
r 1
Ove
r 3
Ove
r 6
Ove
r 1
Ove
r 2
Ove
r 3
Ove
r 5
Up t
o 1
to 3
to 6
mon
ths t
o to
2 to
3 to
5 to
10
Abo
ve
Total
m
onth
m
onth
s m
onth
s 1
year
y
ears
yea
rs y
ears
yea
rs 10
year
s ---
------
------
------
------
------
------
------
------
------
------
------
------
------
--- R
upee
s in ‘
000 -
------
------
------
------
------
------
------
------
------
------
------
------
------
-----
Asse
tsCa
sh an
d bala
nces
with
treas
ury ba
nks
30,42
1,531
30
,421,5
31
- -
- -
- -
- -
Balan
ces w
ith ot
her b
anks
1,12
8,135
1,
128,1
35
- -
- -
- -
- -
Lend
ings t
o fina
ncial
institu
tions
23,23
9,672
18
,351,9
72
4,88
7,700
-
- -
- -
- -
Inves
tmen
ts20
1,807
,654
30,95
4,275
77
,687,0
79
44,50
7,608
14
,118,5
58
7,98
0,417
4,
815,4
44
3,47
0,764
18
,273,5
09
- Ad
vanc
es25
0,455
,534
33,88
1,197
31
,703,6
62
26,00
6,020
80
,557,4
71
31,91
4,264
17
,826,6
71
13,64
1,989
5,
182,1
15
9,74
2,145
Fix
ed as
sets
9,02
6,764
10
4,894
53
2,695
35
6,226
67
3,001
1,
198,1
83
947,9
31
2,39
4,899
66
8,086
2,
150,8
49
Intan
gible
asse
ts 2,
515,5
49
10,04
2 23
3,353
29
,820
59,21
0 11
7,664
11
5,429
22
7,108
25
9,299
1,
463,6
24
Defer
red ta
x ass
ets -
net
- -
- -
- -
- -
- -
Othe
r ass
ets 16
,743,1
07
15,61
4,294
55
9,621
53
4,067
35
,125
- -
- -
- As
sets
held
for sa
le 73
9,200
-
- -
739,2
00
- -
- -
- 53
4,941
,104
130,5
17,28
5 11
5,703
,210
71,58
2,390
96
,479,8
64
41,80
5,124
24
,223,4
65
19,43
3,329
21
,839,8
19
13,35
6,618
Liabil
ities
Bills
paya
ble
4,98
1,983
4,
981,9
83
- -
- -
- -
- -
Borro
wing
s 48
,303,4
12
12,86
6,768
13
,429,5
76
4,60
6,681
70
,979
13,22
1,857
54
0,672
2,
387,8
95
1,17
8,984
-
Depo
sits a
nd ot
her a
ccou
nts43
1,423
,822
54,24
3,111
61
,226,3
76
43,68
1,608
80
,182,2
59
18,06
8,592
13
,002,7
24
161,0
19,15
2 -
- Su
bordi
nated
debt
7,49
2,800
-
- 1,
000
1,00
0 2,
000
5,49
3,600
1,
995,2
00
- -
Liabil
ities a
gains
t ass
ets su
bject
to fin
ance
leas
e -
- -
- -
- -
- -
- De
ferred
tax l
iabiliti
es -
net
1,08
3,590
5,
722
(73,8
63)
(99,6
50)
(142
,504)
110,7
65
176,4
12
159,8
20
946,8
88
- Ot
her li
abiliti
es 19
,875,8
38
3,71
9,781
10
,827,4
48
502,4
14
801,9
93
1,77
8,734
1,
311,4
59
827,3
29
106,6
80
- 51
3,161
,445
75,81
7,365
85
,409,5
37
48,69
2,053
80
,913,7
27
33,18
1,948
20
,524,8
67
166,3
89,39
6 2,
232,5
52
- Ne
t ass
ets 21
,779,6
59
54,69
9,920
30
,293,6
73
22,89
0,337
15
,566,1
37
8,62
3,176
3,
698,5
98
(146
,956,0
67)
19,60
7,267
13
,356,6
18
Share
capit
al - n
et 10
,119,2
42
Rese
rves
1,99
1,169
Su
rplus
on re
valua
tion o
f -
ass
ets -
net o
f tax
3,24
7,593
Un
appro
priate
d profi
t 7,
029,2
51
Non-
contr
olling
inter
est
528,4
46
22,91
5,701

341 Annual Report 2020
Notes to the Consolidated Financial StatementsFor the year ended December 31, 2020
2019
Ove
r 1
Ove
r 3
Ove
r 6
Ove
r 1
Ove
r 2
Ove
r 3
Ove
r 5
Up t
o 1
to 3
to 6
mon
ths to
to
2 to
3 to
5 to
10
Abo
ve
Total
m
onth
mon
ths
mon
ths
1 ye
ar y
ears
yea
rs y
ears
yea
rs 10
years
---
------
------
------
------
------
------
------
------
------
------
------
------
------
------
-----
Rupe
es in
‘000
-----
------
------
------
------
------
------
------
------
------
------
------
------
------
------
--As
sets
Cash
and b
alanc
es w
ith tre
asury
bank
s 25
,590,1
73
25,59
0,173
-
- -
- -
- -
- Ba
lance
s with
othe
r ban
ks 47
6,302
47
6,302
-
- -
- -
- -
- Le
nding
to fin
ancia
l insti
tution
s 30
,320,5
40
30,19
2,074
-
- 12
8,466
-
- -
- -
Inves
tmen
ts 14
3,124
,623
66,00
8,226
16
,171,0
85
4,94
5,573
1,
793,9
32
20,65
4,625
8,
003,3
53
2,26
0,968
23
,286,8
61
- Ad
vanc
es 24
3,285
,308
24,26
2,803
31
,273,8
01
24,73
3,994
76
,279,4
19
27,46
7,362
26
,540,8
65
19,52
5,477
3,
898,6
57
9,30
2,930
Fix
ed as
sets
10,69
3,945
11
6,342
36
9,140
34
3,568
67
5,175
1,
291,4
26
1,14
3,993
2,
375,4
52
1,70
7,232
2,
671,6
17
Intan
gible
asse
ts 2,
302,4
74
8,38
6 11
4,516
24
,979
49,67
0 97
,819
96,37
1 19
2,919
25
4,190
1,
463,6
24
Defer
red ta
x ass
ets -
net
125,8
57
(1,29
1) 87
,719
354,8
06
386,9
96
18,22
3 16
5,503
12
,706
(386
,519)
(512
,286)
Othe
r ass
ets 17
,524,2
49
14,67
6,639
50
1,432
-
95,45
7 78
9,263
41
1,160
(1
41,45
9) 1,
191,7
57
- As
sets
held
for sa
le 37
4,000
-
- 37
4,000
-
- -
- -
- 47
3,817
,471
161,3
29,65
4 48
,517,6
93
30,77
6,920
79
,409,1
15
50,31
8,718
36
,361,2
45
24,22
6,063
29
,952,1
78
12,92
5,885
Liabil
ities
Bills
paya
ble
3,80
4,491
3,
804,4
91
- -
- -
- -
- -
Borro
wing
s 54
,468,2
83
31,97
7,964
13
,068,2
80
4,69
3,216
19
3,571
20
7,839
2,
120,7
79
1,17
9,549
1,
027,0
85
- De
posit
s and
othe
r acc
ounts
368,5
43,60
3 43
,373,1
22
52,17
5,941
36
,130,8
12
81,51
3,876
18
,875,6
34
12,49
1,223
12
3,982
,995
- -
Subo
rdina
ted de
bt 7,
494,8
00
- -
600
1,40
0 2,
000
2,00
0 7,
488,8
00
- -
Liabil
ities a
gains
t ass
ets su
bject
to fin
ance
leas
e -
- -
- -
- -
- -
- De
ferred
tax l
iabiliti
es -
net
- -
- -
- -
- -
- -
Othe
r liab
ilities
20,02
4,982
2,
739,7
62
9,72
9,939
27
7,733
1,
023,1
27
2,33
4,790
1,
769,5
53
1,74
1,881
40
8,197
-
454,3
36,15
9 81
,895,3
39
74,97
4,160
41
,102,3
61
82,73
1,974
21
,420,2
63
16,38
3,555
13
4,393
,225
1,43
5,282
-
Net a
ssets
19,48
1,312
79
,434,3
15
(26,4
56,46
7) (1
0,325
,441)
(3,32
2,859
) 28
,898,4
55
19,97
7,690
(1
10,16
7,162
) 28
,516,8
96
12,92
5,885
Share
capit
al - n
et 10
,119,2
42
Rese
rves
1,74
9,672
Su
rplus
on re
valua
tion o
f a
ssets
- ne
t of ta
x 1,
308,5
31
Unap
propri
ated p
rofit
5,79
5,596
No
n-co
ntroll
ing in
teres
t 50
8,271
19
,481,3
12
45.3.
3To
iden
tify th
e beh
aviou
ral m
aturit
ies of
non-
cont
ractu
al as
sets
and l
iabilit
ies, th
e Gro
up ha
s use
d the
follo
wing
meth
odolo
gy:
For d
eterm
ining
the c
ore po
rtion o
f non
contr
actua
l liabil
ities (
non-
volat
ile po
rtion),
the G
roup h
as us
ed th
e ave
rage m
ethod
whe
reby a
verag
e bala
nce m
aintai
ned o
ver p
ast fi
ve ye
ar ha
s bee
n clas
sified
as co
re an
d has
been
plac
ed
in ‘ov
er 3 t
o 5 ye
ars’ m
aturity
buck
et. N
on co
ntrac
tual a
ssets
and r
emain
ing vo
latile
portio
n of n
on co
ntrac
tual lia
bilitie
s hav
e bee
n stra
tified
in re
levan
t matu
rity bu
cket
using
buck
et wi
se pe
rcenta
ges d
eterm
ined b
y usin
g ave
rage
volat
ility in
resp
ectiv
e peri
od / b
ucke
t.

342Annual Report 2020
Notes to the Consolidated Financial StatementsFor the year ended December 31, 2020
45.4 Operational risk
The Group currently uses Basic Indicator Approach to Operational Risk for regulatory capital calculations. We define operational risk as the risk of loss resulting from inadequate or failed internal processes, people and system or from external events. With the evolution of Operational Risk Management into a separate distinct discipline, the Group’s strategy is to further strengthen its risk management system along new industry standards. Accordingly ,the Group has set up a separate Operational Risk Management (ORM) Unit. ORM Unit resides within Risk Management Group (RMG). Its responsibility is to implement Operational Risk management tools across the Group for effective measurement and monitoring of operational risk faced by different areas of the Group.
The Group’s operational risk management process involves a structured and uniform approach across the bank. It includes risk identification and assessments, the monitoring of Key Risk Indicators (KRIs) and Risk Control Self-Assessment (RCSA) activities for key operational risks. In order to build a robust operational risk monitoring mechanism, an Operational Risk Steering Committee (ORSC) has been constituted to effectively address operational risk issues.
The Group has implemented a comprehensive “Operational Risk Management Framework” which has also been approved by the Board of Directors. The purpose of bank-wide Operational Risk Management Framework is aimed at laying out clearly defined roles and responsibilities of individuals / units across different functions of the Group that are involved in performing various operational risk management tasks. Operational risk is much more pervasive in a financial institution and every operating unit is exposed to operational risk, regardless of whether it is a business or a support function. This framework has been devised to explain the various building blocks of the operational risk management processes, and their inter-relationships. The framework also captures both qualitative and quantitative guidelines for managing and quantifying operational risks across the Group.
The ORM Unit conducts operational risk profiling for all major operational areas of the Group and assists various functions of the bank in developing KRIs which are monitored against predefined thresholds. Findings from KRIs are used as predictive indicators of potential operational risks.
Operational risk incidents and loss data collection is governed by Group’s Operational Risk Management Policy and process documents which have been developed and implemented to collate operational losses and near misses in a systematic and organized way.
The Group’s Business Continuity (BCP) Policy includes risk management strategies to mitigate inherent risks and prevent interruption of mission critical services caused by disaster events. The resilience of BCP is tested and rehearsed on an annual basis by the Group.
46. DERIVATIVE RISK
The policy guidelines for taking derivative exposures are approved by the Board of Directors (BOD). The Holding Company’s Asset & Liability Committee (ALCO) is responsible for reviewing and managing associated risks of the transactions.
The nature, scope and purpose of derivatives business, for trading purposes or hedging purpose and the types of derivative in which they deal.
The overall responsibility for offering derivative products and sustaining profitability lies with the Treasurer and in his absence with his delegate. The Market Risk nit / Treasury Middle Office of the Holding Company responsible for measurement & monitoring of the market risk exposures, analysis of present and potential risk factors.

343 Annual Report 2020
Notes to the Consolidated Financial StatementsFor the year ended December 31, 2020
The Market Risk Unit also monitors associated Credit, Market and Liquidity Risk in line with Board of Directors approved limit framework. The unit coordinates with the business regarding approvals for derivatives risk limits and produces various reports / analysis for ALCO / BRMC on periodic basis. These reports provide details of outstanding un-hedged positions, profitability and status of compliance with limits. Treasury Operations records derivatives activity in the Bank’s books and is responsible for reporting to the SBP.
The derivative transaction such as Cross Currency Swaps carries credit risk which is the risk that a party to a derivative contract will fail to perform its obligation. There are two types of credit risk associated with derivative transactions; 1) settlement, and 2) pre-settlement risk. The Holding Company’s Central Credit Committee is responsible for reviewing and managing associated Counterparty Credit Risks of the transaction.
The Holding Company has also entered into Foreign Currency & Commodity Options from its Wholesale Banking Branch Bahrain for market making activities. The Bank can hedge its risk by taking on & off-balance sheet position in interbank market, where available.
47. CUSTOMER SATISFACTION AND FAIR TREATMENT
The Holding Company is committed to providing its customers with the highest level of service quality and satisfaction. The Holding Company has established an independent Customer Experience function that oversees customer care, branch services, contact centre, customer insights and business conduct. The Holding Company’s Complaint Handling Policy and Grievance Redressal Mechanism ensure that complaints are resolved in a timely manner and recurrence of complaints is prevented where possible. Customers have the option of registering their complaints at the Holding Company’s branches, contact center, The Holding Company’s website or via email.
The complaint handling policy and grievance redressal mechanism ensures that complaints are resolved in a timely manner and recurrence of complaints is prevented where possible. Customers have the option of registering their complaints at our Branches, contact centre, the Holding Company’s website and via email. Complaint management process is kept as transparent as possible through registration, acknowledgement, interim response where applicable and resolution of complaints. Customers are also given the option of contacting the Banking Mohtasib office in case they are dissatisfied with the response received from the Holding Company.
To create enhanced visibility of the recourse mechanism available to its customers, the Holding Company has incorporated awareness messages of its complaint handling function in several customer communications such as account statements, ATM screens and SMS messages. Complete grievance redressal mechanism, touchpoints and online feedback forms have been made available through the Holding Company’s website, and email broadcasts have been sent to the customers for customer education and awareness.
Fair Treatment of Customers is an integral part of our corporate culture. The Holding Company has institutionalized a ‘Consumer Protection Framework’. Our priority is to keep customer benefits in mind while designing, selling and managing products and services, without any discrimination. Our focus is to maintain fairness in our customer dealings, clarity in communication, develop a service culture and design an effective grievance handling mechanism. We also focus on financial literacy of our customers, for promoting responsible conduct and informed financial decisions by consumers, through our consumer education and Financial Literacy Program.

344Annual Report 2020
Notes to the Consolidated Financial StatementsFor the year ended December 31, 2020
48. RECLASSIFICATION
Corresponding figures have been re-arranged and re-classified to reflect more appropriate presentation of events and transactions to enhance comparability with the current period’s financial statements, which are as follows:
ReclassifiedFrom To Rs. in ‘000
Statement of financial position Other liabilities Other assets
Others Credit card settlement 32,027Others Inter bank fund
transfer settlement (91,642)Others Others 290,068
Statement of financial position Other assets Other liabilities
Mark to market gain Mark to market loss on derivative instruments on derivative instruments (491)Mark to market gain on Mark to market loss on forward foreign exchange forward foreign exchangecontracts contracts (375,227)
Cashflow Statement Cash Flow from Operating ActivitiesOther liabilities Other assets (1,748,987)
49. GENERAL
49.1 These consolidated financial statements have been prepared in accordance with the revised format for financial statements of Banks issued by the SBP through BPRD Circular no. 2 dated January 25, 2018 and related clarifications / modifications.
49.2 The figures in these consolidated financial statements have been rounded off to the nearest thousand.
50. DATE OF AUTHORISATION FOR ISSUE
These consolidated financial statements were authorized for issue by the Board of Directors of the Holding Company in their meeting held on February 24, 2021.
__________________President and
Chief Executive Officer
___________________Chief Financial Officer
___________Director
___________Director
___________Chairman

345 Annual Report 2020
Annexure I
S.No.
Name andaddress of the
borrower
Name of individuals/partners/ directors
(with CNIC No.)
Father’s/Husband’s
name
Outstanding Liabilities at beginning of year Principal Interest/ Other financial Total
Principal Interest/Mark-up
Otherthan Interest/
Mark-upTotal written-off
Mark-upwritten-off/
waived
relief provided (9+10+11)
1 2 3 4 5 6 7 8 9 10 11 12-------------------------------------------------------- Rupees in ‘000 --------------------------------------------------------
1 Mahboob Hussain Mahboob Hussain Mubashir Ali 9,327 729 386 10,442 - 729 386 1,115 House No. 263, Measuring 05 Marlas, Situated at Block A, Street 11, Rawalpindi Press Club Cooperative Housing Society (Media Town), Rawalpindi.
37405-0502581-5
2 Sabir Hussain Sabir Hussain Ali Madad 10,596 1,163 472 12,231 - 1,163 472 1,635 Immovable Property Bearing Residential Flat No. A-205, On 2nd Floor, Admeasuring 1480 Square Feet, Project Known As “Shaes Residency”, 1/9Th Undivided Share Of Sub-Plot No.Fl-4/A-V, of Plot No. Fl-4, Block No.3-A, Situated At KDA Scheme No.36, Gulistan-e-Jauhar, Karachi.
42201-9527166-5
3 Abdul Ghaffar Abdul Ghaffar Basher Ahmed 13,856 798 284 14,938 - 798 284 1,082 Flat No.A-204, 2nd Floor, Admeasuring 1000 Square Feets, Building Known As “Clifton Garden-1”, 1/4th undivided Share Of Sub Plot No.A-4, of Plot No.Fl-1, Block-3, Situated At Kda Scheme No.5, Kehkashan Clifton, Karachi.
42301-0882280-1
4 Iqbal Ahmed Iqbal Ahmed Sharfuddin 22,658 7,766 70 30,494 - 6,580 70 6,650 Immovable Property Bearing Residential Plot Town House No.9, Fl-12, Admeasuring 280 Square Yards, Block-5, Situated At Kda Scheme No.5, Clifton, Karachi.
42301-3811362-3
5 Naveed Naiyar Hussain Naveed Naiyar Hussain Naiyar Hussain 117,090 34,576 - 151,666 - 18,666 - 18,666 Immovable Property Bearing Residential Double Storied Bungalow Constructed on Plot of Land No. D-37, Admeasuring 925 Square Yards, Block 9, KDA Scheme No. 5, Kehkashan Clifton, Karachi.
42301-4883876-9
6 Muhammad Ayub Muhammad Ayub Muhammad Yaqoob 12,905 3,465 68 16,438 - 1,299 68 1,367 House 19, Measuring 01 Kanal, Situated at Block-J, Phase 6, Defence Housing Authority, Lahore.
35201-9838927-3
7 Jinsung International (Private) Limited Syed Asghar Ali Shah Syed Bagh Ali Shah 12,413 5,644 - 18,057 - 2,023 - 2,023 279 Q Block, Commerciaol Area, 27637-4875875-1DHA Phase II, Lahore. Muhammad Sarfraz Ahmed Muhammad Sarwar
31303-3942323-3Maryam Zehra Shah Syed Asghar Ali Shah27637-4783110-4
8 Kissan Supplies Muhammad Mushtaq Butt Muhammad Yousaf Butt - 15,694 - 15,694 - 11,894 - 11,894 8-Km, Sardar Town, Raiwind Road, Lahore. 34104-1969246-5
Muhammad Waqas Butt Dost Muhammad Ali34104-2285573-9Muhammad Mushtaq Butt Irfan Ali34101-9002563-4
9 Kohsar Industries Lal Chand Relumal - 5,847 - 5,847 - 3,846 - 3,846 Plot No. H5-B, Site Area, Kotri. 44203-9781662-5
Haraish Kumar Haraish Kumar41306-7572470-3
10 Rehman Metal Atiq ur Rehman Muhammad Rafique 20,000 5,096 - 25,096 - 4,096 - 4,096 Gala Maher Aziz ur Rehman Chan Link Sheikhupura Road Gujranwala.
34101-2535196-7
11 Regent Agroventure Omar Danial Baweja Mahmood Baweja 7,764 2,082 - 9,846 - 1,281 - 1,281 H No. 44 Khayaban-e-Badr Phase 5 DHA Karachi.H No. 82 Khayaban-e-Sehr Street No 30,DHA Phase 6, Karachi.
42301-3857295-9Fiza Ahmed Omar Danial Baweja42301-5766535-8
TOTAL: 226,609 82,860 1,280 310,749 - 52,375 1,280 53,655
* Relief includes amounts which would be due to the Bank under contractual arrangements whether or not accrued in the books.

346Annual Report 2020
Annexure - II
Accumulated depreciation
Written down value
Saleproceeds
Mode ofdisposal
Buyers’ particulars and relationship with Bank (if any)Particulars Cost Gain
--------------------------------- Rupees in ‘000 --------------------------------
Electrical, office and computer equipmentCommunication Equipment 1,615 869 746 778 32 Insurance Name EFU General Insurance Limited - related party,
Address 1st Floor, Kashif Centre, Main Shahra-e-faisal, Karachi
Office Machines and Equipments 5,006 3,415 1,591 1,954 363 Insurance Name EFU General Insurance Limited - related party,Address 1st Floor, Kashif Centre, Main Shahra-e-faisal, Karachi
Computer 1,529 1,423 106 512 406 Insurance Name EFU General Insurance Limited - related party,Address 1st Floor, Kashif Centre, Main Shahra-e-faisal, Karachi
8,150 5,707 2,443 3,244 801
VehiclesToyota Corolla 2,405 460 1,945 2,750 805 Insurance Name EFU General Insurance Limited - related party,
Address 1st Floor, Kashif Centre, Main Shahra-e-faisal, Karachi
Honda Motorcycle 107 17 90 90 - Insurance Name EFU General Insurance Limited - related party,Address 1st Floor, Kashif Centre, Main Shahra-e-faisal, Karachi
Honda Motorcycle 124 7 117 124 7 Insurance Name EFU General Insurance Limited - related party,Address 1st Floor, Kashif Centre, Main Shahra-e-faisal, Karachi
Honda Motorcycle 110 23 87 100 13 Insurance Name EFU General Insurance Limited - related party,Address 1st Floor, Kashif Centre, Main Shahra-e-faisal, Karachi
Honda Motorcycle 104 83 21 75 54 Insurance Name EFU General Insurance Limited - related party,Address 1st Floor, Kashif Centre, Main Shahra-e-faisal, Karachi
2,850 590 2,260 3,139 879
The Subsdiary CompaniesVehicles
Honda City 1,922 1,922 - 1,922 1,922 Dispoal Name Afham Elahi Usmani
Total 12,922 8,219 4,703 8,305 3,602
As at December 31, 2020As referred to in note 11.2.2 to the unconsolidated and consolidated financial statementsDetails of disposal of fixed assets made to related parties

347 Annual Report 2020
Branch Network
SINDHKARACHI Shaheen Complex Branch 111 572 265- 021-32610928 & 021-32272569-92
26th Street Dha Phase V Branch 021-35304685
Bahadarabad Branch 021-34922802/05
Boat Basin Branch 021-35177903/4
Chase Store Jail Chowrangi Branch 021-34370270-71
Cloth Market Branch 021-32464042 - 47
Dehli Colony Branch 021-35168646/8
DHA Phase VIII Branch 021-35171731/33/ 0345-8211949/0345-8211951
Electronic Market Branch 021-32700430-437
Fisheries Branch 021-32384011-14
Garden East Branch 021-32244281-284
Garden West Branch 021-32240093/7
Gulistan-E-Jauhar Branch 021-3466 2002-4-6
Gulshan Chowrangi Branch 021-34833290-5
Gulshan-E-Hadeed Branch 021-34715201-3
Gulshan-E-Iqbal Branch 021-34829055-60-61
Hawksbay Road Branch 021-32373030-32
Ibrahim Hyderi Branch 0346-1012281
Jheel Park Branch 021-34544831-35
Jodia Bazar Branch 021-32435304-06
Branch Stock Exchange 021-32462851/54
Khadda Market Dha Phase V Branch 021-35242401-4
Kh-E-Ittehad Dha Phase II Ext Branch 021-35313811-4
Kh-E-Shahbaz Dha Phase Vi Branch 021-35243416/15
Korangi Industrial Area Branch 021-35052416, 021-35055826-7, 021-35052773-5
Korangi Rd Dha Phase I Branch 021-35803541/46
Lucky Star Branch 021-35622434-39
Nazimabad Branch 021-36612325
New Challi Branch 021-32602100
New Sabzi Mandi Branch 0345-8211641-43
North Branch Ind Area Branch 021-36962912/11/15
North Napier Road Branch 021-32467791-94
North Nazimabad Branch 021-36721010/4
Ocean Tower 021-35166601-6
Orangi Town Branch 021-36697925-30
Paposh Nagar Branch 021-36700071-3
Park Towers Clifton Branch 021-35832011/ 021-35369525
Progressive Centre Sh-E-Faisal Branch 021-34324682-5
Safoora Goth Branch 021-34661805-15
Shah Faisal Colony Branch 021-34686191-94
Shahrah-E-Faisal Branch 021-34373240
Site Branch 021-32550082-84
Soldier Bazar, Branch 021-32244531-33
Teen Talwar Branch 021-35835867 / 021-35856974 / 021-35873279
The Center Saddar Branch 021-35165563/7
Timber Market Branch 021-32763079
Urdu Bazar Branch (AWT Plaza) 021-32603073-77
Zamzama Branch 021-35295221-4
HYDERABAD Anaj Mandi Branch 022-2638802
Citizen Colony Branch 022-2100893-91

348Annual Report 2020
Cloth Market Branch 022-2618271
DHA Branch 022-2108078
Kohsar, Branch 022-3400913-14
Latifabad Branch 022 3817984
Latifabad Unit No VI Branch 022-3422521-6
Qasimabad Branch 022-2652190-92
Saddar Branch 022-2730925-26-32
Site Branch 022-3885192-93
SUKKUR Military Road Branch 071-5630825-32
Shaheed Gunj Branch 071-5627482
Society Branch 071-5815210
Badin Branch 0297-861203
Behar Colony Kotri Branch 022 3410507-09
Bhiria City Branch 0242-432131/35
Chambar Branch 022 -3897032-35-36
Daharki Branch 0723-641290
Digri Branch 023-3870245
Ghotki Branch 072-3600484
Jamshoro Branch 022-3878103-104, 022-3878109
Kandhkot Branch 072-2573048
Kashmore Branch 0722-577705-7
Khairpur Branch 024-3715316-18
Khipro Branch 0235-879071-74
Kot Ghulam Muhammad Branch 0233-866242-4
Kunri Branch 023-8558163-66
Larkana Branch 074-4058603
Maatli Branch 029-7841514
Mehar Branch 025-4730307-308-309
Mirpur Khas Branch 023-3876001-4
Mirpur Mathelo Branch 0723-663315
Mithi Branch 0232-261650
Moro Branch 0242-413200
Nawabshah Branch 024-4330564
Nowshero Feroz Branch 0242-448415-16-18
Pano Aqil Branch 071-5809304
Sanghar Branch 023-5800163
Sehwan Shareef Branch 025-4620305/7
Shahdadkot Branch 074-4013169
Shahdadpur Branch 023-5581523-18
Sheikh Bhirkio Branch 0345-8211923/24
Shikarpur Branch 072-6540374-75
Sultanabad Branch 022-3404106-7
Tando Adam Branch 023-5571880-85
Tando Allah Yaar Branch 022-3892001/4
Tando Jam Branch 022-2765612-14
Tando Mohammad Khan Branch 022-3340594/022-3340617-8
Thatta Branch 029-8550934
Umer Kot Branch 023-8570156-59
BALOCHISTANGawadar Branch 086-4210246
Khuzdar Branch 0848-550334-336
Loralai Branch 0824-410104
MA Jinnah Road Branch 081-2865503-04
Muslim Bagh Branch 0823-66933-36
Ormara Branch 086-3310142-0-3
Quetta Cantt Branch 081-2863335

349 Annual Report 2020
Turbat Branch 085-2414201-4
Zarghoon Road Branch 081-2472981-2
Zhob Branch 0822-412027028
PUNJABLAHORE Air Port Road DHA Devine Mega Branch 042-35700081-84
Allama Iqbal Town Branch 042-37805026-37804479
Azam Cloth Market Branch 042-37671195-96
Badami Bagh Branch 042-37946853/54
Baghbanpura Branch 042-36858873/74
Bahria Town Branch 042-35976212-14
Brandreth Road Branch 042 3738 1316 /9 /
Cavalry Branch 042-36610282-87
Chowburji Branch 042-37362981/8
Circular Road Branch 042-37667921/24
College Road Township Branch 042 -35117491-3
Daroughawala, Branch 042-36530311-15
DHA Block ‘’T” Phase 2 Branch 042-35707651/6
DHA Phase 3 III Block “Y” Branch 0423-5898010-11
DHA Phase VI Branch 042-37180745
Ferozepur Road Branch 042-35402151-53
Gulberg Branch 042-35771036-38
Gulshan Ravi Branch 042-35464541- 45
Gulyana Branch 053-7588459
Ichra Bazar Branch 042-37428406 / 08
Johar Town Branch 042-35241088/89
Mandi Faizabad Branch 056-2882081-83
Mcleod Road Branch 042-36311176
MM Alam Road Branch 042 -35778721 /24
Model Town Branch 042-35915613/14
Mughalpura Branch 042-36533818-822
New Garden Town Branch 042-35940463-67
PECO Road Branch 042-35203014-13
Raiwind Road Branch 042-35291247-70
Shadbagh Branch 042-37604549-51
Shadman Branch 042-37503712/20
Shah Alam Market Branch 042-37375734-37
Shahdara Branch 0423-7931903-5
State Life Cooperating Housing Society Branch 042-35474163
Sundar Industrial Estate Branch 0311-0013425-26
The Mall Branch 042-36285673-75
Upper Mall Branch 042-35776515-18/35776530
Urdu Bazar Branch 042-37115915 /7,20
Valancia Society Branch 042-35226045-47
Walton Road Branch 042-0556-333151
Wapda Town Branch 042- 35182877-74-75
Zarar Shaheed Road Branch 042-36639902-05
GUJRANWALA Bank Square Gujranwala II Branch 055-4234401-3
GT Road Branch 055-3257363/055-3257365/ 055-3254407
Sheikhupura Road Branch 055-4233855-56
Wapda Town Branch 055-4285571
FAISALABAD Ghulam Mohammad Abad Branch 041-2692192-94-97
Grain Market Branch 041-2633382/84
Gulistan Colony Branch 041-8785791-5

350Annual Report 2020
Jaranwala Branch 041-4313032-35
Karkhana Bazar Branch 041-2624501-3
Liaquat Road Branch 041 2541284-86
Satiana Road Branch 041-8556382/84
SIALKOT Cantt Sailkot Branch 052-4272351/53
Gohadpur Branch 052-4265498-99
Kashmir Road Sialkot Branch 052-4272703-04-05
Paris Road Sialkot Branch 052-4266535-6
Pasroor Road Nekapura Branch 052-3543582-4
Shahabpura Sialkot Branch 052-3242681/84
Ugoki Branch 052-3513953/54
MULTAN Abdali Road Branch 061-4574363/4574496/97
Bosan Road Branch 061-6223416 /17
Vehari Road Branch 061-6241102-4
Wapda Town Phase I Branch 061-6524733-38
Mailsi Branch 067-3370163
RAWALPINDI Air Port Cop Housing Society (AECHS) Branch 051-5497012-15
Bahria Town Phase IV Rawalpindi Branch 051-5731351-4
Bahria Town Phase VII Rawalpindi Branch 051-5154891-4
Bank Road Branch 051-5120731-3
Chaklala Scheme 3 Branch 051-5766277-78
Chakri Road Branch 051-5129024
GHQ Branch 051-5202354-55
Gulberg Geen Islamabad Road Branch 0310-5998931
Jinnah Road Branch 051 5778560-62-64
Kurri Road Branch 051-4930342/43/45
Peshawar Road Branch 051-5492873-75
Range Road Rawalpindi Cant Branch 051-5128871,051-5128875
RCCI Industrial Estate Rawat Branch 0345-8210861/71
Saidpur Road Branch 051-5768049/51/53
Satellite Town Branch 051-4264187-86, 4842991,
ISLAMABAD Blue Area Branch 051 111 572 265 & 051 281 0121/4
Bara Kahu Branch 051-2165032-7
Dha Phase II Islamabad Branch 051-5161525
F-10 Markaz Branch 051-2112960/61
F-11, Islamabad Branch 051-2103404-402
F-7 Markaz Branch 051-2653901/4-051-2608404/05
F-8 Markaz Branch 051-2818296-98
G-11 Markaz Branch 051-2363475/77
G-15 Markaz Branch 051-2160240-41
G-8 Islamabad Branch 051-2340537-8
I-8 Markaz Branch 051-4862471-2
I-9 Markaz Branch 051-4431296/8
Islamabad Stock Exchange Branch 051-2894407/09
Khanna Pul Branch 051-4478006/07
NPF O-9 Pwd Road Branch 051-5170584-5
Tarlai Branch 051-2241860-4-66
Wah Cantt Islamabad 051-4256308/309
Agrow Chishtian Branch 0345-8233957
Arifwala Branch 0457-835478-81
Bahawalnagar Branch 063-2279435/38

351 Annual Report 2020
Bahawalpur Branch 062-2889176/78
Bhakkar Branch 0453-510407-9
Burewala Branch 067-3770363/65
Chak 89 Dist Sahiwal Branch 040-4550409/10/11/16
Chak#72 Rahim Yar Branch 068-5708072
Chichawatni Branch 040 5481792/95
Chiniot Branch 047-633259192
Daska Branch 052-6610461/63
Depalpur Branch 044-4542246-49
DG Khan Branch 064-2470952/56
Dharanwala Branch 063-2440080
Dinga Branch 053-7401368
Ghakkhar Mandi Branch 055-3882556-59,055-3882561
Gojra Branch 046-3513637/40
GT Road Gujrat Branch 053-3729479-76
Hafizabad Branch 0547-583249-252,276
Haroonabad Branch 063-2250615
Hasilpur Branch 062-2441302-1310-1308
Jhang Branch 047-7652941 /43
Kacheri Chowk Branch 053-3600584-6
Kamoki Barnch 055-6810282-83-85
Kasur Chandni Chowk Branch 049 2761581-84
Khanewal Branch 065-2557491-93
Kharian Branch 0537-602781-84
Lala Musa Branch 0537-519656/8
Layyah Branch 0606-415045/47
Lodhran Branch 0608-361892/93/96
Luddon Road Branch 067-3351443 ,0673351441
Mandi Bahauddin Branch 0546-509452-53-55
Mian Channu Branch 065-2661282-85
Mouza Gajju Hatta Shujabad Branch 061-4396082-9
Mouza Kachi Jamal Khanpur Branch 068-5577191-195
Mouza Parhar Sharqi Kot Addu Branch 066-2240146-49
Muridke Branch 042 37166454-7
Muzaffargarh Branch 066-2424691-92
Nankana Sahab Branch 056-2877503-504
Narowal Branch 0542-411271/73
Okara Branch 044-2528728-30
Pak Pattan Sharif Branch 045-7352591-93-94
Pattoki Branch 049-4424053-4
Qaboola Dist Pak Pattan Branch 045-7851248-51
Rabwa Branch 047-6214042/44
Rahimyar Khan Branch 068 5879511/14
Sadiqabad Branch 068-5803933/38
Sahiwal Branch 040 4222733/35
Sambrial Branch 052-6524106/07
Sargoodha Branch 048-3768123/24/25
Shiekhupura Branch 056 3810273/6
Taunsa Sharif Branch 064-2601155 EXT 107
Toba Tek Singh Branch 046- 2512052-55
Vehari Branch 067-3360715/18
Wazirabad Branch 055-6605841-4
KPKPESHAWAR Dabgari Garden Branch 091-2591425-7
Fakhr-E-Alam Road Branch 091-5279981/4
Gallanai Branch
GT Road Peshawar Branch

352Annual Report 2020
091-2593901/4
Naz Cinema Branch 091-2211024-26
Ring Road Peshawer Branch 0310-5998903-01
Shakas Khyber Agency Branch 091-5602382-83-85
University Road Peshawar Branch 091-5711573/75
Abbottabad Branch 099-2416110/12/13/14
Attock Branch 057-2610500,057-2610480, 057-2610780
Bafa Branch 0997-389232-233
Bannu Branch 0928-6601673
ChakDara Branch 0945-703334-8
Chakwal Branch 054-3554319/22
Charsadda Branch 091-6512051-55
Chitral Branch 0943-413027-29
Dara Adam Khel (FR Kohat) Branch 0922-180187
DI Khan Branch 0966-733216
Dir Upper Branch 0944-880190
Haripur Branch 099-5627370
Jhelum Branch 0544 611840 -3
Mansehra Branch 0997-301882-4
Mardan Branch 0937-873445/ 0937-873647
Mingora Branch 0946-711740/43
Nowshera Branch 092-3612004
Nowshera Saleh Khana Branch 0923-651113-17
Parachinar Branch 092-6311777
Shaidu, Nowshera Branch 0923-510013-14
Talagang District Chakwal Branch 0543-662574
Taxila Branch 0514-535315-17
Timergara Branch 0945-821921
Topi Branch 0938-272005
AZAD JAMMU & KASHMIR (AJK)Bagh Branch 0345-8210861/71
Chaksawari Branch 05827-454791-94
Charohi Branch 0582-6415474-76
Chillas Branch 05812-450657
Dadyal Branch 05827-465668
Gilgit Branch 05811-450615/6
Jatlan Branch 05827-404391-2
Khui Ratta Branch 058-26414907
Kotli Branch 05826-448228/31
Mirpur Branch 5827448867-70
Muzaffarabad Branch 05822-923251-2
Naarr Branch 058-26420784-85
Sehensa Branch 058-26422779-058-26422300
Seri Branch 058-26-432731/3
Skardu Branch 05815-457404-05
INTERNATIONAL BRANCHBahrain Branch 00973-17104603

353 Annual Report 2020
Pattern of Shareholding
S.No. No. of Shareholders Shareholdings Total Shares Held
1 576 Shareholding From 1 to 100 7,126
2 606 Shareholding From 101 to 500 245,221
3 606 Shareholding From 501 to 1,000 569,139
4 1,258 Shareholding From 1,001 to 5,000 3,637,821
5 409 Shareholding From 5,001 to 10,000 3,262,407
6 613 Shareholding From 10,001 to 50,000 14,826,099
7 113 Shareholding From 50,001 to 100,000 9,246,040
8 102 Shareholding From 100,001 to 500,000 20,464,402
9 17 Shareholding From 500,001 to 1,000,000 12,790,081
10 40 Shareholding From 1,000,001 to 1,297,464,262 1,232,415,926
Total 4,340 Percentage: 100% 1,297,464,262
As at December 31, 2020

354Annual Report 2020
Pattern of ShareholdingAs at December 31, 2020
Particulars Shares Held Percentage %
Directors and their spouse(s) and minor childrenMr. Kalim-ur-Rahman 1,500,001 0.12Mr. Adil Matcheswala 200,000 0.02Mr. Ashraf Nawabi 1 0.00Mr. G.M.Sikander 1 0.00Mr. Munawar Alam Siddiqui 1 0.00Ms. Nargis Ghaloo 33,001 0.00Mr. Hassan Afzal 1 0.00Mr. Sohail Aman 1 0.00Mr. Basir Shamsie 1 0.00Mrs. Safia Munawar 185,000 0.01Mrs. Hafsa Shamsie 1,132,320 0.09Sub-Total 3,050,328 0.24
Associated companies, undertakings and related partiesJahangir Siddiqui & Co. Limited 973,307,324 75.02
Executives 1,002 0.00
NIT & ICP 972 0.00
Banks, development finance institutions, non-banking finance companies, 172,451 0.01
Insurance Companies 19,509,194 1.50
Modarabas and Mutual Funds 9,216,143 0.71
Foreign Investors 11,104 0.00
Others 140,346,465 10.82
Individual - Local 151,849,279 11.70
Totals 1,297,464,262 100.00
Details of the transactions carried out by the Directors, Chief Executive Officer, Chief Financial Officer, Company Secretary and their spouse and minor children during the period from January 01, 2020 to December 31, 2020.
None of the Directors, CEO, CFO and Company Secretary their spouse and minor children during the year Januray 01, 2020 to December 31, 2020 carried out transactions in the shares of the bank, except Ms. Hafsa Shamsie spouse of Mr. Basir Shamsie who purchase 804,000 shares of the Bank and Ms. Safia Munawar spouse of Mr. Munawar Alam who purchase 30,000 shares of the Bank.

355 Annual Report 2020
Notice of Fifteenth Annual General MeetingNotice is hereby given that the Fifteenth Annual General Meeting (“AGM”) of the shareholders of JS Bank Limited (the “Bank”) will be held on Monday, March 29, 2021 at 10:00 a.m. 15th Floor, The Centre, Plot No. 28, SB-5, Abdullah Haroon Road, Saddar, Karachi to transact the following business:
ORDINARY BUSINESS:i. To receive, consider and adopt the Annual
Audited Standalone and Consolidated Financial Statements of the Bank for the year ended December 31, 2020 together with the Directors’ and Auditors’ Reports thereon.
ii. To appoint Bank’s Auditors for the year ending December 31, 2021 and fix their remuneration. The term of the present auditors Messrs. EY Ford Rhodes, Chartered Accountants, (a member firm of Ernst & Young Global Limited) shall expire at the AGM and cannot, in compliance of the Listed Companies (Code of Corporate Governance) Regulations, 2019, be re-appointed as having completed a term of five years. The Board of Directors, on the suggestion of the Audit Committee of the Bank, has recommended KPMG Taseer Hadi & Co., Chartered Accountants as auditors for the year 2021.
SPECIAL BUSINESS:i. To consider and if thought fit, approve the
conversion of Term Finance Certificates (“TFCs”), rated, privately placed, unsecured and subordinated TFCs of PKR 3,000 Million (TFC-I; issued on December 14, 2016) and PKR 2,000 Million (TFC-II; issued in December 29, 2017) of JS Bank Limited (the “Bank”) into common shares if (i) directed by State Bank of Pakistan (“SBP”) on the occurrence of a point of non-viability as determined by SBP, pursuant to the ‘Instructions for Basel III Implementation in Pakistan’ issued by the SBP, subject to a maximum of 467,836,257 in respect of TFC-I and 319,982,544 in respect of TFC-II additional ordinary shares to be issued respectively, and which ordinary shares shall be issued other than by way of rights in accordance with Section 83(1)(b) of the Companies Act, 2017.
The resolutions to be passed by the members as Special Resolutions are as under:
“Resolved that with respect to the Tier-II capital raised by JS Bank Limited (the “Bank”) in the amount of up to PKR 3,000,000,000/- (Pak Rupees Three Billion) in the form of rated, privately placed and unsecured, subordinated, Term Finance Certificates (“TFC-I”) as approved by the Board of Directors on August 25, 2016, and in accordance with the ‘Instructions for Basel III Implementation in Pakistan’ (“Basel III Regulations”) issued by the State Bank of Pakistan (“SBP”) under BPRD Circular No. 06 dated August 15, 2013, as amended from time to time, regarding loss absorbency, in the event SBP exercises its option to convert the TFC-I into ordinary shares of the Bank upon the occurrence of a Point of Non-Viability (“PONV”), such ordinary shares shall be issued, subject to the approval of the Securities and Exchange Commission of Pakistan (“SECP”), other than by way of rights in accordance with Section 83(1)(b) of the Companies Act, 2017 (the “Act”), subject to a maximum of 467,836,257 shares, or such other number as may be agreed to in consultation with the SBP (“TFC-I Additional Shares”).”
“Further resolved that with respect to the Tier-II capital raised by the Bank in the amount of up to PKR 2,000,000,000/- (Pak Rupees Two Billion) in the form of rated, privately placed, listed, unsecured and subordinated Term Finance Certificates (“TFC-II”) as approved by the Board of Directors on September 27, 2017, and in accordance with the ‘Instructions for Basel III Implementation in Pakistan’ (“Basel III Regulations”) issued by the SBP under BPRD Circular No. 06 dated August 15, 2013, as amended from time to time, regarding loss absorbency, in the event SBP exercises its option to convert the TFC-II into ordinary shares of the Bank upon the occurrence of a PONV, such ordinary shares shall be issued, subject to the approval of the SECP, other than by way of rights in accordance with Section 83(1)(b) of the Act, subject to a maximum of 319,982,544 shares, or such other number as may be agreed to in consultation with the SBP(“TFC-II Additional Shares”).”

356Annual Report 2020
“Further resolved that any two of the President & CEO, Chief Operating Officer, Chief Financial Officer and Company Secretary of the Bank be and are hereby authorized to take all steps necessary, ancillary, and incidental to the above-mentioned resolutions, as and when required, and are further authorized to sign, execute, and deliver all necessary documents, agreements, and letters on behalf of the Bank, as may be deemed appropriate and as may be required for the purposes above-mentioned.”
ii. To approve the remuneration paid to the Directors of the Bank for attending Board and Board‘s Sub-Committees meetings on post facto basis in terms of Prudential Regulation No. G-1 C(2) by passing the following ordinary resolution:
“Resolved that the remuneration of PKR 250,000/- per meeting payable to the Directors of the Bank for attending Board meetings and PKR 150,000 per meeting payable to the Directors for attending Board‘s Sub-Committees meetings, be and is hereby approved.”
By Order of the Board
Ashraf ShahzadKarachi: March 8, 2021 Company Secretary
Notes:a) Share transfer books of the Bank will remain
closed from March 22, 2021 to March 28, 2021 (both days inclusive). Transfers received in order at Bank’s Independent Share Registrar, CDC Share Registrar Services Limited, CDC House, Shahra-e-Faisal, Karachi at the close of business on March 21, 2021 will be treated in time for purpose of attending and vote at the Meeting.
b) A member of the Bank entitled to attend, and vote may appoint another member as his/her proxy to attend and vote instead of him/her.
c) Proxies must be received at the Registered Office of the Bank not later than 48 hours before the time of the Meeting.
d) Beneficial owners of the shares registered in the name of CDC Share Registrar Services Limited (CDCSRSL) and/or their proxies will have to follow the following guidelines as laid down by the Securities and Exchange Commission of Pakistan:
For Attending the Meeting• In case of Individuals, the account holder and/or
sub-account holder whose registration details are uploaded as per the CDC Regulations, shall authenticate his/her identity by showing his/her original CNIC or original Passport along with Participant ID number and the account number at the time of attending the Meeting.
• In case of corporate entity, the Board’s resolution / power of attorney with specimen signature of the nominee shall be produced (unless it has been provided earlier) at the time of the Meeting.
• Members whose names are appearing in the register of members as of 21 March, 2021 are entitled to attend and vote at the meeting.
• The proceedings of the AGM shall also be held online through video link.
• The members who wish to attend the Annual General Meeting through video link are requested to get themselves registered by sending the particulars prescribed in the table below at the following email address [email protected] by the close of business hours (5:00pm) on March 26, 2021.
Name of member
Authorised
Representative (in case of corporate member)
CNIC No. /NTN No.
CDC Participant ID / Folio No.
Cellphone #
Email address
• The Video Conference Link would be emailed to the registered members or their proxies who have provided all the requested information.
For Appointing Proxies• In case of individuals, the account holder and/or
sub-account holder whose registration details are uploaded as per the CDC Regulations, shall submit the proxy form as per above requirements.
• The proxy form shall be witnessed by two persons, whose names, addresses and CNIC numbers shall be mentioned on the form.
357 Annual Report 2020
• Attested copies of the CNIC or the passport of beneficial owners and the proxy shall be furnished with the proxy form.
• The proxy shall produce his original CNIC or original passport at the time of the Meeting.
• In case of corporate entity, the Board’s resolution / power of attorney with specimen signature shall be furnished (unless it has been provided earlier) along with proxy form to the Bank.
• Shareholders are requested to notify immediately for any change in their address to the Bank Registrar.
Notice to Shareholders who have not provided CNIC:The Companies (Distribution of Dividends) Regulations, 2017 requires that the dividend warrants should bear the Identification Number which includes: (i) in the case of a registered shareholder or an authorized person, the Computerized National Identity Card Numbers (CNIC); (ii) in the case of a minor, child registration number or juvenile card number; and (iii) in the case of corporate shareholders registration number or national tax number. The Identification Number of the shareholders is, therefore, mandatory for the issuance of dividend warrants and in the absence of such information, payment of dividend may be withheld in terms of the Companies (Distribution of Dividends) Regulations, 2017. Therefore, the shareholders who have not yet provided their Identification Numbers advised to provide their Identification Numbers (if not already provided) directly to our Independent Share Registrar at the address given herein above without any further delay.
Placement of Financial StatementsThe Bank has placed the annual Audited Financial Statements for the year ended December 31 2020, along with the Auditors and Directors Reports on its website: www.jsbl.com.
Mandate for E-DIVIDENDS for shareholdersUnder the provisions of Section 242 of the Companies Act, 2017, it is mandatory for a listed Company to pay cash dividend to its shareholders only through electronic mode directly into bank account designated by the entitled shareholders. In order to receive dividends directly into their bank account,
shareholders are requested to fill in Electronic Credit Mandate Form available on Company’s website and send it duly signed along with a copy of CNIC to the Registrar of the Company M/s. CDC Share Registrar Services Limited, CDC House, Shahra-e-Faisal, Karachi in case of physical shares. In case shares are held in CDC then Electronic Credit Mandate Form must be submitted directly to shareholder’s broker/participant/CDC account services.
Deduction of Income Tax from Dividend at Revised RatesPursuant to the provisions of the Finance Act deduction of income tax from dividend payments shall be made on the basis of filers and non-filers as follows:
S.No Nature of Shareholders Rate of deduction
1 Filers of Income Tax Return 15%2 Non-Filers of Income Tax Return 30%
Income Tax will be deducted on the basis of Active Tax Payers List posted on the Federal Board of Revenue website.
Members seeking exemption from deduction of income tax or are eligible for deduction at a reduced rate are requested to submit a valid tax certificate or necessary documentary evidence, as the case may be.
E-Voting Pursuant to SECP S.R.O. No. 43(I)/2016 dated January 22, 2016, members can also exercise their right to vote through e-voting by giving their consent in writing at least 10 days before the date of meeting to the Bank on the appointment by the Intermediary as a Proxy.
Provision of Video Link Facility Shareholders may participate in the meeting via video-link facility. If the Bank receives a demand (at least 7 days before the date of meeting) from shareholder(s) holding an aggregate 10% or more shareholding residing in any other city, to participate in the meeting through video link, the Company will arrange video link facility in that city.
Shareholders, who wish to participate through video-link facility, are requested to fill in ‘Video Link Facility Form’ available at Bank’s website and send a duly signed copy to the Registered Address of the Company.

358Annual Report 2020
Distribution of Annual Report The audited financial statements of the Bank for the year ended December 31, 2020 have been made available on the Company’s website (http://www.jsbl.com/) in addition to annual and quarterly financial statements for the prior years.
Further, Annual Report of the Bank for the year ended December 31, 2020 is dispatched to the shareholders through CD. However, if a shareholder, in addition, requests for hard copy of Annual Audited Financial Statements, the same shall be provided free of cost within seven days of receipt of such request. For convenience of shareholders, a “Standard Request Form for provision of Annual Audited Accounts” has also been made available on the Bank’s website (http://www.jsbl.com/).
Statement Under Section 134(3) of the Companies Act, 2017
This statement sets out the material facts pertaining to the special business to be transacted at the Annual General Meeting of JS Bank Limited (the “Bank”) to be held on March 29, 2021.
Conversion of Tier –II Term Finance Certificates of PKR 3,000 million (TFC-I) and/or PKR 2,000 million (TFC-II) into common shares.
The Bank on December 14, 2016 and December 29, 2017 issued rated, privately placed, unsecured, subordinated and non-cumulative Term Finance Certificates (“TFCs”) of PKR 3,000 million (TFC-I) and PKR 2,000 million (TFC-II) respectively, as Tier-II Capital. The State Bank of Pakistan (“SBP”), through Banking Policy and Regulation Department Circular No. 06 dated August 15, 2013 (“SBP Circular”), prescribes a “loss absorbency” feature for it to be qualified as Tier-II capital instruments, pursuant to which the TFCs will be converted into ordinary shares of the Bank at the Point of Non-Viability (“PONV”) trigger event as defined in the Basel III regulations. In accordance with the requirements of the SBP Circular, the Bank has agreed with the SBP for the issuance of common shares against TFC-I and TFC-II in case of the occurrence of a conversion event as per the terms of the TFCs and SBP Circular (“Conversion Events”).
The relevant portion of the SBP Circular relating to “loss absorbency” is reproduced below:
“A-5-3 Loss Absorbency of Non-Equity Capital Instruments at the Point of Non-Viability
i. The terms and conditions of all non-CET1 and Tier 2 instruments issued by banks must have a provision in their contractual terms and conditions that the instruments, at the option of the SBP, will either be fully and permanently converted into common share or immediately written off upon the occurrence of a non-viability trigger event called the Point of Non-Viability (PONV) as described below;
ii. The PONV trigger event is the earlier of;
a. A decision made by SBP that a conversion or temporary/ permanent write-off is necessary without which the bank would become non-viable.
b. The decision to make a public sector injection of capital, or equivalent support, without which the bank would have become non-viable, as determined by SBP.
iii. The issuance of any new shares as a result of the trigger event must occur prior to any public sector injection of capital so that the capital provided by the public sector is not diluted.
iv. The amount of non-equity capital to be converted/ written-off will be determined by the SBP.
v. Where an Additional Tier-1 capital instrument or Tier-2 capital instrument provides for conversion into ordinary shares, the terms of the instruments should include provision that upon a trigger event the investors holding 5% or more of paid-up shares (ordinary or preferred) will have to fulfill fit and proper criteria (FPT) of SBP.
vi. The conversion terms of the instruments must contain pricing formula linked to the market value of common equity on or before the date of trigger event. However, to quantify the maximum dilution and to ensure that prior shareholder/ regulatory approvals for any future issue of the required number of shares is held, the conversion method must also include a cap on the maximum number of shares to be issued upon a trigger event.
vii. The conversion method should describe and take into account the order (hierarchy of claims) in which the instruments will absorb losses in liquidation/ gone concern basis. These terms must be clearly stated in the offer documents. However, such hierarchy should not impede the

359 Annual Report 2020
ability of the capital instrument to be immediately converted or to be written off.
viii. There should be no impediments (legal or other) to the conversion i.e. the bank should have all prior authorizations (sufficient room in authorized capital etc.) including regulatory approvals to issue the common shares upon conversion.
ix. The contractual terms of all Additional Tier 1 and Tier 2 capital instruments must state that SBP will have full discretion in deciding/ declaring a bank as a non-viable bank. SBP will, however, form its opinion based on financial and other difficulties by which the bank may no longer remain a going concern on its own unless appropriate measures are taken to revive its operations and thus, enable it to continue as a going concern. The difficulties faced by a bank should be such that these are likely to result in financial losses and raising the CET1/ MCR of the bank should be considered as the most appropriate way to prevent the bank from turning non-viable. Such measures will include complete write-off/ conversion of non-equity regulatory capital into common shares in combination with or without other measures as considered appropriate by the SBP.”
As per the loss absorbency conditions, upon the occurrence of a “Point of Non-Viability” event
(“PONV”), SBP may at its option, fully and permanently convert the TFCs into common shares of the issuer, i.e. the Bank and / or have them immediately written off (either partially or in full).
In light of the above contemplated PONV events, the Bank is required to obtain all approvals for the issuance of such additional shares, which additional shares shall be issued based on the market value of the shares of the Bank, on the date of trigger of PONV as declared by the SBP, and shall be subject to a cap of 467,836,257 for TFC-I and 319,982,544 for TFC-II additional ordinary shares being issued, or such other number as may be agreed to in consultation with the SBP. It may be noted that issuance of such additional shares shall further be subject to approval of the Securities and Exchange Commission of Pakistan (“SECP”) in accordance with the proviso under Section 83(1)(b) of the Companies Act, 2017.
At the time of obtaining prior approval from SECP for conversion of TFC-I and TFC-II into ordinary shares of the Bank at the Point of Non-Viability trigger event as defined in the Basel III regulations, the SECP vide its letter dated March 16, 2020 advised the Bank to submit the revised approval from the shareholders in this regard.
The information required to be annexed to the notice is set out below:
Name and brief profile of the banks/financial institutions to whom such shares are proposed to be issued
The shares will be issued to the holders of TFC-I and/or TFC-II (at that time) in accordance with the directions of SBP at the time of trigger of PONV.
Price at which the proposed shares will be issued The price of the shares shall be issued at the market value of the shares of the Bank, on the date of trigger of PONV as declared by the SBP.
Purpose of the issue of shares other than right, utilization of the proceeds of the issue and benefits to the Bank and its shareholders with necessary details
To convert the outstanding TFC-I and/or TFC-II (in whole or part) into shares of the Bank, as per the directions of the SBP.
Existing shareholding of the banks / financial institutions to whom the proposed shares will be issued
Not Applicable
Total shareholding of the banks / financial institutions after the proposed issue of shares
Not Applicable
Whether the banks/financial institutions have provided written consent for purchase of such shares
The terms of the Trust Deeds for the TFC-I issue and TFC-II issue contain the details regarding such conversion.

360Annual Report 2020
Justification as to why proposed shares are to be issued otherwise than rights and not as rights shares
This is in accordance with the requirements of the SBP vide its Circular No. 6 of Banking Policy and Regulation Department dated August 15, 2013 and further directions of SBP in this matter.
Justification, with details of the latest available market price and break-up value per share, if such price differs from par value.
Not Applicable
Details of the average market price during the last 3 (three) months and 6 (six) months preceding the board announcement as well as the latest available market price.
Not Applicable
The shares issued will rank pari passu in all respects with the existing ordinary shares of the Bank. The issue of shares other than by way of rights is subject to approval from the SECP
The directors of the Bank, whether directly or indirectly, have no personal interest in the resolutions except in their capacity as shareholders of the Bank, to the extent of their respective shareholdings in the Bank.
To approve the remuneration paid to the Directors of the Bank for attending Board and Board‘s Sub-Committees meetings:The remuneration paid to Directors was approved by the Board of Directors in terms of Article 64 of the Articles of Association of the Bank. The remuneration requires approval (which is permissible on post facto basis) of the shareholders in the Annual General Meeting in accordance with the requirements of the Prudential Regulations (Regulation G 1 C(2)) issued by the State Bank of Pakistan.
Statement under Regulation 4 (2) of the Companies (Investment in Associated Companies or Associated Undertaking) Regulations, 2012The Bank in its Annual General Meeting held on March 27, 2020 had approved long term equity investments of up to PKR 675 million in ordinary shares of EFU Life Assurance Limited an associated company of the Bank. The resolution is valid for a period of three years commencing from March 27, 2020.
S.No
Name of Company
Total Investment approved upto PKR
Amount of Investment till Dec.
31, 2020 PKR
Reasons for not making complete investment in
the specified time
Material change in Financial Statement of Associated Company
1 EFU Life Assurance Ltd
675 million 250.7 million Time Remaining No

FORM OF PROXY15th Annual General Meeting
The Company SecretaryJS Bank LimitedShaheen Commercial ComplexDr. Ziauddin Ahmed RoadP.O. Box 4847 Karachi 74200 Pakistan
I/We __________________________ of _____________ being member(s) of JS Bank Limited holding _____________
Ordinary shares as per Register Folio No/CDC /A/c No. __________________ hereby appoint _____________________
of ___________________or failing him __________________ of _____________________ as my / our proxy to
attend, act and vote for me / us and on my / our behalf at the 15th Annual General Meeting of the Bank to be held
on March 29, 2021 and / or any adjournment thereof.
As witness my / our hand / seal this ____ day of _______________ 2021 signed by _________________________
in the presence of (name & address)
Witness:
1. Name: _________________________
Address _________________________
CNIC or _________________________ Passport No. _________________________
Signature _________________________
Witness:
2. Name: _________________________
Address _________________________
CNIC or _________________________ Passport No. _________________________
Signature _________________________
Signature on Rs. 5/- Revenue Stamp
The signature should agree with the specimen registered with the Bank

Important:
1. A member of the Bank entitled to attend and vote may appoint another member as his / her proxy to attend and vote instead of him / her.
2. The proxy form, duly completed and signed, must be received at the Office of the Bank situated at Shaheen Commercial Complex Dr. Ziauddin Ahmed Road, Karachi 74200 not less than 48 hours before the time of holding the meeting.
3. No person shall act as proxy unless he / she himself is a member of the Bank, except that a corporation may appoint a person who is not a member.
4. If a member appoints more than one proxy and / or more than one instruments of proxy are deposited by a member with the Bank, all such instruments of proxy shall be rendered invalid.
5. Beneficial Owner of the physical shares and the shares registered in the name of CDC Share Registrar Services Limited (CDCSRSL) and / or their proxies are required to produce their original Computerized National Identity Card (CNIC) or Passport for identification purposes at the time of attending meeting. The Form of proxy must be submitted with the Bank within the stipulated time, duly witnessed by two persons whose names, address and CNIC numbers must be mentioned on the form, along with attested copies of CNIC or the Passport of the beneficial owner and the proxy. In case of a corporate entity, the Board of Directors’ Resolution / Power of Attorney along with the specimen signature shall be submitted (unless it has been provided earlier along with the proxy form to the Bank).


Shaheen Commercial Complex,Dr. Ziauddin Ahmed Road,P.O Box 4867, Karachi-74200, Pakistan.UAN: (021-051)111-654-321