roumanie: pourquoi et comment diminuer l’emploi agricole dans un contexte européen?
Upload
khangminh22Category
view
0download
0
WORKING EVERY DAY IN THE INTEREST OF OUR CUSTOMERS AND SOCIETY
Bank of America conference
Xavier Musca
Crédit Agricole S.A.

EUROPEAN FINANCIALS CONFERENCE2
NOTE
The Crédit Agricole
Group scope
of consolidation
comprises: the Regional Banks, the Local
Banks, Crédit Agricole S.A. and
their subsidiaries. This is the
scope of consolidation that has
been selected by the competent
authorities to assess the
Group’s position, notably in the
recent stress test exercises.
Crédit Agricole S.A.is the listed entity,
which notably owns
the subsidiaries of its business
lines (Asset gathering, French
retail banking,
International retail banking,
Specialised financial services
and Large customers)
Disclaimer
The financial information on Crédit Agricole S.A. and Crédit Agricole Group for second quarter 2021 and first semester 2021 comprises this
presentation and the attached appendices and press release which are available on the website: https://www.credit-
agricole.com/en/finance/finance/financial-publications.
This presentation may include prospective information on the Group, supplied as information on trends. This data does not represent forecasts
within the meaning of EU Delegated Act 2019/980 of 14 March 2019 (chapter 1, article 1, d).
This information was developed from scenarios based on a number of economic assumptions for a given competitive and regulatory environment.
Therefore, these assumptions are by nature subject to random factors that could cause actual results to differ from projections. Likewise, the
financial statements are based on estimates, particularly in calculating market value and asset impairment.
Readers must take all these risk factors and uncertainties into consideration before making their own judgement.
The figures presented for the six-month period ending 30th June 2021 have been prepared in accordance with IFRS as adopted in the European
Union and applicable at that date, and with prudential regulations currently in force. This financial information does not constitute a set of financial
statements for an interim period as defined by IAS 34 “Interim Financial Reporting” and has not been audited.
Note: The scopes of consolidation of the Crédit Agricole S.A. and Crédit Agricole Groups have not changed materially since the Crédit Agricole S.A.
2020 Universal Registration Document and its A.01 update (including all regulatory information about the Crédit Agricole Group) were filed with the
AMF (the French Financial Markets Authority).
The sum of values contained in the tables and analyses may differ slightly from the total reported due to rounding.
On 30 June 2020, once all necessary regulatory approvals were secured, Amundi acquired the entire share capital of Sabadell Asset Management.
At 30 June 2021, following the buyback by Crédit Agricole Consumer Finance of 49% of the share capital of the CACF Bankia S.A. joint venture,
CACF Bankia S.A. is fully consolidated in Crédit Agricole S.A.’s consolidated financial statements.

EUROPEAN FINANCIALS CONFERENCE3
CRÉDIT AGRICOLE GROUPCRÉDIT AGRICOLE S.A.
3.2%
Crédit Agricole S.A. Coverage ratio(1)
73.6%
Crédit Agricole S.A.(1)
85.5%
Crédit Agricole Group(1)
Loans loss reserves
€10.3 bn
Loans loss reserves of Crédit Agricole
Group representing nearly seven years of
average historical cost of risk, of which 26%
is related to provisions for performing loans
for CASA, 43% for the Regional Banks,
34% for CAG
Doubtful loan ratio stable Q2/Q1
Continued increase in the coverage ratio
(1) Including the full scale of reserves for performing loans due to COVID-19. Loan loss reserves, including collective provisions. Coverage ratios are calculated based on
loans and receivables due from customers.
Doubtful loan ratio (1)
-0.1 pp/Dec. 20 +1.1 pp/March 21
2.3%
Crédit Agricole Group
stable/March 20
€20.3 bn
Crédit Agricole Group
Crédit Agricole S.A. Crédit Agricole Group
Of which €10.0 billion in the
Regional Banks
41 bp/24 bp
Crédit Agricole S.A.
Cost of proven risk historically
low,
reflecting the effectiveness of
economic support measures
Coverage ratio up Q2/Q1, among the best in
EuropeCrédit Agricole Group
CoR/loan
4 rolling quarters
CoR/loan
Annualised
25 bp/18 bpCoR/loan
4 rolling quarters
CoR/loan
Annualised
3
3.4%
Crédit Agricole S.A.
3.2%
Crédit Agricole S.A.
stable/March 21 +1.6 pp/March 21
ASSET QUALITY AND COST OF RISK
Sharp drop in cost of risk

EUROPEAN FINANCIALS CONFERENCE4
CRÉDIT AGRICOLE S.A.
Generation of regularly growing revenues over the past five years
Regular underlying revenue growth for the past 5 ans Strong fees and commissions contribution to revenues
REVENUES
Strong revenue resilience, thanks to the diversity of the universal banking model
34%
42%
12%
12%NIM
Fees
Other revenues,incl. trading
Insurance
Underlying revenue H1 2021
74%
Crédit Agricole S.A.
H1 2021 recurring revenues(2)
(1)
(1) +1 pp H1-21/12M-20(2) -2 pp H1-21/12M-20; recurring revenues are those attached to an inventory item (outstanding loans/customer assets, assets
under management) or an insurance policy (property and casualty insurance, death and disability insurance)
4,779 4,900 4,903
5,137
5,508
4,619
5,146 5,179 5,185
5,829
4,564
4,834
5,073 5,143
4,810 4,814
5,184 5,299
REVENUE : GROWTH Q /Q SINCE 2017
Q2/Q2 Q3/Q3 Q4/Q4Q1/Q1

EUROPEAN FINANCIALS CONFERENCE5
CRÉDIT AGRICOLE GROUP CRÉDIT AGRICOLE S.A.
GROUP DEVELOPMENT MODEL
Constantly renewed organic growth potential
RB Insurance
equipment rate8
+1.7 pp vs end 2019
+6.2 pp vs end 2018
42.4%
LCL
Insurance
equipment rate8
+1.2 pp vs end 2019
+2.5 pp vs end 2018
26.2%
CA Italia
Insurance
equipment rate8
+3.0 pp vs end 2019
+4.7 pp vs end 2018
18.4%
(1) Market share of UCITS in France at end December 2020 (2) End 2020, Crédit Agricole S.A. study – France – market share loans to LCL and RB households (3) End 2019, scope: annual contributions for temporary insurance for death + funeral coverage +
long-term care (4) End 2019, annual contributions collected by CAA originated by CRCA and LCL (total Group market share of 25% including 9% insured by CNP) (5) End 2020, scope: Prédica, outstandings (6) End 2019, Pacifica & La Médicale de France
Property & Casualty business, annual contributions. Market size: Argus de l’Assurance (7) Internal sources (8) Car, home, health, legal, all mobile phones or personal accident insurance
EUROPEAN FINANCIALS CONFERENCE6
CRÉDIT AGRICOLE S.A.
Continued improvement in the cost/income ratio, positive jaws effect
Underlying revenues and costs: positive jaws effect over the past five years Efficiency: improvement in underlying cost/income ratio excl. SRF: 55.3% (-2.1 pp Q2/Q2)
OPERATING EFFICIENCY
Cost-to-income 2022 MTP Target: <60%
59.9%
57.8%58.6%
57.4%
55.3%
Q2-17 Q2-18 Q2-19 Q2-20 Q2-21
2,769 2,974 3,033 2,976
3,221
4,619
5,146 5,179 5,185
5,829
Q2-17 Q2-18 Q2-19 Q2-20 Q2-21
Underlying operating expenses exc. SRF Underlying revenue
Positive jaws effect
4,2 pp
2 pp
9.9 pp
+
+

EUROPEAN FINANCIALS CONFERENCE7
* Arithmetic average of 10 major European banks publishing their RoTE: Société Générale; BNP Paribas; Banco Santander SA; UniCredit SpA; Credit Suisse AG; UBS Group AG; Deutsche Bank AG; HSBC Bank PLC; Standard Chartered Bank; Barclays Bank PLC
(1) Underlying Credit agricole S.A. RoTE calculated based on the annualised underlying net income Group share and IFRIC expenses recorded on a straight-line basis over the year
EBA stress tests, CET1 at highest
level among European G-SIBs
12.6%+4.7 pp above SREP
requirements
Profitability and financial strength at the highest levels of European standards
Solvency
(CET1 phased-in)
9.2%8.8%
8.4%
6.0%
9.7% 9.6% 9.2%
8.0%8.8% 8.9% 8.7%
8.2%
6.3%
5.2%5.6%
5.0%
9.8% 10.0%
13.2%12.5%
11.9%11.1%
12.9%
14.3%13.5%
12.7%
11.7%12.3%
11.7% 11.9%
8.9%
9.9% 10.0%9.3%
13.0%13.6%
Underlying RoTE(1) since 2017
Average of 10 major European banks * Crédit Agricole SA
2022 MTP ROTE Target: >11% ; 2022 MTP CET1 Target: 11%

EUROPEAN FINANCIALS CONFERENCE8
Contents Appendices

WORKING EVERY DAYIN THE INTEREST OFOUR CUSTOMERS ANDSOCIETY
RESULTS
FOR THE SECOND QUARTER
AND
FIRST HALF 2021

10 SECOND QUARTER AND FIRST HALF 2020 RESULTS
NOTE
The Crédit Agricole
Group scope
of consolidation
comprises: the Regional Banks, the Local
Banks, Crédit Agricole S.A. and
their subsidiaries. This is the
scope of consolidation that has
been selected by the competent
authorities to assess the
Group’s position, notably in the
recent stress test exercises.
Crédit Agricole S.A.is the listed entity,
which notably owns
the subsidiaries of its business
lines (Asset gathering, French
retail banking,
International retail banking,
Specialised financial services
and Large customers)
Disclaimer
The financial information on Crédit Agricole S.A. and Crédit Agricole Group for second quarter 2021 and first semester 2021 comprises this
presentation and the attached appendices and press release which are available on the website: https://www.credit-
agricole.com/en/finance/finance/financial-publications.
This presentation may include prospective information on the Group, supplied as information on trends. This data does not represent forecasts
within the meaning of EU Delegated Act 2019/980 of 14 March 2019 (chapter 1, article 1, d).
This information was developed from scenarios based on a number of economic assumptions for a given competitive and regulatory environment.
Therefore, these assumptions are by nature subject to random factors that could cause actual results to differ from projections. Likewise, the
financial statements are based on estimates, particularly in calculating market value and asset impairment.
Readers must take all these risk factors and uncertainties into consideration before making their own judgement.
The figures presented for the six-month period ending 30th June 2021 have been prepared in accordance with IFRS as adopted in the European
Union and applicable at that date, and with prudential regulations currently in force. This financial information does not constitute a set of financial
statements for an interim period as defined by IAS 34 “Interim Financial Reporting” and has not been audited.
Note: The scopes of consolidation of the Crédit Agricole S.A. and Crédit Agricole Groups have not changed materially since the Crédit Agricole S.A.
2020 Universal Registration Document and its A.01 update (including all regulatory information about the Crédit Agricole Group) were filed with the
AMF (the French Financial Markets Authority).
The sum of values contained in the tables and analyses may differ slightly from the total reported due to rounding.
On 30 June 2020, once all necessary regulatory approvals were secured, Amundi acquired the entire share capital of Sabadell Asset Management.
At 30 June 2021, following the buyback by Crédit Agricole Consumer Finance of 49% of the share capital of the CACF Bankia S.A. joint venture,
CACF Bankia S.A. is fully consolidated in Crédit Agricole S.A.’s consolidated financial statements.

11 SECOND QUARTER AND FIRST HALF 2020 RESULTS
Contents
Introduction
02
01 04
05
0603

12 SECOND QUARTER AND FIRST HALF 2020 RESULTS
GROUPE CRÉDIT AGRICOLE
Crédit Agricole Group key figures
(1) Underlying (see slide 52 for details of specific items), contribution to SRF +€95 million Q2/Q2 and -€102 million H1/H1; operating expenses +7.4% Q2/Q2 and +5.4% H1/H1(2) Underlying cost/income ratio excl. SRF (3) Gross negative goodwill of +€925 million in Q2, including an initial provision estimate of -€547 million, before finalisation of the PPA by end of Dec. 2021 (prudential recognition of badwill in Q4-21);
moreover, specific items as per Creval include acquisition costs for €-9 million in NIGS and Stage 1 cost of risk for €-21 million in NIGS(4) Exceptional Italian tax provisions for the non-accounting revaluation of goodwill and its amortisation
Cost/income
ratio(2)59.2%
+0.3 pp Q2/Q2
Revenues
Underlying
Operating expenses excl. SRF(1)
Cost of risk
€9,295m+8.9% Q2/Q2
-€5.504m+9.4% Q2/Q2
-€445m-63.1% Q2/Q2
Gross Operating Income €3,779m+11.2% Q2/Q2
Solvency 17.3%
+8.4ppvs. SREP
(phased- in CET1)
Q2 2021
Stated Net income
Group share€2,770m
+86.8% Q2/Q2
Underlying net income
group share€2,367m
+32.6% Q2/Q2
Specific items €403m
€18,378m+8.7% H1/H1
-€11,005m+4.7% H1/H1
-€982m-54.1% H1/H1
€6,709m+14.8% H1/H1
H1 2021
€4,524m+89.2% H1/H1
€3,967m+43.4% H1/H1
€557mof which Creval badwill(3): €321 million
and Affrancamento gain (4): €116 million

13 SECOND QUARTER AND FIRST HALF 2020 RESULTS
CRÉDIT AGRICOLE S.A.
CASA key figures
Earnings per share -
underlying
(1) Underlying (see slides 40 and 48 for details of specific items), contribution to SRF +€67 million Q2/Q2 and -€83 million H1/H1; operating expenses +5.8% Q2/Q2 and +5.0% H1/H1(2)Underlying cost/income ratio excl. SRF(3) The EPS data is shown as underlying. EPS is calculated after deducting the AT1 coupons, which are recognised in equity; see slide 60(4) Gross negative goodwill of +€925 million in Q2, including an initial provision estimate of -€547 million, before finalisation of the PPA by end of Dec. 2021 (prudential recognition of
badwill in Q4-21); moreover, specific items as per Creval include acquisition costs for €-8 million in NIGS and Stage 1 cost of risk for €-19 million in NIGS (5) Exceptional Italian tax provisions for the non-accounting revaluation of goodwill and its amortisation(6) ROTE calculated on the basis of underlying net income Group share and annualised IFRIC 21 costs (see slide page 61)
Solvency
(phased- in CET1)
Cost/income
ratio(2)
Underlying
Q2 2021
(3)
€1,968m
x 2.1 Q2/Q2
€1,615m
+46.0% Q2/Q2
€353m
0.8 €
+50.8% S1/S1
Net tangible asset value
per share€13.0
-0.2€ vs. 30/06/2020
H1 2021
Stated net income
group share
Specific Items
Underlying net income
group share
Revenues
Operating expenses excl. SRF
Gross operating income
Cost of risk
€3,014m
+89.3% H1/H1
€466m
€2,548m
+44.9% H1/H1
€11,337m
+9.8% H1/H1
€-6,414m
+4.0% H1/H1
€4,401m
+18.5% H1/H1
€-638m
-58.2% H1/H1
€5,829m
+12.4% Q2/Q2
€-3,221m
+8.3% Q2/Q2
€2,596m
+21.9% Q2/Q2
€-254m
-72.0% Q2/Q2
55.3%-2.1 pp Q2/Q2
56.6%-3.2 pp H1/H1
12.6%+4.7 pp vs. SREP
(1)
Underlying ROTE (%)
of which Creval badwill(4): €285 million
and Affrancamento gain(5): €111 million
13.6%
(1)(6)

14 SECOND QUARTER AND FIRST HALF 2020 RESULTS
GROUPE CRÉDIT AGRICOLE CRÉDIT AGRICOLE S.A.
Recovery confirmed, despite uncertainty about the crisis exit pace,
buoyant commercial activity, reflecting the Group’s support of the economy
Loan production in retail banking 15% higher than Q2-2019 pre-crisis level
905,000 new retail banking customers in first half 2021
Reported Q2/Q2 net income up 2.1x, including €353 million of specific items
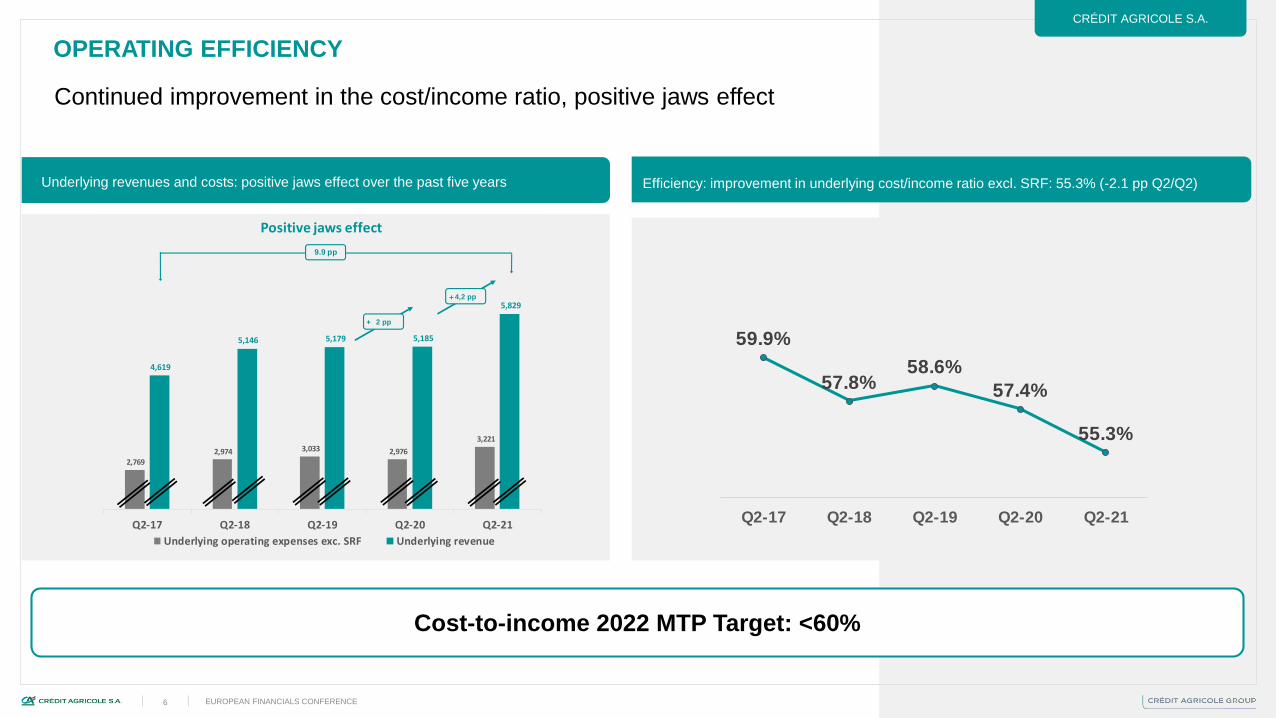
Of which +€258 million related to the acquisition of Creval by CA Italia: gross badwill of +€925 million in Q2, deduction of a first
estimate of -€547 million provisions, before finalisation of the PPA by end of Dec. 2021 (prudential recognition of badwill in Q4-21)
Of which +€111 million related to Affrancamento(1) (exceptional Italian tax provisions for non-accounting revaluation of goodwill)
Strong increase in Q2/Q2 underlying net income (+46.0%), up 30% from pre-crisis levels
Strong increase in underlying gross operating income (+21.9% Q2/Q2-20, +21.3% Q2/Q2-19)
Improvement in the cost/income ratio(2) (55.3%, -2.1 pp Q2/Q2), positive jaws effect (+4.2 pp Q2/Q2-20, +6.3 pp Q2/Q2-19)
Crédit Agricole S.A.’s cost of risk at 41 bp over four rolling quarters, continued increase in coverage ratio
Demonstrated ability to generate a high return on tangible equity in the long term
CASA underlying ROTE 13.6%(4) H1-21, well above the average of 10 major European banks over the past five years
Very robust capital position at Group level
CAG CET1 17.3%, +8.4 pp above SREP requirements. Crédit Agricole S.A. CET1 12.6%, +4.7 pp above SREP requirements
In the adverse EBA stress tests scenario, CAG phased-in CET1 is at the top level of G-SIBs, without triggering the automatic
distribution restriction mechanisms
Ongoing application to ECB for a second share buyback of up to €500 million in Q4 2021
Crédit Agricole Group joins the “Net Zero” 2050 decarbonisation initiatives
Results up sharply in all business lines, pre-crisis level exceeded
Crédit Agricole Group
+46.0%
Crédit Agricole S.A.
Growth of underlying net
income Q2/Q2
Crédit Agricole Group
Growth of underlying net
income Q2/Q2
+32.6%
€500m
Crédit Agricole S.A.
Authorisation request for
a second share buyback
in Q4 2021
55.3%
Crédit Agricole S.A.
Cost-income ratio excl.
SRF Q2 2021
KEY MESSAGES
+5.3 pp
Crédit Agricole Group
RB/LCL/CAI equipment rate
in property and casualty
insurance(3)
Dec. 2018 – June 2021
RB/LCL loan productionQ2-21/Q2-19
+15%
(1) Exceptional Italian tax measures for aligning the fiscal value of intangible assets and goodwill with their book value
(2) Underlying data, cost/income ratio excluding SRF, see slide 48 for details of specific Crédit Agricole S.A. items
(3) Equipment rate average of the Regional Banks, LCL and CA Italia for car, home, health, legal, all mobile phones and personal accident insurance, weighted by the number of individual customers of the three entities
(4) Underlying ROTE calculated on the basis of underlying net income Group share and annualised IFRIC 21 costs (see slide 61)

15 SECOND QUARTER AND FIRST HALF 2020 RESULTS
Contents
Crédit Agricole S.A. Results
summary 02
01 04
05
0603

16 SECOND QUARTER AND FIRST HALF 2020 RESULTS16
Indicators reflect the return to pre-crisis levels of customer activity each time constraints are lifted
Public authorities’ strategy of accompanying and supporting the economy allowed customer activity to
rebound, despite uncertainty about the crisis exit pace and the normalisation of the economy.
CRÉDIT AGRICOLE GROUPCRÉDIT AGRICOLE S.A.
ECONOMIC ACTIVITY
Payments from Group holders (RB + LCL - €Bn)
France – Household and business leaders’ confidence
50
60
70
80
90
100
110
2015 2016 2017 2018 2019 2020 2021
Household confidence Business sentiment
LT average
Manufacturing PMI
30
35
40
45
50
55
60
2015 2016 2017 2018 2019 2020 2021
World Euro zone France Italy

17 SECOND QUARTER AND FIRST HALF 2020 RESULTS17
Loan production(1) (RB and LCL – €bn)
Retail banking (France & Italy) gross customer capture – Crédit Agricole Group
Commercial activity strong in the Group’s business lines in Q2-2020,
back to pre-crisis level of production
906,000 new Retail banking customers in H1 2021 (647,000 Regional Bank customers)
CRÉDIT AGRICOLE GROUPCRÉDIT AGRICOLE S.A.
BUSINESS ACTIVITIES
Consumer credit production (CA
Consumer Finance – €bn)
New business Property & Casualty
insurance (CAA – in thousands of
contracts)
(*) Excluding Regional Bank state-guaranteed loans for Q2-2020
(€12.6 billion) and negligible for Q2-2021/Excluding LCL state-guaranteed
loans

18 SECOND QUARTER AND FIRST HALF 2020 RESULTS
CRÉDIT AGRICOLE S.A.
Strong revenue growth, thanks to sustained activity in all
business lines and a positive market effect
REVENUES (1/2)
CRÉDIT AGRICOLE S.A.
Q2/Q2 and H1/H1 change in underlying revenues(1), by business line Revenues up 10.3% Q2-21/Q2-20 and 10,5% Q2-
21/Q2-19 excluding scope effect(2)
Strong increase in revenues in AG, RB and SFS
AG: strong revenue growth; record level of performance fees in asset
management and dynamic insurance activity, positive market effect
LC: revenue normalisation in capital markets in a context of low volatility;
recovery in structured finance and trade
SFS: dynamic recovery of commercial production in consumer finance,
leasing and factoring
RB: buoyant activity in housing and professionals’ loans at LCL, net interest
margin supported by favourable refinancing conditions, increase in fees and
commissions income; very dynamic commercial production at CAI
CC: base effect related to intra-group eliminations (tightening of spreads in
Q2-21)
(1) Underlying: details of specific items available in slide 48(2) Scope effects Q2-21/Q2-20 +€113 million and H1-21/H1-20 +€110 million: Creval, Sabadell AM, Amundi BOC, Fund Channel, CACF NL, CAIWM Brazil and Miami, CAA Via Vita, scope
effects Q2-21/Q2-19 +€109 million and H1-21/H1-19 +€141 million: Creval, Sabadell AM, Amundi BOC, Fund Channel, CACF NL, CAIWM Brazil and Miami, CAA Via Vita, Kas Bank; S3,
CA Romania; on a like-for-like basis H1-21/H1-20 +8.8%, Q2-21/Q2-19 +10.5% and H1-21/H1-19 +11.1%
5,179 5,185
5,829
+264
-211
+51
+232
+308
Q2-19underlying
Q2-20underlying
Assetgathering
Largecustomers
SFS Retailbanking
Corporatecentre
Q2-21underlying
+12.4% €644m
+12.6% €650m
10,08110,322
11,337
+528
-31
+48+271 +198
H1-19underlying
H1-20underlying
Assetgathering
LargeCustomers
SFS Retailbanking
Corporatecentre
H1-21underlying
+9.8% €1,015m
€1,255m+12.5%
AG: Asset gathering; LC: Large customers; SFS: Specialised financial services; RB: Retail banking; CC: Corporate Centre

19 SECOND QUARTER AND FIRST HALF 2020 RESULTS
CRÉDIT AGRICOLE S.A.
Generation of regularly growing revenues over the past five years
Regular underlying revenue growth for the past 5 ans Strong fees and commissions contribution to revenues
REVENUES (2/2)
Strong revenue resilience, thanks to the diversity of the universal banking model
34%
42%
12%
12%NIM
Fees
Other revenues,incl. trading
Insurance
Underlying revenue H1 2021
74%
Crédit Agricole S.A.
H1 2021 recurring revenues(2)
(1)
(1) +1 pp H1-21/12M-20(2) -2 pp H1-21/12M-20; recurring revenues are those attached to an inventory item (outstanding loans/customer assets, assets
under management) or an insurance policy (property and casualty insurance, death and disability insurance)
4,779 4,900 4,903
5,137
5,508
4,619
5,146 5,179 5,185
5,829
4,564
4,834
5,073 5,143
4,810 4,814
5,184 5,299
REVENUE : GROWTH Q /Q SINCE 2017
Q2/Q2 Q3/Q3 Q4/Q4Q1/Q1

20 SECOND QUARTER AND FIRST HALF 2020 RESULTS
CRÉDIT AGRICOLE S.A.
6,136 6,1706,414
+99 +78 +1 +58 +8
H1-19underlyingexcl. SRF
H1-20underlyingexcl. SRF
Assetgathering
LargeCustomers
SFS Retailbanking
Corporatecentre
H1-21underlyingexcl. SRF
+4.0% €244m
+4.5% €278m
Increase in expenses linked to the recovery in activity,
variable compensation and a scope effect
EXPENSES
CRÉDIT AGRICOLE S.A.
(1) Underlying data, excluding SRF; Underlying: details of specific items on slide 48(2) Scope effects Q2-21/Q2-20 +€59 million and H1-21/H1-20 +€47 million: Creval, Sabadell AM, Amundi BOC, Fund Channel, CACF NL, CAIWM Brazil and Miami, CAA Via Vita,
scope effects Q2-21/Q2-19 +€81 million and H1-21/H1-19 +€99 million: Creval, Sabadell AM, Amundi BOC, Fund Channel, CACF NL, CAIWM Brazil and Miami, CAA Via Vita, Kas
Bank; S3, CA Romania; on a like-for-like basis H1-21/H1-20 +3.2%, Q2-21/Q2-19 +3.6% and H1-21/H1-19 +2.9%(3) Scope effect +€15 million: Sabadell AM, creation of Amundi BOC WM, Fund Channel(4) Transformation costs related to the Turbo project, CACEIS transformation and evolution plan, restated as specific items(5) Transformation costs related to the New generation network project for branch consolidation at LCL, restated as specific items
Q2/Q2 and H1/H1 change in underlying costs excluding SRF(1), by business line Costs up +6.3% Q2-21/Q2-20 and 3.6% Q2-21/Q2-19
excluding scope effect(2)
Increase in costs in the business lines compared to a
low Q2-20 marked by the crisis, and in relation to the
good performance of the business lines
AG: limited increase in insurance costs (+3.8% Q2/Q2 excluding taxes); in
asset management, excellent operating efficiency (cost/income ratio(1) at
47.6%, -5.9 pp Q2/Q2) including a +22.1% increase in costs linked to variable
compensation and a scope effect(3)
LC: low cost/income ratio (52.8%) maintained in CIB. Increase in costs
excluding SRF in CIB mainly linked to IT investments and variable
compensation; for Asset servicing, evolution of underlying costs(4) mainly
linked to the activity (+5.3%)
SFS: low cost/income ratio(1) improving (49.7%, -1.2 pp Q2/Q2)
RB: Change in underlying costs(5) under control at LCL and down at CAI
excluding scope effect, cost/income ratio(1) improving in the business line
(60.0%, -4.3 pp Q2/Q2)
AG: Asset gathering; LC: Large customers; SFS: Specialised financial services; RB: Retail banking; CC: Corporate Centre
3,033 2,976
3,221
+84 +49 +18
+75 +20
Q2-19underlyingexcl. SRF
Q2-20underlyingexcl. SRF
Assetgathering
Largecustomers
SFS Retailbanking
Corporatecentre
Q2-21underlyingexcl. SRF
+8.3% €246m
+6.2% €189m

21 SECOND QUARTER AND FIRST HALF 2020 RESULTS
CRÉDIT AGRICOLE S.A.
Continued improvement in the cost/income ratio, positive jaws effect
Underlying revenues and costs: positive jaws effect over the past five years Efficiency: improvement in underlying cost/income ratio excl. SRF: 55.3% (-2.1 pp Q2/Q2)
OPERATING EFFICIENCY
Underlying gross operating income up sharply
+21.9% Q2-21/Q2-20 and +21.3% Q2-21/Q2-19; +18.5% H1-21/H1-20
59.9%
57.8%58.6%
57.4%
55.3%
Q2-17 Q2-18 Q2-19 Q2-20 Q2-21
2,769 2,974 3,033 2,976
3,221
4,619
5,146 5,179 5,185
5,829
Q2-17 Q2-18 Q2-19 Q2-20 Q2-21
Underlying operating expenses exc. SRF Underlying revenue
Positive jaws effect
4,2 pp
2 pp
9.9 pp
+
+

22 SECOND QUARTER AND FIRST HALF 2020 RESULTS
GROUPE CRÉDIT AGRICOLE CRÉDIT AGRICOLE S.A.
3.4%
Crédit Agricole S.A.
2.5%Crédit Agricole Group
Coverage ratio(1)
73.6%
Crédit Agricole S.A.(1)
85.5%Crédit Agricole Group(1)
Loans loss reserves
€10.3bn
€20.3bn
Crédit Agricole Group’s loan loss reserves represent nearly seven years of
average historical cost of risk, of which 26% is related to provisions for
performing loans for CASA, 43% for the Regional Banks and 34% for CAG
Diversified loan book: home loans (28% CASA, 47% CAG), corporates (44%
CASA, 32% CAG) (see appendix p. 45).
69% of CASA’s corporate EAD(2) rated as investment grade (see appendix
p. 46)
NPL Q2/Q1 stable NPL ratio, sustained increase in
coverage ratio
ASSET QUALITY
1.8%
Regional Banks
102.3%
Regional Banks(1)
€10.0bn
(1) Including the full scale of reserves for performing loans due to COVID-19. Loan loss reserves, including
collective provisions. Coverage ratios are calculated based on loans and receivables due from customers.
(2) EAD (Exposure At Default) is a regulatory definition used in Pillar 3. It corresponds to the exposure in the
event of default after risk mitigation factors. It encompasses balance sheet assets plus a proportion of off-
balance sheet commitments
Crédit Agricole S.A. Regional Banks
Crédit Agricole Group
3.2%
Crédit Agricole S.A.
2.3%Crédit Agricole Group
1.7%
Regional Banks
NPL ratio (1)
+1.6 pp / March 21 +1.1 pp / March 21
+1.1 pp / March 21
stable / March 21 stable / March 21
stable / March 21

23 SECOND QUARTER AND FIRST HALF 2020 RESULTS
GROUPE CRÉDIT AGRICOLE CRÉDIT AGRICOLE S.A.
371 331
531
382
667
425
291 283199
-26 -7 -184
223
236
165
193 90
17
4
39
358 335
340
621
908
577
500
384
254
Q2-19 Q3-19 Q4-19 Q1-20 Q2-20 Q3-20 Q4-20 Q1-21 Q2-21
Others
S1&S2 CoR
S3 CoR*
Total CoR
-72%
-38%
Underlying cost of risk (CoR) broken down by Stage (in millions of euros): S1&S2: provisioning of performing loans; S3: provisioning for proven risks
Cost of proven risk historically low, reflecting the effectiveness
of economic support measures and asset quality
RISKS
-70% Q2/Q2 on S3 provisioning
41 bp (1)
Crédit Agricole S.A.
CoR/outstandings
4 rolling quarters (1)
Crédit Agricole Group
(1) The cost of risk on outstandings (in basis points) over four rolling quarters is calculated on the basis of the cost of risk for the last four quarters to which is added the average of the outstandings at the beginning of the period for the last four quarters; (2) The annualised cost of risk
on outstandings (in basis points) is calculated on the basis of the cost of risk for the quarter multiplied by four to which is added the outstandings at the beginning of the current quarter *Including non-provisioned losses. ** Includes an additional provision for the fine requested by the
AMF against Amundi
Crédit Agricole Group
Crédit Agricole Group
Crédit Agricole S.A.
-78% Q2/Q2 on S3 provisioning
24 bp (2)
CoR/outstandings
Annualised (2)
25 bp (1)
CoR/outstandings
4 rolling quarters (1)
18 bp (2)
CoR/outstandings
Annualised (2)
-34%
Crédit Agricole S.A.
588 420 602 516 785 428 334 371 172
0 -33 -87
398
424
170 651 147
234
598
384494
930
1,208
596
919
537445
Q2-19 Q3-19 Q4-19 Q1-20 Q2-20 Q3-20 Q4-20 Q1-21 Q2-21
Others
S1&S2 CoR
S3 CoR*
Total CoR
-63%
-17%
**40**

24 SECOND QUARTER AND FIRST HALF 2020 RESULTS
CRÉDIT AGRICOLE S.A.
Q2/Q2 and H1/H1 change in underlying net income(1), by business line
(1) Underlying: details of specific items available in slide 48(2) Excluding Creval scope effect
Strong increase in Q2/Q2 net income Group share,
driven by higher gross operating income and lower
cost of risk.
AG: strong increase in net income driven by very favourable markets.
Record level of performance fees in asset management and continued
development of personal insurance
LC: good performance of financing activities and normalisation of market
activities in a context of low volatility. Reversal of loan loss provisions in CIB
SFS: gross operating income up +11.4% Q2/Q2, thanks to strong growth in
commercial production; significant decrease in cost of risk; net income
+38.4% Q2/Q2
RB: strong increase in gross operating income at LCL (+21.3% Q2/Q2) and
CAI (+40.5% Q2/Q2(2)) thanks to dynamic commercial production and a
decrease in expenses excluding scope effect; net income x2
AG: Asset gathering; LC: Large customers; SFS: Specialised financial services; RB: Retail banking; CC: Corporate Centre
Net income up sharply in all business lines
NET INCOME GROUP SHARE
1,242
1,107
1,615
+103+56 +57
+174
+119
Q2-19underlying
Q2-20underlying
Assetgathering
Largecustomers
SFS Retailbanking
Corporatecentre
Q2-21underlying
+46.0% +€509m
+30.0% €373m
2,038
1,758
2,548
+258
+126+106
+210+89
H1-19underlying
H1-20underlying
Assetgathering
LargeCustomers
SFS Retailbanking
Corporatecentre
H1-21underlying
+44.9% €790m
+25.0% €510m

25 SECOND QUARTER AND FIRST HALF 2020 RESULTS
CRÉDIT AGRICOLE S.A.
* Arithmetic average of 10 major European banks publishing a ROTE: Société Générale; BNP Paribas; Banco Santander
SA; UniCredit SpA; Credit Suisse AG; UBS Group AG; Deutsche Bank AG; HSBC Bank PLC; Standard Chartered Bank;
Barclays Bank PLC
PROFITABILITY
Ongoing application to ECB for a second
share buyback of up to €500 million in Q4 21
In line with the announcement made in February 2021 on the
exceptional mechanism of the 2020 dividend payment
After these two operations(2), the earnings per share will have
increased by around 1% and the tangible net book value per
share will have been more that rebuilt.
In total, up to €1.4 billion paid in cash in 2021 (of which
approximately €900 million related to the dividend payment and
the first share buyback, carried out at 77%(3))
Demonstrated ability to generate a high return on tangible equityover the long term
(1) ROTE calculated on the basis of underlying net income Group share and annualised IFRIC 21 costs (see slide page 61)
Underlying RoTE(1) higher by at least 2.6 percentage points over the past 18 quarters
than the average of 10 major European banks publishing a ROTE
(2) And after the entire unwinding of the SWITCH by 2022(3) Proforma of the share cancellation planned for Q3 2021, the status of SBB1 at 30/06/2021 brings the number of free float shares
of Crédit Agricole S.A. to 1,333,636,601 at end-June 2021
9.2%8.8%
8.4%
6.0%
9.7% 9.6% 9.2%
8.0%8.8% 8.9% 8.7%
8.2%
6.3%
5.2%5.6%
5.0%
9.8% 10.0%
13.2%12.5%
11.9%11.1%
12.9%
14.3%13.5%
12.7%
11.7%12.3%
11.7% 11.9%
8.9%
9.9% 10.0%9.3%
13.0%13.6%
Underlying RoTE(1) since 2017
Average of 10 major European banks * Crédit Agricole SA

Smart Business Corporates(4)
Climate transition rating involving 8,000 corporate customers
A plan for employment integration of the young : €25
million for employment, solidarity and financial support
major partner of the public 1jeune1solution platform
Non-banking services for young people(3)
Climate change issues integrated into the activities of the business lines
OUR SOCIETAL PROJECT
(1) Extel/Institutional Investors ranking: 1st place in the SRI & Sustainability ranking 2019. Including Group liquidity portfolio: €11 billion in socially responsible securities (2) 28% market share (3) Youzful platform to assist young people in their orientation and employment. (4) Programme
dedicated to helping SMEs and small businesses identify their transformation challenges (business, digital and environmental) and design ad hoc solutions (5) SCPI, OPCI and SCI ISR or solidarity-based SCI. Spirica (6) electric mobility
To include the youngFor a low-carbon economy
The Group joins the Net Zero alliances
The Group joins the Net Zero Banking Alliance
Amundi joins the Net Zero Asset Managers initiative
100% of open-ended funds with an ESG score >
investment universe average score/ €31 billion
environmental initiatives
A Real Estate UL offering buffered-up (5)
The Group is a leading ESG player
No. 1 in Europe for responsible investment1
No. 1 in renewable energy financing in France2
Energy transition for our customers ESG product range
$24 billion green, social and sustainable bonds arranged /
Green bond issuance advisory servicesGreen finance(6) partnerships with Fnac Darty and FCA
Bank
The Group commits to contribute to a low-carbon economy and to include the young

27 SECOND QUARTER AND FIRST HALF 2020 RESULTS
GROUPE CRÉDIT AGRICOLE CRÉDIT AGRICOLE S.A.
GROUP DEVELOPMENT MODEL
Constantly renewed organic growth potential
RB Insurance
equipment rate8
+1.7 pp vs end 2019
+6.2 pp vs end 2018
42.4%
LCL
Insurance
equipment rate8
+1.2 pp vs end 2019
+2.5 pp vs end 2018
26.2%
CA Italia
Insurance
equipment rate8
+3.0 pp vs end 2019
+4.7 pp vs end 2018
18.4%
(1) Market share of UCITS in France at end December 2020 (2) End 2020, Crédit Agricole S.A. study – France – market share loans to LCL and RB households (3) End 2019, scope: annual contributions for temporary insurance for death + funeral coverage +
long-term care (4) End 2019, annual contributions collected by CAA originated by CRCA and LCL (total Group market share of 25% including 9% insured by CNP) (5) End 2020, scope: Prédica, outstandings (6) End 2019, Pacifica & La Médicale de France
Property & Casualty business, annual contributions. Market size: Argus de l’Assurance (7) Internal sources (8) Car, home, health, legal, all mobile phones or personal accident insurance

28 SECOND QUARTER AND FIRST HALF 2020 RESULTS
Contents
02
01 04
05
06Crédit Agricole S.A. –
Business lines 03

29 SECOND QUARTER AND FIRST HALF 2020 RESULTS
CRÉDIT AGRICOLE S.A.
Strong growth in earnings of the business lines
Assets under management at €2,300 billion
Asset management: dynamic MLT net inflows (+€21.7 billion) particularly in active management in all asset classes
(+€18.9 billion) with the success of diversified funds, thematic management and SRI solutions
Insurance: Unit-linked ratio at 26%. Continued growth in property & casualty insurance and in life & health insurance
Wealth management: assets under management at €131 billion(2), +2.1% over the quarter excluding the scope effect linked to
the exit of the Miami and Brazil businesses
Strong increase in net income Group share, driven by favourable markets; the division accounted
for 41% of the underlying net income Group share of CASA’s business lines in H1-21
Insurance: Record net income at €404 million;
Asset management: Strong results thanks to exceptional level of performance fees
Wealth management: Dynamic revenues over the quarter (+5%; +9% on a like-for-like basis Q2/Q2), driven by the increase in
outstandings with a contained level of costs; underlying net income at a very high level, up by more than +50%
ASSET GATHERING AND INSURANCE
Activity indicators (Assets under management(1) in billions of euros)
* Including advised and distributed assets
(1) Scope: Indosuez Wealth Management and LCL Private Banking
(2) Indosuez Wealth Management
1,5921,755 1,794
302
312 316177
188 189- 3.3
+ 7.2 + 1.6 + 0.6+ 37.3
2,071
2,256 2,300
June 20 Mar. 21 Scope effect Assetmanagement*
Life insurance Wealthmanagement
Market & forexeffects
June 21
Wealth management
Life insurance
Asset management*
Net inflows +€9.4bn
+11.1%
Contribution to earnings
(in €m)
Q2-21
underlying
∆ Q2/Q2
underlying
H1-21
underlying
∆ H1/H1
underlying
Insurance 404 +4.7% 700 +18.7%
Asset management 221 +51.2% 418 +52.7%
Wealth management 28 +51.0% 48 +9.4%
Net income Group Share 653 +18.6% 1,165 +28.5%

30 SECOND QUARTER AND FIRST HALF 2020 RESULTS
CRÉDIT AGRICOLE S.A.
Sustained commercial activity, record net income level
INSURANCE
Activity indicators (in billions of euros)
Savings/Retirement
Net inflows (in billions of euros)
Protection of assets and individuals(4)
Premium income (in billions of euros)
Savings/retirement: very robust net inflows of €1.6 billion, driven by UL contractsSustained gross inflows (+€6.7 billion), high UL rate (41.2%), stable YoY; dynamic net UL inflows, above 2019 and 2020 averages
Outstandings(1): €316.2 billion, +4.7% yoy; record level of UL outstandings at €81.6 billion +19% yoy; UL rate at 25.8%, +3.1 pp yoy
Policyholder Participation Reserve at €12.2 billion at end June 2021 (i.e. 5.9% of outstandings), up by +€0.7 billion over H1
Property & casualty: continued business momentum (+10.0%(2) Q2/Q2)
15.0 million contracts(3) at end June 2021, +5.1% yoy, +380,000 contracts over H1 2021
Personal insurance(4): revenues +23.0%(2) Q2/Q2Good performance by creditor insurance, supported by a favourable property market and a rebound in consumer credit
Record level of net income Group share: €404 million; +4.7% Q2/Q2; positive market effectGrowth in revenues due to a positive market effect (+€187 million) and growth in UL outstandings, despite claims impacted by
weather events in April (frost) and June (hail)
Limited increase in costs excluding taxes (+3.8% Q2/Q2) consistent with the evolution of the activity
Combined Property & Casualty ratio to 97.3%(5) as of 30/06/2021
Solvency 2 Ratio as of 30/06/21: 243%(6)
(1.0)(1.8)
(0.7) (0.5) (0.3) (0.1)
+1.7+0.9 +1.0 +1.3
+2.0 +1.7
+0.8
(0.9)
+0.4+0.8
+1.7 +1.6
Q1-20 Q2-20 Q3-20 Q4-20 Q1-21 Q2-21
Unit-linked In Euros 1.1 1.0 1.1 1.1 1.3 1.1
1.9
1.0 1.0 1.0
2.0
1.1
3.0
1.9 2.0 2.2
3.3
2.2
Q1-20 Q2-20 Q3-20 Q4-20 Q1-21 Q2-21
Property &Casualty
Personalinsurance
+16.2% Q2/Q2
Contribution to earnings
(in €m)
Q2-21
underlying
∆ Q2/Q2
underlying
H1-21
underlying
∆ H1/H1
underlying
Revenues 729 +4.0% 1,354 +11.7%
Operating expenses (180) +8.0% (414) (0.2%)
Gross operating income 549 +2.8% 940 +17.9%
Tax (124) (18.3%) (201) (1.1%)
Net income 423 +9.2% 738 +24.6%
Non controlling interests (19) n.m. (38) n.m.
Net income Group Share 404 +4.7% 700 +18.7%
Cost/Income ratio excl.SRF
(%)24.7% +0.9 pp 30.6% -3.6 pp
Underlying: specific items in Q2-2020 include i) the €38 million contribution to the State Solidarity Fund
(self-employed and VSEs): (-€38 million in expenses, -€38 million in net income), ii) the cost of the
mutual support mechanism on the operating loss guarantee (-€135 million in revenues, -€92 million in
net income), iii) the extra-contractual measure in favour of vulnerable persons (-€8 million in revenues, -
€5 million in net income), iv) the impact of the triggering of the Switch Insurance (+€65 million in cost of
risk, +€45 million in net income) vs 0 in Q2-21.
(1) Outstanding savings/retirement/death & disability assets (2) Changes restated for a change in
accounting methods; excluding restatement, growth in Personal and Property Protection was +14.3%
Q2/Q2, growth in Property & Casualty was +10.7% Q2/Q2, and growth in Personal insurance was
+17.8% Q2/Q2 (3) Scope: Property & Casualty France and international (4) Personal insurance
segment includes Death & disability, Creditor and Group Insurance (5) The ratio (claims + operating
expenses + fee and commission income) / premium income, net of reinsurance, Pacifica scope,
adjusted for weather events, is 96,0% (6) Standard formula with no transitional measure, except for the
grandfathering of subordinated debt

31 SECOND QUARTER AND FIRST HALF 2020 RESULTS
CRÉDIT AGRICOLE S.A.
Very strong net income driven by high MLT inflows and very favourable markets
ASSET MANAGEMENT
Activity indicators (Assets under management in billions of euros)
238 248 254
178 196 206118 151 160104
121 122
503573 584
451
466 468
- 2.9+ 7.6 + 2.6+ 31.4
1,5921,755 1,794
June 20 March 21 Retail ex. JVs JVs Institutionals Market/Forexeffect
June 21
CA & SG insurers
Institutionals and Corporates
French networks
International networks
Third-party distributors
JVs
Net inflows +€7.2bn
+12.7%
(1) Sabadell AM has been included in Amundi’s consolidation scope since 01/07/2020
with AUM of €20.7 billion.
(2) Sabadell AM, creation of Amundi BOC WM, Fund Channel
Recovery in active management inflows, reflecting customers’ risk appetiteNet MLT inflows excluding JV of +€21.7 billion, driven by active management (+€18.9 billion). Continued strong activity from
third-party distributors, international networks (Italy, Spain and China with Amundi-BOC AM) and institutional investors
Seasonal outflows excluding JV in treasury products -€17.0 billion
JVs: dynamic inflow; anticipated outflows in China on low-margin products (-3.2 billion channel business)
Outstandings up Q2/Q1 by +2.2% (+12.7% year-on-year) to €1,794 billion at end June 2021 (1)
Revenues up, improvement in C/I excl. SRF (47.6%), strong +51.2% growth in Net income Group share
Net management revenues +38.9% Q2/Q2 benefiting from very favourable market conditions (Eurostoxx 600 +36% Q2/Q2), record
outperformance fee and commission income (€155 million) and positive scope effect (€17 million, mainly Sabadell AM)
Excellent operating efficiency with a cost/income ratio of 47.6%, including a +22.1% increase in costs linked to the increase in
variable compensation and a scope effect (€15 million)(2)
Equity-accounted entities: +36.1% Q2/Q2
Amundi Technology ramping up: H1-20 revenues at €19 million including €12 million in Q2 2021
Signature of the Lyxor acquisition framework agreement ahead of schedule. Closing by end 2021
Contribution to earnings
(in €m)
Q2-21
underlying
∆ Q2/Q2
underlying
H1-21
underlying
∆ H1/H1
underlying
Revenues 832 +37.2% 1,585 +32.0%
Operating expenses excl.SRF (396) +22.1% (775) +17.6%
SRF 0 (0.2%) (4) +24.1%
Gross operating income 436 +54.6% 806 +49.7%
Cost of risk (18) x 4.3 (20) +15.9%
Equity-accounted entities 21 +36.1% 38 +32.4%
Tax (113) +46.2% (209) +43.4%
Net income 326 +51.0% 615 +52.2%
Non controlling interests (105) +50.6% (197) +51.1%
Net income Group Share 221 +51.2% 418 +52.7%
Cost/Income ratio excl.SRF
(%)47.6% -5.9 pp 48.9% -6.0 pp

32 SECOND QUARTER AND FIRST HALF 2020 RESULTS
CRÉDIT AGRICOLE S.A.
Sustained activity, resilient revenues, net loan loss provisions reversal
Strong commercial dynamic in financing activities
Corporate and investment banking Q2-21 revenues above pre-crisis level (+3.8% vs. Q2-19 and above the quarterly average
since 2014). Good commercial performance of all financing activities over the quarter, despite a decline in Q2/Q2 revenues
(-5.8%, -2.6% excluding foreign exchange impact) vs a Q2-20 market by a historic corporate credit demand. Less monetisation of
customer flows in market activities in a low volatility context.
Asset servicing: strong growth in AuC (12.1% June/June) and AuA (+13.7% June/June).
Sustained increase in income (+12.9% Q2/Q2)Corporate and investment banking: increase in net income Group share (+14.5%, +20.7% excluding foreign exchange impact)
driven by a net reversal in loan loss provisions(+€40 million in Q2-21) vs provisions in Q2-20 (-€339 million, at the peak of the
crisis)
Institutional financial services: slight erosion of net income Group share (-3.8% Q2/Q2)(1), due to pressure on the interest
margin from a Q2-20 high point, and to residual KAS Bank integration costs.
LARGE CUSTOMERS
Activity indicators (Underlying revenues of Large Customers in millions of euros)Contribution to earnings
(in €m)
Q2-21
underlying
∆ Q2/Q2
underlying
H1-21
underlying
∆ H1/H1
underlying
Revenues 1,577 (11.8%) 3,241 (0.9%)
Operating expenses excl.SRF (901) +5.7% (1,810) +4.5%
SRF (0) n.m. (328) +26.2%
Gross operating income 676 (22.7%) 1,102 (13.8%)
Cost of risk 41 n.m. (27) (94.7%)
Income before tax 682 +27.1% 1,042 +33.3%
Tax (162) x 2.2 (229) x 2.4
Net income 519 +12.5% 813 +18.7%
o/w Corporate & Investment
Banking467 +14.5% 727 +21.8%
o/w Asset servicing 52 (3.4%) 86 (2.0%)
Net income Group Share 492 +12.9% 770 +19.5%
o/w Corporate & Investment
Banking457 +14.5% 712 +21.8%
o/w Asset servicing 35 (3.8%) 58 (2.5%)
Cost/Income ratio excl. SRF
(%)57.1% +9.5 pp 55.9% +2.9 pp
(1) Underlying data excluding Turbo project costs (CACEIS transformation and evolution
plan)
268343 334
408 346
326329 346
311331
506506 479
689
494
88
107 88
91
122211
219 233
288
2831,399
1,504 1,479
1,788
1,577
Q2-17 Q2-18 Q2-19 Q2-20 Q2-21
Asset servicing
Investment banking
Capital markets
Structured finance
Commercial banking & other
Fin
Mkts
-11.8%
2.0%
41.7%
-9.9%
7.6%
-3.9%
Var Q2/Q2
-1.8%
33.8%
-28.3%
6.4%
-15.2%
Var H1/H1
+6.6%
(*) Commercial banking and others = Debt Optimisation Distribution + International Trade and Transaction Finance + Others
(*)

33 SECOND QUARTER AND FIRST HALF 2020 RESULTS
CRÉDIT AGRICOLE S.A.
Structured financing activity recovery, income up
CORPORATE AND INVESTMENT BANKING
Activity indicators
Dynamic activity, revenues down compared to a high Q2-20 marked by strong volatility
Financing activities: (-5.8% Q2/Q2, -2.6% excluding foreign exchange impact): recovery in Structured Finance (+6.4% Q2/Q2).
In Commercial Banking (-15.2% Q2/Q2), good performance of the International Trade and Transaction Banking activity partially
offsetting the decline of Debt Optimisation Distribution compared to the historical Q2-20 (7). Leading positions in syndicated loans.
Capital markets and investment banking (-21.0% Q2/Q2, -18.9% excluding FX impact): slowdown in FICC (8) (-28.3% Q2/Q2)
in a context of low volatility, but leading position in French corporate bonds maintained and an excellent quarter for securitisation
activities; good performance in investment banking (33.8% Q2/Q2), sustained equity activity. VaR level down to €5.7 million at end
June 2021 (vs. €14.0 million at end June 2020)
Increase in net income (+14.5%), driven by a net reversal in cost of risk
Good level of operational efficiency: low cost/income ratio excluding SRF at 52.8% (MTP target <55%).
Net reversal of loan loss provisions (+€40 million in Q2-21): both on performing loans due to improved economic forecasts and
on proven risks, reflecting government support measures.
RWA stable at €120.8 billion (+€0.4 billion): moderate increase in organic growth (+€0.5 billion) notably related to net
downgrading impacts (+€0.6 billion, slowing down this quarter).
(1) Excluding “Others”(2) Source: Thomson Refinitiv Bookrunners(3) Source Refinitiv Q2 2021(4) Source: Refinitiv R17
(5) Source: Refinitiv N1(6) Source: Dealogic Q2 2021, in EUR(7) RCF drawdown rate at pre-crisis level (20% June 2021 against a pre-crisis drawdown
rate of about 18%, and 32% at the end April 2020)(8) Including CVA(9) Negative impact of -€37 million due to the deconsolidation of the algerian subsidiary
Contribution to earnings
(in €m)
Q2-21
underlying
∆ Q2/Q2
underlying
H1-21
underlying
∆ H1/H1
underlying
Revenues 1,294 (13.7%) 2,660 (1.5%)
Operating expenses excl.SRF (683) +5.9% (1,372) +4.5%
SRF (1) (98.4%) (295) +27.3%
Gross operating income 610 (23.9%) 993 (14.2%)
Cost of risk 40 n.m. (32) (93.6%)
Net income on other assets (37) x 396 (37) x 135.8
Income before tax 613 +32.1% 924 +39.6%
Tax (146) x 2.6 (198) x 3
Net income 467 +14.5% 727 +21.8%
Non controlling interests (10) +19.1% (15) +22.6%
Net income Group Share 457 +14.5% 712 +21.8%
Cost/Income ratio excl. SRF
(%)52.8% +9.8 pp 51.6% +3.0 pp
Development of financing activities (1) Maintaining leading positions
#1 – Project Finance in EMEA (2)
#1 – Syndicated loans in France (3)
#2 – Syndicated loans in EMEA (4)
#7 - All Bonds in EUR Worldwide (5)
#1 - All French Corporate Bonds (6)
(9)Structured Finance International Trade and
transaction banking
Debt OptimisationDistribution
Q2-19 Q2-20 Q2-21

34 SECOND QUARTER AND FIRST HALF 2020 RESULTS
CRÉDIT AGRICOLE S.A.
Dynamic recovery in activity, strong growth in net income
SPECIALISED FINANCIAL SERVICES
Activity indicators (in billions of euros)
CAL&F – Gross consolidated loansCA Consumer Finance – Gross managed loans
34.2 34.3 33.0 33.4
33.3 31.1 32.8 32.4
19.3 19.7 20.4 20.7
3.7 3.3 5.3 5.6
90.5 88.4 91.4 92.1
Jun. 19 Jun. 20 Mar. 21 Jun. 21*
Other
Crédit AgricoleGroup
Car financepartnerships
Consolidated loanbook
+4.2%
The CACF NL outstandings previously recorded under “consolidated outstandings” are recorded under
“other” as of Sept. 2020. They represent €1.8 billion at 31/12/2020 and €1.7 billion at 31/03/2021 and at
30/06/2021. Excluding CACF NL, consolidated outstanding are stable over one year.
11.9 12.3 12.8 12.8
2.8 2.8 2.9 3.0
14.8 15.1 15.7 15.9
Jun. 19 Jun. 20 Mar. 21 Jun. 21
Leasinginternational
Leasing France
+5.1%
(1) Excluding CACF NL
(2) Q2-21 consumer finance production represents 97% of Q2-19 production
(3) Consolidated loan book
(4) Leasing production in Q2 2021 is 125% of Q2 2019 production. Factoring production in Q2 2021 is
131% of Q2 2019 production.
(5) Underlying and excl. SRF
(6) Normalisation of the level of costs after a Q2-20 marked by the crisis (+2% versus average
quarterly costs in 2019 of CACF excluding CACF NL)
(7) Increase in provisioning on performing loans on clients in certain sectors
Excellent activity upturn in all business lines, outstandings back to 2019 levels
CACF: strong growth in commercial production (+63% Q2/Q2(1)), revenues back to Q2-19(2) levels, driven by all segments: France(3)
(+53% Q2/Q2), automotive partnerships (+64% Q2/Q2), international entities (+57% Q2/Q2(1), production 16% above Q2-2019 level).
Best mobile acquisition journey awarded to Sofinco by Google. 100% digital Digiconso customer journey rolled-out in RB and LCL
CAL&F: strong upturn in leasing production (+65% Q2/Q2(4)) and factoring (+44% Q2/Q2(4)), exceeding 2019 levels. Growth in
leasing outstandings (+1.1% June/March), notably thanks to Poland.
Very good operating results, cost of risk down sharply (-47%(1) Q2/Q2)
CA Consumer Finance: revenues up (+5.2% Q2/Q2(1)) benefiting from a base effect in Q2-20 on insurance revenues in particular,
cost/income ratio still low at 48.9%(5) despite an increase in costs compared to a low point in Q2-20(6).Very good JV performance
(+36% Q2/Q2), thanks to strong growth in Wafasalaf and FCA Bank results. Cost of risk sharply down from Q2-20 (-46.6%(1) Q2/Q2),
22% of cost of risk explained Stage1&2(7); NPL ratio down to 6.3% (-0.3 pp June/March); coverage ratio up to 81.6% (+2.2 pp)
CAL&F: Very dynamic GOI (+34.7% Q2/Q2) thanks to the strong increase in revenues (+19.4% Q2/Q2), both in leasing and
factoring. Cost/income ratio at 52.5%(5) (-3.8 pp Q2/Q2)
Contribution to earnings
(in €m)
Q2-21
underlying
∆ Q2/Q2
underlying
H1-21
underlying
∆ H1/H1
underlying
Revenues 658 +8.4% 1,302 +3.8%
o/w CACF 513 +5.7% 1,015 +1.2%
o/w CAL&F 146 +19.4% 287 +14.6%
Operating expenses excl.SRF (327) +5.9% (662) +0.1%
SRF 1 n.m. (23) +15.9%
Gross operating income 332 +11.4% 617 +7.7%
Cost of risk (134) (45.9%) (262) (40.3%)
Equity-accounted entities 82 +36.1% 156 +18.3%
Net income on other assets 12 (30.3%) 12 (32.9%)
Income before tax 293 x 2.3 524 +83.5%
Tax (59) n.m. (109) n.m.
Net income 234 +33.5% 416 +36.9%
Non controlling interests (28) +6.0% (51) +12.5%
Net income Group Share 206 +38.4% 365 +41.3%
o/w CACF 168 +28.1% 302 +32.5%
o/w CAL&F 39 x 2.1 63 x 2.1
Cost/Income ratio excl.SRF
(%)49.7% -1.2 pp 50.8% -1.9 pp

35 SECOND QUARTER AND FIRST HALF 2020 RESULTS
CRÉDIT AGRICOLE S.A.
Recovery in activity, strong increase in net income vs a crisis impacted Q2-20
Increase in outstanding credit and customer assets, return of loan production to pre-crisis level
Resumption of loan production (+33.4% Q2/Q2 and +5.8% Q2-2021/Q2-2019), dynamic mortgage and professional loans activity
despite competition; outstanding loans up (+4.4% June/June) thanks to the dynamism of mortgage lending (+4.9% June/June)
and loans to professionals (+12.5% June/June); customer assets: increase in on-balance sheet deposits (+6.3% June/June) driven
by demand deposits (+13.4% June/June) and off-balance sheet deposits (+6.2% June/June)
Dynamic customer acquisition (+87,000 new customers in Q2) and equipment: 26.2% in Home-Auto-Health insurance(1) (+1.0 pp
June/June)
Launch of the “LCL New Generation Network” project, regrouping 250 branches, to meet the new demands
of customers and consolidate the positioning of LCL’s urban banking(2)
Gross operating income up thanks to the increase in revenues; normalisation of the cost of risk
Revenues up (+8.2% Q2/Q2), thanks to NII (+9.9%), supported by favourable refinancing conditions, and to fees and commissions
income (+6.3% Q2/Q2), including on payment instruments.
Controlled change in underlying costs excl. SRF (+2.2%); continued improvement in cost/income ratio(3) (59.9% -3.5 pp Q2/Q2)
Reversal of performing loans loss provisioning (-€9m), cost of proven risk below Q1-2021 level, NPL ratio 1.6% and high
coverage ratio at 81.7%
FRENCH RETAIL BANKING – LCL
Activity indicators (in billions of euros)
Customer assetsLoans outstanding
(1) Equipment rate - Home-Car-Health policies, Legal, All Mobile/Portable or
personal accident insurance
(2) Restructuring costs for the amount of €13 million in expenses classified
as specific items
(3) Underlying excl. SRF
Contribution aux résultats
(en m€)
T2-21
ss-jacent
∆ T2/T2
ss-jacent
S1-21
ss-jacent
∆ S1/S1
ss-jacent
Produit net bancaire 927 +8.2% 1,832 +5.0%
Charges d'exploitation hors
FRU(556) +2.2% (1,130) +0.1%
FRU (0) ns (59) +40.9%
Résultat brut d'exploitation 371 +21.3% 644 +11.9%
Coût du risque (43) (62.9%) (126) (42.1%)
Résultat avant impôt 329 +74.0% 519 +45.1%
Impôt (89) +63.0% (158) +37.2%
Résultat net part du Groupe 229 +78.6% 345 +48.9%
Coefficient d'exploitation
hors FRU (%)59.9% -3.5 pp 61.7% -3.0 pp
118.1 133.6 139.6 142.0
81.480.7 83.6 85.7
199.5 214.3 223.1 227.8
June 19 June 20 Mar. 21 June 21
Off-B/S
On-B/S
78.3 83.8 86.7 87.9
7.6 7.7 7.9 8.024.128.4 28.6 27.8
14.618.6 20.9 21.0
124.6138.5 144.0 144.7
June 19 June 20 Mar. 21 June 21
Home loan Consumer credit Corporate Professionals

36 SECOND QUARTER AND FIRST HALF 2020 RESULTS
CRÉDIT AGRICOLE S.A.
Continued recovery in commercial activity, strong rebound in earnings
Very positive commercial production, driven by all segments
Outstanding loans(2) up (+ 3.2%) driven in particular by housing loans (+6.7% June/June); Production close to pre-crisis level.
Off-balance sheet deposits(2) (3) significantly up (+62% June/June), thanks in particular to favourable market conditions; on-
balance sheet deposits slowing down(2) (+4.5% June/June) since December 2020, as a result of resource optimisation initiatives
Underlying gross operating income excl. Creval sharply up(+41% Q2/Q2)(4), decrease in the cost of
risk reflecting the economic situation
Revenues up +12.4% excl. Creval scope effect(4) driven in particular by fees and commissions income (+23% Q2/Q2) on
managed savings and insurance. Expenses excl. SRF decreasing(-1.5% Q2/Q2) excl. Creval scope effect(4), underlying
cost/income ratio excl. Creval scope(4) effect of 58.7%, improving by -8.3 pp Q2/Q2, Net income Group share excl. Creval(4) up
(x2.9) at €66 million
Cost of risk(2) down -58.8% Q2/Q2, linked to the drop in the S3 cost of risk due to the extension of payment holidays; NPL ratio of
6.2% at end June 2021; coverage ratio at 68.6% (+6,5 pp Q2/Q1 2021)
INTERNATIONAL RETAIL BANKING – ITALY
Activity indicators (in billions of euros)
Loans outstanding(1)
The income statement includes the consolidation of 2 months of Creval results
(1) Outstanding at end of june 21 including CREVAL contribution
(2) Excluding scope effect linked to the first consolidation of Creval in Q2-21
(3) Net flows (production minus repayments)
(4) Contribution of Creval to the CAI underlying income this quarter: €98 million in revenues,
€65 million in expenses excl. SRF, €7 million in net income Group share. Net Badwill booked in
specific items (see slide 48)
Contribution to earnings
(in €m)
Q2-21
underlying
∆ Q2/Q2
underlying
H1-21
underlying
∆ H1/H1
underlying
Revenues 582 +35.3% 1,070 +22.3%
Operating expenses excl.SRF (349) +21.0% (629) +10.9%
SRF (12) +32.4% (33) +30.2%
Gross operating income 221 +66.5% 409 +44.7%
Cost of risk (79) (46.1%) (150) (34.4%)
Net income on other assets (0) n.m. (0) n.m.
Income before tax 142 x 2.8 259 x 2.2
Tax (43) x 2.6 (77) x 2.1
Net income 99 x 2.9 182 x 2.2
Non controlling interests (27) x 2.8 (48) x 2.1
Net income Group Share 73 x 2.9 133 x 2.2
Cost/Income ratio excl.SRF
(%)59.9% -7.1 pp 58.7% -6.1 pp
43.0 45.1 46.5 46.6
14.643.0
45.1 46.5
61.2
June 19 June 20 Mar. 21 June 21IRB Italy CREVAL
+35.6%
40.6 42.4 44.1 44.3
35.2 37.4 40.8 42.4
16.8
8.3
75.7 79.8 85.0
111.8
June 19 June 20 Mar. 21 June 21
On-balance sheet Off-balance sheet*
+40.0%
* Excluding assets under custody
CREVAL
Customer assets(1)

37 SECOND QUARTER AND FIRST HALF 2020 RESULTS
CRÉDIT AGRICOLE S.A.
Development in Italy, the Group’s second domestic market
CRÉDIT AGRICOLE GROUP IN ITALY
Distribution of the Group’s net income in Italy
CREVAL
35%
36%
19%
10%
Retail banking
Specialised financial services
Asset gathering
Large customers
Total net income:
€385m
+49%Change in net income H1/H1
€385mUnderlying net income in
H1-21
15%
Underlying net income
of Crédit Agricole S.A.
1st consolidation of Credito Valtellinese
Contribution of two months of results in Q2-21 for €7 million
Revenues: €98 million; expenses excl. SRF €65 million; cost of risk €19 million
Recording of a net badwill of +€378 million at 100%, restated in specific items
gross badwill of +€925 million this quarter
deduction of a first estimate of provisions, before finalisation of the PPA(2) expected
before Dec. 2021, including revaluations of loan portfolios risks, of -€547 million(3)
(prudential recognition of badwill in Q4-21)
Net badwill impact +€378 million at 100% and net income Group share impact of
+285 million(4)
Group Risk Profile Group in Italy(1)
Good performance of all the Group’s business lines
Excellent level of deposits at Amundi in H1-21 at €5.4Bn
Very strong activity in syndicated loans (2nd bookrunner per deal value) and
bond issues all segments confounded; confirmed leadership in ESG
Excellent business mix in insurance products, with a mainly in UL (62% of the
H1-21 net inflows)
Resumption of consumer credit after the slowdown due to the pandemic at more
than 35%
Significant reduction in the cost of risk in H1 2021 (-53% H1/H1) at -€205.5m
5.2 5.0 5.1
3.7 3.6 3.6 3.5 3.5 3.5 3.5 3.5 3.0 3.0
3.9
1.2 0.9 0.9
1.0 0.9 0.9 0.9 0.9 0.9 0.8 1.0 1.0 0.9
0.8
0.1 0.2 0.2
0.1 0.2 0.2 0.2 0.2 0.2 0.2 0.2
0.2
0.7 0.7 0.4
0.4 0.3 0.4 0.4 0.3 0.3 0.3 0.3
0.3 0.3
0.3
7.26.8
6.6
5.2 5.1 5.0 4.9 4.9 4.9 4.75.0
4.5 4.3
5.2
51.0% 52.0%
55.4%
70.2%69.6%
66.0%
71.1%68.8% 69.3%
71.8%67.8% 67.0% 67.7% 68.7%
2015 2016 2017 2018 2019-03 2019-06 2019-09 2019-12 2020-03 2020-06 2020-09 2020-12 2021-03 2021-06
CACIB
FCA Bank (@50%)
Agos
BPI Italie
Group in Italy - Gross
NPL (€bn) and coverage
ratio
(1) Including CREVAL scope effect in Q2-21, NPL stable without this effect (2) Purchase Price Allocation; (3) Of which approximately €330 million related to the revaluation of loan portfolios, approximately €60 million related to litigation and disputes, approximately €50 million related to refinancing costs, and approximately €100 million related to the
revaluation of property and securities portfolios, excluding DTA. In addition to this €378 million, another €25 million were set aside for performing loans provisions and 16 m€ for acquisition costs; (4) Positive prudential impact on Crédit Agricole S.A. CET1 of this badwill before finalisation of the PPA by end of Dec. 2021. Negative impact related to the
consolidation of 8.1 billion Creval RWA recorded in Q2-21

38 SECOND QUARTER AND FIRST HALF 2020 RESULTS
CRÉDIT AGRICOLE S.A.
12.2 12.9 14.0 14.3
2.12.2
2.5 2.114.315.1
16.416.4
June 19 June 20 Mar. 21 June 21
Off -balance
sheet *
On- balance
sheet
+8.3%
+8.9% (1)
11.5 11.7 11.8 12.5
June 19 June 20 Mar. 21 June 21
+6.2%
+6.6% (1)
Rebound of commercial activity, growth in revenues and profitability
Sustained commercial activity in all entities
Outstandings(1): +6.6% Q2/Q2, notably in Ukraine (+17%), Poland (+8%) and Egypt (+5%)
On-balance sheet deposits(1): +11.7% Q2/Q2, notably in Ukraine (+23%) and in Poland (+18%)
Liquidity: net inflow surplus: +€2.6 billion at 30/06/2021
Continued growth in gross operating income, thanks to increased revenues and controlled
expenses; lower cost of risk; high coverage ratio (100%), low NPL ratio (7.0%)
CA Poland(1): rates drop impact compensated by a volume effect, increase in fees and commissions, coverage ratio 113%
CA Egypt(1): increase in revenues (+9% Q2/Q2) driven by retail activity, sharp fall in cost of risk, coverage ratio 137%
CA Ukraine(1): dynamic revenues (+19% Q2/Q2) thanks to the growth of NII and fees and commissions income, cost of risk
divided by 6 Q2/Q2; NPL ratio low (1.7%)
Crédit du Maroc(1): solid revenue growth(+5% Q2/Q2), provisions reversals on cost of risk
INTERNATIONAL RETAIL BANKING – EXCL. ITALY
Activity indicators (in billions of euros)
Customer assetsLoans outstanding
* With change of method on assets under custody from June 21, 2.4 bn excluding change of method
(1) Variations excluding foreign exchange impact
Contribution to earnings
(in €m)
Q2-21
underlying
∆ Q2/Q2
underlying
H1-21
underlying
∆ H1/H1
underlying
Revenues 219 +4.6% 424 (2.5%)
Operating expenses (133) +2.1% (268) (1.7%)
Gross operating income 86 +8.8% 156 (3.9%)
Cost of risk (16) (68.7%) (45) (47.2%)
Income before tax 70 x 2.6 114 +47.6%
Tax (21) n.m. (37) x 2
Net income 49 +79.3% 76 +30.3%
Non controlling interests (12) (22.0%) (21) (18.8%)
Net income Group Share 37 x 3.2 55 +68.1%
Cost/Income ratio excl.SRF
(%)60.6% -1.5 pp 63.2% +0.5 pp

39 SECOND QUARTER AND FIRST HALF 2020 RESULTS
CRÉDIT AGRICOLE S.A.
Back to a positive contribution of private equity
Structural net income Group share stable Q2/Q2
Balance sheet & CASA holding: €65 million decrease mainly due to an unfavourable effective corporate income tax rate effect,
despite continued favourable refinancing conditions
Other business lines: increase of €71 million, particularly for CACIF in a context of dynamic activity and the revaluation of certain
funds
Support functions: -€10 million decrease due to a change in 2021 in the reporting of CAGIP income and expenses
Other items of the division improved (+€123 million)
Base effect related to eliminations on intra-group securities subscribed by Predica and Amundi (tightening of spreads as of
30/06/2020)
CORPORATE CENTRE
Activity indicators (in billions of euros)
8436
(36)
(5)
(39)
1113538
(75)
(210)(252)
(106)
(194)(181)(130)
(205)(191)
Q2-21Q1-21Q4-20Q3-20Q2-20Q1-20Q4-19Q3-19Q2-19
Structural net income excl. IFRIC21 IFRIC21 Other elements Underlying net income
Specific items in Q2 2021: -€4 million on provisions for home
purchase savings plans
€m Q2-21 ∆ Q2/Q2 H1-21 ∆ H1/H1
Revenues 105 +370 119 +285
Operating expenses excl.
SRF(207) (20) (383) +2
SRF 0 +3 58 +144
Gross operat ing income (102) +354 (206) +431
Cost of risk (4) (3) (3) +34
Equity-accounted entit ies (9) (19) (15) (28)
Net income on other
assets4 +4 4 +4
Pre- tax income (111) +336 (222) +441
Tax 44 (141) 75 (149)
Net income Group share
stated(72) +161 (155) +289
Net income Group share
underlying(75) +119 (285) +89
Of which structural net
income(159) (4) (406) +41
- Balance sheet & holding
Crédit Agricole S.A. (204) (65) (464) (31)
- Other activit ies (CACIF, CA
Immobilier, BforBank etc.)45 +71 58 +87
- Support functions (CAPS,
CAGIP, SCI)0 (10) (0) (14)
Of which other elements
of the division84 +123 121 +48

40 SECOND QUARTER AND FIRST HALF 2020 RESULTS
Contents
Crédit Agricole Group
02
01 04
05
0603

41 SECOND QUARTER AND FIRST HALF 2020 RESULTS
GROUPE CRÉDIT AGRICOLE
Continued growth in outstanding loans and customer assets, dynamic customer capture
Loans outstanding: increase of +6.6% (June/June, of which +7.4% on home loans and +5.5% on specialised markets(1); loan
production higher than the pre-crisis level (+17.8% vs. Q2-19, of which +22% on home loans vs. Q2-19 and +6% on consumer
credit vs.Q2-19)
Customer savings: +7.3% yoy, progressive return to the pre-crisis balance sheet collection pace; increase in off-balance sheet
deposits +6.1% June/June; gross life insurance production almost 2x higher than Q2-20, which was marked by restrictions.
Customer capture: +647,000 new customers in H1, relational intensity still increasing (59.6% of customers equipped with four to
five “demand areas” (2) +0.6 pp vs. June-20); cards inventory up +2.6% yoy; mobile application usage rate(3): 68.6% (+3.2 pp vs.
June-20 et +7.5 pp vs. June-19)
Strong increase in net income Group share due to high revenues and lower cost of riskRevenues: increase driven in particular by the rise in NII, supported by favourable refinancing conditions, and by fees and
commissions income, particularly in insurance and account management/payment instruments. Costs: increase due to employee
profit-sharing and incentive plans
Cost of risk: down -37.5% Q2/Q2, 14 bp(4) on outstandings, NPL ratio: 1.7% (stable vs. March-21), coverage ratio very high
(102.3%, +1.1 pp vs. March-21)
Activity indicators (in billions of euros)
Customer assetsLoans outstanding
Sustained commercial momentum and strong growth in income
REGIONAL BANKS
446 496 527 535
266265
278 281
712761
805
Jun. 19 Jun. 20 Mar. 21 Jun. 21
Off-balance sheet
Deposits
+7,3%
(1) Specialised markets: farmers, professionals, corporates and public authorities; (2)
demand areas: deposit account, savings, credit, insurance and cards; (3) Number of
customers with an active profile on the Ma Banque app or who had visited CAEL (CA
online) during the month / number of adult customers having an active demand deposit
account (4) over four rolling quarters and 13 bp on an annualised quarterly basis
306 328 345 352
21 21 21 22174
195 204 205
501543 571 579
Jun. 19 Jun. 20 Mar. 21 Jun. 21
SMEs-Small
business.-Farm.-
Local auth.Consumer credit
Home loans
+6,6%
Contribution to earnings
(in €m)
Q2-21
underlying
∆ Q2/Q2
underlying
H1-21
underlying
∆ H1/H1
underlying
Revenues 3,453 +4.1% 7,007 +7.0%
Operating expenses excl.SRF (2,236) +10.5% (4,503) +5.3%
SRF (1) (98.2%) (142) +15.6%
Gross operating income 1,217 (3.8%) 2,363 +9.8%
Cost of risk (186) (37.5%) (339) (43.9%)
Income before tax 1,023 +6.6% 2,026 +31.3%
Tax (281) (4.8%) (629) +12.8%
Net income Group Share 741 +11.7% 1,396 +41.8%
Cost/Income ratio excl.SRF (%) 64.8% +3.7 pp 64.3% -1.0 pp
816

42 SECOND QUARTER AND FIRST HALF 2020 RESULTS
Contents
Financial strength02
01 04
05
0603

43 SECOND QUARTER AND FIRST HALF 2020 RESULTS
CRÉDIT AGRICOLE S.A.
Phased-in CET1 ratio: 12.6%, +4.7 pp above SREP requirements
FINANCIAL STRENGTH
Change in Crédit Agricole S.A. risk weighted assets (in billions of euros) Change in phased-in CET1 ratio (bp)
CET1 ratio: 12,6%, fully-loaded ratio at 12.4%(3)
Stated net income notably excluding Creval Badwill : +44 bp
Dividends: -23 bp, of which -21 bp dividend provision based on a 50% pay-out policy (€0.39 over
H1-21) ;
Growth of business lines(1): neutral this quarter
Methodology and regulatory effects: +1 bp, of which +6 bp linked to a positive TRIM model review
effect, -7 bp related to CRR2 impact and +2 bp linked to Affrancamento
M&A, OCI and other: -29 bp related to the consolidation of Creval RWAs (prudential integration of
Creval badwill planned in Q4-2021). OCI reserves(4): -4 bp
Distance to SREP requirements: +4.7 pp (-0.1 pp vs Q1 2021)
Phased-in Tier 1 ratio: 14.0% and phased-in total ratio: 18.6%
Phased-in leverage ratio: stable at 4.6% compared to Q1 2021 (3.9% before neutralisation of
ECB exposures vs 4.0% at end March 2021)
Phased-in daily leverage ratio(5): 3.8% before neutralisation of ECB exposures
Increase in risk weighted assets mainly due to the consolidation of Creval, as well
as the CRR2 regulatory impact
Business lines’ contribution : +€0.5 billion of which -€0.2 billion FX impact. Increase in
Retail banking. Slight decrease in Large customers(2)
Equity-accounted value of insurance: -€1.0 billion, related to H1-21 dividend distribution
Methodology, regulatory effects and M&A: +€0,3 billion, of which -€1.7 billion related to the
review of TRIM models and +€2,0 billion related to CRR2 regulatory effect
Consolidation of Creval: +€8.5 billion
(1) Change in business line RWAs excluding the impact of OCIs in equity-accounted value of insurance
(2) Retail banking: +€1.2 bn excluding FX impact ; Large customers: -€0.6 billion excluding FX impact
(3) Excluding the impact of phasing in of IFRS 9 included in Q2-20 as part of the “Quick Fix”
(4) OCI reserves provision as at 30/06/2021: 34 bp (vs. 38 bp at 31/03/2021)
(5) The daily leverage ratio is calculated by taking into account the daily average of the quarter’s securities financing transactions
(SFTs) exposures

44 SECOND QUARTER AND FIRST HALF 2020 RESULTS
GROUPE CRÉDIT AGRICOLE
Phased-in CET1 ratio: 17.3%, +8.4 pp above SREP
FINANCIAL STRENGTH
Change in phased-in CET1 ratio (bp) Change in Crédit Agricole Group risk-weighted assets (in billions of euros)
Risk weighted assets up this quarter
Business lines’ contribution : +€2.5 billion, including -€0.2 billion foreign exchange impact.
Increase in Retail banking. Slight decrease in Large customers(2)
Methodology, regulatory effects and M&A: +1,6 billion, of which +€3.2 billion related to CRR2
regulatory impact and -€1,7 billion related to TRIM
CET1 ratio: 17.3% phased-in (stable vs Q1 2021), +8.4 pp> SREP, 17.0% fully-loaded(3)
Stated net income: +41 bp ; Distribution: -8 bp, of which -6 bp dividend provision
Methodology and regulatory effects: neutral, impact of CRR2 (-10 bp), compensated by positive
impact on TRIM (+5 bp), IFRS9 phasing (+4 bp) and Affrancamento (+1 bp)
M&A, OCI(4) and Others: -19 bp of which -26 bp related to the consolidation of Creval
In the adverse EBA stress tests scenario, phased-in CET1 at 10.9%, is at the highest level
among European G-SIBs, without triggering of the automatic distribution restriction mechanisms
Phased-in Tier 1 ratio: 18.2% and phased-in Total ratio: 21.1%
Phased-in leverage ratio: 5.9% (stable compared to Q1-21); 5.3% before neutralisation of ECB
exposures vs. 5.4% at end March 2021
Phased-in daily leverage ratio(5): 5.3% before neutralisation of ECB exposures
TLAC ratio: 25.6% of risk weighted assets and 8,4% of leverage exposure, excluding eligible
senior preferred debt (7,5% before neutralisation of ECB exposures)
Ratio above regulatory requirements(6) of 6.1 pp in risk weighted assets and 2,4 pp in leverage,
excluding eligible senior preferred debt
MREL ratio: ~31.5% of risk weighted assets and 25.6% excluding eligible senior preferred debt, i.e.
8.3% of TLOF
Subordinated MREL ratio target (excluding eligible senior preferred debt) of 24-25% of risk weighted
assets by end 2022 achieved since 30 September 2020
At 30/06/2021: MREL subordinated ratio > 8% of TLOF
(5) The daily leverage ratio is calculated by taking into account the daily average of the quarter’s securities financing transactions (SFTs) exposures
(6) Crédit Agricole Group must meet the following TLAC requirements at all times: 16% of the RWA plus the total buffer requirement according to
CRDV (including 2.5% for capital conservation buffer, 1% for systemic risk buffer and 0.03% for countercyclical buffer at 30 June 2021); and 6% of
leverage exposure
(1) Change in business line RWAs not including the impact of OCI in equity-accounted value of insurance,
(2) Retail banking: +€2.5 bn excluding FX impact of which +€0.2 bn for LCL and €1.5 bn for Regional Banks. Large customers: -€0.5 bn
excluding FX impact
(3) Excluding the impact of phasing in of IFRS 9 included in Q2-20 as part of the “Quick Fix”
(4) OCI reserves provision as at 30/06/2021: 16 bp (vs. 18 bp at 31/03/2021)

45 SECOND QUARTER AND FIRST HALF 2020 RESULTS
GROUPE CRÉDIT AGRICOLE
FINANCIAL STRENGTH
Comfortable level of reserves and liquidity indicators
€463 bnliquidity reserves at 30/06/2021
+€2 bn vs. 31/03/2021
FINANCIAL STRENGTH
Liquidity reserves maintained at a high level
Central Bank deposits at €226 billion vs. €218 billion end March 2021
Eligible assets in Central Banks stable at €101 billion vs end March 2021
Liquidity reserves at 30/06/2021 (€bn)
LCR: Crédit Agricole Group 165.6%(3), Crédit Agricole S.A.
156.4%(3), above MTP target of ~110%
Stable resources measured by two indicators at 30/06/2021:
Surplus of stable resources of €292 billion. Internal management
excludes the temporary surplus of stable resources provided by the
increase in T-LTRO 3 outstandings in order to secure the MTP target
(>€100 billion), regardless of the future repayment strategy
NSFR: Crédit Agricole Group > 100% and Crédit Agricole S.A. > 100%
Crédit Agricole Group outstandings in T-LTRO 3 €162.2 billion(4)
at end June 2021
(3) Average LCR (Liquidity Coverage Ratio) over 12 months, the ratio’s numerator and denominator
amounting to €362.5 billion and €218.8 billion respectively for the Crédit Agricole Group and
€330.8 billion and €211.5 billion respectively for Crédit Agricole S.A. End of period LCR at 30/06/2021:
Crédit Agricole Group 182.8%, Crédit Agricole S.A. 157.4%(4) Excluding FCA Bank
218 226
124 121
18 1513 10
88 91
461 463
31/03/2021 30/06/2021
Cash and Central Bank deposits
HQLA (High Quality Liquid Assets) securities portfolio (2)
Other non-HQLA securities (2)
Self-securitisations eligible to Central Banks (1)
Eligible claims to Central Banks after haircut (immediate access) (1)
(excl. cash (€4bn) & mandatory reserves (€9bn))
(1) Eligible for central bank operations to improve LCR buffer(2) Available market securities, at market value and after haircut

46 SECOND QUARTER AND FIRST HALF 2020 RESULTS
GROUPE CRÉDIT AGRICOLE CRÉDIT AGRICOLE S.A.
€6.5 billion in MLT market funding issued by
Crédit Agricole S.A. at end July 2021
Crédit Agricole Group - MLT market funding
Breakdown by issuer: €17.9 bn(1) at 30/06/21Crédit Agricole S.A. - MLT market funding
Breakdown by format: €6.5 bn(1) at 31/07/21
(1) Gross amount before buy-back and amortisation
FINANCIAL STRENGTH
Crédit Agricole S.A. (end-July)
€6.5bn(1) of MLT market funding issued (72% of €9bn programme, of which €7bn in
senior non-preferred or Tier 2 debt) - diversified funding with various formats (Senior
secured, Senior preferred, Senior non preferred, Tier 2) and currencies (EUR, USD,
AUD, GBP, JPY, CNY, CHF).
AT1 exchange offer completed on 23/06: successful offer to exchange ineligible
LIBOR-Linked GBP AT1 securities for new CRR-compliant SONIA-Linked GBP AT1
securities, with 79% exchanged (£397M out of a total nominal of £500M).
Social Bond: CA HL SFH inaugural Social Covered bond on the 01/07 for €1bn with a
maturity of 6.75 years at MS + 2 bps.
Crédit Agricole Group (end-June)
€17.9bn(1) issued in the market by Group issuers.
Highly diversified funding mix by types of instruments, investor categories and
targeted geographic areas.
In addition, €1.9bn borrowed from national and supranational organisations or
placed in the Group’s retail banking networks (Regional Banks, LCL, CA Italia) and
other external retail networks.
Crédit Agricole S.A.31%
CA Italia 3%
CACIB 43%
CACF 20%
EFL 3% CANB 1%Senior secured
15%
Senior preferred 6%
Senior non-preferred46%
Subordinated Tier 232%
Senior preferred (€0.4bn)
& senior secured (€1.0bn) €1.4bn
Average maturity: 6.8 years
Spread vs 3m Euribor: 21bp
Senior non-preferred (€3.0bn)
& Tier 2 (€2.1bn)€5.1bn
Average maturity: 9.9 years
Spread vs 3m Euribor: 100bp

47 SECOND QUARTER AND FIRST HALF 2020 RESULTS
Contents
Appendices
02
01 04
05
0603
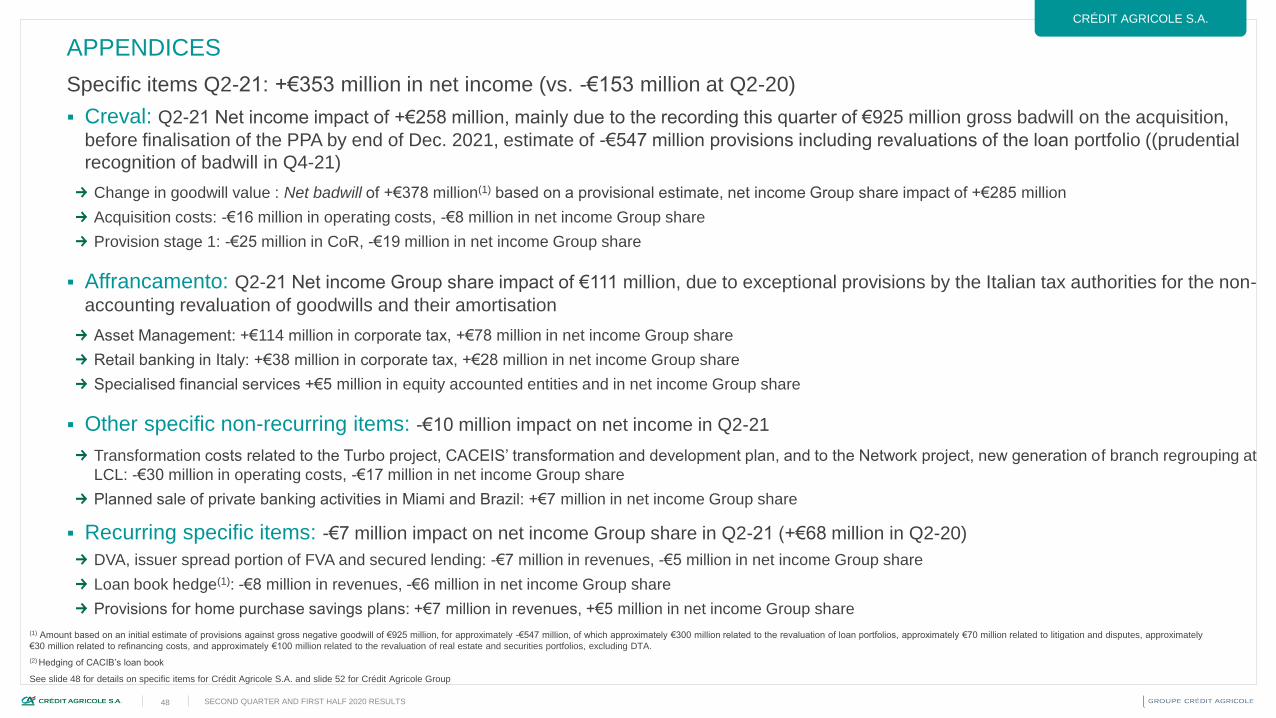
48 SECOND QUARTER AND FIRST HALF 2020 RESULTS
CRÉDIT AGRICOLE S.A.
APPENDICES
Specific items Q2-21: +€353 million in net income (vs. -€153 million at Q2-20)
Creval: Q2-21 Net income impact of +€258 million, mainly due to the recording this quarter of €925 million gross badwill on the acquisition,
before finalisation of the PPA by end of Dec. 2021, estimate of -€547 million provisions including revaluations of the loan portfolio ((prudential
recognition of badwill in Q4-21)
Change in goodwill value : Net badwill of +€378 million(1) based on a provisional estimate, net income Group share impact of +€285 million
Acquisition costs: -€16 million in operating costs, -€8 million in net income Group share
Provision stage 1: -€25 million in CoR, -€19 million in net income Group share
Affrancamento: Q2-21 Net income Group share impact of €111 million, due to exceptional provisions by the Italian tax authorities for the non-
accounting revaluation of goodwills and their amortisation
Asset Management: +€114 million in corporate tax, +€78 million in net income Group share
Retail banking in Italy: +€38 million in corporate tax, +€28 million in net income Group share
Specialised financial services +€5 million in equity accounted entities and in net income Group share
Other specific non-recurring items: -€10 million impact on net income in Q2-21
Transformation costs related to the Turbo project, CACEIS’ transformation and development plan, and to the Network project, new generation of branch regrouping at
LCL: -€30 million in operating costs, -€17 million in net income Group share
Planned sale of private banking activities in Miami and Brazil: +€7 million in net income Group share
Recurring specific items: -€7 million impact on net income Group share in Q2-21 (+€68 million in Q2-20)
DVA, issuer spread portion of FVA and secured lending: -€7 million in revenues, -€5 million in net income Group share
Loan book hedge(1): -€8 million in revenues, -€6 million in net income Group share
Provisions for home purchase savings plans: +€7 million in revenues, +€5 million in net income Group share
(1) Amount based on an initial estimate of provisions against gross negative goodwill of €925 million, for approximately -€547 million, of which approximately €300 million related to the revaluation of loan portfolios, approximately €70 million related to litigation and disputes, approximately
€30 million related to refinancing costs, and approximately €100 million related to the revaluation of real estate and securities portfolios, excluding DTA.
(2) Hedging of CACIB’s loan book
See slide 48 for details on specific items for Crédit Agricole S.A. and slide 52 for Crédit Agricole Group

49 SECOND QUARTER AND FIRST HALF 2020 RESULTS
GROUPE CRÉDIT AGRICOLE CRÉDIT AGRICOLE S.A.
Credit spreads (1-year iTraxx Main CDS index)
Continued market recovery
APPENDICES
Interest rates, in euros (%)
Currencies (rate for €1)Equity indexes (base 100 = 31/12/2016)
EUR vs. USD June 21/June 20: +6.8%
65
75
85
95
105
115
125
135
12.1703.1806.1809.1812.1803.1906.1909.1912.1903.2006.2009.2012.2003.2106.21
CAC 40 Stoxx CAC moy. trim
Stoxx moyen: +29,1% T2/T2, +7,6% T2/T1,
CAC 40 moyen : +37,8% T2/T2, +10,9% T2/T1CAC 40 June 21/June 20
≈ +32%
60
70
80
90
100
110
120
130
140
150
0,7
0,8
0,9
1,0
1,1
1,2
1,3
1,4
1,5
12.1703.18 06.18 09.1812.1803.1906.19 09.1912.1903.2006.20 09.20 12.2003.2106.21
EUR/USD (éch. G) EUR/GBP (éch. G) EUR/JPY (éch. D)
EUR vs. USD T2-21 :
Moyenne 9,4% T2/T2, Fin de période 5,6% juin/juin
-1,0-0,8-0,6-0,4-0,20,00,20,40,60,81,01,21,41,61,82,0
12.1703.18 06.18 09.18 12.1803.1906.19 09.19 12.1903.2006.20 09.20 12.2003.2106.21
(%)
OAT 10 ans Bund 10 ans Euribor 3 mois
Taux OAT 10 ans moyen T2-21 : 0,121% (+29pb T2/T1)Spread moyen T2-21 : France : 33 pb (+10pb T2/T1), Italie : 107 pb (+5pb T2/T1)
Average spread June 21/June 20:
France -2.1%, Italy -42%
40
50
60
70
80
90
100
110
120
130
140

50 SECOND QUARTER AND FIRST HALF 2020 RESULTS
GROUPE CRÉDIT AGRICOLE CRÉDIT AGRICOLE S.A.
Economic scenario
APPENDICES
Source: Eurostat, Crédit Agricole S.A./ECO
France, Italy, Eurozone – GDP growth
Source: Eurostat, Crédit Agricole S.A./ECO
France, Italy, Eurozone – Unemployment rate
For provisioning of performing loans, use of several weighted
economic scenarios:
A more favourable scenario: French GDP +5.9% in 2021, +5.3% in 2022
A less favourable scenario: French GDP +2.7% in 2021, +3.3% in 2022
In France, forecasts by institutions:
IMF (April 2021): +5.8% in 2021 and +4.2% in 2022
OECD (May 2021): +5.8% in 2021 and +4.0% in 2022
Banque de France (June 2021): +5.75% in 2021 and +4.0% in 2022
Source: Eurostat, Crédit Agricole SA / ECO. Estimates at 30 June 2021
The first scenario, the so-called central scenario, has been weighted at 60% for the calculation of Q2 2021 IFRS ECLs. For example, a decrease in the weighting
of the first scenario by 10 points in the calculations in Q2 2021 in favour of the second, more unfavourable scenario, would result in an increase in ECL inventory
under the central forward looking scenario of around 0.5% for Crédit Agricole S.A. However, such a change in the weight would not necessarily have a significant
impact due to “forward looking local” adjustments that could mitigate the effect.
1,8
-8,0
5,8
4,3
0,3
-8,9
4,54,1
1,3
-6,7
4,8 4,5
2019 2020 2021 2022
France Italie Zone euro
%
7
9
11
13
2019 2020 2021 2022
France Italie Zone euro
% de la population active
Unemployment rate in France
9.0% (avg. Q2-21); 9.1% (avg. 2021) and
8.8% (avg. 2022)

51 SECOND QUARTER AND FIRST HALF 2020 RESULTS
GROUPE CRÉDIT AGRICOLE CRÉDIT AGRICOLE S.A.
France: €23.8bn(1)
o 64%(1) of SGL booked within Regional Banks, 28% within LCL
and 8% within CACIB
o Market share of 28%(2) on SGL requests
o 2.9 Bn€(3) exposures net of French State guarantees
Italy: €4.8bn(4)
o 0.6 Bn€ exposures net of State guarantees
France: €0.5 billion(6) for 84,000(6) payment
holidays still active
o 88%(7) regional banks and 12% LCL(7)
o <1.5%(8) of payment holidays of Regional Banks and LCL
are in stage 3
Italy: €0.3 billion(9) for 8,000 payment holidays still
active(9)
SGL and Payment holidays
(1) SGL gross exposures booked as of 30 June 2021 (Regional Banks, LCL and CACIB) (2) LCL and regional banks market share on SGL request as of June 26th 2021 (3) Scope : regional banks , LCL and CACIB. Data as of June 2021 (4) Gross exposure amounts booked as of 30 june 2021. (5) LCL,
CACIB, Regional Banks, CA Italia as of 30 June 2021 (6) Amount of deferred maturities (Regional Banks and LCL). Requests for payment holidays in total number, as at June 2021 (Regional Banks and LCL), corresponding to a remaining capital due of €8.5 billion (7) Percentage of deferred maturity
amounts, data as of June 2021 (8) Based on EBA compliant payment holidays as at June 2021 (9) Non expired payment holidays at CA Italia correspond to €1.4 billion remaining capital due, expired payment holidays at CA Italia correspond to €8.3 billion remaining capital due including 1.4% non
performing loans (10) Represents the share of loans on payment holidays, with payment holiday expired and with resumed payments. Corporate, SME and small business customer scope in Regional Banks. Include LCL. 98% for CACF (retail and corporates)
SGL loans
>98% Expired payment holidays with
payments resumed(10)
Payment holidays
APPENDICES
2.5%(5)
of SGL loan exposures in Stage 3
in France and Italy

52 SECOND QUARTER AND FIRST HALF 2020 RESULTS
GROUPE CRÉDIT AGRICOLE CRÉDIT AGRICOLE S.A.
Underlying credit cost of risk (CoR) by stage and by business line (in millions of euros) - Cost of risk on outstandings (in basis points over four rolling quarters)
High coverage ratios and NPL ratios under control
in all business lines
(*) Including non-provisioned losses; Cost of risk on outstandings (in annualised bp) at 140 bp for CA Consumer Finance, 12 bp for LCL, 65 bp for CA Italia and 13 bp for the RBs. Coverage ratios are calculated based on loans and receivables due from customers.
CoR: -45.6% Q2/Q2; CoR / outstandings: 141 bp;doubtful loan ratio: 6.3%; Coverage: 81.6%
CoR/outstandings: 34 bp
Doubtful loan ratio: 3.1%; Coverage: 67.0%
CoR: -36.7% Q2/Q2; CoR / outstandings: 14 bp;Doubtful loan ratio: 1.7%; Coverage: 102.3%
CoR: -63.0% Q2/Q2; CoR / outstandings: 21 bp;doubtful loan ratio: 1.6%; Coverage: 81.7%
CoR: -42.6% Q2/Q2; CoR / outstandings: 74 bp;doubtful loan ratio: 6.2%; Coverage: 68.6%
APPENDICES
136 123 127 127 199 223 96 119 92
-19 -3 -8
37
19
-100
16
-5
26
118 121 115
164
218
127 128114 119
Q2-19 Q3-19 Q4-19 Q1-20 Q2-20 Q3-20 Q4-20 Q1-21 Q2-21
CA-CF
S3 CoR* S1&S2 CoR Others Total CoR
46 61 86 55 84 33 36 43 47
1
-2 -22
40
54 6038
5158
64
101
117
8389
83
43
Q2-19 Q3-19 Q4-19 Q1-20 Q2-20 Q3-20 Q4-20 Q1-21 Q2-21
LCL
S3 CoR* S1&S2 CoR Others Total CoR
59 57 64 57
115
7688
62 69
6861 62 62
82
146
86
113
7179
Q2-19 Q3-19 Q4-19 Q1-20 Q2-20 Q3-20 Q4-20 Q1-21 Q2-21
CA-Italia
S3 CoR* S1&S2 CoR Others Total CoR
71 42 219 81 222 68 70 14
-13-38-3
-159
54
90
158
52
71
-24
39 4058
137
312
225
121
85
-35
Q2-19 Q3-19 Q4-19 Q1-20 Q2-20 Q3-20 Q4-20 Q1-21 Q2-21
Financing activities
S3 CoR* S1&S2 CoR Others Total CoR
-13
78
217
89 70134 118
243
84
-27
4
26
-26
96
177
4
459
57 214
-26 -4-14
-12
56
238
48
155
307 298
22
415
153188
Q1-19 Q2-19 Q3-19 Q4-19 Q1-20 Q2-20 Q3-20 Q4-20 Q1-21 Q2-21
Regional Banks
S3 CoR* S1&S2 CoR Others Total CoR
-9

53 SECOND QUARTER AND FIRST HALF 2020 RESULTS
CRÉDIT AGRICOLE S.A.
A diversified loan book with a focus on
corporate and home loans
Gross customer loans outstanding(1) at Crédit Agricole S.A. (30/06/2021)
• O/w €88 bn LCL: mostly fixed-rate, amortisable,
secured or mortgage-secured loans
• O/w €36 bn(3) for International retail banking
• Of which €133 bn CACIB, €28 bn LCL, €27 bn(2)
for International retail banking
• O/w €34 bn CA Consumer Finance (incl. Agos)
and €8 bn retail networks, excl. non-consolidated
entities (automobile JVs)
Corporate loans
€195 billion
Home loans
€125 billion
Consumer
finance
€42bn
Loans to
professionals
€33 billion
• O/w €21 bn LCL and €12 bn(4) for International
retail banking
(1) Gross customer loans outstanding excl. credit institutions
APPENDICES
Corporates44%
Real estate28%
Consumer finance
10%
Small businesses
7%
Leasing6%
Private Banking4% Other
1%
Crédit Agricole S.A.
€442 bn(1)
(2) O/w €7 bn linked to the integration of Creval(3) O/w €5 bn linked to the integration of Creval(4) O/w €2 bn linked to the integration of Creval

54 SECOND QUARTER AND FIRST HALF 2020 RESULTS
CRÉDIT AGRICOLE S.A.
A well-balanced corporate portfolio
APPENDICES
69% of Corporate exposures rated Investment
Grade(1)
SME exposure of €23 billion at 30/06/2021
LBO exposure(2) of €4.5 billion at 31/05/2021
(1) Internal rating
(2) CACIB Perimeter
Credit Agricole S.A. : €320 bn in corporate EAD at 30/06/2021
0.1%
0.1%
0.2%
0.7%
0.9%
1.4%
1.6%
2.5%
2.6%
2.6%
2.6%
3.0%
3.6%
3.6%
4.1%
4.8%
4.8%
4.8%
5.0%
5.0%
5.8%
6.4%
7.1%
7.1%
7.6%
11.9%
BANKS (0 Bn)
EVENT (0 Bn)
NON TRADING SERVICES / LOCAL AUTHORITIES (1 Bn)
WOOD / PAPER / PACKAGING (2 Bn)
MEDIA / PUBLISHING (3 Bn)
UTILITIES (5 Bn)
COMMODITY TRADERS O&G (5 Bn)
TOURISM / HOTELS / RESTAURANT (8 Bn)
OTHER INDUSTRIES (8 Bn)
IT / TECHNOLOGY (8 Bn)
BTP (8 Bn)
HEALTHCARE / PHARMACEUTICALS (9 Bn)
OTHER TRANSPORTS (11 Bn)
INSURANCE (12 Bn)
SHIPPING (13 Bn)
AGRICULTURE AND FOOD PROCESSING (15 Bn)
TELECOM (15 Bn)
RETAIL / CONSUMER GOODS INDUSTRIES (16 Bn)
AIR/SPACE (16 Bn)
OTHER (16 Bn)
HEAVY INDUSTRY (19 Bn)
AUTOMOTIVE (20 Bn)
ENERGY (EXCL. OIL & GAS) (23 Bn)
OIL & GAS (23 Bn)
REAL ESTATE (24 Bn)
NON BANKING FINANCIAL ACTIVITIES (38 Bn)

55 SECOND QUARTER AND FIRST HALF 2020 RESULTS
CRÉDIT AGRICOLE S.A.
Oil & Gas 2%
Aviation / Aerospace
2%
Automotive2%
Shipping1%
Retail / distribution (non food)
1%
Tourism / Hospitality / Restaurants
1%
A limited share of EAD exposed to sectors sensitive to the
economic effects of Covid-19
EAD excluding credit institutions (1) at end June 2021
Oil & Gas EAD presented excl. commodity traders
Asset quality is based on internal ratings
(1) EAD excluding credit institutions. EAD (Exposure At Default) is a regulatory definition used in Pillar 3. It corresponds to the exposure in the event of default
after credit conversion factors (CCF). It includes balance sheet assets and part of the off-balance sheet liabilities
€1,057 bn total EAD(1)
The world’s economy remains directly impacted by the pace of the health
crisis. The impact on each sector is still very heterogeneous, with on the
one hand, sectors heavily impacted by continuing health measures:Business segments related to the movement or gathering of people: Passenger
transportation (airlines, shipping, rail), Tourism, Events, Catering
Sectors where the level of demand remains below normal: in spite of a slight
improvement of Non-residential real estate demand on the offices segment, there
is still a wait-and-see attitude from investors linked to the impact of the pandemic
on the whole sector
And on the other hand, sectors that are rebounding with an increase in
activity and prices:
Resilient sectors or taking advantage of the pandemic: Telecoms, Electronics
(sharp increase in demand for equipment in connection with generalized work from
home; shortage of electrical components leading to higher prices for consumers)
Sectors benefiting from a sustained demand from China or driven by the recovery
of the global economy : Agricultural products (Sugar, Cereals), Metals
The progression of the vaccination campaign reinforces the hope that this
improvement will expand to most other economic sectors.
The Investment Grade share of Corporate EAD is 69% at June 2021
APPENDICES
EAD
€bn
%
Investment
Grade
% EAD
sensitive or
in default
% EAD in
default
Automotive 22.7 68.9% 7.9% 1.7%
Oil & Gas (hors commodity traders) 20.4 69.0% 6.8% 0.8%
Aviation / Aerospace 16.1 40.9% 32.6% 6.6%
Retail / distribution (non food) 13.2 44.3% 14.5% 4.3%
Shipping 13.2 64.6% 7.3% 2.2%
Tourism / Hospitality / Restaurants 8.1 31.5% 24.8% 5.8%

56 SECOND QUARTER AND FIRST HALF 2020 RESULTS
CRÉDIT AGRICOLE S.A.
Alternative performance measures – specific items Q2-21 and H1-21
APPENDICES
€353mNet impact of specific items on
Q2-21 net income
€466mNet impact of specific items on
H1-21 net income
€m Gross
impact*
Impact on
Net income
Gross
impact*
Impact on
Net income
Gross
impact*
Impact on
Net income
Gross
impact*
Impact on
Net income
DVA (LC) (7) (5) (7) (5) 1 1 (26) (19)
Loan portfolio hedges (LC) (8) (6) (75) (50) (16) (11) 48 32
Home Purchase Savings Plans (FRB) 2 1 (4) (2) (10) (7) (15) (10)
Home Purchase Savings Plans (CC) 4 3 (16) (11) 0 0 (46) (31)
Liability management upfront payment (CC) - - (41) (28) - - (41) (28)
Support to insured clients Covid-19 (LCL) - - (2) (1) - - (2) (1)
Support to insured clients Covid-19 (AG) - - (143) (97) - - (143) (97)
Ongoing sale project NBI (WM) (1) (1) - - (1) (1) - -
Total impact on revenues (10) (7) (288) (195) (25) (18) (225) (154)
Covid-19 donation (AG) - - - - - - (38) (38)
Covid-19 donation (IRB) - - - - - - (8) (4)
Covid-19 donation (CC) - - - - - - (10) (10)
S3 / Kas Bank integration costs (LC) - - (5) (2) (4) (2) (9) (4)
Transformation costs (LC) (16) (8) - - (16) (8) - -
Transformation costs (FRB) (13) (9) - - (13) (9) - -
Ongoing sale project Expenses (WM) (2) (2) - - (2) (2) - -
Total impact on operating expenses (32) (19) (5) (2) (36) (21) (65) (57)
Restatement SRF2016-2020 - - - - 130 130 - -
Total impact on SRF - - - - 130 130 - -
Triggering of the Switch2 (AG) - - 65 44 - - 65 44
Creval - Cost of Risk stage 1 (IRB) (25) (19) - - (25) (19) - -
Total impact on cost of credit risk (25) (19) 65 44 (25) (19) 65 44"Affrancamento" gain (SFS) 5 5 - - 5 5 - -
Total impact equity-accounted entities 5 5 - - 5 5 - -
Creval acquisition costs (IRB) (16) (8) - - (16) (8) - -
Total impact Net income on other assets (16) (8) - - (16) (8) - -
Badwill Creval (IRB) 378 285 - - 378 285 - -
Total impact on change of value of goodwill 378 285 - - 378 285 - -
"Affrancamento" gain (IRB) 38 28 - - 38 28 - -
"Affrancamento" gain (AG) 114 78 - - 114 78 - -
Total impact on tax 152 106 - - 152 106 - -
Ongoing sale project (WM) 10 10 - - 5 5 - -
Total impact on Net income from discounted or held-
for-sale operations10 10 - - 5 5 - -
Total impact of specific items 462 353 (227) (153) 568 466 (224) (167)
Asset gathering 121 85 (77) (53) 116 80 (116) (91)
French Retail banking (11) (8) (6) (4) (23) (16) (17) (11)
International Retail banking 375 287 - 375 287 (8) (4)
Specialised financial services 5 5 - - 5 5 - -
Large customers (32) (20) (86) (57) (35) (21) 13 9
Corporate centre 4 3 (58) (39) 130 130 (97) (69)
* Impact before tax and before minority interests
Q2-21 Q2-20 H1-21 H1-20
57 SECOND QUARTER AND FIRST HALF 2020 RESULTS
CRÉDIT AGRICOLE S.A.
Reconciliation between stated and underlying income – Q2-21
APPENDICES
€1,615mUnderlying net income in Q2-21
€0.52Underlying earnings per share in Q2-21
€mQ2-21
stated
Specific
items
Q2-21
underlying
Q2-20
stated
Specific
items
Q2-20
underlying
∆ Q2/Q2
stated
∆ Q2/Q2
underlying
Revenues 5,819 (10) 5,829 4,897 (288) 5,185 +18.8% +12.4%
Operating expenses excl.SRF (3,253) (32) (3,221) (2,980) (5) (2,976) +9.2% +8.3%
SRF (11) - (11) (79) - (79) (85.6%) (85.6%)
Gross operating income 2,554 (42) 2,596 1,838 (293) 2,130 +39.0% +21.9%
Cost of risk (279) (25) (254) (842) 65 (908) (66.8%) (72.0%)
Equity-accounted entities 101 5 96 88 - 88 +14.8% +9.2%
Net income on other assets (37) (16) (21) 82 - 82 n.m. n.m.
Change in value of goodwill 378 378 - - - - n.m. n.m.
Income before tax 2,717 300 2,417 1,166 (227) 1,393 x 2.3 +73.5%
Tax (397) 169 (566) (86) 72 (158) x 4.6 x 3.6
Net income from discont'd or held-for-sale ope. 11 10 1 (0) - (0) n.m. n.m.
Net income 2,331 478 1,852 1,080 (155) 1,235 x 2.2 +50.0%
Non controlling interests (363) (126) (237) (126) 2 (129) x 2.9 +84.4%
Net income Group Share 1,968 353 1,615 954 (153) 1,107 x 2.1 +46.0%
Earnings per share (€) 0.64 0.12 0.52 0.31 (0.05) 0.36 x 2.1 +45.4%
Cost/Income ratio excl. SRF (%) 55.9% 55.3% 60.9% 57.4% -5.0 pp -2.1 pp
Net income Group Share excl. SRF 1,976 223 1,753 1,020 (153) 1,173 +93.7% +49.5%

58 SECOND QUARTER AND FIRST HALF 2020 RESULTS
CRÉDIT AGRICOLE S.A.
Reconciliation between stated and underlying income – H1-21
APPENDICES
€2,548mUnderlying net income in H1-21
€0.80Underlying earnings per share in H1-21
€mH1-21
stated
Specific
items
H1-21
underlying
H1-20
stated
Specific
items
H1-20
underlying
∆ H1/H1
stated
∆ H1/H1
underlying
Revenues 11,312 (25) 11,337 10,097 (225) 10,322 +12.0% +9.8%
Operating expenses excl.SRF (6,450) (36) (6,414) (6,235) (65) (6,170) +3.4% +4.0%
SRF (392) 130 (522) (439) - (439) (10.7%) +18.9%
Gross operating income 4,470 69 4,401 3,423 (290) 3,713 +30.6% +18.5%
Cost of risk (663) (25) (638) (1,463) 65 (1,529) (54.7%) (58.2%)
Equity-accounted entities 188 5 183 178 - 178 +5.6% +2.8%
Net income on other assets (34) (16) (18) 87 - 87 n.m. n.m.
Change in value of goodwill 378 378 - - - - n.m. n.m.
Income before tax 4,339 411 3,928 2,226 (224) 2,450 +94.9% +60.3%
Tax (775) 174 (949) (347) 55 (401) x 2.2 x 2.4
Net income from discont'd or held-for-sale ope. 5 5 0 (1) - (1) n.m. n.m.
Net income 3,569 590 2,979 1,879 (170) 2,048 +90.0% +45.4%
Non controlling interests (555) (124) (431) (287) 3 (290) +93.4% +48.5%
Net income Group Share 3,014 466 2,548 1,592 (167) 1,758 +89.3% +44.9%
Earnings per share (€) 0.96 0.16 0.80 0.47 (0.06) 0.53 x 2 +50.8%
Cost/Income ratio excl.SRF (%) 57.0% 56.6% 61.7% 59.8% -4.7 pp -3.2 pp
Net income Group Share excl. SRF 3,351 466 2,885 1,984 (167) 2,151 +68.9% +34.1%

59 SECOND QUARTER AND FIRST HALF 2020 RESULTS
CRÉDIT AGRICOLE S.A.
Changes in underlying net income Group share, by business lines – Q2/Q2 and H1/H1
APPENDICES
€mQ2-21
underlying
Q2-20
underlying
∆ Q2/Q2
underlying
∆ Q2/Q2
underlying
Net income Group Share 1,615 1,107 +46.0% 509
Asset gathering 653 551 +18.6% 103
Insurance 404 386 +4.7% 18
Asset management 221 146 +51.2% 75
Wealth management 28 19 +51.0% 10
Retail banking 338 165 x 2.1 174
LCL 229 128 +78.6% 101
CA Italia 73 25 x 2.9 48
IRB - others 37 12 x 3.2 25
Specialised financial services 206 149 +38.4% 57
CA-CF 168 131 +28.1% 37
CAL&F 39 18 x 2.1 20
Large corporates 492 436 +12.9% 56
CIB 457 400 +14.5% 58
AS 35 37 (3.8%) (1)
Corporate Centre (75) (194) (61.3%) 119
€mH1-21
underlying
H1-20
underlying
∆ H1/H1
underlying
∆ H1/H1
underlying
Net income Group Share 2,548 1,758 +44.9% 790
Asset gathering 1,165 907 +28.5% 258
Insurance 700 590 +18.7% 110
Asset management 418 274 +52.7% 144
Wealth management 48 44 +9.4% 4
Retail banking 534 324 +64.7% 210
LCL 345 232 +48.9% 113
CA Italia 133 59 x 2.2 74
IRB - others 55 33 +68.1% 22
Specialised financial services 365 258 +41.3% 106
CA-CF 302 228 +32.5% 74
CAL&F 63 30 x 2.1 32
Large corporates 770 644 +19.5% 126
CIB 712 585 +21.8% 127
AS 58 59 (2.5%) (1)
Corporate Centre (285) (375) (23.9%) 89

60 SECOND QUARTER AND FIRST HALF 2020 RESULTS
GROUPE CRÉDIT AGRICOLE
Alternative performance measures – specific items Q2-21 and H1-21
APPENDICES
€403mNet impact of specific items on
Q2-21 net income
€557mNet impact of specific items on
H1-21 net income
Q2-21 Q2-20 H1-21 H1-20
€mGross
impact*
Impact on
Net income
Gross
impact*
Impact on
Net income
Gross
impact*
Impact on
Net income
Gross
impact*
Impact on
Net income
DVA (LC) (7) (6) (7) (5) 1 1 (26) (19)
Loan portfolio hedges (LC) (8) (6) (75) (51) (16) (11) 48 32
Home Purchase Savings Plans (LCL) 2 2 (4) (3) (10) (7) (15) (10)
Home Purchase Savings Plans (CC) 4 3 (16) (11) 0 0 (46) (31)
Home Purchase Savings Plans (RB) 19 13 (58) (40) 1 0 (133) (90)
Liability management upfront payment (CC) - - (41) (28) - - (41) (28)
Support to insured clients Covid-19 (AG) - - (2) (1) - - (2) (1)
Support to insured clients Covid-19 (AG) - - (143) (97) - - (143) (97)
Support to insured clients Covid-19 (RB) - - (94) (64) - - (94) (64)
Ongoing sale project NBI (WM) (1) (1) - - (1) (1) - -
Total impact on revenues 9 6 (441) (300) (25) (18) (452) (309)
Covid-19 donation (AG) - - - - - - (38) (38)
Covid-19 donation (IRB) - - - - - - (8) (4)
Covid-19 donation (CC) - - - - - - (10) (10)
Covid-19 donation (RB) - - - - - - (10) (10)
S3 / Kas Bank integration costs (LC) - - (5) (2) (4) (2) (9) (4)
Transformation costs (LC) (16) (8) - - (16) (8) - -
Transformation costs (FRB) (13) (9) - - (13) (9) - -
Ongoing sale project Expenses (WM) (2) (2) - - (2) (2) - -
Total impact on operating expenses (32) (19) (5) (2) (36) (21) (75) (67)
Restatement SRF 2016-2020 (CR) - - - - 55 55 - -
Restatement SRF 2016-2020 (CC) - - - - 130 130 - -
Total impact on SRF - - - - 185 185 - -
Triggering of the Switch2 (AG) - - 65 44 - - 65 44
Triggering of the Switch2 (RB) - - (65) (44) - - (65) (44)
Creval - Cost of Risk stage 1 (IRB) (25) (21) - - (25) (21) - -
Total impact on cost of credit risk (25) (21) - - (25) (21) - -
Badwill Creval (IRB) 378 321 - - 378 321 - -
Total impact on change of value of goodwill 378 321 - - 378 321 - -
"Affrancamento" gain (IRB) 38 32 - - 38 32 - -
"Affrancamento" gain (AG) 114 80 - - 114 80 - -
Total impact on tax 152 111 - - 152 111 - -
"Affrancamento" gain (SFS) 5 5 - - 5 5 - -
Total impact equity-accounted entities 5 5 - - 5 5 - -
Creval acquisition costs (IRB) (16) (9) - - (16) (9) - -
Total impact on Net income on other assets (16) (9) - - (16) (9) - -
Ongoing sale project (WM) 10 10 - - 5 5 - -
Total impact on Net income from discounted or held-for-sale operations10 10 - - 5 5 - -
Total impact of specific items 481 403 (445) (302) 623 557 (527) (376)
Asset gathering 121 87 (77) (53) 116 82 (116) (91)
French Retail banking 8 5 (224) (152) 32 39 (320) (221)
International Retail banking 375 322 - 375 322 (8) (4)
Specialised financial services 5 5 - - 5 5 - -
Large customers (32) (20) (86) (58) (35) (21) 13 9
Corporate centre 4 3 (58) (39) 130 130 (97) (69)

61 SECOND QUARTER AND FIRST HALF 2020 RESULTS
GROUPE CRÉDIT AGRICOLE
Reconciliation between stated and underlying income – Q2-21
APPENDICES
€2,367mUnderlying net income in Q2-21
€mQ2-21
statedSpecific items
Q2-21
underlying
Q2-20
statedSpecific items
Q2-20
underlying
∆ Q2/Q2
stated
∆ Q2/Q2
underlying
Revenues 9,304 9 9,295 8,096 (441) 8,536 +14.9% +8.9%
Operating expenses excl.SRF (5,536) (32) (5,504) (5,036) (5) (5,031) +9.9% +9.4%
SRF (12) - (12) (107) - (107) (89.0%) (89.0%)
Gross operating income 3,756 (23) 3,779 2,953 (445) 3,398 +27.2% +11.2%
Cost of risk (470) (25) (445) (1,208) - (1,208) (61.1%) (63.1%)
Equity-accounted entities 98 5 93 78 - 78 +26.7% +20.2%
Net income on other assets (35) (16) (19) 78 - 78 n.m. n.m.
Change in value of goodwill 379 378 2 (3) - (3) n.m. n.m.
Income before tax 3,728 318 3,409 1,898 (445) 2,343 +96.4% +45.5%
Tax (681) 164 (844) (308) 142 (450) x 2.2 +87.8%
Net income from discont'd or held-for-sale ope. 11 10 1 (0) - (0) n.m. n.m.
Net income 3,058 492 2,566 1,590 (303) 1,893 +92.3% +35.5%
Non controlling interests (287) (89) (199) (107) 1 (108) x 2.7 +83.4%
Net income Group Share 2,770 403 2,367 1,483 (302) 1,785 +86.8% +32.6%
Cost/Income ratio excl.SRF (%) 59.5% 59.2% 62.2% 58.9% -2.7 pp +0.3 pp
Net income Group Share excl. SRF 2,779 218 2,560 1,580 (302) 1,882 +75.9% +36.1%

62 SECOND QUARTER AND FIRST HALF 2020 RESULTS
GROUPE CRÉDIT AGRICOLE
Reconciliation between stated and underlying income – H1-21
APPENDICES
€3,967mUnderlying net income in H1-21
€mH1-21
statedSpecific items
H1-21
underlying
H1-20
statedSpecific items
H1-20
underlying
∆ H1/H1
stated
∆ H1/H1
underlying
Revenues 18,353 (25) 18,378 16,462 (452) 16,914 +11.5% +8.7%
Operating expenses excl.SRF (11,041) (36) (11,005) (10,584) (75) (10,509) +4.3% +4.7%
SRF (479) 185 (664) (562) - (562) (14.7%) +18.2%
Gross operating income 6,834 125 6,709 5,316 (527) 5,843 +28.5% +14.8%
Cost of risk (1,007) (25) (982) (2,137) - (2,137) (52.9%) (54.1%)
Equity-accounted entities 192 5 187 168 - 168 +14.3% +11.3%
Net income on other assets (23) (16) (7) 84 - 84 n.m. n.m.
Change in value of goodwill 379 378 2 (3) - (3) n.m. n.m.
Income before tax 6,376 466 5,909 3,428 (527) 3,955 +86.0% +49.4%
Tax (1,401) 174 (1,576) (789) 148 (937) +77.7% +68.1%
Net income from discont'd or held-for-sale ope. 5 5 0 (1) - (1) n.m. n.m.
Net income 4,979 645 4,334 2,638 (379) 3,017 +88.7% +43.6%
Non controlling interests (455) (88) (367) (248) 3 (251) +83.8% +46.5%
Net income Group Share 4,524 557 3,967 2,391 (376) 2,767 +89.2% +43.4%
Cost/Income ratio excl.SRF (%) 60.2% 59.9% 64.3% 62.1% -4.1 pp -2.3 pp
Net income Group Share excl. SRF 4,948 557 4,391 2,913 (376) 3,289 +69.8% +33.5%

63 SECOND QUARTER AND FIRST HALF 2020 RESULTS
CRÉDIT AGRICOLE S.A.
Profitability in business lines
APPENDICES
H1-21 annualised underlying RoNE (1,2) by business line and 2022 targets (%)
AG: Asset Gathering, including Insurance; RB: Retail Banking, SFS: Specialised financial services; LC: Large customers; CC: Corporate Centre, (1) See slides 48 (Crédit Agricole S.A.) and 52 (Crédit Agricole Group) for further details on specific items, (2) Underlying after deduction of See slide 49 for details
of specific items. Underlying after deduction of AT1 coupons, charged to net equity, see slide 60
22.5%
8.4%5.7%
12.3% 11.7% 10.7%9.3%
24.4%
14.1%11.3%
14.8% 15.8% 15.0%13.6%
>30%
>12.5% >13%
>18%
>14%
>10%11%
AG LCL CA Italia IRB Other SFS LC RoTE underlying CASA
Underlying 2020 Underlying H1-21 2022 MTP target

64 SECOND QUARTER AND FIRST HALF 2020 RESULTS
CRÉDIT AGRICOLE S.A.
Underlying net income(1) H1-21 by business line
(excluding Corporate Centre) (%)
A stable, diversified and profitable business model
APPENDICES
Underlying revenues H1-21 by business line(1)
(excluding Corporate Centre) (%)
(1) See slide 49 for details on specific items
Insurance12%
Asset Mngt14%
Wealth Mngt4%
LCL16%
IRB13%
Consumer finance
9%
Leasing & Factoring
3%
CIB24%
Asset servicing
5%
Underlying revenues excl. CC
H1-21: €11.2bn
Retail banking 30%
Spec. fin. serv. 12%
Large customers
29%
Asset gathering
30%
Retail
banking
19%
Insurance25%
Asset Mngt15%
Wealth Mngt2%LCL
12%
IRB7%
Consumer finance
10%
Leasing & Factoring
2%
CIB25%
Asset servicing
2%
Asset gathering
41%
Spec. fin. serv. 13%
Large customers
27%
Underlying Net income
excl. CC
H1-21: €2.8bn

65 SECOND QUARTER AND FIRST HALF 2020 RESULTS
CRÉDIT AGRICOLE S.A.
Allocated capital by business line at 30/06/2021 (in €bn and %)
Risk-weighted assets and allocated capital by business line
APPENDICES
Risk-weighted assets by business line at 30/06/2021 (€bn and %)
Insurance
25%
Asset
Mngt
3%Wealth
Mngt
1%
LCL
13%
IRB
13%
Consumer
finance
10%
Leasing &
Factoring
3%
CIB
30%
Asset
servicing
2%
Corporate
centre
0%
Retail
banking
€9.6bn
25%
Asset gathering
€11.2bn
29%
Spec. fin. serv.
€4.9bn
13%
Large
customers
€12.3bn
32%
Total allocated
capital
end-June 2021:
€38bn
Insurance
9% Asset
Mngt
3%Wealth
Mngt
1%LCL
14%
IRB
14%
Consumer
finance
11%
Leasing &
Factoring
3%
CIB
34%
Asset
servicing
3%
Corporate
centre
8%
Retail banking
€100.8bn
28%
Asset gathering
€47.2bn
13%
RWA
end-June 2021:
€356.8bn
Large customers
€129.9bn
36%
Spec. fin. serv. €52bn
15%

66 SECOND QUARTER AND FIRST HALF 2020 RESULTS
CRÉDIT AGRICOLE S.A.
RWA and allocated capital by business line
APPENDICES
*** Methodology: 9.5% of RWAs for each business line; Insurance: 80% of Solvency 2 capital requirements less 9.5% of RWA transferred to the Regional banks under the Switch 2 Insurance.
€bnJune
2021
March
2021
June
2020
June
2021March 2021
June
2020
Asset gathering 47.2 47.4 40.9 11.2 11.0 10.0
- Insurance* ** 30.2 31.2 24.8 9.6 9.4 8.5
- Asset management 12.3 11.2 11.1 1.2 1.1 1.1
- Wealth Management 4.7 5.0 5.0 0.5 0.5 0.5
French Retail Banking (LCL) 50.0 51.2 54.1 4.7 4.9 5.1
International retail Banking 50.8 40.9 41.3 4.8 3.9 3.9
Specialised financial services 52.0 51.6 51.7 4.9 4.9 4.9
Large customers 129.9 130.5 131.7 12.3 12.4 12.5
- Financing activities 78.9 78.5 74.7 7.5 7.5 7.1
- Capital markets and investment
banking41.9 42.0 46.7 4.0 4.0 4.4
- Asset servicing 9.1 10.1 10.3 0.9 1.0 1.0
Corporate Centre 26.9 26.8 27.1 0.0 0.0 2.6
TOTAL 356.8 348.4 346.9 38.0 37.0 36.5
Risk-weighted assets Capital
299 291 292 304 311
35 34 34 35 3613 12 10 10 10
347 338 336 348 357
June 20 Sept. 20 Dec. 20 Mar. 21 June 21
Market risk
Operational
risk
Credit risk
+2.4%

67 SECOND QUARTER AND FIRST HALF 2020 RESULTS
CRÉDIT AGRICOLE S.A.
Distribution of share capital and number of shares
APPENDICES
Breakdown of share capital Number of shares % Number of shares % Number of shares %
SAS Rue La Boétie 1,726,880,218 55.8% 1,612,517,290 55.3% 1,612,517,290 56.3%
Treasury shares 15,751,336 0.5% 1,090,000 0.0% 2,458,564 0.1%
Employees (company investment fund, ESOP) 150,209,066 4.9% 169,020,958 5.8% 130,180,992 4.5%
Float 1,199,178,871 38.8% 1,134,060,392 38.9% 1,121,280,310 39.1%
Total shares in issue (period end) 3,092,019,491 2,916,688,640 2,866,437,156
Total shares in issue, excluding treasury shares (period end) 3,076,268,155 2,915,598,640 2,863,978,592
Total shares in issue, excluding treasury shares (average number) 2,943,311,672 2,885,319,047 2,863,261,762
30/06/2021 31/12/2020 30/06/2020
(1) Excluded in the calculation of the earning per share ; including 15 251 336 shares related to the share buy back of Crédit Agricole SA announced on June 9th 20201, for a maximum amount of 558.6 million euros
(1)

68 SECOND QUARTER AND FIRST HALF 2020 RESULTS
CRÉDIT AGRICOLE S.A.
Data per share
APPENDICES
(2)
(3)
(2)
(€m) Q2-21 Q2-20 H1-21 H1-20 ∆ Q2/Q2 ∆ H1/H1
Net income Group share - stated 1,968 954 3,014 1,592 x 2.1 +89.3%
- Interests on AT1, including issuance costs, before tax (79) (72) (193) (229) +9.7% (15.7%)
NIGS attributable to ordinary shares - stated [A] 1,889 882 2,821 1,363 x 2.1 x 2.1
Average number shares in issue, excluding treasury shares (m) [B] 2,943.3 2,882.4 2,943.3 2,882.7 +2.1% +2.1%
Net earnings per share - stated [A]/[B] 0.64 € 0.31 € 0.96 € 0.47 € x 2.1 x 2
Underlying net income Group share (NIGS) 1,615 1,107 2,548 1,758 +46.0% +44.9%
Underlying NIGS attributable to ordinary shares [C] 1,536 1,035 2,355 1,529 +48.5% +54.0%
Net earnings per share - underlying [C]/[B] 0.52 € 0.36 € 0.80 € 0.53 € +45.4% +50.8%
(€m) 30/06/2021 30/06/2020
Shareholder's equity Group share 65,863 63,895
- AT1 issuances (4,882) (5,130)
- Unrealised gains and losses on OCI - Group share (2,313) (2,291)
- Payout assumption on annual results* (1,200)
Net book value (NBV), not revaluated, attributable to ordin. sh. [D] 57,469 56,474
- Goodwill & intangibles** - Group share (17,569) (18,502)
Tangible NBV (TNBV), not revaluated attrib. to ordinary sh. [E] 39,900 37,972
Total shares in issue, excluding treasury shares (period end, m) [F] 3,076.3 2,882.8
NBV per share , after deduction of dividend to pay (€) [D]/[F] 18.7 € 19.6 €
TNBV per share, after deduction of dividend to pay (€) [G]=[E]/[F] 13.0 € 13.2 €
* dividend proposed to the Board meeting to be paid
** including goodwill in the equity-accounted entities
16.0%
8.9%
13.6%
9.9%
Stated ROTE adjusted (%) Underlying ROTE adjusted(%)
Underlying(1) ROTE adjusted(2) (%)
(1) Underlying. See slide 40 for details on specific items. (2) ROTE calculated on
the basis of underlying net income Group share and annualised IFRIC 21 costs
per quarter
(€m) H1-21 H1-20
Net income Group share - stated [K] 3,014 1,592
Impairment of intangible assets [L] 0 0
IFRIC [M] -568 -493
Stated NIGS annualised [N] = ([K]-[L]-[M])*2+[M] 6,595 3,676
Interests on AT1, including issuance costs, before tax, annualised [O] -386 -458
Stated result adjusted [P] = [N]+[O] 6,209 3,218
Tangible NBV (TNBV), not revaluated attrib. to ord. sh. - avg*** [J] 38,872 36,022
Stated ROTE adjusted (%) = [P] / [J] 16.0% 8.9%
Underlying Net income Group share [Q] 2,548 1,758
Underlying NIGS annualised [R] = ([Q]-[M])*2+[M] 5,663 4,010
Underlying NIGS adjusted [S] = [R]+[O] 5,277 3,552
Underlying ROTE adjusted(%) = [S] / [J] 13.6% 9.9%
*** including assumption of dividend for the current exercise 0.0% 0.0%

69 SECOND QUARTER AND FIRST HALF 2020 RESULTS
CRÉDIT AGRICOLE S.A.
Alternative performance indicator: stated and underlying RoTE adjusted
APPENDICES
(2)
(3)
(2)
(1)
* Excluding selected specific items
Underlying RoTE adjusted
Only the numerator changes compared to the stated RoTE adjusted
The underlying annualised Net income Group share corresponds to the annualisation of
the underlying Net income Group share (Q1x4; H1x2; 9Mx4/3) restating each period of the
IFRIC impacts in order to linearise them over the year. Example in Q1-21, annualised
underlying NIGS = [underlying NIGS: €932 million - Net income IFRIC -€560 million] x 4 +
Net income IFRIC -€560 million = €5,410 million
The new methodology for calculating the underlying RoTE adjusted uses this annualised
underlying Net income, plus the annualised AT1 coupon in the numerator, divided by the
denominator.
Stated RoTE adjusted
The stated annualised Net income Group share corresponds to the annualisation of the
stated Net income Group share (Q1x4; H1x2; 9Mx4/3) excluding impairments of intangible
assets and restating each period of the IFRIC impacts in order to linearise them over the
year. Example in Q1-21, annualised stated NIGS = [stated NIGS: €1,045 million - Net
income IFRIC -€560 million - Net income Impairment of intangible assets: €0 million] x 4 +
Net income IFRIC -€560 million = €5,861 million
The new methodology for calculating the stated RoTE adjusted uses this annualised
stated Net income, plus the annualised AT1 coupon in the numerator, divided by the
denominator shown herebelow
The denominator corresponds with the average tangible net assets attributable to ordinary
shares*, without change in method
€m T1 S1 9M 12M T1 S1 9M 12M T1 S1 9M 12M T1 S1 9M 12M T1 S1
Stated NIGS 845 2,195 3,262 3,649 856 2,292 3,393 4,400 763 1,985 3,183 4,844 638 1,592 2,568 2,692 1,045 3,014
incl. Impairment of intangible asset 0 0 0 -222 0 0 0 0 0 0 0 -611 0 0 0 -778 0 0
Underlying NIGS 896 2,081 3,047 3,925 788 2,205 3,338 4,405 796 2,038 3,264 4,582 652 1,758 2,874 3,849 932 2,548
incl. IFRIC -352 -362 -362 -362 -376 -386 -386 -386 -403 -408 -410 -410 -427 -493 -493 -493 -560 -568
Annualised stated NIGS, linearised
IFRIC over the year, excl. Impairment
(A)
4,436 4,752 4,469 3,870 4,551 4,970 4,652 4,400 4,259 4,377 4,381 5,456 3,831 3,676 3,589 3,470 5,861 6,595
Annualised underlying NIGS,
linearised IFRIC (B)4,639 4,524 4,183 3,925 4,280 4,797 4,580 4,405 4,392 4,484 4,489 4,582 3,887 4,010 3,996 3,849 5,410 5,663
Annualised AT1 coupon (C ) -471 -475 -452 -454 -428 -440 -441 -443 -592 -478 -606 -587 -632 -459 -392 -373 -456 -386
Adjusted stated result = (A) + (C )
3,965 4,278 4,018 3,416 4,123 4,530 4,211 3,957 3,667 3,899 3,775 4,868 3,200 3,217 3,197 3,097 5,405 6,209
Adjusted underlying result = (B) + (C )
4,168 4,050 3,732 3,471 3,852 4,357 4,139 3,962 3,800 4,005 3,883 3,995 3,256 3,550 3,604 3,476 4,954 5,277
0
Tangible NBV attributable to ordinary
shareds32,460 32,388 31,255 31,184 29,926 30,398 30,692 31,114 32,573 32,579 33,059 33,525 36,405 36,022 36,102 37,314 38,167 38,872
0
Adjusted stated ROTE 12.2% 13.2% 12.9% 11.0% 13.8% 14.9% 13.7% 12.7% 11.3% 12.0% 11.4% 14.5% 8.8% 8.9% 8.9% 8.3% 14.2% 16.0%
Adjusted underlying ROTE 12.8% 12.5% 11.9% 11.1% 12.9% 14.3% 13.5% 12.7% 11.7% 12.3% 11.7% 11.9% 8.9% 9.9% 10.0% 9.3% 13.0% 13.6%
2017 2018 2019 2020 2021

WORKING EVERY DAY
IN THE INTEREST OF
OUR CUSTOMERS AND
SOCIETY
CREDIT UPDATE
AOUT 2021

Disclaimer
This document has been prepared by Crédit Agricole S.A. on the basis of proprietary information and is available on its website (https://www.credit-agricole.com/finance/finance/espace-
investisseurs/dette). It may not be reproduced by any person, or be forwarded or distributed to any person unless so authorised by Crédit Agricole S.A.. Failure to comply with this directive may
result in a violation of applicable laws. None of Crédit Agricole S.A. or its affiliates, advisers, dealers or representatives takes any responsibility for the use of these materials by any person.
This document does not constitute regulated financial information on Crédit Agricole S.A. and Crédit Agricole Group. Regulatory financial information comprises the periodic financial results
presentations, the financial reports, the registration document and the updates thereto, which are available on Crédit Agricole S.A.’s website (https://www.credit-
agricole.com/en/finance/finance/financial-publications). Some of, but not all, the data presented in this document is derived from the aforementioned regulatory financial information.
Save for the data that has been directly extracted from publications which have been reviewed by the Statutory auditors of Crédit Agricole S.A., the information contained in this document has not
been independently verified. No representation or warranty expressed or implied is made as to, and no reliance should be placed on, the fairness, accuracy, completeness or correctness of the
information or opinions contained herein. None of Crédit Agricole S.A. or its affiliates, advisers, dealers or representatives, or any other person, shall have any liability whatsoever (in negligence or
otherwise) for any loss arising from any use of this document or its contents or otherwise arising in connection with this document. This document is for preliminary informational purposes only
and is not an offer to sell or the solicitation of an offer to purchase or subscribe for any securities and no part of it shall form the basis of or be relied upon in connection with any contract or
commitment whatsoever. This document is not intended for distribution to, or use by, any person or entity in any jurisdiction or country where such distribution or use would be contrary to law or
regulation.
This documents may contain forward-looking information and prospective statements about Crédit Agricole S.A., that are not historical facts. These statements include financial projections and
estimates and their underlying assumptions, statements regarding plans, objectives and expectations with respect to future operations, products and services, and statements regarding future
performance. Such statements do not represent forecasts within the meaning of European Regulation 809/2004 of 29 April 2004 (chapter 1, article 2, § 10). Forward-looking statements may be
identified by the words “believe,” “expect,” “anticipate,” “target” or similar expressions. Although Crédit Agricole S.A.’s management believes that the expectations reflected in such forward-looking
statements are reasonable, investors are cautioned that forward-looking information and statements are subject to various risks and uncertainties, many of which are difficult to predict and
generally beyond the control of Crédit Agricole S.A., that could cause actual results and developments to differ materially from those expressed in, or implied or projected by, the forward-looking
information and statements. These risks and uncertainties include, but are not limited to, those discussed or identified in the annual reports and other filings with the French Autorité des marchés
financiers made or to be made by Crédit Agricole S.A. Crédit Agricole S.A. undertakes no obligation to publicly update its forward-looking statements, whether as a result of new information, future
events, or otherwise.
Forward-Looking and Prospective Statements

CREDIT UPDATE - AOUT 202172
GROUPE CRÉDIT AGRICOLE
Q2/Q2 and H1/H1 change in underlying revenues(1), by division
RB: Regional banks; OR: Other retail (LCL & International retail banking),
AG: Asset gathering, including Insurance, SFS: Specialised financial services;
LC: Large customers; CC: Corporate centre
Strong revenue growth, thanks to sustained activity in all
business lines and a positive market effect
Regular revenue generation for 5 years
Revenues up 7.7% Q2-21/Q2-20 and 7.8% Q2-21/Q2-19
excluding scope effect(2)
Strong increase in revenues in retail networks, AG and SFS
RB: increase in net interest margin supported by favourable refinancing
conditions and hike in fee revenues (insurance, account management and
payments)
OR: buoyant activity in housing and professionals’ loans at LCL, net interest
margin supported by favourable refinancing conditions, increase in fees and
commissions income; very dynamic commercial production at CAI
AG: strong revenue growth; record level of performance fees in asset
management and dynamic insurance activity, positive market effect
LC: revenue normalisation in capital markets in a context of low volatility;
recovery in structured finance and trade
SFS: dynamic recovery of commercial production in consumer finance,
leasing and factoring
CC: base effect related to intra-group eliminations (tightening of spreads in
Q2-21)(1) Underlying: details of specific items on slide 94
(2) Scope effects Q2-21/Q2-20 +€102m and H1-21/H1-20 +€89m : Creval, Sabadell AM, Amundi BOC, Fund Channel, CACF NL, CAIWM
Brazil and Miami, CAA Via Vita, Bankoa ; scope effects Q2-21/Q2-19 +€98m et H1-21/H1-19 +€119m : Creval, Sabadell AM, Amundi
BOC, Fund Channel, CACF NL, CAIWM Brazil and Miami, CAA Via Vita, Kas Bank, S3, CA Romania, Bankoa
CRÉDIT AGRICOLE GROUP Q2-21 & H1-21 HIGHLIGHTS
8,534 8,536
9,295
+137+224
+263
-210
+51+295
Q2-19underlying
Q2-20underlying
RegionalBanks
OtherRetail
Assetgathering
LargeCustomers
SFS Corporatecentre
Q2-21underlying
+8.9% +€759m
+8.9% +€761m
16,857 16,914
18,378
+457+255
+511
-33
+48 +225
H1-19underlying
H1-20underlying
RegionalBanks
OtherRetail
Assetgathering
LargeCustomers
SFS Corporatecentre
H1-21underlying
+8.7% +€1,464m
+9.0% +€1,521m
8,334 8,249 8,323 8,378
9,082
7,940
8,402 8,534 8,536
9,295
7,807
8,097 8,331
8,460 8,235
8,064
8,602 8,660
REVENUE : GROWTH Q /Q SINCE 2017
Q2/Q2 Q3/Q3 Q4/Q4Q1/Q1

CREDIT UPDATE - AOUT 202173
GROUPE CRÉDIT AGRICOLE
Q2/Q2 and H1/H1 change in underlying expenses excluding SRF(1), by division
RB: Regional banks; OR: Other retail (LCL & International retail banking), AG: Asset gathering, including
Insurance, SFS: Specialised financial services; LC: Large customers; CC: Corporate centre
Increase in expenses linked to the recovery in activity,
variable compensation and a scope effect
(1) Underlying data, excluding SRF (Single Resolution Fund); details of specific items on slide 94(2) Scope effects Q2-21/Q2-20 +51€m and H1-21/H1-20 +€+33m : Creval, Sabadell AM, Amundi BOC, Fund Channel, CACF NL, CAIWM Brazil and Miami, CAA Via
Vita, Bankoa ; scope effects Q2-21/Q2-19 +74€m et H1-21/H1-19 +€85m : Creval, Sabadell AM, Amundi BOC, Fund Channel, Annatec, Hama, CACF NL, CAIWM
Brazil and Miami, CAA Via Vita, Kas Bank, S3, CA Romania, Bankoa.
(3) Transformation costs in relation to the New Generation Network project at LCL (grouping of branches) are classified as specific items
(4) Scope effect +€15m Q2/Q2: Sabadell AM, set up of Amundi BOC WM, Fund Channel and Anatec(5) Transformation costs in relation to Turbo project at CACEIS (transformation plan) are classified as specific items
CRÉDIT AGRICOLE GROUP Q2-21 & H1-21 HIGHLIGHTS
5,308
5,031
5,504
+213+68
+84 +49 +18+41
Q2-19underlyingexcl. SRF
Q2-20underlyingexcl. SRF
RegionalBanks
OtherRetail
Assetgathering
LargeCustomers
SFS Corporate centre
Q2-21underlyingexcl. SRF
+9.4% +€473m
+3.7% +€197m
Efficiency : underlying cost to income ratio excluding SRF at
59.2% (+0.3pp Q2/Q2)
Costs up +8.4% Q2/Q2 and +2.3% Q2-21/Q2-19 excluding
scope effect(2)
Increase in costs in all divisions compared to a low Q2-20
marked by the crisis, and in relation to the good performance
of the divisions
RB: expenses up +10.5% due to employee profit-sharing and incentive
schemes from a very low Q2-20 (-8.9% Q2-20/Q2-19)
OR: Change in underlying costs(3) under control at LCL and down at CAI
excluding scope effect, cost/income ratio improving in the business line
(60.0%, -4.3 pp Q2/Q2)
AG: limited increase in insurance costs (+3.8% Q2/Q2 excluding taxes); in
asset management, excellent operating efficiency (cost/income ratio at
47.6%, -5.9 pp Q2/Q2) including a +22.1% increase in costs linked to
variable compensation and a scope effect(4)
LC: low cost/income ratio (52.8%) maintained in CIB. Increase in costs
excluding SRF in CIB mainly linked to IT investments and variable
compensation; for Asset servicing, evolution of underlying costs(5) mainly
linked to the activity (+5.3%)
SFS: low cost/income ratio improving (49.7%, -1.2 pp Q2/Q2)
62.80%
61.30%
62.20%
58.90%
59.20%
Q2-17 Q2-18 Q2-19 Q2-20 Q2-21
10,585 10,509
11,005
+227 +44 +99 +78 +1 +47
H1-19underlyingexcl. SRF
H1-20underlyingexcl. SRF
RegionalBanks
OtherRetail
Assetgathering
LargeCustomers
SFS Corporatecentre
H1-21underlying
exl. SRF
+4.7% +€496m
+4.0% +€420m

CREDIT UPDATE - AOUT 202174
GROUPE CRÉDIT AGRICOLE CRÉDIT AGRICOLE S.A.
CRÉDIT AGRICOLE GROUP Q2-21 & H1-21 HIGHLIGHTS
(1) Including the full scale of reserves for performing loans due to COVID-19. Loan loss reserves, including
collective provisions. Coverage ratios are calculated based on loans and receivables due from customers.
Coverage ratio(1)
73.6%
Crédit Agricole S.A.(1)
85.5%Crédit Agricole Group(1)
Loans loss reserves
€10.3bn
€20.3bn
102.3%
Regional Banks(1)
€10.0bnCrédit Agricole S.A. Regional Banks
Crédit Agricole Group
+1.6 pp / March 21 +1.1 pp / March 21
+1.1 pp / March 21
3.4%
Crédit Agricole S.A.
2.5%Crédit Agricole Group
Crédit Agricole Group’s loan loss reserves represent nearly seven years of
average historical cost of risk, of which 26% is related to provisions for
performing loans for CASA, 43% for the Regional Banks and 34% for CAG
Diversified loan book: home loans (28% CASA, 47% CAG), corporates
(44% CASA, 32% CAG) (see page 38).
Non performing loans ratio stable Q2/Q1, sustained
increase in coverage ratio
1.8%
Regional Banks
3.2%
Crédit Agricole S.A.
2.3%Crédit Agricole Group
1.7%
Regional Banks
NPL ratio (1)
stable / March 21 stable / March 21
stable / March 21

CREDIT UPDATE - AOUT 202175
GROUPE CRÉDIT AGRICOLE CRÉDIT AGRICOLE S.A.
588 420 602 516 785 428 334 371 172
0 -33 -87
398
424
170 651 147
234
598
384494
930
1 208
596
919
537445
Q2-19 Q3-19 Q4-19 Q1-20 Q2-20 Q3-20 Q4-20 Q1-21 Q2-21
Others
S1&S2 CoR
S3 CoR*
Total CoR
-63%
CRÉDIT AGRICOLE GROUP Q2-21 & H1-21 HIGHLIGHTS
371 331
531
382
667
425
291 283199
-26 -7 -184
223
236
165
193 90
17
4
39
358 335
340
621
908
577
500
384
254
Q2-19 Q3-19 Q4-19 Q1-20 Q2-20 Q3-20 Q4-20 Q1-21 Q2-21
Others
S1&S2 CoR
S3 CoR*
Total CoR
-72%
-38%
Underlying cost of risk (CoR) broken down by Stage (in €m)
Cost of proven risk historically low, reflecting the effectiveness
of economic support measures and asset quality
-70% Q2/Q2 on S3 provisioning
41 bp (1)
Crédit Agricole S.A.
CoR/outstandings
4 rolling quarters (1)
Crédit Agricole Group Crédit Agricole Group
Crédit Agricole Group
Crédit Agricole S.A.
-78% Q2/Q2 on S3 provisioning
24 bp (2)
CoR/outstandings
Annualised (2)
25 bp (1)
CoR/outstandings
4 rolling quarters (1)
18 bp (2)
CoR/outstandings
Annualised (2)
-34%
Crédit Agricole S.A.
-17%
**
40**
(1) The cost of risk on outstandings (in basis points) over four rolling quarters is calculated on the basis of the cost of risk for the last four quarters to which is added the average of the outstandings at the beginning of the period for the last four quarters;
(2) The annualised cost of risk on outstandings (in basis points) is calculated on the basis of the cost of risk for the quarter multiplied by four to which is added the outstandings at the beginning of the period
*Including non-provisioned losses. ** Includes an additional provision for the fine requested by the AMF against Amundi

CREDIT UPDATE - AOUT 202176
GROUPE CRÉDIT AGRICOLE
Q2/Q2 and H1/H1 change in underlying net income Group share(1), by division
RB: Regional banks; OR: Other retail (LCL & International retail banking),
AG: Asset gathering, including Insurance, SFS: Specialised financial services;
LC: Large customers; CC: Corporate centre
Net income up sharply in all divisions
(1) Underlying: see slide 94 for further details on specific items (2) Excluding Creval scope effect
Strong increase in Q2/Q2 net income Group share, driven by
higher gross operating income and lower cost of risk.
RB: increase in net income, supported by high revenues and decrease in
cost of risk despite incremental S1&S2 provisioning in Q2-21
OR: strong increase in gross operating income at LCL (+21.3% Q2/Q2) and
CAI (+40.5% Q2/Q2(2)) thanks to dynamic commercial production and a
decrease in expenses excluding scope effect; net income x2
AG: strong increase in income driven by very favourable markets. Record
level of performance fees in asset management and continued development
of personal insurance
LC: good performance of financing activities and normalisation of market
activities in a context of low volatility. Reversal of loan loss provisions in CIB
SFS: gross operating income up +11.4% Q2/Q2, thanks to strong growth in
commercial production; significant decrease in cost of risk; net income
+38.4% Q2/Q2
CRÉDIT AGRICOLE GROUP Q2-21 & H1-21 HIGHLIGHTS
1,846 1,785
2,367
+78
+182+103
+57+57
+105
Q2-19underlying
Q2-20underlying
RegionalBanks
OtherRetail
Assetgathering
LargeCustomers
SFS Corporatecentre
Q2-21underlying
+32.6% +€582m
+28.3% +€522m
3,281
2,767
3,967
+412+223
+249+126
+106+84
H1-19underlying
H1-20underlying
RegionalBanks
OtherRetail
Assetgathering
LargeCustomers
SFS Corporatecentre
H1-21underlying
+43.4% +€1,200m
+20.9% +€686m

CREDIT UPDATE - AOUT 202177
CRÉDIT AGRICOLE S.A.
CRÉDIT AGRICOLE GROUP Q2-21 & H1-21 HIGHLIGHTS
* Arithmetic average of 10 major European banks publishing a ROTE: Société Générale; BNP Paribas; Banco Santander
SA; UniCredit SpA; Credit Suisse AG; UBS Group AG; Deutsche Bank AG; HSBC Bank PLC; Standard Chartered Bank;
Barclays Bank PLC
Ongoing application to ECB for a second
share buyback of up to €500 million in Q4 21
In line with the announcement made in February 2021 on the
exceptional mechanism of the 2020 dividend payment
After these two operations(2), the earnings per share will have
increased by around 1% and the tangible net book value per
share will have been more that rebuilt.
In total, up to €1.4 billion paid in cash in 2021 (of which
approximately €900 million related to the dividend payment and
the first share buyback, carried out at 77%(3))
Demonstrated ability to generate a high return on tangible equity over the long term
(1) ROTE calculated on the basis of underlying net income Group share and annualised IFRIC 21 costs per quarter
Underlying RoTE(1) higher by at least 2.6 percentage points over the past 18 quarters
than the average of 10 major European banks publishing a ROTE
(2) And after the entire unwinding of the SWITCH by 2022(3) Proforma of the share cancellation planned for Q3 2021, the status of SBB1 at 30/06/2021 brings the
number of free float shares of Crédit Agricole S.A. to 1,333,636,601 at end-June 2021
9.2%8.8%
8.4%
6.0%
9.7% 9.6% 9.2%
8.0%8.8% 8.9% 8.7%
8.2%
6.3%
5.2%5.6%
5.0%
9.8% 10.0%
13.2%12.5%
11.9%11.1%
12.9%
14.3%13.5%
12.7%
11.7%12.3%
11.7% 11.9%
8.9%
9.9% 10.0%9.3%
13.0%13.6%
Underlying RoTE(1) since 2017
Average of 10 major European banks * Crédit Agricole SA
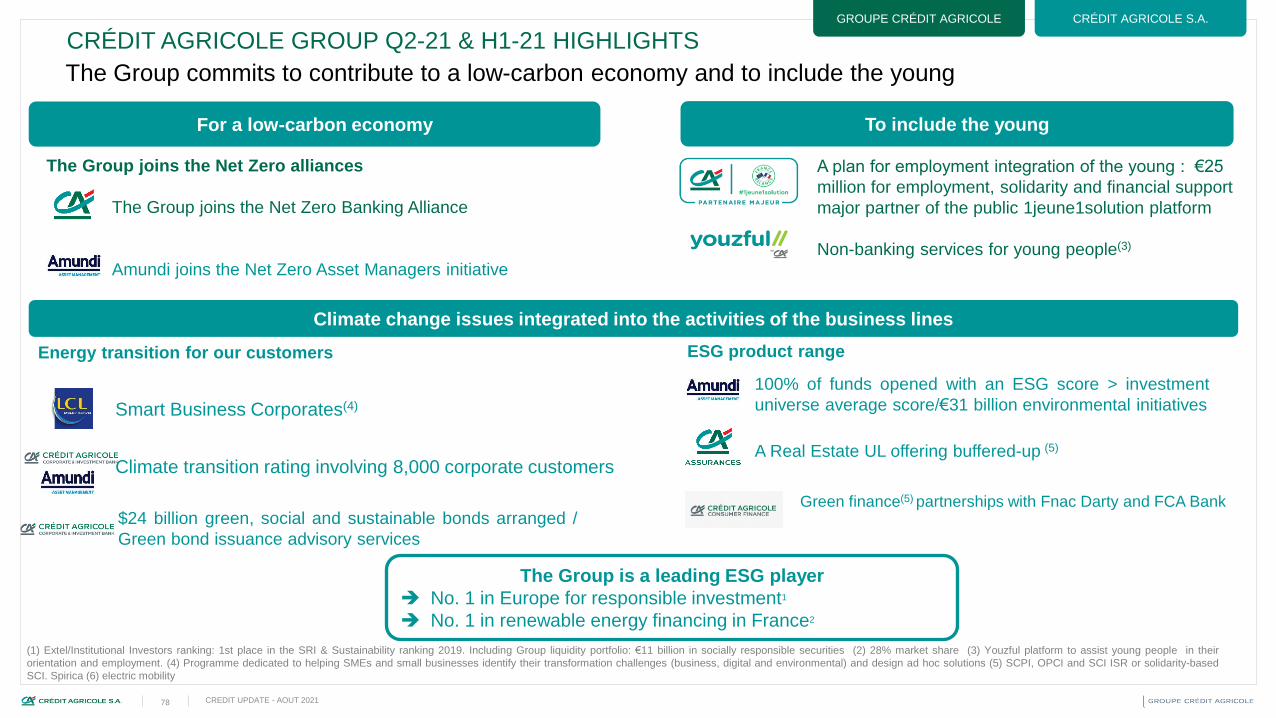
CREDIT UPDATE - AOUT 202178
GROUPE CRÉDIT AGRICOLE CRÉDIT AGRICOLE S.A.
CRÉDIT AGRICOLE GROUP Q2-21 & H1-21 HIGHLIGHTS
The Group commits to contribute to a low-carbon economy and to include the young
A plan for employment integration of the young : €25
million for employment, solidarity and financial support
major partner of the public 1jeune1solution platform
Non-banking services for young people(3)
Climate change issues integrated into the activities of the business lines
To include the youngFor a low-carbon economy
The Group joins the Net Zero alliances
The Group joins the Net Zero Banking Alliance
Amundi joins the Net Zero Asset Managers initiative
100% of funds opened with an ESG score > investment
universe average score/€31 billion environmental initiatives
A Real Estate UL offering buffered-up (5)
The Group is a leading ESG player
No. 1 in Europe for responsible investment1
No. 1 in renewable energy financing in France2
$24 billion green, social and sustainable bonds arranged /
Green bond issuance advisory services
Green finance(5) partnerships with Fnac Darty and FCA Bank
Smart Business Corporates(4)
Climate transition rating involving 8,000 corporate customers
Energy transition for our customers ESG product range
(1) Extel/Institutional Investors ranking: 1st place in the SRI & Sustainability ranking 2019. Including Group liquidity portfolio: €11 billion in socially responsible securities (2) 28% market share (3) Youzful platform to assist young people in their
orientation and employment. (4) Programme dedicated to helping SMEs and small businesses identify their transformation challenges (business, digital and environmental) and design ad hoc solutions (5) SCPI, OPCI and SCI ISR or solidarity-based
SCI. Spirica (6) electric mobility

CREDIT UPDATE - AOUT 202179
GROUPE CRÉDIT AGRICOLE CRÉDIT AGRICOLE S.A.
CRÉDIT AGRICOLE GROUP Q2-21 & H1-21 HIGHLIGHTS
RB Insurance
equipment rate8
+1.7 pp vs end 2019
+6.2 pp vs end 2018
42.4%
LCL
Insurance
equipment rate8
+1.2 pp vs end 2019
+2.5 pp vs end 2018
26.2%
CA Italia
Insurance
equipment rate8
+3.0 pp vs end 2019
+4.7 pp vs end 2018
18.4%
Constantly renewed organic growth potential
(1) Market share of UCITS in France at end December 2020 (2) End 2020, Crédit Agricole S.A. study – France – market share loans to LCL and RB households (3) End 2019, scope: annual contributions for temporary insurance for death + funeral coverage +
long-term care (4) End 2019, annual contributions collected by CAA originated by CRCA and LCL (total Group market share of 25% including 9% insured by CNP) (5) End 2020, scope: Prédica, outstandings (6) End 2019, Pacifica & La Médicale de France
Property & Casualty business, annual contributions. Market size: Argus de l’Assurance (7) Internal sources (8) Car, home, health, legal, all mobile phones or personal accident insurance

CREDIT UPDATE - AOUT 202180
Contents
04
02
01 05
06
07
08
Financial
Management03

CREDIT UPDATE - AOUT 202181
GROUPE CRÉDIT AGRICOLE
FINANCIAL MANAGEMENT
Phased-in CET1 ratio: 17.3%, +8.4 pp above SREP
Change in phased-in CET1 ratio (bp) Change in Crédit Agricole Group risk-weighted assets (€bn)
Risk weighted assets up this quarter
Business lines’ contribution : +€2.5 billion, including -€0.2 billion foreign exchange impact.
Increase in Retail banking. Slight decrease in Large customers(2)
Methodology, regulatory effects and M&A: +1,6 billion, of which +€3.2 billion related to CRR2
regulatory impact and -€1,7 billion related to TRIM
Consolidation of Creval: +€8.5 billion
CET1 ratio: 17.3% phased-in (stable vs Q1 2021), +8.4 pp> SREP, 17.0% fully-loaded(3)
Stated net income: +41 bp ; Distribution: -8 bp, of which -6 bp dividend provision
Methodology and regulatory effects: neutral, impact of CRR2 (-10 bp), compensated by positive
impact on TRIM (+5 bp), IFRS9 phasing (+4 bp) and Affrancamento (+1 bp)
M&A, OCI(4) and Others: -19 bp of which -26 bp related to the consolidation of Creval RWAs
(prudential integration of Creval badwill planned in Q4-2021).
In the adverse EBA stress tests scenario, phased-in restriction mechanisms CET1 at 10.9%, is
at the highest level among European G-SIBs, without triggering of the automatic distribution
Phased-in Tier 1 ratio: 18.2% and phased-in Total ratio: 21.1%
Phased-in leverage ratio: 5.9% (stable compared to Q1-21); 5.3% before neutralisation of ECB
exposures vs. 5.4% at end March 2021
Phased-in daily leverage ratio(5): 5.3% before neutralisation of ECB exposures
(1) Change in business line RWAs not including the impact of OCI in equity-accounted value of insurance,
(2) Retail banking: +€2.5 bn excluding FX impact of which +€0.2 bn for LCL and €1.5 bn for Regional Banks. Large
customers: -€0.5 bn excluding FX impact
(3) Excluding the impact of phasing in of IFRS 9 included in Q2-20 as part of the “Quick Fix”
(4) OCI reserves provision as at 30/06/2021: 16 bp (vs. 18 bp at 31/03/2021)
(5) The daily leverage ratio is calculated by taking into account the daily average of the quarter’s securities financing
transactions (SFTs) exposures
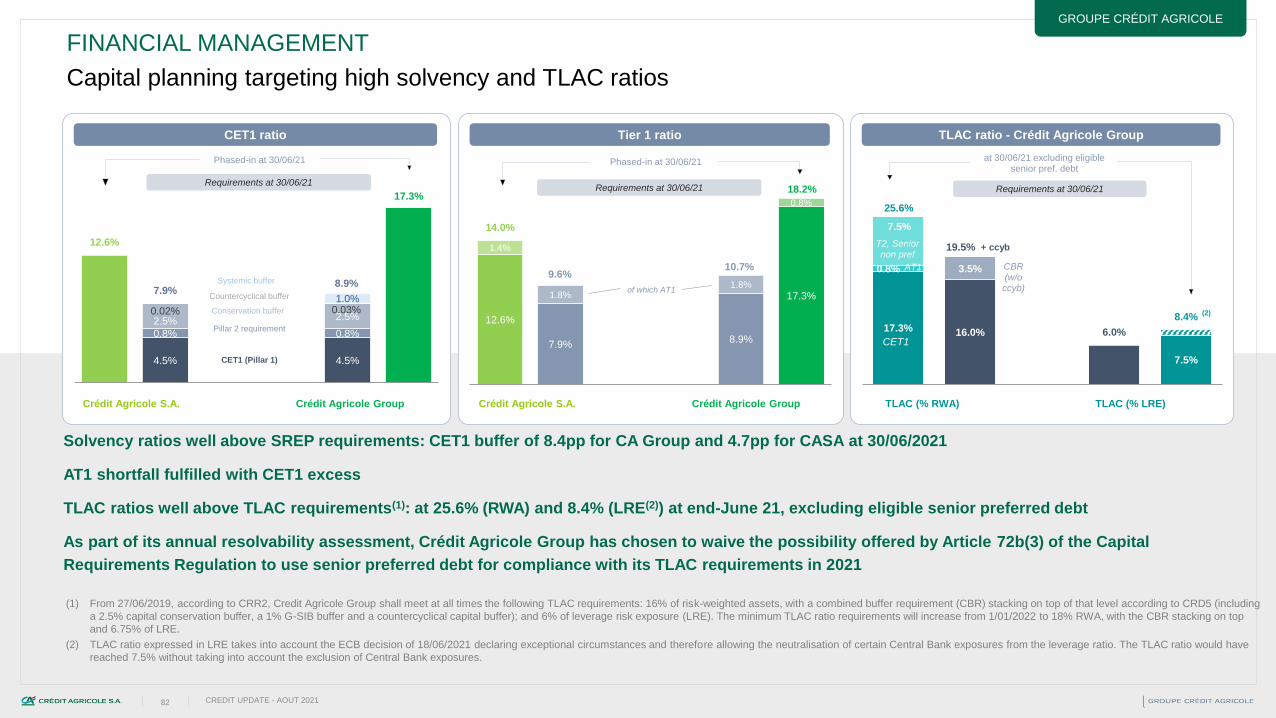
CREDIT UPDATE - AOUT 202182
GROUPE CRÉDIT AGRICOLE
Capital planning targeting high solvency and TLAC ratios
FINANCIAL MANAGEMENT
4.5% 4.5%
0.8% 0.8%
2.5% 2.5%0.02% 0.03%
1.0%
12.6%
7.9%8.9%
17.3%
1 2 3 4 5 6
Crédit Agricole S.A. Crédit Agricole Group
Phased-in at 30/06/21
CET1 ratio
Requirements at 30/06/21
Systemic buffer
Countercyclical buffer
Conservation buffer
Pillar 2 requirement
CET1 (Pillar 1)
12.6%
7.9%8.9%
17.3%
1.4%
1.8%1.8%
0.8%
14.0%
9.6%10.7%
18.2%
1 2 3 4 5 6
Crédit Agricole S.A. Crédit Agricole Group
of which AT1
Phased-in at 30/06/21
Tier 1 ratio
Requirements at 30/06/21
17.3% 16.0%
7.5%
0.8% 3.5%
7.5%
25.6%
19.5%
6.0%
8.4%
1 2 3 4 5
TLAC (% RWA) TLAC (% LRE)
TLAC ratio - Crédit Agricole Group
Requirements at 30/06/21
CBR (w/o ccyb)
at 30/06/21 excluding eligible senior pref. debt
+ ccybT2, Senior non pref
CET1
AT1
(2)
(1) From 27/06/2019, according to CRR2, Credit Agricole Group shall meet at all times the following TLAC requirements: 16% of risk-weighted assets, with a combined buffer requirement (CBR) stacking on top of that level according to CRD5 (including
a 2.5% capital conservation buffer, a 1% G-SIB buffer and a countercyclical capital buffer); and 6% of leverage risk exposure (LRE). The minimum TLAC ratio requirements will increase from 1/01/2022 to 18% RWA, with the CBR stacking on top
and 6.75% of LRE.
(2) TLAC ratio expressed in LRE takes into account the ECB decision of 18/06/2021 declaring exceptional circumstances and therefore allowing the neutralisation of certain Central Bank exposures from the leverage ratio. The TLAC ratio would have
reached 7.5% without taking into account the exclusion of Central Bank exposures.
Solvency ratios well above SREP requirements: CET1 buffer of 8.4pp for CA Group and 4.7pp for CASA at 30/06/2021
AT1 shortfall fulfilled with CET1 excess
TLAC ratios well above TLAC requirements(1): at 25.6% (RWA) and 8.4% (LRE(2)) at end-June 21, excluding eligible senior preferred debt
As part of its annual resolvability assessment, Crédit Agricole Group has chosen to waive the possibility offered by Article 72b(3) of the Capital
Requirements Regulation to use senior preferred debt for compliance with its TLAC requirements in 2021
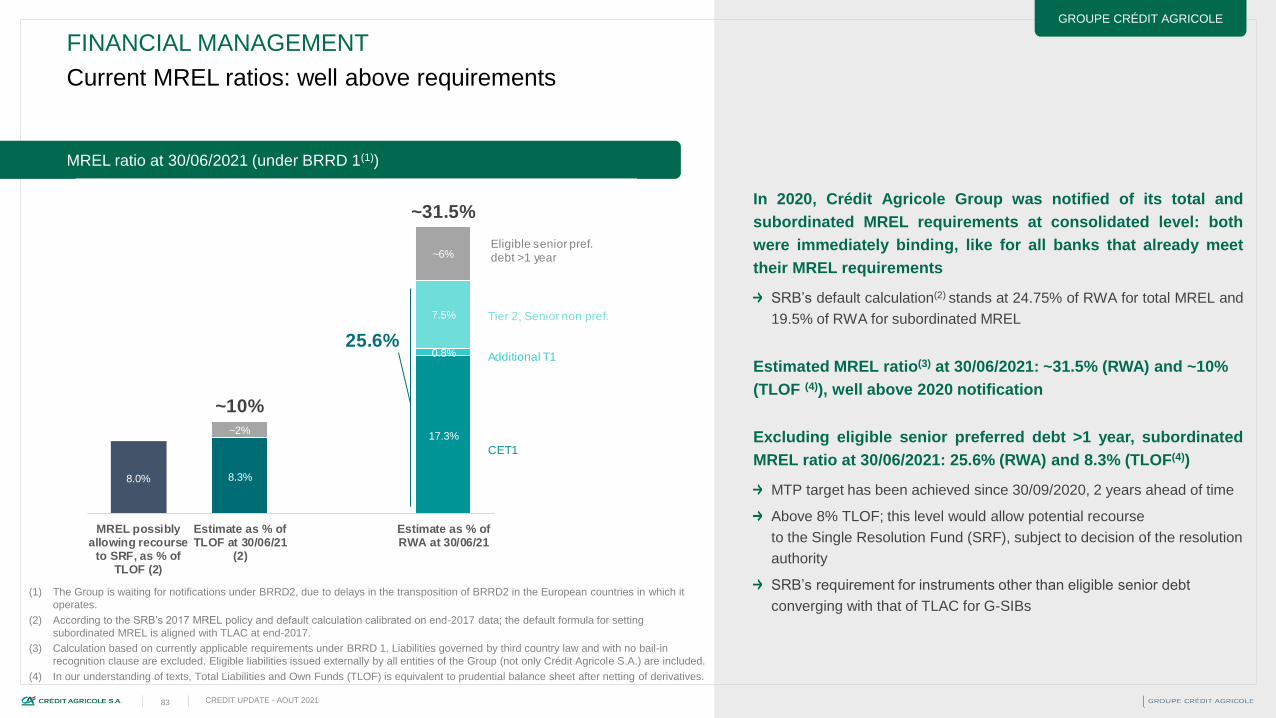
CREDIT UPDATE - AOUT 202183
GROUPE CRÉDIT AGRICOLE
Current MREL ratios: well above requirements
(1) The Group is waiting for notifications under BRRD2, due to delays in the transposition of BRRD2 in the European countries in which it
operates.
(2) According to the SRB’s 2017 MREL policy and default calculation calibrated on end-2017 data; the default formula for setting
subordinated MREL is aligned with TLAC at end-2017.
(3) Calculation based on currently applicable requirements under BRRD 1. Liabilities governed by third country law and with no bail-in
recognition clause are excluded. Eligible liabilities issued externally by all entities of the Group (not only Crédit Agricole S.A.) are included.
(4) In our understanding of texts, Total Liabilities and Own Funds (TLOF) is equivalent to prudential balance sheet after netting of derivatives.
MREL ratio at 30/06/2021 (under BRRD 1(1))
8.3%8.0%
17.3%
0.8%
7.5%
~2%
~6%
~10%
~31.5%
MREL possiblyallowing recourse
to SRF, as % ofTLOF (2)
Estimate as % ofTLOF at 30/06/21
(2)
Estimate as % ofRWA at 30/06/21
CET1
Additional T1
Tier 2, Senior non pref.
Eligible senior pref. debt >1 year
25.6%
FINANCIAL MANAGEMENT
In 2020, Crédit Agricole Group was notified of its total and
subordinated MREL requirements at consolidated level: both
were immediately binding, like for all banks that already meet
their MREL requirements
SRB’s default calculation(2) stands at 24.75% of RWA for total MREL and
19.5% of RWA for subordinated MREL
Estimated MREL ratio(3) at 30/06/2021: ~31.5% (RWA) and ~10%
(TLOF (4)), well above 2020 notification
Excluding eligible senior preferred debt >1 year, subordinated
MREL ratio at 30/06/2021: 25.6% (RWA) and 8.3% (TLOF(4))
MTP target has been achieved since 30/09/2020, 2 years ahead of time
Above 8% TLOF; this level would allow potential recourse
to the Single Resolution Fund (SRF), subject to decision of the resolution
authority
SRB’s requirement for instruments other than eligible senior debt
converging with that of TLAC for G-SIBs

CREDIT UPDATE - AOUT 202184
GROUPE CRÉDIT AGRICOLE
Transposition of BRRD2 in French law: a specific treatment
for cooperative banks
FINANCIAL MANAGEMENT
Directive 2019/879 of 20 May 2019 (“BRRD2”) was transposed into French law
and is applicable since 28 December 2020
The law expressly provides resolution specificities for French cooperative
banking groups
• Assessment of conditions of a resolution procedure at the level of the Network
The resolution authorities will treat the Central Body and its affiliated entities
(“Network”) as a whole when assessing the conditions to enter in resolution
• Resolution and “Coordinated bail-in”
In case of a bail-in, write-down or conversion measures will apply simultaneously to
all entities within the Network
Equity holders and creditors of the same rank* or with identical rights in liquidation will
then be treated equally, regardless of the Network entity of which they are investors
and regardless of the source of the losses
• Liquidation and respect of the “no-creditor-worse-off” principle
A Central Body or one of its affiliated entities could be declared in compulsory
liquidation only when the Central Body and all its affiliated entities are also in
cessation of payments
A sole liquidator will be designated for the entire cooperative group and will ensure
that the holders of equity and creditors of the same rank* or with identical rights in
liquidation will be treated equally, regardless of the Network entity of which they are
investors and regardless of the source of the losses
MREL at consolidated level, when
applicable under BRRD2, will be fulfilled
with eligible liabilities of Credit Agricole SA
and the affiliated entities
The single point of entry resolution
strategy preferred by the resolution
authorities for Credit Agricole Group can
be considered as an « extended SPE »
*According to the creditor hierarchy in resolution as defined by the provisions of Article L 613-55-5 of the CMF, effective as at the date of
implementation of the resolution.

CREDIT UPDATE - AOUT 202185
GROUPE CRÉDIT AGRICOLE
Equiv 21.4% RWA as of 31/12/19
Equiv 22.7% RWA as of 31/12/19
Equiv 17.9% RWA as of 31/12/19
MREL + CBR Noadjustment
Downwardadj.(1)
Upwardadj.(1)
Pillar 1 (8.0%)
Pillar 1 (8.0%)
P2R (1.5%)
CBR
CBR - CCyB
26.0% RWA + CCyB
21.5% RWA + CCyBP2R (1.5%)
TLAC requirements
Equiv 20.0% RWA as of 31/12/19
Consolidated level
LA
AR
CA
M
CC
18% RWA + CBR
6.75% LRE 8% TLOF reference (1)
Pillar 1 sub. MREL requirement for G-SIBs
Additional requirement for G-SIBs
Possible discretionary adjustments to the 8% TLOF reference
Subordinated MRELratio
24-25%
CET1: > 16%
AT1 : ~1%
Tier 2: ~3%
SNP: 4-5%
Expected MREL requirements under BRRD2 at 1/1/2024
Intermediate targets at 1/1/2022 possibly equal to final targets for banks without a shortfall
Targeted ratio at end-2022
o/w subordination requirement range
Target set at 24-25% in 2022 for subordinated MREL
CCyB = countercyclical buffer
CBR = combined buffer requirement
LAA = loss absorption amount
RCA = recapitalization amount
MCC = market confidence charge
LRE = leverage ratio exposure
FINANCIAL MANAGEMENT
(1) Under BBRD2, the reference of 8% TLOF is subject to discretionary adjustments by the resolution authorities, and may be decreased down to
8% TLOF x 1 −3.5%
18%RWA+CBR, i.e. to 17.9% RWA as of 31/12/2019, or increased up to 2 x (P1+P2R) + CBR, i.e. 22.7% RWA as of 31/12/2019, as illustrated
above.
(2) Countercyclical buffer applicable as of 30/06/2021.
NB: this information is provided taking into account our current understanding of the texts and of the SRB’s “MREL Policy under the Banking Package” published
in May 2020. All figures are expressed based on end-2019 data and on the information currently available, without taking into account potential specific
adjustments from the resolution authority, and are subject to future requirements or difference in interpretation of current requirements. Credit Agricole Group’s
target is presented without taking into account the possibility to include eligible senior preferred debt up to 3.5% of RWA, subject to approval by the resolution
authority.
CA Group expects TLAC requirement to be the most
binding subordination requirement at 1/1/2022
Ratios of subordinated MREL and TLAC (as transposed in
European law) will converge, thanks to closely aligned eligibility
criteria for bail-inable liabilities
Under BRRD2, we expect the SRB to use the possibility for
downward adjustment when calibrating CAG’s additional MREL
subordination requirement
TLAC is thus expected to be the most binding subordination
requirement at 1/1/2022
Current TLAC ratio 610 bps above requirement as of
30/6/2021 (= 19.5% + CCyB(2)) and 410bps above expected
requirement as of 1/1/2022 (= 21.5% + CCyB(2))
CA Group MTP targets: subordinated MREL ratio at 24-
25% RWA and >8% TLOF by end-2022

CREDIT UPDATE - AOUT 202186
GROUPE CRÉDIT AGRICOLE
Distance to Maximum Distributable Amount (MDA) trigger threshold(1)
Buffers above distribution restrictions threshold
FINANCIAL MANAGEMENT
4.500%6.000%
8.000%0.844%
1.125%
1.500%
2.500%
2.500%
2.500%
1.000%
1.000%
1.000%
0.026%
0.026%
0.026%
8.870%10.651%
13.026%
CET1 SREPrequirement
Tier 1 SREPrequirement
Overallcapital SREPrequirement
Countercyclical buffer
G-SIB buffer
Conservation buffer
Pillar 2 requirement (P2R)
Pillar 1 minimumrequirement
Phased-in solvency ratios: Distance to SREP requirements
30.06.21 Phased-in solvency
ratios
Distance to SREP
requirements
Δ vs 31.03.21
€44bndistance to restrictions on distribution
€580bn
752bpThe lowest of the 3 figures is the distance
to MDA trigger threshold
30.06.21
Risk Weighted Assets
(1) According to CRD5, institutions must meet the combined buffer requirement (consisting of the capital conservation buffer,
countercyclical buffer and systemic buffer). Failure to do so means the bank must calculate the Maximum Distributable Amount
(MDA). MDA trigger threshold corresponds to a CET1 ratio of 9.804% of RWA as of 30/06/2021 for Crédit Agricole Group.
+7bp
845bp
17.3%
CET1
-13bp
752bp
18.2%
Tier 1
-16bp
810bp
21.1%
Total Capital

CREDIT UPDATE - AOUT 202187
CRÉDIT AGRICOLE S.A.
Buffers above distribution restrictions threshold
FINANCIAL MANAGEMENT
4.500%6.000%
8.000%0.844%
1.125%
1.500%
2.500%
2.500%
2.500%
0.021%
0.021%
0.021%
7.864%
9.646%
12.021%
CET1 SREPrequirement
Tier 1 SREPrequirement
Overallcapital SREPrequirement
Countercyclical buffer
Conservation buffer
Pillar 2 requirement (P2R)
Pillar 1 minimumrequirement
Phased-in solvency ratios: Distance to SREP requirements Distance to Maximum Distributable Amount (MDA) trigger threshold(1)
Distributable items at 30/06/2021 for
Crédit Agricole SA (individual accounts)
amount to €40.2bn(2)
€16bndistance to restrictions on distribution
30.06.21 Phased-in solvency
ratios
Distance to SREP
requirements
The lowest of the 3 figures is the distance
to MDA trigger threshold
30.06.21
Risk Weighted Assets€357bn
440bp
Δ vs 31.03.21
(1) According to CRD5, institutions must meet the combined buffer requirement (consisting of the capital conservation buffer,
countercyclical buffer and systemic buffer). Failure to do so means the bank must calculate the Maximum Distributable Amount
(MDA). MDA trigger threshold corresponds to a CET1 ratio of 8.249% of RWA as of 30/06/2021 for Credit Agricole S.A.
(2) Including reserves of €26.2bn and share issue premium of €14.0bn as of 30/06/2021
-8bp
478bp
12.6%
CET1
-41bp
440bp
14.0%
Tier 1
-43bp
657bp
18.6%
Total Capital

CREDIT UPDATE - AOUT 202188
GROUPE CRÉDIT AGRICOLE
Comfortable level of liquidity reserves
FINANCIAL MANAGEMENT
Liquidity reserves at 30/06/21 (€bn)
€463bnliquidity reserves at 30/06/21
+€2bn vs.31/03/21
Liquidity reserves maintained at a high level
Central Bank deposits at € 226 billion vs. € 218 billion at the
end of March 2021
Eligible assets in Central Banks at € 101 billion, stable vs.
the end of March 2021
218 226
124 121
18 1513 10
88 91
461 463
31/03/2021 30/06/2021
Cash and Central Bank deposits
HQLA (High Quality Liquid Assets) securities portfolio (2)
Other non-HQLA securities (2)
Self-securitisations eligible to Central Banks (1)
Eligible claims to Central Banks after haircut (immediate access) (1)
(excl. cash (€4bn) & mandatory reserves (€9bn))
(1) Eligible for central bank operations to improve LCR buffer(2) Available market securities, at market value and after haircut

CREDIT UPDATE - AOUT 202189
GROUPE CRÉDIT AGRICOLE CRÉDIT AGRICOLE S.A.
Key liquidity indicators are all up
FINANCIAL MANAGEMENT
LCR: the aim of the Group is to secure its
compliance with regulatory requirements by
maintaining a buffer of a magnitude of ~10% over
the regulatory constraint of 100%
SRP: the Group’s financial structure provides for a
Stable Resources Position covering LCR needs (at
100%) of commercial activities.
The Group intends to maintain this structure through
the Medium-Term Plan
CRÉDIT
AGRICOLE
S.A.
CRÉDIT
AGRICOLE
GROUP
CRÉDIT
AGRICOLE
GROUP
CRÉDIT
AGRICOLE
GROUP
100% FROM
01/01/2018
100% FROM
28/06/2021NSFR(3)
SRP(2)
LCR(1)
Regulatory
requirement
Ratio at
30/06/2021
2019-2022
MTP Target
~110%
~110%
>€100bn
>100%
€292bn
>100%
Avg. over 12 months:
Avg. over 12 months:
330,8
211,5156.4%
362,5
218,8
165.6%
(1) LCR calculation: liquidity buffer / net outflows. End of period LCR at 30/06/2021: Crédit Agricole Group
182.8%, Crédit Agricole S.A. 157.4%(2) Stable Resources Position: surplus of long-term funding sources;(3) Calculation based on CRR2 (Capital Requirement Regulation 2)
NSFR: transposed in the EU legislative framework,
and applicable since 28/06/21
The NSFR is part of the CRR2/CRD5 legislative package, which was
published on June 7, 2019
The requirement of a 100% minimum level of NSFR applies at both
individual and consolidated scopes
CRÉDIT
AGRICOLE
S.A.
>100% >100%

CREDIT UPDATE - AOUT 202190
GROUPE CRÉDIT AGRICOLE
Strong cash balance sheet
FINANCIAL MANAGEMENT
(1) MLT market funds include T-LTRO drawings(2) Excluding FCA Bank.
Banking cash balance sheet at 30/06/21 (€bn)
The Stable Resources Position finances the HQLA securities portfolio generated by the LCR
requirement of customer and customer-related activities. Internal management excludes the temporary
surplus of stable resources provided by the increase in T-LTRO 3 outstandings in order to secure the
MTP target (>€100 bn), regardless of the future repayment strategy
Ratio of stable resources(1) / long term assets of funds at 124.8%
>€100bnMTP target for Stable Resources Position
Met at 30/06/21
The Group benefits from large MLT excess of liquidity
mainly due to the active participation in the ECB's MLT
refinancing program
Increase in MLT market funding (+€10bn vs. 31/03/21), out of which
T-LTRO III increase of €10.2bn(2) (including CreVal). T-LTRO III at
€162.2bn(2) at 30/06/21.
Dynamic growth of the commercial activity, supported by the
integration of CreVal : increase in deposits of €30bn (including
CreVal for €17bn) and increase in customer assets of €28bn
(including CreVal for €14bn).53 53
1,002 1,025
94 99
134 13525
2410 12231
239
137 136
984 954
348338
118121
1,549 1,587 1,587 1,549
31/03/2021 30/06/2021 30/06/2021 31/03/2021
Reverse repos (net) & other STInterbank assets
Cash & central bank deposits (incl. mandatory reserves)
Securities portfolio
Customer-related trading assets
Tangible & intangible assets
ASSETS LIABILITIES
ST market funds
Equity & similar items
Surplus: €292bn
(1) MLT market funds include T-LTRO drawings

CREDIT UPDATE - AOUT 202191
GROUPE CRÉDIT AGRICOLE
Breakdown of MLT market funds outstanding
FINANCIAL MANAGEMENT
MLT market funds outstanding at 30/06/21 (€bn)
At €348bn at end-June 2021, medium-to long term
market funds increased by €10bn vs. end-March 2021
Senior secured debt up by €10bn vs. end-March 2021 (including
impact of net T-LTRO drawings and consolidation of CreVal)
Senior preferred debt down by €2bn vs. end-March 2021
Senior non preferred up by €2bn vs. end-March 2021
Tier 2 stable vs. end-March 2021
6 5
0 021 21
25 27
80 78
212 222
0
50
100
150
200
250
300
350
31/03/21 30/06/21
Senior secured
€348bn€338bn
Senior preferred
Senior non-preferred
Tier 2 (1)
Tier 1 (1)
AT1
(1) Notional amountAccounting value (excluding prudential solvency adjustments)

CREDIT UPDATE - AOUT 202192
GROUPE CRÉDIT AGRICOLE
Crédit Agricole S.A. (end-July)
€6.5bn(1) of MLT market funding issued (72% of €9bn programme, of which €7bn in
senior non-preferred or Tier 2 debt) - diversified funding with various formats (Senior
secured, Senior preferred, Senior non preferred, Tier 2) and currencies (EUR, USD,
AUD, GBP, JPY, CNY, CHF).
AT1 exchange offer completed on 23/06: successful offer to exchange ineligible
LIBOR-Linked GBP AT1 securities for new CRR-compliant SONIA-Linked GBP AT1
securities, with 79% exchanged (£397M out of a total nominal of £500M).
Social Bond: CA HL SFH inaugural Social Covered bond on the 01/07 for €1bn with a
maturity of 6.75 years at MS + 2 bps.
€6.5bn in MLT market funding issued by
Crédit Agricole S.A. at end-July 2021
FINANCIAL MANAGEMENT
Crédit Agricole S.A. - MLT market funding
Breakdown by format : €6.5bn(1) at 31/07/21
Crédit Agricole Group - MLT market funding
Breakdown by issuer : €17.9bn(1) at 30/06/21
Crédit Agricole Group (end-June)
€17.9bn(1) issued in the market by Group issuers.
Highly diversified funding mix by types of instruments, investor categories and
targeted geographic areas.
In addition, €1.9bn borrowed from national and supranational organisations or
placed in the Group’s retail banking networks (Regional Banks, LCL, CA Italia) and
other external retail networks.
(1) Gross amount before buy-back and amortisation
Senior preferred (€0.4bn)
& senior secured (€1.0bn) €1.4bn
Average maturity: 6.8 years
Spread vs 3m Euribor: 21bp
Senior non-preferred (€3.0bn)
& Tier 2 (€2.1bn)€5.1bn
Average maturity: 9.9 years
Spread vs 3m Euribor: 100bp
Senior secured15%
Senior preferred 6%
Senior non-preferred46%
Subordinated Tier 232%
Crédit Agricole S.A.31%
CA Italia 3%
CACIB 43%
CACF 20%
EFL 3% CANB 1%

CREDIT UPDATE - AOUT 202193
GROUPE CRÉDIT AGRICOLE
FINANCIAL MANAGEMENT
Low asset encumbrance ratio providing headroom
to increase central bank collateralised drawings
Disclosure
Disclosure requirements, in accordance with Regulation
(EU) N° 2017/2295, include four templates : A, B, C
(quantitative information based on the reporting templates
of asset encumbrance) and D for narrative
on the impact of the business model on assets
encumbrance and the importance of encumbrance
to the institution's business model
The encumbrance ratio defined as “Carrying amount
of encumbered assets and collateral” / “Total assets
and collateral” is mentioned in Template D
Increase of Crédit Agricole Group’s encumbrance
ratio from a very low starting point (17.5% at end
2019)
Below France‘s encumbrance ratio (~28.5% at end
December 2020) which is slightly above the average ratio in
Europe1 (27.8% at end December 2020)
Encumbrance ratios have increased in Europe1 (to 27.8% at
end December 2020 from 25% at end Dec 2019) as a result
of large T-LTRO drawings by banks though decrease in
ECB’s haircuts should has helped limiting such increase
23.9%asset encumbrance ratio
at end December 2020
1) Excluding UK domicilated banks
Asset Encumbrance in EU : Weighted average asset encumbrance by country
27.8%
Crédit Agricole Groupe

CREDIT UPDATE - AOUT 202194
GROUPE CRÉDIT AGRICOLE
Crédit Agricole S.A.’s ratings reflect Crédit Agricole Group’s resilience
LT / ST: AA3 / P-1 | OUTLOOK: STABLE
Last rating action on 19/09/2019:
LT rating upgraded to Aa3
ST rating affirmed
Rating drivers:
The outlook on CASA's long-term issuer rating and GCA
rated entities' long-term deposit and senior unsecured debt
ratings is stable, reflecting Moody's view that the Group
strategy over the next 12-18 months, as released in its
medium-term plan 2022, will lead to the continuation of
capital accretion associated with stable profitability and no
significant deterioration of asset quality.
LT / ST: A+ / A-1 | OUTLOOK: STABLE
Last rating action on 24/06/2021:
LT/ST rating affirmed
Outlook changed to stable from negative
Rating drivers:
The stable outlook on CA and its core banking entities reflects
S&P’s view that the group will maintain a leading franchise in
its key business segments and a strong risk profile (disciplined
underwriting standards, high coverage ratio of impaired
assets). It also reflects S&P’s expectations that the group will
sustain satisfactory cost efficiency and adequate
capitalization. S&P believes that GCA will continue to
demonstrate good resilience to the current COVID-19-related
difficult economic and risk environment, and sufficiently
mitigate the negative effects from persisting low interest rates
on its retail revenue.
LT / ST: A+ / F1 | OUTLOOK: NEGATIVE
Last rating action on 30/03/2020:
LT/ST ratings affirmed
Outlook changed to negative from stable
Rating drivers:
Fitch revised CA's Outlook to Negative from Stable
because Fitch believes the economic fallout from
the coronavirus outbreak represents a medium-term risk to
CA's ratings. The bank enters the economic downturn from
a relative position of strength given its very diverse
business model and leading franchise in multiple
segments. The group's low risk appetite, sound asset
quality together with a solid capital position, resilient
profitability and strong funding are supportive of the ratings.
Breakdown of 30 G-SIB LT ratings* at 27/07/2021(by number of banks)
* Issuer ratings or senior preferred debt ratings
Breakdown of 30 G-SIB LT issuer ratings at 27/07/2021(by number of banks)
Breakdown of 30 G-SIB LT issuer ratings at 27/07/2021(by number of banks)
Moody’s S&P Global Ratings Fitch Ratings
FINANCIAL MANAGEMENT
0 0
4
12 11
1 1 1
AA+ AA AA- A+ A A- BBB+ BBB
25 5
15
1 1 1 0
Aa1 Aa2 Aa3 A1 A2 A3 Baa1 Baa2
0
46
86
4
0 1 1
AA+ AA AA- A+ A A- BBB+ BBB BBB-

CREDIT UPDATE - AOUT 202195
GROUPE CRÉDIT AGRICOLE
Crédit Agricole S.A.’s long-term ratings and 5-year CDS spreadsSenior non-preferred debt now rated in the A range with all rating agencies
(1) On 13 July, Moody’s upgraded the bank’s long-term senior non preferred debt rating to a3 from Baa1. It is now rated in line with the BCA, which better captures the risk characteristics of this class of debt following revised view around the distribution of losses post failure. As a reminder, Moody's
has revised certain elements of its Advanced Loss Given Failure (LGF) Framework in its New Bank Methodology published on 9 July 2021.
Ratings Debt instrument Ratings Debt instrument Ratings Debt instrument
LT Issuer Rating Aa3 LT senior preferred debt
A1
A2
Adjusted Baseline
Credit Assessmenta3 Senior non-preferred (1)
Baa1 T2
Baa2
Baa3Additional T1
(unsolicited rating)
Ba1
5-YEAR CDS SPREADS – SENIOR PREFERRED (bp) 5-YEAR CDS SPREADS – SENIOR NON-PREFERRED (bp) 5-YEAR CDS SPREADS – TIER 2 (bp)
AA-
LT Issuer Credit Rating A+ LT senior preferred debt
Stand-Alone Credit Profile a
A- Senior non-preferred
BBB+ T2
BBB
BBB- Additional T1
BB+
AA- LT senior preferred debt
LT Issuer Default Rating
Viability RatingA+ Senior non-preferred
A
A- T2
BBB+
BBB Additional T1
BBB-
BB+
Source: Bloomberg
Moody’s(1) S&P Global Ratings Fitch Ratings
FINANCIAL MANAGEMENT
31353556
0
20
40
60
80
100
120
140
160
180
ACAFP BNPP Société Générale ITRAXX SENIOR FINANCIAL 5 yr
4953
5956
0
20
40
60
80
100
120
140
160
180
ACAFP BNPP Société Générale ITRAXX SENIOR FINANCIAL 5 yr
8792104106
0
50
100
150
200
250
300
350
ACAFP BNPP Société Générale ITRAXX SUBORDINATED FINANCIAL 5 yr

CREDIT UPDATE - AOUT 202196
GROUPE CRÉDIT AGRICOLE
Further strengthen Group solvency by 2022 & maintain a prudent liquidity management
(1) Excluding senior preferred debt;
(2) Tier 2 capital + amortized portion of Tier 2 instruments with remaining maturity > 1 year;
(3) LCR calculation: liquidity buffer / net outflows;
(4) Stable Resources Position: surplus of long-term funding sources;
(5) Calculation based on CRR2 (Capital Requirement Regulation 2)
CA Group: one of the most solid and robust financial groups amongst European G-SIBs
Strengthening CA Group CET1 capital to €100bn by 2022
Increasing our subordinated MREL ratio by +2-3pp in order to maintain significant
buffer and to secure our funding conditions
11%
> 16%1.50%
~1%
~3%
4%-5%
Crédit Agricole SA CA Group
SNP
Tier 2
AT1
CET1
By 2022
~ 110 %
> €100bn
> 100%
~ 110 %
LCR(3)
SRP(4)
NSFR(5)
Crédit Agricole S.A.
Crédit Agricole Group
Crédit Agricole Group
Crédit Agricole Group
24-25%
Subordinated MREL(1)
(>8% TLOF)
(2)
Permanently
Maintain our prudent liquidity management relying on high level medium/long-term
resources and reserves growing with activity development
Permanently
FINANCIAL MANAGEMENT

CREDIT UPDATE - AOUT 202197
Contents
02
03
01 05
06
07
08Asset
Quality04

CREDIT UPDATE - AOUT 202198
GROUPE CRÉDIT AGRICOLE
Low risk profile
ASSET QUALITY
(1) Calculated on the basis of outstanding's not netted for available collateral and guarantees
Impaired loans ratio Coverage ratio (incl. collective reserves)(1)
2.4% 2.4% 2.3% 2.3%
3.2% 3.2% 3.2% 3.2%
1.8% 1.7% 1.7% 1.7%
June 20 Dec. 20 March 21 June 21
Impaired loans ratio
Crédit Agricole Group Crédit Agricole S.A Regional Banks
84.5% 84.0% 84.4% 85.5%
73.4%71.5% 72.1% 73.6%
99.7% 100.9% 101.2% 102.3%
June 20 Dec. 20 March 21 June 21
Crédit Agricole Group Crédit Agricole S.A. Regional Banks

CREDIT UPDATE - AOUT 202199
GROUPE CRÉDIT AGRICOLE
Credit risk scorecard
Principal amounts, excluding finance lease with customers, excluding intragroup transactions within Crédit Agricole and accrued interest.
Since Q1-19, loans outstanding included in credit risk indicators are only loans to customers, before impairment. Figures from previous
years for impaired loans ratios and coverage ratios have been restated according to the same methodology.
Coverage ratios are calculated on the basis of outstandings, not netted for available collateral and guarantees.
ASSET QUALITY
€m June 20 Dec. 20 March 21 June 21
Gross customer loans outstanding 975,202 985,074 1,002,264 1,026,601
of which: impaired loans 23,815 23,326 23,339 23,737
Loans loss reserves (incl. collective reserves) 20,125 19,584 19,700 20,291
Impaired loans ratio 2.4% 2.4% 2.3% 2.3%
Coverage ratio (excl. collective reserves) 58.8% 55.2% 55.2% 56.1%
Coverage ratio (incl. collective reserves) 84.5% 84.0% 84.4% 85.5%
€m June 20 Dec. 20 March 21 June 21
Gross customer loans outstanding 423,437 415,517 425,987 441,886
of which: impaired loans 13,737 13,407 13,452 13,929
Loans loss reserves (incl. collective reserves) 10,082 9,581 9,693 10,255
Impaired loans ratio 3.2% 3.2% 3.2% 3.2%
Coverage ratio (excl. collective reserves) 55.6% 51.7% 52.0% 54.3%
Coverage ratio (incl. collective reserves) 73.4% 71.5% 72.1% 73.6%
€m June 20 Dec. 20 March 21 June 21
Gross customer loans outstanding 551,786 569,624 576,311 584,565
of which: impaired loans 10,075 9,916 9,885 9,804
Loans loss reserves (incl. collective reserves) 10,039 10,001 10,005 10,032
Impaired loans ratio 1.8% 1.7% 1.7% 1.7%
Coverage ratio (excl. collective reserves) 63.0% 59.9% 59.7% 58.5%
Coverage ratio (incl. collective reserves) 99.7% 100.9% 101.2% 102.3%
Regional Banks - Evolution of credit risk outstandings
Crédit Agricole S.A. - Evolution of credit risk outstandings
Crédit Agricole Group - Evolution of credit risk outstandings

CREDIT UPDATE - AOUT 2021100
GROUPE CRÉDIT AGRICOLE
Home loans47%
Corporate32%
Consumer Finance
6%
Small businesses6%
Agriculture4%
Leasing2%
Private Banking2%
Other1%
A diversified loan portfolio, fairly secured and mainly
exposed to France
Gross customer loans outstanding(1) of Crédit Agricole Group (as of 30 June)
Corporate loans(3)
€329bn
Home loans
€480bn
Consumer loans
€64bn
Small businesses
€63bn
(1) Gross customer loans outstanding, financial institutions excluded
• Including €51bn from distribution networks in
France and €12bn(5) from international
distribution networks
• Including €444bn from distribution networks in
France and €36bn(2) from international
distribution networks
• Mainly in France, fixed rate loans, amortizable,
guaranteed by a guarantor or mortgage security
• Including €133bn from CACIB, €162bn from
distribution networks in France, €27bn(4) from
international distribution networks, €7bn from
CACEIS
• Including €34bn from CACF (including Agos) and
€30bn from distribution networks (consolidated
entities only)
• Loans supporting business only, home loans
excludedAgriculture
€43bn
Crédit Agricole Group
€1,026bn(1)
ASSET QUALITY
(2) Of which €5bn linked to the integration of Creval
(3) Of which €34bn in Regional Banks financing public entities
(4) Of which €7bn linked to the integration of Creval
(5) Of which €2bn linked to the integration of Creval

CREDIT UPDATE - AOUT 2021101
GROUPE CRÉDIT AGRICOLE
French and retail credit risk exposures prevail
Breakdown of the commercial lending portfolio (including Bank counterparties outside the group) stood at
€1,686.9 billion at June 2021 (€1,676.7 billion without “Not allocated” amount) vs. €1,592.9 billion at end
2020 (€1,427.6 billion without “Not allocated” amount). Commercial banking portfolio includes 100% of
balance sheet and off-balance sheet commitments.
ASSET QUALITY
By geographic region Jun. 21 Dec. 20
France (excl. retail banking) 34% 33%
France (retail banking) 38% 39%
Western Europe (excl. Italy) 8% 8%
Italy 7% 7%
North America 3% 3%
Asia and Oceania excl. Japan 3% 3%
Africa and Middle-East 2% 2%
Japan 2% 2%
Eastern Europe 1% 1%
Central and South America 1% 1%
Not allocated 1% 1%
Total 100.0% 100.0%
By business sector Jun. 21 Dec. 20
Retail banking 44% 45%
Non-merchant service / Public sector / Local
authorities21% 19%
Energy 4% 4%
Other non banking financial activities 5% 5%
Banks 2% 1%
Real estate 4% 4%
Aerospace 1% 1%
Others 3% 3%
Automotive 2% 2%
Heavy industry 1% 1%
Retail and consumer goods 2% 2%
Construction 1% 1%
Food 2% 2%
Shipping 1% 1%
Other transport 1% 1%
Other industries 1% 1%
Telecom 1% 1%
Healthcare / pharmaceuticals 1% 1%
Insurance 1% 1%
Tourism / hotels / restaurants 1% 1%
IT / computing 1% 1%
Not allocated 1% 1%
Total 100.0% 100.0%

CREDIT UPDATE - AOUT 2021102
GROUPE CRÉDIT AGRICOLE
Oil & Gas 1%
Aviation / Aerospace1%
Automotive1% Shipping
1%
Retail / Distribution (non food)
1%Tourism / Hospitality / Restaurants
1%
A limited share of EAD exposed to sectors sensitive to the
economic effects of Covid-19
EAD excluding financial institutions(1) at end June 2021
€1,726 bn total EAD(1)
The world’s economy remains directly impacted by the pace of the
health crisis. The impact on each sector is still very heterogeneous, with
on the one hand, sectors heavily impacted by continuing health
measures:Business segments related to the movement or gathering of people:
Passenger transportation (airlines, shipping, rail), Tourism, Events, Catering
Sectors where the level of demand remains below normal: in spite of a slight
improvement of Non-residential real estate demand on the offices segment,
there is still a wait-and-see attitude from investors linked to the impact of the
pandemic on the whole sector
And on the other hand, sectors that are rebounding with an increase in
activity and prices:
Resilient sectors or taking advantage of the pandemic: Telecoms, Electronics
(sharp increase in demand for equipment in connection with generalized work
from home; shortage of electrical components leading to higher prices for
consumers)
Sectors benefiting from a sustained demand from China or driven by the
recovery of the global economy : Agricultural products (Sugar, Cereals),
Metals
The progression of the vaccination campaign reinforces the hope that
this improvement will expand to most other economic sectors.
ASSET QUALITY
Oil & Gas EAD presented excl. commodity traders
Asset quality is based on internal ratings
(1) EAD excluding financial institutions. EAD (exposure at default) is a regulatory definition used in Pillar 3. It corresponds to the exposure in
the event of default after cash conversion factors (CCF). It encompasses balance sheet assets plus a proportion of off-balance sheet
commitments
30/06/2021 €EAD bn % EAD in default
Automotive 24.0 0.9%
Oil & Gas (commodity traders excluded) 23.7 1.7%
Retail / Distribution (non food) 19.5 2.8%
Aviation / Aerospace 16.6 6.4%
Shipping 13.6 4.8%
Tourism / Hospitality / Restaurants 12.6 5.9%

CREDIT UPDATE - AOUT 2021103
CRÉDIT AGRICOLE S.A.
Investment Grade65%
Sub-investment grade
27%
Watched list6%
Defaulted2%
ASSET QUALITY
Crédit Agricole CIB : Oil & Gas
CA CIB perimeter
(1) CA CIB perimeter . EAD (Exposure At Default) is a regulatory definition used in pillar 3. It corresponds to the exposure in the event of default after risk mitigation factors.
It encompasses balance sheet assets plus a proportion of off-balance sheet commitments.
(2) Excluding commodity traders
(3) Internal rating equivalent
20.8 bn€ EAD(1) on Oil & Gas excluding commodity traders as of May 2021
EAD is gross of Export Credit Agency and Credit Risk Insurance covers (3.8 bn€ as of 31/05/2021)
65% of Oil & Gas EAD(1)(2) are Investment Grade(3)
Diversified exposure in terms of operators, activity type, commitments and geographies
87% of Oil & Gas EAD(1)(2) in segments with limited sensitivity to oil prices
13% of EAD(1)(2) in Exploration & Production and Oil services segments, more directly sensitive to oil prices
First-ranking collateral on the vast majority of counterparties in the Exploration & Production segment
Oil & Gas gross exposure net of ECA by geography
Oil & Gas EAD excl. Commodity Traders: 20.8 Bn€
Upstream9%
O&G Services4%
Integrated Oil & Gas companies
18%
Downstream & Refining
16%
State Owned Oil & Gas companies
30%
Midstream (pipelines, LNG, storage)
23%
Oil & Gas EAD excl Commodity Traders
United States18%
United Kingdom10%
Other Western Europe
11%
France3%
Russia7%
Saudi Arabia6%
Brazil6%
Mexico6%
India6%
Other Asia6%
Africa6%
China1%
Gulf countries
8%
South Korea3%
Other3%
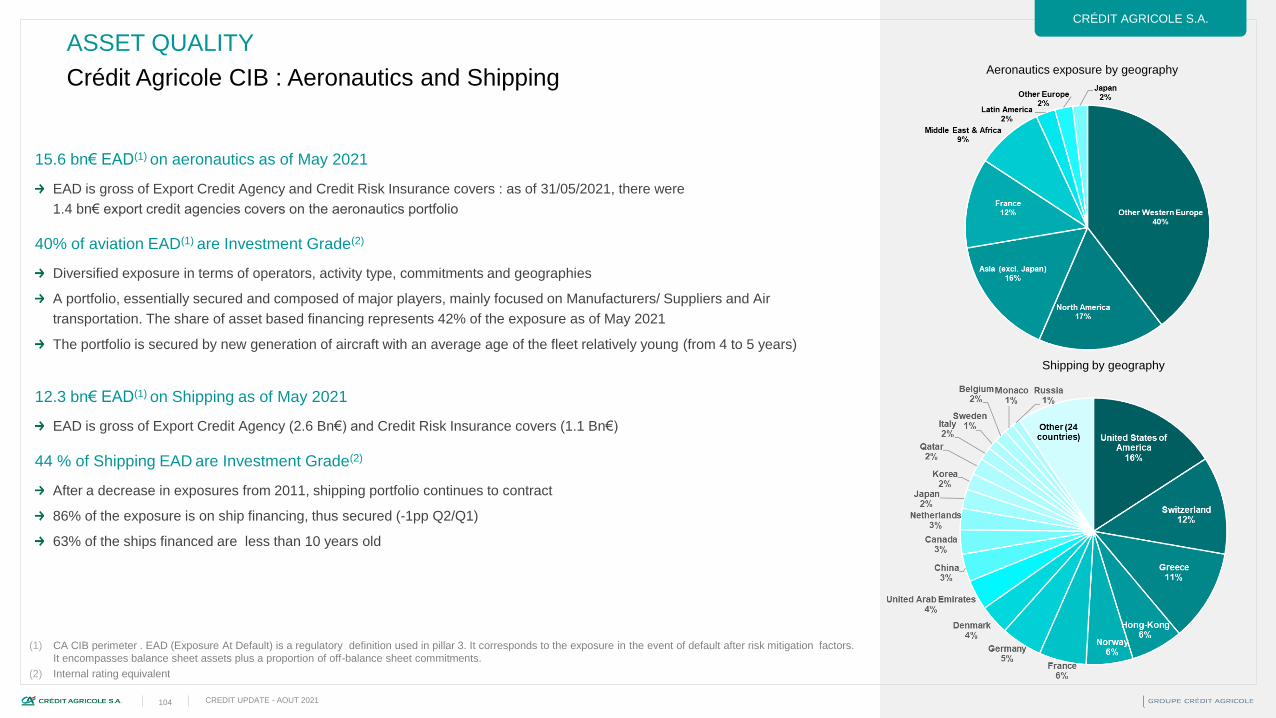
CREDIT UPDATE - AOUT 2021104
CRÉDIT AGRICOLE S.A.
ASSET QUALITY
Crédit Agricole CIB : Aeronautics and Shipping
(1) CA CIB perimeter . EAD (Exposure At Default) is a regulatory definition used in pillar 3. It corresponds to the exposure in the event of default after risk mitigation factors.
It encompasses balance sheet assets plus a proportion of off-balance sheet commitments.
(2) Internal rating equivalent
Aeronautics exposure by geography
15.6 bn€ EAD(1) on aeronautics as of May 2021
EAD is gross of Export Credit Agency and Credit Risk Insurance covers : as of 31/05/2021, there were
1.4 bn€ export credit agencies covers on the aeronautics portfolio
40% of aviation EAD(1) are Investment Grade(2)
Diversified exposure in terms of operators, activity type, commitments and geographies
A portfolio, essentially secured and composed of major players, mainly focused on Manufacturers/ Suppliers and Air
transportation. The share of asset based financing represents 42% of the exposure as of May 2021
The portfolio is secured by new generation of aircraft with an average age of the fleet relatively young (from 4 to 5 years)
12.3 bn€ EAD(1) on Shipping as of May 2021
EAD is gross of Export Credit Agency (2.6 Bn€) and Credit Risk Insurance covers (1.1 Bn€)
44 % of Shipping EAD are Investment Grade(2)
After a decrease in exposures from 2011, shipping portfolio continues to contract
86% of the exposure is on ship financing, thus secured (-1pp Q2/Q1)
63% of the ships financed are less than 10 years old
Shipping by geography

CREDIT UPDATE - AOUT 2021105
CRÉDIT AGRICOLE S.A.
Credit Agricole S.A.: market risk exposure
ASSET QUALITY
Crédit Agricole SA’s VaR (99% - 1 day) is computed taking into account the impact of diversification
between the Group’s various entities
VaR (99% - 1 day) at 30/06/21: €6m for Crédit Agricole S.A.
* Diversification gains between risk factors
Minimum Maximum Average
Fixed income 4 6 5 5 8
Credit 2 4 3 3 4
Foreign Exchange 2 3 2 3 5
Equities 2 3 2 3 2
Commodities 0 0 0 0 0
Mutualised VaR for Crédit Agricole S.A. 5 8 7 6 9
Compensation effects* -6 -8 -10
Crédit Agricole SA - Market risk exposures - VAR (99% - 1day)
€mQ2-21
30/06/2021 31/12/2020

CREDIT UPDATE - AOUT 2021106
04
Contents
French
Housing Market
04
02
03
01 05
06
07
08

CREDIT UPDATE - AOUT 2021107
FRENCH HOUSING MARKET
Economic environment factors and impact of the crisis
A sustained market in 2019 and early 2020
The residential market was very sustained in 2019 and early 2020, with record highs hit by the number of
transactions in existing homes, 1 076 000 in January 2020 (over the last 12 months). Existing home prices
accelerated in early 2020, despite the crisis, and increased by 5.6% over a year in France in Q2 2020.
This housing market boom as of March 2020 is explained by structural factors fuelling demand, an overall positive
economic environment, and -above all- very attractive lending conditions. Lending rates were very low, limited to
1.17% in December 2019 and 1.19% in February 2020, which has been strongly encouraging buyers.
A rather limited impact of the COVID-19 crisis on the housing market*
Housing market activity was strongly reduced from mid-March to mid-May 2020 due to the first lockdown. Most
households were self-isolating, real estate agencies were closed, notaries reduced operations. In March-April,
existing home sales dropped by 37% over a year. Likewise, for new homes, sales dropped and construction was
greatly affected. In Q2, newly-built homes (in the developer segment) dropped by 40% over a year.
Yet, a rebound occurred afterwards, even during the two following lockdowns, due to a strong demand and a
catching-up effect. In 2020 as a whole, the number of sales of existing dwellings remained sustained, 1 024 000
units, down by only 4% over a year. Sales dropped by 17% for newly-built homes. Increase in prices accelerated in
France, +6.4% in Q4 2020, albeit slowed down slightly in Paris, +5.5%.
In 2021, sales of existing dwellings remain very high, 1 130 000 units in May (12mth cumulated), +9.7% over a year.
In 2021 as a whole, they would remain slightly higher than in 2020, close to 1 100 000 units. They should rise a little
for new homes. Prices would slow down somewhat and rise by around 4,8%.
Some factors will limit the dynamism of the housing market in the second half of 2021. Support measures linked to
the health crisis should be gradually reduced, an increase in the unemployment rate should occur, job creations
should be subdued and household income should increase very slightly in nominal terms. Moreover, credit
conditions are slightly tightened, due to rising unemployment and recommendations from the French Financial
Stability Board, or HCSF (in particular, no more than 20% of new loans can involve ratio of debt service to income
greater than 35%, see slide 48) .
Yet, the French housing market remains rather resilient, due to the following factors: solid demand-side structural
factors (see next slide); a high level of accumulated savings; still low and attractive lending rates, as the 10-year
OAT yield should stay quite moderate, close to 0.35% at the end of 2021 (temporary increase linked to the
presidential campaign) and 0.15% at the end of 2022. Lending rates remained at very low levels on last months,
1.14% in May 2021.
France: housing prices and unemployment rate (in %)
Source: Notaries, INSEE
France: home loan rates (in %, monthly average, excluding insurance)
Source: Banque de France, Crédit Agricole S.A.
* according to CASA economic research
1.14
1,0
1,5
2,0
2,5
3,0
3,5
5,9
7,8
6
8
10
12-10
-5
0
5
10
15
20
87 89 91 93 95 97 99 01 03 05 07 09 11 13 15 17 19 21
Annual change in prices (left scale) Unemployment rate (inverse right scale)

CREDIT UPDATE - AOUT 2021108
66 67 70 71 73 74 76 78 81
0
25
50
75
100
125
2011 2012 2013 2014 2015 2016 2017 2018 2019
France Germany Spain UK
Favourable structural fundamentals
Strong demand-side factors
Lower rate of home ownership (65.1% of French households were owner-occupiers in 2018)
compared with other European countries (70% in the EU)
A higher birth rate than in most Western European countries
Other factors also support demand (divorce, retirement planning, limited supply of rental
accommodation)
A “safe haven” effect: in an uncertain environment and given the volatility and low returns of financial
markets, French households are showing a preference for what is perceived as low-risk and more
profitable investments, in particular housing. This factor should act quite strongly in the current
health and economic crisis.
Higher demand towards comfortable and greener housing (terraces, houses with gardens), due to
the health crisis, the ecological priority and the development of work from home.
Weak supply
France has a structural housing deficit of about 600,000 units according to
Crédit Agricole’s economic department
Developers are cautious, adjusting their supply to fluctuating demand. The stock of new housing
units for sale is limited, and 72% of it was still at planning stage in Q4 2020, which limits the risk of
oversupply
A structurally sound home loan market
Prudent lending towards the most creditworthy buyers
The French housing debt ratio (housing debt outstanding/overall household disposable income) is
increasing but remains relatively moderate compared with some other European countries,
particularly the UK.
Home ownership ratio in Europe (in % of total households)
Source 2018 Eurostat
France: housing starts and permits (in thousands, 12-m aggregate)
Source: French Ministry of Ecology
Households’ housing debt ratio (% housing debt / disposable income)
Source: Central Banks
FRENCH HOUSING MARKET
51
65 70 69 70 72 76 76
200
300
400
500
600
98 00 02 04 06 08 10 12 14 16 18 20
Permits
Housing
starts

CREDIT UPDATE - AOUT 2021109
Far more resilient than the rest of Europe
The French market did not experience a bubble / excessive risk-taking,
as seen in the US, the UK, Ireland and Spain between 1998 and 2007
The 2008-2009 recession put an end to the boom.
In France, the correction was very limited, as prices decreased by 5% only between 2008 and
2015, to be compared with a cumulative decline in prices of 50% in Ireland, 35% in Spain, 20 %
in Italy and the Netherlands. In the UK, prices dropped by 19% between 2009 and mid-2012.
In France, a clear rebound has been experienced between 2015 and 2019:
housing sales reached record levels and prices accelerated, albeit modestly
For existing dwellings, the number of sales strongly increased since 2015 and reached a
record level in 2019 (1 067 000, +9.7% over a year), compared with 800 000 in 2015. Prices
accelerated slightly in 2017-2018, up by 3.2% per year, and up by 3.7% in 2019. Prices in
Paris rebounded more strongly, 8.7% in 2017, 5.7% in 2018, 6.7% in 2019.
For newly-built homes (in the developer segment), the number of sales rebounded in 2015-
2016 and have stabilized at a high level in 2017-2019, 130,000 units per year. They were
very slightly affected in 2019 by changes in the Pinel buy-to-let scheme and by an insufficient
supply. Prices increased by 4% in 2019 in France and 4.5% in Ile de France.
In 2020-2021, the French housing market remains rather sustained. However,
prices are not clearly overvalued and the risk of a speculative bubble seems
rather unlikely
No strong acceleration of prices, credit or construction and no significant rise in risks
Price increases remain reasonable: +5.9% year on year in Q1 2021. They are stronger in
the EU as a whole, +6.7%, especially in Germany, +10.7%, and the Netherlands, +10.3%.
Housing price indices (base 100 = Q1-97)
Source: Halifax, Ministerio de Formento, INSEE, DS
France: sales of newly-built homes (in thousands per quarter)
Source: French Ministry of Ecology
France: existing dwellings (sales and prices)
Source: CGEDD, Notaries, Crédit Agricole forecasts
FRENCH HOUSING MARKET
100
200
300
400
500
98 00 02 04 06 08 10 12 14 16 18 20
UK
Ireland
France
Spain
10
20
30
40
50
90 92 94 96 98 00 02 04 06 08 10 12 14 16 18 20
On market
Sales
-15
-10
-5
0
5
10
15
20
300
400
500
600
700
800
900
1 000
1 100
92 94 96 98 00 02 04 06 08 10 12 14 16 18 20
Sales volumes (in thousands, left scale) Annual change in prices (in %, right scale)
%%
Forecasts

CREDIT UPDATE - AOUT 2021110
Lending practices enhance borrower solvency
(1) Debt service to income ratio encompasses both capital and interest
A cautious origination process
In France, the granting of a home loan is based on the borrower’s ability to repay and not on the value and
quality of the housing asset. The ratio of debt service to income(1) (DSTI) must not significantly exceed one third
of the borrower’s income. It remains more or less stable at around 30%
Low risk characteristics of the loans
Loans are almost always amortising, with constant repayments
Most home loans have a fixed rate to maturity (99.4% for new loans in 2020). Most floating rates are capped.
This has a stabilising effect on borrower solvency
The credit standards remain reasonable even if slightly easing :
The initial maturity of new loans remains reasonable, standing at an average of 19 years in 2017, 19.9
years in 2018, 20.3 years in 2019 and 20.5% years in 2020
The LTV for new loans stood at an average of 87.3% in 2018, 88.8% in 2019 and 87.1% on the first 9
months of 2020
The DSTI stood at an average of 30.1% in 2018, 30.3% in 2019 and 30.1% in 2020
Recommendation in December 2019 by the HCSF (the French macro-prudential authority) to have banks
limit new credits granted outside a minimum standard (DSTI above 33% or maturity above 25 years, on a
loan by loan basis), beyond an allowance equal to 15% of the total yearly new home loans. In December
2020, the HCSF slightly softened its recommendations. In particular, the weight of loans with high DSTI
(above 35%) in total production should be limited to 20% (and no longer 15%). The HCSF confirmed in
June 2021 that this recommendation will become a binding standard during the summer of 2021.
French home loan market largely based on guarantees provided by Crédit Logement and home loan insurance
companies
The risk profile remains very low
The non-performing loans ratio for home loans remains low and decreased again in 2020, at 1.06% after 1.29%
in 2019, 1.32% in 2018 and 1.45% in 2017.
New home loans: fixed vs floating rates (in % share)
New home loans: initial average maturity (in years)
Ratio of non performing loans / Total home loans (in %)
FRENCH HOUSING MARKET
Source : ACPR
86
70 6978
8691
87 86 89 92 91 92 96 98 99 99 99 99
03 04 05 06 07 08 09 10 11 12 13 14 15 16 17 18 19 20
Floating rate
loans
Fixed rate
loans
Source : ACPR
1,23
1,070,99
0,90 0,860,94
1,11 1,141,27 1,32
1,451,55 1,55 1,52
1,461,32 1,29
1,06
03 04 05 06 07 08 09 10 11 12 13 14 15 16 17 18 19 20
Source : ACPR
15,9 16,617,4
18,619,6 20 19,6 19,1 19,3 19,5
18,6 18,6 18 18,6 1919,9 20,3 20,5
03 04 05 06 07 08 09 10 11 12 13 14 15 16 17 18 19 20

CREDIT UPDATE - AOUT 2021111
Contents
Crédit Agricole
Home Loan SFH
04
02
03
01 05
06
07
08

CREDIT UPDATE - AOUT 2021112
Crédit Agricole: leader in home finance
CRÉDIT AGRICOLE HOME LOAN SFH
Crédit Agricole Group is the unchallenged leader
in French home finance
€440bn in home loans outstanding at end-June 2021
*Source: Crédit Agricole S.A. Source: Crédit Agricole S.A. - Economic Department
Recognized expertise built on
Extensive geographical coverage via the density of the branch network
Significant local knowledge
Insider view based on a network of real estate agencies
Home financing at the heart of client relationship management
Home finance is the starting point in retail banking for product cross-selling (death and
disability insurance, property and casualty insurance, home loan guarantee, current
account facilities, etc…)31.8%Crédit Agricole Group market share*
in French home loans at end-March 2021
Crédit Agricole Group: French Home Loans Outstanding (€bn)
101 109121
136157
182204
218 224250
268 274 281 288302
321346
372
402427
2001 2002 2003 2004 2005 2006 2007 2008 2009 2010 2011 2012 2013 2014 2015 2016 2017 2018 2019 2020

CREDIT UPDATE - AOUT 2021113
Crédit Agricole’s home loans: very low risk profile
Origination process relies
on the borrower’s repayment capability
Borrower risk is analysed through revenues and credit history checks (3 pay slips,
most recent tax statement, bank statements, Banque de France records)
Analysis includes project features (proof of own equity, construction and work bills,
etc.)
Borrower repayment capability is measured with the income sufficiency test, which
ensures that disposable income after all expenses exceeds a minimum amount,
depending on the size and means of each household
In addition, credit risks are analysed before and after the granting of a guarantee
As a result, the risk profile is very low
The rate of non-performing loans* remains low, despite a slight increase since 2007
The provisioning policy is traditionally very cautious, well above the French market
(42% at end-2020)
Final losses remain very low: 0.018% in 2020
*Doubtful loans and irrecoverable loans
Non-performing loans / Total home loans
Non-performing loans coverage ratio
0.018% Crédit Agricole Group final losses
on French home loans in 2020
CRÉDIT AGRICOLE HOME LOAN SFH
1,06%
0,90%
0,4%
0,6%
0,8%
1,0%
1,2%
1,4%
1,6%
1,8%
2006 2008 2010 2012 2014 2016 2018 2020
FrenchMarket
CréditAgricoleGroup
Source: ACPR, Crédit Agricole S.A.
42%
29%
0%
10%
20%
30%
40%
50%
60%
70%
2006 2008 2010 2012 2014 2016 2018 2020
CréditAgricoleGroup
Source: ACPR, Crédit Agricole S.A.

CREDIT UPDATE - AOUT 2021114
A diversified guarantee policy, adapted to clients’ risks and needs
Guaranteed loans: growing proportion, in line with the French market
Mainly used for well known customers and low risk loans…
In order to avoid mortgage registration costs…
And to simplify administrative procedures both at the signing of the loan and at loan maturity…
Via Crédit Logement (external institution jointly owned by major French banks) or CAMCA (internal mutual insurance company)
Mortgage
French State guarantee for eligible borrowers in addition to a mortgage
PAS loans (social accession loans)
Home loans by guarantee type
Outstanding 2019 New loans 2019 Outstanding 2020 New loans 2020
Mortgage 31.9% 30.4% 32.0% 30.5%
Mortgage & State guarantee 4.5% 4.1% 4.5% 3.8%
Crédit Logement 23.0% 24.0% 22.4% 20.6%
CAMCA 31.1% 33.0% 32.4% 36.9%
Other guarantees + others 9.5% 8.5% 8.7% 8.2%
Total 100.0% 100.0% 100.0% 100.0%
Source: Crédit Agricole
Scope: Crédit Agricole Group French Home Loans
CRÉDIT AGRICOLE HOME LOAN SFH

CREDIT UPDATE - AOUT 2021115
Issuer legal framework
Crédit Agricole Home Loan SFH (CA HL SFH), the Issuer
A French credit institution, 100% owned by Crédit Agricole S.A. and licensed by the French financial regulator (ACPR, Autorité de Contrôle Prudentiel et de Résolution)
Formerly Crédit Agricole Covered Bonds (CACB), it was converted on 12 April 2011 into a SFH (Société de Financement de l’Habitat), a specialised bank created under
the law dedicated to French home loan Covered Bonds
Investor benefits provided by the French SFH legal framework
Strengthened
Issuer
Limited activity of the Issuer : exposure to eligible cover pool and issuance of CB (Obligations à l’Habitat, OH)
Bankruptcy remoteness from bankruptcy of the parent company
Protection
given by the
cover pool
Eligibility criteria : pure residential loans, either 1st lien mortgage or guarantee by a credit institution, a financing company (Société de financement)
or an insurance company, property located in France or another country in the European economic area or a highly rated country
Over-collateralisation : 105% minimum, loan eligible amount capped at 80% of LTV for the purpose of computing the legal coverage ratio
Legal privilege : absolute priority claim on all payments arising from the assets of the SFH
Enhanced
liquidity
Liquidity coverage for interest and principal amounts due over the next 180 days
New source of liquidity as the Issuer may subscribe to its own Covered Bonds for pledge as collateral with the Central Bank, up to 10% of overall Covered Bonds
outstanding
CA HL SFH
recognition
ECB eligible : CA HL SFH Jumbo Covered Bond issues eligible in category II
UCITS 52(4)-Directive compliant
CRR 129 compliant with reduced risk weighting of 10% (Standard Approach)
LCR eligible as Level 1 asset (M€ 500 and above CB issues)
ControlsPublic supervision by the French regulator (ACPR)
Ongoing control by the specific controller to protect bondholders
CRÉDIT AGRICOLE HOME LOAN SFH

CREDIT UPDATE - AOUT 2021116
Structural features
Home loans granted as security in favour of the SFH
Self originated home loans by the Crédit Agricole Regional Banks or
LCL
Property located in France
No arrears
Allowing for the AAA rating of the CB
Monitored by the Asset Cover Test, ensuring
Credit enhancement
The coverage of carrying costs
Audited by PWC and Ernst & Young
Ongoing control by the specific controller, Fides Audit,
approved by the French regulator
Recourse of the Issuer both on the cover pool and on Crédit Agricole S.A.
The structure relies on the European Collateral Directive provisions
transposed into the French Financial and Monetary Code (Article L211-38,
July 2005)
Assets of the cover pool are identified by the collateral providers as granted for the
benefit of the Issuer; and…
Will be transferred as a whole in case of enforcement of collateral security
Double recourse of the Issuer Home loans cover pool
ControlsOver-collateralisation
CRÉDIT AGRICOLE HOME LOAN SFH

CREDIT UPDATE - AOUT 2021117
Proceeds from the issuance of
Covered Bonds will be used by the
Issuer to grant Crédit Agricole S.A.
Borrower Facilities, collateralized
by the eligible cover pool
Crédit Agricole S.A. will grant
Collateral Provider Facilities to
each of the 39 Regional Banks and
LCL (the Collateral Providers)
Each Collateral Provider will
benefit from facilities with an
attractive interest rate
Structure overview
No mismatch between
Covered Bonds and
CASA Borrower
Facilities
Investors
CA Home Loan SFH
The Issuer
Borrower
2nd Lender
Administrator
Collateral Providers
Agent
Covered
Bonds
Proceeds
Borrower
Facilities
Collateral Securities
Collateral
Providers:
Collateral Provider Facilities
Legal privilege over all assets
of the Issuer and the cover pool
Regional
Bank …
LCL
Regional
Bank 1
Regional
Bank i
CRÉDIT AGRICOLE HOME LOAN SFH

CREDIT UPDATE - AOUT 2021118
Liquidity and market risk monitoring
Liquidity and interest rate risks
Average life of the cover pool (including over-
collateralisation) remains shorter than cover
bonds (CB) notably due to the March 2016 LM
exercise followed by longer term issues
Cover pool as well as CB are mostly fixed rate
Monthly control based on cash flow model to
check timely payment of CB with cash from
cover pool including over-collateralisation, with
stressed interest rate and Conditional
Prepayment Rate (CPR) scenarios
Currency risk
A limited currency risk fully hedged through
cross currency swaps with internal counterparty
Average life (in years)
Breakdown by interest rate (€Bn) Breakdown by currency
Source: Crédit Agricole S.A., figures at end-June 2021
CRÉDIT AGRICOLE HOME LOAN SFH

CREDIT UPDATE - AOUT 2021119
Cover pool at end-June 2021
Excellent geographical diversification
Very low LTV, allowing high recoveries, even in highly
stressed scenarios
CRÉDIT AGRICOLE HOME LOAN SFH
Total outstanding current balance € 46 855 510 937
Number of loans 733913
Average loan balance € 63 843
Seasoning 93 months
Remaining term 165 months
WA LTV 61.11%
Indexed WA LTV 55.99%
Interest rates
95.64% fixed
4.36% variable, capped
Guarantee type distribution
Mortgage : 63.9%
(of which 15.5% with additional guarantee of the French
State)
Crédit Logement guarantee : 23.8%
CAMCA guarantee : 12.2%
Occupancy 81.7% owner occupied homes
Origination100% home loans self originated in France by 39 Regional
Banks and LCL
Key eligibility criteria
No arrears
Current LTV max 100%
Ile-de-France19,87%
Auvergne Rhône-Alpes15,63%
Occitanie9,28%
Nouvelle Aquitaine
8,73%
Provence Alpes Cöte-d'Azur
8,53%
Hauts-de-France8,48%
Pays de la Loire5,87%
Grand Est5,39%
Bretagne4,70%
Normandie4,03%
Centre Val-de-Loire3,80%
Bourgogne Franche-Comté3,67%
Outre-Mer1,42%
Corse0,61%

CREDIT UPDATE - AOUT 2021120
Programme size
Ratings
Governing laws
Outstanding series
Outstanding amount
Programme features at end-June 2021
Crédit Agricole Home Loan SFH is registered
with the Covered Bond label
https://coveredbondlabel.com/issuer/73/
Investor information available on Crédit Agricole’s website
https://www.credit-agricole.com/en/finance/finance/investor-s-
corner/debt/wholesale-bonds-issues/ca-home-loan-sfh-covered-bonds€40bn
Aaa by Moody’s, AAA by S&P Global Ratings,
AAA by Fitch
French law, German Law
51 series - 53 tranches
€31.53bn
CRÉDIT AGRICOLE HOME LOAN SFH

CREDIT UPDATE - AOUT 2021121
Contents
Crédit Agricole
Public Sector SCF
04
02
03
01 05
06
07
08

CREDIT UPDATE - AOUT 2021122
Key features
CRÉDIT AGRICOLE PUBLIC SECTOR SCF
CA Public Sector SCF’s objectives
Expanding Crédit Agricole’s export finance activities guaranteed by Export Credit Agencies (ECAs), acting in the name of Governments:
a high credit quality/low margin business requiring low refinancing costs
Diversifying Crédit Agricole’s funding sources at an optimal cost
A €10bn Covered Bond programme rated Aaa (Moody’s) and AAA (S&P Global Ratings) since launch
Compliance with provision 52(4) of the UCITS EU Directive
A regulated credit institution, licensed within the SCF French legal framework
CA Public Sector SCF only refinances eligible exposures to public entities through Covered Bond issues (Obligations Foncières)
Value of cover pool must equal at least 105% of Covered Bonds issued, by Law
Investors in Covered Bonds benefit from legal privilege over the assets
Bankruptcy remoteness of the Issuer from the parent ensured by Law
By law, no early redemption or acceleration of the Covered Bonds in case of insolvency
Close monitoring and supervision (ACPR, specific controller, independent auditors)
Reduced risk weighting of 10% in Standard Approach according to EU Capital Requirements Regulation (CRR)

CREDIT UPDATE - AOUT 2021123
CACIB’s Export Credit Agency (ECA) business
CACIB, 100% subsidiary of Crédit Agricole S.A.,
is an established leader in asset-based finance
Top 5 global Export Finance bank for 2016-2019
Leader in aircraft and rail finance among European banks
Top player in shipping in the European and Asian markets
Major player in project finance and especially infrastructure,
power and oil & gas
Experience of more than 25 years
ECA loan origination has resumed after a dip in 2020
Loans are guaranteed by ECAs, acting in the name of their governments
Steady demand from exporters for long term financing given large infrastructure needs in
emerging markets (construction, telecoms, energy, transportation, etc...)
Very low risk thanks to the recourse to ECAs and security packages
in some cases as well
Very low capital consumption for banks
A portfolio of €17.1bn at end-June 2021
Outstanding ECA loans (in €bn)
CRÉDIT AGRICOLE PUBLIC SECTOR SCF
16,2
13,4 12,7 13,3 15,5 16,3 16,5 16,4 16,3 16,2
18,5 18,2 17,7 16,9 16,7 17,1
Dec.11 Dec.12 Dec.13 Dec.14 Dec.15 Jun.16 Dec.16 Jun.17 Dec.17 Jun.18 Dec.18 Jun.19 Dec.19 Jun.20 Dec.20 Jun.21

CREDIT UPDATE - AOUT 2021124
CACIB’s Export Credit Agency (ECA) business
CACIB continues to dedicate important
resources to the ECA business
Origination capacity in more than 25 countries
Close proximity to ECAs, and well-established relations with them
Dedicated, experienced transaction teams based in Paris
in charge of structuring and managing deals from signature
to final repayment
Sector mix
Borrowers’ country mix
At end-June 2021
Strong credit processes
Annual strategy review by business line, including risk policy
Credit approval granted by specialised credit committees and by
the top credit committee of the Bank
Annual portfolio review
Diversified portfolio
Sovereign guarantees provided by a diversified group of guarantors
Good sector and geographic diversification
ECA mix
CRÉDIT AGRICOLE PUBLIC SECTOR SCF
Germany
8%
France20%
UK18%
Italy17%
Korea15%
Germany8%
Others22%
ME -AFRICA
37%
EUROPE -CENTR. ASIA
27%
ASIA -OCEANIA
20%
AMERICAS16%
Energy32%
Defence18%
Shipping18%
Misc. Industrie
s11%
Aviation7%
Infras.6%
Telecom4%
Mining3%

CREDIT UPDATE - AOUT 2021125
Issuer legal framework
Crédit Agricole Public Sector SCF, the Issuer
A French credit institution, 100% owned by Crédit Agricole S.A., licensed by the French financial regulator (ACPR, Autorité de Contrôle Prudentiel et de Résolution)
Investor benefits provided by the French SCF legal framework
Limited activity of the Issuer: exposure to eligible cover pool and issuance of Covered Bonds (Obligations Foncières)
Bankruptcy remoteness from bankruptcy of the parent
Eligibility criteria: public exposure, as defined by Law (public exposure to European Economic Area or country with a minimum rating of AA-)
Over-collateralisation : 105% minimum
Legal privilege: absolute priority claim on all payments arising from the assets of CA PS SCF
Liquidity coverage for interest and principal amounts due over the next 180 days
Additional source of liquidity as the Issuer may subscribe to its own Covered Bonds for pledge as collateral with the Central Bank, up to 10%
of overall Covered Bonds outstanding
ECB eligible : CA PS SCF Jumbo Covered Bond issues eligible in category II
UCITS 52(4)-Directive compliant
CRR 129 compliant with reduced risk weighting of 10% (Standard Approach)
LCR eligible as Level 1 asset (500m€ and above CB issues)
Public supervision by the French regulator (ACPR)
Ongoing control by the Specific Controller to protect bondholders
StrengthenedIssuer
Protection givenby the cover pool
Enhanced
liquidity
CA PS SCF Recognition
Control
CRÉDIT AGRICOLE PUBLIC SECTOR SCF

CREDIT UPDATE - AOUT 2021126
Structural features
Programme
€10bn programme of Obligations Foncières, with €4bn of issues outstanding
rated Aaa by Moody’s and AAA by S&P Global Ratings since launch
Cover pool
Loans fully guaranteed by ECAs acting on behalf of governments originated by
CACIB
Loans to or fully guaranteed by multinational or national or regional authorities or
public institutions originated by CACIB
Loan transfers achieved on a loan-by-loan basis
Due diligence performed by our French counsel
Review by local counsel in borrowers countries of all transfer formalities
necessary to achieve a transfer binding and enforceable to the ECAs,
the borrower and any third party
Completion of the formalities necessary for obtaining a valid transfer of
the public exposure
Loans to, or guaranteed by, French national, regional authorities or public
institutions only originated by the Crédit Agricole Group Regional Banks to be
potentially included in the future
Over-collateralisation
Over-collateralisation above the 105% legal requirement to reach the maximum
achievable rating
Over-collateralisation ratio monitored by the monthly Asset Cover Test
Double recourse of the Issuer
Recourse of the CA Public Sector SCF both on the cover pool and on Crédit
Agricole S.A.
The structure relies on the European Collateral Directive provisions transposed
into French Law (Article L211-38 July 2005, French Monetary and Financial
Code )
Assets of the cover pool are identified by CACIB as granted for the
benefit of the Issuer
Assets will be effectively transferred as a whole in case of enforcement
of collateral security
Controls
Audit by two auditors : PWC and Ernst & Young
Ongoing control by a Specific Controller approved by the French regulator
(Fides Audit)
CRÉDIT AGRICOLE PUBLIC SECTOR SCF

CREDIT UPDATE - AOUT 2021127
Proceeds from the issuance of Covered
Bonds will be used by the Issuer to grant
Crédit Agricole S.A. Issuer Facilities
Crédit Agricole S.A. will grant CASA
Facilities to CACIB (the Collateral
Provider) with an attractive interest rate
Eligible cover pool will be transferred by
way of security, in accordance with the
French Monetary and Financial code
(Article L 211-38):
by CACIB to CASA as collateral
of CASA Facilities
and by CASA to CA PS SCF, as
collateral
of Issuer Facilities
Structure overview
No mismatch
between Covered
Bonds and Issuer
Facilities
Investors
CA Public Sector SCF
The Issuer
Borrower
2nd Lender
Collateral Providers
Covered
Bonds
Proceeds
Issuer
Facilities
Collateral
Securities
Legal privilege over all assets of the
Issuer and the cover pool
CACIB
Borrower
Collateral Provider
CASA
Facilities
Collateral
Securities
CRÉDIT AGRICOLE PUBLIC SECTOR SCF

CREDIT UPDATE - AOUT 2021128
Cover pool at end-June 2021
€5.88bn eq. drawn public exposures
Total commitment of € 7.2bn eq.
155 loans
Strongly rated exposures, mainly ECA guaranteed loans
(% of drawn amounts)
28.39% France, rated Aa2/ AA/ AA (BPIFRANCE ASSURANCE EXPORT)
23.72% UK, rated Aa2/ AA/ AA (UKEF)
15.86% South Korea, rated Aa2/ AA-/ AA- (K-Sure)
7,42% Germany, rated Aaa/ AAA/ AAA (mainly EULER-HERMES)
Enhancement of the pool diversification by inclusion of new high quality guarantors such as
STATE OF QATAR, Finland (FINNVERA) and World Bank (MIGA), Austria (OeKB),
Denmark (EKF)…
Sector mix (drawn amounts)
Public Exposures
CRÉDIT AGRICOLE PUBLIC SECTOR SCF
Sector mix (% of drawn
amounts) 30.7% Defence
21.3% Oil & Gas
11.5% Aircraft (all aircraft loans
are secured by mortgages)
36.5% Others
Impact of the Covid crisis on the cover pool :
At the onset of the crisis, the global economy experienced a significant slowdown in new
investments. However, in the 2nd half of 2020, there have been signs of a pickup in activity
with ECAs playing a relevant role as they do during times of need. Some ECAs have
developed new support programs for their exporters during the pandemic and are looking more
to energy transition opportunities.
Some sectors have been more impacted than others. The aviation sector was particularly hard
hit and a return to normal is not expected by IATA before 2023.
However, the impact on the collateral pool has been relatively limited as:
Borrowers look to maintain their ECA-covered facilities in place
There are a number of initiatives put in place by ECAs and multilateral institutions to provide
relief to certain borrowers by the introduction of new facilities to alleviate the liquidity crunch.
In general States provide massive support to the aviation sector.
All in all, 4 guaranteed transactions on the aviation sector, with a combined value of less
than €300M, have been considered not eligible any more due to the insolvency of the
debtor (as defined by the program) and have been removed from the cover pool.
At end-June 2021
Defence30,73%
Oil & Gas21,26%Aircraft
Finance11,51%
Power11,09%
Telecommunication7,55%
Infrastructure6,11%
Industries4,31%
Other2,16%
Environment1,76%
Mining1,66%
Rail Finance1,57%
Real Estate & Leisure0,30%
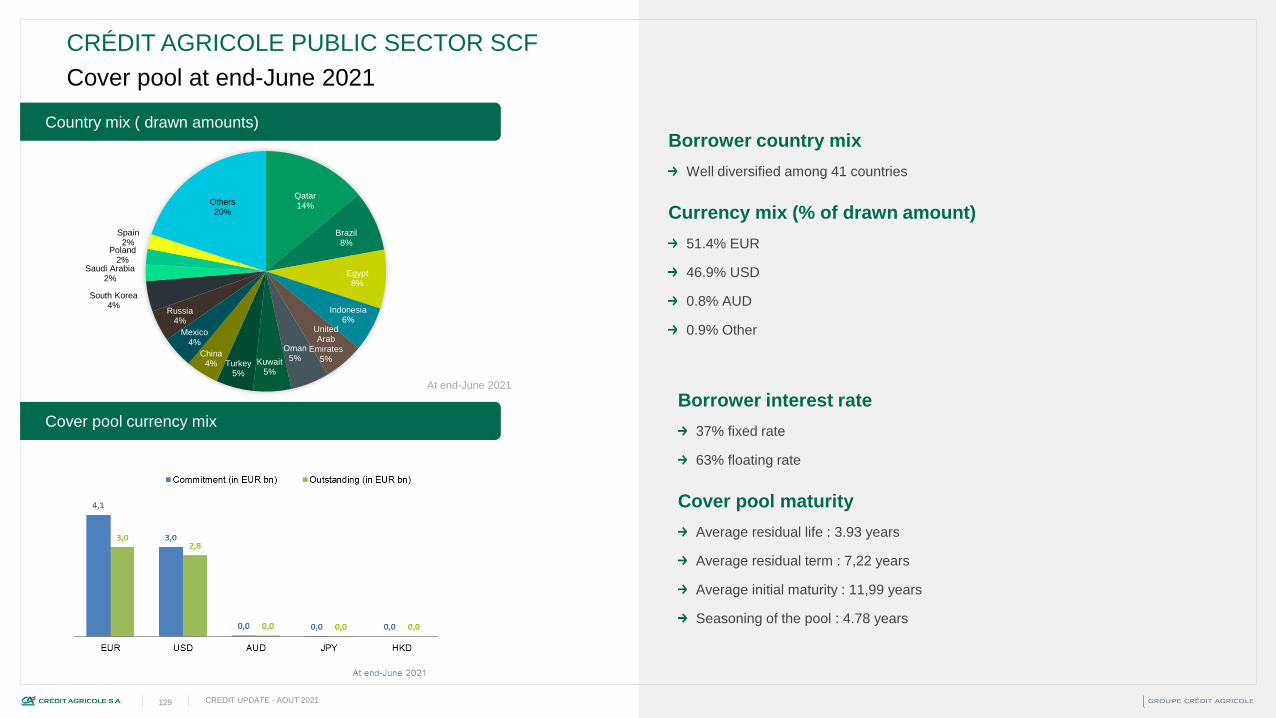
CREDIT UPDATE - AOUT 2021129
Country mix ( drawn amounts)
Cover pool currency mix
Cover pool at end-June 2021
Borrower country mix
Well diversified among 41 countries
Currency mix (% of drawn amount)
51.4% EUR
46.9% USD
0.8% AUD
0.9% Other
CRÉDIT AGRICOLE PUBLIC SECTOR SCF
Borrower interest rate
37% fixed rate
63% floating rate
Cover pool maturity
Average residual life : 3.93 years
Average residual term : 7,22 years
Average initial maturity : 11,99 years
Seasoning of the pool : 4.78 years
Qatar14%
Brazil8%
Egypt8%
Indonesia6%
United Arab
Emirates5%
Oman5%Kuwait
5%Turkey
5%
China4%
Mexico4%
Russia4%
South Korea4%
Saudi Arabia2%
Poland2%
Spain2%
Others20%
At end-June 2021

CREDIT UPDATE - AOUT 2021130
Programme size
Ratings
Governing laws
Outstanding series
Outstanding amount
€10bn
Aaa by Moody’s, AAA by S&P Global Ratings
French law, German Law
6 series
€4 bn
Programme features at end-June 2021
Crédit Agricole Home Public Sector SCF is registered
with the Covered Bond label
https://coveredbondlabel.com/issuer/12/
Investor information available on Crédit Agricole’s website
https://www.credit-agricole.com/en/finance/finance/investor-s-
corner/debt/wholesale-bonds-issues/ca-public-sector-scf-covered-bonds
CRÉDIT AGRICOLE PUBLIC SECTOR SCF

CREDIT UPDATE - AOUT 2021131
Contents
Appendices04
02
03
01 05
06
07
08

CREDIT UPDATE - AOUT 2021132
Key Data
01

CREDIT UPDATE - AOUT 2021133
Crédit Agricole Group
KEY DATA
Leading French co-operative bank
Leading player in Retail Banking and Savings Management in France
Resilient customer-focused universal banking model
10.9mn mutual shareholders and 2,410 Local Credit Co-operatives in
France
39 Regional Banks owning 55.8% of Crédit Agricole S.A. via SAS Rue La
Boétie end Q2-21
52mn clients (o/w 27mn individuals in France); 142,000 employees
worldwide
Leading lender to the French economy, with loans outstanding in respect of
Regional Banks and LCL of €724bn at end-June 21
Leading market shares in non-financial customer deposits and loans in
France: 24.1% and 22.9% respectively at end Q1-21(1)
Leading banking Group in home loans, with outstandings in respect of
Regional Banks and LCL of €440bn at end-June 21; market share of 31.8% at
end Q1-21(1)
No. 1 insurance Group in France by written premiums(2) and also the No. 1
life insurance company in France in 2018(2), 15% market share of life
insurance outstandings at end 2019(2)
No. 1 bancassurer in France(2) and in Europe(2)
No. 1 European Asset Manager by AuM and in the Top 10 worldwide(3)
A leading consumer credit provider in Europe(4)
Retail banking and related activities account for 82% of Crédit Agricole Group’s
underlying net income Group share (excl. Corporate Centre) in H1 2021
Stated net income Group share: €9,304m at Q2-21 (+14.9% Q2/Q2); underlying net
income Group share: €9,295m at Q2-21 (+8.9% Q2/Q2)
Shareholders’ equity: €122.0bn at end Q2-21 vs. €116.8bn at end Q2-20
Phased-in CET1 ratio: 17.3% at end Q2-21 vs.16.1% at end Q2-20
Phased-in leverage ratio: 5.9% at end Q2-21 vs. 5.7% at end Q2-20
Conglomerate ratio: 170%(5) on a phased-in basis at end Q4-20 vs. 148% at end Q4-19,
far above 100% requirement
TLAC ratio excl. eligible senior preferred debt of 25.6% at end Q1-21 vs. 23.8% at end
Q2-20, as % of RWA; estimated MREL ratio excl. potentially eligible senior preferred debt
of 8.3% at end Q1-21 vs. 8.2% at end Q2-20 as % of prudential balance sheet; and of ca.
31.5% at end Q2-21, vs. ca. 32% at end Q2-20 as % of RWA including potentially eligible
senior preferred debt
Liquidity reserves: €463bn at end Q2-21 vs. €461bn at end Q1-21; average LCR over 12
months: 165.6% at end Q2-21 > ca. 110% MTP target, and NSFR in line with MTP target
of >100% at end Q2-21
Broad base of very high-quality assets available for securitisation
Issuer ratings: A+/Stable/A-1 (S&P), Aa3/Stable/P-1 (Moody’s), A+/Negative/F1 (Fitch
Ratings)
Solid fundamentals
Sources: (1) Crédit Agricole S.A. - Economic Department (2) Argus de l’Assurance 03/07/2020 and 18/12/2020, CAA internal
studies based i.on Fédération Française de l’Assurance 2019 data and ii.on 2019 premiums in Europe (3) IPE 06/2020 based
on December 2019 AuM (4) CACF (5) including PPE

CREDIT UPDATE - AOUT 2021134
KEY DATA
Crédit Agricole S.A. and Crédit Agricole Group consolidated balance sheets at 30/06/2021
Assets Crédit Agricole
Group Crédit Agricole S.A. Liabilities Crédit Agricole Group Crédit Agricole S.A.
Cash and Central banks 238.1 234.9 Central banks 0.4 0.4
Financial assets at fair value through profit or loss 448.5 445.1 Financial liabilities at fair value through profit or loss 258.1 260.4
Hedging derivative instruments 18.1 16.6 Hedging derivative instruments 19.3 13.2
Financial assets at fair value through other comprehensive income 271.4 259.2
Loans and receivables due from credit institutions 97.7 497.1 Due to banks 229.1 319.8
Loans and receivables due from customers 1006.3 431.6 Customer accounts 1009.3 757.4
Debt securities 112.6 86.6 Debt securities in issue 175.4 167.5
Revaluation adjustment on interest rate hedged portfolios 9.2 5.3 Revaluation adjustment on interest rate hedged portfolios 8.3 7.4
Current and deferred tax assets 7.4 5.3 Current and deferred tax liabilities 3.2 3.1
Accruals, prepayments and sundry assets 43.5 40.0 Accruals and sundry liabilities 62.4 58.8
Non-current assets held for sale and discontinued operations 2.2 2.2 Liabilities associated with non-current assets held for sale 0.9 0.9
Investments in equity affiliates 7.4 7.7 Insurance Company technical reserves 372.1 369.5
Investment property 7.8 6.8 Provisions 7.2 4.5
Property, plant and equipment 10.9 6.1 Subordinated debt 25.0 25.3
Intangible assets 3.4 3.2 Shareholder's equity 122.0 65.9
Goodwill 15.2 14.7 Non-controlling interests 7.0 8.4
Total assets 2,299.6 2,062.3 Total liabilities 2,299.6 2,062.3

CREDIT UPDATE - AOUT 2021135
Group Structure
02

CREDIT UPDATE - AOUT 2021136
31 m(1) retail customers in France - 52 m(1) customers worldwide
Crédit Agricole Mutual Group: customer-focused universal banking model
GROUP STRUCTURE
The Local Credit Co-operatives form the foundation of the Group and hold nearly all of the share capital of Crédit Agricole’s Regional Banks,
which in turn are the majority shareholders of Crédit Agricole S.A. through SAS La Boétie
Local Credit Co-operatives: Private law co-operative companies owned by their members, owning 100% of the voting rights and the majority of the share capital of the Regional Banks;
no branches
Regional Banks(1): Private law co-operative companies and individually licensed banks, forming France’s leading retail banking network; majority owned by Local Credit Co-operatives,
Sacam Mutualisation (~25% through CCI/CCA) and, for 13 of them, by retail and institutional investors through non-voting listed shares with rights on net assets
SACAM Mutualisation: An entity wholly owned by the Regional Banks for the purpose of pooling part of their earnings.
SAS La Boétie: The HoldCo managing, on behalf of the Regional Banks, their 55.8% equity interest in Crédit Agricole S.A.
Crédit Agricole S.A.: A listed company of Group subsidiaries company and the Central Body of the Crédit Agricole Network, of which it is a member according to the French Monetary
and Financial Code; at the same time, the holding and functionally, the lead institution of the Crédit Agricole Group
4 BUSINESS DIVISIONS
(1) At 31 December 2020
(2) The Regional Bank of Corsica, which is 99.9% controlled by Crédit Agricole S.A., is also a shareholder of SACAM Mutualisation and SAS La Boétie
(3) At 30 June 2021
2,410(1) Local Credit Co-operatives
10.9 m(1) mutual shareholders
38 Regional Banks
(excl. RB of Corsica)(2)
Public(of which 4.9% employees
and treasury shares 0.5%)
Sacam Mutualisation
Crédit Agricole S.A.Listed Company
Central Body and member of CA network
HoldCo of Group subs
100% ~25%(through CCI/CCA)
55.8%(3)
via holding
company
(SAS La Boétie)
44.2%(3)
Asset
gathering
Egypt
Morocco
Poland
Romania
Serbia
Ukraine
Retail
banking
Specialised
financial services
Large
customers

CREDIT UPDATE - AOUT 2021137
GROUP STRUCTURE
Internal support mechanisms
Crédit Agricole S.A.
Regional
BanksCACIB
Jo
int
& S
eve
ral
Gu
ara
nte
e
Fin
. &
Mo
ne
tary
Co
de
Fin
. &
Mo
ne
tary
Co
de
Reciprocal binding
commitments between the
Regional Banks and
Crédit Agricole S.A.
Through a joint and several guarantee issued in 1988, the Regional Banks guarantee all of the obligations of Crédit Agricole S.A. to third parties and they also cross-guarantee each other,
should Crédit Agricole S.A. become insolvent and after the liquidation and dissolution of Crédit Agricole S.A.
The potential liability of the Regional Banks under this guarantee is equal to the aggregate of their share capital, reserves and retained earnings, i.e. €79.8bn* at June 2021
Crédit Agricole S.A. obligations under the Financial & Monetary Code
Regional Banks’ joint and several guarantee
* Aggregate figures from French GAAP, audited individual accounts of the 39 Regional Banks [1] Articles L. 613-48 and L. 613-48-3 of the CMF. [2] Articles L. 613-55 et L. 613-55-1 of the CMF
Crédit Agricole S.A., as the Central Body and as a member of the Crédit Agricole Network
Acts as Central Bank to the Crédit Agricole Regional Banks in terms of refinancing, supervision and reporting to the Supervisory Authority
Reviews and monitors the credit and the financial risks of its affiliated members - essentially the Regional Banks and CACIB.
Is required (cf. Article L511-31) to take all necessary measures to ensure that each and all of the Crédit Agricole Network members - essentially the Regional Banks and CACIB - (defined in
Article R512-18) maintain satisfactory liquidity and solvency; this requirement, being enshrined in law, it is considered to be even stronger than a guarantee.
The alignment of the issuer ratings of the
Regional Banks and CACIB with those of
Crédit Agricole S.A. reflects the support
mechanisms within the Group
In the transposition of Directive 2019/879 of 20 May 2019 “BRRD2” by Order 2020-1636 of 21 December 2020, the French Law expressly provides the specificities
of resolution of a cooperative group composed of a Central Body and affiliated entities
For cooperative banking groups, the ”extended single point of entry” (“extended SPE”) resolution strategy is favoured by the resolution authorities, whereby resolution tools would be applied
simultaneously at the level of Crédit Agricole S.A. and the affiliated entities. In this respect, and in the event of a resolution of the Crédit Agricole Group, the scope comprising Crédit
Agricole S.A. (in its capacity as the Central Body) and the affiliated entities would be considered as a whole as the extended single point of entry. Given the foregoing and the solidarity
mechanisms that exist within the Network, a member of the Crédit Agricole Network cannot be put individually in resolution.
With respect to the Central Body and all affiliated entities, the resolution authorities may decide to implement, in a coordinated manner, write-down or conversion measures and,
where applicable, a bail-in. In such an event, write-down or conversion measures and, where applicable, bail-in would apply to all entities within the Crédit Agricole network,
regardless of the entity and regardless of the source of the losses.
In the event that the resolution authorities decide to put the Crédit Agricole Group in resolution, they will first write down the CET1 instruments (shares, mutual shares, CCI and CCA),
additional Tier 1 and Tier 2 instruments, in order to absorb losses, and then possibly convert the additional Tier 1 and Tier 2 instruments into equity securities[1]. Then, if the resolution
authorities decide to use the bail-in tool, the latter would be applied to debt instruments[2], resulting in the partial or total write-down of these instruments or their conversion into equity in order
to absorb losses. The creditor hierarchy in resolution is defined by the provisions of Article L 613-55-5 of the CMF, effective as at the date of implementation of the resolution.
Equity holders and creditors of the same rank or with identical rights in liquidation will then be treated equally, regardless of the group entity of which they are creditors. Investors must then
be aware that there is therefore a significant risk that holders of shares, mutual shares, CCIs and CCAs and holders of debt instruments of a member of the Network will lose all or part of
their investment if a resolution procedure is implemented on the Group, regardless of the entity of which they are a creditor.
This resolution framework does not affect the legal internal financial solidarity mechanism enshrined in Article L. 511-31 of the French Monetary and Financial Code, which applies to the
Crédit Agricole Network, as defined in Article R. 512-18 of the same Code. Crédit Agricole S.A. considers that, in practice, this mechanism should be implemented prior to any resolution
procedure.
Resolution framework for the Crédit Agricole Network

CREDIT UPDATE - AOUT 2021138
Capital
03

CREDIT UPDATE - AOUT 2021139
GROUPE CRÉDIT AGRICOLE
Crédit Agricole Group
CAPITAL
Crédit Agricole Group: solvency (in € bn)
30/06/21 31/12/20 30/06/21 31/12/20
EQUITY - GROUP SHARE 122.0 119.6 122.0 119.6
(-) Expected dividend (0.6) (1.0) (0.6) (1.0)
(-) AT1 instruments accounted as equity (4.9) (5.9) (4.9) (5.9)
Eligible minority interests 3.4 3.1 3.4 3.1
(-) Prudential filters (2.0) (2.1) (2.0) (2.1)
o/w: Prudent valuation (1.5) (1.2) (1.5) (1.2)
(-) Deduction of goodwills and intangible assets (18.0) (18.1) (18.0) (18.1)
Deferred tax assets that rely on future profitability excluding those arising from temporary differences (0.2) (0.1) (0.2) (0.1)
Shortfall in adjustments for credit risk relative to expected losses under the internal ratings-based approach (0.5) (0.4) (0.5) (0.4)
Amount exceeding thresholds 0.0 0.0 0.0 0.0
Other CET1 components (0.7) 0.1 1.3 1.9
COMMON EQUITY TIER 1 (CET1) 98.4 95.1 100.4 96.9
Additionnal Tier 1 (AT1) 3.1 4.1 4.9 5.8
TOTAL TIER 1 101.5 99.2 105.3 102.7
Tier 2 14.6 15.5 17.1 15.6
TOTAL CAPITAL 116.1 114.8 122.5 118.3
RWAs 579.2 561.5 579.7 562.1
CET1 ratio 17.0% 16.9% 17.3% 17.2%
Tier 1 ratio 17.5% 17.7% 18.2% 18.3%
Total capital ratio 20.0% 20.4% 21.1% 21.1%
Fully-loaded Phased-in

CREDIT UPDATE - AOUT 2021140
CRÉDIT AGRICOLE S.A.
CAPITAL
Phased-in CET1 ratio: 12.6%, +4.7 pp above SREP requirements
Change in Crédit Agricole S.A. risk weighted assets (€bn) Change in phased-in CET1 ratio (bp)
CET1 ratio: 12,6%, fully-loaded ratio at 12.4%(3)
Stated net income notably excluding Creval Badwill : +44 bp
Dividends: -23 bp, of which -21 bp dividend provision based on a 50% pay-out policy (€0.39 over
H1-21) ;
Growth of business lines(1): neutral this quarter
Methodology and regulatory effects: +1 bp, of which +6 bp linked to a positive TRIM model review
effect, -7 bp related to CRR2 impact and +2 bp linked to Affrancamento
M&A, OCI and other: -29 bp related to the consolidation of Creval RWAs (prudential integration of
Creval badwill planned in Q4-2021). OCI reserves(4): -4 bp
Distance to SREP requirements: +4.7 pp (-0.1 pp vs Q1 2021)
Phased-in Tier 1 ratio: 14.0% and phased-in total ratio: 18.6%
Phased-in leverage ratio: stable at 4.6% compared to Q1 2021 (3.9% before neutralisation of
ECB exposures vs 4.0% at end March 2021)
Phased-in daily leverage ratio(5): 3.8% before neutralisation of ECB exposures
Increase in risk weighted assets mainly due to the consolidation of Creval, as well
as the CRR2 regulatory impact
Business lines’ contribution : +€0.5 billion of which -€0.2 billion FX impact. Increase in
Retail banking. Slight decrease in Large customers(2)
Equity-accounted value of insurance: -€1.0 billion, related to H1-21 dividend distribution
Methodology, regulatory effects and M&A: +€0,3 billion, of which -€1.7 billion related to the
review of TRIM models and +€2,0 billion related to CRR2 regulatory effect
Consolidation of Creval: +€8.5 billion
(1) Change in business line RWAs excluding the impact of OCIs in equity-accounted value of insurance
(2) Retail banking: +€1.2 bn excluding FX impact ; Large customers: -€0.6 billion excluding FX impact
(3) Excluding the impact of phasing in of IFRS 9 included in Q2-20 as part of the “Quick Fix”
(4) OCI reserves provision as at 30/06/2021: 34 bp (vs. 38 bp at 31/03/2021)
(5) The daily leverage ratio is calculated by taking into account the daily average of the quarter’s securities financing transactions
(SFTs) exposures
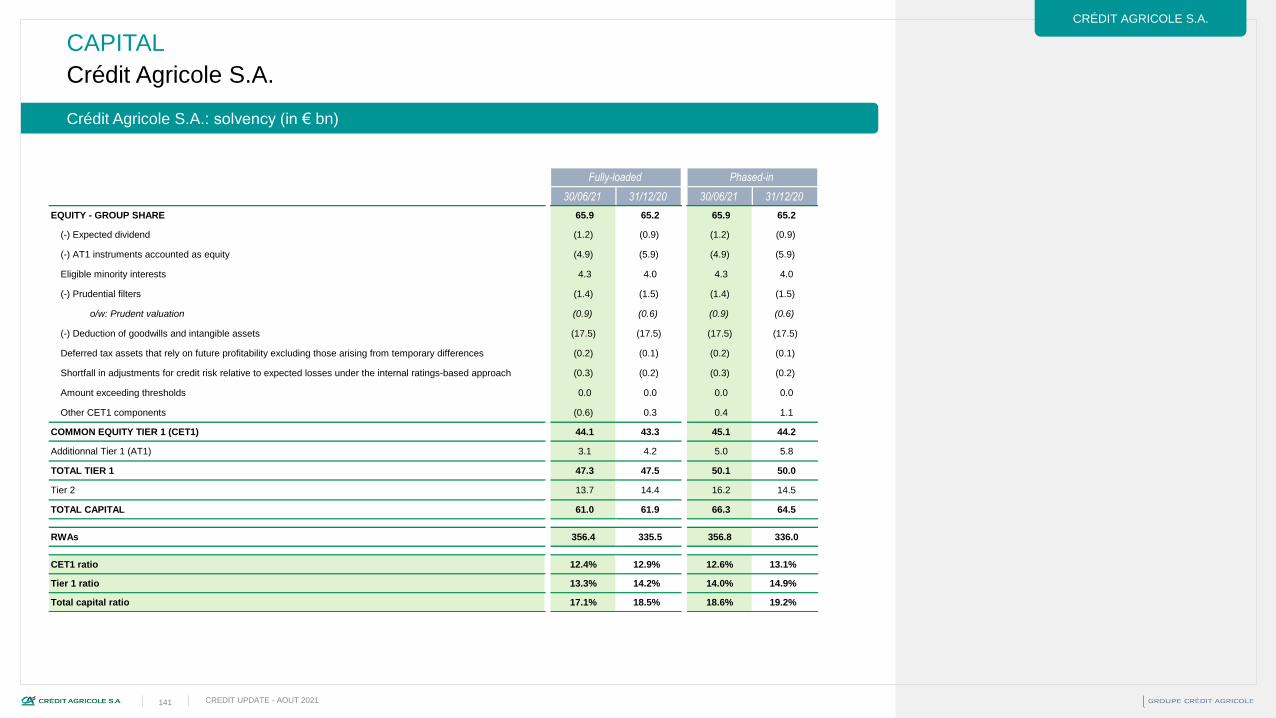
CREDIT UPDATE - AOUT 2021141
CRÉDIT AGRICOLE S.A.
Crédit Agricole S.A.
CAPITAL
Crédit Agricole S.A.: solvency (in € bn)
30/06/21 31/12/20 30/06/21 31/12/20
EQUITY - GROUP SHARE 65.9 65.2 65.9 65.2
(-) Expected dividend (1.2) (0.9) (1.2) (0.9)
(-) AT1 instruments accounted as equity (4.9) (5.9) (4.9) (5.9)
Eligible minority interests 4.3 4.0 4.3 4.0
(-) Prudential filters (1.4) (1.5) (1.4) (1.5)
o/w: Prudent valuation (0.9) (0.6) (0.9) (0.6)
(-) Deduction of goodwills and intangible assets (17.5) (17.5) (17.5) (17.5)
Deferred tax assets that rely on future profitability excluding those arising from temporary differences (0.2) (0.1) (0.2) (0.1)
Shortfall in adjustments for credit risk relative to expected losses under the internal ratings-based approach (0.3) (0.2) (0.3) (0.2)
Amount exceeding thresholds 0.0 0.0 0.0 0.0
Other CET1 components (0.6) 0.3 0.4 1.1
COMMON EQUITY TIER 1 (CET1) 44.1 43.3 45.1 44.2
Additionnal Tier 1 (AT1) 3.1 4.2 5.0 5.8
TOTAL TIER 1 47.3 47.5 50.1 50.0
Tier 2 13.7 14.4 16.2 14.5
TOTAL CAPITAL 61.0 61.9 66.3 64.5
RWAs 356.4 335.5 356.8 336.0
CET1 ratio 12.4% 12.9% 12.6% 13.1%
Tier 1 ratio 13.3% 14.2% 14.0% 14.9%
Total capital ratio 17.1% 18.5% 18.6% 19.2%
Fully-loaded Phased-in
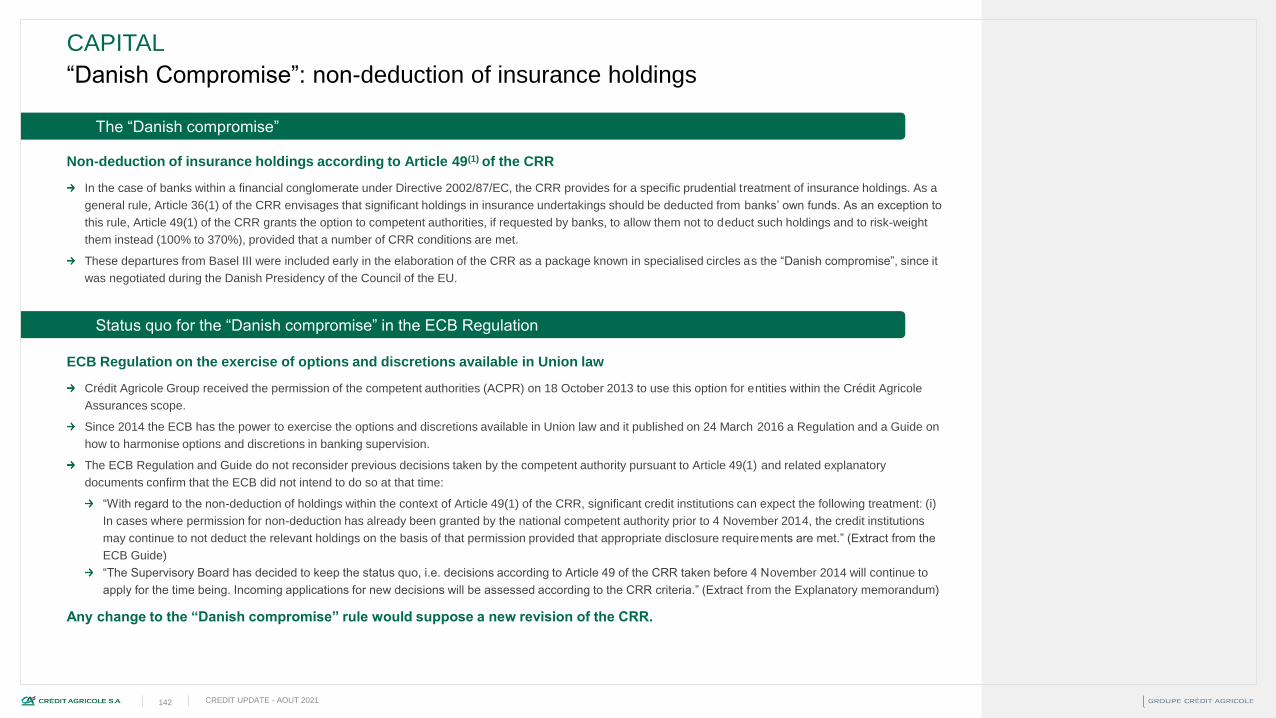
CREDIT UPDATE - AOUT 2021142
“Danish Compromise”: non-deduction of insurance holdings
CAPITAL
Non-deduction of insurance holdings according to Article 49(1) of the CRR
In the case of banks within a financial conglomerate under Directive 2002/87/EC, the CRR provides for a specific prudential treatment of insurance holdings. As a
general rule, Article 36(1) of the CRR envisages that significant holdings in insurance undertakings should be deducted from banks’ own funds. As an exception to
this rule, Article 49(1) of the CRR grants the option to competent authorities, if requested by banks, to allow them not to deduct such holdings and to risk-weight
them instead (100% to 370%), provided that a number of CRR conditions are met.
These departures from Basel III were included early in the elaboration of the CRR as a package known in specialised circles as the “Danish compromise”, since it
was negotiated during the Danish Presidency of the Council of the EU.
ECB Regulation on the exercise of options and discretions available in Union law
Crédit Agricole Group received the permission of the competent authorities (ACPR) on 18 October 2013 to use this option for entities within the Crédit Agricole
Assurances scope.
Since 2014 the ECB has the power to exercise the options and discretions available in Union law and it published on 24 March 2016 a Regulation and a Guide on
how to harmonise options and discretions in banking supervision.
The ECB Regulation and Guide do not reconsider previous decisions taken by the competent authority pursuant to Article 49(1) and related explanatory
documents confirm that the ECB did not intend to do so at that time:
“With regard to the non-deduction of holdings within the context of Article 49(1) of the CRR, significant credit institutions can expect the following treatment: (i)
In cases where permission for non-deduction has already been granted by the national competent authority prior to 4 November 2014, the credit institutions
may continue to not deduct the relevant holdings on the basis of that permission provided that appropriate disclosure requirements are met.” (Extract from the
ECB Guide)
“The Supervisory Board has decided to keep the status quo, i.e. decisions according to Article 49 of the CRR taken before 4 November 2014 will continue to
apply for the time being. Incoming applications for new decisions will be assessed according to the CRR criteria.” (Extract from the Explanatory memorandum)
Any change to the “Danish compromise” rule would suppose a new revision of the CRR.
The “Danish compromise”
Status quo for the “Danish compromise” in the ECB Regulation

CREDIT UPDATE - AOUT 2021143
Crédit Agricole S.A.Crédit Agricole Group
Capital planning targeting high solvency and TLAC ratios
CAPITAL
Fully-loaded CET1
Phased-in Tier 1
o/w Fully-loaded T1 TLAC ratio
Phased-in total ratio
o/w Fully-loaded total ratio Fully-loaded CET1
Phased-in Tier 1
o/w Fully-loaded T1
Phased-in total ratio
o/w Fully-loaded total ratio
Phased-in CET1 Phased-in CET1
16.1%17.0% 16.4% 17.0%
17.9%19.0%
19.7%20.5%
15.5% 15.8% 16.7% 16.1% 16.5% 17.3%18.7% 19.1% 20.0%
22.6%23.8% 24.8%
Mar-20 Jun-20 Sep-20 Mar-20 Jun-20 Sep-20 Mar-20 Jun-20 Sep-20 Mar-20 Jun-20 Sep-20
17.2% 17.3% 17.3%18.3% 18.3% 18.2%
21.1% 21.3% 21.1%
16.9% 17.0% 17.0% 17.7% 17.7% 17.5%20.4% 20.7% 20.0%
25.5% 25.7% 25.6%
Dec-20 Mar-21 Jun-21 Dec-20 Mar-21 Jun-21 Dec-20 Mar-21 Jun-21 Dec-20 Mar-21 Jun-21
13.1% 12.7% 12.6%
14.9% 14.5% 14.0%
19.2% 19.0% 18.6%
12.9% 12.5% 12.4%14.2% 13.7% 13.3%
18.5% 18.3% 17.1%
Dec-20 Mar-21 Jun-21 Dec-20 Mar-21 Jun-21 Dec-20 Mar-21 Jun-21

CREDIT UPDATE - AOUT 2021144
TLAC ratio disclosure
CAPITAL
Crédit Agricole Group - TLAC requirements at resolution group level
(2) TREA of the resolution group is equivalent to CAG’s Risk Weighted Assets.
(4) Total exposure measure of the resolution group is equivalent to CAG’s leverage ratio exposure (LRE).
(6b) As part of its annual resolvability assessment, Crédit Agricole Group has chosen to waive the possibility offered by Article 72b(3) of the
Capital Requirements Regulation to use senior preferred debt for compliance with its TLAC requirements in 2021.
EU KM2: Own funds and eligible liabilities, ratios and components30/06/21
in €bn
1 Own funds and eligible liabilities 148.6
2 Total risk exposure amount of the resolution group (TREA) 579.7
3 Own funds and eligible liabilities as a percentage of TREA 25.6%
4 Total exposure measure of the resolution group 1 777.7
5 Own funds and eligible liabilities as percentage of the total exposure measure 8.4%
6a Does the subordination exemption in Article 72b(4) of the CRR apply? (5% exemption) No
6bPro-memo item - Aggregate amount of permitted non-subordinated eligible liabilities instruments if the
subordination discretion as per Article 72b(3) CRR is applied (max 3.5% exemption)0
6c
Pro-memo item: If a capped subordination exemption applies under Article 72b(3) CRR, the amount of funding
issued that ranks pari passu with excluded liabilities and that is recognised under row 1, divided by funding issued
that ranks pari passu with excluded Liabilities and that would be recognised under row 1 if no cap was applied (%)
N/A

CREDIT UPDATE - AOUT 2021145
Liquidity
04

CREDIT UPDATE - AOUT 2021146
Crédit Agricole Group: construction of the banking cash balance sheet
LIQUIDITY
(1) Deferred tax, JV impacts, collective impairments, short-selling transactions and other assets and liabilities
(2) Netting of repos & reverse repos (excluding MLT repos) + Central Bank refinancing transactions (excluding T-LTRO) + netting of receivables and payables- related
accounts
(3) Including CDC centralisation and netting of derivatives, margin calls, adjustment/settlement/liaison accounts and non-liquid securities held by CA-CIB
(4) Including fixed assets, equity investments and the netting of miscellaneous debtors & creditors
(5) Including MLT repos & T-LTRO
(6) Including EIB and CDC refinancing and other similar refinancing transactions (backed by customer loans), CDC centralisation and MLT issues placed by the branch
networks.
NB: CA-CIB’s bank counterparties with which there is a commercial relationship are considered as customers
After netting, the banking cash
balance sheet amounts to
€1,587bn at 30/06/21
383 383
53137
1025984
99
348135
118
24 12
239
70
net = 99
1911 129
166
137 net = 24 113
69 69
0
500
1000
1500
2000
1 2 3Assets Liabilities
€2,300bn €2,300bn
Transition from statutory to prudential scope (exclusion of insurance
activity mainly)
Tangible & intangible assets (4)
Customer assets (excl. customer-related trading assets)
Customer-related trading assets (3)
Securities portfolio (excl. reverse repos & other ST)
Reverse repos & other ST (2)Interbank assets
Cash & Central Bank deposits (incl. mandatory reserves)
CDC centralisation Accruals, prepayments & sundry assets
Derivative instruments - assets & other necessary elements for the
activity
Reverse repos
Other netted balance sheet items (1)
Netting
Capital & similar items
Customer-related funds (6)
LT market funds (5)
ST market funds
Accruals, deferred income & sundry liabilities
Derivative instruments - liabilities & other necessary elements for the activity
Repos
Nettings

CREDIT UPDATE - AOUT 2021147
April 22th
April 7th
March 12th – 18th
Covid-19 crisis: ECB decisions to support banks (1/2)
LIQUIDITY
Steps to mitigate impact of possible rating downgrades on collateral availability :
ECB to grandfather until September 2021 eligibility of marketable assets used as collateral in
Eurosystem credit operations (example : BBB- for all assets, except asset-backed securities
(ABSs)) falling below current minimum credit quality requirements (at or above credit quality
step 5 “CQS5”, equivalent to a rating of BB))
Appropriate haircuts will apply for assets that fall below the Eurosystem minimum credit quality
requirements
Decision reinforces broader package of collateral easing measures adopted by the Governing
Council on 7 April 2020, which will also remain in place until September 2021
Unchanged rates (-0.50% / 0% / 0.25%)
Improvement of T-LTRO III financial conditions
Implementation of 3-months maturity refinancing operations « LTRO »
Temporary increase of €120bn in the QE program until end-2020, mainly on the PSPP (private
sector)
Adjustment of certains capital and liquidity buffers to support banks
Announcement on March 18 of a €750bn support program "Pandemic Emergency Purchase
Program” (PEPP): enlargement of eligible CPs and widening of the scope of ACC on
Corporates, until end-2020
Program of measures to adjust the collateral framework of the Eurosystem, by adopting a set of
measures to relax the rules for the eligibility of guarantees accepted as collateral for refinancing
operations:
Relaxation of the conditions under which private claims are accepted as collateral, increased risk
tolerance, in particular by lowering the valuation discounts on guarantees for all assets.
Some of these measures concern the permanent collateral framework (securities that can be
mobilized and debts remitted via the TRICP channel), others the only so-called "temporary"
framework (ACC).
Some of these changes are long-term, while others are only temporary and will be reported at the
end of the Covid-19 coronavirus crisis.
Source : Banque de France

CREDIT UPDATE - AOUT 2021148
December 10th
April 7th
Covid-19 crisis: ECB decisions to support banks (2/2)
LIQUIDITY
Source : Banque de France
April 30th
Review of T-LTRO financial conditions on T-LTRO III
Interest rate on T-LTRO III reduced by 25 basis points to -0.5% from June 2020 to June 2021.
For banks meeting the lending threshold of 0% introduced on 12 March 2020, the interest rate
can be as low as -1%.
Start of the lending assessment period brought forward to 1 March 2020.
Announcement of series of additional longer-term refinancing operations to ensure sufficient liquidity
and smooth money Market conditions during the pandemic period, called pandemic emergency longer-
term refinancing operations (PELTROs).
Operations allotted on a near monthly basis maturing in the third quarter of 2021.
Highly accommodative terms : interest rate of 25 basis points below the average rate applied
in the Eurosystem’s main refinancing operations (currently 0%) over the life of the respective
PELTRO.
Extension by an additional 12 months, to June 2022, of period of favourable interest rates for banks
that lend to the real economy
For the period from 24 June 2021 to 23 June 2022, interest rate on T-LTRO III remaining at -
0,50% below the average rate applied in the Eurosystem’s main refinancing operations
Over the same period, application of an additional bonus of 0,50% on the interest rate on all
TLTRO III operations outstanding, subject to a lending performance threshold (strictly positive
growth in eligible net lending between 1 October 2020 and 31 December 2021)
Three additional three-year operations in June, September and December 2021
Borrowing allowance raised to 55% of eligible loans (before at 50%)

CREDIT UPDATE - AOUT 2021149
Q2-21 & H1-21 Results
05
Crédit Agricole Group, Crédit Agricole S.A., Regional
Banks & Business lines

CREDIT UPDATE - AOUT 2021150
GROUPE CRÉDIT AGRICOLE CRÉDIT AGRICOLE S.A.
Q2-21 & H1-21 Results
Economic scenario
Source: Eurostat, Crédit Agricole S.A./ECO
France, Italy, Eurozone – GDP growth
Source: Eurostat, Crédit Agricole S.A./ECO
France, Italy, Eurozone – Unemployment rate
For provisioning of performing loans, use of several weighted
economic scenarios:
A more favourable scenario: French GDP +5.9% in 2021, +5.3% in 2022
A less favourable scenario: French GDP +2.7% in 2021, +3.3% in 2022
In France, forecasts by institutions:
IMF (April 2021): +5.8% in 2021 and +4.2% in 2022
OECD (May 2021): +5.8% in 2021 and +4.0% in 2022
Banque de France (June 2021): +5.75% in 2021 and +4.0% in 2022
Source: Eurostat, Crédit Agricole SA / ECO. Estimates at 30 June 2021
The first scenario, the so-called central scenario, has been weighted at 60% for the calculation of Q2 2021 IFRS ECLs.
For example, a decrease in the weighting of the first scenario by 10 points in the calculations in Q2 2021 in favour of the
second, more unfavourable scenario, would result in an increase in ECL inventory under the central forward looking
scenario of around 0.5% for Crédit Agricole S.A. However, such a change in the weight would not necessarily have a
significant impact due to “forward looking local” adjustments that could mitigate the effect.
1,8
-8,0
5,8
4,3
0,3
-8,9
4,54,1
1,3
-6,7
4,8 4,5
2019 2020 2021 2022
France Italie Zone euro
%
7
9
11
13
2019 2020 2021 2022
France Italie Zone euro
% de la population active
Unemployment rate in France
9.0% (avg. Q2-21); 9.1% (avg. 2021) and
8.8% (avg. 2022)
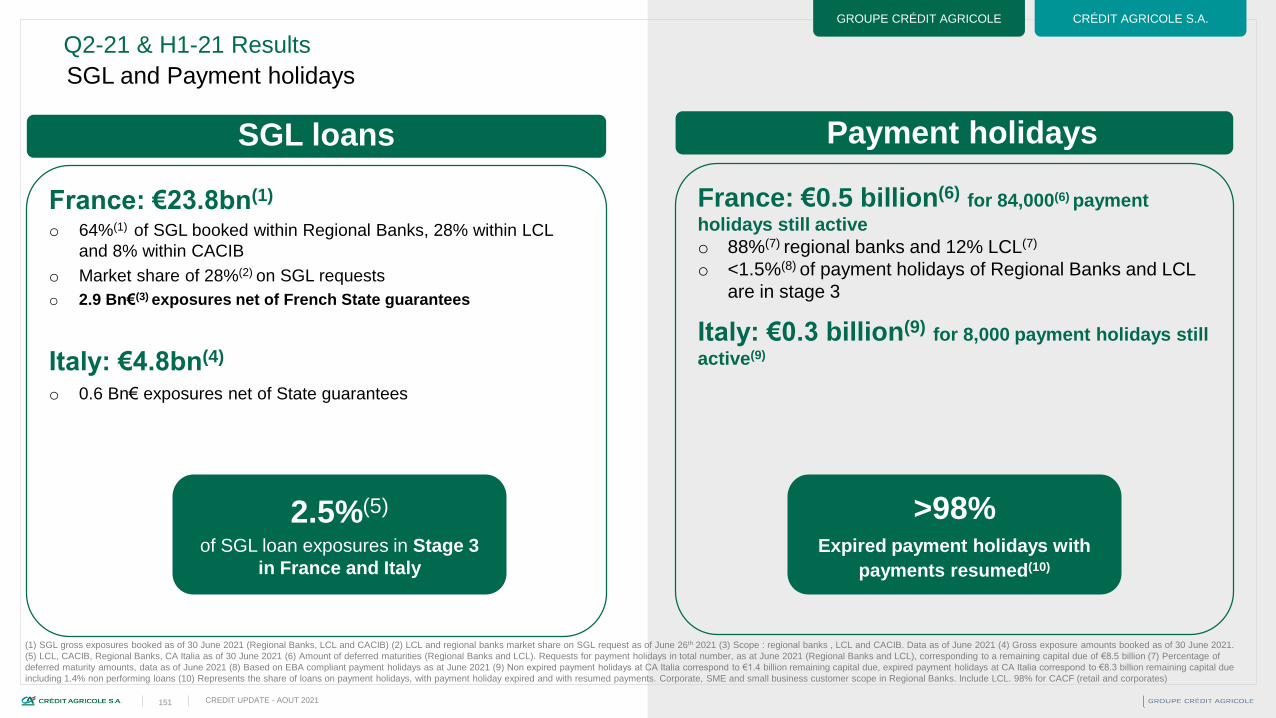
CREDIT UPDATE - AOUT 2021151
GROUPE CRÉDIT AGRICOLE CRÉDIT AGRICOLE S.A.
Q2-21 & H1-21 Results
SGL and Payment holidays
SGL loans Payment holidays
France: €23.8bn(1)
o 64%(1) of SGL booked within Regional Banks, 28% within LCL
and 8% within CACIB
o Market share of 28%(2) on SGL requests
o 2.9 Bn€(3) exposures net of French State guarantees
Italy: €4.8bn(4)
o 0.6 Bn€ exposures net of State guarantees
France: €0.5 billion(6) for 84,000(6) payment
holidays still active
o 88%(7) regional banks and 12% LCL(7)
o <1.5%(8) of payment holidays of Regional Banks and LCL
are in stage 3
Italy: €0.3 billion(9) for 8,000 payment holidays still
active(9)
>98% Expired payment holidays with
payments resumed(10)
2.5%(5)
of SGL loan exposures in Stage 3
in France and Italy
(1) SGL gross exposures booked as of 30 June 2021 (Regional Banks, LCL and CACIB) (2) LCL and regional banks market share on SGL request as of June 26th 2021 (3) Scope : regional banks , LCL and CACIB. Data as of June 2021 (4) Gross exposure amounts booked as of 30 June 2021.
(5) LCL, CACIB, Regional Banks, CA Italia as of 30 June 2021 (6) Amount of deferred maturities (Regional Banks and LCL). Requests for payment holidays in total number, as at June 2021 (Regional Banks and LCL), corresponding to a remaining capital due of €8.5 billion (7) Percentage of
deferred maturity amounts, data as of June 2021 (8) Based on EBA compliant payment holidays as at June 2021 (9) Non expired payment holidays at CA Italia correspond to €1.4 billion remaining capital due, expired payment holidays at CA Italia correspond to €8.3 billion remaining capital due
including 1.4% non performing loans (10) Represents the share of loans on payment holidays, with payment holiday expired and with resumed payments. Corporate, SME and small business customer scope in Regional Banks. Include LCL. 98% for CACF (retail and corporates)
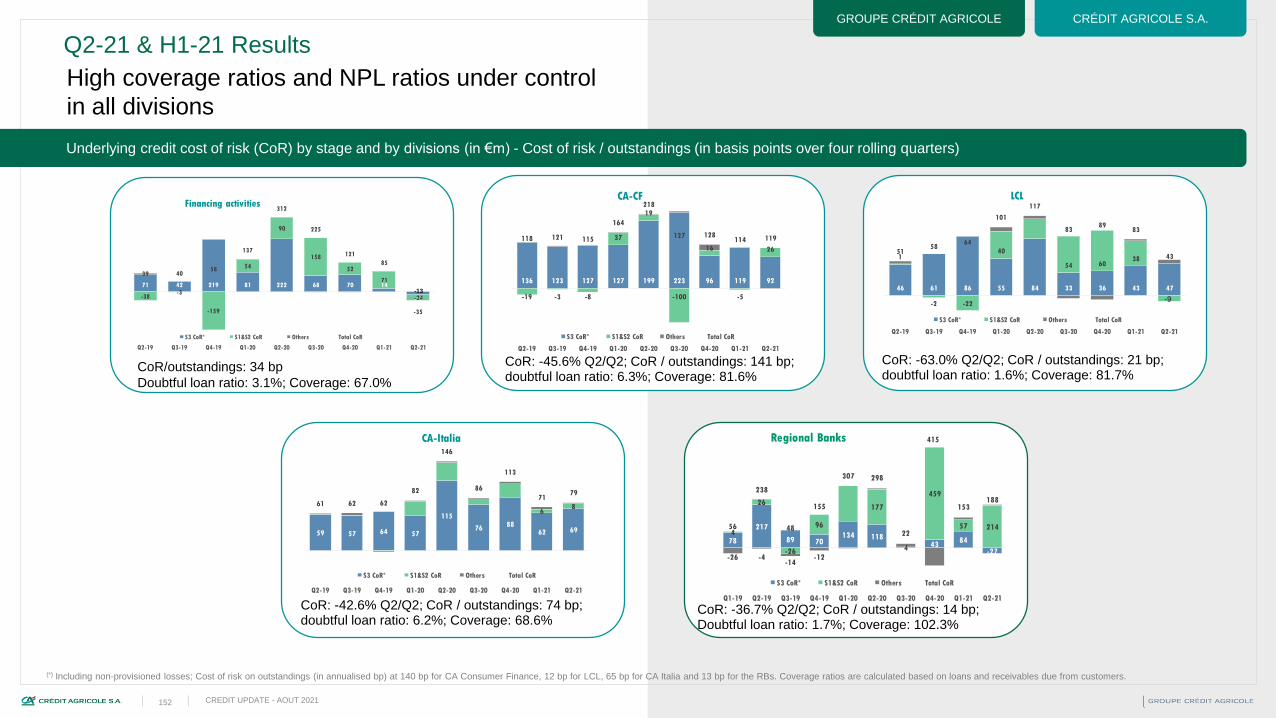
CREDIT UPDATE - AOUT 2021152
GROUPE CRÉDIT AGRICOLE CRÉDIT AGRICOLE S.A.
Q2-21 & H1-21 Results
Underlying credit cost of risk (CoR) by stage and by divisions (in €m) - Cost of risk / outstandings (in basis points over four rolling quarters)
High coverage ratios and NPL ratios under control
in all divisions
CoR: -45.6% Q2/Q2; CoR / outstandings: 141 bp;doubtful loan ratio: 6.3%; Coverage: 81.6%
CoR/outstandings: 34 bp
Doubtful loan ratio: 3.1%; Coverage: 67.0%
CoR: -36.7% Q2/Q2; CoR / outstandings: 14 bp;Doubtful loan ratio: 1.7%; Coverage: 102.3%
CoR: -63.0% Q2/Q2; CoR / outstandings: 21 bp;doubtful loan ratio: 1.6%; Coverage: 81.7%
CoR: -42.6% Q2/Q2; CoR / outstandings: 74 bp;doubtful loan ratio: 6.2%; Coverage: 68.6%
136 123 127 127 199 223 96 119 92
-19 -3 -8
37
19
-100
16
-5
26
118 121 115
164
218
127 128114 119
Q2-19 Q3-19 Q4-19 Q1-20 Q2-20 Q3-20 Q4-20 Q1-21 Q2-21
CA-CF
S3 CoR* S1&S2 CoR Others Total CoR
46 61 86 55 84 33 36 43 47
1
-2 -22
40
54 6038
5158
64
101
117
8389
83
43
Q2-19 Q3-19 Q4-19 Q1-20 Q2-20 Q3-20 Q4-20 Q1-21 Q2-21
LCL
S3 CoR* S1&S2 CoR Others Total CoR
59 57 64 57
115
7688
62 69
6861 62 62
82
146
86
113
7179
Q2-19 Q3-19 Q4-19 Q1-20 Q2-20 Q3-20 Q4-20 Q1-21 Q2-21
CA-Italia
S3 CoR* S1&S2 CoR Others Total CoR
71 42 219 81 222 68 70 14
-13-38-3
-159
54
90
158
52
71
-24
39 4058
137
312
225
121
85
-35
Q2-19 Q3-19 Q4-19 Q1-20 Q2-20 Q3-20 Q4-20 Q1-21 Q2-21
Financing activities
S3 CoR* S1&S2 CoR Others Total CoR
-13
78
217
89 70134 118
243
84
-27
4
26
-26
96
177
4
459
57 214
-26 -4-14
-12
56
238
48
155
307 298
22
415
153188
Q1-19 Q2-19 Q3-19 Q4-19 Q1-20 Q2-20 Q3-20 Q4-20 Q1-21 Q2-21
Regional Banks
S3 CoR* S1&S2 CoR Others Total CoR
-9
(*) Including non-provisioned losses; Cost of risk on outstandings (in annualised bp) at 140 bp for CA Consumer Finance, 12 bp for LCL, 65 bp for CA Italia and 13 bp for the RBs. Coverage ratios are calculated based on loans and receivables due from customers.
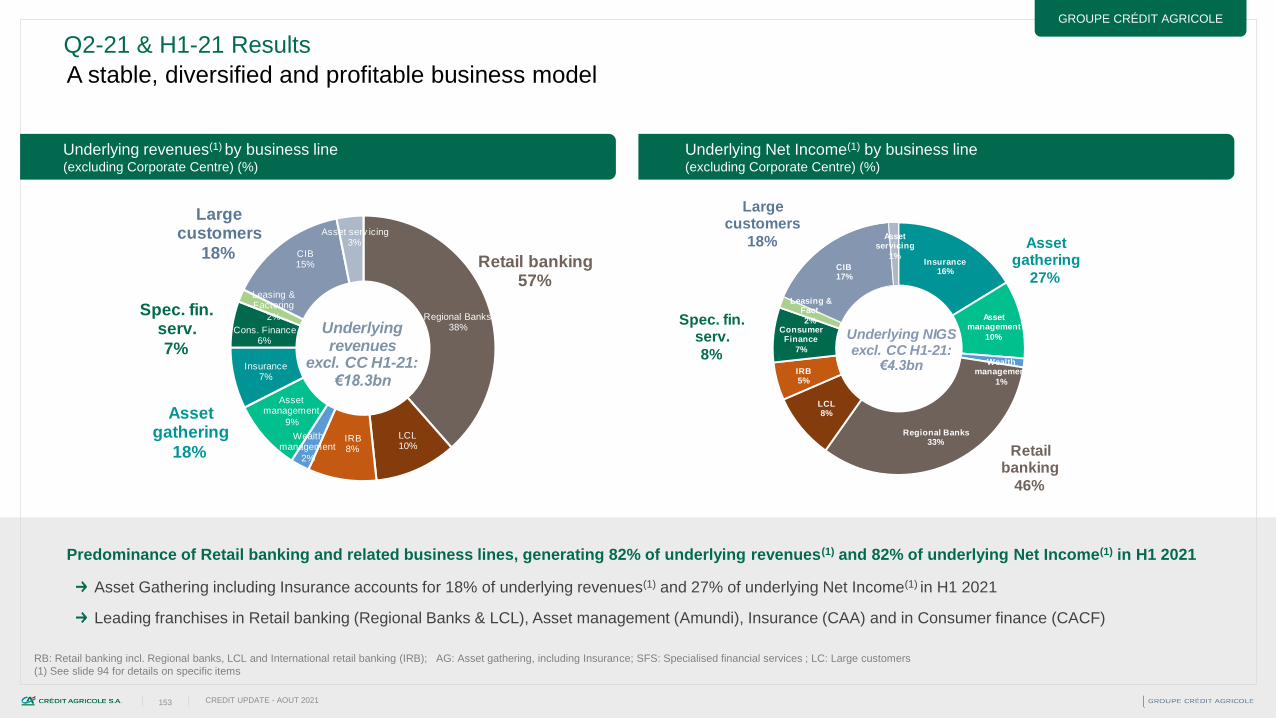
CREDIT UPDATE - AOUT 2021153
GROUPE CRÉDIT AGRICOLE
Insurance16%
Asset management
10%
Wealth management
1%
Regional Banks33%
LCL8%
IRB5%
Consumer Finance
7%
Leasing & Fact.
2%
CIB17%
Asset servicing
1%
Retail banking
46%
Asset gathering
27%
Spec. fin. serv.
8%
Underlying NIGS excl. CC H1-21:
€4.3bn
Large customers
18%
Underlying Net Income(1) by business line(excluding Corporate Centre) (%)
Predominance of Retail banking and related business lines, generating 82% of underlying revenues(1) and 82% of underlying Net Income(1) in H1 2021
A stable, diversified and profitable business model
Asset Gathering including Insurance accounts for 18% of underlying revenues(1) and 27% of underlying Net Income(1) in H1 2021
Leading franchises in Retail banking (Regional Banks & LCL), Asset management (Amundi), Insurance (CAA) and in Consumer finance (CACF)
Underlying revenues(1) by business line(excluding Corporate Centre) (%)
RB: Retail banking incl. Regional banks, LCL and International retail banking (IRB); AG: Asset gathering, including Insurance; SFS: Specialised financial services ; LC: Large customers
(1) See slide 94 for details on specific items
Regional Banks38%
LCL10%
IRB8%
Wealth management
2%
Asset management
9%
Insurance7%
Cons. Finance6%
Leasing & Factoring
2%
CIB15%
Asset serv icing3%
Underlying revenues
excl. CC H1-21: €18.3bn
Retail banking 57%
Asset gathering
18%
Spec. fin. serv.
7%
Large customers
18%
Q2-21 & H1-21 Results

CREDIT UPDATE - AOUT 2021154
CRÉDIT AGRICOLE GROUP
€mQ2-21
statedSpecific items
Q2-21
underlying
Q2-20
statedSpecific items
Q2-20
underlying
∆ Q2/Q2
stated
∆ Q2/Q2
underlying
Revenues 9,304 9 9,295 8,096 (441) 8,536 +14.9% +8.9%
Operating expenses excl.SRF (5,536) (32) (5,504) (5,036) (5) (5,031) +9.9% +9.4%
SRF (12) - (12) (107) - (107) (89.0%) (89.0%)
Gross operating income 3,756 (23) 3,779 2,953 (445) 3,398 +27.2% +11.2%
Cost of risk (470) (25) (445) (1,208) - (1,208) (61.1%) (63.1%)
Equity-accounted entities 98 5 93 78 - 78 +26.7% +20.2%
Net income on other assets (35) (16) (19) 78 - 78 n.m. n.m.
Change in value of goodwill 379 378 2 (3) - (3) n.m. n.m.
Income before tax 3,728 318 3,409 1,898 (445) 2,343 +96.4% +45.5%
Tax (681) 164 (844) (308) 142 (450) x 2.2 +87.8%
Net income from discont'd or held-for-sale ope. 11 10 1 (0) - (0) n.m. n.m.
Net income 3,058 492 2,566 1,590 (303) 1,893 +92.3% +35.5%
Non controlling interests (287) (89) (199) (107) 1 (108) x 2.7 +83.4%
Net income Group Share 2,770 403 2,367 1,483 (302) 1,785 +86.8% +32.6%
Cost/Income ratio excl.SRF (%) 59.5% 59.2% 62.2% 58.9% -2.7 pp +0.3 pp
Net income Group Share excl. SRF 2,779 218 2,560 1,580 (302) 1,882 +75.9% +36.1%
Reconciliation between stated and underlying income – Q2-21
€2,367mUnderlying net income in Q2-21
Q2-21 & H1-21 Results

CREDIT UPDATE - AOUT 2021155
GROUPE CRÉDIT AGRICOLE
€mH1-21
statedSpecific items
H1-21
underlying
H1-20
statedSpecific items
H1-20
underlying
∆ H1/H1
stated
∆ H1/H1
underlying
Revenues 18,353 (25) 18,378 16,462 (452) 16,914 +11.5% +8.7%
Operating expenses excl.SRF (11,041) (36) (11,005) (10,584) (75) (10,509) +4.3% +4.7%
SRF (479) 185 (664) (562) - (562) (14.7%) +18.2%
Gross operating income 6,834 125 6,709 5,316 (527) 5,843 +28.5% +14.8%
Cost of risk (1,007) (25) (982) (2,137) - (2,137) (52.9%) (54.1%)
Equity-accounted entities 192 5 187 168 - 168 +14.3% +11.3%
Net income on other assets (23) (16) (7) 84 - 84 n.m. n.m.
Change in value of goodwill 379 378 2 (3) - (3) n.m. n.m.
Income before tax 6,376 466 5,909 3,428 (527) 3,955 +86.0% +49.4%
Tax (1,401) 174 (1,576) (789) 148 (937) +77.7% +68.1%
Net income from discont'd or held-for-sale ope. 5 5 0 (1) - (1) n.m. n.m.
Net income 4,979 645 4,334 2,638 (379) 3,017 +88.7% +43.6%
Non controlling interests (455) (88) (367) (248) 3 (251) +83.8% +46.5%
Net income Group Share 4,524 557 3,967 2,391 (376) 2,767 +89.2% +43.4%
Cost/Income ratio excl.SRF (%) 60.2% 59.9% 64.3% 62.1% -4.1 pp -2.3 pp
Net income Group Share excl. SRF 4,948 557 4,391 2,913 (376) 3,289 +69.8% +33.5%
Reconciliation between stated and underlying income – H1-21
€3,967mUnderlying net income in H1-21
Q2-21 & H1-21 Results

CREDIT UPDATE - AOUT 2021156
GROUPE CRÉDIT AGRICOLE
Alternative performance measures – specific items
€403mNet impact of specific items
on Q2-21 net income
CRÉDIT AGRICOLE GROUP
Q2-21 & H1-21 Results
€557mNet impact of specific items
on H1-21 net income
Q2-21 Q2-20 H1-21 H1-20
€mGross
impact*
Impact on
Net income
Gross
impact*
Impact on
Net income
Gross
impact*
Impact on
Net income
Gross
impact*
Impact on
Net income
DVA (LC) (7.482) (6) (7) (5) 1 1 (26) (19)
Loan portfolio hedges (LC) (8.396) (6) (75) (51) (16) (11) 48 32
Home Purchase Savings Plans (LCL) 2.147 2 (4) (3) (10) (7) (15) (10)
Home Purchase Savings Plans (CC) 4.447 3 (16) (11) 0 0 (46) (31)
Home Purchase Savings Plans (RB) 18.700 13 (58) (40) 1 0 (133) (90)
Liability management upfront payment (CC) - - (41) (28) - - (41) (28)
Support to insured clients Covid-19 (AG) - - (2) (1) - - (2) (1)
Support to insured clients Covid-19 (AG) - - (143) (97) - - (143) (97)
Support to insured clients Covid-19 (RB) - - (94) (64) - - (94) (64)
Ongoing sale project NBI (WM) (1) (1) - - (1) (1) - -
Total impact on revenues 9 6 (441) (300) (25) (18) (452) (309)
Covid-19 donation (AG) - - - - - - (38) (38)
Covid-19 donation (IRB) - - - - - - (8) (4)
Covid-19 donation (CC) - - - - - - (10) (10)
Covid-19 donation (RB) - - - - - - (10) (10)
S3 / Kas Bank integration costs (LC) - - (5) (2) (4) (2) (9) (4)
Transformation costs (LC) (16) (8) - - (16) (8) - -
Transformation costs (FRB) (13) (9) - - (13) (9) - -
Ongoing sale project Expenses (WM) (2) (2) - - (2) (2) - -
Total impact on operating expenses (32) (19) (5) (2) (36) (21) (75) (67)
Restatement SRF 2016-2020 (CR) - - - - 55 55 - -
Restatement SRF 2016-2020 (CC) - - - - 130 130 - -
Total impact on SRF - - - - 185 185 - -
Triggering of the Switch2 (AG) - - 65 44 - - 65 44
Triggering of the Switch2 (RB) - - (65) (44) - - (65) (44)
Creval - Cost of Risk stage 1 (IRB) (25) (21) - - (25) (21) - -
Total impact on cost of credit risk (25) (21) - - (25) (21) - -
Badwill Creval (IRB) 378 321 - - 378 321 - -
Total impact on change of value of goodwill 378 321 - - 378 321 - -
"Affrancamento" gain (IRB) 38 32 - - 38 32 - -
"Affrancamento" gain (AG) 114 80 - - 114 80 - -
Total impact on tax 152 111 - - 152 111 - -
"Affrancamento" gain (SFS) 5 5 - - 5 5 - -
Total impact equity-accounted entities 5 5 - - 5 5 - -
Creval acquisition costs (IRB) (16) (9) - - (16) (9) - -
Total impact on Net income on other assets (16) (9) - - (16) (9) - -
Ongoing sale project (WM) 10 10 - - 5 5 - -
Total impact on Net income from discounted or held-for-sale operations10 10 - - 5 5 - -
Total impact of specific items 481 403 (445) (302) 623 557 (527) (376)
Asset gathering 121 87 (77) (53) 116 82 (116) (91)
French Retail banking 8 5 (224) (152) 32 39 (320) (221)
International Retail banking 375 322 - 375 322 (8) (4)
Specialised financial services 5 5 - - 5 5 - -
Large customers (32) (20) (86) (58) (35) (21) 13 9
Corporate centre 4 3 (58) (39) 130 130 (97) (69)

CREDIT UPDATE - AOUT 2021157
CRÉDIT AGRICOLE S.A.
€mQ2-21
stated
Specific
items
Q2-21
underlying
Q2-20
stated
Specific
items
Q2-20
underlying
∆ Q2/Q2
stated
∆ Q2/Q2
underlying
Revenues 5,819 (10) 5,829 4,897 (288) 5,185 +18.8% +12.4%
Operating expenses excl.SRF (3,253) (32) (3,221) (2,980) (5) (2,976) +9.2% +8.3%
SRF (11) - (11) (79) - (79) (85.6%) (85.6%)
Gross operating income 2,554 (42) 2,596 1,838 (293) 2,130 +39.0% +21.9%
Cost of risk (279) (25) (254) (842) 65 (908) (66.8%) (72.0%)
Equity-accounted entities 101 5 96 88 - 88 +14.8% +9.2%
Net income on other assets (37) (16) (21) 82 - 82 n.m. n.m.
Change in value of goodwill 378 378 - - - - n.m. n.m.
Income before tax 2,717 300 2,417 1,166 (227) 1,393 x 2.3 +73.5%
Tax (397) 169 (566) (86) 72 (158) x 4.6 x 3.6
Net income from discont'd or held-for-sale ope. 11 10 1 (0) - (0) n.m. n.m.
Net income 2,331 478 1,852 1,080 (155) 1,235 x 2.2 +50.0%
Non controlling interests (363) (126) (237) (126) 2 (129) x 2.9 +84.4%
Net income Group Share 1,968 353 1,615 954 (153) 1,107 x 2.1 +46.0%
Earnings per share (€) 0.60 0.12 0.48 0.31 (0.05) 0.36 +97.1% +34.6%
Cost/Income ratio excl. SRF (%) 55.9% 55.3% 60.9% 57.4% -5.0 pp -2.1 pp
Net income Group Share excl. SRF 1,976 223 1,753 1,020 (153) 1,173 +93.7% +49.5%
Reconciliation between stated and underlying income – Q2-21
Q2-21 & H1-21 Results
€1,615mUnderlying net income in Q2-21
€0.48Underlying earnings per share in Q2-21

CREDIT UPDATE - AOUT 2021158
CRÉDIT AGRICOLE S.A.
€mH1-21
stated
Specific
items
H1-21
underlying
H1-20
stated
Specific
items
H1-20
underlying
∆ H1/H1
stated
∆ H1/H1
underlying
Revenues 11,312 (25) 11,337 10,097 (225) 10,322 +12.0% +9.8%
Operating expenses excl.SRF (6,450) (36) (6,414) (6,235) (65) (6,170) +3.4% +4.0%
SRF (392) 130 (522) (439) - (439) (10.7%) +18.9%
Gross operating income 4,470 69 4,401 3,423 (290) 3,713 +30.6% +18.5%
Cost of risk (663) (25) (638) (1,463) 65 (1,529) (54.7%) (58.2%)
Equity-accounted entities 188 5 183 178 - 178 +5.6% +2.8%
Net income on other assets (34) (16) (18) 87 - 87 n.m. n.m.
Change in value of goodwill 378 378 - - - - n.m. n.m.
Income before tax 4,339 411 3,928 2,226 (224) 2,450 +94.9% +60.3%
Tax (775) 174 (949) (347) 55 (401) x 2.2 x 2.4
Net income from discont'd or held-for-sale ope. 5 5 0 (1) - (1) n.m. n.m.
Net income 3,569 590 2,979 1,879 (170) 2,048 +90.0% +45.4%
Non controlling interests (555) (124) (431) (287) 3 (290) +93.4% +48.5%
Net income Group Share 3,014 466 2,548 1,592 (167) 1,758 +89.3% +44.9%
Earnings per share (€) 0.96 0.16 0.80 0.47 (0.06) 0.53 x 2 +50.8%
Cost/Income ratio excl.SRF (%) 57.0% 56.6% 61.7% 59.8% -4.7 pp -3.2 pp
Net income Group Share excl. SRF 3,351 466 2,885 1,984 (167) 2,151 +68.9% +34.1%
Reconciliation between stated and underlying income – H1-21
Q2-21 & H1-21 Results
€2,548mUnderlying net income in H1-21
€0.80Underlying earnings per share in H1-21

CREDIT UPDATE - AOUT 2021159
CRÉDIT AGRICOLE S.A.
Alternative performance measures – specific items
€353mNet impact of specific items on
Q2-21 net income
Q2-21 & H1-21 Results
€466mNet impact of specific items on
H1-21 net income
€m Gross
impact*
Impact on
Net income
Gross
impact*
Impact on
Net income
Gross
impact*
Impact on
Net income
Gross
impact*
Impact on
Net income
DVA (LC) (7) (5) (7) (5) 1 1 (26) (19)
Loan portfolio hedges (LC) (8) (6) (75) (50) (16) (11) 48 32
Home Purchase Savings Plans (FRB) 2 1 (4) (2) (10) (7) (15) (10)
Home Purchase Savings Plans (CC) 4 3 (16) (11) 0 0 (46) (31)
Liability management upfront payment (CC) - - (41) (28) - - (41) (28)
Support to insured clients Covid-19 (LCL) - - (2) (1) - - (2) (1)
Support to insured clients Covid-19 (AG) - - (143) (97) - - (143) (97)
Ongoing sale project NBI (WM) (1) (1) - - (1) (1) - -
Total impact on revenues (10) (7) (288) (195) (25) (18) (225) (154)
Covid-19 donation (AG) - - - - - - (38) (38)
Covid-19 donation (IRB) - - - - - - (8) (4)
Covid-19 donation (CC) - - - - - - (10) (10)
S3 / Kas Bank integration costs (LC) - - (5) (2) (4) (2) (9) (4)
Transformation costs (LC) (16) (8) - - (16) (8) - -
Transformation costs (FRB) (13) (9) - - (13) (9) - -
Ongoing sale project Expenses (WM) (2) (2) - - (2) (2) - -
Total impact on operating expenses (32) (19) (5) (2) (36) (21) (65) (57)
Restatement SRF2016-2020 - - - - 130 130 - -
Total impact on SRF - - - - 130 130 - -
Triggering of the Switch2 (AG) - - 65 44 - - 65 44
Creval - Cost of Risk stage 1 (IRB) (25) (19) - - (25) (19) - -
Total impact on cost of credit risk (25) (19) 65 44 (25) (19) 65 44"Affrancamento" gain (SFS) 5 5 - - 5 5 - -
Total impact equity-accounted entities 5 5 - - 5 5 - -
Creval acquisition costs (IRB) (16) (8) - - (16) (8) - -
Total impact Net income on other assets (16) (8) - - (16) (8) - -
Badwill Creval (IRB) 378 285 - - 378 285 - -
Total impact on change of value of goodwill 378 285 - - 378 285 - -
"Affrancamento" gain (IRB) 38 28 - - 38 28 - -
"Affrancamento" gain (AG) 114 78 - - 114 78 - -
Total impact on tax 152 106 - - 152 106 - -
Ongoing sale project (WM) 10 10 - - 5 5 - -
Total impact on Net income from discounted or held-
for-sale operations10 10 - - 5 5 - -
Total impact of specific items 462 353 (227) (153) 568 466 (224) (167)
Asset gathering 121 85 (77) (53) 116 80 (116) (91)
French Retail banking (11) (8) (6) (4) (23) (16) (17) (11)
International Retail banking 375 287 - 375 287 (8) (4)
Specialised financial services 5 5 - - 5 5 - -
Large customers (32) (20) (86) (57) (35) (21) 13 9
Corporate centre 4 3 (58) (39) 130 130 (97) (69)
* Impact before tax and before minority interests
Q2-21 Q2-20 H1-21 H1-20

CREDIT UPDATE - AOUT 2021160
GROUPE CRÉDIT AGRICOLE
Q2-21 & H1-21 Results
Contribution to earnings
(in €m)
Q2-21
underlying
∆ Q2/Q2
underlying
H1-21
underlying
∆ H1/H1
underlying
Revenues 3,453 +4.1% 7,007 +7.0%
Operating expenses excl.SRF (2,236) +10.5% (4,503) +5.3%
SRF (1) (98.2%) (142) +15.6%
Gross operating income 1,217 (3.8%) 2,363 +9.8%
Cost of risk (186) (37.5%) (339) (43.9%)
Income before tax 1,023 +6.6% 2,026 +31.3%
Tax (281) (4.8%) (629) +12.8%
Net income Group Share 741 +11.7% 1,396 +41.8%
Cost/Income ratio excl.SRF (%) 64.8% +3.7 pp 64.3% -1.0 pp
Activity indicators (€bn)
Regional Banks: Sustained commercial momentum and strong growthin income
Customer assets
446 496 527 535
266265
278 281
712761
805
Jun. 19 Jun. 20 Mar. 21 Jun. 21
Off-balance sheet
Deposits
+7,3%
306 328 345 352
21 21 21 22174
195 204 205
501543 571 579
Jun. 19 Jun. 20 Mar. 21 Jun. 21
SMEs-Small
business.-Farm.-
Local auth.Consumer credit
Home loans
+6,6%
816
Loans outstanding
Continued growth in outstanding loans and customer assets, dynamic customer capture
Loans outstanding: increase of +6.6% (June/June, of which +7.4% on home loans and +5.5% on specialised markets(1); loan
production higher than the pre-crisis level (+17.8% vs. Q2-19, of which +22% on home loans vs. Q2-19 and +6% on consumer
credit vs.Q2-19)
Customer savings: +7.3% yoy, progressive return to the pre-crisis balance sheet collection pace; increase in off-balance sheet
deposits +6.1% June/June; gross life insurance production almost 2x higher than Q2-20, which was marked by restrictions.
Customer capture: +647,000 new customers in H1, relational intensity still increasing (59.6% of customers equipped with four to
five “demand areas” (2) +0.6 pp vs. June-20); cards inventory up +2.6% yoy; mobile application usage rate(3): 68.6% (+3.2 pp vs.
June-20 et +7.5 pp vs. June-19)
Strong increase in net income Group share due to high revenues and lower cost of riskRevenues: increase driven in particular by the rise in NII, supported by favourable refinancing conditions, and by fees and
commissions income, particularly in insurance and account management/payment instruments. Costs: increase due to employee
profit-sharing and incentive plans
Cost of risk: down -37.5% Q2/Q2, 14 bp(4) on outstandings, NPL ratio: 1.7% (stable vs. March-21), coverage ratio very high
(102.3%, +1.1 pp vs. March-21)
(1) Specialised markets: farmers, professionals, corporates and public
authorities; (2) demand areas: deposit account, savings, credit, insurance
and cards; (3) Number of customers with an active profile on the Ma Banque
app or who had visited CAEL (CA online) during the month / number of
adult customers having an active demand deposit account (4) over four
rolling quarters and 13 bp on an annualised quarterly basis

CREDIT UPDATE - AOUT 2021161
CRÉDIT AGRICOLE S.A.
Q2-21 & H1-21 ResultsDevelopment in Italy, the Group’s second domestic market
Distribution of the Group’s net income in Italy
CREVAL
35%
36%
19%
10%
Retail banking
Specialised financial services
Asset gathering
Large customers
Total net income:
€385m
+49%Change in net income H1/H1
€385mUnderlying net income in
H1-21
15%
Underlying net income
of Crédit Agricole S.A.
1st consolidation of Credito Valtellinese
Contribution of two months of results in Q2-21 for €7 million
Revenues: €98 million; expenses excl. SRF €65 million; cost of risk €19 million
Recording of a net badwill of +€378 million at 100%, restated in specific items
gross badwill of +€925 million this quarter
deduction of a first estimate of provisions, before finalisation of the PPA(2) expected
before Dec. 2021, including revaluations of loan portfolios risks, of -€547 million(3)
(prudential recognition of badwill in Q4-21)
Net badwill impact +€378 million at 100% and net income Group share impact of
+285 million(4)
Group Risk Profile Group in Italy(1)
Good performance of all the Group’s business lines
Excellent level of deposits at Amundi in H1-21 at €5.4Bn
Very strong activity in syndicated loans (2nd bookrunner per deal value) and bond
issues all segments confounded; confirmed leadership in ESG
Excellent business mix in insurance products, with a mainly in UL (62% of the H1-21
net inflows)
Resumption of consumer credit after the slowdown due to the pandemic at more than
35%
Significant reduction in the cost of risk in H1 2021 (-53% H1/H1) at -€205.5m
5.2 5.0 5.1
3.7 3.6 3.6 3.5 3.5 3.5 3.5 3.5 3.0 3.0
3.9
1.2 0.9 0.9
1.0 0.9 0.9 0.9 0.9 0.9 0.8 1.0 1.0 0.9
0.8
0.1 0.2 0.2
0.1 0.2 0.2 0.2 0.2 0.2 0.2 0.2
0.2
0.7 0.7 0.4
0.4 0.3 0.4 0.4 0.3 0.3 0.3 0.3
0.3 0.3
0.3
7.26.8
6.6
5.2 5.1 5.0 4.9 4.9 4.9 4.75.0
4.5 4.3
5.2
51.0% 52.0%
55.4%
70.2%69.6%
66.0%
71.1%68.8% 69.3%
71.8%67.8% 67.0% 67.7% 68.7%
2015 2016 2017 2018 2019-03 2019-06 2019-09 2019-12 2020-03 2020-06 2020-09 2020-12 2021-03 2021-06
CACIB
FCA Bank (@50%)
Agos
BPI Italie
Group in Italy - Gross
NPL (€bn) and coverage
ratio
(1) Including CREVAL scope effect in Q2-21, NPL stable without this effect (2) Purchase Price Allocation; (3) Of which approximately €330 million related to the revaluation of loan portfolios, approximately €60 million related to litigation and disputes, approximately €50 million related to
refinancing costs, and approximately €100 million related to the revaluation of property and securities portfolios, excluding DTA. In addition to this €378 million, another €25 million were set aside for performing loans provisions and 16 m€ for acquisition costs; (4) Positive prudential impact on
Crédit Agricole S.A. CET1 of this badwill before finalisation of the PPA by end of Dec. 2021. Negative impact related to the consolidation of 8.1 billion Creval RWA recorded in Q2-21

CREDIT UPDATE - AOUT 2021162
GROUPE CRÉDIT AGRICOLE
Crédit Agricole Group: results by business line
Q2-21 (stated) Q2-20 (stated)
€m RB LCL IRB AG SFS LC CC Total
Revenues 3,472 929 818 1,765 658 1,561 100 9,304
Operating expenses excl. SRF (2,236) (569) (495) (751) (327) (917) (241) (5,536)
SRF (1) (0) (12) 0 1 (0) 0 (12)
Gross operating income 1,235 360 311 1,014 332 644 (140) 3,756
Cost of risk (186) (43) (123) (18) (134) 41 (6) (470)
Equity-accounted entities (12) - 0 21 87 2 - 98
Net income on other assets 2 1 (16) (1) 12 (37) 3 (35)
Change in value of goodwill 2 - 378 - - - - 379
Income before tax 1,041 318 550 1,015 298 649 (143) 3,728
Tax (287) (86) (21) (121) (59) (154) 47 (681)
Net income from discont'd or held-for-
sale ope.- - 0 10 1 - - 11
Net income 755 232 529 904 239 496 (96) 3,058
Non controlling interests (0) (0) (88) (157) (28) (13) (1) (287)
Net income Group Share 754 232 441 747 211 483 (97) 2,770
Q2-20 (stated)
€m RB LCL AG IRB SFS LC CC Total
Revenues 3,163 851 1,360 664 607 1,706 (256) 8,096
Operating expenses excl. SRF (2,023) (544) (666) (439) (309) (857) (199) (5,036)
SRF (29) (7) 1 (9) (0) (60) (2) (107)
Gross operating income 1,112 301 696 216 298 789 (458) 2,953
Cost of risk (363) (117) 64 (200) (248) (342) (2) (1,208)
Equity-accounted entities (1) - 15 - 60 3 - 78
Net income on other assets (4) - (0) 65 18 (0) (0) 78
Change in value of goodwill (3) - - - - - - (3)
Income before tax 741 183 775 81 128 450 (460) 1,898
Tax (226) (53) (202) (17) 47 (47) 189 (308)
Net income from discont'd or held-for-
sale ope.- - - (0) - - - (0)
Net income 515 130 573 64 175 403 (272) 1,590
Non controlling interests (0) (0) (69) (22) (26) (16) 27 (107)
Net income Group Share 515 130 504 42 149 387 (245) 1,483
Q2-21 & H1-21 Results

CREDIT UPDATE - AOUT 2021163
GROUPE CRÉDIT AGRICOLE
Crédit Agricole Group: results by business line
Q2-21 & H1-21 Results
H1-21 (stated) H1-20 (stated)
€m RB LCL IRB AG SFS LC CC Total
Revenues 7,008 1,822 1,529 3,348 1,302 3,225 120 18,353
Operating expenses excl. SRF (4,503) (1,143) (924) (1,535) (662) (1,831) (445) (11,041)
SRF (87) (59) (33) (7) (23) (328) 58 (479)
Gross operating income 2,418 621 572 1,806 617 1,066 (267) 6,834
Cost of risk (339) (126) (222) (25) (262) (27) (6) (1,007)
Equity-accounted entities (11) - 0 38 161 3 - 192
Net income on other assets 12 1 (14) (0) 12 (37) 3 (23)
Change in value of goodwill 2 - 378 - - - - 379
Income before tax 2,081 496 715 1,819 529 1,006 (270) 6,376
Tax (629) (151) (72) (300) (109) (220) 79 (1,401)
Net income from discontinued or held-
for-sale operations- - (1) 5 1 - - 5
Net income 1,452 345 642 1,524 421 787 (191) 4,979
Non controlling interests (1) (0) (110) (267) (51) (23) (3) (455)
Net income Group Share 1,451 344 532 1,257 370 764 (194) 4,524
H1-20 (stated)
€m RB LCL AG IRB SFS LC CC Total
Revenues 6,323 1,729 2,694 1,360 1,254 3,295 (192) 16,462
Operating expenses excl. SRF (4,286) (1,128) (1,471) (889) (661) (1,741) (408) (10,584)
SRF (123) (42) (6) (25) (20) (260) (86) (562)
Gross operating income 1,914 558 1,217 446 573 1,293 (686) 5,316
Cost of risk (670) (218) 46 (316) (438) (501) (39) (2,137)
Equity-accounted entities 3 - 29 - 132 4 - 168
Net income on other assets (4) 0 3 66 18 (0) (0) 84
Change in value of goodwill (3) - - - - - - (3)
Income before tax 1,240 340 1,294 195 286 796 (725) 3,428
Tax (464) (109) (328) (54) 18 (103) 252 (789)
Net income from discontinued or held-for-
sale operations- - - (1) - - - (1)
Net income 776 231 967 140 304 693 (473) 2,638
Non controlling interests (1) (0) (131) (40) (46) (26) (4) (248)
Net income Group Share 775 231 835 101 258 667 (477) 2,391

CREDIT UPDATE - AOUT 2021164
Contact list:
This Credit Update is available on our website at: www.credit-agricole.com/en/finance/finance/debt
See all our press releases at: www.credit-agricole.com – www.creditagricole.info @Crédit_Agricole Groupe Crédit Agricole @créditagricole_sa
Olivier BÉLORGEY Deputy CEO and CFO, CACIB and Group Head of Treasury and Funding, Crédit Agricole Group + 33 1 57 87 19 24 [email protected]
Aurélien HARFF Head, Medium and Long Term Funding / London Desk + 44 207 214 50 11 [email protected]
Isabelle ROSEAU Head, Covered Bonds Structuring + 33 1 41 89 05 21 [email protected]
Clotilde L’ANGEVIN Head of Investor Relations + 33 1 43 23 32 45 [email protected]
Marie-Laure MALO Debt Investor Relations and Ratings + 33 1 43 23 10 21 [email protected]
Caroline CRÉPIN Debt Investor Relations and Ratings + 33 1 43 23 83 65 [email protected]
Rhita ALAMI Debt Investor Relations and Ratings + 33 1 43 23 15 27 [email protected]
Nadine FEDON + 33 1 41 89 05 19Head of Medium and Long Term Funding, Crédit Agricole Group
General Manager of Crédit Agricole Home Loan SFH / General Manager of Crédit Agricole Public Sector [email protected]
Laurent COTE Group Treasurer, Crédit Agricole Group + 33 1 41 89 46 64 [email protected]
Copyright © 2022 FDOKUMEN


![«Du document fiscal à l’economie agricole: les cultures de Santorin au XVIIIe siècle» [in Greek], Historica fasc. 6 (1986), 282-314](https://static.fdokumen.com/doc/165x107/631796ba831644824d038f6b/du-document-fiscal-a-leconomie-agricole-les-cultures-de-santorin-au-xviiie.jpg)