Bank credit and market-based finance for corporations
64
Working Paper Series Bank credit and market-based finance for corporations: the effects of minibond issuances Steven Ongena, Sara Pinoli, Paola Rossi, Alessandro Scopelliti Disclaimer: This paper should not be reported as representing the views of the European Central Bank (ECB). The views expressed are those of the authors and do not necessarily reflect those of the ECB. No 2508 / December 2020
-
Upload
khangminh22 -
Category
Documents
-
view
0 -
download
0
Transcript of Bank credit and market-based finance for corporations

Working Paper Series Bank credit and market-based finance for corporations: the effects of minibond issuances
Steven Ongena, Sara Pinoli, Paola Rossi, Alessandro Scopelliti
Disclaimer: This paper should not be reported as representing the views of the European Central Bank (ECB). The views expressed are those of the authors and do not necessarily reflect those of the ECB.
No 2508 / December 2020

Abstract
We study the effects of the diversification of funding sources on the financing conditions for firms. We
exploit a regulatory reform which took place in Italy in 2012, i.e., the introduction of “minibonds”,
which opened a new market-based funding opportunity for unlisted firms. Using the Italian Credit
Register, we investigate the impact of minibond issuance on bank credit conditions for issuer firms, both
at the firm-bank and firm level. We compare new loans granted to issuer firms with new loans
concurrently granted to similar non-issuer firms. We find that issuer firms obtain lower interest rates on
bank loans of the same maturity than non-issuer firms, suggesting an improvement in their bargaining
power with banks. In addition, issuer firms reduce the amount of used bank credit but increase the overall
amount of available external funds, pointing to a substitution with bank credit and to a diversification
of corporate funding sources. Studying their ex-post performance, we find that issuer firms expand their
total assets and fixed assets, and also raise their leverage.
Keywords: bank credit; capital markets; minibonds; loan pricing; SME finance.
JEL Classification: G21; G23; G32; G38
ECB Working Paper Series No 2508 / December 2020 1

Non-Technical Summary
The integration between bank credit and market-based finance for corporations is at the center of
the current policy debate in Europe, due to the significant reliance of firms and particularly SMEs on
bank credit for their funding needs. This long-standing feature has become even more topical in the
discussion on the alternatives to bank credit in the recovery from the Covid-19 crisis. In recent years,
policy authorities have considered various initiatives to extend the range of funding sources for SMEs,
including the removal of existing regulatory obstacles to the use of market-based funding, in the context
of the EU strategy to promote the “Capital Markets Union”.
We investigate the impact of the diversification of funding sources – following the issuance of
corporate bonds – on the financing conditions of issuer firms. SMEs rely to a significant extent on bank
credit due to their opaqueness to market investors and the potential benefits of lending relationships.
Banks are able to gather soft information about firms and to perform monitoring activity, thus reducing
agency costs; however, incumbent banks can extract some monopoly rents thanks to their informational
advantage. It is then crucial to explore whether the diversification of funding sources through capital
markets allows issuer firms to improve their bargaining power with banks in setting credit conditions,
and to examine to what extent the ability to issue bonds affects the debt structure of firms.
The introduction of a recent regulatory reform in Italy provides an interesting deregulation
experiment to study the ex-post consequences of bond issuance on corporate credit conditions. In 2012,
a reform aimed at improving the access to capital markets by small and medium enterprises was
introduced by removing pre-existing limits to the issuance of corporate bonds by unlisted firms in Italy.
These new debt instruments were called minibonds for their smaller issuance size when compared with
bonds of large firms. We exploit this regulatory shock in order to investigate the ex-post impact of the
issuance of minibonds on the financing conditions of Italian corporations, both at the firm-bank level
and at the firm-level. We consider the issuances of minibonds from the fourth quarter of 2012 to the end
of 2016 and we focus on the first issuance for each firm.
We analyze whether corporate issuers are able to obtain lower lending rates from banks after the
first minibond issuance, compared to ex-ante similar non-issuer firms. Since the loan offer to a treated
firm in the case of non-issuance would not be observable, we match the loans granted to issuer firms
with the loans granted at the same time to non-issuer firms having the corresponding pre-determined
characteristics. We implement an exact matching technique in order to identify ex-ante similar non-
issuer firms using several firm characteristics, including firm size, economic activity, location, credit
risk, leverage and the identity of the main bank.
ECB Working Paper Series No 2508 / December 2020 2
Using a difference-in-differences analysis, we find that issuer firms obtain – after their first
issuance – a reduction in the lending rates charged by banks versus ex-ante similar non-issuer firms. The
effect of the minibond issuance is measured in the quarter of the first issuance and in the following two
quarters, compared to the two quarters before the event. The decrease in lending rates observed at the
firm-level is around 40 basis points for long-term loans, and around 28 basis points for advances. In the
corresponding analysis on lending volumes, we show that issuer firms reduce the amount of used credit
by around 35 percent at the firm-level, as minibond issuances substitute part of the previous bank debt.
Also, issuer firms decrease by around 11 percentage points the ratio between credit used and credit
granted, a measure commonly used as a proxy for credit constraints. At the same time, considering the
amounts raised in the market with the minibond issuance, issuer firms increase by around 40 percent the
total external funds they can rely upon.
These results support the argument that the access to capital markets allows firms to diversify
their funding sources and to improve their credit conditions. In fact, issuer firms can increase the overall
amount of financial debt without observing significant changes to their overall funding costs and while
actually reducing the cost of bank debt. The results may be explained by the improved bargaining power
with insider banks in setting credit conditions. This may be due also to changes in debt composition in
favor of long-term debt, which might have enhanced the debt sustainability of issuer firms.
We also explore whether this improvement in financial conditions has some implications on the
performance of these firms by estimating a difference-in-differences model for some indicators of asset
and liability composition, turnover and profitability. Comparing one year before with two years after
the minibond issuance, we find that issuer firms increase their amount of total assets and of fixed assets
by 19% and 15% respectively. Moreover, although the leverage of issuer firms raises, their share of
bank debt out of total financial debt decreases. Firms’ turnover and profitability are not significantly
affected.
This empirical analysis provides a first evaluation of the effects of a key regulatory reform in
Italy, aimed at encouraging the issuance of bonds by unlisted firms, by investigating the impact of
minibond issuances on the financing conditions and the performance of issuer firms. The results of the
analysis provide relevant policy implications also for the current discussion on the regulatory initiatives
for the Capital Markets Union. Our study suggests that reforms aimed at improving the access of SMEs
to capital markets, via the removal of regulatory constraints, may contribute significantly to improve the
financing conditions of issuer firms, both via a reduction in the lending rates charged by banks, and via
a partial substitution of bank debt with market-based finance, leading to an overall expansion of total
external funds available to firms.
ECB Working Paper Series No 2508 / December 2020 3

1. Introduction
The integration between bank credit and market-based finance for corporations is at the center of
the current policy debate on the Capital Markets Union in Europe, due to the strong dependence of firms
and particularly SMEs on bank credit for their funding needs. This long-standing feature has become
even more topical in the discussion on the alternatives to bank credit in the recovery from the Covid-19
crisis (Financial Times, 2020).
Indeed, the shock of the pandemic has put additional pressures on existing vulnerabilities of
European banks, and raised some new challenges. Even if the strong response of policy authorities has
provided decisive support to bank credit to firms at the peak of the crisis,6 the weaknesses of the banking
sector accentuated by the shock may hinder its future ability to finance the recovery. In this perspective,
easing access to market-based financing sources may reduce firms’ overly reliance on bank financing,
support their investments and then contribute to economic growth. This strengthens the view that
renewed policy commitments to promote the Capital Markets Union are needed now more than ever, in
dealing with the challenges of the post-pandemic recovery (De Guindos, Panetta and Schnabel, 2020;
High-Level Forum on the Capital Markets Union, 2020; Wieser, 2020).
In previous years, given the strong legacies of the global financial crisis and the sovereign debt
crisis for the European banking system, policy authorities had considered various initiatives to extend
the range of funding sources for SMEs, including the removal of existing regulatory obstacles to the use
of market-based funding. However, progress has been so far limited in the development of the agenda
for establishing the Capital Markets Union (Bhatia et al., 2019; Constâncio et al., 2019). Now, in light
of the fallout from the Covid-19 crisis and of the new financing needs for firms, it is important to assess
the effects of some policy initiatives developed in the area of capital markets in recent years, to draw
relevant implications for the forthcoming policy design at the European level.
In this paper, we investigate the impact of the diversification of funding sources – following the
issuance of corporate bonds – on the financing conditions of issuer firms with a particular focus on their
lending relationships with banks. This is particularly relevant for SMEs, as these firms – also in the case
of bond issuance – may still rely to a significant extent on bank credit due to the potential benefits of
lending relationships. Banks are able to gather soft information about firms and to perform monitoring
activity, thus reducing agency costs and providing effective incentives to firms in favor of high-quality
6 For a recent study on the effects of the monetary, micro- and macroprudential policy measures adopted during the pandemic on bank lending conditions, see Altavilla, Barbiero, Boucinha and Burlon (2020).
ECB Working Paper Series No 2508 / December 2020 4

investments (Diamond, 1984; Rajan, 1992). The flip side of the coin is that the incumbent banks can
extract some monopoly rents due to their informational advantage (hold-up effect; Sharpe, 1990; Von
Thadden, 2004) and, consequently, strong dependence on bank credit may lead to an increase in
financing costs.
It is therefore crucial to explore whether the diversification of funding sources through capital
markets allows issuer firms to improve their bargaining power with banks in setting the credit conditions,
and to examine to what extent the ability to issue corporate bonds affects their debt structure. Such
empirical analysis presents two main challenges: first, we need to identify an exogenous event enacting
the ability of firms to get capital markets funding, such that firms previously unable to issue corporate
bonds would then be allowed to do it; second, for a given sample of issuer firms (treated) we have to
construct a counterfactual sample of non-issuer firms (control) with ex-ante comparable financial
characteristics.
The introduction of a recent regulatory reform in Italy provides an interesting experiment to study
the ex-post consequences of bond issuance on corporate credit conditions, within an empirical setting
useful to deal with the above challenges. In 2012 a reform aimed at improving the access to capital
markets by small and medium enterprises was introduced by the Italian Government. It removed the
pre-existing limits to the issuance of corporate bonds by unlisted firms, provided that the securities were
negotiated in a regulated market or in a multilateral trading facility. It also extended to these bonds the
favorable tax treatment established for the bonds issued by listed firms. Since the new bond issues were
expected to be of limited amounts, they were called “minibonds”.
We exploit this regulatory shock in order to investigate the ex-post impact of the issuance of
minibonds on the financing conditions of Italian corporations, both at the firm-bank level and at the
firm-level. We explore how the recourse to capital markets may have ex-post changed the credit
conditions practiced by banks to the issuer firms and the performance of issuer firms.
We study the effects of the switching behavior of firms from bank credit to debt funding, by
extending the empirical framework developed by Ioannidou and Ongena (2010) to the issuance of debt
instruments. In particular, we analyze whether corporate issuers were able to obtain lower lending rates
from banks after the minibond issuance, compared to ex-ante similar non-issuer firms. On one hand, the
diversification of funding sources may improve the bargaining power of firms in the lending
relationship, so it could eventually lead to an improvement of loan conditions for firms. On the other
hand, if the market rates required by investors are still higher than the bank rates, as for the first issuances
ECB Working Paper Series No 2508 / December 2020 5

of minibonds, credit institutions may have relatively less incentive to ease the lending conditions for
corporations.
We consider the issuances of minibonds starting from the fourth quarter of 2012 to the end of
2016 and we focus on the first issuance for each firm, as this will provide the first clear message that the
firm is able to get funding directly from capital markets. Since the loan offer to a treated firm in the case
of non-issuance would not be observable, we match the new loans granted to issuer firms with the new
loans granted at the same time to non-issuer firms that have similar pre-determined characteristics. To
build the counterfactual sample of non-issuer firms, the existing literature suggests that firm-level
characteristics – such as credit ratings, net worth, investment opportunities – may play some role in the
firms’ choice between bank loans and market debt. We allow the selection of issuer versus non-issuer
firms to be driven by firms’ characteristics rather than by a purely random assignment. This is indeed
relevant for the design of our empirical methodology. To deal with these pre-existing differences and
reduce the possible endogeneity of the treatment, we implement an exact matching technique on a wide
set of ex-ante firms’ characteristics and balance sheet performance in order to identify comparable non-
issuer firms. We are able to match 92 issuer firms with around 2,700 control firms.
The data combine information from various sources. We merge the deal-level information on
minibond issuances by Italian firms with the loan-level data on firm-bank relationships and with the
corporate balance sheets of issuer and non-issuer firms. We collect the data on the issuances of
minibonds from various sources, including the “Borsa Italiana” (Italy's only stock exchange based in
Milan), as minibonds are frequently negotiated on a multilateral trading platform called ExtraMOT Pro
and reserved to professional investors. Loan-level data come from the Italian Credit Register (“Centrale
dei Rischi”), combined with the quarterly survey on lending rates conducted by the Bank of Italy at the
loan-level.
The effect of the minibond issuance is measured in the quarter of the first issuance and in the
following two quarters, compared to the two quarters before the event.7 The difference-in-differences
analysis on lending rates, both at the firm-bank level and at the firm level, shows that issuer firms
obtained – after their first issuance – a reduction in the lending rates charged by banks versus ex-ante
similar non-issuer firms. The decrease in lending rates observed at the firm-level was around 40 basis
points for long-term loans and around 28 basis points for advances. Lending rate reductions of around
7 Our estimates over a longer period, including six quarters after the issuance, show similar results.
ECB Working Paper Series No 2508 / December 2020 6

30 basis points were also observed in the analysis at the firm-bank level, both for long-term loans and
for advances.
The corresponding analysis on lending volumes at the firm-level shows that issuer firms reduced
the amount of used credit by around 35 percent, suggesting that the minibond issuances were used to
substitute part of the previous bank debt. The decrease in the amount of credit granted by banks to issuer
firms was smaller (around 10 percent) and not quite statistically significant. Taking into account the
two effects combined, after the first issuance issuer firms reduced by around 11 percentage points the
ratio between credit used and credit granted, a measure commonly used as a proxy for credit constraints.
Considering the amounts raised in the market with the minibond issuance, the overall effect is an
increase by around 40 percent of the total external funds the issuer firms can rely upon. Importantly, this
significant increase in the total financial debt was achieved by issuer firms without a statistically
significant change in their overall financing costs: indeed, the swift reduction in bank lending rates after
the first issuance balanced the higher coupon rates on minibond issuances.
These results support the argument that the access to capital markets allows firms to diversify
their funding sources and to improve their credit conditions, with a reduction in interest rates on bank
debt and an increase in the overall funds they have access to. We find a significant impact of minibond
issuances on firm-bank relationships even though these bonds were more costly than bank credit (the
average coupon is around 6 percent, 100 basis points more than the average interest rate charged by
banks). The results may be explained by the improved bargaining power with the insider banks in setting
credit conditions. It may be partially due to the changes in debt composition in favor of long-term debt,
which might have enhanced the debt sustainability of issuer firms, in line with previous evidence that
shows how bond issuances were used to reduce maturity mismatches between assets and liabilities
(Accornero et al., 2015).
Our findings on bank lending conditions and volumes raise the question whether this
improvement in financial conditions had some impact on the performance of firms. We estimate a
difference-in-differences model for some indicators of asset and liability composition, turnover and
profitability. We find that issuer firms – after the first minibond issuance – increase their amount of total
assets and of fixed assets, raise their leverage while reducing the share of bank debt out of total financial
debt, thanks to the funding diversification. Firms’ turnover and profitability are not significantly
affected.
Our paper contributes to the literature on the choice between bank credit and market-based finance
for corporations. The theoretical literature has investigated benefits and costs associated with this choice,
ECB Working Paper Series No 2508 / December 2020 7

also by identifying firm characteristics that may explain a higher propensity or a better ability to access
capital markets funding (Diamond, 1991; Holmstrom and Tirole, 1997). The empirical literature has
explored the impact of public listing decisions (for Italy, Pagano, Panetta and Zingales, 1998; for the
US, Schenone, 2010), mostly for very large firms. Recent empirical studies on SME finance analyze the
developments in firm-bank lending relationships, but we lack studies on the integration between
different sources of funding partly due to the limited diffusion of non-bank debt among SMEs.
This analysis provides a first evaluation of the effects of funding diversification on credit
conditions and firms’ performance, by exploiting a key regulatory reform in Italy aimed at encouraging
the issuance of debt instruments by unlisted firms. Italy provides a particularly interesting framework
thanks to the large presence of SMEs in the economy and to the multiplicity of firm-bank relationships
also for relatively small corporations. Moreover, the reform that introduced minibonds in Italy may be
considered a relevant example in the current policy discussion on the regulatory initiatives for the
Capital Markets Union, aimed at improving the access to finance for all businesses across Europe (in
particular SMEs).
The remainder of the paper is structured as follows. Section 2 reviews the literature on bank credit
and capital market finance. Section 3 presents the institutional background and some stylized facts about
minibond issuances. Section 4 introduces the data and describes the empirical strategy. Section 5
presents the results of the analysis at the firm-bank level, while Section 6 discusses the analysis at the
firm-level. Section 7 presents the results of some robustness analyses. Finally, Section 8 concludes.
2. Firm Capital Structure: Bank Credit and Capital Markets
The choice among different sources of financing is a complex decision, which depends upon
several factors and incentives, both firm-specific and economy-wide, and may have significant
implications on corporate costs and performance. The traditional corporate finance literature based on
the pecking order theory (Myers and Majluf, 1984) has highlighted the role of asymmetric information
between the firm and its investors: since the cost of finance increases with asymmetric information,
companies would first use internal financing; then, if external financing is required, they would prefer
to issue debt rather than new equity, both to avoid the dilution of the existing shares and because
investors would perceive debt as less risky than equity due the claim priority.8 External debt financing
8 Since a new equity issuance could be interpreted by market investors as a signal of share overvaluation, managers would refuse to issue undervalued shares in the interest of existing shareholders. The issuance of new
ECB Working Paper Series No 2508 / December 2020 8

can be drawn from an informed lender, such as a bank, or from an uninformed arm’s-length investor
(Rajan, 1992).
Banks gather valuable soft information about the economic prospects of corporations through a
monitoring activity, which contributes to reduce borrowers’ moral hazard and which could not be
conducted in a cost-effective way by individual creditors (Diamond, 1984). Established firm-bank
relationships may bring some benefits to firms, by increasing the credit availability on a long-term basis,
potentially also in crisis times (Petersen and Rajan, 1994; Bolton, Freixas, Gambacorta and Mistrulli,
2016). Moreover, firm-bank relationships allow the borrower a certain degree of flexibility, provided
that credit lines typically carry a draw-down option (Berg, Saunders and Steffen, 2016; Sufi, 2009).
Yet, the bank acquires information in the course of the firm-bank relationship, which is
proprietary and cannot be communicated to other potential lenders. This gives a larger bargaining power
to the bank, which may then extract some surplus from the firm’s profits (hold-up effect; Rajan, 1992;
Sharpe, 1990).9 Therefore, firm-bank relationships may imply higher costs. In von Thadden (2004)
outside lenders implement randomization of offers which limit the rents gained by the inside bank. Some
firms will switch banks and obtain lower lending rates from the outside bank. Ioannidou and Ongena
(2010) analyse empirically the effects of this switching behaviour, showing that the switching firm is
charged by the outside bank lower lending rates than the ones required by the inside bank to ex-ante
comparable non-switching firms. This incentive to switch in order to reduce financing costs could hold
more widely – depending on the financing options available to firms – also for the choice between bank
credit and market-based finance. Firms typically take different types of debt from various sources and
with different priority structures, and the debt-structure heterogeneity varies in relation to the credit-
quality distribution of firms (Rauh and Sufi, 2010).
Diamond (1991) shows that new borrowers take initially bank loans but may later issue debt
directly, if the positive credit record obtained while monitored generates reputation effects. Therefore,
borrowers with higher credit ratings can obtain funding at lower costs from bond issuance, while
borrowers with lower credit ratings are subject to bank monitoring. Similarly, according to Holmstrom
and Tirole (1997), only firms with sufficiently high net worth would be able to issue bonds, while firms
with intermediate capitalisation would have to borrow from intermediaries, and undercapitalised firms
stocks, by diluting the value of the existing equity, would transfer part of the firm’s wealth from current to new shareholders.
9 Under asymmetric information, outside banks would not be able to distinguish between good and bad borrowers due to adverse selection (so called ‘winner curse’) and could not offer better conditions to creditworthy firms. See also Greenbaum et al. (1989).
ECB Working Paper Series No 2508 / December 2020 9

would not be able to invest. Rajan (1992) finds a u-shaped relation between investment opportunities
and bank borrowing: firms with high-quality projects and those with risky projects will prefer arm’s
length finance, while firms with medium-risk project will select bank debt.10 Likewise, in Bolton and
Freixas (2000) the financial structure is endogenously determined by the characteristics of the firm and
by the level of intermediation costs.
Consistently with these theoretical predictions, Hoshi, Kashyap and Scharfstein (1993) find that
firms having ex-ante higher net worth and investment opportunities were more prone to reduce their
reliance on bank debt and issue public debt following the deregulation in Japan during the 1980s. Public
borrowers are larger, more profitable and with higher credit ratings with respect to firms borrowing from
banks (or from non-bank private lenders) also in Denis and Mihov (2003). Santos and Winton (2008)
analyse the pricing of syndicated loans to large firms in the US and provide empirical evidence of the
hold-up effect for firms mainly reliant on bank credit versus other firms able to diversify their funding
sources via the issuance of corporate bonds. Moreover, the spread paid on loans was higher the longer
time passed since the last public bond issuance, thus confirming the informational value of public
issuance for the perception of corporate creditworthiness. However, banks maintain a substantial interest
rate premium on loans with respect to market financing, even once default risk and covenants are
accounted for: this result suggests that either firms place an extra value for bank services that they are
willing to pay, or banks maintain a certain degree of information advantage (Schwert, 2017).
Pagano, Panetta and Zingales (1998) analyse the effects of IPOs on lending conditions and
corporate performance for a sample of Italian firms, by comparing companies that went public with
otherwise identical firms that remained private. They find that firms going public managed to decrease
their relative cost of credit, particularly in the case of independent companies, with a reduction in the
rate between 30 and 55 basis points; independent companies experienced a decrease in the concentration
of credit among banks and an increase in the number of banks. More recently, Hale and Santos (2009)
show that firms obtain lower interest rates after a bond IPO. Schenone (2010) explores whether the
relationship banks exploit their informational advantage by charging higher interest rates than those
prevailing under symmetric information for all banks. The analysis, based on loan-level information for
syndicated loans, focuses on the IPOs of US companies and uses the borrower’s IPO as an information-
releasing event. After the IPO, lending rates decreased particularly for firms with more intense firm-
bank relationships: by reducing the information asymmetries for the other banks not previously involved
10 Low-quality firms will prefer arm’s length finance rather than bank debt to avoid bank monitoring and the threat of termination.
ECB Working Paper Series No 2508 / December 2020 10

in a firm-bank relationship, the IPO decreased the cost of switching banks for the new publicly listed
firm. Accornero et al. (2015) show that, besides reputational aspects, two important drivers of the
decision to enter the bond market are the needs to finance growth and to reduce maturity mismatches
between assets and liabilities.
The above papers suggest that the reduction in lending rates after funding diversification may
come from two channels: first, the increase in the bargaining power of firms towards the relationship
banks may lower the rates charged by inside banks; second, the public release of information previously
available only to the relationship banks may incentivise outside banks to offer better credit conditions.
The above arguments may hold differently for different types of additional funding sources: while the
bargaining power explanation applies both to new equity and debt issuance, the information release
argument depends on the actual amount of information publicly disclosed with the issuance of the new
securities. In general, public listing requires the disclosure of a significant amount of information while
the release of information could be less significant for the issuance of new debt securities, particularly
when they are privately placed. However, even when bonds are publicly issued, some prospectus
requirements could be waived under a regulatory framework that aims at decreasing fixed costs for the
issuers, like the minibond reform.
3. Institutional Background and Stylized Facts
The regulatory reform introduced in Italy in 2012 was aimed at encouraging the issuance of
corporate bonds by small and medium enterprises, in a context characterised by strong reliance of the
corporate sector on bank debt. The reform released some pre-existing regulatory limits to the issuance
of corporate debt by unlisted firms and extended the favourable tax regime previously provided only
for the debt issuances of listed firms. Cerved Group (2013) estimates that there are about 35,000 Italian
companies potentially able to issue minibonds, as they are characterized by an annual turnover of over
EUR 5 million and rated as safe or at least financially solvent.
In Italy, corporations heavily depend on the banking system for their funding, although with some
relevant differences between large (particularly listed) and small-medium firms. In the recent past, while
large corporations could have access to capital markets for the issuance of their bonds, small and
medium enterprises could not obtain market-based funding both for economic reasons and for regulatory
restrictions.
Among the economic factors, small corporations face significantly higher funding costs on capital
markets, due to their opaqueness that increase the informational asymmetries between investors and
ECB Working Paper Series No 2508 / December 2020 11

issuers. Moreover, the recourse to capital markets by Italian SMEs may have been hampered by the
limited presence of specialized domestic investors, interested in investing in corporate debt instruments
(Accornero, Finaldi Russo, Guazzarotti and Nigro, 2018 and 2015). At the same time, given the national
fragmentation of capital markets in the EU, it is unlikely that the debt instruments of Italian SMEs could
be purchased by other EU investors.
The need for a larger diffusion of market-based finance for SMEs in Italy and more generally in
Europe emerged also as a consequence of the contraction in credit supply by banks during the crisis,
particularly for the lending activity to private non-financial corporations.11 Indeed, the wide reliance of
EU corporations – and in particular of SMEs – on bank credit increased the crisis vulnerability of the
corporate sector.
The regulatory framework may add further restrictions to the use of market-based funding for
SMEs, especially if it provides differential treatment to firms according to their size.
3.1. The Regulatory Reform and the ExtraMot Pro Platform
The regulatory reform that introduced minibonds in Italy was carried out in several phases. First,
in June 2012, the so called “Decreto Sviluppo” (Law Decree 83/2012, converted in the Law 134/2012)
removed the pre-existing limits to the issuance of corporate bonds by unlisted firms (other than micro-
enterprises), provided that the securities are negotiated in a regulated market or in a multilateral trading
facility. This legislative act also extended to minibonds the same tax treatment established for the bonds
issued by listed firms, including tax relief on interest costs and issuance expenditures, and a preferential
tax regime for the interest income gained by investors.
Following these regulatory changes, Borsa Italiana (i.e. Milan Stock Exchange, currently part of
the London Stock Exchange) created on March 2013 an ad hoc multilateral trading facility, called
ExtraMot Pro, open only to professional investors and designed to offer to corporations, and particularly
to SMEs, a flexible and cost-effective market suitable for minibond issuance and trading.
11 Becker and Ivashina (2018) argue that the reduction in the credit supply to corporations was also a consequence of a “financial repression” phenomenon in the Euro Area: while National authorities exerted some moral suasion on domestic banks to induce them to increase their holdings of national sovereign debt, banks contracted their credit provision to corporates. Extending the methodology developed in Becker and Ivashina (2014), they find evidence on the cyclicality of bank credit supply based on the financing choices of corporations, which could have used less bank debt and more corporate debt to deal with the contraction in bank credit supply.
ECB Working Paper Series No 2508 / December 2020 12

The listing requirements on ExtraMot Pro are simplified with respect to the MOT market (open
also to retail investors). Since this multilateral trading facility is open only to professional investors, the
listing procedure is not subject to the EU Prospectus Directive and does not need a prior approval by the
financial market supervisory authority (CONSOB). Therefore, the time needed for the listing is
substantially reduced: the security is admitted to trade within 7 working days from the completion of
the initial submission to Borsa Italiana. The issuer is required to publish an Admission Document (or a
Prospectus, at the issuer’s discretion, mainly for amounts above EUR 200 millions) and the annual
financial statements for the last two years (having at least the last one audited). In case a rating (for the
firm or the bond issuance) is assigned, the issuer has to disclose it. Listing fee amounts to 2,500 Euros.
Further legislative innovations were introduced mostly to expand the investor base of minibonds.
In December 2013, the so called “Decreto Destinazione Italia” (Law Decree 145/2013, converted in
Law 9/2014) provided for three main changes, all from the investors’ side: 1) it established the eligibility
of the minibonds as underlying assets for securitization; 2) it included the minibonds in the set of
financial instruments suitable to cover the technical reserves of insurance companies; 3) it applied a
preferential tax treatment to the interests and capital gains for the minibonds underwritten by dedicated
investment funds. Finally, in June 2014, the so called “Decreto Competitivitá” (Law Decree No.
91/2014, converted in Law 116/2014) extended the favorable tax regime on the interests and capital
gains of minibonds not admitted to multilateral trading facilities, as long as they are traded with
institutional investors.
3.2. Some Stylized Facts on Minibond Issuances
In the immediate months following the first reform act, the favorable regulatory framework for
minibonds was exploited also by relatively large firms, eventually listed, which took the opportunity of
the simplified listing procedures to raise funds from public capital markets at cheaper conditions.
However, starting from the second half of 2013, also medium and small enterprises took the opportunity
to issue minibonds (see Figure 1). The legislative acts adopted after 2012 did not change the regulatory
framework for issuers, but, providing further advantages for investors, they enhanced minibonds’
demand and could have contributed to reinforce the issuance incentives for small and medium
enterprises.
According to the Minibond Observatory (Osservatorio Mini-Bond, 2019), up to the end of 2018,
498 firms issued minibonds, gathering more than EUR 25.2 billion through 746 issuances. Among these
firms, 260 are classified as SMEs and they raised debt for an overall amount of EUR 4.6 billion until
ECB Working Paper Series No 2508 / December 2020 13

the end of 2018. For all issuer firms, the average interest rate (generally a fixed coupon) was 5.1 percent,
while the average maturity was around 5.3 years.
4. Empirical Analysis
4.1. Data
The dataset used in the empirical analysis is based on the combination of several data sources:
security-level data on the minibond issuances by firms; annual firm-level information on corporate
balance sheets; and monthly loan-level data on the bank credit amounts and quarterly loan-level data on
the lending rates charged by banks to firms.
The data on minibond issuances were mainly collected from the Italian Stock Exchange (Borsa
Italiana), since most of the bonds were listed on the ExtraMot Pro Platform (Table 1). Further
information on minibond issuances, not listed in ExtraMot Pro Platform, were collected from other
sources.
In order to observe a sufficiently long data series for credit conditions after minibonds issuance,
we conduct our analysis considering the securities issued up to 2016. We gathered information about
231 minibonds, issued by 148 firms between October 2012 and December 2016, for an overall amount
of EUR 8.9 billions in issuance (Table 1). SMEs account for more than 50 percent of the issuers, but
less than one tenth of the outstanding amount, given the relatively smaller size of their issuances (Figure
1). Most of the bonds paid a fixed rate coupon (72 per cent) around 5.8 per cent, on average; therefore,
they were more costly than bank credit.
We obtain the balance sheet information for corporations from the Cerved database.12 Merging
the information on bond issuances with the Cerved database, we get balance sheet information on 92
issuers (‘Sample’ in Table 1) covering the period 2010-2018. The decrease in the number of issuers is
due to the exclusion of firms with financial balance sheets (i.e., holding companies of industrial groups)
or without balance sheet data. Cerved also provides Z-scores (Altman, 1968) for most of the firms, as
well as information on their economic activity and headquarters. Data show that issuer companies were
12 Cerved is a leading Information Provider in Italy and one of the major rating agencies in Europe. Its database collects the balance sheets of all the Italian corporations since 1982 and a sample of partnerships since 2005.
ECB Working Paper Series No 2508 / December 2020 14

concentrated in manufacturing and services, were based in the North of Italy and were mainly medium-
or large-sized firms according to their total assets (Table 2).
We use quarterly data on bank loans, both for the amounts of credit granted and credit used and
for the interest rates charged by banks in the individual firm-bank relationships. Data on bank credit
come from the Bank of Italy’s Central Credit Register (CR, Centrale dei Rischi). CR covers the
population of loans above the threshold of EUR 30,000. For each loan, the database provides information
on the lender and borrower identity, the type of credit (credit lines, advances, long-term loans) and the
maturity. Data on lending rates charged by banks come from the Bank of Italy’s Interest Rate Database
(TAXIA). TAXIA includes all the interest rates charged by a sample of more than 200 banks, out of
around 600 banks operating in Italy, together with the information about the lender and borrower
identity, the type of credit (credit lines, advances, long-term loans) and the maturity. Short-term interest
rates (credit lines and advances) refer to all the outstanding positions at a certain point in time, while
long-term loans refer to new loans granted in the previous quarter only.
Based on the loan-level data on interest rates, one year before the first issuance, the issuer firms
included in the sample displayed an average cost of overall bank debt equal to 4.9%, with some
heterogeneity across different types of bank loans (for instance, 5% on new long-term loans, having a
maturity similar to the one of debt securities). While the average coupon rate for the minibonds issued
by these firms was on average 6%. The latter means a spread of about 100 basis points compared with
the average interest rate charged on new long-term loans to these firms (see Table 3).
4.2. Identification Strategy
The introduction of the minibond reform in Italy provides a striking deregulation experiment to
study the effects of the diversification of funding sources on the financing conditions for corporations.
This applies in particular to small and medium enterprises, and more generally to unlisted firms, given
that they have been designated as the key beneficiaries of this policy measure. The discussed regulatory
changes – by removing the previous restrictions to the issuance of corporate bonds by unlisted firms –
opened a new funding opportunity alternative to the traditional bank credit provision. We exploit this
innovation to analyse the impact of bond issuance on credit conditions and volumes for the issuer firms,
compared with a counterfactual sample of non-issuer firms (that are otherwise similar to the issuers).
We define the ex-ante and the ex-post outcomes with respect to the first minibond issuance: given
that the issuance is the event allowing for funding diversification, even if some firms have undertaken
ECB Working Paper Series No 2508 / December 2020 15

more than one issuance over time, the first issuance conveys the very first message to banks that a given
firm can obtain finance also from capital markets.
Among all the unlisted firms potentially eligible according to the new regulatory framework, only
a few corporations have actually issued and listed minibonds in the ExtraMot Pro platform (or in other
multilateral trading facilities). This can be due to several reasons, in particular to firms' characteristics
and financial conditions prior to the issuance. Therefore, when defining the sample of control firms, we
cannot consider the universe of eligible firms, but we need to construct a counterfactual sample of ex-
ante comparable corporations.
Information barriers may have played also some role, by affecting and/or limiting the diffusion
of news about the additional funding opportunity across firms. Given the limited experience of unlisted
firms with capital market developments, eligible firms could have gained awareness about the new
funding alternative in different periods. In some cases – even across firms with the same financial
characteristics – the issuance decision could have been the consequence of being actually informed about
this possibility. Given the limited contacts of unlisted firms with investment banks, the main bank with
which the firm has a long-lasting credit relationship may have then contributed to inform the firm,
advising it in favor of or discouraging it from the issuance of minibonds13.
In the end, we allow the selection of issuer versus non-issuer firms to be driven by firm-level
characteristics rather than by a purely random assignment. Firms decide whether to issue minibonds on
the basis of their existing financial conditions as well as of their forward-looking growth perspectives.
This self-selection could have implications for our impact evaluation, if these firm-level features –
influencing the probability of the issuance – were correlated with the outcome variables.
We deal with this issue by implementing an exact matching procedure based on ex-ante firm-
level characteristics and restricting the analysis to comparable groups of issuers and non-issuers in a
way consistent with the unconfoundness assumption. This methodology extends the empirical approach
developed by Ioannidou and Ongena (2010) for the switching across banks.14 We study the switching
13 The proximity to the headquarters of the Stock Exchange, and more generally to a financial center, may also explain the probability that a firm is informed about this alternative funding opportunity: we account for this in the robustness checks for firm location, as discussed in Section 7.2.
14 They investigate whether outside banks offer better credit conditions than insider banks to the switching firms. To this aim, firstly they compare the interest rates charged by the outside bank on the new loans to the switching firm with the rates on existing loans from the inside bank to ex-ante comparable non-switching firms. Secondly, they explore whether the outside bank treats its new borrowers better than its existing ones, by matching
ECB Working Paper Series No 2508 / December 2020 16
behavior from bank credit to debt funding: we consider firms initially taking funds only from banks and
then expanding their funding sources with corporate bond issuances. Since the loan offer to a treated
firm in the case of non-issuance would not be observable, we compare the loans granted to issuer firms
with the loans granted at the same time to non-issuer firms – having the corresponding pre-determined
characteristics in the pre-issuance time.
To identify the proper control sample, we consider some observable firm-level features –
measured before the first issuance – which can be relevant for credit conditions and volumes, like the
geographical area, economic activity, total assets, the leverage ratio, and the Z-score. Moreover, since
we admit that the main bank could have played an important role in informing and advising firms about
the possibility to issue minibonds, in selecting the control sample we include also the identity of the
main bank among the matching criteria. We also take into account the fact that minibonds were issued
in different time periods, so we conduct the exact matching in relation to firm characteristics in the year
before the first issuance per each issuer firm. Once we control ex-ante – in the definition of treatment
and control samples – for these firm-level characteristics, and conditional on them, treatment and
outcomes can be assumed to be independent. In this way, we can attribute post-issuance changes in
credit conditions to the minibond issuances rather than to other firm-specific factors, which could
operate anyway, also in absence of debt issuances.
The large size and the wide heterogeneity of the population of eligible firms allow us to fulfill the
overlap assumption, i.e., we are able to find – for any setting of the covariates – units in both the
treatment and the control groups. The relatively contained number of issuer firms, when compared with
the significantly larger universe of eligible firms, puts us in the condition to conduct a very selective
exact matching procedure.
4.3. Control Sample
We identify the control sample of ex-ante comparable non-issuer firms based on the exact
matching for firm-level characteristics observed in the year before the first minibond issuance. As a pool
of potential controls, we first consider all the Italian firms with turnover and total assets of at least EUR
2 Million in 2014 (as among issuer firms) and reporting balance sheet information in Amadeus-Bureau
van Dijk database (around 35,000 firms). Within this sample we define the control group by matching
– for the outside bank – the new loans to the switching firms with the existing loans to ex-ante comparable non-switching firms.
ECB Working Paper Series No 2508 / December 2020 17

firms’ characteristics in the year before the first issuance (from 2011 to 2015, depending on the treated
firm) and the identity of the main bank. To reasonably limit the number of matching cells, we apply a
Coarsened Exact Matching (CEM), i.e. we discretize our continuous variables. The CEM is designed to
reduce the imbalance between the treated and control groups, hence reducing bias and model
dependence (Iacus, King and Porro, 2011). Since the treatment (i.e., the first minibond issuance) occurs
at different time for each firm, we apply the CEM procedure for each year and assign to each control
firm the same time of event of the matched treated firm.15 Among pre-treatment characteristics, we
consider:
1. At least one bank loan in the pre-treatment year (all the treated fulfill the requirement), without
any bond issuance.
2. Firm credit risk (two classes): low risk, Z-score between 1 and 4; medium and high risk, Z-score
between 5 and 9.
3. Leverage ratio (two classes): up to 50 percent; higher than 50 percent
4. Total assets (three classes):16 lower than 10 million; 10 to 43 million; greater than 43 million.
5. Economic activity (five classes): 1. agriculture and fishing; 2. manufacturing industries; 3. non-
manufacturing industries (mining, electricity, gas); 4. construction; 5. service industries.
6. Firm location (three areas): North, Center, South.
7. Identity of the main bank for each firm: the main lender bank is defined as the major creditor of
the firm, in terms of total credit used, in the year before issuing the minibond. We have 33 different
main banks in our sample of treated firms.
We are able to match 92 treated firms with nearly 2,700 control firms (Table 2). By construction,
treated and matched control firms display the same distribution for all the variables considered in the
Coarsened Exact Matching. The differences between the treated firms and the matched control firms are
now negligible as far as economic activity, location, size, Z-score and leverage ratios are concerned,
whereas they are quite sizable when compared with the unmatched control firms. As for other balance-
sheet indicators, in the period before the introduction of minibonds (corresponding to the years 2010-
15 The exact matching is conducted (with replacement) for each year. We consider the subsample of issuer firms having their first issuance in a given year and we execute the matching on the full sample of potential controls, to identify – per each issuer firm – a sample of control firms. The CEM weights ensure that the parametric analysis reflects the actual observations.
16 The three classes for total assets reflect the EU classification of firms in small, medium and large.
ECB Working Paper Series No 2508 / December 2020 18

2012), issuer firms display slightly higher profitability and cost of debt. The share of fixed assets over
total assets is similar across treated and control firms, but the growth rate of tangible fixed assets is much
higher for treated firms.
For robustness, we conducted also a more stringent coarsened exact matching, introducing more
selective criteria for controls17. Even though we drop some treated firms and many control firms, the
estimates confirm our results in both direction and magnitude. In alternative to the exact matching, we
also implemented a propensity score matching using the same selection variables and the estimation
results confirm the outcomes based on the coarsened exact matching18.
Once we identify – per each issuer firm – a restricted sample of ex-ante comparable firms, we can
investigate the effects of the minibond issuances on the credit conditions for issuer firms versus eligible
non-issuer firms. We consider the evolution of the firm-bank lending relationships both in terms of credit
rates charged by banks to the individual firms, and in terms of volumes of credit used and credit granted.
Table 3 presents some descriptive statistics on interest rates, bank loans and financial debt for
issuer and control firms. Consistently with the empirical analysis (see Section 4.4) we considered the
two quarters before the first minibond issuance (before) against the quarter of the first issuance and the
following two quarters (after).
Panel 1 displays the average borrowing rates on different types of banks loans, on the overall
amount of bank loans and on total financial debt. Advances and long-term loans represent jointly a share
of around 90% of credit used for both issuer and control firms. After the issuance, the pre-existing
differences in lending rates between issuer and control firms are significantly reduced for advances and
long-term loans, as issuer firms display a stronger decrease in their average lending rates than control
firms.19 We compute also a composite funding cost for firms, including both bank debt and bond
issuances. Consistently with a general declining trend, also the interest rates on total financial debt
decrease for both issuer and control firms; however, in this case, the differences in the sample means
are still quite sizeable also after the issuance.
17 In particular, we consider 3 different classes in the leverage ratio and three different Z-score levels, matching 84 treated firms with around 1500 controls. The results of this estimation are available on request.
18 Methodology and results are depicted in Appendix A.
19 We compute also the differences in means of each variable comparing the two quarters before with the issuance quarter and the following two quarters, and conduct a two-sample t-test for the statistical significance of the differences-in-means.
ECB Working Paper Series No 2508 / December 2020 19

Panel 2 presents data on the use of bank debt and the lending relationships. After the issuance, a
relevant easing in credit constraints for bank debt is observed for issuer firms: the used share of granted
credit decreased substantially for issuer firms, while remaining unchanged for control firms.
Panel 3 displays the amounts of different components of financial debt expressed as percentages
of total assets. After the issuance, issuer firms reduce the amount of credit used, while increasing
significantly the amount of their financial debt thanks to the minibond issuance.20
While the descriptive statistics on the changes in financial conditions after the first issuance
between the two groups of issuer and matched control firms point to the expected direction, yet these
differences are rarely statistical significant without the proper econometric specification.
4.4. Difference-in-Differences Specification and Hypothesis Testing
Based on the exact matching procedure for issuer firms and ex-ante comparable non-issuer firms,
we use a difference-in-differences (DID) empirical setting to estimate the changes in lending rates and
loan volumes after the first issuance of minibonds.
The main dependent variables are: a) the interest rates charged in the individual firm-bank
relationships, classified by different types of loans, i.e. credit lines, advances and new long-term loans;
b) the amounts of granted and used loans, as well as the ratio between credit used and credit granted in
firm-bank relationships, estimated both for the overall credit volume and for different types of loans.
The analyses on the first set of dependent variables explore the question whether bond issuances
allow corporations to obtain from banks lower lending rates than ex-ante comparable non-issuer firms.
The outcome is not obvious. On the one hand, the diversification of funding sources – while reducing
the reliance of issuer firms on bank credit – may improve their bargaining power in the firm-bank
relationship and eventually lead to better loan conditions. On the other hand, if the market rates required
by investors are higher than the bank rates – as it is usually the case for the first issuances of minibonds
– banks may have lower incentives to ease lending conditions since the bond market would not be a
more attractive source of funding than bank debt. Therefore, no changes in bank lending rates might be
observed.
20 This is observed also when classifying the overall sample of firms depending on their size (small, medium and large firms.
ECB Working Paper Series No 2508 / December 2020 20

With the second set of dependent variables, we examine whether the issuances of minibonds
affected either the volume of credit granted by the banks or the amount actually used by the firm. We
can observe different variations for these two variables, as the amounts of granted loans tend to follow
a “stickier trend” than used amounts. Indeed, while used amounts reflect the actual funding needs by
firms and their preferences about corporate finance composition, granted amounts are mainly
determined by the bank’s decision about the maximum amount of funds it would be willing to provide
to a specific firm. Then we can formulate the relevant hypotheses separately for used and granted
amounts.
The impact of minibonds on credit used would crucially depend on the purpose of the issuance,
given that the amount of used credit is chosen by the borrower firm as a function of demand factors. If
the firm has issued minibonds in order to change the composition of its funding sources, i.e., to substitute
bank credit with capital market financing, then we can expect a decrease in the used amounts after the
issuance. If the firm plans to start a new project requiring additional funding, the minibond issuance can
be used to complement bank credit with capital market financing, then we can expect that the used
amount of bank credit would not be subject to significant changes.
The impact of minibonds on credit granted might also reflect supply decisions, which can be
either bank- or firm-specific. The bank can modify the granted amounts either for a change in its general
lending policy (for example due to tightening or loosening balance sheet constraints) or for some firm-
specific reasons (for instance upcoming concerns about the firm’s creditworthiness or positive news
about the firm’s profitability). Given that generalized changes to the granted amounts for all firms would
be captured by the bank and time fixed effects, the effect of the minibond issuance for the treated firms
can be observed if the bank takes the opportunity of the debt issuance to reduce its exposure to the firm,
or decides to increase or decrease the granted credit based on the assessment of firm creditworthiness.
In our main specification, we conduct our analysis at the level of individual firm-bank
relationships, therefore data are organized as panel data reporting the interest rates and the loan amounts
in each period and for each firm-bank credit relationship.
We conduct a difference-in-differences analysis, in which the treatment is defined as whether the
firm i has issued minibonds (minibond = 1) or not (minibond = 0). The treatment dummy ‘minibond’ is
also interacted with the dummy ‘post’, equal to 1 after the first issuance
(1) Yi, j, t = αi + 𝛿 𝑗 + 𝛾𝑡 + β1posti, t ∗ minibondi + Z Controls𝑖, 𝑡−4 + εi, j, t
We include firm (αi), bank (𝛿𝑗), and year (𝛾𝑡) fixed effects. Given the inclusion of firm and time
fixed effects, the coefficient for the interaction between the first minibond issuance (Minibond) and the
ECB Working Paper Series No 2508 / December 2020 21

post-issuance dummy (Post) measures the average treatment effect of the first issuance on interest rates
and volumes of credit. 21 Among the controls, as additional covariates, we consider some firm
characteristics: total assets (in logs), leverage, Z-score. All the covariates are measured with a one-year
lag. Regressions are weighted with CEM strata weights and standard errors are clustered at the firm
level. The effect of the minibond issuance is measured in the quarter of the first issuance and in the
following two quarters, compared to the two quarters before the event. Data on the matched control
firms cover the same period as the treated firms. As robustness check, we conduct the estimation also
on a longer sample including six quarters after the issuance and the results are confirmed.
In order to meet the requirements of a difference-in-differences approach, we verified the
common trend assumption, i.e. the outcomes of treated and control firms should follow the same trend
in absence of treatment. To check this assumption, we display graphically the dynamics of interest rates,
for different categories of loans, and of the share of credit used in the pre-treatment period.
We need to take into account that the treatment (i.e., the first minibond issuance) occurs at
different time for each firm, in a period between October 2012 and December 2016. Given that different
issuance times were also characterized by different conditions in interest rates and financing costs, we
compare the trends in lending rates and volumes by normalizing the levels just before the time of the
first issuance (i.e. at the end of the quarter preceding the issuance).
The charts (Figure 2) depict the trends for issuer firms and controls from four quarters before the
treatment to six quarters after. Interest rates (by categories of loans) and the share of used credit show
similar trends until the time of the issuance event (tevent = 0), with the only exception of the lending
rates rate on credit lines.22 In the period following the minibond issuance, the effect on interest rates is
noticeable for advances and long-term debt and it tends to strengthen through time. On the contrary, the
impact on the share of used credit used is immediate and it stabilizes afterwards, pointing to a
reimbursement of part of the outstanding loans as a consequence of the market-based finance.
21 We started from a standard specification of the type: Yi, j, t = α + 𝛿𝑗 + β1posti, t ∗ minibondi + β2postii, t + β3 minibondi + Z Controls𝑖, 𝑡−4 + εi, j, t .
Since we introduced firm (αi) and year (𝛾𝑡) fixed effects, the two dummies ‘minibond’ and ‘post’ are dropped, because of collinearity.
22 We shall take into account that the lending rates for credit lines are computed on the basis of the outstanding stocks and not of the lending flows.
ECB Working Paper Series No 2508 / December 2020 22

5. Firm-bank Level Analysis
In the main specification, we conduct our analysis at the firm-bank level to investigate the effects
of the first minibond issuance on the lending rates charged by banks to issuer firms and on the volumes
of credit granted by banks and used by firms. Having data at the firm-bank level in every period, we can
control for firm, bank and year fixed effects.
5.1. Empirical Results: Post-Issuance Lending Rates and Volumes
Table 4 presents the estimates for the impact on lending rates. The coefficient of interest (β2) is
negative and significant for advances and long-term loans: after the first minibond issuance, issuer firms
obtained a reduction in the lending rates charged by banks on the above categories of loans. In particular,
if we look at the specifications with all the control variables (col. 2, 4 and 6), the interest rates lower by
around 30 basis points on advances, 28 basis points on long-term debt; on the other hand, the effect on
credit lines is not significant.
The decrease in lending rates following the diversification of funding sources can be explained
by an increase in the bargaining power of issuer firms and the release of new public information about
them. Both arguments could be relevant in this case. The features of the issuance treatment and the
design of the minibond reform would however suggest a stronger focus on the bargaining power of
issuer firms. The minibond initiative has been introduced to incentivize the issuance of debt instruments
by SMEs by minimizing the fixed cost of issuance, then, provided that only professional investors are
supposed to purchase these securities, the listing procedures are simplified and the disclosure
requirements are less stringent than for standard corporate bonds. Therefore, the first minibond issuance
by a company may have a relatively limited information-release effect, but it conveys a strong public
signal about its ability to obtain capital markets funding (which is indeed important to explain ex-post
its bargaining power with banks). This result holds true even if interest rates on minibonds are typically
higher than interest rates on bank credit.
Table 5 reports the estimates of the effects on the amounts of credit granted and used, for the
overall credit provision without distinction across types of loan contracts. The results show a reduction
in the amount of credit used – at the firm-bank level - by 63 percent after the first minibond issuance.
The decrease in credit granted is sensibly lower in terms of magnitude – 11 percent – and is not
significant. This reflects the different approach of borrower firms and lender banks after the minibond
issuances: while issuer firms replaced bank debt with corporate debt and therefore reduced the amount
ECB Working Paper Series No 2508 / December 2020 23

of bank credit, lender banks were overall still willing to grant credit to these firms and then did not
decreased the volumes of credit granted or to a lesser extent. Resulting from these two effects, the ratio
between credit used and granted fell by 11 percentage points after the first minibond issuance. The short-
term impact on bank credit volumes is then statistically and economically significant.
The reduction in the amount of credit used can be also interpreted as an automatic consequence
of the new funds now available to the firm from capital markets. In principle, there could be some
heterogeneity across firms in relation to their financing choices, based on the investment opportunities
available at the time of the issuance. While most firms did reduce the amount of credit used to a relevant
extent for a substitution across funding sources, a few firms could have used the funding provided by
minibond issuances to finance new investment opportunities. In the period under consideration for the
issuances, the sovereign debt crisis had strong, negative effects on both economic performance and
credit supply, and bond finance could have provided an additional amount of external finance. We will
come back to this point in section 6.
Table 6 displays the regression coefficients for the analysis on the used amounts of specific
categories of loans. The reduction effect observed on the overall credit used in Table 5 is confirmed also
when we consider separately the different types of loans, though with some differences. The reduction
in credit used is larger for credit lines (by 56 percent) than for long-term-loans (by 47 percent). This
suggests also that minibond issuances may have incentivized a change in the maturity composition of
the outstanding bank debt in favor of long-term maturities.
Tables 4, 5 and 6 report estimates on the short time period (from two quarters before up to two
quarters after the first minibond issuance). These effects are observed to be persistent over time, also
when we estimate the same difference-in-differences regression with an ex-post period including six
quarters after the first issuance (Table 7).
Over the longer period, issuer firms obtained – after the first issuance – a reduction in the lending
rates on advances by 36 basis points and on long-term loans by 32 basis points, pointing to a slightly
larger effect in terms of economic magnitude. This suggests that the benefits of this funding
diversification are not purely temporary.
When looking at the lending volumes at the firm-bank level, issuer firms reduced the amount of
used bank credit by 59%, while there is no significant variation in the amount of credit granted and the
ratio between credit used and credit granted decreased by around 10 percentage points after the first
issuance. Therefore, the partial substitution between bank loans and debt issuances is confirmed also in
ECB Working Paper Series No 2508 / December 2020 24

a longer-time horizon, and this occurs even if interest rates on minibonds may be sometimes higher than
interest rates on bank loans.
5.2. Empirical Results: Lending from Insider and Outsider Banks
The above analysis shows that issuer firms obtain better credit conditions than ex-ante comparable
non-issuer firms. In order to disentangle the effect - on the reduction of lending rates - of the bargaining
power channel from the information release channel, we explore the potential differences in the lending
rate policies by insider and outsider banks. We define as insiders all the banks having a lending
relationship with the firm in the 12 months prior to the (first) minibond issuance; we classify as outsiders
all the banks which have not provided credit to the firm in the 12 months before the issuance but which
extend credit to that firm in the issuance quarter or in the following two quarters. This classification
applies correspondingly to the non-issuer firms included in the control sample.
We investigate whether the interest rate reduction may be different in magnitude between insiders
and outsiders. The intuition would suggest that the bargaining power argument might apply mainly to
insider banks, which already know the firm thanks to the existing lending relationships, whereas the
information release argument may be more relevant for outsider banks potentially interested in providing
credit to the issuer firm.
In the end, our specification controls for two types of classification: on the borrower’s side,
between issuer and non-issuer firms; on the lender’s side, between insider and outsider banks. We apply
a difference-in-differences-in-differences analysis for treated and untreated firms, in lending
relationships with both insider and outsider banks, by estimating the following regression equation:
(2) 𝑌𝑖, 𝑗, 𝑡 = 𝛼𝑖 + 𝛿 𝑗 + 𝛾𝑡 + 𝛽1𝑀𝑖𝑛𝑖𝑏𝑜𝑛𝑑𝑖 ∗ 𝑃𝑜𝑠𝑡𝑖,𝑡 + 𝛽2𝑀𝑖𝑛𝑖𝑏𝑜𝑛𝑑𝑖 ∗ 𝑃𝑜𝑠𝑡𝑖,𝑡 ∗ 𝑂𝑢𝑡𝑠𝑖𝑑𝑒𝑟𝑖,𝑗,𝑡
+ 𝛽3𝑀𝑖𝑛𝑖𝑏𝑜𝑛𝑑𝑖 ∗ 𝑂𝑢𝑡𝑠𝑖𝑑𝑒𝑟𝑖,𝑗,𝑡 + 𝛽4𝑃𝑜𝑠𝑡𝑖,𝑡 ∗ 𝑂𝑢𝑡𝑠𝑖𝑑𝑒𝑟𝑖,𝑗,𝑡 + 𝛽5 𝑂𝑢𝑡𝑠𝑖𝑑𝑒𝑟𝑖,𝑗,𝑡
+ 𝑍 𝐶𝑜𝑛𝑡𝑟𝑜𝑙𝑠𝑖, 𝑡−4 + 휀𝑖, 𝑗, 𝑡
Our estimates of (2) can disentangle the effect of the (first) minibond issuance on the lending rates
charged to issuer firms by insider and outsider banks. We are mainly interested in the coefficients of the
double interaction 𝛽1, measuring the change in lending rate for issuer firms after the first minibond, and
of the triple interaction 𝛽2, estimating the variation in the post-issuance rate in the lending relationships
with outsider banks. The coefficient of the triple interaction assesses whether the effect of the first
minibond issuance on the lending rate is different in the new lending relationships with an outsider bank
with respect to an insider bank.
ECB Working Paper Series No 2508 / December 2020 25

Since outsider banks do not have a lending relationship with the firms in the pre-treatment period,
we do not know the interest rate that they would have charged at that time. To construct a counterfactual
interest rate for outsider banks before the treatment, we fill the pre-treatment lending rate with the
average lending rate by insider banks to that firm before the issuance. This reflects the actual credit
conditions obtained by the firm before the treatment. We follow the same approach also for the control
firms identified via the exact matching. In this way, we analyze the actual changes in the credit
conditions charged to issuer firms by insider and outsider banks, assuming the same pre-issuance rate
as starting level; therefore the estimated effect depends only on the post-issuance rates by insiders and
outsiders.
Table 8 displays the results of this diff-in-diff-in-diff analysis for different types of loan contracts
and for different estimation periods. As before, the post-issuance period includes either the quarter of
the issuance and the two following quarters (Col. 1-3) or a longer estimation period considering the
quarter of the issuance and the following six quarters (Col. 4-6).
As for the estimation in Table 4, the minibond effects are significant for advances and long-term
loans: after the first issuance, issuer firms obtain a rate reduction by 27 bps on advances (Col. 2) and 24
bps on long-term loans (Col. 3). The coefficient on the triple interaction is negative but not significant:
this suggests that the effect of the first minibond issuance on the lending rates to issuer firms would not
statistically differ in the lending relationships with outsider banks. The post-treatment reduction in
lending rates for issuer firms seems to be driven by the lending conditions charged by insider banks,
supporting the bargaining power explanation of the post-issuance reduction in lending rates. This does
not exclude that outsider banks may have incentives to offer more favorable lending conditions in order
to start new lending relationships. In line with previous evidence (Ioannidou and Ongena, 2010), in our
sample firms obtain a rate reduction by 36 bps on long-term loans by outsider banks after starting a new
lending relationship (see the coefficient for the double interaction Outsider*Post in Col. 3).23
These results are confirmed also when we consider the longer estimation period, with a rate
reduction by 34 bps on advances and by 27 bps on long-term loans, yet without a significant difference
between insider and outsider banks (the coefficient for the triple interaction is still not significant).
23 In fact, when interpreting these results on insider and outsider banks, we need to consider that – given the traditional multiplicity of lending relationships in the Italian credit market – most loans are provided by existing banks and that the loans from new banks represent only a small part of the overall bank debt of the firm.
ECB Working Paper Series No 2508 / December 2020 26

6. Firm-level Analysis
In this section, we analyze the financial and real effects of minibond issuances at the firm level,
by investigating both the impact on some credit variables including lending rates and volumes, and the
outcome on some firm performance measures and balance sheet indicators. In particular, we explore
whether, and to what extent, minibond issuances may have contributed to an overall improvement in the
financing conditions of issuer firms with banks and whether this may have produced some effects on
the performance of these firms.
6.1. Bank Debt: Lending Rates and Volumes
In the analysis of bank debt and financial conditions, we move the focus from the individual firm-
bank lending relationships (as in the previous section) to the overall bank debt received by a firm. We
address two main points: first, whether issuer firms – after the first issuance – observed a change in their
average cost of bank funding vis-à-vis ex-ante comparable non-issuer firms; second, whether – after the
first issuance – issuer firms changed the overall amount of used bank credit or got a variation in the
overall amount of credit granted by banks.
In this way, we want to test whether the results of the analysis for individual firm-bank
relationships hold in general also at the firm-level: i.e., that firms exploiting the opportunity to issue
minibonds not only reduced their overall reliance on bank credit, but also managed to pay lower
financing costs on that credit. This would be very important in a policy perspective to assess the
effectiveness of the minibond reform.
In this analysis, the dependent variables are: the (weighted) average interest rate paid by a firm
on bank loans, also for different types of debt contracts, where the rates paid on individual loans are
weighted on the basis on their nominal amounts; the overall amount of bank credit used by a firm or
granted to it by all banks. We also analyze the overall amount of financial debt these firms can resort to,
considering the used amount of bank debt, the debt provided by other financial intermediaries and the
amounts raised with minibond issuances.
Based on the described matching procedure, we conduct a difference-in-differences analysis using
the following specification at the firm-level:
(3) Yi, t = αi + 𝛾𝑡 + β1 posti, t ∗ minibondi + Z Controls𝑖, 𝑡−4 + εi, t
ECB Working Paper Series No 2508 / December 2020 27

The variables used in this specification, both for the treatment dummy (minibond) and for the firm
controls, are defined as in the estimation at the firm-bank level. In this specification we use firm (αi)
and year (𝛾𝑡) fixed effects. Tables 9 to 12 present the results for the firm-level analysis on credit
outcomes: the main effects observed at the firm-bank level are confirmed.
Table 9 displays the results for the lending rates, by categories of loans. As for the firm-bank
analysis (Table 4), the coefficients are significant for advances and long-term loans. Following the first
minibond, issuer firms obtained overall a decrease in their funding costs through bank advances by 27
basis points and through long-term loans by 40 basis points, based on the specification with the control
variables. The sizeable reduction in interest rates for long-term loans, also larger than the one observed
in the firm-bank level analysis, confirms that the recourse to capital markets allowed issuer firms to
reduce their funding costs particularly for the financing of long-term projects. At the firm level, we
consider also the weighted average lending rates for all bank debt, including all categories of loans.24
Moreover, to analyze the overall funding costs for firms, we use as a dependent variable also the
weighted average interest rate on financial debt as a whole: this is computed as the weighted average of
the lending rates on bank loans and of the coupon rates on corporate bonds, considering all the issuances
instead of only the first one. Our results confirm the decrease in the cost of bank loans, albeit the
estimates are less precise than those by categories of loans. Overall, this reduction in bank lending rates
for issuer firms seems to balance the higher cost of minibond issuances. The result of these two
counteracting drivers is a negligible impact of minibond issuances on the cost of the total financial debt,
which does not differ significantly across treated firms and controls.25
The above results at the firm-level are observed to be persistent over time also when we estimate
equation (3) over a longer post-issuance period, up to six quarters following the issuance (Table 10).
Issuer firms obtained – in the six quarters after the first minibond – a reduction in their average cost of
bank debt by 35 bps on advances and by 47 bps on long-term loans. Provided that long-term loans
account for around two thirds of the overall bank debt and that this share increases after the minibond
issuances (see Table 3), issuer firms benefited from a decrease in their average funding costs via bank
24 For completeness, it is useful to report that the interest rates on distinct categories of loans are computed differently: while the lending rates on long-term loans are computed on the new flows of loans initiated in the post-treatment period, the lending rates on advances and credit lines are calculated based on the outstanding amount of these loans in the same period.
25 However, these results on the overall financing costs have to be interpreted jointly with the results on the overall amount of financial debt, as discussed in Table 11, particularly in light of the increase in the total financial debt.
ECB Working Paper Series No 2508 / December 2020 28

debt of around 40 bps (estimate for the weighted average interest rates on bank loans). Again, the overall
cost of external fund does not change significantly after the issuance for treated against controls firms,
suggesting that the reduction in the cost of bank credit compensates the higher cost of minibonds.
Table 11 reports the coefficients of the firm-level regressions on credit volumes. As in the firm-
bank level analysis (Table 5), after the first minibond issuance, issuer firms reduced significantly the
amount of used bank credit (by 36 percent) while lender banks decreased only slightly the amount of
credit granted to issuer firms (the reduction, around 10 percent, is not significant). As a combination of
these two effects, issuer firms decreased the share of used credit by around 11 percentage points. This
confirms that issuer firms took the opportunity of the minibond issuance to reduce their reliance on bank
credit, even if banks were still willing to provide credit to them.
To analyze the overall debt position of issuer firms, we add other financial debts and the amounts
raised with minibond issuances to the overall credit used (Columns 7 and 8). As before, in this case we
consider all the issuances instead of only the first one. Our estimates show an increase by around 40
percent in the volume of outstanding debt. We obtain consistent results also when we normalize the
amount of financial debt by firms’ total assets: after the first minibond, issuer firms reduced this ratio
by 10 percentage points. This significant increase in the total financial debt used by firms, associated
with no significant change in the overall funding cost26, suggests that minibonds provided issuer firms
with the opportunity to raise a sizeable amount of additional funds without incurring in higher financing
costs. It is doubtful whether these firms could have reached the same result only relying on bank debt,
both for the difficulties in increasing bank loans to such an extent in a short-time horizon, and for the
likely implications of a significant increase in firm leverage on the pricing of bank debt.
Again, also the increase in the amount of available funds and the change in the debt composition
of issuer firms appear to be persistent over time. In the six quarters after the first issuance (Table 12),
issuer firms reduced the amount of credit used by 35%, while banks decreased the amount of credit
granted to the issuer firms by 10%. As a combination of these two effects, the ratio between credit used
and credit granted fell by around 10 percentage points in the six quarters after the issuance, suggesting
some release in the credit constraints for issuer firms. At the same time, these firms increased their
overall amount of financial debt by 39%.
26 See the results in Table 9 col. 9-10 for the changes in the overall financing costs of issuer firms.
ECB Working Paper Series No 2508 / December 2020 29

6.2. Ex-Post Outcomes: Firm Performance and Balance Sheet
Indicators
The firm-level analysis suggests that firms issuing minibonds managed to improve their financing
conditions and to expand the overall amount of financial debt they have access to, while reducing their
reliance on bank credit. This raises the question whether this diversification of funding sources had some
positive impact also on the ex-post performance of these firms.
We investigate the potential effects of the (first) minibond issuances on firm performance by
estimating a difference-in-differences model for some indicators of asset and liability composition,
turnover and profitability, by comparing issuer firms versus ex-ante matched non-issuer firms. On the
asset side, we consider the log of total assets, total fixed assets, tangible and intangible fixed assets; the
ratios of, respectively, total fixed assets, tangible and intangible fixed assets, over total assets. On the
liability side, we analyze the ratio of bank debt to total financial debt, the ratio of total financial debt to
turnover, and the leverage ratio. In addition, we investigate the log of turnover and two measures of
profitability, i.e., the return on assets and the return on equity. We compare firm performance in the year
before the issuance and in the two following years. The estimates consider firm and time fixed effects
according to the specification:
(4) Yi, t = 𝛼𝑖 + 𝛼𝑡 + β1 posti t ∗ minibondi + εi, t
where Postt is equal to 1 in the two years following the issuance and 0 in the year before the issuance,
while 𝛼𝑖 and 𝛼𝑡 are respectively firm and year fixed effects.
Estimates are depicted in Table 13. The average treatment effect of the first issuance on firm
balance sheet and performance is measured by the coefficient for the double interaction between
minibondi t and postt.
After the issuance, treated firms display an increase in total assets by around 19% (col. 1), partly
as a mechanical effect of the rise in financial resources. The composition of the increase gives some
insights on the use of those resources. Total fixed assets rise by around 15% (col. 2), mainly thanks to
the increase in intangible fixed assets, by around 25% (col. 4); while tangible fixed assets show a modest
increase, not statistically significant. Therefore, issuer firms invested more in patents, copyrights,
trademarks, possibly financing these additional investments with minibond issuances. Since the post-
issuance increase in both types of fixed assets was broadly proportional to the increase in total assets,
we do not observe any significant change in the ratios of tangible and intangible fixed assets to total
assets for treated firms after the issuance.
ECB Working Paper Series No 2508 / December 2020 30

This asset expansion has been possible thanks to a substantive increase in the amount of total
financial debt. Indeed, issuer firms increased their leverage by 10.2 percentage points. However, the
increase in leverage was accompanied by a greater diversification of funding sources: issuer firms
reduced the share of bank debt out of total financial debt by 23 percentage points.
We explore whether this balance sheet expansion and these investments in fixed assets may have
contributed positively to the performance of issuer firms. However, we do not find significant changes
in the amount of turnover after the first minibond. Since issuer firms used additional funding to increase
particularly their intangible fixed assets, the effects of this on turnover may be somehow delayed. Also,
we do not observe relevant changes in the profitability of issuer firms: the coefficient for ROE is not
significant, while the significant and negative result for ROA (-2.49) is most likely driven by the increase
in total assets.
The results discussed above refer to two years after the first minibond issuance. We also explored
the effects of minibonds over a shorter time horizon, one year after the first issuance, and most of the
estimated effects are confirmed with the exception of the investments in intangible fixed assets27.
7. Robustness Checks
We conduct several robustness checks on subsamples differing for bond size and maturity or for
firm size and location. Results are reported in Tables 14 and 15.
7.1. Bond Size and Maturity
The characteristics of the issued minibonds may be relevant in shaping the effects of the issuance
on firms’ financing conditions.
The debt maturity profile of issuer firms can affect funding conditions. On one hand, firms which
can rely on longer-term funding sources may be perceived as less risky and, therefore, benefit from
better financing conditions. As long as debt securities have a longer maturity than bank loans, the
observed partial substitution between bank lending and debt issuances may reduce the perceived risk of
the issuer firms and lower the lending rates charged by banks. On the other hand, bonds with longer
maturity may be subject to higher yields than short-term debt instruments, due to the upward slope of
27 The results of this specification are available in Appendix B.
ECB Working Paper Series No 2508 / December 2020 31

the yield curve. This may limit the incentive to decrease lending rates after the issuance in a bargaining
power perspective, as the reduction in bank lending rates to issuer firms may depend on their funding
costs via the alternative market funding source. If so, the decrease in lending rates should be smaller for
firms issuing longer-term minibonds subject to higher yields. We investigate this issue by estimating the
main regressions on a subsample of minibonds with a maturity of at least two years (Panel A in Tables
14 and 15).
Our previous results are broadly confirmed, though with some difference in the magnitude of the
effects. In the firm-bank level analysis, firms issuing minibonds with a maturity of at least two years
showed a reduction of lending rates on advances by 30 bps and on long-term loans by 19 bps (Table 14
Panel A), slightly less than in the overall sample. However, the results at the firm-level (Table 15 Panel
A) are very similar to our baseline specification: firms issuing minibonds with longer maturities benefit
from a reduction in lending rates by 26 bps on advances and 42 bps on long-term loans. Overall, the
estimates on the longer maturity sample do not support the argument about the lower risk perception of
more stable funding, but may be consistent with the hypothesis of a lower bargaining power associated
with the higher yields for longer-term minibond.
On lending volumes, results on the subsample are similar to the overall sample. Notably, at the
firm level, issuer firms reduced their amount of used bank credit by slightly less than the overall sample,
around 30 percent versus 36 percent. This may be due to a smaller reduction in the more costly short-
term loans, given the lower substitutability between bonds with longer maturity and short-term loans.
The bond issuance amount could also be relevant in explaining the effect of funding
diversification, once we control for firm size: minibond issuances of larger amounts may be more
effective in increasing firms’ bargaining power and as substitutes for bank debt. We investigate this on
a subsample of issuances with volume of at most EUR 20 million (Tables 14 and 15, Panel B).
Estimates on lending rates, controlling for firm size and other firm’s specific characteristics, are
comparable with the overall sample. Instead, the effects on lending volumes are substantially smaller:
in the firm-bank level analysis, firms issuing smaller minibonds reduce the amount of used bank credit
by around 27%, compared with over 60% in the overall sample; at the firm-level, used bank credit
decreases by only 8%, versus 36% in the overall sample.
These results suggest that debt issuances of smaller amount allow for a more limited substitution
between loans and bonds, although the gain on lending rates is not affected.
ECB Working Paper Series No 2508 / December 2020 32

7.2. Firm Size and Location
Different types of firms are likely to benefit from minibond issuance in various ways.
As discussed in Section 3, particularly in the months right after the reform also some large firms
took the opportunity to enter the debt capital market by issuing minibonds instead of employing other
types of debt securities which were available to them. These firms may have gained better funding
conditions, too.
Since the minibond reform was introduced primarily to improve the access to finance for SMEs,
we are interested in developing estimates specifically for medium and small firms. For this purpose, we
conduct our analysis on a subsample of firms with turnover below or equal to EUR 50 million.28
Although this reduces the sample of treated firms, results on SMEs confirm the findings on the overall
sample (Tables 14 and 15, Panel C).
At the firm level, the reduction in lending rates is slightly smaller than in the overall sample, but
still sizeable (decrease by 31 bps on long-term loans). On the other hand, the substitution between debt
issuance and bank loans is more limited (the amount of used bank credit decrease by 23% and 8% at the
firm-bank and firm-level respectively; the ratio between credit used and credit granted declines by
around 6 p.p.). The increase in total financial debt is instead as large as in the overall sample.
These results confirm that SMEs took the opportunity of minibond issuances to increase their
leverage by broadening the range of funding sources. The smaller degree of substitution between bank
loans and debt issuances, even under the comparable increase in total debt, suggests that minibond
issuances were used by SMEs not only to substitute bank lending, but also to obtain additional funding.
The smaller reduction in the amount of bank loans, together with the higher risk perception associated
with SME lending, may explain the slightly smaller post-issuance decrease in lending rates.
At last, we investigate whether firm location may play some role in firms’ capital structure, to the
extent that the proximity to financial centers or to stock exchanges may foster information about new
funding sources like minibonds. Firms closer to the headquarters of the stock exchange may be better
informed and therefore have higher chances to use these new debt instruments. We want to investigate
whether our results hold for farther firms as well.
28 This is one of the criteria used for the classification of medium and small firms. Another criterion is related to the amount of total assets (a firm is defined as a SME if it has an amount of total assets below or equal to EUR 43 million).
ECB Working Paper Series No 2508 / December 2020 33

Therefore, we focus on a subsample of firms located outside Lombardy, since the ExtraMot Pro
Platform is a multilateral trading platform provided by the Italian Stock Exchange (“Borsa Italiana”)
with headquarters in Milan; moreover, Milan is the main financial center for Italy, where most
investment banks are headquartered.
Estimates on the subsample (Tables 14 and 15, Panel D) confirm the results obtained on the
overall sample, both at firm-bank level, and at the firm level. Therefore, the effects described above are
robust also to the potential differences in the likelihood to issue minibonds, which could be related to
the location of firms.
8. Conclusions
This paper analyses the effects of the diversification of funding sources – via the issuance of
corporate bonds – on the financing costs and on the debt structure of issuer firms versus ex-ante
comparable non-issuer firms. We exploit the introduction of a recent regulatory reform in Italy aimed at
removing the existing restrictions on the issuance of corporate bonds by unlisted firms. This reform
provides an interesting deregulation experiment as it enabled firms previously relying only on bank
credit to get funding also from capital markets through the issuance of the so-called minibonds.
We focus on minibond issuances between the end of 2012 and the end of 2016. We investigate
whether the use of market-based finance allowed issuer firms to obtain more favorable credit conditions
in their firm-bank relationships, thanks to an increase in their bargaining power with banks. Given that
only some of the many eligible firms issued minibonds, we develop an exact matching procedure to
identify – per each issuer firm – a control sample of ex-ante comparable non-issuer firms, according to
their size, location, activity and financial characteristics before the first issuance. Then we can identify
the impact of the minibond issuance applying a difference-in-differences methodology. The treatment
effect is measured in the quarter of the first issuance and in the following two quarters, compared to the
two quarters before the event; however, estimates over a longer period - including six quarters after the
issuance - show similar results.
Even though minibonds were more costly than bank credit, the analysis shows that issuer firms
obtained lower lending rates charged by banks, particularly on long-term loans and advances. This effect
is driven by the lending behavior of inside banks, which had existing lending relationships with the
issuer firms. These results support the argument that the diversification of funding sources allows firms
to reduce the hold-up effect of firm-bank relationships and to increase their bargaining power with
banks.
ECB Working Paper Series No 2508 / December 2020 34

Furthermore, issuer firms changed the composition of their debt structure by decreasing their
reliance on bank credit. They reduced significantly the amount of bank credit used while increasing the
overall amount of financial debt, suggesting that the minibond issuances led to a partial substitution
between bank loans and capital markets funding. Thanks to the issuance of minibonds, the total amount
of financial debt taken by issuer firms increased by around 40 percent. Importantly, the large increase
in total financial debt was achieved by issuer firms without observing any significant change in their
overall financing costs: indeed, the swift reduction in bank lending rates after the first issuance was large
enough to balance the higher coupon rates on minibond issuances.
We also explore whether the improvement in financial conditions has any implications on the
performance of firms. Comparing one year before with two years after the minibond issuance, we find
that issuer firms increase their amount of total assets and of fixed assets, particularly intangible fixed
assets, signaling that they invested more in patents, copyrights, trademarks. Moreover, although the
leverage of issuer firms raises, their share of bank debt out of total financial debt decreases. Firms’
turnover and profitability are not significantly affected, as a longer time horizon may be needed to
appreciate the effects of higher funding and investment.
The conclusions of this analysis have relevant implications for the design of policy initiatives in
the domain of the Capital Markets Union, particularly in the current debate on the financing solutions
for the recovery of the private sector from the Covid-19 crisis. This paper shows that deregulation
reforms removing previous restrictions to the use of market-based finance may provide a significant
contribution to promote funding diversification and to increase the amount of financial resources
available to firms. Furthermore, provided that small and medium enterprises may still satisfy a
significant part of their funding needs through bank credit, this study finds that this diversification can
be beneficial in many ways: better financing conditions on bank loans, larger funds availability, a more
balanced maturity profile.
ECB Working Paper Series No 2508 / December 2020 35

References
Accornero, M., P. Finaldi Russo, G. Guazzarotti, and V. Nigro (2015). First-time Corporate Bond
Issuers in Italy. Bank of Italy Occasional Paper Series, 269
Accornero, M., P. Finaldi Russo, G. Guazzarotti, and V. Nigro (2018). Missing Investors in the Italian
Corporate Bond Market. Bank of Italy Occasional Paper Series, 450
Albareto, G., and G. Marinelli (2018). Italian Banks and Market-Based Corporate Financing. Bank of
Italy Occasional Paper Series, 432
Altavilla C., F. Barbiero, M. Boucinha, and L. Burlon (2020). The Great Lockdown: Pandemic Response
Policies and Bank Lending Conditions. ECB Working Paper Series, 2465
Altman E. I. (1968). Financial Ratios, Discriminant Analysis and the Prediction of Corporate
Bankruptcy. The Journal of Finance, 23, 589-609.
Altman, E. I., A. Gande, and A. Saunders (2010). Bank Debt versus Bond Debt: Evidence from
Secondary Market Prices. Journal of Money, Credit and Banking, 42 (4), 755-767
Becker, B. and V. Ivashina (2018). Financial Repression in the European Sovereign Debt Crisis. Review
of Finance, 22 (1), 83-115
Becker, B. and V. Ivashina (2014). Cyclicality of Credit Supply. Journal of Monetary Economics, 62,
76-93
Berg, T., A. Saunders, and S. Steffen (2016). The Total Cost of Corporate Borrowing in the Loan
Market: Don’t Ignore the Fees. The Journal of Finance, 71 (3), 1357-1392.
Besanko, D. and G. Kanatas (1993). Credit Market Equilibrium with Bank Monitoring and Moral
Hazard. Review of Financial Studies, 6 (1), 213-232
Bhatia, A. V., S. Mitra, A. Weber, S. Aiyar, L. Antound de Almeida, C. Cuervo, A. Oliveira Santos, and
T. Gudmundsson (2019). A Capital Market Union for Europe, IMF Discussion Note, 19/07
Bolton, P., X. Freixas, L. Gambacorta, and P. E. Mistrulli (2016). Relationship and Transaction Lending
in a Crisis. Review of Financial Studies, 29 (10), 2643-2676
ECB Working Paper Series No 2508 / December 2020 36

Bolton, P., and X. Freixas (2000). Equity, Bonds and Market Debt: Capital Structure and Financial
Market Equilibrium under Asymmetric Information. Journal of Political Economy, 108 (2), 324-
351
Boot, A., and A. Thakor (1997). Financial System Architecture. Review of Financial Studies, 10 (3),
693-733
Cerved Group (2013). Is There a Market for Mini-bonds in Italy? A Snapshot of Unlisted Companies.
Cerved Group
Constâncio, V., K. Lannoo, and A. Thomadakis (2020). Rebranding Capital Markets Union: A Market
Finance Action Plan. Report of a CEPS-ECMI Task Force
De Guindos, L., F. Panetta, and I. Schnabel (2020). Europe Needs a Fully Fledged Capital Markets
Union – Now more than Ever. ECB Blog Post, 2 September 2020
Denis, D.J., and V.T. Mihov (2003). The Choice among Bank Debt, Non-bank Private Debt, and Public
Debt: Evidence from New Corporate Borrowings. Journal of Financial Economics, 70, 3–28
Diamond, D. (1991). Monitoring and Reputation: The Choice between Bank Loans and Directly Placed
Debt. Journal of Political Economy, 99, 688-721
Diamond, D. (1984). Financial Intermediation and Delegated Monitoring. Review of Economic Studies,
51 (3), 393-414
Drucker, S., and M. Puri (2005). On the Benefits of Concurrent Lending and Underwriting. Journal of
Finance, 60 (6), 2763-2799
EU Commission (2015). Building a Capital Markets Union. Green Paper
Financial Times (2020). EU Urged to Make Radical Changes to Boost Investment Sector. 10 June 2020,
available at https://www.ft.com/content/68987cd1-3394-4a0c-a6a1-e8ab6c5001bf
Greenbaum, S., G. Kanatas, and I. Venezia (1989). Equilibrium Loan Pricing under the Bank-Client
Relationship. Journal of Banking and Finance, 13 (2), 221-235
Hale, G., and J. A. C. Santos (2009). Do Banks Price their Informational Monopoly? Journal of
Financial Economics, 93, 185–206.
High Level Forum on the Capital Markets Union (2020), A New Vision for Europe’s Capital Markets,
Final Report
ECB Working Paper Series No 2508 / December 2020 37

Holmstrom, B., and J. Tirole (1997). Financial Intermediation, Loanable Funds and the Real Sector.
Quarterly Journal of Economics, 112 (3), 663-691
Hoshi, T., A. Kashyap, and D. Scharfstein (1993). The Choice between Public and Private Debt: an
Analysis of Post-Deregulation Corporate Financing in Japan. NBER Working Paper Series, 4421
Iacus, S. M., G. King and G. Porro, (2011). Multivariate Matching Methods That Are Monotonic
Imbalance Bounding. Journal of the American Statistical Association, 106 (493), 345-361.
Ioannidou, V., and S. Ongena (2010). “Time for a Change”: Loan Conditions and Bank Behavior when
Firms Switch Banks. Journal of Finance, 65 (5), 1847-1877
Myers, S. C., and N. S. Majluf (1984). Corporate Financing and Investment Decisions when Firms Have
Information that Investors do not Have. Journal of Financial Economics, 13, 187-221
Osservatorio Mini-Bond (2018). 4° Report Italiano sui Mini-Bond. Politecnico di Milano.
Pagano, M., F. Panetta, and L. Zingales (1998). Why Do Companies Go Public? An Empirical Analysis.
Journal of Finance, 53, 27-64
Petersen, M., and R. Rajan (1994). The Benefits of Lending Relationships: Evidence from Small
Business Data. The Journal of Finance, 49 (1), 3-37.
Rajan, R. (1992). Insiders and Outsiders: The Choice between Informed and Arms’-Length Debt. The
Journal of Finance, 47 (4), 1367-1400
Rauh, J. D., and A. Sufi. (2010). Capital Structure and Debt Structure. The Review of Financial Studies,
23 (12), 4242-4280.
Santos, J. A. C., and A. Winton (2008). Bank Loans, Bonds and Information Monopolies across the
Business Cycle. Journal of Finance, 63 (3), 1315-1359
Schenone, C. (2010). Lending Relationships and Information Rents: Do Banks Exploit their Information
Advantages? Review of Financial Studies, 23 (3), 1149-1199
Schwert, M. (2020). Does Borrowing from Banks Cost More than Borrowing from the Market? Journal
of Finance, forthcoming
Schwert, M. (2018). Bank Capital and Lending Relationships. The Journal of Finance, 73 (2), 787-830
ECB Working Paper Series No 2508 / December 2020 38

Sharpe, S. A. (1990). Asymmetric Information, Bank Lending, and Implicit Contracts: A Stylised Model
of Customer Relationships. Journal of Finance, 45 (4), 1069-1087
Sufi, A. (2009). Bank Lines of Credit in Corporate Finance: An Empirical Analysis. Review of Financial
Studies, 22, 1057–1088.
Von Thadden, E.-L. (2004). Asymmetric Information, Bank Lending and Implicit Contracts: the
Winner’s Curse. Finance Research Letters, 1 (1), 11-23
Wieser, T. (2020). We Must Resurrect EU Capital Markets Union. Financial Times. 10 June 2020,
available at https://www.ft.com/content/7c70a858-79ba-4b3f-af80-7a207e14a558
ECB Working Paper Series No 2508 / December 2020 39

Figure 1: Minibond Issuances: Amount and Number of Firms
This figure displays the composition – in terms of firm size – of the population and of the sample used in the estimates of issuer firms across the years of the first minibond issuance. Firms are classified as small, medium or large in relation to their size based on their total assets, according to EU classification of firms (small: lower than 10 million; medium: 10 to 43 million; large: greater than 43 million). The charts display the composition of firms in terms of overall issuance amounts (in EUR millions, in the panel A) and of number of firms (in units, in the panel B).
Panel A. Issuance amounts by year and firm size
(population and sample of issuer firms; Millions of Euros)
Panel B. Issuer firms by year and size
(population and sample of issuer firms; number of firms)
0
1.000
2.000
3.000
4.000
0
1.000
2.000
3.000
4.000
2012 2013 2014 2015 2016 2012 2013 2014 2015 2016population sample
large firmsmedium firmssmall firms
0
20
40
60
0
20
40
60
2012 2013 2014 2015 2016 2012 2013 2014 2015 2016population sample
large firmsmedium firmssmall firms
ECB Working Paper Series No 2508 / December 2020 40

Figure 2: Common Trends for Issuer and Control Firms
This figure is designed to check the common trends assumption for issuer (treated) firms and matched non-issuer (control) firms. We display graphically the dynamics of interest rates for distinct categories of loans (credit lines, advances and long-term debt) and of the share of credit used over credit granted. Both the lending rates and the ratio of used credit are expressed as weighted averages – at the firm-level – provided that the weights are based on the volumes of loans. We take note that the treatment (i.e., the first minibond issuance) occurs at different time for each firm, in a period between October 2012 and December 2016. Given that different issuance periods were also characterised by different conditions in interest rates and financing costs, we compare the trends in lending rates and volumes by normalizing the levels just before the time of the first issuance (t-1). We consider the issuer firms and the control non-issuer firms at the time of treatment, four quarter before and six quarters after the treatment.
Interest rate on credit lines Interest rate on advances
Interest rate on long term debt Share of used credit
ECB Working Paper Series No 2508 / December 2020 41

Table 1. Characteristics of Minibond Issuances
This table presents some descriptive statistics about the population and the sample used in the empirical analysis for minibond issuers. The population refers to all the issuances of minibonds, while the sample includes only the issuances of minibonds by firms included as treated in the analysis. Panel A reports – for the minibond issuances – the number of bonds and firms, the share of bonds with fixed rate coupon and the average coupon rate; the minibond issuances are classified by market and by issuance date.
# Bonds
# Firms
Value (million Euros)
Share of fixed interest
rate (%)
Average coupon rate
Population of issuer firms
Market:
ExtraMOT Pro 188 124 7,171 78.7 5.9
Other 43 24 1,767 38.2 5.1
Total 231 148 8,937 72.5 5.8
Issuance date
2012 2 2 675 - -
2013 39 26 3,884 82.9 7.1
2014 70 59 1,746 79.4 5.8
2015 43 33 406 81.0 5.4
2016 77 46 2,226 57.1 5.3
Sample used in the empirical analysis
Market
ExtraMOT Pro 107 73 2,765 83.2 6.1
Other 33 19 1,417 26.9 4.9
Total 140 92 4,182 72.2 6.0
Issuance date
2012 2 2 675 - -
2013 18 15 1,572 86.7 7.5
2014 40 35 1,052 87.2 6.3 2015 27 22 200 84.6 5.7
2016 53 29 683 50.9 5.3
ECB Working Paper Series No 2508 / December 2020 42

Table 2 - Characteristics of Minibond Issuers and Control Firms:
Composition and Balance Sheet Data
This table presents some firm-level descriptive statistics regarding the issuer firms and the ex-ante comparable non-issuer firms selected for the control sample. The descriptive statistics present the composition of the two sets of firms according to different variables (economic activity, firm size, firm location, Z-Score) and some balance sheet characteristics before the introduction of the minibond (as median values for the period 2010-2012).
Treated firms
Control firms
Potential control firms
Treated firms
Control firms
Potential control firms
Observations 92 2666 30120 Z-score
Low risk 46.2 43.5 60.3 Economic
Activity Medium risk 35.7 41.3 30.8 Agriculture and fishing 2.2 2.2 1.4 High risk 18.0 15.2 8.9
Manufacturing 45.0 45.7 37.9
Non-manufacturing 10.4 9.8 5.4
Balance sheet data
(median values,
2010-12)
Construction 4.5 4.3 6.0 EBITDA / Assets 7.09 6.47 6.95 Service industries 37.9 38.0 49.3 ROA 4.35 3.32 3.93
ROE 6.35 4.9 5.83 Firm size:
(firm’s total assets) Leverage (2) 65.24 63.96 47.67 Small 12.5 13.0 27.7 Cost of debt/EBITDA 23.18 16.44 9.89 Medium 42.6 41.3 51.6 Wages/Turnover 16.99 10.86 12.31 Large 44.9 45.7 20.6 Fixed Assets / Assets 0.20 0.20 0.20
Tangible fixed assets/Assets 0.11 0.14 0.15
Firm LocationDelta fixed assets/assets (t-1) 0.44 0.04 0.13
North 77.2 77.2 67.2
Delta tangible Fixed assets / tangible fixed assets (t-1) 3.08 0.95 3.67
Centre 12.5 13.0 18.0 South and Isles 10.4 9.8 13.9
(1) Based on firm’s total assets, according to EU classification of firms (small: lower than 10 million; medium: 10 to 43 million;large: greater than 43 million). (2) The leverage ratio is measured as the share of financial debt over the sum of financial debt andnet worth.
ECB Working Paper Series No 2508 / December 2020 43

Table 3 - Characteristics of Minibond Issuers and Control Firms:
Interest Rates, Bank Loans and Financial Debt
This table presents some firm-level descriptive statistics regarding the issuer firms and the ex-ante comparable non-issuer firms selected for the control sample. It reports some firm-level characteristics: 1) for the interest rates on different types of banks loans, on all bank loans and on total financial debt; 2) for the composition and use of bank loans, including the ratio between credit used and granted, the composition of credit used and granted, and the number of lending relationships; 3) for the amounts of different types of financial debt, expressed as a percentage of firm total assets. The descriptive statistics report the averages of the quarterly observations for two periods, respectively the two quarters before the issuance of the first minibond (before) and the quarter of the issuance and the following two quarters (after). Please note that the minibonds were issued in different time periods. The table displays also, respectively for treated and control firms, the differences in means of each variable comparing two quarters before with the issuance quarter and the two following quarters, and reports the results of the two-sample t-test for the statistical significance of the differences-in-means. ***, ** and * indicate, respectively, statistical significance at 1, 5, 10 percent level.
Before After After
– Before
(after-before) Treated firms
– (after-before) Control firms
Treated firms
Control firms
Treated firms
Control firms
Treated firms
Control firms
1. Interest Rates
Outstanding credit lines 7.44 7.57 7.95 7.49 0.51 -0.08 0.59 Outstanding advances 4.16 3.31 3.73 3.04 -0.43** -0.27*** -0.16New long term loans 4.93 4.23 4.31 3.75 -0.62*** -0.48*** -0.14Total bank loans 4.81 4.05 4.43 3.75 -0.38* -0.30*** -0.08Total financial debt (incl. minibonds) 4.81 4.05 4.95 3.75 0.14 -0.30*** 0.44*
2. Bank Loans: Composition and Relationships
Used/granted (percent) 75.8 62.7 65.7 62.9 -10.1*** 0.2 -10.3***
Composition granted (percent)
Credit lines 8.4 9.9 9.4 9.8 Advances 28.7 36.3 29.1 36.0 Long-term loans 62.9 53.8 61.5 54.2
Composition used (percent)
Credit lines 5.6 6.5 2.5 5.7 Advances 23.8 28.6 22.2 28.4 Long-term loans 70.5 65.2 75.3 66.5
Number of banks by firm 13.8 9.0 13.3 9.4
3. Financial Debt (percent. Total Assets)
Used loans (banks) 28.6 28.6 23.8 28.9 -4.8*** 0.3 -5.1**Used loans (banks, other intermediaries) 32.9 32.6 28.1 32.6 -4.8*** 0.1 -4.7*Minibonds 0.0 0.0 17.3 0.0 17.3*** 0.0 17.3*** Total financial debt (incl. minibonds) 32.9 32.6 42.8 32.6 9.8*** 0.1 9.9***
ECB Working Paper Series No 2508 / December 2020 44

Table 4. Firm-bank Level Analysis
Effects of the First Minibond Issuance on Lending Rates
This table presents the results of the difference-in-differences regression for the changes in lending rates at the firm-bank level after the issuance of minibonds. The treatment corresponds to the first issuance of a minibond. The control sample includes ex-ante comparable non-issuer firms identified on the basis of a coarsened exact matching based on ex-ante firm-level characteristics. The control group is selected in each year, and each firm in the control group is assigned the same time of event of the matched treated firms in that year. The regression includes bank, firm and year fixed effects. Given the inclusion of firm and time fixed effects, the coefficient for the interaction between the first minibond issuance (Minibond) and the post-issuance dummy (Post) defines the average treatment effect of the first issuance on lending rates at the firm-bank level, for different categories of credit contracts (credit lines, advances, long-term loans). We consider two quarters before the first issuance by firm (Post=0), against the quarter of the issuance and the following two quarters (dummy Post=1). The issuance period considered in the estimates is between the fourth quarter of 2012 and the end of 2016; the overall sample period consider data between June 2012 up until June 2017. The lending rates are expressed in percent rates. While Col. 1, 3 and 5 correspond to the specifications with the fixed effects and the diff-in-diff interaction term, Col. 2, 4 and 6 report also the one-year lagged firm-level control variables (total assets, leverage and Z-Score). Standard errors are clustered at firm level. Regressions are weighted with CEM strata weights. ***, **, * indicate, respectively, statistical significance at 1, 5, 10 percent level.
(1) (2) (3) (4) (5) (6)Credit lines Advances Long-Term
Minibond * Post 0.052 0.050 -0.285*** -0.294*** -0.289*** -0.279***[0.155] [0.158] [0.099] [0.096] [0.073] [0.074]
Ln (Total Assetst-4) 0.232 0.042 -0.222*[0.253] [0.107] [0.118]
Leveraget-4 -0.009 0.007** 0.002[0.007] [0.003] [0.004]
Z-Scoret-4 0.106 0.299*** -0.035[0.072] [0.039] [0.037]
Firm FE YES YES YES YES YES YES Bank FE YES YES YES YES YES YES Year FE YES YES YES YES YES YES
Observations 64503 64503 66458 66458 49177 49177 R-Squared 0.001 0.001 0.010 0.020 0.015 0.017 No. Firms 2549 2549 2393 2393 2268 2268 No. Issuers 90 90 81 81 86 86
ECB Working Paper Series No 2508 / December 2020 45

Table 5. Firm-bank Level Analysis
Effects of the First Minibond Issuance on Credit Volumes
This table presents the results of the difference-in-differences regression for the changes in lending volumes at the firm-bank level after the issuance of minibonds. The treatment corresponds to the first issuance of a minibond. The control sample includes ex-ante comparable non-issuer firms identified on the basis of a coarsened exact matching based on ex-ante firm-level characteristics. The control group is selected in each year, and each firm in the control group is assigned the same time of event of the matched treated firms in that year. The regression includes bank, firm and year fixed effects. Given the inclusion of firm and time fixed effects, the coefficient for the interaction between the first minibond issuance (Minibond) and the post-issuance dummy (Post) defines the average treatment effect of the first issuance on lending volumes at the firm-bank level, respectively for credit used, credit granted and for the ratio between credit used and credit granted, for all the types of credit contracts. We consider two quarters before the first issuance by firm (Post=0), against the quarter of the issuance and the following two quarters (dummy Post=1). The issuance period considered in the estimates is between the fourth quarter of 2012 and the end of 2016; the overall sample period consider data between June 2012 up until June 2017. While Col. 1, 3 and 5 correspond to the specifications with the fixed effects and the diff-in-diff interaction term, Col. 2, 4 and 6 report also the one-year lagged firm-level control variables (total assets, leverage and Z-Score). Standard errors are clustered at firm level. Regressions are weighted with CEM strata weights. ***, **, * indicate, respectively, statistical significance at 1, 5, 10 percent level.
(1) (2) (3) (4) (5) (6)Credit Used Credit Granted Used / Granted
Minibond * Post -0.604*** -0.627*** -0.082 -0.115 -0.112*** -0.110***[0.141] [0.140] [0.069] [0.070] [0.019] [0.019]
Ln (Total Assetst-4) 0.302*** 0.327** -0.049***[0.100] [0.139] [0.013]
Leveraget-4 0.013*** 0.007*** 0.001***[0.003] [0.002] [0.001]
Z-Scoret-4 0.055 -0.119*** 0.017***[0.052] [0.038] [0.007]
Firm FE YES YES YES YES YES YES Bank FE YES YES YES YES YES YES Year FE YES YES YES YES YES YES
Observations 99906 99906 189060 189060 97213 97213 R-Squared 0.001 0.004 0.000 0.002 0.002 0.007 No. Firms 2744 2744 2758 2758 2729 2729 No. Issuers 91 91 92 92 91 91
ECB Working Paper Series No 2508 / December 2020 46

Table 6. Firm-bank Level Analysis
Effects of the First Minibond Issuance on Credit Used, for Types of Bank Loans
This table presents the results of the difference-in-differences regression for the changes in lending volumes (credit used) at the firm-bank level after the issuance of minibonds. The treatment corresponds to the first issuance of a minibond. The control sample includes ex-ante comparable non-issuer firms identified on the basis of a coarsened exact matching based on ex-ante firm-level characteristics. The control group is selected in each year, and each firm in the control group is assigned the same time of event of the matched treated firms in that year. The regression includes bank, firm and year fixed effects. Given the inclusion of firm and time fixed effects, the coefficient for the interaction between the first minibond issuance (Minibond) and the post-issuance dummy (Post) defines the average treatment effect of the first issuance on the volumes of credit used at the firm-bank level, for different categories of credit contracts (credit lines, advances, long-term loans). We consider two quarters before the first issuance by firm (Post=0), against the quarter of the issuance and the following two quarters (dummy Post=1). The issuance period considered in the estimates is between the fourth quarter of 2012 and the end of 2016; the overall sample period consider data between June 2012 up until June 2017. While Col. 1, 3 and 5 correspond to the specifications with the fixed effects and the diff-in-diff interaction term, Col. 2, 4 and 6 report also the one-year lagged firm-level control variables (total assets, leverage and Z-Score). Standard errors are clustered at firm level. Regressions are weighted with CEM strata weights. ***, **, *indicate, respectively, statistical significance at 1, 5, 10 percent level.
(1) (2) (3) (4) (5) (6)Credit lines Advances Long-Term
Minibond * Post -0.570*** -0.563*** -0.532*** -0.513*** -0.430*** -0.468***[0.102] [0.101] [0.096] [0.099] [0.155] [0.156]
Ln (Total Assetst-4) -0.099 -0.449*** 0.526***[0.100] [0.126] [0.128]
Leveraget-4 0.003 0.012*** 0.011***[0.003] [0.003] [0.004]
Z-Scoret-4 0.102** 0.073 -0.033[0.045] [0.060] [0.052]
Firm FE YES YES YES YES YES YES Bank FE YES YES YES YES YES YES Year FE YES YES YES YES YES YES
Observations 99906 99906 99906 99906 99906 99906 R-Squared 0.002 0.003 0.001 0.006 0.001 0.005 No. Firms 2744 2744 2744 2744 2744 2744 No. Issuers 91 91 91 91 91 91
ECB Working Paper Series No 2508 / December 2020 47

Table 7. Firm-bank Level Analysis
Effects of the First Minibond Issuance on Lending Rates and Volumes
(longer post-issuance period)
This table presents the results of the difference-in-differences regression for the changes in lending rates and volumes at the firm-bank level after the issuance of minibonds. The treatment corresponds to the first issuance of a minibond. The control sample includes ex-ante comparable non-issuer firms identified on the basis of a coarsened exact matching based on ex-ante firm-level characteristics. The control group is selected in each year, and each firm in the control group is assigned the same time of event of the matched treated firms in that year. The regression includes firm and year fixed effects. Given the inclusion of firm and time fixed effects, the coefficient for the interaction between the first minibond issuance (Minibond) and the post-issuance dummy (Post) defines the average treatment effect - at the firm-bank level - of the first issuance on the lending rates for advances and long-term loans, and on credit volumes for used and granted bank credit, as well as for the ratio between used and granted bank credit (for all the types of credit contracts). We consider two quarters before the first issuance by firm (Post=0), against the quarter of the issuance and the following six quarters (dummy Post=1). The issuance period considered in the estimates is between the fourth quarter of 2012 and the end of 2016; the overall sample period consider data between June 2012 up until June 2018. The lending rates are expressed in percent rates. The regression specification includes also the one-year lagged firm-level control variables (total assets, leverage and Z-Score). Standard errors are clustered at firm level. Regressions are weighted with CEM strata weights. ***, **, * indicate, respectively, statistical significance at 1, 5, 10 percent level.
Lending Rates Lending Volumes
Advances Long-Term Credit Used Credit Granted Used / Granted
Minibond * Post -0.361*** -0.321*** -0.588*** -0.106 -0.099***[0.116] [0.099] [0.143] [0.088] [0.019]
Ln (Total Assetst-4) -0.181** -0.272** 0.348*** 0.427*** -0.037***[0.082] [0.119] [0.099] [0.129] [0.012]
Leveraget-4 0.007*** 0.001 0.011*** 0.010*** 0.002***[0.002] [0.002] [0.002] [0.002] [0.000]
Z-Scoret-4 0.280*** 0.026 0.025 -0.122*** 0.014***[0.027] [0.026] [0.035] [0.029] [0.004]
Firm FE YES YES YES YES YES
Bank FE YES YES YES YES YES
Year FE YES YES YES YES YES
Observations 117551 90925 179271 340308 174373 R-Squared 0.048 0.066 0.005 0.004 0.007 No. Firms 2414 2333 2745 2758 2731 No. Issuers 81 86 91 92 91
ECB Working Paper Series No 2508 / December 2020 48

Table 8. Firm-bank Level Analysis.
Effects of the First Minibond Issuance on Lending Rates: Insider and Outsider Banks
This table presents the results of the difference-in-differences-in-differences estimation for the changes in lending rates charged at the firm-bank level by insider and outsider banks after the issuance of minibonds. We explore whether the changes in lending rates after the treatment may be different across insider and outsider banks. The treatment corresponds to the first issuance of a minibond. The control sample includes ex-ante comparable non-issuer firms identified on the basis of a coarsened exact matching based on ex-ante firm-level characteristics. A bank is defined as outsider in a firm-bank lending relationship, if it has not provided credit in the 12 months before the minibond issuance, but extends credit to the firm in the issuance quarter or in the following ones. For the insider banks, we observe the lending rates charged before and after the minibond issuance. For outsider banks, we observe only the interest rates applied after the issuance, so we compute the counterfactual lending rate for the pre-issuance period as the average interest rate charged to the same firm by the insider banks before the minibond issuance. The regression includes bank, firm and year fixed effects. Given the inclusion of firm and time fixed effects, the coefficient for the interaction between the first minibond issuance (Minibond) and the post-issuance dummy (Post) defines the average treatment effect of the first issuance on lending rates at the firm-bank level, for different categories of credit contracts (credit lines, advances, long-term loans). The coefficient for the triple interaction term (Minibond * Post * Outsider) indicates whether and to what extent the average treatment effect on lending rates varies for the lending relationships with outsider banks. We consider two different estimation periods: in Col. 1-3, we compare the two quarters before the first issuance (Post=0), against the quarter of the issuance and the following two quarters (dummy Post=1); in Col. 4-6, we compare the two quarters before the first issuance (Post=0), against the quarter of the issuance and the following six quarters (dummy Post=1). The issuance period considered in the estimation is between the fourth quarter of 2012 and the end of 2016; the overall sample period include data from the second quarter of 2012 to the second quarter of 2018. The lending rates are expressed in percent rates. Standard errors are clustered at firm level. Regressions are weighted with CEM strata weights. ***, **, * indicate, respectively, statistical significance at 1, 5, 10 percent level.
Post=1 for the issuance quarter and the two following ones
Post=1 for the issuance quarter and the six following ones
(1) (2) (3) (4) (5) (6) Credit lines Advances Long term Credit lines Advances Long term
Minibond * Post 0.052 -0.270*** -0.240*** 0.127 -0.336*** -0.269***[0.149] [0.091] [0.064] [0.175] [0.114] [0.088]
Minibond * Post* Outsider 0.383 -0.218 -0.034 0.703 -0.058 0.007[0.804] [0.194] [0.172] [0.771] [0.184] [0.179]
Minibond * Outsider -0.765 0.009 -0.063 -0.934 -0.066 -0.077[0.763] [0.119] [0.129] [0.773] [0.131] [0.139]
Post* Outsider 0.377 -0.018 -0.362*** 0.113 -0.186* -0.521***[0.274] [0.115] [0.056] [0.284] [0.098] [0.048]
Outsider -0.544 0.234*** 0.148*** -0.533 0.239*** 0.185***[0.346] [0.082] [0.049] [0.349] [0.092] [0.048]
Ln (Total Assetst-4) 0.227 0.042 -0.226* 0.190 -0.179** -0.270**[0.252] [0.110] [0.121] [0.194] [0.085] [0.120]
Leveraget-4 -0.009 0.007** 0.001 -0.004 0.007*** 0.001[0.007] [0.003] [0.004] [0.005] [0.002] [0.002]
Z-Scoret-4 0.092 0.293*** -0.030 0.045 0.269*** 0.029[0.072] [0.039] [0.037] [0.065] [0.027] [0.026]
Firm FE YES YES YES YES YES YESBank FE YES YES YES YES YES YESYear FE YES YES YES YES YES YES
Observations 64332 66211 48920 111250 115126 88274R-squared 0.002 0.021 0.020 0.005 0.049 0.068No. Firms 2549 2393 2268 2593 2414 2333No. Issuers 90 81 86 90 81 86
ECB Working Paper Series No 2508 / December 2020 49

Table 9. Firm-level Analysis
Effects of the First Minibond Issuance on Lending Rates
This table presents the results of the difference-in-differences regression for the changes in lending rates at the firm-level after the issuance of minibonds. The treatment corresponds to the first issuance of a minibond. The control sample includes ex-ante comparable non-issuer firms identified on the basis of a coarsened exact matching based on ex-ante firm-level characteristics. The control group is selected in each year, and each firm in the control group is assigned the same time of event of the matched treated firms in that year. The regression includes firm and year fixed effects. Given the inclusion of firm and time fixed effects, the coefficient for the interaction between the first minibond issuance (Minibond) and the post-issuance dummy (Post) defines the average treatment effect of the first issuance on lending rates at the firm-level, for different categories of credit contracts (credit lines, advances, long-term loans) and for the overall bank debt, as well as on the interest rates for the total financial debt used (including bank debt and bond issuances). We consider two quarters before the first issuance by firm (Post=0), against the quarter of the issuance and the following two quarters (dummy Post=1). The issuance period considered in the estimates is between the fourth quarter of 2012 and the end of 2016; the overall sample period consider data between June 2012 up until June 2017. The lending rates are expressed in percent rates. While Col. 1, 3, 5, 7 and 9 correspond to the specifications with the fixed effects and the diff-in-diff interaction term, Col. 2, 4, 6, 8 and 10 report also the one-year lagged firm-level control variables (total assets, leverage and Z-Score). Standard errors are clustered at firm level. Regressions are weighted with CEM strata weights. ***, **, * indicate, respectively, statistical significance at 1, 5, 10 percent level.
(1) (2) (3) (4) (5) (6) (7) (8) (9) (10)
Credit lines Advances Long-Term Overall bank loans
Total Financial Debt
Minibond * Post
0.606 0.535 -0.285*** -0.267*** -0.390*** -0.400*** -0.499* -0.472* 0.067 0.092 [0.424] [0.432] [0.102] [0.103] [0.139] [0.139] [0.294] [0.285] [0.293] [0.283]
Ln (Total Assetst-4)
1.202** -0.235 0.153 -0.476 -0.443[0.595] [0.357] [0.389] [0.549] [0.550]
Leveraget-4 -0.025*** 0.001 0.007* 0.020* 0.020*
[0.009] [0.004] [0.004] [0.012] [0.012]
Z-Scoret-40.118 0.015 0.090 0.065 0.078
[0.207] [0.052] [0.060] [0.105] [0.104]
Firm FE YES YES YES YES YES YES YES YES YES YES Year FE YES YES YES YES YES YES YES YES YES YES
Observations 12265 12265 11650 11650 11079 11079 12694 12694 12694 12694 R-Squared 0.001 0.004 0.058 0.059 0.083 0.089 0.003 0.003 0.002 0.003 No. Firms 2565 2565 2399 2399 2309 2309 2585 2585 2585 2585 No. Issuers 90 90 82 82 87 87 90 90 90 90
ECB Working Paper Series No 2508 / December 2020 50

Table 10. Firm-level Analysis
Effects of the First Minibond Issuance on Lending Rates (longer post-issuance period)
This table presents the results of the difference-in-differences regression for the changes in lending rates at the firm-level after the issuance of minibonds. The treatment corresponds to the first issuance of a minibond. The control sample includes ex-ante comparable non-issuer firms identified on the basis of a coarsened exact matching based on ex-ante firm-level characteristics. The control group is selected in each year, and each firm in the control group is assigned the same time of event of the matched treated firms in that year. The regression includes firm and year fixed effects. Given the inclusion of firm and time fixed effects, the coefficient for the interaction between the first minibond issuance (Minibond) and the post-issuance dummy (Post) defines the average treatment effect issuance on lending rates at the firm-level, for different categories of credit contracts (credit lines, advances, long-term loans) and for the overall bank debt, as well as on the interest rates for the total financial debt used (including bank debt and bond issuances). We consider two quarters before the first issuance by firm (Post=0), against the quarter of the issuance and the following six quarters (dummy Post=1). The issuance period considered in the estimates is between the fourth quarter of 2012 and the end of 2016; the overall sample period consider data between June 2012 up until June 2018. The lending rates are expressed in percent rates. While Col. 1, 3, 5, 7 and 9 correspond to the specifications with the fixed effects and the diff-in-diff interaction term, Col. 2, 4, 6, 8 and 10 report also the one-year lagged firm-level control variables (total assets, leverage and Z-Score). Standard errors are clustered at firm level. Regressions are weighted with CEM strata weights. ***, **, * indicate, respectively, statistical significance at 1, 5, 10 percent level.
(1) (2) (3) (4) (5) (6) (7) (8) (9) (10)Credit lines Advances Long-Term Overall
bank loans Total Financial
Debt
Minibond * Post 0.611 0.572 -0.379*** -0.355*** -0.482*** -0.471*** -0.414** -0.392** 0.230 0.250 [0.478] [0.483] [0.131] [0.129] [0.160] [0.158] [0.199] [0.194] [0.206] [0.200]
Ln (Total Assetst-4) 0.472 -0.171 -0.105 -0.247 -0.224[0.495] [0.179] [0.236] [0.290] [0.290]
Leveraget-4 -0.007 -0.000 0.002 0.002 0.002[0.008] [0.003] [0.003] [0.005] [0.005]
Z-Scoret-4 -0.091 0.075** 0.139*** 0.053 0.055[0.175] [0.037] [0.044] [0.144] [0.143]
Firm FE YES YES YES YES YES YES YES YES YES YES Year FE YES YES YES YES YES YES YES YES YES YES
Observations 20862 20862 20571 20571 19981 19981 22558 22558 22558 22558 R-Squared 0.010 0.011 0.148 0.151 0.162 0.169 0.003 0.003 0.003 0.003 No. Firms 2518 2518 2419 2419 2365 2365 2601 2601 2601 2601 No. Issuers 89 89 82 82 87 87 90 90 90 90
ECB Working Paper Series No 2508 / December 2020 51

Table 11. Firm-level Analysis
Effects of the First Minibond Issuance on Credit Volumes
This table presents the results of the difference-in-differences regression for the changes in lending volumes at the firm-level after the issuance of minibonds. The treatment corresponds to the first issuance of a minibond. The control sample includes ex-ante comparable non-issuer firms identified on the basis of a coarsened exact matching based on ex-ante firm-level characteristics. The control group is selected in each year, and each firm in the control group is assigned the same time of event of the matched treated firms in that year. The regression includes firm and year fixed effects. Given the inclusion of firm and time fixed effects, the coefficient for the interaction between the first minibond issuance (Minibond) and the post-issuance dummy (Post) defines the average treatment effect of the first issuance on lending volumes at the firm-level, respectively for used and granted bank credit, for the ratio between used and granted bank credit (for all the types of credit contracts), as well as for the total financial debt used (including bank credit, debt from other financial intermediaries and minibond issuances). We consider two quarters before the first issuance by firm (Post=0), against the quarter of the issuance and the following two quarters (dummy Post=1). The issuance period considered in the estimates is between the fourth quarter of 2012 and the end of 2016; the overall sample period consider data between June 2012 up until June 2017. While Col. 1, 3, 5 and 7 correspond to the specifications with the fixed effects and the diff-in-diff interaction term, Col. 2, 4, 6 and 8 report also the one-year lagged firm-level control variables (total assets, leverage and Z-Score). Standard errors are clustered at firm level. Regressions are weighted with CEM strata weights. ***, **, * indicate, respectively, statistical significance at 1, 5, 10 percent level.
(1) (2) (3) (4) (5) (6) (7) (8) (9)
Credit Used Credit Granted Used / Granted Total Financial Debt Used
Financial debt/
Assets Minibond * Post -0.341*** -0.360*** -0.086 -0.105 -0.105*** -0.106*** 0.404*** 0.383*** 0.098***
[0.111] [0.111] [0.066] [0.066] [0.018] [0.018] [0.060] [0.057] [0.016]
Ln (Total Assetst-4) 0.221** 0.207** 0.020 0.259*** [0.097] [0.082] [0.023] [0.098]
Leveraget-4 0.005* 0.004** -0.000 0.004* [0.003] [0.002] [0.000] [0.003]
Z-Scoret-4 0.034 -0.019 0.016** 0.036 [0.039] [0.020] [0.007] [0.028]
Firm FE YES YES YES YES YES YES YES YES YES Year FE YES YES YES YES YES YES YES YES YES
Observations 13609 13609 13609 13609 13494 13494 13624 13624 13624 R-Squared 0.006 0.009 0.007 0.015 0.013 0.018 0.006 0.011 0.006 No. Firms 2744 2744 2744 2744 2729 2729 2745 2745 2745 No. Issuers 91 91 91 91 91 91 91 91 91
ECB Working Paper Series No 2508 / December 2020 52

Table 12. Firm-level Analysis
Effects of the First Minibond Issuance on Credit Volumes (longer post-issuance period)
This table presents the results of the difference-in-differences regression for the changes in lending volumes at the firm-level after the issuance of minibonds. The treatment corresponds to the first issuance of a minibond. The control sample includes ex-ante comparable non-issuer firms identified on the basis of a coarsened exact matching based on ex-ante firm-level characteristics. The control group is selected in each year, and each firm in the control group is assigned the same time of event of the matched treated firms in that year. The regression includes firm and year fixed effects. Given the inclusion of firm and time fixed effects, the coefficient for the interaction between the first minibond issuance (Minibond) and the post-issuance dummy (Post) defines the average treatment effect of the first issuance on lending volumes at the firm-level, respectively for used and granted bank credit, for the ratio between used and granted bank credit (for all the types of credit contracts), as well as for the total financial debt used (including bank credit, debt from other financial intermediaries and minibond issuances). We consider two quarters before the first issuance by firm (Post=0), against the quarter of the issuance and the following six quarters (dummy Post=1). The issuance period considered in the estimates is between the fourth quarter of 2012 and the end of 2016; the overall sample period consider data between June 2012 up until June 2018. While Col. 1, 3, 5 and 7 correspond to the specifications with the fixed effects and the diff-in-diff interaction term, Col. 2, 4, 6 and 8 report also the one-year lagged firm-level control variables (total assets, leverage and Z-Score). Standard errors are clustered at firm level. Regressions are weighted with CEM strata weights. ***, **, *indicate, respectively, statistical significance at 1, 5, 10 percent level.
(1) (2) (3) (4) (5) (6) (7) (8) (9)
Credit Used Credit Granted Used / Granted Total Financial Debt Used
Financial debt/ total
assets Minibond * Post -0.263** -0.349*** -0.034 -0.097* -0.092*** -0.099*** 0.475*** 0.392*** 0.102***
[0.115] [0.114] [0.058] [0.058] [0.018] [0.018] [0.063] [0.056] [0.016]
Ln (Total Assetst-4) 0.549*** 0.419*** 0.051*** 0.528*** [0.115] [0.089] [0.016] [0.097]
Leveraget-4 0.005** 0.003** 0.000 0.005*** [0.002] [0.002] [0.000] [0.001]
Z-Scoret-4 -0.056 -0.046** 0.015*** 0.002 [0.044] [0.021] [0.005] [0.024]
Firm FE YES YES YES YES YES YES YES YES YES Year FE YES YES YES YES YES YES YES YES YES
Observations 24283 24283 24283 24283 24021 24021 24322 24322 24322 R-Squared 0.006 0.021 0.006 0.028 0.012 0.022 0.006 0.026 0.004 No. Firms 2745 2745 2745 2745 2731 2731 2745 2745 2745 No. Issuers 91 91 91 91 91 91 91 91 91
ECB Working Paper Series No 2508 / December 2020 53

Table 13. Firm-level Analysis
Effects of the First Minibond Issuance on Firm Ex-post Outcomes
This table presents the results of the difference-in-differences estimation for the ex-post changes in the balance sheet and the performance of issuer firms after the first issuance of minibonds. We explore whether and how issuer firms changed their balance sheet composition, turnover and profitability, in the two years after the first issuance. The treatment corresponds to the first issuance of a minibond. The control sample includes ex-ante comparable non-issuer firms identified on the basis of a coarsened exact matching based on ex-ante firm-level characteristics. The Minibond dummy is equal to 1 for the firms issuing minibonds, while the Post dummy is equal to 1 for the year following the minibond issuance. Given the inclusion of time fixed effects, the coefficient for the interaction between the first minibond issuance (Minibond) and the post-issuance dummy (Post) defines the average treatment effect of the first issuance on firm balance sheet and performance. We consider each dependent variable one year before the first issuance (Post=0), against the two years after the issuance (Post=1). The issuance period considered in the estimates is between the fourth quarter of 2012 and the fourth quarter of 2016; the overall sample period for firm balance sheets consider annual data from 2012 to 2017. Standard errors are clustered at firm level. Regressions are weighted with CEM strata weights. ***, **, * indicate, respectively, statistical significance at 1, 5, 10 percent level.
ASSETS
(1) (2) (3) (4) (5) (6) (7)
VARIABLES
Ln total
assets
Ln total
fixed assets
Ln
tangible
fixed assets
Ln
intangible
fixed assets
Total fixed
assets/ Total
assets
Tangible
fixed assets/
Total assets
Intangible
fixed assets/
Total assets
Minibond * Post 0.186*** 0.148** 0.066 0.247** -0.002 -0.005 0.003 [0.037] [0.071] [0.061] [0.120] [0.009] [0.007] [0.007]
Firm FE YES YES YES YES YES YES YES Year FE YES YES YES YES YES YES YES
Observations 7287 7251 7220 6832 7287 7287 7287 R-squared 0.028 0.011 0.010 0.019 0.015 0.009 0.015 No. Firms 2722 2719 2713 2632 2722 2722 2722 No. Issuers 85 85 85 82 85 85 85
LIABILITIES TURNOVER AND PROFITABILITY
(8) (9) (10) (11) (12) (13)
VARIABLES
Bank debt/
Total
financial
debt
Total
financial
debt/
Turnover
Leverage Ln turnover RoA RoE
Minibond * Post -0.233*** 0.249 0.102*** 0.049 -2.487*** -9.714[0.028] [0.158] [0.019] [0.060] [0.794] [6.205]
Firm FE YES YES YES YES YES YES Year FE YES YES YES YES YES YES
Observations 7077 7269 7287 7269 7287 7281 R-squared 0.050 0.041 0.041 0.010 0.009 0.008 No. Firms 2701 2721 2722 2721 2722 2722 No Issuers 85 85 85 85 85 85
ECB Working Paper Series No 2508 / December 2020 54
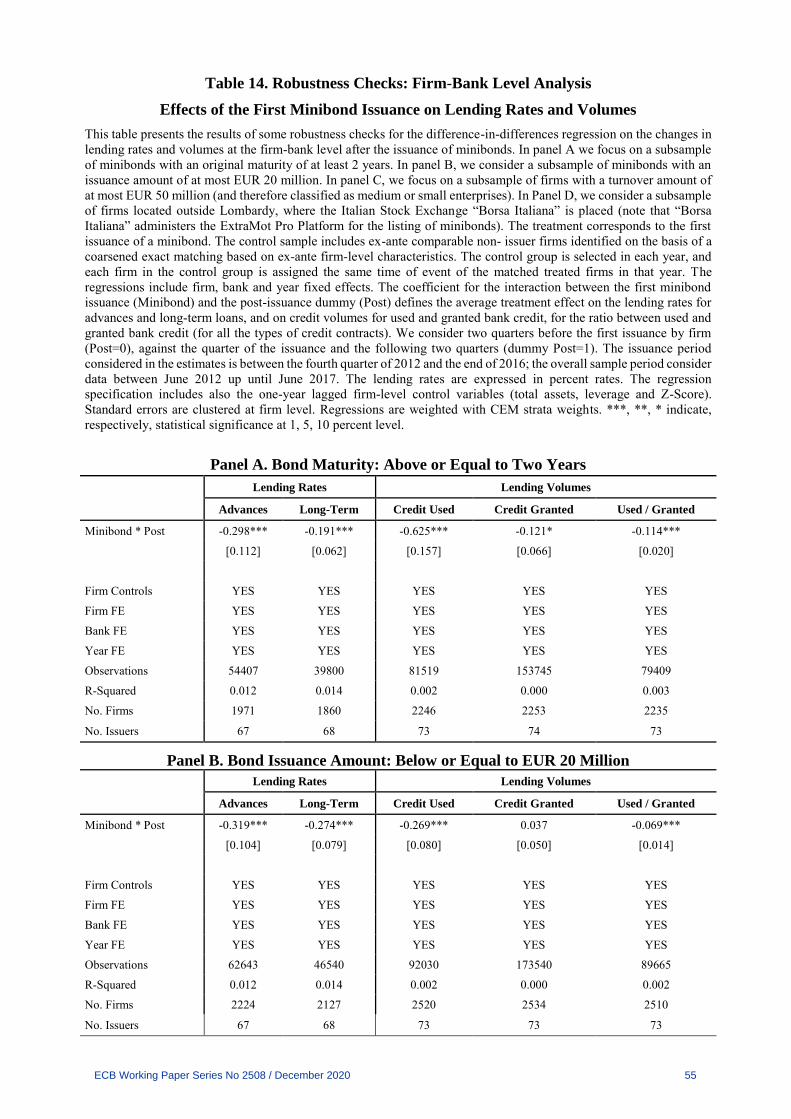
Table 14. Robustness Checks: Firm-Bank Level Analysis
Effects of the First Minibond Issuance on Lending Rates and Volumes
This table presents the results of some robustness checks for the difference-in-differences regression on the changes in lending rates and volumes at the firm-bank level after the issuance of minibonds. In panel A we focus on a subsample of minibonds with an original maturity of at least 2 years. In panel B, we consider a subsample of minibonds with an issuance amount of at most EUR 20 million. In panel C, we focus on a subsample of firms with a turnover amount of at most EUR 50 million (and therefore classified as medium or small enterprises). In Panel D, we consider a subsample of firms located outside Lombardy, where the Italian Stock Exchange “Borsa Italiana” is placed (note that “Borsa Italiana” administers the ExtraMot Pro Platform for the listing of minibonds). The treatment corresponds to the first issuance of a minibond. The control sample includes ex-ante comparable non- issuer firms identified on the basis of a coarsened exact matching based on ex-ante firm-level characteristics. The control group is selected in each year, and each firm in the control group is assigned the same time of event of the matched treated firms in that year. The regressions include firm, bank and year fixed effects. The coefficient for the interaction between the first minibond issuance (Minibond) and the post-issuance dummy (Post) defines the average treatment effect on the lending rates for advances and long-term loans, and on credit volumes for used and granted bank credit, for the ratio between used and granted bank credit (for all the types of credit contracts). We consider two quarters before the first issuance by firm (Post=0), against the quarter of the issuance and the following two quarters (dummy Post=1). The issuance period considered in the estimates is between the fourth quarter of 2012 and the end of 2016; the overall sample period consider data between June 2012 up until June 2017. The lending rates are expressed in percent rates. The regression specification includes also the one-year lagged firm-level control variables (total assets, leverage and Z-Score). Standard errors are clustered at firm level. Regressions are weighted with CEM strata weights. ***, **, * indicate, respectively, statistical significance at 1, 5, 10 percent level.
Panel A. Bond Maturity: Above or Equal to Two Years
Lending Rates Lending Volumes
Advances Long-Term Credit Used Credit Granted Used / Granted
Minibond * Post -0.298*** -0.191*** -0.625*** -0.121* -0.114***
[0.112] [0.062] [0.157] [0.066] [0.020]
Firm Controls YES YES YES YES YES
Firm FE YES YES YES YES YES
Bank FE YES YES YES YES YES
Year FE YES YES YES YES YES
Observations 54407 39800 81519 153745 79409
R-Squared 0.012 0.014 0.002 0.000 0.003
No. Firms 1971 1860 2246 2253 2235
No. Issuers 67 68 73 74 73
Panel B. Bond Issuance Amount: Below or Equal to EUR 20 Million
Lending Rates Lending Volumes
Advances Long-Term Credit Used Credit Granted Used / Granted
Minibond * Post -0.319*** -0.274*** -0.269*** 0.037 -0.069***
[0.104] [0.079] [0.080] [0.050] [0.014]
Firm Controls YES YES YES YES YES
Firm FE YES YES YES YES YES
Bank FE YES YES YES YES YES
Year FE YES YES YES YES YES
Observations 62643 46540 92030 173540 89665
R-Squared 0.012 0.014 0.002 0.000 0.002
No. Firms 2224 2127 2520 2534 2510
No. Issuers 67 68 73 73 73
ECB Working Paper Series No 2508 / December 2020 55

Panel C. Firm Size: Turnover Below or Equal to EUR 50 Million
Lending Rates Lending Volumes
Advances Long-Term Credit Used Credit Granted Used / Granted
Minibond * Post -0.162* -0.316*** -0.232** -0.005 -0.065***
[0.089] [0.121] [0.102] [0.055] [0.017]
Firm Controls YES YES YES YES YES
Firm FE YES YES YES YES YES
Bank FE YES YES YES YES YES
Year FE YES YES YES YES YES
Observations 47434 34194 68857 130460 67080
R-Squared 0.007 0.014 0.001 0.000 0.001
No. Firms 1807 1724 2046 2060 2038
No. Issuers 49 50 54 55 54
Panel D. Firms located outside Lombardy (Less Proximity to the Italian Stock Exchange)
Lending Rates Lending Volumes
Advances Long-Term Credit Used Credit Granted Used / Granted
Minibond * Post -0.312*** -0.295*** -0.628*** -0.054 -0.116***
[0.081] [0.083] [0.170] [0.083] [0.022]
Firm Controls YES YES YES YES YES
Firm FE YES YES YES YES YES
Bank FE YES YES YES YES YES
Year FE YES YES YES YES YES
Observations 38021 28411 59122 112969 57413
R-Squared 0.022 0.015 0.003 0.002 0.007
No. Firms 1393 1331 1584 1590 1579
No. Issuers 62 65 69 69 69
ECB Working Paper Series No 2508 / December 2020 56
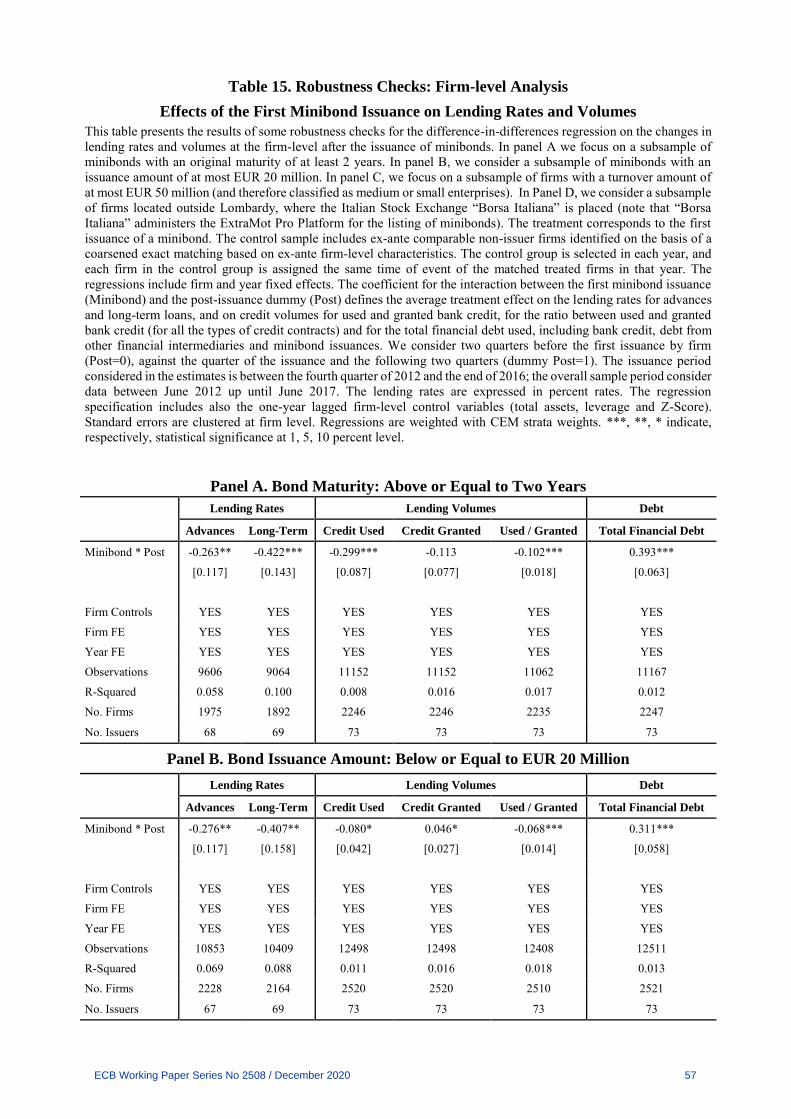
Table 15. Robustness Checks: Firm-level Analysis
Effects of the First Minibond Issuance on Lending Rates and Volumes
This table presents the results of some robustness checks for the difference-in-differences regression on the changes in lending rates and volumes at the firm-level after the issuance of minibonds. In panel A we focus on a subsample of minibonds with an original maturity of at least 2 years. In panel B, we consider a subsample of minibonds with an issuance amount of at most EUR 20 million. In panel C, we focus on a subsample of firms with a turnover amount of at most EUR 50 million (and therefore classified as medium or small enterprises). In Panel D, we consider a subsample of firms located outside Lombardy, where the Italian Stock Exchange “Borsa Italiana” is placed (note that “Borsa Italiana” administers the ExtraMot Pro Platform for the listing of minibonds). The treatment corresponds to the first issuance of a minibond. The control sample includes ex-ante comparable non-issuer firms identified on the basis of a coarsened exact matching based on ex-ante firm-level characteristics. The control group is selected in each year, and each firm in the control group is assigned the same time of event of the matched treated firms in that year. The regressions include firm and year fixed effects. The coefficient for the interaction between the first minibond issuance (Minibond) and the post-issuance dummy (Post) defines the average treatment effect on the lending rates for advances and long-term loans, and on credit volumes for used and granted bank credit, for the ratio between used and granted bank credit (for all the types of credit contracts) and for the total financial debt used, including bank credit, debt from other financial intermediaries and minibond issuances. We consider two quarters before the first issuance by firm (Post=0), against the quarter of the issuance and the following two quarters (dummy Post=1). The issuance period considered in the estimates is between the fourth quarter of 2012 and the end of 2016; the overall sample period consider data between June 2012 up until June 2017. The lending rates are expressed in percent rates. The regression specification includes also the one-year lagged firm-level control variables (total assets, leverage and Z-Score). Standard errors are clustered at firm level. Regressions are weighted with CEM strata weights. ***, **, * indicate, respectively, statistical significance at 1, 5, 10 percent level.
Panel A. Bond Maturity: Above or Equal to Two Years
Lending Rates Lending Volumes Debt
Advances Long-Term Credit Used Credit Granted Used / Granted Total Financial Debt
Minibond * Post -0.263** -0.422*** -0.299*** -0.113 -0.102*** 0.393***
[0.117] [0.143] [0.087] [0.077] [0.018] [0.063]
Firm Controls YES YES YES YES YES YES
Firm FE YES YES YES YES YES YES
Year FE YES YES YES YES YES YES
Observations 9606 9064 11152 11152 11062 11167
R-Squared 0.058 0.100 0.008 0.016 0.017 0.012
No. Firms 1975 1892 2246 2246 2235 2247
No. Issuers 68 69 73 73 73 73
Panel B. Bond Issuance Amount: Below or Equal to EUR 20 Million
Lending Rates Lending Volumes Debt
Advances Long-Term Credit Used Credit Granted Used / Granted Total Financial Debt
Minibond * Post -0.276** -0.407** -0.080* 0.046* -0.068*** 0.311***
[0.117] [0.158] [0.042] [0.027] [0.014] [0.058]
Firm Controls YES YES YES YES YES YES
Firm FE YES YES YES YES YES YES
Year FE YES YES YES YES YES YES
Observations 10853 10409 12498 12498 12408 12511
R-Squared 0.069 0.088 0.011 0.016 0.018 0.013
No. Firms 2228 2164 2520 2520 2510 2521
No. Issuers 67 69 73 73 73 73
ECB Working Paper Series No 2508 / December 2020 57

Panel C. Firm Size: Turnover Below or Equal to EUR 50 Million
Lending Rates Lending Volumes Debt
Advances Long-Term Credit Used Credit Granted Used / Granted Total Financial Debt
Minibond * Post -0.102 -0.307* -0.083* 0.026 -0.058*** 0.408***
[0.124] [0.181] [0.048] [0.029] [0.016] [0.076]
Firm Controls YES YES YES YES YES YES
Firm FE YES YES YES YES YES YES
Year FE YES YES YES YES YES YES
Observations 8828 8425 10150 10150 10090 10163
R-Squared 0.041 0.088 0.016 0.020 0.020 0.019
No. Firms 1809 1756 2046 2046 2038 2047
No. Issuers 49 50 54 54 54 54
Panel D. Firms located outside Lombardy (Less Proximity to the Italian Stock Exchange)
Lending Rates Lending Volumes Debt
Advances Long-Term Credit Used Credit Granted Used / Granted Total Financial Debt
Minibond * Post -0.257** -0.395** -0.267*** -0.060 -0.116*** 0.313***
[0.102] [0.164] [0.087] [0.048] [0.021] [0.046]
Firm Controls YES YES YES YES YES YES
Firm FE YES YES YES YES YES YES
Year FE YES YES YES YES YES YES
Observations 6751 6507 7836 7836 7785 7836
R-Squared 0.065 0.084 0.025 0.020 0.026 0.025
No. Firms 1395 1361 1584 1584 1579 1584
No. Issuers 63 66 69 69 69 69
ECB Working Paper Series No 2508 / December 2020 58

Appendix A
Regressions Based on the Propensity Score Matching
We conduct a further robustness check by estimating the difference-in-differences model on a control
sample identified through propensity score matching, instead of exact coarsened matching.
We first compute the propensity score to issue minibonds based on ex-ante firm characteristics.
We look at issuer firms in the year before the issuance and potential control firms in 2012, i.e., before
the reform. We exclude ex-ante from the sample of potential controls the firms that differed from issuers
in some prominent way: 1) those without lending relationships with banks; 2) those with an amount of
total assets below EUR 1 million; 3) those with a rating very close to the default (Z-Score equal to 9 or
10, as no issuer firm has this rating); 4) those with negative values of leverage; 5) those located in regions
where there are not issuers; 6) those operating in financial services (as by construction we consider only
non-financial corporations for the sample of issuer firms); 7) those having already issued debt securities
on the capital market29.
The propensity score is estimated through a probit regression for the probability to issue
minibonds, using as covariates the following variables: a) the log of total assets; b) the leverage and the
square of leverage (to capture potential non-linearities); c) the Z-Score and the square of the Z-Score;
d) dummies for geographical areas (North, Centre, South); e) industry-level dummies (agriculture and
fishing, manufacturing, utilities and extraction, construction, services); f) dummies for the main bank.
We then implemented with two different matching algorithms. First, we employed a nearest
neighbor matching with replacement, to select the nearest 30 controls for each treated firm. Second, we
applied a radius matching with replacement with a radius of 0.00006 around the propensity score of
each treated firm. These choices were aimed at obtaining a number of control firms similar to the one
used in the Coarsened Exact Matching procedure.
The results for the two specifications are broadly similar. Table A.1 displays the estimates for
the propensity score based on the nearest neighbor matching, while Table A.2 presents the results for
the propensity score using the radius matching.
29The same exclusions were applied in the coarsened exact matching. Furthermore, we had already excluded, also from the sample of potential controls for the exact matching, those firms which had already issued debt securities.
ECB Working Paper Series No 2508 / December 2020 59

Table A.1. Propensity Score Matching: Nearest Neighbor
This table presents the results of the difference-in-differences regression for the changes in lending rates and volumes at the firm-bank level (panel A) and at the firm level (panel B) after the issuance of minibonds. The treatment corresponds to the first issuance of a minibond. The control sample includes ex-ante comparable non-issuer firms identified on the basis of a propensity score matching, which uses a nearest neighbour algorithm with replacement to select the nearest 30 controls for each treated firm based on ex-ante firm-level characteristics. Each firm in the control group is assigned the same time of event of the corresponding matched treated firm. The regressions include bank, firm and year fixed effects in panel A, and firm and year fixed effects in panel B. The coefficient for the interaction between the first minibond issuance (Minibond) and the post-issuance dummy (Post) defines the average treatment effect on the lending rates for advances and long-term loans, and on credit volumes for used and granted bank credit, for the ratio between used and granted bank credit (for all the types of credit contracts) and for the total financial debt used, including bank credit, debt from other financial intermediaries and minibond issuances. We consider two quarters before the first issuance by firm (Post=0), against the quarter of the issuance and the following two quarters (dummy Post=1). The issuance period considered in the estimates is between the fourth quarter of 2012 and the end of 2016; the overall sample period consider data between June 2012 up until June 2017. The lending rates are expressed in percent rates. The regression specification includes also the one-year lagged firm-level control variables (total assets, leverage and Z-Score). Standard errors are clustered at firm level. Regressions are weighted with CEM strata weights. ***, **, * indicate, respectively, statistical significance at 1, 5, 10 percent level.
Panel A. Firm-Bank Level Analysis Lending Rates Lending Volumes
Advances Long-Term Credit Used Credit Granted Used / Granted
Minibond * Post -0.278*** -0.236*** -0.492*** -0.098 -0.091***[0.089] [0.064] [0.104] [0.063] [0.014]
Firm Controls YES YES YES YES YES Firm FE YES YES YES YES YES Bank FE YES YES YES YES YES Year FE YES YES YES YES YES
Observations 60685 49149 110582 217405 106831 R-Squared 0.010 0.011 0.001 0.001 0.002 No. Firms 2199 2342 2850 2889 2837 No. Issuers 94 101 107 109 107
Panel B. Firm Level Analysis Lending Rates Lending Volumes Debt
Advances Long-Term Credit Used Credit Granted Used / Granted Total Financial Debt
Minibond * Post -0.257*** -0.433*** -0.347*** -0.104 -0.097*** 0.412*** [0.092] [0.121] [0.130] [0.064] [0.019] [0.093]
Firm Controls YES YES YES YES YES YES Firm FE YES YES YES YES YES YES Year FE YES YES YES YES YES YES
Observations 10679 11565 14110 14110 13979 14110 R-Squared 0.040 0.050 0.012 0.015 0.011 0.012 No. Firms 2216 2404 2850 2850 2837 2850 No. Issuers 95 102 107 107 107 107
ECB Working Paper Series No 2508 / December 2020 60

Table A.2. Propensity Score Matching: Radius Matching
This table presents the results of the difference-in-differences regression for the changes in lending rates and volumes at the firm-bank level (panel A) and at the firm level (panel B) after the issuance of minibonds. The treatment corresponds to the first issuance of a minibond. The control sample includes ex-ante comparable non-issuer firms identified on the basis of a propensity score matching, which uses a radius matching with replacement to select the controls in the propensity score radius of 0.00006 for each treated firm based on ex-ante firm-level characteristics. Each firm in the control group is assigned the same time of event of the corresponding matched treated firm. The regressions include bank, firm and year fixed effects in panel A, and firm and year fixed effects in panel B. The coefficient for the interaction between the first minibond issuance (Minibond) and the post-issuance dummy (Post) defines the average treatment effect on the lending rates for advances and long-term loans, and on credit volumes for used and granted bank credit, for the ratio between used and granted bank credit (for all the types of credit contracts) and for the total financial debt used, including bank credit, debt from other financial intermediaries and minibond issuances. We consider two quarters before the first issuance by firm (Post=0), against the quarter of the issuance and the following two quarters (dummy Post=1). The issuance period considered in the estimates is between the fourth quarter of 2012 and the end of 2016; the overall sample period consider data between June 2012 up until June 2017. The lending rates are expressed in percent rates. The regression specification includes also the one-year lagged firm-level control variables (total assets, leverage and Z-Score). Standard errors are clustered at firm level. Regressions are weighted with CEM strata weights. ***, **, * indicate, respectively, statistical significance at 1, 5, 10 percent level.
Panel A. Firm-Bank Level Analysis Lending Rates Lending Volumes
Advances Long-Term Credit Used Credit Granted Used / Granted
Minibond * Post -0.267*** -0.283*** -0.457*** -0.060 -0.095***[0.096] [0.072] [0.098] [0.060] [0.015]
Firm Controls YES YES YES YES YES Firm FE YES YES YES YES YES Bank FE YES YES YES YES YES Year FE YES YES YES YES YES
Observations 77934 58522 129085 249110 125440 R-Squared 0.007 0.011 0.001 0.000 0.001 No. Firms 3205 3240 3945 3996 3922 No. Issuers 79 86 90 92 90
Panel B. Firm Level Analysis Lending Rates Lending Volumes Debt
Advances Long-Term Credit Used Credit Granted Used / Granted Total Financial Debt
Minibond * Post -0.293*** -0.446*** -0.312*** -0.088 -0.094*** 0.427*** [0.102] [0.139] [0.110] [0.065] [0.018] [0.059]
Firm Controls YES YES YES YES YES YES Firm FE YES YES YES YES YES YES Year FE YES YES YES YES YES YES
Observations 15532 15853 19531 19531 19372 19531 R-Squared 0.025 0.059 0.005 0.013 0.009 0.005 No. Firms 3231 3307 3945 3945 3922 3945 No. Issuers 80 87 90 90 90 90
ECB Working Paper Series No 2508 / December 2020 61
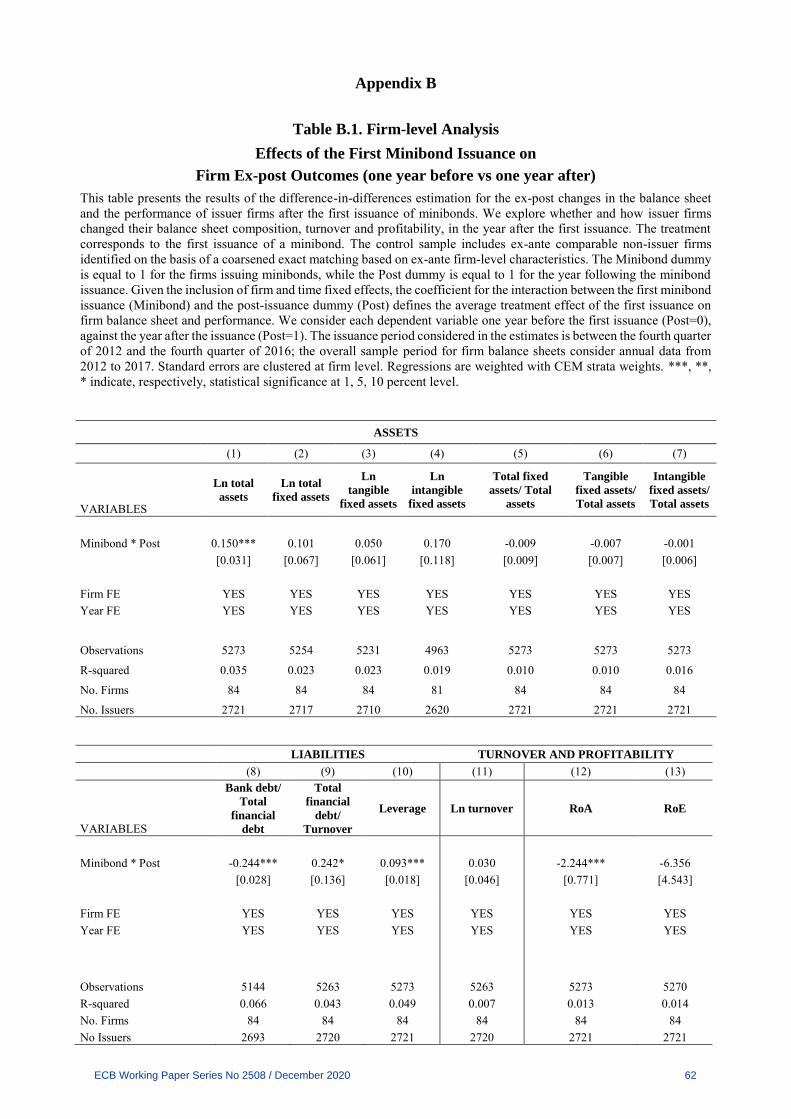
Appendix B
Table B.1. Firm-level Analysis
Effects of the First Minibond Issuance on
Firm Ex-post Outcomes (one year before vs one year after)
This table presents the results of the difference-in-differences estimation for the ex-post changes in the balance sheet and the performance of issuer firms after the first issuance of minibonds. We explore whether and how issuer firms changed their balance sheet composition, turnover and profitability, in the year after the first issuance. The treatment corresponds to the first issuance of a minibond. The control sample includes ex-ante comparable non-issuer firms identified on the basis of a coarsened exact matching based on ex-ante firm-level characteristics. The Minibond dummy is equal to 1 for the firms issuing minibonds, while the Post dummy is equal to 1 for the year following the minibond issuance. Given the inclusion of firm and time fixed effects, the coefficient for the interaction between the first minibond issuance (Minibond) and the post-issuance dummy (Post) defines the average treatment effect of the first issuance on firm balance sheet and performance. We consider each dependent variable one year before the first issuance (Post=0), against the year after the issuance (Post=1). The issuance period considered in the estimates is between the fourth quarter of 2012 and the fourth quarter of 2016; the overall sample period for firm balance sheets consider annual data from 2012 to 2017. Standard errors are clustered at firm level. Regressions are weighted with CEM strata weights. ***, **, * indicate, respectively, statistical significance at 1, 5, 10 percent level.
ASSETS
(1) (2) (3) (4) (5) (6) (7)
VARIABLES
Ln total
assets
Ln total
fixed assets
Ln
tangible
fixed assets
Ln
intangible
fixed assets
Total fixed
assets/ Total
assets
Tangible
fixed assets/
Total assets
Intangible
fixed assets/
Total assets
Minibond * Post 0.150*** 0.101 0.050 0.170 -0.009 -0.007 -0.001[0.031] [0.067] [0.061] [0.118] [0.009] [0.007] [0.006]
Firm FE YES YES YES YES YES YES YES Year FE YES YES YES YES YES YES YES
Observations 5273 5254 5231 4963 5273 5273 5273
R-squared 0.035 0.023 0.023 0.019 0.010 0.010 0.016 No. Firms 84 84 84 81 84 84 84 No. Issuers 2721 2717 2710 2620 2721 2721 2721
LIABILITIES TURNOVER AND PROFITABILITY
(8) (9) (10) (11) (12) (13)
VARIABLES
Bank debt/
Total
financial
debt
Total
financial
debt/
Turnover
Leverage Ln turnover RoA RoE
Minibond * Post -0.244*** 0.242* 0.093*** 0.030 -2.244*** -6.356[0.028] [0.136] [0.018] [0.046] [0.771] [4.543]
Firm FE YES YES YES YES YES YES Year FE YES YES YES YES YES YES
Observations 5144 5263 5273 5263 5273 5270 R-squared 0.066 0.043 0.049 0.007 0.013 0.014 No. Firms 84 84 84 84 84 84 No Issuers 2693 2720 2721 2720 2721 2721
ECB Working Paper Series No 2508 / December 2020 62

Acknowledgements The authors wish to thank Carlo Altavilla, Thorsten Beck, Marina Brogi, Claire Célérier (discussant), Carmine Di Noia, Annalisa Ferrando, Paolo Finaldi Russo, Xavier Freixas, Mariassunta Giannetti, Guillaume Horny (discussant), Victoria Ivashina, Angela Maddaloni, Francesco Manaresi, Valentina Michelangeli (discussant), Fabio Parlapiano, Francesco Saita, Fabiano Schivardi, Andrea Sironi, Zhang Xiang (discussant) and the participants at a workshop held at the Bank of Italy (Rome, December 2018), the Conference “Securities Markets. Trends, Risks and Policies” (Bocconi University, Milan, March 2019), the 2019 Swiss Winter Conference on Financial Intermediation (Lenzerheide, April 2019), the 4th ENTFIN Conference on Entrepreneurial Finance (Trier, July 2019), the Conference on “Regulating Financial Markets” (Goethe University, Frankfurt, August 2019), the Third Annual Workshop of the ESCB Research Cluster 3 on “Financial Stability, Macroprudential Regulation and Microprudential Supervision” (Banco de España, Madrid, October 2019), the 2020 European Economic Association Conference (online, August 2020), and a seminar at the European Central Bank (Frankfurt, October 2020), for their insightful comments. Ongena and Scopelliti acknowledge financial support from ERC ADG 2016 - GA 740272 lending. The views presented in this paper are those of the authors and should not be attributed to Banca d’Italia, the European Central Bank or the Eurosystem.
Steven Ongena University of Zurich, Zurich, Switzerland; Swiss Finance Institute; KU Leuven and CEPR; email: [email protected]
Sara Pinoli Banca d’Italia, Rome, Italy; email: [email protected]
Paola Rossi Banca d’Italia, Rome, Italy; email: [email protected]
Alessandro Scopelliti (corresponding author) European Central Bank, Frankfurt am Main, Germany; University of Zurich, Zurich, Switzerland; email: [email protected]
© European Central Bank, 2020
Postal address 60640 Frankfurt am Main, Germany Telephone +49 69 1344 0 Website www.ecb.europa.eu
All rights reserved. Any reproduction, publication and reprint in the form of a different publication, whether printed or produced electronically, in whole or in part, is permitted only with the explicit written authorisation of the ECB or the authors.
This paper can be downloaded without charge from www.ecb.europa.eu, from the Social Science Research Network electronic library or from RePEc: Research Papers in Economics. Information on all of the papers published in the ECB Working Paper Series can be found on the ECB’s website.
PDF ISBN 978-92-899-4454-0 ISSN 1725-2806 doi:10.2866/175889 QB-AR-20-160-EN-N