BAM Gold Project, Junior Lake Property, Ontario, Canada
392
| 1111 Hay St, West Perth WA 6005 | www.cubeconsulting.com NI 43-101 Technical Report MINERAL RESOURCE ESTIMATE AND PRELIMINARY ECONOMIC ASSESSMENT BAM Gold Project, Junior Lake Property, Ontario, Canada Effective Date: 9/05/2022 Prepared for: Landore Resources Canada Inc. © Cube Consulting Pty Ltd, Perth, Western Australia Cube Project: 2021_094
-
Upload
khangminh22 -
Category
Documents
-
view
1 -
download
0
Transcript of BAM Gold Project, Junior Lake Property, Ontario, Canada

| 1111 Hay St, West Perth WA 6005 | www.cubeconsulting.com
NI 43-101 Technical Report
MINERAL RESOURCE ESTIMATE AND PRELIMINARY ECONOMIC
ASSESSMENT
BAM Gold Project, Junior Lake Property, Ontario, Canada
Effective Date: 9/05/2022
Prepared for: Landore Resources Canada Inc.
© Cube Consulting Pty Ltd, Perth, Western Australia Cube Project: 2021_094

Landore Resources Canada Inc. MINERAL RESOURCE ESTIMATE AND PRELIMINARY ECONOMIC ASSESSMENT, BAM Gold Project, Junior Lake Property, Ontario, Canada
Landore Resources Canada Inc. Page | ii
Report Control Form
Document Title NI 43-101 Technical Report, MINERAL RESOURCE ESTIMATE AND
PRELIMINARY ECONOMIC ASSESSMENT on the BAM Gold Project, Junior
Lake Property, Ontario, Canada
Client Details Landore Resources Canada Inc.
555 Central Avenue
Suite 1
Thunder Bay, Ontario, Canada, P7B 5R5
Issuer Details Cube Consulting Pty Ltd
Level 4, 1111 Hay Street
Perth, Western Australia, 6005
Australia
Report Information File Name: LND_BAM_NI43-101_PEA_Technical
Report_2022_05_09a_FINAL.docx
Last Edited: 9 May 2022
Report Status: Final
Issue Date: 9/05/2022
Signatures
Coordinating
Author
Brian Fitzpatrick
B.Sc. (Geology), MAusIMM
CP (Geo)
Principal Geologist
Cube Consulting Pty Ltd
Signature
Contributing Author Quinton de Klerk
NHD, FAusIMM
Principal Mining Engineer
Cube Consulting Pty Ltd
Signature
Peer Reviewer Rebecca Prain
B.Sc. (Geology)
General Manager
Cube Consulting Pty Ltd
Signature

Landore Resources Canada Inc. MINERAL RESOURCE ESTIMATE AND PRELIMINARY ECONOMIC ASSESSMENT, BAM Gold Project, Junior Lake Property, Ontario, Canada
Landore Resources Canada Inc. Page | iii
Contents Report Control Form ............................................................................................................................... ii
Signatures ............................................................................................................................................... ii
List of Figures ......................................................................................................................................... xi
List of Tables .........................................................................................................................................xvi
1. Summary ......................................................................................................................................... 1
1.1. Executive Summary ................................................................................................................. 1
1.2. Property Location Access and Description.............................................................................. 7
1.3. Property History ...................................................................................................................... 7
1.4. Geological Setting and Mineralization .................................................................................... 8
1.5. Exploration and Project Status ................................................................................................ 8
1.6. Data Validation and Verification ........................................................................................... 10
1.7. Mineral Resource Estimation ................................................................................................ 10
1.8. Mining Methods .................................................................................................................... 11
1.9. Metallurgy ............................................................................................................................. 12
1.10. Environmental Studies ...................................................................................................... 12
1.11. Social and Community Impact .......................................................................................... 13
1.12. Conclusions and Recommendations ................................................................................. 13
1.12.1. Conclusions ................................................................................................................... 13
1.12.2. Recommendations ........................................................................................................ 15
2. Introduction .................................................................................................................................. 18
2.1. Issuer ..................................................................................................................................... 18
2.2. Terms of Reference ............................................................................................................... 18
2.3. Qualifications and Experience ............................................................................................... 18
2.4. Site Visits and Scope of Personal Inspection ........................................................................ 19
2.5. Sources of Information ......................................................................................................... 19
3. Reliance on Other Experts ............................................................................................................ 21
4. Property Description and Location ............................................................................................... 22
4.1. Location ................................................................................................................................. 22
4.2. Mineral Title Status – Land Tenure ....................................................................................... 23
4.3. Other Royalties and Agreements .......................................................................................... 26
4.4. Work Program Permitting ..................................................................................................... 26
4.5. Other Factors and Risks ........................................................................................................ 26

Landore Resources Canada Inc. MINERAL RESOURCE ESTIMATE AND PRELIMINARY ECONOMIC ASSESSMENT, BAM Gold Project, Junior Lake Property, Ontario, Canada
Landore Resources Canada Inc. Page | iv
5. Accessibility, Climate, Local Resources, Infrastructure and Physiography ................................... 27
5.1. Accessibility ........................................................................................................................... 27
5.2. Climate .................................................................................................................................. 27
5.3. Local Resources and Infrastructure ...................................................................................... 27
5.3.1. Local Resources ............................................................................................................. 27
5.3.2. Infrastructure ................................................................................................................ 28
5.4. Physiography ......................................................................................................................... 29
6. History ........................................................................................................................................... 31
6.1. Property History .................................................................................................................... 31
6.2. Previous Exploration ............................................................................................................. 31
6.3. Historical Mine Production ................................................................................................... 33
7. Geological Setting and Mineralization .......................................................................................... 34
7.1. Regional Geology .................................................................................................................. 34
7.1. Property and Local Geology .................................................................................................. 37
7.1.1. Stratigraphy ................................................................................................................... 37
7.1.2. Structure ....................................................................................................................... 44
7.1.3. Intrusives ....................................................................................................................... 46
7.2. Mineralization ....................................................................................................................... 47
7.2.1. BAM Deposit Mineralization ......................................................................................... 47
7.2.2. Lamaune Prospect Mineralization ................................................................................ 51
8. Deposit Types ................................................................................................................................ 52
9. Exploration .................................................................................................................................... 54
9.1. Summary ............................................................................................................................... 54
9.2. Geophysics ............................................................................................................................ 60
9.2.1. 2004 IP Survey – BAM Prospect .................................................................................... 60
9.2.2. 2012 to 2014 Geophysical Surveys (Tuomi, 2018) ........................................................ 67
9.2.3. 2015 Geophysical Surveys (Tuomi, 2018) ..................................................................... 67
9.2.4. 2019 Geophysical Surveys (Simoneau, 2019) ............................................................... 69
9.3. Trenching .............................................................................................................................. 73
9.3.1. 2003 BAM Zone Trenching ............................................................................................ 73
9.3.2. 2016 Trenching ............................................................................................................. 75
9.4. Soil Geochemistry Sampling .................................................................................................. 76
9.4.1. 2019 Soil Sampling Program (Johnston, 2019) ............................................................. 76

Landore Resources Canada Inc. MINERAL RESOURCE ESTIMATE AND PRELIMINARY ECONOMIC ASSESSMENT, BAM Gold Project, Junior Lake Property, Ontario, Canada
Landore Resources Canada Inc. Page | v
9.4.2. 2020 Soil Sampling Program Results (Johnson, 2020) .................................................. 81
10. Drilling ....................................................................................................................................... 91
10.1. Summary ........................................................................................................................... 91
10.2. Drilling Campaigns ............................................................................................................ 95
10.2.1. 2015-2017 BAM Drilling ................................................................................................ 95
10.2.2. 2018 Drilling .................................................................................................................. 96
10.2.3. 2019 Drilling .................................................................................................................. 96
10.2.4. 2020-2021 Drilling ......................................................................................................... 97
10.3. Drilling Methods ................................................................................................................ 98
10.4. Core Logging .................................................................................................................... 100
10.5. Sampling Methods .......................................................................................................... 101
10.6. Drill Sample Quality ......................................................................................................... 103
10.6.1. RQD and Core Recovery .............................................................................................. 103
10.6.2. Core Recovery Results ................................................................................................. 103
10.7. Significant Results - 2019 Drilling .................................................................................... 107
10.8. Principal Authors Statement ........................................................................................... 116
11. Sample Preparation, Analyses, and Security........................................................................... 117
11.1. Summary of Laboratories ................................................................................................ 117
11.2. Sample Preparation and Analysis .................................................................................... 117
11.2.1. ALS Chemex – Sample Preparation and Analysis ........................................................ 117
11.2.2. Accurassay – Sample Preparation and Analysis .......................................................... 118
11.2.3. Actlabs – Sample Preparation and Analysis ................................................................ 119
11.3. Quality Assurance and Quality Control Procedures ........................................................ 120
11.4. Sample Security ............................................................................................................... 123
11.5. Primary Data Storage ...................................................................................................... 124
11.6. Principal Authors Statement ........................................................................................... 125
12. Data Verification ..................................................................................................................... 126
12.1. Overview ......................................................................................................................... 126
12.2. Database Validation ........................................................................................................ 126
12.3. Data Verification ............................................................................................................. 127
12.3.1. Drill Hole Collar Surveys .............................................................................................. 128
12.3.2. Downhole Surveys ....................................................................................................... 132
12.3.3. Assay Data ................................................................................................................... 132

Landore Resources Canada Inc. MINERAL RESOURCE ESTIMATE AND PRELIMINARY ECONOMIC ASSESSMENT, BAM Gold Project, Junior Lake Property, Ontario, Canada
Landore Resources Canada Inc. Page | vi
12.3.4. Geological Logging ...................................................................................................... 134
12.4. QAQC Results – Review by Cube, 2022 ........................................................................... 135
12.4.1. Summary ..................................................................................................................... 135
12.4.2. Certified Reference Material (Standards) and Blanks ................................................. 136
12.4.3. Duplicates .................................................................................................................... 143
12.4.4. QAQC Summary and Recommendations .................................................................... 147
12.5. Screen Metallics Analysis ................................................................................................ 148
12.5.1. Screen Metallics Results – RPA 2016 ......................................................................... 148
12.5.2. Screen Metallics Analysis – 2018-2021 Results .......................................................... 149
12.6. Bulk Density Determinations .......................................................................................... 151
12.6.1. Bulk Density Methodology .......................................................................................... 151
12.6.2. Bulk Density Results .................................................................................................... 152
12.7. Principal Authors Statement ........................................................................................... 154
13. Mineral Processing and Metallurgical Testing ........................................................................ 155
13.1. Preliminary Test work ..................................................................................................... 155
13.2. Recent Test work............................................................................................................. 156
14. Mineral Resource Estimate ..................................................................................................... 158
14.1. Data Sources ................................................................................................................... 158
14.2. Drilling Database ............................................................................................................. 158
14.2.1. Local Grid Conversion ................................................................................................. 158
14.2.2. Database Structure ..................................................................................................... 160
14.2.1. Database Compilation ................................................................................................. 161
14.2.2. Treatment of Below Detection and Null Samples ....................................................... 163
14.3. Geology and Mineralization Models ............................................................................... 163
14.3.1. Topography and Overburden Surfaces ....................................................................... 163
14.3.2. Geological and Structural Interpretations .................................................................. 164
14.3.3. Mineralization Interpretations .................................................................................... 166
14.4. Domain Boundary Analysis ............................................................................................. 172
14.5. Domain Coding and Compositing .................................................................................... 172
14.5.1. Sample Flagging .......................................................................................................... 172
14.5.2. Sample Lengths ........................................................................................................... 173
14.5.3. Raw Sample Statistics.................................................................................................. 174
14.5.4. Compositing Method .................................................................................................. 176

Landore Resources Canada Inc. MINERAL RESOURCE ESTIMATE AND PRELIMINARY ECONOMIC ASSESSMENT, BAM Gold Project, Junior Lake Property, Ontario, Canada
Landore Resources Canada Inc. Page | vii
14.6. Statistical Analysis and Grade Capping ........................................................................... 177
14.6.1. Basic Statistics ............................................................................................................. 177
14.6.2. Grade Capping ............................................................................................................. 181
14.7. Variography Analysis ....................................................................................................... 183
14.8. Block Model Construction ............................................................................................... 184
14.8.1. Block Model Extents and Attributes ........................................................................... 184
14.8.2. Lithology Assignment .................................................................................................. 188
14.8.3. Bulk Density Assignment ............................................................................................. 188
14.8.4. Estimation Domains Assignment ................................................................................ 188
14.8.5. Mining Depletion Assignment ..................................................................................... 189
14.8.6. Classification Assignment ............................................................................................ 189
14.9. Estimation Methodology................................................................................................. 190
14.9.1. Estimation Approach ................................................................................................... 190
14.9.2. Search Neighbourhood Analysis (KNA) ....................................................................... 190
14.9.3. Dynamic Anisotropy .................................................................................................... 192
14.10. Model Validation ............................................................................................................. 194
14.10.1. Visual Validation...................................................................................................... 194
14.10.2. Volumetric Comparisons ......................................................................................... 199
14.10.3. Global Statistical Comparisons ................................................................................ 200
14.10.4. Swath Plots .............................................................................................................. 200
14.10.5. Model Validation Summary .................................................................................... 207
14.11. Resource Classification.................................................................................................... 207
14.12. Mineral Resource Statement .......................................................................................... 211
14.12.1. In situ Mineral Resources ........................................................................................ 211
14.12.2. Pit Optimized Mineral Resources ............................................................................ 212
14.12.1. Cut-off Grade Parameters ....................................................................................... 213
14.12.2. Previous Mineral Resource Estimates ..................................................................... 215
15. Mineral Reserve Estimates ..................................................................................................... 218
16. Mining Methods ...................................................................................................................... 219
16.1. Input Parameters ............................................................................................................ 219
16.2. Load and Haul Costs ........................................................................................................ 221
16.3. Geotechnical Parameters ................................................................................................ 222
16.4. Pit Optimization Results .................................................................................................. 222

Landore Resources Canada Inc. MINERAL RESOURCE ESTIMATE AND PRELIMINARY ECONOMIC ASSESSMENT, BAM Gold Project, Junior Lake Property, Ontario, Canada
Landore Resources Canada Inc. Page | viii
16.5. Mining Schedule .............................................................................................................. 230
17. Recovery Methods .................................................................................................................. 237
17.1. Process Assumptions and Concepts ................................................................................ 237
17.2. Process Description ......................................................................................................... 240
17.2.1. Crushing ...................................................................................................................... 240
17.2.2. Milling ......................................................................................................................... 240
17.2.3. Gravity Separation ...................................................................................................... 241
17.2.4. Carbon-In-Leach (CIL) .................................................................................................. 241
17.2.5. Tails Neutralization ..................................................................................................... 242
17.2.6. Tails Disposal ............................................................................................................... 243
17.2.7. Concentrate Leaching ................................................................................................. 243
17.2.8. Elution ......................................................................................................................... 243
17.2.9. Electrowinning/Refining.............................................................................................. 245
17.2.10. Carbon Handling...................................................................................................... 245
17.2.11. Ancillary Unit Operations ........................................................................................ 246
17.3. Alternative Processes ...................................................................................................... 247
17.3.1. Crushing Alternatives .................................................................................................. 247
17.3.2. Milling Alternatives ..................................................................................................... 247
17.3.3. Gravity Concentration Alternatives ............................................................................ 247
17.3.4. Carbon-In-Leach Alternatives...................................................................................... 247
17.3.5. Concentrate Leaching Alternatives ............................................................................. 248
17.3.6. Tailings Neutralization Alternatives ............................................................................ 248
17.3.7. Tailings Disposal Alternatives ...................................................................................... 248
17.3.8. Elution Alternatives ..................................................................................................... 248
17.3.9. Ancillary Operation Alternatives ................................................................................. 248
17.3.10. Heap Leaching ......................................................................................................... 248
18. Project Infrastructure .............................................................................................................. 249
18.1. Current Resources and Infrastructure ............................................................................ 249
18.1.1. Local Resources ........................................................................................................... 249
18.1.2. Infrastructure .............................................................................................................. 249
18.2. Proposed Infrastructure .................................................................................................. 249
19. Market Studies and Contracts................................................................................................. 251
20. Environmental Studies, Permitting, and Social or Community Impact ................................... 252

Landore Resources Canada Inc. MINERAL RESOURCE ESTIMATE AND PRELIMINARY ECONOMIC ASSESSMENT, BAM Gold Project, Junior Lake Property, Ontario, Canada
Landore Resources Canada Inc. Page | ix
20.1. Summary ......................................................................................................................... 252
20.1.1. Environmental Studies ................................................................................................ 252
20.1.2. Permitting ................................................................................................................... 253
20.2. Environmental Studies .................................................................................................... 253
20.2.1. Surface Water Quality Monitoring Summary ............................................................. 253
20.2.2. Terrestrial Study (Environmental Baseline Study) ...................................................... 259
20.2.3. Bedrock Surface Investigation (Ketchikan Lake) ......................................................... 259
20.2.4. Fish Population Survey and Fish Habitat Assessment (Ketchikan Lake) ..................... 259
20.3. Social and Community Impact ........................................................................................ 260
20.3.1. First Nations Relations ................................................................................................ 260
20.3.2. Landore Engagement and Consultation with Stakeholders ........................................ 260
21. Capital and Operating Costs .................................................................................................... 261
21.1. Summary ......................................................................................................................... 261
21.2. Capital Costs .................................................................................................................... 261
21.3. Operating Costs ............................................................................................................... 262
21.3.1. Mining Operating Costs............................................................................................... 262
21.3.2. Plant Facility Operating Costs ..................................................................................... 263
21.3.3. Total Operating Costs .................................................................................................. 263
22. Economic Analysis ................................................................................................................... 264
22.1. Summary ......................................................................................................................... 264
22.2. Assumptions .................................................................................................................... 265
22.3. Observations ................................................................................................................... 268
22.4. Sensitivity Analysis .......................................................................................................... 268
23. Adjacent Properties ................................................................................................................ 270
24. Other Relevant Data and Information .................................................................................... 271
25. Interpretation and Conclusions .............................................................................................. 272
25.1. Data Quality .................................................................................................................... 272
25.2. Mineral Resource Estimate ............................................................................................. 273
25.3. Future Resource Upgrades and Exploration Potential .................................................... 275
25.3.1. BAM Gold Project - Extensions ................................................................................... 275
25.3.2. Junior Lake Property Exploration Potential ................................................................ 279
26. Recommendations .................................................................................................................. 282
27. References .............................................................................................................................. 283

Landore Resources Canada Inc. MINERAL RESOURCE ESTIMATE AND PRELIMINARY ECONOMIC ASSESSMENT, BAM Gold Project, Junior Lake Property, Ontario, Canada
Landore Resources Canada Inc. Page | x
28. Date and Signature Page ......................................................................................................... 287
29. Certificates of Qualified Persons ............................................................................................. 288
29.1. Certificate of the Qualified Person – Brian Fitzpatrick, B.Sc., MAusIMM CP (Geo) ........ 288
29.2. Certificate of the Qualified Person – Quinton de Klerk, NHD, FAusIMM ....................... 289
30. Abbreviations and Units of Measure ...................................................................................... 290
Appendix 1 – Junior Lake Staked Mineral Claims by Landore Resources Canada Inc. ....................... 292
Appendix 2 – 2020 Soil Geochemistry Survey Maps (Ag, Cu, As) ....................................................... 342
Appendix 3 – Geology Legend............................................................................................................. 345
Appendix 4 – Laboratory Analysis Descriptions .................................................................................. 347
Appendix 5 – Statistical Plots for Minor BAM Au Domains ................................................................ 349
Appendix 6 – Estimation Parameters Summary Tables ...................................................................... 360
Appendix 7 – Geotechnical Study by WSP (Nelson, 2018) ................................................................. 367

Landore Resources Canada Inc. MINERAL RESOURCE ESTIMATE AND PRELIMINARY ECONOMIC ASSESSMENT, BAM Gold Project, Junior Lake Property, Ontario, Canada
Landore Resources Canada Inc. Page | xi
List of Figures
Figure 1-1: Plan View of West and East Pit USD1800 Optimization Shells with Mineralization
Interpretations (January 2022) ............................................................................................................... 4
Figure 1-2: Post-Tax Sensitivity Analysis – Base Case (January 2022) ................................................... 6
Figure 1-3: Plan View Showing Exploration Potential of the Multi-Element Prospects within the
Junior Lake Property (Landore, 2022) ................................................................................................... 17
Figure 4-1 Project Location Map (Tuomi, 2018) ................................................................................... 22
Figure 4-2 Junior Lake Project – Claims and Leases (from Landore, May 2022) .................................. 25
Figure 5-1: Aerial View of Junior Lake Camp and Core Farm (Landore File Photo, 2021) .................... 28
Figure 5-2: Topography and Vegetation on Line 100 E/475 N -- View Looking North (Cube, June 2018)
.............................................................................................................................................................. 29
Figure 5-3: Ladle Flats – Recent View Looking East, Near Drill Platform Along Line 2350 E (Landore
File Photo, 2022) ................................................................................................................................... 30
Figure 5-4: Exposed Outcrop and Vegetation on Line 3500 E/150 N - View Looking West (Cube, June
2018) ..................................................................................................................................................... 30
Figure 7-1: Regional Geology Map (from OGS Map M2542, 1991) ...................................................... 35
Figure 7-2: Regional Geology Map Legend (from OGS Map M2542, 1991) ......................................... 36
Figure 7-3: Junior Lake - Property Geology Map showing Mineral Deposits (from Landore, May 2022)
.............................................................................................................................................................. 38
Figure 7-4: Simplified Stratigraphic Column for Junior Lake property (from RPA, 2018) ..................... 39
Figure 7-5: Example of BAM Sequence in Diamond Drill Core - (Hole #: 0418-645) (Landore Core
Photo, 2018) .......................................................................................................................................... 40
Figure 7-6: Example of BAM Sequence in Surface Outcrop – Trench 0410-59T (Cube, June 2018) ..... 41
Figure 7-7: Example of Massive Sulphide in Diamond Drill Core in Hole 0418-654 (Cube, June 2018) 42
Figure 7-8: Plan View of Local Geology and Structural Interpretation of BAM Sequence; with
reference to Outcrop Photo Locations (January 2022 .......................................................................... 43
Figure 7-9: Example of Junior Lake Shear Zone within BAM Sequence – Hole: 0418-646 (Landore Core
Photo, 2018) .......................................................................................................................................... 45
Figure 7-10: Example of Junior Lake Shear Zone within BAM Sequence – Line 1000 E (Cube, June
2018) ..................................................................................................................................................... 46
Figure 7-11: Example of Dyke Intrusion within BAM Sequence: – Line 1400 E Outcrop (Cube, June
2018) ..................................................................................................................................................... 47
Figure 7-12: Typical Cross Section Example of BAM Sequence Mineralization – Local Grid Section Line
2700 E (January 2022) ........................................................................................................................... 48
Figure 7-13: Example of Mineralization Zone within BAM Sequence in Diamond Drill Core: (Hole
0418-654) (Cube, June 2018) ................................................................................................................ 49
Figure 7-14: Photomicrograph of Native Gold in Specimens from Diamond Drill Core (from Payne,
2016) ..................................................................................................................................................... 50
Figure 7-15: Lamaune Gold Prospect – Oblique Cross Section Example Showing Geology and
Mineralization (Cube, 2020) ................................................................................................................. 51
Figure 8-1: Illustration of Different Settings for Mesothermal Gold Deposits (modified from Dube &
Gosselin, 2007) ...................................................................................................................................... 53

Landore Resources Canada Inc. MINERAL RESOURCE ESTIMATE AND PRELIMINARY ECONOMIC ASSESSMENT, BAM Gold Project, Junior Lake Property, Ontario, Canada
Landore Resources Canada Inc. Page | xii
Figure 9-1: Junior Lake - Property Geology Map showing Mineral Deposits and Exploration Targets
(from Landore 2022) ............................................................................................................................. 55
Figure 9-2: 2004 IP Survey Location of Grid Lines (Johnston, 2004) ..................................................... 62
Figure 9-3: 2004 IP Survey – Filtered Resistivity Contour Plan (Johnston, 2004) ................................. 63
Figure 9-4: 2004 IP Survey - Filtered Chargeability Contour Plan (Johnston, 2004) ............................. 64
Figure 9-5: 2004 IP Survey – Cross Section at Line 1000 E: Chargeability & Resistivity Contours
(Johnston, 2004) ................................................................................................................................... 65
Figure 9-6: 2004 IP Survey – Cross Section at Line 1500 E: Chargeability & Resistivity Contours
(Johnston, 2004) ................................................................................................................................... 66
Figure 9-7: 2015 Geophysical Surveys for the Junior Lake Grid - Plan View of MaxMin and VLF
Anomalies (Landore Image, 2018) ........................................................................................................ 71
Figure 9-8: 2019 Geophysical Surveys for the Felix Lake Grid - Plan View of MaxMin and VLF
Anomalies (Landore Image, 2019) ........................................................................................................ 72
Figure 9-9: Plan View of All Trench Locations in the BAM Project Area (from Landore, February 2019)
.............................................................................................................................................................. 74
Figure 9-10: 2015 Trench Mapping for Trench 15 and 16 (MacTavish, 2003) ...................................... 75
Figure 9-11: Trench 0416-01T on Line 1600 E (Landore File, 2022) ..................................................... 76
Figure 9-12: Line Cutting at Felix Lake Prospect for the 2020 Sampling Progam (Landore File, 2022) 83
Figure 9-13: 2020 Soil Survey - Junior Lake Property Soil Sample Locations (Johnston, 2020). ........... 87
Figure 9-14: 2020 Soil Survey - Junior Lake Property Soil Geochemistry Response Ratio Anomalies
Gold (Au) (Johnston, 2020). .................................................................................................................. 88
Figure 9-15: 2020 Soil Survey - Junior Lake Property Soil Geochemistry Response Ratio Anomalies Au,
As, Cu (Johnston, 2020)......................................................................................................................... 89
Figure 9-16: 2020 Soil Survey - Junior Lake Property Response Ratio Anomalies Au, As, Cu with Gold
(Au) Trends and Geology (Johnston, 2020)........................................................................................... 90
Figure 10-1: Drill hole Location Plan by Drill Stage (January 2022) ...................................................... 93
Figure 10-2: Representative Cross Section Looking West –Line 1250E (January 2022) ....................... 94
Figure 10-3: Drilling Rig in Operation During 2020-21 Drilling Programs (Landore File, 2022) ............ 99
Figure 10-4: Triple Tube Core Extraction for HQ Core Drilling (Cube, June 2018) ................................ 99
Figure 10-5: Core Logging at Junior Lake Exploration Offices (Cube Site Visit, June 2018) ................ 101
Figure 10-6: Core Cutting and Sampling at Junior Lake Exploration Offices (Cube Site Visit, June 2018)
............................................................................................................................................................ 103
Figure 10-7: Core Recovery Statistics – Normal Distribution Plot for All Material Types in 2020-2021
Core Drilling (January 2022) ................................................................................................................ 104
Figure 11-1 Landore CRM Analysis Review Flow Chart (Landore, 2018) ............................................ 122
Figure 11-2: Sample Preparation at Junior Lake Exploration Offices (Cube Site Visit, June 2018) ..... 123
Figure 11-3: Core Storage Facility at Junior Lake Exploration Offices (Cube Site Visit, June 2018).... 124
Figure 12-1: Plan View of Surface Topography Surface DTM Overlay with Drill Hole Collars (January
2022) ................................................................................................................................................... 129
Figure 12-2: Composite Section View Looking North – Showing Surface Topography Surface DTM
Overlay with Drill Hole Collars (January 2022) ................................................................................... 130
Figure 12-3: Field Location of Drill Holes used for Data Verification (Cube Site Visit, June 2018) ..... 131
Figure 12-4 Plan View of Locations of Selected Holes for Hole Verification Analysis (25 June 2018) 133

Landore Resources Canada Inc. MINERAL RESOURCE ESTIMATE AND PRELIMINARY ECONOMIC ASSESSMENT, BAM Gold Project, Junior Lake Property, Ontario, Canada
Landore Resources Canada Inc. Page | xiii
Figure 12-5: Site Photo of Check Logging of for Hole 0416-538, for Interval 135 m to 162.68 m (Cube
Site Visit, June 2018) ........................................................................................................................... 135
Figure 12-6 Accuracy and Precision Concept (Cube, 2018) ................................................................ 136
Figure 12-7 Performance of CRM 310_2 at ALS for Period 2020-2021 .............................................. 139
Figure 12-8 Performance of CRM 315_1 at ALS for Period 2020-2021 .............................................. 139
Figure 12-9 Performance of CRM G320_10 at ALS for Period 2020-2021 .......................................... 139
Figure 12-10 Performance of CRM G398_4 at ALS for Period 2020-2021 .......................................... 140
Figure 12-11 Performance of CRM G905_1 at ALS for Period 2020-2021 .......................................... 140
Figure 12-12 Performance of CRM G907_5 at ALS for Period 2020-2021 .......................................... 140
Figure 12-13 Performance of CRM G908_4 at ALS for Period 2020-2021 .......................................... 141
Figure 12-14 Performance of CRM G912_3 at ALS for Period 2020-2021 .......................................... 141
Figure 12-15 Performance of CRM G913_4 at ALS for Period 2020-2021 .......................................... 141
Figure 12-16 Performance of CRM G913_9 at ALS for Period 2020-2021 .......................................... 142
Figure 12-17 Performance of CRM G913_10 at ALS for Period 2020-2021 ........................................ 142
Figure 12-18 Performance of CRM G914_6 at ALS for Period 2020-2021 .......................................... 142
Figure 12-19 Performance of CRM G914_10 at ALS for Period 2020-2021 ........................................ 143
Figure 12-20 Performance of CRM G915_4 at ALS for Period 2020-2021 .......................................... 143
Figure 12-21 RMPD Chart for Pulp Duplicate Samples – ALS (original) versus ActLabs (duplicates) for
Period 2020-2021 ................................................................................................................................ 144
Figure 12-22 RMPD Chart for Coarse Reject Duplicate Samples – ALS (original) versus ActLabs
(duplicates) for Period 2020-2021 ...................................................................................................... 144
Figure 12-23 Scatter Plot for Pulp Duplicate Samples – ALS (original) versus ActLabs (duplicates) for
Period 2020-2021 ................................................................................................................................ 145
Figure 12-24 Scatter Plot for Coarse Reject Duplicate Samples – ALS (original) versus ActLabs
(duplicates) for Period 2020-2021 ...................................................................................................... 145
Figure 12-25 Q-Q’ Plot for Pulp Duplicate Samples – ALS (original) versus ActLabs (duplicates) for
Period 2020-2021 ................................................................................................................................ 146
Figure 12-26 Q-Q’ Plot for Coarse Reject Duplicate Samples – ALS (original) versus ActLabs
(duplicates) for Period 2020-2021 ...................................................................................................... 146
Figure 12-27 RMPD Chart for Screen Metallics Samples – Pulp Duplicates for Period 2016-2021 .... 150
Figure 12-28 Scatter Plot for Screen Metallics Samples – Pulp Duplicates for Period 2016-2021 ..... 150
Figure 12-29 Q-Q’ Plot for Screen Metallics Samples – Pulp Duplicates for Period 2016-2021 ......... 150
Figure 12-30: BD Statistics– Normal Distribution Plot for BAM Sequence (January 2022) ................ 153
Figure 12-31: BD Statistics– Normal Distribution Plot for GPS – Hangingwall Unit (January 2022) ... 153
Figure 12-32: BD Statistics– Normal Distribution Plot for MLS – Footwall Basalt Unit (January 2022)
............................................................................................................................................................ 154
Figure 14-1: Plan of Junior Lake Grid (in blue) in Relation to the UTM Grid for the BAM Gold Project
Area (as at 14 January 2022) ............................................................................................................... 159
Figure 14-2: Plan of BAM Sequence 3DM Interpretation and Fault Structures with Drill Coverage
(January 2022) ..................................................................................................................................... 165
Figure 14-3: Plan of BAM Gold Mineralization 3DM Interpretations with Drill Coverage (January
2022) ................................................................................................................................................... 168
Figure 14-4: Leapfrog Cross Section on Line 2850 E: Showing Geo-Referenced PDF Cross Section and
3DM Domain Interpretations (January 2022) ..................................................................................... 169

Landore Resources Canada Inc. MINERAL RESOURCE ESTIMATE AND PRELIMINARY ECONOMIC ASSESSMENT, BAM Gold Project, Junior Lake Property, Ontario, Canada
Landore Resources Canada Inc. Page | xiv
Figure 14-5: Leapfrog Cross Section on Line 2700 E: Showing Geo-Referenced PDF Cross Section and
3DM Domain Interpretations (January 2022) ..................................................................................... 169
Figure 14-6: Leapfrog Cross Section on Line 1000 E: Showing Geo-Referenced PDF Cross Section and
3DM Domain Interpretations (January 2022) ..................................................................................... 170
Figure 14-7: Leapfrog Cross Section on Line 900 E: Showing Geo-Referenced PDF Cross Section and
3DM Domain Interpretations (January 2022) ..................................................................................... 170
Figure 14-8: Boundary Analysis between Domain 1001 and Waste Material for Au g/t, (January 2022)
............................................................................................................................................................ 172
Figure 14-9: Normal Histogram Plot of Raw Sample Lengths (up to 02 November 2019) ................. 173
Figure 14-10: Scatter Plot of Raw Sample Lengths versus Au Grades (up to 02 November 2019) .... 174
Figure 14-11 Statistics Plot of Gold Grade for 1 m Composites – Domain 1001 ................................ 177
Figure 14-12 Statistics Plot of Gold Grade for 1 m Composites – Domain 1002 ................................ 178
Figure 14-13 Statistics Plot of Gold Grade for 1 m Composites – Domain 3001 ................................ 178
Figure 14-14 Statistics Plot of Gold Grade for 1 m Composites – Domain 3002 ................................ 179
Figure 14-15 Example Gaussian variogram model – Domain 1001 .................................................... 183
Figure 14-16 Example back-transformed variogram model – Domain 1001 ...................................... 184
Figure 14-17 Plan View of 2022 BAM Block Model Dimensions (January 2022) ................................ 186
Figure 14-18 Long Section View Looking North – 2022 BAM Block Model Dimensions (January 2022)
............................................................................................................................................................ 187
Figure 14-19 Example of KNA Plots for Domain 1001, Showing Slope of Regressions and Kriging
Efficiency for Ranges of Blocks (January 2022) ................................................................................... 191
Figure 14-20 Conceptual View Showing (A) Trend Surface B) Blocks Coloured by Dip Values .......... 193
Figure 14-21 Conceptual View Showing Calculated Blocks Coloured by Dip Direction Values .......... 193
Figure 14-22: Block Model Isometric View – Showing Block Grades Distribution for All Domains
(January 2022) ..................................................................................................................................... 195
Figure 14-23: Block Model Plan View –with Cross Section Reference Line (January 2022) ............... 196
Figure 14-24: Cross Section Line 2850 E– Domain Block Grade Estimation with Drilling (January 2022)
............................................................................................................................................................ 197
Figure 14-25: Cross Section Line 2700 E– Domain Block Grade Estimation with Drilling (January 2022)
............................................................................................................................................................ 197
Figure 14-26: Cross Section Line 1000 E– Domain Block Grade Estimation with Drilling (January 2022)
............................................................................................................................................................ 198
Figure 14-27: Cross Section Line 900 E– Domain Block Grade Estimation with Drilling (January 2022))
............................................................................................................................................................ 198
Figure 14-28 Swath Plots for Gold Grade for Domain 1001 (January 2022)....................................... 201
Figure 14-29 Swath Plots for Gold Grade for Domain 1002 (January 2022)....................................... 202
Figure 14-30 Swath Plots for Gold Grade for Domain 1003 (January 2022)....................................... 203
Figure 14-31 Swath Plots for Gold Grade for Domain 3001 (January 2022)....................................... 204
Figure 14-32 Swath Plots for Gold Grade for Domain 3002 (January 2022)....................................... 205
Figure 14-33 Swath Plots for Gold Grade for Domain 3003 (January 2022)....................................... 206
Figure 14-34:Block Model Long Section View Showing Resource Classification Boundaries Maximum
Extent Versus Drilling Extents and Domain Interpretations (January 2022) ...................................... 209
Figure 14-35:Block Model Isometric View Showing Resource Classification and Drilling Density
(January 2022) ..................................................................................................................................... 210

Landore Resources Canada Inc. MINERAL RESOURCE ESTIMATE AND PRELIMINARY ECONOMIC ASSESSMENT, BAM Gold Project, Junior Lake Property, Ontario, Canada
Landore Resources Canada Inc. Page | xv
Figure 14-36: Plan View of West and East Pit Shells with Resource Blocks (January 2022 Run B Pit
Design) ................................................................................................................................................ 214
Figure 16-1 Run A Optimization Results (Indicated Only) - Tonnage/Cash-flow Chart (January 2022)
............................................................................................................................................................ 225
Figure 16-2 Run B Optimization Results (Indicated and Inferred) - Tonnage/Cash-flow Chart (January
2022) ................................................................................................................................................... 226
Figure 16-3 Plan View of USD1800 Pit Optimization Shells – Run B Shell 21 (January 2022) ............ 227
Figure 16-4 Isometric View Looking NNW of USD1800 Pit Optimization Shells – Run B Shell 21
(January 2022) ..................................................................................................................................... 228
Figure 16-5 Cross Section View at Line 2700 E, Showing US $1800 Pit Optimization Shells and Other
Au Price Shells (January 2022) ............................................................................................................ 229
Figure 16-6 Tonnes Mined by Destination by Quarter (January 2022) .............................................. 231
Figure 16-7 Tonnes Mined by Stage by Quarter – by Pit (January 2022) ........................................... 231
Figure 16-8 Ore Tonnes and Grade Mined by Quarter (January 2022) .............................................. 232
Figure 16-9 Process Material Tonnes and Grade Processed by Quarter – by Destination (January
2022) ................................................................................................................................................... 232
Figure 16-10 Process Material Tonnes and Grade Processed by Quarter – by Classification (January
2022) ................................................................................................................................................... 233
Figure 16-11 Recovered Ounces Produced by Quarter (January 2022) ............................................. 233
Figure 16-12 Undiscounted Cash Flow by Quarter (January 2022) .................................................... 234
Figure 16-13 Undiscounted Cumulative Cash Flow by Quarter (January 2022) ................................. 234
Figure 16-14 Stockpile Closing Balance by Quarter – by Destination and Total (January 2022) ........ 235
Figure 16-15 Plan View of the Open Pit Shells Coded by Shell ID for the Conceptual Quarterly
Schedule (January 2022) ..................................................................................................................... 236
Figure 17-1: Conceptual Milling Flowsheet (Allard, 2019) .................................................................. 239
Figure 18-1 BAM Gold Project Site Plan Showing Proposed Infrastructure Locations (January 2022)
............................................................................................................................................................ 250
Figure 20-1 Surface Water Sampling Locations, Armstrong Region, Ontario (Golder, 2022) ............ 256
Figure 20-2 Surface Water Monitoring Station Locations, Junior Lake Property (Golder, 2022) ....... 257
Figure 22-1: Post-Tax Sensitivity Analysis (January 2022) ................................................................. 269
Figure 25-1: Plan View of Targets for Future Drill Testing for the BAM Gold Project (Landore, 2022)
............................................................................................................................................................ 278
Figure 25-2: Cross Section View Showing Exploration Potential of the B4-7 Deposit (RPA, 2018) ... 280
Figure 25-3: Plan View Showing Exploration Potential of the Multi-Element Prospects within the
Junior Lake Tenements (Landore, 2022) ............................................................................................. 281

Landore Resources Canada Inc. MINERAL RESOURCE ESTIMATE AND PRELIMINARY ECONOMIC ASSESSMENT, BAM Gold Project, Junior Lake Property, Ontario, Canada
Landore Resources Canada Inc. Page | xvi
List of Tables
Table 1-1 BAM Gold Project In Situ Mineral Resources – All Indicated and Inferred Resources (31
January 2022) .......................................................................................................................................... 2
Table 1-2 2017 BAM Gold Project Mineral Resources Inside US $1,800 Pit Shell (as at 31 January
2022) ....................................................................................................................................................... 3
Table 1-3: BAM Gold Project Physicals – Life of Mine (January 2022) ................................................... 5
Table 1-4: BAM Gold Project Financials (Ungeared) (January 2022) ...................................................... 5
Table 1-5: BAM Gold Project Gold Price Sensitivity Analysis: Base Case - Post Tax (January 2022) ...... 6
Table 2-1: List of Authors ...................................................................................................................... 18
Table 4-1 Landore Mineral Leases (100% Interest) (from Landore, 2020) ........................................... 24
Table 6-1 Summary of Historical Exploration Activities by Other Parties in the Junior Lake Area
(updated from RAP, 2018) .................................................................................................................... 31
Table 9-1 Summary of Exploration Activities by Landore on the Junior Lake Property ....................... 58
Table 9-2 Listing of HIM Anomaly Drilling Targets Recommended from Simoneau, 2019 .................. 70
Table 9-3 Summary of Soil Geochemistry Conducted by Landore on the Junior Lake Properties (from
Landore data, January 2019) ................................................................................................................ 77
Table 9-4 Selected Elements Calculated Background Values (from Johnson, 2019) ............................ 78
Table 9-5 Samples Containing Anomalous Au +As +Cu at Specific Locations - Felix Lake Grid (Johnson,
2019) ..................................................................................................................................................... 80
Table 9-6 Samples Containing Anomalous Au +As +Cu at Specific Locations - Junior Lake Grid
(Johnson, 2019) ..................................................................................................................................... 81
Table 9-7 Summary of Soil Geochemistry Conducted by Landore on the Junior Lake Properties
(Landore, 14 January 2021) .................................................................................................................. 82
Table 9-8 Selected Elements Calculated Background Values (Johnson, 2020) ..................................... 84
Table 9-9 Samples Containing Anomalous Au +As +Cu at Specific Locations (Johnson, 2020) ............ 85
Table 10-1 Summary of BAM Gold Project Area Drilling Statistics by Period (to 05 January 2022) ..... 91
Table 10-2: Dimensions of the Drill Coverage for BAM Gold Project Areas with Average Drill Spacing
(up to 02 January 2022) ........................................................................................................................ 94
Table 10-3: BAM Gold Project – Core Recovery Statistics for All Material for Previous Drilling and for
2020-2021 Drilling (January 2022) ...................................................................................................... 104
Table 10-4: BAM Gold Project – Core Recovery Logs for Samples with Core Recovery <80% in 2020-
2021 Core Drilling (January 2022) ....................................................................................................... 105
Table 10-5: Significant Results for BAM Gold Project 2020-2021 Drilling Programs (January 2022) . 109
Table 11-1: ALS - Detection Limits for Principal Metals (ALS, 2019) ................................................... 118
Table 11-2: CRMs For Used by Landore – 2020-2021 Drilling (Landore Database, as at 14 January
2022) ................................................................................................................................................... 121
Table 12-1: Drill Hole Validation Listing (as at 14 January 2022) ........................................................ 127
Table 12-2: Listing of Random Hole Survey Checks (24th June 2018) ................................................. 131
Table 12-3: Listing of Verification Holes for Assay and Logging Checks (25 June 2018) .................... 133
Table 12-4: CRM and Blanks Performance Summary for ALS (2020-2021) ........................................ 137
Table 12-5: CRM and Blanks – Possible Misallocation and Outlier Listing for ALS (2020-2021) ........ 138
Table 12-6: CRM and Blanks Listing of Samples with No Assay (2020-2021) ..................................... 138
Table 12-7: Duplicate Sample Performance Summary (2020-2021) .................................................. 147

Landore Resources Canada Inc. MINERAL RESOURCE ESTIMATE AND PRELIMINARY ECONOMIC ASSESSMENT, BAM Gold Project, Junior Lake Property, Ontario, Canada
Landore Resources Canada Inc. Page | xvii
Table 12-8: Screen Metallic Sample Performance Summary (2018-2019 Drilling) ............................ 149
Table 12-9: BAM Gold Project - Bulk Density Statistics by Rock Type (up to January 2022) .............. 152
Table 13-1 BAM East Gravity/Leach Test Summary (2016 and 2017) ................................................ 155
Table 14-1: Cube Drill Drill hole Database Structure used for BAM 2022 MRE (as at 14 January 2022)
............................................................................................................................................................ 160
Table 14-2: Summary of Samples by Hole Type used for BAM 2022 MRE (as at 14 January 2022) ... 162
Table 14-3: Treatment of BDL Samples and Null Values used for BAM 2022 MRE (as at 14 January
2022) ................................................................................................................................................... 163
Table 14-4: Topographic and Overburden DTM Surfaces -Names and Descriptions (January 2022)) 163
Table 14-5: 3DM Geological Interpretation Files Names and Descriptions (January 2022) ............... 164
Table 14-6: 3DM Mineralization Domain Files Names and Descriptions (January 2022) ................... 167
Table 14-7: Raw Sample Statistics for Gold Inside Mineralization Domains (January 2022) ............. 175
Table 14-8: Structure of Surpac Composite Files (January 2022) ....................................................... 176
Table 14-9 Basic Statistics – Au Grade (Au g/t) for 1 m Composites for All Domains ........................ 180
Table 14-10 Gold Grade Caps (g/t Au) for Composite by Domain – Main BAM Zone ........................ 181
Table 14-11 Gold Grade Caps (g/t Au) for Composite by Domain – West Zone ................................. 182
Table 14-12 Gold Grade Caps (g/t Au) for Composite by Domain – East Zone .................................. 182
Table 14-13 Variogram Model Parameters for Gold Grade Composites - Sills Normalised to 100% . 183
Table 14-14 Assignment of Variogram Model Parameters for Minor Domains (January 2022) ........ 184
Table 14-15 Final Model Construction Parameters for the BAM 2019 Block Model (January 2022) . 185
Table 14-16: Block Model Attributes (January 2022) ......................................................................... 185
Table 14-17: Assigned Lithology Codes in Rock_Code Model Attribute (January 2022) .................... 188
Table 14-18: Assigned BD Values in the Density Attribute (January 2022) ........................................ 188
Table 14-19: Assigned Domain Codes in the Zonecode Attribute (January 2022) ............................. 188
Table 14-20: Assigned Resource Classification in the Rescat Attribute (January 2022) ..................... 189
Table 14-21: Search parameters for Au grade –OK Estimation .......................................................... 191
Table 14-22: Volumetric Comparisons for All Gold Mineralization Domains (January 2022) ............ 199
Table 14-23 Global comparison – OK Estimates Versus Informing 1m Composites (Au g/t) ............. 200
Table 14-24 BAM Gold Project In situ Mineral Resource – All Indicated and Inferred Resources (as at
30 January 2022) ................................................................................................................................. 211
Table 14-25 2019 BAM Gold Project In situ Mineral Resources – Inside USD $1,800 Pit Shell (as at 30
January 2022) ...................................................................................................................................... 212
Table 14-26 2019 BAM East Gold Deposit - Mineral Resource Estimate as at 22 September 2017
(RPA, 2018).......................................................................................................................................... 215
Table 14-27 B4-7 Ni-Cu-Co-PGE Deposit - Mineral Resource Estimate as at 1 December 2017 (RPA,
2018) ................................................................................................................................................... 216
Table 14-28 VW Ni-Cu-Co-PGE Deposit - Mineral Resource Estimate as at 1 December 2017 (RPA,
2018) ................................................................................................................................................... 217
Table 16-1 Summary of Key Input Parameters used in the 2022 Pit Optimization (January 2022) ... 219
Table 16-2 Mining Cost Rates by Bench (January 2022) ..................................................................... 221
Table 16-3 Recommended Pit Wall Angles and Bench Height Based on Geotechnical Studies (Nelson,
2018) ................................................................................................................................................... 222
Table 16-4 Run A Optimization Results Summary (Indicated Only) – January 2022 .......................... 223
Table 16-5 Run B Optimization Results Summary (Indicated and Inferred) – January 2022 .............. 224

Landore Resources Canada Inc. MINERAL RESOURCE ESTIMATE AND PRELIMINARY ECONOMIC ASSESSMENT, BAM Gold Project, Junior Lake Property, Ontario, Canada
Landore Resources Canada Inc. Page | xviii
Table 17-1: Process Assumptions for Conceptual Flowsheet ............................................................. 237
Table 20-1: Listing of Environmental Baseline Studies at Junior Lake Property Commissioned by
Landore (Completed to May, 2022) .................................................................................................... 252
Table 20-2: Water Sampling Protocols (Golder, 2022) ....................................................................... 254
Table 20-3: Summary of Water Quality Sampling Events 2007 to 2017 (Golder, 2022) .................... 258
Table 21-1: Total Capital Cost Summary Estimates (January 2022) ................................................... 261
Table 21-2: Total Capital Cost Summary – Initial and Sustaining Capital Estimates (January 2022) . 262
Table 21-3: Mining Operating Cost Summary Estiamtes– Base Case Case (January 2022) ................ 262
Table 21-4: Plant Operating Cost Estimate Summary – Base Case (January 2022) ............................ 263
Table 21-5: Total Operating Cost Estimate Summary – Base Case (January 2022) ............................ 263
Table 22-1: BAM Gold Project Physicals – Life of Mine (January 2022) ............................................. 264
Table 22-2: BAM Gold Project Financials (Ungeared) (January 2022) ................................................ 265
Table 22-3: BAM Gold Project Gold Price Sensitivity Analysis: Post -Tax (January 2022) .................. 269
Table 26-1: Proposed Work Program for BAM (Landore, 2022) ......................................................... 282
Table 30-1 List of Abbreviations for Units of Measurement .............................................................. 290

Landore Resources Canada Inc. MINERAL RESOURCE ESTIMATE AND PRELIMINARY ECONOMIC ASSESSMENT, BAM Gold Project, Junior Lake Property, Ontario, Canada
Landore Resources Canada Inc. Page | 1
1. Summary
1.1. Executive Summary
Cube Consulting Pty Ltd (Cube) was engaged by Landore Resources Canada Inc. (Landore) to complete
a Mineral Resource estimate (MRE) and conduct a preliminary economic assessment (PEA) for the
BAM Gold Project, in compliance with the requirements of the Canadian National Instruments 43-101
Standards of Disclosure for Mineral Projects (NI 43-101).
The Junior Lake Project is located approximately 235 km north-northeast of Thunder Bay, Ontario, and
approximately 75 km east-northeast of the village of Armstrong Junior Lake Property Status.
Landore has successfully delineated several deposits and other potential areas of significant
mineralization throughout the Junior Lake property including the BAM Gold Deposit, the Lamaune Gold
Prospect, the B4-7 Ni-Cu-Co-PGE Deposit, and VW Ni Deposit. The main focus of this report is the BAM
Gold Deposit which is located in the south-central area of the Junior Lake property and is interpreted
as an Archean-aged mesothermal gold deposit.
Recent exploration and development drilling activity have highlighted the following:
• Acquisition of additional mining claims. The Junior Lake property now consists of six mining
leases and 1,318 staked mining claims, all together totaling approximately 33,029 ha.
• The results of the soil sampling programs in 2019 and 2020 indicated a possible linking of gold
anomaly trends over several hundred metres strike length for several Junior Lake prospects.
• The infill and step out drilling conducted for the 2020-2021 drilling programmes further
confirmed the correlation of previously defined geophysics anomalies within the main BAM
gold mineralization trend and provided upgrades to the BAM Mineral Resource estimate.
The 2020-2021 diamond drilling consisted of 102 HQ size drill holes (0420‐725 to 0421‐826), for 24,361
metres. The BAM gold mineralization trend has now been tested by diamond drilling over a strike
length of 4.5 km. The 2020-2021 drilling has:
• Continued to show the close association between gold mineralization and the VTEM
geophysical anomaly trend
• Confirmed the extension of gold mineral resources at depth within the main BAM
mineralization zone
• Identified additional gold mineralization within the hanging wall GPS unit.
• Demonstrated the continuation of the main BAM gold mineralization to the east and west
• Infill drilling has also allowed for conversion of Mineral Resources from Inferred to Indicated.
The January 2022 Mineral Resources for the BAM Gold Project has been estimated by Cube based on
drill hole and assay data available up to 14th January 2022. The addition of the new drilling data has
resulted in the increase in Indicated and Inferred Resource of 47% (in situ contained metal) above a
cut-off of 0.3 g/t Au compared with the gold mineral resources reported in 2019.
Given the shallow nature of the mineralization and the initial metallurgical test results, material could
be extracted by means of open pit mining methods and processed using conventional milling
techniques. 3DM modelling and block construction were created with aim of preparing a suitable

Landore Resources Canada Inc. MINERAL RESOURCE ESTIMATE AND PRELIMINARY ECONOMIC ASSESSMENT, BAM Gold Project, Junior Lake Property, Ontario, Canada
Landore Resources Canada Inc. Page | 2
model for open pit optimization and mine scheduling. A US $1800 gold price pit optimization run was
selected, which represented a potential 12 year mine life (including pre-production, and post-mining
processing). A series of metallurgical test programs have been carried out on samples from the BAM
Gold Deposit in 2016 and also in 2017. On average, 98% of the feed gold was recovered through
combined gravity concentration and cyanidation leaching of gravity tails for composites tested.
For the preliminary economic analysis, the BAM Gold Project base case considers the economics of
exploiting a resource of 22.4 Mt at 1.16 g/t containing 833 koz Au. Metallurgical recoveries of 98% are
envisaged to yield 816 koz. The base case generates a pre-tax and post-tax NPV of respectively US
$333.6 M and US $231.2 M and pre- and post-tax real IRRs of 87.4%% and 66.7%.
Based on exploration work completed by Landore up to January 2022, there is significant resource
potential that clearly indicates district scale follow up exploration programs are warranted. There is
potential for further gold mineralization and other multi-commodity targets along the 31 km strike
length of Landore’s Junior Lake Properties.
Mineral Resources
The BAM Gold Project Mineral Resource, Effective Date as at 31 January 2022, is suitable for public
reporting in accordance with the NI 43-101 and the CIM Definition Standards (May 2014). All drilling
information, including all drilling completed up to the end of 2021 has been used in the preparation of
the January 2022 MRE.
Table 1-1 is a summary of the Indicated and Inferred Mineral Resources, effective as of 31 January
2022.
Table 1-1 BAM Gold Project In Situ Mineral Resources – All Indicated and Inferred Resources (31 January 2022)
Resource Category
Material Type
Au g/t cut off
Tonnes (kT)
Grade (g/t Au)
Contained Metal
(Oz Au)
Measured ALL >0.3 0 0 0
Indicated ALL >0.3 30,965 1.0 1,029,000
Inferred ALL >0.3 18,266 0.8 467,000
Notes:
1 Effective date 31 January 2022.
2 Mineral Resources are estimated at a block cut-off grade of 0.3 g/t Au.
4 A minimum mining width of two metres was used.
5 Bulk densities for the main host rocks are 2.82 t/m3, 2.84 t/m3, and 2.90 t/m3.
6 Mineral Resources that are not Mineral Reserves do not have demonstrated economic viability.
7 Figures may not add up due to rounding

Landore Resources Canada Inc. MINERAL RESOURCE ESTIMATE AND PRELIMINARY ECONOMIC ASSESSMENT, BAM Gold Project, Junior Lake Property, Ontario, Canada
Landore Resources Canada Inc. Page | 3
Based on the current input parameters that have been used for the 2022 pit optimization by Cube, a
0.3 g/t Au lower cut-off was deemed appropriate for the January 2022 Mineral Resource reporting.
At a cut-off grade of 0.3 g/t Au, the Mineral Resources are reported here within the pit optimization
Run B open pit shell. The Run B open pit shell includes Indicated Mineral Resources and Inferred
Mineral Resources. The figures reported in Table 1-2 are estimated using a long-term gold price of
US$1,800 per ounce.
Table 1-2 2017 BAM Gold Project Mineral Resources Inside US $1,800 Pit Shell (as at 31 January 2022)
Resource Category
Material Type
Au g/t cut off
Tonnes (kT)
Grade (g/t Au)
Contained Metal
(Oz Au)
Measured ALL >0.3 0 0 0
Indicated ALL >0.3 21,922 1.1 785,000
Inferred ALL >0.3 1,483 1.5 72,000
Notes:
1 Effective date of 31 January 2022.
2 Mineral Resources are estimated at a block cut-off grade of 0.3 g/t Au.
3 Mineral Resources are estimated using a long-term gold price of US$1,800 per ounce.
4 A minimum mining width of two metres was used.
5 Bulk densities for the main host rocks are 2.82 t/m3, 2.84 t/m3, and 2.90 t/m3.
6 Mineral Resources are constrained by a preliminary pit shell generated in Whittle software.
7 Mineral Resources that are not Mineral Reserves do not have demonstrated economic viability.
8 Figures may not add up due to rounding
The pit optimization study resulted in two distinct areas, an east pit optimization (BAM East Pit) and a
west pit optimization (BAM West Pit).
Figure 1-1 shows a plan view of the pit designs in relation to the block model mineral resources and
based on the Run B scenario (Indicated and Inferred Resources) from the January 2022 pit optimization
work carried out by Cube.
There are no Mineral Reserves estimated for the BAM Gold Project at this time.
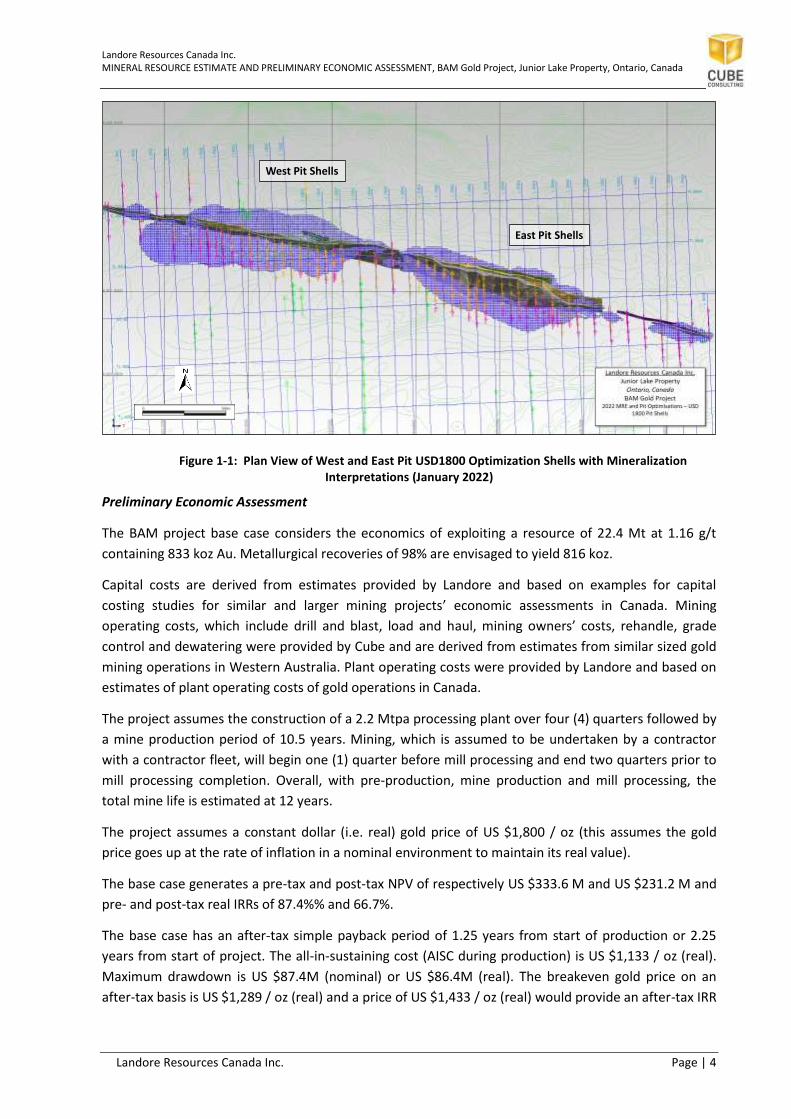
Landore Resources Canada Inc. MINERAL RESOURCE ESTIMATE AND PRELIMINARY ECONOMIC ASSESSMENT, BAM Gold Project, Junior Lake Property, Ontario, Canada
Landore Resources Canada Inc. Page | 4
Figure 1-1: Plan View of West and East Pit USD1800 Optimization Shells with Mineralization Interpretations (January 2022)
Preliminary Economic Assessment
The BAM project base case considers the economics of exploiting a resource of 22.4 Mt at 1.16 g/t
containing 833 koz Au. Metallurgical recoveries of 98% are envisaged to yield 816 koz.
Capital costs are derived from estimates provided by Landore and based on examples for capital
costing studies for similar and larger mining projects’ economic assessments in Canada. Mining
operating costs, which include drill and blast, load and haul, mining owners’ costs, rehandle, grade
control and dewatering were provided by Cube and are derived from estimates from similar sized gold
mining operations in Western Australia. Plant operating costs were provided by Landore and based on
estimates of plant operating costs of gold operations in Canada.
The project assumes the construction of a 2.2 Mtpa processing plant over four (4) quarters followed by
a mine production period of 10.5 years. Mining, which is assumed to be undertaken by a contractor
with a contractor fleet, will begin one (1) quarter before mill processing and end two quarters prior to
mill processing completion. Overall, with pre-production, mine production and mill processing, the
total mine life is estimated at 12 years.
The project assumes a constant dollar (i.e. real) gold price of US $1,800 / oz (this assumes the gold
price goes up at the rate of inflation in a nominal environment to maintain its real value).
The base case generates a pre-tax and post-tax NPV of respectively US $333.6 M and US $231.2 M and
pre- and post-tax real IRRs of 87.4%% and 66.7%.
The base case has an after-tax simple payback period of 1.25 years from start of production or 2.25
years from start of project. The all-in-sustaining cost (AISC during production) is US $1,133 / oz (real).
Maximum drawdown is US $87.4M (nominal) or US $86.4M (real). The breakeven gold price on an
after-tax basis is US $1,289 / oz (real) and a price of US $1,433 / oz (real) would provide an after-tax IRR
West Pit Shells
East Pit Shells

Landore Resources Canada Inc. MINERAL RESOURCE ESTIMATE AND PRELIMINARY ECONOMIC ASSESSMENT, BAM Gold Project, Junior Lake Property, Ontario, Canada
Landore Resources Canada Inc. Page | 5
of 30% showing the leverage to price. AISC does not include income taxes or Ontario Provincial Mining
tax.
A summary of the project physicals is shown in Table 1-3.
Table 1-3: BAM Gold Project Physicals – Life of Mine (January 2022)
Project Physicals (LOM) Units Base Case
Project Life (Total) Years 11.50 Yr(s)
Mine Life (Total) Years 10.75 Yr(s)
Ore Mined kt 22,388
Waste Mined kt 178,168
Total Mined kt 200,555
Gold Grade g/t 1.16 g/t
Contained Au Mined and fed oz 832,620
Plant feed kt 22,388
Au Recovery % 98.0%
Au Recovered oz 815,967
A summary of ungeared financials are summarized in Table 1-4.
Table 1-4: BAM Gold Project Financials (Ungeared) (January 2022)
Project Financials (Ungeared): real unless stated Units Base Case
Gold Price (Average LOM) USD/oz 1,800 / oz
Net Gold Revenue (Ex Site) USD M 1,464.66
Mining Costs USD M 569.95
Plant and Other Operating costs USD M 348.08
Operating Margin USD M 546.63
Margin % of Ex-Site Revenue % 37.3%
Initial Capex USD M 85.45
Sustaining Capex and Mine Development costs USD M 2.24
C1 Cost USD / oz 1,130 / oz
C2 Cost USD / oz 1,239 / oz
C3 Cost (including Ontario Provincial Mining Tax) USD / oz 1,283 / oz
C3 Cost (excluding Ontario Provincial Mining Tax) USD / oz 1,239 / oz
AISC including Ontario Provincial Mining tax USD / oz 1,177 / oz
AISC excluding Ontario Provincial Mining tax USD / oz 1,133 / oz
Project NPV (Pre-Tax) USD M 333.15
Project NPV (Post Tax) USD M 231.28
Project IRR (Pre-Tax) % 87.4%
Project IRR (Post Tax) % 66.7%
Project Break-Even Gold Price USD / oz 1,289 / oz
Breakeven Au Price at 30% IRR USD / oz 1,433 / oz
Project Payback Period from Construction Start Years 2.25 Yr(s)
Maximum Project Drawdown USD M 87.37
A sensitivity analysis for pre-tax and post-tax considerations is illustrated graphically in Figure 1-2 and
tabulated in Table 1-5.

Landore Resources Canada Inc. MINERAL RESOURCE ESTIMATE AND PRELIMINARY ECONOMIC ASSESSMENT, BAM Gold Project, Junior Lake Property, Ontario, Canada
Landore Resources Canada Inc. Page | 6
Figure 1-2: Post-Tax Sensitivity Analysis – Base Case (January 2022)
Table 1-5: BAM Gold Project Gold Price Sensitivity Analysis: Base Case - Post Tax (January 2022)
Base Case - Post Tax
Gold Price -40% -30% -20% -10% 0% 10% 20% 30% 40%
NPV -111.02 -15.30 74.09 154.20 231.28 306.92 382.03 457.12 532.33
Ave. Gold Price (US $/oz) 1080 1260 1,440 1,620 $1,800 1,980 2,160 2,340 2,520
Plant Opex -40% -30% -20% -10% 0% 10% 20% 30% 40%
NPV 302.36 284.73 267.02 249.18 231.28 213.26 195.02 176.61 157.90
Mining Opex -40% -30% -20% -10% 0% 10% 20% 30% 40%
NPV 346.64 318.00 289.29 260.44 231.28 201.71 171.52 140.33 108.78
Overall Opex -40% -30% -20% -10% 0% 10% 20% 30% 40%
NPV 418.15 371.53 325.05 278.45 231.28 183.07 132.93 81.71 23.27
Capex -40% -30% -20% -10% 0% 10% 20% 30% 40%
NPV 256.65 250.33 244.00 237.66 231.28 224.89 218.45 212.01 205.54
Discount Rate (Real) -4% -3% -2% -1% 0% 1% 2% 3% 4%
NPV 300.55 280.95 262.98 246.47 231.28 217.28 204.34 192.37 181.28

Landore Resources Canada Inc. MINERAL RESOURCE ESTIMATE AND PRELIMINARY ECONOMIC ASSESSMENT, BAM Gold Project, Junior Lake Property, Ontario, Canada
Landore Resources Canada Inc. Page | 7
1.2. Property Location Access and Description
The Junior Lake property is located approximately 235 km north-northeast of Thunder Bay, Ontario,
and approximately 75 km ENE of the village of Armstrong. The centre of the Project is located at
87°59’4” W longitude and 50°23’9” N latitude; the NAD83 UTM coordinates (Zone 16) are 430,000E
and 5,584,000N. The BAM Gold Project is located at approximate UTM coordinate 434,910E and
5,581,555N.
Road access to the Junior Lake property from Thunder Bay is via paved provincial highways No. 17 (15
km) and No. 527 to Armstrong, with an overall distance of 255 km. From Armstrong, the Buchanan
Forest Products Inc. gravel haulage road (BHR) is taken east to kilometre 105, where a skidder haulage
road leads approximately one kilometre to the Landore Junior Lake exploration camp. The total
distance from Thunder Bay to the property is approximately 360 km.
Landore mineral holdings in the Lake Nipigon area comprise the Junior Lake claim group and the
immediately adjacent claim group of Lamaune Iron Inc. (Lamaune Iron), subsidiary company of
Landore. In November 2019, the Ontario government granted Landore two mining leases
encompassing all of the staked mining claims within the Lamaune portion of the property. The Junior
Lake property now consists of six mining leases and 1,318 staked mining claims, all together totaling
approximately 33,029 ha.
Landore has access to all of the mining and surface rights for those leases and patented claims over an
area encompassing the BAM Gold Deposit, the Lamaune Gold Prospect, the B4-7/Alpha Zone Ni‐Cu‐Co‐
PGE Deposit, and the VW Ni Deposit. For the BAM Gold Deposit, B4-7/Alpha Zone Deposit (CLM
leases), and VW Deposit, the leases are granted for 21 years up to August 2029, and renewable for
further terms of 21 years. For the Lamaune Gold Prospect and the B4-7/Alpha Zone Deposit (PA
leases), the leases are granted for 21 years up to August 2040, and renewable for further terms of 21
years.
Within the mining leases, Landore has the rights to:
• Sink shafts and carry out excavations, etc., for mining purposes
• Construct dams, reservoirs, railways etc., as needed
• Erect buildings, machinery, furnaces, etc., as required
• Treat ores
These activities may be subject to provisions of certain Acts and reservations.
1.3. Property History
Geological mapping and exploration in the vicinity of the Junior Lake property is recorded as early as
1917. In 1968, Canadian Dyno Mines Limited staked 333 claims in 15 groups to cover conductors
detected by an airborne electromagnetic (EM) and magnetic (Mag) survey. Eight diamond drill holes
totaling 674.8 m were drilled to test conductors in January 1969, resulting in the discovery of the B4-7
sulphide zone. The B4-7 Deposit was delineated by an additional 30 holes (6,850 m, or 22,479 ft) in
1969.

Landore Resources Canada Inc. MINERAL RESOURCE ESTIMATE AND PRELIMINARY ECONOMIC ASSESSMENT, BAM Gold Project, Junior Lake Property, Ontario, Canada
Landore Resources Canada Inc. Page | 8
Landore optioned part of the property from North Coldstream Mines Limited in 1998 and additional
claims from Brancote Canada in 2000. In 2005, the VW Nickel Deposit was discovered by Landore as a
result of drill testing a promising geophysical target. The BAM Gold Deposit was discovered in the fall
of 2015 as a result of drilling a geophysical target located two kilometres to the east of the B4-7 Ni-Cu-
Co-PGE Deposit.
1.4. Geological Setting and Mineralization
Geology
A highly prospective Archean greenstone belt traverses the Junior Lake Property from east to west for
approximately 31 kilometres. The greenstone belt ranges from 0.5 to 1.5 kilometres wide and contains
many of Landore Resources' stated mineral resources and prospects. However, the greater proportion
of this belt remains unexplored. The BAM Gold Deposit is located in the south-central area of the
Junior Lake property and is interpreted as an Archaean mesothermal gold deposit in which gold
mineralization is hosted by sheared and altered rocks of the Grassy Pond Sill and the BAM volcano-
sedimentary sequence.
Mineralization
Mineralized structures appear to strike approximately parallel to lithologies, averaging 280° strike and
steeply dipping to the south between -65° to -80°. Gold mineralization remains open along strike to the
east and west, and down dip.
The gold mineralization is interpreted to reside within a series of tabular shaped zones that are
oriented in a roughly en-echelon configuration and are generally parallel to the overall strike of the
host rock units. The gold mineralization occurs as a fine dissemination and is also commonly observed
in drill core to exist as visible gold that is hosted by very thin, foliation-parallel quartz-rich veinlets,
hosted by highly fissile ultramafic sediments of the BAM Sequence, or by foliated rocks of the Grassy
Pond Sill. A preliminary petrographic study carried out on a number of samples has identified the
presence of coarse native gold in association with either tourmaline, ankerite, or scheelite assemblages
that occur within calcite replacement patches and veinlets.
1.5. Exploration and Project Status
Exploration activities during 2019 included the following:
• Gridding - A large grid was cut on the Junior Lake property during the summer of 2019 and
used for multiple exploration surveys (Felix Lake Grid). The grid roughly spanned 5 km x 1.2 km
and was used as the basis for both soil sampling programs and ground geophysics in 2019.
• Soil Geochemistry ‐ The results of soil sampling programs in 2019 and 2020 indicated a possible
linking of gold anomaly trends over several hundred metres strike length.
• The 2019 soil sampling program over the Felix Lake Grid and Junior Lake Grid collected a total
of 1141 samples (1,036 primary samples plus 105 reference samples). The samples were
collected from the B‐horizon at a nominal distance of 25 m along the grid lines using a hand‐
held Dutch auger. The 2019 soil sampling results indicate prospectivity of the BAM gold
mineralization trend extending a further 1.5 km to the west. Further soil sampling is planned
Landore Resources Canada Inc. MINERAL RESOURCE ESTIMATE AND PRELIMINARY ECONOMIC ASSESSMENT, BAM Gold Project, Junior Lake Property, Ontario, Canada
Landore Resources Canada Inc. Page | 9
for 2020, along with drilling planned to test the potential for extensions of the BAM gold
mineralization.
• The 2020 soil sampling program collected a further 1013 samples, including 121 reference
samples from the Felix and Junior Lake grids. The combined 2019/2020 geochemistry surveys
have identified more exploration targets prospective for potential significant gold
mineralization to the east and west of the currently defined BAM Gold Deposit. Numerous
anomalous gold trends were noted, of which four priority areas are:
o Continuation of the BAM Gold trend an additional 1.5 km to the west of which follow
up drilling along a portion has had encouraging results.
o Anomalous gold values associated with iron formation between Juno Lake and Boras
Lake that are open to the west, towards the known Lamaune Gold occurrence.
o Anomalous gold values continuing west towards Juno Lake along the projected
metasedimentary sequence of the BAM gold and the possibility of a southwest splay
from this trend passing just south of Juno Lake.
o The gold trend east of the BAM Gold Deposit has been extended for a further 2 km.
Gold anomalies continue eastward beyond the surveyed grid.
o Further soil sampling programs were recommended to cover the width of the
property. The soil sampling programs have provided an effective, low cost tool for gold
exploration and potentially other economic minerals.
• Ground Geophysics – Electromagnetic (Horizontal Loop (HLEM) & Very Low Frequency (VLF))
and Magnetic (Mag) ground surveys were conducted in June 2019 on the Junior Lake property.
The EM-VLF and Mag surveys covered 15.85 km of local grid lines. The HLEM-MaxMin survey
covered 14.2 km of lines. The results of the geophysical survey on both the Felix Lake Grid and
Junior Lake Grid areas indicated a number of significant anomalies. Eight (8) MaxMin
anomalies were identified and are located from less than 5 m and up to 40 m depth. Two of
these anomalies coincide at least partly with high magnetic anomalies (MM-21 and MM-22).
Two (2) anomalies coincide with weak magnetic anomalies (MM-24 and MM-27), one anomaly
(MM-28) with low magnetism, and four anomalies have variable magnetic features. Several of
the anomalies have been proposed for drilling.
• From 2015 to 2019, Landore completed several diamond drilling campaigns at the BAM Gold
Project. In 2019, Landore completed a drill programme consisting of 38 HQ diamond drill holes
(0419-687 to 0419-724) for 5,946 m. The aim of this programme was to extend the existing
BAM Gold Resource to the west (14 HQ holes) and infill to a nominal 50 mE x 25 mN spacing
within the BAM pit design areas (24 HQ holes).
• BAM Drilling programs conduced in 2020-2021 consisting of 102 HQ size drill holes (0420‐725
to 0421‐826), for 24,361 metres, have confirmed the continuity of the gold mineralization at
depth within the main BAM mineralization zone and also upgraded the mineralization within
the hanging wall GPS unit. The new drilling results have allowed for conversion of Mineral
Resources from Inferred to Indicated, and also demonstrated the continuation of the main
BAM mineralization to the west to local grid line 200W. The drilling has continued to show the
close association between gold mineralization and the VTEM geophysical anomaly trend. The
BAM gold mineralization trend has now been confirmed by diamond drilling over a strike
length of 4.5 km, extending from the local grid line 200W and passed line 4100E. Drill testing
has confirmed gold mineralization within the main BAM zone extends from below the glacial

Landore Resources Canada Inc. MINERAL RESOURCE ESTIMATE AND PRELIMINARY ECONOMIC ASSESSMENT, BAM Gold Project, Junior Lake Property, Ontario, Canada
Landore Resources Canada Inc. Page | 10
till overburden (~10 m average depth) surface to a maximum vertical depth of approximately
380 m.
1.6. Data Validation and Verification
Landore provided Cube with data files including drilling databases, quality assurance/quality control
(QAQC), topographic survey files, PDF files containing hand drawn cross section interpretations of the
mineralized domains and geological boundaries, and surface topography in DXF file format covering
the entire BAM Gold Project area.
Cube has previously completed a site visit to the Project, data storage facilities at the Junior Lake camp,
and Thunder Bay offices in June 2018 and carried out data verification and data validation on all the
drilling data supplied for the 2022 MRE.
Collar, survey, assay, geology, and other relevant drilling data in .ASC and MS Excel file formats were
provided to Cube up to January 2022, following the completion of the 2020 and 2021 drilling
campaigns. Validation and verification of drill hole data was assessed for all drilling within the BAM
Gold Project area.
The data validation prior to resource estimation included checks for duplicate surveys, downhole
survey errors, assays, and geological intervals beyond drill hole total depths, overlapping intervals, and
gaps between intervals. Data was validated utilizing visual review of digital and paper files, as well as
computer-aided checking systems. Site visit validation included review of recent core samples and
interrogation of digital and paper data, including paper plans and sections, assay records, downhole
survey records, hardcopy geology logs and data storage systems of hardcopy data. Other data
verification included database searches, certificate validation, and quality assurance/quality control
review of assay results.
Verification of supplied electronic drill hole data with drill hole logs and assay certificates was
completed. The primary returned assay result was used for reporting of all intersections in the MRE.
No averaging with field duplicates or laboratory repeats was undertaken so as not to introduce volume
bias.
Cube considers the drilling database to be appropriate for the January 2022 MRE.
1.7. Mineral Resource Estimation
The Mineral Resources for the BAM Gold Project were estimated by Cube based on drill hole and assay
data available as at 14 January 2022. The following key points summarise the modelling process and
key parameters used by Cube for the estimation work:
• A total of 251 diamond drill holes for approximately 45,686 m have been completed within the
BAM Gold Project area, with a total of 207 holes used in the current MRE (37,540 m).
• The data used for the resource estimation is informed by good quality drilling on regular drill
spacing – down to 50 mE x 25 mN for the central areas of the project, stepping out to a
nominal 100mE x 50 mN to the east and west of the main mineralization. Maximum
extrapolation of wireframes from drilling was 25 m to 50 m along strike and 50 m down-dip.

Landore Resources Canada Inc. MINERAL RESOURCE ESTIMATE AND PRELIMINARY ECONOMIC ASSESSMENT, BAM Gold Project, Junior Lake Property, Ontario, Canada
Landore Resources Canada Inc. Page | 11
• Geological and mineralization interpretations in plan and cross sections were provided by LND
and used to assist with updating 3D wireframe models of the gold mineralization envelopes
based on analysis of all the recent information collated. A total of 25 mineralized domains
were modelled for the January 2022 MRE.
• Assessment of the raw assay interval lengths and raw gold assay values were completed in
order to determine the most appropriate length for compositing of the samples. The most
common sample length is 1.0 m and covers the range of the Au grades. Therefore, 1 m
composes were used as the source data for the gold grade estimates.
• Gold grade distributions within the estimation domains were assessed to determine if high
grade cuts or distance limiting should be applied. The effects of grade capping were reviewed
and applied on a domain basis where it was deemed appropriate). The range of cut off values
varied from 10 g/t Au to 25 g/t Au.
• Variogram modelling conducted on estimation domains with sufficient data to provide
parameters for OK estimation method – nugget, sill and range for three directions.
• Kriging Neighbourhood Analysis (KNA) was used to assist with assessing the most appropriate
block sizes and other estimation parameters such as minimum and maximum samples and
discretization to be used for the estimation.
• Parent block size of 25 mE x 5 mN x 25 mRL in the X, Y, Z directions respectively was used,
which was sub-blocked to 6.25 m x 1.25 m x 6.2 5m. This was deemed to be appropriate for
block estimation and modelling the selectivity for a likely open pit operation.
• Ordinary Kriging (“OK”) estimation method was used to estimate gold into the 3D block model
using spatial data analysis parameters informed from the variogram and KNA analyses.
• Au estimated in two passes – 1st pass using optimum search distances for each domain (max
120m) as determined through the KNA process, with a 2nd pass set at longer distances in order
to populate all blocks (2nd = max >360 m).
• Local variations in domain orientations were managed by applying a dynamic anisotropy
search in which the search neighbourhood ellipse dip and dip direction are defined separately
for each block approximating the orientation of the estimation domain where appropriate.
• Blocks have been classified as Indicated Mineral Resources or Inferred Mineral Resources. The
resource classification is based on the quality of information for the geological domaining, well
established continuity of the gold mineralization, as well as the drill spacing and geostatistical
measures to provide confidence in the tonnage and grade estimates.
• The estimation domaining, MRE parameters, classification and block model report replication
have all been internally peer reviewed by qualified professionals at Cube.
With the addition of the 2020-2021 drilling, the new data has resulted in a 47% increase in Indicated
and Inferred Resource (in-situ contained metal) above a cut-off of 0.3g/t Au when compared with the
MRE reported in 2019.
1.8. Mining Methods
Given the shallow nature of the mineralization and the initial metallurgical test results, material could
be extracted by means of open pit mining methods and processed using conventional milling
techniques.

Landore Resources Canada Inc. MINERAL RESOURCE ESTIMATE AND PRELIMINARY ECONOMIC ASSESSMENT, BAM Gold Project, Junior Lake Property, Ontario, Canada
Landore Resources Canada Inc. Page | 12
3DM modelling and block construction were created with the aim of preparing a suitable model for
open pit mine design and pit optimization, with a minimum mining width of 2 m. Internal dilution has
been considered by re-blocking the resource block model, with a maximum downhole width of 3 m
(2.5 m true width) of sub-grade material (<0.3 g/t Au).
Open pit optimization and mine scheduling work has been carried out by Cube for the January 2022
MRE.
1.9. Metallurgy
A series of metallurgical test programs have been carried out on samples from the BAM Gold Deposit.
ALS Metallurgy Americas was engaged by Landore in December 2016 to carry out a preliminary
assessment of the metallurgical response of two composite samples from the BAM East Gold Project
(Allard, 2019). Between 98% and 99% of the feed gold was recovered through combined gravity
concentration and cyanidation leaching of gravity tails for the two composites tested. Gold leach
kinetics were fast, with most of the gold extraction taking place within the first six hours. Gold head
grades were calculated at 2.0 g/t for both composites based on combined gravity and cyanidation
leach test results (Sloan and Roulston, 2016).
Landore completed additional metallurgical testing on the BAM Gold Project in September of 2017
using samples collected from a drill hole completed in the 2017 drilling program (Sloan and Roulston,
2017). This additional test work was designed to assess the metallurgical response of two additional
mineralized samples from the BAM East gold mineralization, and to provide a determination of the
gold feed grade using gravity and cyanidation leach techniques, identical to those employed for the
2016 metallurgical test work. The metallurgical performance was excellent for both tested composites.
Leach kinetics were rapid with most of the gold extraction completed within two to six hours, the
combined gold recovery and cyanidation leach gold extractions for both composite samples measured
between 97% to 99%, and sodium cyanide and lime consumption was very low (<0.1 kg/tonne and 0.3
kg/tonne, respectively). Results indicate that a combination of gravity concentration followed by
cyanidation leaching of the gravity tails would be an effective flowsheet for the composites tested
1.10. Environmental Studies
Landore has conducted various environmental baseline studies on the Junior Lake property since 2007.
Surface water sampling of various lakes and streams has been conducted since 2007.
Beginning in 2007, Landore retained Golder Associates Ltd. (Golder) to implement a baseline surface
water quality monitoring program for the Property. The most recent report on the surface water
quality monitoring was issued on 7 March 2022. The purpose of the water quality monitoring program
is to characterize local baseline surface water quality and help in identifying potential receiving water
environments. This data would be required as one component to the supporting documentation for
permit applications to various regulatory agencies, should the project be developed as a mining
operation.
Bathymetry and fish habitat studies of Ketchikan Lake were conducted in 2007. In 2008, a bedrock
surface investigation of the northern portion of Ketchikan Lake was completed.

Landore Resources Canada Inc. MINERAL RESOURCE ESTIMATE AND PRELIMINARY ECONOMIC ASSESSMENT, BAM Gold Project, Junior Lake Property, Ontario, Canada
Landore Resources Canada Inc. Page | 13
Terrestrial and fish habitat studies were conducted by Golder over the property during 2008 and
subsequently reported in an environmental baseline study in 2009. Results of the vegetation surveys,
wildlife surveys, and incidental observations did not identify any listed species within the site boundary
that would trigger a specialized study. The site has been highly disturbed in some locations by recent
commercial forestry activity.
1.11. Social and Community Impact
Landore maintains a sound working relationship with First Nations on whose traditional lands the
Junior Lake property is situated. In 2007, Landore signed a Memorandum of Understanding (MOU)
with Whitesand and Animbiigoo Zaagi'igan Anishinaabek (AZA) First Nations. This agreement
formalizes the desire and commitment to develop a positive, mutually beneficial relationship amongst
all parties and establishes the process by which this is to be accomplished while Landore is conducting
exploration and advanced exploration activities in the area.
The MOU was later revised to reflect significant changes in Landore’s claim holdings in the Junior Lake
area. Whitesand signed the revised MOU on April 30, 2012. AZA signed the revised MOU on December
6, 2013.
More recently, in December 2018, an Exploration Agreement between Landore, AZA and Aroland First
Nations was signed which reaffirms this mutually beneficial relationship going forward. A separate
Exploration Agreement between Landore and Whitesand First Nation was signed in February 2019.
The Project has involved a range of stakeholders. These stakeholders have included those that hold a
direct interest in the development of the Project, Federal and Provincial government agencies,
community and municipal organizations, First Nation representatives, and other similar groups. The
range of stakeholders is expected to grow with the development of the Project, particularly within the
local community.
1.12. Conclusions and Recommendations
1.12.1. Conclusions
The January 2022 MRE incorporates diamond drilling data over the BAM Gold Project area, completed
predominantly since 2016. It is also informed by sampling and geological information from trenches,
the surface expression of exposed mineralized zones as indicated by geological mapping, a dataset of
bulk density measurements taken from whole core samples, topographic survey files of the project,
digital photos of all relevant diamond drill core, and updated geological interpretations.
Data Quality
The input drill data is comprehensive in its coverage of the gold mineralization at the BAM Gold Project
and is representative of the mineralization. Knowledge of the geological controls on mineralization has
been used to develop the overall January 2022 MRE.
In Cube’s opinion, the drilling, logging, and sampling procedures at the BAM Project have been carried
out to industry best practices. Following the standard validation checks, Cube believes the database for
the BAM Gold Project is adequate for Mineral Resource estimation.

Landore Resources Canada Inc. MINERAL RESOURCE ESTIMATE AND PRELIMINARY ECONOMIC ASSESSMENT, BAM Gold Project, Junior Lake Property, Ontario, Canada
Landore Resources Canada Inc. Page | 14
The typical drilling data spacing (50 m x 50 m) is adequate to determine the geological and grade
continuity for reporting of Mineral Resources and Mineral Reserves.
Interpretation and 3D Modelling
The BAM Gold Deposit is made up predominantly of broad to narrow, very continuous mineralized gold
zones hosted within a volcano-sedimentary sequence The confidence in the geological interpretation
of the January 2022 MRE is good as a result of the optimally spaced diamond core drilling programs
conducted by Landore, predominantly between 2016 and 2021. There are minimal changes in strike
and dip of the mineralization across the sequence, and there is very good continuity overall from east
to west for the main BAM gold mineralization, but it is likely to be affected by minor faulting and
dolerite dyke intrusives, disrupting the mineralization trends.
Estimation and Model Validation
Ordinary Kriging (OK) estimation method is considered an appropriate method to estimate gold into
the 3D block model for the BAM Gold Project. The correspondence between mean grade composite
samples and block grade estimates is good, as demonstrated by the visual inspection in cross sections,
global comparisons of volume and mean grade statistics, and semi‐local comparisons on sections and
levels.
It is Cube’s opinion that the OK gold estimates are valid and satisfactorily represent the informing data
for the January 2022 MRE.
Classification
The January 2022 Mineral Resource has been classified as Indicated or Inferred Resources based on the
following criteria:
• Geological continuity and volume
• Drill spacing and drill data quality
• Modelling technique
• Estimation properties
• Risk or uncertainty present in the estimated grades
The classification of the January 2022 MRE appropriately reflects the QP’s view of the BAM Gold
Project.
Mining and Metallurgical Considerations and Assumptions
Given the shallow nature of the mineralization and the initial metallurgical test results, material could
be extracted by means of open pit mining methods and processed using conventional milling
techniques.
The base input parameters used in the open pit optimization completed by Cube are based on
information collated after discussions with Landore and a review of economic analyses in PEA reports
from similar projects in Ontario, Canada. Geotechnical pit design parameters were based on
recommendations from the geotechnical assessment work carried out by WSP in 2018 (Nelson, 2018).
The open pit optimization study undertaken by Cube has yielded two distinct areas, an east pit shell
(BAM East Pit) and a west pit shell (BAM West Pit).

Landore Resources Canada Inc. MINERAL RESOURCE ESTIMATE AND PRELIMINARY ECONOMIC ASSESSMENT, BAM Gold Project, Junior Lake Property, Ontario, Canada
Landore Resources Canada Inc. Page | 15
Metallurgical Studies
The recent metallurgical test work conducted has determined the following:
• The BAM composite was amenable to gravity concentration of the liberated gold with 65% or
greater of the contained gold recoverable in the gravity concentrate.
• Cyanide consumption was low.
• Cyanide leaching of the gravity tail increased the overall extraction of gold to ±98%. The 98%
recovery has been applied to the pit optimization studies for the 2022 MRE.
PEA Study
For the 2022 economic analysis study, a base case scenario considers the economics of exploiting a
resource of 22.4 Mt at 1.16 g/t containing 833 koz Au. Metallurgical recoveries of 98% are envisaged to
yield 816 koz. The 2022 base case correlates with the 2018 PEA report extended case (Cube, 2019)
which estimated a yield of 760 koz recovered. The subsequent infill and step out drilling carried out by
Landore has therefore met the expectations of the 2018 extended case scenario.
Future Exploration Potential
Based on exploration work completed by Landore up to January 2022, there is significant resource
potential that clearly indicates follow-up district scale exploration programs are warranted. There is
potential for further gold mineralization and other multi-commodity targets along the 31 km strike
length of the Junior Lake Shear (Lamaune) and historic discovery at Toronto Lake (Figure 1-3).
1.12.2. Recommendations
Cube concurs with the Landore opinion there is significant potential to expand the limits of the BAM
Gold Project.
The current 3D model interpretation of the extents of the BAM gold mineralization remains open along
strike, both to the east and west, and future drilling should target the eastern extension of the BAM
Sequence. The BAM gold mineralization remains open down dip, providing additional open pit and
possible underground targets for future drill programs.
The infill and step out drilling conducted for the 2020-2021 drilling programmes further confirmed the
correlation of an IP anomaly from geophysics conducted in 2004, with the main BAM gold
mineralization trend to the west passed local grid line 200W toward the Lamaune Gold Prospect, which
contains anomalous gold mineralization requiring further drill testing.
Future drill testing recommendations to target gold mineralization still open along strike and down dip
and further targets identified and based on the following data are listed as follows:
• To the east past the local grid line 4100E, further exploration and drill testing is planned to test
the relationship between the BAM mineralization and other anomalies associated with the B4-
7 Deposit.
• Highly prospective soil geochemistry results based on recent geochemical sampling.
• IP anomaly targets have been identified by LND previously in 2004 and related to FW massive
to disseminated sulphides zones adjacent to the main BAM Au mineralized units. In addition,

Landore Resources Canada Inc. MINERAL RESOURCE ESTIMATE AND PRELIMINARY ECONOMIC ASSESSMENT, BAM Gold Project, Junior Lake Property, Ontario, Canada
Landore Resources Canada Inc. Page | 16
there are three to four WNW trending anomalies that are possible targets for exploration
drilling (northern anomalies), and step-out drilling along strike from the BAM sequence
• Regional Prospectivity – other gold mineralization targets along the 31 km strike length of the
Junior Lake Shear (Lamaune Prospect), B4-7 Deposit and a historical discovery at Toronto Lake.
Cube concurs with Landore’s proposed exploration and drilling work program on the Junior Lake
Project for 2022. The drilling budget is estimated at C$7.5 M.

Landore Resources Canada Inc. MINERAL RESOURCE ESTIMATE AND PRELIMINARY ECONOMIC ASSESSMENT, BAM Gold Project, Junior Lake Property, Ontario, Canada
Landore Resources Canada Inc. Page | 17
Figure 1-3: Plan View Showing Exploration Potential of the Multi-Element Prospects within the Junior Lake Property (Landore, 2022)
BAM Au Deposit
Felix Au Prospect
Lamaune Au Deposit

Landore Resources Canada Inc. MINERAL RESOURCE ESTIMATE AND PRELIMINARY ECONOMIC ASSESSMENT, BAM Gold Project, Junior Lake Property, Ontario, Canada
Landore Resources Canada Inc. Page | 18
2. Introduction
2.1. Issuer
Landore is a fully owned subsidiary of Landore Resources Ltd., which is based in Guernsey, UK, and
listed on the AIM market of the London Stock Exchange. The BAM Gold Project, located within
Landore’s Junior Lake property, lies approximately 235 km N-NW of Thunder Bay, Ontario, and
approximately 75 km E-NE of the village of Armstrong, Ontario, Canada.
This Independent Technical Report (the “Report”) has been prepared by Cube at the request of
Landore (“the Issuer”) following the release of the January 2022 Mineral Resource estimate for the
BAM Gold Project. The report focuses on Cube’s MRE and pit optimization of the BAM Gold Project for
a potential open pit mining operation. Cube is an Australian owned geological and mining engineering
consulting services company, located in Perth, Western Australia.
2.2. Terms of Reference
Cube was commissioned by Landore to undertake an MRE and prepare an Independent Technical
Report on its 100% owned BAM Gold Project in NW Ontario, Canada. The Report complies with the
requirements of the Canadian Securities Administrators’ National Instrument 43-101, “Standards of
Disclosure for Mineral Projects” - (NI 43-101) for reports filed under Canadian jurisdiction, for the
Effective Date of the Mineral Resource estimate.
The Report was prepared on behalf of the Issuer for the purpose of reporting the results of the
updated MRE and open pit optimization study, with an effective date of 31 January 2022. The report
includes conclusions and recommendations to allow the Issuer to reach informed decisions regarding
the potential for mining operations at the BAM Gold Project.
The scope of work included the following:
• Update of the BAM MRE based on all new drilling completed up to December 2021.
• Carry out a range of pit optimization runs and assessments.
• High level incremental mine production and feed scheduling, mine designs and preliminary
infrastructure designs.
• High level financial modelling with key summary inputs for capital and operating costs.
• Compile January 2022 MRE and open pit mining studies for an Independent NI 43-101
compliant Technical Report. Also compile third party information and studies into the Report.
2.3. Qualifications and Experience
This report has been compiled by the following authors (Table 2-1).
Table 2-1: List of Authors
Author Qualifications, Company Report Section Responsibility
Brian Fitzpatrick
B.Sc. (Geology), MAusIMM CP (Geo), Principal Geologist, Cube Consulting P/L
1 to 12, 14, 23 to 26; Also compilation of Sections 13, 17, 20 to 22
Quinton de Klerk
NHD, FAusIMM, Director – Mining Engineering, Cube Consulting P/L
16 , 18

Landore Resources Canada Inc. MINERAL RESOURCE ESTIMATE AND PRELIMINARY ECONOMIC ASSESSMENT, BAM Gold Project, Junior Lake Property, Ontario, Canada
Landore Resources Canada Inc. Page | 19
Mr. Brian Fitzpatrick B.Sc., MAusIMM CP (Geo), is a Principal Geologist with Cube Consulting Pty Ltd
and a Qualified Person as defined by NI 43-101. Mr. Fitzpatrick has worked as a professional geologist
for more than 37 years since graduating from the University of Tasmania in 1985. Relevant experience
has been gained from working in the gold and base metal mining and exploration industry in various
provinces throughout Australia and other countries. This includes exploration, open pit and
underground mining operations, and mine development and resource estimation in greenstone hosted
gold deposits, epithermal gold deposits and Volcanogenic Massive Sulphide (VMS) poly-metallic
deposits.
Mr. Quinton de Klerk is a mining engineer, with a National Higher Diploma in Metalliferous Mining,
from the University of Johannesburg graduating in 1993. He is a fellow of the Australasian Institute of
Mining and Metallurgy (FAusIMM), member number 210114. I have worked as a Mining Engineer for
more than 25 years since my graduation. Relevant experience has been gained from working in the
gold and base metal mining industry in various in, South Africa, Namibia, Australia and other countries.
This includes open pit and underground mining experience in various mining methods
Mr. Brian Fitzpatrick, Mr. Quinton de Klerk, and Cube are independent from Landore. The relationship
is solely one of professional association between client and independent consultant. This report is
prepared in return for fees based upon agreed commercial rates and the payment of these fees is in no
way contingent on the results of this report
2.4. Site Visits and Scope of Personal Inspection
A site visit to the Junior Lake property was undertaken by the coordinating author, Brian Fitzpatrick, a
Principal Geologist with Cube Consulting Pty Ltd and a Qualified Person under NI 43-101 (Principal
Author) from 23 to 28 June 2018. The main purpose of the site visit included the following:
• Ascertain the geological setting and styles of gold mineralization.
• Field inspection of geological outcrops within the Project area.
• Review core samples and core sample logging and processing facilities.
• Inspect the drilling rig operations and sampling preparation protocols carried out by Landore
and the drilling contractor.
• Carry out data verification and validation checks and review the sample storage, sample
security and transport protocols from site to the assay laboratory.
• Check logging of significant intervals in drill core remaining from recent and current drilling
programs.
• Site visit discussions with Landore staff.
The author did not inspect any of the primary assay laboratories used by Landore.
More recent site visits have not been possible to arrange within the period of drilling during 2020-2021
due to international travel restrictions as a result of the global COVID pandemic.
2.5. Sources of Information
In addition to the 2018 site visit, the author has relied on several sources of information provided by
Landore on the Project area, including relevant published and unpublished third-party information, and

Landore Resources Canada Inc. MINERAL RESOURCE ESTIMATE AND PRELIMINARY ECONOMIC ASSESSMENT, BAM Gold Project, Junior Lake Property, Ontario, Canada
Landore Resources Canada Inc. Page | 20
public domain information. The documentation reviewed, and other sources of information, are listed
in Section 27: References.
A number of phone and Zoom meeting discussions, and correspondence with respect to the BAM Gold
Project and the Junior Lake property were held with Mr. William Humphries, Chairman/President of
Landore, Ms. Michele Tuomi, Director/Vice President Exploration of Landore, and Mr. Chris Cooper,
Senior Geological Consultant, Landore.

Landore Resources Canada Inc. MINERAL RESOURCE ESTIMATE AND PRELIMINARY ECONOMIC ASSESSMENT, BAM Gold Project, Junior Lake Property, Ontario, Canada
Landore Resources Canada Inc. Page | 21
3. Reliance on Other Experts
This report has been prepared by Cube for Landore. The information, key findings, recommendations
and estimates contained herein are based on:
• Information available to Cube at the time of preparation of this report
• Assumptions, conditions, and qualifications as set forth in this report
• Data, technical reports, and other published and unpublished information supplied by Landore,
and other third-party sources as listed in Section 27 of this of this report.
The Qualified Person (QP) for the Report has not independently investigated the mineral tenure status
and information of the Project or the requirements of Canadian mining and exploration legislation.
The QP has fully relied upon and disclaims responsibility for information provided by Landore
pertaining to company ownership and agreements, mineral tenement status, current environmental
permits, and other information relating to exploration expenditure and community relations.
Information on the mineral property locations, title conditions, encumbrances, permits, and
environmental liabilities reported in Section 4 and Appendix 1 of this report was supplied by Landore
and have not been independently verified by the QP.
The QP has taken reasonable care to review the information supplied by Landore and has no reason to
believe that the information supplied is inaccurate.

Landore Resources Canada Inc. MINERAL RESOURCE ESTIMATE AND PRELIMINARY ECONOMIC ASSESSMENT, BAM Gold Project, Junior Lake Property, Ontario, Canada
Landore Resources Canada Inc. Page | 22
4. Property Description and Location
4.1. Location
The Junior Lake Project is located approximately 235 km north-northeast of Thunder Bay, Ontario, and
approximately 75 km east-northeast of the village of Armstrong (Figure 4-1). All coordinates in this
report are defined using the NAD 83 Zone 16 UTM coordinate system and are expressed in metric
units. All locations illustrated in this report are also defined in this projection and datum.
Figure 4-1 Project Location Map (Tuomi, 2018)
The centre of the property is located at 87°59’4” W longitude and 50°23’9” N latitude; the NAD 83
Zone 16 UTM coordinates of the central location of the Junior Lake property are at 430,000 E and
5,584,000 N.

Landore Resources Canada Inc. MINERAL RESOURCE ESTIMATE AND PRELIMINARY ECONOMIC ASSESSMENT, BAM Gold Project, Junior Lake Property, Ontario, Canada
Landore Resources Canada Inc. Page | 23
The central area of the BAM Gold Project is located at UTM coordinate 434,910 E and 5,581,555 N.
Other deposits and prospects located within the Junior Lake property include:
• B4-7 Deposit and Alpha Zone – Nickel-Copper-Cobalt-PGE (+/- Gold) deposit located at
approximate UTM coordinates 432,660 E and 5,581,310 N
• VW Deposit - Nickel-Copper deposit located at approximate UTM coordinates 435,700 E and
5,580,800 N
• Lamaune Gold Prospect - located at approximate UTM coordinates 425,000 E and 5,583,400 N
• Lamaune Iron Deposit - located at approximate UTM coordinates 423,000 E and 5,584,000 N
The project area is within the Junior Lake and Toronto Lake 1:50,000 scale topographic map sheets NTS
52I/08 NE and NTS 44L/05, respectively. The Junior Lake Project leases and claims are located on the
Falcon Lake, Junior Lake, Kapikotongwa River, Summit Lake, Toronto Lake, and Willet Lake claim maps
(Thunder Bay Mining Division areas NTS 52I/08NE and SE, 42L/05NW and SW).
4.2. Mineral Title Status – Land Tenure
Landore mineral holdings in the Lake Nipigon area comprise the Junior Lake claim group and the
immediately adjacent claim group of Lamaune Iron.
In October 2017, Landore acquired a 90.3% ownership of Lamaune Iron Inc (Lamaune), which has
become a subsidiary company of Landore.
Subsequent to this acquisition, in April 2018 Ontario’s Ministry of Energy, Northern Development and
Mines converted all active, unpatented mining claims from their legally defined location by claim posts
on the ground or by township survey to a cell-based provincial grid for the entire province including
Landore’s mining claims (“legacy claims”). All Landore’s legacy claims were converted to the new
Ontario claim system and designated new claim numbers.
In November 2019, the Ontario government granted Lamaune has been granted Mining Leases 109856
and 109857 (the “Lamaune Mining Leases”) encompassing all of Lamaune’s exploration claims over an
area totalling approximately 4,133 hectares, for a 21 year term renewable for further terms of 21
years. The Lamaune Mining Leases lie adjacent to the existing Junior Lake Mining Leases 108257,
108258, 108259 (granted in August 2008) and Mining Lease 109819 (renewed in January 2019). The
Company’s existing Lease interests, all of which are granted for a 21 year period renewable for a
further 21 years, amount to approximately 3,729 hectares.
As of May 2022, the Junior Lake property now consists of six mining leases and 1,318 staked mining
claims. The combined Landore and Lamaune Mining Leases cover a total of approximately 7,862
hectares and extend for 22 kilometres, encompassing all of Landore’s established mineral deposits and
prospects. The BAM Gold Deposit lies on lease CLM 461. The B4-7 Deposit lies on lease 107421
(PA39127, PA39128), and leases 108257 (CLM 459) and 108259 (CLM460), whereas the VW Deposit
lies on lease 108258 (CLM461).
The details of each patented claim and mineral lease are provided in Table 4-1. A tabulation of the
staked mineral claims as of May 2022 is provided in Appendix 1.

Landore Resources Canada Inc. MINERAL RESOURCE ESTIMATE AND PRELIMINARY ECONOMIC ASSESSMENT, BAM Gold Project, Junior Lake Property, Ontario, Canada
Landore Resources Canada Inc. Page | 24
Table 4-1 Landore Mineral Leases (100% Interest) (from Landore, 2020)
Township / Area Legacy
Claim ID Mining
Lease ID G-Number 1 Anniv Date Exp Date Area (ha) Ann. Rent
Junior Lake 109819 2 PA39127, PA39128
n/a 2019-Jan-01 2040-Jan-01 52.97 $158.91
Junior Lake 108257 CLM459 3 G-4040218 2008-Aug-01 2029-Aug-01 1,460.80 $4,382.39
Junior Lake 108258 CLM461 3 G-4040217 2008-Aug-01 2029-Aug-01 1,527.39 $4,582.16
Junior Lake 108259 CLM460 3 G-4040319 2008-Aug-01 2029-Aug-01 687.79 $2,063.38
Junior Lake Sub-Total
3728.95 $11,186.84
Junior Lake - Lamaune Block
109856 CLM548 4 n/a 2019-Aug-01 2040-Aug-01 2,056.45 $6,169.34
Junior Lake - Lamaune Block
109857 CLM549 4 n/a 2019-Aug-01 2040-Aug-01 2,076.12 $6,228.37
Lamaune Sub-Block
4,132.57 $12,397.71
TOTAL 7,861.52 $23,584.55
Notes: 1. G-number is generated when work reports are filed
2. Renewed lease 107143, given new number.
3. Wing Resources Inc. holds a 2% NSR on three claims within CLM459, one claim within CLM460 and three claims within CLM461 subject to a buy-back clause of 1%.
4. Stares Contracting Corp holds a 1% NSR on 11 claims within CLM548 and seven claims within CLM549.
Figure 4-2 shows all the mining leases and claims as of 2 May 2022, as the Ontario government has not
yet updated its drafting coverages with the updated Lamaune mining leases. The only recent changes
are the active mining claims within the Lamaune block, which have been rolled into the two new
mining leases.
The staked mineral claims for Landore and Lamaune Mining Leases include access to the mining rights.
The conditions attached to the mining leases include the mining rights to all of the leased area and
surface rights to all or parts of the leased area as specified in the lease documents. Landore has access
to all of the mining and surface rights for those leases and patented claims over an area encompassing
the BAM Gold Deposit, the Lamaune Gold Prospect, the B4-7/Alpha Zone Deposit, and the VW Deposit.
The leases are granted for 21 years, renewable for further terms of 21 years.
Within the mining leases, Landore has the right, subject to provisions of certain Acts and reservations,
to:
• Sink shafts, excavations, etc., for mining purposes.
• Construct dams, reservoirs, railways, etc., as needed.
• Erect buildings, machinery, furnaces, etc., as required.
• Treat ores.

Landore Resources Canada Inc. MINERAL RESOURCE ESTIMATE AND PRELIMINARY ECONOMIC ASSESSMENT, BAM Gold Project, Junior Lake Property, Ontario, Canada
Landore Resources Canada Inc. Page | 25
Figure 4-2 Junior Lake Project – Claims and Leases (from Landore, May 2022)
VW Ni
Deposit
CLM 461
B4-7 Ni Deposit
CLM 459, 460 & PA
39127, 39128
Lamaune
Deposit (Fe)Lamaune Au
Prospect
BAM Gold Project
CLM 461

Landore Resources Canada Inc. MINERAL RESOURCE ESTIMATE AND PRELIMINARY ECONOMIC ASSESSMENT, BAM Gold Project, Junior Lake Property, Ontario, Canada
Landore Resources Canada Inc. Page | 26
4.3. Other Royalties and Agreements
Wing Resources Inc. holds a 2% NSR on three claims within CLM459, one claim within CLM460 and
three claims within CLM461 subject to a buy-back clause of 1%.
Stares Contracting Corp. holds a 1% NSR on 11 claims within CLM548 and seven claims within
CLM549.
Acquisition of Royalty Rights at Lamaune Lake Property (Landore Public Release, 21 September
2020)
On 20 September 2020, Landore announced that the Company’s wholly owned subsidiary Landore
Resources Canada Inc. (Landore Canada) has entered into an agreement to acquire half of the 2%
Net Smelter Returns Royalty (NSR) that is held on Landore Canada’s 90.2% owned Lamaune Lake
Property, Ontario
In October 2008, Landore Canada entered into an agreement with Stares Contracting Corp, Stephen
Stares, Michael Stares and James Dawson (together, the “Vendors”) through which Landore Canada
purchased the remaining 20% stake in the Lamaune Lake Property from the Vendors. As part of the
agreement, the Vendors retained a 2% NSR on the 8 original Lamaune claims and 9 claims staked by
Landore Canada, and Landore Canada was entitled to purchase half of the 2% NSR from the Vendors
for C$1 million in certain specified circumstances.
Following discussions with the Vendors, Landore Canada elected to purchase half of the Vendors’
NSR for a reduced price of C$150,000 (the “Consideration”). The Consideration was satisfied through
a cash payment of C$75,000 and the issuance of 227,733 new Ordinary Shares in Landore Resources
Limited at a price of 19.25 pence per share (the “Consideration Shares”).
Following the agreement, the Vendors remain holders of a 1% NSR in the Lamaune Lake Property.
4.4. Work Program Permitting
Landore has the necessary work permits pertaining to future work programs proposed by Landore as
described in Section 26 of this report.
4.5. Other Factors and Risks
The QP is not aware of any environmental liabilities associated with the Junior Lake property.
Other than seasonal weather conditions, the QP is not aware of any other significant factors and
risks that may affect access, title, or the right or ability to perform the proposed work program on
the property.
Landore Resources Canada Inc. MINERAL RESOURCE ESTIMATE AND PRELIMINARY ECONOMIC ASSESSMENT, BAM Gold Project, Junior Lake Property, Ontario, Canada
Landore Resources Canada Inc. Page | 27
5. Accessibility, Climate, Local Resources, Infrastructure and
Physiography
5.1. Accessibility
Road access to the Junior Lake property from Thunder Bay is via paved provincial highways No. 17
(15 km) and No. 527 to Armstrong, with an overall distance of 255 km. From Armstrong, the
Buchanan Forest Products Inc. gravel haulage road is taken east to kilometre 105, where a skidder
haulage road leads approximately one kilometre to the Landore camp. In all, the combined distance
from Thunder Bay to the property is approximately 360 km. Skidder and drill roads provide access to
various areas of the property. The BAM Gold Project is located in the south-central area of the Junior
Lake property.
Alternate road access is available to the extreme east portion of the property via a gravel haulage
road that terminates on the northeast side of Toronto Lake. To the southwest and south, this road
connects to the Paint Lake Road (No. 801) and then highways 11 and 17 to Nipigon and Thunder Bay,
respectively.
5.2. Climate
The Armstrong region and Junior Lake property experience hot summers and cold, snowy winters.
Maximum and minimum temperatures range from an extreme low of –50oC in the winter months to
an extreme high of 38oC in the summer months. Winter lows of –40oC are not uncommon in January
and February.
Mean annual precipitation for the area is approximately 710 mm. The area is snow-covered for five
and a half months per year, with monthly snowfalls ranging from 27 cm to 45 cm in winter.
Prevailing winds are from the northwest. The relative humidity ranges from 50% to 77%. The overall
climate of the Project area is such that exploration activities can be carried out on a year-round
basis.
5.3. Local Resources and Infrastructure
5.3.1. Local Resources
Thunder Bay is the major centre for north-western Ontario and provides most of the services
required by exploration and mining operations. The Thunder Bay commercial airport has daily
scheduled service to major Canadian cities, and the city offers rail facilities and a port on Lake
Superior that provides Atlantic Ocean access via the Great Lakes and the St. Lawrence Seaway.
Mining and skilled labour are available in Thunder Bay and elsewhere in Ontario and Québec.
Most consumables, including food, fuel, natural gas, propane, and cement, are readily available in
Thunder Bay. Limited fuel and accommodations are available in Armstrong, formerly a service centre

Landore Resources Canada Inc. MINERAL RESOURCE ESTIMATE AND PRELIMINARY ECONOMIC ASSESSMENT, BAM Gold Project, Junior Lake Property, Ontario, Canada
Landore Resources Canada Inc. Page | 28
for the CNR main cross-country line. Wiskair Helicopters maintains a small jet at a fuel depot at the
Ontario Ministry of Natural Resources (OMNR) site in Armstrong.
5.3.2. Infrastructure
The Junior Lake property currently has a camp setup for mining exploration and surface works
(Figure 5-1). The camp includes messing and cabin accommodation, core logging, exploration and
drill core sample processing and storage facilities. The property is well setup for future development,
and production activities. Many sources of water are present on the property. No grid power is
currently available in the immediate vicinity of the property.
Other than a cabin camp, there is no infrastructure on the property. No electric power or rail lines
exist on the property. Due to the bankruptcy of Buchanan Forest Products Inc. in May 2009,
maintenance of the pulp haulage road to the Junior Lake property has been assumed by the Ontario
Ministry of Transportation to within 30 km of the camp site, with the balance of the distance
maintained by private interests. The CNR main single line is 13 km south of the property, passing
between Junior Lake and the north shore of Lake Nipigon. Ontario Power Generation (OPG) plans on
constructing two hydroelectric power plants (100 MW) on the Little Jackfish River with the power
lines connecting the OPG grid to cross the Junior Lake property.
Figure 5-1: Aerial View of Junior Lake Camp and Core Farm (Landore File Photo, 2021)

Landore Resources Canada Inc. MINERAL RESOURCE ESTIMATE AND PRELIMINARY ECONOMIC ASSESSMENT, BAM Gold Project, Junior Lake Property, Ontario, Canada
Landore Resources Canada Inc. Page | 29
The nearest operating mine is the Lac Des Iles Mine (LDIM) owned by Lac Des Iles Mines Ltd., a
subsidiary of North American Palladium Ltd. (NAP). LDIM is located 100 km north of Thunder Bay,
approximately 15 km west of Highway 527, and is approximately 259 km by road from the Junior
Lake property.
5.4. Physiography
North-western Ontario lies within the Superior Province of the Canadian Precambrian Shield, a
boreal forest region, populated mostly by black spruce, birch, poplar, balsam fir and jack pine in the
uplands and spruce, larch and alder swamps, and lakes in the low areas. Drainage is poorly
integrated and water flows are generally south to Lake Superior via Lake Nipigon.
Land use in the vicinity of the Junior Lake property is primarily forestry-related, and much of the
Junior Lake property has been cleared of spruce for pulpwood. Outcrop averages 2% to 3% of
surface area but may be more than 20% locally. Unconsolidated overburden is primarily boulder-rich
glacio-fluvial materials, with glacio-lacustrine sediments in low areas.
Being generally of low relief, the topography of the Junior Lake property is favourable for the
placement of facilities normally associated with a mining operation. Elevations on the Junior Lake
property range from ±290 meters above sea level (MASL) to 380 MASL. The BAM Gold Project lies in
a cut-over, low-lying swampy area devoid of outcrop, with elevations of 338 MASL to 350 MASL.
Figure 5-2, Figure 5-3, and Figure 5-4 show recent photographs from the Cube site visit illustrating
the typical vegetation, low lying swampy areas (Ladle Flats), and outcrop within the Project area.
Figure 5-2: Topography and Vegetation on Line 100 E/475 N -- View Looking North (Cube, June 2018)

Landore Resources Canada Inc. MINERAL RESOURCE ESTIMATE AND PRELIMINARY ECONOMIC ASSESSMENT, BAM Gold Project, Junior Lake Property, Ontario, Canada
Landore Resources Canada Inc. Page | 30
Figure 5-3: Ladle Flats – Recent View Looking East, Near Drill Platform Along Line 2350 E (Landore File Photo, 2022)
Figure 5-4: Exposed Outcrop and Vegetation on Line 3500 E/150 N - View Looking West (Cube, June 2018)

Landore Resources Canada Inc. MINERAL RESOURCE ESTIMATE AND PRELIMINARY ECONOMIC ASSESSMENT, BAM Gold Project, Junior Lake Property, Ontario, Canada
Landore Resources Canada Inc. Page | 31
6. History
6.1. Property History
Landore optioned part of the property from North Coldstream Mines Limited in 1998 and additional
claims from Brancote Canada in 2000.
In 2008, Landore was granted three mining leases, which include mining and surface rights, over an
area encompassing the BAM and BAM East Gold Deposits, B4-7, and VW Deposits. The leases cover
23 mineral claims and two patents for a total area of 3,729 ha and have been granted for 21 years
renewable for further terms of 21 years.
In June 2011, the Lamaune block, comprised of 23 claims (pre-claim conversion, see section 4.2), for
4,096 ha, containing the Lamaune Iron Deposit as well as the Lamaune Gold Prospect, was
transferred into a separate private company (Lamaune Iron Inc.). In October 2017, Landore acquired
a 90.2% ownership of Lamaune Iron Inc., which has become a subsidiary company of Landore.
In November 2019, the Ontario government granted the Landore two mining leases encompassing
all of the staked mining claims within the Lamaune portion of the property. The Junior Lake property
now consists of six mining leases and 1,318 staked mining claims, all together totaling approximately
33,029 ha.
6.2. Previous Exploration
Geological mapping and exploration in the vicinity of the Junior Lake property is recorded as early as
1917. Much of the work has focused on base metal exploration. More details on the results of
exploration activities carried out by Landore are summarized in Section 9.
A summary of the ownership changes and historical work that has been carried out on the property
by other parties is presented in Table 6-1.
Table 6-1 Summary of Historical Exploration Activities by Other Parties in the Junior Lake Area (updated from RAP, 2018)
Company Years Details of Work Significant Results
Johnson’s Company Ltd
1950 Ground magnetometer and geology surveys.
Outlined peridotite.
Kennco Explorations (Canada) Ltd
1952 Airborne and ground magnetic surveys. Outlined the mafic-ultramafic intrusion under Toronto Lake.
W. Despard and J. Zmudzinski
1958 to 1960
Discovery of iron formation by prospecting. Prospecting, trenching, ground magnetic surveying, geological mapping and one diamond drill hole (30 m) by Sogemines Development Co. Ltd.
Delineation of five magnetic anomalies.

Landore Resources Canada Inc. MINERAL RESOURCE ESTIMATE AND PRELIMINARY ECONOMIC ASSESSMENT, BAM Gold Project, Junior Lake Property, Ontario, Canada
Landore Resources Canada Inc. Page | 32
Company Years Details of Work Significant Results
Panther International
Mining Co. Ltd 1959
Airborne magnetometer and electromagnetic surveying. 5 diamond drill holes, total 550 m.
0.19% Ni over 9.4 m including 0.96% Ni over 0.3 m in one drill hole; 0.18% Ni over 12.2 m in another hole.
Sogemines Frobisher Ltd. and
Ventures Ltd. 1959
Trenching, sampling and diamond drilling totaling 525 m to follow up the discovery of a spodumene-bearing dike.
NA
Ontario Department of
Mines
1959 to 1962
Regional geological mapping. NA
Canadian Dyno Mines Ltd
1968
Staking of 333 claims in 15 groups to cover AEM conductors. Merged with Mogul Mines Ltd which subsequently became International Mogul Mines Ltd.
NA
International Mogul Mines (in
JV with Coldstream Mines
Ltd)
1969
Prospecting, mapping, ground mag and EM surveys, soil sampling and trenching. 8 diamond drill holes, total 675 m.
Drilling resulted in the discovery of the B4-7 Deposit. Deposit delineated by an additional 30 drill holes (6,850 m) in 1969. Eight additional drill holes (628 m) were completed to evaluate other conductors.
Metallurgical testing by SGS Lakefield. Test work performed on a 136 kg composite sample created from 71 assay rejects.
Completion of a non-NI43-101 compliant tonnage and grade estimate.
2,070,689 tonnes averaging 0.87% Ni and 0.59% Cu (Zurowski,1970).
Musselwhite, W.H.
1969 Trenching. Results not reported.
Noranda Exploration
Company Ltd
1969 to 1970
Ground magnetic and electromagnetic surveys, 3 diamond drill holes, total 307.3 m.
Up to 0.03% Ni and 0.01% Cu over 3.65m.
Coldstream Mines Ltd
1970 Acquired 100% of the property. Two claims taken to lease in 1976.
Rickaby Mines Ltd 1977 Ground magnetometer survey. Outlined mafic-ultramafic intrusion under Toronto Lake.
Québec Cobalt and Exploration
Ltd
1983 to 1986
Claim staking, mapping geophysics, soil and rock sampling, litho-geochemical surveys.
Litho-geochemistry indicates alkali mobilization, Na depletion, K enrichment. Highest assays associated with quartz vein on Turtle Island.
Selco Mining Corporation
1980 to 1982
Airborne and ground electromagnetic and magnetic surveys. One drill hole for 82 m.
Pyrite, pyrrhotite, graphite, tourmaline, no Au.
Kerr Addison Mines Ltd
1983 Geology, soil and litho-geochemical surveys.
Au assays in rock over 10,000 ppb, Cu assays up to 3,700 ppm, low Zn and Mo.
Placer Dome Inc. 1986 to
1987
Claim staking, ground magnetic and horizontal loop electromagnetic surveying, geological mapping, rock chip sampling, and limited hand-dug trenches.
Discovery of two consecutive one metre samples of weakly sulphidic iron formation that assayed 1.7 g/t Au and 4.1 g/t Au.
Placer Dome Inc. 1988 to
1989 Diamond drilling of 20 holes (3,317 m).
Best value was 5.48 g/t Au along a core length of 1.35 m hosted within a sulphidized iron formation.

Landore Resources Canada Inc. MINERAL RESOURCE ESTIMATE AND PRELIMINARY ECONOMIC ASSESSMENT, BAM Gold Project, Junior Lake Property, Ontario, Canada
Landore Resources Canada Inc. Page | 33
Company Years Details of Work Significant Results
Ontario Department of
Mines 1989
Airborne magnetometer and electromagnetic surveying.
NA
Ontario Geological Survey
1992 Geological mapping, Toronto Lake area. NA
Stares Brothers 1999 Discovery of Zap and Carrot Top zones by prospecting.
Best value, Zap Zone: 1.55% Cu, 1.11% Ni, 0.15% Co, 0.89 g/t Pt, 0.88 g/t Pd. Best value, Carrot Top zone: 0.34% Cu, 0.33% Ni, 0.02% Co, 0.26 g/t Pt, 1.20 g/t Pd
Norcal Resources 2000
Prospecting, line cutting, ground magnetic, VLF and HEM electromagnetic surveying, and trenching.
Best value, Zap Zone: 0.27% Cu, 0.72% Ni, 0.07% Co, 1.1 g/t Pd.
Ontario Geological Survey
2006 to 2009
Geological mapping, Caribou greenstone belt.
NA
6.3. Historical Mine Production
No historical or recent mining activity has taken place on the Junior Lake property including the BAM
Gold Project area.

Landore Resources Canada Inc. MINERAL RESOURCE ESTIMATE AND PRELIMINARY ECONOMIC ASSESSMENT, BAM Gold Project, Junior Lake Property, Ontario, Canada
Landore Resources Canada Inc. Page | 34
7. Geological Setting and Mineralization
7.1. Regional Geology
The Junior Lake property is located within the Archean-aged Superior Province of the Precambrian
Shield which hosts most major mining camps in Canada. The Superior Province is further subdivided
into numerous provinces of varying aged tectonostratigraphic, plutonic, and supracrustal rock
assemblages. The Junior Lake property is located within the East Wabigoon Subprovince. The
property is within the roughly east-west trending Caribou (Lake)-O’Sullivan greenstone belt. This
greenstone belt ranges from 3.5 km to 15 km wide and extends roughly east-west for 80 km to
100 km (MacDonald, 2006). The belt is flanked to the south by the Robinson Lake Batholith portion
of the Lamaune Batholithic Complex and to the north by a major, roughly east-west trending fault
zone that marks the southern boundary of the English River Subprovince. Northeast of the property,
the belt is intruded by the Summit Lake Batholith which is of tonalitic to quartz dioritic composition.
The western portion of the greenstone belt has been intruded by thick, undulating, flat-lying,
Neoproterozoic-age Nipigon diabase sills and cross-cutting dikes. These sills are thought to represent
the discontinuous, erosional remnants of thick, laterally extensive sills comprising the Nipigon Plate,
which is centred on Lake Nipigon, approximately 30 km to the south.
Regional deformation is expressed as a west to west-northwest trending, sub-vertical to steeply
north dipping foliation and small-scale folding in the area and on most of the property. Some
occurrences of south dipping foliations are found on the northern portion of the property. Based on
metamorphic mineral assemblages, Berger (1992) estimated the regional metamorphism to be of
greenschist rank, increasing to amphibolite rank near the contact metamorphic aureoles of the
Robinson Lake and Summit Lake batholiths.
The Junior Lake property is located within the boundaries of the geologic map of the crescent Lake
area by Pye (1968) (Figure 7-2).
The property is host to the BAM Gold Project located approximately midway between the B4-7 Ni-
Cu-Co-PGE deposit and the VW nickel deposit, located 3 km apart. The Lac des Iles PGE Mine is
located approximately 190 km to the southwest of the Junior Lake property (Figure 7-2).

Landore Resources Canada Inc. MINERAL RESOURCE ESTIMATE AND PRELIMINARY ECONOMIC ASSESSMENT, BAM Gold Project, Junior Lake Property, Ontario, Canada
Landore Resources Canada Inc. Page | 35
Figure 7-1: Regional Geology Map (from OGS Map M2542, 1991)
_________________________Landore Resources Canada Inc.
Junior Lake ProjectOntario, Canada
Regional Geology_______________________

Landore Resources Canada Inc. MINERAL RESOURCE ESTIMATE AND PRELIMINARY ECONOMIC ASSESSMENT, BAM Gold Project, Junior Lake Property, Ontario, Canada
Landore Resources Canada Inc. Page | 36
Figure 7-2: Regional Geology Map Legend (from OGS Map M2542, 1991)
_________________________Landore Resources Canada Inc.
Junior Lake ProjectOntario, Canada
Regional Geology Legend_______________________

Landore Resources Canada Inc. MINERAL RESOURCE ESTIMATE AND PRELIMINARY ECONOMIC ASSESSMENT, BAM Gold Project, Junior Lake Property, Ontario, Canada
Landore Resources Canada Inc. Page | 37
7.1. Property and Local Geology
7.1.1. Stratigraphy
The supracrustal rocks and associated mafic to ultramafic intrusions of the Caribou (Lake) -
O’Sullivan greenstone belt are subdivided by Berger (1992) into the Archean-aged Toronto and
Marshall Lake groups. Locally in the Junior Lake area, the package of Toronto Lake and Marshall Lake
groups has been referred to recently by MacDonald (2006) as the Willet Assemblage. The two
lithostratigraphic groups are similar in many respects, although the Marshall Lake Group (MLG)
contains a higher proportion of clastic metasedimentary rocks and apparently lesser amounts of
mafic intrusive rocks, with the division between the two groups lying along a poorly defined and
possibly faulted margin. The Toronto Lake Group (TLG) represents the host of much of the Ni-Cu-
PGE mineral occurrences on the Junior Lake property, while the lower portions of the MLG host a
large portion of the newly discovered gold mineralization (Figure 7-3).
In the north portions of the Junior Lake property, the MLG includes tholeiitic, amphibolitized mafic
flows and calc-alkalic dacitic tuff, minor tuff breccias, and intercalated greywacke, chert, and
sulphide iron formation. Thin, discontinuous intermediate to felsic metavolcanic rock units also
occur in the MLG. A higher portion of metasedimentary rocks and fewer mafic intrusive rocks occur
in the MLG compared to the TLG. Most of the rocks of the MLG observed on the property are finely
amphibolitized, pillowed, mafic metavolcanic flows with well-defined pillow selvedges, and a greater
occurrence of plagioclase phenocrysts than observed within mafic flows south of the Grassy Pond Sill
(GPS). Some outcrops exhibit an irregular, pervasive alteration that is characterized by large, acicular
actinolite porphyroblasts contained within a fine-grained matrix of chlorite, sericite,
actinolite/tremolite, and epidote. This alteration is very similar to localized alteration observed
within the TLG.
The TLG underlies the southern third of the Junior Lake property and the southern half of the
Lamaune Iron claim group. It consists of a bimodal assemblage of tholeiitic mafic flows and calc-
alkaline rhyolitic to dacitic tuff, tuff breccias, and subordinate flows. The assemblage has been
intruded by numerous mafic to ultramafic sills, dikes, and small stocks. Relative ages based on
superposition and tops indicate the sequences young to the north. Further detailed descriptions of
the major rock types found in the area are provided in Berger, 1992.
Metasedimentary rocks on the Lamaune Iron claim group are predominantly chemical
metasediments composed of oxide facies (chert-magnetite) iron formation with some associated
interbands of silicate facies or sulphide facies iron formation. These iron formation units coincide
with prominent persistent formational electromagnetic and magnetic anomalies as verified by field
observations on outcrops and bedrock exposed by trenching. The clastic metasedimentary rocks
exposed by trenching consist of graphitic pelites that show a weak and discrete electromagnetic and
magnetic signature. Variably flattened thin conglomerate units, usually composed of centimetre size
felsic clasts in a predominantly mafic matrix, are exposed in two locations along the northern and
southern contacts of the western extension of the GPS.
Northwest and northeast striking diabase dikes and flat-lying sills (Nipigon?) crosscut or overlie all
the Archean rocks on the property.

Landore Resources Canada Inc. MINERAL RESOURCE ESTIMATE AND PRELIMINARY ECONOMIC ASSESSMENT, BAM Gold Project, Junior Lake Property, Ontario, Canada
Landore Resources Canada Inc. Page | 38
Figure 7-3: Junior Lake - Property Geology Map showing Mineral Deposits (from Landore, May 2022)
BAM Au Deposit
VW Ni Deposit
B4-7 Ni-Cu-Co-PGE Deposit
Lamaune Au Deposit
Grassy Pond Ni Prospect
Lamaune Fe Deposit
Felix Lake Au Prospect

Landore Resources Canada Inc. MINERAL RESOURCE ESTIMATE AND PRELIMINARY ECONOMIC ASSESSMENT, BAM Gold Project, Junior Lake Property, Ontario, Canada
Landore Resources Canada Inc. Page | 39
A simplified stratigraphic column for the Junior Lake property main deposits and prospects is
presented in Figure 7-4.
Figure 7-4: Simplified Stratigraphic Column for Junior Lake property (from RPA, 2018)

Landore Resources Canada Inc. MINERAL RESOURCE ESTIMATE AND PRELIMINARY ECONOMIC ASSESSMENT, BAM Gold Project, Junior Lake Property, Ontario, Canada
Landore Resources Canada Inc. Page | 40
The main stratigraphic sequence that is observed to host the large majority of the newly discovered
gold mineralization at the BAM East Gold Deposit is referred to as the BAM Sequence. The character
of this package of rocks has been determined mostly from observations in drill core and in limited
exposures in trenches and outcrops in the area. In the immediate deposit area, the BAM Sequence is
comprised largely of very fine grained to aphanitic material which has been recorded as a clastic
sedimentary unit in the drill logs (Figure 7-5). It is typically a medium to dark green-grey to black
colour, contains a weakly to strongly developed foliation, and is characterized by a soapy feel to the
touch locally. Characteristic sedimentary textures are generally not well developed in the immediate
deposit area. Preliminary geochemical characterization suggests that the sediments have been
derived from precursor rocks of ultramafic composition. Numerous small-scale dikes of mafic,
intermediate, and felsic composition are present in the deposit area.
At the eastern end of the BAM East Gold Deposit, the BAM Sequence is exposed in an outcrop
located near to local grid 3500E/150S. At this location, the host units are comprised of a mixed
assemblage of coarse cobble conglomerate, felsic lapilli tuff, and fine felsic ash tuff. A strongly
developed foliation is present that strikes in a general east-south easterly direction and dips sub-
vertically (Figure 7-6).
Figure 7-5: Example of BAM Sequence in Diamond Drill Core - (Hole #: 0418-645) (Landore Core Photo, 2018)
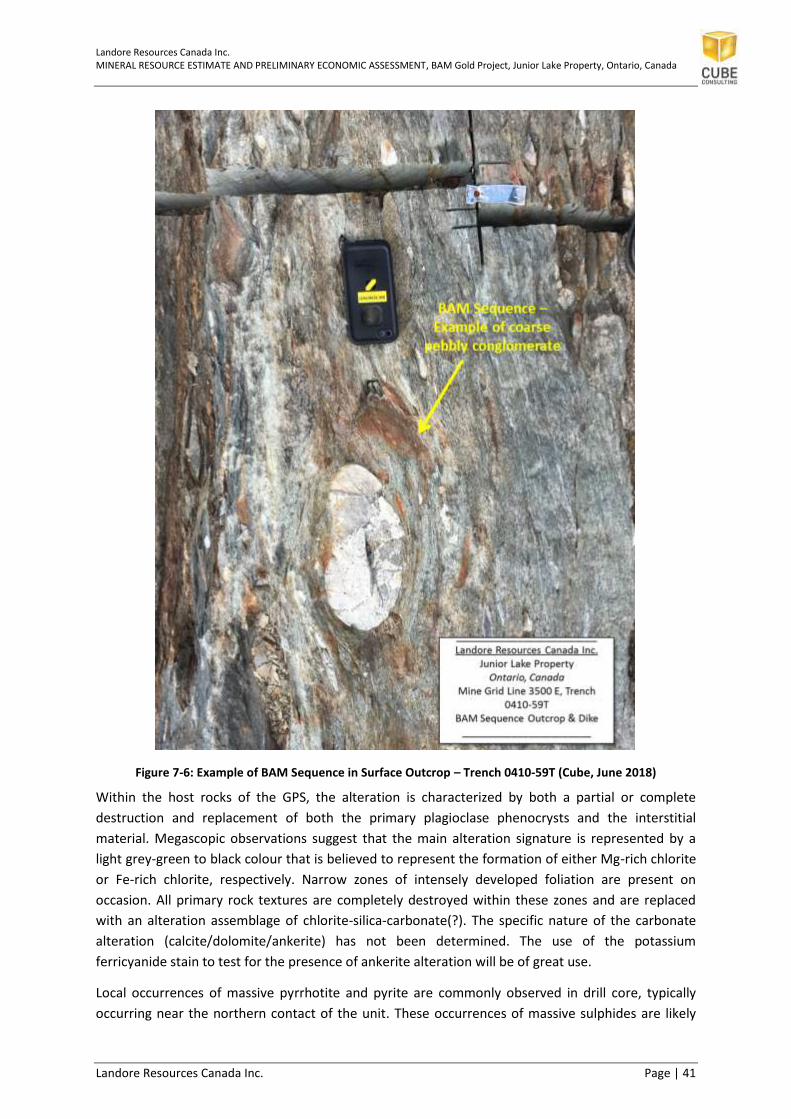
Landore Resources Canada Inc. MINERAL RESOURCE ESTIMATE AND PRELIMINARY ECONOMIC ASSESSMENT, BAM Gold Project, Junior Lake Property, Ontario, Canada
Landore Resources Canada Inc. Page | 41
Figure 7-6: Example of BAM Sequence in Surface Outcrop – Trench 0410-59T (Cube, June 2018)
Within the host rocks of the GPS, the alteration is characterized by both a partial or complete
destruction and replacement of both the primary plagioclase phenocrysts and the interstitial
material. Megascopic observations suggest that the main alteration signature is represented by a
light grey-green to black colour that is believed to represent the formation of either Mg-rich chlorite
or Fe-rich chlorite, respectively. Narrow zones of intensely developed foliation are present on
occasion. All primary rock textures are completely destroyed within these zones and are replaced
with an alteration assemblage of chlorite-silica-carbonate(?). The specific nature of the carbonate
alteration (calcite/dolomite/ankerite) has not been determined. The use of the potassium
ferricyanide stain to test for the presence of ankerite alteration will be of great use.
Local occurrences of massive pyrrhotite and pyrite are commonly observed in drill core, typically
occurring near the northern contact of the unit. These occurrences of massive sulphides are likely

Landore Resources Canada Inc. MINERAL RESOURCE ESTIMATE AND PRELIMINARY ECONOMIC ASSESSMENT, BAM Gold Project, Junior Lake Property, Ontario, Canada
Landore Resources Canada Inc. Page | 42
the source of the conductive source (anomaly MM-7) that has been detected by geophysical surveys
(Figure 7-7.). Gold values are occasionally associated with these intervals, however, gold
mineralization within the BAM Gold Deposit are not typically related to sulphide mineralization, and
anomaly MM-7 has been observed to mark the northern limit of significant gold mineralization.
Visual inspection of the textures of these massive sulphide occurrences suggest that they are likely
of a syngenetic origin and thus may represent some type of a sulphide iron formation or small-scale
sulphide exhalative deposits. More study will be required to determine the precise genetic source of
these sulphide occurrences.
Figure 7-7: Example of Massive Sulphide in Diamond Drill Core in Hole 0418-654 (Cube, June 2018)
The BAM Sequence is in contact with the gabbroic rocks of the GPS along its southern contact and
with mafic volcanic rocks of the MLG along its northern contact. It strikes generally in an ESE
direction and dips steeply to moderately to the south. The widths of the BAM Sequence vary but are
generally on the order of 50 m. Interpretations compiled by Landore from existing drilling, trenching
and geological mapping information has been successful in defining this unit along a strike length of
approximately 5 km (Figure 7-8). The strike limits of the BAM Sequence to the east and west and
down dip have not been defined.

Landore Resources Canada Inc. MINERAL RESOURCE ESTIMATE AND PRELIMINARY ECONOMIC ASSESSMENT, BAM Gold Project, Junior Lake Property, Ontario, Canada
Landore Resources Canada Inc. Page | 43
Figure 7-8: Plan View of Local Geology and Structural Interpretation of BAM Sequence; with reference to Outcrop Photo Locations (January 2022

Landore Resources Canada Inc. MINERAL RESOURCE ESTIMATE AND PRELIMINARY ECONOMIC ASSESSMENT, BAM Gold Project, Junior Lake Property, Ontario, Canada
Landore Resources Canada Inc. Page | 44
7.1.2. Structure
Two periods of deformation have affected the rocks on the property. Regional deformation rotated
the supracrustal packages into near vertical orientation and developed a large west north-west
trending deformation zone (local portion referred to as the Junior Lake Shear Zone) north and west
of Toronto Lake. This zone is the most prominent structural feature in the area and is characterized
by narrow discrete zones of intensely sheared rock separated by relatively undeformed rock
packages. The deformation zone is evident as an aeromagnetic lineament which extends east and
west of the Junior Lake property and appears to join the regional 450 km long Sydney Lake-Lake St.
Joseph (SL-LSJ) Fault zone to the north, which also coincides with the boundary of the English River
(ERT) and East Wabigoon Subprovince (EWT). The brittle-ductile fault zone of the SL-LSJ is steeply
dipping, 1 km to 4 km wide and estimated to have accommodated approximately 30 km of right-
lateral transcurrent displacement and 2.5 km of north vergent thrust movement (Percival, 2007).
Narrow, discrete zones of intense shearing form the Junior Lake Shear Zone, which sits at the
contact between the TLG and MLG. The evidence for the shear zone at Junior Lake is based on
known geology and textures in drill holes and from limited exposures with deformation textures
found from the micro to the macro level encompassing mylonites, cataclasites, sharp thin failure
planes, and pressure-solution features such as stylolites. The widespread occurrence of
pseudotachylite veinlets and infill demonstrates localized melting on failure planes. Based upon
information collected from the recent drilling campaigns at the BAM East Gold Deposit, the shearing
is seen to focus mostly in the BAM Sequence rocks (Figure 7-9) but sheared intervals are also
commonly observed in the gabbroic units of the GPS and within the basalt flows of the MLG to a
lesser degree (Figure 7-10).
A second more local deformation, in the east part of the property is confined to the supracrustal
rocks around the periphery of the Robinson Lake Batholith, with deformation expressed as
crenulation cleavage, northeast trending faults (Figure 7-8), and lineations which clearly post-date
the regional deformation.
Pye (1968) interpreted the presence of a large-scale fold on the western portion of the Junior Lake
property southeast of Lamaune Lake and east-northeast trending syncline in the vicinity of Toronto
Lake to the east. The east-southeast trending, north dipping North Lamaune Lake anticline is
interpreted from magnetometer surveys tracing an iron formation located southwest of the
property boundary.

Landore Resources Canada Inc. MINERAL RESOURCE ESTIMATE AND PRELIMINARY ECONOMIC ASSESSMENT, BAM Gold Project, Junior Lake Property, Ontario, Canada
Landore Resources Canada Inc. Page | 45
Figure 7-9: Example of Junior Lake Shear Zone within BAM Sequence – Hole: 0418-646 (Landore Core Photo, 2018)

Landore Resources Canada Inc. MINERAL RESOURCE ESTIMATE AND PRELIMINARY ECONOMIC ASSESSMENT, BAM Gold Project, Junior Lake Property, Ontario, Canada
Landore Resources Canada Inc. Page | 46
Figure 7-10: Example of Junior Lake Shear Zone within BAM Sequence – Line 1000 E (Cube, June 2018)
7.1.3. Intrusives
Numerous dikes of variable compositions are commonly observed in outcrop and in drill cores in the
vicinity of the BAM, B4-7, and VW Deposit areas. In general, the intrusive rocks in the BAM area are
observed to comprise dikes of either mafic (Figure 7-6) or intermediate (Figure 7-11) composition,
which range from metre-scale widths to widths up to 10 m to 20 m.
Observations made in outcrop and from the geological modelling completed using drill core
information of the mafic dikes consistently suggest that the mafic dikes are generally stratiform in
their orientations or crosscut the stratigraphy and foliation at a low angle. The lack of a pervasive
structural fabric within these dikes suggests that they post-date the gold mineralization, and they
are therefore interpreted to be related to the Nipigon diabase series that is common in the region.
The orientation of the dikes of intermediate (tonalite) composition is not well understood in detail,
given their narrow widths and frequent occurrences. Preliminary interpretation based on the
relationship to the regional foliation observed in outcrop suggest that they are also stratiform to
shallowly cross-cutting in their orientations. The lack of a pervasive structural fabric within these
dikes also suggests that they post-date the gold mineralization found at the BAM Gold Deposit.

Landore Resources Canada Inc. MINERAL RESOURCE ESTIMATE AND PRELIMINARY ECONOMIC ASSESSMENT, BAM Gold Project, Junior Lake Property, Ontario, Canada
Landore Resources Canada Inc. Page | 47
Figure 7-11: Example of Dyke Intrusion within BAM Sequence: – Line 1400 E Outcrop (Cube, June 2018)
7.2. Mineralization
7.2.1. BAM Deposit Mineralization
The BAM Gold Deposit is located in the south-central area of the Junior Lake property and is
interpreted as an Archean-aged mesothermal gold deposit. The deposit consists of gold
mineralization that is hosted by sheared and altered rocks of the Grassy Pond Sill and the BAM
Sequence. The deposit has been traced by detailed drilling at approximately 50 m centres along a
strike length of approximately 2,000 m. Reconnaissance-scale step-out drilling has also intersected
gold mineralization in the same host rocks along a strike length of approximately 1,900 m. Based
BAM Sequence
Tonalite Dikes

Landore Resources Canada Inc. MINERAL RESOURCE ESTIMATE AND PRELIMINARY ECONOMIC ASSESSMENT, BAM Gold Project, Junior Lake Property, Ontario, Canada
Landore Resources Canada Inc. Page | 48
upon the information collected from the detailed scale diamond drill holes, the host rock units strike
in an east-southeast direction (average of azimuth 105°) and dip steeply to moderately to the south
at 70° to 75°. The gold mineralization is interpreted to reside within a series of tabular shaped zones
that are oriented in a roughly en-echelon configuration and are generally parallel to the overall
strike of the host rock units (Figure 7-12 ). Within the main BAM Sequence four to six mineralized
zones are currently recognized, with the estimated true widths of each mineralized zones ranging
from 2 m to 50 m.
The gold mineralization occurs as a fine dissemination and also is commonly observed in drill core to
exist as visible gold that is hosted by very thin, foliation-parallel quartz-rich veinlets (Figure 7-13),
hosted by highly fissile ultramafic sediments of the BAM Sequence, or by foliated rocks of the Grassy
Pond Sill.
Figure 7-12: Typical Cross Section Example of BAM Sequence Mineralization – Local Grid Section Line 2700 E (January 2022)
Topo Surface
Overburden Layer
HW Contact – GPS/ BAM Sequence
FW Contact – BAM Sequence/ MLS
BAM Unit Mineralisation
ZonesHW Min. Domains
(hosted in GPS)

Landore Resources Canada Inc. MINERAL RESOURCE ESTIMATE AND PRELIMINARY ECONOMIC ASSESSMENT, BAM Gold Project, Junior Lake Property, Ontario, Canada
Landore Resources Canada Inc. Page | 49
Figure 7-13: Example of Mineralization Zone within BAM Sequence in Diamond Drill Core: (Hole 0418-654) (Cube, June 2018)
A preliminary petrographic study (Payne, 2016) carried out on a number of samples has identified
the presence of coarse native gold in association with an unidentified silvery mineral that occurs
within calcite replacement patches and veinlets (Figure 7-14).
Apart from the fissile nature observed in the ultramafic sediments, little traditional megascopic
alteration (sericite-ankerite), hydrothermal sulphide deposition (pyrite-pyrrhotite-chalcopyrite-
arsenopyrite) or large-scale quartz veining is observed associated with the mineralized rock units of
the BAM Sequence. Sphalerite is observed on rare occasions. The presence of microscopic scale
ankerite alteration with the gold mineralization cannot be ruled out. Sporadic development of
amphibole-biotite (?) is observed within the BAM Sequence, however, the relationship of this
mineral assemblage to the gold mineralization is not currently understood.
Small-scale quartz veining is observed to be present within the BAM Sequence and the Grassy Pond
Sill on occasion, and the veins can be either barren or be associated with gold-bearing intervals. The
observed veins typically measure up to 10 cm in width and can contain an assemblage of either
tourmaline (schorl), ankerite, or scheelite (?). The veins are observed to be oriented either sub-
parallel or at a high angle to the general foliation of the drill core. Textural evidence suggests that
two generations of quartz veins may be present. The detailed paragenetic relationship of the quartz
veining to the structure and gold veining is not clearly understood at present.

Landore Resources Canada Inc. MINERAL RESOURCE ESTIMATE AND PRELIMINARY ECONOMIC ASSESSMENT, BAM Gold Project, Junior Lake Property, Ontario, Canada
Landore Resources Canada Inc. Page | 50
Figure 7-14: Photomicrograph of Native Gold in Specimens from Diamond Drill Core (from Payne, 2016)

Landore Resources Canada Inc. MINERAL RESOURCE ESTIMATE AND PRELIMINARY ECONOMIC ASSESSMENT, BAM Gold Project, Junior Lake Property, Ontario, Canada
Landore Resources Canada Inc. Page | 51
7.2.2. Lamaune Prospect Mineralization
The Lamaune gold prospect is located in the western area of the property and comprises two sub-
vertical zones of mineralization (Brown, 2010 and Tuomi, 2010). The first of these is a wide low-
grade zone, generally consisting of small, millimetre to centimetre scale quartz–calcite veinlets in a
silicified, garnetiferous amphibolite. The second and more discordant zone is a set of centimetre
wide quartz veins. The mineralogy of the veining is simple, with native gold occurring with quartz,
calcite, and muscovite and sulphides consisting of arsenopyrite and pyrrhotite. Visible gold has been
observed in several holes. Figure 7-15 illustrates the geology and style of mineralization intersected
at the gold zone.
The mineralization has been traced by drilling over a strike length of 500 m and to a depth of 200 m
and remains open both along strike and at depth.
Figure 7-15: Lamaune Gold Prospect – Oblique Cross Section Example Showing Geology and Mineralization (Cube, 2020)
Overburden Layer
Lamaune Iron Zones
Lamaune Au Mine Zones
Lamaune Au Min Zone

Landore Resources Canada Inc. MINERAL RESOURCE ESTIMATE AND PRELIMINARY ECONOMIC ASSESSMENT, BAM Gold Project, Junior Lake Property, Ontario, Canada
Landore Resources Canada Inc. Page | 52
8. Deposit Types
The following general description of Archean-aged mesothermal gold deposits has been referenced
from Dubé and Gosselin (2007).
Greenstone-hosted quartz-carbonate vein deposits typically occur in deformed greenstone belts of
all ages, especially those with variolitic tholeiitic basalts and ultramafic komatiitic flows intruded by
intermediate to felsic porphyry intrusions, and sometimes with swarms of albitite or lamprophyre
dykes (Figure 8-1). They are distributed along major compressional to trans-tensional crustal-scale
fault zones in deformed greenstone terranes, commonly marking the convergent margins between
major lithological boundaries, such as volcano-plutonic and sedimentary domains. The large
greenstone hosted quartz-carbonate vein deposits are commonly spatially associated with fluvio-
alluvial conglomerate (e.g., Timiskaming conglomerate) distributed along major crustal fault zones
(e.g., Destor Porcupine Fault). This association suggests an empirical time and space relationship
between large-scale deposits and regional unconformities.
These types of deposits are most abundant and significant, in terms of total gold content, in Archean
terranes. However, a significant number of “Tier 1” deposits are also found in Proterozoic and
Palaeozoic terranes. In Canada, they represent the main source of gold and are mainly located in the
Archean greenstone belts of the Superior and Slave provinces. They also occur in the Palaeozoic
greenstone terranes of the Appalachian Orogen and in the oceanic terranes of the Cordillera.
The greenstone-hosted quartz-carbonate vein deposits correspond to structurally controlled
complex epigenetic deposits characterized by simple to complex networks of gold-bearing,
laminated quartz-carbonate fault-fill veins. These veins are hosted by moderately to steeply dipping,
compressional brittle-ductile shear zones and faults with locally associated shallow-dipping
extensional veins and hydrothermal breccias. The deposits are hosted by greenschist to locally
amphibolite-facies metamorphic rocks of dominantly mafic composition and formed at intermediate
depth (5 km to 10 km). The mineralization is syn- to late-deformation and typically post-peak
greenschist facies or syn-peak amphibolite facies metamorphism. They are typically associated with
iron-carbonate alteration. Gold is largely confined to the quartz-carbonate vein network but may
also be present in significant amounts within iron-rich sulphidized wall-rock selvages or within
silicified and arsenopyrite-rich replacement zones.
There is a general consensus that the greenstone-hosted quartz-carbonate vein deposits are related
to metamorphic fluids from accretionary processes and generated by prograde metamorphism and
thermal re-equilibration of subducted volcano-sedimentary terranes. The deep-seated, Au-
transporting metamorphic fluid has been channelled to higher crustal levels through major crustal
faults or deformation zones. Along its pathway, the fluid has dissolved various components (notably
gold) from the volcano-sedimentary packages, including a potential gold-rich precursor. The fluid is
then precipitated as vein material or wall-rock replacement in second and third order structures at
higher crustal levels through fluid-pressure cycling processes and temperature, pH and other
physico-chemical variations.
Preliminary exploration work on the BAM Zone (MacTavish, 2004) identified that gold mineralization
satisfies many of the characteristics typical of greenstone-hosted quartz-carbonate vein deposits:

Landore Resources Canada Inc. MINERAL RESOURCE ESTIMATE AND PRELIMINARY ECONOMIC ASSESSMENT, BAM Gold Project, Junior Lake Property, Ontario, Canada
Landore Resources Canada Inc. Page | 53
• It occurs within a volcanic-dominant greenstone belt in close spatial association with felsic
intrusive rocks and a regional-scale deformation zone (Junior Lake Shear) along the northern
contact of the GPS – typical of a brittle-ductile transition regime.
• It exhibits replacement style disseminated pyrite and arsenopyrite mineralization.
• Is closely associated with carbonatization, K-alteration, and silicification.
• Gold mineralization is hosted by greenschist to locally amphibolite-facies metamorphic
rocks.
MacTavish (2004) stated that the BAM Zone gold mineralization observed on surface and in the drill
holes exhibits some of the characteristics common to disseminated replacement style Archean
orogenic gold deposits in Canada.
Figure 8-1: Illustration of Different Settings for Mesothermal Gold Deposits (modified from Dube & Gosselin, 2007)
Analogous with BAM Gold Deposit Setting

Landore Resources Canada Inc. MINERAL RESOURCE ESTIMATE AND PRELIMINARY ECONOMIC ASSESSMENT, BAM Gold Project, Junior Lake Property, Ontario, Canada
Landore Resources Canada Inc. Page | 54
9. Exploration
9.1. Summary
Landore optioned part of the property from North Coldstream Mines Limited in 1998 and additional
claims from Brancote Canada in 2000. Since then, Landore has discovered on the Junior Lake
property: two gold zones, nine Ni-Cu-PGE occurrences, one Cu-Pd zone and several Zn-Au-Ag and Zn
+ Co occurrences in old trenches and boulders bearing base and precious metals or arsenic
mineralization.
Landore has successfully delineated several deposits and other potential areas of significant
mineralization throughout the Junior Lake property, including the BAM Gold Deposit/BAM Gold
Prospect, the Lamaune Gold Prospect, the B4-7 Ni-Cu-Co-PGE Deposit, and VW Ni Deposit (Figure
9-1).
Initial work carried out by Landore in 2000 involved data compilation, Landsat image interpretation,
prospecting, mapping, and resampling of the 1969 core, and followed up an OGS airborne EM and
Mag survey flown over the area.
Ground magnetometer and MaxMin II EM surveys were completed in 2001, in addition to drilling.
In 2003, Landore conducted drilling, overburden stripping and trenching, and channel sampling. All
drilling data were digitized and reinterpreted. 856 core samples from the historical drill core were
assayed to fill in unsampled runs in the B4-7 Deposit, in its hanging wall mineralization known as the
Alpha Zone, as well as in mineralization in the east extension of the B4-7 zone, known as the Beta
Zone.
A low-level helicopter AeroTEM time-domain EM and magnetometer survey was flown by
AeroQuest in 2004. Principal geophysical sensors utilized in this survey included AeroQuest's
helicopter AeroTEM time domain EM system and a high sensitivity cesium vapour magnetometer.
Bedrock EM anomalies were interpreted and graded according to the conductance. Also, in 2004, a
ground geophysical program consisting of induced polarization (IP) and resistivity survey was carried
out over the BAM area. This survey identified resistivity highs associated with disseminated to semi-
massive sulphide mineralization.
The VW Deposit was discovered in 2005 by follow-up prospecting of an AeroTEM conductor where
0.45% Ni was returned in a surface grab sample. Landore drilled 40 NQ holes totaling 8,178 m in
2005, of which 11 holes for 3,620 m tested the newly discovered VW Deposit. The other holes
explored the Whale, NO, and BAM zones, as well as other areas on the Junior Lake and Lamaune
projects.
In 2006, Landore drilled the VW Deposit, B4-7 Deposit, and other exploration targets including the
Junior Lake, Pichette, and Lamaune claims. The 2006 campaign at the VW Deposit included two
surface trenches which were excavated and channel sampled. Metallurgical work included
preliminary flotation and work indexes were carried out at SGS Minerals Services, Lakefield Site in
September–October. Scott Wilson RPA (predecessor to RPA) prepared a NI 43-101-compliant report
on the B4-7 zone in 2006.

Landore Resources Canada Inc. MINERAL RESOURCE ESTIMATE AND PRELIMINARY ECONOMIC ASSESSMENT, BAM Gold Project, Junior Lake Property, Ontario, Canada
Landore Resources Canada Inc. Page | 55
Figure 9-1: Junior Lake - Property Geology Map showing Mineral Deposits and Exploration Targets (from Landore 2022)
Junior Lake
ONTARIOB4-7 Ni-Cu-Co-PGE Deposit
46,661t. NiEqVW Ni Deposit
8,920t. NiEq
Junior Lake Property
Mining Leases21-year renewable
mining, surface rights
BAM Gold Deposit1.5 Million oz Au
(Jan 2022)
Swole LithiumDespard Lithium
Tape Lake Lithium
Lamaune Gold Au Exploration Target
Lamaune Iron

Landore Resources Canada Inc. MINERAL RESOURCE ESTIMATE AND PRELIMINARY ECONOMIC ASSESSMENT, BAM Gold Project, Junior Lake Property, Ontario, Canada
Landore Resources Canada Inc. Page | 56
During 2007, diamond drilling of the VW and B4-7 Deposits was the main focus of exploration
activity. The following work was completed on the Landore property:
• Re-logging of pre-2007 VW Deposit drill core was initiated.
• Drill collars of the VW and B4-7 Deposits and topographic control areas of the Junior Lake
property were surveyed by an Ontario Land Surveyor.
• Minor line cutting was completed near Ketchikan Lake and the B4-7 Deposit area to support
the drilling operations.
• Baseline environmental studies were initiated and conducted by, or under the guidance of
Golder Associates Ltd (Golder), of Sudbury, Ontario:
o These studies were started in March 2007 and include quarterly sampling and
analysis of lake and stream waters.
o Lake and stream sediment sampling was completed during the summer.
o A benthic study, bathymetric study, and a fisheries study of Ketchikan Lake were
completed.
• A weather station was installed at the Landore Junior Lake camp to record wind speed and
direction, temperatures and three seasons of precipitation data.
• Sampling of the VW Deposit drill core (quarter-cut core) was completed for metallurgical
purposes.
• Claim lines were rehabilitated and the claim boundary surrounding an area to be leased was
cut and surveyed in advance of filing the application to the Mining Recorder to lease the
claims.
• The land package was expanded to the southeast by staking an additional 24 claims totaling
5,056 ha.
• Aerial photography (stereo) was completed over the lease area by KBM Forestry Consulting
in late 2007 to produce an air photo mosaic for exploration and infrastructure planning. The
photographic data were processed to establish a detailed digital terrain topographic model
(DTM).
• Golder commenced baseline aquatic studies in February 2007 on lakes and drainage
tributaries in the vicinity of Junior Lake. These studies have been carried out on a quarterly
basis through to 2015 and are on-going. Golder completed a “Fish community and Fish
habitat” survey of Ketchikan Lake, immediately south of the VW Deposit, in addition to a
bedrock resistivity survey on the northern side of the lake to determine depth of silt and
evaluate bedrock competence.
• The camp was expanded, and core storage was improved to hold the Junior Lake drill core
on site.
• Landore’s 2007 drilling program consisted of 68 diamond drill totaling 16,839 m to infill
between existing holes on the VW Deposit and extend the deposit along strike and at depth.
Core from previous Landore drilling in the deposit was re-logged with a view to better
understanding the controls on mineralization and identifying the disposition of mafic
intrusives (dikes and sills) in the zone. In addition, 16 holes totaling 3,575 m were drilled in
the B4-7 Deposit to further test underexplored disseminated mineralization in the hanging
wall. Further petrographic investigation was carried out on the VW Deposit (Mungall, 2007).
The drill hole collars were resurveyed to the Ontario base.

Landore Resources Canada Inc. MINERAL RESOURCE ESTIMATE AND PRELIMINARY ECONOMIC ASSESSMENT, BAM Gold Project, Junior Lake Property, Ontario, Canada
Landore Resources Canada Inc. Page | 57
Exploration work in 2009 included drilling, mapping, and prospecting throughout the contiguous
claims covering approximately ten square kilometres, with work concentrated in the Lamaune Iron,
BAM, and VW areas. Additional exploration included prospecting and mapping at Swole Lake and
Toronto Lake, as well as east and west of the VW Deposit. To date, the VW Deposit has been
delineated and tested by 141 drill holes with 2,766 analyzed intervals over 2,838.36 m completed in
the deposit subzones.
Other exploration work completed in 2007-2020, included the following:
• Detailed geologic mapping (B4-7, VW, BAM, Lamaune).
• Regional scale prospecting, regional reconnaissance and geologic mapping.
• Re-logging, resampling, and reinterpretation of geology for the BAM East, VW, B47, and
BAM sites.
• 70 km of line cutting, including additional grid lines cut in 2019.
• 55 trenches over approximately 13 km (Lamaune Iron, Grassy Pond, Felix Lake, Juno Lake,
BAM Zone, Toronto Lake).
• Airborne geophysical coverage (AeroTEM EM and Mag) of the Toronto Lake area (various Ni,
Au, PGE potential), and Swole Lake (pegmatite lithium) prospecting was also undertaken.
• Additional geophysical work (ORION 3D 'Direct Current Induced Polarization' (DCIP) and
Magnetotellurics (MT) survey over a large portion of the Junior Lake lease area, pulse EM
survey, ground Mag, and reinterpretation and integration with historic magnetic data).
• Reviews of regional exploration potential.
• Surveying of drill collars and claim lines.
• Additional claim staking.
• Aerial photography with digital terrain model (DTM).
• Petrographic Study - Seven samples from the winter and summer 2016 drilling campaigns on
the BAM (East) Gold Deposit central zone were submitted to an independent petrographer
for petrographic studies.
• Numerous consultant reviews and studies have been completed, including:
o Detailed Scanning Electron Microscope (SEM) and petrography studies of the BAM
East, VW and B4-7 Deposits
o Metallurgical test work was undertaken
o Initiation of environmental baseline study
• Soil geochemical sampling programs (2019 and 2020)
A summary of the main exploration activities conducted by Landore from 2000 to 2020 is listed in
Table 9-1.

Landore Resources Canada Inc. MINERAL RESOURCE ESTIMATE AND PRELIMINARY ECONOMIC ASSESSMENT, BAM Gold Project, Junior Lake Property, Ontario, Canada
Landore Resources Canada Inc. Page | 58
Table 9-1 Summary of Exploration Activities by Landore on the Junior Lake Property
Year/ Period
Prospects Description of Main Activities Highlights References
2000 Regional
Data compilation, Landsat image interpretation, prospecting, mapping, and resampling of the 1969 core, and followed up an OGS airborne EM and MAG survey flown over the area.
2001 Regional; B4-7 Ground magnetometer and MaxMin II EM surveys; Exploration drilling.
2003 B4-7; BAM
Exploration drilling; Overburden stripping; Trenching; Channel Sampling; Resampling old core (B4-7 Alpha Zone and Beta Zone). Rehabilitation & extension of B4-7 Local Grid to BAM Zone.
BAM Au Zone discovery – from Geophysical anomaly & Trench mapping & sampling
MacTavish, 2004
2004 Regional; BAM area;
VW IP & Resist. Survey; AeroTEM EM & Magnet. Survey.
Several EM & IP anomalies; possible sulphide mineralization.
Johnston, 2004
2005 Regional; VW; BAM;
Lamaune Exploration drilling; mapping and surface sampling. Petrography
VW discovery; grab sample (0.45% Ni) Landore, 2005; Liferovich, 2005
2006 Regional; B4-7; VW;
Lamaune
Exploration & resource drilling; Trenching & channel sampling; Metallurgical testing (B4-7 zone). Petrography
B4-7 Zone NI 43-101 report Mungall, 2006
2007 B4-7; VW
Exploration & resource drilling; Re-logging (VW); Aerial photo and topo surveying; Baseline environment studies; Metallurgical test work (VW); Tenements expanded; Petrography (VW); DDH collar re-surveys; Grid Line cutting.
Initial MRE for VW Ni (+/-Cu-PGE-Au) deposit Mungall, 2007
2008 Regional; VW;
Lamaune Exploration & resource drilling; Misc. activities including Mineralogy Study
B4-7 Ni-Cu-PGE-Au deposit initial MRE; including updated VW Ni (+/-Cu-PGE-Au) initial MRE
DeMark and Glacken, 2008; Halls, 2008
2009 Regional; B4-7; VW; Lamaune Fe, BAM
Exploration & resource drilling; Mapping and prospecting regional areas. Petrography
Update MRE for VW Ni (+/-Cu-PGE-Au) deposit Mungall, 2009
2010 Regional; Lamaune
Au Exploration & resource drilling; Misc. activities.
Update MRE for VW Ni (+/-Cu-PGE-Au) deposit; Preliminary Lamaune Au estimate
Cheatle, 2010; Brown, 2010

Landore Resources Canada Inc. MINERAL RESOURCE ESTIMATE AND PRELIMINARY ECONOMIC ASSESSMENT, BAM Gold Project, Junior Lake Property, Ontario, Canada
Landore Resources Canada Inc. Page | 59
Year/ Period
Prospects Description of Main Activities Highlights References
2011 Regional; B4-7;
Lamaune Fe Exploration drilling; Misc. activities. Lamaune Fe Resource Chamois, 2011
2012 B4-7; Scorpion Exploration drilling; Geophysics (DCIP and MT Survey); Misc. activities.
Potential for massive sulphide mineralization at Scorpion-B4-7 at depth
2013 Scorpion, VW Exploration drilling; Geophysics MaxMin, VLF, MAG surveys.
Simoneau, 2013
2014 Regional; B4-7; B4-7
East; VW Exploration drilling; Geophysics (DCIP and MT) Survey.
Gharibi and MacGill, 2014
2015 BAM (East); B4-7;
VW West Exploration drilling; Geophysics MaxMin, VLF, MAG surveys.
BAM East Au discovery from NW-ESE trending MaxMin (“MM)” anomalies.
Simoneau, 2015
2016 BAM (East) Exploration & resource drilling; Trenching & channel sampling. Geotechnical Logging
Nelson, 2016
2016 BAM (East) Petrographic Study
2 samples reported significant native gold in both the (+) 100 µm and the (-) 100-µm size. No sulphides were associated with the precious metals
Payne, 2016
2017 BAM (East) Exploration & resource drilling; geological mapping
Initial MRE for BAM East Au Deposit RPA, 2018
2018-2019
BAM Exploration & resource drilling; Geotechnical Logging
MRE updates for BAM Au Deposit Tuomi, 2018; Cube, 2019; Nelson, 2018
2019 BAM, Felix Soil Geochemistry. Geophysics MaxMin, VLF, MAG surveys.
Soil geochemistry sampling program completely over two prospect - Au ppb anomalous results correlated with previous geophysical anomalies
Johnston, 2019; Simoneau, 2019
2020 BAM, BAM
Extensions, Felix Soil Geochemistry
Follow up soil geochemistry infill sampling program. Numerous anomalous gold trends noted, notably four areas east and west of BAM Gold Deposit trend.
Johnston, 2020

Landore Resources Canada Inc. MINERAL RESOURCE ESTIMATE AND PRELIMINARY ECONOMIC ASSESSMENT, BAM Gold Project, Junior Lake Property, Ontario, Canada
Landore Resources Canada Inc. Page | 60
More detailed exploration activity conducted by Landore on the Junior Lake property since 2012 are
provided in the following sections.
9.2. Geophysics
9.2.1. 2004 IP Survey – BAM Prospect
During September 2004, a geophysical survey program consisting of induced polarization and
resistivity surveys was conducted over the northwest area of the BAM Project Area, on claim
numbers 1217181 and 1187560 (Figure 9-2).
Ray Meikle and Associates of North Bay, Ontario (RMA) carried out the geophysical surveys, with
interpretation and reporting of results carried out by Johnston (2004). The IP surveys were
performed in order to evaluate and map the presence of disseminated to massive sulphides with
respect to their location, width, and concentrations.
The geophysical program consisted of induced polarization and resistivity surveying. This survey was
carried out on a grid of previously cut lines oriented at 356° spaced every 100 m and chained and
marked every 25 m. Detail infill lines at 50 m intervals were also surveyed between grid lines 900 E
and 1300 E. The IP survey was performed using a dipole-dipole electrode configuration. The dipole
'a' spacing was 25 m and increasing separations of n=1, n=2, n=3, and n=4 times the dipole spacing
was measured in order to map the response at depth. A total of approximately 11 km of IP data was
measured and recorded by RMA. The IP equipment used for the survey consisted of a Scintrex TSQ-3
3000 W transmitter operating in the time domain powered by a 2-kW motor generator. The
chargeability (measured in mV/V) between the transmitted current and the received voltage is
recorded by a Scintrex IPR-12 IP receiver, which records the chargeability and the apparent
resistivity for each set of dipoles. The chargeability measured in this survey is a direct measure of the
polarization of the underlying lithology.
The results of the IP survey were plotted as plan maps at a scale of 1:5000 showing the contours of
the filtered apparent resistivity and chargeability with the interpretation and location of the IP
anomalies also presented (Figure 9-3 and Figure 9-4). In addition, contoured and posted pseudo-
sections of the apparent resistivity and recorded total chargeability are presented at a scale of
1:2500 (Figure 9-5 and Figure 9-6).
Emphasis was placed on identifying IP anomalies, which were thought to originate within the
bedrock as opposed to cultural sources, and those IP anomalies that may be associated with bedrock
relief. Four anomaly trends were identified and labelled on the plan maps (IP-1 through IP-4), as well
as several other isolated IP anomalies that are not readily grouped into trends.
The majority of the interpreted IP chargeability anomalies located within the grid area are very well
defined and strong with observed chargeability up to 10 times background values. Anomaly IP-1 is
located within or directly adjacent to a resistivity low bedrock response for its entire strike length,
indicating possibly a linear conductive horizon (stratigraphic?) is giving rise to this response. IP
anomalies IP-4 and the western portion of anomaly IP-3 (between lines 600 E and 1050 E) also are
adjacent or within anomalously low resistivity areas. Anomaly IP-2 is associated with anomalously

Landore Resources Canada Inc. MINERAL RESOURCE ESTIMATE AND PRELIMINARY ECONOMIC ASSESSMENT, BAM Gold Project, Junior Lake Property, Ontario, Canada
Landore Resources Canada Inc. Page | 61
higher resistivity bedrock responses, possibly indicating disseminated mineralization associated
within or proximal to a more felsic lithology or silica altered area of the bedrock.
Cube has reviewed the data from the 2004 report in order to correlate the IP anomalies with more
recent drilling information and the 2018 geological and mineralization interpretations for the
January 2022 Mineral Resource estimation work. The 3DM draped images of the IP survey contours,
georeferenced with topography, show a correlation between chargeability high trends and gold
mineralization related with footwall sulphide zones within the BAM sequence, and the trends
associated with resistivity lows.
As noted in the 2004 report, the main resistivity highs appear to map the bedrock ridges and sub-
cropping bedrock areas. The IP anomaly contour breaks may also indicate a potential northeast-
southwest trending fault structure. There is potential to extend the known mineralization further
west with confidence based on the resistivity low trend.

Landore Resources Canada Inc. MINERAL RESOURCE ESTIMATE AND PRELIMINARY ECONOMIC ASSESSMENT, BAM Gold Project, Junior Lake Property, Ontario, Canada
Landore Resources Canada Inc. Page | 62
Figure 9-2: 2004 IP Survey Location of Grid Lines (Johnston, 2004)

Landore Resources Canada Inc. MINERAL RESOURCE ESTIMATE AND PRELIMINARY ECONOMIC ASSESSMENT, BAM Gold Project, Junior Lake Property, Ontario, Canada
Landore Resources Canada Inc. Page | 63
Figure 9-3: 2004 IP Survey – Filtered Resistivity Contour Plan (Johnston, 2004)

Landore Resources Canada Inc. MINERAL RESOURCE ESTIMATE AND PRELIMINARY ECONOMIC ASSESSMENT, BAM Gold Project, Junior Lake Property, Ontario, Canada
Landore Resources Canada Inc. Page | 64
Figure 9-4: 2004 IP Survey - Filtered Chargeability Contour Plan (Johnston, 2004)

Landore Resources Canada Inc. MINERAL RESOURCE ESTIMATE AND PRELIMINARY ECONOMIC ASSESSMENT, BAM Gold Project, Junior Lake Property, Ontario, Canada
Landore Resources Canada Inc. Page | 65
Figure 9-5: 2004 IP Survey – Cross Section at Line 1000 E: Chargeability & Resistivity Contours (Johnston, 2004)

Landore Resources Canada Inc. MINERAL RESOURCE ESTIMATE AND PRELIMINARY ECONOMIC ASSESSMENT, BAM Gold Project, Junior Lake Property, Ontario, Canada
Landore Resources Canada Inc. Page | 66
Figure 9-6: 2004 IP Survey – Cross Section at Line 1500 E: Chargeability & Resistivity Contours (Johnston, 2004)

Landore Resources Canada Inc. MINERAL RESOURCE ESTIMATE AND PRELIMINARY ECONOMIC ASSESSMENT, BAM Gold Project, Junior Lake Property, Ontario, Canada
Landore Resources Canada Inc. Page | 67
9.2.2. 2012 to 2014 Geophysical Surveys (Tuomi, 2018)
In October 2012, a deep penetrating DCIP and MT survey was performed over the Scorpion Zone of
the Junior Lake property. This survey encompassed the western 1 km portion of the Scorpion Zone,
from line 1300 W eastwards to line 300 E in the B4-7 Deposit. This survey acquired three sets of data
in multi-directions: DC, IP, and MT, and is a true three-dimensional survey. Sophisticated digital
signal processing was utilized to obtain high resolution imaging at depths up to 1,000 m below
surface.
This ground geophysical survey utilized DC resistivity to identify prospective nickel mineralization
and used IP chargeability to investigate potential copper and PGE targets. Results of the DC
resistivity section of the survey are highly promising indicating the potential extension at depth of
the B4-7 mineralization to approximately line 800W. IP chargeability and MT results further support
the potential of the Scorpion Zone area for B4-7 style massive sulphide mineralization. Subsequent
drilling in winter 2013 has tested the DC resistivity and IP chargeability results at various localities
along the western portion of the Scorpion zone. Drilling in the Exploration Target area between lines
175 W and 300 W successfully intersected B4-7 massive sulphide mineralization as well as Alpha
zone disseminated sulphide mineralization.
In December 2013, a program of geophysical surveying that included MaxMin, VLF, and Mag surveys
was carried out in the VW Deposit area by Géosig Inc. of Val d’Or, Québec. The VLF and Mag surveys
covered 35.71 km of grid lines, including 3.1 km of tie lines. The MaxMin survey covered 35 km of
grid lines and was run with a 200 m cable (Simoneau, 2013). Results from these surveys identified
multiple near-surface conductor anomalies along the VW Nickel deposit trend with similar signatures
to the VW deposit conductive anomaly itself.
A second Orion 3D DC, IP, and MT survey was completed on the Junior Lake property in January to
February 2014. This survey tied onto the eastern limit of the Phase I survey carried out in 2012 and
covered the eastern projection of the B4-7 stratigraphy along with the VW Deposit area. The surveys
covered an area of 3.5 km by 2.2 km and were successful in detecting low-resistivity (i.e.,
conductive) features that represent good exploration targets.
9.2.3. 2015 Geophysical Surveys (Tuomi, 2018)
In January 2015, a program of geophysical surveying that included MaxMin, VLF, and Mag surveys
was carried out along the eastern projection of the B4-7 Deposit stratigraphy by Géosig Inc. of Val
d’Or, Québec. The VLF and Mag surveys covered 45.51 km of grid lines, including 0.8 km of tie lines,
from 100 W to 4000 E. The MaxMin survey covered 44.7 km of grid lines and was run with a 200 m
cable.
Magnetometric Survey
The measurements for the magnetic total field were taken in a mobile mag mode with two seconds
sampling readings and regular label readings taken each 12.5 meters.
A GSM-19WMV was used on the field with a GSM-19W base station with a 15 seconds registering
readings period. The magnetic readings have been automatically corrected for diurnal variations
Landore Resources Canada Inc. MINERAL RESOURCE ESTIMATE AND PRELIMINARY ECONOMIC ASSESSMENT, BAM Gold Project, Junior Lake Property, Ontario, Canada
Landore Resources Canada Inc. Page | 68
when the data was dumped with a datum value of 57,000 gammas. The magnetometer system
measures the value of the total magnetic field with a precision of ±0.1 gammas.
The magnetic field is very active in the property and ranges from 52,947 gammas to 64,469 gammas,
confirming the presence of ultramafic intrusions or Iron Formations. In the area of the northern grid,
most of the linear magnetic anomalies could be made by weak Iron Formations. Some of the
MaxMin anomalies coincide with magnetic anomalies and are believed to carry pyrrhotite like the
main massive sulphide zone. In other places, some of the MaxMin anomalies appear when the
magnetic anomalies disappear, which could mean that the sulphides are coming from the
transformation of the magnetite into sulphides.
Electromagnetic VLF Survey
The VLF-meter uses the signal from the VLF-transmitting stations operating for communications with
submarines. The antenna current of these VLF-transmitting stations is vertical, creating a concentric
horizontal magnetic field around them. When these magnetic fields meet conductive bodies in the
ground, they create secondary fields that radiate from these bodies. The VLF-meter is simply a
sensitive receiver covering the frequency band of the VLF-transmitting stations. It measures the
vertical field components of these secondary fields.
A GSM-19WMV was used on the field. The readings were taken at a 12.5 m spacing and some details
at 6.25 m spacing. The VLF survey was read with two main VLF-transmitting stations Cutler (NAA,
24.0 kHz) and Jim Creek-Seattle (NLK, 24.8 kHz). The in-phase and quadrature of the vertical
magnetic field were measured as a percentage of the horizontal primary field with a resolution of
0.1%. The VLF and Mag were simultaneously read with the same instrument.
The VLF survey detected 12 new anomalies (VLF-30 to VLF-41). Five are anomalies on their own (VLF-
30, VLF-33, VLF-35, VLF-36, VLF-41). Six anomalies correspond to MaxMin anomalies, and one is an
extension of a known anomaly (VLF-15) identified in 2013 and extended north of Ladle Flats. It
seems to follow the geological limit between the ultramafic plain (south) and a mafic, hilly area to
the north.
Electromagnetic VLF Survey
A MaxMin II-5 portable unit was used in the maximum coupled mode (horizontal loop) with a 200 m
reference cable. The parameters (in phase and out of phase components of the secondary field)
were read and recorded for three frequencies: 444, 1,777 and 3,555 Hz. Readings were taken every
25 m on all the lines
The MaxMin survey with a 200 m cable was conducted to confirm the presence of deep bedrock
conductors. Seven MaxMin anomalies were described. The seven (7) anomalies are located between
50 m and less than 10 m deep. Three of these anomalies coincide with slight magnetic anomalies
(MM-17, MM-18 and MM-20), one anomaly is located at the northern edge of a magnetic anomaly
(MM-7) and two of them have no magnetic feature. Results from the 2015 survey identified further
drill targets north of the pre-existing geophysical surveys from 2001 and 2013, an area in which the
B4-7 polymetallic trend and the BAM East gold trend intersect. The BAM (East) drill targets were
subsequently drilled tested from 2016 to 2018. The MaxMin and VLF anomaly trends along the

Landore Resources Canada Inc. MINERAL RESOURCE ESTIMATE AND PRELIMINARY ECONOMIC ASSESSMENT, BAM Gold Project, Junior Lake Property, Ontario, Canada
Landore Resources Canada Inc. Page | 69
Junior Lake grid are illustrated in Figure 9-7, with significant MaxMin anomalies for the BAM
mineralization trend highlighted.
9.2.4. 2019 Geophysical Surveys (Simoneau, 2019)
During the summer of 2019, ground geophysics surveys were completed west of the BAM Project
area.
Electromagnetic (HLEM & VLF) and Mag ground surveys were conducted in June 2019, covering the
Felix Lake Grid. The EM-VLF and Mag surveys covered 15.85 km of line. The HLEM-MaxMin survey
covered 14.2 km of lines. The MaxMin survey was run with a 100 m cable because of the rocky hills
and shallow overburden, even in swamps, in order to suggest drilling targets.
The Felix Lake Grid measured 5.0 km long and oriented west-northwest including the base line. The
Mag-VLF surveys covered all the cut lines and two uncut lines (Line 1700W and Line 1300W) for a
total of 15.85 km. The baseline was partly cut. The MaxMin survey was run over the cut lines for a
total of 14.2 km. The main lines were spaced every 500 m to 600 m between Line 1000W and Line
6000W with some infill lines 200 m to 300 m apart.
Magnetometric Survey – Method and Results
The measurements for the magnetic total field were taken in a mobile mag mode with two (2)
seconds sampling readings and regular label readings taken each 12.5 m. A GSM-19WMV was used
on the field with a GSM-19W base station, with a 15-seconds registering readings period. The
magnetic readings have been automatically corrected for diurnal variations when the data was
dumped with a datum value of 56 650 gammas. The magnetometer system measures the value of
the total magnetic field with a precision of ± 0.1 gammas.
The magnetic field is very active in the property and ranges from 47 619 gammas to 70 293 gammas,
confirming the presence of ultramafic intrusions or iron formations. In the area of the western grid,
most of the linear magnetic anomalies could be made by weak iron formations. Some of the MaxMin
anomalies coincide with magnetic anomalies and are believed to carry pyrrhotite like the main
massive sulphide zone. For other areas, some of the MaxMin anomalies appear when the magnetic
anomalies disappear, which could mean that the sulphides are coming from the transformation of
the magnetite into sulphides.
EM VLF Survey– Method and Results
A GSM-19WMV was used in the field. The readings were taken at 12.5 m spacing. The VLF survey
was read with two main VLF-transmitting stations - Cutler (NAA, 24.0 kHz) and Jim Creek-Seattle
(NLK, 24.8 kHz). The In-phase and quadrature of the vertical magnetic field were measured as a
percentage of the horizontal primary field with a resolution of 0.l%. VLF and Mag were
simultaneously read with the same instrument.
The VLF survey detected fourteen (14) new anomalies (VLF-42 to VLF-55). Five (5) are anomalies on
their own (VLF-45 to VLF-47, VLF-51 and VLF-54). All other VLF anomalies correspond at least
partially to MaxMin anomalies. The anomalous VLF corroboration from the two independent VLF

Landore Resources Canada Inc. MINERAL RESOURCE ESTIMATE AND PRELIMINARY ECONOMIC ASSESSMENT, BAM Gold Project, Junior Lake Property, Ontario, Canada
Landore Resources Canada Inc. Page | 70
stations frequencies is generally good except for the eastern parts of VLF-52 on Line 1000W which is
much more evident on the Cutler Station.
Interpretation of Results
The results of the geophysical survey on both the Felix Lake Grid and Junior Lake Grid areas indicated
a number of significant anomalies. Eight (8) MaxMin anomalies were identified and are located
between 40 m and less than 5 m depth. Two of these anomalies coincide at least partly with high
magnetic anomalies (MM-21 and MM-22). Two (2) anomalies coincide with weak magnetic
anomalies (MM-24 and MM-27), one anomaly (MM-28) with low magnetism, and four anomalies
have variable magnetic features. Several of the anomalies have been proposed for drilling. A
summary of the results from the HIM anomalies with recommended drill targets by Simoneau (2019)
is provided in Table 9-2.
Table 9-2 Listing of HIM Anomaly Drilling Targets Recommended from Simoneau, 2019
Anomaly Line Station Depth
(m) Width
(m) Length
(m) Association Comments
MM - 21 5000w 475s <5 50 >4600 High Magnetic anomaly;
VLF Massive
MM - 21 1500w 150s <5 12 >4600 High Magnetic anomaly;
VLF Massive
MM - 22 4000w 325s 20 12 >4600 High Magnetic anomaly
VLF Massive
MM - 22 1500w 87s 20 <5 >4600 High Magnetic anomaly;
VLF Massive
MM - 23 4500w 62n 17 12 3200 VLF Massive
MM - 23 3300w 25n 20 12 3200 Weak Mag Anomaly; VLF Massive
MM - 23 1500w 387n 17 12 3200 Weak Mag Anomaly; VLF Massive
MM - 24 4500w 162n 40 <5 200 Weakly Magnetic; VLF Semi-Massive
MM - 24 3300w 62n 17 <5 800 High Magnetic anomaly;
VLF Massive
MM - 25 3000w 825n 25 <5 >200 Slightly Magnetic; VLF Semi-Massive
MM - 26 4500w 325n 35 12 200 Slightly Magnetic; VLF Semi-Massive
MM - 26 2800w 400n 27 12 200 Weakly Magnetic; VLF Semi-Massive
MM - 27 1000w 737n 20 32 >500 Weakly Magnetic; VLF,
open East Semi-Massive
MM - 28 4500w 550n 13 <5 >1600 Weakly Magnetic; VLF Massive
MM - 28 2000w 575n 15 20 1800 VLF; Low Mag Massive
The MaxMin and VLF anomaly trends interpreted from the 2019 results along the Felix Lake grid are
illustrated in Figure 9-8.

Landore Resources Canada Inc. MINERAL RESOURCE ESTIMATE AND PRELIMINARY ECONOMIC ASSESSMENT, BAM Gold Project, Junior Lake Property, Ontario, Canada
Landore Resources Canada Inc. Page | 71
Figure 9-7: 2015 Geophysical Surveys for the Junior Lake Grid - Plan View of MaxMin and VLF Anomalies (Landore Image, 2018)
Base Line
Ketchikan Lake
Juno Lake

Landore Resources Canada Inc. MINERAL RESOURCE ESTIMATE AND PRELIMINARY ECONOMIC ASSESSMENT, BAM Gold Project, Junior Lake Property, Ontario, Canada
Landore Resources Canada Inc. Page | 72
Figure 9-8: 2019 Geophysical Surveys for the Felix Lake Grid - Plan View of MaxMin and VLF Anomalies (Landore Image, 2019)
DD Target
Felix Lake

Landore Resources Canada Inc. MINERAL RESOURCE ESTIMATE AND PRELIMINARY ECONOMIC ASSESSMENT, BAM Gold Project, Junior Lake Property, Ontario, Canada
Landore Resources Canada Inc. Page | 73
9.3. Trenching
9.3.1. 2003 BAM Zone Trenching
MacTavish (2003) noted that the surface exposure consisted of several, discrete, moderately to
strongly silicified, weakly biotitic, variably carbonatized and mineralized, steeply dipping,
anastomosing shear zones occurring near the northern contact of a well-foliated gabbro to meta-
gabbro body.
In 2003, six BAM Zone NQ diamond core holes (0403-01 to 06) totaling 438 m, tested the zone over a
100 m strike length, to a vertical depth of 35 m, in order to better determine its strike, dip,
mineralization, and associated alteration. The drill hole logging and sampling correlated well with
the trenching results. The BAM Zone holes intersected several moderately to strongly sheared,
altered, and mineralized zones, similar to the BAM Zone mineralization observed in Trench T15.
Alteration style and intensity was variable and consisted of moderate to strong biotitization, weak to
strong carbonatization, and localized moderate to strong silicification. Mineralization consisted of
1% to 8% finely disseminated pyrite and fine needles of arsenopyrite. Also, several of the holes
intersected similarly sheared, altered, and mineralized intermediate dykes of highly variable
thicknesses, that occurred in close proximity to the BAM Zone intercepts.
Trenching and mapping carried out since 2003 in the BAM Gold Project area is illustrated in plan
view in Figure 9-9.

Landore Resources Canada Inc. MINERAL RESOURCE ESTIMATE AND PRELIMINARY ECONOMIC ASSESSMENT, BAM Gold Project, Junior Lake Property, Ontario, Canada
Landore Resources Canada Inc. Page | 74
Figure 9-9: Plan View of All Trench Locations in the BAM Project Area (from Landore, February 2019)
Highlighted Area in Figure 9-10 and Figure 9-11
Trench 16
Trench 15
Pit Design
Mineralisation Domains
Trench Outline
Trench 0416-01T on Grid Line 1600 E (Figure 9-11)

Landore Resources Canada Inc. MINERAL RESOURCE ESTIMATE AND PRELIMINARY ECONOMIC ASSESSMENT, BAM Gold Project, Junior Lake Property, Ontario, Canada
Landore Resources Canada Inc. Page | 75
Figure 9-10 shows mapping of two trenches by MacTavish (2003) - Trench T15 and Trench T16.
Figure 9-10: 2015 Trench Mapping for Trench 15 and 16 (MacTavish, 2003)
9.3.2. 2016 Trenching
A trenching program was carried out during summer 2016 to test for the potential for further gold
mineralization both along the 2.7 km long, east-southeast to west-northwest trending MaxMin
geophysical anomaly (MM-7) upon which the BAM Gold Deposit resides, and along a parallel
geophysical anomaly (MM-18) located approximately 200 m to the north of MM-7. An excavator
contracted by Landore cleared three trenches (0416-01T, 0416-02T and 0416-03T) on local grid lines
1600E (MM-7 target), 2600E (MM-18 target), and 2700E (MM-18 target). In addition, eight existing
trenches in the area were re-examined by Landore geologists.
Channel samples from one surface trench were used to prepare the lithologic interpretations and
preliminary outlines of the extent of the gold mineralization
Samples were also taken from trenches excavated on the property. Upon completion of mapping the
exposed lithological units and mineralization, the trench areas were marked up for channel sampling
in typically one metre increments. Channels were cut using a diamond saw, with water cooling for
the blade supplied by another small pump. Channels of approximately 6 cm to 8 cm wide and 5 cm
deep were cut. Each sample site was tagged with aluminium with the appropriate sample number.
As with core samples described above, all channel sample bags were sealed with plastic, sequentially
numbered security tags and eight to ten of these sample bags were placed in larger, labelled rice
bags, also sealed with a numbered security tag. All security tag numbers were recorded prior to
shipping.

Landore Resources Canada Inc. MINERAL RESOURCE ESTIMATE AND PRELIMINARY ECONOMIC ASSESSMENT, BAM Gold Project, Junior Lake Property, Ontario, Canada
Landore Resources Canada Inc. Page | 76
Sampling of trench 0416-01T at local grid line 1600 E (located 700 m to the west and along trend to
the central zone) intersected the same lithology with gold mineralization up to 0.66 g/t Au (Figure
9-11). Drill hole 0416-545, drilled approximately 60 m down dip to Trench 0416-01T intersected the
same lithologic sequence along with gold mineralization of up to 1.49 g/t Au. Re-examination of
existing trench 0410-59T, located on local grid line 3450 E (approximately 750 m to the east of the
BAM (East) Gold Deposit central zone) identified similar lithologies as the BAM (East) Gold Deposit
itself.
Figure 9-11: Trench 0416-01T on Line 1600 E (Landore File, 2022)
9.4. Soil Geochemistry Sampling
Soil geochemistry sampling programs was completed over the BAM and Felix Prospects during the
2019 and 2020 field seasons. The following information is based on a review of sampling information
provided by Landore and reported by Johnson (2019) and Johnson (2020).
9.4.1. 2019 Soil Sampling Program (Johnston, 2019)
Summary
A large grid was cut on the Junior Lake property during the summer of 2019 and used for multiple
exploration surveys (Felix Lake Grid). The grid roughly spanned 5 km x 1.2 km and was used as the
basis for the soil sampling program. A limited number of samples were also collected over the
already established Junior Lake grid.
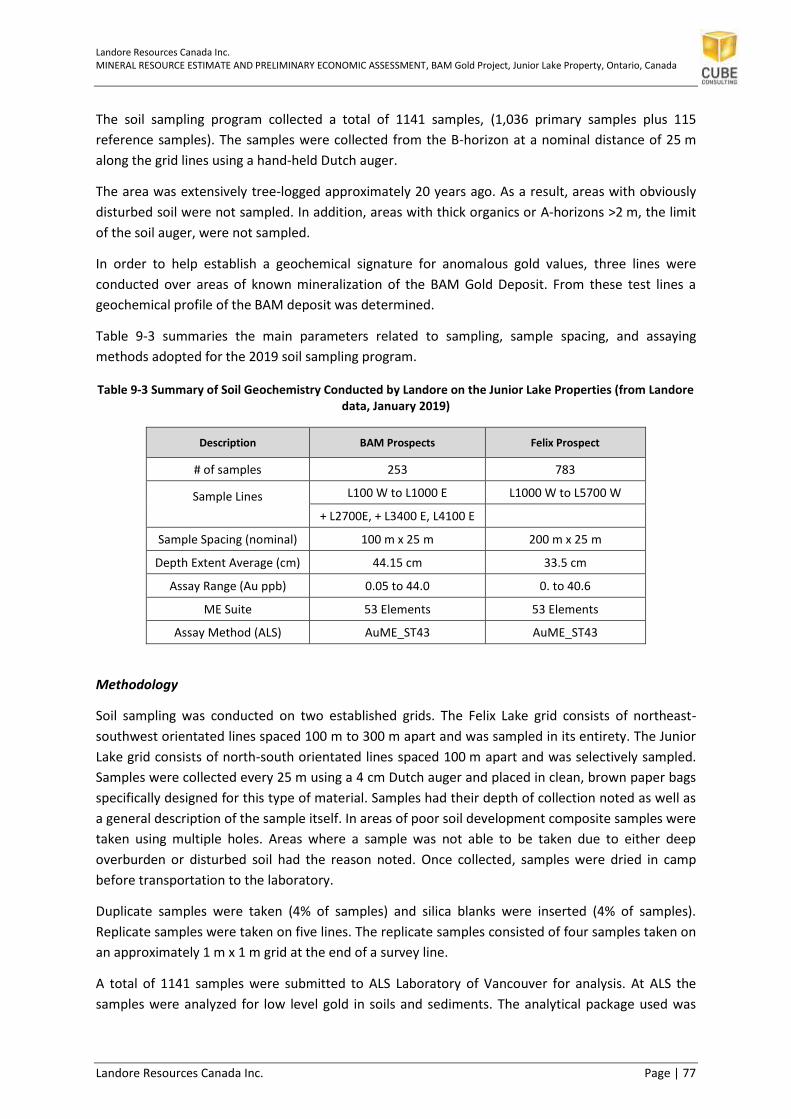
Landore Resources Canada Inc. MINERAL RESOURCE ESTIMATE AND PRELIMINARY ECONOMIC ASSESSMENT, BAM Gold Project, Junior Lake Property, Ontario, Canada
Landore Resources Canada Inc. Page | 77
The soil sampling program collected a total of 1141 samples, (1,036 primary samples plus 115
reference samples). The samples were collected from the B-horizon at a nominal distance of 25 m
along the grid lines using a hand-held Dutch auger.
The area was extensively tree-logged approximately 20 years ago. As a result, areas with obviously
disturbed soil were not sampled. In addition, areas with thick organics or A-horizons >2 m, the limit
of the soil auger, were not sampled.
In order to help establish a geochemical signature for anomalous gold values, three lines were
conducted over areas of known mineralization of the BAM Gold Deposit. From these test lines a
geochemical profile of the BAM deposit was determined.
Table 9-3 summaries the main parameters related to sampling, sample spacing, and assaying
methods adopted for the 2019 soil sampling program.
Table 9-3 Summary of Soil Geochemistry Conducted by Landore on the Junior Lake Properties (from Landore data, January 2019)
Description BAM Prospects Felix Prospect
# of samples 253 783
Sample Lines
L100 W to L1000 E L1000 W to L5700 W
+ L2700E, + L3400 E, L4100 E
Sample Spacing (nominal) 100 m x 25 m 200 m x 25 m
Depth Extent Average (cm) 44.15 cm 33.5 cm
Assay Range (Au ppb) 0.05 to 44.0 0. to 40.6
ME Suite 53 Elements 53 Elements
Assay Method (ALS) AuME_ST43 AuME_ST43
Methodology
Soil sampling was conducted on two established grids. The Felix Lake grid consists of northeast-
southwest orientated lines spaced 100 m to 300 m apart and was sampled in its entirety. The Junior
Lake grid consists of north-south orientated lines spaced 100 m apart and was selectively sampled.
Samples were collected every 25 m using a 4 cm Dutch auger and placed in clean, brown paper bags
specifically designed for this type of material. Samples had their depth of collection noted as well as
a general description of the sample itself. In areas of poor soil development composite samples were
taken using multiple holes. Areas where a sample was not able to be taken due to either deep
overburden or disturbed soil had the reason noted. Once collected, samples were dried in camp
before transportation to the laboratory.
Duplicate samples were taken (4% of samples) and silica blanks were inserted (4% of samples).
Replicate samples were taken on five lines. The replicate samples consisted of four samples taken on
an approximately 1 m x 1 m grid at the end of a survey line.
A total of 1141 samples were submitted to ALS Laboratory of Vancouver for analysis. At ALS the
samples were analyzed for low level gold in soils and sediments. The analytical package used was

Landore Resources Canada Inc. MINERAL RESOURCE ESTIMATE AND PRELIMINARY ECONOMIC ASSESSMENT, BAM Gold Project, Junior Lake Property, Ontario, Canada
Landore Resources Canada Inc. Page | 78
‘Prep-41, Au ME-ST 43’ which involves drying at <60° C and sieving to -180 µ, followed by aqua regia
digestion and ICP-MS finish for analysis of gold and 52 other elements. The samples submitted
consisted of 1036 individual soils, 45 duplicate soils, 15 replicate samples and 45 silica blanks.
To help identify the geochemical signature of the gold mineralization three control lines were
conducted in areas of known mineralization, as proven by past drilling.
QAQC
The duplicate samples taken correspond well. The majority of elements have 70-90% within +/-20%
of the duplicate values, that increases to >90% of the values when the range is expanded to +/-30%.
The outliers may in part be attributed to the sample sites. Numerous locations had thin B-horizons
which resulted in composite samples being taken. It is likely this contributed to the variation in
duplicates.
The replicate samples were taken at five separate locations and consist of four samples on an
approximate 1 m x 1 m square. In three of the replicate sets taken all samples were within 20%. For
two of the replicate sets, one of the four samples was >20%. This was considered within acceptable
limits and the data set was used in its entirety.
Treatment of Anomalous Samples
The samples were screened based on their description to remove anomalous samples. Samples
described as organic rich, black or grey in colour or clay were considered suspect and may not be
representative of the B-horizon. The remaining samples were used for calculating the background
value of each element. The background value is the average of the lower 25% quartile, listed in Table
9-4.
Table 9-4 Selected Elements Calculated Background Values (from Johnson, 2019)
Element Au
(ppb) Ag
(ppm) As
(ppm) Cu
(ppm) Ni
(ppm)
Background Value
0.299 0.013 1.19 4.35 6.43
Response Ratios
The response ratios (RR) were calculated for all elements by taking the background value and
dividing it into the analytical value. This was also done for the suspect samples. RRs are rounded and
values of >=5 considered anomalous.
A correlation matrix was also generated for the samples taken. Gold showed only a very weak
correlation with cobalt, chromium, magnesium and sodium. As a result, it was determined that use
of the correlation matrix was not helpful at this time.
An examination of the gold RR showed that there were 147 samples with anomalous values (RR>=5).
Of these samples, 25 had values of 10-30, while 15 had RR >30. In order to correlate anomalies
across lines, the regional fabric of the area was used. Within the area there is a general fabric that
strikes 105-115°, as highlighted by the recently completed geophysics (VLF, MaxMin). The
Landore Resources Canada Inc. MINERAL RESOURCE ESTIMATE AND PRELIMINARY ECONOMIC ASSESSMENT, BAM Gold Project, Junior Lake Property, Ontario, Canada
Landore Resources Canada Inc. Page | 79
geophysics highlights formation sulphide zones within the area and is used to identify both marker
horizons and to illustrate the fabric within an area. It is important to note that there are cross cutting
structures within the area. These structures may play an important role in the gold mineralization,
acting both as pathways and aiding in concentrating the auriferous fluids. As such, they will require
additional investigation and follow-up in the future.
Control Lines
In order to help establish a signature and trend within the soil samples for the gold mineralization of
the BAM deposit, three control lines (L1000E, L2700E and L3400E) through the defined BAM Gold
Deposit was conducted. Examination of the control lines yielded mixed results with the combination
of Au +As +Cu being considered most useful.
L1000E covers the historic BAM occurrence (located on the western limit of the defined BAM Gold
deposit), values up to 11 g/t Au at surface, as well as the BAM Gold zone defined by drilling. The soil
geochemistry response near the surface occurrence shows a dramatic arsenic spike (RR 11-54) as
well as copper (RR 7-11) and anomalous gold (RR 5-6) and a broader silver (RR 4-5) response.
Additional Au and Au +As +Cu anomalies are located along the southern portion of the sampled line.
Sparse previous drilling has been conducted for nickel in this area in the past.
L2700E covers the drilled portion of the BAM deposit with no surface exposure. Due to the disturbed
nature of the soil, the area overlaying the projected gold zone could not be sampled. Samples
analyzed from near the projection contained no anomalous values.
L3400E is located 100 m to the west of an established drill line. The projected gold zone correlates
with anomalous gold (RR 8, 10), silver (RR 4, 5) and copper (RR 3, 5) anomalies. A 100 m silver
anomaly is located 100 m south of the projected BAM zone but does not have any other correlating
signatures.
2019 Results - Significant Anomalies
To determine significant anomalies, several elements with RR>=5 were looked at (Au, Ag, As, Cu and
Au +As +Cu). Locations with coincident Au +As +Cu, and to a lesser extent Ag, anomalies were
considered to have the same characteristics as the BAM occurrence and examined in detail. Thirty-
one sites were found with coincident Au +As +Cu anomalies and are listed in Table 9-5 and Table 9-6.

Landore Resources Canada Inc. MINERAL RESOURCE ESTIMATE AND PRELIMINARY ECONOMIC ASSESSMENT, BAM Gold Project, Junior Lake Property, Ontario, Canada
Landore Resources Canada Inc. Page | 80
Table 9-5 Samples Containing Anomalous Au +As +Cu at Specific Locations - Felix Lake Grid (Johnson, 2019)
Sample Line Station Response Ratio (RR)
Notes Au As Cu Ag
A0058622 L5700W S200 5 11 77 8 Location has anomalous Au in sample 100 m along strike to the SE, limited strike length.
A0058707 L5000W S360 29 12 23 10
Location along southern margin of a swamp also along edge of interpreted iron formation may represent edge of anomaly. May have additional strike length
A0058817 L4300W S275 7 11 12 3 Anomalous Au+As values in sample 25 m north. Interpreted to be part of a continuous trend <=800 m in length.
A0058908 L3700W N75 6 125 15 17 Located ~50 m N of the projected metasediments of the BAM Gold deposit, within a larger Cu anomaly that extends 25 m south and 125 m north on L3500W. Parallel Au trend 25 m north. A0058951 L3500W N50 7 5 28 6
A0059060 L2800W N200 13 6 10 4
Additional anomalous Au+As values 25 m N, swamp located ~30 m prevented further sampling to north. Part of 900 m Au trend extending to W. Alternative trend can connect to samples A0058909 & A0058951
A0059103 L2500W N775 8 286 41 10 Additional anomalous results 25 m N (Cu), 25 m S (As+Cu), 50 m S (Au) and along strike 200 m SE of Au and Cu.
A0059277 L1700W N500 11 6 9 1
Located ~150 m N of the interpreted BAM Gold metasedimentary sequence. Cu anomaly continues 75 m S and As anomaly continues 25 m S, additional Cu anomalies 200 m SE along strike.
A0059316 L1500W N400 12 11 11 2
Located ~50 m N of interpreted BAM Gold metasedimentary sequence. Cu anomalies continue 25 m S and 100 m N. Interpreted to be part of ~1.3 km long trend parallel to BAM sequence.
A0058531 L1000W N25 5 10 13 4 Samples within swampy region with sparse samples. Nearest samples contain anomalous Cu (150N), As (175N) and Cu+As (50N). Due to sparse samples correlation is difficult, possible extension of sample trend A0059434.
A0058530 L1000W N75 5 7 17 4
A0059437 L100W N550 5 8 9 1 Sample within a large N-S-E Cu anomaly. Location is ~150 m south of the BAM Gold metasedimentary package.
A0059434 L100W N300 21 29 7 2 Location north of historic drilling in area of disturbed soils. Located 100 m W of A059413.

Landore Resources Canada Inc. MINERAL RESOURCE ESTIMATE AND PRELIMINARY ECONOMIC ASSESSMENT, BAM Gold Project, Junior Lake Property, Ontario, Canada
Landore Resources Canada Inc. Page | 81
Table 9-6 Samples Containing Anomalous Au +As +Cu at Specific Locations - Junior Lake Grid (Johnson, 2019)
Sample Line Station Response Ratio
Notes Au As Cu Ag
A0059416 L000 N375 7 14 9 2
Locations are part of a large zone of anomalous Cu, As and Au values surrounding an E-W swampy area south of the BAM Gold trend. Samples part of ‘Y’ shaped trend west of BAM Gold drilling. May represent Au bearing splays from main structure.
A0059413 L000 N300 6 12 8 3
A0059397 L100E N450 10 18 11 1
A0059395 L100E N375 5 16 28 6
A0059375 L200E N525 5 9 7 1
A0059356 L300E N510 12 67 45 3
A0059358 L300E N550 16 7 6 4
A0059357 L300E N525 6 12 8 2
A0059353 L300E N325 5 53 9 4
A0059354 L300E N350 5 9 7 2
A0059460 L400E N400 6 24 12 3
A0059466 L500E N500 5 20 7 1
A0059471 L500E N600 9 140 96 7 Locations above and north of the BAM Gold metasedimentary sequence. Connects to anomalous As and Au to the E and to the BAM occurrence. A0059473 L500E N650 53 25 7 2
A0059606 L4100E S200 147 44 80 40 Locations are within 200 m swampy area. Additional anomalous Au+Cu located at the southern swamp boundary. A0059611 L4100E S300 7 10 10 5
A0059621 L4100E S600 70 6 5 4 Samples are within the middle of a ~300 m wide series of Cu, As+Cu and Au+As anomalous values. A0059620 L4100E S550 7 8 18 5
Interpretation of 2019 Results
The 2019 soil survey indicated it is possible to link together gold anomaly trends up to several
hundred metres strike length. The soil data appears to show that the main BAM Gold trend is
extended 1.5 km to the west. There are also additional gold anomalies continuing for 1.5 km which
may yet be proven to be connected after further soil sampling and drilling. Multiple additional areas
of interest have also been generated and may correlate to additional gold horizons along the BAM
trend and along the north-westerly trend within the Felix grid.
The response of nickel to the use of soil sampling was also examined by Johnson (2019). A total of 37
samples had RR >= 5 for Ni. Of these samples 90% of them correlate with anomalies from the 2019
VLF and MaxMin surveys and are interpreted to be a result of sedimentary sulphide package used as
a marker horizon in the footwall of the BAM Gold deposit. In addition, the Ni anomalies are single
sample responses and have limited strike. Johnson (2019) concluded that the soil sampling has
limited use for generating nickel targets and more traditional ground or airborne EM should be used.
9.4.2. 2020 Soil Sampling Program Results (Johnson, 2020)
Summary
During the summer of 2020, soil sampling was conducted on the Junior Lake property aimed at
infilling and extending the 2019 soil sampling program (Johnston, 2019). A total of 1013 samples,
including QAQC samples, were collected. Soil sampling consisted of collection of the B-horizon at a
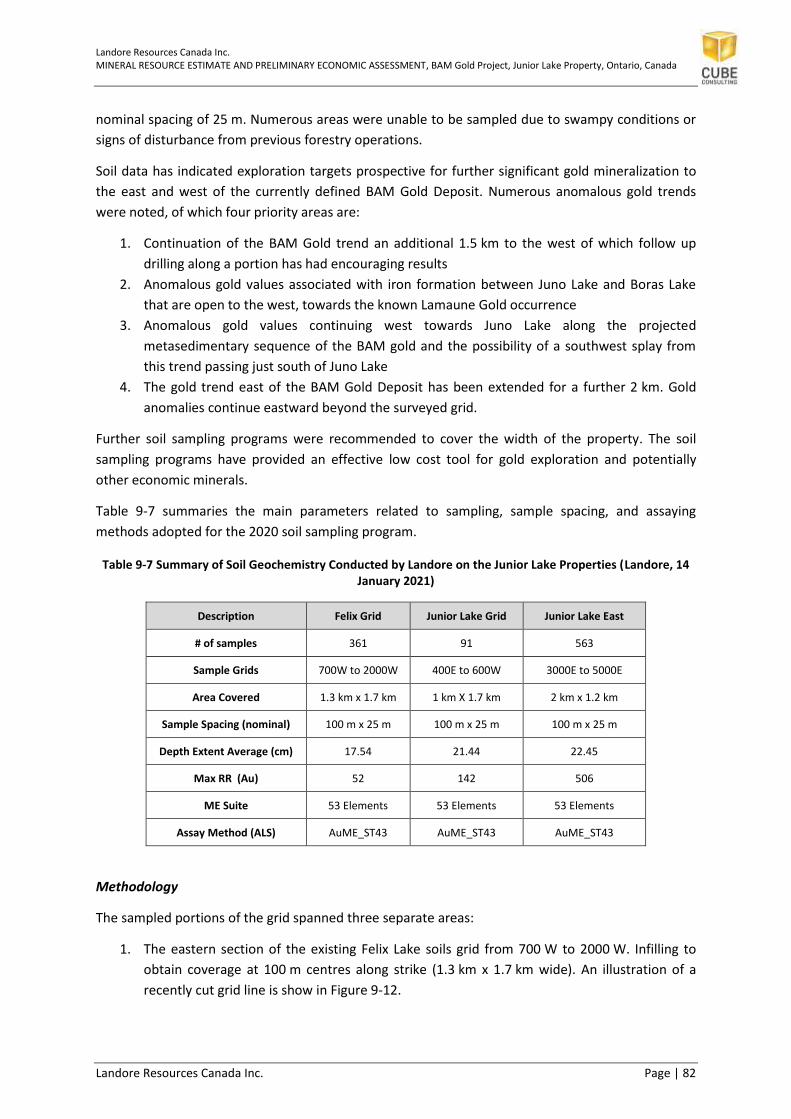
Landore Resources Canada Inc. MINERAL RESOURCE ESTIMATE AND PRELIMINARY ECONOMIC ASSESSMENT, BAM Gold Project, Junior Lake Property, Ontario, Canada
Landore Resources Canada Inc. Page | 82
nominal spacing of 25 m. Numerous areas were unable to be sampled due to swampy conditions or
signs of disturbance from previous forestry operations.
Soil data has indicated exploration targets prospective for further significant gold mineralization to
the east and west of the currently defined BAM Gold Deposit. Numerous anomalous gold trends
were noted, of which four priority areas are:
1. Continuation of the BAM Gold trend an additional 1.5 km to the west of which follow up
drilling along a portion has had encouraging results
2. Anomalous gold values associated with iron formation between Juno Lake and Boras Lake
that are open to the west, towards the known Lamaune Gold occurrence
3. Anomalous gold values continuing west towards Juno Lake along the projected
metasedimentary sequence of the BAM gold and the possibility of a southwest splay from
this trend passing just south of Juno Lake
4. The gold trend east of the BAM Gold Deposit has been extended for a further 2 km. Gold
anomalies continue eastward beyond the surveyed grid.
Further soil sampling programs were recommended to cover the width of the property. The soil
sampling programs have provided an effective low cost tool for gold exploration and potentially
other economic minerals.
Table 9-7 summaries the main parameters related to sampling, sample spacing, and assaying
methods adopted for the 2020 soil sampling program.
Table 9-7 Summary of Soil Geochemistry Conducted by Landore on the Junior Lake Properties (Landore, 14 January 2021)
Description Felix Grid Junior Lake Grid Junior Lake East
# of samples 361 91 563
Sample Grids 700W to 2000W 400E to 600W 3000E to 5000E
Area Covered 1.3 km x 1.7 km 1 km X 1.7 km 2 km x 1.2 km
Sample Spacing (nominal) 100 m x 25 m 100 m x 25 m 100 m x 25 m
Depth Extent Average (cm) 17.54 21.44 22.45
Max RR (Au) 52 142 506
ME Suite 53 Elements 53 Elements 53 Elements
Assay Method (ALS) AuME_ST43 AuME_ST43 AuME_ST43
Methodology
The sampled portions of the grid spanned three separate areas:
1. The eastern section of the existing Felix Lake soils grid from 700 W to 2000 W. Infilling to
obtain coverage at 100 m centres along strike (1.3 km x 1.7 km wide). An illustration of a
recently cut grid line is show in Figure 9-12.

Landore Resources Canada Inc. MINERAL RESOURCE ESTIMATE AND PRELIMINARY ECONOMIC ASSESSMENT, BAM Gold Project, Junior Lake Property, Ontario, Canada
Landore Resources Canada Inc. Page | 83
2. Extending the existing Junior Lake soils grid to the west from 400 E to 600 W at 100 m
centres (1 km X 1.7 km wide).
3. Completing a new soils grid to the east of the BAM Gold Deposit from 3000 E to 5000 E at
100 m centres (2 km x 1.2 km)
Figure 9-12: Line Cutting at Felix Lake Prospect for the 2020 Sampling Progam (Landore File, 2022)
Samples were collected from the B-horizon at a nominal distance of 25 m using a Dutch auger and
placed in clean, brown paper bags specifically designed for this type of material. Samples had their
depth of collection noted as well as a general description of the sample itself. In areas of poor soil
development composite samples, when possible, were taken using multiple holes. Once collected,
samples were dried in camp before shipment to the laboratory.
Duplicate samples were taken (4% of samples) and silica blanks were inserted (4% of samples). Field
replicate samples were taken at thirteen separate locations. The replicate samples consisted of three
or four samples taken on an approximately 1 m x 1 m grid, where possible.
A total of 1,013 soil samples, including 121 reference samples, were submitted to ALS Global Ltd of
Vancouver (ALS, Vancouver) for analysis. The samples were analyzed for low level gold in soils and
sediments. The analytical package used was ‘Prep-41, Au Me-ST 43’ which involves drying at <60oC
and sieving to -180 µ followed by aqua regia digestion and ICP-MS finish for analysis of gold and 42
other elements. The samples submitted consisted of 893 individual soils, 49 duplicate soils, 24
replicate samples and 48 silica blanks.
Samples had their location recorded using a handheld GPS as well as the grid reference. Each sample
also had the depth it was taken, and description of colour and composition noted.

Landore Resources Canada Inc. MINERAL RESOURCE ESTIMATE AND PRELIMINARY ECONOMIC ASSESSMENT, BAM Gold Project, Junior Lake Property, Ontario, Canada
Landore Resources Canada Inc. Page | 84
The area was extensively logged approximately years ago. As a result, areas with obviously disturbed
soil, with thick organics or A-horizons >2 m, the limit of the soil auger, or conversely no developed
soil profile, were not sampled.
QAQC
The duplicate samples taken correspond well. The majority of elements have 70-90% within +/-20%
of the duplicate values, that increases to >90% of the values when the range is expanded to +/-30%.
The outliers may in part be attributed to the sample sites. Numerous locations had thin B-horizons
which resulted in composite samples being taken. It is likely this contributed to the variation in
duplicates.
The replicate samples were taken at eight separate locations and consist of three to four samples on
an approximate one meter by one meter square. Of the replicant samples, four of the sites had one
sample of the replicant set with values greater than double the remaining samples while the other
samples were within 20%. Three of the replicant sets had one sample >20% of the other samples.
One set of replicant samples was within 20% for all samples. The variability may be a result of a
different medium being sampled as often the sample description is different on the outlier sample.
Johnston (2020) concluded that the combined 2019-2020 data set was used for interpretive
purposes.
Treatment of Anomalous Samples
To remove anomalous samples, they were screened based on their description. Samples described
as organic rich, black or grey in colour or clay were considered suspect and may not be
representative of the B-horizon. The remaining samples were used for the calculation of the
background value of each element. The background value is the average of the lower 25% quartile,
listed in Table 9-8.
Table 9-8 Selected Elements Calculated Background Values (Johnson, 2020)
Element Au (ppb) Ag (ppm) As (ppm) Cu (ppm) Ni (ppm)
Background Value 0.261 0.013 1.06 3.78 5.29
Response Ratios (RR) were calculated for all elements by taking the background value and dividing it
into the analytical value. This was also done for the suspect samples. RRs are rounded and values of
>=5 considered anomalous.
2020 Results - Significant Anomalies
To determine significant anomalies several elements with RR>=5 were examined, in particular Au,
Ag, As, and Cu, with these elements often being closely associated with gold deposits. Criterion
developed in 2019 established the combination of Au+As+Cu as being characteristic of the BAM
deposit. Using these criteria, locations with coincident Au+As+Cu, and to a lesser extent Ag,
anomalies were considered to have the same characteristics as the BAM occurrence and examined
in detail. Seventeen sites were found with coincident Au+As+Cu anomalies, as well as 13 additional
sites with Au RR>30 of which selected locations are listed in Table 9-9.

Landore Resources Canada Inc. MINERAL RESOURCE ESTIMATE AND PRELIMINARY ECONOMIC ASSESSMENT, BAM Gold Project, Junior Lake Property, Ontario, Canada
Landore Resources Canada Inc. Page | 85
A plan view showing the sample locations for 2019 and 2020 is illustrated in Figure 9-13. Maps
showing anomalous sites for Au, and Au+As+Cu are in Figure 9-14 and Figure 9-15. A map illustrating
the Junior Lake geology and trend of the gold within the soil samples is illustrated in Figure 9-16.
Maps showing anomalous sites for Ag, Cu and As are illustrated in Appendix 2.
In order to assist in correlating anomalies across lines, the regional fabric of the area was used.
Within the area there is a general fabric that strikes 105-115° - this is highlighted by completed
geophysics (VLF, MaxMin). The geophysics highlights formation sulphide zones within the area which
are used as both marker horizons and to illustrate the fabric within an area. It is important to note
that there are cross cutting structures within the area. These structures may play an important role
in the gold mineralization, acting both as pathways and aiding in concentrating the auriferous fluids.
As such, they will require additional investigation and follow-up in the future.
Table 9-9 Samples Containing Anomalous Au +As +Cu at Specific Locations (Johnson, 2020)
Area Sample Line Station Response Ratio
Notes Au As Cu Ag
Felix Lake A0059943 L1800W 100S 6 66 27 1 Samples are along trend with additional Au and Au and Cu anomalies from the 2019 survey. Trend is traceable for 800 m and may extend for an additional 700 m to the west.
Felix Lake Y068896 L1200W 150S 52 1 4 3
Felix Lake Y068899 L1200W 250S 42 2 1 1
Felix Lake Y068925 L1400W 275S 51 1 10 2 High Au value within previously defined 800 m trend of poor sample coverage.
Felix Lake A0059722 L400W 375N 8 5 16 4 Samples within swampy region, trend can be correlated to W or SSW. Trend ~800 m in length and can be linked to existing BAM Au mineralization and 2019 soil samples.
Felix Lake A0059706 L300W 450N 32 3 5 2
Felix Lake A0059698 L200W 475N 14 18 7 3
BAM A0059413 L000 N300 7 14 9 3
Locations are part of a large zone of anomalous Cu, As and Au values surrounding an E-W swampy area south of the BAM Gold trend. Samples may represent a separate, sub-parallel shear
BAM A0059415 L000 N350 142 20 2 1
BAM A0059416 L000 N375 8 16 10 2
BAM A0059395 L100E N375 6 18 32 6
BAM A0059397 L100E N450 12 21 12 1
BAM A0059353 L300E N325 5 60 10 5
BAM A0059354 L300E N525 5 10 9 2
BAM A0059460 L400E N400 7 28 14 4
BAM A0059471 L500E N600 9 140 96 7 Locations above and north of the BAM Gold metasedimentary sequence. Connects to anomalous As and Au to the E and to the BAM occurrence
BAM A0059473 L500E N650 53 25 7 2
BAM East Y069222 L3200E 175S 101 16 32 16 Samples define a corridor 100-200 m wide and approximately 1.9 km E-W. corridor is along strike from the known BAM Au mineralization. Centred within the corridor are exploration drill holes with gold mineralization as well as surface samples with anomalous Au values. Trend is a continuation of anomalous values found in 2019
BAM East Y069224 L3200E 225S 41 3 3 3
BAM East Y069165 L3400E 187.5S 18 12 9 2
BAM East Y068831 L3500E 175S 218 8 5 3
BAM East Y068829 L3500E 200S 79 1 1 1
BAM East Y068991 L4000E 300S 7 5 9 3
BAM East Y068995 L4000E 400S 8 17 10 3

Landore Resources Canada Inc. MINERAL RESOURCE ESTIMATE AND PRELIMINARY ECONOMIC ASSESSMENT, BAM Gold Project, Junior Lake Property, Ontario, Canada
Landore Resources Canada Inc. Page | 86
Area Sample Line Station Response Ratio
Notes Au As Cu Ag
BAM East Y067660 L4300E 450S 15 24 12 5
BAM East Y067743 L4600E 400S 23 303 137 5
BAM East Y067799 L4800E 450S 22 7 5 5
BAM East Y067757 L5000E 375S 506 1 2 1
BAM East Y069247 L3100E 250S 56 5 4 4 Samples located south of the BAM Au trend and can be loosely correlated together. They may represent small offshoots or ballooning of the BAM mineralization
BAM East Y067667 L4300E 625S 43 3 1 2
BAM East Y068846 L3600E L025N 33 2 2 4
Samples are located north of the BAM Au trend. Numerous additional samples with elevated As, Cu or Ag occur. Northern most samples along surveyed lines show a weak E-W correlation and may represent an additional Au trend
BAM East Y068973 L3700E 100S 28 14 9 2
BAM East Y067703 L4500E 100N 6 58 7 2
BAM East Y067702 L4500E 075N 16 32 9 13
BAM East Y067818 L4700E 200S 10 28 18 5
BAM East Y067757 L5000E 375S 506 1 2 1
A correlation matrix was also generated for the samples taken. Gold (Au) showed only a very weak
correlation with bismuth, and chromium. As a result, it was determined that use of the correlation
matrix was not helpful at this time.
Interpretation of Results
Gold appears to respond well to the sampling programs conducted in both 2019 and 2020. It is
possible to link together anomaly trends across hundreds of meters. It is important to not just rely
on the intensity of the RR but to also use a multi-element classification. This is highlighted when the
BAM occurrence is examined where multiple gram surface samples generate an Au RR of 5-6 in the
immediate samples. This criterion is not meant to exclude single element Au anomalies.
Through use of the soil data the BAM Gold trend was extended 1.1 km to the west. Some
exploratory diamond drilling has been conducted on a portion of this extension during fall 2020 and
indicates the gold mineralization continues. Additional anomalies continue for ~1.5 km and indicate
that the trend may not only continue but indicates the presence of possible parallel, untested
trends.
To the east of the BAM Gold Deposit the trend has been extended for a further 2.0 km. A portion of
this area has already been sparsely drilled with encouraging results. Two parallel areas of interest, to
the north and south, indicate the possible presence of addition gold horizons. These horizons may
correlate to some of the anomalous trends to the west of the BAM Gold mineralization, indicating a
possible second and third, untested mineralized horizon to the north and south of the BAM Gold
deposit.

Landore Resources Canada Inc. MINERAL RESOURCE ESTIMATE AND PRELIMINARY ECONOMIC ASSESSMENT, BAM Gold Project, Junior Lake Property, Ontario, Canada
Landore Resources Canada Inc. Page | 87
Figure 9-13: 2020 Soil Survey - Junior Lake Property Soil Sample Locations (Johnston, 2020).
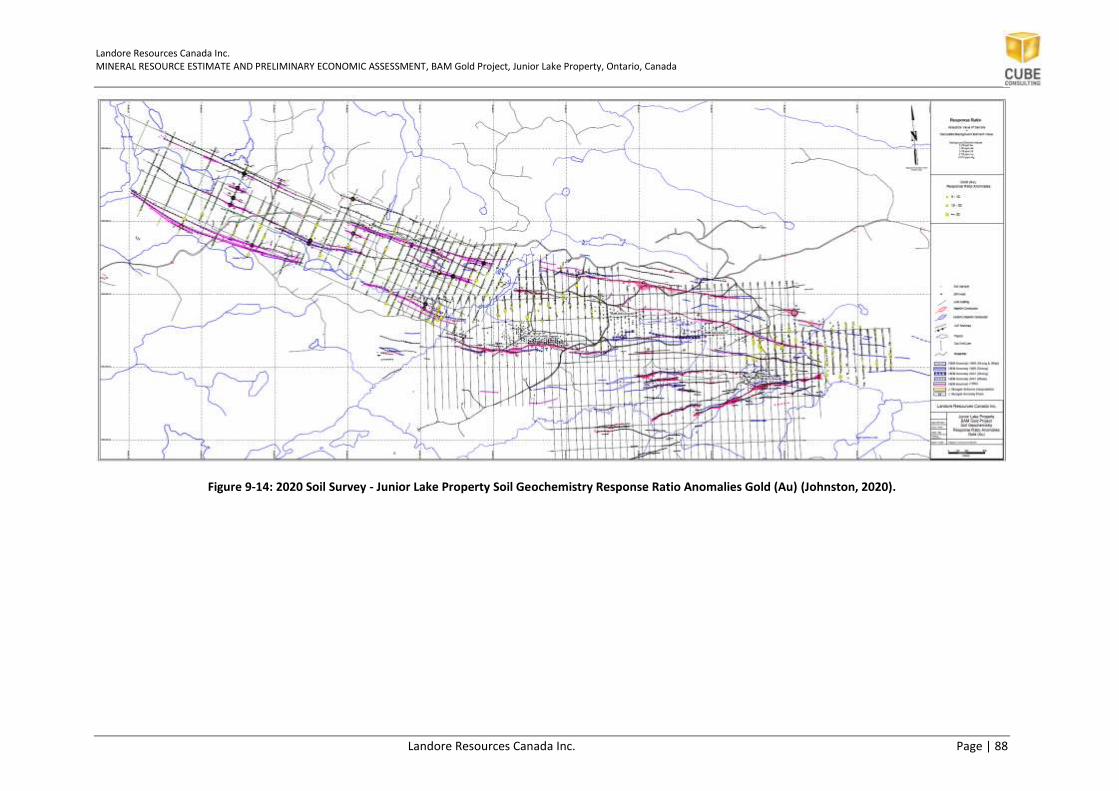
Landore Resources Canada Inc. MINERAL RESOURCE ESTIMATE AND PRELIMINARY ECONOMIC ASSESSMENT, BAM Gold Project, Junior Lake Property, Ontario, Canada
Landore Resources Canada Inc. Page | 88
Figure 9-14: 2020 Soil Survey - Junior Lake Property Soil Geochemistry Response Ratio Anomalies Gold (Au) (Johnston, 2020).

Landore Resources Canada Inc. MINERAL RESOURCE ESTIMATE AND PRELIMINARY ECONOMIC ASSESSMENT, BAM Gold Project, Junior Lake Property, Ontario, Canada
Landore Resources Canada Inc. Page | 89
Figure 9-15: 2020 Soil Survey - Junior Lake Property Soil Geochemistry Response Ratio Anomalies Au, As, Cu (Johnston, 2020).
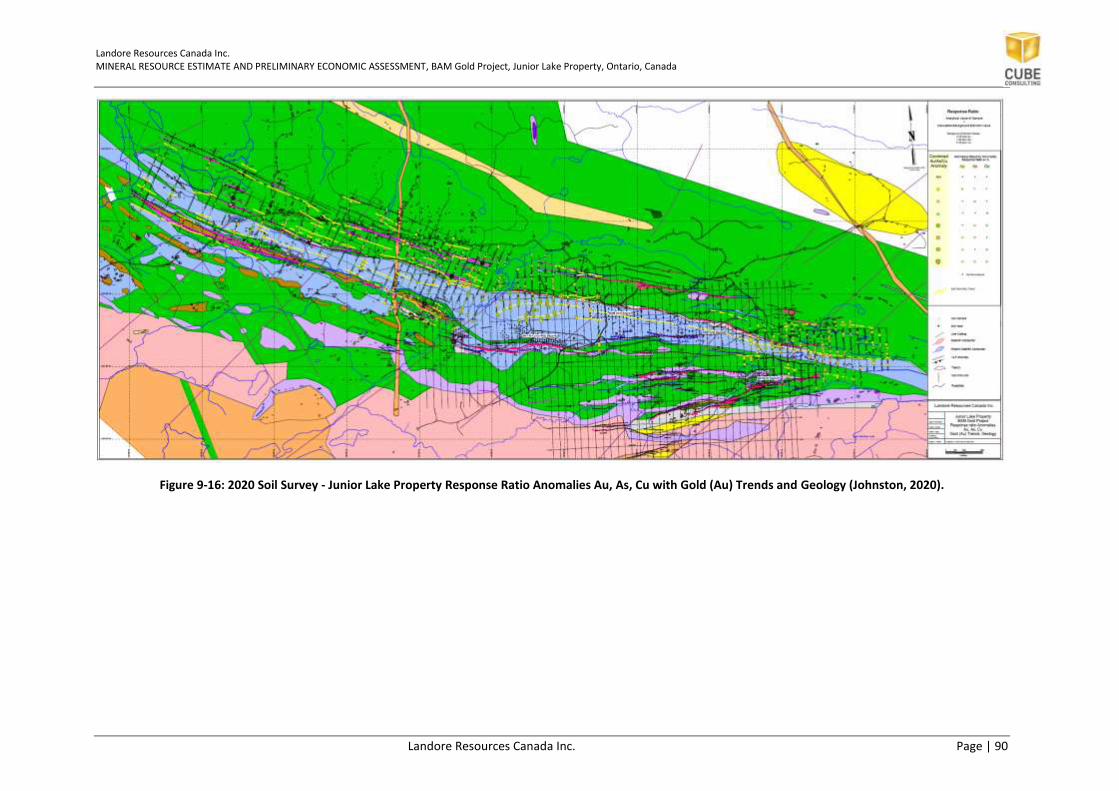
Landore Resources Canada Inc. MINERAL RESOURCE ESTIMATE AND PRELIMINARY ECONOMIC ASSESSMENT, BAM Gold Project, Junior Lake Property, Ontario, Canada
Landore Resources Canada Inc. Page | 90
Figure 9-16: 2020 Soil Survey - Junior Lake Property Response Ratio Anomalies Au, As, Cu with Gold (Au) Trends and Geology (Johnston, 2020).

Landore Resources Canada Inc. MINERAL RESOURCE ESTIMATE AND PRELIMINARY ECONOMIC ASSESSMENT, BAM Gold Project, Junior Lake Property, Ontario, Canada
Landore Resources Canada Inc. Page | 91
10. Drilling
10.1. Summary
Drilling campaigns are described for the drilling programs for the BAM Gold Project conducted by
Landore up to January 2022. Landore’s Junior Lake camp, located at kilometre 105 on the East
Road/Jackfish Road from Armstrong, was used as a base of operations. During dry seasons when
access trail conditions permit, drill sites can be accessed by four-wheel drive truck and all-terrain
vehicle.
The majority of drilling completed up to January 2022 has been drilled on a spacing of 50 m x 50 m
or 100 m x 50 m on a local mine grid north-south sections (Junior Lake grid). The Junior Lake grid is
003o west off the UTM grid north. All drilling was carried out from surface.
To date, a total of 353 drill holes have been completed within the BAM Gold Project area for a total
of 69,856.3 m. The strike and depth extents of the gold mineralization have not been closed off by
diamond drilling. The BAM Gold Project gold mineralization remains open along strike to the east
and west, and down dip.
A summary of the drilling statistics by year within the BAM Project area is presented in Table 10-1
for all results received up to 05 January 2022.
Table 10-1 Summary of BAM Gold Project Area Drilling Statistics by Period (to 05 January 2022)
Year Drilled Hole Type # of holes Metres Ave depth Comments
2003
NQ 6 438.0 73.0
All used in 2022 MRE HQ - - -
sub-tot 6 438.0 73.0
2005
NQ 10 1,284.0 128.4 Exploration; Not used in 2022 MRE
HQ - - -
sub-tot 10 1,284.0 128.4
2006
NQ 7 1,516.0 216.6 Exploration; Not used in 2022 MRE
HQ - - -
sub-tot 7 1,516.0 216.6
2008
NQ 3 738.7 246.2 Exploration; Not used in 2022 MRE
HQ - - -
sub-tot 3 738.7 246.2
2009
NQ 10 2,141.9 214.2 Exploration; Not used in 2022 MRE
HQ - - -
sub-tot 10 2,141.9 214.2
2010
NQ 7 1,356.0 193.7 Exploration; Not used in 2022 MRE
HQ - - -
sub-tot 7 1,356.0 193.7
2014
NQ 1 101.0 101.0 Exploration; Not used in 2022 MRE
HQ - - -
sub-tot 1 101.0 101.0
2015
NQ 2 215.9 108.0
All used in 2022 MRE HQ - - -
sub-tot 2 215.9 108.0
2016 NQ 35 6,431.7 183.8 All used in 2022 MRE

Landore Resources Canada Inc. MINERAL RESOURCE ESTIMATE AND PRELIMINARY ECONOMIC ASSESSMENT, BAM Gold Project, Junior Lake Property, Ontario, Canada
Landore Resources Canada Inc. Page | 92
Year Drilled Hole Type # of holes Metres Ave depth Comments
HQ 6 1,788.0 298.0
sub-tot 41 8,219.6 200.5
2017
NQ 24 3,587.0 149.5 Most holes used in 2022 MRE
HQ 41 7,469.3 182.2
sub-tot 65 11,056.3 170.1
2018
NQ 23 3,730.6 162.2 Most holes used in 2022 MRE
HQ 38 8,941.9 235.3
sub-tot 61 12,672.5 207.7
2019
NQ - - - All holes used in 2022 MRE
HQ 38 5,945.9 156.5
sub-tot 38 5,945.9 156.5
2020-2021
NQ - - - All holes used in 2022 MRE
HQ 102 24,170.6 237.0
sub-tot 102 24,170.6 237.0
ALL
NQ 128 21,540.7 168.3
HQ 225 48,315.6 214.7
TOTAL 353 69,856.3 197.9
The drilling completed was carried out in the UTM NAD83, Zone 16 grid coordinate system. The drill
holes are initially located within an old local grid system (Junior Lake grid) that was established by
previous owners of the property. Landore successfully located this previous grid and refurbished it
for its own use. This local grid uses a baseline azimuth of approximately 087°. The local grid system
has been used as the reference lines for the drilling fences for all of the BAM drilling programs
overlain on the UTM NAD83, Zone 16 grid coordinates.
Drill coverage identified by the recent drilling periods for the BAM Gold Project is shown in Figure
10-1.

Landore Resources Canada Inc. MINERAL RESOURCE ESTIMATE AND PRELIMINARY ECONOMIC ASSESSMENT, BAM Gold Project, Junior Lake Property, Ontario, Canada
Landore Resources Canada Inc. Page | 93
Figure 10-1: Drill hole Location Plan by Drill Stage (January 2022)
100m Spaced step-out drilling Infill & Depth Ext
Drilling to 50m Spacing
Infill & Depth Ext
Drilling
Infill & Depth Ext Drilling
100m spaced, infill and step-
out drilling
BAM sediment unit –main gold
mineralisation host

Landore Resources Canada Inc. MINERAL RESOURCE ESTIMATE AND PRELIMINARY ECONOMIC ASSESSMENT, BAM Gold Project, Junior Lake Property, Ontario, Canada
Landore Resources Canada Inc. Page | 94
A representative drill section on the local grid line 1250E is illustrated in Figure 10-2. The cross
section shows a typical example of the drilling density across the main gold mineralization hosted
within the BAM volcano-sedimentary sequence. Drilling conducted in 2020 and 2021 has further
defined gold mineralization within the hanging wall GPS unit.
Figure 10-2: Representative Cross Section Looking West –Line 1250E (January 2022)
Drilling Dimensions
The dimensions of the drilling for the BAM Gold Project areas are tabulated in Table 10-2.
Table 10-2: Dimensions of the Drill Coverage for BAM Gold Project Areas with Average Drill Spacing (up to 02 January 2022)
Resource Areas Strike length
(km)
Max. Width of Min Zones
(m)
Max. Vertica. Depth (m)
Typical Drill spacing (along strike x across
strike)
Main BAM Deposit & Hanging Wall
Sequence 4.5 ~80 ~380 50 m E x 50/25 m N
Topo Surface
Overburden Layer
GPS HW UnitMLS FW Unit
Main BAM Mineralisation
Zone
HW Min. Domains (hosted in GPS)
BAM Metasediment

Landore Resources Canada Inc. MINERAL RESOURCE ESTIMATE AND PRELIMINARY ECONOMIC ASSESSMENT, BAM Gold Project, Junior Lake Property, Ontario, Canada
Landore Resources Canada Inc. Page | 95
Drilling Orientations
Most drilling has been designed to be orientated normal to the dip of the major mineralization
zones. The drilling orientations are occasionally compromised by mud flats on the surface in the
central area of BAM East (Ladle Flats). Drill holes were mostly oriented to the old local grid north
(357o), with collar angles mostly drilled at -45o dip, with average depth of approximately 187 m.
Mineralized structures strike at approximately 280° and are steeply dipping to the south (-65 to -80°
dips). The capability of drilling with shallower angled holes (<60 degrees dip) has provided a
representative sample across the mineralization.
It is concluded that drill orientation for nearly all holes has not introduced any material sampling
bias.
10.2. Drilling Campaigns
10.2.1. 2015-2017 BAM Drilling
From 2015 to 2017, Landore has completed several diamond drilling campaigns over the BAM Gold
Project area.
Landore carried out a drilling program in late 2015, consisting of eight diamond drill holes for a total
of 2,223 m in length to support borehole transient electromagnetic (DTEM) surveys completed on
drill holes located in the B4-7 nickel-copper-cobalt-PGE deposit area, VW West and BAM (East)
areas.
During this drill program, two drill holes (0415-517 and 0415-518) were completed to test a
geophysical target located two kilometres to the east of the B4-7 deposit, on what was later called
the BAM (East) Gold Deposit. A wide zone of near-surface gold mineralization was intersected in drill
hole 0415-517 that returned 31.29 m grading 1.12 g/t Au. Drill hole 0415-518 encountered a high-
grade intersection of 3.70 m grading 4.21 g/t Au. These are the discovery holes for the BAM (East)
Gold Deposit.
Landore subsequently conducted a follow up drill program on the BAM (East) Gold Deposit during
December 2016. This program consisted of five NQ diamond drill-holes for a total of 564 m in length
(drill holes 0416-519 to 523, inclusive) on local grid lines 2450 E, 2500 E, and 2550 E. These holes
tested for the east, west and down dip extension of the newly discovered gold mineralization. This
drilling was successful in confirming the presence of gold mineralization along the strike and depth
extensions from the original discovery holes.
Two further drill programs were carried out in 2016. One program during summer 2016 comprised
22 NQ sized diamond drill holes (drill holes 0416-524 to 0416-545), for a total of 4,077 m in length,
and one program during fall 2016 comprised 13 (6-HQ and 7-NQ) diamond drill holes (drill holes
0416-546 to 0416-558), totaling 3,385 m in length. These programs tested for the east, west and
down dip extensions of the new gold zone. They were successful in extending the BAM (East) Gold
Deposit to greater than 250 m down dip, and to over 700 m along strike length. The limits of the
BAM (East) Gold Deposit remained undefined along the down dip and both strike directions by the
drill holes completed in 2016.
Landore Resources Canada Inc. MINERAL RESOURCE ESTIMATE AND PRELIMINARY ECONOMIC ASSESSMENT, BAM Gold Project, Junior Lake Property, Ontario, Canada
Landore Resources Canada Inc. Page | 96
In 2017, Landore completed a summer drilling campaign comprising 65 diamond drill holes (drill
holes 0417-561 to 0417-625) for a total of 11,056 m in length. The program focused on the further
detailed delineation of the known gold zones by infill drilling, on extending the defined Mineral
Resource, and identifying other targets located along on the highly prospective geophysical
conductor MM-7, which is spatially associated with the BAM East Gold Deposit. The campaign
successfully infilled much of the Inferred portion of the existing resource zone and has extended its
potential strike length from the existing 700 m length to approximately 1,100 m in length.
In addition, drilling at the original BAM Zone, located 1,000 m along strike to the west, successfully
intersected additional gold mineralization with similar lithology and grades to the BAM (East) Gold
Deposit. Examples of mineralized intervals include 4.01 m grading 3.79 g/t Au in drill hole 0417-581,
and 5.01 m grading 1.00 g/t Au in drill hole 0417-573.
Together, these drilling programs have been successful in demonstrating the continuity of the gold
mineralization by closely spaced drill holes (approximately spaced at 50 m x 50 m pattern) along a
strike length of approximately 1,100 m and from surface to a vertical depth of approximately 350 m.
These drilling programs have also been successful in confirming the presence of the controlling
mineralized shear zone (the Junior Lake Shear Zone) along a strike length of approximately 2,000 m
by widely spaced drill holes.
10.2.2. 2018 Drilling
In 2018, Landore completed a drill program consisting of 23 NQ diamond drill holes (0418-626 to
0418-648) for 3,731 m and 38 HQ diamond drill holes (0418-649 to 0418-686 and 0418-686) for
8,459 m. The aim of this program was to extend the existing BAM Gold Resource to the west. In
addition, a small exploration drilling program of 5 HQ drill holes (0418-681 to 0418-685) for 483 m
was completed to test the gold potential of a prospective zone from 3900 E to 4000 E (mine grid)
approximately one kilometre to the east of the currently defined Mineral Resource. The 2018 drill
program also included a geotechnical hole (0418-655), and two metallurgical test work holes (0418-
653 and 0418-654).
The 2018 drilling has been successful in demonstrating the extension to the west of the main gold
mineralization (by 50 m x 50 m and 100 m x 50 m patterns) along a strike length of approximately
2,100 m and from surface to a maximum vertical depth of approximately 380 m. The maximum
width of the gold mineralization envelope being approximately 50 m, down to a minimum mining
width of 2 m.
Drill testing along the eastern strike extension has intersected gold mineralization hosted within the
BAM sequence, previously defined to 3,000 E, but now identified at 3,900 E and 4,000 E. The BAM
gold mineralization has now been intersected over a total strike length of 3000 m (from 950 E to
4,000 E) and remains open to the east and west and down dip
10.2.3. 2019 Drilling
The 2019 drilling has confirmed the continuity of the gold mineralization within the pit design areas,
resulting in the conversion of Mineral Resources from Inferred to Indicated, and also demonstrated
the continuation of the main BAM mineralization to the west to local grid line 400 E.
Landore Resources Canada Inc. MINERAL RESOURCE ESTIMATE AND PRELIMINARY ECONOMIC ASSESSMENT, BAM Gold Project, Junior Lake Property, Ontario, Canada
Landore Resources Canada Inc. Page | 97
The drilling has continued to show the close association between gold mineralization and the VTEM
geophysical anomaly trend. The BAM gold mineralization trend has now been confirmed by diamond
drilling over a strike length 3.9 km, extending from local grid line 400 E through to and beyond line
4000 E. Drill testing has confirmed gold mineralization within the main BAM zone extends from
below the glacial till overburden surface (~10 m average depth) to a maximum vertical depth of
approximately 380 m. The maximum width of the gold mineralization envelope being approximately
50 m, down to a minimum mining width of 3 m.
The 2019 drilling results also intersected additional narrow, poddy gold mineralization zones within
the hanging wall GPS unit in the West Pit design area. Gold mineralization hosted within the BAM
sequence remains open to the east and west and down dip.
10.2.4. 2020-2021 Drilling
The combined 2020-2021 infill and step out drilling campaigns, consisting of 102 holes HQ diamond
core for a total of 24,171 metres, was completed on the BAM Gold Deposit aimed at the following:
• Identifying additional shallow mineralization along strike west and west of the main BAM
mineralization
• Infill drilling covering the following:
o Depth extension of high grade intersections, including the westerly down plunge
extensions of the main BAM unit mineralization
o Shallow hanging wall mineralization within the Grassy Pond Sill and targeting zones
with good continuity for resource definition.
• Hole twinning of previously drilled holes, testing the repeatability of grade and width of the
main BAM mineralization, and also some holes replacing older holes which had sample
recovery and core quality issues
• Conversion of Inferred Mineral Resources of the existing resource to the Indicated Mineral
Resource category for inclusion in the upgraded January 2022 Mineral Resource Estimate
The 2020-2021 drilling has confirmed the continuity of the gold mineralization at depth within the
main BAM mineralization zone and also upgraded the mineralization within the hanging wall GPS
unit. The new drilling results have allowed for conversion of Mineral Resources from Inferred to
Indicated, and also demonstrated the continuation of the main BAM mineralization to the west to
local grid line 200W.
The drilling has continued to show the close association between gold mineralization and the VTEM
geophysical anomaly trend. The BAM gold mineralization trend has now been confirmed by diamond
drilling over a strike length 4.5 km, extending from the local grid line 200W and passed line 4100E.
Drill testing has confirmed gold mineralization within the main BAM zone extends from below the
glacial till overburden (~10m average depth) surface to a maximum vertical depth of approximately
380m. The maximum width of the gold mineralization envelope is approximately 50 m, down to a
minimum mining width of 2 m.
Landore Resources Canada Inc. MINERAL RESOURCE ESTIMATE AND PRELIMINARY ECONOMIC ASSESSMENT, BAM Gold Project, Junior Lake Property, Ontario, Canada
Landore Resources Canada Inc. Page | 98
10.3. Drilling Methods
All drilling from 2015 to 2021 was carried out by a drilling contractor, Chibougamau Diamond
Drilling, of Chibougamau, Québec. All holes were entirely drilled by surface DD core drilling, either
NQ or HQ diameter, with a 3 m core barrel and standard inner tube. The drill core from this program
is stored on covered core racks at Landore’s Junior Lake camp.
Collar Setup and Drilling
Drill holes were positioned and oriented by chaining from previous casings along cut lines of the
established grid, or by GPS and compass where there was no grid. Upon completion of each hole,
the casing location was recorded by Landore staff using a Geneq Inc. SkyBlue II handheld GPS in UTM
projection NAD 83 for Zone 16. This unit has a nominal horizontal accuracy in the order of one
metre. The vertical accuracy is not specified in the equipment specifications. Landore carries out
detailed survey pickups of the location of completed drill holes on a periodic basis using licensed
surveying companies. In 2017, a program of detailed surveying of drill hole locations in the BAM
Gold Deposit area was carried out with differential GPS (DGPS) instrumentation by J.D. Barnes
Limited, a licensed surveyor located in Thunder Bay, Ontario. All casings were left in the holes and
capped. The water source for drilling at the BAM Gold Deposit was a local unnamed stream near the
drill area, and a pond north of the VW Deposit area.
The contractor sets the diamond drill onto the drill site and aligns it under the direction of Landore’s
drill geologist using front and back sights emplaced by Landore crew prior to drilling. Two sizes of
diamond drill core are used on the BAM Gold Deposit: NQ and HQ. The NQ size is used primarily for
exploration drilling and for some deposit drilling. The larger HQ size is used within the central zone
of the BAM Gold Deposit. Figure 10-3 shows a Landore photo of the recent winter drilling programs
from 2019-2020.
For the recent drilling programs, a triple tube core barrel for some holes was utilized. The core
recovery and core quality was observed to be poor in the BAM sequence mineralized zones in some
holes when drilled with the smaller diameter NQ drill size. Some units in the BAM sequence had the
tendency to break into very thin discs, or there were some highly fractured intervals. The triple tube
setup enabled improvement in the core recovery and core quality and allowed for the core to be
carefully extracted. Figure 10-4 shows photos of triple tube NQ core extraction from the 2018
drilling program for hole 0418-654.
• Photo A: Triple tube core extraction
• Photo B: Core measurement inside triple tube and transfer to core tray
• Photo C: Example of core within mineralized BAM sequence.

Landore Resources Canada Inc. MINERAL RESOURCE ESTIMATE AND PRELIMINARY ECONOMIC ASSESSMENT, BAM Gold Project, Junior Lake Property, Ontario, Canada
Landore Resources Canada Inc. Page | 99
Figure 10-3: Drilling Rig in Operation During 2020-21 Drilling Programs (Landore File, 2022)
Figure 10-4: Triple Tube Core Extraction for HQ Core Drilling (Cube, June 2018)

Landore Resources Canada Inc. MINERAL RESOURCE ESTIMATE AND PRELIMINARY ECONOMIC ASSESSMENT, BAM Gold Project, Junior Lake Property, Ontario, Canada
Landore Resources Canada Inc. Page | 100
Drill core is placed by the drillers into wooden core boxes with lids affixed to them prior to being
transported by pickup truck to the core shack located at Landore’s exploration camp. Once at the
core shack, the boxes are loaded on to racks for examination and subsequent core logging by
Landore’s drill geologist.
Down Hole Surveys
All drill holes were surveyed within ten metres past the casing using a Reflex Instruments EZ-Shot (EZ
Shot) down-hole survey instrument to ensure the departing hole orientation and inclination were
correct. The drill hole was stopped if the hole deviated outside Landore’s acceptable tolerance. In
addition, inclination deviation was monitored as the holes progressed using an EZ-Shot survey
instrument and, upon completion of each hole, a Reflex Instruments Maxibor II (Maxibor)
instrument (optical method) was used to survey the hole to obtain reliable information on both
inclination and azimuth deviation. Both instruments digitally record the down-hole survey data.
Down-hole deviation was minimized by the use of a hexagonal core barrel and long (18”) reaming
shell for both the NQ and HQ size drill rods.
10.4. Core Logging
Drill core was aligned, measured, and logged for geology. Core logging records major and minor rock
units (grain sizes, texture structural information including core angles of geological contacts,
foliation and bedding, fractures, faults, veins, joints, etc.), alteration and sulphide species, content
and mode of occurrence. Logging and sampling information was recorded by hand on paper and/or
in Microsoft Word and Excel software, then edited as required (Figure 10-5 (B)). Access and MapInfo
GIS databases are maintained for drilling information available for the resource estimation work, and
mining and metallurgical studies.
The Landore database records up to January 2022 contain 18,496 lithology entries for 60,107.5 m of
all drilling completed on the Project that were used for the resource estimation work in January
2022. The total drill metres recorded in the collar records is 62,719.03 m, which shows that 96% of
the drill metres within the drill hole database have been logged. Several recent holes had incomplete
logging records by the close off date for the resource estimate work, otherwise 100% of all drilling
has been geologically logged in detail.
All drill core is digitally photographed for both dry and wet core trays with photos maintained on file
in Landore’s Thunder Bay office.
Figure 10-5 shows photos of the check logging area and enclosed core logging facilities at the Junior
Lake exploration offices:
• Photo A: Core unloaded from drill site
• Photo B: Core logging sheet
• Photo C and D: Core logging facility at the Junior Lake camp.
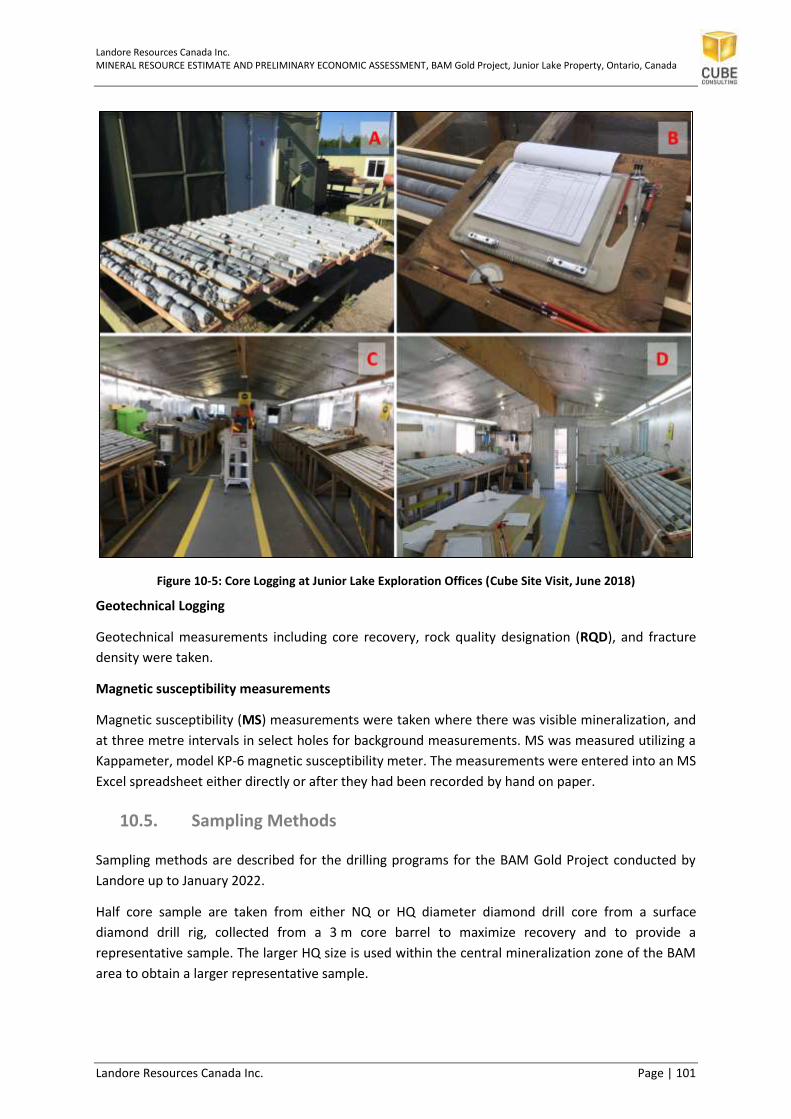
Landore Resources Canada Inc. MINERAL RESOURCE ESTIMATE AND PRELIMINARY ECONOMIC ASSESSMENT, BAM Gold Project, Junior Lake Property, Ontario, Canada
Landore Resources Canada Inc. Page | 101
Figure 10-5: Core Logging at Junior Lake Exploration Offices (Cube Site Visit, June 2018)
Geotechnical Logging
Geotechnical measurements including core recovery, rock quality designation (RQD), and fracture
density were taken.
Magnetic susceptibility measurements
Magnetic susceptibility (MS) measurements were taken where there was visible mineralization, and
at three metre intervals in select holes for background measurements. MS was measured utilizing a
Kappameter, model KP-6 magnetic susceptibility meter. The measurements were entered into an MS
Excel spreadsheet either directly or after they had been recorded by hand on paper.
10.5. Sampling Methods
Sampling methods are described for the drilling programs for the BAM Gold Project conducted by
Landore up to January 2022.
Half core sample are taken from either NQ or HQ diameter diamond drill core from a surface
diamond drill rig, collected from a 3 m core barrel to maximize recovery and to provide a
representative sample. The larger HQ size is used within the central mineralization zone of the BAM
area to obtain a larger representative sample.

Landore Resources Canada Inc. MINERAL RESOURCE ESTIMATE AND PRELIMINARY ECONOMIC ASSESSMENT, BAM Gold Project, Junior Lake Property, Ontario, Canada
Landore Resources Canada Inc. Page | 102
Extracted core was placed in a core cradle, ensuring that the core was maintained intact and in the
correct order. The core was cleaned, with segments pieced back together in order to reconstruct the
in situ position as closely as possible. The core was then placed into numbered wooden core boxes in
which wooden blocks were inserted with drilling depth labelled and lids fixed to the top of the trays
to minimize disruption of the core during transportation back to the core shack at Landore’s Junior
Lake exploration camp.
All drill core was geologically logged and sampled to lithological contacts or changes in the nature of
mineralization to ensure appropriate representation of lithological/alteration/mineralization
intervals. Sample intervals are typically 1.0 m to 1.5 m in length. For sampling completed to January
2022, minimum sample length was 0.18 m, and maximum length was 2.2 m.
The sampling protocols are described as follows:
1. All drill core is aligned and measured prior to sampling.
2. Samples for assay are selected and marked for sampling based on sulphide
geology/mineralogy and rock units.
3. Sample intervals avoid crossing geological contacts.
4. Samples are sawn in half with a diamond saw blade.
5. One half of the sample is placed in a standard, numbered transparent plastic bag with an
identifying sample tag and the remaining half is returned to the core box with a
corresponding tag placed at the beginning of the sample interval.
6. The halved drill core is retained in core racks on site.
7. No sample compositing of diamond drill core samples has been applied for the diamond
drilling programs.
Diamond drill core was used to obtain representative half core samples weighing 3 kg to 5 kg, which
was sufficient to be pulverized to produce a 50 g charge for fire assay.
Figure 10-6 shows photos of the core cutting facility at the Junior Lake exploration camp, and
illustrations of the sample labelling and collection:
• Photo A: Half core cutting and sampling at Junior Lake camp
• Photo B: Sample dispatch tickets, inserted in each sample bag
• Photo C: Zip-tied core sample collection.

Landore Resources Canada Inc. MINERAL RESOURCE ESTIMATE AND PRELIMINARY ECONOMIC ASSESSMENT, BAM Gold Project, Junior Lake Property, Ontario, Canada
Landore Resources Canada Inc. Page | 103
Figure 10-6: Core Cutting and Sampling at Junior Lake Exploration Offices (Cube Site Visit, June 2018)
10.6. Drill Sample Quality
10.6.1. RQD and Core Recovery
Rock-Quality Designation (RQD) and core recovery was determined over three metre intervals. RQD
is calculated using the following formula:
RQD = (Sum of all pieces over 0.1 m/metres recovered) *100
Diamond drilling core recovery length and percentage of both the total drilled interval and for each
metre interval was calculated and recorded. Core recovery is calculated using the following formula:
Core recovery = (Metres recovered/metres drilled) *100
The longest and smallest pieces of drill core in the three metre intervals were measured and
recorded, as well as the fracture density. The fracture density is the visual inspection of the intensity
of natural fractures in a given three metres and is a numerical value on a scale of 0 to 9 (0 being no
fractures, 9 being very intensely fractured).
10.6.2. Core Recovery Results
From core recovery calculated from core logged by Landore for the BAM Gold Project area since
2015, the basic statistics representative of all material types is summarized in Table 10-3 for 2015 to
2019 drilling and compared with the 2020-2021 drilling programs.
A tabulation of the recoveries below 80% is provided in Table 10-4.

Landore Resources Canada Inc. MINERAL RESOURCE ESTIMATE AND PRELIMINARY ECONOMIC ASSESSMENT, BAM Gold Project, Junior Lake Property, Ontario, Canada
Landore Resources Canada Inc. Page | 104
Table 10-3: BAM Gold Project – Core Recovery Statistics for All Material for Previous Drilling and for 2020-2021 Drilling (January 2022)
Statistic All Drilling (2016-2019) 2020-21 Drilling
Rec (m) Rec (pct) Rec (m) Rec (pct)
Number 12,073 12,073 6,319 6,319
Minimum 0.20 12.00 0.28 9.33
Maximum 3.94 100.00 3.94 100.00
Mean 2.98 98.93 2.98 98.89
Median 3.00 100.00 3.00 100.00
Std Dev 0.17 4.55 0.18 4.29
Variance 0.029 20.736 0.03 18.40
Coeff Var 0.057 0.046 0.060 0.043
Figure 10-7 graphically show the normal distribution of the core recovery results for all material
types for the 2020-2021 drilling.
Figure 10-7: Core Recovery Statistics – Normal Distribution Plot for All Material Types in 2020-2021 Core Drilling (January 2022)
Lower recovery samples (<80%) predominantly after hole collaring at
start of core runs

Landore Resources Canada Inc. MINERAL RESOURCE ESTIMATE AND PRELIMINARY ECONOMIC ASSESSMENT, BAM Gold Project, Junior Lake Property, Ontario, Canada
Landore Resources Canada Inc. Page | 105
Table 10-4: BAM Gold Project – Core Recovery Logs for Samples with Core Recovery <80% in 2020-2021 Core Drilling (January 2022)
Hole ID Depth From (m)
Depth To (m)
Interval (m)
Rec (m) Rec (pct) Core Dia.
Lith Code
Log Desc. Assay (au
ppm) Comments
0420-730 9.00 12.00 3.00 2.34 78.0 HQ OB Overburden/ in situ rock
interface ns Start of core run, core loss expected
0420-733 10.50 12.00 1.50 0.77 51.3 HQ OB Overburden/ in situ rock
interface ns Start of core run, core loss expected
0420-733 276.00 278.00 2.00 1.40 70.0 HQ 2A Mafic volcanic 0.0005 Core Loss - highly fractured/fault?
0420-738 9.00 12.00 3.00 2.10 70.0 HQ OB Overburden/ in situ rock
interface ns Start of core run, core loss expected
0420-738 12.00 15.00 3.00 1.30 43.3 HQ OB " 0.0005 Start of core run, core loss expected
0420-740 10.50 12.00 1.50 0.82 54.7 HQ OB " ns Start of core run, core loss expected
0421-753 6.00 9.00 3.00 1.50 50.0 HQ OB " ns Start of core run, core loss expected
0421-754 13.50 15.00 1.50 0.71 47.3 HQ OB " ns Start of core run, core loss expected
0421-755 10.50 12.00 1.50 0.89 59.3 HQ OB " ns Start of core run, core loss expected
0421-759 14.50 18.00 3.50 0.61 17.4 HQ OB " ns Start of core run, core loss expected
0421-760 7.50 9.00 1.50 1.14 76.0 HQ OB " ns Start of core run, core loss expected
0421-762 6.00 9.00 3.00 2.26 75.3 HQ OB " ns Start of core run, core loss expected
0421-763 13.50 15.00 1.50 0.84 56.0 HQ OB " ns Start of core run, core loss expected
0421-766 6.00 9.00 3.00 2.04 68.0 HQ OB " ns Start of core run, core loss expected
0421-771 13.50 15.00 1.50 0.45 30.0 HQ OB " ns Start of core run, core loss expected
0421-771 15.00 18.00 3.00 2.29 76.3 HQ OB " ns Start of core run, core loss expected
0421-774 10.50 12.00 1.50 1.17 78.0 HQ OB " ns Start of core run, core loss expected
0421-777 9.00 12.00 3.00 2.37 79.0 HQ OB " ns Start of core run, core loss expected
0421-780 9.00 12.00 3.00 2.17 72.3 HQ OB " ns Start of core run, core loss expected
0421-781 6.00 9.00 3.00 2.14 71.3 HQ OB " ns Start of core run, core loss expected
0421-783 7.50 9.00 1.50 0.70 46.7 HQ OB " ns Start of core run, core loss expected

Landore Resources Canada Inc. MINERAL RESOURCE ESTIMATE AND PRELIMINARY ECONOMIC ASSESSMENT, BAM Gold Project, Junior Lake Property, Ontario, Canada
Landore Resources Canada Inc. Page | 106
Hole ID Depth From (m)
Depth To (m)
Interval (m)
Rec (m) Rec (pct) Core Dia.
Lith Code
Log Desc. Assay (au
ppm) Comments
0421-784 4.50 6.00 1.50 0.65 43.3 HQ OB " ns Start of core run, core loss expected
0421-789 12.00 15.00 3.00 2.27 75.7 HQ OB " ns Start of core run, core loss expected
0421-791 7.50 9.00 1.50 0.78 52.0 HQ OB " ns Start of core run, core loss expected
0421-792 6.00 9.00 3.00 0.75 25.0 HQ OB " ns Start of core run, core loss expected
0421-793 7.50 9.00 1.50 0.60 40.0 HQ OB " ns Start of core run, core loss expected
0421-796 6.00 9.00 3.00 2.29 76.3 HQ OB " ns Start of core run, core loss expected
0421-798 12.00 15.00 3.00 2.30 76.7 HQ OB " ns Start of core run, core loss expected
0421-799 13.50 15.00 1.50 0.82 54.7 HQ OB " ns Start of core run, core loss expected
0421-799 15.00 18.00 3.00 0.28 9.3 HQ OB " ns Start of core run, core loss expected
0421-801 12.00 15.00 3.00 1.63 54.3 HQ OB " ns Start of core run, core loss expected
0421-802 177.00 180.00 3.00 2.29 76.3 HQ 9C 9D Mafic dolerite, sheared 0.0125 Core Loss - Shear/Fault zone?
0421-805 7.50 9.00 1.50 0.84 56.0 HQ OB Overburden/ in situ rock
interface ns Start of core run, core loss expected
0421-806 6.00 9.00 3.00 0.80 26.7 HQ OB " ns Start of core run, core loss expected
0421-807 7.50 12.00 4.50 2.34 52.0 HQ OB " ns Start of core run, core loss expected
0421-808 6.00 9.00 3.00 1.00 33.3 HQ OB " ns Start of core run, core loss expected
0421-808 9.00 12.00 3.00 1.68 56.0 HQ OB " ns Start of core run, core loss expected
0421-809 12.00 15.00 3.00 1.00 33.3 HQ OB " ns Start of core run, core loss expected
0421-810 9.00 12.00 3.00 0.33 11.0 HQ OB " ns Start of core run, core loss expected
0421-811 9.00 12.00 3.00 1.07 35.7 HQ OB " ns Start of core run, core loss expected
0421-815 16.50 18.00 1.50 0.96 64.0 HQ OB " ns Start of core run, core loss expected
0421-817 10.50 12.00 1.50 0.98 65.3 HQ OB " ns Start of core run, core loss expected
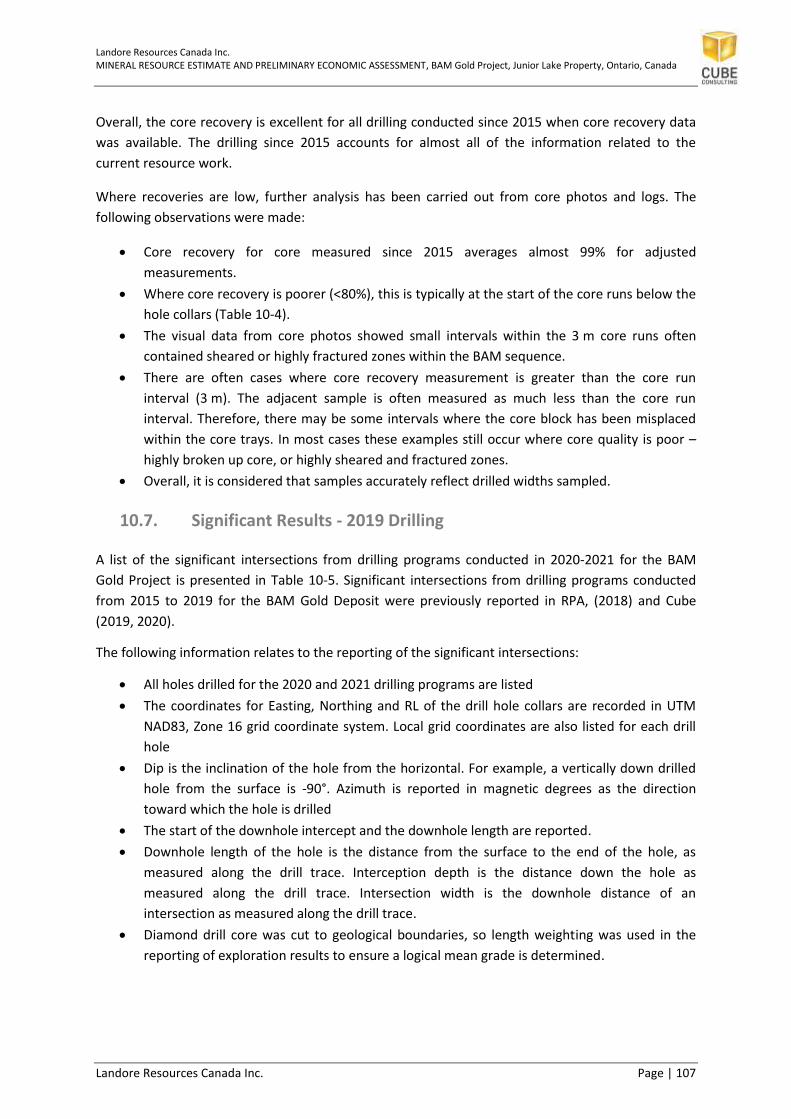
Landore Resources Canada Inc. MINERAL RESOURCE ESTIMATE AND PRELIMINARY ECONOMIC ASSESSMENT, BAM Gold Project, Junior Lake Property, Ontario, Canada
Landore Resources Canada Inc. Page | 107
Overall, the core recovery is excellent for all drilling conducted since 2015 when core recovery data
was available. The drilling since 2015 accounts for almost all of the information related to the
current resource work.
Where recoveries are low, further analysis has been carried out from core photos and logs. The
following observations were made:
• Core recovery for core measured since 2015 averages almost 99% for adjusted
measurements.
• Where core recovery is poorer (<80%), this is typically at the start of the core runs below the
hole collars (Table 10-4).
• The visual data from core photos showed small intervals within the 3 m core runs often
contained sheared or highly fractured zones within the BAM sequence.
• There are often cases where core recovery measurement is greater than the core run
interval (3 m). The adjacent sample is often measured as much less than the core run
interval. Therefore, there may be some intervals where the core block has been misplaced
within the core trays. In most cases these examples still occur where core quality is poor –
highly broken up core, or highly sheared and fractured zones.
• Overall, it is considered that samples accurately reflect drilled widths sampled.
10.7. Significant Results - 2019 Drilling
A list of the significant intersections from drilling programs conducted in 2020-2021 for the BAM
Gold Project is presented in Table 10-5. Significant intersections from drilling programs conducted
from 2015 to 2019 for the BAM Gold Deposit were previously reported in RPA, (2018) and Cube
(2019, 2020).
The following information relates to the reporting of the significant intersections:
• All holes drilled for the 2020 and 2021 drilling programs are listed
• The coordinates for Easting, Northing and RL of the drill hole collars are recorded in UTM
NAD83, Zone 16 grid coordinate system. Local grid coordinates are also listed for each drill
hole
• Dip is the inclination of the hole from the horizontal. For example, a vertically down drilled
hole from the surface is -90°. Azimuth is reported in magnetic degrees as the direction
toward which the hole is drilled
• The start of the downhole intercept and the downhole length are reported.
• Downhole length of the hole is the distance from the surface to the end of the hole, as
measured along the drill trace. Interception depth is the distance down the hole as
measured along the drill trace. Intersection width is the downhole distance of an
intersection as measured along the drill trace.
• Diamond drill core was cut to geological boundaries, so length weighting was used in the
reporting of exploration results to ensure a logical mean grade is determined.

Landore Resources Canada Inc. MINERAL RESOURCE ESTIMATE AND PRELIMINARY ECONOMIC ASSESSMENT, BAM Gold Project, Junior Lake Property, Ontario, Canada
Landore Resources Canada Inc. Page | 108
• The primary returned assay result was used for reporting of significant intersections in this
report. No averaging with laboratory repeats was undertaken so as not to introduce volume
bias.
• A maximum of 2 m internal dilution has been applied for significant zones of mineralization.
• A grade threshold of 1.0 gram x metres has been used for the reporting of the significant
intersections
• No grade truncation or high-grade cutting was applied in the results reported in January
2022.

Landore Resources Canada Inc. MINERAL RESOURCE ESTIMATE AND PRELIMINARY ECONOMIC ASSESSMENT, BAM Gold Project, Junior Lake Property, Ontario, Canada
Landore Resources Canada Inc. Page | 109
Table 10-5: Significant Results for BAM Gold Project 2020-2021 Drilling Programs (January 2022)
Hole ID utm z16_n83
easting utm z16_n83
northing Elevation
(m) Hole Depth
(m) Hole Size
Local grid easting
Local grid northing
Plan Azi
Plan Dip
Depth From (m)
Depth To (m)
Interval Length (m)
Grade (g/t Au)
0420-725 5,582,017.23 432,644.16 349.43 117.08 HQ 175 675 360 -90 NSI
0420-726 5,581,872.37 432,853.27 345.49 183.04 HQ 400 524 357 -45 NSI
0420-727 5,581,924.56 432,755.28 344.62 150.14 HQ 300 580 357 -45 86.26 87.29 1.03 0.72
0420-728 5,582,133.94 432,747.32 352.72 246.06 HQ 300 790 177 -45 221.85 222.66 0.81 0.83
0420-729 5,582,073.35 432,950.18 351.89 210.00 HQ 500 720 177 -45 58.81 59.80 0.99 0.70
0420-730 5,581,930.29 432,662.87 343.80 129.00 HQ 200 590 357 -45 22.13 23.06 0.93 0.55
0420-731 5,581,938.09 432,557.90 341.82 141.00 HQ 100 600 357 -45 24.81 25.65 0.84 1.21 and 103.11 104.11 1.00 0.96
0420-732 5,581,902.94 432,461.15 338.61 225.00 HQ 0 570 357 -45 193.26 194.28 1.02 1.67
0420-733 5,581,671.21 433,511.32 355.98 278.33 HQ 1050 295 357 -45 78.43 79.77 1.34 2.05 and 232.82 235.42 2.60 1.83 and 239.51 243.48 3.97 3.75 and 246.00 247.00 1.00 0.95 and 255.91 256.69 0.78 1.14 and 263.49 264.32 0.83 1.34 and 266.00 266.75 0.75 1.34
0420-734 5,581,649.96 433,612.92 353.99 333.00 HQ 1150 270 357 -52 103.50 104.50 1.00 4.32 and 282.71 286.40 1.81 1.15 and 289.75 295.18 5.43 1.92
0420-735 5,581,609.85 433,810.82 353.85 312.00 HQ 1350 220 357 -52 187.05 188.10 1.05 1.69 and 269.00 271.77 2.77 0.80
0420-736 5,581,589.81 433,913.98 352.41 315.00 HQ 1450 195 357 -52 258.88 267.61 8.73 0.96 and 271.56 273.58 2.02 5.21
0420-737 5,581,578.54 433,964.15 352.26 312.07 HQ 1500 185 357 -52 268.26 269.34 1.08 6.34 and 273.52 277.59 4.07 1.02
0420-738 5,581,350.12 434,816.25 348.97 390.04 HQ 2350 -85 357 -55 255.70 259.81 4.11 1.52 and 324.38 337.25 12.87 0.94 and 343.72 347.20 3.48 0.96
0420-739 5,581,593.92 434,013.79 351.84 291.03 HQ 1550 190 357 -52 55.70 57.70 2.00 0.90 and 91.40 92.40 1.00 1.13 and 259.46 264.52 5.06 2.27
0420-740 5,581,513.15 434,365.78 352.56 300.00 HQ 1900 100 357 -45 141.54 146.68 5.14 0.70 and 239.00 251.83 12.83 0.85
0420-741 5,581,312.61 434,863.02 348.53 423.00 HQ 2400 -123 357 -57 282.93 284.91 1.98 1.36

Landore Resources Canada Inc. MINERAL RESOURCE ESTIMATE AND PRELIMINARY ECONOMIC ASSESSMENT, BAM Gold Project, Junior Lake Property, Ontario, Canada
Landore Resources Canada Inc. Page | 110
Hole ID utm z16_n83
easting utm z16_n83
northing Elevation
(m) Hole Depth
(m) Hole Size
Local grid easting
Local grid northing
Plan Azi
Plan Dip
Depth From (m)
Depth To (m)
Interval Length (m)
Grade (g/t Au)
and 360.32 362.19 1.87 1.55 and 375.72 383.81 8.09 0.70
0420-742 5,581,680.48 434,056.98 351.58 222.00 HQ 1600 280 357 -67 148.74 149.51 0.77 3.10 and 169.60 170.66 1.06 2.17 and 182.69 183.67 0.98 0.97
0420-743 5,581,756.51 434,008.47 355.47 105.00 HQ 1550 360 357 -45 34.35 35.30 0.95 1.37 and 39.06 42.60 3.54 1.37 and 55.22 56.20 0.98 6.04
0420-744 5,581,757.43 434,160.25 356.09 105.00 HQ 1700 350 357 -45 36.73 37.72 0.99 1.08 and 40.84 41.88 1.04 2.02
0420-745 5,581,727.81 434,161.60 354.15 117.00 HQ 1700 320 357 -45 70.46 71.25 0.79 1.09
0420-746 5,581,337.82 434,915.37 349.56 386.94 HQ 2450 -90 357 -55 216.95 219.00 2.05 0.68 and 224.00 225.00 1.00 1.16 and 228.00 232.00 4.00 0.57 and 253.42 265.75 12.33 0.66 and 327.88 334.72 6.84 0.67
0420-747 5,581,673.86 434,260.26 351.77 159.02 HQ 1800 260 357 -55 117.58 119.16 1.58 1.20 and 131.41 135.12 3.71 1.88
0420-748 5,581,694.60 434,257.68 352.32 120.00 HQ 1800 280 357 -45 85.41 86.38 0.97 0.77
0420-749 5,581,678.40 434,362.43 351.91 108.00 HQ 1900 260 357 -45 86.15 87.15 1.00 0.73
0420-750 5,581,401.98 434,616.95 359.39 336.04 HQ 2150 -25 357 -45 292.26 293.26 1.00 1.04 and 307.63 309.54 1.91 0.70 and 320.00 321.02 1.02 1.41
0420-751 5,581,728.86 434,359.71 354.30 102.04 HQ 1900 310 357 -45 35.83 36.81 0.98 1.73
0420-752 5,581,672.62 433,459.98 356.13 297.00 HQ 1000 295 357 -45 236.85 238.22 3.07 4.02 and 237.75 239.14 1.75 5.01 and 247.08 250.12 3.04 0.87 and 255.86 257.69 5.11 1.93
0421-753 5,581,380.66 434,717.20 350.48 329.98 HQ 2250 -50 357 -45 257.00 259.00 2.00 1.59
0421-754 5,581,755.26 433,345.22 355.84 207.00 HQ 900 385 357 -45 166.82 175.42 2.91 0.59
0421-755 5,581,674.11 433,407.47 353.65 303.00 HQ 950 300 357 -45 118.15 123.45 5.30 1.13 and 237.25 238.05 0.80 1.60 and 256.80 261.00 4.20 1.69
0421-756 5,581,197.48 436,548.32 342.36 198.03 HQ 4100 -300 357 -45 NSI
0421-757 5,581,766.33 433,259.20 349.83 222.11 HQ 800 400 357 -45 163.50 165.54 2.04 2.16 and 188.50 189.50 1.00 8.14

Landore Resources Canada Inc. MINERAL RESOURCE ESTIMATE AND PRELIMINARY ECONOMIC ASSESSMENT, BAM Gold Project, Junior Lake Property, Ontario, Canada
Landore Resources Canada Inc. Page | 111
Hole ID utm z16_n83
easting utm z16_n83
northing Elevation
(m) Hole Depth
(m) Hole Size
Local grid easting
Local grid northing
Plan Azi
Plan Dip
Depth From (m)
Depth To (m)
Interval Length (m)
Grade (g/t Au)
0421-758 5,581,098.13 436,551.00 340.86 282.10 HQ 4100 -400 357 -45 NSI
0421-759 5,581,770.79 433,159.88 348.34 279.00 HQ 700 410 357 -45 193.27 194.33 1.06 0.51
0421-760 5,581,205.15 436,448.95 340.68 189.01 HQ 4100 -290 357 -45 NSI
0421-761 5,582,052.74 433,150.13 359.56 219.00 HQ 700 690 357 -45 NSI
0421-762 5,581,106.80 436,452.69 339.67 258.00 HQ 4000 -390 357 -45 NSI
0421-763 5,581,777.02 433,054.68 347.47 279.00 HQ 600 420 357 -45 127.91 128.96 1.05 3.23 and 237.05 239.38 2.33 0.79
0421-764 5,581,215.23 436,349.83 340.14 150.02 HQ 3900 -280 357 -45 13.31 14.29 0.98 0.82
0421-765 5,581,115.01 436,354.67 339.15 264.09 HQ 3900 -380 357 -45 116.04 118.35 2.31 1.27
0421-766 5,581,824.14 432,855.62 343.82 255.16 HQ 400 475 357 -45 106.10 106.87 0.77 1.64 and 214.20 217.94 3.74 0.67
0421-767 5,581,229.06 436,254.41 346.00 189.03 HQ 3800 -260 357 -45 NSI
0421-768 5,581,802.14 432,464.20 337.77 387.07 HQ 0 470 357 -45 346.15 348.35 2.20 2.51
0421-769 5,581,264.38 436,347.96 340.79 102.00 HQ 3900 -230 357 -45 NSI
0421-770 5,581,390.20 436,244.30 342.94 123.11 HQ 3800 -100 177 -45 NSI
0421-771 5,581,838.17 432,561.32 338.83 309.03 HQ 100 500 357 -45 266.13 267.11 0.98 0.74
0421-772 5,581,312.19 436,148.66 348.18 201.06 HQ 3700 -170 357 -45 NSI
0421-773 5,581,228.16 436,151.38 341.56 108.03 HQ 3700 -260 357 -45 16.00 17.60 1.60 1.20
0421-774 5,581,830.67 432,665.55 339.91 288.03 HQ 200 490 357 -45 238.14 239.20 1.06 0.62
0421-775 5,581,224.22 436,068.05 347.26 122.94 HQ 3600 -260 357 -45 38.15 45.15 7.00 1.72 and 71.62 78.00 6.38 0.73
0421-776 5,581,120.56 436,074.87 341.19 309.06 HQ 3600 -360 357 -45 166.62 167.62 1.00 1.38 and 177.00 178.00 1.00 2.04 and 220.90 221.90 1.00 4.20
0421-777 5,581,156.87 435,970.97 344.10 276.00 HQ 3500 -325 357 -45 155.90 157.90 2.00 0.84 and 185.00 188.00 3.00 0.81 and 204.05 205.05 1.00 1.58
0421-778 5,581,228.61 435,868.57 345.93 195.00 HQ 3400 -250 357 -45 NSI
0421-779 5,581,219.15 435,768.23 346.16 252.00 HQ 3300 -250 357 -45 34.58 35.68 1.10 0.85 and 145.80 146.80 1.00 0.90
0421-780 5,581,208.96 435,667.35 346.89 291.01 HQ 3200 -260 357 -45 190.90 195.60 4.70 0.48
0421-781 5,581,353.56 435,464.90 349.84 102.00 HQ 3000 -105 357 -45 84.58 85.60 1.02 1.46 and 89.60 90.60 1.00 1.85
0421-782 5,581,312.78 435,565.98 347.94 177.00 HQ 3100 -150 357 -45 54.90 55.90 1.00 0.65
0421-783 5,581,257.32 435,469.56 347.88 243.01 HQ 3000 -200 357 -45 226.90 227.74 0.84 7.34
0421-784 5,581,309.38 435,417.80 347.95 207.02 HQ 2950 -150 357 -45 92.64 94.45 1.81 1.65

Landore Resources Canada Inc. MINERAL RESOURCE ESTIMATE AND PRELIMINARY ECONOMIC ASSESSMENT, BAM Gold Project, Junior Lake Property, Ontario, Canada
Landore Resources Canada Inc. Page | 112
Hole ID utm z16_n83
easting utm z16_n83
northing Elevation
(m) Hole Depth
(m) Hole Size
Local grid easting
Local grid northing
Plan Azi
Plan Dip
Depth From (m)
Depth To (m)
Interval Length (m)
Grade (g/t Au)
and 183.76 185.74 1.98 2.06
0421-785 5,581,329.63 435,317.21 348.85 201.02 HQ 2850 -125 357 -45 88.92 93.50 4.58 0.43 and 179.00 184.70 5.70 0.36 and 191.82 192.85 1.35 113.35
0421-786 5,581,377.17 435,262.97 351.65 195.00 HQ 2800 -75 357 -45 36.58 37.59 1.01 1.47 and 60.00 61.00 1.00 2.94 and 71.00 80.14 9.14 1.75 and 112.18 113.21 1.03 2.29 and 163.72 170.89 7.17 0.92
0421-787 5,581,427.16 435,260.41 351.60 165.00 HQ 2800 -25 357 -45 17.01 17.59 0.58 2.28 and 20.65 21.77 1.12 1.13 and 31.33 32.30 0.97 1.03 and 45.05 47.76 2.71 0.94 and 53.38 54.00 0.62 2.92 and 71.05 75.22 4.17 1.32 and 126.20 129.27 3.07 0.52
0421-788 5,581,401.20 435,218.06 351.28 185.00 HQ 2750 -50 357 -45 59.89 60.86 0.97 2.17 and 79.00 81.00 2.00 1.39 and 87.00 89.53 2.53 1.10 and 98.01 99.08 1.07 2.46 and 109.00 111.55 2.55 1.00
0421-789 5,581,348.49 435,161.51 351.02 303.00 HQ 2700 -100 357 -45 126.00 147.84 21.84 2.57 and 133.74 135.00 1.00 6.68 and 134.25 136.00 1.00 5.50 and 135.00 137.00 0.51 9.70 and 149.00 162.26 20.61 0.66 and 219.00 226.53 4.80 1.58
0421-790 5,581,348.10 435,118.97 350.59 306.00 HQ 2650 -100 357 -45 64.56 66.50 1.94 0.87 and 132.17 134.26 2.09 1.06 and 140.50 141.54 1.04 1.13 and 146.74 147.78 1.04 1.39 and 152.79 154.72 1.93 0.67 and 168.91 174.96 6.05 0.53 and 178.86 179.84 0.98 1.55 and 181.61 184.96 3.35 1.98 and 224.45 225.46 1.01 2.97

Landore Resources Canada Inc. MINERAL RESOURCE ESTIMATE AND PRELIMINARY ECONOMIC ASSESSMENT, BAM Gold Project, Junior Lake Property, Ontario, Canada
Landore Resources Canada Inc. Page | 113
Hole ID utm z16_n83
easting utm z16_n83
northing Elevation
(m) Hole Depth
(m) Hole Size
Local grid easting
Local grid northing
Plan Azi
Plan Dip
Depth From (m)
Depth To (m)
Interval Length (m)
Grade (g/t Au)
0421-791 5,581,875.64 432,363.14 337.34 294.00 HQ -100 550 357 -45 244.40 245.53 1.13 3.66
0421-792 5,581,871.47 432,255.23 337.56 333.09 HQ -200 550 357 -45 NSI
0421-793 5,581,353.92 435,317.15 350.70 200.96 HQ 2850 -100 357 -45 83.77 85.81 10.12 1.28 and 84.78 86.84 1.01 5.57 and 87.84 94.02 4.12 0.69 and 101.25 109.59 8.34 0.56 and 149.86 153.12 5.66 0.90 and 156.59 159.85 3.26 6.31 and 159.05 160.85 0.61 29.40
0421-794 5,581,302.94 435,317.38 349.12 257.98 HQ 2850 -150 357 -45 108.98 112.54 2.59 0.55 and 127.33 130.79 0.86 1.12 and 198.27 202.00 9.25 1.02 and 207.03 209.82 0.49 3.73
0421-795 5,581,322.44 435,265.78 350.76 240.00 HQ 2800 -125 357 -45 112.70 120.68 7.98 0.91 and 190.86 193.78 2.92 0.73 and 201.10 202.13 1.03 2.38
0421-796 5,581,342.49 435,295.61 350.74 222.00 HQ 2825 -110 357 -45 95.32 99.44 15.38 0.97 and 119.66 122.98 4.10 0.56 and 168.51 171.40 2.14 1.14
0421-797 5,581,315.16 435,345.09 348.92 245.86 HQ 2875 -140 357 -45 88.00 90.53 2.53 1.66 and 95.72 96.78 1.06 1.07 and 99.93 104.08 4.15 1.23 and 110.85 114.53 3.68 0.65 and 179.36 180.30 0.94 1.32 and 183.72 188.64 4.92 2.14
0421-798 5,581,195.94 436,136.45 342.98 155.89 HQ 3700 -310 357 -47 75.83 82.92 7.09 1.13 and 97.30 99.30 2.00 1.02
0421-799 5,581,171.84 436,071.13 347.07 207.00 HQ 3600 -310 357 -45 192.81 193.85 1.04 0.67
0421-800 5,581,071.09 436,077.83 343.23 308.96 HQ 3600 -410 357 -45 269.41 270.24 0.83 3.20
0421-801 5,581,108.21 435,973.43 345.25 291.00 HQ 3500 -375 357 -45 217.80 218.82 1.02 1.43 and 236.14 240.20 4.06 1.04 and 258.00 260.79 2.79 0.68
0421-802 5,581,179.18 435,870.81 346.34 257.99 HQ 3400 -305 357 -45 193.92 195.98 2.06 0.58
0421-803 5,581,278.59 435,866.22 347.02 117.02 HQ 3400 -205 357 -45 15.91 16.91 1.00 1.01
0421-804 5,581,319.58 435,763.01 347.56 99.03 HQ 3300 -150 357 -45 85.20 86.20 1.00 2.56
0421-805 5,581,265.42 435,766.28 347.01 170.93 HQ 3300 -200 357 -45 81.00 82.00 1.00 1.14

Landore Resources Canada Inc. MINERAL RESOURCE ESTIMATE AND PRELIMINARY ECONOMIC ASSESSMENT, BAM Gold Project, Junior Lake Property, Ontario, Canada
Landore Resources Canada Inc. Page | 114
Hole ID utm z16_n83
easting utm z16_n83
northing Elevation
(m) Hole Depth
(m) Hole Size
Local grid easting
Local grid northing
Plan Azi
Plan Dip
Depth From (m)
Depth To (m)
Interval Length (m)
Grade (g/t Au)
and 93.00 94.00 1.00 1.16 and 102.50 105.50 3.00 0.95 and 161.00 162.03 1.03 1.95
0421-806 5,581,363.67 435,564.06 348.95 159.00 HQ 3100 -100 357 -45 53.10 55.12 2.02 2.50 and 104.35 105.00 0.65 2.53
0421-807 5,581,265.16 435,568.71 347.63 239.96 HQ 3100 -200 357 -45 89.15 90.15 1.00 0.96
0421-808 5,581,351.28 435,220.55 351.61 243.00 HQ 2750 -100 357 -45 103.65 108.70 5.05 0.69 and 111.70 117.70 6.00 0.79 and 127.80 129.80 2.00 0.75 and 193.73 199.90 6.17 1.45
0421-809 5,581,298.20 435,162.67 350.72 300.18 HQ 2700 -150 357 -45 156.30 160.30 6.00 2.15 and 159.30 161.30 1.00 11.35 and 179.30 183.30 15.00 2.48 and 182.30 184.30 2.00 12.88 and 194.55 198.55 9.15 1.52 and 197.55 199.55 1.00 10.75 and 249.70 253.20 1.69 2.15
0421-810 5,581,343.66 435,070.80 350.34 330.05 HQ 2600 -100 357 -46 161.74 164.84 3.10 0.57 and 180.26 181.29 1.03 2.93 and 195.19 203.86 8.67 1.02 and 254.58 255.64 1.06 0.97
0421-811 5,581,382.02 435,018.39 351.00 287.93 HQ 2550 -60 357 -57 138.80 140.13 1.33 1.92 and 175.63 179.59 3.96 2.87 and 200.51 203.17 2.66 0.96 and 232.95 235.96 3.01 1.06 and 238.11 243.62 5.51 0.89 and 280.50 281.56 1.06 8.80
0421-812 5,581,377.99 434,913.48 350.03 282.00 HQ 2450 -55 357 -57 238.28 240.33 2.05 1.23
0421-813 5,581,719.93 433,261.29 350.04 275.81 HQ 800 350 357 -45 38.36 40.37 2.01 0.75 and 220.80 228.90 8.10 1.73 and 232.91 241.35 8.44 0.95 and 251.62 252.62 1.00 3.30
0421-814 5,581,707.58 433,348.64 353.18 266.81 HQ 900 335 357 -45 235.80 239.57 17.45 4.13 and 238.72 240.48 1.02 7.93 and 239.57 241.39 1.02 47.20
0421-815 5,581,733.97 433,402.49 358.27 239.76 HQ 950 350 357 -45 160.52 162.28 1.76 4.25

Landore Resources Canada Inc. MINERAL RESOURCE ESTIMATE AND PRELIMINARY ECONOMIC ASSESSMENT, BAM Gold Project, Junior Lake Property, Ontario, Canada
Landore Resources Canada Inc. Page | 115
Hole ID utm z16_n83
easting utm z16_n83
northing Elevation
(m) Hole Depth
(m) Hole Size
Local grid easting
Local grid northing
Plan Azi
Plan Dip
Depth From (m)
Depth To (m)
Interval Length (m)
Grade (g/t Au)
and 170.77 178.12 7.35 0.84 and 187.60 189.89 2.29 0.83
0421-816 5,581,664.55 433,460.38 355.65 347.50 HQ 1000 290 357 -52 237.00 240.84 1.92 1.78 and 288.80 292.73 8.69 1.58 and 291.71 293.69 2.78 4.24
0421-817 5,581,607.74 434,013.32 351.64 132.00 HQ 1550 205 357 -44 50.22 51.24 1.02 1.16 and 66.21 68.57 2.36 1.67
0421-818 5,581,580.33 434,011.41 354.18 149.88 HQ 1550 175 357 -60 NSI
0421-819 5,581,660.83 433,351.29 352.19 333.00 HQ 900 285 357 -45 271.75 275.18 1.50 3.46 and 286.72 290.37 3.05 1.08
0421-820 5,581,668.80 433,261.97 350.80 341.98 HQ 300 800 357 -45 148.08 149.91 1.83 9.25 and 212.41 213.43 1.02 1.14 and 282.78 283.88 1.10 1.02 and 315.69 316.69 1.00 1.12
0421-821 5,581,667.52 433,509.44 355.98 354.05 HQ 291 1050 357 -54 90.47 91.55 1.08 1.44
0421-822 5,581,709.38 433,057.31 347.71 362.95 HQ 350 600 357 -45 144.49 145.46 0.97 7.47 and 150.56 151.58 1.02 14.40 and 176.19 177.22 1.03 2.15 and 211.79 212.78 0.99 1.75 and 328.39 329.45 1.06 2.51
0421-823 5,581,709.86 433,311.22 352.20 288.21 HQ 340 850 357 -45 15.59 19.55 3.96 0.93 and 38.48 53.11 6.15 0.43 and 231.72 240.97 9.25 4.04
0421-824 5,581,770.79 433,309.78 352.71 198.12 HQ 400 850 357 -45 132.19 133.20 1.01 2.29
0421-825 5,581,764.77 433,212.12 350.00 229.20 HQ 400 750 357 -45 202.74 206.28 3.54 0.88
0421-826 5,581,695.26 433,213.55 350.00 321.02 HQ 330 750 357 -45 163.45 164.45 1.00 1.18 and 255.30 256.30 1.00 2.76 and 274.30 275.16 0.86 9.81 and 292.27 293.27 1.00 1.76

Landore Resources Canada Inc. MINERAL RESOURCE ESTIMATE AND PRELIMINARY ECONOMIC ASSESSMENT, BAM Gold Project, Junior Lake Property, Ontario, Canada
Landore Resources Canada Inc. Page | 116
10.8. Principal Authors Statement
In summary, the drilling and sampling practises used are adequate for and consistent with the
Principal Author’s understanding of the style of gold mineralization targeted by Landore for the BAM
Gold Project.
In relation to sample (core) quality, the core recovery analysis has shown that the core recovery is
very good for the majority of the diamond drill holes where core recovery has been recorded since
2015 for the BAM Gold Project. Based on the site visit inspections of core conducted in 2018 and
review of core photos from 2019 to 2021, there is no evidence to suggest the small number of poor
core recovery intervals would impact significantly on the resource grade estimates.

Landore Resources Canada Inc. MINERAL RESOURCE ESTIMATE AND PRELIMINARY ECONOMIC ASSESSMENT, BAM Gold Project, Junior Lake Property, Ontario, Canada
Landore Resources Canada Inc. Page | 117
11. Sample Preparation, Analyses, and Security
11.1. Summary of Laboratories
From 2012, Landore has utilized ALS Chemex in Vancouver (ALS) as its primary laboratory, and
Accurassay Laboratories in Thunder Bay (Accurassay), and Activation Laboratories (Actlabs)
analytical facilities located in Ancaster as the secondary laboratories.
ALS is an independent, commercial mineral laboratory accredited by the Standards Council of
Canada (SCC) under ISO/IEC 17025 guidelines for Au, PGE, Cu, Ni, and Co analysis by AA. Each ALS
laboratory has a Quality Management System (QMS) to ensure the production of consistently
reliable data, and ensures that standard operating procedures are in place, and are being followed.
The QMS is monitored by global and regional Quality Control teams. ALS participates in a number of
proficiency tests, such as those managed by Geostats and CANMET.
Accurassay is an independent, commercial mineral laboratory accredited by the SCC under ISO/IEC
17025 guidelines for PGE, Ni, Cu, and Co analysis by atomic absorption spectroscopy (AA). The
laboratory undergoes proficiency testing PTP-MAL through the SCC and participates in round robin
testing through the Society of Mineral Analysts (SMA).
All laboratories are independent of Landore.
11.2. Sample Preparation and Analysis
11.2.1. ALS Chemex – Sample Preparation and Analysis
Sample Preparation
The sample preparation procedures used by ALS were as follows:
1. The rock samples were first entered into the ALS Local Information System (LIMS), then bar-
coded and weighed.
2. The samples were dried, riffled split, and then pulverized to better than 70% -2 mm.
3. Silica sand was used to clean out the pulverizing dishes between each sample to prevent
cross contamination.
4. The homogeneous sample then received final preparation and was analysed as per the
required methods. It is not recorded whether the laboratory carries out homogeneity checks
(grind size checks).
5. Assay results were checked by the laboratory manager before the hard copy was sent in the
mail, and/or emailed to Landore.
The nature, quality and appropriateness of the sample preparation protocols is considered
appropriate for grain sizes of the material expected and is consistent with industry standard
practice.

Landore Resources Canada Inc. MINERAL RESOURCE ESTIMATE AND PRELIMINARY ECONOMIC ASSESSMENT, BAM Gold Project, Junior Lake Property, Ontario, Canada
Landore Resources Canada Inc. Page | 118
Analysis
ALS has been Landore’s primary independent laboratory since 2012. The majority of drill core
samples from all diamond drilling consisted of Au analyses by “ore” grade fire assay with AA finish
(50 g) (ALS analysis code Au-AA26). This analytical method is accredited under ISO/IEC 17025.
Samples which exceed analysis Au-AA26’s limit of 100 g/t Au are re-analysed using fire assay with
gravimetric finish (50 g) (ALS analysis code Au-GRA22).
Drill holes 0415-517, 0415-518, and 0415-519 to 0415-523 were analysed for Au, Pt, and Pd using
fire assay with ICP-AES finish (ALS analysis code PGM-ICP23).
All drill core samples from 2015 to 2018 drilling campaigns were analysed for a multi-element (35)
suite by ICP (ALS analysis code ME-ICP41). Detection limits for the principal metals are listed in Table
11-1. Analysis descriptions from ALS are recorded in Appendix 3.
Table 11-1: ALS - Detection Limits for Principal Metals (ALS, 2019)
Element Detection
Limit
Au 5 ppb
Ag 1 ppm
Co 1 ppm
Cu 1 ppm
Ni 1 ppm
Pb 1 ppm
Pd 10 ppb
Pt 15 ppb
Zn 1 ppm
11.2.2. Accurassay – Sample Preparation and Analysis
Accurassay has been utilized by Landore as a secondary laboratory since 2012. As such, Landore
submits duplicates pulp repeats and pulps reject samples derived from its drilling programs for
QAQC analysis to Accurassay.
For the 2015 and 2016 drill programs, pulp and reject testing at Accurassay consisted of Au analyses
by ore grade fire assay with AA finish (50 g), Accurassay analysis code ALFA2. This analytical method
is accredited under ISO/IEC 17025. Samples which exceed analysis ALFA2’s limit of 10 g/t Au are re-
analyzed using fire assay with gravimetric finish (50 g), Accurassay analysis code ALFA7.
The sample preparation and assay/analytical procedures used by Accurassay were as follows:
• Core sample numbers were entered into LIMS.
• Samples were dried, if necessary.
• Samples were jaw crushed to minus eight mesh (2.36 mm).
• A 250 g to 400 g cut was taken by riffle splitting, with the balance stored as coarse reject.
• The above split was ground to 90% passing -150 mesh (106 μm) in a TM plate pulverizer, and
then matted to ensure homogeneity. Silica sand was used to clean out the pulverizing dishes
between each sample to prevent cross-contamination. The homogeneous sample was then

Landore Resources Canada Inc. MINERAL RESOURCE ESTIMATE AND PRELIMINARY ECONOMIC ASSESSMENT, BAM Gold Project, Junior Lake Property, Ontario, Canada
Landore Resources Canada Inc. Page | 119
sent to the fire assay laboratory or the wet chemistry laboratory depending on the analysis
required.
• For precious metals assays for samples from the BAM East Gold Deposit, a 50 g pulp split
(prior to 2015, 30 g pulp split) was mixed with a lead-based flux and fused in a muffle oven
for one hour and fifteen minutes. The charge mass was adjusted, where necessary, to
accommodate high sulphide content. Each sample had a silver solution added to it prior to
fusion which allows it to produce a precious metal bead after cupellation. The resulting lead
button was placed in a cupelling furnace where all of the lead was absorbed by the cupel,
while a silver bead, which contained any gold, platinum and palladium, was left in the cupel.
Once the cupel had been removed from the furnace and cooled, the silver bead was placed
in a labelled small test tube and digested using a 1:3 ratio of nitric acid to hydrochloric acid.
The samples were bulked up with 1.0 mL of distilled de-ionized water and 1.0 mL of 1%
digested lanthanum solution for a total volume of 3.0 mL. The solution was cooled and
vortexed, and then allowed to settle. Analysis for gold, platinum, and palladium was then
done using AA. The AA unit was calibrated for each element using the appropriate ISO 9002
certified standards in an air-acetylene flame.
• Sample pulps for base metal (copper, nickel, cobalt, lead, zinc) and silver geochemical
analysis were weighed and digested using an aqua regia (HNO3, HCl) or multi-acid (HNO3,
HF, HCl) digest. The samples were bulked up with 2.0 mL of hydrochloric acid and brought to
a final volume of 10.0 mL with distilled de-ionized water. The samples were vortexed (mixed)
and allowed to settle and then analyzed for copper, nickel, and cobalt using AA. The AA unit
was calibrated for each element using the appropriate ISO 9002 certified standards in an air-
acetylene flame.
• The results for the AA analysis were checked by the technician and forwarded for data entry
by electronic transfer, and a certificate was produced. The laboratory manager checked the
data and validated them if they were error-free. The results were then forwarded to Landore
by email, with hardcopy sent by mail.
The multi-element analysis was carried out by aqua regia digestion of a pulp split and analysis by
inductively coupled plasma (ICP) atomic emission spectroscopy finish.
11.2.3. Actlabs – Sample Preparation and Analysis
Actlabs has been utilized by Landore as an alternate secondary laboratory for independent sampling
check assaying (RPA, 2018), and for pulp duplicate sampling (2017 and 2018). As with the Accurassay
laboratory, Landore submits duplicates pulp repeats and pulps reject samples derived from its
drilling programs for QAQC analysis to Actlabs.
For the 2017 and 2018 drill programs, the sample pulps that were sent to Actlabs were analysed for
gold using Actlabs’ Code 1A3-50 Fire Assay, gravimetric finish package using a 50 g aliquot. This
analytical method is accredited under ISO/IEC 17025.
The sample preparation and assay/analytical procedures used by Actlabs were as follows:
• Core sample numbers were entered into LIMS.
• Samples were dried, if necessary.

Landore Resources Canada Inc. MINERAL RESOURCE ESTIMATE AND PRELIMINARY ECONOMIC ASSESSMENT, BAM Gold Project, Junior Lake Property, Ontario, Canada
Landore Resources Canada Inc. Page | 120
• Samples were jaw crushed to a nominal 2 mm, mechanically (riffle) split to obtain a
representative sample (250 g). The balance was stored as coarse reject for 60 days from the
date of the final report.
• The representative sample was then pulverized to at least 95% -105 μm. Quality of crushing
and pulverization was routinely checked as part of Actlabs quality assurance program.
• Cleaner sand was used to clean out the pulverizing dishes between each sample to prevent
cross-contamination.
• The homogeneous sample was then sent to the fire assay laboratory or the wet chemistry
laboratory depending on the analysis required.
• For all samples, gold was analysed using Actlabs’ Code 1A3-50 Fire Assay, gravimetric finish
package using a 50 g aliquot (range 0.02 ppm Au to 10.0 ppm Au).
• Samples analyzed for gold, which exceed analysis Code1A3-50 limit of 10 g/t Au can be re-
analyzed by Code 1C (Exploration or Research). This method involves Fire Assay and analysis
by inductively coupled plasma with Mass Spectrometry (ICP-MS).
Actlabs uses the online LIMS system, allowing Landore to track samples from sample job numbers
from reception through to preparation, analysis and reporting. The results were forwarded to
Landore by email.
11.3. Quality Assurance and Quality Control Procedures
QAQC protocol was for sample blanks and standards (or certified reference material (CRM)) to be
inserted into the sample stream at regular intervals and sent for analysis at the primary laboratory
(ALS Chemex). Systematic check analyses on pulps were completed by ALS, Accurassay or Actlabs).
Current Landore quality control procedures for gold analyses include the following:
• Tracking to avoid sample swapping or other preparation errors; the rock samples are
entered into LIMS, then bar-coded.
• All samples are weighed.
• Insertion of a gold CRM following every 20th drill core sample.
• Insertion of a blank sample following each base element CRM.
• There has been no RC or other drill chip sampling completed, so there are no field
duplicates. No second half or quarter core samples are known to have been taken to date.
• For the 2019 program, approximately three percent of the pulp and reject samples were
check assayed at the secondary laboratory (Accurassay) or, Ontario. For Actlabs pulps, gold
content was determined using Actlabs Code 1A3-50 Fire Assay, gravimetric finish package
using a 50 g aliquot.
• Screen metallics gold analysis - this analytical method consists of passing the pulp sample
through a (-) 100 µm screen and analyzing the resultant sample portions using fire assay
with AA finish (ALS analytical code Au-AA26). Landore re-submitted a total of 596 pulp
samples and pulp reject samples derived from the diamond drill core drilled from 2015 to
2018 to ALS for screen metallic gold analysis (analysis code Au-SCR24) to check
reproducibility of gold assays for (ALS), and for check assaying of the primary lab results by

Landore Resources Canada Inc. MINERAL RESOURCE ESTIMATE AND PRELIMINARY ECONOMIC ASSESSMENT, BAM Gold Project, Junior Lake Property, Ontario, Canada
Landore Resources Canada Inc. Page | 121
an umpire laboratory (Accurassay). A further 120 samples were re-submitted for screen
metallic gold analysis from screen entire pulps from drill hole sampling carried out 2019.
For the 2020-2021 drilling programs, Landore has used an assortment of CRMs at various gold
grades that have been purchased from Geostats Pty Ltd, Fremantle, Australia (Table 11-2).
Landore used silica sand, commercially available from mineral laboratories, for blank samples.
Table 11-2: CRMs For Used by Landore – 2020-2021 Drilling (Landore Database, as at 14 January 2022)
CRM ID
Fire Assay Aqua Regia Assay
Description Expected Value
(Au ppm) SD
Confidence Interval
(+/-)
Expected Value
(Au ppm) SD
Confidence Interval
(+/-)
G310-2 0.20 0.01 0.003 0.20 0.03 0.01 Milled waste low sulphide
G315-1 5.64 0.25 0.037 5.38 0.35 0.089 Low Sulphide ore ex Eastern Goldfields
G315-8 9.93 0.32 0.048 9.83 0.44 0.114 High Grade gold ore.
G320-10 0.65 0.03 0.005 0.66 0.05 0.014 Cut off samples milled.
G398-4 0.66 0.05 0.007 0.64 0.07 0.013 Cu/Au ore Mineralized sulphidic waste. Basaltic.
G905-1 1.16 0.05 0.012 1.14 0.09 0.03 Composite of free milling ores. Low Sulphide
G907-5 1.34 0.07 0.009 1.31 0.09 0.02 Run of mine low grade ore
G908-4 0.96 0.05 0.009 0.93 0.06 0.02 Composite low sulphide ore.
G912-3 2.09 0.08 0.013 2.10 0.12 0.027 Low Sulphide ore minor Cu ex Eastern Goldfields
G913-9 4.91 0.17 0.025 4.88 0.21 0.048 Low sulphide mine ore
G913-10 7.09 0.25 0.037 7.10 0.33 0.075 Low sulphide mine ore.
G913-4 1.37 0.04 0.007 1.35 0.08 0.017 Oxide ore.
G914-6 3.21 0.12 0.017 3.16 0.17 0.045 High Grade low sulphide ore
G914-10 10.26 0.38 0.057 10.17 0.56 0.147 High Grade low sulphide ore
G915-4 9.16 0.35 0.053 9.00 0.36 0.1 High grade gold Cu Pb Zn ore
Prior to 2008, Accurassay employed an internal quality control system that tracked CRM and in-
house quality assurance standards. This practice was discontinued in 2008, after which Landore
introduced its own QAQC protocols in which Landore staff selected five percent of the samples and
sent rejects and pulps together with QAQC control samples to the outside laboratory for check
analyses.
Landore’s approach to reviewing results of CRM analyses is illustrated in Figure 11-1. Landore carries
out its analysis of the results of the CRM and blank sample material by means of a comparative table
using pass-fail criteria.
A review of the QAQC results for standards and blanks, duplicates, and screen metallics repeat
sampling is reported in Section 12.4, as part of independent data verification.

Landore Resources Canada Inc. MINERAL RESOURCE ESTIMATE AND PRELIMINARY ECONOMIC ASSESSMENT, BAM Gold Project, Junior Lake Property, Ontario, Canada
Landore Resources Canada Inc. Page | 122
Figure 11-1 Landore CRM Analysis Review Flow Chart (Landore, 2018)
If one or more CRM test outside 3 SD of certified standard value (on Au value).
Pull 2 samples above and 2 samples below the bad CRM. Insert new CRM and new Blank.
If samples are currently in laboratory custody, dispatch the new control samples and new analytical request form to the lab.
If samples are in Landore custody (i.e. chain of custody is broken), re-number the samples before dispatching them to the lab.
If a new CRM is good and re-assayed samples are within +/-5% of original results:
Insert new CRM results into the original assay table, take bad sample out (i.e. input into separate ‘bad assays’ table).
Insert re-assays into ‘re-assays’ table. If samples are currently in laboratory custody, dispatch the new control samples and new analytical request form to the lab.
If samples are in Landore custody (i.e. chain of
custody is broken), re-number the samples
before dispatching them to the lab.
If a new CRM is good and re-assayed samples are NOT within +/-5% of original results:
Pull all samples from the original assay job. Insert new control samples.

Landore Resources Canada Inc. MINERAL RESOURCE ESTIMATE AND PRELIMINARY ECONOMIC ASSESSMENT, BAM Gold Project, Junior Lake Property, Ontario, Canada
Landore Resources Canada Inc. Page | 123
11.4. Sample Security
Drilling and sampling are carried out in a remote, sparsely populated region. The project site is
255 km along a mostly unsealed road to the east of Armstrong, so any unauthorized access is
difficult.
All core sample bags are sealed with plastic sequentially numbered security tags and three to five of
these sample bags are placed in larger rice bags, also sealed with a numbered security tag. All
security tag numbers are recorded prior to shipping and checked upon delivery at the lab (Figure
11-2).
Half core samples are secured in the logging/sampling building at the Junior Lake exploration camp
on site. The samples are then transported directly from the site to the ALS, Accurassay or Actlabs
laboratories by Landore personnel. Samples were submitted in batches of 50, soon after they are
collected. Chain of custody is supported by the Landore site staff sample logbook and sample reports
from the laboratories.
Landore have not recorded any instances of samples being lost and the risk of sample tampering is
low.
Figure 11-2: Sample Preparation at Junior Lake Exploration Offices (Cube Site Visit, June 2018)

Landore Resources Canada Inc. MINERAL RESOURCE ESTIMATE AND PRELIMINARY ECONOMIC ASSESSMENT, BAM Gold Project, Junior Lake Property, Ontario, Canada
Landore Resources Canada Inc. Page | 124
11.5. Primary Data Storage
For geological and geotechnical logging, all analytical results and quality control reports from all
drilling completed to date are stored digitally within the drilling database, controlled and maintained
by Landore personnel at the Landore offices in Thunder Bay. Hard copies of the more recent drilling
data, including logging, drill plods, mapping, downhole surveys and reports are kept at the Junior
Lake exploration camp site office. All documentation relating to drilling and sampling is collated and
validated either on site or at the Landore offices in Thunder Bay.
Diamond drill core storage facilities are adequate, with core stored in covered core racks at
Landore’s Junior Lake camp (Figure 11-3).
Landore logging and sampling information is recorded in Microsoft Word and Access software,
respectively. Through 2007, the Word and Access files were edited and converted into .txt and .csv
files for import into MapInfo GIS software for plan map and cross section generation, as well as
Borsurv logging software for drill log generation and supplementary cross section plotting. Borsurv
software was not used after 2007. MapInfo has been the primary drafting software utilized since
2007.
Figure 11-3: Core Storage Facility at Junior Lake Exploration Offices (Cube Site Visit, June 2018)

Landore Resources Canada Inc. MINERAL RESOURCE ESTIMATE AND PRELIMINARY ECONOMIC ASSESSMENT, BAM Gold Project, Junior Lake Property, Ontario, Canada
Landore Resources Canada Inc. Page | 125
11.6. Principal Authors Statement
Following the author’s 2018 site visit review of the chain of custody and security, and laboratory
sample preparation and analytical methods described by the ALS documentation, the following
conclusions have been made:
• Samples are stored securely prior to transportation to the laboratory by Landore employees
in the dedicated field office and lockable sample preparation facility, with minimal risk of
sample tampering.
• The chain of custody is supported by the Landore site staff sample logbook and sample
reports from the laboratories.
• Samples were transported from the camp office by trailer, and under supervision of Landore
personnel to the laboratories and as such the risk of sample tampering is low.
• The nature, quality and appropriateness of the laboratory sample preparation protocols is
considered suitable for grain sizes of the material expected and is consistent with industry
standard practice.
• The appropriateness of the assaying and laboratory methods is considered a total measure
of gold for the BAM Gold Project.
In summary, the sampling preparation and analytical methods used are adequate for and consistent
with the Principal Author’s understanding of the style of gold mineralization targeted by Landore at
the BAM Gold Project.

Landore Resources Canada Inc. MINERAL RESOURCE ESTIMATE AND PRELIMINARY ECONOMIC ASSESSMENT, BAM Gold Project, Junior Lake Property, Ontario, Canada
Landore Resources Canada Inc. Page | 126
12. Data Verification
12.1. Overview
Data verification has included data validation of the 2019 drill data following on from a site visit
conducted by Cube from 23 to 28 June 2018. The 2018 site visit included the following activities:
• The site visit included inspection of current diamond drilling and sampling activities and
facilities, and inspection of the sample dispatch and security at the site sampling and storage
facilities.
• Examination of diamond drill core and core logging activities on site (both geological and
geotechnical) and discussions with the on-site geologists regarding the current
understanding of the nature of the host rocks and controls on the gold mineralization.
• Inspection of diamond drill rig and drilling activities.
• Inspection of outcrops and the general topographic conditions in the area of the Project.
• Confirmation of the location of selected hole collars in the field, and in relation to the
supplied topographic surface digital terrain model.
• The lithologies, structure, alteration, and mineralization in selected intervals of drill core
were examined and compared with the descriptions presented in the drill hole logs.
For the new drilling data, Cube conducted a data compilation review and validation of all drilling
data prior to the 2022 MRE work.
12.2. Database Validation
Data was validated through a visual review of digital and paper files, as well as computer-aided
checking systems. Validation included review of core samples from drilling completed in 2019, plus
previous drilling by Landore and interrogation of digital and paper data, including paper plans and
sections, assay records, downhole survey records and geology logs.
Validation checks included the following work:
• Check for drill hole collar outliers for Easting, Northing, and RL.
• Any discrepancies in maximum hole depths between collar, assay, survey and geology
records.
• Any discrepancies in interval lengths for the database records, including downhole surveys,
assays, geology.
• Checks for duplicate numbering, missing data, and interval error checks using validation
rules in MS Excel before importing records into MS Access.
• The survey table drill hole azimuths were checked and verified to be within the 0° to 360°
expected range.
• The survey table was checked for any positive or near zero drill hole inclinations.
• The assay table was checked for overlaps of assay sample intervals.
• The assay table was checked for negative assays, missing assays, assays outside of expected
ranges or evidence of smearing.

Landore Resources Canada Inc. MINERAL RESOURCE ESTIMATE AND PRELIMINARY ECONOMIC ASSESSMENT, BAM Gold Project, Junior Lake Property, Ontario, Canada
Landore Resources Canada Inc. Page | 127
• Other data base tables were checked, including core recovery, density, structure.
• The significant mineralized intervals were checked for unsampled intervals close to the
mineralized margins and within the mineralized zones.
• Checking drill holes using visual inspection of the drill holes in Surpac 3D workspace to
identify inconsistencies of drill hole traces (unnatural hole deviations).
• Checking in Surpac 3D workspace of drill hole collar positions to the topography.
Cube completed the data validation checks prior to exploratory data analysis for the new MRE. The
drilling data was found to be very well structured and no obvious material discrepancies were
detected in the collar, survey, assay or geology data.
A few queries and minor issues were noted and forwarded to Landore for review and feedback (e.g.,
downhole survey queries). All issues were adequately explained. All relevant database validation
queries and any adjustments to data by Cube are listed in Table 12-1.
Table 12-1: Drill Hole Validation Listing (as at 14 January 2022)
DB Table Hole ID Validation Query Action Comment
All Records 2004 to 2010
holes Outside of MRE area Ignored in BAM MRE
Collar 0414-493 Hole drilled North to South Ignored in BAM MRE Potentially drilled down mineralization
Collar 0417-617 Hole drilled North to South Ignored in BAM MRE Potentially drilled down mineralization
Collar 0417-619 Hole drilled North to South Ignored in BAM MRE Potentially drilled down mineralization
Collar 0418-655 Hole drilled North to South Ignored in BAM MRE Hole drilled for Geotechnical studies
Assay 0418-653 No Assays in Min zone Ignored in BAM MRE Metallurgical Testwork holes
Assay 0418-654 No Assays in Min zone Ignored in BAM MRE Metallurgical Testwork holes
Assay 0418-655 No Assays Ignored in BAM MRE Geotech Hole
Survey 0420-726 to
0420-736 Downhole survey checks
Landore provided Updated DHS data
DHS updated in MRE database
Geology 0421-768 87.64 to 87.64 interval duplicated
Removed duplicated interval
Core Recovery
0421-819 to 0421-826
Logging in process Not reviewed for 2022 MRE Not available by MRE cut-off date
Density 0421-819 to
0421-826 BD sampling in progress Not reviewed for 2022 MRE
Not available by MRE cut-off date
12.3. Data Verification
Data verification carried out by Cube included the following:
• Confirmation of the location of random hole collars in the field against the original location
data collected by the surveyor. No material discrepancies were noted.
• Confirmation of all hole collar survey pickups in relation to the supplied topographic surface
digital terrain model.
• Checking of downhole survey information, mostly digital printouts where available, from site
office logs.
• Review of original assay certificates to confirm assay data in the drilling database used for
the 2022 MRE.

Landore Resources Canada Inc. MINERAL RESOURCE ESTIMATE AND PRELIMINARY ECONOMIC ASSESSMENT, BAM Gold Project, Junior Lake Property, Ontario, Canada
Landore Resources Canada Inc. Page | 128
• Review of available drill hole geology logging using supplied electronic logging files.
Previous data verification and check logging of selected holes was carried out on selected diamond
drill core at the Junior Lake camp site core farm during the site visit in 2018.
12.3.1. Drill Hole Collar Surveys
All drilling and block model data used for the January 2022 MRE work has used the UTM NAD83,
Zone 16 grid coordinate system. All of the holes have easting, northing and RL collar coordinates
which have two decimal place values. This indicates all the holes are likely to have collar coordinates
which were actually surveyed.
All collars were pegged prior to the commencement of the program using a differential GPS (Trimble
GPS, with accuracy +/120 cm). After the drilling programs were finished, certified contract surveyors
(JD Barnes & Associates of Thunder Bay) would pick up the actual collar locations using a differential
GPS or total station Electronic Distance Measuring (EDM) survey equipment.
A topographic surface created in 2018 in DXF file format was imported into Surpac as a DTM file for
use in the MRE work. The topography models are considered to be adequate for the purposes of
Mineral Resource estimation, evaluation and reporting.
A review of the drilling data showed that there were no significant variations between the surveyed
collar positions and the supplied topographic surface DTM (Figure 12-1 and Figure 12-2).

Landore Resources Canada Inc. MINERAL RESOURCE ESTIMATE AND PRELIMINARY ECONOMIC ASSESSMENT, BAM Gold Project, Junior Lake Property, Ontario, Canada
Landore Resources Canada Inc. Page | 129
Figure 12-1: Plan View of Surface Topography Surface DTM Overlay with Drill Hole Collars (January 2022)
BAM sediment unit –main gold
mineralisation host

Landore Resources Canada Inc. MINERAL RESOURCE ESTIMATE AND PRELIMINARY ECONOMIC ASSESSMENT, BAM Gold Project, Junior Lake Property, Ontario, Canada
Landore Resources Canada Inc. Page | 130
Figure 12-2: Composite Section View Looking North – Showing Surface Topography Surface DTM Overlay with Drill Hole Collars (January 2022)
+1000m RL
-500m RL
BAM gold mineralisation interpretations
Surface Topography

Landore Resources Canada Inc. MINERAL RESOURCE ESTIMATE AND PRELIMINARY ECONOMIC ASSESSMENT, BAM Gold Project, Junior Lake Property, Ontario, Canada
Landore Resources Canada Inc. Page | 131
During the 2018 site visit, several random holes were checked in the field by Cube against the hole
collar coordinates in the BAM drilling database (Table 12-2 and Figure 12-3). Hole collars are clearly
marked and preserved for later collar survey pickup and DH surveying. Hole numbers are stamped
on top of the metal hole covering.
There were no variances from the original database co-ordinate records for the holes identified.
Table 12-2: Listing of Random Hole Survey Checks (24th June 2018)
Hole ID Local Grid East
Local Grid
North RL UTM East UTM North
Field GPS
Check
EOH Depth
Hole Size
Plan Dip
Plan Azi
DHS Method
DH Survey Check
0403-003
1000 615 358.59 5,581,993.14 433,444.84 OK 60.00 NQ -46 357 Maxibor OK
0403-004
1000 592 359.31 5,581,967.70 433,445.62 OK 81.00 NQ -45 357 Maxibor OK
0416-536
2400 50 351.91 5,581,484.40 434,854.22 OK 183.00 NQ -46 357 Maxibor OK
0416-541
2400 0 351.15 5,581,435.73 434,863.15 OK 222.00 NQ -46 357 Maxibor OK
0416-557
2397 0 351.25 5,581,436.63 434,860.10 OK 267.00 HQ -55 357 Easy Shot
OK
0417-580
1000 550 359.95 5,581,924.95 433,449.22 OK 156.04 NQ -45 357 Maxibor OK
0417-621
2350 75 351.84 5,581,507.80 434,814.94 OK 173.98 HQ -39 358 Maxibor OK
0417-625
2350 73 351.66 5,581,506.20 434,815.06 OK 173.75 HQ -40.2 9 Maxibor OK
Figure 12-3: Field Location of Drill Holes used for Data Verification (Cube Site Visit, June 2018)

Landore Resources Canada Inc. MINERAL RESOURCE ESTIMATE AND PRELIMINARY ECONOMIC ASSESSMENT, BAM Gold Project, Junior Lake Property, Ontario, Canada
Landore Resources Canada Inc. Page | 132
12.3.2. Downhole Surveys
Downhole surveys were conducted at 9 m depth after hole collaring and then at 50 m intervals using
a Reflex Easy-Shot, single-shot survey tool supplied by the drilling company. On completion of each
hole, downhole surveys were completed using a continuous Reflex Maxibor survey unit by third
party contractors, providing a dip and azimuth reading at 3 m intervals down hole.
Downhole surveys have been checked against transcribed information on the original drill hole logs
or summary sheets. As part of the validation work, Cube checked drill hole traces visually using
Surpac to ensure there were no unnatural deviations.
The 3D location of the individual samples is considered by Cube to be adequate for the 3D
interpretation and resource modelling work.
12.3.3. Assay Data
Cube reviewed the sample collection, submission, and data entry protocols during the 2018 site visit
at the Junior Lake site office as part of the data verification process.
Cube verified supplied electronic drill hole data with drill hole logs and assay certificates for a
selection of significant holes within the supplied drilling database (Figure 12-4 and Table 12-3).
Cube verified selected intercepts within the mineralized domains using downhole compositing
calculations in Surpac Mining Software (Surpac), checked against calculations in MS Excel using the
assay records for significant intersection zones.
There were no material issues or errors noted during the assay verification between the supplied
drill hole database and original laboratory data.

Landore Resources Canada Inc. MINERAL RESOURCE ESTIMATE AND PRELIMINARY ECONOMIC ASSESSMENT, BAM Gold Project, Junior Lake Property, Ontario, Canada
Landore Resources Canada Inc. Page | 133
Figure 12-4 Plan View of Locations of Selected Holes for Hole Verification Analysis (25 June 2018)
Table 12-3: Listing of Verification Holes for Assay and Logging Checks (25 June 2018)
Hole ID
Assay Checks Geology Logging Checks
Sampling Original Lab Certificates Landore QAQC Significant
Intervals Check in 3DM
Original Logs Check (PDF
copies)
Check Logging,
June 2018
Core Photos?
0416-519 1/2 NQ
Core TB16034211, TB16142570, TB16034219, TB16034221
CRM/ Blanks Checked PDF Log Checked YES
0416-525 1/2 NQ
Core TB16120651, TB16110975, TB16110979
CRM/ Blanks Checked PDF Log Checked YES
0416-526 1/2 NQ
Core TB16110981, TB16110983, CRM/ Blanks Checked PDF Log Checked YES
0416-534 1/2 NQ
Core TB16217399, TB16123628, TB16123629, TB16123632
CRM/ Blanks Checked PDF Log Checked YES
0416-535 1/2 NQ
Core TB16123633, TB16123634, TB16123636, TB16123637
CRM/ Blanks Checked PDF Log Checked YES
0416-537 1/2 NQ
Core TB16129989, TB16129991, TB16129993
CRM/ Blanks Checked PDF Log Checked YES

Landore Resources Canada Inc. MINERAL RESOURCE ESTIMATE AND PRELIMINARY ECONOMIC ASSESSMENT, BAM Gold Project, Junior Lake Property, Ontario, Canada
Landore Resources Canada Inc. Page | 134
Hole ID
Assay Checks Geology Logging Checks
Sampling Original Lab Certificates Landore QAQC
Significant Intervals Check in
3DM
Original Logs Check (PDF
copies)
Check Logging,
June 2018
Core Photos?
0416-538 1/2 NQ
Core TB16129994, TB16129995, TB16129996, TB18116219
CRM/ Blanks Checked PDF Log Checked YES
0416-541 1/2 NQ
Core TB16135702, TB16135722, TB16135726, TB16135727
CRM/ Blanks Checked PDF Log Checked YES
0416-543 1/2 NQ
Core TB16138075, TB16138077, TB16138078
CRM/ Blanks Checked PDF Log Checked YES
0416-563 1/2 HQ
Core TB17071796, TB17077977, TB17077978, TB17077979
CRM/ Blanks Checked PDF Log Checked YES
0417-620 1/2 HQ
Core TB17139543, TB17139544, TB17139545
CRM/ Blanks Checked PDF Log Checked YES
12.3.4. Geological Logging
Cube has reviewed and verified the logging and sampling protocols used for all Landore drilling
programs:
• All diamond drill holes were geologically logged in full.
• Logging by Landore is done both qualitatively and quantitatively with description of
lithologies, structural measurements and comments being done. Logging records major and
minor rock units (grain sizes, texture structural information including the following: core
angles of geological contacts, foliation and bedding, fractures, faults, veins, joints etc.),
alteration and sulphide species, content and mode of occurrence.
• Geotechnical measurements including core recovery, RQD and fracture density are also
taken.
• All diamond drill core is digitally photographed for both dry and wet core trays with photos
maintained on file in Landore’s Thunder Bay office.
Several holes were summary logged by Cube during the 2018 site visit to verify the interpreted
geology and compare against the Landore geology logging and assay results supplied as part of the
drilling database (Figure 12-5).
The objective was to understand the style of the mineralization, core quality and recovery, and to
confirm the consistency of the logging codes for use in interpretation. This was supplemented by
examination of core photography where available from the drilling.
Cube concluded that the gross stratigraphy of the deposit from the summary logging confirmed the
original detailed logging in the Landore drilling logs and database.
Landore Resources Canada Inc. MINERAL RESOURCE ESTIMATE AND PRELIMINARY ECONOMIC ASSESSMENT, BAM Gold Project, Junior Lake Property, Ontario, Canada
Landore Resources Canada Inc. Page | 135
Figure 12-5: Site Photo of Check Logging of for Hole 0416-538, for Interval 135 m to 162.68 m (Cube Site
Visit, June 2018)
12.4. QAQC Results – Review by Cube, 2022
12.4.1. Summary
An independent review of the QAQC sample statistics and results for the 2020-2021 drilling was
carried out by Cube as part of the data verification analysis. Cube has previously conducted QAQC
reviews for all drilling results from 2015 to 2019 (Cube, 2020).
For the 2020-2021 review, all gold assay values are reported in ppm units and all assay values
reported below the lower analytical detection limit were set to half the detection limit for the
analysis. All control samples were assessed on the basis of accuracy and precision. The precision of
the sample results is the measure of how closely the results can be repeated. Precision is measured
by the use of duplicate and replicate assays, whereas accuracy is measured through the use of
certified reference materials.
The accuracy of sample results relates to how similar the results are to the true value.
Figure 12-6 graphically illustrates how it is possible to have good accuracy without good precision,
and good precision without good accuracy.

Landore Resources Canada Inc. MINERAL RESOURCE ESTIMATE AND PRELIMINARY ECONOMIC ASSESSMENT, BAM Gold Project, Junior Lake Property, Ontario, Canada
Landore Resources Canada Inc. Page | 136
Figure 12-6 Accuracy and Precision Concept (Cube, 2018)
The QAQC analysis is summarized below with some of the most significant plots for each of the
control sample types.
12.4.2. Certified Reference Material (Standards) and Blanks
Cube has reviewed the supplied control assays for sample data for the BAM Gold Project drilling
programs for the period 2020 to 2021.
From a total of 15,341 samples:
• 836 CRMs inserted at a 5% insertion rate, or at a rate of 1 CRM for every 20 samples
• 821 blanks inserted at a 5% insertion rate, or at a rate of 1 blank for every 20 samples.
The performances of the CRM and blanks for ALS are detailed in Table 12-4. A listing of failed
samples and possible causes is tabulated in Table 12-5. Also, a listing of QAQC samples provided
which had missing assays is provided in Table 12-6.
QAQC plots for specific expected grades are illustrated in Figure 12-7 to Figure 12-20.

Landore Resources Canada Inc. MINERAL RESOURCE ESTIMATE AND PRELIMINARY ECONOMIC ASSESSMENT, BAM Gold Project, Junior Lake Property, Ontario, Canada
Landore Resources Canada Inc. Page | 137
Table 12-4: CRM and Blanks Performance Summary for ALS (2020-2021)
CRM ID No. of
Samples
Samples not
Assayed
Expected Value
(Au ppm)
SD Accuracy Precision % Outside
3SD % Bias
Period In Use
Comments
G310-2 110 2 0.20 0.010 Pass Fail 2.88 1.78 2017-2021 1 sample possible mislabel; 2 samples failed 3SD; negative bias
G315-1 43 2 5.64 0.250 Pass Fail 5.41 - 2.53 2017-2021 2 sample failed 3SD
G315-8 4 0 9.93 0.320 Pass Pass - - 0.98 2020-2021
G320-10 74 0 0.65 0.030 Pass Fail 4.17 8.59 2020-2021 2 samples possible mislabel; 1 sample failed 3SD, positive bias
G398-4 50 2 0.66 0.050 Pass Fail 2.27 1.48 2020-2021 2 samples possible mislabel
G905-1 78 1 1.16 0.050 Pass Pass - - 1.33 2016-2021
G907-5 7 0 1.34 0.070 Pass Pass - - 0.21 2017-2021
G908-4 104 3 0.96 0.050 Pass Fail 2.20 8.20 2017-2021 2 samples possible mislabel
G912-3 69 0 2.09 0.080 Pass Fail 4.62 - 1.07 2017-2021 2 samples possible mislabel; 1 sample failed 3SD
G913-4 114 4 1.37 0.040 Pass Fail 5.00 7.39 2020-2021 5 samples possible mislabel
G913-9 59 1 4.91 0.170 Pass Fail 3.70 - 2.13 2017-2021 2 samples possible mislabel
G913-10 31 0 7.09 0.250 Pass Pass - 0.09 2020-2021
G914-6 75 2 3.21 0.120 Pass Pass - 0.05 2017-2021
G914-10 8 1 10.26 0.380 Pass Fail 1.00 - 9.55 2017-2021 1 sample possible mislabel or outlier
G915-4 10 0 9.16 0.350 Pass Fail 1.00 - 11.23 2017-2021 1 sample possible mislabel or outlier
TOTAL 836 18
BLANK 821 1 <0.05 0.002 Pass Pass 0.13 2016-2021 1 sample possible contamination or sample swap error

Landore Resources Canada Inc. MINERAL RESOURCE ESTIMATE AND PRELIMINARY ECONOMIC ASSESSMENT, BAM Gold Project, Junior Lake Property, Ontario, Canada
Landore Resources Canada Inc. Page | 138
Table 12-5: CRM and Blanks – Possible Misallocation and Outlier Listing for ALS (2020-2021)
CRM ID
Expected Value
(Au ppm)
Sample ID
Assay Value (Au
ppm) Lab Job No.
Date Reported
Comment
G310-2 0.2 A0057261 0.26 TB20248599 13/12/2020 Outlier, marginally outside 3SD
G310-2 0.2 Y069455 0.16 TB21061280 06/04/2021 Outlier, marginally outside 3SD
G315-1 5.64 C757174 6.47 TB21195712 19/08/2021 Outlier, possibly nugget
G315-1 5.64 D560976 1.38 TB21216935 05/09/2021 Possible mislabel - G913-4 or G907-5 ?
G320-10 0.65 Y070988 4.95 TB21084726 28/04/2021 Possible mislabel - G913-9 ?
G320-10 0.65 C753721 0.19 TB21129342 11/06/2021 Possible mislabel - G310-2 ?
G320-10 0.65 C754483 0.46 TB21140615 19/06/2021 Outlier, outside 3SD
G398-4 0.66 Y067378 1.37 TB21049716 01/04/2021 Possible mislabel - G913-4 or G907-5 ?
G908-4 0.96 A0058441 0.68 TB20277001 31/01/2021 Possible mislabel - 320-10 or G398-4 ?
G908-4 0.96 Y070968 8.93 TB21084726 28/04/2021 Possible mislabel - G915-4 ?
G912-3 2.09 A0057820 2.66 TB20262891 21/12/2020 Outlier, outside 3SD
G912-3 2.09 D560547 1.71 TB21207040 31/08/2021 Outlier, outside 3SD
G912-3 2.09 D561921 1.34 TB21226744 19/09/2021 Possible mislabel - G913-4 or G907-5 ?
G913-4 1.37 Y067448 5.14 TB21049717 02/04/2021 Possible mislabel - G913-9 ?
G913-4 1.37 Y070473 0.2 TB21074741 19/04/2021 Possible mislabel - G310-2 ?
G913-4 1.37 C753296 4.9 TB21125282 08/06/2021 Possible mislabel - G913-9 ?
G913-4 1.37 B729008 2.06 TB21183575 09/08/2021 Possible mislabel - G912-3 ?
G913-4 1.37 D560767 4.77 TB21207217 31/08/2021 Possible mislabel - G913-9 ?
G913-9 4.91 B725402 2.08 TB20297143 04/02/2021 Possible mislabel - G912-3 ?
G913-9 4.91 Y071038 0.65 TB21084727 30/04/2021 Possible mislabel - 320-10 or G398-4 ?
G914-10 10.26 A0058072 5.00 TB20290906 26/12/2020 Possible mislabel - G913-9 ?
G915-4 9.16 Y071018 0.92 TB21084727 30/04/2021 Possible mislabel - G908-4 ?
BLK 0.005 B729160 0.17 TB21207044 19/08/2021 Possible sample swap or contamination
CRMs and blanks that did not have assays are listed in Table 12-6.
Table 12-6: CRM and Blanks Listing of Samples with No Assay (2020-2021)
Hole ID Sample
ID Date Reported Lab Job No. CRM ID
0420-736 Y068141 na na G905-1
0420-738 Y068420 29/01/2021 TB20290910 G398-4
0420-742 A0058066 na na G914-10
0420-742 A0058067 na na BLK
0420-746 Y068745 11/02/2021 TB20302680 G398-4
0420-752 C753062 31/05/2021 TB21112785 G913-4
0421-758 Y066687 16/03/2021 TB21037043 G908-4
0421-793 C754235 23/06/2021 TB21137846 G310-2
0421-797 C754875 25/06/2021 TB21144048 G908-4
0421-806 C756774 17/08/2021 TB21192841 G908-4
0421-807 C756843 18/08/2021 TB21192844 G913-4
0421-807 C756943 18/08/2021 TB21192846 G913-9
0421-808 C757124 23/08/2021 TB21195709 G913-4
0421-808 C757224 20/08/2021 TB21195713 G914-6
0421-811 D560517 31/08/2021 TB21207039 G914-6
0421-815 D561560 20/09/2021 TB21226733 G315-1
0421-816 D561797 27/09/2021 TB21226741 G315-1
0421-817 D561891 20/09/2021 TB21226743 G913-4
0421-819 D562147 01/12/2021 TB21291199 G310-2

Landore Resources Canada Inc. MINERAL RESOURCE ESTIMATE AND PRELIMINARY ECONOMIC ASSESSMENT, BAM Gold Project, Junior Lake Property, Ontario, Canada
Landore Resources Canada Inc. Page | 139
Figure 12-7 Performance of CRM 310_2 at ALS for Period 2020-2021
Figure 12-8 Performance of CRM 315_1 at ALS for Period 2020-2021
Figure 12-9 Performance of CRM G320_10 at ALS for Period 2020-2021
Expected Value: 0.200
Std Dev: 0.010
No. of Assays: 104
Actual Mean: 0.204
Actual Std Dev: 0.115
Bias: 1.78%
|m-µ|: 0.004
2*√(σ2+s2/n): 0.030
(Sw/σC)2: 132.212
χ2 @ 0.95 prob.: 1.240
Accuracy Test: PASS
Precision Test: FAIL
Samples Outside 2SD: 5
% Outside 2SD: 4.81%
Samples Outside 3SD: 3
% Outside 3SD: 2.88%
Date Filter From: 12-Dec-20
Date Filter To: 25-Dec-21
Summary Statistics CRM : G310-2Analyte = Au; Laboratory = ALS
Landore; BAM
0.1568
0.17112
0.18544
0.19976
0.21408
0.2284
0.24272
0.25704
0.27136
0.28568
0.3
Ass
ay V
alu
e (p
pm
)
Date
3SD
2SD
Expected Value
Expected Value: 5.640
Std Dev: 0.250
No. of Assays: 37
Actual Mean: 5.497
Actual Std Dev: 0.736
Bias: -2.53%
|m-µ|: 0.143
2*√(σ2+s2/n): 0.555
(Sw/σC)2: 8.660
χ2 @ 0.95 prob.: 1.417
Accuracy Test: PASS
Precision Test: FAIL
Samples Outside 2SD: 3
% Outside 2SD: 8.11%
Samples Outside 3SD: 2
% Outside 3SD: 5.41%
Date Filter From: 15-Dec-20
Date Filter To: 25-Dec-21
Summary Statistics CRM : G315-1Analyte = Au; Laboratory = ALS
Landore; BAM
3
3.35994
3.71988
4.07982
4.43976
4.7997
5.15964
5.51958
5.87952
6.23946
6.5994
Ass
ay V
alu
e (p
pm
)
Date
3SD
2SD
Expected Value
Expected Value: 0.650
Std Dev: 0.030
No. of Assays: 72
Actual Mean: 0.706
Actual Std Dev: 0.511
Bias: 8.59%
|m-µ|: 0.056
2*√(σ2+s2/n): 0.135
(Sw/σC)2: 290.040
χ2 @ 0.95 prob.: 1.291
Accuracy Test: PASS
Precision Test: FAIL
Samples Outside 2SD: 3
% Outside 2SD: 4.17%
Samples Outside 3SD: 3
% Outside 3SD: 4.17%
Date Filter From: 02-Apr-21
Date Filter To: 30-Dec-21
Summary Statistics CRM : G320-10Analyte = Au; Laboratory = ALS
Landore; BAM
0.1862
0.26758
0.34896
0.43034
0.51172
0.5931
0.67448
0.75586
0.83724
0.91862
1
Ass
ay V
alu
e (p
pm
)
Date
3SD
2SD
Expected Value

Landore Resources Canada Inc. MINERAL RESOURCE ESTIMATE AND PRELIMINARY ECONOMIC ASSESSMENT, BAM Gold Project, Junior Lake Property, Ontario, Canada
Landore Resources Canada Inc. Page | 140
Figure 12-10 Performance of CRM G398_4 at ALS for Period 2020-2021
Figure 12-11 Performance of CRM G905_1 at ALS for Period 2020-2021
Figure 12-12 Performance of CRM G907_5 at ALS for Period 2020-2021
Expected Value: 0.660
Std Dev: 0.050
No. of Assays: 44
Actual Mean: 0.670
Actual Std Dev: 0.113
Bias: 1.48%
|m-µ|: 0.010
2*√(σ2+s2/n): 0.106
(Sw/σC)2: 5.076
χ2 @ 0.95 prob.: 1.379
Accuracy Test: PASS
Precision Test: FAIL
Samples Outside 2SD: 2
% Outside 2SD: 4.55%
Samples Outside 3SD: 1
% Outside 3SD: 2.27%
Date Filter From: 12-Dec-20
Date Filter To: 29-Jul-21
Summary Statistics CRM : G398-4Analyte = Au; Laboratory = ALS
Landore; BAM
0.4998
0.54982
0.59984
0.64986
0.69988
0.7499
0.79992
0.84994
0.89996
0.94998
1
Ass
ay V
alu
e (p
pm
)
Date
3SD
2SD
Expected Value
Expected Value: 1.160
Std Dev: 0.050
No. of Assays: 72
Actual Mean: 1.145
Actual Std Dev: 0.028
Bias: -1.33%
|m-µ|: 0.015
2*√(σ2+s2/n): 0.100
(Sw/σC)2: 0.319
χ2 @ 0.95 prob.: 1.291
Accuracy Test: PASS
Precision Test: PASS
Samples Outside 2SD: 1
% Outside 2SD: 1.39%
Samples Outside 3SD: 0
% Outside 3SD: 0.00%
Date Filter From: 13-Dec-20
Date Filter To: 25-Dec-21
Summary Statistics CRM : G905-1Analyte = Au; Laboratory = ALS
Landore; BAM
0.9
0.95
1
1.05
1.1
1.15
1.2
1.25
1.3
1.35
1.4
Ass
ay V
alu
e (p
pm
)
Date
3SD
2SD
Expected Value
Expected Value: 1.340
Std Dev: 0.070
No. of Assays: 7
Actual Mean: 1.337
Actual Std Dev: 0.027
Bias: -0.21%
|m-µ|: 0.003
2*√(σ2+s2/n): 0.141
(Sw/σC)2: 0.148
χ2 @ 0.95 prob.: 2.099
Accuracy Test: PASS
Precision Test: PASS
Samples Outside 2SD: 0
% Outside 2SD: 0.00%
Samples Outside 3SD: 0
% Outside 3SD: 0.00%
Date Filter From: 02-Mar-21
Date Filter To: 25-Dec-21
Summary Statistics CRM : G907-5Analyte = Au; Laboratory = ALS
Landore; BAM
1
1.06
1.12
1.18
1.24
1.3
1.36
1.42
1.48
1.54
1.6
Ass
ay V
alu
e (p
pm
)
Date
3SD
2SD
Expected Value

Landore Resources Canada Inc. MINERAL RESOURCE ESTIMATE AND PRELIMINARY ECONOMIC ASSESSMENT, BAM Gold Project, Junior Lake Property, Ontario, Canada
Landore Resources Canada Inc. Page | 141
Figure 12-13 Performance of CRM G908_4 at ALS for Period 2020-2021
Figure 12-14 Performance of CRM G912_3 at ALS for Period 2020-2021
Figure 12-15 Performance of CRM G913_4 at ALS for Period 2020-2021
Expected Value: 0.960
Std Dev: 0.050
No. of Assays: 91
Actual Mean: 1.039
Actual Std Dev: 0.837
Bias: 8.20%
|m-µ|: 0.079
2*√(σ2+s2/n): 0.202
(Sw/σC)2: 280.450
χ2 @ 0.95 prob.: 1.257
Accuracy Test: PASS
Precision Test: FAIL
Samples Outside 2SD: 2
% Outside 2SD: 2.20%
Samples Outside 3SD: 2
% Outside 3SD: 2.20%
Date Filter From: 13-Dec-20
Date Filter To: 18-Aug-21
Summary Statistics CRM : G908-4Analyte = Au; Laboratory = ALS
Landore; BAM
0.6664
0.71976
0.77312
0.82648
0.87984
0.9332
0.98656
1.03992
1.09328
1.14664
1.2
Ass
ay V
alu
e (p
pm
)
Date
3SD
2SD
Expected Value
Expected Value: 2.090
Std Dev: 0.080
No. of Assays: 65
Actual Mean: 2.068
Actual Std Dev: 0.133
Bias: -1.07%
|m-µ|: 0.022
2*√(σ2+s2/n): 0.163
(Sw/σC)2: 2.781
χ2 @ 0.95 prob.: 1.307
Accuracy Test: PASS
Precision Test: FAIL
Samples Outside 2SD: 3
% Outside 2SD: 4.62%
Samples Outside 3SD: 3
% Outside 3SD: 4.62%
Date Filter From: 16-Dec-20
Date Filter To: 30-Dec-21
Summary Statistics CRM : G912-3Analyte = Au; Laboratory = ALS
Landore; BAM
1.3132
1.4532
1.5932
1.7332
1.8732
2.0132
2.1532
2.2932
2.4332
2.5732
2.7132
Ass
ay V
alu
e (p
pm
)
Date
3SD
2SD
Expected Value
Expected Value: 1.370
Std Dev: 0.040
No. of Assays: 100
Actual Mean: 1.471
Actual Std Dev: 0.629
Bias: 7.39%
|m-µ|: 0.101
2*√(σ2+s2/n): 0.149
(Sw/σC)2: 247.240
χ2 @ 0.95 prob.: 1.245
Accuracy Test: PASS
Precision Test: FAIL
Samples Outside 2SD: 7
% Outside 2SD: 7.00%
Samples Outside 3SD: 5
% Outside 3SD: 5.00%
Date Filter From: 12-Dec-20
Date Filter To: 25-Dec-21
Summary Statistics CRM : G913-4Analyte = Au; Laboratory = ALS
Landore; BAM
1.2
1.24
1.28
1.32
1.36
1.4
1.44
1.48
1.52
1.56
1.6
Ass
ay V
alu
e (p
pm
)
Date
3SD
2SD
Expected Value

Landore Resources Canada Inc. MINERAL RESOURCE ESTIMATE AND PRELIMINARY ECONOMIC ASSESSMENT, BAM Gold Project, Junior Lake Property, Ontario, Canada
Landore Resources Canada Inc. Page | 142
Figure 12-16 Performance of CRM G913_9 at ALS for Period 2020-2021
Figure 12-17 Performance of CRM G913_10 at ALS for Period 2020-2021
Figure 12-18 Performance of CRM G914_6 at ALS for Period 2020-2021
Expected Value: 4.910
Std Dev: 0.170
No. of Assays: 54
Actual Mean: 4.805
Actual Std Dev: 0.705
Bias: -2.13%
|m-µ|: 0.105
2*√(σ2+s2/n): 0.390
(Sw/σC)2: 17.193
χ2 @ 0.95 prob.: 1.339
Accuracy Test: PASS
Precision Test: FAIL
Samples Outside 2SD: 3
% Outside 2SD: 5.56%
Samples Outside 3SD: 2
% Outside 3SD: 3.70%
Date Filter From: 15-Dec-20
Date Filter To: 21-Sep-21
Summary Statistics CRM : G913-9Analyte = Au; Laboratory = ALS
Landore; BAM
3
3.3
3.6
3.9
4.2
4.5
4.8
5.1
5.4
5.7
6
Ass
ay V
alu
e (p
pm
)
Date
3SD
2SD
Expected Value
Expected Value: 7.090
Std Dev: 0.250
No. of Assays: 31
Actual Mean: 7.096
Actual Std Dev: 0.169
Bias: 0.09%
|m-µ|: 0.006
2*√(σ2+s2/n): 0.504
(Sw/σC)2: 0.457
χ2 @ 0.95 prob.: 1.459
Accuracy Test: PASS
Precision Test: PASS
Samples Outside 2SD: 0
% Outside 2SD: 0.00%
Samples Outside 3SD: 0
% Outside 3SD: 0.00%
Date Filter From: 13-Dec-20
Date Filter To: 20-Dec-21
Summary Statistics CRM : G913-10Analyte = Au; Laboratory = ALS
Landore; BAM
6
6.2
6.4
6.6
6.8
7
7.2
7.4
7.6
7.8
8
Ass
ay V
alu
e (p
pm
)
Date
3SD
2SD
Expected Value
Expected Value: 3.210
Std Dev: 0.120
No. of Assays: 68
Actual Mean: 3.212
Actual Std Dev: 0.071
Bias: 0.05%
|m-µ|: 0.002
2*√(σ2+s2/n): 0.241
(Sw/σC)2: 0.355
χ2 @ 0.95 prob.: 1.300
Accuracy Test: PASS
Precision Test: PASS
Samples Outside 2SD: 0
% Outside 2SD: 0.00%
Samples Outside 3SD: 0
% Outside 3SD: 0.00%
Date Filter From: 16-Dec-20
Date Filter To: 20-Dec-21
Summary Statistics CRM : G914-6Analyte = Au; Laboratory = ALS
Landore; BAM
2.8
2.88
2.96
3.04
3.12
3.2
3.28
3.36
3.44
3.52
3.6
Ass
ay V
alu
e (p
pm
)
Date
3SD
2SD
Expected Value

Landore Resources Canada Inc. MINERAL RESOURCE ESTIMATE AND PRELIMINARY ECONOMIC ASSESSMENT, BAM Gold Project, Junior Lake Property, Ontario, Canada
Landore Resources Canada Inc. Page | 143
Figure 12-19 Performance of CRM G914_10 at ALS for Period 2020-2021
Figure 12-20 Performance of CRM G915_4 at ALS for Period 2020-2021
12.4.3. Duplicates
Pulp repeats and coarse reject samples were check assayed at the secondary laboratory, Actlabs.
A summary of the duplicate types inserted into the sample stream is summarized as follows:
• There were 468 combined laboratory duplicate samples recorded at an 3% insertion rate, or
at a rate of 1 in every 33 samples.
• For the 2020-2021 combined drilling programs, there were 241 laboratory pulp duplicates
(2% insertion rate), and 227 coarse reject duplicates (1% insertion rate).
A summary of the statistics relating to the duplicate sampling performances are illustrated in the
following paired duplicate control charts for both the pulp duplicates and the coarse reject
duplicates:
• Relative Mean Paired Difference (RMPD) charts (Figure 12-21 and Figure 12-22)
Expected Value: 10.260
Std Dev: 0.380
No. of Assays: 6
Actual Mean: 9.280
Actual Std Dev: 2.141
Bias: -9.55%
|m-µ|: 0.980
2*√(σ2+s2/n): 1.906
(Sw/σC)2: 31.749
χ2 @ 0.95 prob.: 2.214
Accuracy Test: PASS
Precision Test: FAIL
Samples Outside 2SD: 2
% Outside 2SD: 33.33%
Samples Outside 3SD: 1
% Outside 3SD: 16.67%
Date Filter From: 20-Dec-20
Date Filter To: 15-Apr-21
Summary Statistics CRM : G914-10Analyte = Au; Laboratory = ALS
Landore; BAM
6
6.6
7.2
7.8
8.4
9
9.6
10.2
10.8
11.4
12
Ass
ay V
alu
e (p
pm
)
Date
3SD
2SD
Expected Value
Expected Value: 9.160
Std Dev: 0.350
No. of Assays: 10
Actual Mean: 8.131
Actual Std Dev: 2.549
Bias: -11.23%
|m-µ|: 1.029
2*√(σ2+s2/n): 1.757
(Sw/σC)2: 53.032
χ2 @ 0.95 prob.: 1.880
Accuracy Test: PASS
Precision Test: FAIL
Samples Outside 2SD: 2
% Outside 2SD: 20.00%
Samples Outside 3SD: 1
% Outside 3SD: 10.00%
Date Filter From: 16-Dec-20
Date Filter To: 20-Dec-21
Summary Statistics CRM : G915-4Analyte = Au; Laboratory = ALS
Landore; BAM
7
7.4
7.8
8.2
8.6
9
9.4
9.8
10.2
10.6
11
Ass
ay V
alu
e (p
pm
)
Date
3SD
2SD
Expected Value

Landore Resources Canada Inc. MINERAL RESOURCE ESTIMATE AND PRELIMINARY ECONOMIC ASSESSMENT, BAM Gold Project, Junior Lake Property, Ontario, Canada
Landore Resources Canada Inc. Page | 144
• Scatter Plot charts (Figure 12-23 and Figure 12-24)
• Q-Q Plot charts (Figure 12-25 and Figure 12-26).
Figure 12-21 RMPD Chart for Pulp Duplicate Samples – ALS (original) versus ActLabs (duplicates) for Period
2020-2021
Figure 12-22 RMPD Chart for Coarse Reject Duplicate Samples – ALS (original) versus ActLabs (duplicates) for
Period 2020-2021
No. of Assays: 241
Original Max: 5.17
Duplicate Max: 2.96
No. Assays within 10%: 76
No. Assays within 20%: 122
No. Assays within 50%: 190
% Assays within 10%: 31.5%
% Assays within 20%: 50.6%
% Assays within 50%: 78.8%
Average RMPD%: -5.5%
Absolute Average RMPD%: 46.3%
Average CV%: 32.7%
Filter Values From: 0.00375
Filter Values To: 2.83
Summary Statistics Umpire Pulp Duplicates : RMPD PlotOrig Lab = ALS & Dup Lab = ACT_Lab; Analyte = Au (ppm)
Landore; BAM
-200%
-150%
-100%
-50%
0%
50%
100%
150%
200%
0.001 0.01 0.1 1 10
RM
PD
% [
(Du
p -
Ori
g) /
((O
rig
+ D
up
) /
2)]
Average Assay Value (Au ppm)
RMPD
Zero Line
Mov. Ave. (5pt)
No. of Assays: 227
Original Max: 47.20
Duplicate Max: 58.30
No. Assays within 10%: 49
No. Assays within 20%: 93
No. Assays within 50%: 175
% Assays within 10%: 21.6%
% Assays within 20%: 41.0%
% Assays within 50%: 77.1%
Average RMPD%: -13.2%
Absolute Average RMPD%: 53.0%
Average CV%: 37.5%
Filter Values From: 0.00375
Filter Values To: 52.75
Summary Statistics Umpire Coarse Reject Duplicates : RMPD PlotOrig Lab = ALS & Dup Lab = ACT_Lab; Analyte = Au (ppm)
Landore; BAM
-200%
-150%
-100%
-50%
0%
50%
100%
150%
200%
0.001 0.01 0.1 1 10 100
RM
PD
% [
(Du
p -
Ori
g) /
((O
rig
+ D
up
) /
2)]
Average Assay Value (Au ppm)
RMPD
Zero Line
Mov. Ave. (5pt)

Landore Resources Canada Inc. MINERAL RESOURCE ESTIMATE AND PRELIMINARY ECONOMIC ASSESSMENT, BAM Gold Project, Junior Lake Property, Ontario, Canada
Landore Resources Canada Inc. Page | 145
Figure 12-23 Scatter Plot for Pulp Duplicate Samples – ALS (original) versus ActLabs (duplicates) for Period
2020-2021
Figure 12-24 Scatter Plot for Coarse Reject Duplicate Samples – ALS (original) versus ActLabs (duplicates) for
Period 2020-2021
No. of Assays: 241
Original Min: 0.0050
Duplicate Min: 0.0025
Original Max: 5.17
Duplicate Max: 2.96
Original Mean: 0.403
Duplicate Mean: 0.351
Average Difference %: -13.0%
Correlation Coefficient: 0.79
Slope: 0.98
Intercept: 0.06
Summary Statistics Umpire Pulp Duplicates : Scatter PlotOrig Lab = ALS & Dup Lab = ACT_Lab; Analyte = Au (ppm)
Landore; BAM
0.001
0.01
0.1
1
10
0.001 0.01 0.1 1 10
Du
pli
cate
Ass
ay V
alu
e (A
u p
pm
)
Original Assay Value (Au ppm)
Assays
Unbiased Line
Linear Regr.
No. of Assays: 227
Original Min: 0.0050
Duplicate Min: 0.0025
Original Max: 47.20
Duplicate Max: 58.30
Original Mean: 2.481
Duplicate Mean: 2.132
Average Difference %: -14.1%
Correlation Coefficient: 0.84
Slope: 0.85
Intercept: 0.67
Summary Statistics Umpire Coarse Reject Duplicates : Scatter PlotOrig Lab = ALS & Dup Lab = ACT_Lab; Analyte = Au (ppm)
Landore; BAM
0.001
0.01
0.1
1
10
100
0.001 0.01 0.1 1 10 100
Du
pli
cate
Ass
ay V
alu
e (A
u p
pm
)
Original Assay Value (Au ppm)
Assays
Unbiased Line
Linear Regr.

Landore Resources Canada Inc. MINERAL RESOURCE ESTIMATE AND PRELIMINARY ECONOMIC ASSESSMENT, BAM Gold Project, Junior Lake Property, Ontario, Canada
Landore Resources Canada Inc. Page | 146
Figure 12-25 Q-Q’ Plot for Pulp Duplicate Samples – ALS (original) versus ActLabs (duplicates) for Period
2020-2021
Figure 12-26 Q-Q’ Plot for Coarse Reject Duplicate Samples – ALS (original) versus ActLabs (duplicates) for
Period 2020-2021
A summary of the results and performance of the duplicate sampling is outlined in Table 12-7.
The measurement of the relative precision error between paired duplicate sample data is based on
the average coefficient of variation (ACV). Approximate guidelines for assessing analytical quality
No. of Assays: 241
Orig: 0.0100
Dupl: 0.0090
Orig: 0.030
Dupl: 0.046
Orig: 0.130
Dupl: 0.126
Orig: 0.460
Dupl: 0.412
Orig: 1.130
Dupl: 1.020
Correlation Coefficient: 0.79
Slope: 0.98
Intercept: 0.06
Umpire Pulp Duplicates : Q-Q PlotOrig Lab = ALS & Dup Lab = ACT_Lab; Analyte = Au (ppm)
Landore; BAM
Summary Statistics
10th Perc.
25th Perc.
50th Perc.
75th Perc.
90th Perc.
10th Perc.
25th Perc.
50th Perc.
75th Perc.
90th Perc.
0.001
0.01
0.1
1
10
0.001 0.01 0.1 1 10
Du
pli
cate
Ass
ay V
alu
e (A
u p
pm
)
Original Assay Value (Au ppm)
Q-Q Assays
Unbiased Line
No. of Assays: 227
Orig: 0.1800
Dupl: 0.1502
Orig: 0.470
Dupl: 0.458
Orig: 1.260
Dupl: 1.160
Orig: 3.070
Dupl: 2.615
Orig: 5.598
Dupl: 4.730
Correlation Coefficient: 0.84
Slope: 0.85
Intercept: 0.67
25th Perc.
50th Perc.
75th Perc.
90th Perc.
Umpire Coarse Reject Duplicates : Q-Q PlotOrig Lab = ALS & Dup Lab = ACT_Lab; Analyte = Au (ppm)
Landore; BAM
Summary Statistics
10th Perc.
10th Perc.
25th Perc.
50th Perc.
75th Perc.
90th Perc.
0.01
0.1
1
10
100
0.01 0.1 1 10 100
Du
pli
cate
Ass
ay V
alu
e (A
u p
pm
)
Original Assay Value (Au ppm)
Q-Q Assays
Unbiased Line

Landore Resources Canada Inc. MINERAL RESOURCE ESTIMATE AND PRELIMINARY ECONOMIC ASSESSMENT, BAM Gold Project, Junior Lake Property, Ontario, Canada
Landore Resources Canada Inc. Page | 147
allows for a maximum ACV of around 40% for field duplicates in gold deposits with very coarse-
grained nuggetty gold and 30% for coarse to medium grain gold (Abzalov, 2006).
The results of the paired duplicate data analysis indicates that the duplicate data fails the Abzalov
(2006) test which prescribes an acceptable ACV below 30%. The control charts indicate no significant
bias between the original assays and the pulp duplicates for each of the laboratory control charts.
Table 12-7: Duplicate Sample Performance Summary (2020-2021)
Dup. Type Period No.
Orig. Samples
No. Dup.
Samples
%Ave Pair Mean
Difference %ACV
%Assay with 10%
%Assay with 20%
%Assay with 50%
Abzalov* score
Umpire Pulp Dup 2020-2021 241 241 - 5.5 32.7 31.5 50.6 78.8 Fail
Umpire Coarse Reject 2020-2021 227 227 - 13.2 37.5 21.6 41.0 77.1 Fail
TOTAL 468 468
* Reference for Abzalov (2006): ACV Fail at 10-20% threshold for Pulps; 20-30% threshold for
coarse duplicates.
12.4.4. QAQC Summary and Recommendations
The following summary and conclusions have been noted from the review.
• CRM and Blanks Performance:
o CRM and blanks insertion rate is considered acceptable for the recent drilling
completed during the 2020-2021 drilling programs.
o CRM and blanks inserted in batches at ALS overall have been performing well during
the 2020-2021 period.
o There is evidence of possible misclassification of CRMs during sample insertion
which should be investigated to ensure this is minimised.
o There are several outlier values, outside of the 3SD range which should be
investigated for any evidence of sample swapping or smearing.
• Duplicate Performance:
o The combined pulp and coarse duplicate sampling for the 2020 to 2021 have a lower
than acceptable insertion rate of 3%.
o For 2020-21, the combined duplicates contained inserted CRM and blanks which are
not included in the duplicate statistical analysis.
o All duplicate reviews from the laboratories comparison have an ACV which is higher
than the acceptable range for duplicates of this sample type (Pulp 10-20% or Reject
20-30%).
o The duplicate results are indicative of the “nuggety” nature of the gold
mineralization at BAM, where up to 1 mm visible gold specks have been regularly
logged in the diamond drill core. The erratic results observed in the RPMD plots
between the assays for the laboratories comparison for some samples is attributed
to the presence of coarse gold in the samples.
The following general recommendations are summarized below:
• Investigate the possible misclassification of CRMs during sample preparation.

Landore Resources Canada Inc. MINERAL RESOURCE ESTIMATE AND PRELIMINARY ECONOMIC ASSESSMENT, BAM Gold Project, Junior Lake Property, Ontario, Canada
Landore Resources Canada Inc. Page | 148
• Further analysis of the duplicate sampling is required, including re-analysis of duplicate
sample pulps where ACVs are high.
12.5. Screen Metallics Analysis
12.5.1. Screen Metallics Results – RPA 2016
During 2016, Landore re-submitted a total of 265 pulp samples and 20 reject samples derived from
the BAM Gold Deposit drill core to its primary analytical laboratory ALS Minerals of British Columbia
for screen metallics gold analysis (analysis code Au-SCR24) to check reproducibility of gold assays.
Landore commissioned RPA to carry out a preliminary analysis of the results from the screen metallic
analysis program in October 2016 (RPA, 2018). The analysis was carried out using the results from
216 samples from 16 drill holes on which both fire assays and screen metallic assays had been
carried out. RPA updated the results with 310 screen metallic assays taken in 2017 from 32 drill
holes, of which 264 had fire assay results. The updated conclusions included the following:
• Overall, the screen metallics assays correlate reasonably well with the fire assays, except
that the fire assays are higher on average than the metallics assays for values greater than
approximately 3 g/t Au.
• The 64 fire assays greater than 3 g/t Au average 8.54 g/t Au and the equivalent metallics
assays average 7.66 g/t Au (10% lower).
• It is not known why the fire assays are lower overall than the metallics assays for higher gold
values, but it may be related to the larger amount of material assayed in the latter.
• The fire assays correlate reasonably well with the screen metallic assays for values less than
approximately 3 g/t Au.
• The 200 fire assays less than 3 g/t Au average 0.82 g/t Au and the equivalent metallics assays
average 0.85 g/t (4% higher).
• For all 264 samples combined, the fire assays average 2.76 g/t Au and the equivalent
metallics assays average 2.51 g/t Au (10% higher).
• The coarse fraction weight averages 90 g and the fine fraction averages 700 g, with some
variability.
• Overall, 34% of the gold by weight is in the coarse fraction and 66% is in the fine fraction,
although proportions are quite variable.
• For fire assays over 1 g/t Au, 43% of the gold by weight is in the coarse fraction on average;
for assays under 1 g/t Au, 27% by weight is in the coarse fraction on average.
This data provides strong evidence to conclude that the presence of significant quantities of coarse
gold in a given sample plays an impact on the reproducibility of the assay results between the Fire
Assay and Screen Metallic assay methods. The data is in good agreement with the industry
experience that the smaller aliquot size used to prepare a Fire Assay sample relative to a Screen
Metallic sample is not always adequate when coarse gold is present in a sample.
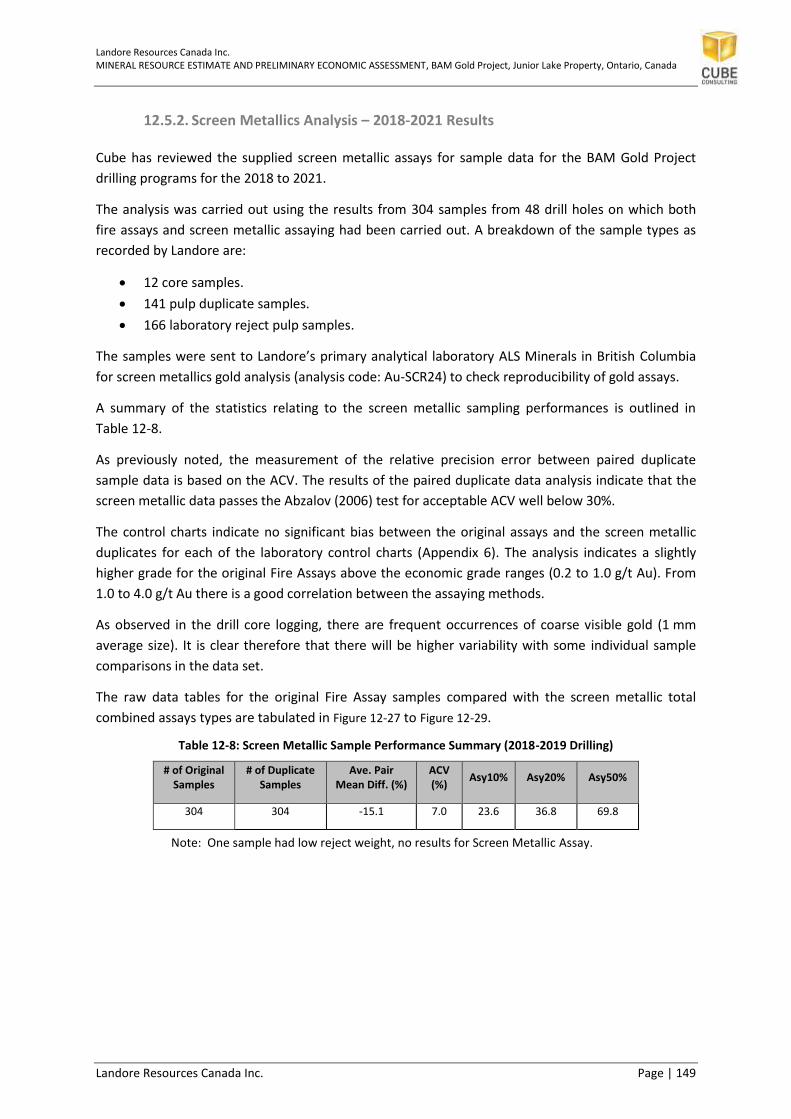
Landore Resources Canada Inc. MINERAL RESOURCE ESTIMATE AND PRELIMINARY ECONOMIC ASSESSMENT, BAM Gold Project, Junior Lake Property, Ontario, Canada
Landore Resources Canada Inc. Page | 149
12.5.2. Screen Metallics Analysis – 2018-2021 Results
Cube has reviewed the supplied screen metallic assays for sample data for the BAM Gold Project
drilling programs for the 2018 to 2021.
The analysis was carried out using the results from 304 samples from 48 drill holes on which both
fire assays and screen metallic assaying had been carried out. A breakdown of the sample types as
recorded by Landore are:
• 12 core samples.
• 141 pulp duplicate samples.
• 166 laboratory reject pulp samples.
The samples were sent to Landore’s primary analytical laboratory ALS Minerals in British Columbia
for screen metallics gold analysis (analysis code: Au-SCR24) to check reproducibility of gold assays.
A summary of the statistics relating to the screen metallic sampling performances is outlined in
Table 12-8.
As previously noted, the measurement of the relative precision error between paired duplicate
sample data is based on the ACV. The results of the paired duplicate data analysis indicate that the
screen metallic data passes the Abzalov (2006) test for acceptable ACV well below 30%.
The control charts indicate no significant bias between the original assays and the screen metallic
duplicates for each of the laboratory control charts (Appendix 6). The analysis indicates a slightly
higher grade for the original Fire Assays above the economic grade ranges (0.2 to 1.0 g/t Au). From
1.0 to 4.0 g/t Au there is a good correlation between the assaying methods.
As observed in the drill core logging, there are frequent occurrences of coarse visible gold (1 mm
average size). It is clear therefore that there will be higher variability with some individual sample
comparisons in the data set.
The raw data tables for the original Fire Assay samples compared with the screen metallic total
combined assays types are tabulated in Figure 12-27 to Figure 12-29.
Table 12-8: Screen Metallic Sample Performance Summary (2018-2019 Drilling)
# of Original Samples
# of Duplicate Samples
Ave. Pair Mean Diff. (%)
ACV (%)
Asy10% Asy20% Asy50%
304 304 -15.1 7.0 23.6 36.8 69.8
Note: One sample had low reject weight, no results for Screen Metallic Assay.

Landore Resources Canada Inc. MINERAL RESOURCE ESTIMATE AND PRELIMINARY ECONOMIC ASSESSMENT, BAM Gold Project, Junior Lake Property, Ontario, Canada
Landore Resources Canada Inc. Page | 150
Figure 12-27 RMPD Chart for Screen Metallics Samples – Pulp Duplicates for Period 2016-2021
Figure 12-28 Scatter Plot for Screen Metallics Samples – Pulp Duplicates for Period 2016-2021
Figure 12-29 Q-Q’ Plot for Screen Metallics Samples – Pulp Duplicates for Period 2016-2021

Landore Resources Canada Inc. MINERAL RESOURCE ESTIMATE AND PRELIMINARY ECONOMIC ASSESSMENT, BAM Gold Project, Junior Lake Property, Ontario, Canada
Landore Resources Canada Inc. Page | 151
The updated conclusions included the following:
• Overall, the screen metallics assays correlate well with the fire assays, except that the fire
assays are higher on average than the metallics assays for values above 0.1 g/t Au.
• The coarse fraction weight averages 80 g and the fine fraction averages 894 g, with some
variability.
• Overall, 8% of the gold by weight is in the coarse fraction and 92% is in the fine fraction,
although proportions are quite variable.
As previously noted from the 2016-2017 analysis, there was strong evidence to suggest that the
presence of significant quantities of coarse gold in a given sample makes an impact on the
reproducibility of the assay results between the Fire Assay and Screen Metallic assay methods. RPA
concluded that the data is in good agreement with the industry experience that the smaller aliquot
size used to prepare a Fire Assay sample relative to a Screen Metallic sample is not always adequate
when coarse gold is present in a sample.
However, the results from the 2018 analysis are less variable and may be the result of larger HQ half
core sample size for some diamond core holes used for the original Fire Assaying having improved
the reproducibility of the assay results between the Fire Assay and Screen Metallic assay methods.
12.6. Bulk Density Determinations
12.6.1. Bulk Density Methodology
Bulk Density (BD) measurements are determined and based on samples taken by Landore staff at
the Junior Lake exploration camp.
BD measurements were taken where there was visible mineralization, and at three metres intervals
in select holes for background measurements. The methodology is described as follows:
• BD was measured utilizing a Denver Instrument Model PI-2002 scale, accurate to 0.01 gram.
The scale was securely setup on a sturdy table and levelled.
• A plastic weighting basket was suspended beneath the scale so that it is completely
submerged in a pail of water (at room temperature) and then the scale is calibrated to read
zero.
• The dry sample is weighted on the scale and the dry weight (DW) recorded. The sample is
then placed in the basket, completely submerged in the water and the wet weight (WW) is
recorded.
• All dry and wet weights are entered into an Excel spreadsheet and the BD is calculated using
the following formula: BD=DW/DW-WW
A total of 10,390 BD samples from 303 holes have been taken up to January 2022, representing 25%
of all samples taken at BAM for analysis. The amount of BD samples is considered a good
representation of all material types across the BAM Project area.

Landore Resources Canada Inc. MINERAL RESOURCE ESTIMATE AND PRELIMINARY ECONOMIC ASSESSMENT, BAM Gold Project, Junior Lake Property, Ontario, Canada
Landore Resources Canada Inc. Page | 152
The BD methodology is considered adequate for the rock material types at the BAM Gold Project.
There are no oxide/transition zones present within the sequence, and no porous or ‘vuggy’ zones
within the rock units below the shallow overburden material.
12.6.2. Bulk Density Results
From BD determinations calculated from core samples collected by Landore for the BAM Gold
Project area, the basic statistics representative of the main lithology types is summarized in Table
12-9. A total of 12 BD samples were excluded from the BD statistics, including very low and very high
outlier values, or values with negative readings.
Table 12-9: BAM Gold Project - Bulk Density Statistics by Rock Type (up to January 2022)
Description
Material Type
BAM - metasediments
GPS - mafic HW
MLS - basalt FW
BIF and MSS/SMS
zones
Felsic - Dykes
Vein Quartz
Ultramafic
No. of Samples 2,069 5,810 1,297 97 842 22 422
Minimum (t/m3) 1.80 1.25 2.48 2.02 1.77 2.63 2.70
Maximum (t/m3) 4.66 7.75 6.20 4.71 4.38 2.77 3.57
Mean (t/m3) 2.82 2.84 2.93 3.33 2.73 2.67 2.96
Median (t/m3) 2.79 2.82 2.93 3.32 2.72 2.65 2.97
Std Dev 0.157 0.120 0.172 0.487 0.095 0.036 0.096
Variance 0.025 0.014 0.030 0.238 0.009 0.001 0.009
Coeff Var 0.056 0.042 0.059 0.146 0.035 0.013 0.033
Figure 12-30 to Figure 12-32 graphically show the normal distribution of the BD results for the three
main material types.

Landore Resources Canada Inc. MINERAL RESOURCE ESTIMATE AND PRELIMINARY ECONOMIC ASSESSMENT, BAM Gold Project, Junior Lake Property, Ontario, Canada
Landore Resources Canada Inc. Page | 153
Figure 12-30: BD Statistics– Normal Distribution Plot for BAM Sequence (January 2022)
Figure 12-31: BD Statistics– Normal Distribution Plot for GPS – Hangingwall Unit (January 2022)

Landore Resources Canada Inc. MINERAL RESOURCE ESTIMATE AND PRELIMINARY ECONOMIC ASSESSMENT, BAM Gold Project, Junior Lake Property, Ontario, Canada
Landore Resources Canada Inc. Page | 154
Figure 12-32: BD Statistics– Normal Distribution Plot for MLS – Footwall Basalt Unit (January 2022)
12.7. Principal Authors Statement
In Cube’s opinion, the drilling, logging, and sampling procedures at the BAM Gold Project have been
carried out according to industry standards and are suitable for the preparation of geological
modelling and Mineral Resource estimation.
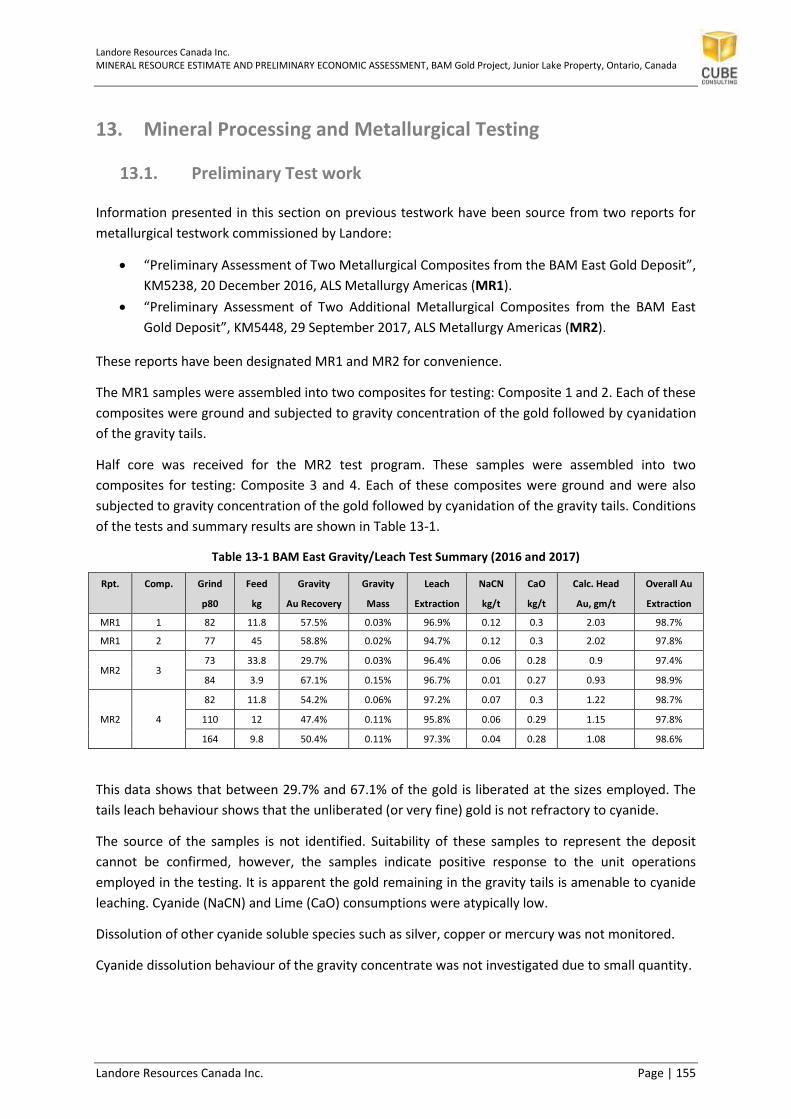
Landore Resources Canada Inc. MINERAL RESOURCE ESTIMATE AND PRELIMINARY ECONOMIC ASSESSMENT, BAM Gold Project, Junior Lake Property, Ontario, Canada
Landore Resources Canada Inc. Page | 155
13. Mineral Processing and Metallurgical Testing
13.1. Preliminary Test work
Information presented in this section on previous testwork have been source from two reports for
metallurgical testwork commissioned by Landore:
• “Preliminary Assessment of Two Metallurgical Composites from the BAM East Gold Deposit”,
KM5238, 20 December 2016, ALS Metallurgy Americas (MR1).
• “Preliminary Assessment of Two Additional Metallurgical Composites from the BAM East
Gold Deposit”, KM5448, 29 September 2017, ALS Metallurgy Americas (MR2).
These reports have been designated MR1 and MR2 for convenience.
The MR1 samples were assembled into two composites for testing: Composite 1 and 2. Each of these
composites were ground and subjected to gravity concentration of the gold followed by cyanidation
of the gravity tails.
Half core was received for the MR2 test program. These samples were assembled into two
composites for testing: Composite 3 and 4. Each of these composites were ground and were also
subjected to gravity concentration of the gold followed by cyanidation of the gravity tails. Conditions
of the tests and summary results are shown in Table 13-1.
Table 13-1 BAM East Gravity/Leach Test Summary (2016 and 2017)
Rpt. Comp. Grind Feed Gravity Gravity Leach NaCN CaO Calc. Head Overall Au
p80 kg Au Recovery Mass Extraction kg/t kg/t Au, gm/t Extraction
MR1 1 82 11.8 57.5% 0.03% 96.9% 0.12 0.3 2.03 98.7%
MR1 2 77 45 58.8% 0.02% 94.7% 0.12 0.3 2.02 97.8%
MR2 3 73 33.8 29.7% 0.03% 96.4% 0.06 0.28 0.9 97.4%
84 3.9 67.1% 0.15% 96.7% 0.01 0.27 0.93 98.9%
MR2 4
82 11.8 54.2% 0.06% 97.2% 0.07 0.3 1.22 98.7%
110 12 47.4% 0.11% 95.8% 0.06 0.29 1.15 97.8%
164 9.8 50.4% 0.11% 97.3% 0.04 0.28 1.08 98.6%
This data shows that between 29.7% and 67.1% of the gold is liberated at the sizes employed. The
tails leach behaviour shows that the unliberated (or very fine) gold is not refractory to cyanide.
The source of the samples is not identified. Suitability of these samples to represent the deposit
cannot be confirmed, however, the samples indicate positive response to the unit operations
employed in the testing. It is apparent the gold remaining in the gravity tails is amenable to cyanide
leaching. Cyanide (NaCN) and Lime (CaO) consumptions were atypically low.
Dissolution of other cyanide soluble species such as silver, copper or mercury was not monitored.
Cyanide dissolution behaviour of the gravity concentrate was not investigated due to small quantity.

Landore Resources Canada Inc. MINERAL RESOURCE ESTIMATE AND PRELIMINARY ECONOMIC ASSESSMENT, BAM Gold Project, Junior Lake Property, Ontario, Canada
Landore Resources Canada Inc. Page | 156
13.2. Recent Test work
Phase 1 metallurgical work conducted by Landore is documented in a report “BAM Project –
Metallurgical Report – Phase 1”, 11 January 2019, Allard Engineering Services LLC (Allard, 2019). This
document is referred to as the “Met. Report” in the discussions. The reader is referred to this report
for more in-depth discussion of the Phase 1 Metallurgical Testing and detailed test reporting.
Landore commissioned additional metallurgical test work in 2018. This testing, identified as Phase 1,
included gravity separation, flotation, and cyanide leaching using both column leaching of coarser
sizes and bottle roll leaching of fine ground pulp.
Drill core from the Landore’s BAM Project at the Junior Lake Concession was delivered to Base
Metals Laboratory in Kamloops, BC for Phase 1 metallurgical testing. The metallurgical testing
reported in this study was supervised by Geoff Allard of Allard Engineering Services LLC, Tucson,
Arizona USA.
A summary of the main findings and recommendations is outlined as follows:
Test program observations:
1. Significant free gold is present in the composite tested.
2. High extractions of gold are achievable with grinding, gravity separation (+65%), and cyanide
leaching (+95%) with overall extractions around 98%.
3. Cyanide and lime consumptions were low in the leaching tests.
4. Liberation of gold particles is reduced in size-fractions above 300 µm.
5. Flotation of the BAM composite achieved reasonable extractions of gold, albeit at low
concentrate grades.
6. Heap leaching with fine crushing and agglomeration can achieve acceptable extractions of
gold (±84% at test conditions).
7. In fine-ground material, gold occurs predominantly as coarse liberated particles and as
attachments and inclusions in chlorite and cobaltite. Minor quantities of gold are associated
with tellurides.
8. Cyanide leach extractions of gold at sizes below 300 µm do not appear to be dependent on
particle size.
9. Sparging agitation leach tests with oxygen improves the extraction of gold over sparging
with air.
10. Reasonable variations of cyanide concentration and percent solids do not appear to
influence gold extractions from agitated leach tests at typical grind sizes.
11. Agitation leach pulps are amenable to Carbon in Leach/Carbon in Pulp operations.
12. Silver and copper species are present in the ore but only partially dissolved by cyanide.
Based on the current level of testing, the following recommendations are made:
1. Eliminate flotation as a viable unit operation.
2. Develop further understanding of a milling/gravity/leach circuit. This would require
investigation of the following:
o Variability of the deposit for physical properties and amenability to the flowsheet.

Landore Resources Canada Inc. MINERAL RESOURCE ESTIMATE AND PRELIMINARY ECONOMIC ASSESSMENT, BAM Gold Project, Junior Lake Property, Ontario, Canada
Landore Resources Canada Inc. Page | 157
o HPGR (High Pressure Grinding Roll) crushing as a way to increase the gold liberation.
o Rheology/filtration/thickening tests on ground and cyanided pulps.
o Gravity-recoverable gold tests to establish a baseline.
o Cyanide destruction in slurried tails.
o Gold loading tests on activated carbon from pulps.
o Cyanidation of gravity concentrate.
3. Develop additional understanding on the viability of heap leaching. This would require
investigation of the following:
o Cold temperature leach extraction rate.
o Heap stability testing to determine agglomeration requirements and allowable heap
height.
o HPGR crushing as a way to increase gold extraction rate.
o Effect of cyanide cure on extraction rate.
o Effect of application rate on leach extraction.
o Gold loading tests on activated carbon in leach solutions.

Landore Resources Canada Inc. MINERAL RESOURCE ESTIMATE AND PRELIMINARY ECONOMIC ASSESSMENT, BAM Gold Project, Junior Lake Property, Ontario, Canada
Landore Resources Canada Inc. Page | 158
14. Mineral Resource Estimate
14.1. Data Sources
The MRE for BAM Gold Project is based on the data available and validated by Cube up to 14 January
2022, and consisting of:
• Drill hole data as an ASCII file format (*.txt) and also MS Excel data files
• Topographic survey file made available as elevations in DXF format
• Geological logging sheets in PDF format
• Cross sections showing all drilling, including 2020-2021 holes with site interpretations (PDF
format)
• Digital photos of diamond drill core (JPG format)
• Surface geochemistry sampling results in MS Excel format.
All other data files relating to the 2022 MRE are original work files that have been created by Cube.
14.2. Drilling Database
Collar, survey, assay, geology and other relevant drilling data as at 14 January 2022 were validated
prior to importing into a Cube standard and structured MS Access database, which was then ODBC
mapped to Surpac and labelled as follows:
• MS Access Database: BAM_MRE_DB_2021_12_10.mdb
• Surpac database ODBC link: BAM_MRE_DB_2021_12_10.ddb.
Further validation checks in Surpac were carried out and minor corrections were made in the MS
Access database, prior to wireframe interpretation and subsequent modelling and grade
interpolation work.
14.2.1. Local Grid Conversion
The drill hole collar records were supplied with both NAD 83 Zone 16 UTM coordinate system and
local grid co-ordinates for eastings, northings and elevation. The majority of drilling completed up to
December 2021 has been drilled on a spacing of 50 m x 50 m or 100 m x 50 m on local mine grid
north-south sections. The old local grid is 003o west of the UTM grid north. All drilling was carried
out from surface. All coordinates in this report are defined using the NAD 83 Zone 16 UTM
coordinate system and are expressed in metric units.
An example of the local grid setup is shown in Figure 14-1.

Landore Resources Canada Inc. MINERAL RESOURCE ESTIMATE AND PRELIMINARY ECONOMIC ASSESSMENT, BAM Gold Project, Junior Lake Property, Ontario, Canada
Landore Resources Canada Inc. Page | 159
Figure 14-1: Plan of Junior Lake Grid (in blue) in Relation to the UTM Grid for the BAM Gold Project Area (as at 14 January 2022)

Landore Resources Canada Inc. MINERAL RESOURCE ESTIMATE AND PRELIMINARY ECONOMIC ASSESSMENT, BAM Gold Project, Junior Lake Property, Ontario, Canada
Landore Resources Canada Inc. Page | 160
14.2.2. Database Structure
All the supplied drill hole data was compiled into a Cube structured MS Access drill hole database (BAM_MRE_DB_2021_12_10.mdb). The MS Access database was then mapped to Surpac. A description of the database and the relevant tables and main fields are noted in Table 14-1.
Table 14-1: Cube Drill Drill hole Database Structure used for BAM 2022 MRE (as at 14 January 2022)
DB Table DB Field Description DB Table DB Field Description
Collar
hole_id Hole Name
Geology
hole_id Hole Name
x Collar Easting depth_from Interval Depth From
y Collar Northing depth_to Interval Depth To
z Collar RL interval DH logging interval length
max_Depth Total Hole Depth Lith_Plot Adjusted Main Lithology code for Surpac
hole_path Downhole trace (Linear or Curved)
Lith_Plot2 Logged Secondary Lithology code
hole_size Core Size (e.g. NQ, HQ) Major_Unit
Code Landore Rock Code description
Resource Used in 2022 MRE (Y or N)
Core Recovery
hole_id Hole Name
Local Grid coordinates
Local grid Easting and Northing
depth_from Interval Depth From
Program Program description depth_to Interval Depth To
Year Drilled Year Drilled interval DH Sample interval length, calculated
Rank Completeness of data; design v. survey
rec_m Core recovery measured (m)
Collar Dip/Azi Planned collar dip and azimuth
rec_pct Core recovery calculated (%)
Survey
hole_id Hole Name RQD_m RQD measured metres
depth Downhole Depth of Survey RQD_pct RQD & calculated
dip Drill hole Inclination core_size diamond drill core size
azimuth Drill hole Azimuth (MGA) or Mag Azimuth
Density
hole_id Hole Name
Local, Mag Azi Local and Magnetic azimuths recorded
samp_id Sample Id
dhs_method Downhole survey method depth_from Interval Depth From
Resource Used in 2022 MRE (Y or N) depth_to Interval Depth To
Assay
hole_id Hole Name BD_use bulk density value, errors corrected
samp_id Sample Id DRY_Ma Dry Weight - measured
depth_from Interval Depth From WET_Mw Wet Weight - measured
depth_to Interval Depth To Vol_Vc Volume - calculated
interval DH Sample interval length BD_calc bulk density value - calculated
au_use Assay used in estimate (Au ppm)
Zonecode
hole_id Hole Name
au_ppm_FA50 Fire Assay (FA50 - Au ppm) depth_from Interval Depth From
au_PPB_FA50 Fire Assay (FA50 - Au ppb) depth_to Interval Depth To
Au_ppm_SFA Screen Metallic Assay (Au ppm)
length mineralization interval
sample_type Sample type (e.g. half core) zone_code Gold mineralization domain number
Note: Main database fields only listed.

Landore Resources Canada Inc. MINERAL RESOURCE ESTIMATE AND PRELIMINARY ECONOMIC ASSESSMENT, BAM Gold Project, Junior Lake Property, Ontario, Canada
Landore Resources Canada Inc. Page | 161
For the 2022 MRE database, a validated assay field was added by Cube into the assay table
(‘au_use’) to convert gold values to Au ppm and also to convert any intercepts that have negative
values or null values in the primary Au field (‘Au_ppb FA50’).
MS Access database (BAM_MRE_DB_2021_12_10.mdb) compiled from drilling data exported from
Landore’s database, has been used as the source of data for the January 2022 MRE work completed
by Cube.
14.2.1. Database Compilation
A breakdown of hole types and drill hole statistics used for the MRE work is summarized in Table
14-2. The statistics show that on average, 65% of the drill core in each hole has been sampled. The
drilling statistics also show that for each drilling period summarized by year, 100% of each drill hole
has been geologically logged.

Landore Resources Canada Inc. MINERAL RESOURCE ESTIMATE AND PRELIMINARY ECONOMIC ASSESSMENT, BAM Gold Project, Junior Lake Property, Ontario, Canada
Landore Resources Canada Inc. Page | 162
Table 14-2: Summary of Samples by Hole Type used for BAM 2022 MRE (as at 14 January 2022)
Year Prefix # of holes Metres
Drilled (m) Ave Hole
Depth # DH
Surveys # samples
Sample Metres (m)
Ave Sample Interval
(m)
% of Holes
Sampled
# logging records
Logged Metres (m)
% of Holes
Logged
# BD Samples
2003 0403- 6 438.00 73.00 19 234 193.58 0.83 44% 102 438.00 100% -
2015 0415- 2 215.93 107.97 45 196 188.40 0.96 87% 85 215.93 100% 28
2016 0416- 41 8,219.62 200.48 2,475 6,012 6,602.88 1.10 80% 2,297 8,219.62 100% 1,767
2017 0417- 63 11,056.25 175.50 2,401 8,123 8,156.00 1.00 74% 3,136 11,056.25 100% 1,967
2018 0418- 57 12,672.51 222.32 3,770 7,724 7,634.75 0.99 60% 4,209 12,672.51 100% 2,691
2019 0419- 38 5,945.85 156.47 1,934 3,759 3,541.02 0.94 60% 2,413 5,945.85 100% 1,416
2020 0420- 28 6,413.83 229.07 1,044 3,751 3,532.44 0.94 55% 1,716 6,235.91 97% 604
2021 0421- 74 17,757.04 239.96 5,055 11,590 11,086.00 0.96 62% 4,538 15,323.55 86% 1,917
TOTAL 309 62,719.03 202.97 16,743 41,389 40,935.07 0.99 65% 18,496 60,107.62 96% 10,390

Landore Resources Canada Inc. MINERAL RESOURCE ESTIMATE AND PRELIMINARY ECONOMIC ASSESSMENT, BAM Gold Project, Junior Lake Property, Ontario, Canada
Landore Resources Canada Inc. Page | 163
14.2.2. Treatment of Below Detection and Null Samples
During database validation and verification by Cube, the following changes were made to the Cube
MS Access database in relation to below detection limit (BDL) samples, negative values and any
‘Null’ values.
Unsampled intervals or interval gaps were left blank (i.e. ‘null’ values). There were no unsampled
intervals within the mineralization domain zones for the 2022 MRE and therefore this did not affect
the gold compositing routine and subsequent grade interpolation work.
All assay data within the BAM MRE area below detection limit values have been entered as a small
value of 0.005 ppm Au, which is half the lowest common value reported in the primary Au ppb
analysis (10 ppb Au).
The other negative values recorded, (-5 and -7) were recorded for drill holes not within the BAM
mineralization zones and subsequently ignored in the 2022 MRE work.
Table 14-3: Treatment of BDL Samples and Null Values used for BAM 2022 MRE (as at 14 January 2022)
Period Landore DB
(Au_ppb Field)
No. of records Cube 'Au_use'
Field (ppm) Comments
2022 Update
<10 260 0.005 Assigned half detection limit
Null 104 -2 Ignored in MRE (0420-737, 0420-752)
Pre-2020 Data
-1 10644 0.005 Assigned half detection limit
-5 61 0.005 Drilled 2001-03: Samples not used in MRE.
-7 300 0.005 Drilled 2005-06: Samples not used in MRE.
Null 1 -2 Drilled 2006: Samples not used in MRE.
14.3. Geology and Mineralization Models
14.3.1. Topography and Overburden Surfaces
A topographic surface wireframe file in DXF format was supplied by Landore for the 2022 MRE and
imported into Surpac, validated and saved as a DTM surface.
An overburden surface DTM was interpreted for the 10-15 m thick glacial till, which acted as a
boundary with the interpreted lithological units and mineralization domains underneath.
A description of the validated file names which were saved as DTM surfaces is outlined in Table 14-4.
Table 14-4: Topographic and Overburden DTM Surfaces -Names and Descriptions (January 2022))
Description Landore File Name (.dxf) Cube File Name
(*.dtm/str) Comments
Topographic surface
DTM_ATLIS_0809_Z_contours_2 bam_topo_surface_2018 Topographic surface DTM layer clipped to block model area from 2018 survey
Overburden Surface
NA bam_ob_surface_dec_2021 Updated Overburden contact surface with primary lithology units.

Landore Resources Canada Inc. MINERAL RESOURCE ESTIMATE AND PRELIMINARY ECONOMIC ASSESSMENT, BAM Gold Project, Junior Lake Property, Ontario, Canada
Landore Resources Canada Inc. Page | 164
The overburden boundary was also used to assign bulk density assignment for overburden material
above the different lithological units.
14.3.2. Geological and Structural Interpretations
Data used for the creation of 3DM wireframes for the 2022 MRE were sourced from the recent hard
copy cross section and plan interpretations from logging and sampling data based on a consistent
drill spacing of 50 m x 50 m. The logging information has been used by Landore to interpret
stratigraphic units, major structural features (major faults) and mineralization trends.
There were no definitive interpreted dyke intrusives modelled from the logging data, but surface
outcrop exposures show numerous dyke intrusives (tonalite and dolerite) and minor scale faulting.
These structures are likely to have an influence over morphology, volume and grade continuity at a
local scale.
Geological and structural interpretations were reviewed and edited in Leapfrog and Surpac in plan,
cross section and 3D views. Plan view slices were used to check the trends of the moderate to
steeply dipping lithology and potential fault offsets against recent geological interpretations by
Landore.
A listing of the lithological and structural 3DM wireframe interpretations is provided in Table 14-5
and illustrated in Figure 14-2.
Table 14-5: 3DM Geological Interpretation Files Names and Descriptions (January 2022)
Description Cube File Name
(*.dtm/str) Cube Comments
Planar DTM of Fault Interpretations
bam_geo_fz_2021 Interpretations based on surface regional geology interpretations and geophysics
Lithology 3DM - BAM Sequence
bam_geo_su_2021 BAM metasediment sequence based on site geology cross section interpretations
Lithology 3DM - Grassy Pond Sill
bam_geo_gps_bdy_2021 Hanging Wall GPS unit - boundary with BAM sequence, based on site geology cross section interpretations
Lithology 3DM - Marshal Lake Group Lith Unit
bam_geo_mls_bdy_2021 Footwall MLS unit - boundary with BAM sequence, based on site geology cross section interpretations

Landore Resources Canada Inc. MINERAL RESOURCE ESTIMATE AND PRELIMINARY ECONOMIC ASSESSMENT, BAM Gold Project, Junior Lake Property, Ontario, Canada
Landore Resources Canada Inc. Page | 165
Figure 14-2: Plan of BAM Sequence 3DM Interpretation and Fault Structures with Drill Coverage (January 2022)
Fault Interpretations
BAM Sequence (meta-sediments)

Landore Resources Canada Inc. MINERAL RESOURCE ESTIMATE AND PRELIMINARY ECONOMIC ASSESSMENT, BAM Gold Project, Junior Lake Property, Ontario, Canada
Landore Resources Canada Inc. Page | 166
14.3.3. Mineralization Interpretations
The interpretation of the gold mineralization domain boundaries was guided by the orientation of
the main lithological units in 3D, observations noted from Landore hard copy sections, and
observations from diamond drill core viewed on site and from core photos. Descriptions of
alteration, mineral assemblages and grade distribution within each host lithological units were also
used to inform mineralization domain boundaries.
All mineralization domain outlines were modelled to a nominal grade cut-off of approximately
0.2 g/t Au which allowed the model shapes to have optimum continuity. The use of this low-grade
threshold has resulted in some areas having simplified mineralized domains encompassing
discontinuous tabular shapes.
Sectional interpretations were then used to create 3DM wireframe models based on analysis of all
the relevant information collated. In order of priority, gold mineralization zones were interpreted
based on the following methodology:
• Creation of 50 m north-south cross section reference lines in Surpac along the drilling fences
approximate to the local grid reference line number.
• Review of Landore geologists’ hand drawn cross-sections and logging descriptions.
• Core photos, where available, were used to visually identify mineralized zones.
• Mineralized domains were digitized on cross-section using 3D strings and then wireframed
to generate solids.
• Interpretation strings were snapped to drill holes along the defined mineralization
boundaries for later flagging of estimation domain codes into the MS Access database.
• End sections were projected to the distance of the average drill hole spacing along strike of
50 m.
• Projection down dip was extended to 0 m RL, ~50 to 100 m below the deepest drill hole for
the main BAM Sequence hosted mineralization.
• Projection down dip was confined to projected plunge and dip for minor mineralization
zones, on average ~25 m past the deepest hole.
• Review of interpretation in long section and plan view flitches, then editing in 3D space.
• Final validation checks of 3D wireframe and volume checks.
A listing of the mineralization 3DM wireframe interpretations is provided in Table 14-6. A total of 28
Au mineralization domains were modelled for the January 2022 MRE.

Landore Resources Canada Inc. MINERAL RESOURCE ESTIMATE AND PRELIMINARY ECONOMIC ASSESSMENT, BAM Gold Project, Junior Lake Property, Ontario, Canada
Landore Resources Canada Inc. Page | 167
Table 14-6: 3DM Mineralization Domain Files Names and Descriptions (January 2022)
Zones Cube File Name (*.dtm/str) Cube Comments
BAM Main Zone min_dom_v2_1001 BAM sequence Main Zone - HW
BAM Main Zone min_dom_v2_1002 BAM sequence Main Zone - FW
BAM Main Zone min_dom_v2_1003 GPS Main Zone - HW1
BAM Main Zone min_dom_v2_1004 GPS Main Zone - HW2
BAM Main Zone min_dom_v2_1005 GPS Main Zone - HW3
BAM Main Zone min_dom_v2_1006 GPS Main Zone - HW4
BAM Main Zone min_dom_v2_1007 BAM Main Zone - FW contact
BAM Main Zone min_dom_v2_1008 GPS Main Zone - HW5
BAM East min_dom_v2_2001 BAM East Zone - HW
BAM East min_dom_v2_2002 BAM East Extension - HW
BAM East min_dom_v2_2003 BAM East Zone - FW contact
BAM East min_dom_v2_2004 GPS East Zone - HW1
BAM East min_dom_v2_2005 GPS East Zone - HW2
BAM West min_dom_v2_3001 BAM West Zone -HW
BAM West min_dom_v2_3002 BAM West Zone -FW
BAM West min_dom_v2_3003 GPS West Zone - HW1
BAM West min_dom_v2_3004 GPS West Zone - HW2
BAM West min_dom_v2_3005 GPS West Zone - HW3
BAM West min_dom_v2_3006 GPS West Zone - HW4
BAM West min_dom_v2_3007 GPS West Zone - HW5
BAM West min_dom_v2_3008 GPS West Zone - HW6
BAM West min_dom_v2_3009 GPS West Zone - FW contact
BAM West min_dom_v2_3010 GPS West Ext Zone - HW8
BAM West min_dom_v2_3011 GPS West Ext Zone - HW9
BAM West min_dom_v2_3012 GPS West Ext Zone - HW10
A plan view of the all the gold mineralization domains interpretations illustrates the relatively simple
strike orientation, dimensions and continuity of gold mineralization (Figure 14-3).
Factors Affecting Geological and Grade Continuity
• Grade distribution plots were created in Surpac to assist with assessing grade continuity
along strike, down dip, and to assess if any down plunge component was apparent. The main
BAM zone gold mineralization displays good continuity along strike for ~800 m with an
apparent WSW plunge component of ~16°.
• The main BAM Sequence hosting gold mineralization was guided by the Hanging wall (HW)
contact within the GPS unit (gabbro). Gold mineralization often crosses the HW contact, so
there does not appear to be a consistent boundary directly on the contact.
• Within the BAM sequence, the main mineralization grade varies, as evident from the visible
gold observed in the drill core. In some sections, the domain interpretations were drawn to
include intervals in the drill holes where the average grades did not meet the nominal cut-
off grade criteria (0.2 g/t Au). It is likely some of these low-grade zones are due to the post
mineralization dike intrusives.
• Minor mineralization domains occur along the BAM sequence footwall (FW) contact and
within sheared and altered “lensoidal” zones within the hanging wall sequence. Gold
mineralization tends to be less continuous and narrower outside of the main BAM Sequence
host unit.

Landore Resources Canada Inc. MINERAL RESOURCE ESTIMATE AND PRELIMINARY ECONOMIC ASSESSMENT, BAM Gold Project, Junior Lake Property, Ontario, Canada
Landore Resources Canada Inc. Page | 168
Figure 14-3: Plan of BAM Gold Mineralization 3DM Interpretations with Drill Coverage (January 2022)
Main BAM Gold Mineralisation Trend
West Extension Mineralisation
Domains
Eastern Extension Mineralisation
Domains
Line 900 E
Line 2850 E
Line 1000 E
Line 2700 E
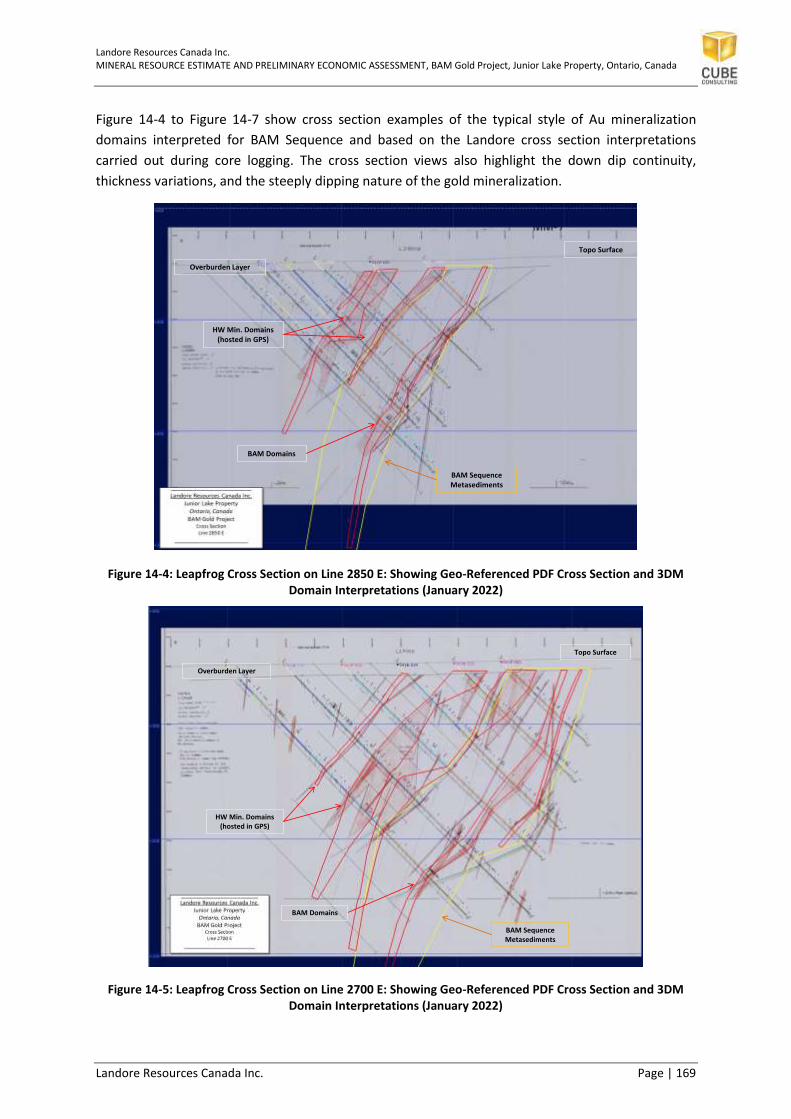
Landore Resources Canada Inc. MINERAL RESOURCE ESTIMATE AND PRELIMINARY ECONOMIC ASSESSMENT, BAM Gold Project, Junior Lake Property, Ontario, Canada
Landore Resources Canada Inc. Page | 169
Figure 14-4 to Figure 14-7 show cross section examples of the typical style of Au mineralization
domains interpreted for BAM Sequence and based on the Landore cross section interpretations
carried out during core logging. The cross section views also highlight the down dip continuity,
thickness variations, and the steeply dipping nature of the gold mineralization.
Figure 14-4: Leapfrog Cross Section on Line 2850 E: Showing Geo-Referenced PDF Cross Section and 3DM Domain Interpretations (January 2022)
Figure 14-5: Leapfrog Cross Section on Line 2700 E: Showing Geo-Referenced PDF Cross Section and 3DM Domain Interpretations (January 2022)
Topo Surface
Overburden Layer
BAM Domains
HW Min. Domains (hosted in GPS)
BAM Sequence Metasediments
Topo Surface
Overburden Layer
BAM Domains
HW Min. Domains (hosted in GPS)
BAM Sequence Metasediments

Landore Resources Canada Inc. MINERAL RESOURCE ESTIMATE AND PRELIMINARY ECONOMIC ASSESSMENT, BAM Gold Project, Junior Lake Property, Ontario, Canada
Landore Resources Canada Inc. Page | 170
Figure 14-6: Leapfrog Cross Section on Line 1000 E: Showing Geo-Referenced PDF Cross Section and 3DM Domain Interpretations (January 2022)
Figure 14-7: Leapfrog Cross Section on Line 900 E: Showing Geo-Referenced PDF Cross Section and 3DM Domain Interpretations (January 2022)
Topo Surface
Overburden Layer
BAM Domains
HW Min. Domains (hosted in GPS)
BAM Sequence Metasediments
Topo Surface
Overburden Layer
BAM Domains
HW Min. Domains (hosted in GPS)
BAM Sequence Metasediments

Landore Resources Canada Inc. MINERAL RESOURCE ESTIMATE AND PRELIMINARY ECONOMIC ASSESSMENT, BAM Gold Project, Junior Lake Property, Ontario, Canada
Landore Resources Canada Inc. Page | 171
Resource Dimensions
The 2020-2021 drilling has continued to show the close association between gold mineralization and
the VTEM geophysical anomaly trend. The BAM gold mineralization trend has now been confirmed
by diamond drilling over a strike length 5.0 km and is now drilled from the local grid Line 200W to
Line 4100E.
Drill testing has confirmed gold mineralization within the main BAM zone extends from below the
glacial till overburden (~10 m average depth) surface to a maximum vertical depth of approximately
380 m. The maximum width of the gold mineralization envelope being approximately 50 m, down to
a minimum mining width of 2 m
There are minimal changes in strike and dip of the mineralization across the sequence, and there is
very good continuity overall from east to west for the main BAM mineralization, but this is likely to
be affected locally by minor faulting and dolerite dyke intrusives, disrupting the mineralization
trends.
For the previous 3DM interpretations in 2018 and 2019, the main BAM mineralization was projected
further along strike and down dip for conceptual modelling and drill targeting within the BAM
sequence. The 2020-2021 infill, depth extension and step out drilling has confirmed these
projections of the host unit, along with identifying significant zones of mineralization in the GOS
hanging wall unit.
The main BAM mineralization is steeply south dipping which narrows to both the west and east,
although drill lines 200 m away in both directions have intersected significant mineralization along
the general strike of the main anomalous trend. Currently the gold mineralization hosted within the
BAM sequence remains open to the east and west and down dip.
Changes from Previous Interpretations
The major change compared to previous interpretations prior to the 2018 drilling program has been
the broadening of the main BAM mineralization domain along the HW contact with the GPS unit and
including internal waste zones of up to 3 m downhole, or ~2 m true width. Previous interpretations
included very narrow domaining of high-grade zones within the BAM Sequence. Many of these sub-
domains were in close proximity and were not consistent in orientation and true thickness from one
section to the next. With the likelihood of open pit mining methods, broader domaining with
minimum open pit single mining unit (SMU) width (2.0 m) was used as a guide for updated
interpretation width threshold.
Interpretations prior to 2018 for the minor HW mineralization contained very low-grade intervals, or
across unsampled intervals. For the 2022 MRE, these zones were interpreted as more discrete gold
mineralization envelopes in order to define any zones that may contain higher grade pods large
enough for open pit mining extraction.
The 2020-2021 drilling program infill and step out drilling to the east and west continued to intersect
BAM style mineralization, resulting in extensions to the main BAM mineralization (Domain 1001-

Landore Resources Canada Inc. MINERAL RESOURCE ESTIMATE AND PRELIMINARY ECONOMIC ASSESSMENT, BAM Gold Project, Junior Lake Property, Ontario, Canada
Landore Resources Canada Inc. Page | 172
1002 and Domain 3001 and 3002), along with additional hanging wall mineralization. These gold
intersections have been interpreted and modelled in the 2022 MRE.
14.4. Domain Boundary Analysis
A boundary analysis was undertaken to assess the grade boundary characteristics between the main
mineralization domains and the waste material. The boundary analysis plots the average grade of
Au, based on a nominal distance above and below the boundary of interest (Figure 14-8).
The example in Figure 14-8 shows the characteristics for the BAM Sequence mineralization (Domain
1001). The domain boundary plots clearly show sharp (or hard) boundary between the main
mineralization domains and the waste material. The analysis provides confidence that the
mineralization domains created can be used as hard boundaries to constrain the sample data during
the later sample compositing process. Similar results were evident in all interpreted mineralized
domains where there was sufficient sample population.
Figure 14-8: Boundary Analysis between Domain 1001 and Waste Material for Au g/t, (January 2022)
14.5. Domain Coding and Compositing
14.5.1. Sample Flagging
Drilling intervals within mineralized domains were flagged with a unique database code in the
following manner:
• Within the MS Access database, a table named “zonecode” was created to store the unique
codes.

Landore Resources Canada Inc. MINERAL RESOURCE ESTIMATE AND PRELIMINARY ECONOMIC ASSESSMENT, BAM Gold Project, Junior Lake Property, Ontario, Canada
Landore Resources Canada Inc. Page | 173
• The mineralized domain was initially coded using the drill hole intersect wireframe process
in Surpac to write a unique code representing the interpreted domain.
• A four-digit numbering system was created to define the domains which were stored in the
‘zonecode’ field within the zonecode table (e.g. 1001 = Domain 1001).
• Cube graphically checked each intercept and made manual adjustments where necessary.
• The zonecode table unique codes were used to extract sample and composite data
combinations for later statistical analysis and estimation.
14.5.2. Sample Lengths
Analysis of the overall raw sample length within the mineralization domains was carried out prior to
compositing, as illustrated in the normal histogram for sample lengths graph as shown in Figure
14-9. Sample lengths for the diamond drill core varied from 0.5 m to 2.0 m, controlled by geology.
The common sample length is 1 m (49%), although there are a number of samples with lengths up to
1.5 m. Approximately 30% of the sample intervals were less than 1 m, which would generally be
sample intervals within mineralized zones, or to lithological or structural contacts.
Figure 14-9: Normal Histogram Plot of Raw Sample Lengths (up to 02 November 2019)
The scatter plot (Figure 14-10) shows sample length versus gold grade, which assesses if there is any
high or low bias related to sample size within the domains.
No bias was evident from the graphical analysis as illustrated.

Landore Resources Canada Inc. MINERAL RESOURCE ESTIMATE AND PRELIMINARY ECONOMIC ASSESSMENT, BAM Gold Project, Junior Lake Property, Ontario, Canada
Landore Resources Canada Inc. Page | 174
Figure 14-10: Scatter Plot of Raw Sample Lengths versus Au Grades (up to 02 November 2019)
14.5.3. Raw Sample Statistics
Statistical and visual analysis (grade distribution plots) for gold was undertaken to validate the
overall domain controls on mineralization and to determine whether further sub-domaining was
required on the basis of mineralization controls, lithology or other factors.
The raw statistical summary for gold values is shown for each mineralization domain in Table 14-7.
The table provides information about the univariate statistics for samples informing the domain to
be used for spatial data analysis prior to estimation.
For both the well-informed domains (higher number of samples populating the domain) and less
informed domains, the coefficient of variation (CV) varies greatly and is in most cases very high. It is
likely that this is the result of the coarse nature of visible gold, and the variable sample lengths
within the mineralized envelopes. The CV statistics are not uncommon in the raw statistical analysis
for gold but do indicate the need for compositing the sample lengths in order to reduce the
variability in the CV and improve the conditional bias evident in the raw data.

Landore Resources Canada Inc. MINERAL RESOURCE ESTIMATE AND PRELIMINARY ECONOMIC ASSESSMENT, BAM Gold Project, Junior Lake Property, Ontario, Canada
Landore Resources Canada Inc. Page | 175
Table 14-7: Raw Sample Statistics for Gold Inside Mineralization Domains (January 2022)
Main Zone West Zone
Domain ID 1001 1002 1003 1004 1005 1006 1007 1008 2001 2002 2003 2004 2005
# of Samples 1329 903 718 13 32 17 116 134 35 13 39 134 24
Sample Length Mean (m) 0.96 0.96 1.04 0.97 0.99 0.95 0.95 1.00 0.97 0.97 1.02 1.02 1.09
Minimum (au g/t) 0.001 0.001 0.001 0.1 0.001 0.01 0.001 0.001 0.01 0.03 0.001 0.001 0.001
Maximum (au g/t) 38.90 29.40 22.60 1.06 3.13 2.42 37.40 12.35 4.20 26.20 2.56 5.94 1.43
Mean (au g/t) 1.31 0.99 0.76 0.36 0.40 0.82 0.86 0.53 0.63 2.15 0.38 0.60 0.38
SD 2.994 2.144 1.436 0.31 0.586 0.833 3.605 1.225 0.916 7.229 0.511 0.849 0.415
CV 2.279 2.158 1.880 0.871 1.480 1.019 4.197 2.318 1.451 3.369 1.357 1.421 1.097
Variance 8.965 4.595 2.061 0.096 0.344 0.694 12.997 1.5 0.838 52.253 0.261 0.72 0.172
East Zone
Domain ID 3001 3002 3003 3004 3005 3006 3007 3008 3009 3010 3011 3012
# of Samples 1286 525 250 45 59 45 30 15 23 7 5 5
Sample Length Mean (m) 0.93 0.92 0.98 0.94 0.92 0.97 0.93 1.01 0.87 1.01 1.03 1.00
Minimum (au g/t) 0.001 0.001 0.001 0.001 0.001 0.001 0.001 0.01 0.01 0.01 0.08 0.27
Maximum (au g/t) 47.20 32.00 7.24 22.90 28.80 12.10 15.20 1.25 6.66 3.23 1.39 2.04
Mean (au g/t) 1.01 0.89 0.44 1.35 2.17 1.25 0.96 0.36 0.53 0.88 0.73 0.81
SD 2.461 2.046 0.841 3.747 5.733 2.722 2.813 0.391 1.383 1.207 0.602 0.704
CV 2.444 2.299 1.892 2.785 2.639 2.171 2.928 1.091 2.616 1.365 0.829 0.869
Variance 6.054 4.186 0.707 14.043 32.866 7.409 7.913 0.153 1.913 1.457 0.362 0.496

Landore Resources Canada Inc. MINERAL RESOURCE ESTIMATE AND PRELIMINARY ECONOMIC ASSESSMENT, BAM Gold Project, Junior Lake Property, Ontario, Canada
Landore Resources Canada Inc. Page | 176
14.5.4. Compositing Method
The compositing of raw sample intervals aims to reduce the variability inherent in raw samples and
assist in reducing the nugget effect when carrying out spatial data analysis (variography). Several
factors were considered when determining the most appropriate compositing length for the various
mineralized styles at BAM:
• Sample length statistics
• Gold mineralization complexity and dimensions
• Homogeneity of gold mineralization in the zones
• Suitability of the composites for the MRE.
The drill hole sampling information was composited to a 1.0 m composite interval for all
mineralization domains in order to reduce the variability inherent in variable raw sample intervals
and evident in the 1.0 m composite length relative to estimation resource model block dimensions.
The compositing approach was carried out in the following manner:
• In diamond core holes drilled from north to south (potentially drilling down mineralized
structures), the assay data was not used for the 1 m compositing data extraction and later
interpolation process due to the potential for drilling down mineralized structures.
• Compositing was done using Surpac software on samples selected inside the mineralized
domain being modelled.
• Composites were extracted from the ‘au_use’ field within the MS Access database table
‘assay’.
• Sample data was composited to 1 m downhole length using the ‘Best Fit’ method algorithm,
to ensure equal weighting within each interval.
• Composites that failed the length threshold of 50% (0.5 m) were length weighted and added
back into the preceding full composite.
• The composite files for each mineralized domain were viewed in Surpac to analyse spatial
grade distribution as part of spatial data analysis.
The structure for composite files created in Surpac is summarized in Table 14-8.
Table 14-8: Structure of Surpac Composite Files (January 2022)
Field Description
D1 Au g/t – Uncut composite
D2 Hole ID
D3 Interval Depth From
D4 Interval Depth To
D6 Downhole Length
D15 Zonecode (Domain number)
D20 Au g/t – Cut composites grades

Landore Resources Canada Inc. MINERAL RESOURCE ESTIMATE AND PRELIMINARY ECONOMIC ASSESSMENT, BAM Gold Project, Junior Lake Property, Ontario, Canada
Landore Resources Canada Inc. Page | 177
14.6. Statistical Analysis and Grade Capping
A statistical and visual analysis of the extracted downhole composites was undertaken for each of
the mineralized domains. A key objective was to validate the definition of the mineralized domains
and also to evaluate the need for special treatment of obvious statistical outliers (top cutting or
grade capping).
14.6.1. Basic Statistics
Histogram plots, log probability plots and mean/variance plots showing the composite gold grade
distribution trends for the major domains are shown in Figure 14-11 to Figure 14-14. Basic statistics
for the composite gold grades for all domains are summarized in Table 14-9. Plots for all other
domains are included in Appendix 5.
The gold grade statistics reveal that the distributions are highly variable and positively skewed,
which is typical of this deposit type in the relatively broad domains. The log-probability distribution
plots generally show an inflexion point separating significantly mineralized from unmineralized areas
in the 0.1 g/t Au to 0.3 g/t Au range. The broad domains are highly tolerant of internal waste, which
accounts for most the ‘unmineralized’ portion of the distribution. No other prominent or systematic
inflexion points are visible.
Figure 14-11 Statistics Plot of Gold Grade for 1 m Composites – Domain 1001

Landore Resources Canada Inc. MINERAL RESOURCE ESTIMATE AND PRELIMINARY ECONOMIC ASSESSMENT, BAM Gold Project, Junior Lake Property, Ontario, Canada
Landore Resources Canada Inc. Page | 178
Figure 14-12 Statistics Plot of Gold Grade for 1 m Composites – Domain 1002
Figure 14-13 Statistics Plot of Gold Grade for 1 m Composites – Domain 3001

Landore Resources Canada Inc. MINERAL RESOURCE ESTIMATE AND PRELIMINARY ECONOMIC ASSESSMENT, BAM Gold Project, Junior Lake Property, Ontario, Canada
Landore Resources Canada Inc. Page | 179
Figure 14-14 Statistics Plot of Gold Grade for 1 m Composites – Domain 3002

Landore Resources Canada Inc. MINERAL RESOURCE ESTIMATE AND PRELIMINARY ECONOMIC ASSESSMENT, BAM Gold Project, Junior Lake Property, Ontario, Canada
Landore Resources Canada Inc. Page | 180
Table 14-9 Basic Statistics – Au Grade (Au g/t) for 1 m Composites for All Domains
Main Zone West Zone
Domain ID 1001 1002 1003 1004 1005 1006 1007 1008 2001 2002 2003 2004 2005
# of Samples 1273 875 745 13 32 16 111 133 34 13 40 137 26
Minimum (au g/t) 0.001 0.001 0.001 0.115 0.001 0.01 0.001 0.001 0.01 0.03 0.001 0.01 0.004
Maximum (au g/t) 38.39 27.80 22.60 1.06 2.77 2.24 36.08 12.35 4.20 26.20 2.56 5.94 1.43
Mean (au g/t) 1.31 0.99 0.76 0.36 0.39 0.76 0.85 0.52 0.63 2.19 0.37 0.58 0.38
SD 2.805 1.824 1.356 0.305 0.525 0.743 3.542 1.205 0.9 7.217 0.5 0.775 0.386
CV 2.141 1.851 1.776 0.847 1.356 0.984 4.187 2.342 1.428 3.301 1.341 1.328 1.010
Variance 7.869 3.329 1.839 0.093 0.275 0.552 12.549 1.453 0.811 52.091 0.25 0.601 0.149
East Zone
Domain ID 3001 3002 3003 3004 3005 3006 3007 3008 3009 3010 3011 3012
# of Samples 1210 487 242 43 56 44 28 15 21 7 5 5
Minimum (au g/t) 0.001 0.001 0.001 0.001 0.001 0.001 0.001 0.01 0.022 0.01 0.08 0.27
Maximum (au g/t) 33.32 32.00 6.33 22.59 28.80 11.95 11.06 1.25 5.13 3.23 1.39 1.95
Mean (au g/t) 1.01 0.91 0.44 1.33 2.07 1.22 0.80 0.36 0.67 0.89 0.73 0.79
SD 2.237 2.021 0.755 3.679 5.163 2.605 2.122 0.383 1.351 1.202 0.602 0.663
CV 2.208 2.223 1.736 2.777 2.495 2.137 2.647 1.076 2.025 1.347 0.829 0.840
Variance 5.003 4.085 0.571 13.532 26.657 6.786 4.501 0.147 1.824 1.445 0.362 0.44

Landore Resources Canada Inc. MINERAL RESOURCE ESTIMATE AND PRELIMINARY ECONOMIC ASSESSMENT, BAM Gold Project, Junior Lake Property, Ontario, Canada
Landore Resources Canada Inc. Page | 181
14.6.2. Grade Capping
Cube reviewed the statistics of the composites to check for outlier composite grades prior to
estimation. The composite data were reviewed for each domain and gold grade caps were chosen,
where considered appropriate, using the following criteria:
• By consideration of the stability of the upper tail of the grade distribution, as observed in
log-probability plots and log-histograms
• By graphical inspection of the spatial grade distribution.
High-grade top cuts were applied to the gold composite data for estimation in the various domains
as listed in Table 14-10.
In the major domains, the caps have an immaterial impact on the mean composite grade. Much
larger effects are evident in some of the smaller domains, where the capping of isolated outlier
values has significantly reduced the mean grade. However, such domains make only a minor
contribution to the overall resource inventory.
Table 14-10 Gold Grade Caps (g/t Au) for Composite by Domain – Main BAM Zone
Main Zone
Domain ID 1001 1002 1003 1004 1005 1006 1007 1008
Number 1,751 1,322 1,595 428 55 55 197 -
Minimum 0.001 0.001 0.001 0.001 0.001 0.001 0.001 -
Maximum 38.39 150.04 22.60 12.35 2.47 2.20 37.40 -
Mean 1.01 0.81 0.43 0.21 0.25 0.36 0.51 -
Standard deviation 2.42 4.38 0.99 0.67 0.40 0.50 2.77 -
Variance 5.86 19.19 0.99 0.45 0.16 0.25 7.68 -
CV 2.39 5.42 2.32 3.23 1.61 1.38 5.42 - -
Top Cut 25 20 12 10 na na 10 -
No. Cut 5 2 1 1 0 0 1 -
Uncut Mean 1.01 0.81 0.43 0.21 0.25 0.36 0.51 -
Cut Mean 0.92 0.69 0.42 0.22 0.25 0.37 0.36 -
% Reduction Mean -8.8% -14.5% -1.4% 8.2% 1.2% 2.2% -29.0% -
Uncut CV 2.393 5.424 2.317 3.232 1.609 1.382 5.423 -
Cut CV 1.99 2.064 1.987 3.157 1.587 1.419 2.749 -
%Reduction CV -16.8% -61.9% -14.2% -2.3% -1.4% 2.7% -49.3% -
Uncut Metal Index 1,772 1,067 683 89 14 20 101 0
Uncut Metal % 28.9% 17.4% 11.1% 1.4% 0.2% 0.3% 1.6% 0.0%
Cut Metal Index 1,616 912 673 96 14 20 72 0
Cut Metal % 28.5% 16.1% 11.9% 1.7% 0.2% 0.4% 1.3% 0.0%

Landore Resources Canada Inc. MINERAL RESOURCE ESTIMATE AND PRELIMINARY ECONOMIC ASSESSMENT, BAM Gold Project, Junior Lake Property, Ontario, Canada
Landore Resources Canada Inc. Page | 182
Table 14-11 Gold Grade Caps (g/t Au) for Composite by Domain – West Zone
West Zone
Domain ID 2001 2002 2003 2004 2005
Number 125 30 105 356 -
Minimum 0.001 0.020 0.001 0.001 -
Maximum 4.20 26.20 2.56 5.94 -
Mean 0.25 1.03 0.18 0.29 -
Standard deviation 0.56 4.76 0.33 0.54 -
Variance 0.31 22.65 0.11 0.29 -
CV 2.19 4.62 1.83 1.85 -
Top Cut na 10 na na -
No. Cut 0 1 0 0 -
Uncut Mean 0.25 1.03 0.18 0.29 -
Cut Mean 0.31 0.53 0.22 0.36 -
% Reduction Mean 22.0% -48.3% 20.8% 23.0% -
Uncut CV 2.194 4.623 1.829 1.845 -
Cut CV 2.222 3.509 1.837 1.755 -
%Reduction CV 1.3% -24.1% 0.4% -4.9% -
Uncut Metal Index 32 31 19 104 0
Uncut Metal % 0.5% 0.5% 0.3% 1.7% 0.0%
Cut Metal Index 39 16 23 127 0
Cut Metal % 0.7% 0.3% 0.4% 2.2% 0.0%
Table 14-12 Gold Grade Caps (g/t Au) for Composite by Domain – East Zone
East Zone
Domain ID 3001 3002 3003 3004 3005 3006 3007 3008 3009 3010
Number 1,692 833 535 198 144 115 102 22 58 20
Minimum 0.001 0.001 0.001 0.001 0.001 0.001 0.001 0.001 0.001 0.001
Maximum 31.19 30.64 22.05 15.92 28.36 10.43 11.06 1.25 5.13 3.23
Mean 0.77 0.57 0.27 0.45 0.53 0.48 0.31 0.26 0.29 0.30
Standard deviation
1.92 1.54 1.07 1.76 2.69 1.59 1.16 0.35 0.85 0.79
Variance 3.70 2.38 1.15 3.11 7.23 2.54 1.35 0.12 0.72 0.63
CV 2.50 2.71 4.03 3.90 5.04 3.33 3.73 1.36 2.89 2.69
Top Cut 25 15 10 8 13 9 6 na na na
No. Cut 5 2 1 3 2 2 1 0 0 0
Uncut Mean 0.77 0.57 0.27 0.45 0.53 0.48 0.31 0.26 0.29 0.30
Cut Mean 0.72 0.52 0.25 0.43 0.46 0.55 0.32 0.26 0.35 0.29
% Reduction Mean
-6.1% -8.3% -5.6% -5.8% -14.3% 15.4% 1.0% 3.1% 18.0% -3.4%
Uncut CV 2.501 2.708 4.027 3.903 5.044 3.327 3.725 1.357 2.892 2.685
Cut CV 1.97 2.143 2.757 2.923 3.649 3.035 2.612 1.371 2.764 2.814
%Reduction CV -21.2% -20.9% -31.5% -25.1% -27.7% -8.8% -29.9% 1.0% -4.4% 4.8%
Uncut Metal Index 1,301 474 143 89 77 55 32 6 17 6
Uncut Metal % 21.2% 7.7% 2.3% 1.5% 1.3% 0.9% 0.5% 0.1% 0.3% 0.1%
Cut Metal Index 1,222 435 135 84 66 64 32 6 20 6
Cut Metal % 21.5% 7.7% 2.4% 1.5% 1.2% 1.1% 0.6% 0.1% 0.4% 0.1%

Landore Resources Canada Inc. MINERAL RESOURCE ESTIMATE AND PRELIMINARY ECONOMIC ASSESSMENT, BAM Gold Project, Junior Lake Property, Ontario, Canada
Landore Resources Canada Inc. Page | 183
14.7. Variography Analysis
Variograms generated from the composited raw variable produced uninterpretable experimental
variograms. To overcome the influence of the skewed distribution, the raw data were transformed
into standard Gaussian space.
Variogram models were based on the 1 m composites derived from the mineralized domains,
initially evaluated after a Gaussian transformation, and then back-transformed. Where data for
smaller, less populated domains proved to be insufficient for variography analysis, parameters for
grade estimation were adopted from other, representative mineralization domains.
Table 14-13 summarises the gold grade variogram parameters for the key domains, with an example
of Gaussian and back-transformed variogram models for Domain 1001 shown in Figure 14-15 and
Figure 14-16, respectively. Variogram parameter substitutions are listed in Table 14-14.
Table 14-13 Variogram Model Parameters for Gold Grade Composites - Sills Normalised to 100%
Domain Nugget
Spherical 1 Spherical 2 Isatis Rotation (Geol.
Plane)
sill major
(m)
semi
(m)
minor
(m) sill
major
(m)
semi
(m)
minor
(m) A +X -Z
1001 27.6% 56.2% 8 8 3 16.2% 51 51 9 100 80 0
1002 38.4% 42.5% 10 10 5 19.2% 48 48 10 100 75 0
1003 37.7% 43.1% 10 10 5 19.1% 50 50 10 100 70 0
3002 38.7% 41.7% 8 8 5 19.6% 65 65 8 100 85 0
Figure 14-15 Example Gaussian variogram model – Domain 1001

Landore Resources Canada Inc. MINERAL RESOURCE ESTIMATE AND PRELIMINARY ECONOMIC ASSESSMENT, BAM Gold Project, Junior Lake Property, Ontario, Canada
Landore Resources Canada Inc. Page | 184
Figure 14-16 Example back-transformed variogram model – Domain 1001
Table 14-14 Assignment of Variogram Model Parameters for Minor Domains (January 2022)
Domain for Source Variogram Model
Domains for Model Substitution
1001 1003-to 1008; 3001
1002 2001 to 2005; 3002 to 3012
14.8. Block Model Construction
Several key points were considered in the selection of an appropriate estimation block size are:
• Evaluate the parent cell size with the drill density in the X (easting) and Y (northing)
dimensions.
• Consider the approach to mining and minimum SMU dimensions when deciding on the
vertical block size (Z).
• Ensure sufficient sub-celling to fill the wireframes in the most efficient manner. More sub-
celling will be required around narrower mineralized structures, whereas less sub-celling will
be required around the broader core of the mineralized breccia zone.
• Optimize the block model dimensions to the immediate confines of the interpreted area to
reduce processing time and optimising the block model size.
A single block model was created in Surpac with dimensions extended out to fully cover the entire
BAM Gold Project mineral resource area.
14.8.1. Block Model Extents and Attributes
The block model construction was optimized for data spacing, volume fill and mine planning
purposes. The parent block size was set to a chosen block size of 25 mX x 5 mY x 25 mRL and sub-
blocked to 6.25 mX x 1.25 mY x 6.25 mRL. The model construction was not rotated.

Landore Resources Canada Inc. MINERAL RESOURCE ESTIMATE AND PRELIMINARY ECONOMIC ASSESSMENT, BAM Gold Project, Junior Lake Property, Ontario, Canada
Landore Resources Canada Inc. Page | 185
The origin and extent of the Surpac model are summarized in Table 14-15. The spatial dimensions for
the block model are illustrated in the plan and section views in Figure 14-17 and Figure 14-18.
Table 14-15 Final Model Construction Parameters for the BAM 2019 Block Model (January 2022)
Block Model File ID bam_mre_bm_20211231.mdl
Type Northing (y) Easting (x) RL (z)
Minimum Coordinates 5580900 432000 -100
Maximum Coordinates 5582400 436800 450
User Block Size 5 25 25
Min. Block Size 1.25 6.25 6.25
Rotation 0 0 0
Total Blocks 18456
Storage Efficiency % 99.97
The block model was generated in Surpac, and flagged with the appropriate estimation domains,
topographical surfaces and other domain coding attributes listed in Table 14-16.
Table 14-16: Block Model Attributes (January 2022)
Attribute Name
Background Description
au_id2_cut 0.001 Au ppm (cut) - ID2 estimate
au_id2_uncut 0.001 Au ppm (uncut) - ID2 estimate
au_ok_cut 0.001 Au ppm (cut) - OK estimate
au_ok_uncut 0.001 Au ppm (uncut) - OK uncut estimate
au_ppm_fin 0.001 Au ppm (cut) - Reporting Final MRE Estimate
density 2.8 Density: Air=0, 2.2 = Overburden; 2.82 = BAM; 2.84 = GPS;2.9 = MLS
depletion 1 Depletion - Numeric: 0= Air, 1=Insitu, 2 = Open Pit, 9=Cover/Dumps
design -1 Mine Design - Numeric: 0=Above topo, 1=Inside Opti_v1, 2=Inside Opti v2, etc
material_code -1 Material Type: 0=Air, 1=Ore, 2=Waste
ok_asd -1 Average Distance to Samples - OK estimation
ok_dns -1 Average Distance to Samples - OK estimation
ok_ns -1 Distance to Nearest Sample - OK estimation
ok_sor -1 Slope of regression - Au_ppm - OK estimation
oxidation 3 Oxidation - Numeric: 0=Air, 1=Fresh, 9=Overburden
pass_no -1 search pass number - 1, 2 or 3
rep_flag -1 Reporting Flag - Numeric: 0=Not Reported, 1=Reported
res_cat 4 Resource Classification - Numeric: 0=Air, 1=Measured, 2=Indicated, 3=Inferred, 4=Unclassified
rock_code NL Lith Codes for Density assign: OB=Overburden; GPS = Grassy Pond Sill; BAM = BAM Sequence; MLS = Marshall Lake Sequence
zonecode -1 Mineralized Domain Code - Numeric: 1001, 1002, etc

Landore Resources Canada Inc. MINERAL RESOURCE ESTIMATE AND PRELIMINARY ECONOMIC ASSESSMENT, BAM Gold Project, Junior Lake Property, Ontario, Canada
Landore Resources Canada Inc. Page | 186
Figure 14-17 Plan View of 2022 BAM Block Model Dimensions (January 2022)
2022 BAM Block Model
Area

Landore Resources Canada Inc. MINERAL RESOURCE ESTIMATE AND PRELIMINARY ECONOMIC ASSESSMENT, BAM Gold Project, Junior Lake Property, Ontario, Canada
Landore Resources Canada Inc. Page | 187
Figure 14-18 Long Section View Looking North – 2022 BAM Block Model Dimensions (January 2022)
Block Model Dimensions

Landore Resources Canada Inc. MINERAL RESOURCE ESTIMATE AND PRELIMINARY ECONOMIC ASSESSMENT, BAM Gold Project, Junior Lake Property, Ontario, Canada
Landore Resources Canada Inc. Page | 188
14.8.2. Lithology Assignment
Lithology codes were assigned within the block model attribute ‘rock_code’ based on the interpreted
lithology 3DM wireframes and the overburden surface DTM as listed in Table 14-17.
Table 14-17: Assigned Lithology Codes in Rock_Code Model Attribute (January 2022)
Lithology/ Other Type
Rock_Code Code
Constraint Constraint ID (*.dtm/str)
Air AIR Above bam_topo_surface_2018
Overburden OB Above bam_ob_surface_dec_2021
Below bam_topo_surface_2018
BAM Sequence BAM Inside bam_geo_su_2021
Grassy Pond Sill GPS Inside bam_geo_gps_bdy_2021
Marshall Lake Group MLS Inside bam_geo_mls_bdy_2021
14.8.3. Bulk Density Assignment
Bulk density was assigned within the block model attribute ‘density’ according to the lithology, based
on the ‘rock_code’ attributes in Table 14-18.
Table 14-18: Assigned BD Values in the Density Attribute (January 2022)
Material Type Density Value (t/m3)
Constraint Constraint ID (*.con)
Air 0 = rock_code= AIR
Overburden 2.2 = rock_code= OB
BAM Sequence 2.82 = rock_code= BAM
Grassy Pond Sill 2.84 = rock_code= GPS
Marshall Lake Group 2.92 = rock_code= MLS
14.8.4. Estimation Domains Assignment
The mineralized domains acted as hard boundaries to control the Mineral Resource estimation.
Geological domains were assigned within the block model attribute ‘zonecode’ according to the 3D
wireframes and are summarized in Table 14-19.
Table 14-19: Assigned Domain Codes in the Zonecode Attribute (January 2022)
Description Domain
Code Constraint Constraint ID (.dtm/str)
BAM Main Zone 1001 Inside min_dom_v2_1001
BAM Main Zone 1002 Inside min_dom_v2_1002
BAM Main Zone 1003 Inside min_dom_v2_1003
BAM Main Zone 1004 Inside min_dom_v2_1004
BAM Main Zone 1005 Inside min_dom_v2_1005
BAM Main Zone 1006 Inside min_dom_v2_1006
BAM Main Zone 1007 Inside min_dom_v2_1007
BAM Main Zone 1008 Inside min_dom_v2_1008
BAM East 2001 Inside min_dom_v2_2001
BAM East 2002 Inside min_dom_v2_2002
BAM East 2003 Inside min_dom_v2_2003

Landore Resources Canada Inc. MINERAL RESOURCE ESTIMATE AND PRELIMINARY ECONOMIC ASSESSMENT, BAM Gold Project, Junior Lake Property, Ontario, Canada
Landore Resources Canada Inc. Page | 189
Description Domain
Code Constraint Constraint ID (.dtm/str)
BAM East 2004 Inside min_dom_v2_2004
BAM East 2005 Inside min_dom_v2_2005
BAM West 3001 Inside min_dom_v2_3001
BAM West 3002 Inside min_dom_v2_3002
BAM West 3003 Inside min_dom_v2_3003
BAM West 3004 Inside min_dom_v2_3004
BAM West 3005 Inside min_dom_v2_3005
BAM West 3006 Inside min_dom_v2_3006
BAM West 3007 Inside min_dom_v2_3007
BAM West 3008 Inside min_dom_v2_3008
BAM West 3009 Inside min_dom_v2_3009
BAM West 3010 Inside min_dom_v2_3010
BAM West 3011 Inside min_dom_v2_3011
BAM West 3012 Inside min_dom_v2_3012
14.8.5. Mining Depletion Assignment
There have been no historic mine excavations or major ground disturbance previously within the
BAM Gold Project area.
The topography wireframe supplied by Landore has been used to assign blocks above the
topographic surface to a value of “0” for the following attributes – density, depletion, design, and
res_cat.
14.8.6. Classification Assignment
Mineral Resource classification boundaries were created in Surpac for each mineralized domain
following grade interpolation and model validation. Assigned codes in the ‘res_cat’ attribute used for
classifying the block model as Indicated and Inferred are summarized in Table 14-20.
There are no Measured mineral resources classified for the January 2022 MRE. Material within the
mineralization domain zone_code attributes that are below the Inferred category have been coded
as Unclassified material within the block model.
Table 14-20: Assigned Resource Classification in the Rescat Attribute (January 2022)
Classification Type Rescat Code
Constraint Constraint ID
Air/Overburden 0 Above bam_ob_surface_dec_2021
Indicated 2
Inside bam_rescat_ind_2021
> zone_code > '0'
= depletion = 1 (in situ material)
Inferred 3
Inside bam_rescat_inf_2021
> zone_code > '0'
= depletion = 1 (in situ material)
Unclassified 4 Default Value depletion = 1 (in situ material)

Landore Resources Canada Inc. MINERAL RESOURCE ESTIMATE AND PRELIMINARY ECONOMIC ASSESSMENT, BAM Gold Project, Junior Lake Property, Ontario, Canada
Landore Resources Canada Inc. Page | 190
14.9. Estimation Methodology
14.9.1. Estimation Approach
The estimation of the January 2022 MRE for the BAM Gold Project consisted of:
• Undertaking Kriging Neighbourhood Analysis (KNA) to establish search parameters.
• Three-dimensional Ordinary Kriging (OK) estimation for all mineralization domains.
• Assess local variations in domain orientations and applying a dynamic anisotropy search in
which the search neighbourhood ellipse dip and dip direction are defined separately for
each block approximating the orientation of the estimation domain where appropriate.
• Inverse Distance to the power of 2 (ID2) estimation approach for model comparison analysis.
• Assess whether global assignment at an average grade is appropriate to apply for small
estimation domains due to limited sampling information.
14.9.2. Search Neighbourhood Analysis (KNA)
KNA analysis was undertaken using Supervisor software. KNA was performed to optimize the
orientation and dimensions of the 3D volume used to select the samples as well as the actual
optimal number of samples to be utilized in the estimation process. The KNA process and use of the
key kriging statistics are described in Vann et al (2003).
Suitability of the search neighbourhoods by reviewing a number of statistics defined during the
kriging process, being:
• The estimation bias: by reviewing the slope of regression between the estimated and true
grades of the panels
• The estimation precision: by reviewing the correlation coefficient of the regression between
the estimated and true grades of the panels
• The weight of the mean in simple kriging (SK): the weight of the SK mean can help to
determine if an adequate number of data are used within the search neighbourhood
• The kriging weights focusing on the percentage of positive weights to ensure a large number
of negative weights are not used in the estimation process.
The shape of the search ellipsoid was determined with due consideration given to the anisotropy in
the variogram models. In addition, some visual inspections using tools available in Isatis were
undertaken to assess the pattern of informing sample selection. The search ellipsoid radii ratios
were then chosen so as to provide an optimal sample neighbour selection for estimation.
The minimum and maximum allowable number of samples were chosen using KNA. KNA makes use
of kriging quality statistics, in this case the Slope of Regression, Weight of the Mean and Negative
Weights statistics, to select optimal minimum and maximum values for estimation. An example of
the KNA analysis is shown in Figure 14-19.

Landore Resources Canada Inc. MINERAL RESOURCE ESTIMATE AND PRELIMINARY ECONOMIC ASSESSMENT, BAM Gold Project, Junior Lake Property, Ontario, Canada
Landore Resources Canada Inc. Page | 191
Figure 14-19 Example of KNA Plots for Domain 1001, Showing Slope of Regressions and Kriging Efficiency for Ranges of Blocks (January 2022)
Search neighbourhood parameters used for the model estimation are listed in Table 14-21. The most
appropriate search parameters were generally applied globally for all domains for the selected block
sizes, minimum and maximum samples, search distances and descretisation.
Table 14-21: Search parameters for Au grade –OK Estimation
New Number
Min No. of
Samples
Max No. of
Samples
Search Radius -
Run 1
Max Vert
Search
Search Radius -
Run 2
Major/ Semi-major
Major/ Minor
Discretisation
(m) (m) (m) ratio ratio x y z
1001 6 16 120 999 360 2 4 5 2 5
1002 6 16 120 999 360 2 4 5 2 5
1003 6 16 120 999 360 2 4 5 2 5
1004 4 16 120 999 360 2 4 5 2 5
1005 6 16 120 999 360 2 4 5 2 5
1006 4 16 120 999 360 2 4 5 2 5
1007 6 16 120 999 360 2 4 5 2 5
1008 6 16 120 999 360 2 4 5 2 5
2001 6 16 120 999 360 2 4 5 2 5
2002 6 16 120 999 360 2 4 5 2 5

Landore Resources Canada Inc. MINERAL RESOURCE ESTIMATE AND PRELIMINARY ECONOMIC ASSESSMENT, BAM Gold Project, Junior Lake Property, Ontario, Canada
Landore Resources Canada Inc. Page | 192
New Number
Min No. of
Samples
Max No. of
Samples
Search Radius -
Run 1
Max Vert
Search
Search Radius -
Run 2
Major/ Semi-major
Major/ Minor
Discretisation
(m) (m) (m) ratio ratio x y z
2003 6 16 120 999 360 2 4 5 2 5
2004 6 16 120 999 360 2 4 5 2 5
2005 6 16 120 999 360 2 4 5 2 5
3001 6 16 120 999 360 2 4 5 2 5
3002 6 16 120 999 360 2 4 5 2 5
3003 6 16 120 999 360 2 4 5 2 5
3004 6 16 120 999 360 2 4 5 2 5
3005 6 16 120 999 360 2 4 5 2 5
3006 6 16 120 999 360 2 4 5 2 5
3007 6 16 120 999 360 2 4 5 2 5
3008 4 16 120 999 360 2 4 5 2 5
3009 6 16 120 999 360 2 4 5 2 5
3010 4 16 120 999 360 2 4 5 2 5
3011 4 16 120 999 360 2 4 5 2 5
3012 4 16 120 999 360 2 4 5 2 5
14.9.3. Dynamic Anisotropy
Dynamic Anisotropy is a method where the estimation parameters (specifically search and
variography orientation) are modified in a frequent or “dynamic” sense to suit the orientation of the
estimation domain, whilst maintaining 3D space. The dynamic anisotropy search feature in Surpac
allows the search neighbourhood ellipse dip and dip direction to be defined separately for each
block (the variogram is also rotated to align with the search).
For all domains in the resource areas, local dips and dip directions were each calculated from the
orientation of DTM surface wireframe triangles, approximating the orientation of each of the
mineralized zones. Tolerances can be set during this process, so that ‘erroneous’ points will not be
generated, such as flat dips on the top of the wireframe or vertical dips at the edges.
The validated point data were then used to produce the dip and dip direction for each parent block.
The dip and dip direction are treated as variables (dynamic_dip and dynamic_dipd) and estimated
into the block model using special parameters in Cube’s ECX function in Surpac (to account for dip
between 90° and -90°, and dip direction between 0° and 360°). During estimation of the grade
variables, the search ellipse and variogram orientation is rotated for each parent block.
Figure 14-20 shows an example of the surface DTM and individual points containing the search
ellipse orientations (dip and dip direction) for Domain 1001

Landore Resources Canada Inc. MINERAL RESOURCE ESTIMATE AND PRELIMINARY ECONOMIC ASSESSMENT, BAM Gold Project, Junior Lake Property, Ontario, Canada
Landore Resources Canada Inc. Page | 193
Figure 14-20 Conceptual View Showing (A) Trend Surface B) Blocks Coloured by Dip Values
Figure 14-21 illustrates a flitch plan slice of the domain 1001, showing the changing orientation of
the mineralization and the colour changes representing the change in dip direction of the data
points created in order to approximate the orientation changes.
Figure 14-21 Conceptual View Showing Calculated Blocks Coloured by Dip Direction Values
Landore Resources Canada Inc. MINERAL RESOURCE ESTIMATE AND PRELIMINARY ECONOMIC ASSESSMENT, BAM Gold Project, Junior Lake Property, Ontario, Canada
Landore Resources Canada Inc. Page | 194
14.10. Model Validation
Cube carried out the following validation methods for the BAM gold grade OK estimates:
• Visual inspection of block grade estimates versus raw samples from drill holes in 3D or on a
section by section basis
• Volumetric comparison of the wireframe/solid volume to that of the block model volume for
each domain (3D wireframe vs block model domain volume)
• Global comparison of the estimated mean OK block grades to the un-declustered and
declustered mean of informing composite grades, on a domain-by-domain basis. The OK
estimates were also compared to the mean grade of a check ID2 estimation.
• Semi-local validation checks using multi data relationship plots (Swath plots) comparing the
local composite grades (by easting and RL), to the block model OK estimate grade for each
domain.
There are no historic workings, and no mining activity has taken place at the BAM Gold Project, so
there are no mine reconciliation records which could be used to assess past performance comparing
mineral resources against mine production.
14.10.1. Visual Validation
Figure 14-22 and Figure 14-23 show an isometric view and a plan view respectively of the block
model in 3D space whereby block grades for each mineralized domain are compared with the 1 m
composite grade distributions and also the raw drill hole grades.

Landore Resources Canada Inc. MINERAL RESOURCE ESTIMATE AND PRELIMINARY ECONOMIC ASSESSMENT, BAM Gold Project, Junior Lake Property, Ontario, Canada
Landore Resources Canada Inc. Page | 195
Figure 14-22: Block Model Isometric View – Showing Block Grades Distribution for All Domains (January 2022)
BAM January 2022 Block Model - Constrained by Estimation Domains

Landore Resources Canada Inc. MINERAL RESOURCE ESTIMATE AND PRELIMINARY ECONOMIC ASSESSMENT, BAM Gold Project, Junior Lake Property, Ontario, Canada
Landore Resources Canada Inc. Page | 196
Figure 14-23: Block Model Plan View –with Cross Section Reference Line (January 2022)
Line 1000 E
Line 2700 E
Line 900 E
Line 2850 E

Landore Resources Canada Inc. MINERAL RESOURCE ESTIMATE AND PRELIMINARY ECONOMIC ASSESSMENT, BAM Gold Project, Junior Lake Property, Ontario, Canada
Landore Resources Canada Inc. Page | 197
Figure 14-24 to Figure 14-27 show examples of visual validation conducted in cross section views on
local grid Lines 2850 E and 2700 E within the Central zones of the BAM sequence, and 1000 E and
900 E within the West Zone, where significant mineralization has been intersected from recent
drilling in 2020 and 2021.
Figure 14-24: Cross Section Line 2850 E– Domain Block Grade Estimation with Drilling (January 2022)
Figure 14-25: Cross Section Line 2700 E– Domain Block Grade Estimation with Drilling (January 2022)
Hole 0421-79310.1m @ 1.28g/t Au
Hole 0421-79615.4m @ 1.0g/t Au
Hole 0421-7933.3m @ 6.31g/t Au
Hole 0421-7962.1m @ 1.1g/t Au
Hole 0421-7855.7m @ 0.4g/t Au
Hole 0421-7949.3m @ 1.0g/t Au
Hole 0421-7854.6m @ 0.4g/t Au
2019 Old Interpretation Outlines
2022 Block Model Interpretations
Overburden Surface
BAM Sediment Contacts

Landore Resources Canada Inc. MINERAL RESOURCE ESTIMATE AND PRELIMINARY ECONOMIC ASSESSMENT, BAM Gold Project, Junior Lake Property, Ontario, Canada
Landore Resources Canada Inc. Page | 198
Figure 14-26: Cross Section Line 1000 E– Domain Block Grade Estimation with Drilling (January 2022)
Figure 14-27: Cross Section Line 900 E– Domain Block Grade Estimation with Drilling (January 2022))
Analysis of the cross sections indicate:
• Local block grade estimates in general are honouring the higher and lower grade
intersections around the actual raw data intersections within the drill holes.
• The section shows that the grades in the blocks around the HG intersections are tightly
controlled by the estimation factors applied in the case.
Hole 0420-7523.0m @ 4.0g/t Au
Hole 0421-8161.9m @ 1.8g/t Au
Hole 0420-7525.1m @ 1.9g/t Au
Hole 0421-8168.7m @ 1.6g/t Au
Hole 0421-81417.5m @ 4.1g/t Au
Hole 0421-8191.5m @ 3.5g/t Au,3.1m @ 1.1g/t Au

Landore Resources Canada Inc. MINERAL RESOURCE ESTIMATE AND PRELIMINARY ECONOMIC ASSESSMENT, BAM Gold Project, Junior Lake Property, Ontario, Canada
Landore Resources Canada Inc. Page | 199
The visual validation showed that overall, the raw samples superimposed on the block grade
estimates demonstrated that the estimates have honoured the raw sample data satisfactorily.
There are some instances where some smearing of the grade occurs in poorly informed areas and
this is most prominent where drilling spacing is broader. These zones have been classified
accordingly in the resource classification boundary definitions at a later stage.
14.10.2. Volumetric Comparisons
Validation checks included volumetric comparison between undepleted 3DM wireframes against the
mineralized domains coded in the block model to ensure no errors in coding would lead to
discrepancies in mineral resource reporting at a later stage.
All domain 3DM wireframes correlated well with the volume estimates from the block model. In
addition, a calculation check was made of the BD assignment, with no discrepancies noted.
The volume variance between the wireframes and the block models was acceptable for the intended
use of the block models (Table 14-22).
Table 14-22: Volumetric Comparisons for All Gold Mineralization Domains (January 2022)
Domain 3DM Volume (undepleted)
(m3)
BM Volume (undepleted)
(m3) % diff chk
BM Volume - depleted of OB (m3)
BM Tonnage (t) BD -
calculated (ave)
1001 3,252,642 3,208,691 -1.4% 3,208,691 9,072,583 2.83
1002 2,396,465 2,380,615 -0.7% 2,380,615 6,731,073 2.83
1003 2,431,848 2,415,869 -0.7% 2,415,869 6,861,030 2.84
1004 53,311 52,539 -1.5% 52,539 149,211 2.84
1005 141,994 138,086 -2.8% 138,086 392,164 2.84
1006 95,122 92,773 -2.5% 92,773 263,477 2.84
1007 295,434 290,771 -1.6% 290,771 830,596 2.86
1008 239,911 238,379 -0.6% 238,379 676,996 2.84
2001 223,306 223,145 -0.1% 223,145 630,934 2.83
2002 93,301 91,455 -2.0% 91,455 257,974 2.82
2003 337,457 335,352 -0.6% 335,352 951,102 2.84
2004 889,670 881,738 -0.9% 881,738 2,503,118 2.84
2005 96,120 93,164 -3.2% 93,164 264,586 2.84
3001 5,425,884 5,406,641 -0.4% 5,406,641 15,264,156 2.82
3002 1,858,712 1,859,473 0.0% 1,859,473 5,255,099 2.83
3003 517,821 507,959 -1.9% 507,959 1,442,603 2.84
3004 152,713 150,439 -1.5% 150,439 427,248 2.84
3005 398,105 397,998 0.0% 397,998 1,130,314 2.84
3006 197,822 197,070 -0.4% 197,070 559,680 2.84
3007 93,464 93,506 0.0% 93,506 265,557 2.84
3008 18,130 19,189 5.5% 19,189 54,498 2.84
3009 56,286 54,443 -3.4% 54,443 155,244 2.85
3010 68,367 69,189 1.2% 69,189 196,498 2.84
3011 27,637 27,051 -2.2% 27,051 76,824 2.84
3012 20,264 20,166 -0.5% 20,166 57,271 2.84
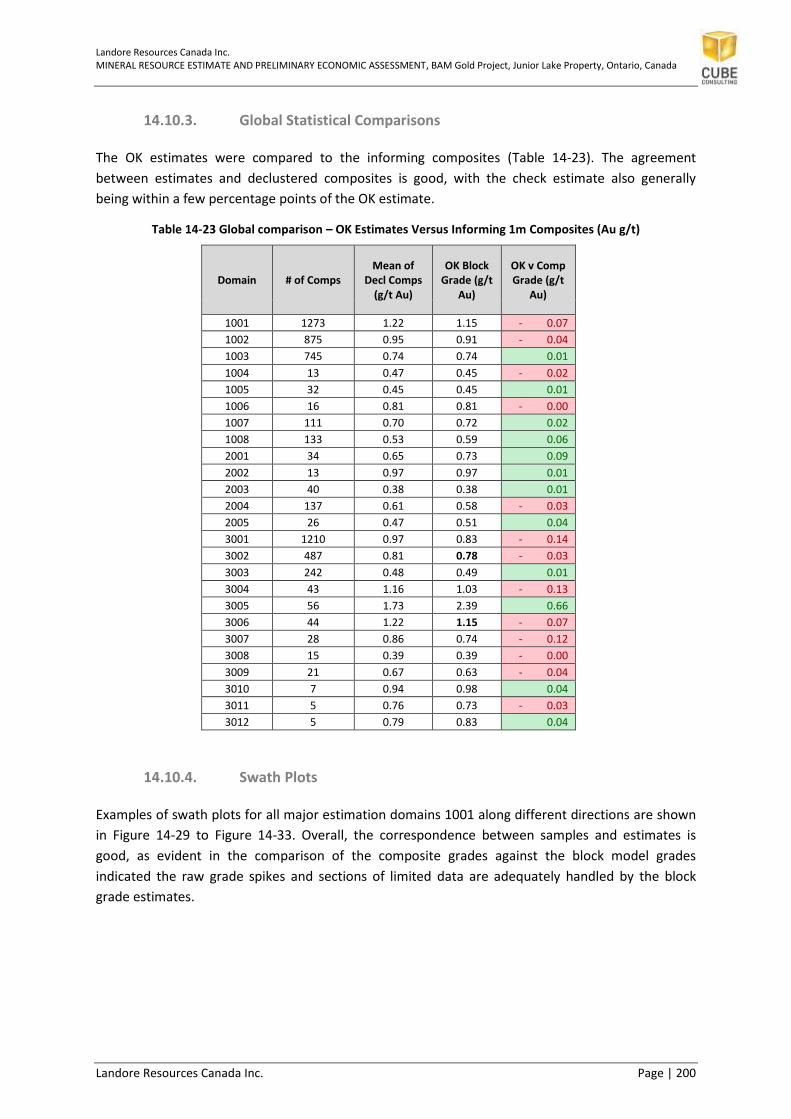
Landore Resources Canada Inc. MINERAL RESOURCE ESTIMATE AND PRELIMINARY ECONOMIC ASSESSMENT, BAM Gold Project, Junior Lake Property, Ontario, Canada
Landore Resources Canada Inc. Page | 200
14.10.3. Global Statistical Comparisons
The OK estimates were compared to the informing composites (Table 14-23). The agreement
between estimates and declustered composites is good, with the check estimate also generally
being within a few percentage points of the OK estimate.
Table 14-23 Global comparison – OK Estimates Versus Informing 1m Composites (Au g/t)
Domain # of Comps Mean of
Decl Comps (g/t Au)
OK Block Grade (g/t
Au)
OK v Comp Grade (g/t
Au)
1001 1273 1.22 1.15 - 0.07
1002 875 0.95 0.91 - 0.04
1003 745 0.74 0.74 0.01
1004 13 0.47 0.45 - 0.02
1005 32 0.45 0.45 0.01
1006 16 0.81 0.81 - 0.00
1007 111 0.70 0.72 0.02
1008 133 0.53 0.59 0.06
2001 34 0.65 0.73 0.09
2002 13 0.97 0.97 0.01
2003 40 0.38 0.38 0.01
2004 137 0.61 0.58 - 0.03
2005 26 0.47 0.51 0.04
3001 1210 0.97 0.83 - 0.14
3002 487 0.81 0.78 - 0.03
3003 242 0.48 0.49 0.01
3004 43 1.16 1.03 - 0.13
3005 56 1.73 2.39 0.66
3006 44 1.22 1.15 - 0.07
3007 28 0.86 0.74 - 0.12
3008 15 0.39 0.39 - 0.00
3009 21 0.67 0.63 - 0.04
3010 7 0.94 0.98 0.04
3011 5 0.76 0.73 - 0.03
3012 5 0.79 0.83 0.04
14.10.4. Swath Plots
Examples of swath plots for all major estimation domains 1001 along different directions are shown
in Figure 14-29 to Figure 14-33. Overall, the correspondence between samples and estimates is
good, as evident in the comparison of the composite grades against the block model grades
indicated the raw grade spikes and sections of limited data are adequately handled by the block
grade estimates.

Landore Resources Canada Inc. MINERAL RESOURCE ESTIMATE AND PRELIMINARY ECONOMIC ASSESSMENT, BAM Gold Project, Junior Lake Property, Ontario, Canada
Landore Resources Canada Inc. Page | 201
Figure 14-28 Swath Plots for Gold Grade for Domain 1001 (January 2022)

Landore Resources Canada Inc. MINERAL RESOURCE ESTIMATE AND PRELIMINARY ECONOMIC ASSESSMENT, BAM Gold Project, Junior Lake Property, Ontario, Canada
Landore Resources Canada Inc. Page | 202
Figure 14-29 Swath Plots for Gold Grade for Domain 1002 (January 2022)

Landore Resources Canada Inc. MINERAL RESOURCE ESTIMATE AND PRELIMINARY ECONOMIC ASSESSMENT, BAM Gold Project, Junior Lake Property, Ontario, Canada
Landore Resources Canada Inc. Page | 203
Figure 14-30 Swath Plots for Gold Grade for Domain 1003 (January 2022)

Landore Resources Canada Inc. MINERAL RESOURCE ESTIMATE AND PRELIMINARY ECONOMIC ASSESSMENT, BAM Gold Project, Junior Lake Property, Ontario, Canada
Landore Resources Canada Inc. Page | 204
Figure 14-31 Swath Plots for Gold Grade for Domain 3001 (January 2022)

Landore Resources Canada Inc. MINERAL RESOURCE ESTIMATE AND PRELIMINARY ECONOMIC ASSESSMENT, BAM Gold Project, Junior Lake Property, Ontario, Canada
Landore Resources Canada Inc. Page | 205
Figure 14-32 Swath Plots for Gold Grade for Domain 3002 (January 2022)

Landore Resources Canada Inc. MINERAL RESOURCE ESTIMATE AND PRELIMINARY ECONOMIC ASSESSMENT, BAM Gold Project, Junior Lake Property, Ontario, Canada
Landore Resources Canada Inc. Page | 206
Figure 14-33 Swath Plots for Gold Grade for Domain 3003 (January 2022)

Landore Resources Canada Inc. MINERAL RESOURCE ESTIMATE AND PRELIMINARY ECONOMIC ASSESSMENT, BAM Gold Project, Junior Lake Property, Ontario, Canada
Landore Resources Canada Inc. Page | 207
14.10.5. Model Validation Summary
Visual comparison of the block model grade estimates to the informing composites shows that the
estimation reflects local variations in the data. Given the drill hole spacing and the high nugget
effect, the estimates reconciled well against the drill hole composited data.
The informing composites and the OK block estimates, as well as the ID2 check estimates were
observed to correspond satisfactorily both globally and in the swath plots.
It is Cube’s opinion that the OK gold estimates are valid and satisfactorily represent the informing
data for the January 2022 MRE.
14.11. Resource Classification
A range of criteria were considered when addressing the suitability of the classification boundaries.
These criteria include:
• Geological continuity and volume.
• Drill spacing and drill data quality - drill holes oriented to the south or drilled close to the
same orientation as the mineralization dip were removed from the estimation composite
data. There was sufficient confidence in all other data used, and the reliability of data based
on high quality diamond drill core.
• Geostatistical measures to provide confidence in the tonnage and grade estimates, including
search strategy, number of informing composites, average distance of composites from
blocks and kriging quality parameters which are quantified in the slope of regression.
• Risk or uncertainty present in the estimated gold grades.
The drill spacing at BAM is considered by Cube to be adequate to determine the geological and
grade continuity for reporting of Mineral Resources. Most drilling completed is orientated normal to
the dip of the mineralization, providing in most instances a representative sample across the
mineralization.
The resource classification for the BAM Gold Project is mostly based on drill data spacing in
combination with the slope of regression data for each block in the estimate.
Blocks have been classified as Indicated or Inferred essentially based on data spacing and using a
combination of search volume and number of data used for the estimation. No material in the MRE
has been classified as Measured Mineral Resources.
The drill spacing criteria for classification is as follows:
• Indicated Mineral Resources are defined nominally by 50 m x 50 m spaced drilling or less.
• Inferred Mineral Resources are defined by data greater than 50 m x 50 m spaced drilling and
the confidence that the continuity of geology and mineralization can be extended along
strike and at depth to a nominal 50 m maximum extent past Indicated Resource limit.
• Unclassified material, all material within the mineralization domains, but outside of
indicated and inferred material. Blocks in the 2nd and 3rd passes that contained high-grade
smearing due to the effects of the OK estimation were re-assigned the mean block grade of

Landore Resources Canada Inc. MINERAL RESOURCE ESTIMATE AND PRELIMINARY ECONOMIC ASSESSMENT, BAM Gold Project, Junior Lake Property, Ontario, Canada
Landore Resources Canada Inc. Page | 208
the overall estimation domain. These blocks were located at lower depths or along strike,
extending more than 100 m passed the last drilling fences and were assigned in the block
model as unclassified blocks.
Figure 14-34 illustrates a long section view of the drilling density and depth extents, the maximum
extents of the mineralization domain projections, and the Indicated boundary applied around the
highest density data. Figure 14-35 provides visual overviews summarizing the Mineral Resource
classification categories for the BAM block model area.

Landore Resources Canada Inc. MINERAL RESOURCE ESTIMATE AND PRELIMINARY ECONOMIC ASSESSMENT, BAM Gold Project, Junior Lake Property, Ontario, Canada
Landore Resources Canada Inc. Page | 209
Figure 14-34:Block Model Long Section View Showing Resource Classification Boundaries Maximum Extent Versus Drilling Extents and Domain Interpretations (January 2022)
2022 Indicated Resource Boundary – Maximum Extent
2022 Inferred Resource Extents, Below Indicated
Boundary

Landore Resources Canada Inc. MINERAL RESOURCE ESTIMATE AND PRELIMINARY ECONOMIC ASSESSMENT, BAM Gold Project, Junior Lake Property, Ontario, Canada
Landore Resources Canada Inc. Page | 210
Figure 14-35:Block Model Isometric View Showing Resource Classification and Drilling Density (January 2022)

Landore Resources Canada Inc. MINERAL RESOURCE ESTIMATE AND PRELIMINARY ECONOMIC ASSESSMENT, BAM Gold Project, Junior Lake Property, Ontario, Canada
Landore Resources Canada Inc. Page | 211
14.12. Mineral Resource Statement
14.12.1. In situ Mineral Resources
The BAM Gold Project Mineral Resource, Effective Date as at 30 January 2022 is suitable for public
reporting in accordance with the NI 43-101 and the CIM Definition Standards (May 2014). All drilling
information, including all drilling completed up to the end of 2019 has been used in the preparation
of the current MRE. The input drilling data is comprehensive in its coverage of the gold
mineralization at the BAM Gold Project and does not misrepresent the mineralization. Knowledge of
the geological controls on mineralization has been used to develop the overall resource estimate.
The January 2022 Mineral Resource is reported at a base-case 0.3 g/t gold cut-off grade within the
interpreted mineralized domains to a maximum vertical depth of 380 m.
Table 14-24 is a summary of the Indicated and Inferred Mineral Resources, effective as of 30 January
2022.
Table 14-24 BAM Gold Project In situ Mineral Resource – All Indicated and Inferred Resources (as at 30 January 2022)
Resource Category
Material Type
Au g/t cut off
Tonnes (kT)
Grade (g/t Au)
Contained Metal
(Oz Au)
Measured ALL >0.3 0 0 0
Indicated ALL >0.3 30,965 1.0 1,029,000
Inferred ALL >0.3 18,266 0.8 467,000
Notes:
1 Effective date of 30 January 2022.
2 The tonnages are estimated on a dry tonnes basis. Moisture was not considered in the bulk density assignment
3 Mineral Resources are estimated at a block cut-off grade of 0.3 g/t Au.
4 A minimum mining width of two metres was used.
5 Bulk densities for the main lithologies are 2.82 t/m3, 2.84 t/m3, and 2.90 t/m3. All material below the glacial overburden is fresh rock.
6 Mineral resources that are not mineral reserves do not have demonstrated economic viability.
7 Figures may not add up due to rounding

Landore Resources Canada Inc. MINERAL RESOURCE ESTIMATE AND PRELIMINARY ECONOMIC ASSESSMENT, BAM Gold Project, Junior Lake Property, Ontario, Canada
Landore Resources Canada Inc. Page | 212
14.12.2. Pit Optimized Mineral Resources
Based on the current input parameters that have been used for the 2019 pit optimization by Cube, a
0.3 g/t Au lower cut-off was deemed appropriate for the January 2022 Mineral Resource reporting.
At a cut-off grade of 0.3 g/t Au, the Mineral Resources are reported here within the pit optimization
Run B open pit shell. The Run B open pit shell include Indicated Mineral Resources and Inferred
Mineral Resources. The figures reported in Table 14-25 are estimated using a long-term gold price of
US$1,500 per ounce.
Table 14-25 2019 BAM Gold Project In situ Mineral Resources – Inside USD $1,800 Pit Shell (as at 30 January 2022)
Resource Category
Material Type
Au g/t cut off
Tonnes (kT)
Grade (g/t Au)
Contained Metal
(Oz Au)
Measured ALL >0.3 0 0 0
Indicated ALL >0.3 21,922 1.1 785,000
Inferred ALL >0.3 1,483 1.5 72,000
Notes:
1 Effective date of 30 January 2022.
2 Mineral Resources are estimated at a block cut-off grade of 0.3 g/t Au.
3 Mineral Resources are estimated using a long-term gold price of US$1,500 per ounce.
4 A minimum mining width of two metres was used.
5 Bulk densities for the main lithologies are 2.82 t/m3, 2.84 t/m3, and 2.90 t/m3. All material below the glacial overburden is fresh rock.
6 Mineral Resources are constrained by a preliminary pit shell generated in Whittle software.
7 Mineral Resources that are not Mineral Reserves do not have demonstrated economic viability.
8 Figures may not add up due to rounding
The pit optimization study resulted in two distinct areas, an east pit optimization (BAM East Pit Shell)
and a west pit optimization (BAM West Pit Shell). No further work involving pit designs and open pit
schedules were carried out for the January 2022 MRE work.
Figure 14-36 shows a plan view of the pit designs in relation to the block model mineral resources
and based on the Run B scenario from the January 2022 pit optimization work carried out by Cube.

Landore Resources Canada Inc. MINERAL RESOURCE ESTIMATE AND PRELIMINARY ECONOMIC ASSESSMENT, BAM Gold Project, Junior Lake Property, Ontario, Canada
Landore Resources Canada Inc. Page | 213
14.12.1. Cut-off Grade Parameters
The economic portion of a resource is typically determined by the application of a breakeven cut-off
grade that considers the total estimated operating costs for the mine, process plant and
administration.
As gold resources occur at near-surface, the model was constructed with a view towards selective
open pit mining and processed using conventional milling techniques. A block cut-off grade of 0.3 g/t
Au has been selected for reporting of all mineral resources for the BAM Gold Project.
Based on the current input parameters that have been used for the January 2022 pit optimization by
Cube, a 0.3 g/t Au lower cut-off was deemed appropriate for the January 2022 Mineral Resource
reporting.

Landore Resources Canada Inc. MINERAL RESOURCE ESTIMATE AND PRELIMINARY ECONOMIC ASSESSMENT, BAM Gold Project, Junior Lake Property, Ontario, Canada
Landore Resources Canada Inc. Page | 214
Figure 14-36: Plan View of West and East Pit Shells with Resource Blocks (January 2022 Run B Pit Design)
WEST PIT Shells
EAST PIT Shells
2022 Pit Shell 21, $1800

Landore Resources Canada Inc. MINERAL RESOURCE ESTIMATE AND PRELIMINARY ECONOMIC ASSESSMENT, BAM Gold Project, Junior Lake Property, Ontario, Canada
Landore Resources Canada Inc. Page | 215
14.12.2. Previous Mineral Resource Estimates
During 2017, RPA was retained by Landore to update the Mineral Resource estimates for the BAM
East Gold Deposit, the B4-7 Nickel-Copper-Cobalt-Platinum-Group Element (PGE) Deposit (B4-7
Deposit) and associated Alpha Zone PGE Deposit (Alpha Zone), and the VW Nickel Deposit (VW
Deposit), all located on Landore’s Junior Lake property. RPA prepared a supporting Technical Report,
with an Effective Date of 16 January 2018, which is compliant with the requirements of National
Instrument 43-101 Standards of Disclosure for Mineral Projects (NI 43-101) (RPA, 2018).
2018 BAM East Gold Deposit MRE
The 2018 MRE for the BAM East Gold Deposit as estimated by RPA were based on drill hole and
assay data available up to 22 September 2017 and are summarized in Table 14-26.
Table 14-26 2019 BAM East Gold Deposit - Mineral Resource Estimate as at 22 September 2017 (RPA, 2018)
Resource Category
Material Type
COG Tonnes
(kt) Grade
(g/t Au)
Contained Metal
(oz Au)
Measured ALL >0.3 0 0 0
Indicated ALL >0.3 7,413 1.37 326,000
Inferred ALL >0.3 1,662 1.39 74,000
Notes:
1 CIM (2014) definitions were followed for Mineral Resource estimation and classification.
2 Mineral Resources are estimated at a block cut-off grade of 0.3 g/t Au.
3 Mineral Resources are estimated using a long-term gold price of US$1,500 per ounce, and an exchange rate (C$/US$) of 0.75.
4 A minimum mining width of three metres was used.
5 Bulk densities for the main host rocks are 2.82 t/m3, 2.84 t/m3, and 2.90 t/m3.
6 Mineral Resources are constrained by a preliminary pit shell generated in Whittle software.
7 Mineral Resources that are not Mineral Reserves do not have demonstrated economic viability.
8 Numbers may not add due to rounding

Landore Resources Canada Inc. MINERAL RESOURCE ESTIMATE AND PRELIMINARY ECONOMIC ASSESSMENT, BAM Gold Project, Junior Lake Property, Ontario, Canada
Landore Resources Canada Inc. Page | 216
B4-7 Nickel-Copper-Cobalt-PGE Deposit and Alpha Zone MRE
A non-NI 43-101 compliant mineral resource estimate was carried out by the Snowden Group (De
Mark and Glacken, 2008) on the B4-7 deposit in 2008. Scott Wilson RPA prepared resource estimates
for the B4-7 deposit in 2006 and 2009.
The 2017 Mineral Resource estimates for the B4-7 Deposit and Alpha Zone by RPA (2018) is the most
recent estimate and incorporates metal prices and exchange rate as at 1 December 2017, as well as
additional geotechnical and engineering parameters (Table 14-27). The Mineral Resource estimates
include open pit and underground mining scenario resources.
Table 14-27 B4-7 Ni-Cu-Co-PGE Deposit - Mineral Resource Estimate as at 1 December 2017 (RPA, 2018)
Material Deposit Tonnes (t) Ni (%) Cu (%) Co (%) Pt (g/t) Pd (g/t) Au (g/t) Ni_Eq (%)
Open Pit
Indicated Alpha Zone 132,000 0.23 0.09 0.02 0.18 0.99 0.01 0.63
Indicated B4-7 1,640,000 0.62 0.41 0.05 0.14 0.55 0.03 1.20
Inferred - - - - - - - - -
Underground
Indicated B4-7 1,520,000 0.65 0.45 0.06 0.12 0.48 0.03 1.25
Inferred B4-7 568,000 0.61 0.52 0.05 0.08 0.50 0.03 1.26
TOTAL
Indicated All 3,292,000 0.62 0.42 0.05 0.13 0.53 0.03 1.20
Inferred All 568,000 0.61 0.52 0.05 0.08 0.50 0.03 1.26
Notes:
1 CIM (2014) definitions were followed for Mineral Resource estimation and classification.
2
Mineral Resources are estimated using average long-term metal prices (US$) of $8.00/lb nickel, $3.50/lb copper, $19.00/lb cobalt, $1,400/oz platinum, $1,000/oz palladium, and $1,400/oz gold and an exchange rate (C$/US$) of 1.25, and the NSR factors stated in the body of this report.
3 Open Pit Mineral Resources are reported within a resource pit shell at an NSR cut-off value of $22/t. Underground Mineral Resources are reported at an NSR cut-off value of $62/t.
4 Tonnage figures are rounded to three significant figures. Totals may not add correctly due to rounding.
5 The Mineral Resource estimate uses drill hole data available as of December 16, 2015.
6 The Mineral Resource estimate for the B4-7 Deposit is reported using densities calculated from estimated nickel + cobalt grades. The Mineral Resource estimate for the Alpha Zone is reported using densities calculated from estimated nickel grades.

Landore Resources Canada Inc. MINERAL RESOURCE ESTIMATE AND PRELIMINARY ECONOMIC ASSESSMENT, BAM Gold Project, Junior Lake Property, Ontario, Canada
Landore Resources Canada Inc. Page | 217
VW Nickel Deposit MRE
In early 2007, a resource estimate was carried out by RPA on the VW Deposit.
In May 2008, Scott Wilson RPA prepared an updated resource estimate and NI 43-101 compliant
technical report for the VW deposit. Scott Wilson RPA updated the VW deposit estimated resources
to reflect 2008 to 2009 drilling and prepared an updated NI 43-101 compliant technical report
(Routledge and Scott, 2009).
The 2017 Mineral Resource estimates for the VW Deposit by RPA (2018, is the most recent estimate
and incorporates metal prices and exchange rate as at 1 December 2017 (Table 14-28). The VW
Mineral Resource estimate is based on a potential combined open pit and underground mining
scenario.
Table 14-28 VW Ni-Cu-Co-PGE Deposit - Mineral Resource Estimate as at 1 December 2017 (RPA, 2018)
Material Tonnes (t) Ni (%) Cu (%) Co (%) Pt (g/t) Pd (g/t) Au (g/t) Ni_Eq (%)
Open Pit
Indicated 165,000 0.43 0.05 0.02 0.03 0.03 0.01 0.49
Inferred 69,000 0.45 0.08 0.02 0.02 0.02 0.01 0.52
Underground
Indicated 919,000 0.67 0.07 0.02 0.04 0.06 0.01 0.75
Inferred 111,000 0.69 0.07 0.02 0.03 0.05 0.01 0.77
TOTAL
Indicated 1,084,000 0.63 0.07 0.02 0.04 0.05 0.01 0.71
Inferred 180,000 0.60 0.07 0.02 0.02 0.04 0.01 0.68
Notes:
1 CIM (2014) definitions were followed for Mineral Resource estimation and classification.
2
Mineral Resources are estimated using average long-term metal prices (US$) of $8.00/lb nickel, $3.50/lb copper, $19.00/lb cobalt, $1,400/oz platinum, $1,000/oz palladium, and $1,400/oz gold and an exchange rate (C$/US$) of 1.25, and the NSR factors stated in the body of this report.
3
Open Pit Mineral Resources are reported within a resource pit shell at an NSR cut-off value of $22/t.
Underground Mineral Resources for the VW Deposit are reported within preliminary mining shapes that are based on an NSR block value of $62/t.
4 Tonnage figures are rounded to three significant figures. Totals may not add correctly due to rounding.
5 The Mineral Resource estimate uses drill hole data available as of October 8, 2014.

Landore Resources Canada Inc. MINERAL RESOURCE ESTIMATE AND PRELIMINARY ECONOMIC ASSESSMENT, BAM Gold Project, Junior Lake Property, Ontario, Canada
Landore Resources Canada Inc. Page | 218
15. Mineral Reserve Estimates
There have been no studies of the Project designed to convert Mineral Resources described in this
report to Mineral Reserves at this time.

Landore Resources Canada Inc. MINERAL RESOURCE ESTIMATE AND PRELIMINARY ECONOMIC ASSESSMENT, BAM Gold Project, Junior Lake Property, Ontario, Canada
Landore Resources Canada Inc. Page | 219
16. Mining Methods
The BAM gold resources occur close to the surface below a thin glacial till overburden, ranging from
10 – 15 m vertical thickness. The 2022 model was therefore constructed with a view towards
selective open pit mining.
The base input parameters used in the open pit optimization completed by Cube are based on
information collated after discussions with Landore and review of economic analyses in PEA reports
from similar projects in Ontario, Canada. Geotechnical pit design parameters were based on
recommendations from the geotechnical assessment work carried out by WSP in 2018 (Nelson,
2018).
16.1. Input Parameters
A summary of key input parameters as used in the pit optimization process is listed in Table 16-1.
The mining costs supplied by Landore were broadly based on costs of similar operations in the
region with adjustments for base elevations, with smoothed incremental cost increases above and
below this base elevation.
Table 16-1 Summary of Key Input Parameters used in the 2022 Pit Optimization (January 2022)
Item Descriptor Unit Input Source/Comment
PROJECT BASE PARAMETERS
Processing feed capacity Mtpa 2.2
Project discount rate % 10 Not a critical item at this stage
Project start date dd/mm/yyyy tba Not critical, for info only
Base currency USD
Production schedule periodicity Not needed at this stage
USD:XXX Currency exchange rate USD:XXX Not needed at this stage
MINING
Load & Haul Cost $/t Variable See Load & Haul Rate Tab
Drill & Blast Cost $/t Variable See Drill & Blast Rates Tab
Mining Dilution % 0 Block model SMU account for dilution
Mining Recovery % 0 Block model SMU account for dilution
ORE BASED COSTS
Process Variable Costs
Weathered $/t N/A No weathered ore below OB
Fresh $/t 14 Variable operating costs. Client metallurgist to advise
Plant Fixed Costs
Labour and laboratory $/t 0 Assumed included in Process operating costs
General & Administration $/t 1.5 This is a catch-all for all other site based costs. Client to advise

Landore Resources Canada Inc. MINERAL RESOURCE ESTIMATE AND PRELIMINARY ECONOMIC ASSESSMENT, BAM Gold Project, Junior Lake Property, Ontario, Canada
Landore Resources Canada Inc. Page | 220
Item Descriptor Unit Input Source/Comment
Tailing Storage Facility (TSF) $/t 0.1 To include construction of wall lifts. Client to advise
Subtotal Plant Costs $/t 1.6
Mining - Ore Based Costs
Ore re-handle Cost $/t 0.50 ROM Re-handle cost
Percentage Ore Re-handle % 50% Common to use 100%
Ore re-handle Cost per feed tonne $/t 0.25
Mining Owner's team cost $/t 0.30 "typical' number from other projects
Pit Dewatering $/t 0.10 token number to show it is accounted for
Grade Control $/t 0.42 20x10 drill spacing, $35/m, 4:1 w:o metres, 2.7 SG, +$0.1 for assays
Ore Over- Haulage $/t 0.00 No over-haul
Subtotal Mining Ore Costs $/t 1.07
Total Ore Based Costs
Weathered $/t N/A No weathered ore below OB
Fresh $/t 16.67
METALLURGICAL RECOVERIES
Weathered % N/A No weathered ore below OB
Fresh % 0.98 Based on 2018 Met studies
REVENUE
Selling price $/oz 1800 Needs to be in same currency as the costs (or apply the exchange rate conversion)
Royalty
Government Royalty % 0 Confirmed by client email 1 Dec 2018
Other Royalty %
Net Selling cost $/oz 1800 Net of all selling costs and royalties
Discount Rate for DCF model % 0.05 Based on Client Email 1 Dec 2018
CUT-OFF GRADE
Weathered g/t N/A All fresh material below OB
Fresh g/t 0.29 Calculation
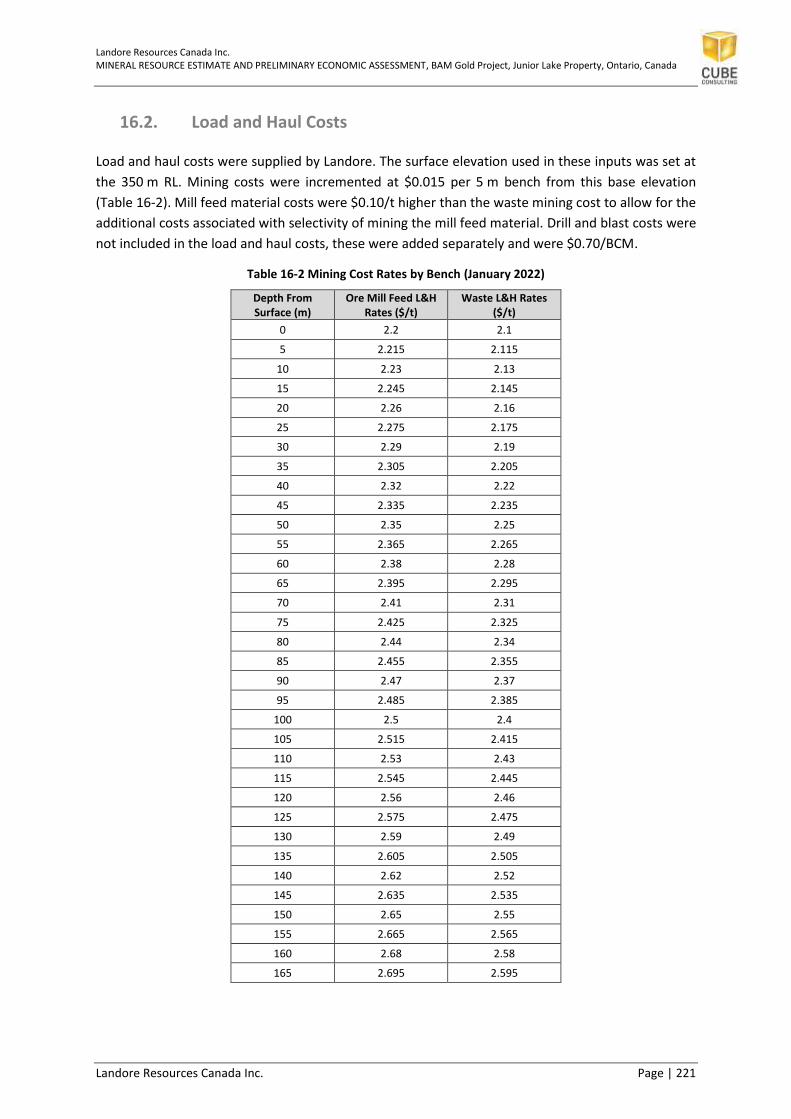
Landore Resources Canada Inc. MINERAL RESOURCE ESTIMATE AND PRELIMINARY ECONOMIC ASSESSMENT, BAM Gold Project, Junior Lake Property, Ontario, Canada
Landore Resources Canada Inc. Page | 221
16.2. Load and Haul Costs
Load and haul costs were supplied by Landore. The surface elevation used in these inputs was set at
the 350 m RL. Mining costs were incremented at $0.015 per 5 m bench from this base elevation
(Table 16-2). Mill feed material costs were $0.10/t higher than the waste mining cost to allow for the
additional costs associated with selectivity of mining the mill feed material. Drill and blast costs were
not included in the load and haul costs, these were added separately and were $0.70/BCM.
Table 16-2 Mining Cost Rates by Bench (January 2022)
Depth From Surface (m)
Ore Mill Feed L&H Rates ($/t)
Waste L&H Rates ($/t)
0 2.2 2.1
5 2.215 2.115
10 2.23 2.13
15 2.245 2.145
20 2.26 2.16
25 2.275 2.175
30 2.29 2.19
35 2.305 2.205
40 2.32 2.22
45 2.335 2.235
50 2.35 2.25
55 2.365 2.265
60 2.38 2.28
65 2.395 2.295
70 2.41 2.31
75 2.425 2.325
80 2.44 2.34
85 2.455 2.355
90 2.47 2.37
95 2.485 2.385
100 2.5 2.4
105 2.515 2.415
110 2.53 2.43
115 2.545 2.445
120 2.56 2.46
125 2.575 2.475
130 2.59 2.49
135 2.605 2.505
140 2.62 2.52
145 2.635 2.535
150 2.65 2.55
155 2.665 2.565
160 2.68 2.58
165 2.695 2.595

Landore Resources Canada Inc. MINERAL RESOURCE ESTIMATE AND PRELIMINARY ECONOMIC ASSESSMENT, BAM Gold Project, Junior Lake Property, Ontario, Canada
Landore Resources Canada Inc. Page | 222
16.3. Geotechnical Parameters
Geotechnical parameters used for the 2022 pit optimization work by Cube were based on
recommendations from the geotechnical assessment work carried out by WSP in 2018 (Nelson,
2018) and are summarized in Table 16-3. A summary of the Nelson (2018) report is provided in
Appendix 7.
Table 16-3 Recommended Pit Wall Angles and Bench Height Based on Geotechnical Studies (Nelson, 2018)
Description Units Inputs
Bench Height m 20
Berm Width m 8.5
Batter Angle Degrees 80
Crest to Crest Degrees 59
Stack Height m 200
Ramp Width m 28
Ramp gradient ratio 1 in 10
Optimisation Slope Degrees 54
No Ramp Passes # 1
Number of Benches # 10
Horizontal distance m 148
Crest to Crest m 53.4
16.4. Pit Optimization Results
The input parameters listed in Table 16-1 were used in the following optimization runs in which a
combination of runs was completed for Indicated Resources only exclude (Run A) and Indicated plus
Inferred Resources (Run B).
The results of the optimization runs at a range of gold prices for each Run option (A or B) are listed in
Table 16-4 and Table 16-5. Visual trends for each Run option are shown in Figure 16-1 and Figure
16-2.
The optimization runs comprise of a range of nested shells obtained by varying the base metal price
by means of revenue factors to enable evaluation across a range of pit shell sizes. These are also
presented graphically to assist in the shell selection process.
Selection of optimization shells on which the pit designs is to be based was undertaken in
consultation with Landore. Only Run B (including Indicated and Inferred Resources only) was
considered for the shell selection for pit optimization study results with the Run A being for
information only. In selecting the shells, consideration was given to mine life and overall value.
Within Run B, optimization run 21 was selected as it represented a potential 12-year mine life with
only a marginal reduction in shell value compared to smaller shells. The pit optimization shells for
run 21 are illustrated in different views in Figure 16-3 to Figure 16-5. The cross section view
illustrates the pit optimization differences at various gold prices, and against the 2019 optimization.

Landore Resources Canada Inc. MINERAL RESOURCE ESTIMATE AND PRELIMINARY ECONOMIC ASSESSMENT, BAM Gold Project, Junior Lake Property, Ontario, Canada
Landore Resources Canada Inc. Page | 223
Table 16-4 Run A Optimization Results Summary (Indicated Only) – January 2022
Shell Factor Price Base RL Pit Depth (m) Total Tonnes
(Mt) Waste Tonnes
(Mt) Strip Ratio
Processed Ore
Mining Cost ($M) Process Cost ($M) Revenue Au ($M) Undiscounted Cash
Flow ($M) Discounted (Best)
$M) Discounted (Worst
($M) Cost/ Oz ($)
Incremental Cost /Oz ($)
Tonnes (Mt) Grade (g/t Au Rec. Au (KOz)
1 0.600 1080 162.5 187.5 50.72 39.91 3.7 10.81 1.28 435.2 123.7 181.3 783.3 478.3 350.5 350.5 701 701
2 0.620 1116 162.5 187.5 58.75 46.93 4.0 11.81 1.26 468.1 143.6 198.1 842.6 500.9 363.3 358.5 730 1,113
3 0.640 1152 156.3 193.8 62.38 49.99 4.0 12.39 1.24 484.4 152.6 207.8 871.9 511.4 369.0 360.2 744 1,152
4 0.660 1188 156.3 193.8 71.68 58.13 4.3 13.55 1.22 520.2 175.8 227.3 936.3 533.3 380.4 363.7 775 1,190
5 0.680 1224 156.3 193.8 73.92 60.08 4.3 13.84 1.21 528.8 181.4 232.2 951.9 538.4 383.1 364.6 782 1,210
6 0.700 1260 150.0 200.0 78.26 63.96 4.5 14.30 1.21 543.7 192.3 239.8 978.7 546.6 387.3 365.8 795 1,246
7 0.720 1296 143.8 206.3 86.94 71.55 4.7 15.40 1.19 575.0 214.5 258.2 1,035.1 562.4 394.6 365.9 822 1,296
8 0.740 1332 143.8 206.3 89.36 73.67 4.7 15.70 1.18 583.5 220.6 263.2 1,050.3 566.5 396.6 366.1 829 1,318
9 0.760 1368 131.3 218.8 92.64 76.59 4.8 16.06 1.18 594.2 229.0 269.3 1,069.6 571.3 399.0 366.6 839 1,350
10 0.780 1404 131.3 218.8 98.29 81.65 4.9 16.64 1.17 611.5 243.2 279.1 1,100.6 578.4 402.3 365.6 854 1,392
11 0.800 1440 131.3 218.8 107.04 89.73 5.2 17.31 1.17 635.1 265.4 290.2 1,143.2 587.5 406.4 363.7 875 1,412
12 0.820 1476 125.0 225.0 111.84 94.07 5.3 17.77 1.16 648.6 277.4 298.0 1,167.5 592.1 408.3 361.6 887 1,465
13 0.840 1512 125.0 225.0 114.57 96.57 5.4 17.99 1.16 655.8 284.4 301.7 1,180.4 594.3 409.3 360.8 894 1,489
14 0.860 1548 125.0 225.0 119.64 101.21 5.5 18.43 1.15 669.1 297.3 309.2 1,204.3 597.9 410.9 358.6 906 1,533
15 0.880 1584 125.0 225.0 145.81 125.63 6.2 20.18 1.15 730.1 363.0 338.4 1,314.2 612.8 416.7 342.2 961 1,555
16 0.900 1620 125.0 225.0 148.70 128.31 6.3 20.39 1.15 736.9 370.4 341.9 1,326.4 614.1 417.1 340.7 967 1,602
17 0.920 1656 125.0 225.0 152.72 132.08 6.4 20.64 1.15 745.8 380.7 346.1 1,342.4 615.6 417.6 338.6 975 1,638
18 0.940 1692 125.0 225.0 154.20 133.43 6.4 20.77 1.15 749.3 384.6 348.3 1,348.8 616.0 417.6 337.8 978 1,683
19 0.960 1728 125.0 225.0 155.58 134.71 6.5 20.88 1.14 752.5 388.2 350.1 1,354.6 616.3 417.7 337.0 981 1,707
20 0.980 1764 125.0 225.0 158.78 137.68 6.5 21.10 1.14 759.4 396.3 353.9 1,366.9 616.6 417.7 334.6 988 1,747
21 1.000 1800 125.0 225.0 166.60 145.06 6.7 21.54 1.14 774.7 416.4 361.3 1,394.5 616.9 417.5 329.6 1,004 1,784
22 1.020 1836 118.8 231.3 170.56 148.77 6.8 21.79 1.14 782.7 426.7 365.4 1,408.8 616.7 417.3 326.8 1,012 1,825
23 1.040 1872 118.8 231.3 172.52 150.62 6.9 21.91 1.14 786.4 431.8 367.4 1,415.6 616.5 417.1 325.4 1,016 1,855
24 1.060 1908 118.8 231.3 174.25 152.20 6.9 22.05 1.14 790.1 436.2 369.7 1,422.1 616.1 417.0 324.1 1,020 1,892
25 1.080 1944 118.8 231.3 177.47 155.19 7.0 22.27 1.14 796.4 444.6 373.5 1,433.5 615.4 416.7 321.8 1,027 1,925
26 1.100 1980 112.5 237.5 180.55 158.11 7.1 22.43 1.13 801.8 452.6 376.2 1,443.3 614.5 416.3 319.5 1,034 1,963
27 1.120 2016 112.5 237.5 184.48 161.67 7.1 22.81 1.13 810.2 463.0 382.6 1,458.4 612.8 415.7 316.3 1,044 1,999
28 1.140 2052 112.5 237.5 194.09 170.55 7.2 23.55 1.12 828.2 487.2 394.9 1,490.8 608.7 414.3 304.6 1,065 2,025
29 1.160 2088 100.0 250.0 205.26 181.01 7.5 24.25 1.11 847.6 515.3 406.7 1,525.7 603.7 412.6 291.8 1,088 2,062
30 1.180 2124 93.8 256.3 209.81 185.31 7.6 24.51 1.11 855.4 527.3 411.0 1,539.7 601.4 411.7 288.3 1,097 2,098
31 1.200 2160 87.5 262.5 212.91 188.24 7.6 24.68 1.11 860.4 535.4 413.8 1,548.8 599.6 411.1 285.8 1,103 2,154
32 1.220 2196 87.5 262.5 216.92 192.03 7.7 24.89 1.11 866.9 545.9 417.4 1,560.4 597.1 410.3 282.5 1,111 2,181
33 1.240 2232 87.5 262.5 223.88 198.57 7.9 25.31 1.10 878.3 564.2 424.5 1,581.0 592.3 408.7 276.5 1,126 2,221
34 1.260 2268 87.5 262.5 230.85 205.02 7.9 25.83 1.09 890.2 582.2 433.2 1,602.4 587.0 407.0 268.7 1,141 2,245
35 1.280 2304 87.5 262.5 233.04 207.09 8.0 25.95 1.09 893.5 587.9 435.1 1,608.4 585.4 406.5 266.6 1,145 2,291
36 1.300 2340 87.5 262.5 234.05 208.04 8.0 26.01 1.09 895.2 590.6 436.3 1,611.3 584.5 406.3 265.7 1,147 2,326
37 1.320 2376 87.5 262.5 234.95 208.88 8.0 26.06 1.09 896.5 593.0 437.1 1,613.8 583.7 406.0 264.9 1,149 2,364
38 1.340 2412 87.5 262.5 237.66 211.45 8.1 26.21 1.09 900.5 600.1 439.5 1,621.0 581.4 405.3 262.3 1,154 2,392
39 1.360 2448 87.5 262.5 239.67 213.34 8.1 26.33 1.09 903.6 605.4 441.6 1,626.5 579.4 404.7 260.4 1,159 2,433
40 1.380 2484 87.5 262.5 240.42 214.02 8.1 26.40 1.09 904.8 607.4 442.7 1,628.7 578.6 404.5 259.5 1,161 2,475
41 1.400 2520 81.3 268.8 243.75 217.20 8.2 26.55 1.09 909.3 616.1 445.2 1,636.7 575.5 403.5 256.4 1,167 2,503
42 1.420 2556 81.3 268.8 244.35 217.75 8.2 26.61 1.09 910.3 617.7 446.2 1,638.6 574.7 403.2 255.7 1,169 2,540
43 1.440 2592 81.3 268.8 246.10 219.40 8.2 26.70 1.09 912.7 622.3 447.8 1,642.9 572.8 402.6 254.0 1,172 2,597
44 1.460 2628 81.3 268.8 247.36 220.56 8.2 26.79 1.08 914.5 625.5 449.3 1,646.1 571.3 402.2 252.3 1,175 2,648
45 1.480 2664 81.3 268.8 248.24 221.40 8.3 26.84 1.08 915.7 627.8 450.1 1,648.2 570.3 401.9 251.4 1,177 2,663
46 1.500 2700 81.3 268.8 249.91 222.99 8.3 26.92 1.08 917.7 632.1 451.4 1,651.9 568.4 401.3 249.6 1,181 2,714
47 1.520 2736 81.3 268.8 251.38 224.39 8.3 26.99 1.08 919.6 636.0 452.6 1,655.3 566.7 400.7 248.2 1,184 2,721
48 1.540 2772 81.3 268.8 254.06 226.90 8.4 27.16 1.08 923.2 642.9 455.5 1,661.7 563.3 399.7 244.9 1,190 2,745
49 1.560 2808 81.3 268.8 254.57 227.38 8.4 27.19 1.08 923.8 644.3 456.0 1,662.8 562.6 399.5 244.3 1,191 2,860
50 1.580 2844 81.3 268.8 256.75 229.44 8.4 27.31 1.08 926.6 650.0 458.0 1,667.8 559.8 398.7 242.1 1,196 2,824
51 1.600 2880 81.3 268.8 257.95 230.58 8.4 27.36 1.08 927.9 653.1 458.9 1,670.3 558.3 398.2 240.8 1,198 2,881

Landore Resources Canada Inc. MINERAL RESOURCE ESTIMATE AND PRELIMINARY ECONOMIC ASSESSMENT, BAM Gold Project, Junior Lake Property, Ontario, Canada
Landore Resources Canada Inc. Page | 224
Table 16-5 Run B Optimization Results Summary (Indicated and Inferred) – January 2022
Shell Factor Price Base RL Pit Depth (m) Total Tonnes
(Mt) Waste Tonnes
(Mt) Strip Ratio
Processed Ore
Mining Cost ($M) Process Cost ($M) Revenue Au ($M) Undiscounted
Cash Flow ($M) Discounted (Best)
$M) Discounted (Worst
($M) Cost/ Oz ($)
Incremental Cost /Oz ($)
Tonnes (Mt) Grade (g/t
Au Rec. Au
(KOz)
1 0.600 1080 162.5 187.5 59.56 48.43 4.4 11.13 1.32 463.5 145.2 186.6 834.3 502.5 361.6 361.6 716 716
2 0.620 1116 162.5 187.5 68.72 56.45 4.6 12.27 1.30 501.4 168.0 205.8 902.5 528.8 376.7 370.2 745 1,107
3 0.640 1152 156.3 193.8 74.85 61.94 4.8 12.91 1.29 523.9 183.2 216.5 943.0 543.4 384.5 372.3 763 1,151
4 0.660 1188 156.3 193.8 84.52 70.46 5.0 14.06 1.27 560.5 207.3 235.9 1,008.8 565.7 396.2 375.8 791 1,189
5 0.680 1224 156.3 193.8 87.55 73.12 5.1 14.42 1.26 571.6 214.8 241.9 1,028.9 572.2 399.4 376.3 799 1,215
6 0.700 1260 150.0 200.0 92.10 77.23 5.2 14.87 1.25 586.9 226.2 249.4 1,056.3 580.7 403.5 376.6 810 1,244
7 0.720 1296 143.8 206.3 102.87 86.73 5.4 16.14 1.23 624.5 253.6 270.7 1,124.1 599.8 412.5 376.8 840 1,293
8 0.740 1332 143.8 206.3 106.79 90.23 5.5 16.56 1.22 637.3 263.5 277.7 1,147.1 606.0 415.3 376.6 849 1,317
9 0.760 1368 131.3 218.8 109.75 92.85 5.5 16.90 1.22 647.1 271.1 283.4 1,164.8 610.4 417.2 376.4 857 1,352
10 0.780 1404 125.0 225.0 120.34 102.48 5.7 17.86 1.21 678.0 297.9 299.5 1,220.4 623.0 422.6 373.3 881 1,390
11 0.800 1440 125.0 225.0 123.36 105.21 5.8 18.15 1.20 686.9 305.6 304.3 1,236.3 626.4 424.1 372.9 888 1,416
12 0.820 1476 118.8 231.3 128.29 109.66 5.9 18.63 1.19 700.8 317.9 312.4 1,261.4 631.2 426.0 370.3 899 1,460
13 0.840 1512 112.5 237.5 161.06 140.31 6.8 20.75 1.19 780.3 400.4 348.0 1,404.5 656.1 435.1 353.8 959 1,486
14 0.860 1548 112.5 237.5 165.87 144.68 6.8 21.19 1.19 793.1 412.7 355.4 1,427.6 659.6 436.0 350.8 968 1,532
15 0.880 1584 112.5 237.5 170.52 148.91 6.9 21.61 1.18 805.1 424.5 362.4 1,449.2 662.3 436.7 346.7 977 1,572
16 0.900 1620 112.5 237.5 174.62 152.70 7.0 21.93 1.18 814.9 435.0 367.7 1,466.9 664.2 437.1 343.9 985 1,605
17 0.920 1656 106.3 243.8 178.82 156.60 7.1 22.21 1.18 824.5 445.8 372.5 1,484.1 665.8 437.6 341.4 993 1,637
18 0.940 1692 106.3 243.8 181.29 158.86 7.1 22.44 1.18 830.6 452.2 376.3 1,495.1 666.6 437.8 340.1 997 1,672
19 0.960 1728 106.3 243.8 183.77 161.11 7.1 22.67 1.17 836.6 458.6 380.1 1,505.8 667.1 438.0 338.1 1,003 1,713
20 0.980 1764 106.3 243.8 187.67 164.68 7.2 23.00 1.17 845.4 468.6 385.7 1,521.8 667.5 438.1 334.8 1,010 1,749
21 1.000 1800 106.3 243.8 193.17 169.77 7.3 23.41 1.16 857.4 482.9 392.5 1,543.2 667.8 438.2 331.0 1,021 1,776
22 1.020 1836 106.3 243.8 198.88 175.08 7.4 23.80 1.16 869.1 497.8 399.1 1,564.4 667.6 438.1 326.6 1,032 1,821
23 1.040 1872 106.3 243.8 200.87 176.95 7.4 23.92 1.16 873.0 502.9 401.2 1,571.4 667.3 438.0 324.8 1,036 1,856
24 1.060 1908 106.3 243.8 204.02 179.92 7.5 24.10 1.16 878.8 511.1 404.1 1,581.9 666.8 437.7 322.3 1,041 1,900
25 1.080 1944 100.0 250.0 205.63 181.43 7.5 24.21 1.16 881.9 515.2 406.0 1,587.5 666.4 437.6 320.6 1,044 1,923
26 1.100 1980 100.0 250.0 213.31 188.49 7.6 24.82 1.15 897.5 535.1 416.3 1,615.4 664.0 436.8 314.2 1,060 1,954
27 1.120 2016 87.5 262.5 220.88 195.49 7.7 25.39 1.14 912.2 555.1 425.8 1,641.9 661.0 435.8 308.8 1,075 2,001
28 1.140 2052 87.5 262.5 230.95 204.81 7.8 26.14 1.13 930.9 580.5 438.4 1,675.7 656.7 434.5 296.4 1,095 2,029
29 1.160 2088 75.0 275.0 251.32 223.82 8.1 27.50 1.12 967.3 632.7 461.1 1,741.2 647.3 431.3 275.8 1,131 2,060
30 1.180 2124 68.8 281.3 257.99 230.07 8.2 27.92 1.11 978.9 650.1 468.2 1,762.0 643.7 430.2 269.4 1,142 2,111
31 1.200 2160 68.8 281.3 263.96 235.68 8.3 28.29 1.11 989.0 665.7 474.3 1,780.2 640.1 429.1 263.8 1,153 2,151
32 1.220 2196 68.8 281.3 268.02 239.51 8.4 28.51 1.11 995.5 676.1 478.1 1,792.0 637.7 428.4 259.5 1,159 2,173
33 1.240 2232 56.3 293.8 271.30 242.58 8.4 28.73 1.11 1,001.1 684.8 481.7 1,801.9 635.4 427.7 256.6 1,165 2,215
34 1.260 2268 56.3 293.8 282.27 252.78 8.6 29.48 1.10 1,019.4 713.4 494.4 1,835.0 627.2 425.4 245.7 1,185 2,248
35 1.280 2304 56.3 293.8 285.30 255.62 8.6 29.67 1.10 1,024.3 721.2 497.6 1,843.7 624.8 424.8 242.5 1,190 2,292
36 1.300 2340 50.0 300.0 289.97 259.93 8.7 30.05 1.09 1,032.1 733.3 503.9 1,857.8 620.7 423.7 236.7 1,199 2,327
37 1.320 2376 50.0 300.0 300.23 269.70 8.8 30.53 1.09 1,046.8 760.0 511.9 1,884.2 612.3 421.5 226.6 1,215 2,369
38 1.340 2412 50.0 300.0 304.48 273.76 8.9 30.72 1.09 1,052.8 771.2 515.3 1,895.1 608.7 420.6 222.6 1,222 2,400
39 1.360 2448 50.0 300.0 307.74 276.81 9.0 30.93 1.09 1,057.6 779.5 518.6 1,903.7 605.6 419.8 218.9 1,227 2,444
40 1.380 2484 50.0 300.0 310.26 279.18 9.0 31.08 1.08 1,061.4 786.1 521.3 1,910.4 603.1 419.1 216.3 1,232 2,481
41 1.400 2520 43.8 306.3 317.04 285.59 9.1 31.45 1.08 1,070.9 804.0 527.4 1,927.6 596.2 417.4 210.0 1,243 2,512
42 1.420 2556 43.8 306.3 319.48 287.90 9.1 31.58 1.08 1,074.3 810.4 529.6 1,933.7 593.7 416.8 207.8 1,247 2,540
43 1.440 2592 43.8 306.3 320.12 288.49 9.1 31.62 1.08 1,075.2 812.1 530.3 1,935.4 593.0 416.6 207.0 1,248 2,607
44 1.460 2628 43.8 306.3 327.36 295.40 9.2 31.96 1.08 1,084.7 831.3 536.0 1,952.5 585.1 414.7 200.3 1,261 2,629
45 1.480 2664 37.5 312.5 331.27 299.06 9.3 32.21 1.07 1,090.2 841.6 540.1 1,962.3 580.5 413.6 196.4 1,267 2,647
46 1.500 2700 37.5 312.5 332.34 300.06 9.3 32.28 1.07 1,091.6 844.3 541.4 1,964.9 579.2 413.3 194.7 1,269 2,690
47 1.520 2736 37.5 312.5 337.76 305.17 9.4 32.59 1.07 1,098.6 858.4 546.5 1,977.5 572.6 411.7 188.5 1,279 2,743
48 1.540 2772 31.3 318.8 342.61 309.86 9.5 32.75 1.07 1,104.3 871.3 549.2 1,987.7 567.2 410.5 184.3 1,286 2,761
49 1.560 2808 31.3 318.8 344.84 311.98 9.5 32.86 1.07 1,107.0 877.1 551.1 1,992.6 564.4 409.9 182.1 1,290 2,795
50 1.580 2844 31.3 318.8 345.78 312.87 9.5 32.91 1.07 1,108.2 879.6 551.9 1,994.7 563.2 409.6 181.0 1,292 2,847
51 1.600 2880 31.3 318.8 353.89 320.56 9.6 33.33 1.07 1,118.0 900.8 559.0 2,012.5 552.6 407.1 172.1 1,306 2,876

Landore Resources Canada Inc. MINERAL RESOURCE ESTIMATE AND PRELIMINARY ECONOMIC ASSESSMENT, BAM Gold Project, Junior Lake Property, Ontario, Canada
Landore Resources Canada Inc. Page | 225
Figure 16-1 Run A Optimization Results (Indicated Only) - Tonnage/Cash-flow Chart (January 2022)
0.0
0.1
0.2
0.3
0.4
0.5
0.6
0.7
0.0
0.1
0.1
0.2
0.2
0.3
1 3 5 7 9 11 13 15 17 19 21 23 25 27 29 31 33 35 37 39 41 43 45 47 49
$ (
00
0)
To
nn
es (
000
)
Shell
Bam Gold Deposit Run A Optimisation - USD$1,800/oz Gold Price, Measured and Indicated Resources
Waste (t) Mill Feed (t) Undiscounted Disc. Best Disc. Worst
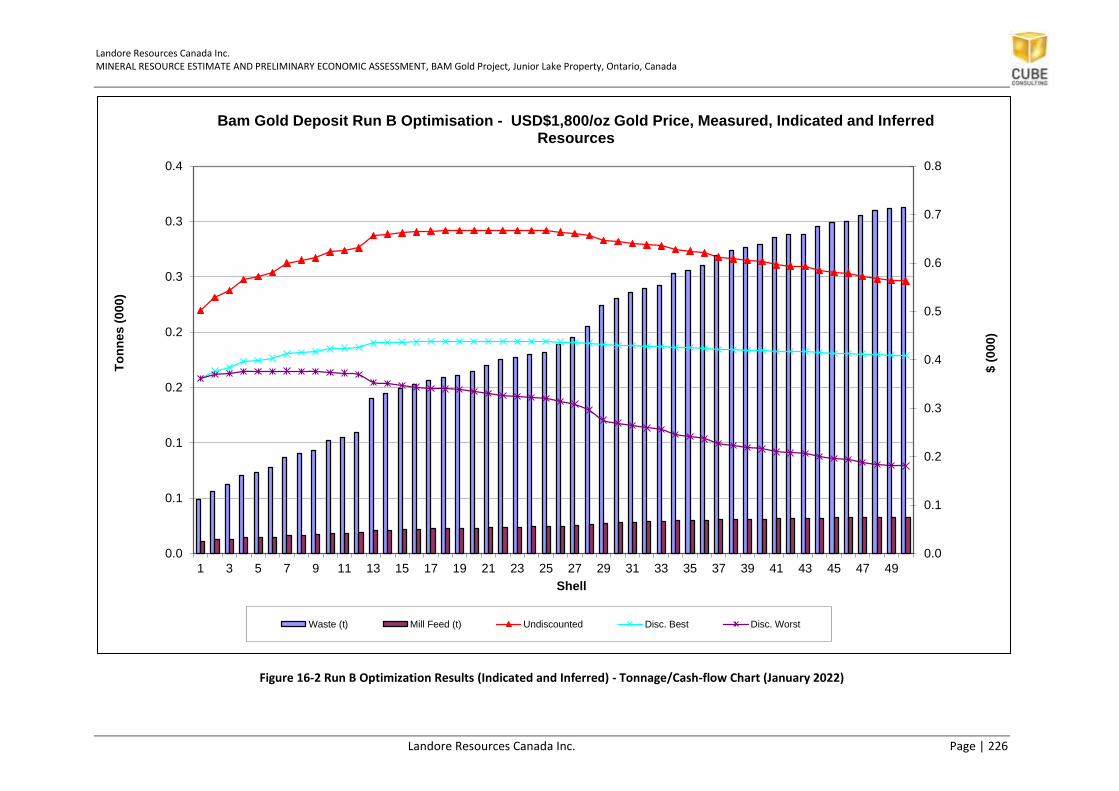
Landore Resources Canada Inc. MINERAL RESOURCE ESTIMATE AND PRELIMINARY ECONOMIC ASSESSMENT, BAM Gold Project, Junior Lake Property, Ontario, Canada
Landore Resources Canada Inc. Page | 226
Figure 16-2 Run B Optimization Results (Indicated and Inferred) - Tonnage/Cash-flow Chart (January 2022)
0.0
0.1
0.2
0.3
0.4
0.5
0.6
0.7
0.8
0.0
0.1
0.1
0.2
0.2
0.3
0.3
0.4
1 3 5 7 9 11 13 15 17 19 21 23 25 27 29 31 33 35 37 39 41 43 45 47 49
$ (
000)
To
nn
es (
000)
Shell
Bam Gold Deposit Run B Optimisation - USD$1,800/oz Gold Price, Measured, Indicated and Inferred Resources
Waste (t) Mill Feed (t) Undiscounted Disc. Best Disc. Worst

Landore Resources Canada Inc. MINERAL RESOURCE ESTIMATE AND PRELIMINARY ECONOMIC ASSESSMENT, BAM Gold Project, Junior Lake Property, Ontario, Canada
Landore Resources Canada Inc. Page | 227
Figure 16-3 Plan View of USD1800 Pit Optimization Shells – Run B Shell 21 (January 2022)
WEST PIT Shells
EAST PIT Shells
2022 Pit Shell 21, $1800

Landore Resources Canada Inc. MINERAL RESOURCE ESTIMATE AND PRELIMINARY ECONOMIC ASSESSMENT, BAM Gold Project, Junior Lake Property, Ontario, Canada
Landore Resources Canada Inc. Page | 228
Figure 16-4 Isometric View Looking NNW of USD1800 Pit Optimization Shells – Run B Shell 21 (January 2022)
WEST PIT
EAST PIT
2022 Pit Shell 21, $1800
Jan 2022 Block Model

Landore Resources Canada Inc. MINERAL RESOURCE ESTIMATE AND PRELIMINARY ECONOMIC ASSESSMENT, BAM Gold Project, Junior Lake Property, Ontario, Canada
Landore Resources Canada Inc. Page | 229
Figure 16-5 Cross Section View at Line 2700 E, Showing US $1800 Pit Optimization Shells and Other Au Price Shells (January 2022)
2019 Pit Shell 21, $1500
2022 Pit Shell 21, $1800
2022 Pit Shell 27, $2000
2022 Pit Shell 27, $2250
Surface Topo
Overburden Surface
Landore Resources Canada Inc. MINERAL RESOURCE ESTIMATE AND PRELIMINARY ECONOMIC ASSESSMENT, BAM Gold Project, Junior Lake Property, Ontario, Canada
Landore Resources Canada Inc. Page | 230
16.5. Mining Schedule
The planned development of the open pits was scheduled based on the open pit optimization shells
for Run B (Indicated and Inferred Resources). The schedule intervals are in quarterly increments for
the life of the mine and includes a crusher feed schedule together with end of period stockpile
balances.
The schedule was prepared within a schedule optimization tool (Minemax Scheduler) to obtain the
maximum project value within the applied practical constraints. The schedule includes pre-
production, mining production from the open pits, stockpiling and processing. To guide the
schedule, a combination of prescribed and practical targets and constraints were adhered to as
follows:
• The primary target of the schedule is to supply 2.2 Mtpa of mill feed material
• Some consideration for the smoothing of overall material movement was applied. This
would normally be refined in further detailed studies to assist in allocation of mining
equipment and the efficient utilization of such machinery
• The scheduling included a process feed schedule and stockpile balance to simulate practical
working conditions to provide a consistent process feed with a variable production from the
open pit operations.
Based on the selected, preliminary pit shells and the above-mentioned targets and constraints, a
mine life of 12 years was scheduled while achieving a consistent material feed of 2.2 Mtpa to the
process facility over this time with ore feed only receding as the project leached the final 2 quarters
of its planned life.
Details of the mine production and process feed schedule physical outputs are shown in the
following graphs:
• Figure 16-6 - Quarterly schedule of tonnes mined by destination (by material type)
• Figure 16-7 – Quarterly schedule of tonnes mined by stage (by pit)
• Figure 16-8 - Quarterly schedule of process ore tonnes by ore mined and estimated mined
grade
• Figure 16-9 – Quarterly schedule of process ore tonnes by ore processed and mill grade (by
destination)
• Figure 16-10 - Quarterly schedule of process ore tonnes by ore processed and mill grade (by
classification)
• Figure 16-11 - Quarterly schedule of total recovered ounces produced
• Figure 16-12 - Quarterly schedule of quarterly undiscounted cash flow
• Figure 16-13 - Quarterly schedule of the cumulative undiscounted cash flow
• Figure 16-14 Quarterly schedule of closing stockpile balance, by destination and total.
A plan view of the scheduling of each open pit shell and the conceptual order of mining in relation to
the quarterly schedule chart in Figure 16-7 is illustrated in Figure 16-15. The conceptual schedule
includes starter pit options for both East Pit (E1) and West Pit (W1).

Landore Resources Canada Inc. MINERAL RESOURCE ESTIMATE AND PRELIMINARY ECONOMIC ASSESSMENT, BAM Gold Project, Junior Lake Property, Ontario, Canada
Landore Resources Canada Inc. Page | 231
Figure 16-6 Tonnes Mined by Destination by Quarter (January 2022)
Figure 16-7 Tonnes Mined by Stage by Quarter – by Pit (January 2022)

Landore Resources Canada Inc. MINERAL RESOURCE ESTIMATE AND PRELIMINARY ECONOMIC ASSESSMENT, BAM Gold Project, Junior Lake Property, Ontario, Canada
Landore Resources Canada Inc. Page | 232
Figure 16-8 Ore Tonnes and Grade Mined by Quarter (January 2022)
Figure 16-9 Process Material Tonnes and Grade Processed by Quarter – by Destination (January 2022)

Landore Resources Canada Inc. MINERAL RESOURCE ESTIMATE AND PRELIMINARY ECONOMIC ASSESSMENT, BAM Gold Project, Junior Lake Property, Ontario, Canada
Landore Resources Canada Inc. Page | 233
Figure 16-10 Process Material Tonnes and Grade Processed by Quarter – by Classification (January 2022)
Figure 16-11 Recovered Ounces Produced by Quarter (January 2022)

Landore Resources Canada Inc. MINERAL RESOURCE ESTIMATE AND PRELIMINARY ECONOMIC ASSESSMENT, BAM Gold Project, Junior Lake Property, Ontario, Canada
Landore Resources Canada Inc. Page | 234
Figure 16-12 Undiscounted Cash Flow by Quarter (January 2022)
Figure 16-13 Undiscounted Cumulative Cash Flow by Quarter (January 2022)

Landore Resources Canada Inc. MINERAL RESOURCE ESTIMATE AND PRELIMINARY ECONOMIC ASSESSMENT, BAM Gold Project, Junior Lake Property, Ontario, Canada
Landore Resources Canada Inc. Page | 235
Figure 16-14 Stockpile Closing Balance by Quarter – by Destination and Total (January 2022)

Landore Resources Canada Inc. MINERAL RESOURCE ESTIMATE AND PRELIMINARY ECONOMIC ASSESSMENT, BAM Gold Project, Junior Lake Property, Ontario, Canada
Landore Resources Canada Inc. Page | 236
Figure 16-15 Plan View of the Open Pit Shells Coded by Shell ID for the Conceptual Quarterly Schedule (January 2022)
S1
S2
W2W1
E1
E2
S3
S4
S5
E1 = East Pit – Starter Pit Shell E2 = East Pit – Final Pit ShellW1 = West Pit – Starter Pit Shell W2 = West Pit – Final Pit ShellS1 = Small Pit Shell 1S2 = Small Pit Shell 2S3 = Small Pit Shell 3S4 = Small Pit Shell 4S5 = Small Pit Shell 5

Landore Resources Canada Inc. MINERAL RESOURCE ESTIMATE AND PRELIMINARY ECONOMIC ASSESSMENT, BAM Gold Project, Junior Lake Property, Ontario, Canada
Landore Resources Canada Inc. Page | 237
17. Recovery Methods
All information presented in this section on recovery methods has been sourced from the previous
PEA for the BAM Gold Project (Cube, 2019) which was reported by Allard Engineering Services.
Phase 1 metallurgical work commissioned by Landore is documented in a report “BAM Project –
Metallurgical Report – Phase 1”, 11 January 2019, Allard Engineering Services LLC (Allard, 2019). The
reader is referred to this report for more in-depth discussion of the Phase 1 Metallurgical Testing
and discussion of recovery methods.
17.1. Process Assumptions and Concepts
The Phase 1 test work indicated high extraction of gold was achieved with the BAM composite using
a combination of grinding, gravity separation and agitation leaching of the gravity tails with cyanide.
A conceptual flowsheet of this concept has been prepared for the BAM project. It is understood that
this flowsheet represents one option, albeit favoured by the current testing, and that additional
testing may identify alternative processes that would be attractive (either metallurgically or
economically) for the BAM Project. The basic design criteria and assumptions are included in Table
17-1 and the flowsheet is included as Figure 17-1. It is anticipated that all the facilities will be
enclosed for all-weather operation.
Table 17-1: Process Assumptions for Conceptual Flowsheet
Area Unit Assumption
Operating:
Production Rate: tonne/day 8,000
Operating Time: hrs/day 24
Ore:
Gold Grade: g/t 1.3
Silver Grade: g/t 1
Copper Grade: g/t 130
SPG: t/m3 2.7
Extractions - Gold:
Gravity Separation: % nom. 65%
Agitation Leach: % nom. 95%
Overall: % nom. 98%
Extractions - Silver:
Agitation Leach: % nom. 22%
Extractions - Copper:
Agitation Leach: % nom. 0%
Crushing Plant:
Feed: type ROM
Feed Grizzly Opening: cm 60
Availability: % 80%
Primary: type Sizer

Landore Resources Canada Inc. MINERAL RESOURCE ESTIMATE AND PRELIMINARY ECONOMIC ASSESSMENT, BAM Gold Project, Junior Lake Property, Ontario, Canada
Landore Resources Canada Inc. Page | 238
Area Unit Assumption
Product, Nom.100% passing: mm 150
Secondary: type Sizer
Product, Nom.100% passing: mm 40
Stockpile, Live Volume: hrs 24
Tertiary: type HPGR
Product, Nom.100% passing: mm 6
Milling: type Ball
Classification: Hydro-cyclones
Mesh-of-Grind, 80% passing: µm 150
Leaching: type CIL
Residence Time: hrs 72
Percent Solids, w/w: % 40%
Tank Volume: m3 each 4,580
Number of Trains in parallel: each 2
Number of Tanks in Series: each 6
Sparge: type O2
Cyanide Consumption: kg/t 0.4
Lime Consumption: kg/t 0.6
Neutralization: type Air/SO2
Tailings Disposal: type impoundment
Concentrate Leaching: type in-line reactor
Recovery: type Direct Electrowinning
Elution Plant: type Pressure Zadra
Capacity, carbon: t/d 4
Electrowinning: type sludging
Reactivation: %/day 100%

Landore Resources Canada Inc. MINERAL RESOURCE ESTIMATE AND PRELIMINARY ECONOMIC ASSESSMENT, BAM Gold Project, Junior Lake Property, Ontario, Canada
Landore Resources Canada Inc. Page | 239
Figure 17-1: Conceptual Milling Flowsheet (Allard, 2019)

Landore Resources Canada Inc. MINERAL RESOURCE ESTIMATE AND PRELIMINARY ECONOMIC ASSESSMENT, BAM Gold Project, Junior Lake Property, Ontario, Canada
Landore Resources Canada Inc. Page | 240
17.2. Process Description
A brief discussion of each processing area is presented that includes the rationale for selection of the
unit processes. Potential alternatives to the conceptual unit processes are identified. Testing
recommendations in Section 13.0 will confirm (or refute) the selections in the conceptual flowsheet.
Recommendations for tests requisite to obtain engineering design information are included.
17.2.1. Crushing
Run of Mine (ROM) ore is fed to a hopper at the crushing station. The hopper is enclosed with a stilling
shed to reduce dust. A 60 cm x 60 cm static grizzly is included on top of the hopper to limit the size of
feed to the primary sizer. A hydraulic rock pick is included to reduce any oversize.
Ore in the hopper is fed to a primary sizer using an apron feeder. Product from the primary sizer is fed
by gravity to a secondary sizer. Secondary product is sent to a screen. The screen is fitted with a 40 mm
deck with the oversize returning to the secondary. Screen undersize reports to a covered stockpile. It is
assumed that all conveyors will be in galleries.
Ore is reclaimed from the stockpile and fed to a High-Pressure Grinding Roll (HPGR) crusher. A
powered flake breaker is included after the HPGR to eliminate flakes prior to milling. The HPGR product
is conveyed to a fine ore bin at the milling area.
Dust collection is employed rather than wet dust suppression due to the cold temperatures.
Sizers were selected due to the low abrasion index of the ore and because sizers produce less fines.
Lower fines are preferable due to the reduced liberation of free gold particles that could segregate in
stockpiles.
Depending on the design of the secondary sizer, closing the secondary product with a screen may not
be necessary. The screen is included to ensure that the feed to the HPGR is top-side limited.
The HPGR has not been tested on the BAM material; however, it is included due to its ability to break
on grain boundaries which will potentially liberate additional gold. An additional rationale is that
power at BAM will likely be generated on site. Using the HPGR will reduce required mill power.
Future investigations should provide information on the following:
• Crushability testing on samples from the depth and breadth of the deposit are needed to
determine the variability of the properties
• Tests for compressive strength of the BAM material will be required to confirm suitability of
the sizers. Vendor testing should follow for product size determination and capacity
• Metallurgical tests will be required on HPGR crushed products to assess the benefit
• Testing should determine the extent of flake generation and the necessity of the flake breaker.
17.2.2. Milling
Ore from the fine ore bin is fed to a wet screen above the ball mill. The wet screen is fitted with one or
two decks to separate the feed into a size suitable for feed to the gravity separators and the oversize
drops by gravity to the ball mill feed chute.

Landore Resources Canada Inc. MINERAL RESOURCE ESTIMATE AND PRELIMINARY ECONOMIC ASSESSMENT, BAM Gold Project, Junior Lake Property, Ontario, Canada
Landore Resources Canada Inc. Page | 241
The ball mill is a conventional overflow wet grinding mill. The ball mill discharges to a sump and is
pumped to a hydrocyclone cluster where the fines are removed in the overflow and the coarser
material is discharged onto the wet screen to join the new feed. Mesh of grind is approximately 80
percent passing 150 µm and 100% passing 212 µm.
The hydrocyclone overflow reports to a grind thickener where it is flocculated and settled to increase
the percent solids and to reclaim process water for use in the milling circuit. The underflow of the grind
thickener reports to the agitation leach.
It is anticipated that the grinding circuit would be run without cyanide to reduce soluble inventory and
make the gravity circuit less complicated to operate
Future investigations should provide information on the following:
• Grindability and abrasion tests will be required using samples from various locations and depth
in the deposit to determine variability
• Variability of the process flowsheet to these samples should also be assessed to determine an
optimized mesh-of-grind
• Rheology, flocculant screening, and thickener testing will be required for design of the pumps
and thickener.
17.2.3. Gravity Separation
Undersize of the wet screen is distributed to a trio of Knelson concentrators where the coarse liberated
gold is removed from the stream. Tails from the gravity concentrators report to a sump and are
pumped to the ball mill feed. The gravity concentrate is fed to a wet magnetic separator where any
ferromagnetic materials are removed (wear metal, magnetite, etc.). The magnetics drop to a bin for
disposal. The non-magnetics are tabled to increase the concentrate grade. The table tails join the
Knelson tails and are returned to the ball mill feed chute. The table concentrate reports to Concentrate
Leaching.
Future investigations should provide information on the following:
• Investigation into the Gravity Recoverable Gold (GRG) variation over multiple samples should
be conducted to determine the reliable recovery in the gold circuit and confirm the liberation
size
• Investigation should be made into recovery of fine gold in the cyclone overflow
• Communications with the vendor should be held to determine the optimal number and size of
the gravity separators required
• Bulk gravity separation tests will be needed to assess the upgrading using tables
• Vendor testing would be required to size the wet drum magnetic separators.
17.2.4. Carbon-In-Leach (CIL)
Grind thickener underflow reports to two trains of agitated leach tanks in parallel. The pulp density is
adjusted with solution from the leach tails thickener overflow. Cyanide concentration is adjusted in the
feed. Oxygen is sparged into the leach tanks through the hollow shaft on the agitator.

Landore Resources Canada Inc. MINERAL RESOURCE ESTIMATE AND PRELIMINARY ECONOMIC ASSESSMENT, BAM Gold Project, Junior Lake Property, Ontario, Canada
Landore Resources Canada Inc. Page | 242
Preliminary sizing of the CIL tanks in the conceptual flowsheet is 18.0 m dia. X 18.0 m high, agitated,
rubber-lined, open-top vessels. The tanks are arranged with a 2 m elevation difference so the pulp will
flow by gravity from the first tank to the second. All agitated tanks can be bypassed for maintenance.
Activated carbon in the pulp is prevented from flowing to the second tank by a submerged, agitated
“Interstage” screen. These screens consist of slotted wedge wire cylinders with a slot opening smaller
than the finest carbon in the tank. Pulp freely flows through the slots while the carbon remains in the
tank.
Reactivated granular activated carbon at a design rate of 2.0 dry tonnes per day per train is
continuously introduced to the sixth tank of each leach train where it is mixed with the pulp by a bridge
mounted agitator. Fresh carbon is pumped as a water slurry to a sieve bend screen above the sixth
tank where the water is removed and the dewatered carbon drops into the feed launder entering the
tank.
A fraction of the slurry and the contained carbon from the sixth tank is pumped over a separate sieve
bend screen to advance the carbon to the fifth stage. Pulp that flows through the screen returns to the
tank from where it came. The granular carbon drops into the launder immediately before the fifth
tank. This operation is continuous and advances carbon from the last (sixth) tank to the first tank,
adsorbing gold in the process. In a similar manner, the pulp and carbon from the first tank is pumped
to a screen. The screen receiving the pulp from the first tank is a horizontal vibrating screen, where any
remaining pulp is washed from the carbon and returned to the first tank. The carbon from the screen
reports to elution.
Slurry overflowing the last tank in the CIL circuit flows by gravity to a leach tails thickener. The tails are
flocculated and thickened to reclaim water for makeup to the leach circuit. Thickener underflow is
pumped to the cyanide neutralization circuit.
Future investigations should provide information on the following:
• Carbon loading tests from pulps should be conducted to determine carbon advance rate and
concentration in the pulp
• Rheology to determine agitator performance and pump requirements should be pursued
• Additional investigation should be conducted with various percent solids and cyanide
concentration on the residence time of the agitation leach circuit.
17.2.5. Tails Neutralization
Once the metal values are extracted from the feed, the slurry will be thickened and discharged to
settling ponds. Prior to discharge, any residual cyanide must be neutralized, which occurs in the air/SO2
circuit. The combination of air and sulfur dioxide oxidizes the free cyanide (CN-) and weakly-bound
metal cyanide complexes (weak acid dissociable -WAD) to form cyanate (CNO-):
CN- + SO2 + O2 +H2O → OCN- + H2SO4
SO2 is provided by sodium meta-bisulfite (Na2S2O5) that is prepared from either solid or liquid
depending on what form is available. Milk of lime is added as necessary to neutralize the sulfuric acid
generated by the reaction. Copper is a catalyst for the reaction. A mixing tank for copper sulfate is

Landore Resources Canada Inc. MINERAL RESOURCE ESTIMATE AND PRELIMINARY ECONOMIC ASSESSMENT, BAM Gold Project, Junior Lake Property, Ontario, Canada
Landore Resources Canada Inc. Page | 243
included to ensure the pulp has sufficient copper after leaching to achieve sufficient extent of the
neutralization reaction.
The agitated, closed-top neutralization reactor is estimated at 10.0 m dia. X 12.0 m high to provide 90
minutes retention time. The slurry, SO2 and compressed air are contacted in this reactor to oxidize any
residual cyanides. Detoxified slurry overflows the reactor and flows to the tails impoundment.
Future investigations should provide information on the following:
• Neutralization test work has not been performed on the BAM composite. This will be needed
to determine the reagent addition required to obtain acceptable cyanide levels for discharge.
17.2.6. Tails Disposal
Neutralized tails are pumped to a lined tailings impoundment. In the impoundment the pulp
consolidates, releasing process water that is pumped back to the process facility as necessary.
Future investigations should provide information on the following:
• A geotechnical engineer will be required to evaluate the material for the properties relevant to
tails impoundment design.
17.2.7. Concentrate Leaching
Table concentrate is charged to a Gekko In-Line leach reactor that rotates to vigorously agitate the
slurry. Concentrated cyanide and oxygen are added to the reactor. The leached pulp is filtered on a
countercurrent washing vacuum filter. The filtercake is deposited into the concentrate tails sump and
returned to the mill. The filtrate reports to a pair of electrowinning cells in series where the precious
metals are plated onto stainless steel knit mesh.
Future investigations should provide information on the following:
• If a Gekko In-Line leach reactor is selected, vendor testing would be required to size an
appropriate unit
• Rheology, filtration and wash rate testing of the leached concentrate will be required to select
the filter.
17.2.8. Elution
The elution circuit as depicted in Figure 17-1 is a standard Pressure Zadra circuit, which is a semi-
continuous batch operation
Loaded carbon from the first stage of the CIL circuit is screened and washed of the pulp on a screen.
The washed carbon drops into a holding tank in the elution circuit. When sufficient carbon is
accumulated (a unit batch) it is discharged to the acid wash column.
Acid Washing
Activated carbon accumulates carbonate scale during the adsorption cycle. This scale is caused by the
calcium in the lime used for pH control and CO2 absorbed from the atmosphere. This scale, typically,
does not interfere with adsorption of gold onto the carbon but will extend the elution time and

Landore Resources Canada Inc. MINERAL RESOURCE ESTIMATE AND PRELIMINARY ECONOMIC ASSESSMENT, BAM Gold Project, Junior Lake Property, Ontario, Canada
Landore Resources Canada Inc. Page | 244
consume more carbon during reactivation. This scale is removed by soaking the carbon in a
hydrochloric acid solution.
The acid wash solution is made up to about 3% HCl and pumped into the acid wash vessel which is
constructed of FRP. The carbon in the holding tank is flushed in the acid wash column. Once the acid
wash column is full, solution is circulated through the bed of carbon and additional acid is injected into
the recirculating stream as required.
Once the pH of the circulating stream stabilizes below 1.0, the solution is drained from the carbon and
the carbon is rinsed with a sodium hydroxide solution to neutralize the acid. This neutralization step is
required to reduce the evolution of hydrogen cyanide and corrosion in subsequent unit operations.
The neutralized carbon is transferred by pump to the elution column.
Hydrogen cyanide monitors are included in this area to notify the operators if HCN gas is present. The
acid wash area is isolated from the rest of the plant by low containment walls with a separate gravity
sump.
Since HCL is a gas at room temperature, all the tanks that have acid are closed top and are vented to a
caustic scrubber. An ID fan maintains a slight negative pressure on the tanks to minimize acid vapor
from entering the operating area. Overflow of the scrubber sump reports to the acid gravity drain.
Elution
The conditions that enhance gold adsorption onto carbon are high ionic strength, divalent cations, low
temperatures and low pH (within reason). The elution circuit reverses some of these conditions to
remove the gold from the carbon. RO (reverse osmosis) water is used to make the elution solution to
give it a lower ionic strength. Acid washing removes some of the divalent cations. The elution solution
is made with NaOH to achieve a high pH and the solution is heated to around 130o C. As might be
expected with the elevated temperature, the elution column is a coded carbon steel, epoxy lined
pressure vessel.
The elution solution is stored in a lean eluate tank, which is insulated and constructed of epoxy-lined
carbon steel. The solution is pumped through heat exchangers where it is heated to the appropriate
temperature and enters the bottom of the elution column. The solution flows upwards through the
activated carbon and carries away the desorbed metals.
The solution exits the top of the column and is cooled to below the flash point. The solution then flows
to a strong eluate tank. The strong eluate is pumped to the electrowinning area. After electrowinning
the gold from the solution, the now-lean eluate is returned to a lean eluate tank for recycling to the
elution column.
Once the elution cycle is complete (nominally 20 hours), the carbon is cooled, drained and transferred
by pump to a reactivation kiln.
Little mercury was identified in the composite tested in Phase 1, so a wet scrubber or retort was not
included.
Future investigations should provide information on the following:
• Assaying for mercury should continue as the metallurgical testing continues.

Landore Resources Canada Inc. MINERAL RESOURCE ESTIMATE AND PRELIMINARY ECONOMIC ASSESSMENT, BAM Gold Project, Junior Lake Property, Ontario, Canada
Landore Resources Canada Inc. Page | 245
17.2.9. Electrowinning/Refining
Gold is removed from the strong eluate by electro-plating it on stainless steel mesh. A DC electrical
current is passed through the solution, and the gold plus any silver or copper will be reduced at the
cathode to form a metallic plating. The elevated voltage generates hydrogen gas at the cathode,
dislodging some of the plated material, which falls to the bottom of the cell as a metallic sludge.
Two electrowinning cells in series/parallel are included. Periodically, the cathodes are removed, and
the adhering gold sludge is washed off. The sludge in the bottom of the cell is removed and all the gold
sludge is filtered. The filter cake is dried and sent to the refinery.
The electrowinning cells for direct electrowinning of the concentrate leach are operated in an identical
manner. The two are kept separate to prevent contamination of the low ionic strength eluate.
In the refinery, the gold sludge filtercake is mixed with fluxes and smelted in a propane-fired nose-pour
crucible furnace. The mixture is heated until liquid and the impurities are dissolved in the slag. The slag
is poured off and the liquid metal remaining is poured into molds where it is allowed to cool and
solidify into a doré bar. The doré is cleaned, weighed and shipped offsite for refining into bullion.
Combustion products from the smelting furnace are vented from the refinery through a baghouse. Any
dust in the baghouse is occasionally returned to the furnace.
17.2.10. Carbon Handling
As carbon is processed through each unit operation, a small portion is abraded into fines. These fines
are removed each cycle and replaced with new carbon. In addition, the activity (the ability to adsorb
gold to a high level) diminishes over time. The carbon is thermally reactivated to regain the original
activity.
Eluted carbon is transferred to a hopper that feeds a reactivation kiln. The kiln is sized to reactivate
100% of the carbon batch each elution cycle.
The wet carbon is heated to 650o C in a steam atmosphere in a rotary kiln where the conditions are
such that the carbon activity is restored. The hot carbon is discharged sub-surface into a tank filled
with water to cool and quench the carbon. The quenched carbon is transferred by pump to the carbon
sizing screen.
The carbon sizing screen is a wet, horizontal vibrating screen with an 850 µm aperture where the
screen undersize is discharged to a fines tank. The screen oversize reports to a carbon holding tank for
return to the CIL circuit.
Fine carbon slurry in the fines tank is pumped through a plate and frame filter to remove the carbon.
When the filter is full the cake is blown down with compressed air and the cake is manually discharged
into a supersack and stored.
New coconut-shell activated-carbon is delivered in supersacks. New activated carbon has a dry bulk
density of 0.48 tonne/m3 due to the large quantity of pores created in the activation process. Dry
carbon needs to soak in water to allow the pores to fill and displace the air in the pores, otherwise the
carbon would float in the process. Typically, 24 - 48 hours is sufficient to displace the air. An agitated
tank is provided to soak the fresh carbon. In addition to de-gassing the carbon, the agitator action
Landore Resources Canada Inc. MINERAL RESOURCE ESTIMATE AND PRELIMINARY ECONOMIC ASSESSMENT, BAM Gold Project, Junior Lake Property, Ontario, Canada
Landore Resources Canada Inc. Page | 246
abrades the carbon edges and breaks up any fragile pieces before these get introduced into the
process. Degassed and abraded carbon is stored under water in this tank and is transferred to the
carbon sizing screen as necessary.
17.2.11. Ancillary Unit Operations
Several ancillary operations required for the process are not included with the conceptual flowsheet in
Figure 17-1. These areas are discussed briefly below.
Reagents
Concentrated cyanide solution is prepared in a dedicated mix building separated from the rest of the
process. Two carbon steel tanks are provided in the mix building for preparing cyanide solution.
Sodium cyanide is commonly available as briquettes in 1 tonne bags. One of the tanks is filled with
water and sufficient NaOH is added to elevate the pH. The cyanide bags are emptied into the tank and
the agitator started. Once the briquettes are dissolved the solution is transferred by pump to the
second tank. Cyanide is mixed to 23% NaCN by weight in solution.
Hydrogen cyanide monitors are included in this area to notify the operators if HCN gas is present. The
cyanide mix area is inside a containment wall that will contain the total volume of the two tanks.
Hydrochloric acid (HCl) is used in the carbon acid wash circuit. HCl is available as a 34% solution in 1000
litre totes. This solution will be metered directly into the process stream as necessary.
Quick lime (CaO) will be used in the agitation leach circuit. Lime will be delivered as 3/8” pebble lime
and slaked on-site before dilution and feeding to the process.
Sodium hydroxide (NaOH) will be used in the elution circuit. Sodium hydroxide will be delivered to site
in solid flake form in 25-kg bags or one-tonne supersacks. A mix tank and storage tank will be used to
prepare solution at 25% strength. The uses of NaOH in the elution plant are for carbon stripping
(NaCN/NaOH solution), neutralization of acid wash solution, acid scrubber, and pH adjustment of the
cyanide mix solution.
Oxygen is generated on-site and on-demand by vacuum swing adsorption (VSA) for sparging into the
leach circuits.
Utilities
Propane is used to fire the Smelting Furnace, Elution Boiler, Carbon Reactivation Kiln and various
drying ovens.
Compressed air is used in the refinery for air tools, the baghouse and to blow down the gold sludge
filter. In the process plant, compressed air is used to blow down the fine carbon filter. Compressed air
is also used in the crushing plant for cleaning the bag houses and bin vents. The air/SO2 reactor uses
compressed air as part of the process.
Raw water for the project is assumed to be available from wells. Residual water in the impounded tails
slurry represents the bulk of the water requirement for the process area. Water is reclaimed from the
tailings impoundment as necessary.

Landore Resources Canada Inc. MINERAL RESOURCE ESTIMATE AND PRELIMINARY ECONOMIC ASSESSMENT, BAM Gold Project, Junior Lake Property, Ontario, Canada
Landore Resources Canada Inc. Page | 247
A water softener and Reverse Osmosis (RO) unit are included to obtain higher quality water for the
elution area.
It is assumed that power is by on-site generation. It is also anticipated that the waste heat from the
generators will be recovered for various heating duties.
17.3. Alternative Processes
Additional testing and investigation is anticipated to bring to light methods for optimization of the
conceptual flowsheet. Some of the obvious alternative processes are discussed below.
17.3.1. Crushing Alternatives
Various potential alternatives for the crushing area are apparent. A primary jaw could be used if the
milling circuit consisted of a Semi-Autogenous Grinding (SAG) mill /ball mill combination.
If additional test work determines the ore characteristics do not favor using sizers or an HPGR, a
conventional compression crushing (jaw/cone) circuit could be employed
17.3.2. Milling Alternatives
The most obvious alternative unit operations for the milling circuit would be to install a SAG/Ball
circuit.
17.3.3. Gravity Concentration Alternatives
The only obvious alternative in the gravity concentration area would be for equipment of different
manufacture. Whole ore leaching resulted in high extractions of gold and agitation leaching without
gravity separation is a potential alternative. Current operating wisdom is that removing the gravity
recoverable gold before leaching typically results in higher overall extraction.
17.3.4. Carbon-In-Leach Alternatives
Agnico-Eagle’s Goldex operation in Ontario, Canada achieves high recovery of the free gold in a gravity
circuit followed by flotation to generate a concentrate that is leached off-site. Flotation of the gravity
tail with the BAM composite was less attractive than cyanide leaching and produced a low-grade
concentrate. The Goldex concentrate was leached at a near-by Agnico-Eagle facility, so this approach
may not be directly applicable to BAM. However, the option exists where, with additional gravity
separation testing, a situation may be obtained where a gravity-only facility can be constructed that
would achieve acceptable extraction of gold with a lower expenditure of capital. The un-leached
gravity tails would be sent to an interim tailings impoundment. Then, after positive cash flow is
achieved, an over-sized agitation leach facility can be constructed that would be fed from the milling
circuit in real-time and with material reclaimed from the interim tailings impoundment.

Landore Resources Canada Inc. MINERAL RESOURCE ESTIMATE AND PRELIMINARY ECONOMIC ASSESSMENT, BAM Gold Project, Junior Lake Property, Ontario, Canada
Landore Resources Canada Inc. Page | 248
17.3.5. Concentrate Leaching Alternatives
It is possible that with additional test work, the table concentrate may be sufficiently high in grade that
it could be smelted directly which would eliminate the need for the Gekko In-Line Leach Reactor and
the direct electrowinning circuits. This is the method employed at Agnico-Eagle’s Goldex mine.
17.3.6. Tailings Neutralization Alternatives
Various methods of cyanide destruction have been developed, however, air/SO2 (Inco Process) is the
most common.
17.3.7. Tailings Disposal Alternatives
The obvious alternative for a tailings impoundment would be for dry stacked tails. This would require
filters, conveyors and stacking operations.
17.3.8. Elution Alternatives
Several alternatives for the elution circuit are available. However, the obvious choice would be to
install an Anglo American Research Laboratory (AARL) circuit. The AARL system has a faster cycle which
equates to a smaller plant; however, it requires more automation.
17.3.9. Ancillary Operation Alternatives
Alternative unit operations are available for the ancillary operations; however, these are limited to
nuance, form of reagent, or minor in scope and would not significantly impact the cost or feasibility of
the project.
17.3.10. Heap Leaching
Heap leach testing showed acceptable extraction of gold from fine-crushed material. Fine-crushed, in
this case, being minus 6 mm heap feed. Observation indicated that the ore is likely to require
agglomeration to be successfully leached. The observation indicated that agglomeration would be
needed not only to reduce the mobility of the fines, but to maintain the porosity.
Cold weather heap leaches are common, and the climate is accommodated by seasonal curtailments,
snow removal, solution heating, buried emitters, and insulated pipes, among other operational
procedures. The potential requirement for agglomeration has a significant impact on the
implementation of heap leaching at the BAM site. Extensive test work would be required to justify
pursuing heap leaching as an alternative processing option.

Landore Resources Canada Inc. MINERAL RESOURCE ESTIMATE AND PRELIMINARY ECONOMIC ASSESSMENT, BAM Gold Project, Junior Lake Property, Ontario, Canada
Landore Resources Canada Inc. Page | 249
18. Project Infrastructure
18.1. Current Resources and Infrastructure
18.1.1. Local Resources
Thunder Bay is the major centre for north-western Ontario and provides most of the services required
by exploration and mining operations. The Thunder Bay commercial airport has daily scheduled service
to major Canadian cities, and the city offers rail facilities and a port on Lake Superior that provides
Atlantic Ocean access via the Great Lakes and the St. Lawrence Seaway. Mining and skilled labour are
available in Thunder Bay and elsewhere in Ontario and Québec.
Most consumables, including food, fuel, natural gas, propane, and cement are readily available in
Thunder Bay. Limited fuel and accommodations are available in Armstrong, formerly a service centre
for the CNR main cross-country line. Wiskair Helicopters maintains a small jet at a fuel depot at the
Ontario Ministry of Natural Resources (OMNR) site in Armstrong.
18.1.2. Infrastructure
Other than a cabin camp, there is no infrastructure on the property. No electric power or rail lines exist
on the property. Due to the bankruptcy of Buchanan Forest Products Inc. in May 2009, maintenance of
the pulp haulage road to the Junior Lake property has been assumed by the Ontario Ministry of
Transportation to within 30 km of the camp site, with the balance of the distance maintained by
private interests. The CNR main single line is 13 km south of the property, passing between Junior Lake
and the north shore of Lake Nipigon. Ontario Power Generation (OPG) plans on constructing two
hydroelectric power plants (100 MW) on the Little Jackfish River with the power lines connecting the
OPG grid to cross the Junior Lake property.
The size of the property is more than sufficient for mining exploration, development, and production
activities. Many sources of water are present on the property. No grid power is currently available in
the immediate vicinity of the property.
The nearest operating mine is the Lac Des Iles Mine (LDIM) owned by Lac Des Iles Mines Ltd., a
subsidiary of North American Palladium Ltd. (NAP). LDIM is located 100 km north of Thunder Bay,
approximately 15 km west of Highway 527, and is approximately 259 km by road from the Junior Lake
property.
18.2. Proposed Infrastructure
The project is to consist of two pits, (BAM West Pit and BAM East Pit). There will also be a processing
facility, a tailings storage area, a waste dump and a camp site.
The proposed locations of these infrastructures can be seen on plan view in Figure 18-1. The plan also
includes the location of the B4-7 Ni-Cu-Co-PGE Deposit pit shell, from optimization work previously
completed by RAP (2018).

Landore Resources Canada Inc. MINERAL RESOURCE ESTIMATE AND PRELIMINARY ECONOMIC ASSESSMENT, BAM Gold Project, Junior Lake Property, Ontario, Canada
Landore Resources Canada Inc. Page | 250
Figure 18-1 BAM Gold Project Site Plan Showing Proposed Infrastructure Locations (January 2022)
BAM West Pit Shells
BAM East Pit Shells
Proposed B4-7 Pit Shell (2017)
Proposed Camp Site
Proposed Waste Dump
Proposed Tailings
Area
Proposed Mill Site
Juneau Lake
Ketchikan Lake

Landore Resources Canada Inc. MINERAL RESOURCE ESTIMATE AND PRELIMINARY ECONOMIC ASSESSMENT, BAM Gold Project, Junior Lake Property, Ontario, Canada
Landore Resources Canada Inc. Page | 251
19. Market Studies and Contracts
This report has not disclosed any market studies or contracts information relating to the BAM Gold
Project at this time. Landore has not requisitioned any market studies or entered into any market
contracts pertaining to the BAM Gold Project. Gold is the primary product of the expected operation
and is readily marketable

Landore Resources Canada Inc. MINERAL RESOURCE ESTIMATE AND PRELIMINARY ECONOMIC ASSESSMENT, BAM Gold Project, Junior Lake Property, Ontario, Canada
Landore Resources Canada Inc. Page | 252
20. Environmental Studies, Permitting, and Social or Community
Impact
20.1. Summary
20.1.1. Environmental Studies
Landore has conducted various environmental baseline studies on the Junior Lake property since 2007.
Surface water sampling of various lakes and streams has been conducted since 2007.
Beginning in 2007, Landore retained Golder Associates Ltd. (Golder) to implement a baseline surface
water quality monitoring program for the Property. The most recent report on the surface water
quality monitoring was issued on December 5, 2018. The purpose of a water quality monitoring
program is to characterize local baseline surface water quality and to help in identifying potential
receiving water environments. This data would be required as one component to the supporting
documentation for permit applications to various regulatory agencies, should the project be developed
as a mining operation.
Bathymetry and fish habitat studies of Ketchikan Lake were conducted in 2007. In 2008, a bedrock
surface investigation of the northern portion of Ketchikan Lake was completed.
Terrestrial and fish habitat studies were conducted by Golder over the property during 2008,
subsequently reported in an environmental baseline study in 2009. Results of the vegetation surveys,
wildlife surveys, and incidental observations did not identify any listed species within the site boundary
that would trigger a specialized study. The site has been highly disturbed in some locations by recent
commercial forestry activity.
The environmental and baseline studies are all pre-requisites for permitting requirements for the
development of the BAM Gold Project. A list of the reports covering all the environmental baseline
studies carried out since 2007 is provided in Table 20-1.
Table 20-1: Listing of Environmental Baseline Studies at Junior Lake Property Commissioned by Landore (Completed to May, 2022)
Report Title Issue Date Report Issuer
Baseline Water Quality Interim Monitoring Report, Junior Lake Property, Ontario
13 July 2007 Golder
Fish Population Survey and Fish Habitat Assessment including bathymetry survey of Ketchikan Lake, Junior Lake Property, Thunder Bay, Ontario
15 January 2008 Golder
Surface Water and Sediment Quality Monitoring Report, February 2007 to January 2008, Junior Lake Property
18 April 2008 Golder
ERI Investigation of Bedrock Surface, Ketchikan Lake, Landore Resources Canada
June 2008 Golder
Surface Water Quality Monitoring Report, February 2007 to October 2008, Junior Lake Property
28 January 2009 Golder
Junior Lake Property, Environmental Baseline Study, Landore Resources Canada Inc, Armstrong, Ontario
13 February 2009 Golder
Surface Water Quality Monitoring Report, February 2009 to January 2010, Junior Lake Property
18 February 2010 Golder
2010 Surface Water Quality Monitoring Report, Junior Lake Property
6 April 2011 Golder

Landore Resources Canada Inc. MINERAL RESOURCE ESTIMATE AND PRELIMINARY ECONOMIC ASSESSMENT, BAM Gold Project, Junior Lake Property, Ontario, Canada
Landore Resources Canada Inc. Page | 253
Report Title Issue Date Report Issuer
2011 Surface Water Quality Monitoring Report, Junior Lake Property
3 May 2012 Golder
2012 Surface Water Quality Monitoring Report, Junior Lake Property
27 March 2013 Golder
2013 Surface Water Quality Monitoring Report, Junior Lake Property
26 February 2014 Golder
2014 Surface Water Quality Monitoring Report, Junior Lake Property
22 October 2015 Golder
2015 Surface Water Quality Monitoring Report, Junior Lake Property
24 January 2017 Golder
2016 Surface Water Quality Monitoring Report, Junior Lake Property
18 October 2017 Golder
2017 Surface Water Quality Monitoring Report, Junior Lake Property
5 December 2018 Golder
2018 Surface Water Quality Monitoring Report, Junior Lake Property
21 July 2020 Golder
2019 Surface Water Quality Monitoring Report, Junior Lake Property
7 March 2022 Golder
20.1.2. Permitting
The Ontario Ministry of the Environment Conservation and Parks (MECP) will require baseline surface
water quality information from Landore to support an Environmental Compliance Approval (formerly
called Certificate of Approval) application associated with a potential mine project, while the Ontario
Ministry of Energy, Northern Development and Mines (ENDM) will require similar information to
support Closure Plan requirements under Part VII of the Mining Act.
In addition to these requirements, Landore will be required to supply baseline water quality
information to Environment Canada under the Metal and Diamond Mining Effluent Regulations
(MDMER) to fulfil the "site characterization" and "initial monitoring” requirements contained in the
Environmental Effects Monitoring section of the MDMER. The information compiled from this
monitoring program could assist in meeting some of these requirements.
Social/Community Impact
Landore continues to work with the following First Nations and Aboriginal groups to ensure that each is
informed of the project details such that their engagement helps to contribute to the development of
the project:
• Whitesand First Nation
• Animbiigoo Zaagi'igan Anishinaabek (AZA) First Nation
• Aroland First Nation.
20.2. Environmental Studies
20.2.1. Surface Water Quality Monitoring Summary
The surface water quality monitoring programs were established in February 2007 and have been
conducted continuously up to the present day.

Landore Resources Canada Inc. MINERAL RESOURCE ESTIMATE AND PRELIMINARY ECONOMIC ASSESSMENT, BAM Gold Project, Junior Lake Property, Ontario, Canada
Landore Resources Canada Inc. Page | 254
The 2007 baseline surface water quality monitoring program was initiated to characterize the local
water quality and potential receiving water environments (Braun and Grant, 2009).
Lake sample stations on the Junior Lake property include Ketchikan Lake, Juneau Lake, Junior Lake, East
Ketchikan Lake, North Lamaune Lake, Lamaune Lake, and two small unnamed lakes located
approximately 3 km north of Lamaune Lake (Figure 20-1 and Figure 20-2, from Golder, 2018). Stream
sample locations include an unnamed stream flowing from Ketchikan Lake to Juneau Lake, an unnamed
stream flowing from Juno Lake to Juneau Lake, and an unnamed stream flowing into Lamaune Lake
from the north. In 2017, sampling was carried out on one occasion in November at the three stream
sample locations.
Five lakes and two interconnecting streams are designated as sampling locations and have been
monitored since monitoring commenced in 2007. A further three lakes and one stream were added in
2010, for a total monitoring program of eight lakes and three interconnecting streams. Sampling
protocols were established by Golder and qualified Landore personnel were trained in the collection
and documentation methods (Table 20-2). Samples are analyzed by a qualified laboratory designated
by Golder and the validity of data is assessed through standard QAQC methods in the laboratory. The
sampling program remains on-going as of 2017.
Surface water quality results are compared by Golder to the applicable Ontario Provincial Water
Quality Objectives (PWQO), which outlines criteria established for surface waters. Results were
reported for the 2007 to 2008 two-year period. Over the course of the period, Golder did not identify
any trend changes in the surface water quality with all samples reporting within the acceptable levels
as established by government guidelines and reflective of background conditions at the sample sites.
Table 20-2: Water Sampling Protocols (Golder, 2022)
Analytical Parameters Preparation and Preservation Protocols
General chemistry (TDS, alkalinity, chloride, etc.)
Plastic bottle, unfiltered and unpreserved.
Ammonia Glass bottle, unfiltered and preserved to pH<2 with sulphuric acid.
Total Metals Plastic bottle, unfiltered and preserved to pH<2 with nitric acid.
Dissolved Metals Plastic bottle, lab filtered to 0.45 microns and preserved to pH<2 with nitric acid.
Additional sampling programs were carried out in subsequent years as summarized in Golder (2012) as
follows.
• The initial surface water quality monitoring program was established in 2007. Landore
employees were trained in water sampling techniques by Golder during the June 2007
sampling period and have carried out the sampling program since that time. In 2007, four
rounds of water samples (February, June, August, and November) were collected from three
lakes and two streams. A fifth round of water sampling was completed in January 2008 due to
ice conditions that prevented sampling at all stations in November 2007.
• In 2008, three rounds of water samples (April, July, and October) were collected from the same
locations. Two additional sampling stations were established for the April, July, and October
2008 sampling rounds on Junior Lake and East Ketchikan Lake.

Landore Resources Canada Inc. MINERAL RESOURCE ESTIMATE AND PRELIMINARY ECONOMIC ASSESSMENT, BAM Gold Project, Junior Lake Property, Ontario, Canada
Landore Resources Canada Inc. Page | 255
• In 2009, three rounds of water samples (February, June, and September) were collected from
the five lake stations and two stream stations. An additional sampling round was conducted in
January 2010 due to ice conditions that prevented sampling at all locations in December 2009.
• In 2010, two rounds of surface water samples were collected (June and September) from
Ketchikan Lake, Juneau Lake, Junior Lake East Ketchikan Lake, and stream stations R2 and R3.
No samples were collected from Juno Lake in 2010 due to a drop in water levels. This shallow
lake, more accurately described as a beaver pond, is no longer accessible by boat. Additional
sampling locations were added to the program in 2010 and were sampled on one occasion
(September 2010). The new sampling locations included North Lamaune Lake, Lamaune Lake
(two locations), two small unnamed lakes north of Lamaune Lake, and an unnamed stream
flowing to Lamaune Lake.
• In 2011, two rounds of water samples were collected (June and November) from each of the
stations sampled in 2010. Results of the 2011 sampling program indicated that surface water
quality was generally meeting applicable PWQO at all stations during the June and November
sampling rounds.
• In 2011, the only noted exceedances of PWQO were total phosphorous in East Ketchikan Lake
during the November sampling round and dissolved aluminium at Stations L8-S and L8-B during
both the June and November sampling rounds. Water quality in 2011 generally appears to be
consistent with historical data collected between 2007 and 2010. It should be noted that total
phosphorous values reported prior to 2010 are higher than true values as the contract
laboratory (Testmark Laboratories Ltd.) analysed phosphorus with equipment normally
reserved for detecting phosphorous at much higher levels (industrial waste-water) rather than
surface water. Total phosphorous levels from 2010 onward are considered a more accurate
reflection of true total phosphorous concentrations. The 2011 water quality data is interpreted
to be reflective of background conditions.
• Quarterly surface water testing was also conducted during 2012. Between one and three
rounds of surface water testing per year were conducted during 2013 to 2019.
A summary of surface water quality results for the years 2007 through 2019 is presented in Table 20-3.
Juno Lake (L3) has not been sampled since 2009 and the bottom sample (L6-B) from East Ketchikan
Lake has not been sampled since 2010. As only R2, R3, and R4 were sampled in 2017, the table below
has only been updated for those stations. Results for other locations represent only historical results.
Results and Discussion (Golder, 2022)
Surface water quality results were compared to the applicable MECP PWQO criteria established for
surface waters, as stated in the MECP document Water Management Policies, Guidelines, Provincial
Water Quality Objectives of the Ministry of the Environment and Energy, (MOE 1994).
2019 was the 13th year of water quality sampling for the Junior Lake Property. Complete surface water
quality results, including those collected from 2007 through 2019 are available in the Golder (2022)
report. The 2019 water quality results generally appear to be consistent with the historical data
collected between 2007 and 2018 in the lake and stream locations. The 2019 results are interpreted to
be reflective of baseline, pre-development conditions. The results of the sampling program indicate
that surface water quality at the selected stations sampled in 2019, in general meet the applicable
PWQO criteria.
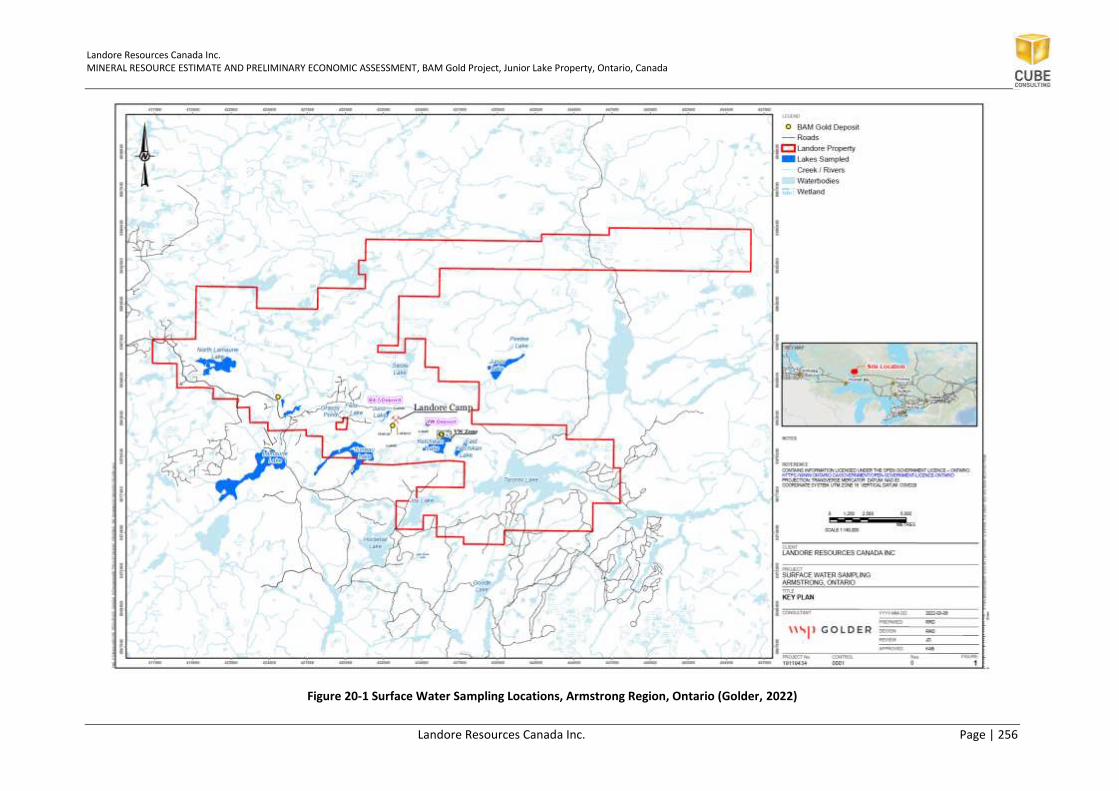
Landore Resources Canada Inc. MINERAL RESOURCE ESTIMATE AND PRELIMINARY ECONOMIC ASSESSMENT, BAM Gold Project, Junior Lake Property, Ontario, Canada
Landore Resources Canada Inc. Page | 256
Figure 20-1 Surface Water Sampling Locations, Armstrong Region, Ontario (Golder, 2022)

Landore Resources Canada Inc. MINERAL RESOURCE ESTIMATE AND PRELIMINARY ECONOMIC ASSESSMENT, BAM Gold Project, Junior Lake Property, Ontario, Canada
Landore Resources Canada Inc. Page | 257
Figure 20-2 Surface Water Monitoring Station Locations, Junior Lake Property (Golder, 2022)

Landore Resources Canada Inc. MINERAL RESOURCE ESTIMATE AND PRELIMINARY ECONOMIC ASSESSMENT, BAM Gold Project, Junior Lake Property, Ontario, Canada
Landore Resources Canada Inc. Page | 258
Table 20-3: Summary of Water Quality Sampling Events 2007 to 2017 (Golder, 2022)
Sampling Date Sampling Location
Year Month
Ketchikan Lake
Juno Lake2
Juneau Lake
Junior Lake1
E. Ketchikan
Lake1
N. Lamaune
Lake3 Misc. Streams
Lamaune Lake3
Misc. Lakes
(L2) (L3) (L4-1, L4-2)
(L5) (L6) (L7) R2 R3 R43 (L11-1, L11-2)
L8 L9
2007
February
June X X X X X
August X X X X X
November X X X
2008
January X X
April X X X
July X X X X X X X
October X X X X X X X
2009
February X X X X X X
June X X X X X X X
September X X X X X X X
2010
January X X X X X X
June X X X X X X
September X X X X X
October X X X X X X
2011 June X X X X X X X X X X X
November X X X X X X X X X X X
2012
May X X X X X X X X X X X
August X X X X X X X X X X X
October X X X X X X X
November X
2013
January X X X X X X X X
June X X X X X X X X X X X
October X X X X X X X X X X X
2014 July X X X X X X X X X X X
October X X X X X X X X X X X
2015 June X X X X X X X X X X X
2016 September X X X X X X X X X X X
2017 November X X X
2018 June X
July X X X X X X X X X X
2019 October X X X X X X X X X X X
Notes: 1 Sampling location established in 2008; 2 Sampling location removed from sampling program in 2010 due to a drop-in water level; 3 Sampling location established in 2010.
X annotates sampling event.
Landore Resources Canada Inc. MINERAL RESOURCE ESTIMATE AND PRELIMINARY ECONOMIC ASSESSMENT, BAM Gold Project, Junior Lake Property, Ontario, Canada
Landore Resources Canada Inc. Page | 259
20.2.2. Terrestrial Study (Environmental Baseline Study)
The purpose of the terrestrial study was to characterize existing site conditions at the Junior Lake
property and to identify potential environmental constraints associated with the site. It included a
field study to ground truth existing background information, identify plant communities, and make
supplemental observations of wildlife and wildlife habitat. An aquatic survey was also completed
(Braun et al., 2009). The field study was undertaken in July 2008 and the fishery study in August
2008.
General information was collected to determine the presence of:
• Areas of Natural and Scientific Interest
• Significant wetlands
• Listed flora and fauna
• Habitat of significant species, waterfowl concentration areas, important wildlife habitats,
raptors forestry information
• Fish community and habitat.
Results of the vegetation surveys, wildlife surveys, and incidental observations did not identify any
listed species within the site boundary that would trigger a specialized study. The site has been
highly disturbed in some locations by recent commercial forestry activity.
20.2.3. Bedrock Surface Investigation (Ketchikan Lake)
The elevation of bedrock surface and depth of lake sediments near Ketchikan Lake’s north shore was
required for open pit stripping and design at the VW Deposit. Golder was contracted to complete an
electrical resistivity imaging (ERI) survey from approximately 100 m onshore towards a baseline
located near the centre of the lake. The survey was undertaken in March 2008 which included six
lines of ERI, with one oriented perpendicular for correlation purposes (Mulder and Monier-Williams,
2008).
Results of the survey included an interpreted bedrock contour map indicating shallow bedrock along
the north shore and within the eastern arm of Ketchikan Lake. The bedrock appears to be deeper
toward the centre of the lake. There appear to be zones of low resistivity beneath the
overburden/bedrock contact which have an interpreted east–west trend (correlating to local
stratigraphy/geology and mineralized horizons of the VW Deposit).
Golder recommendations are a correlation study of local drill hole data in order to verify and
produce a better model of the bedrock surface.
20.2.4. Fish Population Survey and Fish Habitat Assessment (Ketchikan Lake)
The fish habitat of Ketchikan Lake (at the VW Deposit) on the Junior Lake property was examined in
late summer 2007, including mapping of the shoreline of the lake to determine the types of habitat,
available fish, and included collection of bathymetric data to characterize deeper areas of the lake
(greater than 2.0 m) (Genrich and Seyler, 2008).

Landore Resources Canada Inc. MINERAL RESOURCE ESTIMATE AND PRELIMINARY ECONOMIC ASSESSMENT, BAM Gold Project, Junior Lake Property, Ontario, Canada
Landore Resources Canada Inc. Page | 260
A bathymetry map and coded habitat map were produced identifying the various types of fish and
habitats in Ketchikan Lake. Surface water quality of the lake was within acceptable parameters
applicable to the Ontario PWQO. Water quality at surface, mid-depth, and bottom indicated metal
values below the applicable acceptability, with the exception of one elevated cobalt value from a
sample taken from near lake-bottom. General values were indicative of those associated with other
typical Precambrian Shield lakes.
20.3. Social and Community Impact
20.3.1. First Nations Relations
Landore maintains a sound working relationship with First Nations on whose traditional lands the
Junior Lake property is situated. In 2007, Landore signed a Memorandum of Understanding (MOU)
with Whitesand and AZA First Nations. This agreement formalizes the desire and commitment to
develop a positive, mutually beneficial relationship amongst all parties and establishes the process
by which this is to be accomplished while Landore is conducting exploration and advanced
exploration activities in the area.
The MOU was later revised to reflect significant changes in Landore’s claim holdings in the Junior
Lake area. Whitesand signed the revised MOU on April 30, 2012. AZA signed the revised MOU on
December 6, 2013.
More recently, in December 2018 an Exploration Agreement between Landore, AZA and Aroland
First Nations was signed which reaffirms this mutually beneficial relationship going forward. A
separate Exploration Agreement between Landore and Whitesand First Nation was signed in
February 2019.
20.3.2. Landore Engagement and Consultation with Stakeholders
No other pending or approved agreements are in place over Landore’s Junior Lake property at the
current stage of development.
The Project has involved a range of stakeholders associated with the Project. This range of
stakeholders has included those that hold direct interest in the development of the Project, Federal
and Provincial government agencies, community and municipal organizations, First Nation
representatives, and other similar groups. The range of stakeholders is expected to grow with the
development of the Project and with the reintroduction of the Project’s development within the
local community representing the varying levels of interest and opportunities presented by the
Project.

Landore Resources Canada Inc. MINERAL RESOURCE ESTIMATE AND PRELIMINARY ECONOMIC ASSESSMENT, BAM Gold Project, Junior Lake Property, Ontario, Canada
Landore Resources Canada Inc. Page | 261
21. Capital and Operating Costs
21.1. Summary
Capital costs are derived from estimates provided by Landore and based on examples for capital
costing studies for similar and larger mining projects economic assessments in Canada. Mining
operating costs, which include drill and blast, load and haul, mining owners’ costs, rehandle, grade
control and dewatering were provided by Cube and are derived from estimates from similar sized
gold mining operations in Western Australia. Plant operating costs were provided by Landore and
based on estimates of plant operating costs of gold operations in Canada.
Except where noted, all costs are presented in US Dollars (USD).
21.2. Capital Costs
For the purposes of this PEA, capital costs for environmental studies, ongoing permitting activity,
feasibility study (including metallurgical test work) are not included at this stage. These items are
part of the ongoing work programs proposed by Landore as pre-build capital.
Exploration work completed on the project is deductible in full (100%) in the first year of production
at 25% per quarter in respect of both income tax (federal and provincial) and Ontario Provincial
Mining tax. The amount applied in this modelling is US $ 29.5M (C $ 40.1M).
A capital cost of US $73.5M (real) (equivalent to C $100M (real)) is assumed for plant capital and site
infrastructure (including TSF). To this is added US $11.9M (real) of capitalised pre-production mining,
plant operating and G & A costs to give a total initial capital of US $85.5M (real). Initial capital spend
is assumed to be 40% in Q1 of build and 20% for each of the three quarters thereafter. Sustaining
capital of US $ 2.24M (real) is included for TSF lifts and expansions and this is based on a rule of
thumb US $ 0.10 / ore t fed. Additional sustaining capital may need to be considered, especially
given the expanded plant life in this new Base Case.
PEA capital cost estimates for mining, processing and infrastructure are summarized in Table 21-1.
Table 21-1: Total Capital Cost Summary Estimates (January 2022)
Description Units Total Cost
(real $)
Initial Plant and Infrastructure USD M 73.53
Open Pit Pre-production capitalized operating expenses (mining, plant, G & A) including mining pre-strip
USD M 11.92
Total Initial Capital USD M 85.45
Initial capital costs for (including pre-production capitalised operating costs) and sustaining capital
(for the expansion of TSF over an 11.50 year production life)) is estimated for both a base case
(11.75 year mine life) and is summarized in Table 21-2.

Landore Resources Canada Inc. MINERAL RESOURCE ESTIMATE AND PRELIMINARY ECONOMIC ASSESSMENT, BAM Gold Project, Junior Lake Property, Ontario, Canada
Landore Resources Canada Inc. Page | 262
Table 21-2: Total Capital Cost Summary – Initial and Sustaining Capital Estimates (January 2022)
Description Units Base Case
($)
Total Initial Capital USD M 85.45
Total Sustaining Capital USD M 2.24
Total USD M 87.69
21.3. Operating Costs
21.3.1. Mining Operating Costs
For the base case, mining costs during plant operations are US $569.69M (US $ 573.62M LOM
including US $ 3.67M pre-production mining costs).
Mining costs (LOM) include drill and blast, load and haul rates, which have been provided by Cube:
• Mining ore and waste = US $2.86/t mined
• Mining ore = US 25.62 /t ore
The mining cost of ore at US $25.46 / t ore includes all mining costs after production commences.
Pre-production mining costs, including pre-stripping, are included as part of capital costs. The ore
mining costs include drill and blast, load and haul, mining owners’ costs, rehandle, grade control and
dewatering divided by ore tonnes mined during production.
A breakdown of costs includes:
• Owner Mining costs (applied as a fixed cost of US $0.66M (real) p.a. in all periods where
mining occurs
• Grade control and dewatering (variable rates per ore tonnes mined of respectively US $0.42
/t and US $0.10 /t – both real)
• Ore rehandling (based on 50% rehandling of ore during mining and 100% thereafter) at a
rate of US $0.50 (real) per ore tonne rehandled.
A summary of the mining operating are presented in Table 21-3.
Table 21-3: Mining Operating Cost Summary Estiamtes– Base Case Case (January 2022)
Description Units Base Case LOM ($)
Mining Ore USD M 65.87
Mining Waste USD M 479.93
Mining Ore and Waste USD M 545.78
Mining Owners Team Costs USD M 6.93
Other Ore Based Costs (Rehandle, Grade Control, Dewatering)
USD M 17.24
Total Mining USD M 569.95

Landore Resources Canada Inc. MINERAL RESOURCE ESTIMATE AND PRELIMINARY ECONOMIC ASSESSMENT, BAM Gold Project, Junior Lake Property, Ontario, Canada
Landore Resources Canada Inc. Page | 263
21.3.2. Plant Facility Operating Costs
Plant operating costs are estimate based inputs into the cash flow model. The costing estimate was
supplied by Landore.
The total processing operating costs include labour, power and consumables which are the major
contributors to the overall processing costs. Maintenance costs are considered as a proportion of
the total installed mechanical equipment costs.
A processing cost of US $14/t fed (real) has been applied. It has been estimated that 30% of
processing costs are assumed to be fixed (US $9.24M p.a.) and, of these fixed costs, 50% are deemed
to be incurred in each of the first three quarters of pre-production (at US $1.16 p.q.) and 100% is
deemed to be applied in the final pre-production quarter (US $2.31M). Total pre-production plant
expenses are assumed to be US $5.8M.
A summary of the processing operating costs estimate are presented in Table 21-4.
Table 21-4: Plant Operating Cost Estimate Summary – Base Case (January 2022)
Description Units Base Case LOM ($)
Processing Operating Costs USD M 313.48
21.3.3. Total Operating Costs
General and Administration (G & A) fixed costs of US $3.3M (real) p.a. have been applied, being the
equivalent of US $1.50 / t fed. During pre-production, 50% of fixed costs have been applied for the
first two quarters and 100% for the final two quarters. G & A total pre-production cost is estimated
at US $2.5M.
Gold doré refining, transport and insurance are costed at US $ 5.00 / oz.
A summary of the total operating cost estimates, made up of mining, processing and G & A
operating costs are shown in Table 21-5.
Table 21-5: Total Operating Cost Estimate Summary – Base Case (January 2022)
Description Units Base Case LOM ($)
Mining Costs USD M 569.95
Processing Costs USD M 313.43
Site G & A Costs USD M 34.65
Gold Doré Transport and Refining, and Insurance Charges
USD M 4.08
Total Operating Expenses USD M 922.11
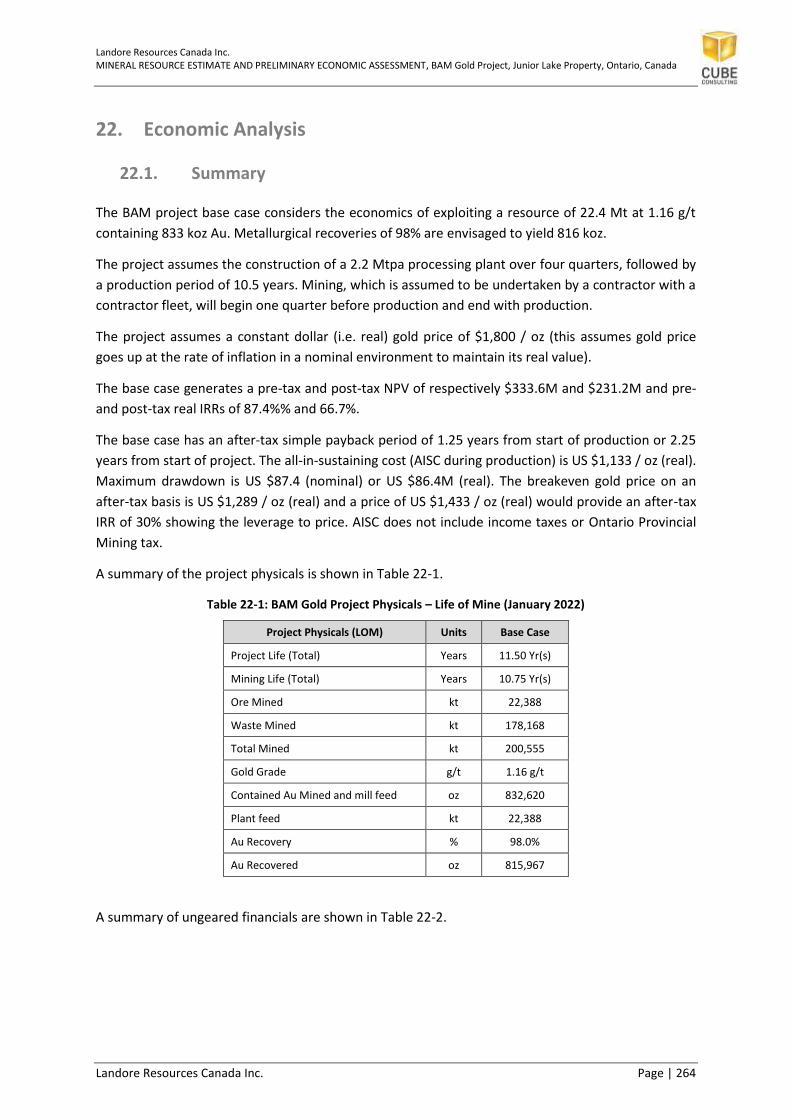
Landore Resources Canada Inc. MINERAL RESOURCE ESTIMATE AND PRELIMINARY ECONOMIC ASSESSMENT, BAM Gold Project, Junior Lake Property, Ontario, Canada
Landore Resources Canada Inc. Page | 264
22. Economic Analysis
22.1. Summary
The BAM project base case considers the economics of exploiting a resource of 22.4 Mt at 1.16 g/t
containing 833 koz Au. Metallurgical recoveries of 98% are envisaged to yield 816 koz.
The project assumes the construction of a 2.2 Mtpa processing plant over four quarters, followed by
a production period of 10.5 years. Mining, which is assumed to be undertaken by a contractor with a
contractor fleet, will begin one quarter before production and end with production.
The project assumes a constant dollar (i.e. real) gold price of $1,800 / oz (this assumes gold price
goes up at the rate of inflation in a nominal environment to maintain its real value).
The base case generates a pre-tax and post-tax NPV of respectively $333.6M and $231.2M and pre-
and post-tax real IRRs of 87.4%% and 66.7%.
The base case has an after-tax simple payback period of 1.25 years from start of production or 2.25
years from start of project. The all-in-sustaining cost (AISC during production) is US $1,133 / oz (real).
Maximum drawdown is US $87.4 (nominal) or US $86.4M (real). The breakeven gold price on an
after-tax basis is US $1,289 / oz (real) and a price of US $1,433 / oz (real) would provide an after-tax
IRR of 30% showing the leverage to price. AISC does not include income taxes or Ontario Provincial
Mining tax.
A summary of the project physicals is shown in Table 22-1.
Table 22-1: BAM Gold Project Physicals – Life of Mine (January 2022)
Project Physicals (LOM) Units Base Case
Project Life (Total) Years 11.50 Yr(s)
Mining Life (Total) Years 10.75 Yr(s)
Ore Mined kt 22,388
Waste Mined kt 178,168
Total Mined kt 200,555
Gold Grade g/t 1.16 g/t
Contained Au Mined and mill feed oz 832,620
Plant feed kt 22,388
Au Recovery % 98.0%
Au Recovered oz 815,967
A summary of ungeared financials are shown in Table 22-2.

Landore Resources Canada Inc. MINERAL RESOURCE ESTIMATE AND PRELIMINARY ECONOMIC ASSESSMENT, BAM Gold Project, Junior Lake Property, Ontario, Canada
Landore Resources Canada Inc. Page | 265
Table 22-2: BAM Gold Project Financials (Ungeared) (January 2022)
Project Financials (Ungeared): real unless stated Units Base Case
Gold Price (Average LOM) USD/oz 1,800 / oz
Net Gold Revenue (Ex Site) USD M 1,464.66
Mining Costs USD M 569.95
Plant and Other Operating costs USD M 348.08
Operating Margin USD M 546.63
Margin % of Ex-Site Revenue % 37.3%
Initial Capex USD M 85.45
Sustaining Capex and Mine Development costs USD M 2.24
C1 Cost USD / oz 1,130 / oz
C2 Cost USD / oz 1,239 / oz
C3 Cost (including Ontario Provincial Mining Tax) USD / oz 1,283 / oz
C3 Cost (excluding Ontario Provincial Mining Tax) USD / oz 1,239 / oz
AISC including Ontario Provincial Mining tax USD / oz 1,177 / oz
AISC excluding Ontario Provincial Mining tax USD / oz 1,133 / oz
Project NPV (Pre-Tax) USD M 333.15
Project NPV (Post Tax) USD M 231.28
Project IRR (Pre-Tax) % 87.4%
Project IRR (Post Tax) % 66.7%
Project Break-Even Gold Price USD / oz 1,289 / oz
Breakeven Au Price at 30% IRR USD / oz 1,433 / oz
Project Payback Period from Construction Start Years 2.25 Yr(s)
Maximum Project Drawdown USD M 87.37
22.2. Assumptions
A summary of assumptions used for the cash flow modelling work are presented below:
• Model is built in quarterly periodicity in USD and all costs, prices and revenues are expressed
in USD. Plant and infrastructure costs are derived from an estimate of CAD 100M at an
exchange rate of USDCAD 1.36.
• Tax and debt are calculated using nominal cashflows to ensure correct treatment of wasting
assets like depreciation and tax losses and hence references to both real and nominal values
below. A USD inflation rate of 2.0% p.a. is assumed.
• A real discount rate of 5% is used after nominal cashflows have been deflated at 2.0%. 5% is
the typical discount rate used for precious metals projects in North America but would be
considered low in Australia especially for an early stage project. A 5% real discount rate is
the equivalent of a 7.1% nominal discount rate at 2% p.a. inflation (i.e. ((1+5%)*(1+2%))-1).

Landore Resources Canada Inc. MINERAL RESOURCE ESTIMATE AND PRELIMINARY ECONOMIC ASSESSMENT, BAM Gold Project, Junior Lake Property, Ontario, Canada
Landore Resources Canada Inc. Page | 266
• No royalties (provincial or third party) are assumed or indicated for the project. Royalties in
Canada are, to some extent, replaced by Provincial Mining taxes, which are described later.
However, the Ontario Provincial Mining Tax is not included here as part of the pre-tax cash
flow (only as part of after-tax cash flows). If the provincial mining tax were stated on a
percent of gross revenue basis, the equivalent value looks to be around 2.4%.
• No native title or tenement-based royalties are considered.
• A cost of US $5.00 / oz is assumed for transport and refining costs and this cost has been
benchmarked against the 2014 Rainy River Feasibility Study (refining cost quoted as US
$3.90 / oz).
• The base case project has a LOM strip ratio of 8.0 x for the mining of 200.6 Mt (178.2 Mt
waste and 22.4 Mt ore). Total mining costs (real) are US $573.6M. Mining costs pre-
production are included in capital and amount to US $3.7M (real). Overall mining costs
during plant operations are US $570M (real), which equates to US $2.87 / t ore and waste
mined or US $25.47 / t ore. Overall mining costs include drill and blast, load and haul rates as
provided by Cube and additional allowances form Mining owners costs (applied as a fixed
cost of US $0.66M (real) p.a. in all periods where mining occurs), grade control and
dewatering (variable rates per ore t mined of respectively US $0.42 / t and US $0.10 / t –
both real) and ore rehandling (based on 50% rehandling of ore during mining and 100%
thereafter) at a rate of US $0.50 (real) / ore t rehandled. Mining Owners costs appear low at
US $0.66M p.a.
• Processing cost of US $14/t fed (real) has been applied. 30% of processing costs are assumed
to be fixed (US $9.24M p.a.) and, of these fixed costs, 50% is deemed to be incurred in each
of the first 3 quarters of pre-production (at US $1.16 p.q.) and 100% is deemed to be applied
in the final pre-production quarter (US $2.31M). Total pre-production plant expenses are
assumed to be US $5.8M.
• General and Administration (G & A) fixed costs of US $3.3M (real) p.a. have been applied,
being the equivalent of US $1.50 / t fed. During pre-production 50% of fixed costs have been
applied for the first two quarters and 100% for the final two quarters. G & A total pre-
production cost is estimated at US $2.5M.
• No allowance is made in the model for rehabilitation.
• A capital cost of US $73.5M (real) (equivalent to C $100M (real)) is assumed for plant capital
and site infrastructure (including TSF). To this is added US $11.9M (real) of capitalised pre-
production mining, plant operating and G & A costs, to give a total initial capital of US
$85.5M (real). Initial capital spend is assumed to be 40% in Q1 of build and 20% for each of
the three quarters thereafter. Sustaining capital of US $2.24M (real) is included for TSF lifts
and expansions and this is based on a rule of thumb US $0.10 / ore t fed. Additional
sustaining capital may need to be considered, especially given the expanded plant life in this
new Base Case compared to the 2019 PEA study (Cube, 2019).
• Canadian Mining taxation is complex and operates at three key levels: (i) federal income tax,
(ii) provincial income tax (iii) provincial mining taxes. Different systems of deductions and
allowances operate at each level and generous exploration allowances also exist. The author
is not an expert on Canadian taxation, nor has advice specific to this project been provided
by experts. The tax modelling has been based on interpretations of (i) Treasury Metals
Goliath Project PEA (April 2017) (ii) New Gold Rainy River Feasibility Study (February 2014)

Landore Resources Canada Inc. MINERAL RESOURCE ESTIMATE AND PRELIMINARY ECONOMIC ASSESSMENT, BAM Gold Project, Junior Lake Property, Ontario, Canada
Landore Resources Canada Inc. Page | 267
(iii) PWC Canadian Mining Taxation overview (November 2016) (iv) Natural Resources
Canada Website (Canadian Government).
• The model currently aims to capture the relevant elements of the tax system in terms of
structure and available deductions. These core taxation assumptions made in 2019 appear
to remain valid but there may be additional relevant Covid-19 related incentives. As the
project moves forward, it is strongly suggested that a more tailored understanding of the tax
system is sought from experts, not least because there is flexibility / choice in the way in
which deductions are applied and there will be specified formats for record keeping for
costs, which will later form the basis for these deductions.
• The taxation assumptions made in the model are as follows:
o Federal income tax is levied at 15% and Ontario provincial income tax is levied at
10%. Federal and provincial income taxes are subject to the same depreciation
regime, deduction allowances and tax base, and so a combined income tax rate of
25% is applied in the model to represent both.
o The relevant deductions included in respect of Federal and Ontario Income tax are:
▪ Project Operating Costs
▪ Capital Cost Allowance (CCA) aka depreciation for federal and provincial
income tax, which is depreciated on a declining balance basis at 25% of
opening balance plus net additions in a given year. CCA is applied to the true
physical capital elements of the project (i.e. to the nominal value equivalent
of initial plant and infrastructure capital of C $100M real and tailings
expansion capital of US $0.1 / t fed real)
▪ Canadian Exploration Expenses (CEE) of C $40.1M (US $29.5M), which are
deducted in full (100%) in the first year of production on the basis of 25%
per quarter. Exploration expenses carried forward will have increased since
the previous study, but numbers are kept the same for now for comparative
purposes.
▪ Canadian Development Expense (CDE), which is taken to comprise mining
pre-strip and other capitalised pre-production operating costs (US $11.9M
real, which is US $12.1M nominal) and is amortised on a declining balance
basis at 30% of the opening balance plus net additions in a given year.
▪ Debt interest expense (applicable only to geared cases).
▪ Ontario Provincial Mining tax (see below).
o The model assumes that any unused depreciation in respect of income taxes is
deducted in full in the last operating period of the model (thus due to quantum
potentially generating unrecoverable tax losses in that period.
• In terms of Federal and Provincial income taxes, tax losses can be carried forward and
applied to later periods and these effects are reflected in the financial model.
• Ontario Provincial Mining tax is levied at 10% on profits based on a different set of
deductions to Federal and Provincial income taxes. The relevant deductions applied in the
case of Ontario Provincial Mining Tax include:
o Project Operating Costs (excluding third party royalties)
o Depreciation on Processing and Transportation assets (15% straight line p.a.). Since
the project will use contract mining it is assumed that all the pure capital costs (i.e.

Landore Resources Canada Inc. MINERAL RESOURCE ESTIMATE AND PRELIMINARY ECONOMIC ASSESSMENT, BAM Gold Project, Junior Lake Property, Ontario, Canada
Landore Resources Canada Inc. Page | 268
nominal value equivalent of initial plant and infrastructure capital of C $100M real
and tailings expansion capital of US $0.1 / t fed real) will belong to this depreciation
category.
o Depreciation of Exploration and Development expenses at 100% across year 1 of
production. This is taken to include the C $40.1M exploration and the US $12.1 M
nominal (US $11.9M real) of pre-production capitalised operating expenses
described above.
o Processing allowance per annum of 8% of processing capital installed at period start
(being the nominal value equivalent of initial plant and infrastructure capital of C $
100M real and tailings expansion capital of US $0.1 / t fed real) to a maximum of
65% of net profit and a minimum of 15% of net profit as determined by deducting
from revenue the items in the three paragraphs immediately above.
o In addition to the deductions above, the project (assumed to be designated non-
remote) is entitled to up to C $10M (US $7.35M) of exempt income provided this
income falls in the first three years of production and is also entitled to the first C
$500k (US $368k) tax exempt per annum throughout the project. These thresholds
are, conservatively, assumed not to increase with inflation.
o However, there is no tax-loss carry forward availability in the Ontario Provincial
Mining tax structure, nor is debt interest deductible.
o The model assumes that any unused depreciation in respect of Provincial Ontario
Mining Tax is deducted in full in the last operating period of the model
• Working capital has been modelled as 30 days for both receivables and payables, whilst
capital cost has been assumed paid as incurred.
• VAT exists in Canada as a harmonised sales tax (HST) between federal (5%) and Ontario (8%)
and the VAT cycle is applied to capital and operating costs in the model at 13% on the basis
of a 30 day cycle. Applying HST to all costs is very conservative. HST is not applied to
revenue, which is for export and zero-rated.
22.3. Observations
The cash flow model currently aims to capture the relevant elements of the tax system in terms of
structure and available deductions. As the project moves forward, it recommended that a more
tailored understanding of the tax system is sought from experts, not least because there is flexibility
and/or choice in the way in which deductions are applied and there will be specified formats for
record keeping for costs, which will later form the basis for these deductions
22.4. Sensitivity Analysis
A sensitivity analysis for pre-tax and post-tax considerations is tabulated in Table 22-3 and illustrated
graphically in Figure 22-1.

Landore Resources Canada Inc. MINERAL RESOURCE ESTIMATE AND PRELIMINARY ECONOMIC ASSESSMENT, BAM Gold Project, Junior Lake Property, Ontario, Canada
Landore Resources Canada Inc. Page | 269
Table 22-3: BAM Gold Project Gold Price Sensitivity Analysis: Post -Tax (January 2022)
Base Case - Post Tax
Gold Price -40% -30% -20% -10% 0% 10% 20% 30% 40%
NPV -111.02 -15.30 74.09 154.20 231.28 306.92 382.03 457.12 532.33
Ave. Gold Price (US $/oz) 1080 1260 1,440 1,620 $1,800 1,980 2,160 2,340 2,520
Plant Opex -40% -30% -20% -10% 0% 10% 20% 30% 40%
NPV 302.36 284.73 267.02 249.18 231.28 213.26 195.02 176.61 157.90
Mining Opex -40% -30% -20% -10% 0% 10% 20% 30% 40%
NPV 346.64 318.00 289.29 260.44 231.28 201.71 171.52 140.33 108.78
Overall Opex -40% -30% -20% -10% 0% 10% 20% 30% 40%
NPV 418.15 371.53 325.05 278.45 231.28 183.07 132.93 81.71 23.27
Capex -40% -30% -20% -10% 0% 10% 20% 30% 40%
NPV 256.65 250.33 244.00 237.66 231.28 224.89 218.45 212.01 205.54
Discount Rate (Real) -4% -3% -2% -1% 0% 1% 2% 3% 4%
NPV 300.55 280.95 262.98 246.47 231.28 217.28 204.34 192.37 181.28
Figure 22-1: Post-Tax Sensitivity Analysis (January 2022)

Landore Resources Canada Inc. MINERAL RESOURCE ESTIMATE AND PRELIMINARY ECONOMIC ASSESSMENT, BAM Gold Project, Junior Lake Property, Ontario, Canada
Landore Resources Canada Inc. Page | 270
23. Adjacent Properties
There are no mining operations or advanced mineral projects in close proximity to the Junior Lake
properties. The following mines are the nearest advanced projects.
Lac Des Iles Mine
The nearest operating mine is the Lac Des Iles Mine (LDIM), an open pit and underground palladium
mine located 100 km north of Thunder Bay, approximately 15 km west of Highway 527, and 190 km
to the southwest of the Junior Lake property (approximately 259 km by road). LDIM extends over
86.4km2 of mineral claims and leases.
LDIM was a subsidiary of North American Palladium Ltd (NAPL). NAPL was purchased by
Johannesburg-based Impala Platinum Holdings Limited for CA$1 billion in 2019. From that point on,
LDIM has been operated by the new company called Impala Canada Limited.
LDIM primarily mined and explored for palladium but also for gold. Platinum, silver, nickel, and
copper are mined as by-products. Metal production figures from 1994 to 2008 have been reported
up to December 2017 (NAP, 2018):
• Palladium = 3.6Moz (2.5 g/t head grade)
• Platinum = 277koz
• Gold = 253koz
• Copper = 71Mlb
• Nickel = 37.5Mlb.
Greenstone Gold Project
Greenstone Gold Mines is located approximately 275 kilometers northeast of the city of Thunder
Bay, Ontario and approximately four kilometers south of the town of Geraldton, Ontario, at the
intersection of Provincial Highway 584 and Trans-Canada Highway 11
This project is advancing on plans to design, construct and operate an open-pit gold mine,
processing plant and ancillary facilities, collectively known as the Greenstone Project.
The Greenstone Project encompasses the former Hardrock, MacLeod-Cockshutt and Mosher
underground mines which operated from the late 1930s until 1970 and together produced more
than two million ounces of gold. Site rehabilitation work was undertaken during the 1990s.
Greenstone Gold Mines proposes to mine the Hardrock deposit as an open pit over a Life of Mine
(LOM) of approximately 15 years. Project infrastructure will include a process plant operating 365
days per year and a mill with throughput averaging 27,000 tonnes per day. The overall Project
schedule will consist of the following phases:
• Construction: Years -3 to -1, with ore stockpiling commencing after the first year of
construction
• Operation: Years 1 to 15, with Year 1 representing a transition from construction to
operation
• Closure: Years 16 to 20 for Active Closure and Years 21 to 36 for Post-Closure.
Landore Resources Canada Inc. MINERAL RESOURCE ESTIMATE AND PRELIMINARY ECONOMIC ASSESSMENT, BAM Gold Project, Junior Lake Property, Ontario, Canada
Landore Resources Canada Inc. Page | 271
24. Other Relevant Data and Information
No historic mining activity has taken place within the BAM Gold Project area and so there are no
production records or reconciliation data available for review.
There is no other relevant data or information required for disclosure in this NI 43-101 technical
report.

Landore Resources Canada Inc. MINERAL RESOURCE ESTIMATE AND PRELIMINARY ECONOMIC ASSESSMENT, BAM Gold Project, Junior Lake Property, Ontario, Canada
Landore Resources Canada Inc. Page | 272
25. Interpretation and Conclusions
25.1. Data Quality
The January 2022 MRE incorporates diamond drilling data completed predominantly since 2016 over
the BAM Gold Project area. It is also informed by sampling and geological information from trenches,
the surface expression of exposed mineralized zones as indicated by geological mapping, a dataset
of bulk density measurements taken from whole core samples, topographic survey files of the
project, digital photos of all relevant diamond drill core, and updated geological interpretations.
The drilling information reviewed by Cube is considered to be consistent with the Principal Authors’
understanding of the style of gold mineralization targeted by Landore and is adequate for the
estimation of Mineral Resources, based on review and analysis of the following:
• Drilling and sampling methodology.
• Collar and downhole surveying techniques.
• Sample preparation and assaying methods by independent laboratories.
• Bulk density methodology review and analysis.
• Geological logging and core sampling; core recovery analysis.
• Cube has reviewed and independently assessed all available QAQC sample data for
diamond drill drilling.
• Use of certified standards and assay blanks as control samples in the sample stream to
monitor QAQC trends.
• Drilling data and QAQC storage is securely stored in Landore electronic database.
• Systematic data validation and verification checks of diamond drill core, collar locations,
and hardcopy data were conducted by Cube at during the site visit and subsequent
follow up analysis.
• The drilling database used for the 2022 MRE was validated and found to be well
structured and no obvious material discrepancies were detected in the collar, survey,
assay or geology data. There were only a small number of minor issues that were noted
but were not a material influence within the Mineral Resource area.
Cube has made the following conclusions based on the data validation and data verification review:
• The typical drilling data spacing (50 m x 50 m) is adequate to determine the geological
and grade continuity for reporting of Mineral Resources and Mineral Reserves.
• Core logging is conducted both qualitatively and quantitatively with description of
lithologies, structural measurements and comments completed; 100% of all holes have
been logged.
• Industry standard sample preparation and gold analysis has been conducted for all
sampling. The appropriateness of the assaying and laboratory methods is considered a
total measure of gold.
Landore Resources Canada Inc. MINERAL RESOURCE ESTIMATE AND PRELIMINARY ECONOMIC ASSESSMENT, BAM Gold Project, Junior Lake Property, Ontario, Canada
Landore Resources Canada Inc. Page | 273
• Geometry and true widths of the mineralization zones within the BAM Gold Project are
well understood because the area has been infill drilled on a regular spacing using only
diamond drill core since the 2004.
• This information has been used to create 3D models of the lithologies and mineralization
domains. It is well known that the main mineralization zones dip steeply toward 280° at -
65° to -80°.
• Infill and step-out drilling since 2018 has provided sufficient confidence in the current
mineralization true widths for the main mineralization zones in the BAM Project area.
• The 2020-2021 diamond drilling results have verified the reproducibility of the original
mineralized drill intersections from the previous stages of drilling.
• Whilst QAQC analysis completed so far for the drilling since 2016 is satisfactory,
recommendations have been made in order to follow up precision and bias related to
duplicate sampling and check sampling by an independent laboratory.
In Cube’s opinion, the drilling, logging, and sampling procedures at the BAM Project have been
carried out to industry best practices.
The input drill data is comprehensive in its coverage of the gold mineralization at BAM Gold Project
and adequately represents the mineralization. Knowledge of the geological controls on
mineralization has been used to develop the overall January 2022 MRE.
Following the standard validation checks, Cube believes the database for the BAM Gold Project is
adequate for Mineral Resource estimation.
25.2. Mineral Resource Estimate
The MRE appropriately reflects the Competent Person’s view of the BAM Gold Project mineral
resources. The following interpretations and conclusions have been made following the 2022 MRE.
Interpretation and Domaining:
• The January 2022 MRE is made up predominantly of broad to narrow, very continuous
mineralized gold zones hosted within a volcano-sedimentary sequence.
• The confidence in the geological interpretation of the January 2022 MRE is good as a
result of the optimally spaced diamond core drilling programs, predominantly between
2016 and 2021, conducted by Landore.
• The interpretation of the mineralization domain boundaries was guided by the
orientation of the main lithological units in 3D, from observations noted from Landore
hard copy sections and observations from DD core viewed on site. Descriptions of
alteration, mineral assemblages and grade distribution within each host lithological unit
were used to inform mineralization domain boundaries.
• The BAM Mineral Resource currently has an overall strike length of almost 3,700 m, with
a maximum width of the mineralization envelope being approximately 50 m, down to a
minimum mining width of 2 m. The resource is modelled to 380 m vertical depth, with
the estimate based on diamond core drilling collared from surface.

Landore Resources Canada Inc. MINERAL RESOURCE ESTIMATE AND PRELIMINARY ECONOMIC ASSESSMENT, BAM Gold Project, Junior Lake Property, Ontario, Canada
Landore Resources Canada Inc. Page | 274
• There are minimal changes in strike and dip of the mineralization across the sequence,
and there is very good continuity overall from east to west for the main BAM gold
mineralization, but it is likely to be affected by minor faulting and dolerite dyke
intrusives, disrupting the mineralization trends.
• Gold mineralization domain boundary analyses clearly show sharp (or hard) boundary
between the main mineralization domains and the waste material (>0.2 g/t Au). The
analysis provides confidence that the mineralization domains created can be used as
hard boundaries to constrain the sample data during the sample compositing process.
• The domaining interpretations are based on good quality diamond drilling information
which shows steeply dipping mineralization hosted within the BAM sequence.
Data Analysis:
• The drill hole sampling information was composited to a 1 m composite interval in order
to reduce the variability inherent in raw samples or a smaller composite length relative
to estimation resource model block dimensions.
• Statistical and visual analysis for Au grades was undertaken to validate the overall
controls on mineralization and to determine which estimation approach to adopt. The
aim was also to evaluate the need for special treatment of obvious statistical outliers.
• Experimental variograms were generated within major mineralization domains. Gaussian
variograms for the mineralization domains were generated and interpreted as part of
the spatial data analysis. Where data for particular domains proved to be insufficient for
variography analysis, parameters for grade estimation were adopted from other
representative mineralization.
Estimation Methodology and Validation:
• The block model definition parameters included a primary block size and sub-blocking
deemed appropriate for the mineralization and to provide adequate volume definition
where there are narrow or disrupted zones due to contacts or structural boundaries.
These dimensions are suitable for block estimation and modelling the selectivity for an
open pit operation.
• OK estimation was used to produce the reported estimates for the mineralization
domains within a parent block size of 20 m x 5 m x 5 m in the X, Y, Z directions
respectively was used, which were sub-blocked to 5 m x 1.25 m x 1.25 m. These
dimensions were deemed to be appropriate for block estimation and modelling the
selectivity for an open pit mining operation.
• After exploratory data analysis on all domains, it was decided that no grade capping
would be used for any of the domains as there was either no material difference when
applying suitable top cut values, or there were no significant outliers for most of the
domains. Instead, Cube has adopted a distance limiting factor to domains where grade
outliers were prevalent and top cutting had some influence on improving CoV.

Landore Resources Canada Inc. MINERAL RESOURCE ESTIMATE AND PRELIMINARY ECONOMIC ASSESSMENT, BAM Gold Project, Junior Lake Property, Ontario, Canada
Landore Resources Canada Inc. Page | 275
• The CoV is relatively high in the economically most important Domain 1001 and for most
of the other well-informed domains, most likely as a result of the high nugget value and
visual evidence of coarse gold in the diamond drill core. In some domains with poorly
informed data (sparsely drilled), it is possible that the use of a standard linear estimation
method such as OK may produce over-smoothed block estimates.
• Search ellipse geometry and size was determined from the experimental variograms
generated for mineralized domain.
• Cube carried out the several validation methods for the block OK estimates and check
ID2 estimates - no significant variations in global estimate results were noted. The
correspondence between mean grade composite samples and block grade estimates is
good, as demonstrated by the visual inspection in cross sections, global comparisons of
volume and mean grade statistics, and semi-local comparisons on sections and levels.
• There are no historic workings, and no mining activity has taken place at the BAM Gold
Project, so there are mine reconciliation records in order to assess past performance
comparing mineral resources against mine production.
Classification and Reporting:
• The mineral resource classification for the BAM Gold Project is mainly based on data
quality, drill data spacing, kriging parameters and the number of composites used for
the estimation. Blocks have been classified as Indicated or Inferred only.
• The cut-off grade for reporting is 0.3 g/t Au. As gold resources occur near-surface, the
model was constructed with a view towards selective open pit mining and heap leach
operation. Thus, a 0.3 g/t Au lower cut-off was deemed appropriate.
• The current modelled MRE is a reasonable representation of the global contained metal.
• The density of drilling supports the classification Mineral Resource to be classified as
Indicated and Inferred. The resource risk is considered to be low to moderate.
• The January 2022 BAM MRE constitutes a global resource estimate.
25.3. Future Resource Upgrades and Exploration Potential
25.3.1. BAM Gold Project - Extensions
Cube concurs with the Landore opinion there is significant potential to expand the limits of the BAM
Gold Project.
The 2020 soil sampling program was successful in generating several anomalies of interest as well as
expanding on previously-generated anomalies. Exploration targets to the east and west of the
currently defined BAM Gold deposit are prospective for further significant gold mineralization. Gold
is shown to respond well to the low-cost survey which has strong potential for future exploration.
Recommendations (Johnston, 2020):
• Survey lines should be conducted in areas of interest and to expand on observed trends.
These lines can be done quickly via GPS and do not require a cut line. Initial line spacing of

Landore Resources Canada Inc. MINERAL RESOURCE ESTIMATE AND PRELIMINARY ECONOMIC ASSESSMENT, BAM Gold Project, Junior Lake Property, Ontario, Canada
Landore Resources Canada Inc. Page | 276
200 m is acceptable with the line spacing being reduced to 100 m spaced lines with samples
every 25 m in areas being infilled. The length of the infill line should extend a minimum of
100 m above and below the interpreted anomaly.
• Intensive prospecting to be conducted along anomalous gold trends. Previous work has
indicated that unassuming, weakly sheared surface samples can return significant gold
values. Sampling of all outcrops where they occur needs to be conducted in high priority
areas. Ideally samples perpendicular to the trend should be spaced at 10 m while sampling
along the strike of the anomaly should be at <50 m.
• Property scale exploration to be done using 500m spaced lines across areas of interest both
east and west.
• Test lines should be done over the Lamaune Gold occurrence to determine its characteristics
and once characterized, additional iron formations on the project sampled.
From the soil sampling program there are four areas identified as priority targets (Johnson, 2020):
1. Gold anomaly trend west of Juno Lake, adjacent to the interpreted BAM Gold
metasedimentary sequence. The presence of anomalous gold values along this trend gives
additional strength to the continuation of gold mineralization along this horizon. The
possibility of a southwest auriferous splay occurring and passing just south of Juno Lake
needs to be evaluated.
2. Follow up on the multiple anomalous trends between Juno Lake and Boras Lake associated
with the iron formations. Unfortunately, terrain may prove to be a problem as much of the
area has thick overburden. Identification of a fingerprint for the Lamaune Gold occurrence
to the west may assist in narrowing down the targets.
3. Extend surveyed lines to the north and south of the BAM Gold deposit to test for possible
parallel trends. Evidence of possible multiple mineralized shears can be interpreted from the
soil sampling.
4. The eastern extension of the Junior Lake grid contains numerous anomalies including the
highest Au RR’s (506, 218 and 101) of the survey. Work in the area includes five exploration
diamond drill holes conducted in 2018. These exploration diamond drill holes intersected
elevated gold values. The 2020 sampling shows a continuous soil anomaly along the
interpreted BAM Gold mineralization as well as possible additional anomalies to the north
and south.
Recommendations in the area consist of:
• Drilling along the defined trend.
• Detailed prospecting along the possible anomalous trends to the north and south.
• Extension of the soil sampling grid to the east to follow along the anomalous values and
guide exploration
The current 3D model interpretation of the extents of the BAM gold mineralization remains open
along strike, both to the east and west, and future drilling should target the eastern extension of the
BAM Sequence, beyond approximately local grid section 4000 E. The BAM gold mineralization
remains open down dip, providing additional exploration targets for future drill programs.
Landore Resources Canada Inc. MINERAL RESOURCE ESTIMATE AND PRELIMINARY ECONOMIC ASSESSMENT, BAM Gold Project, Junior Lake Property, Ontario, Canada
Landore Resources Canada Inc. Page | 277
The 2019-2020 soil sampling programs were successful in generating several anomalies of interest.
Gold is shown to respond well to the low cost survey and has strong potential for future exploration.
Figure 25-1 shows a plan view of highly prospective geophysical anomaly targets that have been
identified by Landore from IP surveys carried out in 2006 and now confirmed by the soil sampling
and ground geophysical survey conducted in 2019. The geophysical anomaly trends are interpreted
as representing massive to disseminated sulphides zones along the FW within the main BAM
sequence gold mineralized trends. The results of the additional geophysics and soil geochemistry
conducted at the Felix Lake Prospect has opened up the area north-west of the BAM Project for
further potential economic gold mineralization.

Landore Resources Canada Inc. MINERAL RESOURCE ESTIMATE AND PRELIMINARY ECONOMIC ASSESSMENT, BAM Gold Project, Junior Lake Property, Ontario, Canada
Landore Resources Canada Inc. Page | 278
Figure 25-1: Plan View of Targets for Future Drill Testing for the BAM Gold Project (Landore, 2022)
VW Ni Deposit
B4-7 Ni/Cu Deposit
BAM Gold Deposit
Felix Prospect

Landore Resources Canada Inc. MINERAL RESOURCE ESTIMATE AND PRELIMINARY ECONOMIC ASSESSMENT, BAM Gold Project, Junior Lake Property, Ontario, Canada
Landore Resources Canada Inc. Page | 279
25.3.2. Junior Lake Property Exploration Potential
Based on exploration work completed by Landore up to January 2022, there is significant resource
potential that clearly indicates follow up, district scale exploration programs are warranted. There is
potential for other gold mineralization targets along the 31 km strike length of the Junior Lake Shear
(Lamaune) and historic discovery at Toronto Lake.
Lamaune Gold Prospect (RPA, 2018)
In 2010, Landore prepared a 3D model and a conceptual estimate for the Lamaune Gold Prospect
using Inverse Distance to the power of three (ID3) linear weighting of composite samples extracted
from within the defined weak and high-grade mineralization zones (Brown, 2010). A specific gravity
of 2.93 g/cm3 was used for tonnage calculations. Low grade composites were not capped, and high-
grade composites were capped at 30 g/t Au prior to estimation. A percent block model was used to
represent the volumes contained within the constraining mineralization domains, based on a 5 m x
5 m x 5 m rotated block model. The estimate was not NI 43-101 compliant and was used for internal
purposes only.
The RPA report noted that, based upon the review of the existing drill hole and assay information,
there is potential to find additional mineralization in this area that may total 50,000 tonnes to
100,000 tonnes and grade 4 g/t Au to 8 g/t Au.
It is important to note that the tonnage and grade of this exploration potential is conceptual in
nature, that there has been insufficient exploration to define a mineral resource, and that it is
uncertain if further exploration will result in the target being delineated as a Mineral Resource.
B4-7 Deposit (RPA, 2018)
Based upon its detailed review of the drill hole information, it was noted that good potential remains
along the down-plunge direction of the B4-7 Deposit. In establishing its estimate of the exploration
target, RPA considered the spatial configuration and trends of the grade distribution of the known
mineralization, the location of those drill holes that form the limits of the B4-7 Deposits, the average
thickness of that portion of the $62/t NSR mineralized wireframe that lies below the preliminary
open pit shell, and the average densities of the available samples in this portion of the $62/t NSR
wireframe model (Figure 25-2).
Based upon these criteria, it was recommended that additional drilling along the down-plunge
extensions of the B4-7 Deposit has the potential to outline an additional 1.5 Mt to 2.0 Mt of sulphide
mineralization of similar grades to that which has been outlined to-date. It is important to note that
the potential quantity and grade is conceptual in nature, that insufficient exploration has been
carried out in this area to define a Mineral Resource and that it is uncertain if further exploration will
result in the target being delineated as a Mineral Resource.
Further detailed review of the drill hole information at shallow depths along the western strike
projection of the $22/t NSR wireframe outline of the B4-7 Deposit led to the observation that the
limits of the mineralization in this area is poorly defined by the existing drill holes.
RPA made the following conclusions:

Landore Resources Canada Inc. MINERAL RESOURCE ESTIMATE AND PRELIMINARY ECONOMIC ASSESSMENT, BAM Gold Project, Junior Lake Property, Ontario, Canada
Landore Resources Canada Inc. Page | 280
• Potential exists to outline additional sulphide mineralization at shallow depths for a
150 m to 200 m long segment to the west of Section Line 0+00.
• Any such mineralization located in this area would have the potential of extending the
western limit of the current preliminary open pit shell.
Figure 25-2: Cross Section View Showing Exploration Potential of the B4-7 Deposit (RPA, 2018)
B4-8 Conductor (RPA, 2018)
As part of its scope of work for the Junior Lake Project, RPA carried out preliminary compilations of
available drilling, mapping and geophysical information along an approximately 10 km strike length
of the Grassy Pond sill. Examination of the compiled information in the immediate area of the B4-7
Deposit and Alpha Zone shows that, while the known mineralization for the B4-7 Deposit correlates
very well with the B4-7 Horizontal Loop conductor, a second conductor is located to the south and
west (Figure 25-3)
This conductor is known as the B4-8 conductor and has been intersected by drill holes at depth.
These drill holes have shown this conductor to be caused by narrow zones of massive sulphide
mineralization. It was noted that the shallow portions of the B4-8 conductor have not been
adequately tested by drilling and so there is potential to locate additional sulphide mineralization at
shallow levels that could be exploited by means of open pit mining methods.

Landore Resources Canada Inc. MINERAL RESOURCE ESTIMATE AND PRELIMINARY ECONOMIC ASSESSMENT, BAM Gold Project, Junior Lake Property, Ontario, Canada
Landore Resources Canada Inc. Page | 281
Figure 25-3: Plan View Showing Exploration Potential of the Multi-Element Prospects within the Junior Lake Tenements (Landore, 2022)

Landore Resources Canada Inc. MINERAL RESOURCE ESTIMATE AND PRELIMINARY ECONOMIC ASSESSMENT, BAM Gold Project, Junior Lake Property, Ontario, Canada
Landore Resources Canada Inc. Page | 282
26. Recommendations
Landore plans to focus on advancing the highly prospective targets within the Junior Lake Property.
Significant exploration and drill testing is summarised as follows:
• Phase 1 - Exploration:
o Further soil sampling Felix Lake to BAM along the local grid lines.
o Follow up exploration ground geophysics and soil sampling on other multi-element
prospects within the Junior Lake Project area.
• Phase 2 - Diamond Drilling at BAM:
o Exploration drilling to follow-up on identified gold targets = 15,000 m
o Resource infill and extension = 5,000 m.
Cube concurs with Landore’s proposed work program on the Junior Lake Project. The Phase 2 drilling
is not contingent on the Phase 1 results. The work program expenditure estimates are summarised
in Table 26-1.
Table 26-1: Proposed Work Program for BAM (Landore, 2022)
Phase/Item Estimated
Budget (C$)
PHASE 1
Gridding, soil geochemistry, ground geophysics, assaying
$ 300,000
Total - Phase 1 $ 300,000
PHASE 2
Personnel and Logistics $1,500,000
20,000 metres drilling, assays, access $4,500,000
Studies and Consultants $ 500,000
Sub Total Operations $6,500,000
Management/Administration $ 700,000
Total - Phase 1 and 2 $7,500,000

Landore Resources Canada Inc. MINERAL RESOURCE ESTIMATE AND PRELIMINARY ECONOMIC ASSESSMENT, BAM Gold Project, Junior Lake Property, Ontario, Canada
Landore Resources Canada Inc. Page | 283
27. References
Abzalov, M.Z. 2008: Quality Control of Assay Data: A Review of Procedures for Measuring and Monitoring Precision and Accuracy. Exploration and Mining Geology, Vol 17(3-4), pp 131-144.
Abzalov, M.Z. 2009: Use of Twinned Drill holes in Mineral Resource Estimation. Exploration and Mining Geology, Vol 18(1-4), pp 13-23.
Allard, G. 2019: BAM Project – Metallurgical Report – Phase 1. Unpublished Technical Report for Landore Resources Canada. Allard Engineering Services LLC. Dated 11 January 2019.
Amdel Mineral Laboratories, 2010, Landore Resources Canada Inc. Flotation Testing of B4-7 Ore Types: Unpublished Internal Document Prepared for Landore Resources, February 2010, 166 p.
Armstrong, M. (1998). Basic Linear Geostatistics. Verlag: Springer.
Berger, B. R., 1992, Geology of the Toronto Lake area, District of Thunder Bay, Ontario: Geological Survey Open File report 5784, 195 p.
Brown, F.H., 2010: Conceptual model and mineral resource inventory for the Lamaune gold deposit, Ontario, Canada. A report prepared for Landore Resources Canada Inc., 12 p.
Chamois, P., 2011, Technical Report on the Lamaune Iron Project, North western Ontario, Canada: Unpublished Report prepared for Landore Resources Canada Inc., 124 p.
Cheatle, A.M., 2010: 2008 Diamond Drill Program on the Junior Lake Property, Lamaune Lake Section (Grassy Pond, Carrot Top, Zap, DC Zones). Falcon Lake and Junior Lake areas, Thunder Bay North Mines and Minerals Division, Ontario. NTS 52I/08 and 42L/05. An unpublished report prepared for Landore Resources Canada Inc., 56 p.
Cooper, C. C., 2009, B4-7 Short review; Galloway Mineral Services Mineral Exploration Consultant: Landore intercompany memo, 3 p.
Cooper, C. C., 2009, VW Short review; Galloway Mineral Services Mineral Exploration Consultant: Landore intercompany memo, 2 p.
Cooper, C. C., 2009, Exploration potential of Lamaune Properties, Junior Lake during 2009, results of recent drilling campaign and a property review; Galloway Mineral Services Mineral Exploration Consultant: Landore intercompany memo, 27 p.
Cooper, C. C. 2009: Exploration potential of the Junior Lake Area, Ontario Canada; Galloway Mineral Services Mineral Exploration Consultant: Landore intercompany memo, 14 p.
Cox, J., and Weir, I., 2013, Preliminary Open Pit Results for the Junior Lake Project: Unpublished Document prepared by Roscoe Postle Inc., 7 p.
CUBE, 2019, Preliminary Economic Assessment for the BAM Gold Project, Junior Lake Property, Ontario, Canada. Unpublished Technical Report prepared for Landore Resources Canada Inc, Dated 19 February 2019.
Cullen, D., Brown, F.H., and Sedore, L., 2007, Technical Report on the Shebandowan West Property, Thunder Bay Mining Division, Northwestern Ontario: Unpublished document prepared for North American Palladium Ltd., and available from the SEDAR web site at www.SEDAR.com, 153 p.

Landore Resources Canada Inc. MINERAL RESOURCE ESTIMATE AND PRELIMINARY ECONOMIC ASSESSMENT, BAM Gold Project, Junior Lake Property, Ontario, Canada
Landore Resources Canada Inc. Page | 284
De Mark, P., and Glacken, I., 2008, Landore: B4-7 Zone, Junior Lake Project, Ontario Canada, mineral resource estimate; report #080609_V581_FINAL_Landore _TR_R_NI.docx, Snowden Group: Unpublished Report, 44 p.
Dubé, B., and Gosselin, P., 2007, Greenstone-Hosted Quartz-Carbonate Vein Deposits: in Goodfellow, W.D., ed., Mineral Deposits of Canada: A Synthesis of Major Deposit-Types, District Metallogeny, the Evolution of Geological Provinces, and Exploration Methods: Geological Association of Canada, Mineral Deposits Division, Special Publication No. 5, p.49-73.
Genrich, E., and Seyler, J., 2008, Jan 2008-Revised report on fish population survey and fish habitat assessment of Ketchikan Lake, Junior Lake Property Thunder Bay, Ontario; report # 07-1192-007OR 07JAN15 FHA: unpublished report, Golder Associates Ltd. Sudbury ON, 54 p.
Gharibi, M., and McGill, D., 2014, Orion 3D DC-IP-MT Survey Geophysical Report, Junior Lake Project, Phase II: Unpublished document prepared for Landore Resources Canada Ltd, 215 p.
Halls, C., 2008, The Mineralogy of a Sample Drillcore from The Junior Lake Prospect, Ontario, Canada – 0405-33 at 96.4m, Unpublished internal company report, 20 p
Isaaks, E., & Srivastava, M., 1989. An Introduction to Applied Geostatistics. Oxford: Oxford Press.
Jindra, A. R., 2009, BAM Zone, Junior Lake Project: Unpublished report prepared for Landore Resources, 11 p.
Johnston, J., 2019, Soil Sampling Program 2019, Junior Lake Property: Unpublished report prepared for Landore Resources Canada Inc, 30 November 2019, 57 p
Johnston, J., 2020, Soil Sampling Program 2020, Junior Lake Property: Unpublished report prepared for Landore Resources Canada Inc, 11 January 2020, 55 p
Johnston, M., 2004, Geophysical Review, Junior Lake Property Report of an Induced Polarization Survey on the Junior Lake Property, Junior Lake Area, Ontario Claim Nos. 1217181 and 1187560, Thunder Bay Mining Division: Unpublished report prepared for Landore Resources, 14 p
King, A. R., 2015, Geophysical Review, Junior Lake Property: Unpublished report prepared for Landore Resources, 40 p.
Landore Resources Limited, 2006, Progress report Junior Lake drilling report. Public release, February 7, 2006, 4 p.
Landore Resources Limited, 2005, Junior Lake drilling progress report-VW zone. Public release, December 8, 2005, 2 p.
Landore Resources Limited, 2005, Significant Nickel Discovery. Public release, October 12, 2005, 4 p.
Lester, J., 2009a, Metallurgy VW 43101 091509. Unpublished summary report prepared for Landore Resources Canada Inc., September 15, 2009, 12 p.
Lester, J., 2009b, Geology VW 43101 091309. Unpublished summary report prepared for Landore Resources Canada Inc., September 13, 2009, 12 p.
Lester, J., 2009c, Exploration summary VW 43101 091309. Unpublished summary report prepared for Landore Resources Canada Inc., September 13, 2009, 9 p.
Lester, J., 2009d, Environmental baseline studies 43101 091309. Unpublished summary report prepared for Landore Resources Canada Inc., September 13, 2009, 2 p.

Landore Resources Canada Inc. MINERAL RESOURCE ESTIMATE AND PRELIMINARY ECONOMIC ASSESSMENT, BAM Gold Project, Junior Lake Property, Ontario, Canada
Landore Resources Canada Inc. Page | 285
Liferovich, R., 2005, Petrographic analysis report. Unpublished report prepared for Landore Resources Canada Inc., November 2005, 24 p.
MacDonald, C.A., 2006, Project Unit 06-007. Precambrian Geology of the East-Central Caribou Lake Greenstone Belt. Summary of Field Work and Other Activities 2006. Ontario Geological Survey, Open File Report 6192, p. 10-1 to 10-17.
MacDonald, C.A., ter Meer, M., Lowe, D., Isaac, C. and Stott, G.M., 2009, Precambrian geology of the Caribou Lake greenstone belt, northwestern Ontario; Ontario Geological Survey, Preliminary Map P.3613, scale 1:50,000.
MacDonald, C.A. and Tremblay, E., 2004, Lake Nipigon Region Geoscience Initiative: Results of bedrock mapping in the northern part of the western Nipigon Embayment, northwestern Ontario, Canada; oral presentation abstract in Institute on Lake Superior Geology, Proceedings, v. 50, pt. 1, Programs and Abstracts, pp. 102-103.
MacTavish, A. D., 2004, Diamond drilling report BAM and B4-7 zones Junior Lake property 2003: Landore Resources report published on SEDAR, February 20, 2004.
McKay, B. J., 2005 Technical Report of the Lamaune Lake Project, Spring 2005: Unpublished Landore Resources report, 48 p.
McKay, B. J., 2006, Technical report of the Junior Lake Project Falcon Lake and Junior Lake areas NTS 2I/08NE and SE, 42L/05NW and SW for Landore Resources Canada Inc.: Unpublished draft company report, Volumes I to IV, 35 p. (Vol. 1).
Mungall, J. E., 2009, Preliminary petrological report on samples from the Junior Lake Property: Picrite Consulting Inc. Unpublished Report, 28 p.
Mungall, J. E., 2007, Petrographic report on samples from the VW zone on the Junior Lake property prepared for Landore Resources Inc.: Unpublished Picrite Consulting Inc. report, December 12, 2007, 60 p.
Mungall, J. E., 2006, Petrographic report prepared for Landore Resources Inc.: Unpublished Picrite Consulting Inc. report, October 21, 2006, 36 p.
NAP, 2018, Feasibility Study for Lac des Iles Mine Incorporating Underground Mining of the Roby Zone, Unpublished Report by North American Palladium Ltd, Thunder Bay, Ontario, Canada. Report Date: October 2, 2018.
Nelson, D., 2016, B4-7 Project Geotechnical Study and Report, Unpublished WSP Canada Inc. report, March 11, 2016, 130 p.
Nelson, D., 2018, Prefeasibility Geotechnical Pit Design, BAM Deposit, Unpublished WSP Canada Inc. report, October 26, 2018, 240p.
Payne, J., G., 2016, Petrographic Report: Unpublished Internal Document Prepared for Landore Resources Canada Inc., 19 p.
Percival, J. A., 2007, Geology and Metallogeny of the Superior Province, Canada; in Goodfellow, W.D., ed., Mineral deposits of Canada: A synthesis of major deposit-types, district metallogeny, the evolution of the Geological Provinces, and exploration methods: Geological Association of Canada, Mineral Deposits Division, Special Publication, No 5, pp. 903-928.
Pressacco, R., 2015, Technical Report on the Junior Lake Project, Unpublished Roscoe Postle Associates Inc. report, October 7, 2015, 201 p.

Landore Resources Canada Inc. MINERAL RESOURCE ESTIMATE AND PRELIMINARY ECONOMIC ASSESSMENT, BAM Gold Project, Junior Lake Property, Ontario, Canada
Landore Resources Canada Inc. Page | 286
Pressacco, R., 2016, Evaluation of Downhole Geophysical Results, Junior Lake Project, Unpublished Roscoe Postle Associates Inc. Letter Report, April 12, 2016, 21 p.
Pressacco, R., 2017, Technical Report on the BAM East Gold Deposit, Ontario, Canada: Unpublished Roscoe Postle Associates Inc. report, February 17, 2017, 189 p.
Pressacco, R. and Masun, K.M., 2018, Technical Report on the Mineral Resource Estimates, Junior Lake Project, Ontario, Canada – BAM East; B4-7, VW Deposits: Unpublished Roscoe Postle Associates Inc. report, January16, 2018, 388 p.
Percival, J. A., 2007, Geology and Metallogeny of the Superior Province, Canada; in Goodfellow, W.D., ed., Mineral deposits of Canada: A synthesis of major deposit-types, district metallogeny, the evolution of the Geological Provinces, and exploration methods: Geological Association of Canada, Mineral Deposits Division, Special Publication, No 5, pp. 903-928.
Pye, E.G., 1968, Geology of the Crescent Lake Area: Ontario Department of Mines Geological Report 55, 72 p.
Rivoirard J. 1987. Two key parameters when choosing the kriging neighbourhood; J Math Geol, 19:851-856.
SGS Lakefield, 2008, An Investigation into the Metallurgical Testing of Samples from Junior Lake-VW Mineralization; project # 11366-002 – final report Aug. 15, 2008: SGS Lakefield Research Limited unpublished report, 140 p.
Simoneau, P., 2013, Electromagnetic (MaxMin), VLF and Magnetometric Surveys on the Junior Lake Property, Toronto Lake Area: Unpublished document prepared for Landore Resources, 33 p.
Simoneau, P., 2015, Electromagnetic (MaxMin), VLF and Magnetometric Surveys on the Junior Lake Property, Toronto Lake Area: Unpublished document prepared for Landore Resources, 27 p.
Simoneau, P., 2019, Electromagnetic (HLEM-MaxMin), VLF and Magnetometric Surveys on Junior Lake Property, BAM Gold Project, Junior Lake G-0057 Area and Falcon Lake G-0035 Area: Unpublished document prepared for Landore Resources, 69 p.
Sloan, R., and Roulston, D., 2017, Preliminary Assessment of Two Metallurgical Composites from the BAM East Gold Deposit, Unpublished ALS Metallurgy Americas report, September 29, 2017, 58 p.
Sloan, R., and Roulston, D., 2016, Preliminary Assessment of Two Metallurgical Composites from the BAM East Gold Deposit, Unpublished ALS Metallurgy Americas report, December 20, 2016, 44 p.
Smee, B. W., 2008, A Review of Accurassay Laboratory Thunder Bay, Ontario: Unpublished Smee and Associates Consulting Ltd. report prepared for Landore Resources Canada Inc., September 19, 2008, 36 p.
Tuomi, M., 2018: Work Assessment Report on the Junior Lake Property. 2016 Winter Diamond Drilling Program (BAM East Gold Deposit). Falcon Lake Area, Thunder Bay North Mines and Minerals Division. NTS 52I/08 and 42L/05. A report prepared for Landore Resources Canada Inc., 51 p
Vann, J., Jackson, S., & Bertoli, O. (2003), Quantitative Kriging Neighbourhood Analysis for the Mining Geologist — A Description of the Method with Worked Case Examples, Proceedings 5th International Mining Geology Conference, Bendigo, Victoria, November 2003.
Zurowski, M., 1970, Report on the exploration activities in the Pikitigushi-Crescent-Toronto lakes area, Thunder Bay Mining Division, Province of Ontario for the calendar year 1969. Unpublished M.E.M. Consultants Limited report, October 19, 1970, 24 p

Landore Resources Canada Inc. MINERAL RESOURCE ESTIMATE AND PRELIMINARY ECONOMIC ASSESSMENT, BAM Gold Project, Junior Lake Property, Ontario, Canada
Landore Resources Canada Inc. Page | 287
28. Date and Signature Page
This Report titled “MINERAL RESOURCE ESTIMATE AND PRELIMINARY ECONOMIC ASSESSMENT on
the BAM Gold Project, Junior Lake Property, Ontario, Canada” for Landore Resources Canada Inc.
and dated 9/05/2022 was prepared and signed by the following authors.
Dated at Perth, Western Australia, Australia,
this 9th day of May 2022
Brian Fitzpatrick B.Sc., MAusIMM CP (Geo) Principal Geologist Cube Consulting Pty Ltd
Dated at Perth, Western Australia, Australia,
this 9th day of May 2022
Quinton de Klerk
NHD, FAusIMM Principal Mining Engineer Cube Consulting Pty Ltd

Landore Resources Canada Inc. MINERAL RESOURCE ESTIMATE AND PRELIMINARY ECONOMIC ASSESSMENT, BAM Gold Project, Junior Lake Property, Ontario, Canada
Landore Resources Canada Inc. Page | 288
29. Certificates of Qualified Persons
29.1. Certificate of the Qualified Person – Brian Fitzpatrick, B.Sc.,
MAusIMM CP (Geo)
I, Brian Fitzpatrick, do hereby certify that:
• I am a Principal Geologist with Cube Consulting Pty Ltd of 1111 Hay Street, West Perth, WA 6005.
• I am the lead author of the technical report titled “NI 43-101 Independent Technical Report (NI 43-
101), Mineral Resource Estimate / Preliminary Economic Assessment, XYZ Project, Location, Country"
and dated 31st day of January 2022 (the “Technical Report”) relating to Landore’s BAM Gold Project
in Ontario, Canada.
• I am a Geologist, with a Bachelor of Science degree, majoring in Geology from the University of
Tasmania graduating in 1985. I am a member of the Australasian Institute of Mining and Metallurgy
(MAusIMM) with Chartered Professional accreditation (member number 203397). I have worked as a
geologist for more than 33 years since my graduation from University.
• I am a Qualified Person as defined in NI 43-101, having more than 5 years of experience which is
relevant to the style of mineralization and type of deposit described in the Technical Report, and to
the activity for which I am accepting responsibility. Relevant experience has been gained from
working in the gold and base metal mining and exploration industry in various provinces throughout
Australia and other countries. This includes exploration, open pit and underground mining experience
in greenstone hosted gold deposits, epithermal gold deposits and Volcanogenic Massive Sulphide
(VMS) poly-metallic deposits.
• I conducted site visits of the BAM Gold Project area from 23 to 28 June 2018. The site visit included
field inspection of the lithologies and mineralization outcropping at the project area, and inspection
of core samples, sample preparation and data storage facilities at the Junior Lake property. Data
verification and data validation on all the drilling data supplied for the current MRE was also
conducted.
• I am responsible for the preparation of sections 1 to 14, 17 and 20 to 26 of the Technical Report.
• I am independent of Landore Resources Canada Inc. in accordance with Section 1.5 of NI 43-101.
• I have read NI 43-101 and Form 43-101F1 and the Technical Report has been prepared in compliance
with that instrument and form.
• As of the date of this Technical Report and certificate, to the best of my knowledge, information and
belief, the Technical Report contains all scientific and technical information that is required to be
disclosed to make the Technical Report not misleading.
Dated at Perth, Western Australia, Australia, this 9th day of May 2022.
Brian Fitzpatrick B.Sc., MAusIMM CP (Geo) Principal Geologist Cube Consulting Pty Ltd

Landore Resources Canada Inc. MINERAL RESOURCE ESTIMATE AND PRELIMINARY ECONOMIC ASSESSMENT, BAM Gold Project, Junior Lake Property, Ontario, Canada
Landore Resources Canada Inc. Page | 289
29.2. Certificate of the Qualified Person – Quinton de Klerk, NHD,
FAusIMM
I, Quinton de Klerk, do hereby certify that:
• I am a Principal Mining Engineer with Cube Consulting Pty Ltd of 1111 Hay Street, West Perth, WA
6005.
• I am the co-author of the technical report titled “NI 43-101 Independent Technical Report (NI 43-101),
Preliminary Economic Assessment for the BAM Gold Project, Junior Lake Property, Ontario, Canada"
and dated 19th February (the “Technical Report”) relating to Landore’s BAM Gold Project in Ontario,
Canada.
• I am a Mining Engineer, with a National Higher Diploma in Metalliferous Mining, from the University
of Johannesburg graduating in 1993. I am a fellow of the Australasian Institute of Mining and
Metallurgy (FAusIMM), member number 210114. I have worked as a Mining Engineer for more than
25 years since my graduation.
• I am a Qualified Person as defined in NI 43-101, having more than 5 years of experience which is
relevant to the style of mineralization and type of deposit described in the Technical Report, and to
the activity for which I am accepting responsibility. Relevant experience has been gained from
working in the gold and base metal mining industry in various in, South Africa, Namibia, Australia and
other countries. This includes open pit and underground mining experience in various mining
methods.
• I have not conducted a site visit of the BAM Gold Project area.
• I am responsible for the preparation of sections 16 and 18 of the Technical Report.
• I am independent of Landore Resources Canada Inc. in accordance with Section 1.5 of NI 43-101.
• I have read NI 43-101 and Form 43-101F1 and the Technical Report has been prepared in compliance
with that instrument and form.
• As of the date of this Technical Report and certificate, to the best of my knowledge, information and
belief, the Technical Report contains all scientific and technical information that is required to be
disclosed to make the Technical Report not misleading.
Dated at Perth, Western Australia, Australia, this 9th day of May 2022.
Quinton de Klerk NHD, FAusIMM Principal Mining Engineer Cube Consulting Pty Ltd

Landore Resources Canada Inc. MINERAL RESOURCE ESTIMATE AND PRELIMINARY ECONOMIC ASSESSMENT, BAM Gold Project, Junior Lake Property, Ontario, Canada
Landore Resources Canada Inc. Page | 290
30. Abbreviations and Units of Measure
Units of measurement used in the report conform to the metric system, unless noted otherwise
(Table 30-1). All costs in this study are expressed in Canadian dollars (C$ or $) unless noted
otherwise.
Table 30-1 List of Abbreviations for Units of Measurement
Units Description Units Description
a annum L litre
A ampere lb pound
bbl barrels L/s litres per second
btu British thermal units m metre
bcm bank cubic metre M million
°C degree Celsius Ma Millions of years
$ or C$ Canadian dollars m2 square metre
$US US dollars m3 cubic metre
cal calorie µm microns
cfm cubic feet per minute MASL metres above sea level
cm centimetre µg microgram
cm2 square centimetre m3/h cubic metres per hour
d day ml millilitre
dia diameter mi mile
dmt dry metric tonne min minute
dwt dead-weight ton µm micrometre
°F degree Fahrenheit mm millimetre
ft foot mph miles per hour
ft2 square foot Mt Million tonnes
ft3 cubic foot Mtpa million tonnes per annum
ft/s foot per second MVA megavolt-amperes
g gram MW megawatt
G giga (billion) MWh megawatt-hour
Gal Imperial gallon oz Troy ounce (31.1035g)
g/L gram per litre oz/st, opt ounce per short ton
g/m3 gram per cubic metre P80-75µ 80% passing 75 µm

Landore Resources Canada Inc. MINERAL RESOURCE ESTIMATE AND PRELIMINARY ECONOMIC ASSESSMENT, BAM Gold Project, Junior Lake Property, Ontario, Canada
Landore Resources Canada Inc. Page | 291
Units Description Units Description
Gpm Imperial gallons per minute % Percentage
g/t gram per tonne ppb part per billion
gr/ft3 grain per cubic foot ppm part per million
gr/m3 grain per cubic metre psia pound per square inch absolute
ha hectare psig pound per square inch gauge
hp horsepower RL reduced level
hr hour s second
Hz hertz st short ton
" or in. inch stpa short ton per year
in2 square inch stpd short ton per day
J joule t or T metric tonne
k kilo (thousand) t/m3 tonnes per cubic metre
kcal kilocalorie tpa metric tonne per year
kg kilogram tpd metric tonne per day
kg/t kilogram per tonne US$ United States dollar
km kilometre USg United States gallon
km2 square kilometre USgpm US gallon per minute
km/h kilometre per hour V volt
koz Thousand ounces W watt
kPa kilopascal wmt wet metric tonne
kVA kilovolt-amperes wt% weight percent
kW kilowatt yd3 cubic yard
kWh kilowatt-hour yr year
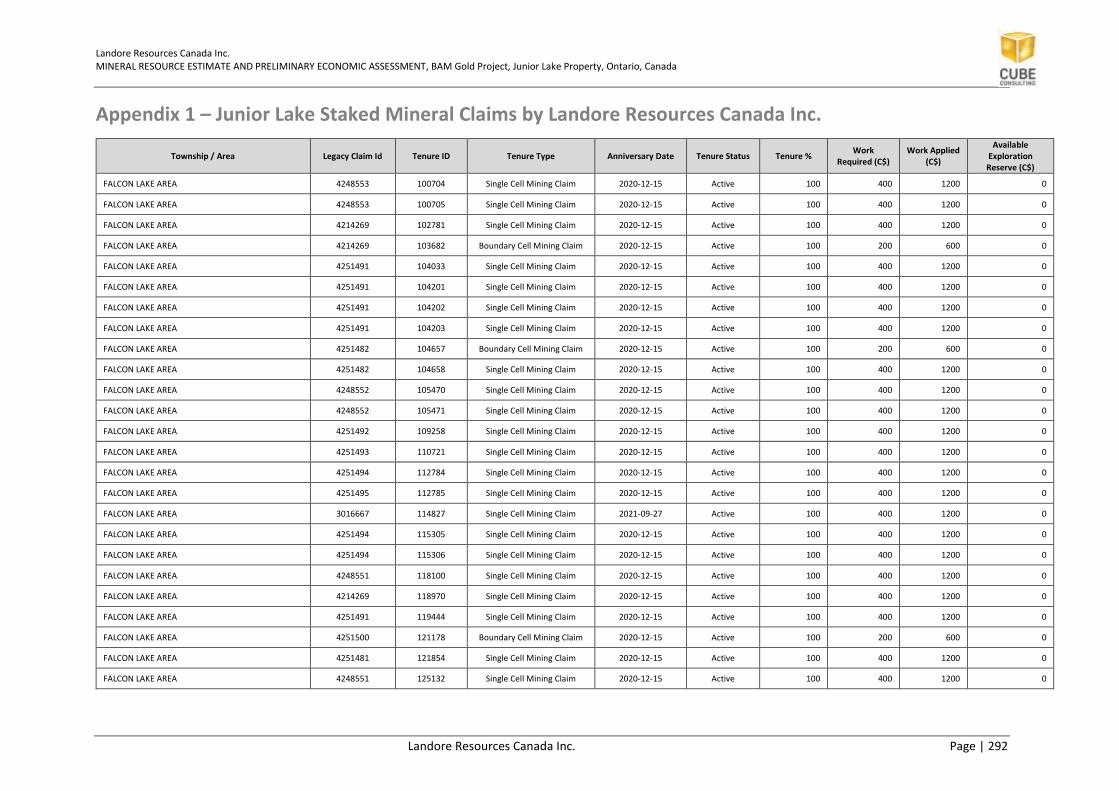
Landore Resources Canada Inc. MINERAL RESOURCE ESTIMATE AND PRELIMINARY ECONOMIC ASSESSMENT, BAM Gold Project, Junior Lake Property, Ontario, Canada
Landore Resources Canada Inc. Page | 292
Appendix 1 – Junior Lake Staked Mineral Claims by Landore Resources Canada Inc.
Township / Area Legacy Claim Id Tenure ID Tenure Type Anniversary Date Tenure Status Tenure % Work
Required (C$) Work Applied
(C$)
Available Exploration Reserve (C$)
FALCON LAKE AREA 4248553 100704 Single Cell Mining Claim 2020-12-15 Active 100 400 1200 0
FALCON LAKE AREA 4248553 100705 Single Cell Mining Claim 2020-12-15 Active 100 400 1200 0
FALCON LAKE AREA 4214269 102781 Single Cell Mining Claim 2020-12-15 Active 100 400 1200 0
FALCON LAKE AREA 4214269 103682 Boundary Cell Mining Claim 2020-12-15 Active 100 200 600 0
FALCON LAKE AREA 4251491 104033 Single Cell Mining Claim 2020-12-15 Active 100 400 1200 0
FALCON LAKE AREA 4251491 104201 Single Cell Mining Claim 2020-12-15 Active 100 400 1200 0
FALCON LAKE AREA 4251491 104202 Single Cell Mining Claim 2020-12-15 Active 100 400 1200 0
FALCON LAKE AREA 4251491 104203 Single Cell Mining Claim 2020-12-15 Active 100 400 1200 0
FALCON LAKE AREA 4251482 104657 Boundary Cell Mining Claim 2020-12-15 Active 100 200 600 0
FALCON LAKE AREA 4251482 104658 Single Cell Mining Claim 2020-12-15 Active 100 400 1200 0
FALCON LAKE AREA 4248552 105470 Single Cell Mining Claim 2020-12-15 Active 100 400 1200 0
FALCON LAKE AREA 4248552 105471 Single Cell Mining Claim 2020-12-15 Active 100 400 1200 0
FALCON LAKE AREA 4251492 109258 Single Cell Mining Claim 2020-12-15 Active 100 400 1200 0
FALCON LAKE AREA 4251493 110721 Single Cell Mining Claim 2020-12-15 Active 100 400 1200 0
FALCON LAKE AREA 4251494 112784 Single Cell Mining Claim 2020-12-15 Active 100 400 1200 0
FALCON LAKE AREA 4251495 112785 Single Cell Mining Claim 2020-12-15 Active 100 400 1200 0
FALCON LAKE AREA 3016667 114827 Single Cell Mining Claim 2021-09-27 Active 100 400 1200 0
FALCON LAKE AREA 4251494 115305 Single Cell Mining Claim 2020-12-15 Active 100 400 1200 0
FALCON LAKE AREA 4251494 115306 Single Cell Mining Claim 2020-12-15 Active 100 400 1200 0
FALCON LAKE AREA 4248551 118100 Single Cell Mining Claim 2020-12-15 Active 100 400 1200 0
FALCON LAKE AREA 4214269 118970 Single Cell Mining Claim 2020-12-15 Active 100 400 1200 0
FALCON LAKE AREA 4251491 119444 Single Cell Mining Claim 2020-12-15 Active 100 400 1200 0
FALCON LAKE AREA 4251500 121178 Boundary Cell Mining Claim 2020-12-15 Active 100 200 600 0
FALCON LAKE AREA 4251481 121854 Single Cell Mining Claim 2020-12-15 Active 100 400 1200 0
FALCON LAKE AREA 4248551 125132 Single Cell Mining Claim 2020-12-15 Active 100 400 1200 0

Landore Resources Canada Inc. MINERAL RESOURCE ESTIMATE AND PRELIMINARY ECONOMIC ASSESSMENT, BAM Gold Project, Junior Lake Property, Ontario, Canada
Landore Resources Canada Inc. Page | 293
Township / Area Legacy Claim Id Tenure ID Tenure Type Anniversary Date Tenure Status Tenure % Work
Required (C$) Work Applied
(C$)
Available Exploration Reserve (C$)
FALCON LAKE AREA 4248551 125133 Boundary Cell Mining Claim 2020-12-15 Active 100 200 600 0
FALCON LAKE AREA 4248552 125895 Single Cell Mining Claim 2020-12-15 Active 100 400 1200 0
FALCON LAKE AREA 4251492 132380 Single Cell Mining Claim 2020-12-15 Active 100 400 1200 0
FALCON LAKE AREA 4251492 132381 Single Cell Mining Claim 2020-12-15 Active 100 400 1200 0
FALCON LAKE AREA 4251494 134706 Single Cell Mining Claim 2020-12-15 Active 100 400 1200 0
FALCON LAKE AREA 4251493 137009 Single Cell Mining Claim 2020-12-15 Active 100 400 1200 0
FALCON LAKE AREA 3016667 142808 Single Cell Mining Claim 2021-09-27 Active 100 400 1200 0
FALCON LAKE AREA 3016667 142809 Single Cell Mining Claim 2021-09-27 Active 100 400 1200 0
FALCON LAKE AREA 4248552 144011 Boundary Cell Mining Claim 2020-12-15 Active 100 200 600 0
FALCON LAKE AREA 4251481 145185 Boundary Cell Mining Claim 2020-12-15 Active 100 200 600 0
FALCON LAKE AREA 4251481 145186 Single Cell Mining Claim 2020-12-15 Active 100 400 1200 0
FALCON LAKE AREA 4251486 149198 Single Cell Mining Claim 2020-12-15 Active 100 400 1200 0
FALCON LAKE AREA 4251494 151074 Single Cell Mining Claim 2020-12-15 Active 100 400 1200 0
FALCON LAKE AREA 4251486 152693 Single Cell Mining Claim 2020-12-15 Active 100 400 1200 0
FALCON LAKE AREA 4251494 154050 Single Cell Mining Claim 2020-12-15 Active 100 400 1200 0
FALCON LAKE AREA 3016667 155581 Boundary Cell Mining Claim 2021-09-27 Active 100 200 600 0
FALCON LAKE AREA 4248553 156106 Single Cell Mining Claim 2020-12-15 Active 100 400 1200 0
FALCON LAKE AREA 4248553 156107 Single Cell Mining Claim 2020-12-15 Active 100 400 1200 0
FALCON LAKE AREA 4251482 158272 Single Cell Mining Claim 2020-12-15 Active 100 400 1200 0
FALCON LAKE AREA 4251482 158273 Single Cell Mining Claim 2020-12-15 Active 100 400 1200 0
FALCON LAKE AREA 4251481 158274 Single Cell Mining Claim 2020-12-15 Active 100 400 1200 0
FALCON LAKE AREA 4251500 159635 Boundary Cell Mining Claim 2020-12-15 Active 100 200 600 0
FALCON LAKE AREA 4251491 160335 Single Cell Mining Claim 2020-12-15 Active 100 400 1200 0
FALCON LAKE AREA 4251481 164061 Boundary Cell Mining Claim 2020-12-15 Active 100 200 600 0
FALCON LAKE AREA 4251481 164062 Single Cell Mining Claim 2020-12-15 Active 100 400 1200 0
FALCON LAKE AREA 4251481 164063 Single Cell Mining Claim 2020-12-15 Active 100 400 1200 0
FALCON LAKE AREA 4251495 169238 Single Cell Mining Claim 2020-12-15 Active 100 400 1200 0

Landore Resources Canada Inc. MINERAL RESOURCE ESTIMATE AND PRELIMINARY ECONOMIC ASSESSMENT, BAM Gold Project, Junior Lake Property, Ontario, Canada
Landore Resources Canada Inc. Page | 294
Township / Area Legacy Claim Id Tenure ID Tenure Type Anniversary Date Tenure Status Tenure % Work
Required (C$) Work Applied
(C$)
Available Exploration Reserve (C$)
FALCON LAKE AREA 4248551 170272 Single Cell Mining Claim 2020-12-15 Active 100 400 1200 0
FALCON LAKE AREA 4248552 170414 Boundary Cell Mining Claim 2020-12-15 Active 100 200 600 0
FALCON LAKE AREA 3016667 172167 Single Cell Mining Claim 2021-09-27 Active 100 400 1200 0
FALCON LAKE AREA 3016667 172169 Boundary Cell Mining Claim 2021-09-27 Active 100 200 600 0
FALCON LAKE AREA 4248552 172550 Boundary Cell Mining Claim 2020-12-15 Active 100 200 600 0
FALCON LAKE AREA 4251482 177783 Single Cell Mining Claim 2020-12-15 Active 100 400 1200 0
FALCON LAKE AREA 4251492 178129 Single Cell Mining Claim 2020-12-15 Active 100 400 1200 0
FALCON LAKE AREA 4251500 179172 Boundary Cell Mining Claim 2020-12-15 Active 100 200 600 0
FALCON LAKE AREA 4251491 179831 Single Cell Mining Claim 2020-12-15 Active 100 400 1200 0
FALCON LAKE AREA 4214269 181189 Single Cell Mining Claim 2020-12-15 Active 100 400 1200 0
FALCON LAKE AREA 4214269 181190 Single Cell Mining Claim 2020-12-15 Active 100 400 1200 0
FALCON LAKE AREA 4214269 181191 Boundary Cell Mining Claim 2020-12-15 Active 100 200 600 0
FALCON LAKE AREA 4251493 182200 Single Cell Mining Claim 2020-12-15 Active 100 400 1200 0
FALCON LAKE AREA 4251491 185365 Single Cell Mining Claim 2020-12-15 Active 100 400 1200 0
FALCON LAKE AREA 4251495 185828 Single Cell Mining Claim 2020-12-15 Active 100 400 1200 0
FALCON LAKE AREA 4251486 186454 Single Cell Mining Claim 2020-12-15 Active 100 400 1200 0
FALCON LAKE AREA 4214269 188509 Boundary Cell Mining Claim 2020-12-15 Active 100 200 600 0
FALCON LAKE AREA 4251493 189631 Single Cell Mining Claim 2020-12-15 Active 100 400 1200 0
FALCON LAKE AREA 4251495 199208 Single Cell Mining Claim 2020-12-15 Active 100 400 1200 0
FALCON LAKE AREA 3016667 201406 Single Cell Mining Claim 2021-09-27 Active 100 400 1200 0
FALCON LAKE AREA 3016667 201407 Single Cell Mining Claim 2021-09-27 Active 100 400 1200 0
FALCON LAKE AREA 3016667 201408 Boundary Cell Mining Claim 2021-09-27 Active 100 200 600 0
FALCON LAKE AREA 4248553 201432 Boundary Cell Mining Claim 2020-12-15 Active 100 200 600 0
FALCON LAKE AREA 4251496 203291 Single Cell Mining Claim 2020-12-15 Active 100 400 1200 0
FALCON LAKE AREA 4251481 203906 Boundary Cell Mining Claim 2020-12-15 Active 100 200 600 0
FALCON LAKE AREA 4251486 205299 Single Cell Mining Claim 2020-12-15 Active 100 400 1200 0
FALCON LAKE AREA 4251486 205300 Single Cell Mining Claim 2020-12-15 Active 100 400 1200 0

Landore Resources Canada Inc. MINERAL RESOURCE ESTIMATE AND PRELIMINARY ECONOMIC ASSESSMENT, BAM Gold Project, Junior Lake Property, Ontario, Canada
Landore Resources Canada Inc. Page | 295
Township / Area Legacy Claim Id Tenure ID Tenure Type Anniversary Date Tenure Status Tenure % Work
Required (C$) Work Applied
(C$)
Available Exploration Reserve (C$)
FALCON LAKE AREA 4251495 206689 Single Cell Mining Claim 2020-12-15 Active 100 400 1200 0
FALCON LAKE AREA 4248551 207731 Boundary Cell Mining Claim 2020-12-15 Active 100 200 600 0
FALCON LAKE AREA 4251493 209145 Single Cell Mining Claim 2020-12-15 Active 100 400 1200 0
FALCON LAKE AREA 4251481 215144 Single Cell Mining Claim 2020-12-15 Active 100 400 1200 0
FALCON LAKE AREA 4251491 215145 Single Cell Mining Claim 2020-12-15 Active 100 400 1200 0
FALCON LAKE AREA 4214269 216532 Single Cell Mining Claim 2020-12-15 Active 100 400 1200 0
FALCON LAKE AREA 4248552 219233 Single Cell Mining Claim 2020-12-15 Active 100 400 1200 0
FALCON LAKE AREA 4248552 221563 Single Cell Mining Claim 2020-12-15 Active 100 400 1200 0
FALCON LAKE AREA 4251482 223148 Single Cell Mining Claim 2020-12-15 Active 100 400 1200 0
FALCON LAKE AREA 4251496 223379 Single Cell Mining Claim 2020-12-15 Active 100 400 1200 0
FALCON LAKE AREA 4214269 225024 Single Cell Mining Claim 2020-12-15 Active 100 400 1200 0
FALCON LAKE AREA 4248554 225890 Single Cell Mining Claim 2020-12-15 Active 100 400 1200 0
FALCON LAKE AREA 4248553 228317 Boundary Cell Mining Claim 2020-12-15 Active 100 200 600 0
FALCON LAKE AREA 4251482 231122 Boundary Cell Mining Claim 2020-12-15 Active 100 200 600 0
FALCON LAKE AREA 4251482 231123 Single Cell Mining Claim 2020-12-15 Active 100 400 1200 0
FALCON LAKE AREA 4214269 232514 Single Cell Mining Claim 2020-12-15 Active 100 400 1200 0
FALCON LAKE AREA 4251481 233178 Single Cell Mining Claim 2020-12-15 Active 100 400 1200 0
FALCON LAKE AREA 4251491 233179 Single Cell Mining Claim 2020-12-15 Active 100 400 1200 0
FALCON LAKE AREA 4251494 235523 Single Cell Mining Claim 2020-12-15 Active 100 400 1200 0
FALCON LAKE AREA 4251494 235524 Single Cell Mining Claim 2020-12-15 Active 100 400 1200 0
FALCON LAKE AREA 4251499 236611 Boundary Cell Mining Claim 2020-12-15 Active 100 200 600 0
FALCON LAKE AREA 4251493 238272 Single Cell Mining Claim 2020-12-15 Active 100 400 1200 0
FALCON LAKE AREA 4251481 239210 Single Cell Mining Claim 2020-12-15 Active 100 400 1200 0
FALCON LAKE AREA 4251482 243831 Boundary Cell Mining Claim 2020-12-15 Active 100 200 600 0
FALCON LAKE AREA 4251482 243832 Single Cell Mining Claim 2020-12-15 Active 100 400 1200 0
FALCON LAKE AREA 4251482 243833 Single Cell Mining Claim 2020-12-15 Active 100 400 1200 0
FALCON LAKE AREA 4251492 244300 Single Cell Mining Claim 2020-12-15 Active 100 400 1200 0

Landore Resources Canada Inc. MINERAL RESOURCE ESTIMATE AND PRELIMINARY ECONOMIC ASSESSMENT, BAM Gold Project, Junior Lake Property, Ontario, Canada
Landore Resources Canada Inc. Page | 296
Township / Area Legacy Claim Id Tenure ID Tenure Type Anniversary Date Tenure Status Tenure % Work
Required (C$) Work Applied
(C$)
Available Exploration Reserve (C$)
FALCON LAKE AREA 4251491 245881 Single Cell Mining Claim 2020-12-15 Active 100 400 1200 0
FALCON LAKE AREA 4251491 245882 Single Cell Mining Claim 2020-12-15 Active 100 400 1200 0
FALCON LAKE AREA 4251495 246413 Single Cell Mining Claim 2020-12-15 Active 100 400 1200 0
FALCON LAKE AREA 4251481 247951 Single Cell Mining Claim 2020-12-15 Active 100 400 1200 0
FALCON LAKE AREA 4251481 247952 Single Cell Mining Claim 2020-12-15 Active 100 400 1200 0
FALCON LAKE AREA 4251491 252008 Boundary Cell Mining Claim 2020-12-15 Active 100 200 600 0
FALCON LAKE AREA 4214269 253389 Single Cell Mining Claim 2020-12-15 Active 100 400 1200 0
FALCON LAKE AREA 4214269 253390 Single Cell Mining Claim 2020-12-15 Active 100 400 1200 0
FALCON LAKE AREA 4251495 253881 Single Cell Mining Claim 2020-12-15 Active 100 400 1200 0
FALCON LAKE AREA 4248552 256041 Single Cell Mining Claim 2020-12-15 Active 100 400 1200 0
FALCON LAKE AREA 4251493 256971 Single Cell Mining Claim 2020-12-15 Active 100 400 1200 0
FALCON LAKE AREA 4251493 257863 Single Cell Mining Claim 2020-12-15 Active 100 400 1200 0
FALCON LAKE AREA 4251500 260374 Single Cell Mining Claim 2020-12-15 Active 100 400 1200 0
FALCON LAKE AREA 4251500 260375 Single Cell Mining Claim 2020-12-15 Active 100 400 1200 0
FALCON LAKE AREA 4251481 260960 Boundary Cell Mining Claim 2020-12-15 Active 100 200 600 0
FALCON LAKE AREA 4251492 264333 Single Cell Mining Claim 2020-12-15 Active 100 400 1200 0
FALCON LAKE AREA 4251492 264334 Single Cell Mining Claim 2020-12-15 Active 100 400 1200 0
FALCON LAKE AREA 4251494 264821 Single Cell Mining Claim 2020-12-15 Active 100 400 1200 0
FALCON LAKE AREA 4251495 265944 Single Cell Mining Claim 2020-12-15 Active 100 400 1200 0
FALCON LAKE AREA 4248551 266169 Single Cell Mining Claim 2020-12-15 Active 100 400 1200 0
FALCON LAKE AREA 4251491 269717 Single Cell Mining Claim 2020-12-15 Active 100 400 1200 0
FALCON LAKE AREA 4214269 269718 Single Cell Mining Claim 2020-12-15 Active 100 400 1200 0
FALCON LAKE AREA 4251499 270429 Boundary Cell Mining Claim 2020-12-15 Active 100 200 600 0
FALCON LAKE AREA 4214269 270430 Single Cell Mining Claim 2020-12-15 Active 100 400 1200 0
FALCON LAKE AREA 4214269 270431 Boundary Cell Mining Claim 2020-12-15 Active 100 200 600 0
FALCON LAKE AREA 4251481 271085 Single Cell Mining Claim 2020-12-15 Active 100 400 1200 0
FALCON LAKE AREA 4251493 274545 Single Cell Mining Claim 2020-12-15 Active 100 400 1200 0

Landore Resources Canada Inc. MINERAL RESOURCE ESTIMATE AND PRELIMINARY ECONOMIC ASSESSMENT, BAM Gold Project, Junior Lake Property, Ontario, Canada
Landore Resources Canada Inc. Page | 297
Township / Area Legacy Claim Id Tenure ID Tenure Type Anniversary Date Tenure Status Tenure % Work
Required (C$) Work Applied
(C$)
Available Exploration Reserve (C$)
FALCON LAKE AREA 4251493 274546 Single Cell Mining Claim 2020-12-15 Active 100 400 1200 0
FALCON LAKE AREA 3016667 275499 Single Cell Mining Claim 2021-09-27 Active 100 400 1200 0
FALCON LAKE AREA 3016667 275500 Single Cell Mining Claim 2021-09-27 Active 100 400 1200 0
FALCON LAKE AREA 4248552 275529 Single Cell Mining Claim 2020-12-15 Active 100 400 1200 0
FALCON LAKE AREA 4248553 275530 Single Cell Mining Claim 2020-12-15 Active 100 400 1200 0
FALCON LAKE AREA 4251481 277892 Single Cell Mining Claim 2020-12-15 Active 100 400 1200 0
FALCON LAKE AREA 4251482 278376 Single Cell Mining Claim 2020-12-15 Active 100 400 1200 0
FALCON LAKE AREA 4251481 278377 Single Cell Mining Claim 2020-12-15 Active 100 400 1200 0
FALCON LAKE AREA 4251482 279146 Single Cell Mining Claim 2020-12-15 Active 100 400 1200 0
FALCON LAKE AREA 4214269 280492 Boundary Cell Mining Claim 2020-12-15 Active 100 200 600 0
FALCON LAKE AREA 4251491 281159 Single Cell Mining Claim 2020-12-15 Active 100 400 1200 0
FALCON LAKE AREA 4251491 281160 Single Cell Mining Claim 2020-12-15 Active 100 400 1200 0
FALCON LAKE AREA 4251499 282526 Boundary Cell Mining Claim 2020-12-15 Active 100 200 600 0
FALCON LAKE AREA 4251494 284883 Single Cell Mining Claim 2020-12-15 Active 100 400 1200 0
FALCON LAKE AREA 4251494 284884 Single Cell Mining Claim 2020-12-15 Active 100 400 1200 0
FALCON LAKE AREA 4251494 284885 Single Cell Mining Claim 2020-12-15 Active 100 400 1200 0
FALCON LAKE AREA 4248552 285182 Single Cell Mining Claim 2020-12-15 Active 100 400 1200 0
FALCON LAKE AREA 4248551 285716 Single Cell Mining Claim 2020-12-15 Active 100 400 1200 0
FALCON LAKE AREA 4248553 288135 Boundary Cell Mining Claim 2020-12-15 Active 100 200 600 0
FALCON LAKE AREA 4251491 289250 Single Cell Mining Claim 2020-12-15 Active 100 400 1200 0
FALCON LAKE AREA 4248554 292495 Single Cell Mining Claim 2020-12-15 Active 100 400 1200 0
FALCON LAKE AREA 4214269 293014 Single Cell Mining Claim 2020-12-15 Active 100 400 1200 0
FALCON LAKE AREA 4214269 293015 Single Cell Mining Claim 2020-12-15 Active 100 400 1200 0
FALCON LAKE AREA 4248553 294872 Single Cell Mining Claim 2020-12-15 Active 100 400 1200 0
FALCON LAKE AREA 4248553 294873 Single Cell Mining Claim 2020-12-15 Active 100 400 1200 0
FALCON LAKE AREA 4248553 294874 Single Cell Mining Claim 2020-12-15 Active 100 400 1200 0
FALCON LAKE AREA 4248552 294875 Single Cell Mining Claim 2020-12-15 Active 100 400 1200 0

Landore Resources Canada Inc. MINERAL RESOURCE ESTIMATE AND PRELIMINARY ECONOMIC ASSESSMENT, BAM Gold Project, Junior Lake Property, Ontario, Canada
Landore Resources Canada Inc. Page | 298
Township / Area Legacy Claim Id Tenure ID Tenure Type Anniversary Date Tenure Status Tenure % Work
Required (C$) Work Applied
(C$)
Available Exploration Reserve (C$)
FALCON LAKE AREA 4214270 296454 Boundary Cell Mining Claim 2021-09-24 Active 100 200 600 0
FALCON LAKE AREA 4251482 297771 Single Cell Mining Claim 2020-12-15 Active 100 400 1000 0
FALCON LAKE AREA 4251481 297772 Single Cell Mining Claim 2020-12-15 Active 100 400 1200 0
FALCON LAKE AREA 4251492 299435 Single Cell Mining Claim 2020-12-15 Active 100 400 1200 0
FALCON LAKE AREA 4251492 300362 Single Cell Mining Claim 2020-12-15 Active 100 400 1200 0
FALCON LAKE AREA 4251486 301175 Single Cell Mining Claim 2020-12-15 Active 100 400 1200 0
FALCON LAKE AREA 4251495 302552 Single Cell Mining Claim 2020-12-15 Active 100 400 1200 0
FALCON LAKE AREA 4251494 303255 Single Cell Mining Claim 2020-12-15 Active 100 400 1200 0
FALCON LAKE AREA 4248553 311461 Single Cell Mining Claim 2020-12-15 Active 100 400 1200 0
FALCON LAKE AREA 4251492 318358 Single Cell Mining Claim 2020-12-15 Active 100 400 1200 0
FALCON LAKE AREA 4251492 318359 Single Cell Mining Claim 2020-12-15 Active 100 400 1200 0
FALCON LAKE AREA 4251495 320400 Single Cell Mining Claim 2020-12-15 Active 100 400 1200 0
FALCON LAKE AREA 4251494 320401 Single Cell Mining Claim 2020-12-15 Active 100 400 1200 0
FALCON LAKE AREA 4251494 321471 Single Cell Mining Claim 2020-12-15 Active 100 400 1200 0
FALCON LAKE AREA 4251495 322056 Single Cell Mining Claim 2020-12-15 Active 100 400 1200 0
FALCON LAKE AREA 4248551 322259 Single Cell Mining Claim 2020-12-15 Active 100 400 1200 0
FALCON LAKE AREA 3016667 324147 Single Cell Mining Claim 2021-09-27 Active 100 400 1200 0
FALCON LAKE AREA 4251481 327240 Boundary Cell Mining Claim 2020-12-15 Active 100 200 600 0
FALCON LAKE AREA 4251499 328255 Boundary Cell Mining Claim 2020-12-15 Active 100 200 600 0
FALCON LAKE AREA 4251491 328927 Single Cell Mining Claim 2020-12-15 Active 100 400 1200 0
FALCON LAKE AREA 4214269 330320 Single Cell Mining Claim 2020-12-15 Active 100 400 1200 0
FALCON LAKE AREA 4251496 331674 Single Cell Mining Claim 2020-12-15 Active 100 400 1200 0
FALCON LAKE AREA 4251481 331768 Single Cell Mining Claim 2020-12-15 Active 100 400 1200 0
FALCON LAKE AREA 4251486 332746 Single Cell Mining Claim 2020-12-15 Active 100 400 1200 0
FALCON LAKE AREA 4251486 332747 Single Cell Mining Claim 2020-12-15 Active 100 400 1200 0
FALCON LAKE AREA 4251494 333634 Single Cell Mining Claim 2020-12-15 Active 100 400 1200 0
FALCON LAKE AREA 4251482 338791 Single Cell Mining Claim 2020-12-15 Active 100 400 1200 0

Landore Resources Canada Inc. MINERAL RESOURCE ESTIMATE AND PRELIMINARY ECONOMIC ASSESSMENT, BAM Gold Project, Junior Lake Property, Ontario, Canada
Landore Resources Canada Inc. Page | 299
Township / Area Legacy Claim Id Tenure ID Tenure Type Anniversary Date Tenure Status Tenure % Work
Required (C$) Work Applied
(C$)
Available Exploration Reserve (C$)
FALCON LAKE AREA 4251482 338792 Single Cell Mining Claim 2020-12-15 Active 100 400 1200 0
FALCON LAKE AREA 4251492 339734 Single Cell Mining Claim 2020-12-15 Active 100 400 1200 0
FALCON LAKE AREA 4251491 340831 Single Cell Mining Claim 2020-12-15 Active 100 400 1200 0
FALCON LAKE AREA 4251491 340832 Single Cell Mining Claim 2020-12-15 Active 100 400 1200 0
FALCON LAKE AREA 4214269 342181 Single Cell Mining Claim 2020-12-15 Active 100 400 1200 0
FALCON LAKE AREA 4251493 343824 Single Cell Mining Claim 2020-12-15 Active 100 400 1200 0
FALCON LAKE AREA 4251493 343825 Single Cell Mining Claim 2020-12-15 Active 100 400 1200 0
FALCON LAKE AREA, RETURN LAKE 4214270 104395 Single Cell Mining Claim 2021-09-24 Active 100 400 1200 0
FALCON LAKE AREA,JUNIOR LAKE AREA 4251496 114568 Single Cell Mining Claim 2020-12-15 Active 100 400 1200 0
FALCON LAKE AREA,JUNIOR LAKE AREA 4214270 129065 Boundary Cell Mining Claim 2021-09-24 Active 100 200 600 0
FALCON LAKE AREA,JUNIOR LAKE AREA 4251486 133114 Single Cell Mining Claim 2020-12-15 Active 100 400 1200 0
FALCON LAKE AREA,JUNIOR LAKE AREA 4248554 136600 Single Cell Mining Claim 2020-12-15 Active 100 400 1200 0
FALCON LAKE AREA,JUNIOR LAKE AREA 4251496 139169 Single Cell Mining Claim 2020-12-15 Active 100 400 1200 0
FALCON LAKE AREA,JUNIOR LAKE AREA 4251486 149197 Single Cell Mining Claim 2020-12-15 Active 100 400 1200 0
FALCON LAKE AREA,JUNIOR LAKE AREA 4251496 163483 Single Cell Mining Claim 2020-12-15 Active 100 400 1200 0
FALCON LAKE AREA,JUNIOR LAKE AREA 3016667 172166 Single Cell Mining Claim 2021-09-27 Active 100 400 1200 0
FALCON LAKE AREA,JUNIOR LAKE AREA 3016667 172168 Boundary Cell Mining Claim 2021-09-27 Active 100 200 600 0
FALCON LAKE AREA,JUNIOR LAKE AREA 4214270 176456 Single Cell Mining Claim 2021-09-24 Active 100 400 1200 0
FALCON LAKE AREA,JUNIOR LAKE AREA 4251486 186453 Single Cell Mining Claim 2020-12-15 Active 100 400 1200 0
FALCON LAKE AREA,JUNIOR LAKE AREA 3016667 209462 Single Cell Mining Claim 2021-09-27 Active 100 400 1200 0
FALCON LAKE AREA,JUNIOR LAKE AREA 4251486 245007 Single Cell Mining Claim 2020-12-15 Active 100 400 1200 0
FALCON LAKE AREA,JUNIOR LAKE AREA 3016667 311427 Single Cell Mining Claim 2021-09-27 Active 100 400 1200 0
JUNIOR LAKE AREA 4251497 103569 Boundary Cell Mining Claim 2020-12-15 Active 100 200 600 0
JUNIOR LAKE AREA 4251497 103570 Boundary Cell Mining Claim 2020-12-15 Active 100 200 600 0
JUNIOR LAKE AREA 4251497 103571 Single Cell Mining Claim 2020-12-15 Active 100 400 1200 0
JUNIOR LAKE AREA 4251466 104168 Single Cell Mining Claim 2020-12-15 Active 100 400 1200 0
JUNIOR LAKE AREA 4248558 104428 Single Cell Mining Claim 2020-12-15 Active 100 200 600 0

Landore Resources Canada Inc. MINERAL RESOURCE ESTIMATE AND PRELIMINARY ECONOMIC ASSESSMENT, BAM Gold Project, Junior Lake Property, Ontario, Canada
Landore Resources Canada Inc. Page | 300
Township / Area Legacy Claim Id Tenure ID Tenure Type Anniversary Date Tenure Status Tenure % Work
Required (C$) Work Applied
(C$)
Available Exploration Reserve (C$)
JUNIOR LAKE AREA 4259635 106123 Single Cell Mining Claim 2021-10-14 Active 100 400 1200 0
JUNIOR LAKE AREA 4245112 106560 Single Cell Mining Claim 2021-08-20 Active 100 200 600 0
JUNIOR LAKE AREA 4247746 107355 Boundary Cell Mining Claim 2020-12-17 Active 100 200 600 0
JUNIOR LAKE AREA 4259631 108052 Single Cell Mining Claim 2021-10-14 Active 100 400 1200 0
JUNIOR LAKE AREA 4259631 108053 Single Cell Mining Claim 2021-10-14 Active 100 400 1200 0
JUNIOR LAKE AREA 4251486 111233 Single Cell Mining Claim 2020-12-15 Active 100 400 1200 0
JUNIOR LAKE AREA 4251486 111234 Single Cell Mining Claim 2020-12-15 Active 100 400 1200 0
JUNIOR LAKE AREA 4251498 111509 Boundary Cell Mining Claim 2020-12-15 Active 100 200 600 0
JUNIOR LAKE AREA 4251498 111510 Single Cell Mining Claim 2020-12-15 Active 100 400 1000 0
JUNIOR LAKE AREA 4251488 112187 Single Cell Mining Claim 2020-12-15 Active 100 400 1200 0
JUNIOR LAKE AREA 4251488 112188 Single Cell Mining Claim 2020-12-15 Active 100 400 1200 0
JUNIOR LAKE AREA 4251488 112209 Boundary Cell Mining Claim 2020-12-15 Active 100 200 600 0
JUNIOR LAKE AREA 4251476 112415 Single Cell Mining Claim 2020-12-15 Active 100 400 1200 0
JUNIOR LAKE AREA 4251469 112539 Single Cell Mining Claim 2020-12-15 Active 100 400 1200 0
JUNIOR LAKE AREA 4251469 112540 Single Cell Mining Claim 2020-12-15 Active 100 400 1200 0
JUNIOR LAKE AREA 4251467 112564 Single Cell Mining Claim 2020-12-15 Active 100 400 1200 0
JUNIOR LAKE AREA 4251477 112565 Single Cell Mining Claim 2020-12-15 Active 100 400 1200 0
JUNIOR LAKE AREA 4251468 112639 Single Cell Mining Claim 2020-12-15 Active 100 400 1200 0
JUNIOR LAKE AREA 4259632 113250 Single Cell Mining Claim 2021-10-14 Active 100 400 1200 0
JUNIOR LAKE AREA 4251478 114001 Single Cell Mining Claim 2020-12-15 Active 100 400 1200 0
JUNIOR LAKE AREA 4214270 119673 Single Cell Mining Claim 2021-09-24 Active 100 200 600 0
JUNIOR LAKE AREA 4259634 119992 Single Cell Mining Claim 2021-10-14 Active 100 400 1200 0
JUNIOR LAKE AREA 4259633 119993 Single Cell Mining Claim 2021-10-14 Active 100 400 1200 0
JUNIOR LAKE AREA 1187651 120183 Boundary Cell Mining Claim 2021-08-14 Active 100 200 600 0
JUNIOR LAKE AREA 4248573 120296 Single Cell Mining Claim 2020-12-15 Active 100 400 1200 0
JUNIOR LAKE AREA 4245112 120772 Boundary Cell Mining Claim 2021-08-20 Active 100 200 600 0
JUNIOR LAKE AREA 4259633 120938 Single Cell Mining Claim 2021-10-14 Active 100 400 1200 0

Landore Resources Canada Inc. MINERAL RESOURCE ESTIMATE AND PRELIMINARY ECONOMIC ASSESSMENT, BAM Gold Project, Junior Lake Property, Ontario, Canada
Landore Resources Canada Inc. Page | 301
Township / Area Legacy Claim Id Tenure ID Tenure Type Anniversary Date Tenure Status Tenure % Work
Required (C$) Work Applied
(C$)
Available Exploration Reserve (C$)
JUNIOR LAKE AREA 4259633 120939 Single Cell Mining Claim 2021-10-14 Active 100 400 1200 0
JUNIOR LAKE AREA 4251466 121826 Single Cell Mining Claim 2020-12-15 Active 100 400 1200 0
JUNIOR LAKE AREA 4259635 122683 Single Cell Mining Claim 2021-10-14 Active 100 400 1200 0
JUNIOR LAKE AREA 4248555 123951 Single Cell Mining Claim 2020-12-15 Active 100 400 1200 0
JUNIOR LAKE AREA 4248555 123952 Boundary Cell Mining Claim 2020-12-15 Active 100 200 600 0
JUNIOR LAKE AREA 4248554 124626 Single Cell Mining Claim 2020-12-15 Active 100 400 1200 0
JUNIOR LAKE AREA 4247746 127447 Single Cell Mining Claim 2020-12-17 Active 100 400 1200 0
JUNIOR LAKE AREA 4247746 127448 Single Cell Mining Claim 2020-12-17 Active 100 400 1200 0
JUNIOR LAKE AREA 1187651 127449 Single Cell Mining Claim 2021-08-14 Active 100 200 600 0
JUNIOR LAKE AREA 3019857 128034 Single Cell Mining Claim 2021-07-21 Active 100 400 1200 1649
JUNIOR LAKE AREA 4248572 128174 Single Cell Mining Claim 2020-12-15 Active 100 400 1200 0
JUNIOR LAKE AREA 4248573 128835 Single Cell Mining Claim 2020-12-15 Active 100 400 1200 0
JUNIOR LAKE AREA 4248574 128836 Single Cell Mining Claim 2020-12-15 Active 100 400 1200 0
JUNIOR LAKE AREA 1077140 130958 Single Cell Mining Claim 2021-03-16 Active 100 400 1200 0
JUNIOR LAKE AREA 1187651 131014 Boundary Cell Mining Claim 2021-08-14 Active 100 200 600 0
JUNIOR LAKE AREA 4259634 131460 Single Cell Mining Claim 2021-10-14 Active 100 400 1200 0
JUNIOR LAKE AREA 4245112 132756 Boundary Cell Mining Claim 2021-08-20 Active 100 200 600 0
JUNIOR LAKE AREA 4245112 132757 Boundary Cell Mining Claim 2021-08-20 Active 100 200 600 0
JUNIOR LAKE AREA 4251468 133858 Single Cell Mining Claim 2020-12-15 Active 100 400 1200 0
JUNIOR LAKE AREA 4251468 133859 Single Cell Mining Claim 2020-12-15 Active 100 400 1200 0
JUNIOR LAKE AREA 4259635 134190 Single Cell Mining Claim 2021-10-14 Active 100 400 1200 0
JUNIOR LAKE AREA 4251476 135299 Boundary Cell Mining Claim 2020-12-15 Active 100 200 600 0
JUNIOR LAKE AREA 4251470 136170 Single Cell Mining Claim 2020-12-15 Active 100 400 1200 0
JUNIOR LAKE AREA 4251470 136171 Single Cell Mining Claim 2021-10-14 Active 100 400 1200 0
JUNIOR LAKE AREA 4251469 136172 Single Cell Mining Claim 2020-12-15 Active 100 400 1200 0
JUNIOR LAKE AREA 4245111 136279 Boundary Cell Mining Claim 2021-08-20 Active 100 200 600 0
JUNIOR LAKE AREA 4259632 136518 Single Cell Mining Claim 2021-10-14 Active 100 400 1200 0

Landore Resources Canada Inc. MINERAL RESOURCE ESTIMATE AND PRELIMINARY ECONOMIC ASSESSMENT, BAM Gold Project, Junior Lake Property, Ontario, Canada
Landore Resources Canada Inc. Page | 302
Township / Area Legacy Claim Id Tenure ID Tenure Type Anniversary Date Tenure Status Tenure % Work
Required (C$) Work Applied
(C$)
Available Exploration Reserve (C$)
JUNIOR LAKE AREA 4251469 138501 Single Cell Mining Claim 2020-12-15 Active 100 400 1200 0
JUNIOR LAKE AREA 4251477 138526 Boundary Cell Mining Claim 2020-12-15 Active 100 200 600 0
JUNIOR LAKE AREA 4247746 139499 Single Cell Mining Claim 2020-12-17 Active 100 400 1200 0
JUNIOR LAKE AREA 4251478 140614 Single Cell Mining Claim 2020-12-15 Active 100 400 1200 0
JUNIOR LAKE AREA 4248574 140858 Single Cell Mining Claim 2020-12-15 Active 100 400 1200 0
JUNIOR LAKE AREA 4245111 141828 Single Cell Mining Claim 2021-08-20 Active 100 400 1200 0
JUNIOR LAKE AREA 4251470 142203 Single Cell Mining Claim 2020-12-15 Active 100 400 1200 0
JUNIOR LAKE AREA 4251469 142204 Single Cell Mining Claim 2020-12-15 Active 100 400 1200 0
JUNIOR LAKE AREA 4251470 142205 Single Cell Mining Claim 2021-10-14 Active 100 400 1200 0
JUNIOR LAKE AREA 4259631 143515 Single Cell Mining Claim 2021-10-14 Active 100 400 1200 0
JUNIOR LAKE AREA 4251469 143938 Single Cell Mining Claim 2020-12-15 Active 100 400 1200 0
JUNIOR LAKE AREA 4251477 143965 Single Cell Mining Claim 2020-12-15 Active 100 400 1200 0
JUNIOR LAKE AREA 4251477 143966 Single Cell Mining Claim 2020-12-15 Active 100 400 1200 0
JUNIOR LAKE AREA 4245114 144938 Single Cell Mining Claim 2021-08-20 Active 100 400 1200 0
JUNIOR LAKE AREA 4245114 144939 Boundary Cell Mining Claim 2021-08-20 Active 100 200 600 0
JUNIOR LAKE AREA 1187651 144949 Boundary Cell Mining Claim 2021-08-14 Active 100 200 600 0
JUNIOR LAKE AREA 3019857 145538 Boundary Cell Mining Claim 2021-07-21 Active 100 200 600 1649
JUNIOR LAKE AREA 3019857 145539 Boundary Cell Mining Claim 2021-07-21 Active 100 200 600 1649
JUNIOR LAKE AREA 4251467 146014 Single Cell Mining Claim 2020-12-15 Active 100 400 1200 0
JUNIOR LAKE AREA 4248574 146321 Single Cell Mining Claim 2020-12-15 Active 100 400 1200 0
JUNIOR LAKE AREA 4248574 146322 Single Cell Mining Claim 2020-12-15 Active 100 400 1200 0
JUNIOR LAKE AREA 4248574 146323 Single Cell Mining Claim 2020-12-15 Active 100 200 600 0
JUNIOR LAKE AREA 4251478 146563 Single Cell Mining Claim 2020-12-15 Active 100 400 1200 0
JUNIOR LAKE AREA 4251498 147126 Single Cell Mining Claim 2020-12-15 Active 100 400 1000 0
JUNIOR LAKE AREA 4251498 147127 Boundary Cell Mining Claim 2020-12-15 Active 100 200 600 0
JUNIOR LAKE AREA 4259634 147461 Single Cell Mining Claim 2021-10-14 Active 100 400 1200 0
JUNIOR LAKE AREA 4259633 147462 Single Cell Mining Claim 2021-10-14 Active 100 400 1200 0

Landore Resources Canada Inc. MINERAL RESOURCE ESTIMATE AND PRELIMINARY ECONOMIC ASSESSMENT, BAM Gold Project, Junior Lake Property, Ontario, Canada
Landore Resources Canada Inc. Page | 303
Township / Area Legacy Claim Id Tenure ID Tenure Type Anniversary Date Tenure Status Tenure % Work
Required (C$) Work Applied
(C$)
Available Exploration Reserve (C$)
JUNIOR LAKE AREA 1077140 147667 Single Cell Mining Claim 2021-03-16 Active 100 400 1200 0
JUNIOR LAKE AREA 4245112 148211 Single Cell Mining Claim 2021-08-20 Active 100 400 1200 0
JUNIOR LAKE AREA 1187651 148223 Single Cell Mining Claim 2021-08-14 Active 100 200 600 0
JUNIOR LAKE AREA 4248573 148350 Single Cell Mining Claim 2020-12-15 Active 100 200 600 0
JUNIOR LAKE AREA 4248586 148398 Single Cell Mining Claim 2020-12-15 Active 100 400 1200 0
JUNIOR LAKE AREA 4259633 148979 Single Cell Mining Claim 2021-10-14 Active 100 400 1200 0
JUNIOR LAKE AREA 4259635 150137 Single Cell Mining Claim 2021-10-14 Active 100 400 1200 0
JUNIOR LAKE AREA 4248555 151849 Boundary Cell Mining Claim 2020-12-15 Active 100 200 600 0
JUNIOR LAKE AREA 4248555 151850 Boundary Cell Mining Claim 2020-12-15 Active 100 200 600 0
JUNIOR LAKE AREA 4248555 151851 Single Cell Mining Claim 2020-12-15 Active 100 400 1200 0
JUNIOR LAKE AREA 4248555 151852 Boundary Cell Mining Claim 2020-12-15 Active 100 200 600 0
JUNIOR LAKE AREA 4251486 152692 Single Cell Mining Claim 2020-12-15 Active 100 400 1200 0
JUNIOR LAKE AREA 4259632 156073 Single Cell Mining Claim 2021-10-14 Active 100 400 1200 0
JUNIOR LAKE AREA 4259632 156074 Single Cell Mining Claim 2021-10-14 Active 100 400 1200 0
JUNIOR LAKE AREA 4259632 156075 Single Cell Mining Claim 2021-10-14 Active 100 400 1200 0
JUNIOR LAKE AREA 4251476 157401 Single Cell Mining Claim 2020-12-15 Active 100 400 1200 0
JUNIOR LAKE AREA 4251476 157402 Single Cell Mining Claim 2020-12-15 Active 100 400 1200 0
JUNIOR LAKE AREA 4251476 157403 Single Cell Mining Claim 2020-12-15 Active 100 400 1200 0
JUNIOR LAKE AREA 4251476 157404 Boundary Cell Mining Claim 2020-12-15 Active 100 200 600 0
JUNIOR LAKE AREA 4251469 158000 Single Cell Mining Claim 2020-12-15 Active 100 400 1200 0
JUNIOR LAKE AREA 4251477 158021 Single Cell Mining Claim 2020-12-15 Active 100 400 1200 0
JUNIOR LAKE AREA 4251477 158022 Single Cell Mining Claim 2020-12-15 Active 100 400 1200 0
JUNIOR LAKE AREA 4251488 159891 Boundary Cell Mining Claim 2020-12-15 Active 100 200 600 0
JUNIOR LAKE AREA 4251488 159892 Single Cell Mining Claim 2020-12-15 Active 100 400 1200 0
JUNIOR LAKE AREA 4251488 159893 Boundary Cell Mining Claim 2020-12-15 Active 100 200 600 0
JUNIOR LAKE AREA 4251466 160298 Single Cell Mining Claim 2020-12-15 Active 100 400 1200 0
JUNIOR LAKE AREA 4251498 161226 Single Cell Mining Claim 2020-12-15 Active 100 400 1200 0

Landore Resources Canada Inc. MINERAL RESOURCE ESTIMATE AND PRELIMINARY ECONOMIC ASSESSMENT, BAM Gold Project, Junior Lake Property, Ontario, Canada
Landore Resources Canada Inc. Page | 304
Township / Area Legacy Claim Id Tenure ID Tenure Type Anniversary Date Tenure Status Tenure % Work
Required (C$) Work Applied
(C$)
Available Exploration Reserve (C$)
JUNIOR LAKE AREA 4251487 161779 Single Cell Mining Claim 2020-12-15 Active 100 400 1200 0
JUNIOR LAKE AREA 4251476 162660 Single Cell Mining Claim 2020-12-15 Active 100 400 1200 0
JUNIOR LAKE AREA 4251476 162661 Single Cell Mining Claim 2020-12-15 Active 100 400 1200 0
JUNIOR LAKE AREA 4248558 163101 Single Cell Mining Claim 2020-12-15 Active 100 400 1200 0
JUNIOR LAKE AREA 4251477 163332 Single Cell Mining Claim 2020-12-15 Active 100 400 1200 0
JUNIOR LAKE AREA 4251496 163482 Single Cell Mining Claim 2020-12-15 Active 100 400 1200 0
JUNIOR LAKE AREA 4259634 165184 Single Cell Mining Claim 2021-10-14 Active 100 400 1200 0
JUNIOR LAKE AREA 4259634 165185 Single Cell Mining Claim 2021-10-14 Active 100 400 1200 0
JUNIOR LAKE AREA 4251467 165405 Single Cell Mining Claim 2020-12-15 Active 100 400 1200 0
JUNIOR LAKE AREA 4251478 165443 Single Cell Mining Claim 2020-12-15 Active 100 400 1200 0
JUNIOR LAKE AREA 4245112 165959 Boundary Cell Mining Claim 2021-08-20 Active 100 200 600 0
JUNIOR LAKE AREA 4245112 165960 Boundary Cell Mining Claim 2021-08-20 Active 100 200 600 0
JUNIOR LAKE AREA 4251466 166379 Single Cell Mining Claim 2020-12-15 Active 100 400 1200 0
JUNIOR LAKE AREA 4251497 167128 Single Cell Mining Claim 2020-12-15 Active 100 400 1200 0
JUNIOR LAKE AREA 4248555 168471 Boundary Cell Mining Claim 2020-12-15 Active 100 200 600 0
JUNIOR LAKE AREA 4248555 168472 Boundary Cell Mining Claim 2020-12-15 Active 100 200 600 0
JUNIOR LAKE AREA 4251468 168595 Single Cell Mining Claim 2020-12-15 Active 100 400 1200 0
JUNIOR LAKE AREA 4251476 172051 Single Cell Mining Claim 2020-12-15 Active 100 400 1200 0
JUNIOR LAKE AREA 4245114 173540 Single Cell Mining Claim 2021-08-20 Active 100 400 1000 0
JUNIOR LAKE AREA 4245114 173541 Single Cell Mining Claim 2021-08-20 Active 100 400 1200 0
JUNIOR LAKE AREA 3019857 174127 Boundary Cell Mining Claim 2021-07-21 Active 100 200 600 1649
JUNIOR LAKE AREA 4251488 174388 Boundary Cell Mining Claim 2020-12-15 Active 100 200 600 0
JUNIOR LAKE AREA 4248572 174748 Single Cell Mining Claim 2020-12-15 Active 100 400 1200 0
JUNIOR LAKE AREA 4248572 174749 Single Cell Mining Claim 2020-12-15 Active 100 200 600 0
JUNIOR LAKE AREA 4248573 174887 Single Cell Mining Claim 2020-12-15 Active 100 400 1200 0
JUNIOR LAKE AREA 4251498 176399 Single Cell Mining Claim 2020-12-15 Active 100 400 1200 0
JUNIOR LAKE AREA 4214270 176455 Single Cell Mining Claim 2021-09-24 Active 100 200 600 0

Landore Resources Canada Inc. MINERAL RESOURCE ESTIMATE AND PRELIMINARY ECONOMIC ASSESSMENT, BAM Gold Project, Junior Lake Property, Ontario, Canada
Landore Resources Canada Inc. Page | 305
Township / Area Legacy Claim Id Tenure ID Tenure Type Anniversary Date Tenure Status Tenure % Work
Required (C$) Work Applied
(C$)
Available Exploration Reserve (C$)
JUNIOR LAKE AREA 4248558 176485 Boundary Cell Mining Claim 2020-12-15 Active 100 200 600 0
JUNIOR LAKE AREA 4259634 176707 Single Cell Mining Claim 2021-10-14 Active 100 400 1200 0
JUNIOR LAKE AREA 4259634 176708 Single Cell Mining Claim 2021-10-14 Active 100 400 1200 0
JUNIOR LAKE AREA 1077140 176783 Single Cell Mining Claim 2021-03-16 Active 100 400 1200 0
JUNIOR LAKE AREA 1187651 176833 Single Cell Mining Claim 2021-08-14 Active 100 400 1200 0
JUNIOR LAKE AREA 4248573 176939 Single Cell Mining Claim 2020-12-15 Active 100 400 1200 0
JUNIOR LAKE AREA 4245112 177980 Single Cell Mining Claim 2021-08-20 Active 100 400 1000 0
JUNIOR LAKE AREA 4248585 178792 Single Cell Mining Claim 2020-12-15 Active 100 400 1200 0
JUNIOR LAKE AREA 4248585 178793 Single Cell Mining Claim 2020-12-15 Active 100 400 1200 0
JUNIOR LAKE AREA 4251466 179801 Single Cell Mining Claim 2020-12-15 Active 100 400 1200 0
JUNIOR LAKE AREA 4251487 180536 Single Cell Mining Claim 2020-12-15 Active 100 400 1200 0
JUNIOR LAKE AREA 4251497 180537 Single Cell Mining Claim 2020-12-15 Active 100 400 1200 0
JUNIOR LAKE AREA 4245111 180938 Boundary Cell Mining Claim 2021-08-20 Active 100 200 600 0
JUNIOR LAKE AREA 4251487 181267 Single Cell Mining Claim 2020-12-15 Active 100 400 1200 0
JUNIOR LAKE AREA 4251487 181268 Single Cell Mining Claim 2020-12-15 Active 100 400 1200 0
JUNIOR LAKE AREA 4248554 182578 Single Cell Mining Claim 2020-12-15 Active 100 400 1200 0
JUNIOR LAKE AREA 4251498 183713 Single Cell Mining Claim 2020-12-15 Active 100 400 1200 0
JUNIOR LAKE AREA 4251498 183714 Boundary Cell Mining Claim 2020-12-15 Active 100 200 600 0
JUNIOR LAKE AREA 4245112 184758 Boundary Cell Mining Claim 2021-08-20 Active 100 200 600 0
JUNIOR LAKE AREA 4245112 184759 Single Cell Mining Claim 2021-08-20 Active 100 400 1200 0
JUNIOR LAKE AREA 4251466 185326 Single Cell Mining Claim 2020-12-15 Active 100 400 1200 0
JUNIOR LAKE AREA 4248585 185700 Single Cell Mining Claim 2020-12-15 Active 100 400 1200 0
JUNIOR LAKE AREA 4251468 187200 Single Cell Mining Claim 2020-12-15 Active 100 400 1200 0
JUNIOR LAKE AREA 4251468 187201 Single Cell Mining Claim 2020-12-15 Active 100 400 1200 0
JUNIOR LAKE AREA 4251476 187302 Single Cell Mining Claim 2020-12-15 Active 100 400 1200 0
JUNIOR LAKE AREA 4248555 187954 Boundary Cell Mining Claim 2020-12-15 Active 100 200 600 0
JUNIOR LAKE AREA 4259631 189496 Single Cell Mining Claim 2021-10-14 Active 100 400 1200 0

Landore Resources Canada Inc. MINERAL RESOURCE ESTIMATE AND PRELIMINARY ECONOMIC ASSESSMENT, BAM Gold Project, Junior Lake Property, Ontario, Canada
Landore Resources Canada Inc. Page | 306
Township / Area Legacy Claim Id Tenure ID Tenure Type Anniversary Date Tenure Status Tenure % Work
Required (C$) Work Applied
(C$)
Available Exploration Reserve (C$)
JUNIOR LAKE AREA 4247746 191474 Single Cell Mining Claim 2020-12-17 Active 100 400 1200 0
JUNIOR LAKE AREA 1187651 191475 Single Cell Mining Claim 2021-08-14 Active 100 400 1200 0
JUNIOR LAKE AREA 4248572 192213 Single Cell Mining Claim 2020-12-15 Active 100 200 600 0
JUNIOR LAKE AREA 3000987 192240 Single Cell Mining Claim 2021-06-22 Active 100 400 1200 0
JUNIOR LAKE AREA 4248558 192500 Boundary Cell Mining Claim 2020-12-15 Active 100 200 600 0
JUNIOR LAKE AREA 4248574 192869 Single Cell Mining Claim 2020-12-15 Active 100 400 1200 0
JUNIOR LAKE AREA 4248573 192870 Single Cell Mining Claim 2020-12-15 Active 100 200 600 0
JUNIOR LAKE AREA 4251488 192961 Boundary Cell Mining Claim 2020-12-15 Active 100 200 600 0
JUNIOR LAKE AREA 4248573 194401 Single Cell Mining Claim 2020-12-15 Active 100 400 1200 0
JUNIOR LAKE AREA 4251498 195260 Single Cell Mining Claim 2020-12-15 Active 100 400 1000 0
JUNIOR LAKE AREA 4248573 196464 Single Cell Mining Claim 2020-12-15 Active 100 400 1200 0
JUNIOR LAKE AREA 4248573 196465 Single Cell Mining Claim 2020-12-15 Active 100 400 1200 0
JUNIOR LAKE AREA 4248586 196523 Single Cell Mining Claim 2020-12-15 Active 100 400 1200 0
JUNIOR LAKE AREA 4248586 196524 Single Cell Mining Claim 2020-12-15 Active 100 400 1200 0
JUNIOR LAKE AREA 4259632 197106 Single Cell Mining Claim 2021-10-14 Active 100 400 1200 0
JUNIOR LAKE AREA 4259632 197107 Single Cell Mining Claim 2021-10-14 Active 100 400 1200 0
JUNIOR LAKE AREA 4259633 197108 Single Cell Mining Claim 2021-10-14 Active 100 400 1200 0
JUNIOR LAKE AREA 4248585 198356 Single Cell Mining Claim 2020-12-15 Active 100 400 1200 0
JUNIOR LAKE AREA 4251468 198555 Single Cell Mining Claim 2020-12-15 Active 100 400 1200 0
JUNIOR LAKE AREA 4251468 198556 Single Cell Mining Claim 2020-12-15 Active 100 400 1200 0
JUNIOR LAKE AREA 4245111 201063 Boundary Cell Mining Claim 2021-08-20 Active 100 200 600 0
JUNIOR LAKE AREA 4245111 201064 Single Cell Mining Claim 2021-08-20 Active 100 200 600 0
JUNIOR LAKE AREA 4251476 202021 Single Cell Mining Claim 2020-12-15 Active 100 400 1200 0
JUNIOR LAKE AREA 4251477 202660 Single Cell Mining Claim 2020-12-15 Active 100 400 1200 0
JUNIOR LAKE AREA 4251496 203290 Single Cell Mining Claim 2020-12-15 Active 100 400 1200 0
JUNIOR LAKE AREA 3019857 204196 Boundary Cell Mining Claim 2021-07-21 Active 100 200 600 1649
JUNIOR LAKE AREA 3019857 204197 Single Cell Mining Claim 2021-07-21 Active 100 400 1000 1649

Landore Resources Canada Inc. MINERAL RESOURCE ESTIMATE AND PRELIMINARY ECONOMIC ASSESSMENT, BAM Gold Project, Junior Lake Property, Ontario, Canada
Landore Resources Canada Inc. Page | 307
Township / Area Legacy Claim Id Tenure ID Tenure Type Anniversary Date Tenure Status Tenure % Work
Required (C$) Work Applied
(C$)
Available Exploration Reserve (C$)
JUNIOR LAKE AREA 3000987 204343 Single Cell Mining Claim 2021-06-22 Active 100 400 1200 0
JUNIOR LAKE AREA 4248585 205193 Single Cell Mining Claim 2020-12-15 Active 100 400 1200 0
JUNIOR LAKE AREA 4251468 206032 Single Cell Mining Claim 2020-12-15 Active 100 400 1200 0
JUNIOR LAKE AREA 4251467 206033 Single Cell Mining Claim 2020-12-15 Active 100 400 1200 0
JUNIOR LAKE AREA 4251467 206034 Single Cell Mining Claim 2020-12-15 Active 100 400 1200 0
JUNIOR LAKE AREA 4245111 207904 Boundary Cell Mining Claim 2021-08-20 Active 100 200 600 0
JUNIOR LAKE AREA 4245111 207905 Boundary Cell Mining Claim 2021-08-20 Active 100 200 600 0
JUNIOR LAKE AREA 4248556 208248 Boundary Cell Mining Claim 2020-12-15 Active 100 200 600 0
JUNIOR LAKE AREA 4251476 210052 Single Cell Mining Claim 2020-12-15 Active 100 400 1200 0
JUNIOR LAKE AREA 4251476 210053 Single Cell Mining Claim 2020-12-15 Active 100 400 1200 0
JUNIOR LAKE AREA 4251476 210054 Boundary Cell Mining Claim 2020-12-15 Active 100 200 600 0
JUNIOR LAKE AREA 4245114 210257 Single Cell Mining Claim 2021-08-20 Active 100 400 1000 0
JUNIOR LAKE AREA 3019857 210339 Boundary Cell Mining Claim 2021-07-21 Active 100 200 600 1649
JUNIOR LAKE AREA 4251477 210689 Single Cell Mining Claim 2020-12-15 Active 100 400 1200 0
JUNIOR LAKE AREA 4251477 210690 Single Cell Mining Claim 2020-12-15 Active 100 400 1200 0
JUNIOR LAKE AREA 4248574 211623 Single Cell Mining Claim 2020-12-15 Active 100 400 1200 0
JUNIOR LAKE AREA 4248574 211624 Single Cell Mining Claim 2020-12-15 Active 100 200 600 0
JUNIOR LAKE AREA 4251488 212425 Boundary Cell Mining Claim 2020-12-15 Active 100 200 600 0
JUNIOR LAKE AREA 4251498 213761 Boundary Cell Mining Claim 2020-12-15 Active 100 200 600 0
JUNIOR LAKE AREA 4259633 214343 Single Cell Mining Claim 2021-10-14 Active 100 400 1200 0
JUNIOR LAKE AREA 4248586 214561 Single Cell Mining Claim 2020-12-15 Active 100 400 1200 0
JUNIOR LAKE AREA 4251497 215876 Boundary Cell Mining Claim 2020-12-15 Active 100 200 600 0
JUNIOR LAKE AREA 4251497 215877 Boundary Cell Mining Claim 2020-12-15 Active 100 200 600 0
JUNIOR LAKE AREA 4251487 216597 Single Cell Mining Claim 2020-12-15 Active 100 400 1200 0
JUNIOR LAKE AREA 4251470 217362 Single Cell Mining Claim 2020-12-15 Active 100 400 1200 0
JUNIOR LAKE AREA 4248556 218473 Single Cell Mining Claim 2020-12-15 Active 100 400 1200 0
JUNIOR LAKE AREA 4259631 219375 Single Cell Mining Claim 2021-10-14 Active 100 400 1200 0

Landore Resources Canada Inc. MINERAL RESOURCE ESTIMATE AND PRELIMINARY ECONOMIC ASSESSMENT, BAM Gold Project, Junior Lake Property, Ontario, Canada
Landore Resources Canada Inc. Page | 308
Township / Area Legacy Claim Id Tenure ID Tenure Type Anniversary Date Tenure Status Tenure % Work
Required (C$) Work Applied
(C$)
Available Exploration Reserve (C$)
JUNIOR LAKE AREA 4259631 219376 Single Cell Mining Claim 2021-10-14 Active 100 400 1200 0
JUNIOR LAKE AREA 4259634 223289 Single Cell Mining Claim 2021-10-14 Active 100 400 1200 0
JUNIOR LAKE AREA 4245112 224531 Single Cell Mining Claim 2021-08-20 Active 100 400 1000 0
JUNIOR LAKE AREA 4245112 224532 Single Cell Mining Claim 2021-08-20 Active 100 400 1200 0
JUNIOR LAKE AREA 4245112 224533 Single Cell Mining Claim 2021-08-20 Active 100 400 1200 0
JUNIOR LAKE AREA 4245112 224534 Single Cell Mining Claim 2021-08-20 Active 100 400 1200 0
JUNIOR LAKE AREA 4251466 225169 Single Cell Mining Claim 2020-12-15 Active 100 400 1200 0
JUNIOR LAKE AREA 4251466 225170 Single Cell Mining Claim 2020-12-15 Active 100 400 1200 0
JUNIOR LAKE AREA 4248554 226428 Boundary Cell Mining Claim 2020-12-15 Active 100 200 600 0
JUNIOR LAKE AREA 4248556 226429 Boundary Cell Mining Claim 2020-12-15 Active 100 200 600 0
JUNIOR LAKE AREA 3019857 229372 Boundary Cell Mining Claim 2021-07-21 Active 100 200 600 1649
JUNIOR LAKE AREA 4214270 229832 Boundary Cell Mining Claim 2021-09-24 Active 100 200 600 0
JUNIOR LAKE AREA 4248558 230366 Boundary Cell Mining Claim 2020-12-15 Active 100 200 600 0
JUNIOR LAKE AREA 4248558 230367 Boundary Cell Mining Claim 2020-12-15 Active 100 200 600 0
JUNIOR LAKE AREA 4259634 231322 Single Cell Mining Claim 2021-10-14 Active 100 400 1200 0
JUNIOR LAKE AREA 4259634 231323 Single Cell Mining Claim 2021-10-14 Active 100 400 1200 0
JUNIOR LAKE AREA 4251478 231476 Single Cell Mining Claim 2020-12-15 Active 100 400 1200 0
JUNIOR LAKE AREA 4245112 232558 Boundary Cell Mining Claim 2021-08-20 Active 100 200 600 0
JUNIOR LAKE AREA 4245112 232559 Single Cell Mining Claim 2021-08-20 Active 100 200 600 0
JUNIOR LAKE AREA 4251466 233147 Single Cell Mining Claim 2020-12-15 Active 100 400 1200 0
JUNIOR LAKE AREA 4251487 234426 Single Cell Mining Claim 2020-12-15 Active 100 400 1200 0
JUNIOR LAKE AREA 4251486 234427 Single Cell Mining Claim 2020-12-15 Active 100 400 1200 0
JUNIOR LAKE AREA 4251497 234428 Single Cell Mining Claim 2020-12-15 Active 100 400 1200 0
JUNIOR LAKE AREA 4248555 235786 Boundary Cell Mining Claim 2020-12-15 Active 100 200 600 0
JUNIOR LAKE AREA 4251487 236681 Single Cell Mining Claim 2020-12-15 Active 100 400 1200 0
JUNIOR LAKE AREA 4251487 236682 Single Cell Mining Claim 2020-12-15 Active 100 400 1200 0
JUNIOR LAKE AREA 4251470 236805 Single Cell Mining Claim 2021-10-14 Active 100 400 1200 0

Landore Resources Canada Inc. MINERAL RESOURCE ESTIMATE AND PRELIMINARY ECONOMIC ASSESSMENT, BAM Gold Project, Junior Lake Property, Ontario, Canada
Landore Resources Canada Inc. Page | 309
Township / Area Legacy Claim Id Tenure ID Tenure Type Anniversary Date Tenure Status Tenure % Work
Required (C$) Work Applied
(C$)
Available Exploration Reserve (C$)
JUNIOR LAKE AREA 4259632 237809 Single Cell Mining Claim 2021-10-14 Active 100 400 1200 0
JUNIOR LAKE AREA 4245114 240161 Single Cell Mining Claim 2021-08-20 Active 100 400 1200 0
JUNIOR LAKE AREA 4245114 240162 Boundary Cell Mining Claim 2021-08-20 Active 100 200 600 0
JUNIOR LAKE AREA 4245114 240163 Boundary Cell Mining Claim 2021-08-20 Active 100 200 600 0
JUNIOR LAKE AREA 4247746 240167 Single Cell Mining Claim 2020-12-17 Active 100 400 1200 0
JUNIOR LAKE AREA 4247746 240168 Single Cell Mining Claim 2020-12-17 Active 100 400 1200 0
JUNIOR LAKE AREA 4251469 240492 Single Cell Mining Claim 2020-12-15 Active 100 400 1200 0
JUNIOR LAKE AREA 4251477 240515 Single Cell Mining Claim 2020-12-15 Active 100 400 1200 0
JUNIOR LAKE AREA 4251477 240516 Single Cell Mining Claim 2020-12-15 Active 100 400 1200 0
JUNIOR LAKE AREA 4248572 240864 Single Cell Mining Claim 2020-12-15 Active 100 400 1200 0
JUNIOR LAKE AREA 4248572 240865 Single Cell Mining Claim 2020-12-15 Active 100 200 600 0
JUNIOR LAKE AREA 4248572 240866 Single Cell Mining Claim 2020-12-15 Active 100 200 600 0
JUNIOR LAKE AREA 3000987 240885 Single Cell Mining Claim 2021-06-22 Active 100 400 1200 0
JUNIOR LAKE AREA 3000987 240886 Single Cell Mining Claim 2021-06-22 Active 100 400 1200 0
JUNIOR LAKE AREA 1077140 240887 Single Cell Mining Claim 2021-06-22 Active 100 400 1200 0
JUNIOR LAKE AREA 4251498 242417 Single Cell Mining Claim 2020-12-15 Active 100 400 1000 0
JUNIOR LAKE AREA 4251498 242418 Single Cell Mining Claim 2020-12-15 Active 100 400 1200 0
JUNIOR LAKE AREA 4248558 242563 Boundary Cell Mining Claim 2020-12-15 Active 100 200 600 0
JUNIOR LAKE AREA 4259634 243447 Single Cell Mining Claim 2021-10-14 Active 100 400 1200 0
JUNIOR LAKE AREA 4259634 243448 Single Cell Mining Claim 2021-10-14 Active 100 400 1200 0
JUNIOR LAKE AREA 4248573 243552 Single Cell Mining Claim 2020-12-15 Active 100 400 1200 0
JUNIOR LAKE AREA 4248586 243718 Single Cell Mining Claim 2020-12-15 Active 100 400 1200 0
JUNIOR LAKE AREA 4259633 244212 Single Cell Mining Claim 2021-10-14 Active 100 400 1200 0
JUNIOR LAKE AREA 4259632 244213 Single Cell Mining Claim 2021-10-14 Active 100 400 1200 0
JUNIOR LAKE AREA 4248585 244973 Single Cell Mining Claim 2020-12-15 Active 100 400 1200 0
JUNIOR LAKE AREA 4251466 245335 Single Cell Mining Claim 2020-12-15 Active 100 400 1200 0
JUNIOR LAKE AREA 4251466 245336 Single Cell Mining Claim 2020-12-15 Active 100 400 1200 0

Landore Resources Canada Inc. MINERAL RESOURCE ESTIMATE AND PRELIMINARY ECONOMIC ASSESSMENT, BAM Gold Project, Junior Lake Property, Ontario, Canada
Landore Resources Canada Inc. Page | 310
Township / Area Legacy Claim Id Tenure ID Tenure Type Anniversary Date Tenure Status Tenure % Work
Required (C$) Work Applied
(C$)
Available Exploration Reserve (C$)
JUNIOR LAKE AREA 4251466 245337 Single Cell Mining Claim 2020-12-15 Active 100 400 1200 0
JUNIOR LAKE AREA 4251466 245338 Single Cell Mining Claim 2020-12-15 Active 100 400 1200 0
JUNIOR LAKE AREA 4251469 247202 Single Cell Mining Claim 2020-12-15 Active 100 400 1200 0
JUNIOR LAKE AREA 4245114 247643 Boundary Cell Mining Claim 2021-08-20 Active 100 200 600 0
JUNIOR LAKE AREA 4247746 247655 Single Cell Mining Claim 2020-12-17 Active 100 400 1200 0
JUNIOR LAKE AREA 4248572 248370 Single Cell Mining Claim 2020-12-15 Active 100 200 600 0
JUNIOR LAKE AREA 1077140 248897 Single Cell Mining Claim 2021-06-22 Active 100 400 1200 0
JUNIOR LAKE AREA 4248574 249026 Single Cell Mining Claim 2020-12-15 Active 100 400 1200 0
JUNIOR LAKE AREA 4251488 249131 Boundary Cell Mining Claim 2020-12-15 Active 100 200 600 0
JUNIOR LAKE AREA 4251488 249132 Single Cell Mining Claim 2020-12-15 Active 100 400 1200 0
JUNIOR LAKE AREA 4251467 249971 Single Cell Mining Claim 2020-12-15 Active 100 400 1200 0
JUNIOR LAKE AREA 4251467 249972 Single Cell Mining Claim 2020-12-15 Active 100 400 1200 0
JUNIOR LAKE AREA 4251478 250008 Single Cell Mining Claim 2020-12-15 Active 100 400 1200 0
JUNIOR LAKE AREA 1077140 250387 Single Cell Mining Claim 2021-03-16 Active 100 200 600 0
JUNIOR LAKE AREA 4259633 250790 Single Cell Mining Claim 2021-10-14 Active 100 400 1200 0
JUNIOR LAKE AREA 4259633 250791 Single Cell Mining Claim 2021-10-14 Active 100 400 1200 0
JUNIOR LAKE AREA 1187651 250969 Single Cell Mining Claim 2021-08-14 Active 100 200 600 0
JUNIOR LAKE AREA 4251466 251968 Single Cell Mining Claim 2020-12-15 Active 100 400 1200 0
JUNIOR LAKE AREA 4251486 252527 Single Cell Mining Claim 2020-12-15 Active 100 400 1200 0
JUNIOR LAKE AREA 4251487 252748 Single Cell Mining Claim 2020-12-15 Active 100 400 1200 0
JUNIOR LAKE AREA 4248554 252749 Boundary Cell Mining Claim 2020-12-15 Active 100 200 600 0
JUNIOR LAKE AREA 4259635 253489 Single Cell Mining Claim 2021-10-14 Active 100 400 1200 0
JUNIOR LAKE AREA 4251467 253765 Single Cell Mining Claim 2020-12-15 Active 100 400 1200 0
JUNIOR LAKE AREA 4251486 253952 Single Cell Mining Claim 2020-12-15 Active 100 400 1200 0
JUNIOR LAKE AREA 4248555 254612 Boundary Cell Mining Claim 2020-12-15 Active 100 200 600 0
JUNIOR LAKE AREA 4251470 254928 Single Cell Mining Claim 2020-12-15 Active 100 400 1200 0
JUNIOR LAKE AREA 4245111 255715 Boundary Cell Mining Claim 2021-08-20 Active 100 200 600 0

Landore Resources Canada Inc. MINERAL RESOURCE ESTIMATE AND PRELIMINARY ECONOMIC ASSESSMENT, BAM Gold Project, Junior Lake Property, Ontario, Canada
Landore Resources Canada Inc. Page | 311
Township / Area Legacy Claim Id Tenure ID Tenure Type Anniversary Date Tenure Status Tenure % Work
Required (C$) Work Applied
(C$)
Available Exploration Reserve (C$)
JUNIOR LAKE AREA 4259632 255846 Single Cell Mining Claim 2021-10-14 Active 100 400 1200 0
JUNIOR LAKE AREA 4259631 256266 Single Cell Mining Claim 2021-10-14 Active 100 400 1200 0
JUNIOR LAKE AREA 4251476 258050 Single Cell Mining Claim 2020-12-15 Active 100 400 1200 0
JUNIOR LAKE AREA 4251469 258668 Single Cell Mining Claim 2020-12-15 Active 100 400 1200 0
JUNIOR LAKE AREA 4251477 258695 Single Cell Mining Claim 2020-12-15 Active 100 400 1200 0
JUNIOR LAKE AREA 4251496 259337 Single Cell Mining Claim 2020-12-15 Active 100 400 1200 0
JUNIOR LAKE AREA 4251467 260715 Single Cell Mining Claim 2020-12-15 Active 100 400 1200 0
JUNIOR LAKE AREA 4251478 260746 Single Cell Mining Claim 2020-12-15 Active 100 400 1200 0
JUNIOR LAKE AREA 4259633 263758 Single Cell Mining Claim 2021-10-14 Active 100 400 1200 0
JUNIOR LAKE AREA 4259632 263759 Single Cell Mining Claim 2021-10-14 Active 100 400 1200 0
JUNIOR LAKE AREA 4248585 265030 Single Cell Mining Claim 2020-12-15 Active 100 400 1200 0
JUNIOR LAKE AREA 4245111 267676 Boundary Cell Mining Claim 2021-08-20 Active 100 200 600 0
JUNIOR LAKE AREA 4245111 267677 Boundary Cell Mining Claim 2021-08-20 Active 100 200 600 0
JUNIOR LAKE AREA 4251478 268690 Single Cell Mining Claim 2020-12-15 Active 100 400 1200 0
JUNIOR LAKE AREA 4251498 269219 Boundary Cell Mining Claim 2020-12-15 Active 100 200 600 0
JUNIOR LAKE AREA 4251498 269220 Boundary Cell Mining Claim 2020-12-15 Active 100 200 600 0
JUNIOR LAKE AREA 4251498 269221 Boundary Cell Mining Claim 2020-12-15 Active 100 200 600 0
JUNIOR LAKE AREA 4251497 271804 Single Cell Mining Claim 2020-12-15 Active 100 400 1200 0
JUNIOR LAKE AREA 4251497 271805 Boundary Cell Mining Claim 2020-12-15 Active 100 200 600 0
JUNIOR LAKE AREA 4248556 273650 Single Cell Mining Claim 2020-12-15 Active 100 400 1200 0
JUNIOR LAKE AREA 4245111 273803 Boundary Cell Mining Claim 2021-08-20 Active 100 200 600 0
JUNIOR LAKE AREA 4259632 274700 Single Cell Mining Claim 2021-10-14 Active 100 400 1200 0
JUNIOR LAKE AREA 4251469 276631 Single Cell Mining Claim 2020-12-15 Active 100 400 1200 0
JUNIOR LAKE AREA 4251467 276657 Single Cell Mining Claim 2020-12-15 Active 100 400 1200 0
JUNIOR LAKE AREA 4251477 276658 Single Cell Mining Claim 2020-12-15 Active 100 400 1200 0
JUNIOR LAKE AREA 4251477 276659 Single Cell Mining Claim 2020-12-15 Active 100 400 1200 0
JUNIOR LAKE AREA 4248558 277621 Boundary Cell Mining Claim 2020-12-15 Active 100 200 600 0

Landore Resources Canada Inc. MINERAL RESOURCE ESTIMATE AND PRELIMINARY ECONOMIC ASSESSMENT, BAM Gold Project, Junior Lake Property, Ontario, Canada
Landore Resources Canada Inc. Page | 312
Township / Area Legacy Claim Id Tenure ID Tenure Type Anniversary Date Tenure Status Tenure % Work
Required (C$) Work Applied
(C$)
Available Exploration Reserve (C$)
JUNIOR LAKE AREA 4248558 278404 Boundary Cell Mining Claim 2020-12-15 Active 100 200 600 0
JUNIOR LAKE AREA 4259634 279316 Single Cell Mining Claim 2021-10-14 Active 100 400 1200 0
JUNIOR LAKE AREA 4259634 279317 Single Cell Mining Claim 2021-10-14 Active 100 400 1200 0
JUNIOR LAKE AREA 4259634 279318 Single Cell Mining Claim 2021-10-14 Active 100 400 1200 0
JUNIOR LAKE AREA 4259634 279319 Single Cell Mining Claim 2021-10-14 Active 100 400 1200 0
JUNIOR LAKE AREA 1187651 279486 Boundary Cell Mining Claim 2021-08-14 Active 100 200 600 0
JUNIOR LAKE AREA 4248573 280106 Single Cell Mining Claim 2020-12-15 Active 100 400 1200 0
JUNIOR LAKE AREA 4259633 280735 Single Cell Mining Claim 2021-10-14 Active 100 400 1200 0
JUNIOR LAKE AREA 4259635 281995 Single Cell Mining Claim 2021-10-14 Active 100 400 1200 0
JUNIOR LAKE AREA 4259635 281996 Single Cell Mining Claim 2021-10-14 Active 100 400 1200 0
JUNIOR LAKE AREA 4251487 282399 Boundary Cell Mining Claim 2020-12-15 Active 100 200 600 0
JUNIOR LAKE AREA 4251486 283107 Single Cell Mining Claim 2020-12-15 Active 100 400 1200 0
JUNIOR LAKE AREA 4248555 283751 Boundary Cell Mining Claim 2020-12-15 Active 100 200 600 0
JUNIOR LAKE AREA 4245114 286787 Single Cell Mining Claim 2021-08-20 Active 100 400 1000 0
JUNIOR LAKE AREA 4245114 286788 Boundary Cell Mining Claim 2021-08-20 Active 100 200 600 0
JUNIOR LAKE AREA 4248574 288635 Single Cell Mining Claim 2020-12-15 Active 100 200 600 0
JUNIOR LAKE AREA 4214270 289090 Boundary Cell Mining Claim 2021-09-24 Active 100 200 600 0
JUNIOR LAKE AREA 4251466 289208 Single Cell Mining Claim 2020-12-15 Active 100 400 1200 0
JUNIOR LAKE AREA 4259635 290045 Single Cell Mining Claim 2021-10-14 Active 100 400 1200 0
JUNIOR LAKE AREA 4251497 290466 Single Cell Mining Claim 2020-12-15 Active 100 400 1200 0
JUNIOR LAKE AREA 4251496 290467 Single Cell Mining Claim 2020-12-15 Active 100 400 1200 0
JUNIOR LAKE AREA 4251497 290468 Boundary Cell Mining Claim 2020-12-15 Active 100 200 600 0
JUNIOR LAKE AREA 4251497 290469 Boundary Cell Mining Claim 2020-12-15 Active 100 200 600 0
JUNIOR LAKE AREA 4251487 291172 Single Cell Mining Claim 2020-12-15 Active 100 400 1200 0
JUNIOR LAKE AREA 4248555 291821 Boundary Cell Mining Claim 2020-12-15 Active 100 200 600 0
JUNIOR LAKE AREA 4251470 292017 Single Cell Mining Claim 2020-12-15 Active 100 400 1200 0
JUNIOR LAKE AREA 4251470 292018 Single Cell Mining Claim 2020-12-15 Active 100 400 1200 0

Landore Resources Canada Inc. MINERAL RESOURCE ESTIMATE AND PRELIMINARY ECONOMIC ASSESSMENT, BAM Gold Project, Junior Lake Property, Ontario, Canada
Landore Resources Canada Inc. Page | 313
Township / Area Legacy Claim Id Tenure ID Tenure Type Anniversary Date Tenure Status Tenure % Work
Required (C$) Work Applied
(C$)
Available Exploration Reserve (C$)
JUNIOR LAKE AREA 4259631 292814 Single Cell Mining Claim 2021-10-14 Active 100 400 1200 0
JUNIOR LAKE AREA 4248554 293041 Single Cell Mining Claim 2020-12-15 Active 100 400 1200 0
JUNIOR LAKE AREA 4245114 294802 Single Cell Mining Claim 2021-08-20 Active 100 400 1200 0
JUNIOR LAKE AREA 4248558 296488 Single Cell Mining Claim 2020-12-15 Active 100 400 1200 0
JUNIOR LAKE AREA 4259633 298007 Single Cell Mining Claim 2021-10-14 Active 100 400 1200 0
JUNIOR LAKE AREA 4248573 298693 Single Cell Mining Claim 2020-12-15 Active 100 200 600 0
JUNIOR LAKE AREA 4259633 298857 Single Cell Mining Claim 2021-10-14 Active 100 400 1200 0
JUNIOR LAKE AREA 4245112 299266 Single Cell Mining Claim 2021-08-20 Active 100 400 1200 0
JUNIOR LAKE AREA 1187651 299535 Single Cell Mining Claim 2021-08-14 Active 100 400 1200 0
JUNIOR LAKE AREA 1187651 299536 Boundary Cell Mining Claim 2021-08-14 Active 100 200 600 0
JUNIOR LAKE AREA 4259634 300062 Single Cell Mining Claim 2021-10-14 Active 100 400 1200 0
JUNIOR LAKE AREA 4259634 300063 Single Cell Mining Claim 2021-10-14 Active 100 400 1200 0
JUNIOR LAKE AREA 4259633 300301 Single Cell Mining Claim 2021-10-14 Active 100 400 1200 0
JUNIOR LAKE AREA 4251470 304150 Single Cell Mining Claim 2020-12-15 Active 100 400 1200 0
JUNIOR LAKE AREA 4251470 304151 Single Cell Mining Claim 2020-12-15 Active 100 400 1200 0
JUNIOR LAKE AREA 4245111 304298 Boundary Cell Mining Claim 2021-08-20 Active 100 200 600 0
JUNIOR LAKE AREA 4259631 305494 Single Cell Mining Claim 2021-10-14 Active 100 400 1200 0
JUNIOR LAKE AREA 4251476 305815 Single Cell Mining Claim 2020-12-15 Active 100 400 1200 0
JUNIOR LAKE AREA 4251469 306448 Single Cell Mining Claim 2020-12-15 Active 100 400 1200 0
JUNIOR LAKE AREA 4245114 307492 Single Cell Mining Claim 2021-08-20 Active 100 400 1000 0
JUNIOR LAKE AREA 4245114 307493 Single Cell Mining Claim 2021-08-20 Active 100 400 1200 0
JUNIOR LAKE AREA 3000987 308239 Single Cell Mining Claim 2021-06-22 Active 100 400 1200 0
JUNIOR LAKE AREA 4251488 308402 Single Cell Mining Claim 2020-12-15 Active 100 400 1200 0
JUNIOR LAKE AREA 4251488 308403 Boundary Cell Mining Claim 2020-12-15 Active 100 200 600 0
JUNIOR LAKE AREA 4251467 308571 Single Cell Mining Claim 2020-12-15 Active 100 400 1200 0
JUNIOR LAKE AREA 1077140 310253 Single Cell Mining Claim 2021-03-16 Active 100 400 1200 0
JUNIOR LAKE AREA 1077140 310254 Single Cell Mining Claim 2021-03-16 Active 100 200 600 0

Landore Resources Canada Inc. MINERAL RESOURCE ESTIMATE AND PRELIMINARY ECONOMIC ASSESSMENT, BAM Gold Project, Junior Lake Property, Ontario, Canada
Landore Resources Canada Inc. Page | 314
Township / Area Legacy Claim Id Tenure ID Tenure Type Anniversary Date Tenure Status Tenure % Work
Required (C$) Work Applied
(C$)
Available Exploration Reserve (C$)
JUNIOR LAKE AREA 4251470 310923 Single Cell Mining Claim 2021-10-14 Active 100 400 1200 0
JUNIOR LAKE AREA 4251470 310924 Single Cell Mining Claim 2020-12-15 Active 100 400 1200 0
JUNIOR LAKE AREA 4251470 310925 Single Cell Mining Claim 2020-12-15 Active 100 400 1200 0
JUNIOR LAKE AREA 4251469 310926 Single Cell Mining Claim 2020-12-15 Active 100 400 1200 0
JUNIOR LAKE AREA 4251469 310927 Single Cell Mining Claim 2020-12-15 Active 100 400 1200 0
JUNIOR LAKE AREA 4245111 311115 Single Cell Mining Claim 2021-08-20 Active 100 400 1200 0
JUNIOR LAKE AREA 4259632 311302 Single Cell Mining Claim 2021-10-14 Active 100 400 1200 0
JUNIOR LAKE AREA 4259631 312234 Single Cell Mining Claim 2021-10-14 Active 100 400 1200 0
JUNIOR LAKE AREA 4259631 312235 Single Cell Mining Claim 2021-10-14 Active 100 400 1200 0
JUNIOR LAKE AREA 4245114 314199 Single Cell Mining Claim 2021-08-20 Active 100 400 1200 0
JUNIOR LAKE AREA 4247746 314203 Single Cell Mining Claim 2020-12-17 Active 100 400 1200 0
JUNIOR LAKE AREA 3019857 314301 Boundary Cell Mining Claim 2021-07-21 Active 100 200 600 1649
JUNIOR LAKE AREA 3000987 314963 Single Cell Mining Claim 2021-06-22 Active 100 400 1200 0
JUNIOR LAKE AREA 4251467 315291 Single Cell Mining Claim 2020-12-15 Active 100 400 1200 0
JUNIOR LAKE AREA 4248574 315604 Single Cell Mining Claim 2020-12-15 Active 100 400 1200 0
JUNIOR LAKE AREA 4251478 315838 Single Cell Mining Claim 2020-12-15 Active 100 400 1200 0
JUNIOR LAKE AREA 4251478 315839 Single Cell Mining Claim 2020-12-15 Active 100 400 1200 0
JUNIOR LAKE AREA 4251498 316462 Boundary Cell Mining Claim 2020-12-15 Active 100 200 600 0
JUNIOR LAKE AREA 4251498 316463 Single Cell Mining Claim 2020-12-15 Active 100 400 1000 0
JUNIOR LAKE AREA 4259634 316706 Single Cell Mining Claim 2021-10-14 Active 100 400 1200 0
JUNIOR LAKE AREA 4245112 317445 Boundary Cell Mining Claim 2021-08-20 Active 100 200 600 0
JUNIOR LAKE AREA 4245112 317446 Boundary Cell Mining Claim 2021-08-20 Active 100 200 600 0
JUNIOR LAKE AREA 1187651 317540 Boundary Cell Mining Claim 2021-08-14 Active 100 200 600 0
JUNIOR LAKE AREA 4248586 317738 Single Cell Mining Claim 2020-12-15 Active 100 400 1200 0
JUNIOR LAKE AREA 4251468 321918 Single Cell Mining Claim 2020-12-15 Active 100 400 1200 0
JUNIOR LAKE AREA 4259632 324017 Single Cell Mining Claim 2021-10-14 Active 100 400 1200 0
JUNIOR LAKE AREA 4259632 324018 Single Cell Mining Claim 2021-10-14 Active 100 400 1200 0

Landore Resources Canada Inc. MINERAL RESOURCE ESTIMATE AND PRELIMINARY ECONOMIC ASSESSMENT, BAM Gold Project, Junior Lake Property, Ontario, Canada
Landore Resources Canada Inc. Page | 315
Township / Area Legacy Claim Id Tenure ID Tenure Type Anniversary Date Tenure Status Tenure % Work
Required (C$) Work Applied
(C$)
Available Exploration Reserve (C$)
JUNIOR LAKE AREA 4259632 324019 Single Cell Mining Claim 2021-10-14 Active 100 400 1200 0
JUNIOR LAKE AREA 4248558 325651 Single Cell Mining Claim 2020-12-15 Active 100 400 1200 0
JUNIOR LAKE AREA 4251469 325985 Single Cell Mining Claim 2020-12-15 Active 100 400 1200 0
JUNIOR LAKE AREA 4251477 326012 Single Cell Mining Claim 2020-12-15 Active 100 400 1200 0
JUNIOR LAKE AREA 4251467 328581 Single Cell Mining Claim 2020-12-15 Active 100 400 1200 0
JUNIOR LAKE AREA 4251478 328616 Single Cell Mining Claim 2020-12-15 Active 100 400 1200 0
JUNIOR LAKE AREA 4251478 328617 Single Cell Mining Claim 2020-12-15 Active 100 400 1200 0
JUNIOR LAKE AREA 4251498 329158 Single Cell Mining Claim 2020-12-15 Active 100 400 1200 0
JUNIOR LAKE AREA 4251497 329677 Single Cell Mining Claim 2020-12-15 Active 100 400 1200 0
JUNIOR LAKE AREA 4251497 329678 Single Cell Mining Claim 2020-12-15 Active 100 400 1200 0
JUNIOR LAKE AREA 4251497 329679 Single Cell Mining Claim 2020-12-15 Active 100 400 1200 0
JUNIOR LAKE AREA 4251496 329680 Single Cell Mining Claim 2020-12-15 Active 100 400 1200 0
JUNIOR LAKE AREA 4251487 330376 Single Cell Mining Claim 2020-12-15 Active 100 400 1200 0
JUNIOR LAKE AREA 4251487 330377 Boundary Cell Mining Claim 2020-12-15 Active 100 200 600 0
JUNIOR LAKE AREA 4248555 331032 Boundary Cell Mining Claim 2020-12-15 Active 100 200 600 0
JUNIOR LAKE AREA 4251469 331507 Single Cell Mining Claim 2020-12-15 Active 100 400 1200 0
JUNIOR LAKE AREA 4251467 331538 Single Cell Mining Claim 2020-12-15 Active 100 400 1200 0
JUNIOR LAKE AREA 4251467 332081 Single Cell Mining Claim 2020-12-15 Active 100 400 1200 0
JUNIOR LAKE AREA 4251468 333319 Single Cell Mining Claim 2020-12-15 Active 100 400 1200 0
JUNIOR LAKE AREA 4251467 333320 Single Cell Mining Claim 2020-12-15 Active 100 400 1200 0
JUNIOR LAKE AREA 4251468 333321 Single Cell Mining Claim 2020-12-15 Active 100 400 1200 0
JUNIOR LAKE AREA 4251476 334749 Single Cell Mining Claim 2020-12-15 Active 100 400 1200 0
JUNIOR LAKE AREA 4248574 336457 Single Cell Mining Claim 2020-12-15 Active 100 400 1200 0
JUNIOR LAKE AREA 4251488 336516 Single Cell Mining Claim 2020-12-15 Active 100 400 1200 0
JUNIOR LAKE AREA 4251488 336517 Boundary Cell Mining Claim 2020-12-15 Active 100 200 600 0
JUNIOR LAKE AREA 4251488 336538 Boundary Cell Mining Claim 2020-12-15 Active 100 200 600 0
JUNIOR LAKE AREA 4248558 338014 Boundary Cell Mining Claim 2020-12-15 Active 100 200 600 0
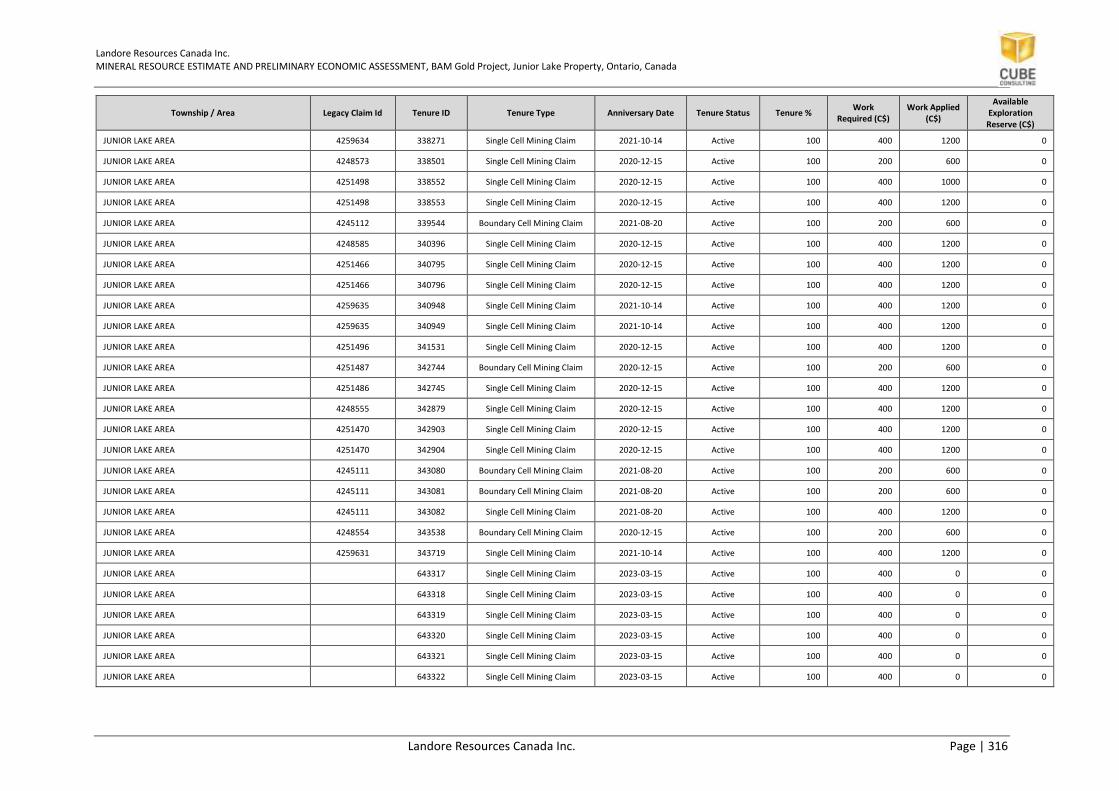
Landore Resources Canada Inc. MINERAL RESOURCE ESTIMATE AND PRELIMINARY ECONOMIC ASSESSMENT, BAM Gold Project, Junior Lake Property, Ontario, Canada
Landore Resources Canada Inc. Page | 316
Township / Area Legacy Claim Id Tenure ID Tenure Type Anniversary Date Tenure Status Tenure % Work
Required (C$) Work Applied
(C$)
Available Exploration Reserve (C$)
JUNIOR LAKE AREA 4259634 338271 Single Cell Mining Claim 2021-10-14 Active 100 400 1200 0
JUNIOR LAKE AREA 4248573 338501 Single Cell Mining Claim 2020-12-15 Active 100 200 600 0
JUNIOR LAKE AREA 4251498 338552 Single Cell Mining Claim 2020-12-15 Active 100 400 1000 0
JUNIOR LAKE AREA 4251498 338553 Single Cell Mining Claim 2020-12-15 Active 100 400 1200 0
JUNIOR LAKE AREA 4245112 339544 Boundary Cell Mining Claim 2021-08-20 Active 100 200 600 0
JUNIOR LAKE AREA 4248585 340396 Single Cell Mining Claim 2020-12-15 Active 100 400 1200 0
JUNIOR LAKE AREA 4251466 340795 Single Cell Mining Claim 2020-12-15 Active 100 400 1200 0
JUNIOR LAKE AREA 4251466 340796 Single Cell Mining Claim 2020-12-15 Active 100 400 1200 0
JUNIOR LAKE AREA 4259635 340948 Single Cell Mining Claim 2021-10-14 Active 100 400 1200 0
JUNIOR LAKE AREA 4259635 340949 Single Cell Mining Claim 2021-10-14 Active 100 400 1200 0
JUNIOR LAKE AREA 4251496 341531 Single Cell Mining Claim 2020-12-15 Active 100 400 1200 0
JUNIOR LAKE AREA 4251487 342744 Boundary Cell Mining Claim 2020-12-15 Active 100 200 600 0
JUNIOR LAKE AREA 4251486 342745 Single Cell Mining Claim 2020-12-15 Active 100 400 1200 0
JUNIOR LAKE AREA 4248555 342879 Single Cell Mining Claim 2020-12-15 Active 100 400 1200 0
JUNIOR LAKE AREA 4251470 342903 Single Cell Mining Claim 2020-12-15 Active 100 400 1200 0
JUNIOR LAKE AREA 4251470 342904 Single Cell Mining Claim 2020-12-15 Active 100 400 1200 0
JUNIOR LAKE AREA 4245111 343080 Boundary Cell Mining Claim 2021-08-20 Active 100 200 600 0
JUNIOR LAKE AREA 4245111 343081 Boundary Cell Mining Claim 2021-08-20 Active 100 200 600 0
JUNIOR LAKE AREA 4245111 343082 Single Cell Mining Claim 2021-08-20 Active 100 400 1200 0
JUNIOR LAKE AREA 4248554 343538 Boundary Cell Mining Claim 2020-12-15 Active 100 200 600 0
JUNIOR LAKE AREA 4259631 343719 Single Cell Mining Claim 2021-10-14 Active 100 400 1200 0
JUNIOR LAKE AREA 643317 Single Cell Mining Claim 2023-03-15 Active 100 400 0 0
JUNIOR LAKE AREA 643318 Single Cell Mining Claim 2023-03-15 Active 100 400 0 0
JUNIOR LAKE AREA 643319 Single Cell Mining Claim 2023-03-15 Active 100 400 0 0
JUNIOR LAKE AREA 643320 Single Cell Mining Claim 2023-03-15 Active 100 400 0 0
JUNIOR LAKE AREA 643321 Single Cell Mining Claim 2023-03-15 Active 100 400 0 0
JUNIOR LAKE AREA 643322 Single Cell Mining Claim 2023-03-15 Active 100 400 0 0

Landore Resources Canada Inc. MINERAL RESOURCE ESTIMATE AND PRELIMINARY ECONOMIC ASSESSMENT, BAM Gold Project, Junior Lake Property, Ontario, Canada
Landore Resources Canada Inc. Page | 317
Township / Area Legacy Claim Id Tenure ID Tenure Type Anniversary Date Tenure Status Tenure % Work
Required (C$) Work Applied
(C$)
Available Exploration Reserve (C$)
JUNIOR LAKE AREA 643323 Single Cell Mining Claim 2023-03-15 Active 100 400 0 0
JUNIOR LAKE AREA 643324 Single Cell Mining Claim 2023-03-15 Active 100 400 0 0
JUNIOR LAKE AREA 643325 Single Cell Mining Claim 2023-03-15 Active 100 400 0 0
JUNIOR LAKE AREA 643326 Single Cell Mining Claim 2023-03-15 Active 100 400 0 0
JUNIOR LAKE AREA 643327 Single Cell Mining Claim 2023-03-15 Active 100 400 0 0
JUNIOR LAKE AREA 643328 Single Cell Mining Claim 2023-03-15 Active 100 400 0 0
JUNIOR LAKE AREA 643329 Single Cell Mining Claim 2023-03-15 Active 100 400 0 0
JUNIOR LAKE AREA 643330 Single Cell Mining Claim 2023-03-15 Active 100 400 0 0
JUNIOR LAKE AREA 643331 Single Cell Mining Claim 2023-03-15 Active 100 400 0 0
JUNIOR LAKE AREA 643332 Single Cell Mining Claim 2023-03-15 Active 100 400 0 0
JUNIOR LAKE AREA 643333 Single Cell Mining Claim 2023-03-15 Active 100 400 0 0
JUNIOR LAKE AREA 643334 Single Cell Mining Claim 2023-03-15 Active 100 400 0 0
JUNIOR LAKE AREA 643335 Single Cell Mining Claim 2023-03-15 Active 100 400 0 0
JUNIOR LAKE AREA 643336 Single Cell Mining Claim 2023-03-15 Active 100 400 0 0
JUNIOR LAKE AREA 643337 Single Cell Mining Claim 2023-03-15 Active 100 400 0 0
JUNIOR LAKE AREA 643338 Single Cell Mining Claim 2023-03-15 Active 100 400 0 0
JUNIOR LAKE AREA 643339 Single Cell Mining Claim 2023-03-15 Active 100 400 0 0
JUNIOR LAKE AREA 643340 Single Cell Mining Claim 2023-03-15 Active 100 400 0 0
JUNIOR LAKE AREA 643341 Single Cell Mining Claim 2023-03-15 Active 100 400 0 0
JUNIOR LAKE AREA 643342 Single Cell Mining Claim 2023-03-15 Active 100 400 0 0
JUNIOR LAKE AREA 643343 Single Cell Mining Claim 2023-03-15 Active 100 400 0 0
JUNIOR LAKE AREA 643344 Single Cell Mining Claim 2023-03-15 Active 100 400 0 0
JUNIOR LAKE AREA 643345 Single Cell Mining Claim 2023-03-15 Active 100 400 0 0
JUNIOR LAKE AREA 643346 Single Cell Mining Claim 2023-03-15 Active 100 400 0 0
JUNIOR LAKE AREA 643347 Single Cell Mining Claim 2023-03-15 Active 100 400 0 0
JUNIOR LAKE AREA 643348 Single Cell Mining Claim 2023-03-15 Active 100 400 0 0
JUNIOR LAKE AREA 643349 Single Cell Mining Claim 2023-03-15 Active 100 400 0 0

Landore Resources Canada Inc. MINERAL RESOURCE ESTIMATE AND PRELIMINARY ECONOMIC ASSESSMENT, BAM Gold Project, Junior Lake Property, Ontario, Canada
Landore Resources Canada Inc. Page | 318
Township / Area Legacy Claim Id Tenure ID Tenure Type Anniversary Date Tenure Status Tenure % Work
Required (C$) Work Applied
(C$)
Available Exploration Reserve (C$)
JUNIOR LAKE AREA 643350 Single Cell Mining Claim 2023-03-15 Active 100 400 0 0
JUNIOR LAKE AREA 643351 Single Cell Mining Claim 2023-03-15 Active 100 400 0 0
JUNIOR LAKE AREA 643352 Single Cell Mining Claim 2023-03-15 Active 100 400 0 0
JUNIOR LAKE AREA 643353 Single Cell Mining Claim 2023-03-15 Active 100 400 0 0
JUNIOR LAKE AREA 643354 Single Cell Mining Claim 2023-03-15 Active 100 400 0 0
JUNIOR LAKE AREA 643355 Single Cell Mining Claim 2023-03-15 Active 100 400 0 0
JUNIOR LAKE AREA 643356 Single Cell Mining Claim 2023-03-15 Active 100 400 0 0
JUNIOR LAKE AREA 643357 Single Cell Mining Claim 2023-03-15 Active 100 400 0 0
JUNIOR LAKE AREA 643358 Single Cell Mining Claim 2023-03-15 Active 100 400 0 0
JUNIOR LAKE AREA 643359 Single Cell Mining Claim 2023-03-15 Active 100 400 0 0
JUNIOR LAKE AREA 643360 Single Cell Mining Claim 2023-03-15 Active 100 400 0 0
JUNIOR LAKE AREA 643361 Single Cell Mining Claim 2023-03-15 Active 100 400 0 0
JUNIOR LAKE AREA 643362 Single Cell Mining Claim 2023-03-15 Active 100 400 0 0
JUNIOR LAKE AREA 643363 Single Cell Mining Claim 2023-03-15 Active 100 400 0 0
JUNIOR LAKE AREA 643364 Single Cell Mining Claim 2023-03-15 Active 100 400 0 0
JUNIOR LAKE AREA 643365 Single Cell Mining Claim 2023-03-15 Active 100 400 0 0
JUNIOR LAKE AREA 643366 Single Cell Mining Claim 2023-03-15 Active 100 400 0 0
JUNIOR LAKE AREA 643367 Single Cell Mining Claim 2023-03-15 Active 100 400 0 0
JUNIOR LAKE AREA 643368 Single Cell Mining Claim 2023-03-15 Active 100 400 0 0
JUNIOR LAKE AREA 643369 Single Cell Mining Claim 2023-03-15 Active 100 400 0 0
JUNIOR LAKE AREA 643370 Single Cell Mining Claim 2023-03-15 Active 100 400 0 0
JUNIOR LAKE AREA 643371 Single Cell Mining Claim 2023-03-15 Active 100 400 0 0
JUNIOR LAKE AREA 643372 Single Cell Mining Claim 2023-03-15 Active 100 400 0 0
JUNIOR LAKE AREA 643373 Single Cell Mining Claim 2023-03-15 Active 100 400 0 0
JUNIOR LAKE AREA 643374 Single Cell Mining Claim 2023-03-15 Active 100 400 0 0
JUNIOR LAKE AREA 643375 Single Cell Mining Claim 2023-03-15 Active 100 400 0 0
JUNIOR LAKE AREA 643376 Single Cell Mining Claim 2023-03-15 Active 100 400 0 0

Landore Resources Canada Inc. MINERAL RESOURCE ESTIMATE AND PRELIMINARY ECONOMIC ASSESSMENT, BAM Gold Project, Junior Lake Property, Ontario, Canada
Landore Resources Canada Inc. Page | 319
Township / Area Legacy Claim Id Tenure ID Tenure Type Anniversary Date Tenure Status Tenure % Work
Required (C$) Work Applied
(C$)
Available Exploration Reserve (C$)
JUNIOR LAKE AREA 643377 Single Cell Mining Claim 2023-03-15 Active 100 400 0 0
JUNIOR LAKE AREA 643378 Single Cell Mining Claim 2023-03-15 Active 100 400 0 0
JUNIOR LAKE AREA, SUMMIT LAKE 4215922 283523 Single Cell Mining Claim 2021-06-22 Active 100 400 1200 0
JUNIOR LAKE AREA,SUMMIT LAKE AREA 4259635 134191 Single Cell Mining Claim 2021-10-14 Active 100 400 1200 0
JUNIOR LAKE AREA,SUMMIT LAKE AREA 4259635 198872 Single Cell Mining Claim 2021-10-14 Active 100 400 1200 0
JUNIOR LAKE AREA,SUMMIT LAKE AREA 4259635 198873 Single Cell Mining Claim 2021-10-14 Active 100 400 1200 0
JUNIOR LAKE AREA,SUMMIT LAKE AREA 4259635 319392 Single Cell Mining Claim 2021-10-14 Active 100 400 1200 0
JUNIOR LAKE AREA,SUMMIT LAKE AREA 4259635 319393 Single Cell Mining Claim 2021-10-14 Active 100 400 1200 0
JUNIOR LAKE AREA,TORONTO LAKE AREA 3000984 108606 Single Cell Mining Claim 2021-06-22 Active 100 400 1200 0
JUNIOR LAKE AREA,TORONTO LAKE AREA 3000987 109425 Single Cell Mining Claim 2021-06-22 Active 100 400 1200 0
JUNIOR LAKE AREA,TORONTO LAKE AREA 4214270 119674 Single Cell Mining Claim 2021-09-24 Active 100 400 1200 0
JUNIOR LAKE AREA,TORONTO LAKE AREA 4214270 129063 Single Cell Mining Claim 2021-09-24 Active 100 400 1200 0
JUNIOR LAKE AREA,TORONTO LAKE AREA 3000987 140221 Single Cell Mining Claim 2021-06-22 Active 100 400 1200 0
JUNIOR LAKE AREA,TORONTO LAKE AREA 4215921 153279 Single Cell Mining Claim 2021-06-22 Active 100 400 1200 0
JUNIOR LAKE AREA,TORONTO LAKE AREA 4215920 161978 Single Cell Mining Claim 2021-06-22 Active 100 400 1200 0
JUNIOR LAKE AREA,TORONTO LAKE AREA 3000984 185701 Single Cell Mining Claim 2021-06-22 Active 100 400 1200 0
JUNIOR LAKE AREA,TORONTO LAKE AREA 4215921 187055 Single Cell Mining Claim 2021-06-22 Active 100 400 1200 0
JUNIOR LAKE AREA,TORONTO LAKE AREA 3000984 228030 Single Cell Mining Claim 2021-06-22 Active 100 400 1200 0
JUNIOR LAKE AREA,TORONTO LAKE AREA 4215922 234166 Single Cell Mining Claim 2021-06-22 Active 100 400 1200 0
JUNIOR LAKE AREA,TORONTO LAKE AREA 1077140 262437 Single Cell Mining Claim 2021-03-16 Active 100 200 600 0
JUNIOR LAKE AREA,TORONTO LAKE AREA 3000984 265031 Single Cell Mining Claim 2021-06-22 Active 100 400 1200 0
JUNIOR LAKE AREA,TORONTO LAKE AREA 4214270 277590 Single Cell Mining Claim 2021-09-24 Active 100 200 600 0
JUNIOR LAKE AREA,TORONTO LAKE AREA 4214270 277591 Single Cell Mining Claim 2021-09-24 Active 100 400 1200 0
JUNIOR LAKE AREA,TORONTO LAKE AREA 1077140 279419 Single Cell Mining Claim 2021-03-16 Active 100 400 1200 0
JUNIOR LAKE AREA,TORONTO LAKE AREA 4215920 300413 Single Cell Mining Claim 2021-06-22 Active 100 400 1200 0
JUNIOR LAKE AREA,TORONTO LAKE AREA 1077140 314964 Single Cell Mining Claim 2021-06-22 Active 100 400 1200 0
JUNIOR LAKE AREA,TORONTO LAKE AREA 4215920 317739 Single Cell Mining Claim 2021-06-22 Active 100 400 1200 0

Landore Resources Canada Inc. MINERAL RESOURCE ESTIMATE AND PRELIMINARY ECONOMIC ASSESSMENT, BAM Gold Project, Junior Lake Property, Ontario, Canada
Landore Resources Canada Inc. Page | 320
Township / Area Legacy Claim Id Tenure ID Tenure Type Anniversary Date Tenure Status Tenure % Work
Required (C$) Work Applied
(C$)
Available Exploration Reserve (C$)
JUNIOR LAKE AREA,TORONTO LAKE AREA 3000984 319013 Single Cell Mining Claim 2021-06-22 Active 100 400 1200 0
JUNIOR LAKE AREA,TORONTO LAKE AREA 4215921 319096 Single Cell Mining Claim 2021-06-22 Active 100 400 1200 0
JUNIOR LAKE AREA,TORONTO LAKE AREA 4215921 321264 Single Cell Mining Claim 2021-06-22 Active 100 400 1200 0
JUNIOR LAKE AREA,TORONTO LAKE AREA 1077140 338345 Single Cell Mining Claim 2021-03-16 Active 100 400 1200 0
RETURN LAKE AREA 4214270 163075 Single Cell Mining Claim 2021-09-24 Active 100 400 1200 0
RETURN LAKE AREA 4214270 222379 Single Cell Mining Claim 2021-09-24 Active 100 400 1200 0
RETURN LAKE AREA 643415 Single Cell Mining Claim 2023-03-15 Active 100 400 0 0
RETURN LAKE AREA 643420 Single Cell Mining Claim 2023-03-15 Active 100 400 0 0
RETURN LAKE AREA, TORONTO LAKE 643409 Single Cell Mining Claim 2023-03-15 Active 100 400 0 0
RETURN LAKE AREA, TORONTO LAKE 643411 Single Cell Mining Claim 2023-03-15 Active 100 400 0 0
RETURN LAKE AREA, TORONTO LAKE 643412 Single Cell Mining Claim 2023-03-15 Active 100 400 0 0
RETURN LAKE AREA, TORONTO LAKE 643416 Single Cell Mining Claim 2023-03-15 Active 100 400 0 0
RETURN LAKE AREA,TORONTO LAKE AREA 4214270 192470 Single Cell Mining Claim 2021-09-24 Active 100 400 1200 0
RETURN LAKE AREA,TORONTO LAKE AREA 4214270 337488 Single Cell Mining Claim 2021-09-24 Active 100 400 1200 0
STONE LAKE AREA,SUMMIT LAKE AREA 4259646 108456 Single Cell Mining Claim 2021-10-14 Active 100 400 1200 0
STONE LAKE AREA,SUMMIT LAKE AREA 4259642 132570 Single Cell Mining Claim 2021-10-14 Active 100 400 1200 0
STONE LAKE AREA,SUMMIT LAKE AREA 4259647 134479 Single Cell Mining Claim 2021-10-14 Active 100 400 1200 0
STONE LAKE AREA,SUMMIT LAKE AREA 4259644 144551 Single Cell Mining Claim 2021-10-14 Active 100 400 1200 0
STONE LAKE AREA,SUMMIT LAKE AREA 4259638 163263 Single Cell Mining Claim 2021-10-14 Active 100 400 1200 0
STONE LAKE AREA,SUMMIT LAKE AREA 4259644 163417 Single Cell Mining Claim 2021-10-14 Active 100 400 1200 0
STONE LAKE AREA,SUMMIT LAKE AREA 4259640 166122 Single Cell Mining Claim 2021-10-14 Active 100 400 1200 0
STONE LAKE AREA,SUMMIT LAKE AREA 4259640 166123 Single Cell Mining Claim 2021-10-14 Active 100 400 1200 0
STONE LAKE AREA,SUMMIT LAKE AREA 4259647 206668 Single Cell Mining Claim 2021-10-14 Active 100 400 1200 0
STONE LAKE AREA,SUMMIT LAKE AREA 4259638 222534 Single Cell Mining Claim 2021-10-14 Active 100 400 1200 0
STONE LAKE AREA,SUMMIT LAKE AREA 4259646 242281 Single Cell Mining Claim 2021-10-14 Active 100 400 1200 0
STONE LAKE AREA,SUMMIT LAKE AREA 4259638 242681 Single Cell Mining Claim 2021-10-14 Active 100 400 1200 0
STONE LAKE AREA,SUMMIT LAKE AREA 4259642 251404 Single Cell Mining Claim 2021-10-14 Active 100 400 1200 0
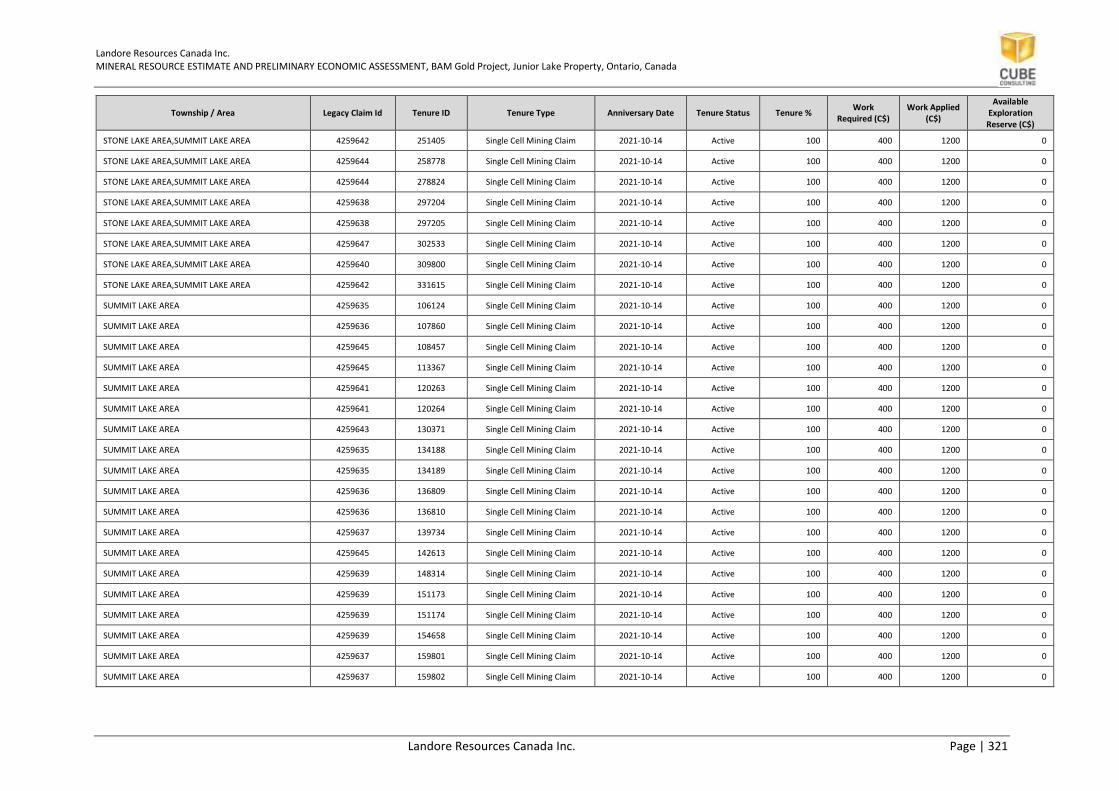
Landore Resources Canada Inc. MINERAL RESOURCE ESTIMATE AND PRELIMINARY ECONOMIC ASSESSMENT, BAM Gold Project, Junior Lake Property, Ontario, Canada
Landore Resources Canada Inc. Page | 321
Township / Area Legacy Claim Id Tenure ID Tenure Type Anniversary Date Tenure Status Tenure % Work
Required (C$) Work Applied
(C$)
Available Exploration Reserve (C$)
STONE LAKE AREA,SUMMIT LAKE AREA 4259642 251405 Single Cell Mining Claim 2021-10-14 Active 100 400 1200 0
STONE LAKE AREA,SUMMIT LAKE AREA 4259644 258778 Single Cell Mining Claim 2021-10-14 Active 100 400 1200 0
STONE LAKE AREA,SUMMIT LAKE AREA 4259644 278824 Single Cell Mining Claim 2021-10-14 Active 100 400 1200 0
STONE LAKE AREA,SUMMIT LAKE AREA 4259638 297204 Single Cell Mining Claim 2021-10-14 Active 100 400 1200 0
STONE LAKE AREA,SUMMIT LAKE AREA 4259638 297205 Single Cell Mining Claim 2021-10-14 Active 100 400 1200 0
STONE LAKE AREA,SUMMIT LAKE AREA 4259647 302533 Single Cell Mining Claim 2021-10-14 Active 100 400 1200 0
STONE LAKE AREA,SUMMIT LAKE AREA 4259640 309800 Single Cell Mining Claim 2021-10-14 Active 100 400 1200 0
STONE LAKE AREA,SUMMIT LAKE AREA 4259642 331615 Single Cell Mining Claim 2021-10-14 Active 100 400 1200 0
SUMMIT LAKE AREA 4259635 106124 Single Cell Mining Claim 2021-10-14 Active 100 400 1200 0
SUMMIT LAKE AREA 4259636 107860 Single Cell Mining Claim 2021-10-14 Active 100 400 1200 0
SUMMIT LAKE AREA 4259645 108457 Single Cell Mining Claim 2021-10-14 Active 100 400 1200 0
SUMMIT LAKE AREA 4259645 113367 Single Cell Mining Claim 2021-10-14 Active 100 400 1200 0
SUMMIT LAKE AREA 4259641 120263 Single Cell Mining Claim 2021-10-14 Active 100 400 1200 0
SUMMIT LAKE AREA 4259641 120264 Single Cell Mining Claim 2021-10-14 Active 100 400 1200 0
SUMMIT LAKE AREA 4259643 130371 Single Cell Mining Claim 2021-10-14 Active 100 400 1200 0
SUMMIT LAKE AREA 4259635 134188 Single Cell Mining Claim 2021-10-14 Active 100 400 1200 0
SUMMIT LAKE AREA 4259635 134189 Single Cell Mining Claim 2021-10-14 Active 100 400 1200 0
SUMMIT LAKE AREA 4259636 136809 Single Cell Mining Claim 2021-10-14 Active 100 400 1200 0
SUMMIT LAKE AREA 4259636 136810 Single Cell Mining Claim 2021-10-14 Active 100 400 1200 0
SUMMIT LAKE AREA 4259637 139734 Single Cell Mining Claim 2021-10-14 Active 100 400 1200 0
SUMMIT LAKE AREA 4259645 142613 Single Cell Mining Claim 2021-10-14 Active 100 400 1200 0
SUMMIT LAKE AREA 4259639 148314 Single Cell Mining Claim 2021-10-14 Active 100 400 1200 0
SUMMIT LAKE AREA 4259639 151173 Single Cell Mining Claim 2021-10-14 Active 100 400 1200 0
SUMMIT LAKE AREA 4259639 151174 Single Cell Mining Claim 2021-10-14 Active 100 400 1200 0
SUMMIT LAKE AREA 4259639 154658 Single Cell Mining Claim 2021-10-14 Active 100 400 1200 0
SUMMIT LAKE AREA 4259637 159801 Single Cell Mining Claim 2021-10-14 Active 100 400 1200 0
SUMMIT LAKE AREA 4259637 159802 Single Cell Mining Claim 2021-10-14 Active 100 400 1200 0

Landore Resources Canada Inc. MINERAL RESOURCE ESTIMATE AND PRELIMINARY ECONOMIC ASSESSMENT, BAM Gold Project, Junior Lake Property, Ontario, Canada
Landore Resources Canada Inc. Page | 322
Township / Area Legacy Claim Id Tenure ID Tenure Type Anniversary Date Tenure Status Tenure % Work
Required (C$) Work Applied
(C$)
Available Exploration Reserve (C$)
SUMMIT LAKE AREA 4259643 168624 Single Cell Mining Claim 2021-10-14 Active 100 400 1200 0
SUMMIT LAKE AREA 4259637 175953 Single Cell Mining Claim 2021-10-14 Active 100 400 1200 0
SUMMIT LAKE AREA 4259641 176912 Single Cell Mining Claim 2021-10-14 Active 100 400 1200 0
SUMMIT LAKE AREA 4259639 176913 Single Cell Mining Claim 2021-10-14 Active 100 400 1200 0
SUMMIT LAKE AREA 4259641 176914 Single Cell Mining Claim 2021-10-14 Active 100 400 1200 0
SUMMIT LAKE AREA 4259635 179403 Single Cell Mining Claim 2021-10-14 Active 100 400 1200 0
SUMMIT LAKE AREA 4259641 184272 Single Cell Mining Claim 2021-10-14 Active 100 400 1200 0
SUMMIT LAKE AREA 4259643 185719 Single Cell Mining Claim 2021-10-14 Active 100 400 1200 0
SUMMIT LAKE AREA 4259643 185720 Single Cell Mining Claim 2021-10-14 Active 100 400 1200 0
SUMMIT LAKE AREA 4259639 187790 Single Cell Mining Claim 2021-10-14 Active 100 400 1200 0
SUMMIT LAKE AREA 4259637 193308 Single Cell Mining Claim 2021-10-14 Active 100 400 1200 0
SUMMIT LAKE AREA 4259637 193805 Single Cell Mining Claim 2021-10-14 Active 100 400 1200 0
SUMMIT LAKE AREA 4259643 198584 Single Cell Mining Claim 2021-10-14 Active 100 400 1200 0
SUMMIT LAKE AREA 4259643 198585 Single Cell Mining Claim 2021-10-14 Active 100 400 1200 0
SUMMIT LAKE AREA 4259643 198586 Single Cell Mining Claim 2021-10-14 Active 100 400 1200 0
SUMMIT LAKE AREA 4259639 199300 Single Cell Mining Claim 2021-10-14 Active 100 400 1200 0
SUMMIT LAKE AREA 4259636 200973 Single Cell Mining Claim 2021-10-14 Active 100 400 1200 0
SUMMIT LAKE AREA 4259636 200974 Single Cell Mining Claim 2021-10-14 Active 100 400 1200 0
SUMMIT LAKE AREA 4259645 201308 Single Cell Mining Claim 2021-10-14 Active 100 400 1200 0
SUMMIT LAKE AREA 4259643 206580 Single Cell Mining Claim 2021-10-14 Active 100 400 1200 0
SUMMIT LAKE AREA 4259643 206581 Single Cell Mining Claim 2021-10-14 Active 100 400 1200 0
SUMMIT LAKE AREA 4259639 207314 Single Cell Mining Claim 2021-10-14 Active 100 400 1200 0
SUMMIT LAKE AREA 4259641 213645 Single Cell Mining Claim 2021-10-14 Active 100 400 1200 0
SUMMIT LAKE AREA 4259641 213646 Single Cell Mining Claim 2021-10-14 Active 100 400 1200 0
SUMMIT LAKE AREA 4259641 213647 Single Cell Mining Claim 2021-10-14 Active 100 400 1200 0
SUMMIT LAKE AREA 4259636 218683 Single Cell Mining Claim 2021-10-14 Active 100 400 1200 0
SUMMIT LAKE AREA 4259636 218684 Single Cell Mining Claim 2021-10-14 Active 100 400 1200 0

Landore Resources Canada Inc. MINERAL RESOURCE ESTIMATE AND PRELIMINARY ECONOMIC ASSESSMENT, BAM Gold Project, Junior Lake Property, Ontario, Canada
Landore Resources Canada Inc. Page | 323
Township / Area Legacy Claim Id Tenure ID Tenure Type Anniversary Date Tenure Status Tenure % Work
Required (C$) Work Applied
(C$)
Available Exploration Reserve (C$)
SUMMIT LAKE AREA 4259636 218685 Single Cell Mining Claim 2021-10-14 Active 100 400 1200 0
SUMMIT LAKE AREA 4259636 236054 Single Cell Mining Claim 2021-10-14 Active 100 400 1200 0
SUMMIT LAKE AREA 4259637 240456 Single Cell Mining Claim 2021-10-14 Active 100 400 1200 0
SUMMIT LAKE AREA 4259637 240457 Single Cell Mining Claim 2021-10-14 Active 100 400 1200 0
SUMMIT LAKE AREA 4259637 242682 Single Cell Mining Claim 2021-10-14 Active 100 400 1200 0
SUMMIT LAKE AREA 4259637 242683 Single Cell Mining Claim 2021-10-14 Active 100 400 1200 0
SUMMIT LAKE AREA 4259643 245790 Single Cell Mining Claim 2021-10-14 Active 100 400 1200 0
SUMMIT LAKE AREA 4259639 246506 Single Cell Mining Claim 2021-10-14 Active 100 400 1200 0
SUMMIT LAKE AREA 4259637 248512 Single Cell Mining Claim 2021-10-14 Active 100 400 1200 0
SUMMIT LAKE AREA 4259637 248513 Single Cell Mining Claim 2021-10-14 Active 100 400 1200 0
SUMMIT LAKE AREA 4259637 248514 Single Cell Mining Claim 2021-10-14 Active 100 400 1200 0
SUMMIT LAKE AREA 4259637 248515 Single Cell Mining Claim 2021-10-14 Active 100 400 1200 0
SUMMIT LAKE AREA 4259641 251061 Single Cell Mining Claim 2021-10-14 Active 100 400 1200 0
SUMMIT LAKE AREA 4259639 251062 Single Cell Mining Claim 2021-10-14 Active 100 400 1200 0
SUMMIT LAKE AREA 4259641 251063 Single Cell Mining Claim 2021-10-14 Active 100 400 1200 0
SUMMIT LAKE AREA 4259635 253488 Single Cell Mining Claim 2021-10-14 Active 100 400 1200 0
SUMMIT LAKE AREA 4259643 253793 Single Cell Mining Claim 2021-10-14 Active 100 400 1200 0
SUMMIT LAKE AREA 4259643 253794 Single Cell Mining Claim 2021-10-14 Active 100 400 1200 0
SUMMIT LAKE AREA 4259639 254481 Single Cell Mining Claim 2021-10-14 Active 100 400 1200 0
SUMMIT LAKE AREA 4259639 254482 Single Cell Mining Claim 2021-10-14 Active 100 400 1200 0
SUMMIT LAKE AREA 4259636 255571 Single Cell Mining Claim 2021-10-14 Active 100 400 1200 0
SUMMIT LAKE AREA 4259636 255572 Single Cell Mining Claim 2021-10-14 Active 100 400 1200 0
SUMMIT LAKE AREA 4259645 256475 Single Cell Mining Claim 2021-10-14 Active 100 400 1200 0
SUMMIT LAKE AREA 4259639 263090 Single Cell Mining Claim 2021-10-14 Active 100 400 1200 0
SUMMIT LAKE AREA 4259641 263091 Single Cell Mining Claim 2021-10-14 Active 100 400 1200 0
SUMMIT LAKE AREA 4259643 272580 Single Cell Mining Claim 2021-10-14 Active 100 400 1200 0
SUMMIT LAKE AREA 4259639 273299 Single Cell Mining Claim 2021-10-14 Active 100 400 1200 0

Landore Resources Canada Inc. MINERAL RESOURCE ESTIMATE AND PRELIMINARY ECONOMIC ASSESSMENT, BAM Gold Project, Junior Lake Property, Ontario, Canada
Landore Resources Canada Inc. Page | 324
Township / Area Legacy Claim Id Tenure ID Tenure Type Anniversary Date Tenure Status Tenure % Work
Required (C$) Work Applied
(C$)
Available Exploration Reserve (C$)
SUMMIT LAKE AREA 4259645 275300 Single Cell Mining Claim 2021-10-14 Active 100 400 1200 0
SUMMIT LAKE AREA 4259637 277178 Single Cell Mining Claim 2021-10-14 Active 100 400 1200 0
SUMMIT LAKE AREA 4259637 277179 Single Cell Mining Claim 2021-10-14 Active 100 400 1200 0
SUMMIT LAKE AREA 4259636 284595 Single Cell Mining Claim 2021-10-14 Active 100 400 1200 0
SUMMIT LAKE AREA 4259636 284596 Single Cell Mining Claim 2021-10-14 Active 100 400 1200 0
SUMMIT LAKE AREA 4259645 297430 Single Cell Mining Claim 2021-10-14 Active 100 400 1200 0
SUMMIT LAKE AREA 4259641 298159 Single Cell Mining Claim 2021-10-14 Active 100 400 1200 0
SUMMIT LAKE AREA 4259641 299618 Single Cell Mining Claim 2021-10-14 Active 100 400 1200 0
SUMMIT LAKE AREA 4259639 299619 Single Cell Mining Claim 2021-10-14 Active 100 400 1200 0
SUMMIT LAKE AREA 4259643 302437 Single Cell Mining Claim 2021-10-14 Active 100 400 1200 0
SUMMIT LAKE AREA 4259643 302438 Single Cell Mining Claim 2021-10-14 Active 100 400 1200 0
SUMMIT LAKE AREA 4259643 302439 Single Cell Mining Claim 2021-10-14 Active 100 400 1200 0
SUMMIT LAKE AREA 4259639 303152 Single Cell Mining Claim 2021-10-14 Active 100 400 1200 0
SUMMIT LAKE AREA 4259639 303153 Single Cell Mining Claim 2021-10-14 Active 100 400 1200 0
SUMMIT LAKE AREA 4259645 305115 Single Cell Mining Claim 2021-10-14 Active 100 400 1200 0
SUMMIT LAKE AREA 4259645 311925 Single Cell Mining Claim 2021-10-14 Active 100 400 1200 0
SUMMIT LAKE AREA 4259637 315006 Single Cell Mining Claim 2021-10-14 Active 100 400 1200 0
SUMMIT LAKE AREA 4259641 317623 Single Cell Mining Claim 2021-10-14 Active 100 400 1200 0
SUMMIT LAKE AREA 4259643 319791 Single Cell Mining Claim 2021-10-14 Active 100 400 1200 0
SUMMIT LAKE AREA 4259639 320500 Single Cell Mining Claim 2021-10-14 Active 100 400 1200 0
SUMMIT LAKE AREA 4259643 321956 Single Cell Mining Claim 2021-10-14 Active 100 400 1200 0
SUMMIT LAKE AREA 4259645 324640 Single Cell Mining Claim 2021-10-14 Active 100 400 1200 0
SUMMIT LAKE AREA 4259637 327191 Single Cell Mining Claim 2021-10-14 Active 100 400 1200 0
SUMMIT LAKE AREA 4259643 333337 Single Cell Mining Claim 2021-10-14 Active 100 400 1200 0
SUMMIT LAKE AREA 4259643 333338 Single Cell Mining Claim 2021-10-14 Active 100 400 1200 0
SUMMIT LAKE AREA 4259639 333733 Single Cell Mining Claim 2021-10-14 Active 100 400 1200 0
SUMMIT LAKE AREA 4259639 333734 Single Cell Mining Claim 2021-10-14 Active 100 400 1200 0

Landore Resources Canada Inc. MINERAL RESOURCE ESTIMATE AND PRELIMINARY ECONOMIC ASSESSMENT, BAM Gold Project, Junior Lake Property, Ontario, Canada
Landore Resources Canada Inc. Page | 325
Township / Area Legacy Claim Id Tenure ID Tenure Type Anniversary Date Tenure Status Tenure % Work
Required (C$) Work Applied
(C$)
Available Exploration Reserve (C$)
SUMMIT LAKE AREA 4259637 335928 Single Cell Mining Claim 2021-10-14 Active 100 400 1200 0
SUMMIT LAKE AREA 4259637 335929 Single Cell Mining Claim 2021-10-14 Active 100 400 1200 0
SUMMIT LAKE AREA 4259636 337512 Single Cell Mining Claim 2021-10-14 Active 100 400 1200 0
SUMMIT LAKE AREA 4259641 338482 Single Cell Mining Claim 2021-10-14 Active 100 400 1200 0
SUMMIT LAKE AREA 4259636 343028 Single Cell Mining Claim 2021-10-14 Active 100 400 1200 0
SUMMIT LAKE AREA,WILLET LAKE AREA 4215922 113842 Single Cell Mining Claim 2021-06-22 Active 100 400 1200 0
TORONTO LAKE AREA 4216258 104879 Single Cell Mining Claim 2021-07-04 Active 100 400 1200 0
TORONTO LAKE AREA 4216251 105476 Single Cell Mining Claim 2021-07-04 Active 100 400 1200 0
TORONTO LAKE AREA 4218852 106052 Single Cell Mining Claim 2021-06-22 Active 100 400 1200 0
TORONTO LAKE AREA 4216254 106591 Single Cell Mining Claim 2021-08-03 Active 100 400 1200 0
TORONTO LAKE AREA 3000987 107354 Single Cell Mining Claim 2022-10-09 Active 100 400 1600 0
TORONTO LAKE AREA 4208950 107446 Single Cell Mining Claim 2022-10-09 Active 100 400 1600 0
TORONTO LAKE AREA 4216253 108515 Single Cell Mining Claim 2021-07-04 Active 100 400 1200 0
TORONTO LAKE AREA 4216255 108580 Single Cell Mining Claim 2021-07-04 Active 100 400 1200 0
TORONTO LAKE AREA 4208950 109048 Single Cell Mining Claim 2021-10-09 Active 100 400 1200 0
TORONTO LAKE AREA 4208951 109845 Single Cell Mining Claim 2021-10-09 Active 100 400 1200 0
TORONTO LAKE AREA 4218854 112097 Single Cell Mining Claim 2021-06-22 Active 100 400 1200 0
TORONTO LAKE AREA 4247744 112530 Single Cell Mining Claim 2021-05-15 Active 100 400 1200 0
TORONTO LAKE AREA 4248589 115373 Single Cell Mining Claim 2020-12-15 Active 100 400 1200 0
TORONTO LAKE AREA 4248589 122080 Single Cell Mining Claim 2020-12-15 Active 100 400 1200 0
TORONTO LAKE AREA 4215924 124233 Single Cell Mining Claim 2021-06-22 Active 100 400 1200 0
TORONTO LAKE AREA 4215924 124318 Single Cell Mining Claim 2021-06-22 Active 100 400 1200 0
TORONTO LAKE AREA 3000984 125899 Single Cell Mining Claim 2021-07-04 Active 100 400 1200 0
TORONTO LAKE AREA 4216251 125900 Single Cell Mining Claim 2021-07-04 Active 100 400 1200 0
TORONTO LAKE AREA 4216258 128024 Single Cell Mining Claim 2021-07-04 Active 100 400 1200 0
TORONTO LAKE AREA 4216250 128035 Single Cell Mining Claim 2022-07-04 Active 100 400 1600 0
TORONTO LAKE AREA 4216250 128054 Single Cell Mining Claim 2022-07-04 Active 100 400 1600 0

Landore Resources Canada Inc. MINERAL RESOURCE ESTIMATE AND PRELIMINARY ECONOMIC ASSESSMENT, BAM Gold Project, Junior Lake Property, Ontario, Canada
Landore Resources Canada Inc. Page | 326
Township / Area Legacy Claim Id Tenure ID Tenure Type Anniversary Date Tenure Status Tenure % Work
Required (C$) Work Applied
(C$)
Available Exploration Reserve (C$)
TORONTO LAKE AREA 4208950 128055 Single Cell Mining Claim 2022-10-09 Active 100 400 1600 0
TORONTO LAKE AREA 4214270 129064 Single Cell Mining Claim 2021-09-24 Active 100 400 1200 0
TORONTO LAKE AREA 4216257 130084 Single Cell Mining Claim 2021-07-04 Active 100 400 1200 0
TORONTO LAKE AREA 4216256 130085 Single Cell Mining Claim 2022-07-04 Active 100 400 1600 0
TORONTO LAKE AREA 4216257 130086 Single Cell Mining Claim 2021-07-04 Active 100 400 1200 0
TORONTO LAKE AREA 4216257 130087 Single Cell Mining Claim 2022-07-04 Active 100 400 1600 0
TORONTO LAKE AREA 4216252 130370 Single Cell Mining Claim 2022-07-04 Active 100 400 1600 0
TORONTO LAKE AREA 4216253 130929 Single Cell Mining Claim 2021-07-04 Active 100 400 1200 0
TORONTO LAKE AREA 4216256 131380 Single Cell Mining Claim 2021-07-04 Active 100 400 1200 0
TORONTO LAKE AREA 4208950 131671 Single Cell Mining Claim 2021-10-09 Active 100 400 1200 0
TORONTO LAKE AREA 4216254 132785 Single Cell Mining Claim 2021-08-03 Active 100 400 1200 0
TORONTO LAKE AREA 4216254 132786 Single Cell Mining Claim 2021-08-03 Active 100 400 1200 0
TORONTO LAKE AREA 4216255 133030 Single Cell Mining Claim 2021-07-04 Active 100 400 1200 0
TORONTO LAKE AREA 4248589 133279 Single Cell Mining Claim 2020-12-15 Active 100 400 1200 0
TORONTO LAKE AREA 4248590 134089 Single Cell Mining Claim 2020-12-15 Active 100 400 1200 0
TORONTO LAKE AREA 4208951 135960 Single Cell Mining Claim 2021-10-09 Active 100 400 1200 0
TORONTO LAKE AREA 3000984 137365 Single Cell Mining Claim 2021-07-04 Active 100 400 1200 0
TORONTO LAKE AREA 4216251 137366 Single Cell Mining Claim 2021-07-04 Active 100 400 1200 0
TORONTO LAKE AREA 4208951 138309 Single Cell Mining Claim 2021-10-09 Active 100 400 1200 0
TORONTO LAKE AREA 4208951 138402 Single Cell Mining Claim 2021-10-09 Active 100 400 1200 0
TORONTO LAKE AREA 4216258 139985 Single Cell Mining Claim 2021-07-04 Active 100 400 1200 0
TORONTO LAKE AREA 4215924 141786 Single Cell Mining Claim 2021-06-22 Active 100 400 1200 0
TORONTO LAKE AREA 4215924 141787 Single Cell Mining Claim 2021-06-22 Active 100 400 1200 0
TORONTO LAKE AREA 4247744 143930 Single Cell Mining Claim 2021-05-15 Active 100 400 1200 0
TORONTO LAKE AREA 4218853 144469 Single Cell Mining Claim 2021-06-22 Active 100 400 1200 0
TORONTO LAKE AREA 4218853 144470 Single Cell Mining Claim 2021-06-22 Active 100 400 1200 0
TORONTO LAKE AREA 4248591 144471 Single Cell Mining Claim 2020-12-15 Active 100 400 1200 0

Landore Resources Canada Inc. MINERAL RESOURCE ESTIMATE AND PRELIMINARY ECONOMIC ASSESSMENT, BAM Gold Project, Junior Lake Property, Ontario, Canada
Landore Resources Canada Inc. Page | 327
Township / Area Legacy Claim Id Tenure ID Tenure Type Anniversary Date Tenure Status Tenure % Work
Required (C$) Work Applied
(C$)
Available Exploration Reserve (C$)
TORONTO LAKE AREA 4208949 144947 Single Cell Mining Claim 2022-10-09 Active 100 400 1600 0
TORONTO LAKE AREA 4208949 144948 Single Cell Mining Claim 2021-10-09 Active 100 400 1200 0
TORONTO LAKE AREA 4218854 145701 Single Cell Mining Claim 2021-06-22 Active 100 400 1200 0
TORONTO LAKE AREA 4216257 147568 Single Cell Mining Claim 2022-07-04 Active 100 400 1600 0
TORONTO LAKE AREA 4216253 147641 Single Cell Mining Claim 2022-07-04 Active 100 400 1600 0
TORONTO LAKE AREA 4216253 147642 Single Cell Mining Claim 2022-07-04 Active 100 400 1600 0
TORONTO LAKE AREA 4216253 147643 Single Cell Mining Claim 2022-07-04 Active 100 400 1600 0
TORONTO LAKE AREA 4218852 147706 Single Cell Mining Claim 2021-06-22 Active 100 400 1200 0
TORONTO LAKE AREA 4208951 148743 Single Cell Mining Claim 2021-10-09 Active 100 400 1200 0
TORONTO LAKE AREA 4248590 149543 Single Cell Mining Claim 2020-12-15 Active 100 400 1200 0
TORONTO LAKE AREA 4248590 149544 Single Cell Mining Claim 2020-12-15 Active 100 400 1200 0
TORONTO LAKE AREA 4216255 149711 Single Cell Mining Claim 2021-07-04 Active 100 400 1200 0
TORONTO LAKE AREA 4216255 149712 Single Cell Mining Claim 2021-07-04 Active 100 400 1200 0
TORONTO LAKE AREA 4216255 149713 Single Cell Mining Claim 2021-07-04 Active 100 400 1200 0
TORONTO LAKE AREA 4216258 154531 Single Cell Mining Claim 2021-07-04 Active 100 400 1200 0
TORONTO LAKE AREA 4215925 157175 Single Cell Mining Claim 2021-06-22 Active 100 400 1200 0
TORONTO LAKE AREA 4247744 162784 Single Cell Mining Claim 2021-05-15 Active 100 400 1200 0
TORONTO LAKE AREA 4247744 162804 Single Cell Mining Claim 2021-05-15 Active 100 400 1200 0
TORONTO LAKE AREA 4214270 163074 Single Cell Mining Claim 2021-09-24 Active 100 400 1200 0
TORONTO LAKE AREA 4247743 168487 Single Cell Mining Claim 2021-05-15 Active 100 400 1200 0
TORONTO LAKE AREA 4247743 168488 Single Cell Mining Claim 2021-05-15 Active 100 400 1200 0
TORONTO LAKE AREA 4248589 170080 Single Cell Mining Claim 2020-12-15 Active 100 400 1200 0
TORONTO LAKE AREA 4216250 170416 Single Cell Mining Claim 2021-07-04 Active 100 400 1200 0
TORONTO LAKE AREA 4216251 170417 Single Cell Mining Claim 2021-07-04 Active 100 400 1200 0
TORONTO LAKE AREA 4216254 172529 Single Cell Mining Claim 2021-08-03 Active 100 400 1200 0
TORONTO LAKE AREA 3000984 172553 Single Cell Mining Claim 2021-07-04 Active 100 400 1200 0
TORONTO LAKE AREA 4216251 172554 Single Cell Mining Claim 2021-07-04 Active 100 400 1200 0

Landore Resources Canada Inc. MINERAL RESOURCE ESTIMATE AND PRELIMINARY ECONOMIC ASSESSMENT, BAM Gold Project, Junior Lake Property, Ontario, Canada
Landore Resources Canada Inc. Page | 328
Township / Area Legacy Claim Id Tenure ID Tenure Type Anniversary Date Tenure Status Tenure % Work
Required (C$) Work Applied
(C$)
Available Exploration Reserve (C$)
TORONTO LAKE AREA 4208951 172967 Single Cell Mining Claim 2021-10-09 Active 100 400 1200 0
TORONTO LAKE AREA 4248591 173035 Single Cell Mining Claim 2020-12-15 Active 100 400 1200 0
TORONTO LAKE AREA 4248591 173036 Single Cell Mining Claim 2020-12-15 Active 100 400 1200 0
TORONTO LAKE AREA 4248591 173037 Single Cell Mining Claim 2020-12-15 Active 100 400 1200 0
TORONTO LAKE AREA 4208949 173547 Single Cell Mining Claim 2022-10-09 Active 100 400 1600 0
TORONTO LAKE AREA 4208949 173548 Single Cell Mining Claim 2021-10-09 Active 100 400 1200 0
TORONTO LAKE AREA 4216258 174688 Single Cell Mining Claim 2021-07-04 Active 100 400 1200 0
TORONTO LAKE AREA 4216257 176178 Single Cell Mining Claim 2021-07-04 Active 100 400 1200 0
TORONTO LAKE AREA 4215923 176812 Single Cell Mining Claim 2021-06-22 Active 100 400 1200 0
TORONTO LAKE AREA 4216254 178009 Single Cell Mining Claim 2021-08-03 Active 100 400 1200 0
TORONTO LAKE AREA 4216254 178010 Single Cell Mining Claim 2021-08-03 Active 100 400 1200 0
TORONTO LAKE AREA 4215921 180287 Single Cell Mining Claim 2021-06-22 Active 100 400 1200 0
TORONTO LAKE AREA 4215924 180880 Single Cell Mining Claim 2021-06-22 Active 100 400 1200 0
TORONTO LAKE AREA 4215923 180928 Single Cell Mining Claim 2021-06-22 Active 100 400 1200 0
TORONTO LAKE AREA 4247743 181928 Single Cell Mining Claim 2021-05-15 Active 100 400 1200 0
TORONTO LAKE AREA 4216252 182988 Single Cell Mining Claim 2021-07-04 Active 100 400 1200 0
TORONTO LAKE AREA 4215923 183676 Single Cell Mining Claim 2021-06-22 Active 100 400 1200 0
TORONTO LAKE AREA 4218852 183677 Single Cell Mining Claim 2021-06-22 Active 100 400 1200 0
TORONTO LAKE AREA 4216255 183678 Single Cell Mining Claim 2021-07-04 Active 100 400 1200 0
TORONTO LAKE AREA 4216254 184798 Single Cell Mining Claim 2021-08-03 Active 100 400 1200 0
TORONTO LAKE AREA 4216254 184799 Single Cell Mining Claim 2021-08-03 Active 100 400 1200 0
TORONTO LAKE AREA 4248589 186101 Single Cell Mining Claim 2020-12-15 Active 100 400 1200 0
TORONTO LAKE AREA 4247743 187970 Single Cell Mining Claim 2021-05-15 Active 100 400 1200 0
TORONTO LAKE AREA 4215924 188342 Single Cell Mining Claim 2021-06-22 Active 100 400 1200 0
TORONTO LAKE AREA 4215924 188343 Single Cell Mining Claim 2021-06-22 Active 100 400 1200 0
TORONTO LAKE AREA 4215923 188344 Single Cell Mining Claim 2021-06-22 Active 100 400 1200 0
TORONTO LAKE AREA 4215924 188345 Single Cell Mining Claim 2021-06-22 Active 100 400 1200 0

Landore Resources Canada Inc. MINERAL RESOURCE ESTIMATE AND PRELIMINARY ECONOMIC ASSESSMENT, BAM Gold Project, Junior Lake Property, Ontario, Canada
Landore Resources Canada Inc. Page | 329
Township / Area Legacy Claim Id Tenure ID Tenure Type Anniversary Date Tenure Status Tenure % Work
Required (C$) Work Applied
(C$)
Available Exploration Reserve (C$)
TORONTO LAKE AREA 4215920 188394 Single Cell Mining Claim 2021-06-22 Active 100 400 1200 0
TORONTO LAKE AREA 4215925 189629 Single Cell Mining Claim 2021-06-22 Active 100 400 1200 0
TORONTO LAKE AREA 4216252 190934 Single Cell Mining Claim 2021-07-04 Active 100 400 1200 0
TORONTO LAKE AREA 4208951 191009 Single Cell Mining Claim 2021-10-09 Active 100 400 1200 0
TORONTO LAKE AREA 4208951 191010 Single Cell Mining Claim 2021-10-09 Active 100 400 1200 0
TORONTO LAKE AREA 4248591 191083 Single Cell Mining Claim 2020-12-15 Active 100 400 1200 0
TORONTO LAKE AREA 3000987 191572 Single Cell Mining Claim 2022-07-04 Active 100 400 1600 0
TORONTO LAKE AREA 4216250 192107 Single Cell Mining Claim 2022-07-04 Active 100 400 1600 0
TORONTO LAKE AREA 4216257 195697 Single Cell Mining Claim 2022-07-04 Active 100 400 1600 0
TORONTO LAKE AREA 4216257 195698 Single Cell Mining Claim 2022-07-04 Active 100 400 1600 0
TORONTO LAKE AREA 4216253 195759 Single Cell Mining Claim 2022-07-04 Active 100 400 1600 0
TORONTO LAKE AREA 4215923 195806 Single Cell Mining Claim 2021-06-22 Active 100 400 1200 0
TORONTO LAKE AREA 4218852 195807 Single Cell Mining Claim 2021-06-22 Active 100 400 1200 0
TORONTO LAKE AREA 4216255 197826 Single Cell Mining Claim 2021-07-04 Active 100 400 1200 0
TORONTO LAKE AREA 4248589 198835 Single Cell Mining Claim 2020-12-15 Active 100 400 1200 0
TORONTO LAKE AREA 4215924 200526 Single Cell Mining Claim 2021-06-22 Active 100 400 1200 0
TORONTO LAKE AREA 4218853 200556 Single Cell Mining Claim 2021-06-22 Active 100 400 1200 0
TORONTO LAKE AREA 4215925 201821 Single Cell Mining Claim 2021-06-22 Active 100 400 1200 0
TORONTO LAKE AREA 4247744 202630 Single Cell Mining Claim 2021-05-15 Active 100 400 1200 0
TORONTO LAKE AREA 4216252 203108 Single Cell Mining Claim 2021-07-04 Active 100 400 1200 0
TORONTO LAKE AREA 1077140 203624 Single Cell Mining Claim 2021-10-09 Active 100 200 600 0
TORONTO LAKE AREA 4208951 203714 Single Cell Mining Claim 2021-10-09 Active 100 400 1200 0
TORONTO LAKE AREA 4216250 204215 Single Cell Mining Claim 2022-07-04 Active 100 400 1600 0
TORONTO LAKE AREA 4216255 205166 Single Cell Mining Claim 2021-07-04 Active 100 400 1200 0
TORONTO LAKE AREA 4215923 207891 Single Cell Mining Claim 2021-06-22 Active 100 400 1200 0
TORONTO LAKE AREA 4215923 207892 Single Cell Mining Claim 2021-06-22 Active 100 400 1200 0
TORONTO LAKE AREA 4208949 210264 Single Cell Mining Claim 2021-10-09 Active 100 200 600 0

Landore Resources Canada Inc. MINERAL RESOURCE ESTIMATE AND PRELIMINARY ECONOMIC ASSESSMENT, BAM Gold Project, Junior Lake Property, Ontario, Canada
Landore Resources Canada Inc. Page | 330
Township / Area Legacy Claim Id Tenure ID Tenure Type Anniversary Date Tenure Status Tenure % Work
Required (C$) Work Applied
(C$)
Available Exploration Reserve (C$)
TORONTO LAKE AREA 4216252 210411 Single Cell Mining Claim 2021-07-04 Active 100 400 1200 0
TORONTO LAKE AREA 4218853 210565 Single Cell Mining Claim 2021-06-22 Active 100 400 1200 0
TORONTO LAKE AREA 4248591 210566 Single Cell Mining Claim 2020-12-15 Active 100 400 1200 0
TORONTO LAKE AREA 4248591 210567 Single Cell Mining Claim 2020-12-15 Active 100 400 1200 0
TORONTO LAKE AREA 4248591 210568 Single Cell Mining Claim 2020-12-15 Active 100 400 1200 0
TORONTO LAKE AREA 4247744 210634 Single Cell Mining Claim 2021-05-15 Active 100 400 1200 0
TORONTO LAKE AREA 4216253 212380 Single Cell Mining Claim 2022-07-04 Active 100 400 1600 0
TORONTO LAKE AREA 4218852 213043 Single Cell Mining Claim 2021-06-22 Active 100 400 1200 0
TORONTO LAKE AREA 4216255 213044 Single Cell Mining Claim 2021-07-04 Active 100 400 1200 0
TORONTO LAKE AREA 4218852 215318 Single Cell Mining Claim 2021-06-22 Active 100 400 1200 0
TORONTO LAKE AREA 4248590 215319 Single Cell Mining Claim 2020-12-15 Active 100 400 1200 0
TORONTO LAKE AREA 4248590 215320 Single Cell Mining Claim 2020-12-15 Active 100 400 1200 0
TORONTO LAKE AREA 4218852 215321 Single Cell Mining Claim 2021-06-22 Active 100 400 1200 0
TORONTO LAKE AREA 4248589 215322 Single Cell Mining Claim 2020-12-15 Active 100 400 1200 0
TORONTO LAKE AREA 4247743 217287 Single Cell Mining Claim 2021-05-15 Active 100 400 1200 0
TORONTO LAKE AREA 4248589 218956 Single Cell Mining Claim 2020-12-15 Active 100 400 1200 0
TORONTO LAKE AREA 4215923 219235 Single Cell Mining Claim 2021-07-04 Active 100 400 1200 0
TORONTO LAKE AREA 4215923 219236 Single Cell Mining Claim 2021-07-04 Active 100 400 1200 0
TORONTO LAKE AREA 4216250 219237 Single Cell Mining Claim 2021-07-04 Active 100 400 1200 0
TORONTO LAKE AREA 4218853 220142 Single Cell Mining Claim 2021-06-22 Active 100 400 1200 0
TORONTO LAKE AREA 4216256 221284 Single Cell Mining Claim 2021-07-04 Active 100 400 1200 0
TORONTO LAKE AREA 4216258 221285 Single Cell Mining Claim 2022-07-04 Active 100 400 1600 0
TORONTO LAKE AREA 4247744 222181 Single Cell Mining Claim 2021-05-15 Active 100 400 1200 0
TORONTO LAKE AREA 4214270 222378 Single Cell Mining Claim 2021-09-24 Active 100 200 600 0
TORONTO LAKE AREA 4247744 222689 Single Cell Mining Claim 2021-05-15 Active 100 400 1200 0
TORONTO LAKE AREA 4247744 222690 Single Cell Mining Claim 2021-05-15 Active 100 400 1200 0
TORONTO LAKE AREA 4208951 224569 Single Cell Mining Claim 2021-10-09 Active 100 400 1200 0

Landore Resources Canada Inc. MINERAL RESOURCE ESTIMATE AND PRELIMINARY ECONOMIC ASSESSMENT, BAM Gold Project, Junior Lake Property, Ontario, Canada
Landore Resources Canada Inc. Page | 331
Township / Area Legacy Claim Id Tenure ID Tenure Type Anniversary Date Tenure Status Tenure % Work
Required (C$) Work Applied
(C$)
Available Exploration Reserve (C$)
TORONTO LAKE AREA 4216254 224570 Single Cell Mining Claim 2021-08-03 Active 100 400 1200 0
TORONTO LAKE AREA 4248589 226233 Single Cell Mining Claim 2020-12-15 Active 100 400 1200 0
TORONTO LAKE AREA 4215923 226673 Single Cell Mining Claim 2021-07-04 Active 100 400 1200 0
TORONTO LAKE AREA 4208949 228795 Single Cell Mining Claim 2021-10-09 Active 100 400 1200 0
TORONTO LAKE AREA 4216254 232598 Single Cell Mining Claim 2021-08-03 Active 100 400 1200 0
TORONTO LAKE AREA 4216256 232823 Single Cell Mining Claim 2021-07-04 Active 100 400 1200 0
TORONTO LAKE AREA 4216256 232824 Single Cell Mining Claim 2021-07-04 Active 100 400 1200 0
TORONTO LAKE AREA 4248590 233883 Single Cell Mining Claim 2020-12-15 Active 100 400 1200 0
TORONTO LAKE AREA 4247743 235800 Single Cell Mining Claim 2021-05-15 Active 100 400 1200 0
TORONTO LAKE AREA 4215923 237037 Single Cell Mining Claim 2021-06-22 Active 100 400 1200 0
TORONTO LAKE AREA 4247743 237361 Single Cell Mining Claim 2021-05-15 Active 100 400 1200 0
TORONTO LAKE AREA 4247743 237362 Single Cell Mining Claim 2021-05-15 Active 100 400 1200 0
TORONTO LAKE AREA 4216252 239046 Single Cell Mining Claim 2021-07-04 Active 100 400 1200 0
TORONTO LAKE AREA 4216251 239309 Single Cell Mining Claim 2021-07-04 Active 100 400 1200 0
TORONTO LAKE AREA 4248591 239714 Single Cell Mining Claim 2020-12-15 Active 100 400 1200 0
TORONTO LAKE AREA 4248591 239715 Single Cell Mining Claim 2020-12-15 Active 100 400 1200 0
TORONTO LAKE AREA 4247744 240484 Single Cell Mining Claim 2021-05-15 Active 100 400 1200 0
TORONTO LAKE AREA 4216258 241421 Single Cell Mining Claim 2022-07-04 Active 100 400 1600 0
TORONTO LAKE AREA 4216253 242278 Single Cell Mining Claim 2021-07-04 Active 100 400 1200 0
TORONTO LAKE AREA 4216253 242279 Single Cell Mining Claim 2022-07-04 Active 100 400 1600 0
TORONTO LAKE AREA 4216257 242280 Single Cell Mining Claim 2022-07-04 Active 100 400 1600 0
TORONTO LAKE AREA 4214270 242531 Single Cell Mining Claim 2021-09-24 Active 100 400 1200 0
TORONTO LAKE AREA 4208950 243565 Single Cell Mining Claim 2021-10-09 Active 100 400 1200 0
TORONTO LAKE AREA 4216255 246066 Single Cell Mining Claim 2021-07-04 Active 100 400 1200 0
TORONTO LAKE AREA 4248590 246067 Single Cell Mining Claim 2020-12-15 Active 100 400 1200 0
TORONTO LAKE AREA 4248590 246068 Single Cell Mining Claim 2020-12-15 Active 100 400 1200 0
TORONTO LAKE AREA 4208951 247717 Single Cell Mining Claim 2021-10-09 Active 100 400 1200 0

Landore Resources Canada Inc. MINERAL RESOURCE ESTIMATE AND PRELIMINARY ECONOMIC ASSESSMENT, BAM Gold Project, Junior Lake Property, Ontario, Canada
Landore Resources Canada Inc. Page | 332
Township / Area Legacy Claim Id Tenure ID Tenure Type Anniversary Date Tenure Status Tenure % Work
Required (C$) Work Applied
(C$)
Available Exploration Reserve (C$)
TORONTO LAKE AREA 3000987 248237 Single Cell Mining Claim 2021-07-04 Active 100 400 1200 0
TORONTO LAKE AREA 4218853 248536 Single Cell Mining Claim 2021-06-22 Active 100 400 1200 0
TORONTO LAKE AREA 4216257 248728 Single Cell Mining Claim 2022-07-04 Active 100 400 1600 0
TORONTO LAKE AREA 4216257 250291 Single Cell Mining Claim 2022-07-04 Active 100 400 1600 0
TORONTO LAKE AREA 4216253 250362 Single Cell Mining Claim 2022-07-04 Active 100 400 1600 0
TORONTO LAKE AREA 4216254 252110 Single Cell Mining Claim 2021-08-03 Active 100 400 1200 0
TORONTO LAKE AREA 4216255 252978 Single Cell Mining Claim 2021-07-04 Active 100 400 1200 0
TORONTO LAKE AREA 4216255 252979 Single Cell Mining Claim 2021-07-04 Active 100 400 1200 0
TORONTO LAKE AREA 4218853 255211 Single Cell Mining Claim 2021-06-22 Active 100 400 1200 0
TORONTO LAKE AREA 4215923 255646 Single Cell Mining Claim 2021-06-22 Active 100 400 1200 0
TORONTO LAKE AREA 4215923 255699 Single Cell Mining Claim 2021-06-22 Active 100 400 1200 0
TORONTO LAKE AREA 4215923 255700 Single Cell Mining Claim 2021-06-22 Active 100 400 1200 0
TORONTO LAKE AREA 4247744 257296 Single Cell Mining Claim 2021-05-15 Active 100 400 1200 0
TORONTO LAKE AREA 4247744 258659 Single Cell Mining Claim 2021-05-15 Active 100 400 1200 0
TORONTO LAKE AREA 4247744 258660 Single Cell Mining Claim 2021-05-15 Active 100 400 1200 0
TORONTO LAKE AREA 4214270 259026 Single Cell Mining Claim 2021-09-24 Active 100 400 1200 0
TORONTO LAKE AREA 4216252 259148 Single Cell Mining Claim 2021-07-04 Active 100 400 1200 0
TORONTO LAKE AREA 4208951 259232 Single Cell Mining Claim 2021-10-09 Active 100 400 1200 0
TORONTO LAKE AREA 4208951 259233 Single Cell Mining Claim 2021-10-09 Active 100 400 1200 0
TORONTO LAKE AREA 4216257 262338 Single Cell Mining Claim 2022-07-04 Active 100 400 1600 0
TORONTO LAKE AREA 4208950 263124 Single Cell Mining Claim 2021-10-09 Active 100 400 1200 0
TORONTO LAKE AREA 4248589 265436 Single Cell Mining Claim 2020-12-15 Active 100 400 1200 0
TORONTO LAKE AREA 4215921 267054 Single Cell Mining Claim 2021-06-22 Active 100 400 1200 0
TORONTO LAKE AREA 4208951 272486 Single Cell Mining Claim 2021-10-09 Active 100 400 1200 0
TORONTO LAKE AREA 4248589 272834 Single Cell Mining Claim 2020-12-15 Active 100 400 1200 0
TORONTO LAKE AREA 4248589 272835 Single Cell Mining Claim 2020-12-15 Active 100 400 1200 0
TORONTO LAKE AREA 4248589 272836 Single Cell Mining Claim 2020-12-15 Active 100 400 1200 0
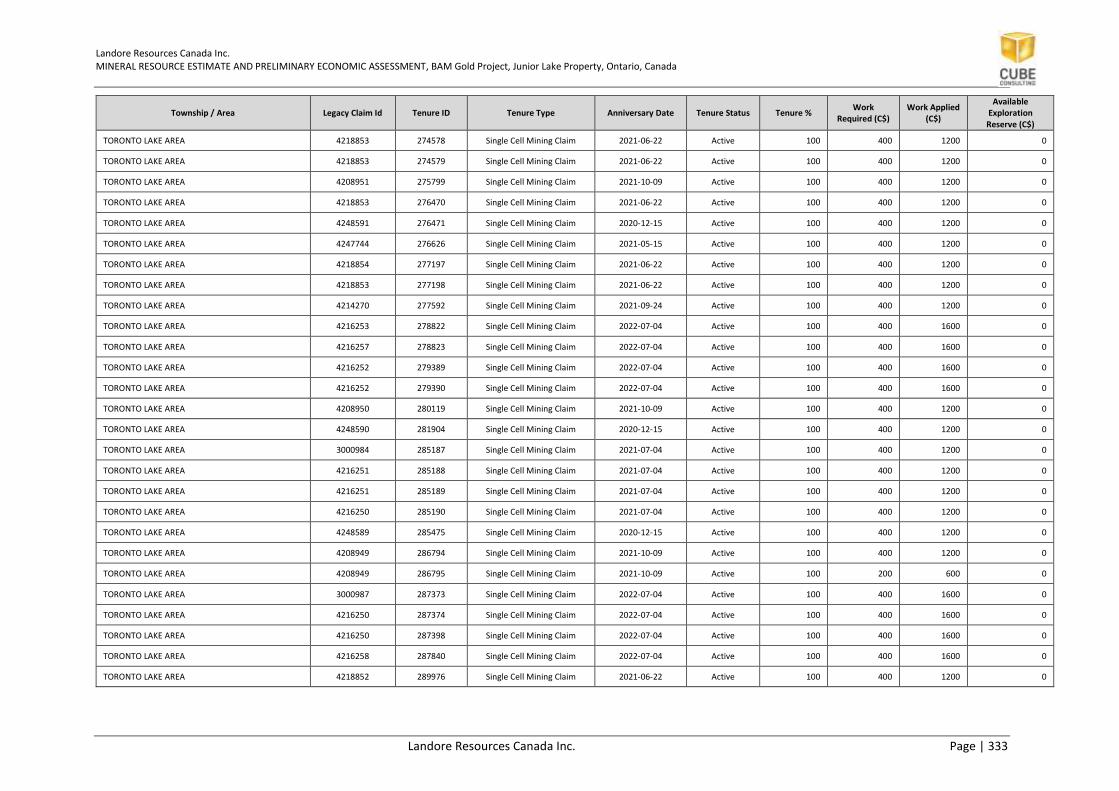
Landore Resources Canada Inc. MINERAL RESOURCE ESTIMATE AND PRELIMINARY ECONOMIC ASSESSMENT, BAM Gold Project, Junior Lake Property, Ontario, Canada
Landore Resources Canada Inc. Page | 333
Township / Area Legacy Claim Id Tenure ID Tenure Type Anniversary Date Tenure Status Tenure % Work
Required (C$) Work Applied
(C$)
Available Exploration Reserve (C$)
TORONTO LAKE AREA 4218853 274578 Single Cell Mining Claim 2021-06-22 Active 100 400 1200 0
TORONTO LAKE AREA 4218853 274579 Single Cell Mining Claim 2021-06-22 Active 100 400 1200 0
TORONTO LAKE AREA 4208951 275799 Single Cell Mining Claim 2021-10-09 Active 100 400 1200 0
TORONTO LAKE AREA 4218853 276470 Single Cell Mining Claim 2021-06-22 Active 100 400 1200 0
TORONTO LAKE AREA 4248591 276471 Single Cell Mining Claim 2020-12-15 Active 100 400 1200 0
TORONTO LAKE AREA 4247744 276626 Single Cell Mining Claim 2021-05-15 Active 100 400 1200 0
TORONTO LAKE AREA 4218854 277197 Single Cell Mining Claim 2021-06-22 Active 100 400 1200 0
TORONTO LAKE AREA 4218853 277198 Single Cell Mining Claim 2021-06-22 Active 100 400 1200 0
TORONTO LAKE AREA 4214270 277592 Single Cell Mining Claim 2021-09-24 Active 100 400 1200 0
TORONTO LAKE AREA 4216253 278822 Single Cell Mining Claim 2022-07-04 Active 100 400 1600 0
TORONTO LAKE AREA 4216257 278823 Single Cell Mining Claim 2022-07-04 Active 100 400 1600 0
TORONTO LAKE AREA 4216252 279389 Single Cell Mining Claim 2022-07-04 Active 100 400 1600 0
TORONTO LAKE AREA 4216252 279390 Single Cell Mining Claim 2022-07-04 Active 100 400 1600 0
TORONTO LAKE AREA 4208950 280119 Single Cell Mining Claim 2021-10-09 Active 100 400 1200 0
TORONTO LAKE AREA 4248590 281904 Single Cell Mining Claim 2020-12-15 Active 100 400 1200 0
TORONTO LAKE AREA 3000984 285187 Single Cell Mining Claim 2021-07-04 Active 100 400 1200 0
TORONTO LAKE AREA 4216251 285188 Single Cell Mining Claim 2021-07-04 Active 100 400 1200 0
TORONTO LAKE AREA 4216251 285189 Single Cell Mining Claim 2021-07-04 Active 100 400 1200 0
TORONTO LAKE AREA 4216250 285190 Single Cell Mining Claim 2021-07-04 Active 100 400 1200 0
TORONTO LAKE AREA 4248589 285475 Single Cell Mining Claim 2020-12-15 Active 100 400 1200 0
TORONTO LAKE AREA 4208949 286794 Single Cell Mining Claim 2021-10-09 Active 100 400 1200 0
TORONTO LAKE AREA 4208949 286795 Single Cell Mining Claim 2021-10-09 Active 100 200 600 0
TORONTO LAKE AREA 3000987 287373 Single Cell Mining Claim 2022-07-04 Active 100 400 1600 0
TORONTO LAKE AREA 4216250 287374 Single Cell Mining Claim 2022-07-04 Active 100 400 1600 0
TORONTO LAKE AREA 4216250 287398 Single Cell Mining Claim 2022-07-04 Active 100 400 1600 0
TORONTO LAKE AREA 4216258 287840 Single Cell Mining Claim 2022-07-04 Active 100 400 1600 0
TORONTO LAKE AREA 4218852 289976 Single Cell Mining Claim 2021-06-22 Active 100 400 1200 0

Landore Resources Canada Inc. MINERAL RESOURCE ESTIMATE AND PRELIMINARY ECONOMIC ASSESSMENT, BAM Gold Project, Junior Lake Property, Ontario, Canada
Landore Resources Canada Inc. Page | 334
Township / Area Legacy Claim Id Tenure ID Tenure Type Anniversary Date Tenure Status Tenure % Work
Required (C$) Work Applied
(C$)
Available Exploration Reserve (C$)
TORONTO LAKE AREA 4248590 289977 Single Cell Mining Claim 2020-12-15 Active 100 400 1200 0
TORONTO LAKE AREA 4247743 291831 Single Cell Mining Claim 2021-05-15 Active 100 400 1200 0
TORONTO LAKE AREA 4247743 291832 Single Cell Mining Claim 2021-05-15 Active 100 400 1200 0
TORONTO LAKE AREA 4247743 291833 Single Cell Mining Claim 2021-05-15 Active 100 400 1200 0
TORONTO LAKE AREA 4215924 292838 Single Cell Mining Claim 2021-06-22 Active 100 400 1200 0
TORONTO LAKE AREA 4215924 292839 Single Cell Mining Claim 2021-06-22 Active 100 400 1200 0
TORONTO LAKE AREA 4216251 293301 Single Cell Mining Claim 2021-07-04 Active 100 400 1200 0
TORONTO LAKE AREA 4216251 293302 Single Cell Mining Claim 2021-07-04 Active 100 400 1200 0
TORONTO LAKE AREA 4216258 295960 Single Cell Mining Claim 2021-07-04 Active 100 400 1200 0
TORONTO LAKE AREA 4214270 296453 Single Cell Mining Claim 2021-09-24 Active 100 200 600 0
TORONTO LAKE AREA 4216252 297429 Single Cell Mining Claim 2022-07-04 Active 100 400 1600 0
TORONTO LAKE AREA 4216255 298057 Single Cell Mining Claim 2021-07-04 Active 100 400 1200 0
TORONTO LAKE AREA 4208950 299656 Single Cell Mining Claim 2021-10-09 Active 100 400 1200 0
TORONTO LAKE AREA 4216256 299904 Single Cell Mining Claim 2021-07-04 Active 100 400 1200 0
TORONTO LAKE AREA 4216254 300848 Single Cell Mining Claim 2021-08-03 Active 100 400 1200 0
TORONTO LAKE AREA 4215924 303711 Single Cell Mining Claim 2021-06-22 Active 100 400 1200 0
TORONTO LAKE AREA 4216250 305932 Single Cell Mining Claim 2021-07-04 Active 100 400 1200 0
TORONTO LAKE AREA 4216252 306335 Single Cell Mining Claim 2021-07-04 Active 100 400 1200 0
TORONTO LAKE AREA 4248591 307027 Single Cell Mining Claim 2020-12-15 Active 100 400 1200 0
TORONTO LAKE AREA 1077140 307500 Single Cell Mining Claim 2022-10-09 Active 100 400 1600 0
TORONTO LAKE AREA 1077140 307501 Single Cell Mining Claim 2022-10-09 Active 100 400 1600 0
TORONTO LAKE AREA 4208949 307502 Single Cell Mining Claim 2021-10-09 Active 100 200 600 0
TORONTO LAKE AREA 4216257 308068 Single Cell Mining Claim 2022-07-04 Active 100 400 1600 0
TORONTO LAKE AREA 4216258 308069 Single Cell Mining Claim 2022-07-04 Active 100 400 1600 0
TORONTO LAKE AREA 4216254 308070 Single Cell Mining Claim 2021-08-03 Active 100 400 1200 0
TORONTO LAKE AREA 4216250 308132 Single Cell Mining Claim 2022-07-04 Active 100 400 1600 0
TORONTO LAKE AREA 4216256 310143 Single Cell Mining Claim 2022-07-04 Active 100 400 1600 0

Landore Resources Canada Inc. MINERAL RESOURCE ESTIMATE AND PRELIMINARY ECONOMIC ASSESSMENT, BAM Gold Project, Junior Lake Property, Ontario, Canada
Landore Resources Canada Inc. Page | 335
Township / Area Legacy Claim Id Tenure ID Tenure Type Anniversary Date Tenure Status Tenure % Work
Required (C$) Work Applied
(C$)
Available Exploration Reserve (C$)
TORONTO LAKE AREA 4218852 310289 Single Cell Mining Claim 2021-06-22 Active 100 400 1200 0
TORONTO LAKE AREA 4215921 310999 Single Cell Mining Claim 2021-06-22 Active 100 400 1200 0
TORONTO LAKE AREA 4215921 311000 Single Cell Mining Claim 2021-06-22 Active 100 400 1200 0
TORONTO LAKE AREA 4215920 311001 Single Cell Mining Claim 2021-06-22 Active 100 400 1200 0
TORONTO LAKE AREA 4215924 311061 Single Cell Mining Claim 2021-06-22 Active 100 400 1200 0
TORONTO LAKE AREA 4215920 311102 Single Cell Mining Claim 2021-06-22 Active 100 400 1200 0
TORONTO LAKE AREA 4218853 311167 Single Cell Mining Claim 2021-06-22 Active 100 400 1200 0
TORONTO LAKE AREA 4215922 312346 Single Cell Mining Claim 2021-06-22 Active 100 400 1200 0
TORONTO LAKE AREA 4216252 313136 Single Cell Mining Claim 2021-07-04 Active 100 400 1200 0
TORONTO LAKE AREA 4248591 313788 Single Cell Mining Claim 2020-12-15 Active 100 400 1200 0
TORONTO LAKE AREA 1077140 314202 Single Cell Mining Claim 2021-10-09 Active 100 400 1200 0
TORONTO LAKE AREA 4216250 314821 Single Cell Mining Claim 2022-07-04 Active 100 400 1600 0
TORONTO LAKE AREA 3000987 314965 Single Cell Mining Claim 2022-06-22 Active 100 400 1600 0
TORONTO LAKE AREA 4216257 316865 Single Cell Mining Claim 2021-07-04 Active 100 400 1200 0
TORONTO LAKE AREA 4208951 317479 Single Cell Mining Claim 2021-10-09 Active 100 400 1200 0
TORONTO LAKE AREA 4216255 318989 Single Cell Mining Claim 2021-07-04 Active 100 400 1200 0
TORONTO LAKE AREA 3000984 322428 Single Cell Mining Claim 2021-07-04 Active 100 400 1200 0
TORONTO LAKE AREA 4215923 322429 Single Cell Mining Claim 2021-07-04 Active 100 400 1200 0
TORONTO LAKE AREA 4216251 322430 Single Cell Mining Claim 2021-07-04 Active 100 400 1200 0
TORONTO LAKE AREA 4214270 325631 Single Cell Mining Claim 2021-09-24 Active 100 400 1200 0
TORONTO LAKE AREA 4216252 325828 Single Cell Mining Claim 2021-07-04 Active 100 400 1200 0
TORONTO LAKE AREA 4248591 326478 Single Cell Mining Claim 2020-12-15 Active 100 400 1200 0
TORONTO LAKE AREA 4248591 335175 Single Cell Mining Claim 2020-12-15 Active 100 400 1200 0
TORONTO LAKE AREA 4248591 335176 Single Cell Mining Claim 2020-12-15 Active 100 400 1200 0
TORONTO LAKE AREA 4216250 335673 Single Cell Mining Claim 2022-07-04 Active 100 400 1600 0
TORONTO LAKE AREA 4216256 336205 Single Cell Mining Claim 2021-07-04 Active 100 400 1200 0
TORONTO LAKE AREA 4216256 336206 Single Cell Mining Claim 2021-07-04 Active 100 400 1200 0

Landore Resources Canada Inc. MINERAL RESOURCE ESTIMATE AND PRELIMINARY ECONOMIC ASSESSMENT, BAM Gold Project, Junior Lake Property, Ontario, Canada
Landore Resources Canada Inc. Page | 336
Township / Area Legacy Claim Id Tenure ID Tenure Type Anniversary Date Tenure Status Tenure % Work
Required (C$) Work Applied
(C$)
Available Exploration Reserve (C$)
TORONTO LAKE AREA 4216258 336207 Single Cell Mining Claim 2021-07-04 Active 100 400 1200 0
TORONTO LAKE AREA 4216257 337745 Single Cell Mining Claim 2022-07-04 Active 100 400 1600 0
TORONTO LAKE AREA 4216257 337746 Single Cell Mining Claim 2022-07-04 Active 100 400 1600 0
TORONTO LAKE AREA 4216253 337811 Single Cell Mining Claim 2022-07-04 Active 100 400 1600 0
TORONTO LAKE AREA 4218852 338385 Single Cell Mining Claim 2021-06-22 Active 100 400 1200 0
TORONTO LAKE AREA 4208951 339581 Single Cell Mining Claim 2021-10-09 Active 100 400 1200 0
TORONTO LAKE AREA 4216254 339582 Single Cell Mining Claim 2021-08-03 Active 100 400 1200 0
TORONTO LAKE AREA 4216254 339583 Single Cell Mining Claim 2021-08-03 Active 100 400 1200 0
TORONTO LAKE AREA 4248590 340362 Single Cell Mining Claim 2020-12-15 Active 100 400 1200 0
TORONTO LAKE AREA 4215924 342428 Single Cell Mining Claim 2021-06-22 Active 100 400 1200 0
TORONTO LAKE AREA 4215923 342499 Single Cell Mining Claim 2021-06-22 Active 100 400 1200 0
TORONTO LAKE AREA 4215924 342500 Single Cell Mining Claim 2021-06-22 Active 100 400 1200 0
TORONTO LAKE AREA 4215924 342501 Single Cell Mining Claim 2021-06-22 Active 100 400 1200 0
TORONTO LAKE AREA 4208951 343399 Single Cell Mining Claim 2021-10-09 Active 100 400 1200 0
TORONTO LAKE AREA 4247743 343400 Single Cell Mining Claim 2021-05-15 Active 100 400 1200 0
TORONTO LAKE AREA 4208951 343401 Single Cell Mining Claim 2021-10-09 Active 100 400 1200 0
TORONTO LAKE AREA 4215925 343823 Single Cell Mining Claim 2021-06-22 Active 100 400 1200 0
TORONTO LAKE AREA 4216251 344858 Single Cell Mining Claim 2021-07-04 Active 100 400 1200 0
TORONTO LAKE AREA 4208951 345195 Single Cell Mining Claim 2021-10-09 Active 100 400 1200 0
TORONTO LAKE AREA 643379 Single Cell Mining Claim 2023-03-15 Active 100 400 0 0
TORONTO LAKE AREA 643380 Single Cell Mining Claim 2023-03-15 Active 100 400 0 0
TORONTO LAKE AREA 643381 Single Cell Mining Claim 2023-03-15 Active 100 400 0 0
TORONTO LAKE AREA 643382 Single Cell Mining Claim 2023-03-15 Active 100 400 0 0
TORONTO LAKE AREA 643383 Single Cell Mining Claim 2023-03-15 Active 100 400 0 0
TORONTO LAKE AREA 643384 Single Cell Mining Claim 2023-03-15 Active 100 400 0 0
TORONTO LAKE AREA 643385 Single Cell Mining Claim 2023-03-15 Active 100 400 0 0
TORONTO LAKE AREA 643386 Single Cell Mining Claim 2023-03-15 Active 100 400 0 0
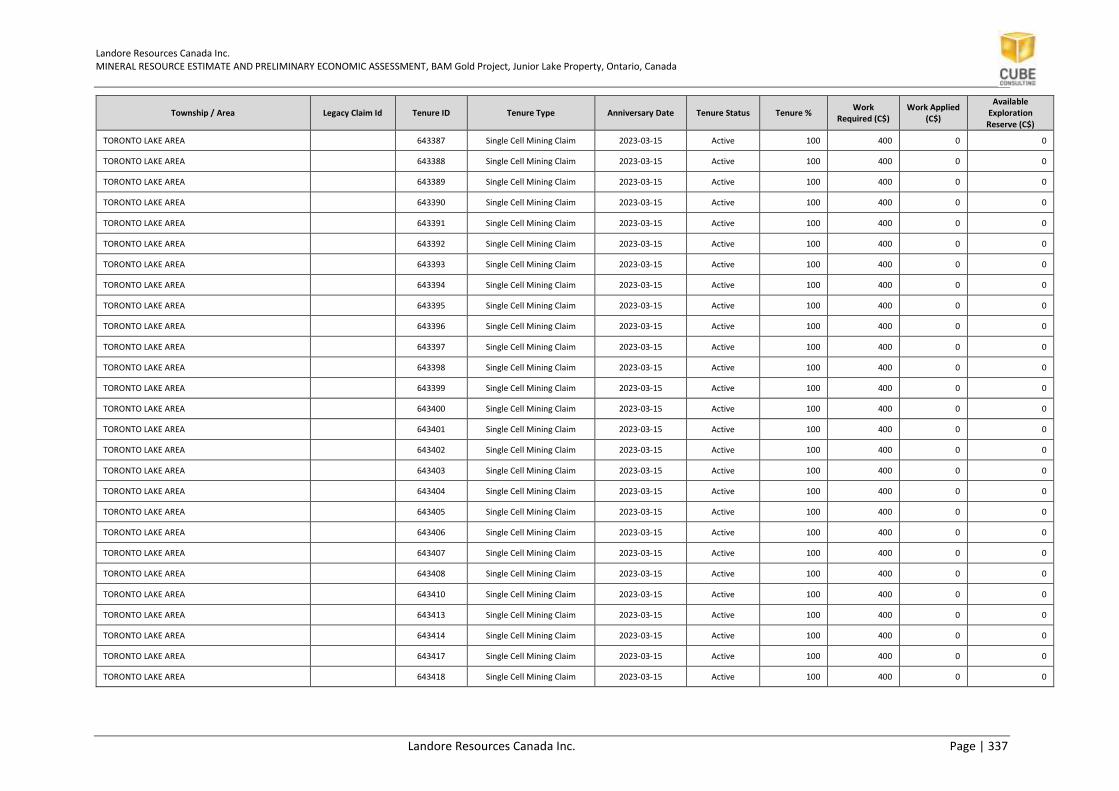
Landore Resources Canada Inc. MINERAL RESOURCE ESTIMATE AND PRELIMINARY ECONOMIC ASSESSMENT, BAM Gold Project, Junior Lake Property, Ontario, Canada
Landore Resources Canada Inc. Page | 337
Township / Area Legacy Claim Id Tenure ID Tenure Type Anniversary Date Tenure Status Tenure % Work
Required (C$) Work Applied
(C$)
Available Exploration Reserve (C$)
TORONTO LAKE AREA 643387 Single Cell Mining Claim 2023-03-15 Active 100 400 0 0
TORONTO LAKE AREA 643388 Single Cell Mining Claim 2023-03-15 Active 100 400 0 0
TORONTO LAKE AREA 643389 Single Cell Mining Claim 2023-03-15 Active 100 400 0 0
TORONTO LAKE AREA 643390 Single Cell Mining Claim 2023-03-15 Active 100 400 0 0
TORONTO LAKE AREA 643391 Single Cell Mining Claim 2023-03-15 Active 100 400 0 0
TORONTO LAKE AREA 643392 Single Cell Mining Claim 2023-03-15 Active 100 400 0 0
TORONTO LAKE AREA 643393 Single Cell Mining Claim 2023-03-15 Active 100 400 0 0
TORONTO LAKE AREA 643394 Single Cell Mining Claim 2023-03-15 Active 100 400 0 0
TORONTO LAKE AREA 643395 Single Cell Mining Claim 2023-03-15 Active 100 400 0 0
TORONTO LAKE AREA 643396 Single Cell Mining Claim 2023-03-15 Active 100 400 0 0
TORONTO LAKE AREA 643397 Single Cell Mining Claim 2023-03-15 Active 100 400 0 0
TORONTO LAKE AREA 643398 Single Cell Mining Claim 2023-03-15 Active 100 400 0 0
TORONTO LAKE AREA 643399 Single Cell Mining Claim 2023-03-15 Active 100 400 0 0
TORONTO LAKE AREA 643400 Single Cell Mining Claim 2023-03-15 Active 100 400 0 0
TORONTO LAKE AREA 643401 Single Cell Mining Claim 2023-03-15 Active 100 400 0 0
TORONTO LAKE AREA 643402 Single Cell Mining Claim 2023-03-15 Active 100 400 0 0
TORONTO LAKE AREA 643403 Single Cell Mining Claim 2023-03-15 Active 100 400 0 0
TORONTO LAKE AREA 643404 Single Cell Mining Claim 2023-03-15 Active 100 400 0 0
TORONTO LAKE AREA 643405 Single Cell Mining Claim 2023-03-15 Active 100 400 0 0
TORONTO LAKE AREA 643406 Single Cell Mining Claim 2023-03-15 Active 100 400 0 0
TORONTO LAKE AREA 643407 Single Cell Mining Claim 2023-03-15 Active 100 400 0 0
TORONTO LAKE AREA 643408 Single Cell Mining Claim 2023-03-15 Active 100 400 0 0
TORONTO LAKE AREA 643410 Single Cell Mining Claim 2023-03-15 Active 100 400 0 0
TORONTO LAKE AREA 643413 Single Cell Mining Claim 2023-03-15 Active 100 400 0 0
TORONTO LAKE AREA 643414 Single Cell Mining Claim 2023-03-15 Active 100 400 0 0
TORONTO LAKE AREA 643417 Single Cell Mining Claim 2023-03-15 Active 100 400 0 0
TORONTO LAKE AREA 643418 Single Cell Mining Claim 2023-03-15 Active 100 400 0 0

Landore Resources Canada Inc. MINERAL RESOURCE ESTIMATE AND PRELIMINARY ECONOMIC ASSESSMENT, BAM Gold Project, Junior Lake Property, Ontario, Canada
Landore Resources Canada Inc. Page | 338
Township / Area Legacy Claim Id Tenure ID Tenure Type Anniversary Date Tenure Status Tenure % Work
Required (C$) Work Applied
(C$)
Available Exploration Reserve (C$)
TORONTO LAKE AREA 643419 Single Cell Mining Claim 2023-03-15 Active 100 400 0 0
TORONTO LAKE AREA 643421 Single Cell Mining Claim 2023-03-15 Active 100 400 0 0
TORONTO LAKE AREA 643422 Single Cell Mining Claim 2023-03-15 Active 100 400 0 0
TORONTO LAKE AREA 643423 Single Cell Mining Claim 2023-03-15 Active 100 400 0 0
TORONTO LAKE AREA 643424 Single Cell Mining Claim 2023-03-15 Active 100 400 0 0
TORONTO LAKE AREA 643425 Single Cell Mining Claim 2023-03-15 Active 100 400 0 0
TORONTO LAKE AREA 643426 Single Cell Mining Claim 2023-03-15 Active 100 400 0 0
TORONTO LAKE AREA 643427 Single Cell Mining Claim 2023-03-15 Active 100 400 0 0
TORONTO LAKE AREA 643428 Single Cell Mining Claim 2023-03-15 Active 100 400 0 0
TORONTO LAKE AREA 643429 Single Cell Mining Claim 2023-03-15 Active 100 400 0 0
TORONTO LAKE AREA 643430 Single Cell Mining Claim 2023-03-15 Active 100 400 0 0
TORONTO LAKE AREA 643431 Single Cell Mining Claim 2023-03-15 Active 100 400 0 0
TORONTO LAKE AREA 643432 Single Cell Mining Claim 2023-03-15 Active 100 400 0 0
TORONTO LAKE AREA 643433 Single Cell Mining Claim 2023-03-15 Active 100 400 0 0
TORONTO LAKE AREA 643434 Single Cell Mining Claim 2023-03-15 Active 100 400 0 0
TORONTO LAKE AREA 643435 Single Cell Mining Claim 2023-03-15 Active 100 400 0 0
TORONTO LAKE AREA 643436 Single Cell Mining Claim 2023-03-15 Active 100 400 0 0
TORONTO LAKE AREA 643437 Single Cell Mining Claim 2023-03-15 Active 100 400 0 0
TORONTO LAKE AREA 643438 Single Cell Mining Claim 2023-03-15 Active 100 400 0 0
TORONTO LAKE AREA 643439 Single Cell Mining Claim 2023-03-15 Active 100 400 0 0
TORONTO LAKE AREA 643440 Single Cell Mining Claim 2023-03-15 Active 100 400 0 0
TORONTO LAKE AREA 643441 Single Cell Mining Claim 2023-03-15 Active 100 400 0 0
TORONTO LAKE AREA 643442 Single Cell Mining Claim 2023-03-15 Active 100 400 0 0
TORONTO LAKE AREA 643443 Single Cell Mining Claim 2023-03-15 Active 100 400 0 0
TORONTO LAKE AREA 643444 Single Cell Mining Claim 2023-03-15 Active 100 400 0 0
TORONTO LAKE AREA 643445 Single Cell Mining Claim 2023-03-15 Active 100 400 0 0
TORONTO LAKE AREA 643446 Single Cell Mining Claim 2023-03-15 Active 100 400 0 0

Landore Resources Canada Inc. MINERAL RESOURCE ESTIMATE AND PRELIMINARY ECONOMIC ASSESSMENT, BAM Gold Project, Junior Lake Property, Ontario, Canada
Landore Resources Canada Inc. Page | 339
Township / Area Legacy Claim Id Tenure ID Tenure Type Anniversary Date Tenure Status Tenure % Work
Required (C$) Work Applied
(C$)
Available Exploration Reserve (C$)
TORONTO LAKE AREA 643447 Single Cell Mining Claim 2023-03-15 Active 100 400 0 0
TORONTO LAKE AREA 643448 Single Cell Mining Claim 2023-03-15 Active 100 400 0 0
TORONTO LAKE AREA 643449 Single Cell Mining Claim 2023-03-15 Active 100 400 0 0
TORONTO LAKE AREA 643450 Single Cell Mining Claim 2023-03-15 Active 100 400 0 0
TORONTO LAKE AREA 643451 Single Cell Mining Claim 2023-03-15 Active 100 400 0 0
TORONTO LAKE AREA 643452 Single Cell Mining Claim 2023-03-15 Active 100 400 0 0
TORONTO LAKE AREA 643453 Single Cell Mining Claim 2023-03-15 Active 100 400 0 0
TORONTO LAKE AREA 643454 Single Cell Mining Claim 2023-03-15 Active 100 400 0 0
TORONTO LAKE AREA 643455 Single Cell Mining Claim 2023-03-15 Active 100 400 0 0
TORONTO LAKE AREA 643456 Single Cell Mining Claim 2023-03-15 Active 100 400 0 0
TORONTO LAKE AREA 643457 Single Cell Mining Claim 2023-03-15 Active 100 400 0 0
TORONTO LAKE AREA 643458 Single Cell Mining Claim 2023-03-15 Active 100 400 0 0
TORONTO LAKE AREA 643459 Single Cell Mining Claim 2023-03-15 Active 100 400 0 0
TORONTO LAKE AREA 643460 Single Cell Mining Claim 2023-03-15 Active 100 400 0 0
TORONTO LAKE AREA 643461 Single Cell Mining Claim 2023-03-15 Active 100 400 0 0
TORONTO LAKE AREA 643462 Single Cell Mining Claim 2023-03-15 Active 100 400 0 0
TORONTO LAKE AREA 643463 Single Cell Mining Claim 2023-03-15 Active 100 400 0 0
TORONTO LAKE AREA 643464 Single Cell Mining Claim 2023-03-15 Active 100 400 0 0
TORONTO LAKE AREA 643465 Single Cell Mining Claim 2023-03-15 Active 100 400 0 0
TORONTO LAKE AREA 643466 Single Cell Mining Claim 2023-03-15 Active 100 400 0 0
TORONTO LAKE AREA 643467 Single Cell Mining Claim 2023-03-15 Active 100 400 0 0
TORONTO LAKE AREA 643468 Single Cell Mining Claim 2023-03-15 Active 100 400 0 0
TORONTO LAKE AREA 643469 Single Cell Mining Claim 2023-03-15 Active 100 400 0 0
TORONTO LAKE AREA 643470 Single Cell Mining Claim 2023-03-15 Active 100 400 0 0
TORONTO LAKE AREA 643471 Single Cell Mining Claim 2023-03-15 Active 100 400 0 0
TORONTO LAKE AREA 643472 Single Cell Mining Claim 2023-03-15 Active 100 400 0 0
TORONTO LAKE AREA 643473 Single Cell Mining Claim 2023-03-15 Active 100 400 0 0

Landore Resources Canada Inc. MINERAL RESOURCE ESTIMATE AND PRELIMINARY ECONOMIC ASSESSMENT, BAM Gold Project, Junior Lake Property, Ontario, Canada
Landore Resources Canada Inc. Page | 340
Township / Area Legacy Claim Id Tenure ID Tenure Type Anniversary Date Tenure Status Tenure % Work
Required (C$) Work Applied
(C$)
Available Exploration Reserve (C$)
TORONTO LAKE AREA 643474 Single Cell Mining Claim 2023-03-15 Active 100 400 0 0
TORONTO LAKE AREA 643475 Single Cell Mining Claim 2023-03-15 Active 100 400 0 0
TORONTO LAKE AREA 643476 Single Cell Mining Claim 2023-03-15 Active 100 400 0 0
TORONTO LAKE AREA,WILLET LAKE AREA 4215922 157172 Single Cell Mining Claim 2021-06-22 Active 100 400 1200 0
TORONTO LAKE AREA,WILLET LAKE AREA 4215925 157174 Single Cell Mining Claim 2021-06-22 Active 100 400 1200 0
TORONTO LAKE AREA,WILLET LAKE AREA 4215925 157176 Single Cell Mining Claim 2021-06-22 Active 100 400 1200 0
TORONTO LAKE AREA,WILLET LAKE AREA 4218854 192365 Single Cell Mining Claim 2021-06-22 Active 100 400 1200 0
TORONTO LAKE AREA,WILLET LAKE AREA 4218854 192366 Single Cell Mining Claim 2021-06-22 Active 100 400 1200 0
TORONTO LAKE AREA,WILLET LAKE AREA 4215925 201822 Single Cell Mining Claim 2021-06-22 Active 100 400 1200 0
TORONTO LAKE AREA,WILLET LAKE AREA 4218854 248535 Single Cell Mining Claim 2021-06-22 Active 100 400 1200 0
TORONTO LAKE AREA,WILLET LAKE AREA 4215925 291610 Single Cell Mining Claim 2021-06-22 Active 100 400 1200 0
WILLET LAKE AREA 4218854 139746 Single Cell Mining Claim 2021-06-22 Active 100 400 1200 0
WILLET LAKE AREA 4215922 143053 Single Cell Mining Claim 2021-06-22 Active 100 400 1200 0
WILLET LAKE AREA 4215925 143054 Single Cell Mining Claim 2021-06-22 Active 100 400 1200 0
WILLET LAKE AREA 4215925 157173 Single Cell Mining Claim 2021-06-22 Active 100 400 1200 0
WILLET LAKE AREA 4218854 174294 Single Cell Mining Claim 2021-06-22 Active 100 400 1200 0
WILLET LAKE AREA 4218854 174295 Single Cell Mining Claim 2021-06-22 Active 100 400 1200 0
WILLET LAKE AREA 4215925 182198 Single Cell Mining Claim 2021-06-22 Active 100 400 1200 0
WILLET LAKE AREA 4215925 209142 Single Cell Mining Claim 2021-06-22 Active 100 400 1200 0
WILLET LAKE AREA 4218854 260535 Single Cell Mining Claim 2021-06-22 Active 100 400 1200 0
WILLET LAKE AREA 4215925 291611 Single Cell Mining Claim 2021-06-22 Active 100 400 1200 0
WILLET LAKE AREA 4218854 308308 Single Cell Mining Claim 2021-06-22 Active 100 400 1200 0
WILLET LAKE AREA 4218854 308309 Single Cell Mining Claim 2021-06-22 Active 100 400 1200 0
WILLET LAKE AREA 4215925 312347 Single Cell Mining Claim 2021-06-22 Active 100 400 1200 0

Landore Resources Canada Inc. MINERAL RESOURCE ESTIMATE AND PRELIMINARY ECONOMIC ASSESSMENT, BAM Gold Project, Junior Lake Property, Ontario, Canada
Landore Resources Canada Inc. Page | 341

Landore Resources Canada Inc. MINERAL RESOURCE ESTIMATE AND PRELIMINARY ECONOMIC ASSESSMENT, BAM Gold Project, Junior Lake Property, Ontario, Canada
Landore Resources Canada Inc. Page | 342
Appendix 2 – 2020 Soil Geochemistry Survey Maps (Ag, Cu, As)
Junior Lake Property BAM Gold Project Soil Geochemistry Response Ratio Anomalies Silver (Ag).

Landore Resources Canada Inc. MINERAL RESOURCE ESTIMATE AND PRELIMINARY ECONOMIC ASSESSMENT, BAM Gold Project, Junior Lake Property, Ontario, Canada
Landore Resources Canada Inc. Page | 343
Junior Lake Property BAM Gold Project Soil Geochemistry Response Ratio Anomalies Copper (Cu).
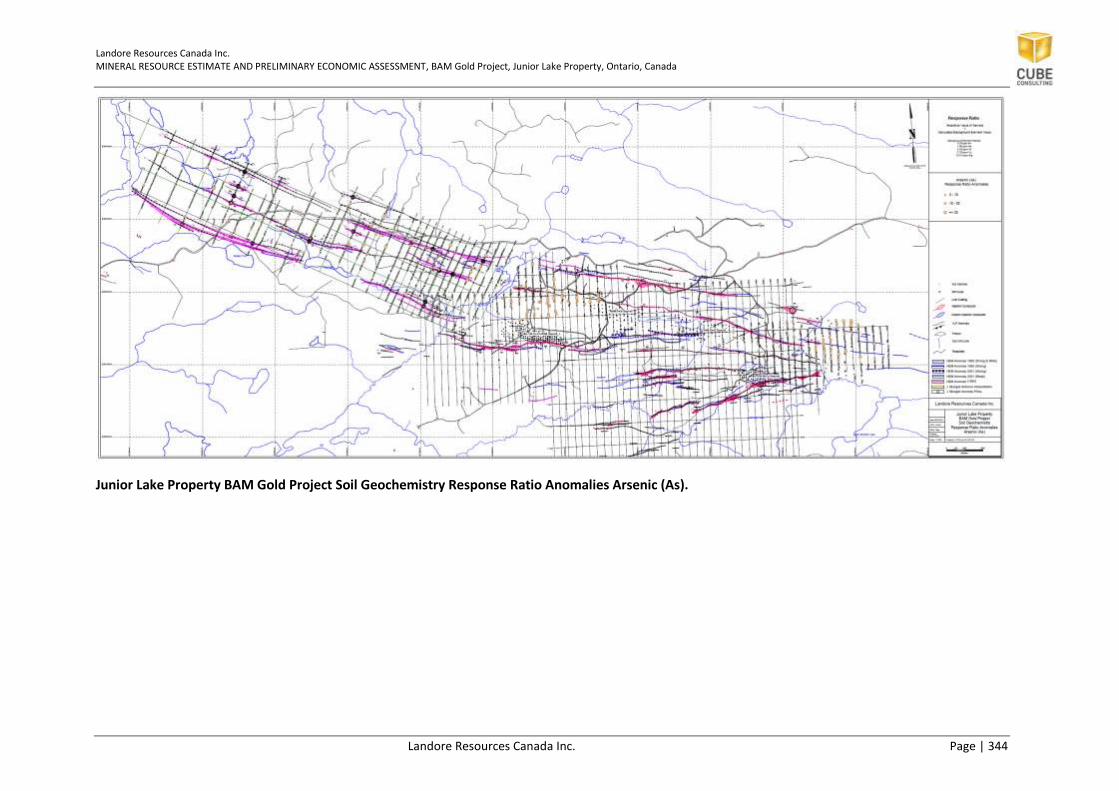
Landore Resources Canada Inc. MINERAL RESOURCE ESTIMATE AND PRELIMINARY ECONOMIC ASSESSMENT, BAM Gold Project, Junior Lake Property, Ontario, Canada
Landore Resources Canada Inc. Page | 344
Junior Lake Property BAM Gold Project Soil Geochemistry Response Ratio Anomalies Arsenic (As).
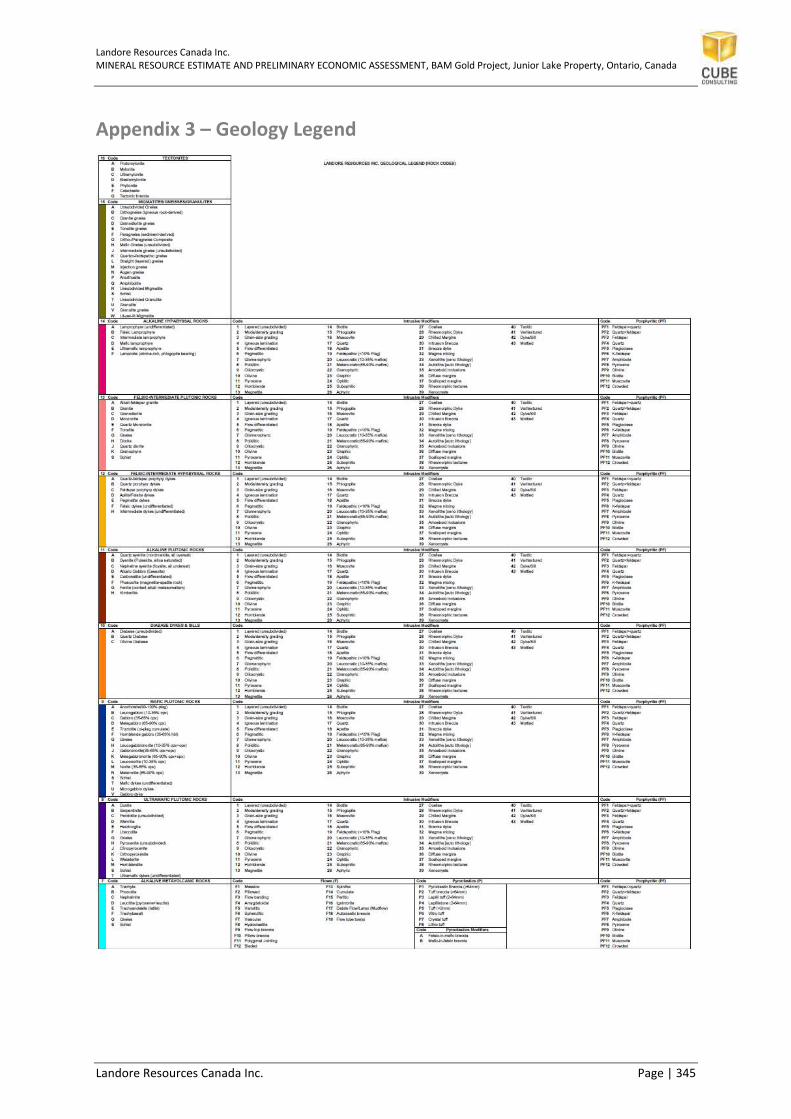
Landore Resources Canada Inc. MINERAL RESOURCE ESTIMATE AND PRELIMINARY ECONOMIC ASSESSMENT, BAM Gold Project, Junior Lake Property, Ontario, Canada
Landore Resources Canada Inc. Page | 345
Appendix 3 – Geology Legend

Landore Resources Canada Inc. MINERAL RESOURCE ESTIMATE AND PRELIMINARY ECONOMIC ASSESSMENT, BAM Gold Project, Junior Lake Property, Ontario, Canada
Landore Resources Canada Inc. Page | 346

Landore Resources Canada Inc. MINERAL RESOURCE ESTIMATE AND PRELIMINARY ECONOMIC ASSESSMENT, BAM Gold Project, Junior Lake Property, Ontario, Canada
Landore Resources Canada Inc. Page | 347
Appendix 4 – Laboratory Analysis Descriptions
Analytical Descriptions for - ALS Chemex, Vancouver, BC, Canada (from www.alsglobal.com)
Aqua regia digestion:
The standard aqua regia digestion consists of treating a geological sample with a 3:1 mixture of
hydrochloric and nitric acids. Nitric acid destroys organic matter and oxidizes sulphide material. It
reacts with concentrated hydrochloric acid to generate aqua regia:
3 HCl + HNO3 = 2 H2O + NOCl + Cl2
Aqua regia is an effective solvent for most base metal sulphates, sulphides, oxides and carbonates.
Atomic Absorption Finish:
In atomic absorption spectroscopy, an element in its atomic form is introduced into a light beam of
appropriate wavelength causing the atom to absorb light (atomic absorption) and enter an excited
state. At the same time there is a reduction in the intensity of the light beam which can be measured
and directly correlated with the concentration of the elemental atomic species. This is carried out by
comparing the light absorbance of the unknown sample with the light absorbance of known
calibration standards.
A typical atomic absorption spectrometer consists of an appropriate light source (usually a hollow
cathode lamp containing the element to be measured), an absorption path (usually a flame but
occasionally an absorption cell), a monochromator (to isolate the light of appropriate wavelength)
and a detector.
The most common form of atomic absorption spectroscopy is called flame atomic absorption. In this
technique, a solution of the element of interest is drawn through a flame in order to generate the
element in its atomic form. At the same time, light from a hollow cathode lamp is passed through the
flame and atomic absorption occurs. The flame temperature can be varied by using different fuel and
oxidant combinations; for example, a hotter flame is required for those elements which resist
atomization by tending to form refractory oxides.
Lithium Borate fusion:
At ALS Chemex, lithium metaborate fusions are carried out in an automated fashion using a Claisse-
type fluxer. The fusion melts can be poured into disks in preparation for X-ray fluorescence (XRF)
analysis or they can be dissolved in acid for subsequent ICPMS analysis.
XRF:
In X-ray fluorescence spectroscopy, a beam of electrons strikes a target (such as Mo or Au) causing
the target to release a primary source of X- rays. These primary X-rays are then used to irradiate a
secondary target (the sample), causing the sample to produce fluorescent (secondary) X- rays. These
fluorescent X-rays are emitted with characteristic energies that can be used to identify the nucleus
(i.e. element) from which they arise. The number of X-rays measured at each characteristic energy
can therefore in principle be used to measure the concentration of the element from which it arises.

Landore Resources Canada Inc. MINERAL RESOURCE ESTIMATE AND PRELIMINARY ECONOMIC ASSESSMENT, BAM Gold Project, Junior Lake Property, Ontario, Canada
Landore Resources Canada Inc. Page | 348
The fluorescent X-rays are then dispersed and sorted by wavelength using a selection of different
diffraction crystals, hence the term wavelength-dispersive X-ray fluorescence. The dispersed X-rays
are then detected with a thallium-doped sodium iodide detector or a flow proportional counter. Each
X-ray striking the detector causes a small electrical impulse which can be amplified and measured
using a computer-controlled multichannel analyser. Samples of unknown concentration are
compared with well-known international standard reference materials in order to define precise
concentration levels of the unknown sample

Landore Resources Canada Inc. MINERAL RESOURCE ESTIMATE AND PRELIMINARY ECONOMIC ASSESSMENT, BAM Gold Project, Junior Lake Property, Ontario, Canada
Landore Resources Canada Inc. Page | 349
Appendix 5 – Statistical Plots for Minor BAM Au Domains

Landore Resources Canada Inc. MINERAL RESOURCE ESTIMATE AND PRELIMINARY ECONOMIC ASSESSMENT, BAM Gold Project, Junior Lake Property, Ontario, Canada
Landore Resources Canada Inc. Page | 350

Landore Resources Canada Inc. MINERAL RESOURCE ESTIMATE AND PRELIMINARY ECONOMIC ASSESSMENT, BAM Gold Project, Junior Lake Property, Ontario, Canada
Landore Resources Canada Inc. Page | 351

Landore Resources Canada Inc. MINERAL RESOURCE ESTIMATE AND PRELIMINARY ECONOMIC ASSESSMENT, BAM Gold Project, Junior Lake Property, Ontario, Canada
Landore Resources Canada Inc. Page | 352

Landore Resources Canada Inc. MINERAL RESOURCE ESTIMATE AND PRELIMINARY ECONOMIC ASSESSMENT, BAM Gold Project, Junior Lake Property, Ontario, Canada
Landore Resources Canada Inc. Page | 353

Landore Resources Canada Inc. MINERAL RESOURCE ESTIMATE AND PRELIMINARY ECONOMIC ASSESSMENT, BAM Gold Project, Junior Lake Property, Ontario, Canada
Landore Resources Canada Inc. Page | 354

Landore Resources Canada Inc. MINERAL RESOURCE ESTIMATE AND PRELIMINARY ECONOMIC ASSESSMENT, BAM Gold Project, Junior Lake Property, Ontario, Canada
Landore Resources Canada Inc. Page | 355

Landore Resources Canada Inc. MINERAL RESOURCE ESTIMATE AND PRELIMINARY ECONOMIC ASSESSMENT, BAM Gold Project, Junior Lake Property, Ontario, Canada
Landore Resources Canada Inc. Page | 356

Landore Resources Canada Inc. MINERAL RESOURCE ESTIMATE AND PRELIMINARY ECONOMIC ASSESSMENT, BAM Gold Project, Junior Lake Property, Ontario, Canada
Landore Resources Canada Inc. Page | 357

Landore Resources Canada Inc. MINERAL RESOURCE ESTIMATE AND PRELIMINARY ECONOMIC ASSESSMENT, BAM Gold Project, Junior Lake Property, Ontario, Canada
Landore Resources Canada Inc. Page | 358

Landore Resources Canada Inc. MINERAL RESOURCE ESTIMATE AND PRELIMINARY ECONOMIC ASSESSMENT, BAM Gold Project, Junior Lake Property, Ontario, Canada
Landore Resources Canada Inc. Page | 359

Landore Resources Canada Inc. MINERAL RESOURCE ESTIMATE AND PRELIMINARY ECONOMIC ASSESSMENT, BAM Gold Project, Junior Lake Property, Ontario, Canada
Landore Resources Canada Inc. Page | 360
Appendix 6 – Estimation Parameters Summary Tables
Estimation Domain
Control Parameters
Line Run Assay File Assay File Id
Assay String Range
Assay D Field
Estimation Attribute
Constrain Estimate
Estimate Constraint File
Constrain Assays
Assay Constraint
File
Save Constrained
Assays
Constrained Assay File
Output
Assay File Id
1001 1 Y ../composites/comp_1m_ 1001 1,2 D1 au_ok_uncut Y con_dom_1001 N N
1002 2 Y ../composites/comp_1m_ 1002 1,2 D1 au_ok_uncut Y con_dom_1002 N N
1003 3 Y ../composites/comp_1m_ 1003 1,2 D1 au_ok_uncut Y con_dom_1003 N N
1004 4 Y ../composites/comp_1m_ 1004 1,2 D1 au_ok_uncut Y con_dom_1004 N N
1005 5 Y ../composites/comp_1m_ 1005 1,2 D1 au_ok_uncut Y con_dom_1005 N N
1006 6 Y ../composites/comp_1m_ 1006 1,2 D1 au_ok_uncut Y con_dom_1006 N N
1007 7 Y ../composites/comp_1m_ 1007 1,2 D1 au_ok_uncut Y con_dom_1007 N N
1008 8 Y ../composites/comp_1m_ 1008 1,2 D1 au_ok_uncut Y con_dom_1008 N N
2001 9 Y ../composites/comp_1m_ 2001 1,2 D1 au_ok_uncut Y con_dom_2001 N N
2002 10 Y ../composites/comp_1m_ 2002 1,2 D1 au_ok_uncut Y con_dom_2002 N N
2003 11 Y ../composites/comp_1m_ 2003 1,2 D1 au_ok_uncut Y con_dom_2003 N N
2004 12 Y ../composites/comp_1m_ 2004 1,2 D1 au_ok_uncut Y con_dom_2004 N N
2005 13 Y ../composites/comp_1m_ 2005 1,2 D1 au_ok_uncut Y con_dom_2005 N N
3001 14 Y ../composites/comp_1m_ 3001 1,2 D1 au_ok_uncut Y con_dom_3001 N N
3002 15 Y ../composites/comp_1m_ 3002 1,2 D1 au_ok_uncut Y con_dom_3002 N N
3003 16 Y ../composites/comp_1m_ 3003 1,2 D1 au_ok_uncut Y con_dom_3003 N N
3004 17 Y ../composites/comp_1m_ 3004 1,2 D1 au_ok_uncut Y con_dom_3004 N N
3005 18 Y ../composites/comp_1m_ 3005 1,2 D1 au_ok_uncut Y con_dom_3005 N N
3006 19 Y ../composites/comp_1m_ 3006 1,2 D1 au_ok_uncut Y con_dom_3006 N N
3007 20 Y ../composites/comp_1m_ 3007 1,2 D1 au_ok_uncut Y con_dom_3007 N N
3008 21 Y ../composites/comp_1m_ 3008 1,2 D1 au_ok_uncut Y con_dom_3008 N N
3009 22 Y ../composites/comp_1m_ 3009 1,2 D1 au_ok_uncut Y con_dom_3009 N N
3010 23 Y ../composites/comp_1m_ 3010 1,2 D1 au_ok_uncut Y con_dom_3010 N N
3011 24 Y ../composites/comp_1m_ 3011 1,2 D1 au_ok_uncut Y con_dom_3011 N N
3012 25 Y ../composites/comp_1m_ 3012 1,2 D1 au_ok_uncut Y con_dom_3012 N N
1001 26 Y ../composites/comp_1m_ 1001 1,2 D20 au_ok_cut Y con_dom_1001 N N
1002 27 Y ../composites/comp_1m_ 1002 1,2 D20 au_ok_cut Y con_dom_1002 N N
1003 28 Y ../composites/comp_1m_ 1003 1,2 D20 au_ok_cut Y con_dom_1003 N N
1004 29 Y ../composites/comp_1m_ 1004 1,2 D20 au_ok_cut Y con_dom_1004 N N
1005 30 Y ../composites/comp_1m_ 1005 1,2 D20 au_ok_cut Y con_dom_1005 N N

Landore Resources Canada Inc. MINERAL RESOURCE ESTIMATE AND PRELIMINARY ECONOMIC ASSESSMENT, BAM Gold Project, Junior Lake Property, Ontario, Canada
Landore Resources Canada Inc. Page | 361
Estimation Domain
Control Parameters
Line Run Assay File Assay File Id
Assay String Range
Assay D Field
Estimation Attribute
Constrain Estimate
Estimate Constraint File
Constrain Assays
Assay Constraint
File
Save Constrained
Assays
Constrained Assay File
Output
Assay File Id
1006 31 Y ../composites/comp_1m_ 1006 1,2 D20 au_ok_cut Y con_dom_1006 N N
1007 32 Y ../composites/comp_1m_ 1007 1,2 D20 au_ok_cut Y con_dom_1007 N N
1008 33 Y ../composites/comp_1m_ 1008 1,2 D20 au_ok_cut Y con_dom_1008 N N
2001 34 Y ../composites/comp_1m_ 2001 1,2 D20 au_ok_cut Y con_dom_2001 N N
2002 35 Y ../composites/comp_1m_ 2002 1,2 D20 au_ok_cut Y con_dom_2002 N N
2003 36 Y ../composites/comp_1m_ 2003 1,2 D20 au_ok_cut Y con_dom_2003 N N
2004 37 Y ../composites/comp_1m_ 2004 1,2 D20 au_ok_cut Y con_dom_2004 N N
2005 38 Y ../composites/comp_1m_ 2005 1,2 D20 au_ok_cut Y con_dom_2005 N N
3001 39 Y ../composites/comp_1m_ 3001 1,2 D20 au_ok_cut Y con_dom_3001 N N
3002 40 Y ../composites/comp_1m_ 3002 1,2 D20 au_ok_cut Y con_dom_3002 N N
3003 41 Y ../composites/comp_1m_ 3003 1,2 D20 au_ok_cut Y con_dom_3003 N N
3004 42 Y ../composites/comp_1m_ 3004 1,2 D20 au_ok_cut Y con_dom_3004 N N
3005 43 Y ../composites/comp_1m_ 3005 1,2 D20 au_ok_cut Y con_dom_3005 N N
3006 44 Y ../composites/comp_1m_ 3006 1,2 D20 au_ok_cut Y con_dom_3006 N N
3007 45 Y ../composites/comp_1m_ 3007 1,2 D20 au_ok_cut Y con_dom_3007 N N
3008 46 Y ../composites/comp_1m_ 3008 1,2 D20 au_ok_cut Y con_dom_3008 N N
3009 47 Y ../composites/comp_1m_ 3009 1,2 D20 au_ok_cut Y con_dom_3009 N N
3010 48 Y ../composites/comp_1m_ 3010 1,2 D20 au_ok_cut Y con_dom_3010 N N
3011 49 Y ../composites/comp_1m_ 3011 1,2 D20 au_ok_cut Y con_dom_3011 N N
3012 50 Y ../composites/comp_1m_ 3012 1,2 D20 au_ok_cut Y con_dom_3012 N N

Landore Resources Canada Inc. MINERAL RESOURCE ESTIMATE AND PRELIMINARY ECONOMIC ASSESSMENT, BAM Gold Project, Junior Lake Property, Ontario, Canada
Landore Resources Canada Inc. Page | 362
Estimation Domain
Search Parameters
Search Method
Minimum Samples
Maximum Samples
Maximum Search Radius
Max Vert Search
Dist Bearing Plunge Dip
Major/Semi_Major Ratio
Major/Minor Ratio
Limit Samples
by Hole Id
Hole Id D Field
Max Samps
per Hole
Estimation Block Size
(X,Y,Z)
Max No of Adj Empty Octs
1001 ELLIPSOID 6 16 120 99999 na na na 2 4 N D2 6 25, 5, 25
1002 ELLIPSOID 6 16 120 99999 na na na 2 4 N D2 6 25, 5, 25
1003 ELLIPSOID 6 16 120 99999 na na na 2 4 N D2 6 25, 5, 25
1004 ELLIPSOID 4 16 120 99999 na na na 2 4 N D2 6 25, 5, 25
1005 ELLIPSOID 6 16 120 99999 na na na 2 4 N D2 6 25, 5, 25
1006 ELLIPSOID 4 16 120 99999 na na na 2 4 N D2 6 25, 5, 25
1007 ELLIPSOID 6 16 120 99999 na na na 2 4 N D2 6 25, 5, 25
1008 ELLIPSOID 6 16 120 99999 na na na 2 4 N D2 6 25, 5, 25
2001 ELLIPSOID 6 16 120 99999 na na na 2 4 N D2 6 25, 5, 25
2002 ELLIPSOID 6 16 120 99999 na na na 2 4 N D2 6 25, 5, 25
2003 ELLIPSOID 6 16 120 99999 na na na 2 4 N D2 6 25, 5, 25
2004 ELLIPSOID 6 16 120 99999 na na na 2 4 N D2 6 25, 5, 25
2005 ELLIPSOID 6 16 120 99999 na na na 2 4 N D2 6 25, 5, 25
3001 ELLIPSOID 6 16 120 99999 na na na 2 4 N D2 6 25, 5, 25
3002 ELLIPSOID 6 16 120 99999 na na na 2 4 N D2 6 25, 5, 25
3003 ELLIPSOID 6 16 120 99999 na na na 2 4 N D2 6 25, 5, 25
3004 ELLIPSOID 6 16 120 99999 na na na 2 4 N D2 6 25, 5, 25
3005 ELLIPSOID 6 16 120 99999 na na na 2 4 N D2 6 25, 5, 25
3006 ELLIPSOID 6 16 120 99999 na na na 2 4 N D2 6 25, 5, 25
3007 ELLIPSOID 6 16 120 99999 na na na 2 4 N D2 6 25, 5, 25
3008 ELLIPSOID 4 16 120 99999 na na na 2 4 N D2 6 25, 5, 25
3009 ELLIPSOID 6 16 120 99999 na na na 2 4 N D2 6 25, 5, 25
3010 ELLIPSOID 4 16 120 99999 na na na 2 4 N D2 6 25, 5, 25
3011 ELLIPSOID 4 16 120 99999 na na na 2 4 N D2 6 25, 5, 25
3012 ELLIPSOID 4 16 120 99999 na na na 2 4 N D2 6 25, 5, 25
1001 ELLIPSOID 6 16 120 99999 na na na 2 4 N D2 6 25, 5, 25
1002 ELLIPSOID 6 16 120 99999 na na na 2 4 N D2 6 25, 5, 25
1003 ELLIPSOID 6 16 120 99999 na na na 2 4 N D2 6 25, 5, 25
1004 ELLIPSOID 4 16 120 99999 na na na 2 4 N D2 6 25, 5, 25
1005 ELLIPSOID 6 16 120 99999 na na na 2 4 N D2 6 25, 5, 25
1006 ELLIPSOID 4 16 120 99999 na na na 2 4 N D2 6 25, 5, 25
1007 ELLIPSOID 6 16 120 99999 na na na 2 4 N D2 6 25, 5, 25

Landore Resources Canada Inc. MINERAL RESOURCE ESTIMATE AND PRELIMINARY ECONOMIC ASSESSMENT, BAM Gold Project, Junior Lake Property, Ontario, Canada
Landore Resources Canada Inc. Page | 363
Estimation Domain
Search Parameters
Search Method
Minimum Samples
Maximum Samples
Maximum Search Radius
Max Vert Search
Dist Bearing Plunge Dip
Major/Semi_Major Ratio
Major/Minor Ratio
Limit Samples
by Hole Id
Hole Id D Field
Max Samps
per Hole
Estimation Block Size
(X,Y,Z)
Max No of Adj Empty Octs
1008 ELLIPSOID 6 16 120 99999 na na na 2 4 N D2 6 25, 5, 25
2001 ELLIPSOID 6 16 120 99999 na na na 2 4 N D2 6 25, 5, 25
2002 ELLIPSOID 6 16 120 99999 na na na 2 4 N D2 6 25, 5, 25
2003 ELLIPSOID 6 16 120 99999 na na na 2 4 N D2 6 25, 5, 25
2004 ELLIPSOID 6 16 120 99999 na na na 2 4 N D2 6 25, 5, 25
2005 ELLIPSOID 6 16 120 99999 na na na 2 4 N D2 6 25, 5, 25
3001 ELLIPSOID 6 16 120 99999 na na na 2 4 N D2 6 25, 5, 25
3002 ELLIPSOID 6 16 120 99999 na na na 2 4 N D2 6 25, 5, 25
3003 ELLIPSOID 6 16 120 99999 na na na 2 4 N D2 6 25, 5, 25
3004 ELLIPSOID 6 16 120 99999 na na na 2 4 N D2 6 25, 5, 25
3005 ELLIPSOID 6 16 120 99999 na na na 2 4 N D2 6 25, 5, 25
3006 ELLIPSOID 6 16 120 99999 na na na 2 4 N D2 6 25, 5, 25
3007 ELLIPSOID 6 16 120 99999 na na na 2 4 N D2 6 25, 5, 25
3008 ELLIPSOID 4 16 120 99999 na na na 2 4 N D2 6 25, 5, 25
3009 ELLIPSOID 6 16 120 99999 na na na 2 4 N D2 6 25, 5, 25
3010 ELLIPSOID 4 16 120 99999 na na na 2 4 N D2 6 25, 5, 25
3011 ELLIPSOID 4 16 120 99999 na na na 2 4 N D2 6 25, 5, 25
3012 ELLIPSOID 4 16 120 99999 na na na 2 4 N D2 6 25, 5, 25

Landore Resources Canada Inc. MINERAL RESOURCE ESTIMATE AND PRELIMINARY ECONOMIC ASSESSMENT, BAM Gold Project, Junior Lake Property, Ontario, Canada
Landore Resources Canada Inc. Page | 364
Domain
Estimation Parameters
Estimation Method
X Desc.
Y Desc.
Z Desc.
ID Power
Dip Attribute
Dip Dir Attribute
Structures
Nugget Sill 1
Range 1
Bearing 1
Plunge 1
Dip 1
Semi Ratio
1
Minor Ratio
1
Sill 2
Range 2
Bearing 2
Plunge 2
Dip 2
Semi Ratio
2
Minor Ratio
2
1001 Dynamic Kriging 5 2 5 2 dynamic_dip dynamic_dipd 2 0.27 0.64 80 na na na 1.60 1.64 0.09 126 na na na 13.33 12.60
1002 Dynamic Kriging 5 2 5 2 dynamic_dip dynamic_dipd 2 0.34 0.47 68 na na na 1.33 1.01 0.19 91 na na na 13.60 6.50
1003 Dynamic Kriging 5 2 5 2 dynamic_dip dynamic_dipd 2 0.19 0.45 61 na na na 1.05 1.32 0.35 103 na na na 15.25 4.68
1004 Ordinary Kriging 5 2 5 2 dynamic_dip dynamic_dipd 2 0.26 0.57 62 na na na 1.68 1.70 0.17 90 na na na 8.86 3.91
1005 Ordinary Kriging 5 2 5 2 dynamic_dip dynamic_dipd 2 0.26 0.57 62 na na na 1.68 1.70 0.17 90 na na na 8.86 3.91
1006 Dynamic Kriging 5 2 5 2 dynamic_dip dynamic_dipd 2 0.26 0.57 62 na na na 1.68 1.70 0.17 90 na na na 8.86 3.91
1007 Dynamic Kriging 5 2 5 2 dynamic_dip dynamic_dipd 2 0.19 0.45 61 na na na 1.05 1.32 0.35 103 na na na 15.25 4.68
1008 Dynamic Kriging 5 2 5 2 dynamic_dip dynamic_dipd 2 0.26 0.57 62 na na na 1.68 1.70 0.17 90 na na na 8.86 3.91
2001 Ordinary Kriging 5 2 5 2 dynamic_dip dynamic_dipd 2 0.27 0.64 80 na na na 1.60 1.64 0.09 126 na na na 13.33 12.60
2002 Ordinary Kriging 5 2 5 2 dynamic_dip dynamic_dipd 2 0.27 0.64 80 na na na 1.60 1.64 0.09 126 na na na 13.33 12.60
2003 Ordinary Kriging 5 2 5 2 dynamic_dip dynamic_dipd 2 0.27 0.64 80 na na na 1.60 1.64 0.09 126 na na na 13.33 12.60
2004 Dynamic Kriging 5 2 5 2 dynamic_dip dynamic_dipd 2 0.27 0.64 80 na na na 1.60 1.64 0.09 126 na na na 13.33 12.60
2005 Ordinary Kriging 5 2 5 2 dynamic_dip dynamic_dipd 2 0.27 0.64 80 na na na 1.60 1.64 0.09 126 na na na 13.33 12.60
3001 Dynamic Kriging 5 2 5 2 dynamic_dip dynamic_dipd 2 0.27 0.64 80 na na na 1.60 1.64 0.09 126 na na na 13.33 12.60
3002 Dynamic Kriging 5 2 5 2 dynamic_dip dynamic_dipd 2 0.27 0.64 80 na na na 1.60 1.64 0.09 126 na na na 13.33 12.60
3003 Dynamic Kriging 5 2 5 2 dynamic_dip dynamic_dipd 2 0.27 0.64 80 na na na 1.60 1.64 0.09 126 na na na 13.33 12.60
3004 Ordinary Kriging 5 2 5 2 dynamic_dip dynamic_dipd 2 0.27 0.64 80 na na na 1.60 1.64 0.09 126 na na na 13.33 12.60
3005 Ordinary Kriging 5 2 5 2 dynamic_dip dynamic_dipd 2 0.27 0.64 80 na na na 1.60 1.64 0.09 126 na na na 13.33 12.60
3006 Ordinary Kriging 5 2 5 2 dynamic_dip dynamic_dipd 2 0.27 0.64 80 na na na 1.60 1.64 0.09 126 na na na 13.33 12.60
3007 Ordinary Kriging 5 2 5 2 dynamic_dip dynamic_dipd 2 0.27 0.64 80 na na na 1.60 1.64 0.09 126 na na na 13.33 12.60
3008 Ordinary Kriging 5 2 5 2 dynamic_dip dynamic_dipd 2 0.27 0.64 80 na na na 1.60 1.64 0.09 126 na na na 13.33 12.60
3009 Dynamic Kriging 5 2 5 2 dynamic_dip dynamic_dipd 2 0.27 0.64 80 na na na 1.60 1.64 0.09 126 na na na 13.33 12.60
3010 Ordinary Kriging 5 2 5 2 dynamic_dip dynamic_dipd 2 0.27 0.64 80 na na na 1.60 1.64 0.09 126 na na na 13.33 12.60
3011 Ordinary Kriging 5 2 5 2 dynamic_dip dynamic_dipd 2 0.27 0.64 80 na na na 1.60 1.64 0.09 126 na na na 13.33 12.60
3012 Ordinary Kriging 5 2 5 2 dynamic_dip dynamic_dipd 2 0.27 0.64 80 na na na 1.60 1.64 0.09 126 na na na 13.33 12.60
1001 Dynamic Kriging 5 2 5 2 dynamic_dip dynamic_dipd 2 0.27 0.64 80 na na na 1.60 1.64 0.09 126 na na na 13.33 12.60
1002 Dynamic Kriging 5 2 5 2 dynamic_dip dynamic_dipd 2 0.34 0.47 68 na na na 1.33 1.01 0.19 91 na na na 13.60 6.50
1003 Dynamic Kriging 5 2 5 2 dynamic_dip dynamic_dipd 2 0.19 0.45 61 na na na 1.05 1.32 0.35 103 na na na 15.25 4.68
1004 Ordinary Kriging 5 2 5 2 dynamic_dip dynamic_dipd 2 0.26 0.57 62 na na na 1.68 1.70 0.17 90 na na na 8.86 3.91
1005 Ordinary Kriging 5 2 5 2 dynamic_dip dynamic_dipd 2 0.26 0.57 62 na na na 1.68 1.70 0.17 90 na na na 8.86 3.91
1006 Dynamic Kriging 5 2 5 2 dynamic_dip dynamic_dipd 2 0.26 0.57 62 na na na 1.68 1.70 0.17 90 na na na 8.86 3.91
1007 Dynamic Kriging 5 2 5 2 dynamic_dip dynamic_dipd 2 0.19 0.45 61 na na na 1.05 1.32 0.35 103 na na na 15.25 4.68
1008 Dynamic Kriging 5 2 5 2 dynamic_dip dynamic_dipd 2 0.26 0.57 62 na na na 1.68 1.70 0.17 90 na na na 8.86 3.91
2001 Ordinary Kriging 5 2 5 2 dynamic_dip dynamic_dipd 2 0.27 0.64 80 na na na 1.60 1.64 0.09 126 na na na 13.33 12.60
2002 Ordinary Kriging 5 2 5 2 dynamic_dip dynamic_dipd 2 0.27 0.64 80 na na na 1.60 1.64 0.09 126 na na na 13.33 12.60
2003 Ordinary Kriging 5 2 5 2 dynamic_dip dynamic_dipd 2 0.27 0.64 80 na na na 1.60 1.64 0.09 126 na na na 13.33 12.60
2004 Dynamic Kriging 5 2 5 2 dynamic_dip dynamic_dipd 2 0.27 0.64 80 na na na 1.60 1.64 0.09 126 na na na 13.33 12.60
2005 Ordinary Kriging 5 2 5 2 dynamic_dip dynamic_dipd 2 0.27 0.64 80 na na na 1.60 1.64 0.09 126 na na na 13.33 12.60
3001 Dynamic Kriging 5 2 5 2 dynamic_dip dynamic_dipd 2 0.27 0.64 80 na na na 1.60 1.64 0.09 126 na na na 13.33 12.60
3002 Dynamic Kriging 5 2 5 2 dynamic_dip dynamic_dipd 2 0.27 0.64 80 na na na 1.60 1.64 0.09 126 na na na 13.33 12.60
3003 Dynamic Kriging 5 2 5 2 dynamic_dip dynamic_dipd 2 0.27 0.64 80 na na na 1.60 1.64 0.09 126 na na na 13.33 12.60
3004 Ordinary Kriging 5 2 5 2 dynamic_dip dynamic_dipd 2 0.27 0.64 80 na na na 1.60 1.64 0.09 126 na na na 13.33 12.60
3005 Ordinary Kriging 5 2 5 2 dynamic_dip dynamic_dipd 2 0.27 0.64 80 na na na 1.60 1.64 0.09 126 na na na 13.33 12.60
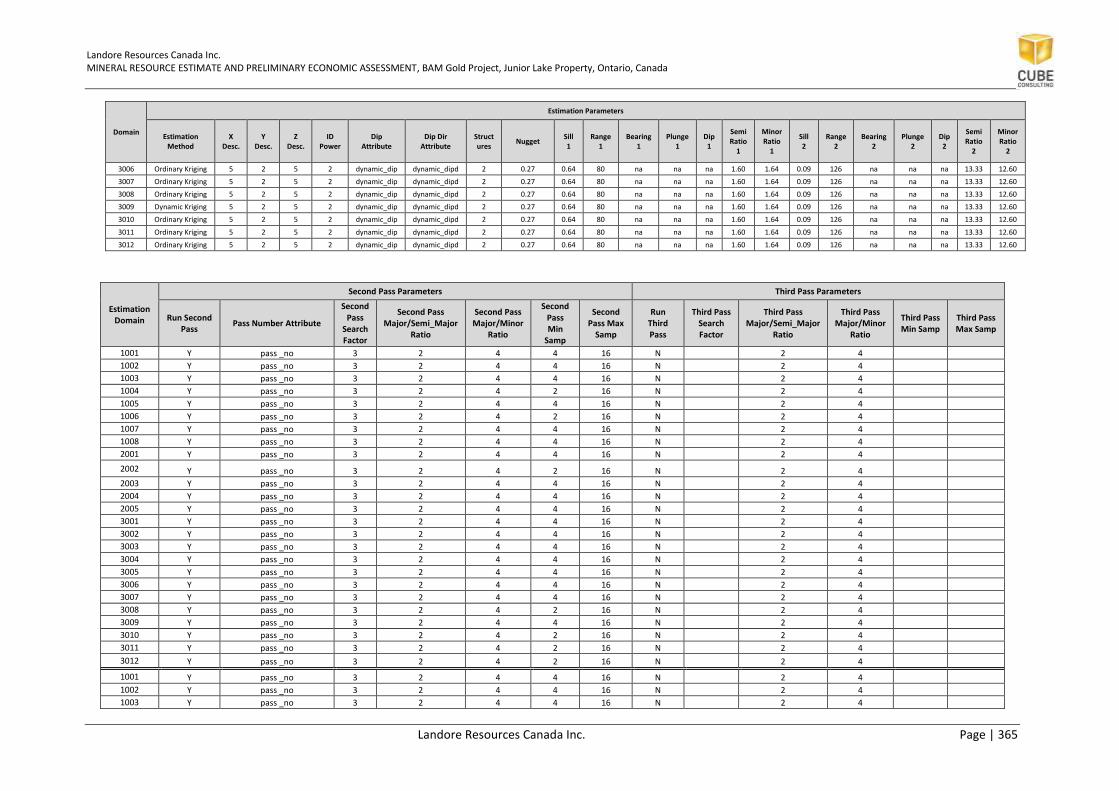
Landore Resources Canada Inc. MINERAL RESOURCE ESTIMATE AND PRELIMINARY ECONOMIC ASSESSMENT, BAM Gold Project, Junior Lake Property, Ontario, Canada
Landore Resources Canada Inc. Page | 365
Domain
Estimation Parameters
Estimation Method
X Desc.
Y Desc.
Z Desc.
ID Power
Dip Attribute
Dip Dir Attribute
Structures
Nugget Sill 1
Range 1
Bearing 1
Plunge 1
Dip 1
Semi Ratio
1
Minor Ratio
1
Sill 2
Range 2
Bearing 2
Plunge 2
Dip 2
Semi Ratio
2
Minor Ratio
2
3006 Ordinary Kriging 5 2 5 2 dynamic_dip dynamic_dipd 2 0.27 0.64 80 na na na 1.60 1.64 0.09 126 na na na 13.33 12.60
3007 Ordinary Kriging 5 2 5 2 dynamic_dip dynamic_dipd 2 0.27 0.64 80 na na na 1.60 1.64 0.09 126 na na na 13.33 12.60
3008 Ordinary Kriging 5 2 5 2 dynamic_dip dynamic_dipd 2 0.27 0.64 80 na na na 1.60 1.64 0.09 126 na na na 13.33 12.60
3009 Dynamic Kriging 5 2 5 2 dynamic_dip dynamic_dipd 2 0.27 0.64 80 na na na 1.60 1.64 0.09 126 na na na 13.33 12.60
3010 Ordinary Kriging 5 2 5 2 dynamic_dip dynamic_dipd 2 0.27 0.64 80 na na na 1.60 1.64 0.09 126 na na na 13.33 12.60
3011 Ordinary Kriging 5 2 5 2 dynamic_dip dynamic_dipd 2 0.27 0.64 80 na na na 1.60 1.64 0.09 126 na na na 13.33 12.60
3012 Ordinary Kriging 5 2 5 2 dynamic_dip dynamic_dipd 2 0.27 0.64 80 na na na 1.60 1.64 0.09 126 na na na 13.33 12.60
Estimation Domain
Second Pass Parameters Third Pass Parameters
Run Second Pass
Pass Number Attribute
Second Pass
Search Factor
Second Pass Major/Semi_Major
Ratio
Second Pass Major/Minor
Ratio
Second Pass Min
Samp
Second Pass Max
Samp
Run Third Pass
Third Pass Search Factor
Third Pass Major/Semi_Major
Ratio
Third Pass Major/Minor
Ratio
Third Pass Min Samp
Third Pass Max Samp
1001 Y pass _no 3 2 4 4 16 N 2 4
1002 Y pass _no 3 2 4 4 16 N 2 4
1003 Y pass _no 3 2 4 4 16 N 2 4
1004 Y pass _no 3 2 4 2 16 N 2 4
1005 Y pass _no 3 2 4 4 16 N 2 4
1006 Y pass _no 3 2 4 2 16 N 2 4
1007 Y pass _no 3 2 4 4 16 N 2 4
1008 Y pass _no 3 2 4 4 16 N 2 4
2001 Y pass _no 3 2 4 4 16 N 2 4
2002 Y pass _no 3 2 4 2 16 N 2 4
2003 Y pass _no 3 2 4 4 16 N 2 4
2004 Y pass _no 3 2 4 4 16 N 2 4
2005 Y pass _no 3 2 4 4 16 N 2 4
3001 Y pass _no 3 2 4 4 16 N 2 4
3002 Y pass _no 3 2 4 4 16 N 2 4
3003 Y pass _no 3 2 4 4 16 N 2 4
3004 Y pass _no 3 2 4 4 16 N 2 4
3005 Y pass _no 3 2 4 4 16 N 2 4
3006 Y pass _no 3 2 4 4 16 N 2 4
3007 Y pass _no 3 2 4 4 16 N 2 4
3008 Y pass _no 3 2 4 2 16 N 2 4
3009 Y pass _no 3 2 4 4 16 N 2 4
3010 Y pass _no 3 2 4 2 16 N 2 4
3011 Y pass _no 3 2 4 2 16 N 2 4
3012 Y pass _no 3 2 4 2 16 N 2 4
1001 Y pass _no 3 2 4 4 16 N 2 4
1002 Y pass _no 3 2 4 4 16 N 2 4
1003 Y pass _no 3 2 4 4 16 N 2 4

Landore Resources Canada Inc. MINERAL RESOURCE ESTIMATE AND PRELIMINARY ECONOMIC ASSESSMENT, BAM Gold Project, Junior Lake Property, Ontario, Canada
Landore Resources Canada Inc. Page | 366
Estimation Domain
Second Pass Parameters Third Pass Parameters
Run Second Pass
Pass Number Attribute
Second Pass
Search Factor
Second Pass Major/Semi_Major
Ratio
Second Pass Major/Minor
Ratio
Second Pass Min
Samp
Second Pass Max
Samp
Run Third Pass
Third Pass Search Factor
Third Pass Major/Semi_Major
Ratio
Third Pass Major/Minor
Ratio
Third Pass Min Samp
Third Pass Max Samp
1004 Y pass _no 3 2 4 2 16 N 2 4
1005 Y pass _no 3 2 4 4 16 N 2 4
1006 Y pass _no 3 2 4 2 16 N 2 4
1007 Y pass _no 3 2 4 4 16 N 2 4
1008 Y pass _no 3 2 4 4 16 N 2 4
2001 Y pass _no 3 2 4 4 16 N 2 4
2002 Y pass _no 3 2 4 2 16 N 2 4
2003 Y pass _no 3 2 4 4 16 N 2 4
2004 Y pass _no 3 2 4 4 16 N 2 4
2005 Y pass _no 3 2 4 4 16 N 2 4
3001 Y pass _no 3 2 4 4 16 N 2 4
3002 Y pass _no 3 2 4 4 16 N 2 4
3003 Y pass _no 3 2 4 4 16 N 2 4
3004 Y pass _no 3 2 4 4 16 N 2 4
3005 Y pass _no 3 2 4 4 16 N 2 4
3006 Y pass _no 3 2 4 4 16 N 2 4
3007 Y pass _no 3 2 4 4 16 N 2 4
3008 Y pass _no 3 2 4 2 16 N 2 4
3009 Y pass _no 3 2 4 4 16 N 2 4
3010 Y pass _no 3 2 4 2 16 N 2 4
3011 Y pass _no 3 2 4 2 16 N 2 4
3012 Y pass _no 3 2 4 2 16 N 2 4

Landore Resources Canada Inc. MINERAL RESOURCE ESTIMATE AND PRELIMINARY ECONOMIC ASSESSMENT, BAM Gold Project, Junior Lake Property, Ontario, Canada
Landore Resources Canada Inc. Page | 367
Appendix 7 – Geotechnical Study by WSP (Nelson, 2018)
Excerpts from 2018 WAP Geotechnical Report (Nelson, 2018)
Background Information
WSP Canada Inc. (“WSP”) was retained to develop prefeasibility level pit design parameters through
characterization of rock mass and geological discontinuities in the proposed pit walls.
A logging program was designed to acquire rock strength parameters and rock mass parameters, and a
televiewer survey was completed to determine orientation of discontinuity datasets. Samples from
core were selected and subjected to laboratory testing to determine rock strength parameters. Based
on this information, geotechnical domains and pit sectors were evaluated, and kinematic and limit
equilibrium modelling and analysis were undertaken to complete recommendations for slope design.
Geotechnical Logging Program - WSP, June 2018
WSP completed a geotechnical logging program of selected holes to provide data for the purposes of
evaluating geotechnical pit design for the BAM Gold Project. A large quantity of pre-existing boreholes
were available for geotechnical logging.
Boreholes were selected by WSP using the following rationale:
• A variance of strike (west to centre of deposit to east)
• A variance in depth (surface to mid-pit height to pit depth)
• Selection of holes from both the hanging wall and footwall.
TABLE 1 below presents the geotechnically logged holes. In addition, Landore had previously
completed an acoustic televiewer survey of some of the historical holes (DGI Geoscience, 2016) and
this information was provided to WSP for interpretation.
Table 1 Geotechnical Log Borehole Details (Nelson, 2018)
Hole ID
Collar Easting (UTM
E_Z16N83)
Collar Northing
(UTM E_Z16N83
Azimuth
(degrees)
Dip
(degrees)
Drilled Length
(m)
Depth in Borehole to
Bedrock Contact*
(m)
Depth to Bedrock Contact
(vertical) (m)
Notes
0415-534 435158 5581448 357 -46 198 12.75 9 This borehole was also televiewed; core currently split, from hanging wall.
0417- 586 433554 5581733 357 -45 204 13.59 9.6 Hole to west side of area of interest - BAM deposit, from hanging wall.
0417- 603 435372 5581257 357 -45 255 6.97 4.9 On east side of BAM East Deposit, from hanging wall.
0418 -652 434466 5581489 357 -45 306 5.4 3.8 On west side of BAM East Deposit, from hanging wall.
0418- 654 434861 5581462 357 -45 192 16.57 11.7 In centre of BAM East Deposit, from hanging wall.
0418- 655 434855 5581699 357 -44 250 8.21 6.7 In centre of BAM East Deposit, from footwall.
• Note: * - From geotechnical logging

Landore Resources Canada Inc. MINERAL RESOURCE ESTIMATE AND PRELIMINARY ECONOMIC ASSESSMENT, BAM Gold Project, Junior Lake Property, Ontario, Canada
Landore Resources Canada Inc. Page | 368
TABLE 2 details the drill hole coordinates for the selected drill holes that were subjected to the acoustic
televiewer survey.
Table 2 Borehole Coordinates for Acoustical Televiewer Surveyed Holes (Nelson, 2018)
Hole ID
Collar Easting (UTM
E_Z16N83)
Collar Northing
(UTM
E_Z16N83
Azimuth (degrees)
Dip (degrees)
Drilled Length
(m) Core Size
Depth in Borehole to
Bedrock Contact*
(m)
Depth in Borehole to
Bedrock Contact
Televiewer (m)
Depth to Bedrock Contact
(vertical) (m)
Survey Depth
(m)
0416-520 435013 5581547 357 -45 110 NQ 14.4 21.07 10.2 106
0416-528 434966 5581438 357 -45 204 NQ 13.12 14.85 9.3 201
0416-534 435158 5581448 357 -46 198 NQ 12.25 12.05 8.8 195
0416-547 434866 5581409 357 -56.5 312 NQ 10.53 11.65 8.8 309
0416-549 434765 5581403 357 -56.5 342 NQ 7.61 6.73 6.3 340
0416-557 434859 5581438 357 -55 267 NQ 11.98 12.87 9.8 264
Ave 8.9
Note:
• * - From geological logging
• Grid E and Grid N are local cut grid coordinates; Data is sourced from DGI Geoscience Acoustic
Televiewer Report, 2016.
FIGURE 1 details the location of the geotechnical drill holes, with azimuth, dip and length in relation to
the main lithological units and a conceptual pit outline.

Landore Resources Canada Inc. MINERAL RESOURCE ESTIMATE AND PRELIMINARY ECONOMIC ASSESSMENT, BAM Gold Project, Junior Lake Property, Ontario, Canada
Landore Resources Canada Inc. Page | 369
Figure 1 - Location Plan Showing Geotechnical Hole Locations in Relation to Lithology and Conceptual Pit Outline (Nelson,2018)

Landore Resources Canada Inc. MINERAL RESOURCE ESTIMATE AND PRELIMINARY ECONOMIC ASSESSMENT, BAM Gold Project, Junior Lake Property, Ontario, Canada
Landore Resources Canada Inc. Page | 370
Landore provided the DGI Geoscience Report (December 2016) and associated dataset for the
acoustic televiewer survey for the six drill holes noted previously. The dataset included the WellCAD
output files, as well Excel based spreadsheets with the magnetic declination correction for all
identified features within the drill holes. Over 2,000 features were identified within the drill holes.
WSP used the following core logging procedure: core was logged at the Project site. Core had not
been sampled for mineral content prior to geotechnical logging. The following geotechnical logging
processes were completed:
1. Photographing core
2. Identifying all fractures as well as driller and machine induced breaks within the core
3. Logging drill hole identification data including site, hole identification, location, length,
orientation, and azimuth of drill hole
4. Geotechnical logging of the solid core, including the rock type, the degree of weathering
and/or alteration, solid core recovery and the Rock Quality Designation (RQD)
5. Geotechnical logging of the fractures that intersect the solid core, including details of
fracture orientation relative to the core axis and fracture spacing, undulation, weathering,
and infilling (thickness and type)
6. Selecting samples of varying rock lithologies, alteration and weathering for unconfined
compressive strength (UCS)
7. Rock mass classification was completed using the Rock Mass Rating (RMR) Classification
system (Bieniawski, 1989).
Weathering
The site overburden from visual observation can be described as glacial till with a thin organic layer.
The average vertical depth to bedrock is around 8 m.
Weathering at the Project site is generally limited to near-surface bedrock and is slightly weathered
(SW) and partial staining of discontinuity surfaces. Most of the rock within the drill holes is fresh,
without any sign of rock material weathering.
Pit Slope Design Criteria
Pit slope design is completed using the geological, structural, material properties and
hydrogeological information to complete a geotechnical model. The primary focus of the pit slope
design is to create a safe and economical design at the bench, inter-ramp, and overall slope scale
(FIGURE 2).
The design for pit slope has three major components that must be determined to analyze for pit
slope stability. The major components of pit slope geometry are as follows:
• Bench geometry (height, catch bench width, and bench face angle (BFA))

Landore Resources Canada Inc. MINERAL RESOURCE ESTIMATE AND PRELIMINARY ECONOMIC ASSESSMENT, BAM Gold Project, Junior Lake Property, Ontario, Canada
Landore Resources Canada Inc. Page | 371
• Inter-ramp slope angle (for a given bench stack that is uninterrupted by access roads or
ramps and is the angle measured from bench toe-to-toe)
• Overall slope angle (measured from the pit floor to the crest and includes haul roads and
ramps).
Figure 2 - Schematic Representation of Pit Slope Geometry and Scale (Nelson, 2018 after Read and Stacey, 2009)
The formulation of the slope design criteria for each sector of a pit wall involves performing stability
analysis to the required acceptance level (factor of safety (FoS) or probability of failure (PoF)). The
type of analysis is dictated by the anticipated failure mode, the scale of the slope, available data, and
the level of the project.
The main analyses used for design include:
• Kinematic analysis for bench designs in strong rock
• Limit equilibrium for inter-ramp and overall slopes where stability is controlled by rock mass
strength, with or without rock anisotropy
• Numerical analysis for assessing failure modes and potential deformation levels in inter-
ramp and overall slopes.

Landore Resources Canada Inc. MINERAL RESOURCE ESTIMATE AND PRELIMINARY ECONOMIC ASSESSMENT, BAM Gold Project, Junior Lake Property, Ontario, Canada
Landore Resources Canada Inc. Page | 372
As the BAM Pit is expected to be extracted within competent rock, pit stability is expected to be
controlled by structure and orientation of discontinuities.
Bench Geometry
An inter-bench height of 10 m has been selected in consultation with Landore. This was chosen as
the maximum reach of available equipment for adequate scaling to remove piece of loose rock in the
pit high wall and for grade control purposes. No compensation has been made for offset (if required)
of drills from the pit face.
Bench width has been determined from the empirical formula, the Modified Ritchie Bench Width,
which is determined by:
Bench Width = 0.2H +4.5 m
This equation has been published in several papers by Dr. Richard Call and in the SME Mine
Engineering Handbook (1992) and is considered empirical for field data and rockfall analysis. The
width determined by the Ritchie formula is the required bench width required to catch and retain
any falls of rock or ground from the pit walls.
For a given bench height of 10 m, the Modified Ritchie Bench Width formula dictates a bench width
of 6.5 m. For a double benching scenario (i.e., stacked bench height of 20 m), the Modified Ritchie
Bench Width formula dictates a bench width of 8.5 m. This was selected as the design criteria for the
BAM Pit.
Hydrogeological Assessment
A hydrogeologic assessment has not been completed for the BAM Project at the time of WSP
geotechnical assessment in 2018.
The hydrogeological conditions are currently unknown, and it has been assumed for the purposes of
this study that the water table is coincident or slightly above the overburden/bedrock interface, as
determined by the site investigation program. Inflow rates or permissivity values were not
considered for this analysis.
Generally, high groundwater pressures and water pressure in tension cracks will reduce the rock
mass shear strength to adversely affect slope stability. Depressurization programs can reduce water
pressure behind the pit walls and may allow steeper slopes to be developed, if so desired. The rock
mass strength appears to be sufficient to preclude rock mass failure even if high water pressures are
present within the slopes, so natural drawdown that will develop will likely be adequate for the
design slopes.
Additionally, drawdown and dewatering of the pit is recommended to minimize damage associated
with freeze / thaw and problems caused by local adversely oriented structure.
Although high-level parameters are assumed for the stability analysis, further analysis is required to
understand the hydrogeological conditions to predict the effect on pit wall stability.
During the 2018 drilling program, it was noted that the piezometric surface was at or just above the
overburden/bedrock intercept.

Landore Resources Canada Inc. MINERAL RESOURCE ESTIMATE AND PRELIMINARY ECONOMIC ASSESSMENT, BAM Gold Project, Junior Lake Property, Ontario, Canada
Landore Resources Canada Inc. Page | 373
Recommended Pit Slope Design Criteria
The recommended bench geometry is a bench face angle of 80 degrees for all rock units and a bench
width of 8.5 m for a stacked bench height of 20 m (i.e., 2 x 10 m benches stacked) as calculated
during the WSP work in 2018.
For a given height of 20 m, TABLE 3 illustrates the calculated inter-ramp angles using the Modified
Ritchie Bench Width criterion. Based on information provided for a bench face angle of 80 degrees,
the inter-ramp angle is 59.0 degrees.
Table 3 - Recommended Bench Face Angles and Inter Ramp Angels with a Defined Bench Height (Nelson, 2018)
Lith Type
Face Angel
(degrees)
Berm Width
(m)
Berm Interval
(m)
Inter-Ramp Angle
(degrees)
All 80O 8.5 20 59O
Further studies should consider collection of additional data, to provide information that must be
considered for future analysis, including further assessment of any large-scale interpreted structural
features (such as faults) as well as additional holes at various azimuths to reduce any directional
bias.
The overall ramp angle has not been provided in this report but will be determined upon finalization
of the open pit design and will include ramping and other infrastructure considerations to be
provided by Landore and will result in a flatter overall pit wall angle.
Summary and Conclusions from 2018 Geotechnical Assessment
Given the quality of the rock mass, the strength of the rock, the generalized fabric description, and
the depth of the proposed pit, the stability of the pit will be governed by the kinematic instability of
the rock mass. The kinematic assessment identified a recommended bench face angle of 80 degrees
to minimize bench scale associated failures. Due to the presence of a concordant joint set system,
wedge failures have a high probability in the North Wall and the West Abutment. Toppling
associated failures have a high probability in the South Wall. The bench width has been scaled
appropriately to catch and retain this material, should a failure occur. However, the stability of the
benches should be assessed for each additional design stage and during production as more
additional geotechnical information becomes available and compared with the design criteria used
in this study.
Limit equilibrium analysis modelling of the global pit slope was undertaken to analyze for stability
and using the average values for rock quality rock and rock strength contributes to a Factor of Safety
greater than 1.3 for saturated conditions considering variations in blasting conditions and associated
deformation.
Further geotechnical campaigns should be completed to validate the input data parameters, and
orientation of structures in addition to more detailed stability assessments that reflect a geological,

Landore Resources Canada Inc. MINERAL RESOURCE ESTIMATE AND PRELIMINARY ECONOMIC ASSESSMENT, BAM Gold Project, Junior Lake Property, Ontario, Canada
Landore Resources Canada Inc. Page | 374
structural and geotechnical 3D model. Additional data will be required to be assessed at depth and
at varying orientations such that directional bias is minimized.
It is recommended that the assumptions for the structural regime and orientation of structures be
verified with future collected geotechnical data collection. This could include additional geotechnical
drill holes, trenching, televiewer campaigns. In addition, the assessment of the rock mass
parameters of the known structural discontinuities (faults/shears) on site should be completed and
included within a 3D geotechnical, structural and geological model.
It is recommended that data collection be completed of direct shear, shear box, and triaxial tests to
supplement the geotechnical dataset and to provide shear strength information of the intact rock
mass and validate the inputs used in this study.
Additional testing is recommended and data verification of the thickness of the overburden is
recommended to assess the in-situ parameters of the subsurface soil properties. Further detailed
modelling should incorporate these in situ parameters to validate the assumptions used in the
modelling analysis in this study. As well, further studies should include an assessment of the
proposed location of the waste dump(s) and the effects on high wall stability. If the proposed waste
dumps are proximal to the pit walls, they would be a surficial load and should be considered within a
limit equilibrium stability assessment. Hydrogeological studies should be implemented to
understand the hydrogeological regime to provide input data for assessment on the effect on the
open pit stability. Location of the piezometric surface is required to be verified. Detailed analysis (3D
numerical modelling) of the proposed stope configuration and sequencing of mining blocks is
recommended to proceed to a feasibility study.
Additional geotechnical campaigns should continue to collect discontinuity characteristics. In
addition, shear box tests on various lithological type would further determine/validate shear
strength parameters at the BAM Project.
Stability of the final bench faces can be improved through the use of good, controlled blasting
techniques and through scaling of loose rock from the bench faces and removal of loose on benches
after blasting. This design has an operational constraint including careful controlled blasting.
Extensive monitoring of pit slopes and ongoing commitment to data collection throughout the life of
the Project is required to ensure design appropriateness and validate for assumed design
parameters.
A hydrogeologic assessment has not been completed for the BAM Project at the time of assessment.
During the 2018 drilling program, it was noted that the piezometric surface was at or just above the
overburden/bedrock intercept.